Cambridge IGCSE Geography 0460 — 2020 May/June Paper 2 · Variant 3
0460/23/M/J/20 · 6 questions · 60 marks · ≈68 min
The question paper and its mark scheme, free to read here and free to download. This is Cambridge’s own paper, exactly as it was sat.
Question paper20 pages

Mark scheme6 pages
Answers below. Sit the paper first if you are practising.
Questions as text
Q1 · Study the map extract for Esneux, Belgium
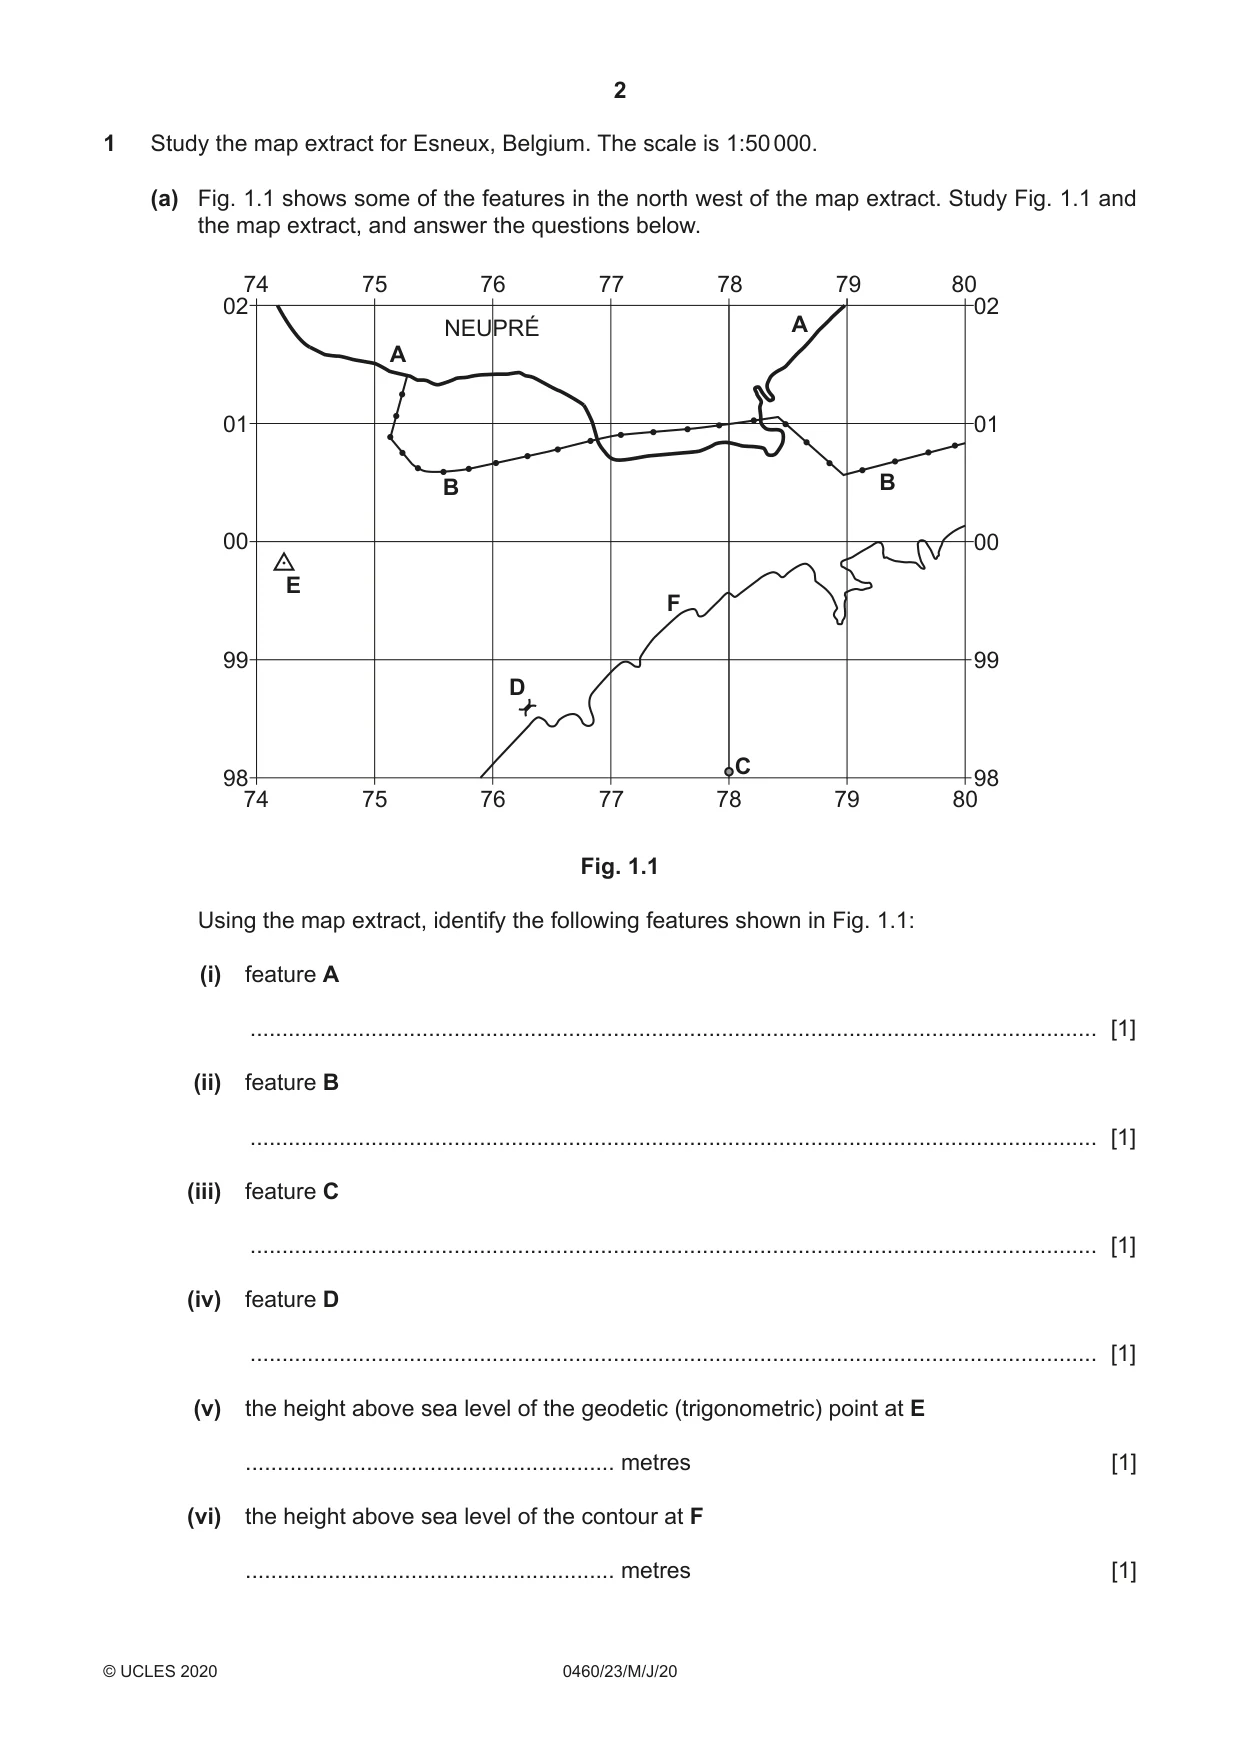
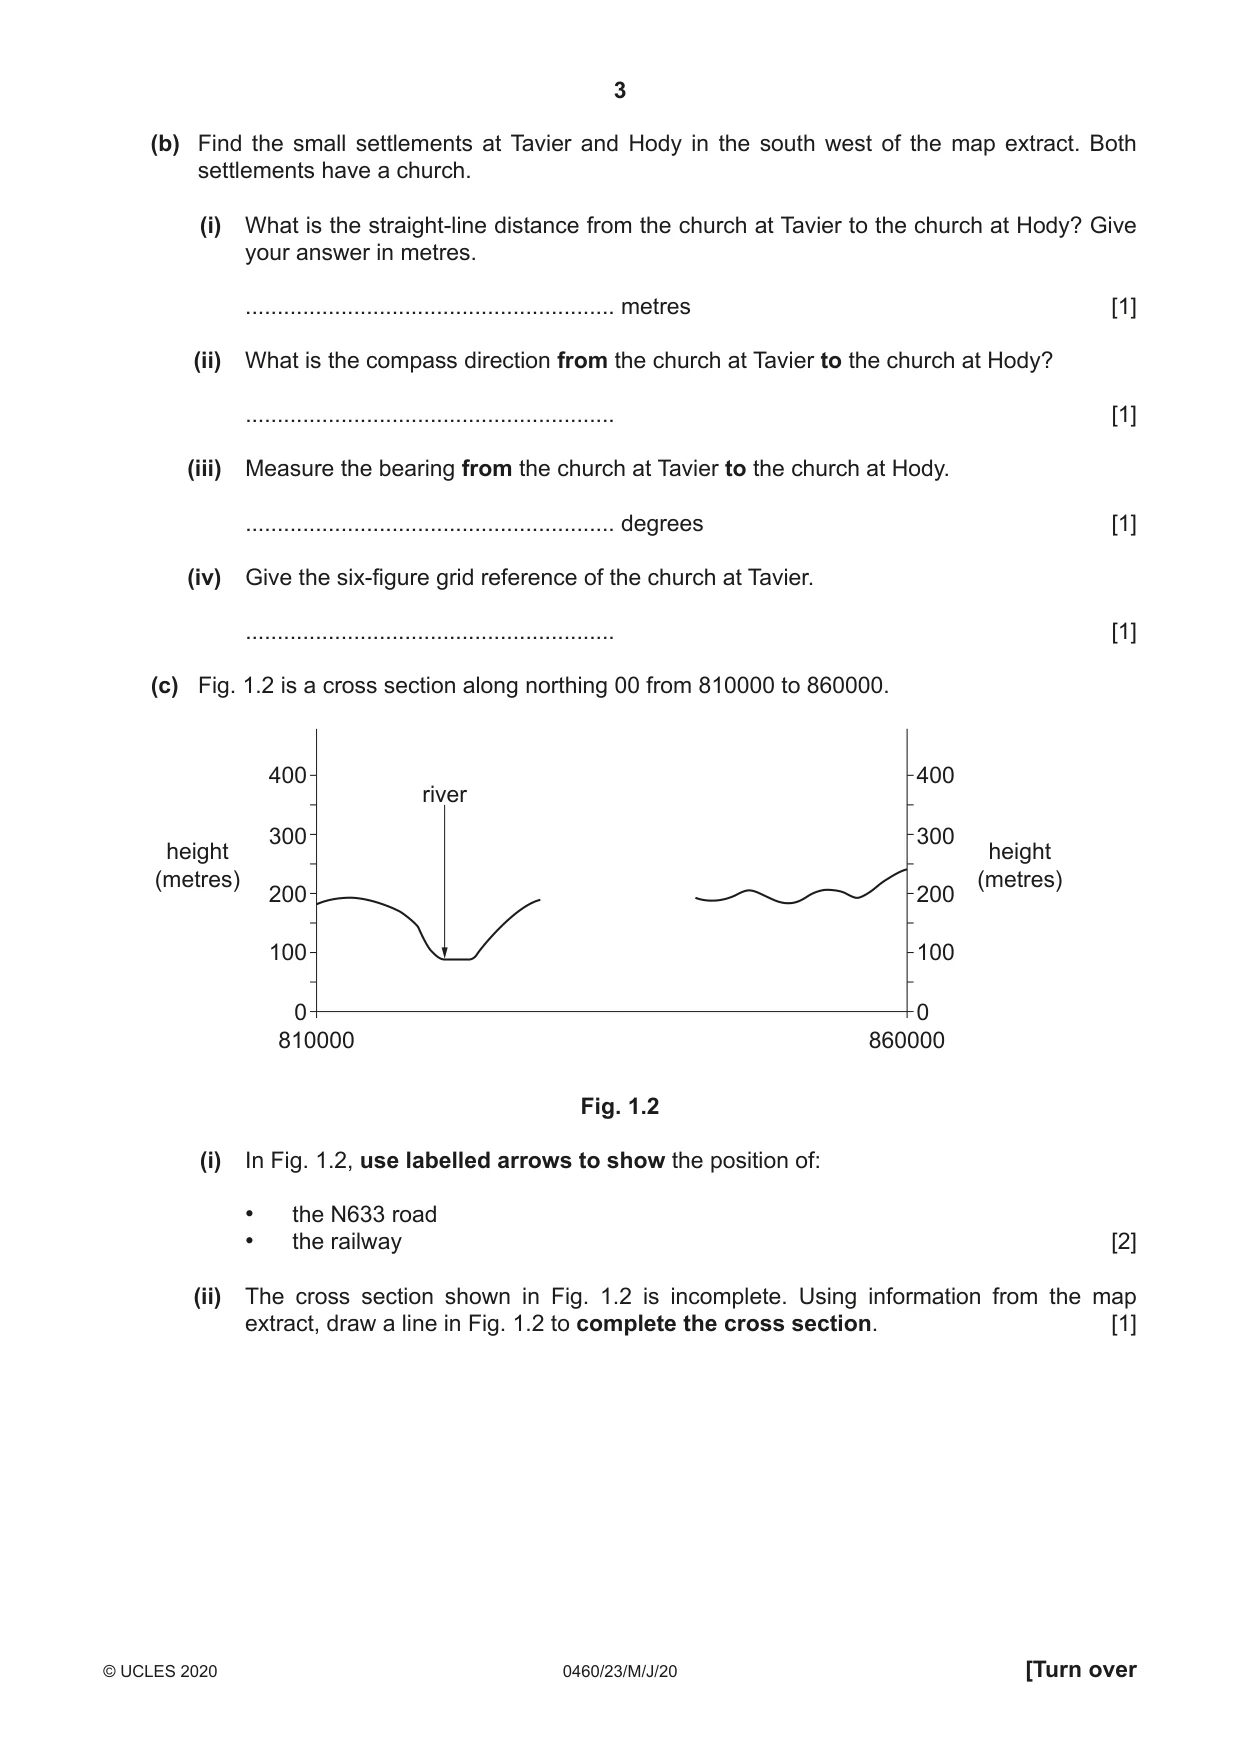
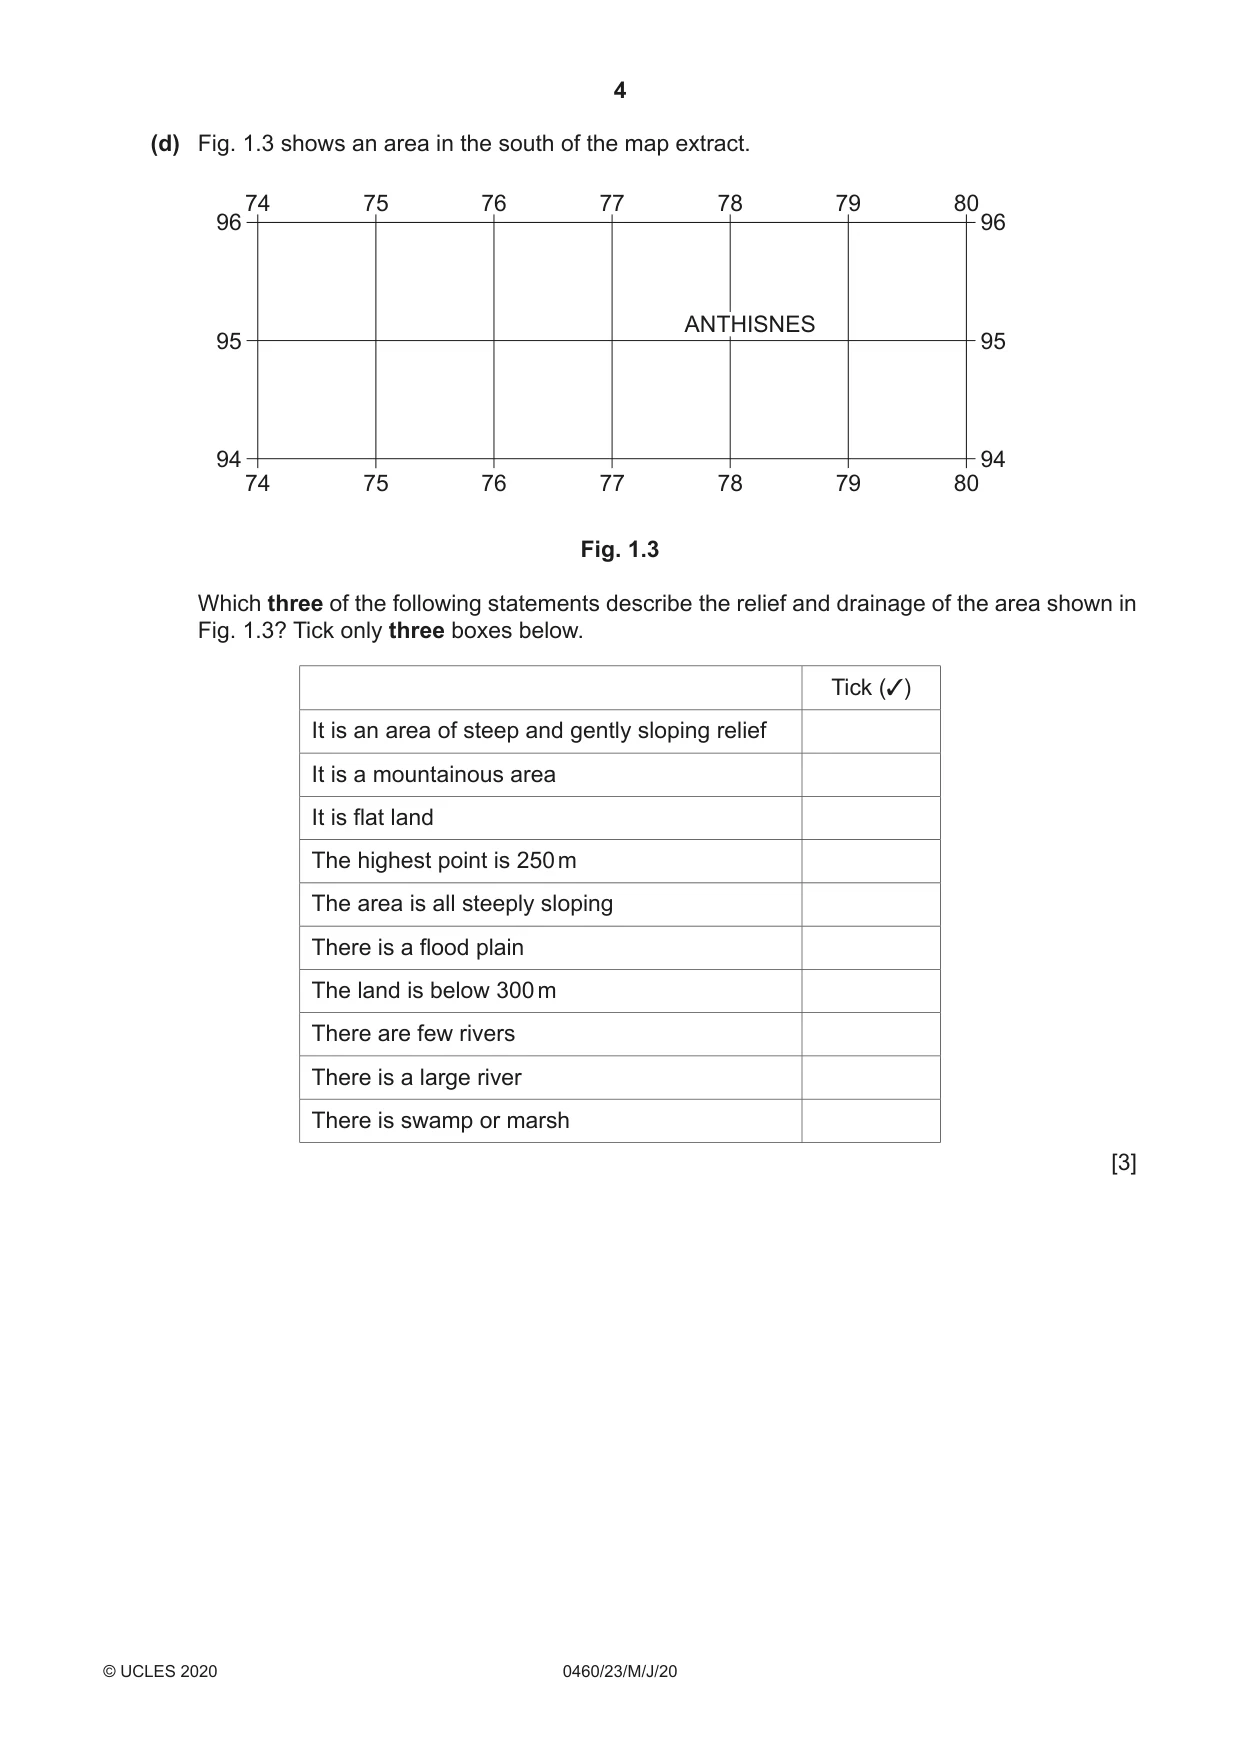
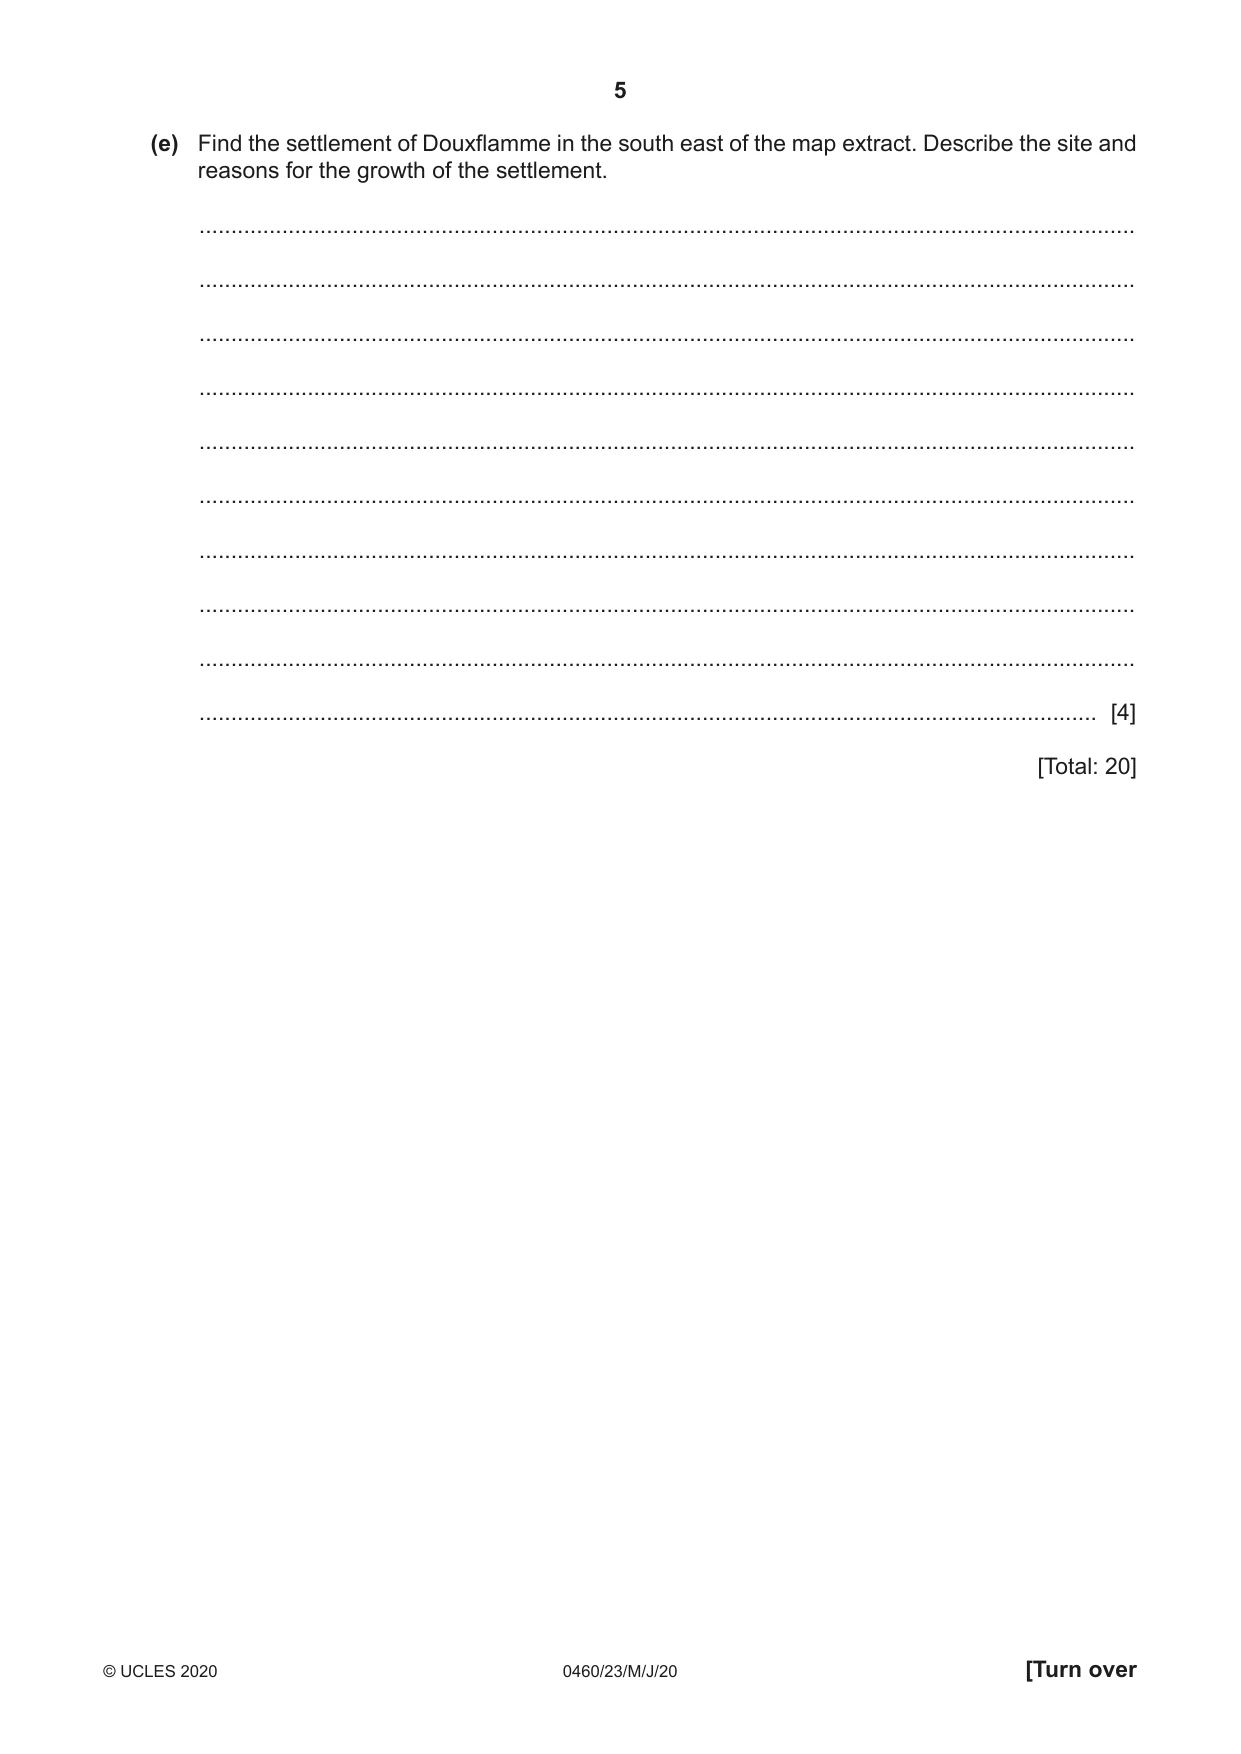
1 Study the map extract for Esneux, Belgium. The scale is 1:50 000. (a) Fig. 1.1 shows some of the features in the north west of the map extract. Study Fig. 1.1 and the map extract, and answer the questions below. 74 75 76 77 78 79 80 02 02 NEUPRÉ A A 01 01 B B 00 00 E F 99 99 D C 98 98 74 75 76 77 78 79 80 Fig. 1.1 Using the map extract, identify the following features shown in Fig. 1.1: (i) feature A ..................................................................................................................................... [1] (ii) feature B ..................................................................................................................................... [1] (iii) feature C ..................................................................................................................................... [1] (iv) feature D ..................................................................................................................................... [1] (v) the height above sea level of the geodetic (trigonometric) point at E .......................................................... metres [1] (vi) the height above sea level of the contour at F .......................................................... metres [1] (b) Find the small settlements at Tavier and Hody in the south west of the map extract. Both settlements have a church. (i) What is the straight-line distance from the church at Tavier to the church at Hody? Give your answer in metres. .......................................................... metres [1] (ii) What is the compass direction from the church at Tavier to the church at Hody? .......................................................... [1] (iii) Measure the bearing from the church at Tavier to the church at Hody. .......................................................... degrees [1] (iv) Give the six-figure grid reference of the church at Tavier. .......................................................... [1] (c) Fig. 1.2 is a cross section along northing 00 from 810000 to 860000. 400 400 river 300 300 height height (metres) (metres) 200 200 100 100 0 0 810000 860000 Fig. 1.2 (i) In Fig. 1.2, use labelled arrows to show the position of: • the N633 road • the railway [2] (ii) The cross section shown in Fig. 1.2 is incomplete. Using information from the map extract, draw a line in Fig. 1.2 to complete the cross section. [1] (d) Fig. 1.3 shows an area in the south of the map extract. 74 75 76 77 78 79 80 96 96 ANTHISNES 95 95 94 94 74 75 76 77 78 79 80 Fig. 1.3 Which three of the following statements describe the relief and drainage of the area shown in Fig. 1.3? Tick only three boxes below. Tick (3) It is an area of steep and gently sloping relief It is a mountainous area It is flat land The highest point is 250 m The area is all steeply sloping There is a flood plain The land is below 300 m There are few rivers There is a large river There is swamp or marsh [3] (e) Find the settlement of Douxflamme in the south east of the map extract. Describe the site and reasons for the growth of the settlement. ................................................................................................................................................... ................................................................................................................................................... ................................................................................................................................................... ................................................................................................................................................... ................................................................................................................................................... ................................................................................................................................................... ................................................................................................................................................... ................................................................................................................................................... ................................................................................................................................................... ............................................................................................................................................. [4] [Total: 20]
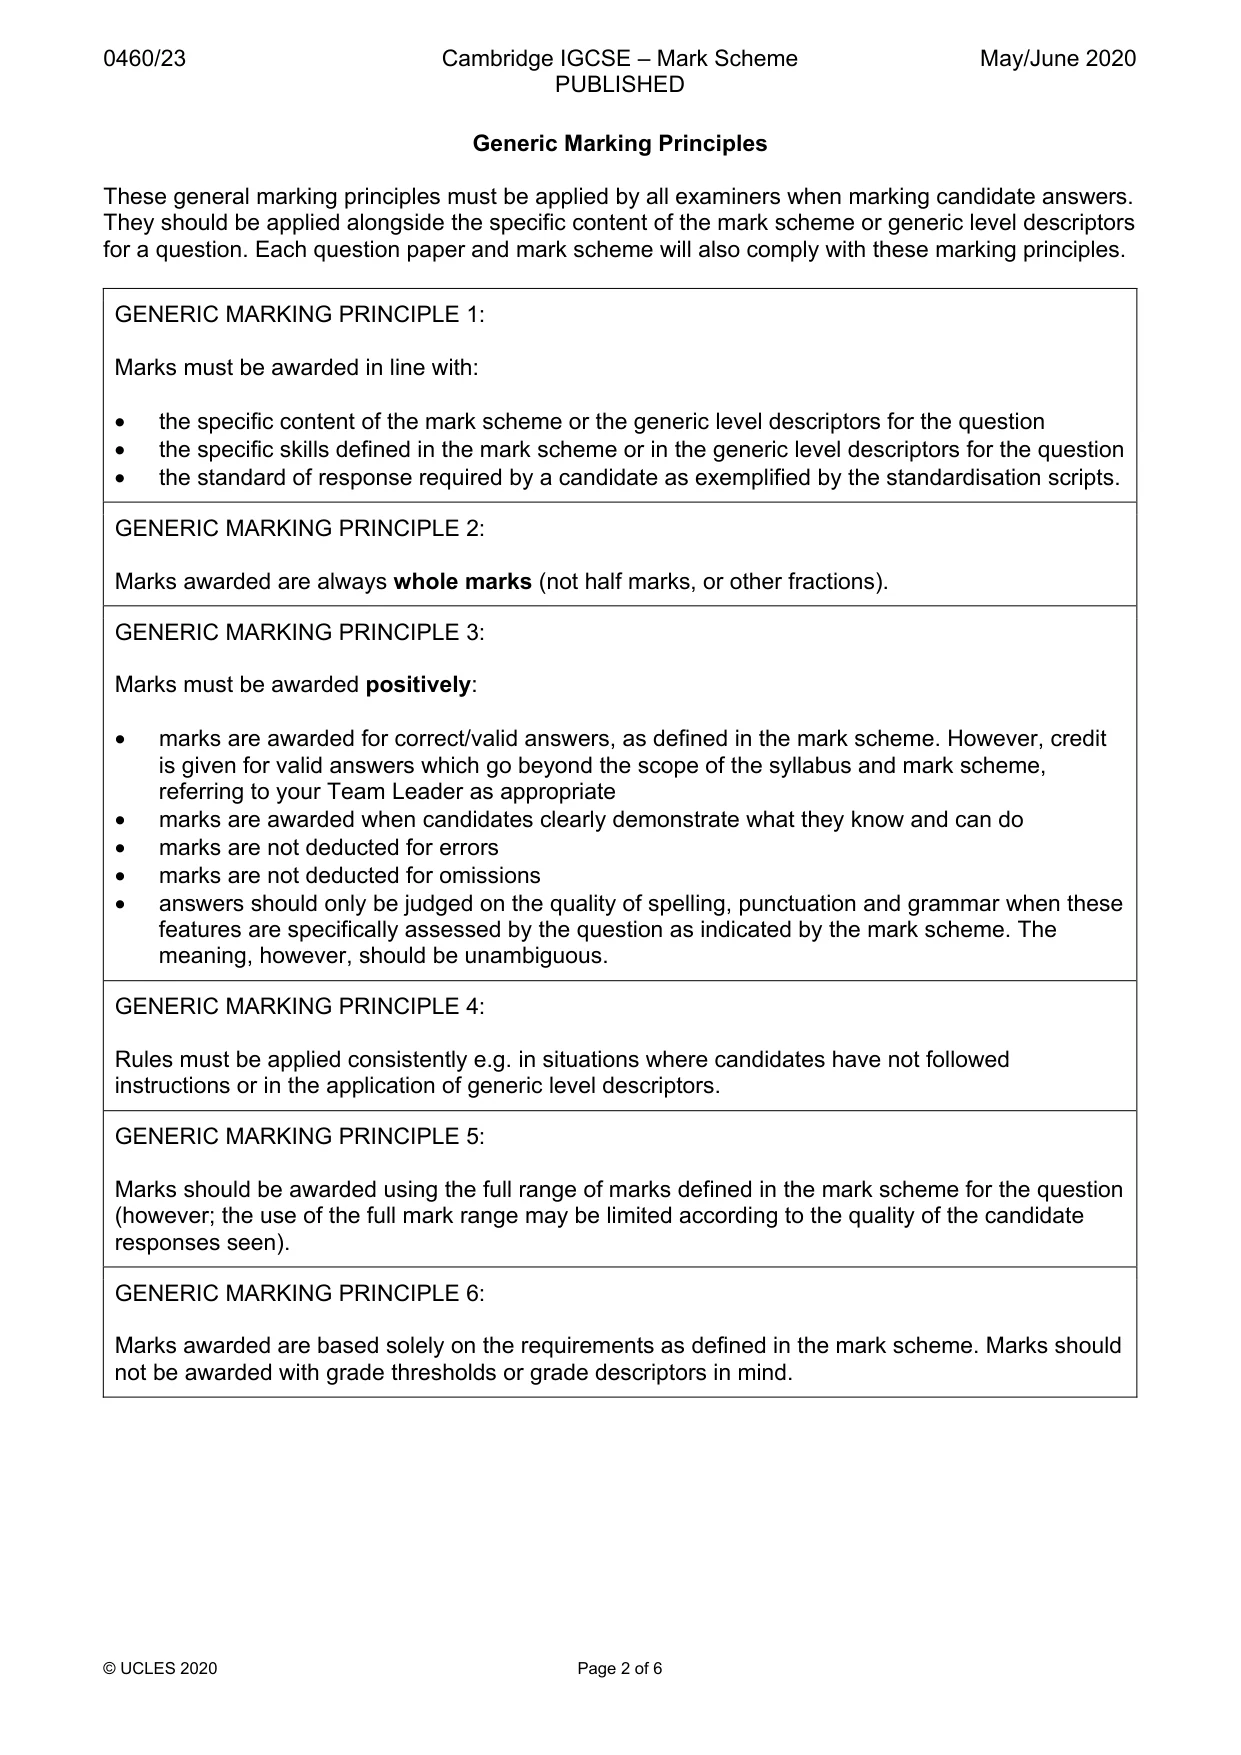
Mark scheme: Question Answer Marks 1(a)(i) (secondary) road, 1 1(a)(ii) high voltage line, 1 1(a)(iii) water tower, 1 1(a)(iv) castle, 1 1(a)(v) 258 (m), 1 1(a)(vi) 200 (m), 1 1(b)(i) 2300–2400 m, 1 1(b)(ii) south east/east-south east, 1 1(b)(iii) 111–113° 1 1(b)(iv) 752/3967, 1 1(c)(i) correct position of N633 road, 2 correct position of railway, 1(c)(ii) land rising to a summit below 250 m, 1 1(d) it is an area of steep and gently sloping relief, 3 the land is below 300 m, there are few rivers, 1(e) on valley floor, ) 4 on valley side, ) in valley alone = 1 junction of valleys, accessibility (dev.), road junction, bridge point, railway, water from river, woodland for fuel,
Q2 · Information about the population of Costa Rica, a country in Central America, in 1990 and…
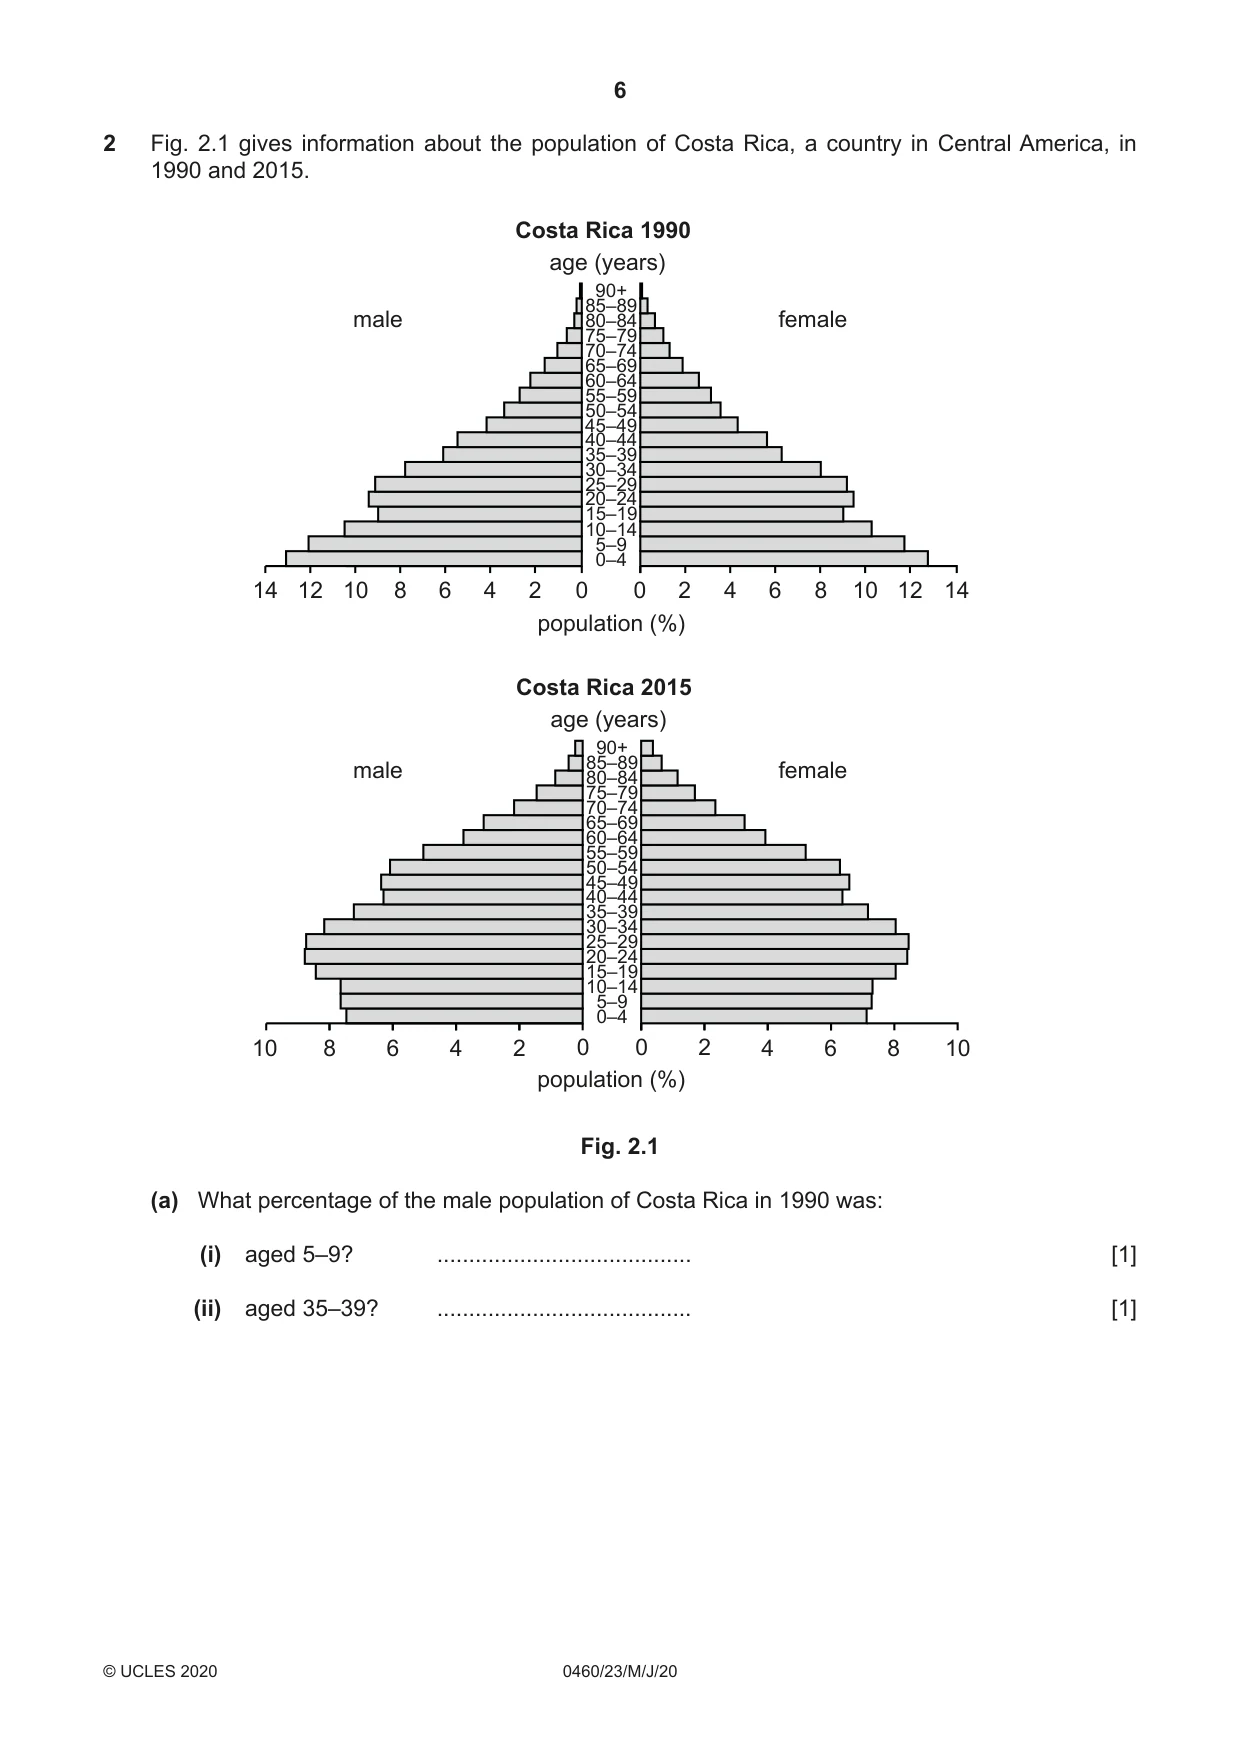
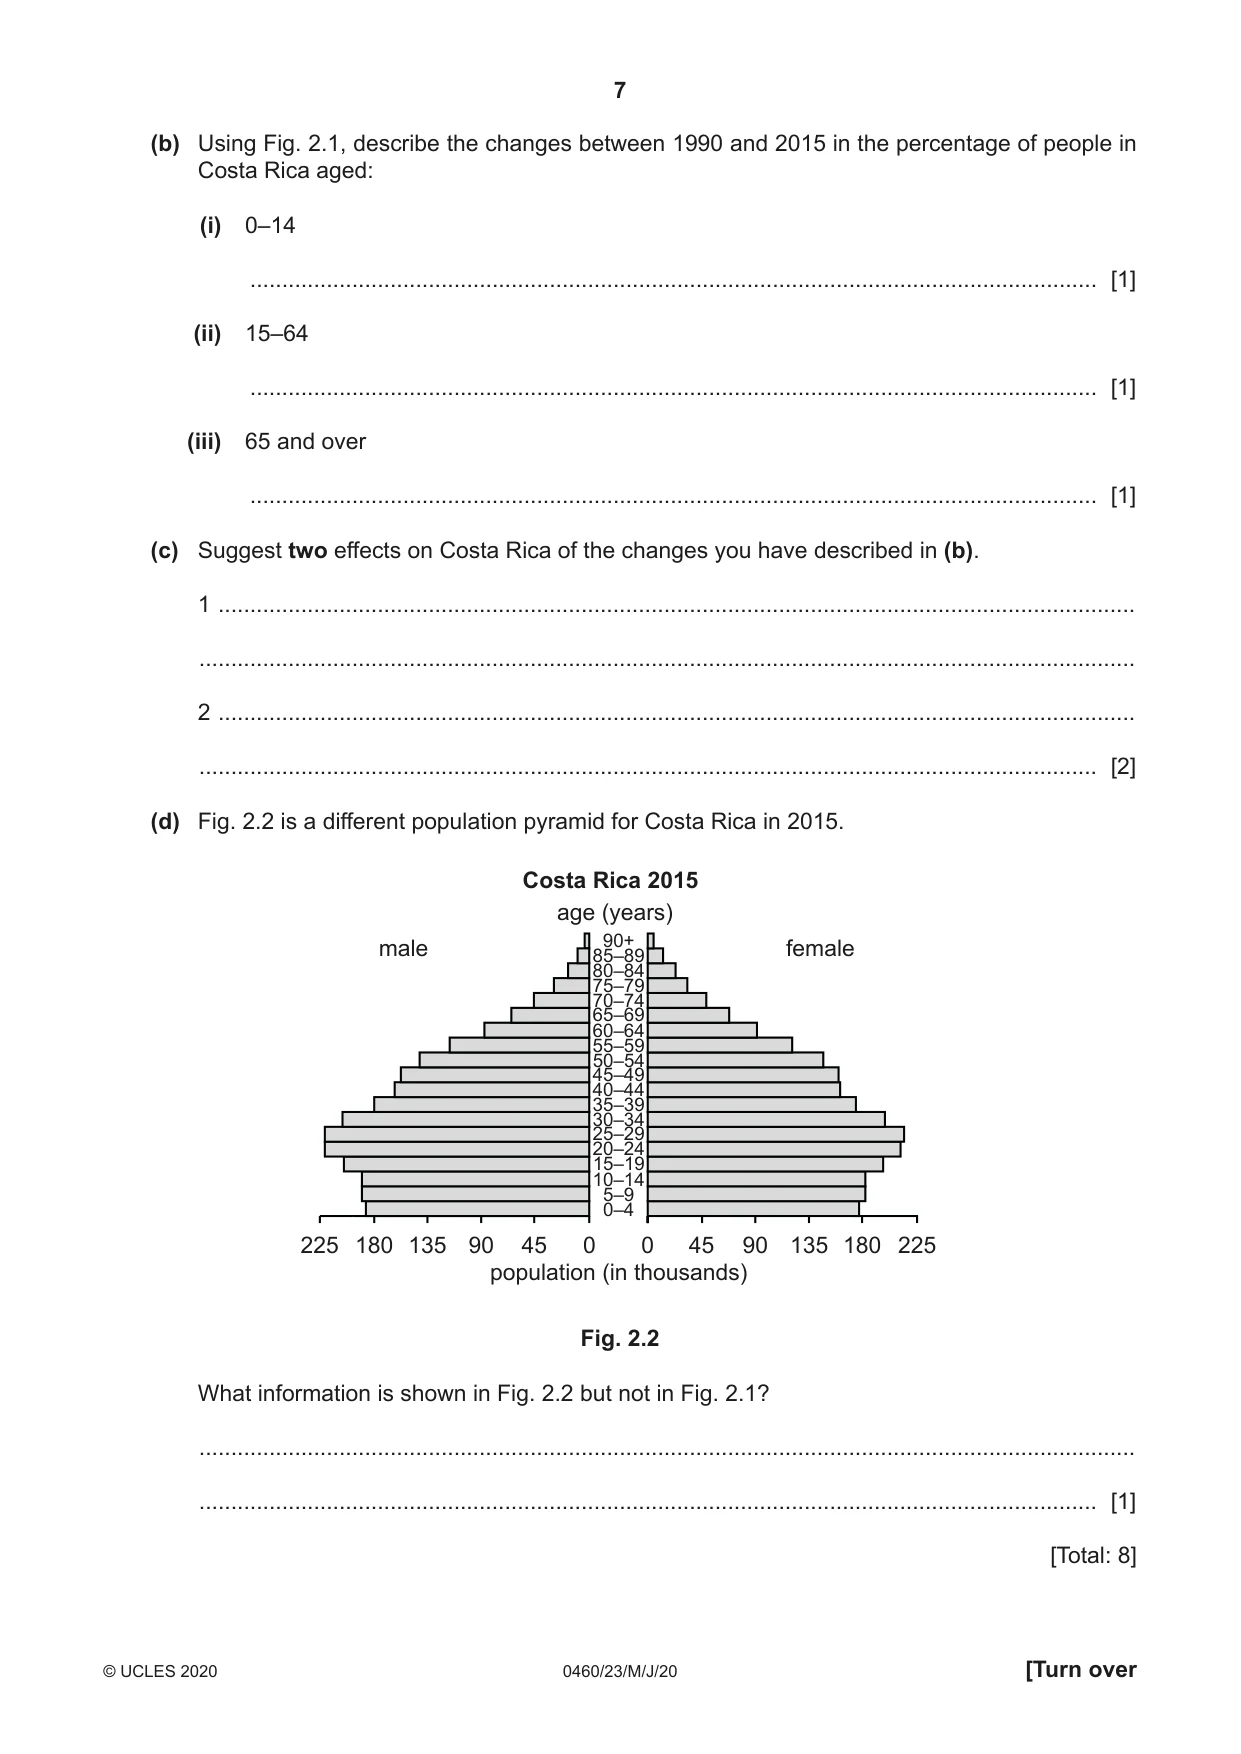
2 Fig. 2.1 gives information about the population of Costa Rica, a country in Central America, in 1990 and 2015. Costa Rica 1990 age (years) 90+ 85–89 male 80–84 female 75–79 70–74 65–69 60–64 55–59 50–54 45–49 40–44 35–39 30–34 25–29 20–24 15–19 10–14 5–9 0–4 14 12 10 8 6 4 2 0 0 2 4 6 8 10 12 14 population (%) Costa Rica 2015 age (years) 90+ male 85–8980–84 female 75–79 70–74 65–69 60–64 55–59 50–54 45–49 40–44 35–39 30–34 25–29 20–24 15–19 10–14 5–9 0–4 10 8 6 4 2 0 0 2 4 6 8 10 population (%) Fig. 2.1 (a) What percentage of the male population of Costa Rica in 1990 was: (i) aged 5–9? ........................................ [1] (ii) aged 35–39? ........................................ [1] (b) Using Fig. 2.1, describe the changes between 1990 and 2015 in the percentage of people in Costa Rica aged: (i) 0–14 ..................................................................................................................................... [1] (ii) 15–64 ..................................................................................................................................... [1] (iii) 65 and over ..................................................................................................................................... [1] (c) Suggest two effects on Costa Rica of the changes you have described in (b). 1 ................................................................................................................................................ ................................................................................................................................................... 2 ................................................................................................................................................ ............................................................................................................................................. [2] (d) Fig. 2.2 is a different population pyramid for Costa Rica in 2015. Costa Rica 2015 age (years) male 85–8990+ female 80–84 75–79 70–74 65–69 60–64 55–59 50–54 45–49 40–44 35–39 30–34 25–29 20–24 15–19 10–14 5–9 0–4 225 180 135 90 45 0 0 45 90 135 180 225 population (in thousands) Fig. 2.2 What information is shown in Fig. 2.2 but not in Fig. 2.1? ................................................................................................................................................... ............................................................................................................................................. [1] [Total: 8]
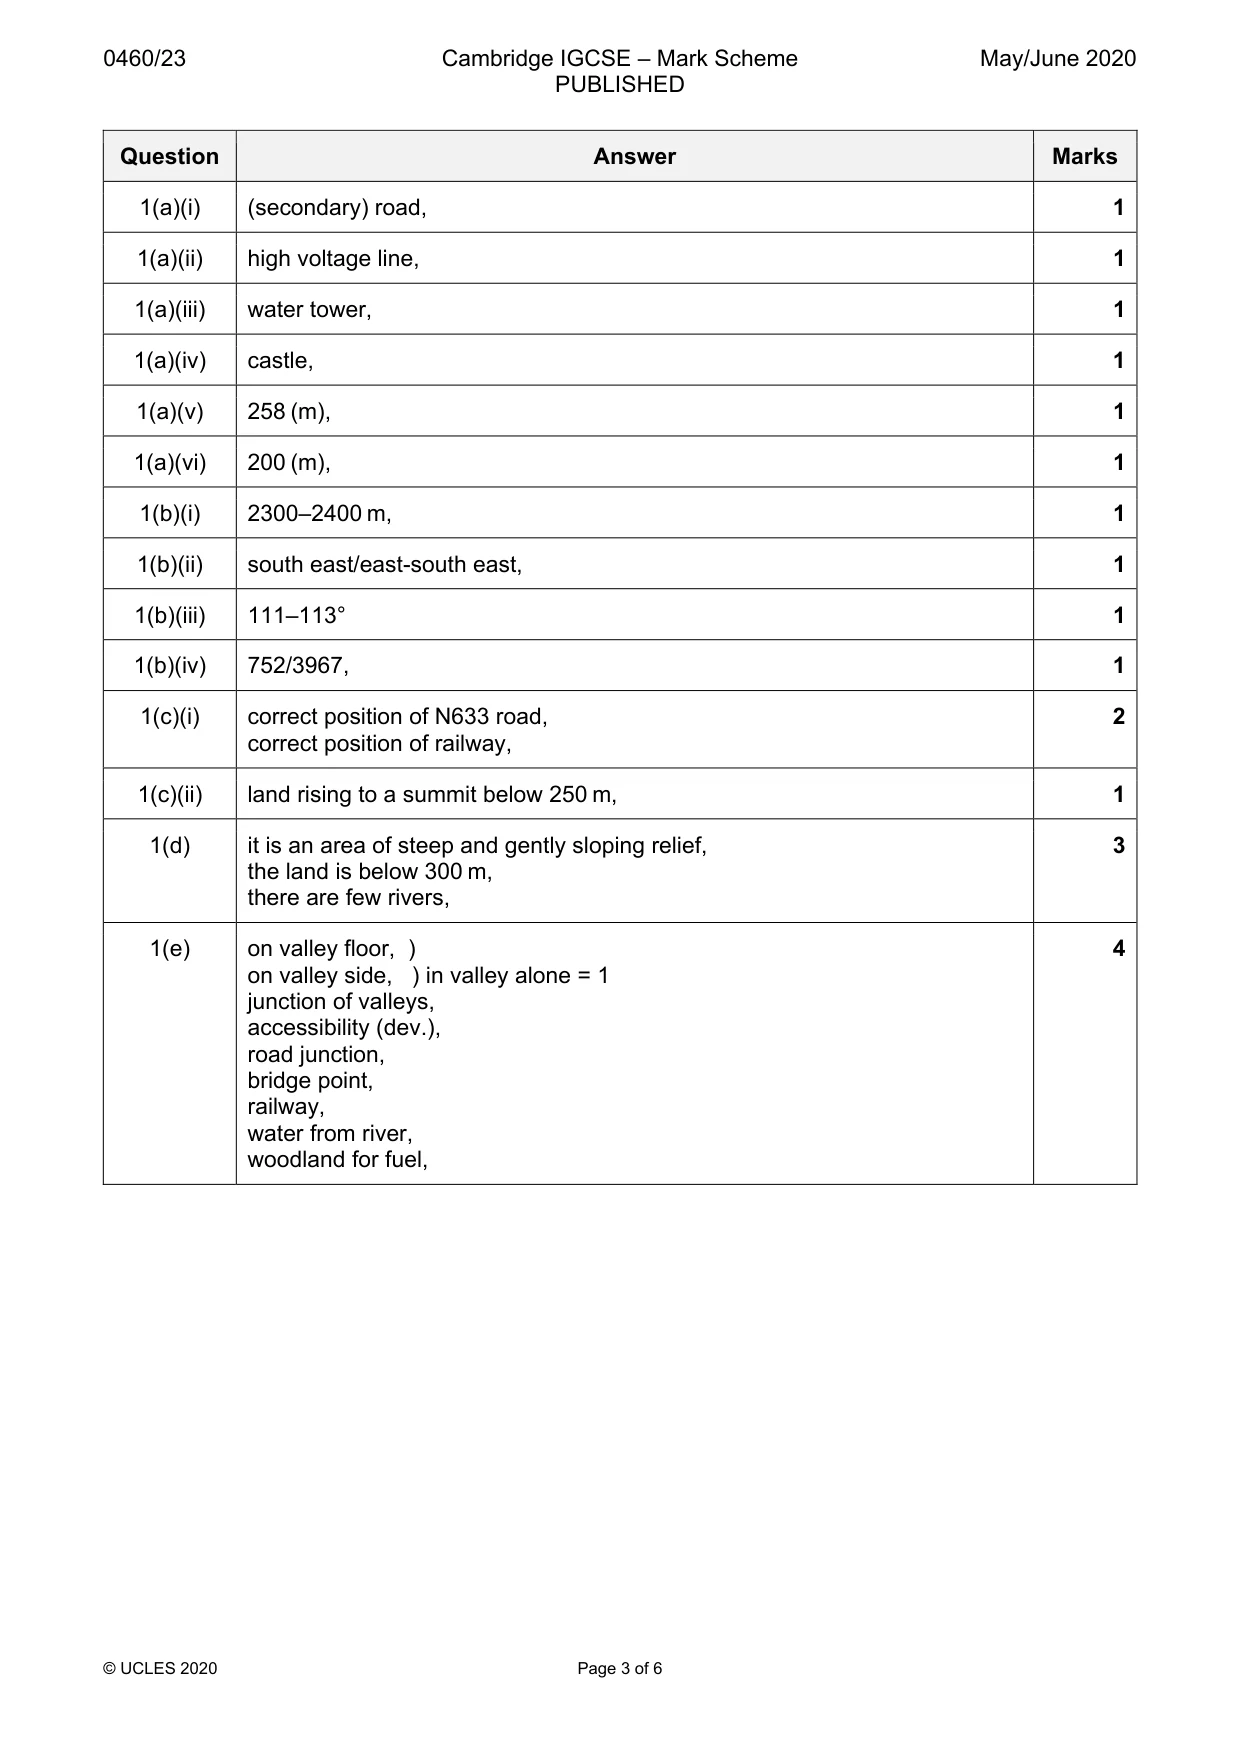
Mark scheme: 2(a)(i) 12(%) 1 2(a)(ii) 6(%) 1 2(b)(i) decrease, 1 2(b)(ii) increase, 1 2(b)(iii) increase, 1 2(c) less spent on schools/child care, 2 larger workforce, greater economic output, more spent on care for elderly, 2(d) shows number of people/total population, 1
Question 3
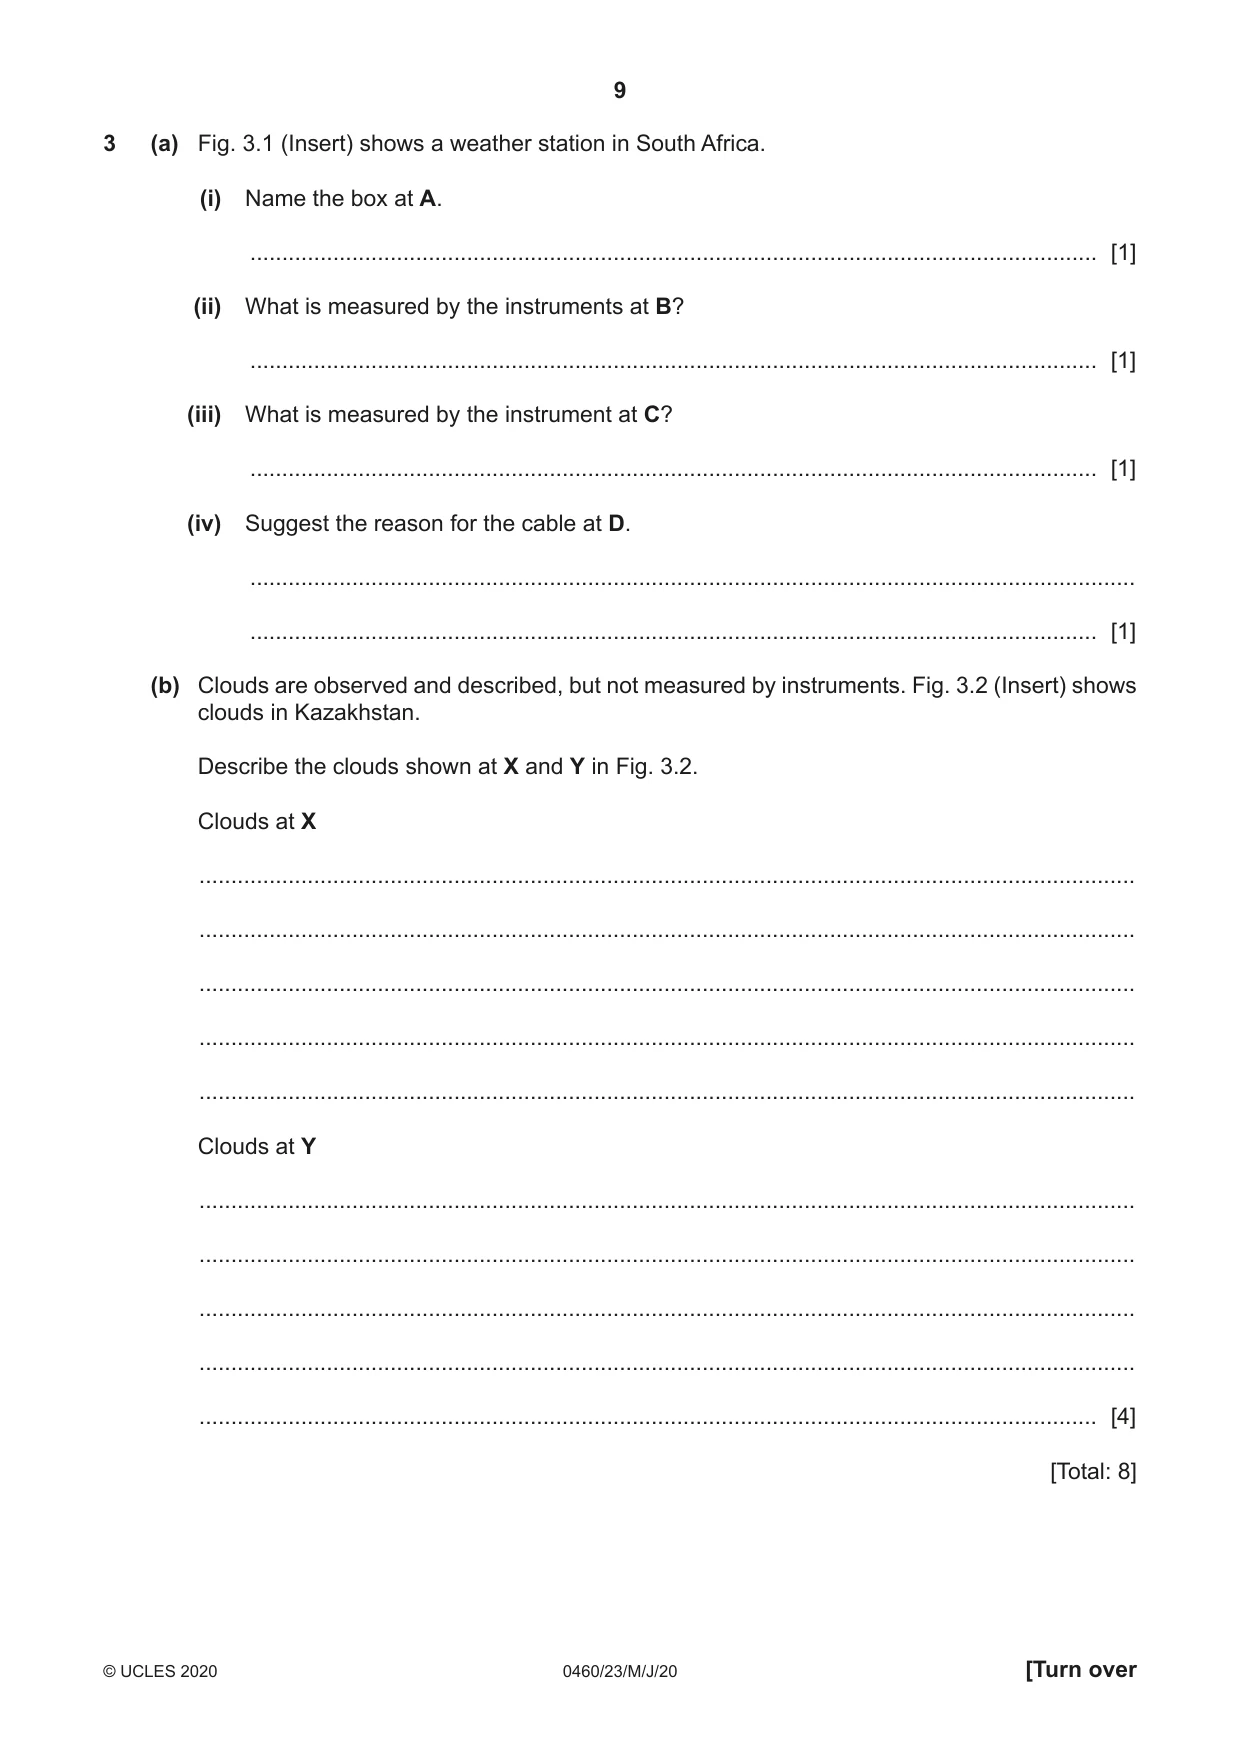
3 (a) Fig. 3.1 (Insert) shows a weather station in South Africa. (i) Name the box at A. ..................................................................................................................................... [1] (ii) What is measured by the instruments at B? ..................................................................................................................................... [1] (iii) What is measured by the instrument at C? ..................................................................................................................................... [1] (iv) Suggest the reason for the cable at D. ........................................................................................................................................... ..................................................................................................................................... [1] (b) Clouds are observed and described, but not measured by instruments. Fig. 3.2 (Insert) shows clouds in Kazakhstan. Describe the clouds shown at X and Y in Fig. 3.2. Clouds at X ................................................................................................................................................... ................................................................................................................................................... ................................................................................................................................................... ................................................................................................................................................... ................................................................................................................................................... Clouds at Y ................................................................................................................................................... ................................................................................................................................................... ................................................................................................................................................... ................................................................................................................................................... ............................................................................................................................................. [4] [Total: 8]
Mark scheme: 3(a)(i) Stevenson screen, 1 3(a)(ii) wind (speed or direction), 1 3(a)(iii) rainfall/precipitation, 1 3(a)(iv) transmit data, 1 3(b) Clouds at X 4 low, fluffy/cotton wool/cauliflower, cumulus, Clouds at Y high, wispy, cirrus, anvil, Reserve one mark for each.
Q4 · In 2017, 36% of Germany’s electricity was generated from renewable energy sources and 64%…
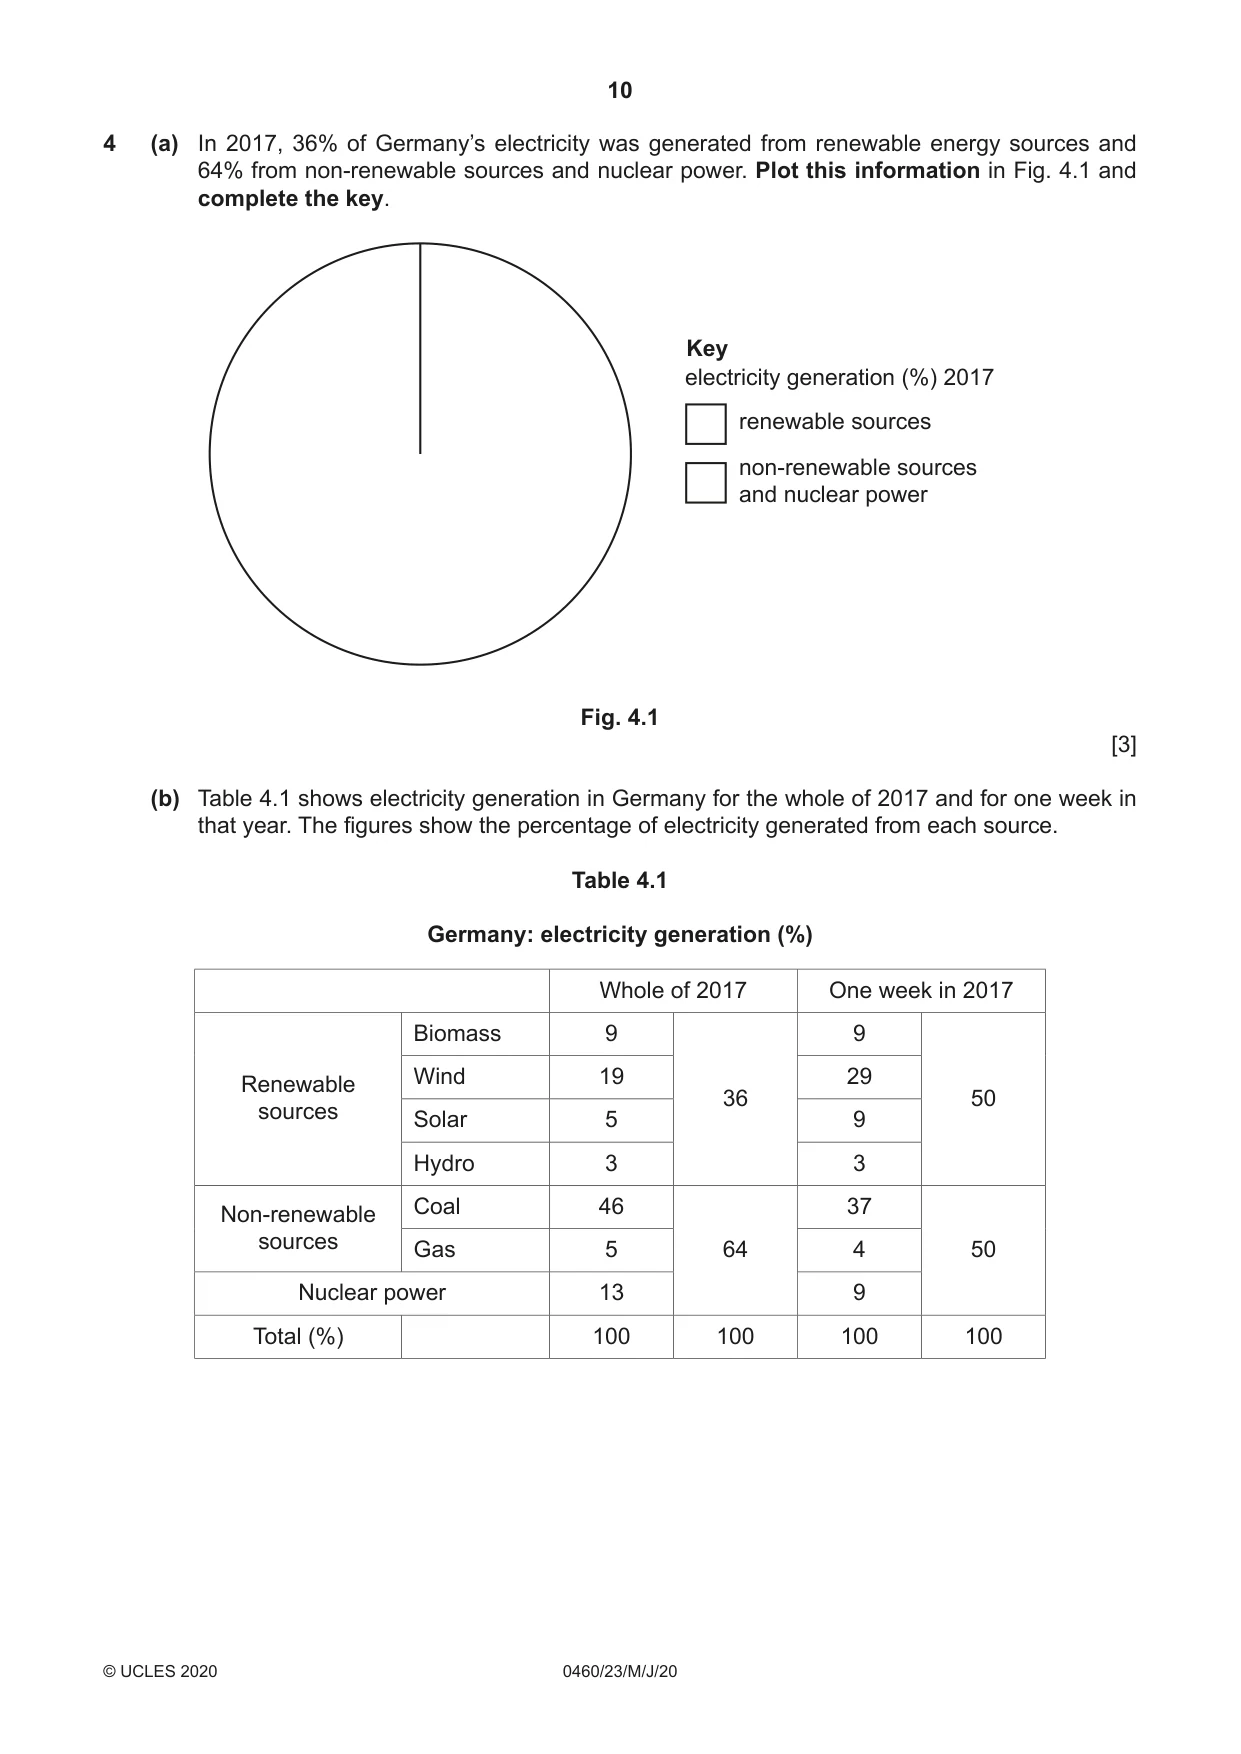
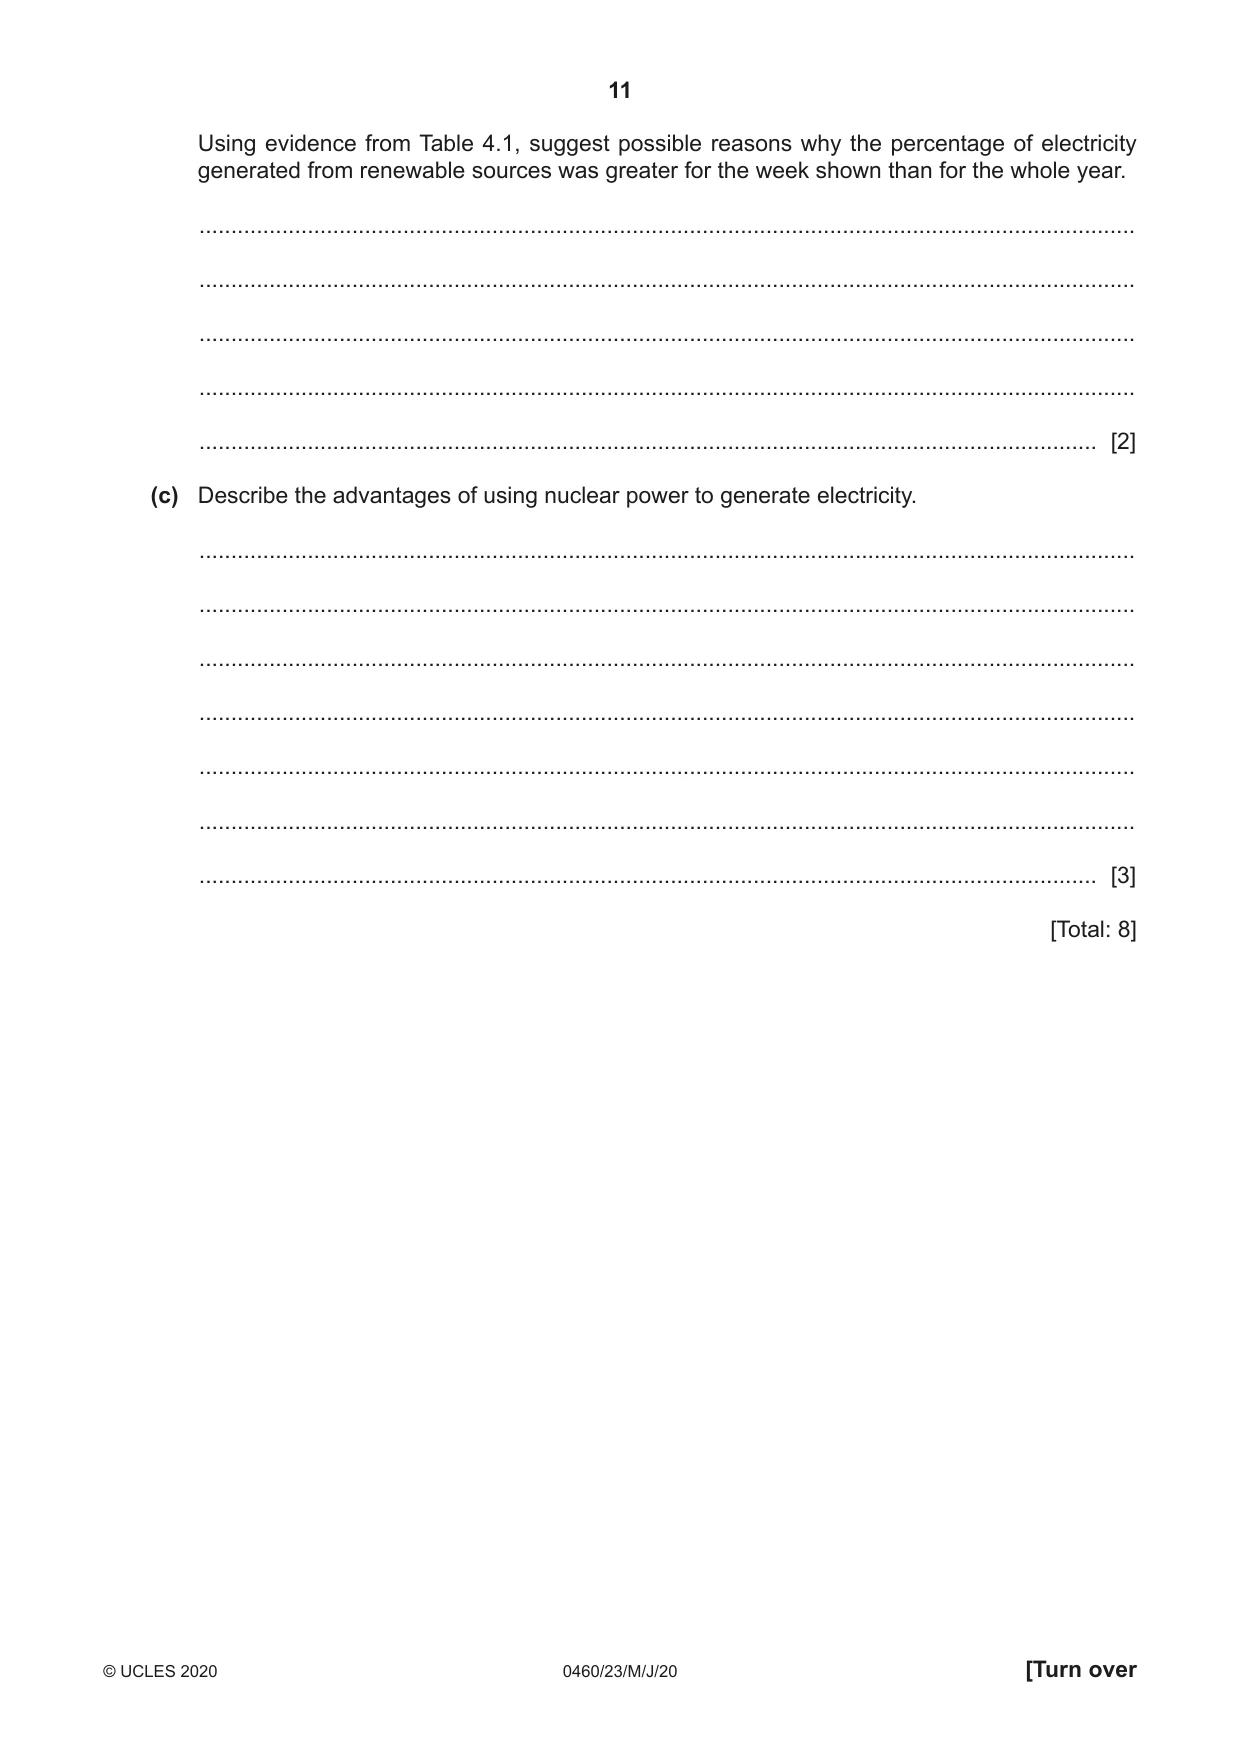
4 (a) In 2017, 36% of Germany’s electricity was generated from renewable energy sources and 64% from non-renewable sources and nuclear power. Plot this information in Fig. 4.1 and complete the key. Key electricity generation (%) 2017 renewable sources non-renewable sources and nuclear power Fig. 4.1 [3] (b) Table 4.1 shows electricity generation in Germany for the whole of 2017 and for one week in that year. The figures show the percentage of electricity generated from each source. Table 4.1 Germany: electricity generation (%) Whole of 2017 One week in 2017 Biomass 9 9 Wind 19 29 Renewable 36 50 sources Solar 5 9 Hydro 3 3 Coal 46 37 Non-renewable sources Gas 5 64 4 50 Nuclear power 13 9 Total (%) 100 100 100 100 Using evidence from Table 4.1, suggest possible reasons why the percentage of electricity generated from renewable sources was greater for the week shown than for the whole year. ................................................................................................................................................... ................................................................................................................................................... ................................................................................................................................................... ................................................................................................................................................... ............................................................................................................................................. [2] (c) Describe the advantages of using nuclear power to generate electricity. ................................................................................................................................................... ................................................................................................................................................... ................................................................................................................................................... ................................................................................................................................................... ................................................................................................................................................... ................................................................................................................................................... ............................................................................................................................................. [3] [Total: 8]
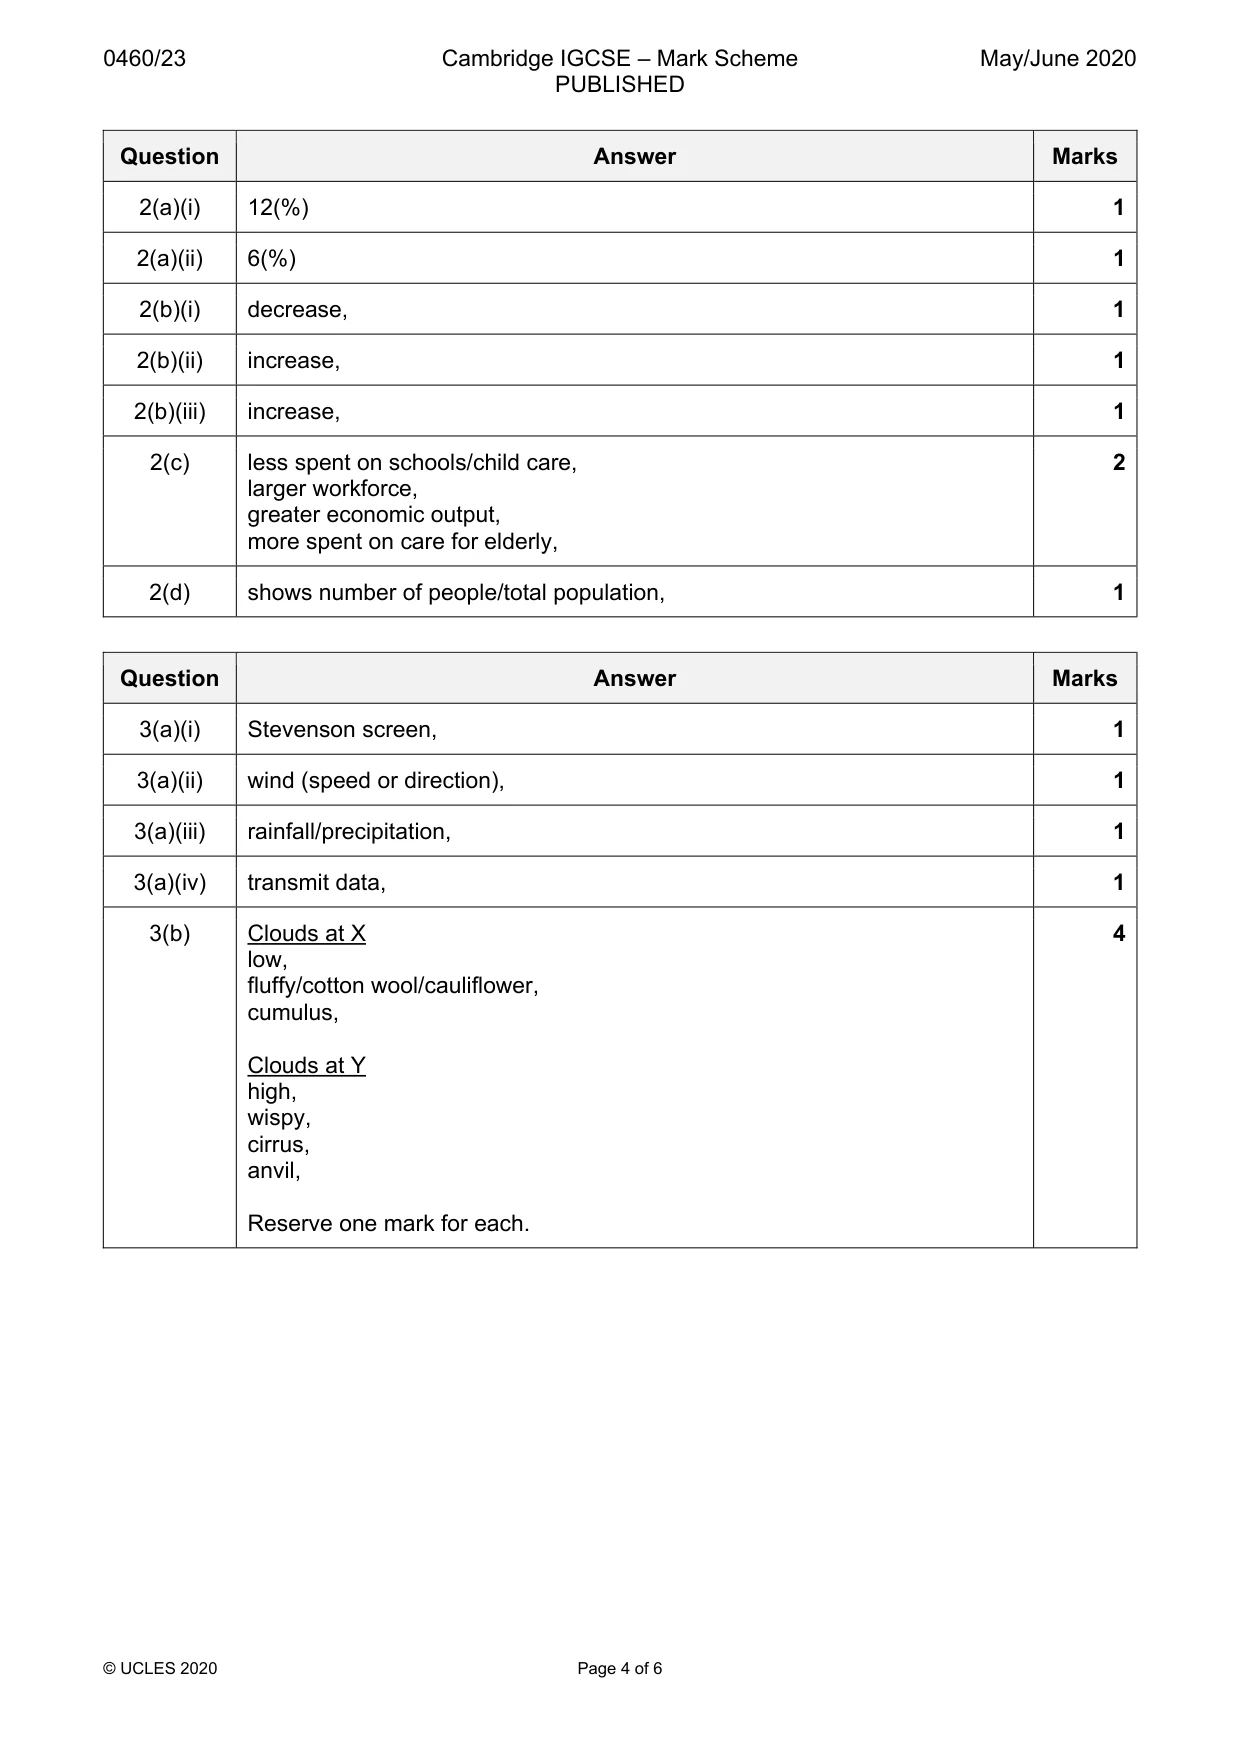
Mark scheme: 4(a) smaller sector plotted at 128–131° = 2, 3 smaller sector plotted at 126–133° = 1, key used correctly with renewables as the smaller sector = 1 4(b) more wind that week, 2 more sun that week, allowed sources to be switched from nuclear/coal, 4(c) only small amounts of uranium/fuel needed (to generate large amounts of 3 power), uranium will not run out in the foreseeable future, does not produce greenhouse gases/acid rain, improved regulation and safety record,
Question 5
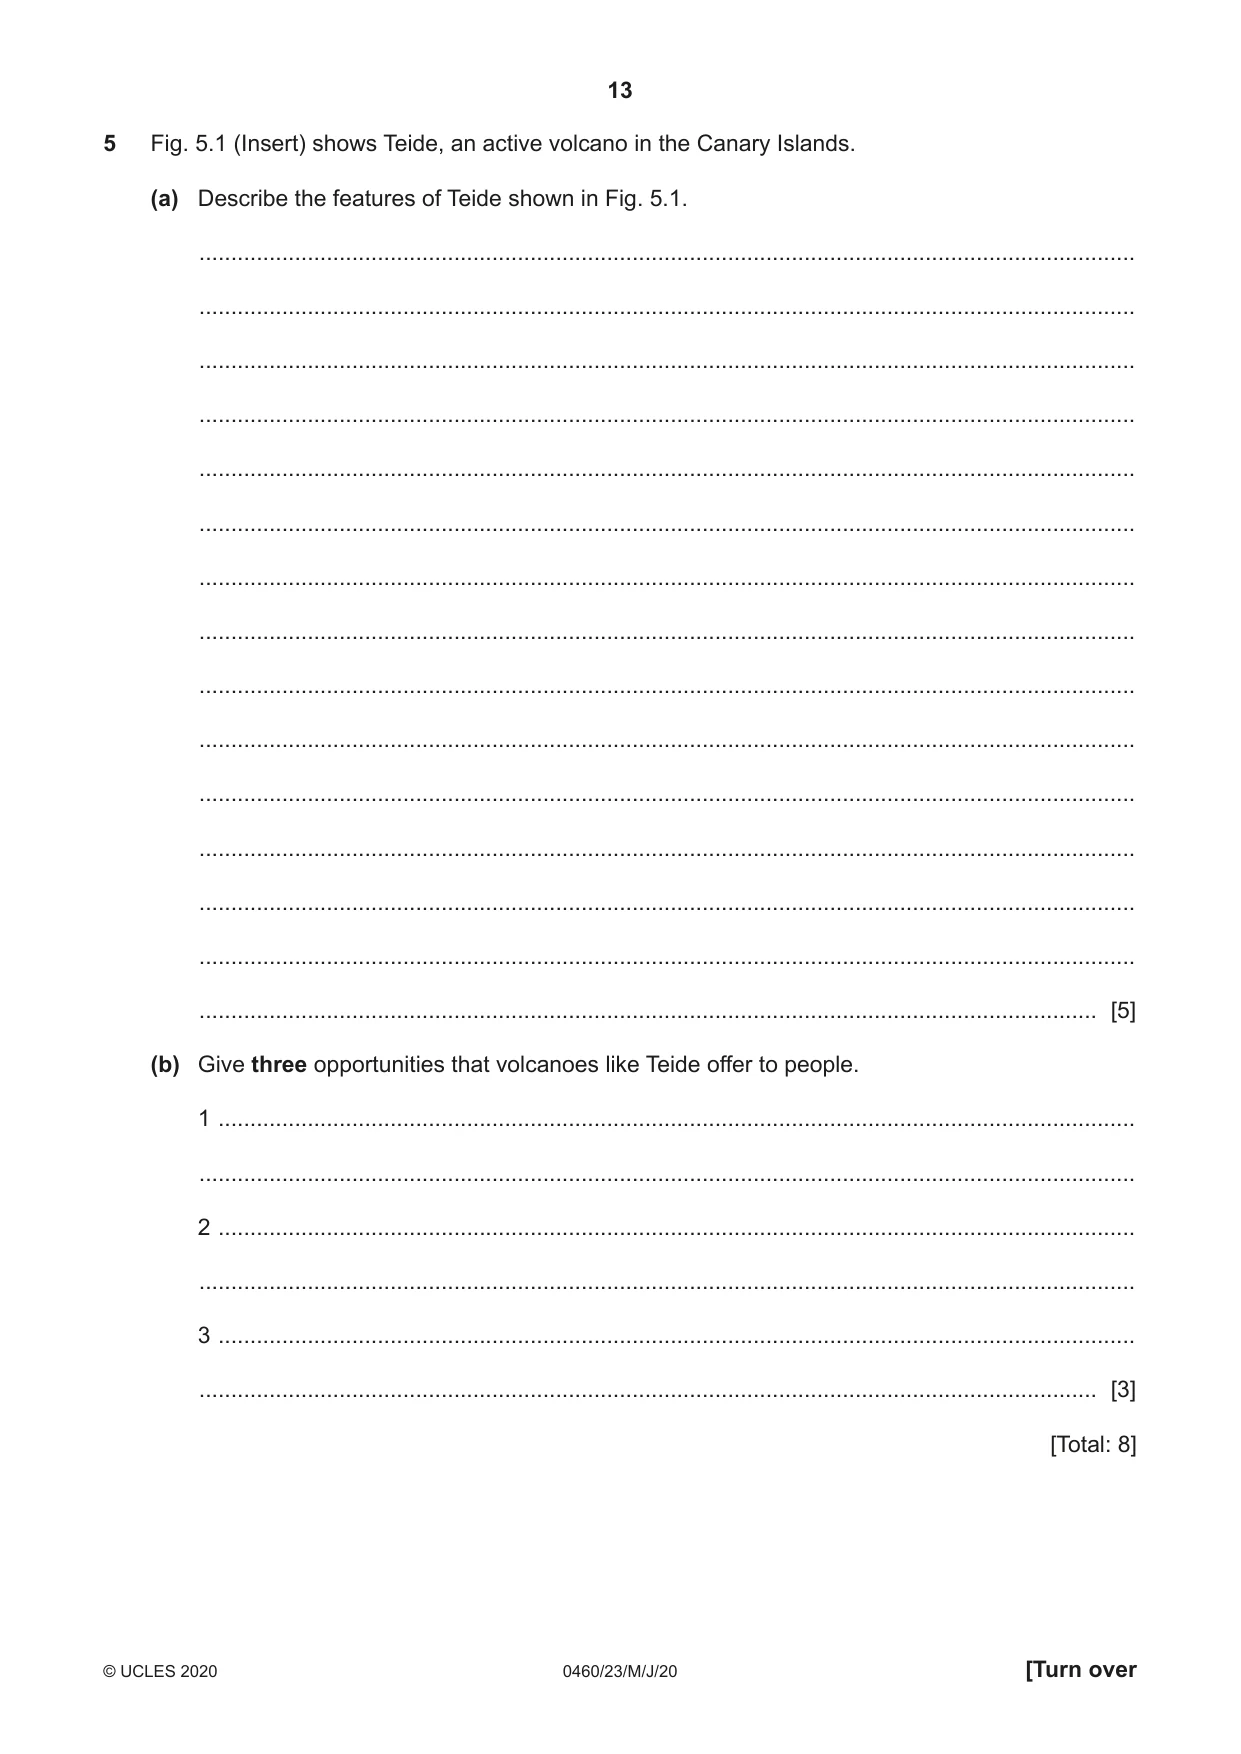
5 Fig. 5.1 (Insert) shows Teide, an active volcano in the Canary Islands. (a) Describe the features of Teide shown in Fig. 5.1. ................................................................................................................................................... ................................................................................................................................................... ................................................................................................................................................... ................................................................................................................................................... ................................................................................................................................................... ................................................................................................................................................... ................................................................................................................................................... ................................................................................................................................................... ................................................................................................................................................... ................................................................................................................................................... ................................................................................................................................................... ................................................................................................................................................... ................................................................................................................................................... ................................................................................................................................................... ............................................................................................................................................. [5] (b) Give three opportunities that volcanoes like Teide offer to people. 1 ................................................................................................................................................ ................................................................................................................................................... 2 ................................................................................................................................................ ................................................................................................................................................... 3 ................................................................................................................................................ ............................................................................................................................................. [3] [Total: 8]
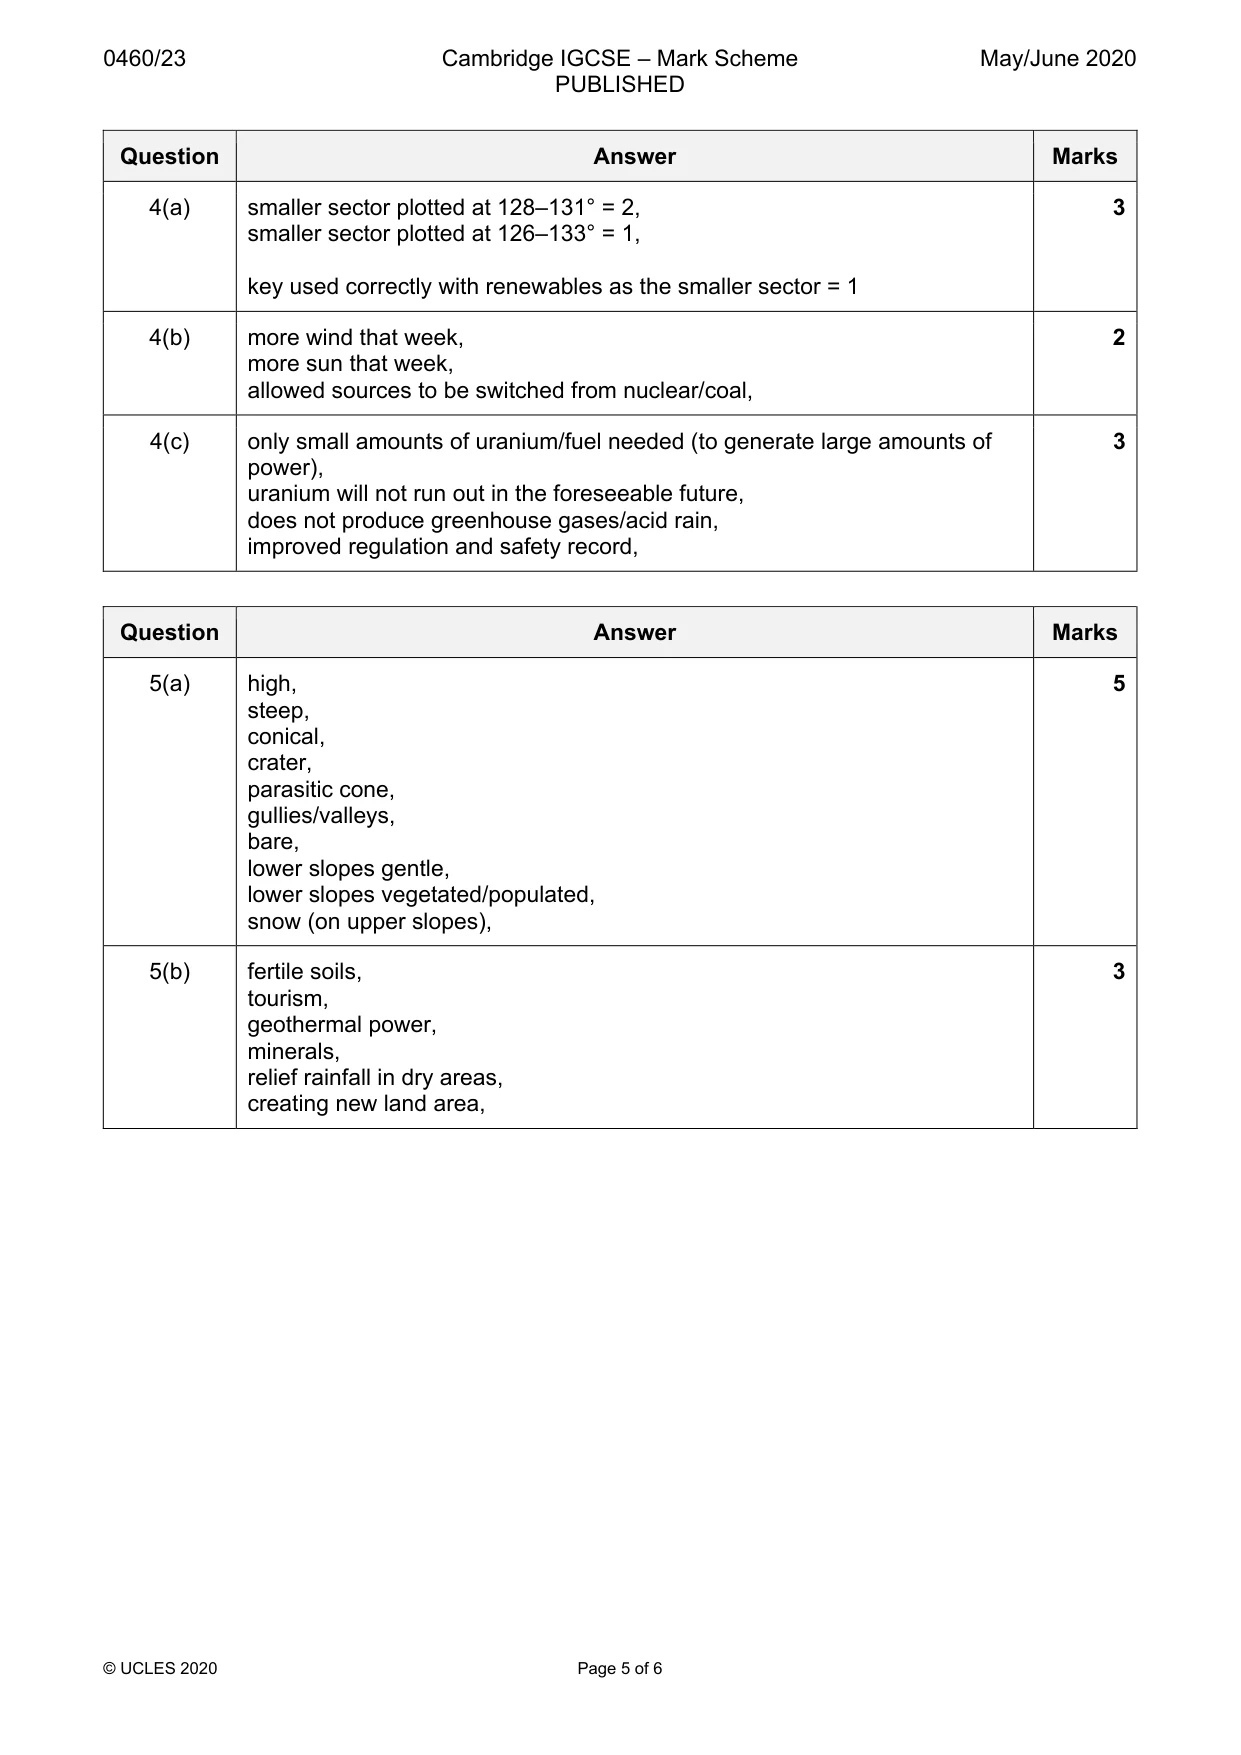
Mark scheme: 5(a) high, 5 steep, conical, crater, parasitic cone, gullies/valleys, bare, lower slopes gentle, lower slopes vegetated/populated, snow (on upper slopes), 5(b) fertile soils, 3 tourism, geothermal power, minerals, relief rainfall in dry areas, creating new land area,
Q6 · Areas in Africa at risk of desertification
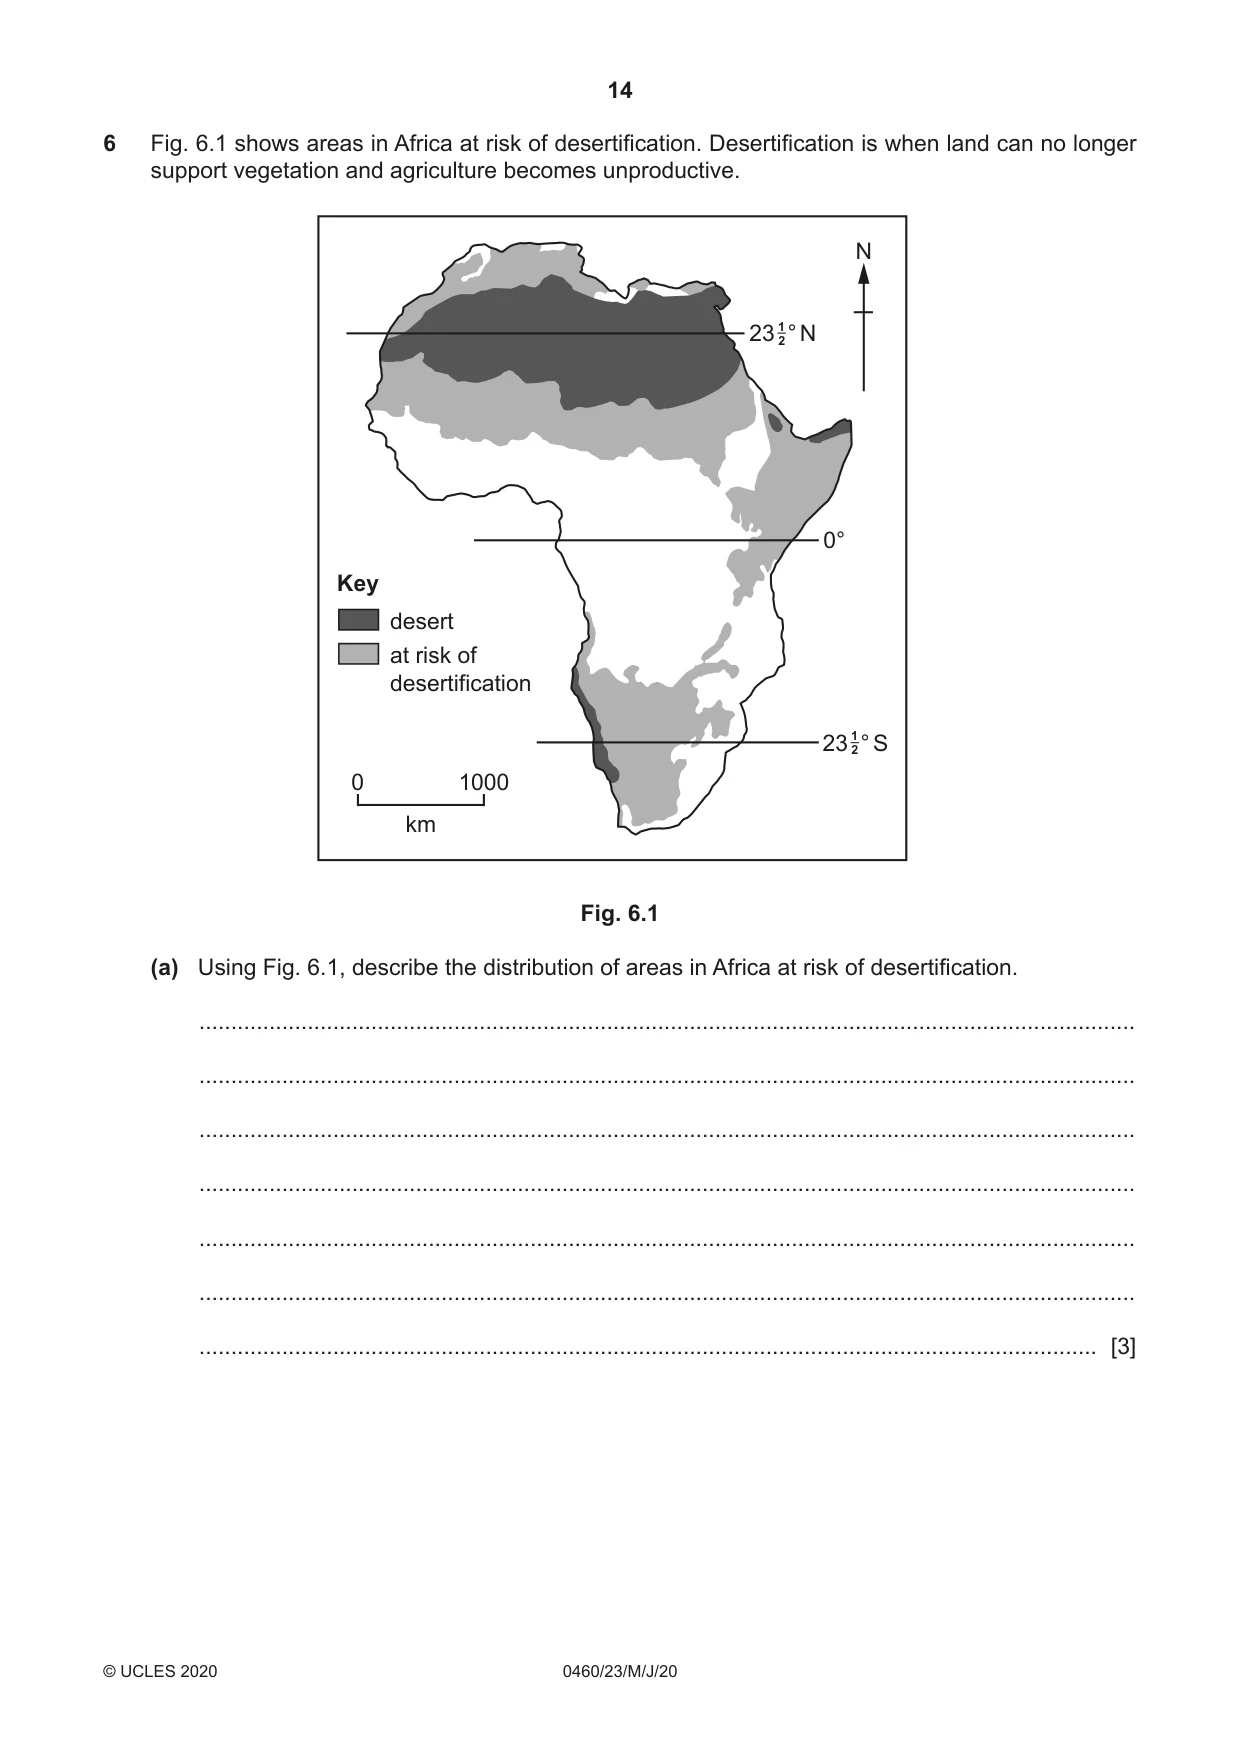
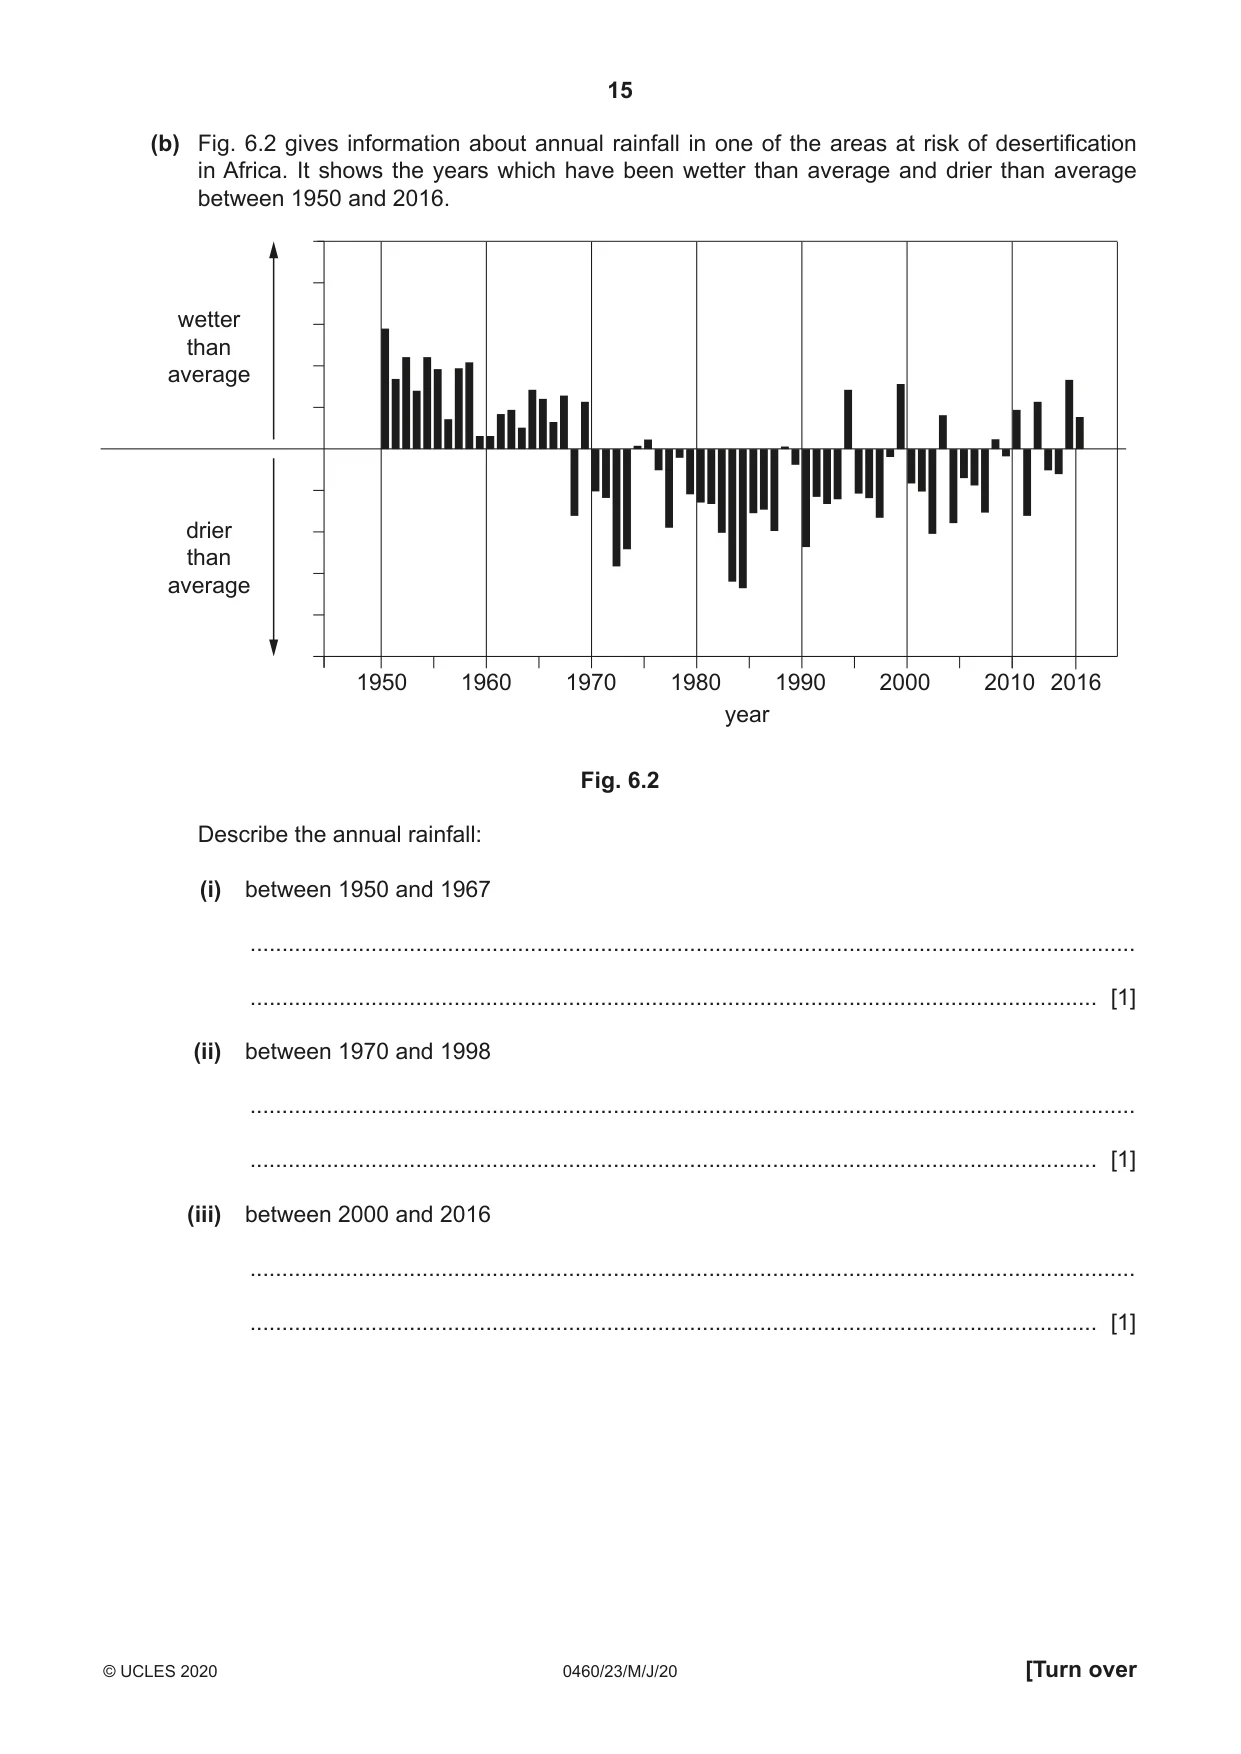
6 Fig. 6.1 shows areas in Africa at risk of desertification. Desertification is when land can no longer support vegetation and agriculture becomes unproductive. N 23 12 ° N 0° Key desert at risk of desertification 23 12 ° S 0 1000 km Fig. 6.1 (a) Using Fig. 6.1, describe the distribution of areas in Africa at risk of desertification. ................................................................................................................................................... ................................................................................................................................................... ................................................................................................................................................... ................................................................................................................................................... ................................................................................................................................................... ................................................................................................................................................... ............................................................................................................................................. [3] (b) Fig. 6.2 gives information about annual rainfall in one of the areas at risk of desertification in Africa. It shows the years which have been wetter than average and drier than average between 1950 and 2016. wetter than average drier than average 1950 1960 1970 1980 1990 2000 2010 2016 year Fig. 6.2 Describe the annual rainfall: (i) between 1950 and 1967 ........................................................................................................................................... ..................................................................................................................................... [1] (ii) between 1970 and 1998 ........................................................................................................................................... ..................................................................................................................................... [1] (iii) between 2000 and 2016 ........................................................................................................................................... ..................................................................................................................................... [1] (c) Using Fig. 6.2, explain how rainfall could be one factor which could lead to desertification. ................................................................................................................................................... ................................................................................................................................................... ................................................................................................................................................... ................................................................................................................................................... ............................................................................................................................................. [2] [Total: 8]
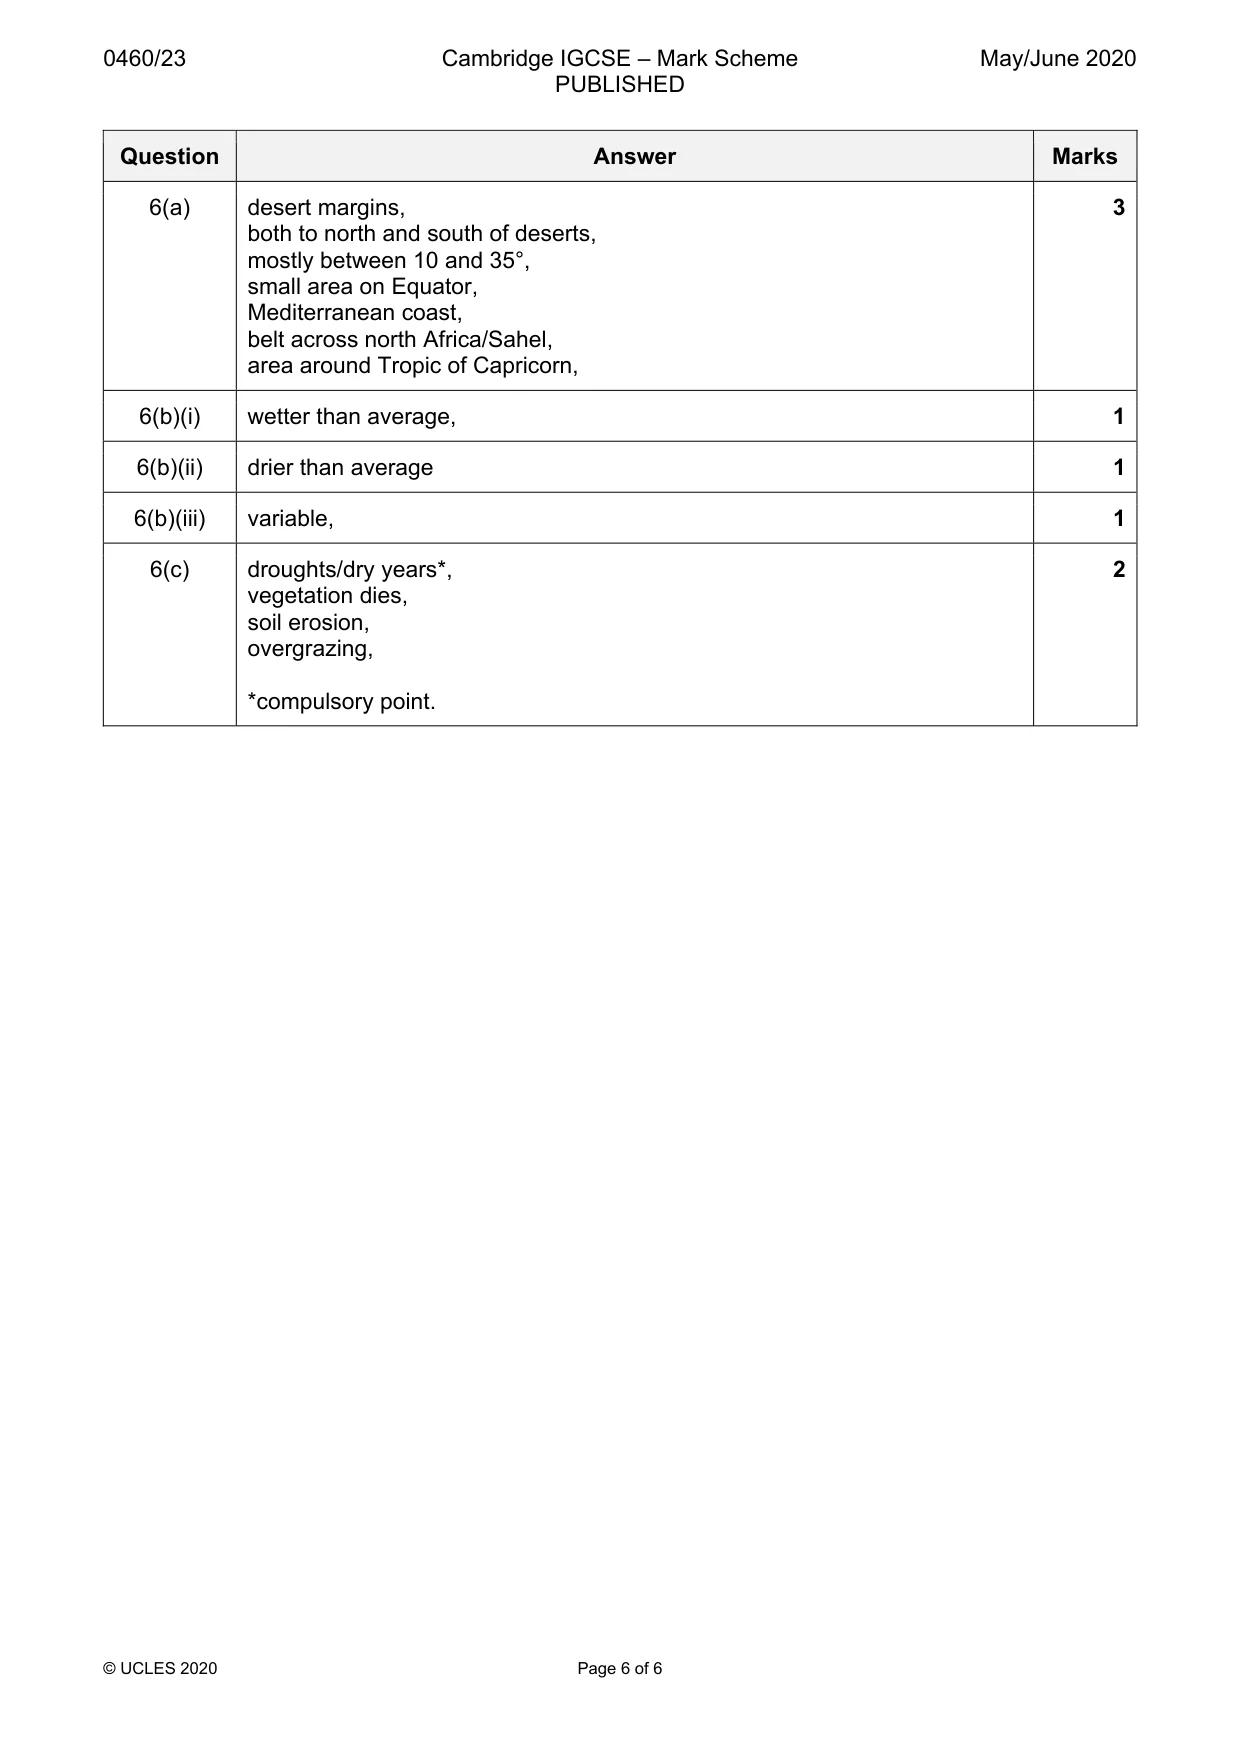
Mark scheme: 6(a) desert margins, 3 both to north and south of deserts, mostly between 10 and 35°, small area on Equator, Mediterranean coast, belt across north Africa/Sahel, area around Tropic of Capricorn, 6(b)(i) wetter than average, 1 6(b)(ii) drier than average 1 6(b)(iii) variable, 1 6(c) droughts/dry years*, 2 vegetation dies, soil erosion, overgrazing, *compulsory point.
What was in this paper
The subtopics covered by these 6 questions, and how many questions each got. Open one in a new tab to see every Cambridge question on it.