Cambridge IGCSE Geography 0460 — 2023 Oct/Nov Paper 2 · Variant 2
0460/22/O/N/23 · 6 questions · 60 marks · ≈68 min
The question paper and its mark scheme, free to read here and free to download. This is Cambridge’s own paper, exactly as it was sat.
Question paper16 pages



Mark scheme10 pages
Answers below. Sit the paper first if you are practising.
Questions as text
Q1 · Study the map extract for Stewarton, Scotland
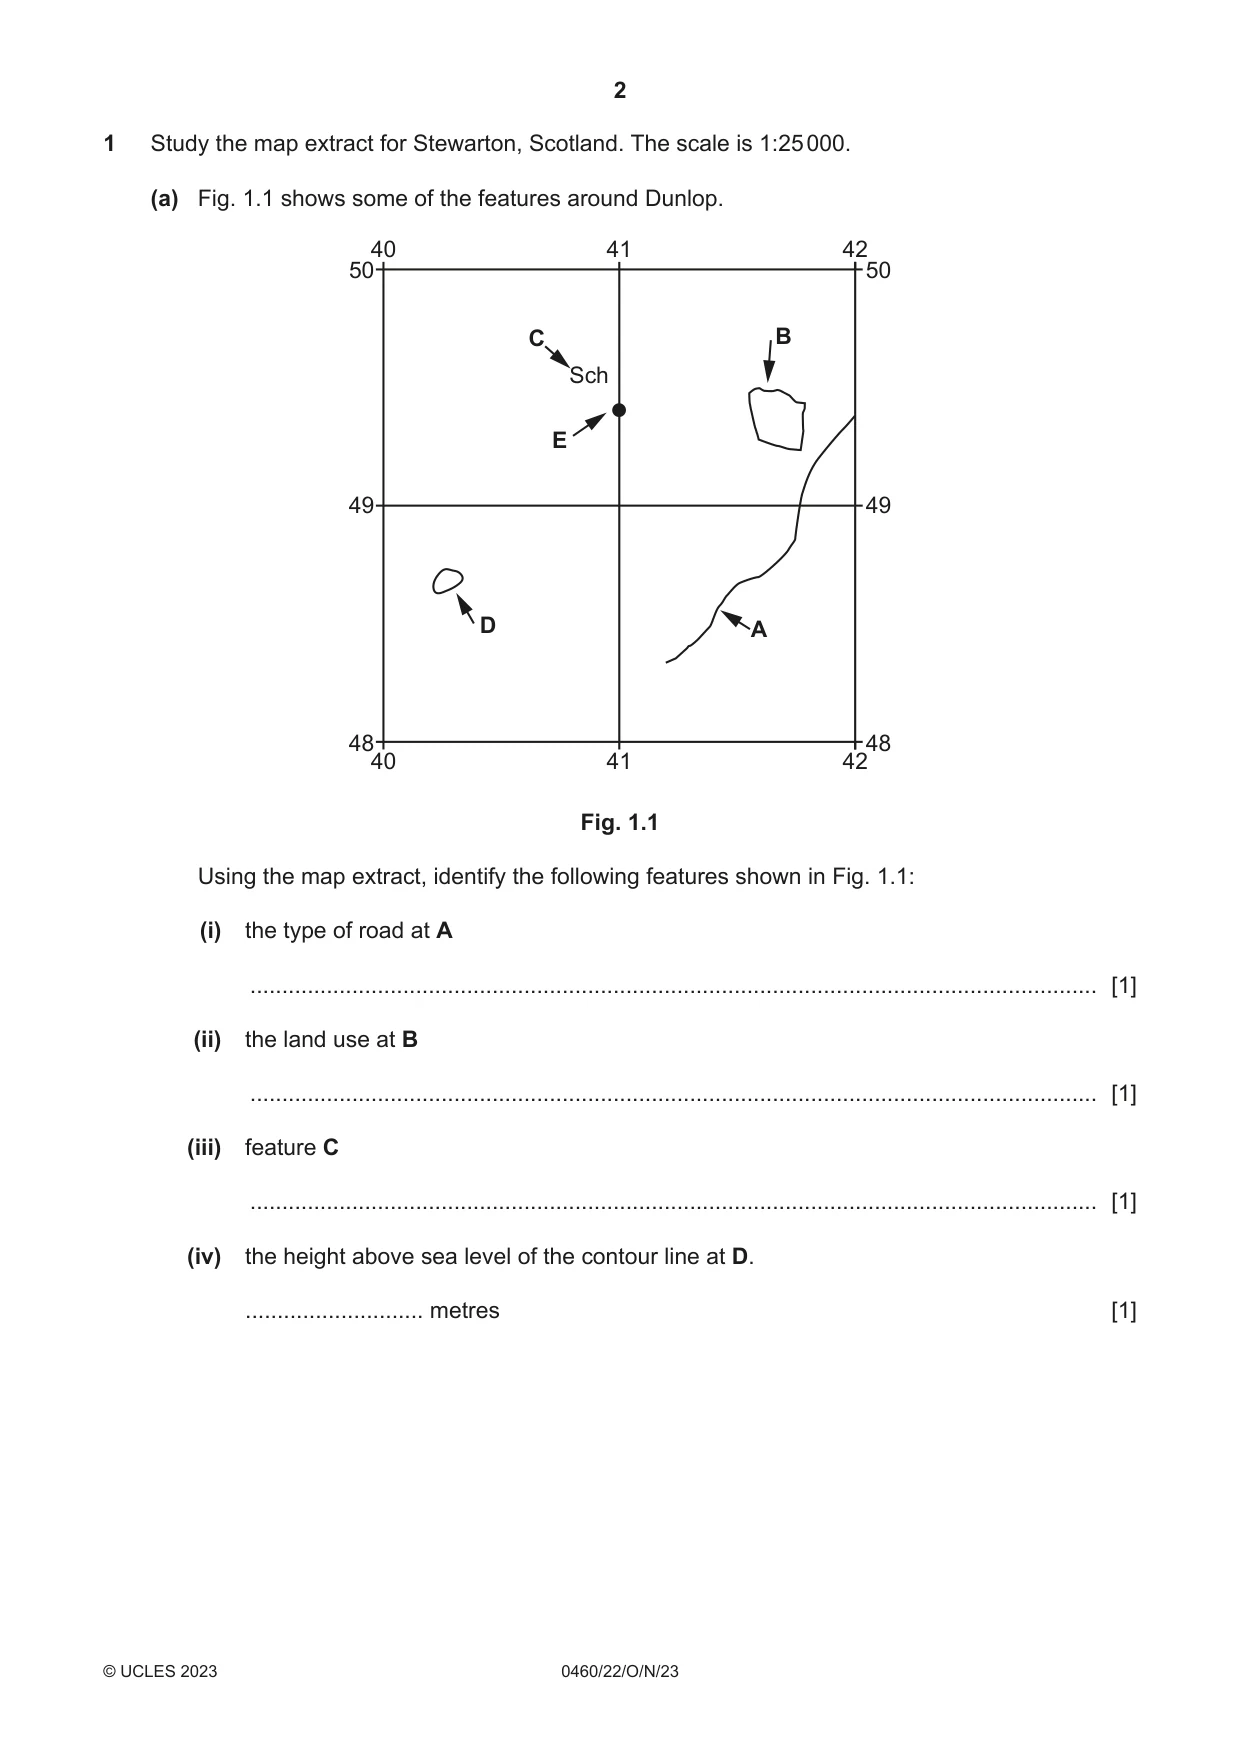
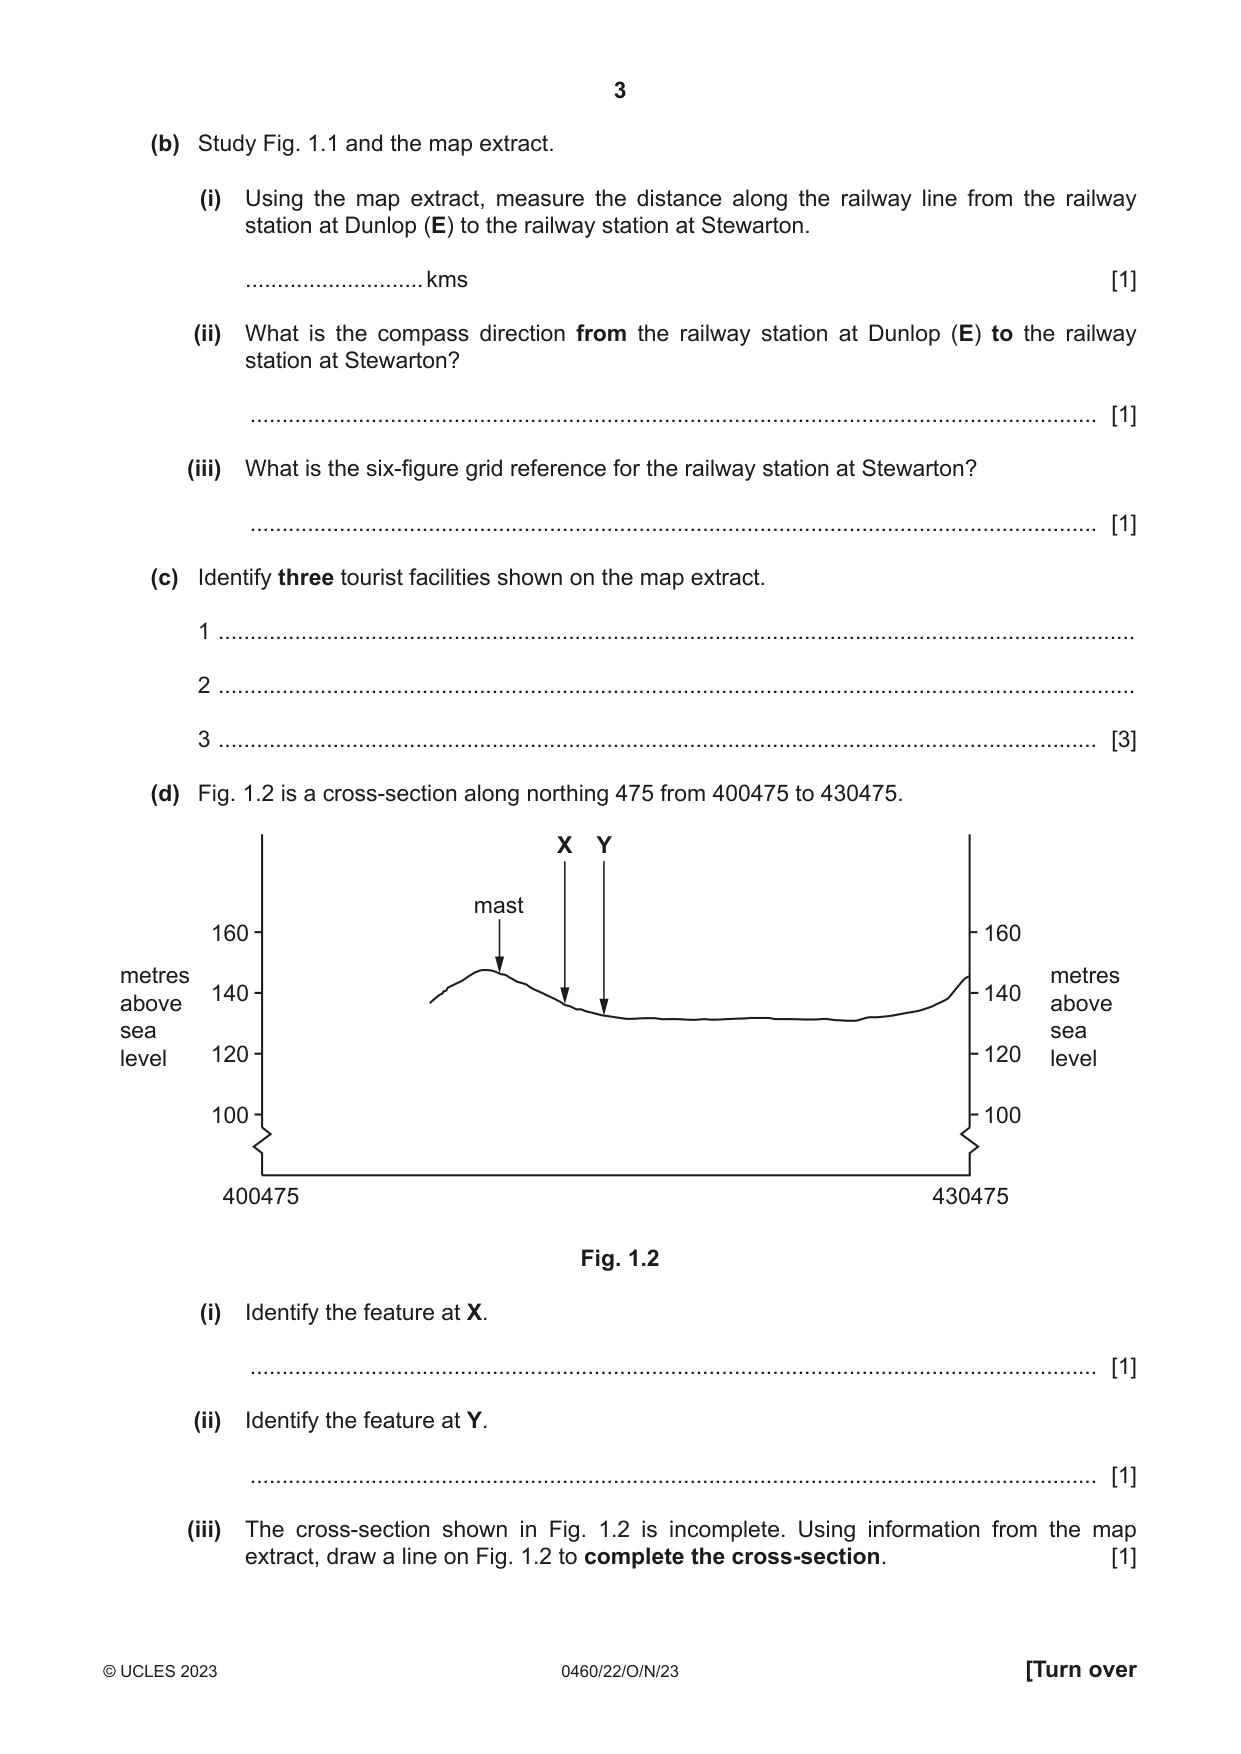
1 Study the map extract for Stewarton, Scotland. The scale is 1:25 000. (a) Fig. 1.1 shows some of the features around Dunlop. 40 41 42 50 50 C B Sch E 49 49 D A 48 48 40 41 42 Fig. 1.1 Using the map extract, identify the following features shown in Fig. 1.1: (i) the type of road at A ..................................................................................................................................... [1] (ii) the land use at B ..................................................................................................................................... [1] (iii) feature C ..................................................................................................................................... [1] (iv) the height above sea level of the contour line at D. ............................ metres [1] (b) Study Fig. 1.1 and the map extract. (i) Using the map extract, measure the distance along the railway line from the railway station at Dunlop (E) to the railway station at Stewarton. ............................ kms [1] (ii) What is the compass direction from the railway station at Dunlop (E) to the railway station at Stewarton? ..................................................................................................................................... [1] (iii) What is the six‑figure grid reference for the railway station at Stewarton? ..................................................................................................................................... [1] (c) Identify three tourist facilities shown on the map extract. 1 ................................................................................................................................................ 2 ................................................................................................................................................ 3 .......................................................................................................................................... [3] (d) Fig. 1.2 is a cross‑section along northing 475 from 400475 to 430475. X Y mast 160 160 metres metres 140 140above above sea sea level 120 120 level 100 100 400475 430475 Fig. 1.2 (i) Identify the feature at X. ..................................................................................................................................... [1] (ii) Identify the feature at Y. ..................................................................................................................................... [1] (iii) The cross‑section shown in Fig. 1.2 is incomplete. Using information from the map extract, draw a line on Fig. 1.2 to complete the cross‑section. [1] (e) Describe and explain the pattern of rural settlement shown on the map extract. Do not refer to Dunlop and Stewarton. ................................................................................................................................................... ................................................................................................................................................... ................................................................................................................................................... ................................................................................................................................................... ................................................................................................................................................... ................................................................................................................................................... ................................................................................................................................................... ................................................................................................................................................... ................................................................................................................................................... ................................................................................................................................................... ................................................................................................................................................... ................................................................................................................................................... ................................................................................................................................................... ............................................................................................................................................. [7] [Total: 20]
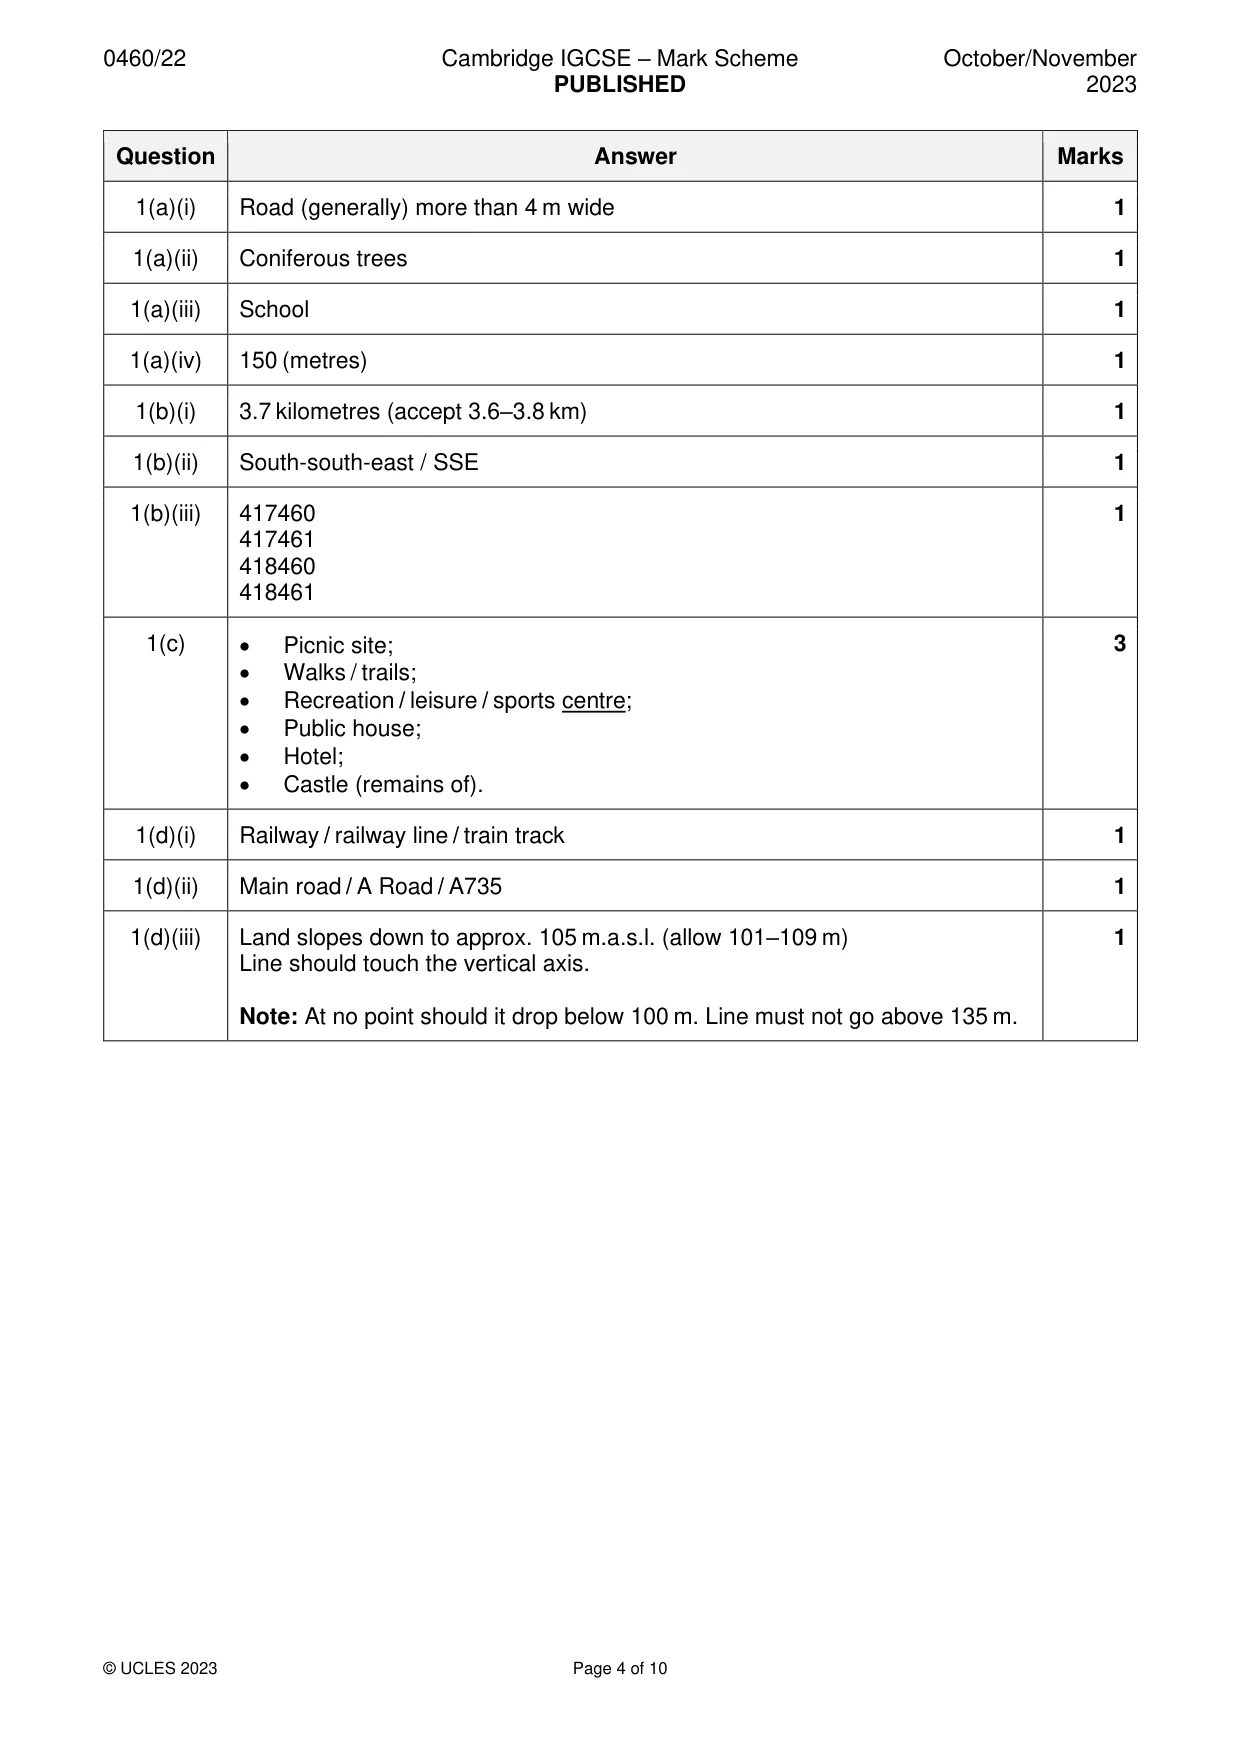
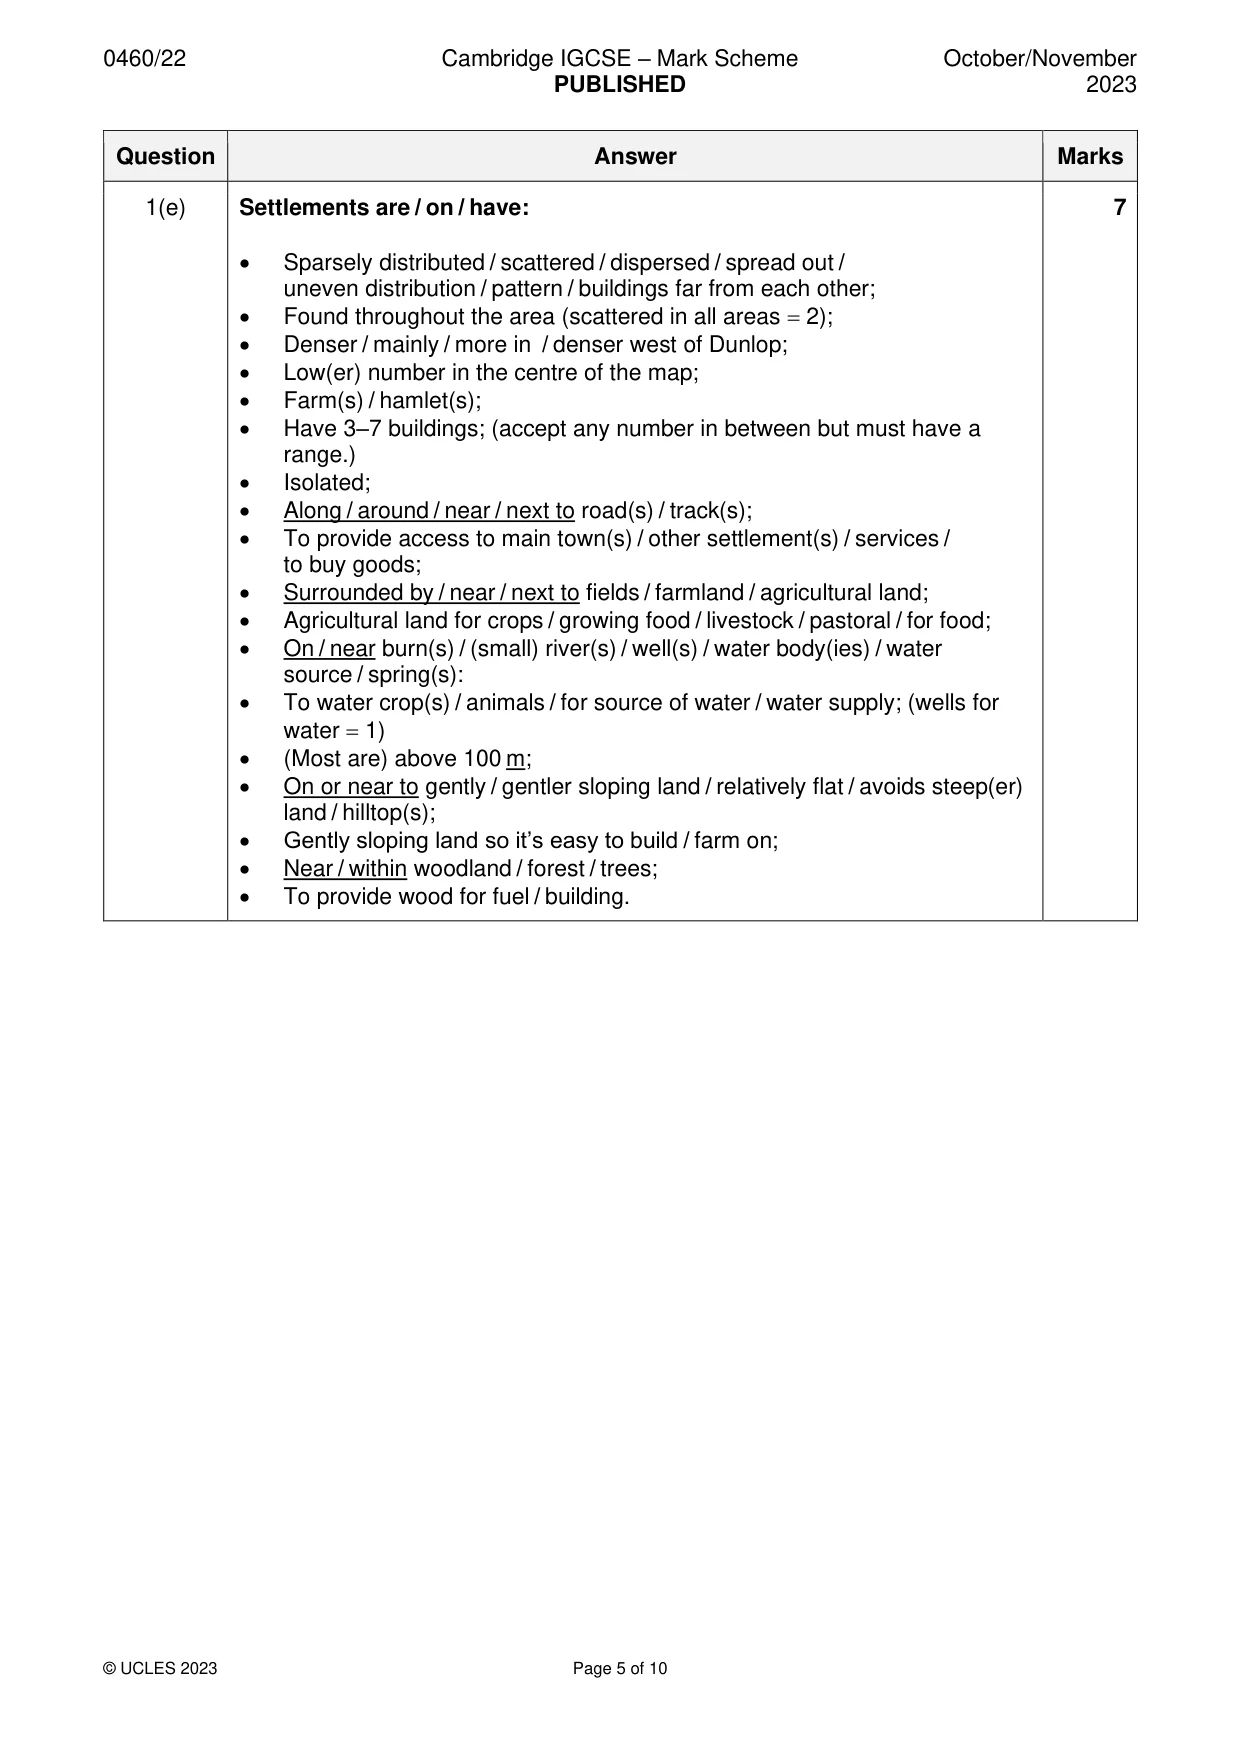
Mark scheme: Question Answer Marks 1(a)(i) Road (generally) more than 4 m wide 1 1(a)(ii) Coniferous trees 1 1(a)(iii) School 1 1(a)(iv) 150 (metres) 1 1(b)(i) 3.7 kilometres (accept 3.6–3.8 km) 1 1(b)(ii) South-south-east / SSE 1 1(b)(iii) 417460 1 417461 418460 418461 1(c) • Picnic site; 3 • Walks / trails; • Recreation / leisure / sports centre; • Public house; • Hotel; • Castle (remains of). 1(d)(i) Railway / railway line / train track 1 1(d)(ii) Main road / A Road / A735 1 1(d)(iii) Land slopes down to approx. 105 m.a.s.l. (allow 101–109 m) 1 Line should touch the vertical axis. Note: At no point should it drop below 100 m. Line must not go above 135 m. 1(e) Settlements are / on / have: 7 • Sparsely distributed / scattered / dispersed / spread out / uneven distribution / pattern / buildings far from each other; • Found throughout the area (scattered in all areas = 2); • Denser / mainly / more in / denser west of Dunlop; • Low(er) number in the centre of the map; • Farm(s) / hamlet(s); • Have 3–7 buildings; (accept any number in between but must have a range.) • Isolated; • Along / around / near / next to road(s) / track(s); • To provide access to main town(s) / other settlement(s) / services / to buy goods; • Surrounded by / near / next to fields / farmland / agricultural land; • Agricultural land for crops / growing food / livestock / pastoral / for food; • On / near burn(s) / (small) river(s) / well(s) / water body(ies) / water source / spring(s): • To water crop(s) / animals / for source of water / water supply; (wells for water = 1) • (Most are) above 100 m; • On or near to gently / gentler sloping land / relatively flat / avoids steep(er) land / hilltop(s); • Gently sloping land so it’s easy to build / farm on; • Near / within woodland / forest / trees; • To provide wood for fuel / building.
More questions on Settlements (rural and urban) and service provision
Question 2
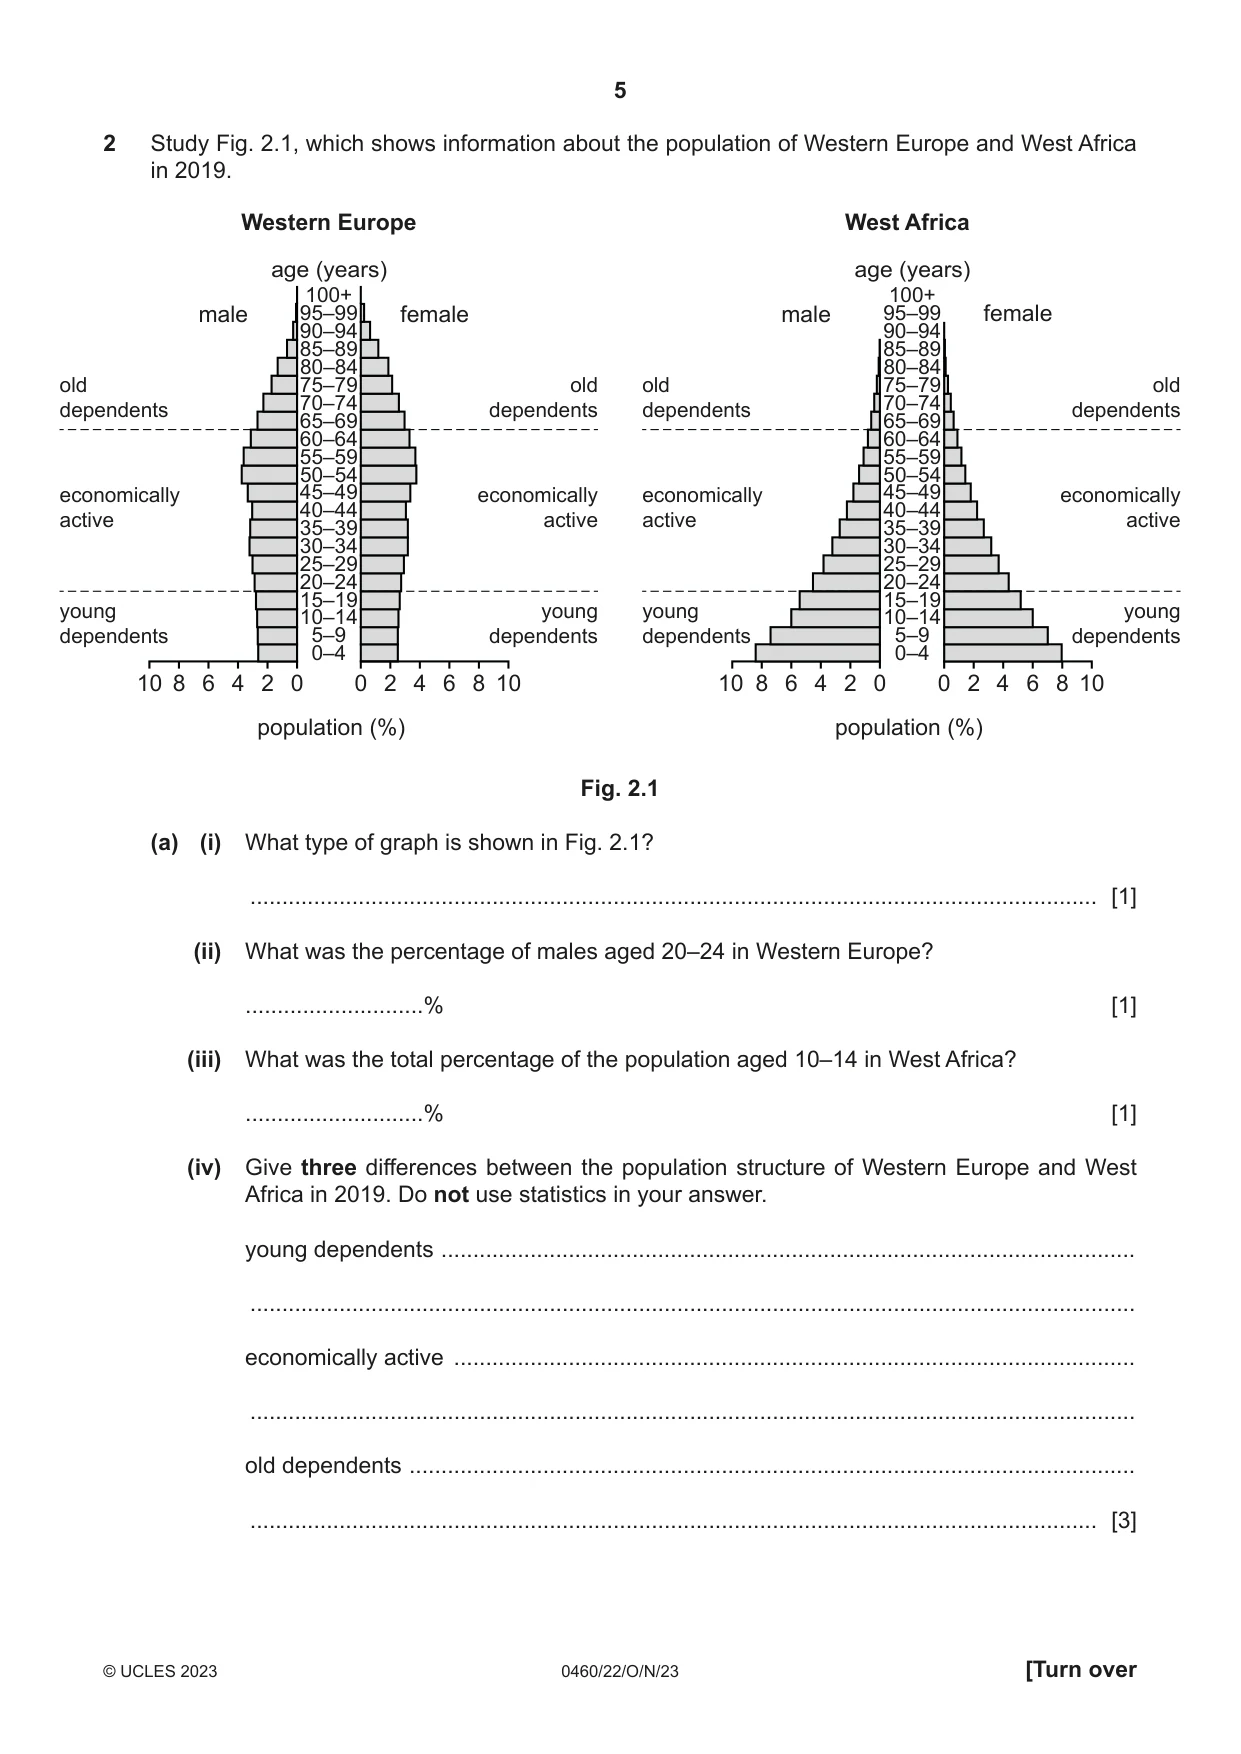
2 Study Fig. 2.1, which shows information about the population of Western Europe and West Africa in 2019. Western Europe West Africa age (years) age (years) 100+ 100+ male 95–99 female male 95–99 female 90–94 90–94 85–89 85–89 80–84 80–84 old 75–79 old old 75–79 old 70–74 70–74dependents dependents dependents dependents 65–69 65–69 60–64 60–64 55–59 55–59 50–54 50–54 economically 45–49 economically economically 45–49 economically 40–44 40–44active active active active 35–39 35–39 30–34 30–34 25–29 25–29 20–24 20–24 15–19 15–19 young 10–14 young young 10–14 young dependents 5–9 dependents dependents 5–9 dependents 0–4 0–4 10 8 6 4 2 0 0 2 4 6 8 10 10 8 6 4 2 0 0 2 4 6 8 10 population (%) population (%) Fig. 2.1 (a) (i) What type of graph is shown in Fig. 2.1? ..................................................................................................................................... [1] (ii) What was the percentage of males aged 20–24 in Western Europe? ............................% [1] (iii) What was the total percentage of the population aged 10–14 in West Africa? ............................% [1] (iv) Give three differences between the population structure of Western Europe and West Africa in 2019. Do not use statistics in your answer. young dependents ............................................................................................................. ........................................................................................................................................... economically active ........................................................................................................... ........................................................................................................................................... old dependents .................................................................................................................. ..................................................................................................................................... [3] (b) Suggest two economic problems caused by a large population of young dependents. ................................................................................................................................................... ................................................................................................................................................... ................................................................................................................................................... ............................................................................................................................................. [2] [Total: 8]
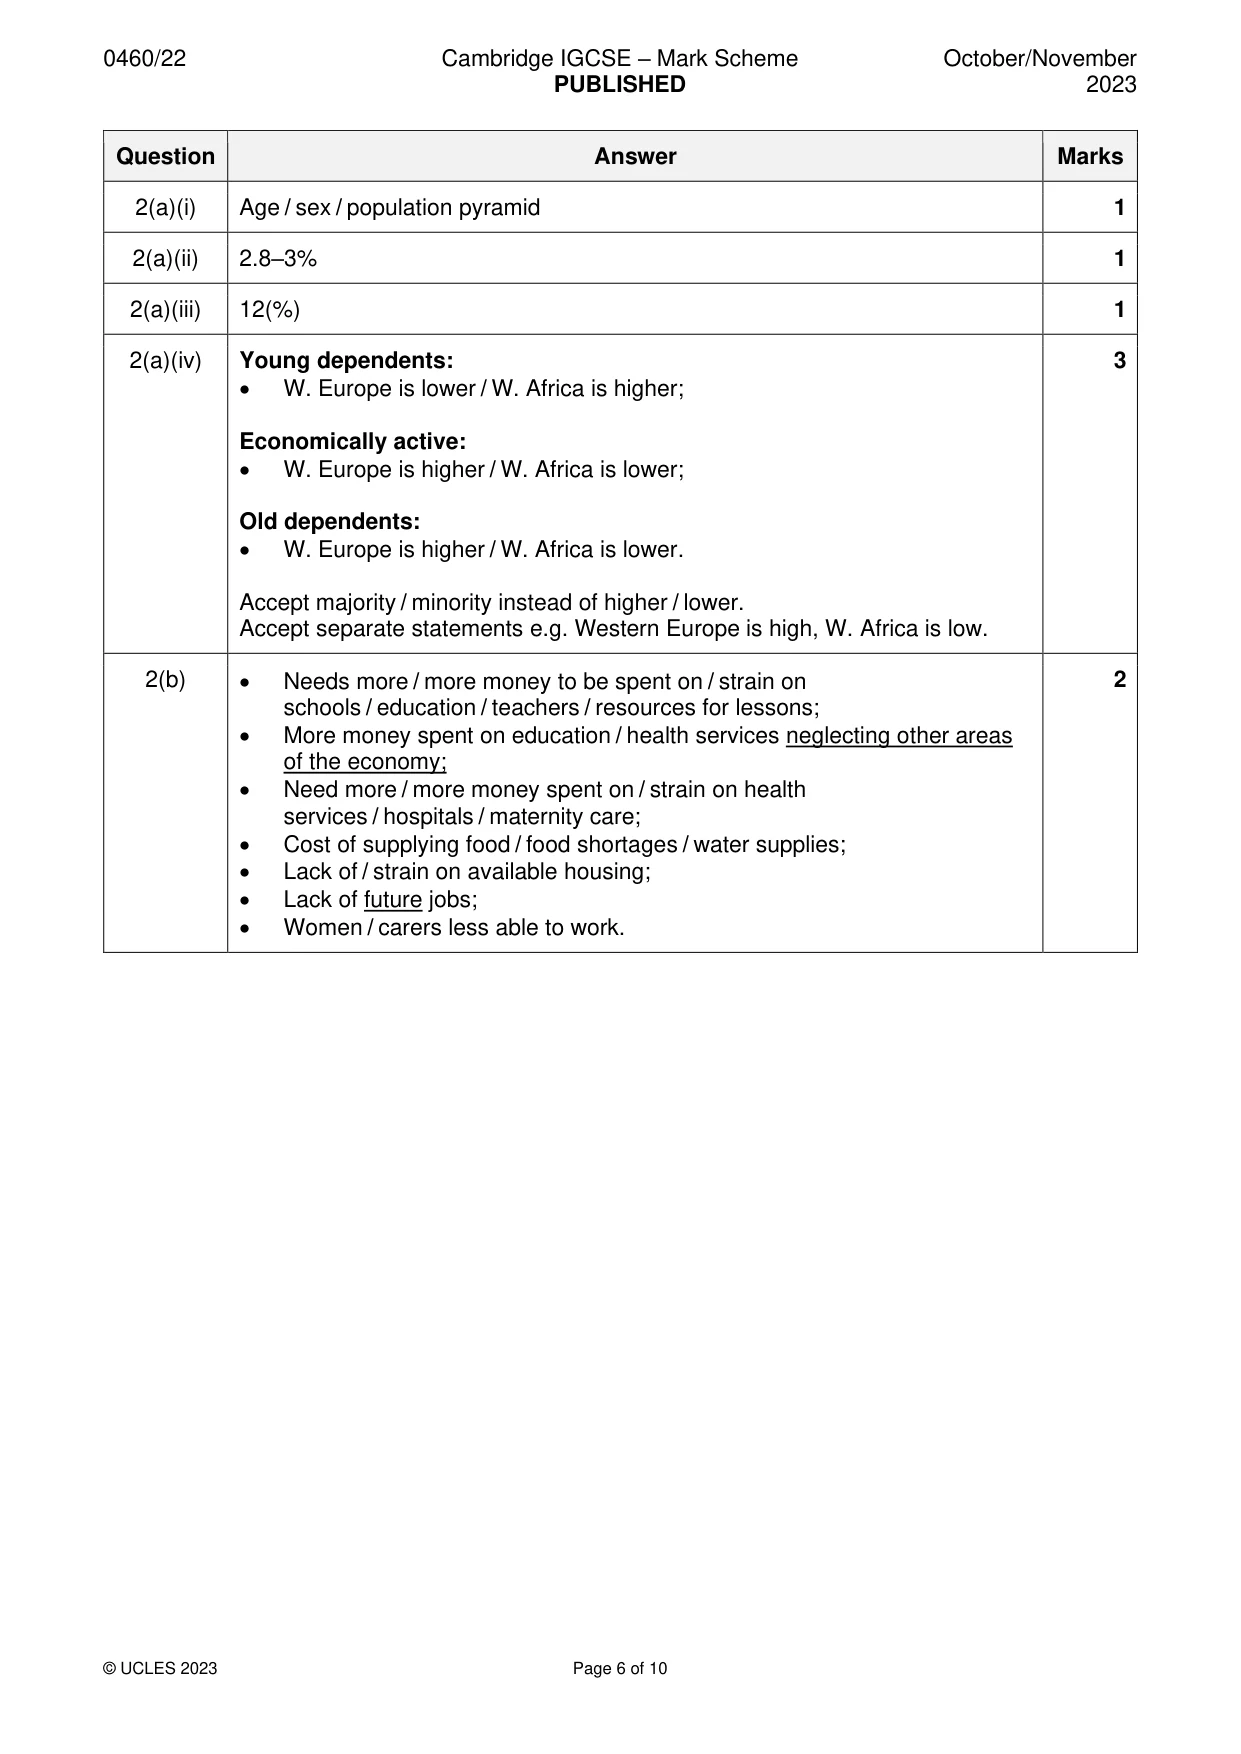
Mark scheme: 2(a)(i) Age / sex / population pyramid 1 2(a)(ii) 2.8–3% 1 2(a)(iii) 12(%) 1 2(a)(iv) Young dependents: 3 • W. Europe is lower / W. Africa is higher; Economically active: • W. Europe is higher / W. Africa is lower; Old dependents: • W. Europe is higher / W. Africa is lower. Accept majority / minority instead of higher / lower. Accept separate statements e.g. Western Europe is high, W. Africa is low. 2(b) • Needs more / more money to be spent on / strain on 2 schools / education / teachers / resources for lessons; • More money spent on education / health services neglecting other areas of the economy; • Need more / more money spent on / strain on health services / hospitals / maternity care; • Cost of supplying food / food shortages / water supplies; • Lack of / strain on available housing; • Lack of future jobs; • Women / carers less able to work.
Question 3
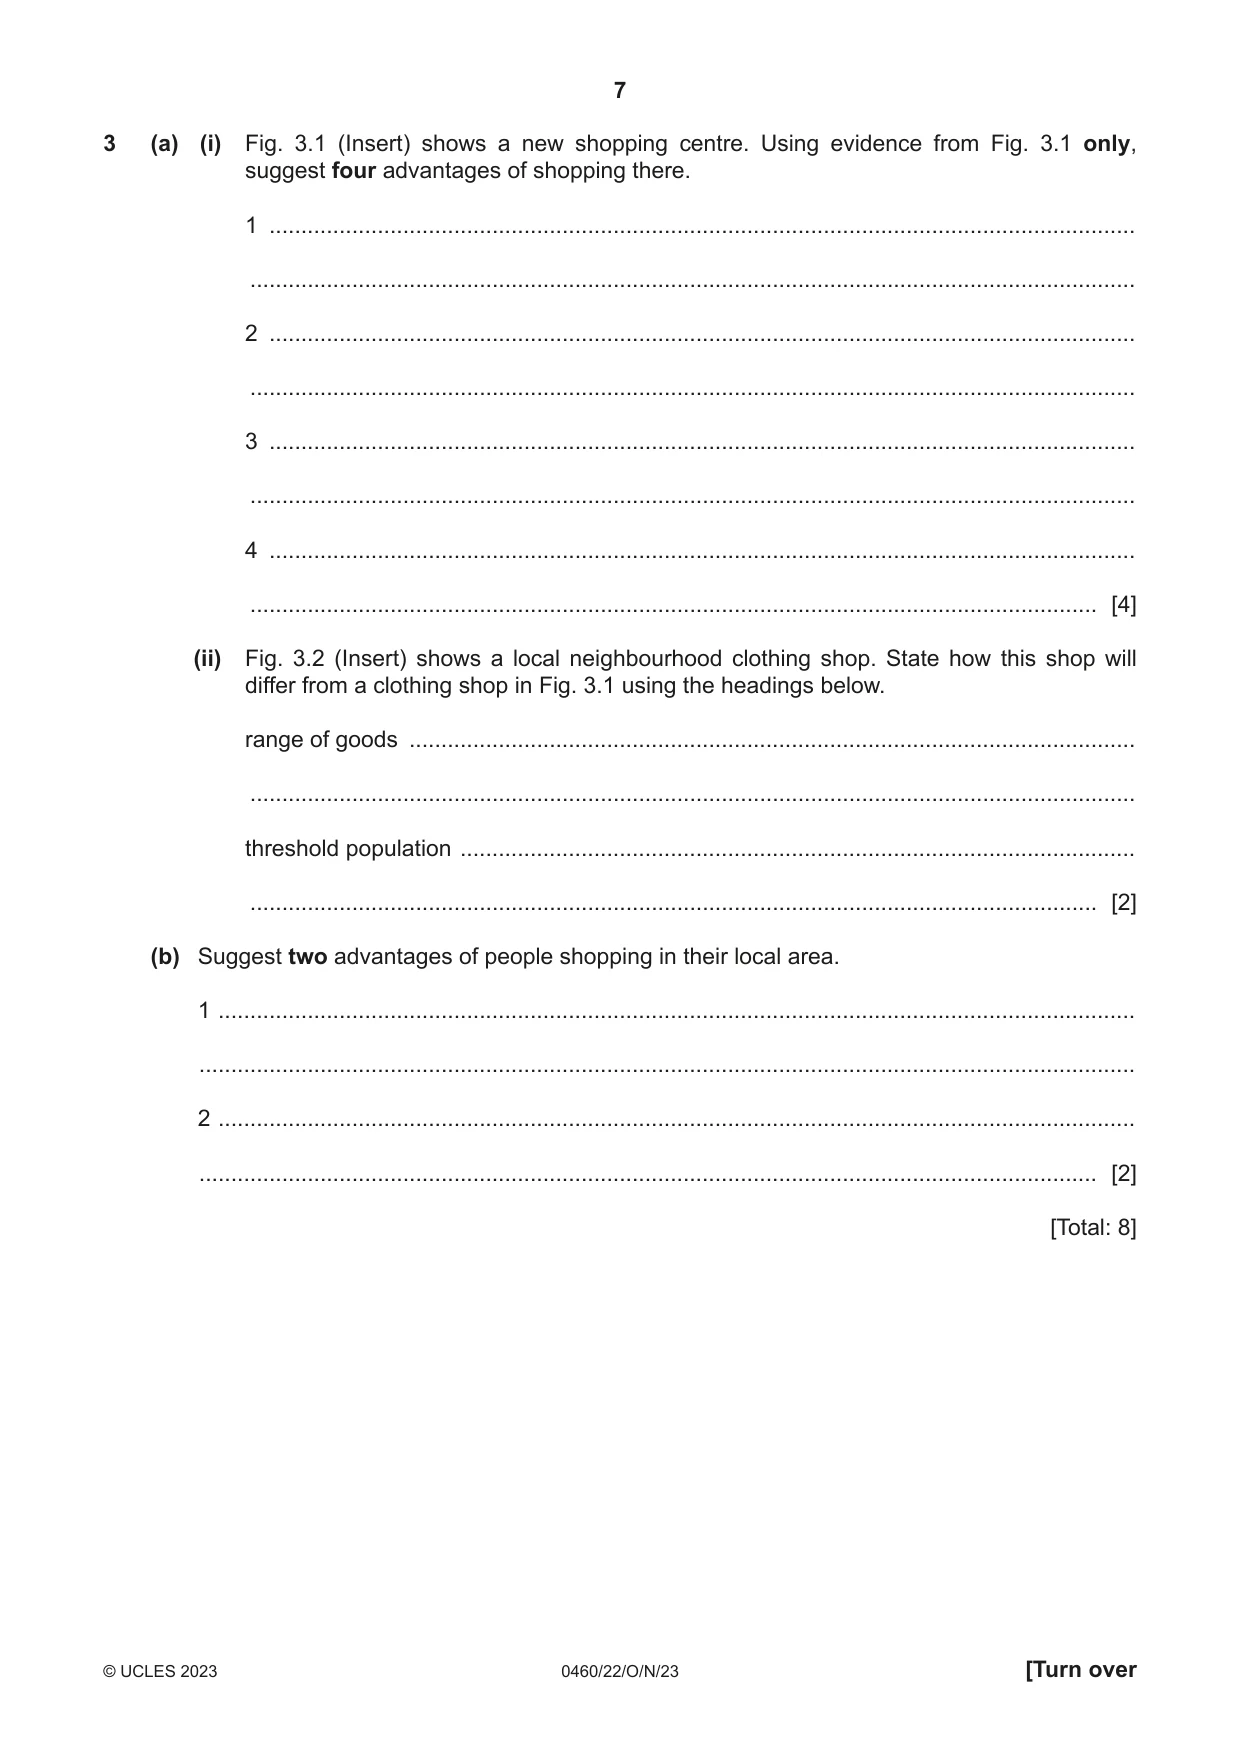
3 (a) (i) Fig. 3.1 (Insert) shows a new shopping centre. Using evidence from Fig. 3.1 only, suggest four advantages of shopping there. 1 ........................................................................................................................................ ........................................................................................................................................... 2 ........................................................................................................................................ ........................................................................................................................................... 3 ........................................................................................................................................ ........................................................................................................................................... 4 ........................................................................................................................................ ..................................................................................................................................... [4] (ii) Fig. 3.2 (Insert) shows a local neighbourhood clothing shop. State how this shop will differ from a clothing shop in Fig. 3.1 using the headings below. range of goods .................................................................................................................. ........................................................................................................................................... threshold population .......................................................................................................... ..................................................................................................................................... [2] (b) Suggest two advantages of people shopping in their local area. 1 ................................................................................................................................................ ................................................................................................................................................... 2 ................................................................................................................................................ ............................................................................................................................................. [2] [Total: 8]
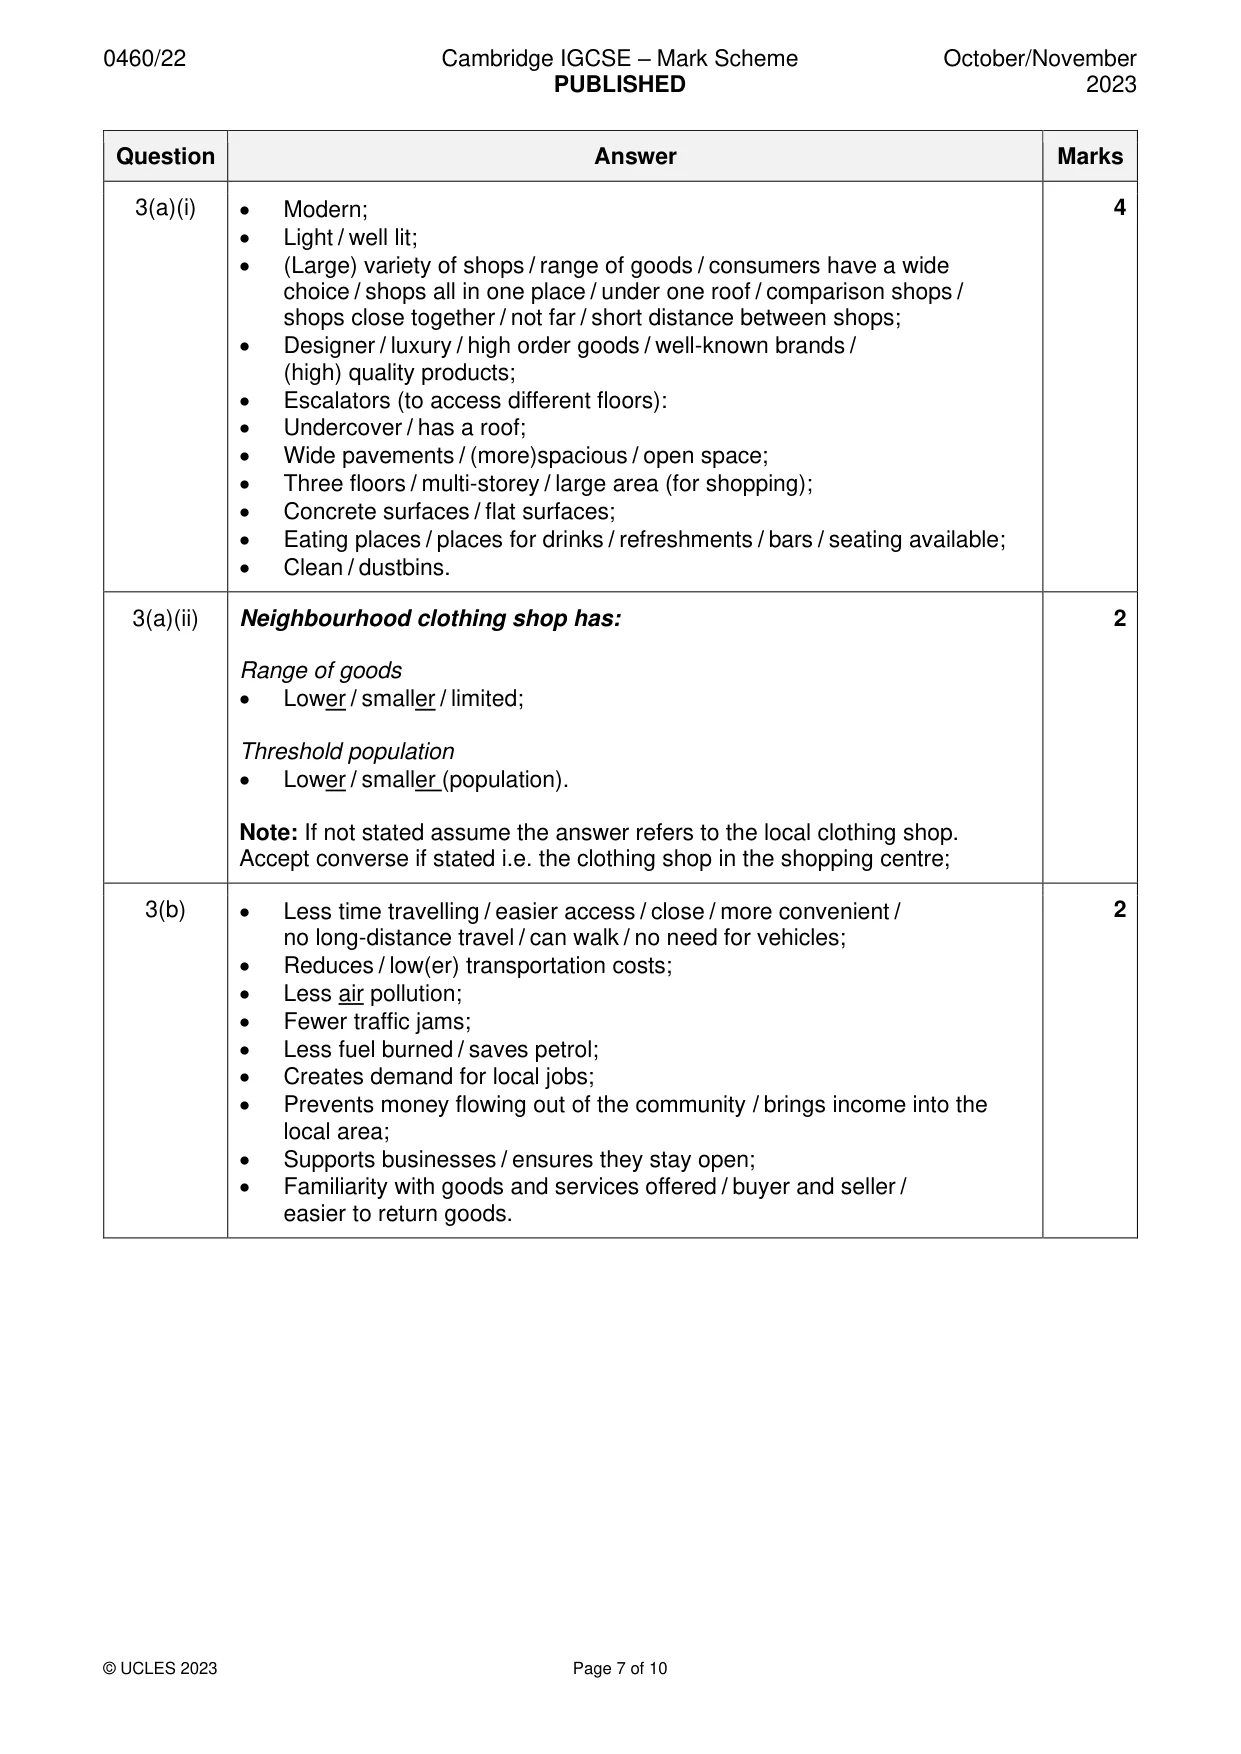
Mark scheme: 3(a)(i) • Modern; 4 • Light / well lit; • (Large) variety of shops / range of goods / consumers have a wide choice / shops all in one place / under one roof / comparison shops / shops close together / not far / short distance between shops; • Designer / luxury / high order goods / well-known brands / (high) quality products; • Escalators (to access different floors): • Undercover / has a roof; • Wide pavements / (more)spacious / open space; • Three floors / multi-storey / large area (for shopping); • Concrete surfaces / flat surfaces; • Eating places / places for drinks / refreshments / bars / seating available; • Clean / dustbins. 3(a)(ii) Neighbourhood clothing shop has: 2 Range of goods • Lower / smaller / limited; Threshold population • Lower / smaller (population). Note: If not stated assume the answer refers to the local clothing shop. Accept converse if stated i.e. the clothing shop in the shopping centre; 3(b) • Less time travelling / easier access / close / more convenient / 2 no long-distance travel / can walk / no need for vehicles; • Reduces / low(er) transportation costs; • Less air pollution; • Fewer traffic jams; • Less fuel burned / saves petrol; • Creates demand for local jobs; • Prevents money flowing out of the community / brings income into the local area; • Supports businesses / ensures they stay open; • Familiarity with goods and services offered / buyer and seller / easier to return goods.
More questions on Settlements (rural and urban) and service provision
Question 4
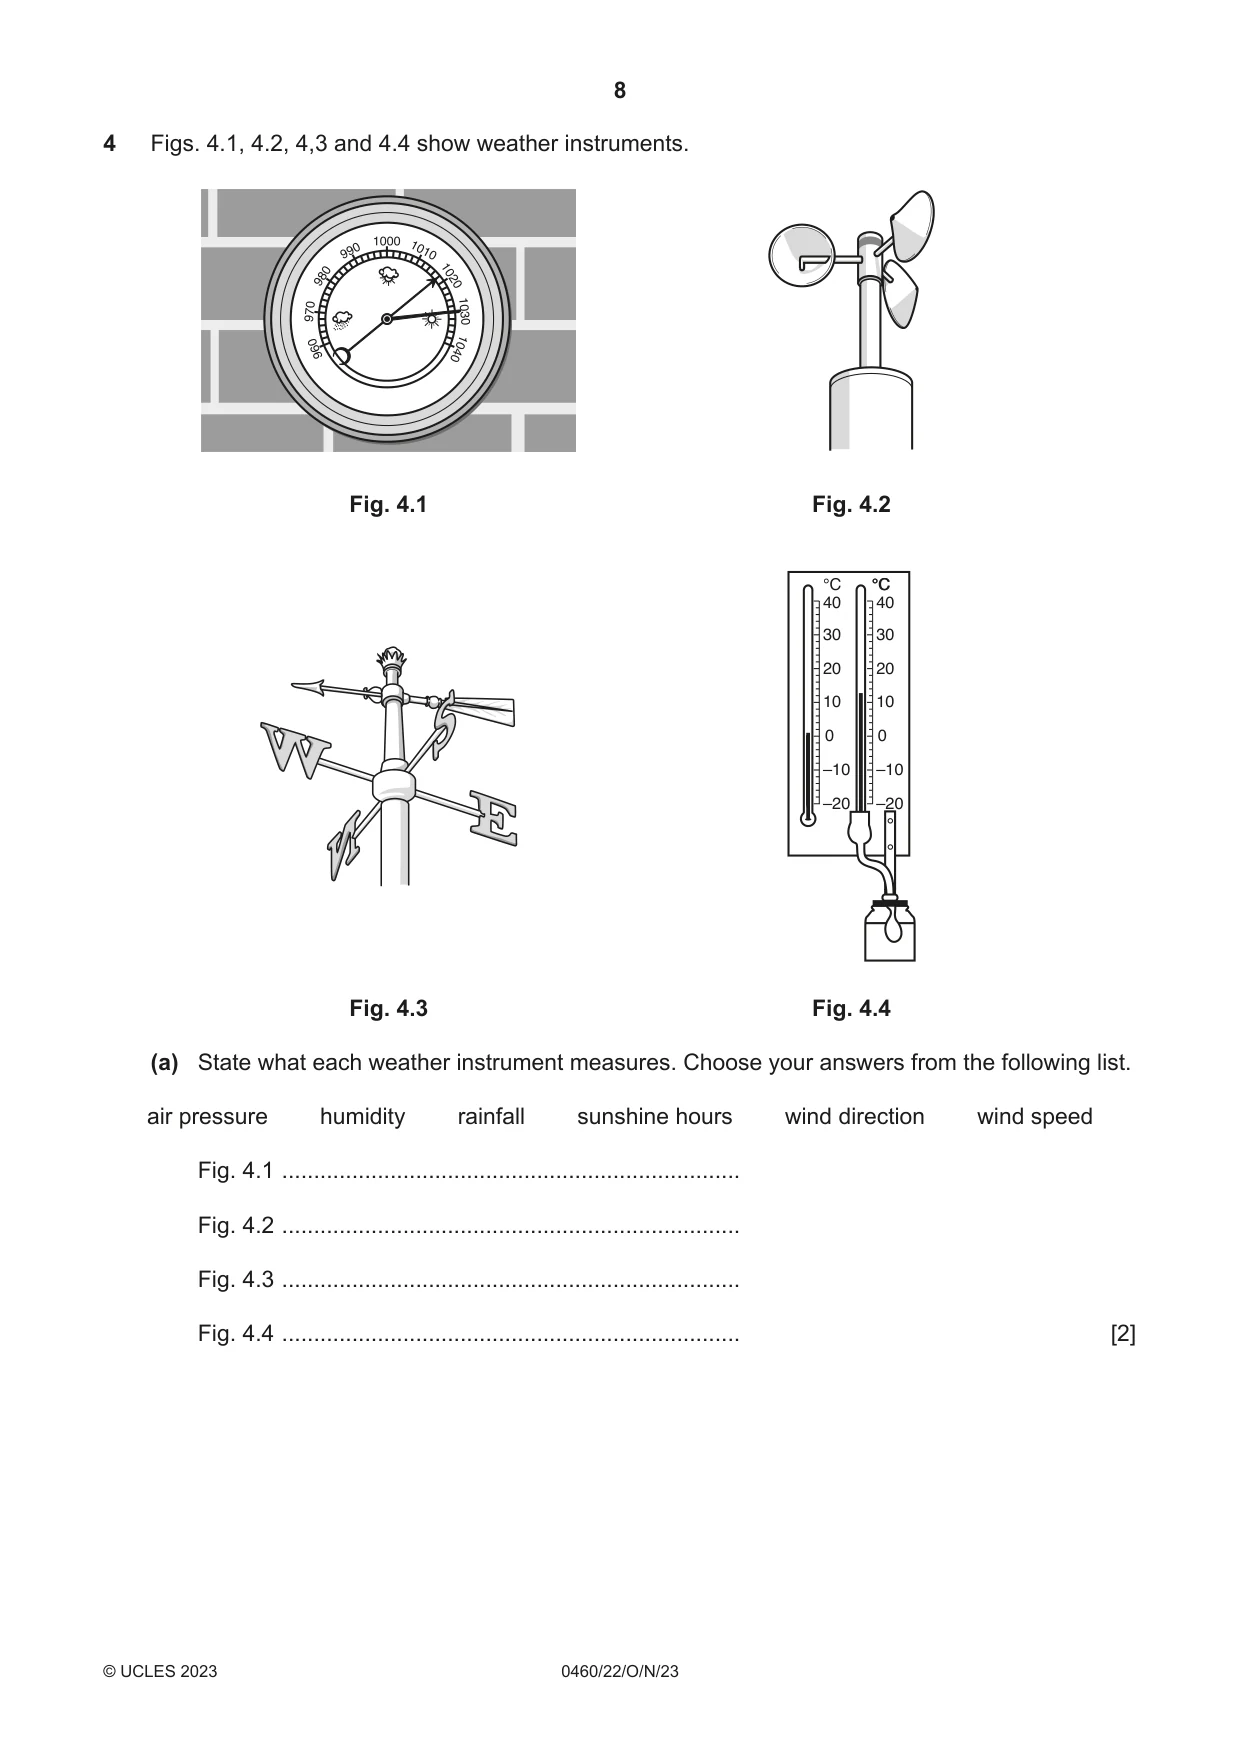
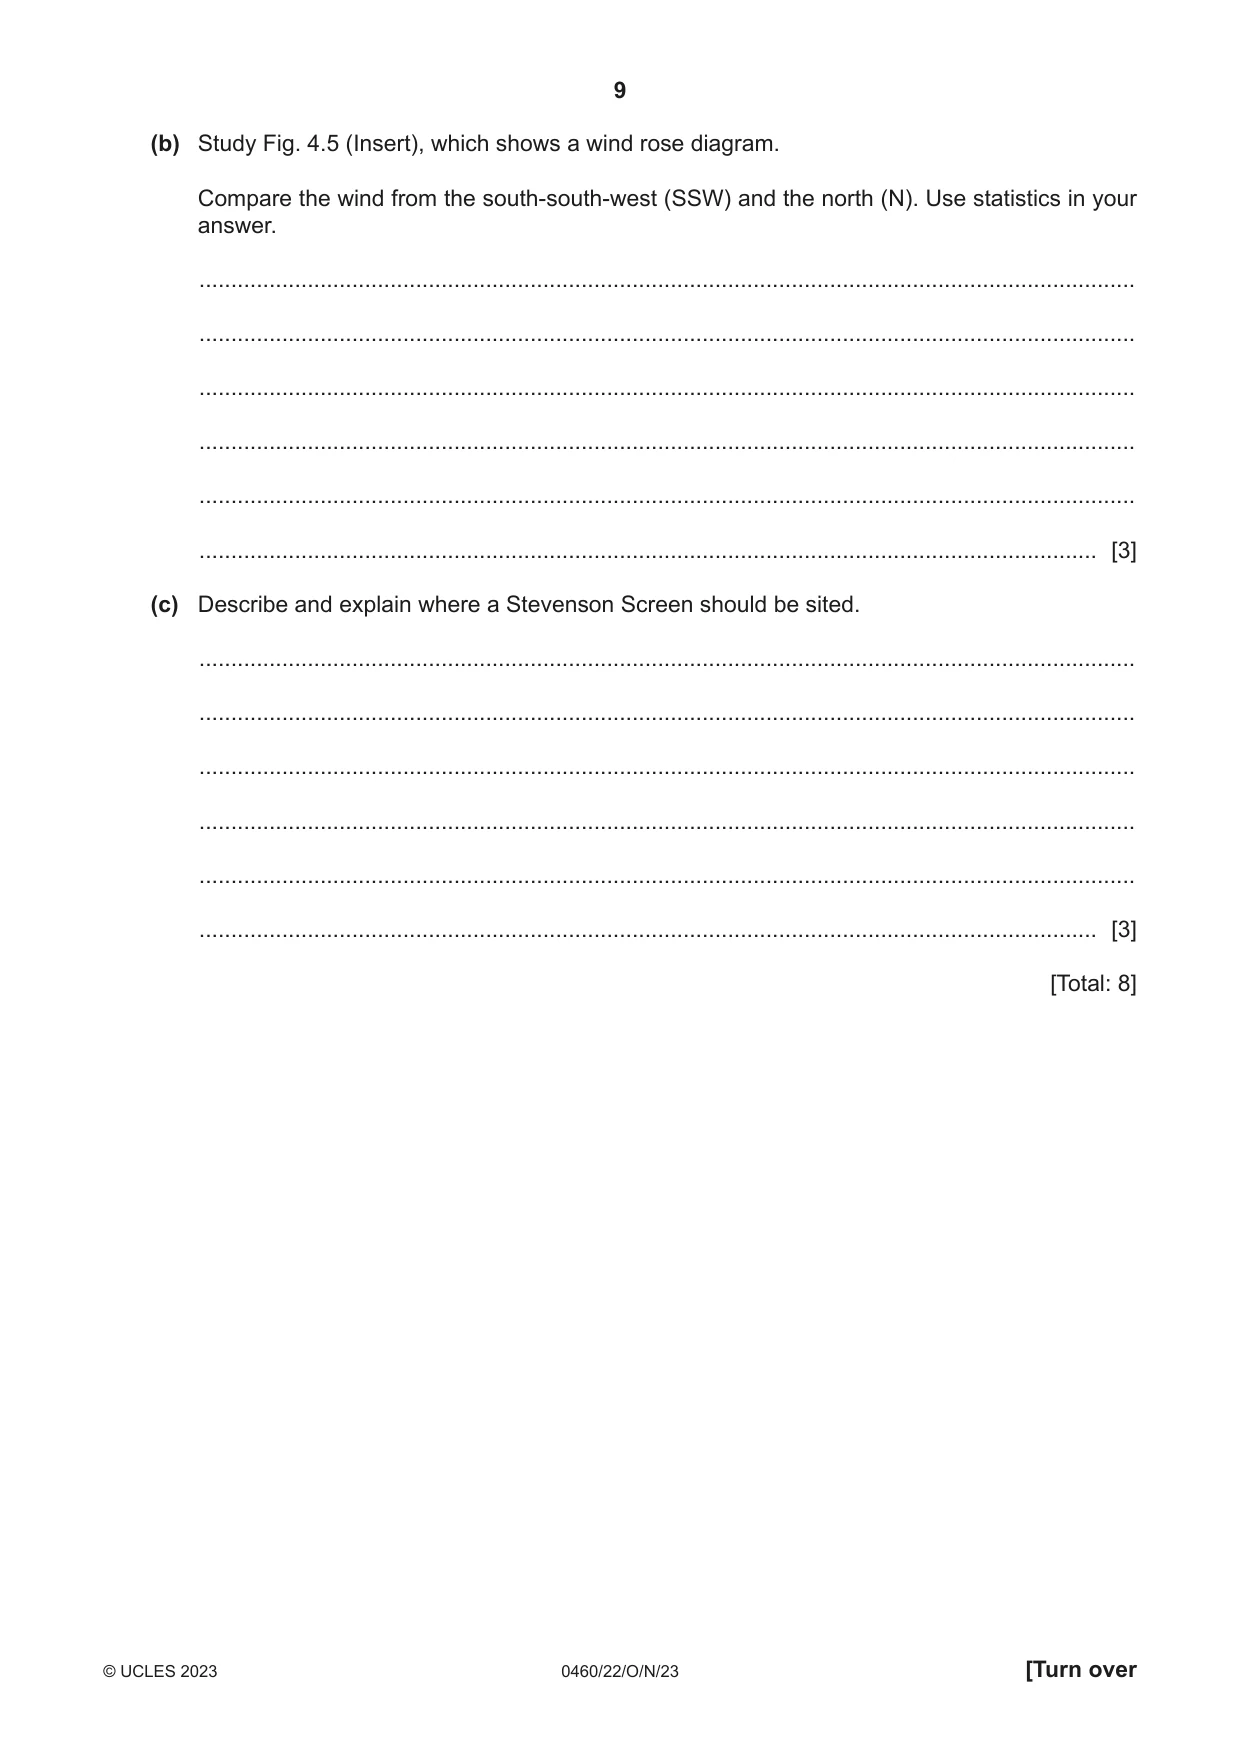
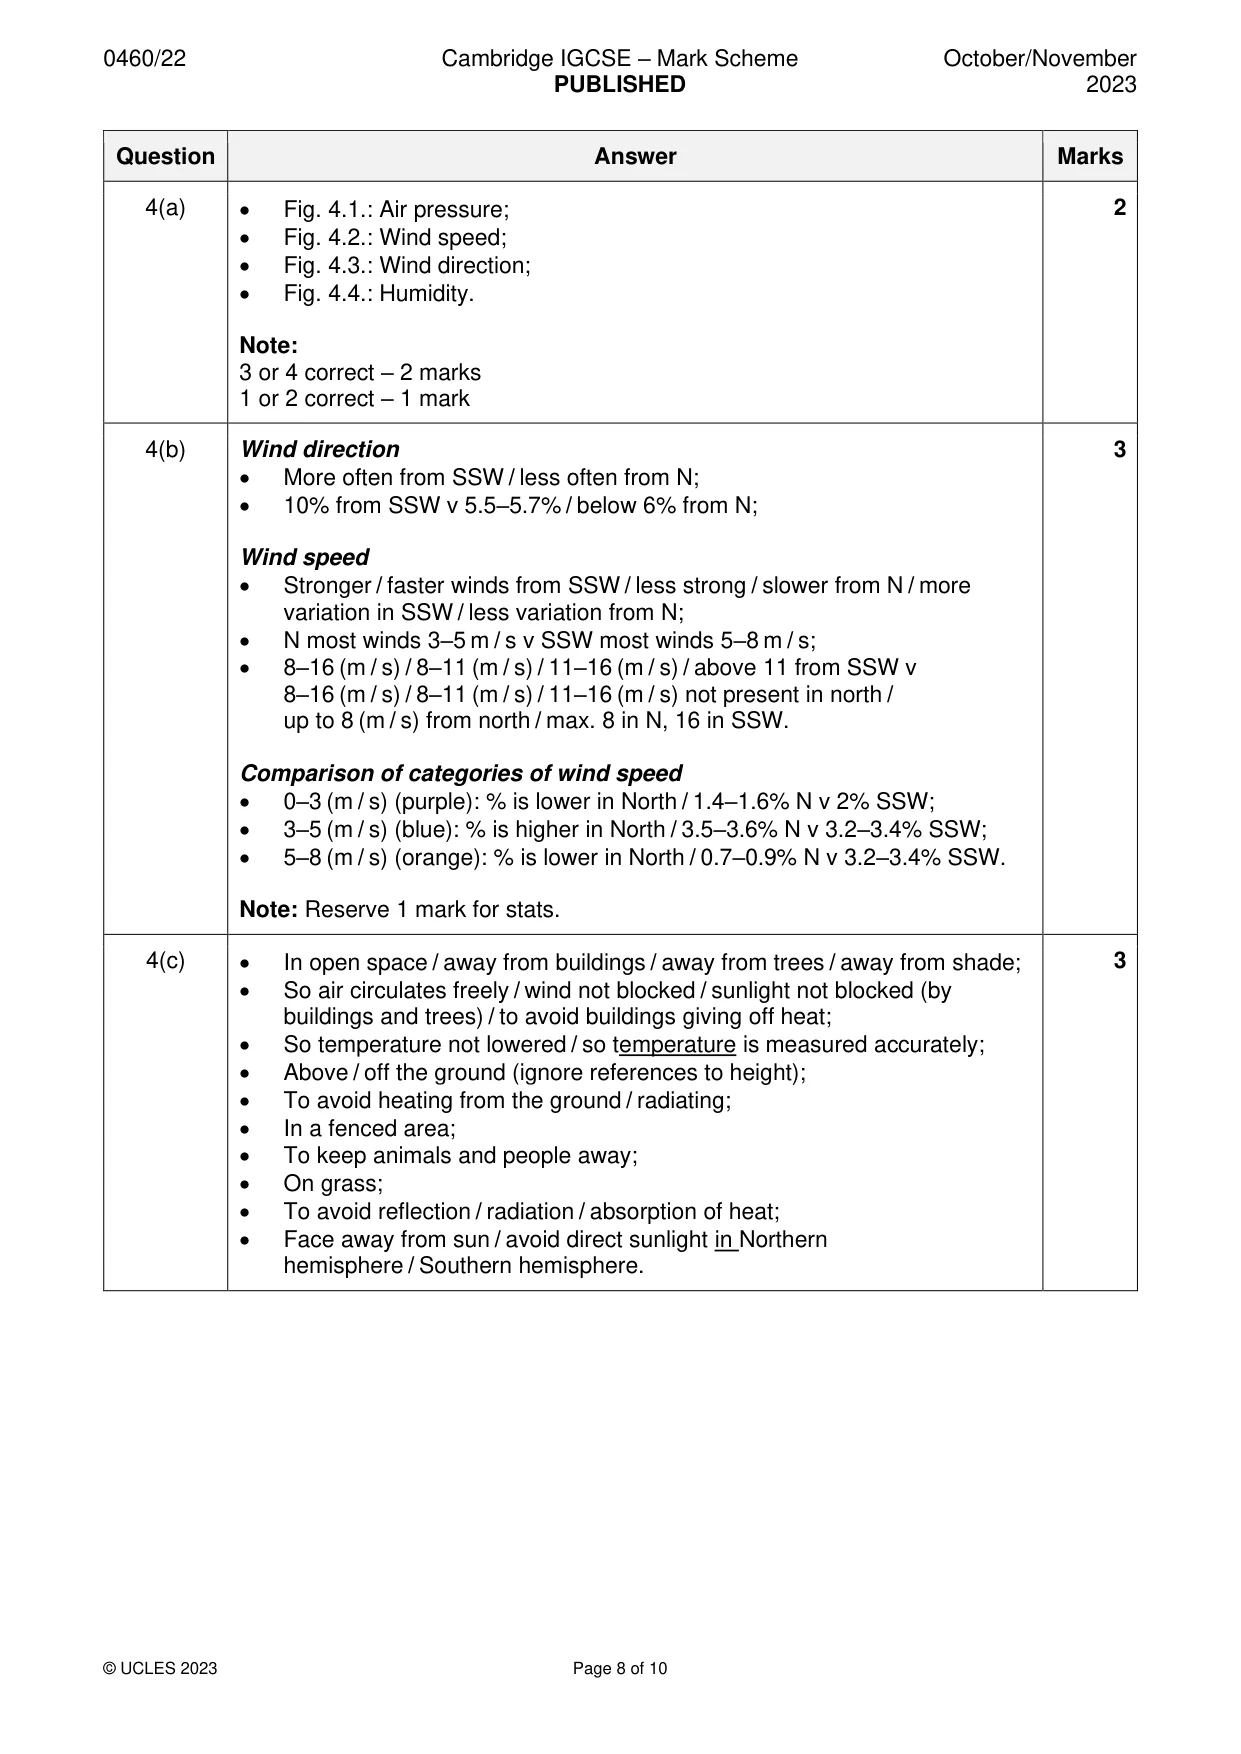
4 Figs. 4.1, 4.2, 4,3 and 4.4 show weather instruments. Fig. 4.1 Fig. 4.2 °C °C°C 40 40 30 30 20 20 10 10 0 0 –10 –10 –20 –20 Fig. 4.3 Fig. 4.4 (a) State what each weather instrument measures. Choose your answers from the following list. air pressure humidity rainfall sunshine hours wind direction wind speed Fig. 4.1 ........................................................................ Fig. 4.2 ........................................................................ Fig. 4.3 ........................................................................ Fig. 4.4 ........................................................................ [2] (b) Study Fig. 4.5 (Insert), which shows a wind rose diagram. Compare the wind from the south‑south‑west (SSW) and the north (N). Use statistics in your answer. ................................................................................................................................................... ................................................................................................................................................... ................................................................................................................................................... ................................................................................................................................................... ................................................................................................................................................... ............................................................................................................................................. [3] (c) Describe and explain where a Stevenson Screen should be sited. ................................................................................................................................................... ................................................................................................................................................... ................................................................................................................................................... ................................................................................................................................................... ................................................................................................................................................... ............................................................................................................................................. [3] [Total: 8]
Mark scheme: 4(a) • Fig. 4.1.: Air pressure; 2 • Fig. 4.2.: Wind speed; • Fig. 4.3.: Wind direction; • Fig. 4.4.: Humidity. Note: 3 or 4 correct – 2 marks 1 or 2 correct – 1 mark 4(b) Wind direction 3 • More often from SSW / less often from N; • 10% from SSW v 5.5–5.7% / below 6% from N; Wind speed • Stronger / faster winds from SSW / less strong / slower from N / more variation in SSW / less variation from N; • N most winds 3–5 m / s v SSW most winds 5–8 m / s; • 8–16 (m / s) / 8–11 (m / s) / 11–16 (m / s) / above 11 from SSW v 8–16 (m / s) / 8–11 (m / s) / 11–16 (m / s) not present in north / up to 8 (m / s) from north / max. 8 in N, 16 in SSW. Comparison of categories of wind speed • 0–3 (m / s) (purple): % is lower in North / 1.4–1.6% N v 2% SSW; • 3–5 (m / s) (blue): % is higher in North / 3.5–3.6% N v 3.2–3.4% SSW; • 5–8 (m / s) (orange): % is lower in North / 0.7–0.9% N v 3.2–3.4% SSW. Note: Reserve 1 mark for stats. 4(c) • In open space / away from buildings / away from trees / away from shade; 3 • So air circulates freely / wind not blocked / sunlight not blocked (by buildings and trees) / to avoid buildings giving off heat; • So temperature not lowered / so temperature is measured accurately; • Above / off the ground (ignore references to height); • To avoid heating from the ground / radiating; • In a fenced area; • To keep animals and people away; • On grass; • To avoid reflection / radiation / absorption of heat; • Face away from sun / avoid direct sunlight in Northern hemisphere / Southern hemisphere.
Q5 · Information about the total number of global deaths from natural hazards between 1900 and…
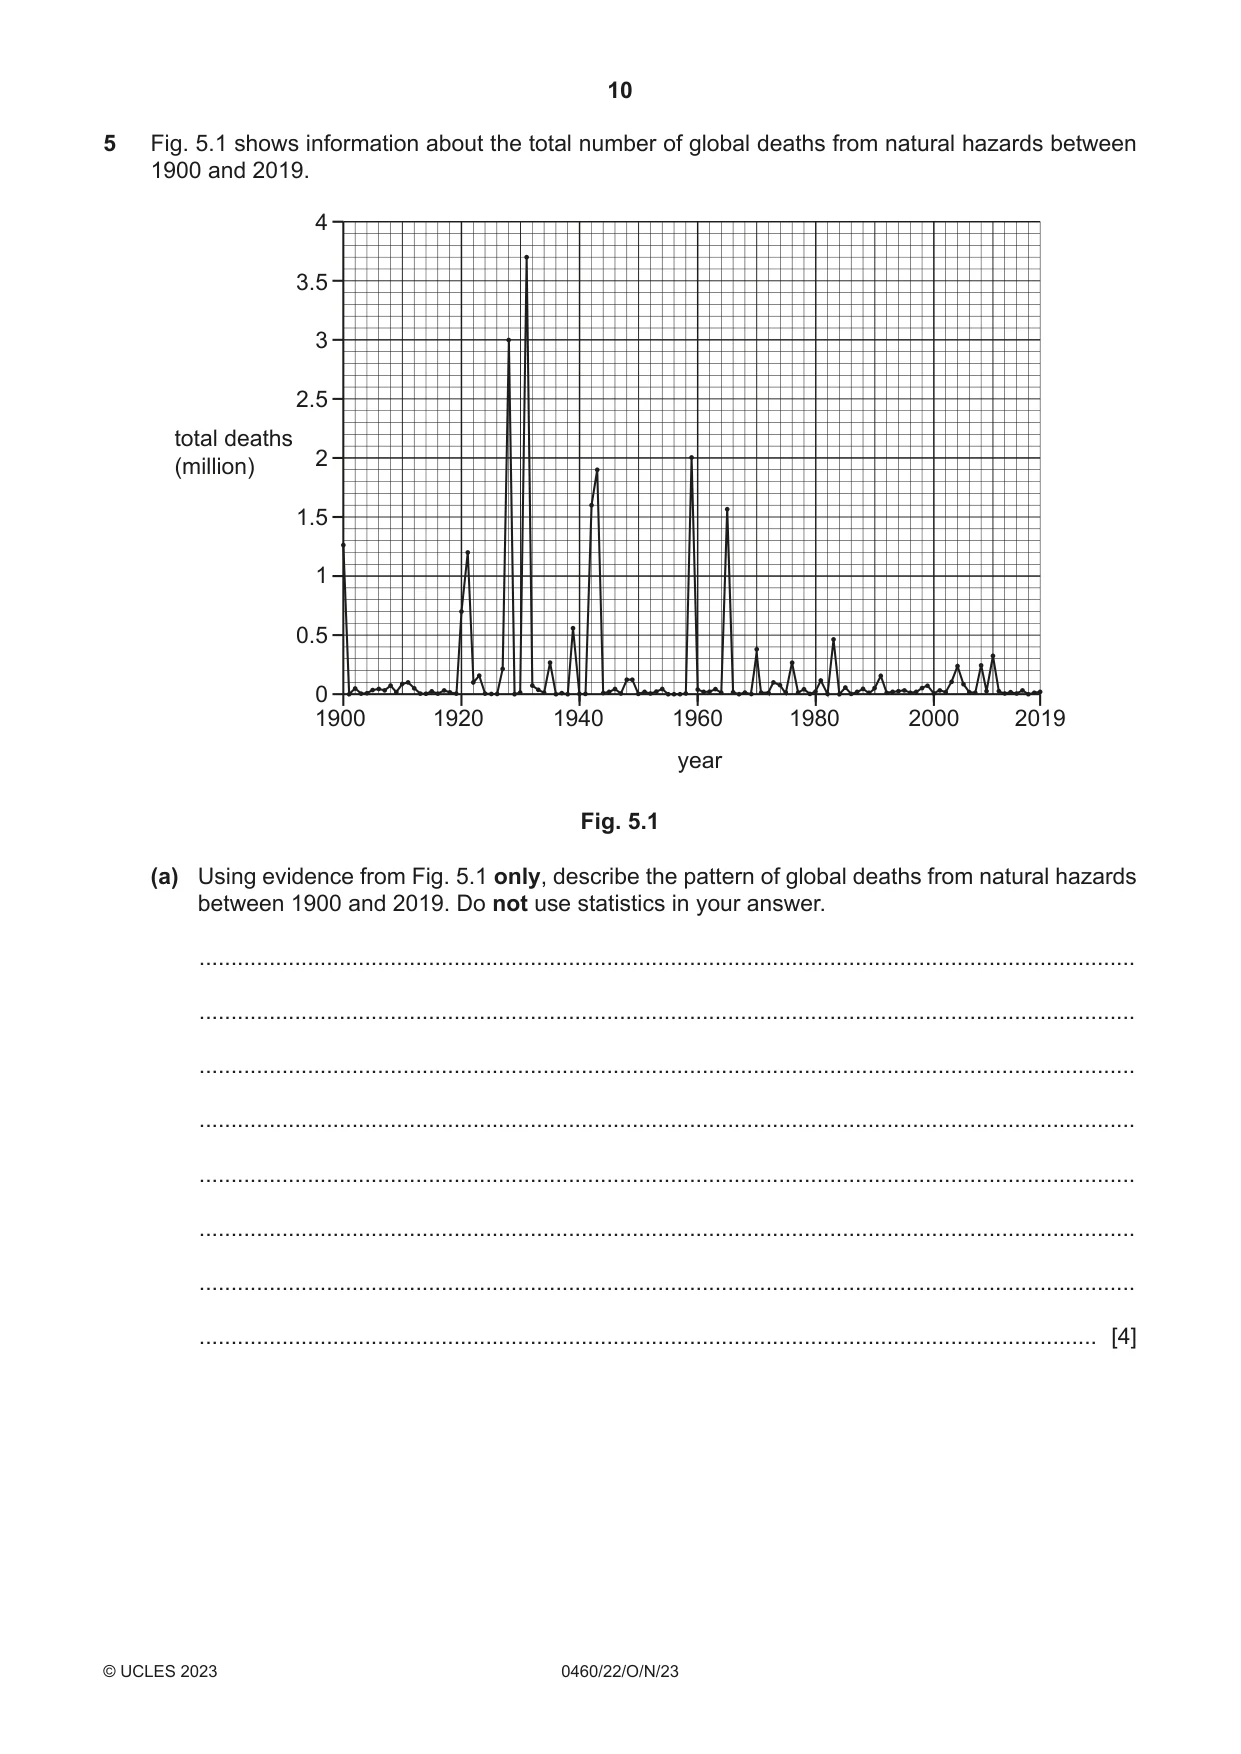
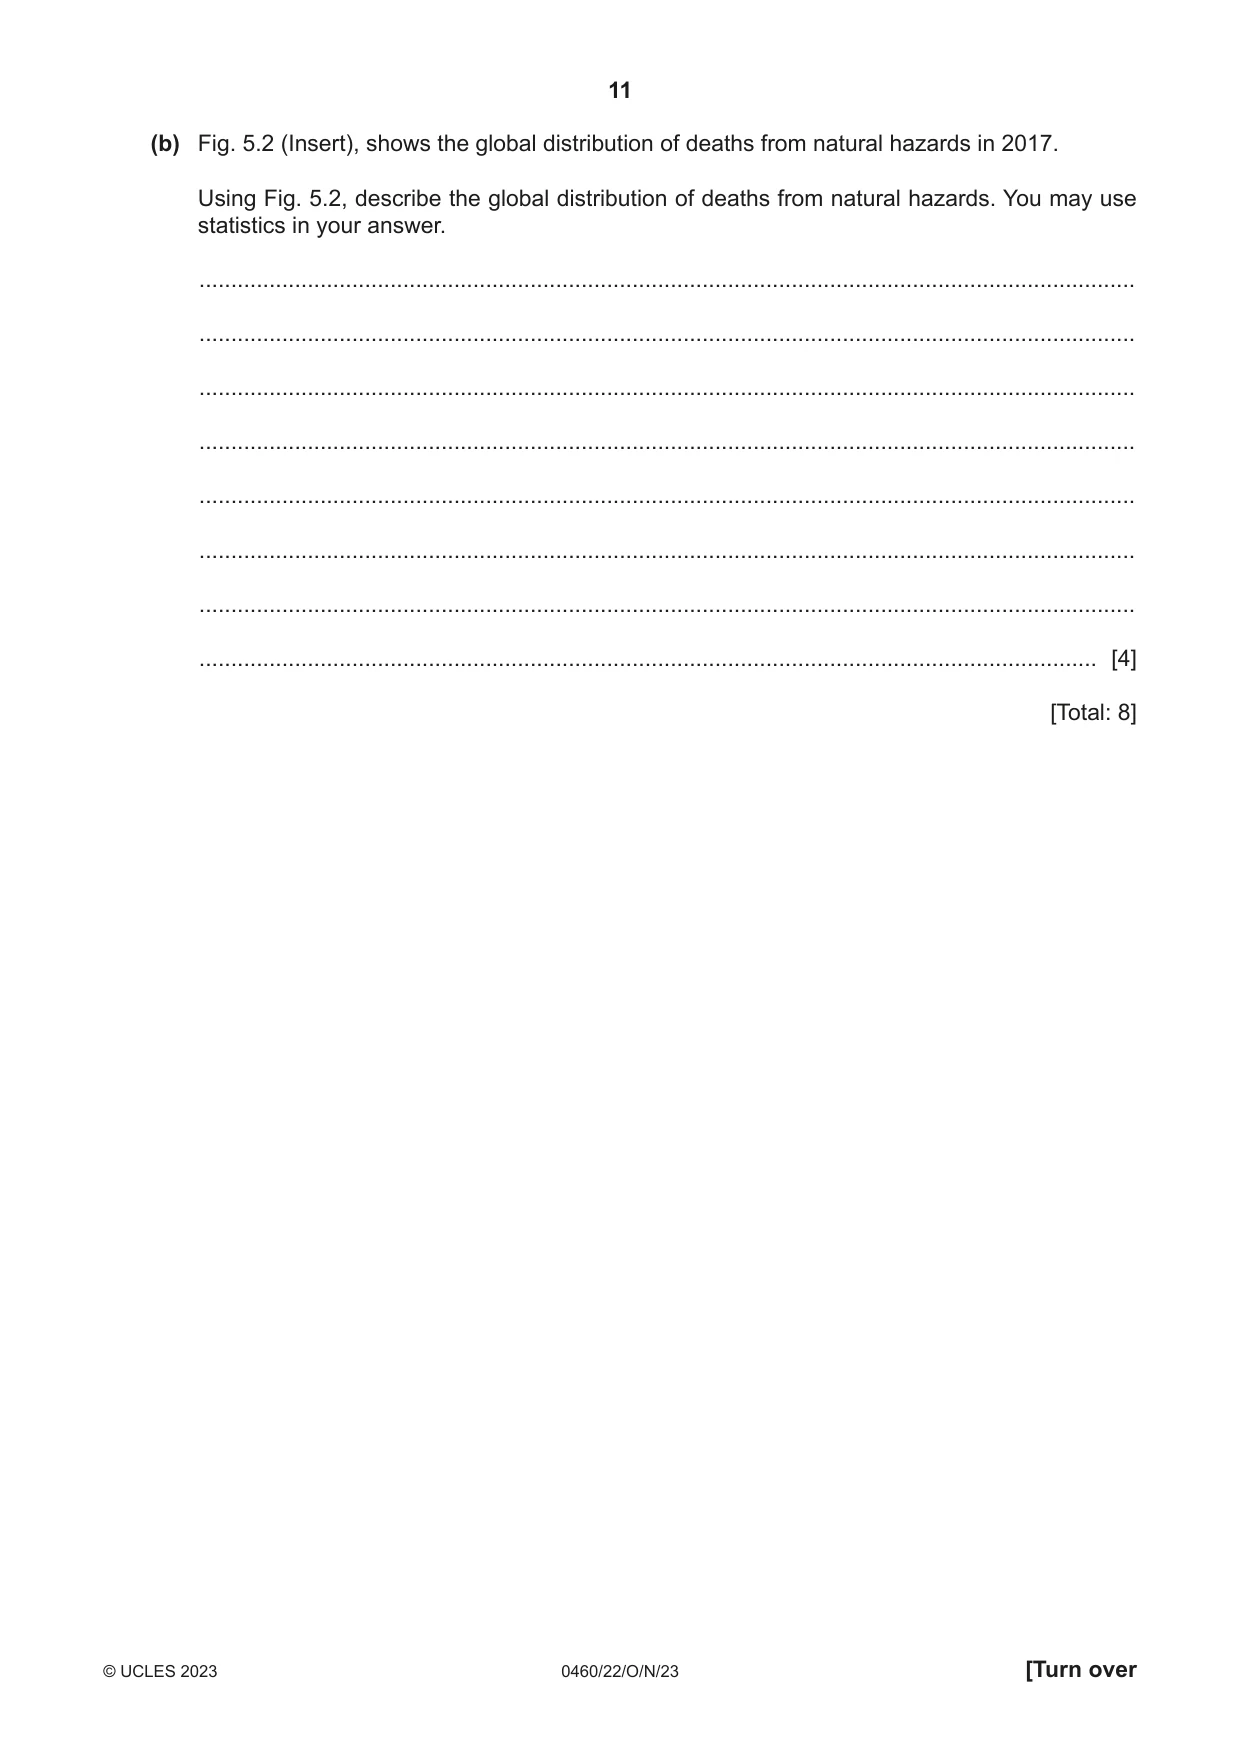
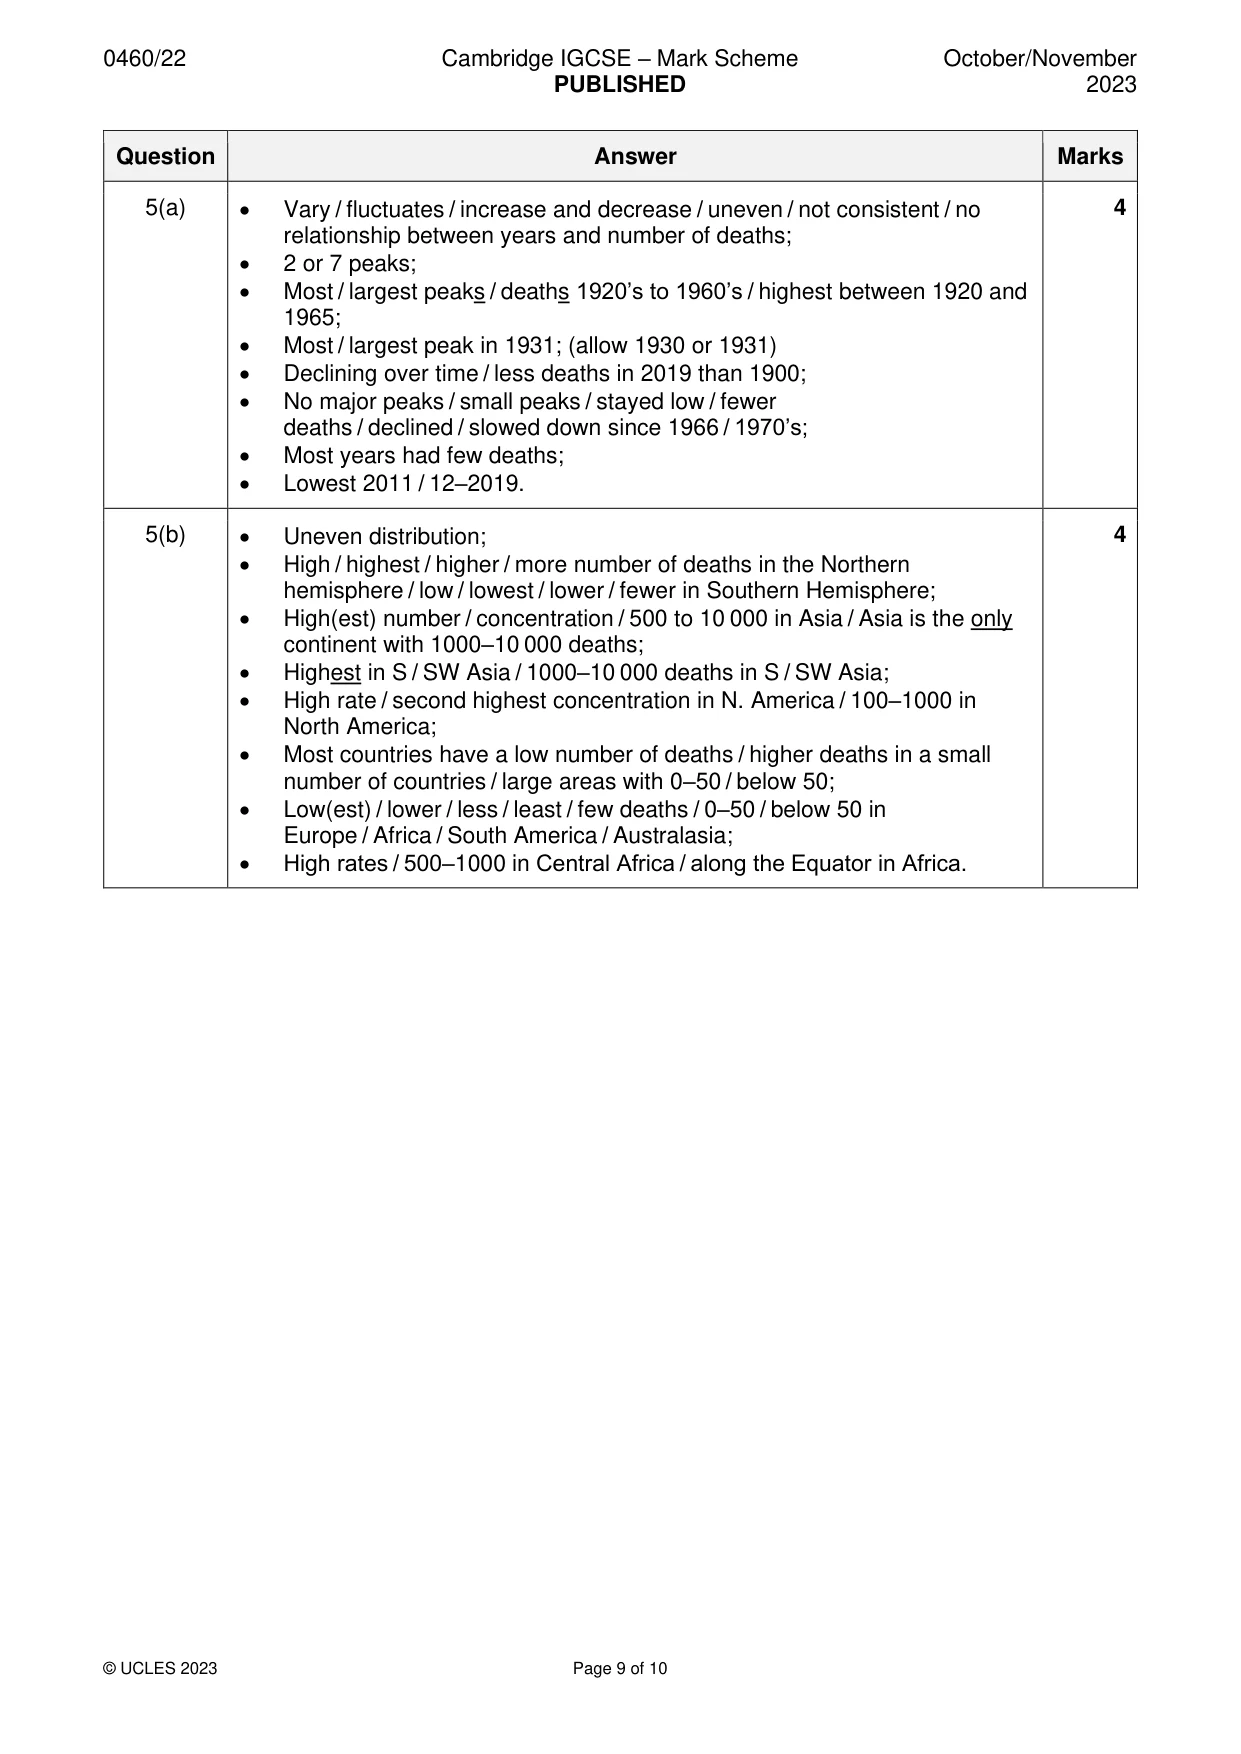
5 Fig. 5.1 shows information about the total number of global deaths from natural hazards between 1900 and 2019. 4 3.5 3 2.5 total deaths 2 (million) 1.5 1 0.5 0 1900 1920 1940 1960 1980 2000 2019 year Fig. 5.1 (a) Using evidence from Fig. 5.1 only, describe the pattern of global deaths from natural hazards between 1900 and 2019. Do not use statistics in your answer. ................................................................................................................................................... ................................................................................................................................................... ................................................................................................................................................... ................................................................................................................................................... ................................................................................................................................................... ................................................................................................................................................... ................................................................................................................................................... ............................................................................................................................................. [4] (b) Fig. 5.2 (Insert), shows the global distribution of deaths from natural hazards in 2017. Using Fig. 5.2, describe the global distribution of deaths from natural hazards. You may use statistics in your answer. ................................................................................................................................................... ................................................................................................................................................... ................................................................................................................................................... ................................................................................................................................................... ................................................................................................................................................... ................................................................................................................................................... ................................................................................................................................................... ............................................................................................................................................. [4] [Total: 8]
Mark scheme: 5(a) • Vary / fluctuates / increase and decrease / uneven / not consistent / no 4 relationship between years and number of deaths; • 2 or 7 peaks; • Most / largest peaks / deaths 1920’s to 1960’s / highest between 1920 and 1965; • Most / largest peak in 1931; (allow 1930 or 1931) • Declining over time / less deaths in 2019 than 1900; • No major peaks / small peaks / stayed low / fewer deaths / declined / slowed down since 1966 / 1970’s; • Most years had few deaths; • Lowest 2011 / 12–2019. 5(b) • Uneven distribution; 4 • High / highest / higher / more number of deaths in the Northern hemisphere / low / lowest / lower / fewer in Southern Hemisphere; • High(est) number / concentration / 500 to 10 000 in Asia / Asia is the only continent with 1000–10 000 deaths; • Highest in S / SW Asia / 1000–10 000 deaths in S / SW Asia; • High rate / second highest concentration in N. America / 100–1000 in North America; • Most countries have a low number of deaths / higher deaths in a small number of countries / large areas with 0–50 / below 50; • Low(est) / lower / less / least / few deaths / 0–50 / below 50 in Europe / Africa / South America / Australasia; • High rates / 500–1000 in Central Africa / along the Equator in Africa.
Q6 · The Dominican Republic is a popular tourist destination
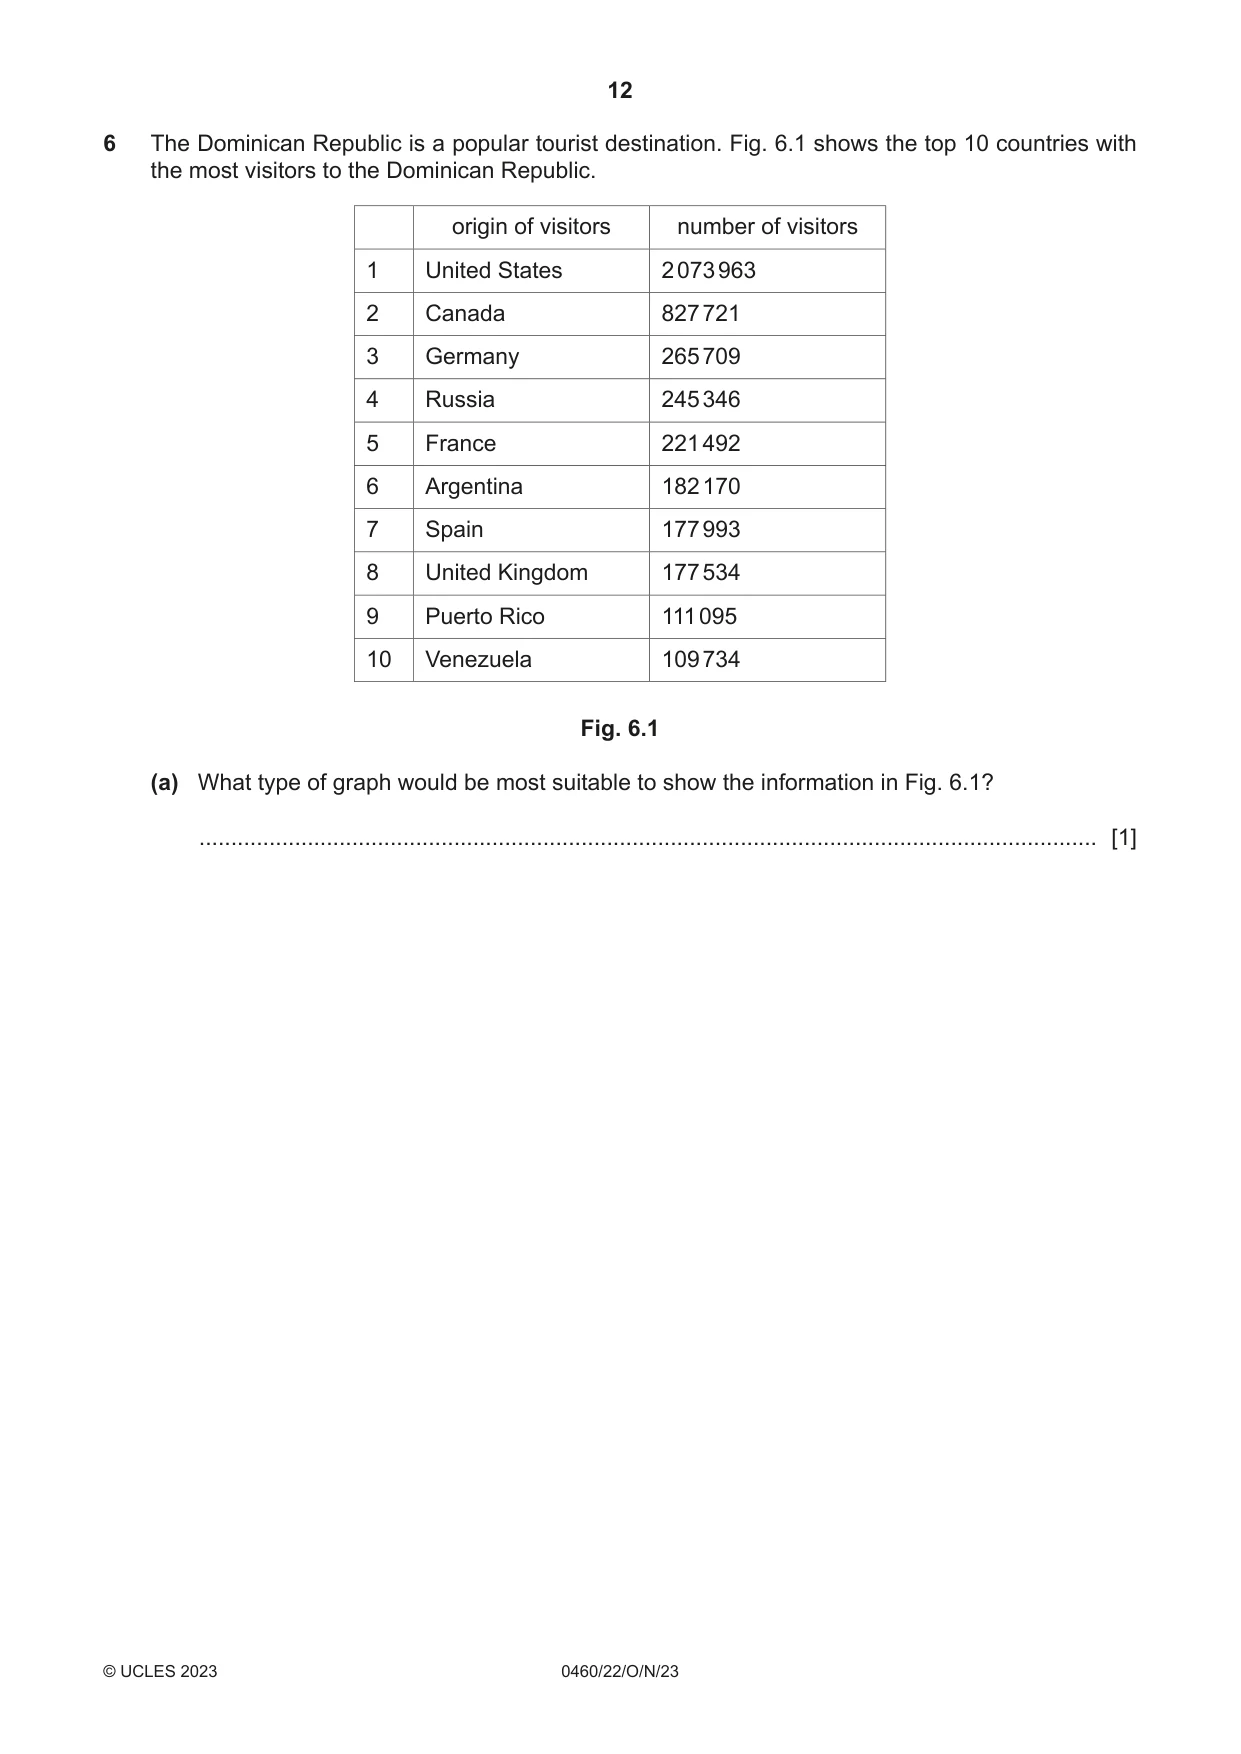
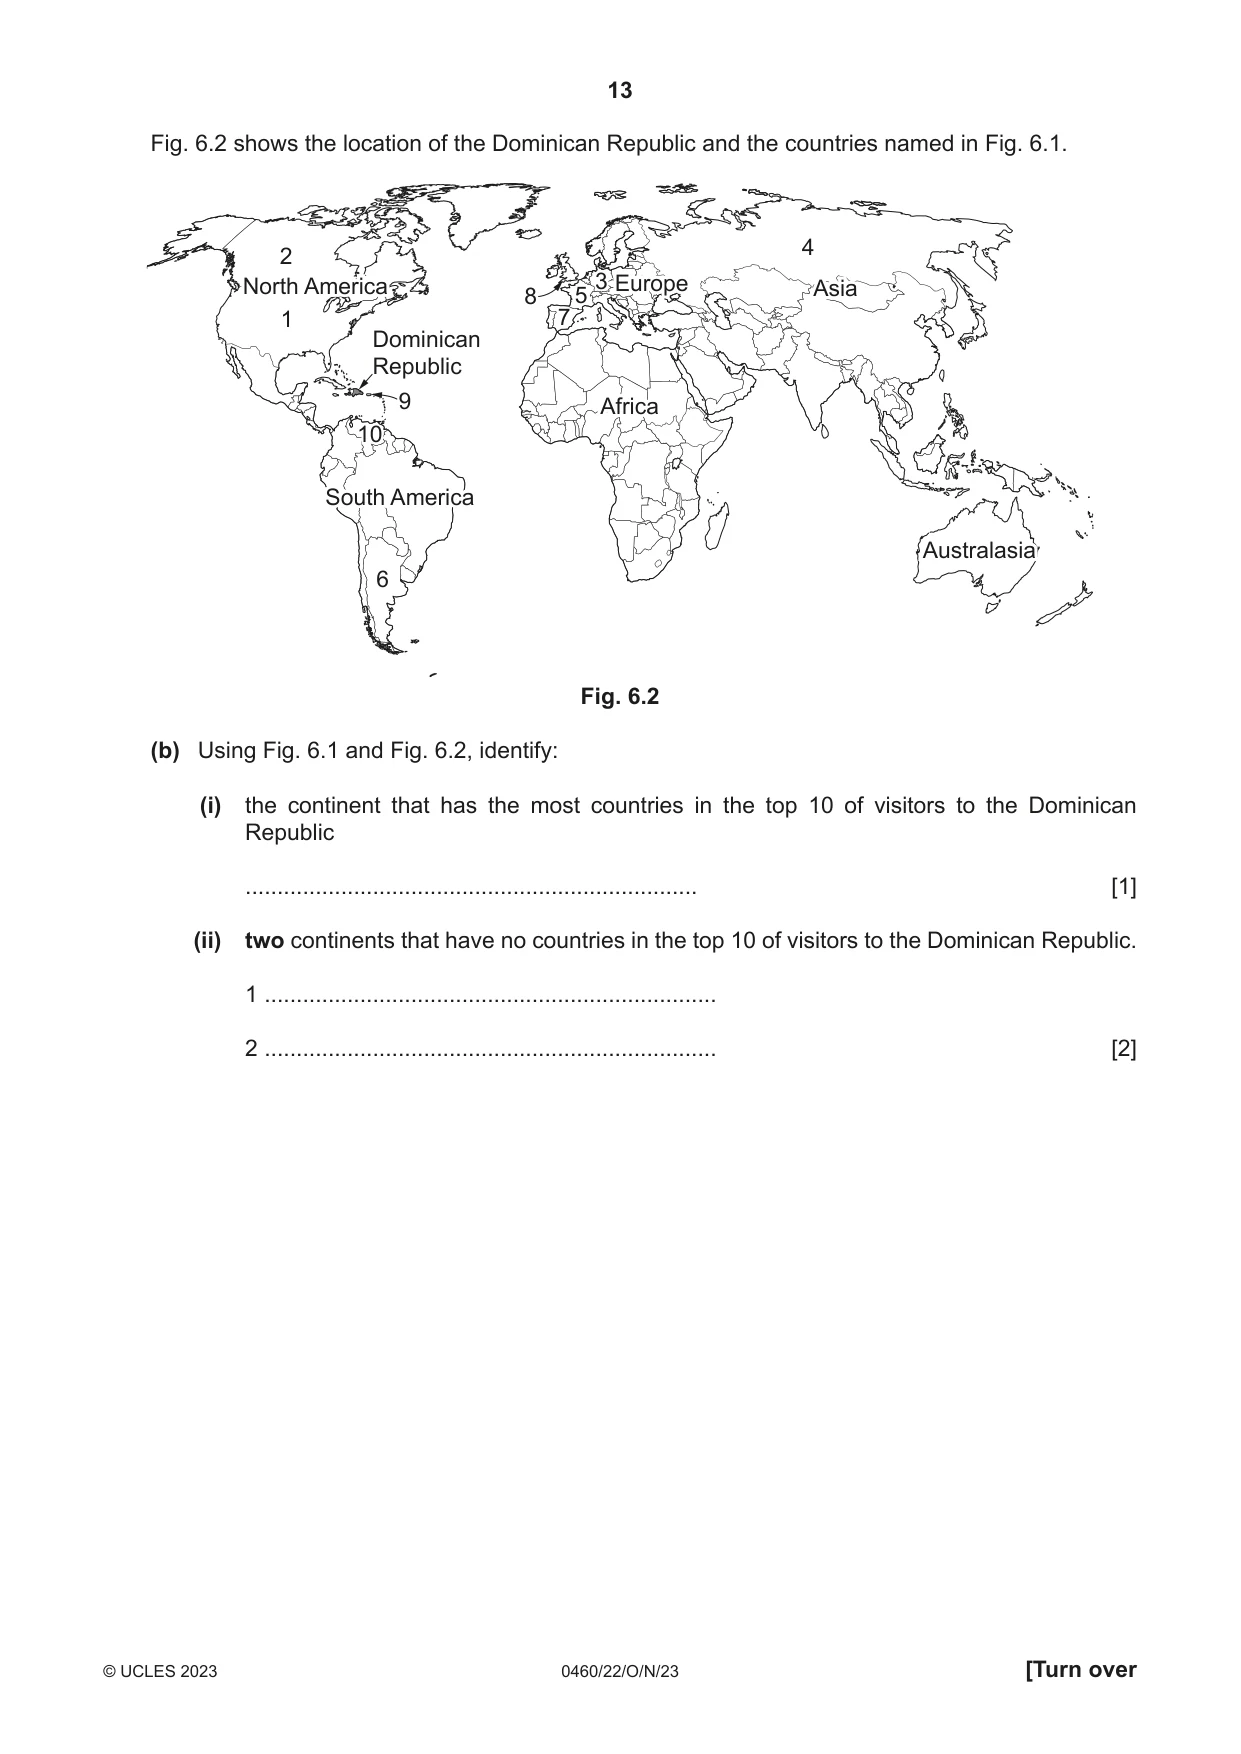
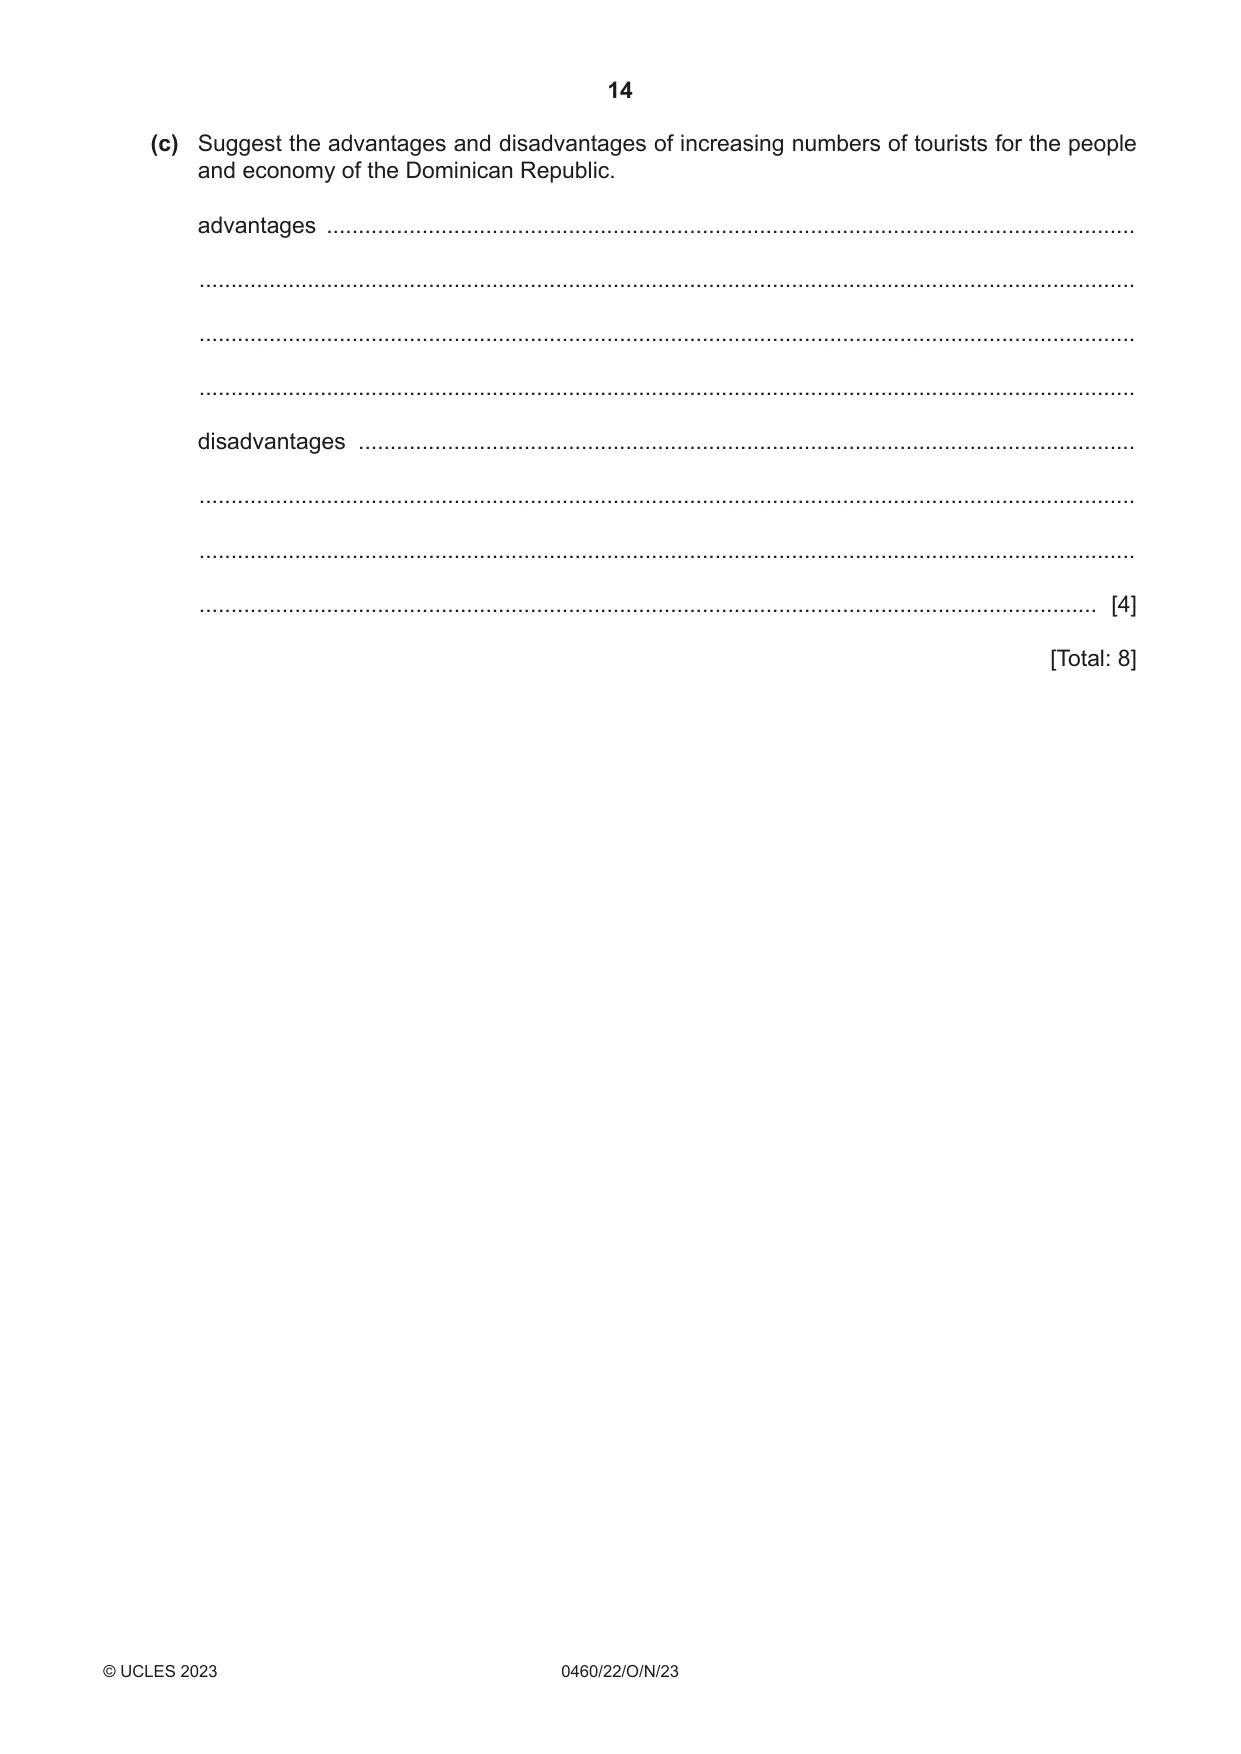
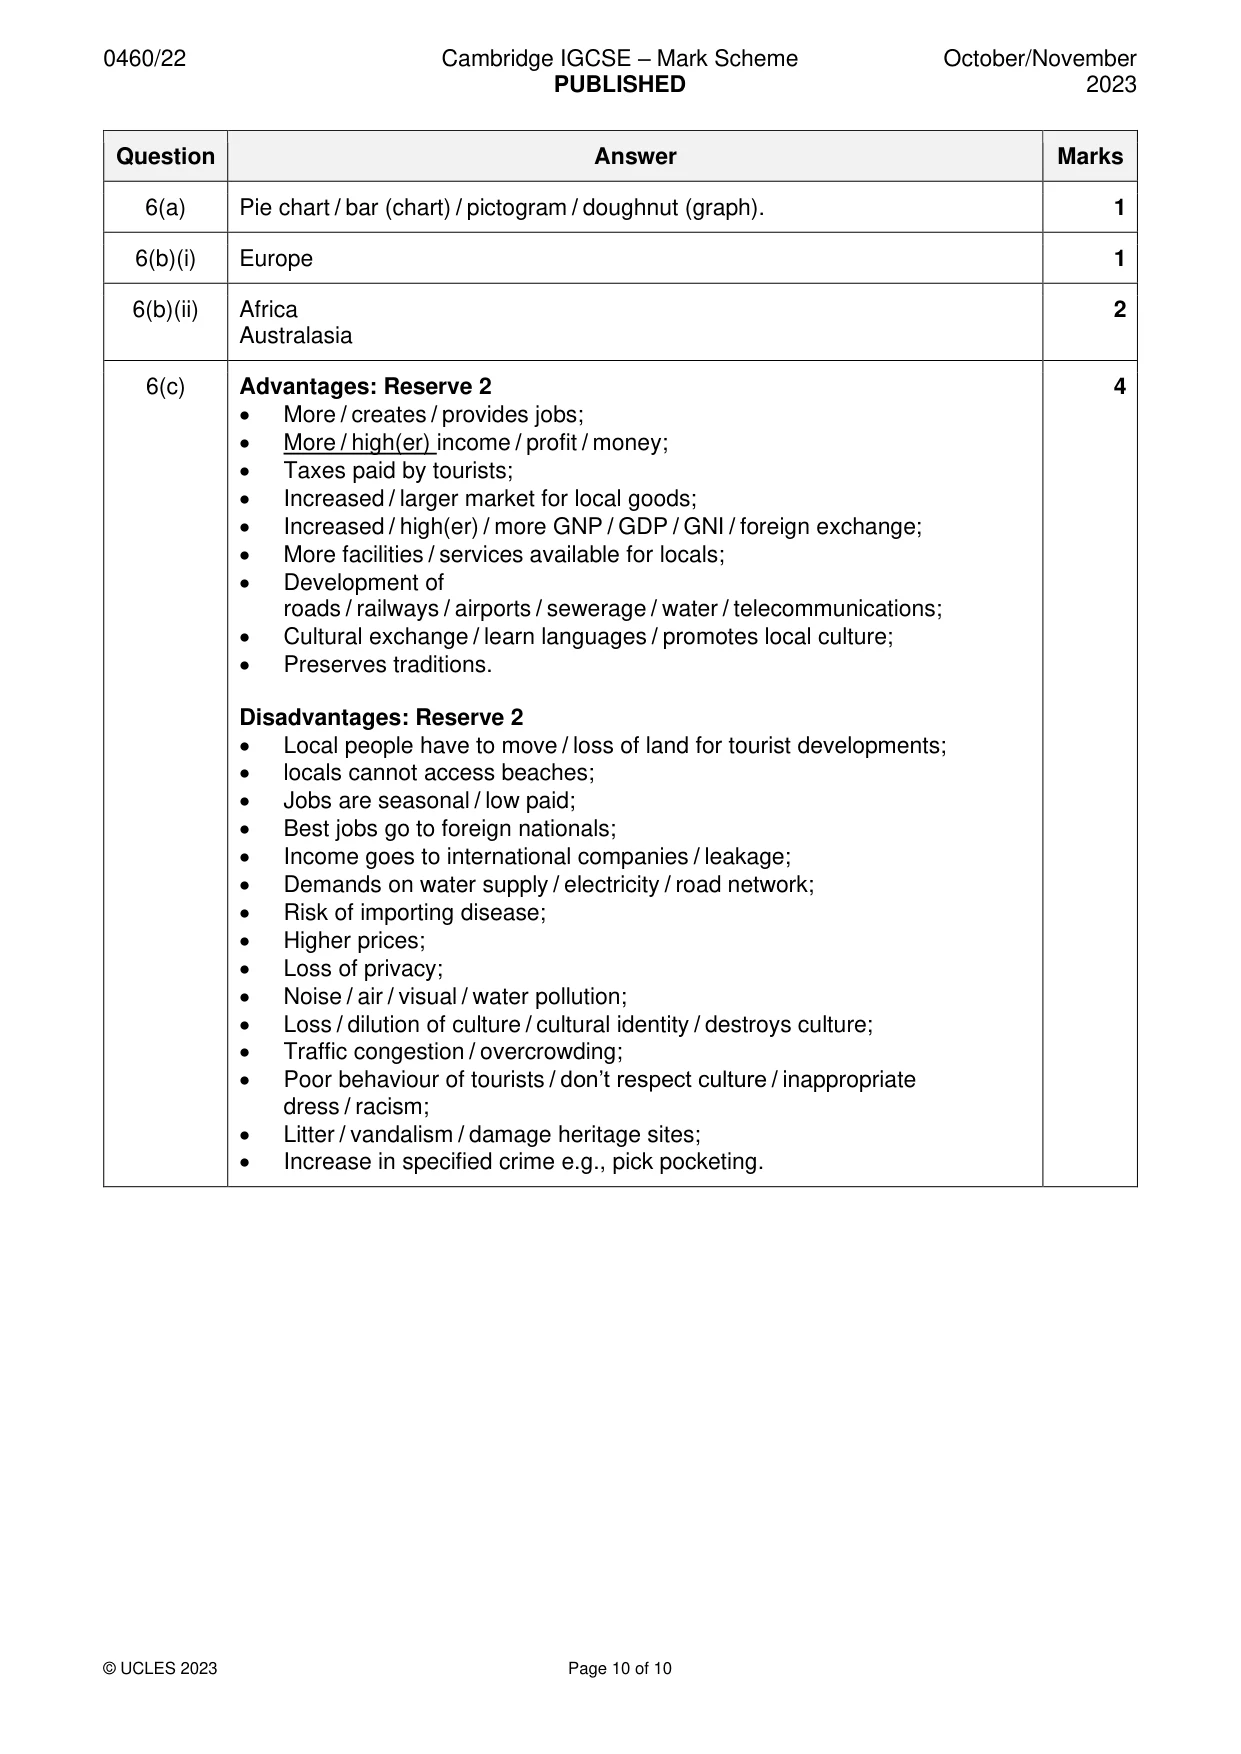
6 The Dominican Republic is a popular tourist destination. Fig. 6.1 shows the top 10 countries with the most visitors to the Dominican Republic. origin of visitors number of visitors 1 United States 2 073 963 2 Canada 827 721 3 Germany 265 709 4 Russia 245 346 5 France 221 492 6 Argentina 182 170 7 Spain 177 993 8 United Kingdom 177 534 9 Puerto Rico 111 095 10 Venezuela 109 734 Fig. 6.1 (a) What type of graph would be most suitable to show the information in Fig. 6.1? ............................................................................................................................................. [1] Fig. 6.2 shows the location of the Dominican Republic and the countries named in Fig. 6.1. 4 2 NorthNorth AmericaAmerica 3 EuropeEurope AsiaAsia 8 5 1 7 Dominican Republic 9 AfricaAfrica 1010 SouthSouth AmericaAmerica AustralasiaAustralasia 6 Fig. 6.2 (b) Using Fig. 6.1 and Fig. 6.2, identify: (i) the continent that has the most countries in the top 10 of visitors to the Dominican Republic ....................................................................... [1] (ii) two continents that have no countries in the top 10 of visitors to the Dominican Republic. 1 ....................................................................... 2 ....................................................................... [2] (c) Suggest the advantages and disadvantages of increasing numbers of tourists for the people and economy of the Dominican Republic. advantages ............................................................................................................................... ................................................................................................................................................... ................................................................................................................................................... ................................................................................................................................................... disadvantages .......................................................................................................................... ................................................................................................................................................... ................................................................................................................................................... ............................................................................................................................................. [4] [Total: 8]
Mark scheme: 6(a) Pie chart / bar (chart) / pictogram / doughnut (graph). 1 6(b)(i) Europe 1 6(b)(ii) Africa 2 Australasia 6(c) Advantages: Reserve 2 4 • More / creates / provides jobs; • More / high(er) income / profit / money; • Taxes paid by tourists; • Increased / larger market for local goods; • Increased / high(er) / more GNP / GDP / GNI / foreign exchange; • More facilities / services available for locals; • Development of roads / railways / airports / sewerage / water / telecommunications; • Cultural exchange / learn languages / promotes local culture; • Preserves traditions. Disadvantages: Reserve 2 • Local people have to move / loss of land for tourist developments; • locals cannot access beaches; • Jobs are seasonal / low paid; • Best jobs go to foreign nationals; • Income goes to international companies / leakage; • Demands on water supply / electricity / road network; • Risk of importing disease; • Higher prices; • Loss of privacy; • Noise / air / visual / water pollution; • Loss / dilution of culture / cultural identity / destroys culture; • Traffic congestion / overcrowding; • Poor behaviour of tourists / don’t respect culture / inappropriate dress / racism; • Litter / vandalism / damage heritage sites; • Increase in specified crime e.g., pick pocketing.
What was in this paper
The subtopics covered by these 6 questions, and how many questions each got. Open one in a new tab to see every Cambridge question on it.
What you needed in this session
Cambridge’s own grade thresholds for 2023 Oct/Nov, Paper 2 · Variant 2. A higher threshold means an easier paper — the bar moves with how the cohort did.