Questions as text
Q1 · Answer the whole of this question on one sheet of graph paper 0580/41 Oct/Nov 2005
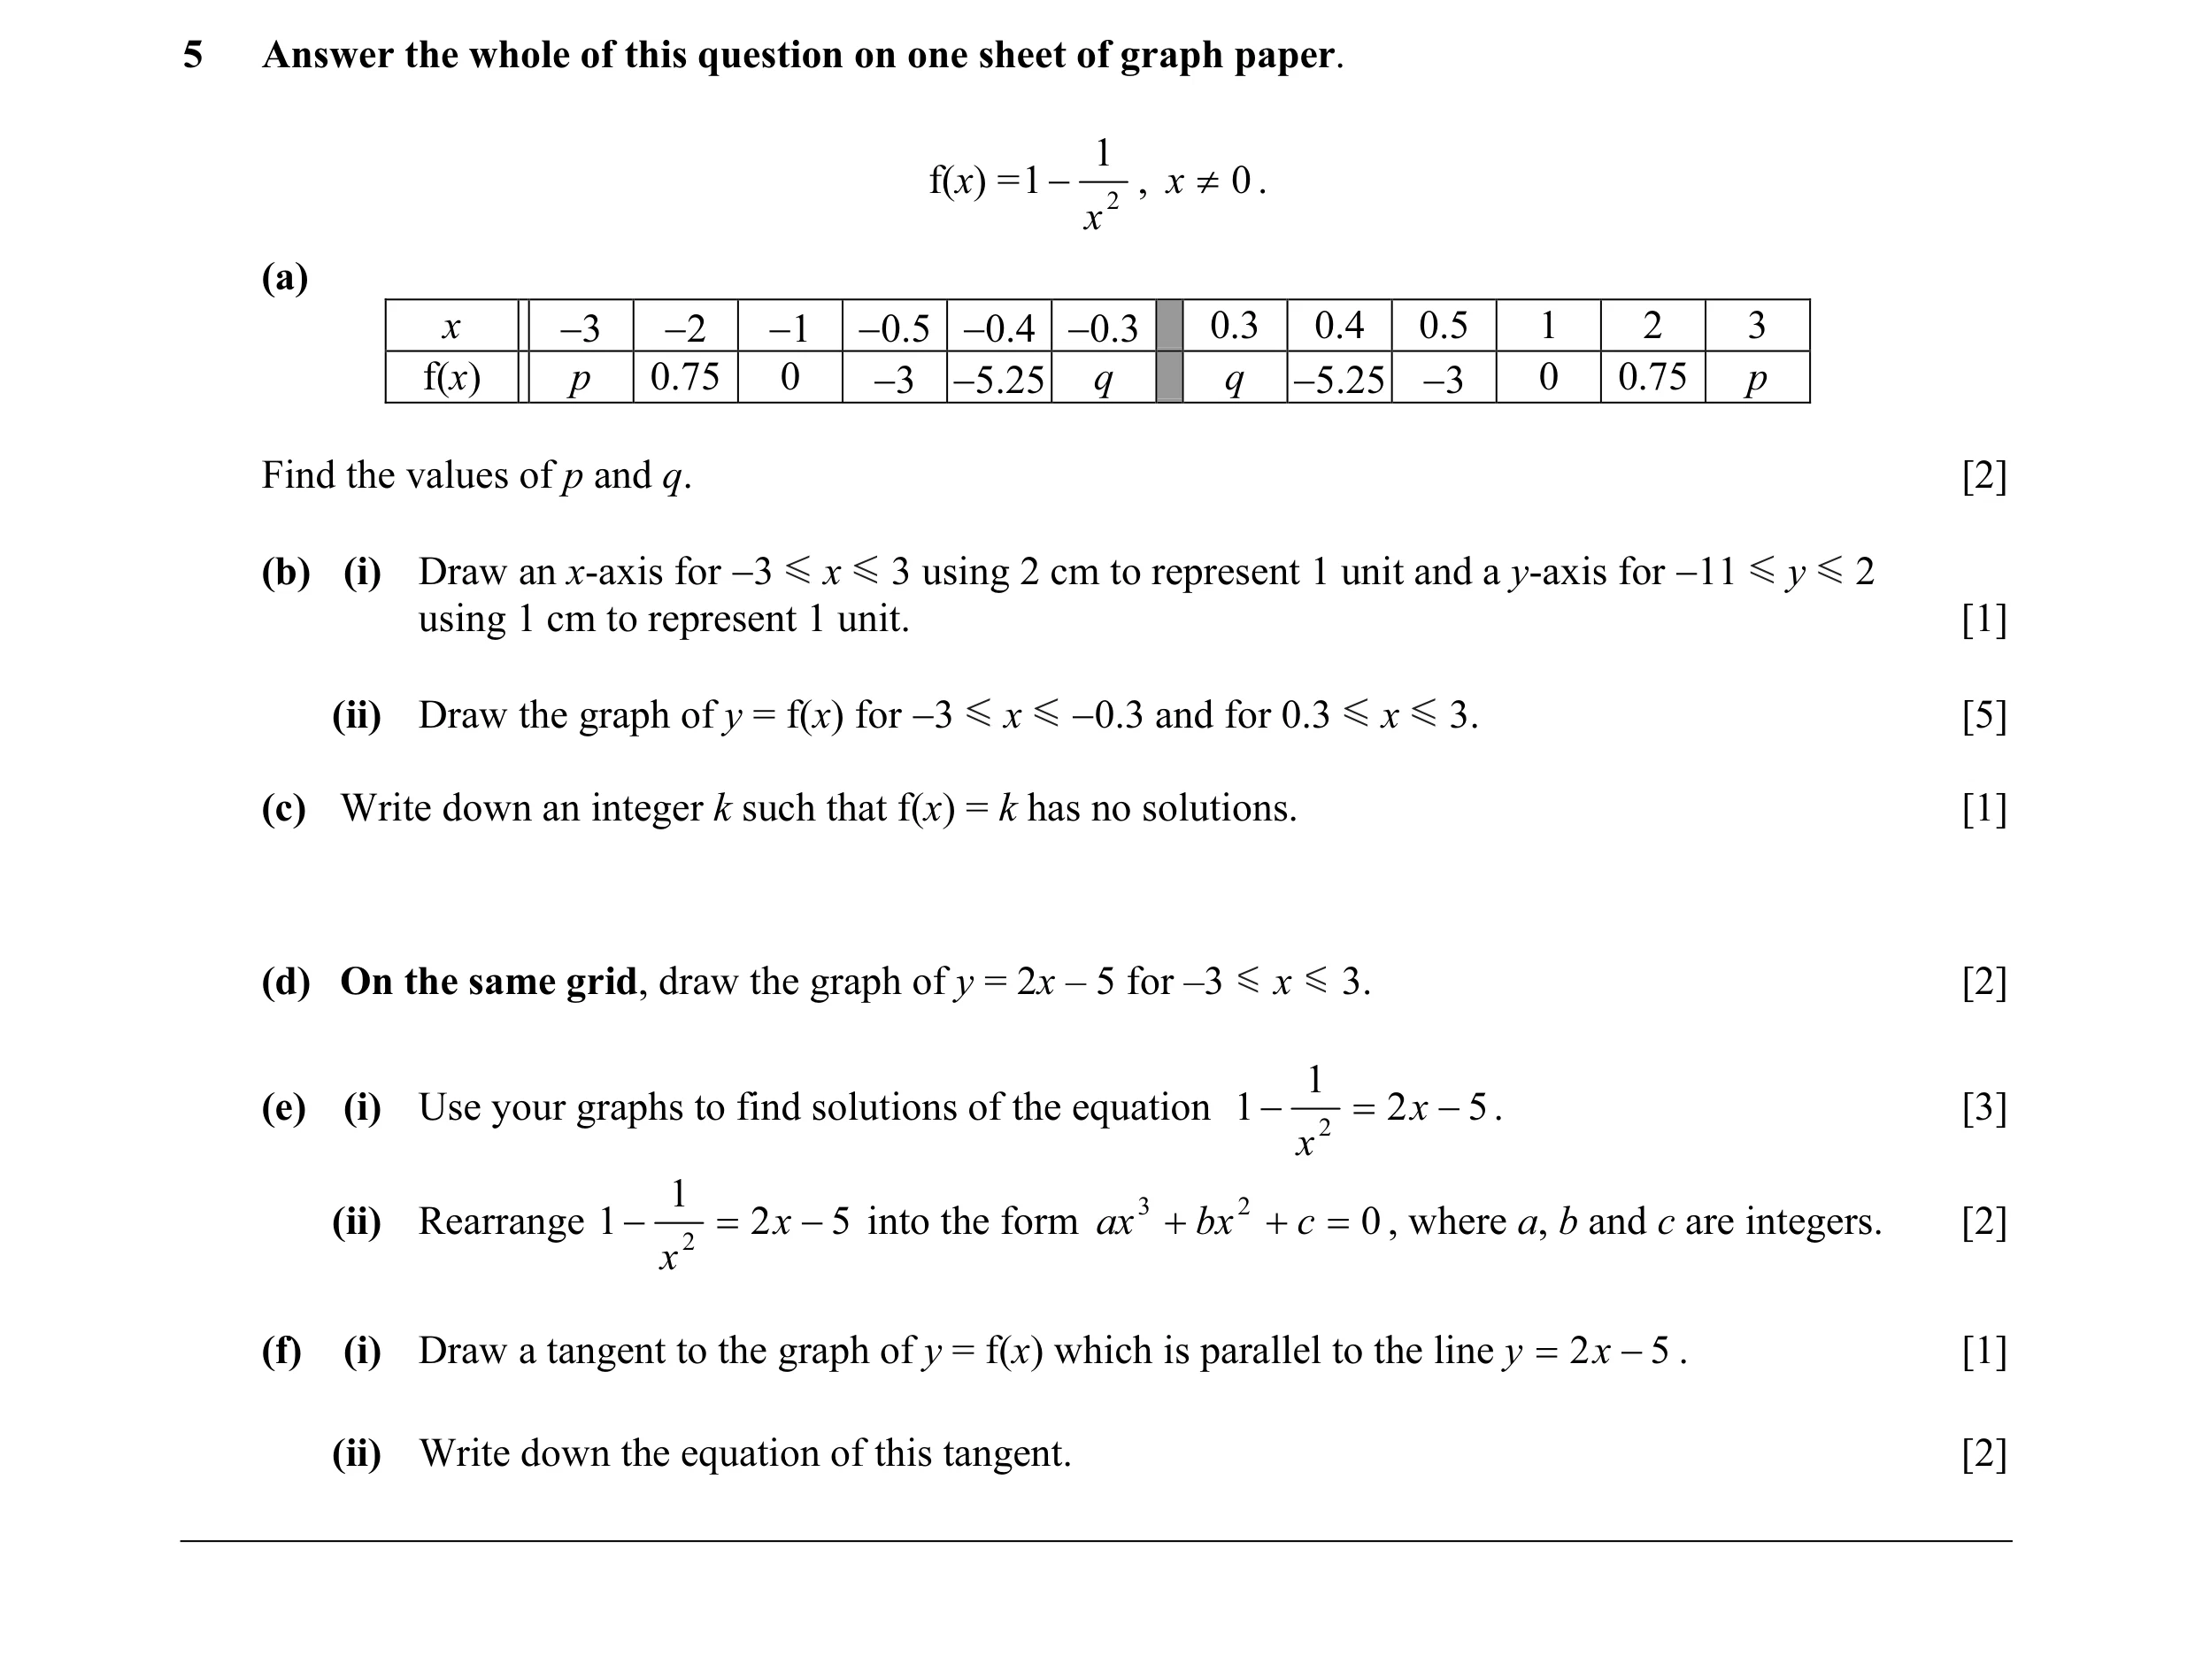
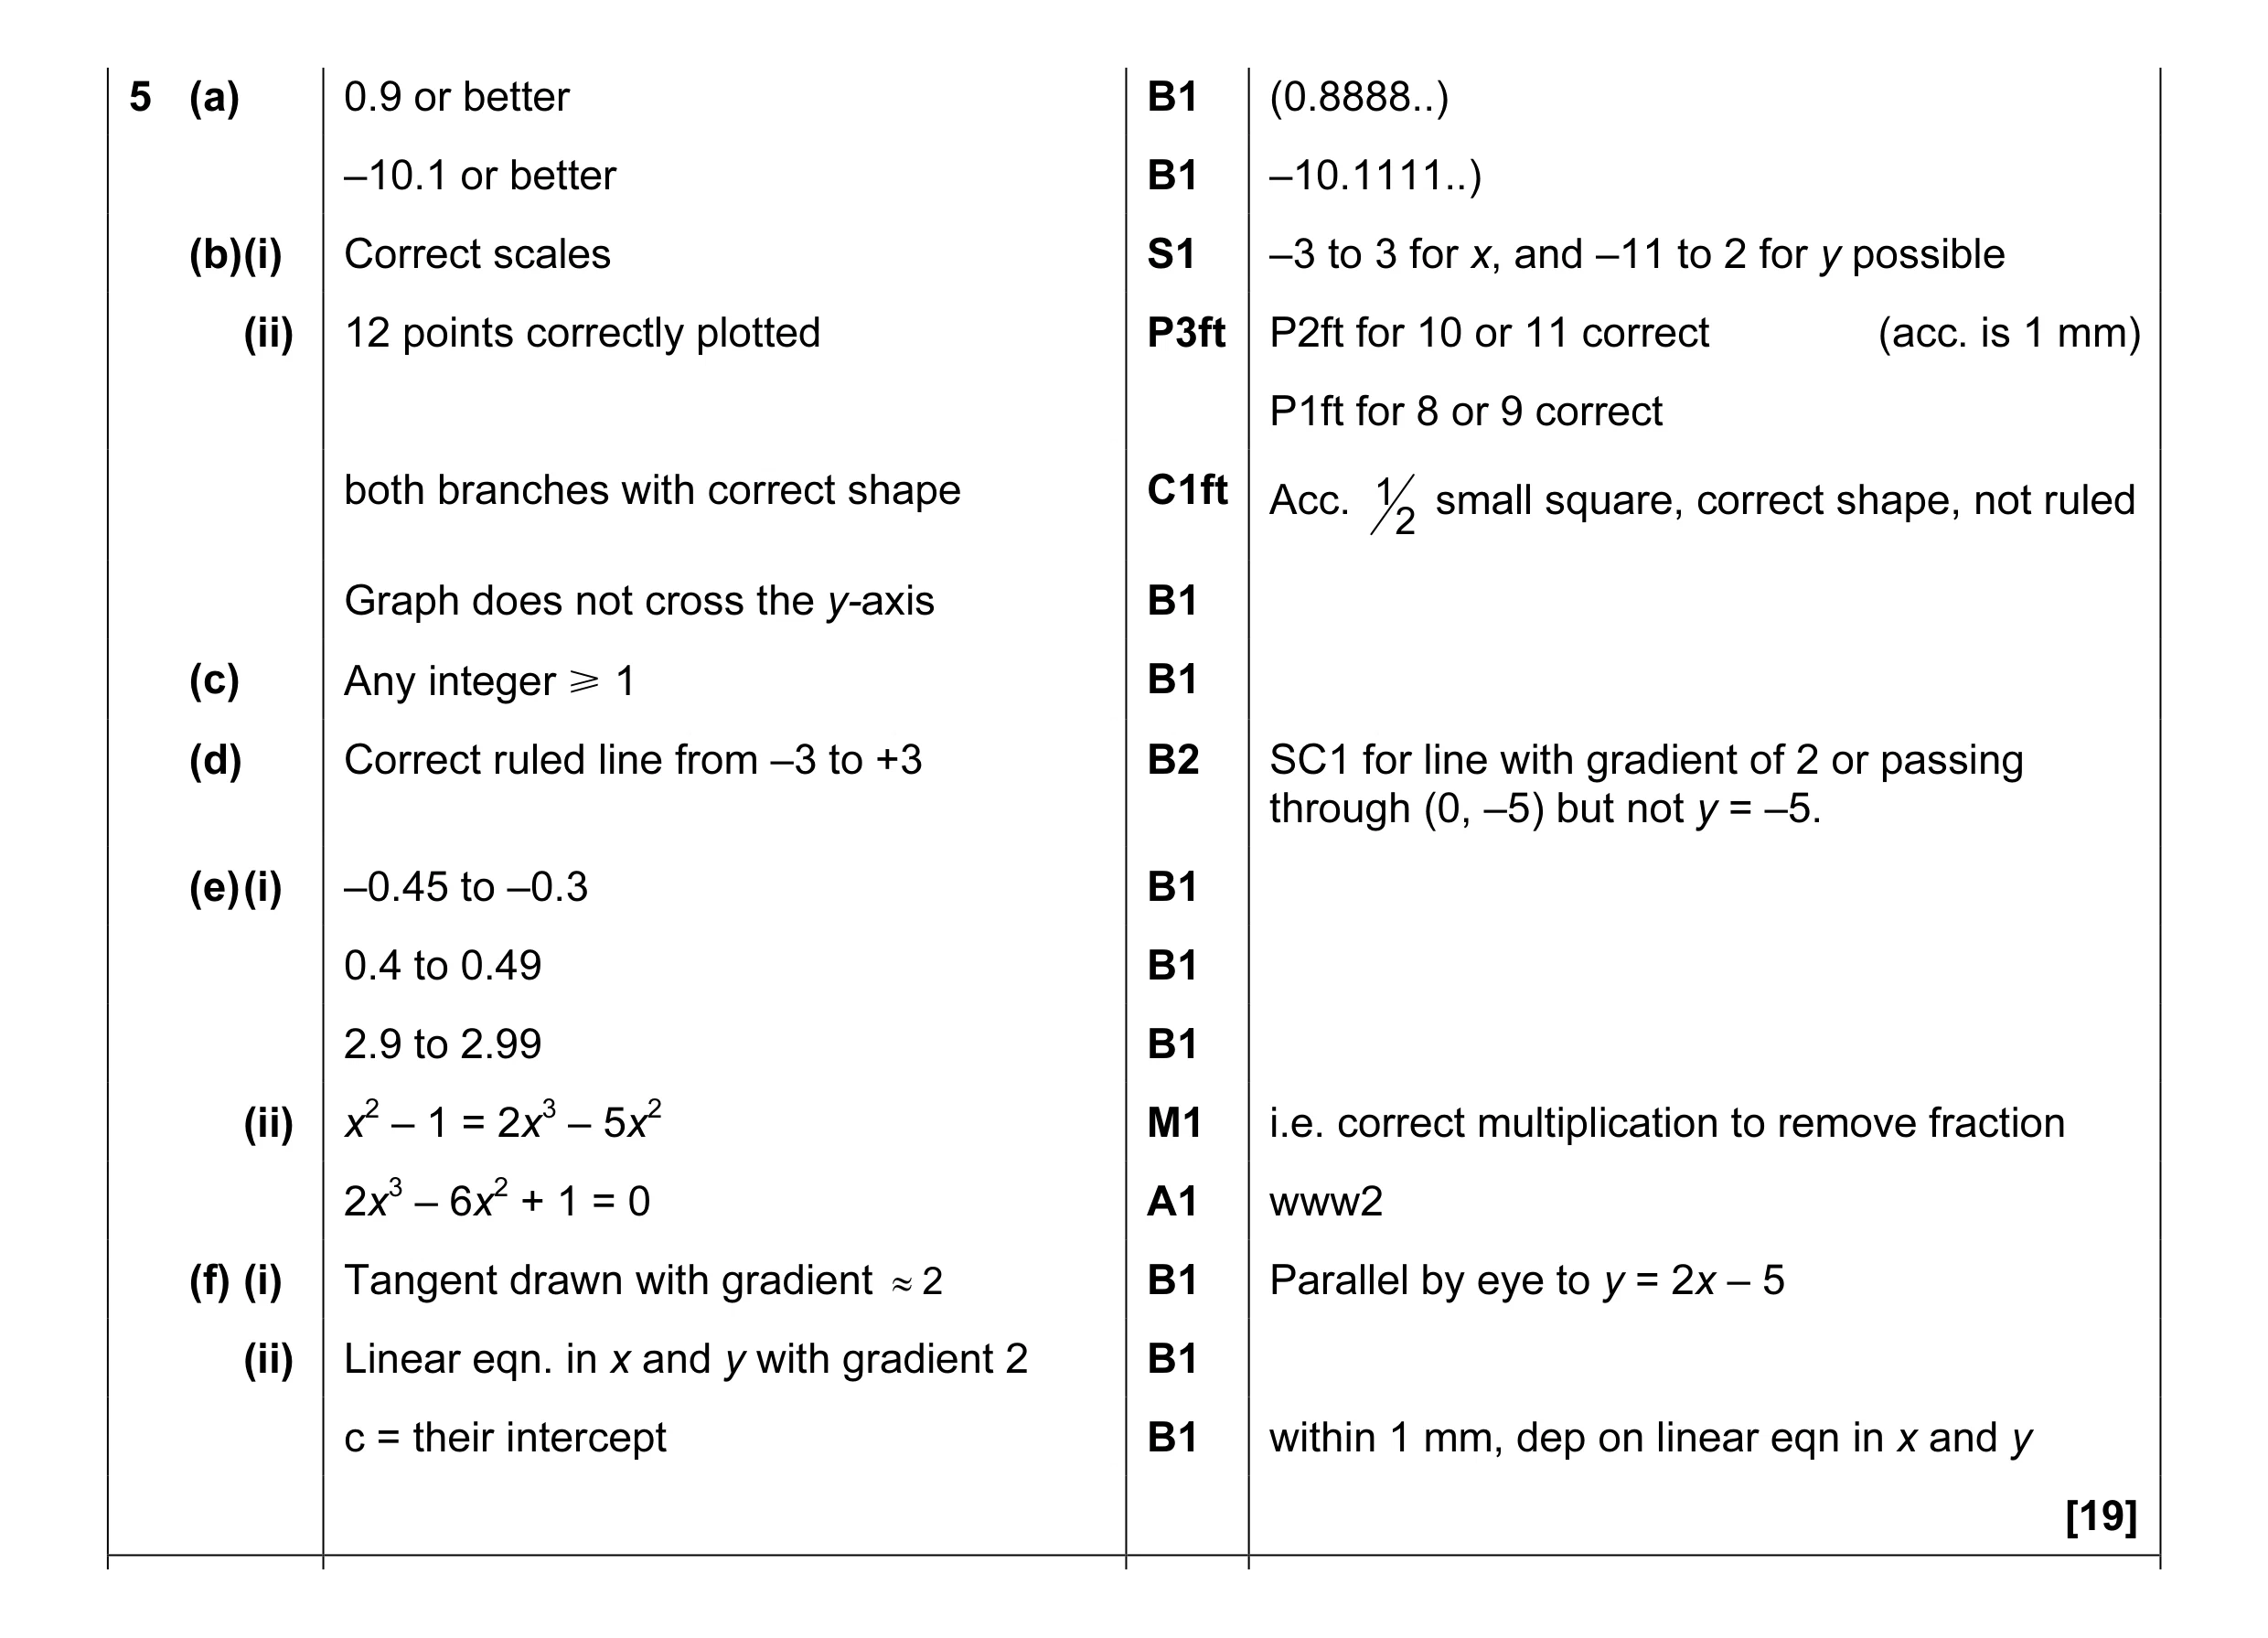
5 Answer the whole of this question on one sheet of graph paper. 1 f(x) = 1 − , x ≠ 0 . x 2 (a) x −3 −2 −1 −0.5 −0.4 −0.3 0.3 0.4 0.5 1 2 3 f(x) p 0.75 0 −3 −5.25 q q −5.25 −3 0 0.75 p Find the values of p and q. [2] (b) (i) Draw an x-axis for −3 x 3 using 2 cm to represent 1 unit and a y-axis for −11 y 2 using 1 cm to represent 1 unit. [1] (ii) Draw the graph of y = f(x) for −3 x −0.3 and for 0.3 x 3. [5] (c) Write down an integer k such that f(x) = k has no solutions. [1] (d) On the same grid, draw the graph of y = 2x – 5 for –3 x 3. [2] 1 (e) (i) Use your graphs to find solutions of the equation 1 − 2 = 2 x − 5 . [3] x 1 3 2 (ii) Rearrange 1 − 2 = 2 x − 5 into the form ax + bx + c = 0 , where a, b and c are integers. [2] x (f) (i) Draw a tangent to the graph of y = f(x) which is parallel to the line y = 2 x − 5 . [1] (ii) Write down the equation of this tangent. [2]
19 marks
Mark scheme: 5 (a) 0.9 or better B1 (0.8888..) –10.1 or better B1 –10.1111..) (b) (i) Correct scales S1 –3 to 3 for x, and –11 to 2 for y possible (ii) 12 points correctly plotted P3ft P2ft for 10 or 11 correct (acc. is 1 mm) P1ft for 8 or 9 correct 1 small square, correct shape, not ruled both branches with correct shape C1ft Acc. 2 Graph does not cross the y-axis B1 (c) Any integer [ 1 B1 (d) Correct ruled line from –3 to +3 B2 SC1 for line with gradient of 2 or passing through (0, –5) but not y = –5. (e) (i) –0.45 to –0.3 B1 0.4 to 0.49 B1 2.9 to 2.99 B1 (ii) x2 – 1 = 2x3 – 5x2 M1 i.e. correct multiplication to remove fraction 2x3 – 6x2 + 1 = 0 A1 www2 (f) (i) Tangent drawn with gradient ≈ 2 B1 Parallel by eye to y = 2x – 5 (ii) Linear eqn. in x and y with gradient 2 B1 c = their intercept B1 within 1 mm, dep on linear eqn in x and y [19]
This question in 0580/41 Oct/Nov 2005
Q2 · X _ 25 (a) The table shows some values for the equation y = for – 4 Y x Y=–0.5 and 0.5 Y… 0580/41 May/June 2009
x _ 25 (a) The table shows some values for the equation y = for – 4 Y x Y=–0.5 and 0.5 Y x Y 4. Examiner'sFor 2 x Use x –4 –3 –2 –1.5 –1 –0.5 0.5 1 1.5 2 3 4 y –1.5 –0.83 0 0.58 –3.75 –0.58 0 0.83 1.5 (i) Write the missing values of y in the empty spaces. [3] x _ 2 for – 4 Y x Y=–0.5 and 0.5 Y x Y 4. (ii) On the grid, draw the graph of y = 2 x y 4 3 2 1 x –4 –3 –2 –1 0 1 2 3 4 –1 –2 –3 –4 [5] x _ 2 For (b) Use your graph to solve the equation = 1 . Examiner's 2 x Use Answer(b) x = or x = [2] (c) (i) By drawing a tangent, work out the gradient of the graph where x = 2. Answer(c)(i) [3] (ii) Write down the gradient of the graph where x = –2. Answer(c)(ii) [1] (d) (i) On the grid, draw the line y = – x for – 4 Y x Y4. [1] x _ 2 _ (ii) Use your graphs to solve the equation = x . 2 x Answer(d)(ii) x = or x = [2] (e) Write down the equation of a straight line which passes through the origin and does not x _ 2 intersect the graph of y = . 2 x Answer(e) [2]
19 marks
Mark scheme: 5 (a) (i) 1.5, 3.75, –1.5 B1,B1,B1 (ii) 12 points plotted ft P3 ft P2 ft for 10 or 11 points, Curve through at least 10 points and correct P1 ft for 8 or 9 points shape over full domain C1 i.s.w. if two branches joined Two separate branches, one on each side of y-axis, neither in contact with y-axis B1 Independent (b) –1.4 ≤ x ≤ –1.1 and 3.1 ≤ x ≤ 3.4 B1,B1 i.s.w. 3rd answer if curve cuts y = 1 again (c) (i) Correct ruled tangent at x = 2 or x = –2 M1 Long enough to be able to find gradient Evidence of rise/run M1 Dependent – check their graph against gradient of 1 – must be correct side of 1 No tangent drawn M0M0 0.8 to 1.2 A1 (ii) 0.8 to 1.2 inc. or same answer as (i) ft B1 ft (d) (i) Correct ruled line to cut curve for all B1 Within ½ square of (–1, 1) and (1, –1) possible intersections (at least 2) (ii) –1.3 to –1.05, 1.05 to 1.3 inclusive B1, B1 i.s.w. any extra answers (e) y = kx with k ≥ 12 o.e. or x = 0 B2 If B0, allow SC1 for y = kx with k < 12 or for y-axis stated [19] IGCSE – May/June 2009 0580, 0581 04
This question in 0580/41 May/June 2009
Q3 · 2 For 7 (a) Complete the table for the function f(x) = − x 0580/42 Oct/Nov 2010
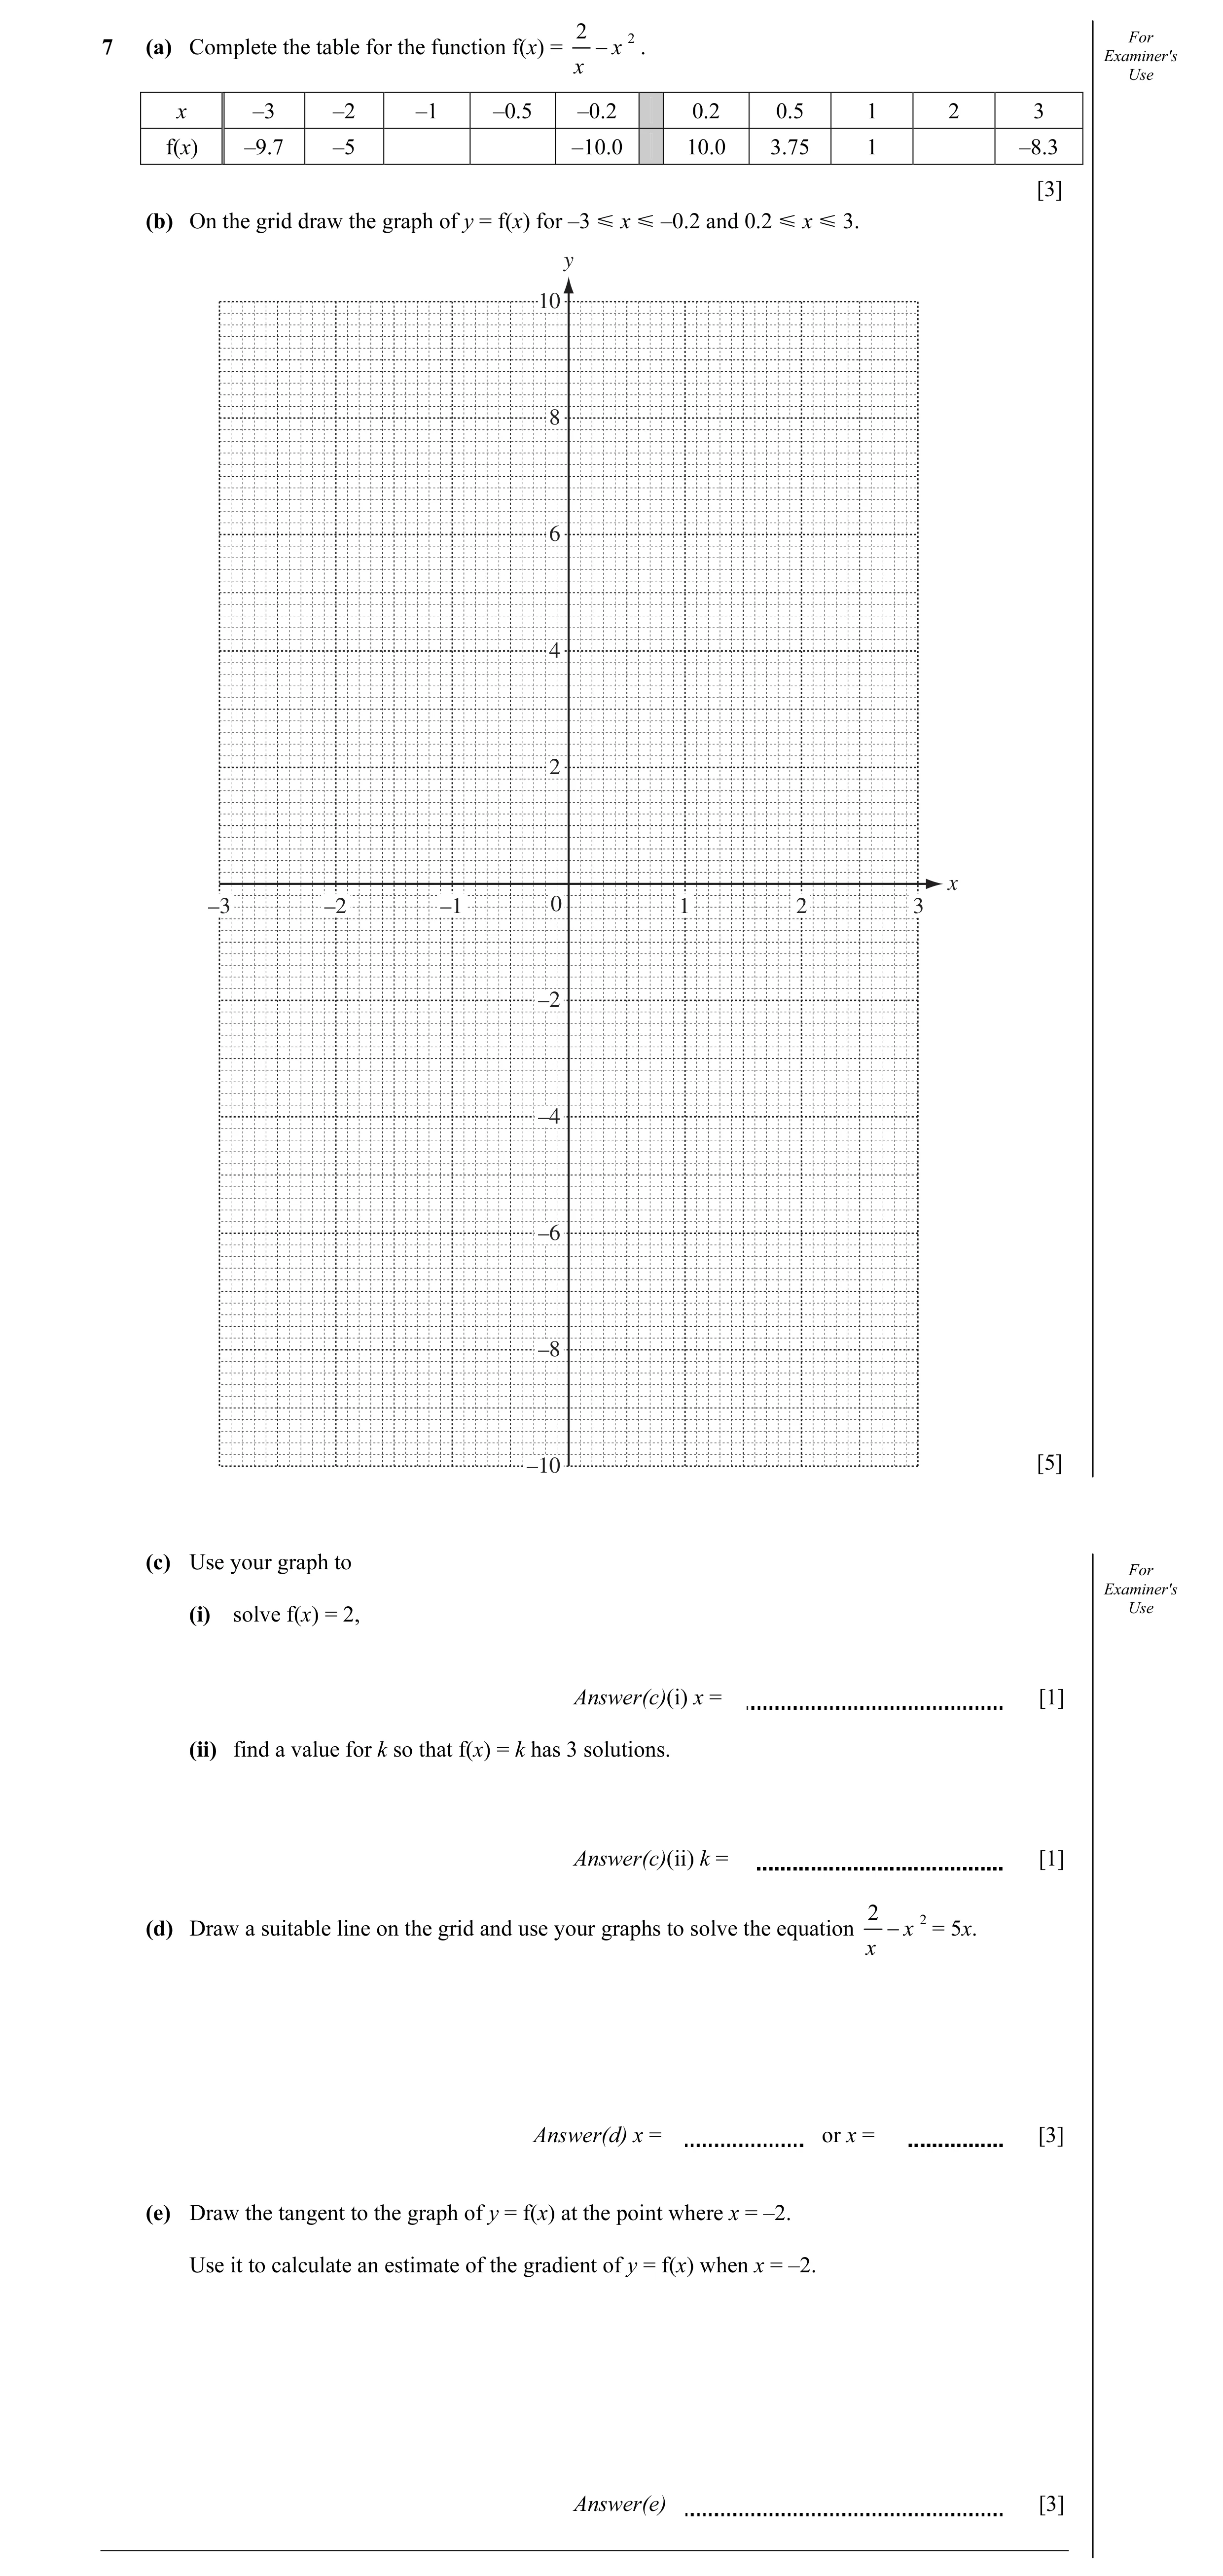
2 2 For 7 (a) Complete the table for the function f(x) = − x . Examiner's x Use x –3 –2 –1 –0.5 –0.2 0.2 0.5 1 2 3 f(x) –9.7 –5 –10.0 10.0 3.75 1 –8.3 [3] (b) On the grid draw the graph of y = f(x) for –3 Y x Y –0.2 and 0.2 Y x Y 3. y 10 8 6 4 2 x –3 –2 –1 0 1 2 3 –2 –4 –6 –8 –10 [5] (c) Use your graph to For Examiner's (i) solve f(x) = 2, Use Answer(c)(i) x = [1] (ii) find a value for k so that f(x) = k has 3 solutions. Answer(c)(ii) k = [1] 2 2(d) Draw a suitable line on the grid and use your graphs to solve the equation − x = 5x. x Answer(d) x = or x = [3] (e) Draw the tangent to the graph of y = f(x) at the point where x = –2. Use it to calculate an estimate of the gradient of y = f(x) when x = –2. Answer(e) [3]
16 marks
Mark scheme: 7 (a) –3, –4.25, –3 1, 1, 1 Allow – 4.2 or – 4.3 for – 4.25 (b) 10 correct points plotted P3ft P2ft for 8 or 9 correct P1ft for 6 or 7 correct Smooth curve through their 10 points C1 Correct shape not ruled, (curves could be joined) and correct shape Two separate branches B1ft Indep but needs two ‘curves’ on either side of y- axis (c) (i) 0.7 to 0.85 1 –1 each extra (ii) Any value of k such that k Y –3 1ft ft consistent with their graph and must be consistent with their (If curves are joined then k = –3 only) graph (d) y = 5x drawn L1 Ruled and long enough to meet curves – 0.6 to –0.75, 0.55 to 0.65 1, 1 Indep –1 each extra (e) Tangent drawn at x = –2 T1 Must be a reasonable tangent, not chord, no clear daylight y change / x change attempt M1 Depend on T and uses scales correctly. Mark intention – allow one slight slip e.g. sign error from coords but not scale misread If no working shown and answer is out of range – check their tangent for method 2.7 to 4.3 A1 Answer in range gets 2 marks after T1 earned 3 k
This question in 0580/42 Oct/Nov 2010
Q4 · X 3 For 7 (a) Complete the table for the function f(x) = + 1 0580/43 Oct/Nov 2010
x 3 For 7 (a) Complete the table for the function f(x) = + 1 . Examiner's 10 Use x –4 –3 –2 –1 0 1 2 3 f(x) –1.7 0.2 0.9 1 1.1 1.8 [2] (b) On the grid, draw the graph of y = f(x) for –4 Y x Y=3. y 4 3 2 1 x –4 –3 –2 –1 0 1 2 3 –1 –2 –3 –4 –5 –6 –7 –8 [4] 4 (c) Complete the table for the function g(x) = , x ≠ 0 . x x –4 –3 –2 –1 1 2 3 g(x) –1 –1.3 2 1.3 [2] (d) On the grid, draw the graph of y = g(x) for –4 Y x Y –1 and 1 Y x Y 3. [3] For Examiner's Use x 3 4 (e) (i) Use your graphs to solve the equation + 1 = . 10 x Answer(e)(i) x = or x = [2] x 3 4 4 (ii) The equation + 1 = can be written as x + ax + b = 0 . 10 x Find the values of a and b. Answer(e)(ii) a = b = [2]
15 marks
Mark scheme: 7 (a) – 5.4 1 3.7 1 (b) 8 points correctly plotted ft P3 P3ft their table. P2ft for 6 or 7 points. P1ft for 4 or 5 points Smooth cubic curve through all 8 C1 Only ft points if shape not affected. points (c) –2, –4, 4 2 B1 for 2 correct (d) 7 points correctly plotted ft P2 P2ft P1ft for 5 or 6 points Two separate smooth branches of C1 Must pass through all 7 points, only ft if shape rectangular hyperbola not affected and no contact with either axis. (e) (i) –2.9 Y x Y– 2.8 1 Not with y coordinates 2.05 Y x Y 2.15 1 (ii) a = 10 1 b = –40 1 IGCSE – October/November 2010 0580 43 2
This question in 0580/43 Oct/Nov 2010
Q5 · For 7 (a) Complete the table of values for the equation y = , x ≠ 0 0580/41 May/June 2011
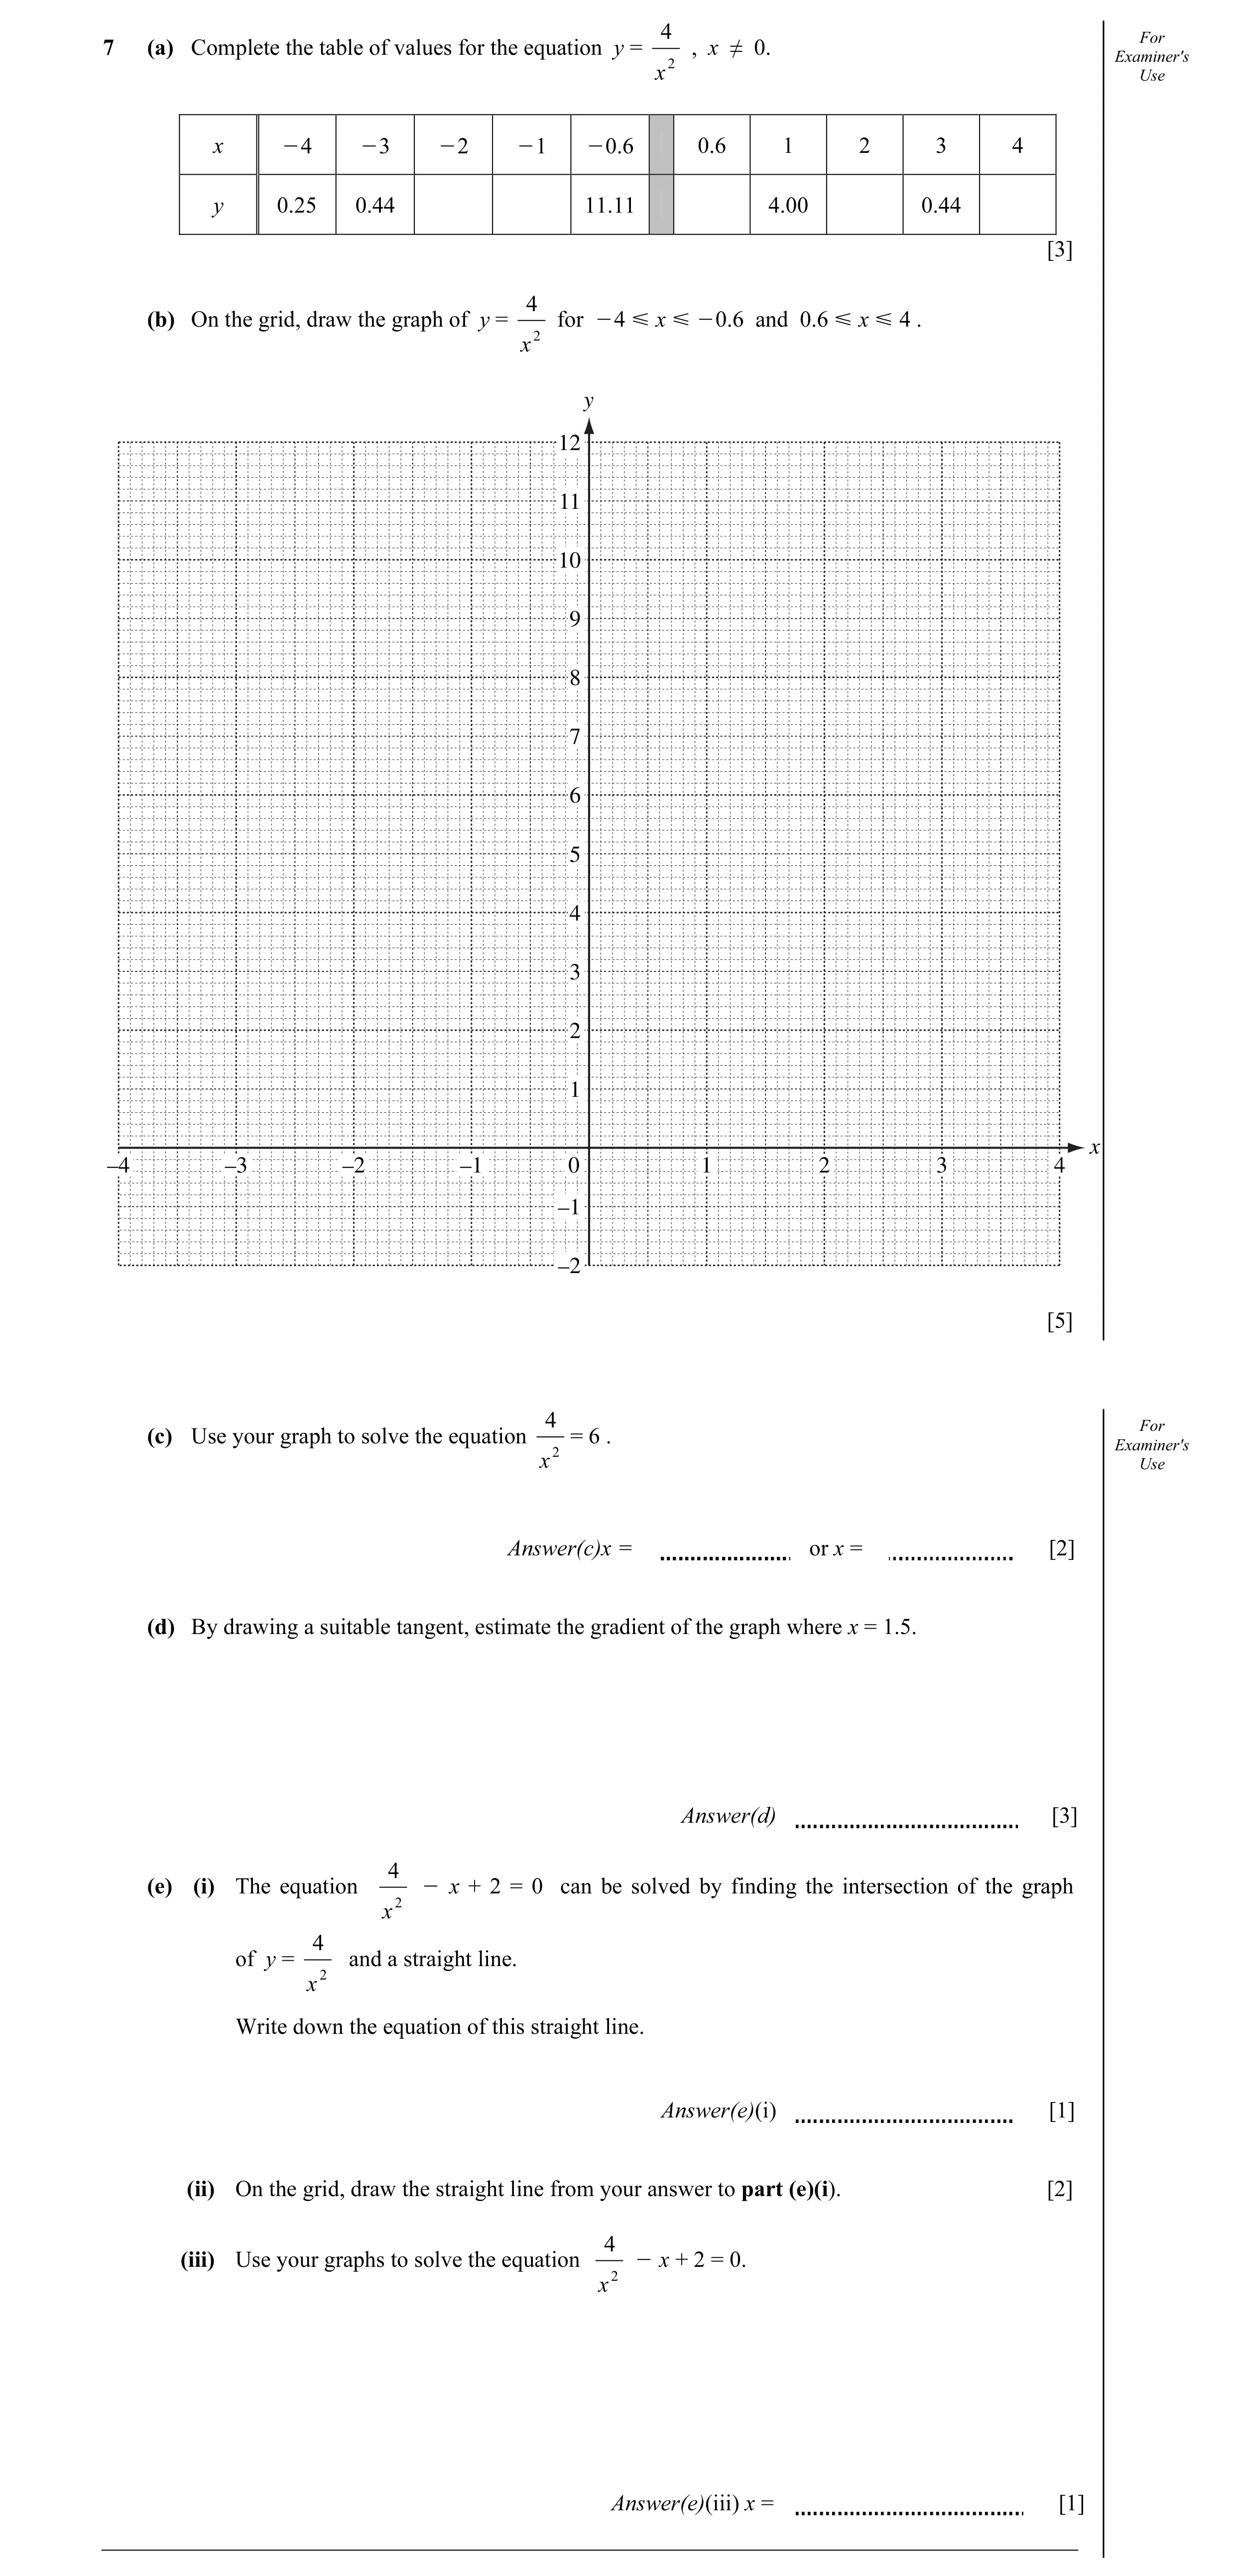
4 For 7 (a) Complete the table of values for the equation y = , x ≠ 0. Examiner's x 2 Use x O4 O3 O2 O1 O0.6 0.6 1 2 3 4 y 0.25 0.44 11.11 4.00 0.44 [3] 4 (b) On the grid, draw the graph of y = for O4 Y x Y O0.6 and 0.6 Y x Y 4 . x 2 y 12 11 10 9 8 7 6 5 4 3 2 1 x –4 –3 –2 –1 0 1 2 3 4 –1 –2 [5] 4 For (c) Use your graph to solve the equation = 6 . Examiner's x 2 Use Answer(c)x = or x = [2] (d) By drawing a suitable tangent, estimate the gradient of the graph where x = 1.5. Answer(d) [3] 4 (e) (i) The equation O x + 2 = 0 can be solved by finding the intersection of the graph x 2 4 of y = and a straight line. x 2 Write down the equation of this straight line. Answer(e)(i) [1] (ii) On the grid, draw the straight line from your answer to part (e)(i). [2] 4 (iii) Use your graphs to solve the equation O x + 2 = 0. x 2 Answer(e)(iii) x = [1]
17 marks
Mark scheme: 7 (a) 1(.00) 4(.00) 11.1(1) 1(.00) 0.25 3 B2 for 4 correct, B1 for 3 correct (b) 10 points plotted P3 ft B2 for 8 or 9 points correct ft B1 for 6 or 7 points correct ft Correct shaped curve through 10 points C1 ft ft their points if shape correct – ignore anything (condone 2 points slightly missed) between – 0.6 and 0.6 2 separate curves not crossing x-axis and B1 Independent not touching or crossing y-axis (c) −0.85 to – 0.75 cao 1 0.75 to 0.85 cao 1 (d) Tangent drawn (ruled) at x = 1.5 T1 Allow slight daylight – 3 to −2 2 Dep on T1 M1 evidence rise/run dependent on tangent SC1 for answer in range 2 to 3 Answer implies M but not the T mark (e) (i) y = x − 2 oe 1 (ii) line ruled to cross curve 2 ft Dependent on (i) in form y = mx + c, m ≠ 0, c ≠ 0 B1 for gradient ft or y intercept ft but again to cross curve at all possible points (iii) 2.5 to 2.7 cao 1 Dependent on (e)(i) correct
This question in 0580/41 May/June 2011
Q6 · Lucy works in a clothes shop 0580/43 May/June 2011
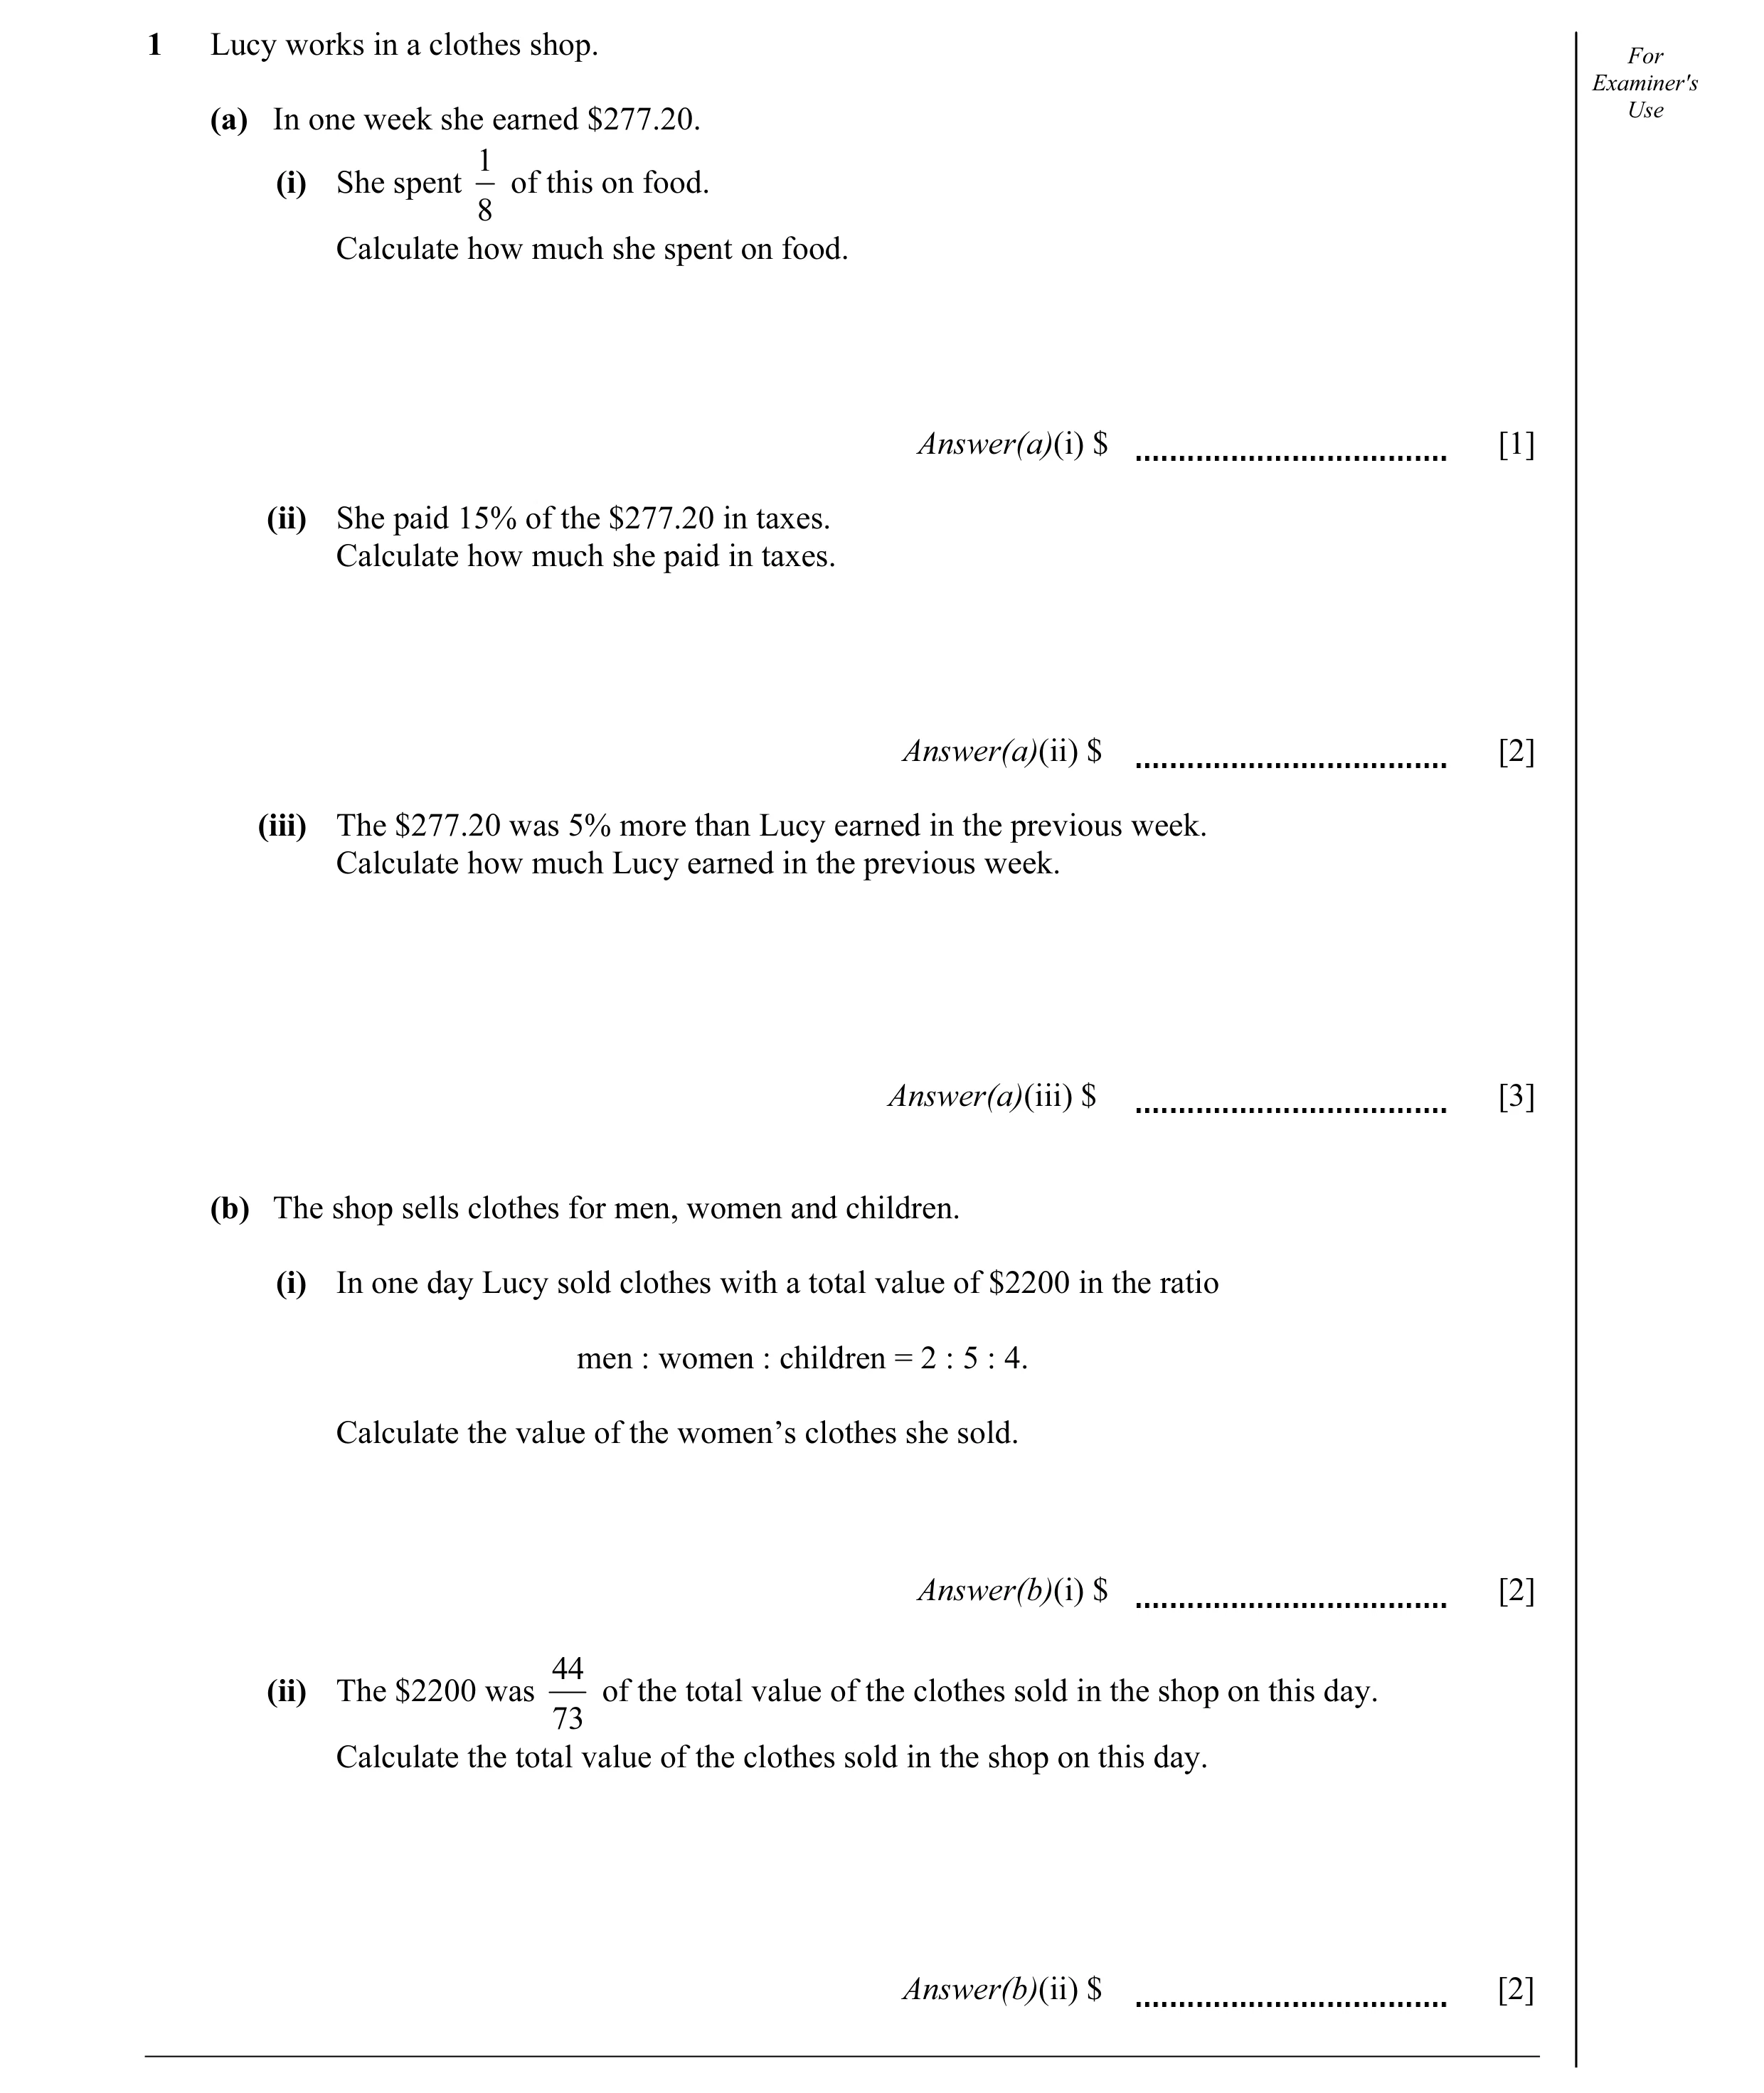
1 Lucy works in a clothes shop. For Examiner's (a) In one week she earned $277.20. Use 1 (i) She spent of this on food. 8 Calculate how much she spent on food. Answer(a)(i) $ [1] (ii) She paid 15% of the $277.20 in taxes. Calculate how much she paid in taxes. Answer(a)(ii) $ [2] (iii) The $277.20 was 5% more than Lucy earned in the previous week. Calculate how much Lucy earned in the previous week. Answer(a)(iii) $ [3] (b) The shop sells clothes for men, women and children. (i) In one day Lucy sold clothes with a total value of $2200 in the ratio men : women : children = 2 : 5 : 4. Calculate the value of the women’s clothes she sold. Answer(b)(i) $ [2] 44 (ii) The $2200 was of the total value of the clothes sold in the shop on this day. 73 Calculate the total value of the clothes sold in the shop on this day. Answer(b)(ii) $ [2]
10 marks
Mark scheme: Qu. Answers Mark Part Marks 1 (a) (i) 34.65 1 (ii) 41.58 2 M1 for 0.15 × 277.2 implied by 41.6 or 41.58 seen and not spoiled (iii) 264 3 M2 for 277.2 ÷ (1 + 0.05) o.e. or M1 for recognition that 105(%) = 277.20 (b) (i) 1000 2 M1 for 2200 ÷ (2 + 4 + 5) × 5 (ii) 3650 2 M1 for 2200 ÷ 44 × 73
This question in 0580/43 May/June 2011
Q7 · Complete the table of values for y = 2x 0580/43 Oct/Nov 2011
2 (a) Complete the table of values for y = 2x. For Examiner's Use x –2 –1 0 1 2 3 y 0.25 1 2 8 [2] (b) On the grid, draw the graph of y = 2x for O2 Y x Y 3. y 10 9 8 7 6 5 4 3 2 1 x –2 –1 0 1 2 3 –1 [3] For Examiner's (c) (i) On the grid, draw the straight line which passes through the points (0, 2) and (3, 8). [1] Use (ii) The equation of this line is y = mx + 2. Show that the value of m is 2. Answer(c)(ii) [1] (iii) One answer to the equation 2x =2x + 2 is x = 3. Use your graph to find the other answer. Answer(c)(iii) x = [1] (d) Draw the tangent to the curve at the point where x = 1. Use this tangent to calculate an estimate of the gradient of y = 2x when x = 1. Answer(d) [3]
11 marks
Mark scheme: 2 (a) 0.5, 4 1+1 (b) 6 points plotted ft P2 P1 for 5 points Correct shaped curve through 6 points C1 Ignore to left of x = −2 (exponential) (c) (i) Correct ruled line reaching both L1 points (ii) 6 ÷ 3 oe 1 Allow ‘test’ with a coordinate on the line (not 0, 2) (iii) –0.8 to –0.6 1 Dep on L1 (d) Tangent drawn at (1, 2) T1 Not chord, allow up to 1 mm daylight Rise/run attempt using correct scales M1 Dep on T1 1.2 to 1.6 cao A1
This question in 0580/43 Oct/Nov 2011
Q8 · For 4 f(x) = O 3x, x ≠ 0 Examiner's 2 x Use (a) Complete the table 0580/43 Oct/Nov 2012
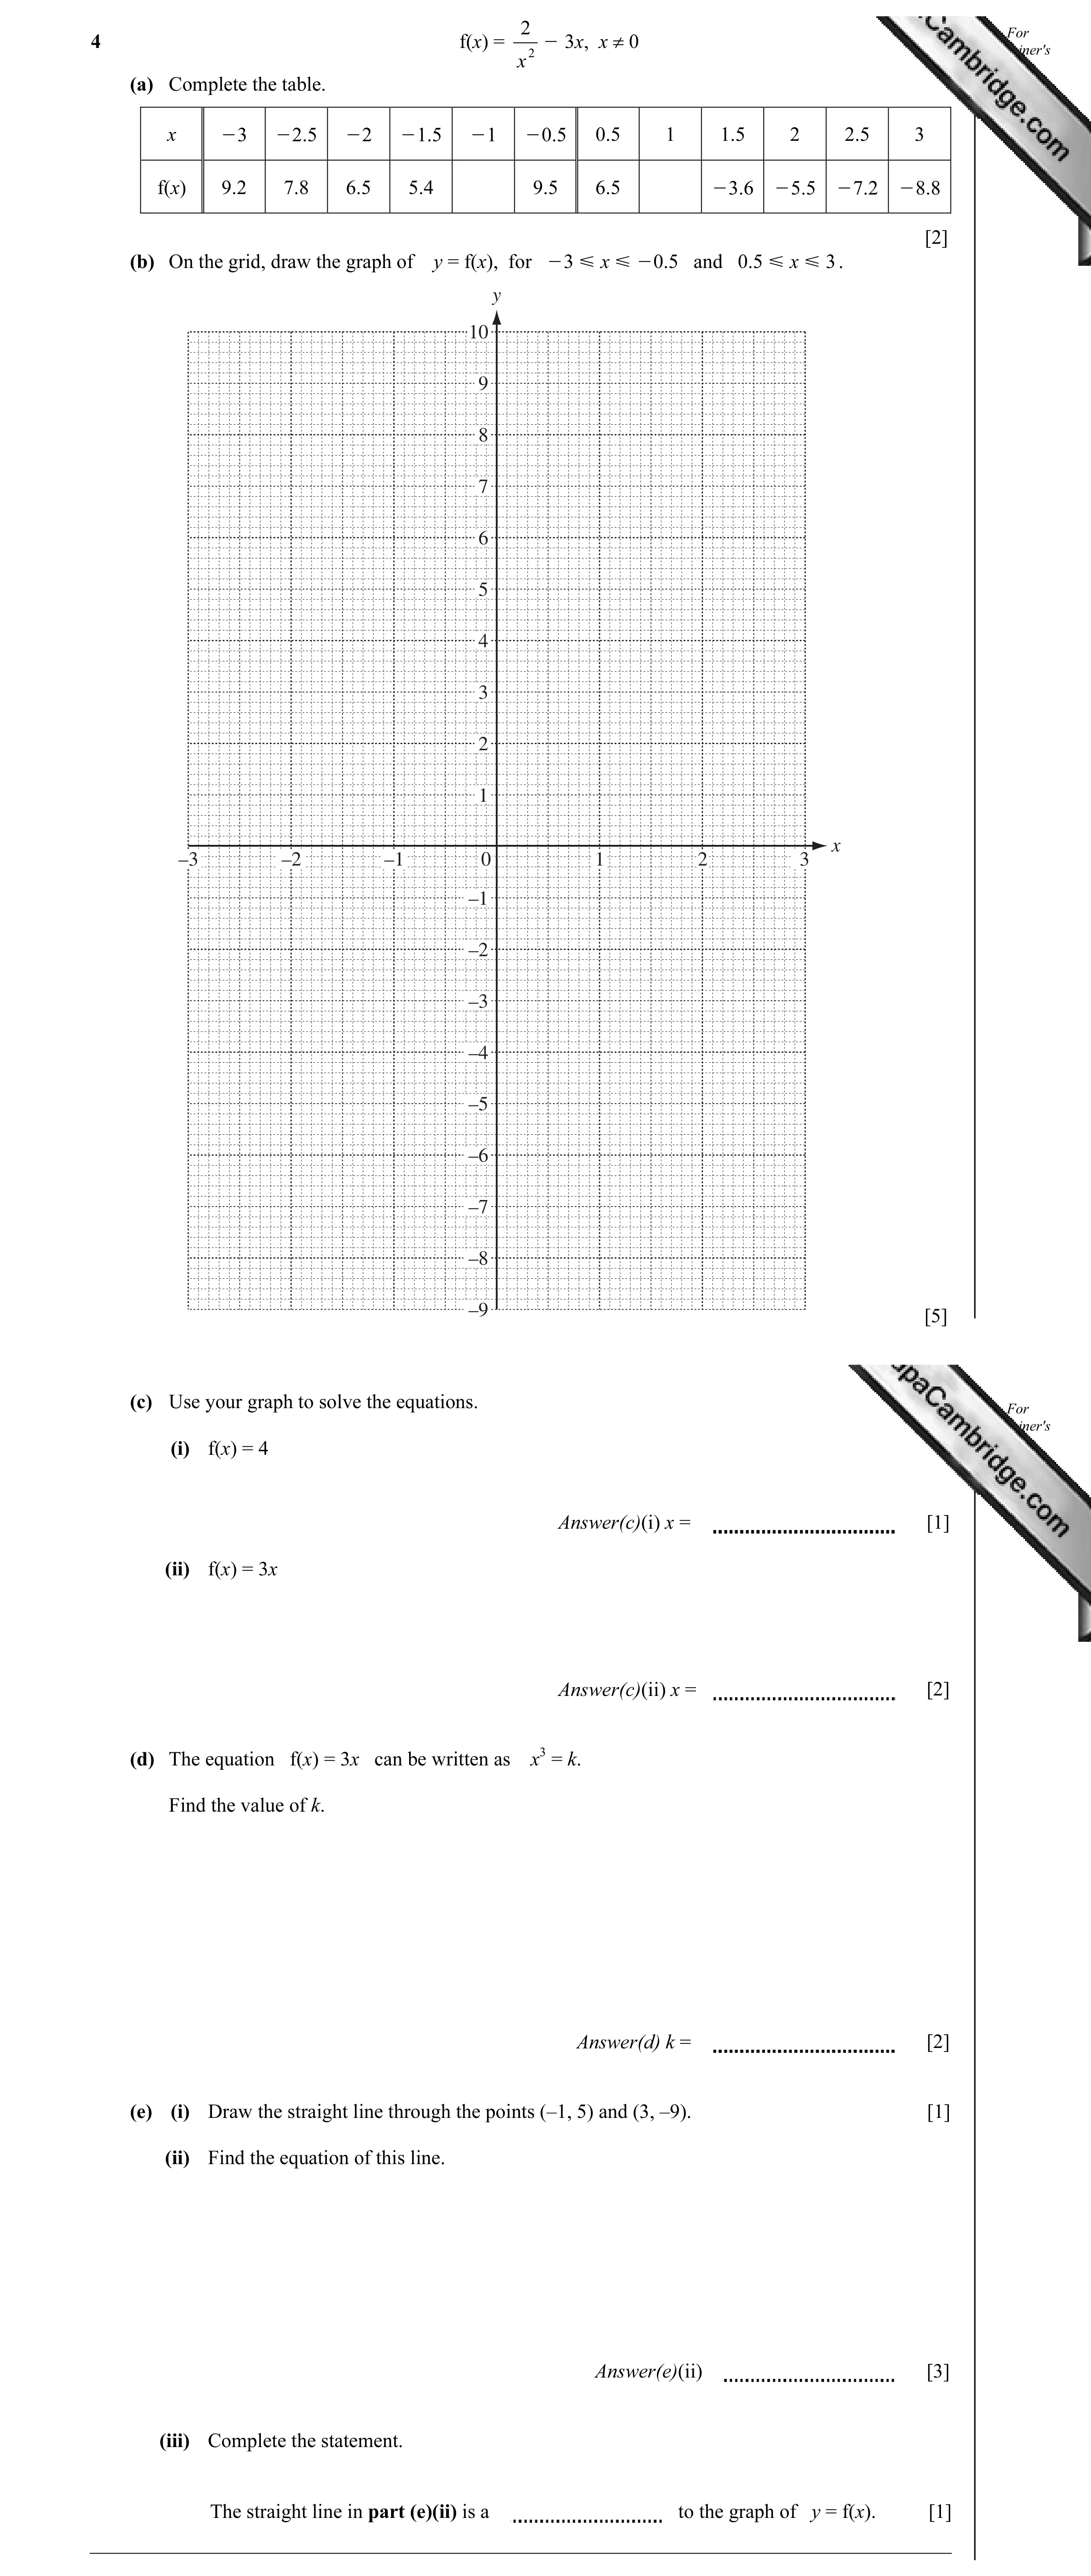
2 For 4 f(x) = O 3x, x ≠ 0 Examiner's 2 x Use (a) Complete the table. x O3 O2.5 O2 O1.5 O1 O0.5 0.5 1 1.5 2 2.5 3 f(x) 9.2 7.8 6.5 5.4 9.5 6.5 O3.6 O5.5 O7.2 O8.8 [2] (b) On the grid, draw the graph of y = f(x), for O3 Y x Y O0.5 and 0.5 Y x Y 3 . y 10 9 8 7 6 5 4 3 2 1 x –3 –2 –1 0 1 2 3 –1 –2 –3 –4 –5 –6 –7 –8 –9 [5] (c) Use your graph to solve the equations. For Examiner's (i) f(x) = 4 Use Answer(c)(i) x = [1] (ii) f(x) = 3x Answer(c)(ii) x = [2] (d) The equation f(x) = 3x can be written as x3 = k. Find the value of k. Answer(d) k = [2] (e) (i) Draw the straight line through the points (–1, 5) and (3, –9). [1] (ii) Find the equation of this line. Answer(e)(ii) [3] (iii) Complete the statement. The straight line in part (e)(ii) is a to the graph of y = f(x). [1]
17 marks
Mark scheme: 4 (a) 5, – 1 2 B1 B1 (b) 12 points plotted ft P3ft P2ft for 10 or 11, P1ft for 8 or 9 Smooth curve through at least 12 C1 In absence of plot[s], allow curve to imply plot[s]. points No ruled sections Two separate branches B1 Not touching y-axis (c) (i) 0.55 to 0.65 1 (ii) 0.65 to 0.75 2 M1 for y = 3x drawn (ruled) to cross curve 1 0.3& (d) 2 Accept 0.333[3….] or 3 2 M1 for 2 − 3 x = 3 x or better x IGCSE – October/November 2012 0580 43 (e) (i) Ruled line through (– 1, 5) 1 and (3, – 9) (ii) y = −5.3 x + 5.1 oe final 3 B2 for y = kx + 5.1 [k ≠ 0] oe or y = −5.3 x + d oe answer B1 for gradient = – 3.5 oe accept integer/integer or y = kx + 4.1[ to 6.1] oe SC2 for answer − 5.3 x + 5.1 [no ‘y =’ ] (iii) Tangent 1 5 (a) 0.57 B4 Condone use of other variables M1 for 2 w + 3l = 6.3 oe and M1 for l = w + .0 25 oe A1 for correct aw = b or cl = d or M2 for 2 w + (3 w + .025) = 6.3 oe or 2(l − .025) + 3l = 6.3 oe or M1 for w + 0.25 or l – 0.25 seen A1 for 2 w + 3w = 6.3 − .075 or better or 2l + 3l = 6.3 + 5.0 or better l = 0.82 implies M2A1 trial & error scores B4 or zero accept answer 57 if written 57 cents after M0, SC3 if answer 57
This question in 0580/43 Oct/Nov 2012
Q9 · Write as a single fraction For Examiner′s Use 5 2x (i) – , 4 5 Answer(a)(i) … [2] 4 2x… 0580/42 May/June 2013
10 (a) Write as a single fraction For Examiner′s Use 5 2x (i) – , 4 5 Answer(a)(i) … [2] 4 2x - 1 (ii) + . x + 3 3 Answer(a)(ii) … [3] (b) Solve the simultaneous equations. 9x – 2y = 12 3x + 4y = –10 Answer(b) x = … y = … [3] 7 x + 21 For (c) Simplify 2 . Examiner′s 2 x + 9 x + 9 Use Answer(c) … [4] _____________________________________________________________________________________
12 marks
Mark scheme: 25 8 x 5 × 5 4 × 2 x 10 (a) (i) final answer 2 M1 for or better seen 20 5 × 4 (ii) 2 x 2 + 5 x + 9 3 B1 for 2 x 2 + 6 x − x − 3 soi final answer 3( x + 3 ) and B1 for denom 3( x + 3 ) or 3 x + 9 seen (b) x = 2 3 oe or 0.667 or 0.6666 to 3 M1 for correct method to eliminate one variable A1 for x = 2 3 oe or 0.667 or 0.6666 to 0.6667 0.6667 y = −3 or y = −3 IGCSE – May/June 2013 0580 42 7 (c) final answer www 4 B1 for 7 ( x + 3 ) in numerator 2 x + 3 and B2 for(2 x + 3 )( x + 3 ) in denominator or SC1 for (2 x + a )( x + b ) where a and b are integers and a + 2b= 9 or ab = 9 After B1 scored, SC1 for final answer 7 5.3 or 2( x + 5.1 ) x + 5.1 2 2
This question in 0580/42 May/June 2013
Q10 · 1 - - Examiner′s 3x .5 (a) Complete the table of values for y = Use x2 x x –3 –2 –1 –0.5… 0580/42 Oct/Nov 2013
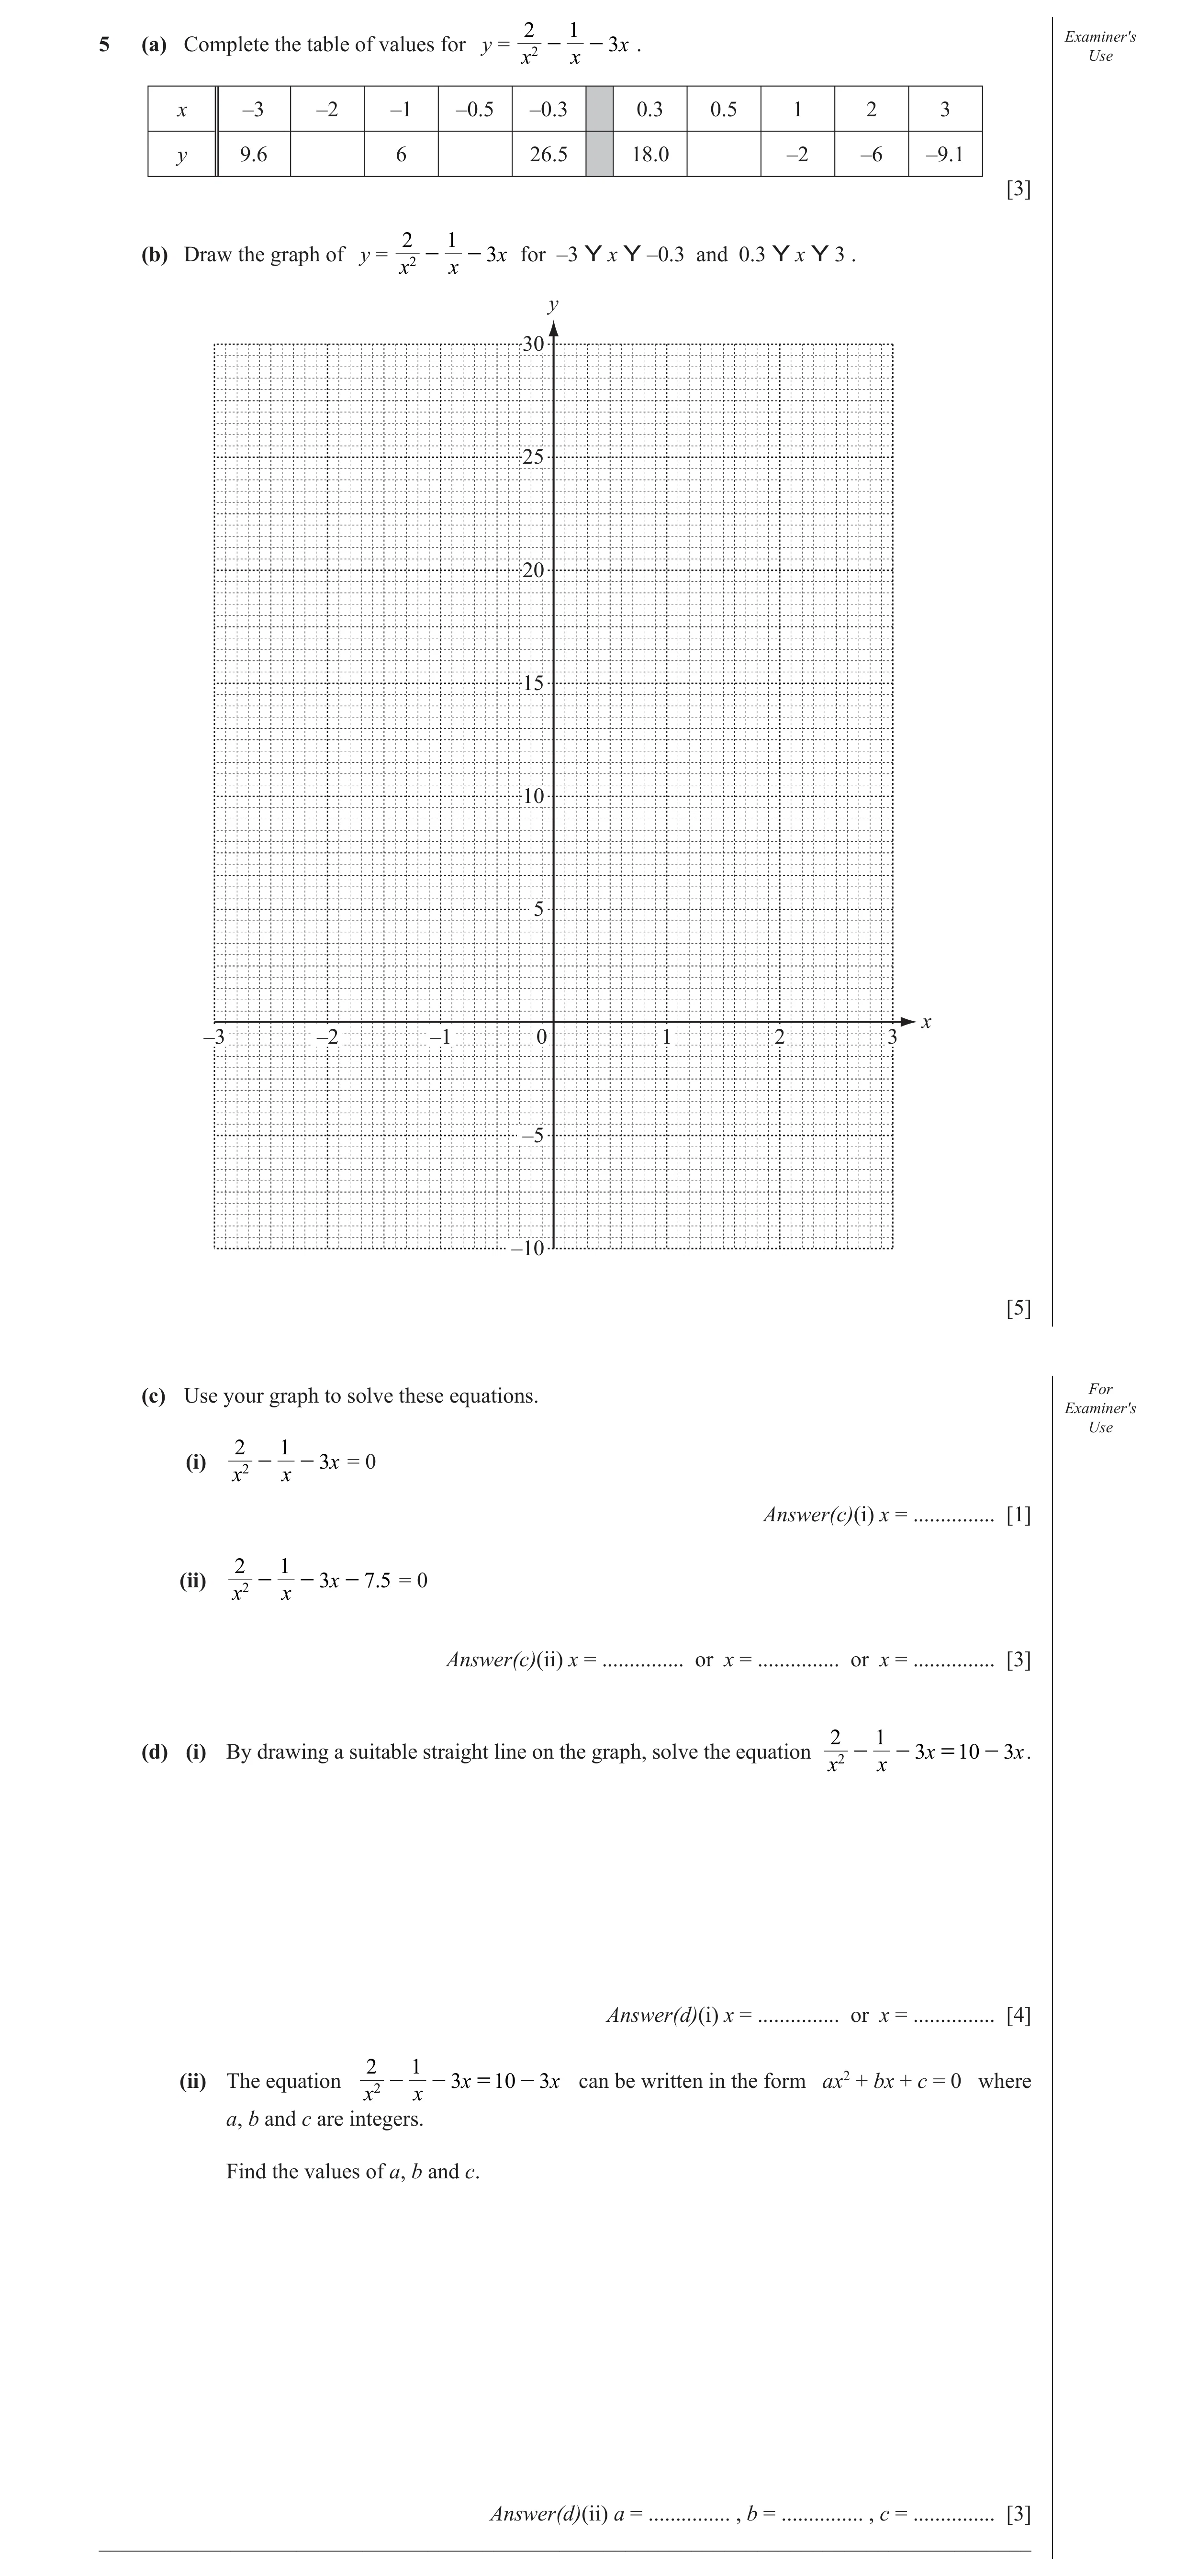
2 1 - - Examiner′s 3x .5 (a) Complete the table of values for y = Use x2 x x –3 –2 –1 –0.5 –0.3 0.3 0.5 1 2 3 y 9.6 6 26.5 18.0 –2 –6 –9.1 [3] 2 1 - - 3x for –3 Y x Y –0.3 and 0.3 Y x Y 3 . (b) Draw the graph of y = 2 x x y 30 25 20 15 10 5 x –3 –2 –1 0 1 2 3 –5 –10 [5] (c) Use your graph to solve these equations. For Examiner′s Use 2 1 - - (i) 2 3x = 0 x x Answer(c)(i) x = … [1] 2 1 - - - (ii) 2 3x 7. 5 = 0 x x Answer(c)(ii) x = … or x = … or x = … [3] 2 1 - - = - (d) (i) By drawing a suitable straight line on the graph, solve the equation 2 3x 10 3 x . x x Answer(d)(i) x = … or x = … [4] 2 1 - - = - (ii) The equation 2 3x 10 3 x can be written in the form ax2 + bx + c = 0 where x x a, b and c are integers. Find the values of a, b and c. Answer(d)(ii) a = … , b = … , c = … [3] _____________________________________________________________________________________
19 marks
Mark scheme: 5 (a) 7, 11.5, 4.5 1,1,1 (b) Correct curve cao 5 B3FT for 10 correct plots, on correct vertical grid line and within correct 2 mm square vertically Or B2FT for 8 or 9 correct plots Or B1FT for 6 or 7 correct plots and B1 indep for two separate branches on either side of y-axis (c) (i) 0.69 < x < 0.81 1 (ii) –2.3 < x < –2.2 –0.8 < x < –0.6 0.35 < x < 0.5 3 B1 for each correct After 0 scored, allow SC1 for drawing line y = 7.5 long enough to cross curve at least once (d) (i) y = 10 – 3x ruled correctly B2 long enough to cross curve twice. B1 for ruled line gradient –3 or y intercept at 10 but not y = 10 Or B1 for ‘correct’ but freehand –0.55 < x < –0.45 B1dep Dependent on at least B1 scored for line 0.35 < x < 0.45 B1dep After 0 scored, SC2 for –0.5 and 0.4 [from solving equation] (ii) 10 1 –2 3 B2 for 2 – x – 10x2 [= 0] oe or –10 –1 2 2 1 Or B1 for x 2 −x − 10 = 0 oe Correctly eliminating – 3x Or B1 for 2 – x – 3x3 = 10x2 – 3x3 oe Correctly clearing fractions IGCSE – October/November 2013 0580 42 1 1 1
This question in 0580/42 Oct/Nov 2013
Q11 · Complete the table of values for y = x3 – 3x + 1 0580/41 May/June 2014
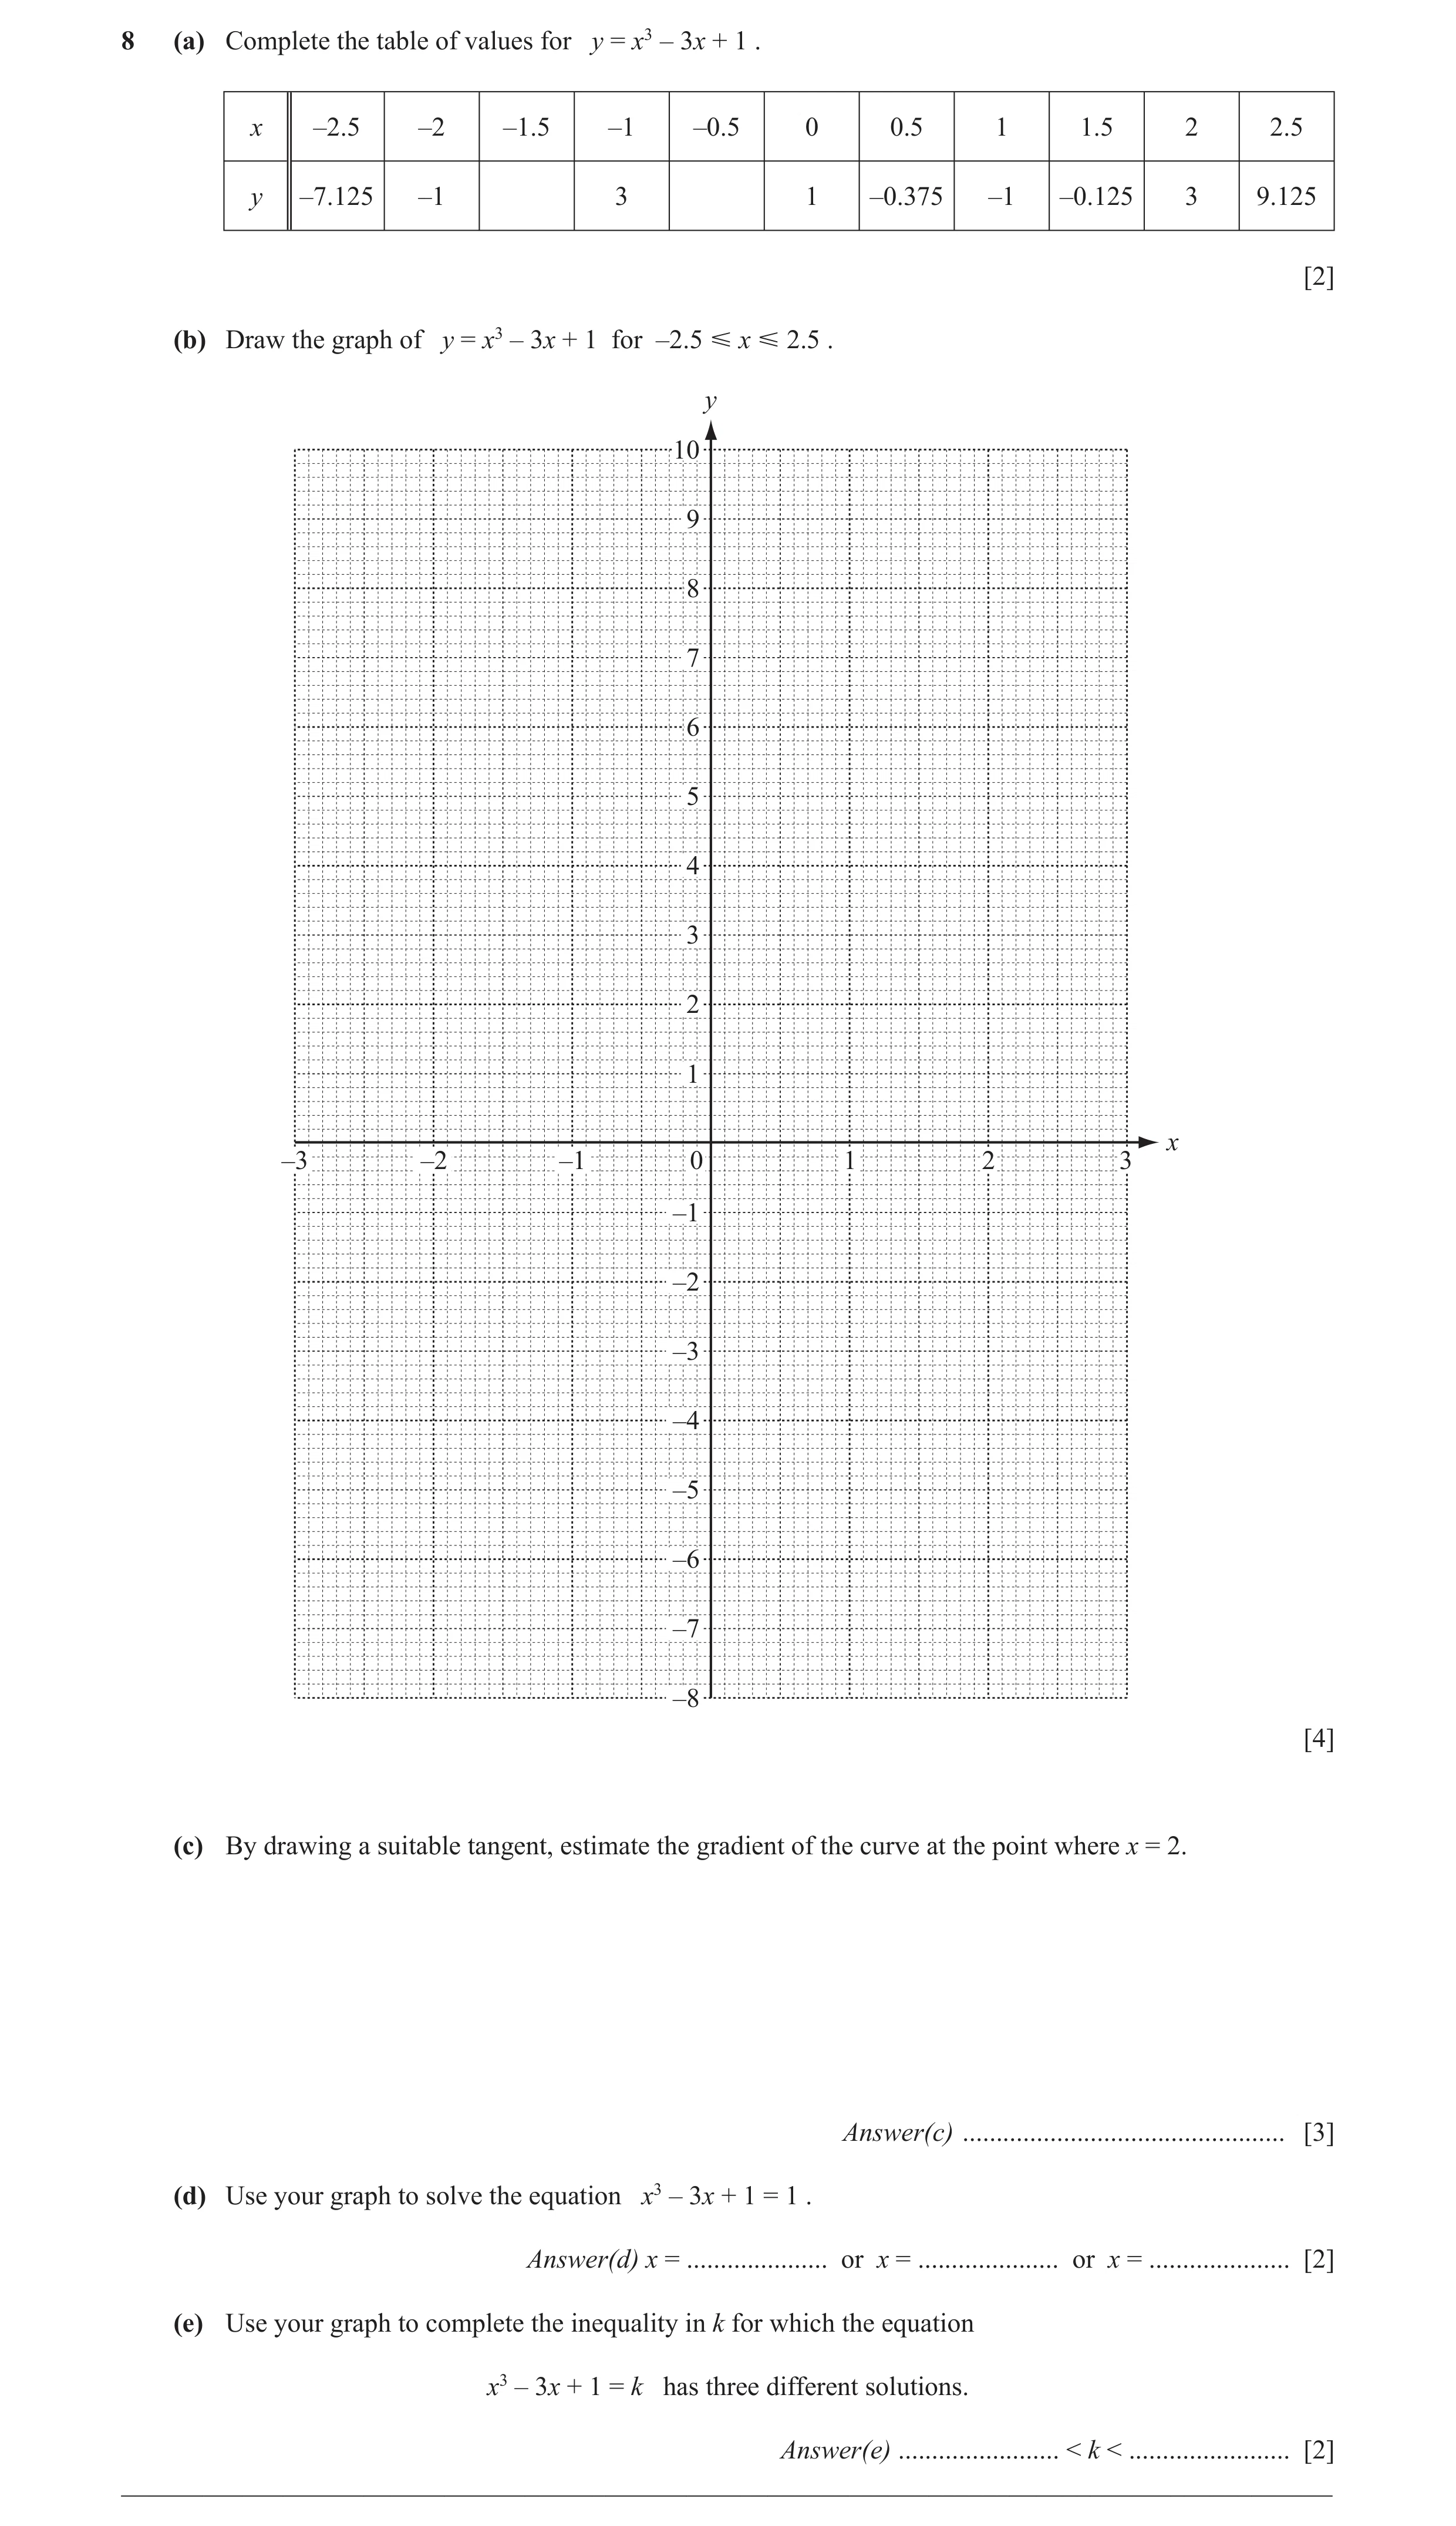
8 (a) Complete the table of values for y = x3 – 3x + 1 . x –2.5 –2 –1.5 –1 –0.5 0 0.5 1 1.5 2 2.5 y –7.125 –1 3 1 –0.375 –1 –0.125 3 9.125 [2] (b) Draw the graph of y = x3 – 3x + 1 for –2.5 Ğ x Ğ 2.5 . y 10 9 8 7 6 5 4 3 2 1 x –3 –2 –1 0 1 2 3 –1 –2 –3 –4 –5 –6 –7 –8 [4] (c) By drawing a suitable tangent, estimate the gradient of the curve at the point where x = 2. Answer(c) … [3] (d) Use your graph to solve the equation x3 – 3x + 1 = 1 . Answer(d) x = … or x = … or x = … [2] (e) Use your graph to complete the inequality in k for which the equation x3 – 3x + 1 = k has three different solutions. Answer(e) … < k < … [2] __________________________________________________________________________________________
13 marks
Mark scheme: 8 (a) 2.125 and 2.375 2 B1 for one correct value (b) Correct curve B4 B3FT for 11 correct plots or B2FT for 9 or 10 correct plots or B1FT for 7 or 8 correct plots (c) Ruled tangent at x = 2 B1 No daylight at x = 2. Consider point of contact as midpoint between two vertices of daylight, this must be between x = 1.8 and 2.2 Gradient from 7.8 to 10.2 2 Dep on B1 awarded Allow integer/integer or a mixed number if within range or M1 dep for (change in y) ÷ (change in x) Dependent on any tangent drawn or close attempt at a tangent at any point Must see correct or implied calculation from a drawn tangent (d) 0 and –1.75 to –1.65 and 1.65 to 1.75 2 B1 for two correct values (e) –1.2 to –0.8 < k < 2.8 to 3.2 2 B1 for each correct or SC1 for reversed answers IGCSE – May/June 2014 0580 41 Qu Answers Mark Part Marks
This question in 0580/41 May/June 2014
Q12 · 210 f(x) = , x ≠ 0 g(x) = 1 – x h(x) = x + 1 x 1 (a) Find fg 2 ` j 0580/42 May/June 2014
1 210 f(x) = , x ≠ 0 g(x) = 1 – x h(x) = x + 1 x 1 (a) Find fg 2 ` j. Answer(a) … [2] (b) Find g–1(x), the inverse of g(x). Answer(b) g–1(x) = … [1] (c) Find hg(x), giving your answer in its simplest form. Answer(c) hg(x) = … [3] (d) Find the value of x when g(x) = 7 . Answer(d) x = … [1] (e) Solve the equation h(x) = 3x. Show your working and give your answers correct to 2 decimal places. Answer(e) x = … or x = … [4] (f) A function k(x) is its own inverse when k –1(x) = k(x). For which of the functions f(x) , g(x) and h(x) is this true? Answer(f) … [1] __________________________________________________________________________________________ Question 11 is printed on the next page.
12 marks
Mark scheme: 1 1 110 (a) 2 2 B1 for g = soi or [fg=] 2 2 1 − x (b) 1 – x 1 Accept equivalents e.g. –(x – 1) (c) x 2 −x2 + 2 3 M1 for 1( −x ) 2 + 1 2 or better B1 for [(1 − x ) 2 = ] 1 − x − x + x (d) – 6 1 2 2 3 (e) ( −3) − 41()()1 or better B1 or for x − 2 p + q p − q p = − (−3) and r = 2× 1 oe B1 Must see or or both r r 2 3 3 or for + or − − 1 2 2 0.38, 2.62 B1B1 SC1 for answers 0.4 and 2.6 or 0.3819 to 0.3820 and 2.618… or 0.38 and 2.62 seen in working or for –0.38 and –2.62 as final ans (f) f(x) and g(x) 1 Accept f and g or 1/x and 1 – x IGCSE – May/June 2014 0580 42 Qu Answers Mark Part Marks 1
This question in 0580/42 May/June 2014
Q13 · Diagram 1 Diagram 2 Diagram 3 The fi rst three diagrams in a sequence are shown above 0580/43 May/June 2014
11 Diagram 1 Diagram 2 Diagram 3 The fi rst three diagrams in a sequence are shown above. Diagram 1 shows an equilateral triangle with sides of length 1 unit. 1 In Diagram 2, there are 4 triangles with sides of length unit. 2 1 In Diagram 3, there are 16 triangles with sides of length unit. 4 (a) Complete this table for Diagrams 4, 5, 6 and n. Diagram 1 Diagram 2 Diagram 3 Diagram 4 Diagram 5 Diagram 6 Diagram n 1 1 Length of side 1 2 4 Length of side 20 2–1 2–2 as a power of 2 [6] (b) (i) Complete this table for the number of the smallest triangles in Diagrams 4, 5 and 6. Diagram 1 Diagram 2 Diagram 3 Diagram 4 Diagram 5 Diagram 6 Number of smallest 1 4 16 triangles Number of smallest 20 22 24 triangles as a power of 2 [2] (ii) Find the number of the smallest triangles in Diagram n, giving your answer as a power of 2. Answer(b)(ii) … [1] (c) Calculate the number of the smallest triangles in the diagram where the smallest triangles have sides of 1 length unit. 128 Answer(c) … [2]
11 marks
Mark scheme: 1 1 1 11 (a) 2 B1 for 2 correct 8 16 32 1 1 n −1 oe 2 SC1 for n oe 2 2 2−3 2−4 2−5 1 21− n or 2 −n( −)1 1 (b) (i) 64 256 1024 1 6 8 10 1 2 2 2 (ii) 2 ( n −)1 1 2 or 22n-2 (c) 16 384 2 B1 for n = 8
This question in 0580/43 May/June 2014
Q14 · Complete the table of values for y = x2 + , x ≠ 0 0580/41 Oct/Nov 2014
35 (a) Complete the table of values for y = x2 + , x ≠ 0. x x –3 –2 –1 –0.5 0.4 0.6 1 1.5 2 3 y 8 2.5 –5.8 7.7 5.4 4 4.3 10 [2] 3 (b) Draw the graph of y = x2 + for –3 Y x Y –0.5 and 0.4 Y x Y 3. x y 10 8 6 4 2 x –3 –2 –1 0 1 2 3 –2 –4 –6 [5] 3 (c) Use your graph to solve the equation x2 + = 5. x Answer(c) x = … or x = … or x = … [3] 3 (d) By drawing a suitable straight line, solve the equation x2 + = x + 5. x Answer(d) x = … or x = … or x = … [4] __________________________________________________________________________________________
14 marks
Mark scheme: 5 (a) –2, 5.5 2 B1 for each value (b) Correct curve 5 B5 for correct curve over full domain 10 y or B3FT for 9 or 10 points or B2FT for 7 or 8 points 5 or B1FT for 5 or 6 points Point must touch line if exact or be in correct square if not exact (including boundaries) and x −3 −2 −1 1 2 3 B1 independent for one branch on each side of the y-axis and not touching or crossing the y-axis −5 SC4 for correct curve with branches joined (c) –2.6 Y x Y –2.4 3 B1 for each value 0.6 Y x Y 0.7 1.8 Y x Y 1.9 If B0 then SC1 for y = 5 used Qu Answers Mark Part Marks (d) y = x + 5 ruled correctly 4 B1 for y = x + 5 ruled correctly and –2.2 Y x Y –2.0 B1indep for each value 0.5 Y x Y 0.6 2.4 Y x Y 2.6
This question in 0580/41 Oct/Nov 2014
Q15 · F(x) = 5x3 – 8x2 + 10 (a) Complete the table of values 0580/42 Oct/Nov 2014
6 f(x) = 5x3 – 8x2 + 10 (a) Complete the table of values. x –1.5 –1 –0.5 0 0.5 0.75 1 1.5 2 f(x) –24.9 10 8.6 7.6 7 18 [3] (b) Draw the graph of y = f(x) for –1.5 Y x Y 2. y 20 15 10 5 x –1.5 –1 –0.5 0 0.5 1 1.5 2 –5 –10 –15 –20 –25 [4] (c) Use your graph to fi nd an integer value of k so that f(x) = k has (i) exactly one solution, Answer(c)(i) k = … [1] (ii) three solutions. Answer(c)(ii) k = … [1] (d) By drawing a suitable straight line on the graph, solve the equation f(x) = 15x + 2 for –1.5 Y x Y 2. Answer(d) x = … or x = … [4] (e) Draw a tangent to the graph of y = f(x) at the point where x = 1.5 . Use your tangent to estimate the gradient of y = f(x) when x = 1.5 . Answer(e) … [3] __________________________________________________________________________________________
16 marks
Mark scheme: 6 (a) –3, 7.375, 8.875 1, 1, 1 Accept 7.4 or 7.37 or 7.38 for 7.375 and 8.9 or 8.87 or 8.88 for 8.875 (b) Correct curve 4 B3FT for 8 or 9 correct plots B2FT for 6 or 7 correct plots B1FT for 4 or 5 correct plots Point must touch line if exact or be in correct square if not exact (including boundaries) (c) (i) Any integer less than 7 or greater 1 than 10 (ii) 7, 8 or 9 1 (d) y = 15x + 2 ruled and fit for B2 B1 for short line but correct or freehand full purpose length correct line or for ruled line through (0, 2) (but not y = 2) or for ruled line with gradient 15 (acc ±1 mm vertically for 1 horizontal unit) B2 B1 for each –1.45 to –1.35 and 0.4 to 0.5 (e) Tangent ruled at x = 1.5 B1 No daylight at point of contact. Consider point of contact as midpoint between two vertices of daylight, the midpoint must be between x = 1.4 and 1.6 7 to 12 2 Dep on B1 or close attempt at tangent at x = 1.5 M1 for y – step/x – step for their tangent
This question in 0580/42 Oct/Nov 2014
Question 16 0580/43 Oct/Nov 2014
6 (a) Simplify. (i) x3 ÷ 53 x Answer(a)(i) … [1] (ii) 5xy8 × 3x6y–5 Answer(a)(ii) … [2] 2 (iii) (64x12) 3 Answer(a)(iii) … [2] (b) Solve 3x2 – 7x – 12 = 0. Show your working and give your answers correct to 2 decimal places. Answer(b) x = … or x = … [4] x2 - 25 . (c) Simplify 3 2 x - 5 x Answer(c) … [3] __________________________________________________________________________________________
12 marks
Mark scheme: x 6 (a) (i) final answer 1 3 (ii) 15x7y3 final answer 2 M1 for 2 elements correct (iii) 16x8 final answer 2 M1 for 16xk or kx8 2 7 (b) 2 B1 or for x − [ − ]7 − 3.4 − 12 or better 6 and p + q p − q B1 Must see or or both p = [– –]7 and r = 2(3) oe r r 2 7 7 or for ± 4 + 6 6 B1B1 After B0, 3.48, –1.15 cao SC1 for answer 3.5 and –1.1 or 3.482… and –1.149 to –1.148 seen or for 3.48, –1.15 seen or for answer –3.48 and 1.15 x + 5 1 5 (c) 2 or + 2 final answer 3 B1 for (x + 5)(x – 5) x x x and nfww B1 for x2(x – 5) 1 [½ 2] 8 i 28 8 28 [½ 2] 7 06
This question in 0580/43 Oct/Nov 2014
Q17 · 12 000 vehicles drive through a road toll on one day 0580/41 May/June 2015
1 12 000 vehicles drive through a road toll on one day. The ratio cars : trucks : motorcycles = 13 : 8 : 3. (a) (i) Show that 6500 cars drive through the road toll on that day. Answer(a)(i) [1] (ii) Calculate the number of trucks that drive through the road toll on that day. Answer(a)(ii) … [1] (b) The toll charges in 2014 are shown in the table. Vehicle Charge Cars $2 Trucks $5 Motorcycles $1 Show that the total amount paid in tolls on that day is $34 500. Answer(b) [2] (c) This total amount is a decrease of 8% on the total amount paid on the same day in 2013. Calculate the total amount paid on that day in 2013. Answer(c) $ … [3] (d) 2750 of the 6500 car drivers pay their toll using a credit card. Write down, in its simplest terms, the fraction of car drivers who pay using a credit card. Answer(d) … [2] (e) To the nearest thousand, 90 000 cars drive through the road toll in one week. Write down the lower bound for this number of cars. Answer(e) … [1]
10 marks
Mark scheme: Question Answers Mark Part Marks 1313 1 (a) (i) × 12000 with no 1 13 + 8 + 3 subsequent errors (ii) 4000 1 (b) 2 × 6500 + 5 × their (a)(ii) + 2 B1 for any two of (12000 − 6500 − their (a)(ii) ) 2 × 6500, 5 × their (a)(ii) , (12000 – 6500 – their(a)(ii)) seen or or (13 × 2 + 8 × 5 + 3 × 1) × 500 13 × 2 + 8 × 5 + 3 × 1 34500 (c) 37 500 3 M2 for × 100 oe 100 − 8 or M1 for 34500 associated with (100 – 8)% 11 (d) cao 2 M1 for any correct simplified version of 26 2750 6500 (e) 89 500 1
This question in 0580/41 May/June 2015
Q18 · 1 2 The table shows some values for y = x - 2 , x ! 0580/41 May/June 2015
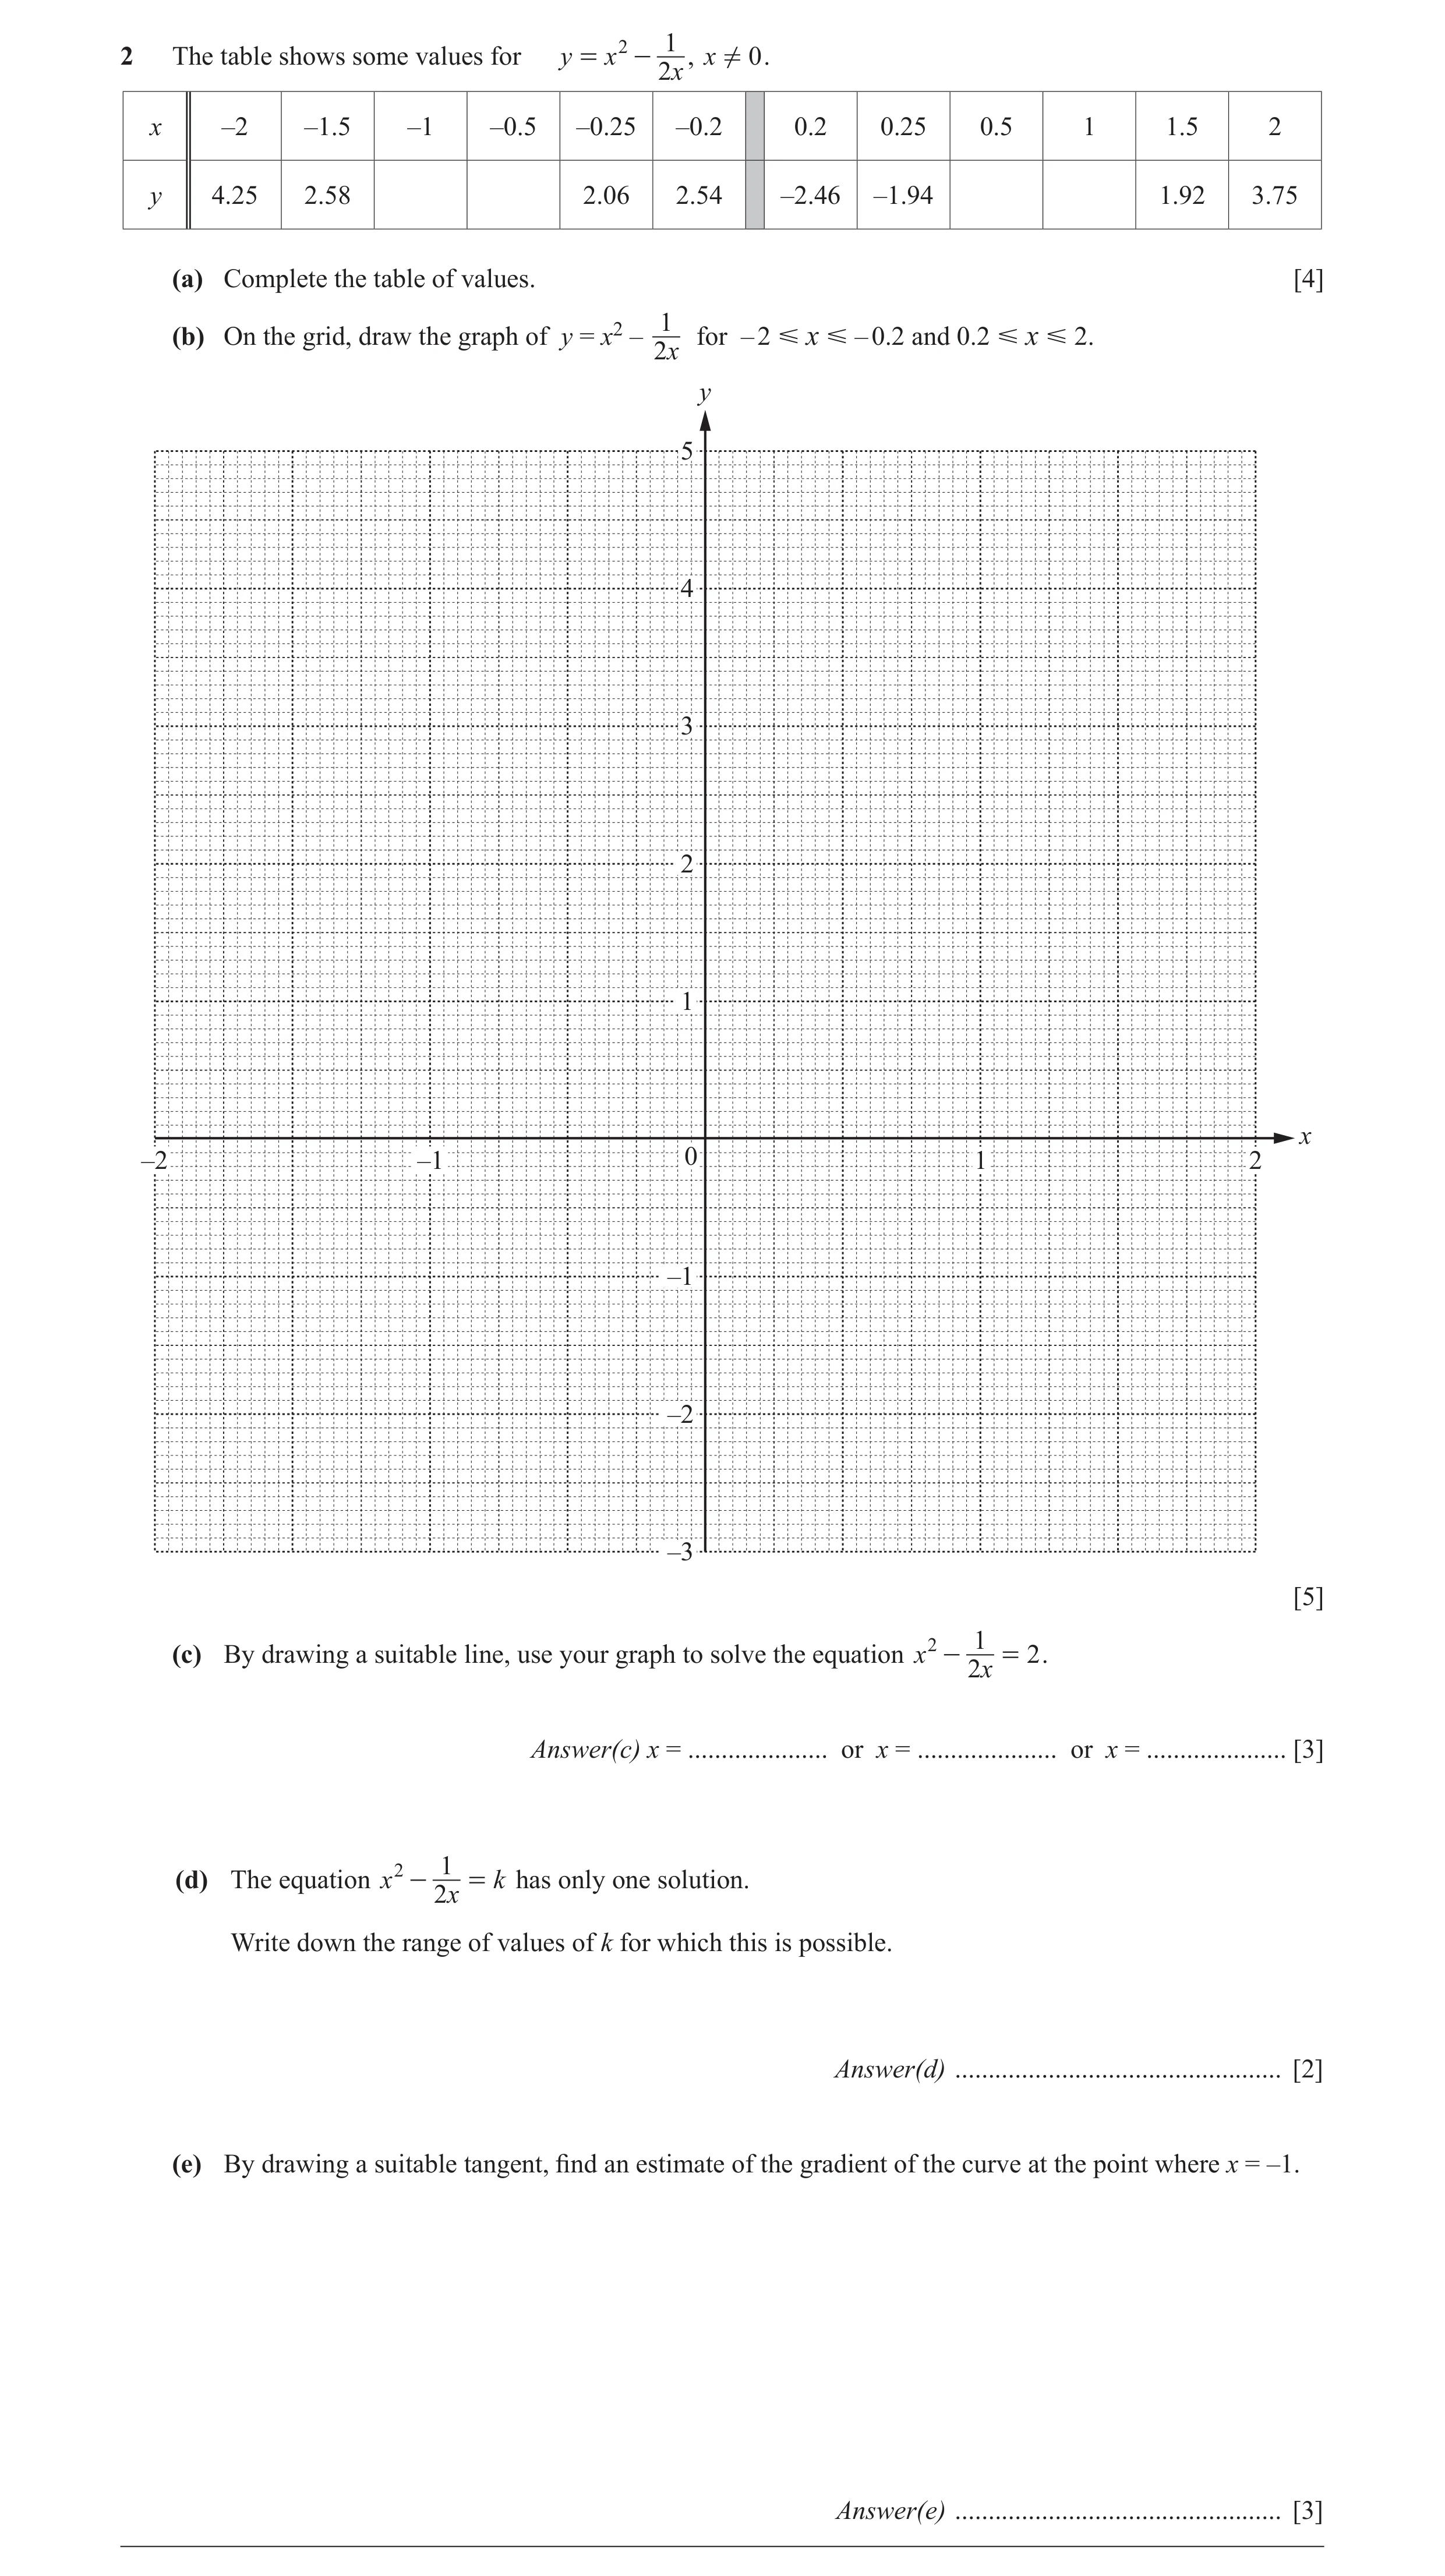
2 1 2 The table shows some values for y = x - 2 , x ! 0 . x x –2 –1.5 –1 –0.5 –0.25 –0.2 0.2 0.25 0.5 1 1.5 2 y 4.25 2.58 2.06 2.54 –2.46 –1.94 1.92 3.75 (a) Complete the table of values. [4] 1 x – 0.2 and 0.2 x 2. (b) On the grid, draw the graph of y = x2 – 2 for – 2 x y 5 4 3 2 1 x –2 –1 0 1 2 –1 –2 –3 [5] 2 1 (c) By drawing a suitable line, use your graph to solve the equation x - 2 = 2 . x Answer(c) x = … or x = … or x = … [3] 2 1 (d) The equation x - 2 = k has only one solution. x Write down the range of values of k for which this is possible. Answer(d) … [2] (e) By drawing a suitable tangent, find an estimate of the gradient of the curve at the point where x = –1. Answer(e) … [3]
17 marks
Mark scheme: 2 (a) 1.5 1.25 −0.75 0.5 4 B1 for each (b) Fully correct curve 5 B5 for correct curve over full domain or B3 FT for 11 or 12 points or B2 FT for 9 or 10 points or B1 FT for 7 or 8 points and B1 independent for one complete branch on each side of the y-axis and not touching or crossing the y-axis SC4 for correct curve with branches joined
This question in 0580/41 May/June 2015
Q19 · 5 y = x2 – 2x + , x ! 0580/42 May/June 2015
12 5 y = x2 – 2x + , x ! 0 x (a) Complete the table of values. x –4 –3 –2 –1 –0.5 0.5 1 2 3 4 y 21 11 –9 –22.75 23.25 11 6 11 [2] 12 (b) On the grid, draw the graph of y = x2 – 2x + for –4 x –0.5 and 0.5 x 4. x y 25 20 15 10 5 x –4 –3 –2 –1 0 1 2 3 4 –5 –10 –15 –20 –25 [5] (c) By drawing a suitable tangent, find an estimate of the gradient of the graph at the point (1, 11). Answer(c) … [3] 12 (d) The equation x2 – 2x + = k has exactly two distinct solutions. x Use the graph to find (i) the value of k, Answer(d)(i) k = … [1] 12 (ii) the solutions of x2 – 2x + = k. x Answer(d)(ii) x = … or x = … [2] (e) The equation x3 + ax2 + bx + c = 0 can be solved by drawing the line y = 3x + 1 on the grid. Find the value of a, the value of b and the value of c. Answer(e) a = … b = … c = … [3] __________________________________________________________________________________________
16 marks
Mark scheme: 5 (a) 2 and 7 2 B1 for each value (b) Complete correct curve 5 B3 FT for their 9 or 10 points or B2 FT for their 7 or 8 points or B1 FT for their 5 or 6 points and B1 independent for one branch on each side of the y-axis and not touching the y-axis SC4 for correct curve with branches joined (c) Correct tangent and 3 B2 for close attempt at tangent at x = 1 and –13 Y grad Y –8 answer in range OR B1 for ruled tangent at x = 1, no daylight at x = 1 Consider point of contact as midpoint between two vertices of daylight, the midpoint must be between x = 0.8 and 1.2 and M1 (dep on B1 or close attempt at tangent rise [at any point ] for run (d) (i) 5 to 6 1 (ii) 2 to 2.35 and –2.55 to –2.35 2FT FT their k B1FT for each correct solution (e) [a =] –5 3 B2 for two correct values [b =] –1 or for x3 – 5x2 – x + 12 [= 0] oe [c =] 12 or 12 M1 for x2 – 2x + = 3x + 1 x 2 2 955. 2 + 831.2 − AB 2 f
This question in 0580/42 May/June 2015
Q20 · The table shows some values for y = x 3 - 3x + 2 0580/42 Oct/Nov 2015
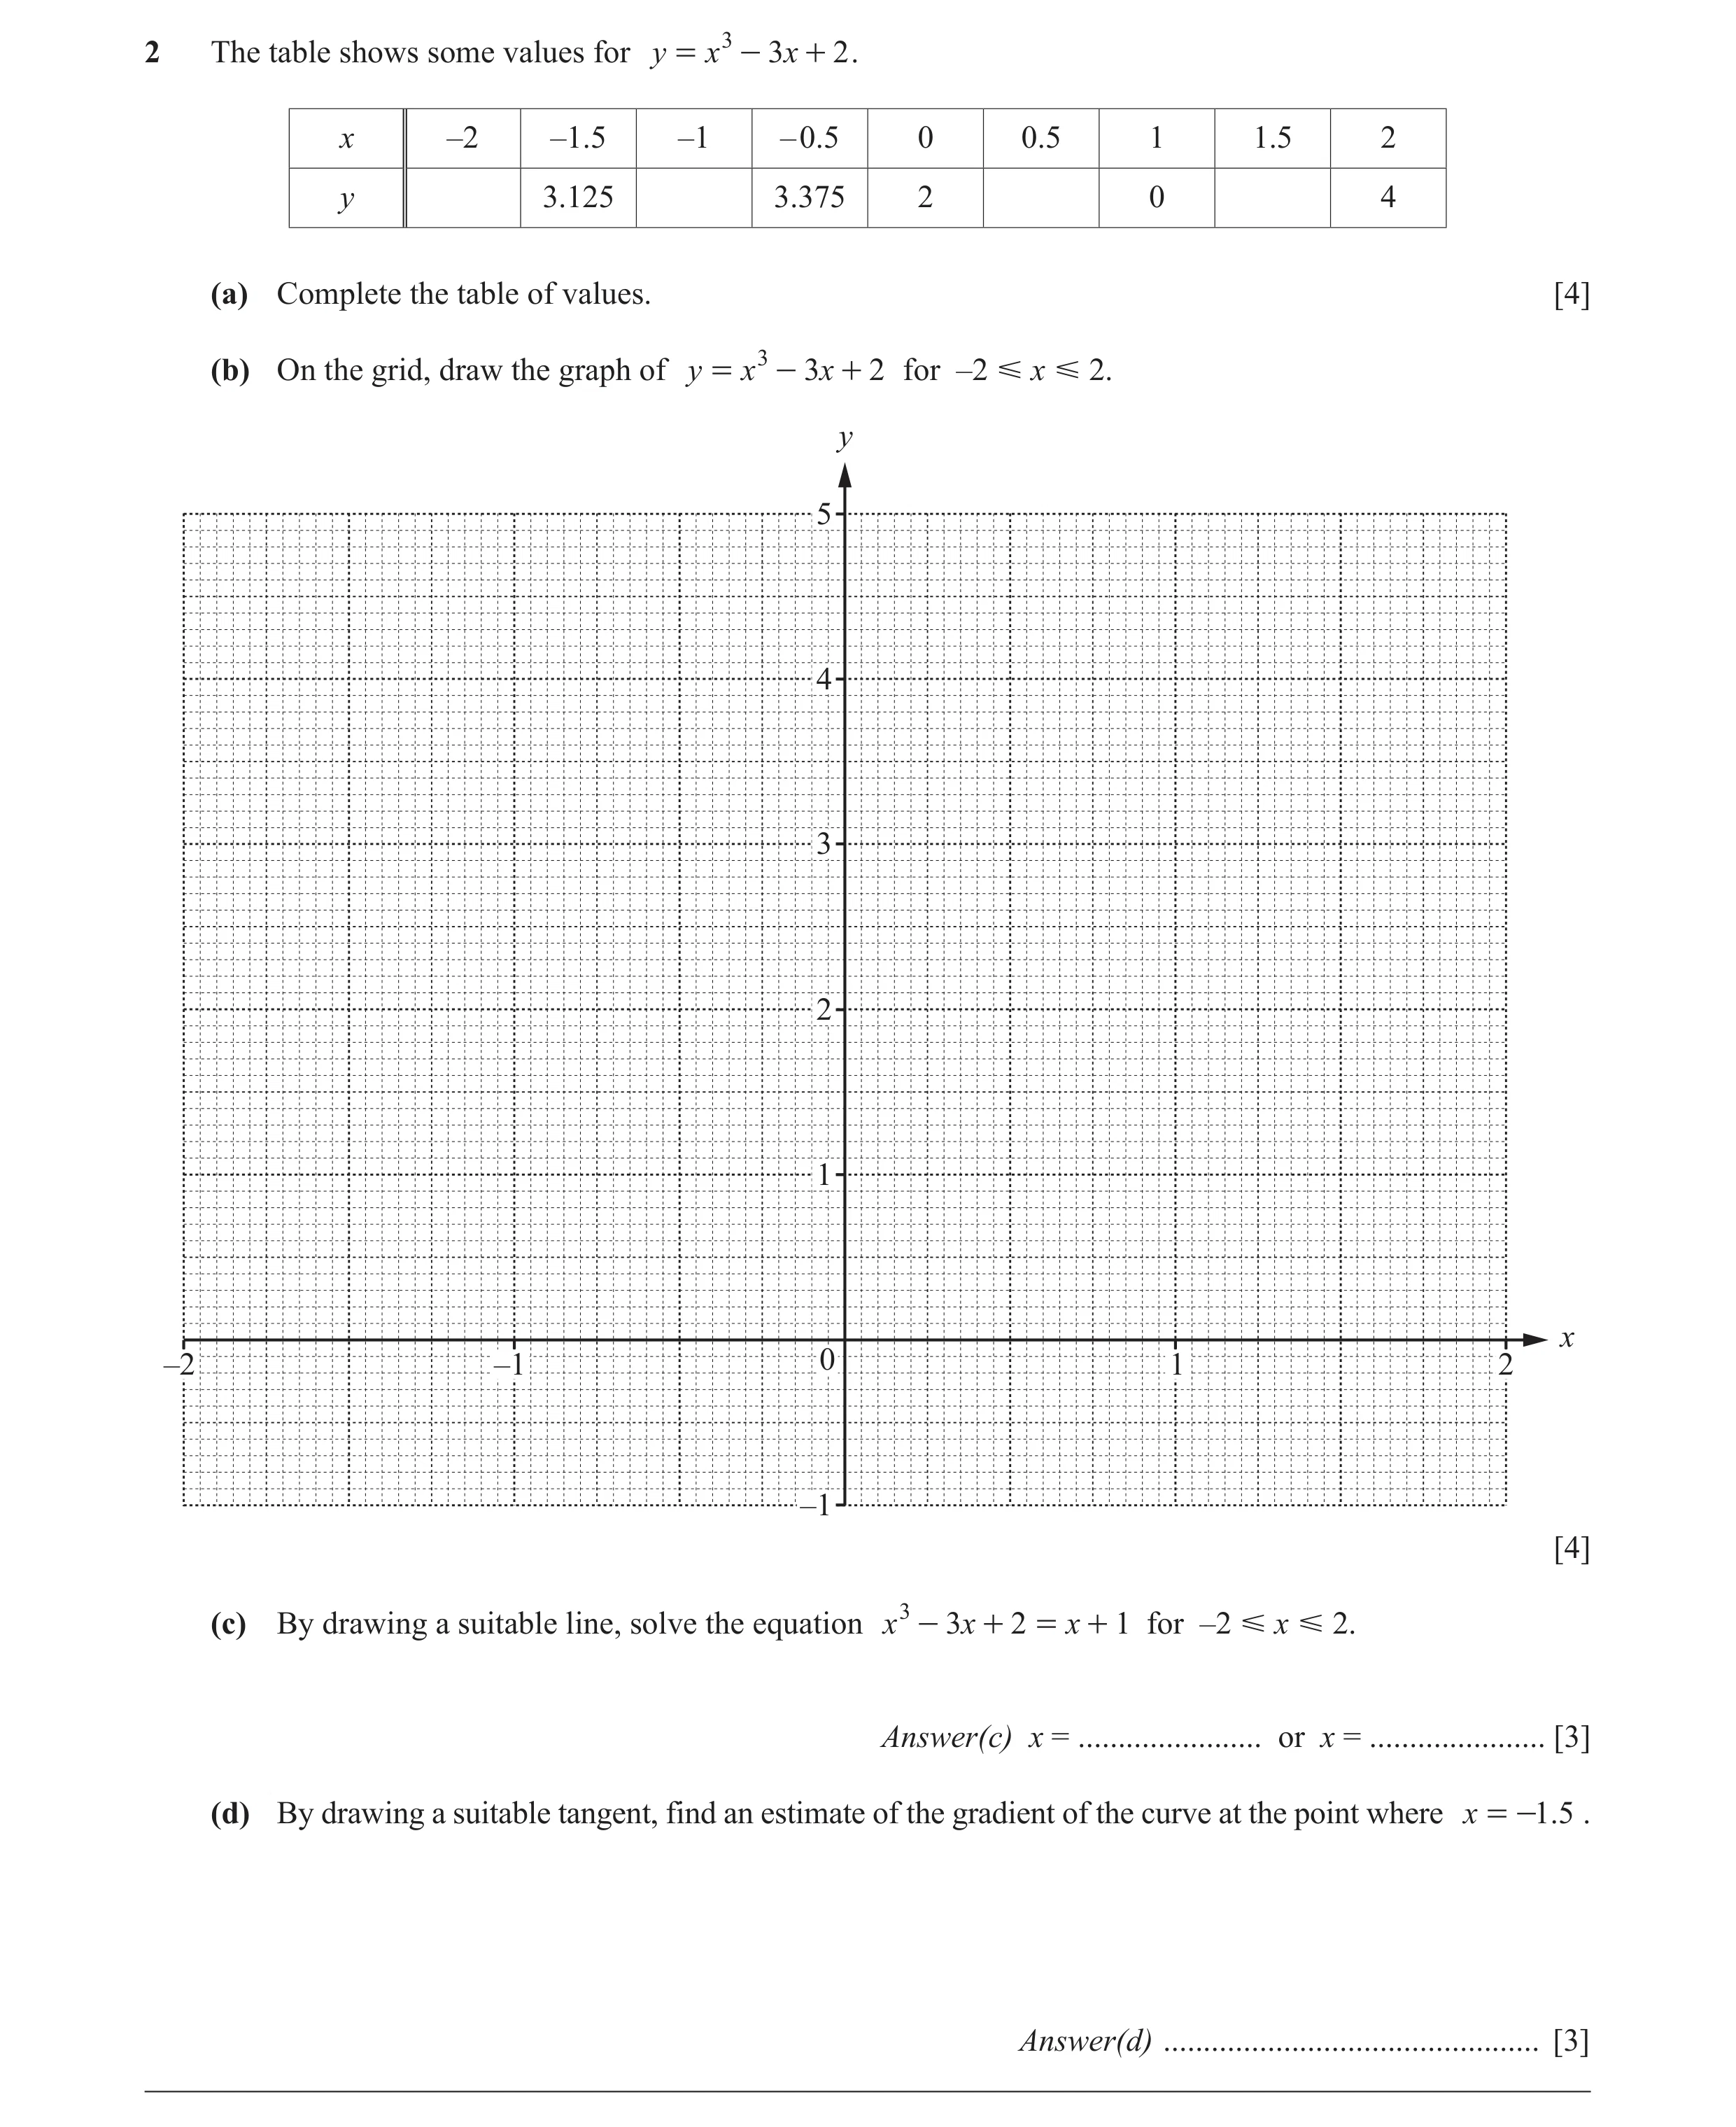
2 The table shows some values for y = x 3 - 3x + 2 . x –2 –1.5 –1 –0.5 0 0.5 1 1.5 2 y 3.125 3.375 2 0 4 (a) Complete the table of values. [4] (b) On the grid, draw the graph of y = x 3 - 3x + 2 for –2 x 2. y 5 4 3 2 1 x –2 –1 0 1 2 –1 [4] (c) By drawing a suitable line, solve the equation x 3 - 3x + 2 = x + 1 for –2 x 2. Answer(c) x = … or x = … [3] (d) By drawing a suitable tangent, find an estimate of the gradient of the curve at the point where x = -1.5 . Answer(d) … [3]
14 marks
Mark scheme: 2 (a) 0 4 0.625 0.875 1,1,1,1 (b) Fully correct smooth curve 4 B3 FT for 8 or 9 points or B2 FT for 6 or 7 points or B1 FT for 4 or 5 points (c) line y = x + 1 ruled 3 Line must be fit for purpose ie at least from x = 0 and to x = 2 0.2 to 0.3 B2 for correct line and 1 correct value and 1.8 to 1.95 or B1 for correct line or SC1 for no/wrong line and 2 correct values (d) Tangent ruled at x = −1.5 B1 No daylight between tangent and curve at point of contact. Consider point of contact as midpoint between two vertices of daylight, the midpoint must be between x = –1.6 and x = –1.4 2 dep on B1 2.2 to 5 rise M1 for also dep on any tangent drawn or run close attempt at tangent at any point Must see correct or implied calculation from a drawn tangent
This question in 0580/42 Oct/Nov 2015
Q21 · F(x) = x – 2 , x 0 2x (a) Complete the table of values 0580/43 Oct/Nov 2015
14 f(x) = x – 2 , x 0 2x (a) Complete the table of values. x –3 –2 –1.5 –1 –0.5 –0.3 0.3 0.5 1 1.5 2 f(x) –3.1 –2.1 –1.7 –2.5 –5.9 –5.3 –1.5 1.3 1.9 [2] (b) On the grid, draw the graph of y = f(x) for –3 x –0.3 and 0.3 x 2. y 5 4 3 2 1 x –3 –2 –1 0 1 2 –1 –2 –3 –4 –5 –6 [5] (c) Use your graph to solve the equation f(x) = 1. Answer(c) x = … [1] (d) There is only one negative integer value, k, for which f(x) = k has only one solution for all real x. Write down this value of k. Answer(d) k = … [1] 1 (e) The equation 2x – 2 – 2 = 0 can be solved using the graph of y = f(x) and a straight line graph. 2x (i) Find the equation of this straight line. Answer(e)(i) y = … [1] 1 (ii) On the grid, draw this straight line and solve the equation 2x – 2 – 2 = 0. 2x Answer(e)(ii) x = … [3] __________________________________________________________________________________________
13 marks
Mark scheme: 4 (a) –1.5, 0.5 2 B1, B1 (b) Correct curve 5 B3 FT for 10 or 11 points or B2FT for 8 or 9 points or B1FT for 6 or 7 points and B1 independent for two branches SC4 for correct curve but branches joined (c) 1.25 to 1.35 1 (d) –1 1 (e) (i) 2 – x 1 (ii) Ruled line with gradient –1 through 2FT SC1 for ruled line, with gradient –1 or through (0, 2) and fit for purpose (0, 2), but not y = 2 FT their y = mx + c from (e)(i), if m ≠ 0 SC1FT for ruled line either with correct gradient or through (0, c), but not y = c 1.15 to 1.25 cao 1
This question in 0580/43 Oct/Nov 2015
Q22 · Aasha, Biren and Cemal share $640 in the ratio 8 : 15 : 9 0580/42 Feb/March 2016
1 Aasha, Biren and Cemal share $640 in the ratio 8 : 15 : 9. (a) Show that Aasha receives $160. [1] (b) Calculate the amount that Biren and Cemal receive. Biren $ … Cemal $ … [2] (c) Aasha uses her $160 to buy some books. Each book costs $15.25 . Find the greatest number of books that she can buy. … [2] 3 1 (d) Biren spends of his share on clothes and of his share on a computer. 8 3 Find the fraction of his share that he has left. Write your fraction in its lowest terms. … [3]
8 marks
Mark scheme: 8 1 (a) × 640 oe 1 With no errors seen 8 + 15 + 9 (b) 300 and 180 2 B1 for each or SC1 for answers reversed (c) 10 nfww 2 M1 for 160 ÷ 15.25 implied by 10.5 or 10.49... nfww 7 3 1 (d) 3 M1 for + oe 24 8 3 3 1 M1dep on previous M1 for 1 − their ( + ) oe 8 3
This question in 0580/42 Feb/March 2016
Q23 · The table shows some values of y = x + , x ! 0580/42 Feb/March 2016
17 The table shows some values of y = x + , x ! 0 . x 2 x –2 –1.5 –1 –0.75 –0.5 0.5 0.75 1 1.5 2 3 y –1.75 –1.06 0 1.03 4.50 2.53 2 2.25 (a) Complete the table of values. [3] 1 (b) On the grid, draw the graph of y = x + for – 2 x – 0.5 and 0.5 x 3. x 2 y 5 4 3 2 1 x –2 –1 0 1 2 3 –1 –2 [5] 1(c) Use your graph to solve the equation x + = 1.5 . x 2 x = … [1] 1(d) The line y = ax + b can be drawn on the grid to solve the equation = 2.5 - 2 x . x 2 (i) Find the value of a and the value of b. a = … b = … [2] 1 (ii) Draw the line y = ax + b to solve the equation = 2.5 - 2 x . x 2 x = … [3] (e) By drawing a suitable tangent, find an estimate of the gradient of the curve at the point where x = 2. … [3]
17 marks
Mark scheme: 7 (a) 3.5[0] 1.94 3.11 3 B1 for each (b) Fully correct curve 5 B3 FT for 10 or 11 points or B2 FT for 8 or 9 points or B1 FT for 6 or 7 points B1 indep two separate branches not touching or cutting y-axis SC4 for correct curve, but branches joined (c) – 0.7 to – 0.6 1 Qu. Answers Mark Part Marks (d) (i) – 1 1 2.5 1 If 0,0, M1 for y = 2.5 – x oe seen in working (ii) – 0.6 to – 0.5 with correct ruled line 3 B2FT for drawing their ruled line from (d)(i) or M1 for ruled line through (0, 2.5)FT or gradient −1 FT (e) Correct tangent and 3 B2 for close attempt at tangent at x = 2 and 0.5 ⩽ grad ⩽ 0.85 answer in range OR B1 for ruled tangent at x = 2, no daylight at x = 2 Consider point of contact as midpoint between two vertices of daylight, the midpoint must be between x = 1.8 and 2.2 and M1 (dep on B1 or close attempt at tangent rise [at any point ] for run ( )
This question in 0580/42 Feb/March 2016
Q24 · F(x) = x2 – – 4 , x ≠ 0 x (a) (i) Complete the table 0580/42 May/June 2016
14 f(x) = x2 – – 4 , x ≠ 0 x (a) (i) Complete the table. x –3 –2 –1 –0.5 –0.1 0.2 0.5 1 2 3 f(x) 5.3 0.5 –1.8 6.0 –9.0 –5.8 –4 4.7 [2] (ii) On the grid, draw the graph of y = f(x) for –3 G x G –0.1 and 0.2 G x G 3. y 10 9 8 7 6 5 4 3 2 1 x –3 –2 –1 0 1 2 3 –1 –2 –3 –4 –5 –6 –7 –8 –9 –10 [5] (b) Use your graph to solve the equation f(x) = 0. x = … or x = … or x = … [3] (c) Find an integer k, for which f(x) = k has one solution. k = … [1] (d) (i) By drawing a suitable straight line, solve the equation f(x) + 2 = – 5x. x = … or x = … [4] (ii) f(x) + 2 = – 5x can be written as x3 + ax2 + bx – 1 = 0. Find the value of a and the value of b. a = … b = … [2]
17 marks
Mark scheme: 4 (a) (i) 1 2 B1 for each – 2, – 0.5 or – 2 (ii) Complete correct curve 5 SC4 for correct curves but branches joined or touching y-axis 10 y or B3FT 9 or 10 points 9 8 or B2FT for 7 or 8 points 7 or B1FT for 5 or 6 points 6 5 4 3 2 1 x −3 −2 −1 1 2 3 −1 −2 and B1indep two separate branches not −3 −4 touching or crossing y-axis −5 −6 −7 −8 −9 −10 (b) – 1.95 to – 1.8 3 B1 for each – 0.4 to – 0.2 2.05 to 2.2 (c) Any integer k where k ⩽ – 3 1
This question in 0580/42 May/June 2016
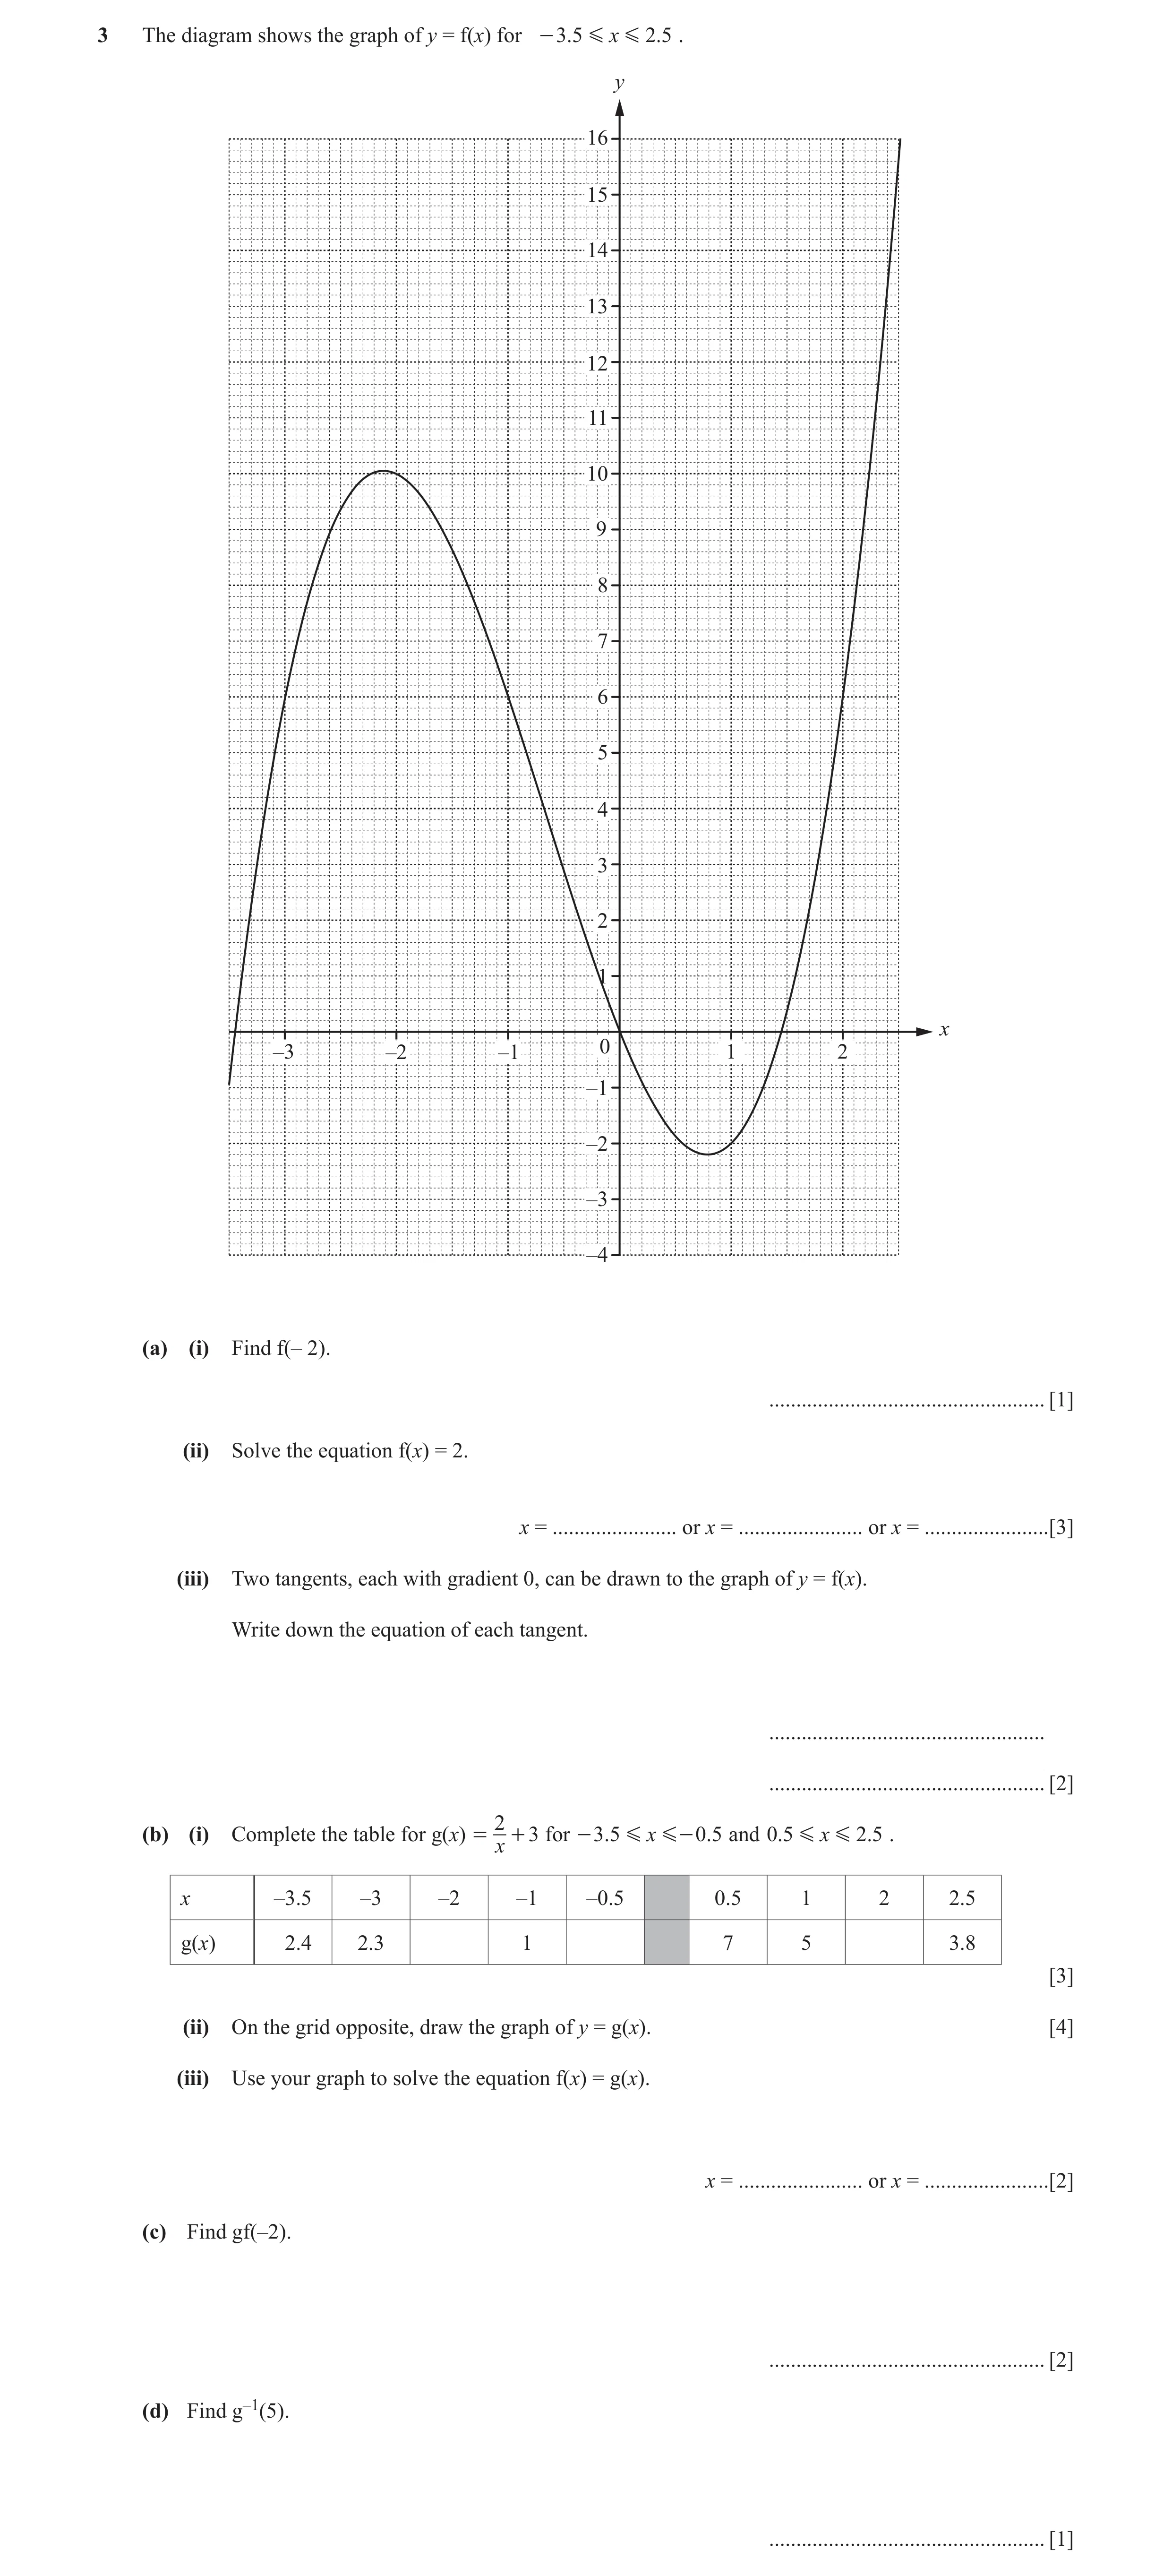
Q25 · The diagram shows the graph of y = f(x) for - 3.5 G x G 2.5 0580/43 May/June 2016
3 The diagram shows the graph of y = f(x) for - 3.5 G x G 2.5 . y 16 15 14 13 12 11 10 9 8 7 6 5 4 3 2 1 x –3 –2 –1 0 1 2 –1 –2 –3 –4 (a) (i) Find f(– 2). … [1] (ii) Solve the equation f(x) = 2. x = … or x = … or x = … [3] (iii) Two tangents, each with gradient 0, can be drawn to the graph of y = f(x). Write down the equation of each tangent. … … [2] 2 (b) (i) Complete the table for g(x) = + 3 for - 3. 5 G x G - 0. 5 and 0. 5 G x G 2. 5 . x x –3.5 –3 –2 –1 –0.5 0.5 1 2 2.5 g(x) 2.4 2.3 1 7 5 3.8 [3] (ii) On the grid opposite, draw the graph of y = g(x). [4] (iii) Use your graph to solve the equation f(x) = g(x). x = … or x = … [2] (c) Find gf(–2). … [2] (d) Find g–1(5). … [1]
18 marks
Mark scheme: 3 (a) (i) 10 1 (ii) –3.4 to –3.3 and –0.4 to –0.3 3 B1 for each and 1.6 to 1.7 (iii) y = –2.3 to –2.1oe 2 B1 for each y = 10 to 10.1oe (b) (i) 2, –1, 4 3 B1 for each (ii) Fully correct curve drawn 4 SC3 for correct curves but branches joined or touching y-axis or B2FT for 8 or 9 correct plots or B1FT for 6 or 7 correct plots and B1 indep for two separate branches not touching or crossing y- axis (iii) –3.4 to –3.2 and 1.8 to 1.9 2 B1 for each (c) 3.2 oe 2FT FT 2 ÷ their (a)(i) + 3 M1 for f(–2) = 10 or their (a)(i) used (d) 1 1 1
This question in 0580/43 May/June 2016
Q26 · Y = 1 - 2 , x ! 0580/41 Oct/Nov 2016
24 y = 1 - 2 , x ! 0 x (a) Complete the table. x –5 –4 –3 –2 –1 –0.5 0.5 1 2 3 4 5 y 0.88 0.78 –7 –7 0.78 0.88 [3] 2 (b) On the grid, draw the graph of y = 1 - 2 for - 5 G x G - 0 .5 and 0.5 G x G 5 . x y 2 1 x –5 –4 –3 –2 –1 0 1 2 3 4 5 –1 –2 –3 –4 –5 –6 –7 –8 [5] (c) (i) On the grid, draw the graph of y =- x - 1 for - 3 G x G 5 . [2] 2 (ii) Solve the equation 1 - 2 =- x - 1. x x = … [1] 2 3 2 (iii) The equation 1 - 2 =- x - 1 can be written in the form x + px + q = 0 . x Find the value of p and the value of q. p = … q = … [3] 2(d) The graph of y = 1 - 2 cuts the positive x-axis at A. x B is the point (0, – 2). (i) Write down the co-ordinates of A. ( … , … ) [1] (ii) On the grid, draw the straight line that passes through A and B. [1] (iii) Complete the statement. The straight line that passes through A and B is a … at the point … [2]
18 marks
Mark scheme: 4 (a) 0.92, …., …., 0.5, – 1, …., ….., – 1, 3 B2 for 4 or 5 correct 0.5, …., …., 0.92 or B1 for 2 or 3 correct (b) Fully correct graph 5 B4 for correct graph but branches joined OR B3FT for 11 or 12 correct points or B2FT for 9 or 10 correct points or B1FT for 7 or 8 correct points B1indep for a branch on each side of the y-axis, without touching it (c) (i) Correct ruled line through (–2, 1) and 2 B1 for straight line with gradient –1 or cutting (2, –3) y-axis at –1 or correct line but freehand or short correct ruled line (ii) 0.7 to 0.95 1 (iii) [p = ] 2 and [q = ] – 2 3 B2 for x 3 + 2 x 2 − 2 = 0 oe or B1 for x 2 − 2 = − x 3 − x 2 oe or better 2 or 1 + 1 − + x [ = 0] or better x 2 (d) (i) (1.3 to 1.6, 0) 1 (ii) Ruled line from (0, –2) to intersection 1FT of their graph with positive x-axis (iii) Tangent [ to curve ] 1 A or (1.3 to 1.6, 0) 1
This question in 0580/41 Oct/Nov 2016
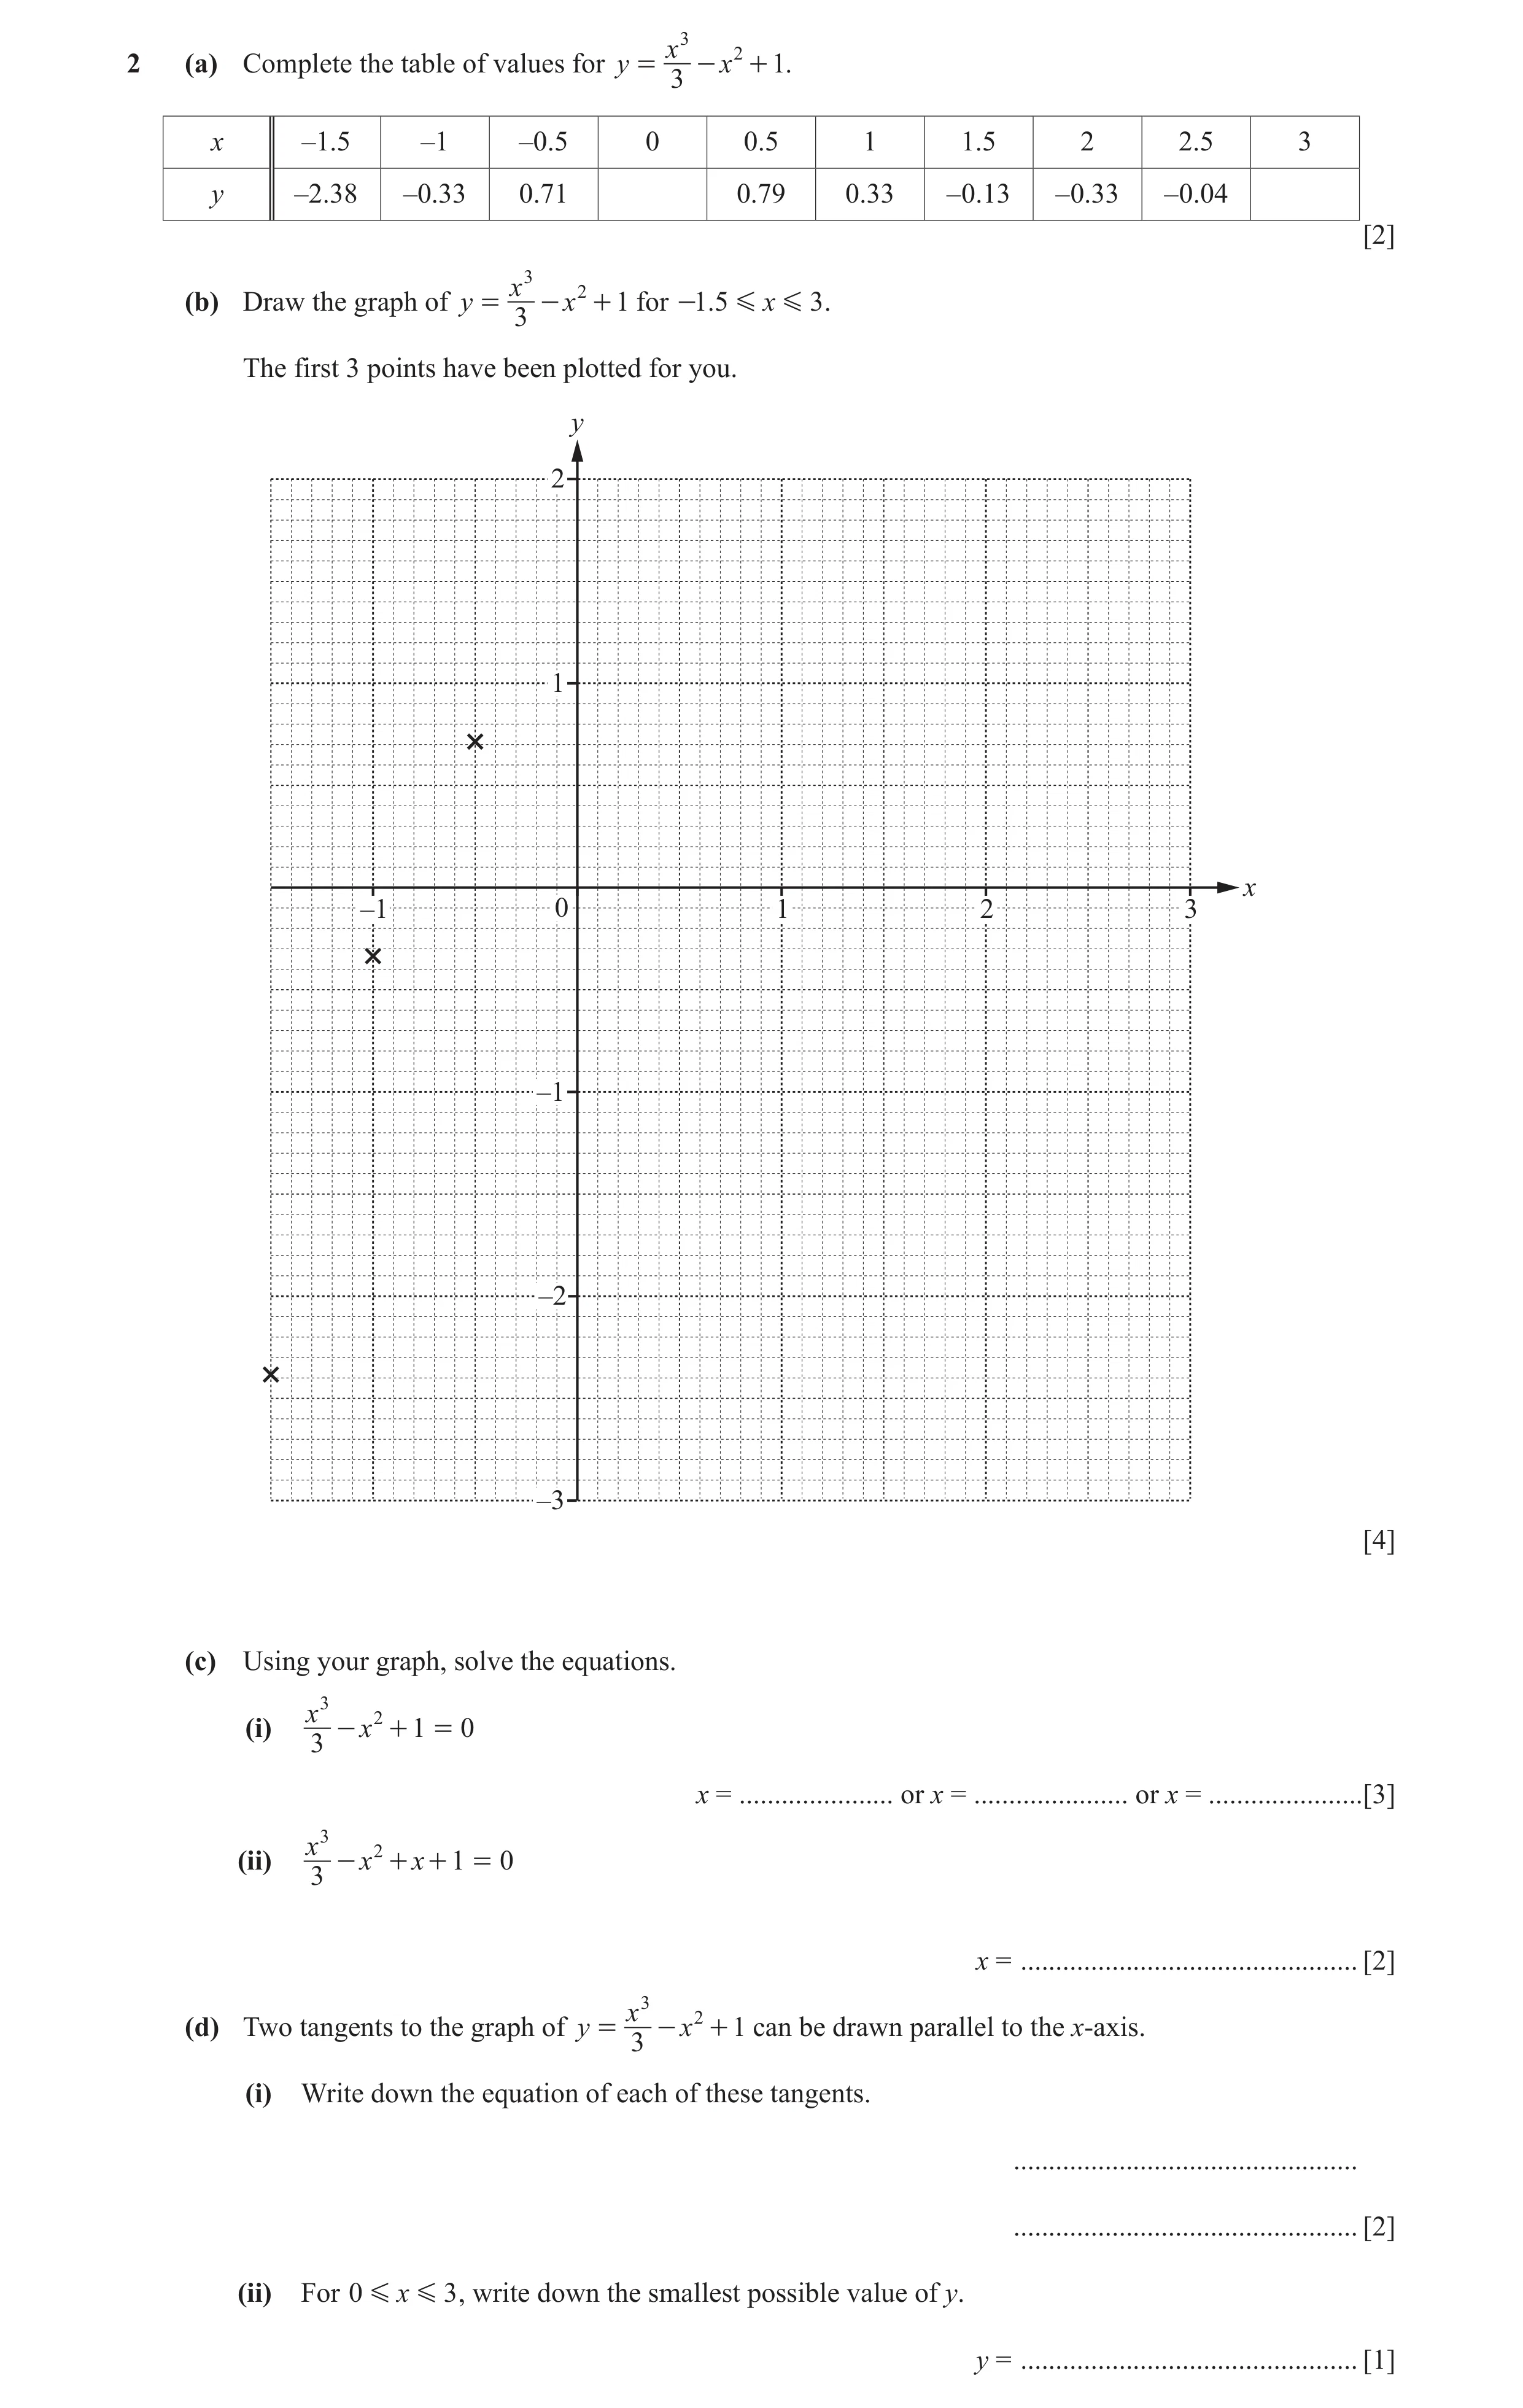
Q27 · X 3 22 (a) Complete the table of values for y = - x + 1 0580/42 Oct/Nov 2016
x 3 22 (a) Complete the table of values for y = - x + 1. 3 x –1.5 –1 –0.5 0 0.5 1 1.5 2 2.5 3 y –2.38 –0.33 0.71 0.79 0.33 –0.13 –0.33 –0.04 [2] x 3 2 (b) Draw the graph of y = - x + 1 for -1.5 G x G 3 . 3 The first 3 points have been plotted for you. y 2 1 x –1 0 1 2 3 –1 –2 –3 [4] (c) Using your graph, solve the equations. x 3 2 (i) - x + 1 = 0 3 x = … or x = … or x = … [3] x 3 2 (ii) - x + x + 1 = 0 3 x = … [2] x 3 2(d) Two tangents to the graph of y = - x + 1 can be drawn parallel to the x-axis. 3 (i) Write down the equation of each of these tangents. … … [2] (ii) For 0 G x G 3 , write down the smallest possible value of y. y = … [1]
14 marks
Mark scheme: 2 (a) 1 1 1 1 (b) Fully correct graph 4 B3FT for 6 or 7 points plotted or B2FT for 4 or 5 points plotted or B1FT for 2 or 3 points plotted (c) (i) –1 < ans < –0.8 1 1.25 < ans < 1.45 1 2.5 < ans < 2.6 1 (ii) –0.7 < ans < –0.5 2 x 3 2 M1 for evidence of y = –x or – x + 1 = –x 3 (d) (i) y = 1 to 1.1 oe 1FT FT only if a clear maximum point y = –0.4 to –0.33 oe 1FT FT only if a clear minimum point (ii) –0.4 to –0.33 oe 1FT Correct or FT their graph 240sin85 sin50 sin85
This question in 0580/42 Oct/Nov 2016
Q28 · Y = + 2 , x ! 0580/42 Oct/Nov 2016
39 (a) y = + 2 , x ! 0 x (i) Find the value of y when x =- 6 . y = … [1] (ii) Find x in terms of y. x = … [3] (b) g(x) = 2 - x h( x) = 2 x (i) Find g(5). … [1] (ii) Find hhh(2). … [2] (iii) Find x when g( x) = h(3) . x = … [2] (iv) Find x when g –1 (x) =- 1. x = … [1] Question 10 is printed on the next page.
10 marks
Mark scheme: 9 (a) (i) 1.5 oe 1 3 (ii) oe final answer 3 M1 for correct removal of fraction y − 2 M1 for collection of terms in x and factorises OR M1 subtracts 2 from both sides M1 multiplies by x to remove fraction and M1 for correct division by expression of the form ay + b, a and b ≠ 0 (b) (i) –3 1 (ii) 65 536 final answer 2 B1 for h(16) oe e.g. h(2 4 ) (iii) –6 2 M1 for 2 – x = 23 oe (iv) 3 1
This question in 0580/42 Oct/Nov 2016
Q29 · 2 (a) Complete the table for y = 3x + 2 + 1, x ! 0580/43 Oct/Nov 2016
2 2 (a) Complete the table for y = 3x + 2 + 1, x ! 0 . x x –3 –2 –1 –0.5 –0.3 0.3 0.5 1 2 3 y –7.8 0 7.5 22.3 24.1 6 7.5 10.2 [2] 2 (b) On the grid, draw the graph of y = 3 x + + 1 for -3 G x G -0.3 and 0.3 G x G 3 . x2 y 25 20 15 10 5 x –3 –2 –1 0 1 2 3 –5 –10 [5] 2 (c) Write down the value of the largest integer, k, so that the equation 3x + 2 + 1 = k has exactly one x solution. k = … [1] 2 (d) (i) By drawing a suitable straight line on the grid, solve 3x + 2 + 1 = 15 - 3x . x x = … or x = … or x = … [4] 2 3 2 (ii) The equation 3x + 2 + 1 = 15 - 3x can be written in the form ax + bx + cx + 2 = 0 , x where a, b and c are integers. Find a, b and c. a = … b = … c = … [3]
15 marks
Mark scheme: 2 (a) –4.5 and 10.5 2 B1 for each value (b) Correct curve 5 B4 for correct curve with branches joined OR B3 FT for 9 or 10 points or B2 FT for 7 or 8 points or B1 FT for 5 or 6 points and B1 independent for one branch on each side of the y-axis and not touching or crossing the y-axis (c) 5 1 (d) (i) Line y = 15 – 3x ruled and –0.4 to –0.31 4 B3 for correct line and 2 correct values 0.35 to 0.45 or B2 for correct line 2.2 to 2.3 or M1 for ruled line with gradient –3 or through (0, 15) or SC2 for no/wrong line and three correct values or SC1 for no/wrong line and two correct values or for correct freehand line (ii) [a =] 6 3 B2 for 6x3 – 14x2 + 2 = 0 oe [b =] –14 or [c =] 0 M1 for correct removal of denominator or collection of terms on one side
This question in 0580/43 Oct/Nov 2016
Q30 · Adele, Barbara and Collette share $680 in the ratio 9 : 7 : 4 0580/41 May/June 2018
1 Adele, Barbara and Collette share $680 in the ratio 9 : 7 : 4. (a) Show that Adele receives $306. [1] (b) Calculate the amount that Barbara and Collette each receives. Barbara $ … Collette $ … [3] (c) Adele changes her $306 into euros (€) when the exchange rate is €1 = $1.125 . Calculate the number of euros she receives. € … [2] (d) Barbara spends a total of $17.56 on 5 kg of apples and 3 kg of bananas. Apples cost $2.69 per kilogram. Calculate the cost per kilogram of bananas. $ … [3] 1 (e) Collette spends half of her share on clothes and of her share on books. 5 Calculate the amount she has left. $ … [3]
12 marks
Mark scheme: Question Answer Marks Partial Marks 1(a) 9 1 × 680 9 + 7 + 4 1(b) 238 136 3 B2 for 238 or 136 7 or M1 for × 680 oe or 9 + 7 + 4 4 × 680 oe seen 9 + 7 + 4 1(c) 272 2 M1 for 306 ÷ 1.125 1(d) 1.37 3 M2 for (17.56 −×5 2.69 ) ÷ 3 or M1 for 17.56 − 5 × 2.69 or B1 for 13.45 [cost of apples] 1(e) 40.8[0] 3 3FT for 0.3 × their 136 from part (b) 1 1 or M2 for their 136( + ) or better 2 5 1 1 or M1 for their 136 × or their 136 × 2 5 3 or B1 for 68 or 27.2 or or 0.3 seen 10
This question in 0580/41 May/June 2018
Q31 · The table shows some values of y = x3 – 3x – 1 0580/42 Oct/Nov 2018
5 The table shows some values of y = x3 – 3x – 1. x –3 –2.5 –2 –1.5 –1 0 1 1.5 2 2.5 3 y –19 –9.1 0.1 1 –1 –3 –2.1 1 7.1 (a) Complete the table of values. [2] (b) Draw the graph of y = x 3 - 3x - 1 for - 3 G x G 3 . y 20 15 10 5 0 x –3 –2 –1 1 2 3 –5 –10 –15 –20 [4] (c) A straight line through (0, –17) is a tangent to the graph of y = x 3 - 3x - 1. (i) On the grid, draw this tangent. [1] (ii) Find the co-ordinates of the point where the tangent meets your graph. ( … , … ) [1] (iii) Find the equation of the tangent. Give your answer in the form y = mx + c. y = … [3] (d) By drawing a suitable straight line on the grid, solve the equation x 3 - 6x - 3 = 0 . x = … or x = … or x = … [4]
15 marks
Mark scheme: 5(a) –3, 17 2 B1 for each 5(b) Fully correct curve 4 B3 FT for 10 or 11 points or B2 FT for 8 or 9 points or B1 FT for 6 or 7 points 5(c)(i) Correct ruled tangent for their curve 1 through (0, −17) 5(c)(ii) (1.7 to 2.2, –1 to 2.5) 1 5(c)(iii) [y =] 9x – 17 final answer 3 M2dep for answer [y =] 9x[+] – c OR rise M1dep for gradient = for their tangent run at any point B1 for answer [y =] kx[+] – 17 (k ≠ 0) 5(d) y = 3x + 2 ruled correctly and 4 B2 for y = 3x + 2 ruled –2.2 … to –2.1 or B1 for [y =] 3x + 2 soi –0.6 to –0.4 or y = 3x + k ruled 2.6 to 2.8 or y = kx + 2 but not y = 2 B2 for all 3 values or B1 for 2 values
This question in 0580/42 Oct/Nov 2018
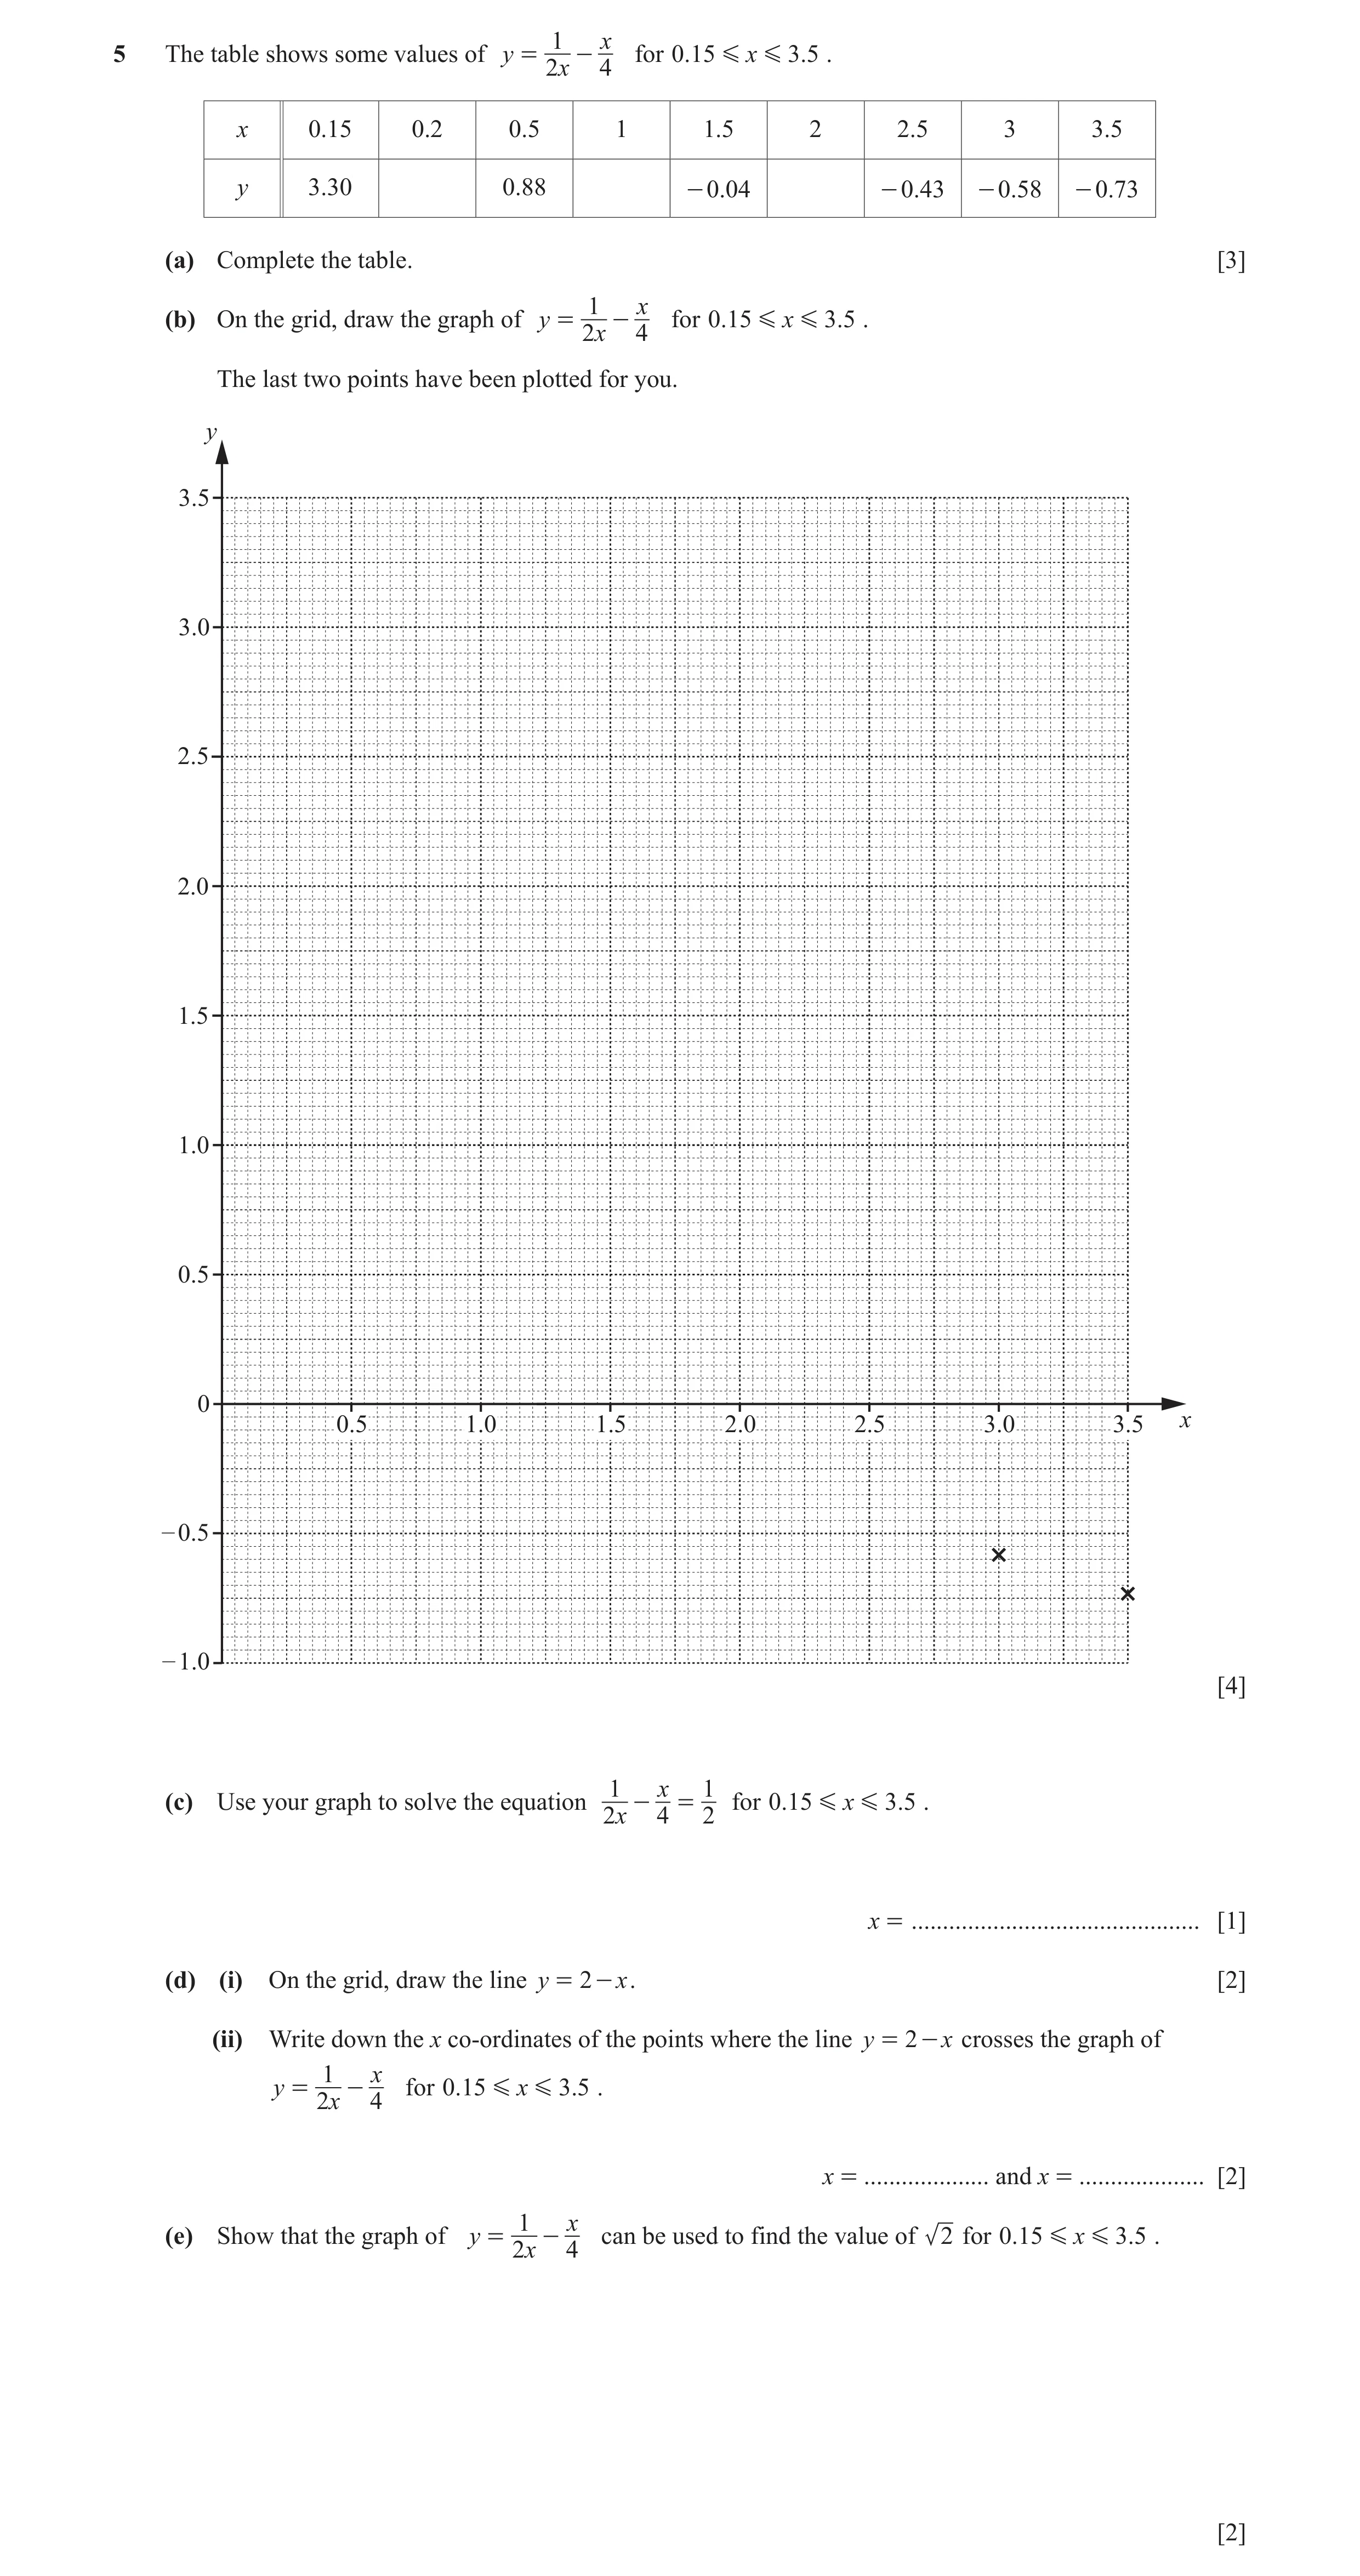
Q32 · X5 The table shows some values of y = - for 0.15 G x G 3.5 0580/42 May/June 2019
1 x5 The table shows some values of y = - for 0.15 G x G 3.5 . 2x 4 x 0.15 0.2 0.5 1 1.5 2 2.5 3 3.5 y 3.30 0.88 - 0.04 - 0.43 - 0.58 - 0.73 (a) Complete the table. [3] 1 x (b) On the grid, draw the graph of y = - for 0.15 G x G 3.5 . 2x 4 The last two points have been plotted for you. y 3.5 3.0 2.5 2.0 1.5 1.0 0.5 0 0.5 1.0 1.5 2.0 2.5 3.0 3.5 x – 0.5 – 1.0 [4] 1 x 1(c) Use your graph to solve the equation - = for 0.15 G x G 3.5 . 2x 4 2 x = … [1] (d) (i) On the grid, draw the line y = 2 - x . [2] (ii) Write down the x co-ordinates of the points where the line y = 2 - x crosses the graph of 1 x y = - for 0.15 G x G 3.5 . 2x 4 x = … and x = … [2] 1 x(e) Show that the graph of y = - can be used to find the value of 2 for 0.15 G x G 3.5 . 2x 4 [2]
14 marks
Mark scheme: 5(a) 2.45, 0.25, − 0.25 3 B1 for each 5(b) Fully correct smooth curve 4 B3FT for 6 or 7 points or B2 FT for 4 or 5 points or B1 FT for 2 or 3 points 5(c) 0.7 to 0.8 1 FT their curve 5(d)(i) Correct ruled line 2 M1 for good freehand, or ruled line with gradient −1.05 to −0.95 or ruled line through (0, 2) but not line y = 2 5(d)(ii) Both intersections of their (b) and 2 Strict FT intersection of their (b) and their (d)(i) their (d)(i) B1FT for one correct OR B2 for 0.27 to 0.28 and 2.38 to 2.39 5(e) 1 x M1 Substitutes x = 2 into − 2 x 4 OR Identifies y = 0 oe OR Correctly manipulates to a single fraction 2 − x 2 e.g. oe seen 4 x Concludes ‘read the graph at y = 0’ A1 oe OR 1 x Manipulates 0 = − oe 2 x 4 leading to x 2 = 2 OR 2 − x 2 States oe = 0 leading to 4 x x 2 = 2
This question in 0580/42 May/June 2019
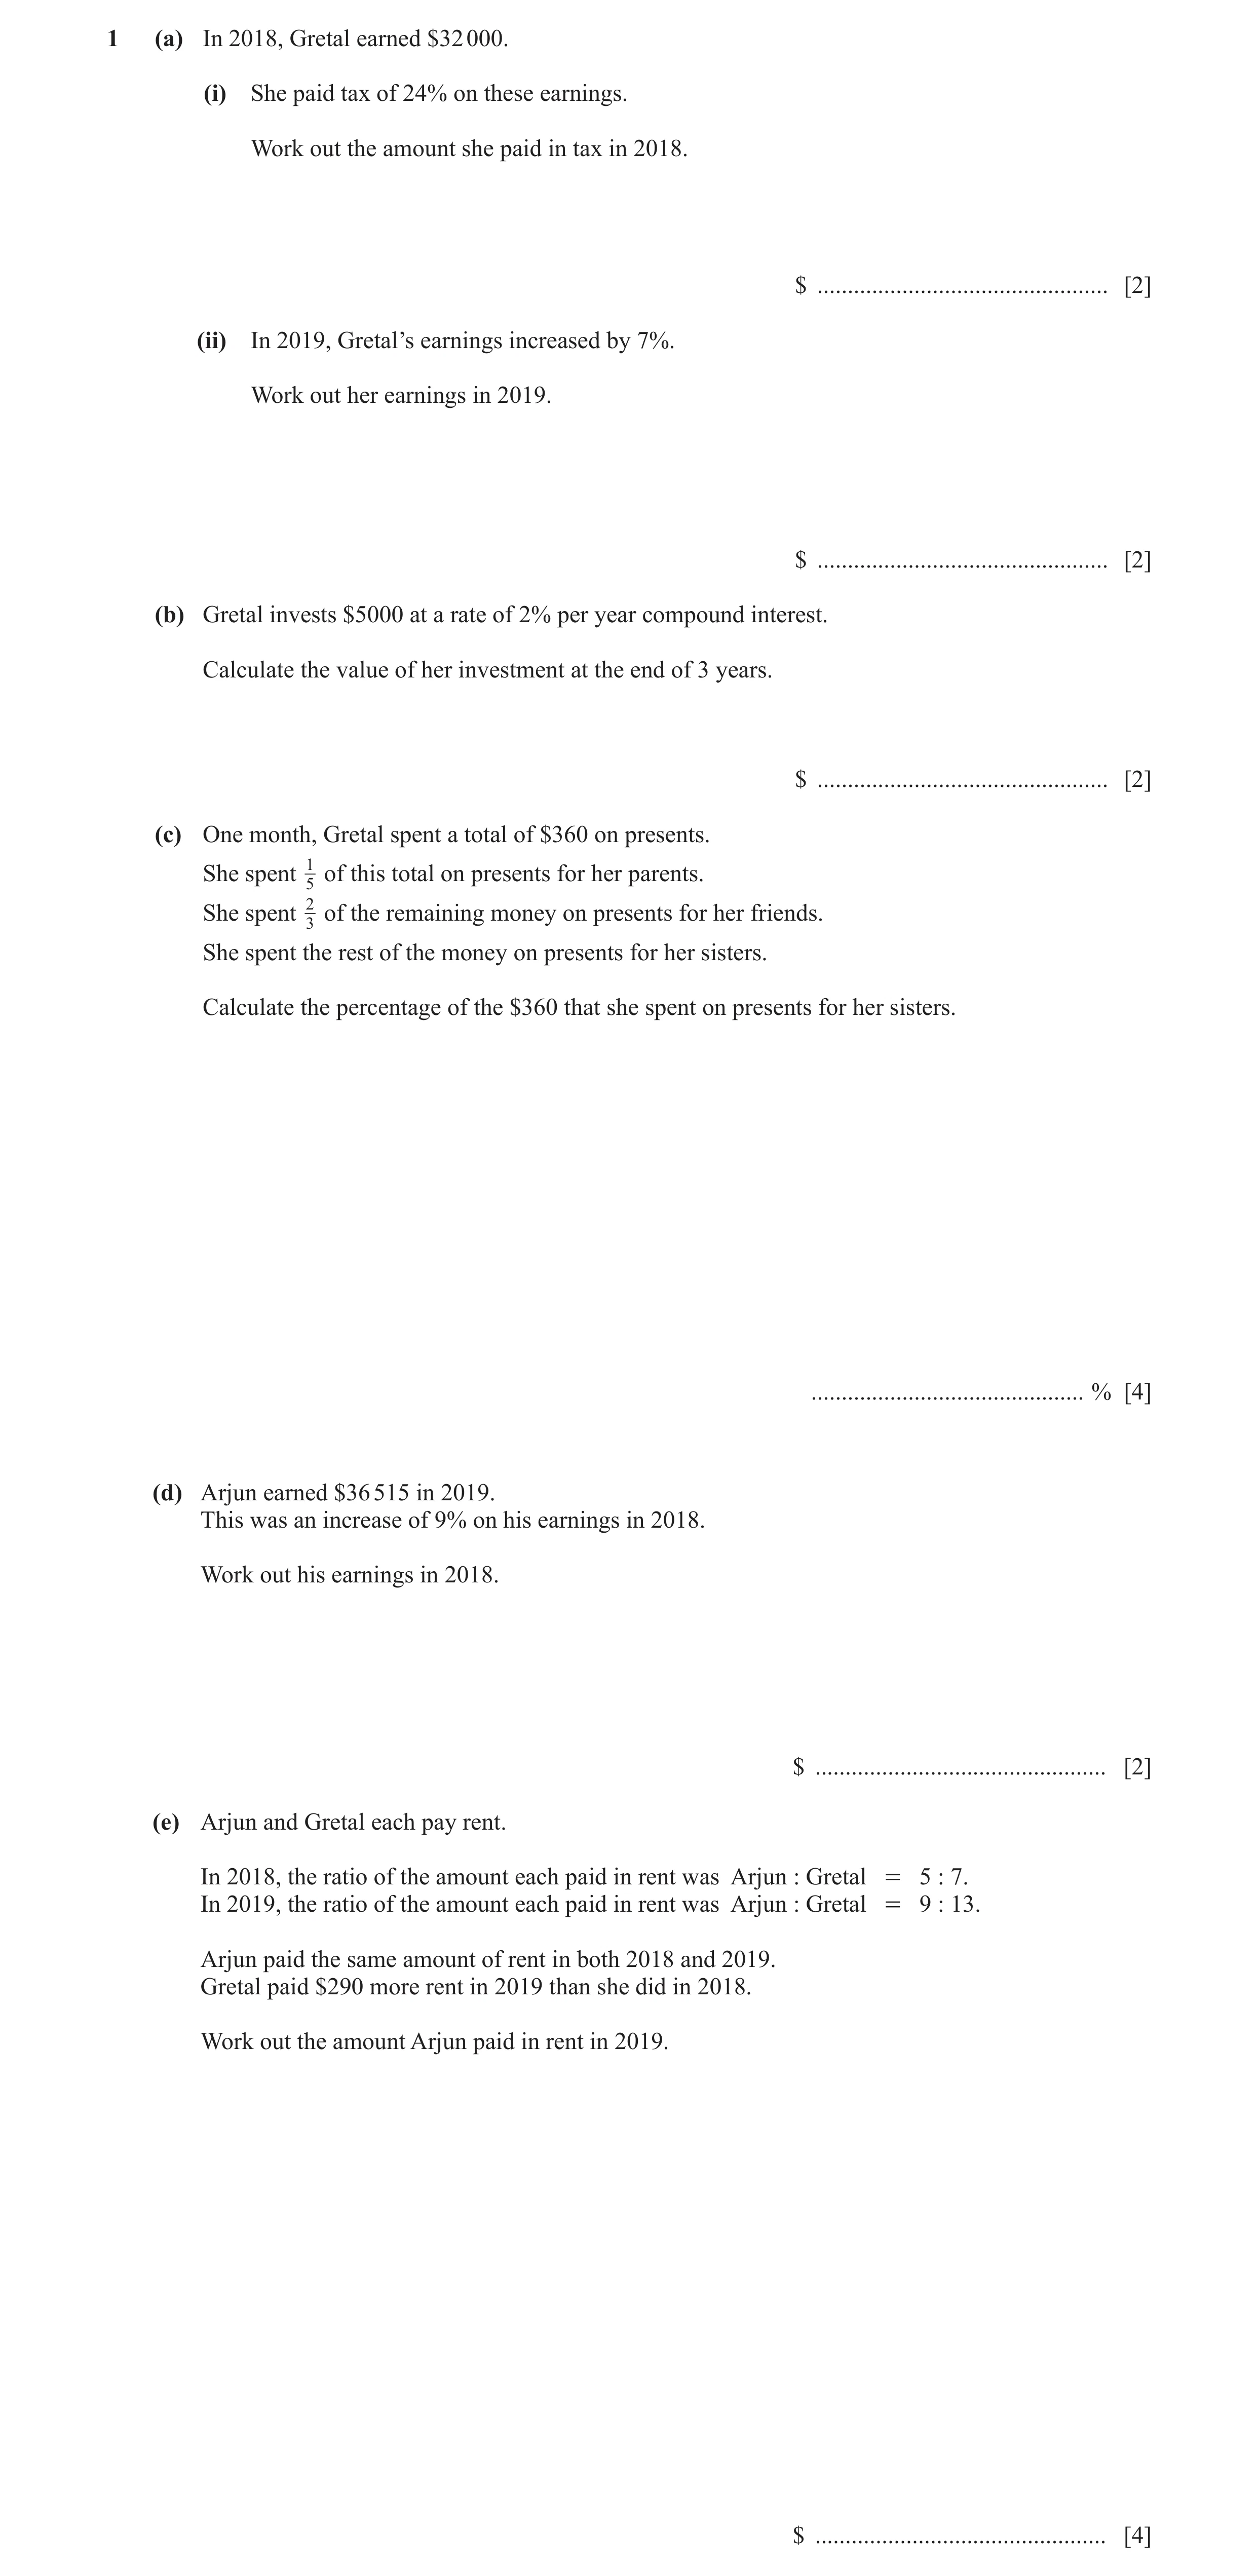
Q33 · In 2018, Gretal earned $32 000 0580/41 May/June 2020
1 (a) In 2018, Gretal earned $32 000. (i) She paid tax of 24% on these earnings. Work out the amount she paid in tax in 2018. $ … [2] (ii) In 2019, Gretal’s earnings increased by 7%. Work out her earnings in 2019. $ … [2] (b) Gretal invests $5000 at a rate of 2% per year compound interest. Calculate the value of her investment at the end of 3 years. $ … [2] (c) One month, Gretal spent a total of $360 on presents. She spent 15 of this total on presents for her parents. She spent 23 of the remaining money on presents for her friends. She spent the rest of the money on presents for her sisters. Calculate the percentage of the $360 that she spent on presents for her sisters. … % [4] (d) Arjun earned $36 515 in 2019. This was an increase of 9% on his earnings in 2018. Work out his earnings in 2018. $ … [2] (e) Arjun and Gretal each pay rent. In 2018, the ratio of the amount each paid in rent was Arjun : Gretal = 5 : 7. In 2019, the ratio of the amount each paid in rent was Arjun : Gretal = 9 : 13. Arjun paid the same amount of rent in both 2018 and 2019. Gretal paid $290 more rent in 2019 than she did in 2018. Work out the amount Arjun paid in rent in 2019. $ … [4]
16 marks
Mark scheme: Question Answer Marks Partial Marks 1(a)(i) 7680 2 M1 for 0.24 × 32 000 oe 1(a)(ii) 34 240 2 100 + 7 M1 for 32 000 × oe 100 1(b) 5306.04 2 3 2 M1 for 5000 × 1 + oe 100 1(c) 26.7 or 26.66... to 26.67 4 96 B3 for 96 or oe 360 OR 1 M3 for (1 − ) × (1 −2 ) × 100 oe 5 3 1 or M2 for (1 − ) and (1 −2 ) oe 5 3 OR M1 for 360 ÷ 5 [× 4] oe M1 for their 288 ÷ 3 [× 2] 1(d) 33 500 2 100 + 9 M1 for 36 515 ÷ oe 100 1(e) 6525 4 65 63 M3 for − [ A ] = 290 oe 45 45 13 7 or M2 for − [ A ] = 290 oe 9 5 or M1 for correct attempt to convert to a common ratio value for Arjun 13 7 or for − oe 9 5
This question in 0580/41 May/June 2020
Q34 · Find the lowest common multiple (LCM) of 30 and 75 0580/42 May/June 2022
1 (a) Find the lowest common multiple (LCM) of 30 and 75. … [2] (b) Share $608 in the ratio 4 : 5 : 7. $ … $ … $ … [3] 6 .39 # 10 4 (c) Work out 6 . 2 .45 # 10 Give your answer in standard form. … [2] (d) Write .027o o as a fraction. … [1] (e) A stone has volume 45 cm 3 and mass 126 g. Find the density of the stone, giving the units of your answer. [Density = mass ' volume] … … [2]
10 marks
Mark scheme: Question Answer Marks Partial Marks 1(a) 150 2 B1 for answer 150k or M1 for prime factors of 30 or 75 seen or a list of multiples of both 30 and 75 with at least 3 of each 30 75 or for oe 15 or for answer 2 3 52 1(b) 152 3 Accept in any order B2 for two correct answers 190 608 or M1 for k oe where k =1, 4, 5, 7 4 5 7 266 1(c) 2.61 10–2 2.61 10 2 or 2 B1 for figs 2608 or 261 seen 2.608… 10–2 If 0 scored, SC1 for answer 2.6[0] 10–2 without more accurate value in standard form seen 1(d) 27 1 oe fraction 99 1(e) 2.8 1 g/cm3 or g cm–3 1
This question in 0580/42 May/June 2022
Q35 · The table shows the numbers of tigers reported to be living in the wild in the year 2014… 0580/43 May/June 2022
3 (a) The table shows the numbers of tigers reported to be living in the wild in the year 2014 in some countries. Country Number India 2226 Indonesia 371 Nepal 198 Bangladesh 106 (i) Using the table, (a) find the number of tigers in Nepal as a percentage of the number of tigers in Bangladesh, … % [1] (b) find the ratio tigers in Bangladesh : tigers in Indonesia : tigers in India, giving your answer in its simplest form. … : … : … [2] (ii) Five years later, the number of tigers reported in India was 2967. Find the percentage increase in the population of tigers in India. … % [2] (iii) The number of tigers in India in the year 2014 is approximately 30.48% greater than in the year 2010. Find the number of tigers in India in the year 2010. Give your answer correct to the nearest integer. … [3] (b) At the start of June, a hive has a population of 2000 bees. Three months after the start of June the hive has a population of 2662 bees. The population of this hive can be calculated using the formula P = abx , where P is the population of the hive x months after the start of June. By finding the value of a and the value of b, calculate the population of the hive 7 months after the start of June. Give your answer correct to the nearest integer. … [5]
13 marks
Mark scheme: 3(a)(i)(a) 42 1 187 or 186.7 to 186.8 or 186 53 3(a)(i)(b) 2 : 7 : 42 cao 2 B1 for 106 : 371 : 2226 or any equivalent ratio If 0 scored, SC1 for 2 : 7 : 42 in the wrong order 3(a)(ii) 33.3 or 33.28 to 33.29 2 2967 2226 M1 for [ 100] oe 2226 2967 or 100 [– 100] oe 2226 3(a)(iii) 1706 cao nfww 3 B2 for 1705 to 1706.0… or 1710 30.48 or M1 for 1 x = 2226 oe or 100 better If 0 or M1 scored, SC1 for rounding their decimal answer seen to nearest integer 3(b) 3897 5 B1 for a = 2000 2662 M2 for [b =] 3 2000 or M1 for 2662 = 2000b3 2662 7 M1 for their 2000 3 their 2000 or for their a (their b)7 provided their a and their b are clearly identified in the working If 0 or M1 scored, SC1 for rounding their decimal answer seen to nearest integer.
This question in 0580/43 May/June 2022
Q36 · Write (i) 2994.99 correct to the nearest 10, … [1] (ii) 0.983 correct to 1 decimal place… 0580/41 Oct/Nov 2022
2 (a) Write (i) 2994.99 correct to the nearest 10, … [1] (ii) 0.983 correct to 1 decimal place, … [1] (iii) 2090 correct to 2 significant figures. … [1] (b) Write down a prime number between 90 and 100. … [1] (c) Write 2 -6 as a fraction. … [1] (d) Write 0.007 01 in standard form. … [1] (e) Simplify 1.5 # 10 x + 1 .5 # 10 x - 1 giving your answer in standard form. … [2] (f) Write .037o as a fraction. You must show all your working. … [2]
10 marks
Mark scheme: 2(a)(i) 2990 cao 1 2(a)(ii) 1.0 cao 1 2(a)(iii) 2100 cao 1 2(b) 97 1 2(c) 1 1 final answer 64 2(d) 7.01[0] 10–3 1 2(e) 1.65 10x 2 M1 for final answer figs 165 or for 15 10 x −1 seen or for 0.15 10 x seen 2(f) 37.7... – 3.7... [= 34] oe M1 34 B1 oe fraction 90
This question in 0580/41 Oct/Nov 2022
Q37 · The stem-and-leaf diagram shows the age of each of 16 adults 0580/43 Oct/Nov 2025
2 The stem-and-leaf diagram shows the age of each of 16 adults. 3 2 3 3 5 6 7 4 0 1 5 5 6 8 9 5 1 1 1 Key: 3 | 2 represents age 32 years (a) Find the mode. … years [1] (b) Find the median. … years [1] (c) Find the percentage of the 16 adults with an age of less than 38 years. … % [2]
4 marks
Mark scheme: 2(a) 51 1 2(b) 43 1 2(c) 37.5 2 6 M1 for oe 16
This question in 0580/43 Oct/Nov 2025
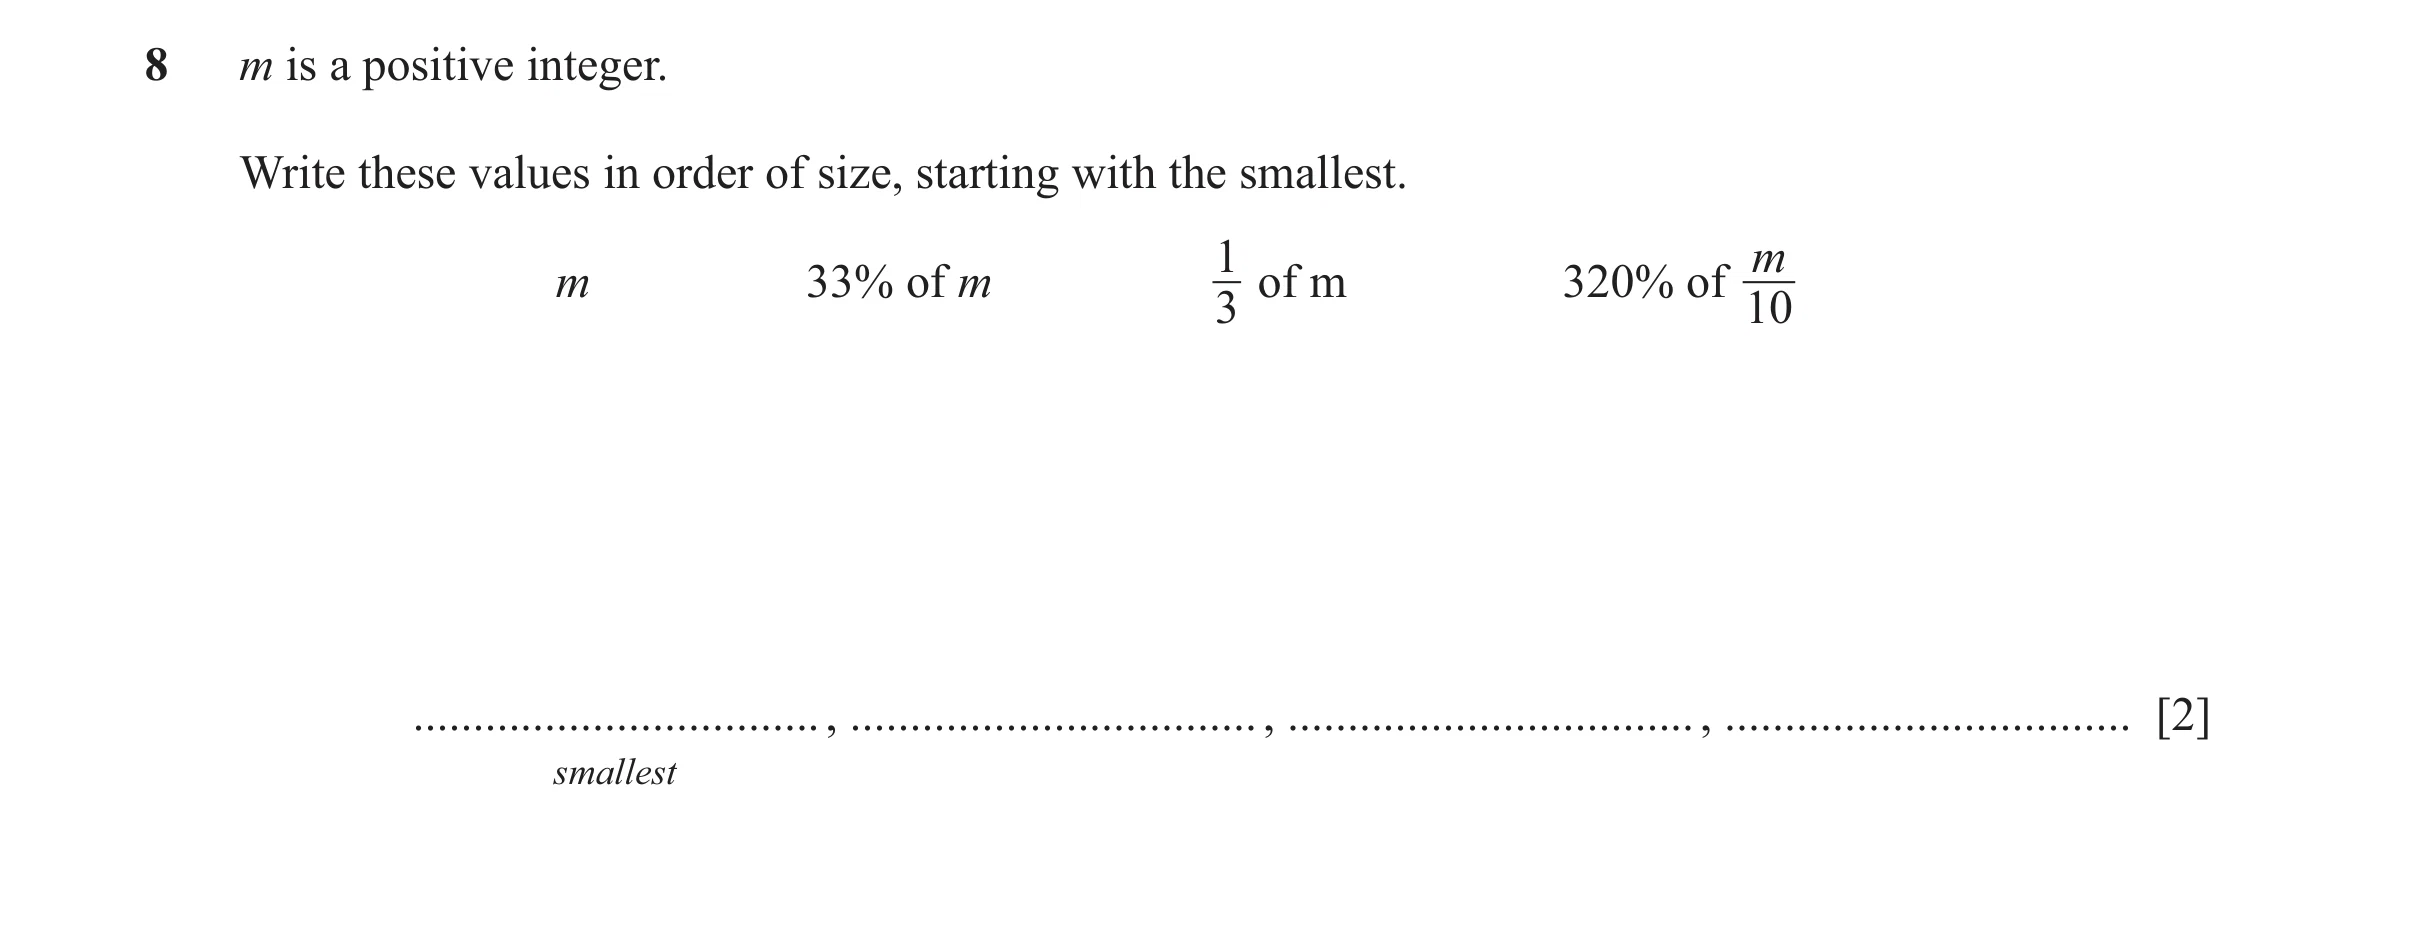
Q38 · M is a positive integer 0580/43 Oct/Nov 2025
8 m is a positive integer. Write these values in order of size, starting with the smallest. 1 m m 33% of m of m 320% of 3 10 … , … , … , … [2] smallest
2 marks
Mark scheme: 8 m 1 2 B1 for three in the correct order 320% of 33% of m of m m 10 3
This question in 0580/43 Oct/Nov 2025
 1 / 59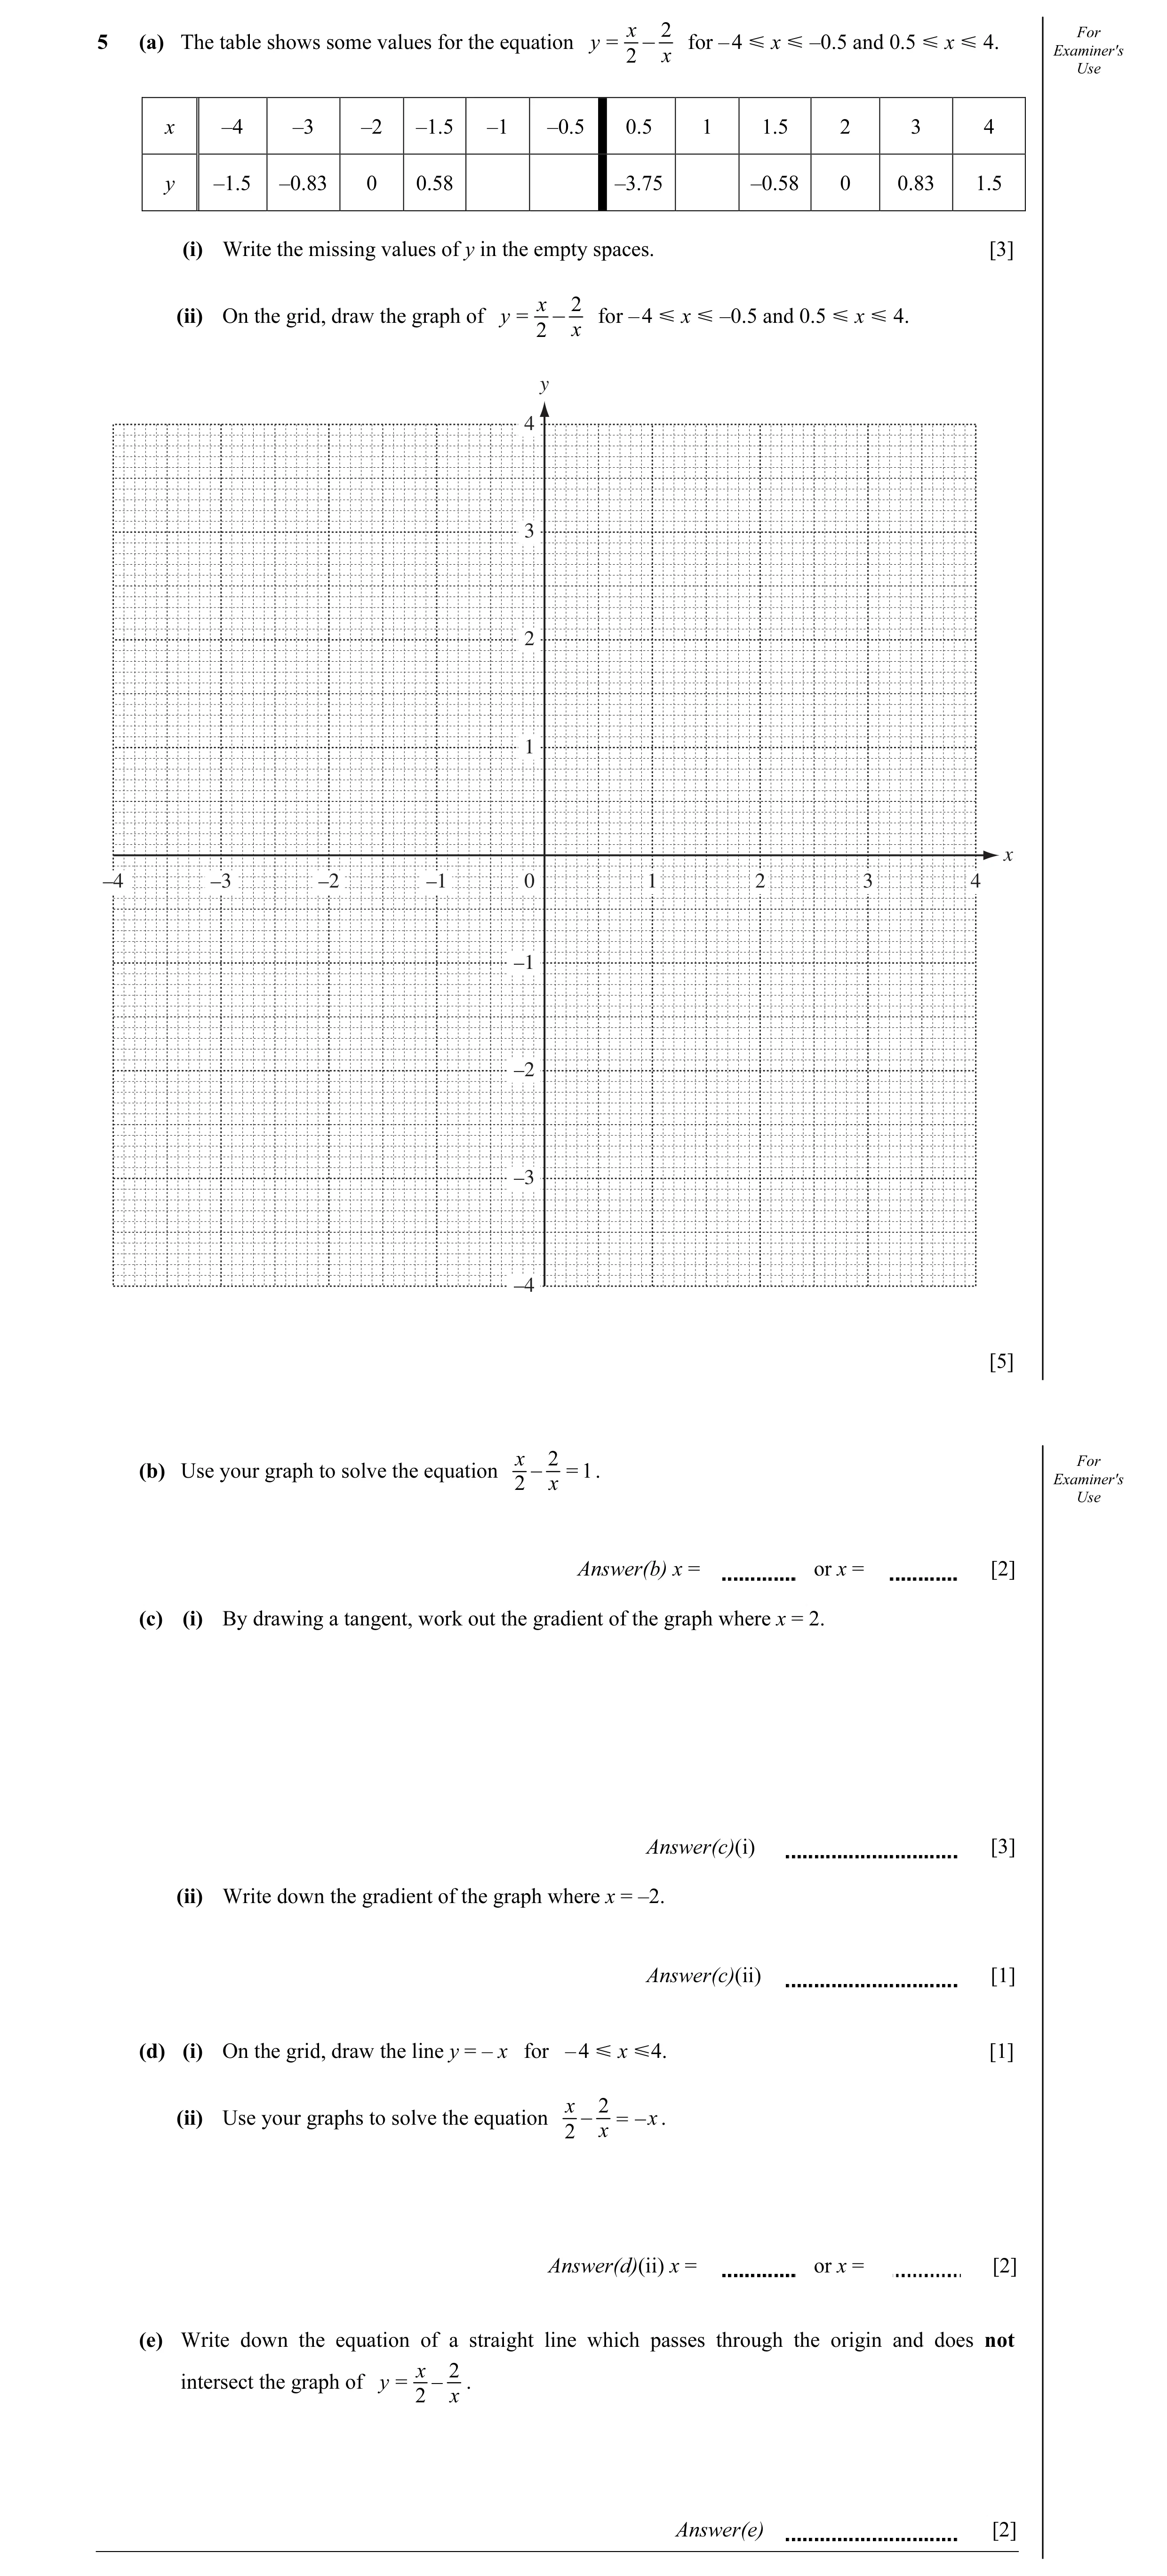
![Question 4: x 3 For 7 (a) Complete the table for the function f(x) = + 1 . Examiner's 10 Use x –4 –3 –2 –1 0 1 2 3 f(x) –1.7 0.2 0.9 1 1.1 1.8 [2] (b) …](https://img.pastlit.com/crops/26e2f3ec-796c-4ed4-a4e0-312a9afdb7ea/q7.webp)
 10 / 59
![Question 7: (a) Complete the table of values for y = 2x. For Examiner's Use x –2 –1 0 1 2 3 y 0.25 1 2 8 [2] (b) On the grid, draw the graph of y = 2x …](https://img.pastlit.com/crops/f07ad104-2a6b-49d0-ad7d-955a4a8e93a4/q2.webp)
![Question 9: (a) Write as a single fraction For Examiner′s Use 5 2x (i) – , 4 5 Answer(a)(i) ............................................... [2] 4 2x - …](https://img.pastlit.com/crops/b8c23ea7-184a-4bff-a2ba-a4fca064ab1a/q10.webp)
![Question 12: 210 f(x) = , x ≠ 0 g(x) = 1 – x h(x) = x + 1 x 1 (a) Find fg 2 ` j. Answer(a) ................................................ [2] (b) Find…](https://img.pastlit.com/crops/1da4eebe-629e-4247-b219-f8902c9d6ba4/q10.webp) 21 / 59
21 / 59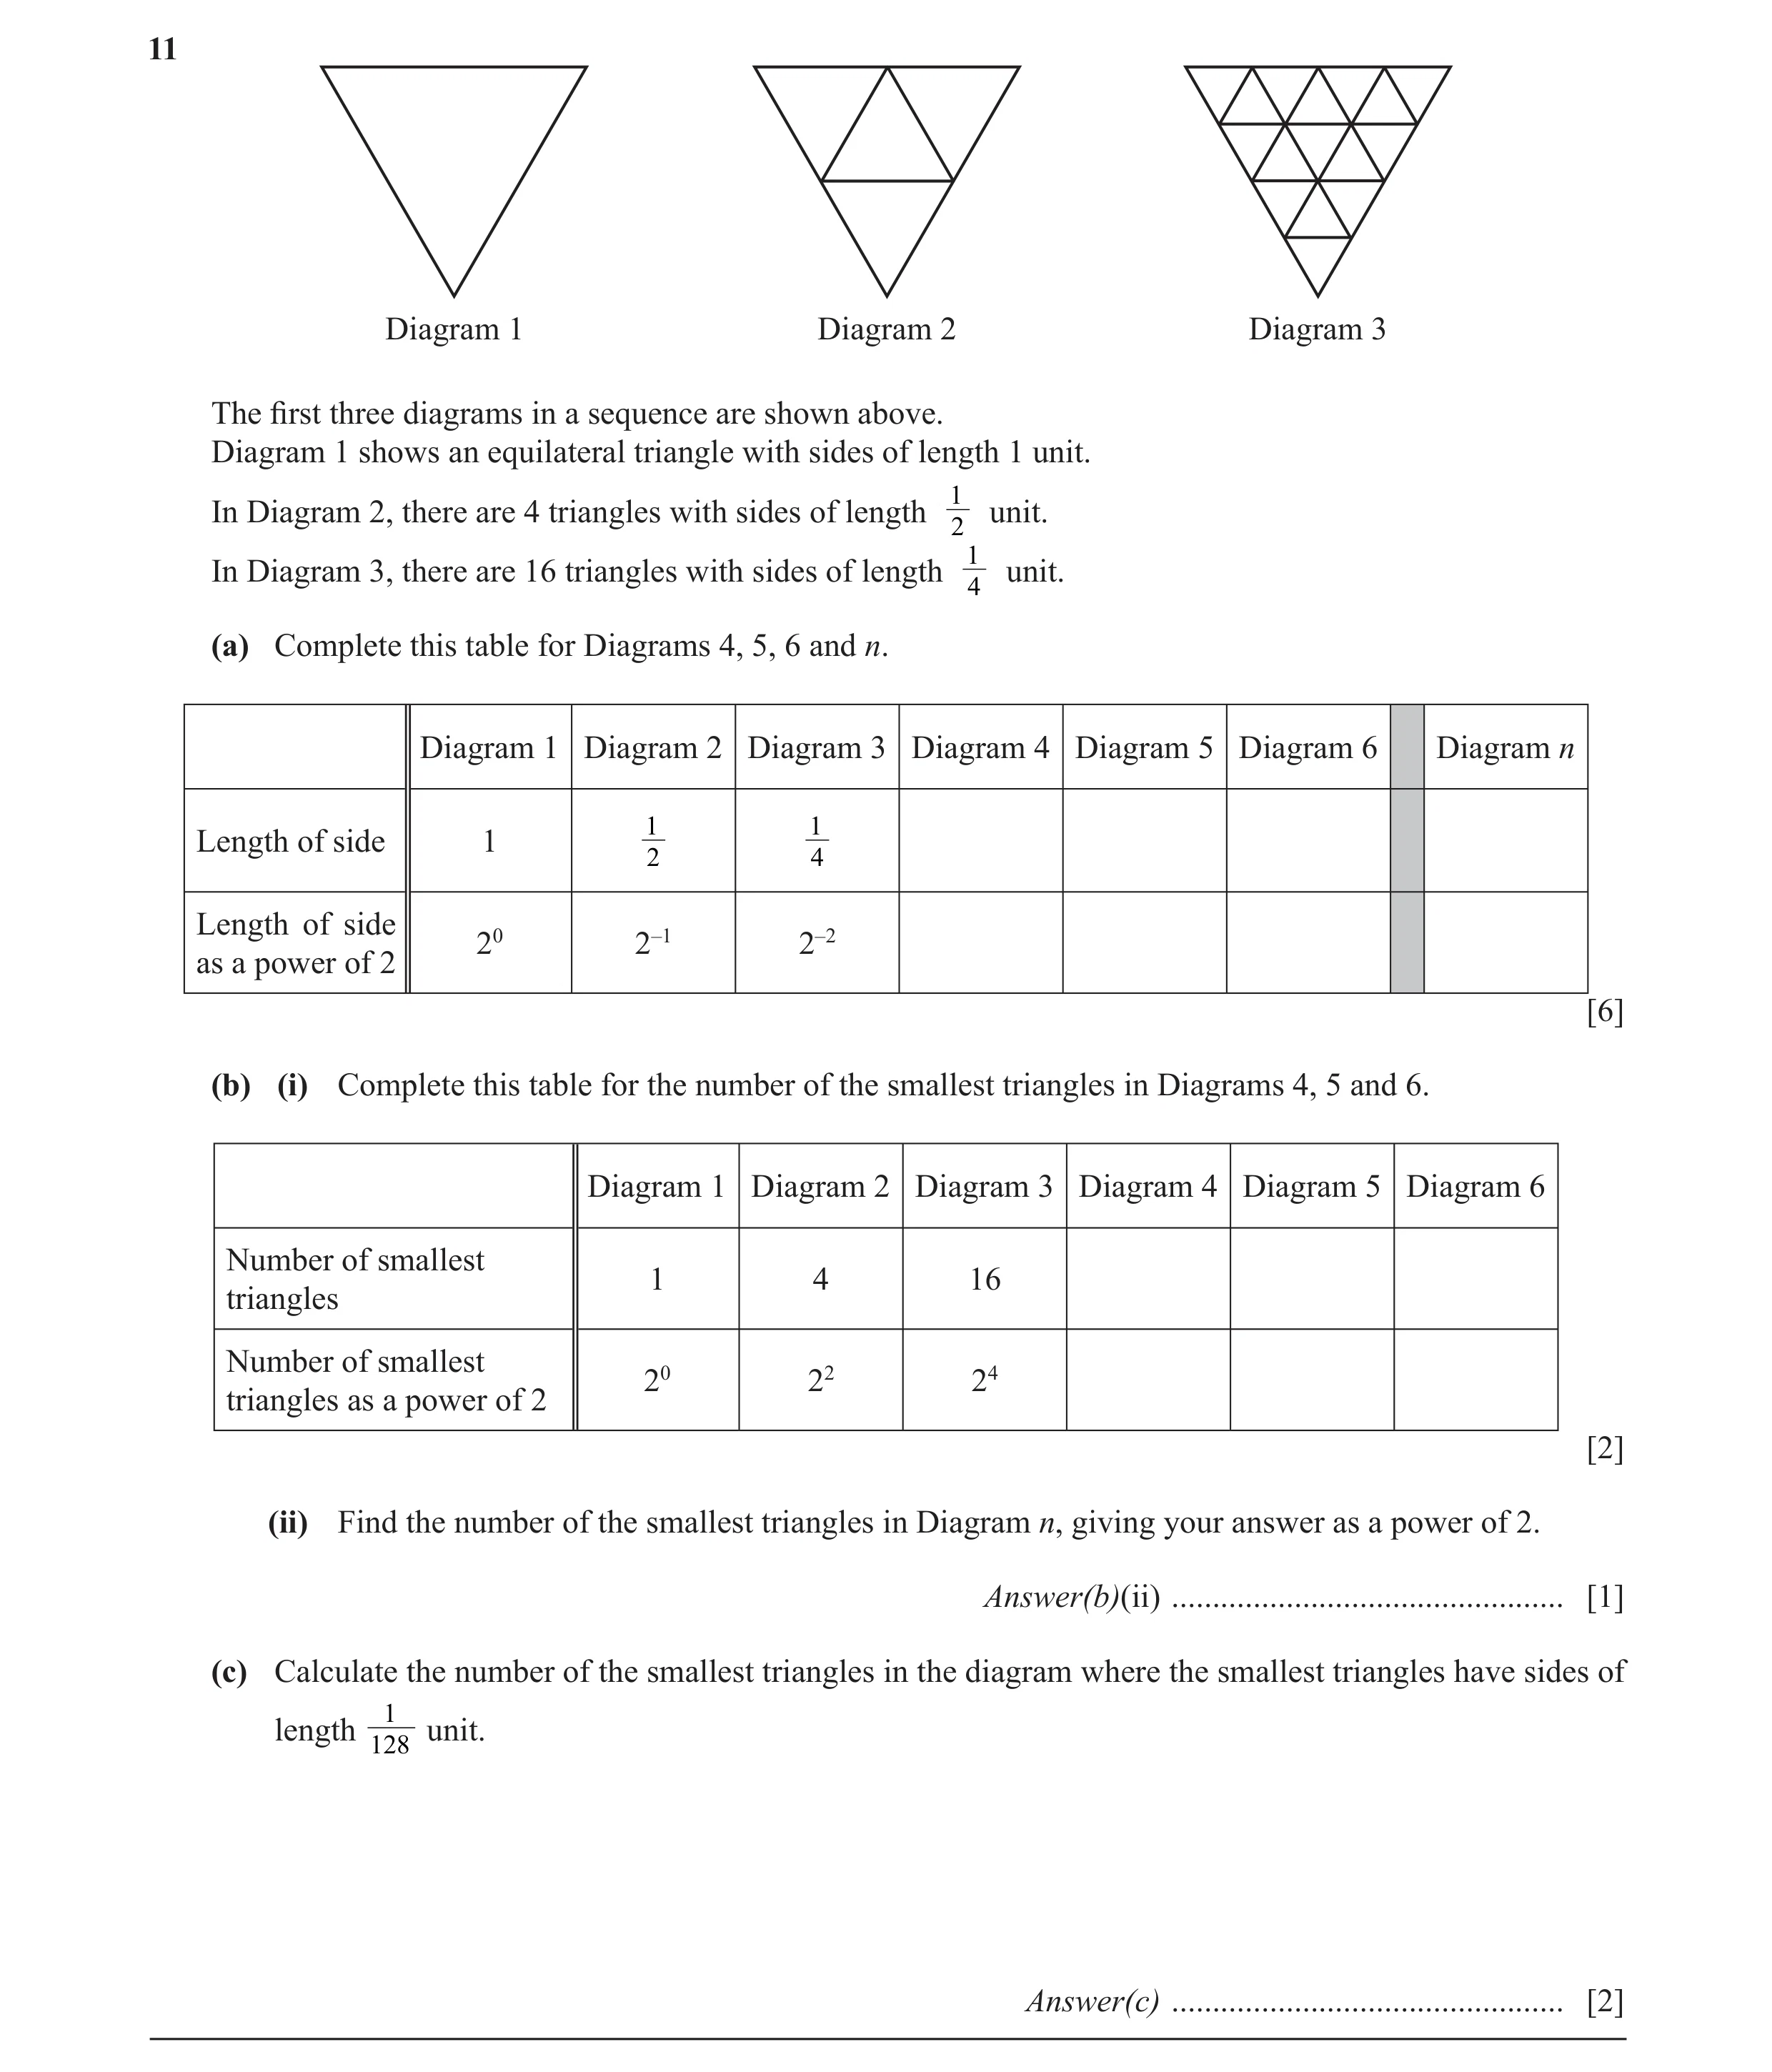 22 / 59
![Question 14: (a) Complete the table of values for y = x2 + , x ≠ 0. x x –3 –2 –1 –0.5 0.4 0.6 1 1.5 2 3 y 8 2.5 –5.8 7.7 5.4 4 4.3 10 [2] 3 (b) Draw the…](https://img.pastlit.com/crops/ec92df10-6424-44d9-8448-d4b1d5fa7d57/q5.webp)
![Question 15: f(x) = 5x3 – 8x2 + 10 (a) Complete the table of values. x –1.5 –1 –0.5 0 0.5 0.75 1 1.5 2 f(x) –24.9 10 8.6 7.6 7 18 [3] (b) Draw the graph…](https://img.pastlit.com/crops/287731cd-98b4-47fa-acc5-f6c59864e235/q6.webp)
![Question 16: (a) Simplify. (i) x3 ÷ 53 x Answer(a)(i) ................................................ [1] (ii) 5xy8 × 3x6y–5 Answer(a)(ii) ............…](https://img.pastlit.com/crops/2811b34f-9498-45ce-9854-52969cac6399/q6.webp) 27 / 59
27 / 59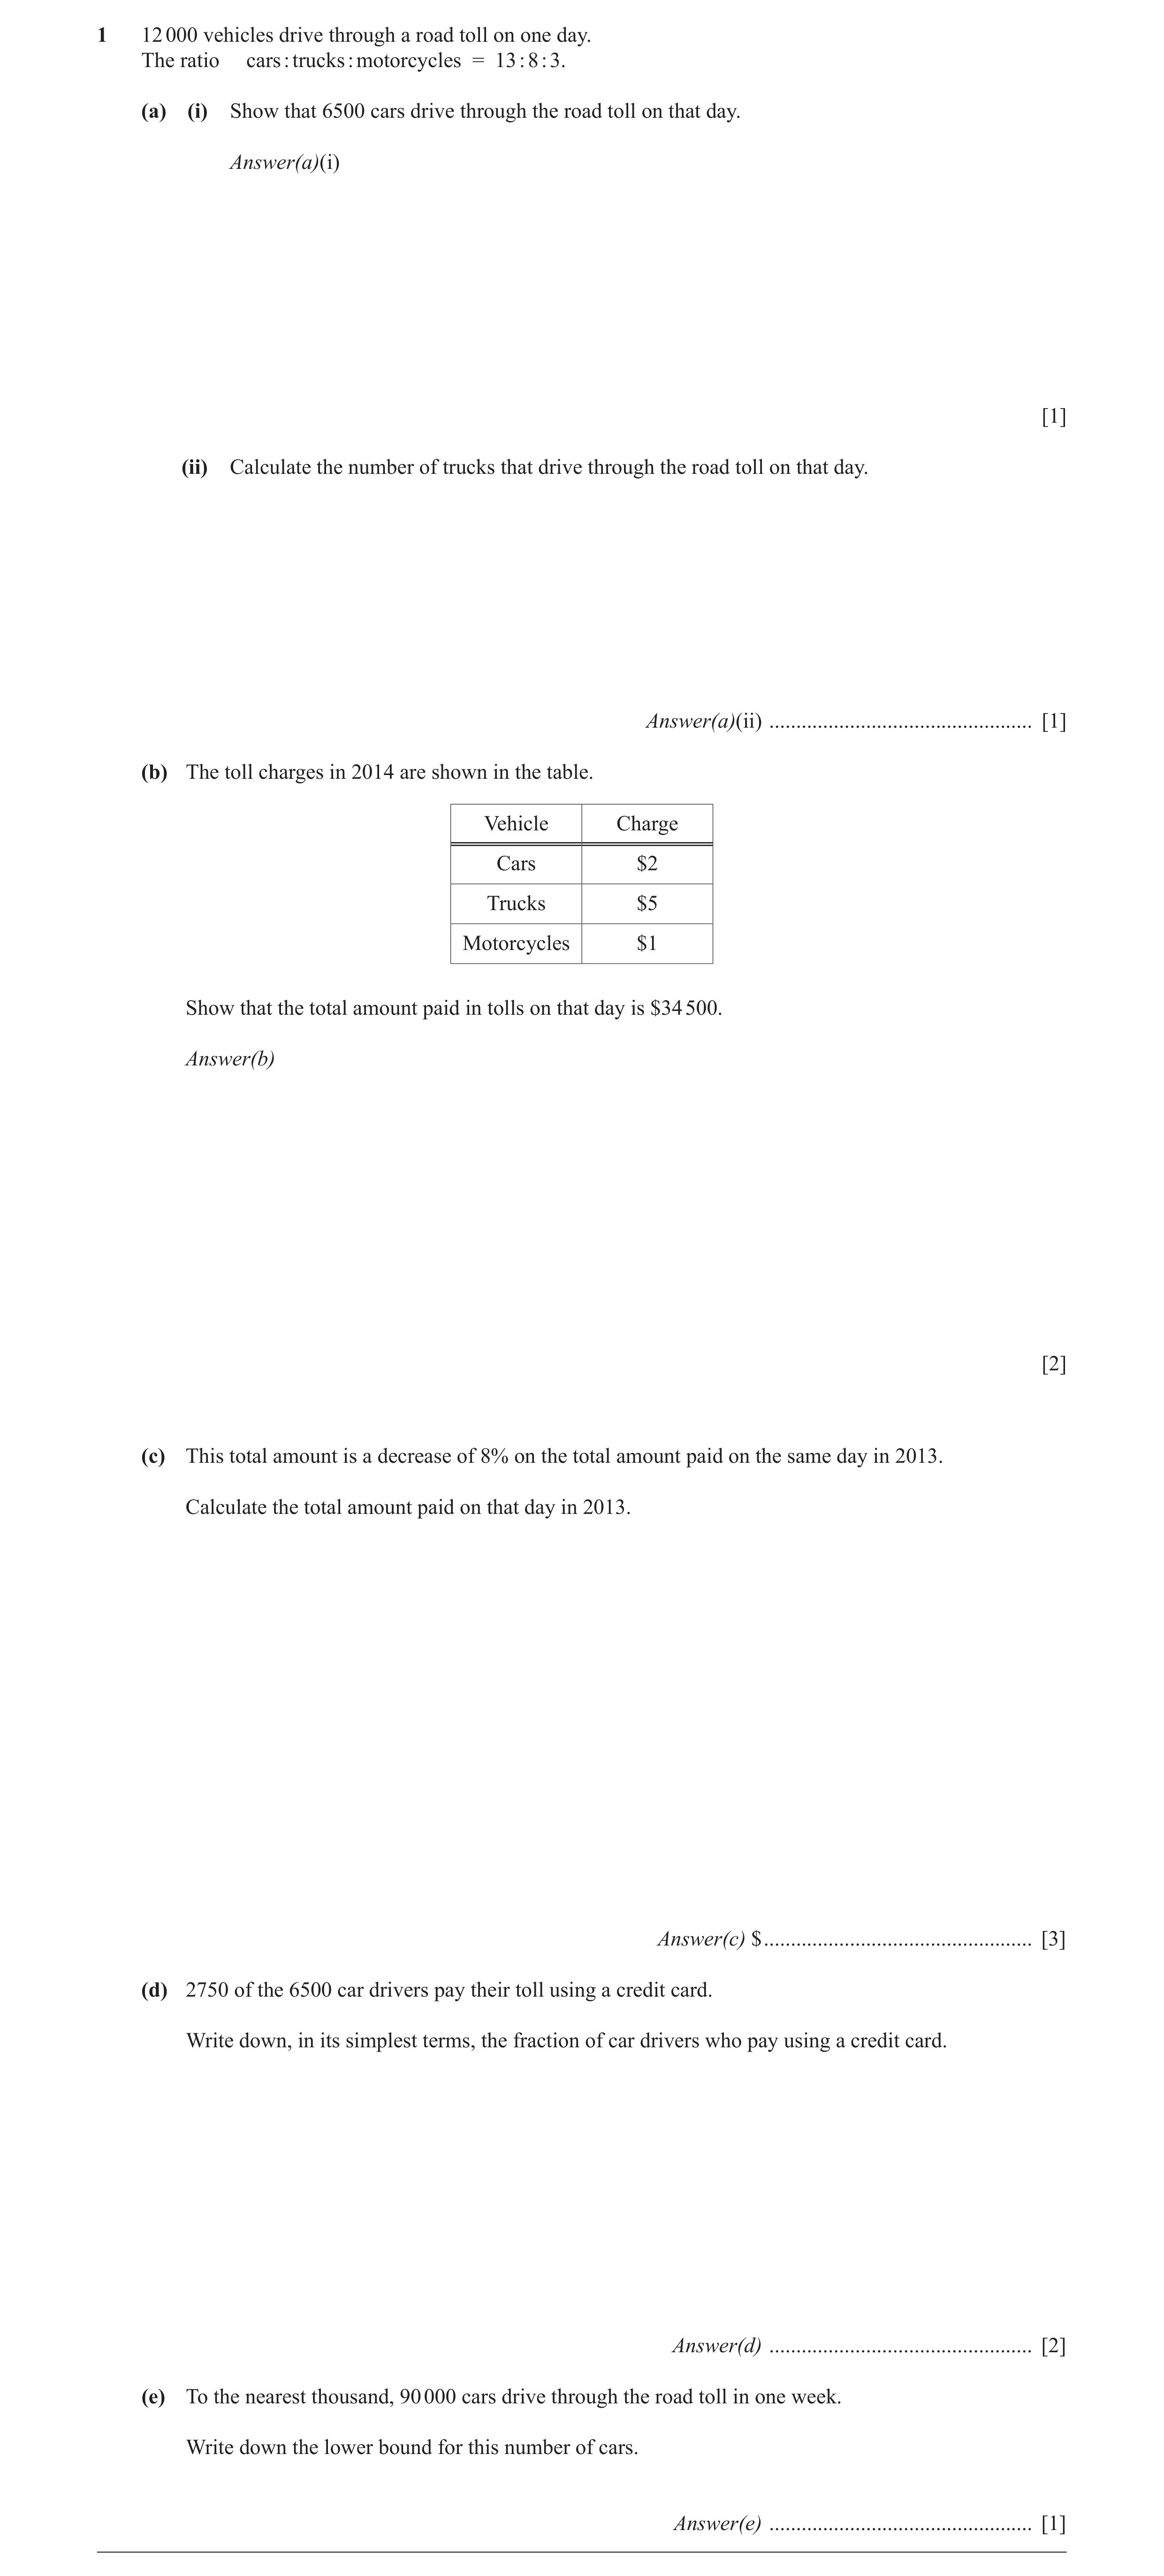
![Question 19: 5 y = x2 – 2x + , x ! 0 x (a) Complete the table of values. x –4 –3 –2 –1 –0.5 0.5 1 2 3 4 y 21 11 –9 –22.75 23.25 11 6 11 [2] 12 (b) On th…](https://img.pastlit.com/crops/d67c2d7b-362c-456d-8c2b-63f45c442870/q5.webp)
 34 / 59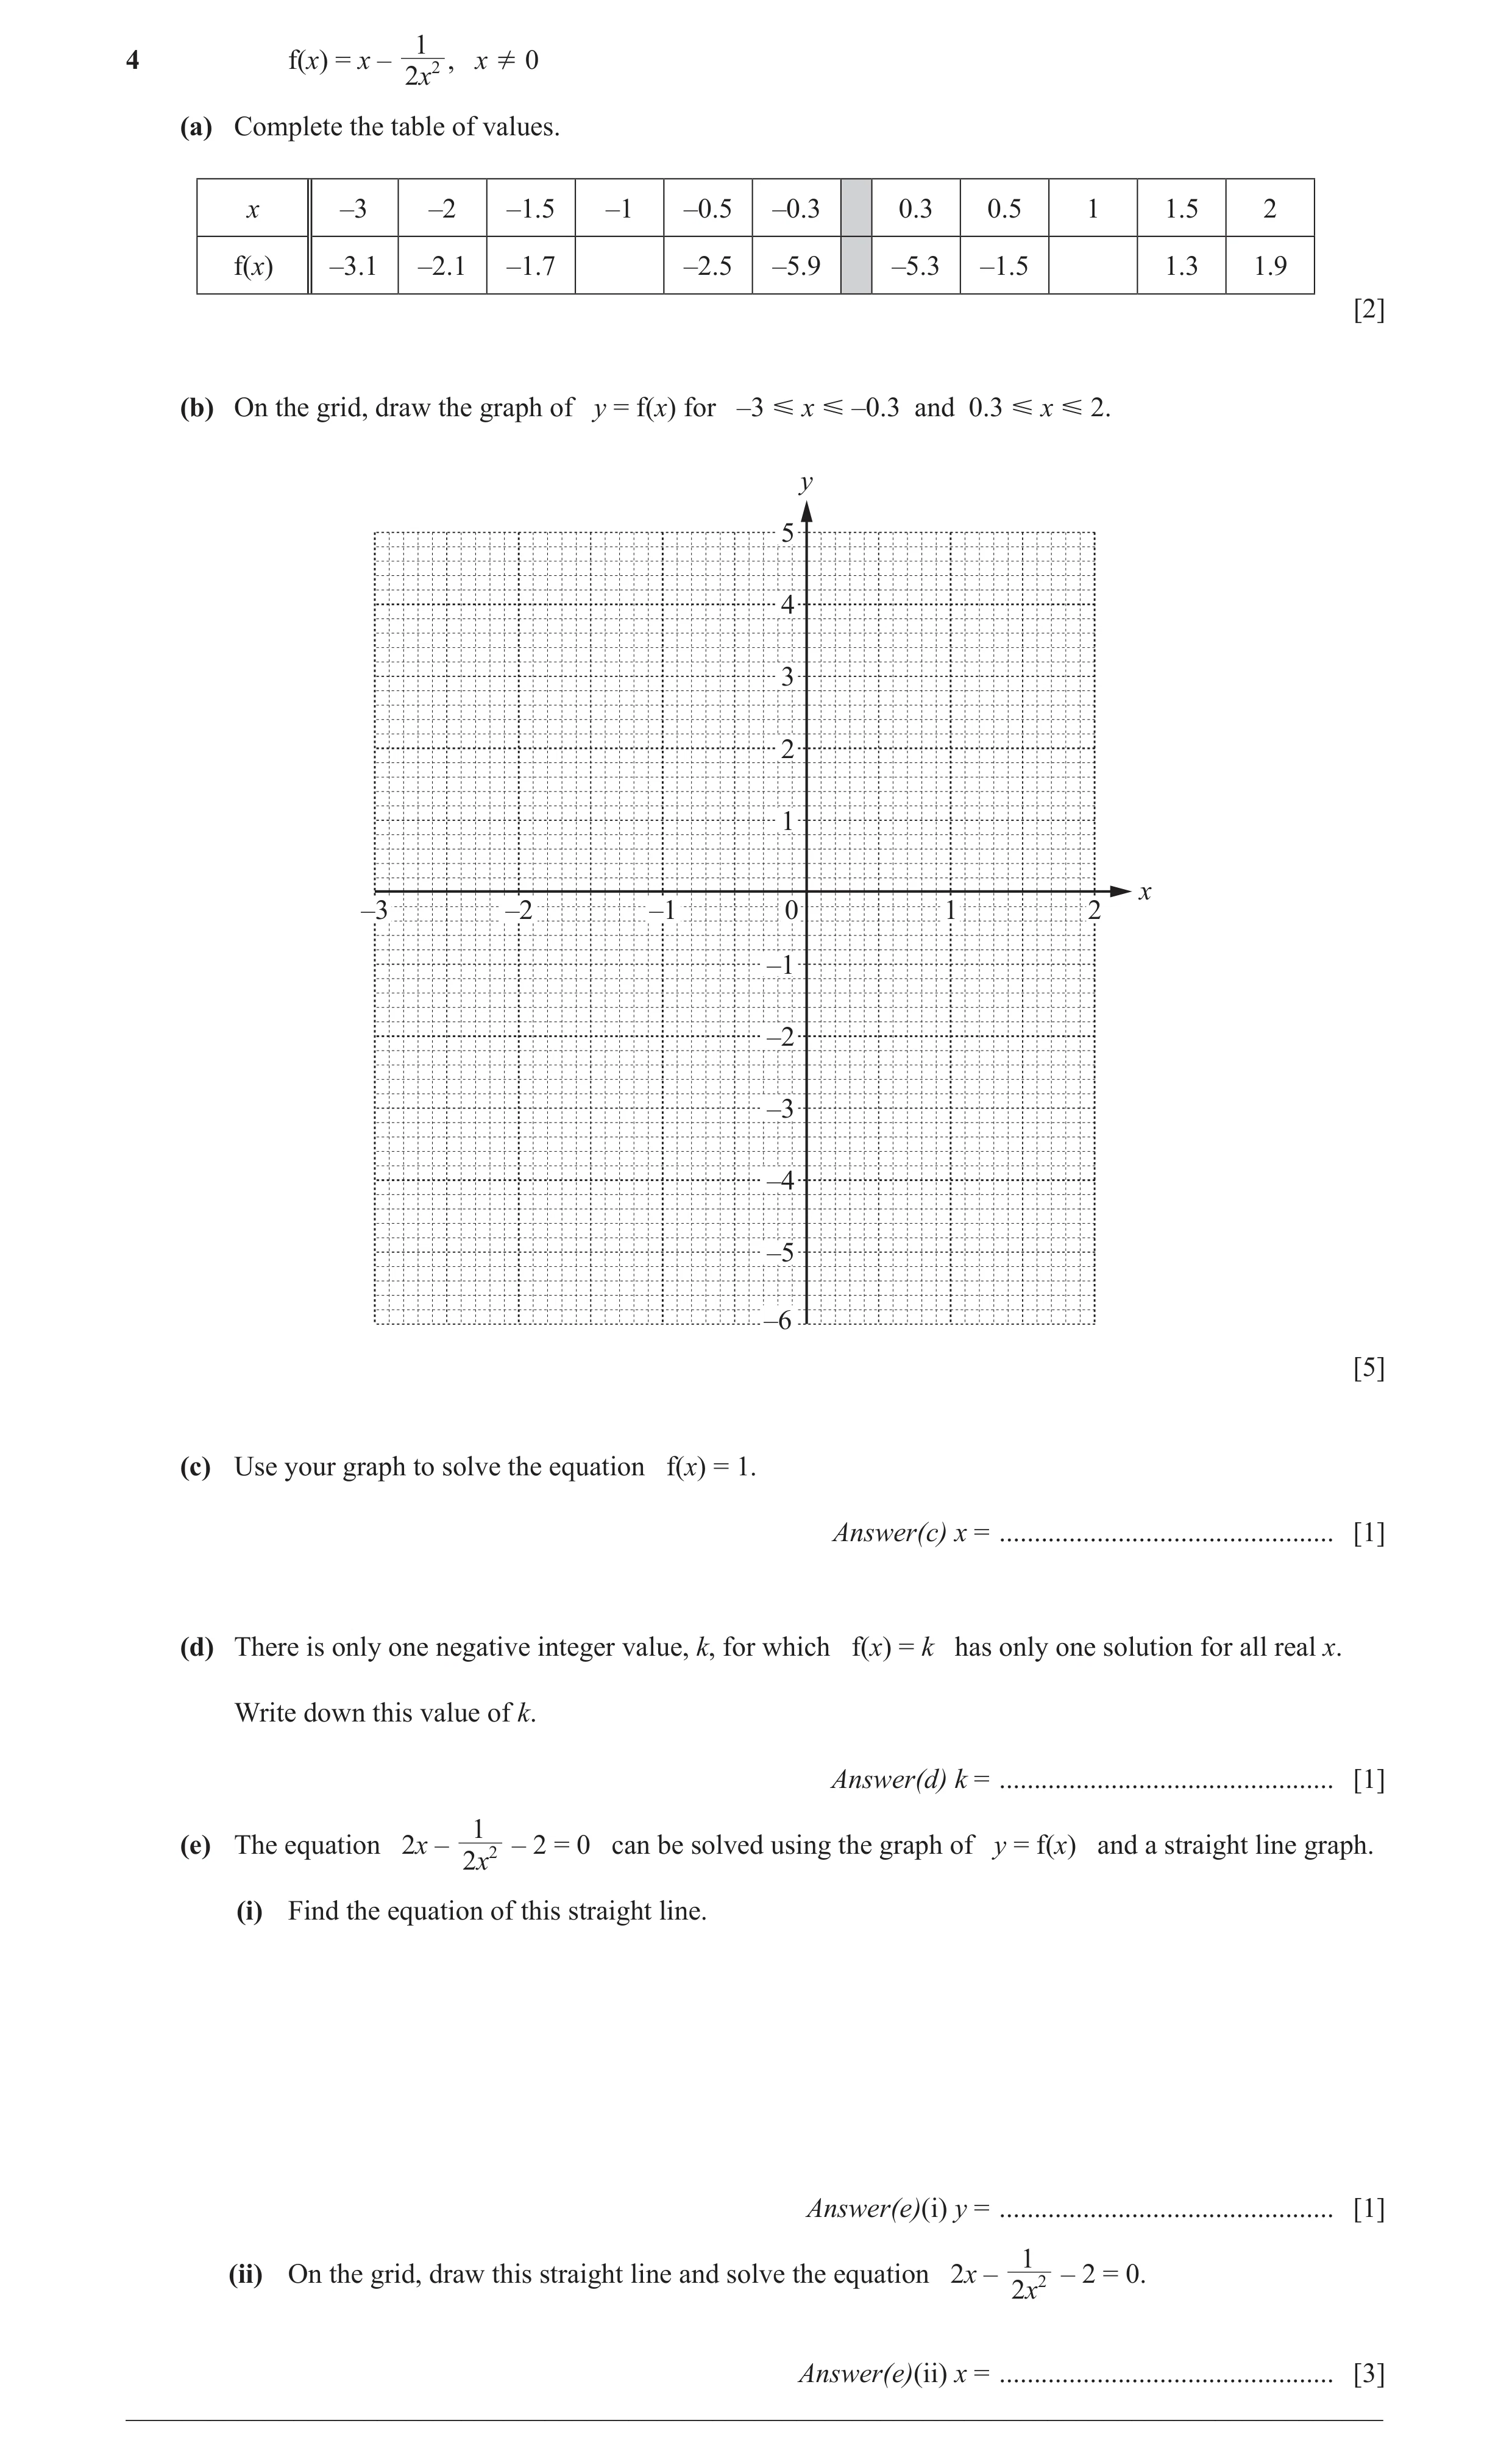
![Question 22: Aasha, Biren and Cemal share $640 in the ratio 8 : 15 : 9. (a) Show that Aasha receives $160. [1] (b) Calculate the amount that Biren and C…](https://img.pastlit.com/crops/fcf7a9c2-0fd7-45d7-bc04-a6609aa885ff/q1.webp) 36 / 59
36 / 59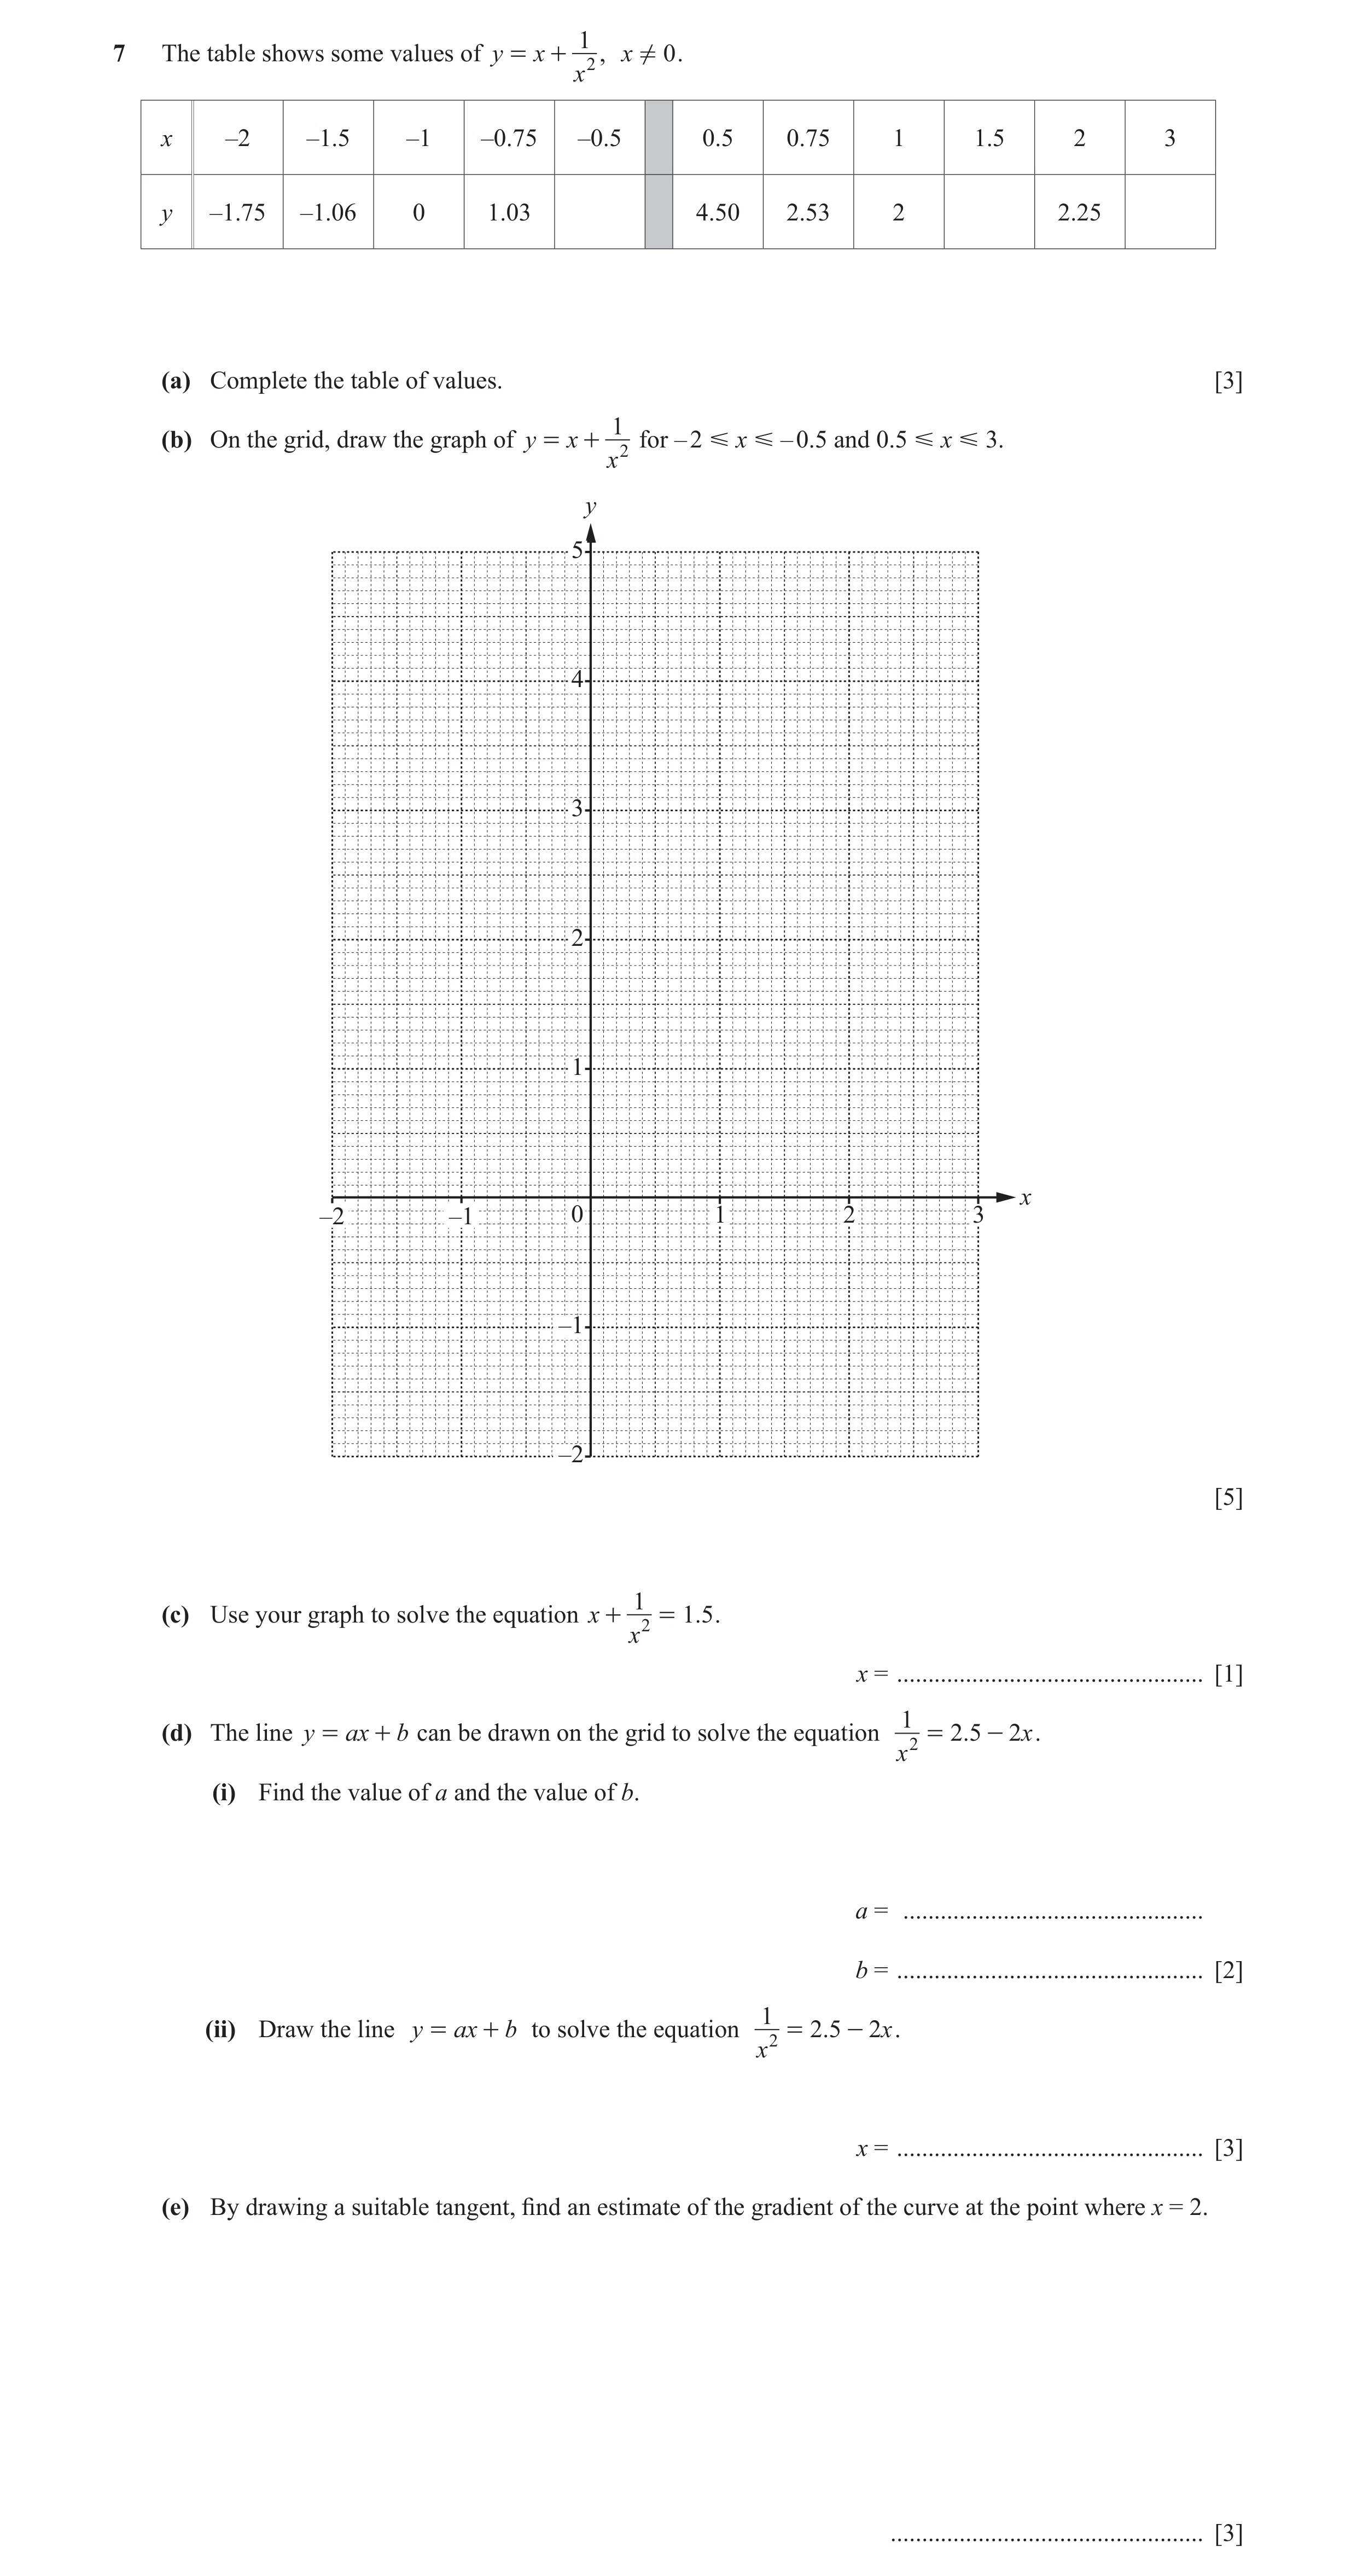
![Question 24: f(x) = x2 – – 4 , x ≠ 0 x (a) (i) Complete the table. x –3 –2 –1 –0.5 –0.1 0.2 0.5 1 2 3 f(x) 5.3 0.5 –1.8 6.0 –9.0 –5.8 –4 4.7 [2] (ii) On…](https://img.pastlit.com/crops/96b1433c-3483-4c80-9f1d-73eaadd6f482/q4.webp)
![Question 26: y = 1 - 2 , x ! 0 x (a) Complete the table. x –5 –4 –3 –2 –1 –0.5 0.5 1 2 3 4 5 y 0.88 0.78 –7 –7 0.78 0.88 [3] 2 (b) On the grid, draw the…](https://img.pastlit.com/crops/956e0141-7e9d-4b98-b8dd-49ce7e6a3766/q4.webp)
![Question 28: (a) y = + 2 , x ! 0 x (i) Find the value of y when x =- 6 . y = ................................................ [1] (ii) Find x in terms o…](https://img.pastlit.com/crops/e909654b-3034-4f2c-b8fd-c7096f64ba20/q9.webp)
![Question 29: 2 (a) Complete the table for y = 3x + 2 + 1, x ! 0 . x x –3 –2 –1 –0.5 –0.3 0.3 0.5 1 2 3 y –7.8 0 7.5 22.3 24.1 6 7.5 10.2 [2] 2 (b) On th…](https://img.pastlit.com/crops/49a97ea4-6968-4402-8883-cdd1c9afca05/q2.webp)
![Question 30: Adele, Barbara and Collette share $680 in the ratio 9 : 7 : 4. (a) Show that Adele receives $306. [1] (b) Calculate the amount that Barbara…](https://img.pastlit.com/crops/23aec1f2-14cb-4886-8915-911fc6e70031/q1.webp) 49 / 59
49 / 59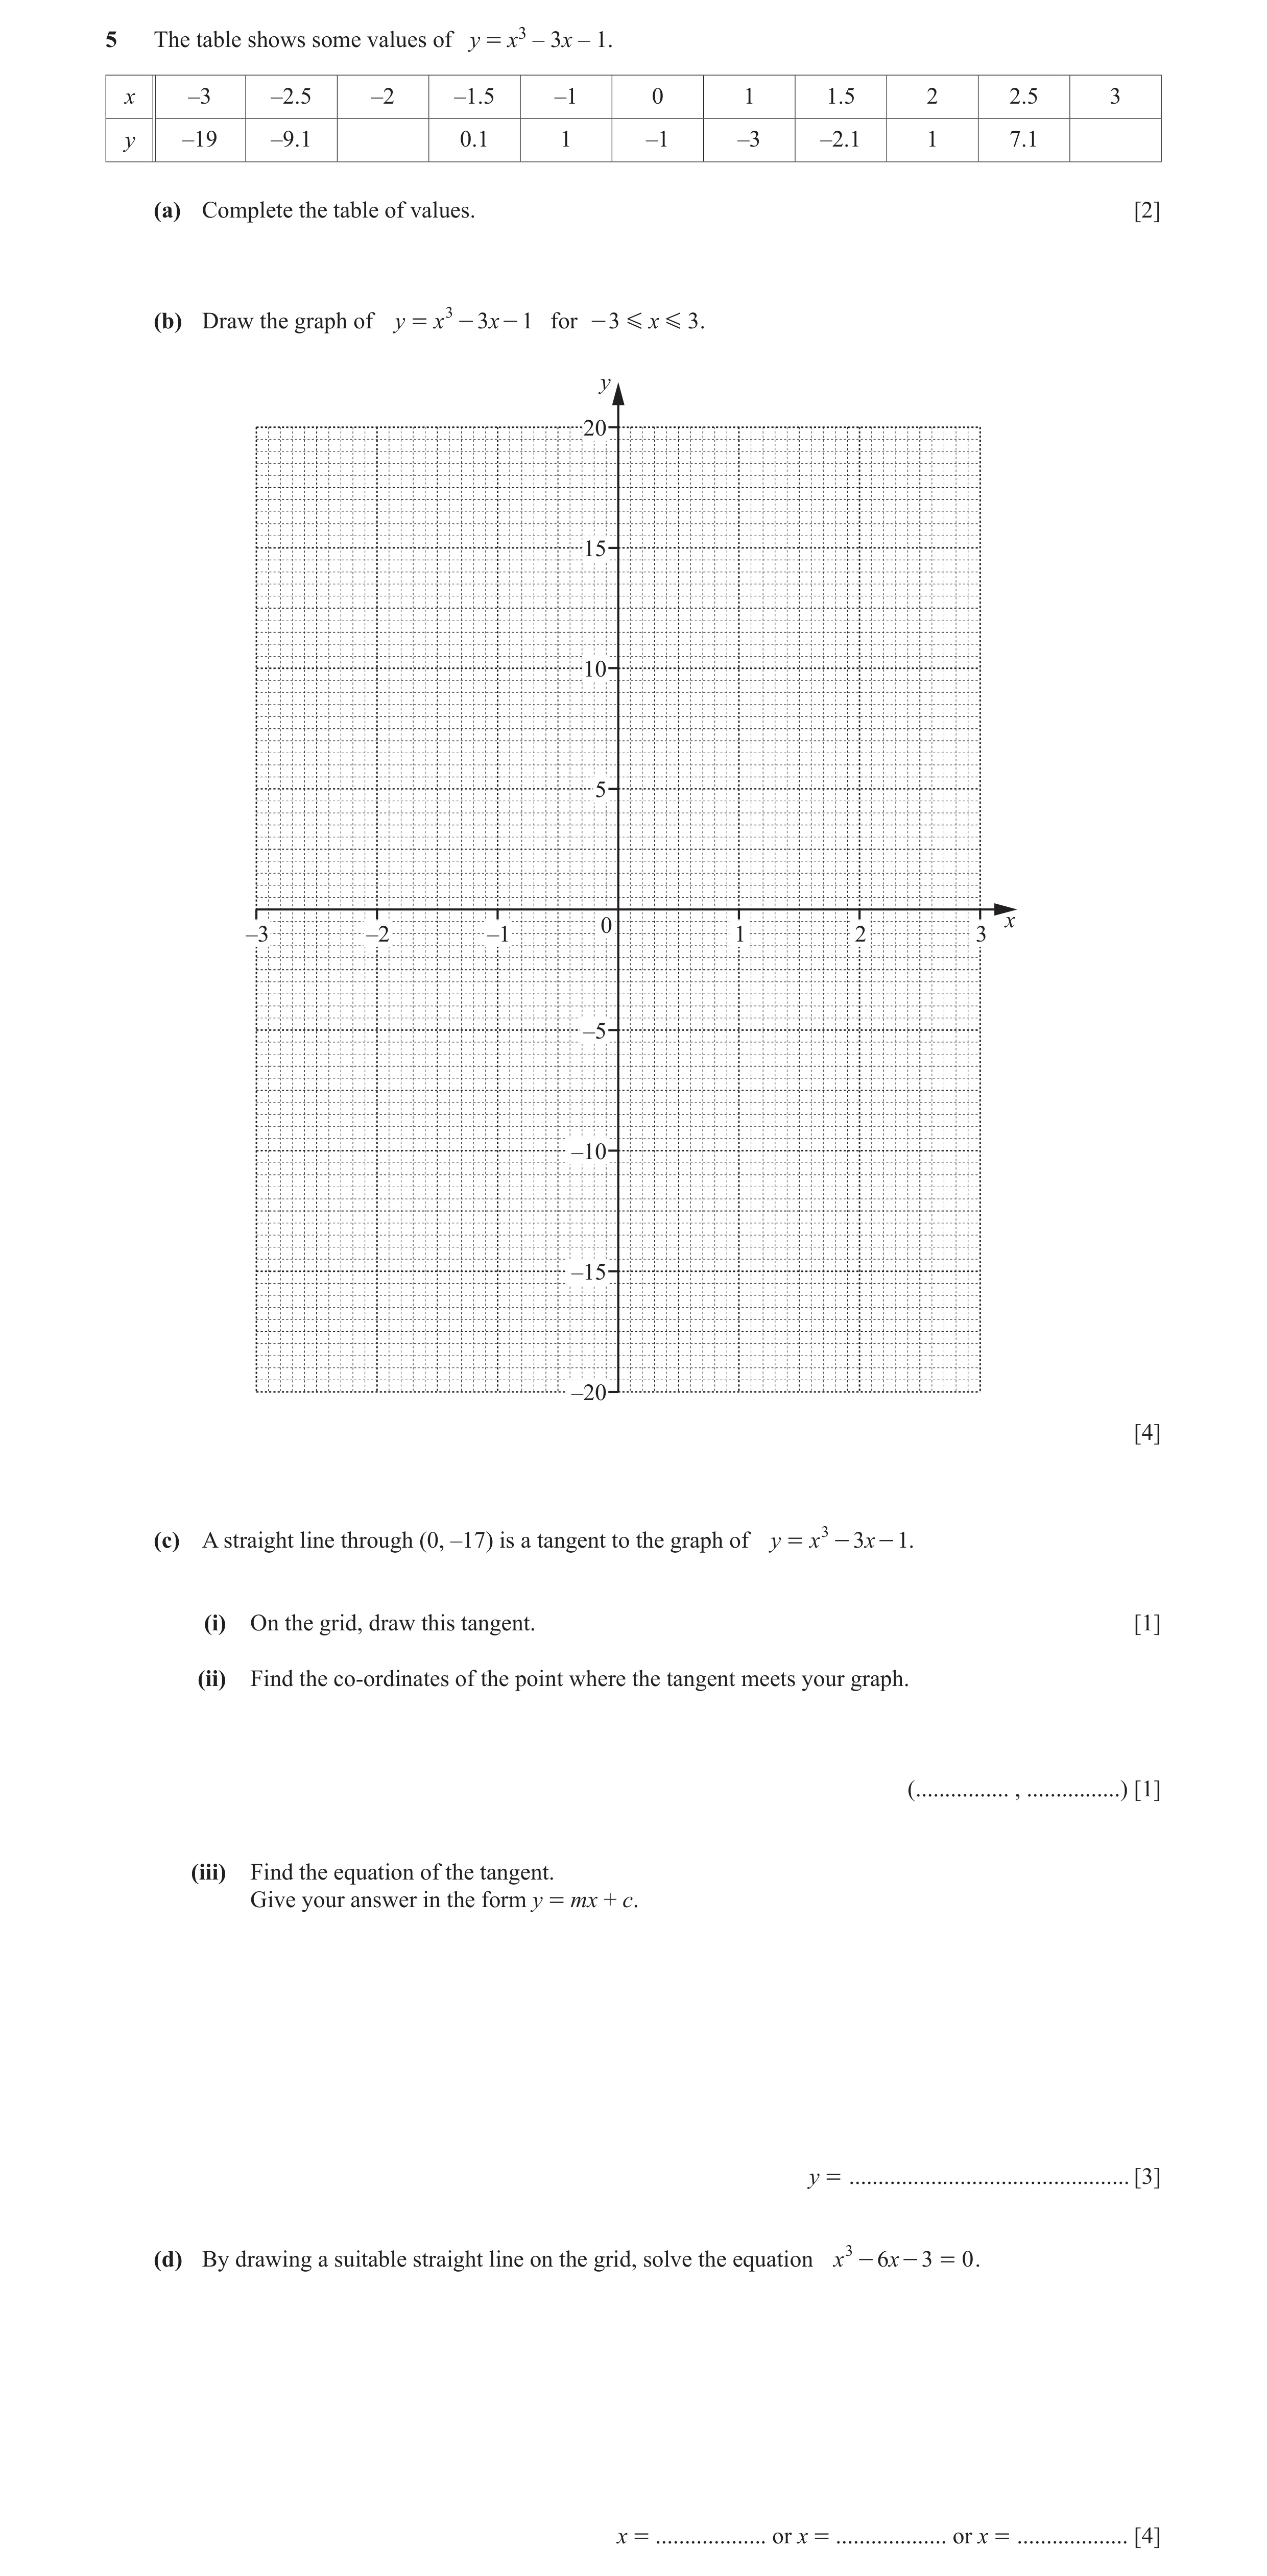
![Question 34: (a) Find the lowest common multiple (LCM) of 30 and 75. ................................................. [2] (b) Share $608 in the ratio 4…](https://img.pastlit.com/crops/29ef37e9-dd2c-4fce-91ee-a10d2f60d3a3/q1.webp) 55 / 59
55 / 59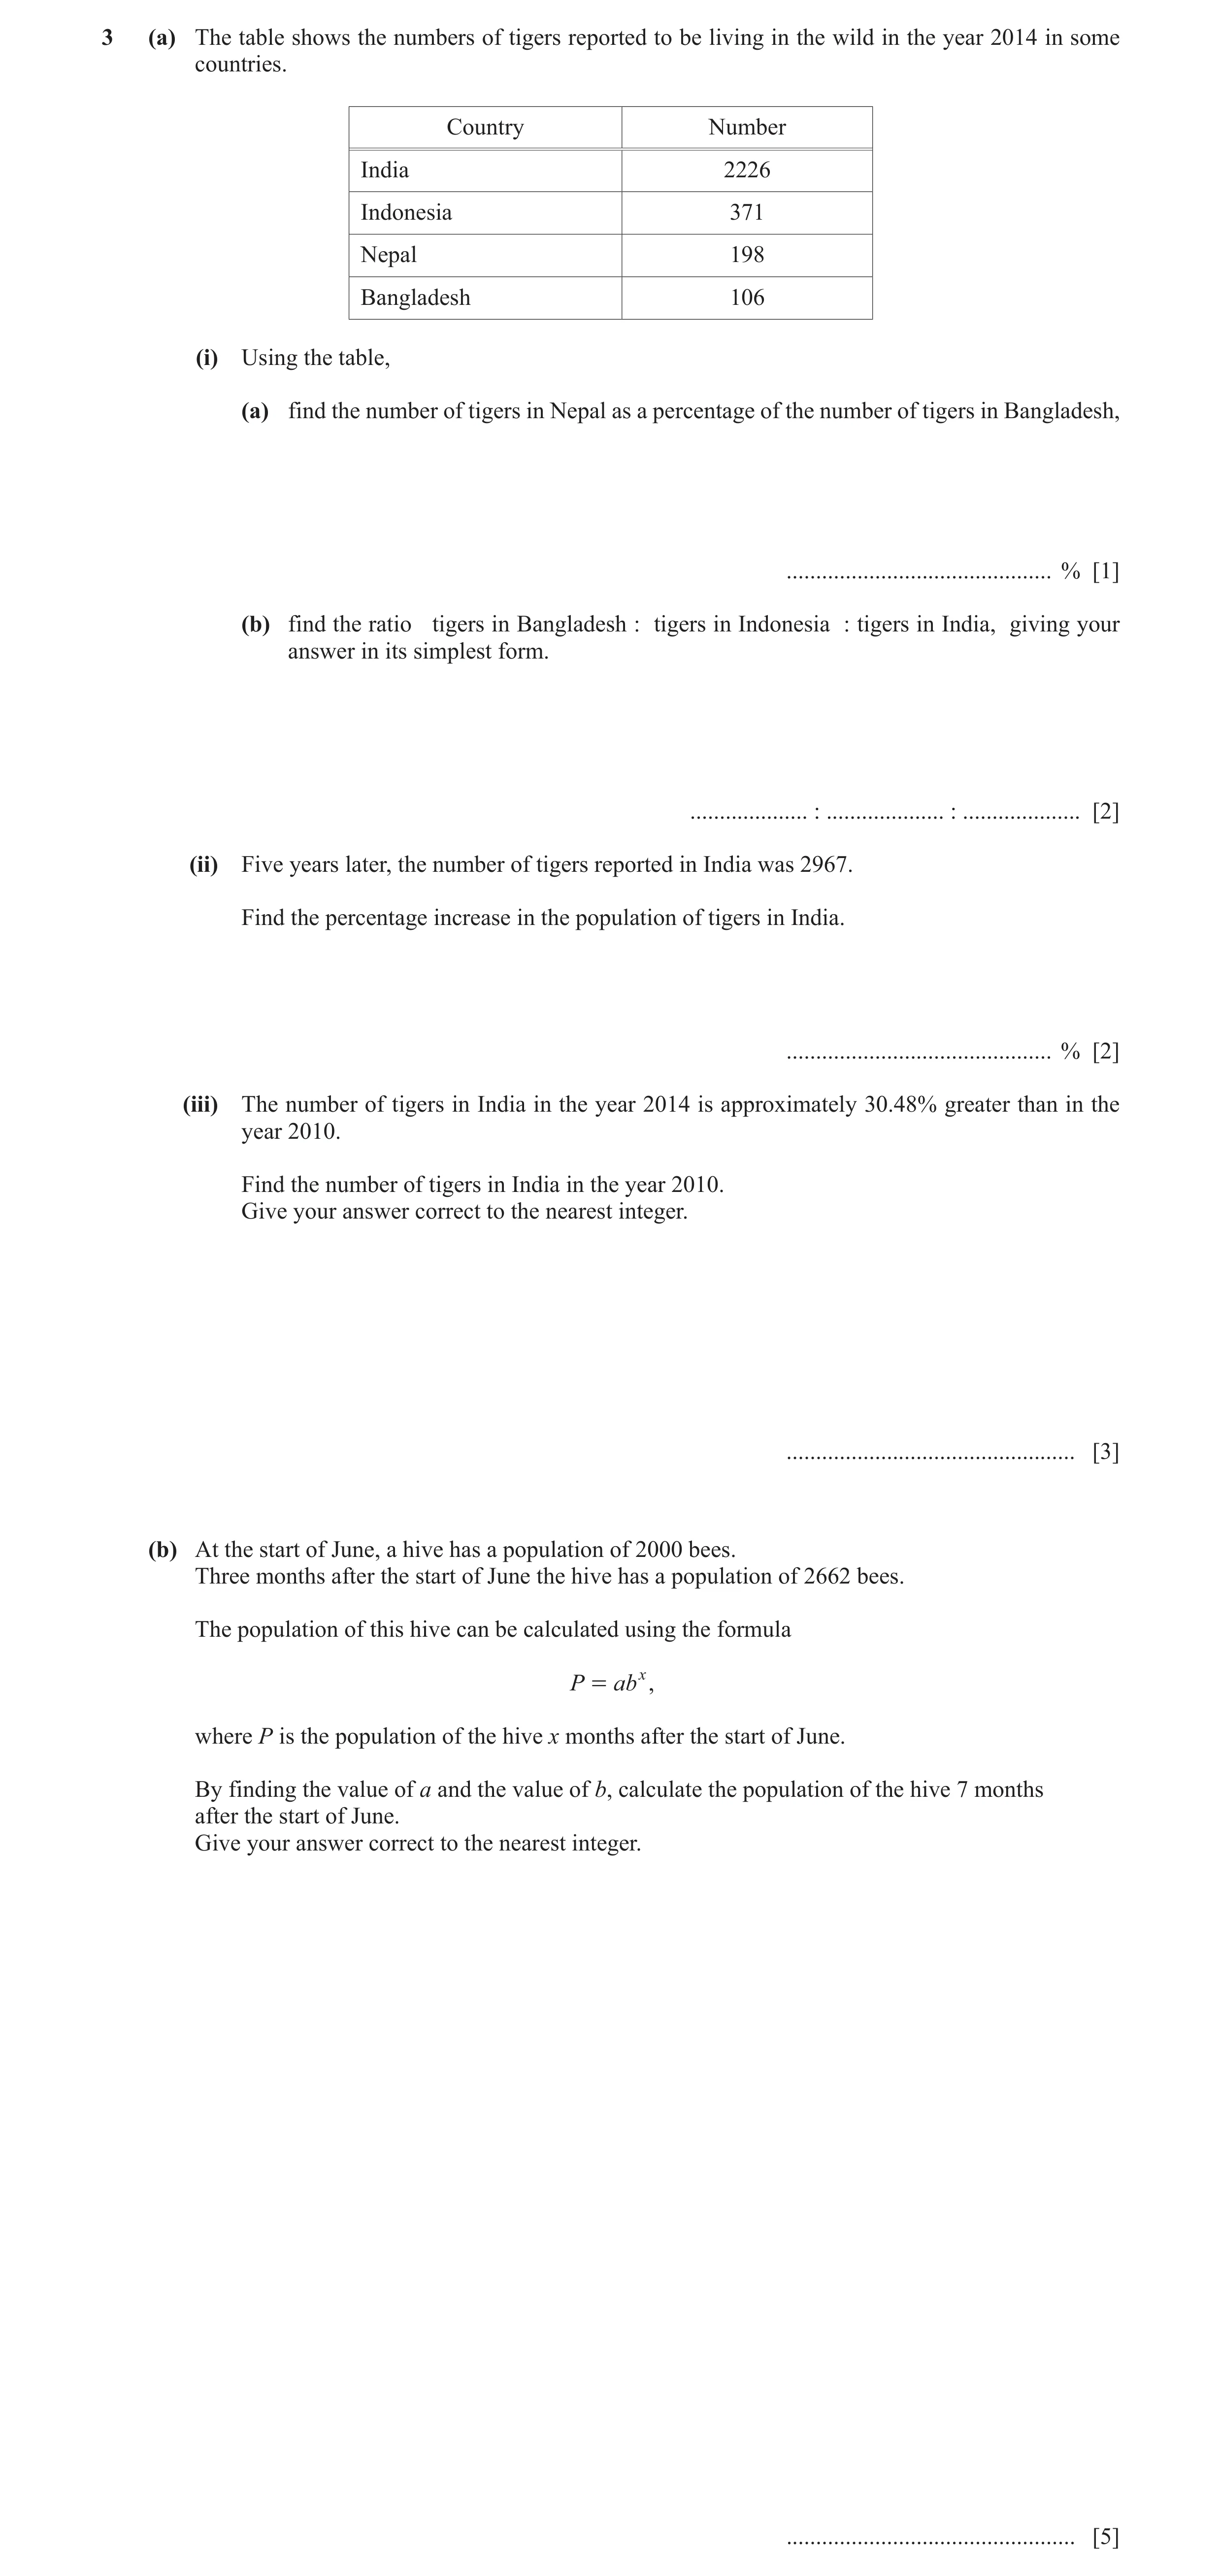
![Question 36: (a) Write (i) 2994.99 correct to the nearest 10, ................................................. [1] (ii) 0.983 correct to 1 decimal plac…](https://img.pastlit.com/crops/de0c6118-ae4f-4056-a3a6-1af874f4aa0f/q2.webp) 58 / 59
58 / 59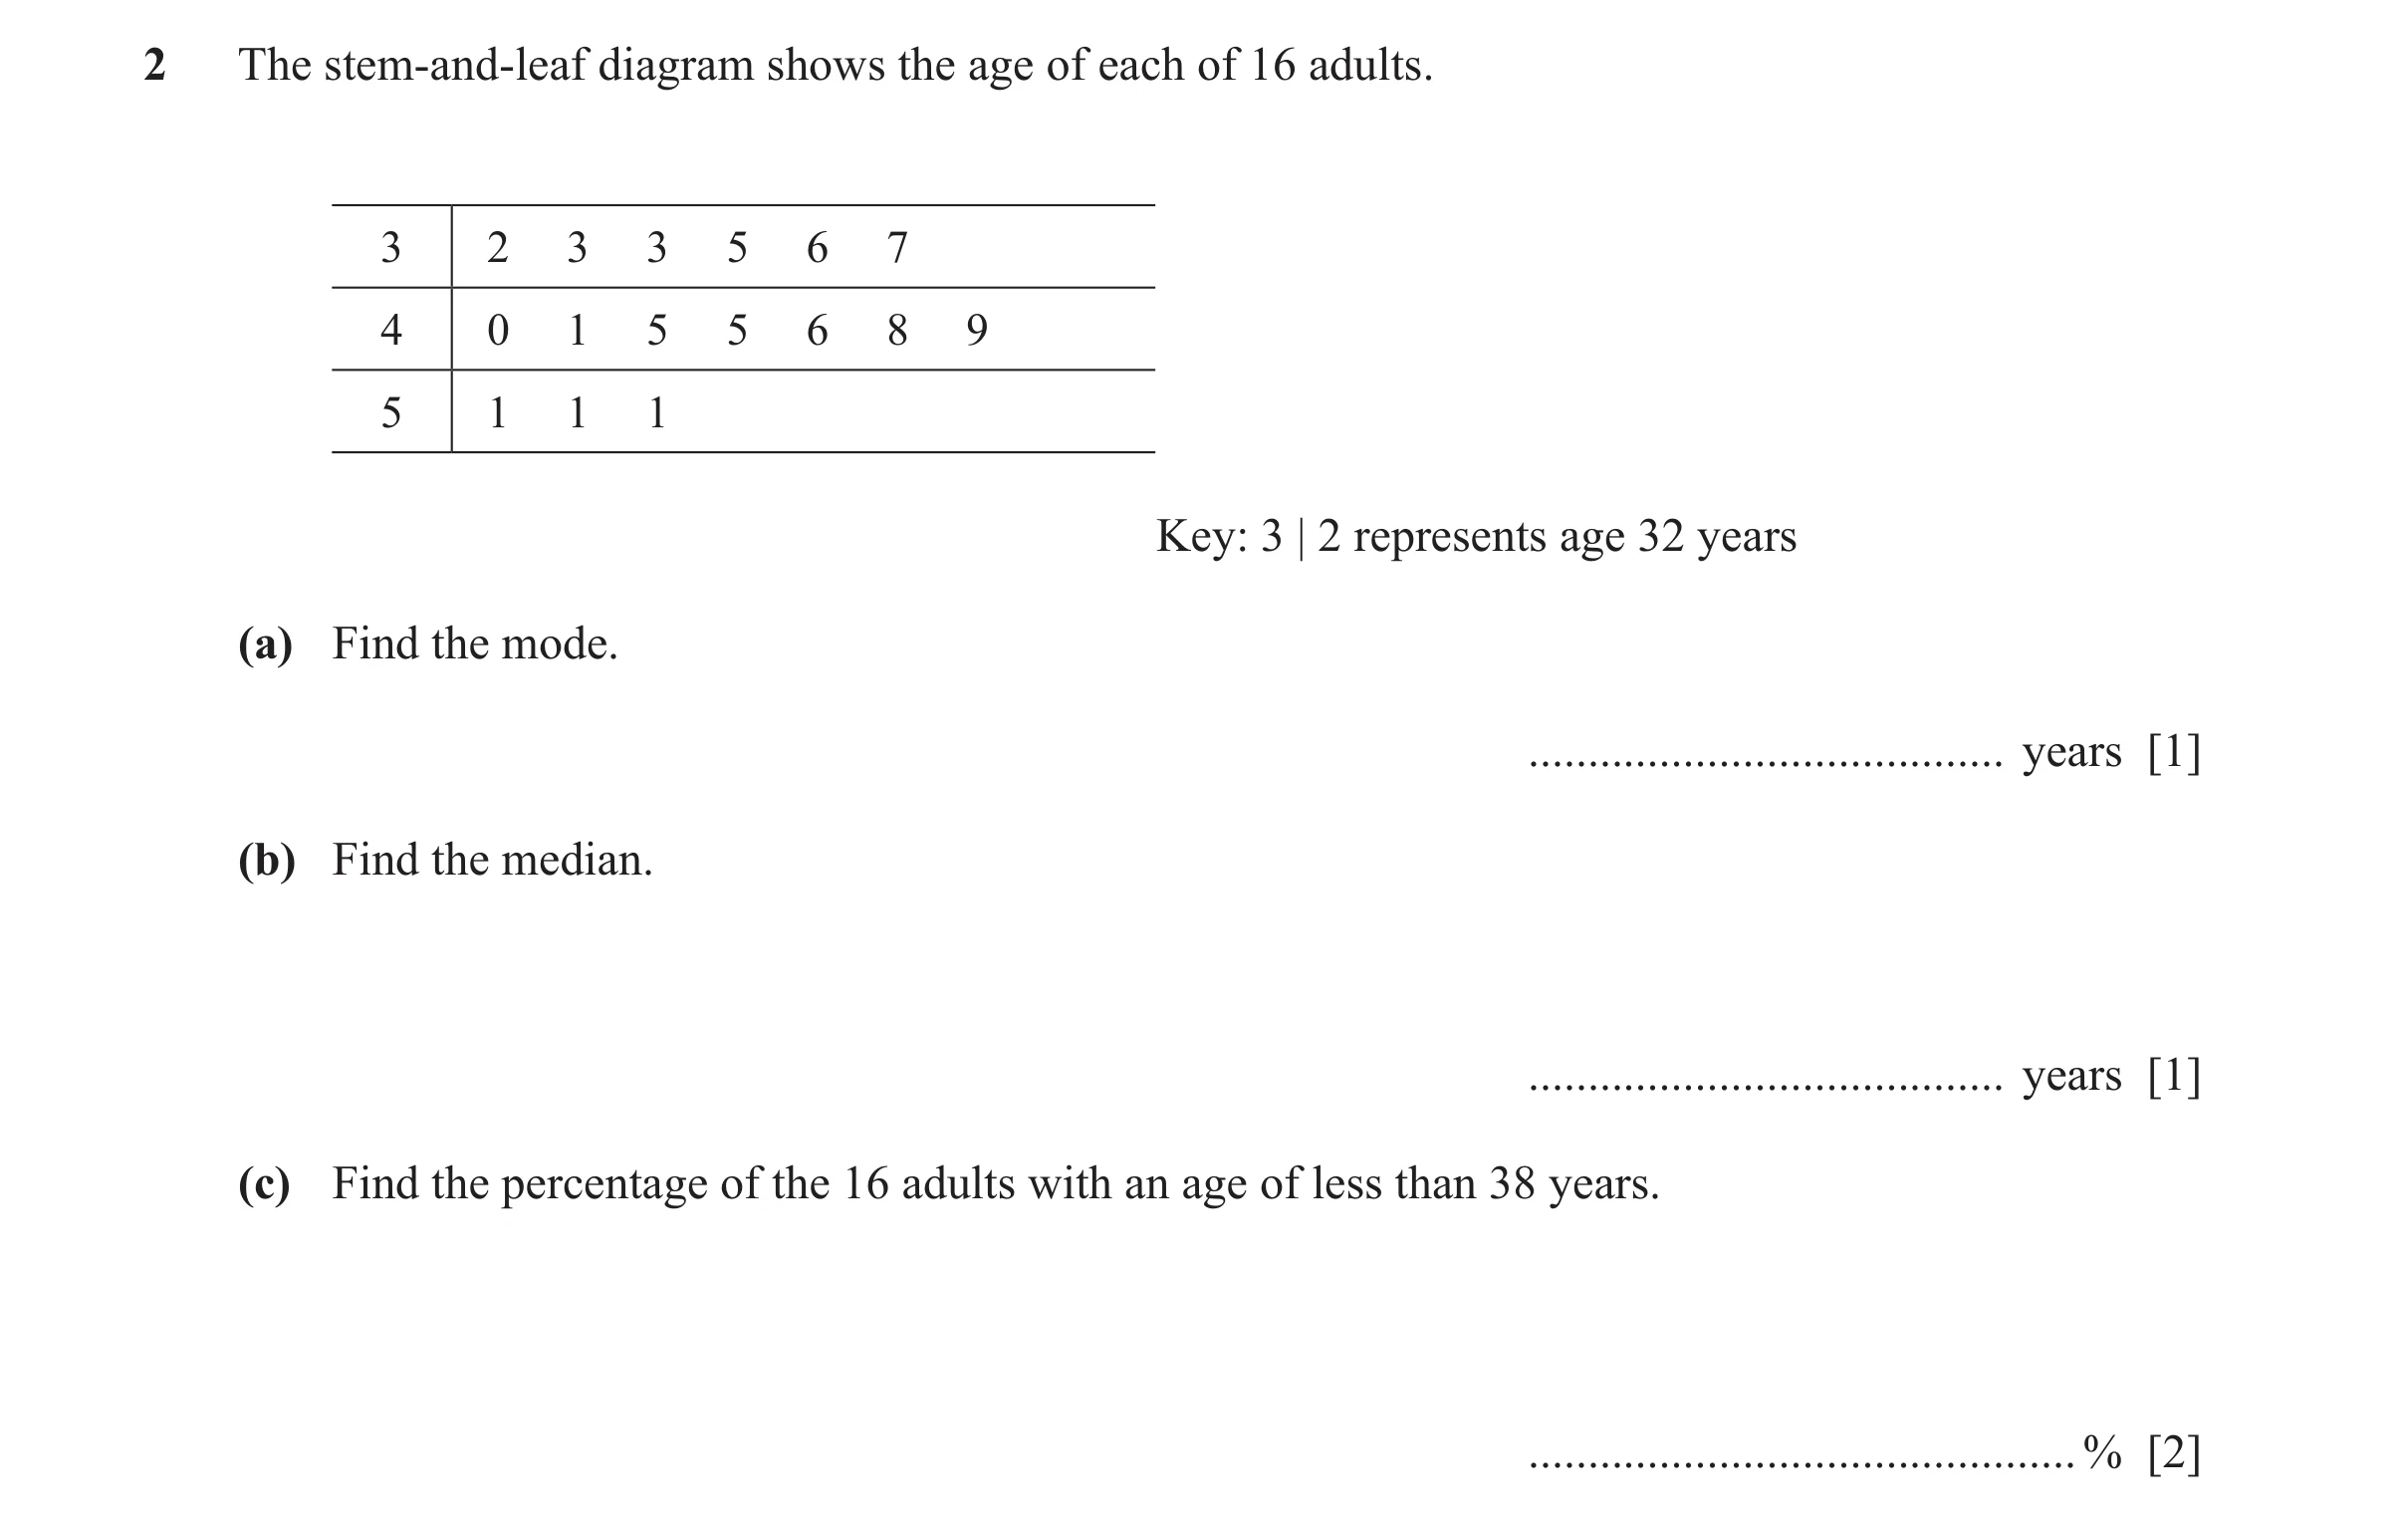
 59 / 59
 19
19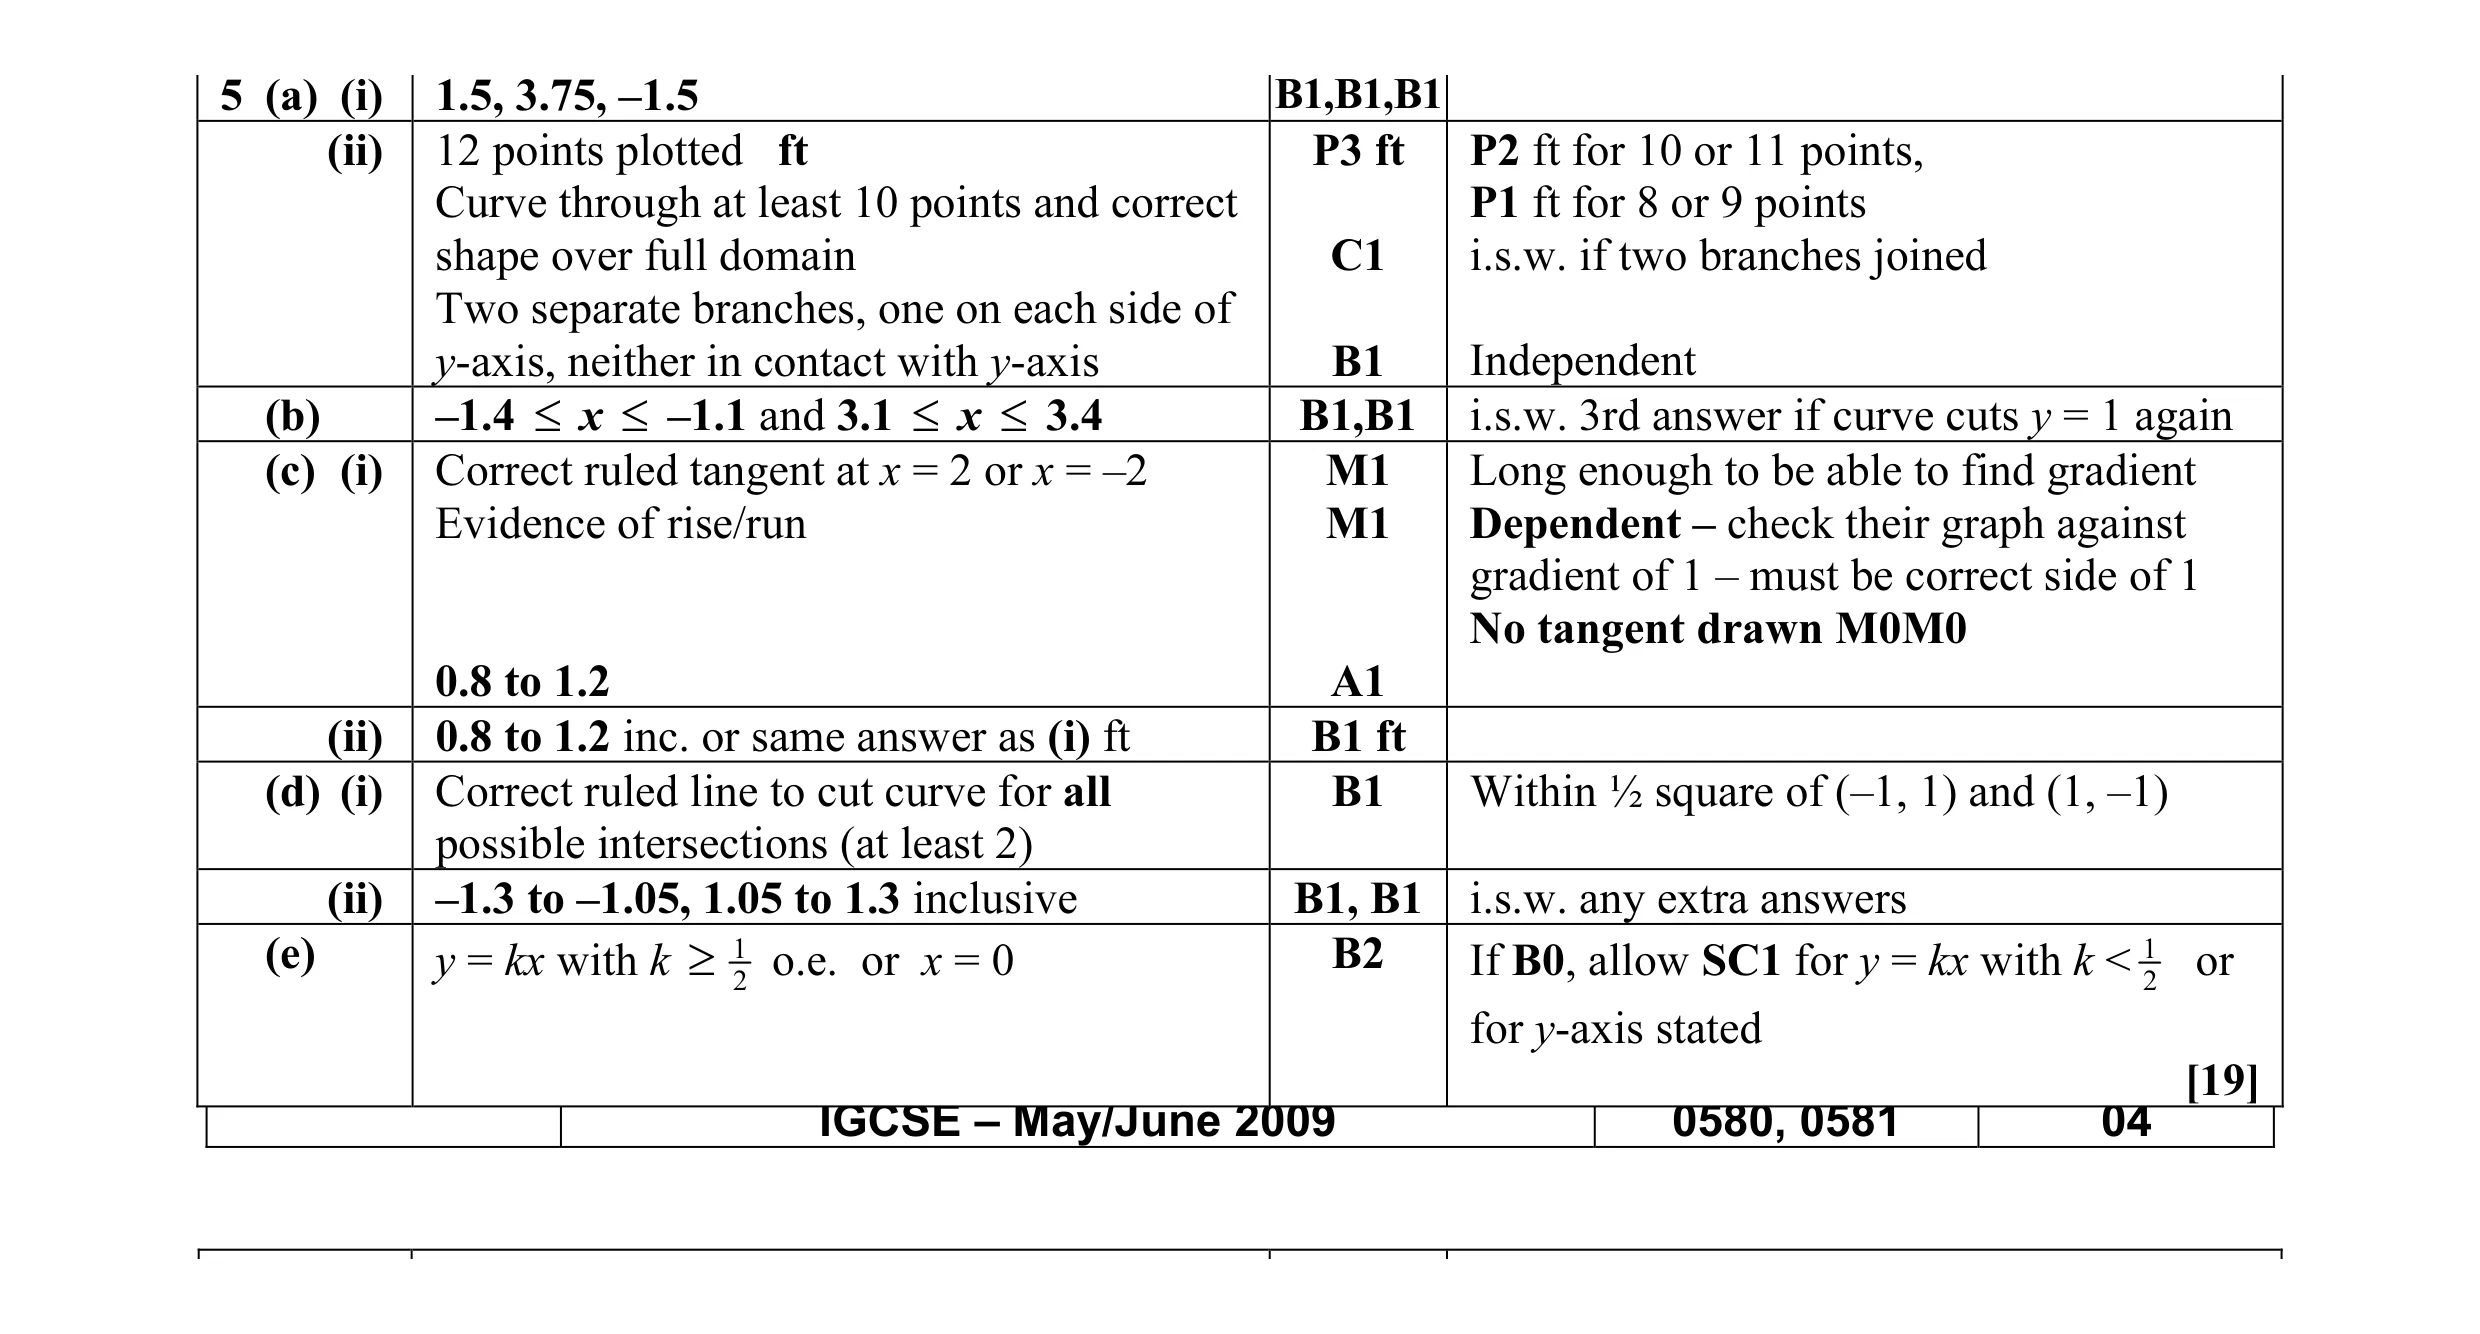 19
19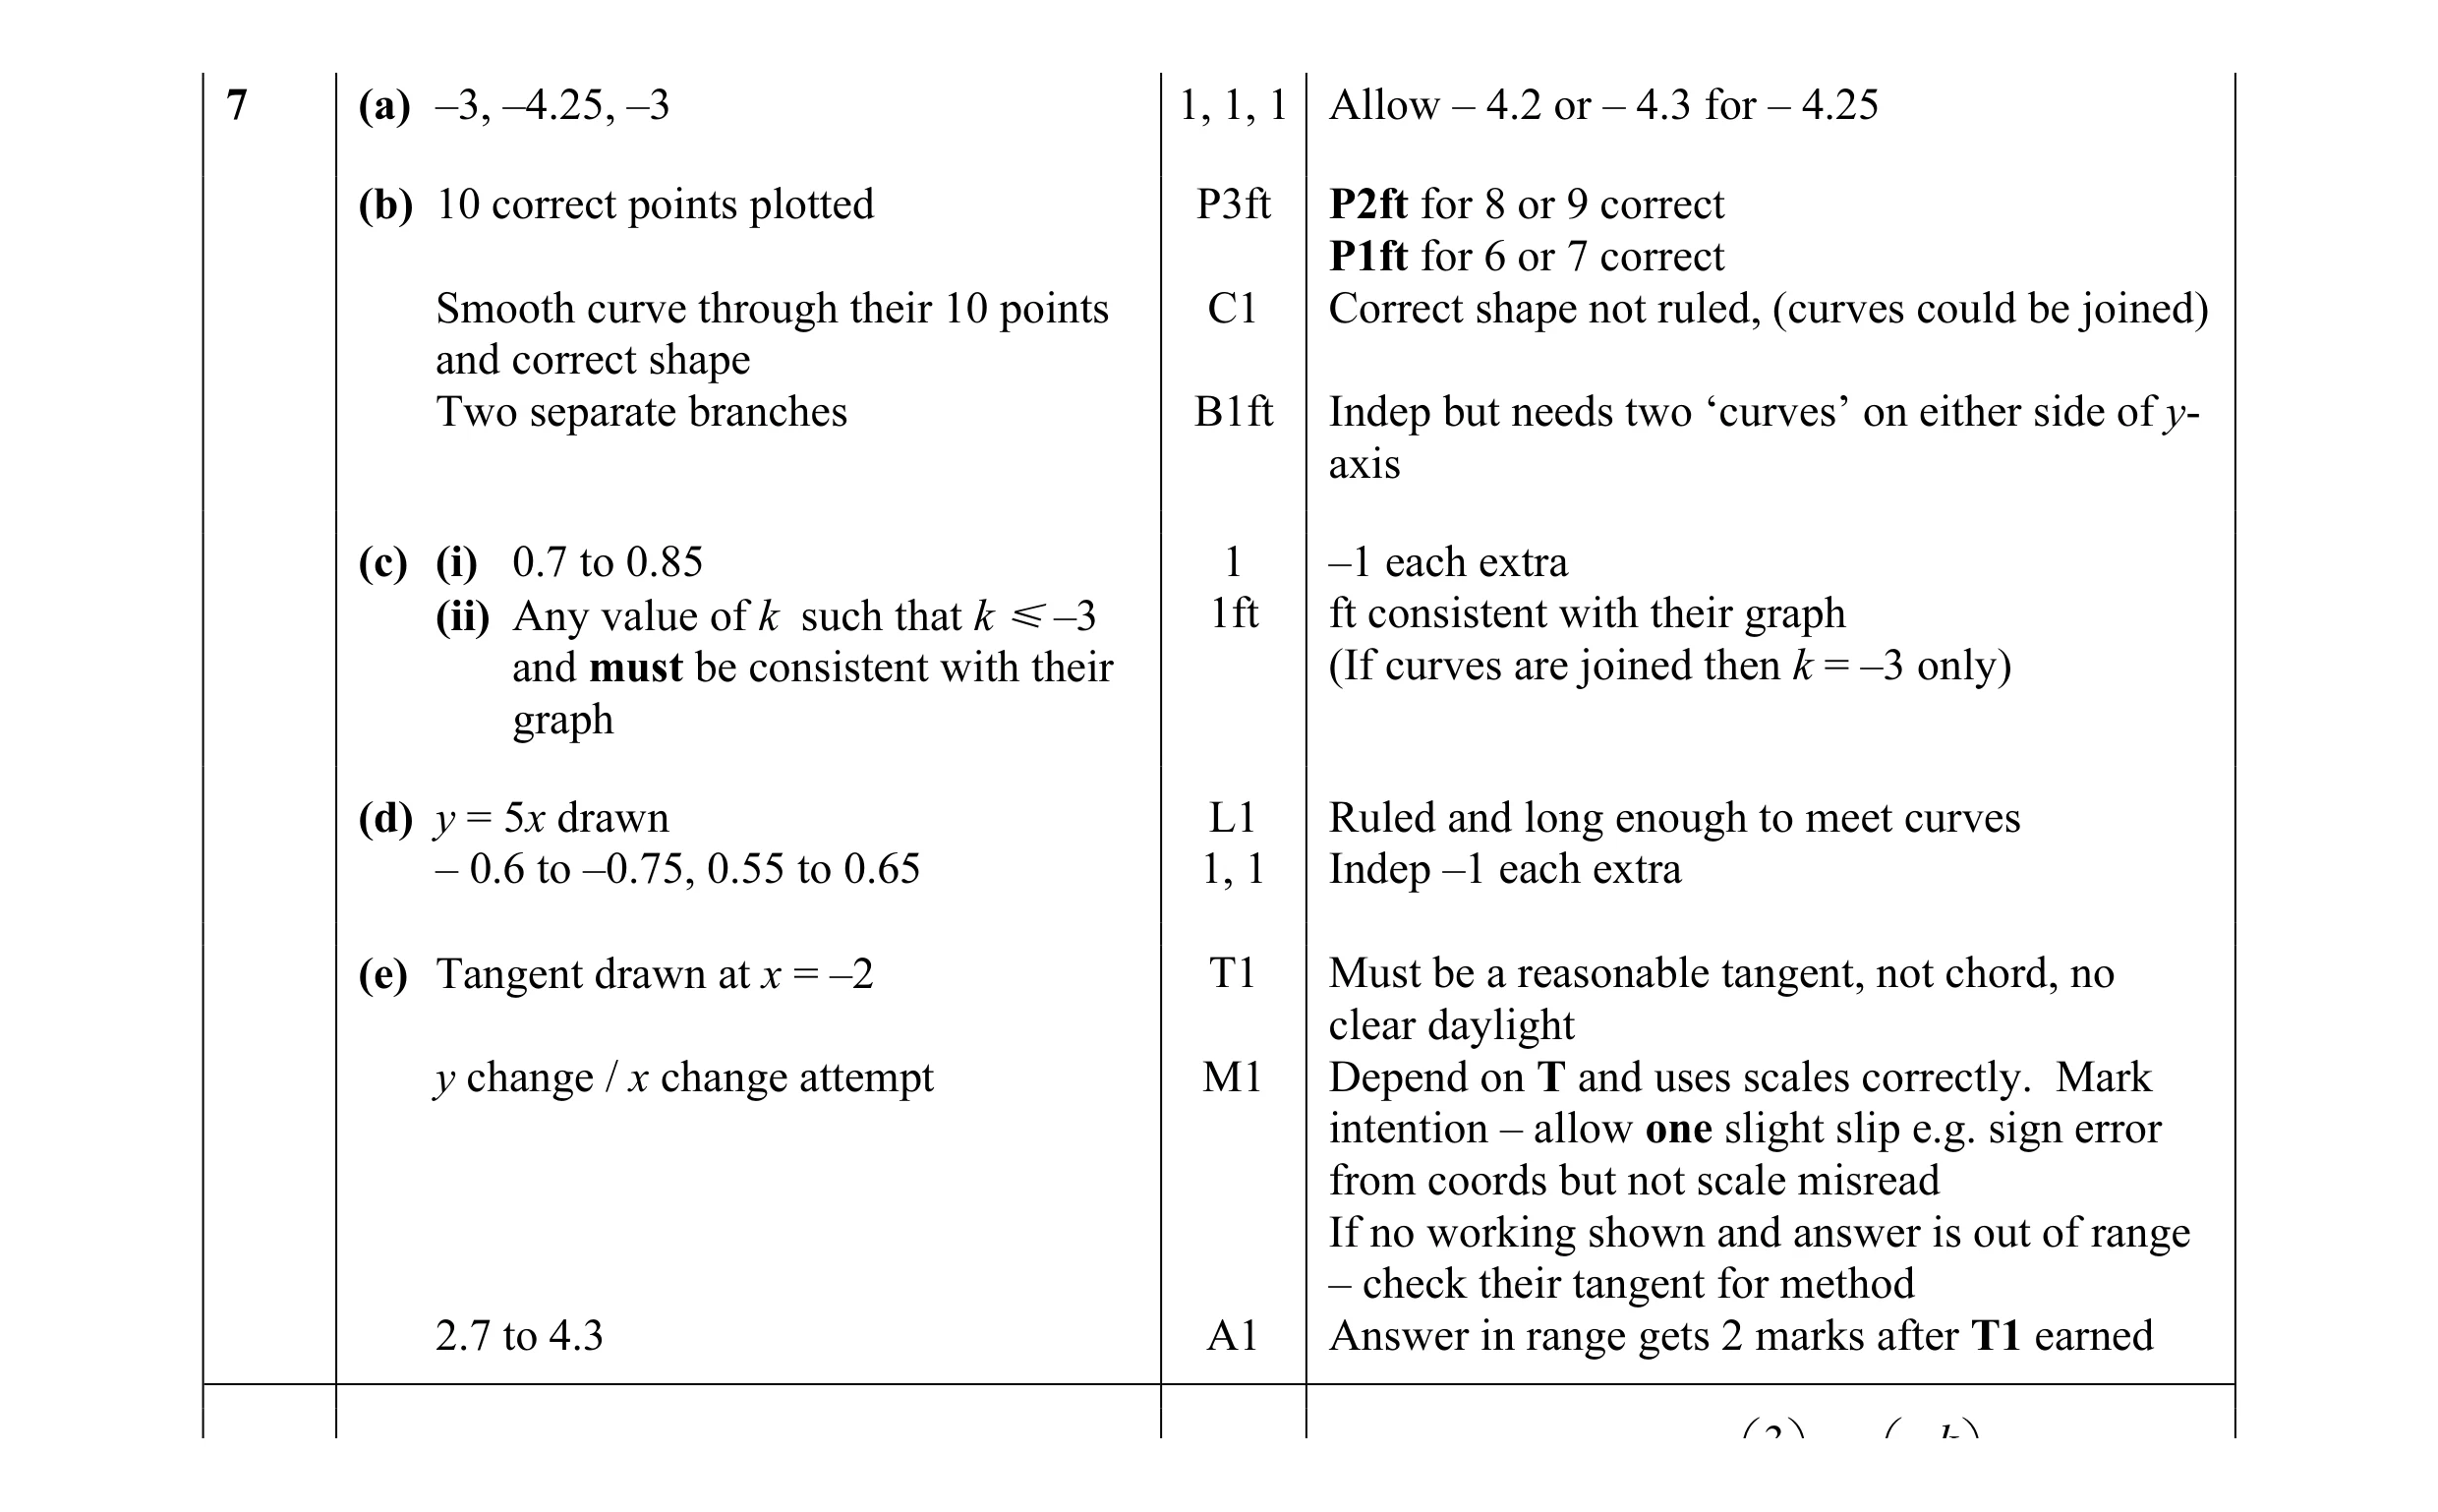 16
16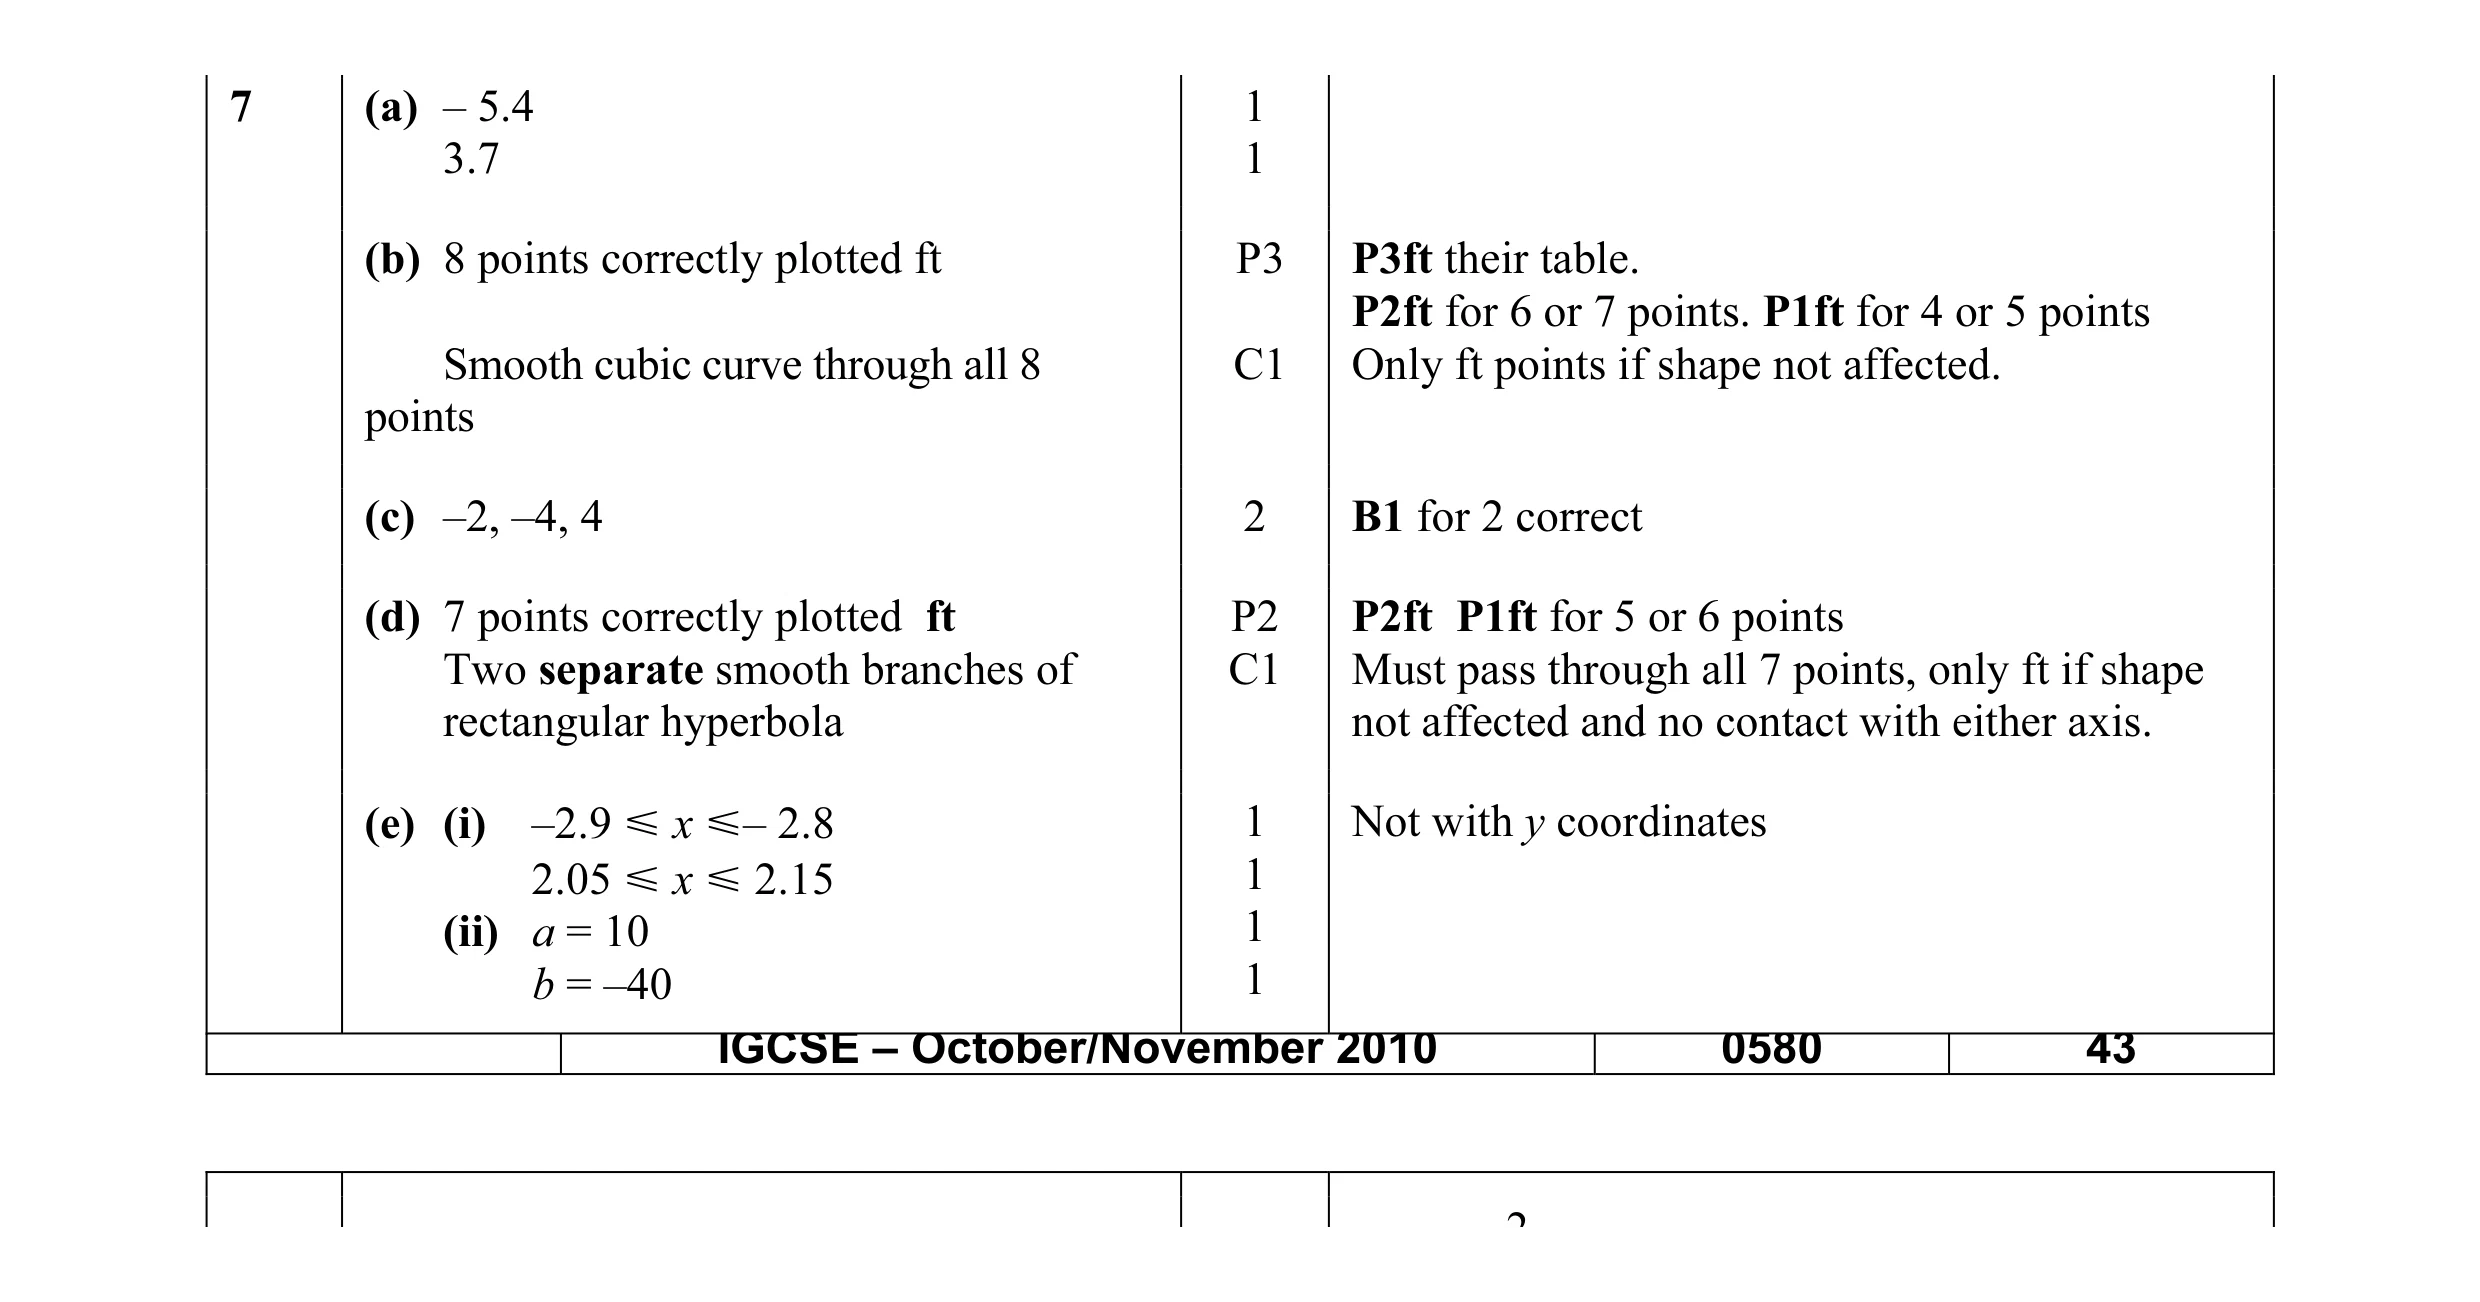 15
15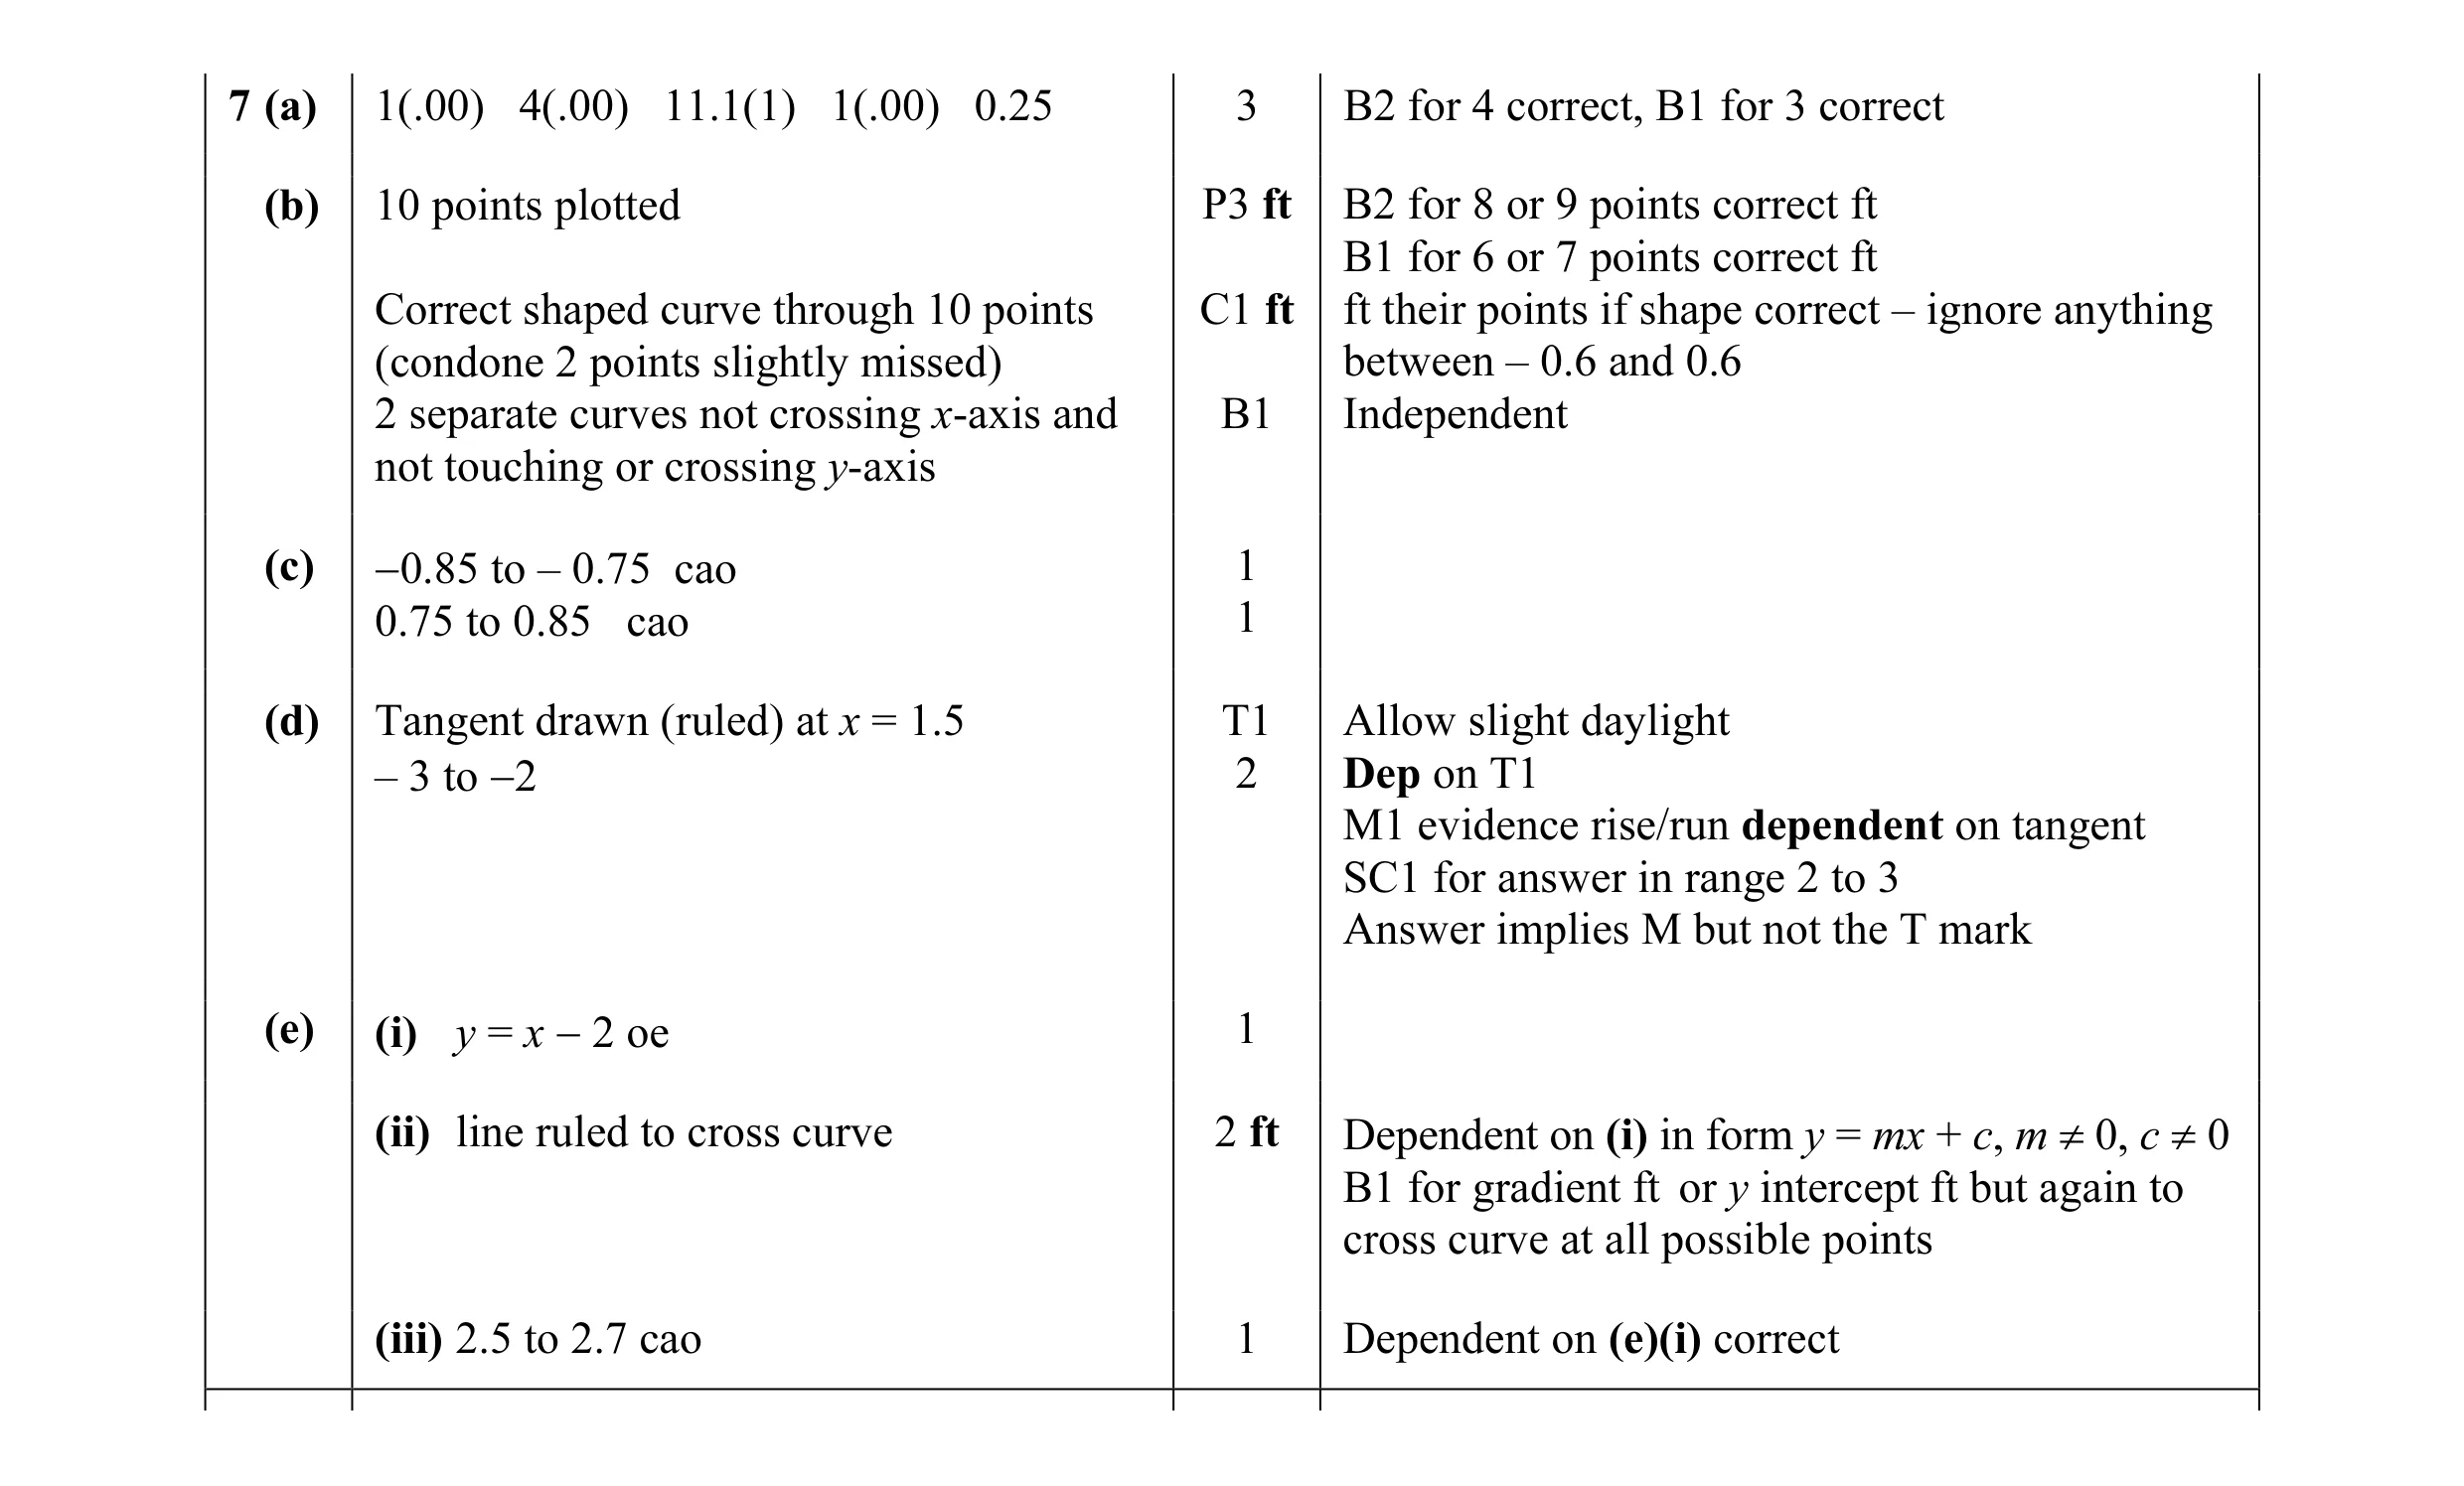 17
17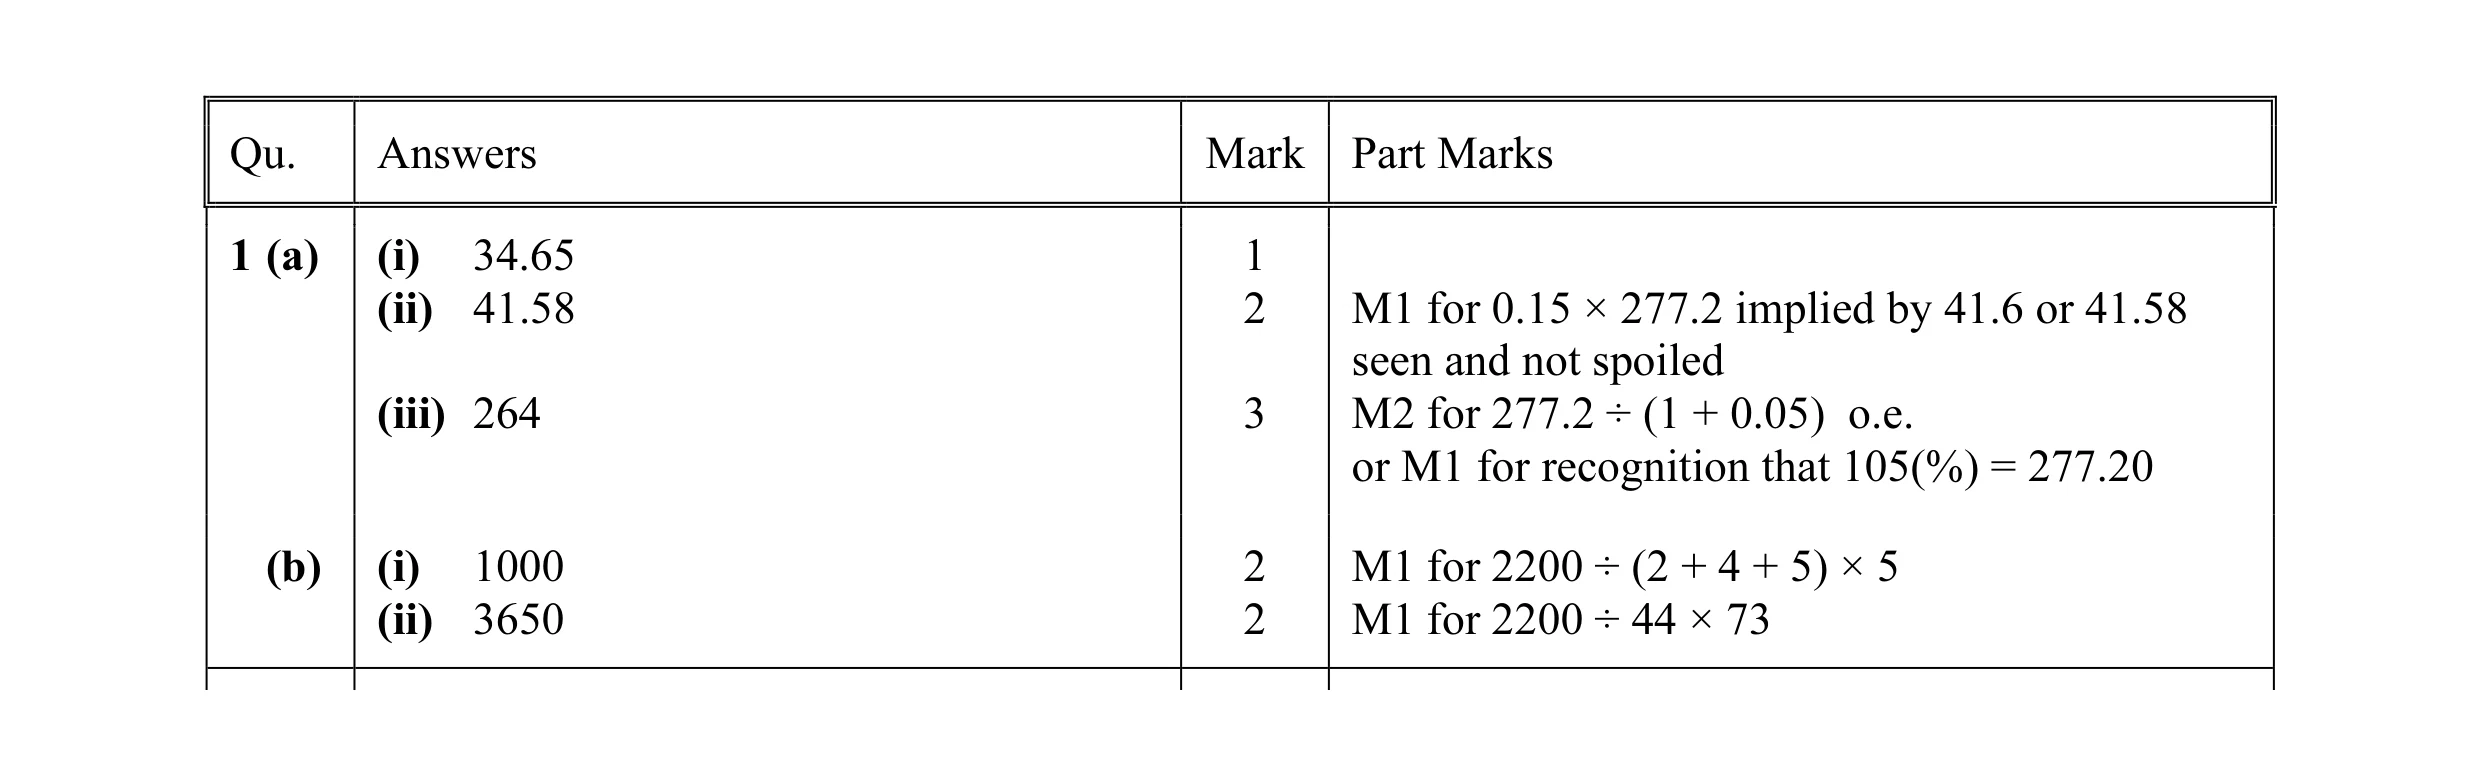 10
10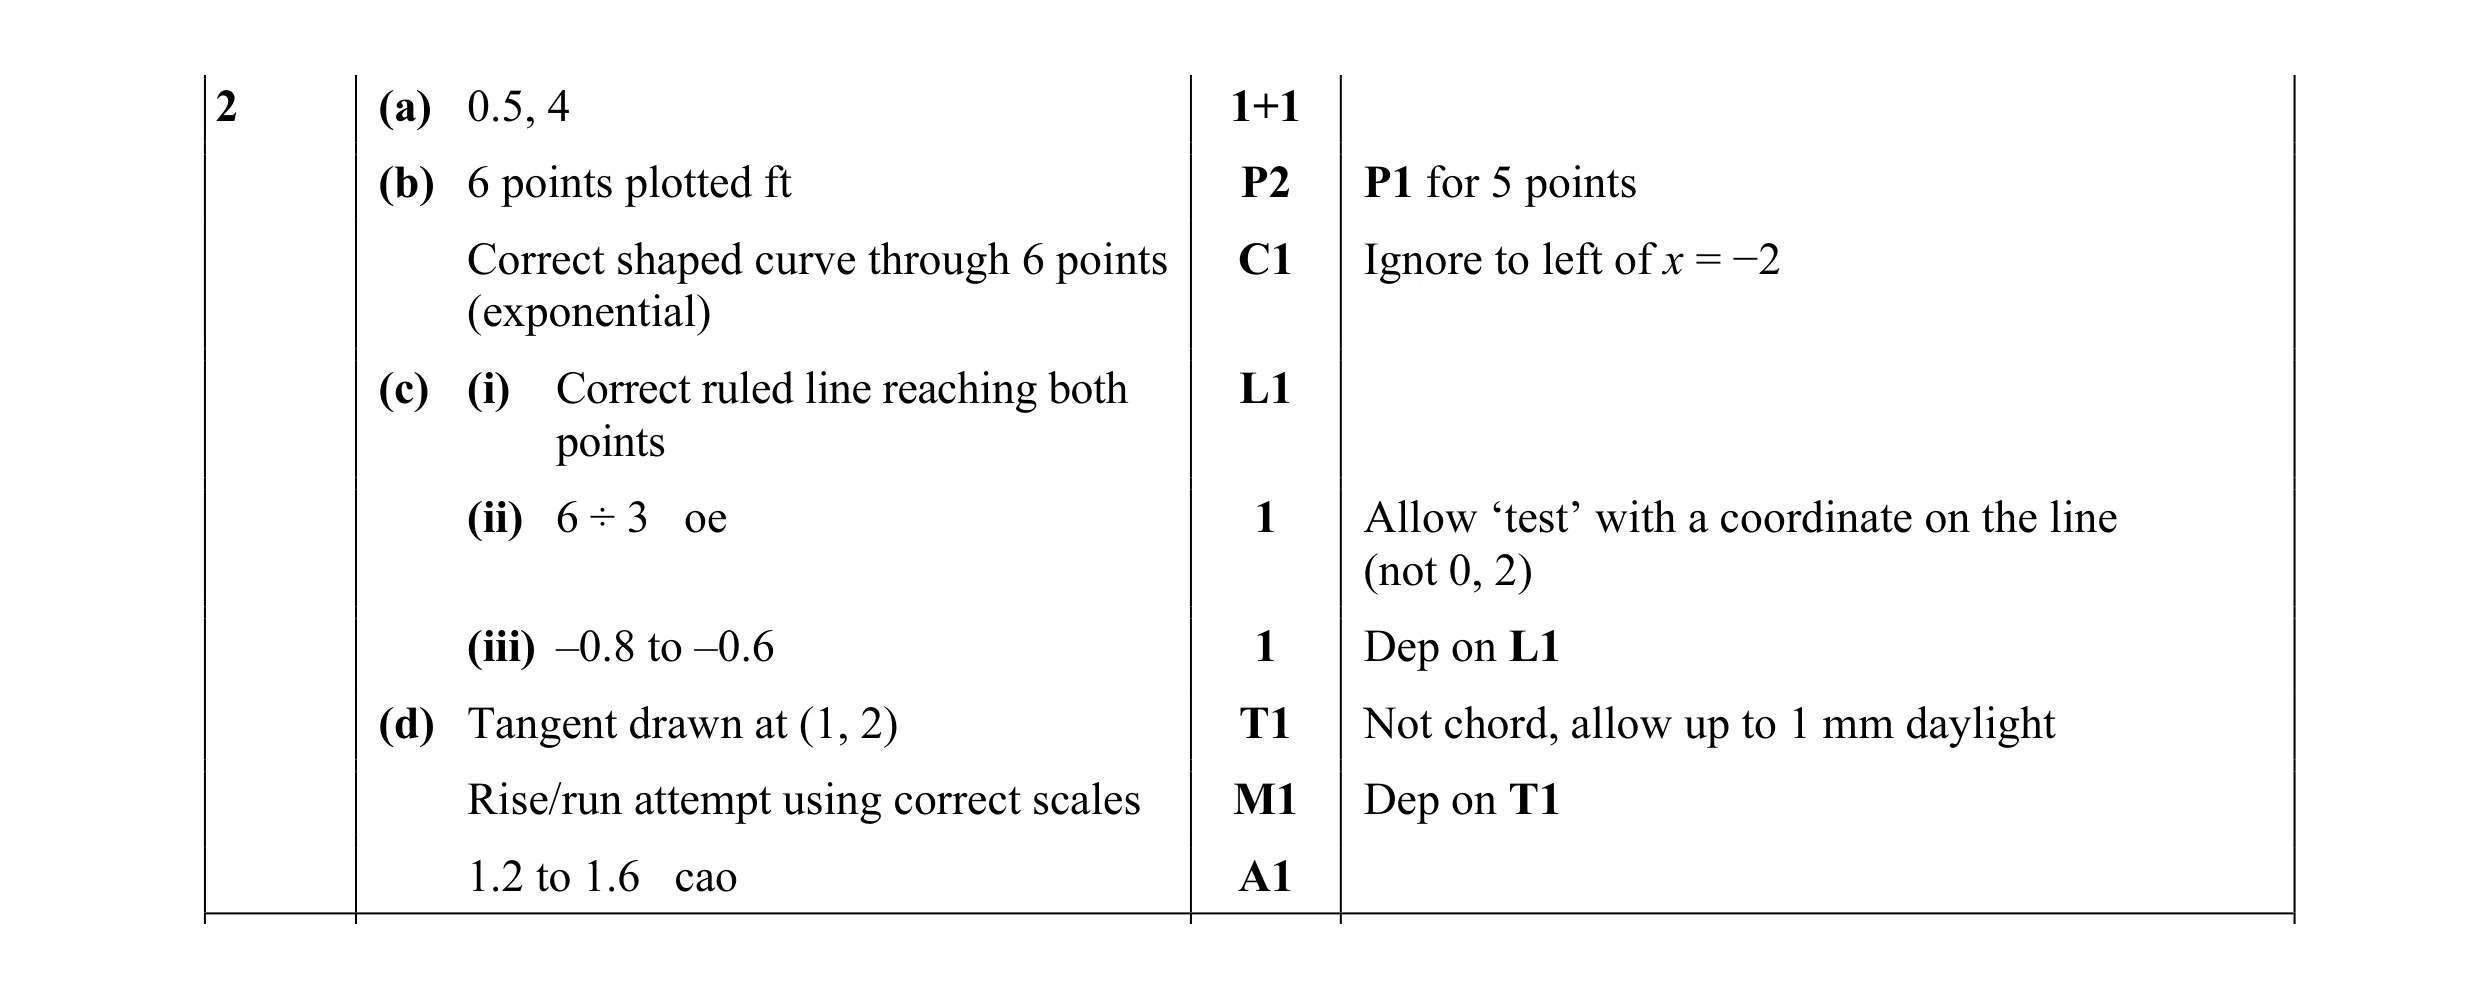 11
11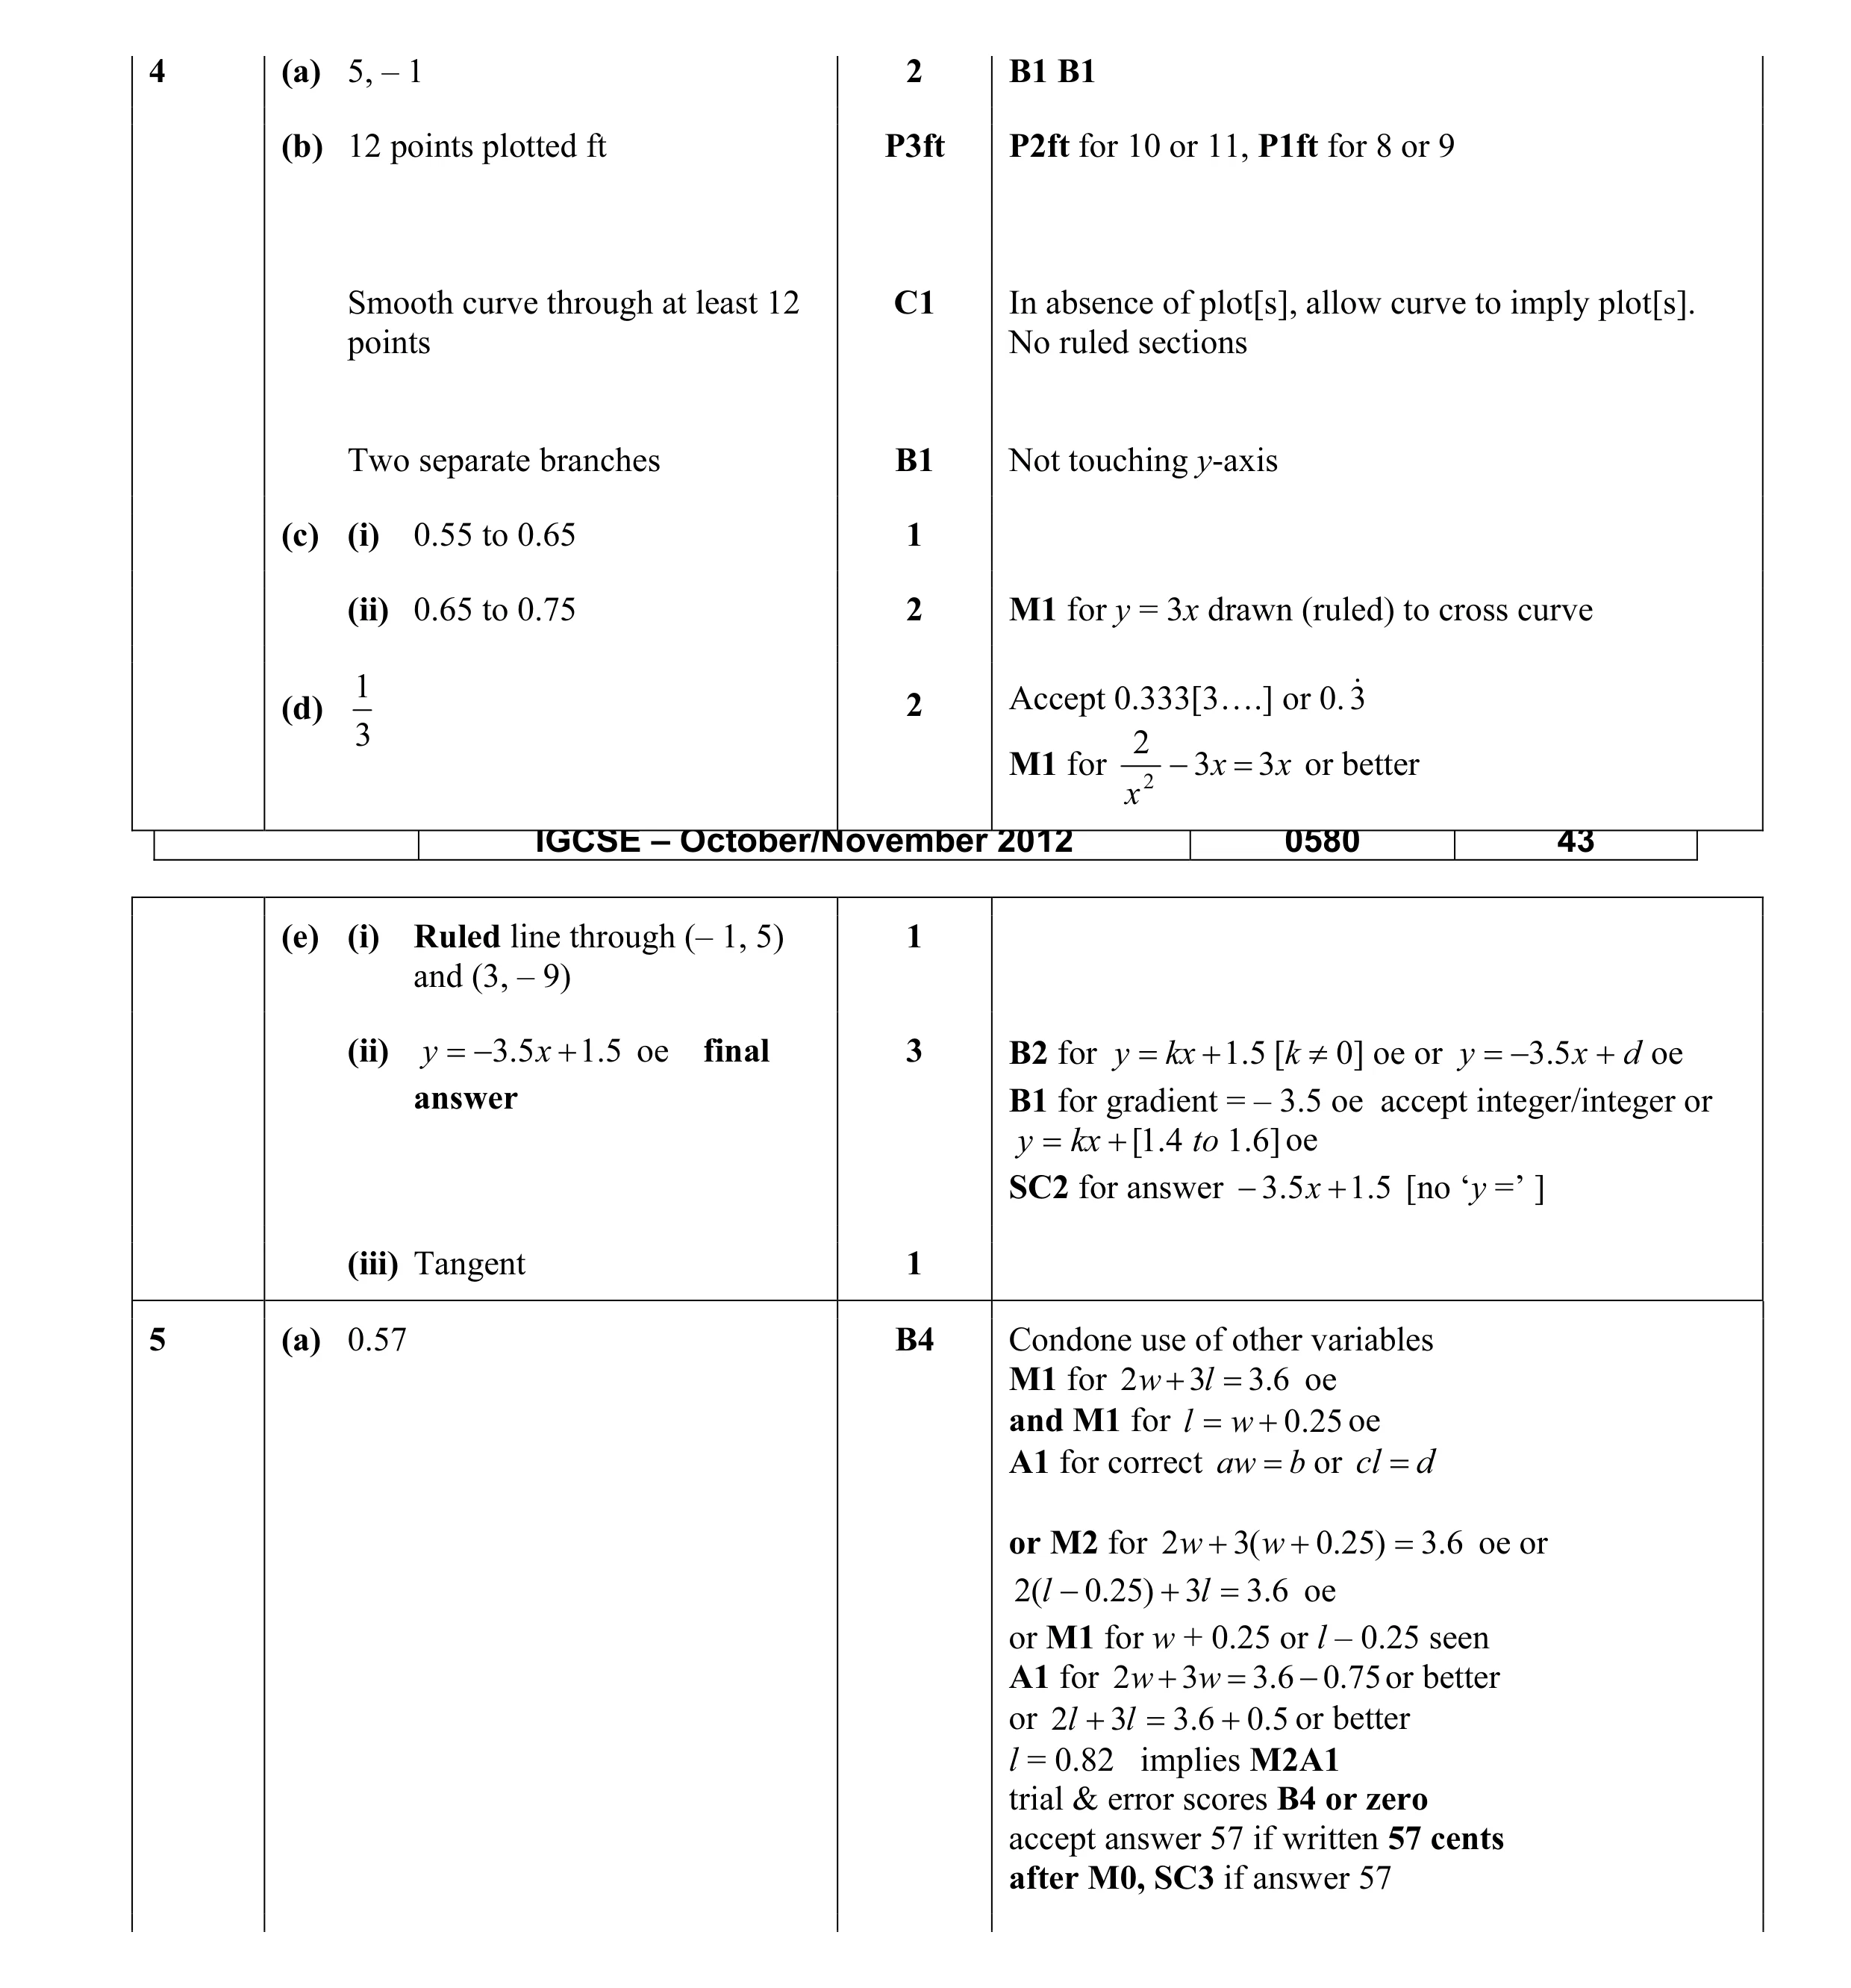 17
17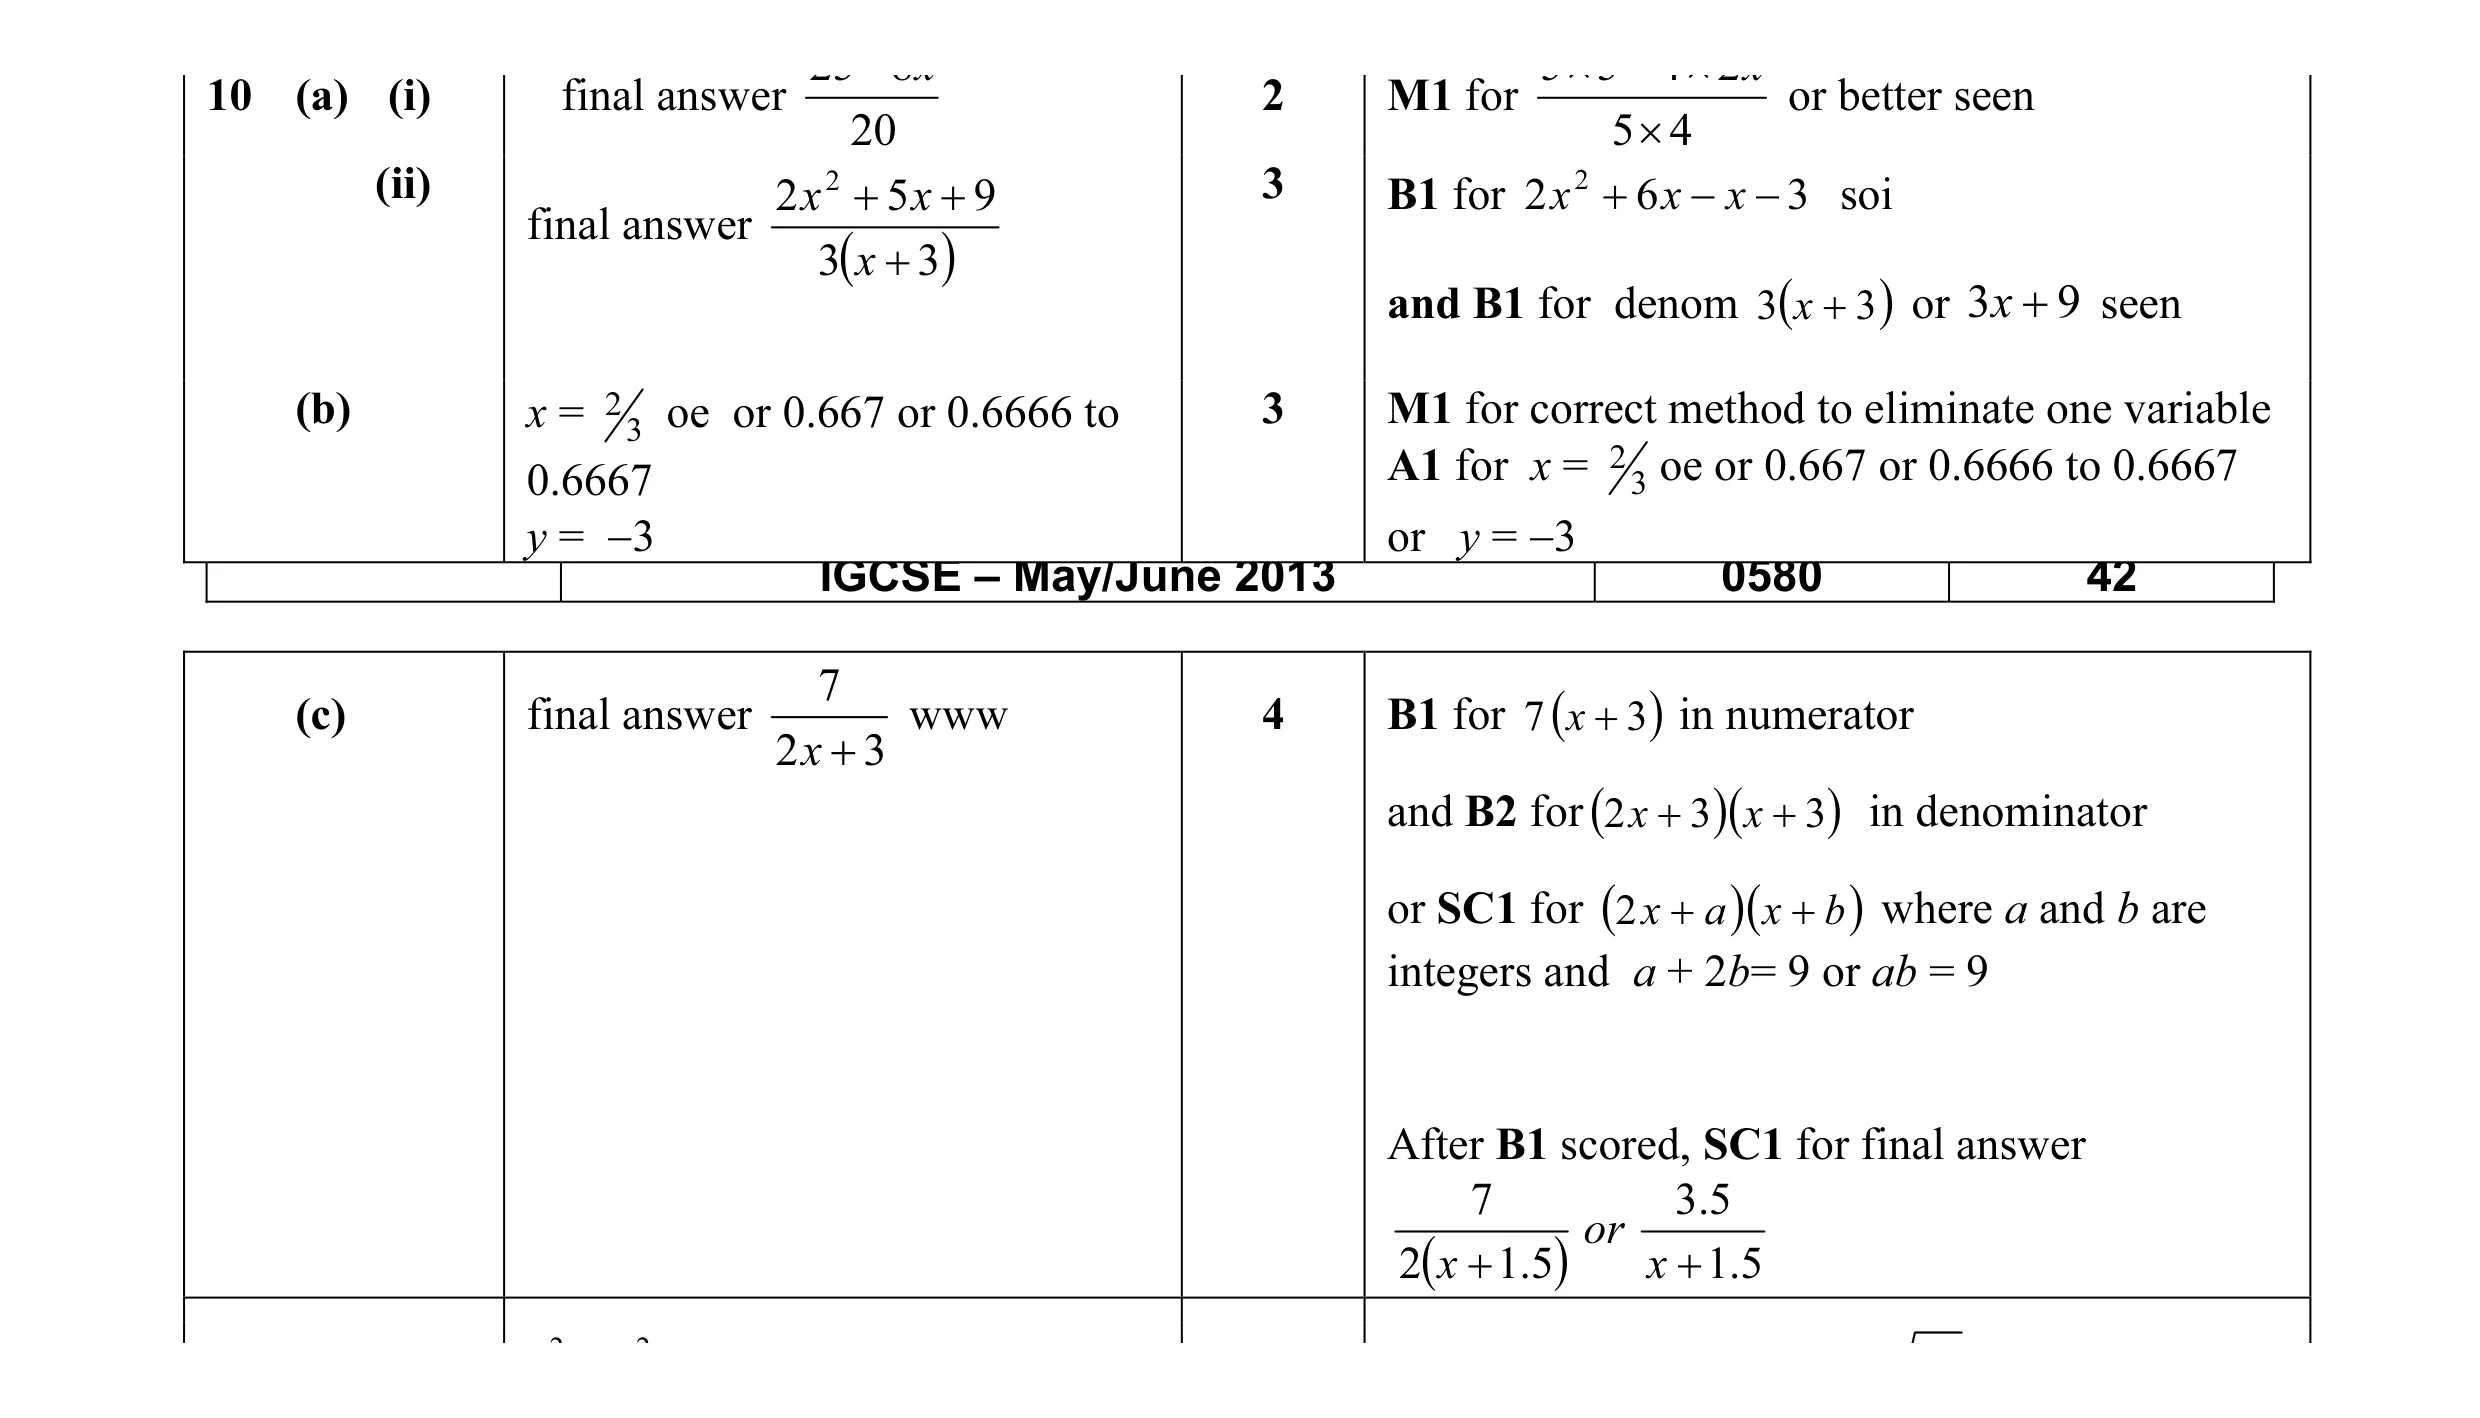 12
12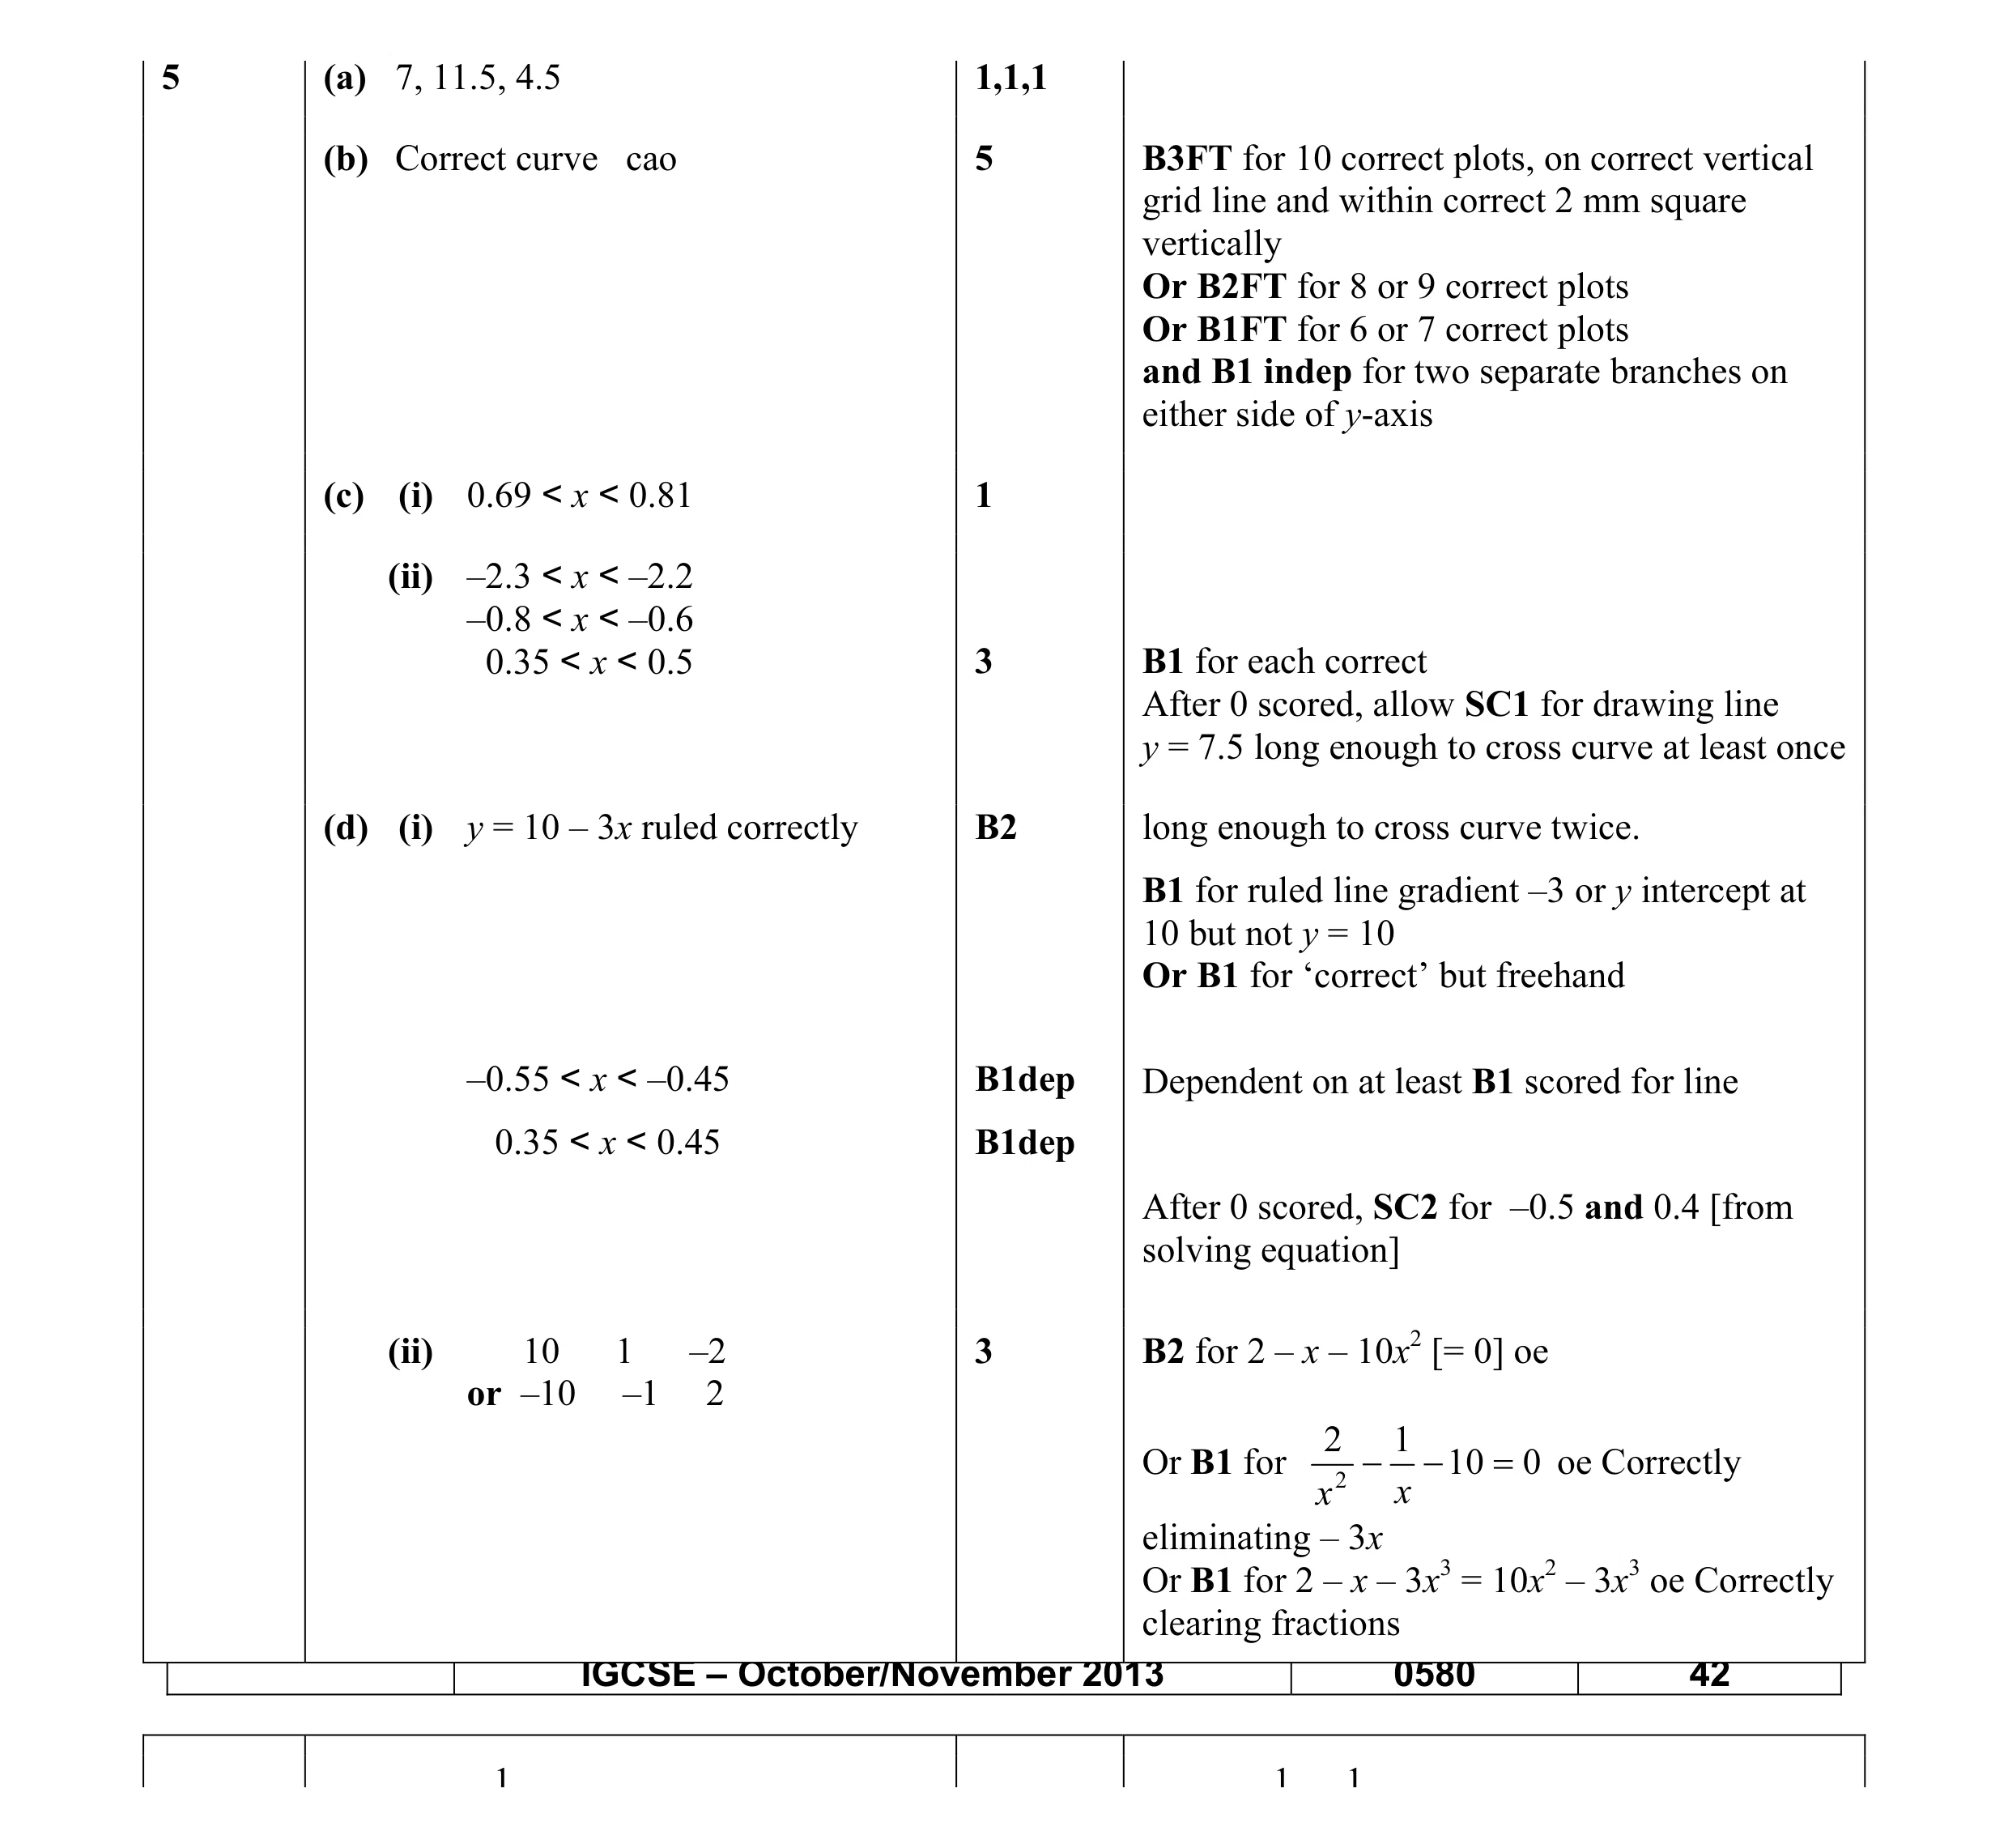 19
19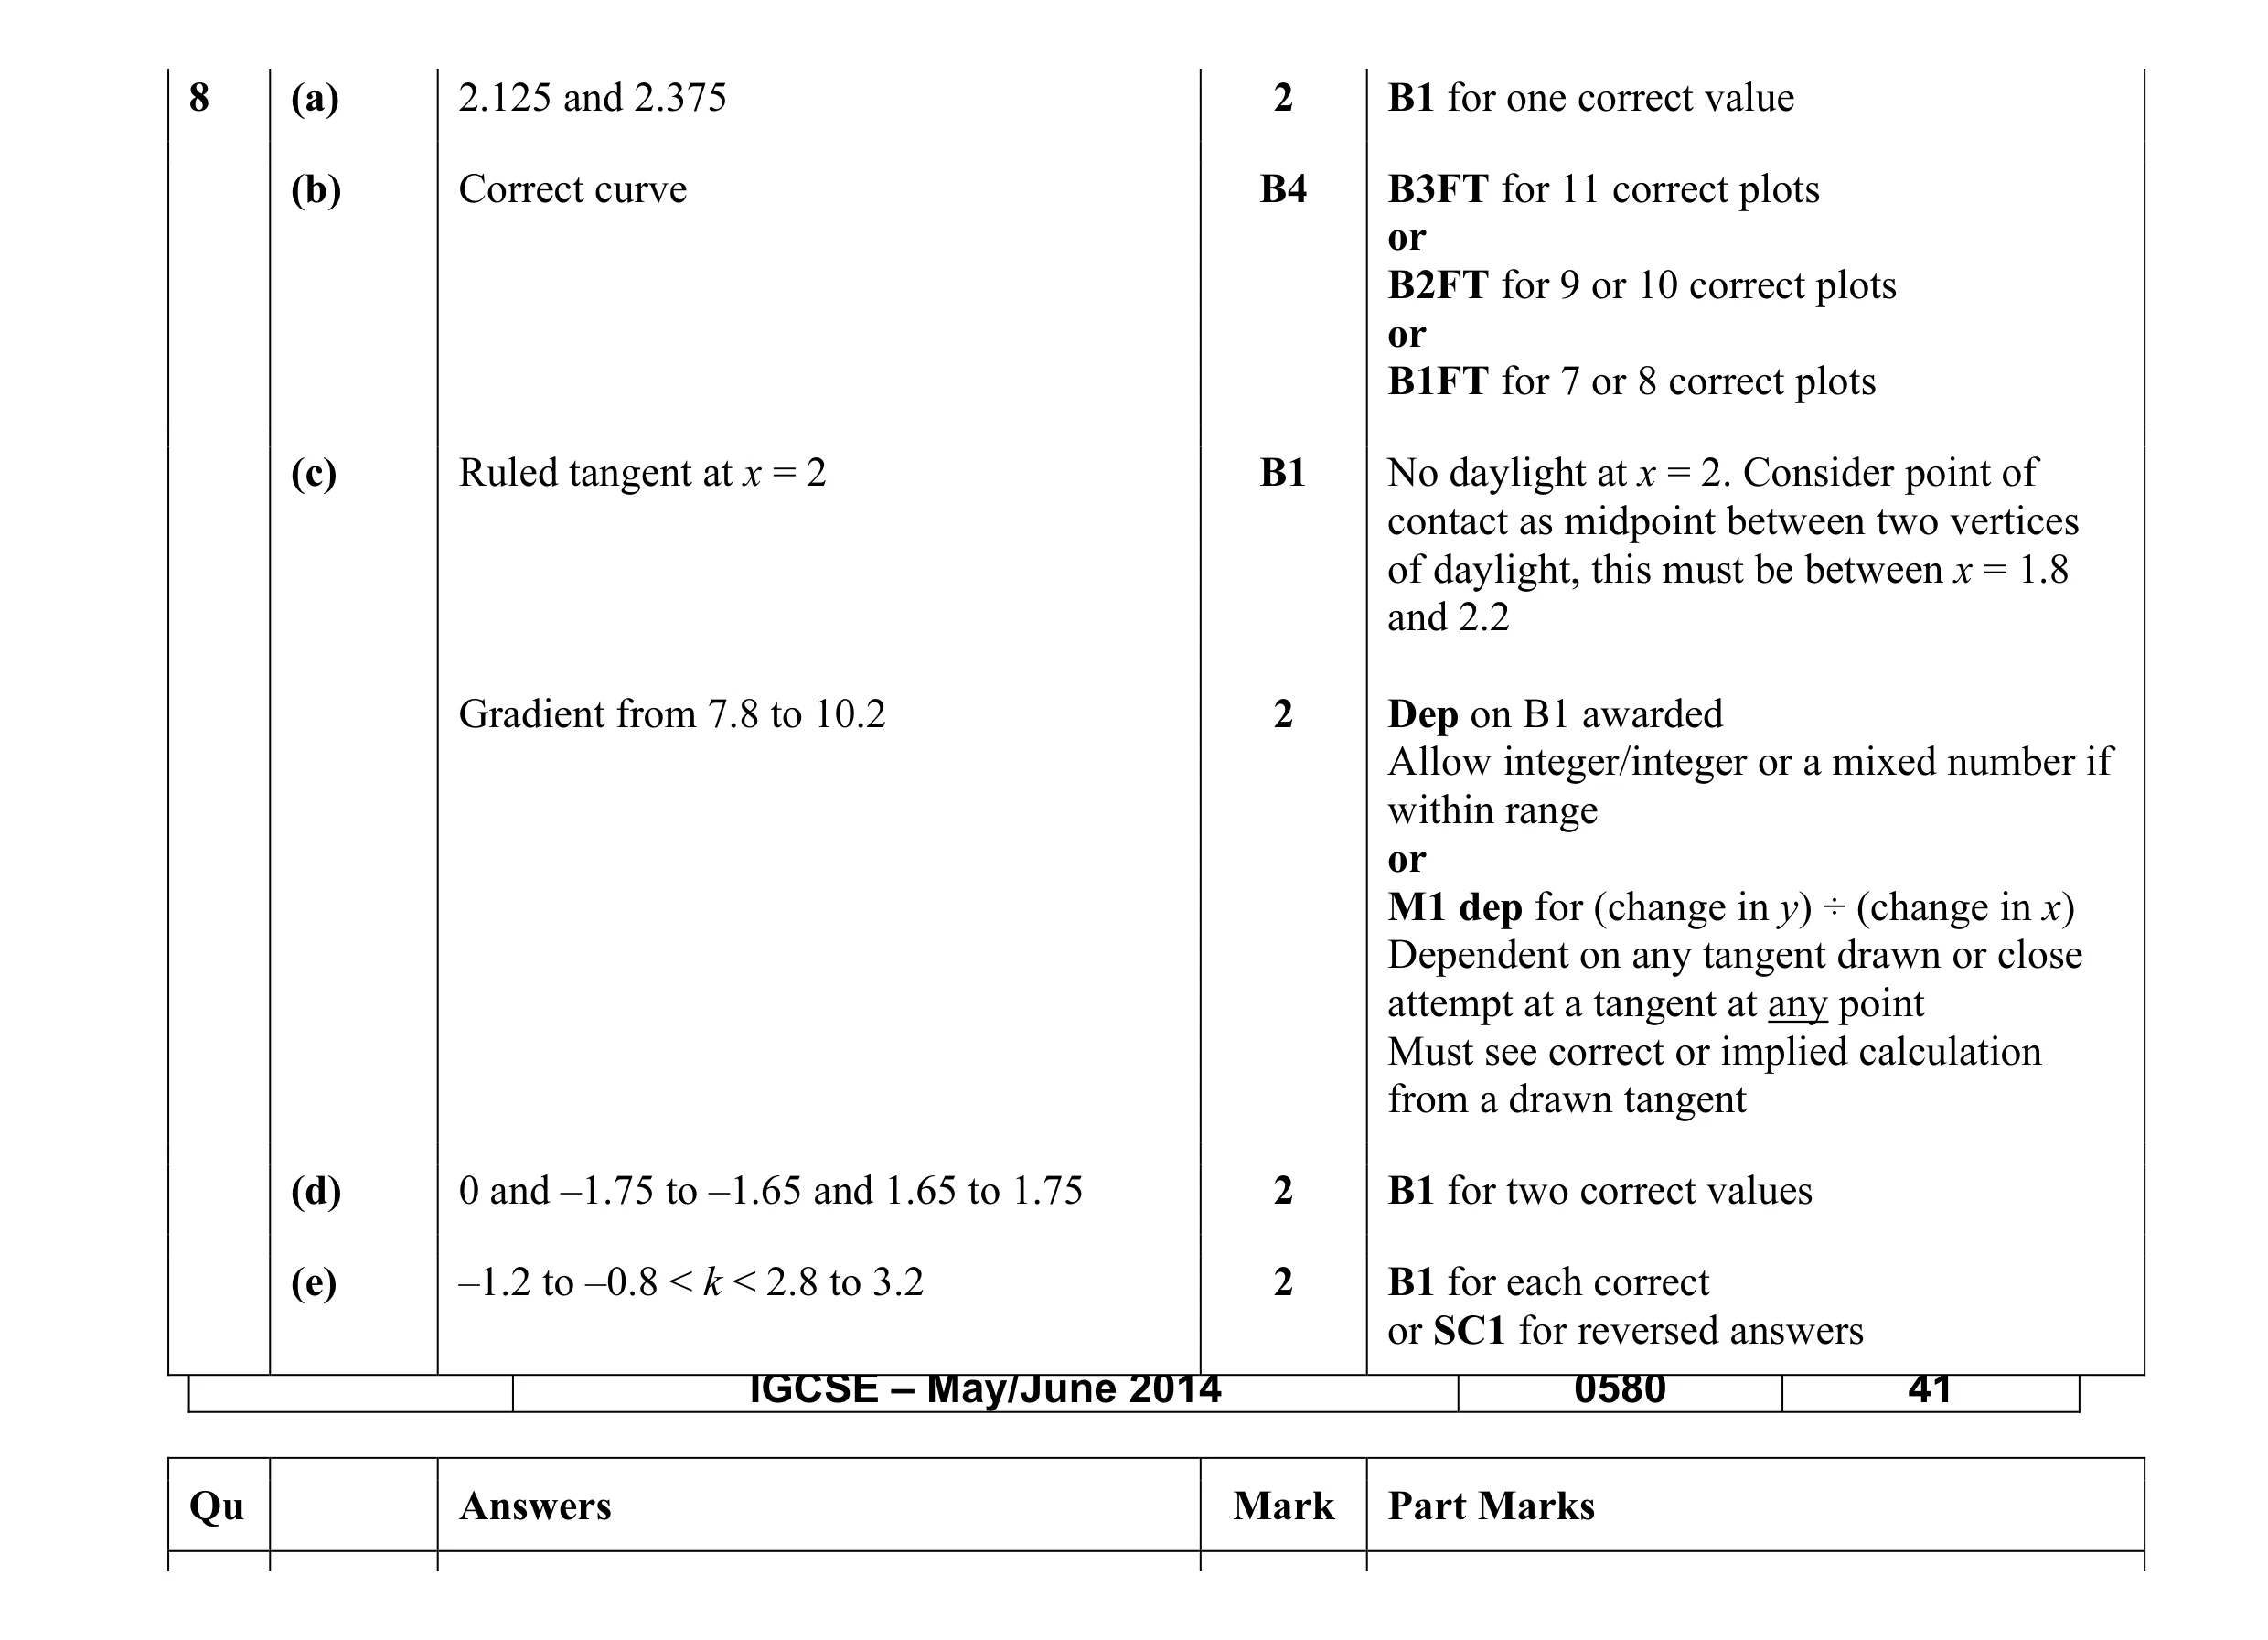 13
13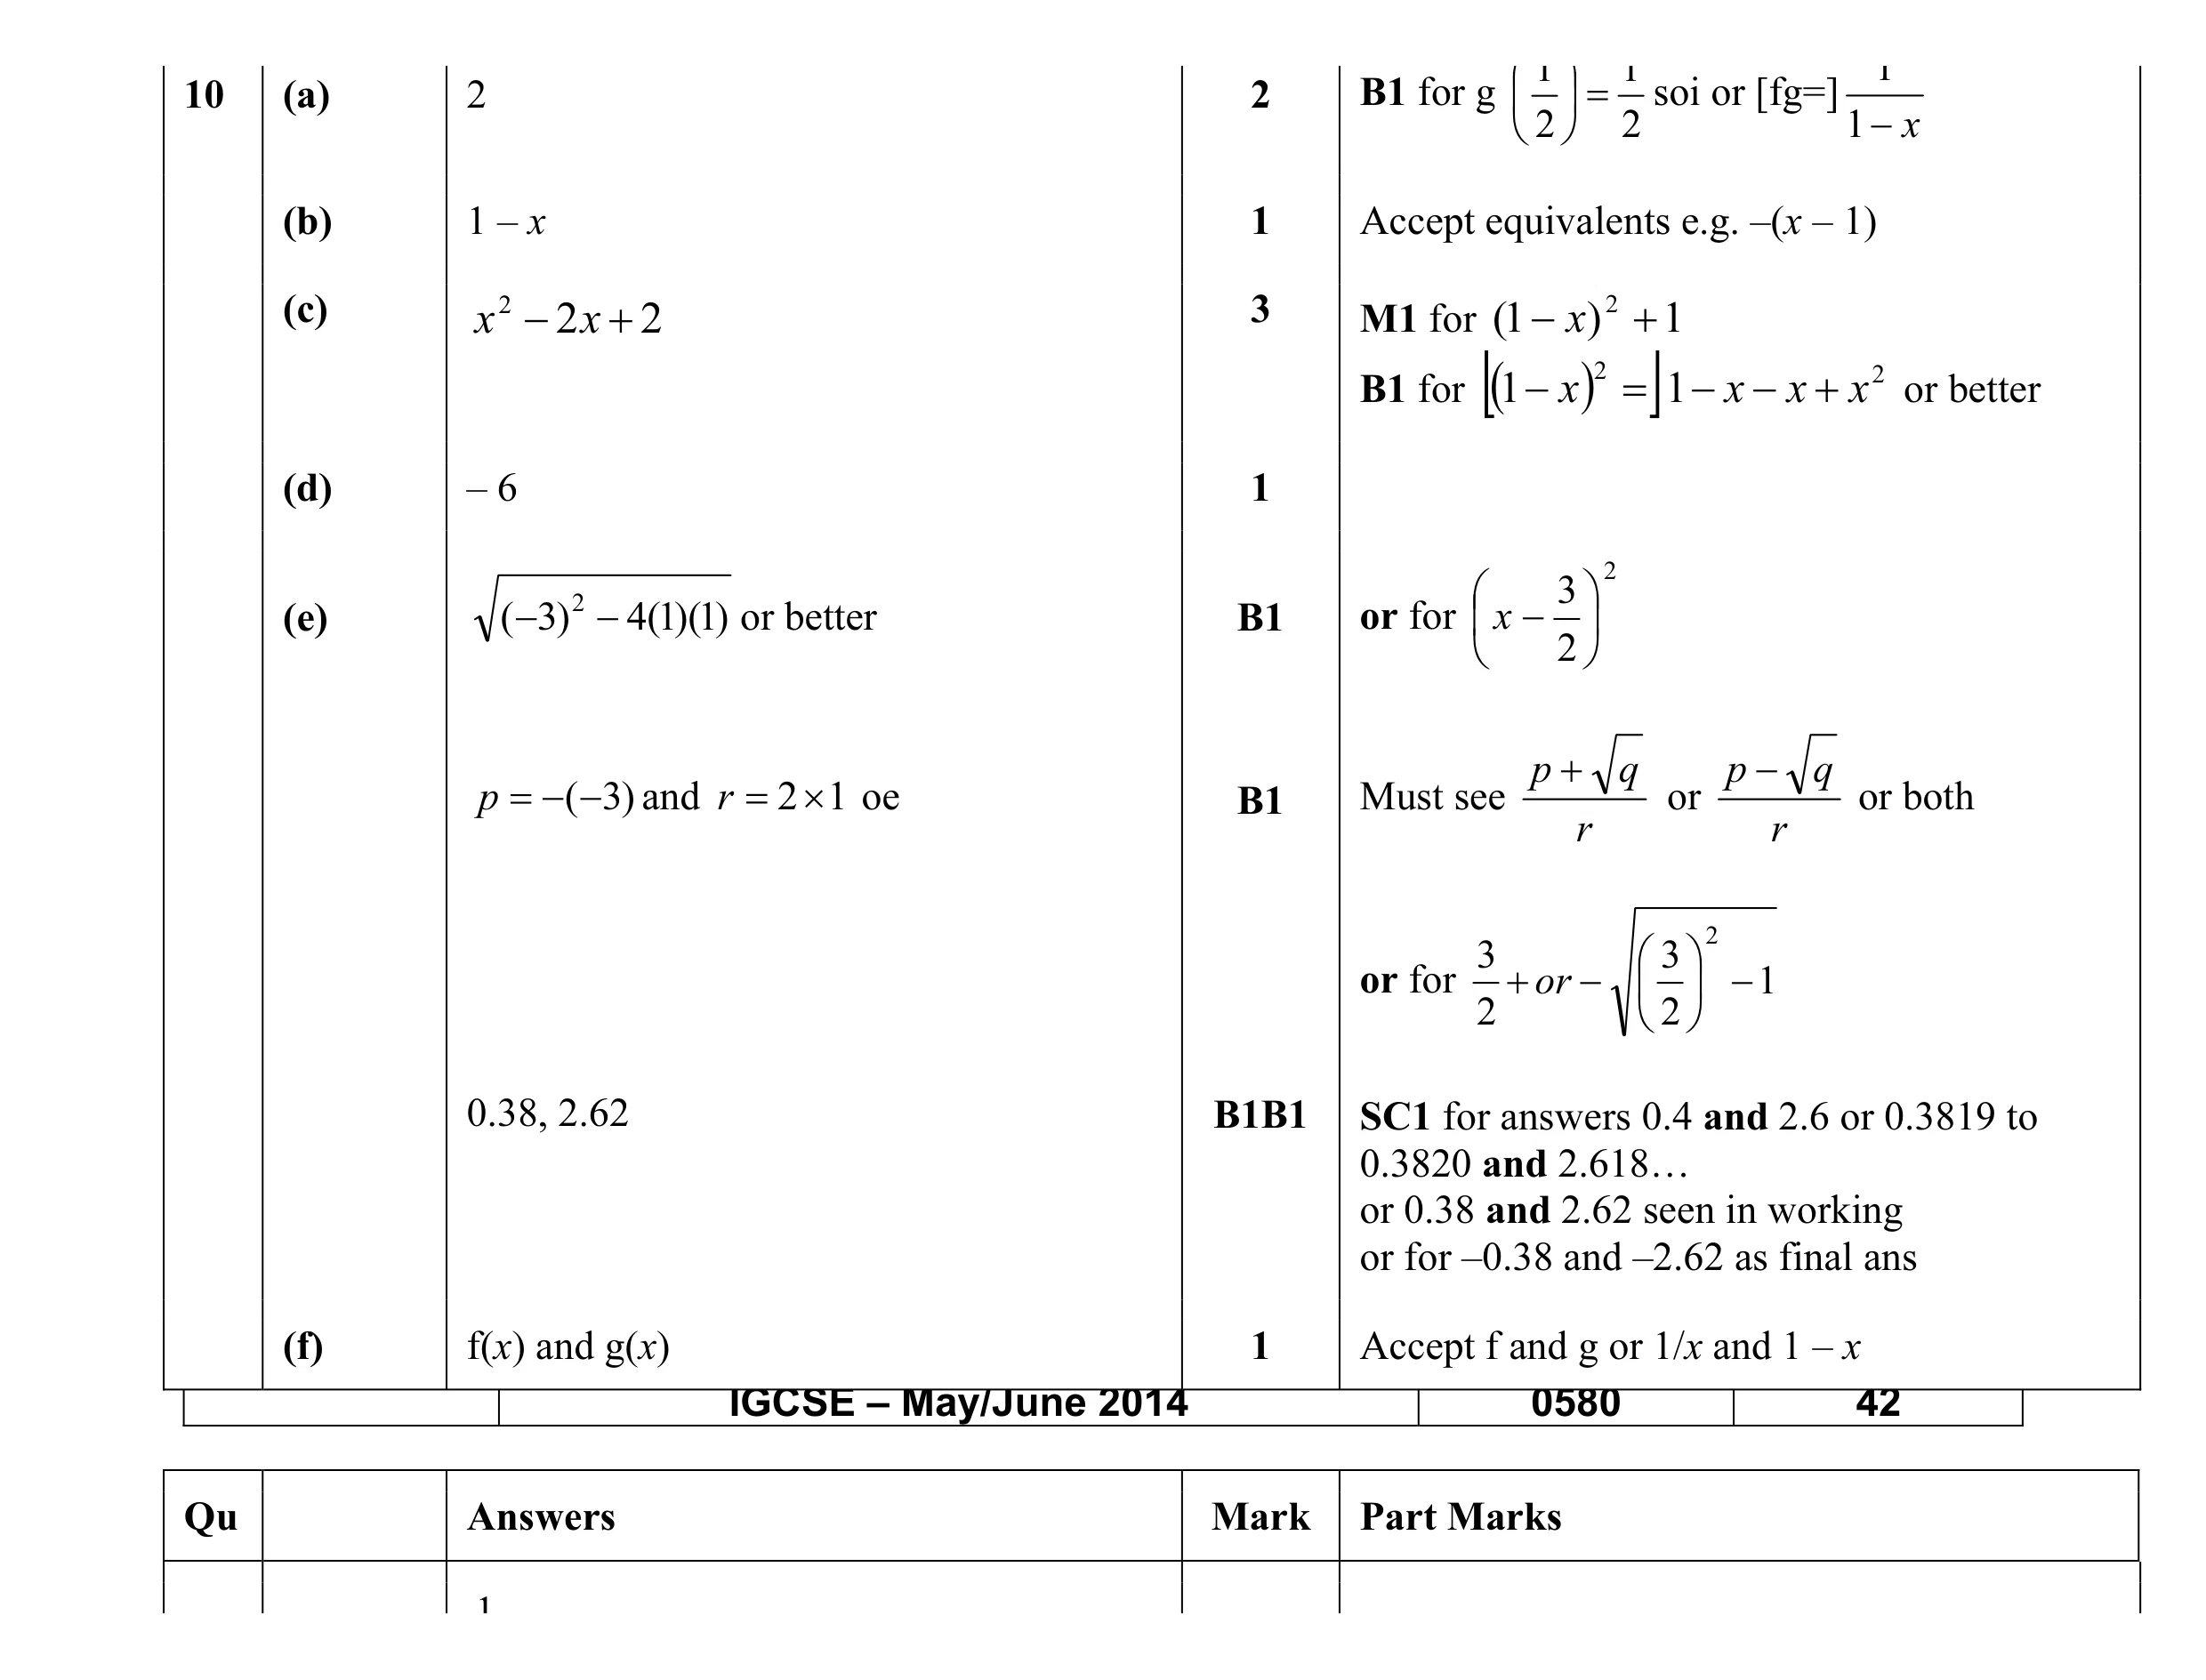 12
12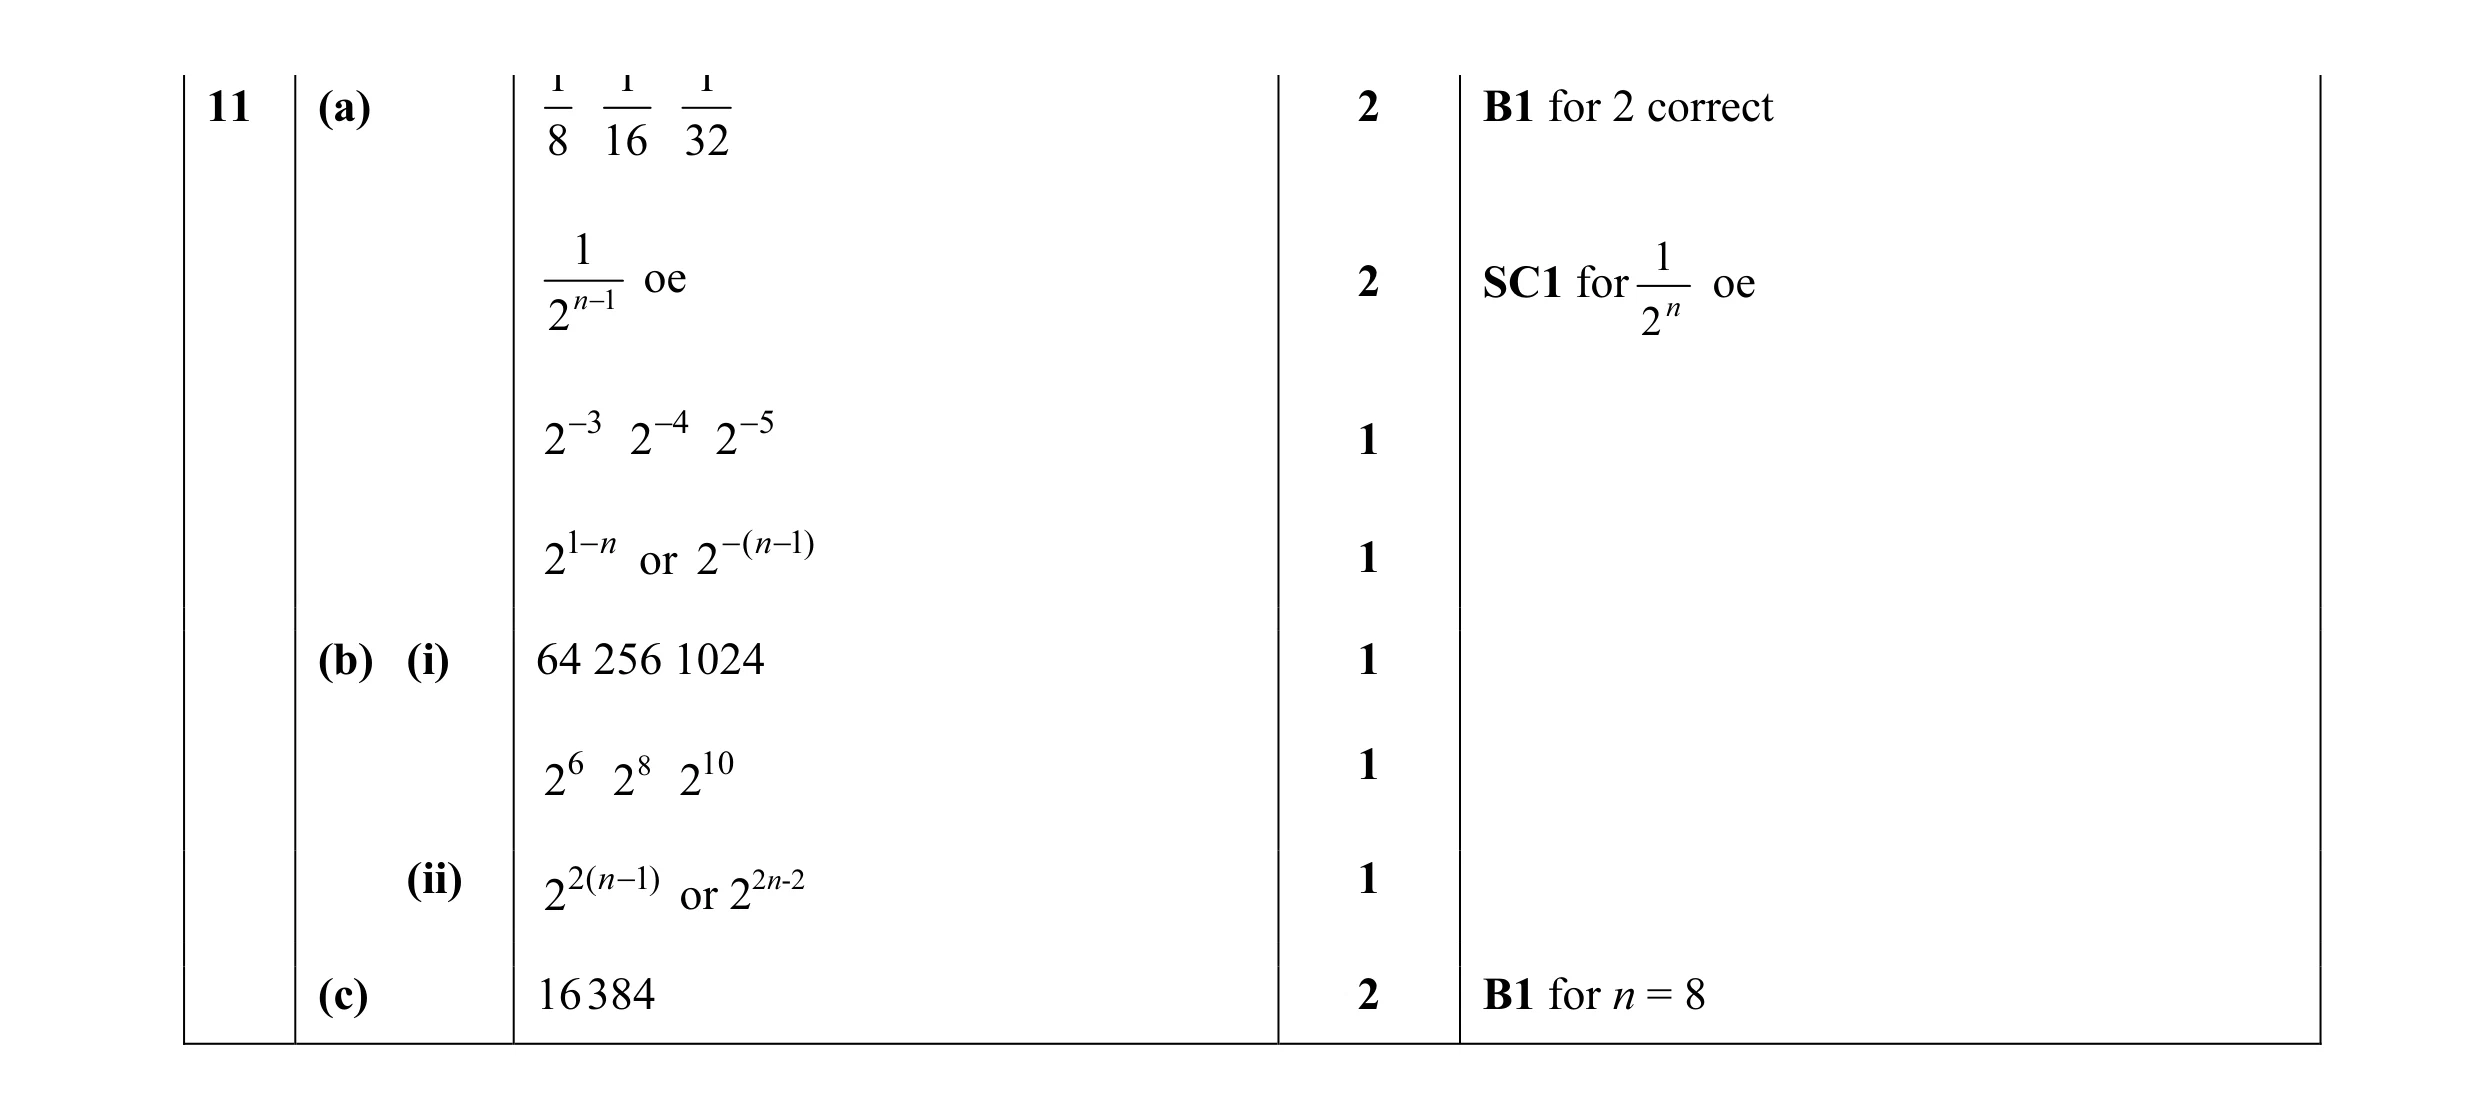 11
11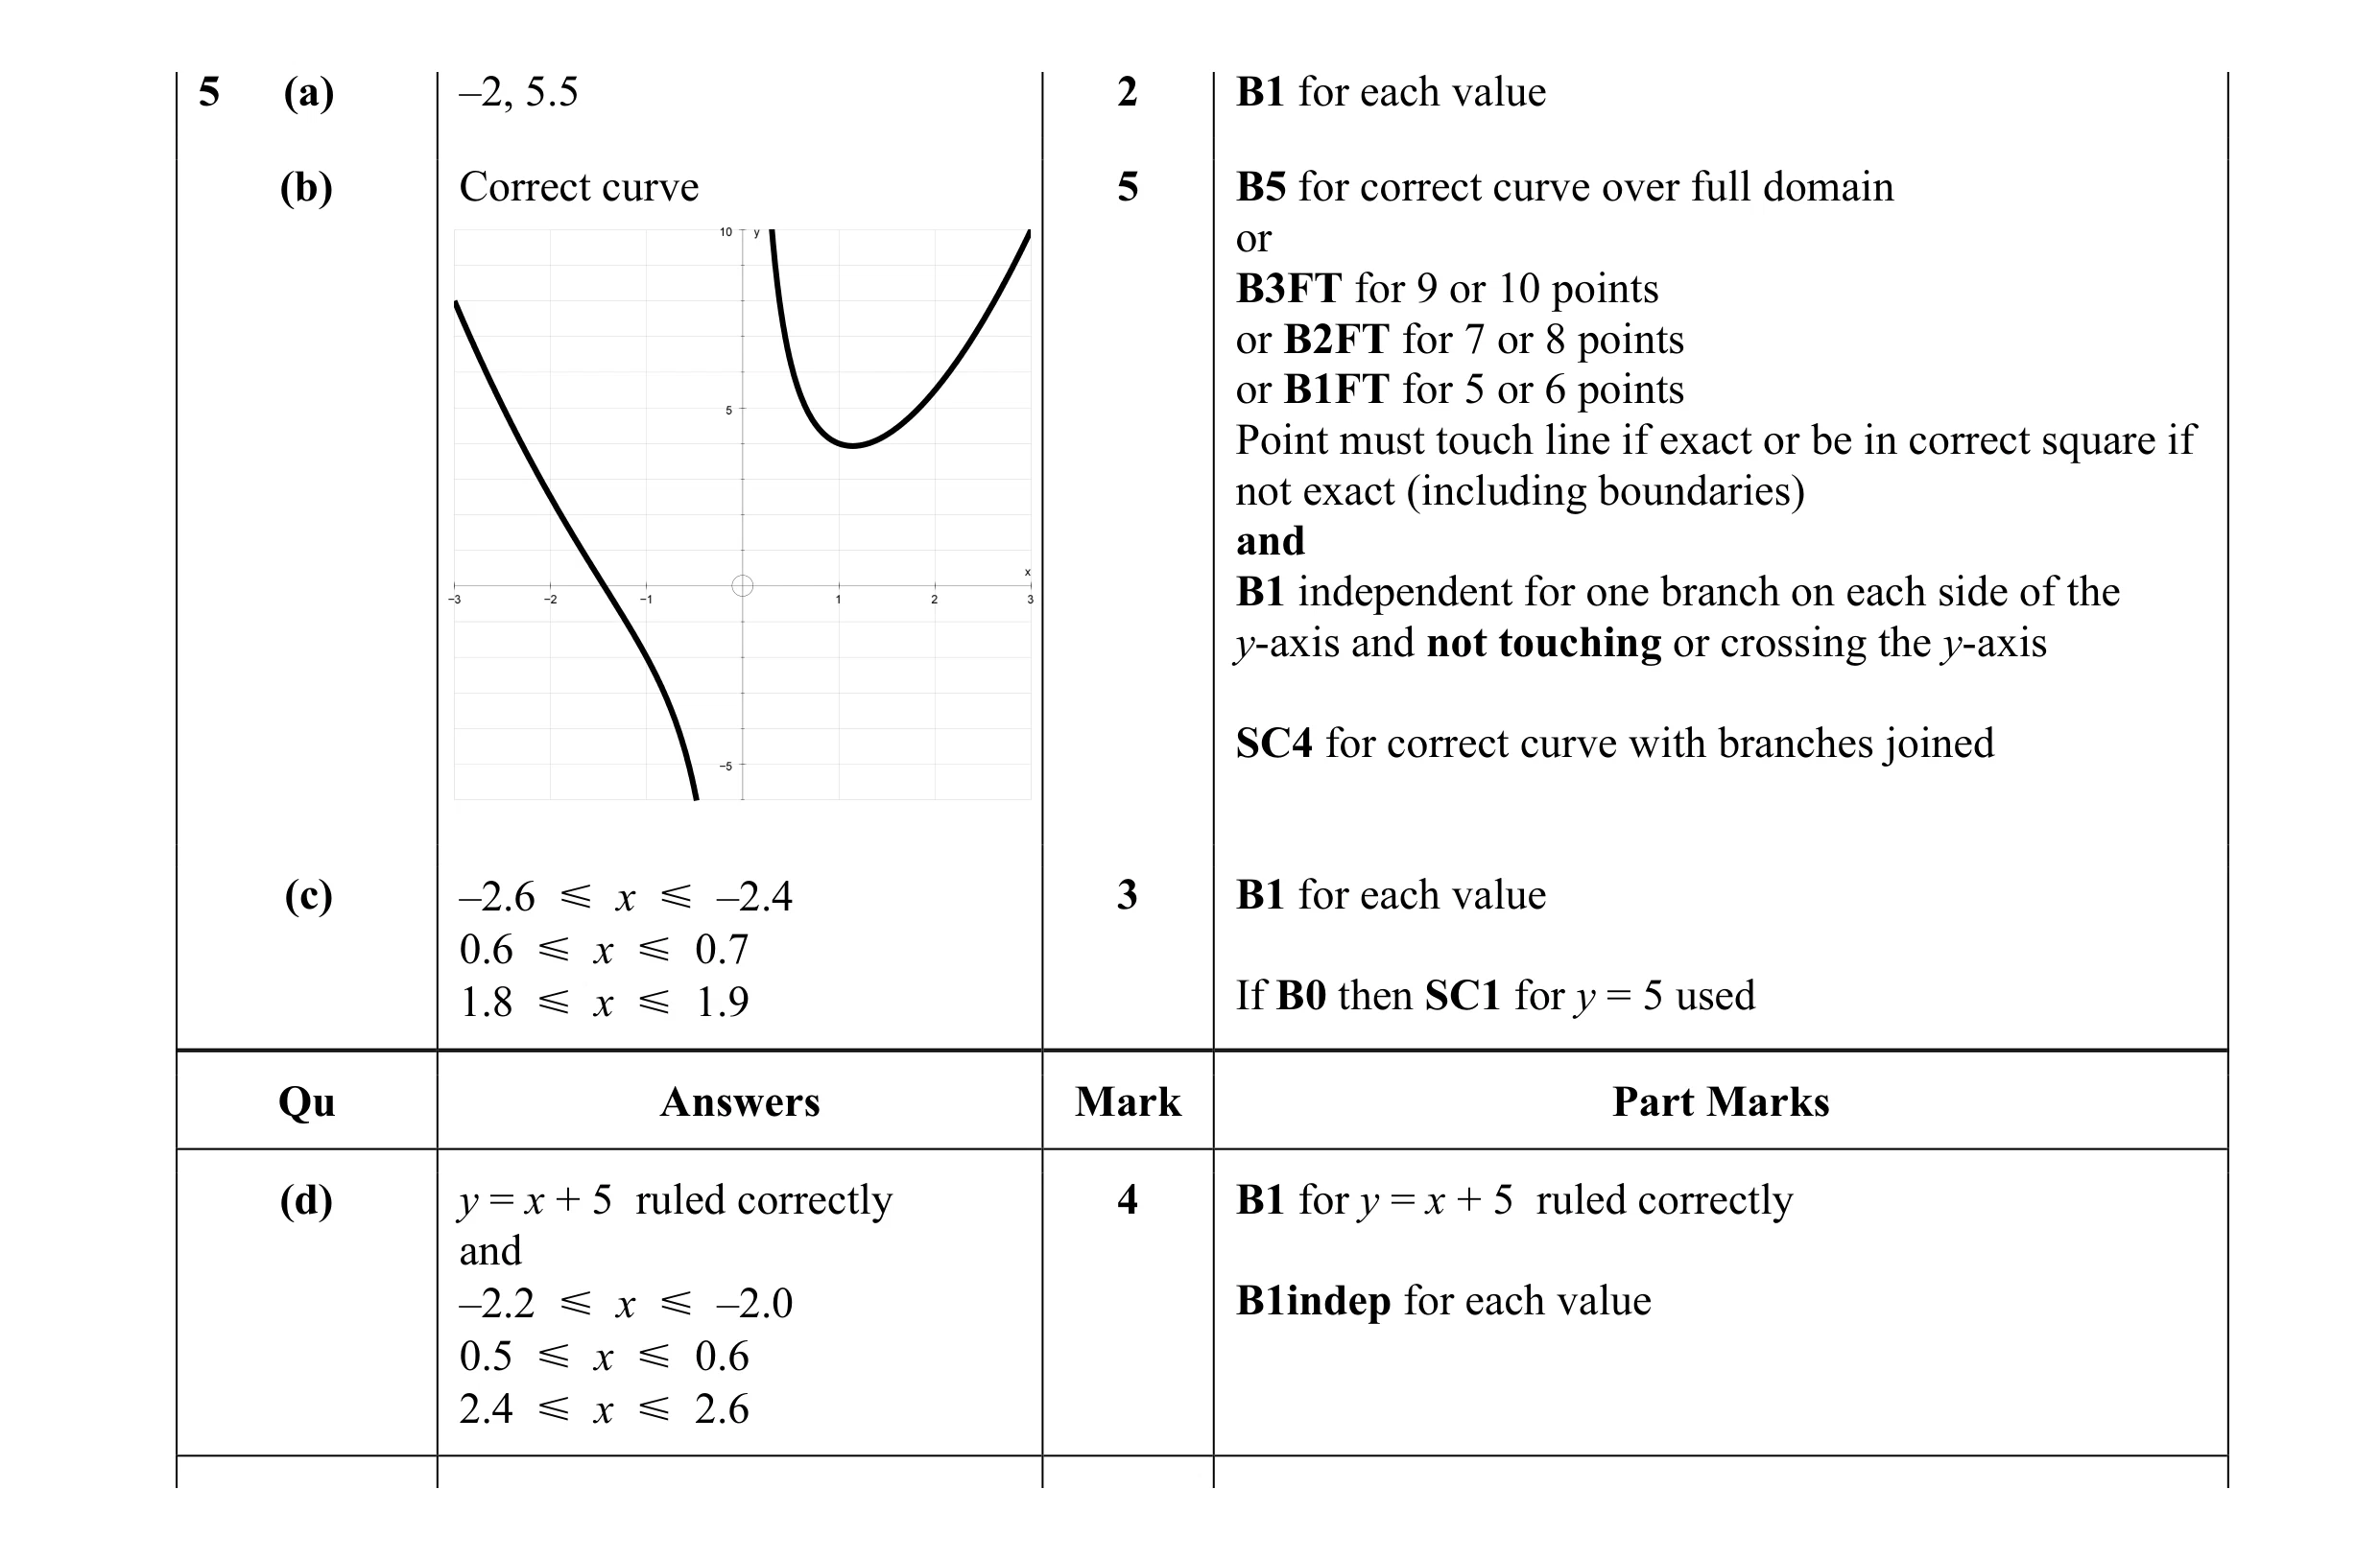 14
14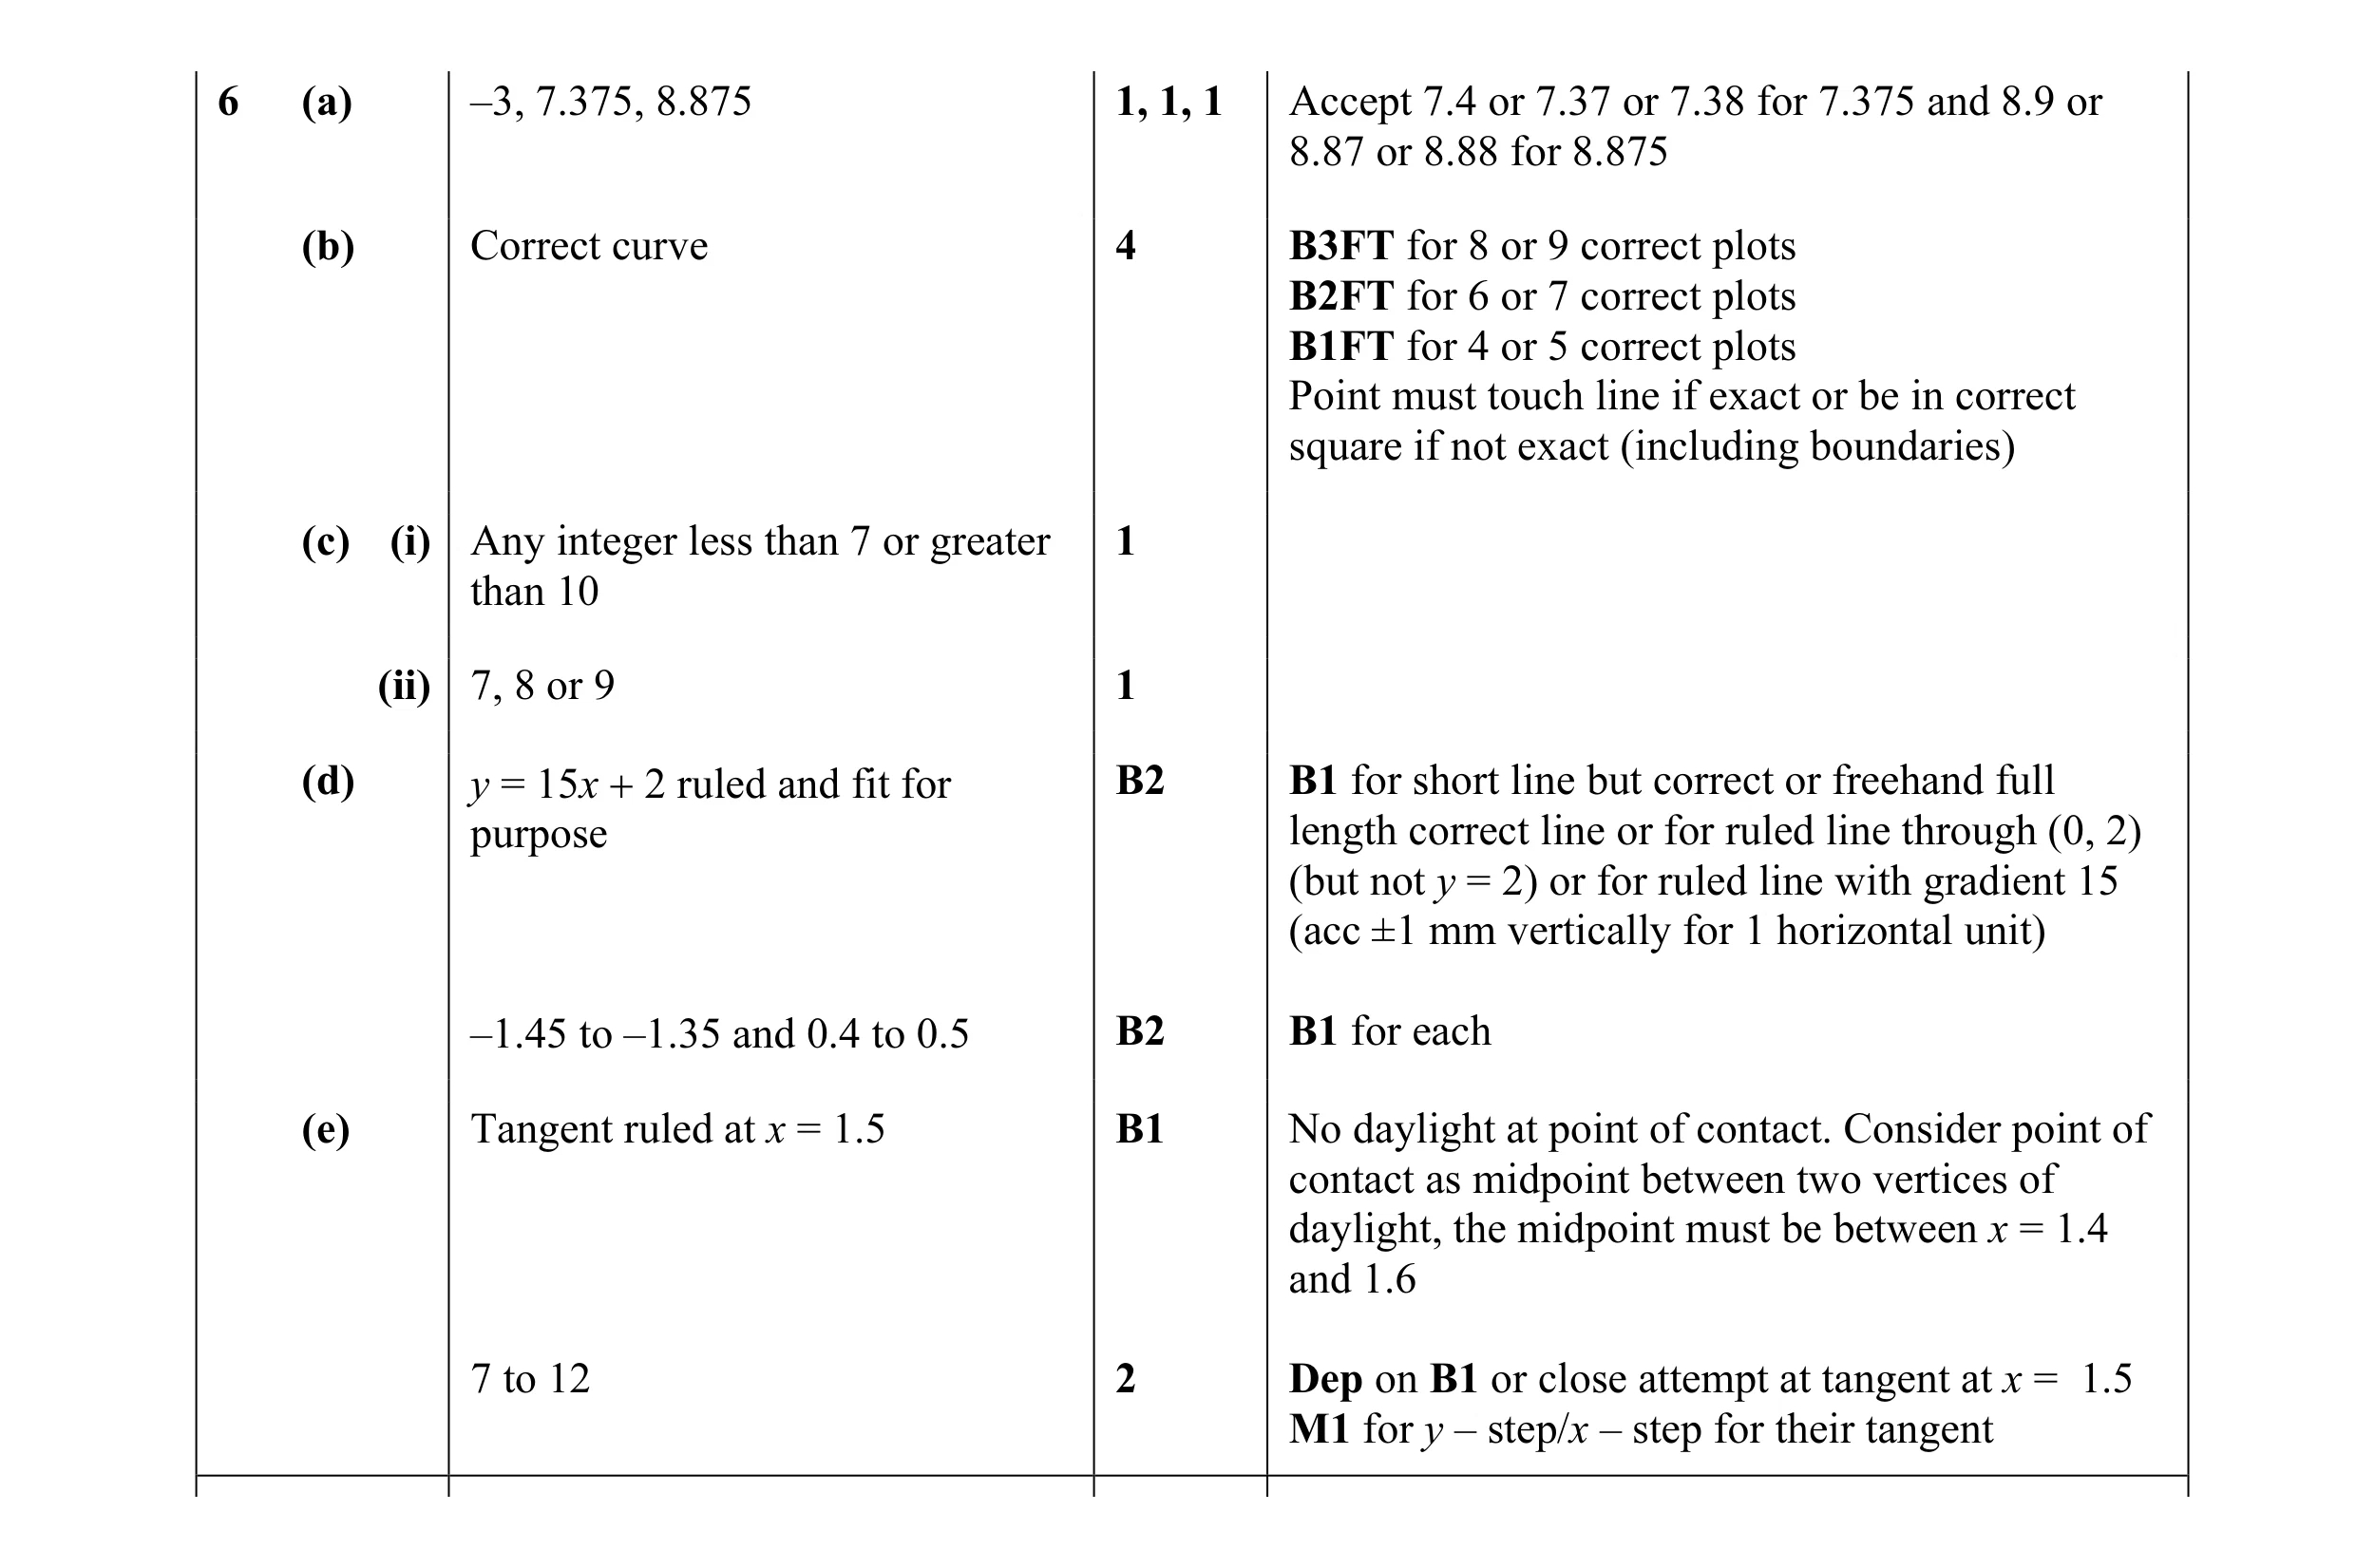 16
16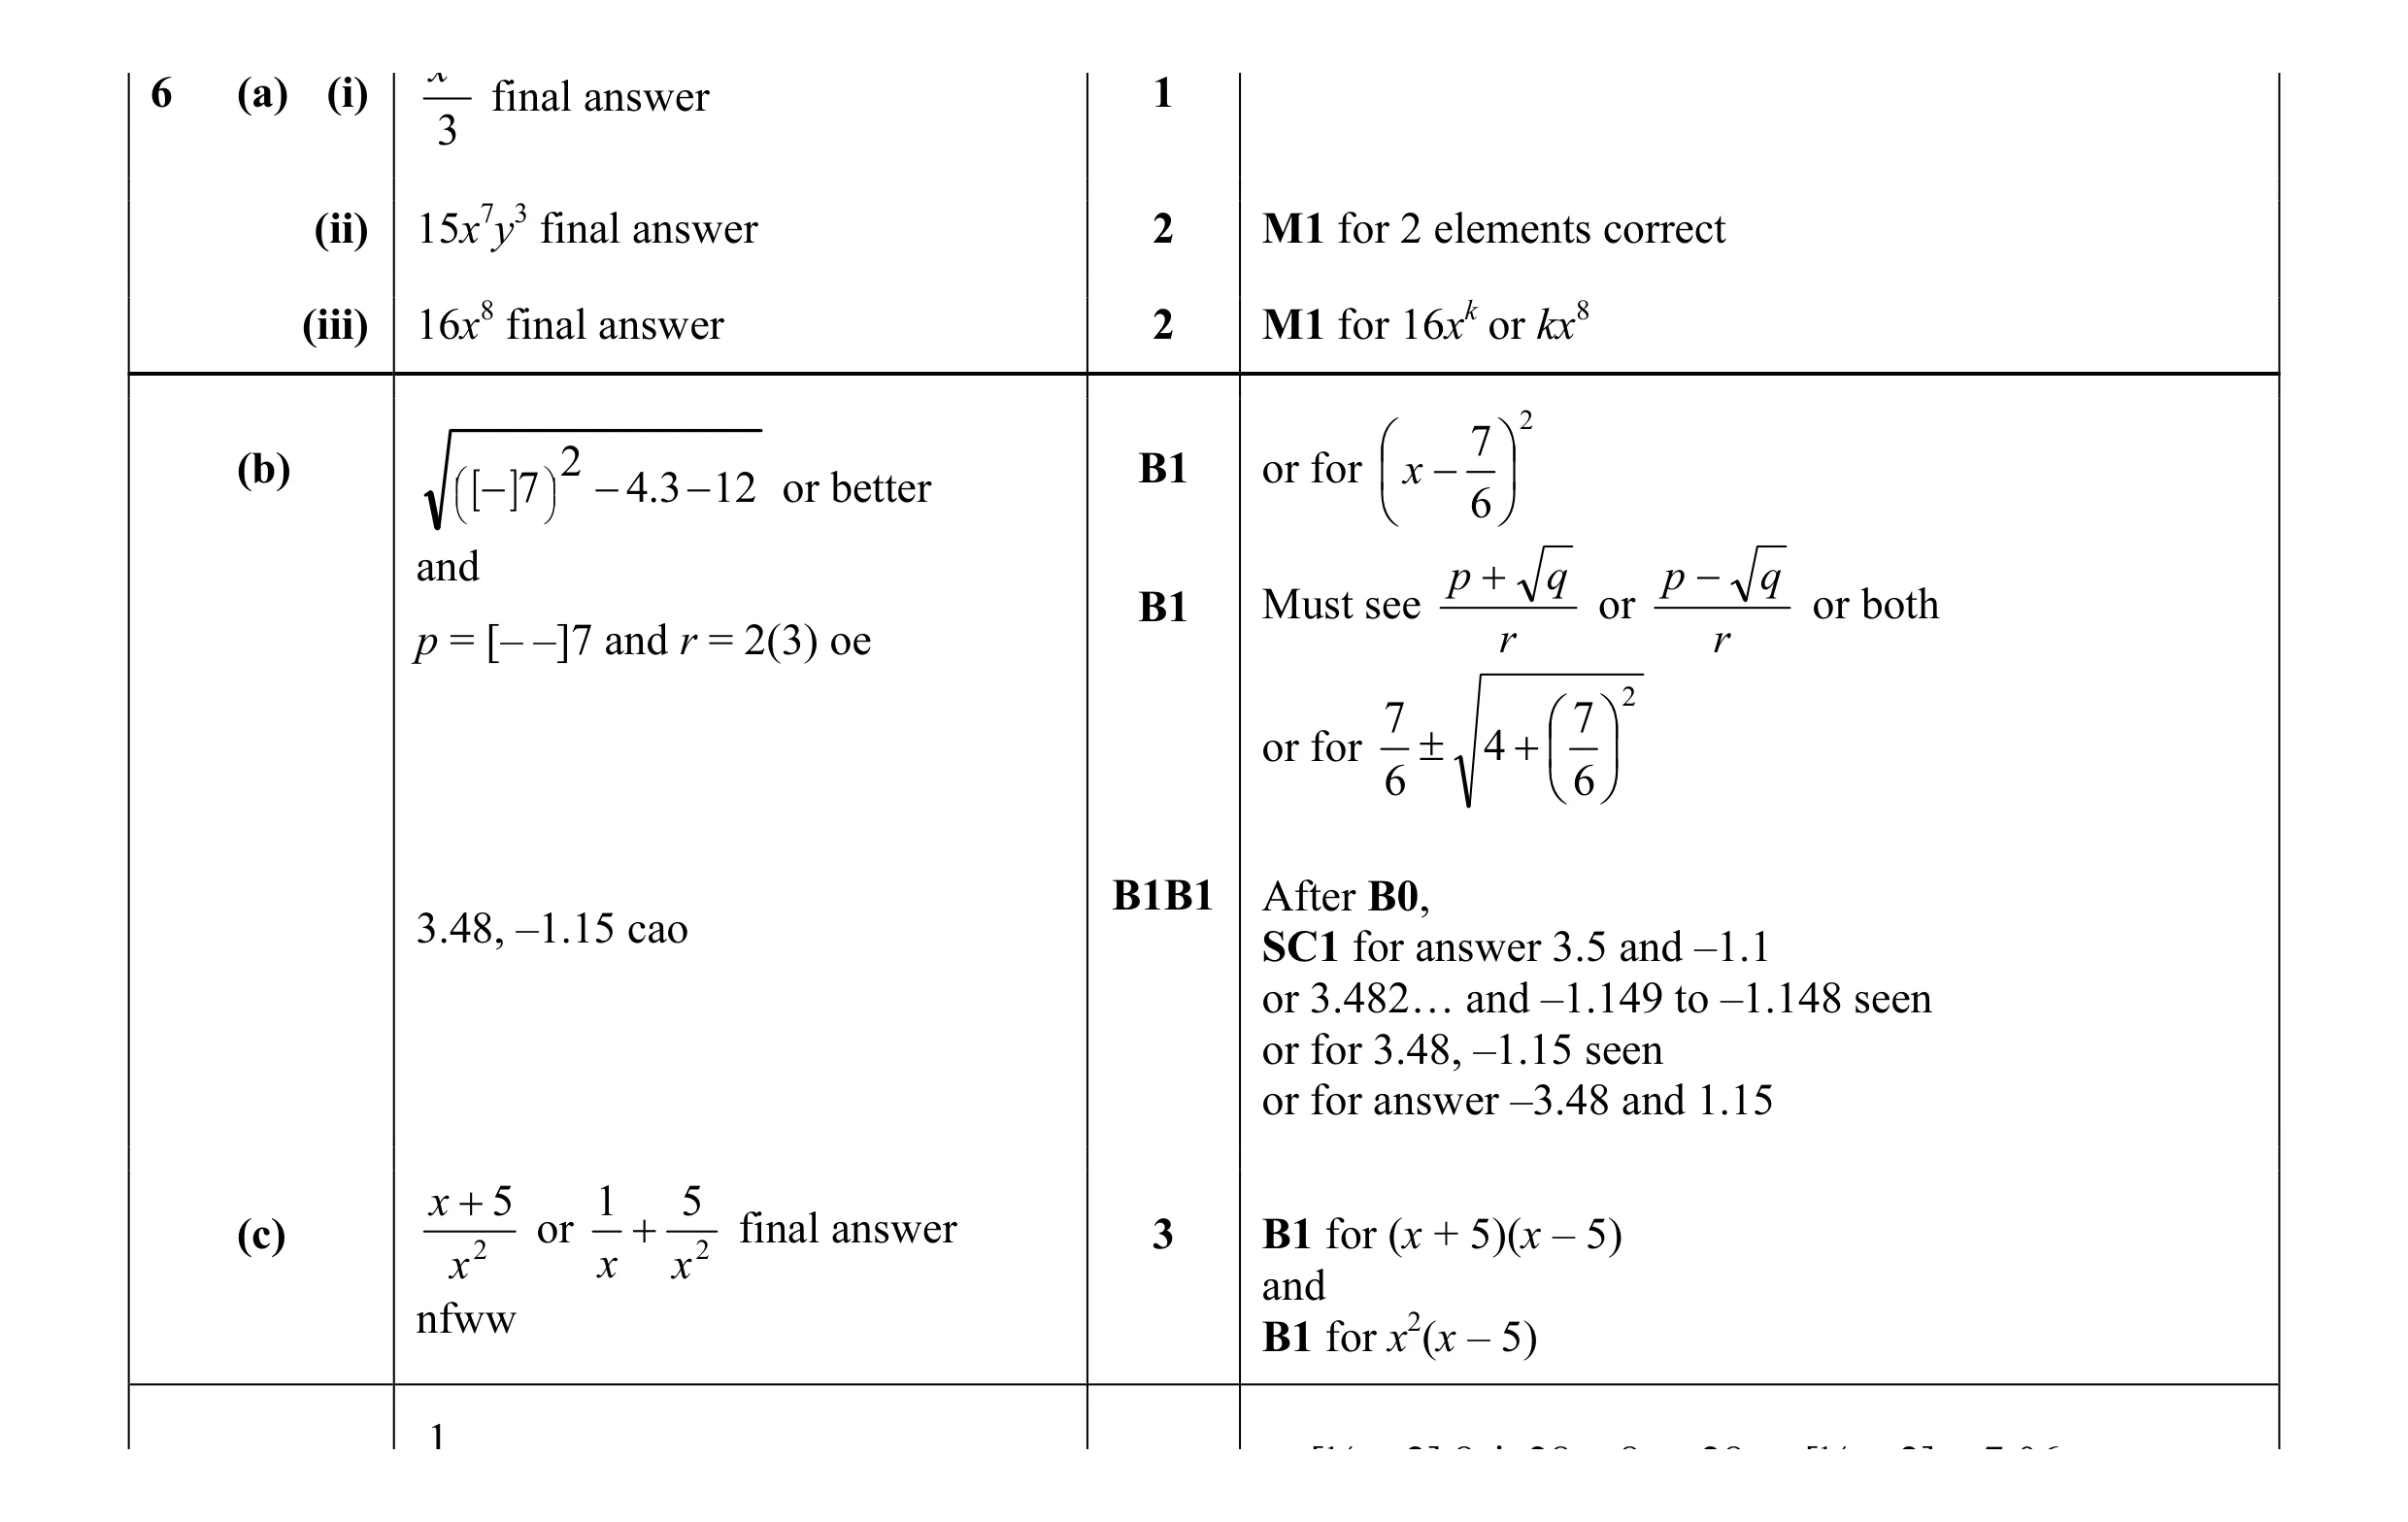 12
12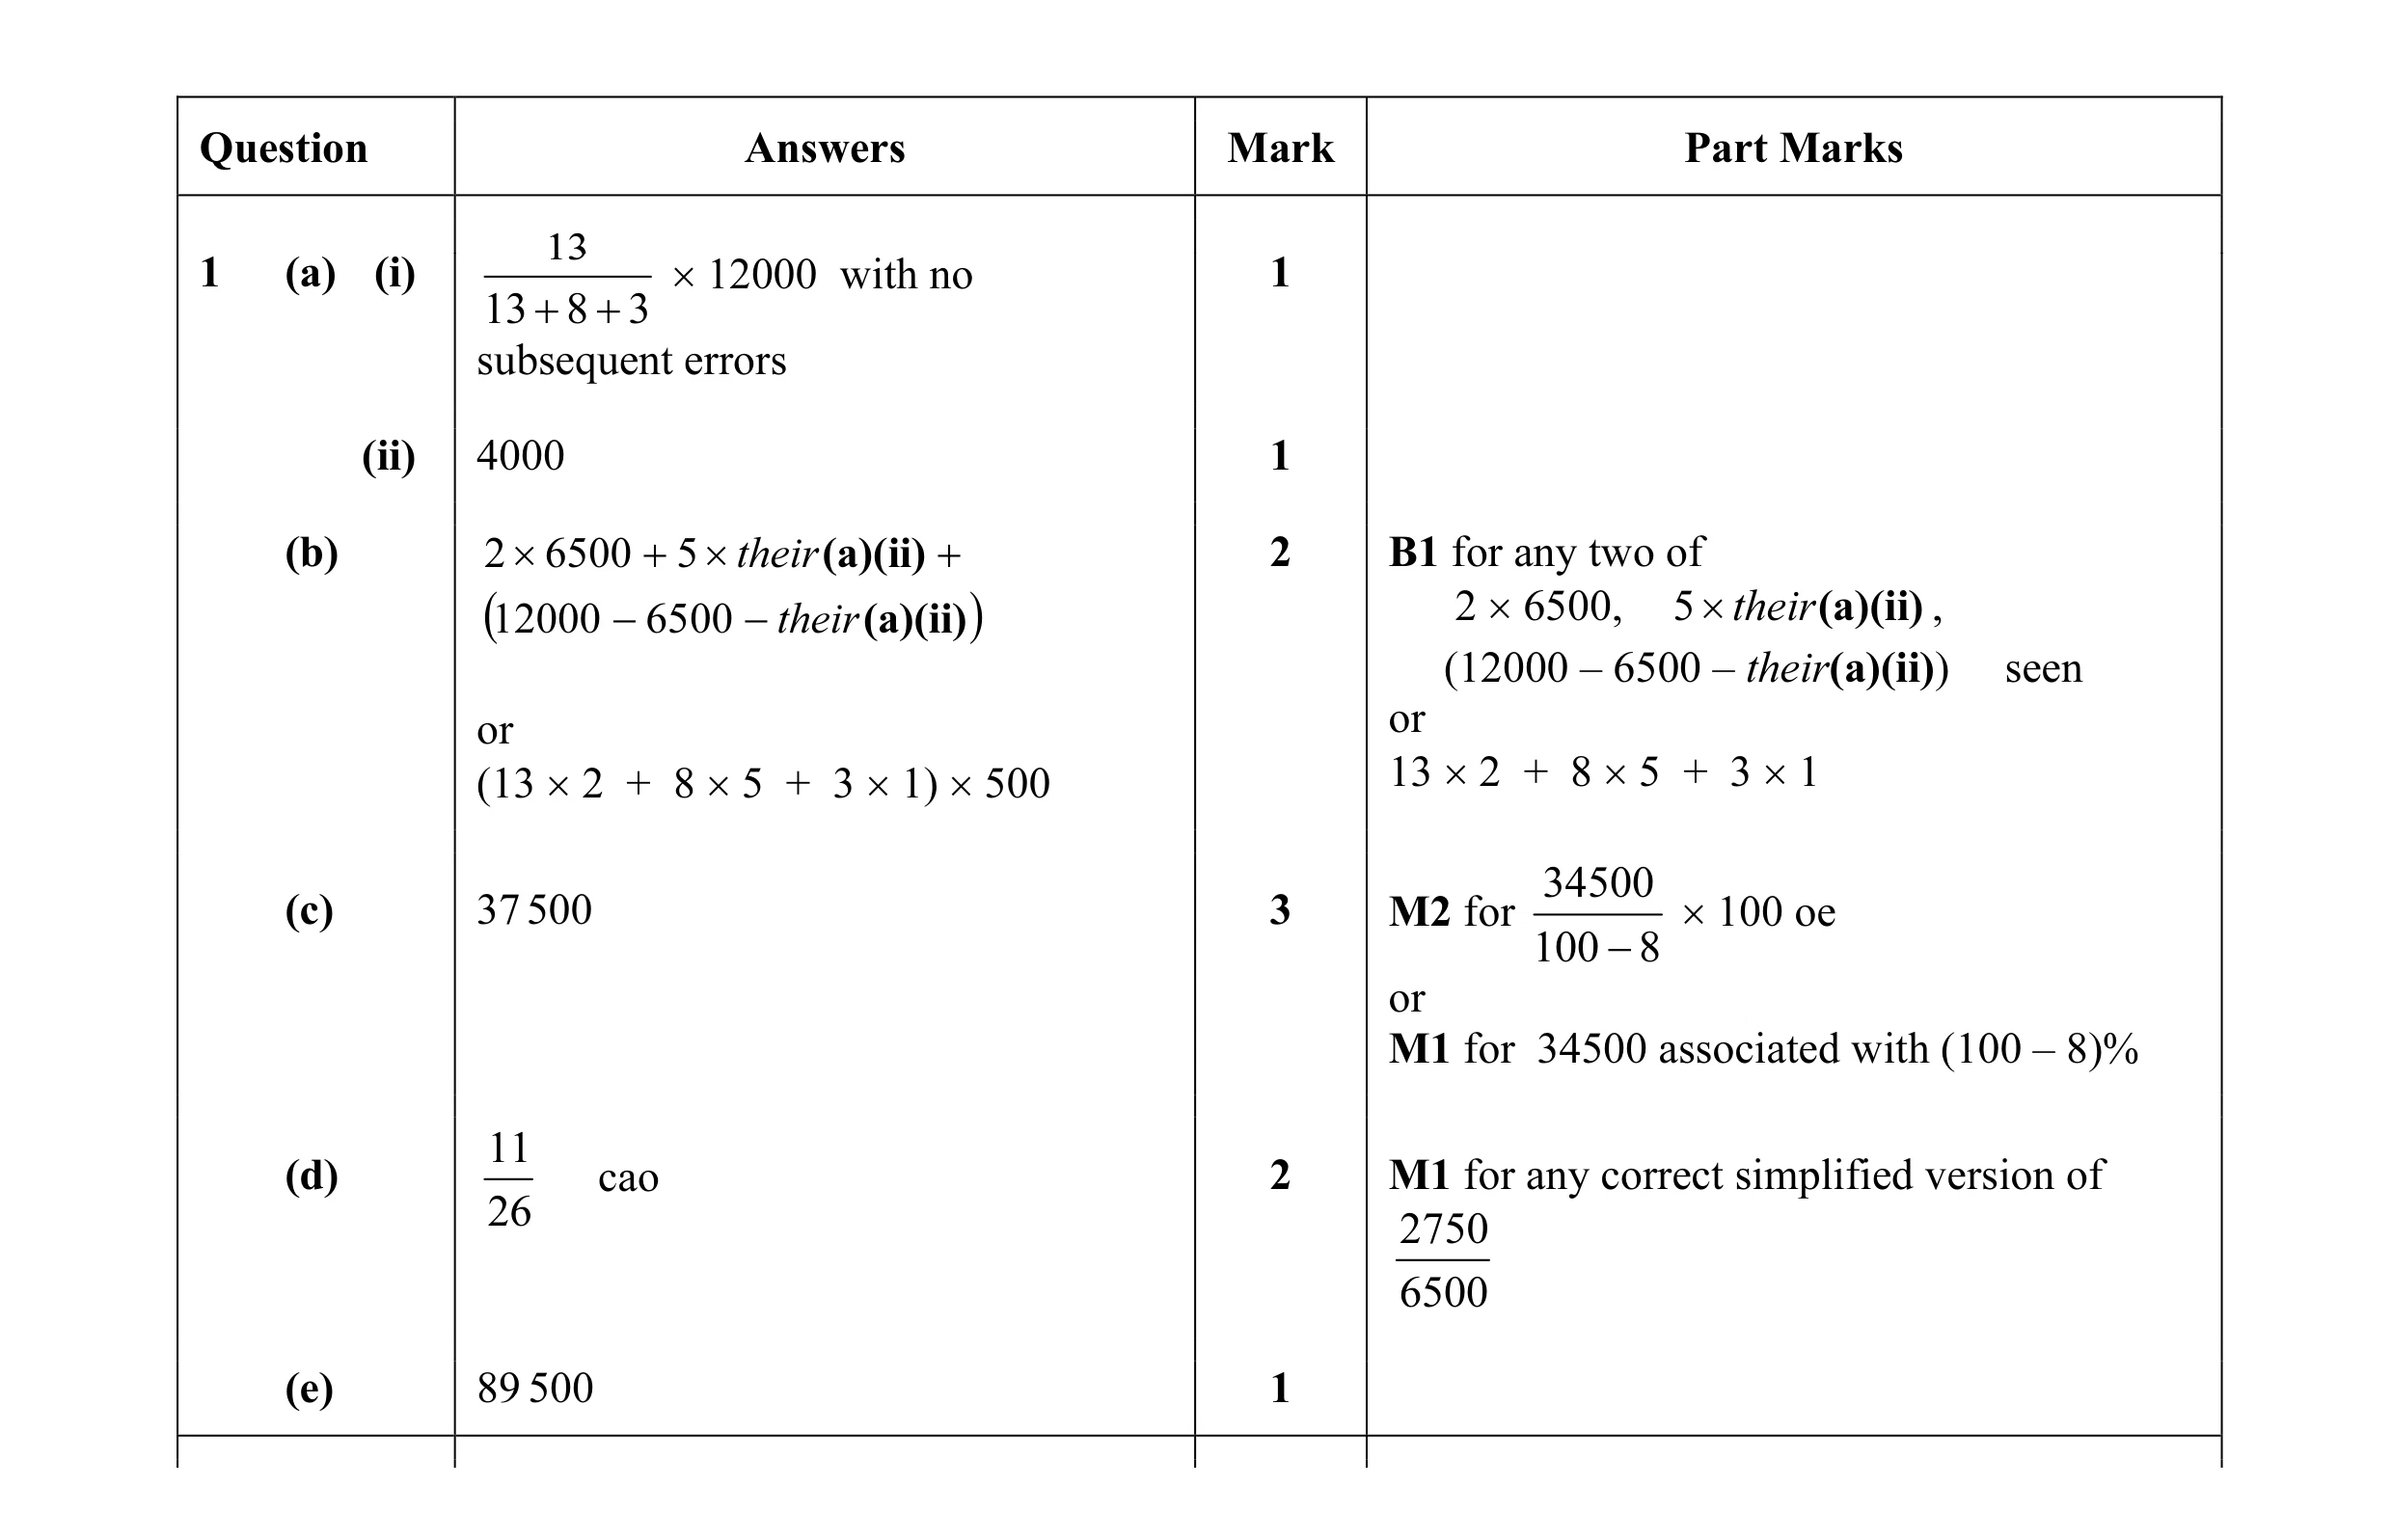 10
10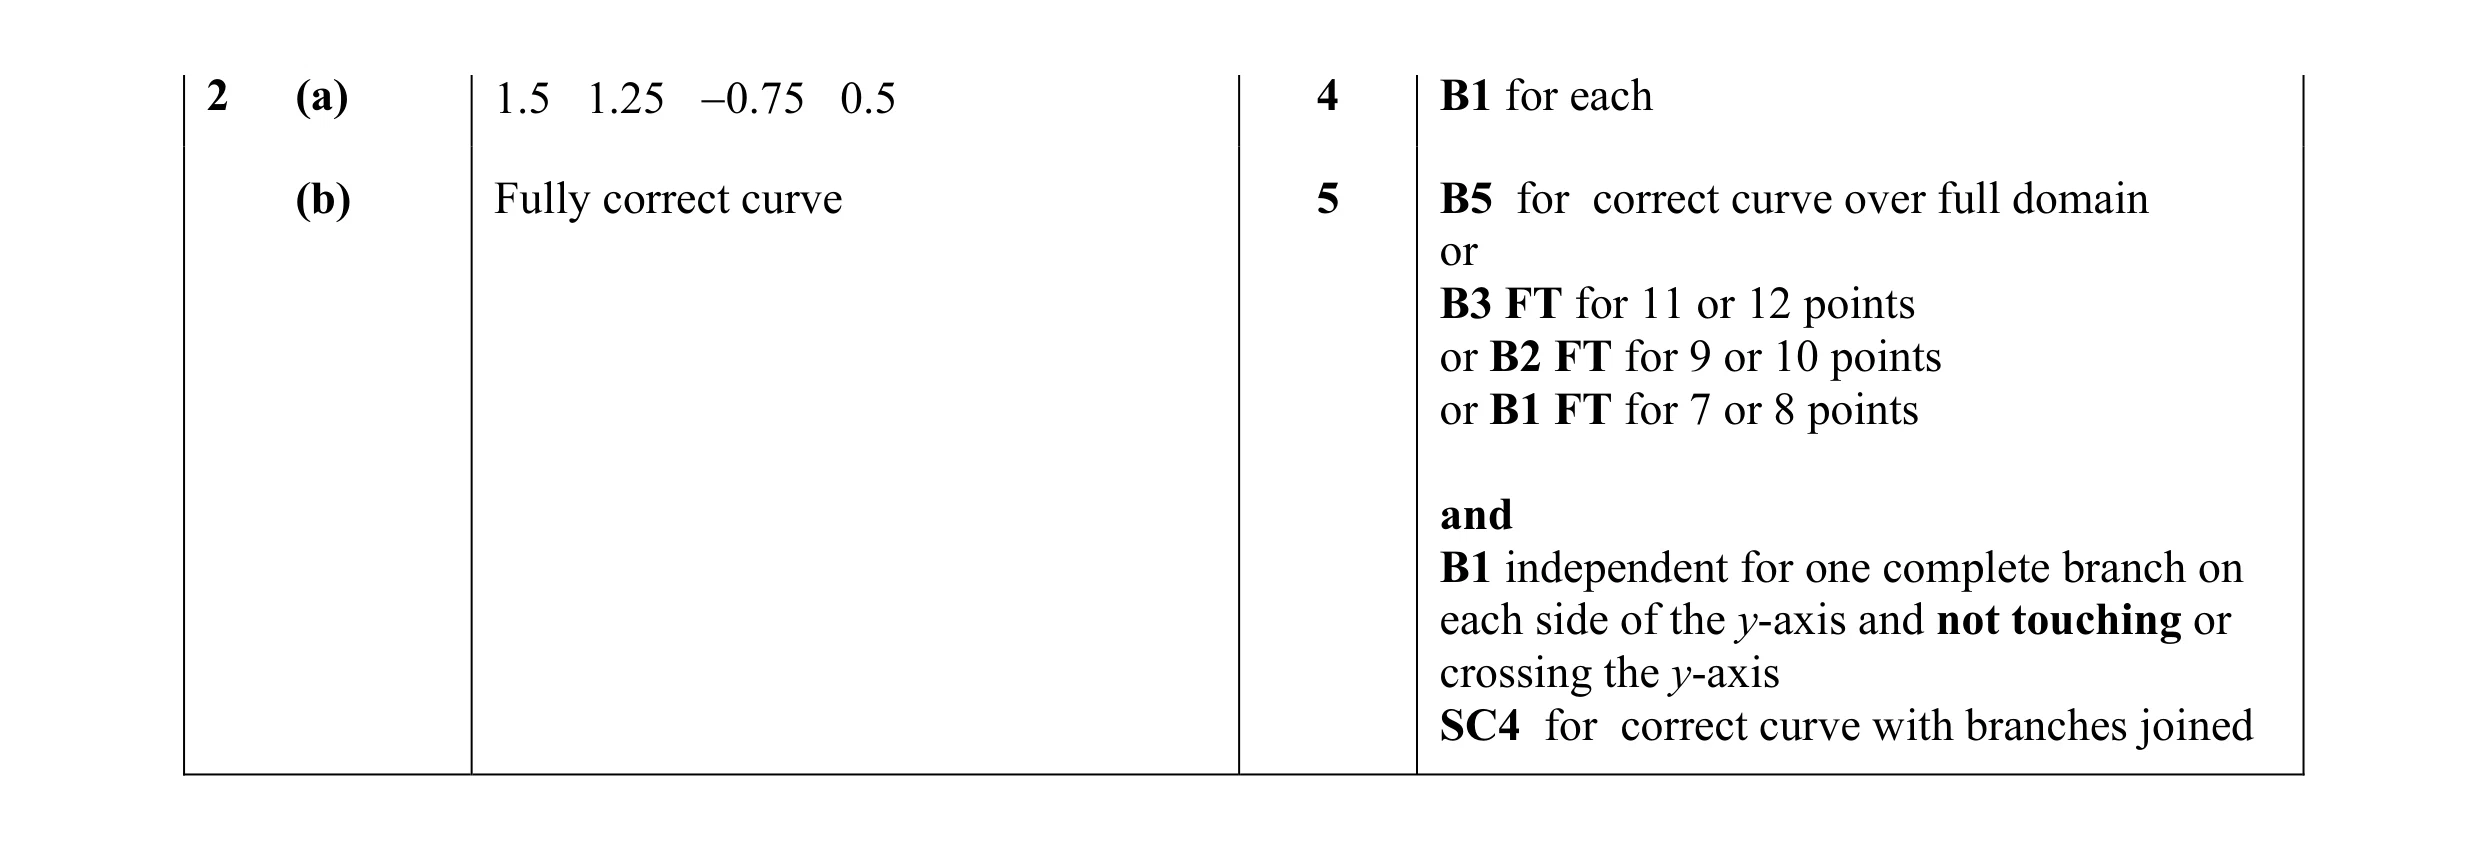 17
17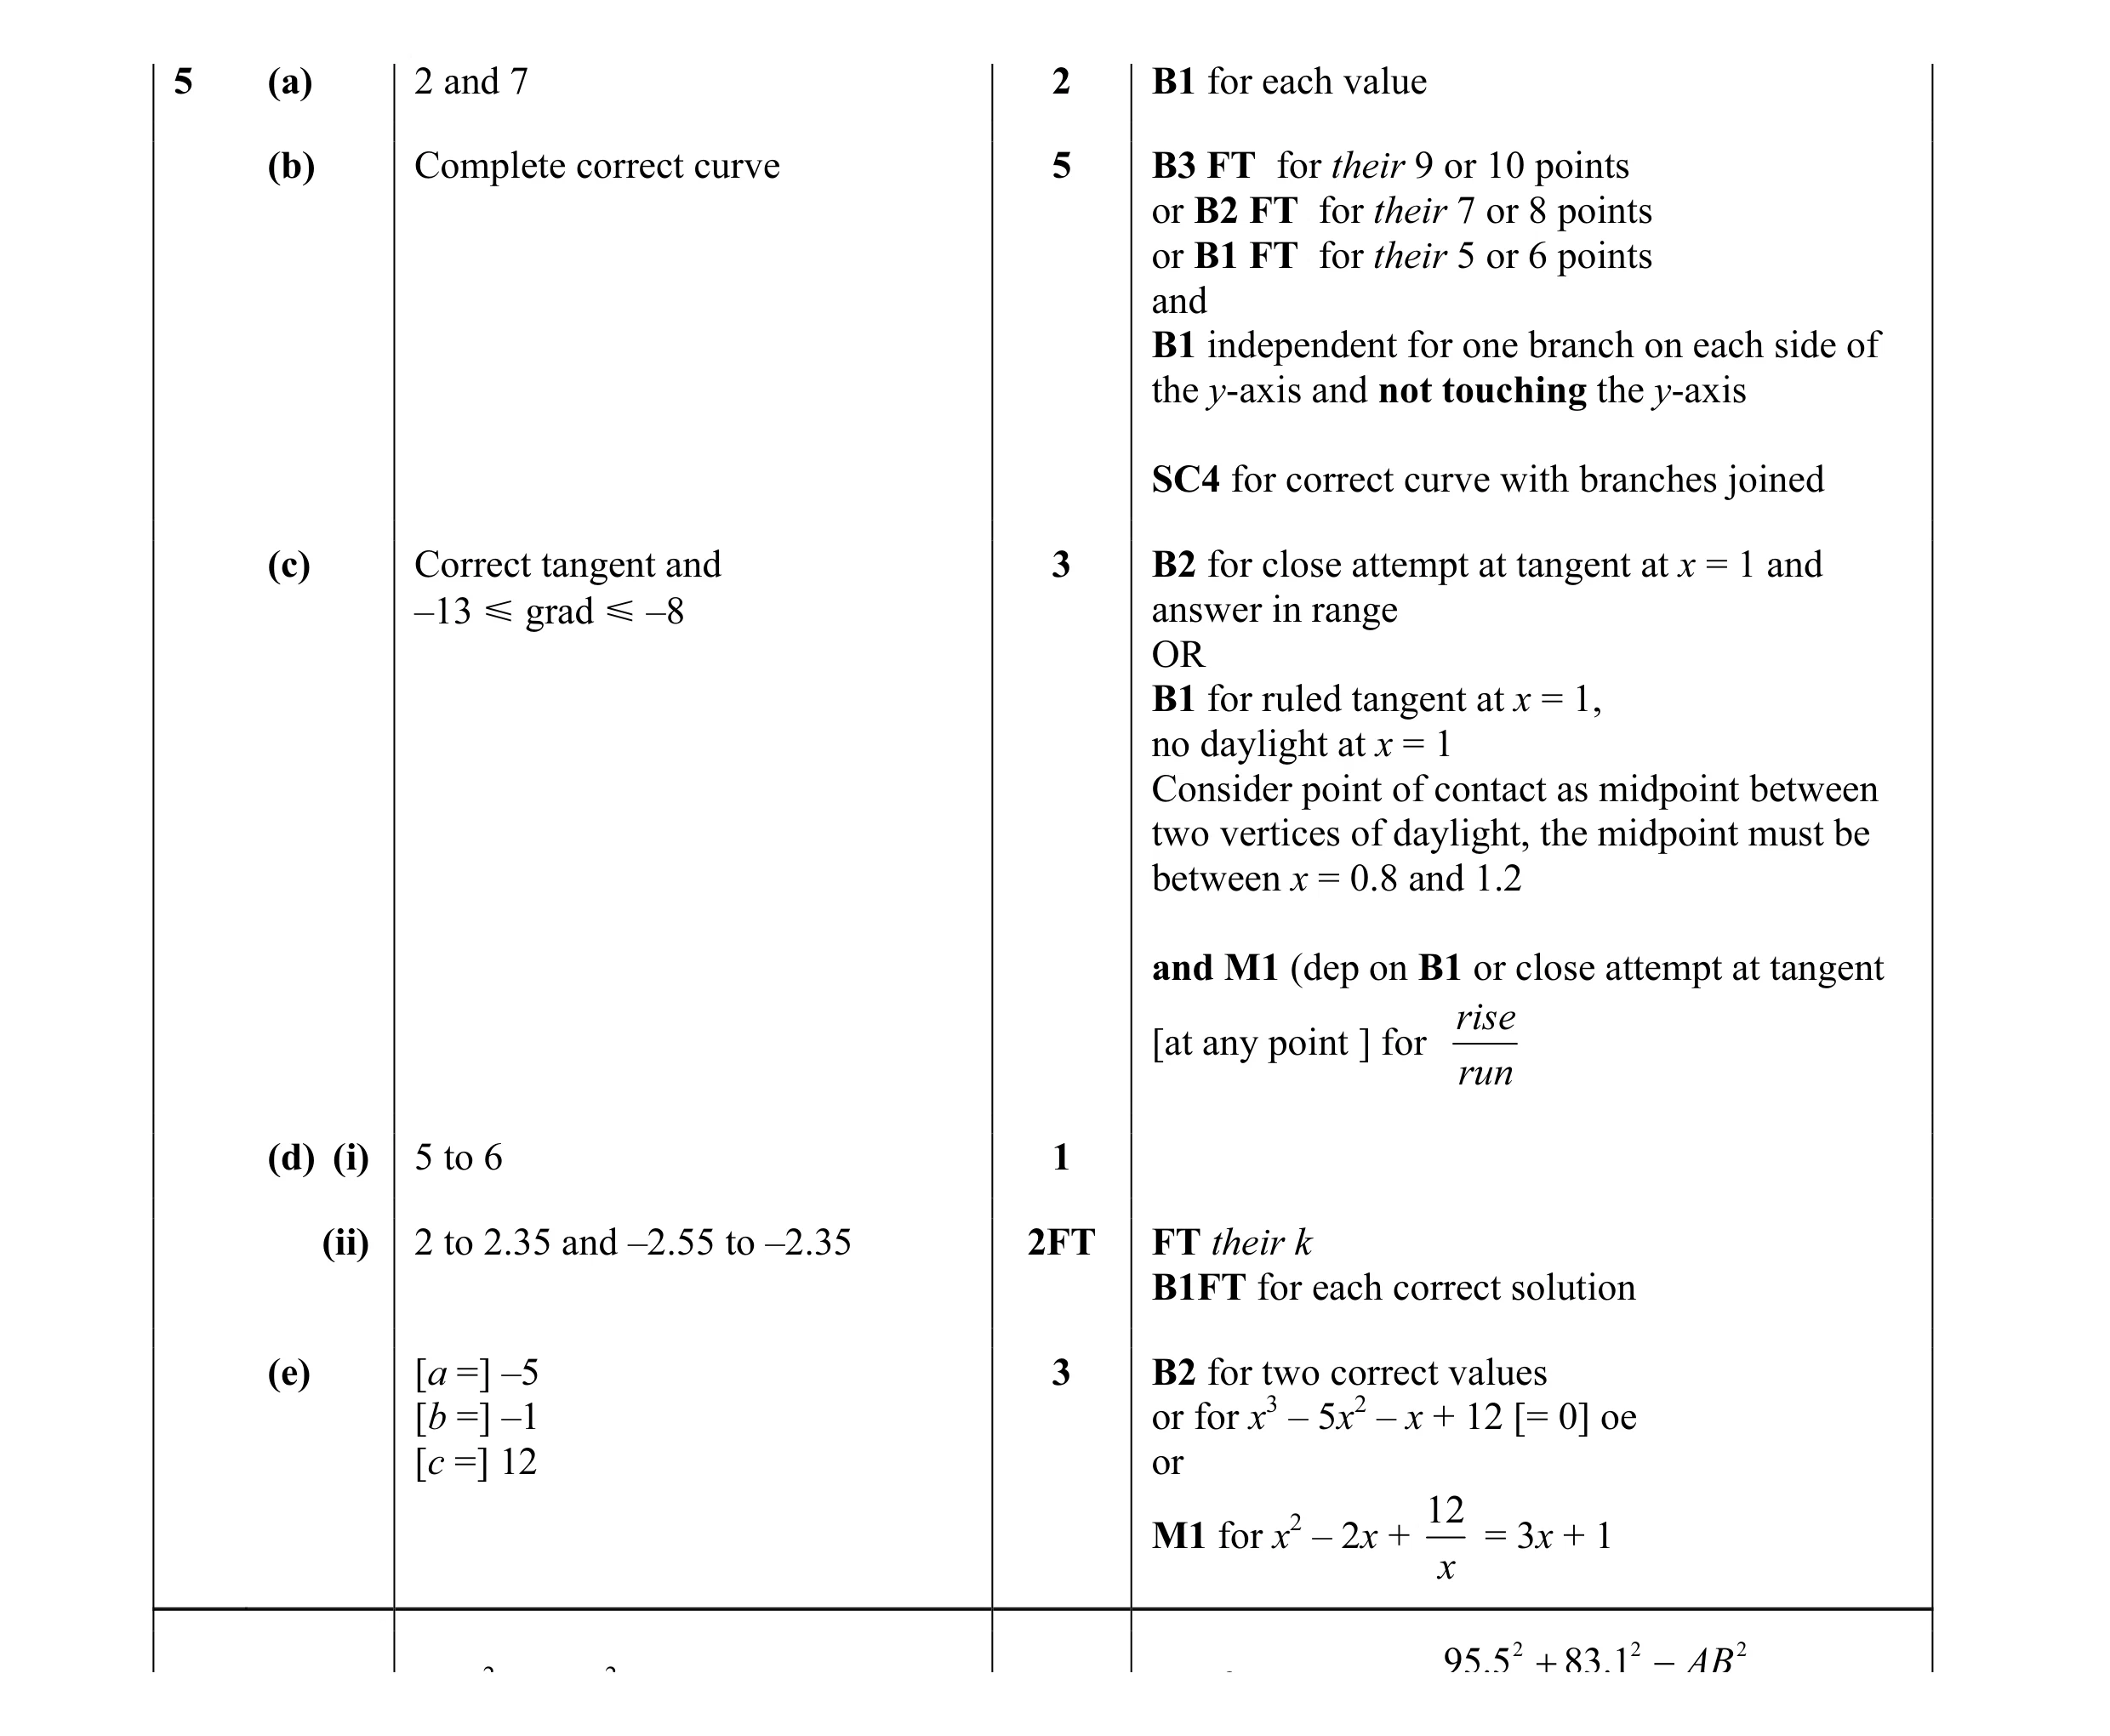 16
16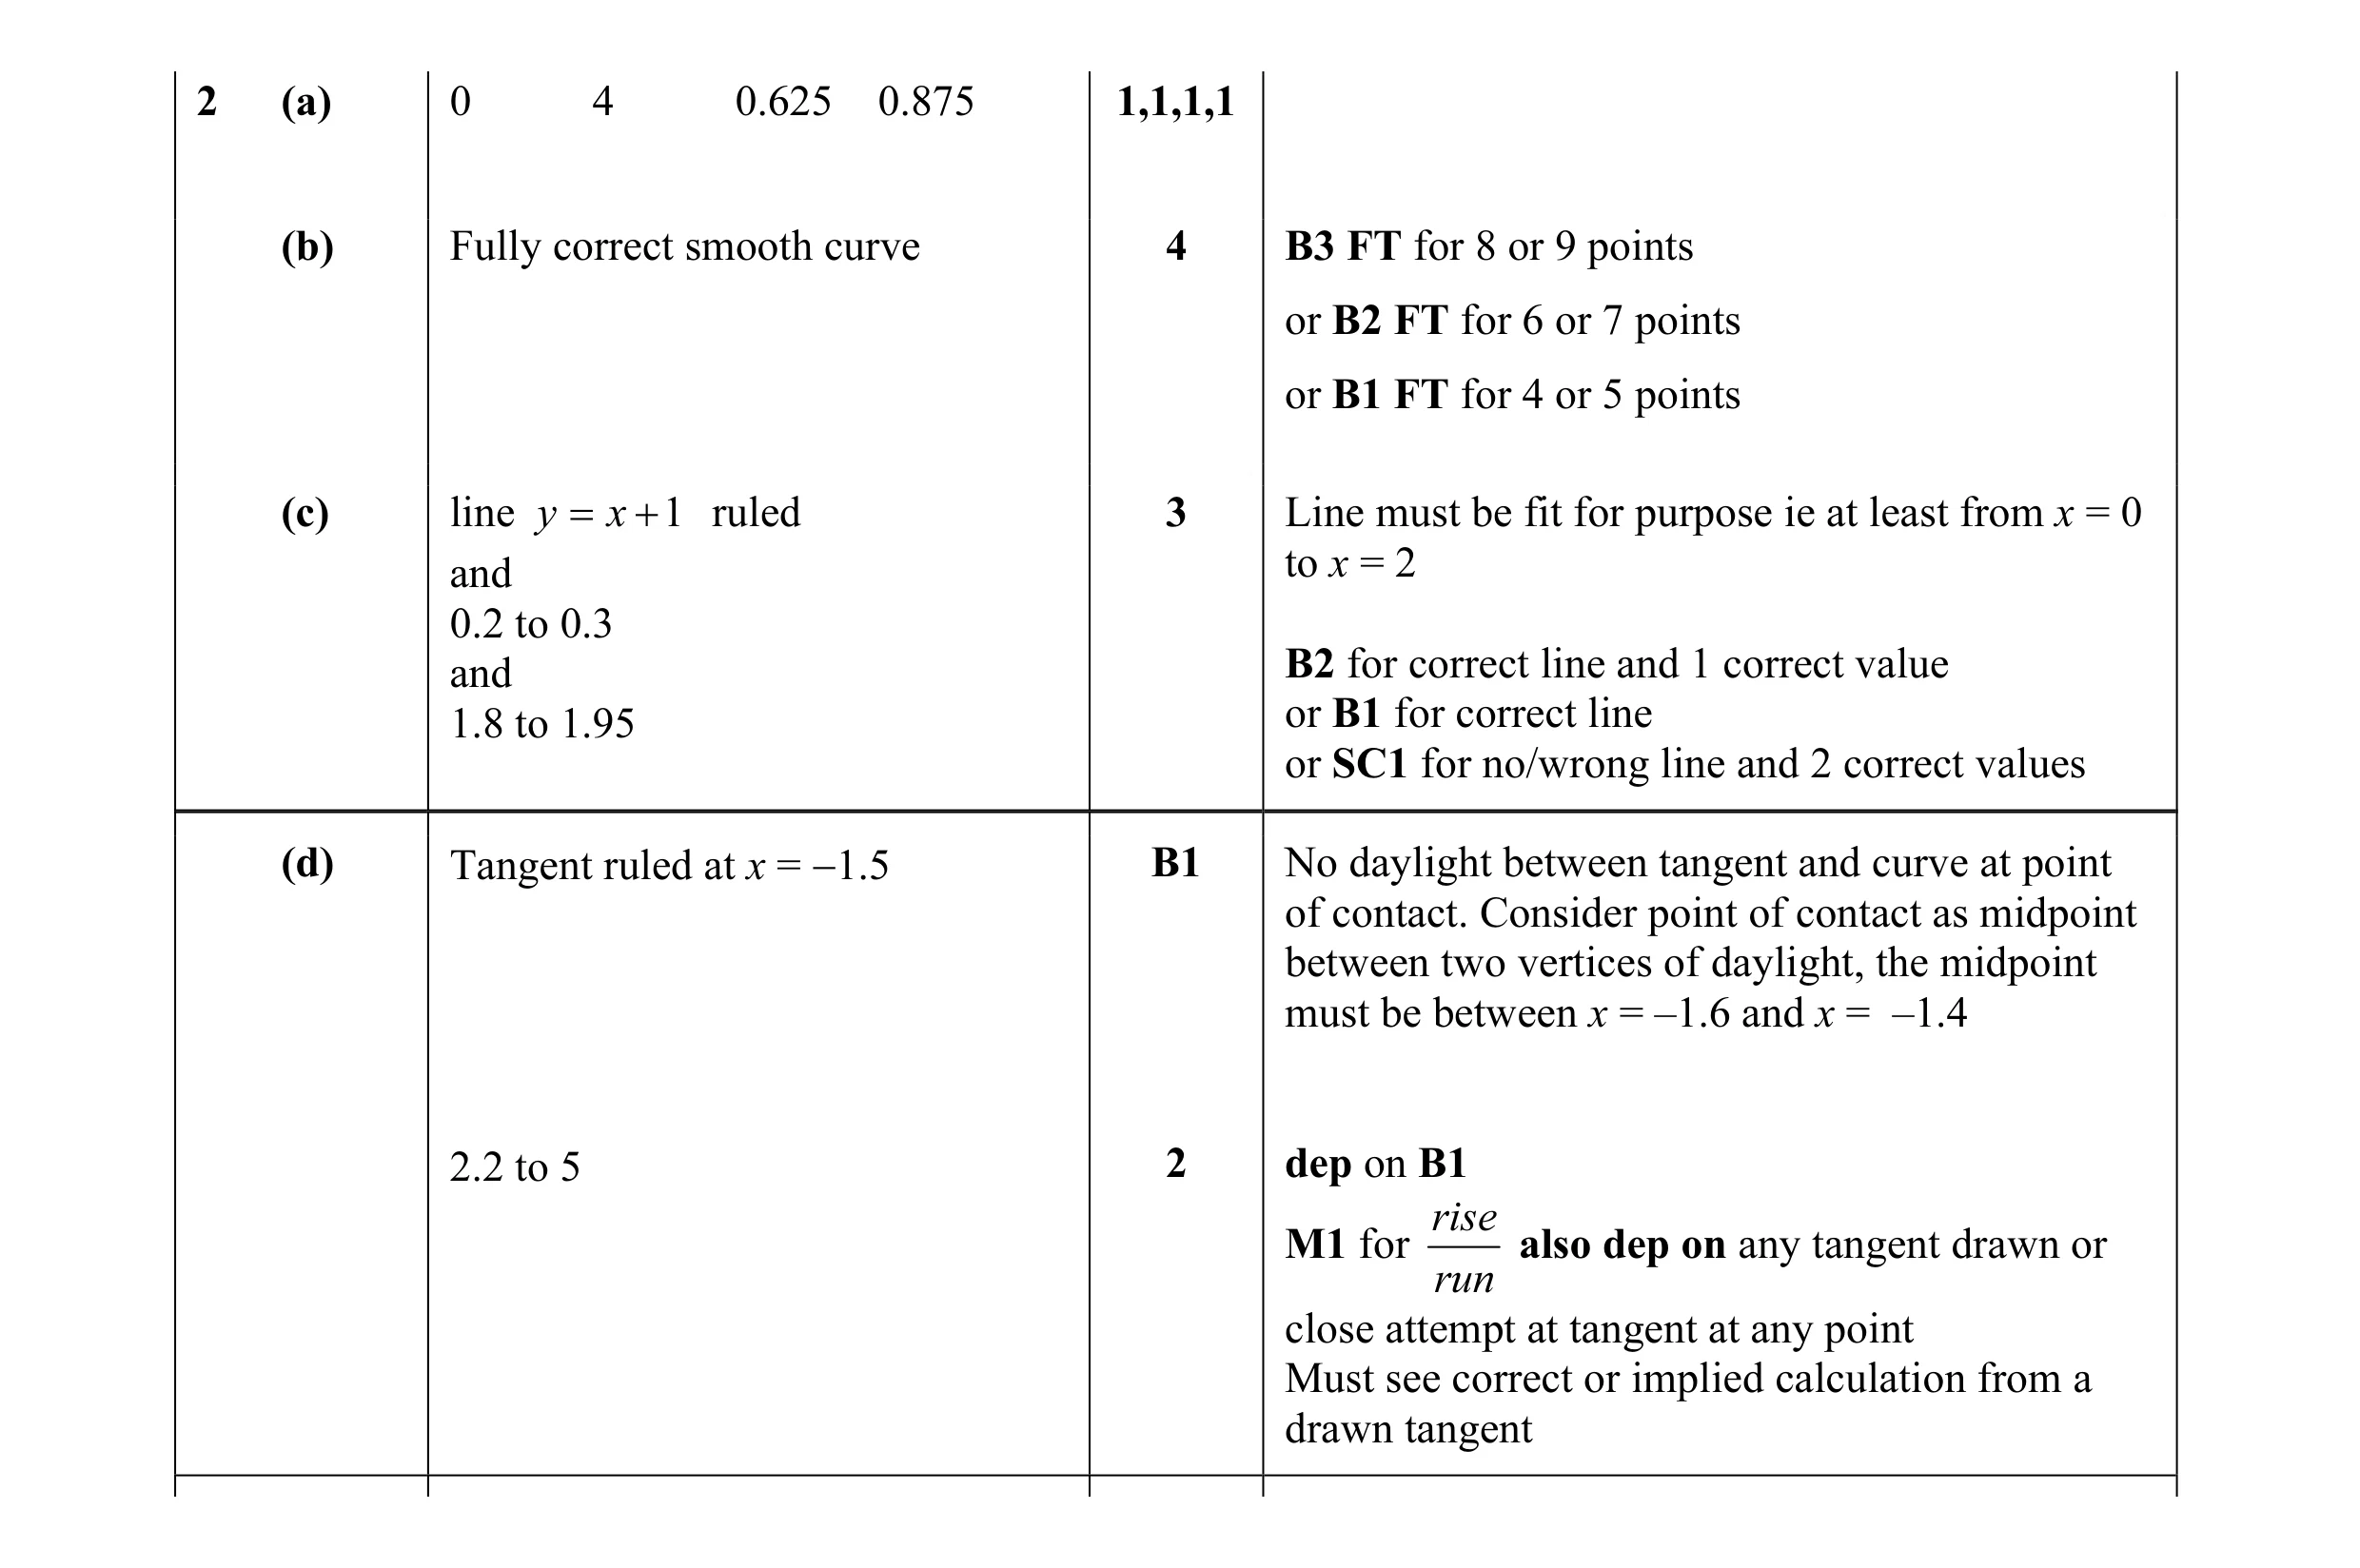 14
14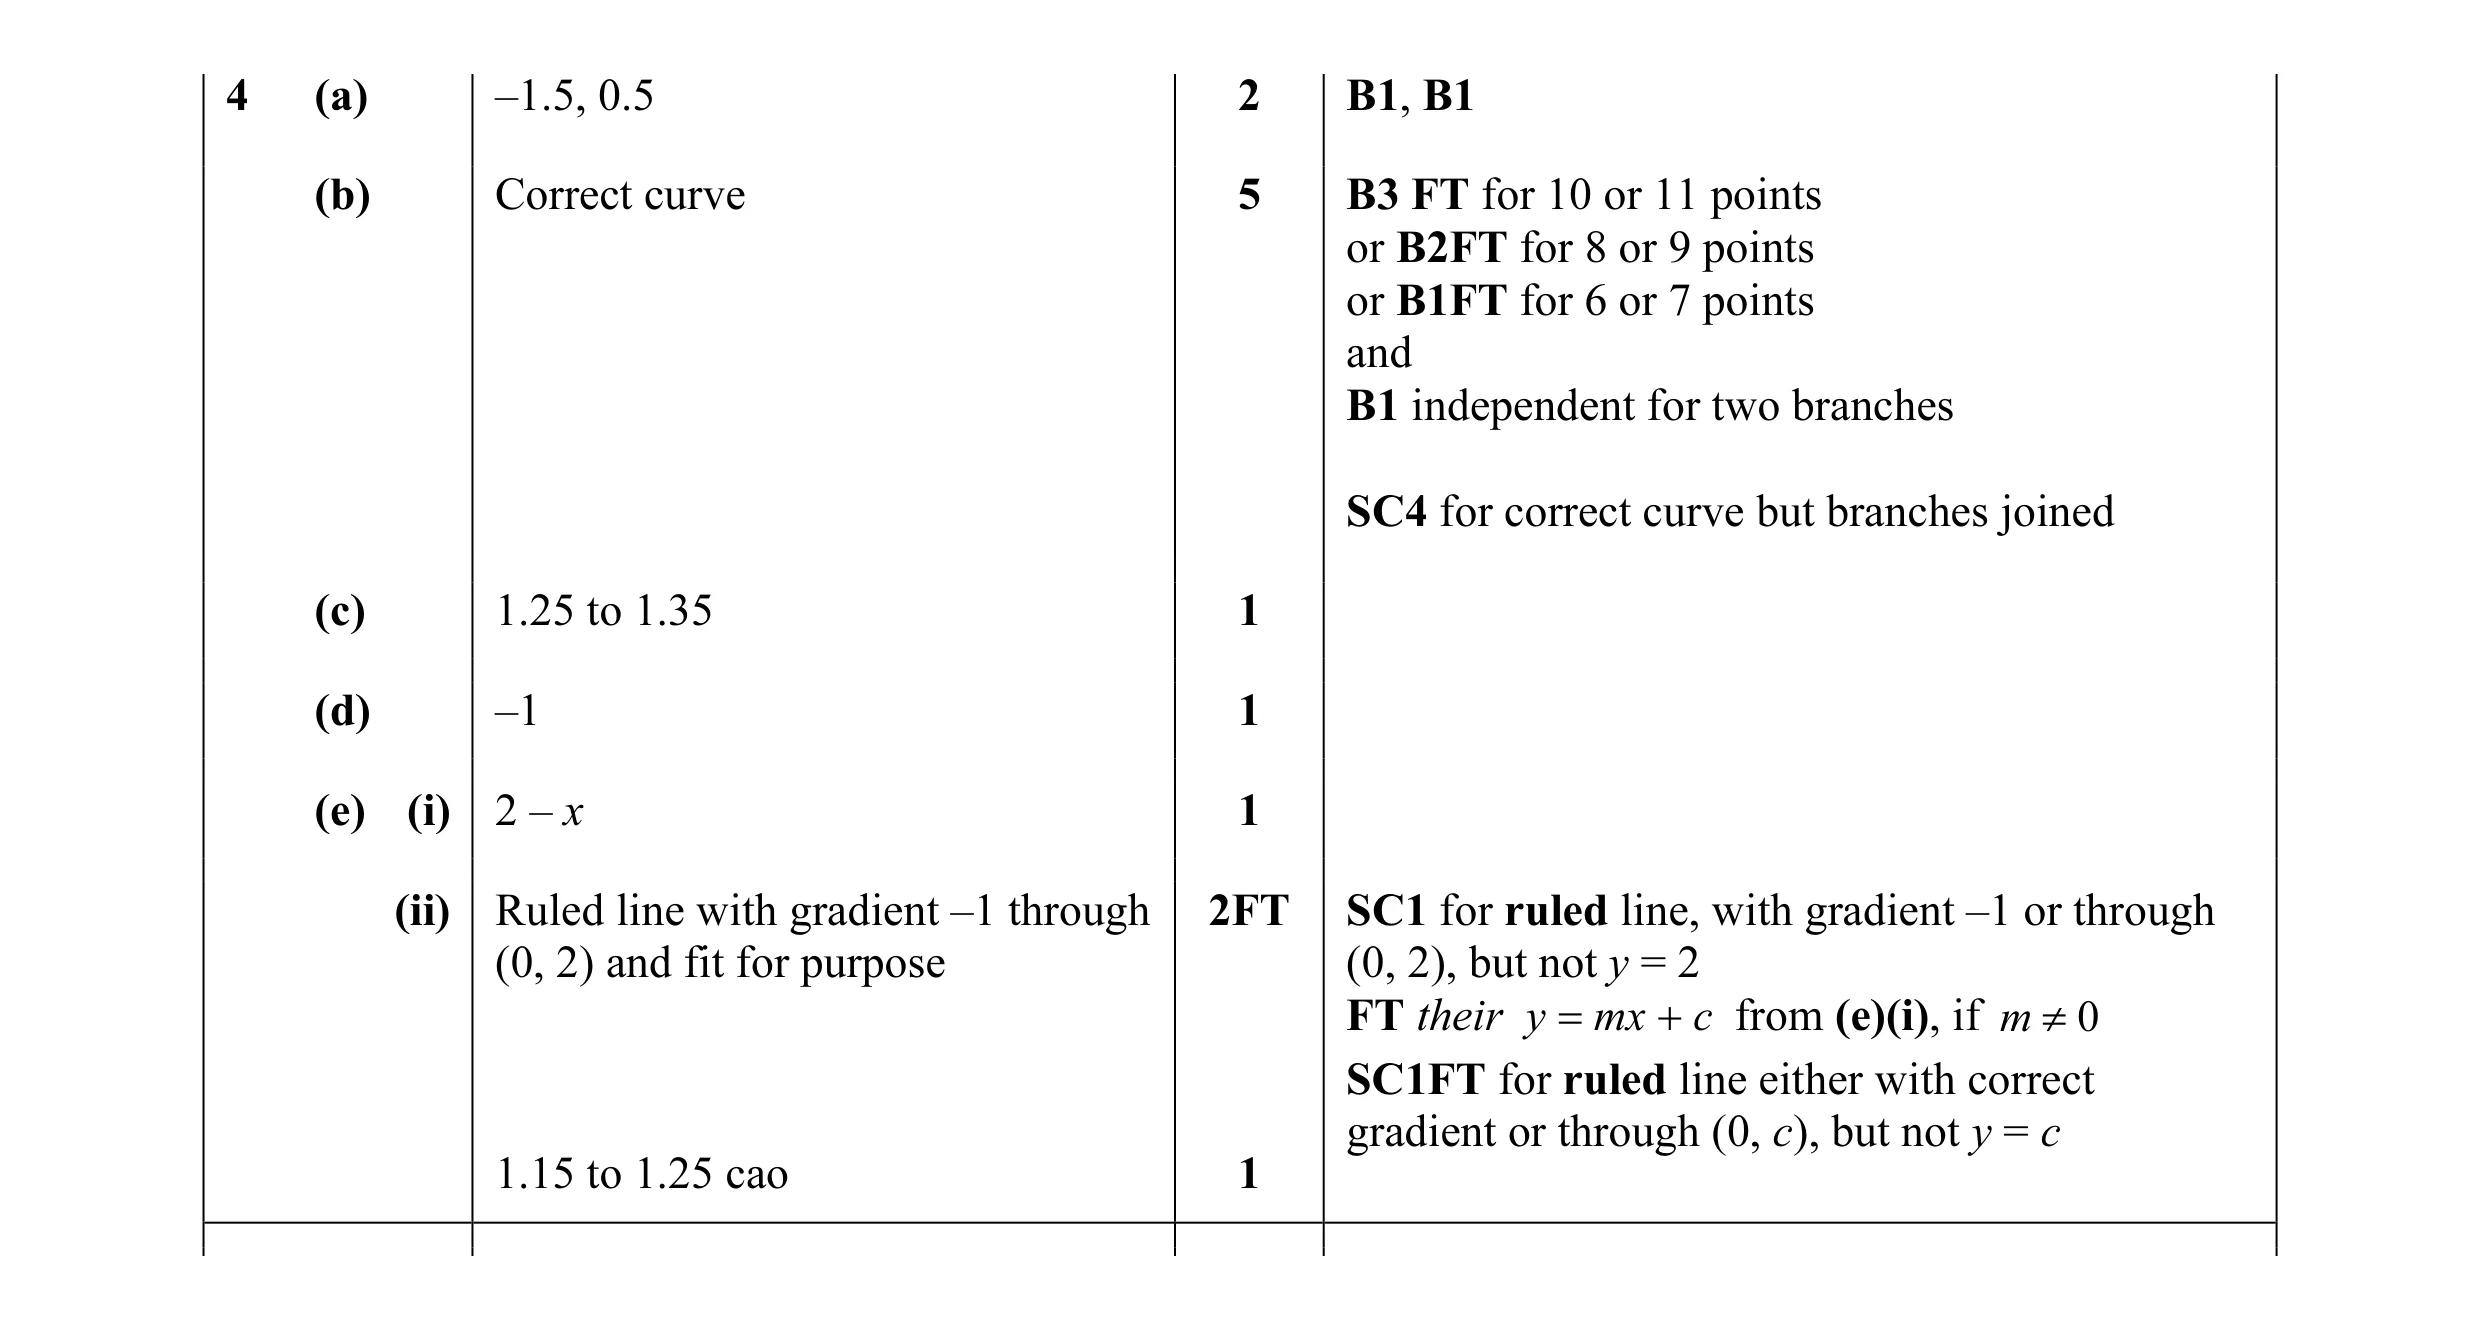 13
13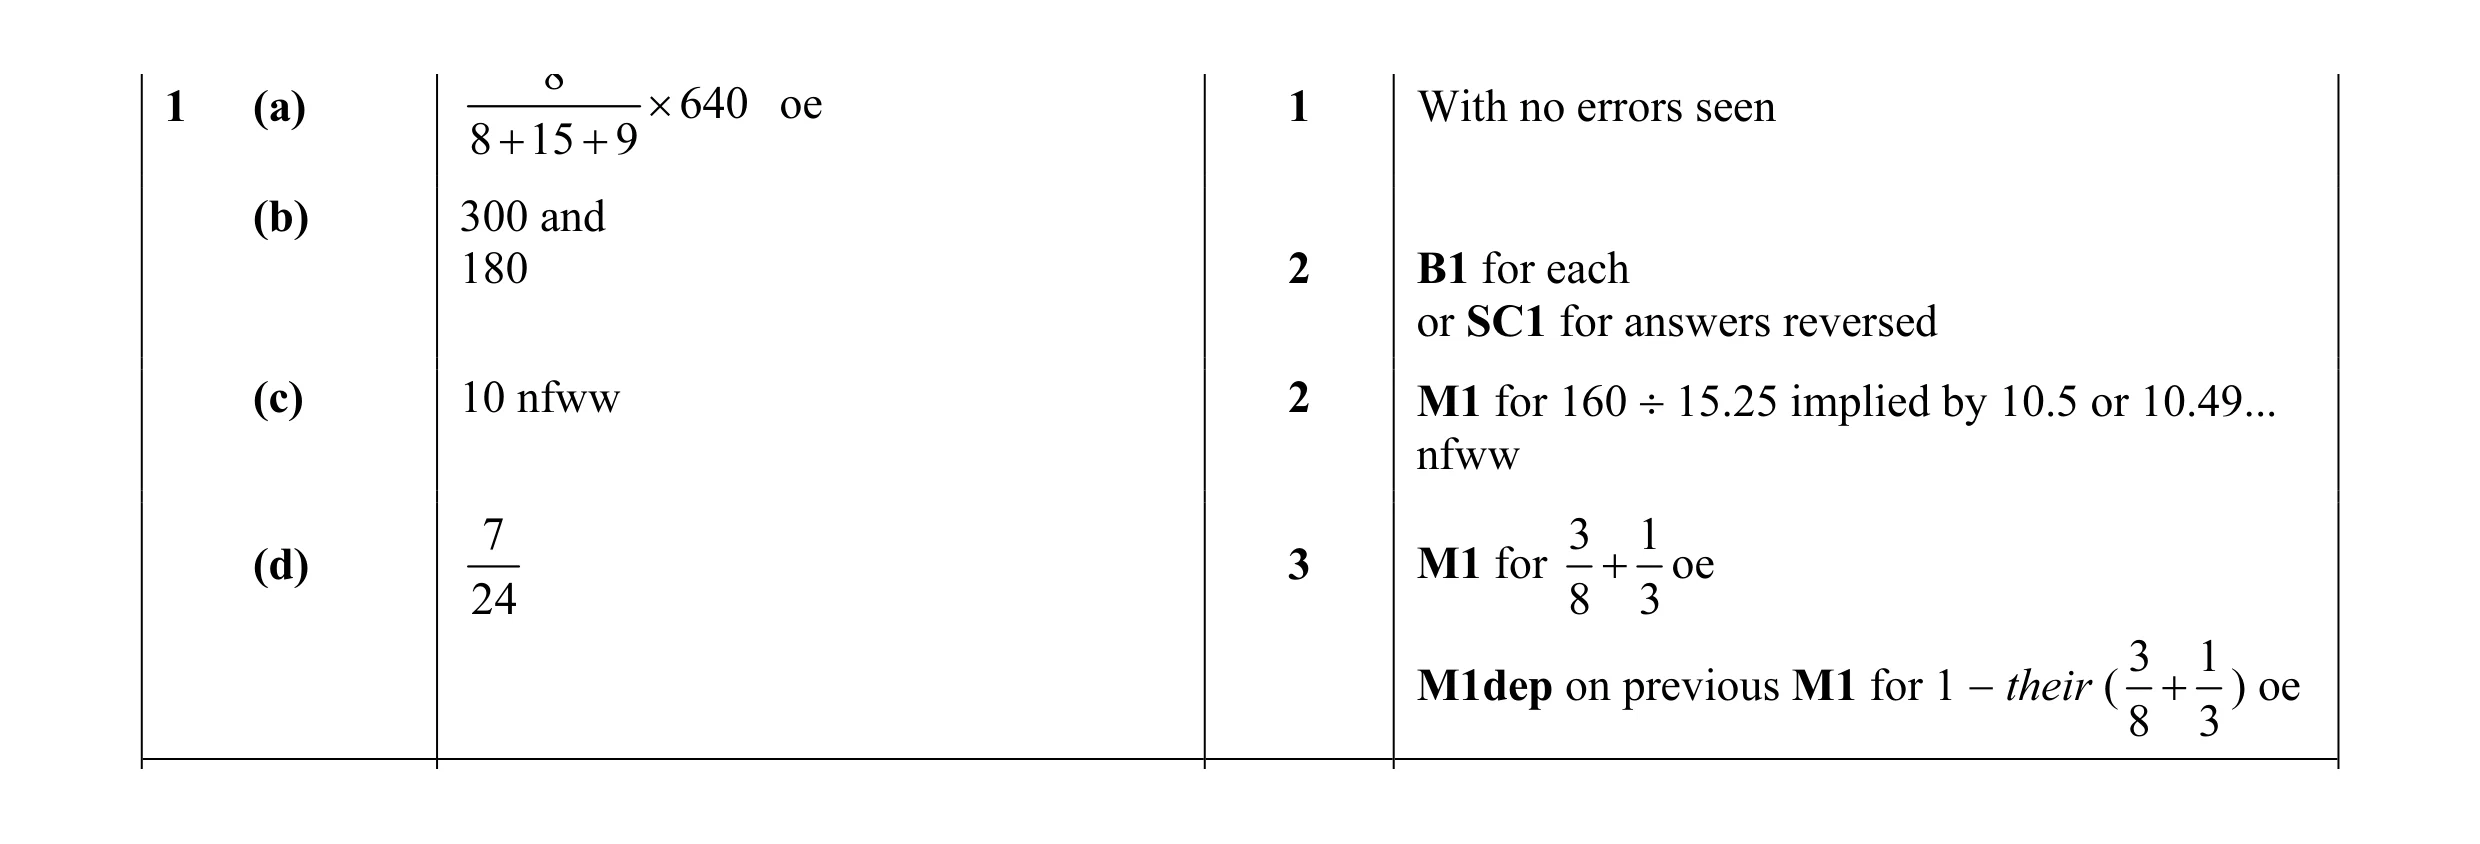 8
8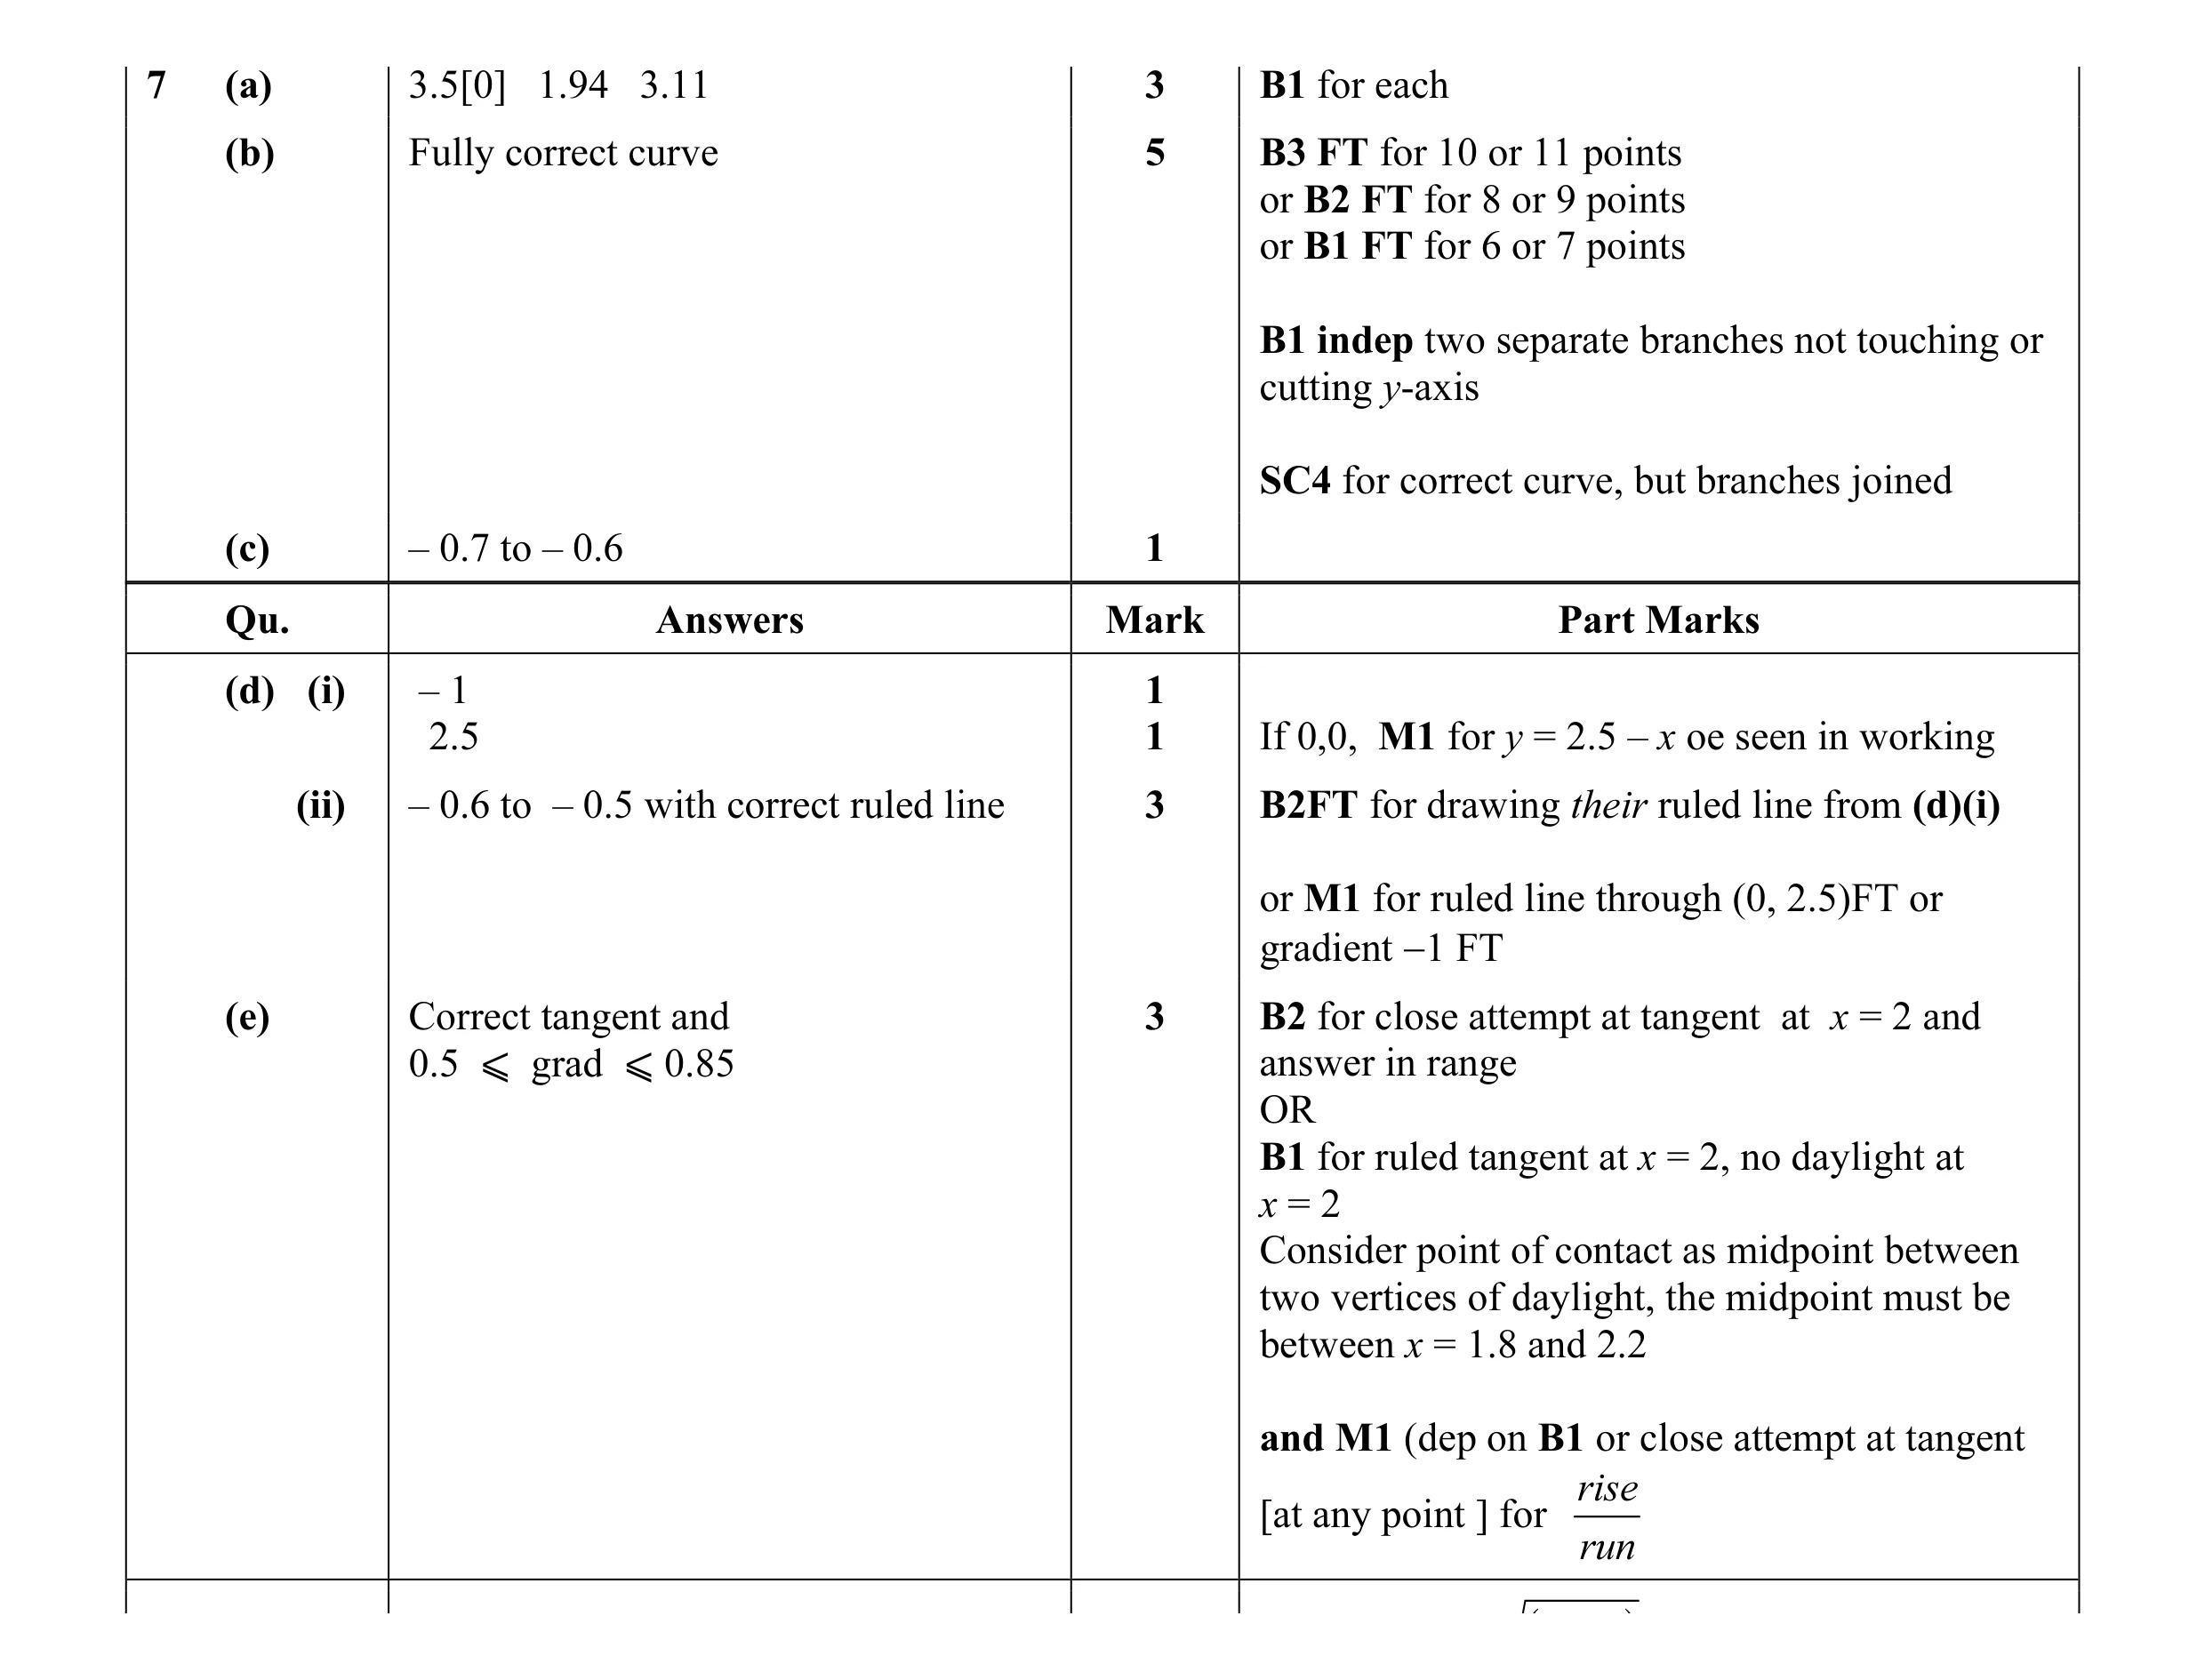 17
17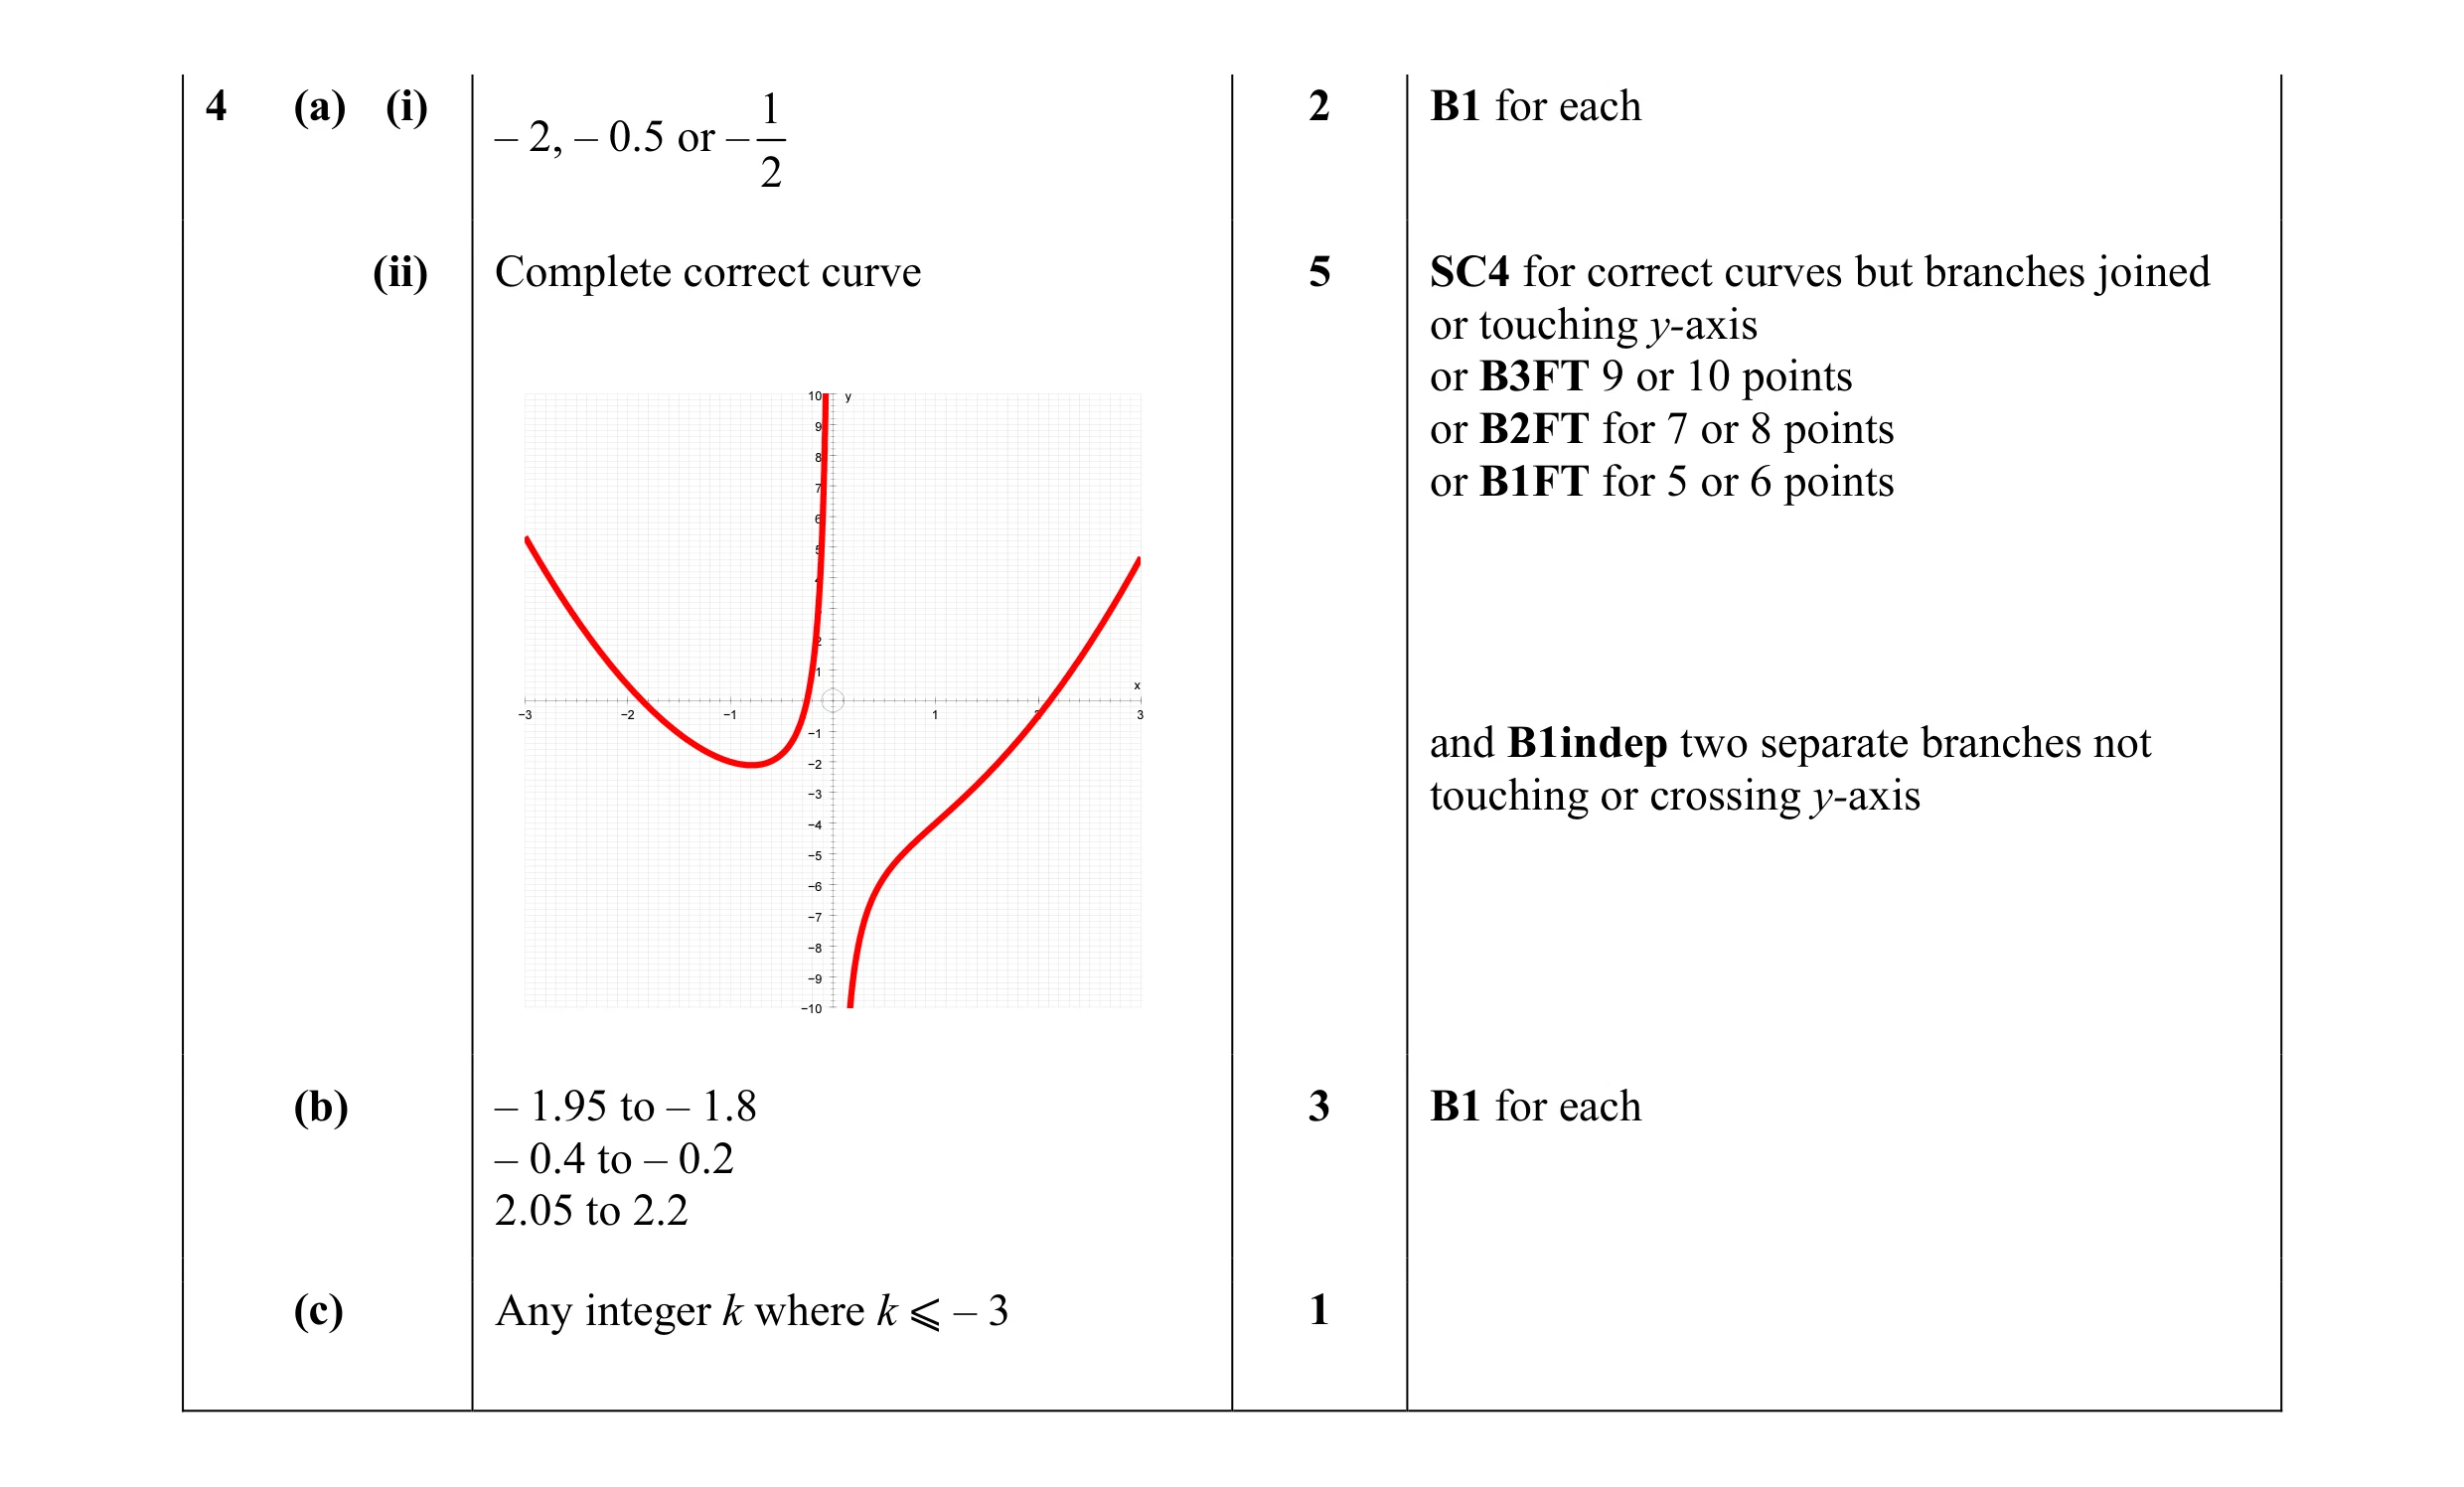 17
17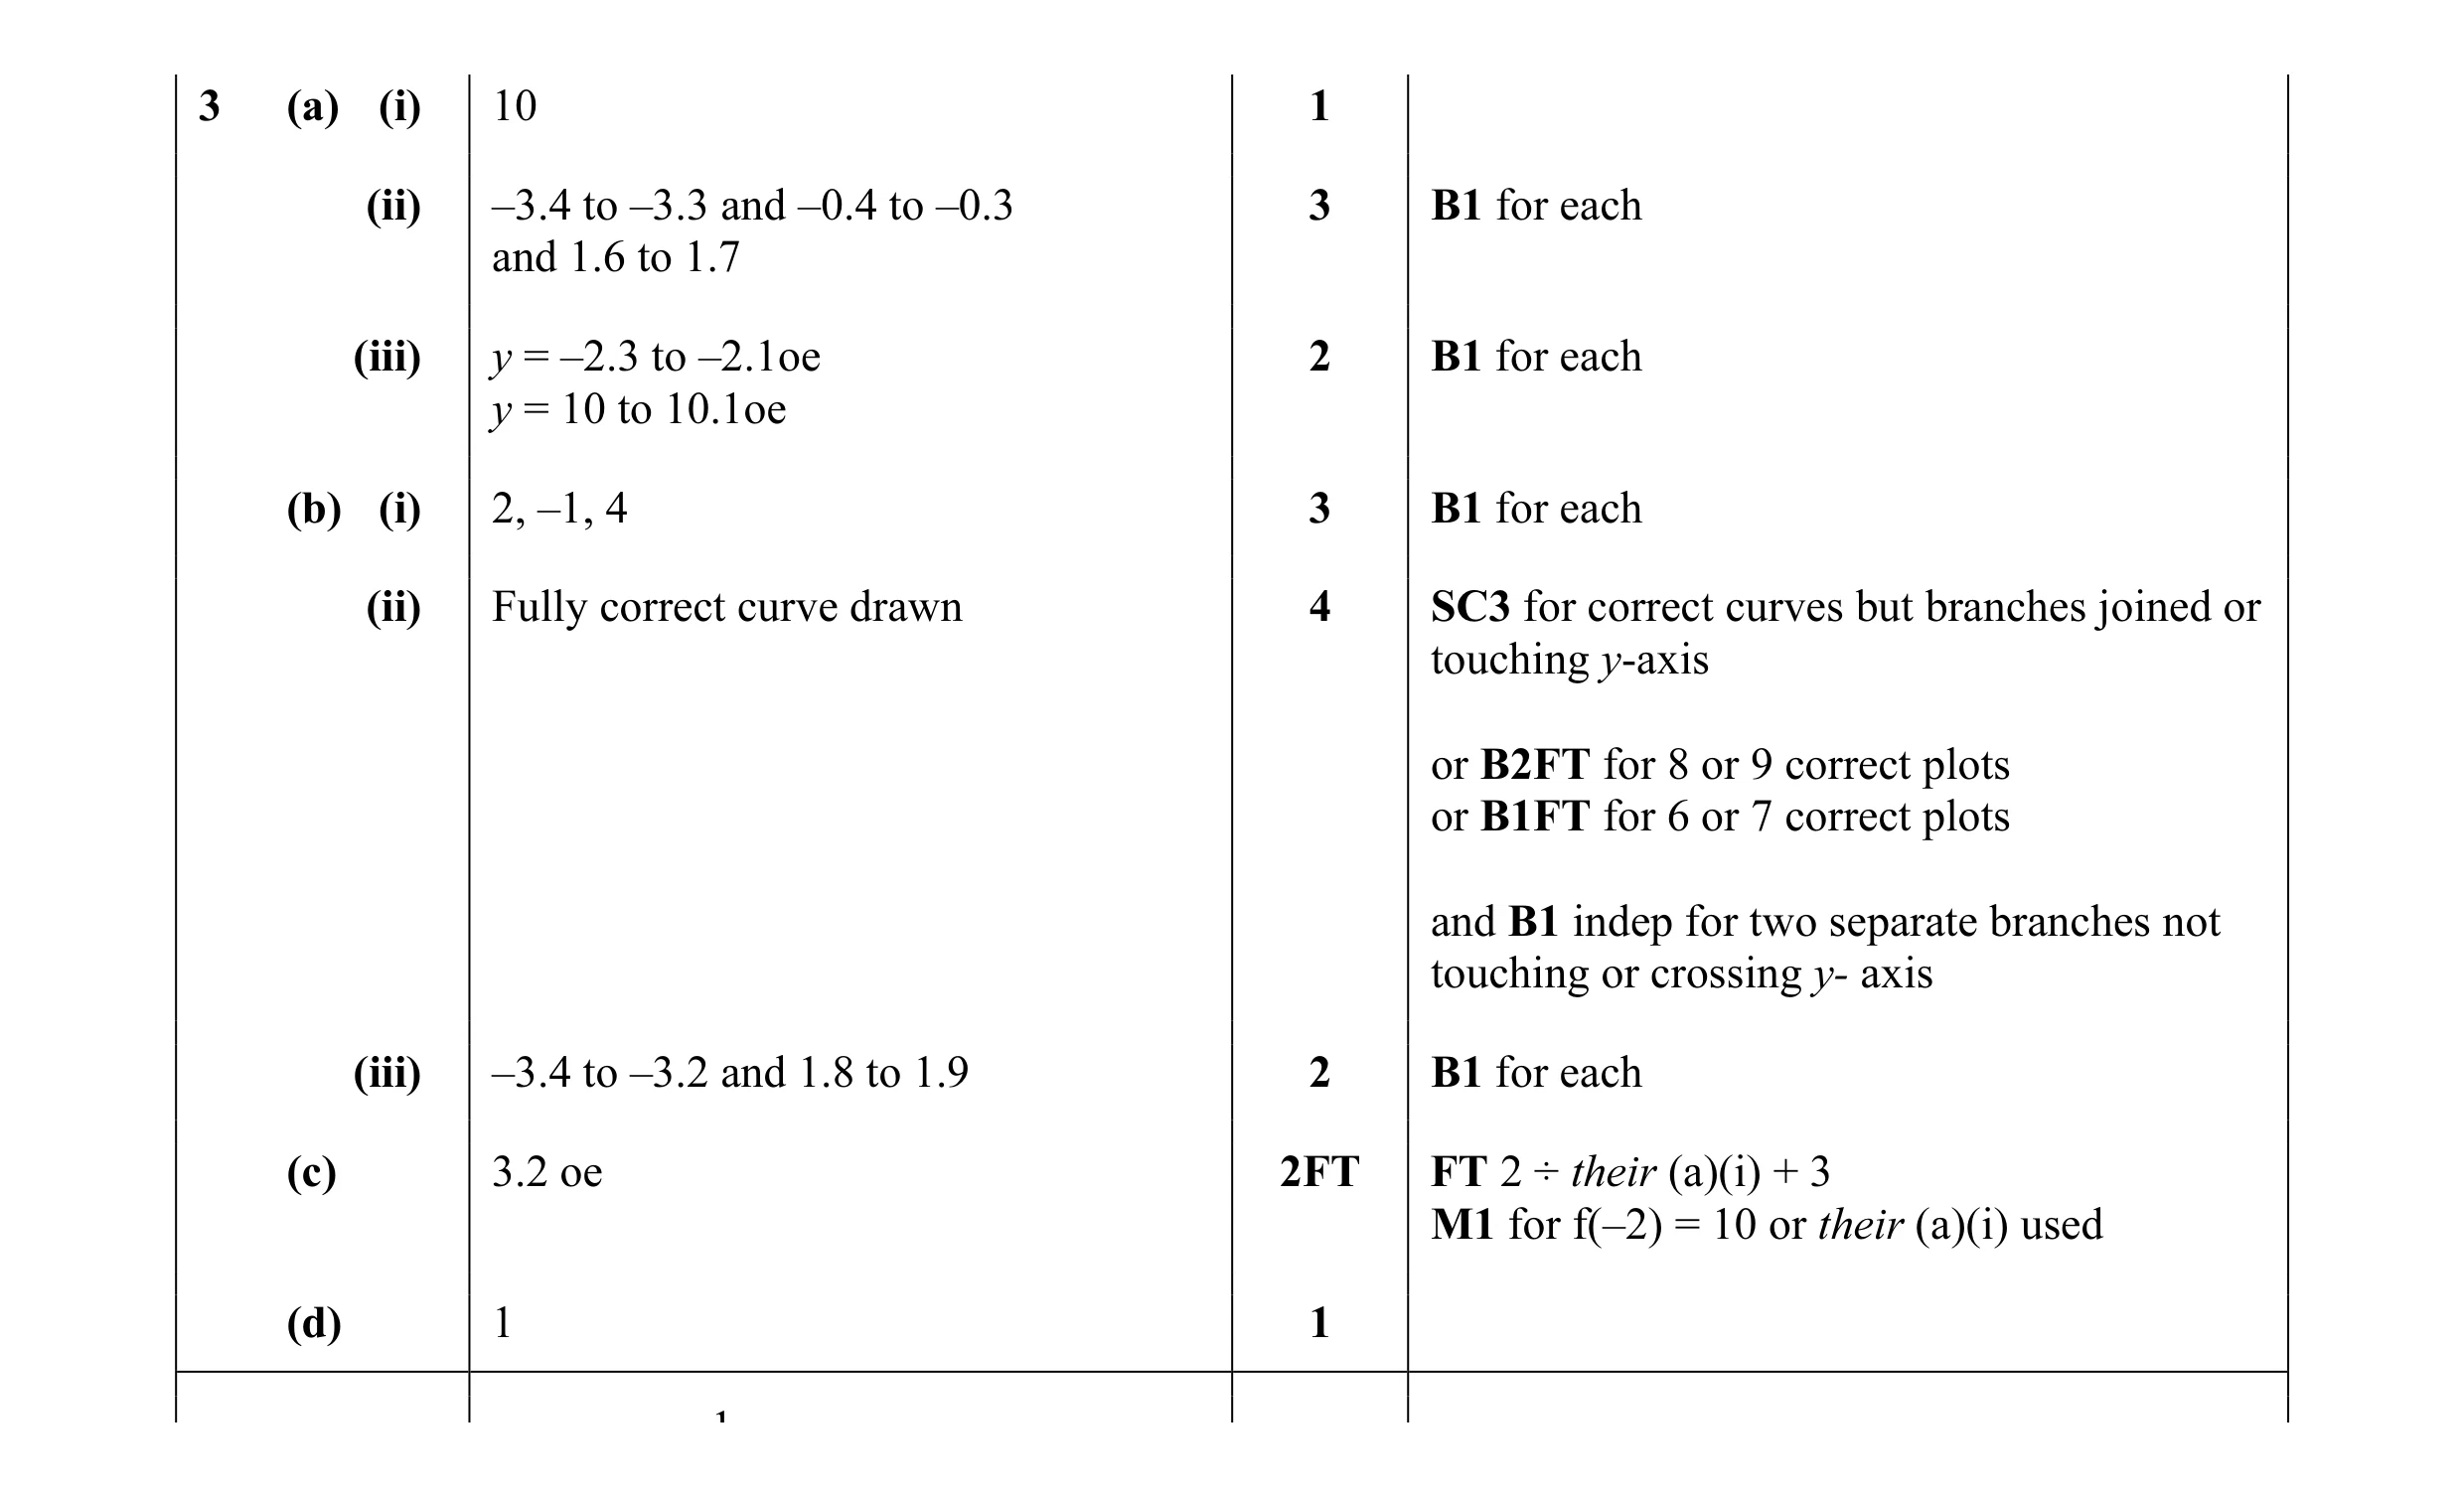 18
18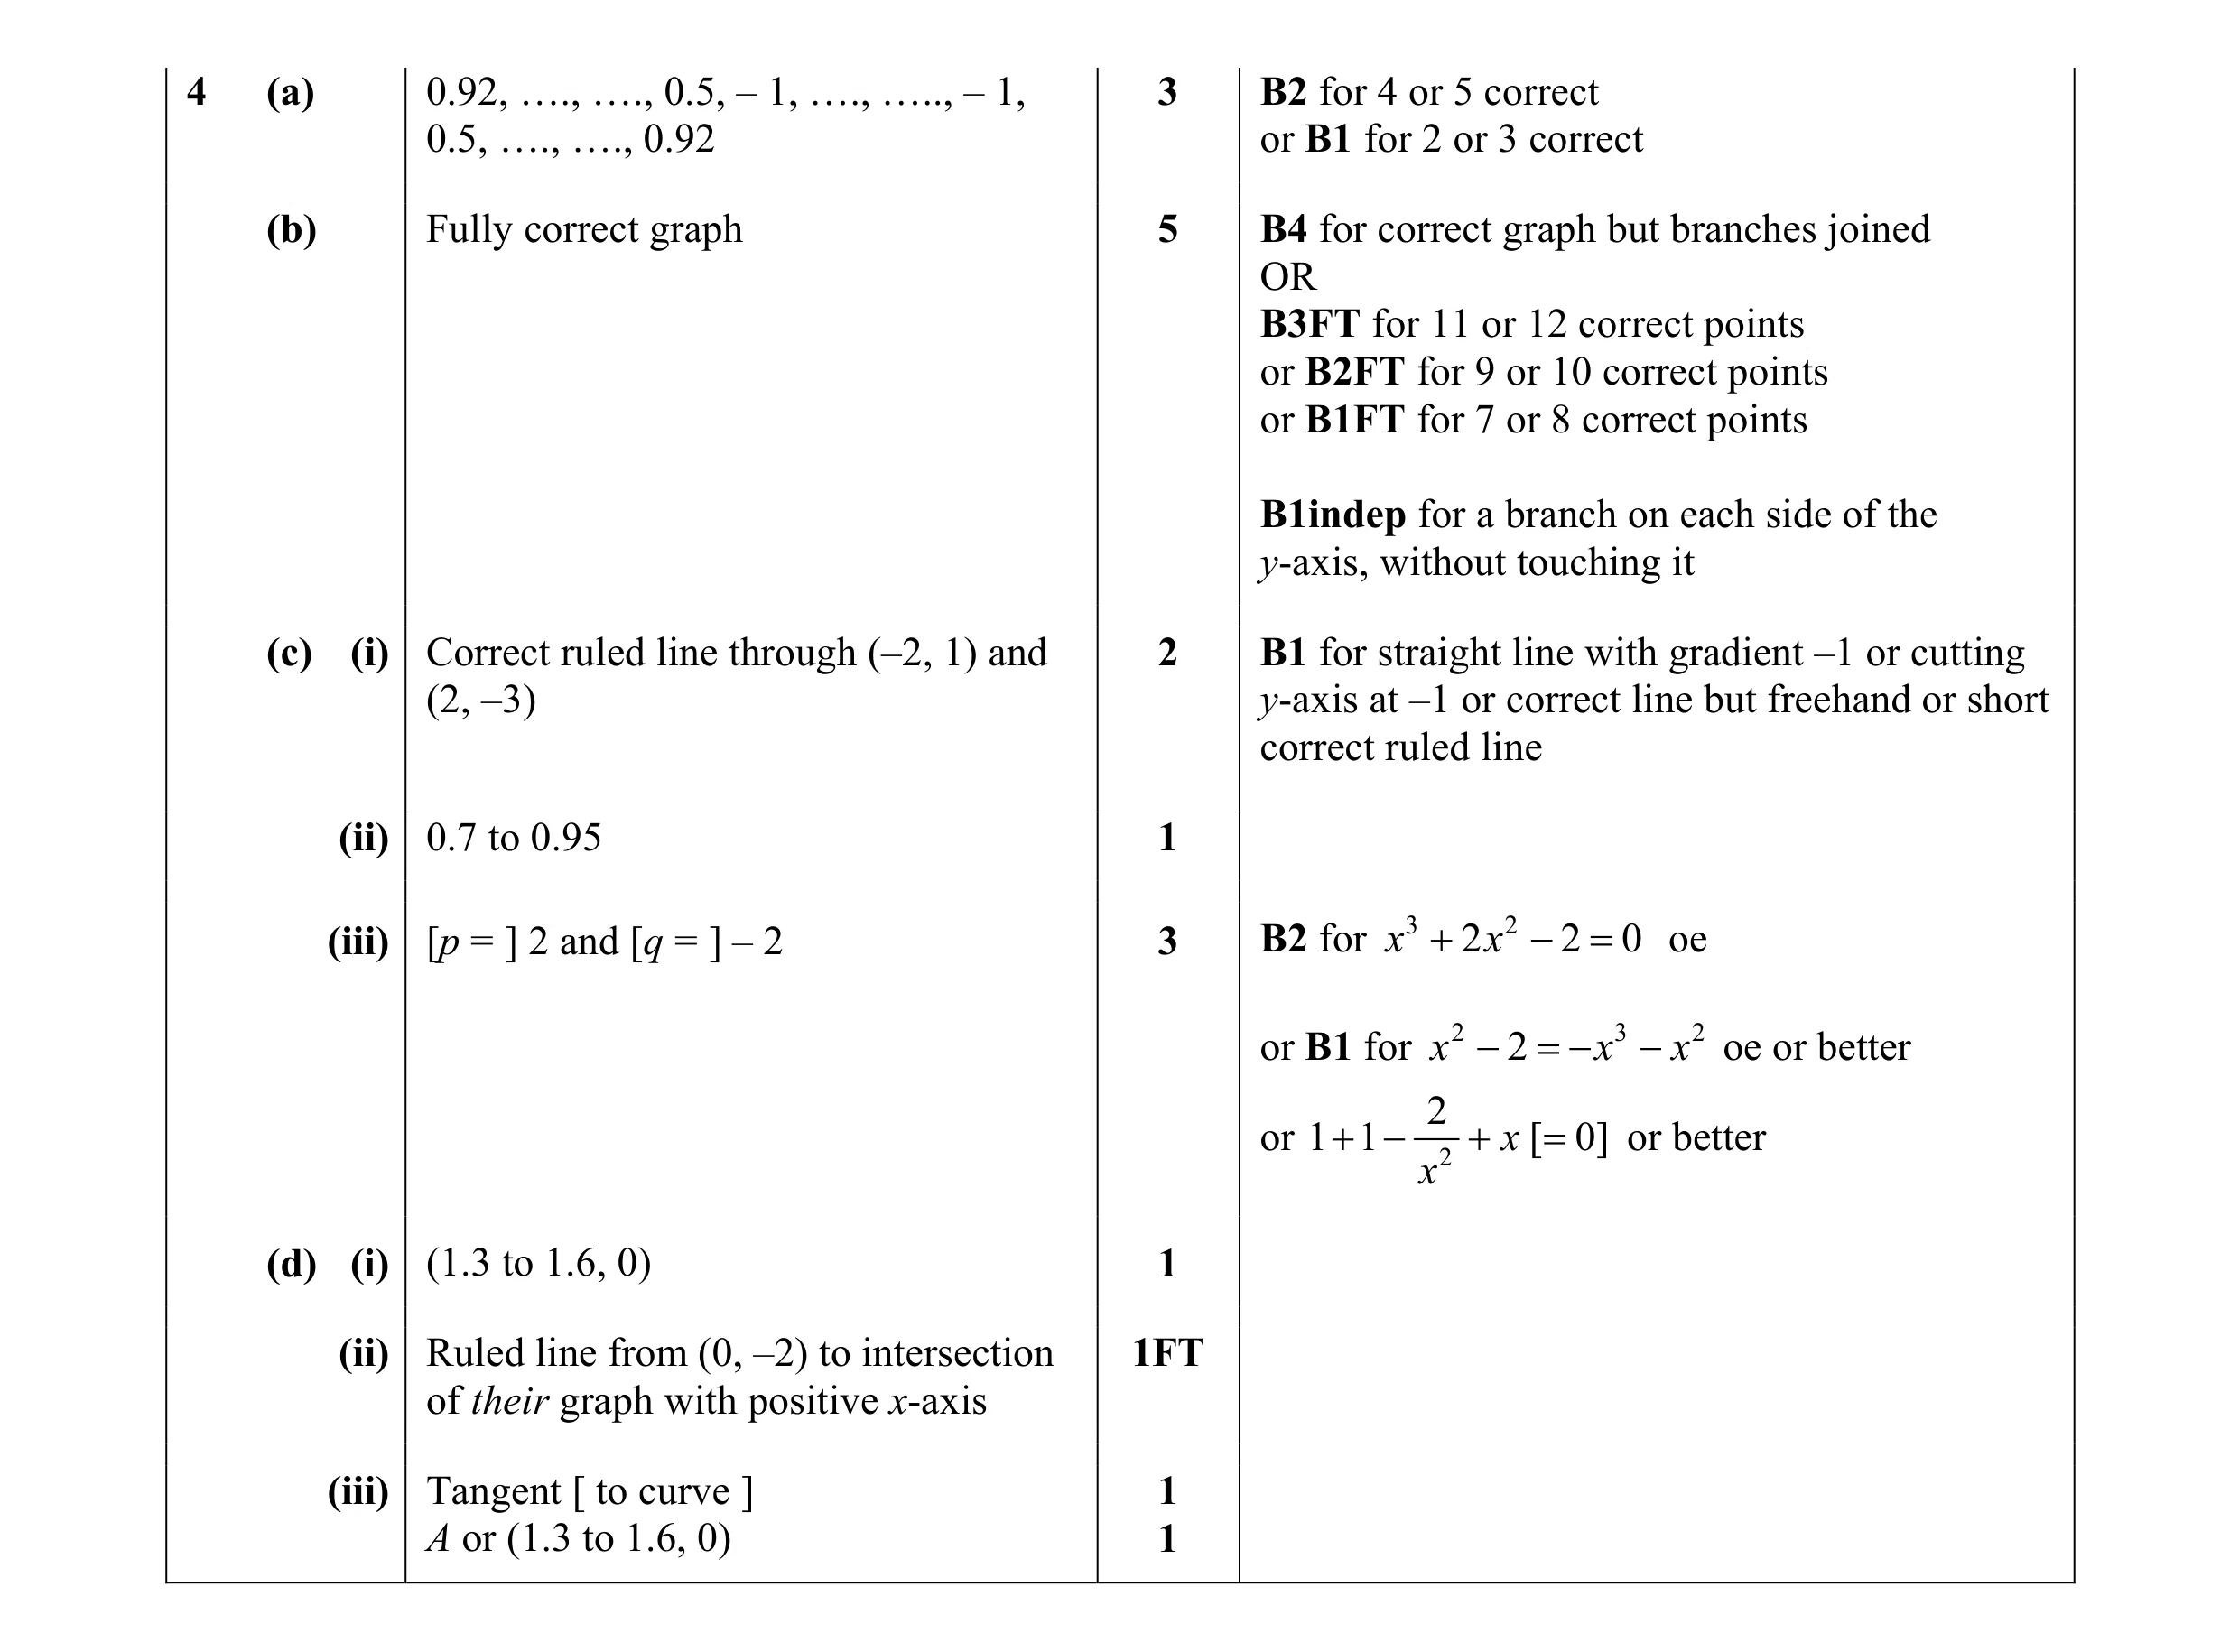 18
18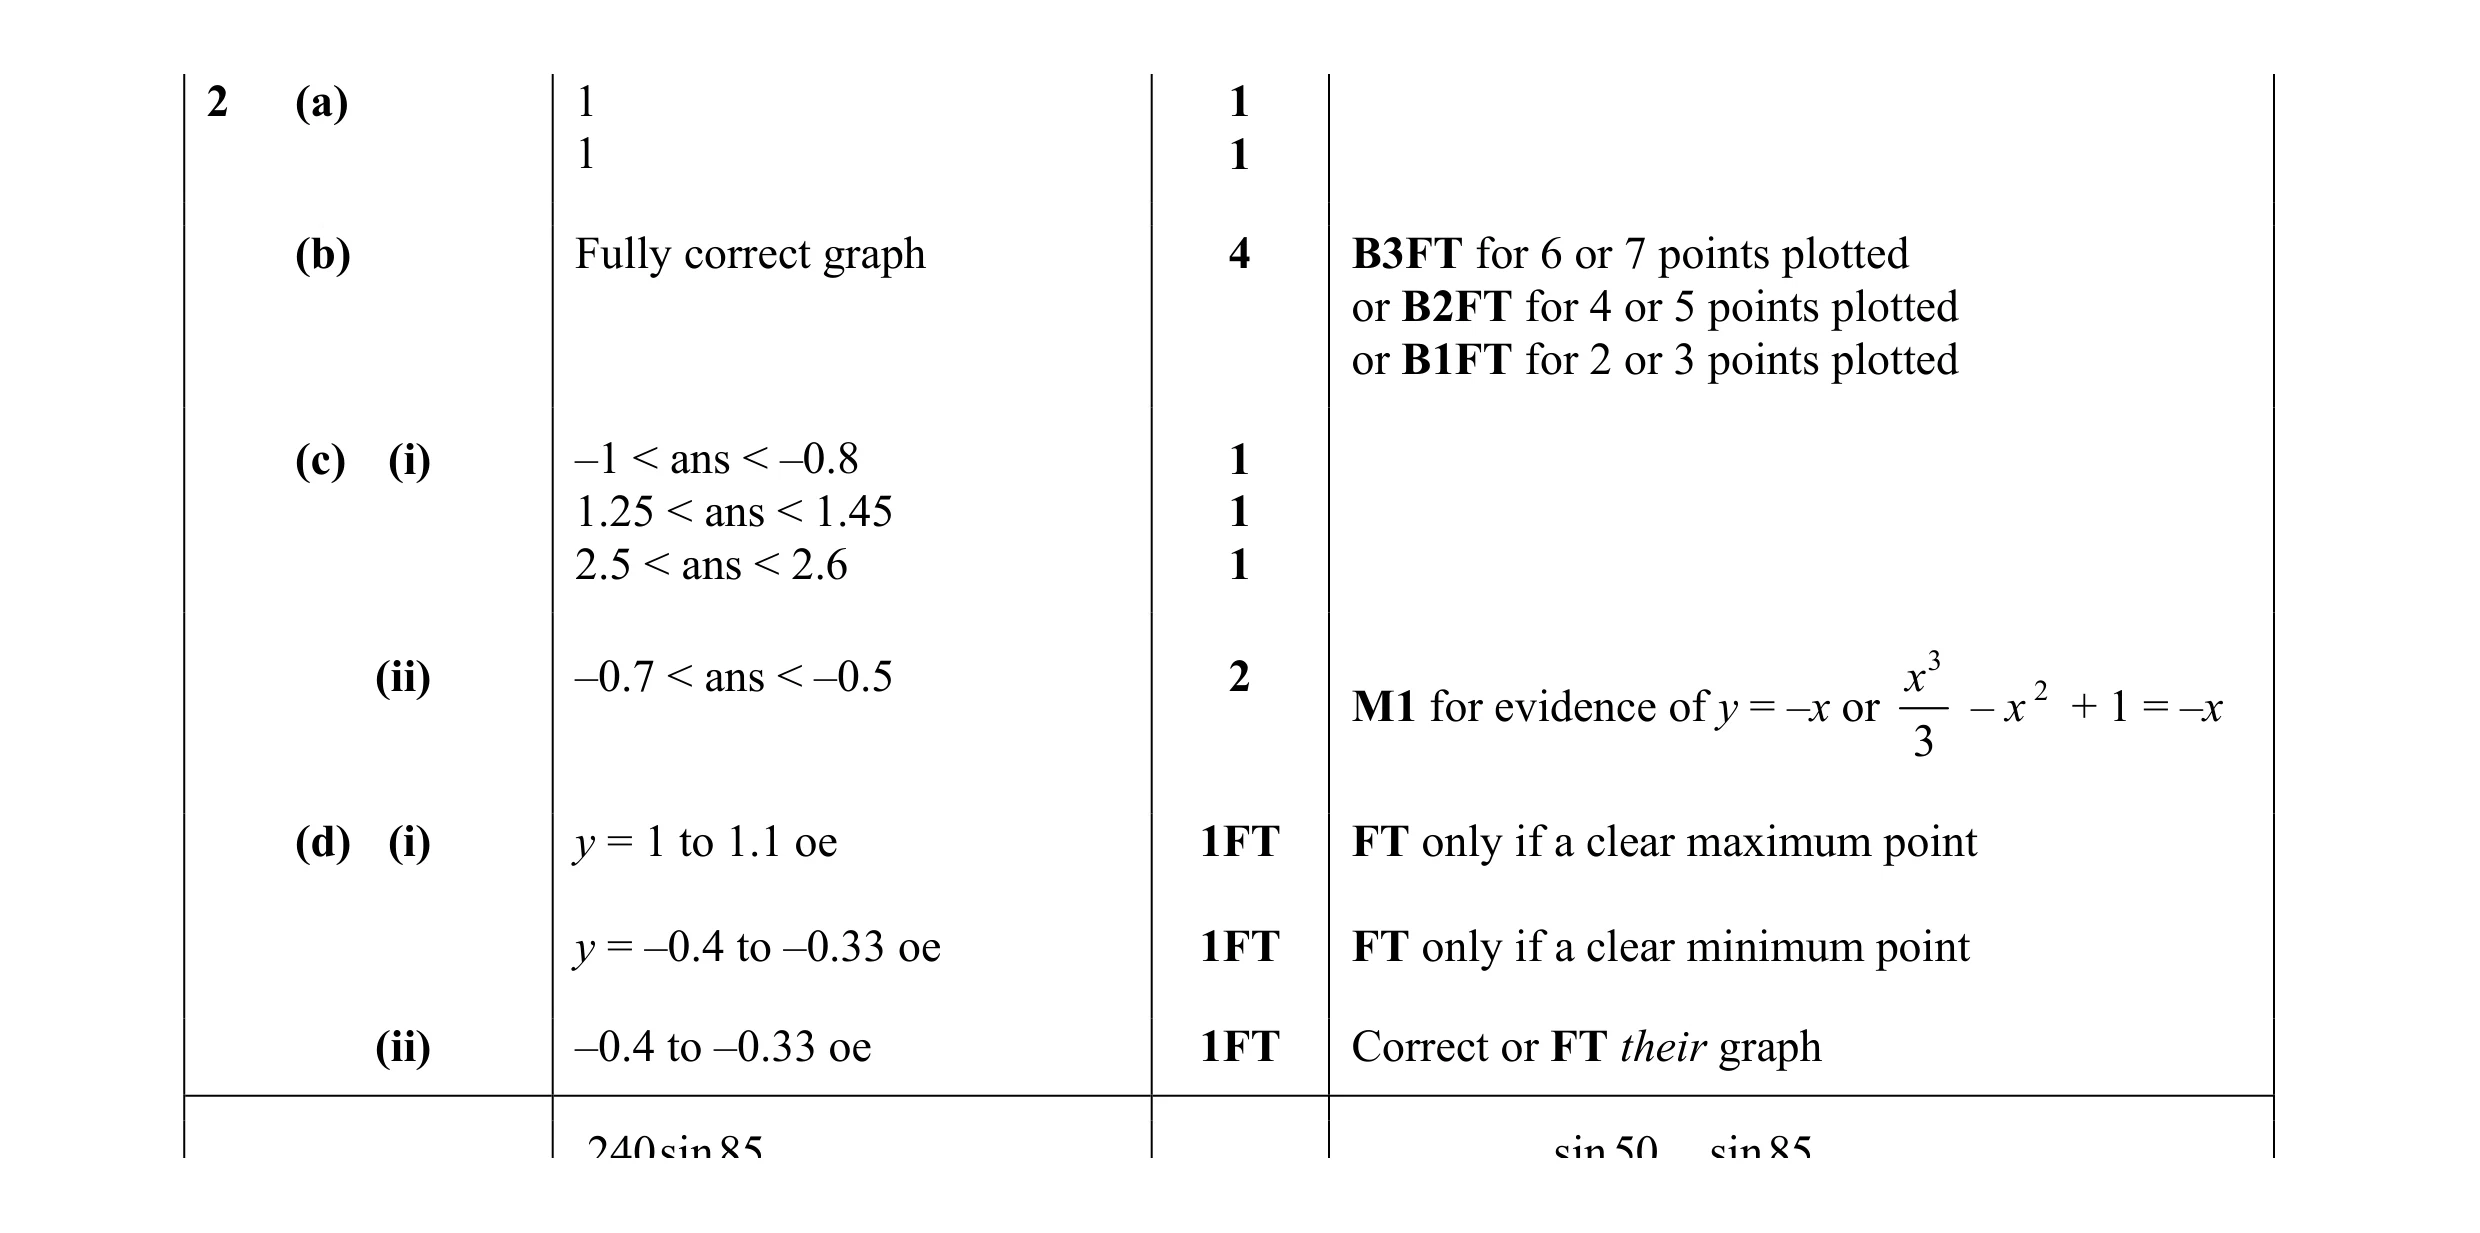 14
14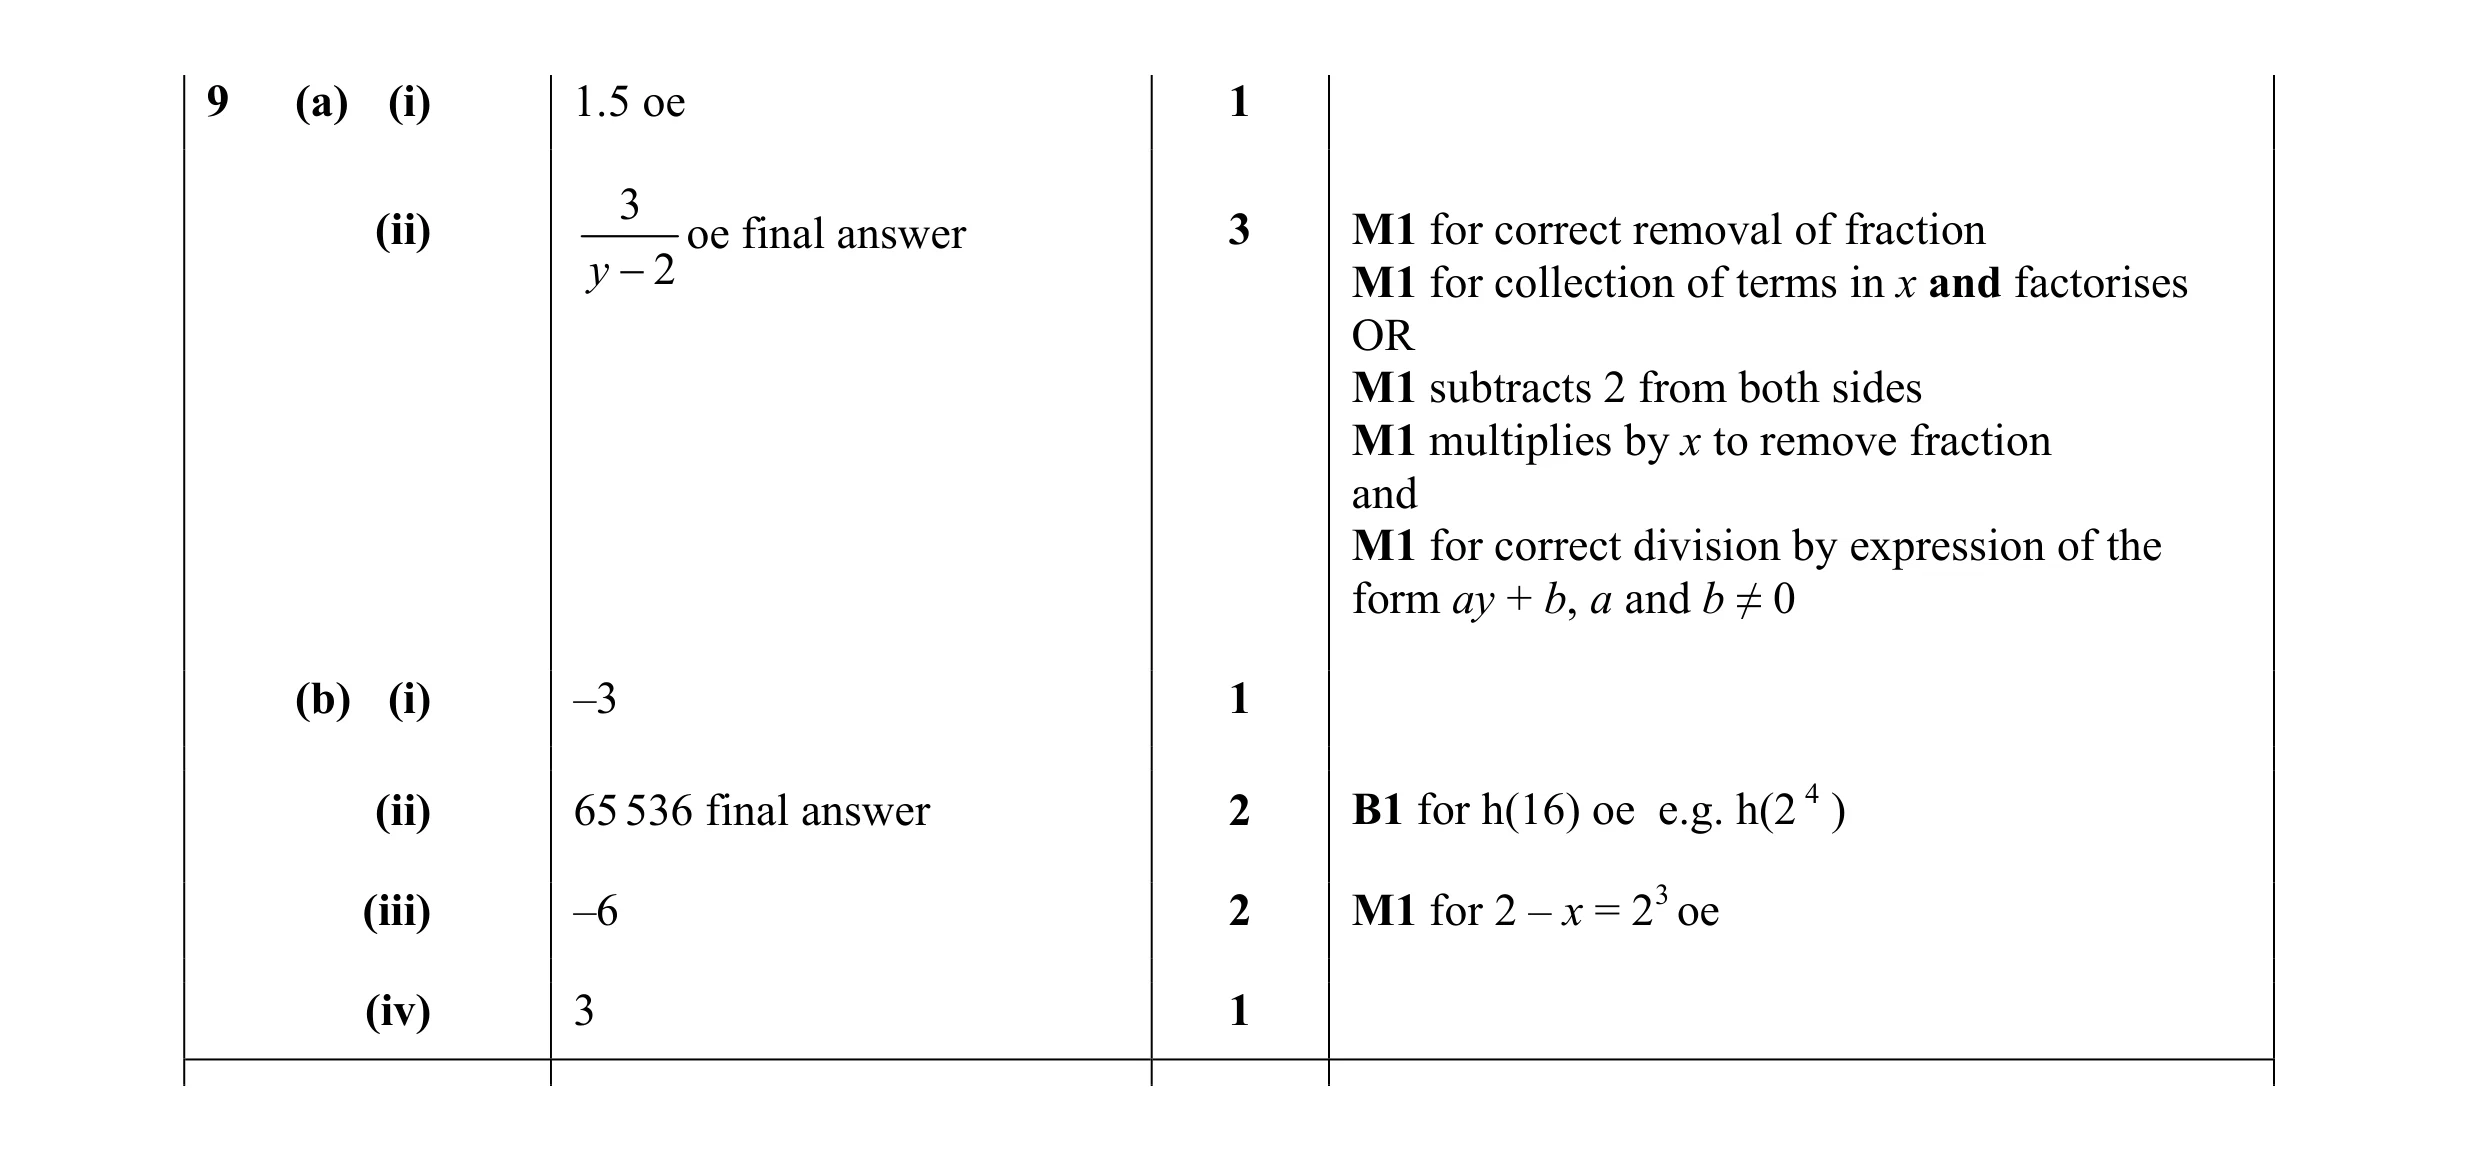 10
10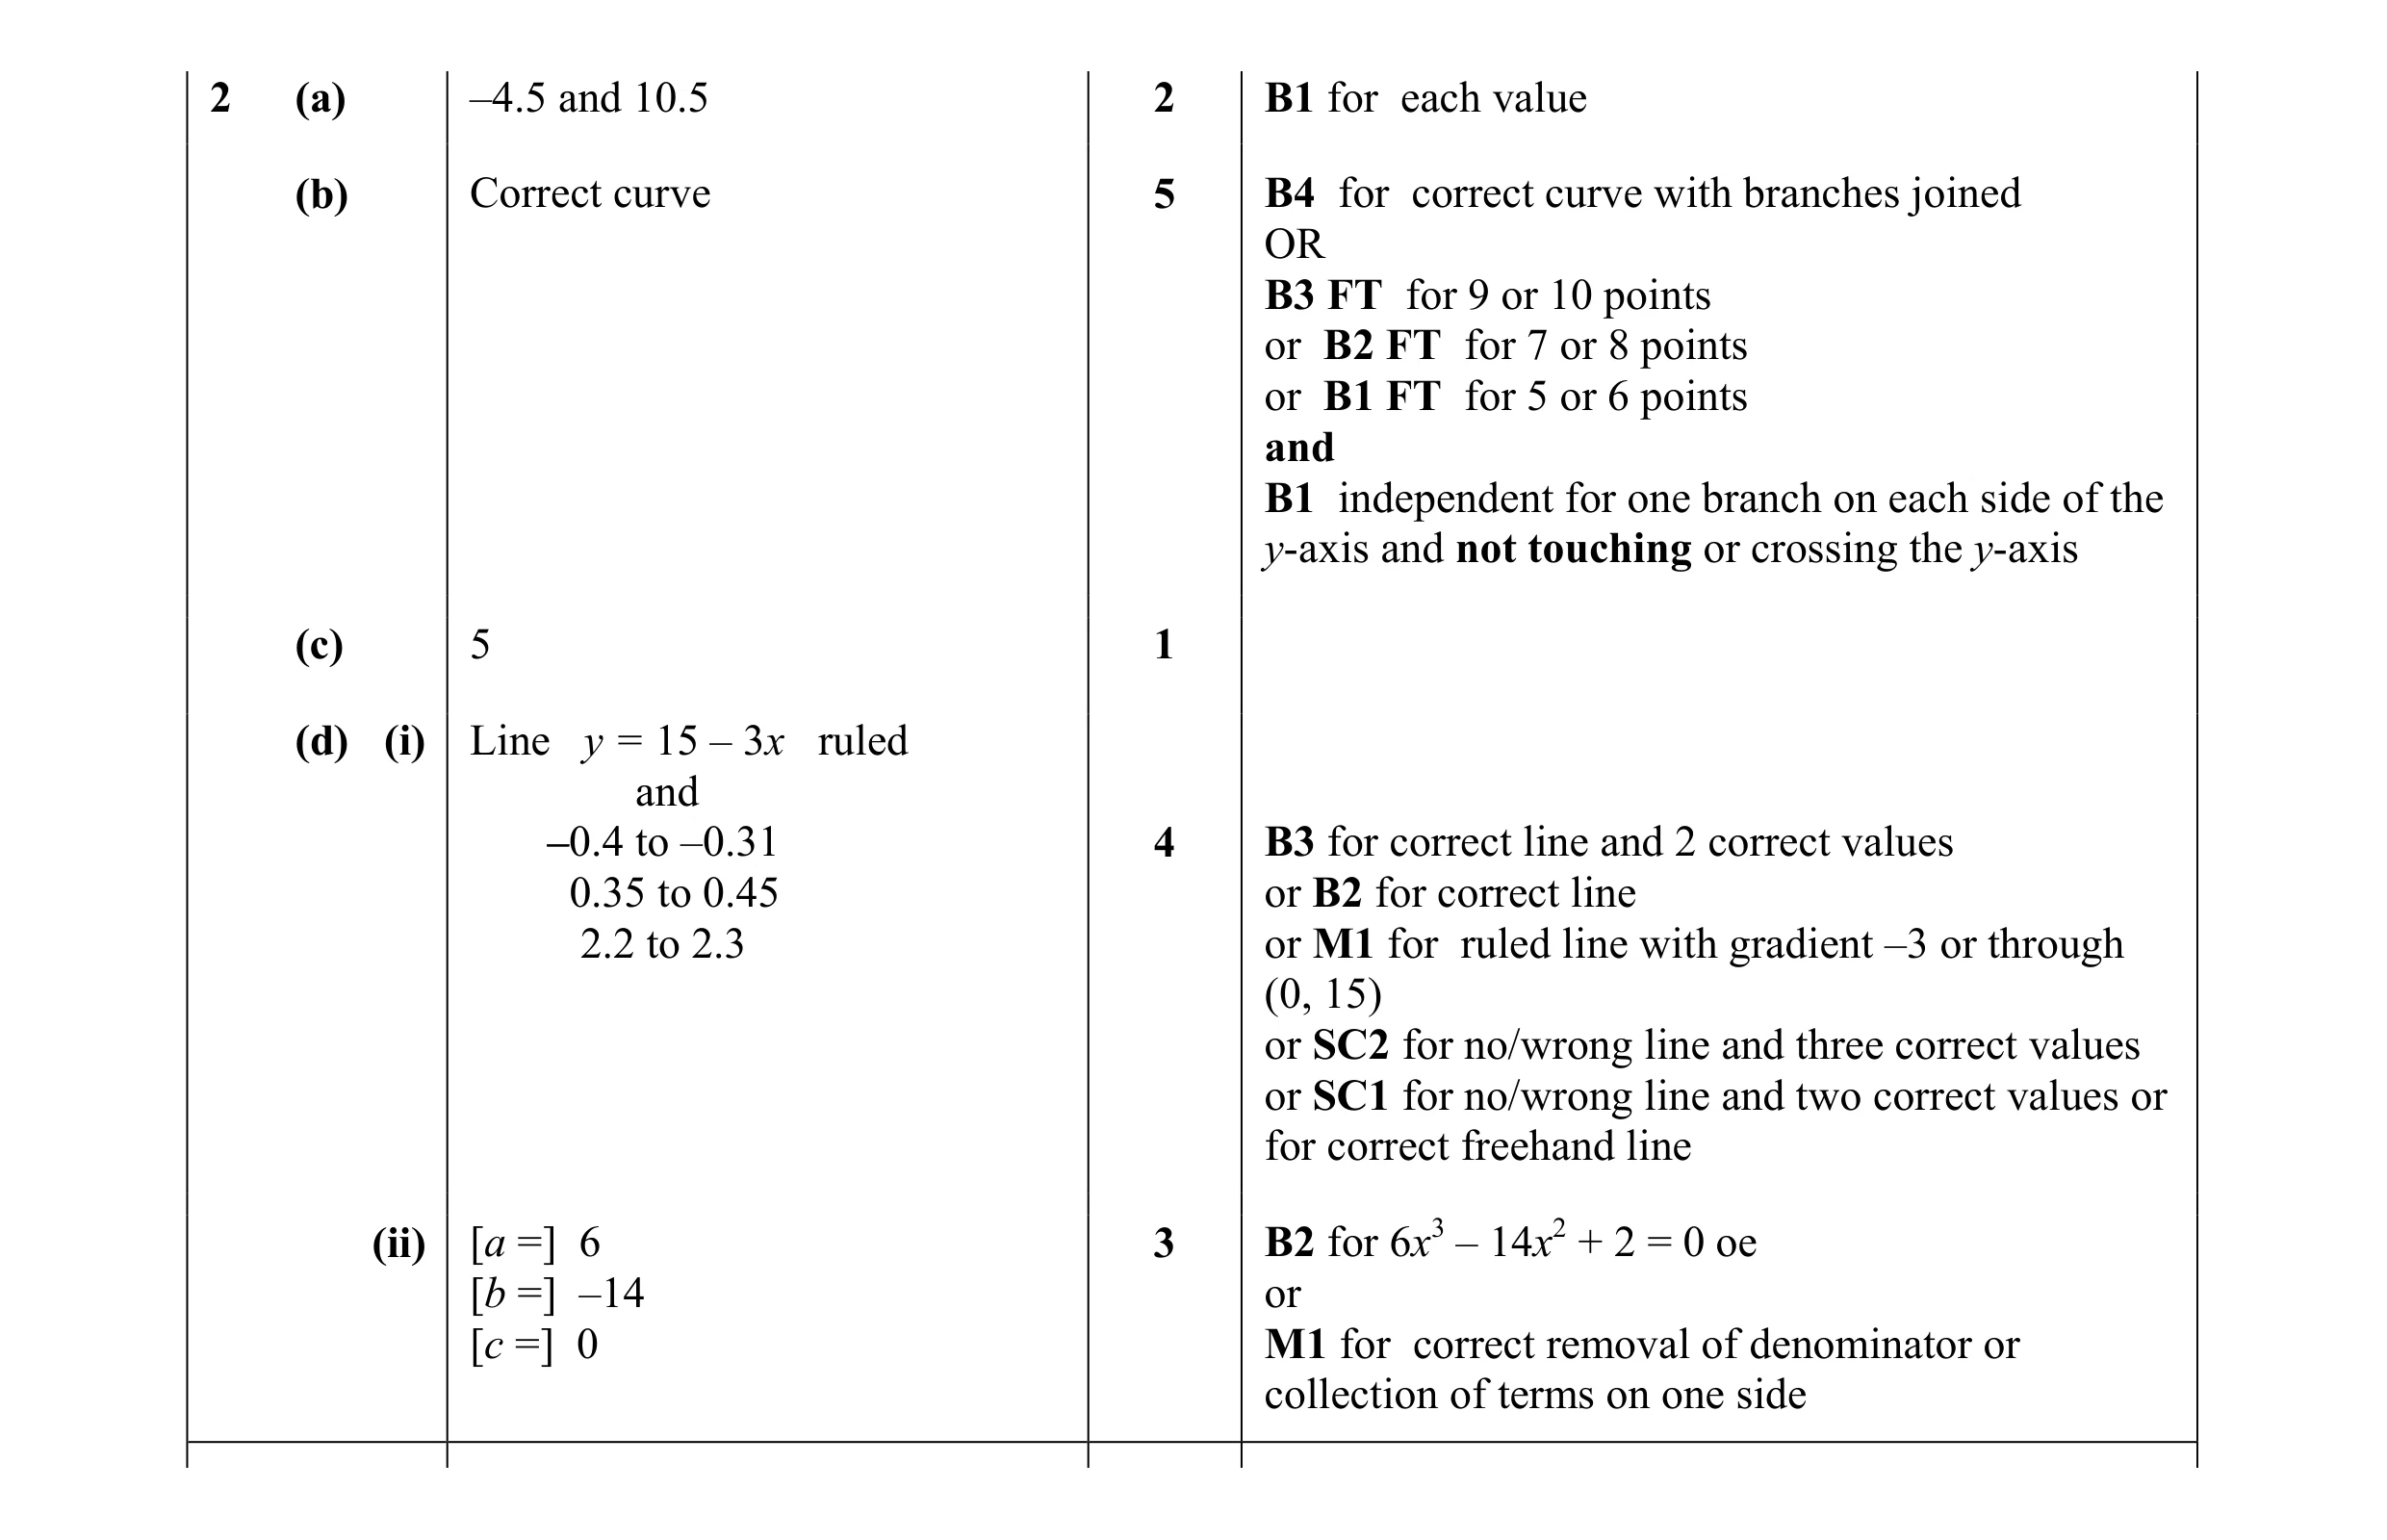 15
15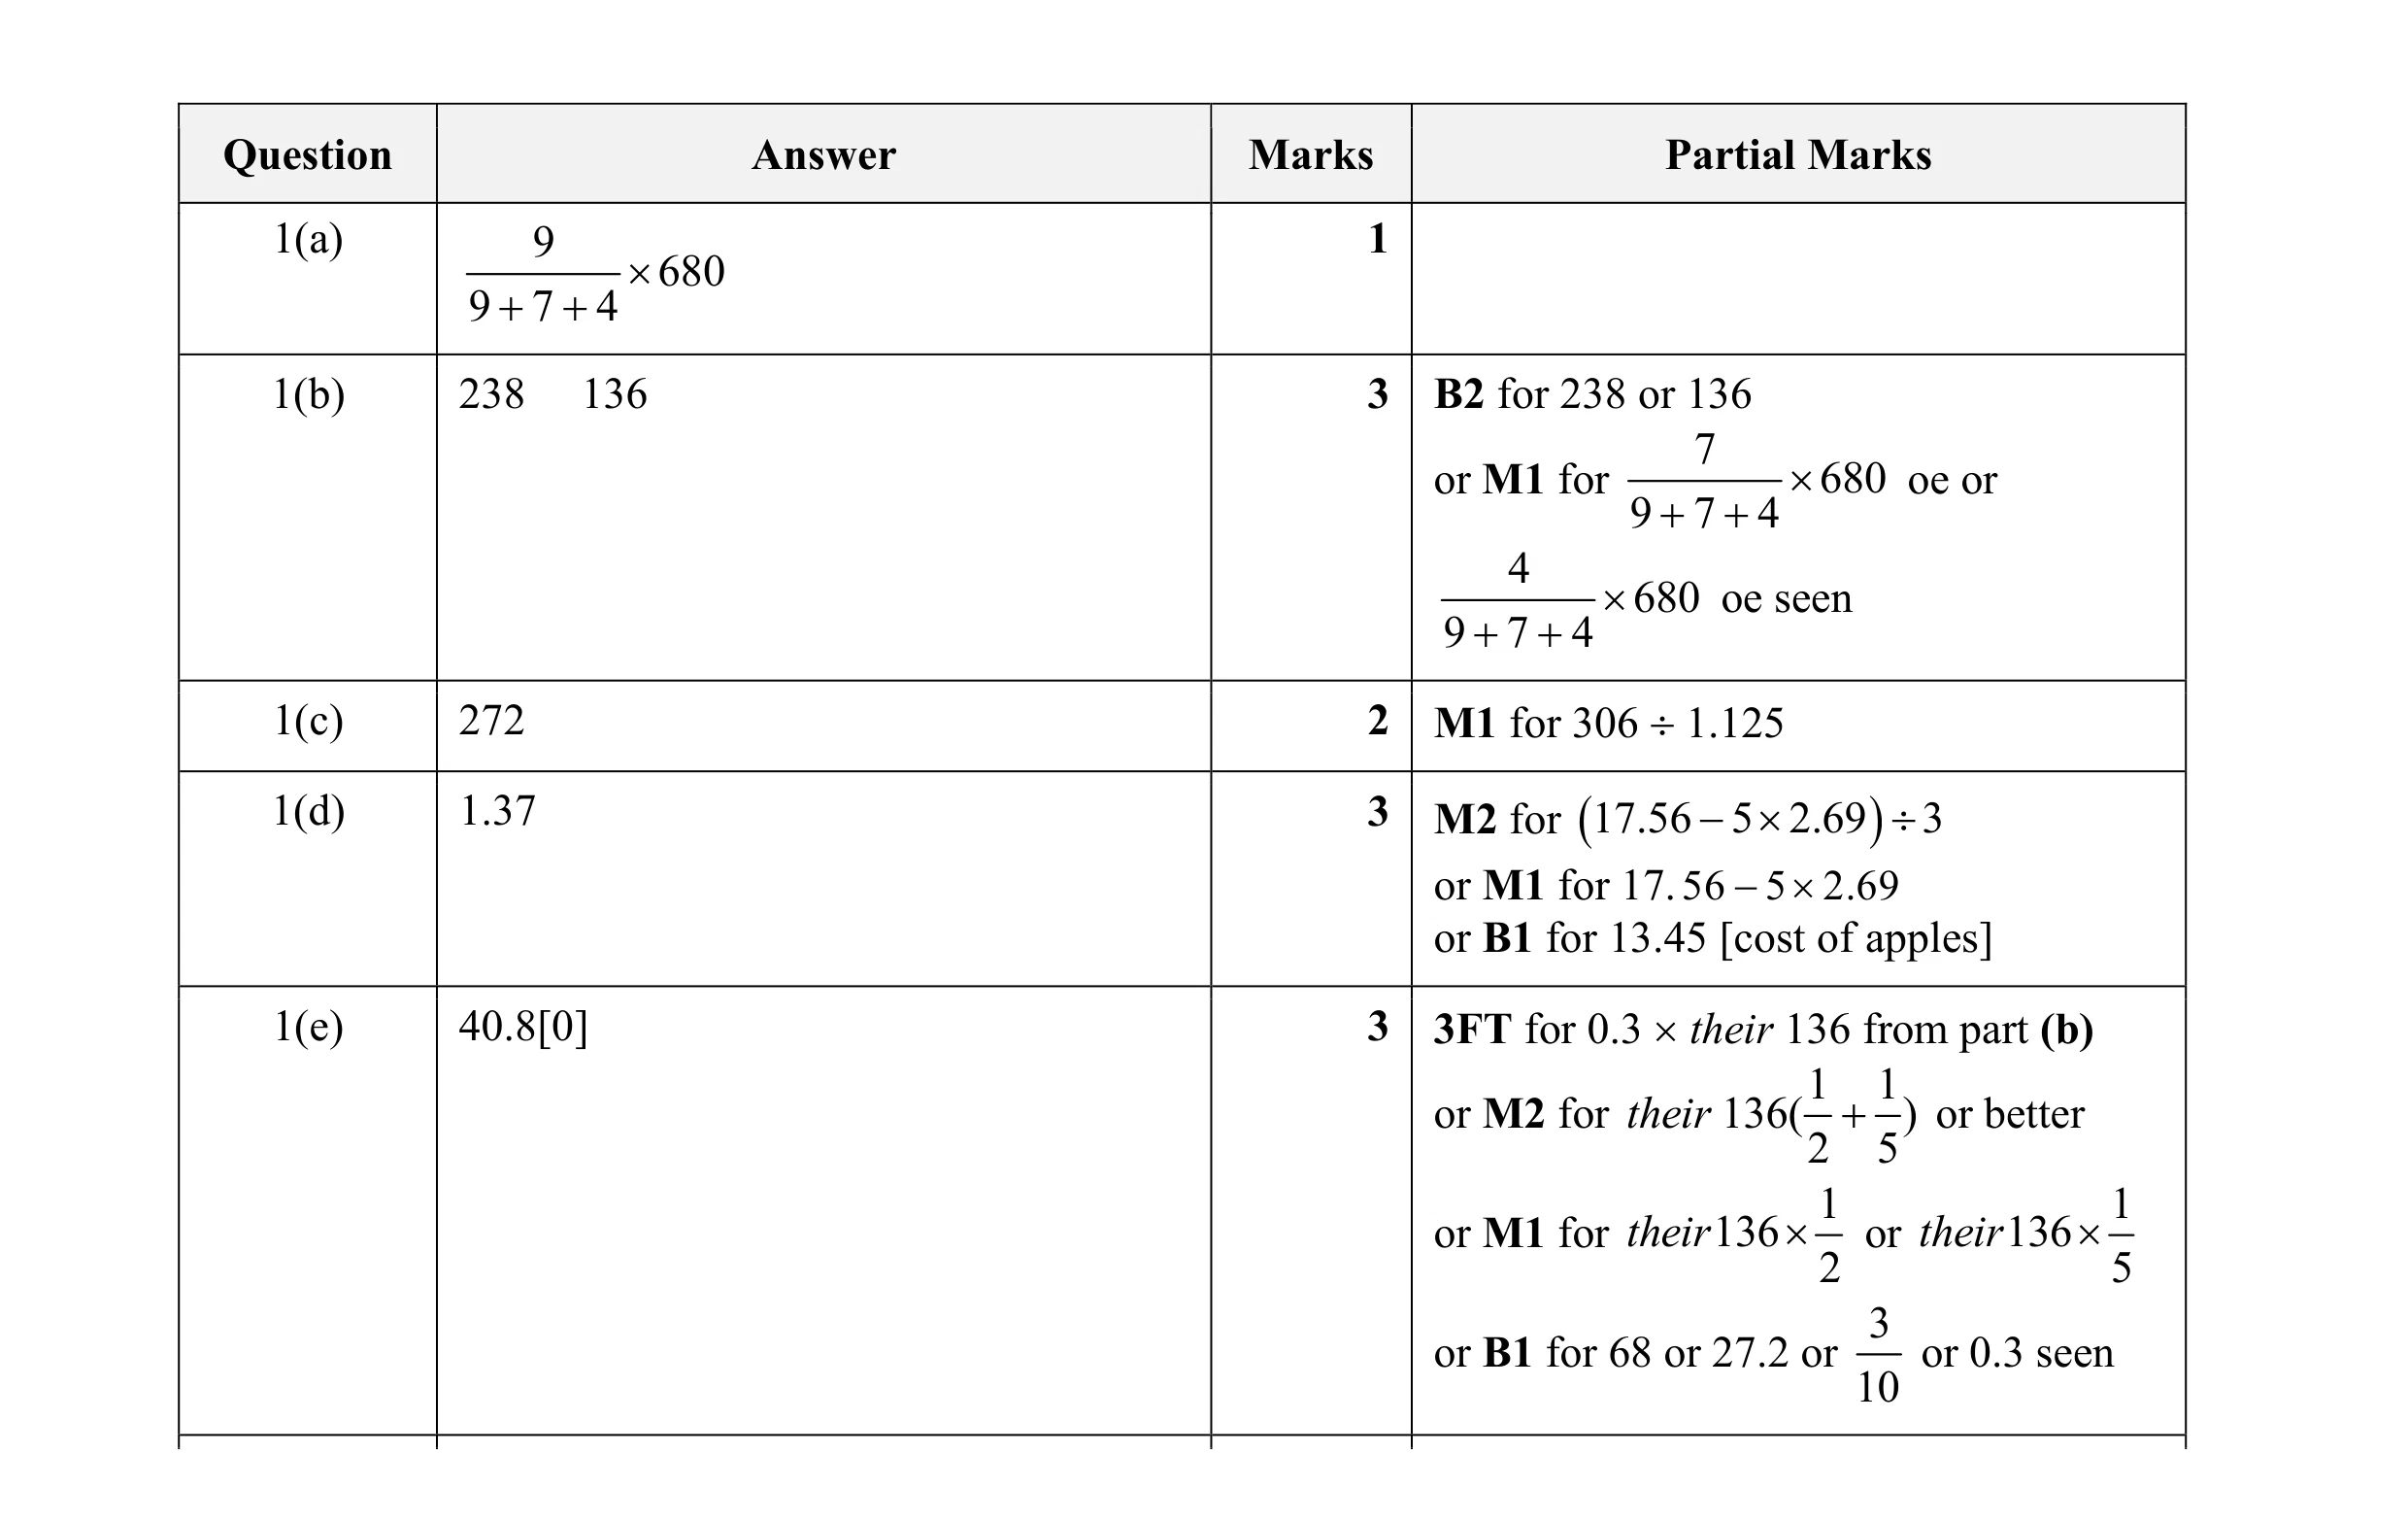 12
12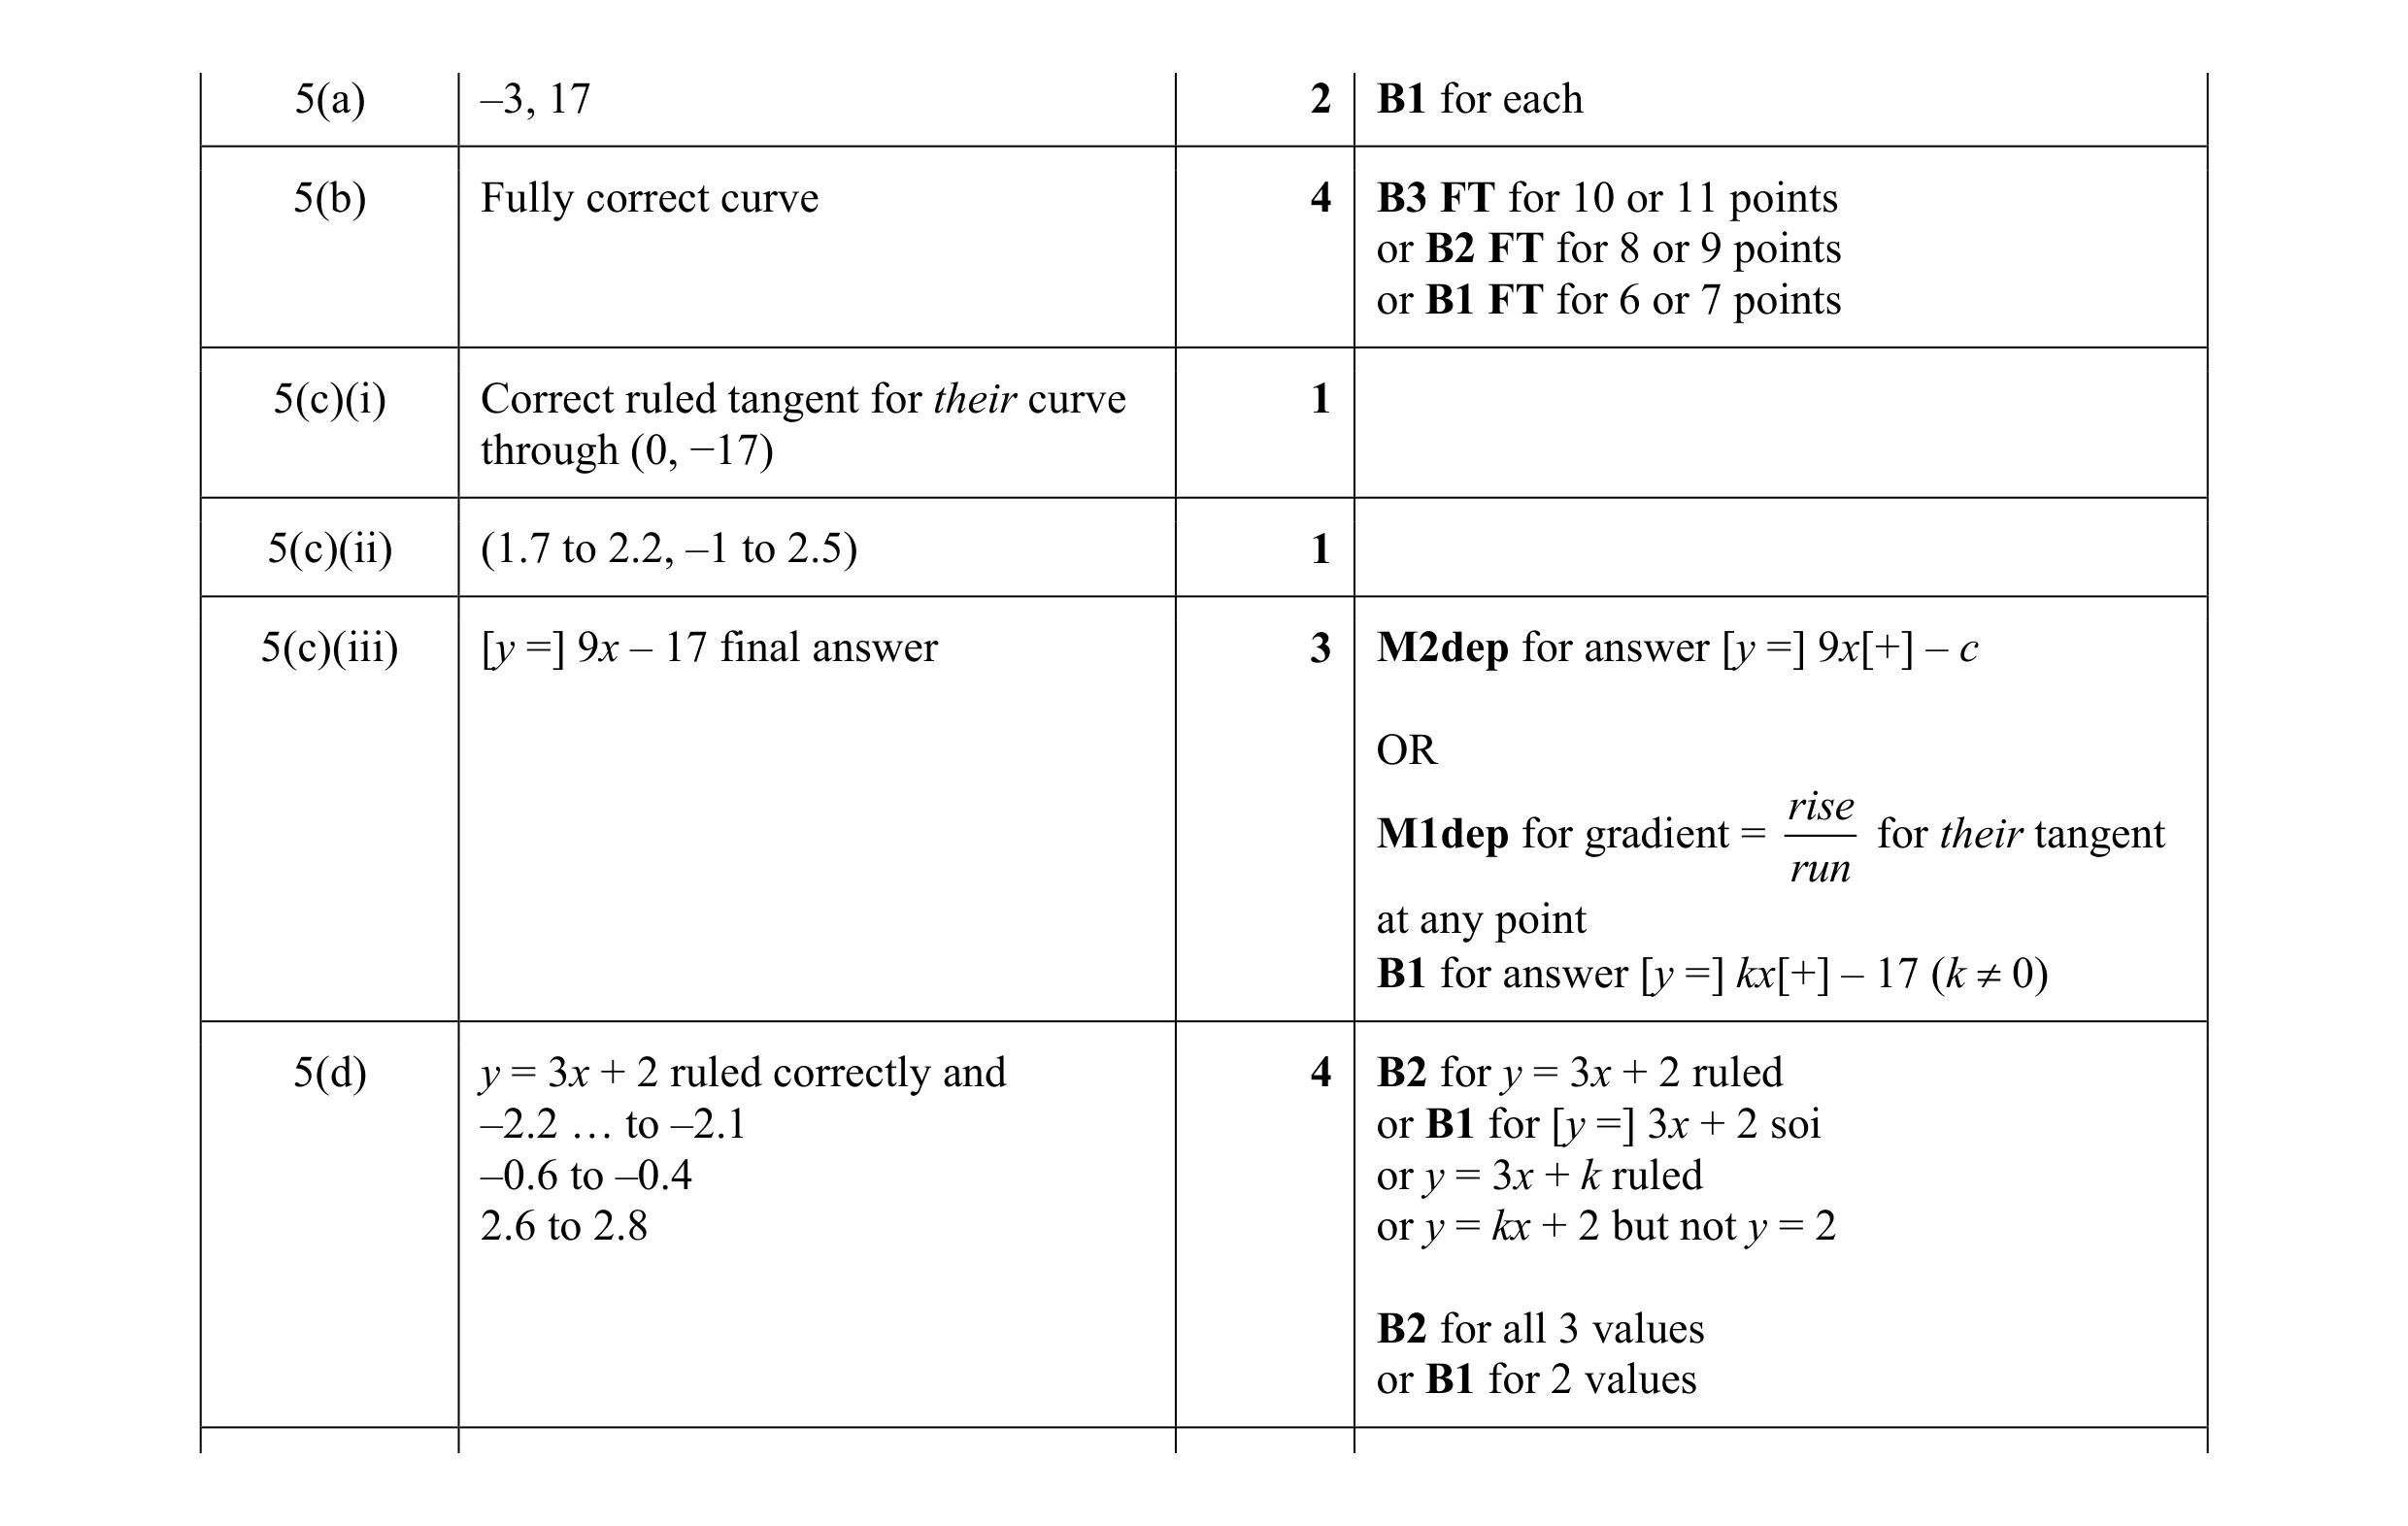 15
15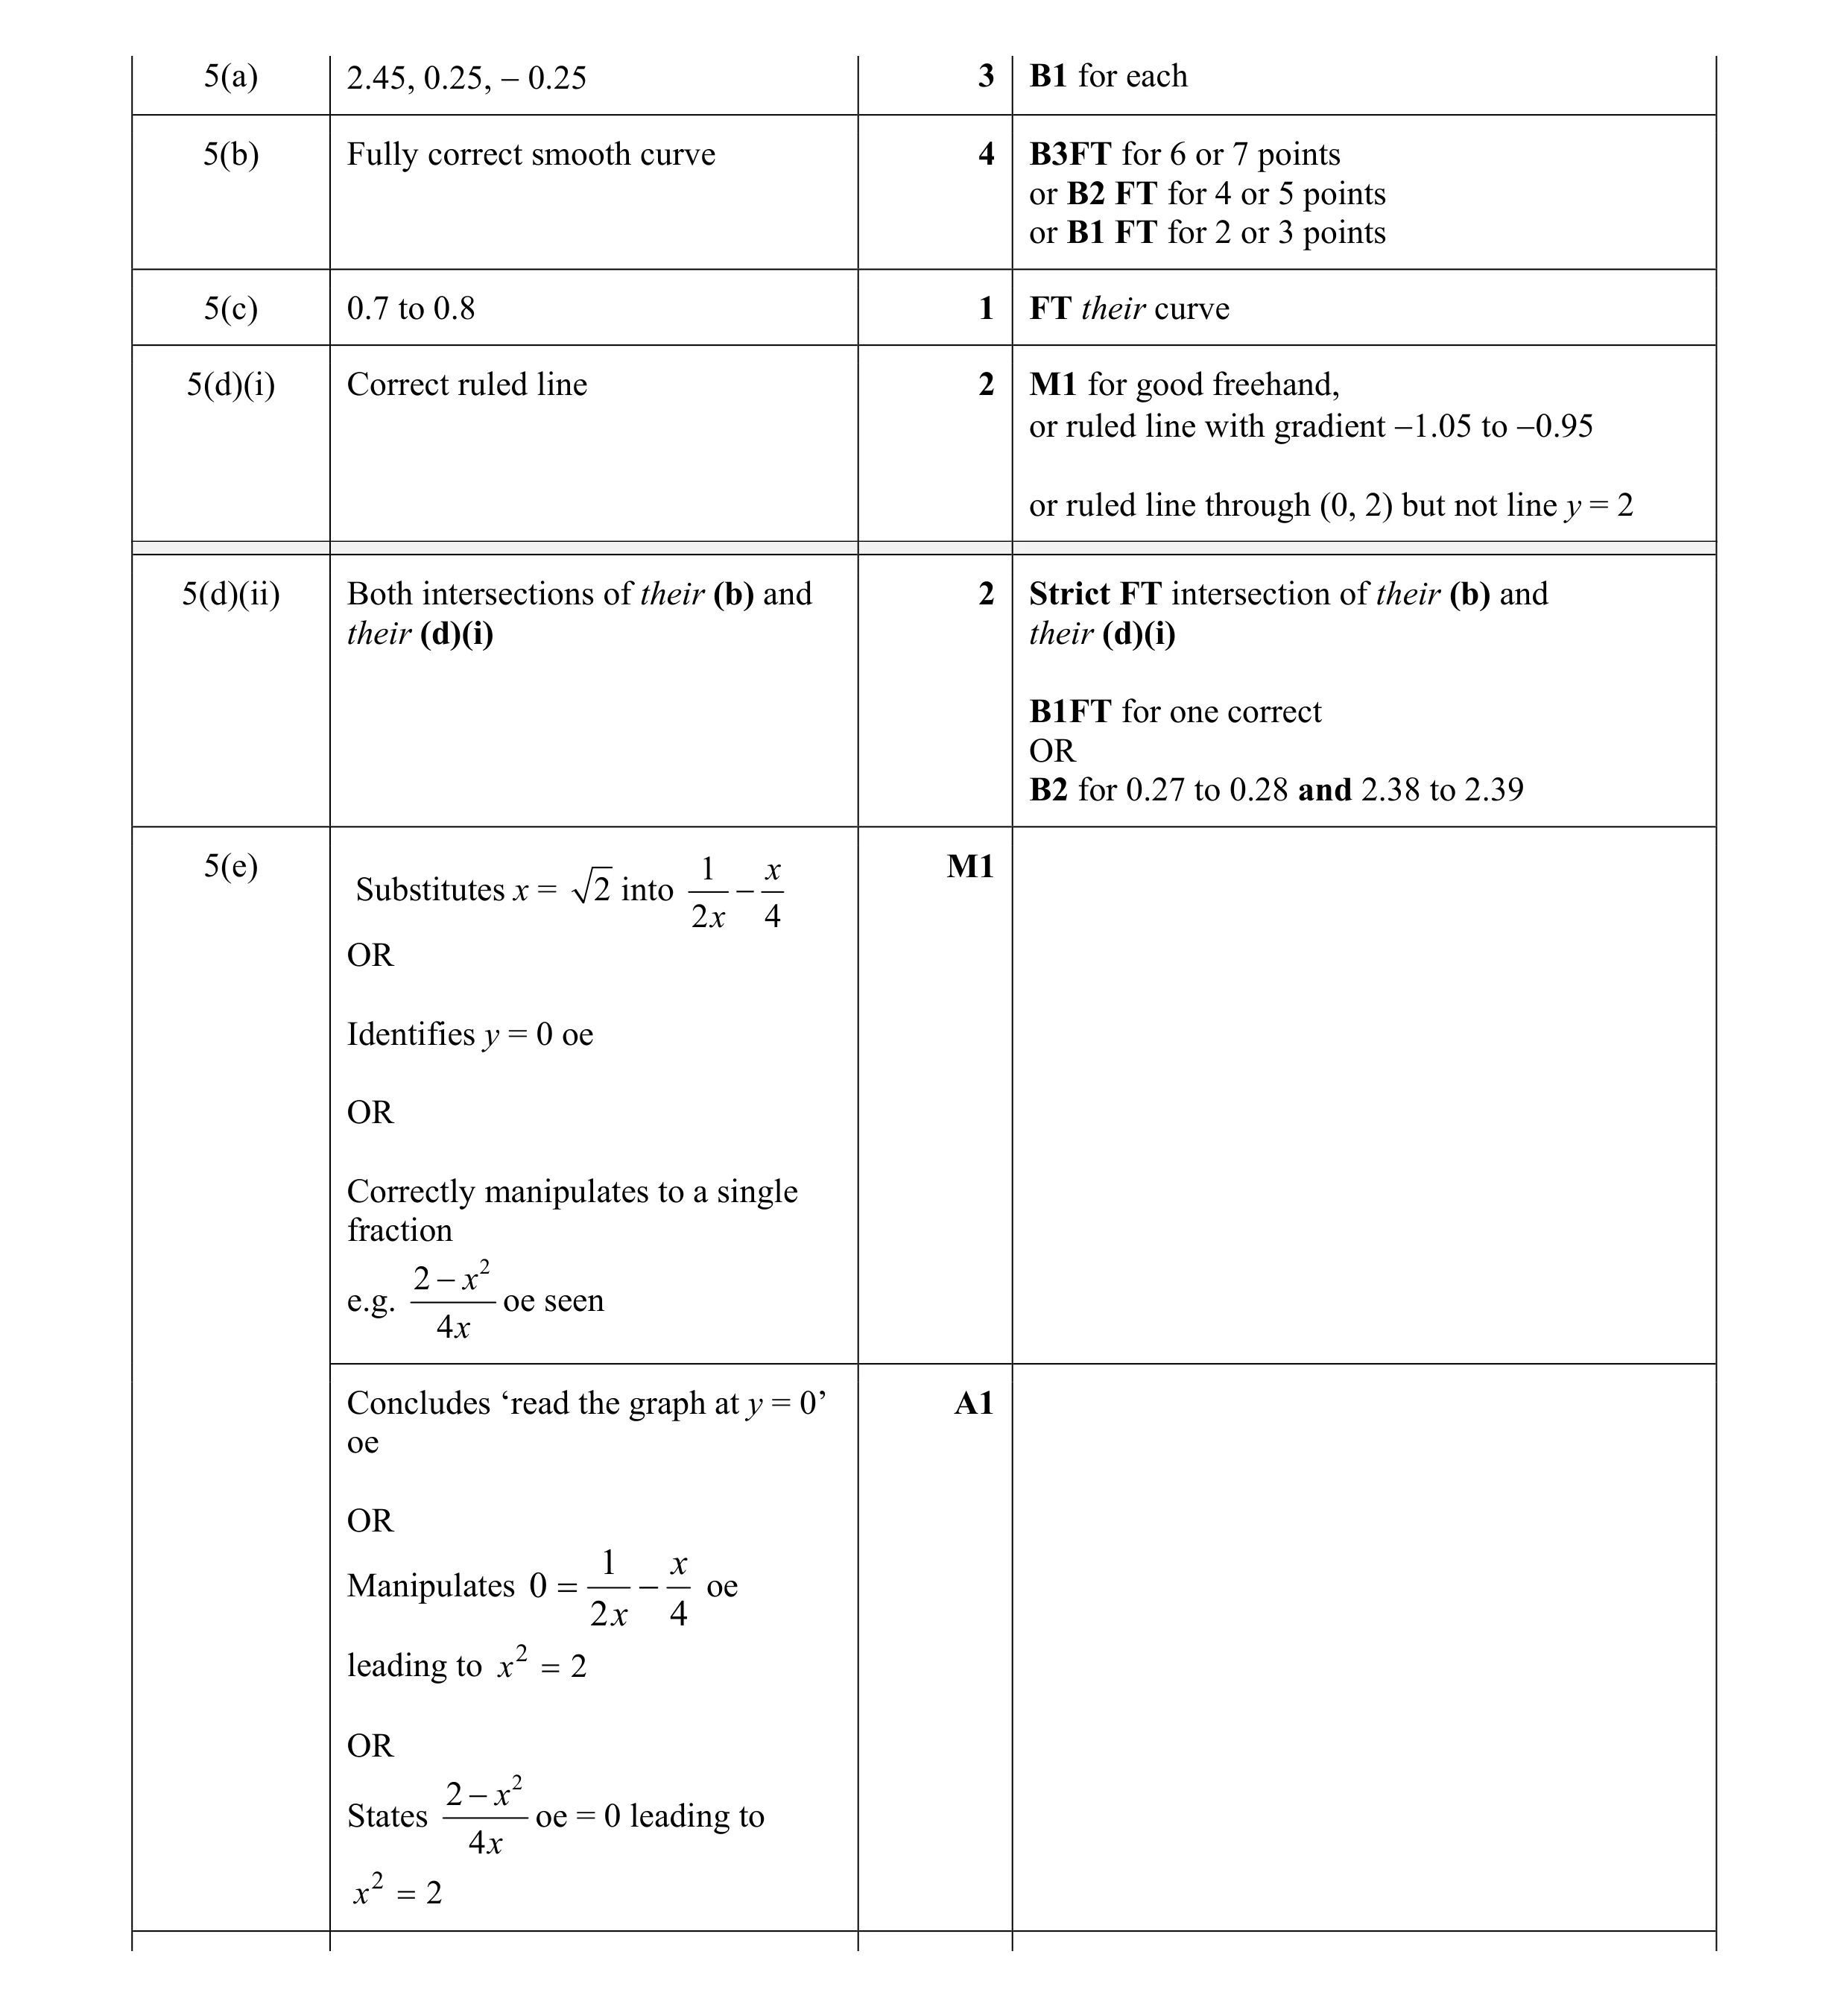 14
14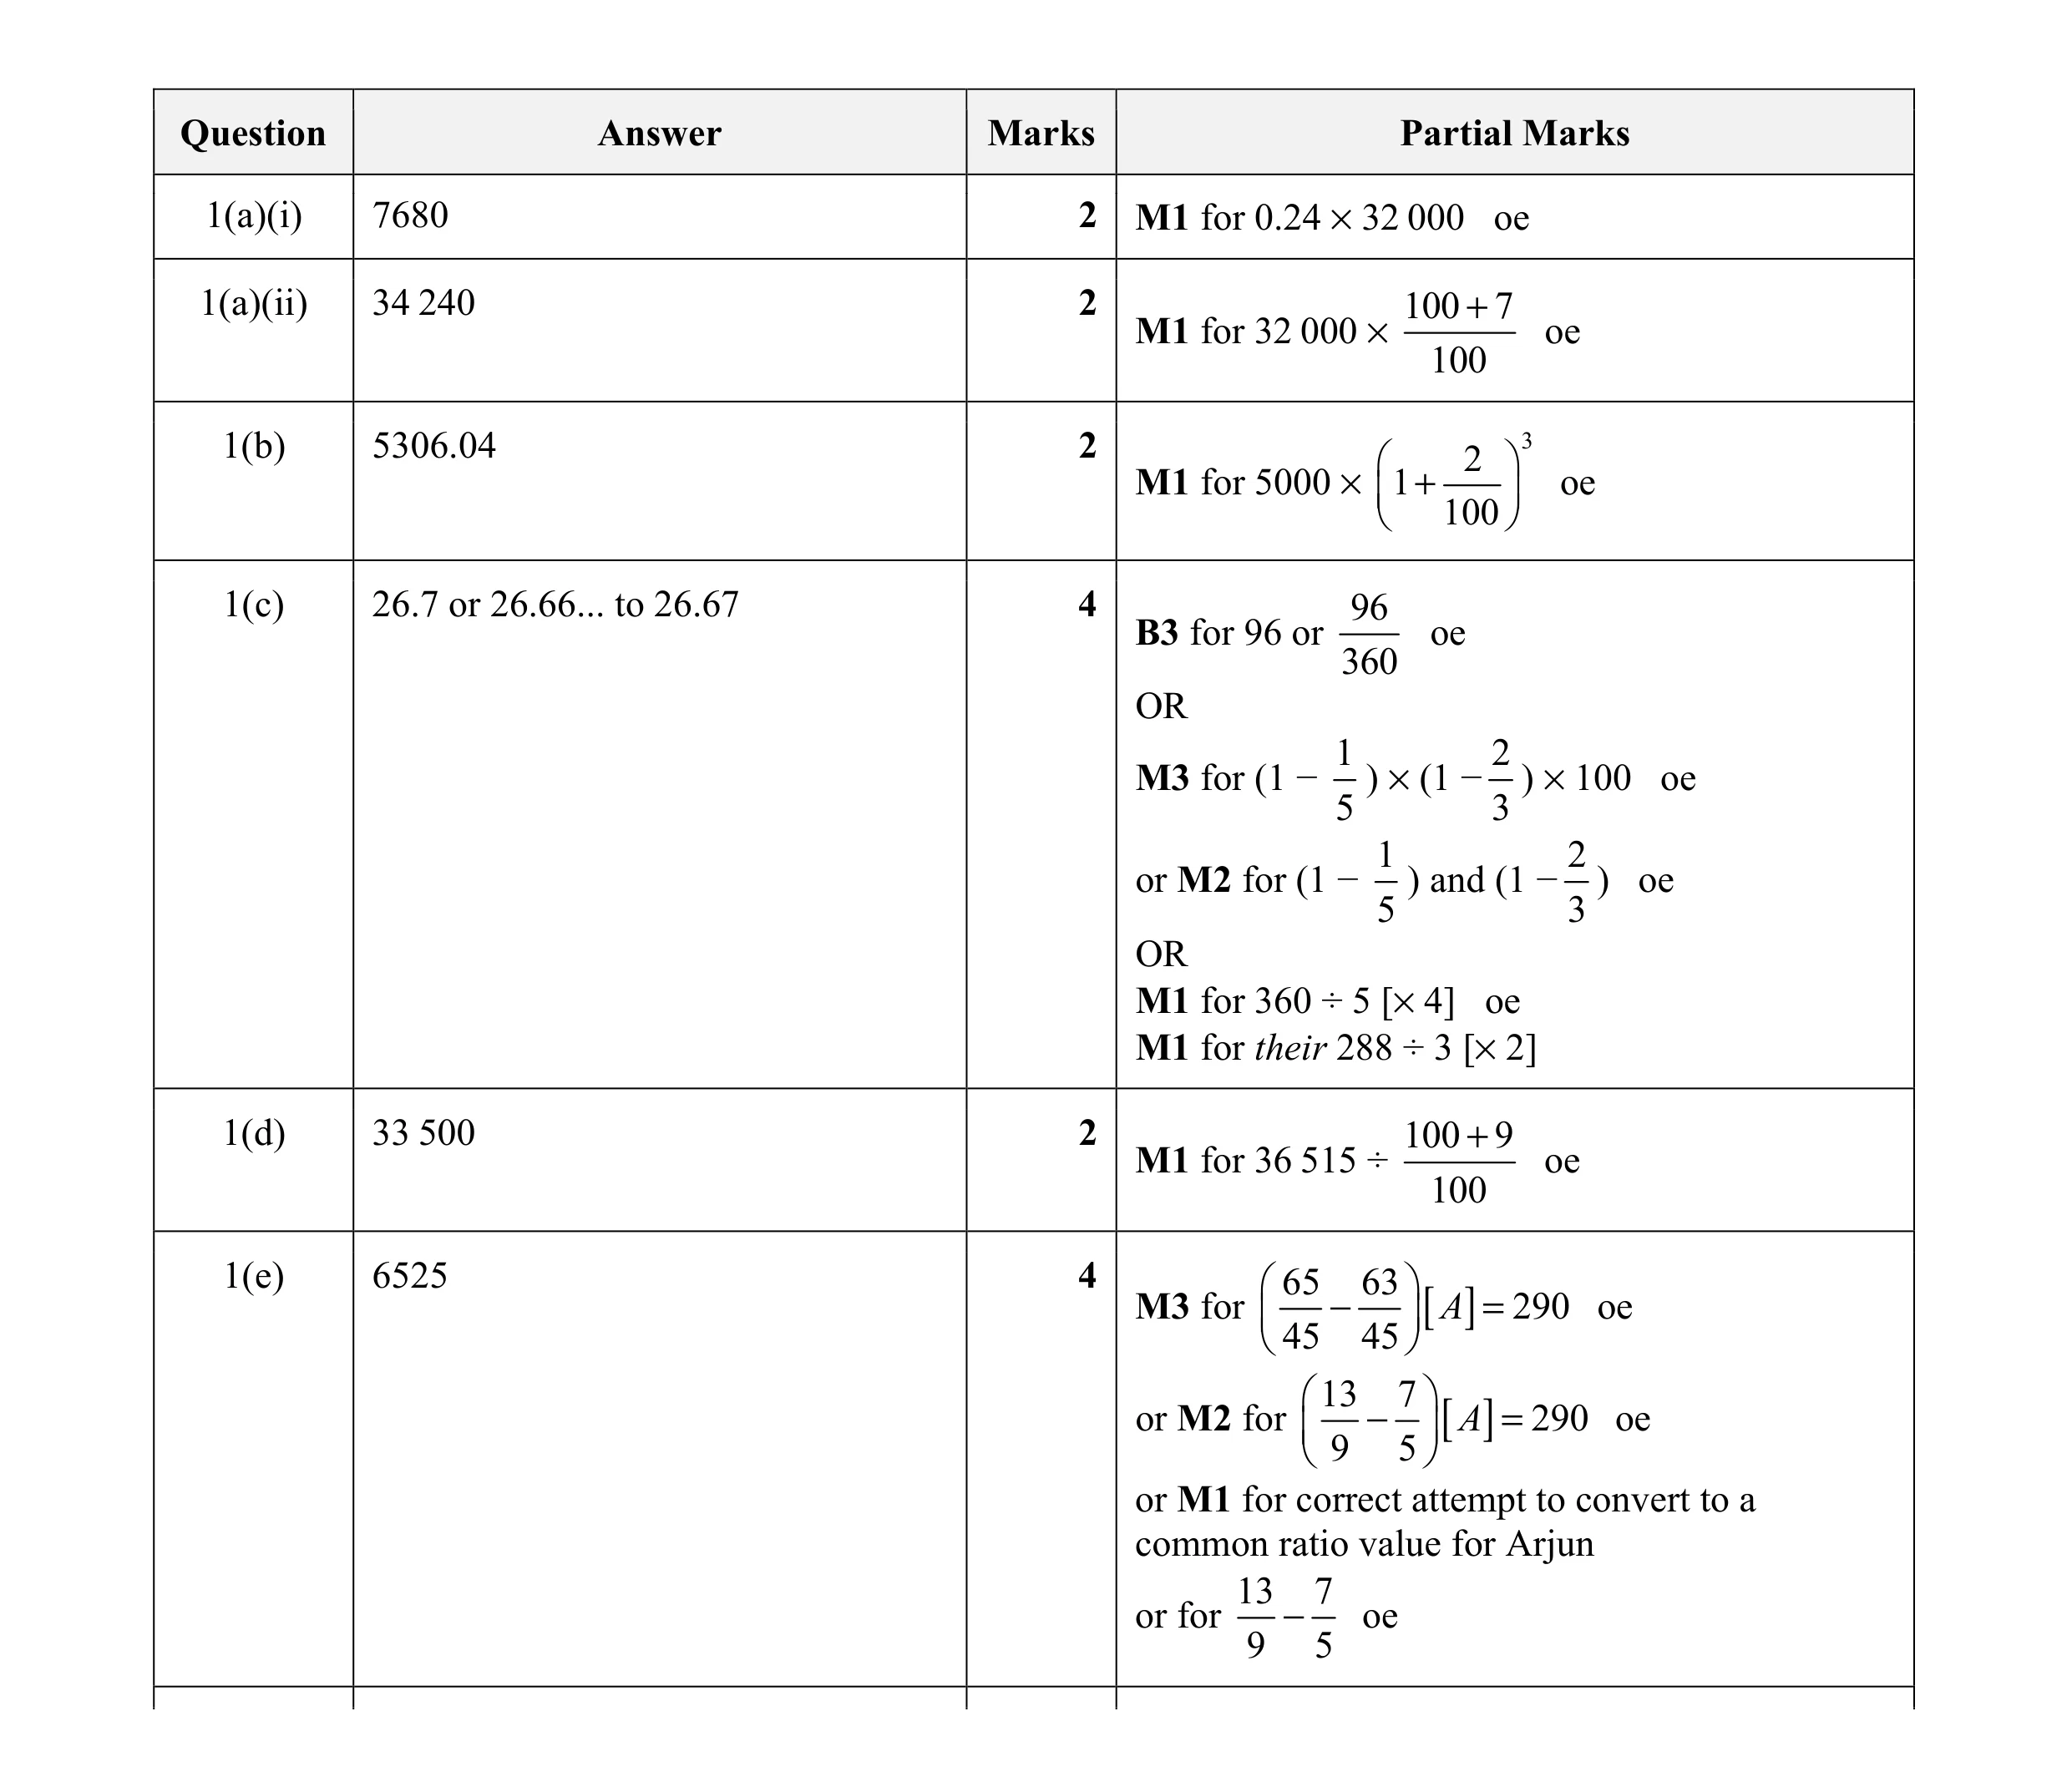 16
16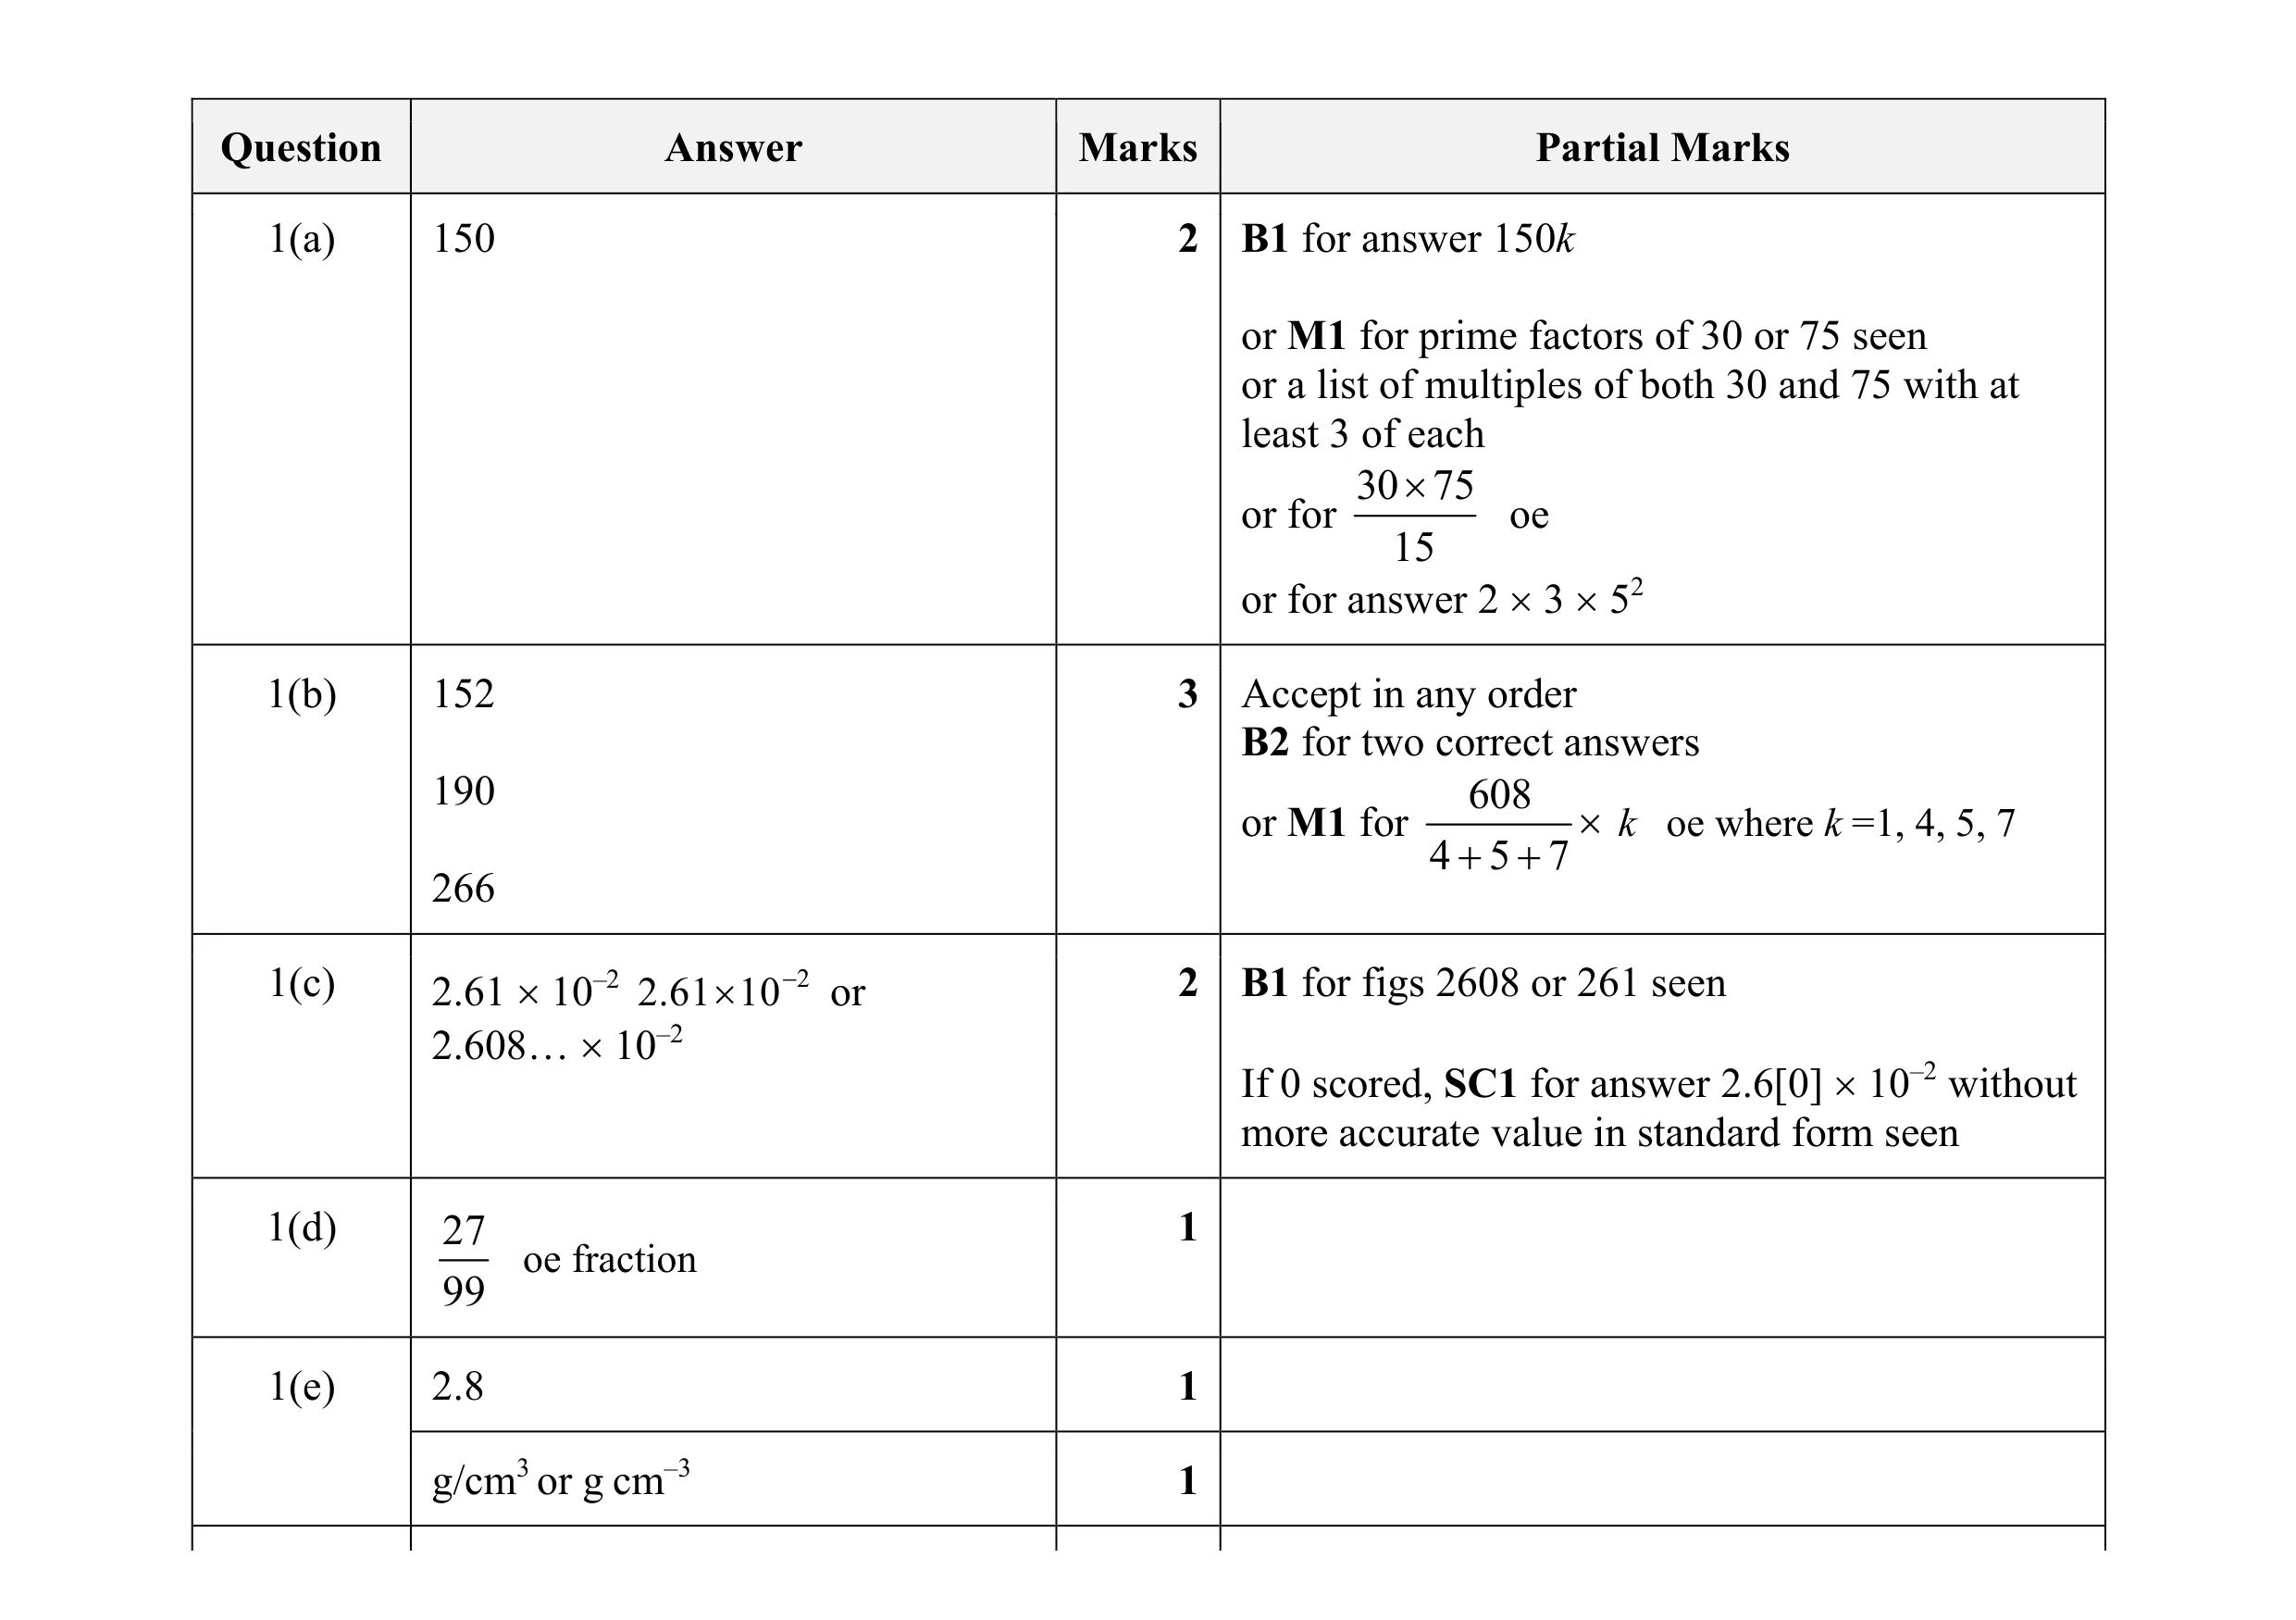 10
10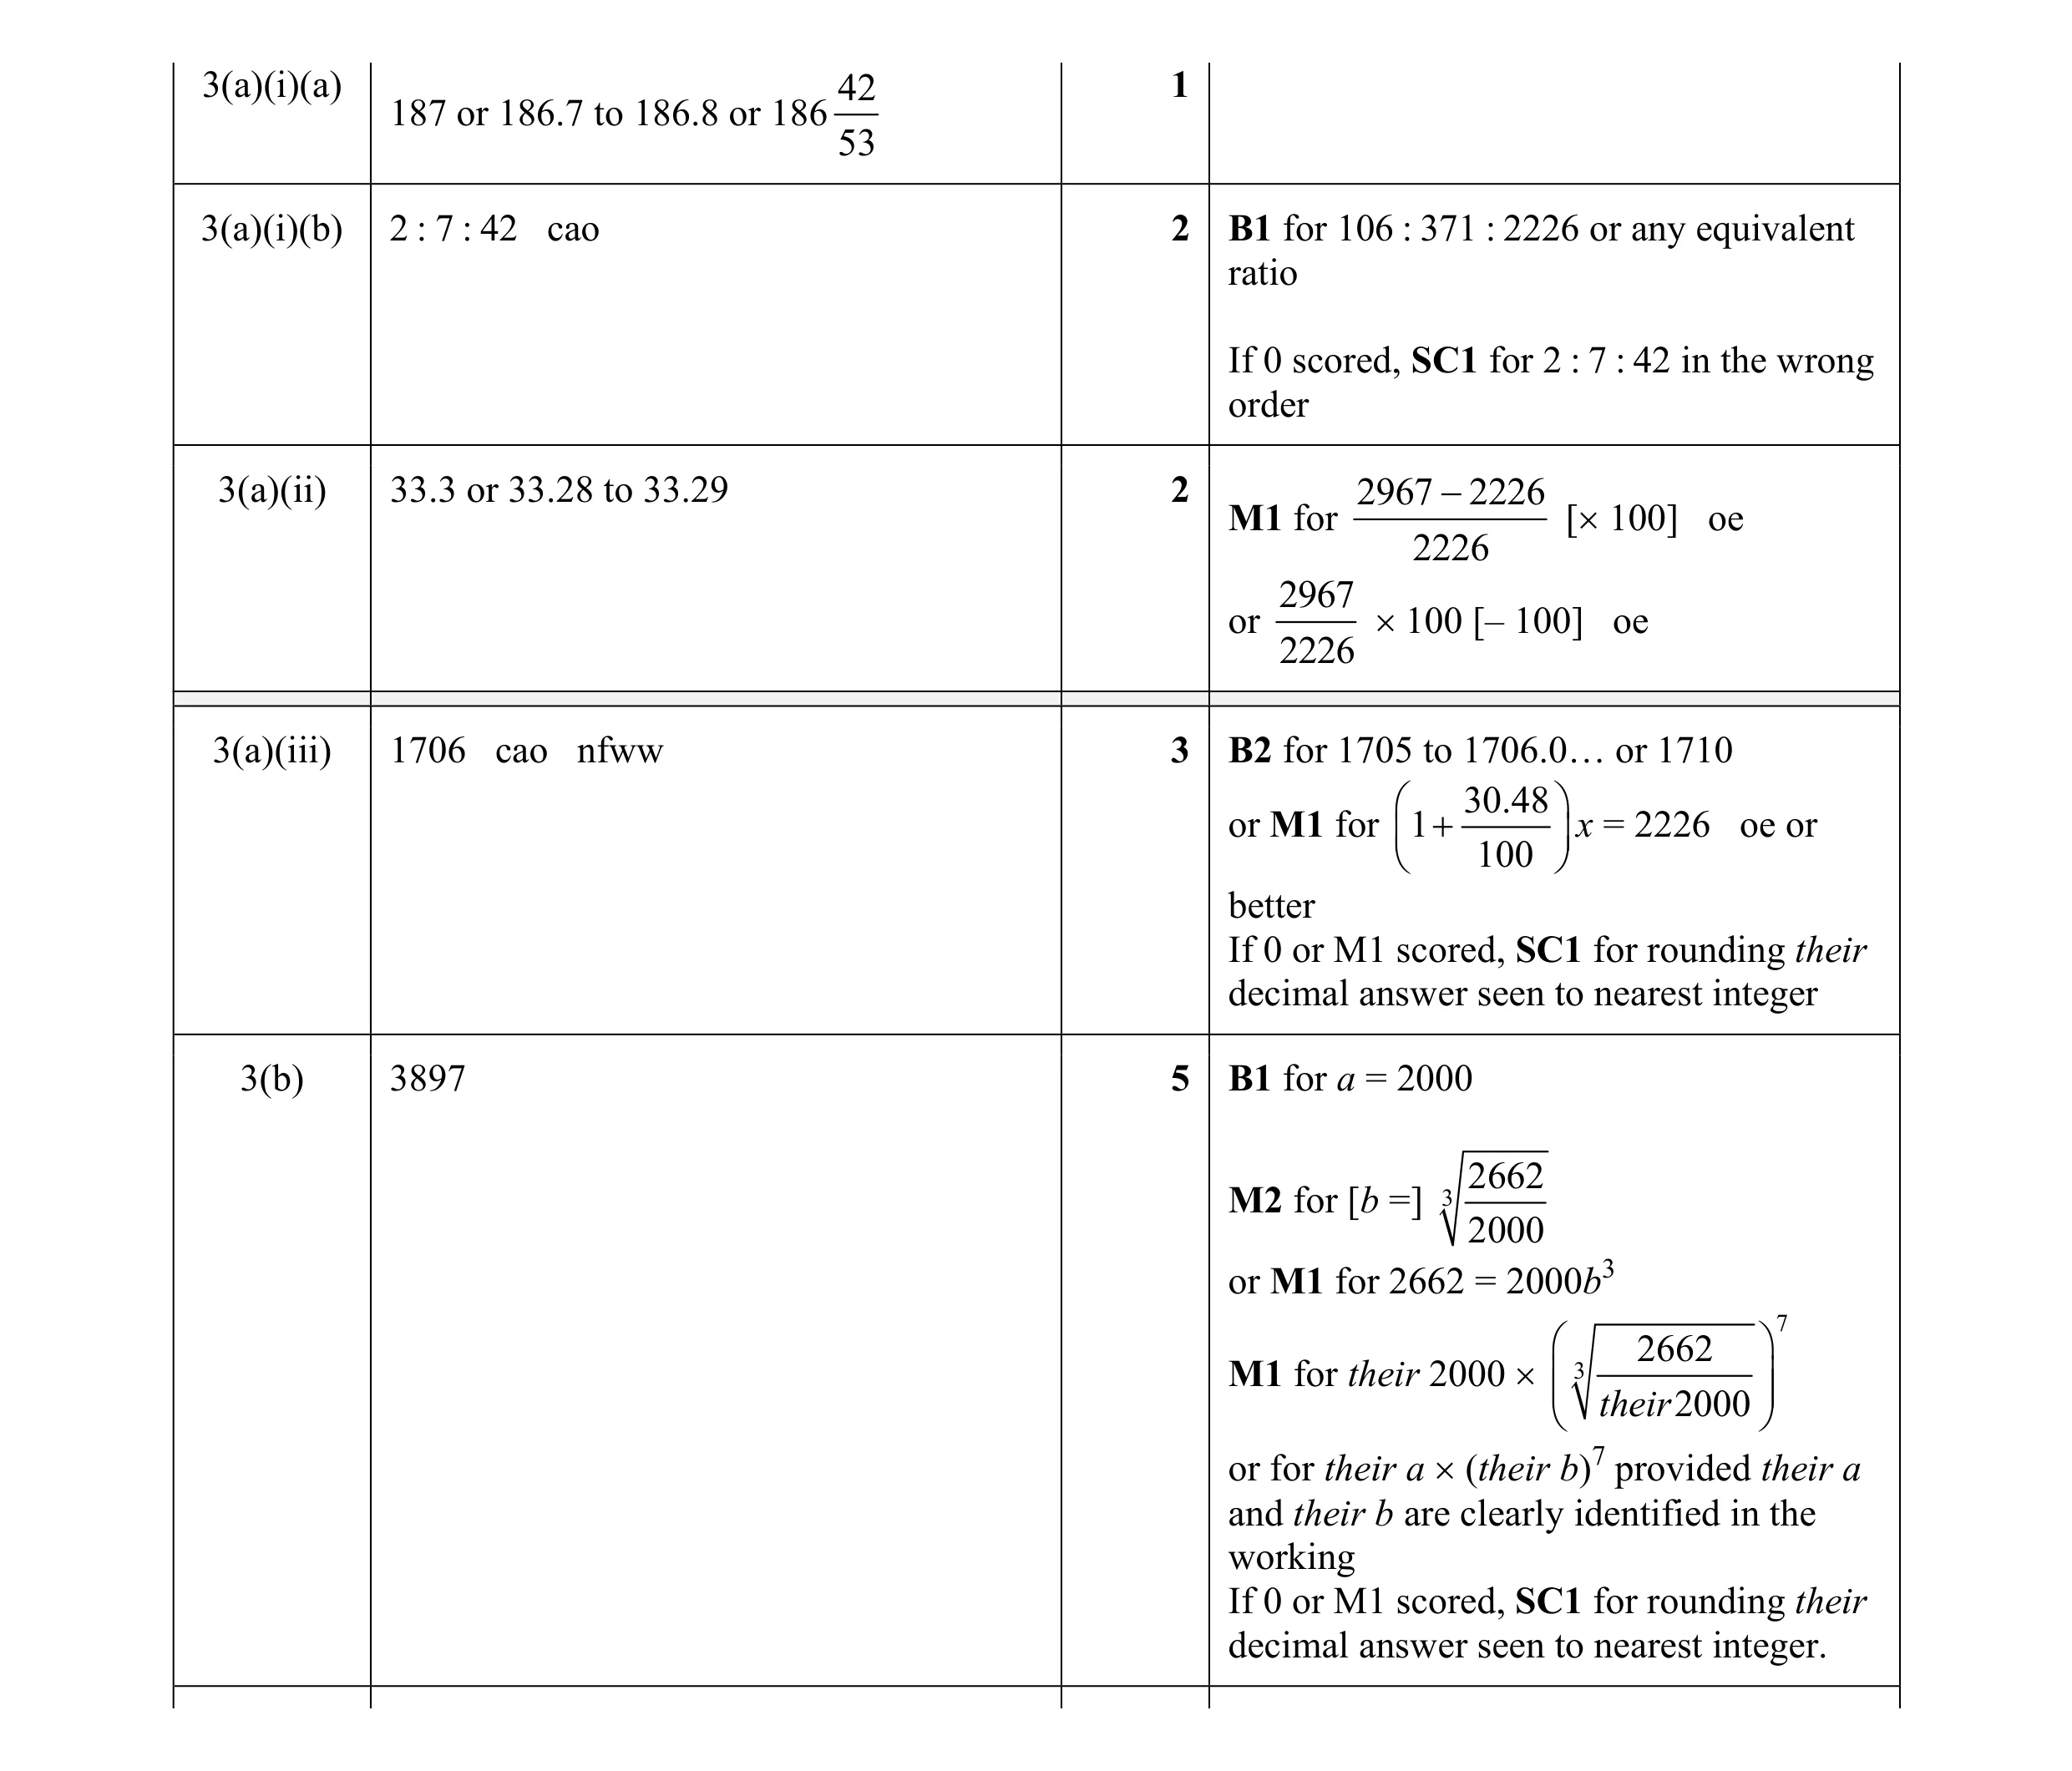 13
13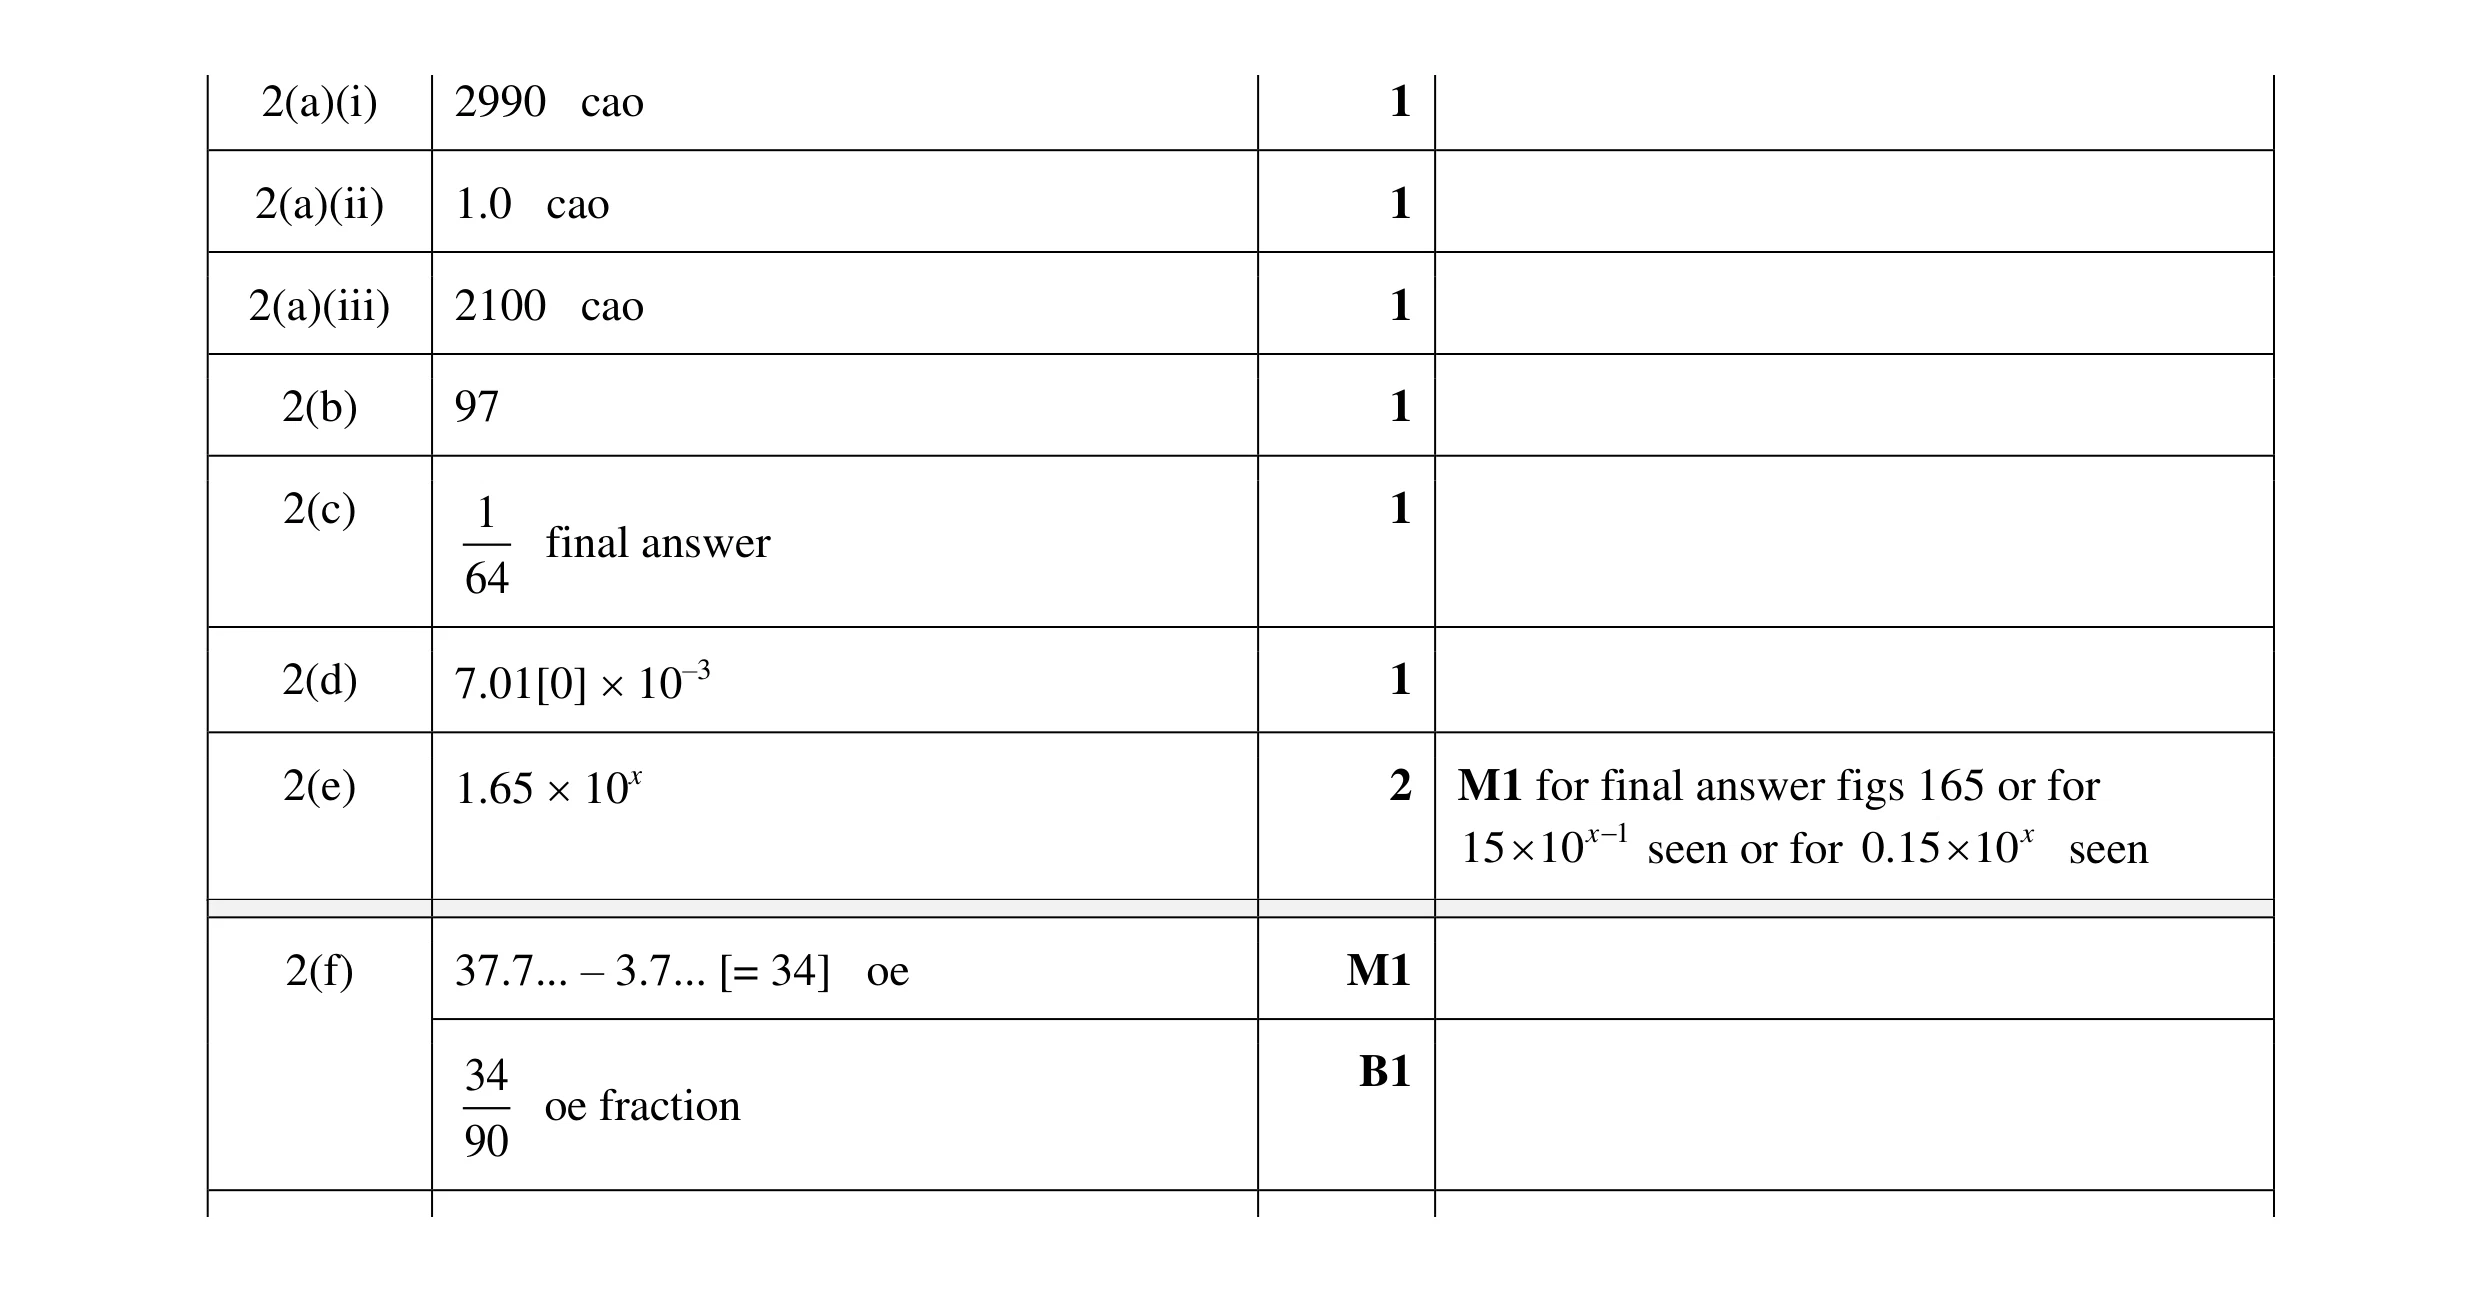 10
10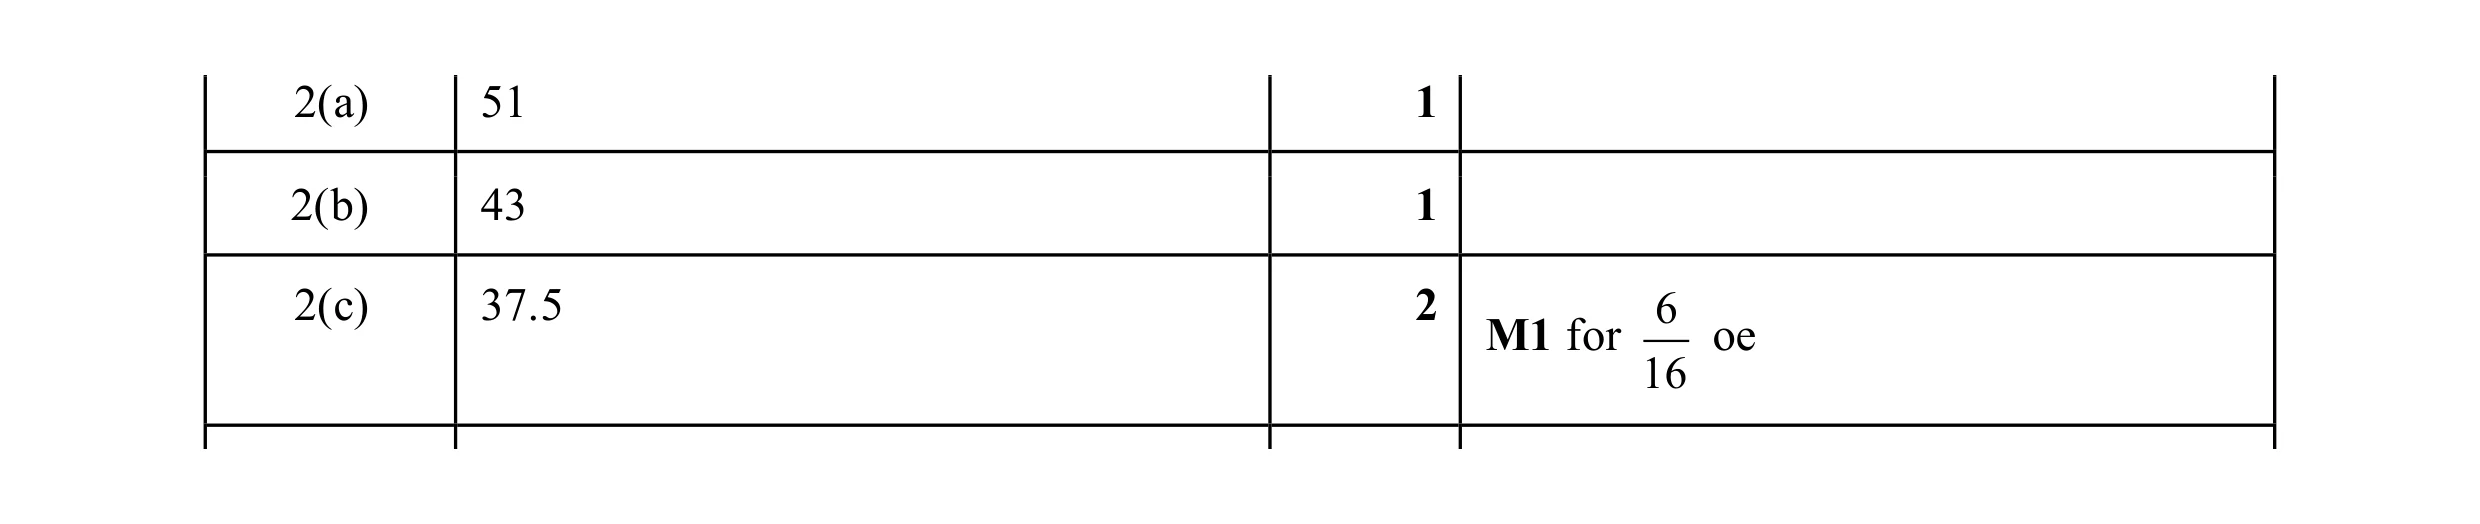 4
4 2
2