Cambridge IGCSE Mathematics 0580 — 2015 May/June Paper 4 · Variant 1
0580/41/M/J/15 · 11 questions · 130 marks · ≈146 min
The question paper and its mark scheme, free to read here and free to download. This is Cambridge’s own paper, exactly as it was sat.
Question paper20 pages
Mark scheme8 pages
Answers below. Sit the paper first if you are practising.
Questions as text
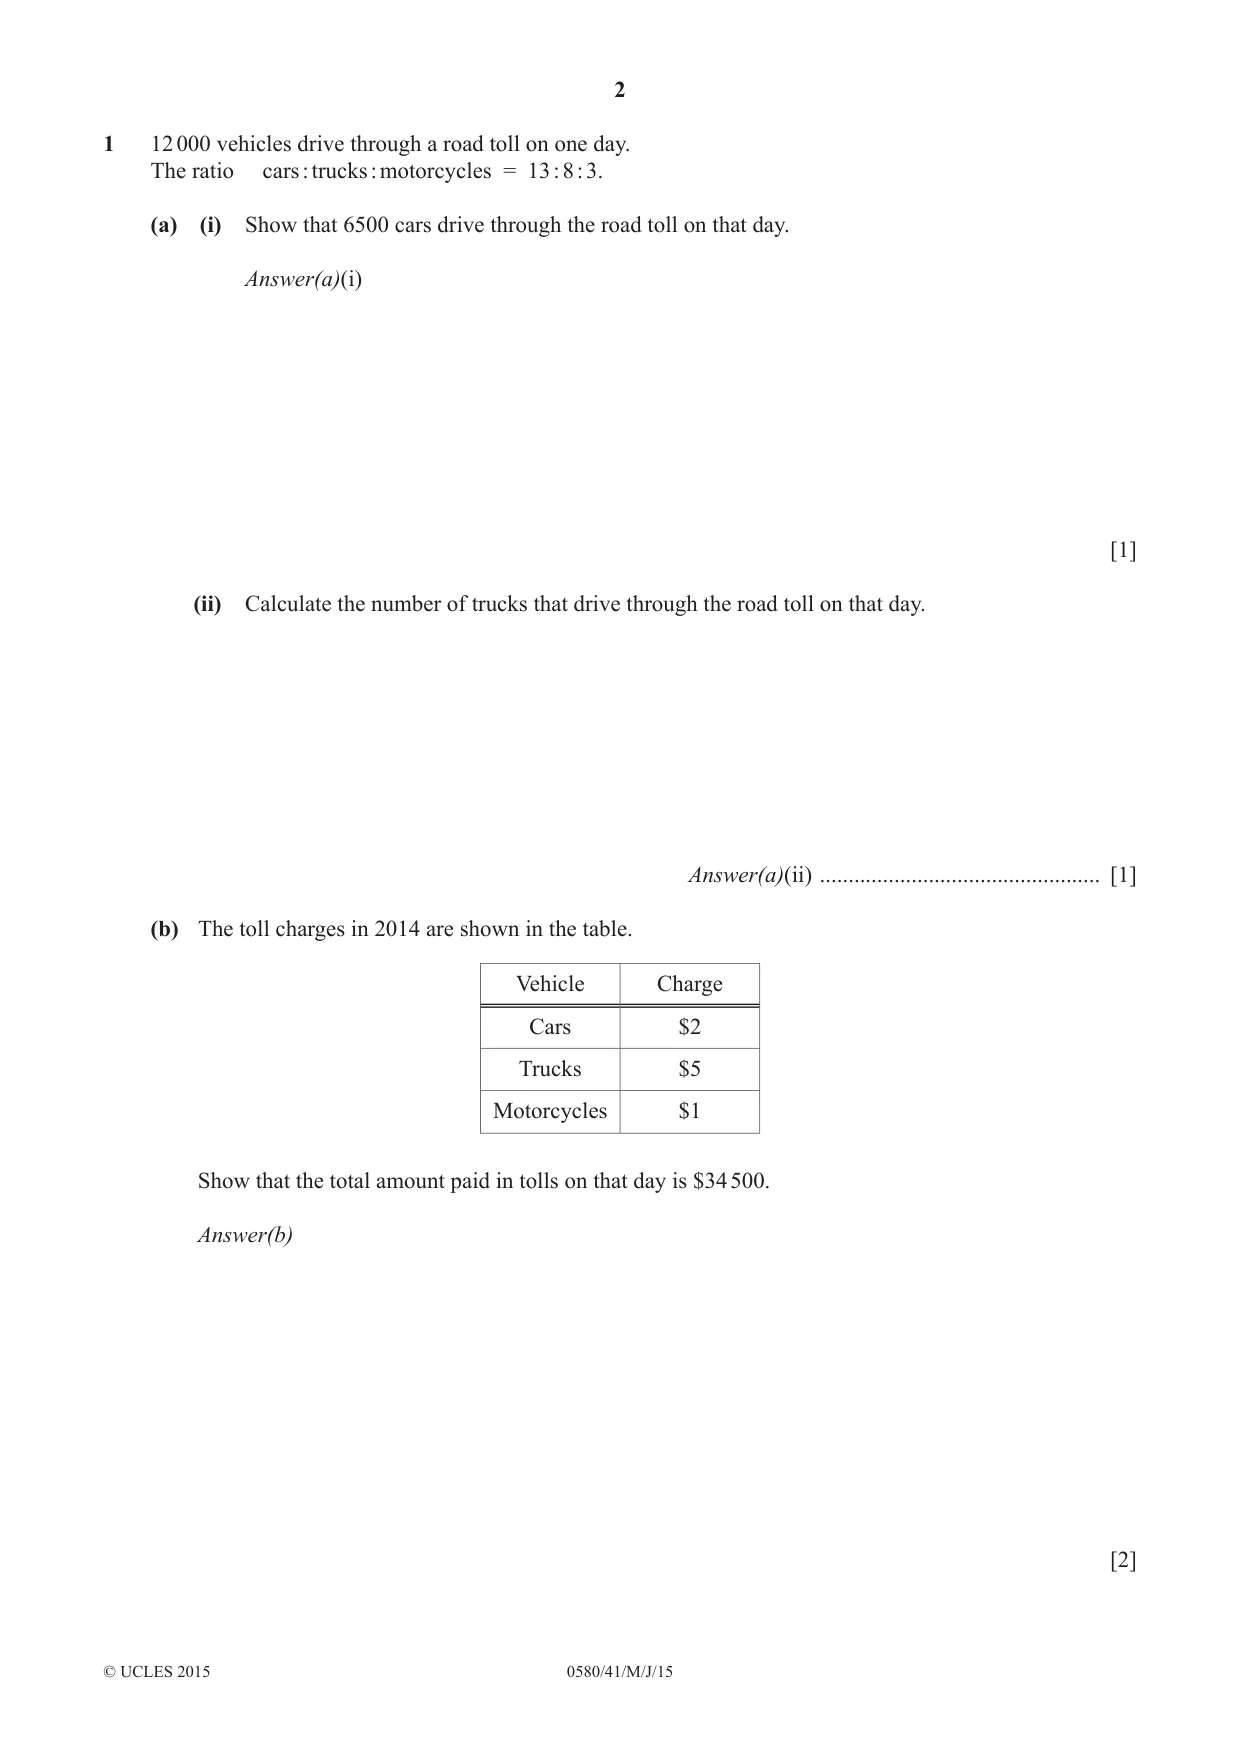
Q1 · 12 000 vehicles drive through a road toll on one day
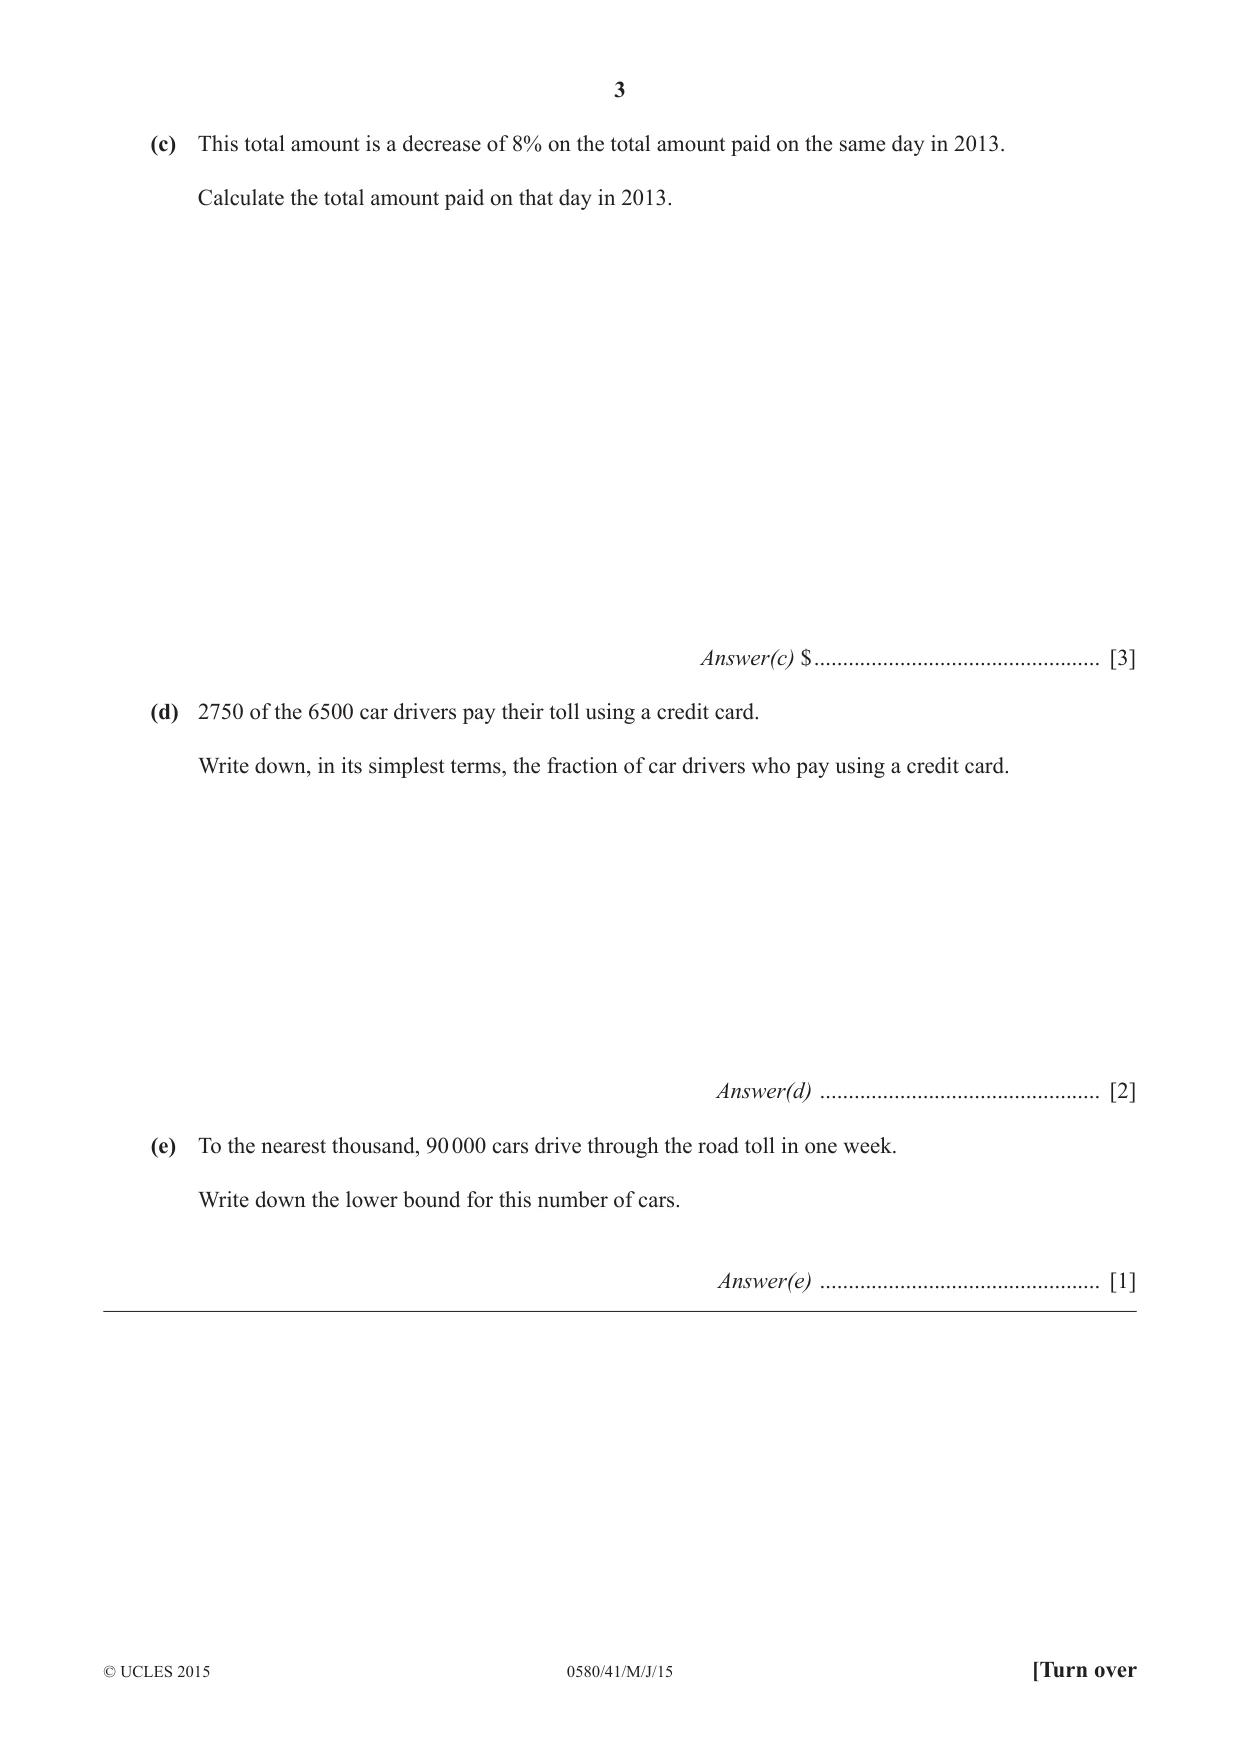
1 12 000 vehicles drive through a road toll on one day. The ratio cars : trucks : motorcycles = 13 : 8 : 3. (a) (i) Show that 6500 cars drive through the road toll on that day. Answer(a)(i) [1] (ii) Calculate the number of trucks that drive through the road toll on that day. Answer(a)(ii) ................................................. [1] (b) The toll charges in 2014 are shown in the table. Vehicle Charge Cars $2 Trucks $5 Motorcycles $1 Show that the total amount paid in tolls on that day is $34 500. Answer(b) [2] (c) This total amount is a decrease of 8% on the total amount paid on the same day in 2013. Calculate the total amount paid on that day in 2013. Answer(c) $ .................................................. [3] (d) 2750 of the 6500 car drivers pay their toll using a credit card. Write down, in its simplest terms, the fraction of car drivers who pay using a credit card. Answer(d) ................................................. [2] (e) To the nearest thousand, 90 000 cars drive through the road toll in one week. Write down the lower bound for this number of cars. Answer(e) ................................................. [1]
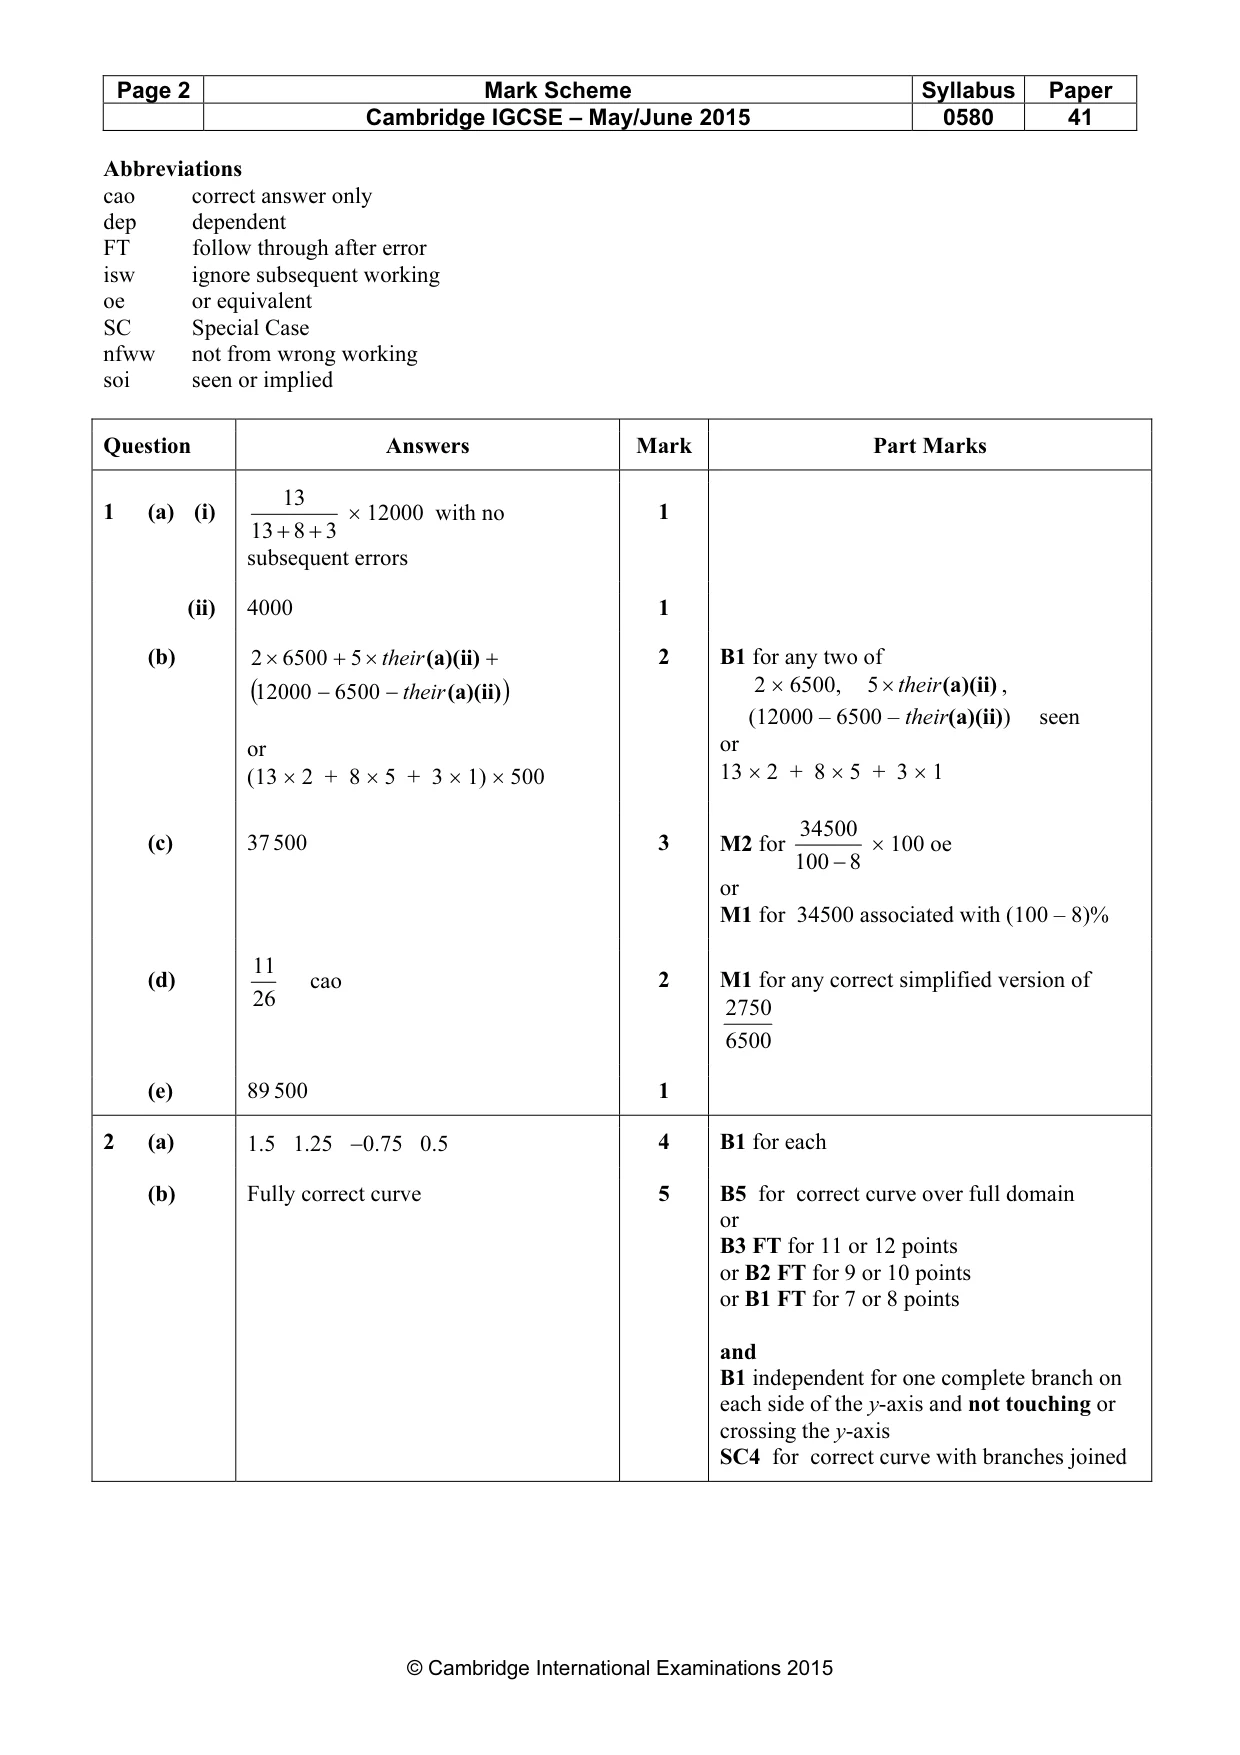
Mark scheme: Question Answers Mark Part Marks 1313 1 (a) (i) × 12000 with no 1 13 + 8 + 3 subsequent errors (ii) 4000 1 (b) 2 × 6500 + 5 × their (a)(ii) + 2 B1 for any two of (12000 − 6500 − their (a)(ii) ) 2 × 6500, 5 × their (a)(ii) , (12000 – 6500 – their(a)(ii)) seen or or (13 × 2 + 8 × 5 + 3 × 1) × 500 13 × 2 + 8 × 5 + 3 × 1 34500 (c) 37 500 3 M2 for × 100 oe 100 − 8 or M1 for 34500 associated with (100 – 8)% 11 (d) cao 2 M1 for any correct simplified version of 26 2750 6500 (e) 89 500 1
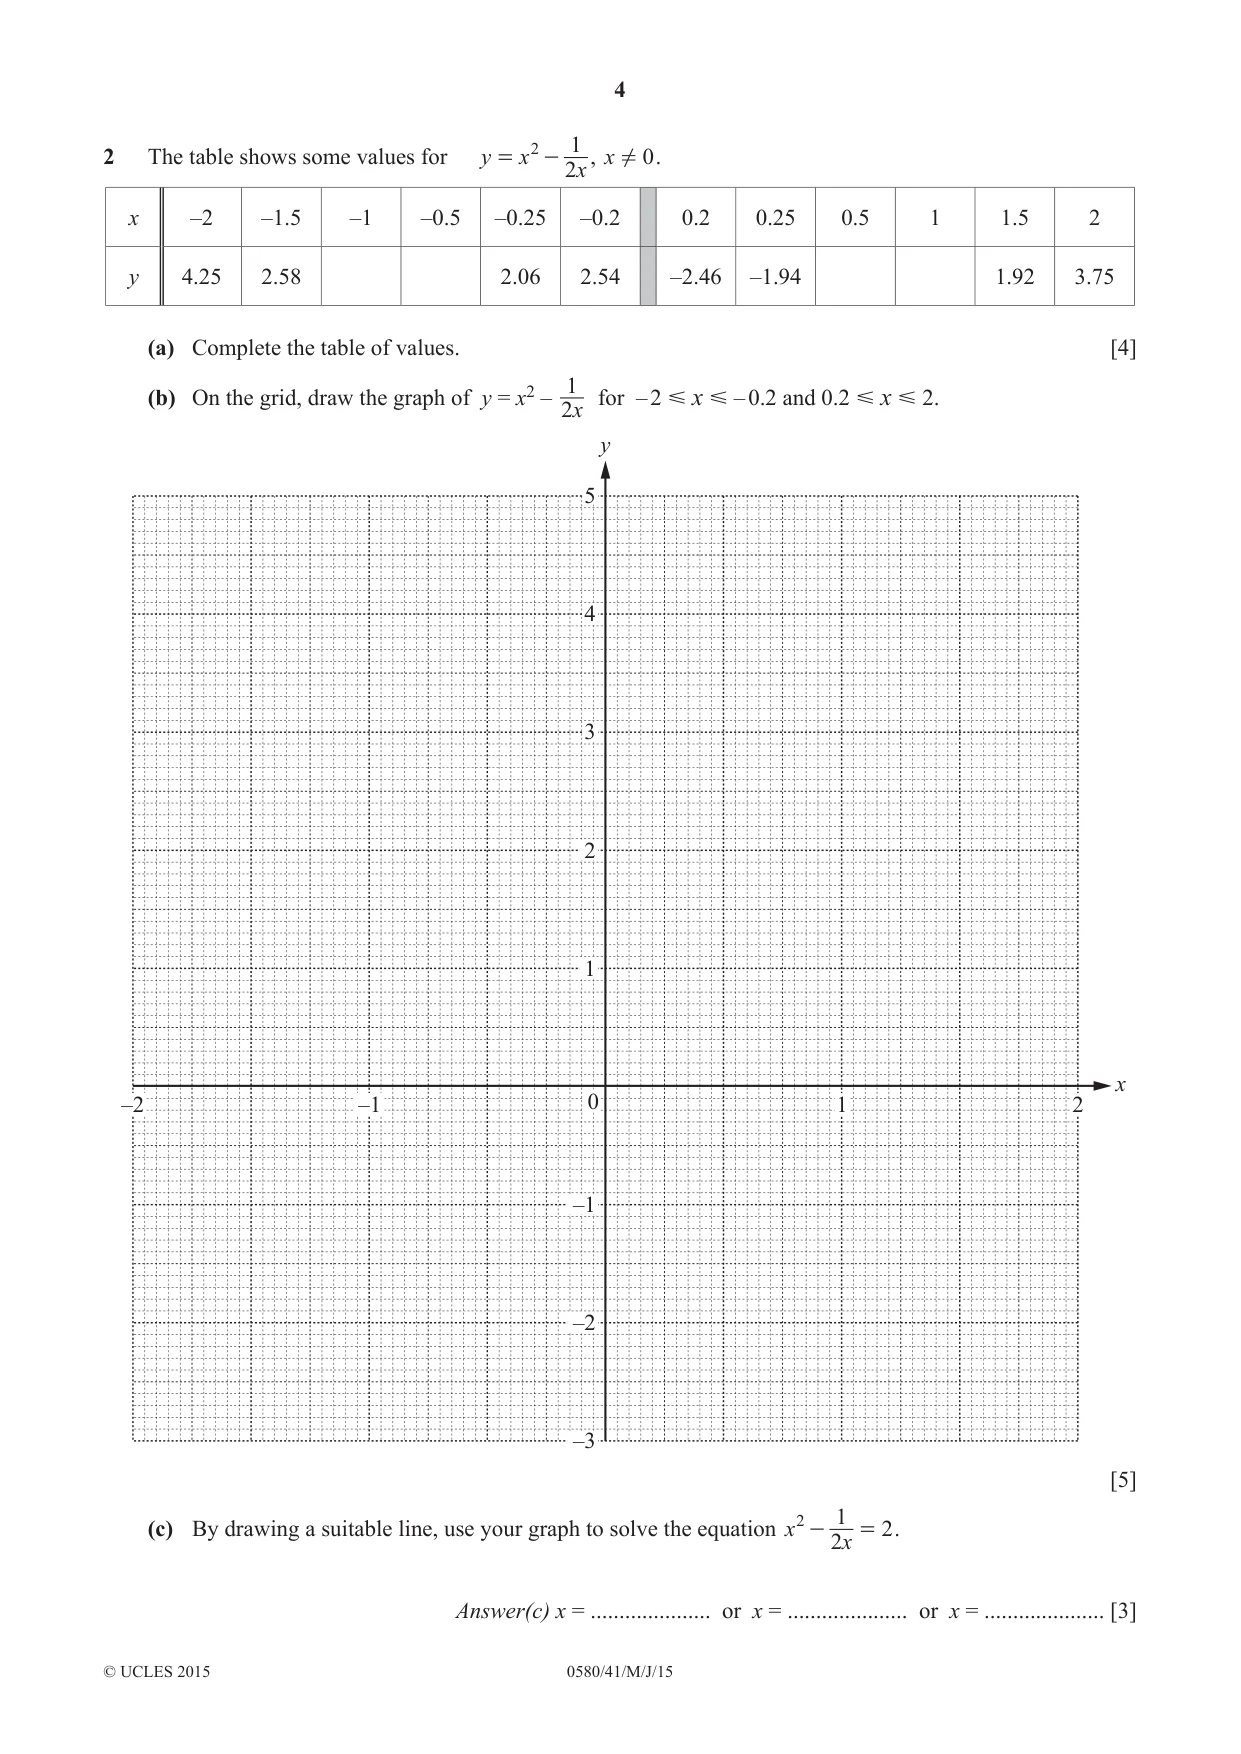
Q2 · 1 2 The table shows some values for y = x - 2 , x !
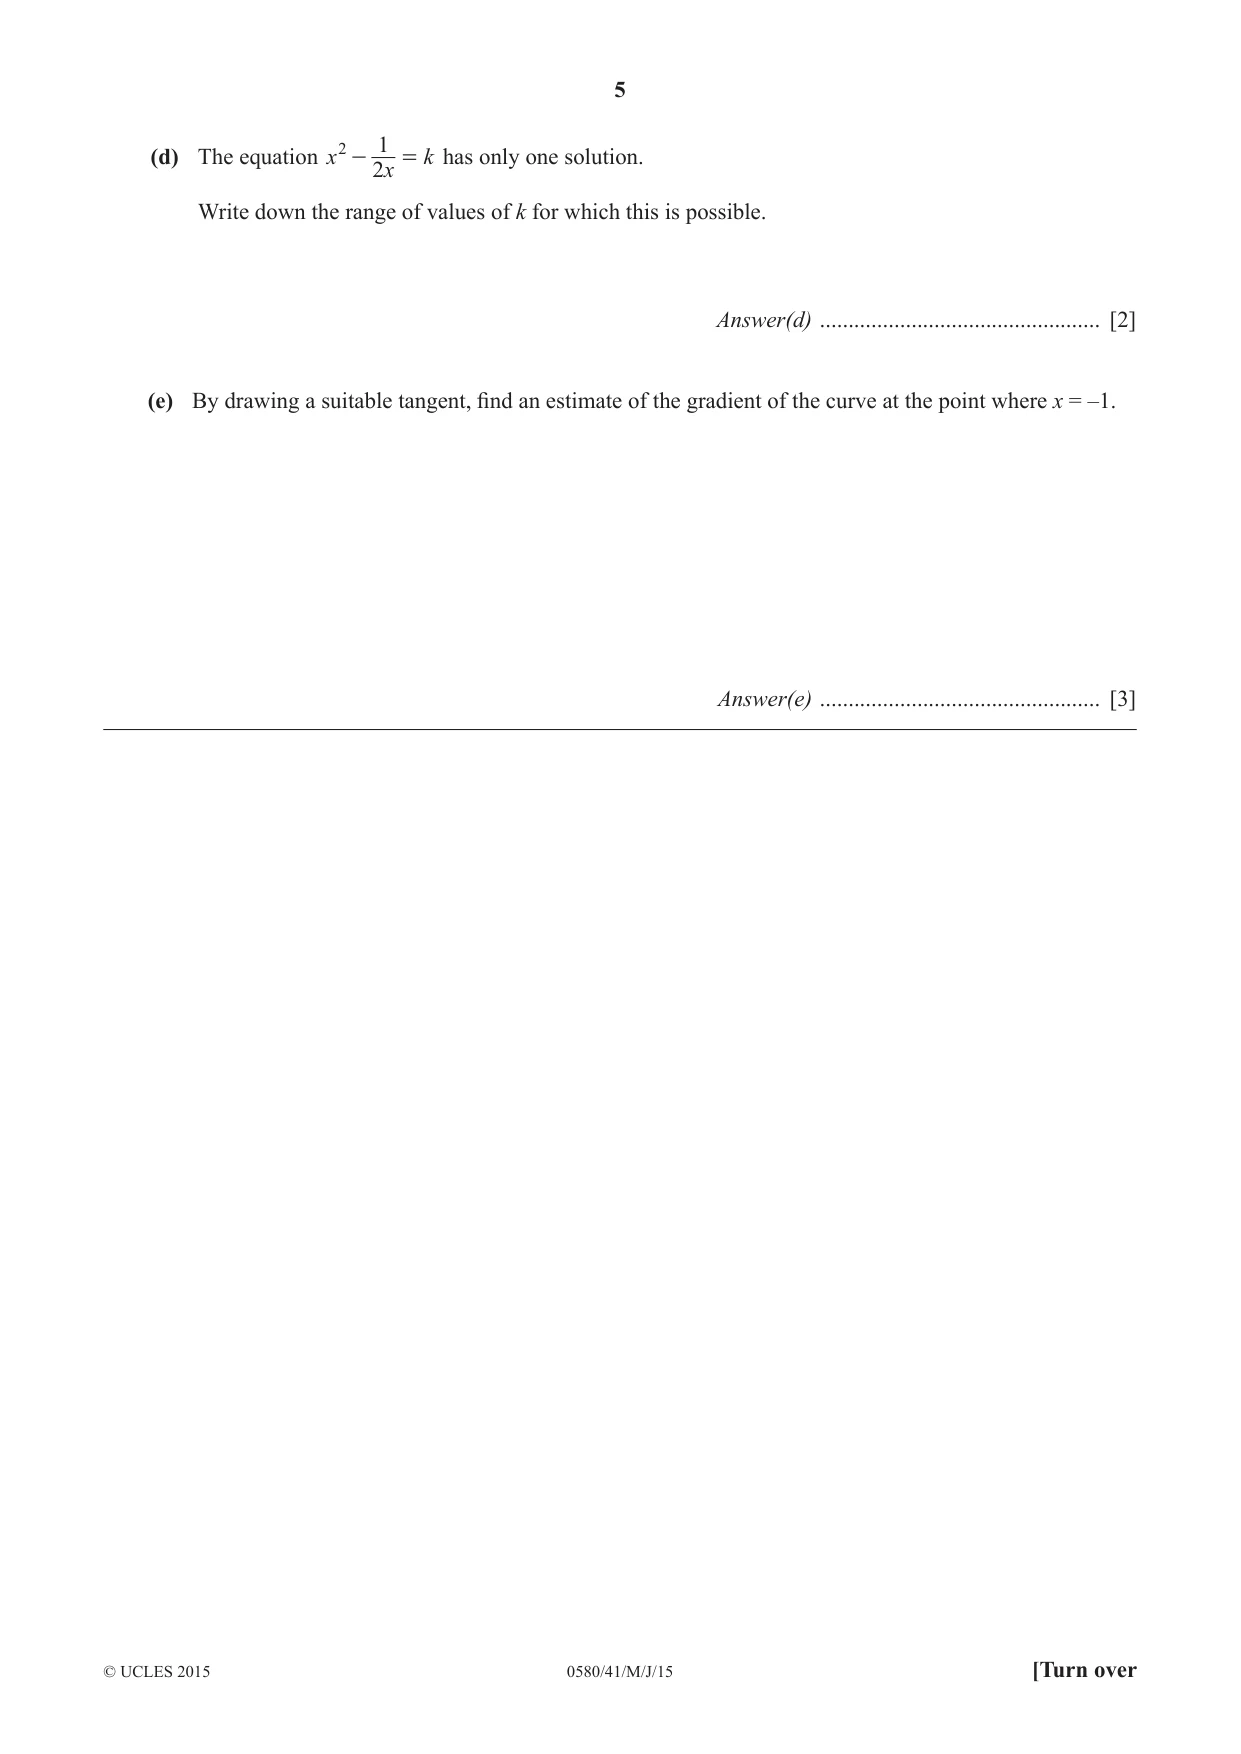
2 1 2 The table shows some values for y = x - 2 , x ! 0 . x x –2 –1.5 –1 –0.5 –0.25 –0.2 0.2 0.25 0.5 1 1.5 2 y 4.25 2.58 2.06 2.54 –2.46 –1.94 1.92 3.75 (a) Complete the table of values. [4] 1 x – 0.2 and 0.2 x 2. (b) On the grid, draw the graph of y = x2 – 2 for – 2 x y 5 4 3 2 1 x –2 –1 0 1 2 –1 –2 –3 [5] 2 1 (c) By drawing a suitable line, use your graph to solve the equation x - 2 = 2 . x Answer(c) x = ..................... or x = ..................... or x = ..................... [3] 2 1 (d) The equation x - 2 = k has only one solution. x Write down the range of values of k for which this is possible. Answer(d) ................................................. [2] (e) By drawing a suitable tangent, find an estimate of the gradient of the curve at the point where x = –1. Answer(e) ................................................. [3]
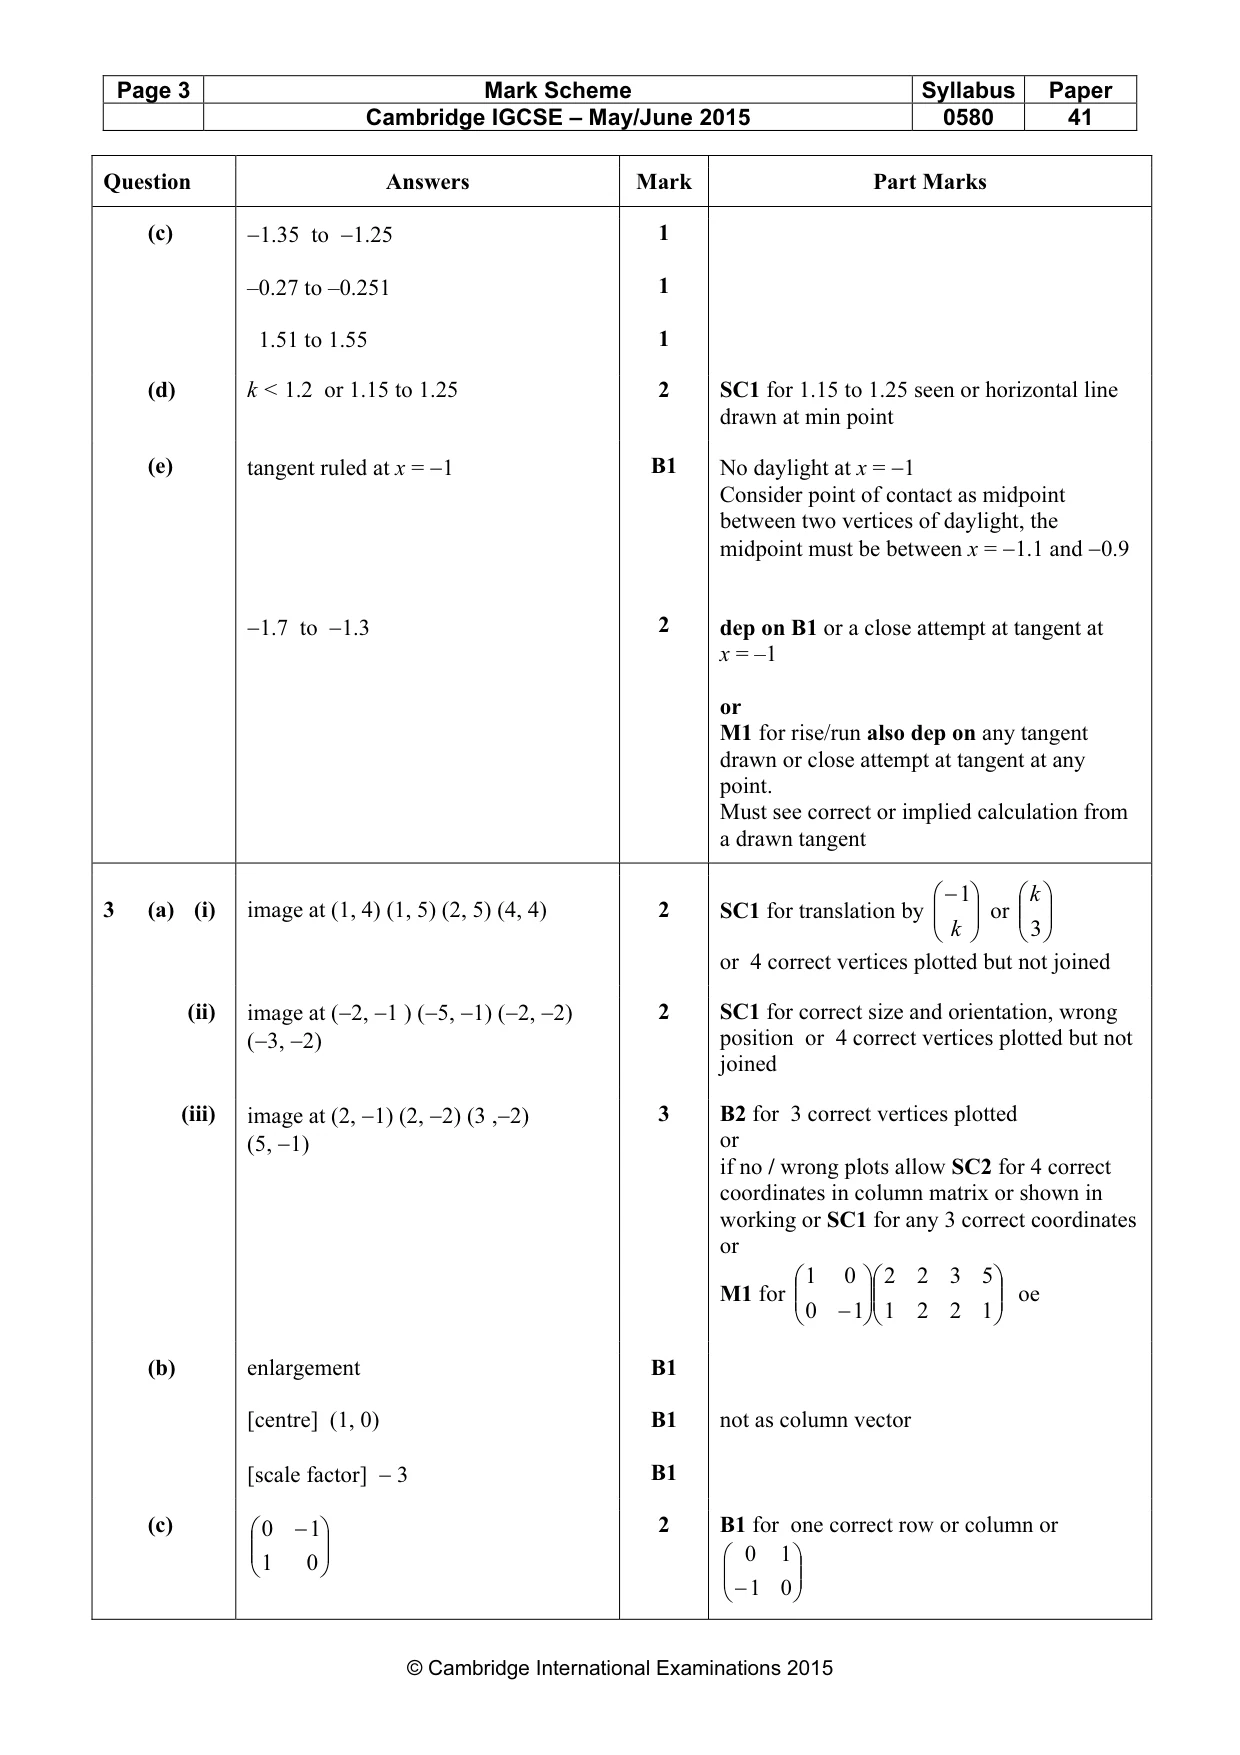
Mark scheme: 2 (a) 1.5 1.25 −0.75 0.5 4 B1 for each (b) Fully correct curve 5 B5 for correct curve over full domain or B3 FT for 11 or 12 points or B2 FT for 9 or 10 points or B1 FT for 7 or 8 points and B1 independent for one complete branch on each side of the y-axis and not touching or crossing the y-axis SC4 for correct curve with branches joined
Q3 · Y 7 6 5 4 3 C 2 A 1 x –12 –11 –10 –9 –8 –7 –6 –5 –4 –3 –2 –1 0 1 2 3 4 5 6 –1 –2 –3 –4 B…
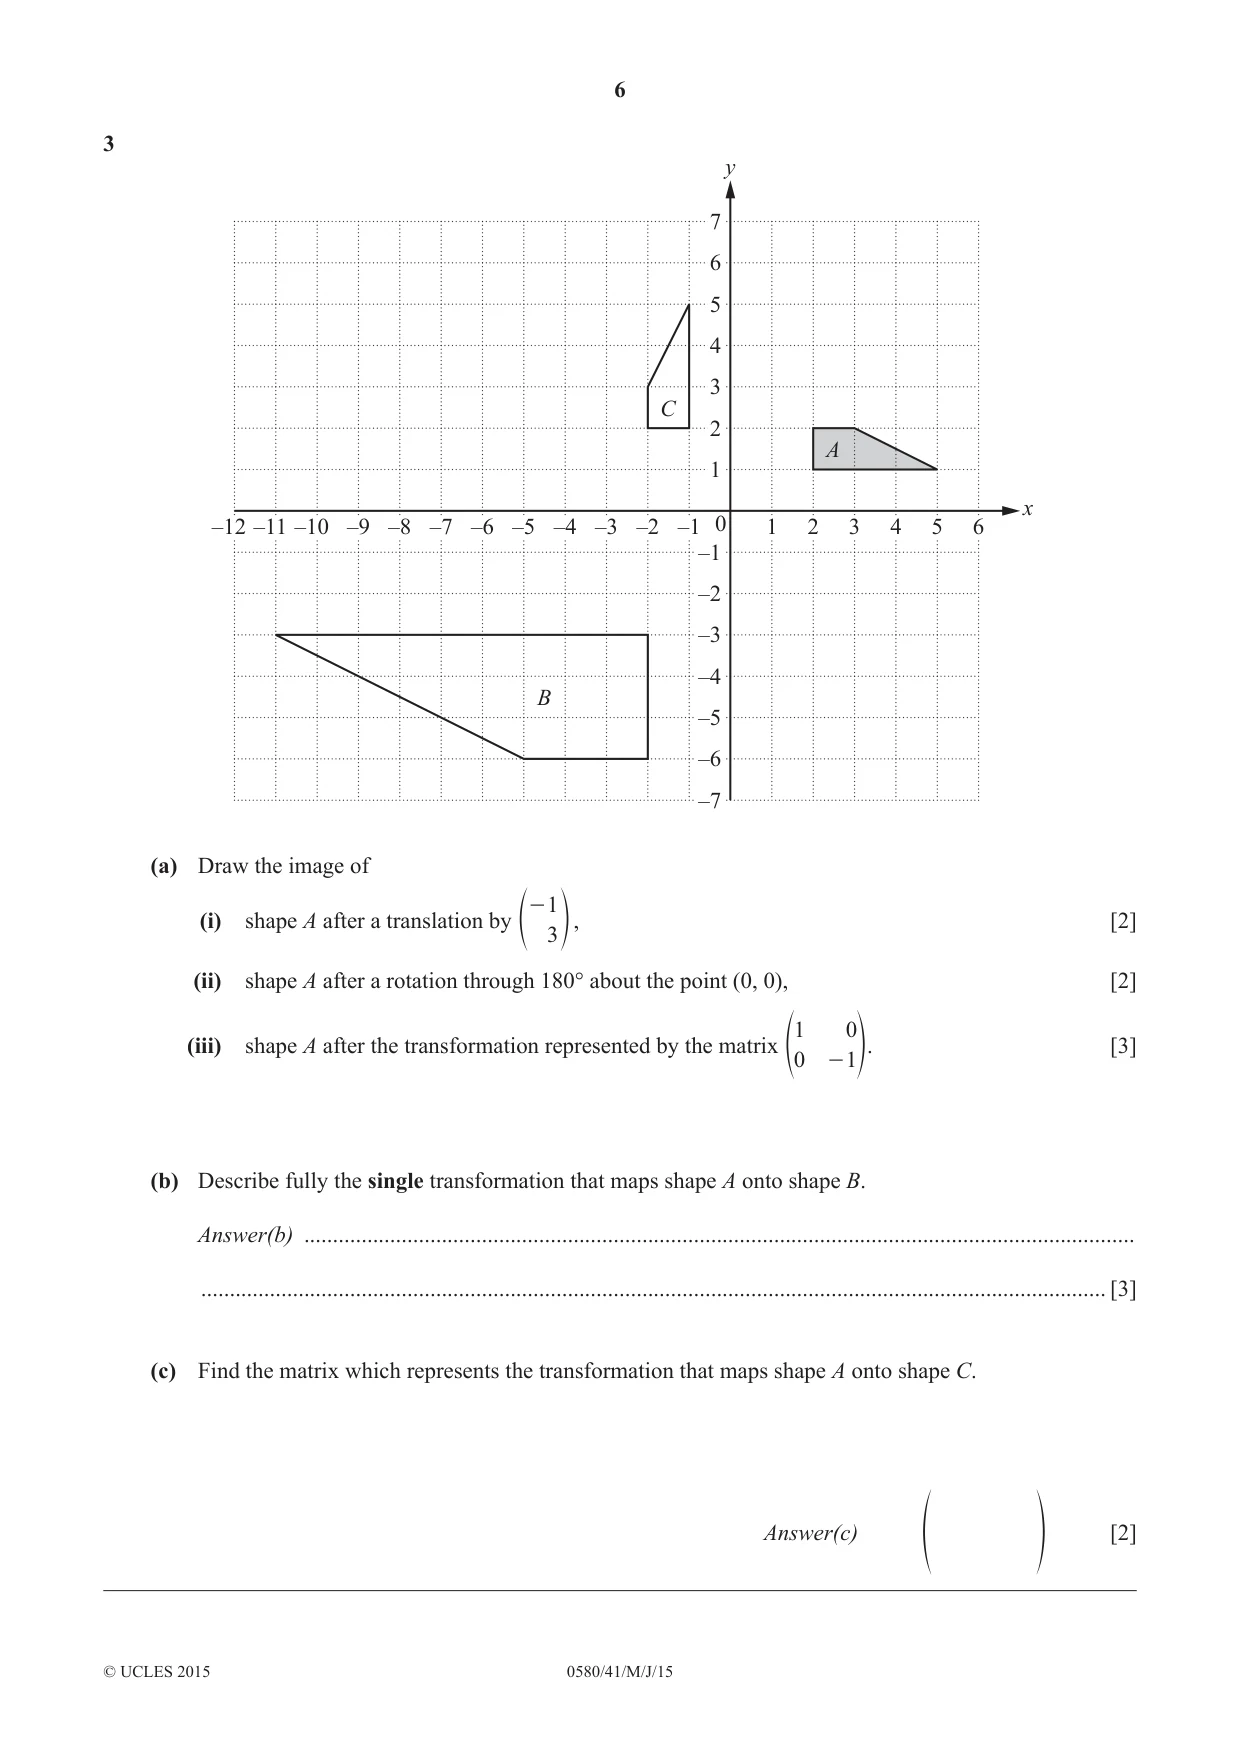
3 y 7 6 5 4 3 C 2 A 1 x –12 –11 –10 –9 –8 –7 –6 –5 –4 –3 –2 –1 0 1 2 3 4 5 6 –1 –2 –3 –4 B –5 –6 –7 (a) Draw the image of - 1 (i) shape A after a translation by , [2] 3 f p (ii) shape A after a rotation through 180° about the point (0, 0), [2] 1 0 (iii) shape A after the transformation represented by the matrix [3] 0 - 1 f p. (b) Describe fully the single transformation that maps shape A onto shape B. Answer(b) ................................................................................................................................................. .............................................................................................................................................................. [3] (c) Find the matrix which represents the transformation that maps shape A onto shape C. Answer(c) [2] f p
Mark scheme: 1 k 3 (a) (i) image at (1, 4) (1, 5) (2, 5) (4, 4) 2 SC1 for translation by or k 3 or 4 correct vertices plotted but not joined (ii) image at (−2, −1 ) (−5, −1) (−2, −2) 2 SC1 for correct size and orientation, wrong (−3, −2) position or 4 correct vertices plotted but not joined (iii) image at (2, −1) (2, −2) (3 ,−2) 3 B2 for 3 correct vertices plotted (5, −1) or if no / wrong plots allow SC2 for 4 correct coordinates in column matrix or shown in working or SC1 for any 3 correct coordinates or 1 0 2 2 3 5 M1 for oe 0 − 1 1 2 2 1 (b) enlargement B1 [centre] (1, 0) B1 not as column vector [scale factor] − 3 B1 (c) 0 − 1 2 B1 for one correct row or column or 0 1 1 0 − 1 0
Q4 · 30 students were asked if they had a bicycle (B), a mobile phone (M) and a computer (C)
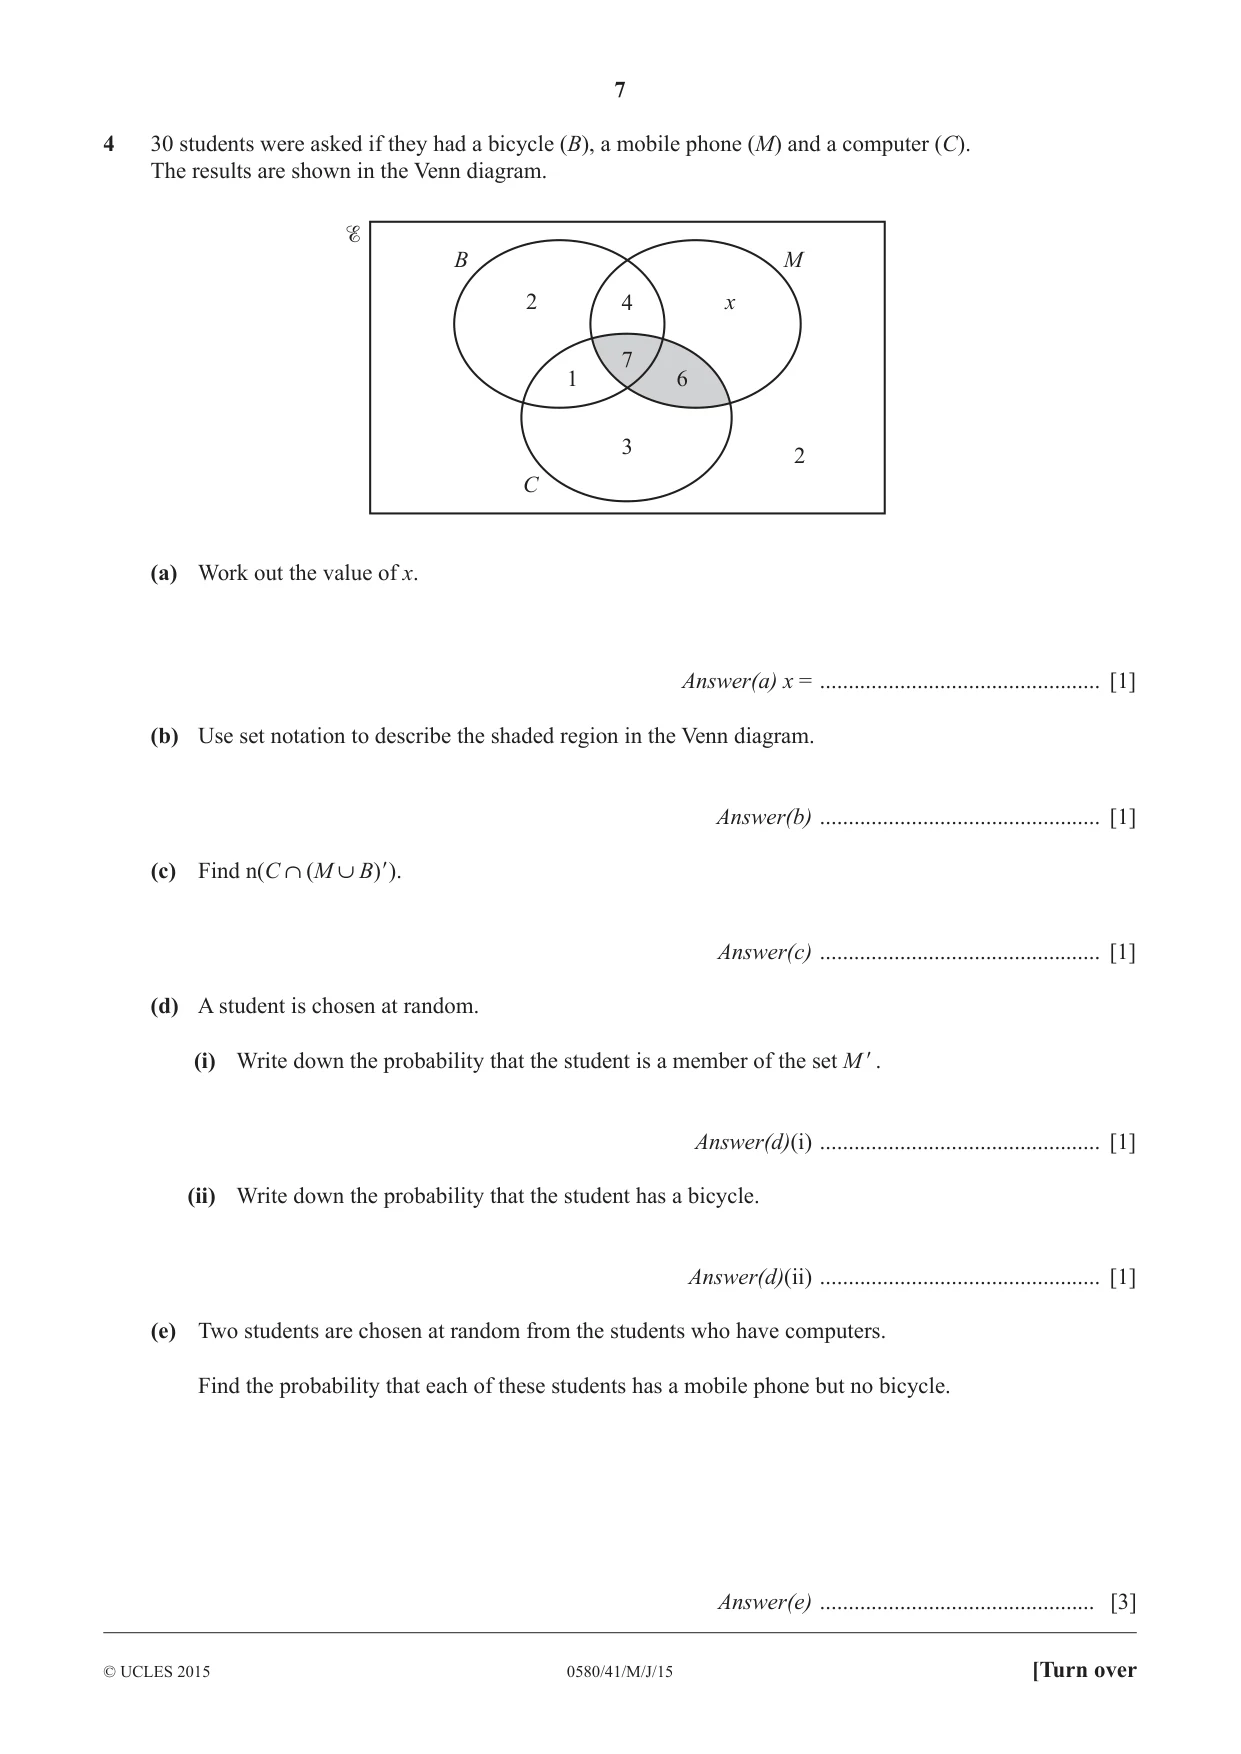
4 30 students were asked if they had a bicycle (B), a mobile phone (M) and a computer (C). The results are shown in the Venn diagram. B M 2 4 x 7 1 6 3 2 C (a) Work out the value of x. Answer(a) x = ................................................. [1] (b) Use set notation to describe the shaded region in the Venn diagram. Answer(b) ................................................. [1] (c) Find n(C (M B)). Answer(c) ................................................. [1] (d) A student is chosen at random. (i) Write down the probability that the student is a member of the set M . Answer(d)(i) ................................................. [1] (ii) Write down the probability that the student has a bicycle. Answer(d)(ii) ................................................. [1] (e) Two students are chosen at random from the students who have computers. Find the probability that each of these students has a mobile phone but no bicycle. Answer(e) ................................................ [3]
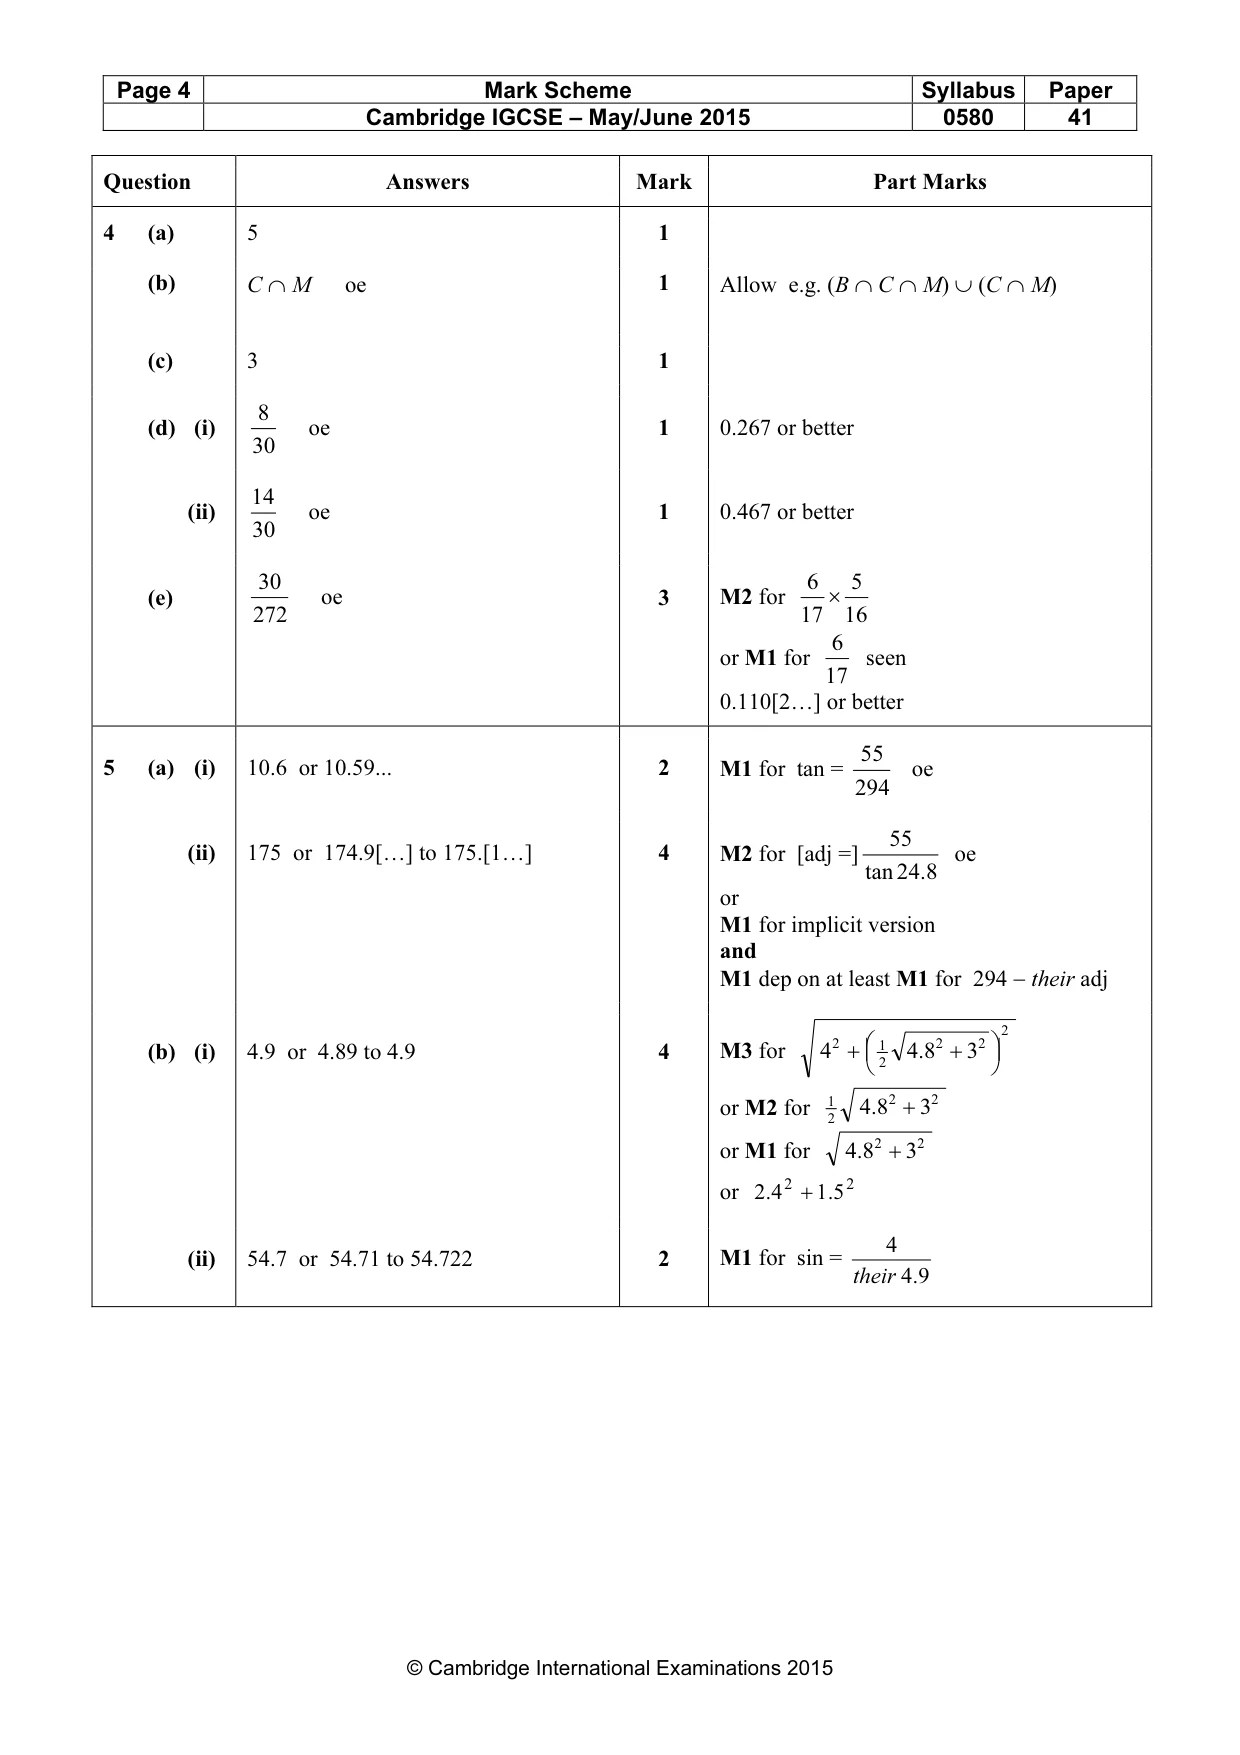
Mark scheme: 4 (a) 5 1 (b) C ∩ M oe 1 Allow e.g. (B ∩ C ∩ M) ∪ (C ∩ M) (c) 3 1 8 (d) (i) oe 1 0.267 or better 30 14 (ii) oe 1 0.467 or better 30 30 6 5 (e) oe 3 M2 for × 272 17 16 6 or M1 for seen 17 0.110[2…] or better 55
Q5 · Andrei stands on level horizontal ground, 294 m from the foot of a vertical tower which…
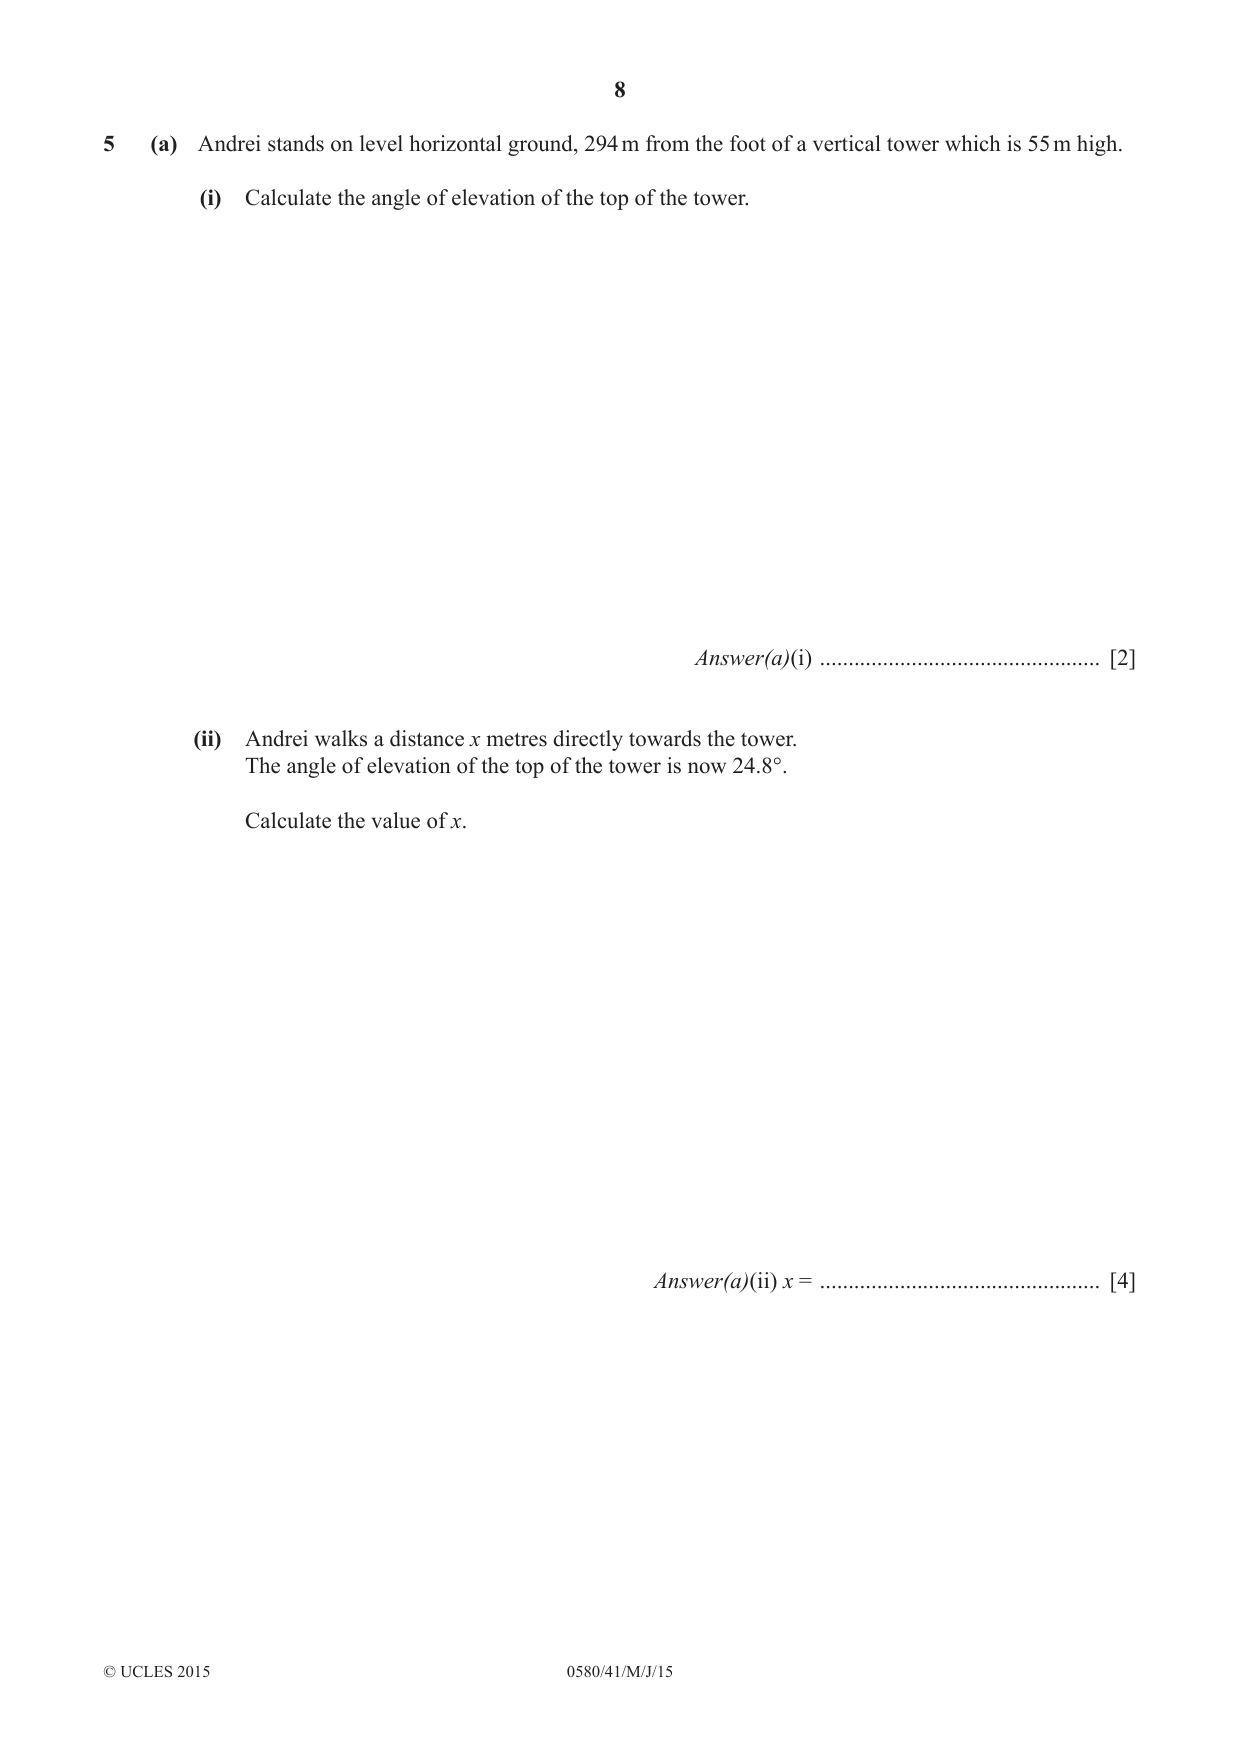
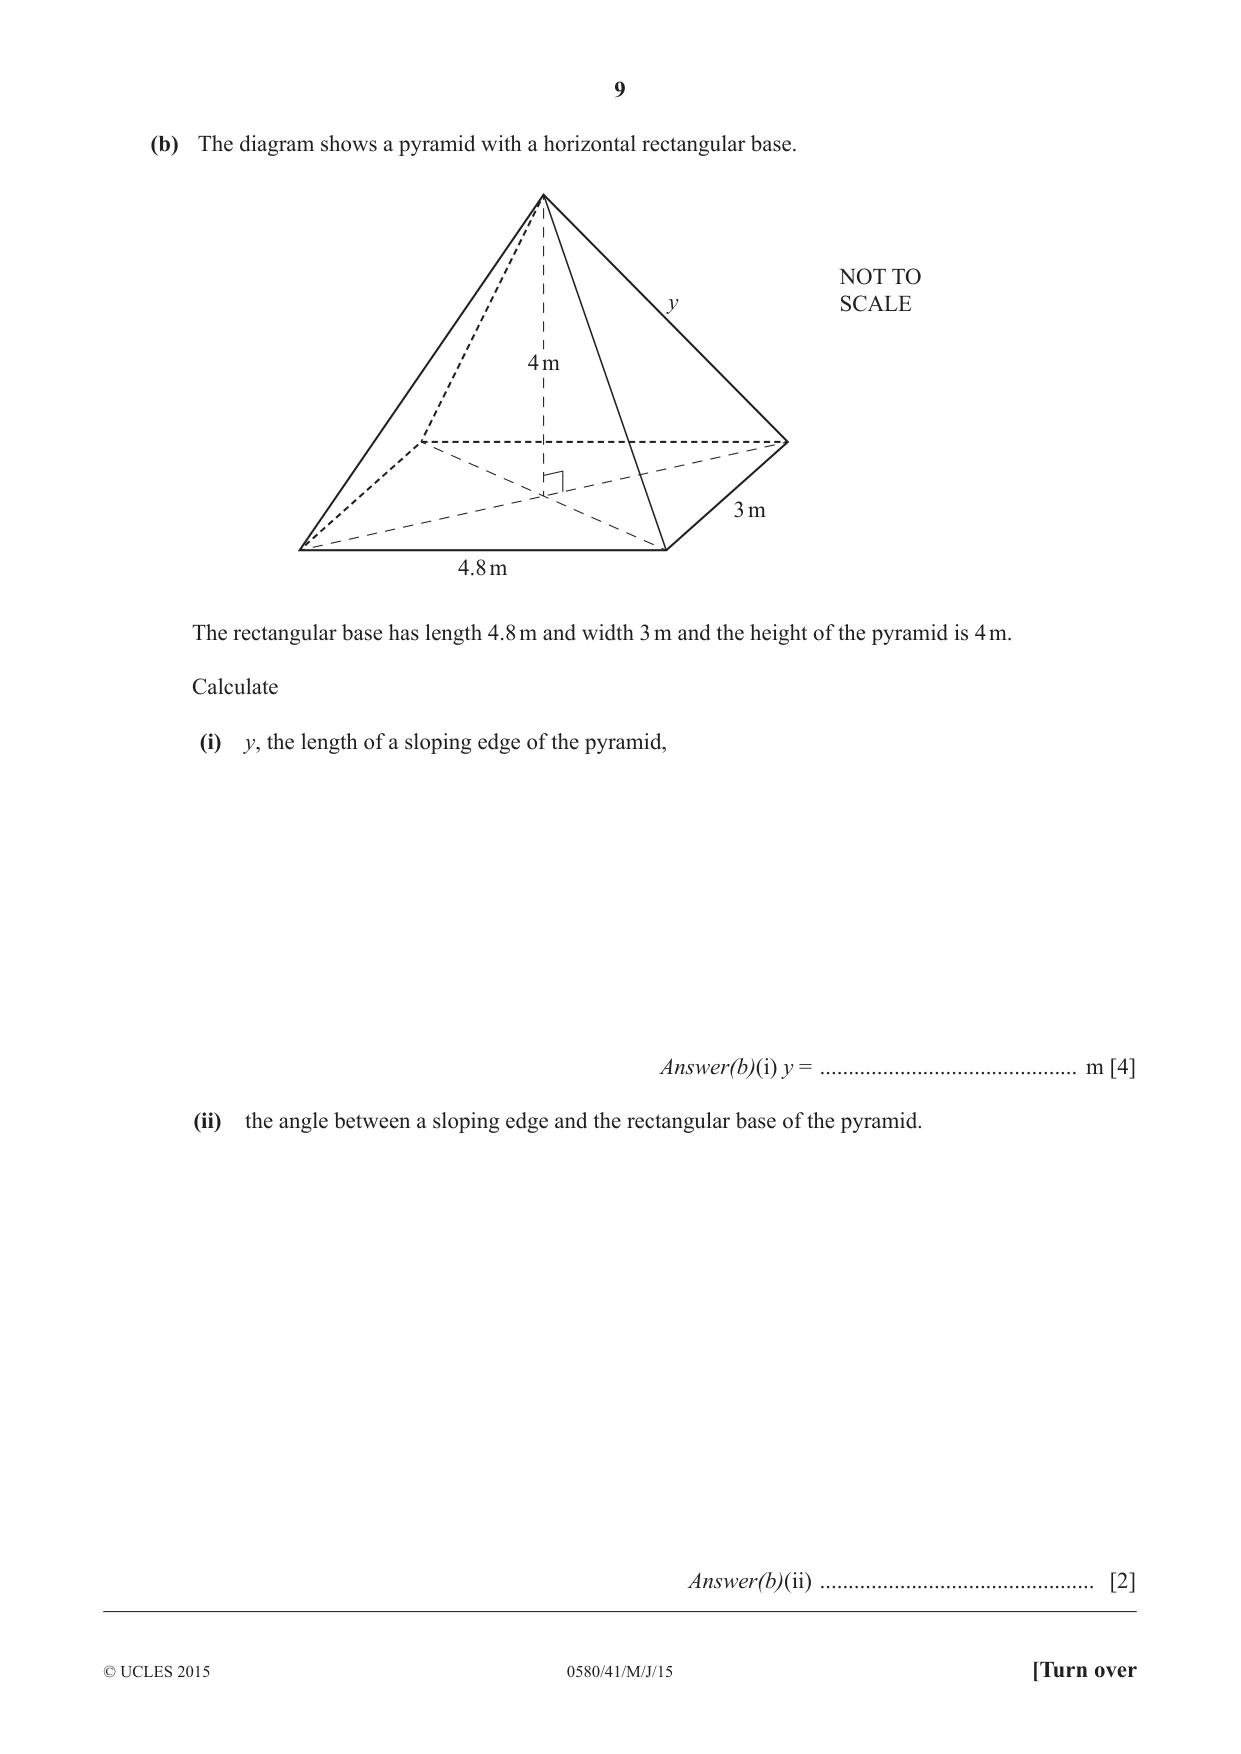
5 (a) Andrei stands on level horizontal ground, 294 m from the foot of a vertical tower which is 55 m high. (i) Calculate the angle of elevation of the top of the tower. Answer(a)(i) ................................................. [2] (ii) Andrei walks a distance x metres directly towards the tower. The angle of elevation of the top of the tower is now 24.8°. Calculate the value of x. Answer(a)(ii) x = ................................................. [4] (b) The diagram shows a pyramid with a horizontal rectangular base. NOT TO y SCALE 4 m 3 m 4.8 m The rectangular base has length 4.8 m and width 3 m and the height of the pyramid is 4 m. Calculate (i) y, the length of a sloping edge of the pyramid, Answer(b)(i) y = ............................................. m [4] (ii) the angle between a sloping edge and the rectangular base of the pyramid. Answer(b)(ii) ................................................ [2]
Mark scheme: 55 5 (a) (i) 10.6 or 10.59... 2 M1 for tan = oe 294 55 (ii) 175 or 174.9[…] to 175.[1…] 4 M2 for [adj =] oe tan 24 8. or M1 for implicit version and M1 dep on at least M1 for 294 − their adj 2 2 1 2 2 2 8.4 + 3 (b) (i) 4.9 or 4.89 to 4.9 4 M3 for 4 + or M2 for 12 8.4 2 + 32 or M1 for 8.4 2 + 3 2 or 4.2 2 + 5.1 2 4 (ii) 54.7 or 54.71 to 54.722 2 M1 for sin = their 9.4
Q6 · The table shows the time, t minutes, that 400 people take to complete a test
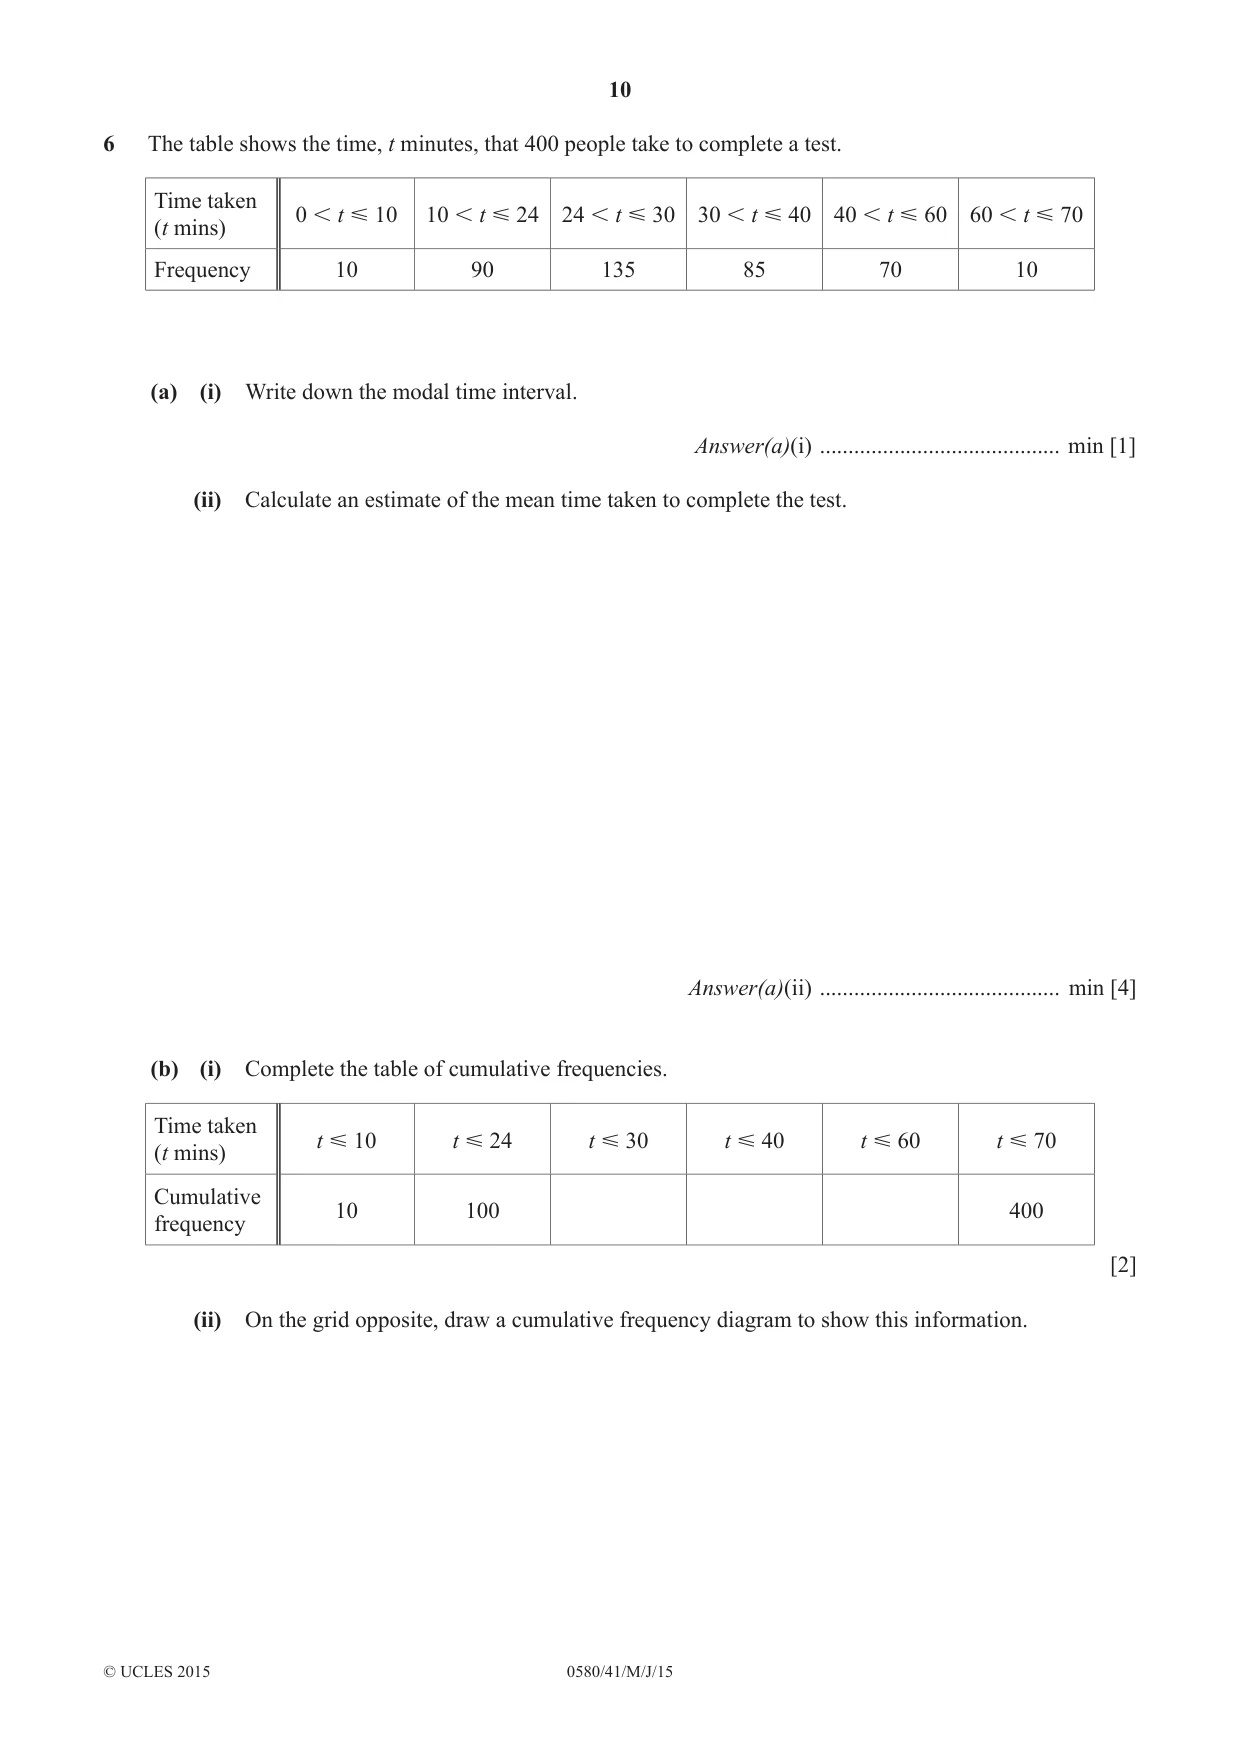
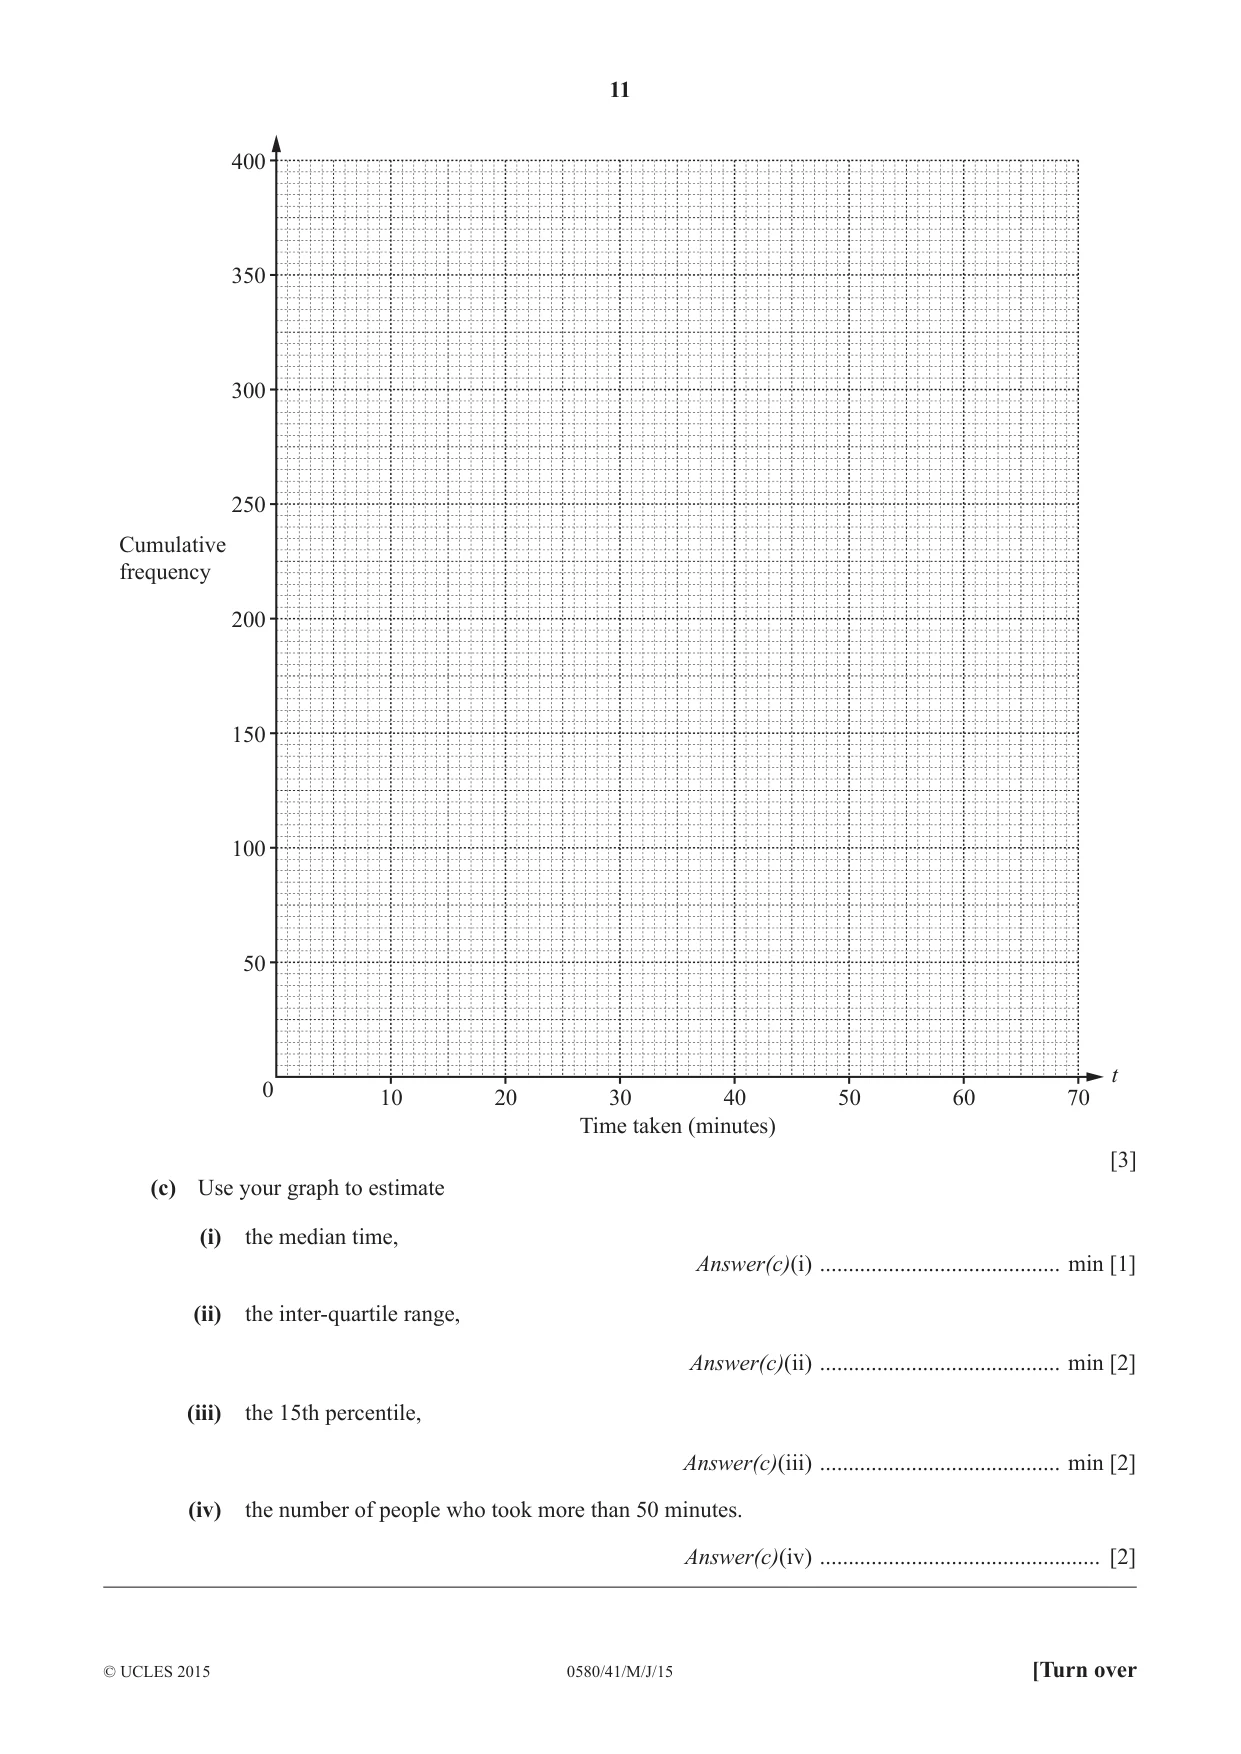
6 The table shows the time, t minutes, that 400 people take to complete a test. Time taken 0 t 10 10 t 24 24 t 30 30 t 40 40 t 60 60 t 70 (t mins) Frequency 10 90 135 85 70 10 (a) (i) Write down the modal time interval. Answer(a)(i) .......................................... min [1] (ii) Calculate an estimate of the mean time taken to complete the test. Answer(a)(ii) .......................................... min [4] (b) (i) Complete the table of cumulative frequencies. Time taken t 10 t 24 t 30 t 40 t 60 t 70 (t mins) Cumulative 10 100 400 frequency [2] (ii) On the grid opposite, draw a cumulative frequency diagram to show this information. 400 350 300 250 Cumulative frequency 200 150 100 50 t 0 10 20 30 40 50 60 70 Time taken (minutes) [3] (c) Use your graph to estimate (i) the median time, Answer(c)(i) .......................................... min [1] (ii) the inter-quartile range, Answer(c)(ii) .......................................... min [2] (iii) the 15th percentile, Answer(c)(iii) .......................................... min [2] (iv) the number of people who took more than 50 minutes. Answer(c)(iv) ................................................. [2]
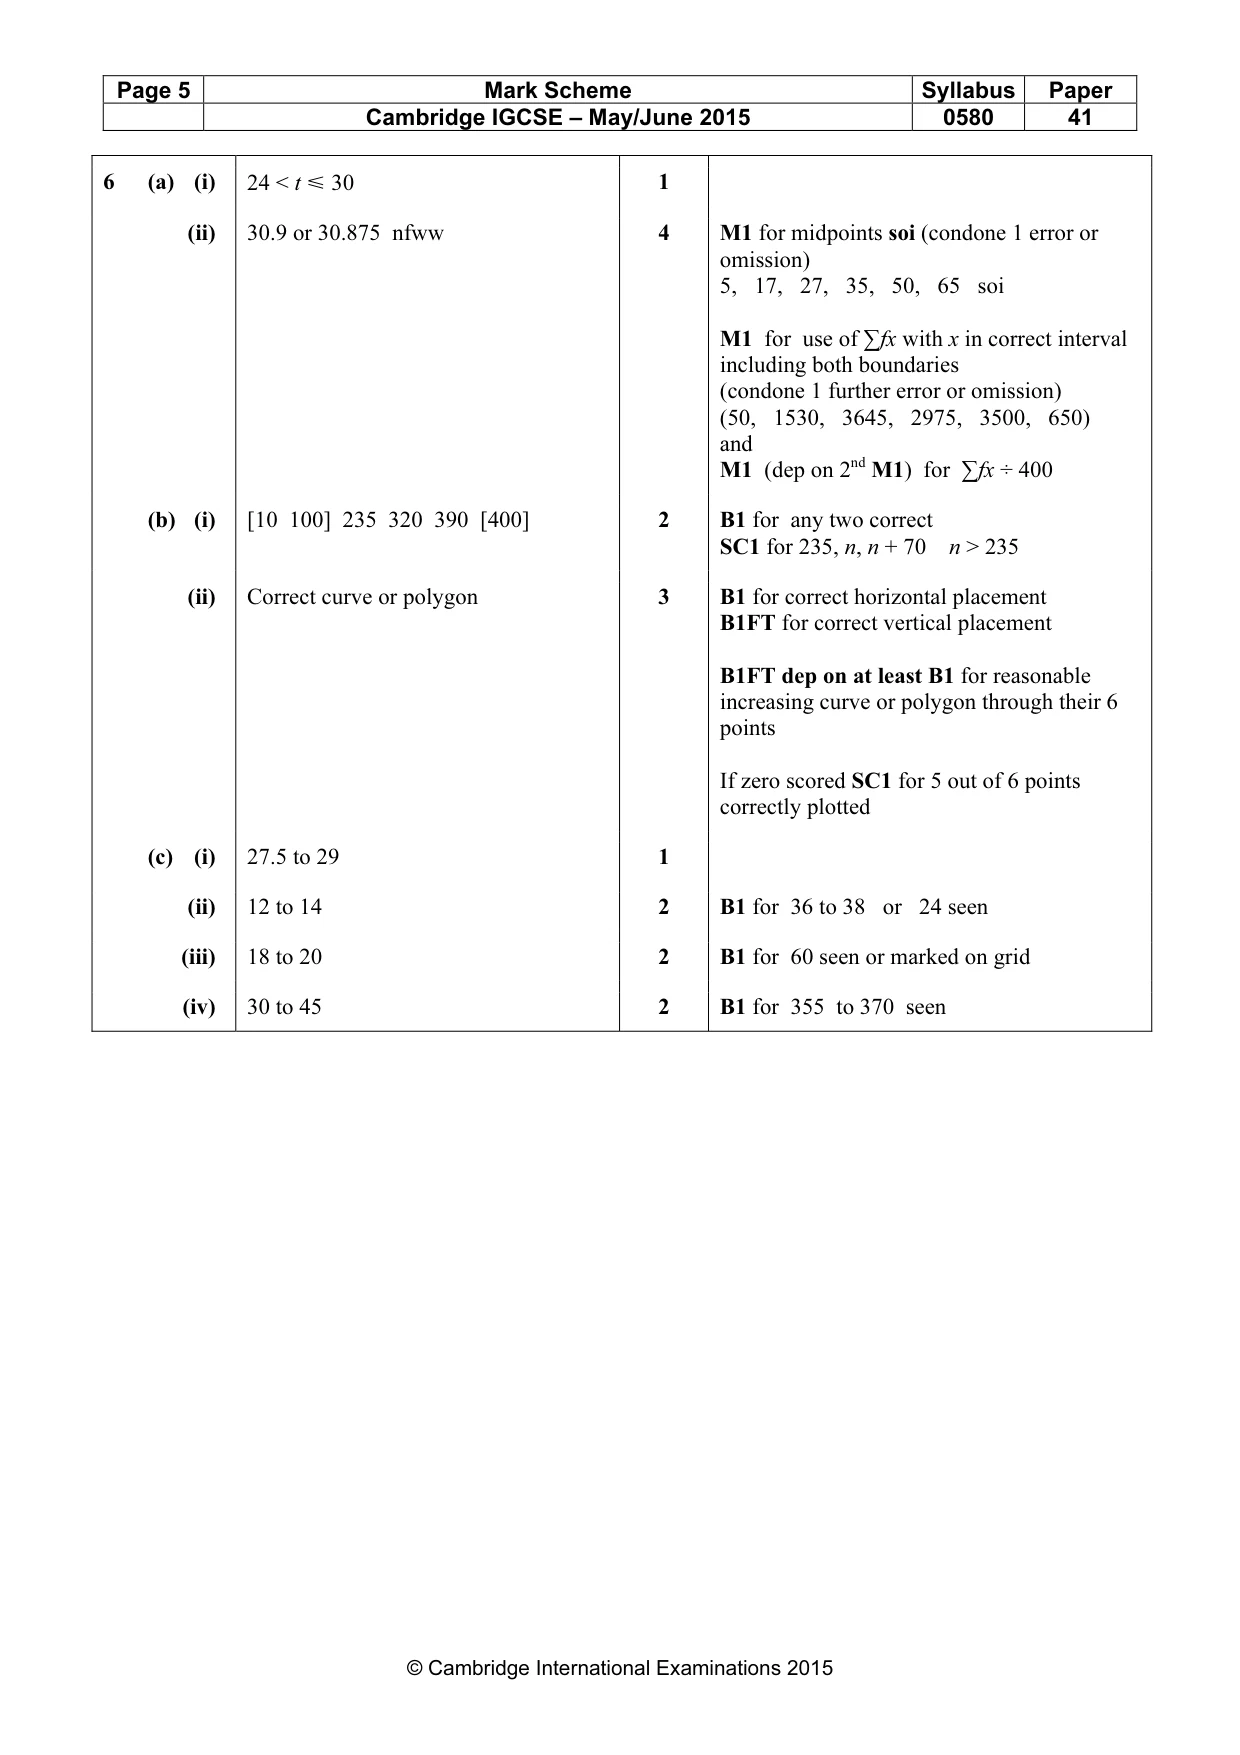
Mark scheme: 6 (a) (i) 24 < t Y 30 1 (ii) 30.9 or 30.875 nfww 4 M1 for midpoints soi (condone 1 error or omission) 5, 17, 27, 35, 50, 65 soi M1 for use of ∑fx with x in correct interval including both boundaries (condone 1 further error or omission) (50, 1530, 3645, 2975, 3500, 650) and M1 (dep on 2nd M1) for ∑fx ÷ 400 (b) (i) [10 100] 235 320 390 [400] 2 B1 for any two correct SC1 for 235, n, n + 70 n > 235 (ii) Correct curve or polygon 3 B1 for correct horizontal placement B1FT for correct vertical placement B1FT dep on at least B1 for reasonable increasing curve or polygon through their 6 points If zero scored SC1 for 5 out of 6 points correctly plotted (c) (i) 27.5 to 29 1 (ii) 12 to 14 2 B1 for 36 to 38 or 24 seen (iii) 18 to 20 2 B1 for 60 seen or marked on grid (iv) 30 to 45 2 B1 for 355 to 370 seen
Q7 · P NOT TO SCALE 8.4 cm Q 7.6 cm 62° R In the triangle PQR, QR = 7.6 cm and PR = 8.4 cm
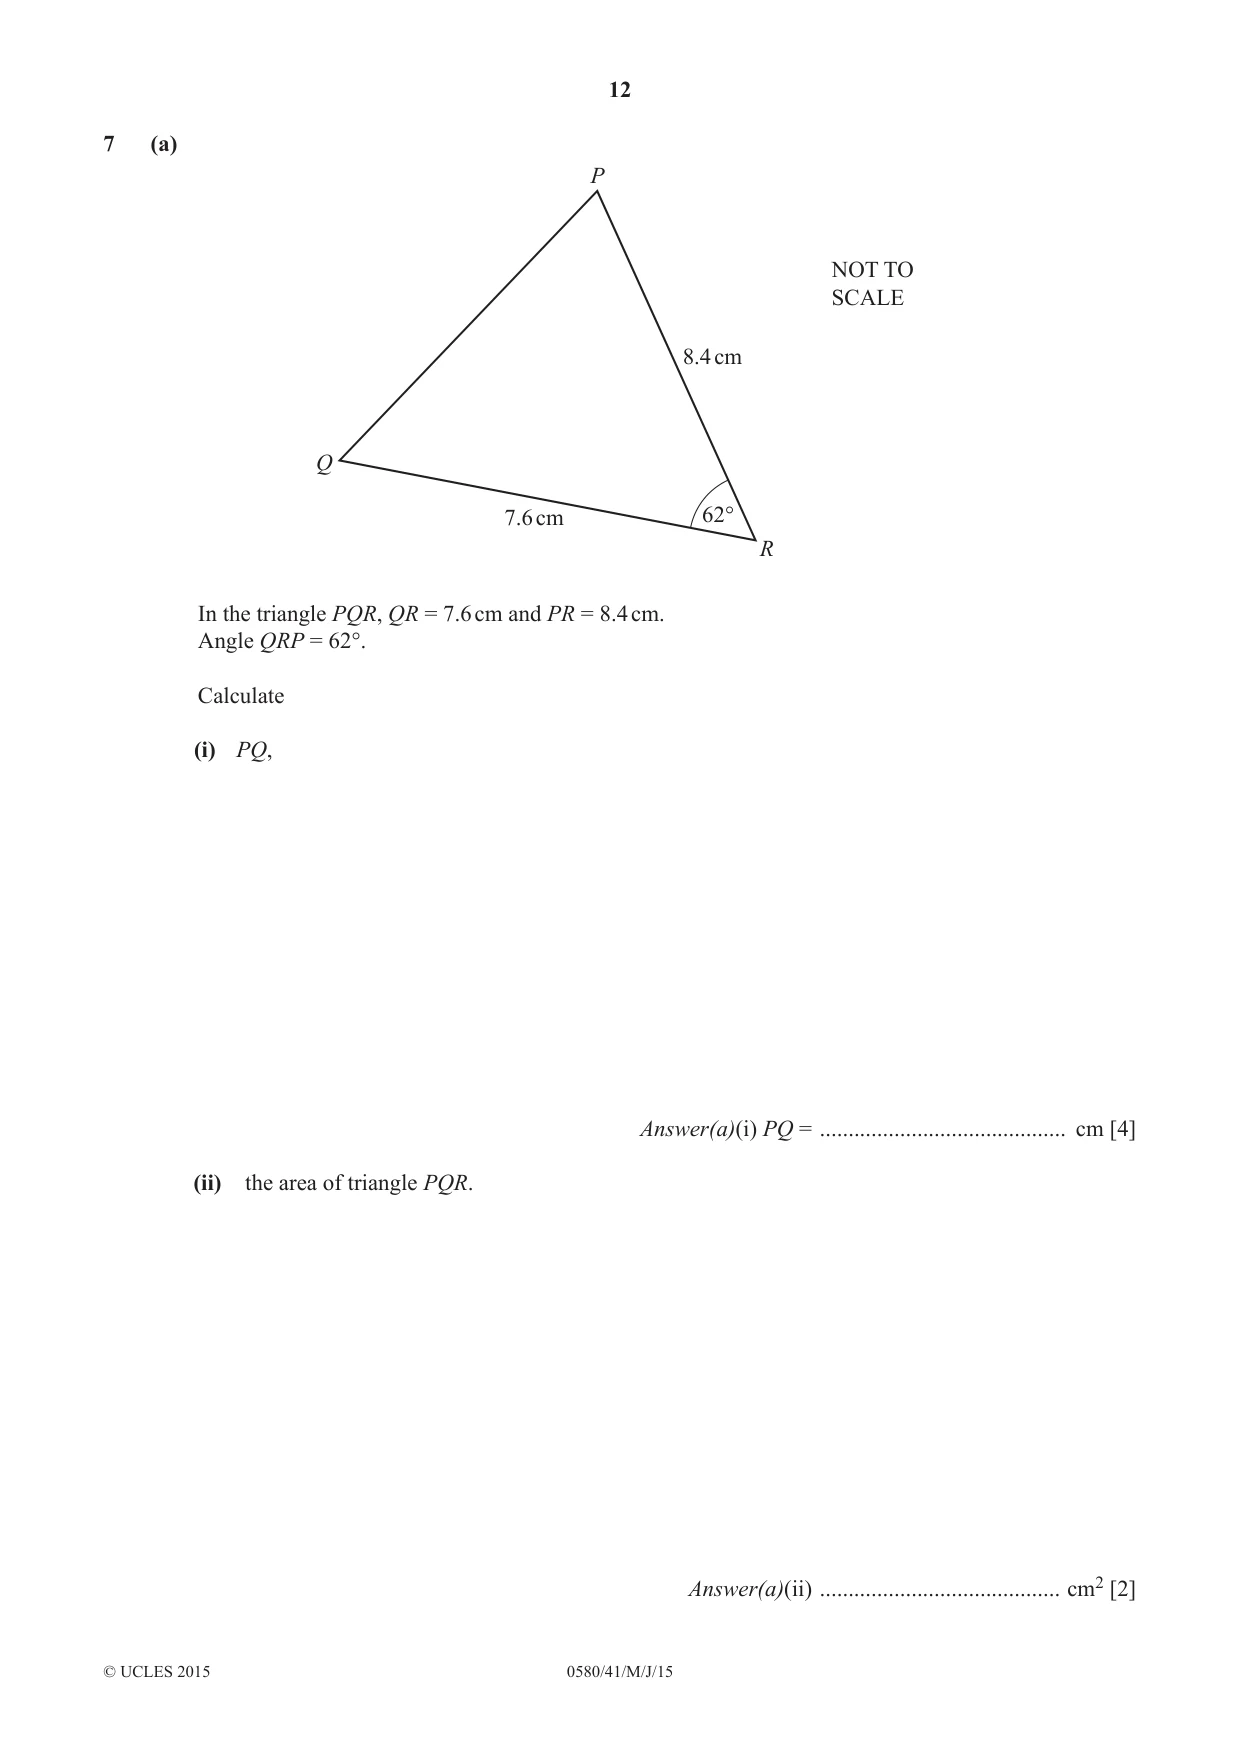
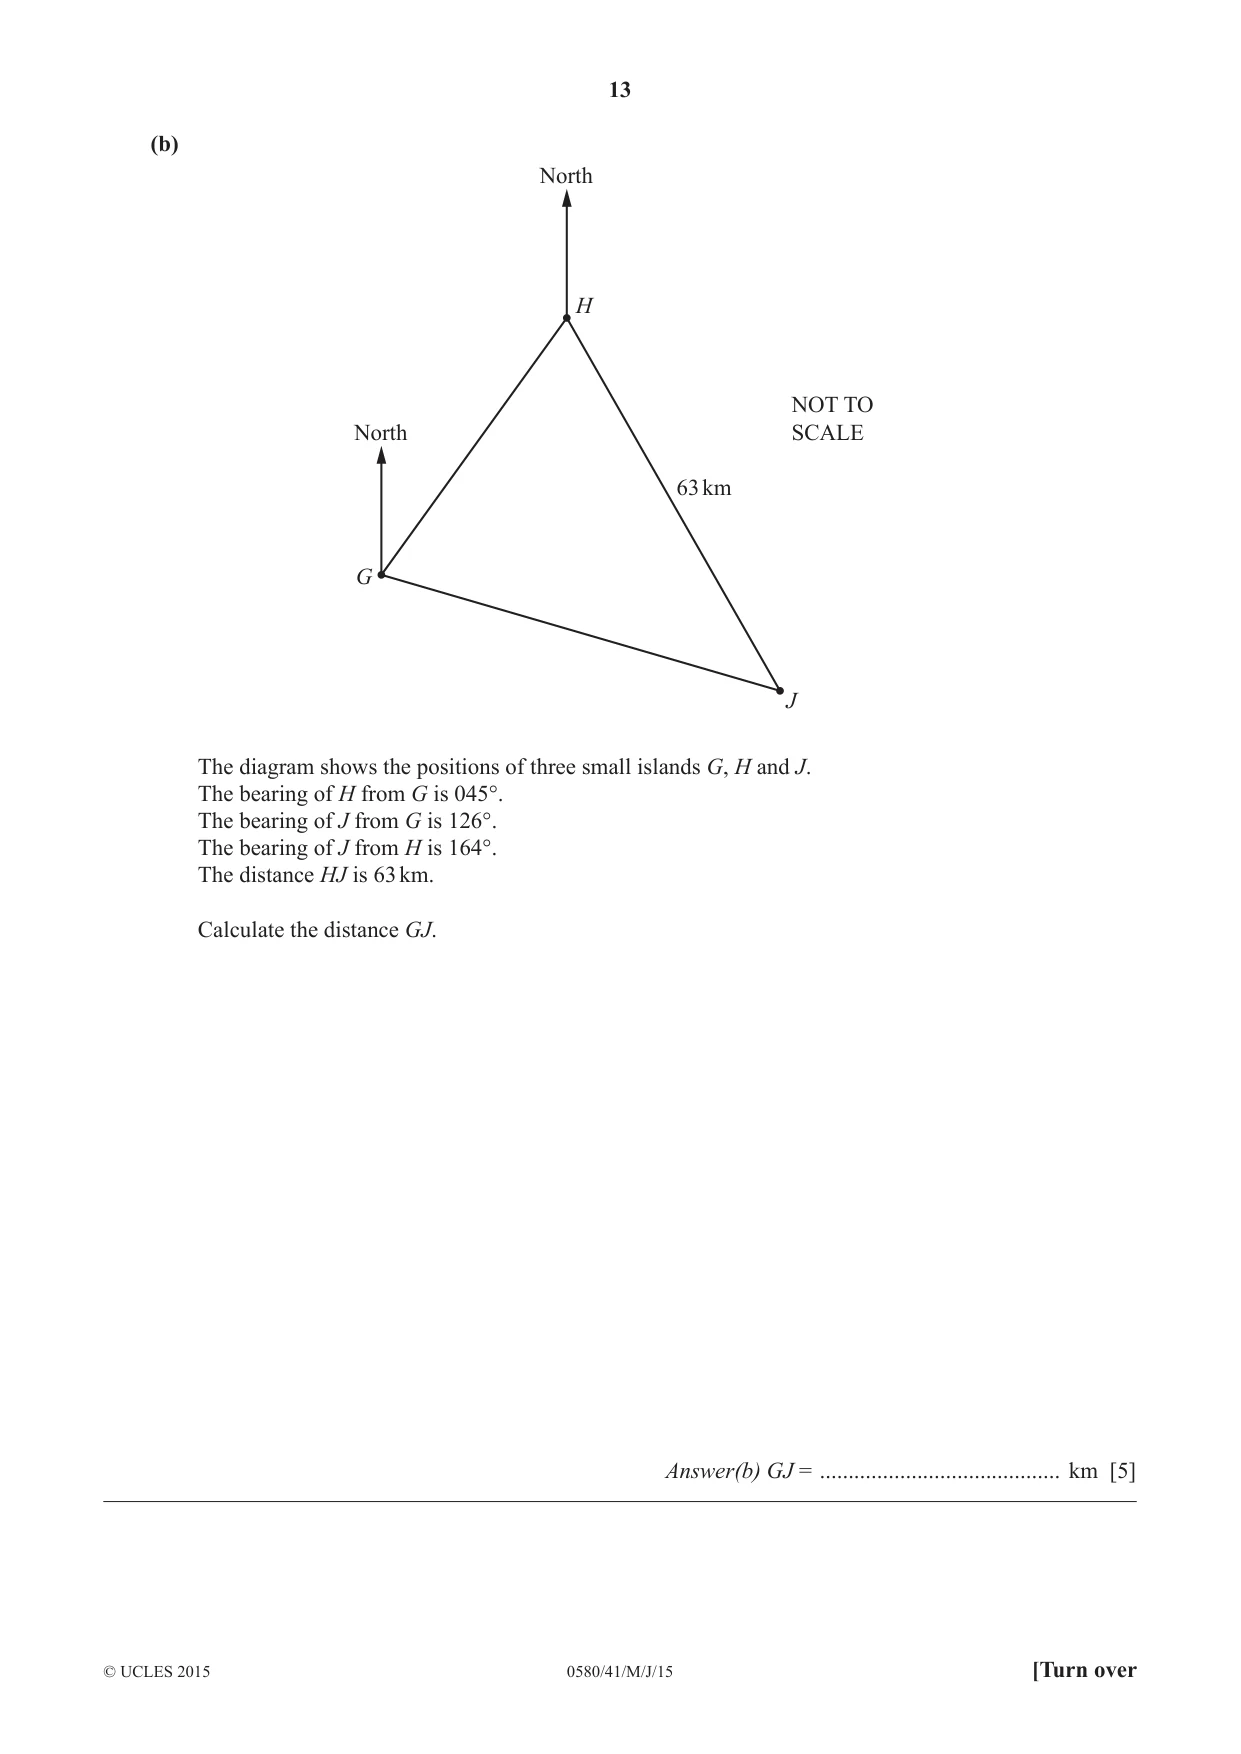
7 (a) P NOT TO SCALE 8.4 cm Q 7.6 cm 62° R In the triangle PQR, QR = 7.6 cm and PR = 8.4 cm. Angle QRP = 62°. Calculate (i) PQ, Answer(a)(i) PQ = ........................................... cm [4] (ii) the area of triangle PQR. Answer(a)(ii) .......................................... cm2 [2] (b) North H NOT TO North SCALE 63 km G J The diagram shows the positions of three small islands G, H and J. The bearing of H from G is 045°. The bearing of J from G is 126°. The bearing of J from H is 164°. The distance HJ is 63 km. Calculate the distance GJ. Answer(b) GJ = .......................................... km [5]
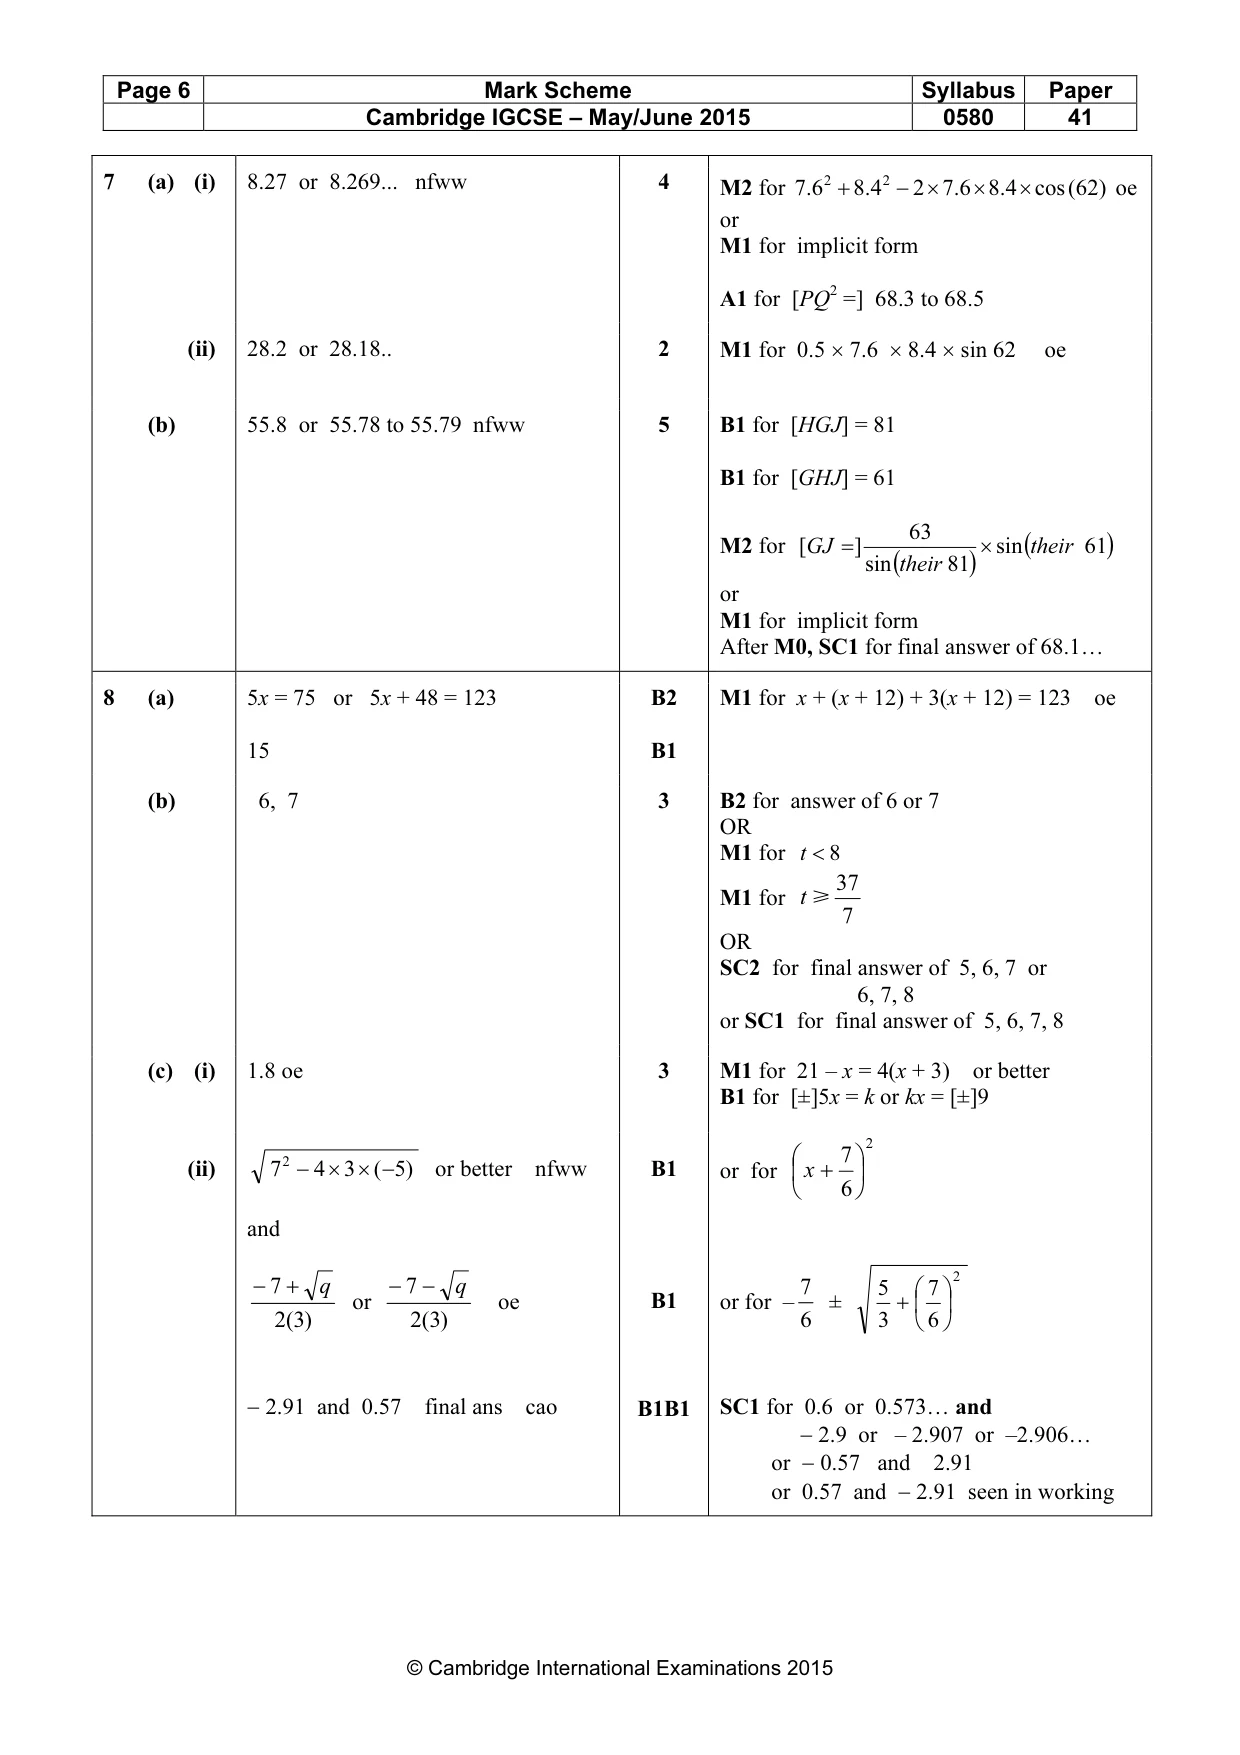
Mark scheme: 7 (a) (i) 8.27 or 8.269... nfww 4 M2 for 6.7 2 + 4.8 2 − 2 × 6.7 × 4.8 × cos ( 62) oe or M1 for implicit form A1 for [PQ2 =] 68.3 to 68.5 (ii) 28.2 or 28.18.. 2 M1 for 0.5 × 7.6 × 8.4 × sin 62 oe (b) 55.8 or 55.78 to 55.79 nfww 5 B1 for [HGJ] = 81 B1 for [GHJ] = 61 63 M2 for [GJ = ] × sin (their 61) sin (their 81) or M1 for implicit form After M0, SC1 for final answer of 68.1…
Q8 · Jamil, Kiera and Luther collect badges
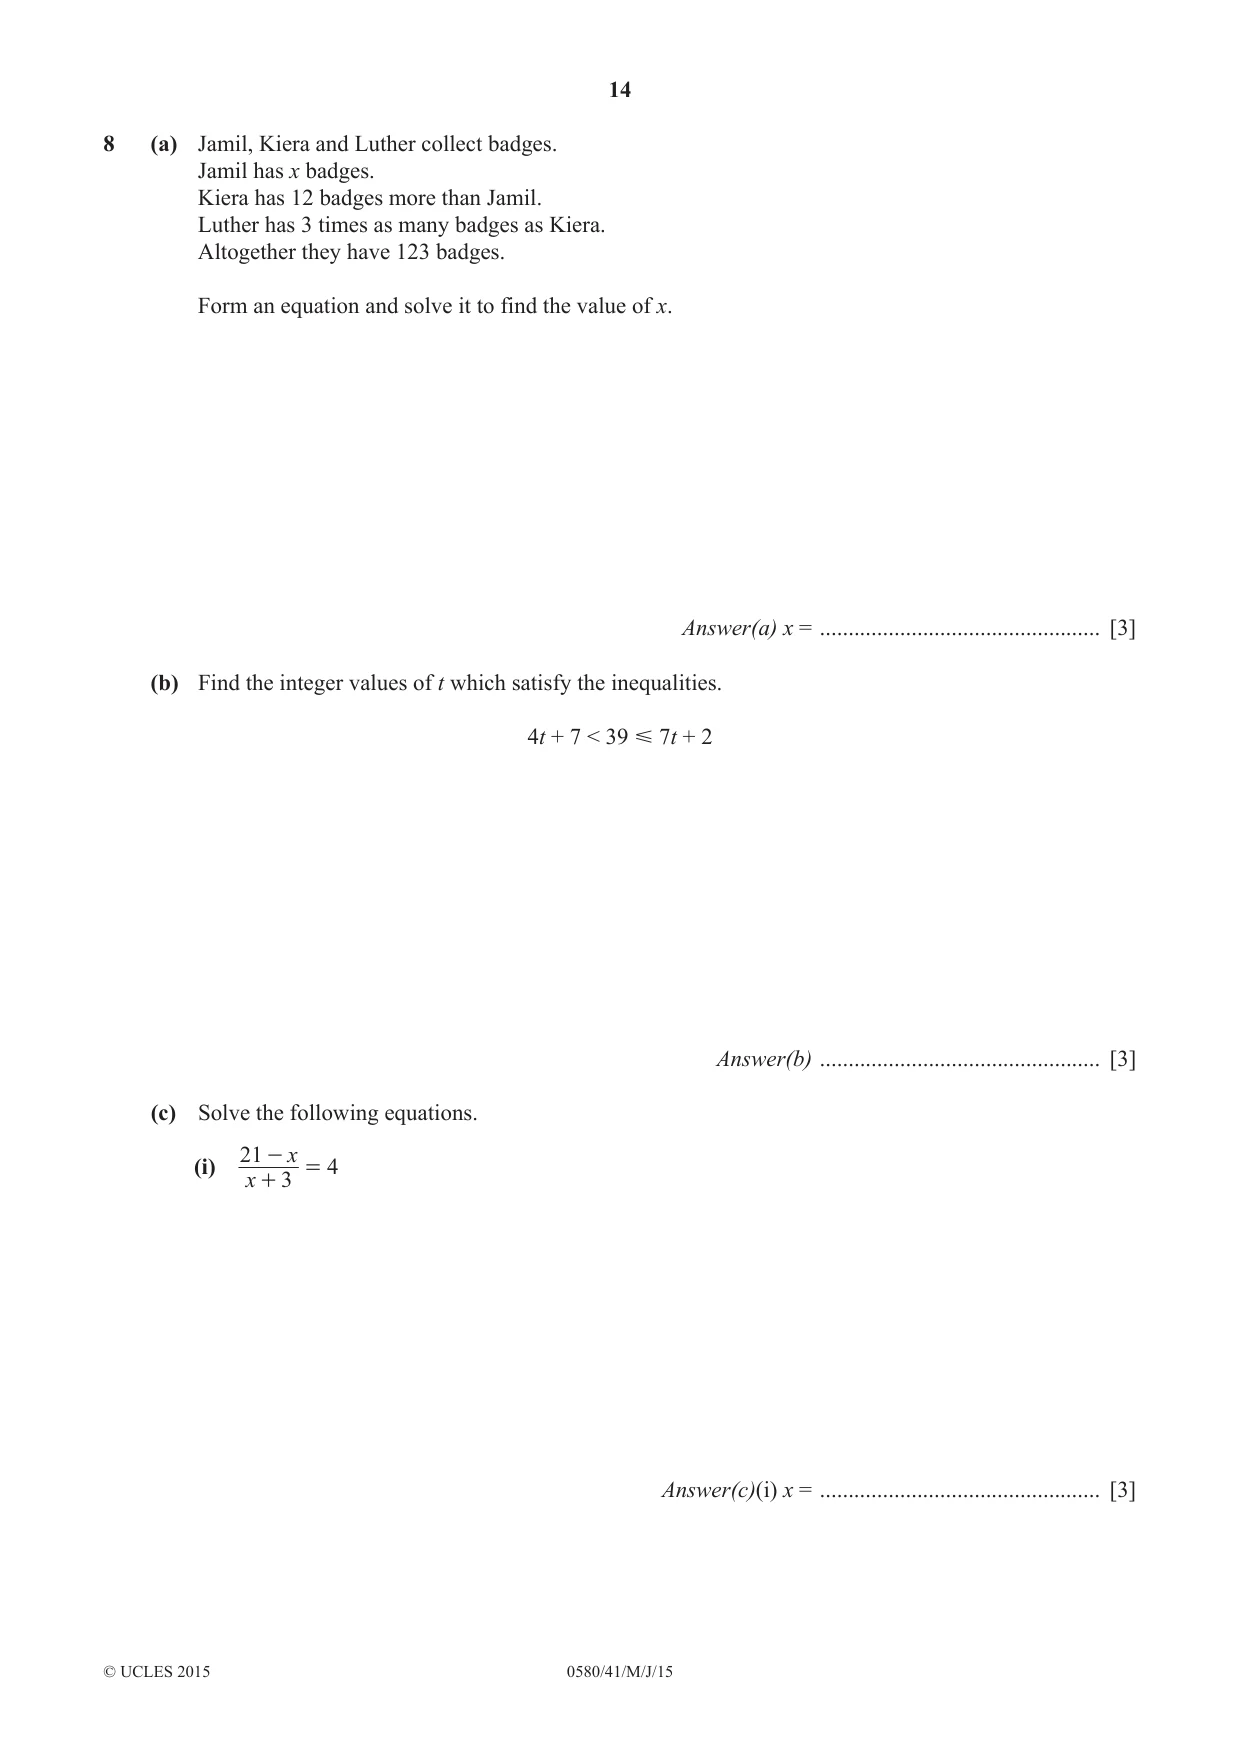
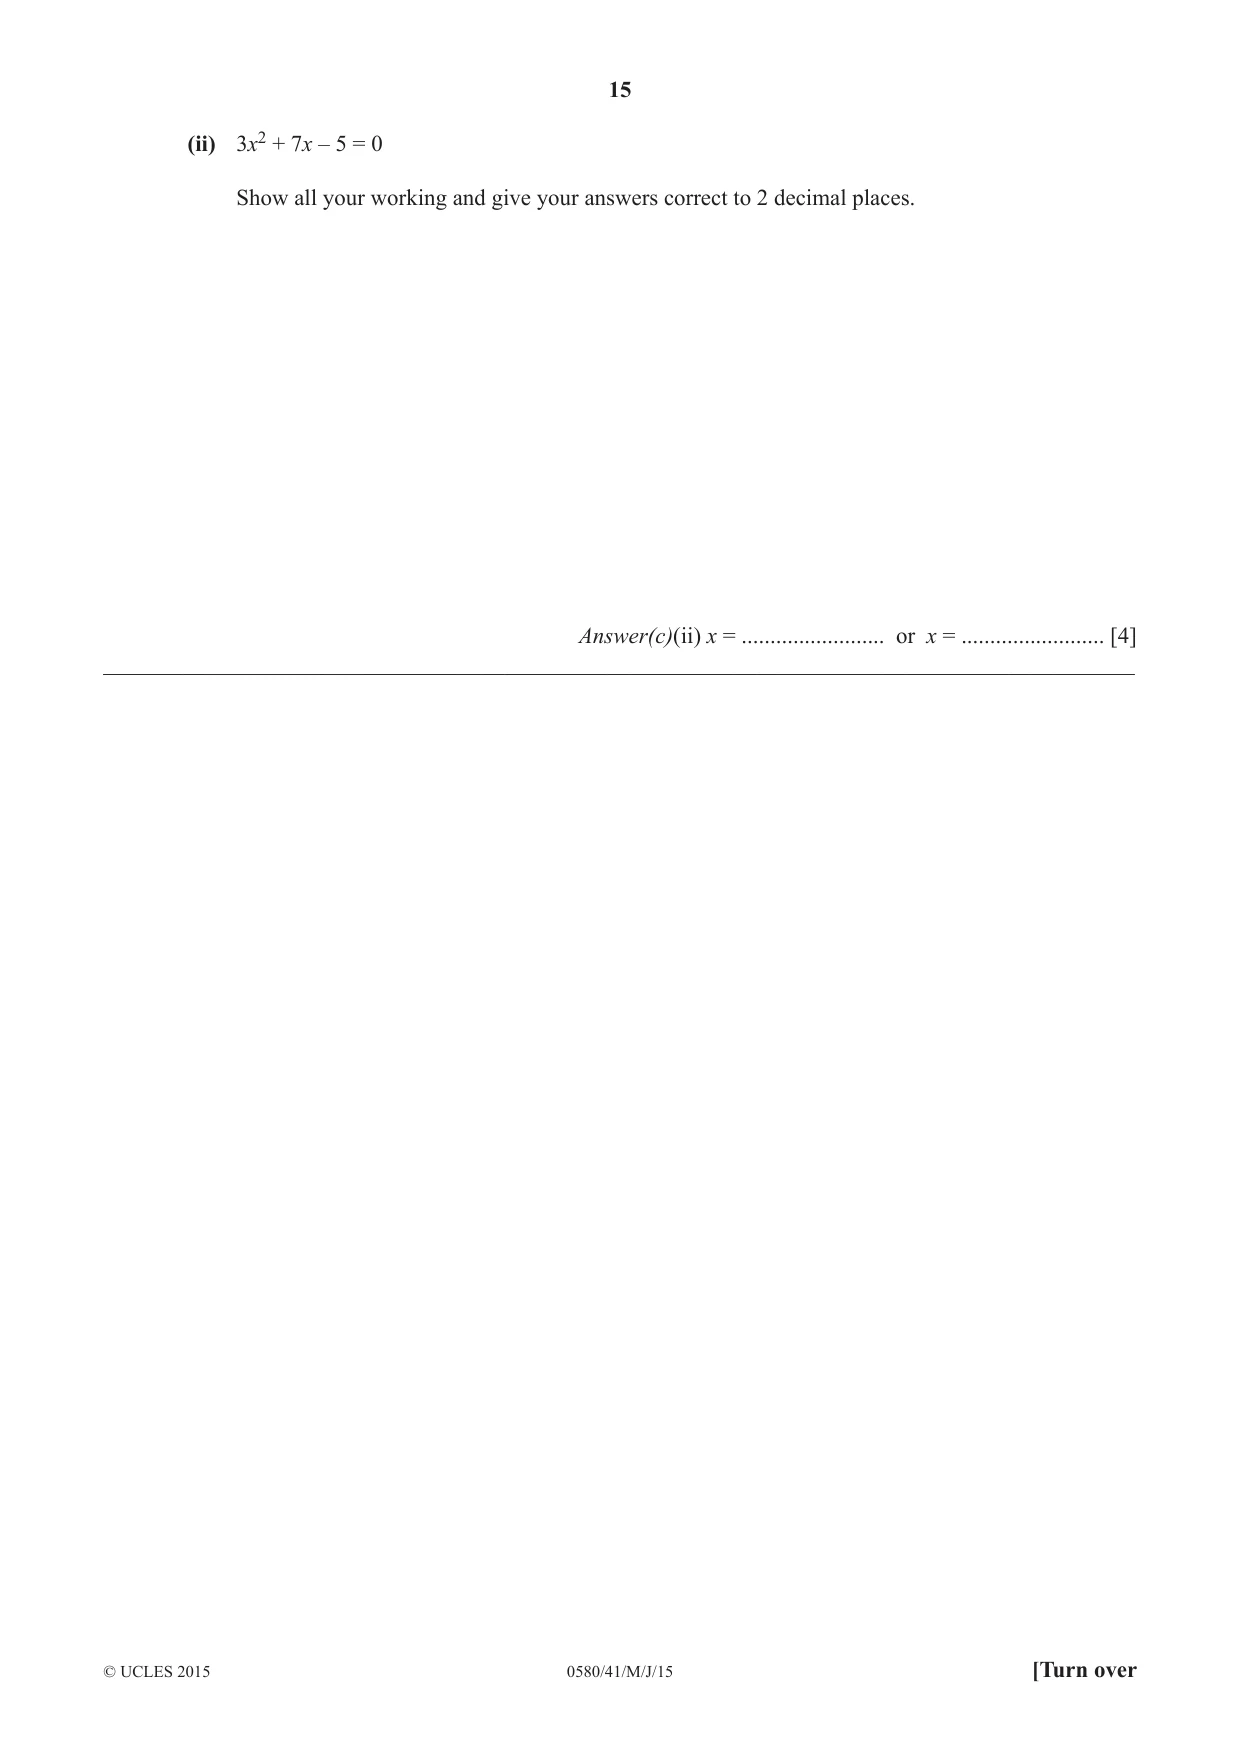
8 (a) Jamil, Kiera and Luther collect badges. Jamil has x badges. Kiera has 12 badges more than Jamil. Luther has 3 times as many badges as Kiera. Altogether they have 123 badges. Form an equation and solve it to find the value of x. Answer(a) x = ................................................. [3] (b) Find the integer values of t which satisfy the inequalities. 4t + 7 < 39 7t + 2 Answer(b) ................................................. [3] (c) Solve the following equations. 21 - x = 4 (i) 3 x + Answer(c)(i) x = ................................................. [3] (ii) 3x2 + 7x – 5 = 0 Show all your working and give your answers correct to 2 decimal places. Answer(c)(ii) x = ......................... or x = ......................... [4] __________________________________________________________________________________________
Mark scheme: 8 (a) 5x = 75 or 5x + 48 = 123 B2 M1 for x + (x + 12) + 3(x + 12) = 123 oe 15 B1 (b) 6, 7 3 B2 for answer of 6 or 7 OR M1 for t < 8 37 M1 for t [ 7 OR SC2 for final answer of 5, 6, 7 or 6, 7, 8 or SC1 for final answer of 5, 6, 7, 8 (c) (i) 1.8 oe 3 M1 for 21 – x = 4(x + 3) or better B1 for [±]5x = k or kx = [±]9 2 7 (ii) 72 − 4 × 3 × ( −5) or better nfww B1 or for x + 6 and − 7 + q − 7 − q 7 5 7 2 or oe B1 or for – ± + 2()3 2 (3) 6 3 6 − 2.91 and 0.57 final ans cao B1B1 SC1 for 0.6 or 0.573… and − 2.9 or – 2.907 or –2.906… or − 0.57 and 2.91 or 0.57 and − 2.91 seen in working
Q9 · The points A, B, C and D lie on a circle
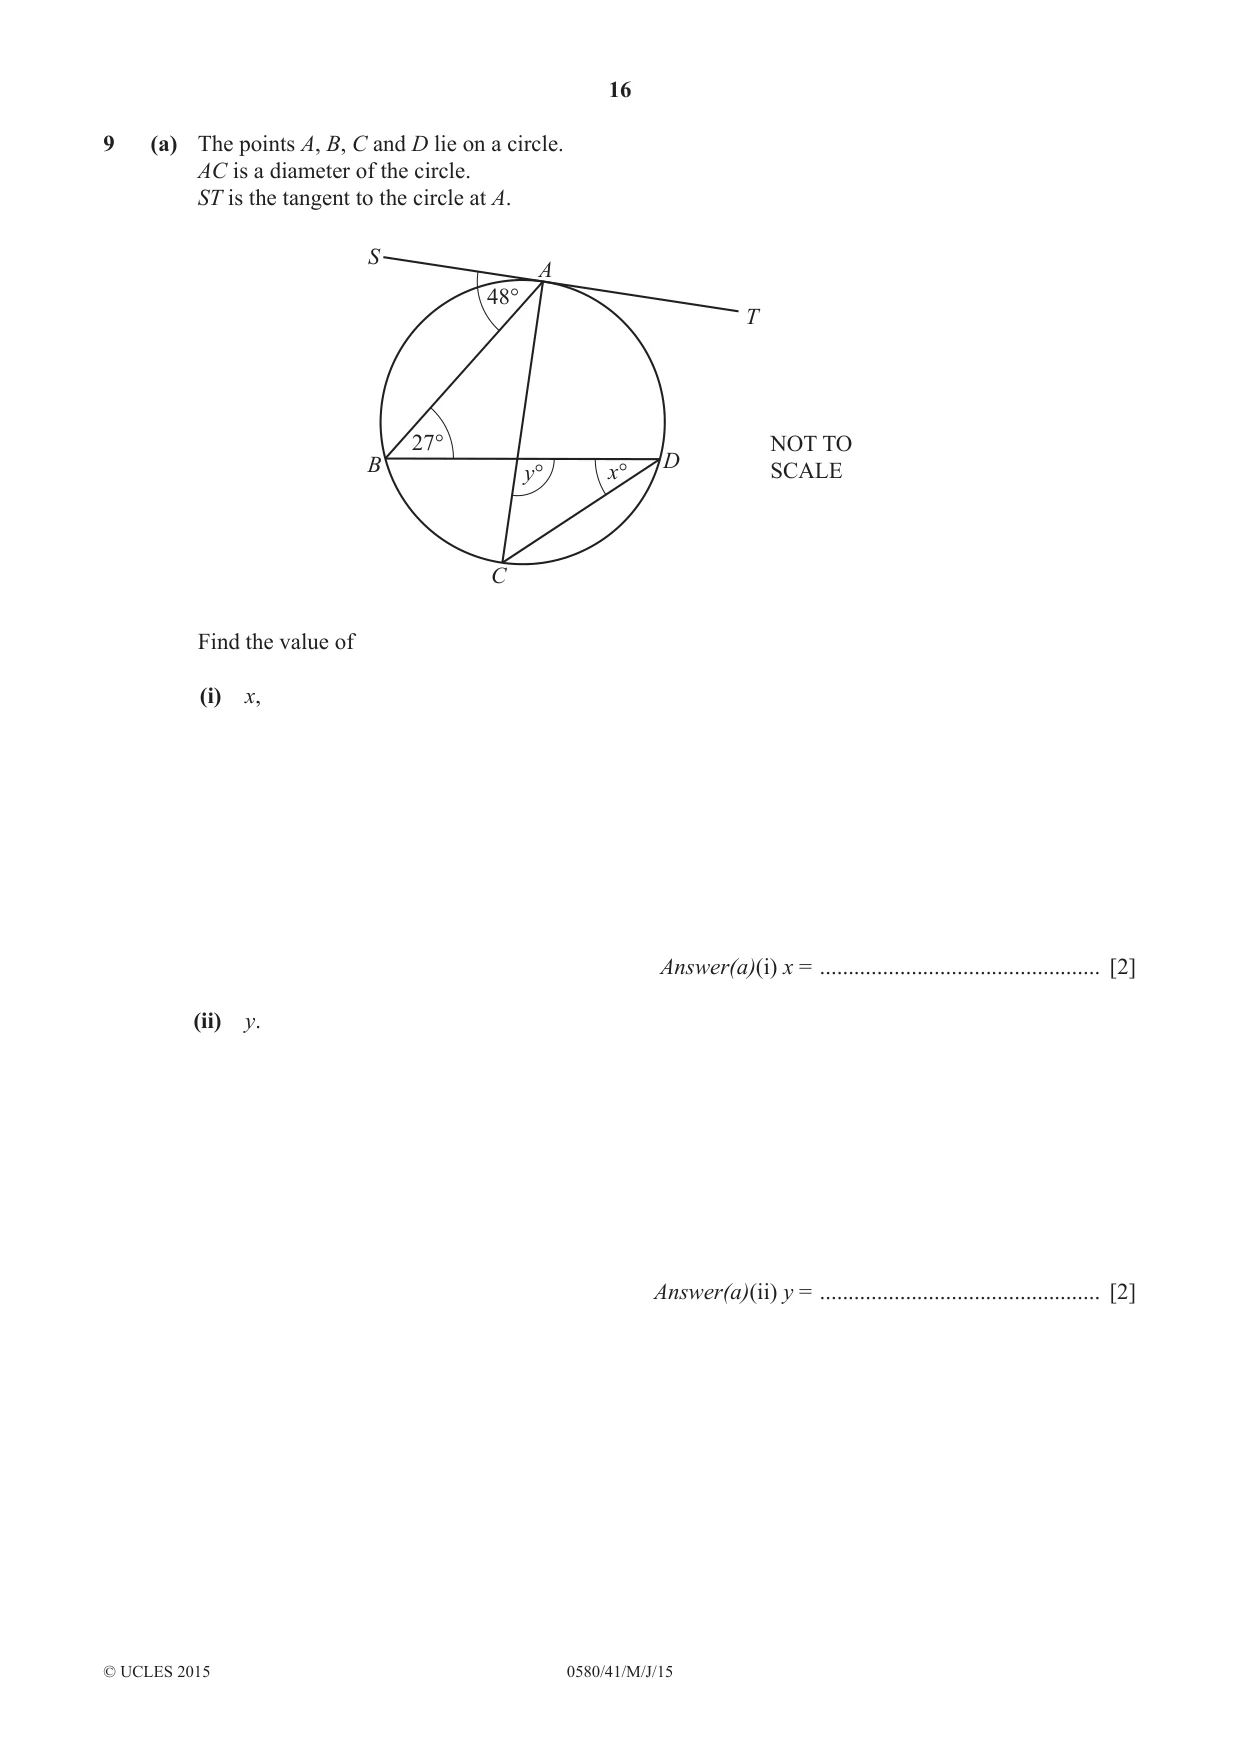
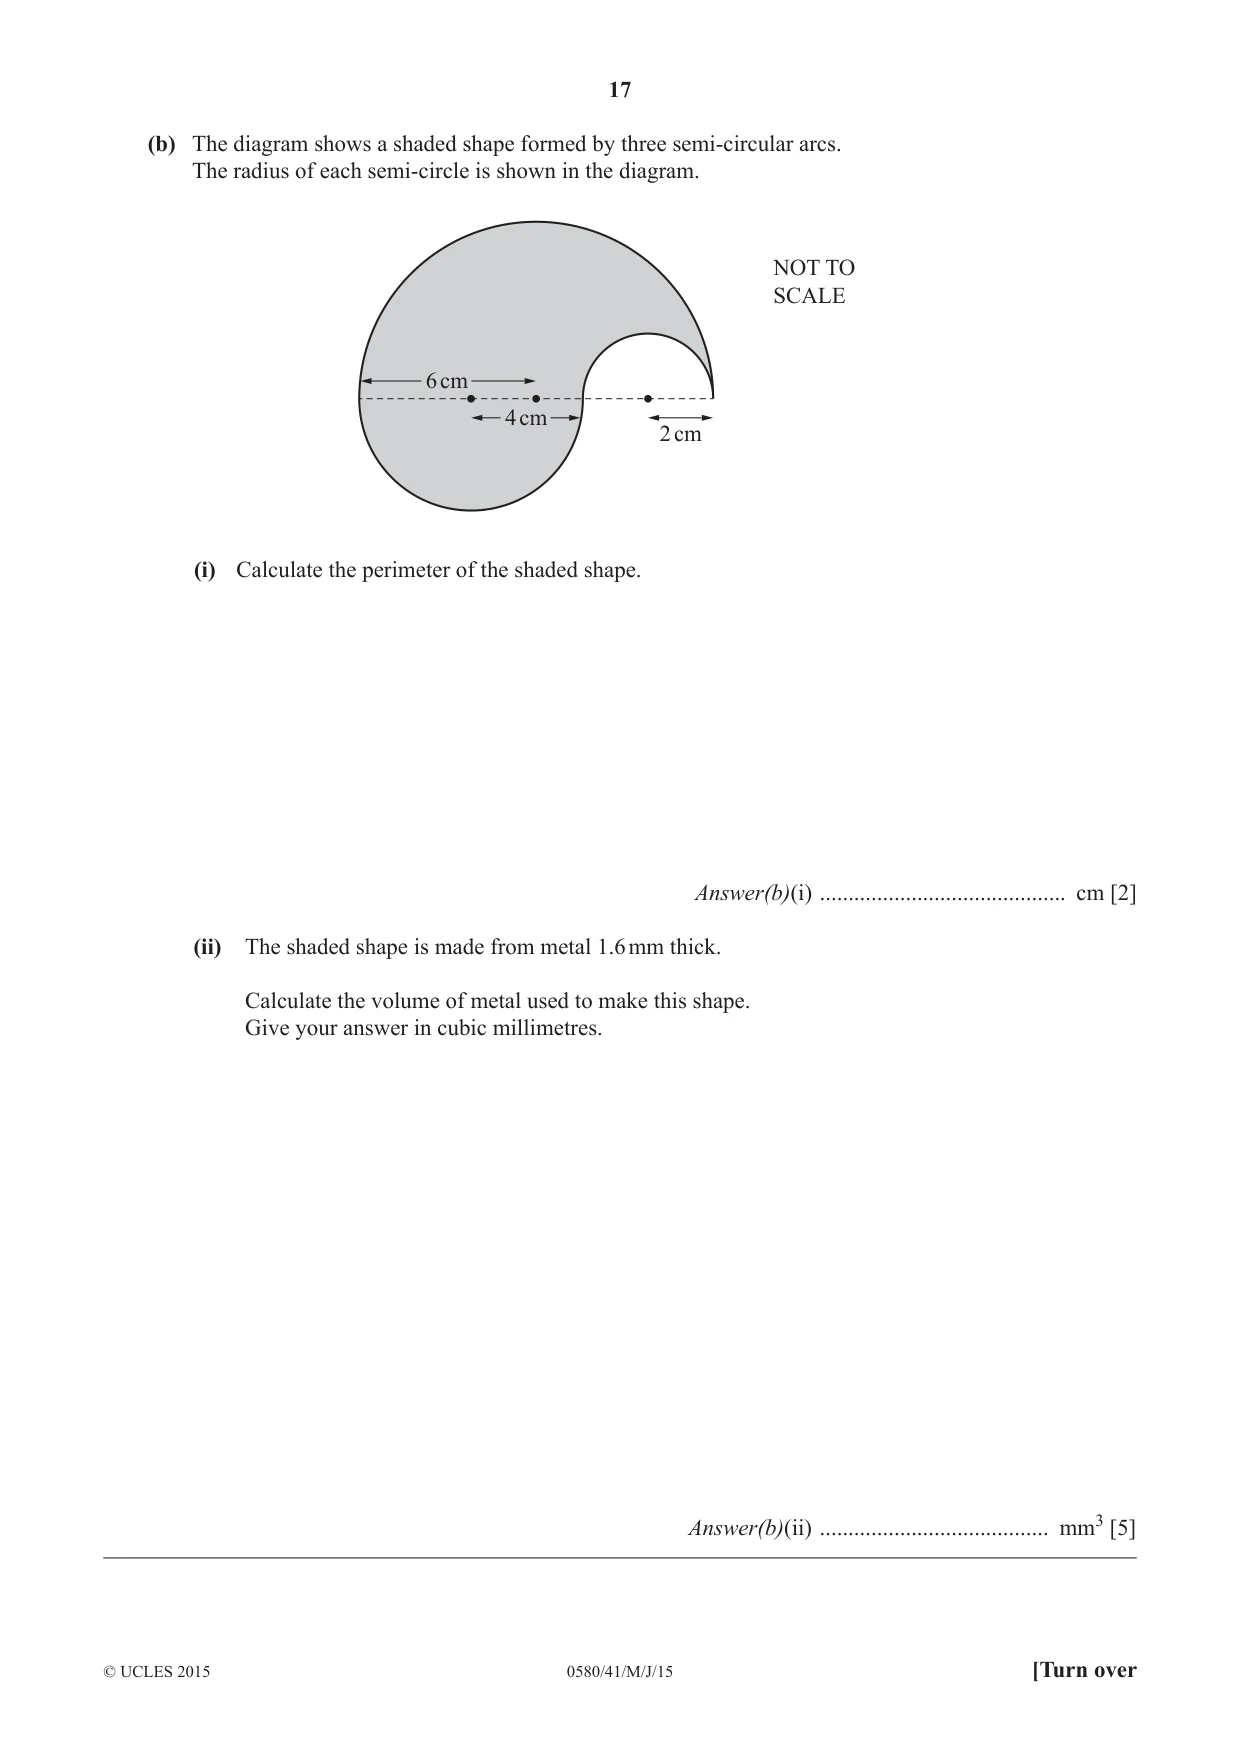
9 (a) The points A, B, C and D lie on a circle. AC is a diameter of the circle. ST is the tangent to the circle at A. S A 48° T 27° NOT TO B D y° x° SCALE C Find the value of (i) x, Answer(a)(i) x = ................................................. [2] (ii) y. Answer(a)(ii) y = ................................................. [2] (b) The diagram shows a shaded shape formed by three semi-circular arcs. The radius of each semi-circle is shown in the diagram. NOT TO SCALE 6 cm 4 cm 2 cm (i) Calculate the perimeter of the shaded shape. Answer(b)(i) ........................................... cm [2] (ii) The shaded shape is made from metal 1.6 mm thick. Calculate the volume of metal used to make this shape. Give your answer in cubic millimetres. Answer(b)(ii) ........................................ mm3 [5]
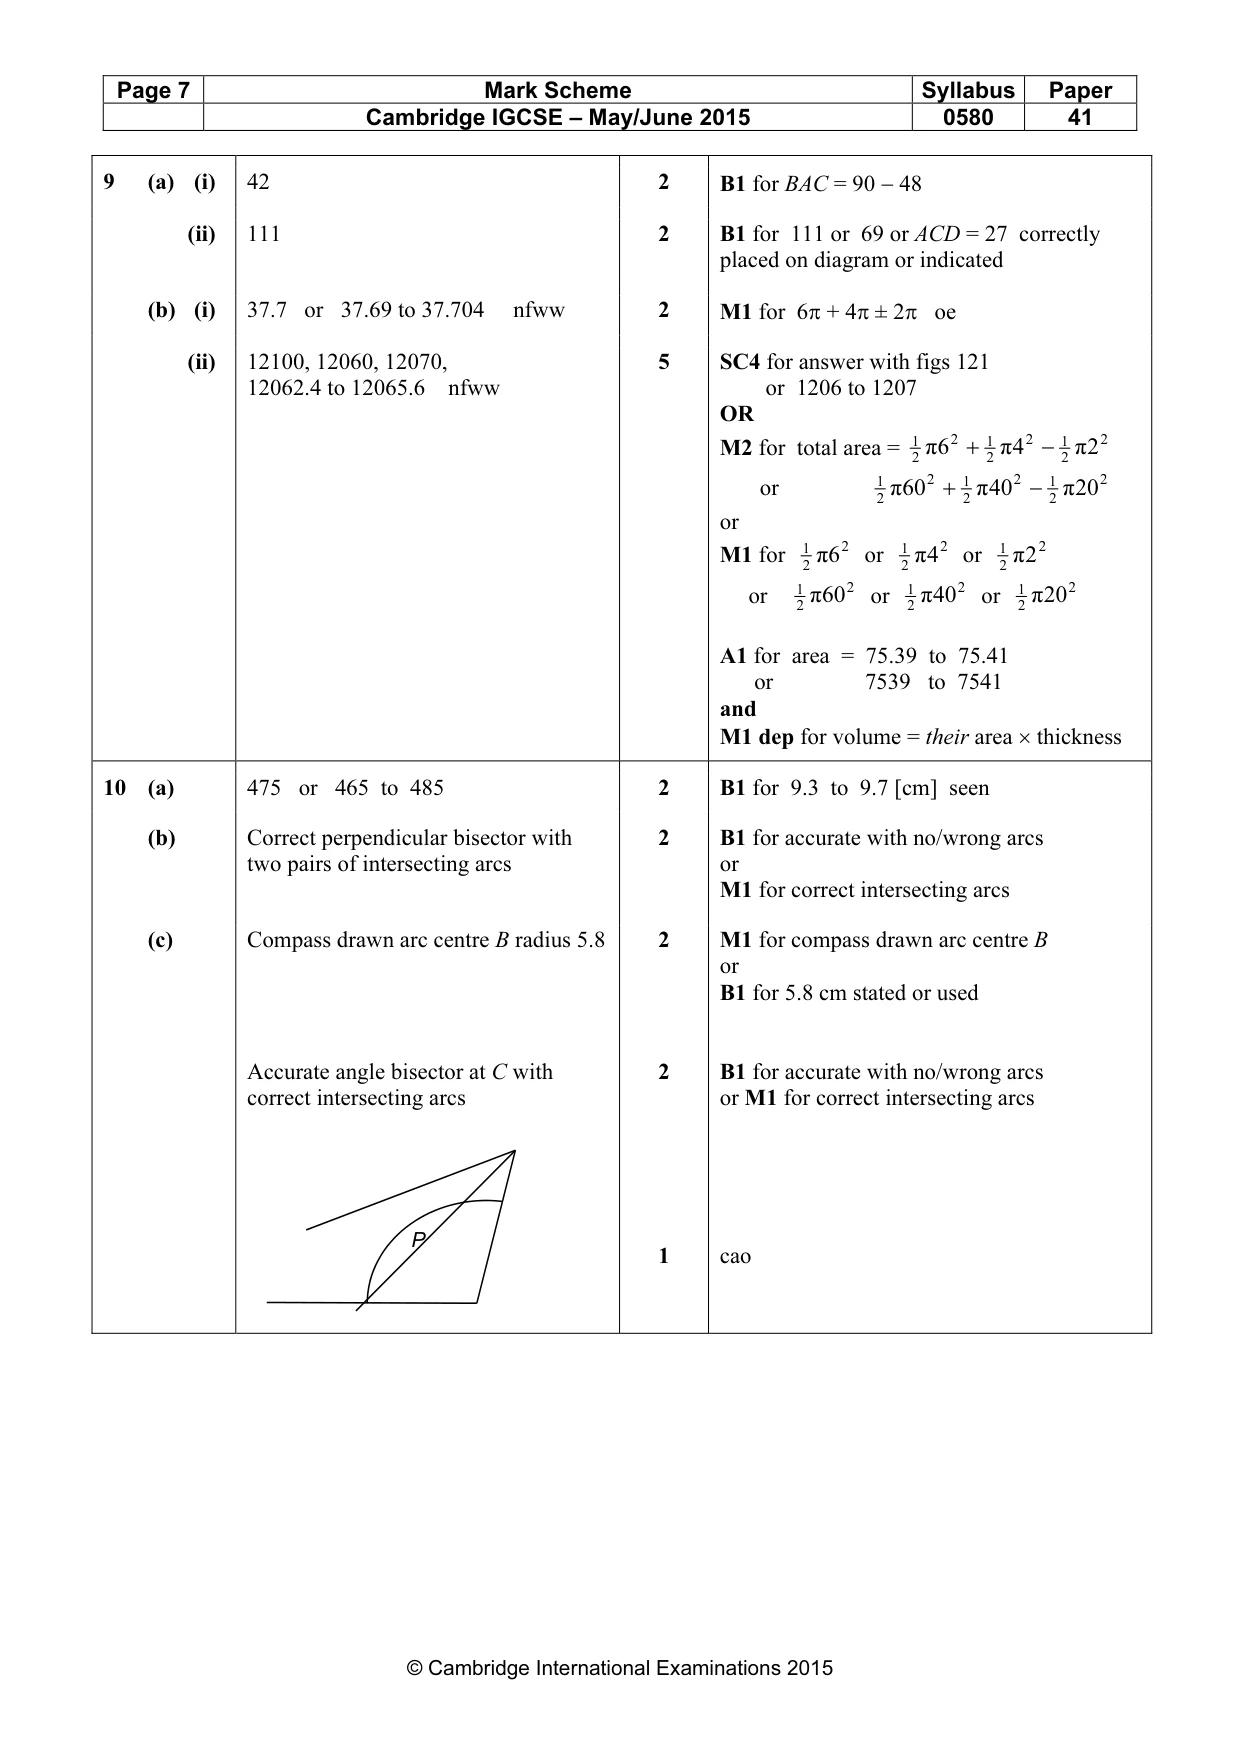
Mark scheme: 9 (a) (i) 42 2 B1 for BAC = 90 − 48 (ii) 111 2 B1 for 111 or 69 or ACD = 27 correctly placed on diagram or indicated (b) (i) 37.7 or 37.69 to 37.704 nfww 2 M1 for 6π + 4π ± 2π oe (ii) 12100, 12060, 12070, 5 SC4 for answer with figs 121 12062.4 to 12065.6 nfww or 1206 to 1207 OR M2 for total area = 12 π 6 2 + 12 π 4 2 − 12 π 2 2 or 12 π 60 2 + 12 π 40 2 − 12 π 20 2 or M1 for 12 π 6 2 or 12 π 4 2 or 12 π 2 2 or 12 π 60 2 or 12 π 40 2 or 12 π 20 2 A1 for area = 75.39 to 75.41 or 7539 to 7541 and M1 dep for volume = their area × thickness
Q10 · The diagram is a scale drawing of three straight roads, AB, BC and CD
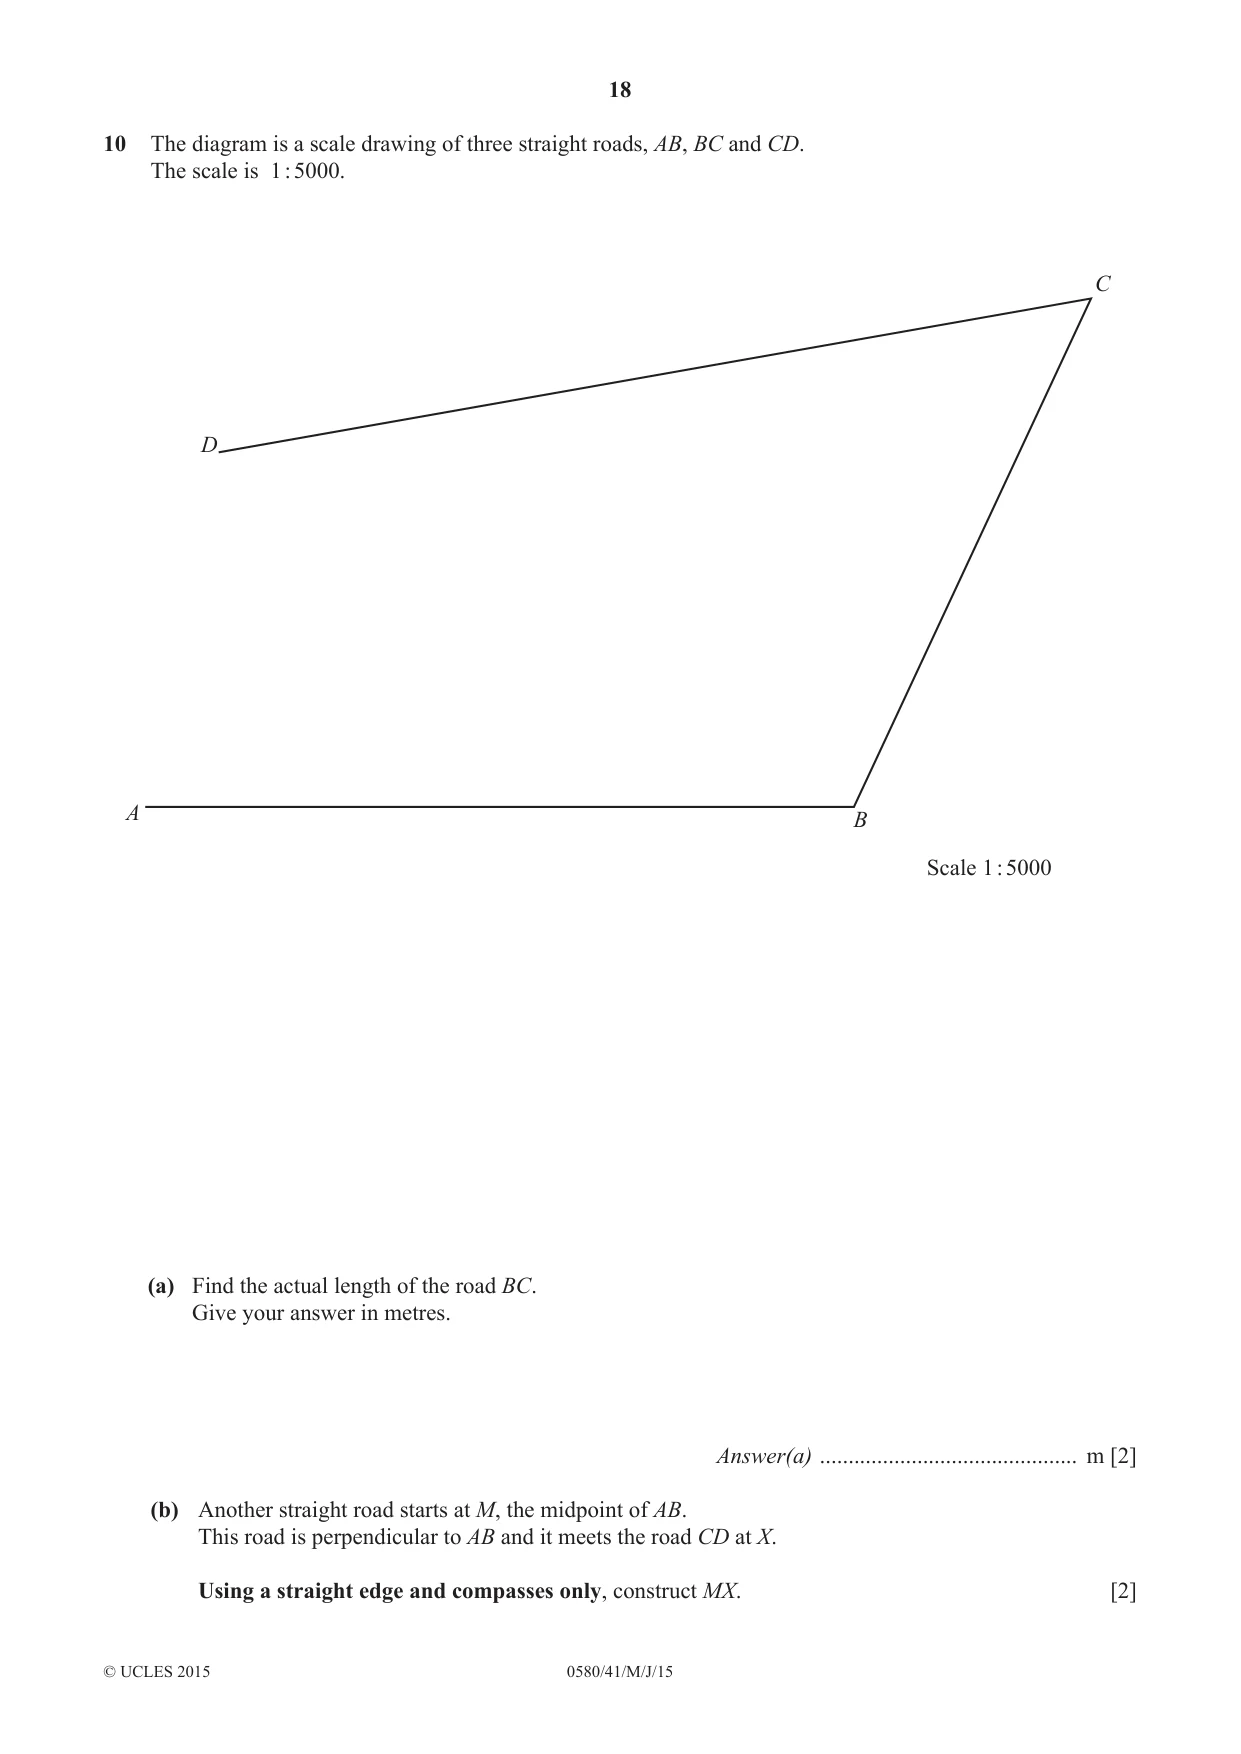
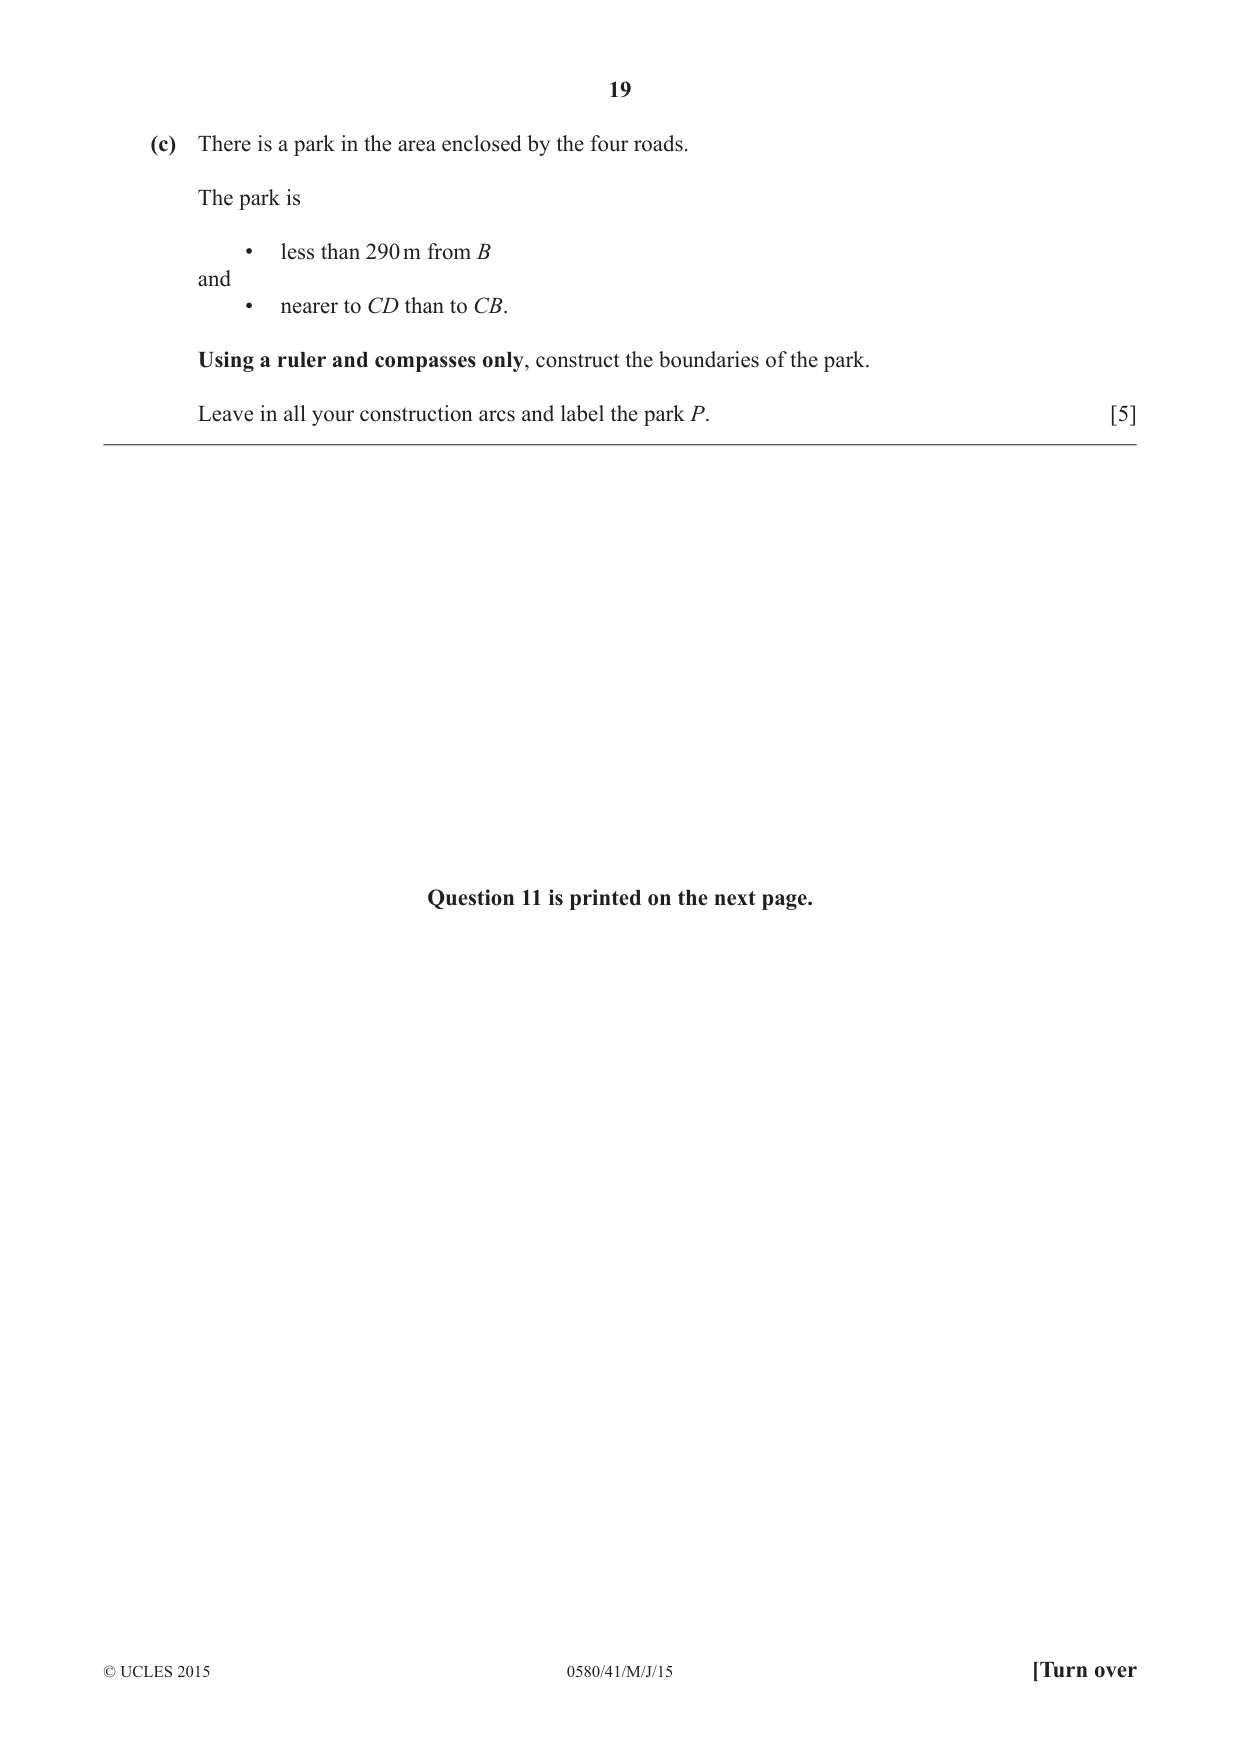
10 The diagram is a scale drawing of three straight roads, AB, BC and CD. The scale is 1 : 5000. C D A B Scale 1 : 5000 (a) Find the actual length of the road BC. Give your answer in metres. Answer(a) ............................................. m [2] (b) Another straight road starts at M, the midpoint of AB. This road is perpendicular to AB and it meets the road CD at X. Using a straight edge and compasses only, construct MX. [2] (c) There is a park in the area enclosed by the four roads. The park is • less than 290 m from B and • nearer to CD than to CB. Using a ruler and compasses only, construct the boundaries of the park. Leave in all your construction arcs and label the park P. [5] Question 11 is printed on the next page.
Mark scheme: 10 (a) 475 or 465 to 485 2 B1 for 9.3 to 9.7 [cm] seen (b) Correct perpendicular bisector with 2 B1 for accurate with no/wrong arcs two pairs of intersecting arcs or M1 for correct intersecting arcs (c) Compass drawn arc centre B radius 5.8 2 M1 for compass drawn arc centre B or B1 for 5.8 cm stated or used Accurate angle bisector at C with 2 B1 for accurate with no/wrong arcs correct intersecting arcs or M1 for correct intersecting arcs P 1 cao At
Q11 · Make x the subject of the formula
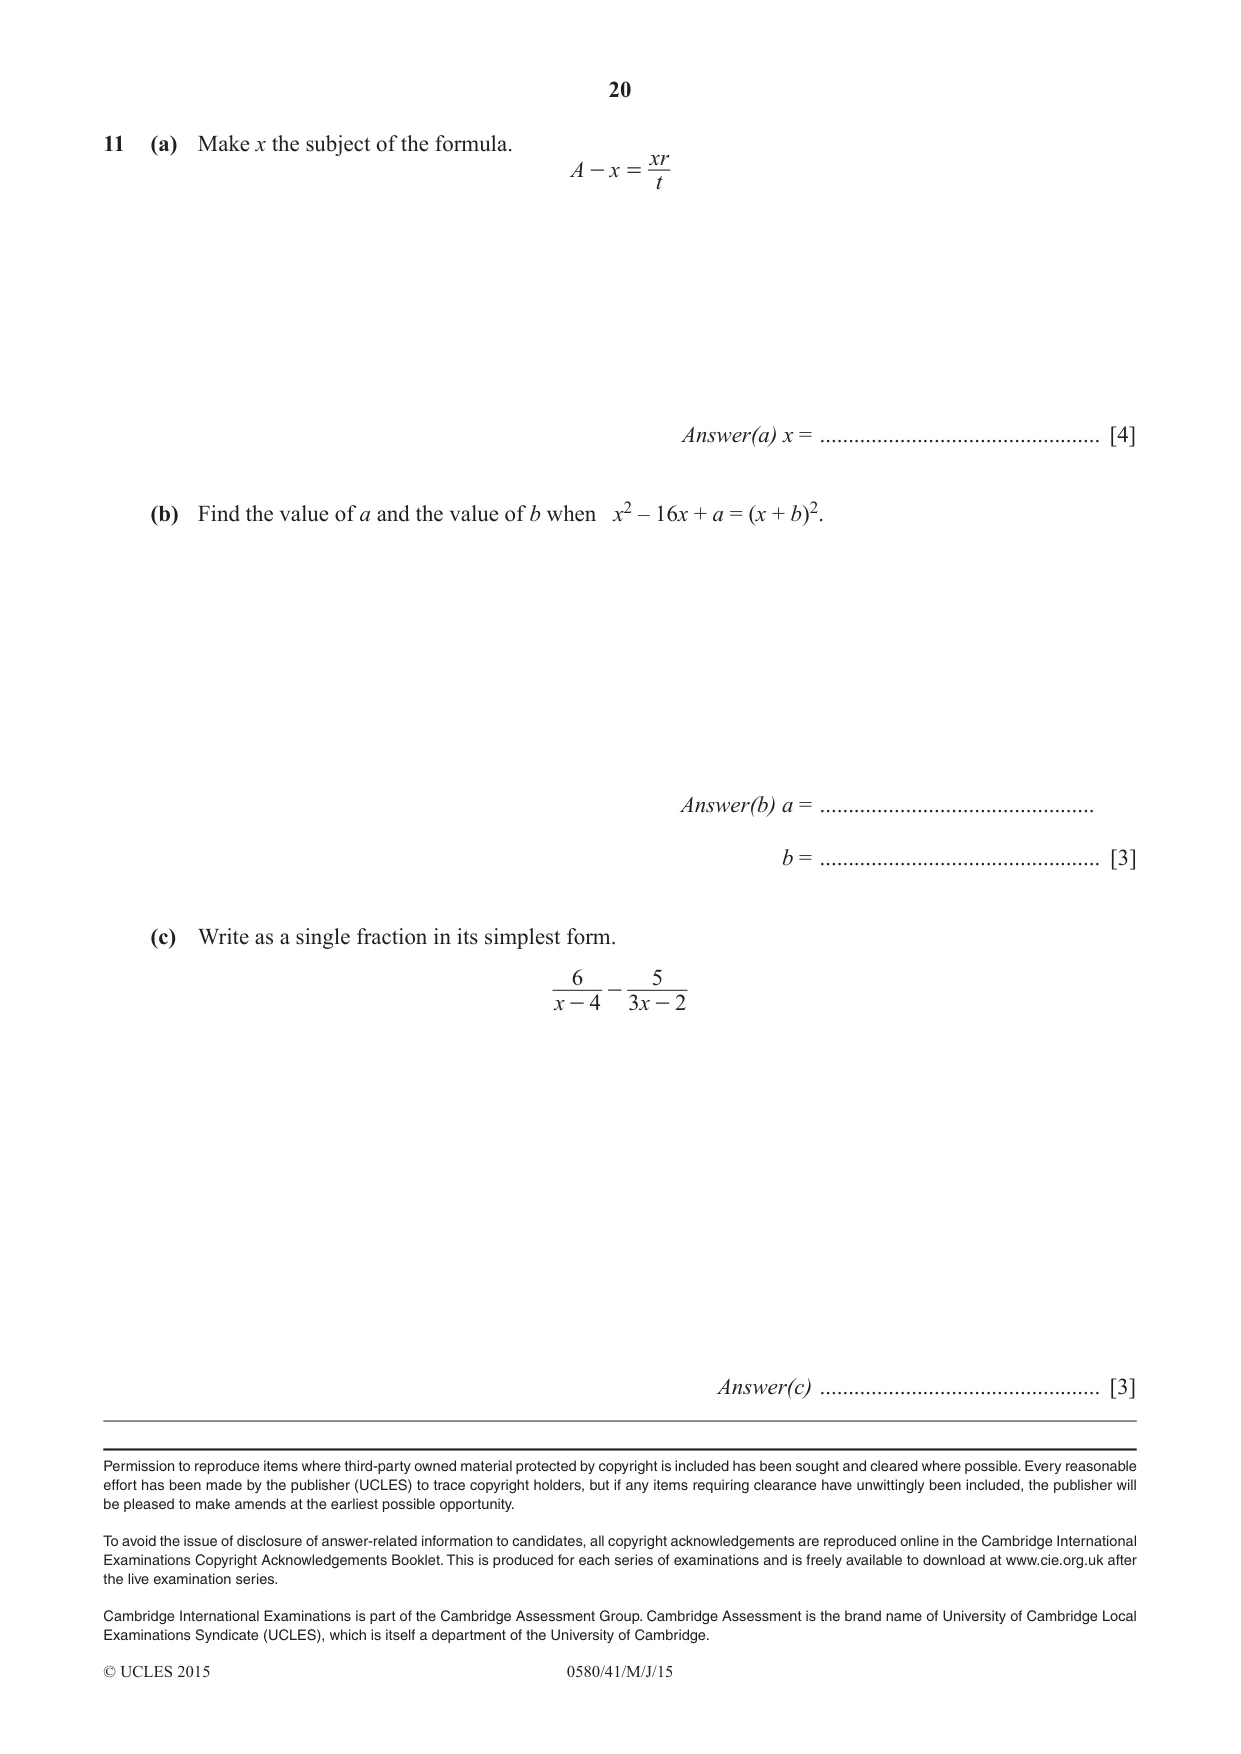
11 (a) Make x the subject of the formula. xr A - x = t Answer(a) x = ................................................. [4] (b) Find the value of a and the value of b when x2 – 16x + a = (x + b)2. Answer(b) a = ................................................ b = ................................................. [3] (c) Write as a single fraction in its simplest form. 6 5 - x - 4 3x - 2 Answer(c) ................................................. [3]
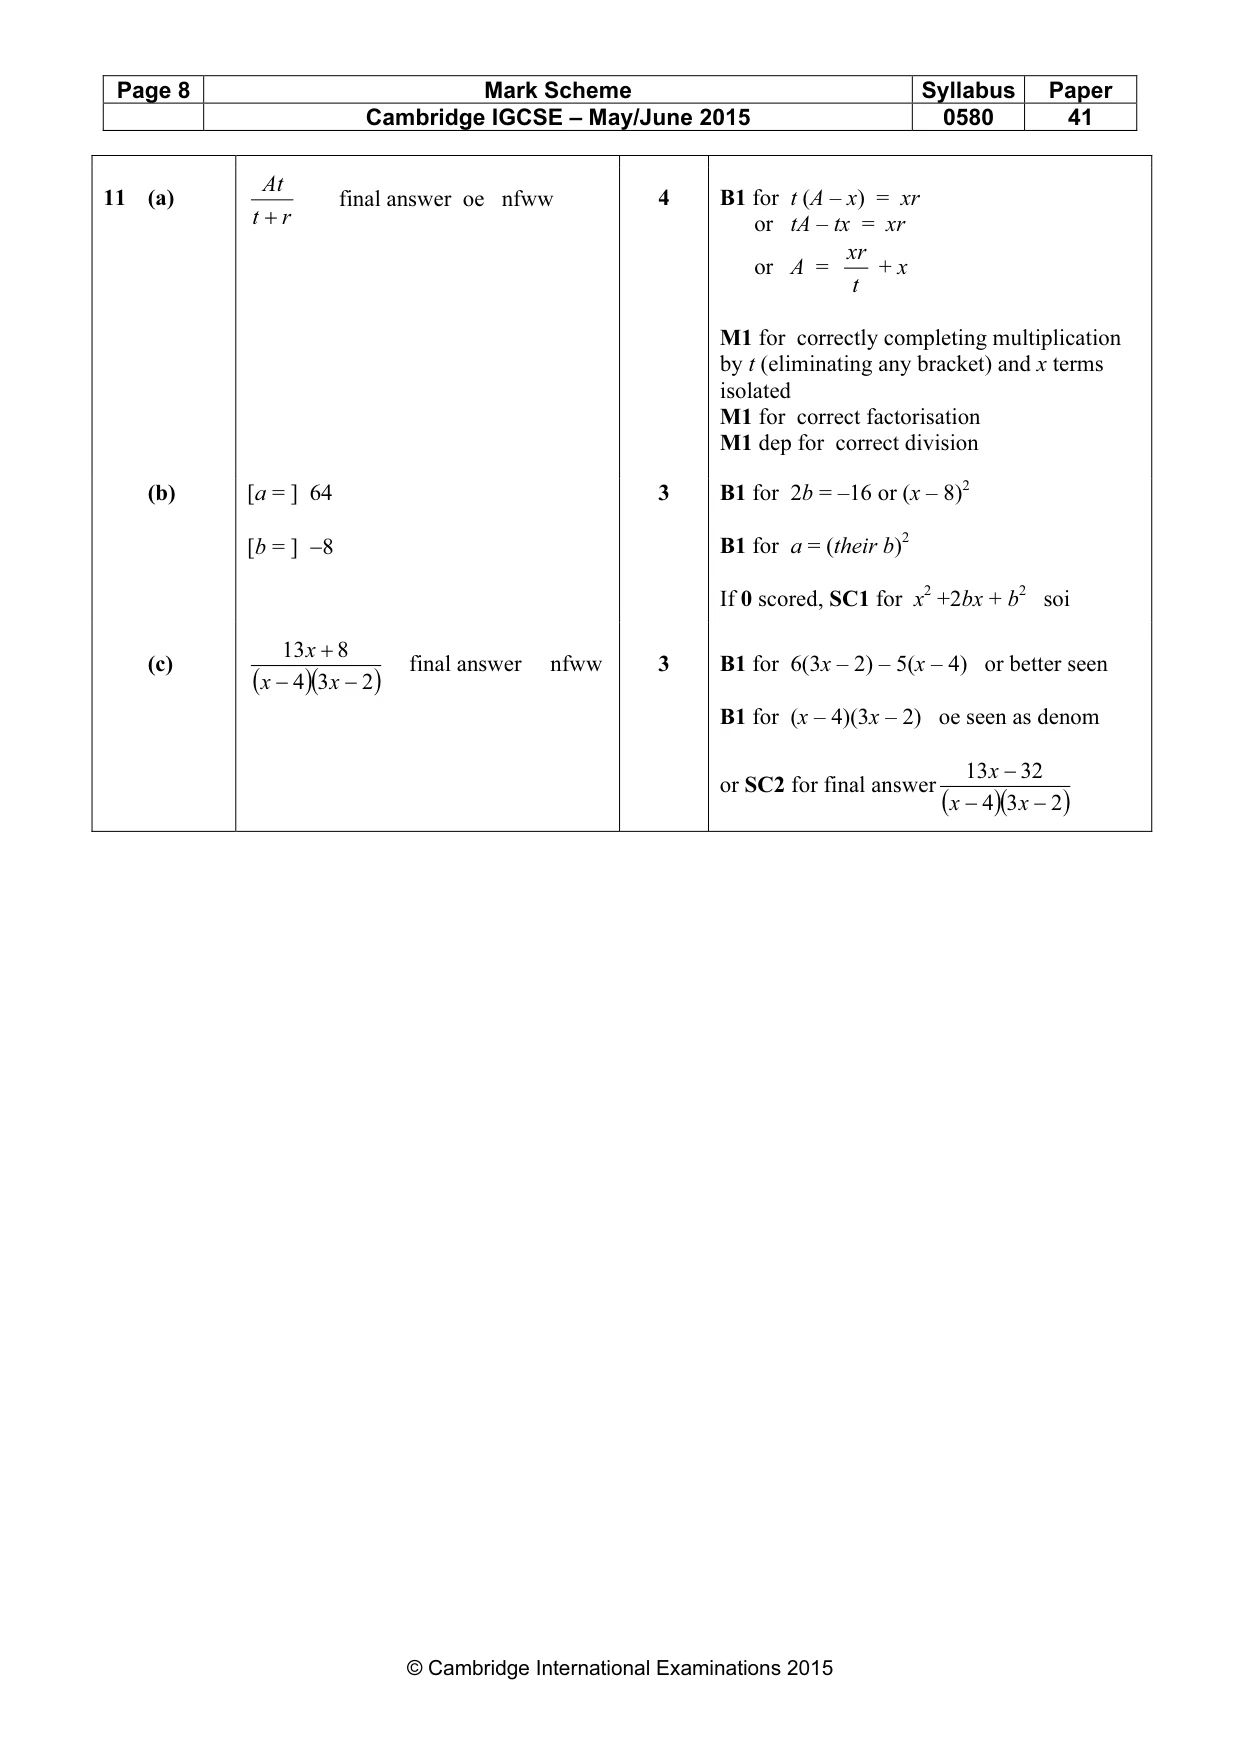
Mark scheme: At 11 (a) final answer oe nfww 4 B1 for t (A – x) = xr t + r or tA – tx = xr xr or A = + x t M1 for correctly completing multiplication by t (eliminating any bracket) and x terms isolated M1 for correct factorisation M1 dep for correct division (b) [a = ] 64 3 B1 for 2b = –16 or (x – 8)2 [b = ] −8 B1 for a = (their b)2 If 0 scored, SC1 for x2 +2bx + b2 soi 13 x + 8 (c) final answer nfww 3 B1 for 6(3x – 2) – 5(x – 4) or better seen ( x − 4 )(3 x − 2 ) B1 for (x – 4)(3x – 2) oe seen as denom 13 x − 32 or SC2 for final answer ( x − 4 )(3 x − 2 )
What was in this paper
The subtopics covered by these 11 questions, and how many questions each got. Open one in a new tab to see every Cambridge question on it.
What you needed in this session
Cambridge’s own grade thresholds for 2015 May/June, Paper 4 · Variant 1. A higher threshold means an easier paper — the bar moves with how the cohort did.