Cambridge IGCSE Mathematics 0580 — 2014 Oct/Nov Paper 4 · Variant 1
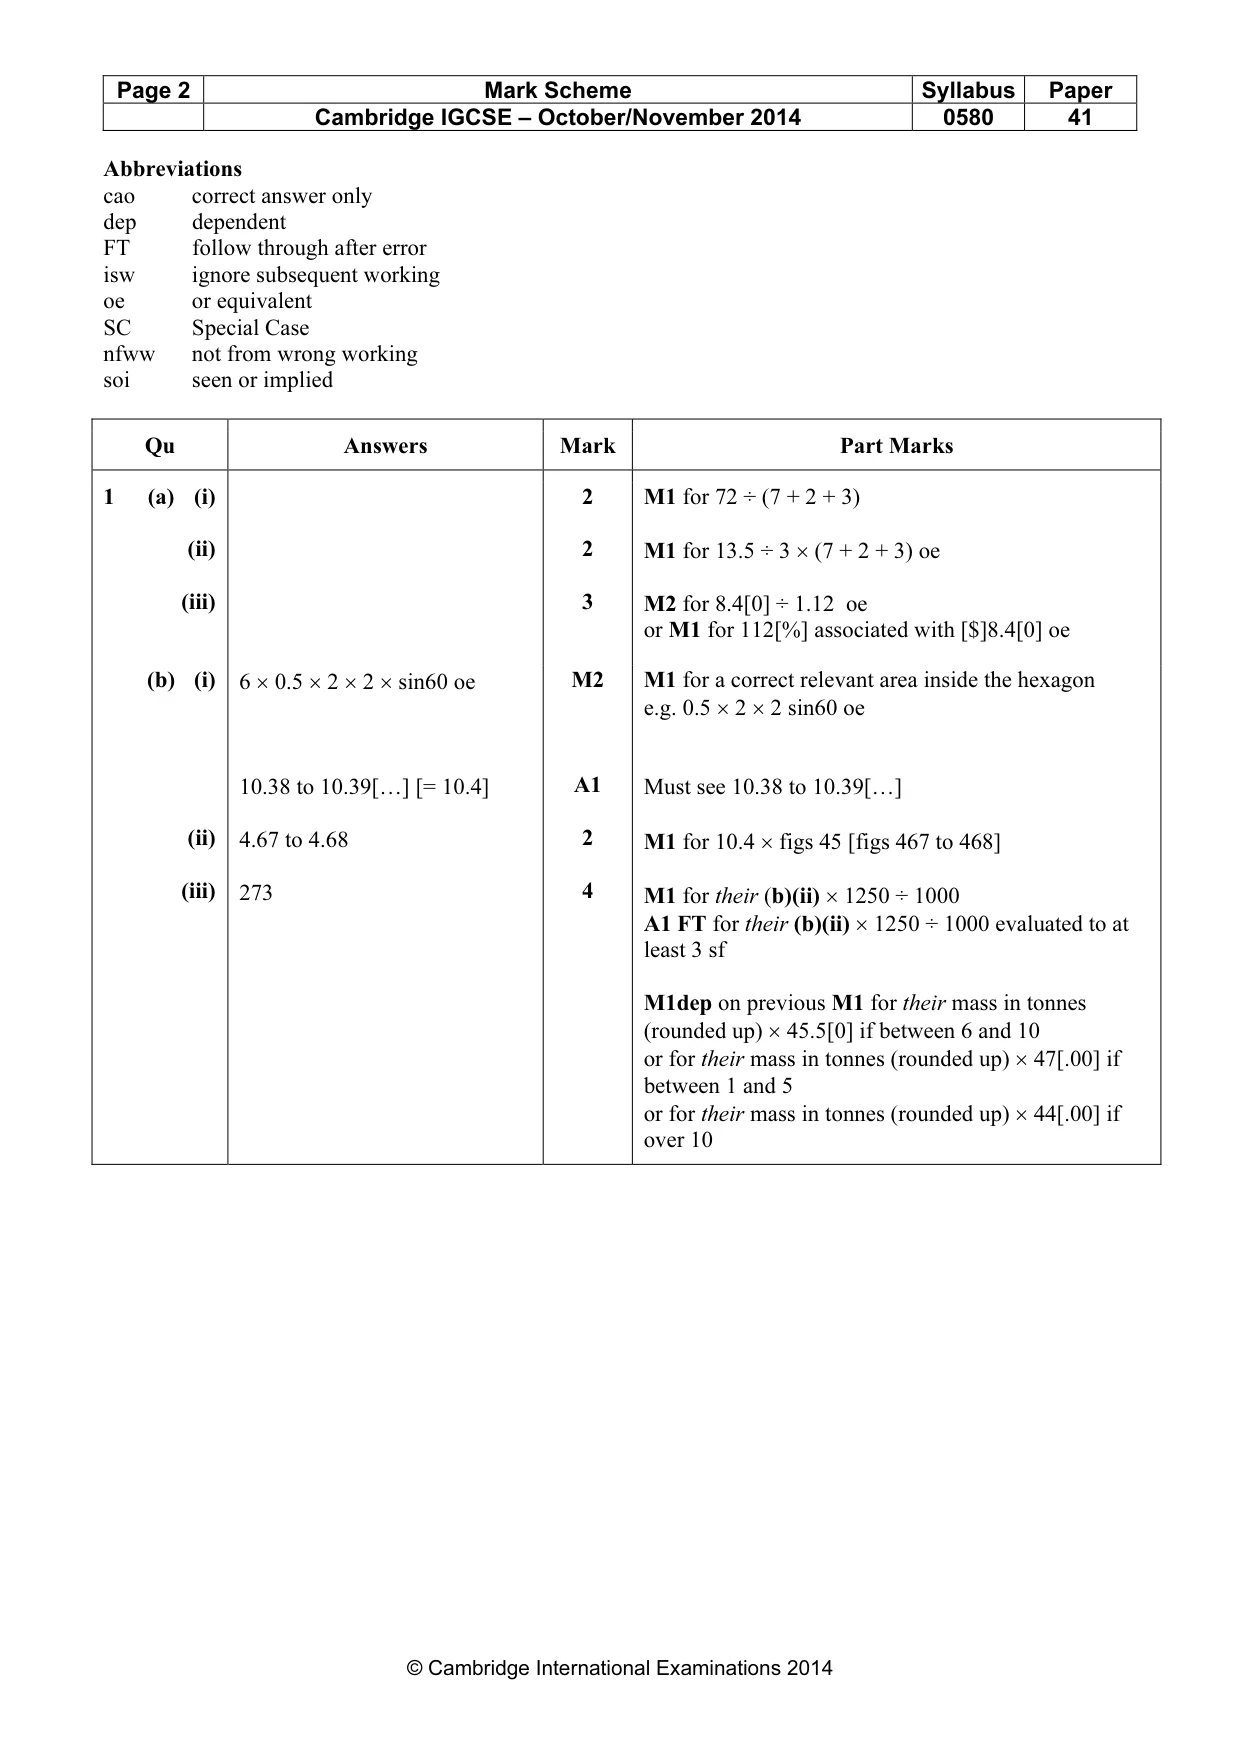
0580/41/O/N/14 · 7 questions · 130 marks · ≈146 min
The question paper and its mark scheme, free to read here and free to download. This is Cambridge’s own paper, exactly as it was sat.
Question paper20 pages
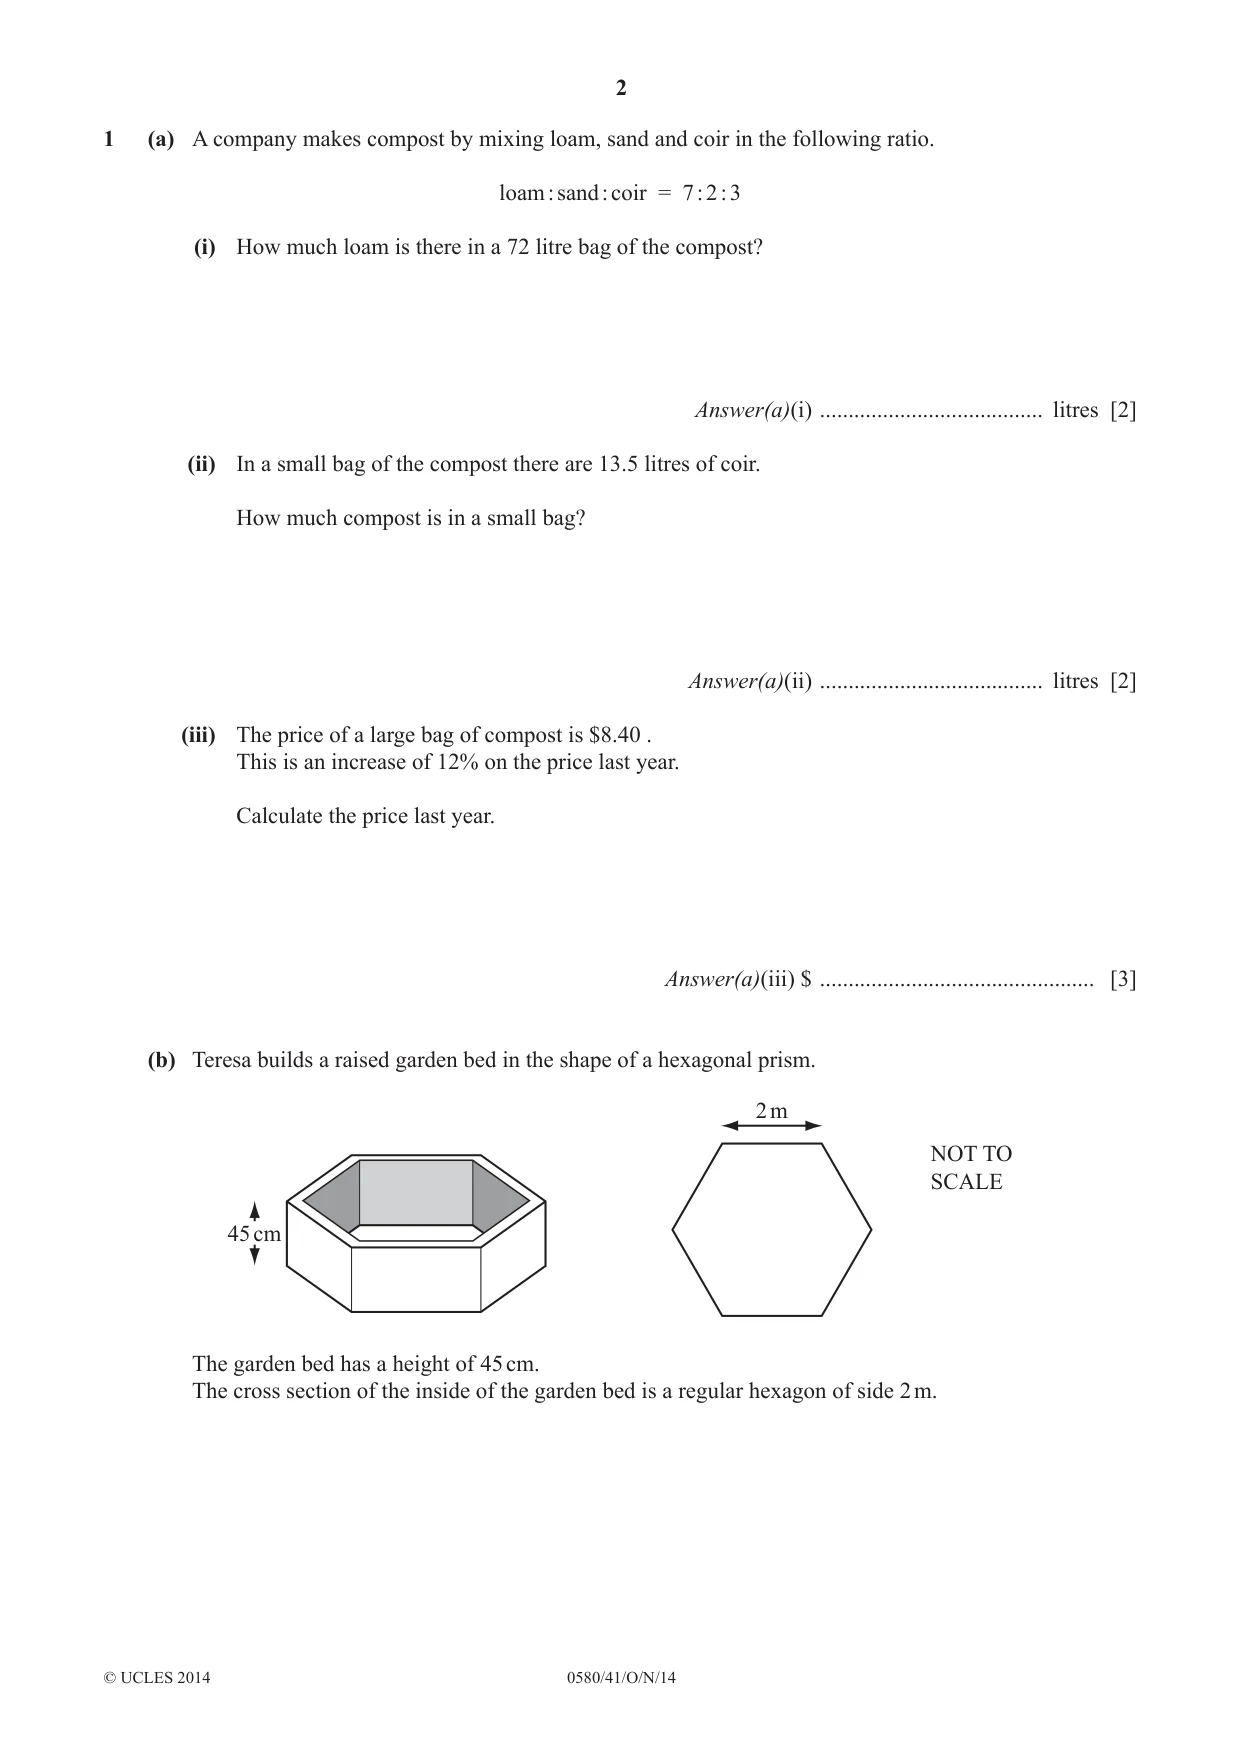
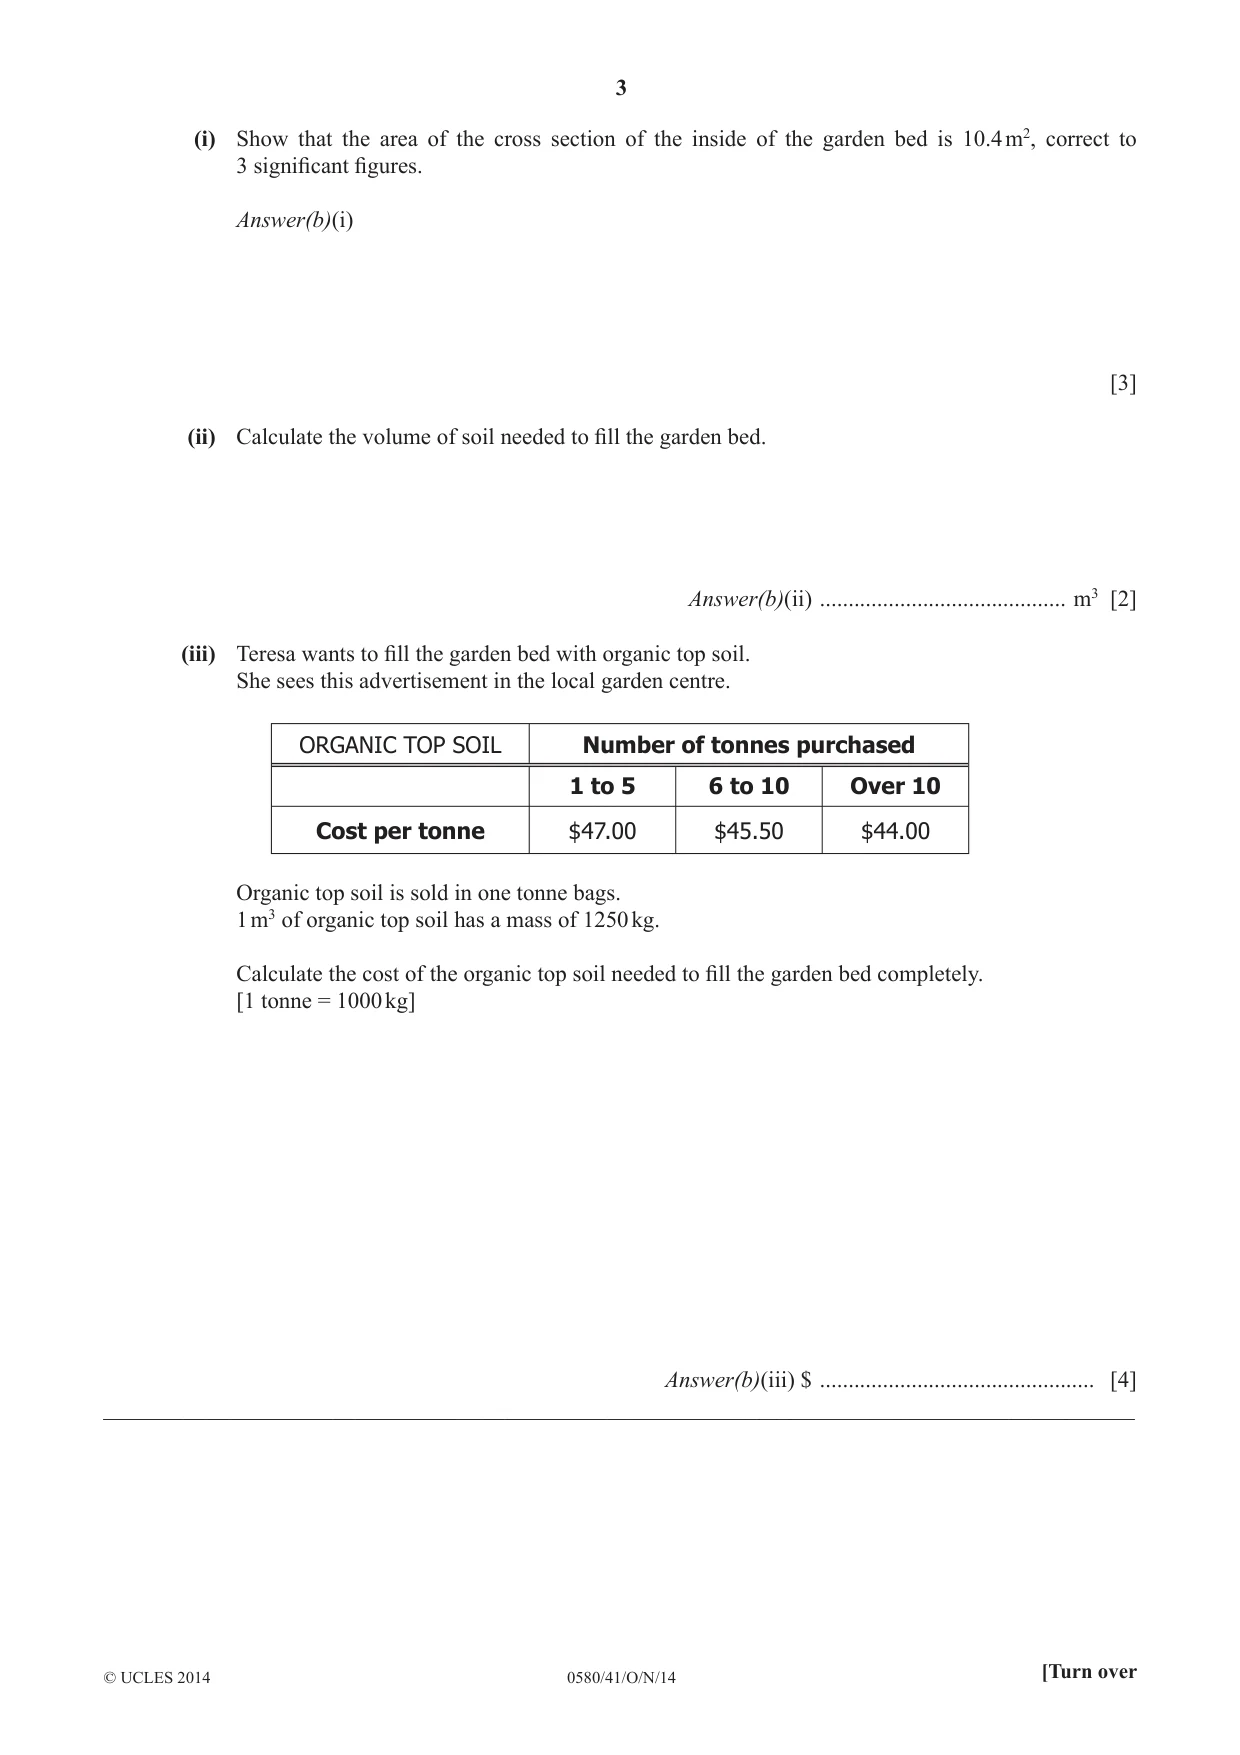
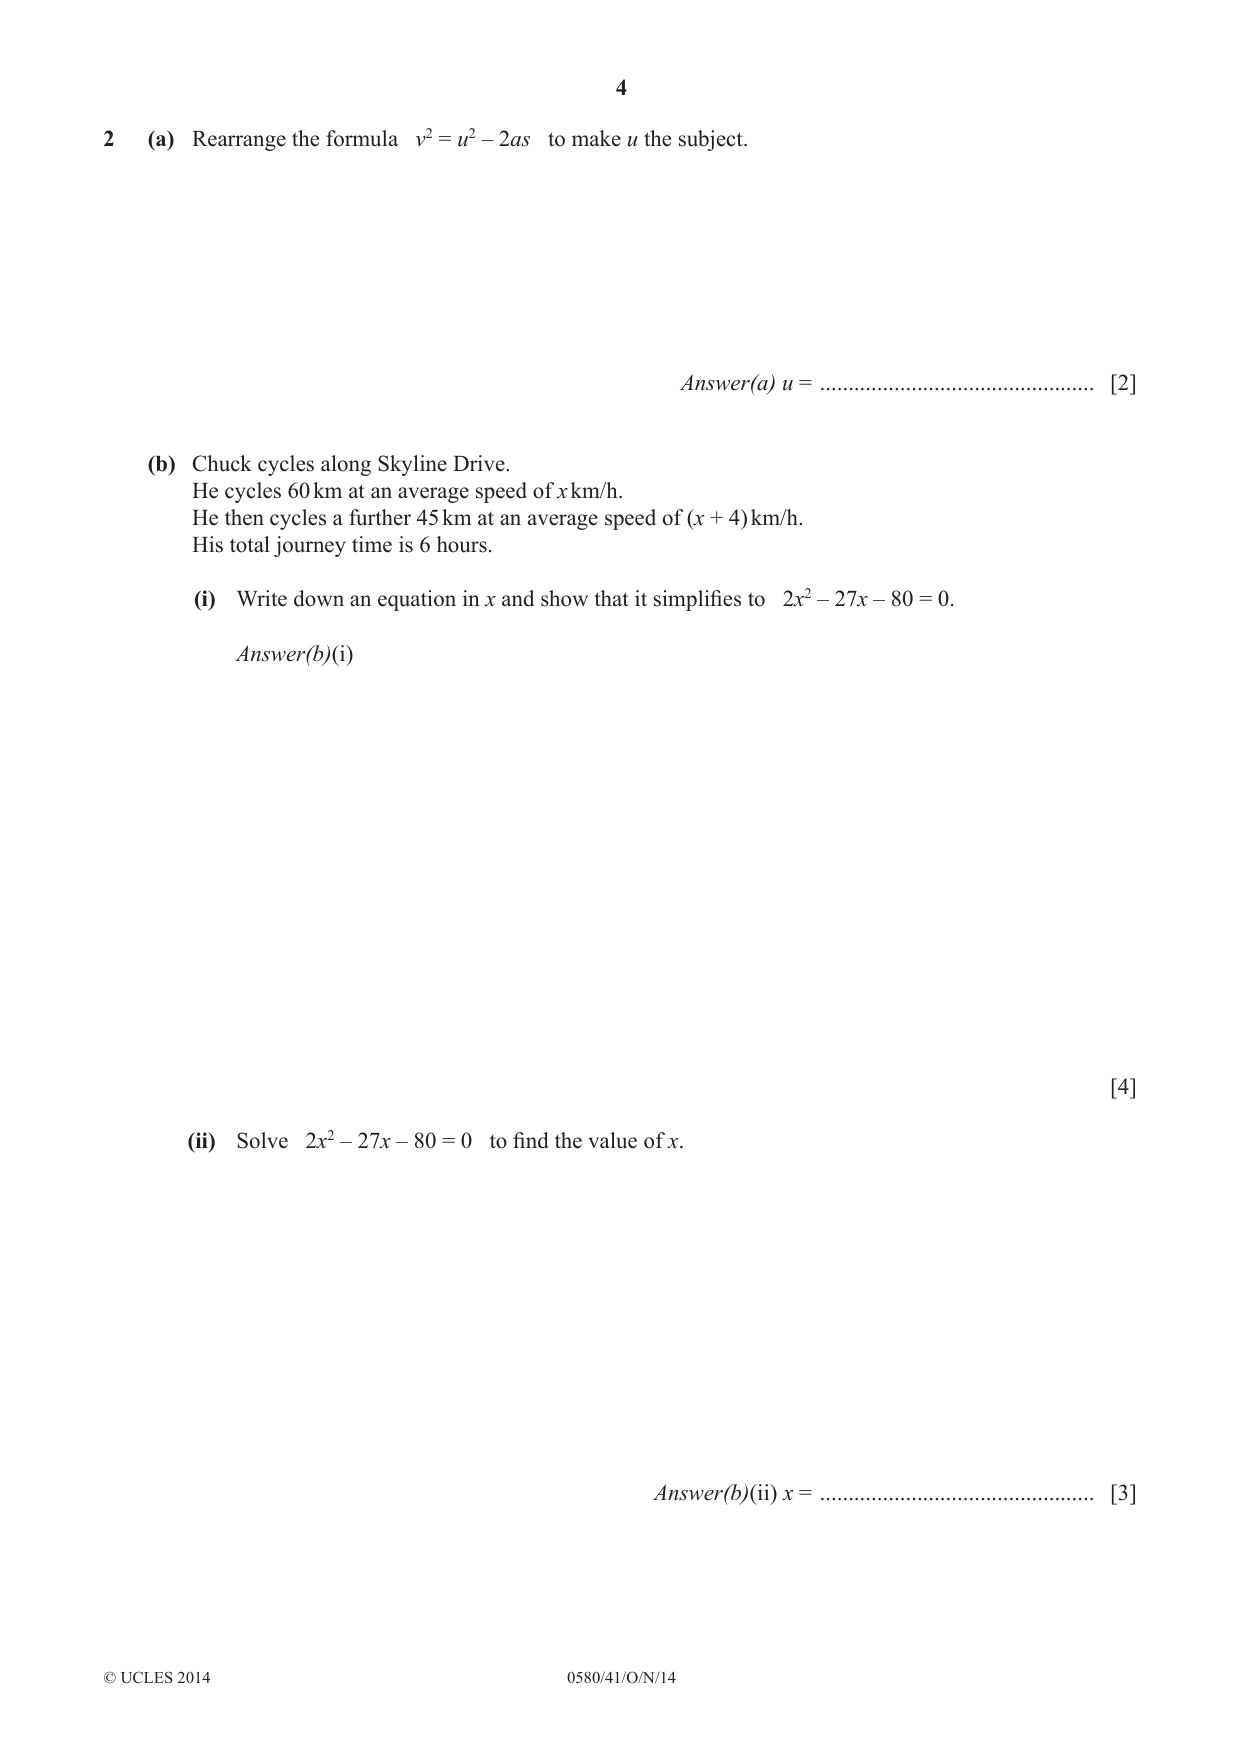
Mark scheme8 pages
Answers below. Sit the paper first if you are practising.
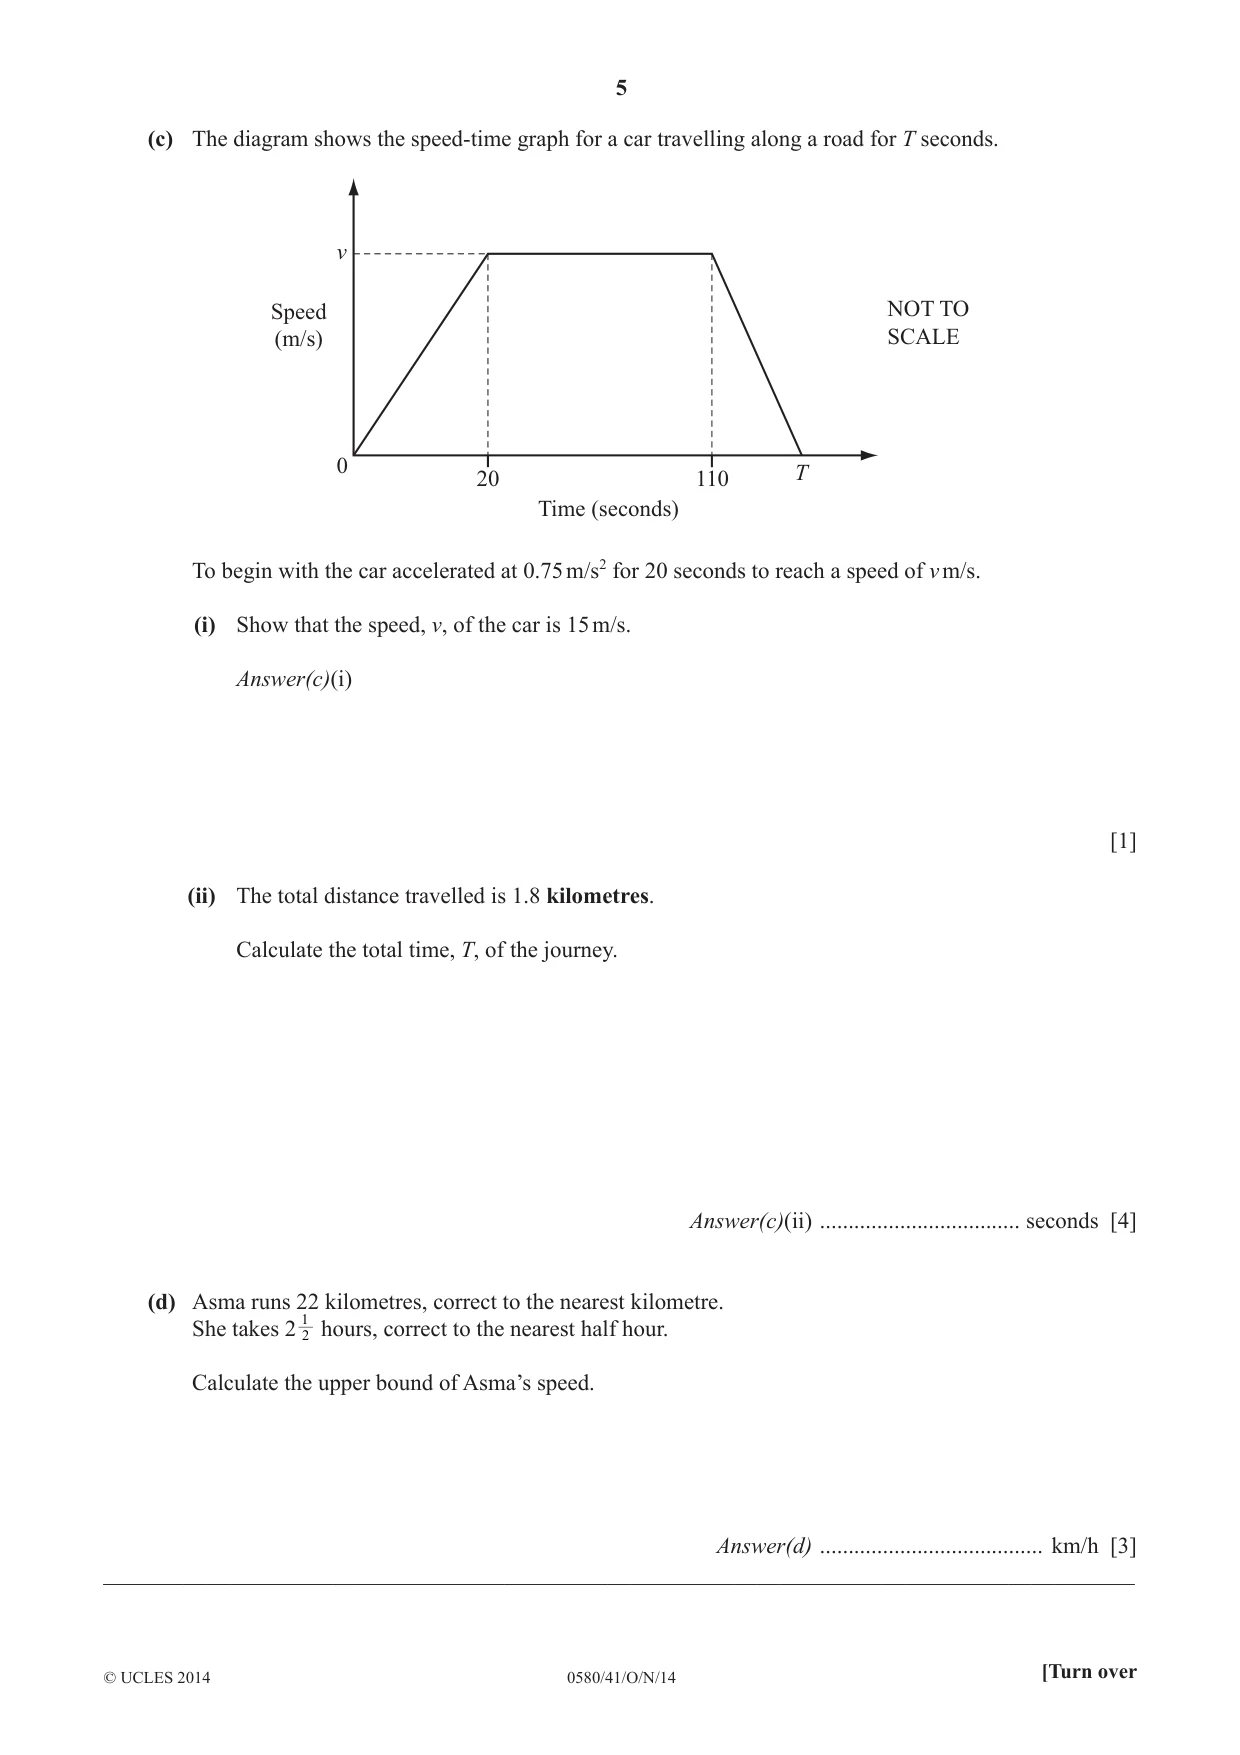
Questions as text
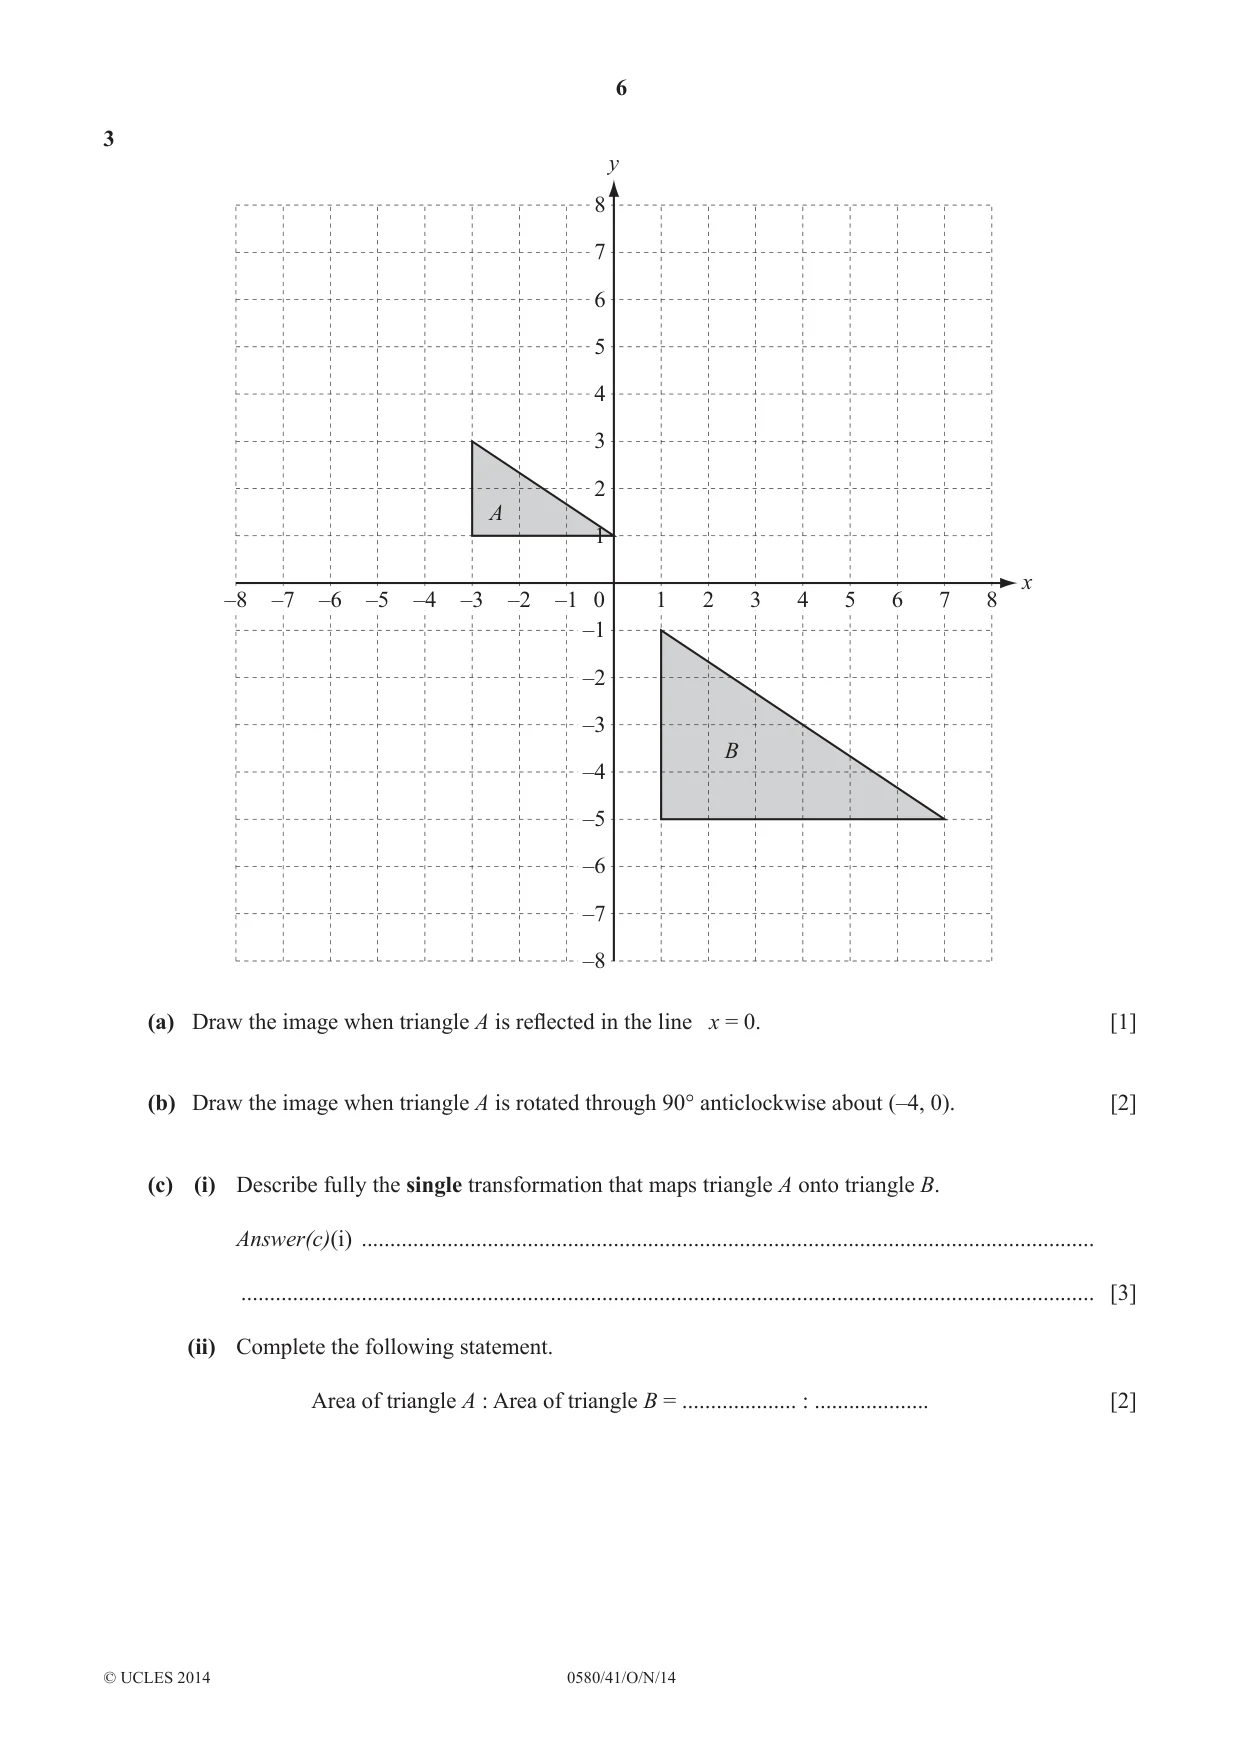
Q3 · Y 8 7 6 5 4 3 2 A 1 x –8 –7 –6 –5 –4 –3 –2 –1 0 1 2 3 4 5 6 7 8 –1 –2 –3 B –4 –5 –6 –7 –8…
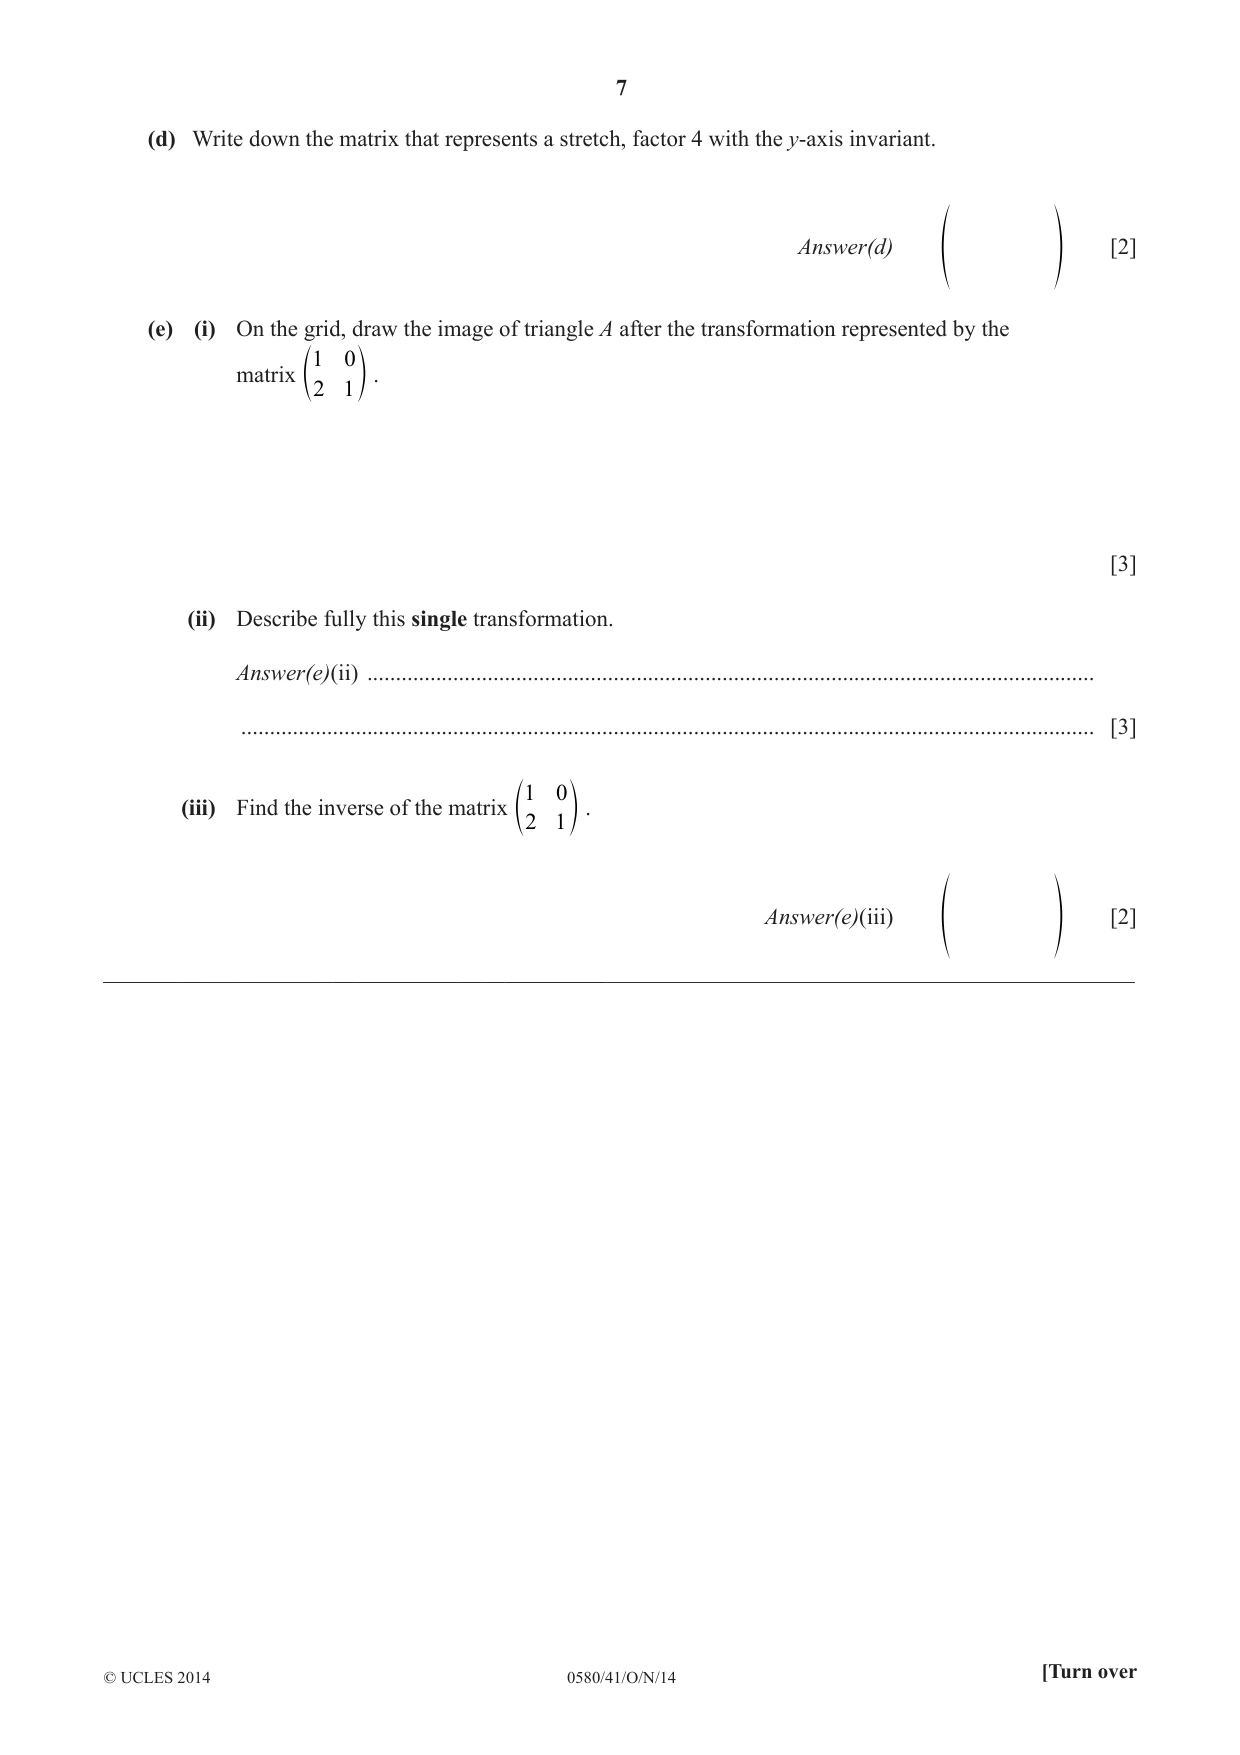
3 y 8 7 6 5 4 3 2 A 1 x –8 –7 –6 –5 –4 –3 –2 –1 0 1 2 3 4 5 6 7 8 –1 –2 –3 B –4 –5 –6 –7 –8 (a) Draw the image when triangle A is refl ected in the line x = 0. [1] (b) Draw the image when triangle A is rotated through 90° anticlockwise about (–4, 0). [2] (c) (i) Describe fully the single transformation that maps triangle A onto triangle B. Answer(c)(i) ................................................................................................................................ ..................................................................................................................................................... [3] (ii) Complete the following statement. Area of triangle A : Area of triangle B = .................... : .................... [2] (d) Write down the matrix that represents a stretch, factor 4 with the y-axis invariant. Answer(d) [2] f p (e) (i) On the grid, draw the image of triangle A after the transformation represented by the 1 0 matrix . e 2 1 o [3] (ii) Describe fully this single transformation. Answer(e)(ii) ............................................................................................................................... ..................................................................................................................................................... [3] 1 0 (iii) Find the inverse of the matrix . e 2 1 o Answer(e)(iii) [2] f p __________________________________________________________________________________________
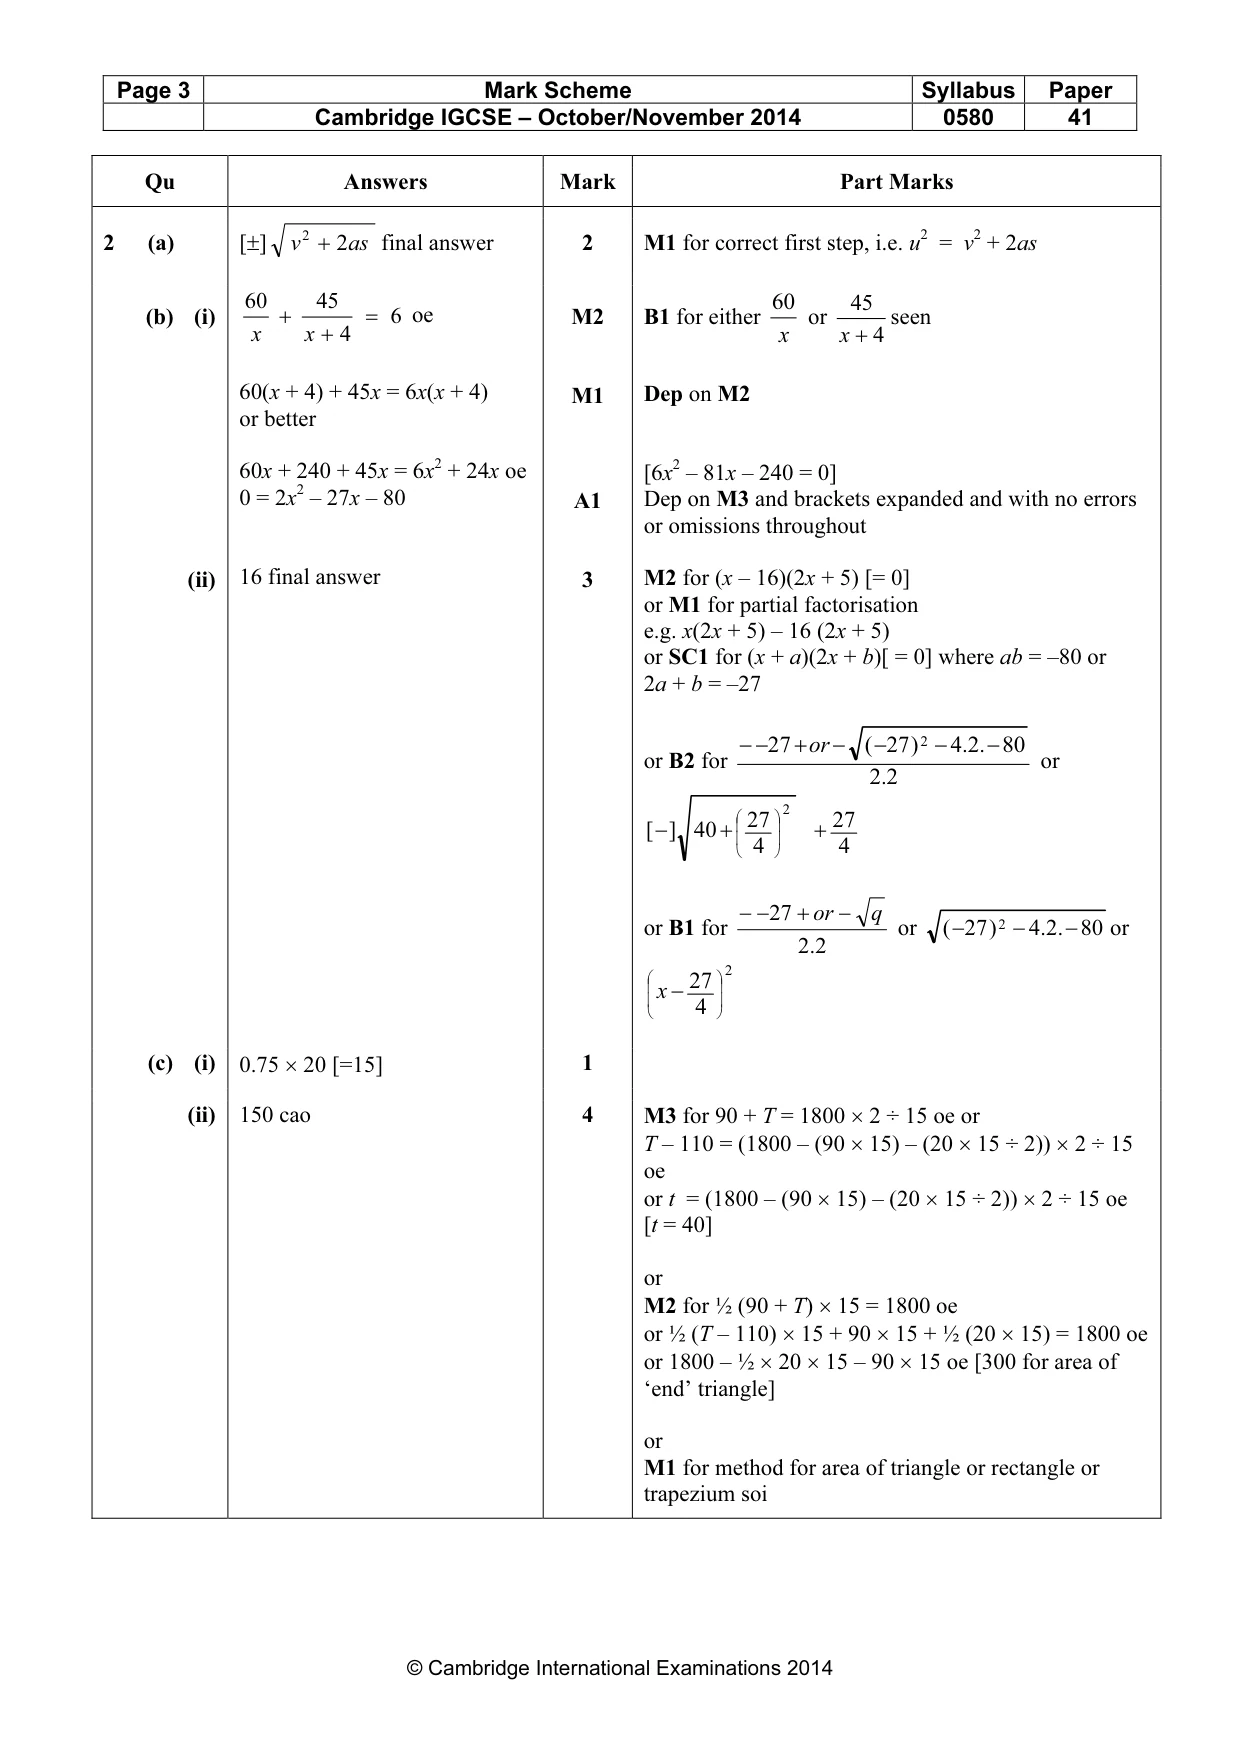
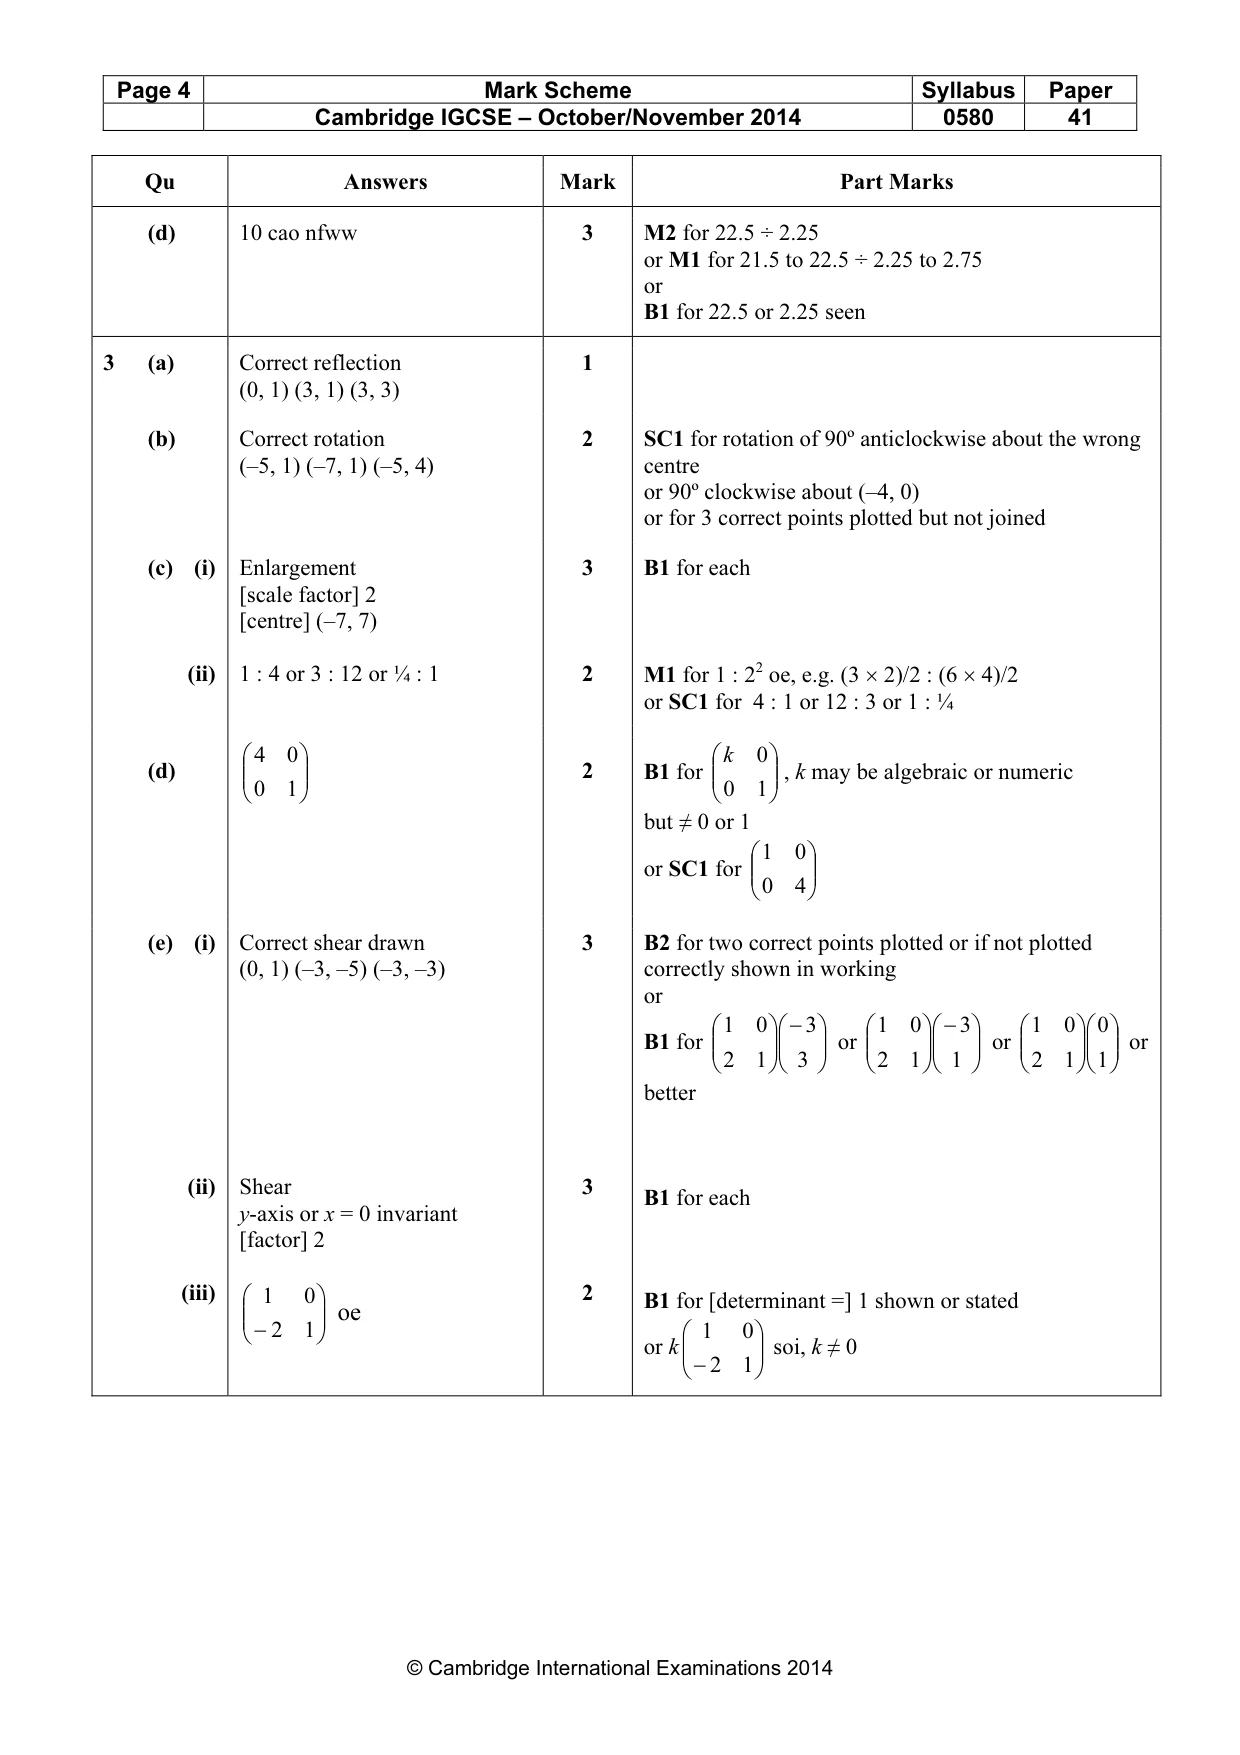
Mark scheme: 3 (a) Correct reflection 1 (0, 1) (3, 1) (3, 3) (b) Correct rotation 2 SC1 for rotation of 90º anticlockwise about the wrong (–5, 1) (–7, 1) (–5, 4) centre or 90º clockwise about (–4, 0) or for 3 correct points plotted but not joined (c) (i) Enlargement 3 B1 for each [scale factor] 2 [centre] (–7, 7) (ii) 1 : 4 or 3 : 12 or ¼ : 1 2 M1 for 1 : 22 oe, e.g. (3 × 2)/2 : (6 × 4)/2 or SC1 for 4 : 1 or 12 : 3 or 1 : ¼ 4 0 k 0 (d) 2 B1 for , k may be algebraic or numeric 0 1 0 1 but ≠ 0 or 1 1 0 or SC1 for 0 4 (e) (i) Correct shear drawn 3 B2 for two correct points plotted or if not plotted (0, 1) (–3, –5) (–3, –3) correctly shown in working or 1 0 − 3 1 0 − 3 1 0 0 B1 for or or or 2 1 3 2 1 1 2 1 1 better (ii) Shear 3 B1 for each y-axis or x = 0 invariant [factor] 2 (iii) 1 0 2 B1 for [determinant =] 1 shown or stated oe − 2 1 1 0 or k soi, k ≠ 0 − 2 1 Qu Answers Mark Part Marks
Question 4
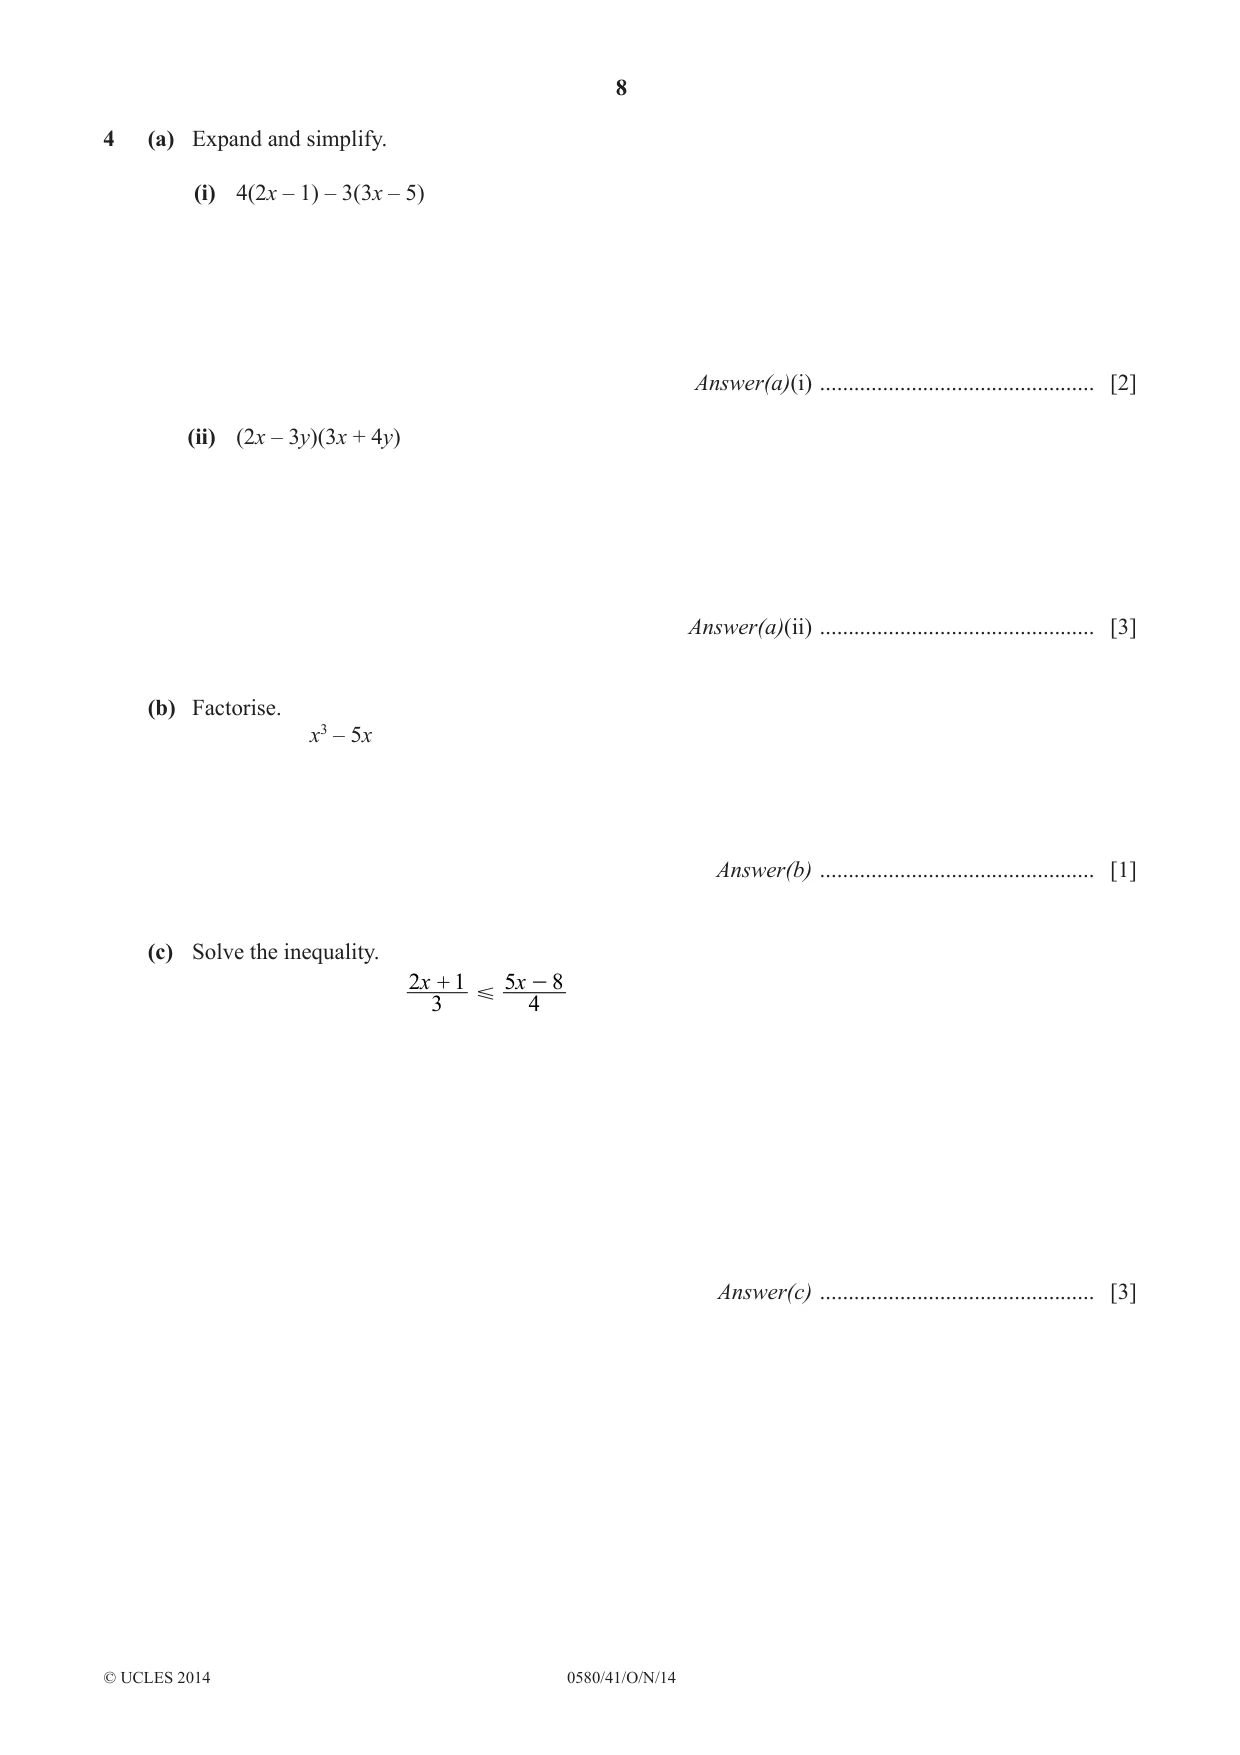
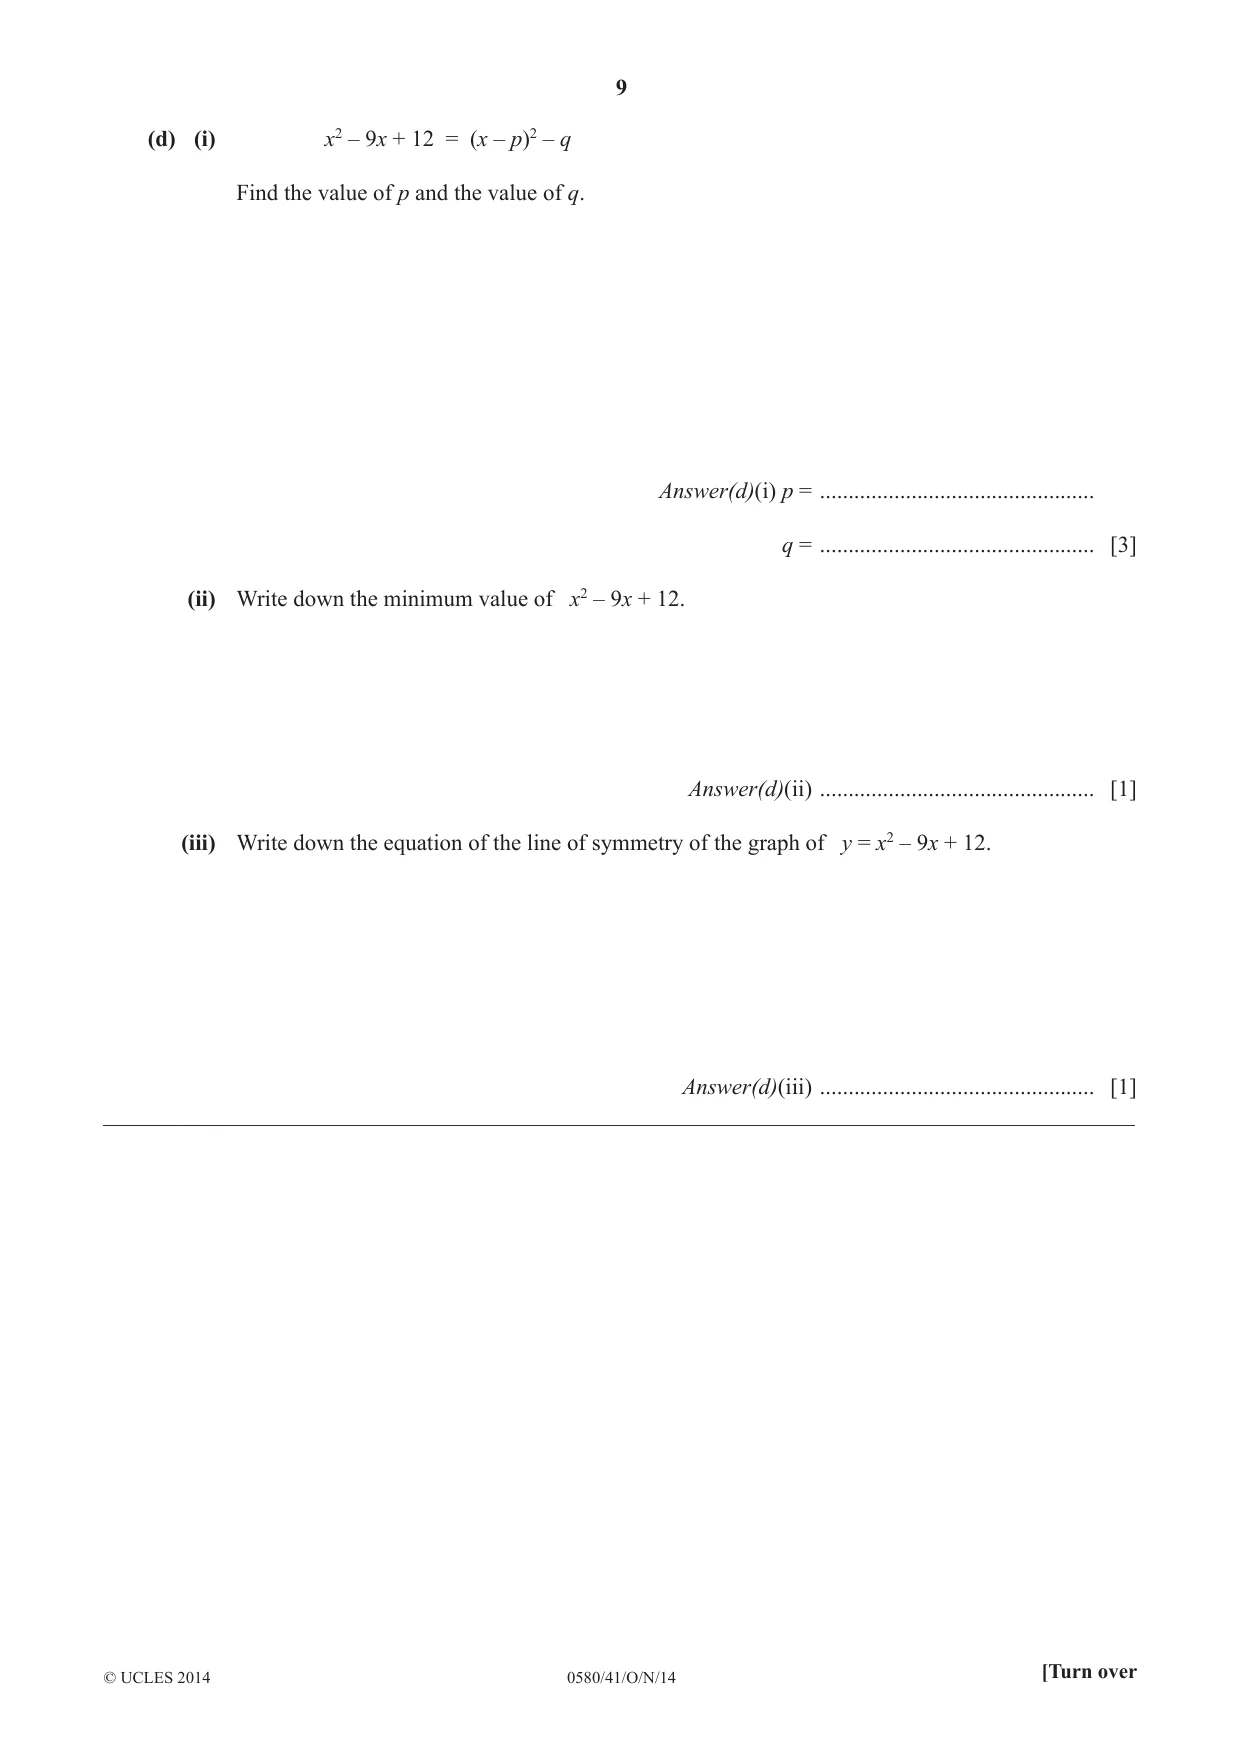
4 (a) Expand and simplify. (i) 4(2x – 1) – 3(3x – 5) Answer(a)(i) ................................................ [2] (ii) (2x – 3y)(3x + 4y) Answer(a)(ii) ................................................ [3] (b) Factorise. x3 – 5x Answer(b) ................................................ [1] (c) Solve the inequality. 2x + 1 5x - 8 Y= 3 4 Answer(c) ................................................ [3] (d) (i) x2 – 9x + 12 = (x – p)2 – q Find the value of p and the value of q. Answer(d)(i) p = ................................................ q = ................................................ [3] (ii) Write down the minimum value of x2 – 9x + 12. Answer(d)(ii) ................................................ [1] (iii) Write down the equation of the line of symmetry of the graph of y = x2 – 9x + 12. Answer(d)(iii) ................................................ [1] __________________________________________________________________________________________
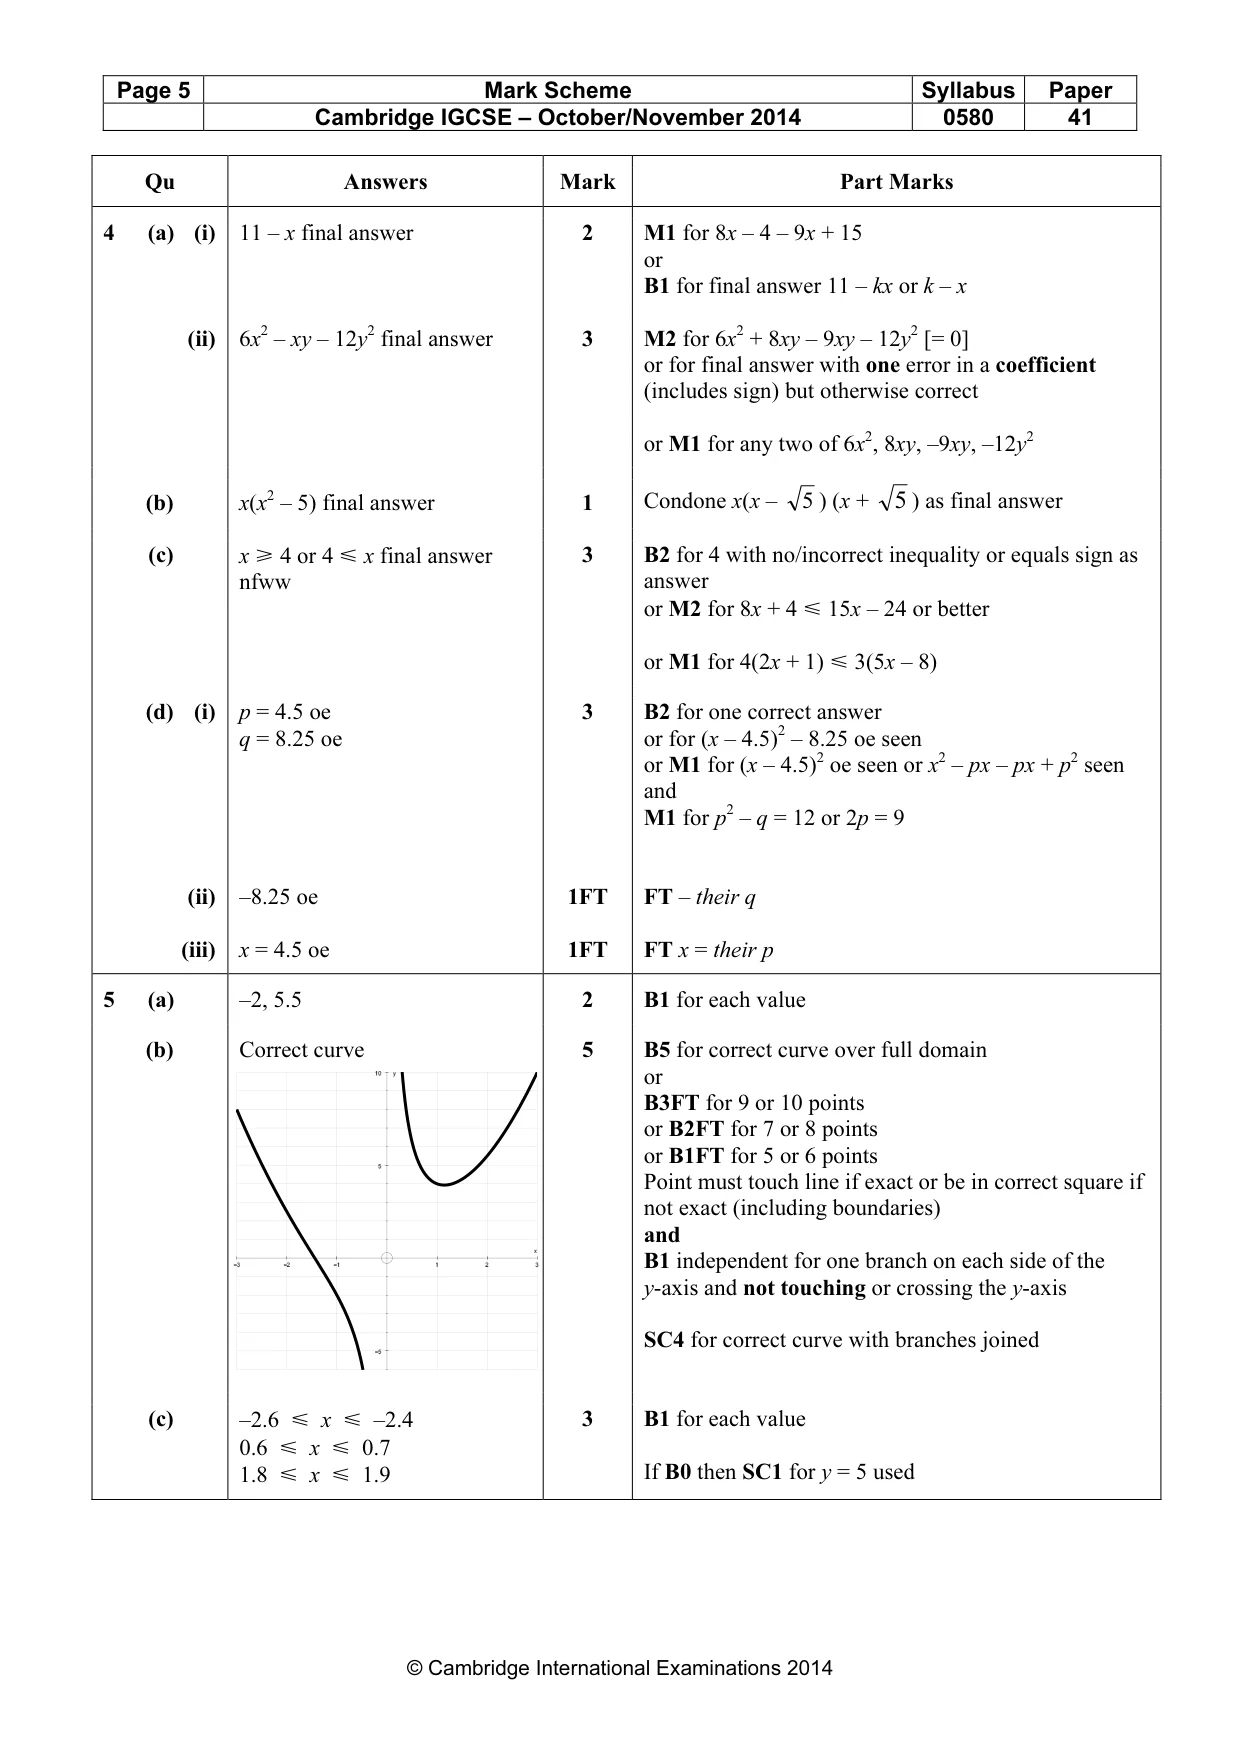
Mark scheme: 4 (a) (i) 11 – x final answer 2 M1 for 8x – 4 – 9x + 15 or B1 for final answer 11 – kx or k – x (ii) 6x2 – xy – 12y2 final answer 3 M2 for 6x2 + 8xy – 9xy – 12y2 [= 0] or for final answer with one error in a coefficient (includes sign) but otherwise correct or M1 for any two of 6x2, 8xy, –9xy, –12y2 (b) x(x2 – 5) final answer 1 Condone x(x – 5 ) (x + 5 ) as final answer (c) x [ 4 or 4 Y x final answer 3 B2 for 4 with no/incorrect inequality or equals sign as nfww answer or M2 for 8x + 4 Y 15x – 24 or better or M1 for 4(2x + 1) Y 3(5x – 8) (d) (i) p = 4.5 oe 3 B2 for one correct answer q = 8.25 oe or for (x – 4.5)2 – 8.25 oe seen or M1 for (x – 4.5)2 oe seen or x2 – px – px + p2 seen and M1 for p2 – q = 12 or 2p = 9 (ii) –8.25 oe 1FT FT – their q (iii) x = 4.5 oe 1FT FT x = their p
Q5 · Complete the table of values for y = x2 + , x ≠ 0
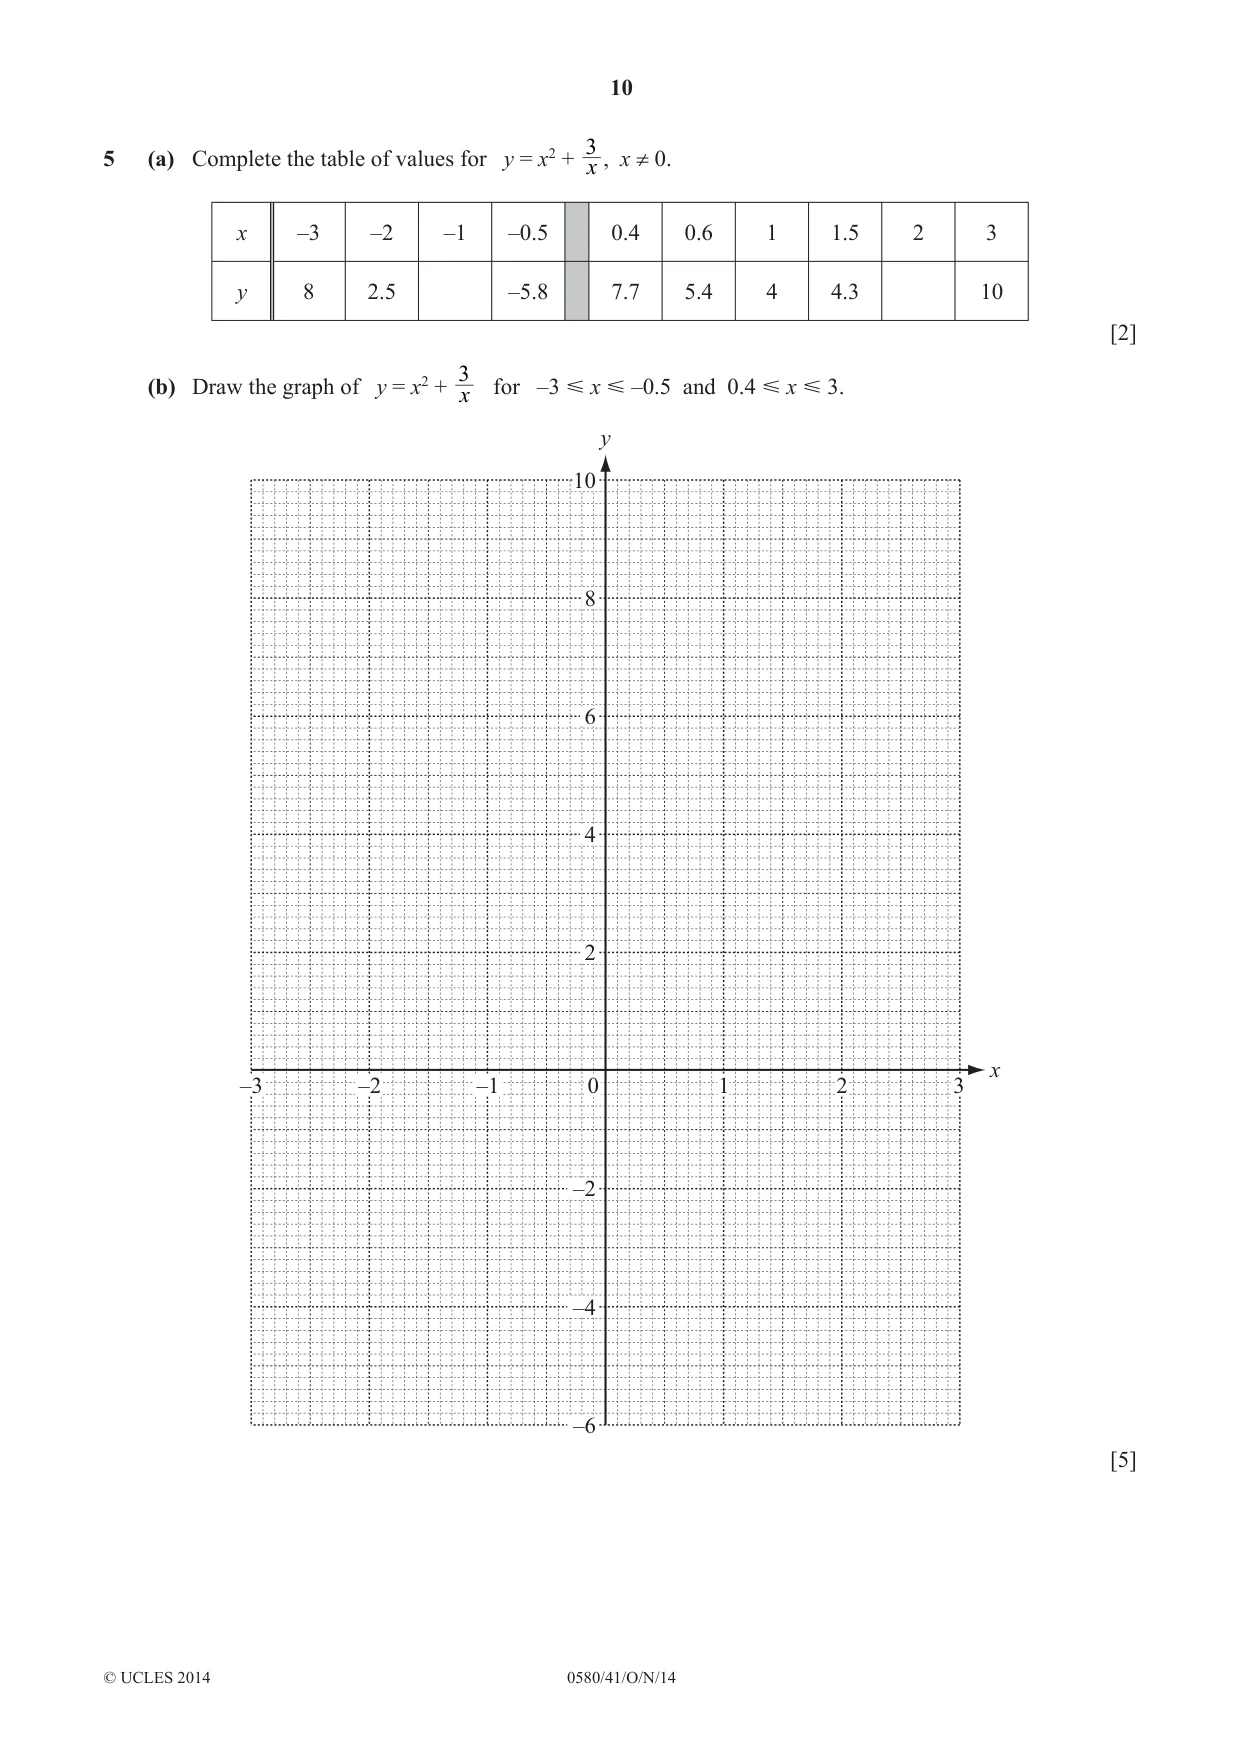
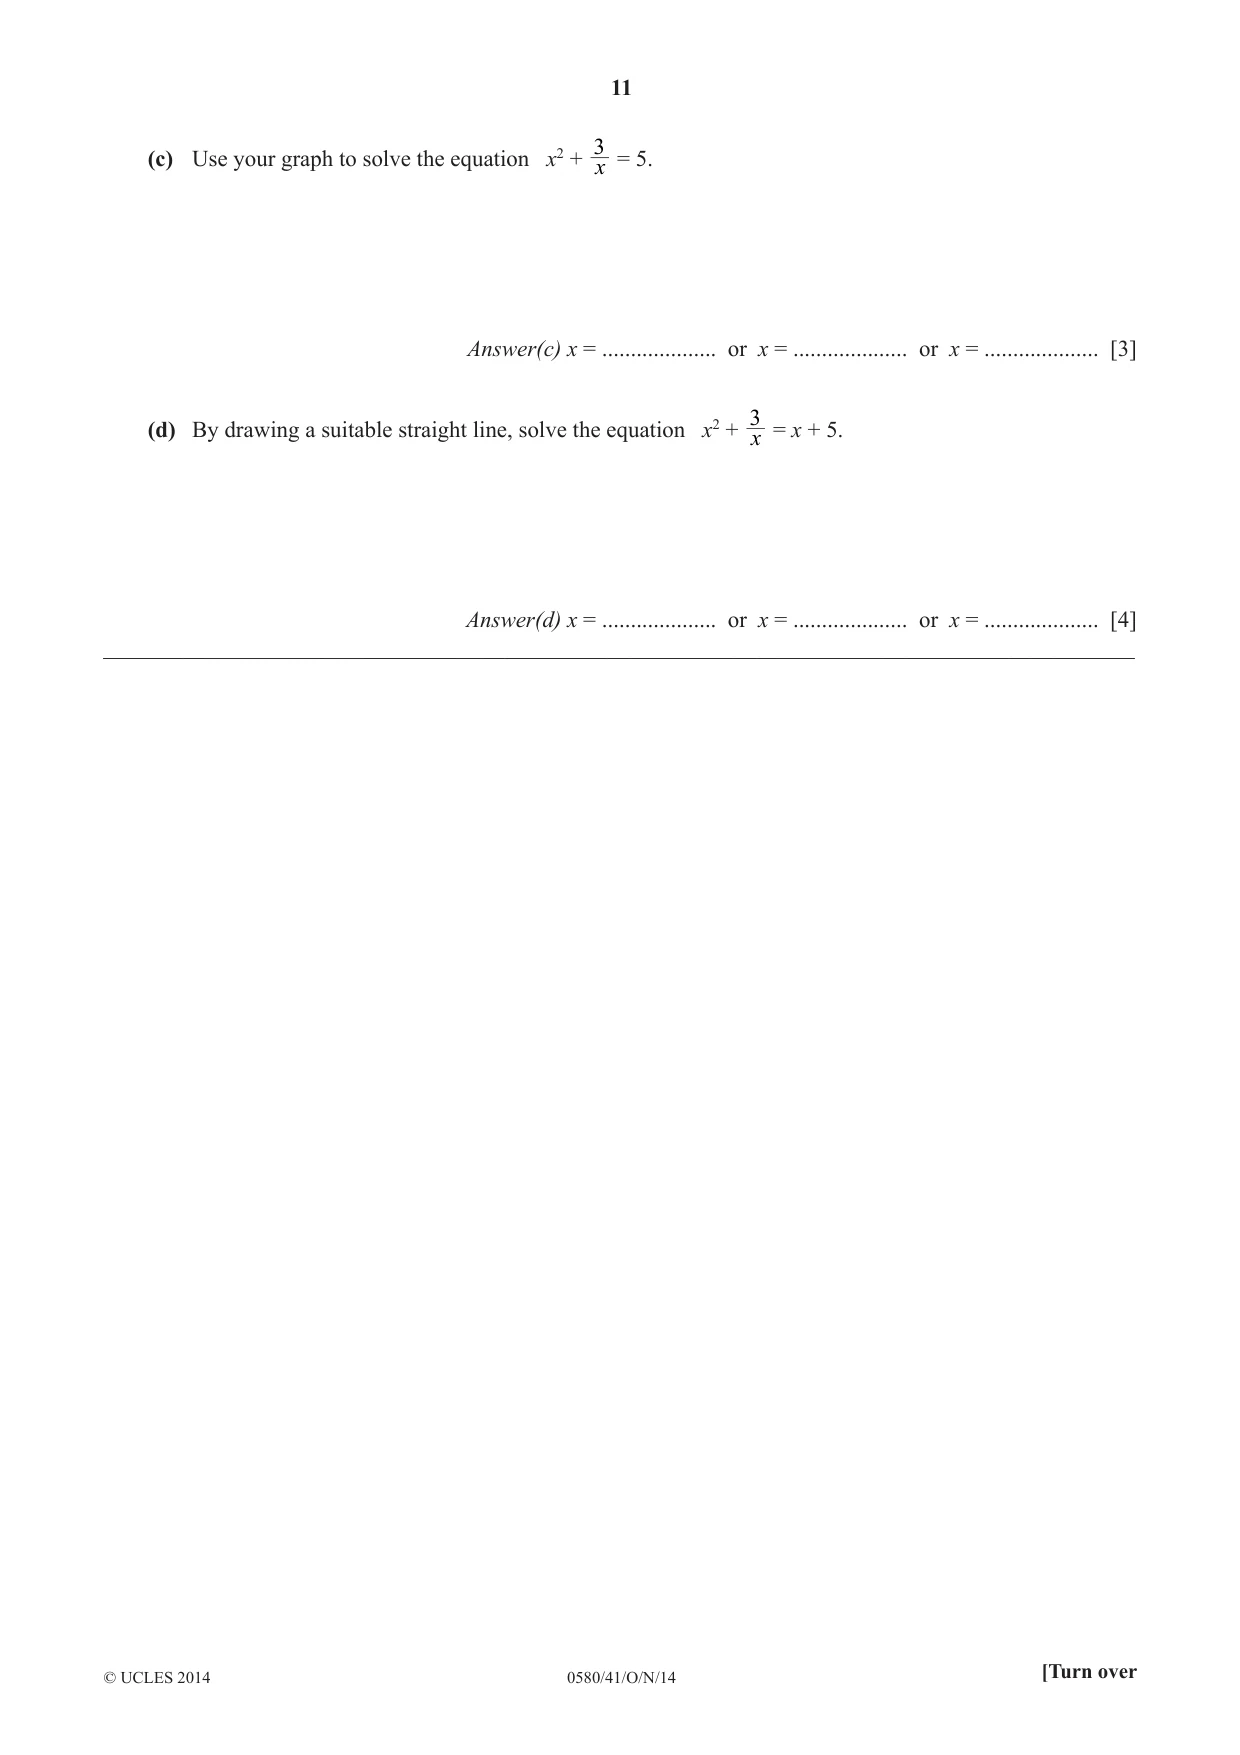
35 (a) Complete the table of values for y = x2 + , x ≠ 0. x x –3 –2 –1 –0.5 0.4 0.6 1 1.5 2 3 y 8 2.5 –5.8 7.7 5.4 4 4.3 10 [2] 3 (b) Draw the graph of y = x2 + for –3 Y x Y –0.5 and 0.4 Y x Y 3. x y 10 8 6 4 2 x –3 –2 –1 0 1 2 3 –2 –4 –6 [5] 3 (c) Use your graph to solve the equation x2 + = 5. x Answer(c) x = .................... or x = .................... or x = .................... [3] 3 (d) By drawing a suitable straight line, solve the equation x2 + = x + 5. x Answer(d) x = .................... or x = .................... or x = .................... [4] __________________________________________________________________________________________
Mark scheme: 5 (a) –2, 5.5 2 B1 for each value (b) Correct curve 5 B5 for correct curve over full domain 10 y or B3FT for 9 or 10 points or B2FT for 7 or 8 points 5 or B1FT for 5 or 6 points Point must touch line if exact or be in correct square if not exact (including boundaries) and x −3 −2 −1 1 2 3 B1 independent for one branch on each side of the y-axis and not touching or crossing the y-axis −5 SC4 for correct curve with branches joined (c) –2.6 Y x Y –2.4 3 B1 for each value 0.6 Y x Y 0.7 1.8 Y x Y 1.9 If B0 then SC1 for y = 5 used Qu Answers Mark Part Marks (d) y = x + 5 ruled correctly 4 B1 for y = x + 5 ruled correctly and –2.2 Y x Y –2.0 B1indep for each value 0.5 Y x Y 0.6 2.4 Y x Y 2.6
Q6 · A company tested 200 light bulbs to fi nd the lifetime, T hours, of each bulb
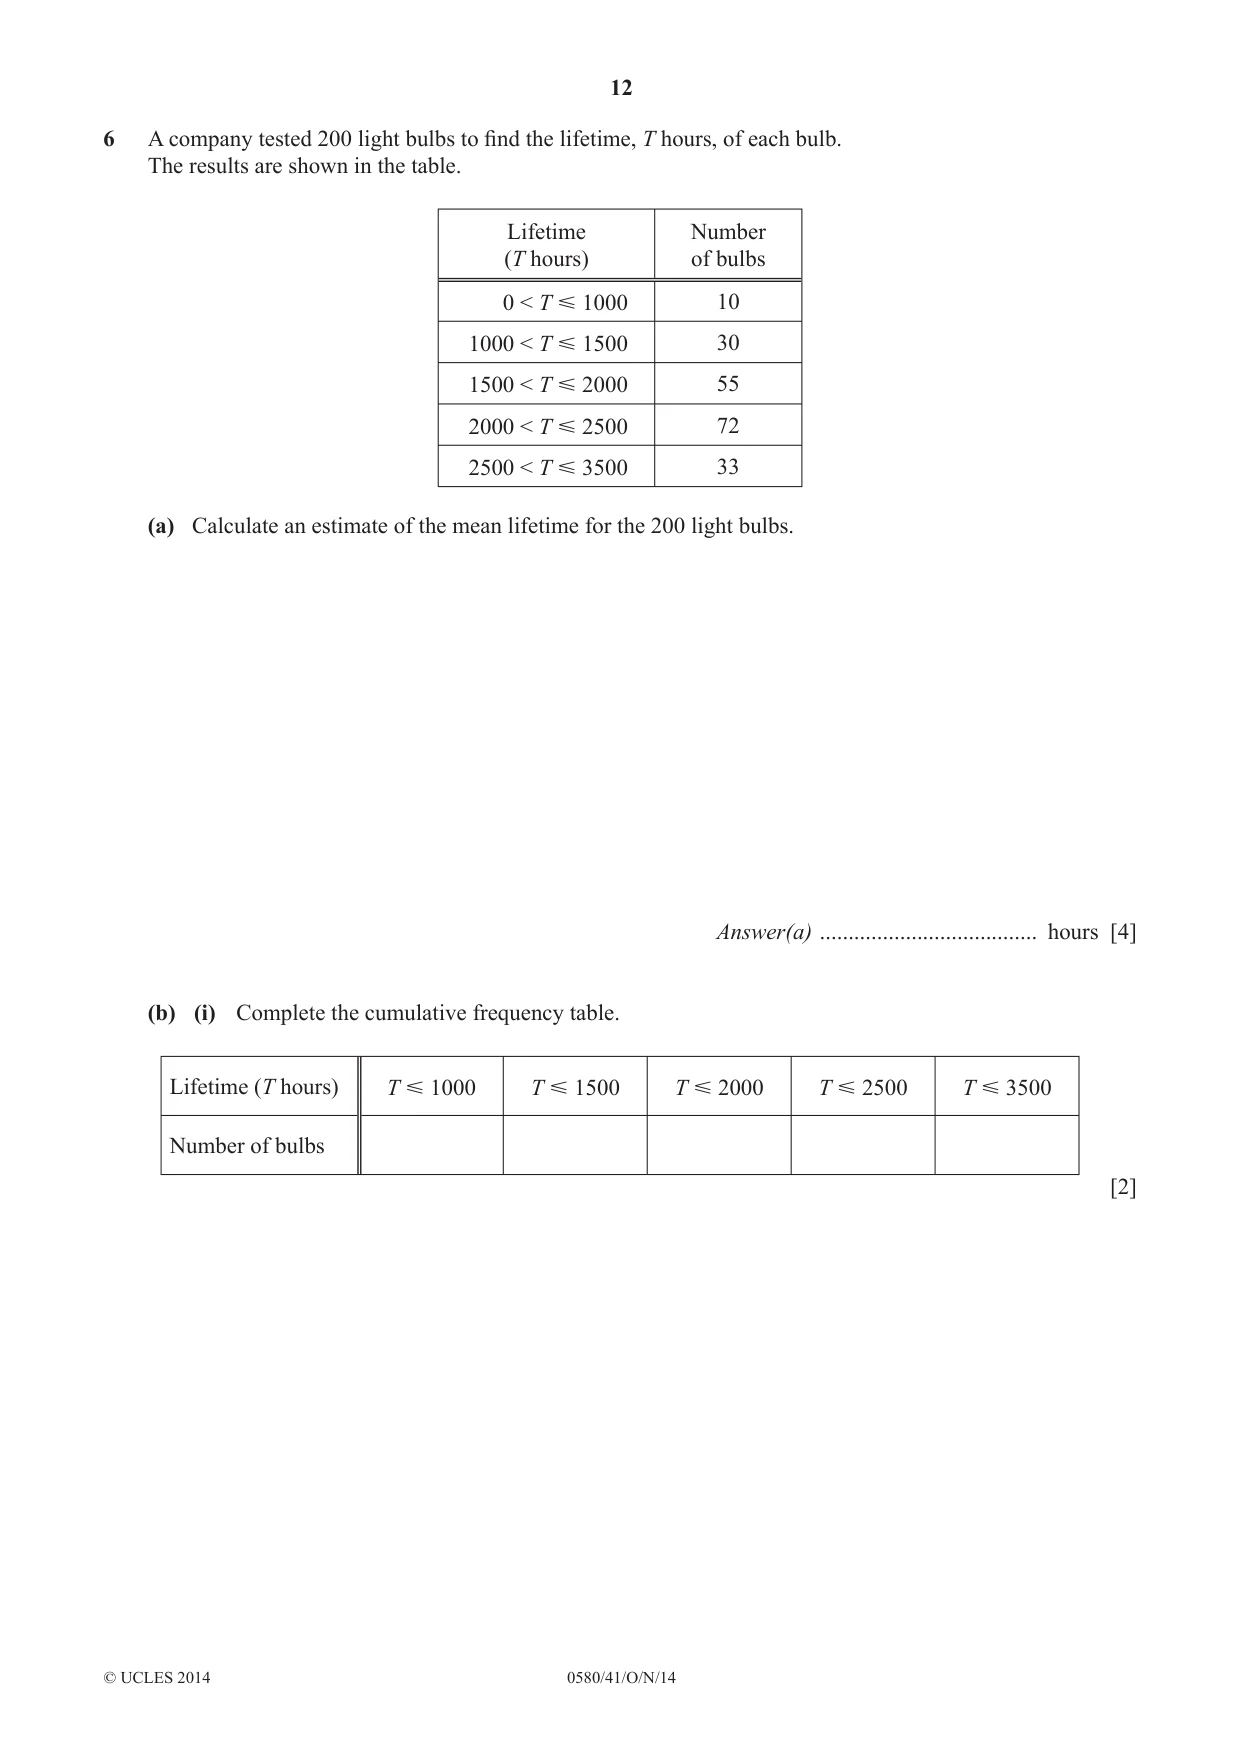
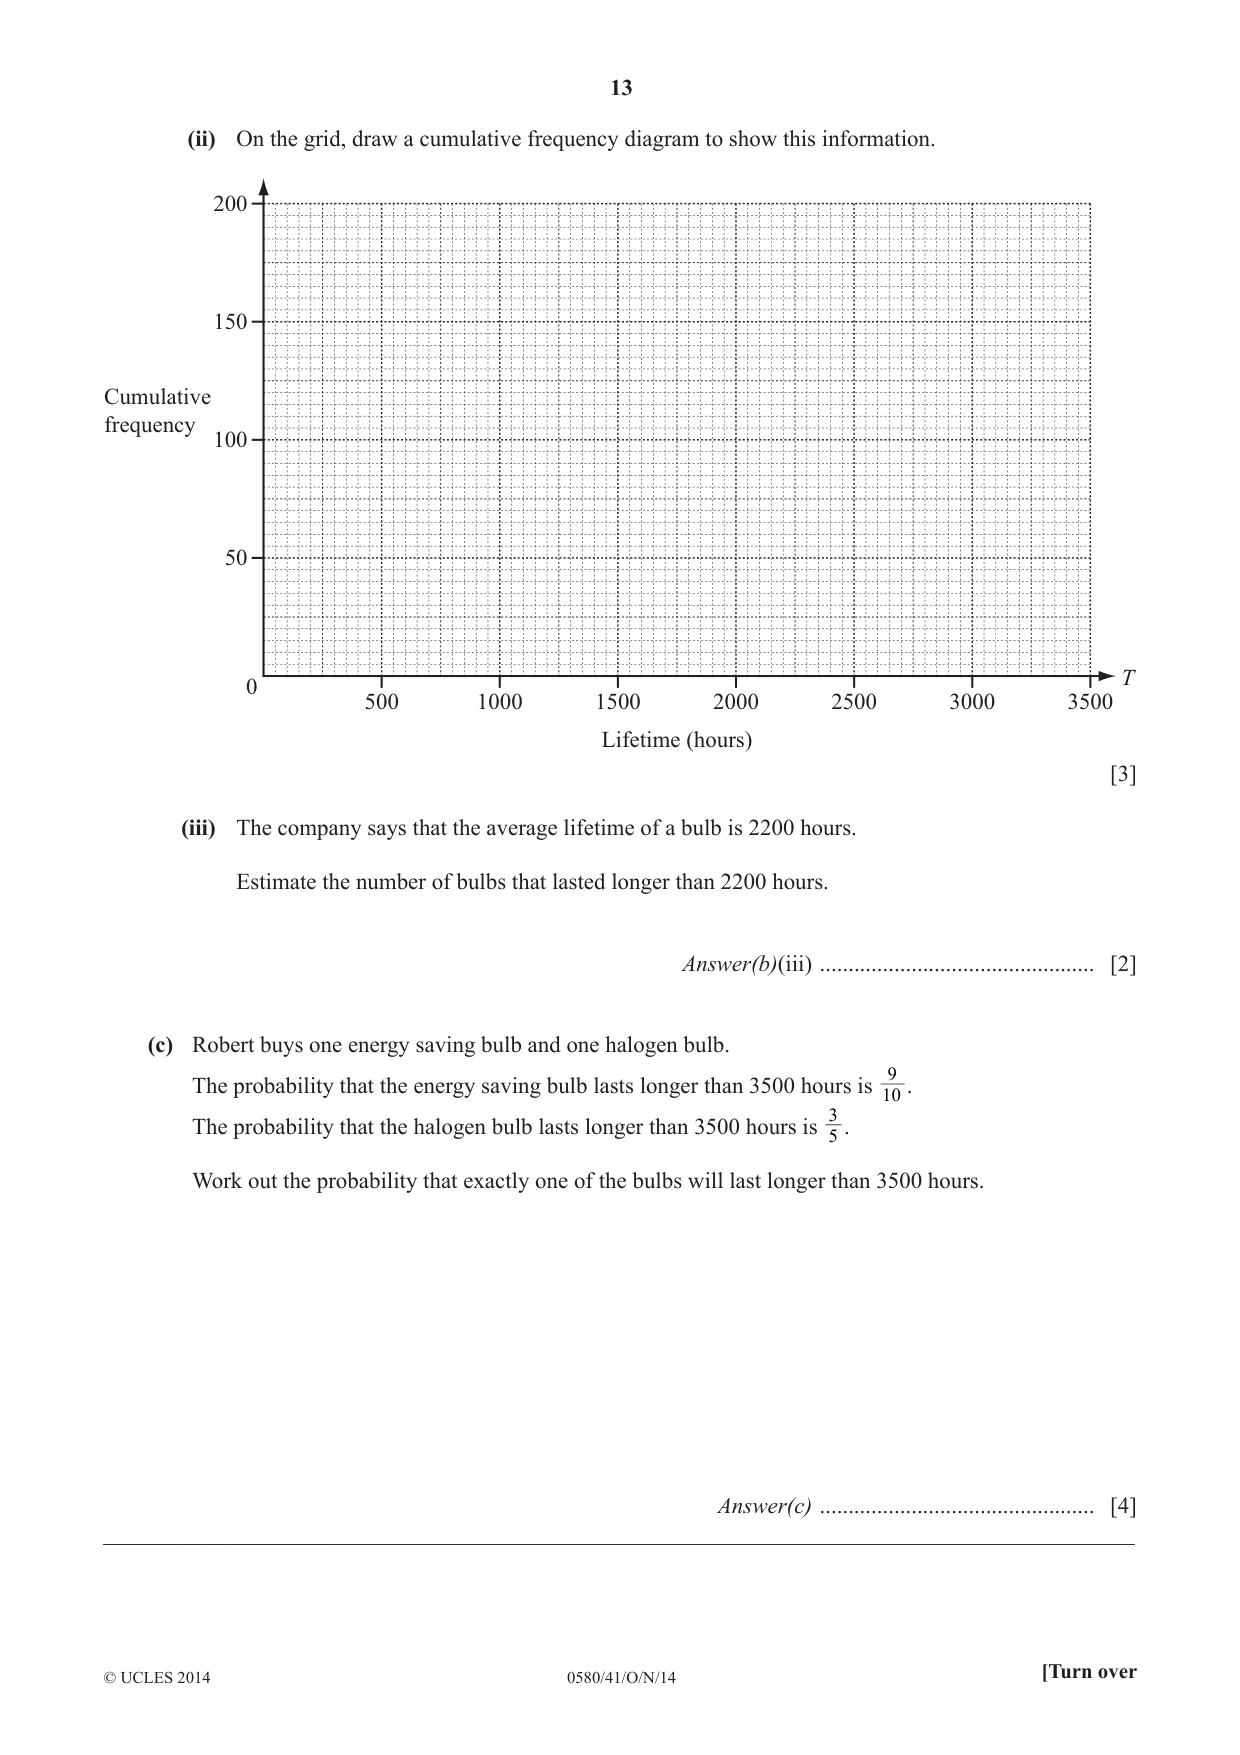
6 A company tested 200 light bulbs to fi nd the lifetime, T hours, of each bulb. The results are shown in the table. Lifetime Number (T hours) of bulbs 0 < T Y 1000 10 1000 < T Y 1500 30 1500 < T Y 2000 55 2000 < T Y 2500 72 2500 < T Y 3500 33 (a) Calculate an estimate of the mean lifetime for the 200 light bulbs. Answer(a) ...................................... hours [4] (b) (i) Complete the cumulative frequency table. Lifetime (T hours) T Y 1000 T Y 1500 T Y 2000 T Y 2500 T Y 3500 Number of bulbs [2] (ii) On the grid, draw a cumulative frequency diagram to show this information. 200 150 Cumulative frequency 100 50 T 0 500 1000 1500 2000 2500 3000 3500 Lifetime (hours) [3] (iii) The company says that the average lifetime of a bulb is 2200 hours. Estimate the number of bulbs that lasted longer than 2200 hours. Answer(b)(iii) ................................................ [2] (c) Robert buys one energy saving bulb and one halogen bulb. 9 The probability that the energy saving bulb lasts longer than 3500 hours is . 10 3 The probability that the halogen bulb lasts longer than 3500 hours is . 5 Work out the probability that exactly one of the bulbs will last longer than 3500 hours. Answer(c) ................................................ [4] __________________________________________________________________________________________
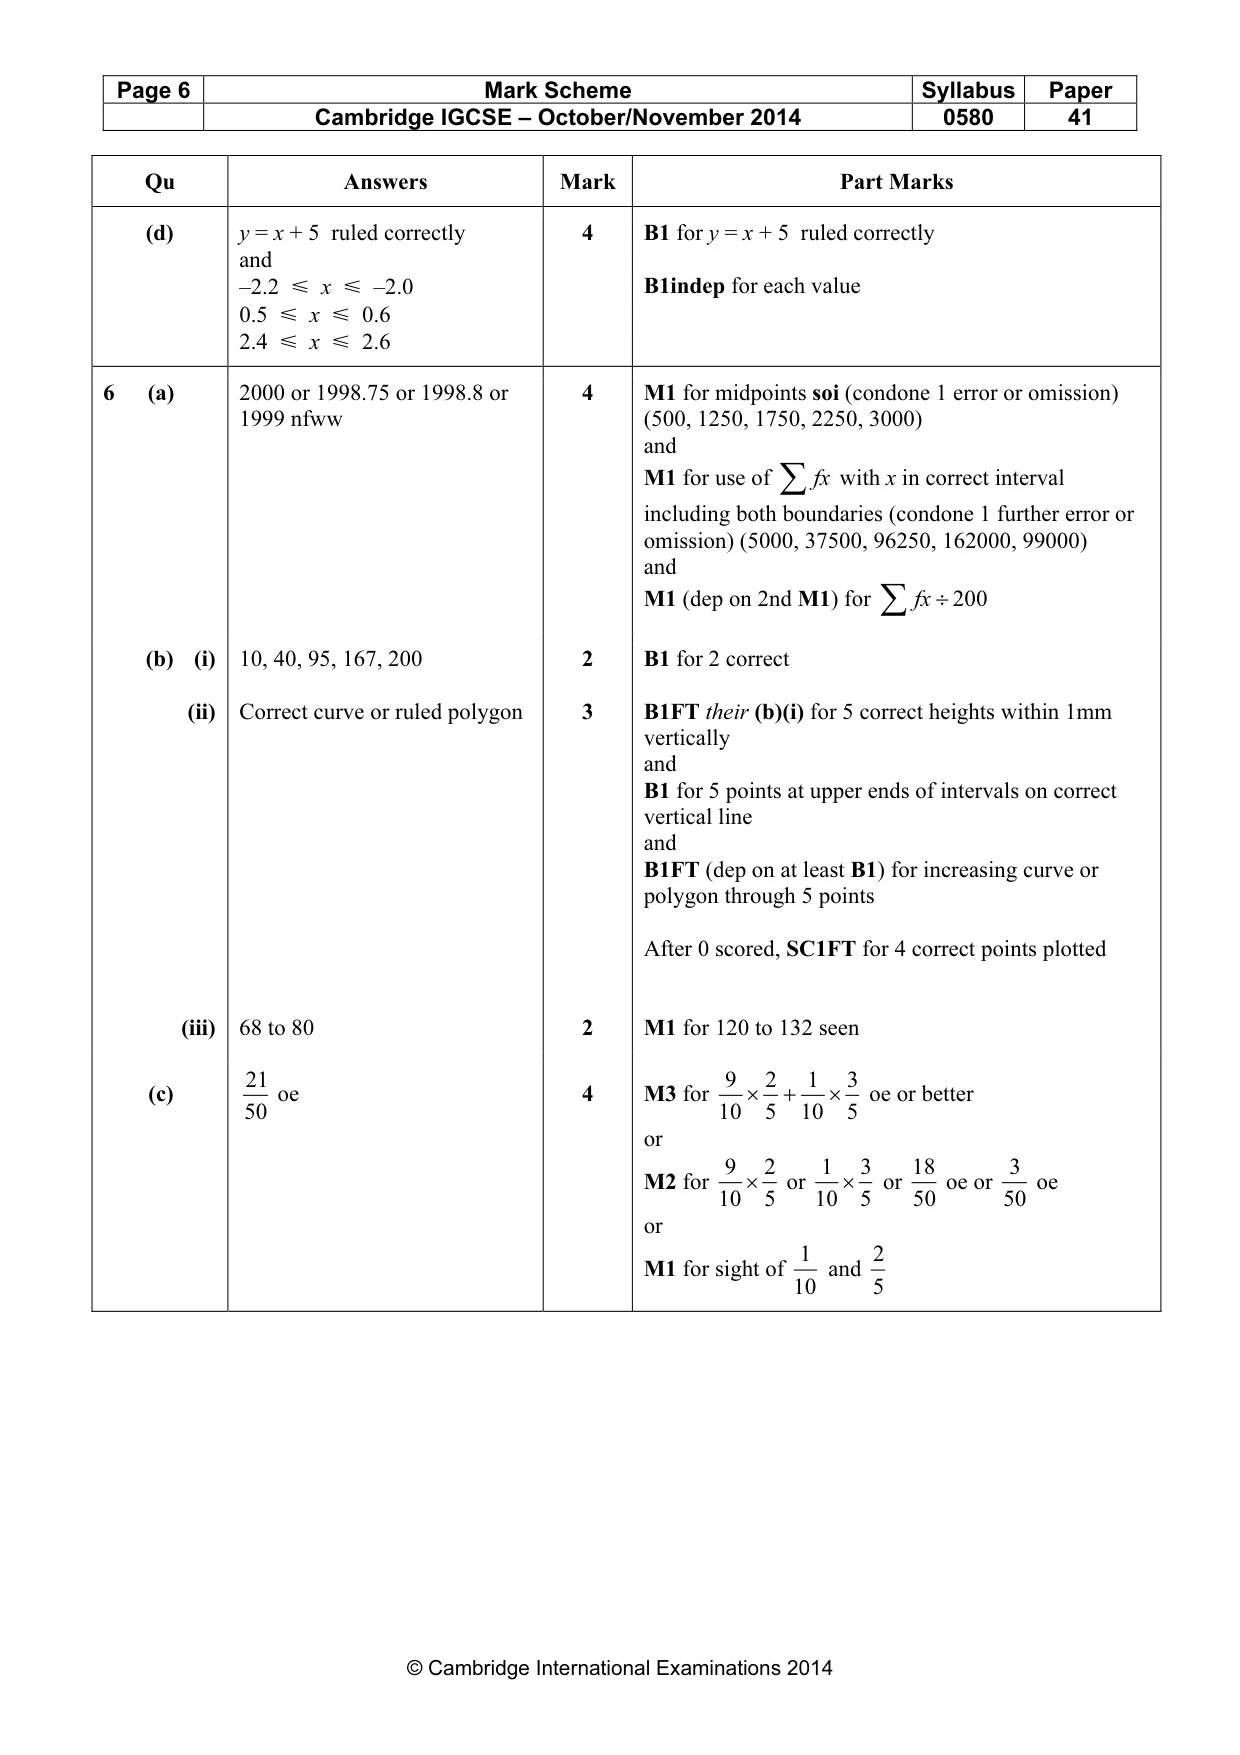
Mark scheme: 6 (a) 2000 or 1998.75 or 1998.8 or 4 M1 for midpoints soi (condone 1 error or omission) 1999 nfww (500, 1250, 1750, 2250, 3000) and with x in correct interval M1 for use of ∑fx including both boundaries (condone 1 further error or omission) (5000, 37500, 96250, 162000, 99000) and M1 (dep on 2nd M1) for ∑fx ÷ 200 (b) (i) 10, 40, 95, 167, 200 2 B1 for 2 correct (ii) Correct curve or ruled polygon 3 B1FT their (b)(i) for 5 correct heights within 1mm vertically and B1 for 5 points at upper ends of intervals on correct vertical line and B1FT (dep on at least B1) for increasing curve or polygon through 5 points After 0 scored, SC1FT for 4 correct points plotted (iii) 68 to 80 2 M1 for 120 to 132 seen 21 9 2 1 3 (c) oe 4 M3 for × + × oe or better 50 10 5 10 5 or 9 2 1 3 18 3 M2 for × or × or oe or oe 10 5 10 5 50 50 or 1 2 M1 for sight of and 10 5 Qu Answers Mark Part Marks
Q7 · The diagram shows a circle with two chords, AB and CD, intersecting at X
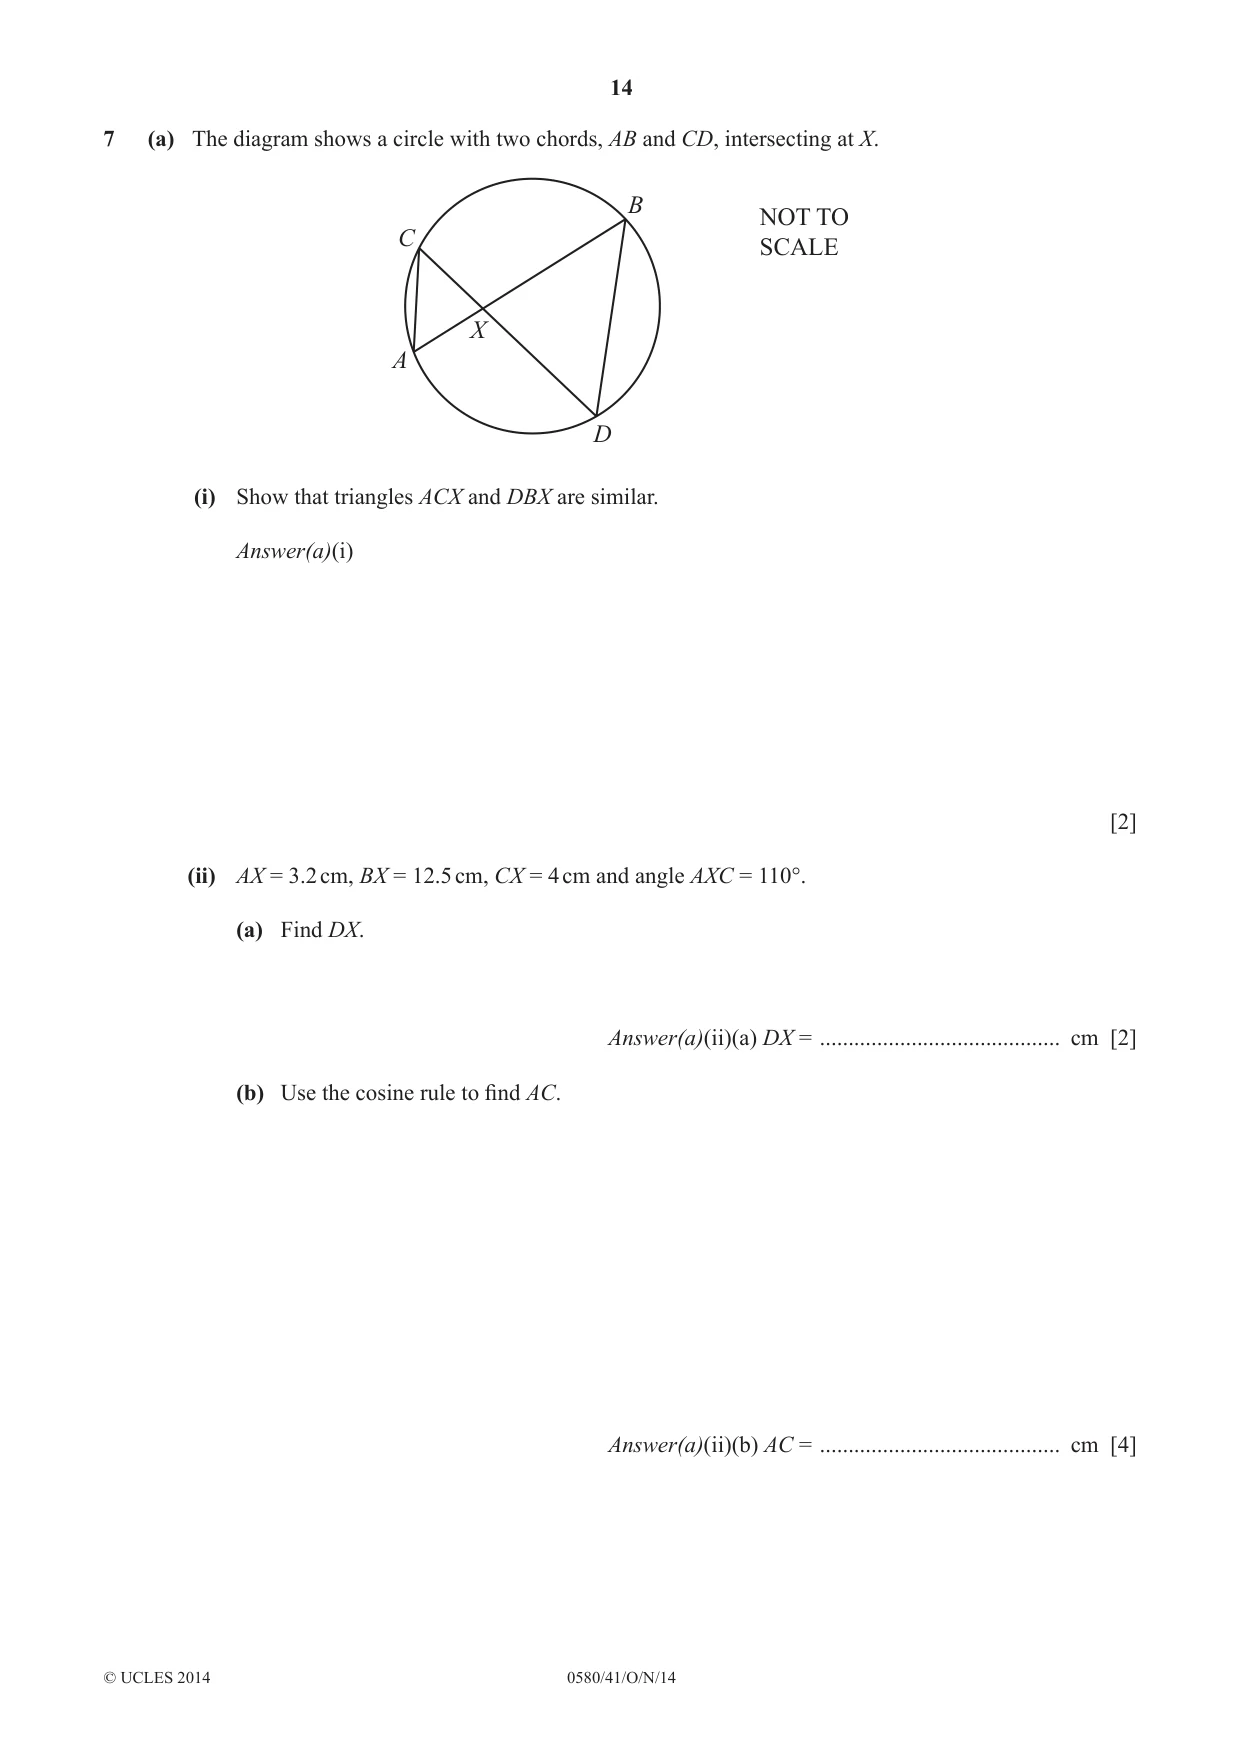
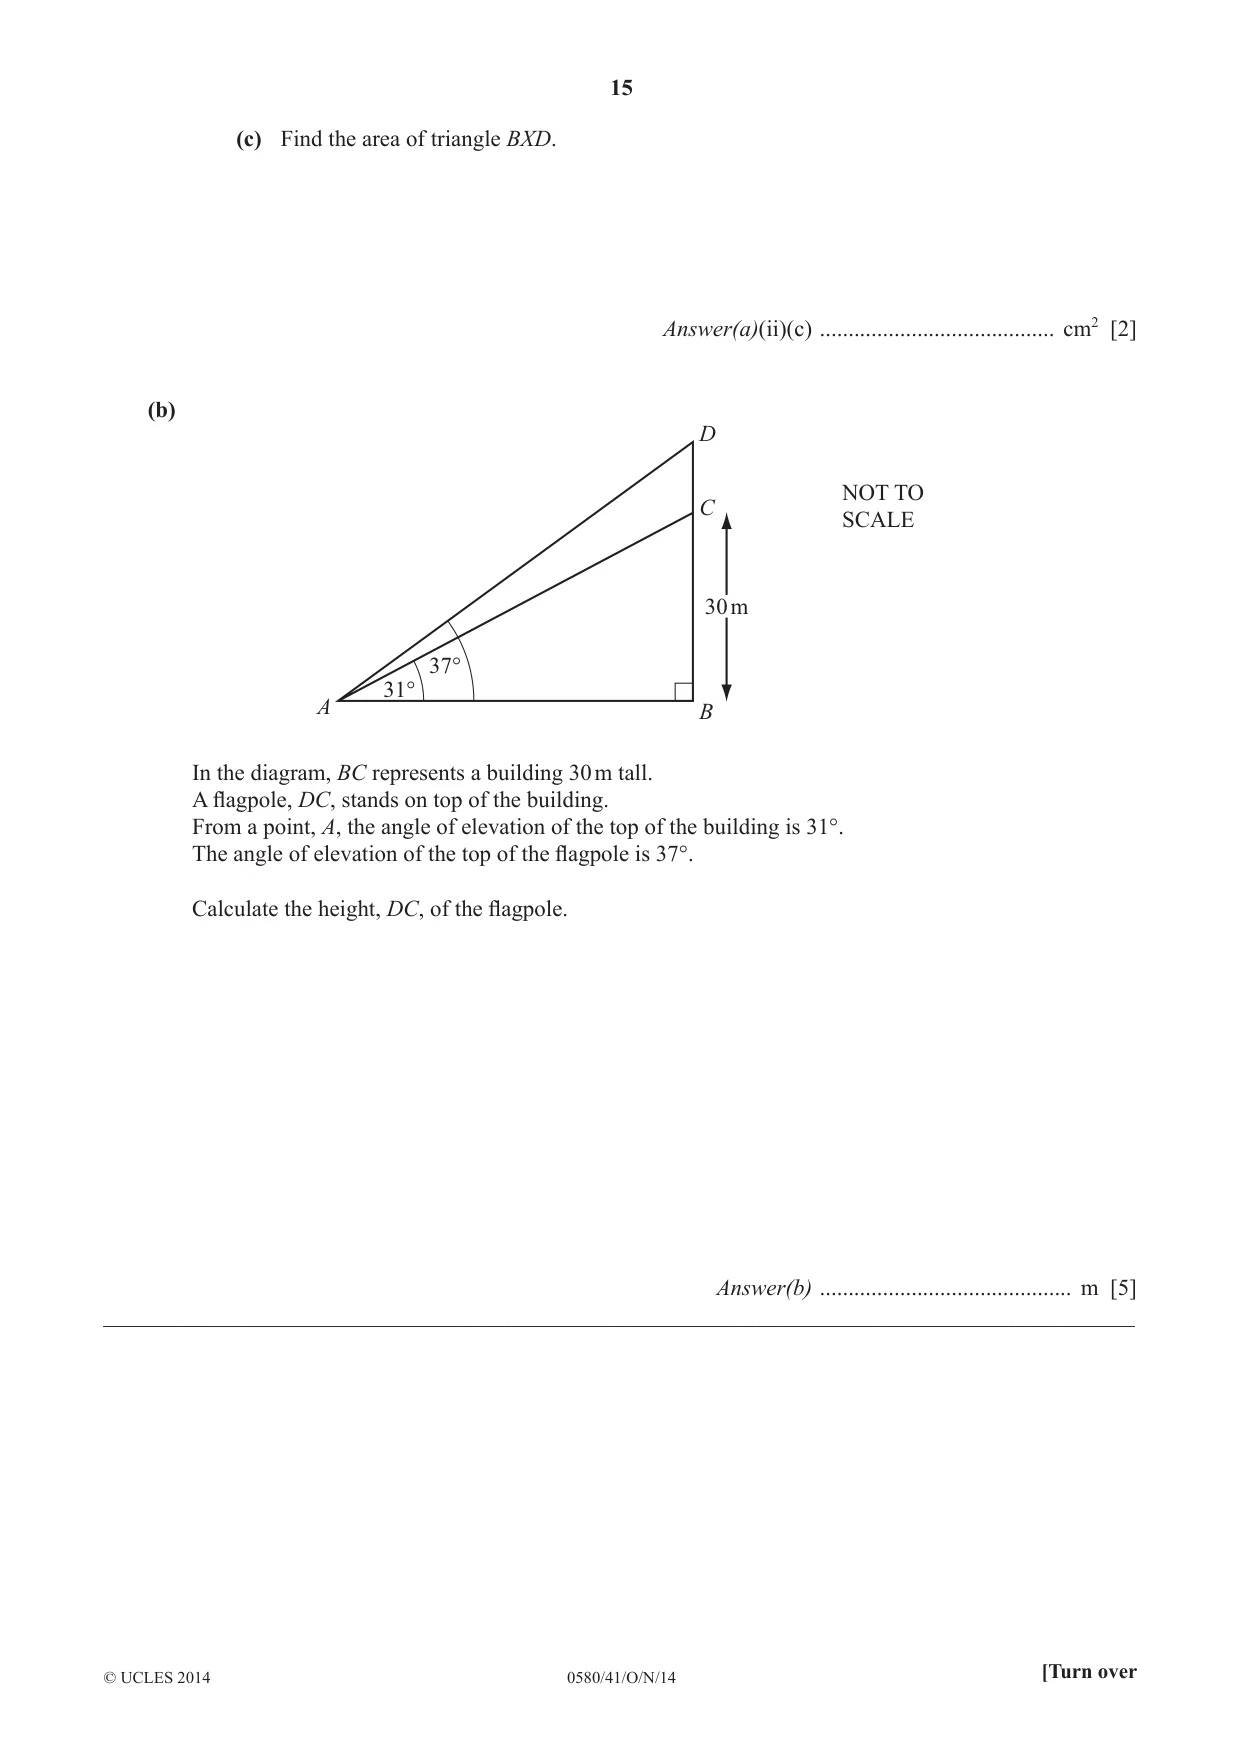
7 (a) The diagram shows a circle with two chords, AB and CD, intersecting at X. B NOT TO C SCALE X A D (i) Show that triangles ACX and DBX are similar. Answer(a)(i) [2] (ii) AX = 3.2 cm, BX = 12.5 cm, CX = 4 cm and angle AXC = 110°. (a) Find DX. Answer(a)(ii)(a) DX = .......................................... cm [2] (b) Use the cosine rule to fi nd AC. Answer(a)(ii)(b) AC = .......................................... cm [4] (c) Find the area of triangle BXD. Answer(a)(ii)(c) ......................................... cm2 [2] (b) D NOT TO C SCALE 30 m 37° 31° A B In the diagram, BC represents a building 30 m tall. A fl agpole, DC, stands on top of the building. From a point, A, the angle of elevation of the top of the building is 31°. The angle of elevation of the top of the fl agpole is 37°. Calculate the height, DC, of the fl agpole. Answer(b) ............................................ m [5] __________________________________________________________________________________________
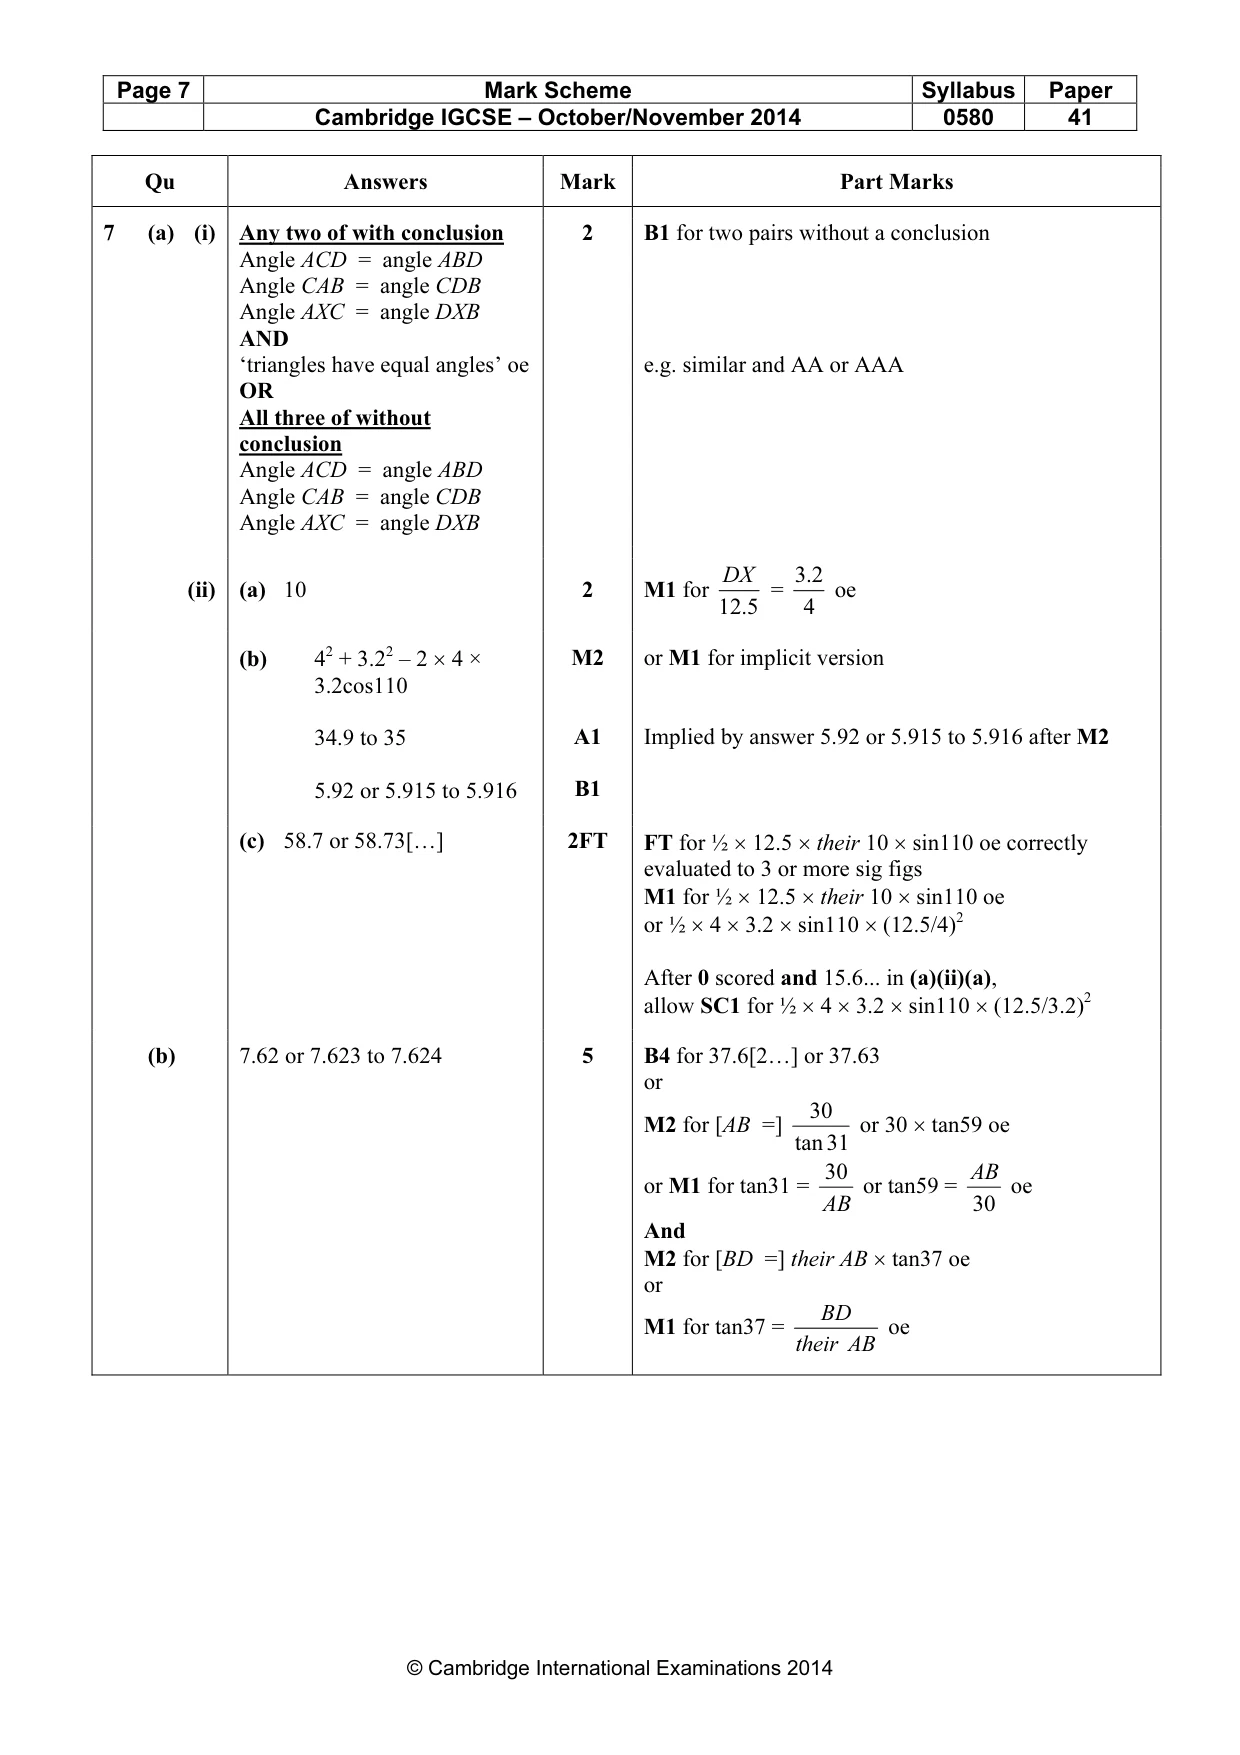
Mark scheme: 7 (a) (i) Any two of with conclusion 2 B1 for two pairs without a conclusion Angle ACD = angle ABD Angle CAB = angle CDB Angle AXC = angle DXB AND ‘triangles have equal angles’ oe e.g. similar and AA or AAA OR All three of without conclusion Angle ACD = angle ABD Angle CAB = angle CDB Angle AXC = angle DXB DX 2.3 (ii) (a) 10 2 M1 for = oe 125. 4 (b) 42 + 3.22 – 2 × 4 × M2 or M1 for implicit version 3.2cos110 34.9 to 35 A1 Implied by answer 5.92 or 5.915 to 5.916 after M2 5.92 or 5.915 to 5.916 B1 (c) 58.7 or 58.73[…] 2FT FT for ½ × 12.5 × their 10 × sin110 oe correctly evaluated to 3 or more sig figs M1 for ½ × 12.5 × their 10 × sin110 oe or ½ × 4 × 3.2 × sin110 × (12.5/4)2 After 0 scored and 15.6... in (a)(ii)(a), allow SC1 for ½ × 4 × 3.2 × sin110 × (12.5/3.2)2 (b) 7.62 or 7.623 to 7.624 5 B4 for 37.6[2…] or 37.63 or 30 M2 for [AB =] or 30 × tan59 oe tan 31 30 AB or M1 for tan31 = or tan59 = oe AB 30 And M2 for [BD =] their AB × tan37 oe or BD M1 for tan37 = oe their AB Qu Answers Mark Part Marks 1 f OQ i d
Q8 · B P A NOT TO SCALE Q 9b 6a C 3c O In the diagram, O is the origin and = 6a, = 9b and = 3c
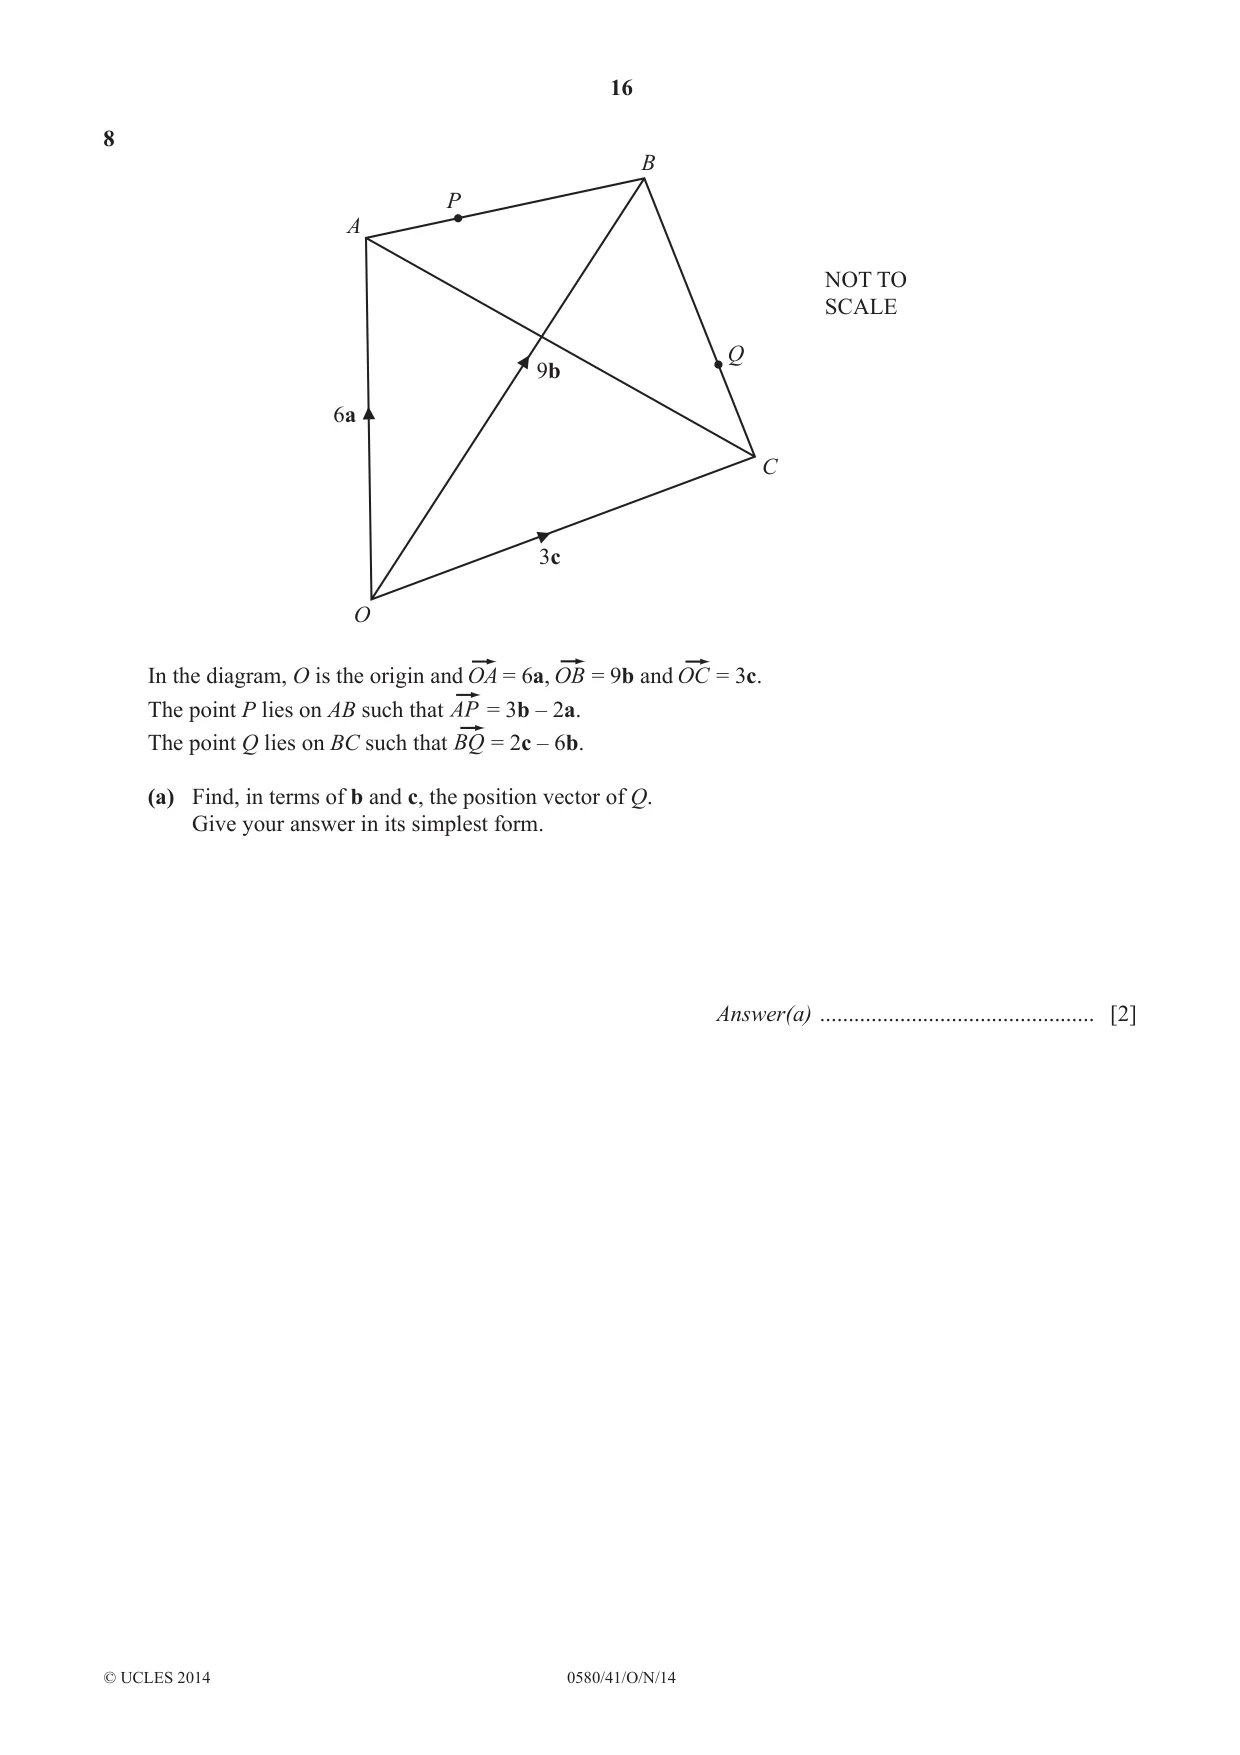
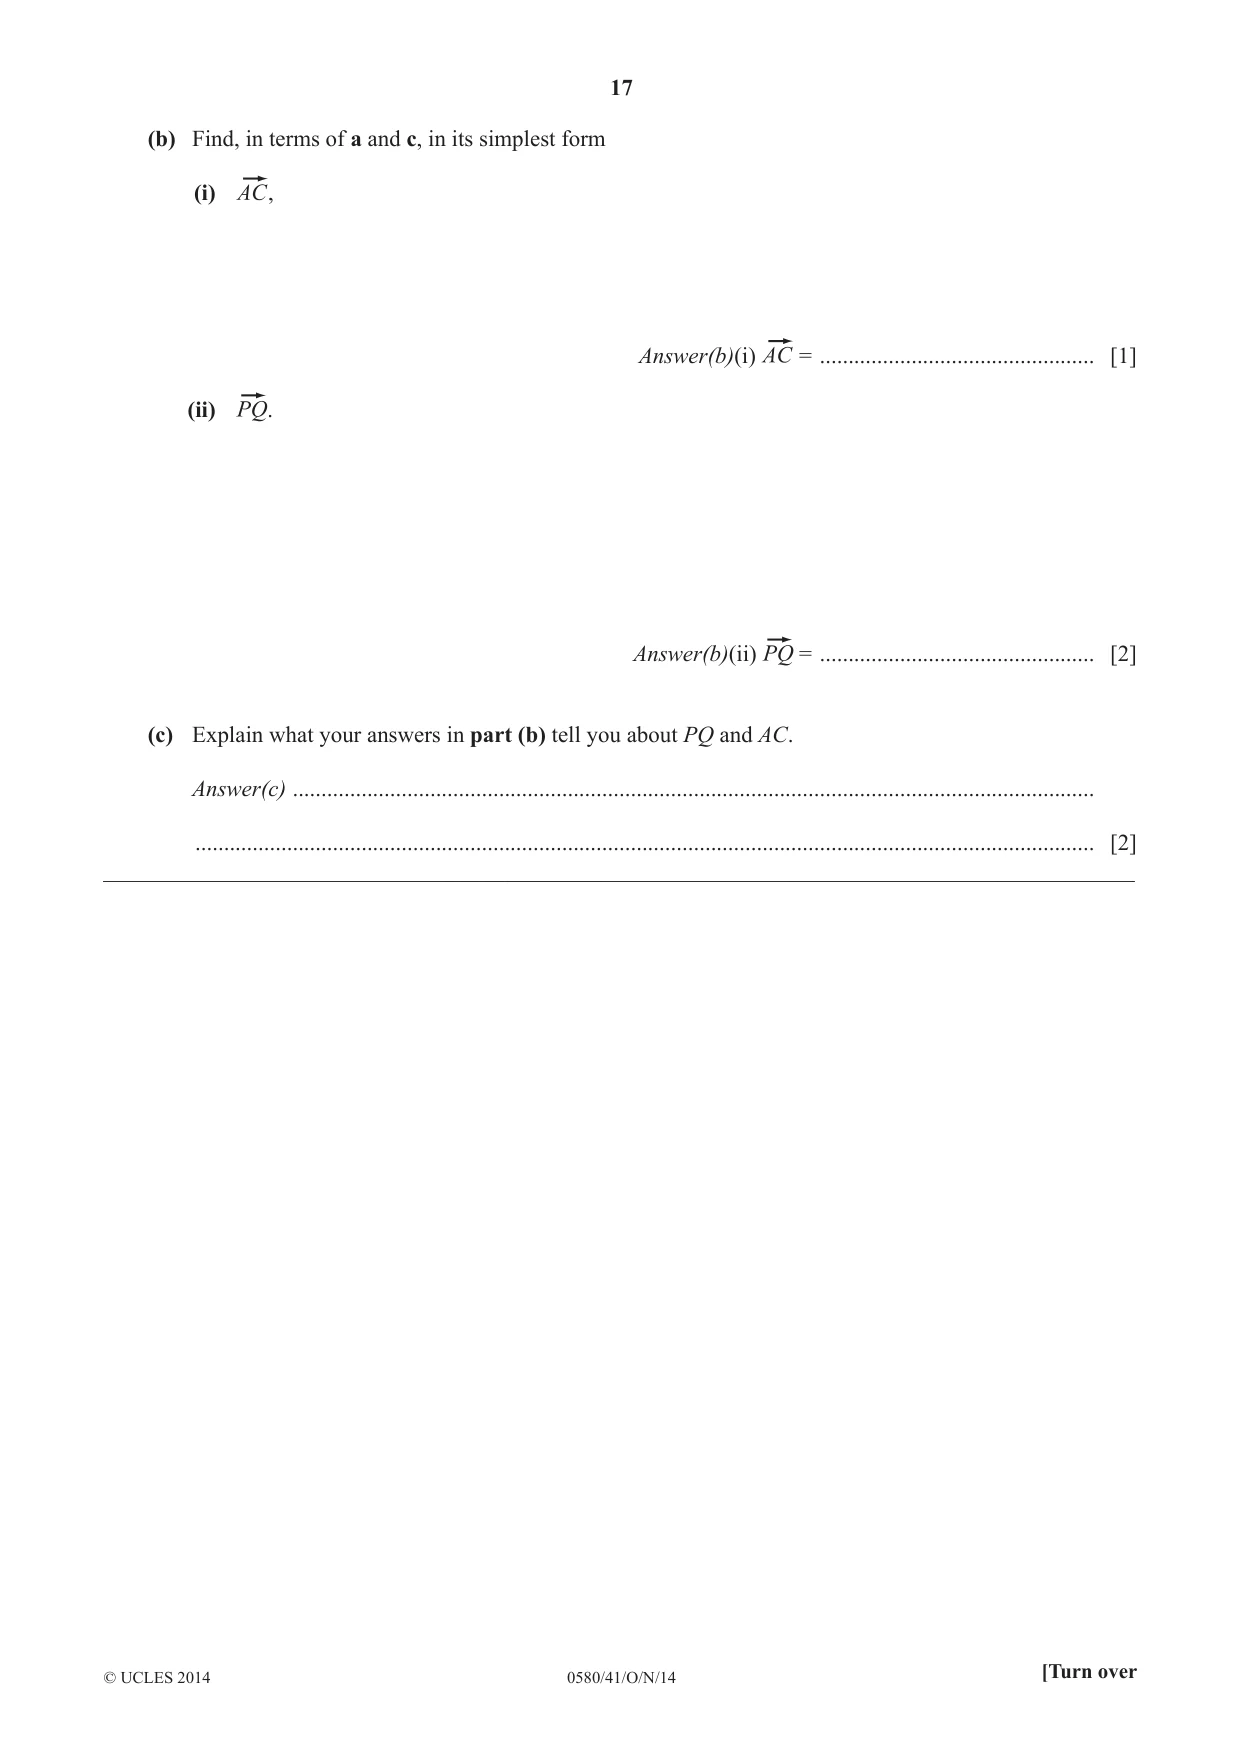
8 B P A NOT TO SCALE Q 9b 6a C 3c O In the diagram, O is the origin and = 6a, = 9b and = 3c. The point P lies on AB such that = 3b – 2a. The point Q lies on BC such that = 2c – 6b. (a) Find, in terms of b and c, the position vector of Q. Give your answer in its simplest form. Answer(a) ................................................ [2] (b) Find, in terms of a and c, in its simplest form (i) , Answer(b)(i) = ................................................ [1] (ii) . Answer(b)(ii) = ................................................ [2] (c) Explain what your answers in part (b) tell you about PQ and AC. Answer(c) ............................................................................................................................................ ............................................................................................................................................................. [2] __________________________________________________________________________________________
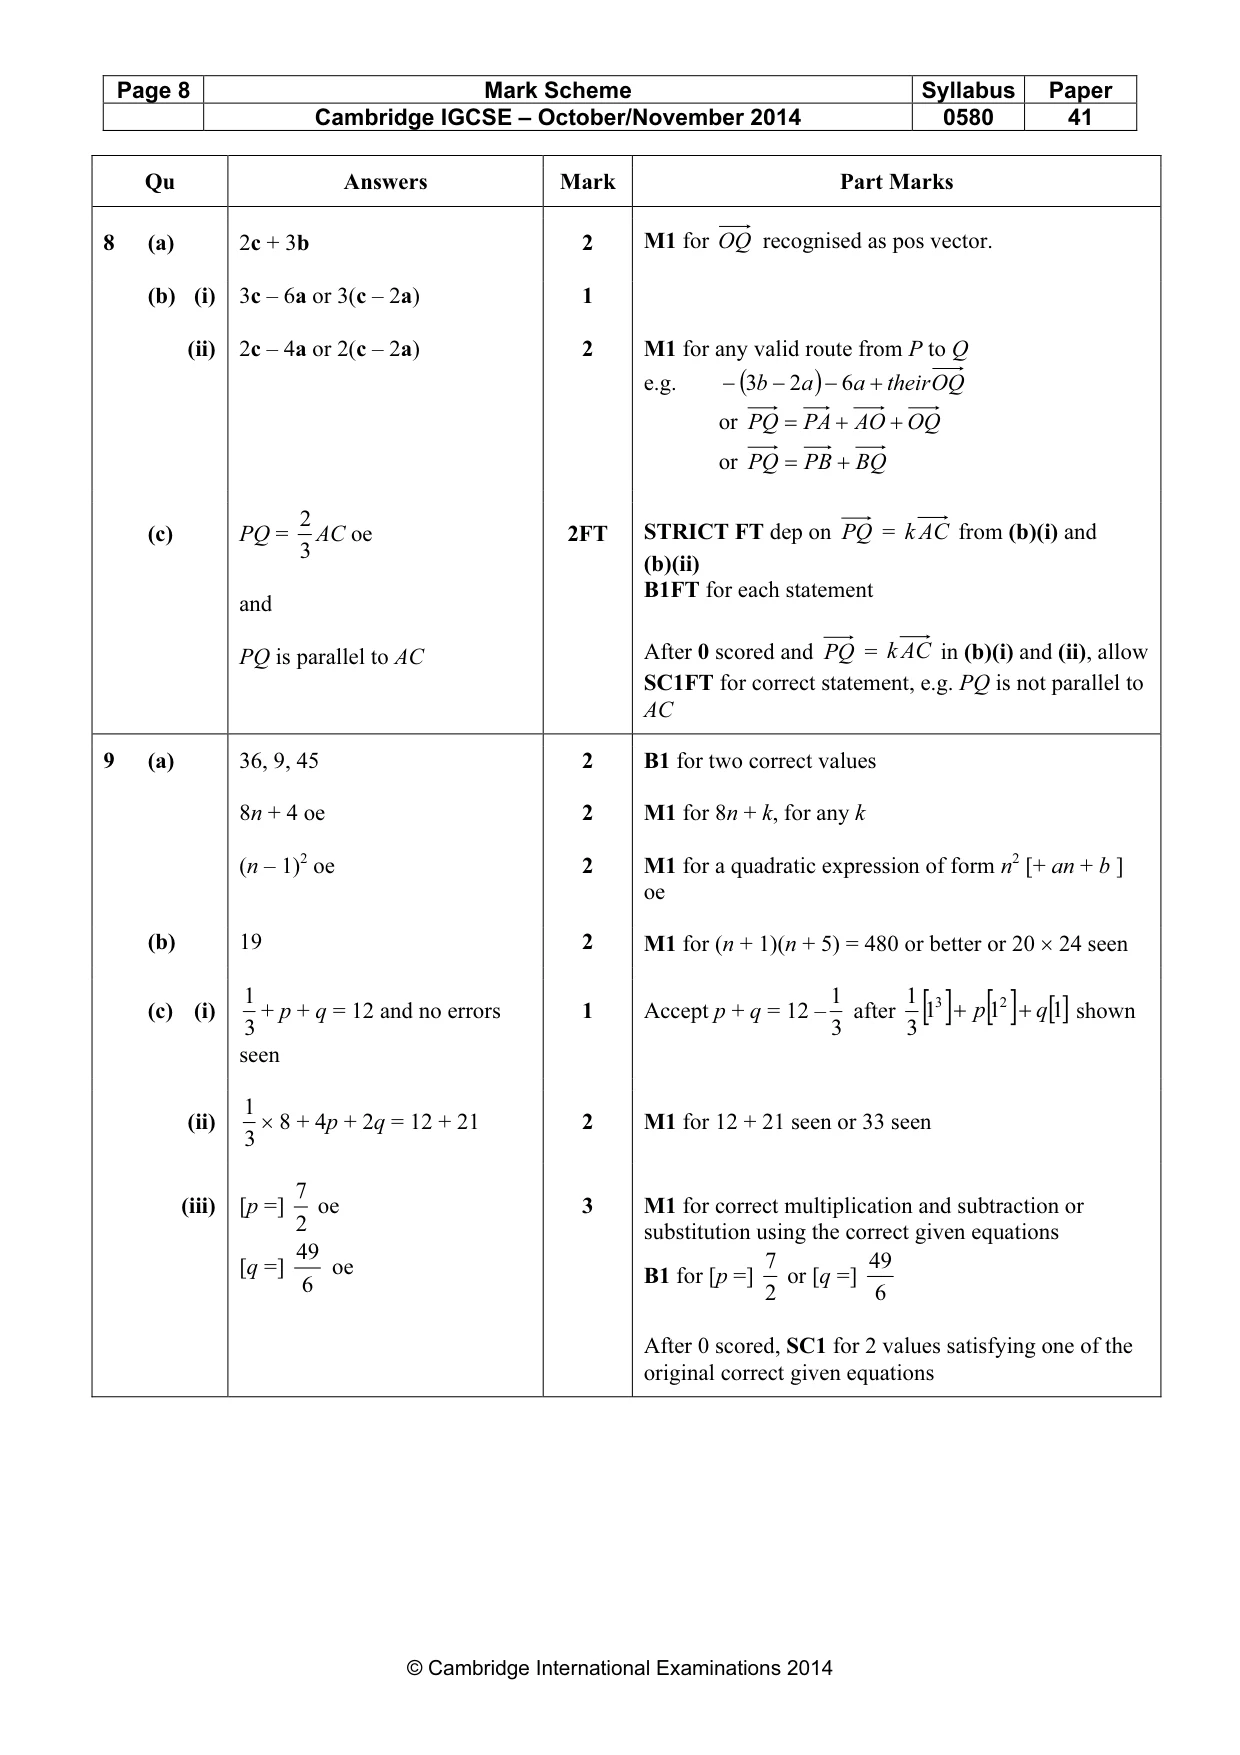
Mark scheme: 8 (a) 2c + 3b 2 M1 for OQ recognised as pos vector. (b) (i) 3c – 6a or 3(c – 2a) 1 (ii) 2c – 4a or 2(c – 2a) 2 M1 for any valid route from P to Q e.g. − (3b − 2 a ) − 6 a + their OQ or PQ = PA + AO + OQ or PQ = PB + BQ 2 (c) PQ = AC oe 2FT STRICT FT dep on PQ = k AC from (b)(i) and 3 (b)(ii) B1FT for each statement and PQ is parallel to AC After 0 scored and PQ = k AC in (b)(i) and (ii), allow SC1FT for correct statement, e.g. PQ is not parallel to AC
Q9 · Diagram 1 Diagram 2 Diagram 3 Diagram 4 The fi rst four diagrams in a sequence are shown…
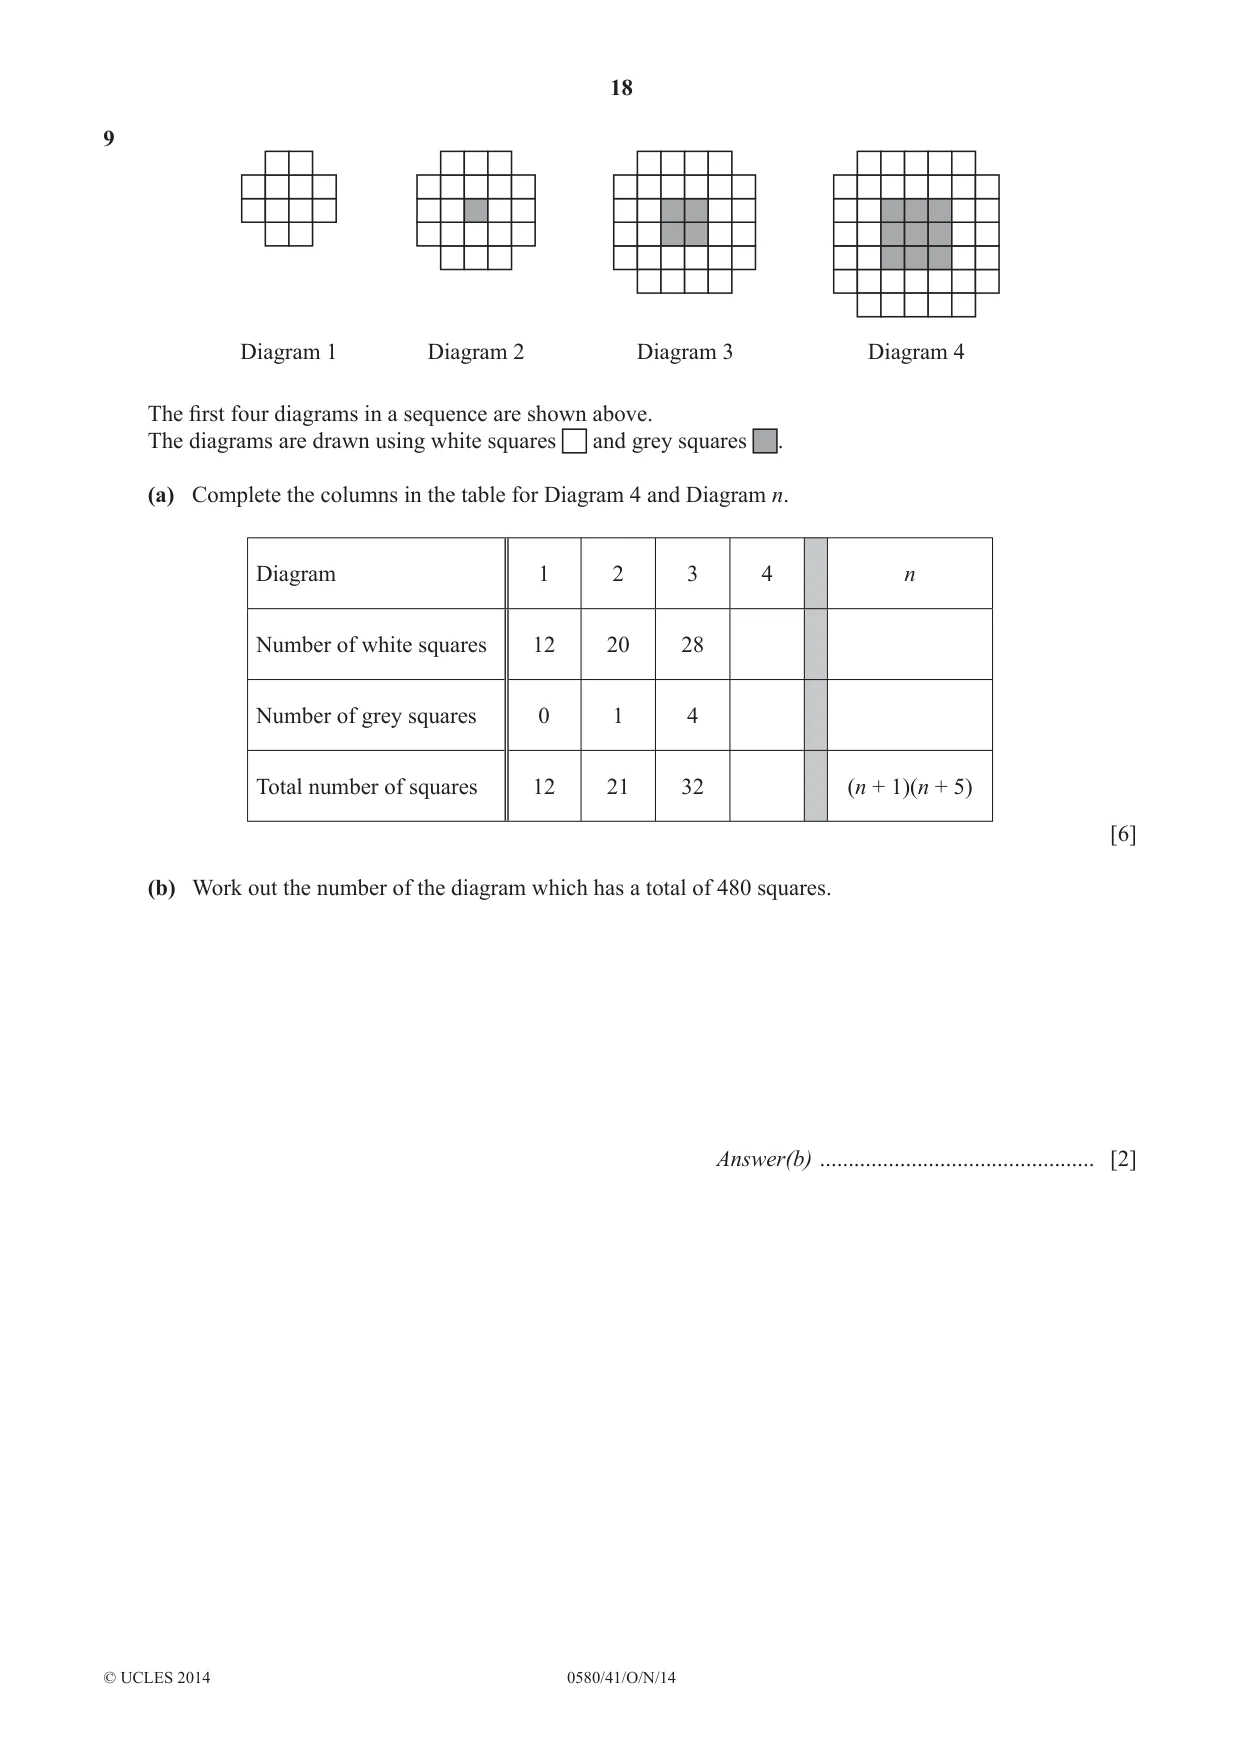
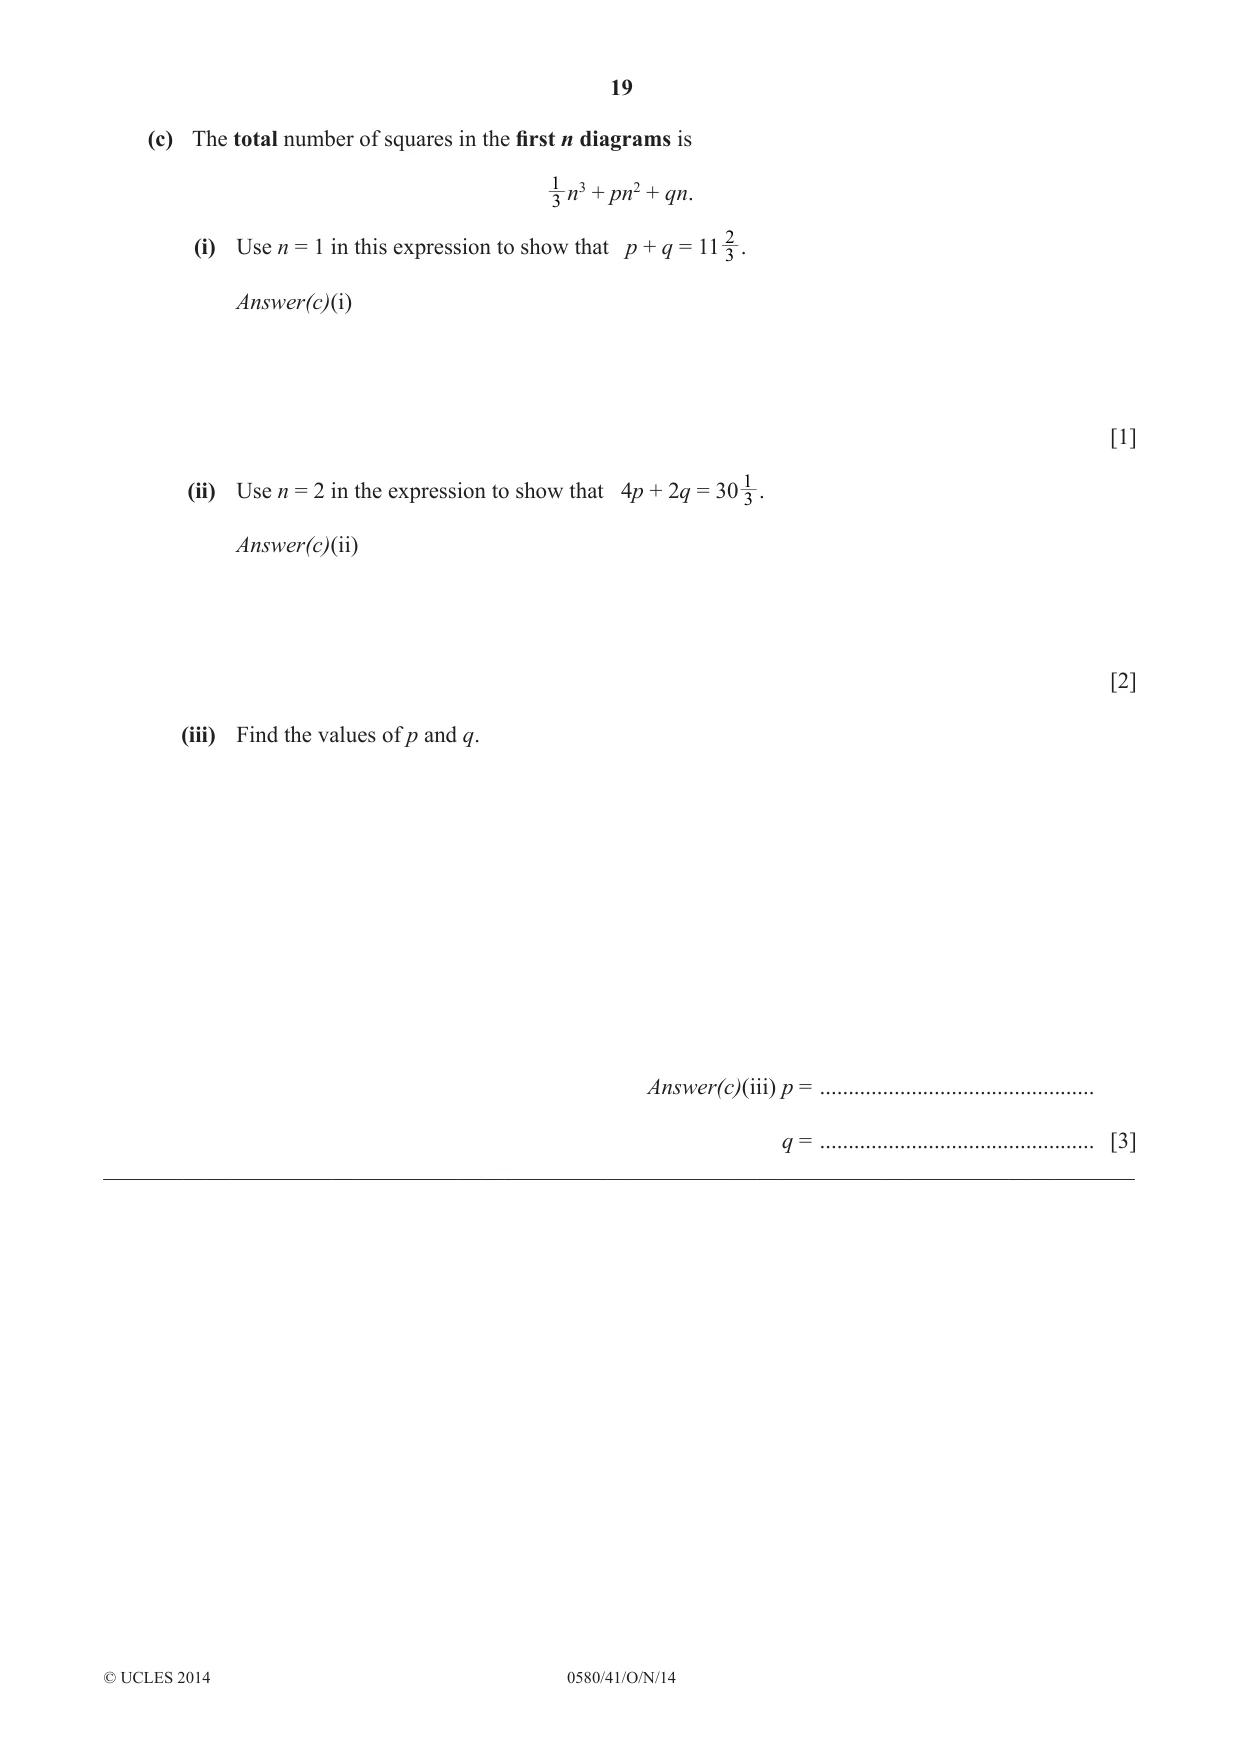
9 Diagram 1 Diagram 2 Diagram 3 Diagram 4 The fi rst four diagrams in a sequence are shown above. The diagrams are drawn using white squares and grey squares . (a) Complete the columns in the table for Diagram 4 and Diagram n. Diagram 1 2 3 4 n Number of white squares 12 20 28 Number of grey squares 0 1 4 Total number of squares 12 21 32 (n + 1)(n + 5) [6] (b) Work out the number of the diagram which has a total of 480 squares. Answer(b) ................................................ [2] (c) The total number of squares in the fi rst n diagrams is 1 3 n3 + pn2 + qn. 2 (i) Use n = 1 in this expression to show that p + q = 11 3 . Answer(c)(i) [1] 1 (ii) Use n = 2 in the expression to show that 4p + 2q = 30 3 . Answer(c)(ii) [2] (iii) Find the values of p and q. Answer(c)(iii) p = ................................................ q = ................................................ [3] __________________________________________________________________________________________
Mark scheme: 9 (a) 36, 9, 45 2 B1 for two correct values 8n + 4 oe 2 M1 for 8n + k, for any k (n – 1)2 oe 2 M1 for a quadratic expression of form n2 [+ an + b ] oe (b) 19 2 M1 for (n + 1)(n + 5) = 480 or better or 20 × 24 seen 1 1 1 3 2 (c) (i) + p + q = 12 and no errors 1 Accept p + q = 12 – after [1 ] + p [1 ] + q []1 shown 3 3 3 seen 1 (ii) × 8 + 4p + 2q = 12 + 21 2 M1 for 12 + 21 seen or 33 seen 3 7 (iii) [p =] oe 3 M1 for correct multiplication and subtraction or 2 substitution using the correct given equations 49 7 49 [q =] oe B1 for [p =] or [q =] 6 2 6 After 0 scored, SC1 for 2 values satisfying one of the original correct given equations
What was in this paper
The subtopics covered by these 7 questions, and how many questions each got. Open one in a new tab to see every Cambridge question on it.
What you needed in this session
Cambridge’s own grade thresholds for 2014 Oct/Nov, Paper 4 · Variant 1. A higher threshold means an easier paper — the bar moves with how the cohort did.