Cambridge IGCSE Mathematics 0580 — 2011 May/June Paper 4 · Variant 1
0580/41/M/J/11 · 7 questions · 130 marks · ≈146 min
The question paper and its mark scheme, free to read here and free to download. This is Cambridge’s own paper, exactly as it was sat.
Question paper16 pages
Mark scheme6 pages
Answers below. Sit the paper first if you are practising.
Questions as text
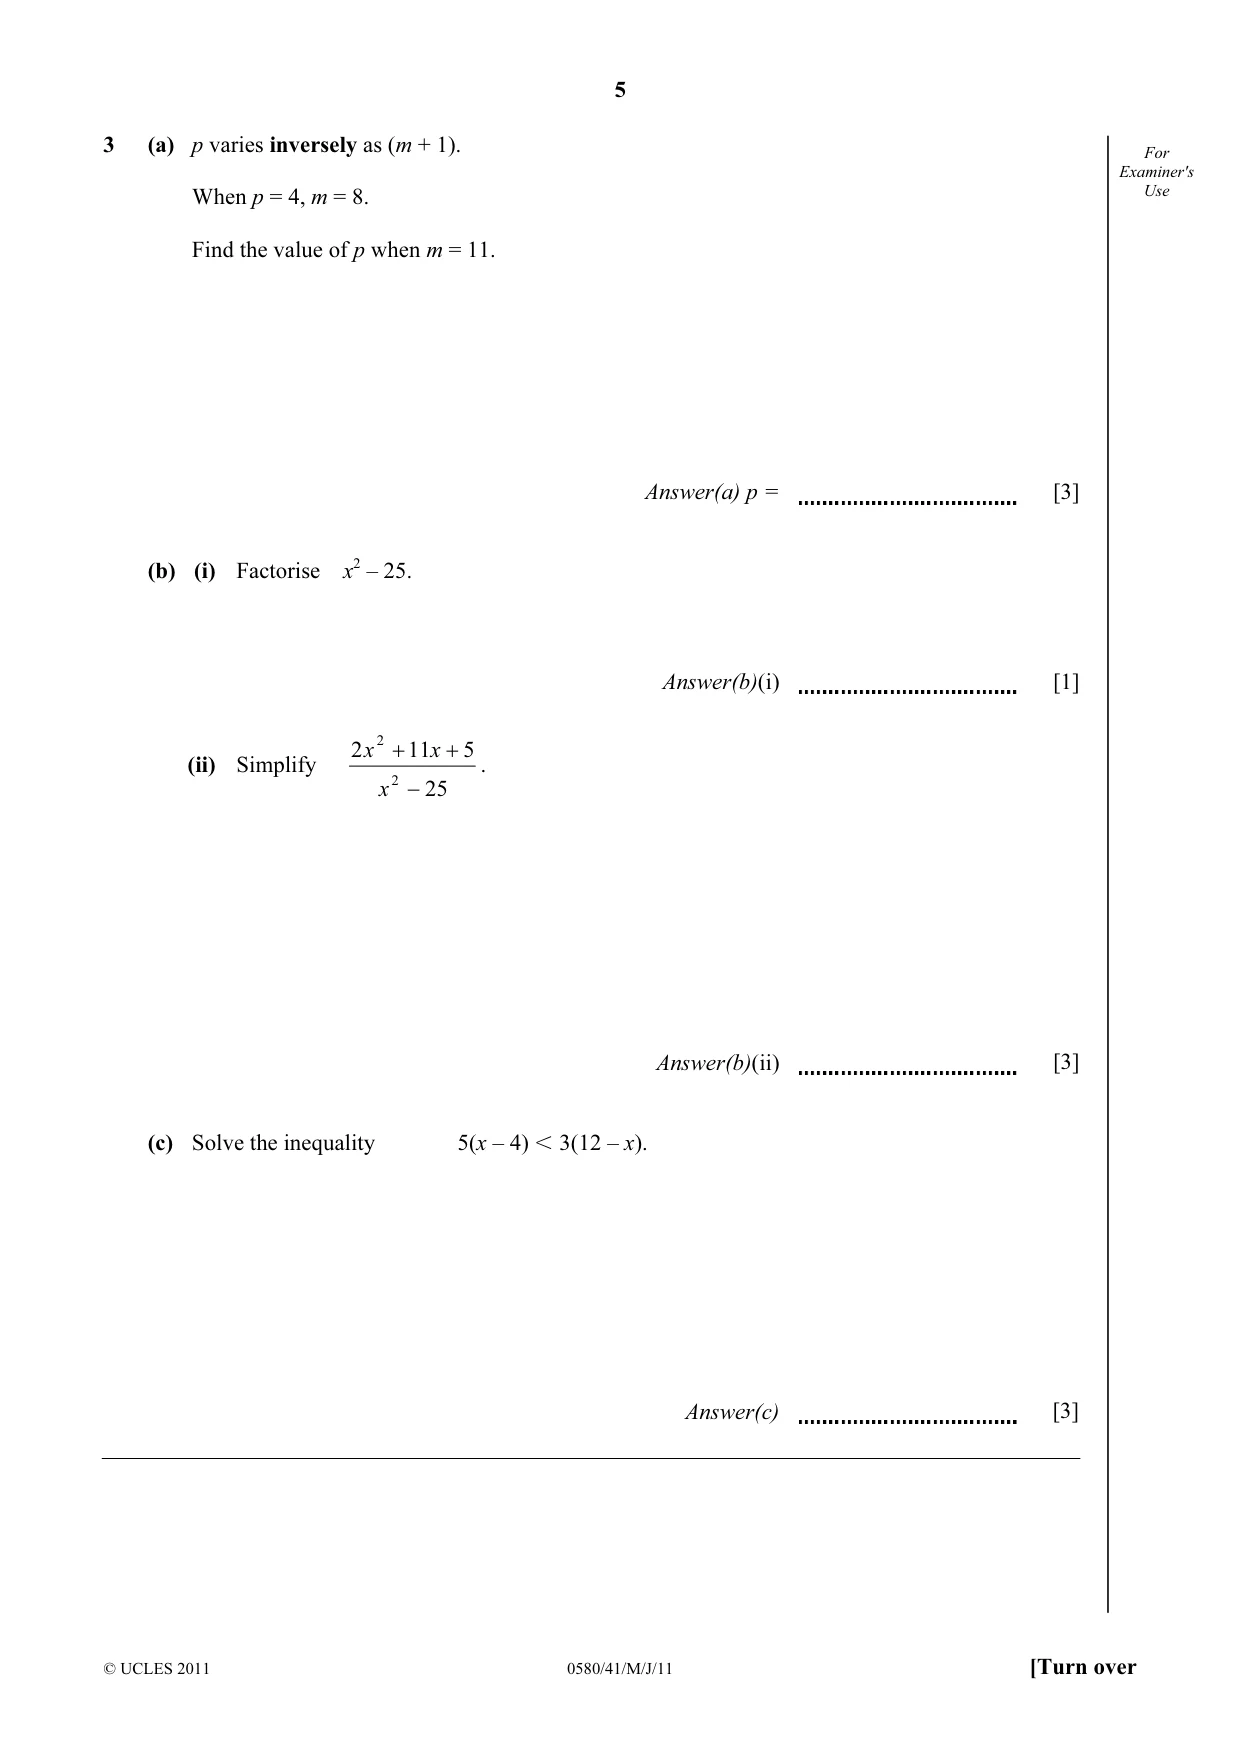
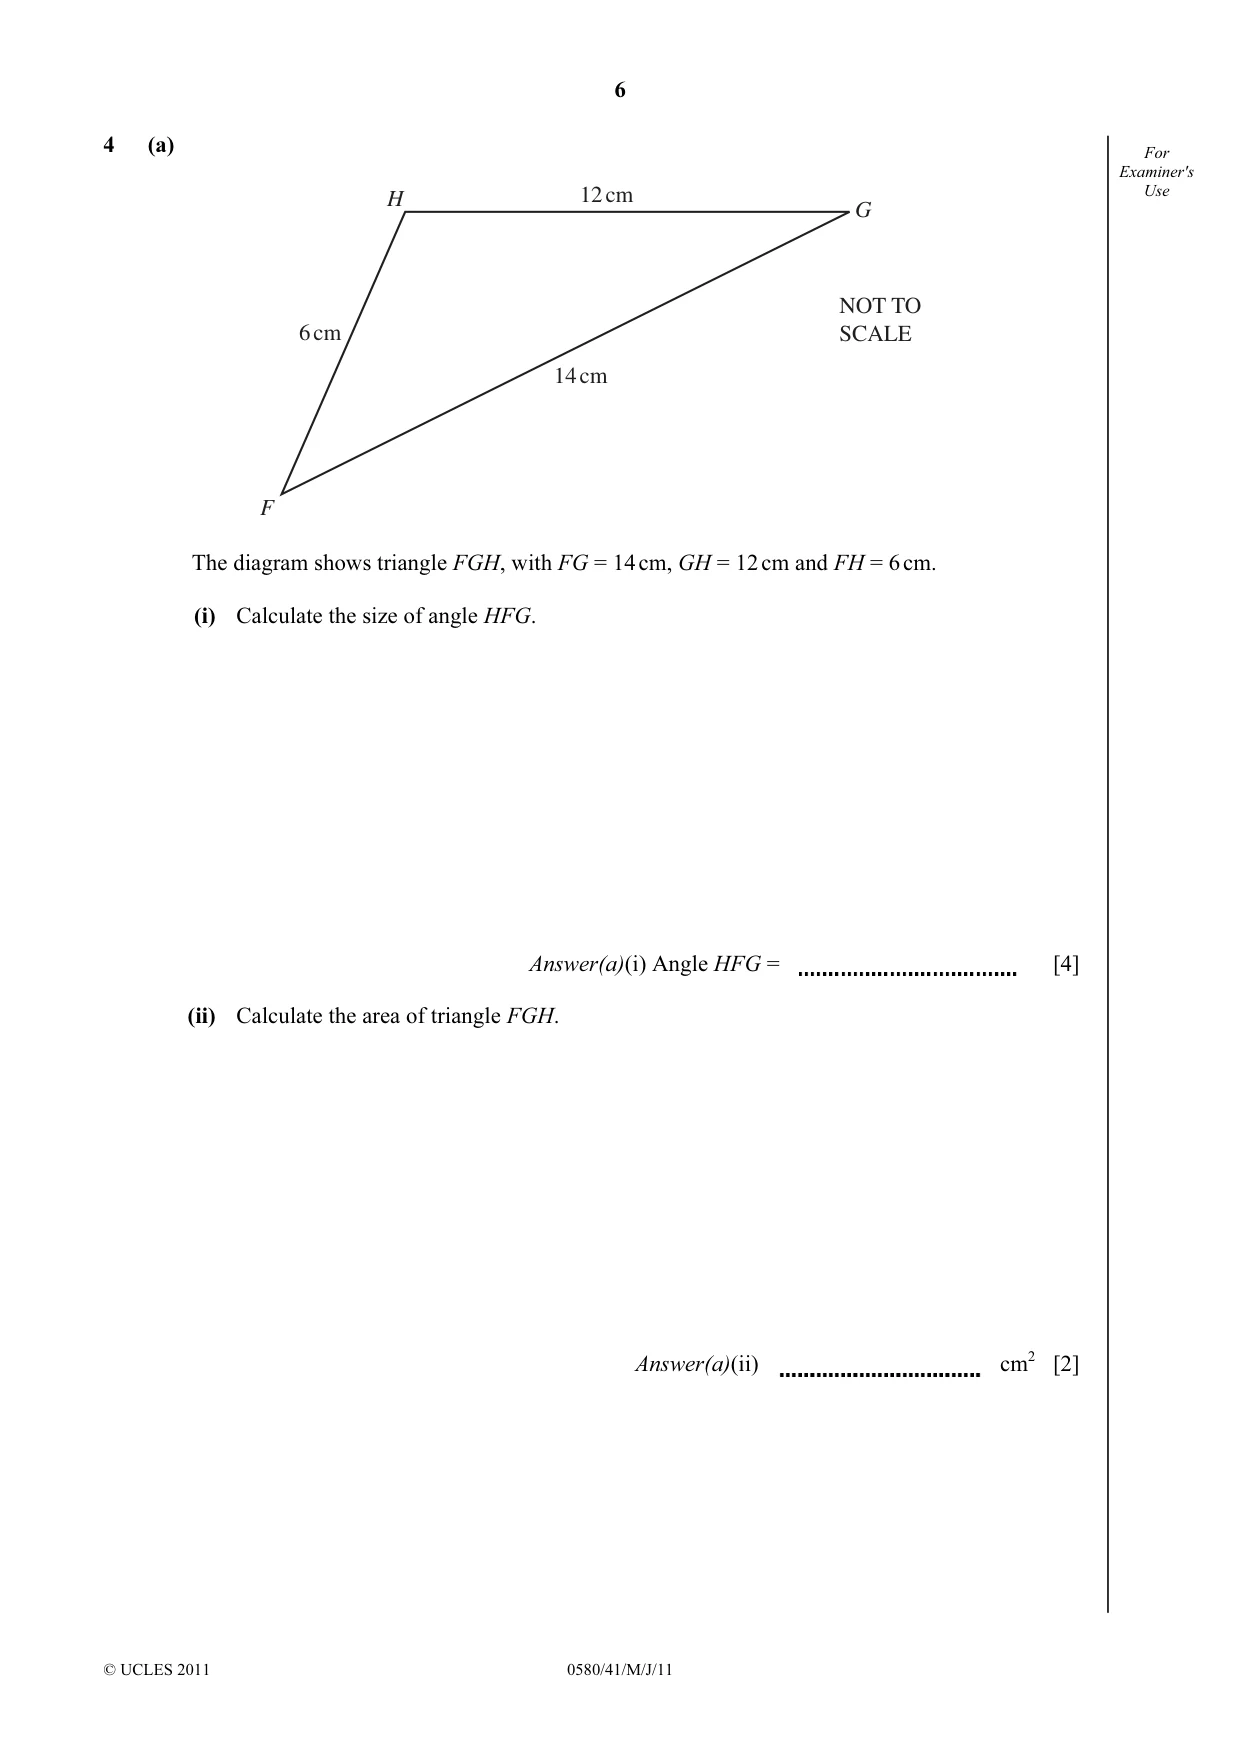
Q4 · For Examiner's 12 cm Use H G NOT TO 6 cm SCALE 14 cm F The diagram shows triangle FGH…
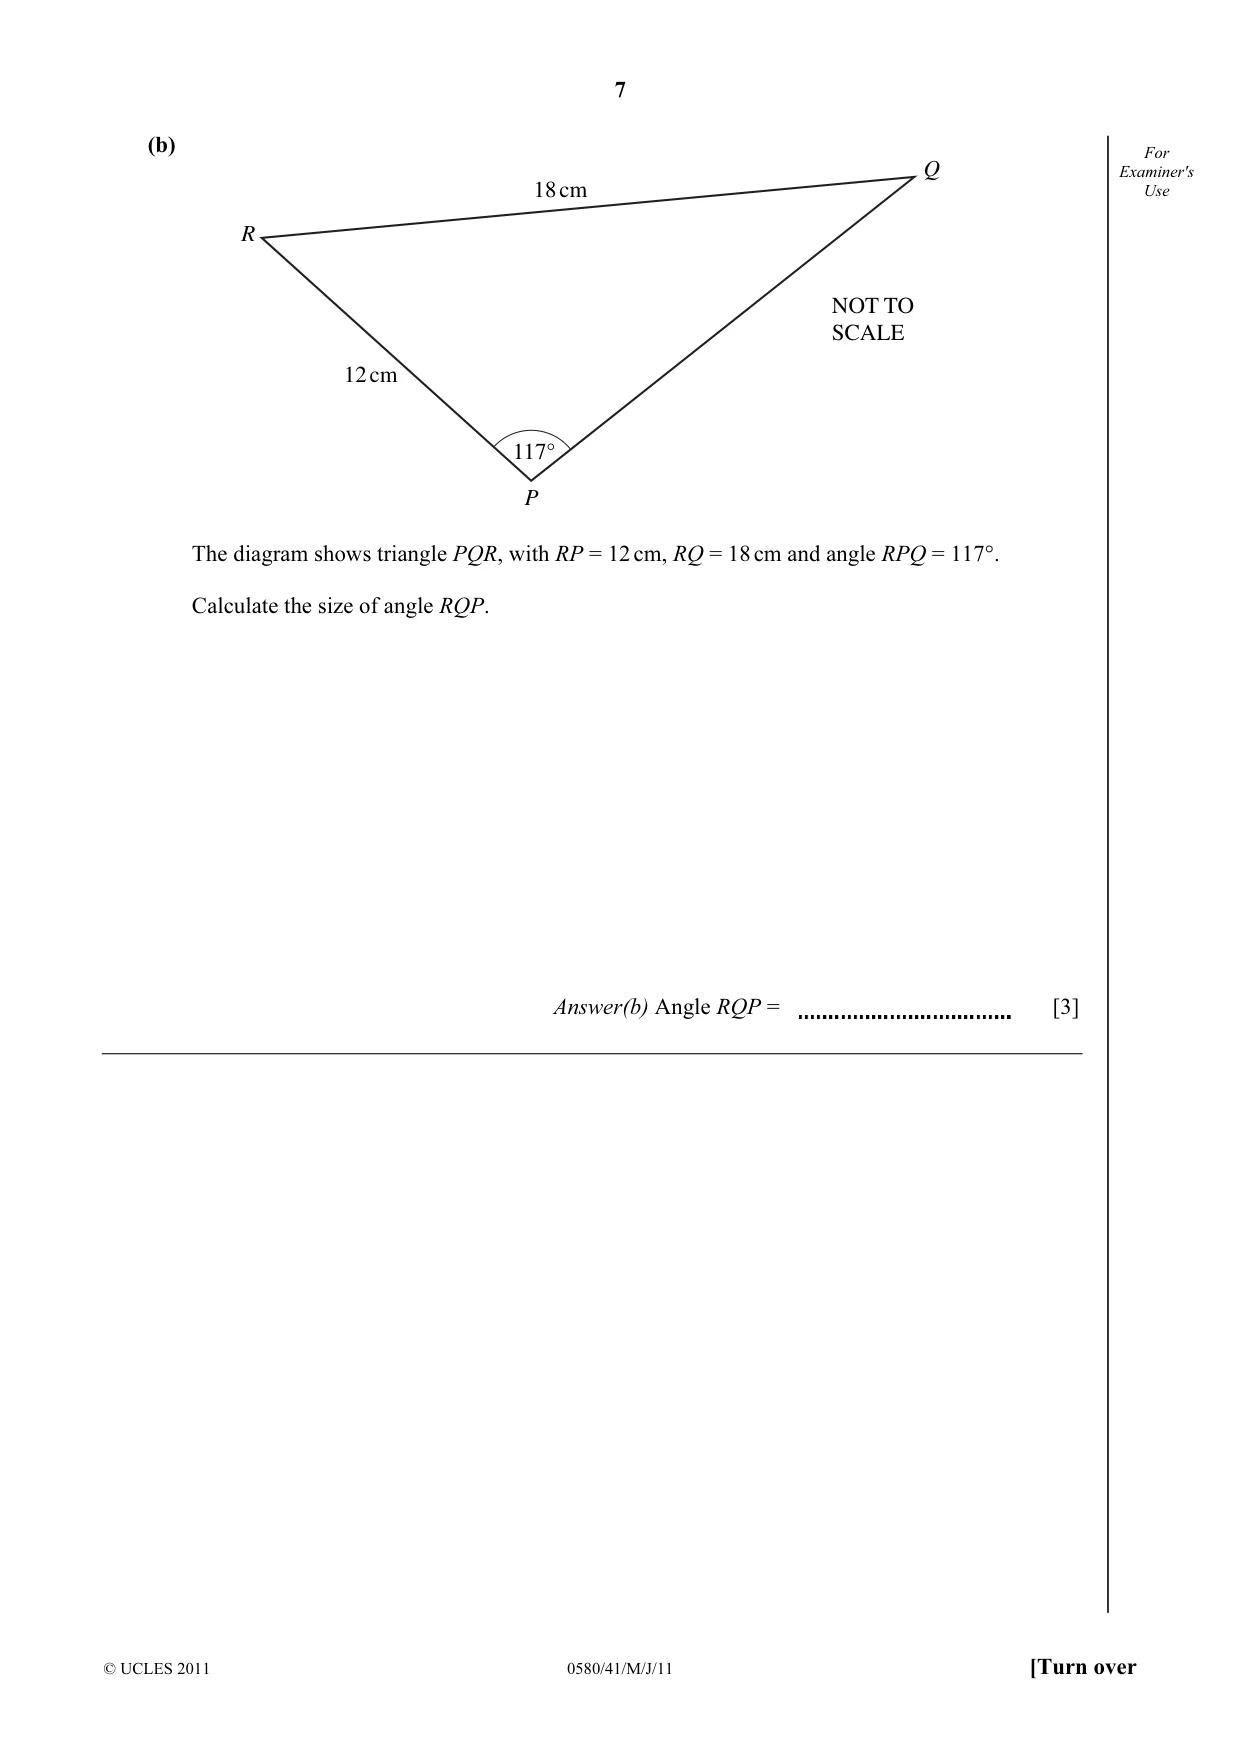
4 (a) For Examiner's 12 cm Use H G NOT TO 6 cm SCALE 14 cm F The diagram shows triangle FGH, with FG = 14 cm, GH = 12 cm and FH = 6 cm. (i) Calculate the size of angle HFG. Answer(a)(i) Angle HFG = [4] (ii) Calculate the area of triangle FGH. Answer(a)(ii) cm2 [2] (b) For Q Examiner's 18 cm Use R NOT TO SCALE 12 cm 117° P The diagram shows triangle PQR, with RP = 12 cm, RQ = 18 cm and angle RPQ = 117°. Calculate the size of angle RQP. Answer(b) Angle RQP = [3]
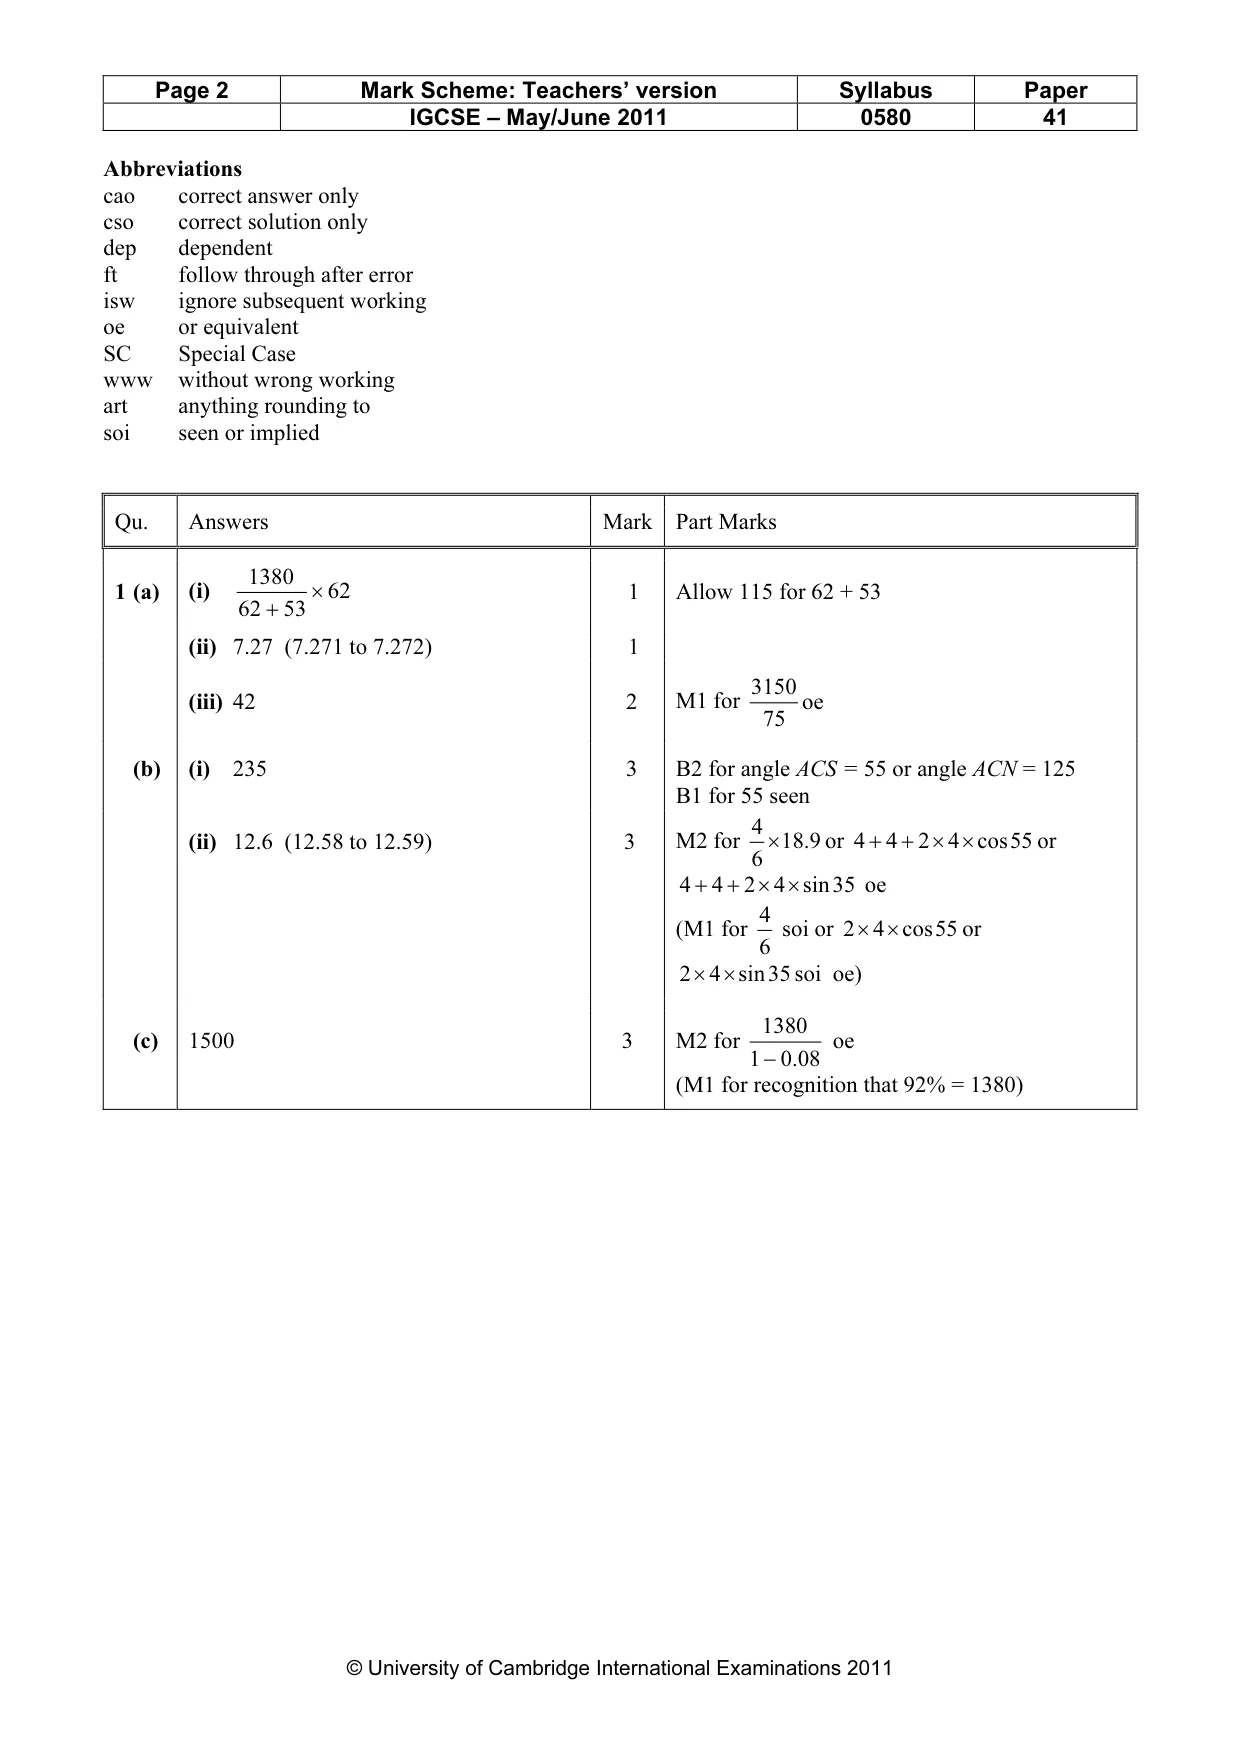
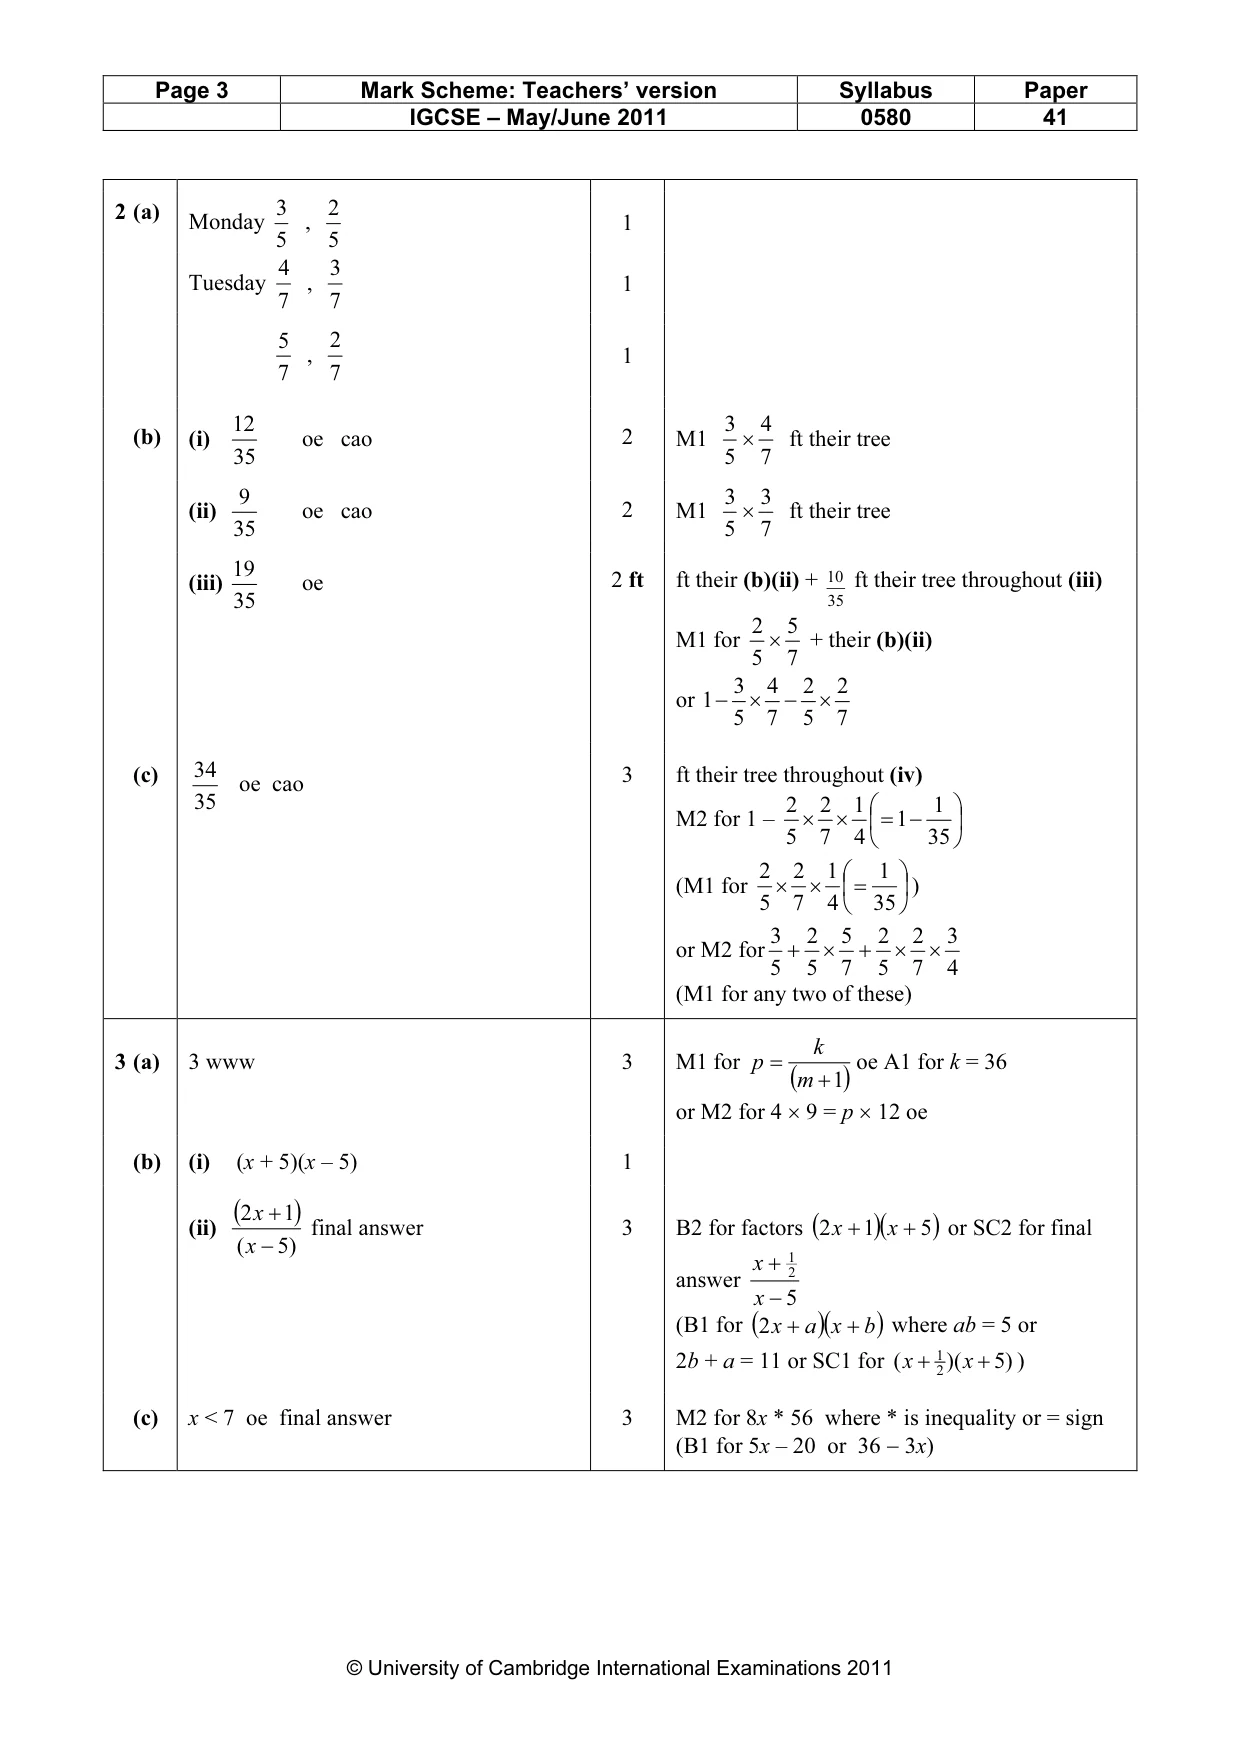
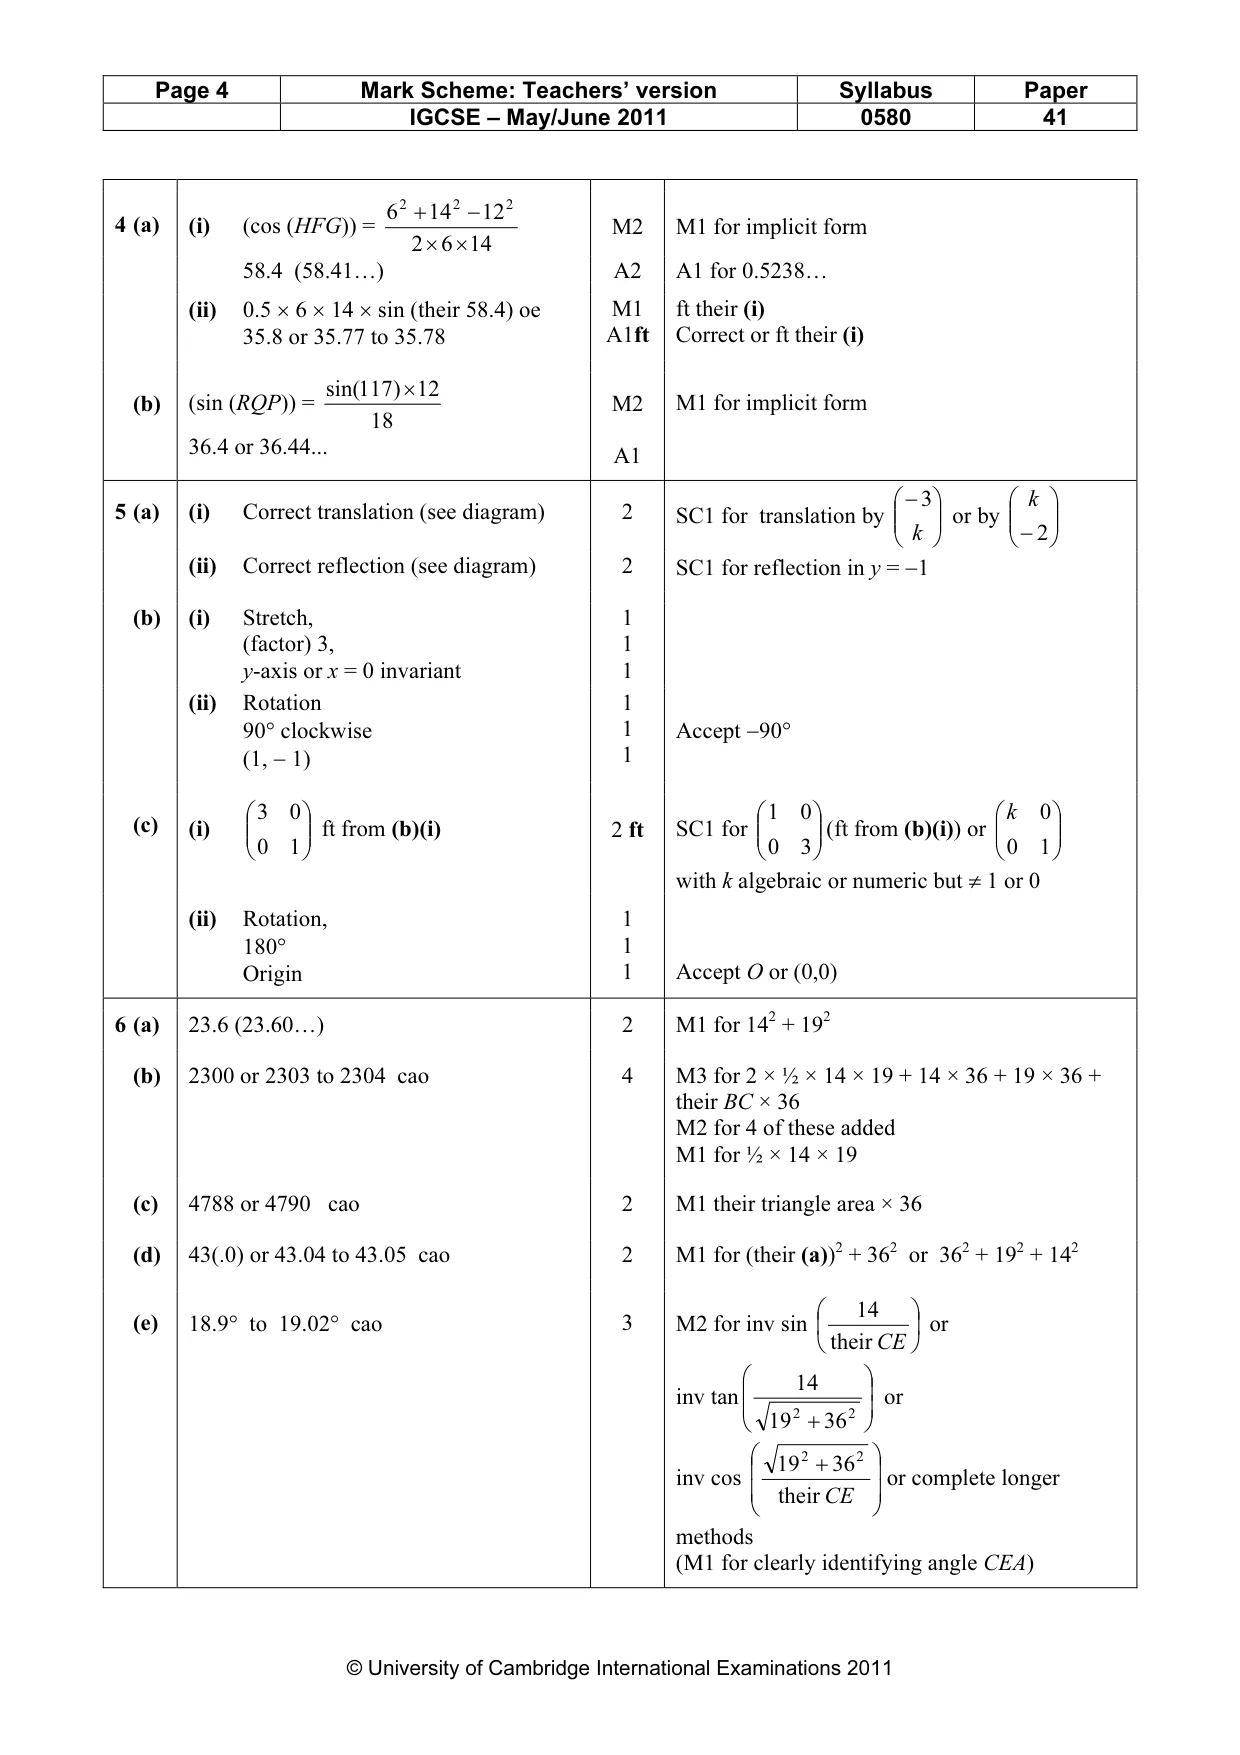
Mark scheme: 6 + 14 − 12 4 (a) (i) (cos (HFG)) = M2 M1 for implicit form 2 × 6 × 14 58.4 (58.41…) A2 A1 for 0.5238… (ii) 0.5 × 6 × 14 × sin (their 58.4) oe M1 ft their (i) 35.8 or 35.77 to 35.78 A1ft Correct or ft their (i) sin(117 ) × 12 (b) (sin (RQP)) = M2 M1 for implicit form 18 36.4 or 36.44... A1 3 k
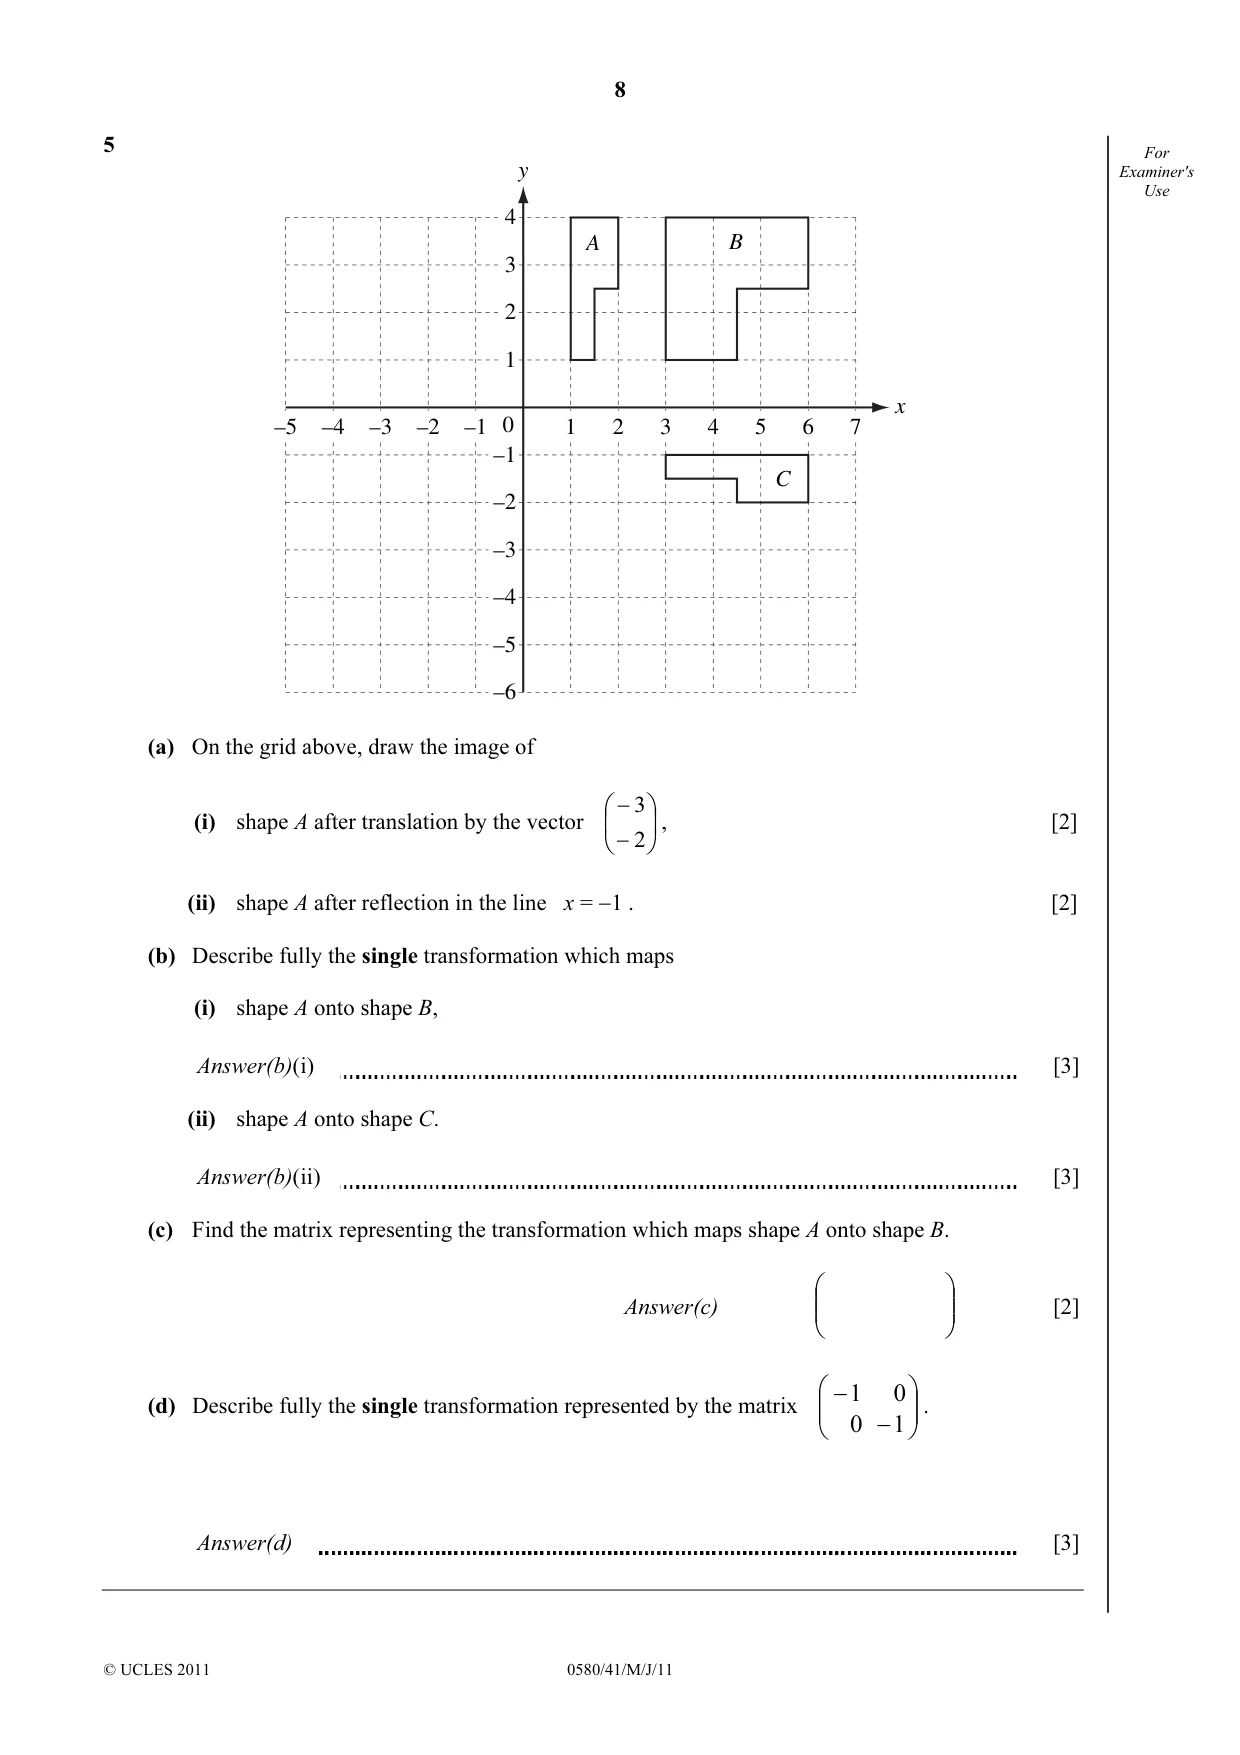
Q5 · For y Examiner's Use 4 A B 3 2 1 x –5 –4 –3 –2 –1 0 1 2 3 4 5 6 7 –1 C –2 –3 –4 –5 –6 (a)…
5 For y Examiner's Use 4 A B 3 2 1 x –5 –4 –3 –2 –1 0 1 2 3 4 5 6 7 –1 C –2 –3 –4 –5 –6 (a) On the grid above, draw the image of − 3 (i) shape A after translation by the vector , [2] − 2 (ii) shape A after reflection in the line x = −1 . [2] (b) Describe fully the single transformation which maps (i) shape A onto shape B, Answer(b)(i) [3] (ii) shape A onto shape C. Answer(b)(ii) [3] (c) Find the matrix representing the transformation which maps shape A onto shape B. Answer(c) [2] − 1 0 (d) Describe fully the single transformation represented by the matrix . 0 − 1 Answer(d) [3]
Mark scheme: − 3 k 5 (a) (i) Correct translation (see diagram) 2 SC1 for translation by or by k −2 (ii) Correct reflection (see diagram) 2 SC1 for reflection in y = −1 (b) (i) Stretch, 1 (factor) 3, 1 y-axis or x = 0 invariant 1 (ii) Rotation 1 90° clockwise 1 Accept −90° (1, − 1) 1 3 0 1 0 k 0 (c) (i) ft from (b)(i) 2 ft SC1 for (ft from (b)(i)) or 0 1 0 3 0 1 with k algebraic or numeric but ≠ 1 or 0 (ii) Rotation, 1 180° 1 Origin 1 Accept O or (0,0)
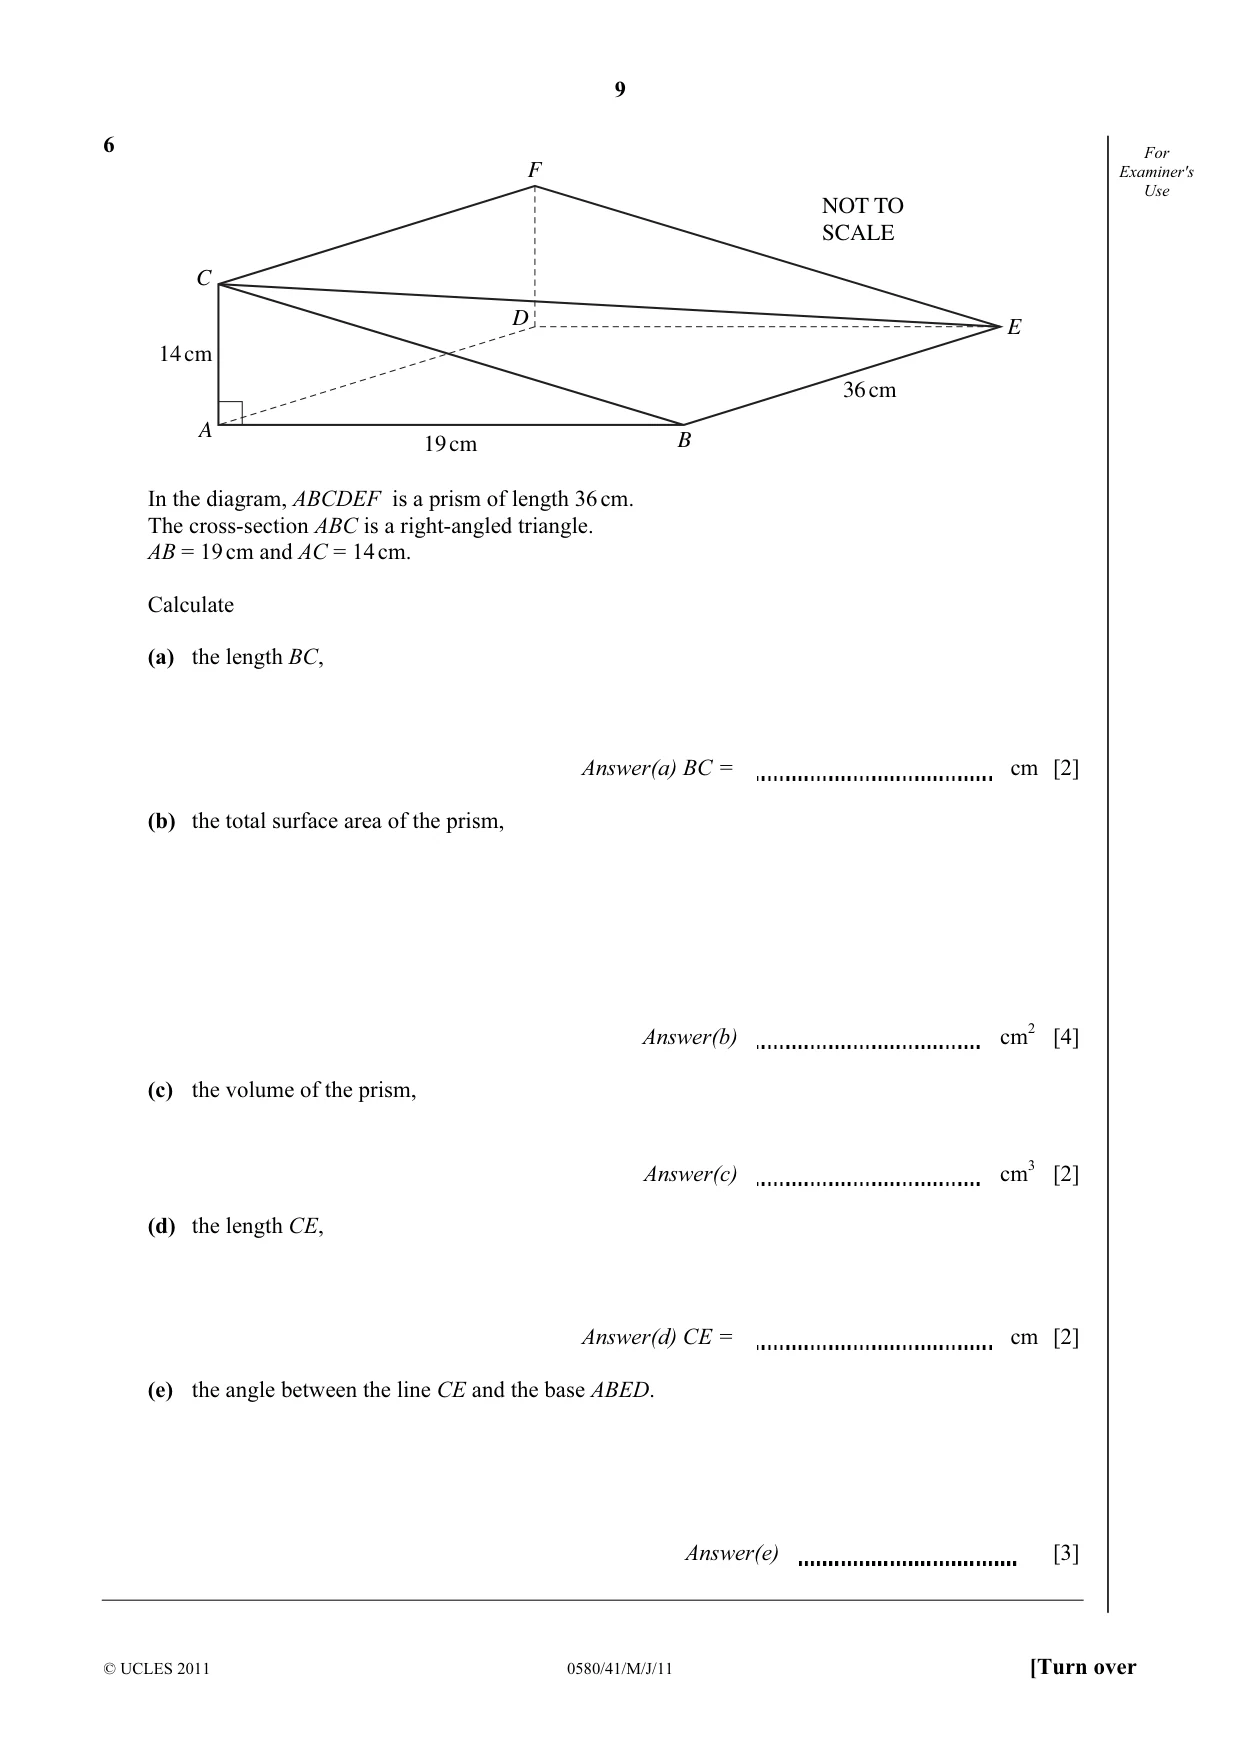
Q6 · For F Examiner's Use NOT TO SCALE C D E 14 cm 36 cm A 19 cm B In the diagram, ABCDEF is a…
6 For F Examiner's Use NOT TO SCALE C D E 14 cm 36 cm A 19 cm B In the diagram, ABCDEF is a prism of length 36 cm. The cross-section ABC is a right-angled triangle. AB = 19 cm and AC = 14 cm. Calculate (a) the length BC, Answer(a) BC = cm [2] (b) the total surface area of the prism, Answer(b) cm2 [4] (c) the volume of the prism, Answer(c) cm3 [2] (d) the length CE, Answer(d) CE = cm [2] (e) the angle between the line CE and the base ABED. Answer(e) [3]
Mark scheme: 6 (a) 23.6 (23.60…) 2 M1 for 142 + 192 (b) 2300 or 2303 to 2304 cao 4 M3 for 2 × ½ × 14 × 19 + 14 × 36 + 19 × 36 + their BC × 36 M2 for 4 of these added M1 for ½ × 14 × 19 (c) 4788 or 4790 cao 2 M1 their triangle area × 36 (d) 43(.0) or 43.04 to 43.05 cao 2 M1 for (their (a))2 + 362 or 362 + 192 + 142 14 (e) 18.9° to 19.02° cao 3 M2 for inv sin or their CE 14 inv tan 2 2 or 19 + 36 2 2 19 + 36 inv cos or complete longer their CE methods (M1 for clearly identifying angle CEA) IGCSE – May/June 2011 0580 41
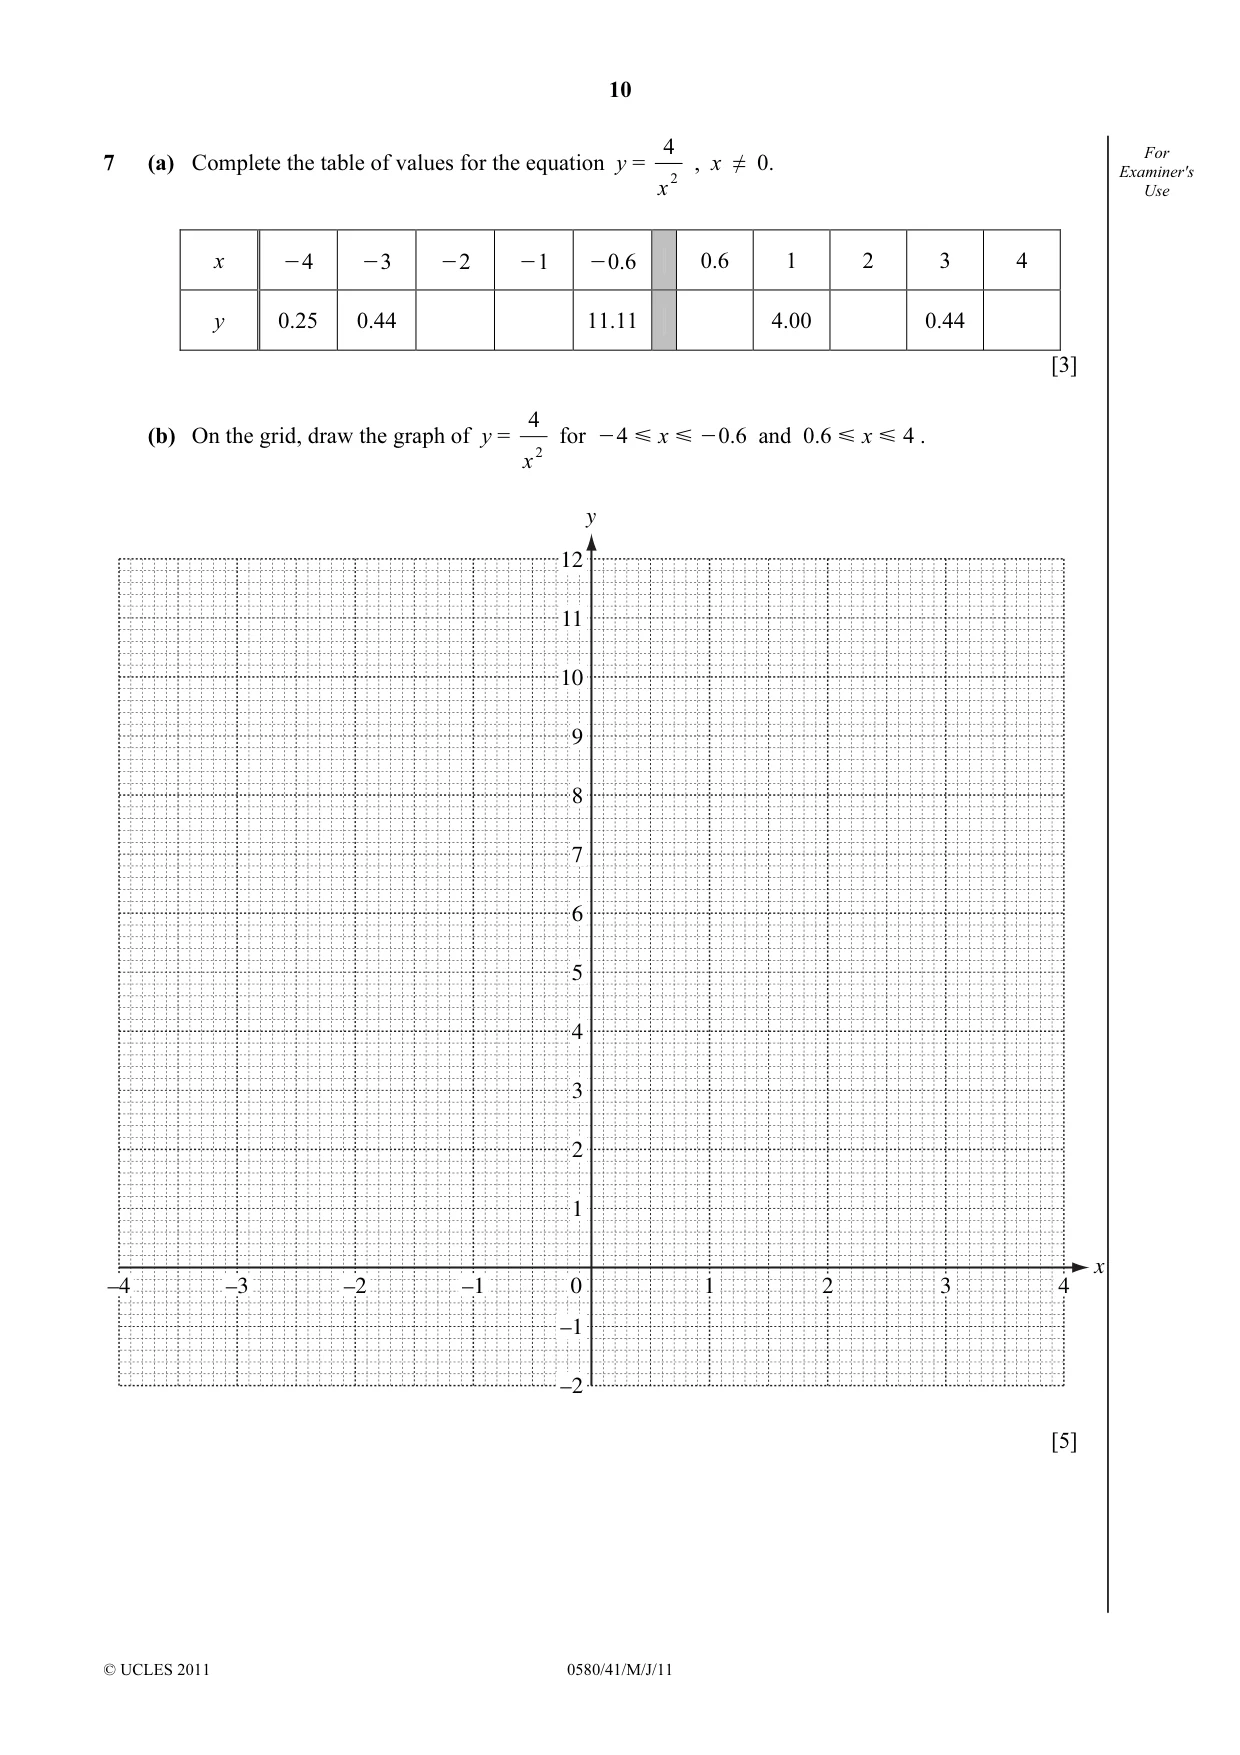
Q7 · For 7 (a) Complete the table of values for the equation y = , x ≠ 0
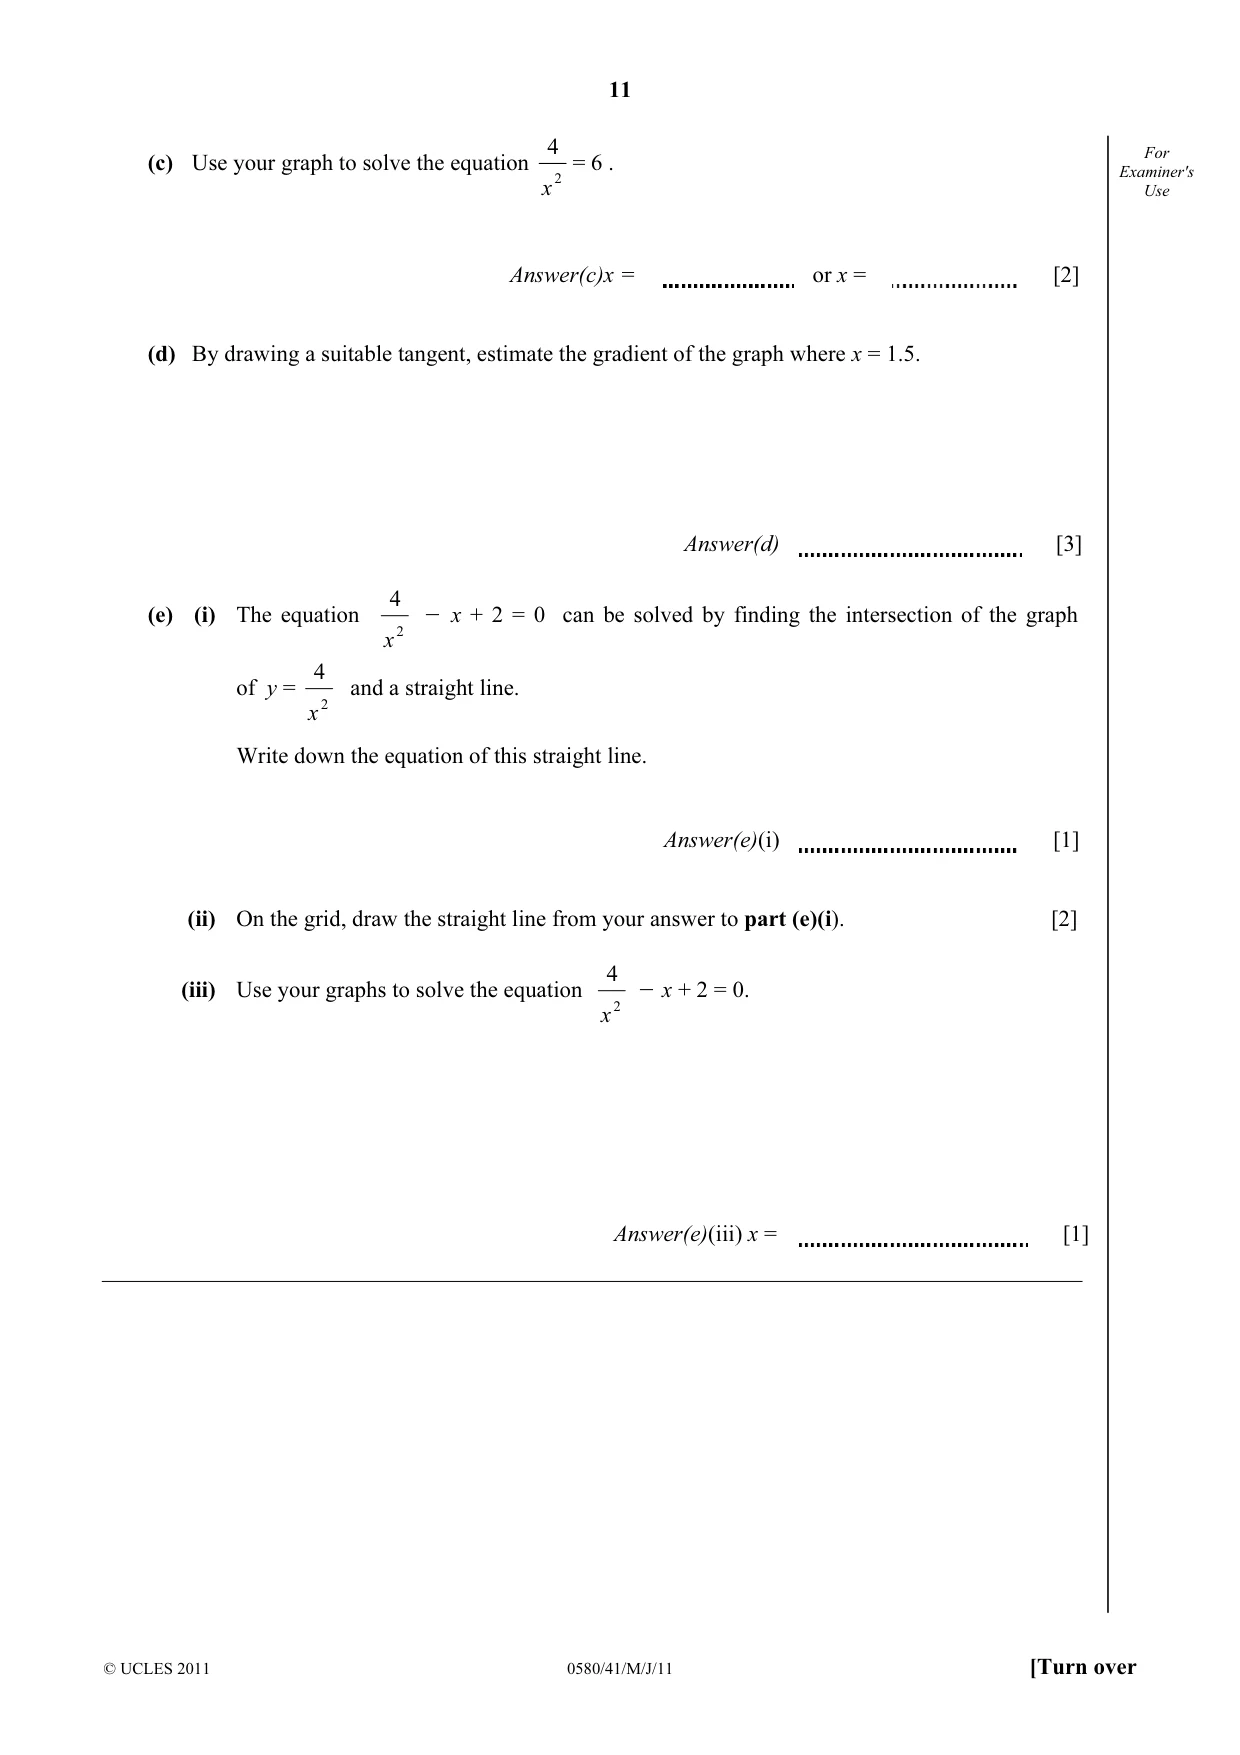
4 For 7 (a) Complete the table of values for the equation y = , x ≠ 0. Examiner's x 2 Use x O4 O3 O2 O1 O0.6 0.6 1 2 3 4 y 0.25 0.44 11.11 4.00 0.44 [3] 4 (b) On the grid, draw the graph of y = for O4 Y x Y O0.6 and 0.6 Y x Y 4 . x 2 y 12 11 10 9 8 7 6 5 4 3 2 1 x –4 –3 –2 –1 0 1 2 3 4 –1 –2 [5] 4 For (c) Use your graph to solve the equation = 6 . Examiner's x 2 Use Answer(c)x = or x = [2] (d) By drawing a suitable tangent, estimate the gradient of the graph where x = 1.5. Answer(d) [3] 4 (e) (i) The equation O x + 2 = 0 can be solved by finding the intersection of the graph x 2 4 of y = and a straight line. x 2 Write down the equation of this straight line. Answer(e)(i) [1] (ii) On the grid, draw the straight line from your answer to part (e)(i). [2] 4 (iii) Use your graphs to solve the equation O x + 2 = 0. x 2 Answer(e)(iii) x = [1]
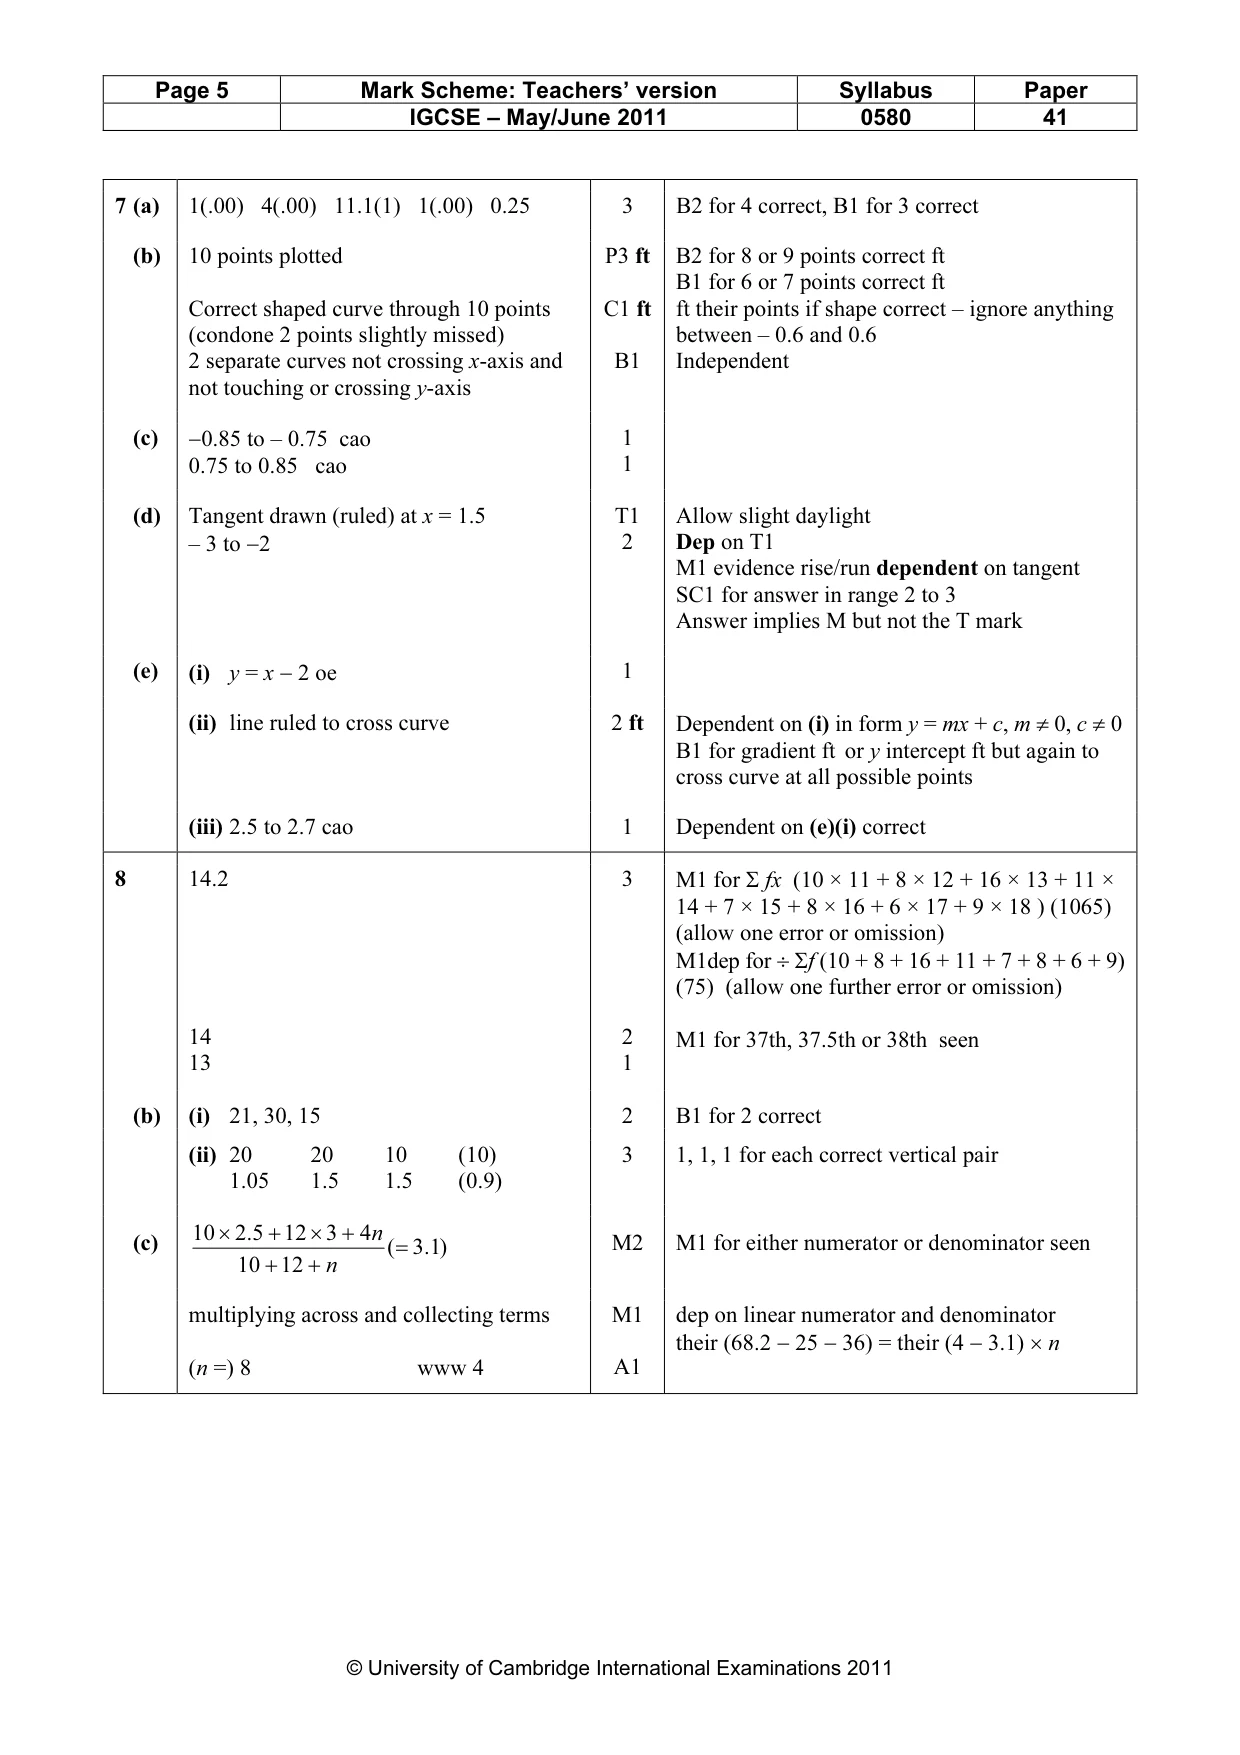
Mark scheme: 7 (a) 1(.00) 4(.00) 11.1(1) 1(.00) 0.25 3 B2 for 4 correct, B1 for 3 correct (b) 10 points plotted P3 ft B2 for 8 or 9 points correct ft B1 for 6 or 7 points correct ft Correct shaped curve through 10 points C1 ft ft their points if shape correct – ignore anything (condone 2 points slightly missed) between – 0.6 and 0.6 2 separate curves not crossing x-axis and B1 Independent not touching or crossing y-axis (c) −0.85 to – 0.75 cao 1 0.75 to 0.85 cao 1 (d) Tangent drawn (ruled) at x = 1.5 T1 Allow slight daylight – 3 to −2 2 Dep on T1 M1 evidence rise/run dependent on tangent SC1 for answer in range 2 to 3 Answer implies M but not the T mark (e) (i) y = x − 2 oe 1 (ii) line ruled to cross curve 2 ft Dependent on (i) in form y = mx + c, m ≠ 0, c ≠ 0 B1 for gradient ft or y intercept ft but again to cross curve at all possible points (iii) 2.5 to 2.7 cao 1 Dependent on (e)(i) correct
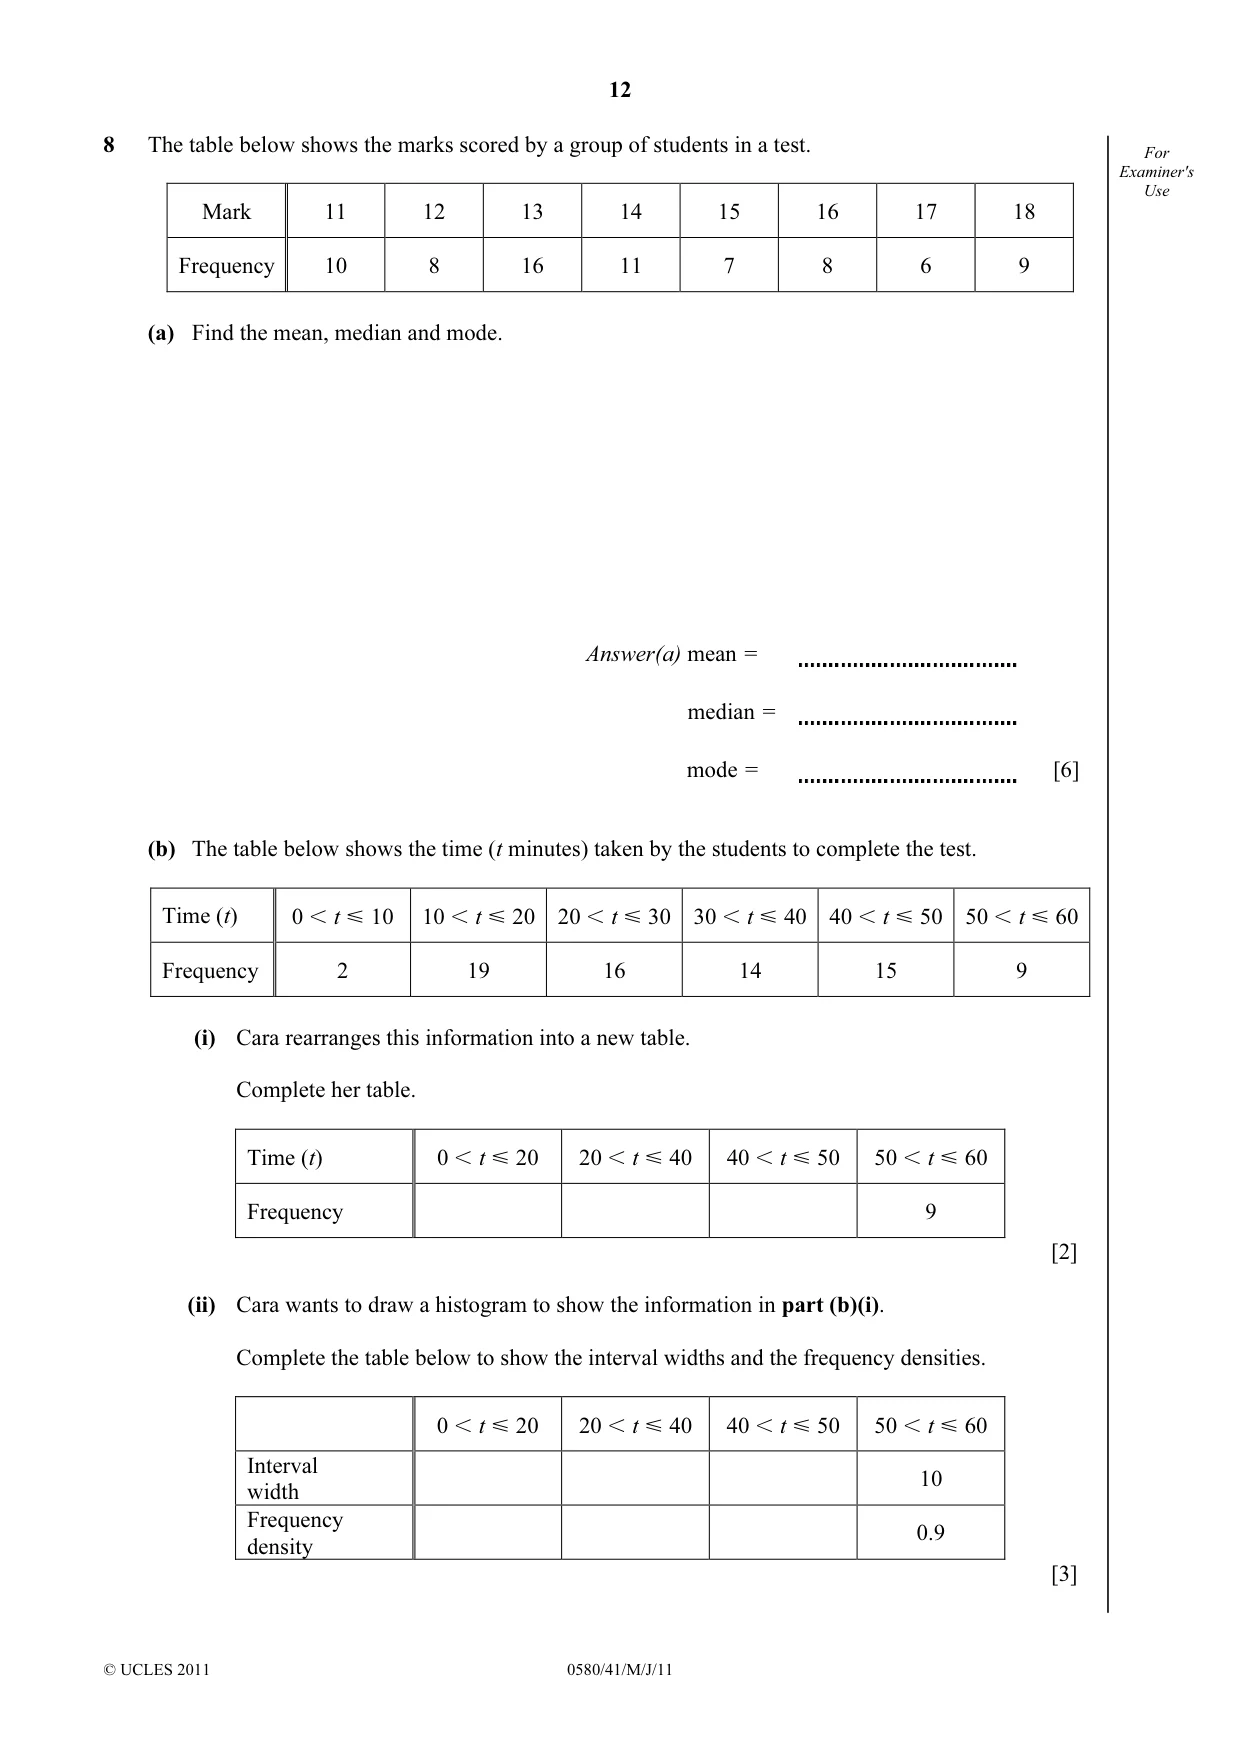
Q8 · The table below shows the marks scored by a group of students in a test
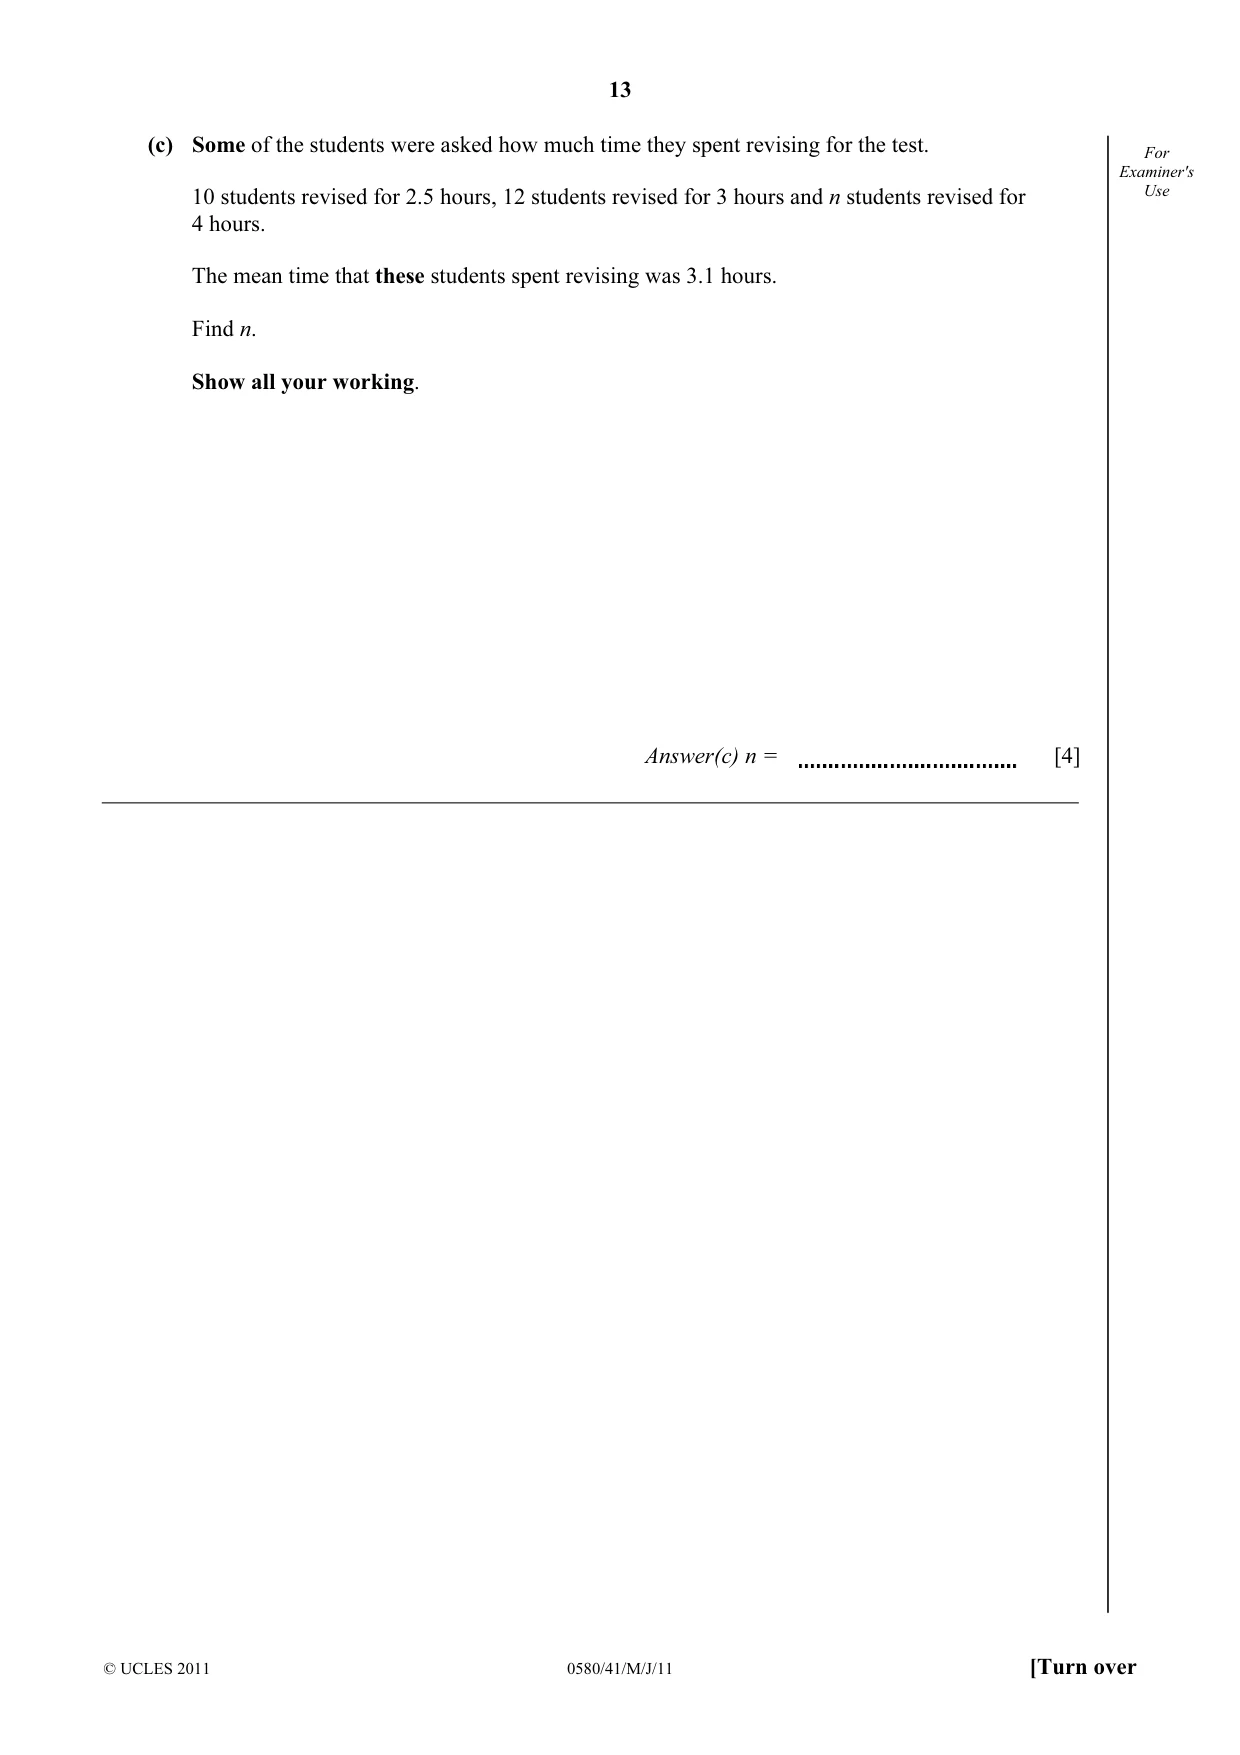
8 The table below shows the marks scored by a group of students in a test. For Examiner's Use Mark 11 12 13 14 15 16 17 18 Frequency 10 8 16 11 7 8 6 9 (a) Find the mean, median and mode. Answer(a) mean = median = mode = [6] (b) The table below shows the time (t minutes) taken by the students to complete the test. Time (t) 0 I=t Y=10 10 I=t Y=20 20 I=t Y=30 30 I=t Y=40 40 I=t Y=50 50 I=t Y=60 Frequency 2 19 16 14 15 9 (i) Cara rearranges this information into a new table. Complete her table. Time (t) 0 I=t Y=20 20 I=t Y=40 40 I=t Y=50 50 I=t Y=60 Frequency 9 [2] (ii) Cara wants to draw a histogram to show the information in part (b)(i). Complete the table below to show the interval widths and the frequency densities. 0 I=t Y=20 20 I=t Y=40 40 I=t Y=50 50 I=t Y=60 Interval 10 width Frequency 0.9 density [3] (c) Some of the students were asked how much time they spent revising for the test. For Examiner's 10 students revised for 2.5 hours, 12 students revised for 3 hours and n students revised for Use 4 hours. The mean time that these students spent revising was 3.1 hours. Find n. Show all your working. Answer(c) n = [4]
Mark scheme: 8 14.2 3 M1 for Σ fx (10 × 11 + 8 × 12 + 16 × 13 + 11 × 14 + 7 × 15 + 8 × 16 + 6 × 17 + 9 × 18 ) (1065) (allow one error or omission) M1dep for ÷ Σf (10 + 8 + 16 + 11 + 7 + 8 + 6 + 9) (75) (allow one further error or omission) 14 2 M1 for 37th, 37.5th or 38th seen 13 1 (b) (i) 21, 30, 15 2 B1 for 2 correct (ii) 20 20 10 (10) 3 1, 1, 1 for each correct vertical pair 1.05 1.5 1.5 (0.9) (c) 10 × 5.2 + 12 × 3 + 4 n ( = )1.3 M2 M1 for either numerator or denominator seen 10 + 12 + n multiplying across and collecting terms M1 dep on linear numerator and denominator their (68.2 − 25 − 36) = their (4 − 3.1) × n (n =) 8 www 4 A1 IGCSE – May/June 2011 0580 41
Q9 · Peter wants to plant x plum trees and y apple trees
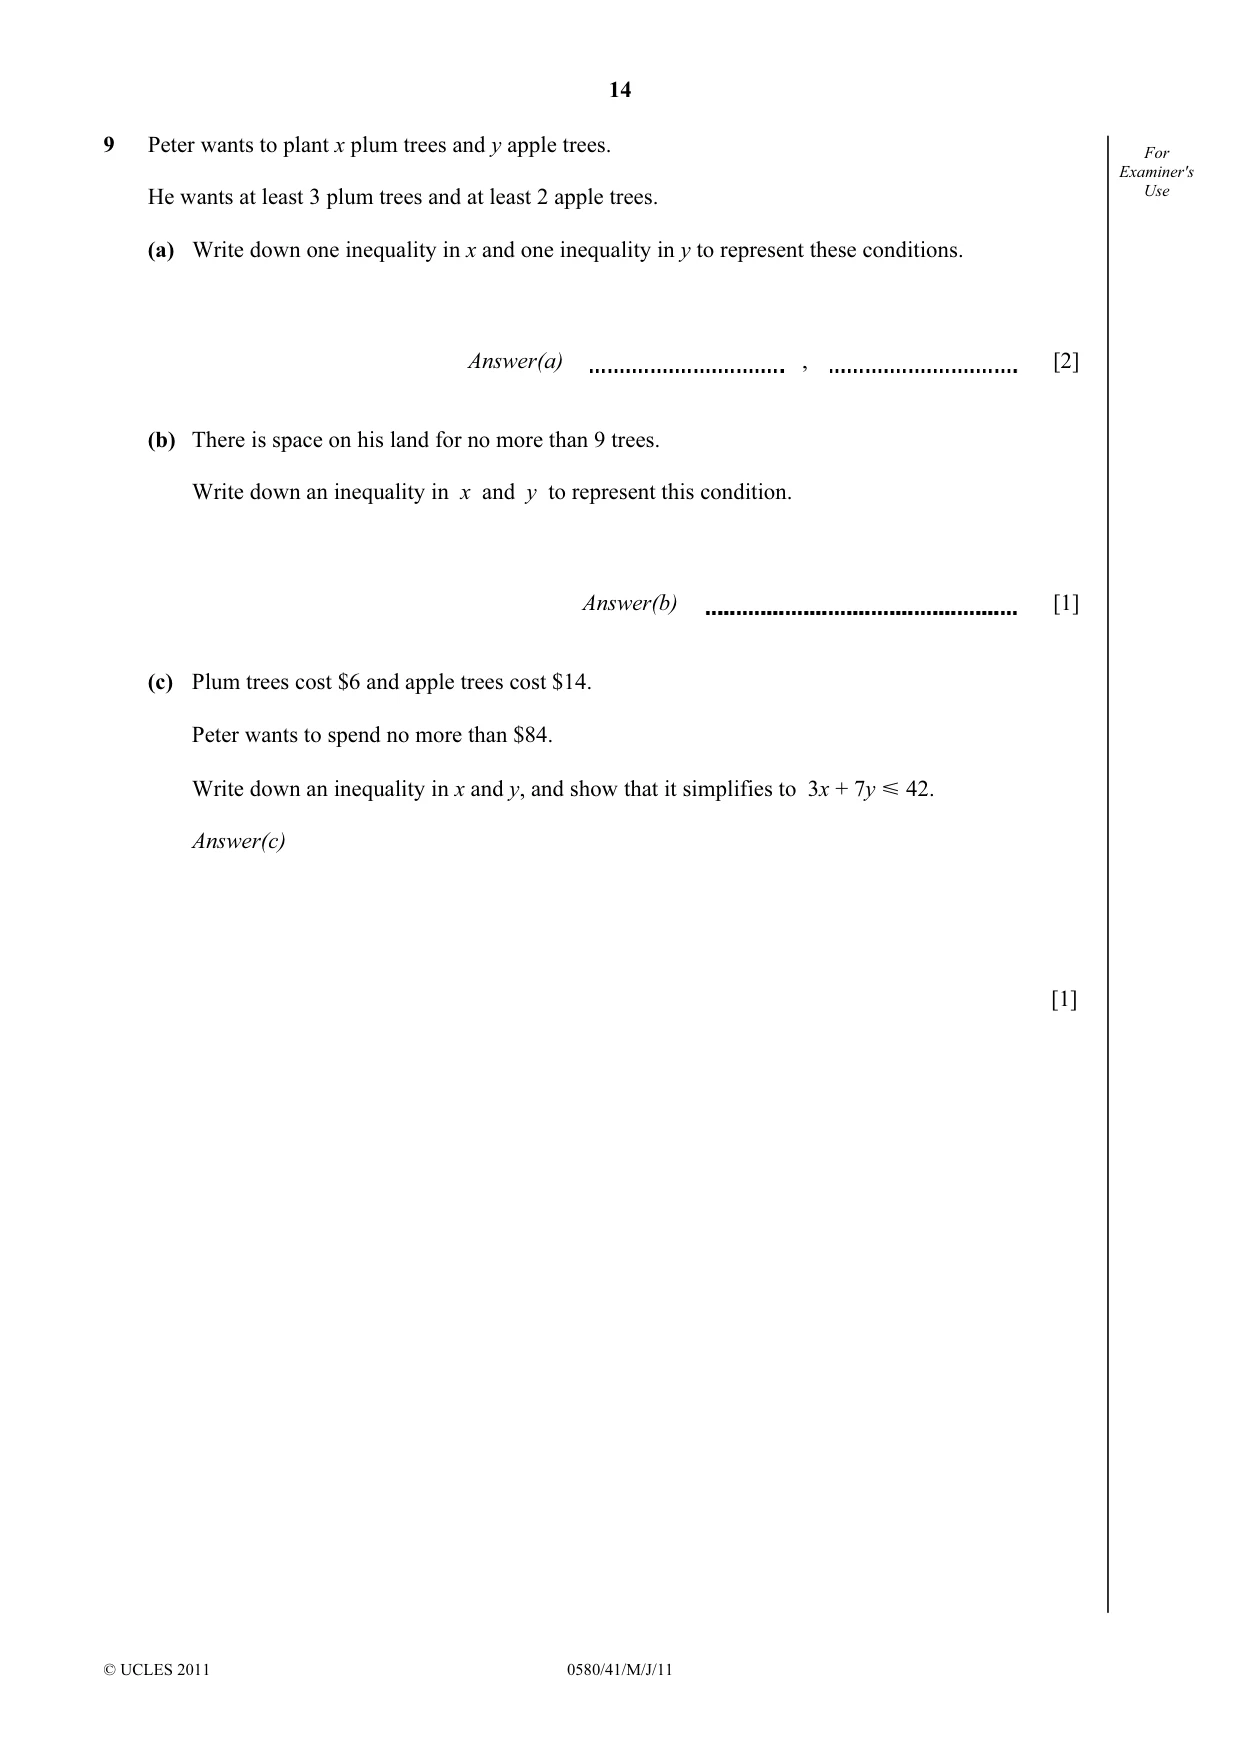
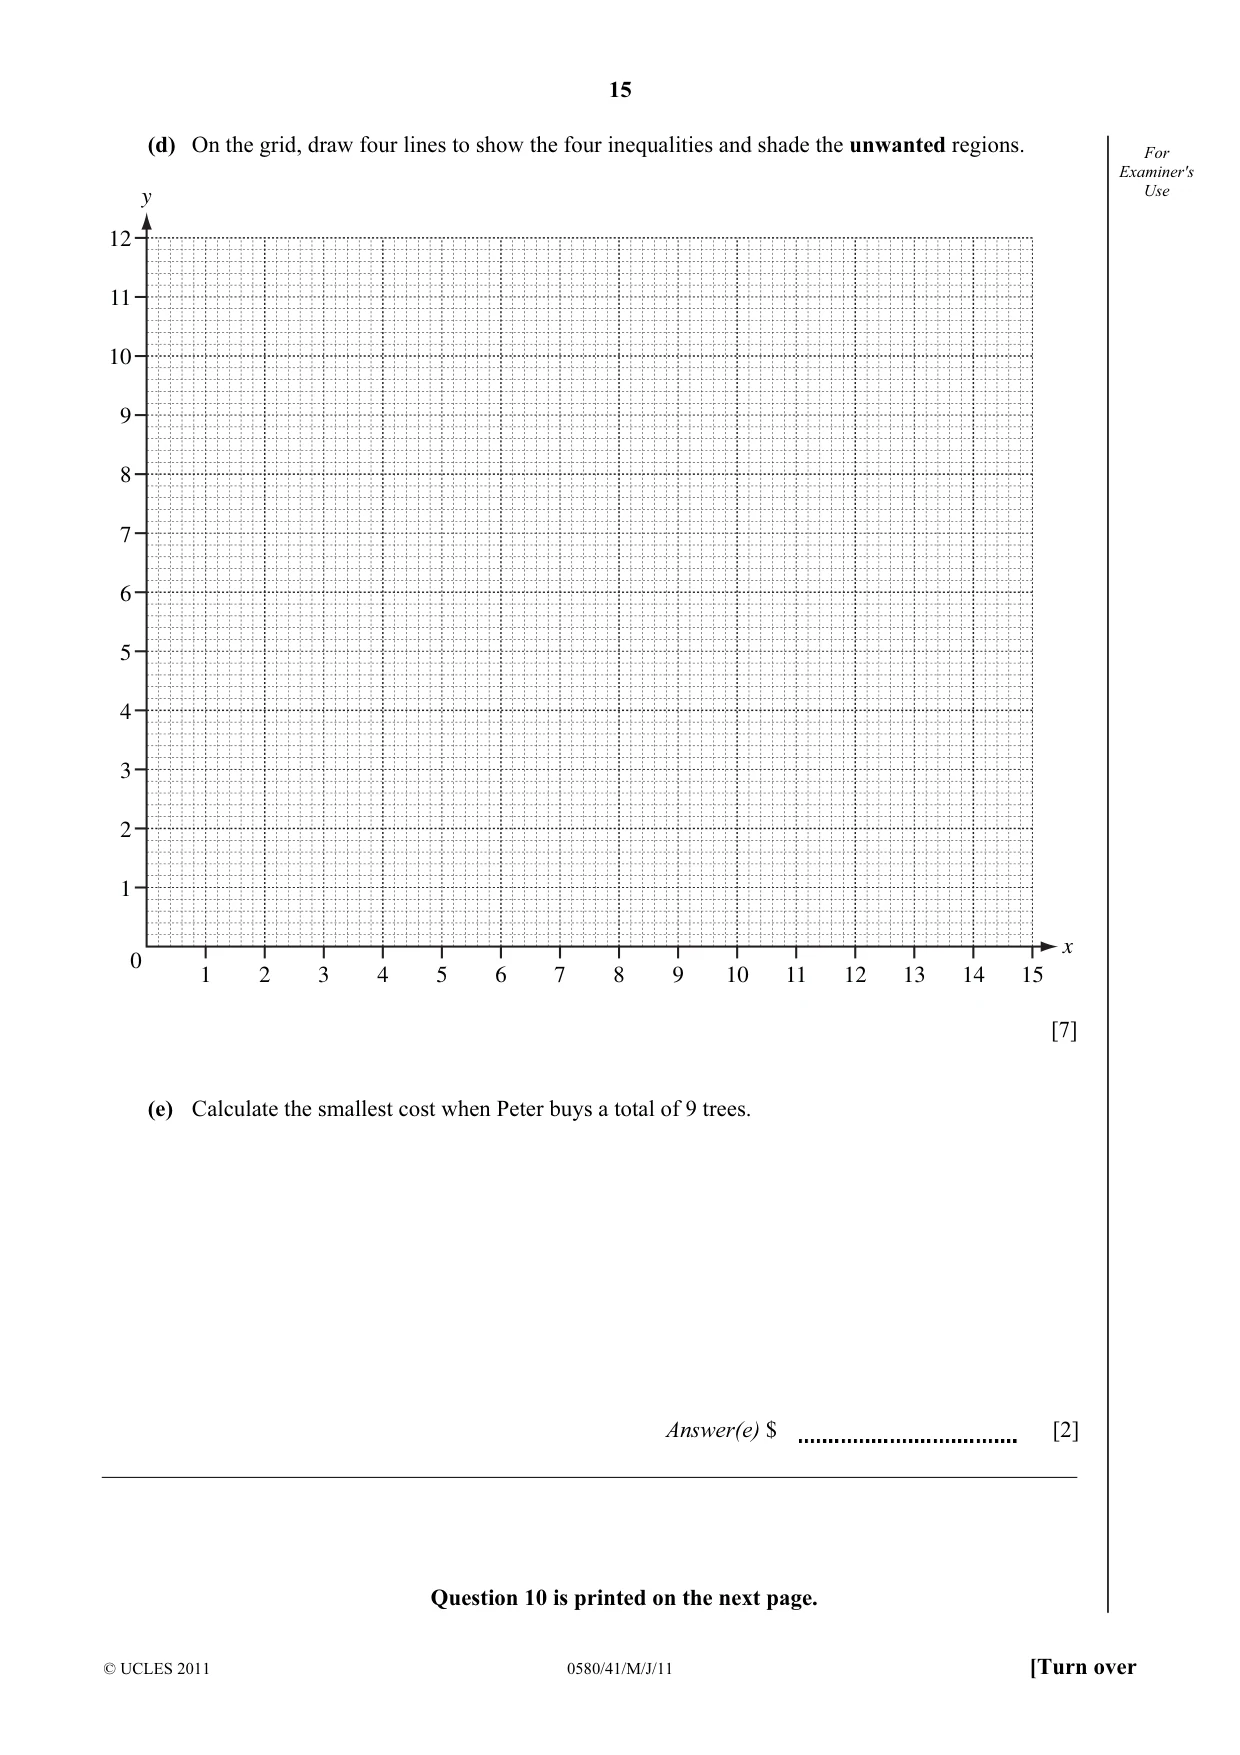
9 Peter wants to plant x plum trees and y apple trees. For Examiner's He wants at least 3 plum trees and at least 2 apple trees. Use (a) Write down one inequality in x and one inequality in y to represent these conditions. Answer(a) , [2] (b) There is space on his land for no more than 9 trees. Write down an inequality in x and y to represent this condition. Answer(b) [1] (c) Plum trees cost $6 and apple trees cost $14. Peter wants to spend no more than $84. Write down an inequality in x and y, and show that it simplifies to 3x + 7y Y 42. Answer(c) [1] (d) On the grid, draw four lines to show the four inequalities and shade the unwanted regions. For Examiner's y Use 12 11 10 9 8 7 6 5 4 3 2 1 x 0 1 2 3 4 5 6 7 8 9 10 11 12 13 14 15 [7] (e) Calculate the smallest cost when Peter buys a total of 9 trees. Answer(e) $ [2] Question 10 is printed on the next page.
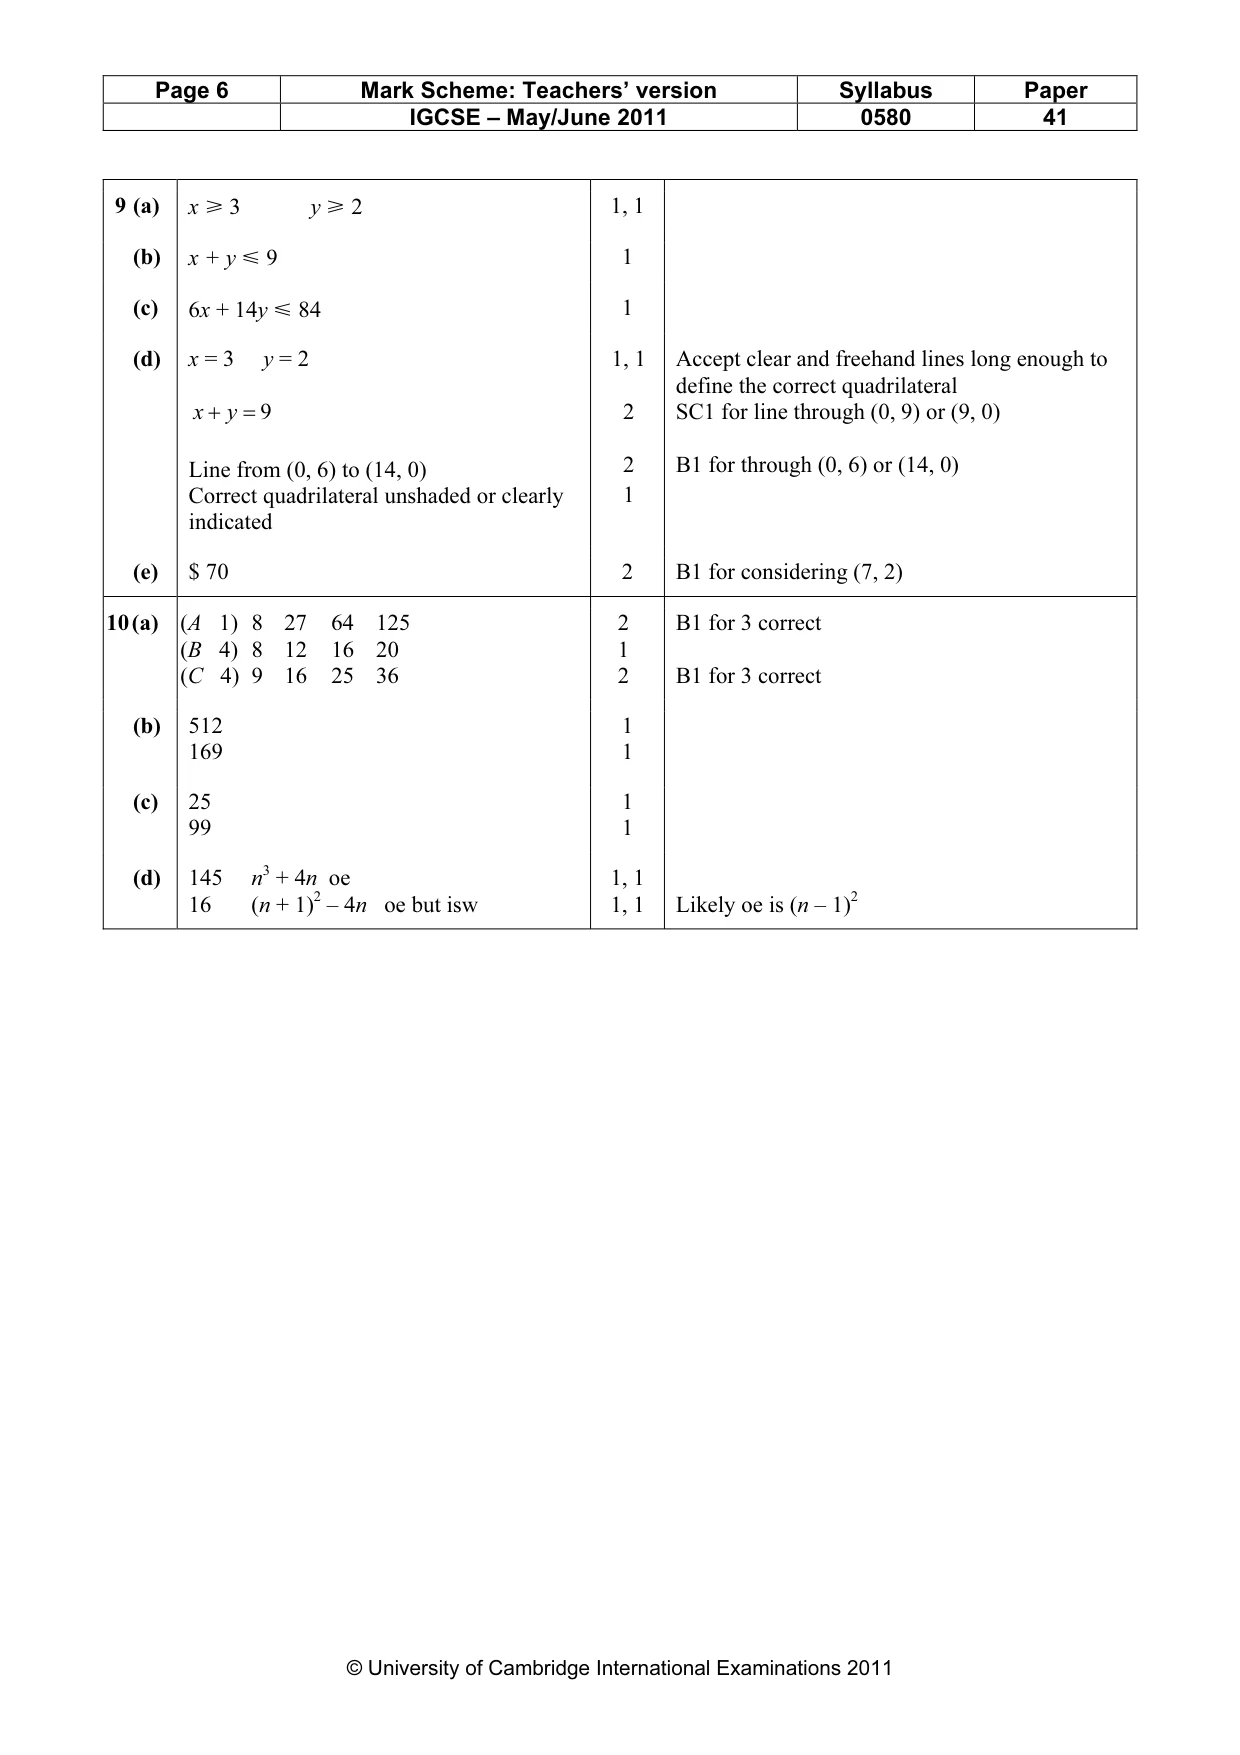
Mark scheme: 9 (a) x [=3 y [=2 1, 1 (b) x + y Y 9 1 (c) 6x + 14y Y 84 1 (d) x = 3 y = 2 1, 1 Accept clear and freehand lines long enough to define the correct quadrilateral x + y = 9 2 SC1 for line through (0, 9) or (9, 0) Line from (0, 6) to (14, 0) 2 B1 for through (0, 6) or (14, 0) Correct quadrilateral unshaded or clearly 1 indicated (e) $ 70 2 B1 for considering (7, 2)
Q10 · The first and the nth terms of sequences A, B and C are shown in the table below
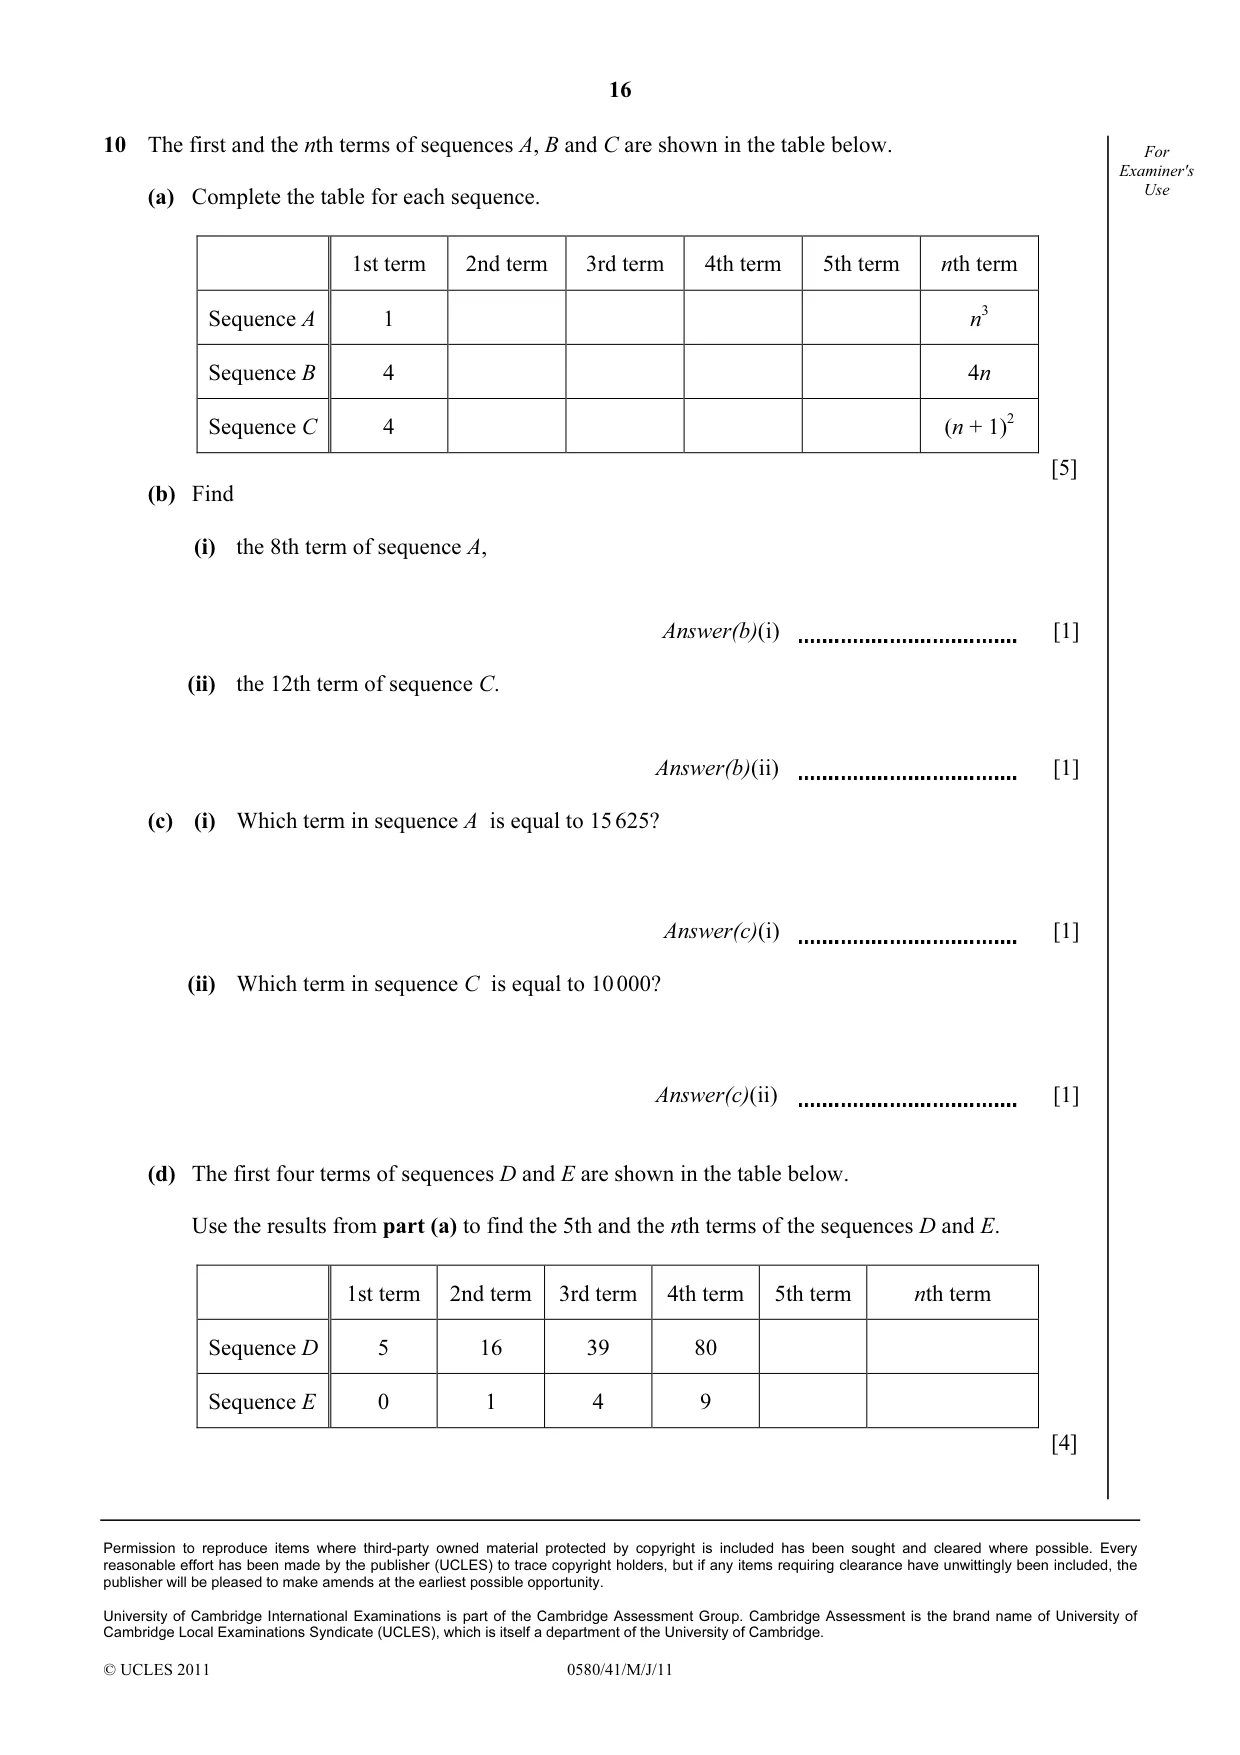
10 The first and the nth terms of sequences A, B and C are shown in the table below. For Examiner's (a) Complete the table for each sequence. Use 1st term 2nd term 3rd term 4th term 5th term nth term Sequence A 1 n3 Sequence B 4 4n Sequence C 4 (n + 1)2 [5] (b) Find (i) the 8th term of sequence A, Answer(b)(i) [1] (ii) the 12th term of sequence C. Answer(b)(ii) [1] (c) (i) Which term in sequence A is equal to 15 625? Answer(c)(i) [1] (ii) Which term in sequence C is equal to 10 000? Answer(c)(ii) [1] (d) The first four terms of sequences D and E are shown in the table below. Use the results from part (a) to find the 5th and the nth terms of the sequences D and E. 1st term 2nd term 3rd term 4th term 5th term nth term Sequence D 5 16 39 80 Sequence E 0 1 4 9 [4]
Mark scheme: 10 (a) (A 1) 8 27 64 125 2 B1 for 3 correct (B 4) 8 12 16 20 1 (C 4) 9 16 25 36 2 B1 for 3 correct (b) 512 1 169 1 (c) 25 1 99 1 (d) 145 n3 + 4n oe 1, 1 16 (n + 1)2 – 4n oe but isw 1, 1 Likely oe is (n – 1)2
What was in this paper
The subtopics covered by these 7 questions, and how many questions each got. Open one in a new tab to see every Cambridge question on it.
What you needed in this session
Cambridge’s own grade thresholds for 2011 May/June, Paper 4 · Variant 1. A higher threshold means an easier paper — the bar moves with how the cohort did.