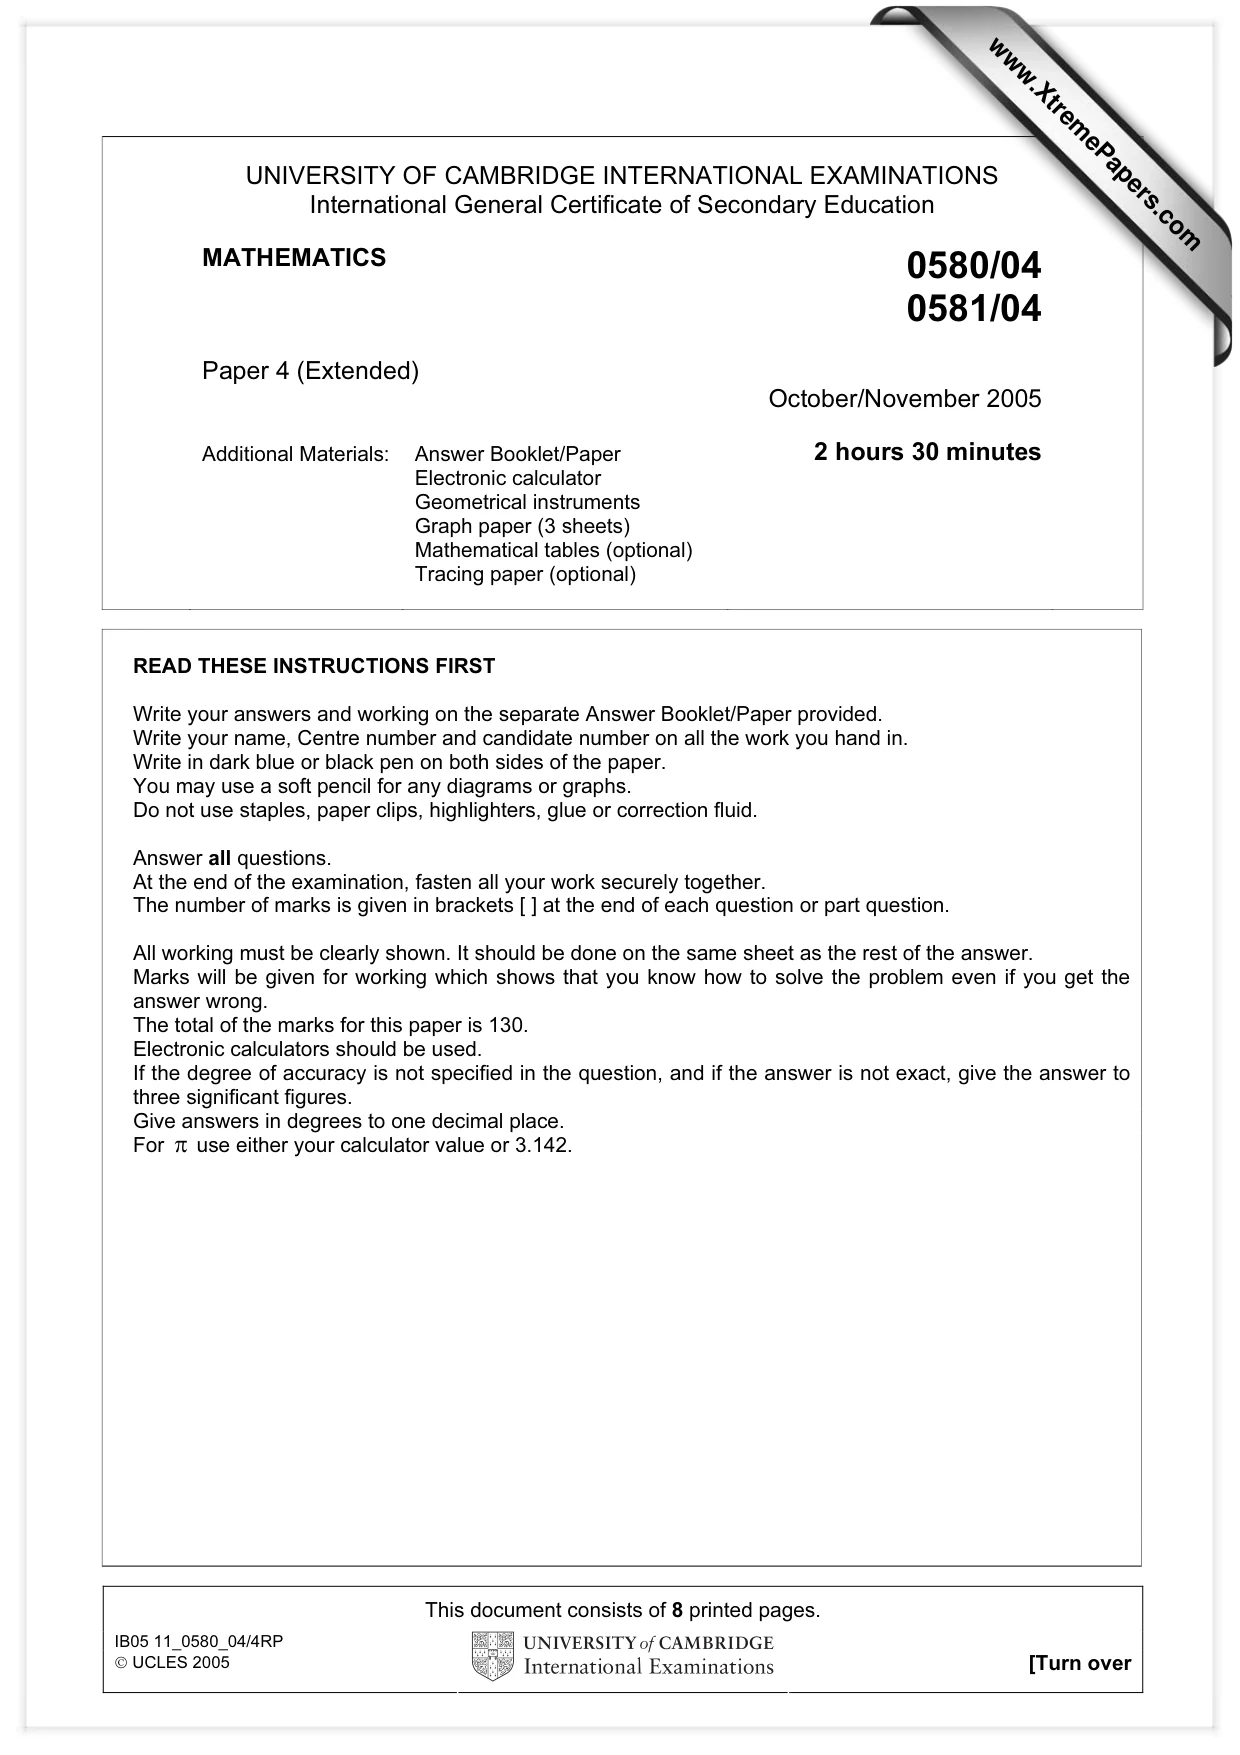
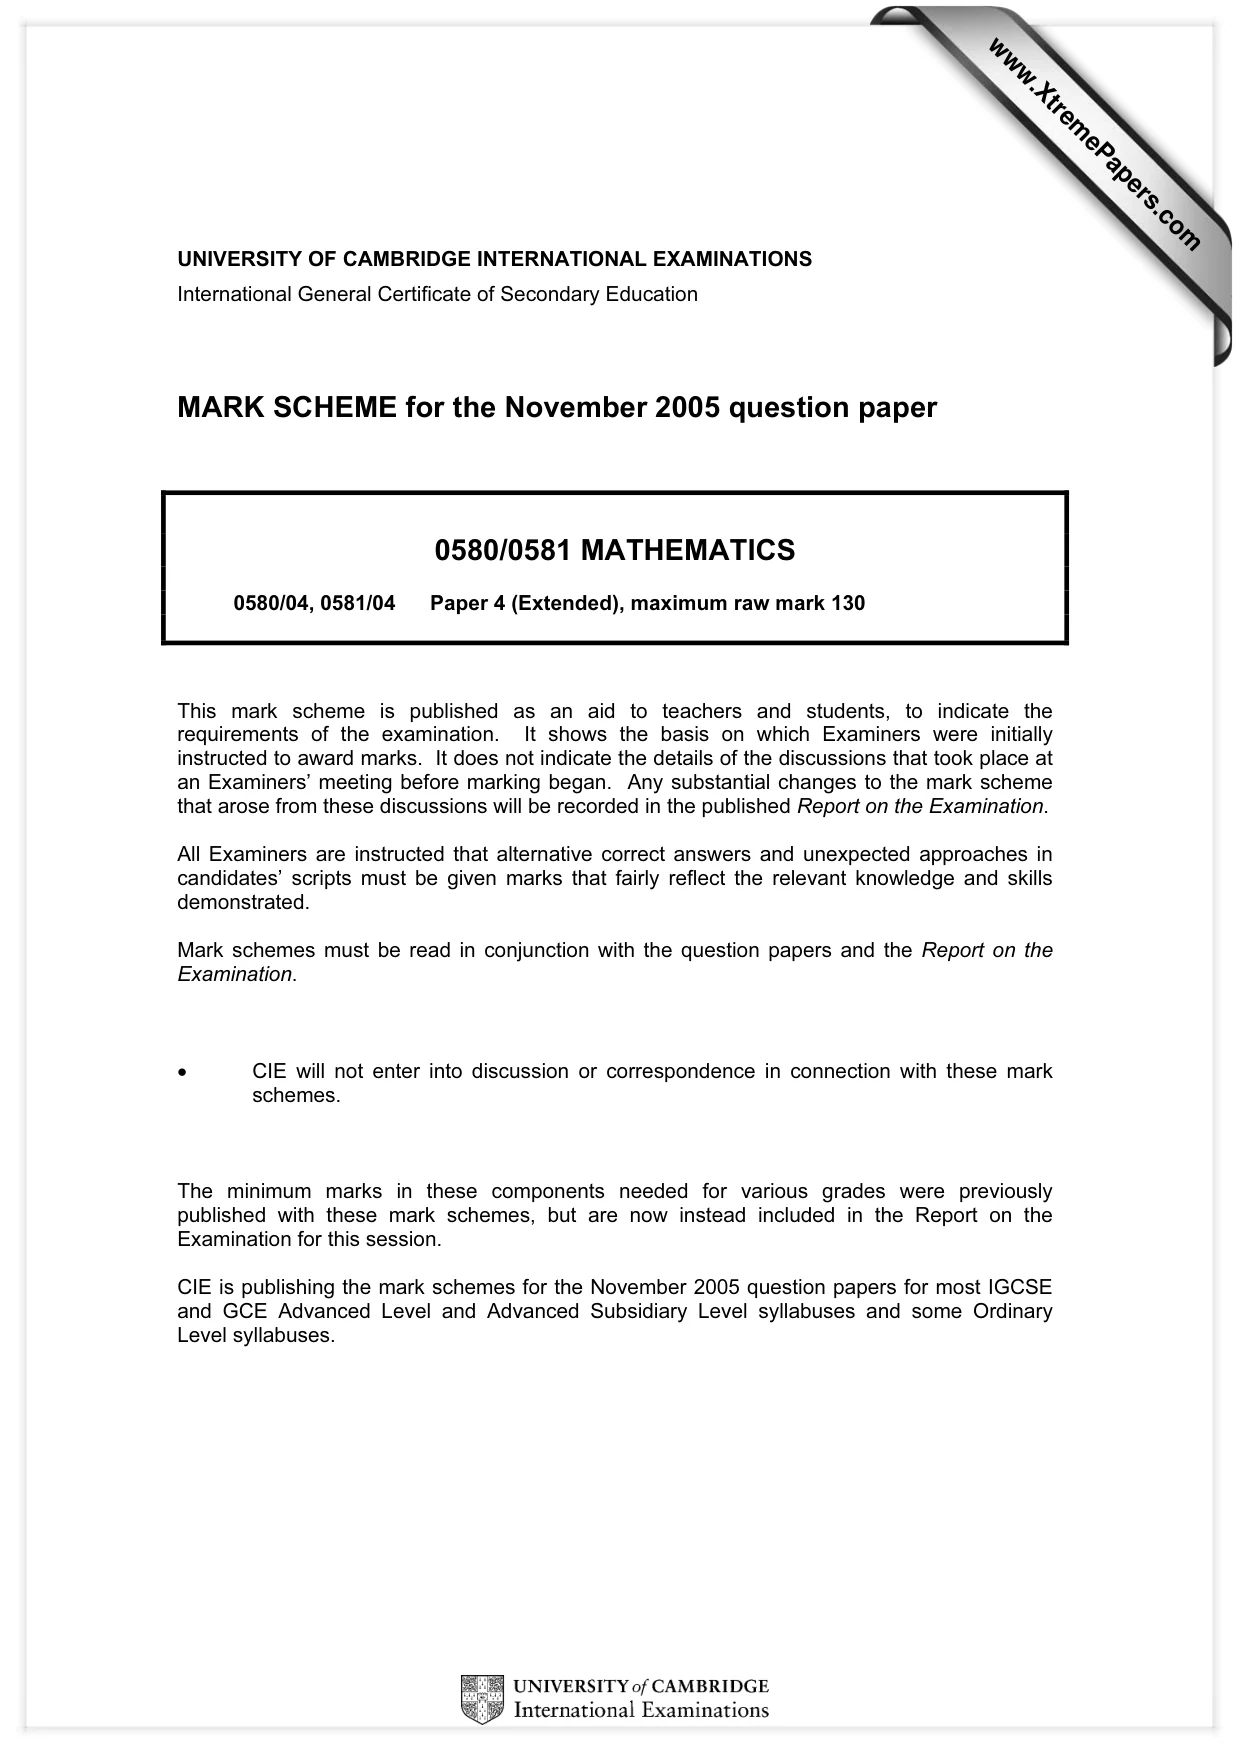
Cambridge IGCSE Mathematics 0580 — 2005 Oct/Nov Paper 4 · Variant 1
0580/41/O/N/05 · 9 questions · 130 marks · ≈146 min
The question paper and its mark scheme, free to read here and free to download. This is Cambridge’s own paper, exactly as it was sat.
Question paper8 pages
Mark scheme10 pages
Answers below. Sit the paper first if you are practising.
Questions as text
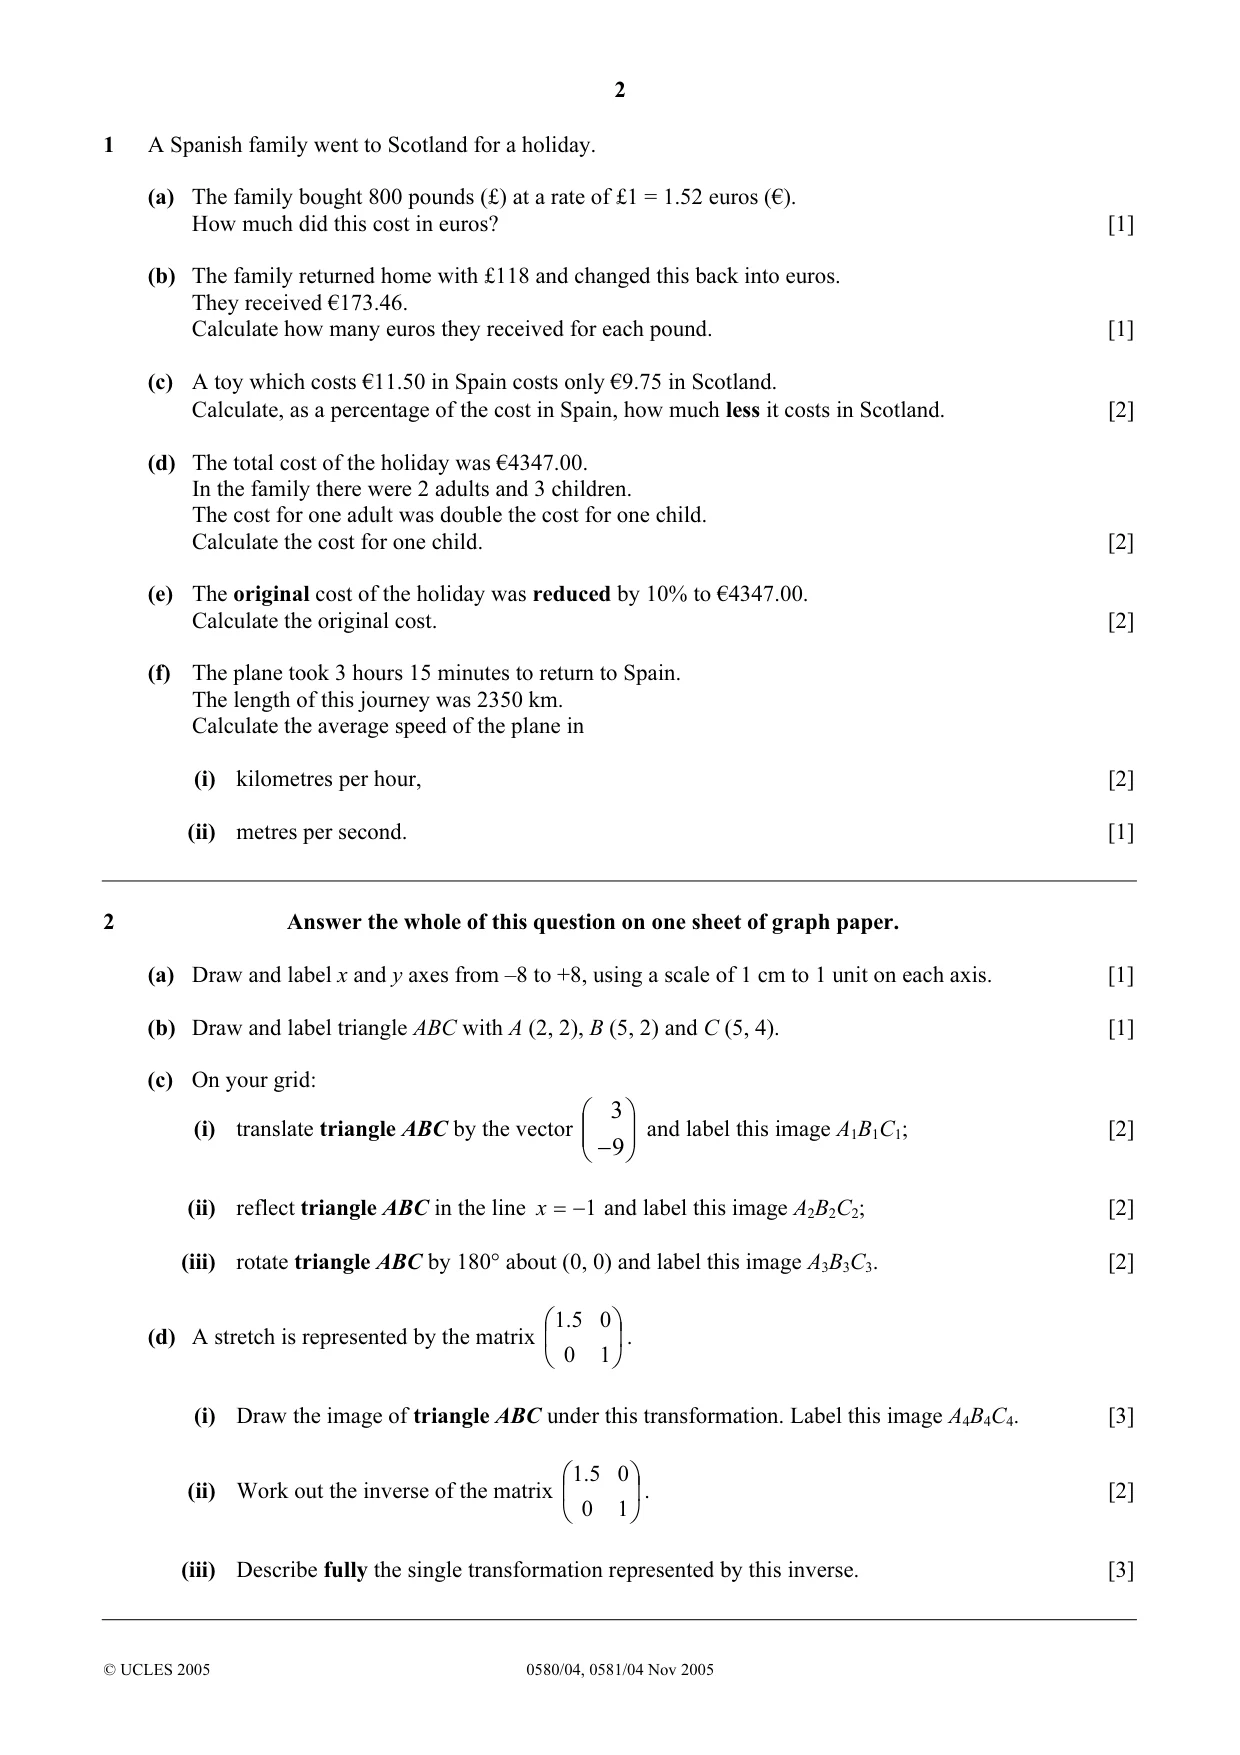
Q1 · A Spanish family went to Scotland for a holiday
1 A Spanish family went to Scotland for a holiday. (a) The family bought 800 pounds (£) at a rate of £1 = 1.52 euros (€). How much did this cost in euros? [1] (b) The family returned home with £118 and changed this back into euros. They received €173.46. Calculate how many euros they received for each pound. [1] (c) A toy which costs €11.50 in Spain costs only €9.75 in Scotland. Calculate, as a percentage of the cost in Spain, how much less it costs in Scotland. [2] (d) The total cost of the holiday was €4347.00. In the family there were 2 adults and 3 children. The cost for one adult was double the cost for one child. Calculate the cost for one child. [2] (e) The original cost of the holiday was reduced by 10% to €4347.00. Calculate the original cost. [2] (f) The plane took 3 hours 15 minutes to return to Spain. The length of this journey was 2350 km. Calculate the average speed of the plane in (i) kilometres per hour, [2] (ii) metres per second. [1]
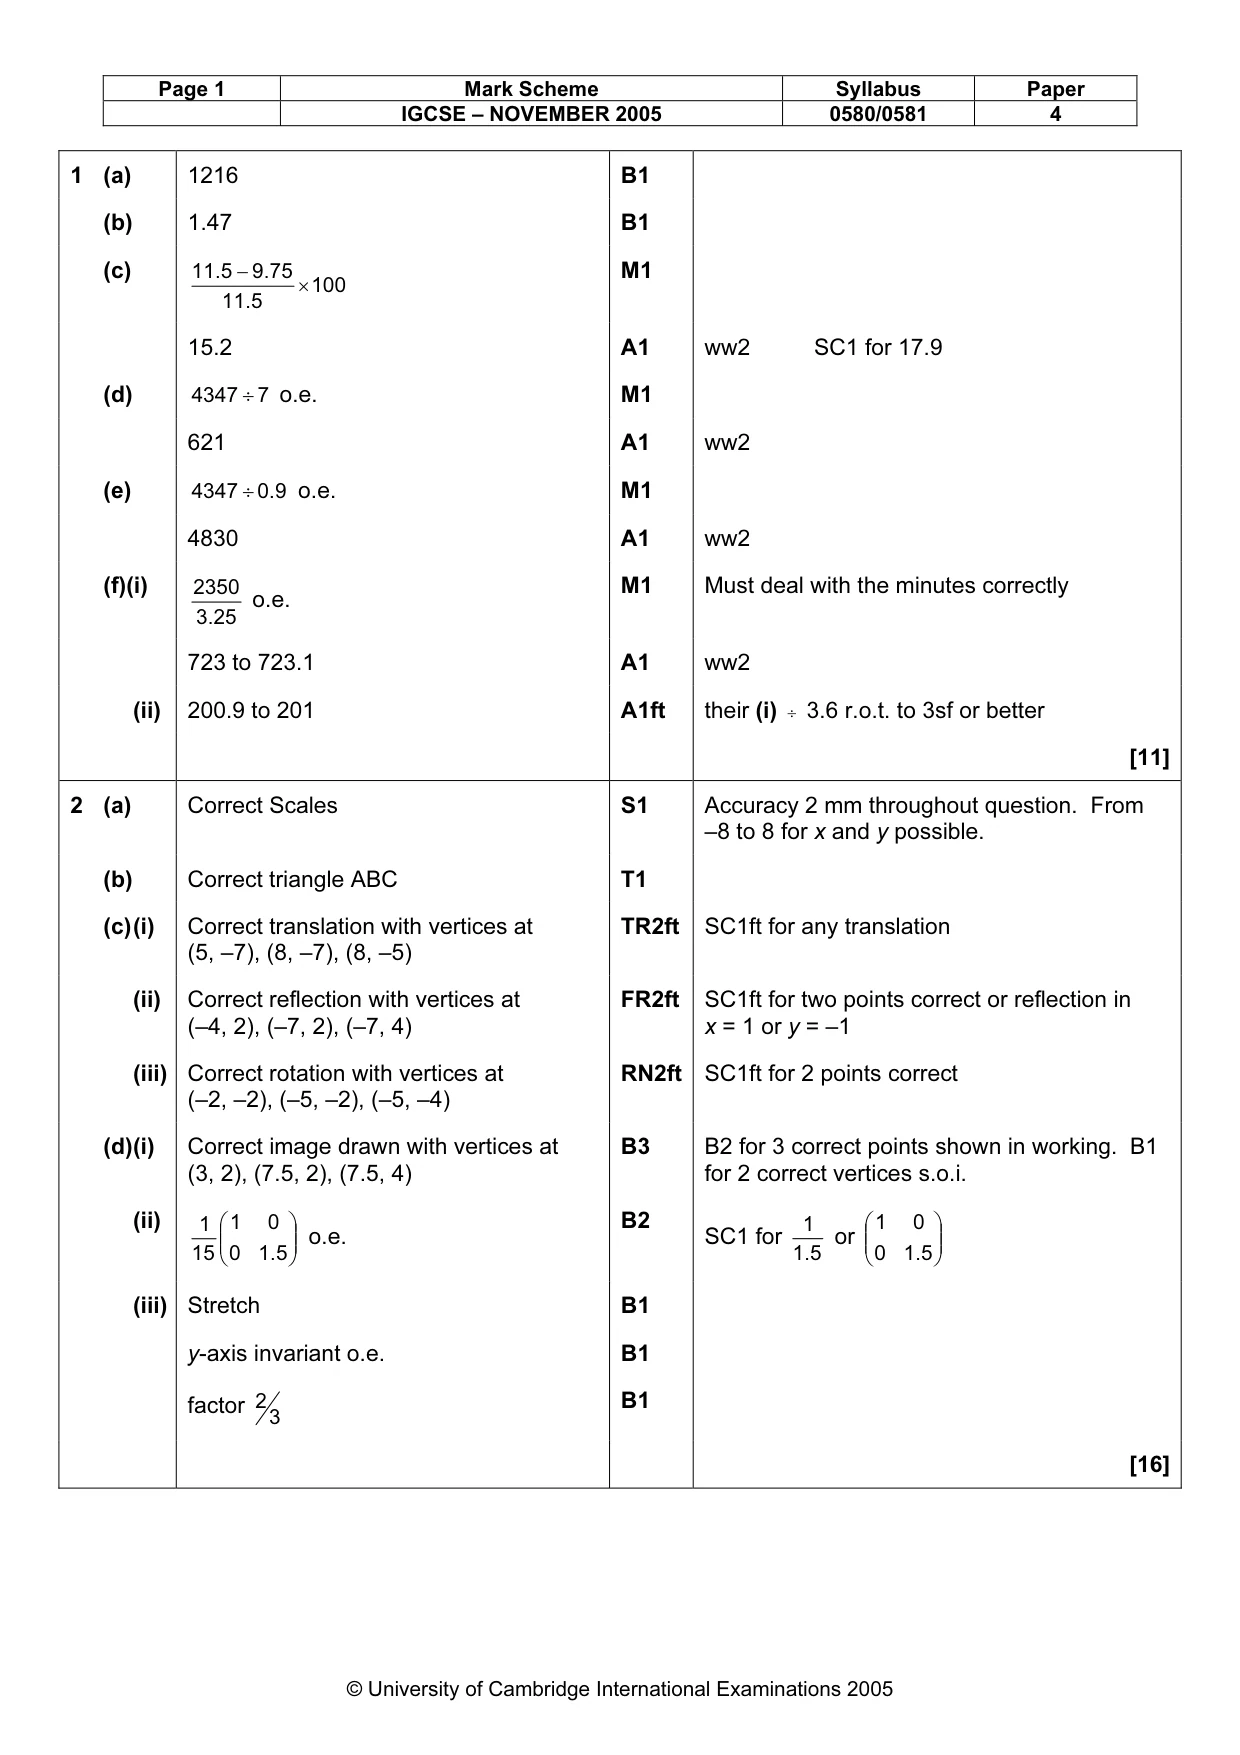
Mark scheme: 1 (a) 1216 B1 (b) 1.47 B1 (c) 11 . 5 − 9 . 75 M1 × 100 11 . 5 15.2 A1 ww2 SC1 for 17.9 (d) 4347 ÷ 7 o.e. M1 621 A1 ww2 (e) 4347 ÷ 0 . 9 o.e. M1 4830 A1 ww2 (f)(i) 2350 M1 Must deal with the minutes correctly o.e. 3 . 25 723 to 723.1 A1 ww2 (ii) 200.9 to 201 A1ft their (i) ÷ 3.6 r.o.t. to 3sf or better [11]
Q2 · Answer the whole of this question on one sheet of graph paper
2 Answer the whole of this question on one sheet of graph paper. (a) Draw and label x and y axes from –8 to +8, using a scale of 1 cm to 1 unit on each axis. [1] (b) Draw and label triangle ABC with A (2, 2), B (5, 2) and C (5, 4). [1] (c) On your grid: 3 (i) translate triangle ABC by the vector and label this image A1B1C1; [2] −9 (ii) reflect triangle ABC in the line x = −1 and label this image A2B2C2; [2] (iii) rotate triangle ABC by 180° about (0, 0) and label this image A3B3C3. [2] 1.5 0 (d) A stretch is represented by the matrix . 0 1 (i) Draw the image of triangle ABC under this transformation. Label this image A4B4C4. [3] 1.5 0 (ii) Work out the inverse of the matrix . [2] 0 1 (iii) Describe fully the single transformation represented by this inverse. [3]
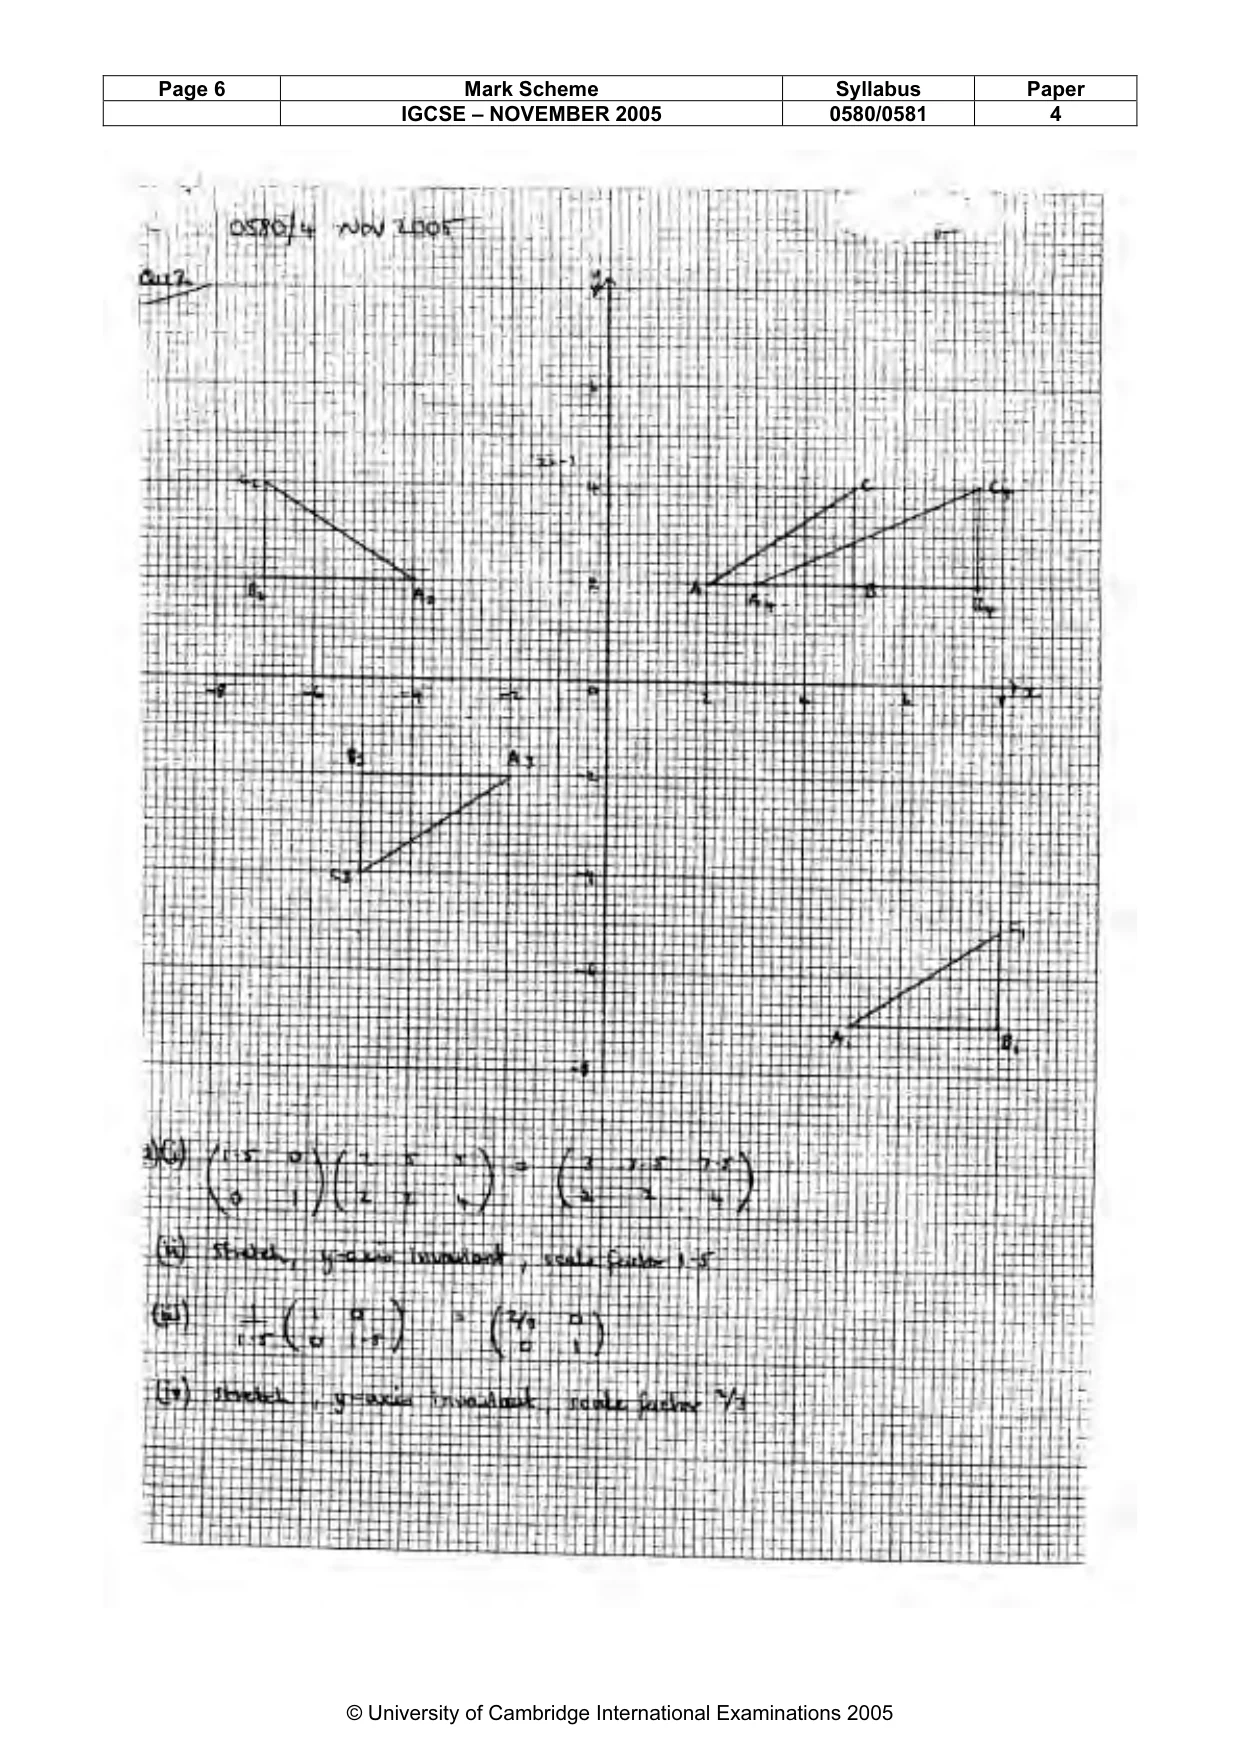
Mark scheme: 2 (a) Correct Scales S1 Accuracy 2 mm throughout question. From –8 to 8 for x and y possible. (b) Correct triangle ABC T1 (c) (i) Correct translation with vertices at TR2ft SC1ft for any translation (5, –7), (8, –7), (8, –5) (ii) Correct reflection with vertices at FR2ft SC1ft for two points correct or reflection in (–4, 2), (–7, 2), (–7, 4) x = 1 or y = –1 (iii) Correct rotation with vertices at RN2ft SC1ft for 2 points correct (–2, –2), (–5, –2), (–5, –4) (d) (i) Correct image drawn with vertices at B3 B2 for 3 correct points shown in working. B1 (3, 2), (7.5, 2), (7.5, 4) for 2 correct vertices s.o.i. B2 (ii) 1 1 0 1 1 0 o.e. SC1 for or 15 0 1 . 5 1 . 5 0 1 . 5 (iii) Stretch B1 y-axis invariant o.e. B1 B1 factor 2 3 [16] IGCSE – NOVEMBER 2005 0580/0581 4
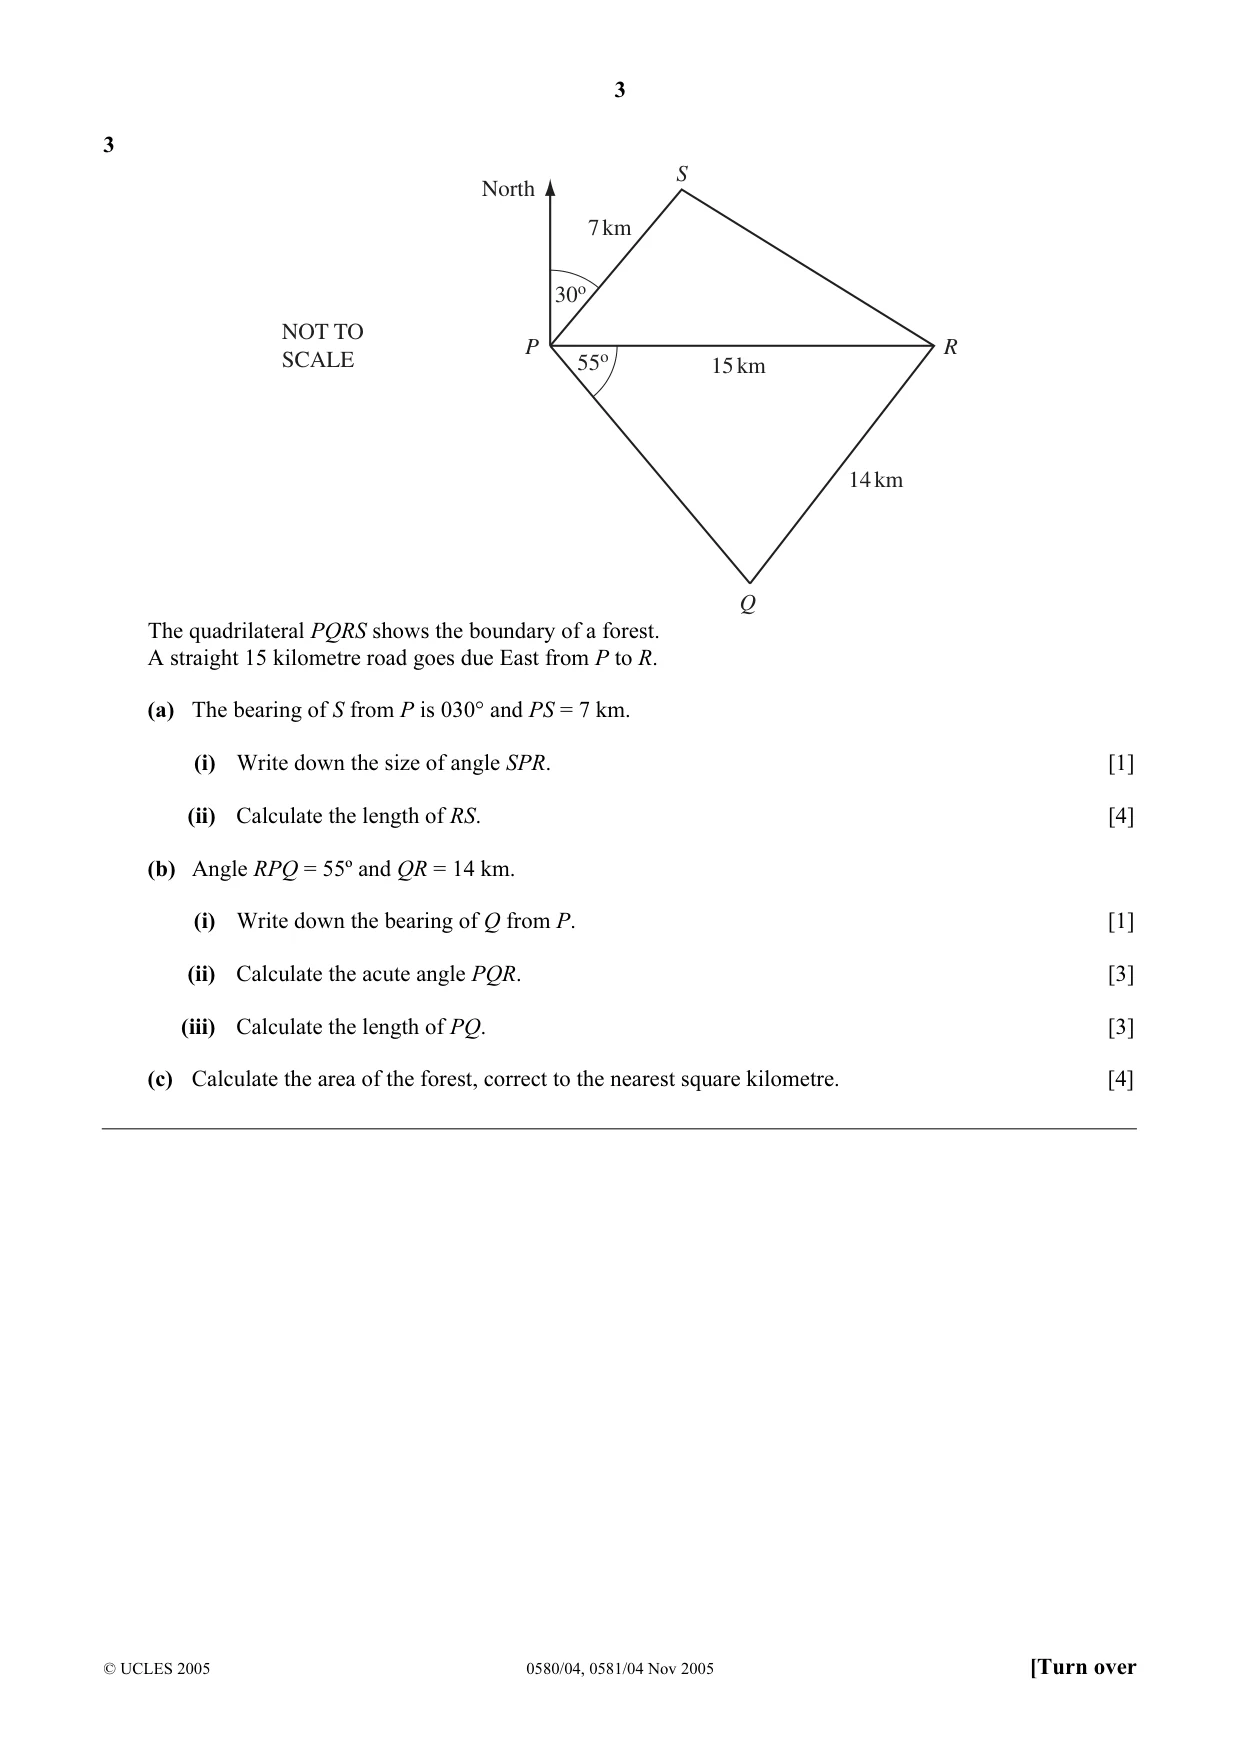
Q3 · S North 7 km 30o NOT TO P R SCALE 55o 15 km 14 km Q The quadrilateral PQRS shows the…
3 S North 7 km 30o NOT TO P R SCALE 55o 15 km 14 km Q The quadrilateral PQRS shows the boundary of a forest. A straight 15 kilometre road goes due East from P to R. (a) The bearing of S from P is 030° and PS = 7 km. (i) Write down the size of angle SPR. [1] (ii) Calculate the length of RS. [4] (b) Angle RPQ = 55º and QR = 14 km. (i) Write down the bearing of Q from P. [1] (ii) Calculate the acute angle PQR. [3] (iii) Calculate the length of PQ. [3] (c) Calculate the area of the forest, correct to the nearest square kilometre. [4]
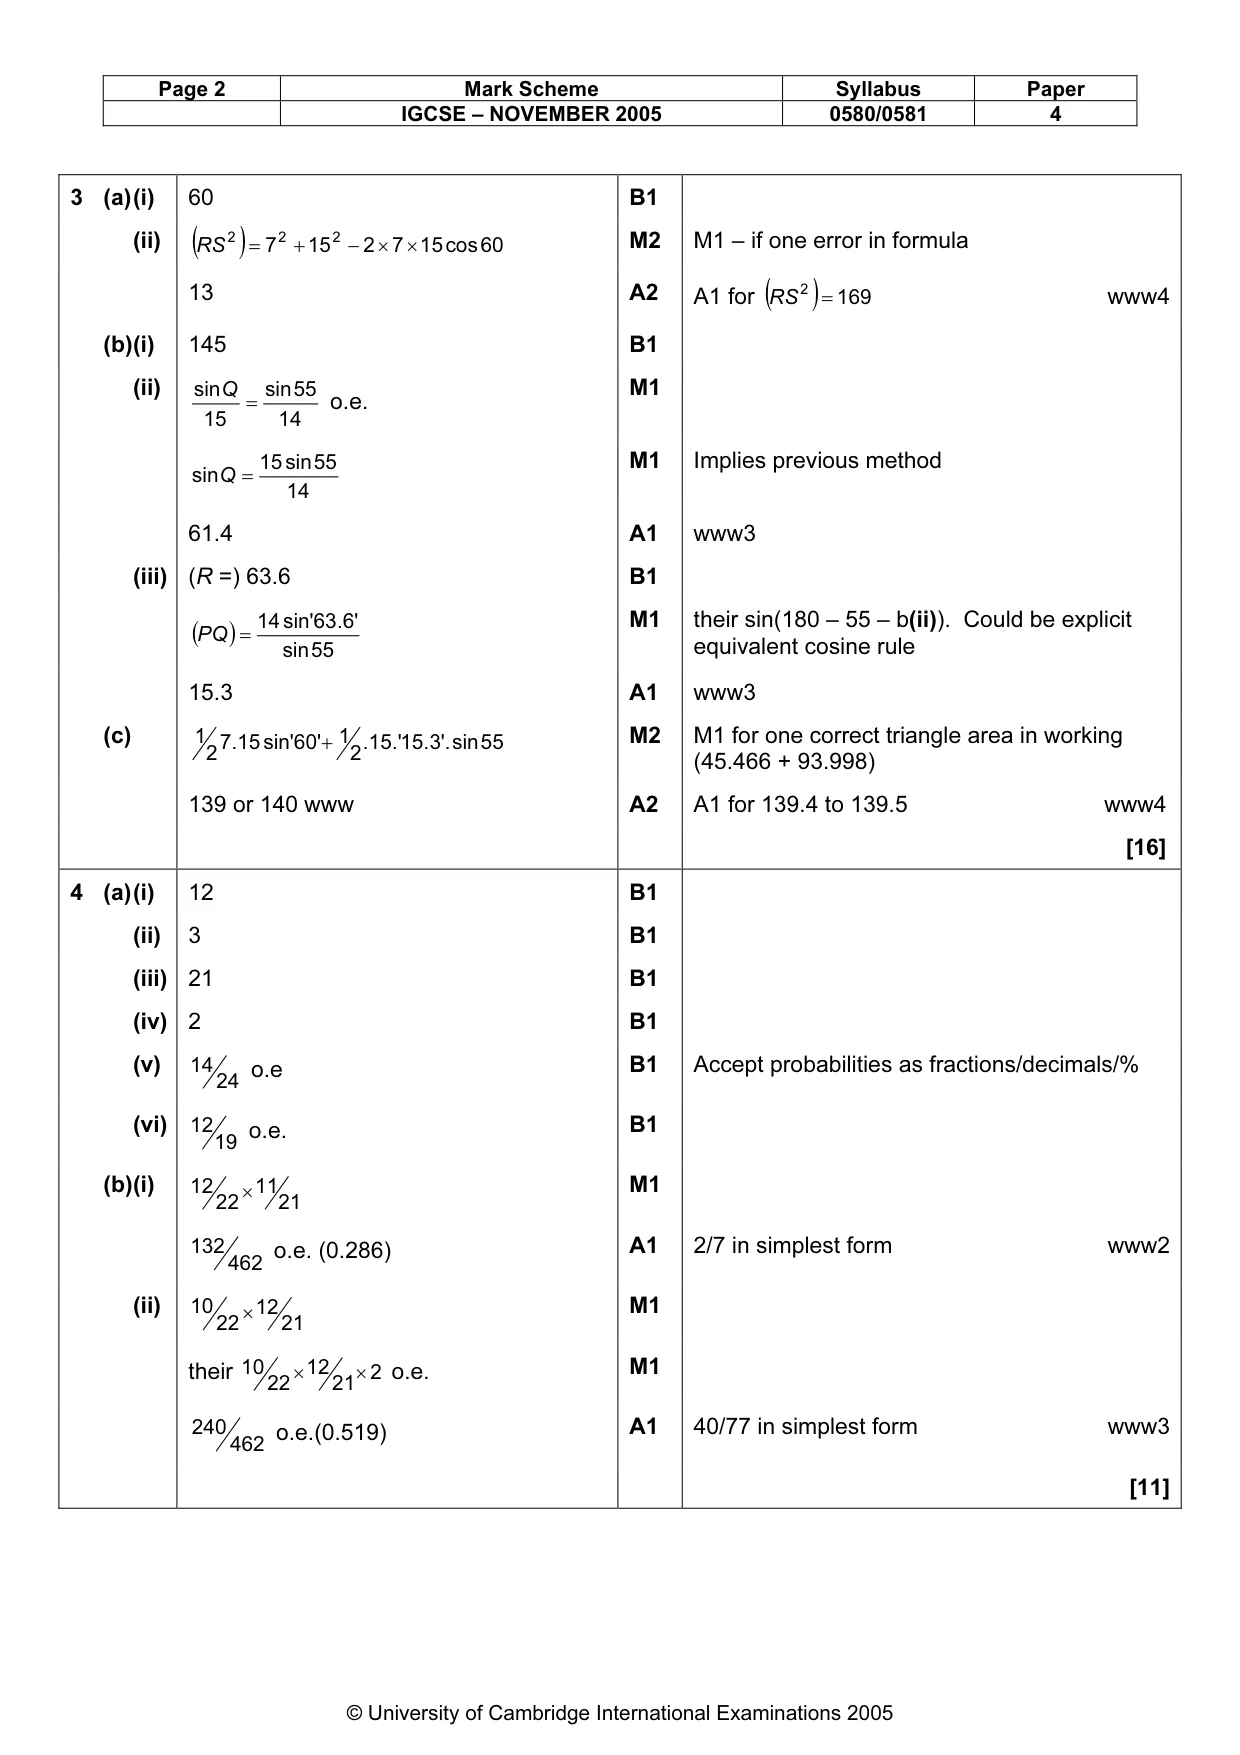
Mark scheme: 3 (a) (i) 60 B1 2 2 + 15 2 − 2 × 7 × 15 cos 60 M2 M1 – if one error in formula (ii) (RS ) = 7 2 13 A2 A1 for (RS ) = 169 www4 (b) (i) 145 B1 (ii) sin Q sin 55 M1 = o.e. 15 14 15 sin 55 M1 Implies previous method sin Q = 14 61.4 A1 www3 (iii) (R =) 63.6 B1 14 sin'63 . '6 M1 their sin(180 – 55 – b(ii)). Could be explicit (PQ ) = sin 55 equivalent cosine rule 15.3 A1 www3 (c) 1 7 . 15 sin'60' + 1 . 15 .'15 . 3'. sin 55 M2 M1 for one correct triangle area in working 2 2 (45.466 + 93.998) 139 or 140 www A2 A1 for 139.4 to 139.5 www4 [16]
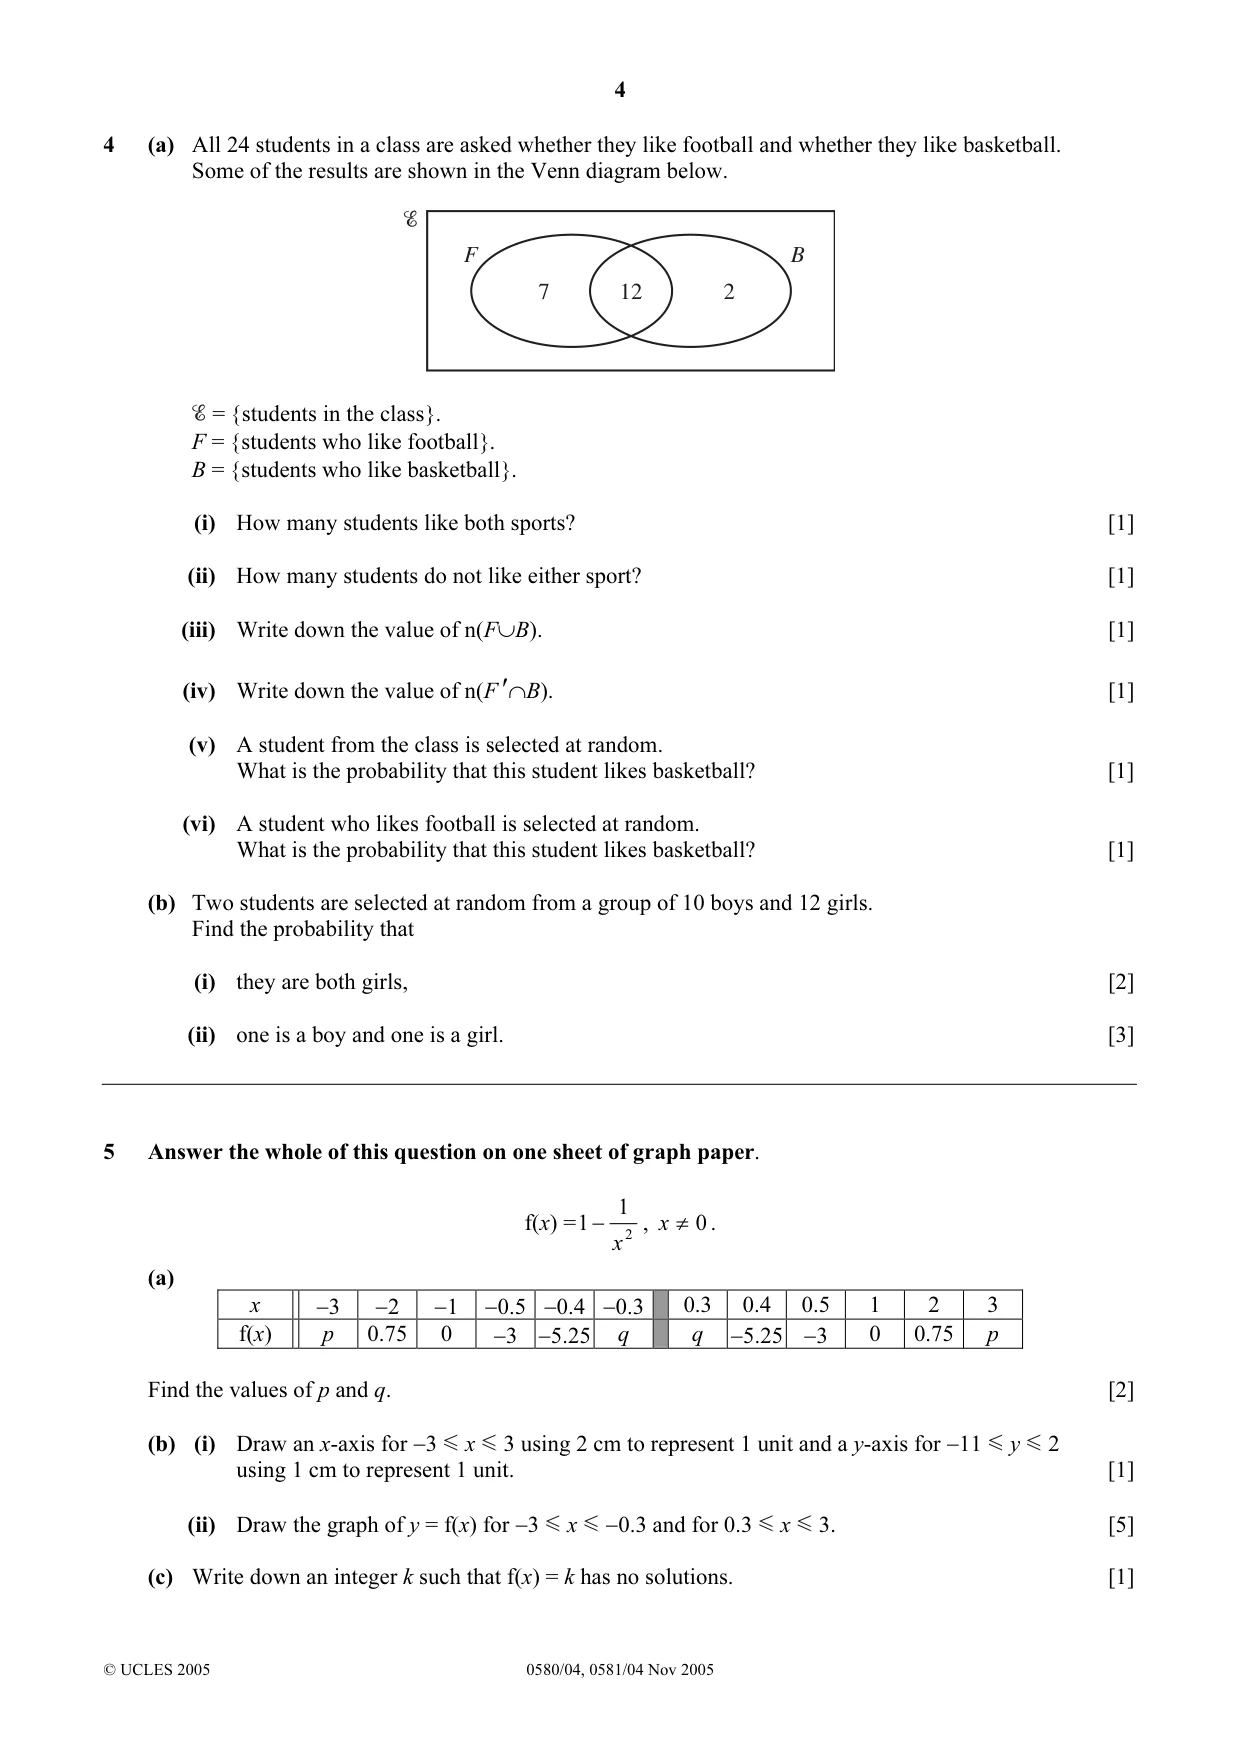
Q4 · All 24 students in a class are asked whether they like football and whether they like…
4 (a) All 24 students in a class are asked whether they like football and whether they like basketball. Some of the results are shown in the Venn diagram below. F B 7 12 2 = {students in the class}. F = {students who like football}. B = {students who like basketball}. (i) How many students like both sports? [1] (ii) How many students do not like either sport? [1] (iii) Write down the value of n(F∪B). [1] (iv) Write down the value of n(F ′∩B). [1] (v) A student from the class is selected at random. What is the probability that this student likes basketball? [1] (vi) A student who likes football is selected at random. What is the probability that this student likes basketball? [1] (b) Two students are selected at random from a group of 10 boys and 12 girls. Find the probability that (i) they are both girls, [2] (ii) one is a boy and one is a girl. [3]
Mark scheme: 4 (a) (i) 12 B1 (ii) 3 B1 (iii) 21 B1 (iv) 2 B1 (v) 14 o.e B1 Accept probabilities as fractions/decimals/% 24 (vi) 12 B1 o.e. 19 (b) (i) 12 × 11 M1 22 21 A1 2/7 in simplest form www2 132 o.e. (0.286) 462 (ii) 10 × 12 M1 22 21 M1 their 10 × 12 × 2 o.e. 22 21 A1 40/77 in simplest form www3 240 o.e.(0.519) 462 [11] IGCSE – NOVEMBER 2005 0580/0581 4
Q5 · Answer the whole of this question on one sheet of graph paper
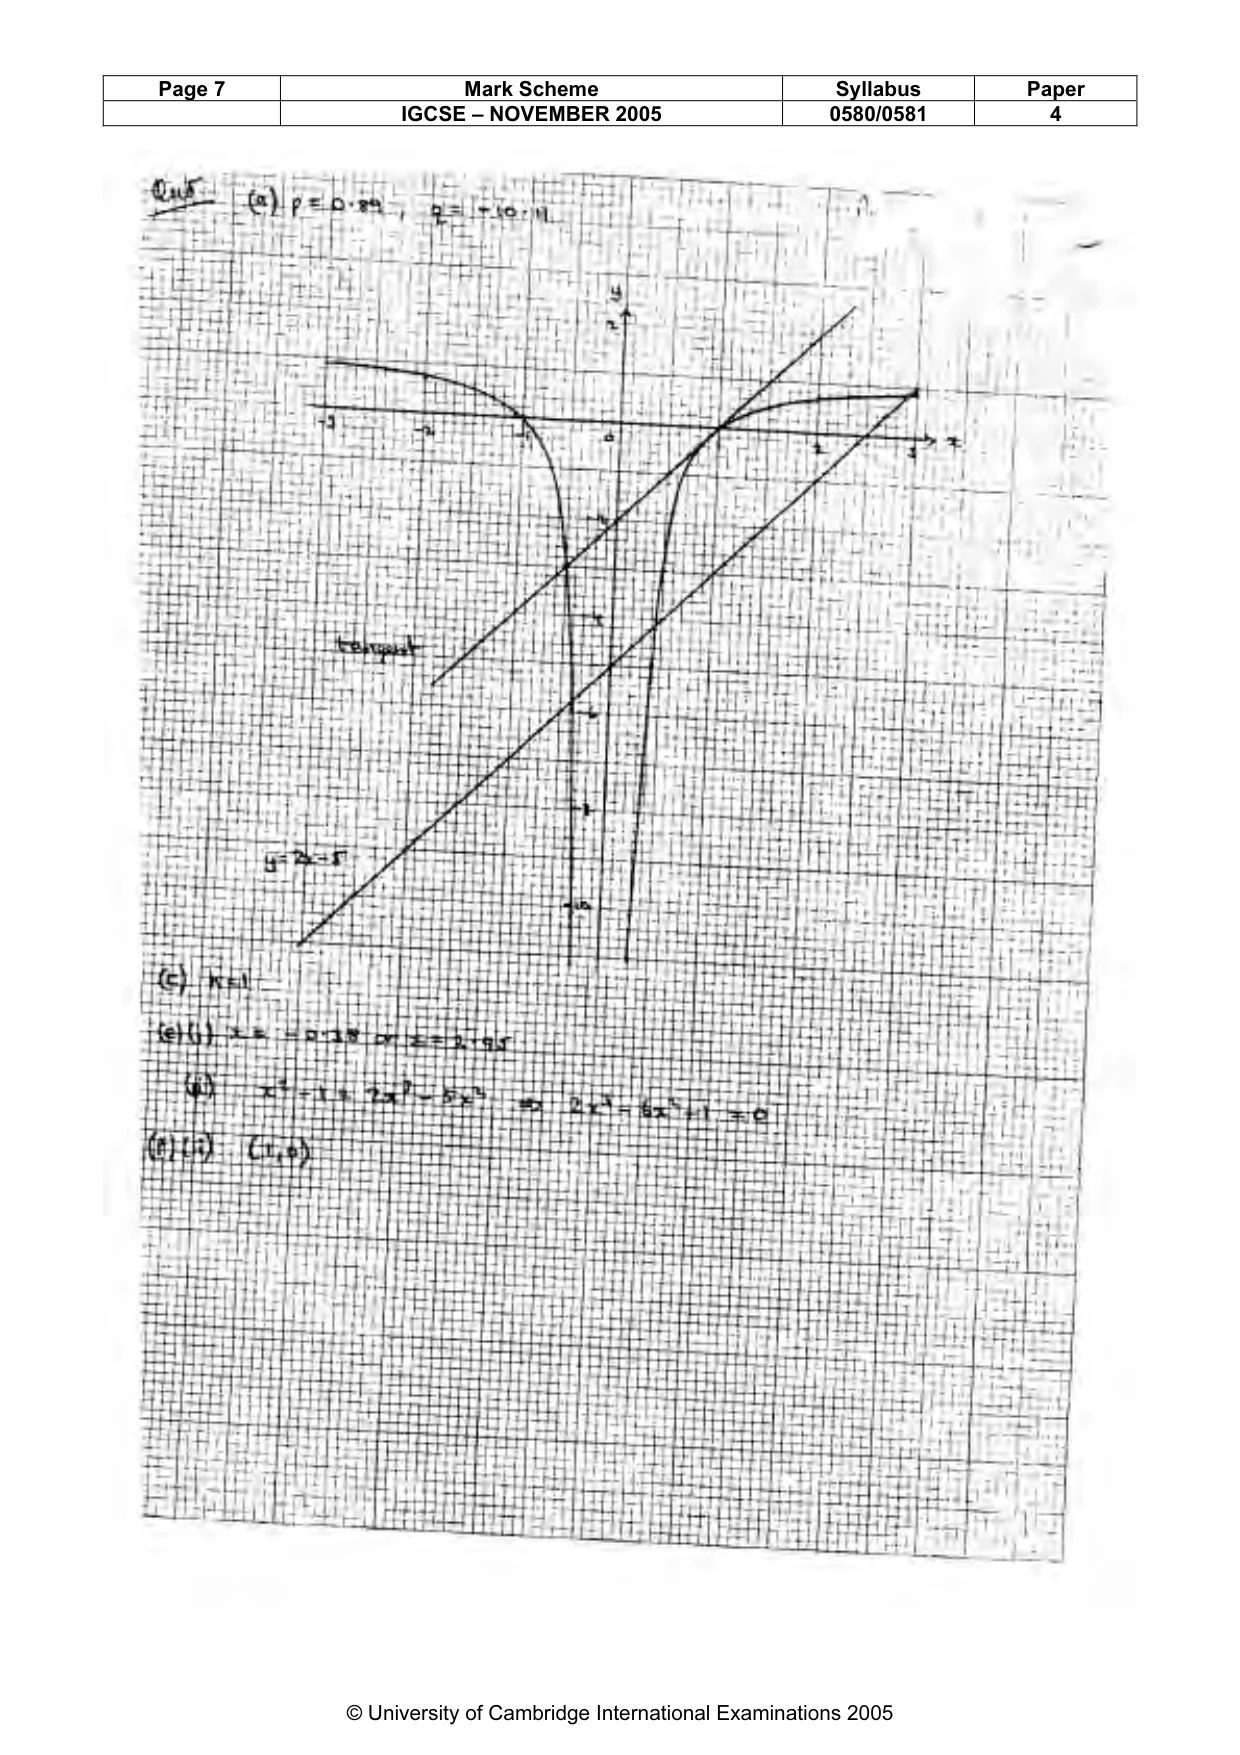
5 Answer the whole of this question on one sheet of graph paper. 1 f(x) = 1 − , x ≠ 0 . x 2 (a) x −3 −2 −1 −0.5 −0.4 −0.3 0.3 0.4 0.5 1 2 3 f(x) p 0.75 0 −3 −5.25 q q −5.25 −3 0 0.75 p Find the values of p and q. [2] (b) (i) Draw an x-axis for −3 x 3 using 2 cm to represent 1 unit and a y-axis for −11 y 2 using 1 cm to represent 1 unit. [1] (ii) Draw the graph of y = f(x) for −3 x −0.3 and for 0.3 x 3. [5] (c) Write down an integer k such that f(x) = k has no solutions. [1] (d) On the same grid, draw the graph of y = 2x – 5 for –3 x 3. [2] 1 (e) (i) Use your graphs to find solutions of the equation 1 − 2 = 2 x − 5 . [3] x 1 3 2 (ii) Rearrange 1 − 2 = 2 x − 5 into the form ax + bx + c = 0 , where a, b and c are integers. [2] x (f) (i) Draw a tangent to the graph of y = f(x) which is parallel to the line y = 2 x − 5 . [1] (ii) Write down the equation of this tangent. [2]
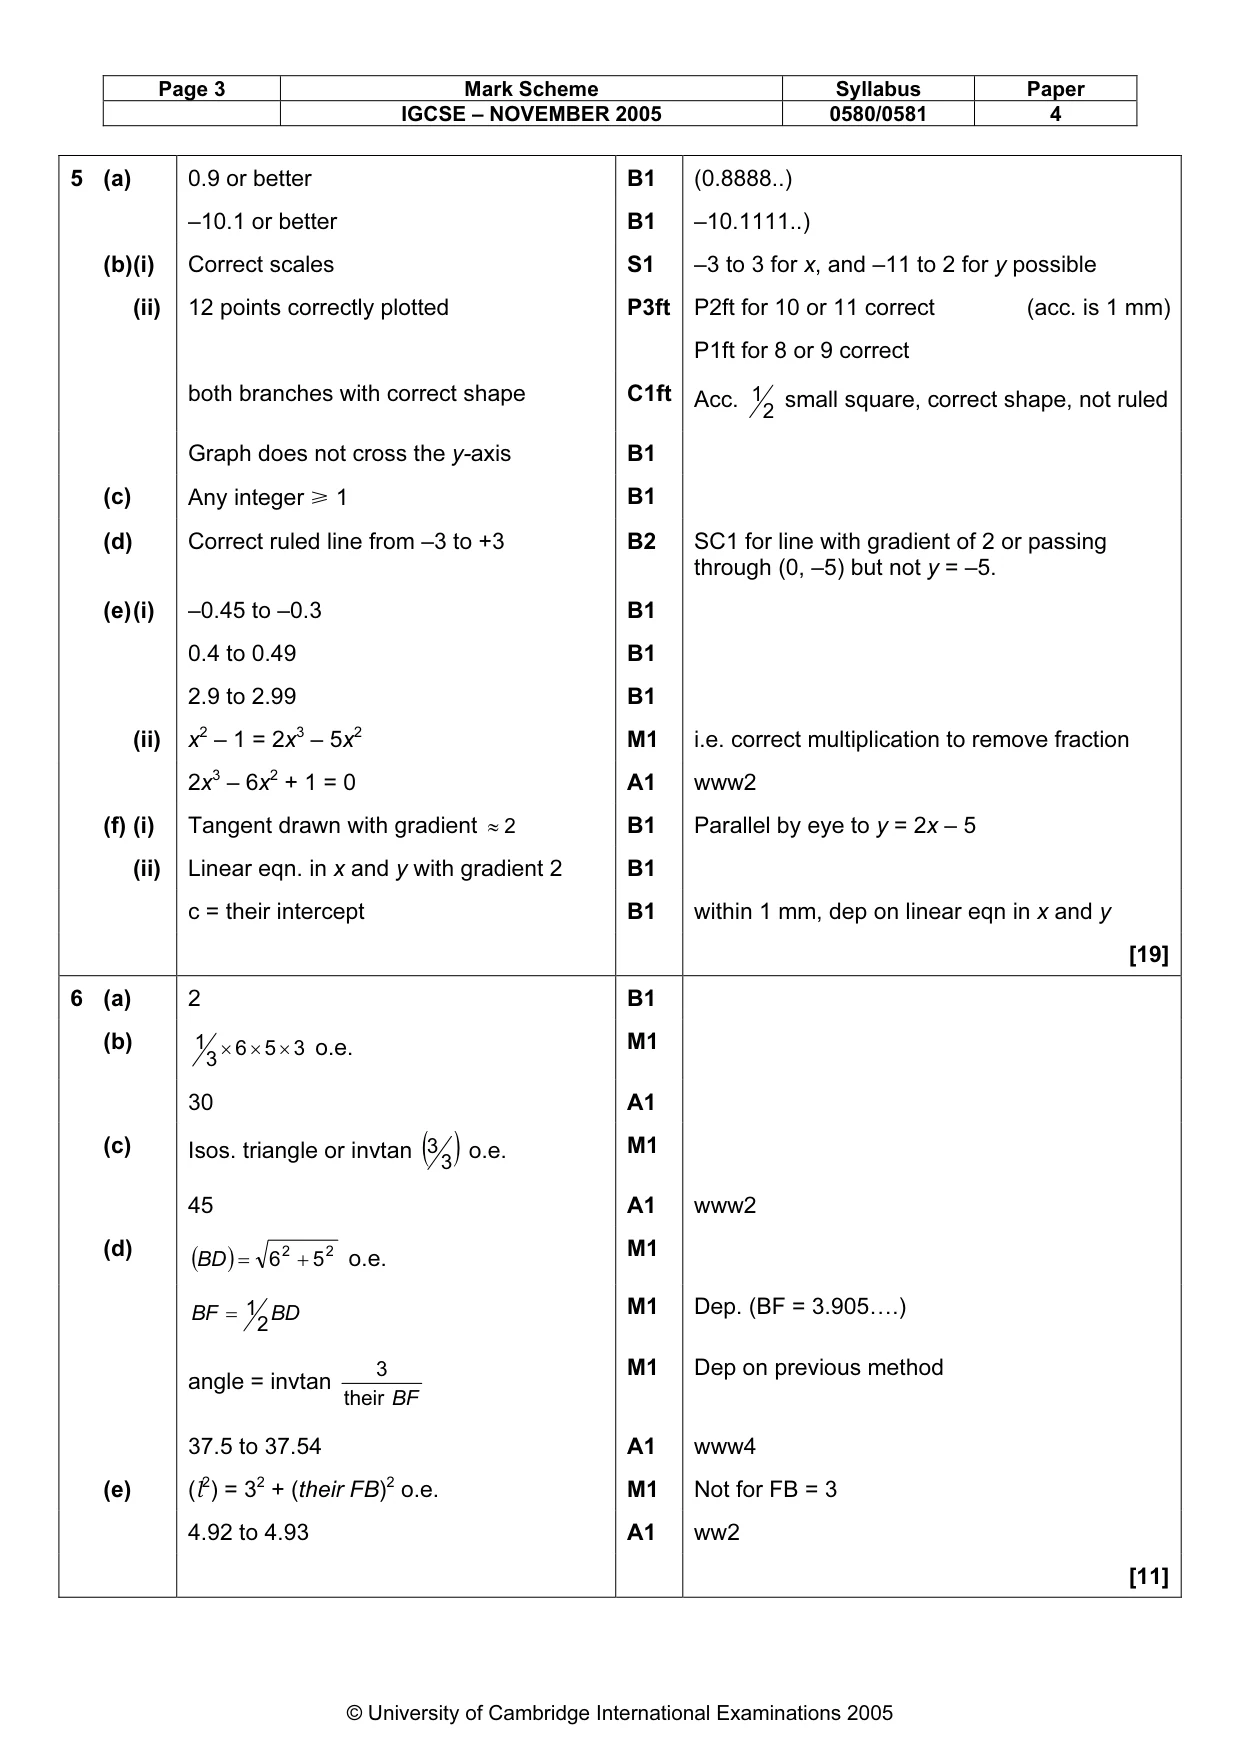
Mark scheme: 5 (a) 0.9 or better B1 (0.8888..) –10.1 or better B1 –10.1111..) (b) (i) Correct scales S1 –3 to 3 for x, and –11 to 2 for y possible (ii) 12 points correctly plotted P3ft P2ft for 10 or 11 correct (acc. is 1 mm) P1ft for 8 or 9 correct 1 small square, correct shape, not ruled both branches with correct shape C1ft Acc. 2 Graph does not cross the y-axis B1 (c) Any integer [ 1 B1 (d) Correct ruled line from –3 to +3 B2 SC1 for line with gradient of 2 or passing through (0, –5) but not y = –5. (e) (i) –0.45 to –0.3 B1 0.4 to 0.49 B1 2.9 to 2.99 B1 (ii) x2 – 1 = 2x3 – 5x2 M1 i.e. correct multiplication to remove fraction 2x3 – 6x2 + 1 = 0 A1 www2 (f) (i) Tangent drawn with gradient ≈ 2 B1 Parallel by eye to y = 2x – 5 (ii) Linear eqn. in x and y with gradient 2 B1 c = their intercept B1 within 1 mm, dep on linear eqn in x and y [19]
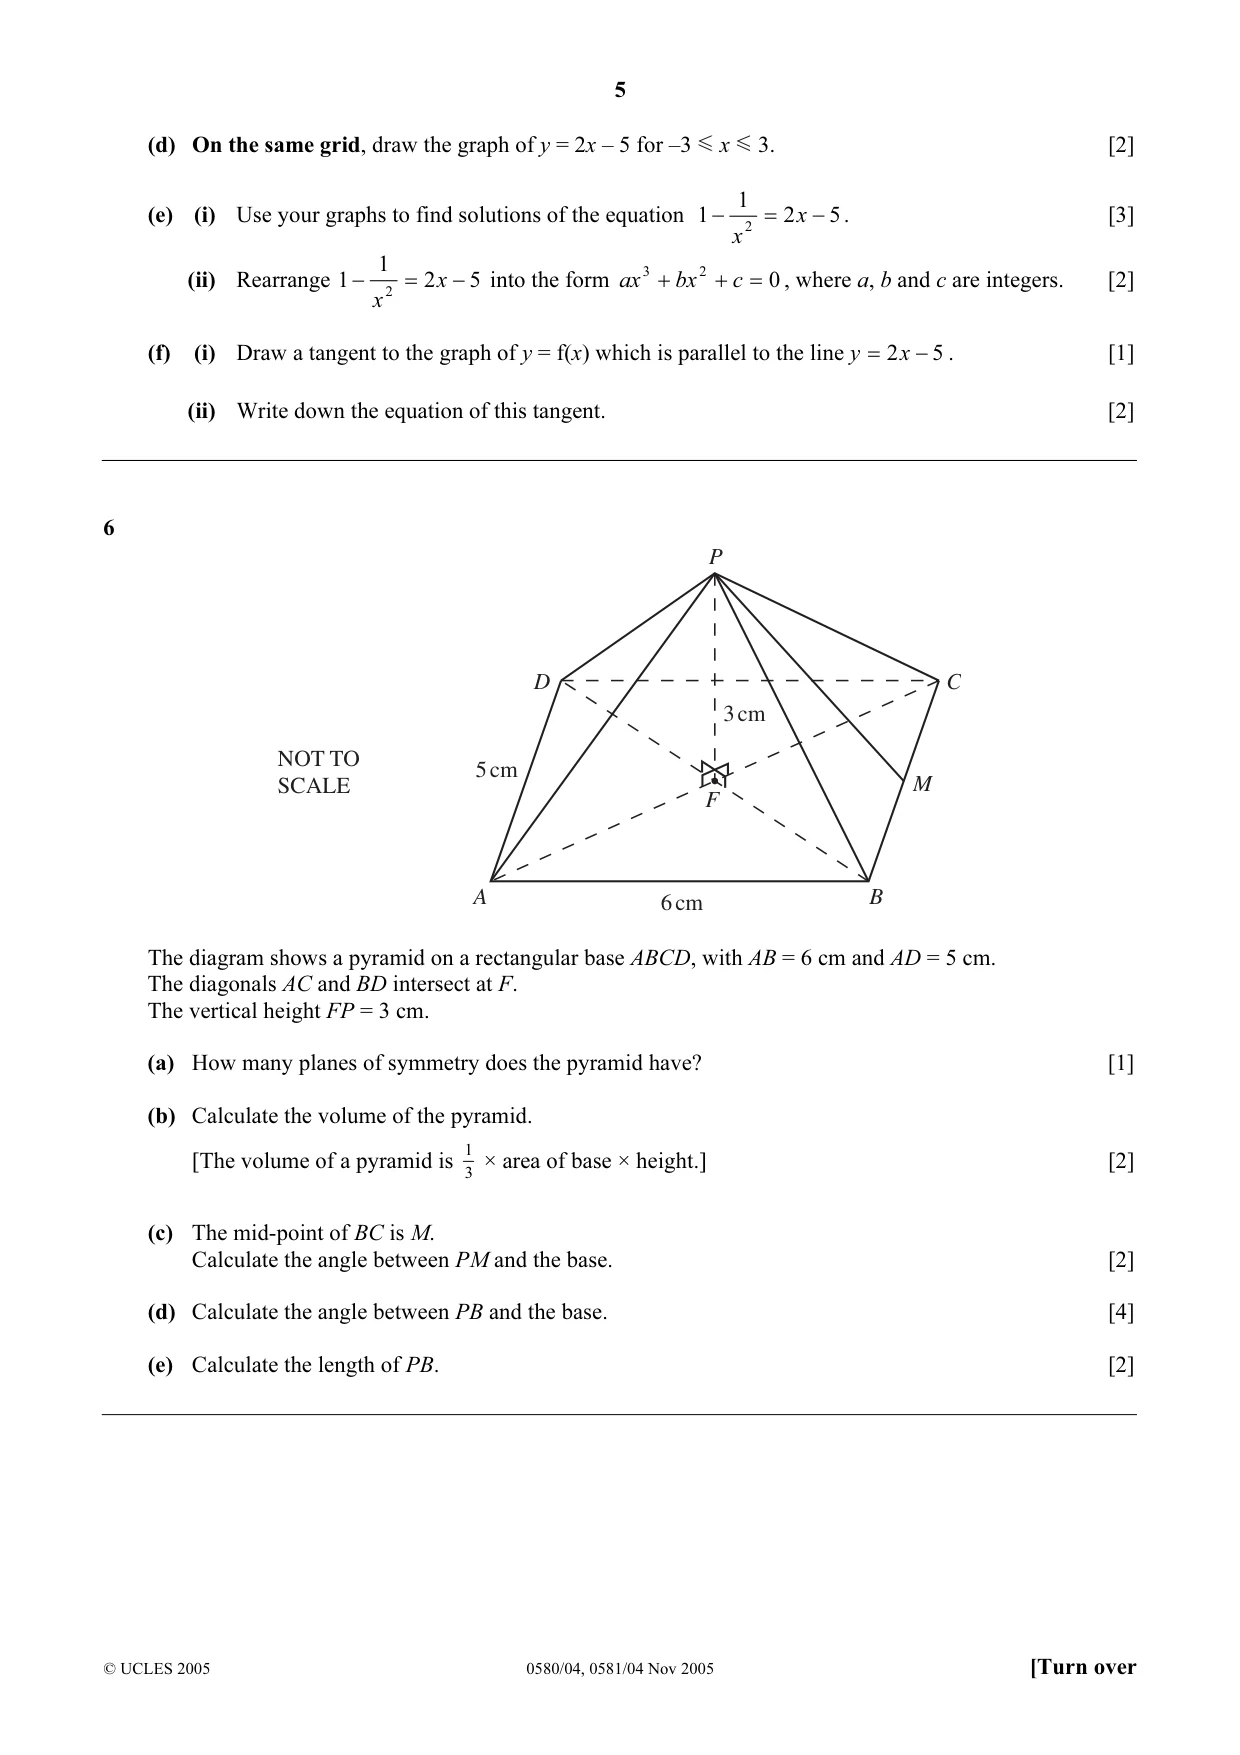
Q6 · P D C 3 cm NOT TO 5 cm SCALE M F A 6 cm B The diagram shows a pyramid on a rectangular…
6 P D C 3 cm NOT TO 5 cm SCALE M F A 6 cm B The diagram shows a pyramid on a rectangular base ABCD, with AB = 6 cm and AD = 5 cm. The diagonals AC and BD intersect at F. The vertical height FP = 3 cm. (a) How many planes of symmetry does the pyramid have? [1] (b) Calculate the volume of the pyramid. 1 [The volume of a pyramid is × area of base × height.] [2] 3 (c) The mid-point of BC is M. Calculate the angle between PM and the base. [2] (d) Calculate the angle between PB and the base. [4] (e) Calculate the length of PB. [2]
Mark scheme: 6 (a) 2 B1 (b) 1 × 6 × 5 × 3 o.e. M1 3 30 A1 (c) 3 M1 Isos. triangle or invtan ( ) o.e. 3 45 A1 www2 (d) 2 2 M1 (BD ) = 6 + 5 o.e. M1 Dep. (BF = 3.905….) BF = 1 BD 2 3 M1 Dep on previous method angle = invtan their BF 37.5 to 37.54 A1 www4 (e) (l2) = 32 + (their FB)2 o.e. M1 Not for FB = 3 4.92 to 4.93 A1 ww2 [11] IGCSE – NOVEMBER 2005 0580/0581 4
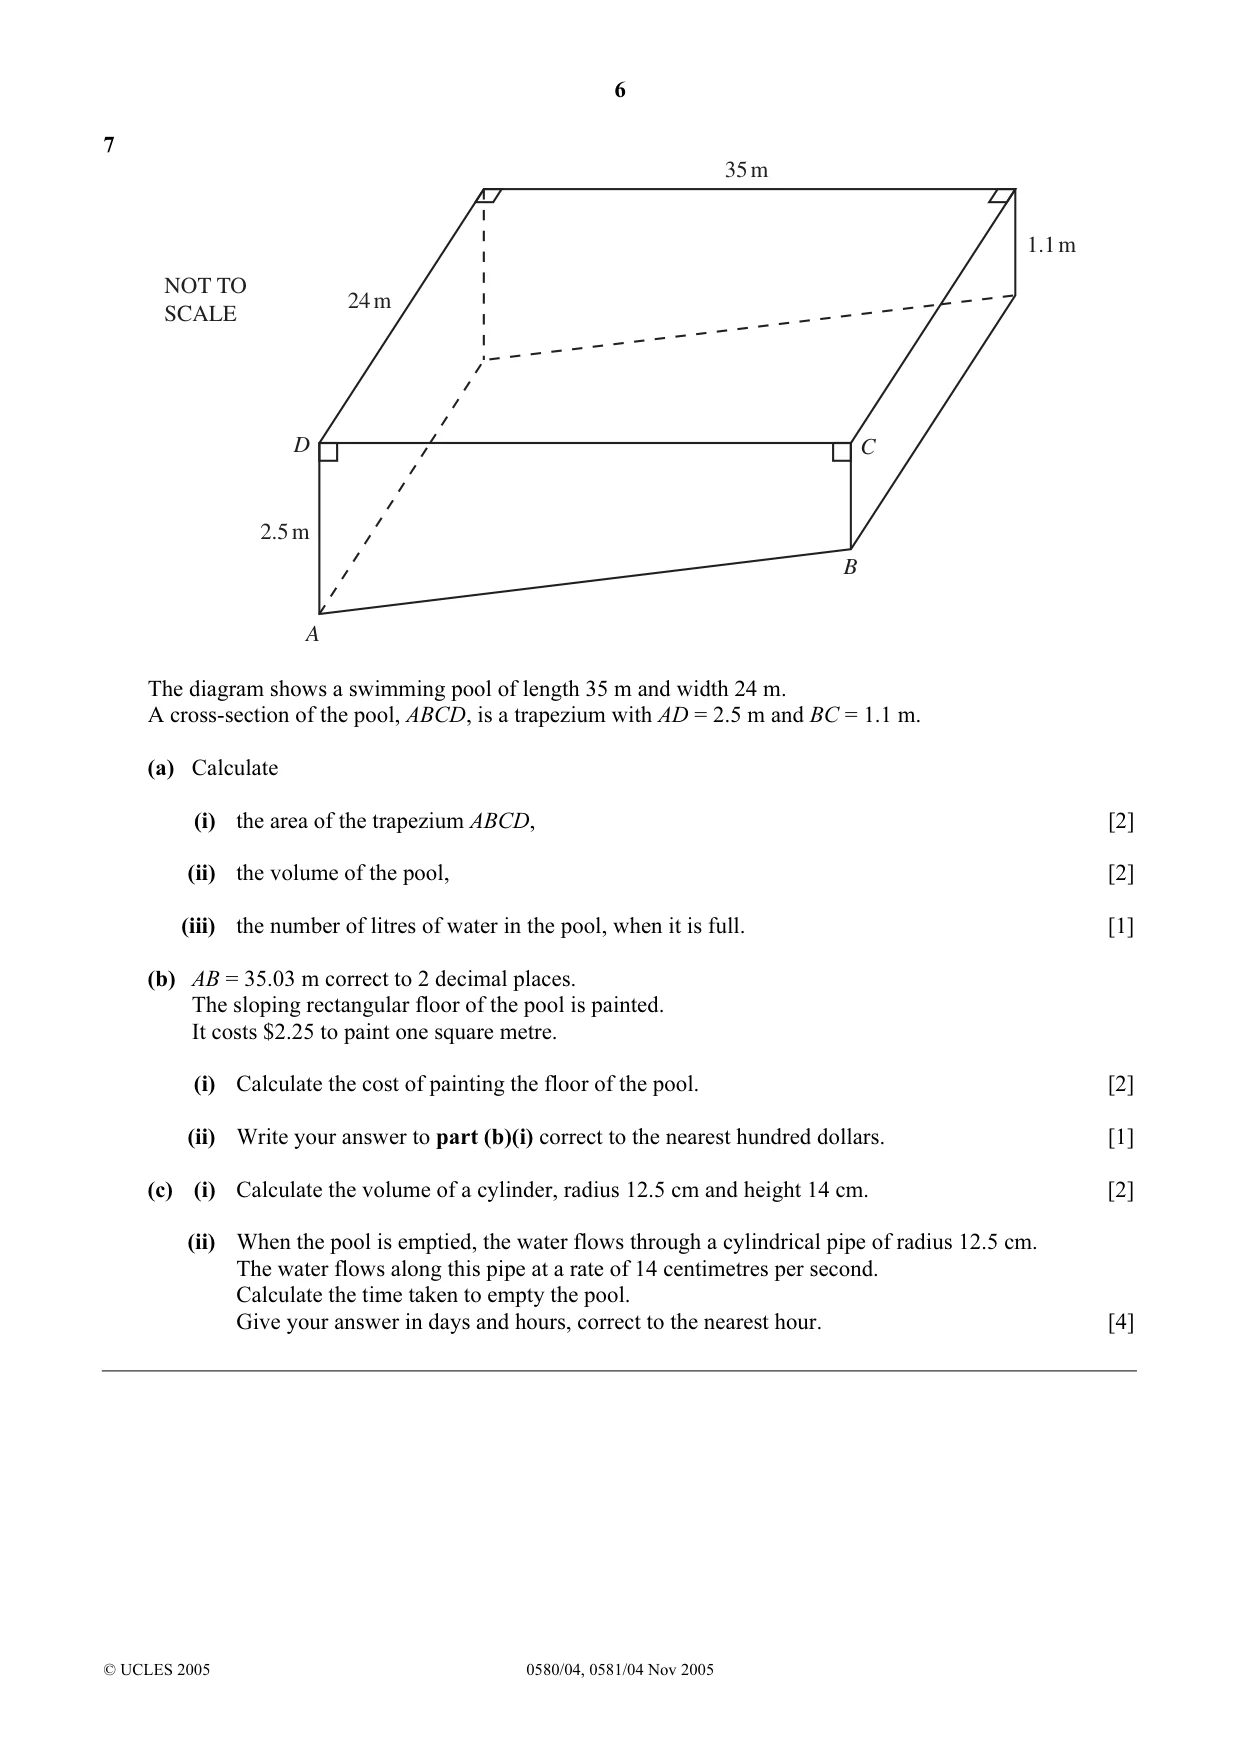
Q7 · 35 m 1.1 m NOT TO 24 m SCALE D C 2.5 m B A The diagram shows a swimming pool of length 35…
7 35 m 1.1 m NOT TO 24 m SCALE D C 2.5 m B A The diagram shows a swimming pool of length 35 m and width 24 m. A cross-section of the pool, ABCD, is a trapezium with AD = 2.5 m and BC = 1.1 m. (a) Calculate (i) the area of the trapezium ABCD, [2] (ii) the volume of the pool, [2] (iii) the number of litres of water in the pool, when it is full. [1] (b) AB = 35.03 m correct to 2 decimal places. The sloping rectangular floor of the pool is painted. It costs $2.25 to paint one square metre. (i) Calculate the cost of painting the floor of the pool. [2] (ii) Write your answer to part (b)(i) correct to the nearest hundred dollars. [1] (c) (i) Calculate the volume of a cylinder, radius 12.5 cm and height 14 cm. [2] (ii) When the pool is emptied, the water flows through a cylindrical pipe of radius 12.5 cm. The water flows along this pipe at a rate of 14 centimetres per second. Calculate the time taken to empty the pool. Give your answer in days and hours, correct to the nearest hour. [4]
Mark scheme: 7 (a) (i) 1 (2 . 5 + 1 . 1) × 35 o.e. M1 2 63 A1 (ii) their (a) x 24 M1 1512 A1ft (iii) 1512000 B1ft their (a)(ii) x 1000 (b) (i) 35.03 x 24 x 2.25 M1 1891.62… A1 www2 (ii) 1900 B1ft their b(i) rounded to nearest 100 (c) (i) 2 M1 π × 12 . 5 × 14 6870 or better A1 (6872.2339 or 6873.125 (π = 3.142)) (ii) [their (a)(ii) ÷ their (c)(i)] M1 x 1 000 000 A1 o.e. e.g. using litres ÷ (60 x 60 x 24) M1 Implied by 2.54 2 days 13 hours A1 www4 [14]
Q8 · The cost of a book is $x
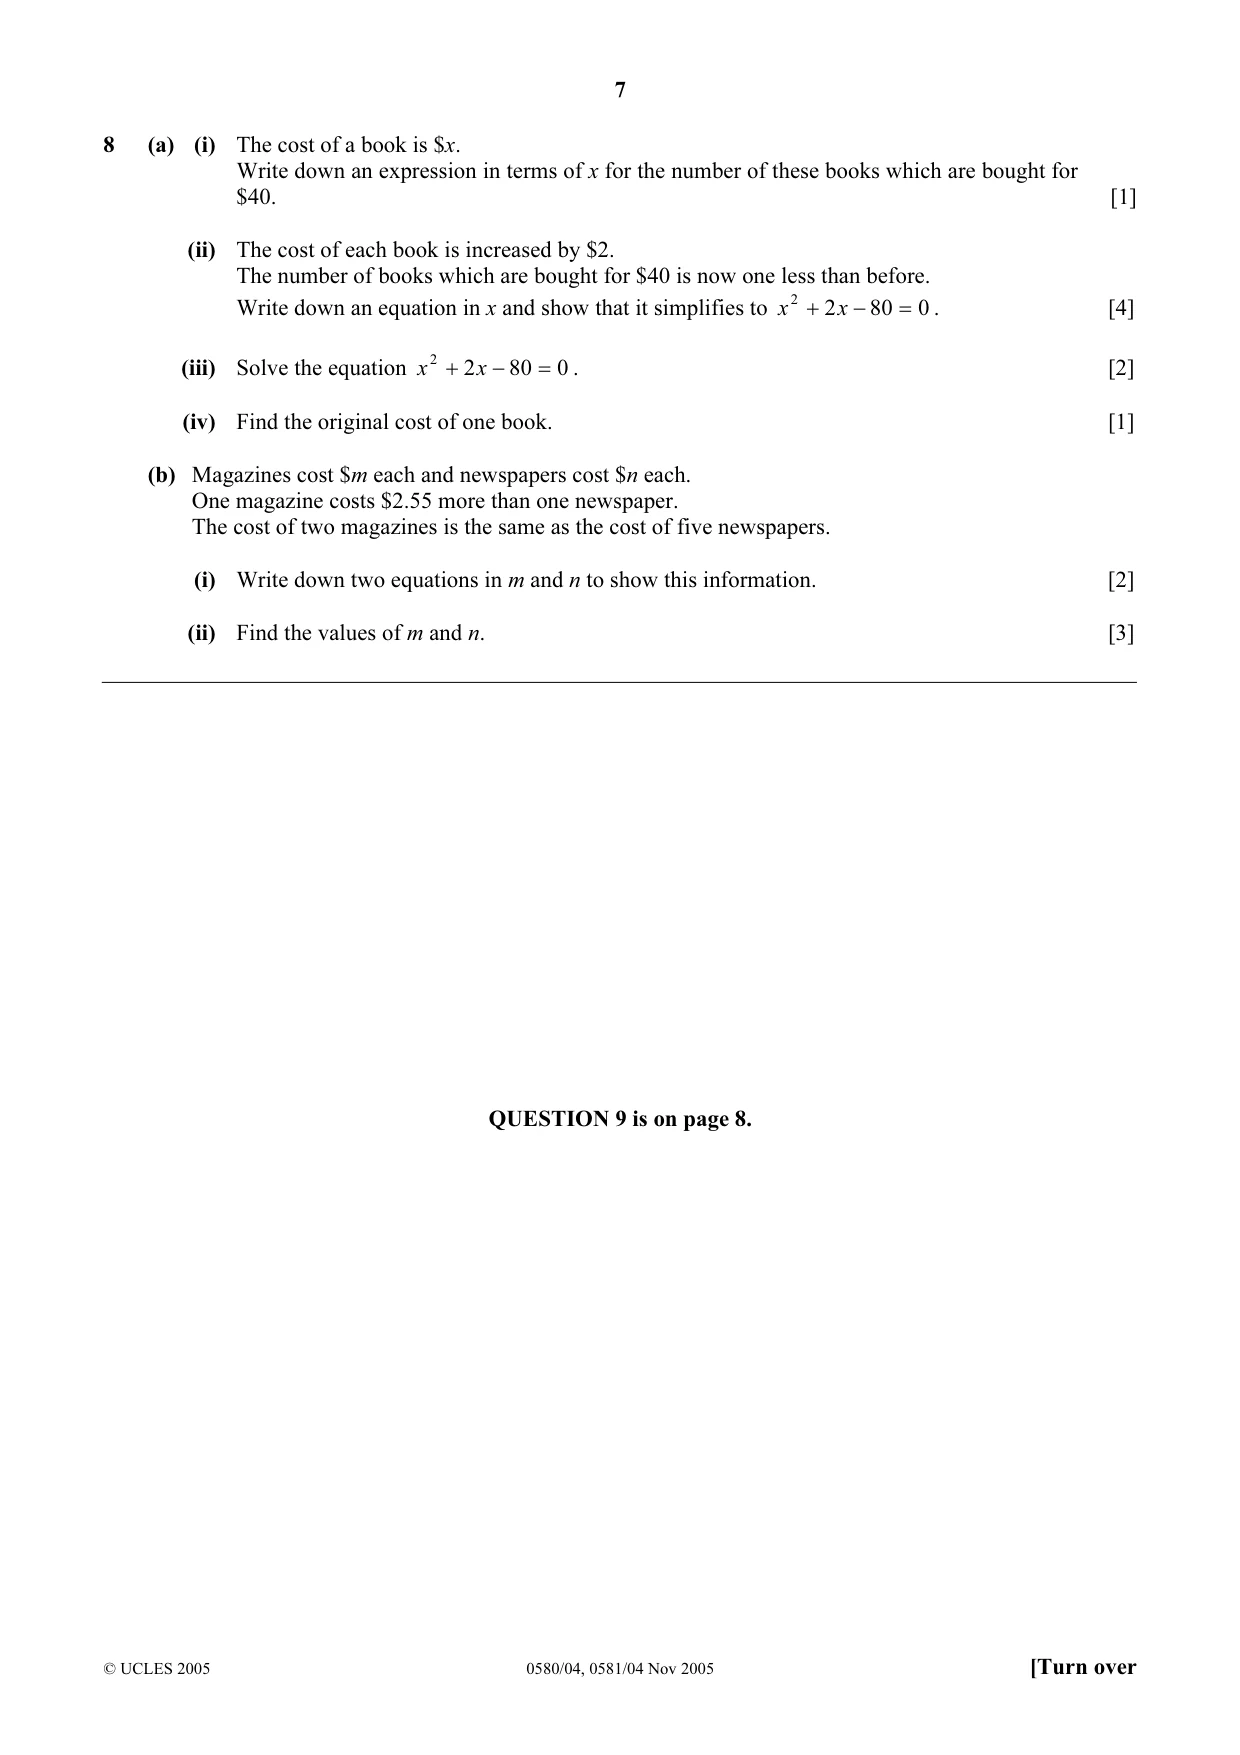
8 (a) (i) The cost of a book is $x. Write down an expression in terms of x for the number of these books which are bought for $40. [1] (ii) The cost of each book is increased by $2. The number of books which are bought for $40 is now one less than before. Write down an equation in x and show that it simplifies to x 2 + 2 x − 80 = 0 . [4] (iii) Solve the equation x 2 + 2 x − 80 = 0 . [2] (iv) Find the original cost of one book. [1] (b) Magazines cost $m each and newspapers cost $n each. One magazine costs $2.55 more than one newspaper. The cost of two magazines is the same as the cost of five newspapers. (i) Write down two equations in m and n to show this information. [2] (ii) Find the values of m and n. [3] QUESTION 9 is on page 8.
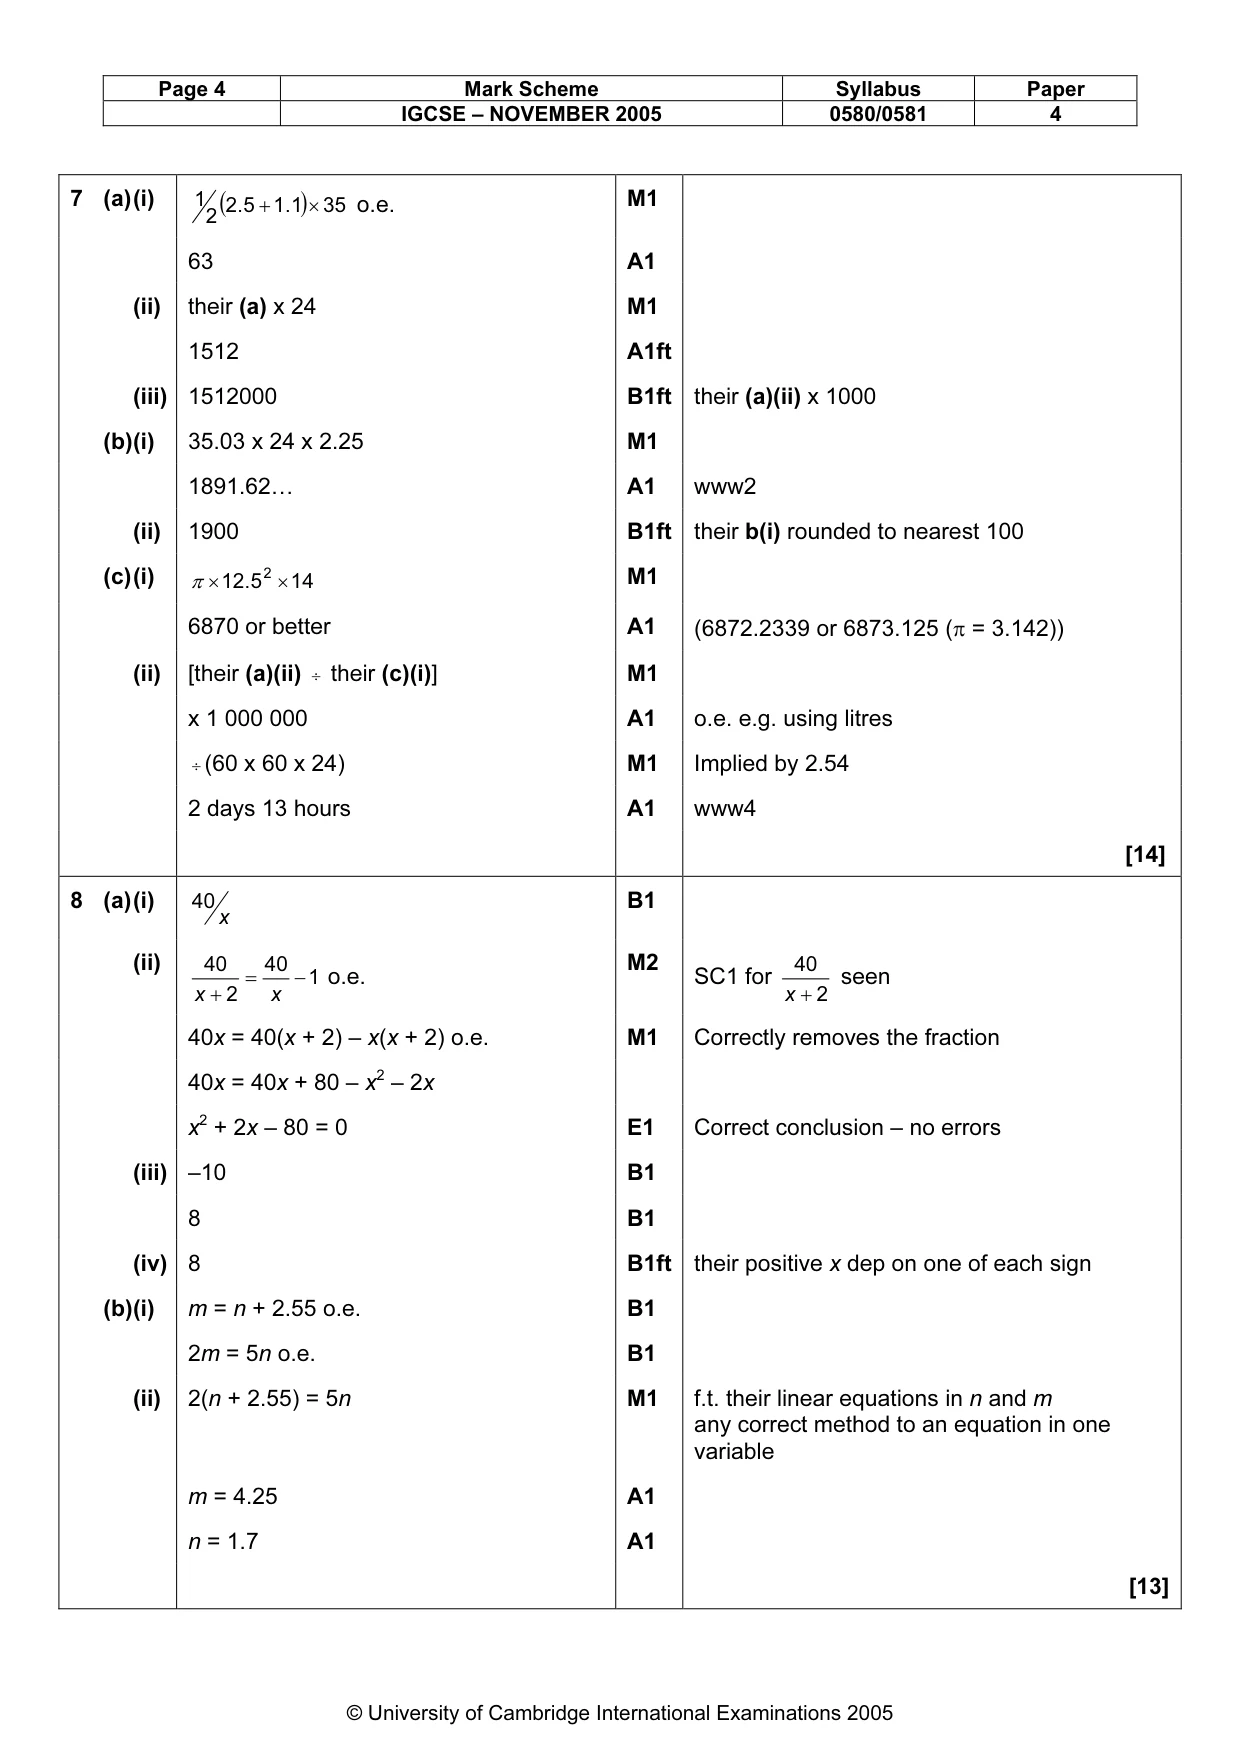
Mark scheme: 8 (a) (i) 40 B1 x (ii) 40 40 M2 40 = − 1 o.e. SC1 for seen x + 2 x x + 2 40x = 40(x + 2) – x(x + 2) o.e. M1 Correctly removes the fraction 40x = 40x + 80 – x2 – 2x x2 + 2x – 80 = 0 E1 Correct conclusion – no errors (iii) –10 B1 8 B1 (iv) 8 B1ft their positive x dep on one of each sign (b) (i) m = n + 2.55 o.e. B1 2m = 5n o.e. B1 (ii) 2(n + 2.55) = 5n M1 f.t. their linear equations in n and m any correct method to an equation in one variable m = 4.25 A1 n = 1.7 A1 [13] IGCSE – NOVEMBER 2005 0580/0581 4
Q9 · Answer the whole of this question on one sheet of graph paper
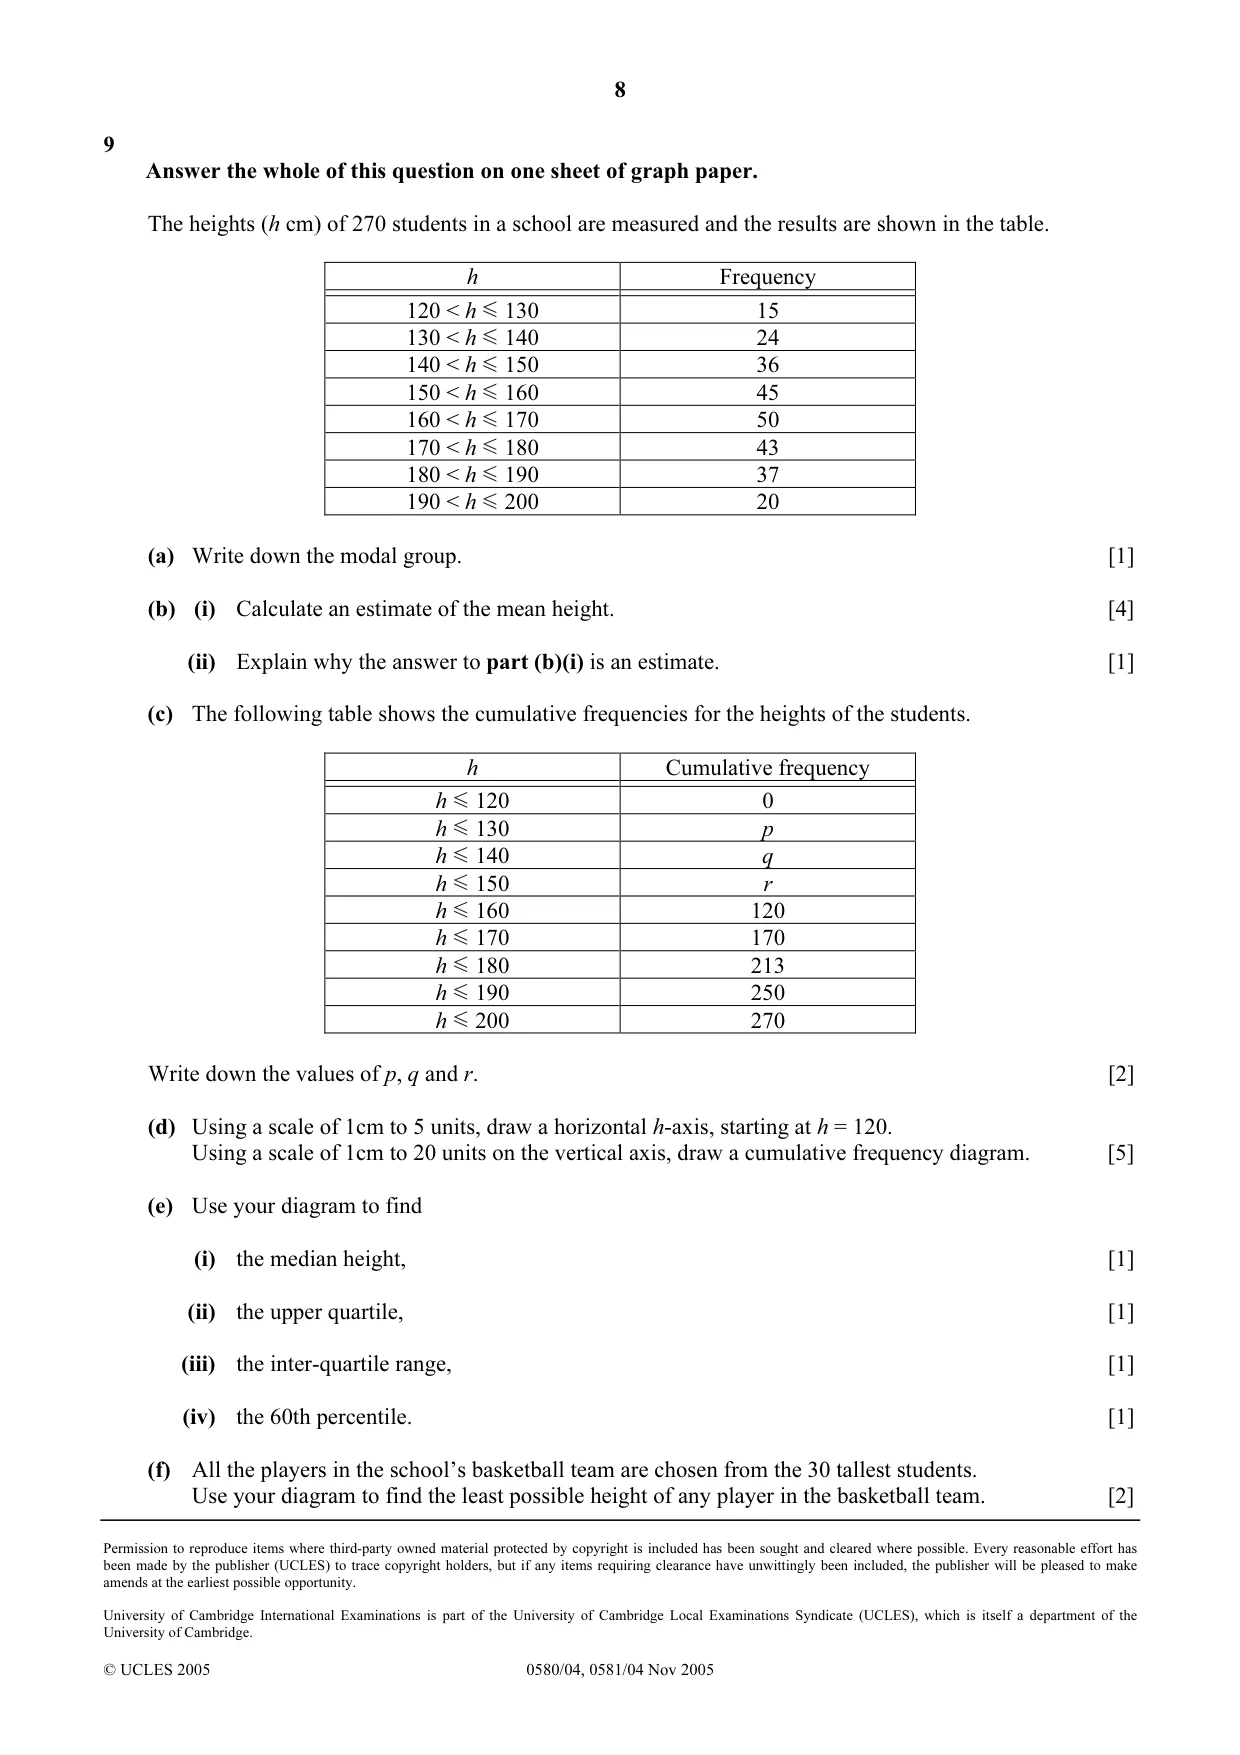
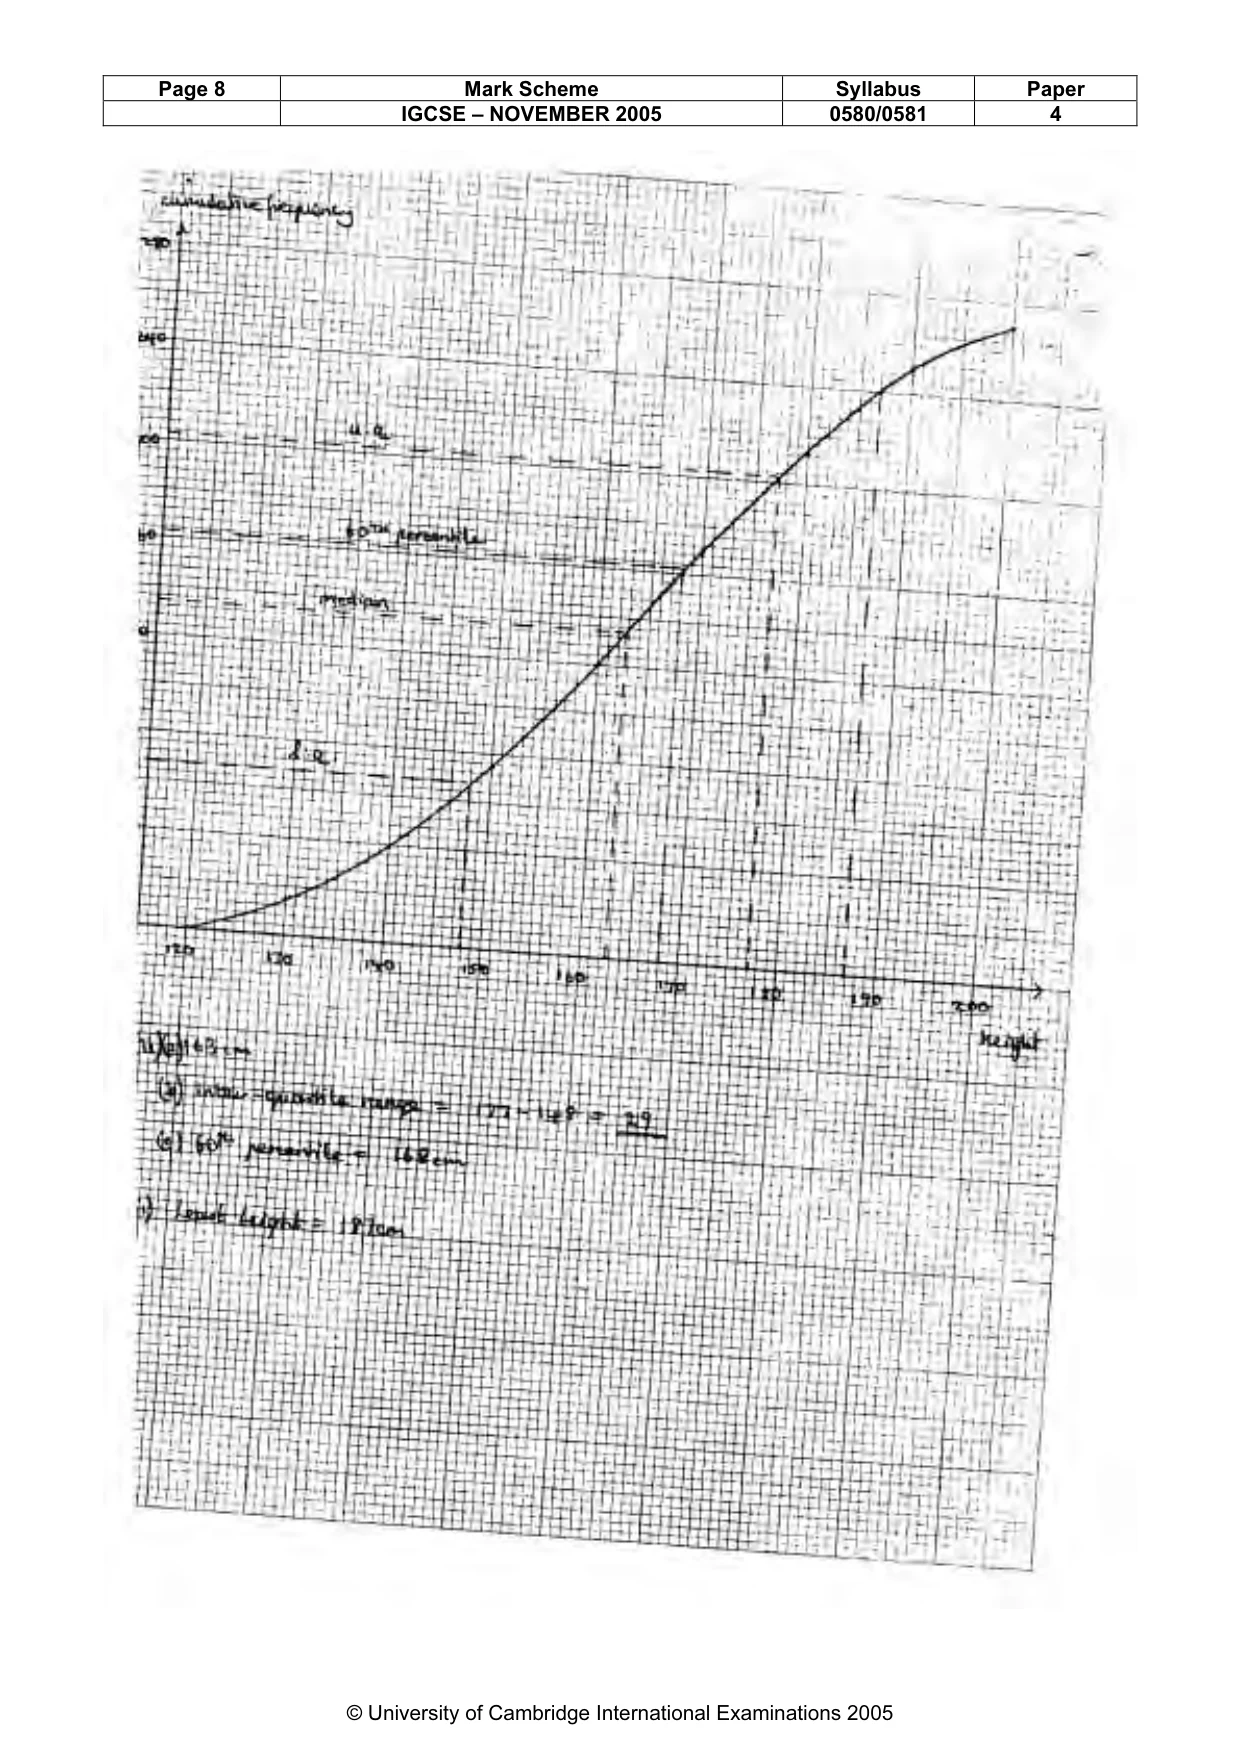
9 Answer the whole of this question on one sheet of graph paper. The heights (h cm) of 270 students in a school are measured and the results are shown in the table. h Frequency 120 < h 130 15 130 < h 140 24 140 < h 150 36 150 < h 160 45 160 < h 170 50 170 < h 180 43 180 < h 190 37 190 < h 200 20 (a) Write down the modal group. [1] (b) (i) Calculate an estimate of the mean height. [4] (ii) Explain why the answer to part (b)(i) is an estimate. [1] (c) The following table shows the cumulative frequencies for the heights of the students. h Cumulative frequency h 120 0 h 130 p h 140 q h 150 r h 160 120 h 170 170 h 180 213 h 190 250 h 200 270 Write down the values of p, q and r. [2] (d) Using a scale of 1cm to 5 units, draw a horizontal h-axis, starting at h = 120. Using a scale of 1cm to 20 units on the vertical axis, draw a cumulative frequency diagram. [5] (e) Use your diagram to find (i) the median height, [1] (ii) the upper quartile, [1] (iii) the inter-quartile range, [1] (iv) the 60th percentile. [1] (f) All the players in the school’s basketball team are chosen from the 30 tallest students. Use your diagram to find the least possible height of any player in the basketball team. [2]
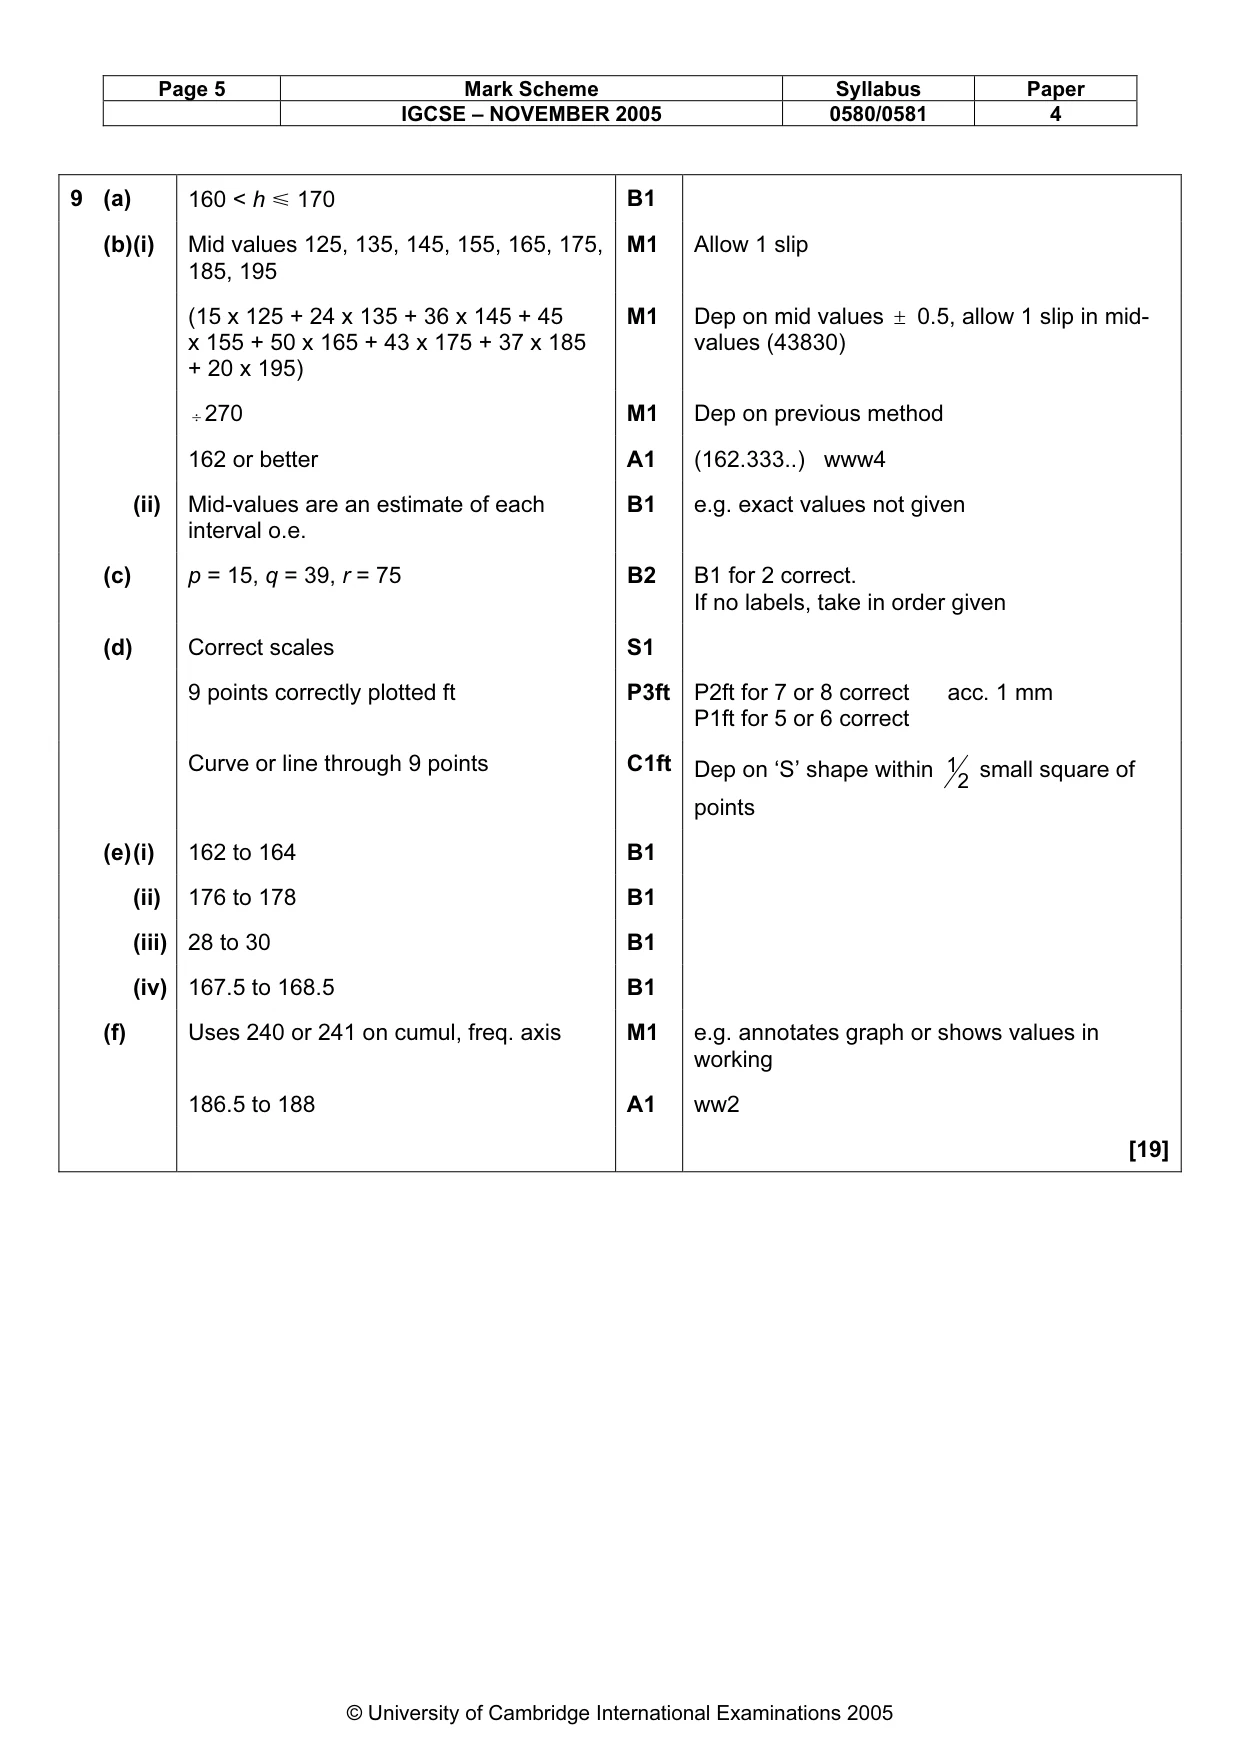
Mark scheme: 9 (a) 160 < h Y 170 B1 (b) (i) Mid values 125, 135, 145, 155, 165, 175, M1 Allow 1 slip 185, 195 (15 x 125 + 24 x 135 + 36 x 145 + 45 M1 Dep on mid values ± 0.5, allow 1 slip in mid- x 155 + 50 x 165 + 43 x 175 + 37 x 185 values (43830) + 20 x 195) ÷ 270 M1 Dep on previous method 162 or better A1 (162.333..) www4 (ii) Mid-values are an estimate of each B1 e.g. exact values not given interval o.e. (c) p = 15, q = 39, r = 75 B2 B1 for 2 correct. If no labels, take in order given (d) Correct scales S1 9 points correctly plotted ft P3ft P2ft for 7 or 8 correct acc. 1 mm P1ft for 5 or 6 correct Curve or line through 9 points C1ft Dep on ‘S’ shape within 1 small square of 2 points (e) (i) 162 to 164 B1 (ii) 176 to 178 B1 (iii) 28 to 30 B1 (iv) 167.5 to 168.5 B1 (f) Uses 240 or 241 on cumul, freq. axis M1 e.g. annotates graph or shows values in working 186.5 to 188 A1 ww2 [19] IGCSE – NOVEMBER 2005 0580/0581 4 IGCSE – NOVEMBER 2005 0580/0581 4 IGCSE – NOVEMBER 2005 0580/0581 4
What was in this paper
The subtopics covered by these 9 questions, and how many questions each got. Open one in a new tab to see every Cambridge question on it.