Questions as text
Q1 · A pipe drips water into an empty glass jar 0625/31 May/June 2017
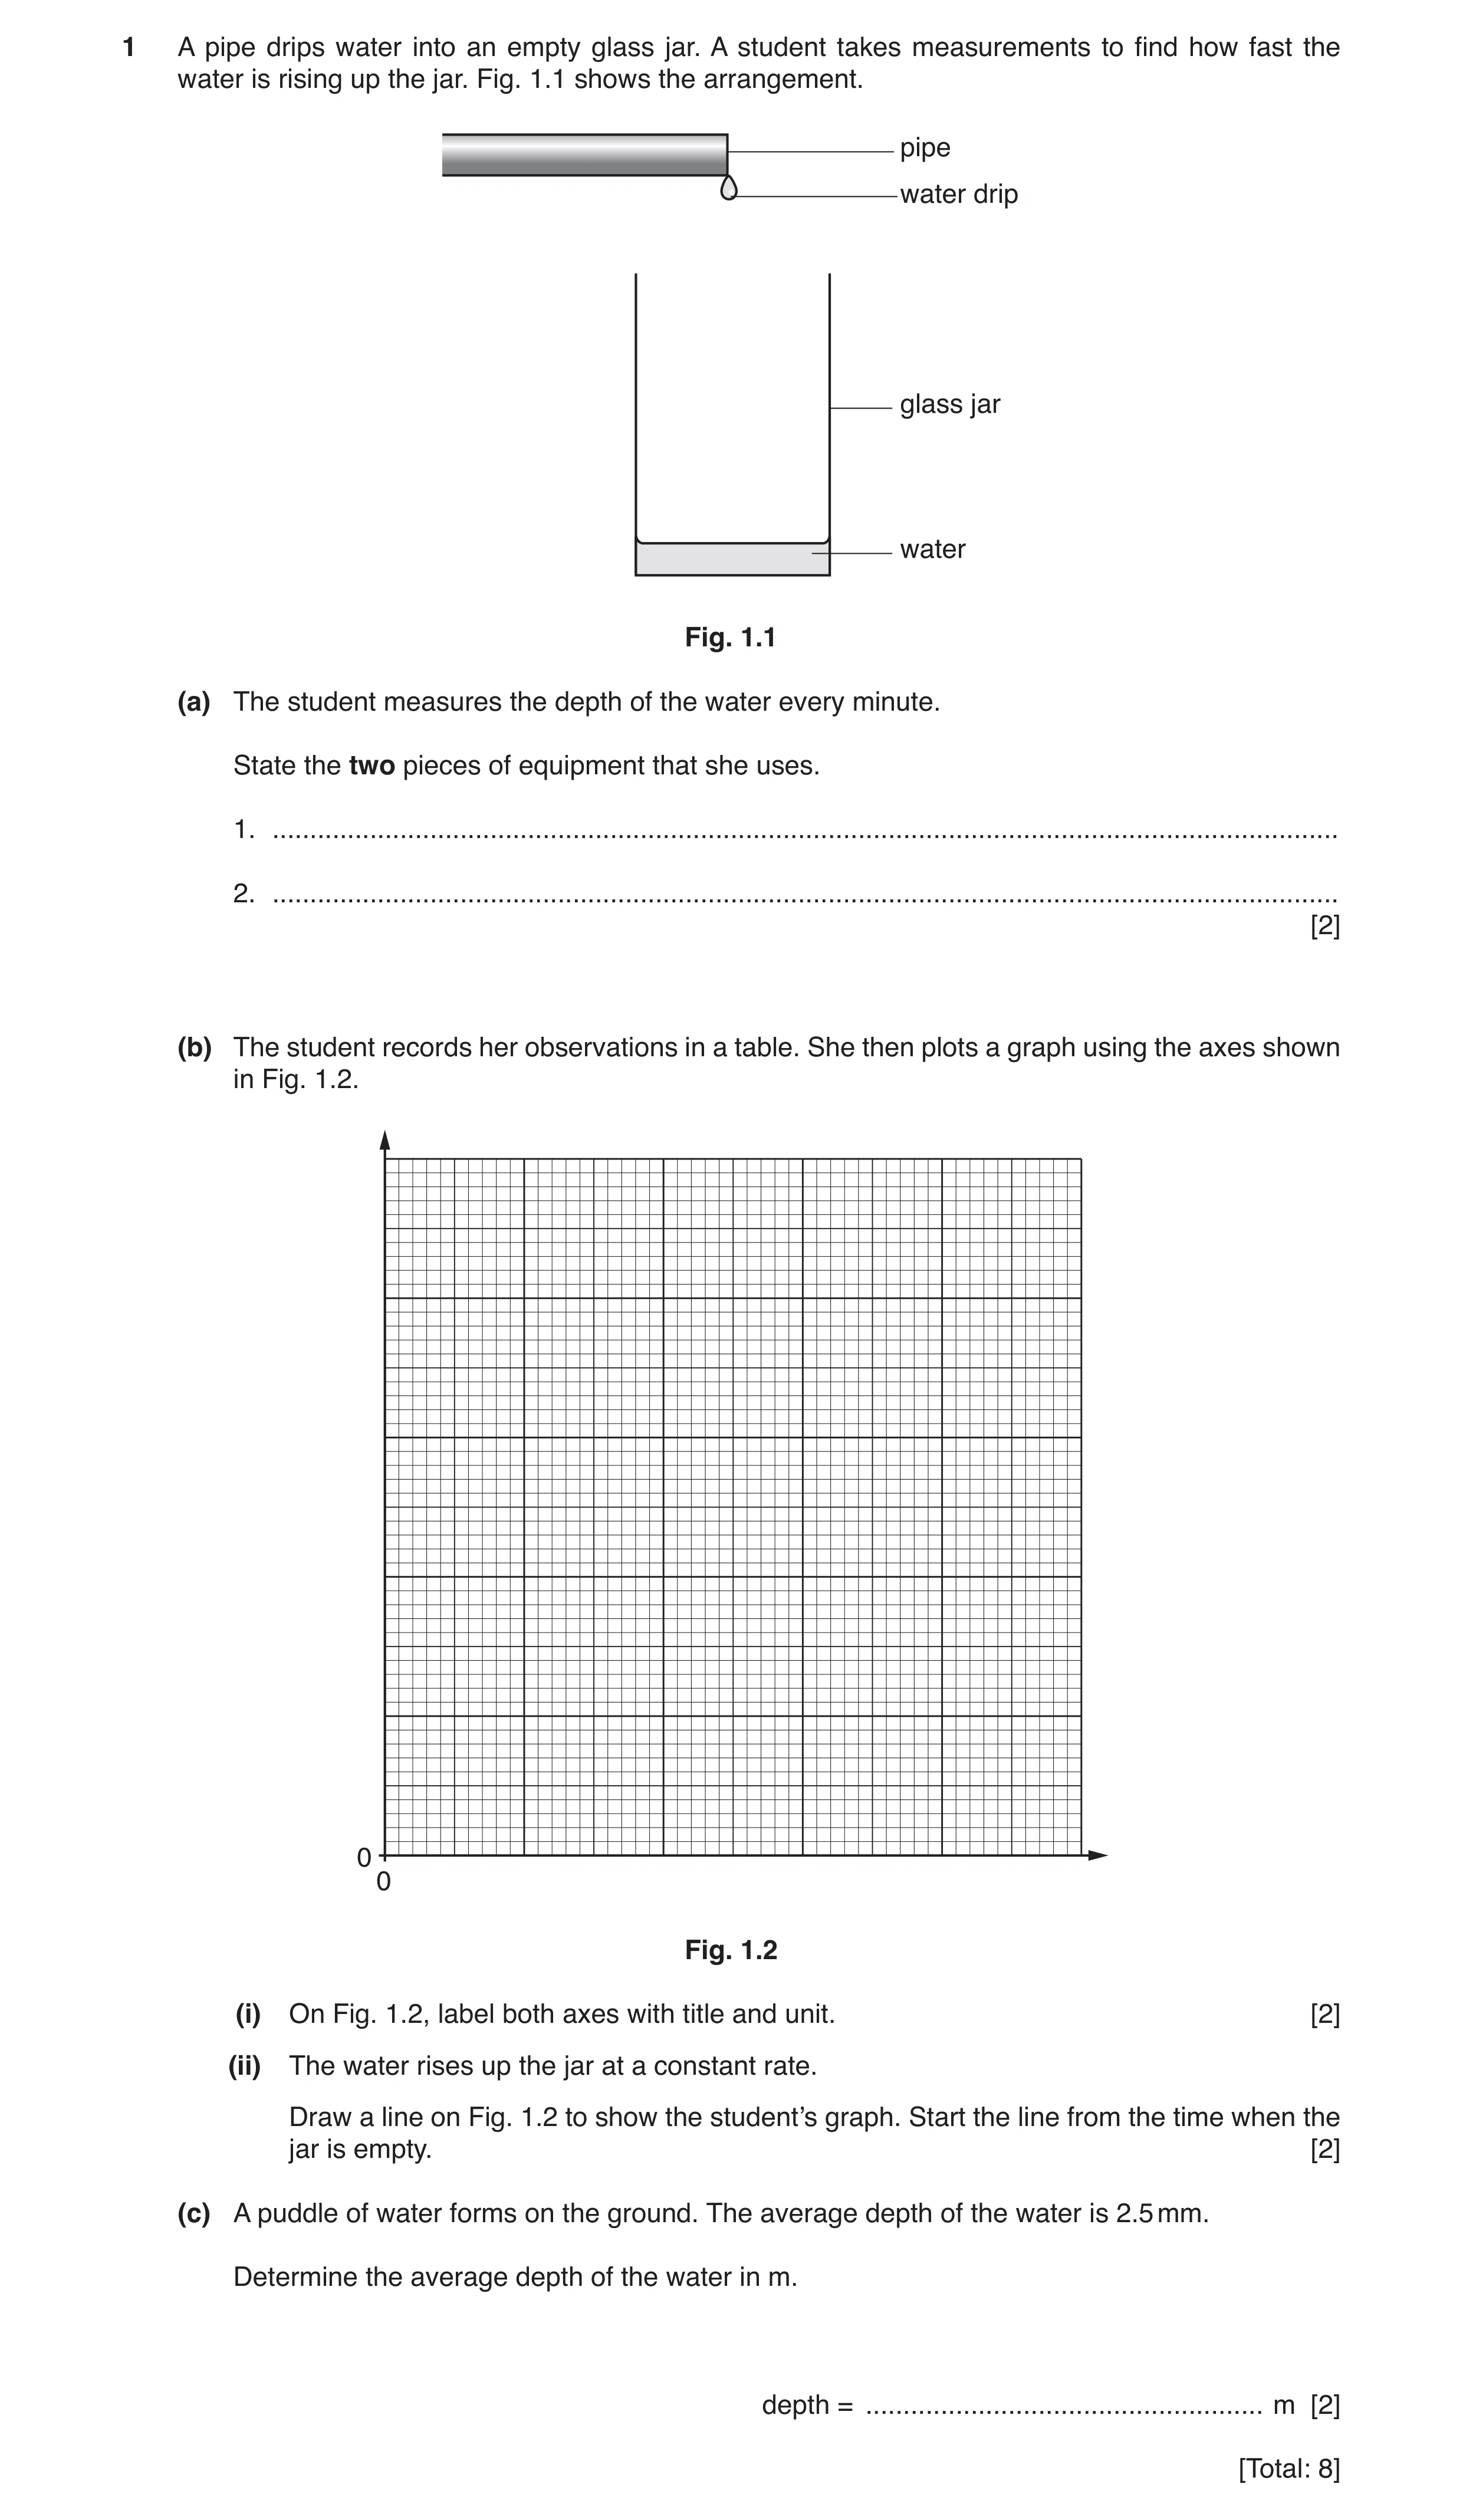
1 A pipe drips water into an empty glass jar. A student takes measurements to find how fast the water is rising up the jar. Fig. 1.1 shows the arrangement. pipe water drip glass jar water Fig. 1.1 (a) The student measures the depth of the water every minute. State the two pieces of equipment that she uses. 1. … 2. … [2] (b) The student records her observations in a table. She then plots a graph using the axes shown in Fig. 1.2. 0 0 Fig. 1.2 (i) On Fig. 1.2, label both axes with title and unit. [2] (ii) The water rises up the jar at a constant rate. Draw a line on Fig. 1.2 to show the student’s graph. Start the line from the time when the jar is empty. [2] (c) A puddle of water forms on the ground. The average depth of the water is 2.5 mm. Determine the average depth of the water in m. depth = … m [2] [Total: 8]
8 marks
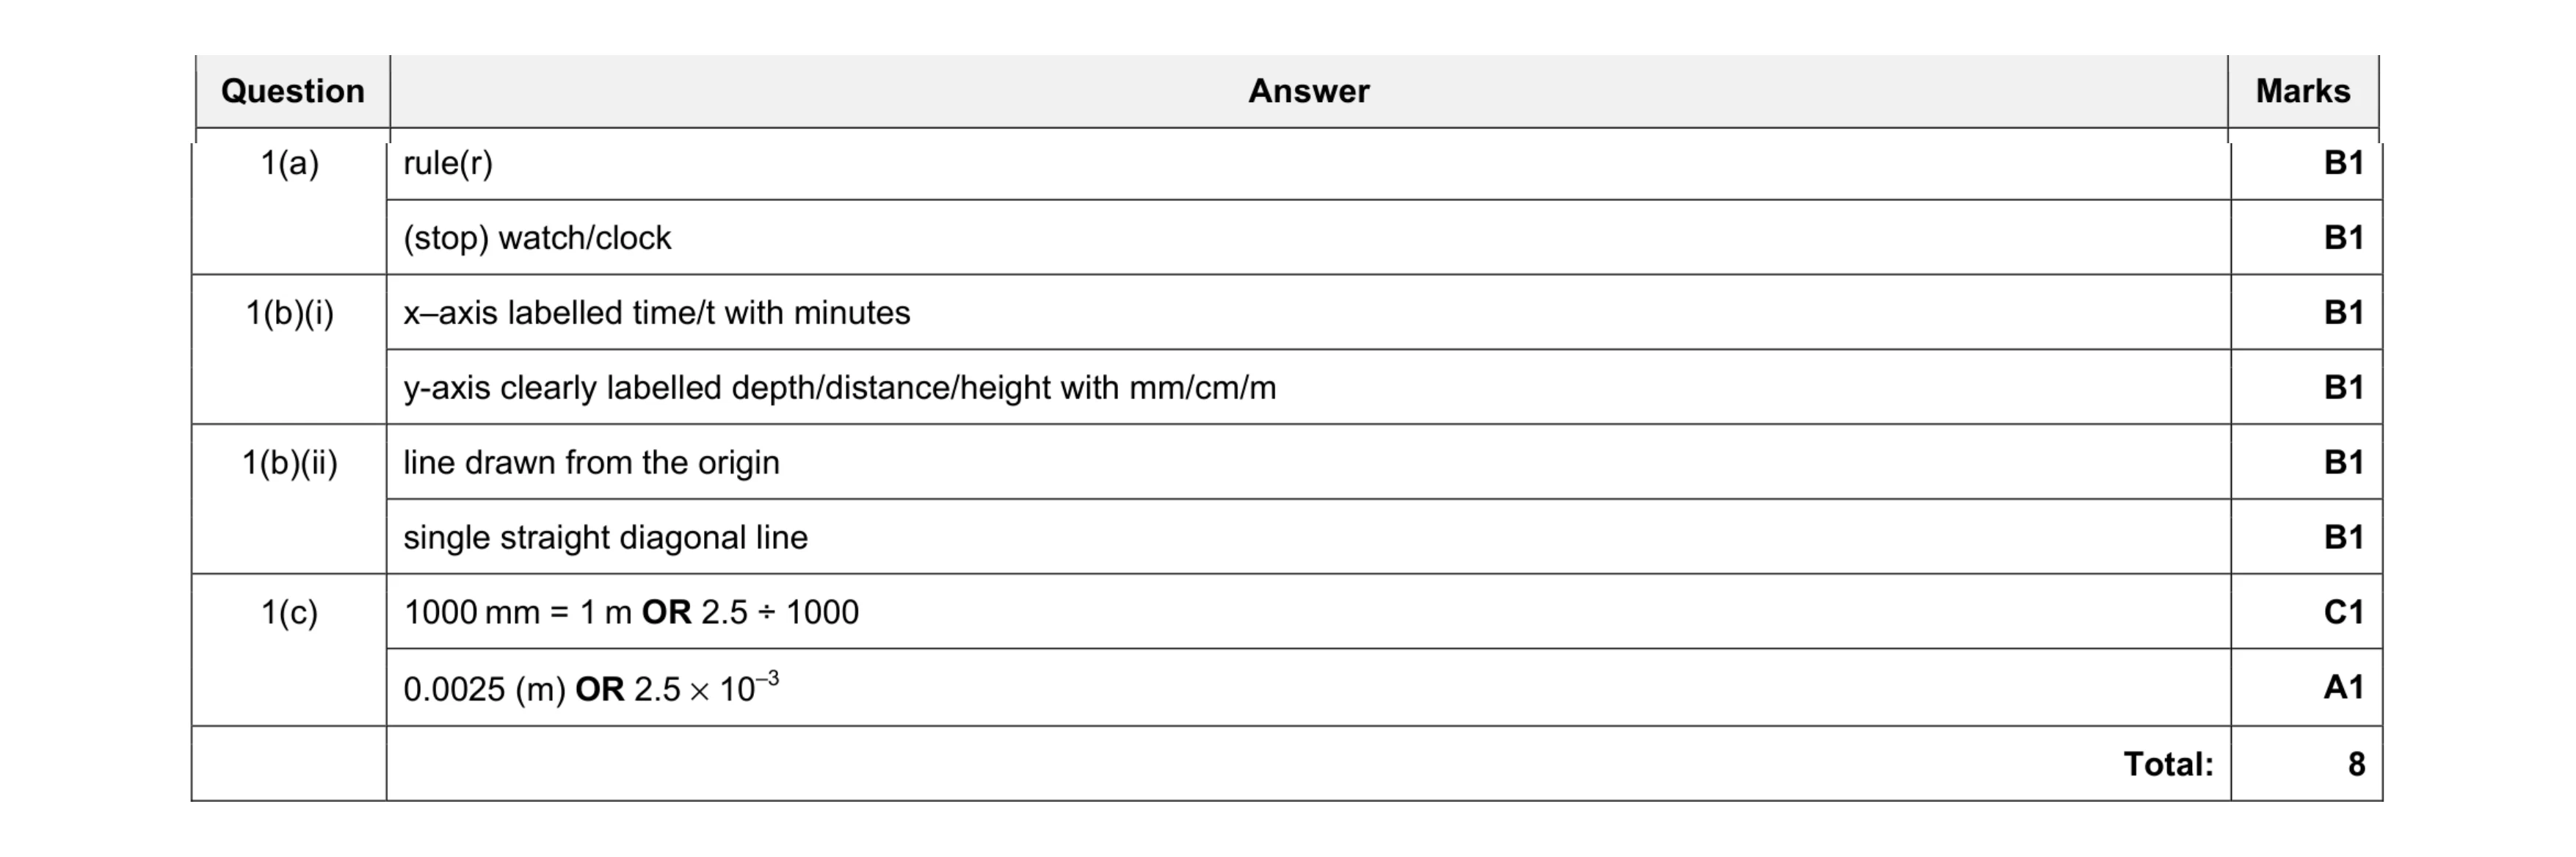
Mark scheme: 1(a) rule(r) B1 (stop) watch/clock B1 1(b)(i) x–axis labelled time/t with minutes B1 y-axis clearly labelled depth/distance/height with mm/cm/m B1 1(b)(ii) line drawn from the origin B1 single straight diagonal line B1 1(c) 1000 mm = 1 m OR 2.5 ÷ 1000 C1 0.0025 (m) OR 2.5 × 10⁻³ A1 Total: 8
This question in 0625/31 May/June 2017
Q2 · Students about to start a 50.0 m swimming race 0625/32 May/June 2017
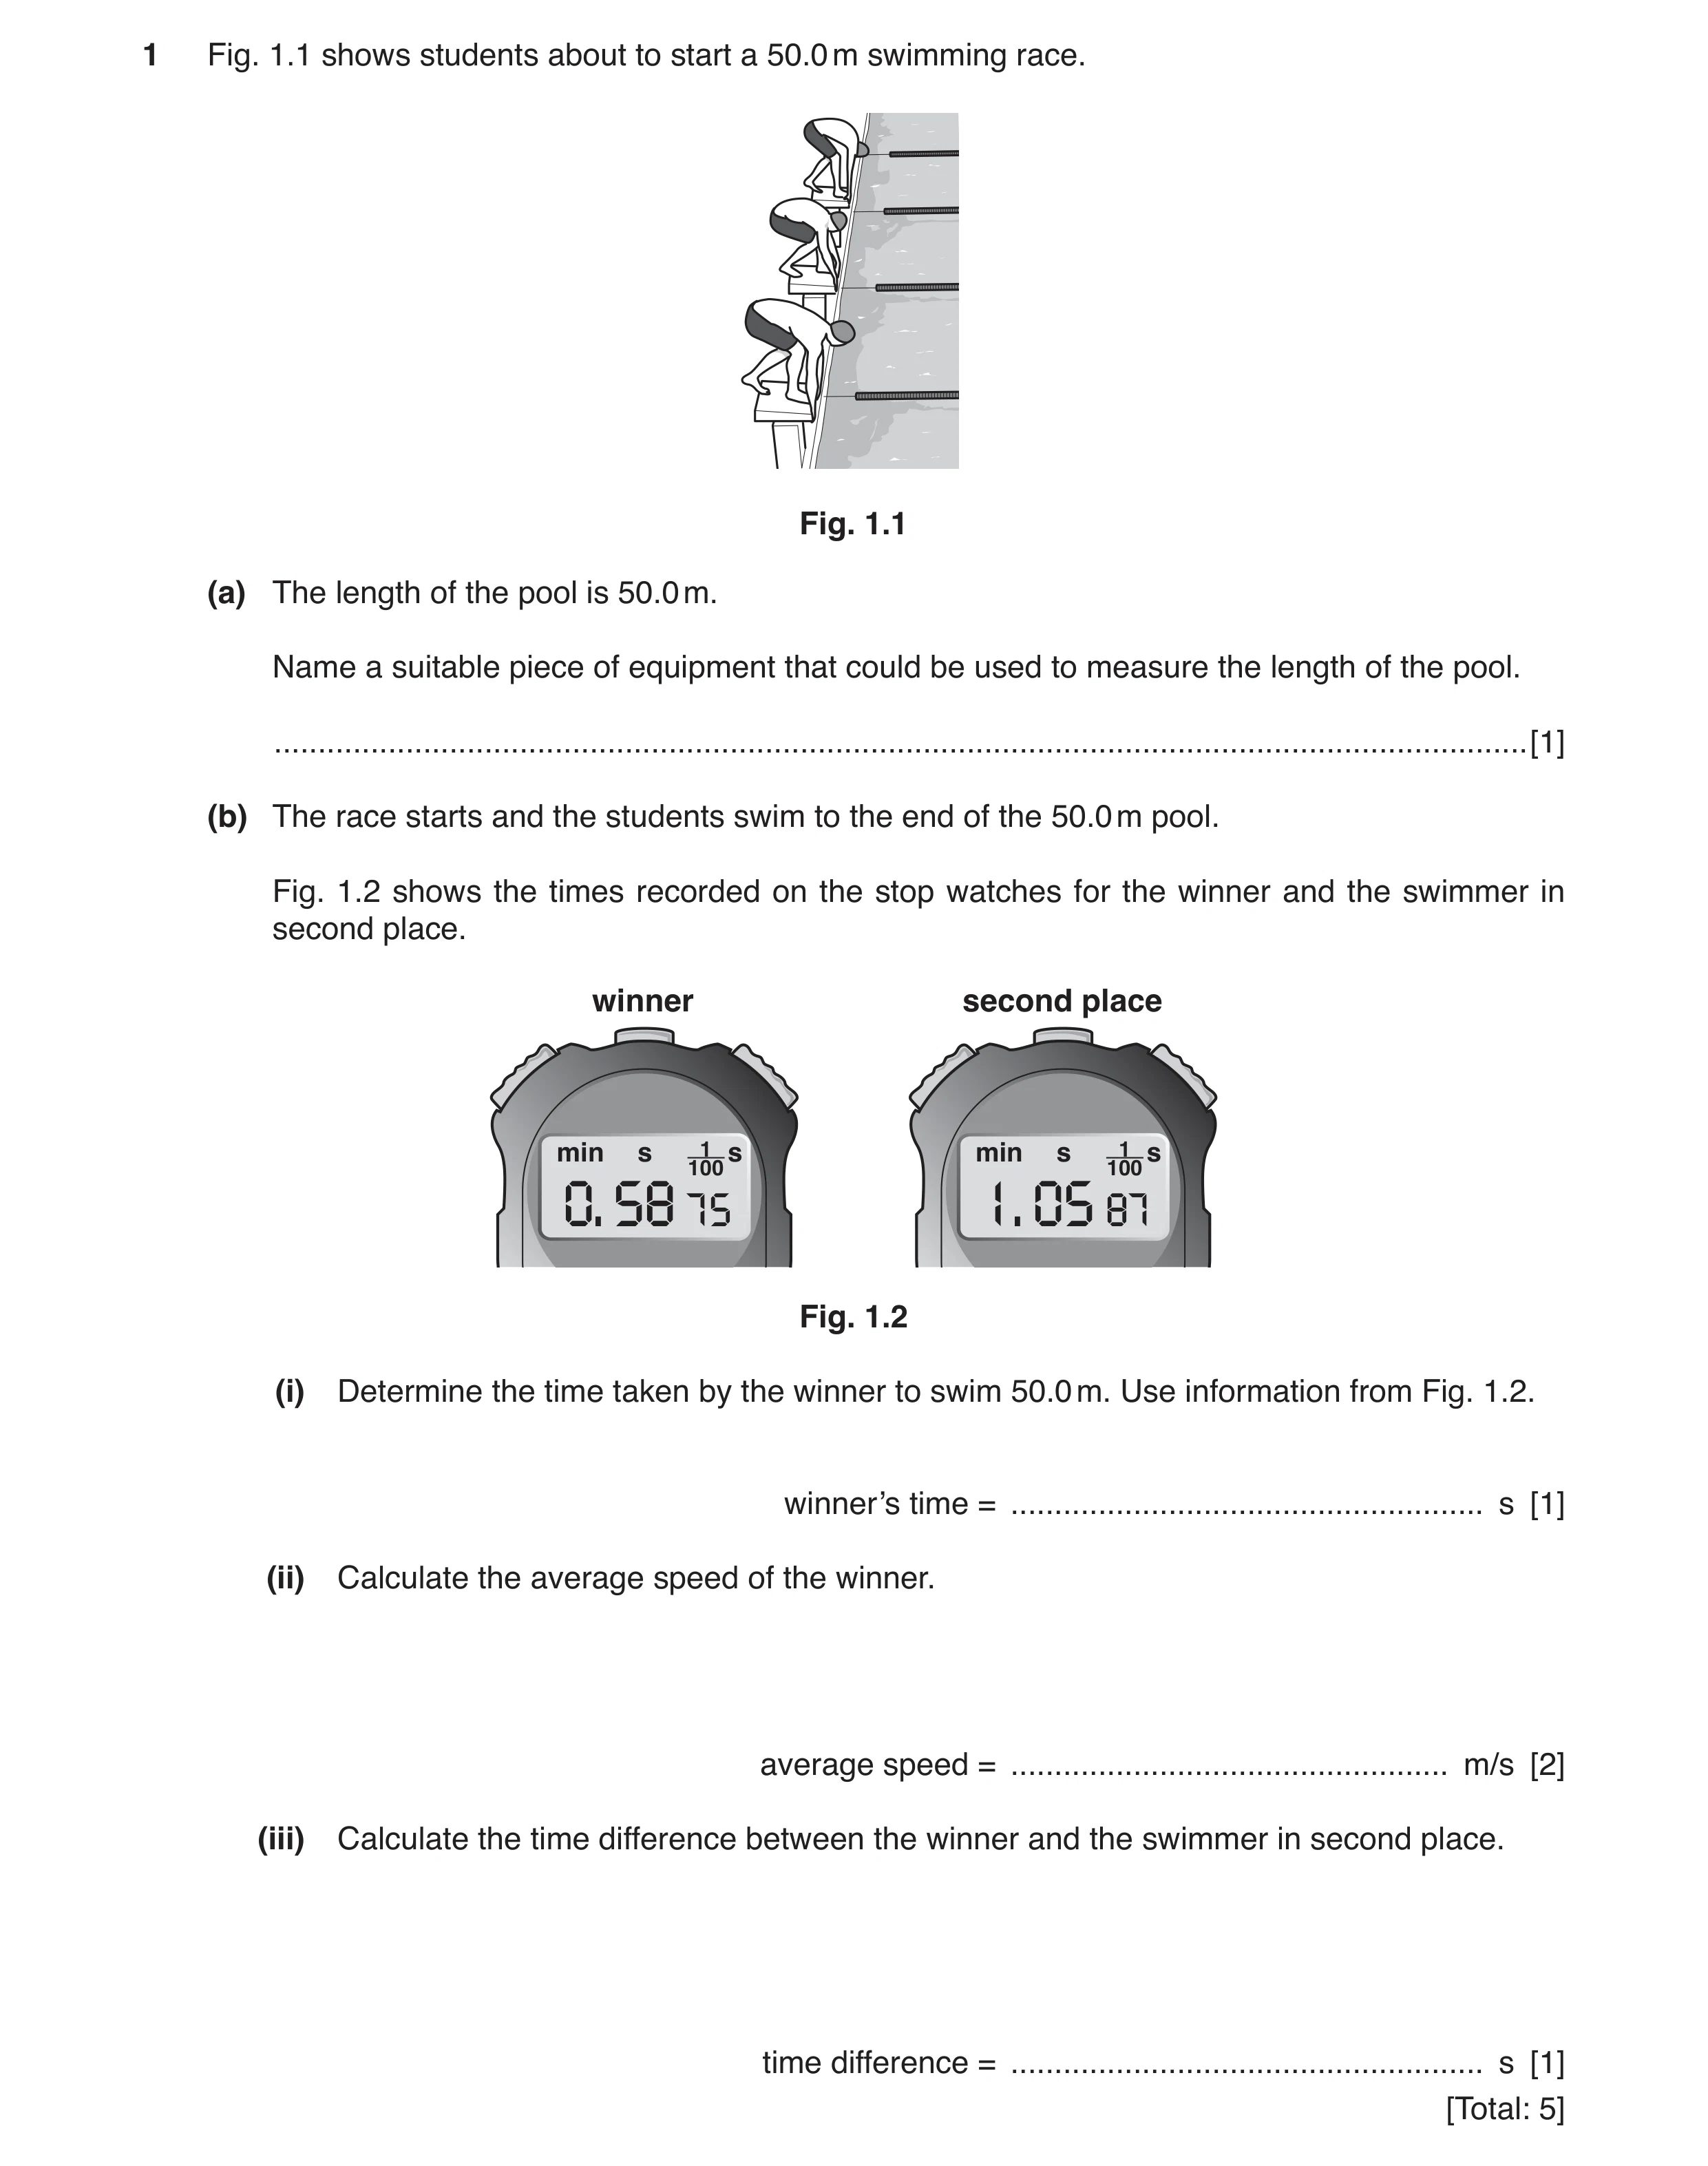
1 Fig. 1.1 shows students about to start a 50.0 m swimming race. Fig. 1.1 (a) The length of the pool is 50.0 m. Name a suitable piece of equipment that could be used to measure the length of the pool. … [1] (b) The race starts and the students swim to the end of the 50.0 m pool. Fig. 1.2 shows the times recorded on the stop watches for the winner and the swimmer in second place. winner second place min s 1 s min s 1 s 100 100 0. 58 75 1. 05 87 Fig. 1.2 (i) Determine the time taken by the winner to swim 50.0 m. Use information from Fig. 1.2. winner’s time = … s [1] (ii) Calculate the average speed of the winner. average speed = … m/s [2] (iii) Calculate the time difference between the winner and the swimmer in second place. time difference = … s [1] [Total: 5]
5 marks
Mark scheme: 1(a) flexible rule/tape measure/measuring tape B1 1(b)(i) 58.75 (s) B1 1(b)(ii) speed = distance ÷ time in any form C1 0.85 (m / s) A1 1(b)(iii) 7.12 (s) B1 Total: 5
This question in 0625/32 May/June 2017
Q3 · A student measures a book 0625/33 May/June 2017
1 A student measures a book. (a) He measures the length of the book, as shown in Fig. 1.1. PHYSICS 0 5 10 15 20 25 30 centimetres Fig. 1.1 The student records his measurement. 19.9 cm length of book = … His measurement is not accurate. Describe two ways that the student can improve the accuracy of his measurement. 1. … … 2. … … [2] (b) The book contains 200 thin sheets of paper. The student wants to find the average (mean) thickness of a sheet of paper in the book. Describe how he can determine such a small distance using only a ruler. … … … … … [3] (c) The book has a mass of 400 g. Calculate the weight of the book. Include the unit. weight = … [4] [Total: 9]
9 marks
Mark scheme: 1(a) any two from: use a ruler with mm (scale) ruler close(r) to book/no space between book and ruler have zero on ruler at one end of book take reading with eye in line with end of book owtte B2 1(b) use large number of pages i.e. more than 50 B1 measure (total) thickness (with ruler) B1 divide (total) thickness by number of pages B1 1(c) convert g to kg or 400 ÷ 1000 B1 Weight = mass × gravitational field strength in any form C1 (weight = ) 4.0 A1 (unit) N or newtons B1 Total: 9
This question in 0625/33 May/June 2017
Q4 · A student clamps a metre rule to the end of a bench, as shown in Fig 0625/31 Oct/Nov 2017
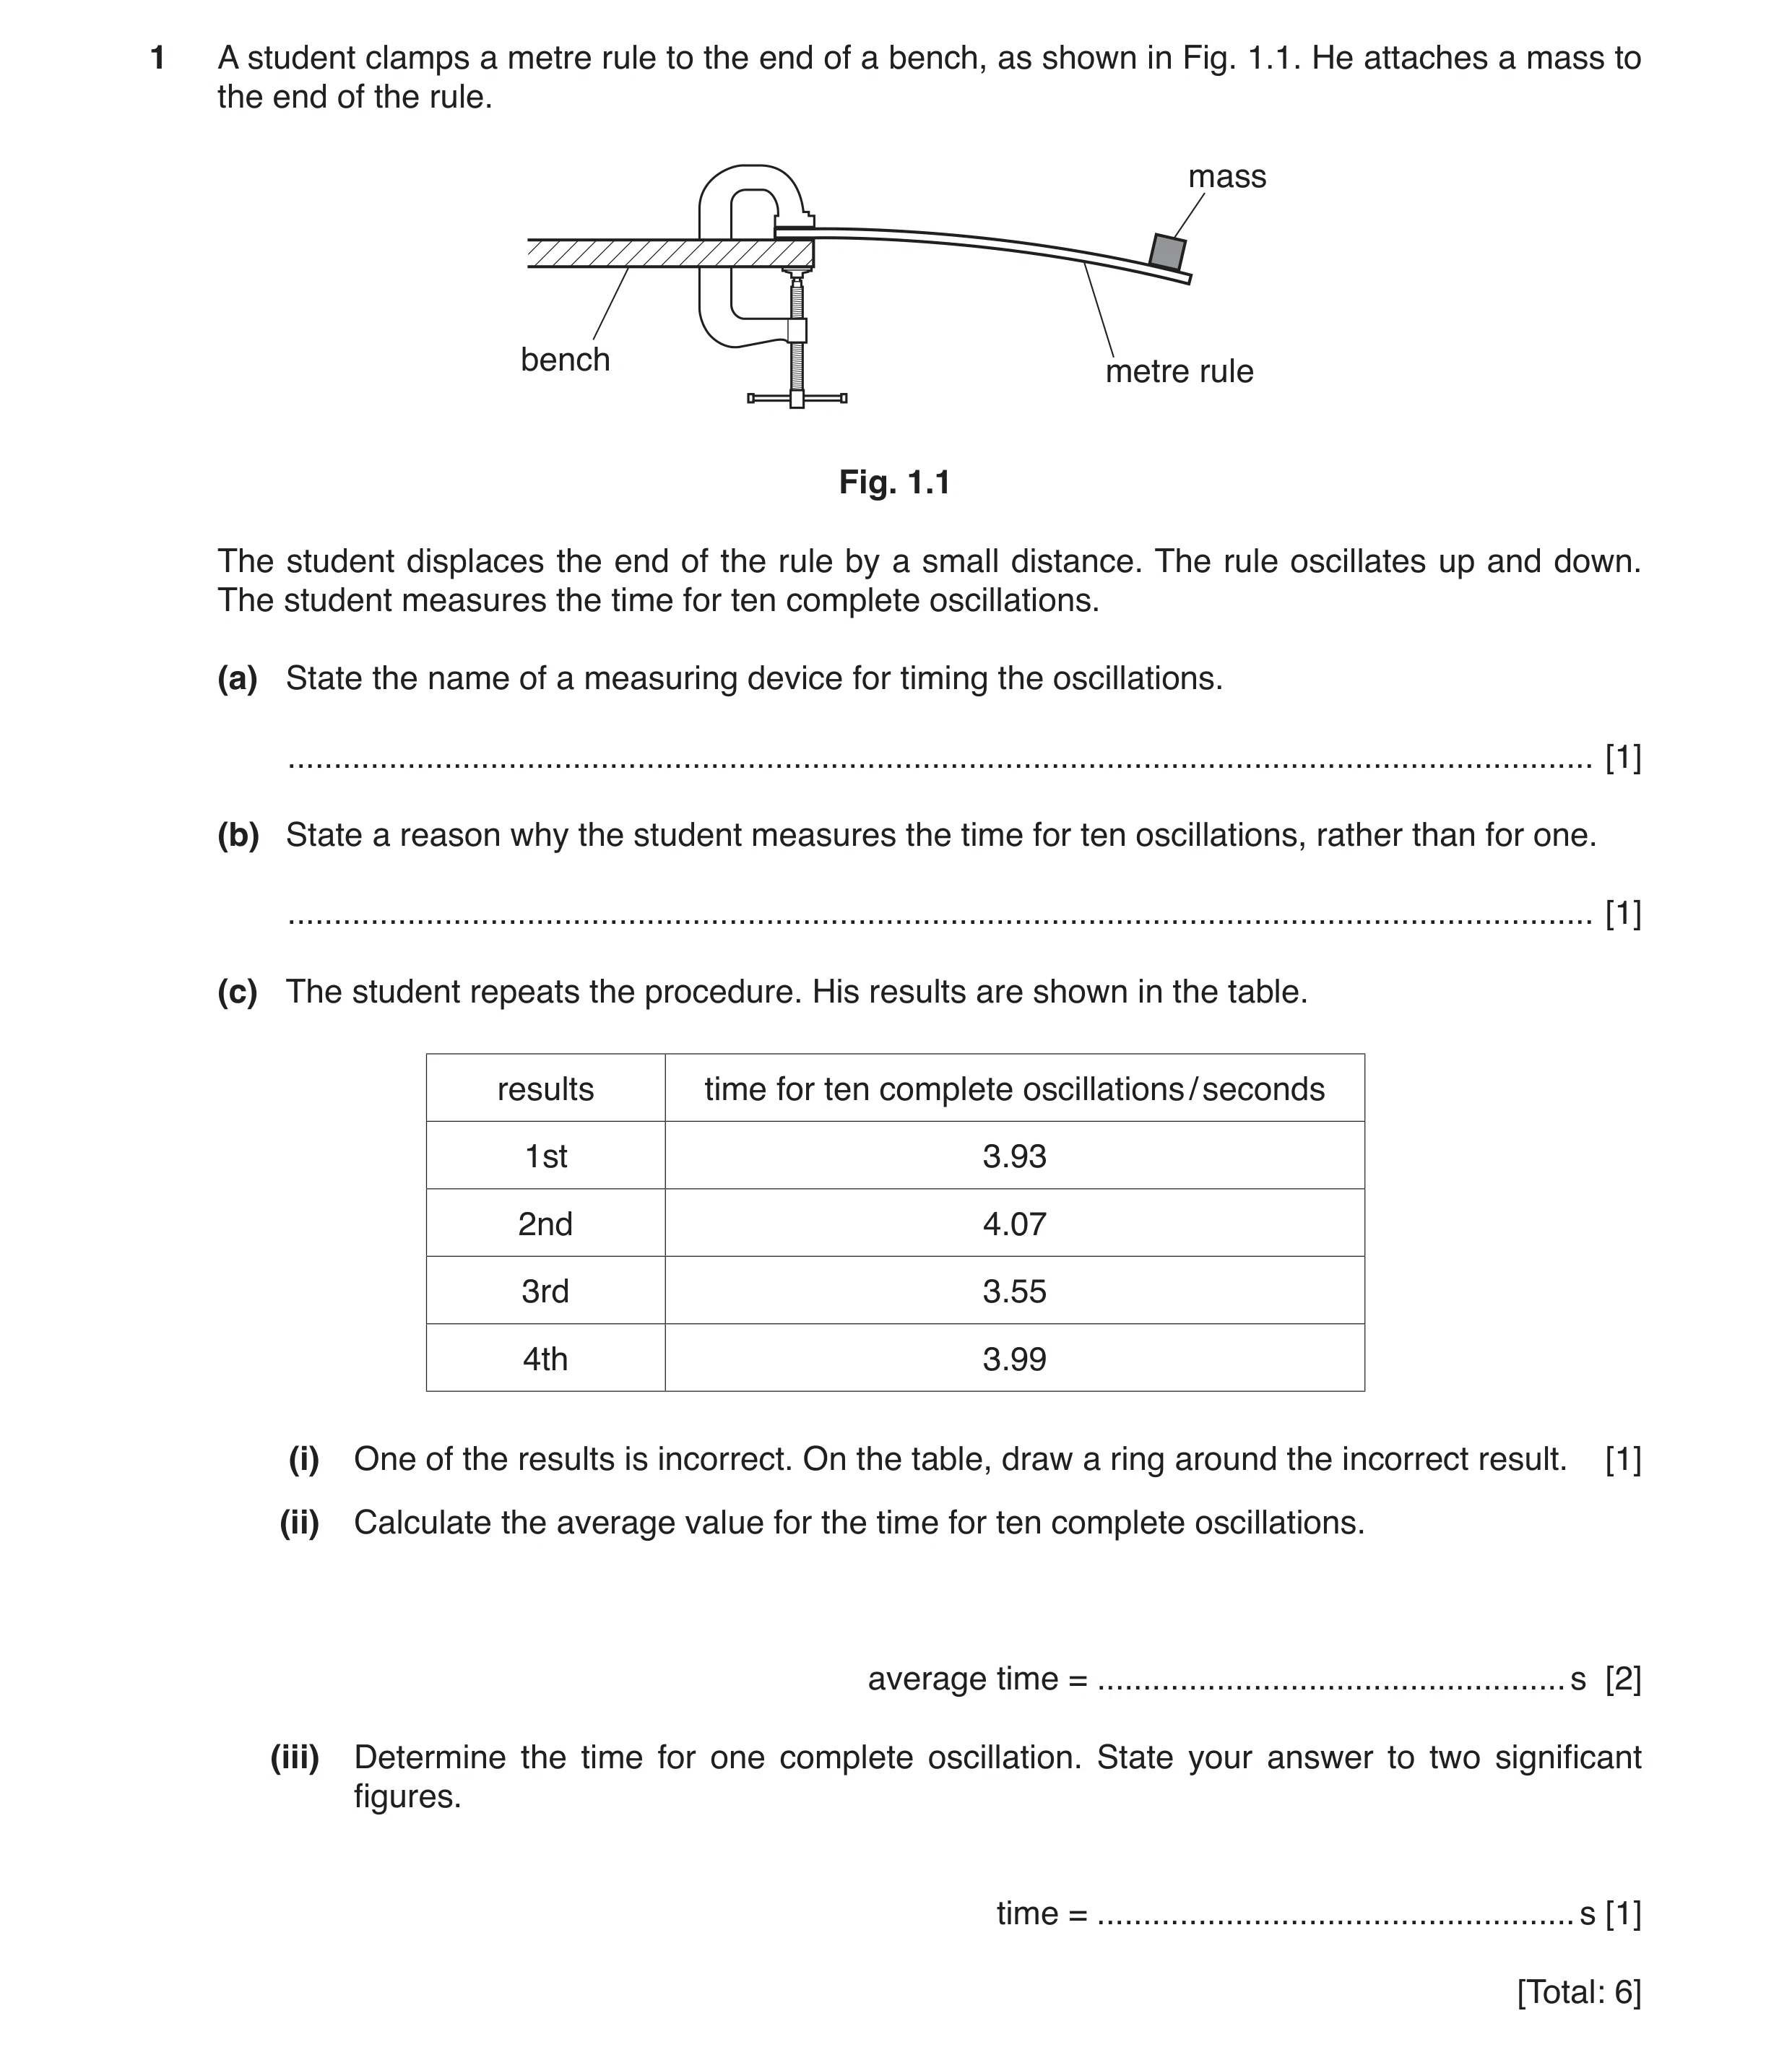
1 A student clamps a metre rule to the end of a bench, as shown in Fig. 1.1. He attaches a mass to the end of the rule. mass bench metre rule Fig. 1.1 The student displaces the end of the rule by a small distance. The rule oscillates up and down. The student measures the time for ten complete oscillations. (a) State the name of a measuring device for timing the oscillations. … [1] (b) State a reason why the student measures the time for ten oscillations, rather than for one. … [1] (c) The student repeats the procedure. His results are shown in the table. results time for ten complete oscillations / seconds 1st 3.93 2nd 4.07 3rd 3.55 4th 3.99 (i) One of the results is incorrect. On the table, draw a ring around the incorrect result. [1] (ii) Calculate the average value for the time for ten complete oscillations. average time = … s [2] (iii) Determine the time for one complete oscillation. State your answer to two significant figures. time = … s [1] [Total: 6]
6 marks
Mark scheme: 1(a) stopwatch or stopclock B1 1(b) improved accuracy B1 1(c)(i) circle around 3rd OR 3.55 B1 1(c)(ii) 3.93 + 4.07 + 3.99 = 11.99 C1 (11.99 ÷ 3 =) 4.0 (s) A1 1(c)(iii) 0.40 (s) OR (c)(ii) ÷ 10 B1
This question in 0625/31 Oct/Nov 2017
Q5 · This question is about measuring the speed of sound in air 0625/31 May/June 2018
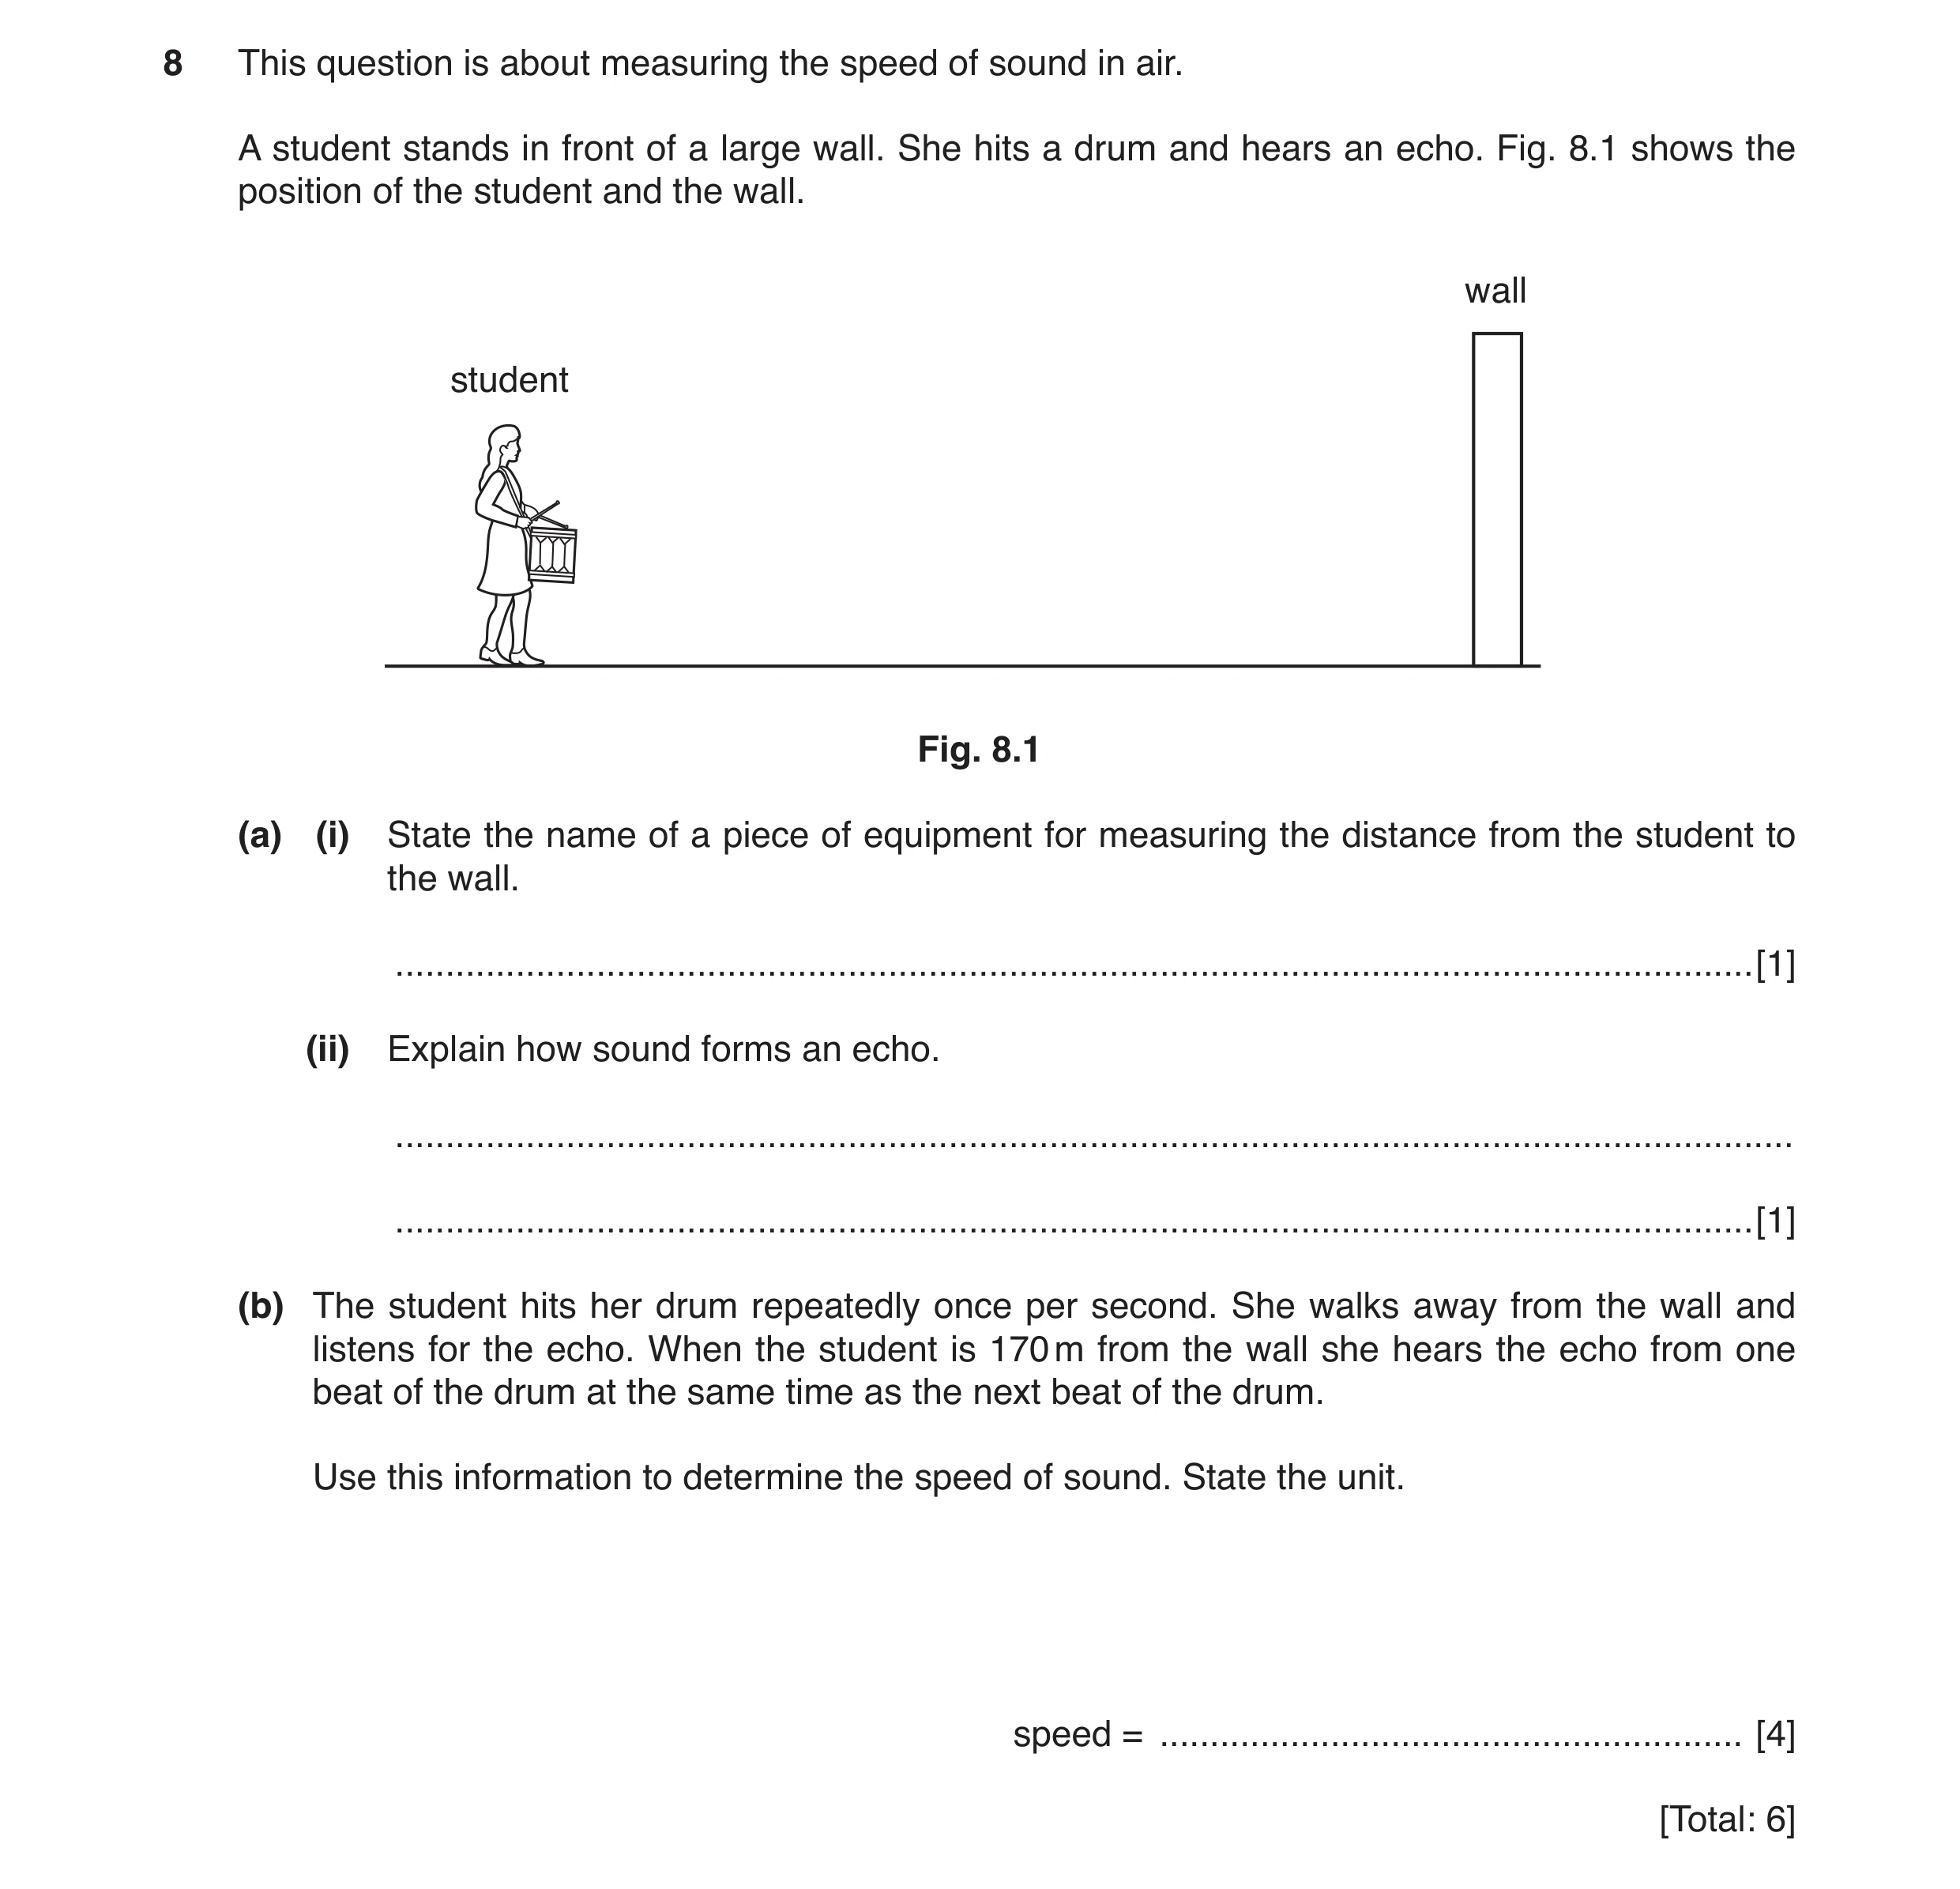
8 This question is about measuring the speed of sound in air. A student stands in front of a large wall. She hits a drum and hears an echo. Fig. 8.1 shows the position of the student and the wall. wall student Fig. 8.1 (a) (i) State the name of a piece of equipment for measuring the distance from the student to the wall. … [1] (ii) Explain how sound forms an echo. … … [1] (b) The student hits her drum repeatedly once per second. She walks away from the wall and listens for the echo. When the student is 170 m from the wall she hears the echo from one beat of the drum at the same time as the next beat of the drum. Use this information to determine the speed of sound. State the unit. speed = … [4] [Total: 6]
6 marks
Mark scheme: 8(a)(i) tape measure 1 8(a)(ii) reflection (of sound) 1 8(b) time for sound to travel to wall and back = 1.0 s 1 340 m in 1.0 s 1 (speed =) 340 1 m / s 1
This question in 0625/31 May/June 2018
Q6 · A student is studying elephants 0625/32 Oct/Nov 2018
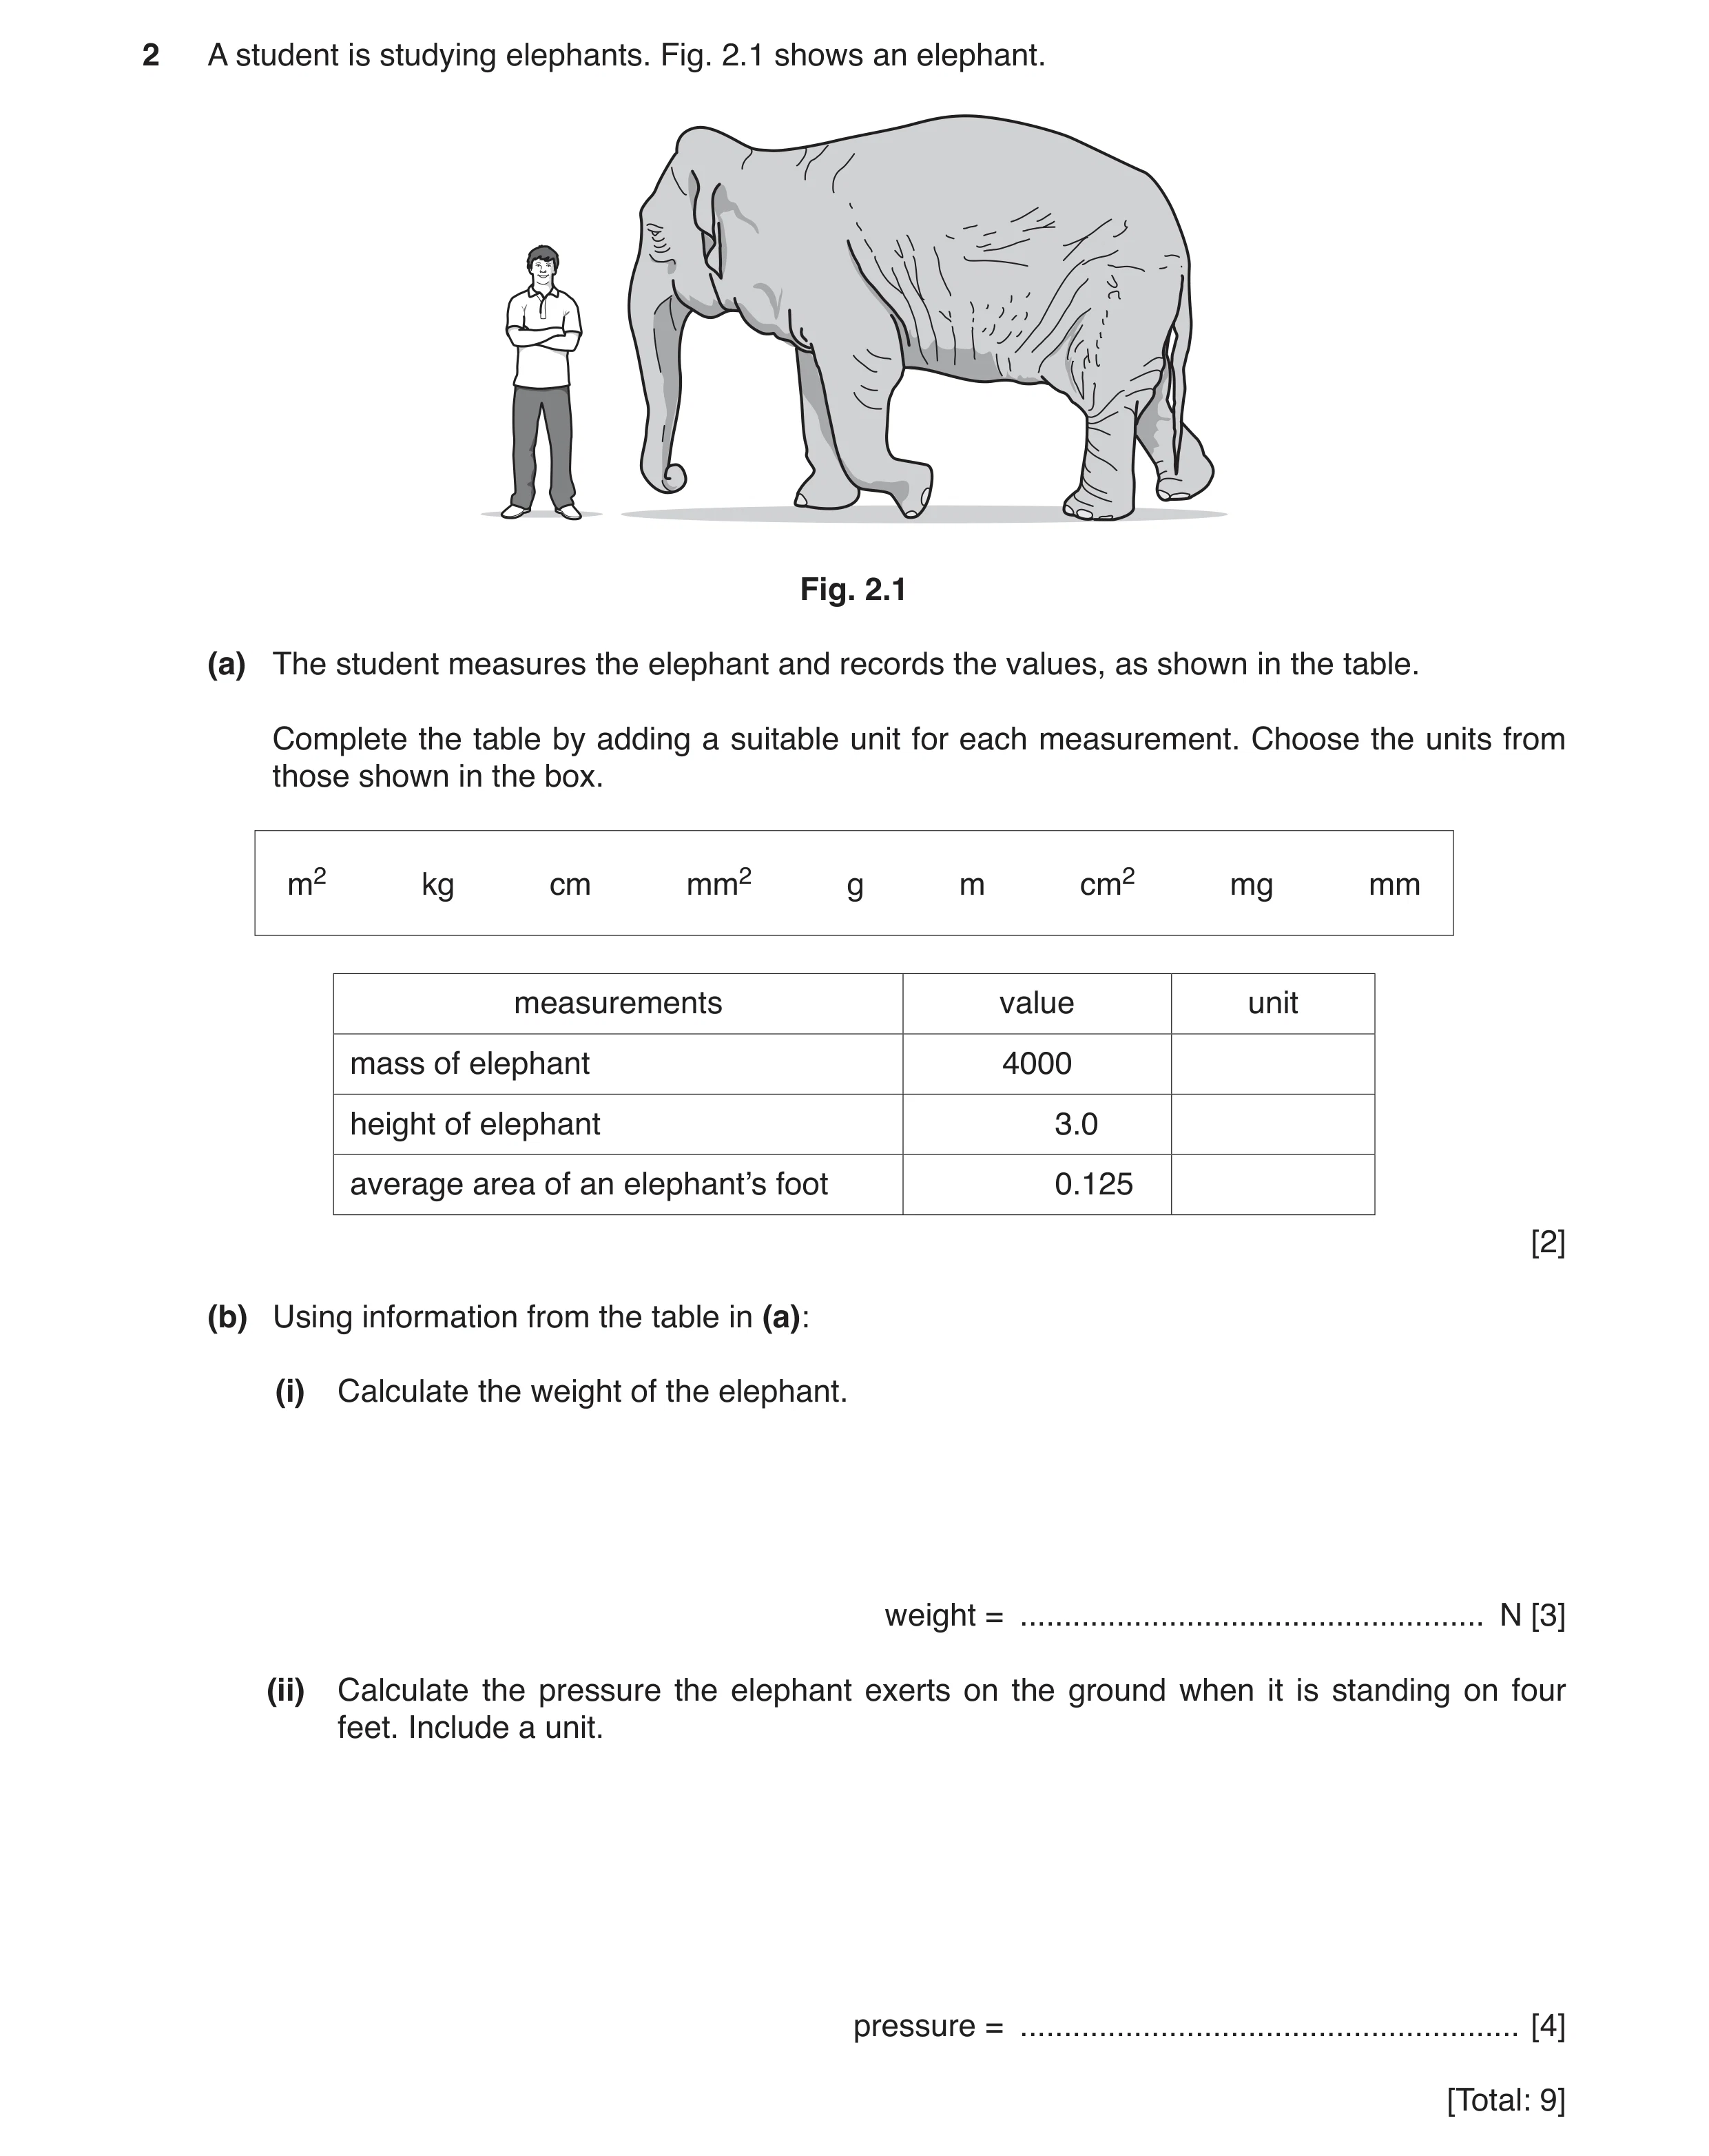
2 A student is studying elephants. Fig. 2.1 shows an elephant. Fig. 2.1 (a) The student measures the elephant and records the values, as shown in the table. Complete the table by adding a suitable unit for each measurement. Choose the units from those shown in the box. m2 kg cm mm2 g m cm2 mg mm measurements value unit mass of elephant 4000 height of elephant 3.0 average area of an elephant’s foot 0.125 [2] (b) Using information from the table in (a): (i) Calculate the weight of the elephant. weight = … N [3] (ii) Calculate the pressure the elephant exerts on the ground when it is standing on four feet. Include a unit. pressure = … [4] [Total: 9]
9 marks
Mark scheme: 2(a) mass in kg AND height in m B1 area in m2 B1 2(b)(i) W = m × g C1 4000 × 10 C1 40 000 (N) A1 2(b)(ii) P = F ÷ A in any recognisable form C1 (area = ) 0.125 × 4 = 0.50 (m2) B1 b(i) ÷ 5000 OR 40 000 ÷ 0.500 C1 80 000 N / m2 OR 80 000 Pa A1
This question in 0625/32 Oct/Nov 2018
Q7 · A large tank containing water 0625/33 Oct/Nov 2018
1 Fig. 1.1 shows a large tank containing water. The tank leaks. Drops of water fall from the tank. The drops hit the ground at a regular rate. tank water drops of water 12 m ground Fig. 1.1 (a) A student measures the time interval between two drops of water hitting the ground. She uses a stopwatch and repeats the procedure three times. Fig. 1.2 shows each stopwatch reading. min s 1 s min s 1 s min s 1 s 100 100 100 . . . 0. 01. 24 0. 01. 14 0. 01. 16 time = … s time = … s time = … s Fig. 1.2 (i) On the line below each stopwatch, state the time readings shown, in seconds. [1] (ii) Calculate the average time interval between two drops of water hitting the ground. average time = … s [2] (b) Another student measures the average time taken for a drop of water to fall from the tank to the ground. The time taken is 1.6 s. Calculate the average speed of this drop of water. average speed = … m/s [3] (c) Fig. 1.3 shows the speed-time graph for a different drop of water. 5.0 P Q 4.5 speed m / s 4.0 3.5 3.0 2.5 2.0 1.5 1.0 0.5 0 0 0.5 1.0 1.5 2.0 2.5 time / s Fig. 1.3 Use Fig. 1.3 to determine the distance fallen by the drop between P and Q. distance = … m [3] [Total: 9]
9 marks
Mark scheme: 1(a)(i) 1.24 (s) AND 1.14 (s) AND 1.16 (s) B1 1(a)(ii) (1.24 + 1.14 + 1.16) ÷ 3 OR 3.54 ÷ 3 C1 1.18 (s) A1 1(b) (average speed =) dist ÷ time C1 12 ÷ 1.6 C1 7.5 (m / s) A1 1(c) distance travelled = area under graph OR counting squares C1 4.5 × 0.75 C1 3.375 OR 3.4 A1
This question in 0625/33 Oct/Nov 2018
Q8 · A student has a piece of metal that has an irregular shape 0625/33 Oct/Nov 2018
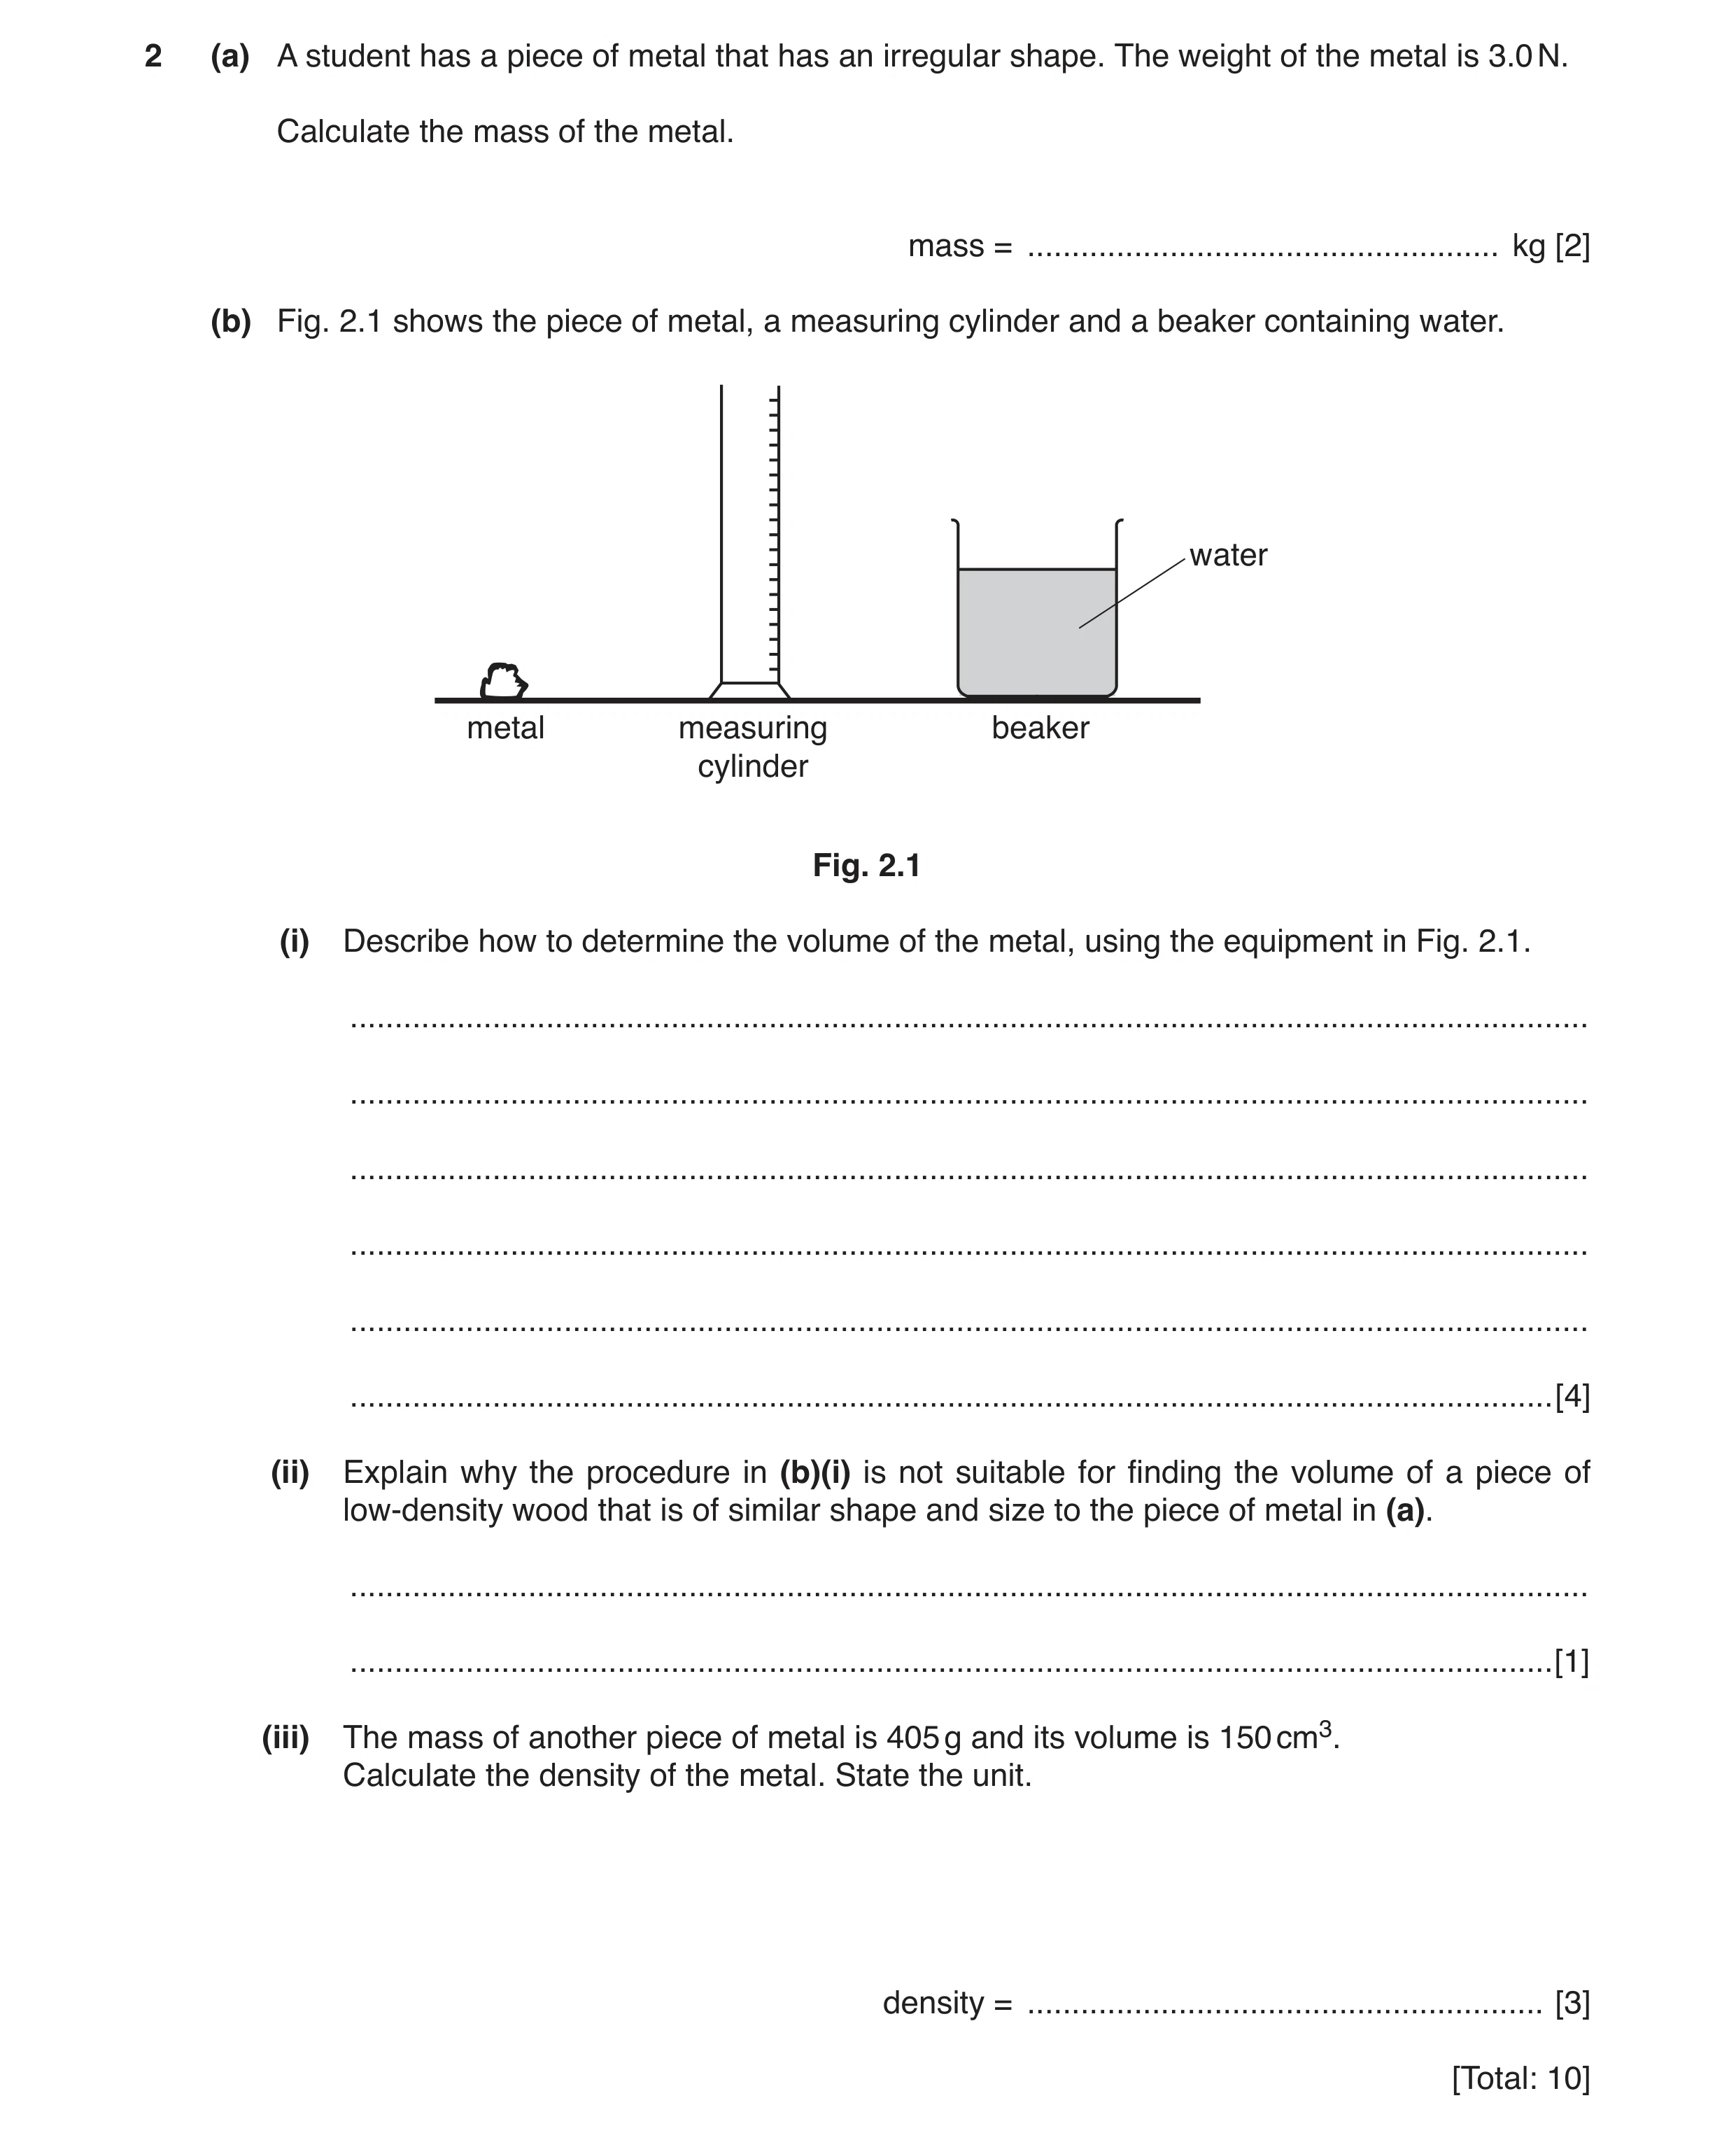
2 (a) A student has a piece of metal that has an irregular shape. The weight of the metal is 3.0 N. Calculate the mass of the metal. mass = … kg [2] (b) Fig. 2.1 shows the piece of metal, a measuring cylinder and a beaker containing water. water metal measuring beaker cylinder Fig. 2.1 (i) Describe how to determine the volume of the metal, using the equipment in Fig. 2.1. … … … … … … [4] (ii) Explain why the procedure in (b)(i) is not suitable for finding the volume of a piece of low-density wood that is of similar shape and size to the piece of metal in (a). … … [1] (iii) The mass of another piece of metal is 405 g and its volume is 150 cm3. Calculate the density of the metal. State the unit. density = … [3] [Total: 10]
10 marks
Mark scheme: 2(a) W = m g OR (m =) W / g OR 3.0 ÷ 10 C1 0.3 (kg) A1 2(b)(i) determine / read volume of water in measuring cylinder B1 (submerge / sink) metal in water / measuring cylinder B1 determine / read new volume of water (and metal) B1 find difference between final and initial volumes B1 2(b)(ii) wood floats OR does not sink B1 2(b)(iii) D = M / V OR 405 ÷ 150 C1 2.7 A1 g / cm3 B1
This question in 0625/33 Oct/Nov 2018
Q9 · A set of masses made from the same material 0625/32 Feb/March 2019
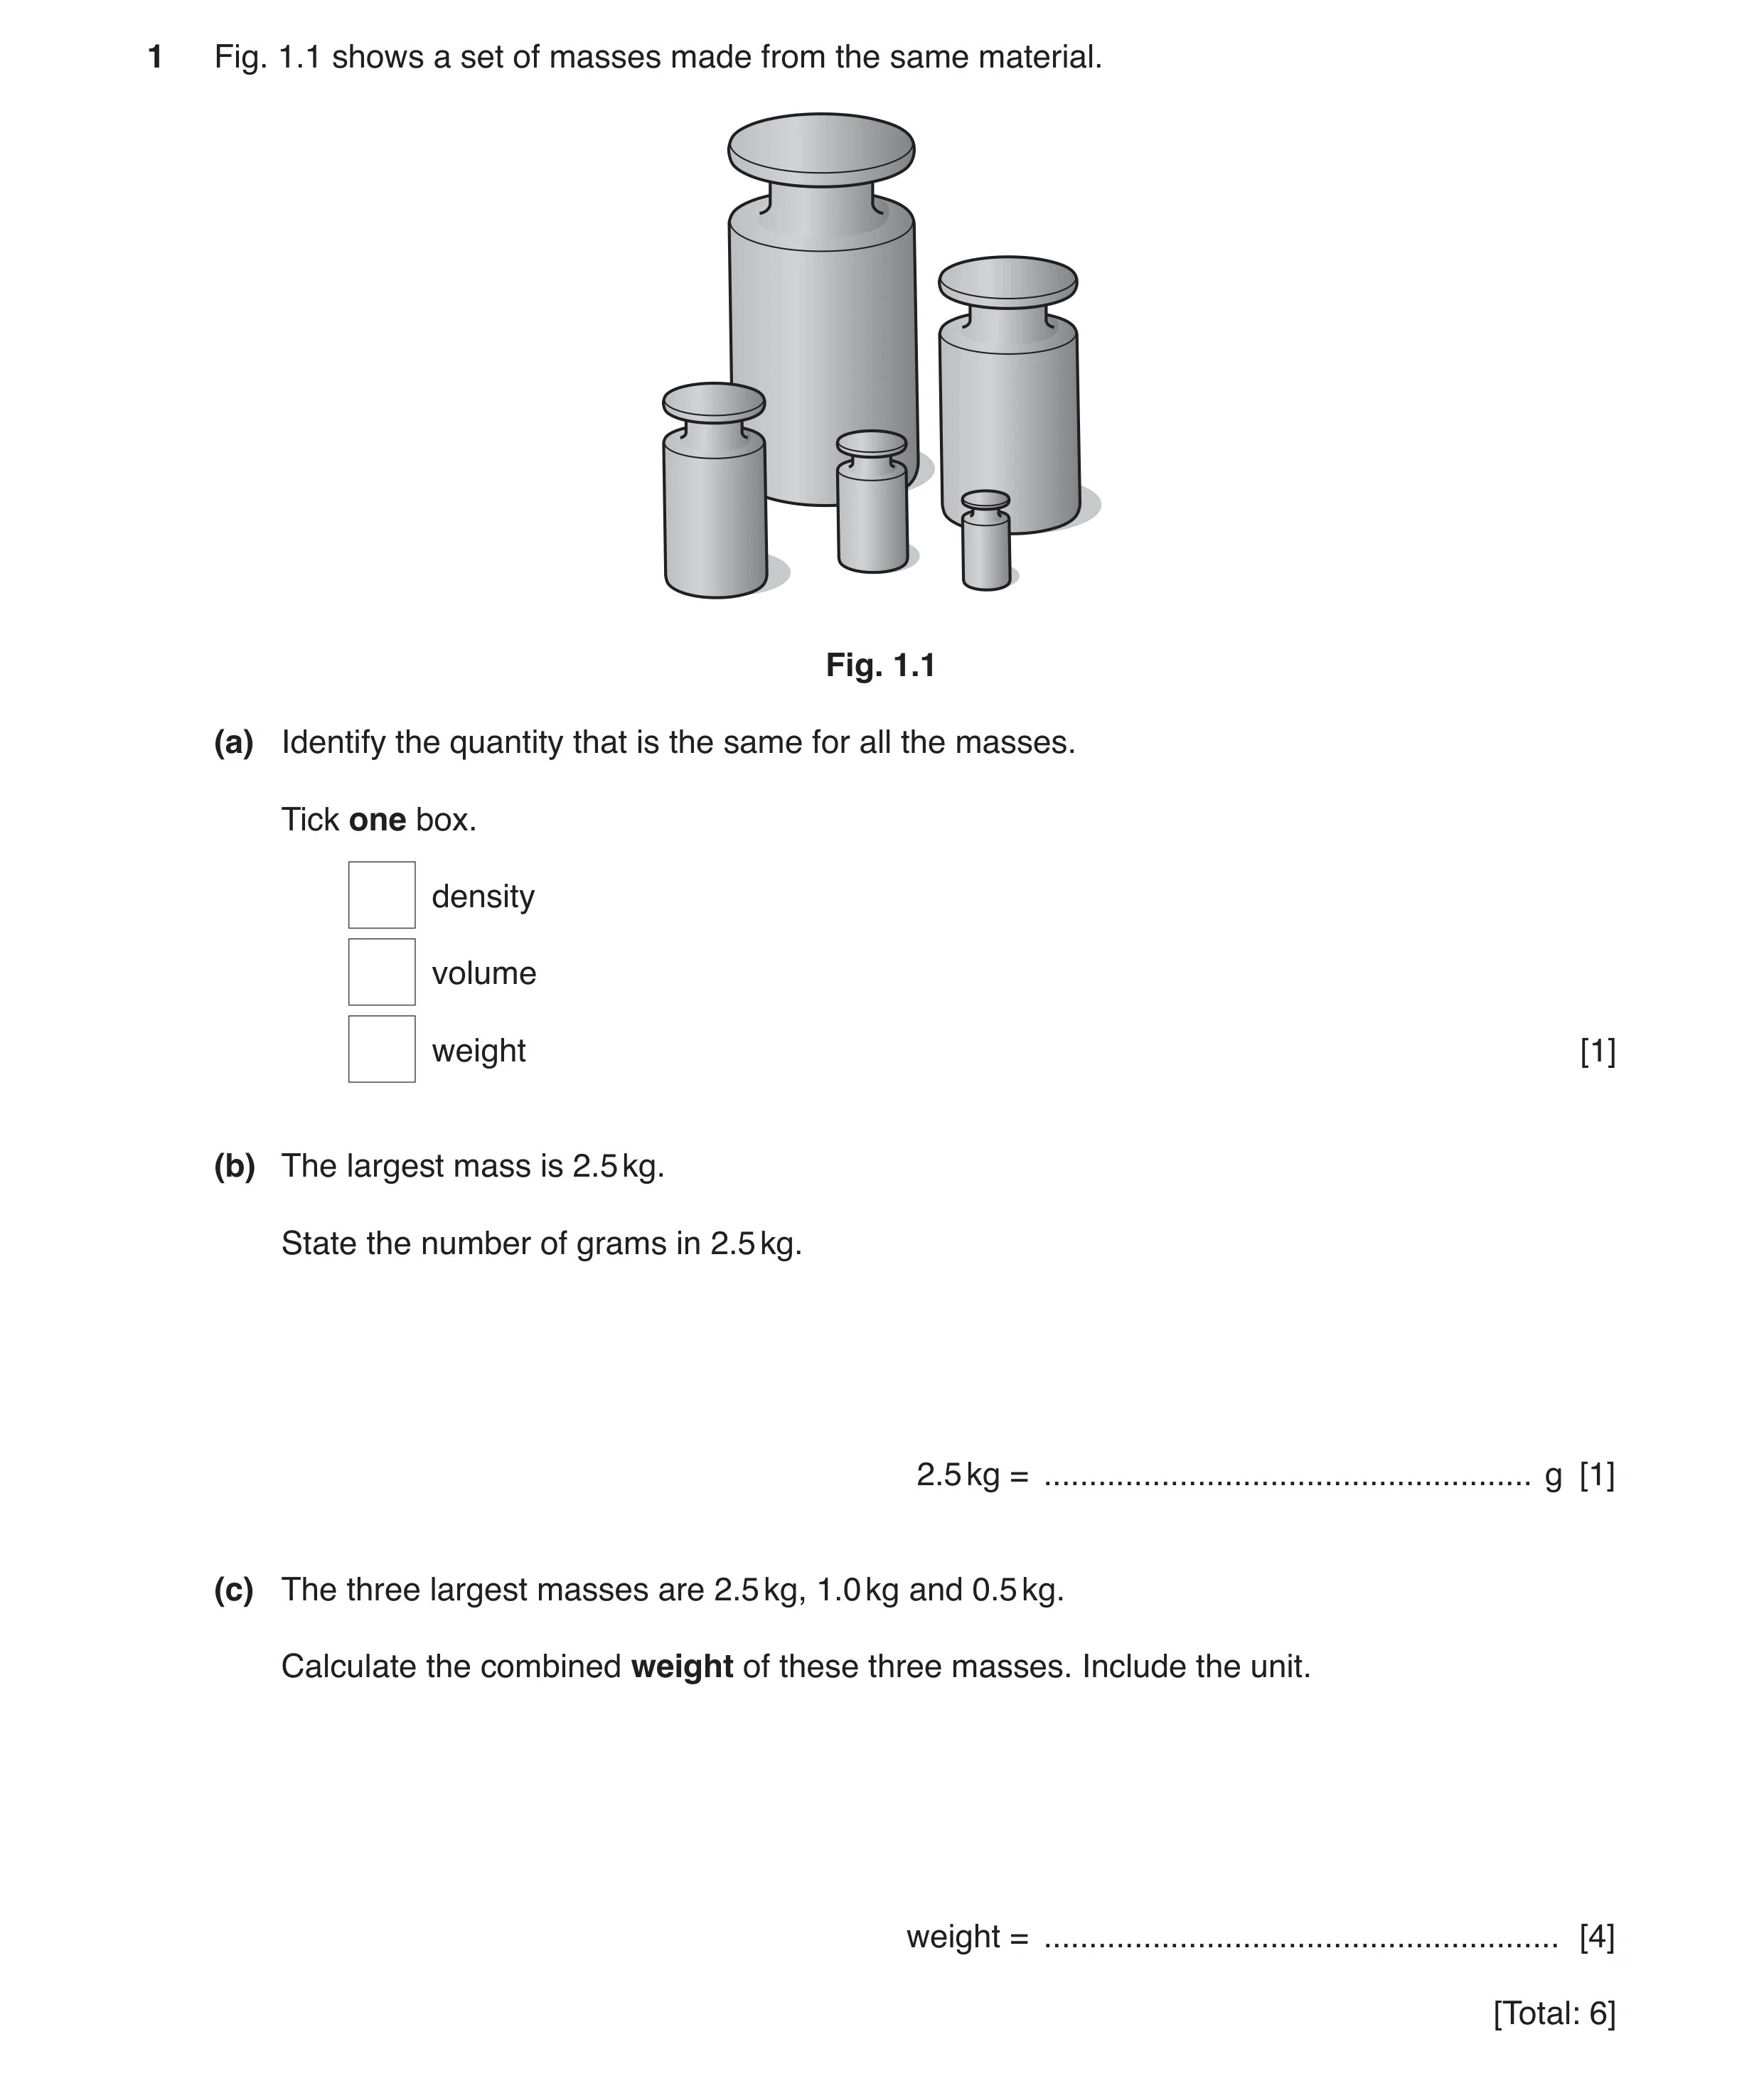
1 Fig. 1.1 shows a set of masses made from the same material. Fig. 1.1 (a) Identify the quantity that is the same for all the masses. Tick one box. density volume weight [1] (b) The largest mass is 2.5 kg. State the number of grams in 2.5 kg. 2.5 kg = … g [1] (c) The three largest masses are 2.5 kg, 1.0 kg and 0.5 kg. Calculate the combined weight of these three masses. Include the unit. weight = … [4] [Total: 6]
6 marks
Mark scheme: 1(a) top box ticked: density B1 1(b) 2500 (g) B1 1(c) W = mg in any form C1 (2.5 + 1.0 + 0.5) = 4 C1 40 A1 N or newtons B1
This question in 0625/32 Feb/March 2019
Q10 · A student has a metal object 0625/31 May/June 2019
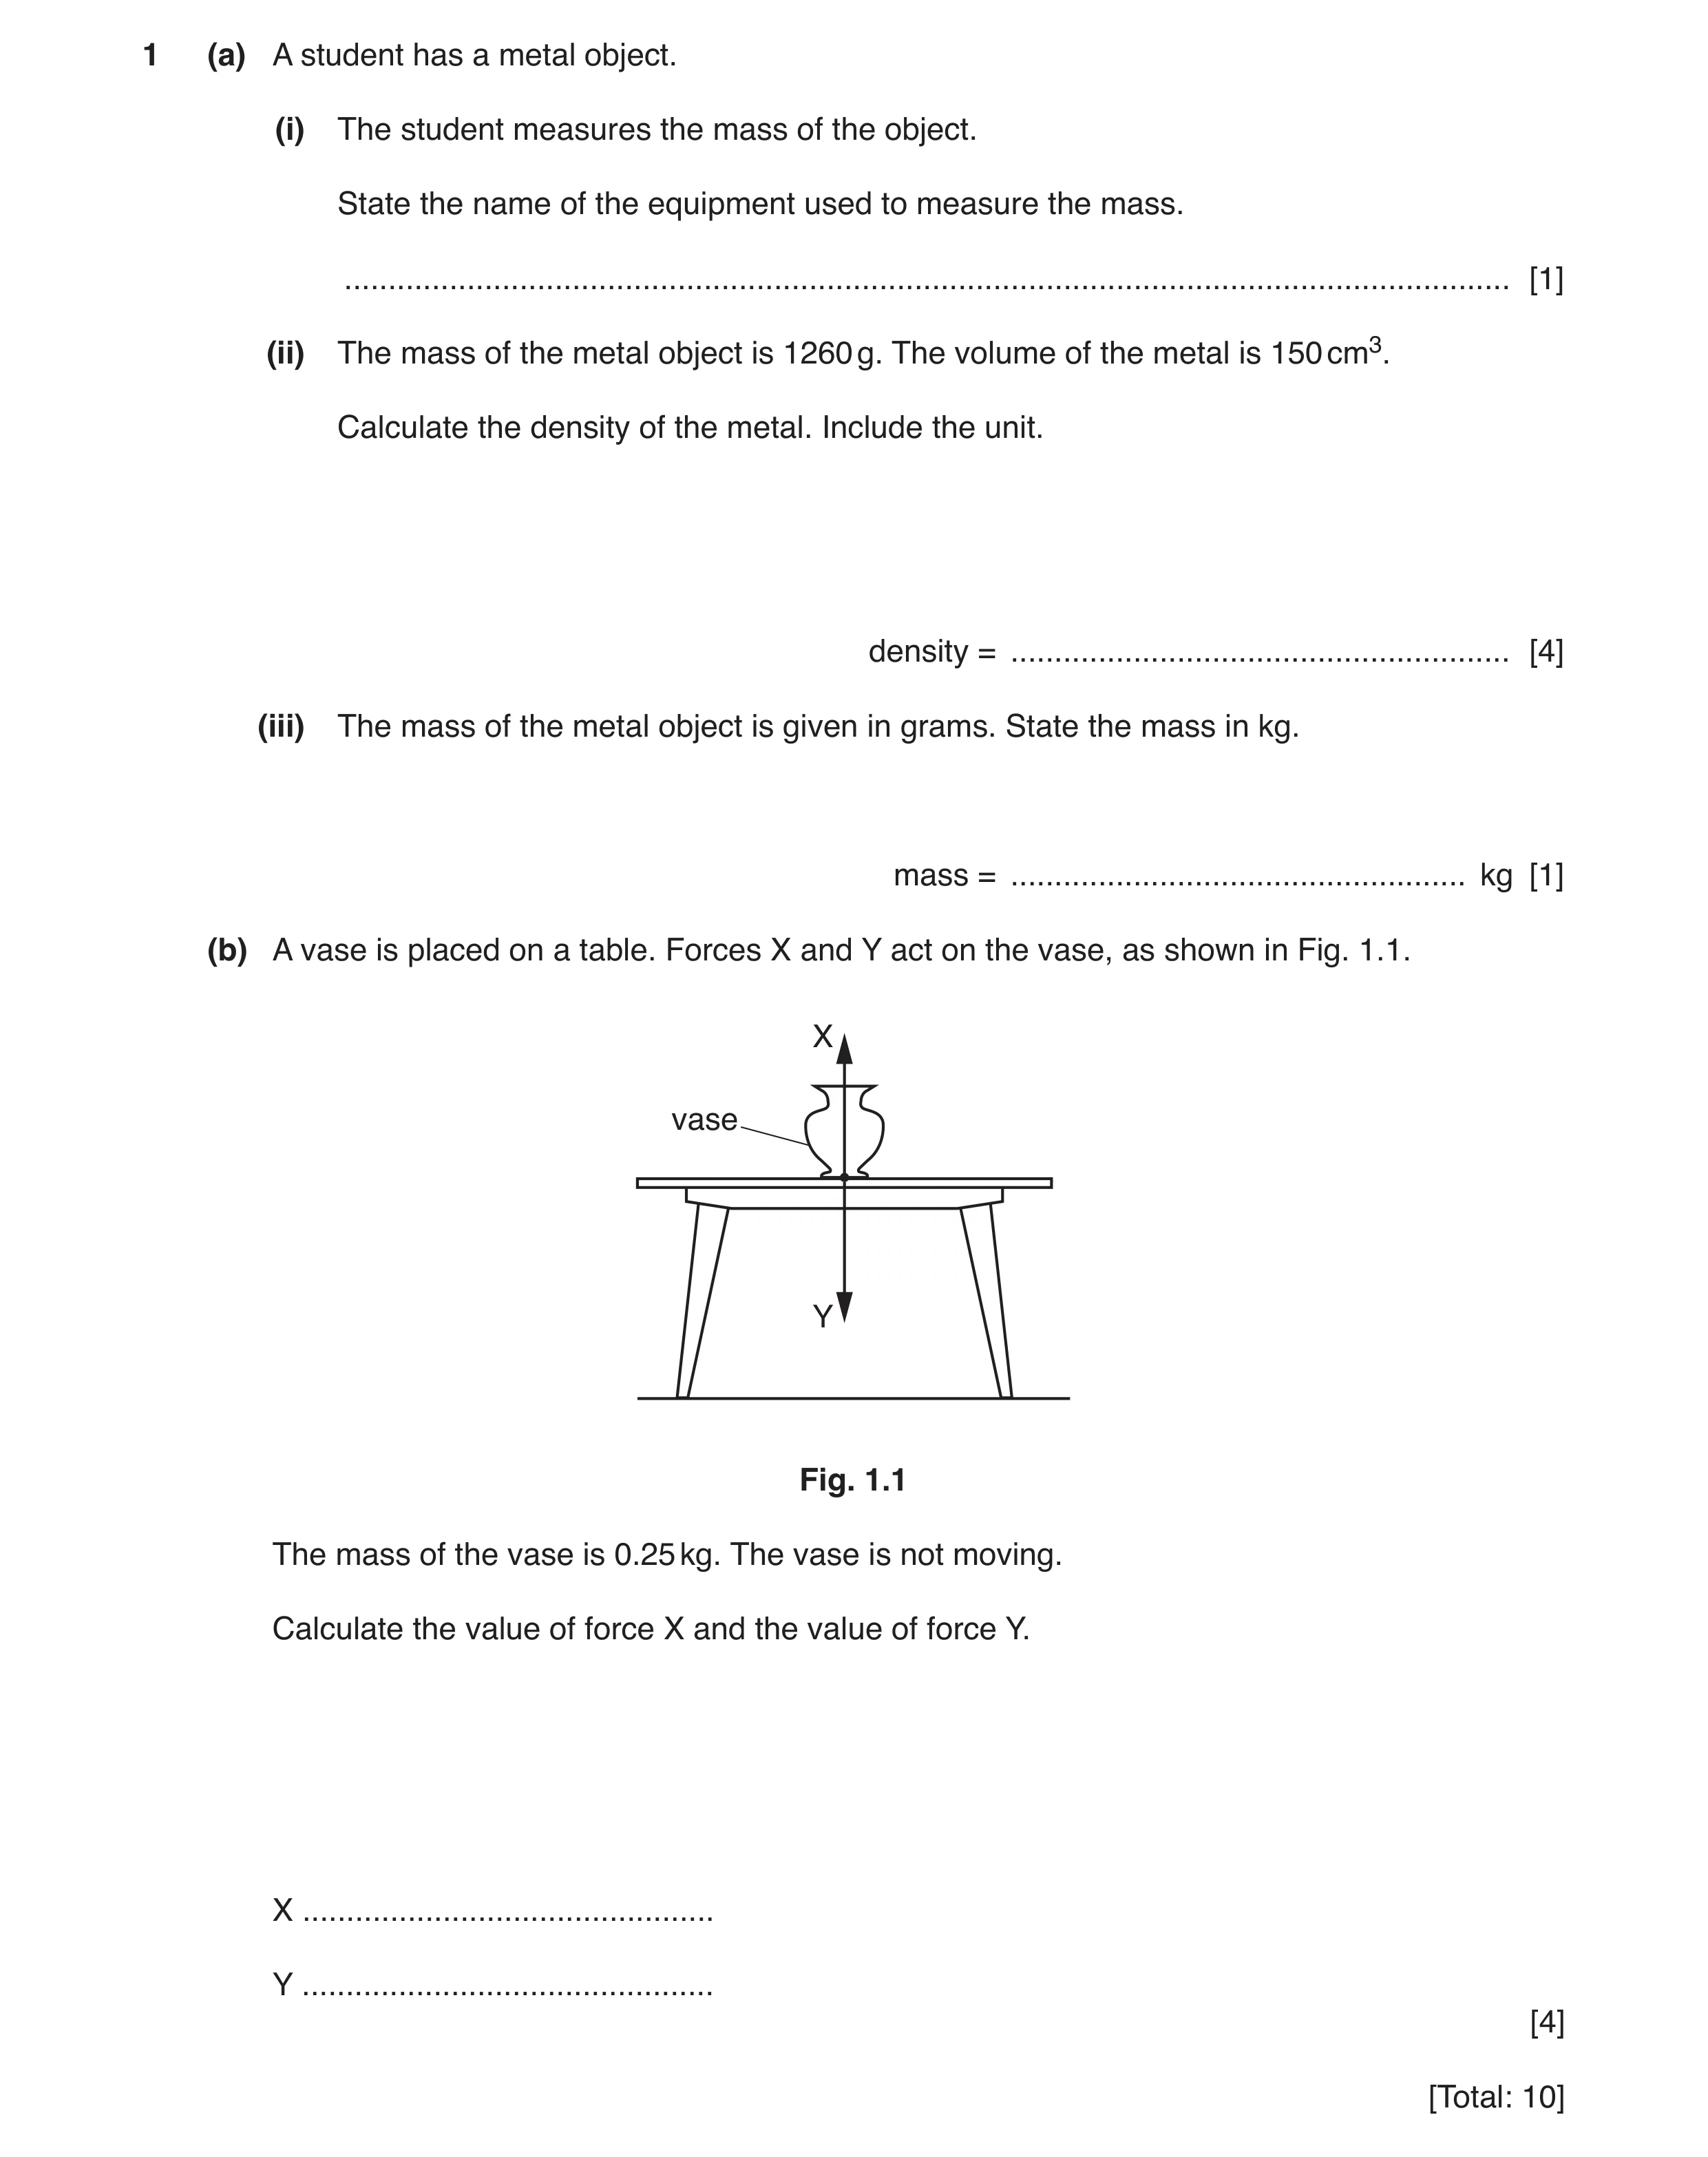
1 (a) A student has a metal object. (i) The student measures the mass of the object. State the name of the equipment used to measure the mass. … [1] (ii) The mass of the metal object is 1260 g. The volume of the metal is 150 cm3. Calculate the density of the metal. Include the unit. density = … [4] (iii) The mass of the metal object is given in grams. State the mass in kg. mass = … kg [1] (b) A vase is placed on a table. Forces X and Y act on the vase, as shown in Fig. 1.1. X vase Y Fig. 1.1 The mass of the vase is 0.25 kg. The vase is not moving. Calculate the value of force X and the value of force Y. X … Y … [4] [Total: 10]
10 marks
Mark scheme: 1(a)(i) balance B1 1(a)(ii) density = mass ÷ volume in any form C1 1260 ÷ 150 C1 8.4 A1 g / cm3 B1 1(a)(iii) 1.26 (kg) B1 1(b) W = mg in any form C1 0.25 × 10 C1 2.5 (N) A1 Both lines have 2.5 (N) B1
This question in 0625/31 May/June 2019
Q11 · A teacher investigates the reaction time of five students 0625/31 May/June 2019
3 A teacher investigates the reaction time of five students. A 0.50 m ruler is held above the hand of a student before being allowed to fall. The arrangement is shown in Fig. 3.1. teacher’s hand student’s hand Fig. 3.1 As soon as the ruler falls the student closes their hand, catching the ruler. The further the ruler falls, the greater the reaction time of the student. The results obtained are shown in Fig. 3.2. 24 distance ruler 22 falls / cm 20 18 16 14 12 10 8 6 4 2 0 A B C D E students Fig. 3.2 (a) Using the results shown in Fig. 3.2, calculate the average distance that the ruler drops. average distance = … cm [2] (b) List the students in order of their reaction times, with the shortest reaction time at the top of the table. One has been done for you. order student 1st 2nd 3rd B 4th 5th [2] (c) In a similar investigation, a ruler drops a distance of 11.0 cm and has an average speed of 16 cm / s. Calculate the reaction time. reaction time = … s [3] [Total: 7]
7 marks
Mark scheme: 3(a) 67 (cm) C1 (67 ÷ 5 =) 13.4 (cm) A1 3(b) C 1st ; A 2nd; B1 D 4th; E 5th B1 3(c) speed = distance ÷ time in any form OR (t = ) distance ÷ speed C1 11 ÷ 16 C1 0.69 (s) A1
This question in 0625/31 May/June 2019
Q12 · A wheelbarrow and Fig 0625/33 May/June 2019
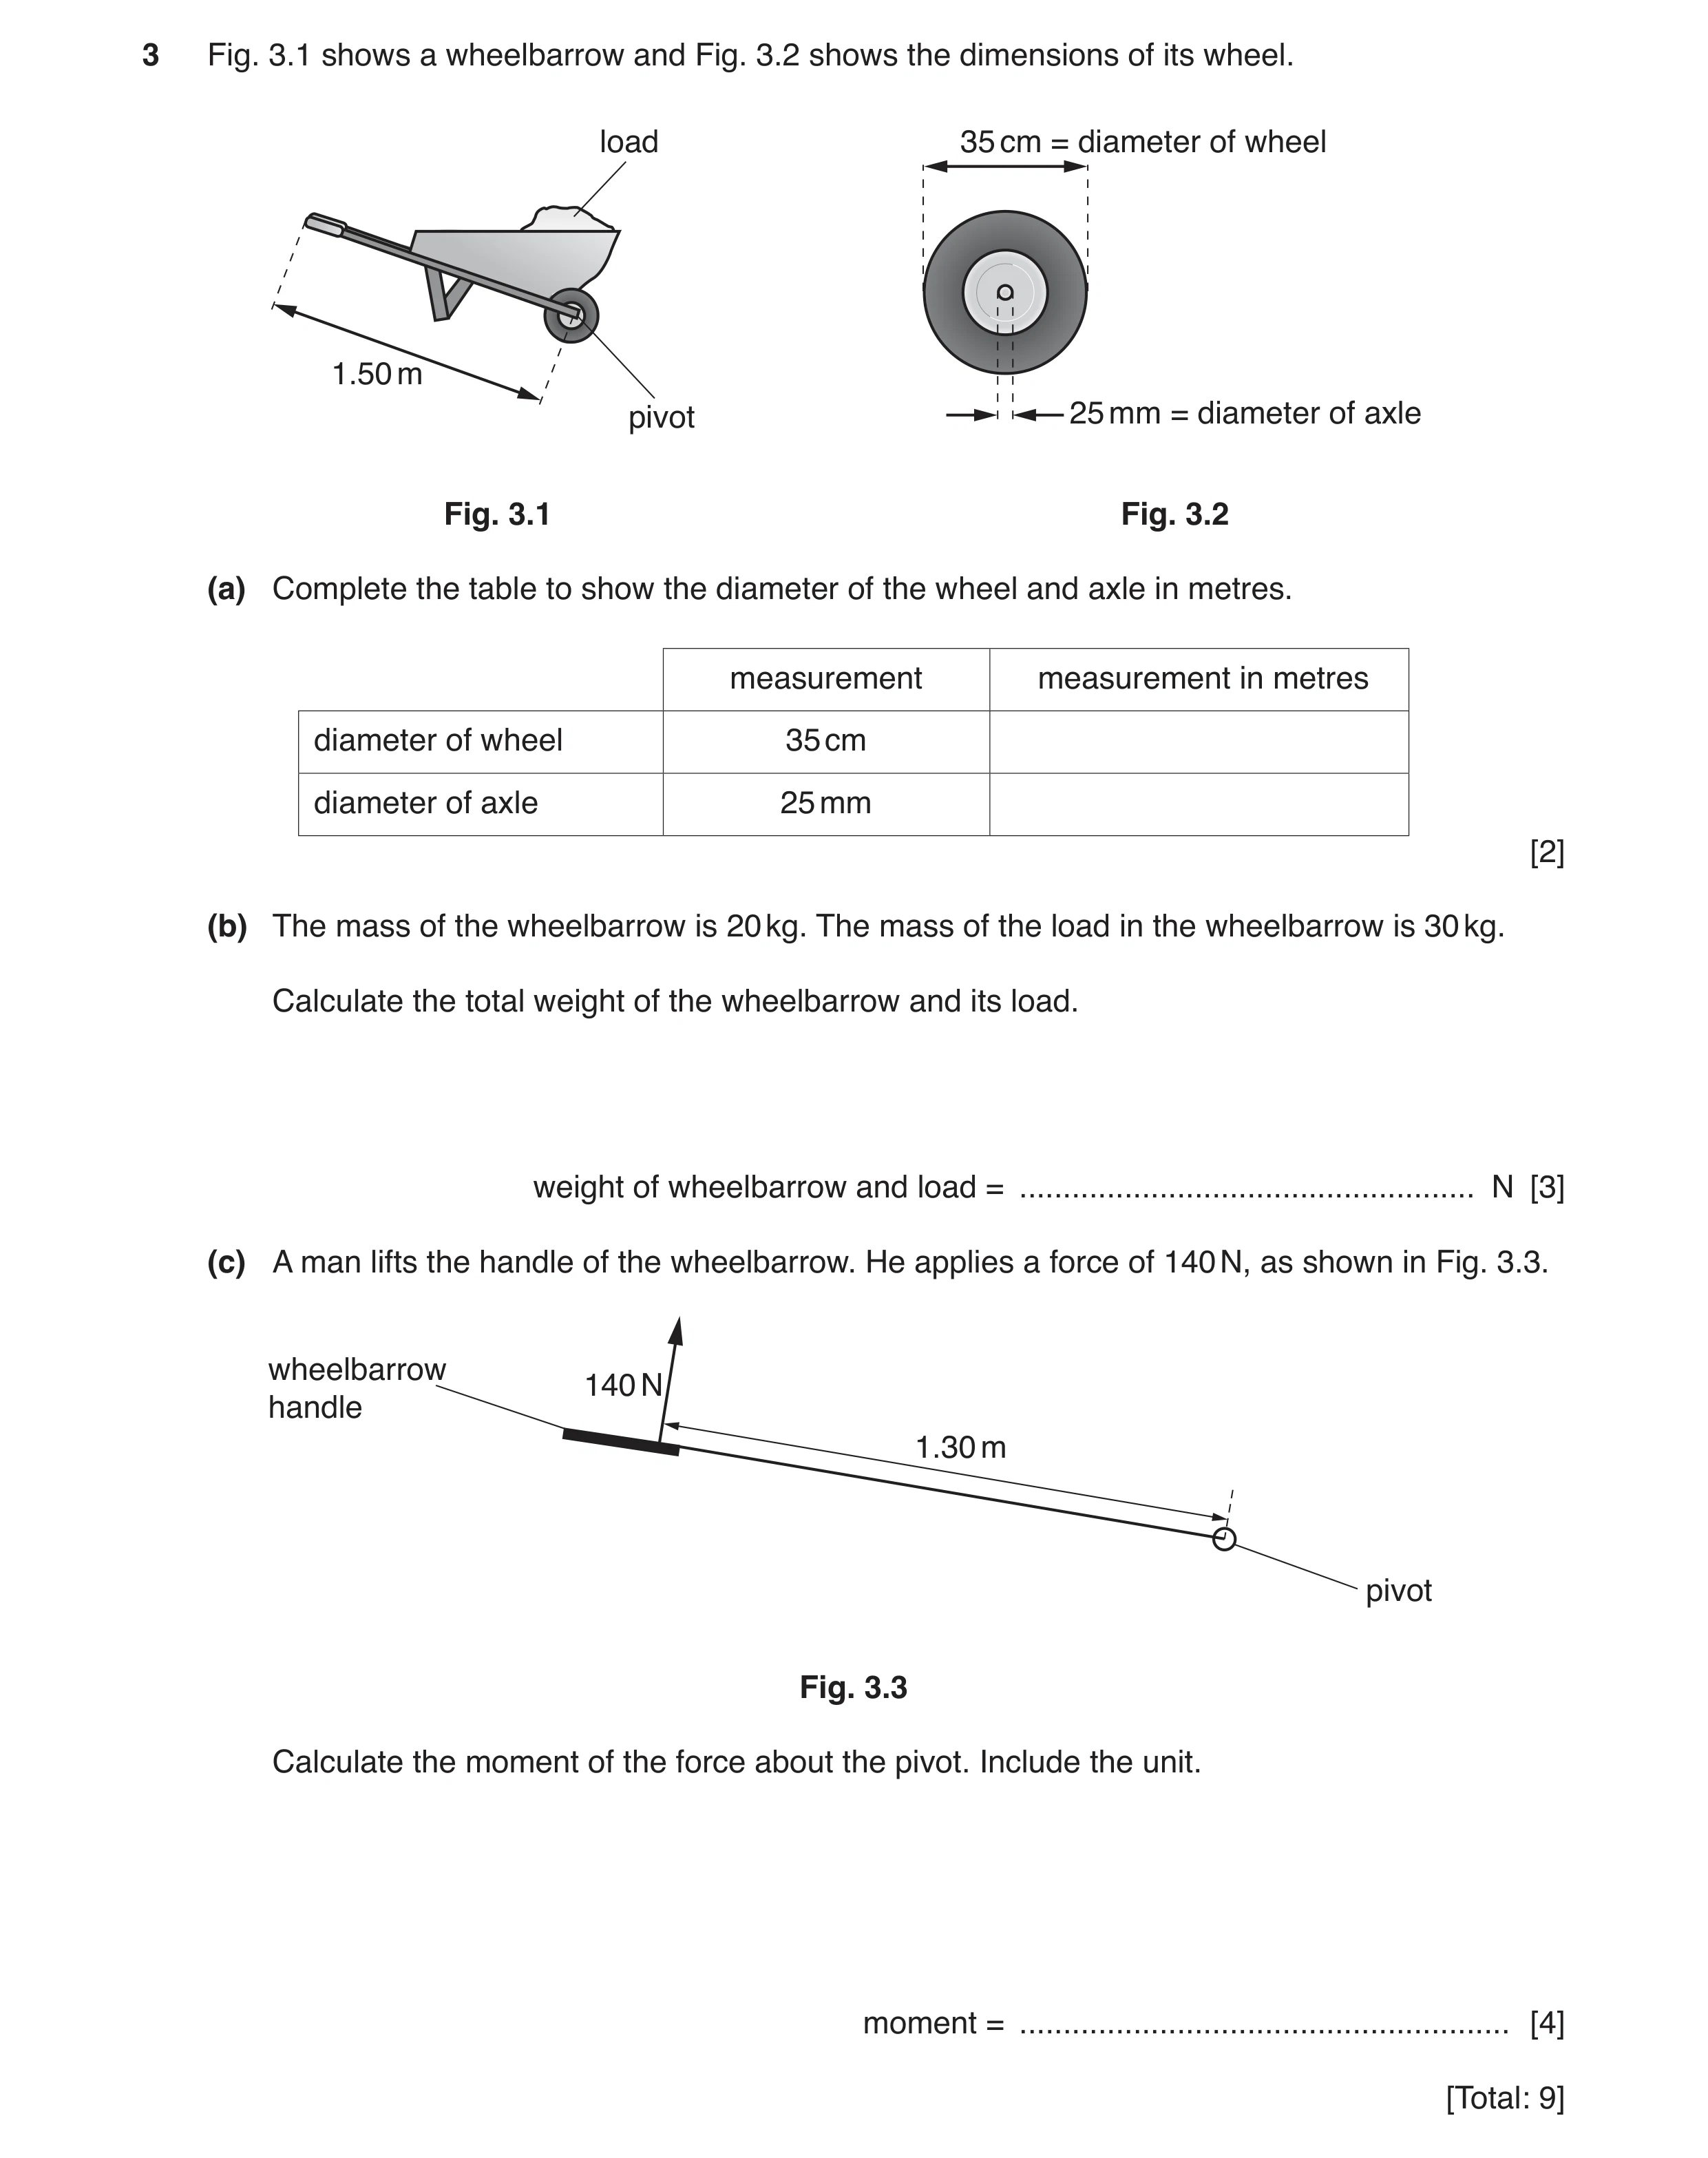
3 Fig. 3.1 shows a wheelbarrow and Fig. 3.2 shows the dimensions of its wheel. load 35 cm = diameter of wheel 1.50 m pivot 25 mm = diameter of axle Fig. 3.1 Fig. 3.2 (a) Complete the table to show the diameter of the wheel and axle in metres. measurement measurement in metres diameter of wheel 35 cm diameter of axle 25 mm [2] (b) The mass of the wheelbarrow is 20 kg. The mass of the load in the wheelbarrow is 30 kg. Calculate the total weight of the wheelbarrow and its load. weight of wheelbarrow and load = … N [3] (c) A man lifts the handle of the wheelbarrow. He applies a force of 140 N, as shown in Fig. 3.3. wheelbarrow 140 N handle 1.30 m pivot Fig. 3.3 Calculate the moment of the force about the pivot. Include the unit. moment = … [4] [Total: 9]
9 marks
Mark scheme: 3(a) 0.35 (m) B1 0.025 (m) B1 3(b) (weight =) mass × gravity in any form C1 50 × 10 OR (20 × 10) + (30 × 10) C1 500 (N) A1 3(c) moment = force × distance from pivot C1 140 × 1.3 C1 180 A1 Nm B1
This question in 0625/33 May/June 2019
Q13 · Four students P, Q, R and S each attempt to measure the time period (the time for one… 0625/31 Oct/Nov 2019
2 Four students P, Q, R and S each attempt to measure the time period (the time for one complete oscillation) of a pendulum. The arrows in Fig. 2.1 show the movements of the pendulum that each student times. P Q R S start end start start start end end end Fig. 2.1 (a) State the student who has chosen the correct movement for one period of a pendulum. student … [1] (b) Another student uses a stopwatch to measure the time taken for 50 periods of a pendulum. Fig. 2.2 shows the time taken on the stopwatch. min s 1 s 100 01:23.37 Fig. 2.2 Calculate the time for one period of the pendulum. Give your answer to 3 significant figures. time for one period = … s [3] (c) The student measures the displacement of the pendulum bob from its rest position. The displacement is 16.5 cm, as shown in Fig. 2.3. 16.5 cm Fig. 2.3 State the displacement in millimetres. displacement = … mm [1] [Total: 5]
5 marks
Mark scheme: 2(a) (student) S B1 2(b) 83.37 (s) seen C1 83.37 ÷ 50 C1 1.67 (s) cao A1 2(c) 165 (mm) B1
This question in 0625/31 Oct/Nov 2019
Q14 · A water tank that is leaking 0625/32 Oct/Nov 2019
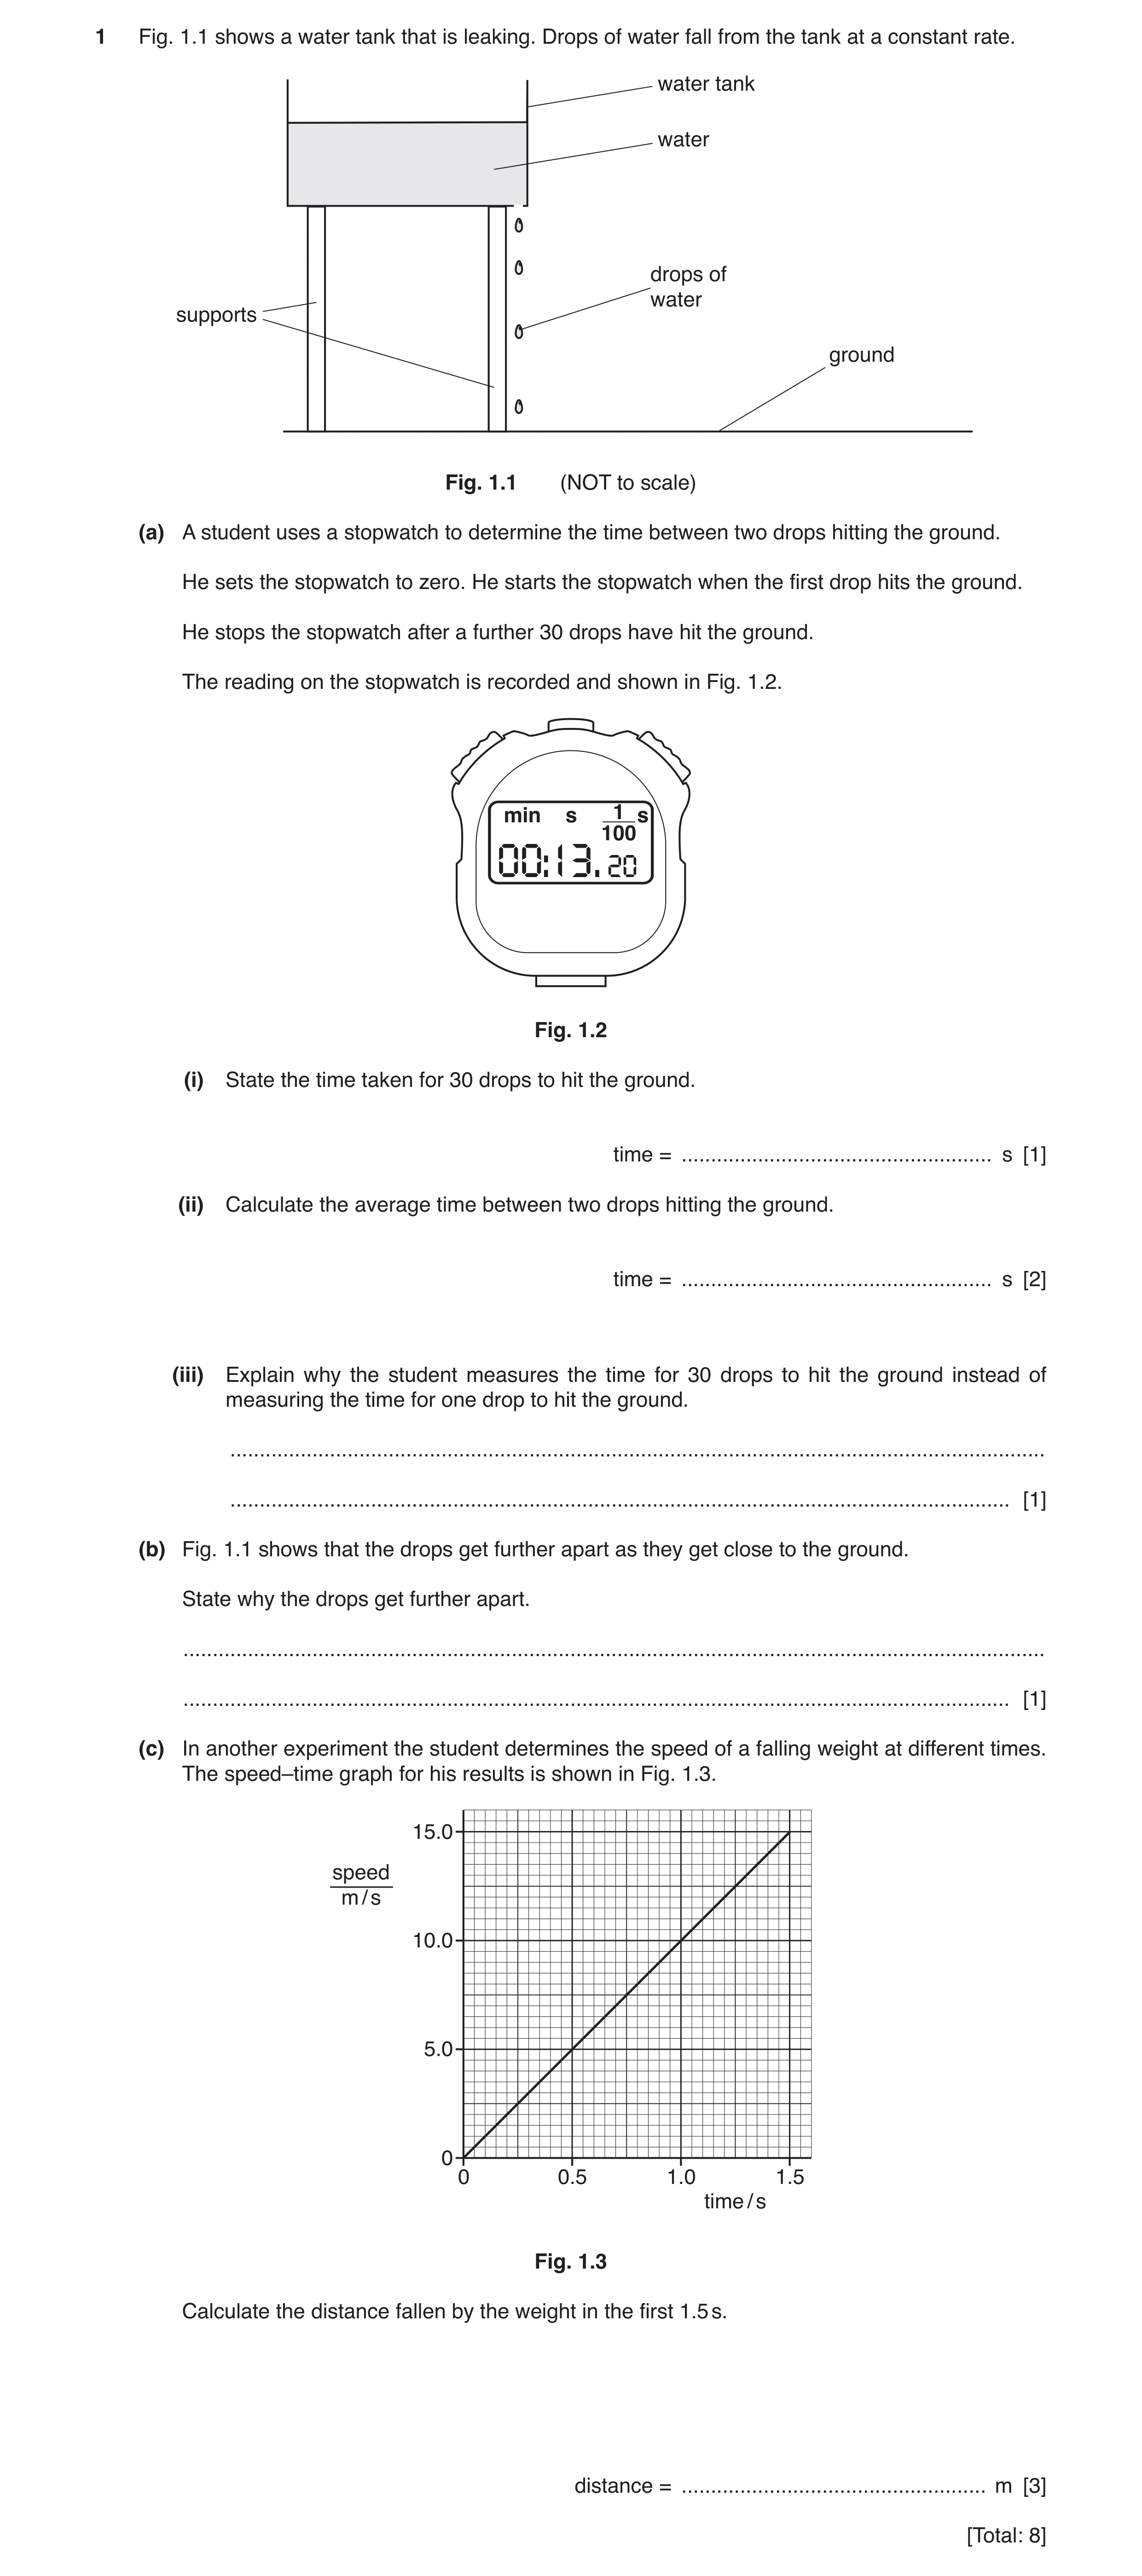
1 Fig. 1.1 shows a water tank that is leaking. Drops of water fall from the tank at a constant rate. water tank water drops of water supports ground Fig. 1.1 (NOT to scale) (a) A student uses a stopwatch to determine the time between two drops hitting the ground. He sets the stopwatch to zero. He starts the stopwatch when the first drop hits the ground. He stops the stopwatch after a further 30 drops have hit the ground. The reading on the stopwatch is recorded and shown in Fig. 1.2. min s 1 s 100 00:13. 20 Fig. 1.2 (i) State the time taken for 30 drops to hit the ground. time = … s [1] (ii) Calculate the average time between two drops hitting the ground. time = … s [2] (iii) Explain why the student measures the time for 30 drops to hit the ground instead of measuring the time for one drop to hit the ground. … … [1] (b) Fig. 1.1 shows that the drops get further apart as they get close to the ground. State why the drops get further apart. … … [1] (c) In another experiment the student determines the speed of a falling weight at different times. The speed–time graph for his results is shown in Fig. 1.3. 15.0 speed m / s 10.0 5.0 0 0 0.5 1.0 1.5 time / s Fig. 1.3 Calculate the distance fallen by the weight in the first 1.5 s. distance = … m [3] [Total: 8]
8 marks
Mark scheme: 1(a)(i) 13.2(0) (s) B1 1(a)(ii) 13.2 ÷ 30 C1 0.44 (s) A1 1(a)(iii) reduces the effects of (timing / reaction time) errors owtte B1 1(b) Drops are accelerating OR moving with increasing speed B1 1(c) distance = area under graph OR ½ × b × h C1 0.5 × 1.5 × 15 C1 11.25 (m) A1
This question in 0625/32 Oct/Nov 2019
Q15 · A student has an irregularly shaped piece of metal, a beaker of water and a measuring… 0625/32 Oct/Nov 2019
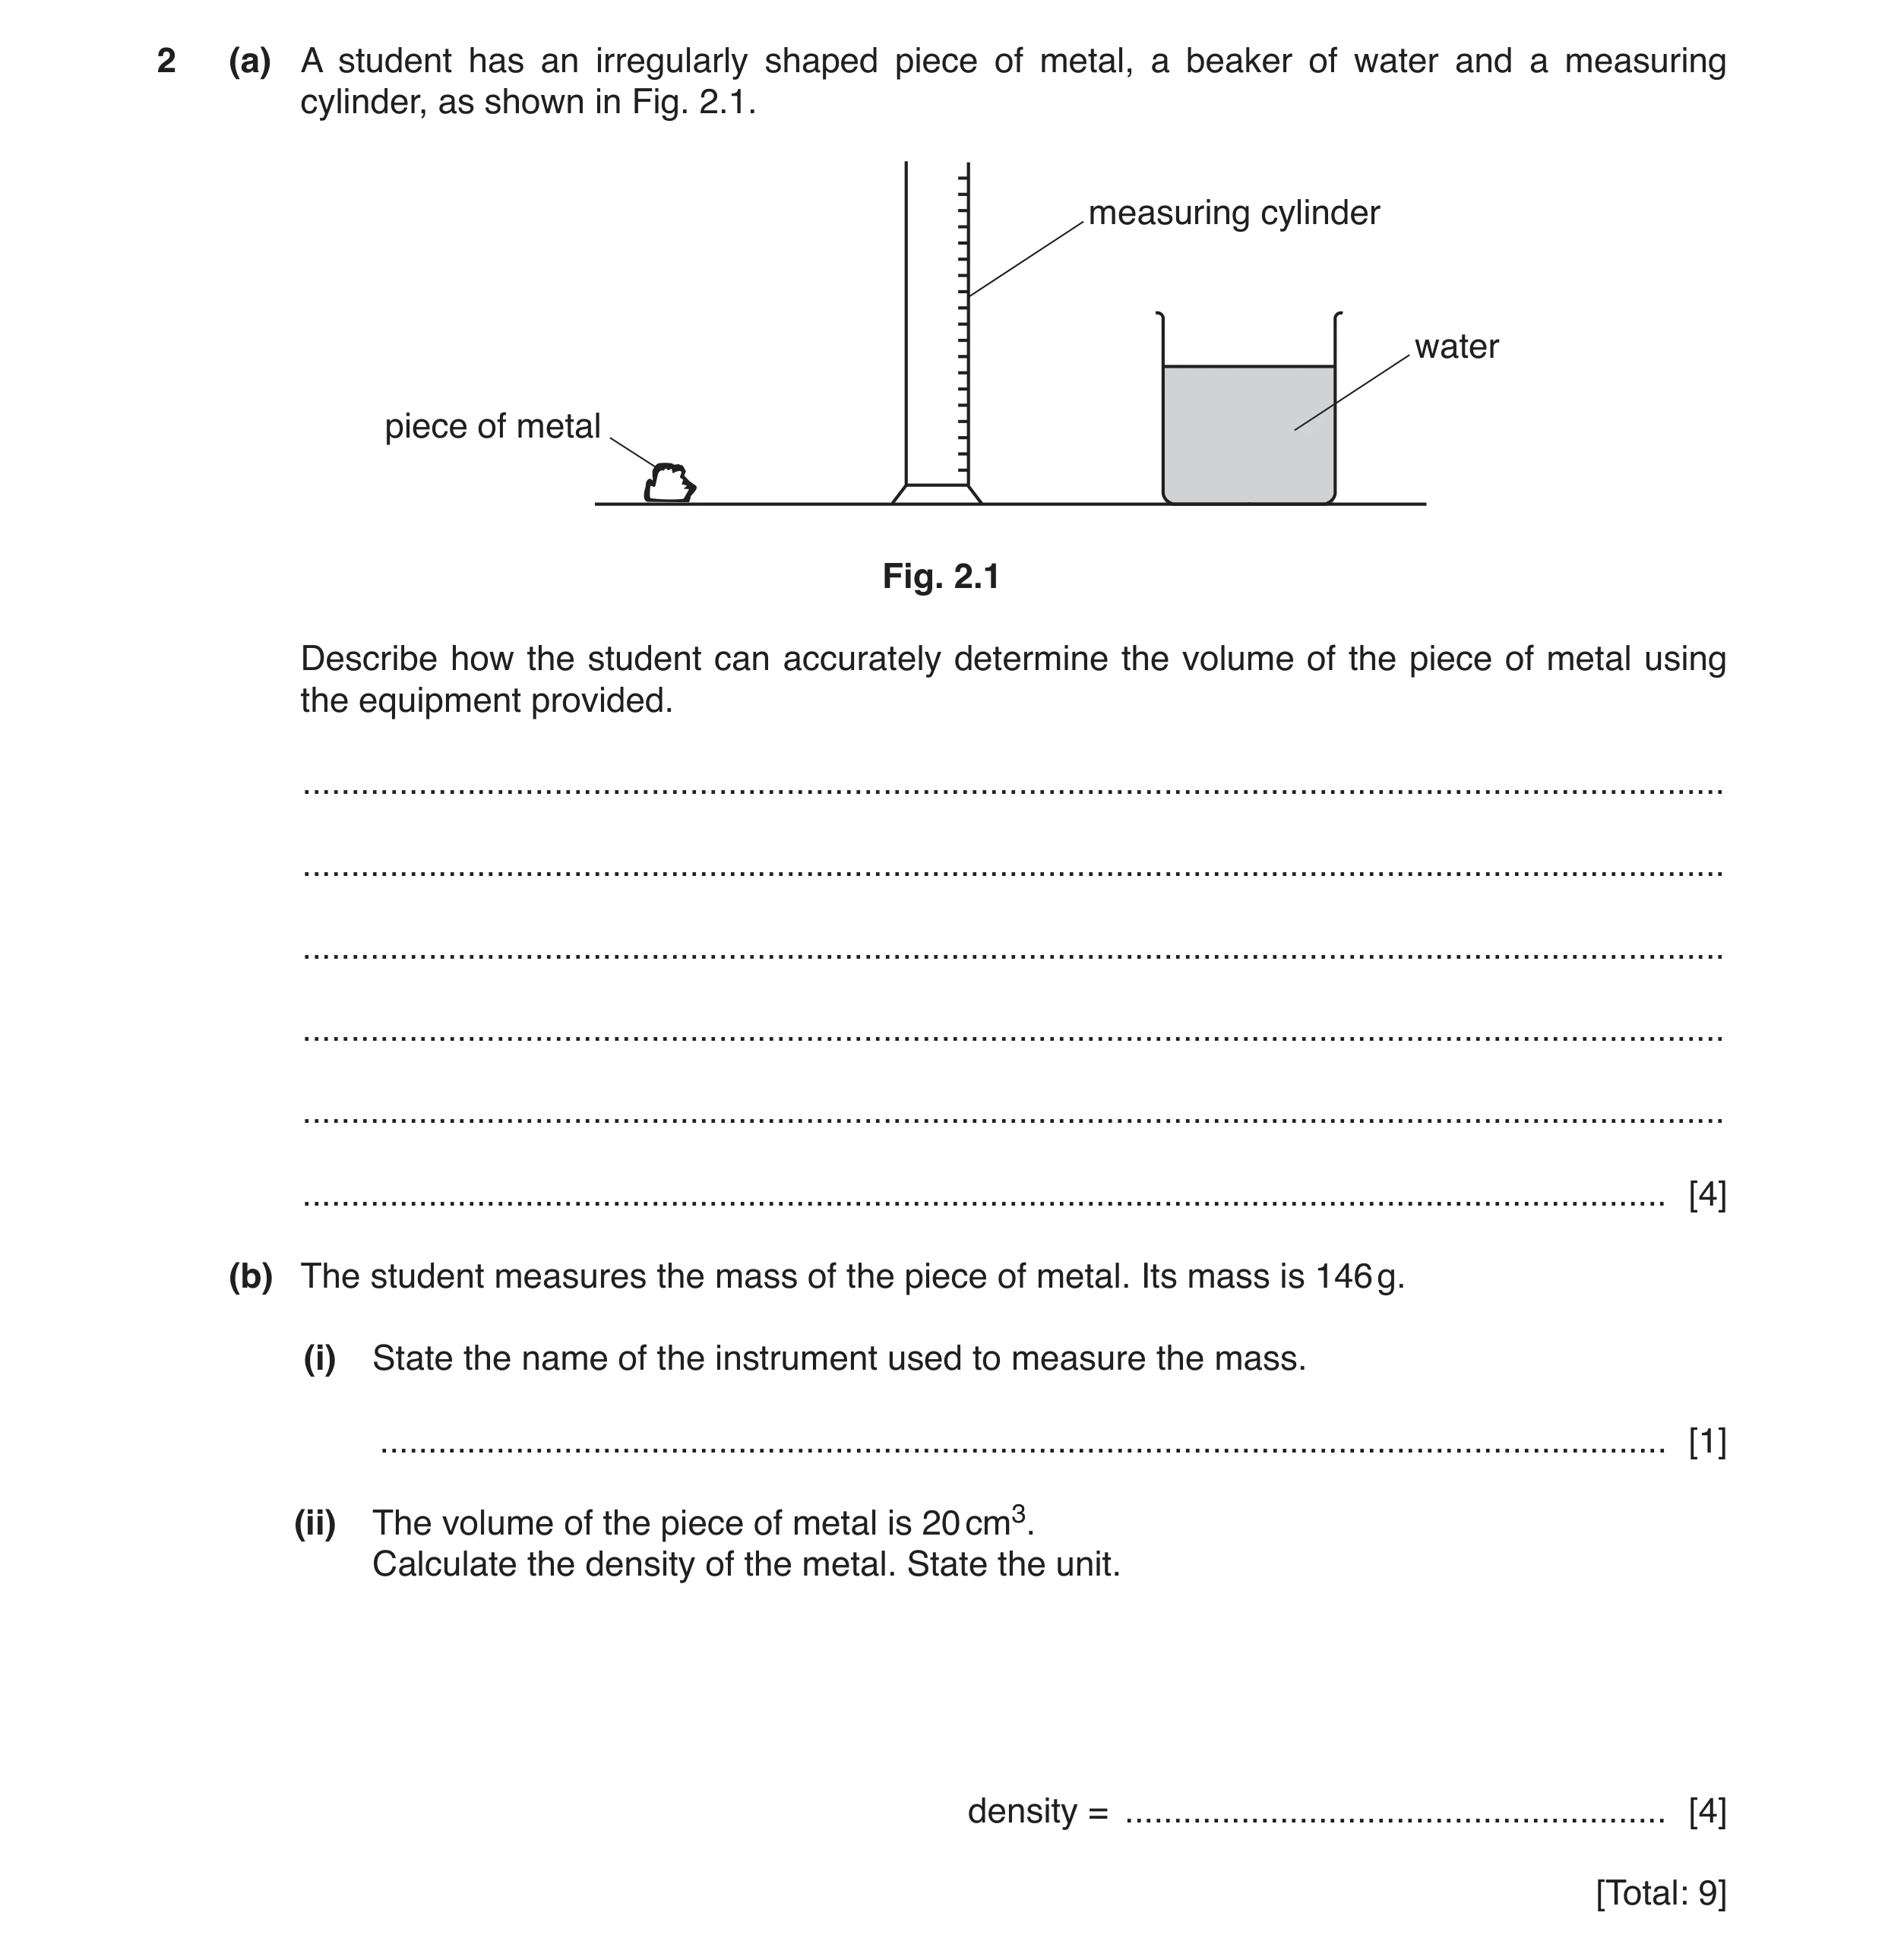
2 (a) A student has an irregularly shaped piece of metal, a beaker of water and a measuring cylinder, as shown in Fig. 2.1. measuring cylinder water piece of metal Fig. 2.1 Describe how the student can accurately determine the volume of the piece of metal using the equipment provided. … … … … … … [4] (b) The student measures the mass of the piece of metal. Its mass is 146 g. (i) State the name of the instrument used to measure the mass. … [1] (ii) The volume of the piece of metal is 20 cm3. Calculate the density of the metal. State the unit. density = … [4] [Total: 9]
9 marks
Mark scheme: 2(a) Any four from: pour some water into measuring cylinder record volume / reading of water (in measuring cylinder) place metal in water (in cylinder and completely submerge) record volume of water and metal (in cylinder) subtract starting volume from final volume (to give volume of metal) B4 2(b)(i) balance B1 2(b)(ii) density = mass ÷ volume C1 146 ÷ 20 C1 7.3 A1 g/cm3 B1
This question in 0625/32 Oct/Nov 2019
Q16 · A student uses a stopwatch in a timing experiment 0625/33 Oct/Nov 2019
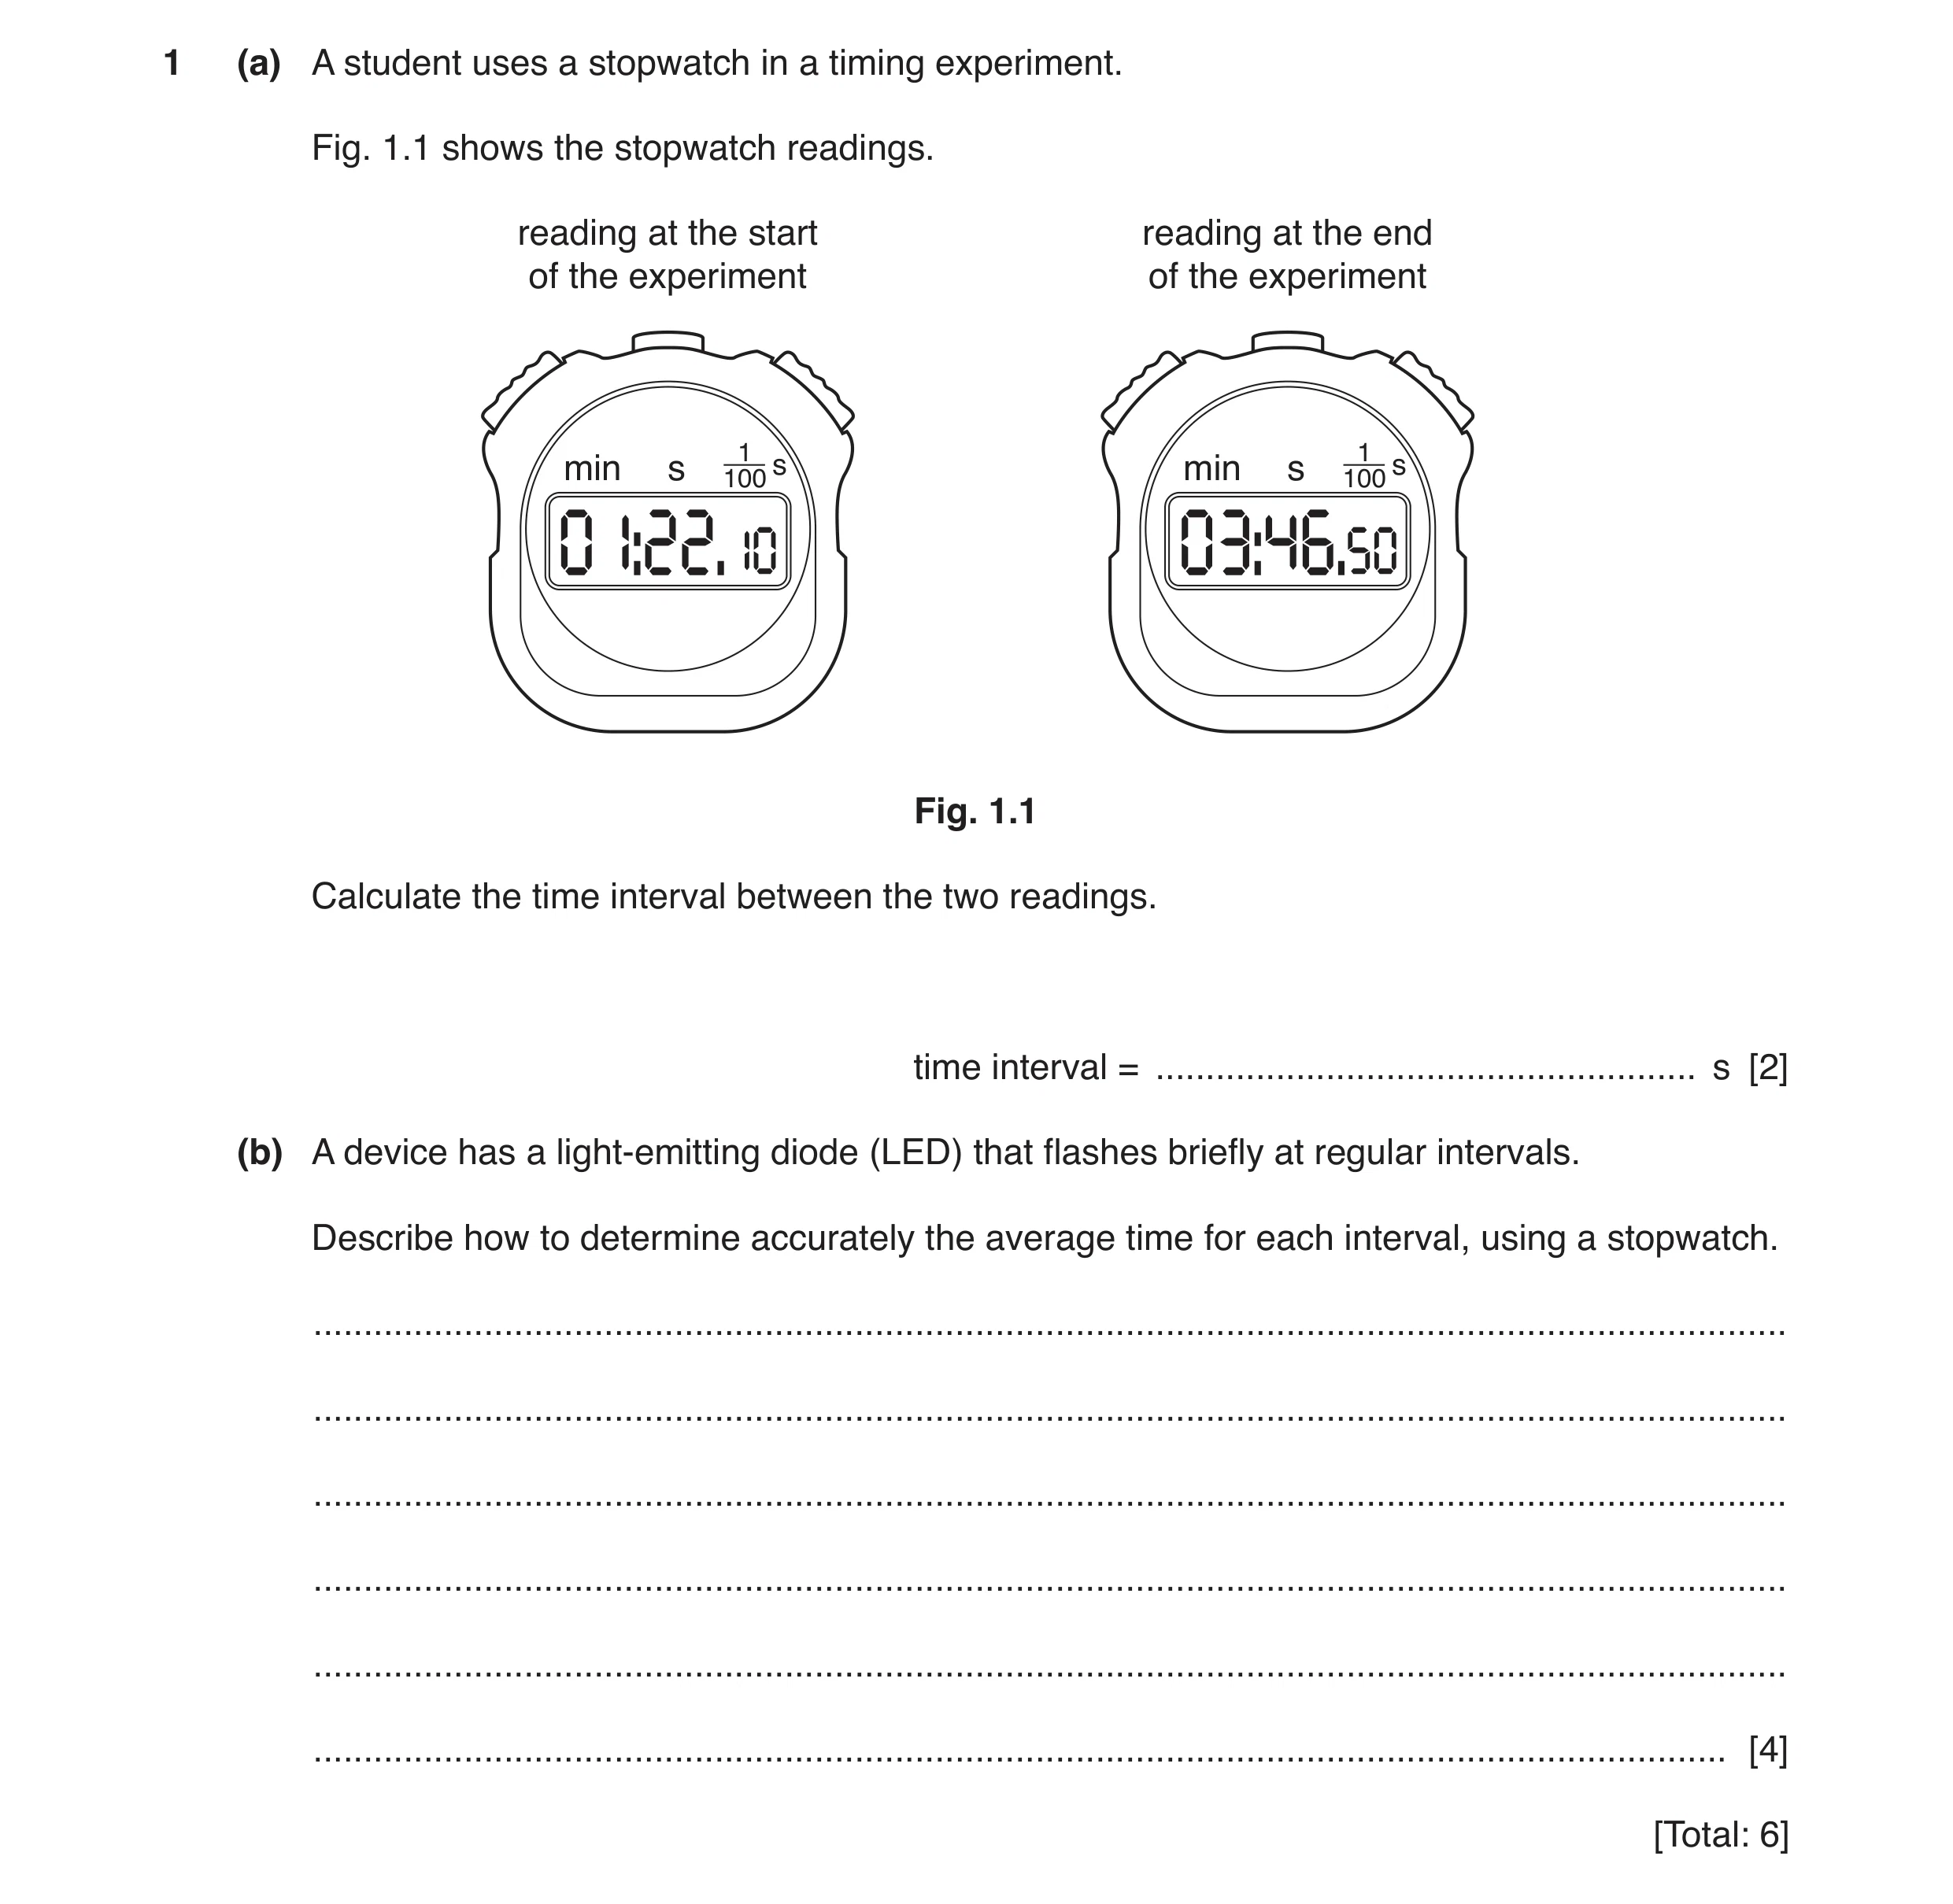
1 (a) A student uses a stopwatch in a timing experiment. Fig. 1.1 shows the stopwatch readings. reading at the start reading at the end of the experiment of the experiment min s 1001 1 s min s 100 s Fig. 1.1 Calculate the time interval between the two readings. time interval = … s [2] (b) A device has a light-emitting diode (LED) that flashes briefly at regular intervals. Describe how to determine accurately the average time for each interval, using a stopwatch. … … … … … … [4] [Total: 6]
6 marks
Mark scheme: 1(a) 226.50 – 82.10 OR 3:46.5(0) – 1:22.1(0) OR 2 min 24.4 (s) 144.4(0) (s) C1 A1 1(b) start stopwatch as LED lights owtte count large number of flashes i.e. > = 10 stop stopwatch on nth lighting of LED AND n > = 1 divide time on stopwatch by n B4
This question in 0625/33 Oct/Nov 2019
Q17 · A student places 8 similar coins in a pile, as shown in Fig 0625/32 Feb/March 2020
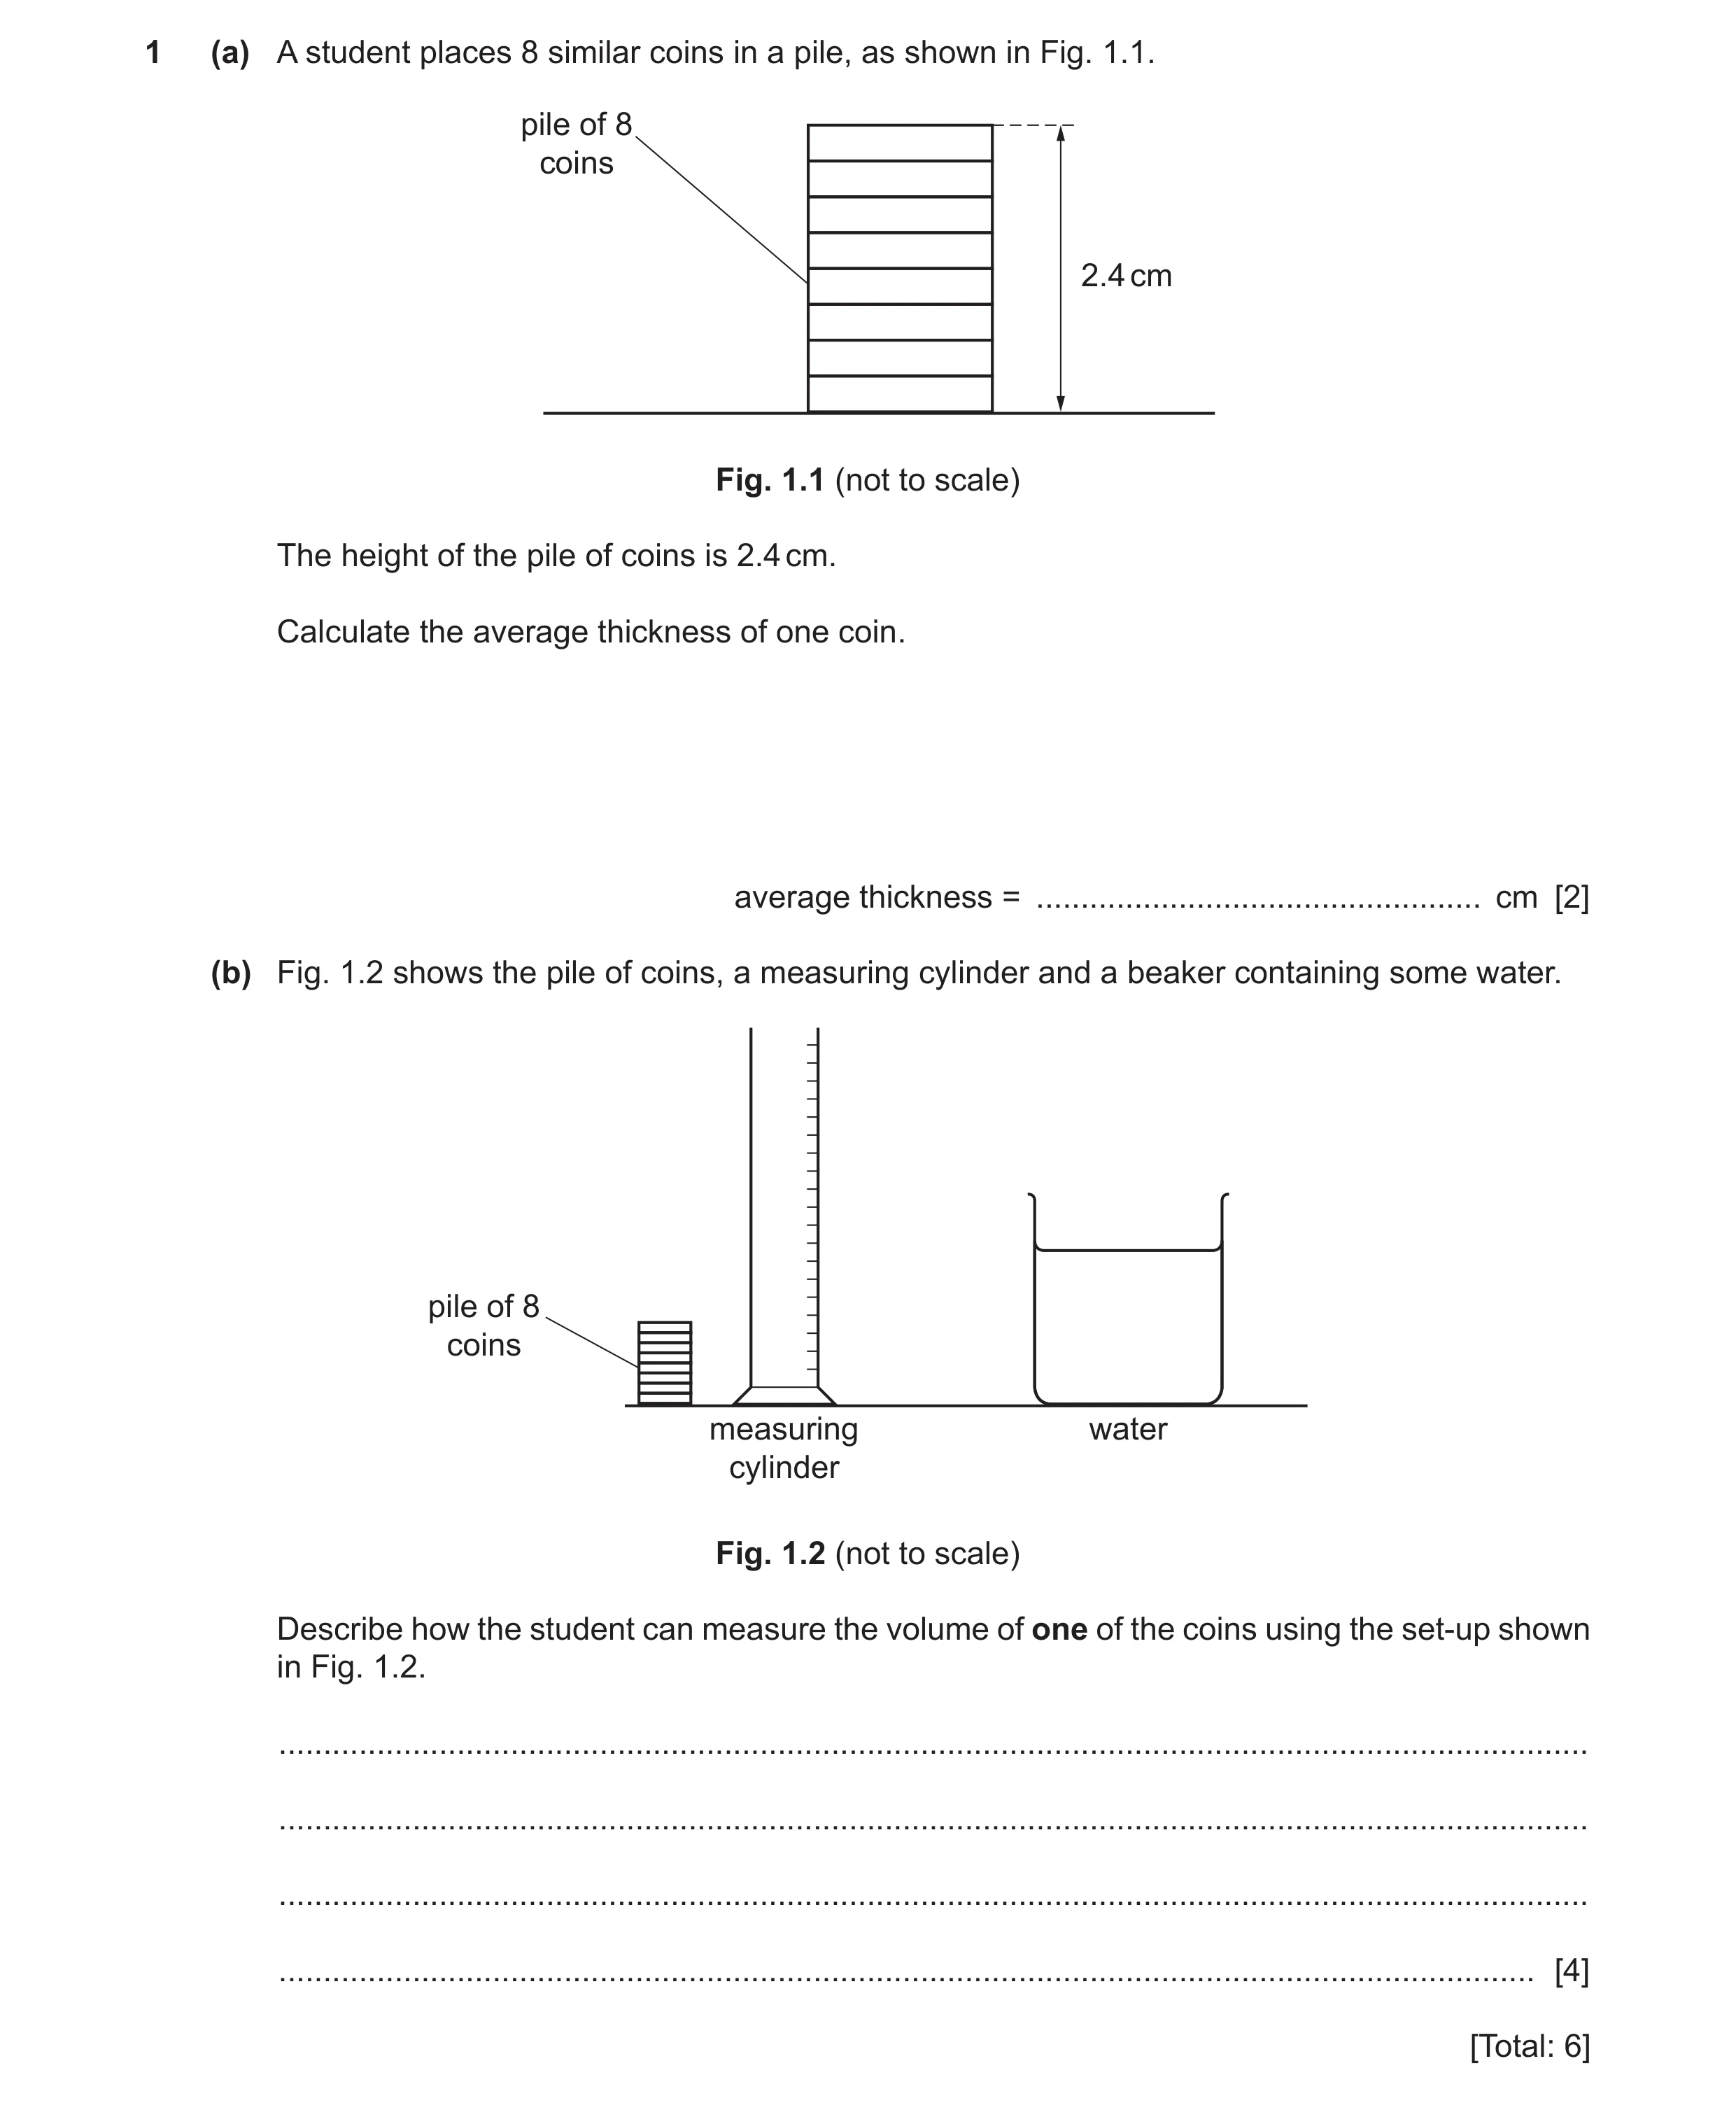
1 (a) A student places 8 similar coins in a pile, as shown in Fig. 1.1. pile of 8 coins 2.4 cm Fig. 1.1 (not to scale) The height of the pile of coins is 2.4 cm. Calculate the average thickness of one coin. average thickness = … cm [2] (b) Fig. 1.2 shows the pile of coins, a measuring cylinder and a beaker containing some water. pile of 8 coins measuring water cylinder Fig. 1.2 (not to scale) Describe how the student can measure the volume of one of the coins using the set-up shown in Fig. 1.2. … … … … [4] [Total: 6]
6 marks
Mark scheme: 1(a) (average thickness =) 2.4 ÷ 8 C1 (average thickness =) 0.3 (cm) A1 1(b) any four from: measuring cylinder partially filled with water / displacement can filled with water volume of water recorded / empty measuring cylinder under spout coin(s) in water OR water covers all coin(s) new volume noted / displaced water collected in measuring cylinder ( average) volume of a coin = increase in volume OR increase in volume ÷ number of coins B4
This question in 0625/32 Feb/March 2020
Q18 · A coil of wire 0625/31 May/June 2020
1 Fig. 1.1 shows a coil of wire. length of coil Fig. 1.1 (not to scale) (a) A student measures the length of the coil using a ruler. His measurement is 3.8 cm. There are 20 turns of wire in the coil. The student uses his measurement to calculate the average thickness of the wire. (i) Show that the average thickness of the wire is about 0.2 cm. average thickness of wire = … cm [2] (ii) The student’s measurement of 3.8 cm is inaccurate. Suggest one reason why the measurement is inaccurate. … … [1] (b) The volume of the wire in the coil is 16.6 cm3 and its mass is 148 g. Calculate the density of the metal used for the wire in the coil. density = … g / cm3 [3] (c) The student has a measuring cylinder and a beaker of water, as shown in Fig. 1.2. coil measuring beaker of water cylinder Fig. 1.2 Describe how the student can determine the volume of the coil by using the equipment shown in Fig. 1.2. … … … … … … [4] [Total: 10]
10 marks
Mark scheme: 1(a)(i) C1 (average thickness =) 0.19 (cm) (which is about 0.2 cm) A1 1(a)(ii) any one from: wire(s) not touching OR wire stretched (in places) OR ruler not at zero (owtte) OR wire(s) overlapping OR eye not directly above ruler (owtte) B1 1(b) density = mass ÷ volume OR m V ρ = in any form. C1 (ρ =) 148 ÷ 16.6 C1 (ρ =) 8.9 (g / cm3) A1 1(c) measuring cylinder partially filled with water coil submerged in water (owtte) new volume noted volume of wire = difference or increase in volume(s) B4
This question in 0625/31 May/June 2020
Q19 · Some students observe drops of water falling from a tap that leaks, as shown in Fig 0625/32 May/June 2020
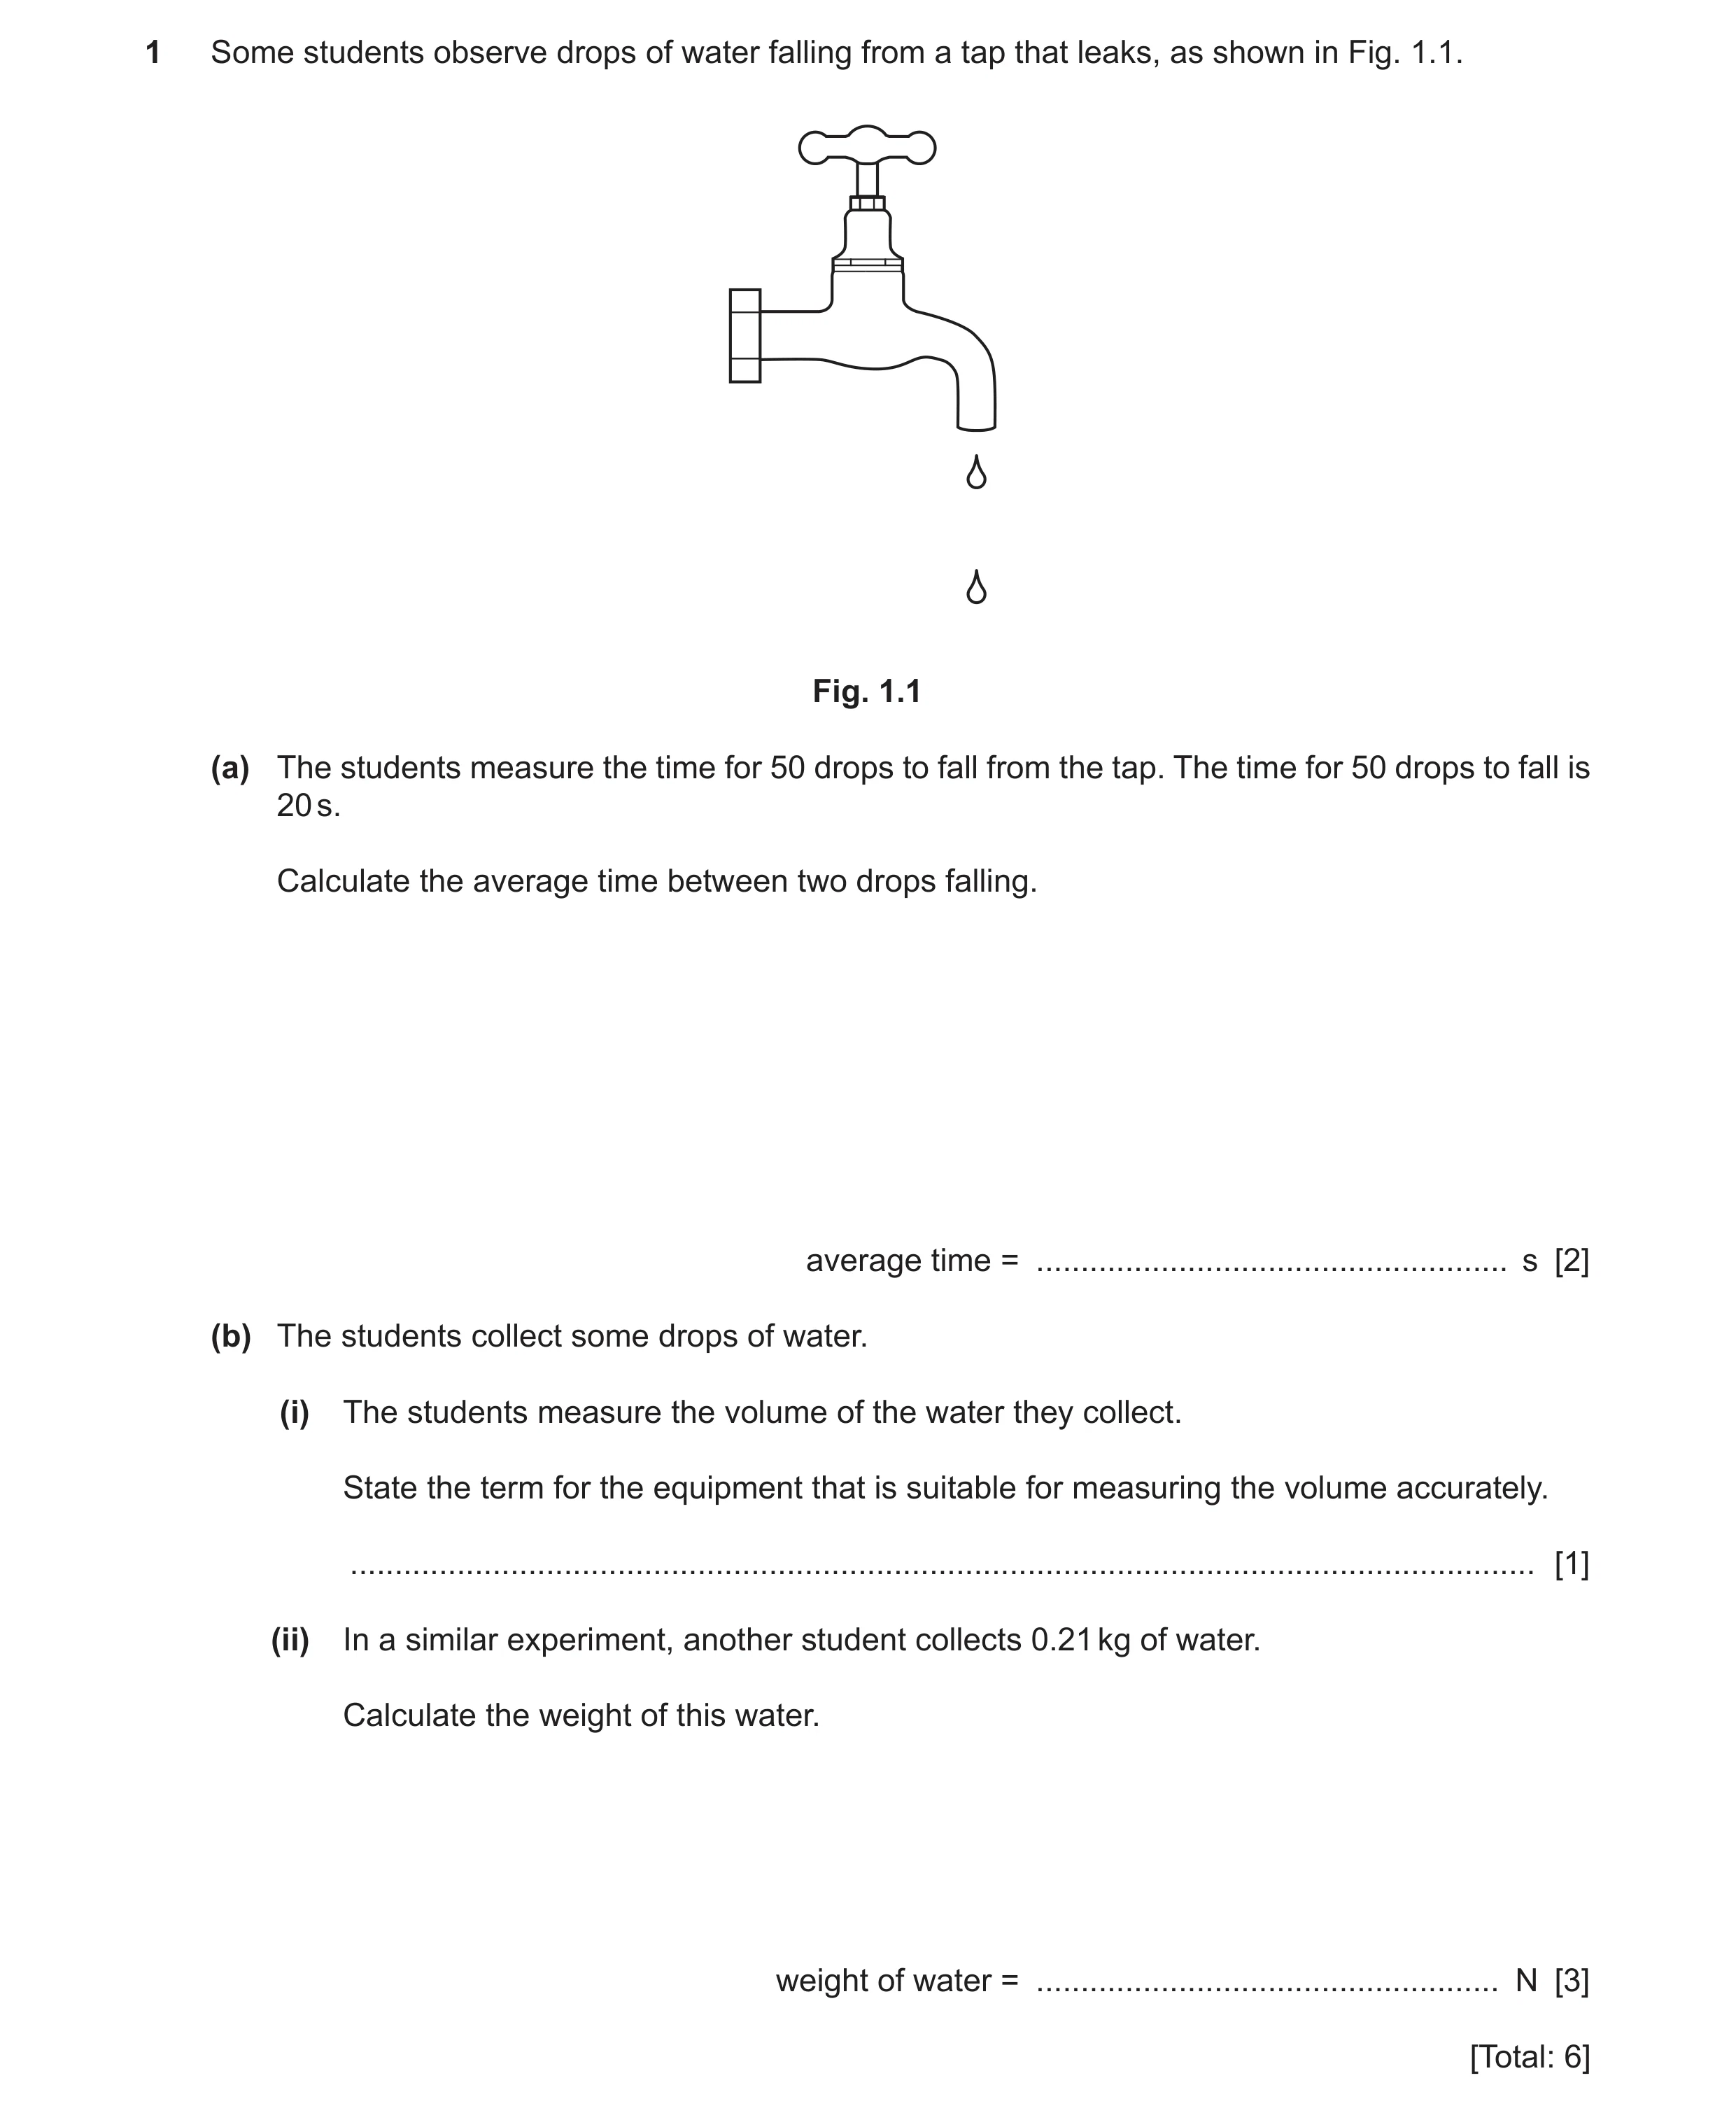
1 Some students observe drops of water falling from a tap that leaks, as shown in Fig. 1.1. Fig. 1.1 (a) The students measure the time for 50 drops to fall from the tap. The time for 50 drops to fall is 20 s. Calculate the average time between two drops falling. average time = … s [2] (b) The students collect some drops of water. (i) The students measure the volume of the water they collect. State the term for the equipment that is suitable for measuring the volume accurately. … [1] (ii) In a similar experiment, another student collects 0.21 kg of water. Calculate the weight of this water. weight of water = … N [3] [Total: 6]
6 marks
Mark scheme: 1(a) (time =) 20 ÷ 50 C1 0.4 (s) A1 1(b)(i) measuring cylinder B1 1(b)(ii) W = m x g C1 (W =) 0.21 × 10 C1 2.1 (N) A1
This question in 0625/32 May/June 2020
Q20 · The core of a transformer 0625/32 May/June 2021
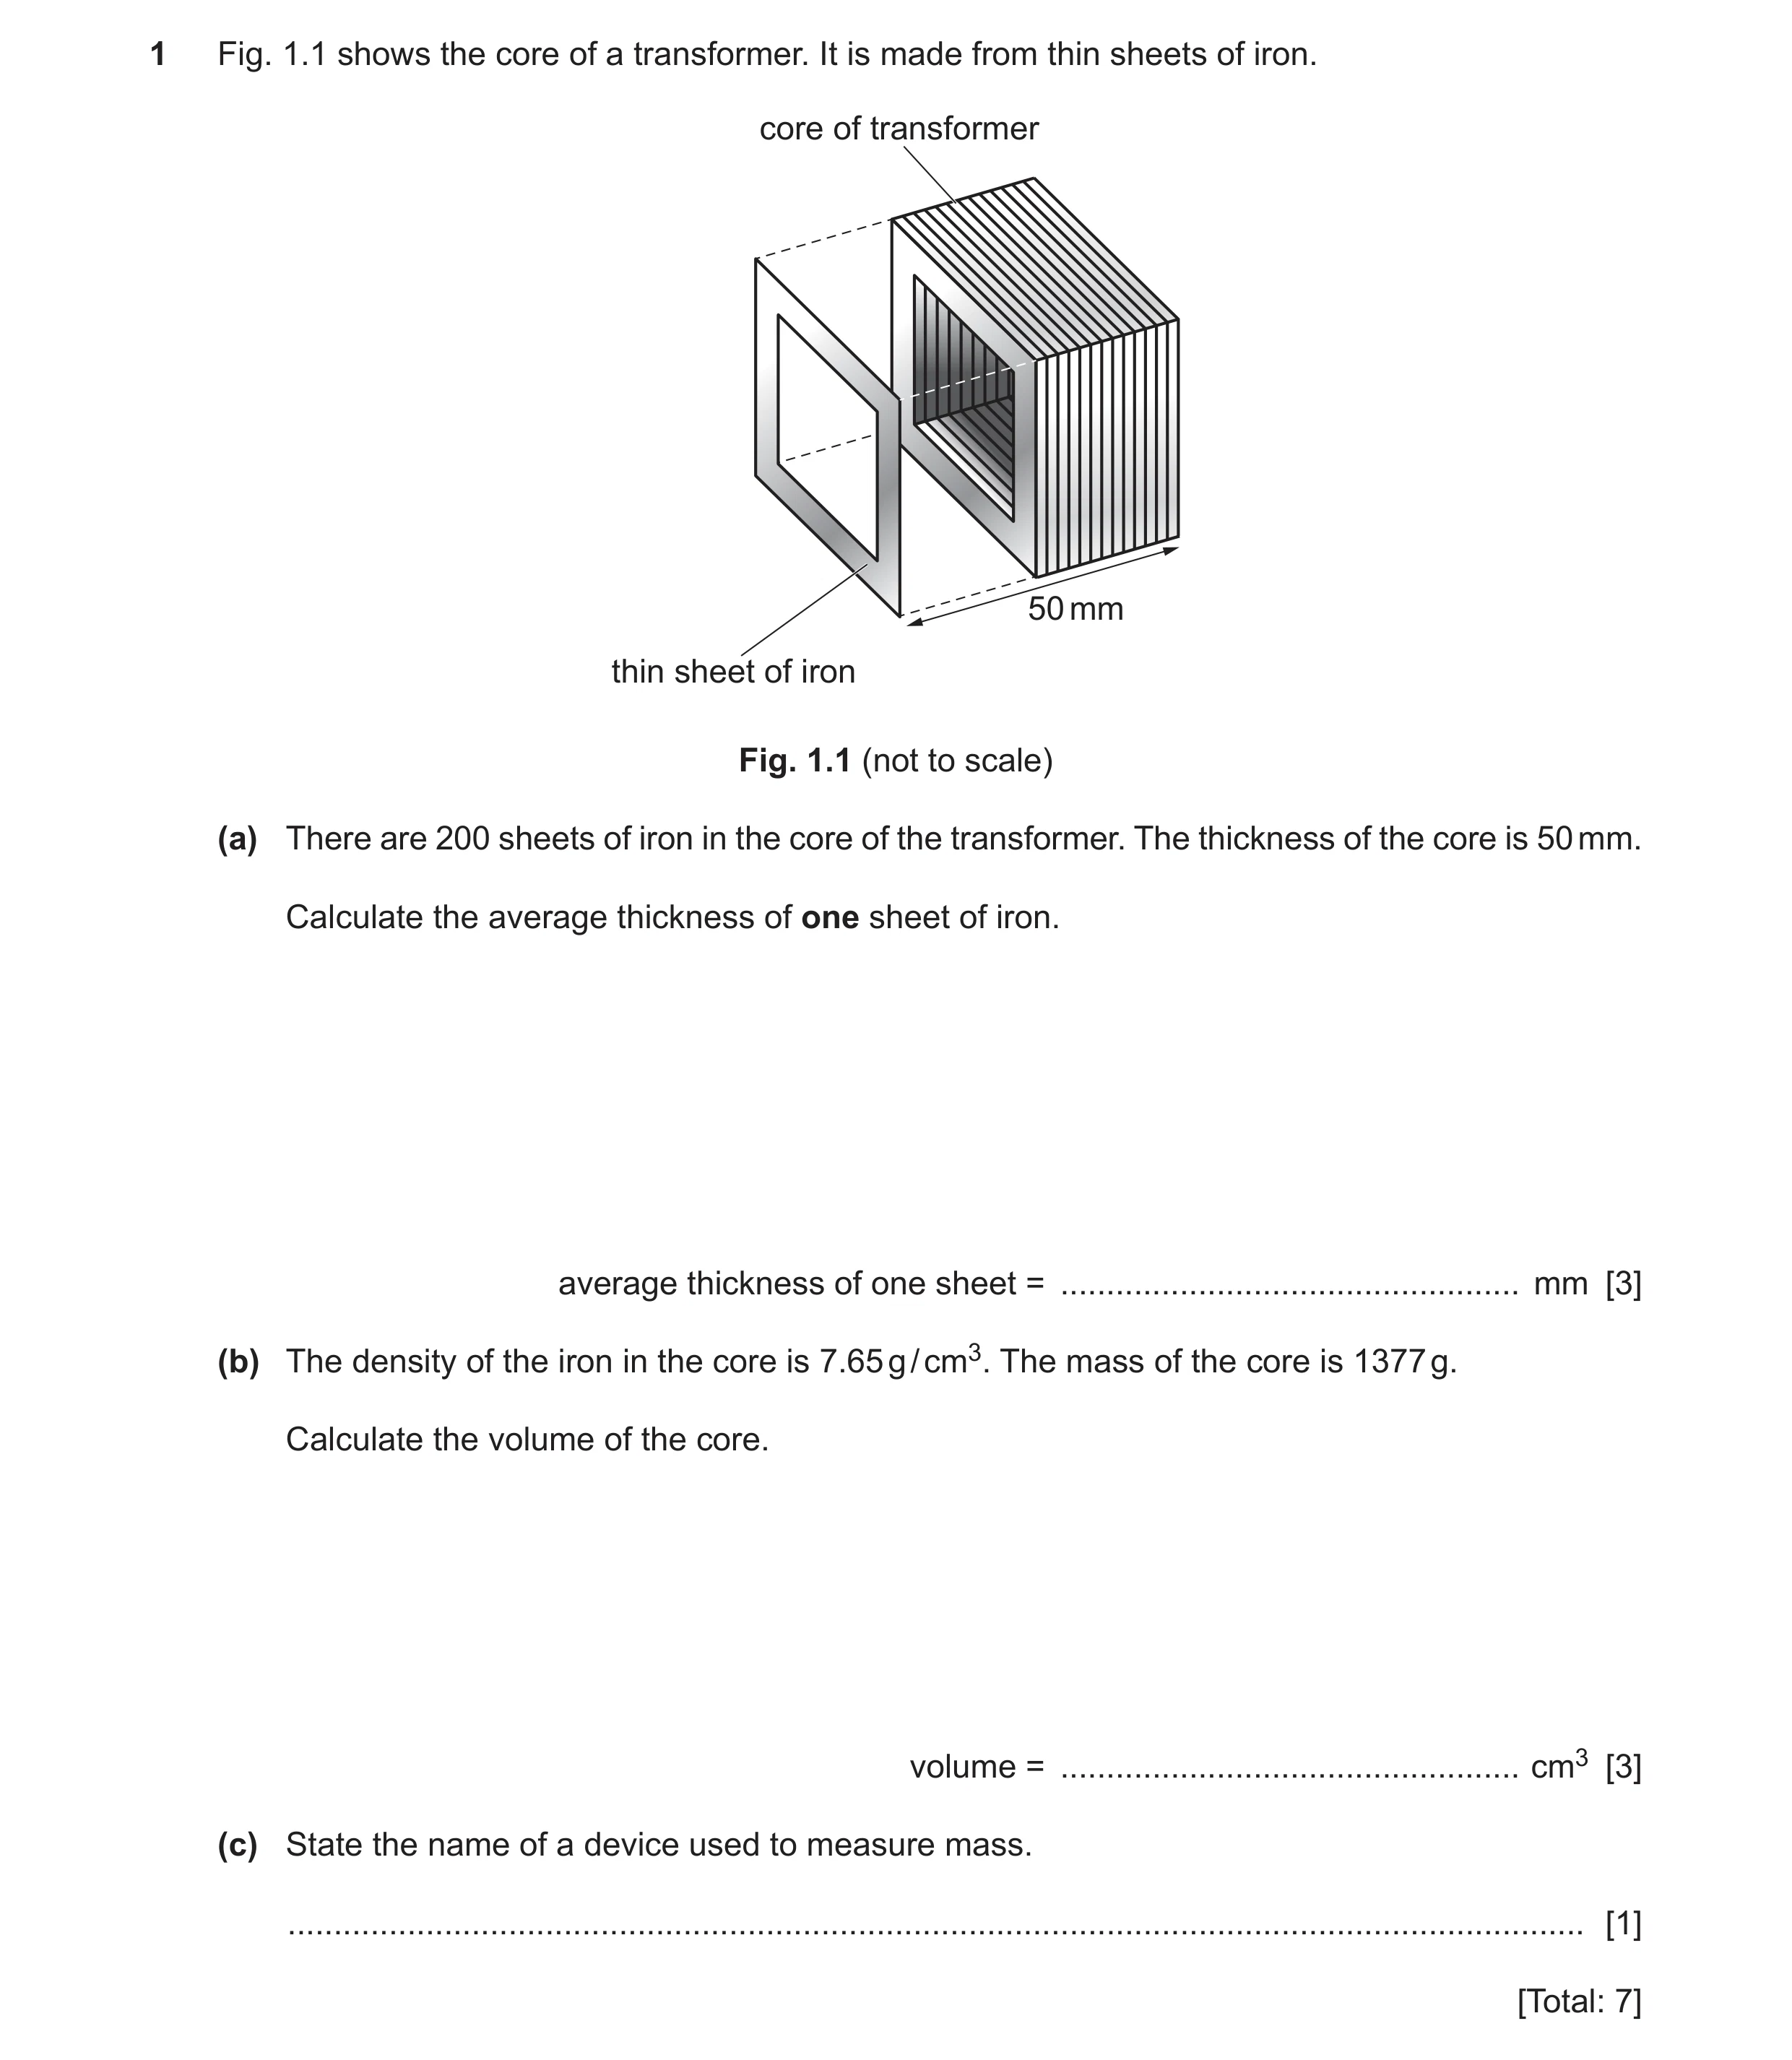
1 Fig. 1.1 shows the core of a transformer. It is made from thin sheets of iron. core of transformer 50 mm thin sheet of iron Fig. 1.1 (not to scale) (a) There are 200 sheets of iron in the core of the transformer. The thickness of the core is 50 mm. Calculate the average thickness of one sheet of iron. average thickness of one sheet = … mm [3] (b) The density of the iron in the core is 7.65 g / cm3. The mass of the core is 1377 g. Calculate the volume of the core. volume = … cm3 [3] (c) State the name of a device used to measure mass. … [1] [Total: 7]
7 marks
Mark scheme: 1(a) (average thickness =) 50 ÷ 200 C1 0.25 (mm) A1 1(b) density = mass ÷ volume OR (volume =) mass ÷ density C1 (volume =) 1377 ÷ 7.65 C1 180 (cm3) A1 1(c) (top pan or chemical) balance B1
This question in 0625/32 May/June 2021
Q21 · A student uses a ruler to measure the length of a piece of wire, as shown in Fig 0625/31 Oct/Nov 2021
1 A student uses a ruler to measure the length of a piece of wire, as shown in Fig. 1.1. wire 0 1 2 3 4 5 6 7 8 9 10 11 12 13 14 15 16 cm Fig. 1.1 (not to scale) (a) Use the ruler in Fig. 1.1 to determine the length of the piece of wire. length of wire = … cm [2] (b) The student folds the piece of wire and measures its mass. (i) State the name of an instrument the student can use to measure mass. … [1] (ii) The student determines the volume of the wire. He uses a measuring cylinder part‑filled with water and places the wire in it, as shown in Fig. 1.2. folded wire cm3 cm3 50 50 40 40 30 30 20 20 water water 10 10 folded wire Fig. 1.2 Determine the volume of the wire by using information in Fig. 1.2. volume of wire = … cm3 [2] (c) The student measures the mass and the volume of a piece of metal. The mass of the piece of metal is 93.6 g and its volume is 12 cm3. Calculate the density of the metal. density of metal = … g / cm3 [3] [Total: 8]
8 marks
Mark scheme: 1(a) 1.6 (cm) OR 14.8 (cm) seen OR used C1 13.2 (cm) A1 1(b)(i) (top pan / chemical / beam) balance B1 1(b)(ii) 22 (cm3) OR 18 (cm3) seen OR used C1 4(.0) (cm3) A1 1(c) (density = ) mass ÷ volume OR ( d =) m ÷ v in any form C1 93.6 ÷ 12 C1 7.8 (g / cm3) A1
This question in 0625/31 Oct/Nov 2021
Q22 · A slope is made by resting one end of a plank of wood on a block, as shown in Fig 0625/31 Oct/Nov 2021
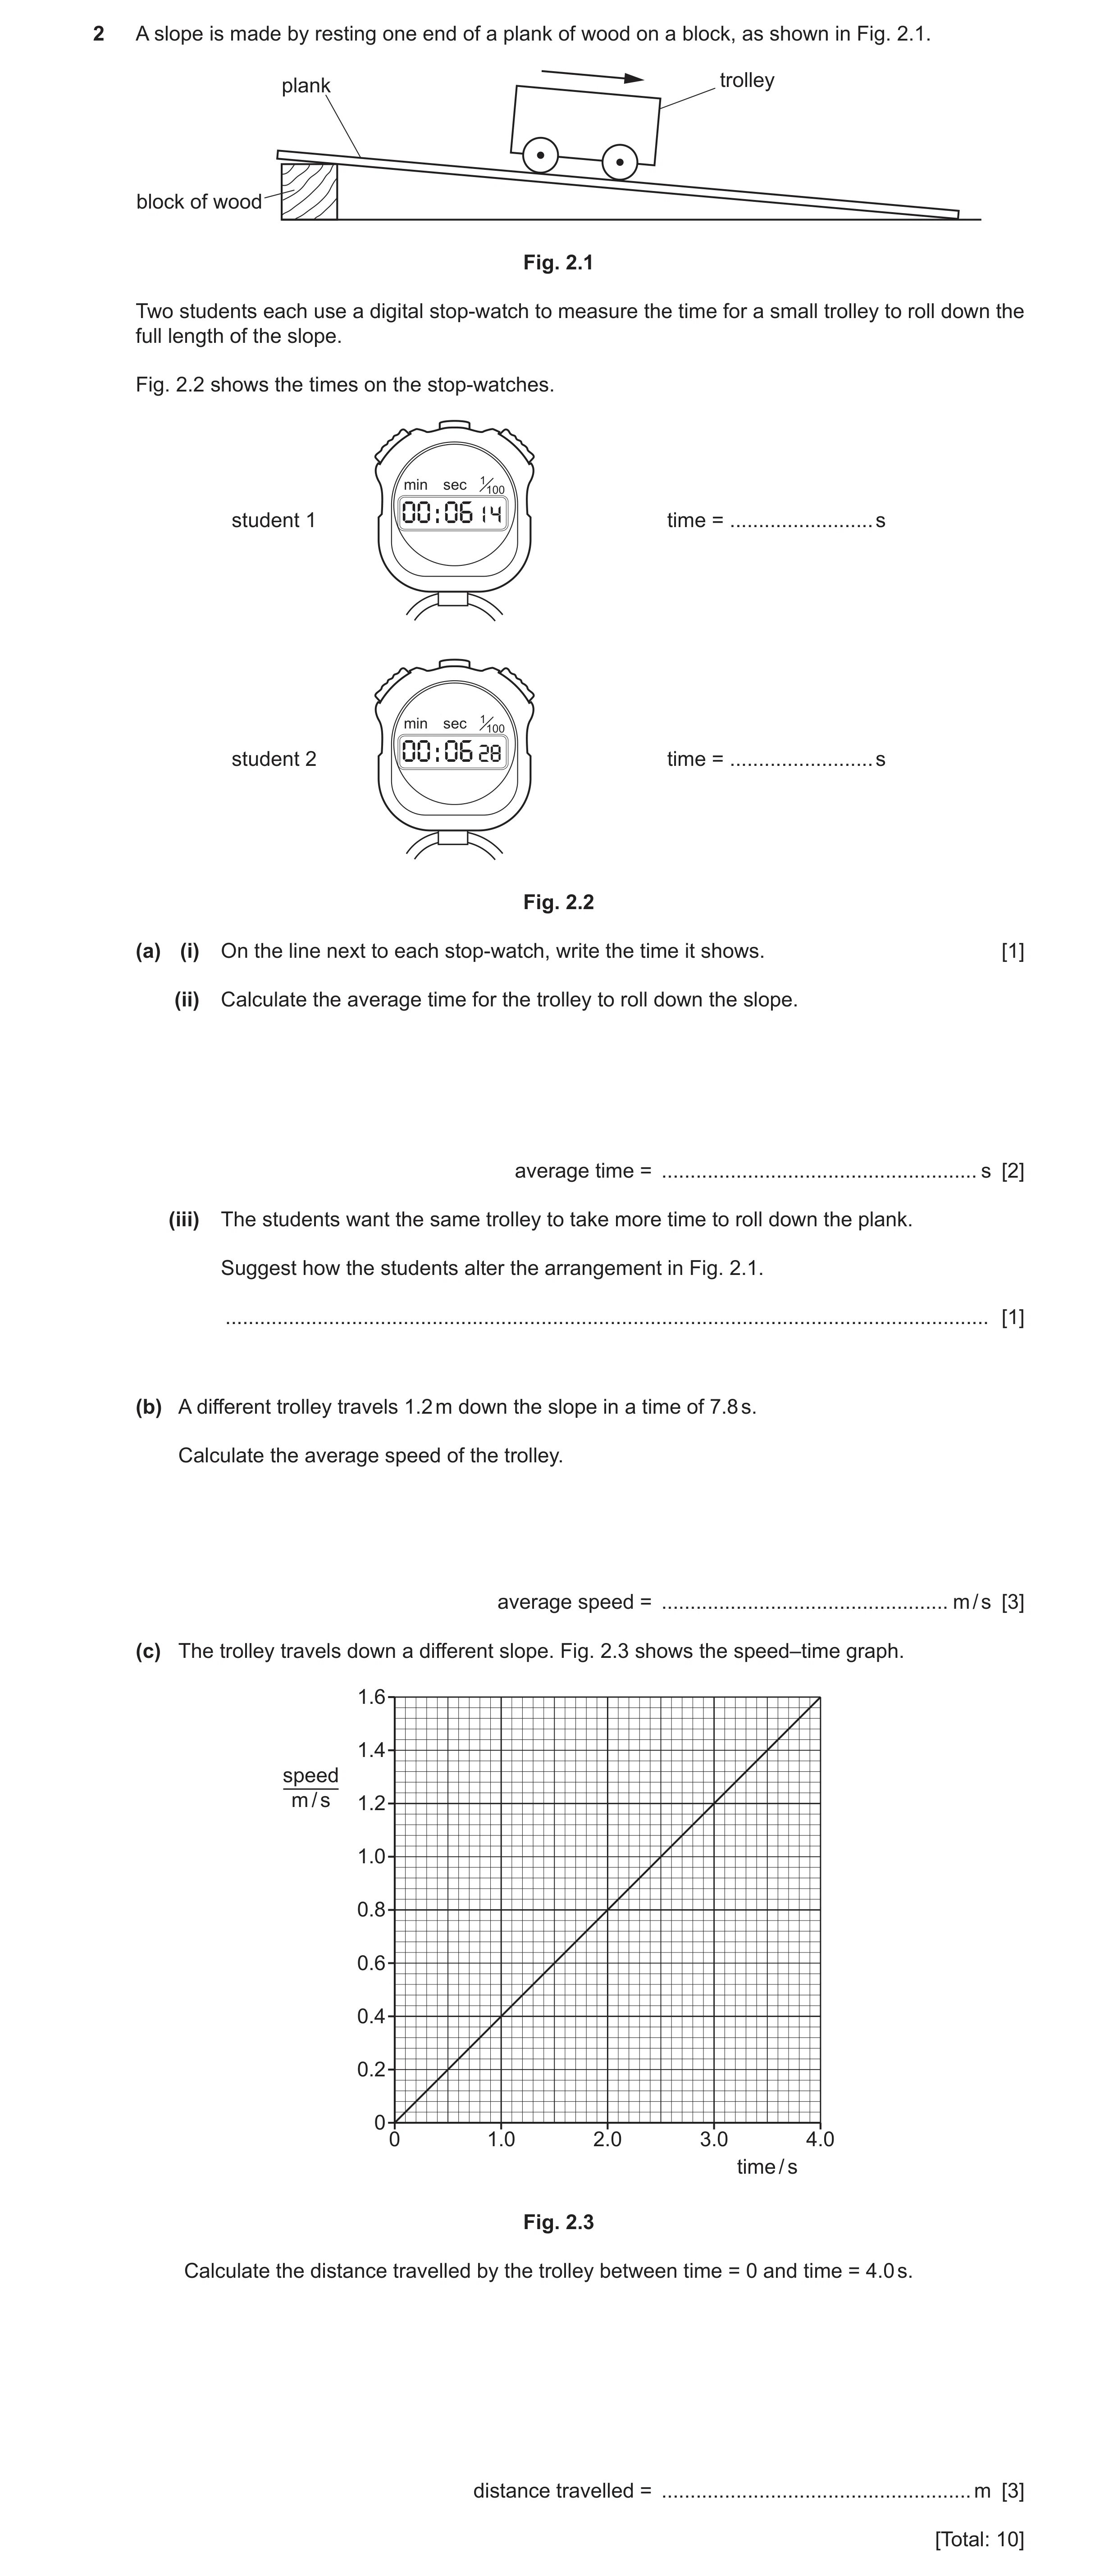
2 A slope is made by resting one end of a plank of wood on a block, as shown in Fig. 2.1. plank trolley block of wood Fig. 2.1 Two students each use a digital stop‑watch to measure the time for a small trolley to roll down the full length of the slope. Fig. 2.2 shows the times on the stop‑watches. min sec 1100 student 1 00 : 06 14 time = … s min sec 1100 student 2 00 : 06 28 time = … s Fig. 2.2 (a) (i) On the line next to each stop‑watch, write the time it shows. [1] (ii) Calculate the average time for the trolley to roll down the slope. average time = … s [2] (iii) The students want the same trolley to take more time to roll down the plank. Suggest how the students alter the arrangement in Fig. 2.1. … [1] (b) A different trolley travels 1.2 m down the slope in a time of 7.8 s. Calculate the average speed of the trolley. average speed = … m / s [3] (c) The trolley travels down a different slope. Fig. 2.3 shows the speed–time graph. 1.6 1.4 speed m / s 1.2 1.0 0.8 0.6 0.4 0.2 0 0 1.0 2.0 3.0 4.0 time / s Fig. 2.3 Calculate the distance travelled by the trolley between time = 0 and time = 4.0 s. distance travelled = … m [3] [Total: 10]
10 marks
Mark scheme: 2(a)(i) 6.14 (s) AND 6.28 (s) B1 2(a)(ii) (6.14 + 6.28) ÷ 2 OR 12.42 ÷ 2 C1 6.21 (s) A1 2(a)(iii) idea of decreasing (angle of) slope OR less steep OR smaller gradient B1 2(b) (average speed =)( total) distance ÷ (total) time in any form C1 1.2 ÷ 7.8 C1 0.15 (m / s) A1 Question Answer Marks 2(c) distance = area under graph OR ½ × base × height C1 4.0 × 1.6 × 0.5 C1 3.2 (m) A1
This question in 0625/31 Oct/Nov 2021
Q23 · A coin collector has 19 identical coins, as shown in Fig 0625/32 Oct/Nov 2021
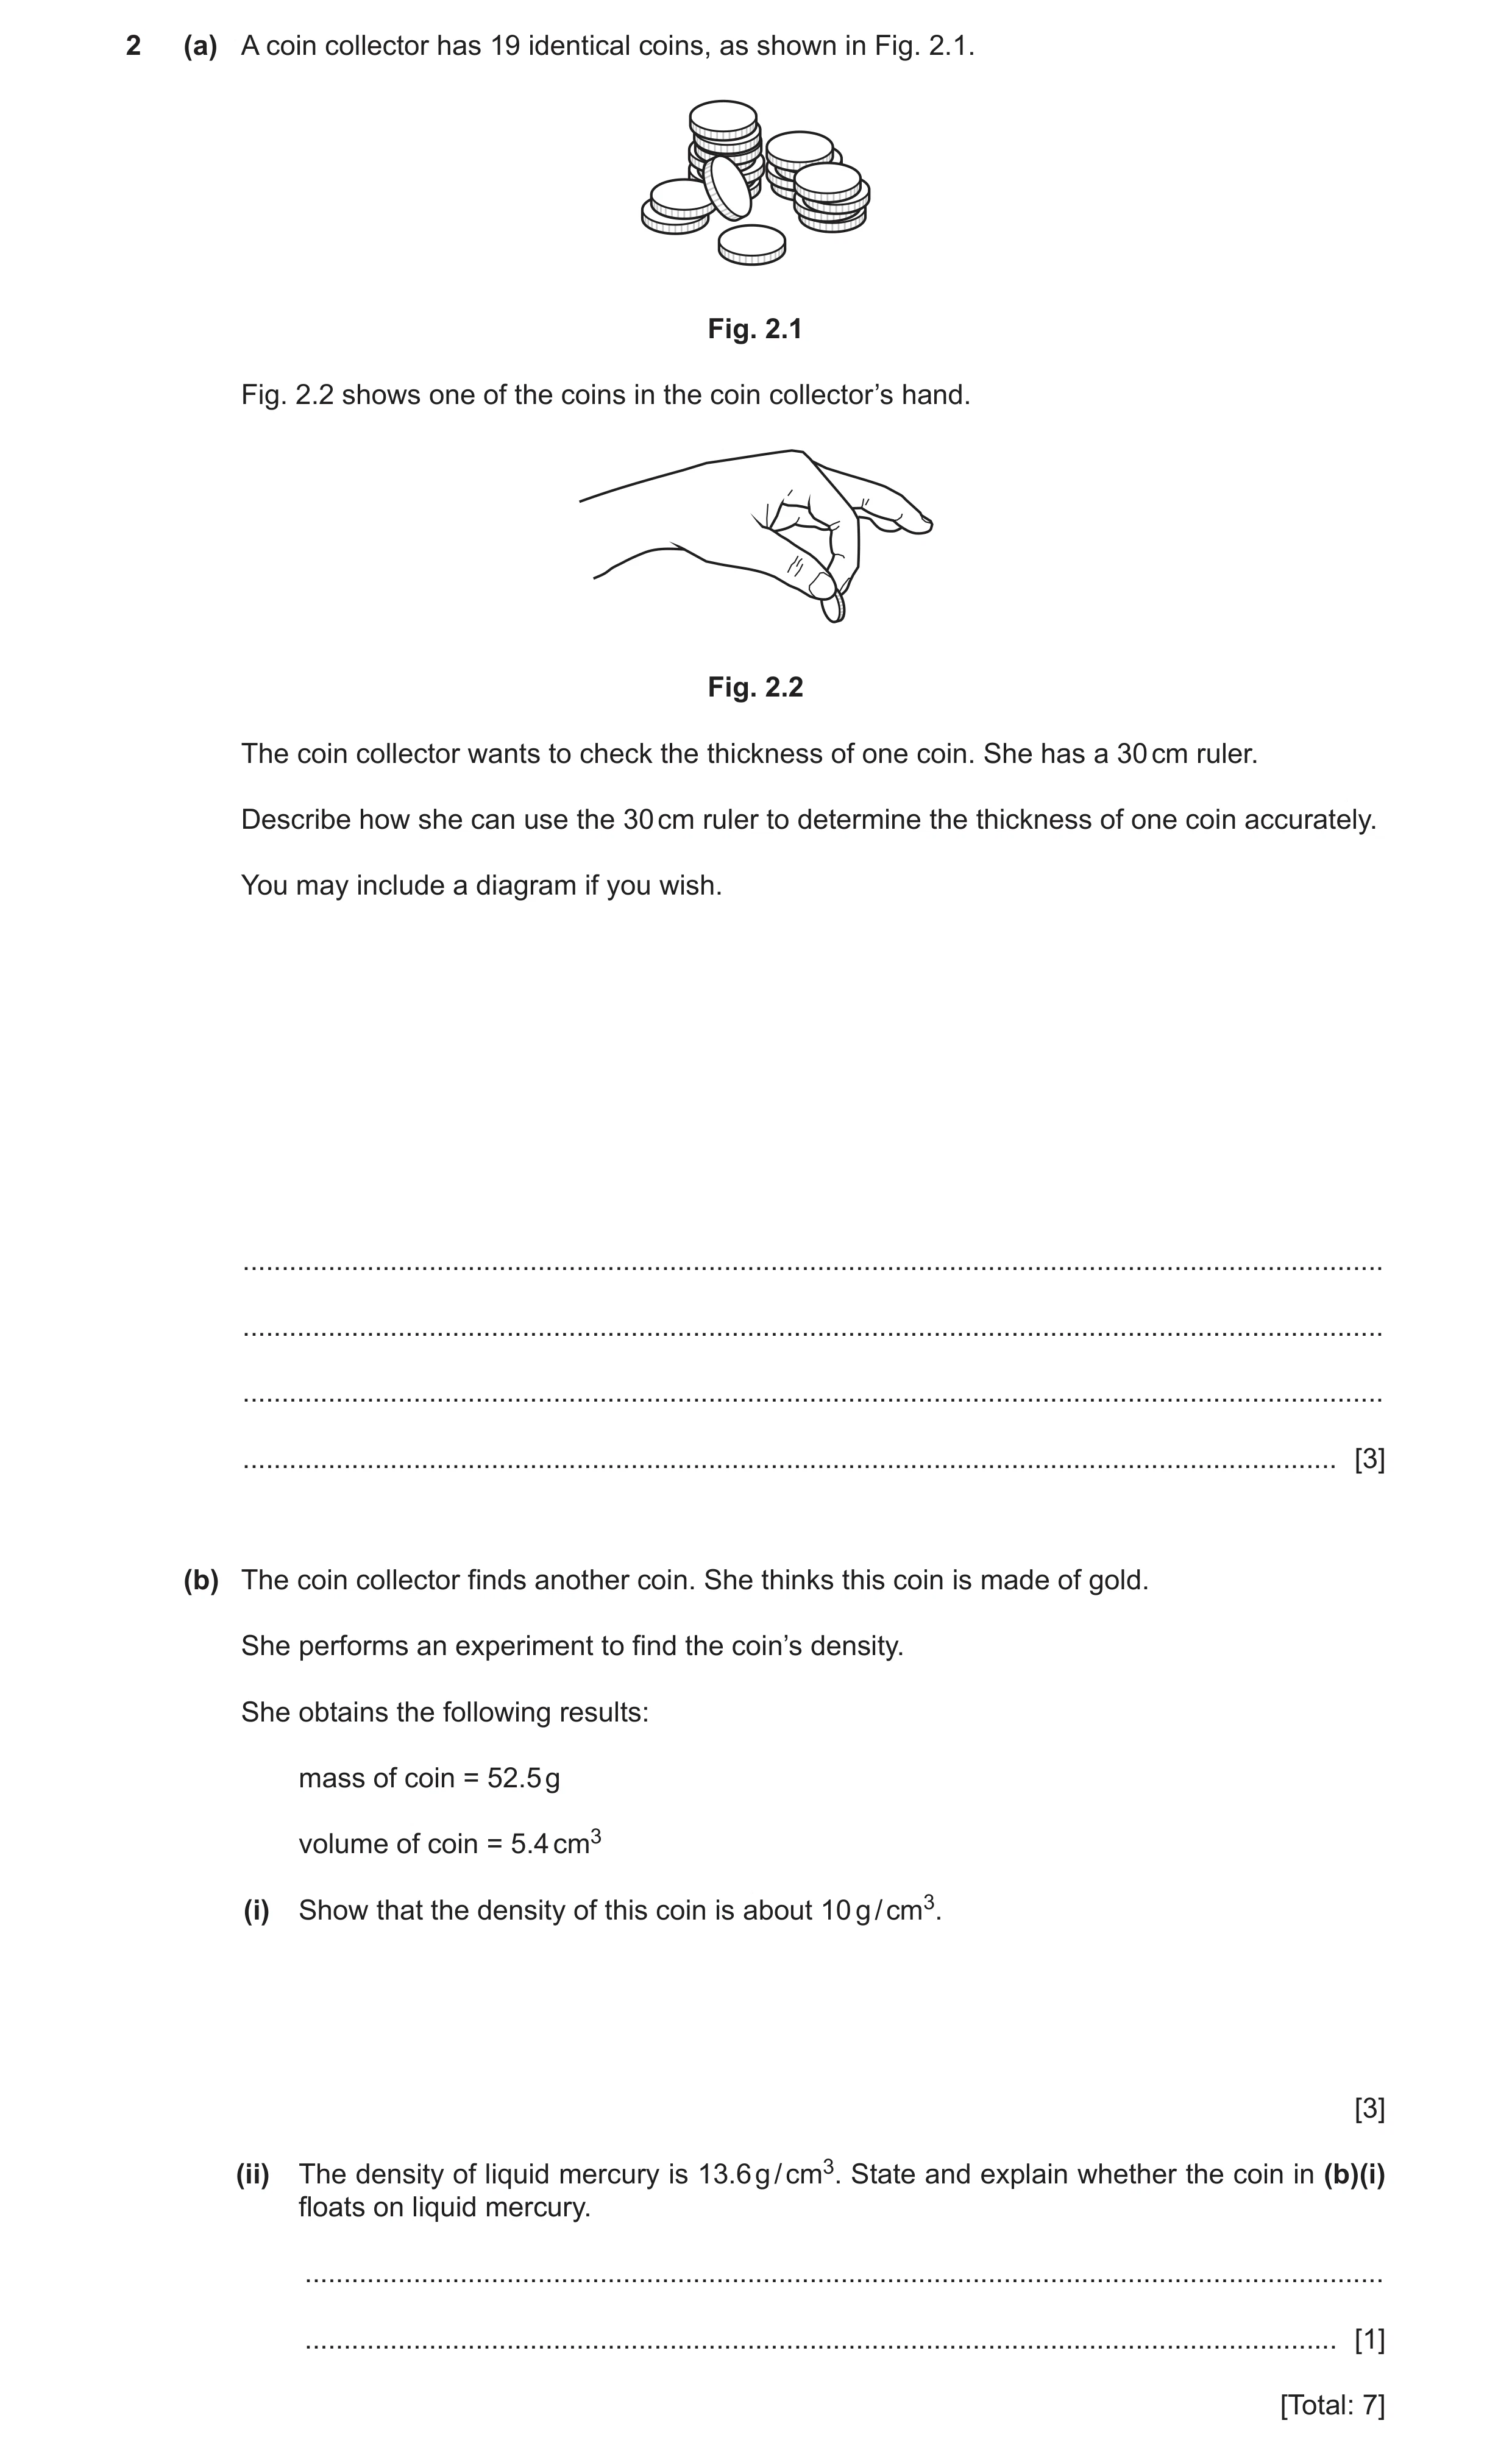
2 (a) A coin collector has 19 identical coins, as shown in Fig. 2.1. Fig. 2.1 Fig. 2.2 shows one of the coins in the coin collector’s hand. Fig. 2.2 The coin collector wants to check the thickness of one coin. She has a 30 cm ruler. Describe how she can use the 30 cm ruler to determine the thickness of one coin accurately. You may include a diagram if you wish. … … … … [3] (b) The coin collector finds another coin. She thinks this coin is made of gold. She performs an experiment to find the coin’s density. She obtains the following results: mass of coin = 52.5 g volume of coin = 5.4 cm3 (i) Show that the density of this coin is about 10 g / cm3. [3] (ii) The density of liquid mercury is 13.6 g / cm3. State and explain whether the coin in (b)(i) floats on liquid mercury. … … [1] [Total: 7]
7 marks
Mark scheme: 2(a) any three from: (put some coins) on top of each other OR in a stack idea measure the (total) thickness (of stack) 10 or more coins thickness (of one coin) = total thickness / ’length’ ÷ number of coins 2(b)(i) (D) = M ÷ V in any form C1 52.5 ÷ 5.4 C1 9.7(2) (g / cm3) A1 2(b)(ii) floats AND coin is less dense (than mercury) ora B1
This question in 0625/32 Oct/Nov 2021
Q24 · A teacher wants to measure the mass of a block of metal 0625/32 Oct/Nov 2021
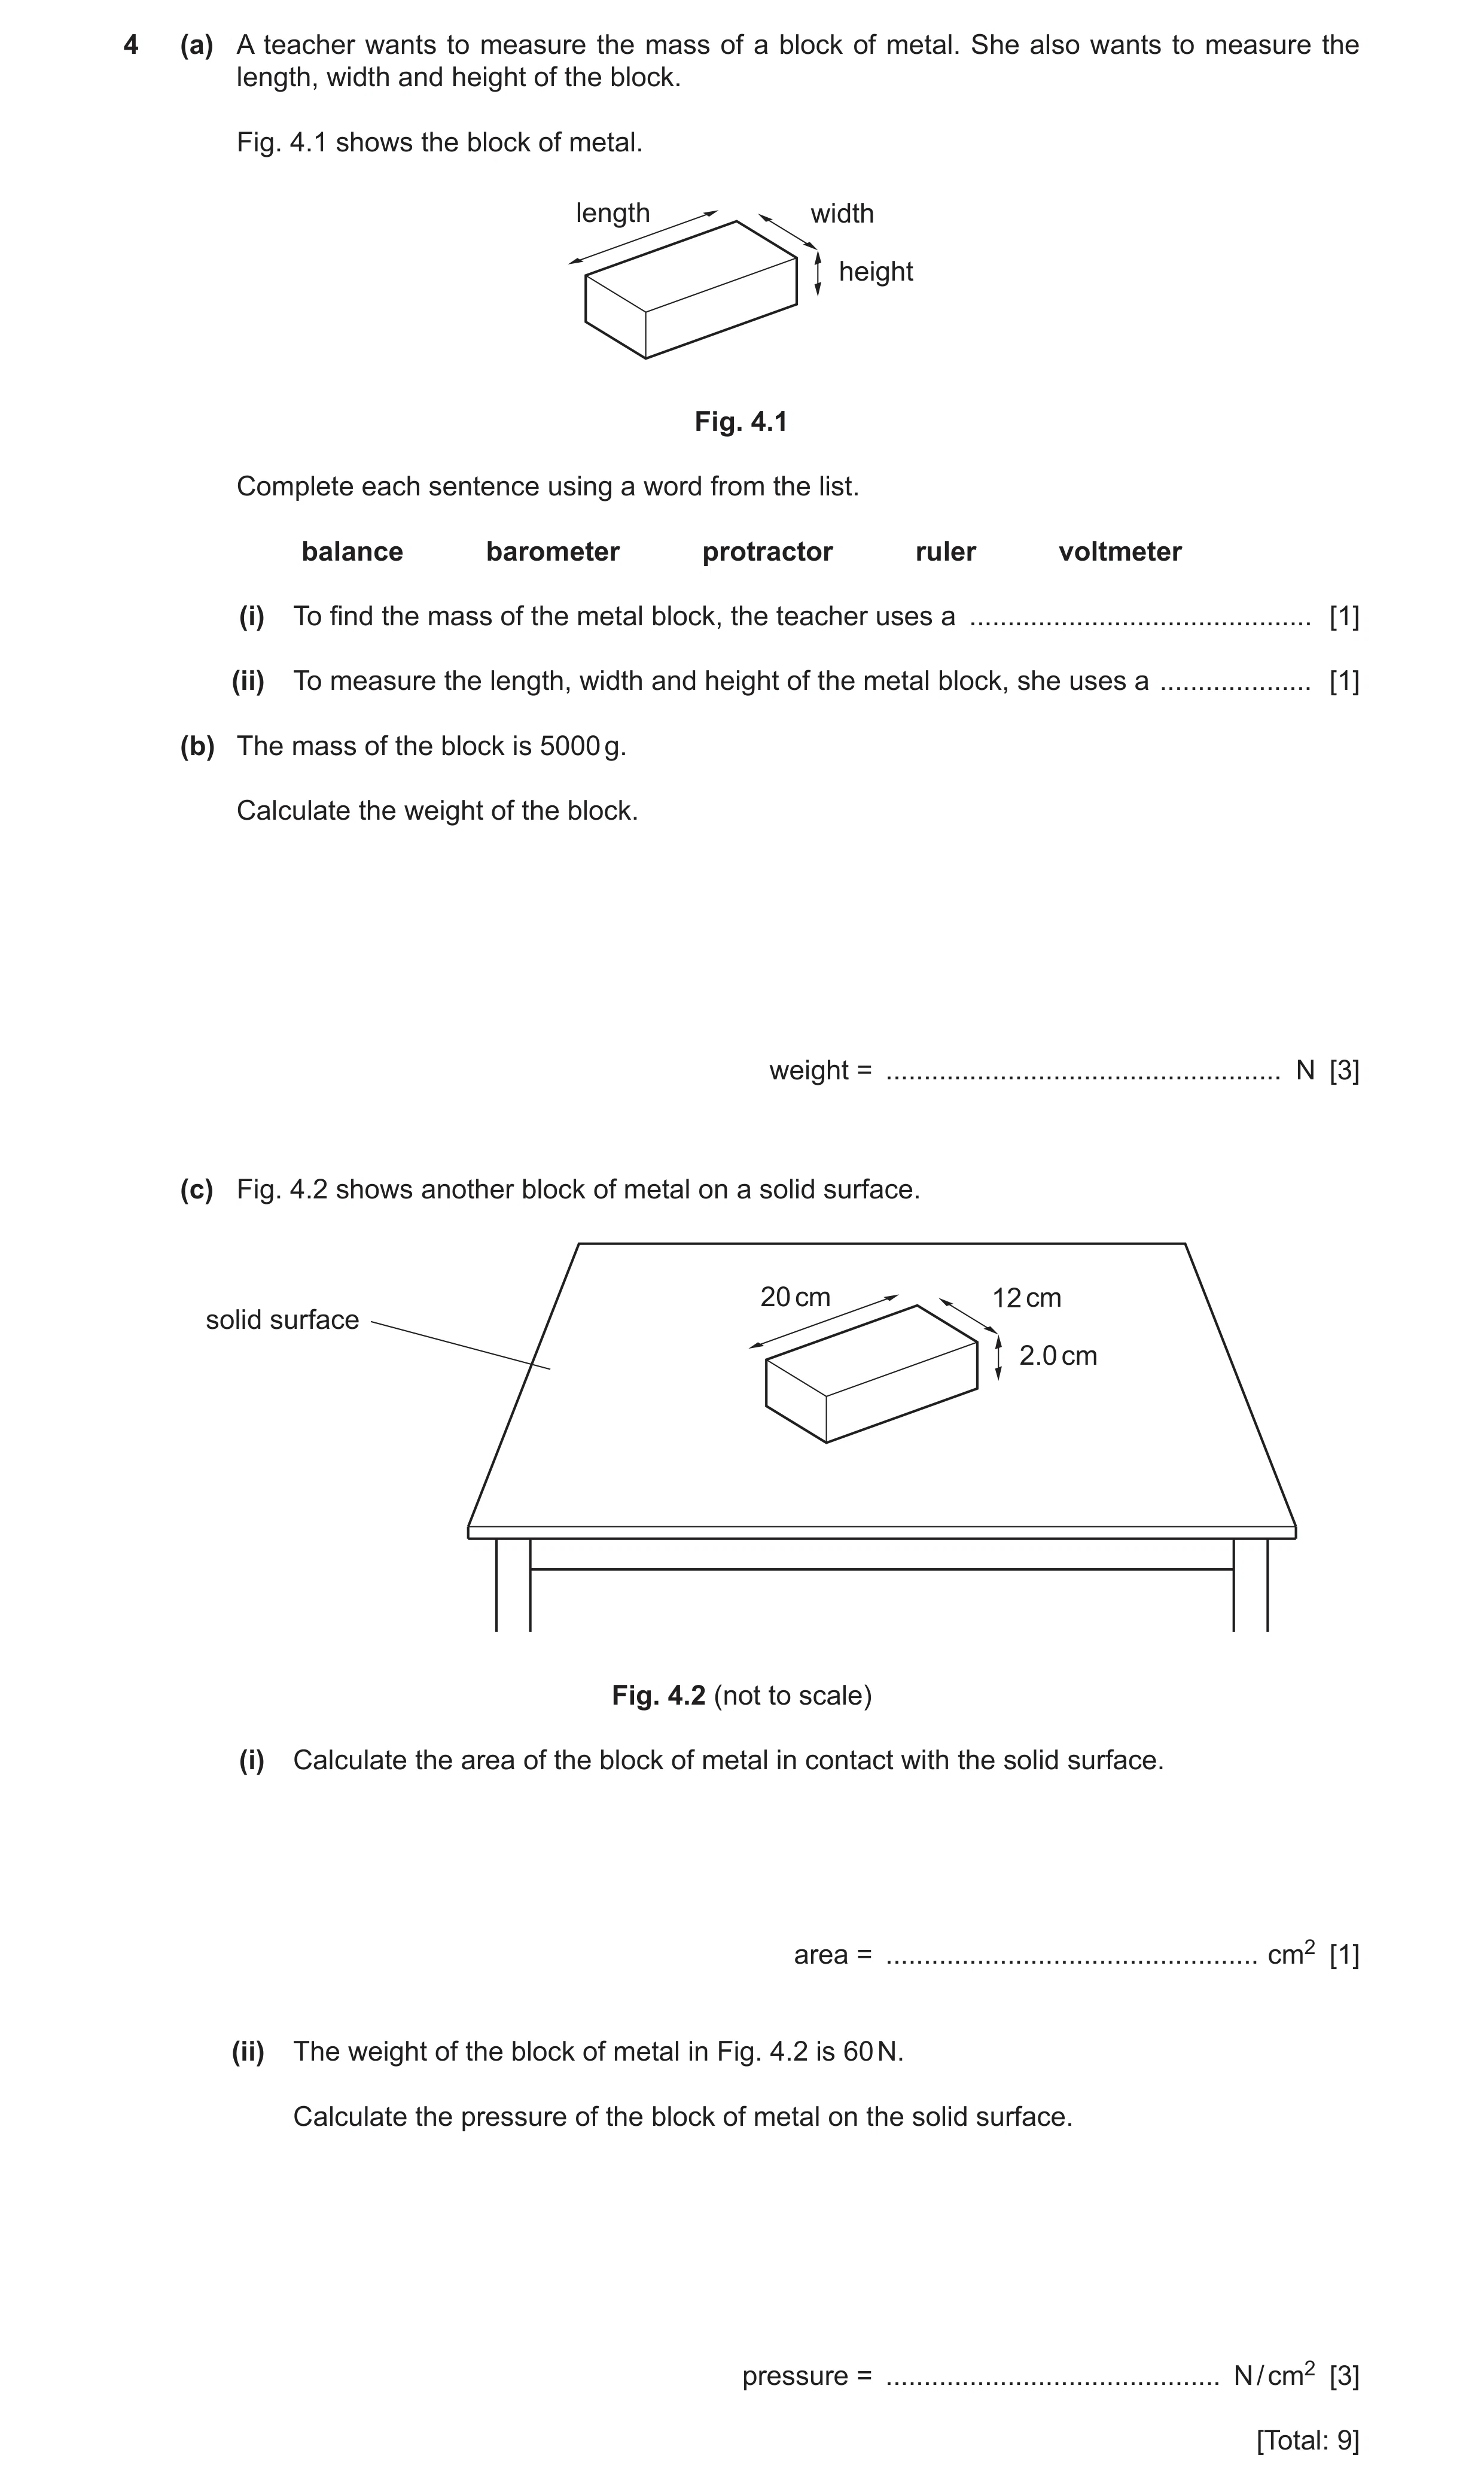
4 (a) A teacher wants to measure the mass of a block of metal. She also wants to measure the length, width and height of the block. Fig. 4.1 shows the block of metal. length width height Fig. 4.1 Complete each sentence using a word from the list. balance barometer protractor ruler voltmeter (i) To find the mass of the metal block, the teacher uses a … [1] (ii) To measure the length, width and height of the metal block, she uses a … [1] (b) The mass of the block is 5000 g. Calculate the weight of the block. weight = … N [3] (c) Fig. 4.2 shows another block of metal on a solid surface. 20 cm 12 cm solid surface 2.0 cm Fig. 4.2 (not to scale) (i) Calculate the area of the block of metal in contact with the solid surface. area = … cm2 [1] (ii) The weight of the block of metal in Fig. 4.2 is 60 N. Calculate the pressure of the block of metal on the solid surface. pressure = … N / cm2 [3] [Total: 9]
9 marks
Mark scheme: 4(a)(i) balance B1 4(a)(ii) ruler B1 4(b) mass = 5(.0) kg B1 (W =) m × g OR 5(.0) × 10 C1 50 (N) A1 4(c)(i) 240 (cm2) B1 4(c)(ii) (P =) F ÷ A in any form C1 60 ÷ (20 × 12) OR 60 ÷ 240 C1 0.25 (N / cm2) A1
This question in 0625/32 Oct/Nov 2021
Q25 · A girl has eight objects made of different materials 0625/32 Oct/Nov 2021
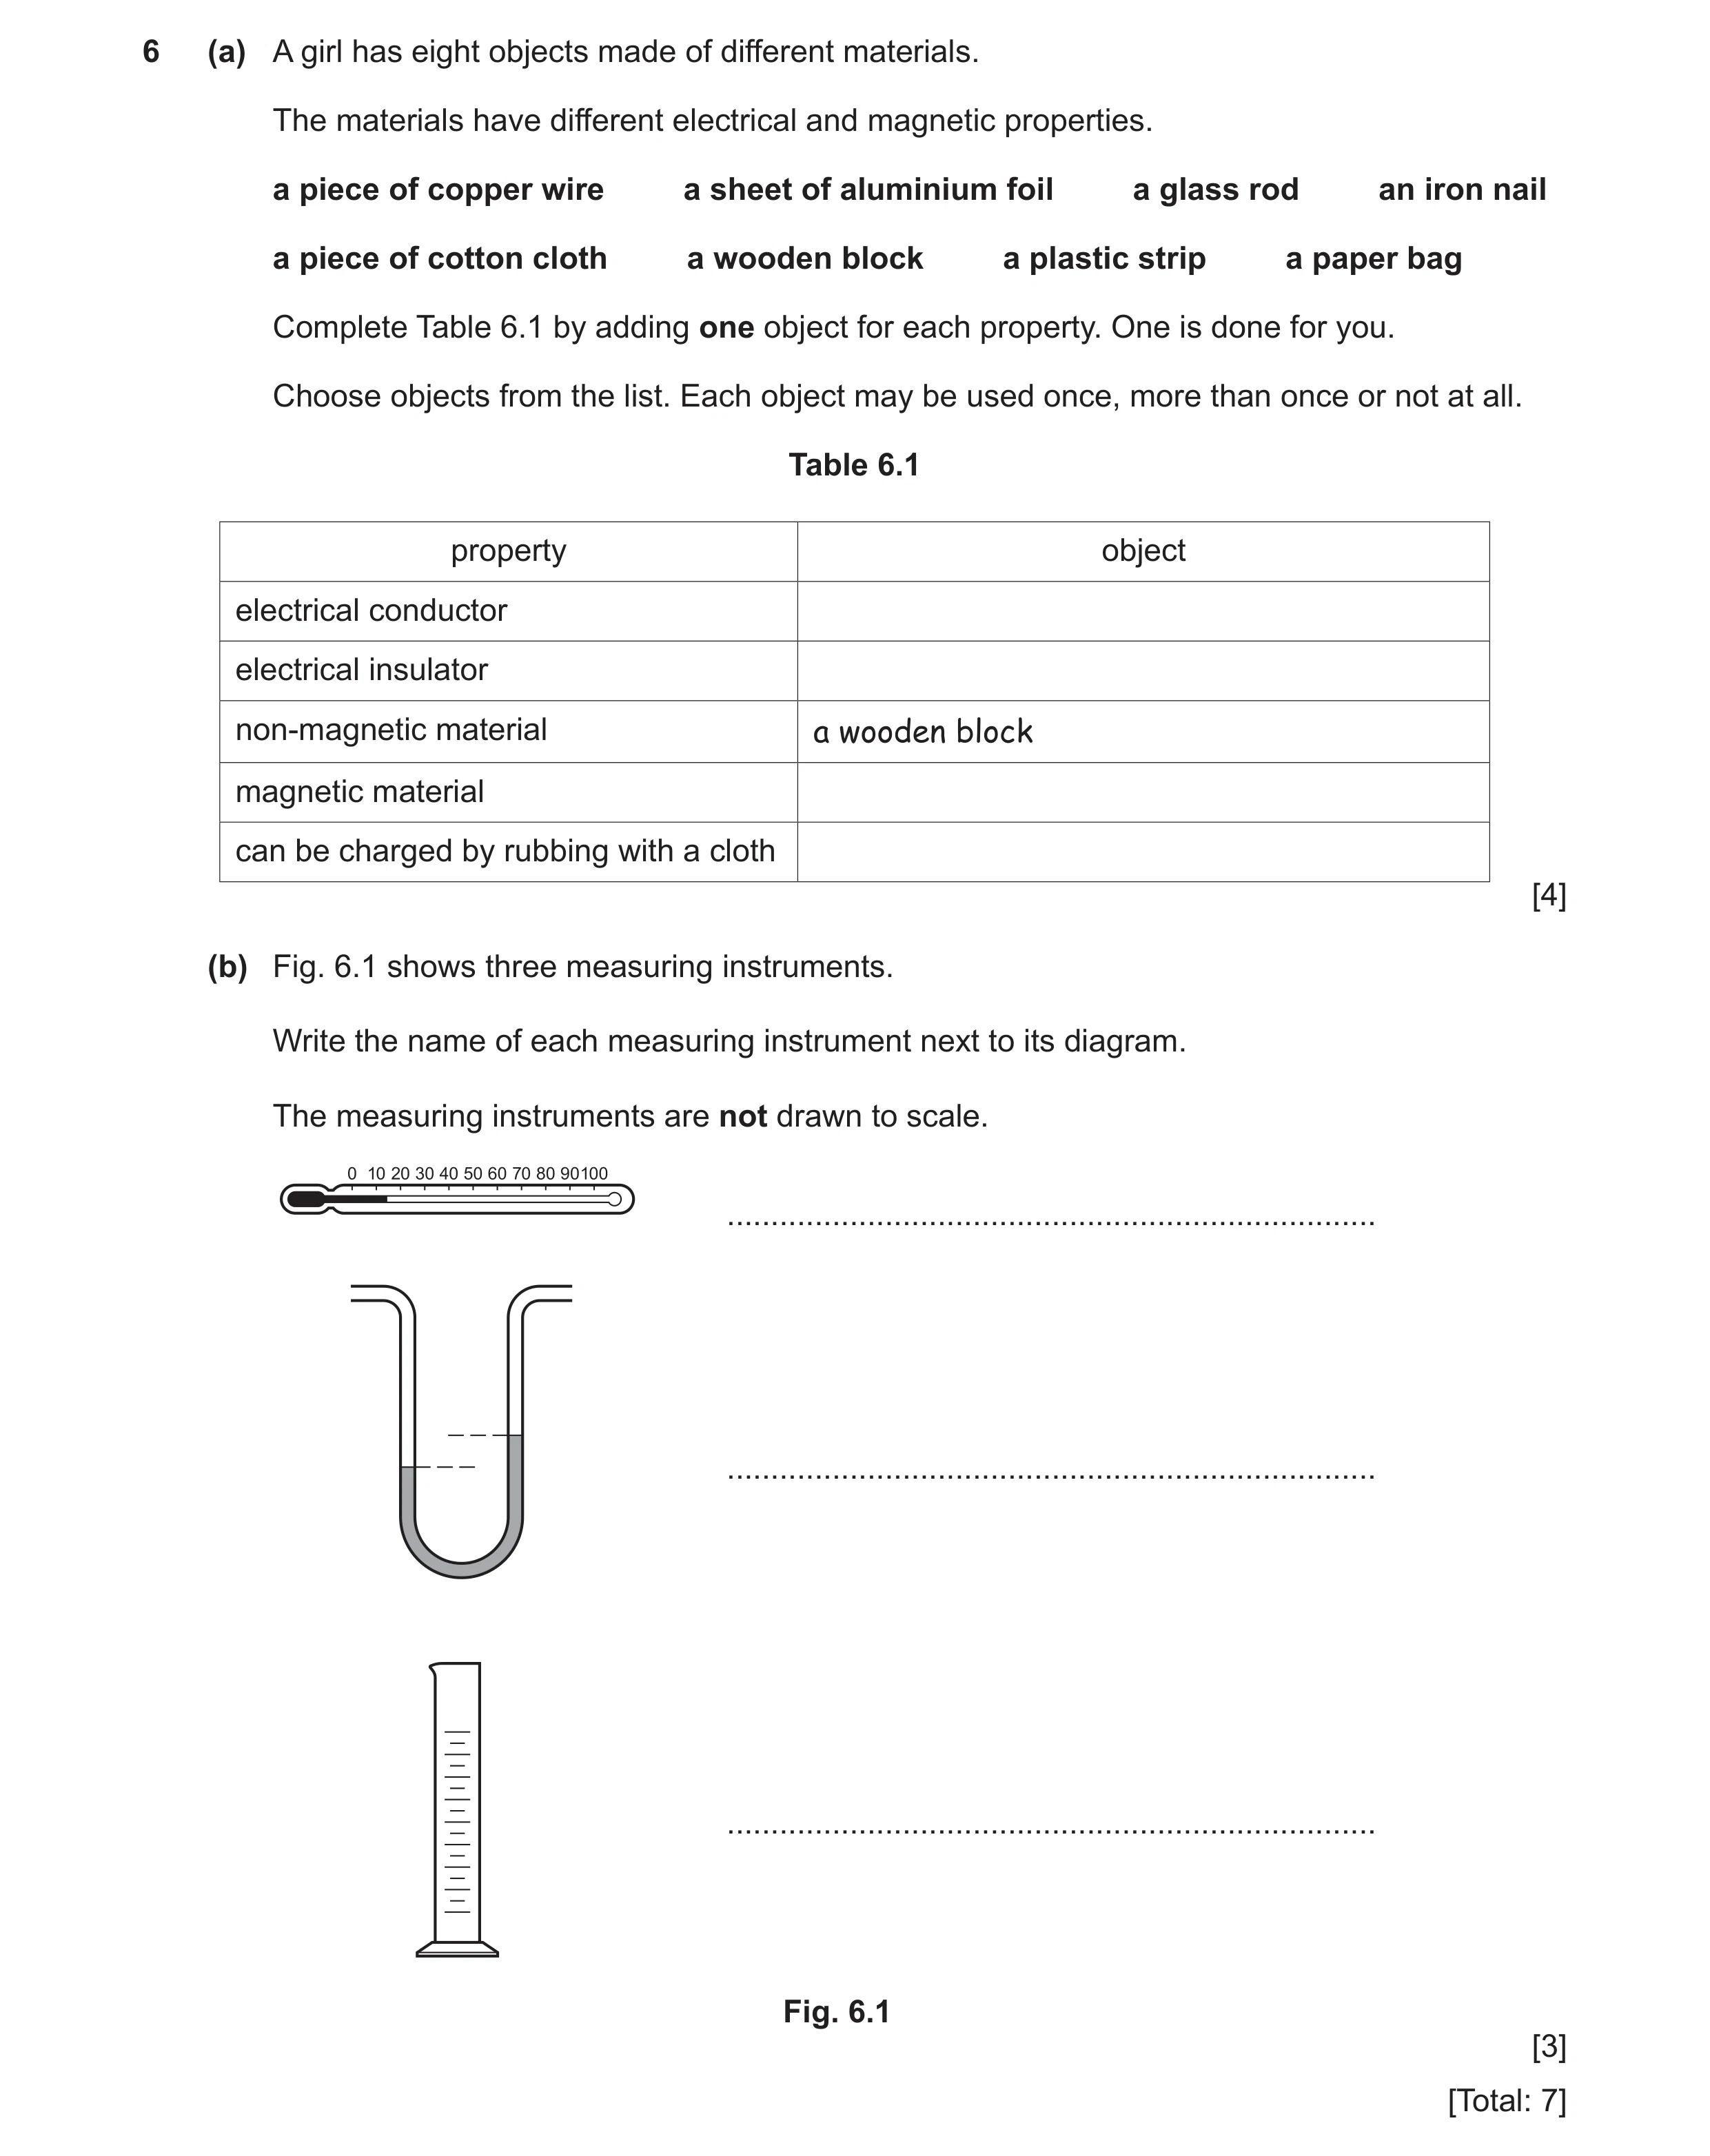
6 (a) A girl has eight objects made of different materials. The materials have different electrical and magnetic properties. a piece of copper wire a sheet of aluminium foil a glass rod an iron nail a piece of cotton cloth a wooden block a plastic strip a paper bag Complete Table 6.1 by adding one object for each property. One is done for you. Choose objects from the list. Each object may be used once, more than once or not at all. Table 6.1 property object electrical conductor electrical insulator non-magnetic material a wooden block magnetic material can be charged by rubbing with a cloth [4] (b) Fig. 6.1 shows three measuring instruments. Write the name of each measuring instrument next to its diagram. The measuring instruments are not drawn to scale. … … … Fig. 6.1 [3] [Total: 7]
7 marks
Mark scheme: 6(a) property object conductor copper wire OR aluminium foil OR iron nail insulator cotton cloth OR wooden block OR plastic strip OR paper bag OR glass rod non-magnetic a wooden block magnetic material iron nail can be charged by rubbing with a cloth plastic strip OR glass rod B1 B1 B1 B1 6(b) (liquid-in-glass) thermometer B1 manometer B1 measuring cylinder B1
This question in 0625/32 Oct/Nov 2021
Question 26 0625/33 Oct/Nov 2021
2 Fig. 2.1 shows a pea plant. One of the pods is open, showing the peas inside. pea plant pea pods peas Fig. 2.1 (a) A food scientist needs to find the average diameter of a pea. She places 14 peas against a ruler, as shown in Fig. 2.2. Fig. 2.2 Use information from Fig. 2.2 to determine the average diameter of one pea. average diameter of one pea = … cm [3] (b) The food scientist needs to find the average density of some peas. She uses the following values: mass of peas = 183 g volume of peas = 250 cm3. Calculate the average density of these peas. average density = … g / cm3 [3] (c) A different variety of pea has a density of 0.89 g / cm3. One pea of this variety is placed in salt water. The density of the salt water is 1.02 g / cm3. State whether this pea floats or sinks in the salt water. Give a reason for your answer. answer … reason … [1] [Total: 7]
7 marks
Mark scheme: 2(a) 12.6 C1 12.6 ÷ 14 C1 0.9(0) (cm) A1 2(b) (D =) M ÷ V in any form C1 183 ÷ 250 C1 0.73 (g / cm3) A1 2(c) float AND (peas / it) less dense (than salt water) B1
This question in 0625/33 Oct/Nov 2021
Q27 · A group of students are taking measurements so they can calculate the speed of sound 0625/33 Oct/Nov 2021
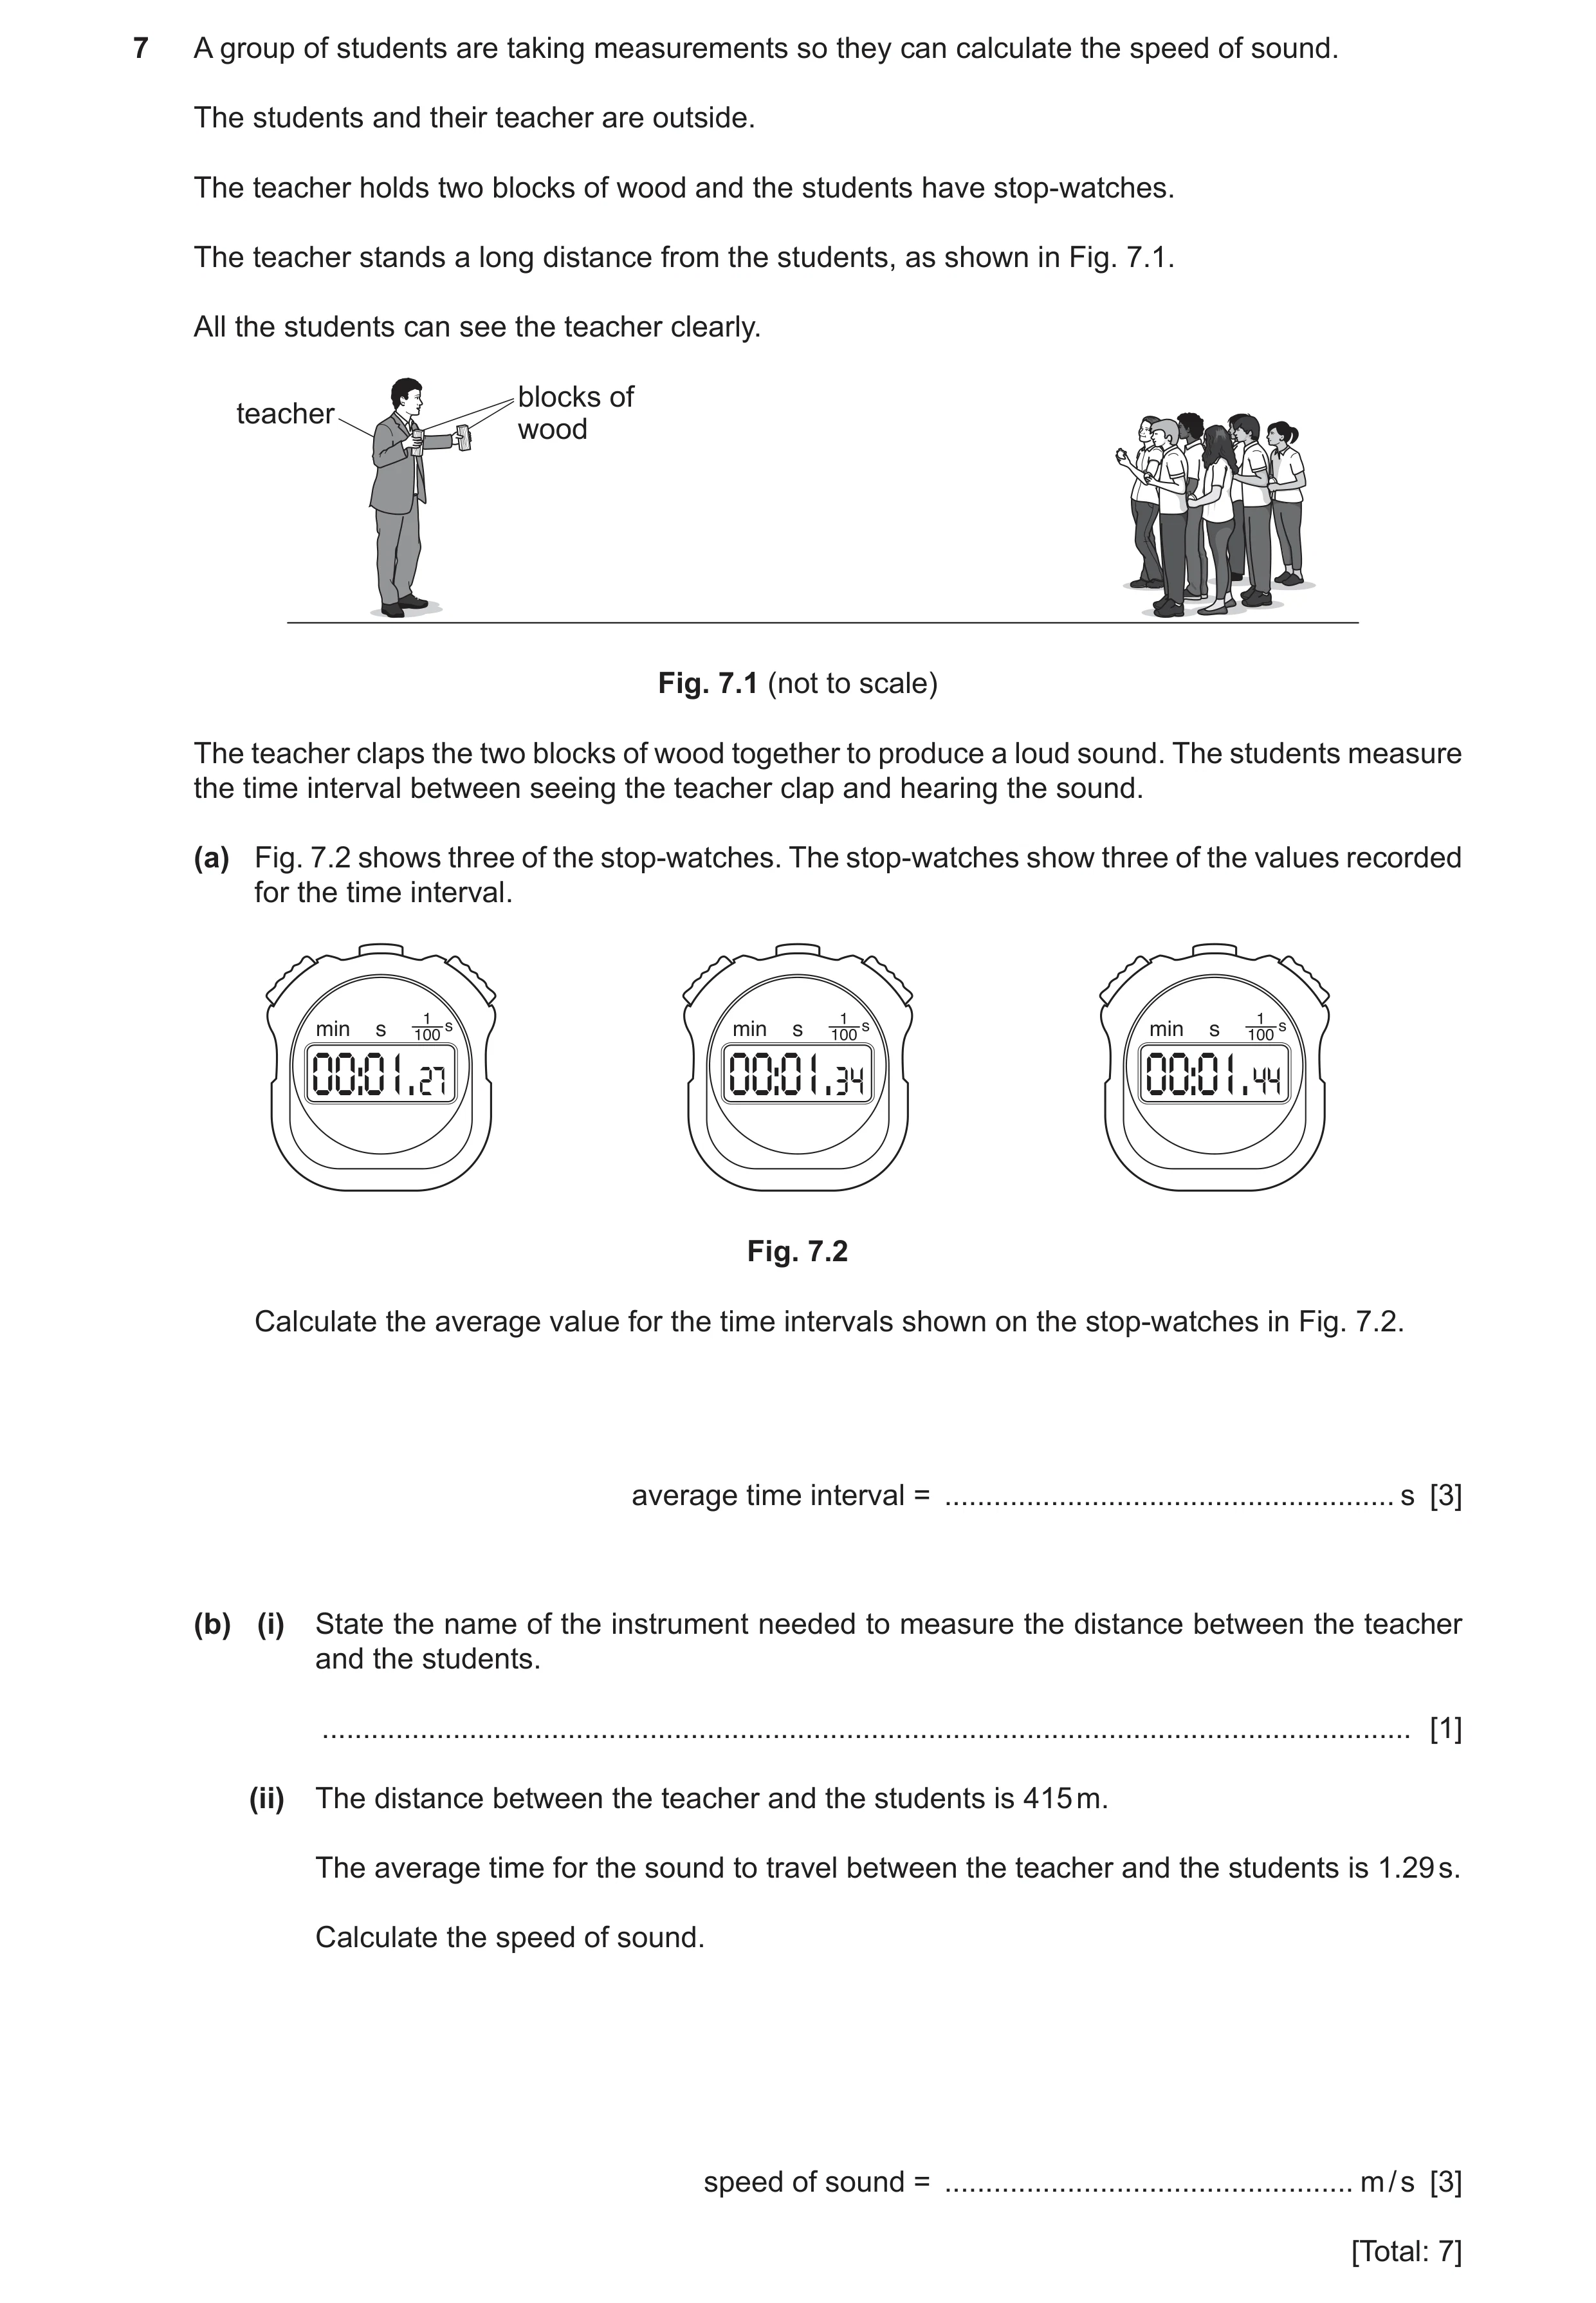
7 A group of students are taking measurements so they can calculate the speed of sound. The students and their teacher are outside. The teacher holds two blocks of wood and the students have stop-watches. The teacher stands a long distance from the students, as shown in Fig. 7.1. All the students can see the teacher clearly. blocks of teacher wood Fig. 7.1 (not to scale) The teacher claps the two blocks of wood together to produce a loud sound. The students measure the time interval between seeing the teacher clap and hearing the sound. (a) Fig. 7.2 shows three of the stop-watches. The stop-watches show three of the values recorded for the time interval. 00:01.27 00:01.34 00:01.44 Fig. 7.2 Calculate the average value for the time intervals shown on the stop-watches in Fig. 7.2. average time interval = … s [3] (b) (i) State the name of the instrument needed to measure the distance between the teacher and the students. … [1] (ii) The distance between the teacher and the students is 415 m. The average time for the sound to travel between the teacher and the students is 1.29 s. Calculate the speed of sound. speed of sound = … m / s [3] [Total: 7]
7 marks
Mark scheme: 7(a) 1.27 1.34 1.44 C1 (1.27 + 1.34 + 1.44) ÷ 3 OR (4.05 ) ÷ 3 C1 1.4 (s) A1 7(b)(i) tape (measure) B1 7(b)(ii) (speed =) d ÷ t in any form C1 415 ÷ 1.29 C1 320 (m / s) A1
This question in 0625/33 Oct/Nov 2021
Q28 · A dripping tap and a measuring cylinder 0625/31 May/June 2022
1 Fig. 1.1 shows a dripping tap and a measuring cylinder. The water drops all have the same volume. The drops fall from the tap at equal time intervals. dripping tap measuring cylinder Fig. 1.1 (not to scale) (a) (i) The student collects 200 of the drops in a measuring cylinder. The total volume collected is 60 cm3. Calculate the average volume of one drop of water. volume = … cm3 [3] (ii) Another student uses a stop-watch to measure the time taken for the tap to produce 200 drops. Fig. 1.2 shows the time reading on the stop-watch. 1 min s 100 s 03 : 46. 50 Fig. 1.2 Determine the time, in seconds, for the tap to produce 200 drops. time = … s [2] (iii) Determine the average time interval between one drop starting to fall and the next drop starting to fall. time interval = … s [2] (b) Fig. 1.3 shows the volume of water collected in the measuring cylinder by another student. cm3 100 90 80 70 60 50 water 40 30 20 10 Fig. 1.3 Determine the volume of water in the measuring cylinder in Fig. 1.3. volume = … cm3 [1] [Total: 8]
8 marks
Mark scheme: 1(a)(i) 0.3(0) (cm3) A3 (average volume of one drop) = 60 ÷ 200 (C2) total volume = number of drops (average) volume of one drop (C1) 1(a)(ii) 226.5 (s) A2 180 (+ 46.5 =) (C1) 1(a)(iii) 1.1 (s) A2 time for one drop = total time ÷ no of intervals (C1) 1(b) 84 (cm3) B1
This question in 0625/31 May/June 2022
Q29 · A student investigates the motion of a trolley as it travels down a slope 0625/32 May/June 2022
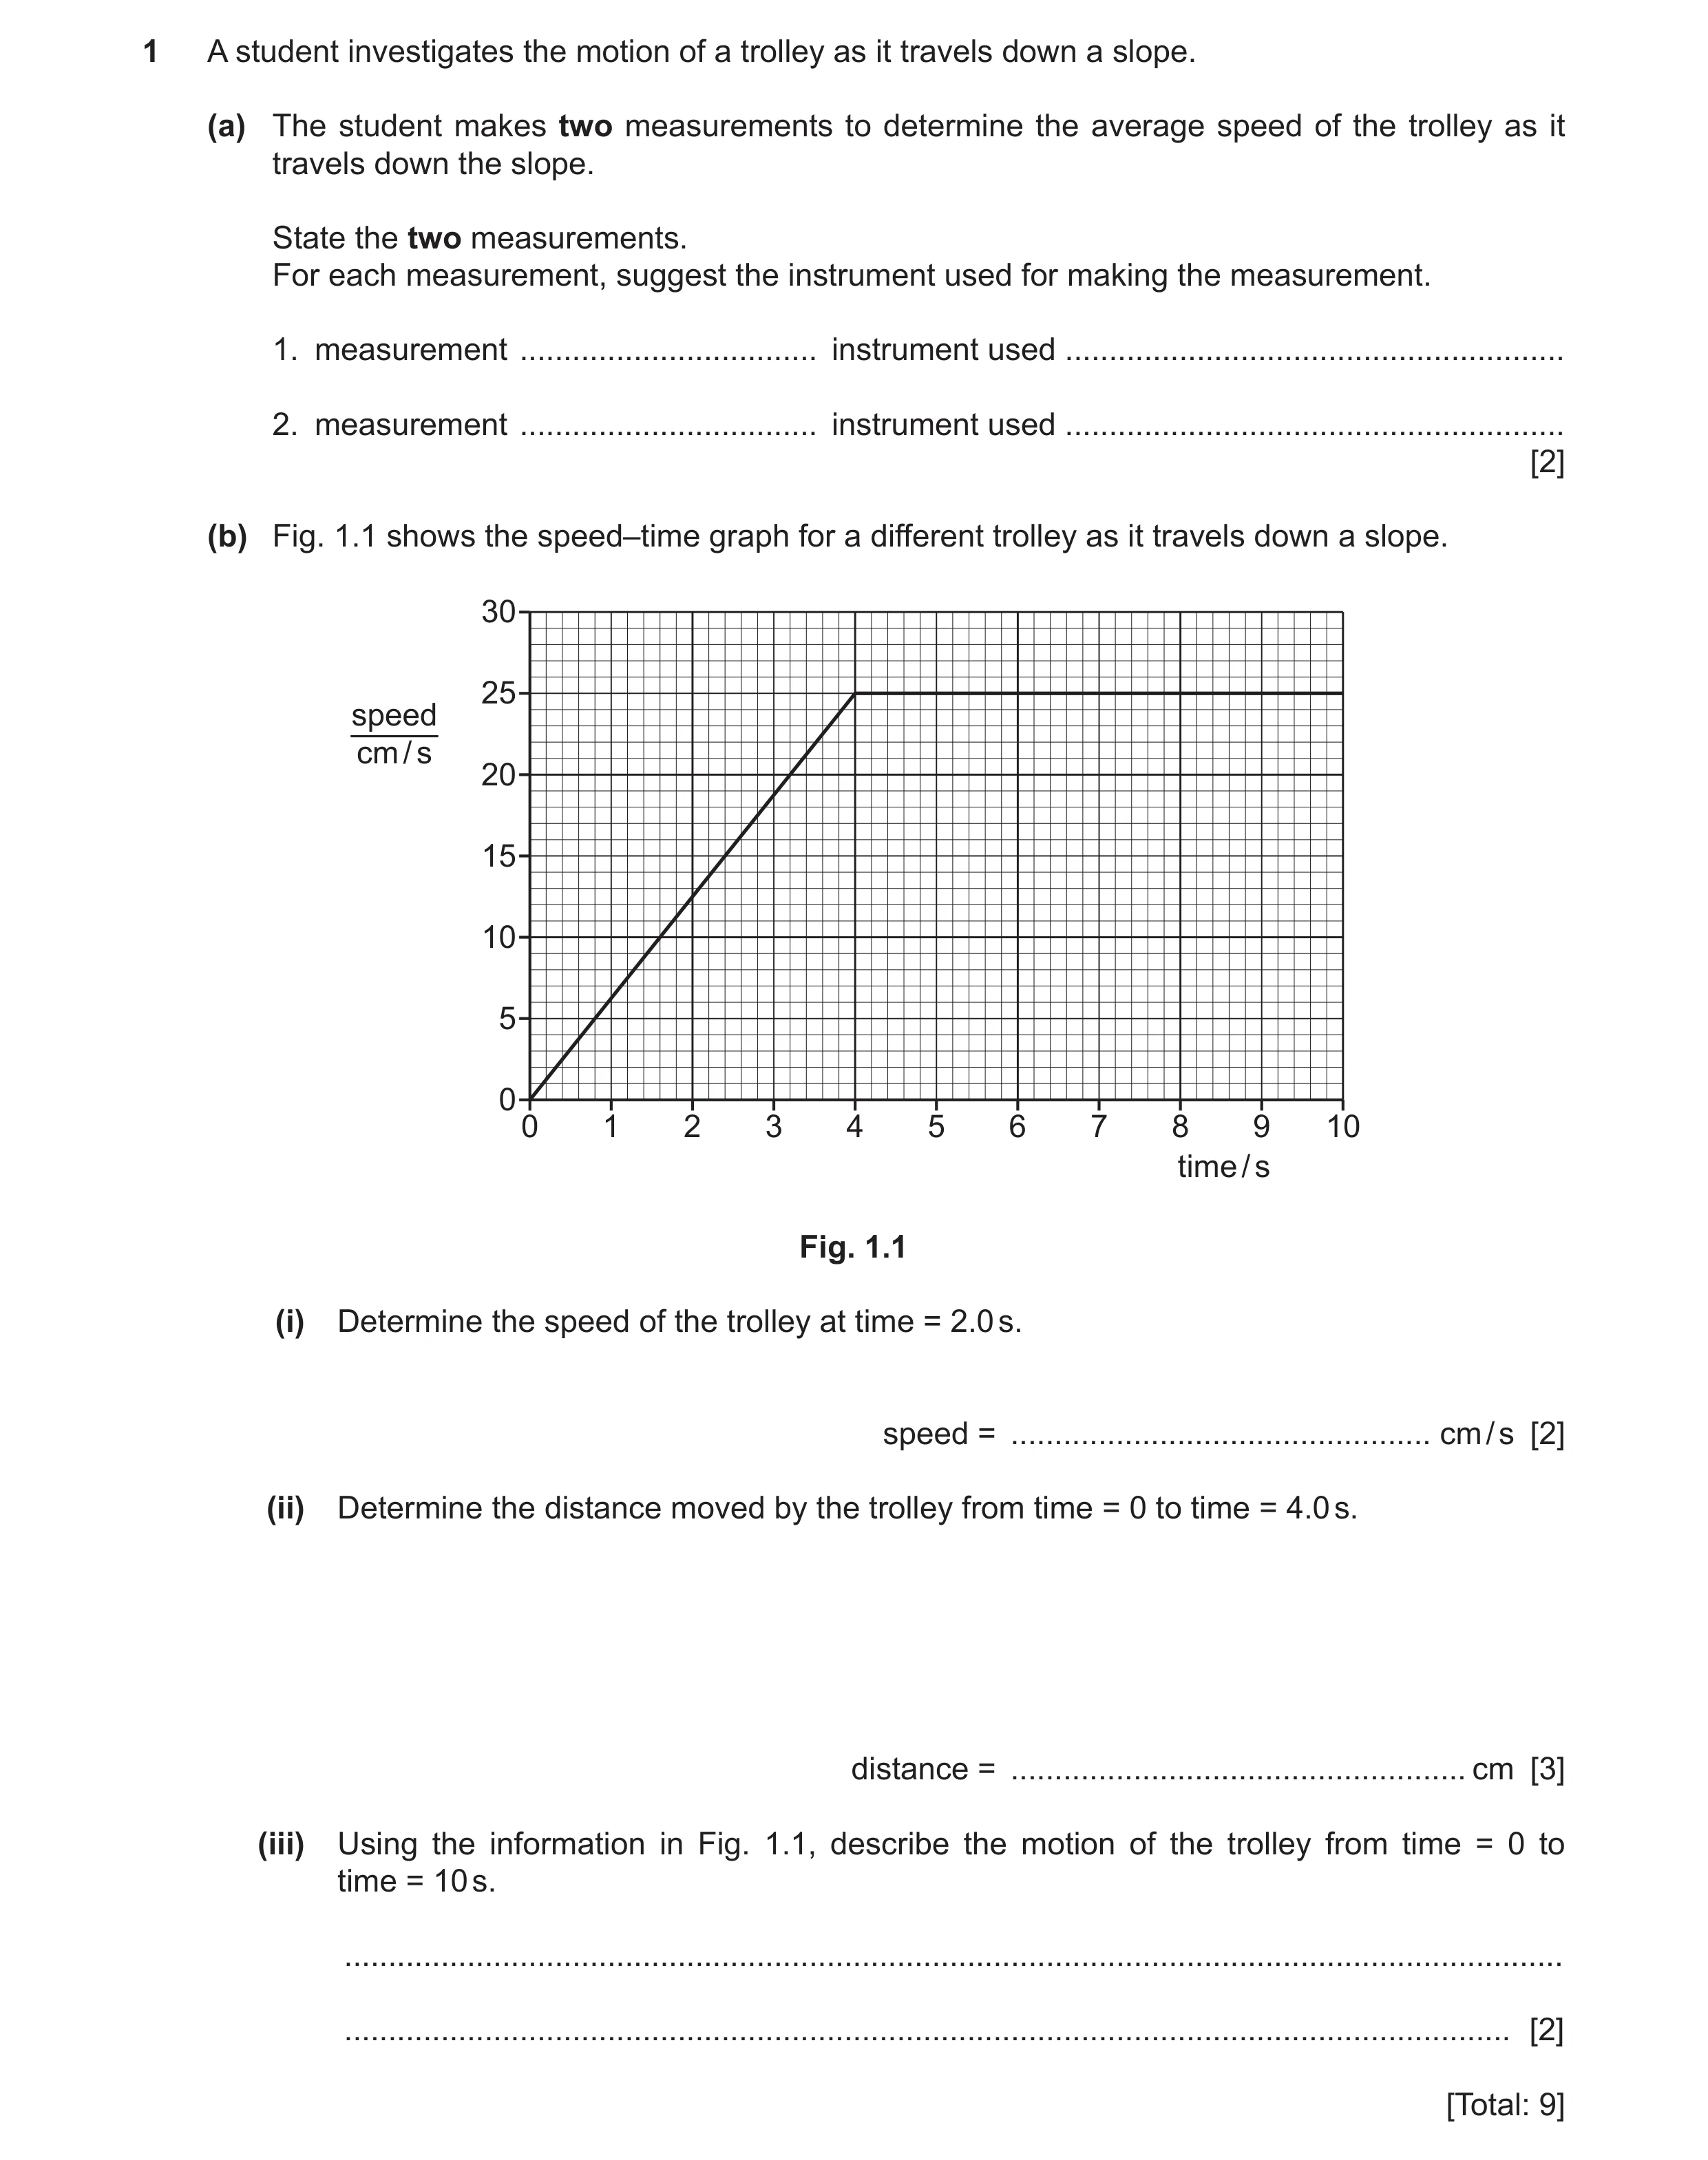
1 A student investigates the motion of a trolley as it travels down a slope. (a) The student makes two measurements to determine the average speed of the trolley as it travels down the slope. State the two measurements. For each measurement, suggest the instrument used for making the measurement. 1. measurement … instrument used … 2. measurement … instrument used … [2] (b) Fig. 1.1 shows the speed–time graph for a different trolley as it travels down a slope. 30 25 speed cm / s 20 15 10 5 0 0 1 2 3 4 5 6 7 8 9 10 time / s Fig. 1.1 (i) Determine the speed of the trolley at time = 2.0 s. speed = … cm / s [2] (ii) Determine the distance moved by the trolley from time = 0 to time = 4.0 s. distance = … cm [3] (iii) Using the information in Fig. 1.1, describe the motion of the trolley from time = 0 to time = 10 s. … … [2] [Total: 9]
9 marks
Mark scheme: 1(a) (measurement) time (instrument used) stopwatch B1 (measurement) distance (instrument used) metre rule(r) B1 1(b)(i) 12.5 (cm / s) A2 any indication on graph or in working of vertical line from 2.0 s (C1) 1(b)(ii) 50 (cm) A3 ½ 4 25 (C2) ( distance = ) area under graph OR ( distance = ) speed time (C1) 1(b)(iii) accelerating (for 4 seconds) B1 (then) constant / steady speed (for 6 seconds) B1
This question in 0625/32 May/June 2022
Question 30 0625/32 May/June 2022
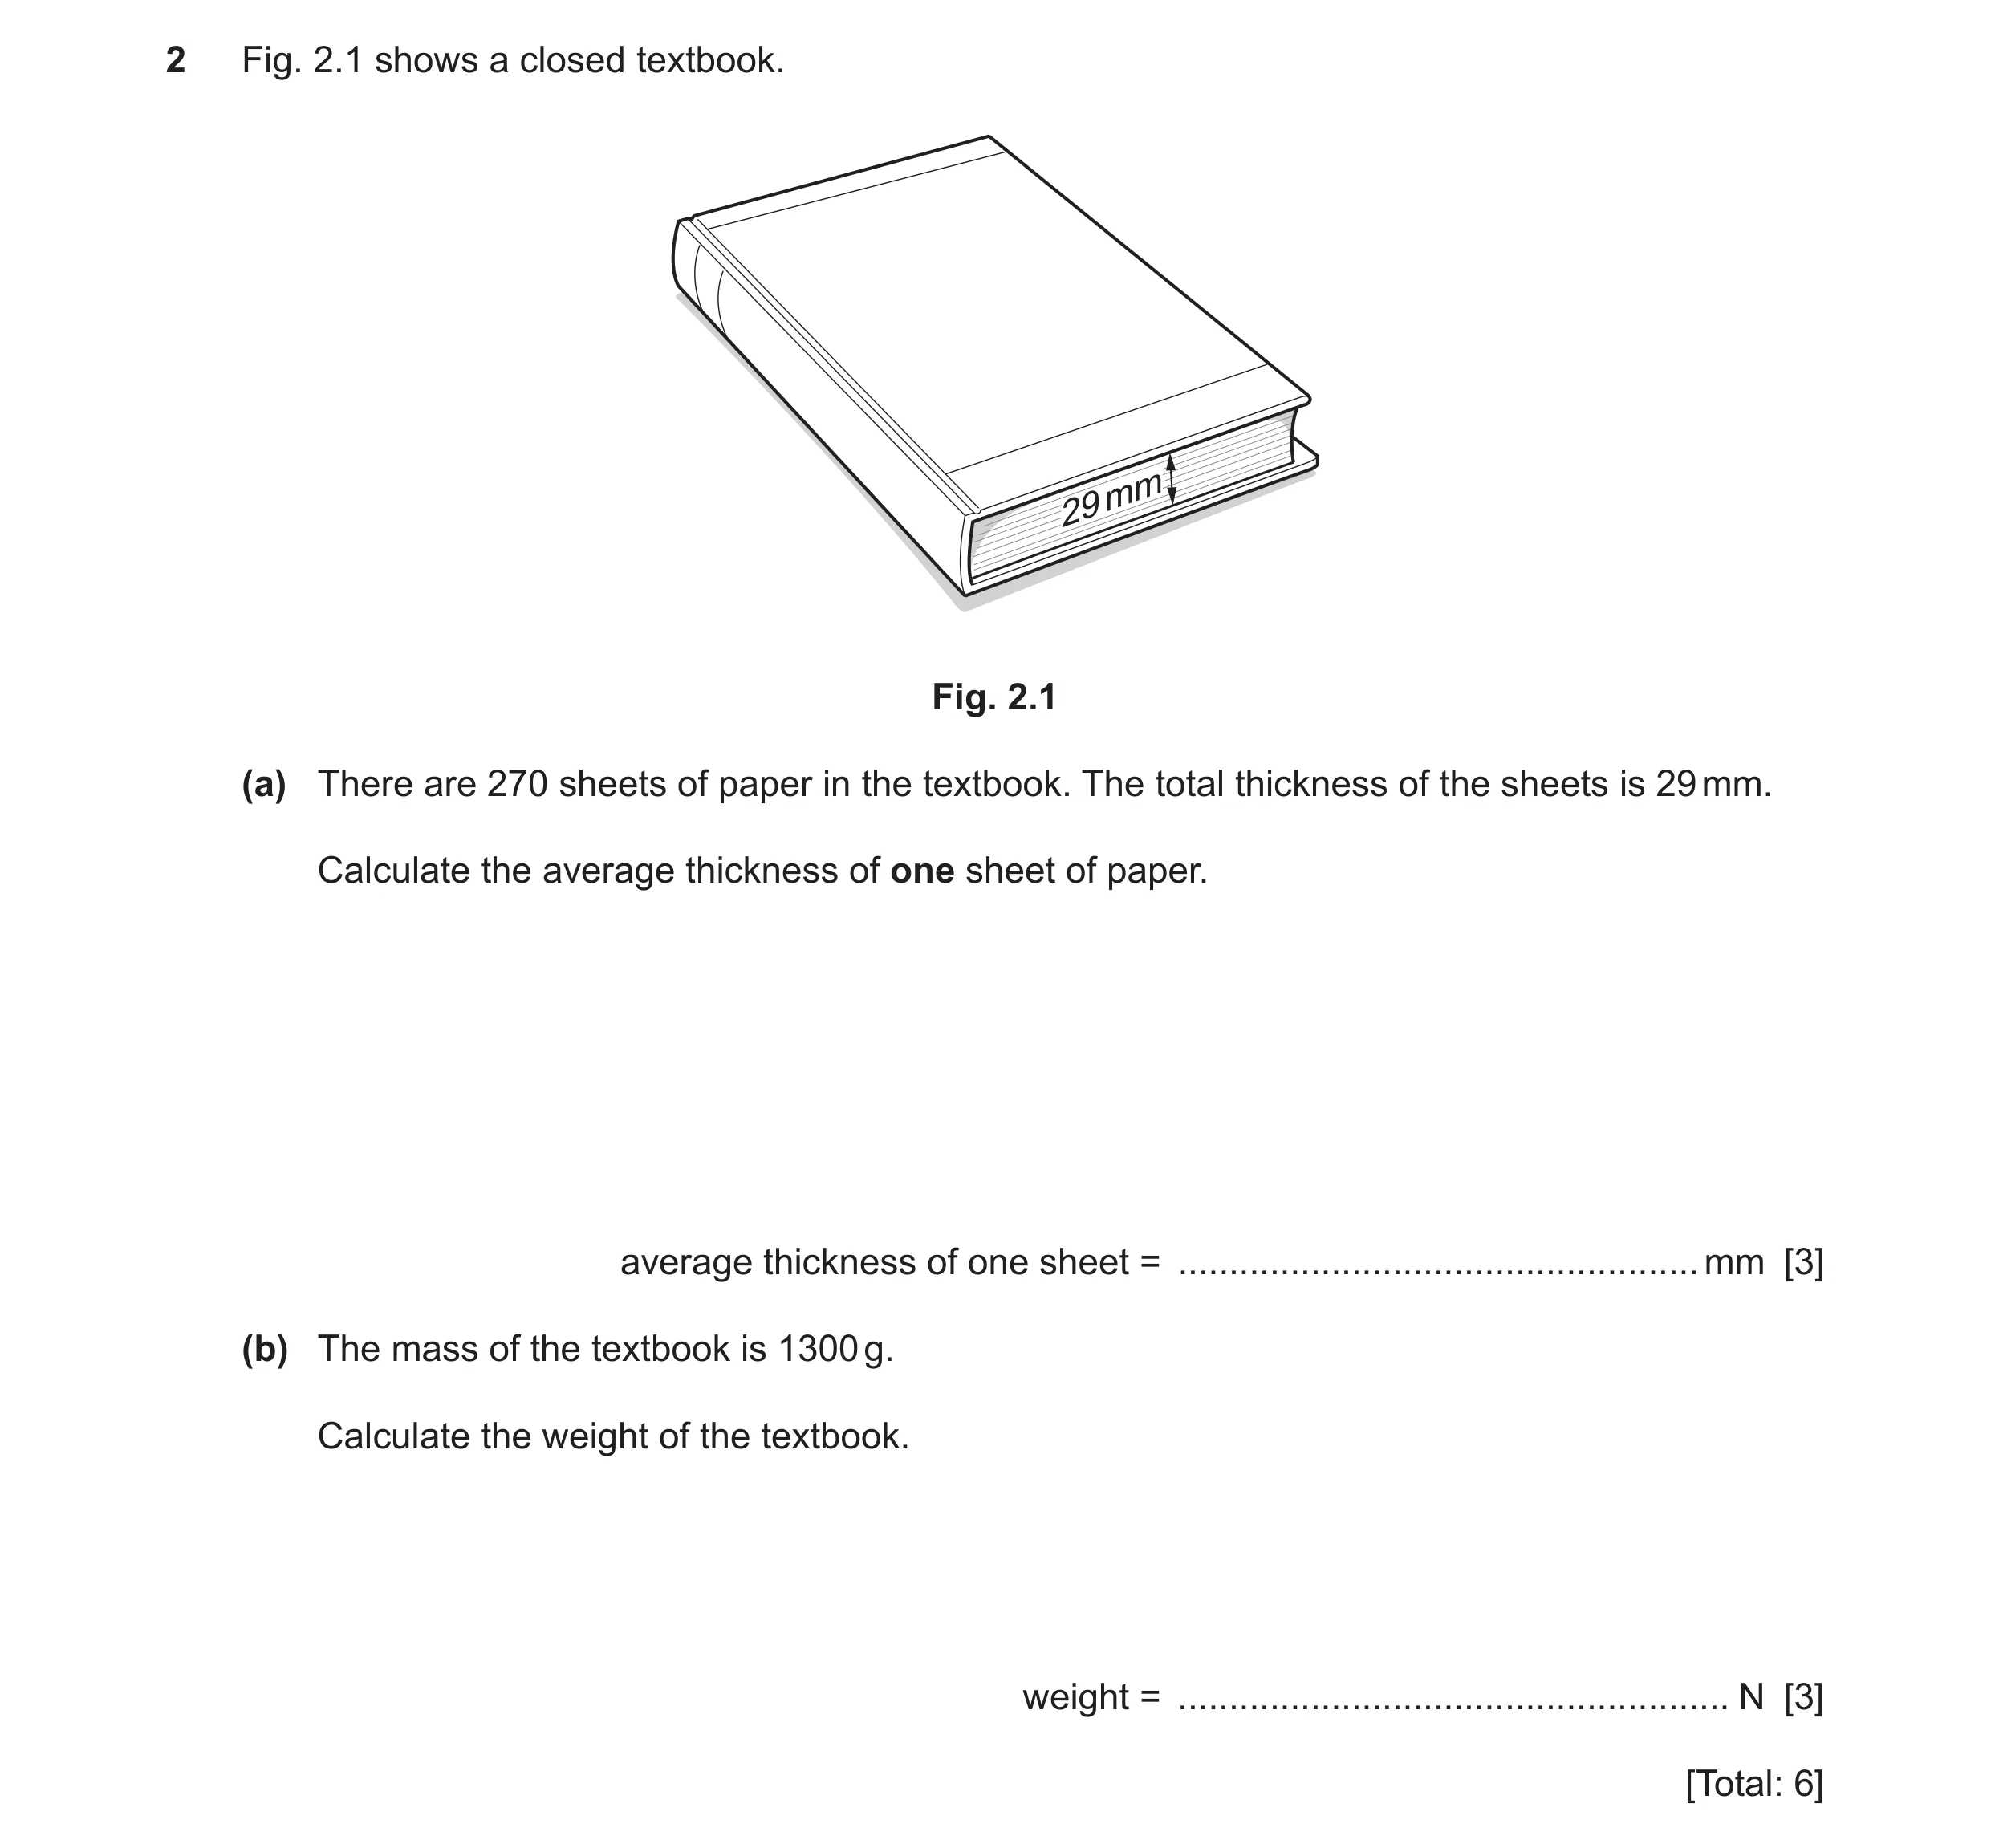
2 Fig. 2.1 shows a closed textbook. mm 29 Fig. 2.1 (a) There are 270 sheets of paper in the textbook. The total thickness of the sheets is 29 mm. Calculate the average thickness of one sheet of paper. average thickness of one sheet = … mm [3] (b) The mass of the textbook is 1300 g. Calculate the weight of the textbook. weight = … N [3] [Total: 6]
6 marks
Mark scheme: 2(a) 0.11 (mm) A3 (average thickness =) 29 ÷ 270 (C2) (average thickness =) total thickness ÷ number of sheets (C1) 2(b) (1300 g = ) 1.3 kg (B1) (weight =) 13(.0) N A3 (weight =) mass g OR mass 10 (C1)
This question in 0625/32 May/June 2022
Q31 · Children about to run a race 0625/33 May/June 2022
1 Fig. 1.1 shows children about to run a race. They have to run 25 m, pick up a small plastic ring and run back to the base line. Each child finishes when they cross the base line holding the plastic ring. hooter base line 25 m plastic rings Fig. 1.1 (a) (i) Suggest what equipment the teacher uses to measure the length of 25 m. … [1] (ii) Determine the total distance for the race. distance = … m [1] (b) The teacher records the following information for one of the children. The child starts to run at time = 0. The child picks up the ring at time = 9.0 s. The child finishes the race at time = 17.0 s. The highest speed occurs as the child finishes the race. Using this information, sketch a speed–time graph on Fig. 1.2, suggesting how the speed of this child varies during the race. speed 0 5 10 15 20 time / s Fig. 1.2 [3] (c) In a different race, a child runs 500 m in 4 minutes and 20 seconds. (i) Determine how many seconds there are in 4 minutes and 20 seconds. time = … s [1] (ii) Calculate the average speed of the child. average speed = … m / s [3] [Total: 9]
9 marks
Mark scheme: 1(a)(i) metre rule B1 1(a)(ii) 50 (m) B1 1(b) graph starts at origin B1 speed = 0 at 9.0 s B1 highest speed at 17 s B1 1(c)(i) 260 (s) B1 1(c)(ii) 1.9 (m / s) A3 500 ÷ 260 OR 500 ÷ (c)(i) (C2) (speed = ) distance ÷ time in any form (C1)
This question in 0625/33 May/June 2022
Q32 · A measuring cylinder containing some water 0625/31 Oct/Nov 2022
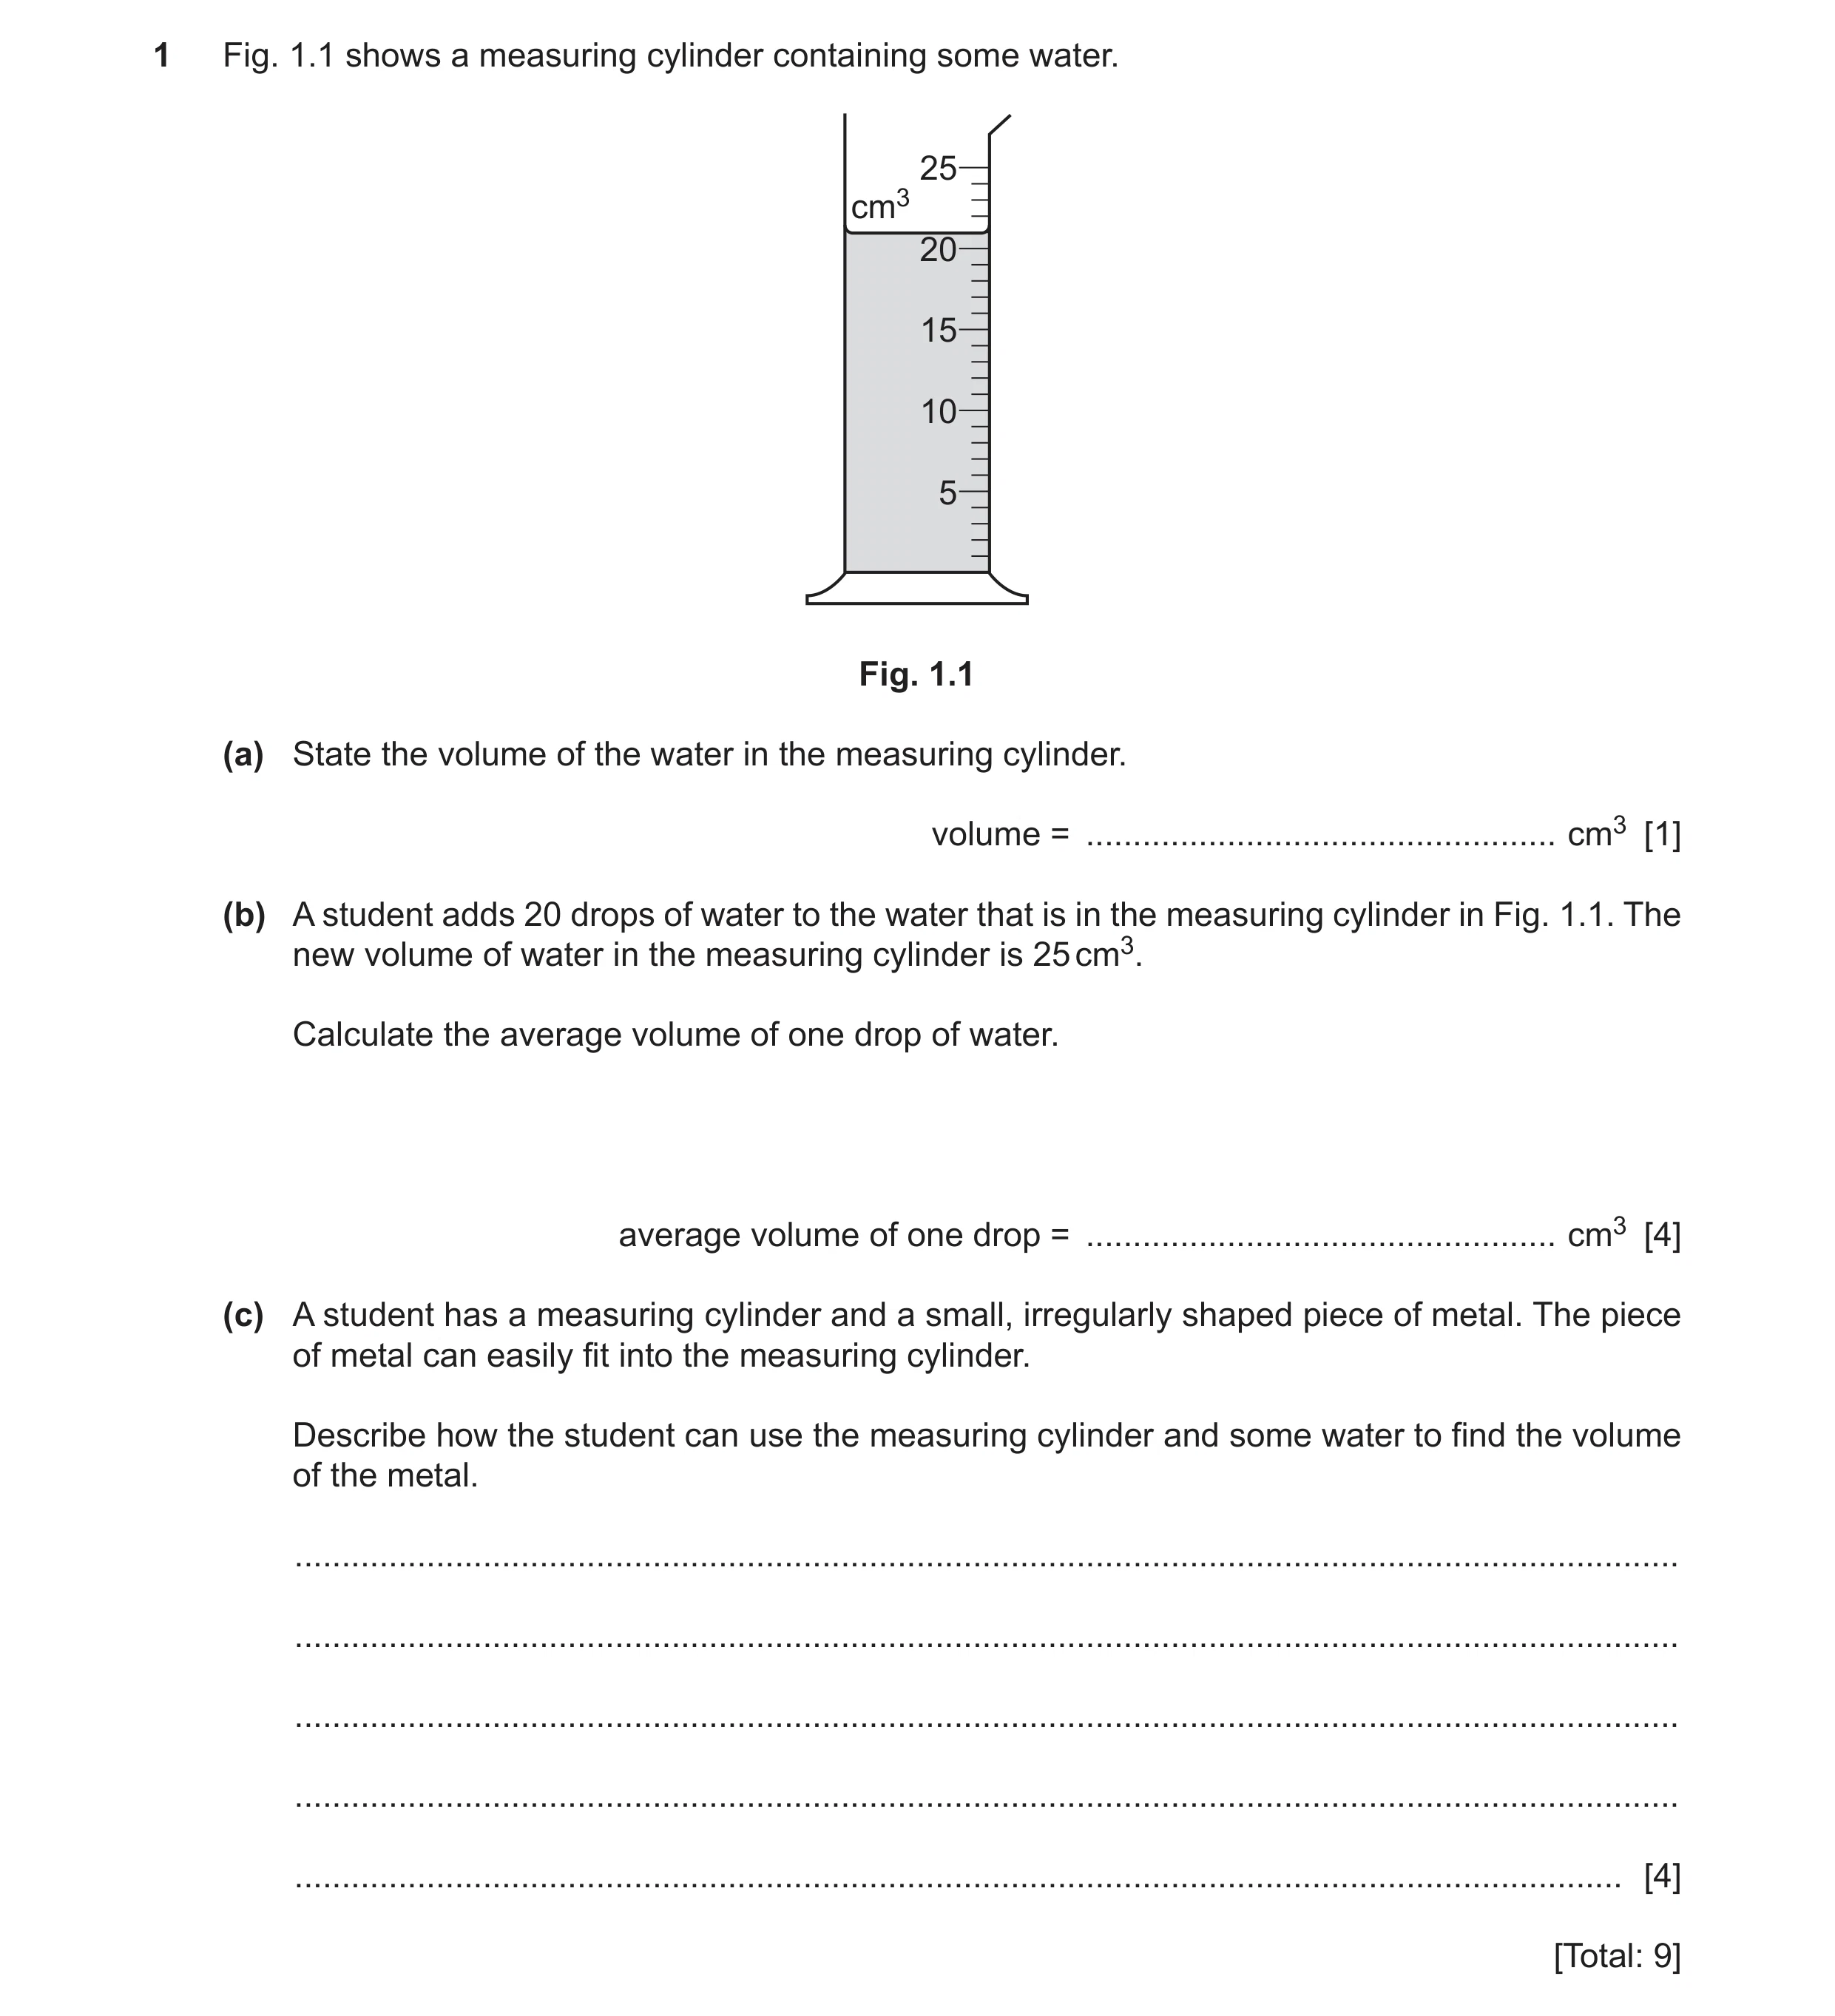
1 Fig. 1.1 shows a measuring cylinder containing some water. 25 cm3 20 15 10 5 Fig. 1.1 (a) State the volume of the water in the measuring cylinder. volume = … cm3 [1] (b) A student adds 20 drops of water to the water that is in the measuring cylinder in Fig. 1.1. The new volume of water in the measuring cylinder is 25 cm3. Calculate the average volume of one drop of water. average volume of one drop = … cm3 [4] (c) A student has a measuring cylinder and a small, irregularly shaped piece of metal. The piece of metal can easily fit into the measuring cylinder. Describe how the student can use the measuring cylinder and some water to find the volume of the metal. … … … … … [4] [Total: 9]
9 marks
Mark scheme: Question Answer Marks 1(a) 21 (cm3) B1 1(b) 0.2(0) (cm3) A4 (average volume of one drop) = 4(.0) / 20 C3 (volume = 25 – 21 =) 4(.0) (cm3) C1 total volume = number of drops (average) volume of one drop C1 1(c) any four from: B4 • measure volume of water (in a measuring cylinder) • add metal to water in the measuring cylinder • so that metal is completely submerged • measure (new) volume of water in a measuring cylinder (with metal) • find the difference between the two volumes.
This question in 0625/31 Oct/Nov 2022
Q33 · A builder buys some tiles to repair a floor 0625/33 Oct/Nov 2022
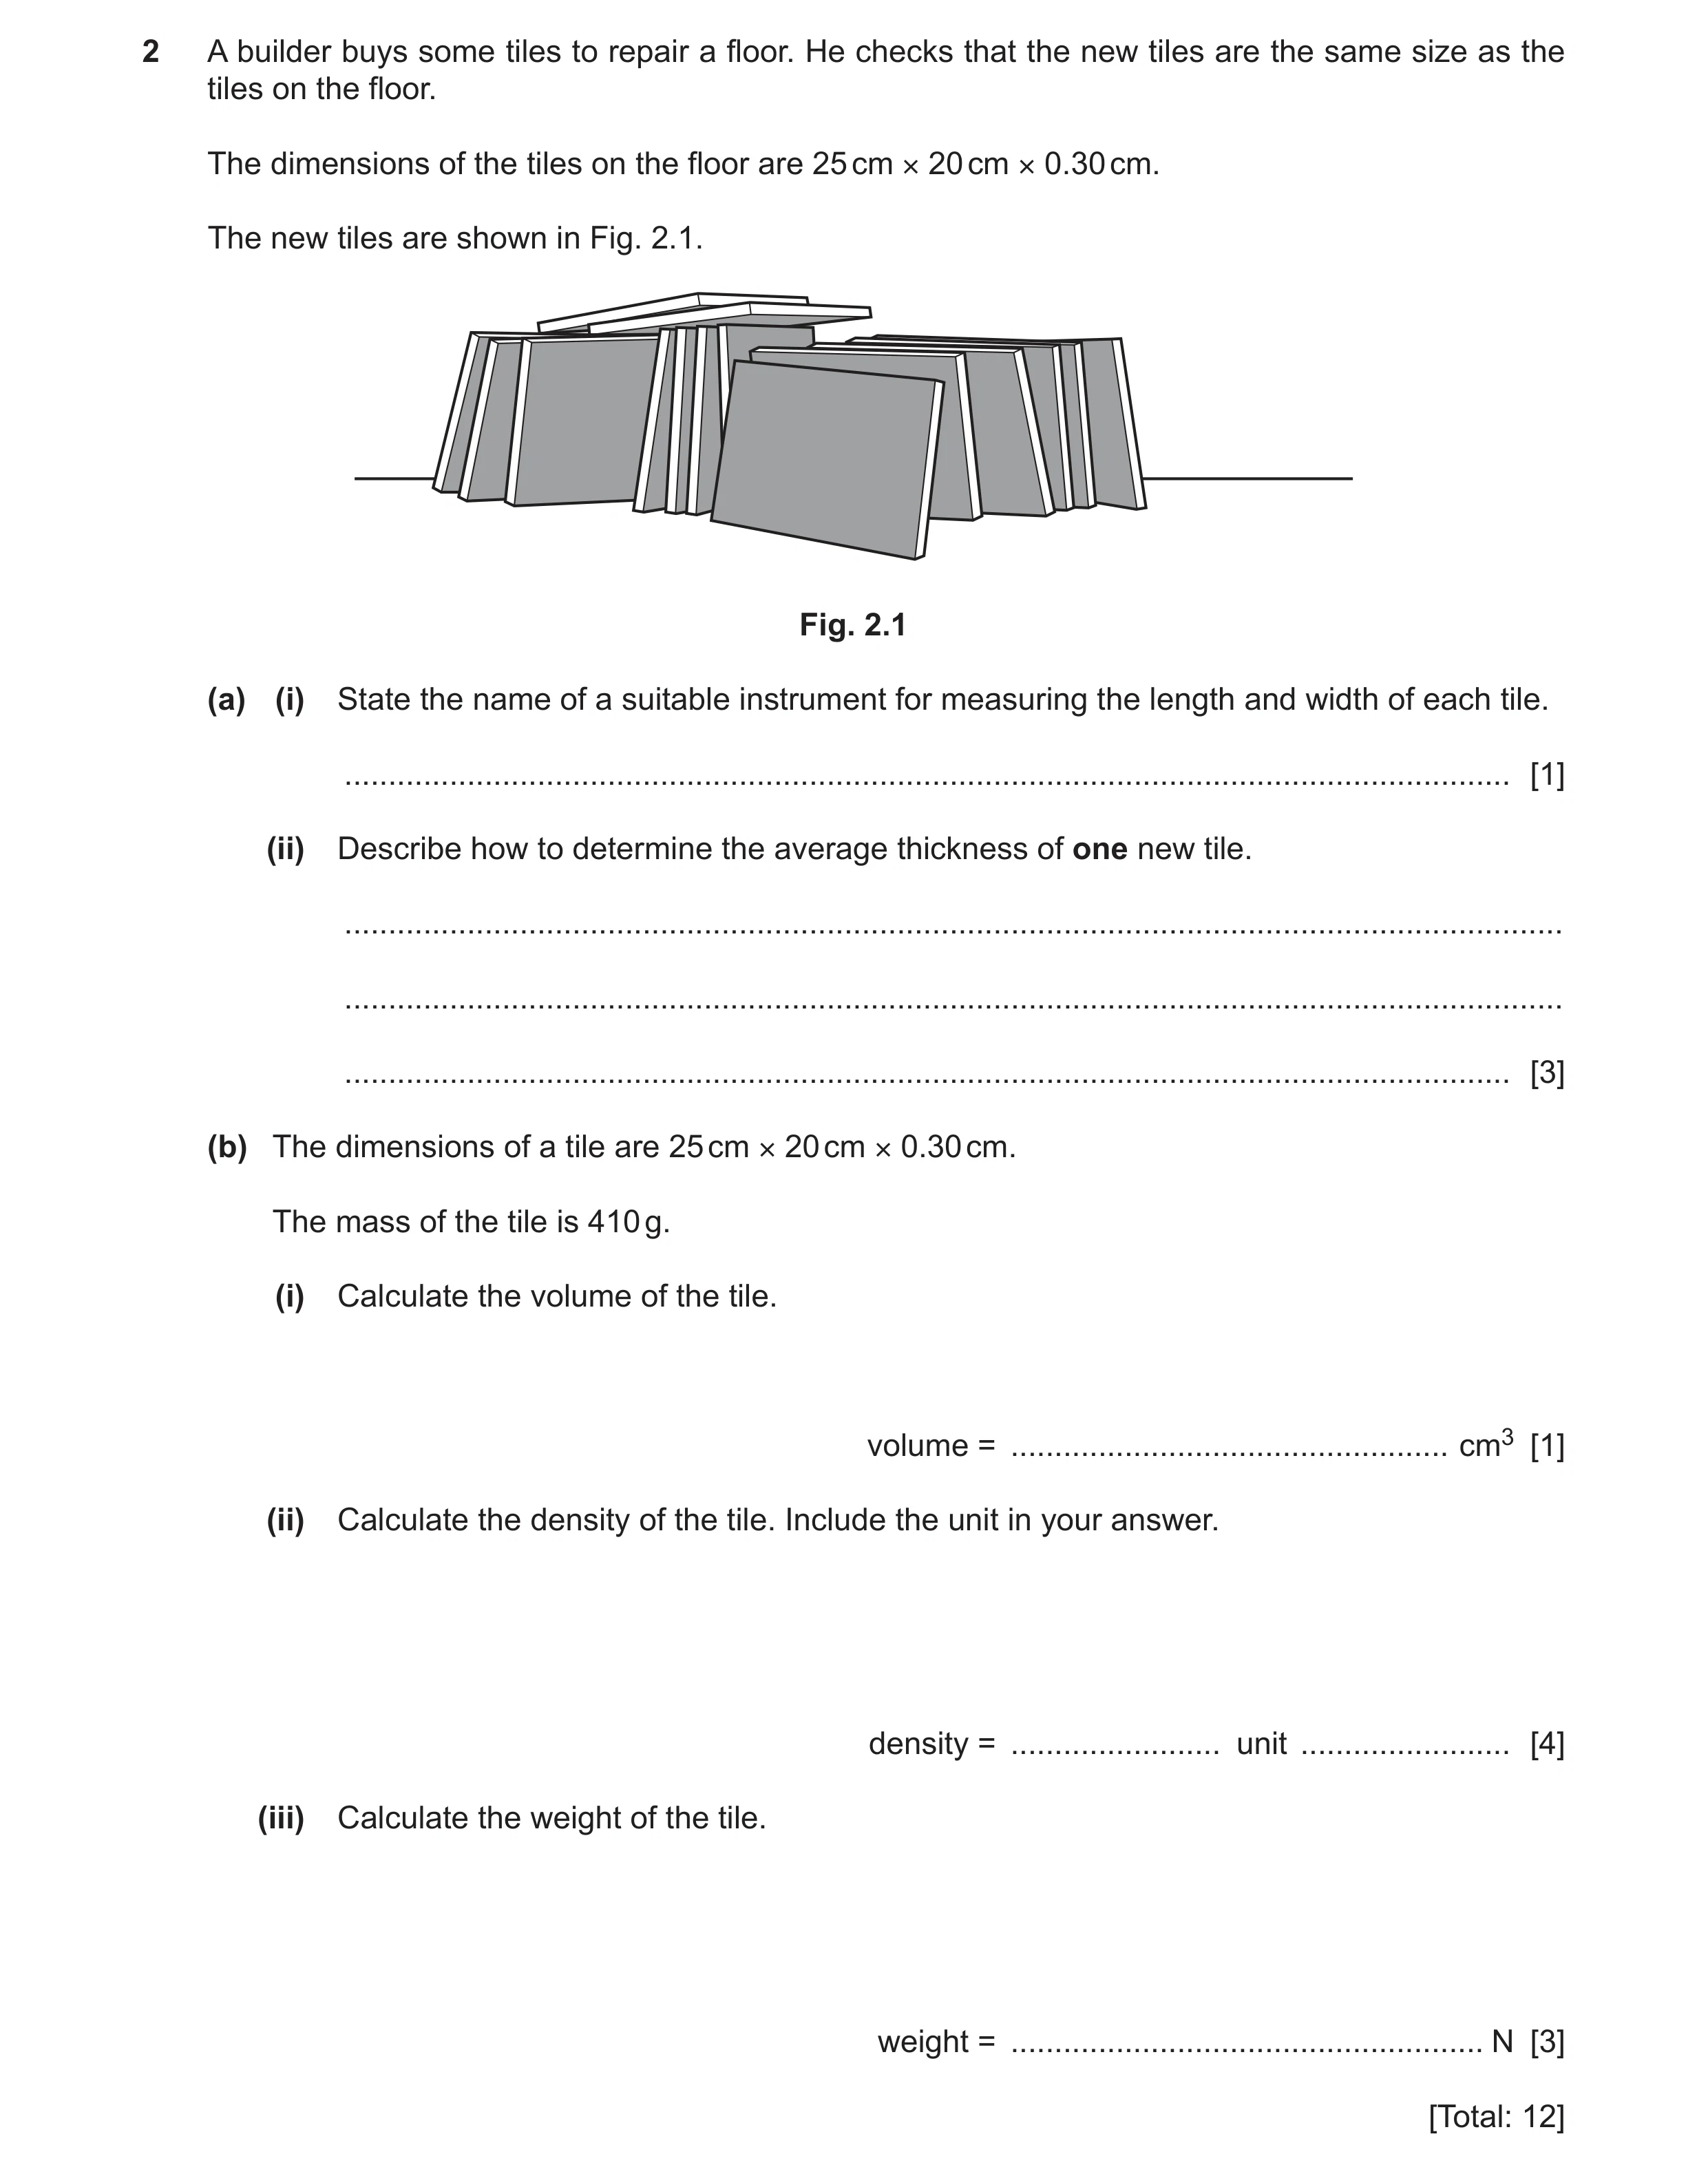
2 A builder buys some tiles to repair a floor. He checks that the new tiles are the same size as the tiles on the floor. The dimensions of the tiles on the floor are 25 cm × 20 cm × 0.30 cm. The new tiles are shown in Fig. 2.1. Fig. 2.1 (a) (i) State the name of a suitable instrument for measuring the length and width of each tile. … [1] (ii) Describe how to determine the average thickness of one new tile. … … … [3] (b) The dimensions of a tile are 25 cm × 20 cm × 0.30 cm. The mass of the tile is 410 g. (i) Calculate the volume of the tile. volume = … cm3 [1] (ii) Calculate the density of the tile. Include the unit in your answer. density = … unit … [4] (iii) Calculate the weight of the tile. weight = … N [3] [Total: 12]
12 marks
Mark scheme: 2(a)(i) rule(r) / metre stick / tape measure B1 2(a)(ii) place n tiles on top of each other owtte AND n = 10 or more B1 measure the (total) thickness of more than one tile B1 divide by n AND n = 2 or more B1 2(b)(i) (volume =) (25 20 0.30 =) 150 (cm3) B1 2(b)(ii) 2.7 A3 410 ÷ 150 OR 410 ÷ (their ans (b)(i)) (C2) density = mass ÷ volume in any form (C1) g / cm3 B1 2(b)(iii) 4.1(0) (N) A3 0.41(0) (C1) (W =) m g OR m 10 in any form (C1)
This question in 0625/33 Oct/Nov 2022
Q34 · Two strips of staples 0625/32 Feb/March 2023
1 Fig. 1.1 shows two strips of staples. strip of 40 staples width of strip Fig. 1.1 NOT to scale (a) The width of one strip is 56 mm. There are 40 staples in the strip. Calculate the average width of one staple. average width of one staple = … mm [2] (b) A student wants to find the volume of one strip of 40 staples. The student has a measuring cylinder and a beaker of water as shown in Fig. 1.2. strip measuring water of staples cylinder Fig. 1.2 Describe how the student can determine the volume of one strip of staples by using the equipment shown in Fig. 1.2. … … … … … … [4] (c) The staples are made from a block of metal. The mass of the block is 296 g. The volume of the block is 33.2 cm3. Calculate the density of the metal. Include the unit. density of the metal = … unit … [4] [Total: 10]
10 marks
Mark scheme: Question Answer Marks 1(a) (average thickness =) 1.4 (mm) A2 (average thickness =) 56 ÷ 40 (C1) 1(b) any three from: B3 measuring cylinder (partially) filled with water (initial) volume measured / noted strip submerged in water owtte (new / 2nd) volume (of strip and water) measured volume of strip = difference in volumes B1 1(c) (=) 8.92 A3 (=) 296 ÷ 33.2 (C2) (density =) mass ÷ volume OR (=) m / V in any form (C1) g / cm3 B1
This question in 0625/32 Feb/March 2023
Q35 · A student measures the diameter of some identical steel balls 0625/32 May/June 2023
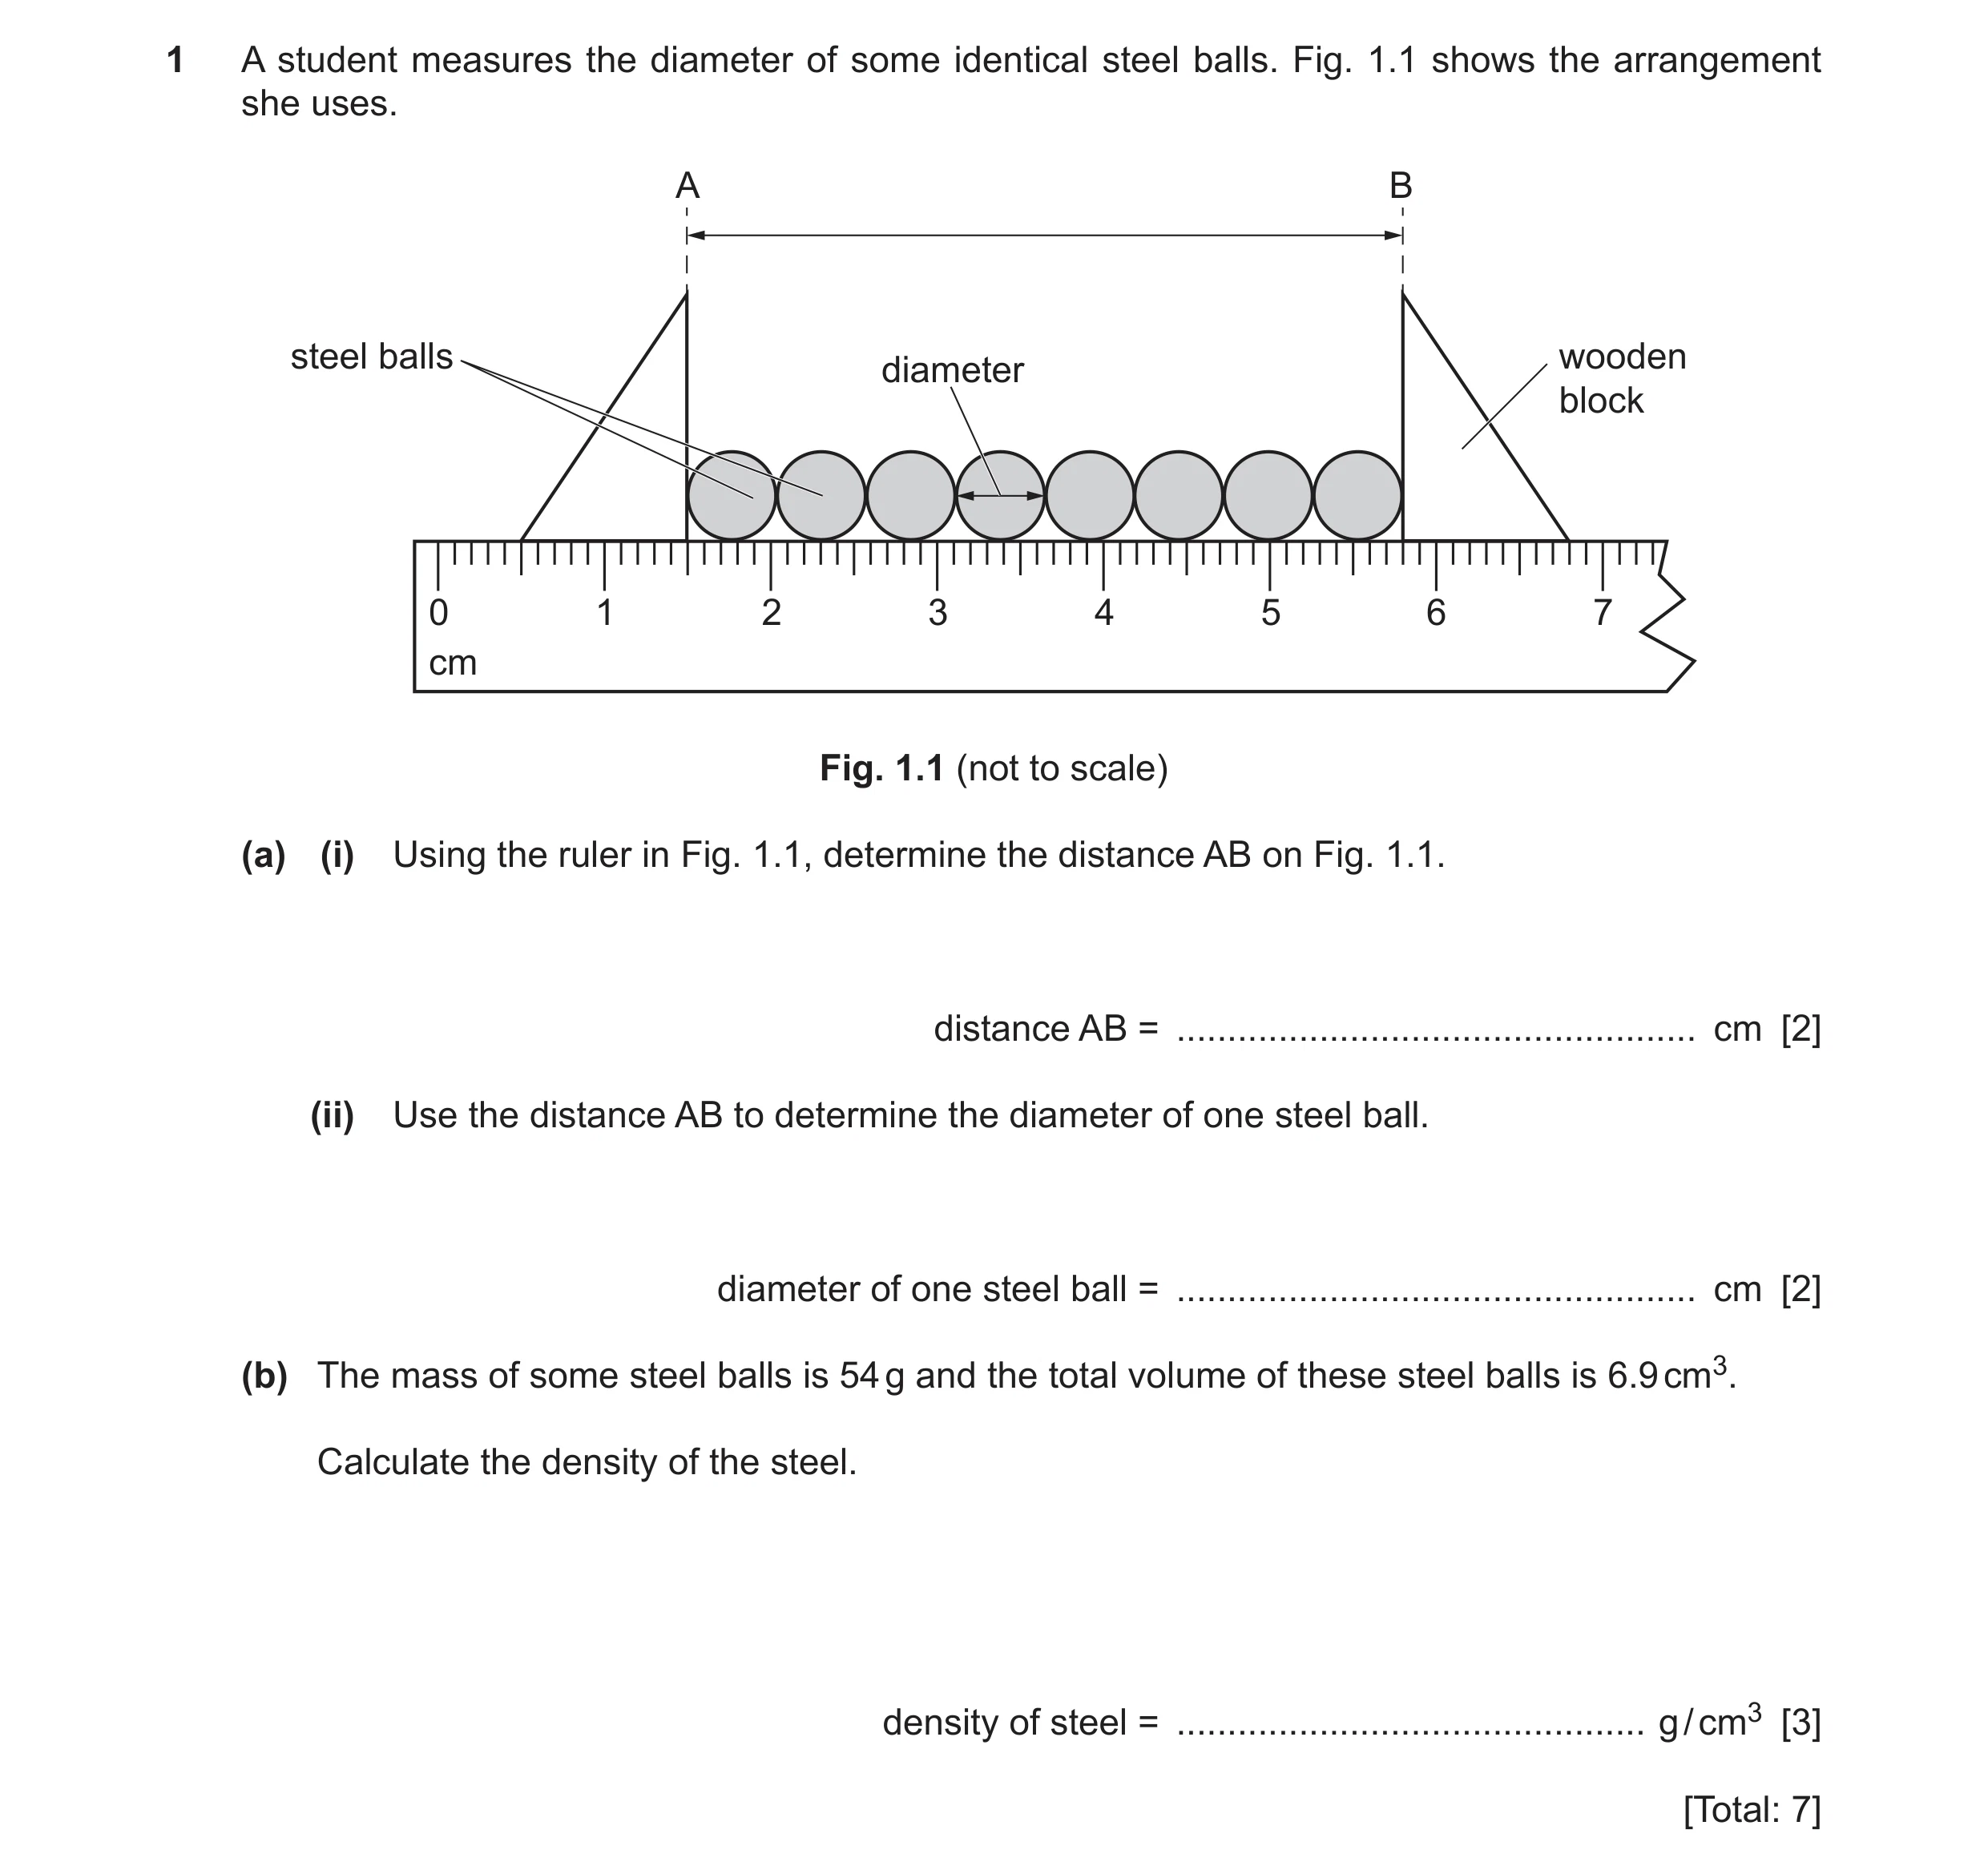
1 A student measures the diameter of some identical steel balls. Fig. 1.1 shows the arrangement she uses. A B steel balls wooden diameter block 0 1 2 3 4 5 6 7 cm Fig. 1.1 (not to scale) (a) (i) Using the ruler in Fig. 1.1, determine the distance AB on Fig. 1.1. distance AB = … cm [2] (ii) Use the distance AB to determine the diameter of one steel ball. diameter of one steel ball = … cm [2] (b) The mass of some steel balls is 54 g and the total volume of these steel balls is 6.9 cm3. Calculate the density of the steel. density of steel = … g / cm3 [3] [Total: 7]
7 marks
Mark scheme: 1(a)(i) 4.3 (cm) A2 5.8 (– 1.5) C1 1(a)(ii) (a)(i) ÷ 8 correctly evaluated (0.54 (cm) if 4.3 cm used) A2 (a)(i) ÷ 8 (C1) 1(b) 7.8 (g / cm3) A3 54 ÷ 6.9 (C2) D = m ÷ v in any form (C1)
This question in 0625/32 May/June 2023
Q36 · A student can hear trains passing her house 0625/32 Oct/Nov 2023
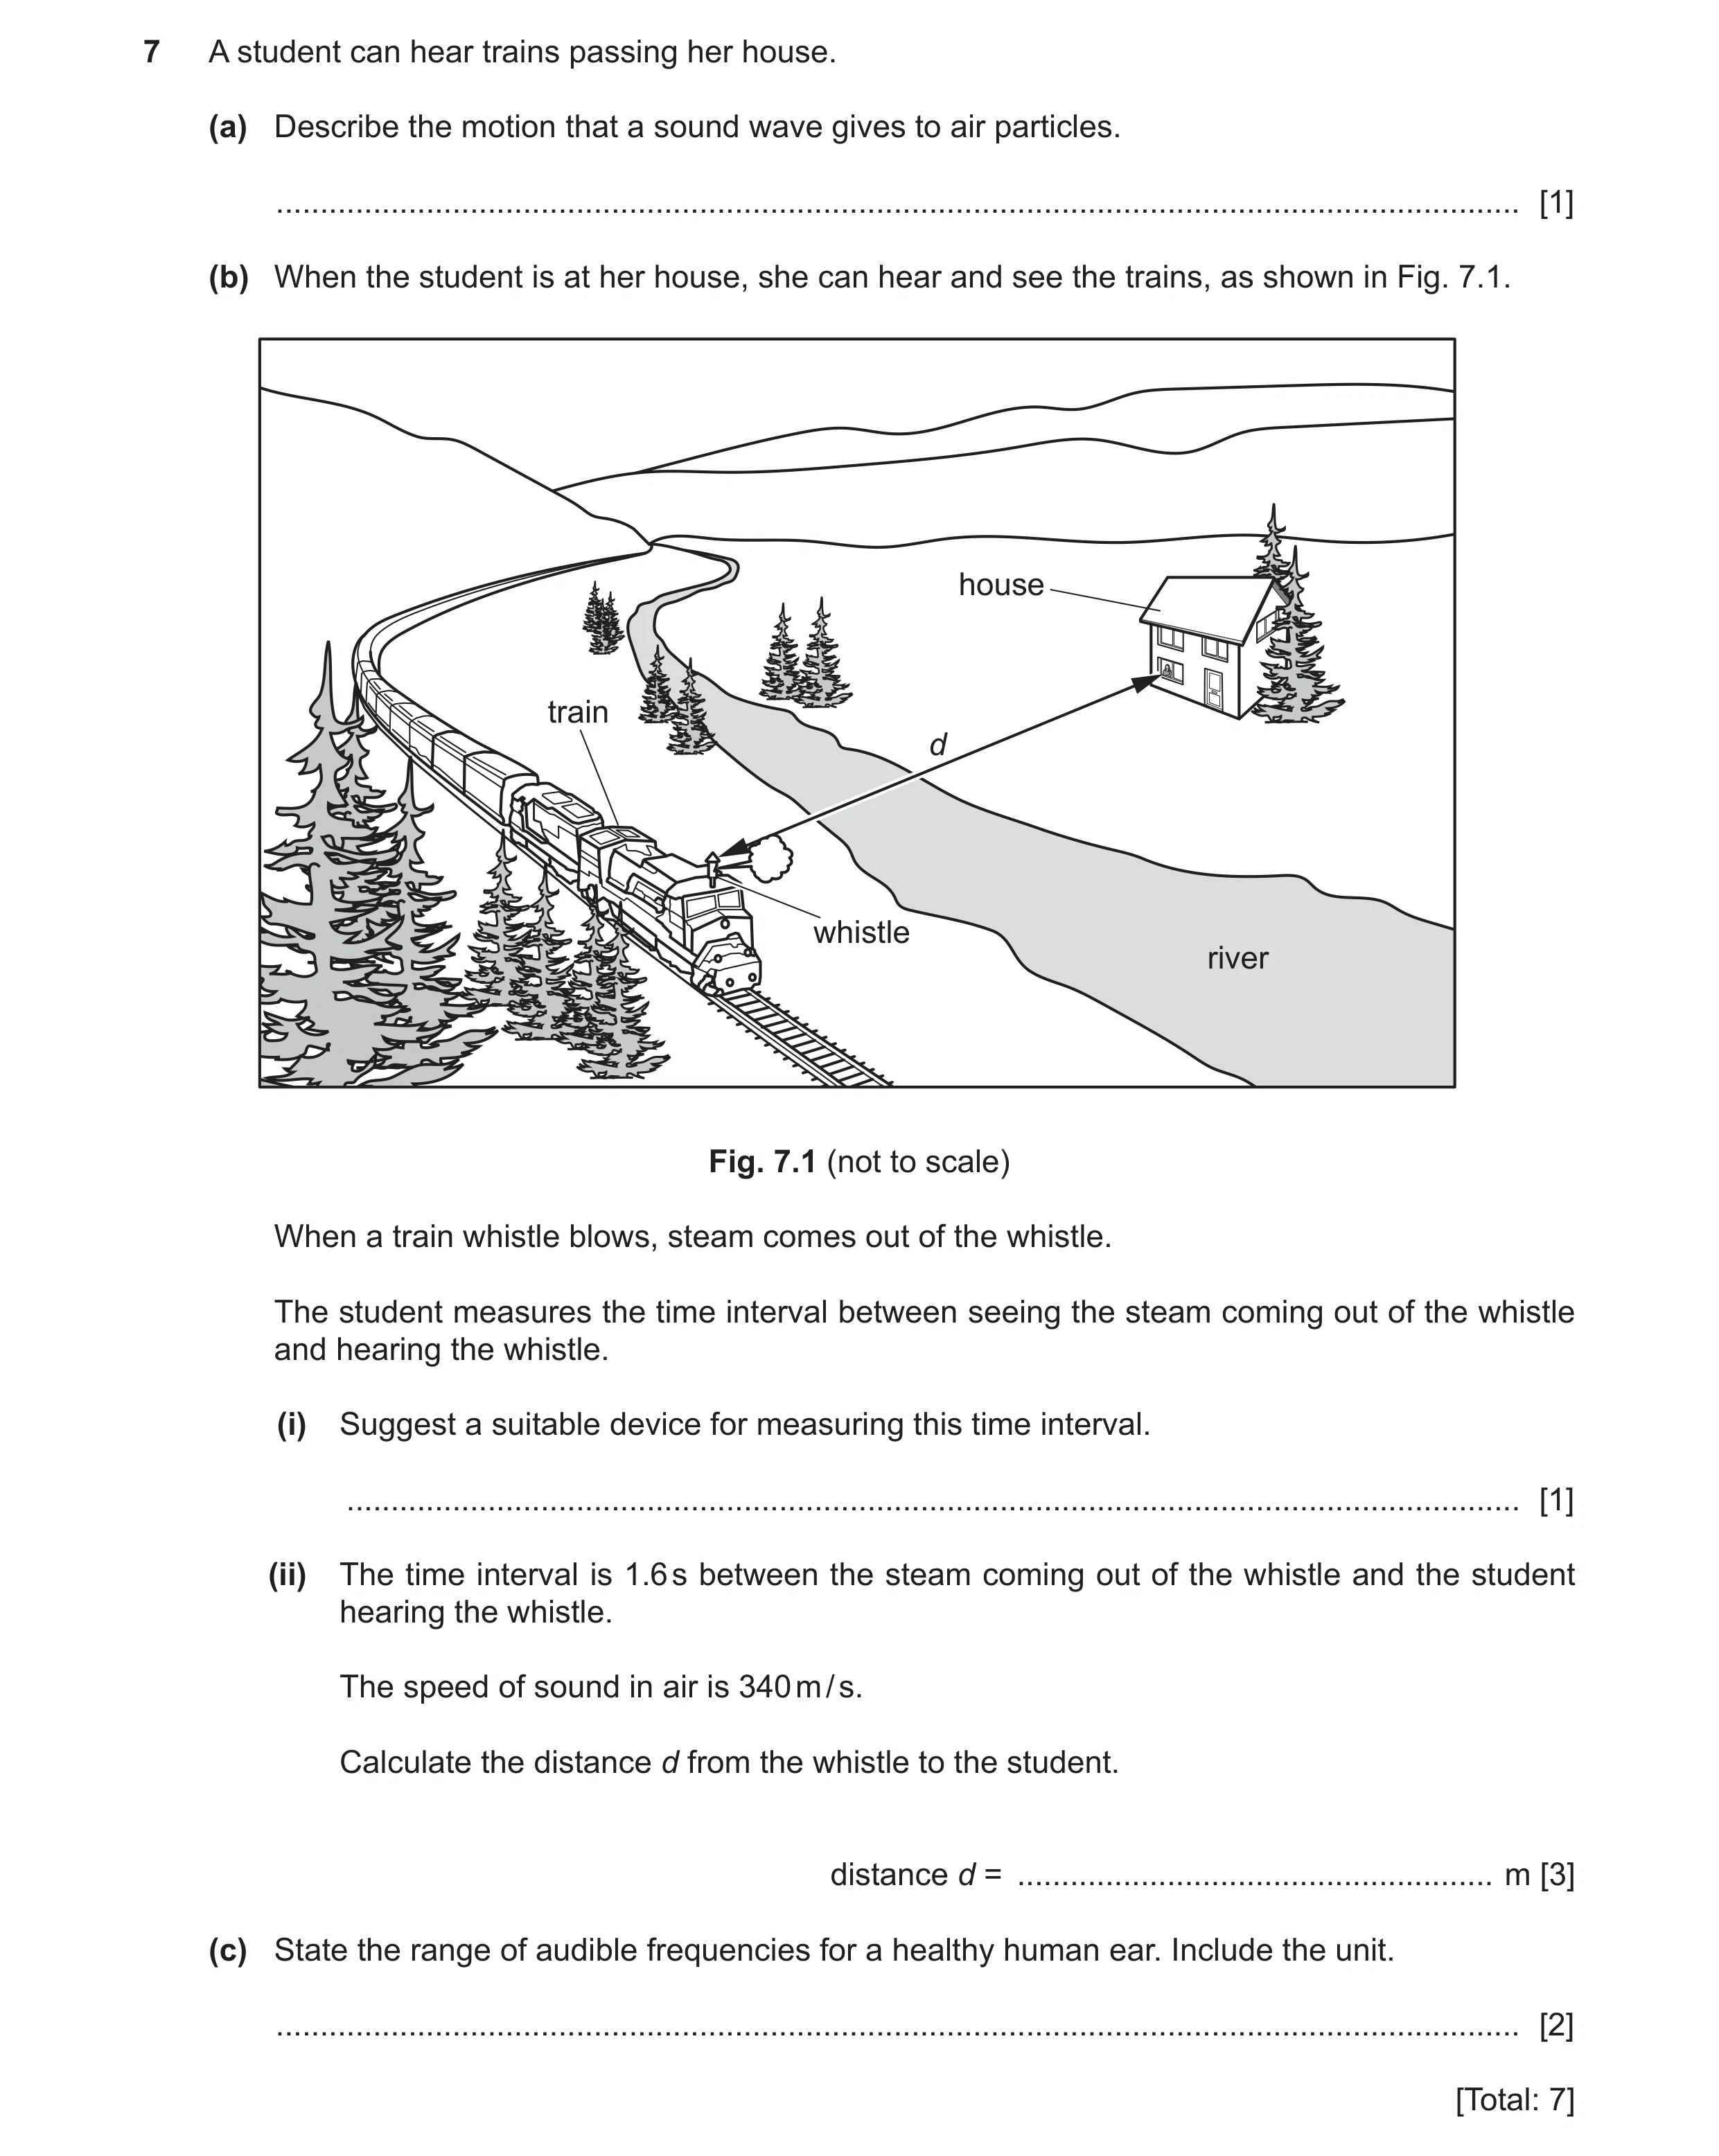
7 A student can hear trains passing her house. (a) Describe the motion that a sound wave gives to air particles. … [1] (b) When the student is at her house, she can hear and see the trains, as shown in Fig. 7.1. house train d whistle river Fig. 7.1 (not to scale) When a train whistle blows, steam comes out of the whistle. The student measures the time interval between seeing the steam coming out of the whistle and hearing the whistle. (i) Suggest a suitable device for measuring this time interval. … [1] (ii) The time interval is 1.6 s between the steam coming out of the whistle and the student hearing the whistle. The speed of sound in air is 340 m / s. Calculate the distance d from the whistle to the student. distance d = … m [3] (c) State the range of audible frequencies for a healthy human ear. Include the unit. … [2] [Total: 7]
7 marks
Mark scheme: 7(a) oscillating / vibrating/backwards and forwards B1 7(b)(i) stopwatch / (stop)clock B1 7(b)(ii) 540 (m) A3 340 1.6 (C1) (distance =) speed time (C1) 7(c) 20 – 20 000 B1 Hz / hertz B1
This question in 0625/32 Oct/Nov 2023
Q37 · A student places six 100 g masses in a stack, as shown in Fig 0625/31 May/June 2024
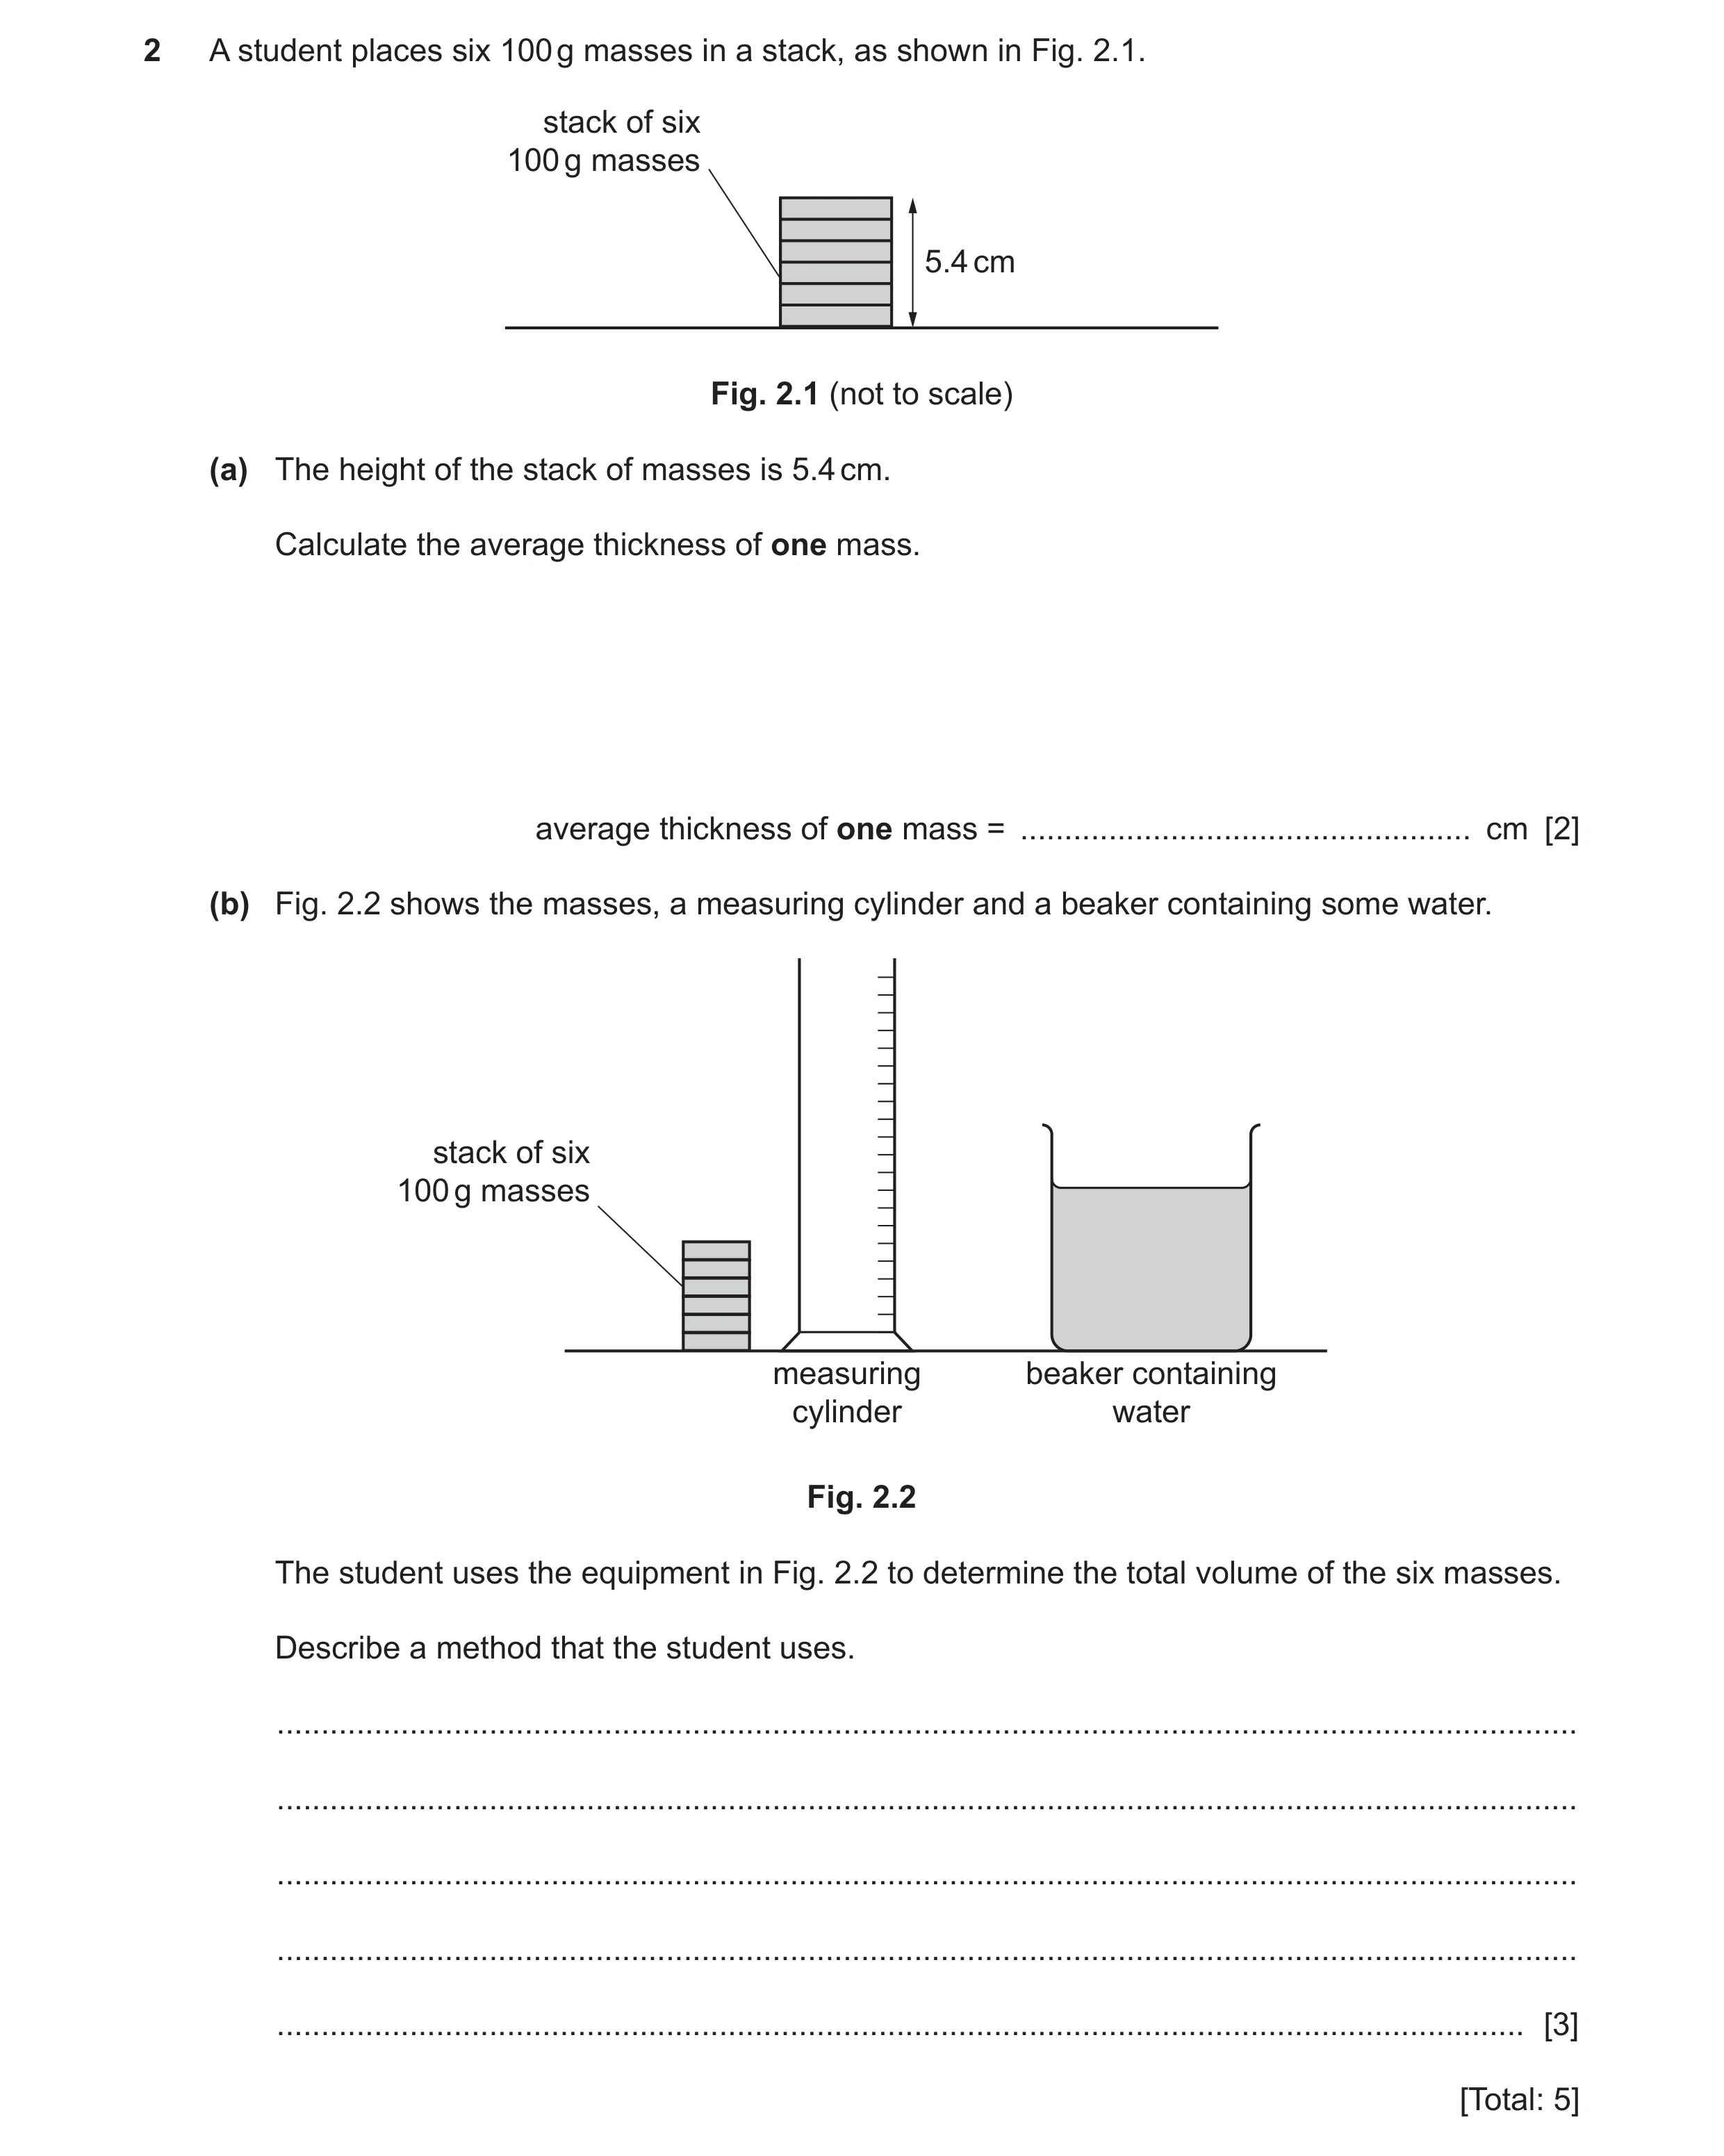
2 A student places six 100 g masses in a stack, as shown in Fig. 2.1. stack of six 100 g masses 5.4 cm Fig. 2.1 (not to scale) (a) The height of the stack of masses is 5.4 cm. Calculate the average thickness of one mass. average thickness of one mass = … cm [2] (b) Fig. 2.2 shows the masses, a measuring cylinder and a beaker containing some water. stack of six 100 g masses measuring beaker containing cylinder water Fig. 2.2 The student uses the equipment in Fig. 2.2 to determine the total volume of the six masses. Describe a method that the student uses. … … … … … [3] [Total: 5]
5 marks
Mark scheme: 2(a) (average thickness =) 0.9 (cm) A2 (average thickness =) 5.4 ÷ 6 (C1) 2(b) any two from: (measuring) cylinder (partially) filled with water (initial) volume of water (in measuring cylinder) measured or recorded / noted / read mass(es) in water OR water covers all mass(es) new volume measured or recorded / noted / read B2 difference between two values (of water with and without masses is determined) B1
This question in 0625/31 May/June 2024
Q38 · A student wants to find the volume of a piece of metal 0625/32 May/June 2024
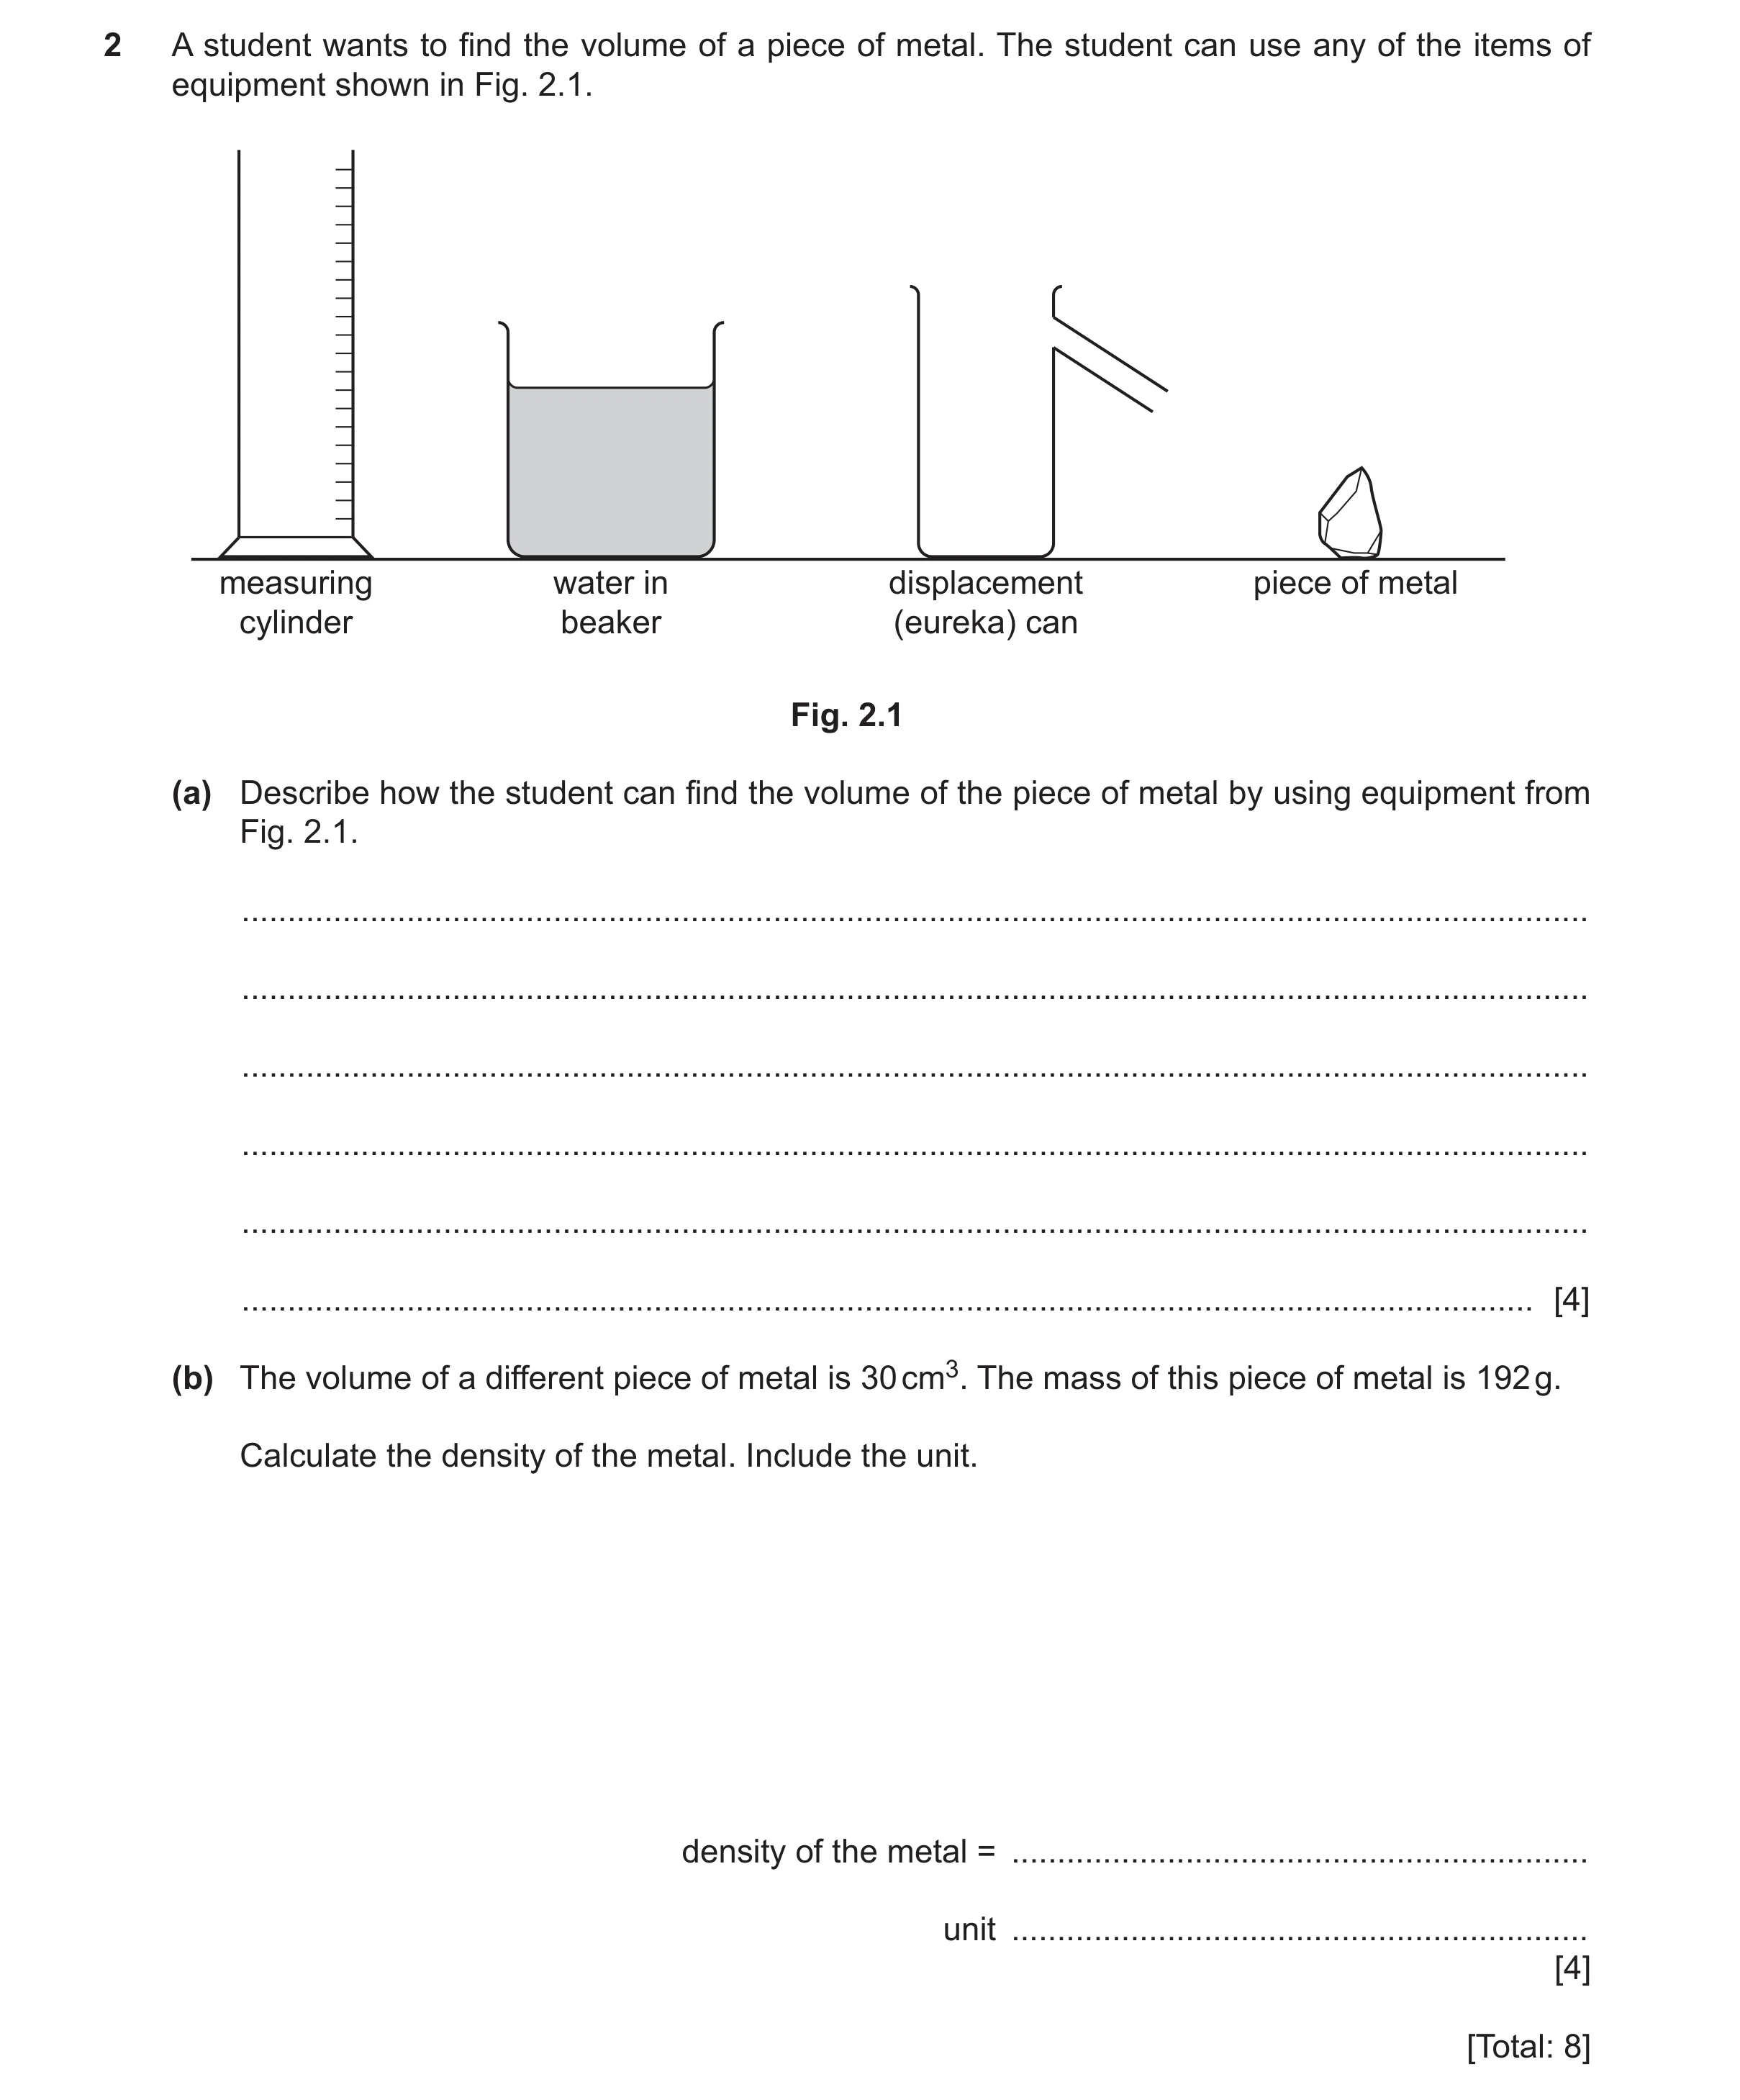
2 A student wants to find the volume of a piece of metal. The student can use any of the items of equipment shown in Fig. 2.1. measuring water in displacement piece of metal cylinder beaker (eureka) can Fig. 2.1 (a) Describe how the student can find the volume of the piece of metal by using equipment from Fig. 2.1. … … … … … … [4] (b) The volume of a different piece of metal is 30 cm3. The mass of this piece of metal is 192 g. Calculate the density of the metal. Include the unit. density of the metal = … unit … [4] [Total: 8]
8 marks
Mark scheme: 2(a) any three from: measuring cylinder (part) filled with water volume of water measured or recorded/noted/read metal submerged / placed in water owtte new volume read / noted / measured / recorded volume of metal = difference in volumes B1 2(b) ( =) 6 A3 ( =) 192 ÷ 30 (C2) (density =) mass ÷ volume OR ( =) m / V in any form (C1) g / cm3 B1
This question in 0625/32 May/June 2024
Q39 · A student wants to measure the diameter of a wire 0625/32 Oct/Nov 2024
2 A student wants to measure the diameter of a wire. The wire is thinner than a single gradation on her ruler. She coils the wire carefully and makes 12 loops as shown in Fig. 2.1. coil of 12 loops Fig. 2.1 (a) Describe how she can use her ruler to determine the diameter of the wire accurately. You may draw on Fig. 2.1 as part of your answer. … … … … [3] (b) The student determines the density of the metal of the wire. She folds some of the wire into a small shape as shown in Fig. 2.2. small shape of wire Fig. 2.2 She then puts this small shape of wire into a measuring cylinder containing water. The measuring cylinder is on an electric balance. This procedure is shown in Fig. 2.3. 50 cm3 50 cm3 measuring cylinder 40 40 30 30 water wire 20 20 electric balance 10 10 67 g 112 g wire not in water wire in water Fig. 2.3 Using the information in Fig. 2.3, calculate: (i) the mass of the wire mass of the wire = … g [1] (ii) the volume of the wire. volume of the wire = … cm3 [2] (c) The mass of a different wire is 64 g. The volume of this wire is 7.2 cm3. Using this information, calculate the density of this wire. density = … g / cm3 [3] [Total: 9]
9 marks
Mark scheme: 2(a) measure the width of n loops with rule B1 n =10 or more loops B1 (diameter of one loop) = total width n if n 1 B1 2(b)(i) 45 (g) B1 2(b)(ii) 5(.0) (cm3) A2 32 – 27 (C1) 2(c) 8.9 (g / cm3) A3 64 7.2 (C2) (density = ) mass volume OR (ρ =) m V (C1)
This question in 0625/32 Oct/Nov 2024
Q40 · A teacher uses a spring in a demonstration 0625/33 Oct/Nov 2024
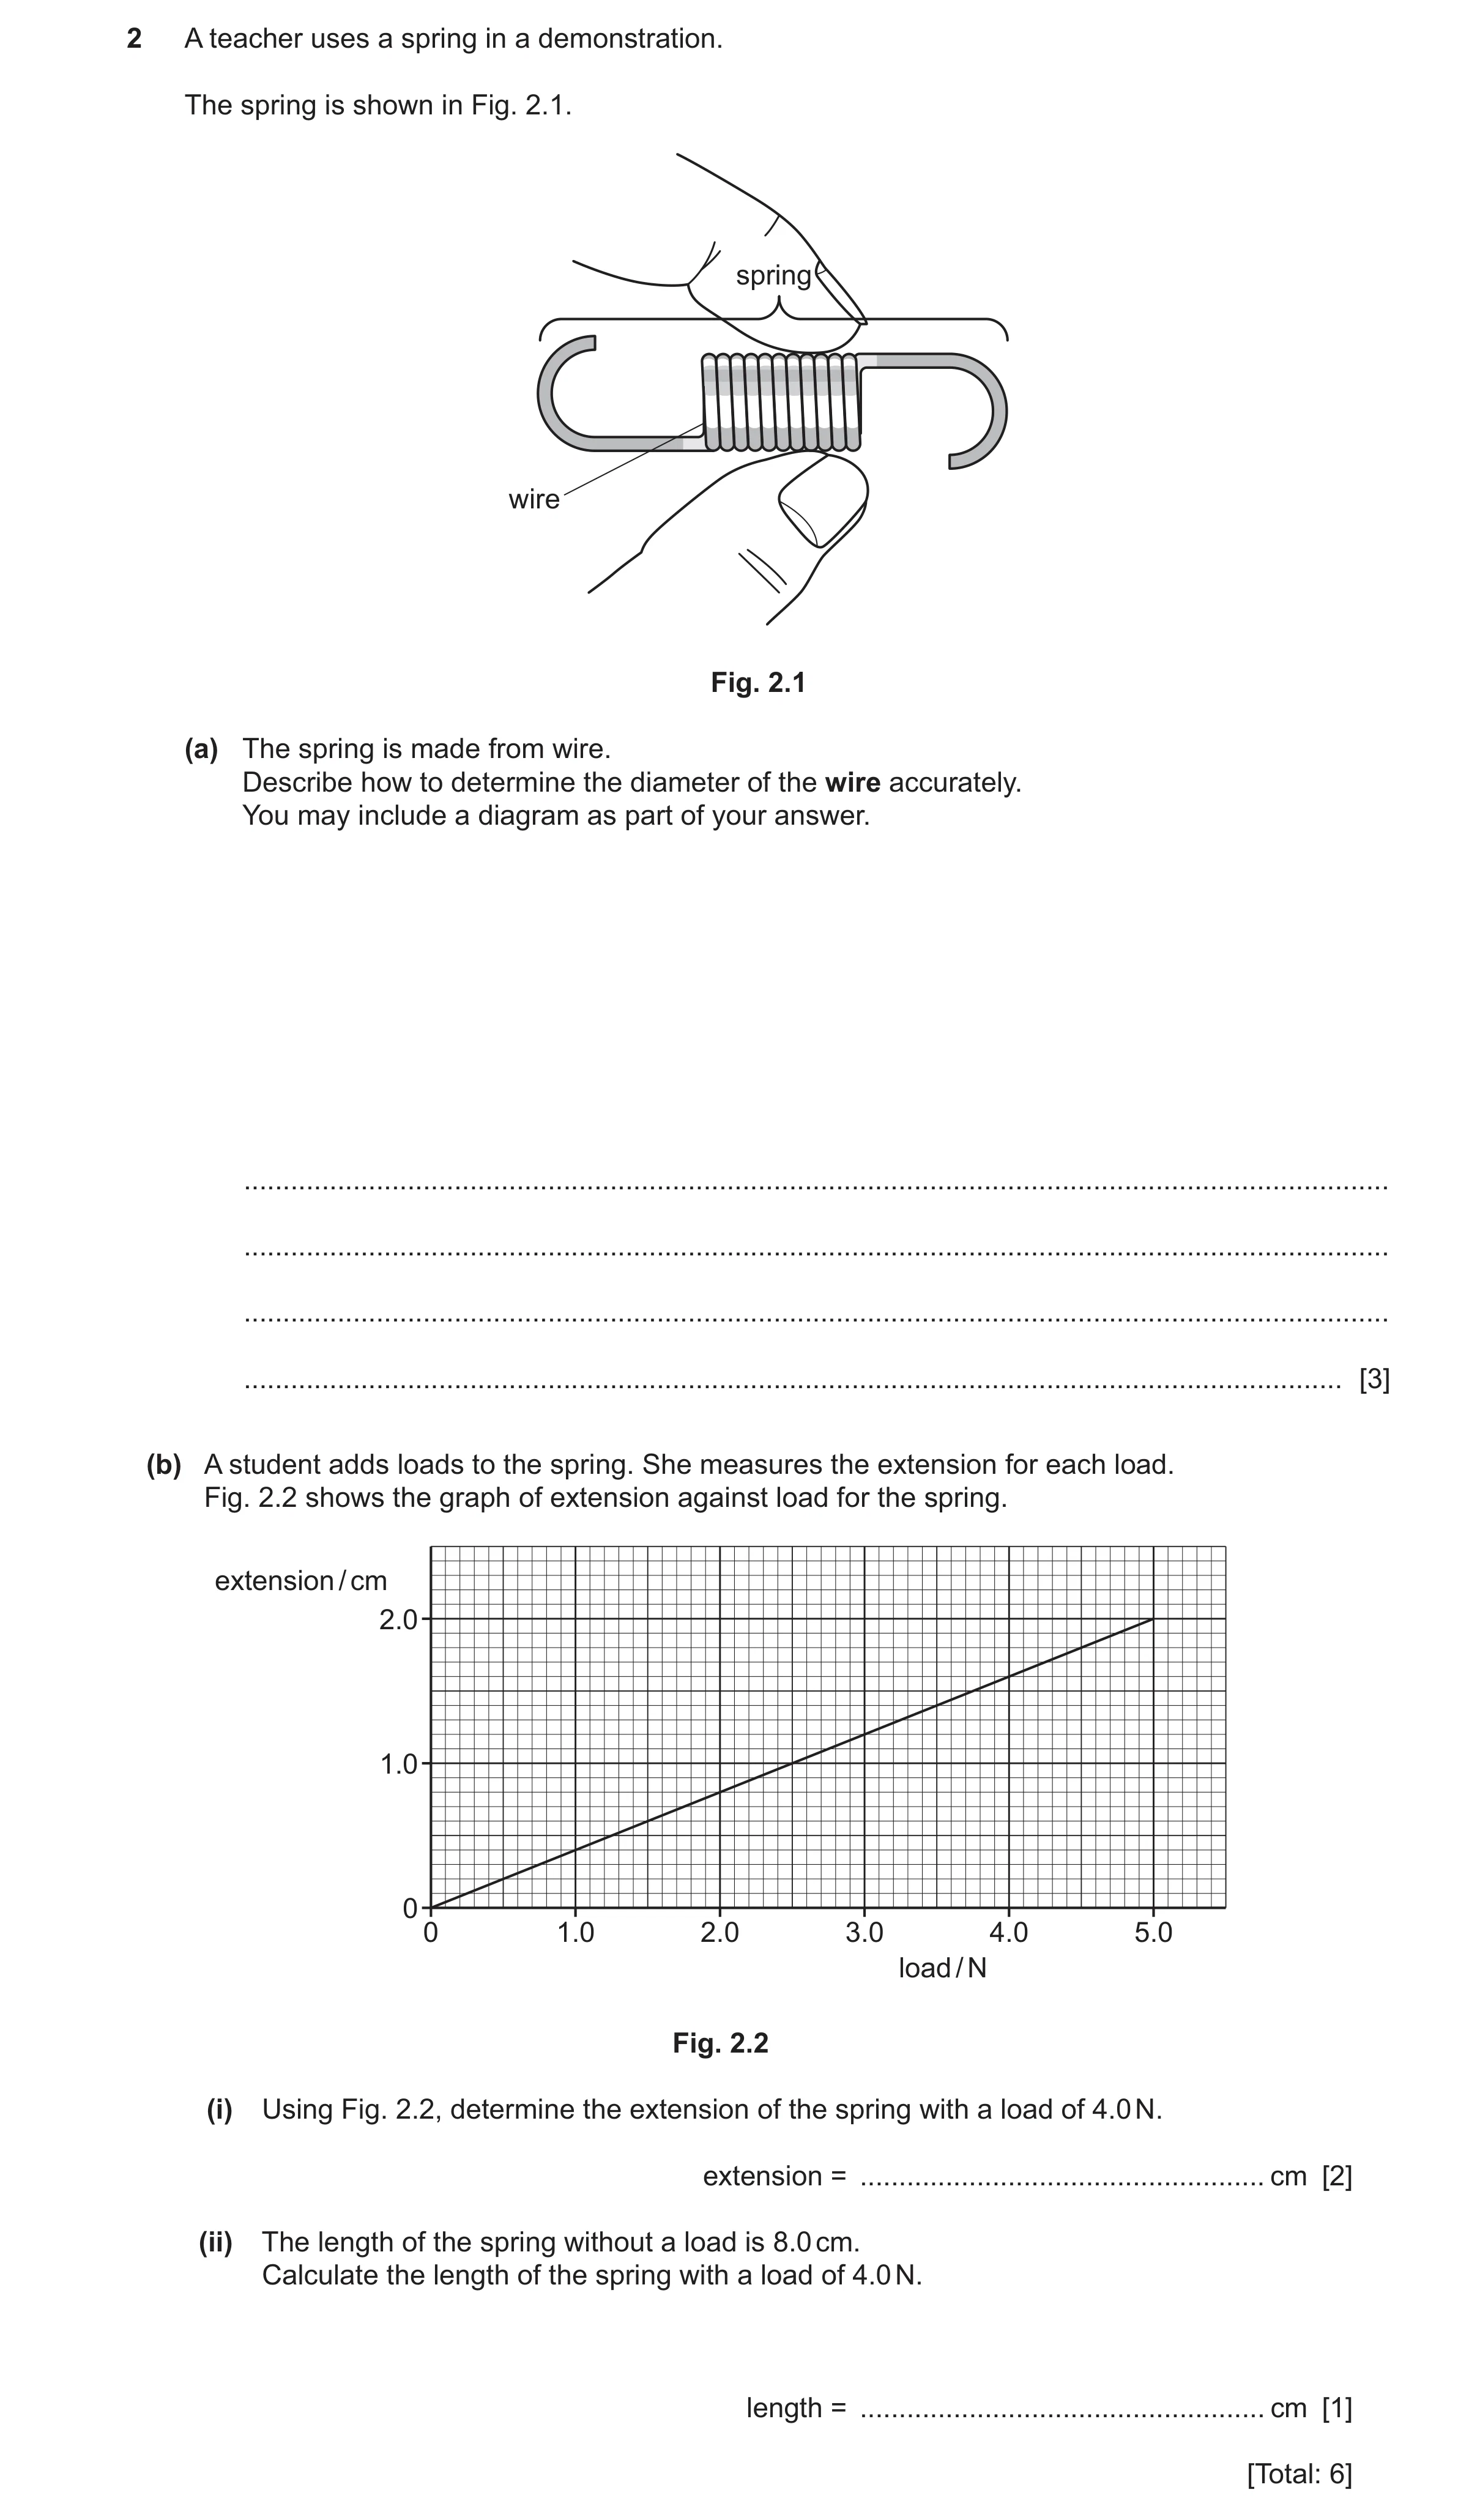
2 A teacher uses a spring in a demonstration. The spring is shown in Fig. 2.1. spring wire Fig. 2.1 (a) The spring is made from wire. Describe how to determine the diameter of the wire accurately. You may include a diagram as part of your answer. … … … … [3] (b) A student adds loads to the spring. She measures the extension for each load. Fig. 2.2 shows the graph of extension against load for the spring. extension / cm 2.0 1.0 0 0 1.0 2.0 3.0 4.0 5.0 load / N Fig. 2.2 (i) Using Fig. 2.2, determine the extension of the spring with a load of 4.0 N. extension = … cm [2] (ii) The length of the spring without a load is 8.0 cm. Calculate the length of the spring with a load of 4.0 N. length = … cm [1] [Total: 6]
6 marks
Mark scheme: 2(a) measure the diameter of n loops / turns with rule(r) B1 n = 5 or more loops / loops B1 (diameter of wire =) their measurement n if n 1 B1 2(b)(i) 1.6 (cm) A2 any indication of correct attempt on graph (C1) 2(b)(ii) 9.6 (cm) B1
This question in 0625/33 Oct/Nov 2024
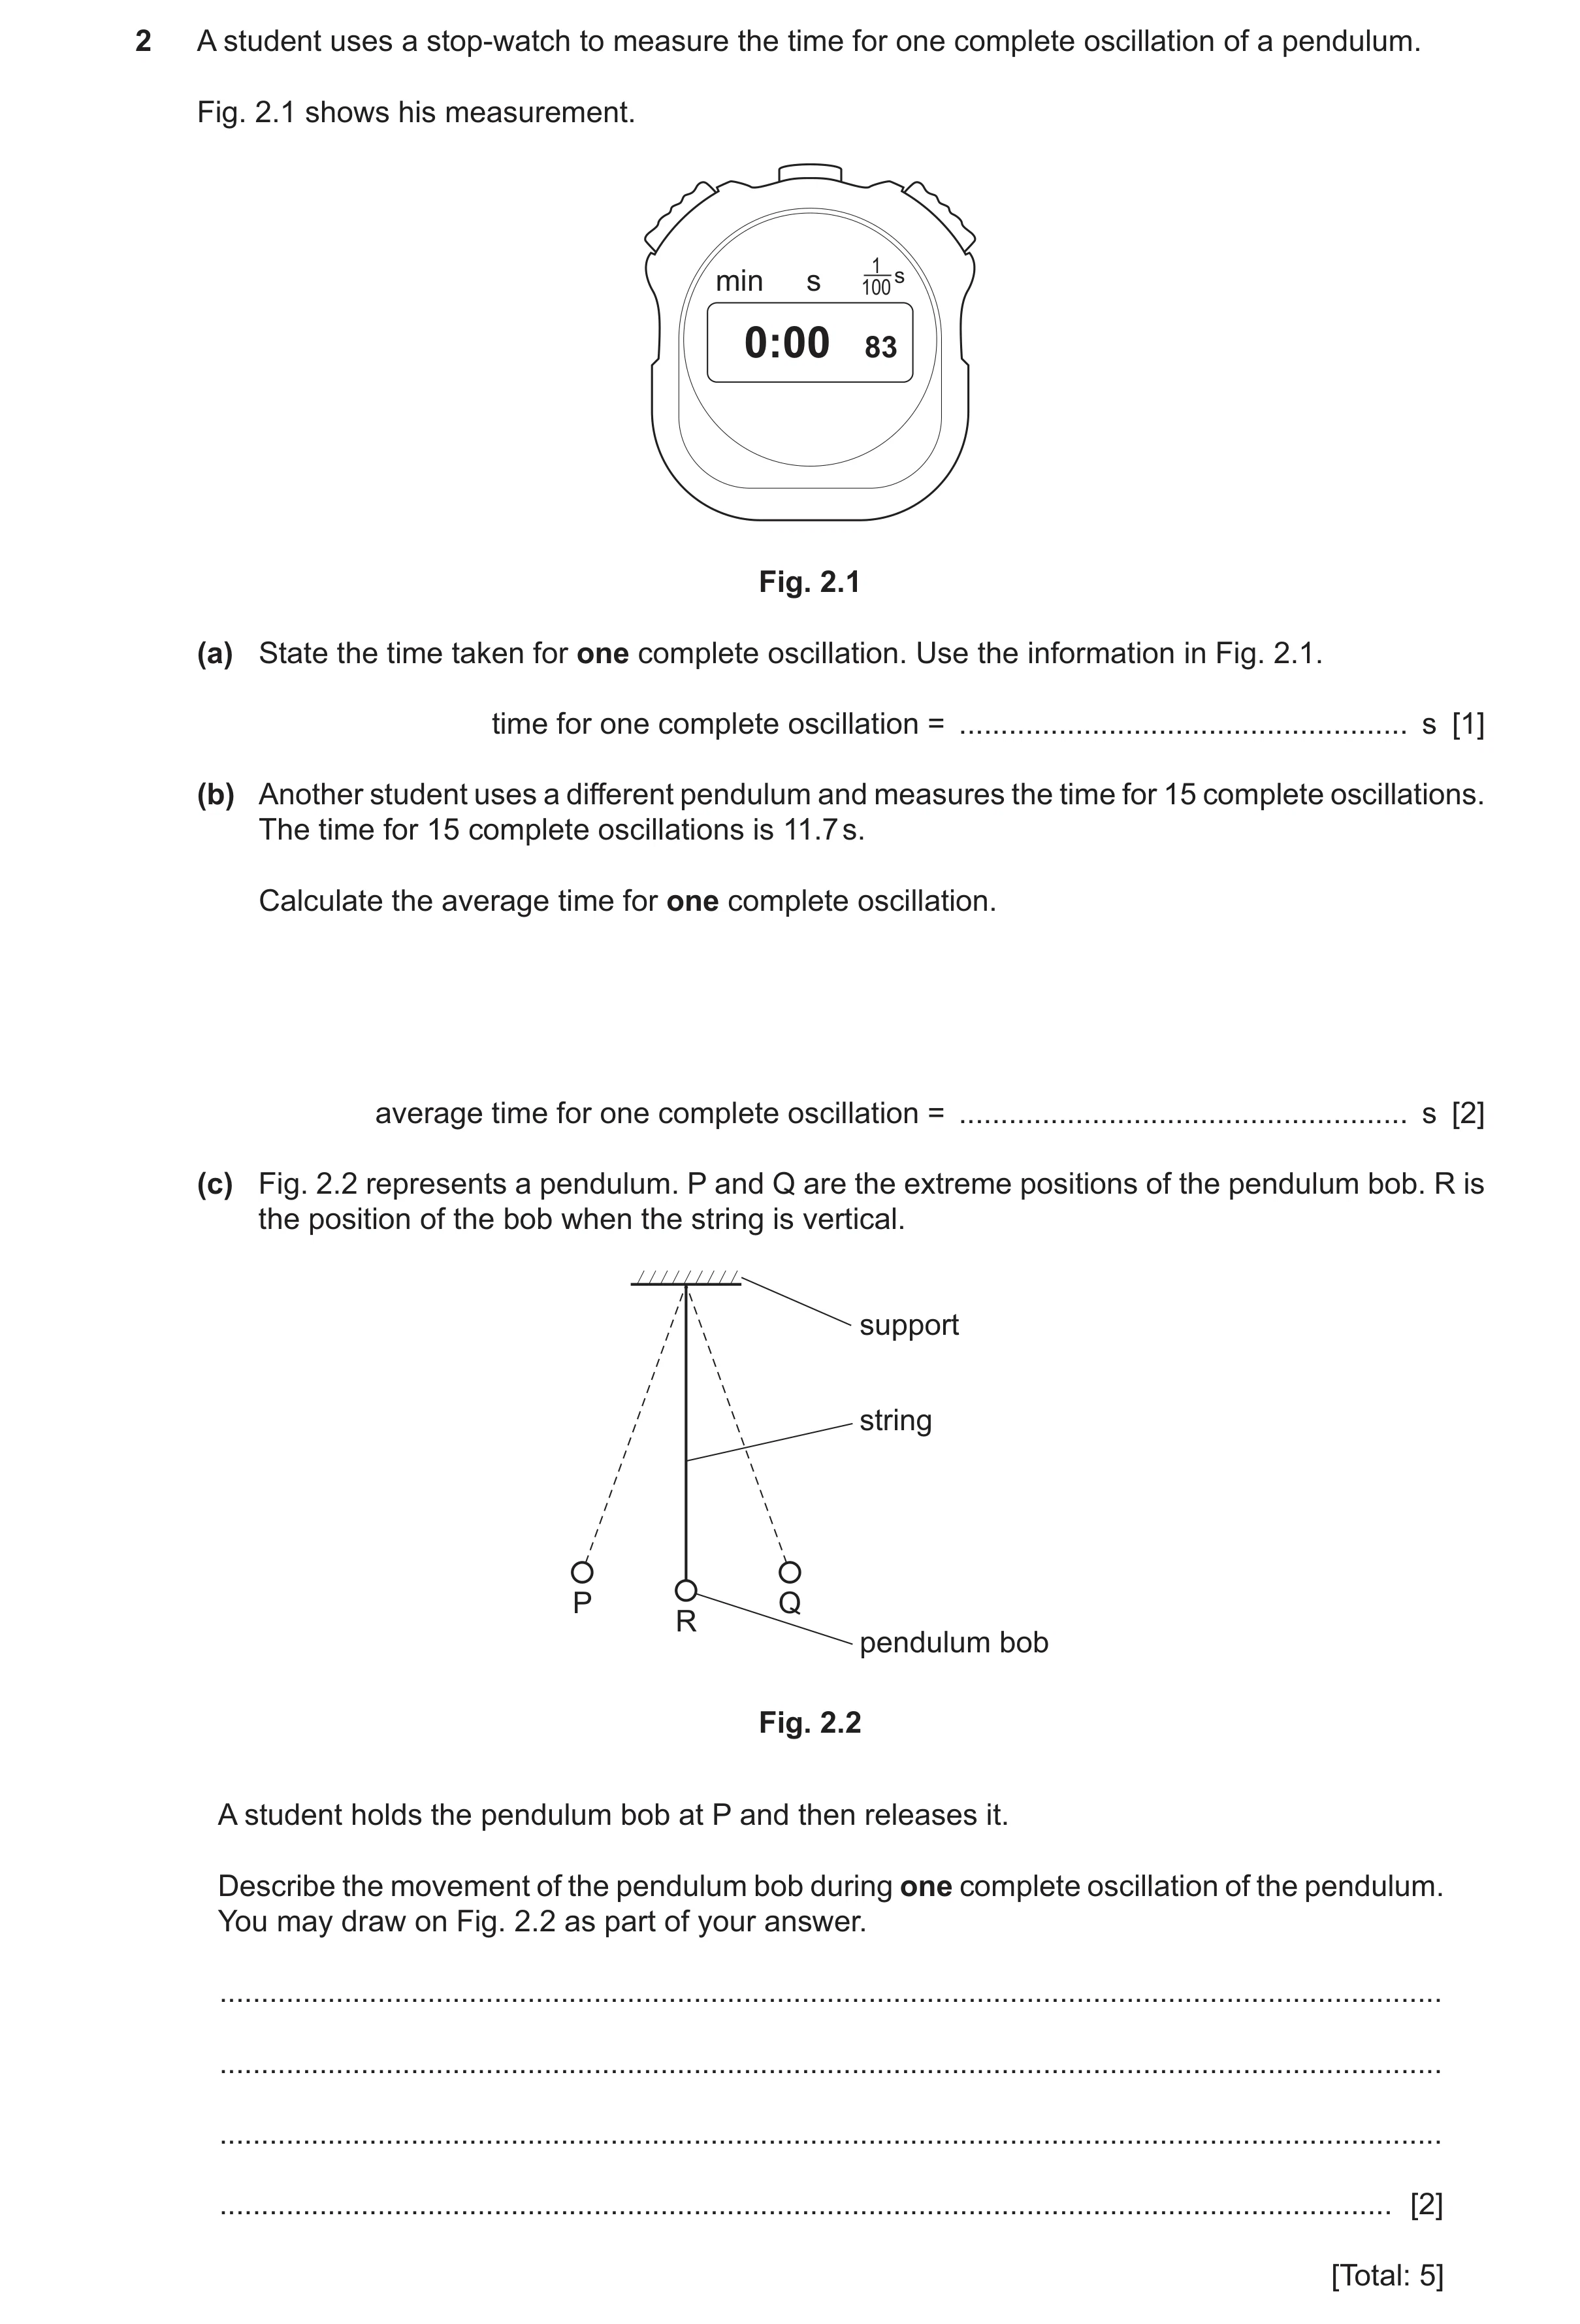
Q41 · A student uses a stop-watch to measure the time for one complete oscillation of a pendulum 0625/31 May/June 2025
2 A student uses a stop-watch to measure the time for one complete oscillation of a pendulum. Fig. 2.1 shows his measurement. 1 min s 100 s 0:00 83 Fig. 2.1 (a) State the time taken for one complete oscillation. Use the information in Fig. 2.1. time for one complete oscillation = … s [1] (b) Another student uses a different pendulum and measures the time for 15 complete oscillations. The time for 15 complete oscillations is 11.7 s. Calculate the average time for one complete oscillation. average time for one complete oscillation = … s [2] (c) Fig. 2.2 represents a pendulum. P and Q are the extreme positions of the pendulum bob. R is the position of the bob when the string is vertical. support string P Q R pendulum bob Fig. 2.2 A student holds the pendulum bob at P and then releases it. Describe the movement of the pendulum bob during one complete oscillation of the pendulum. You may draw on Fig. 2.2 as part of your answer. … … … … [2] [Total: 5]
5 marks
Mark scheme: 2(a) 0.83 (s) B1 2(b) (average time =) 0.78 (s) A2 (average time =) (total) time ÷ (number of complete) oscillations C1 OR 11.7 ÷ 15 2(c) idea / description of pendulum swings (from P) to Q and back (to P) / (almost) to start position A2 idea of pendulum moving (from P) to Q OR Q to P C1
This question in 0625/31 May/June 2025
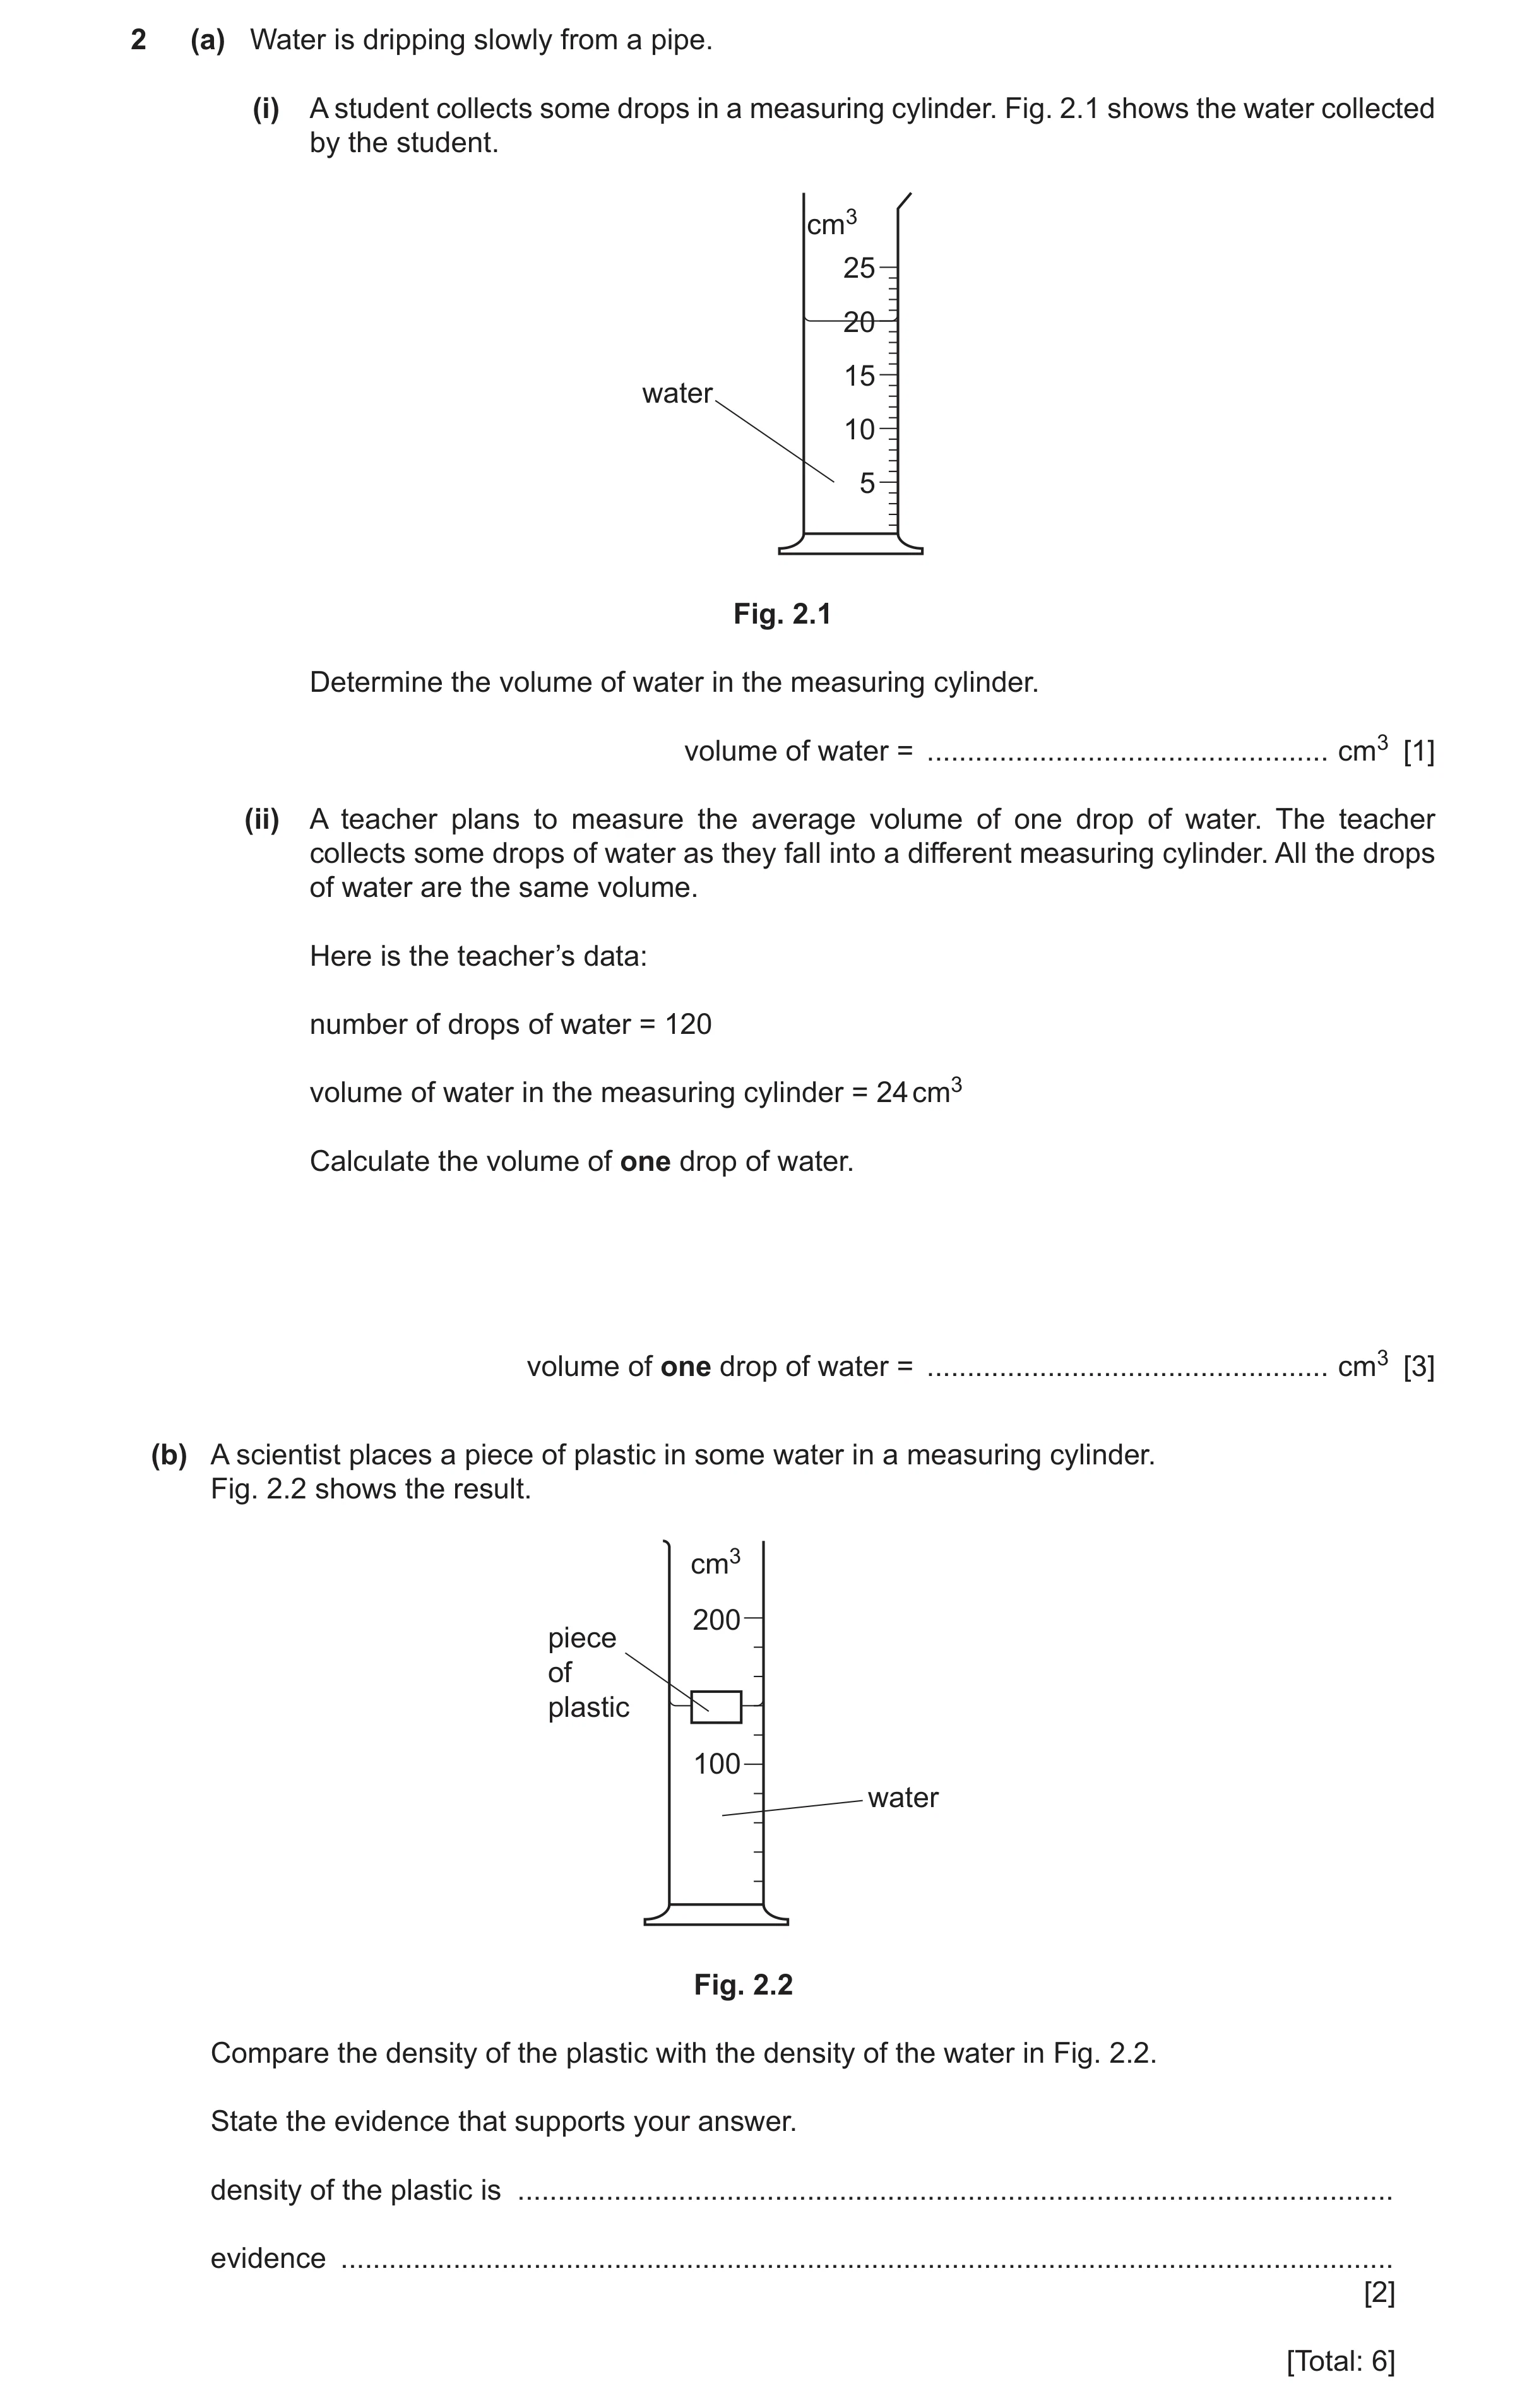
Q42 · Water is dripping slowly from a pipe 0625/31 Oct/Nov 2025
2 (a) Water is dripping slowly from a pipe. (i) A student collects some drops in a measuring cylinder. Fig. 2.1 shows the water collected by the student. cm3 25 20 15 water 10 5 Fig. 2.1 Determine the volume of water in the measuring cylinder. volume of water = … cm3 [1] (ii) A teacher plans to measure the average volume of one drop of water. The teacher collects some drops of water as they fall into a different measuring cylinder. All the drops of water are the same volume. Here is the teacher’s data: number of drops of water = 120 volume of water in the measuring cylinder = 24 cm3 Calculate the volume of one drop of water. volume of one drop of water = … cm3 [3] (b) A scientist places a piece of plastic in some water in a measuring cylinder. Fig. 2.2 shows the result. cm3 200 piece of plastic 100 water Fig. 2.2 Compare the density of the plastic with the density of the water in Fig. 2.2. State the evidence that supports your answer. density of the plastic is … evidence … [2] [Total: 6]
6 marks
Mark scheme: 2(a)(i) 20 (cm3) B1 2(a)(ii) (volume of one drop =) 0.20 (cm3) A3 (volume of one drop =) 24 ÷ 120 (C2) (volume of one drop =) volume of water ÷ number of drops (C1) 2(b) (density of plastic is) less OR lower (than water) B1 (because) plastic/it floats (on water) B1
This question in 0625/31 Oct/Nov 2025
 3 / 54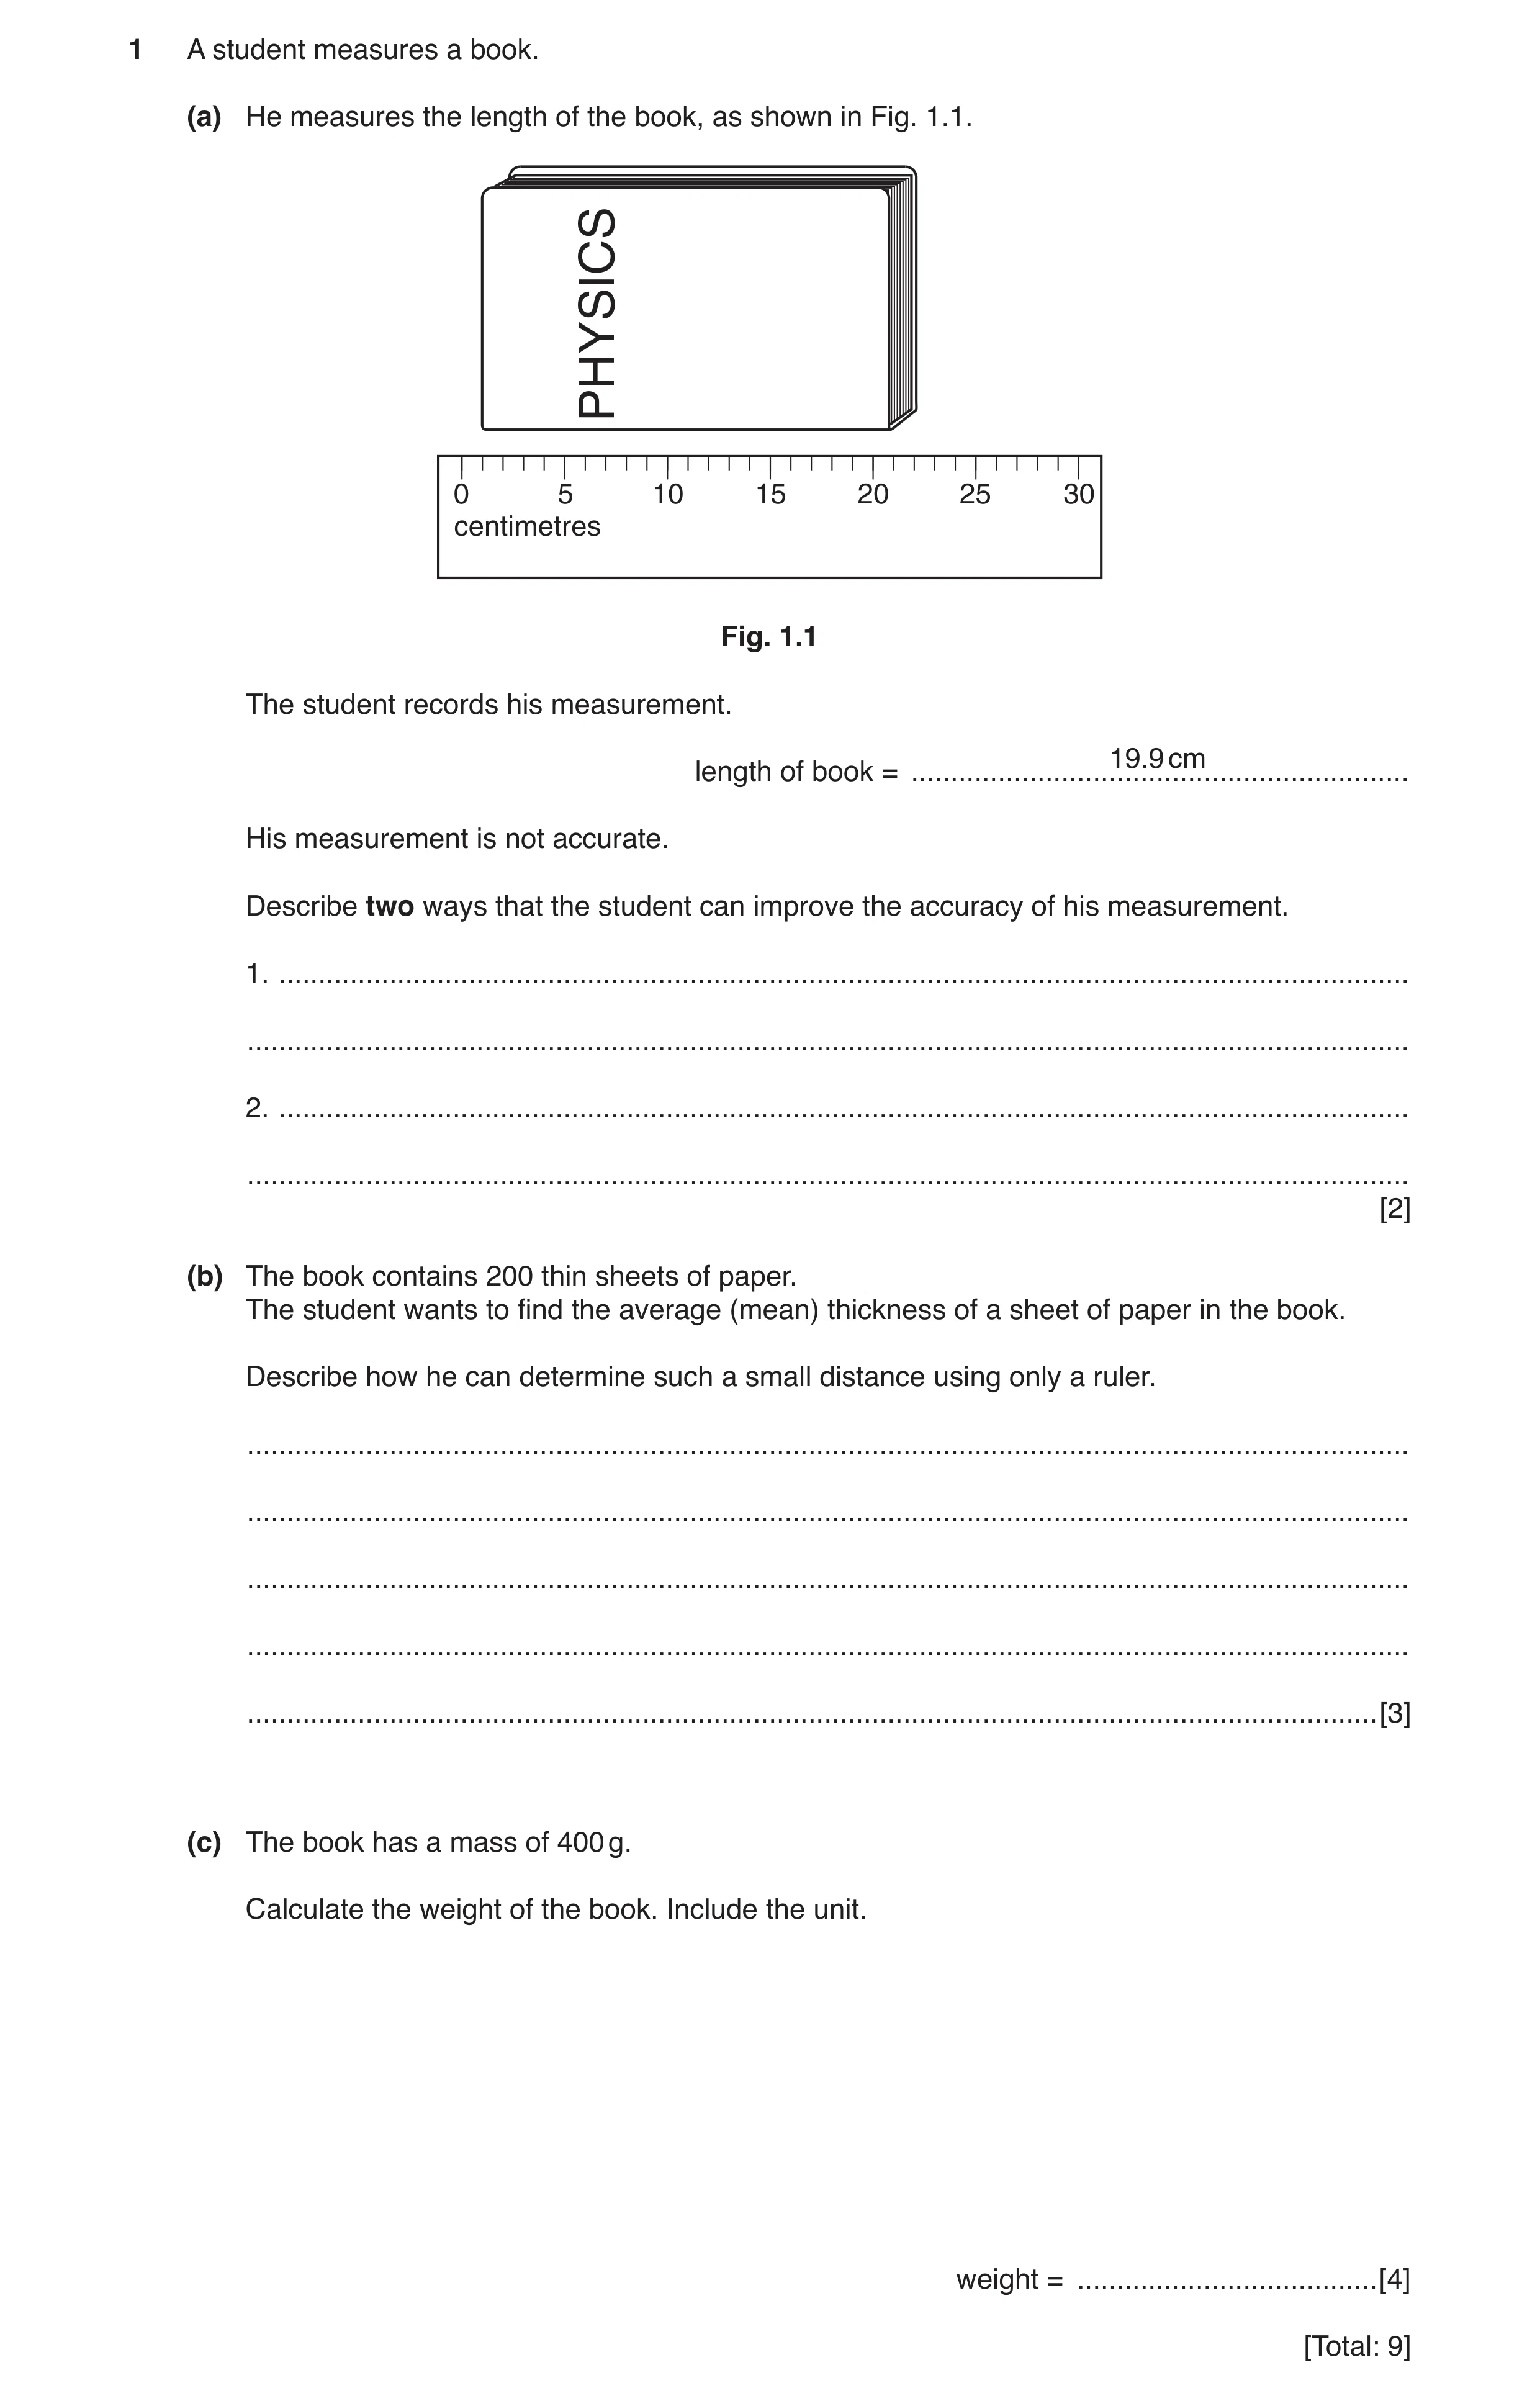
 6 / 54
 7 / 54
 8 / 54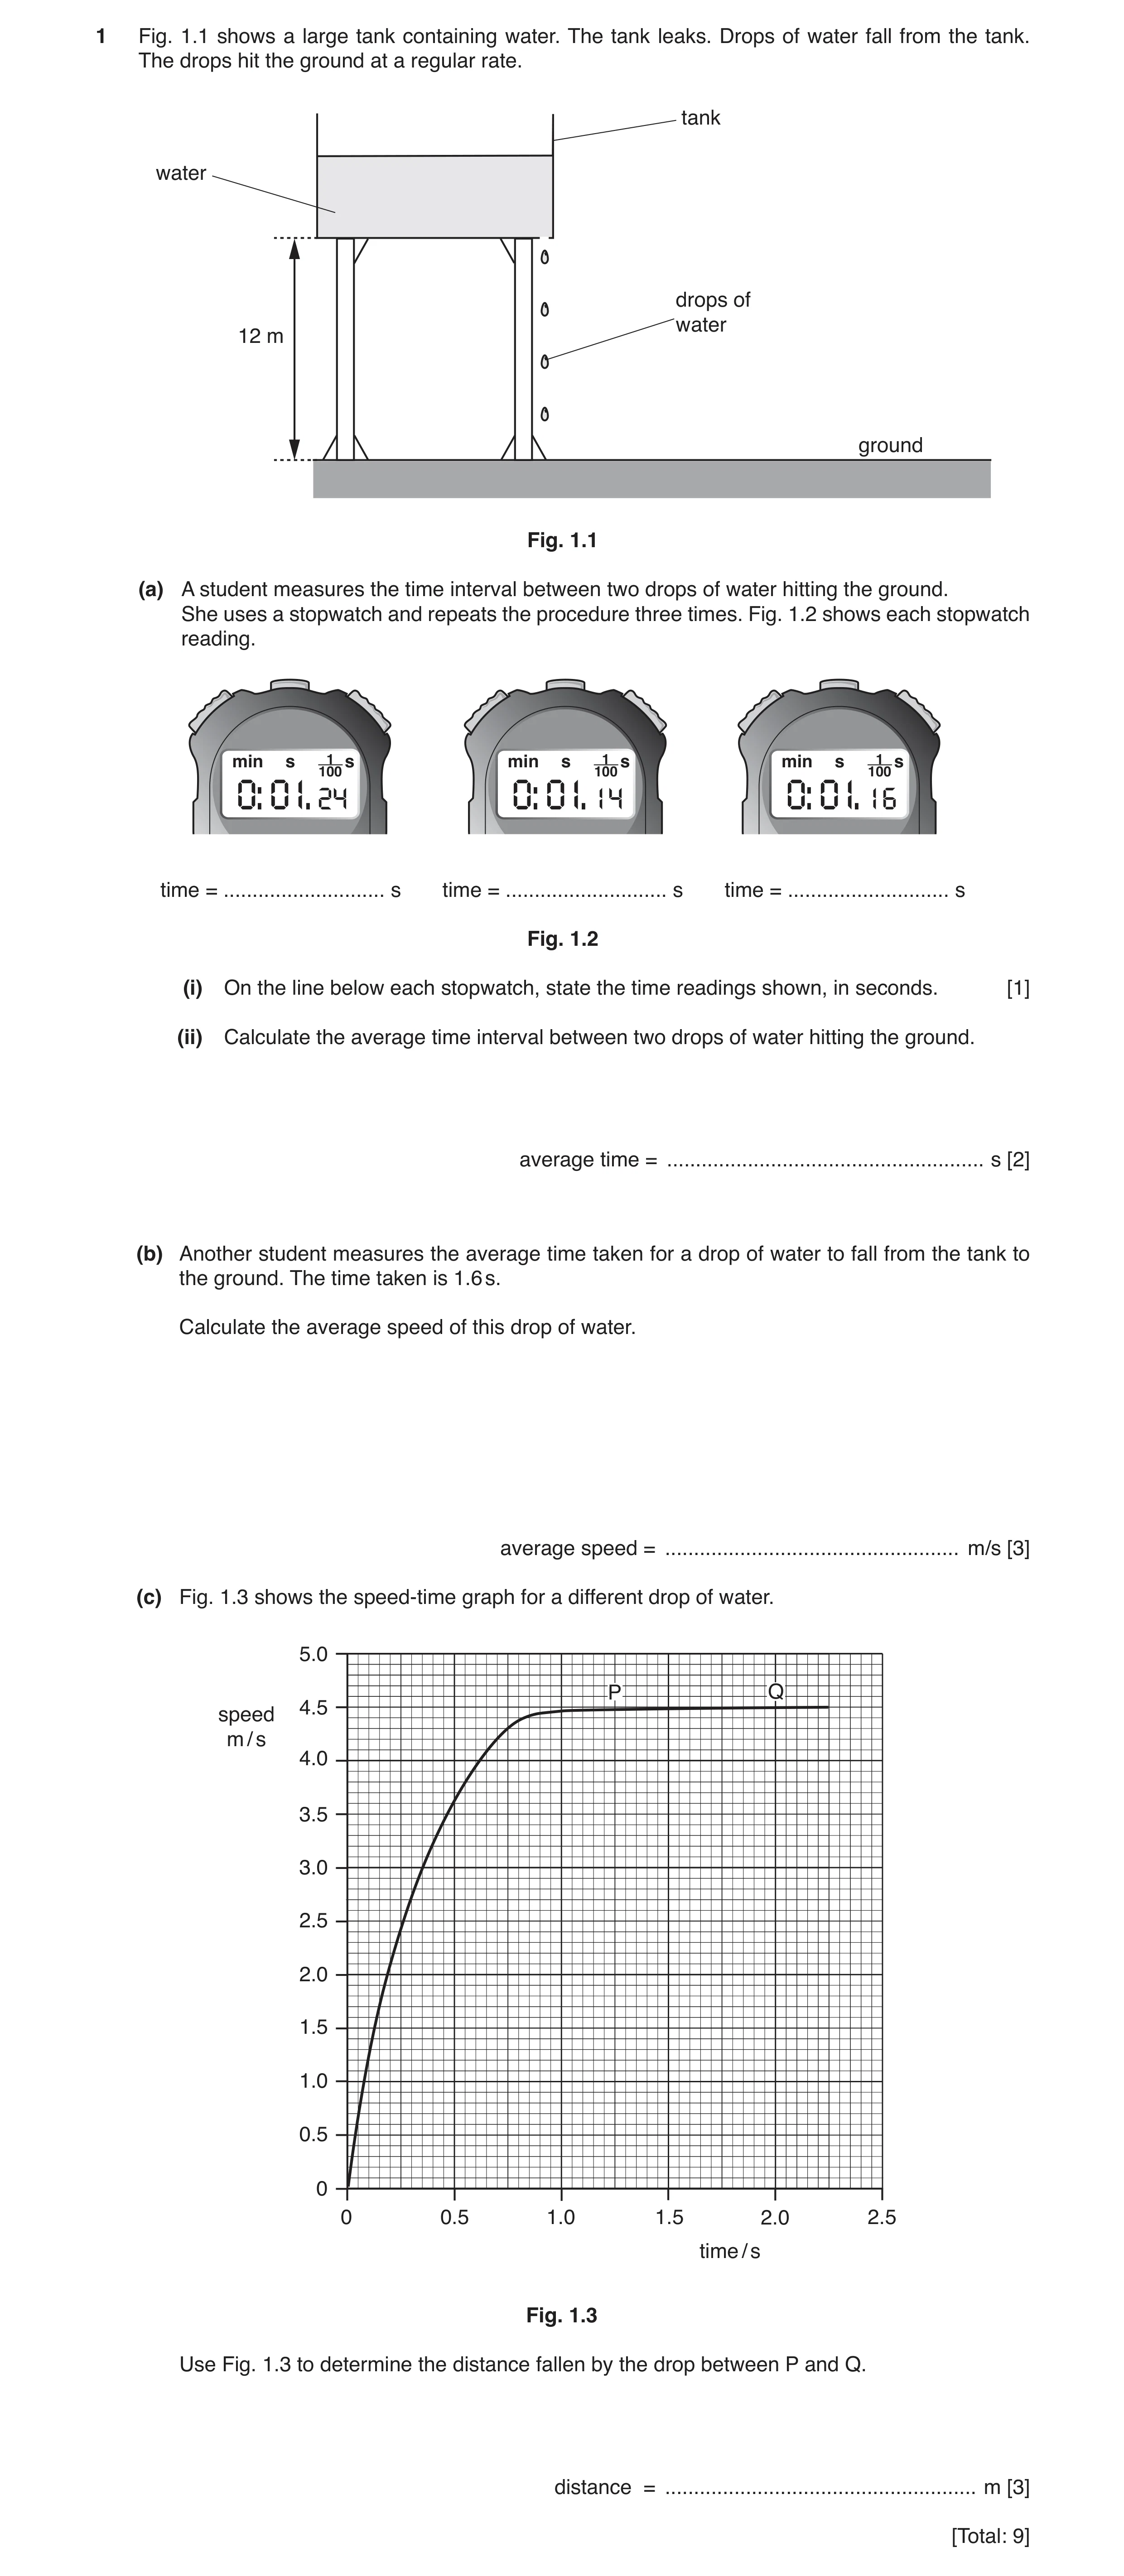
 11 / 54
 12 / 54
 13 / 54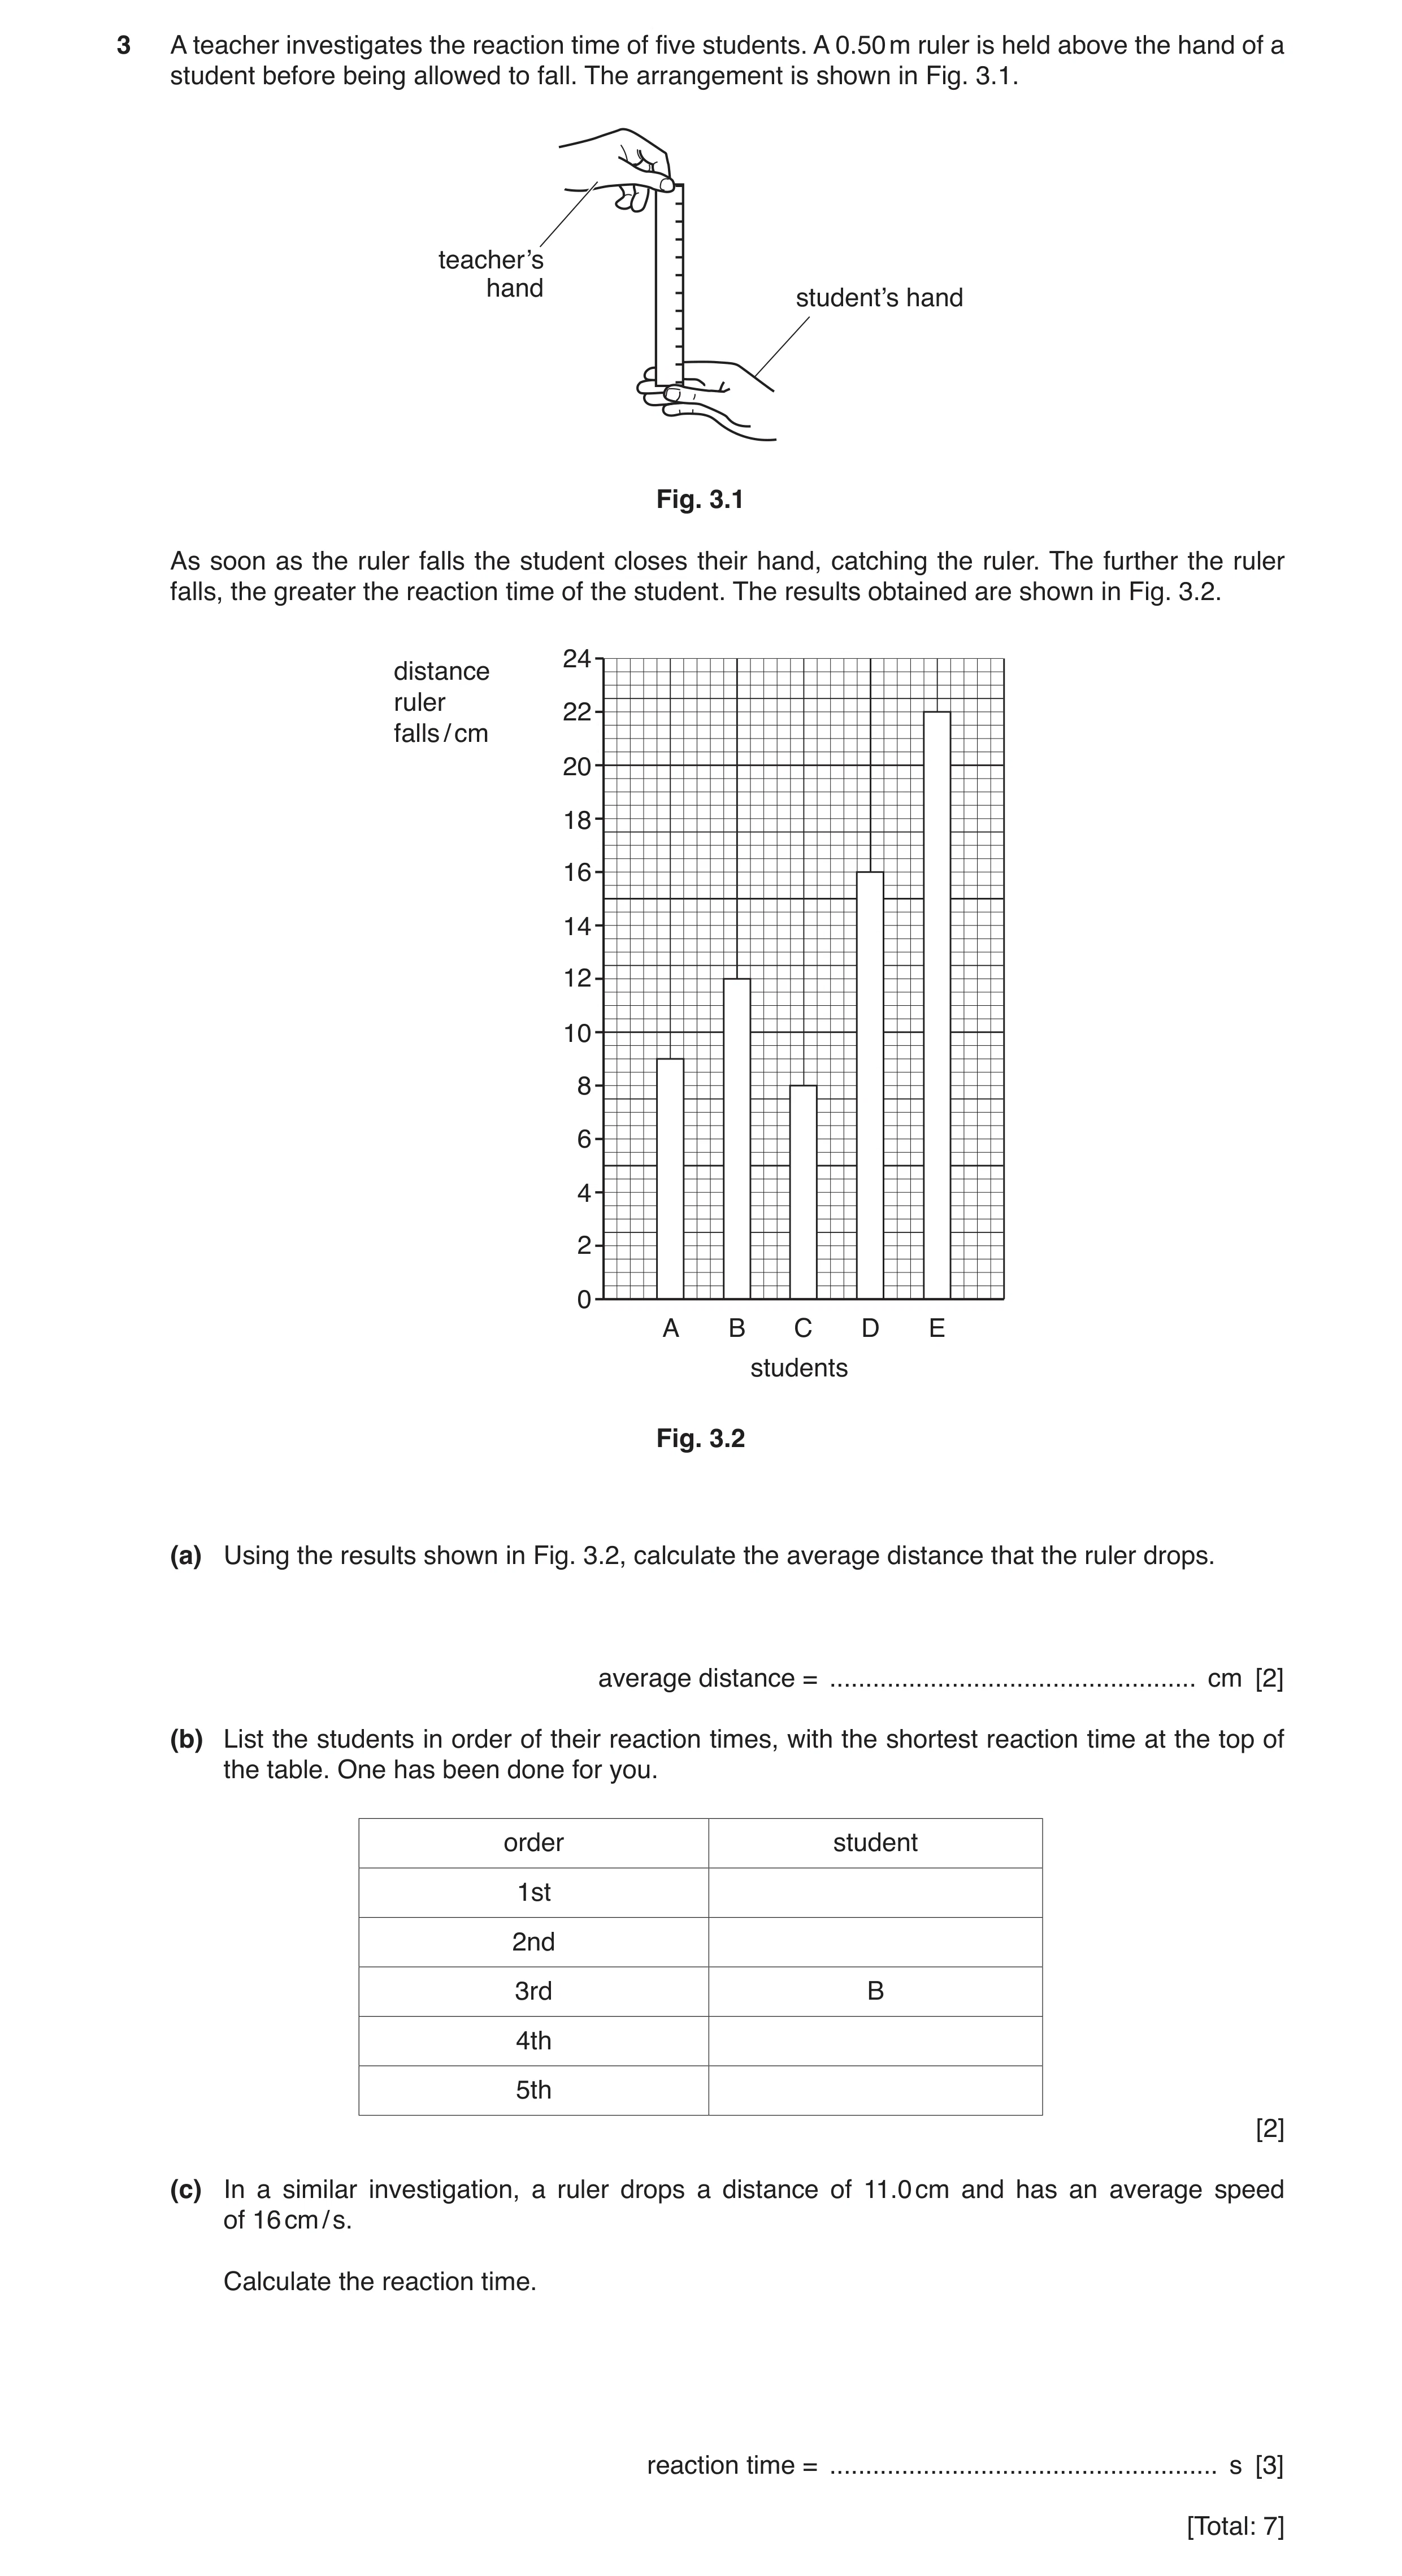
 16 / 54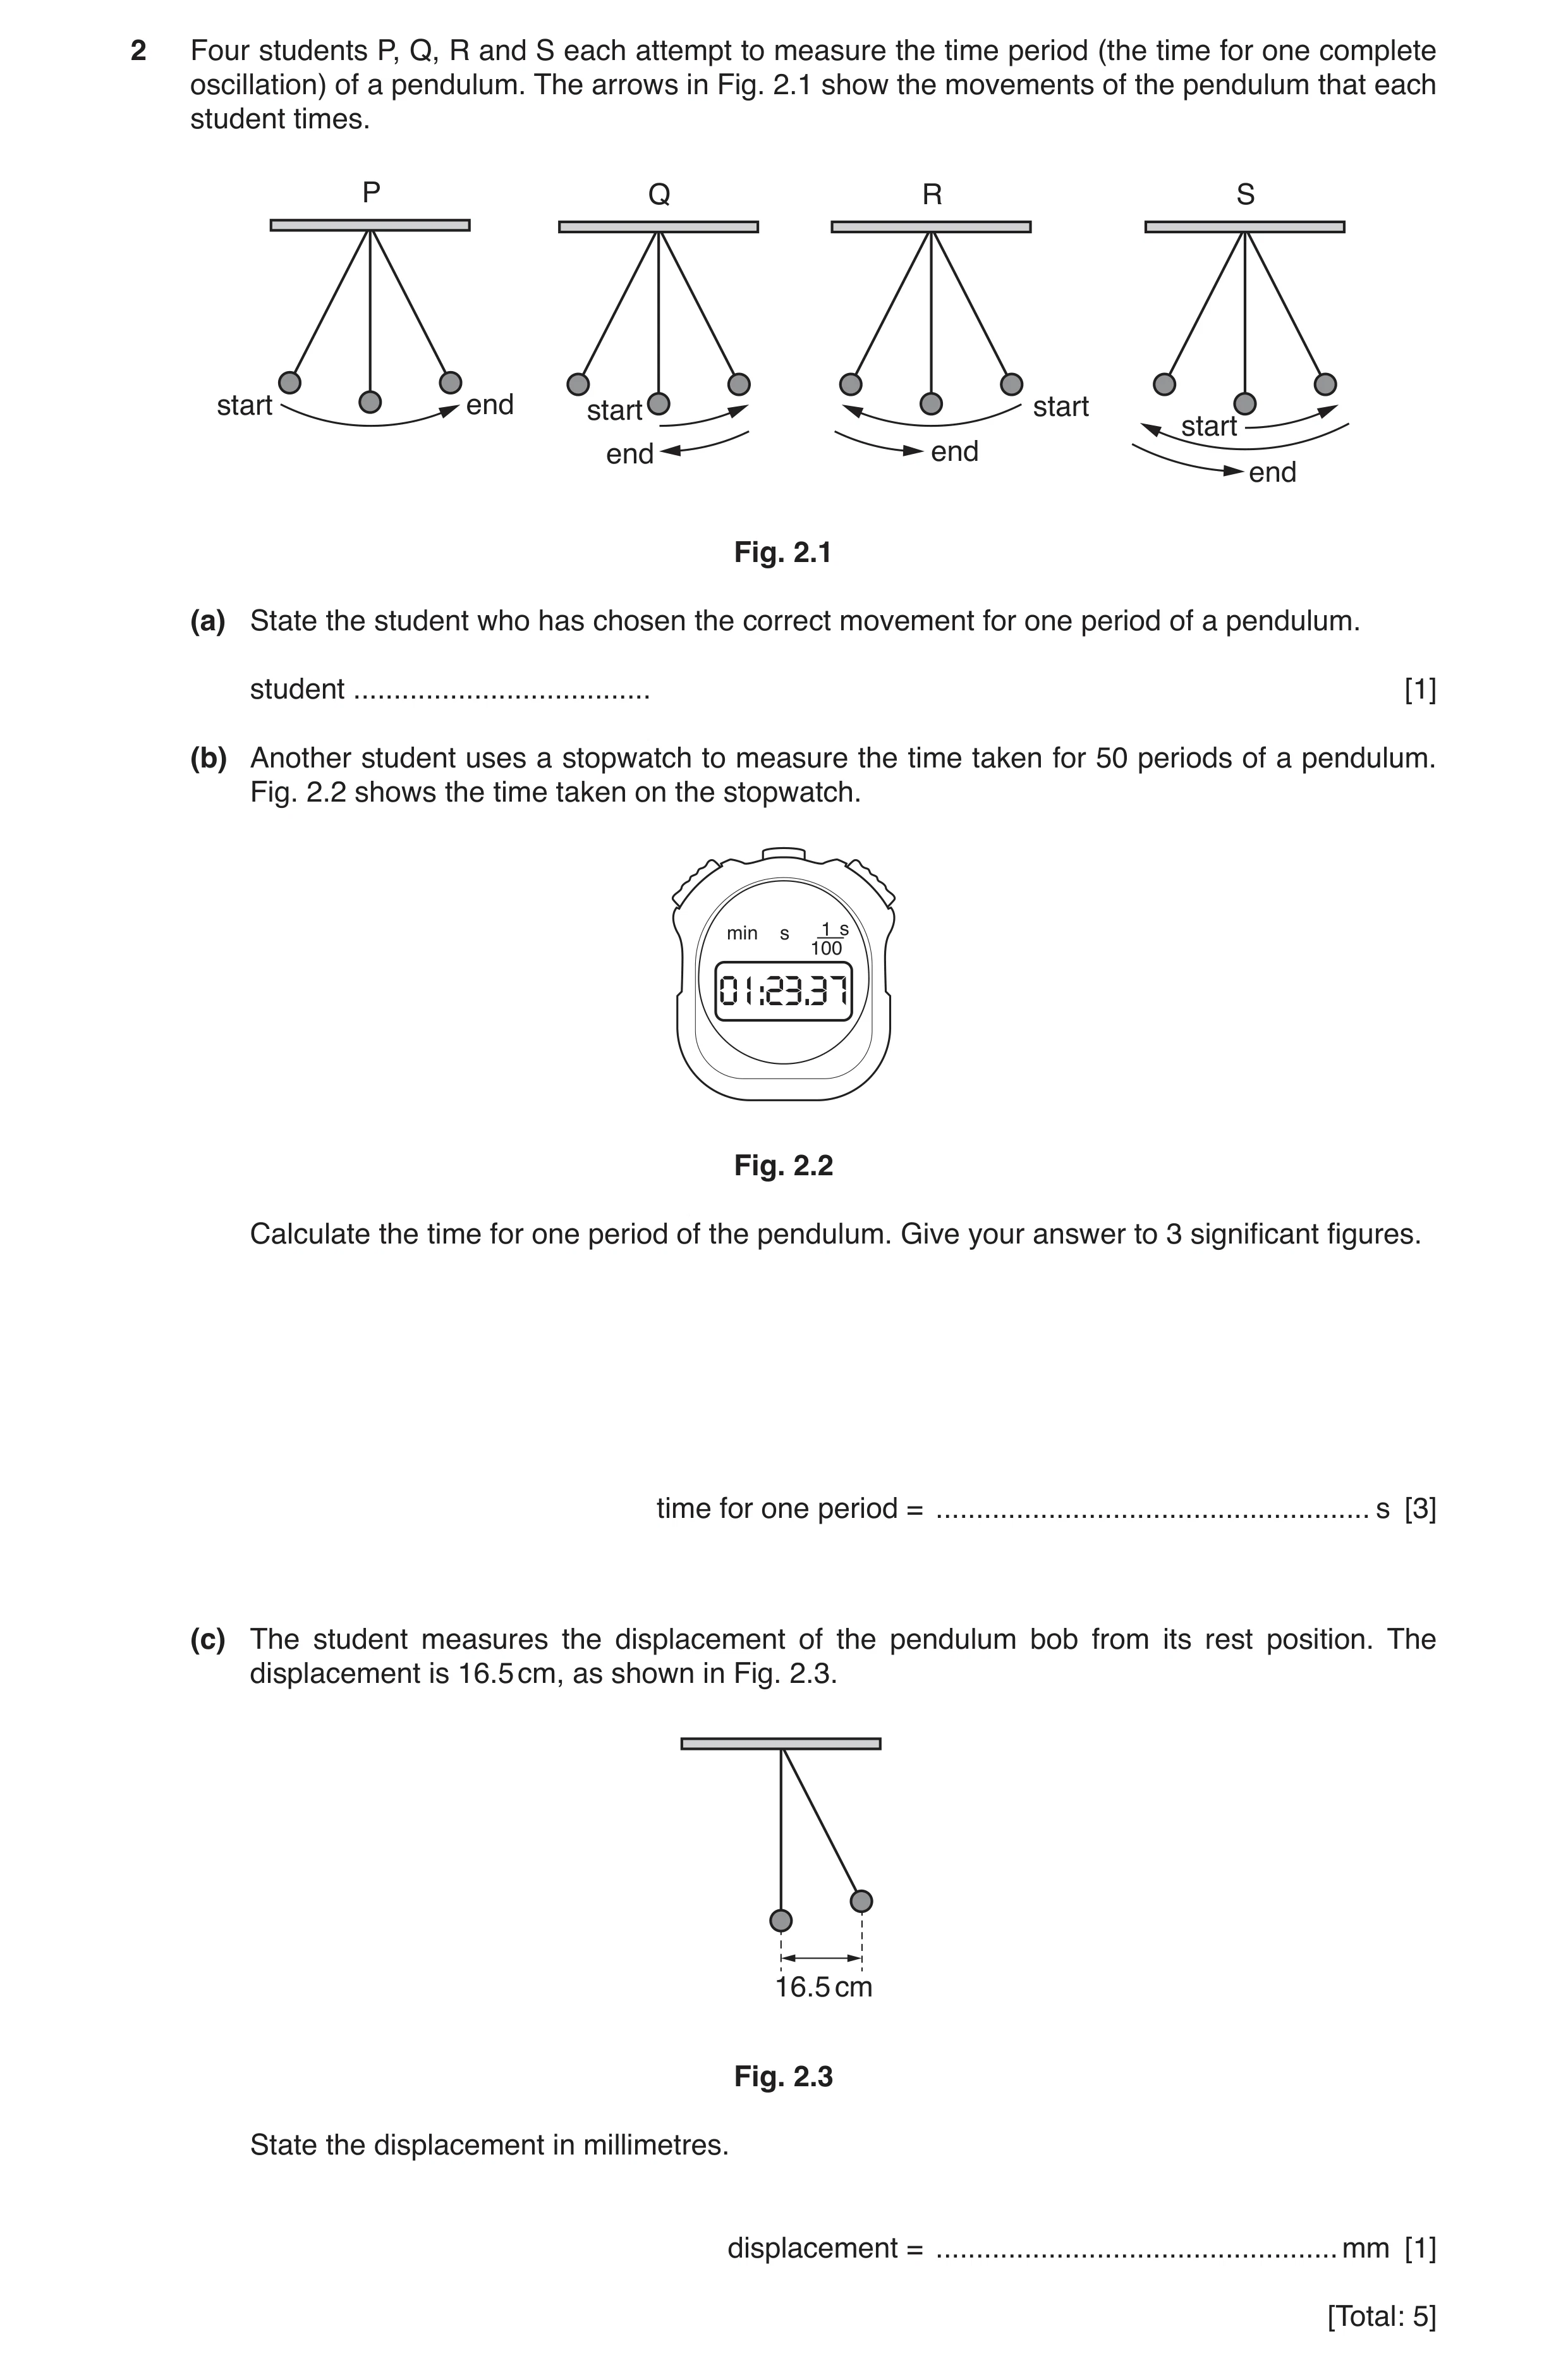
 20 / 54
 21 / 54
 22 / 54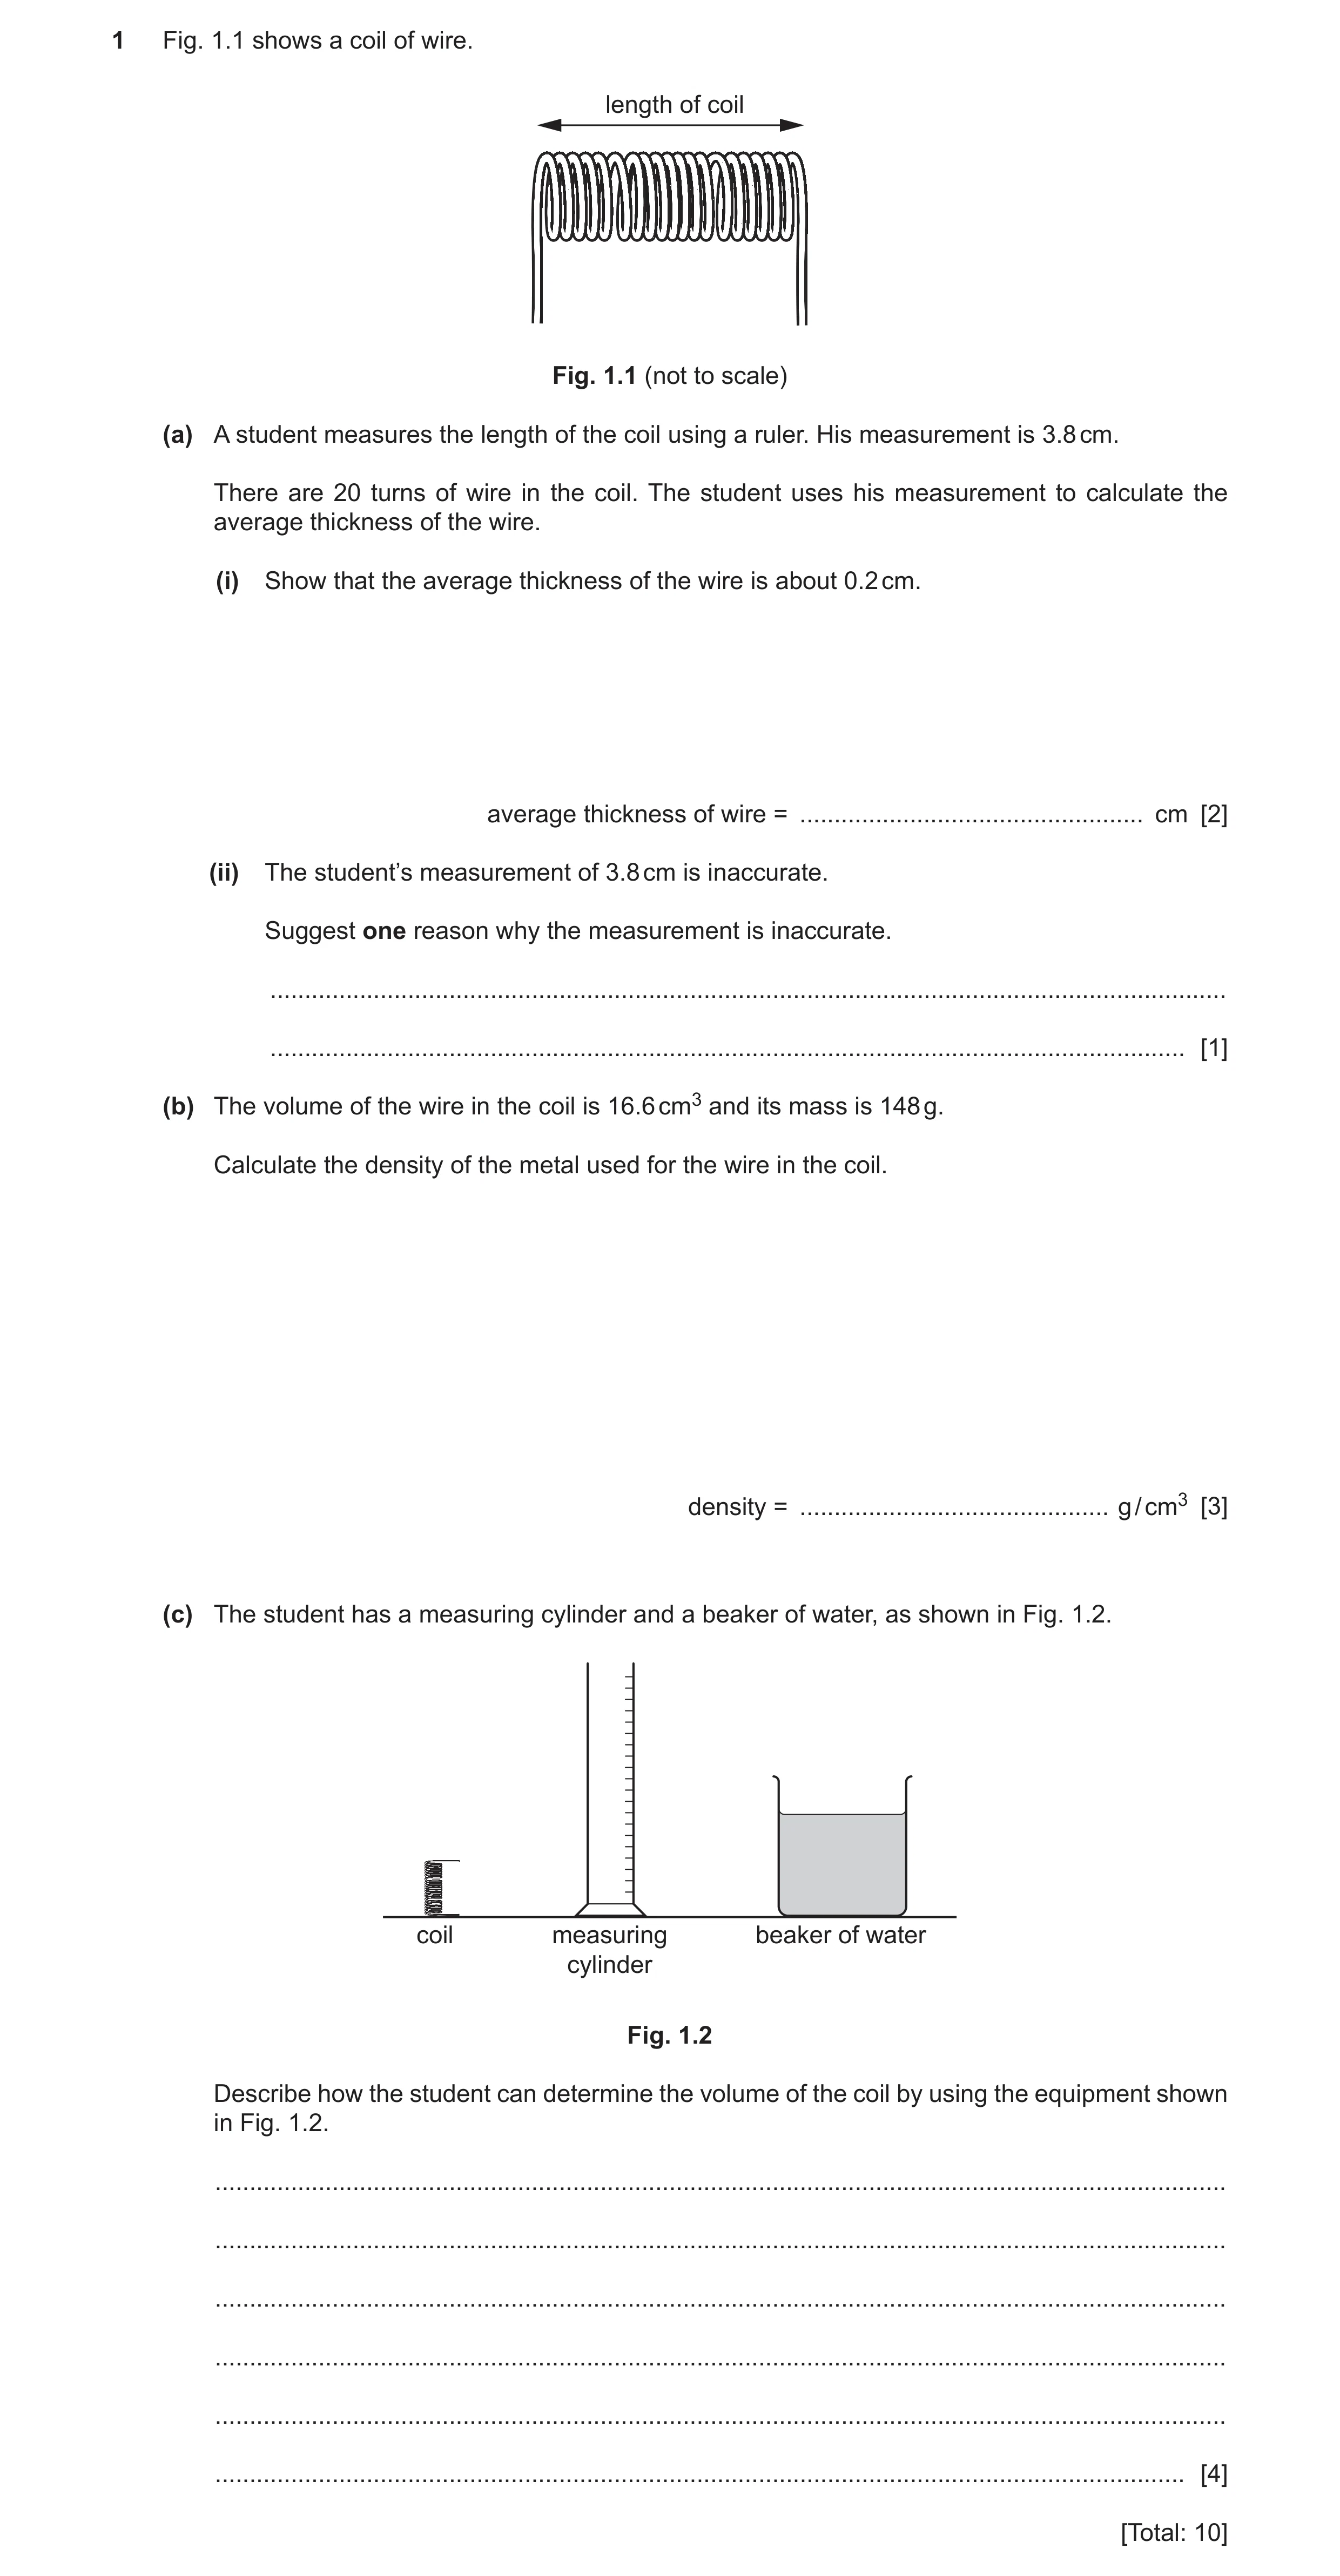
 25 / 54
 26 / 54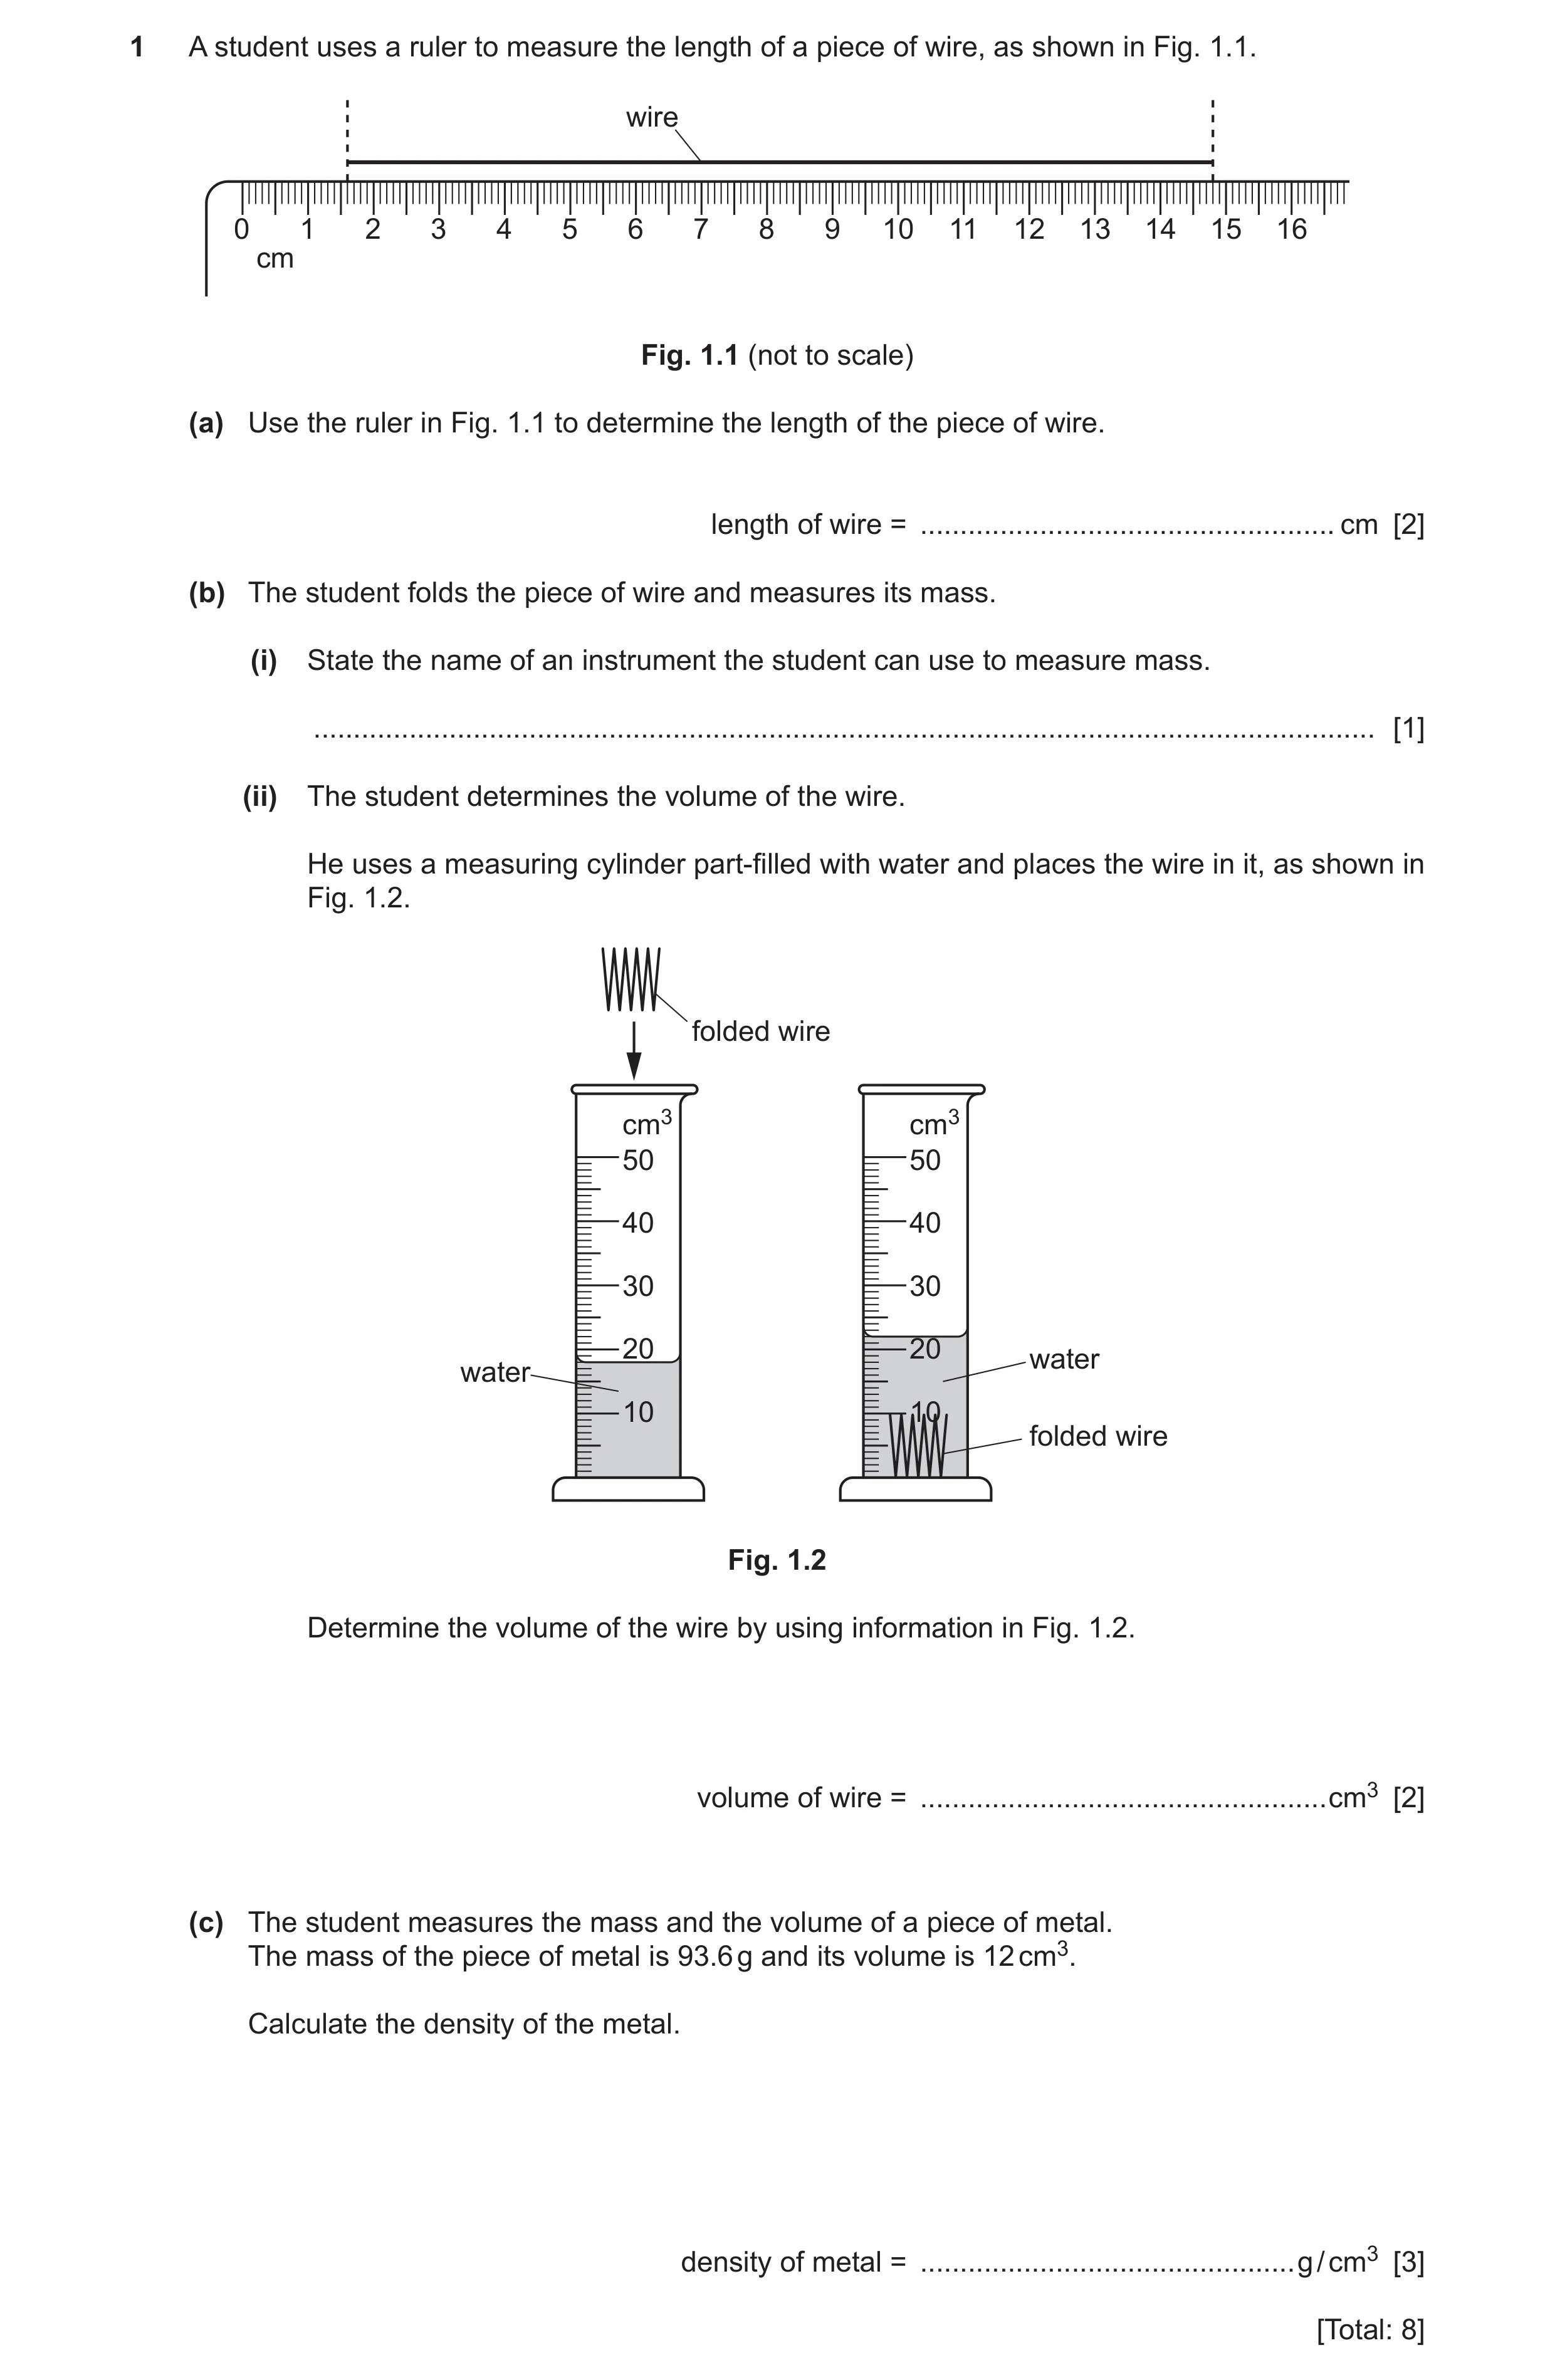
 33 / 54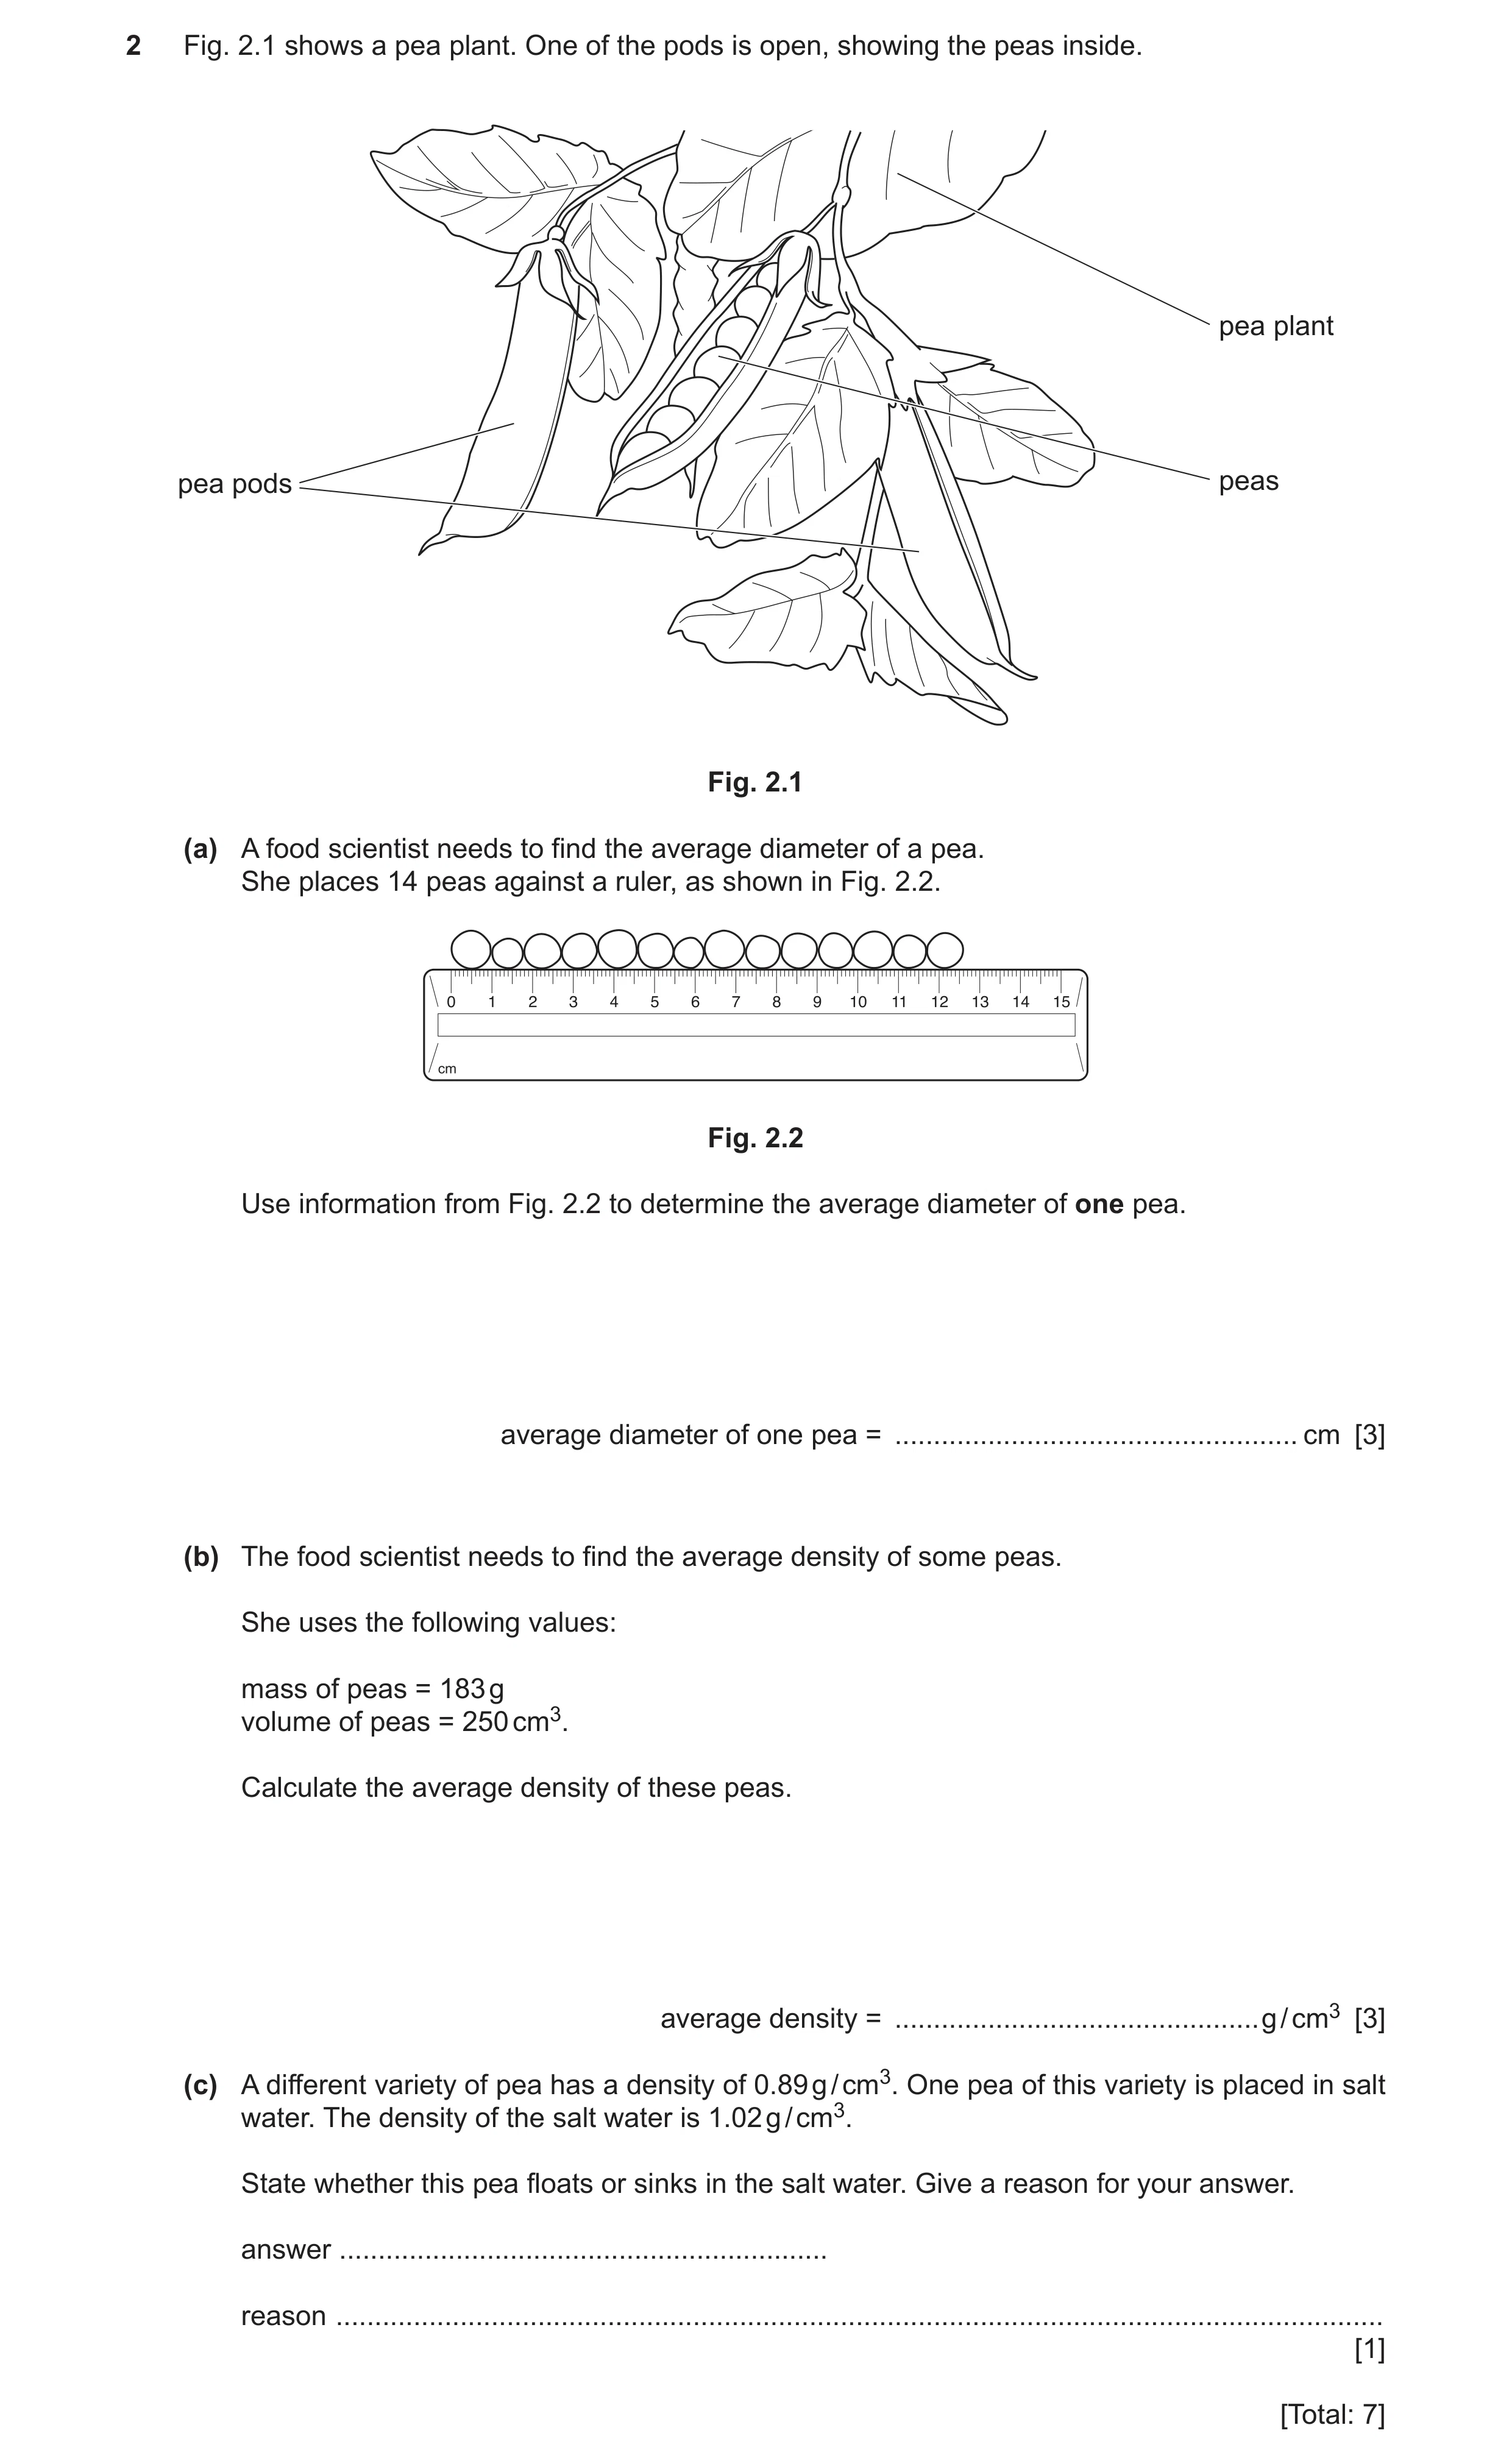
 36 / 54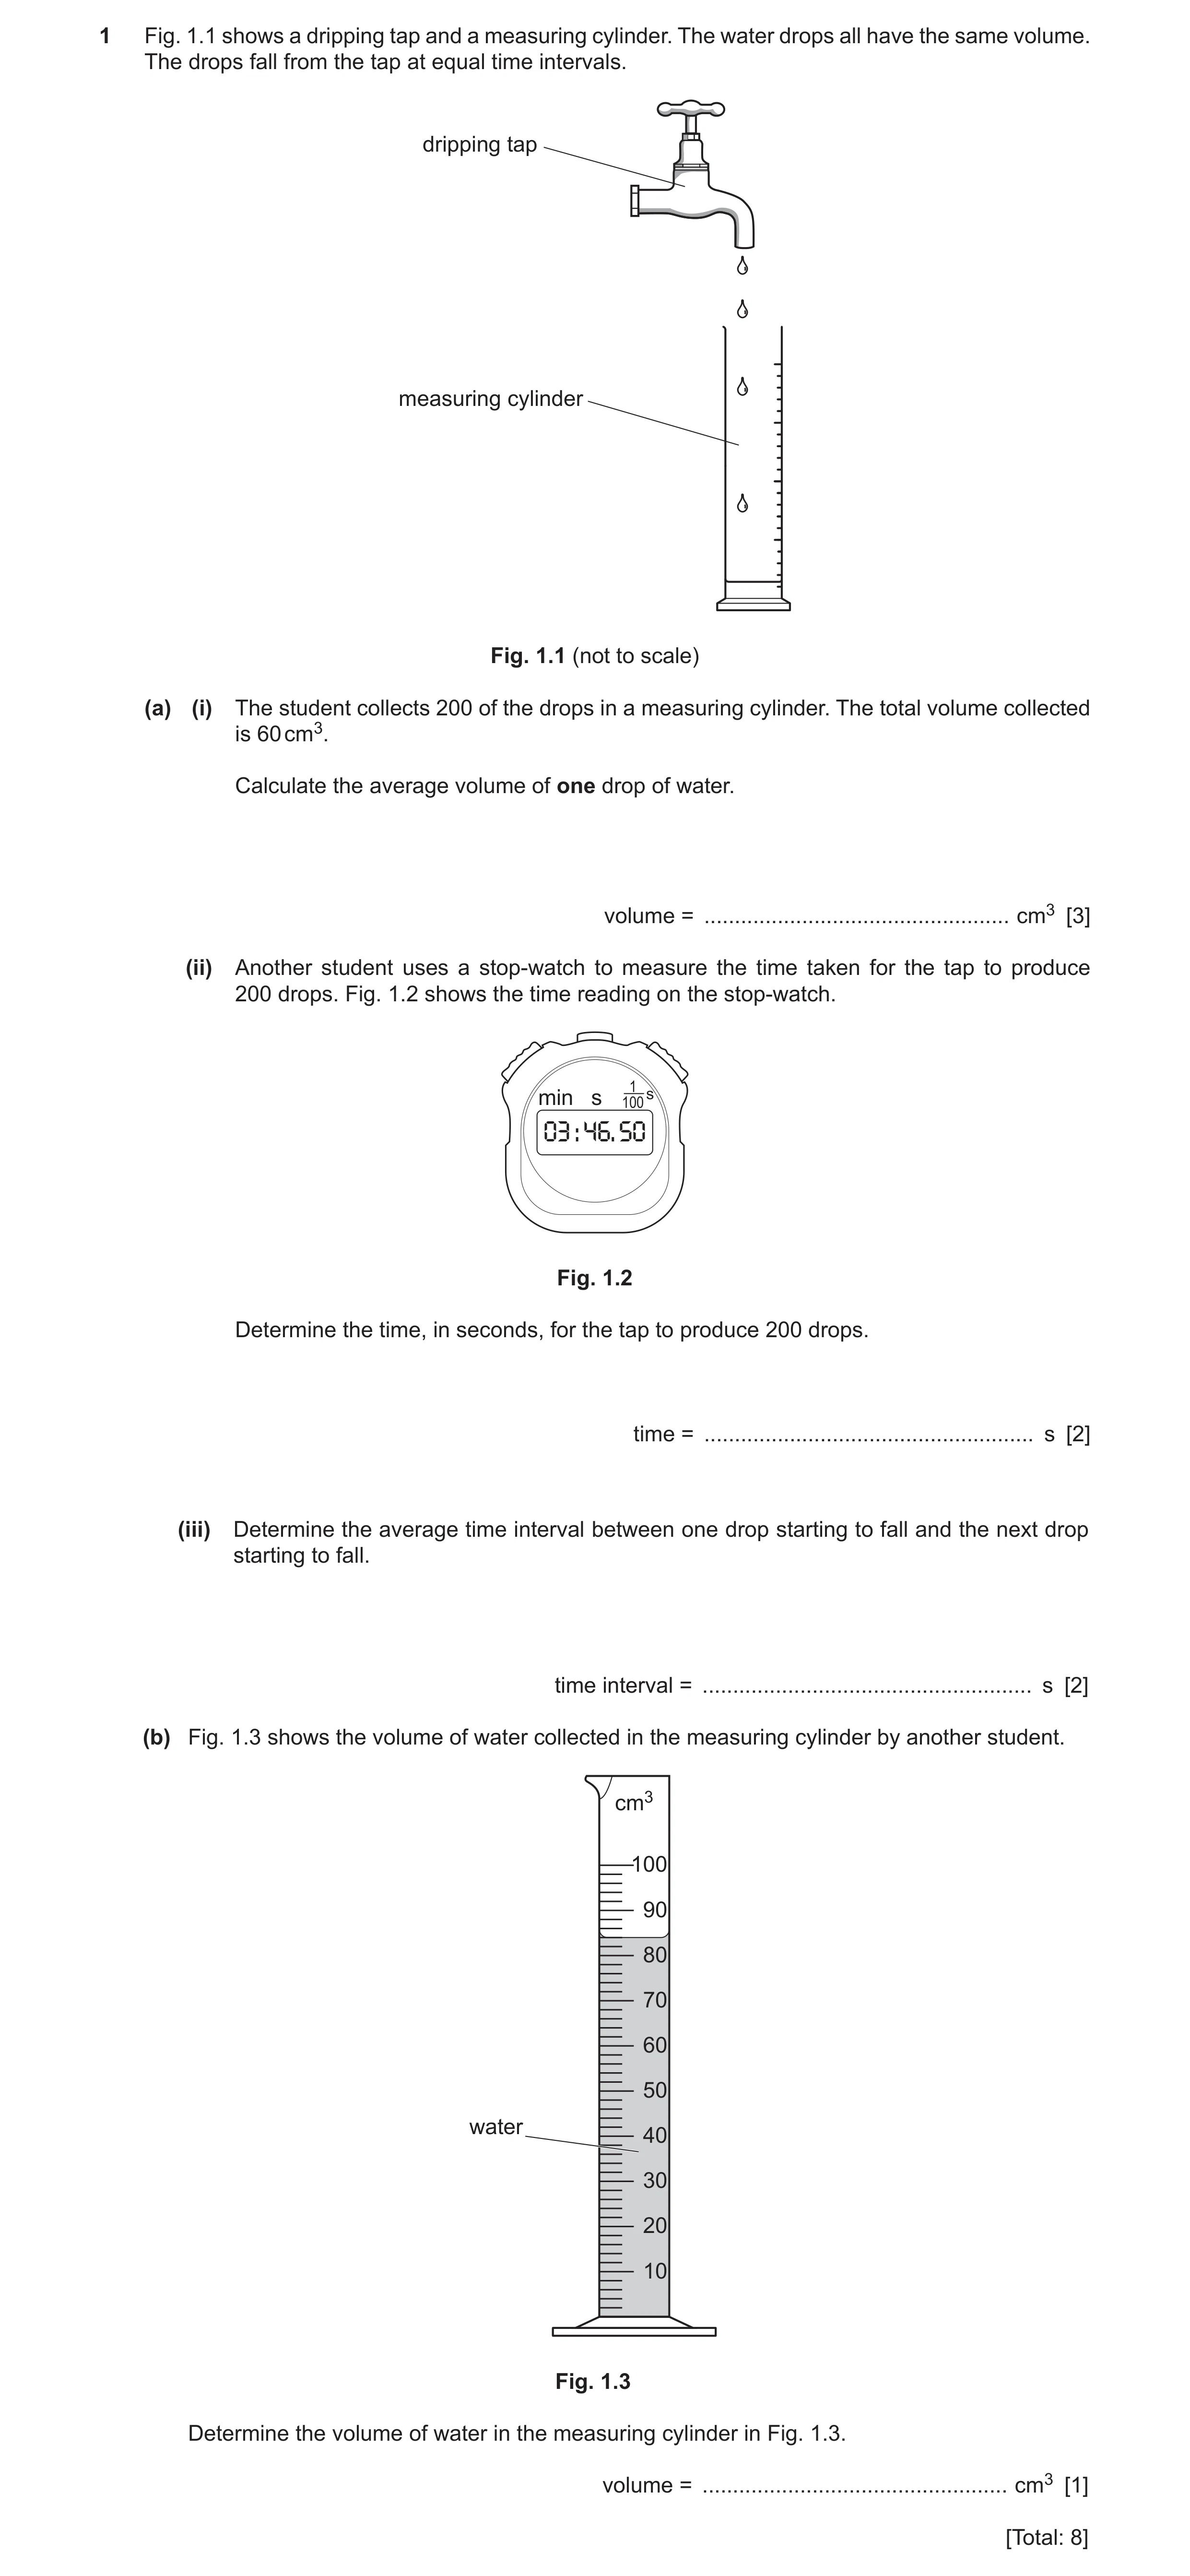
 39 / 54
 40 / 54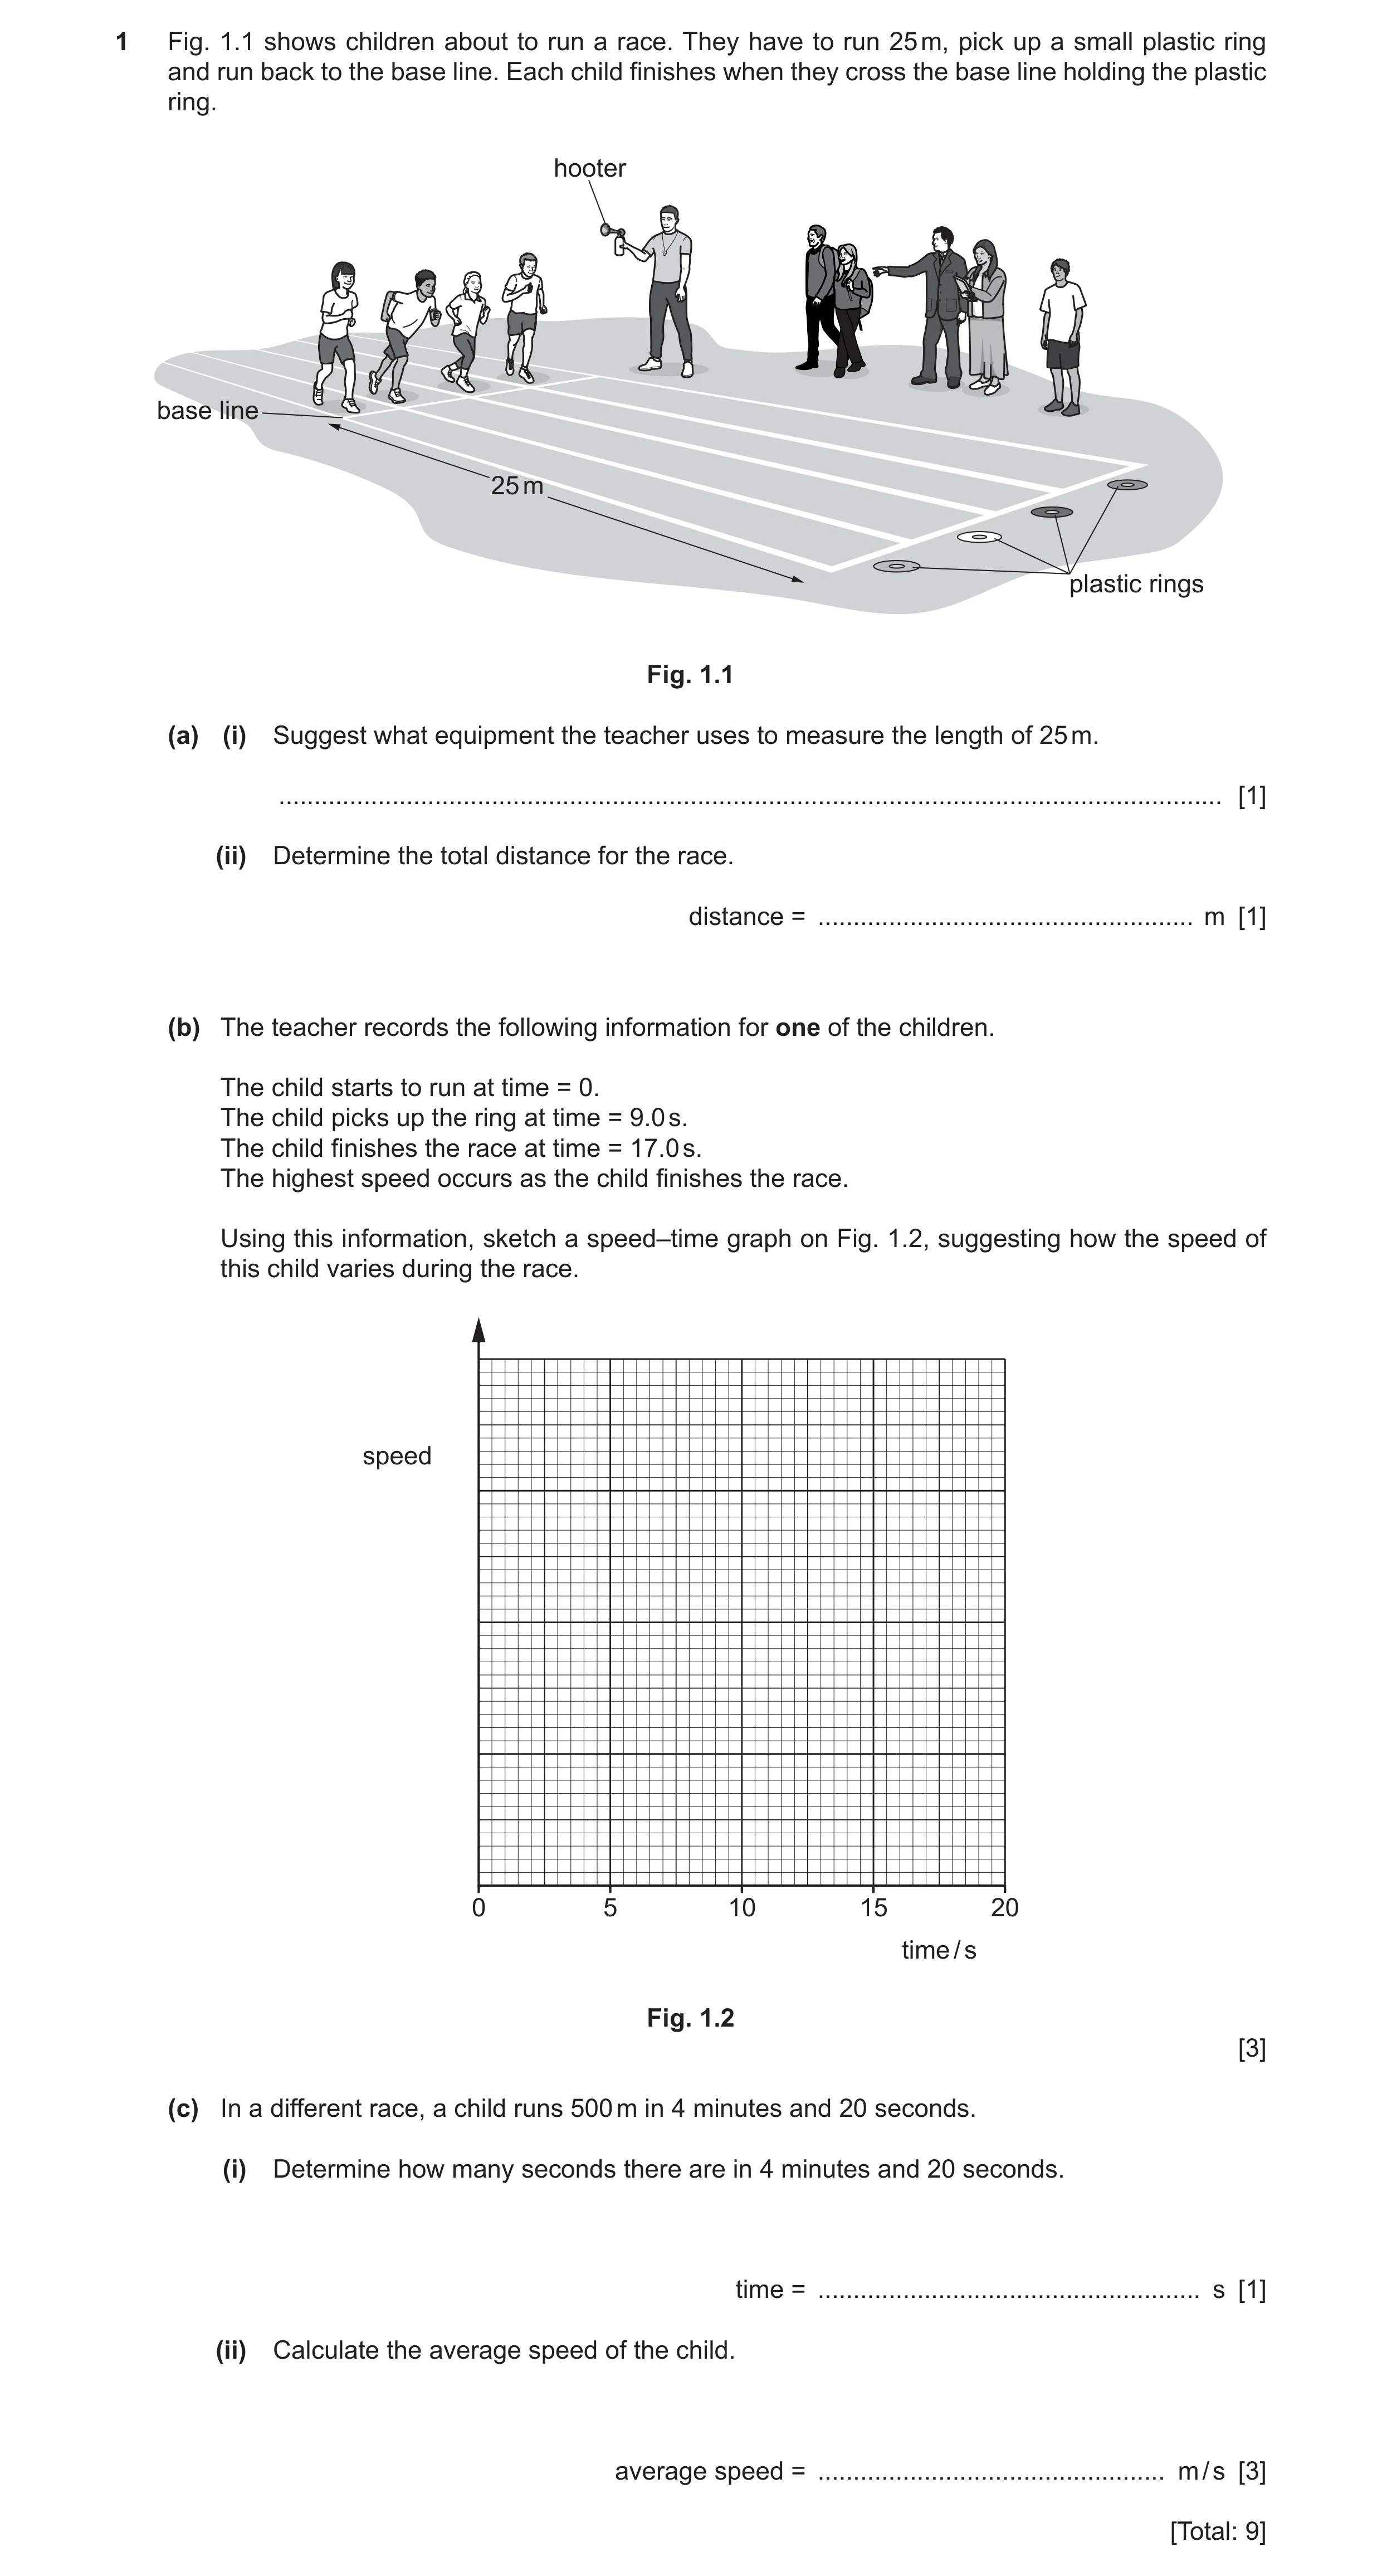
 42 / 54
 43 / 54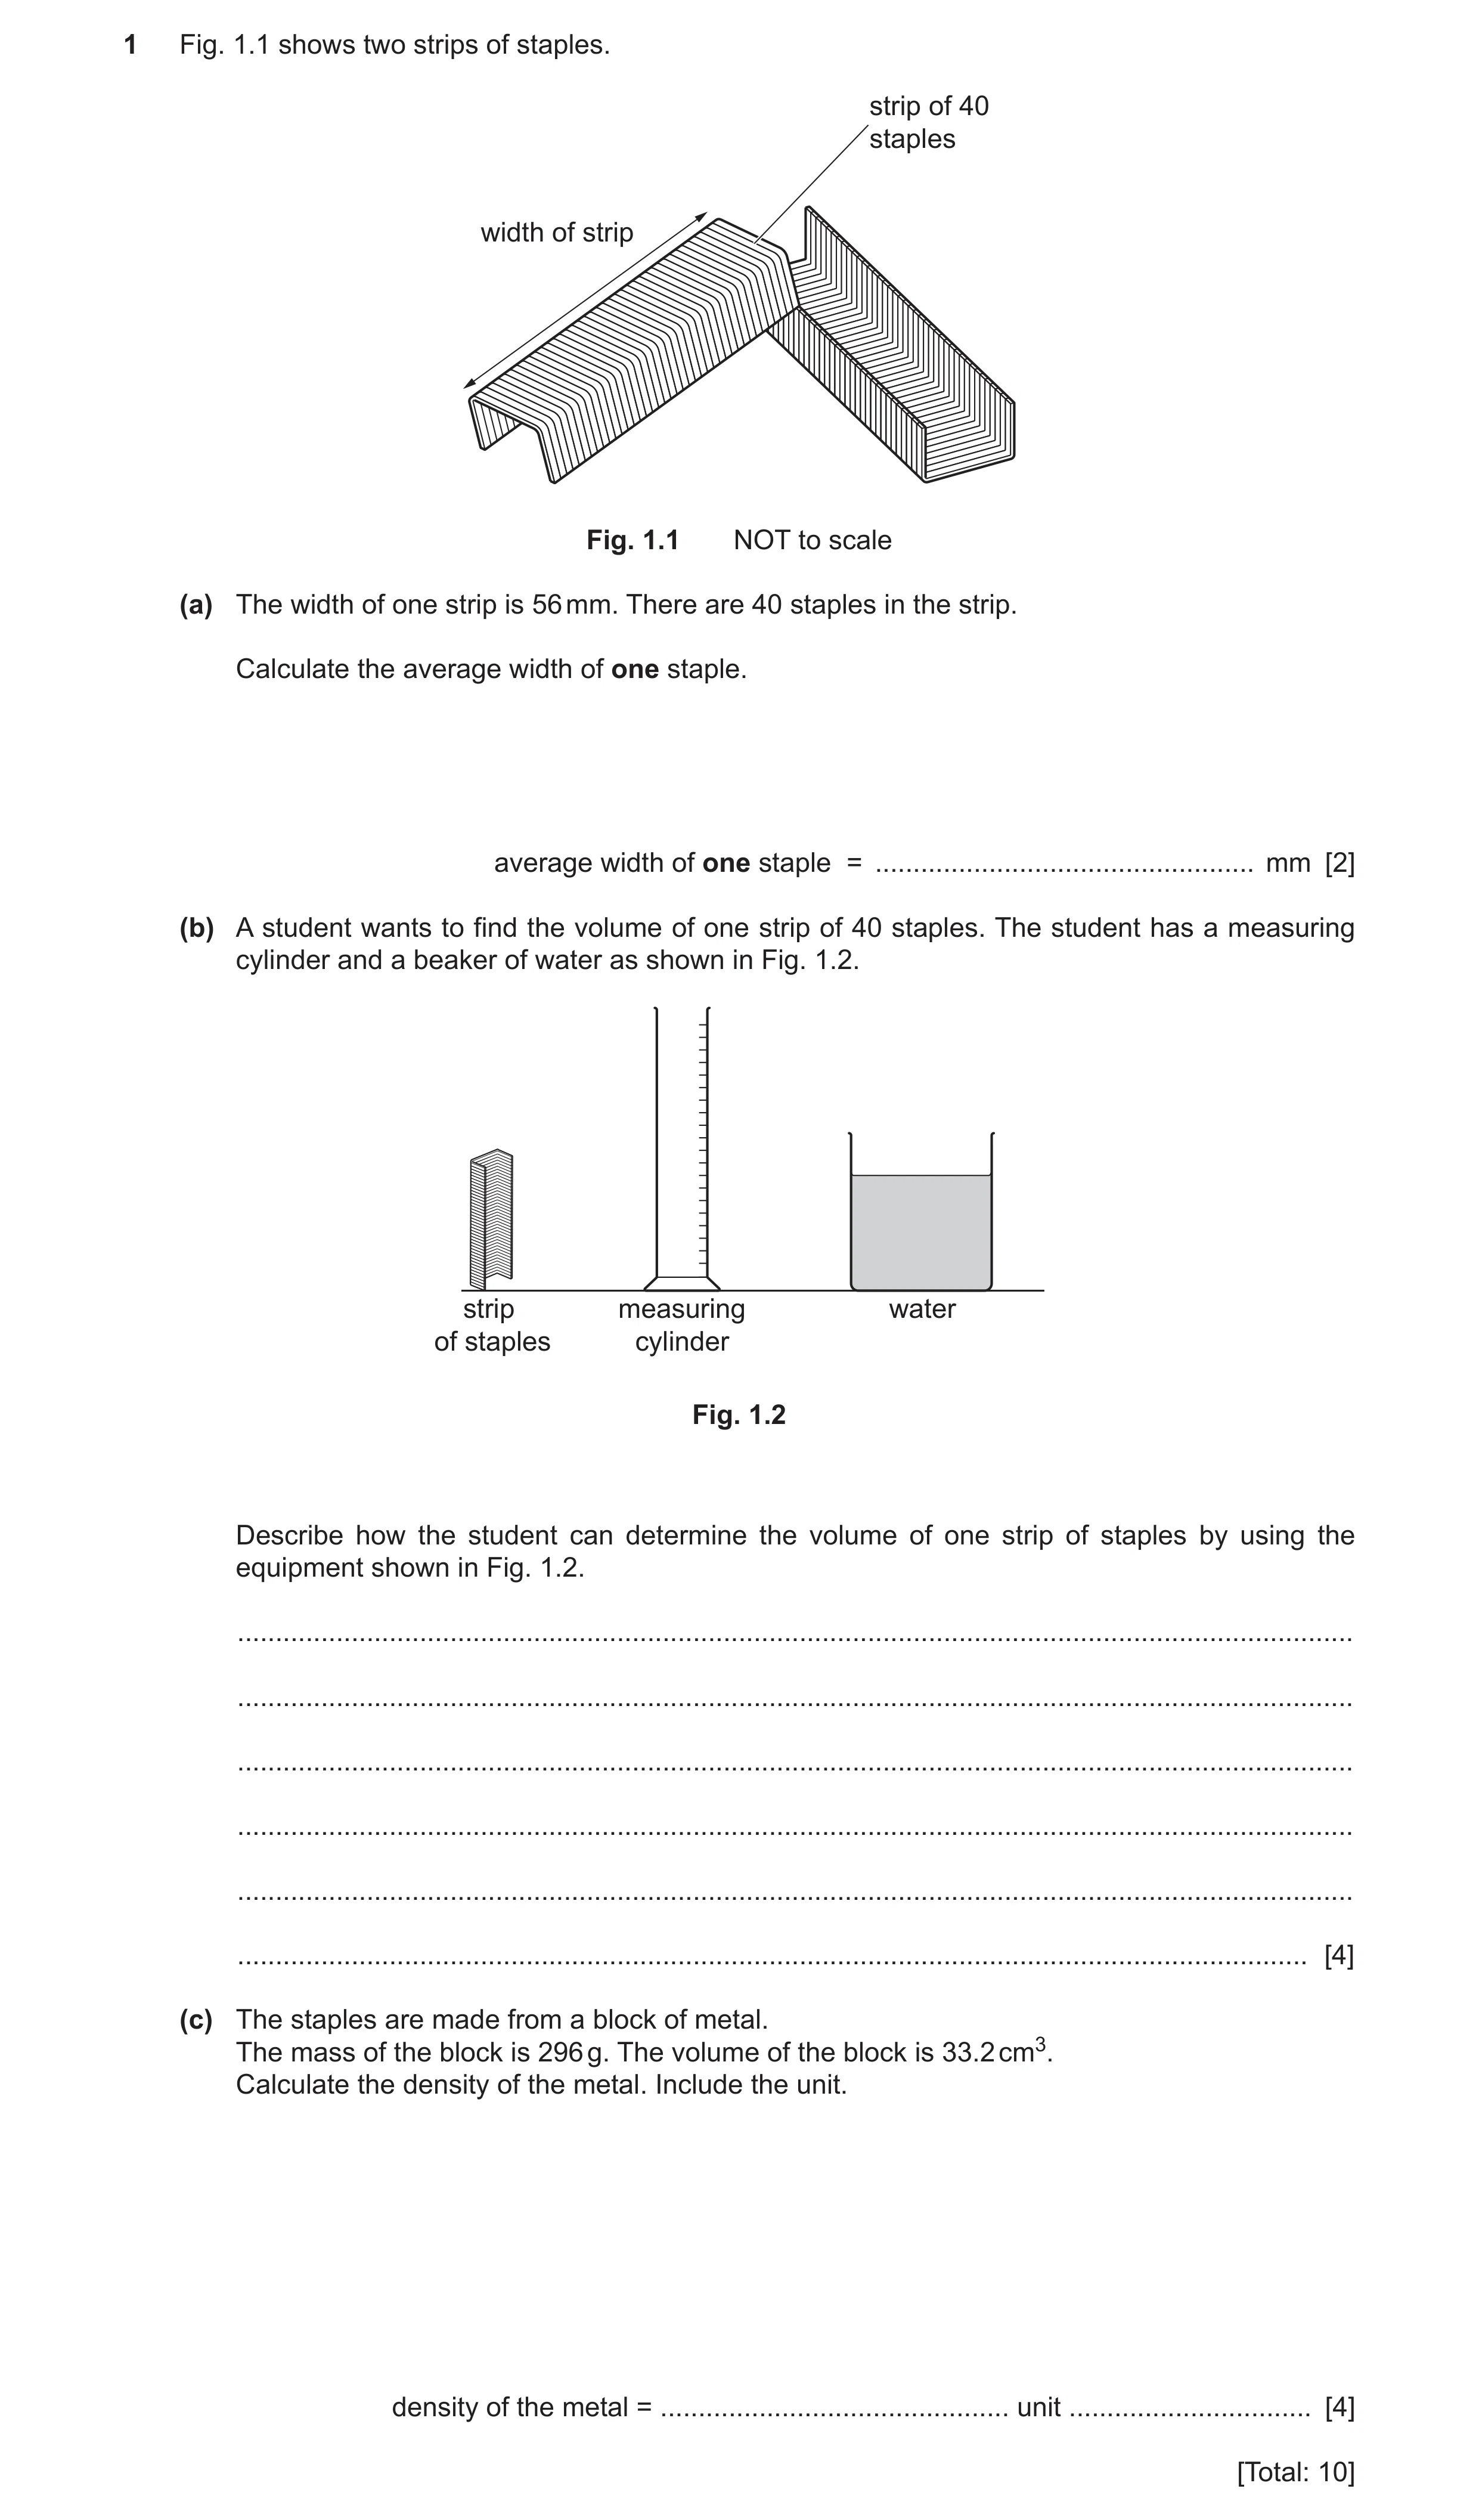
 45 / 54
 46 / 54
 47 / 54
 48 / 54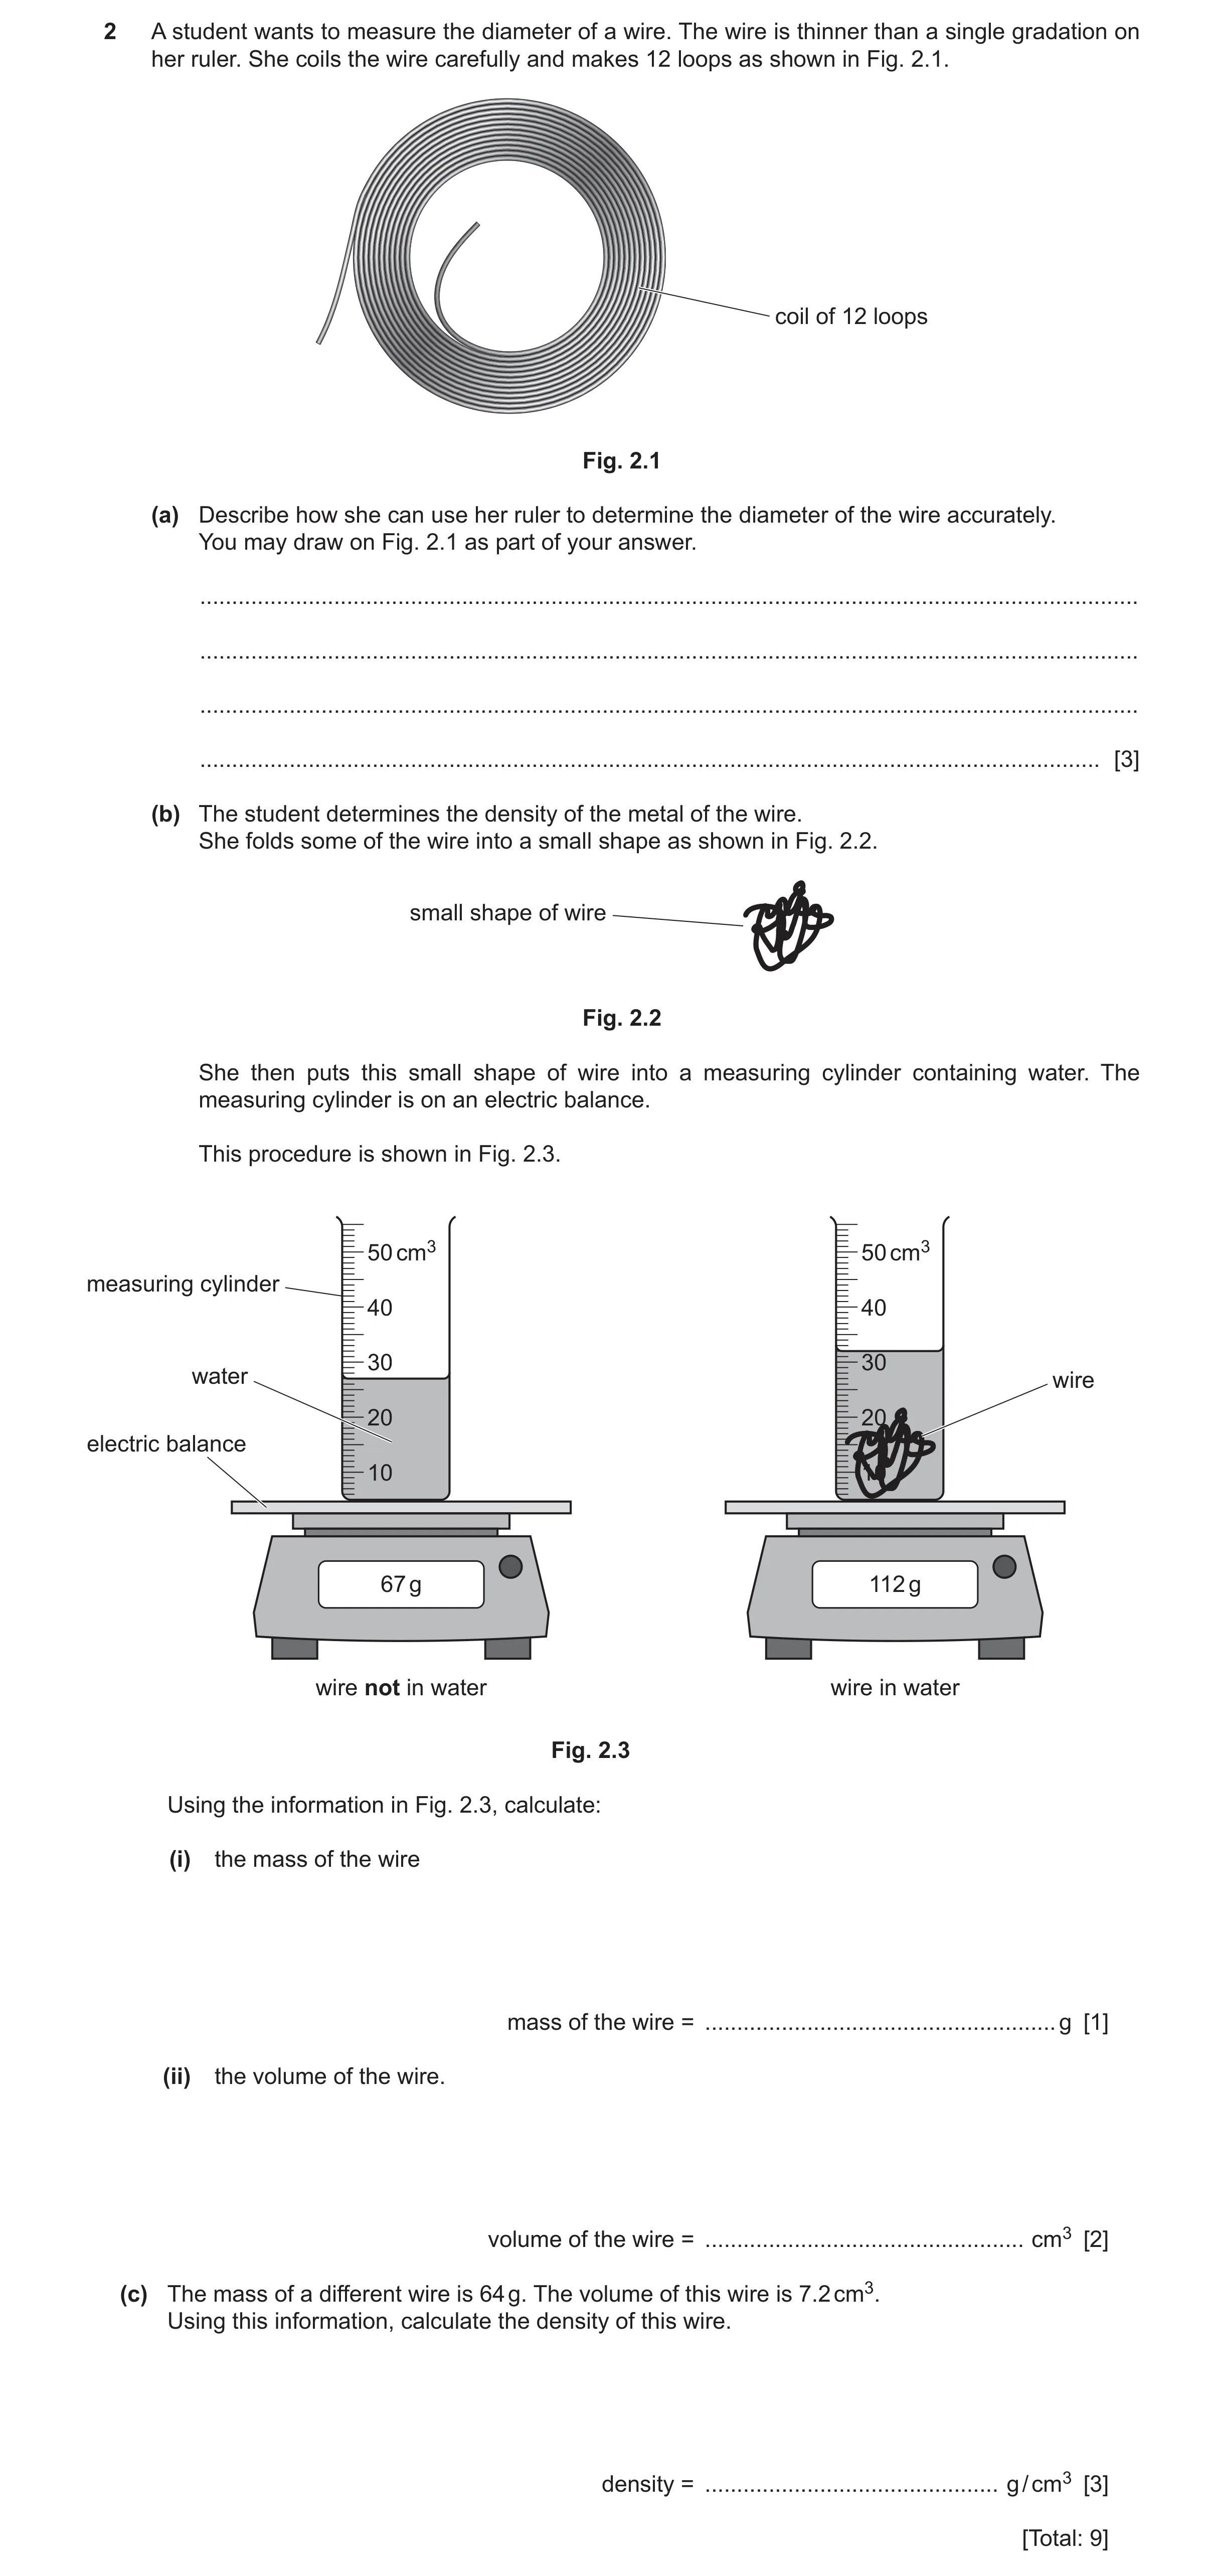
 8
8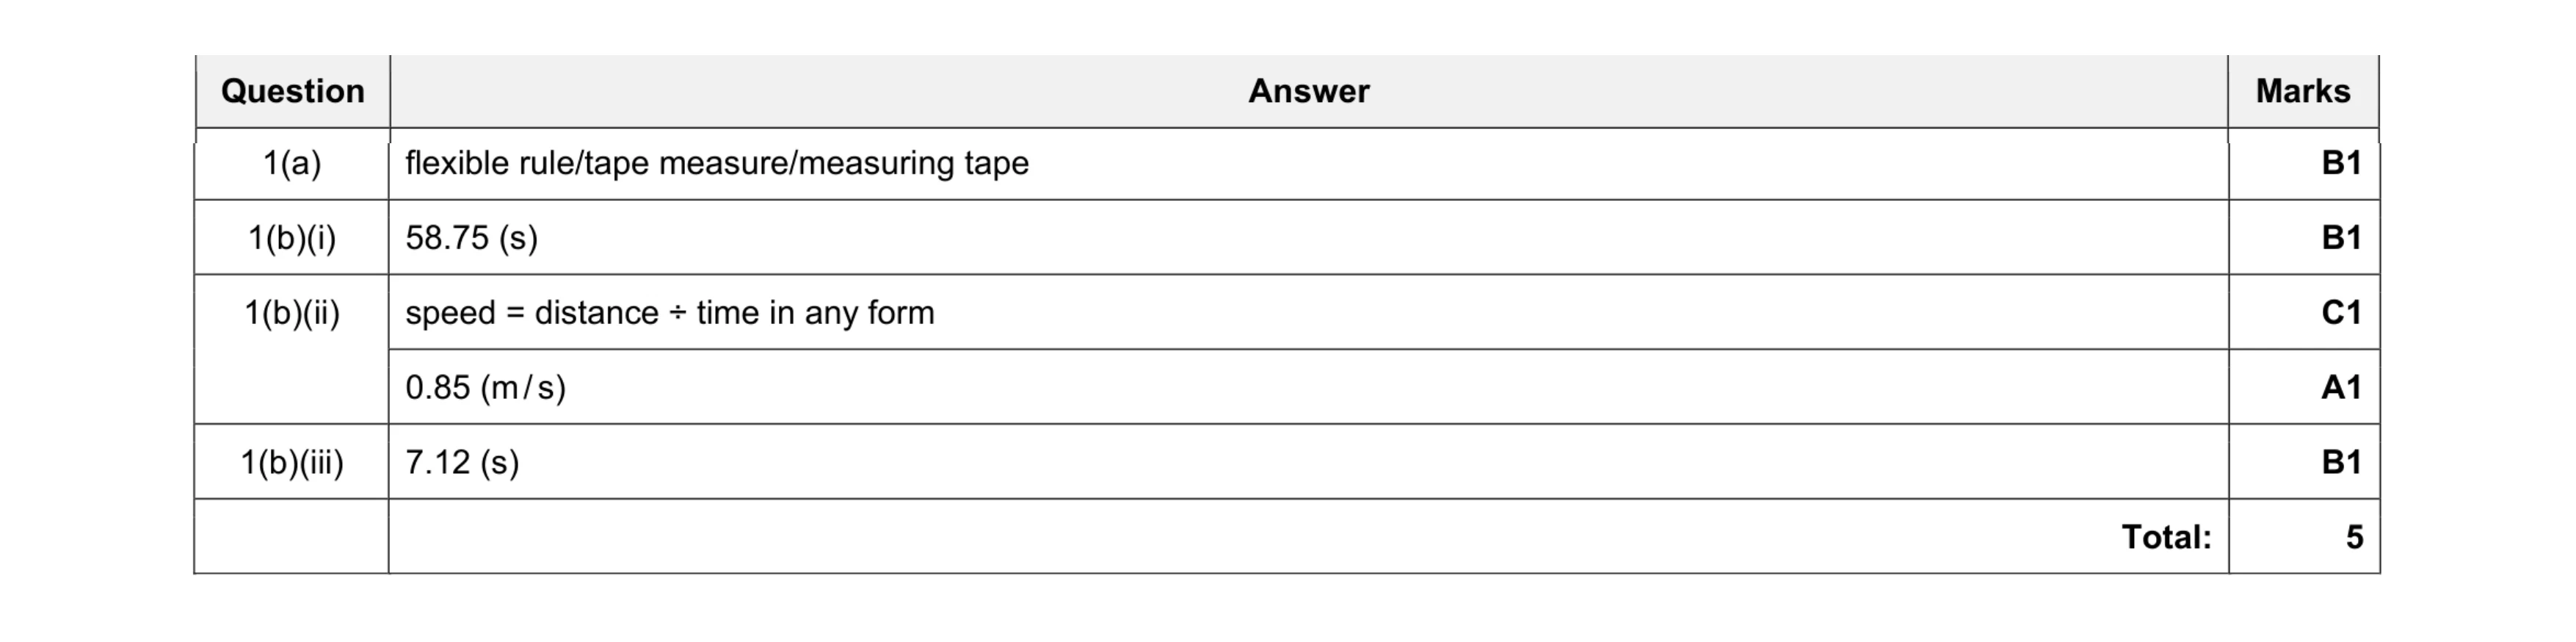 5
5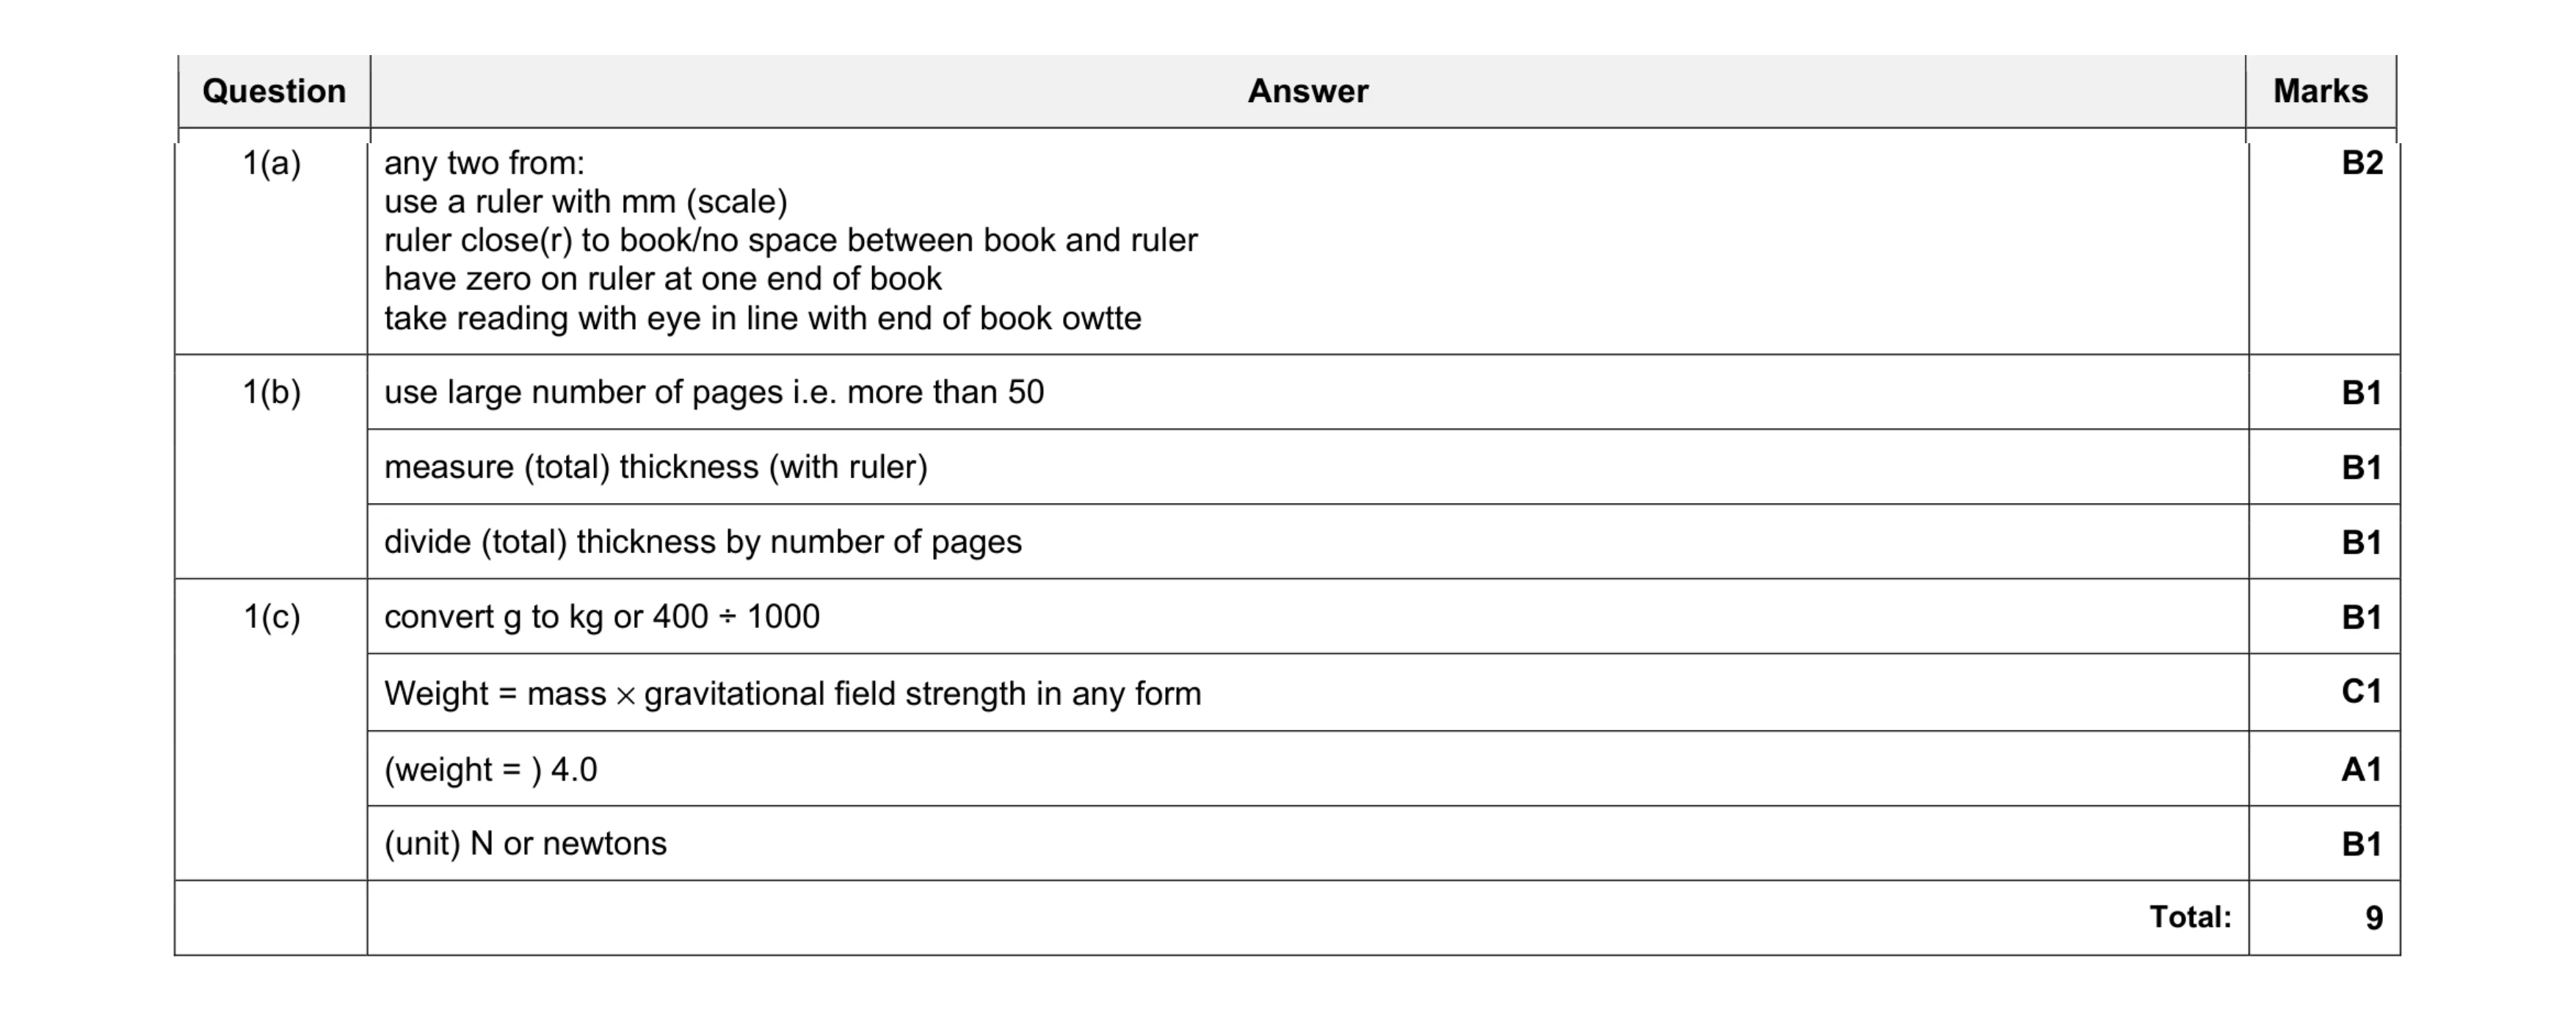 9
9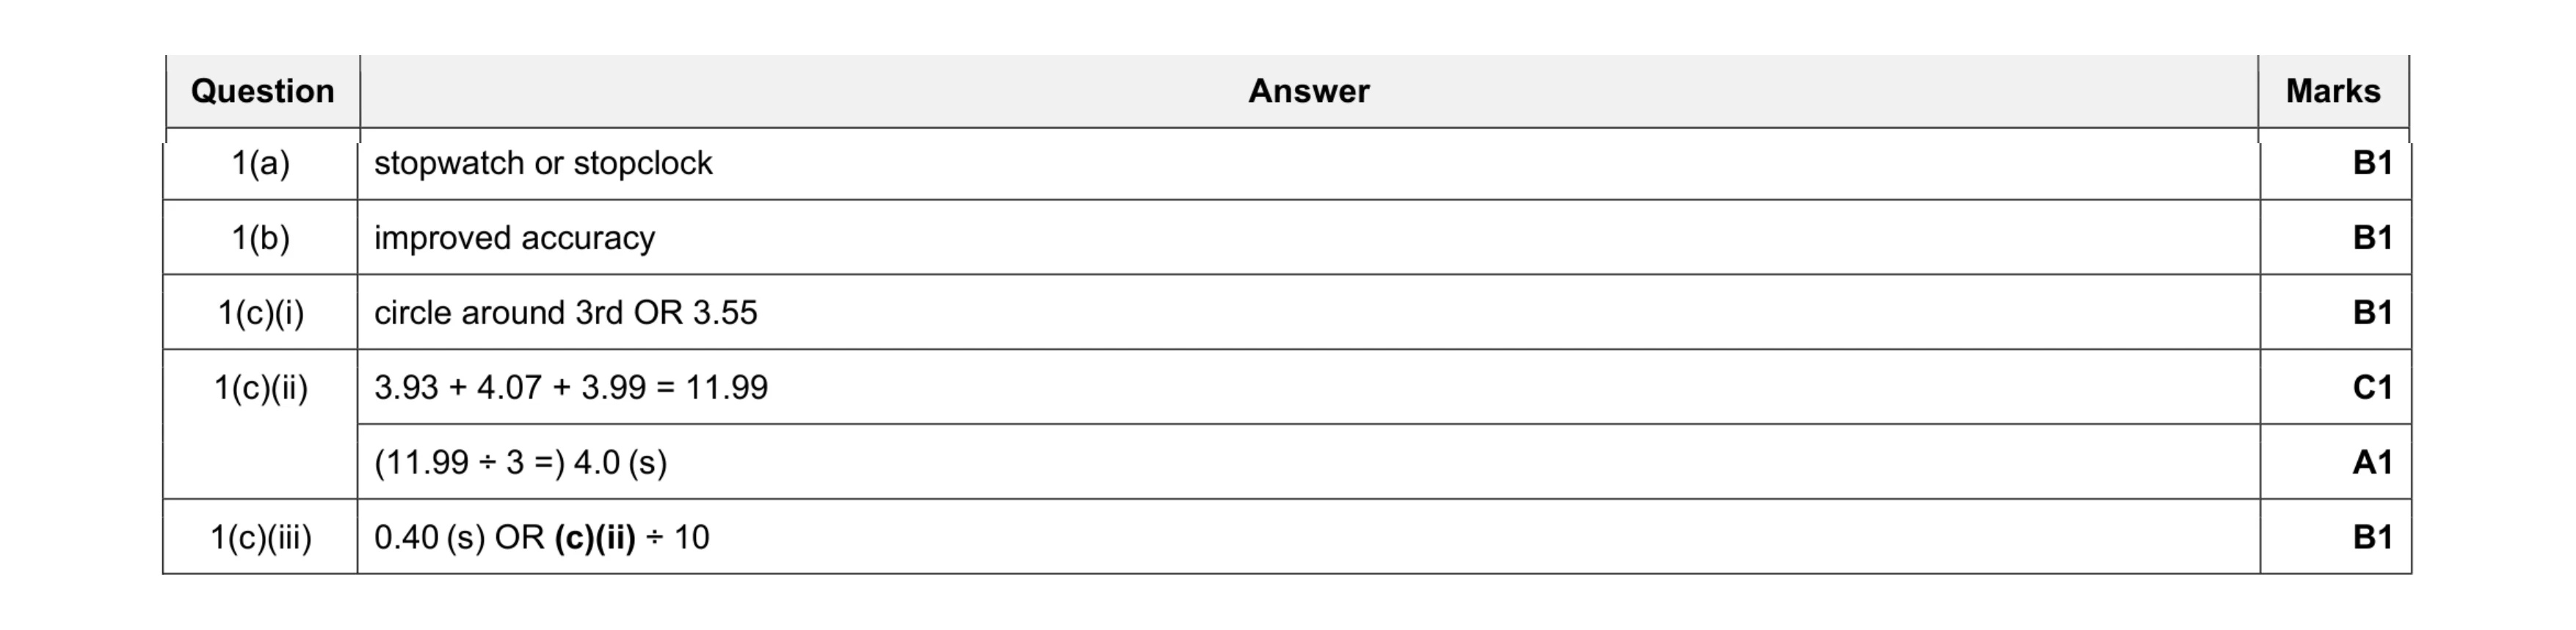 6
6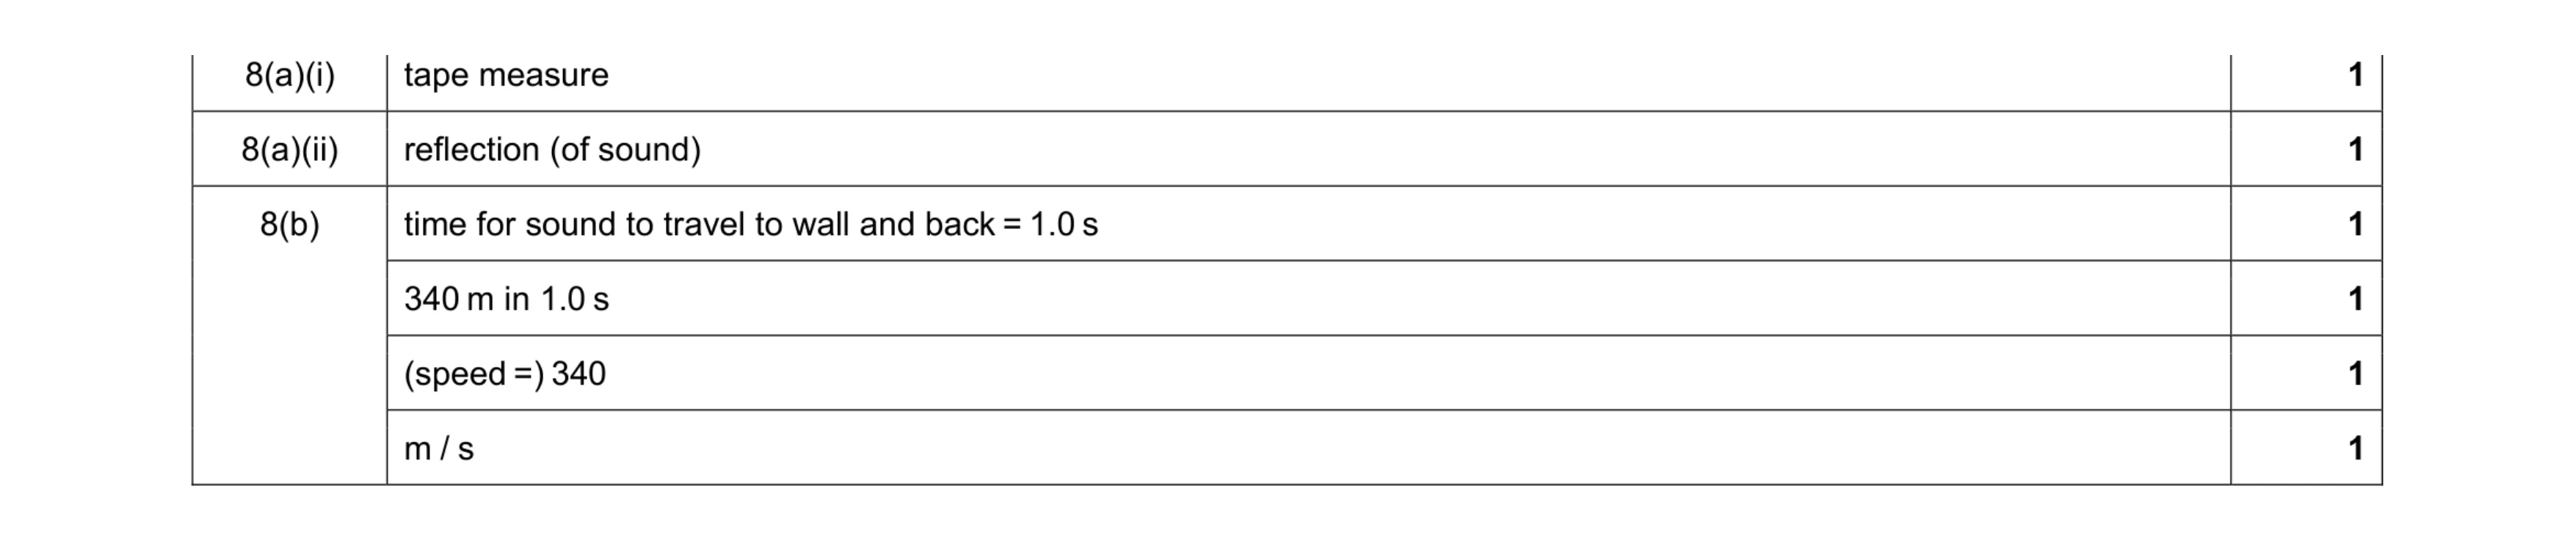 6
6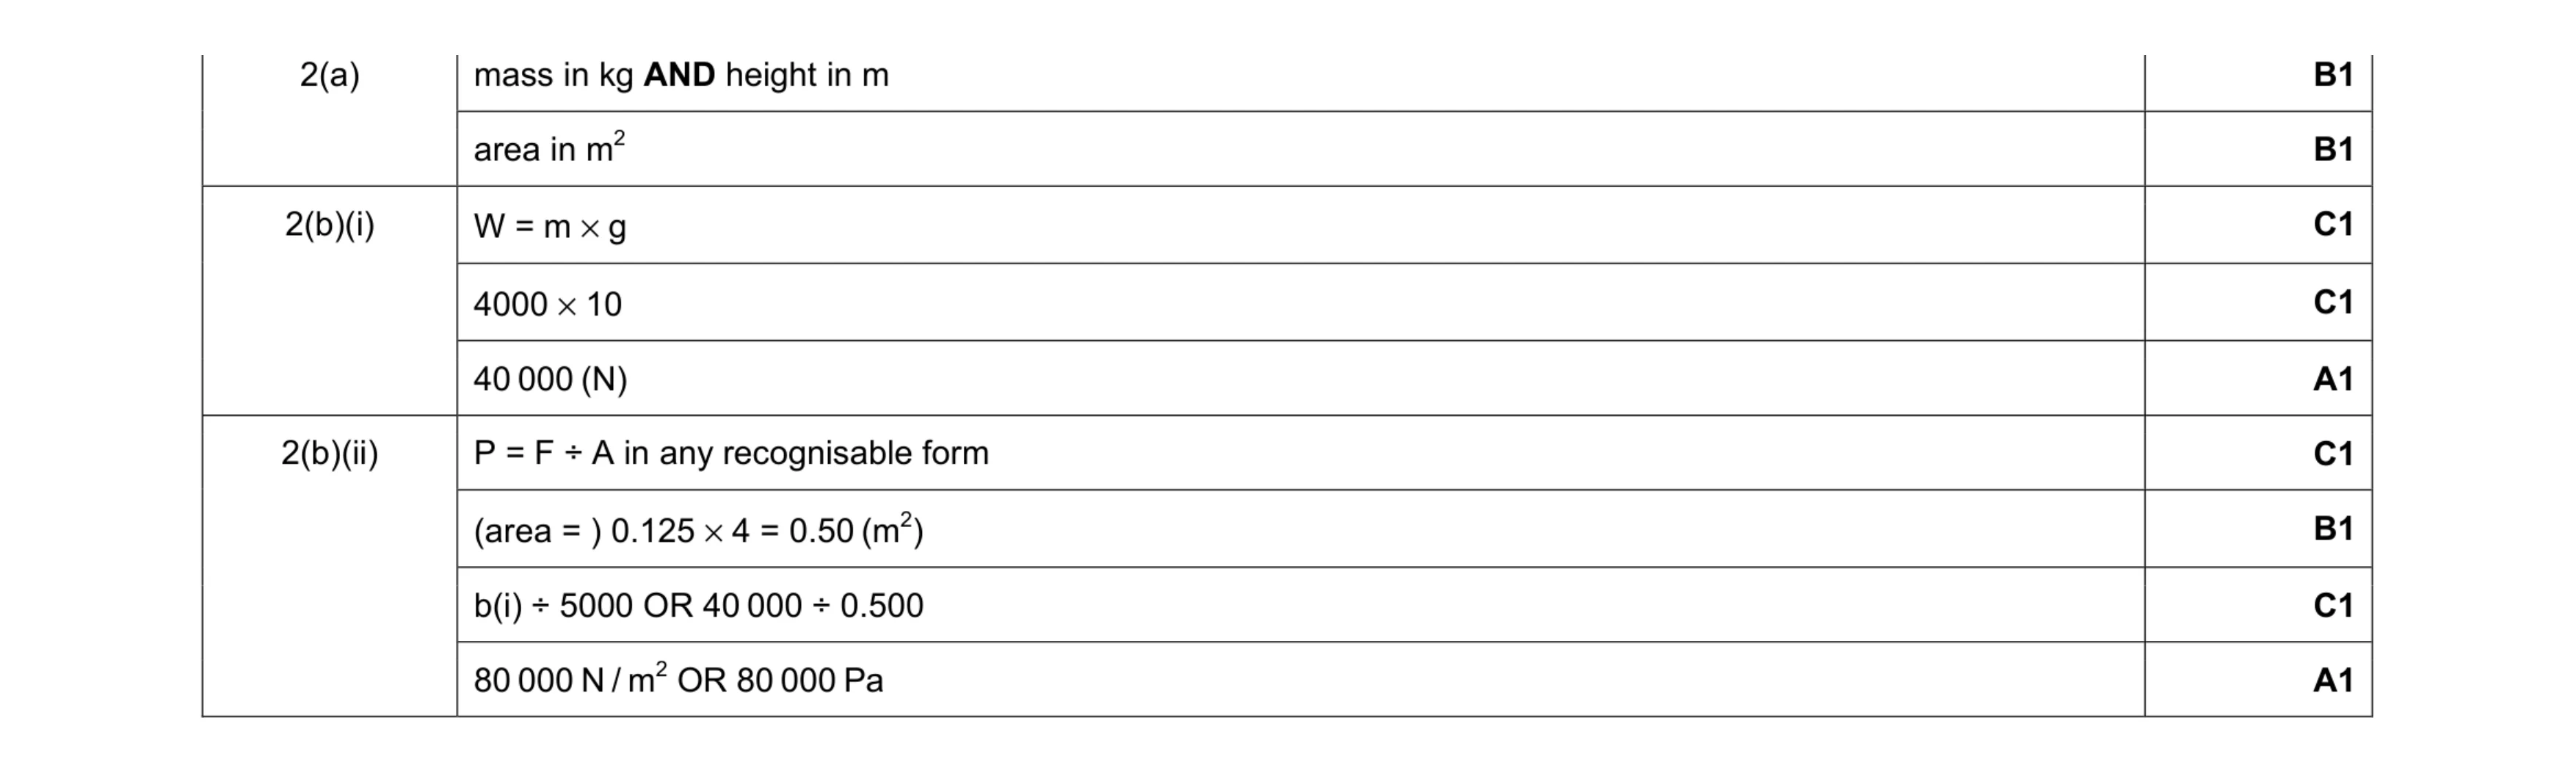 9
9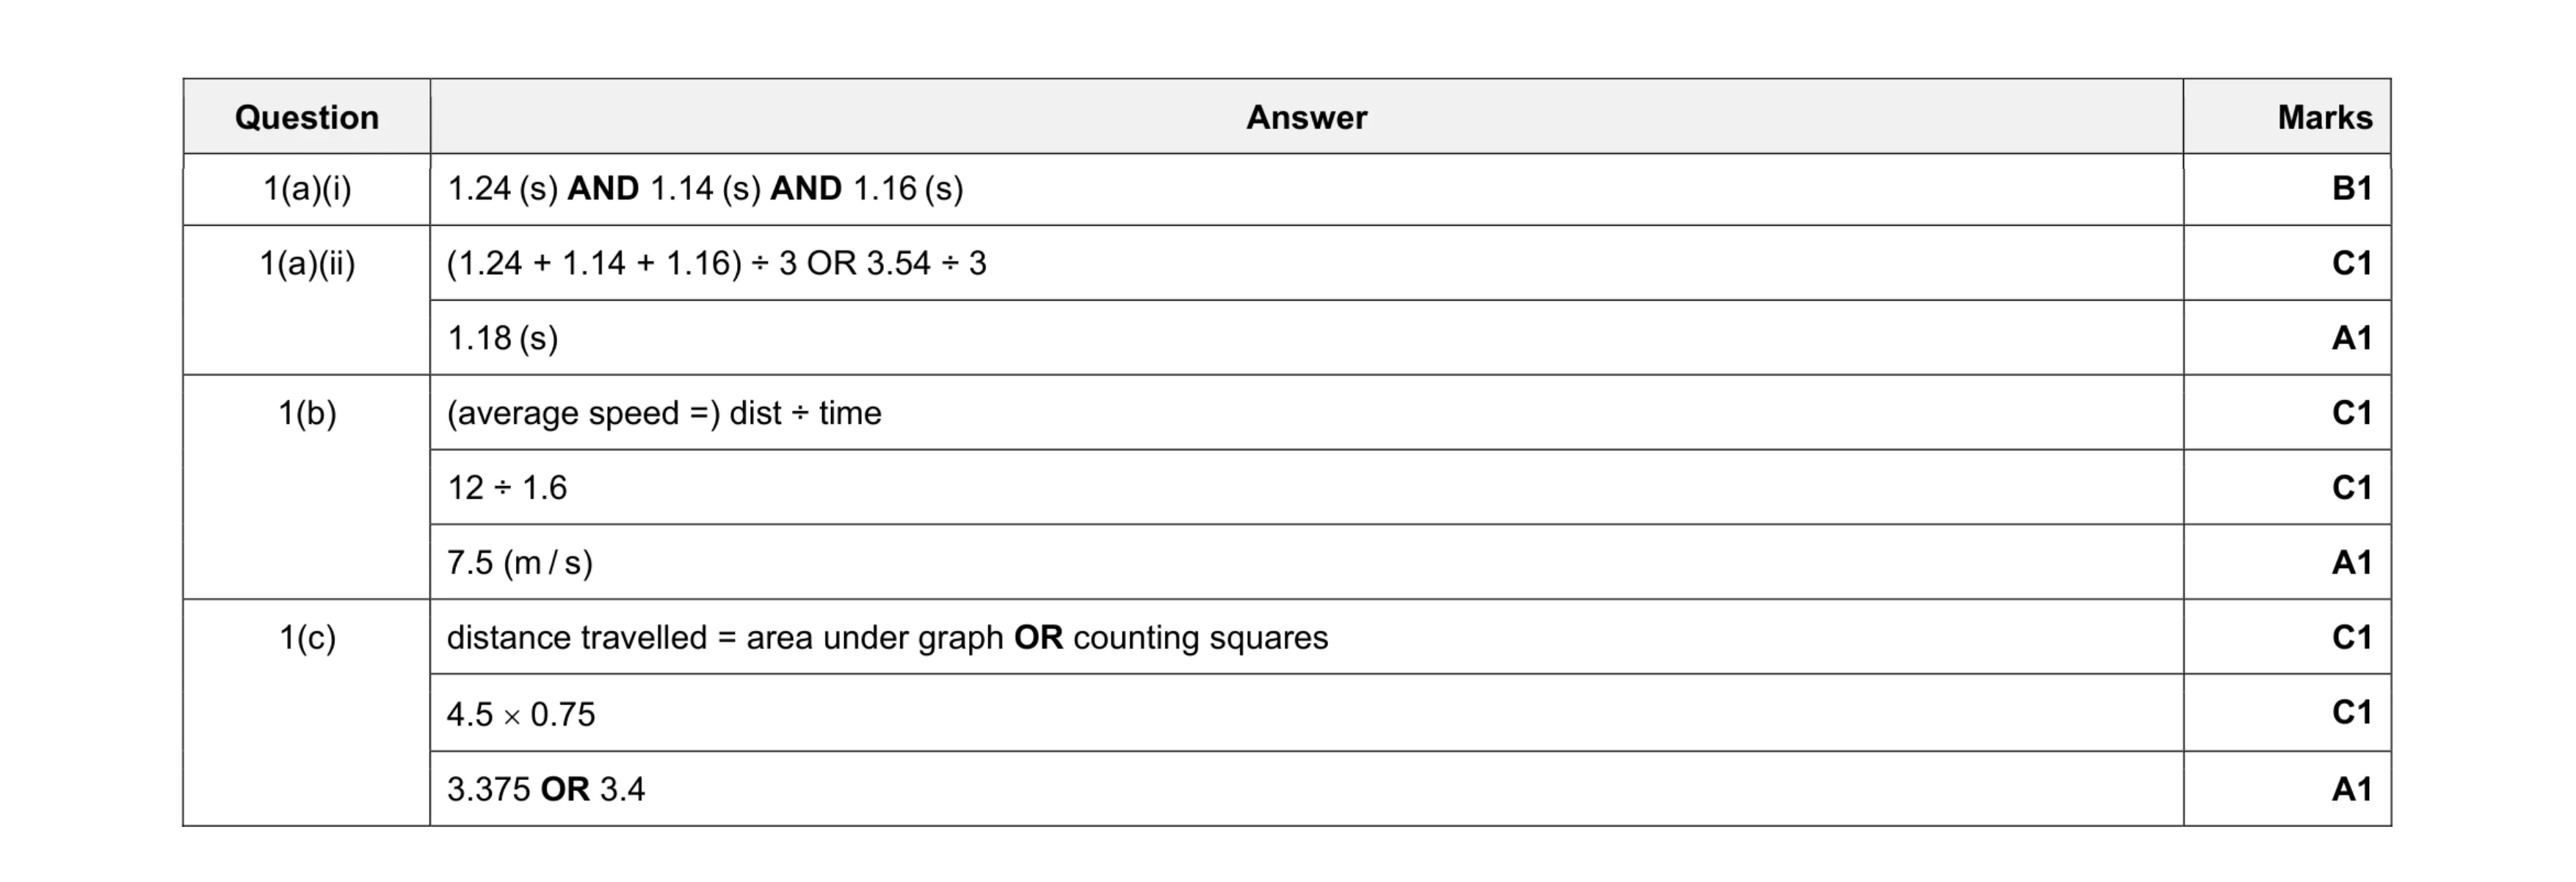 9
9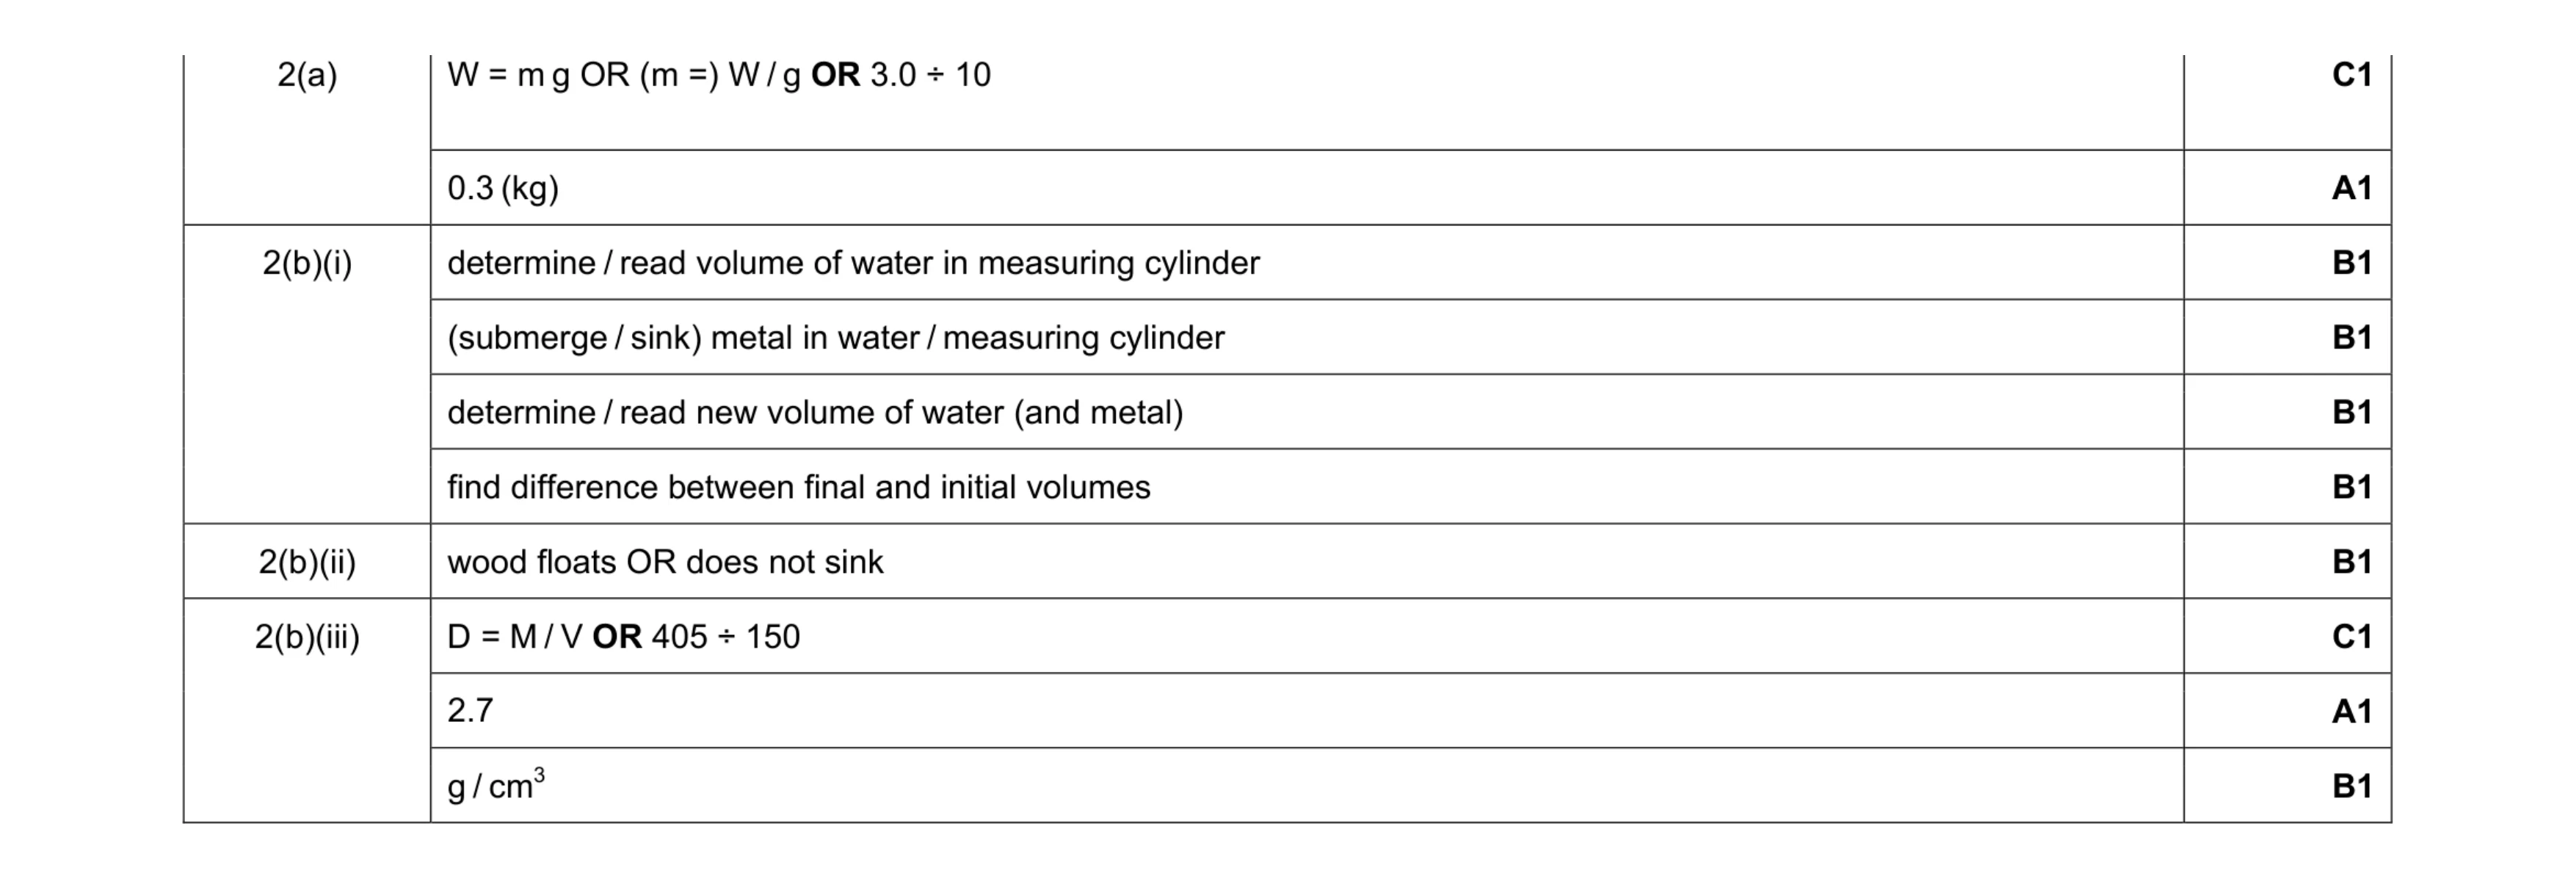 10
10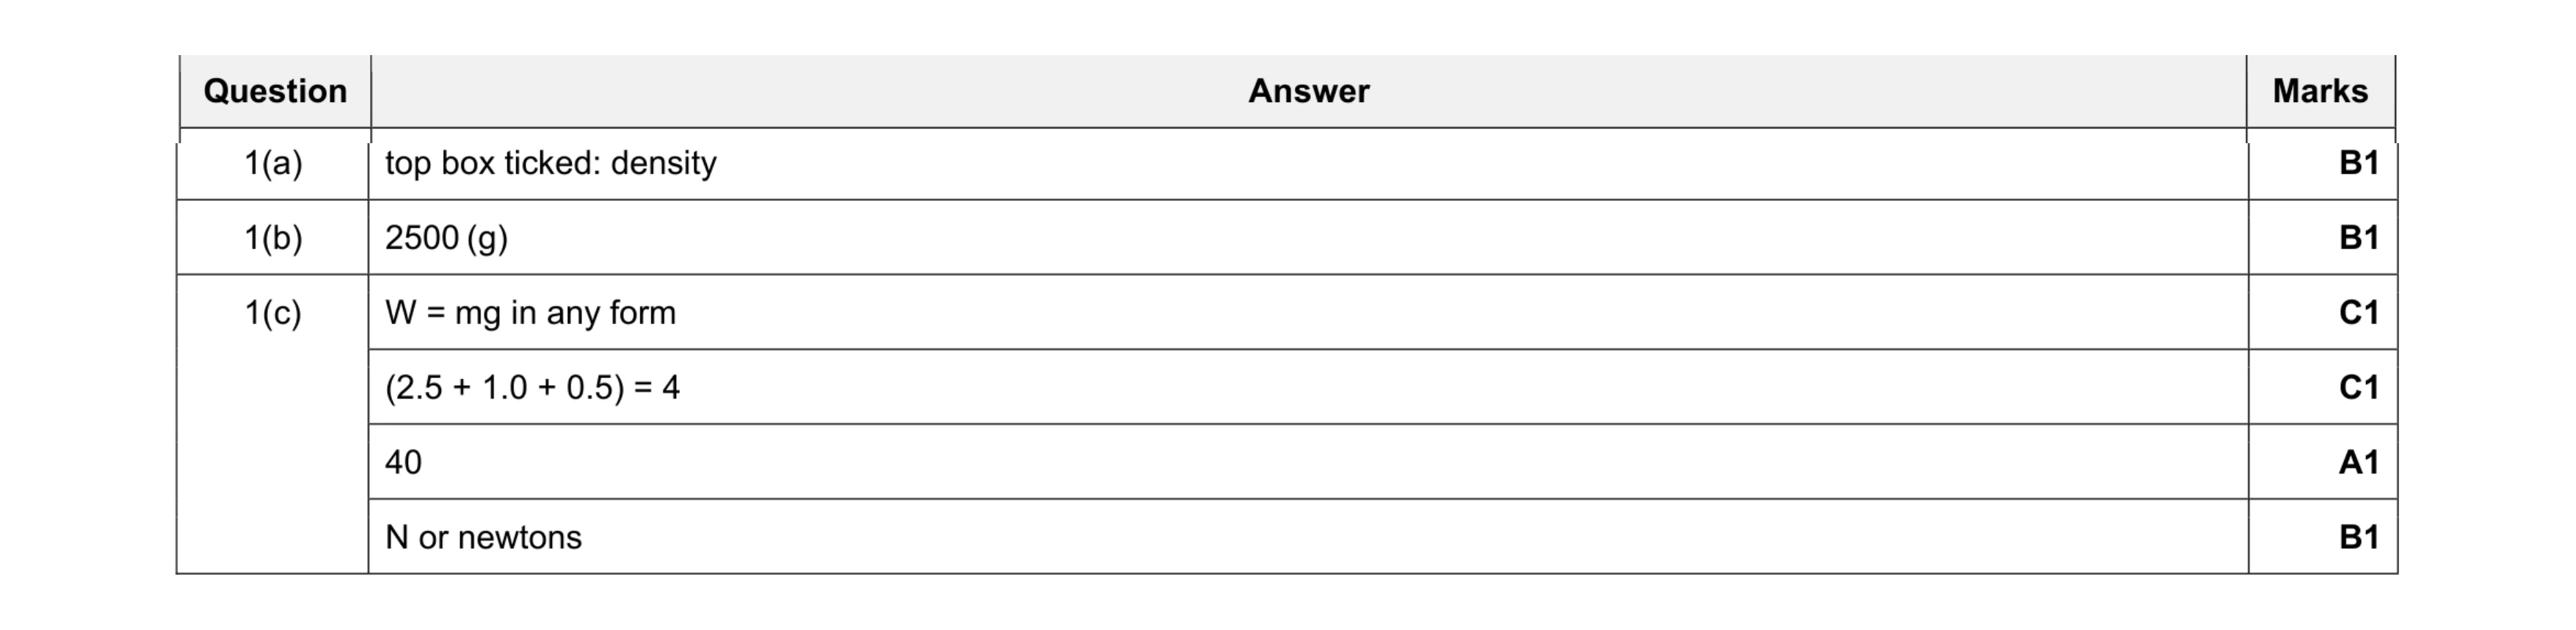 6
6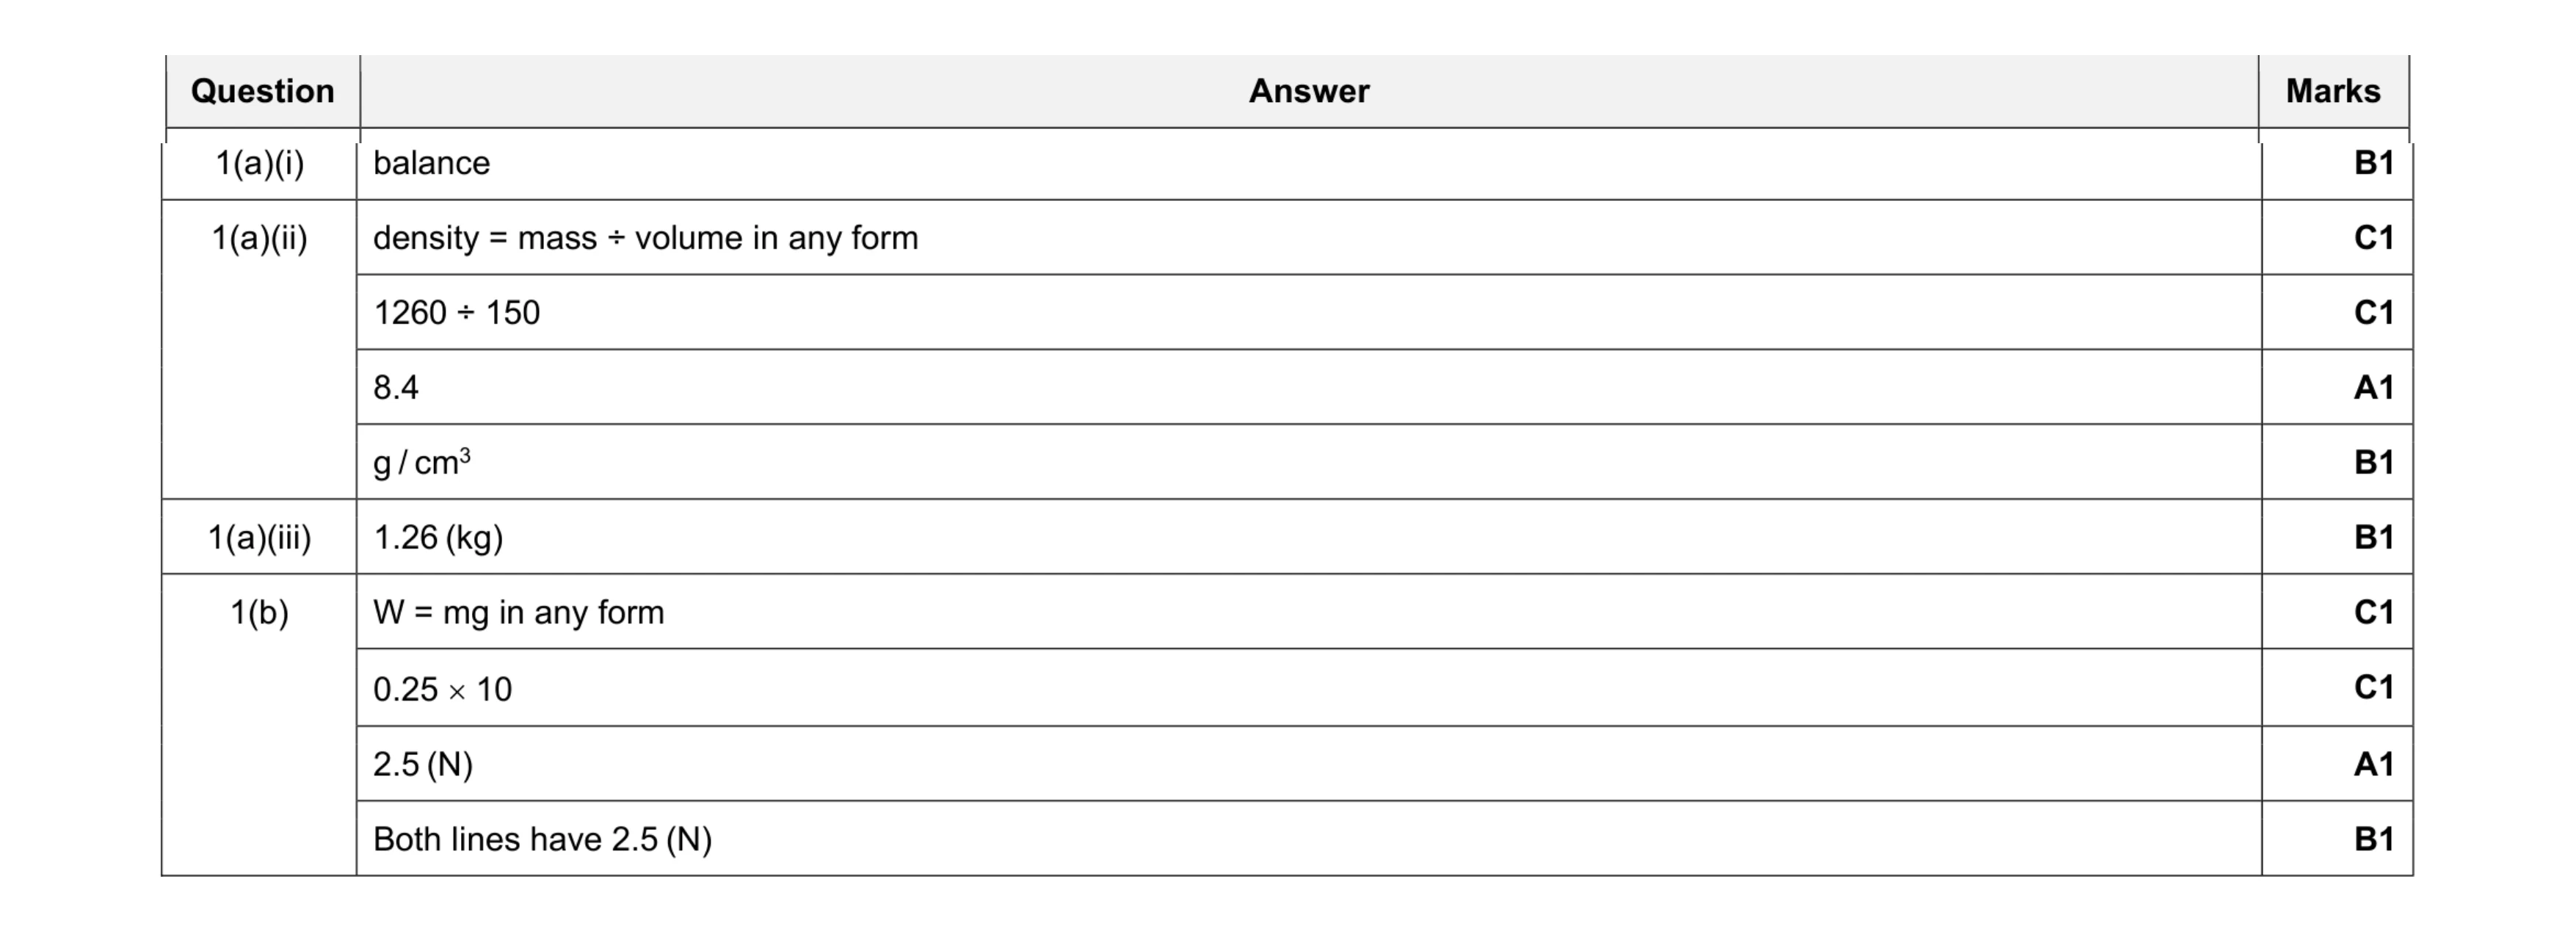 10
10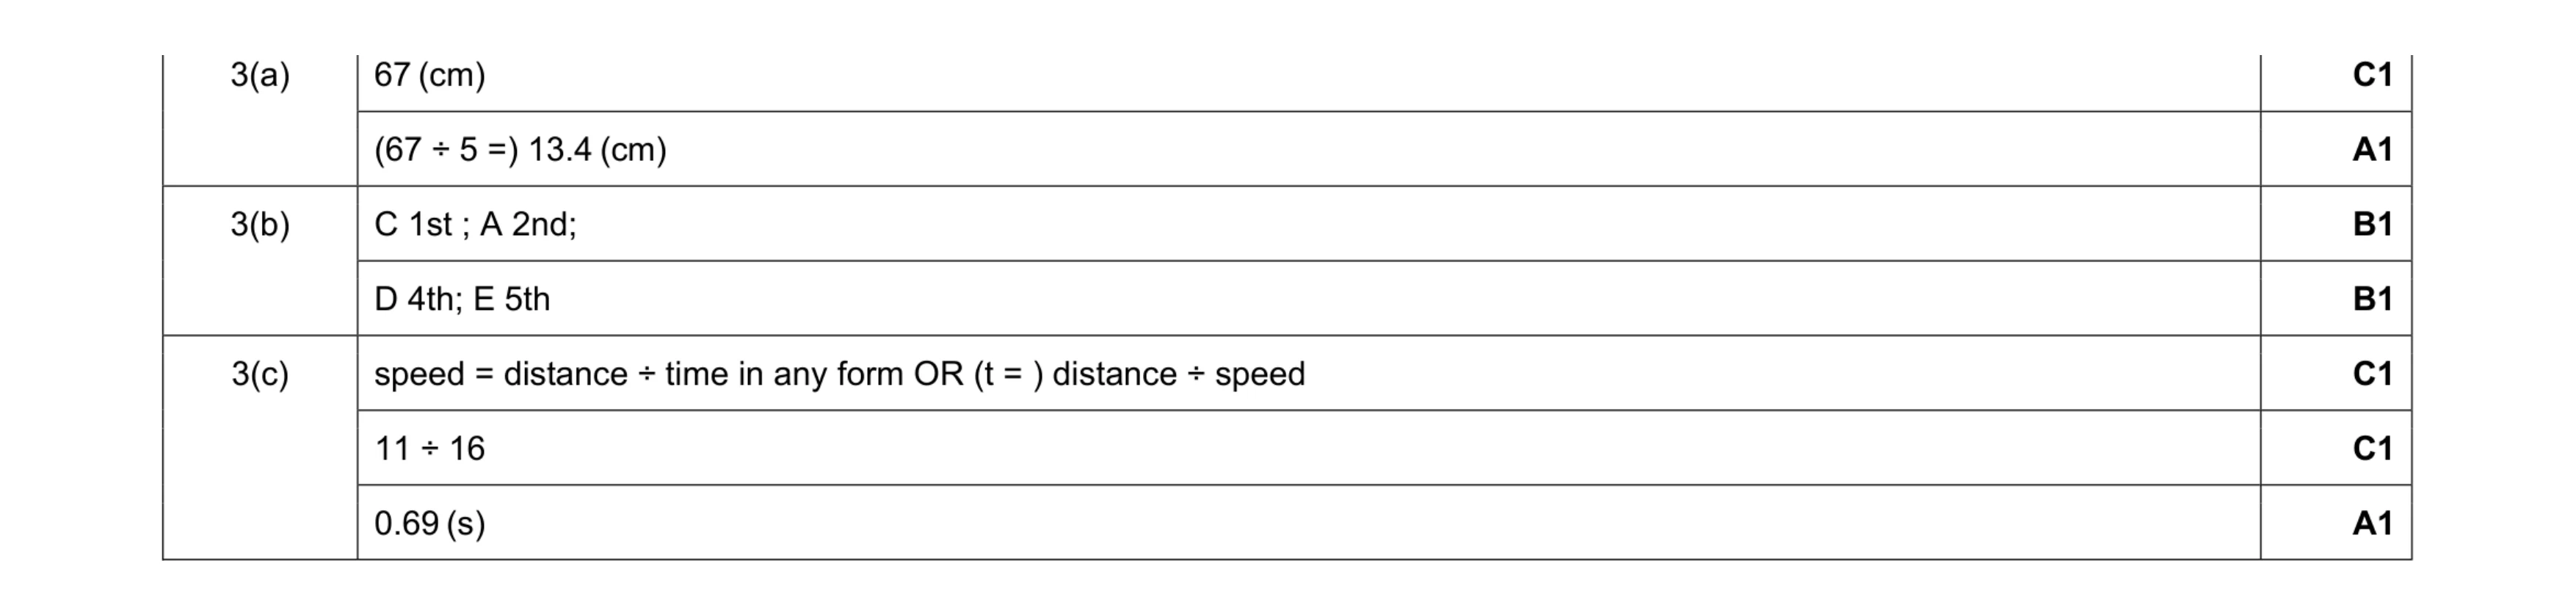 7
7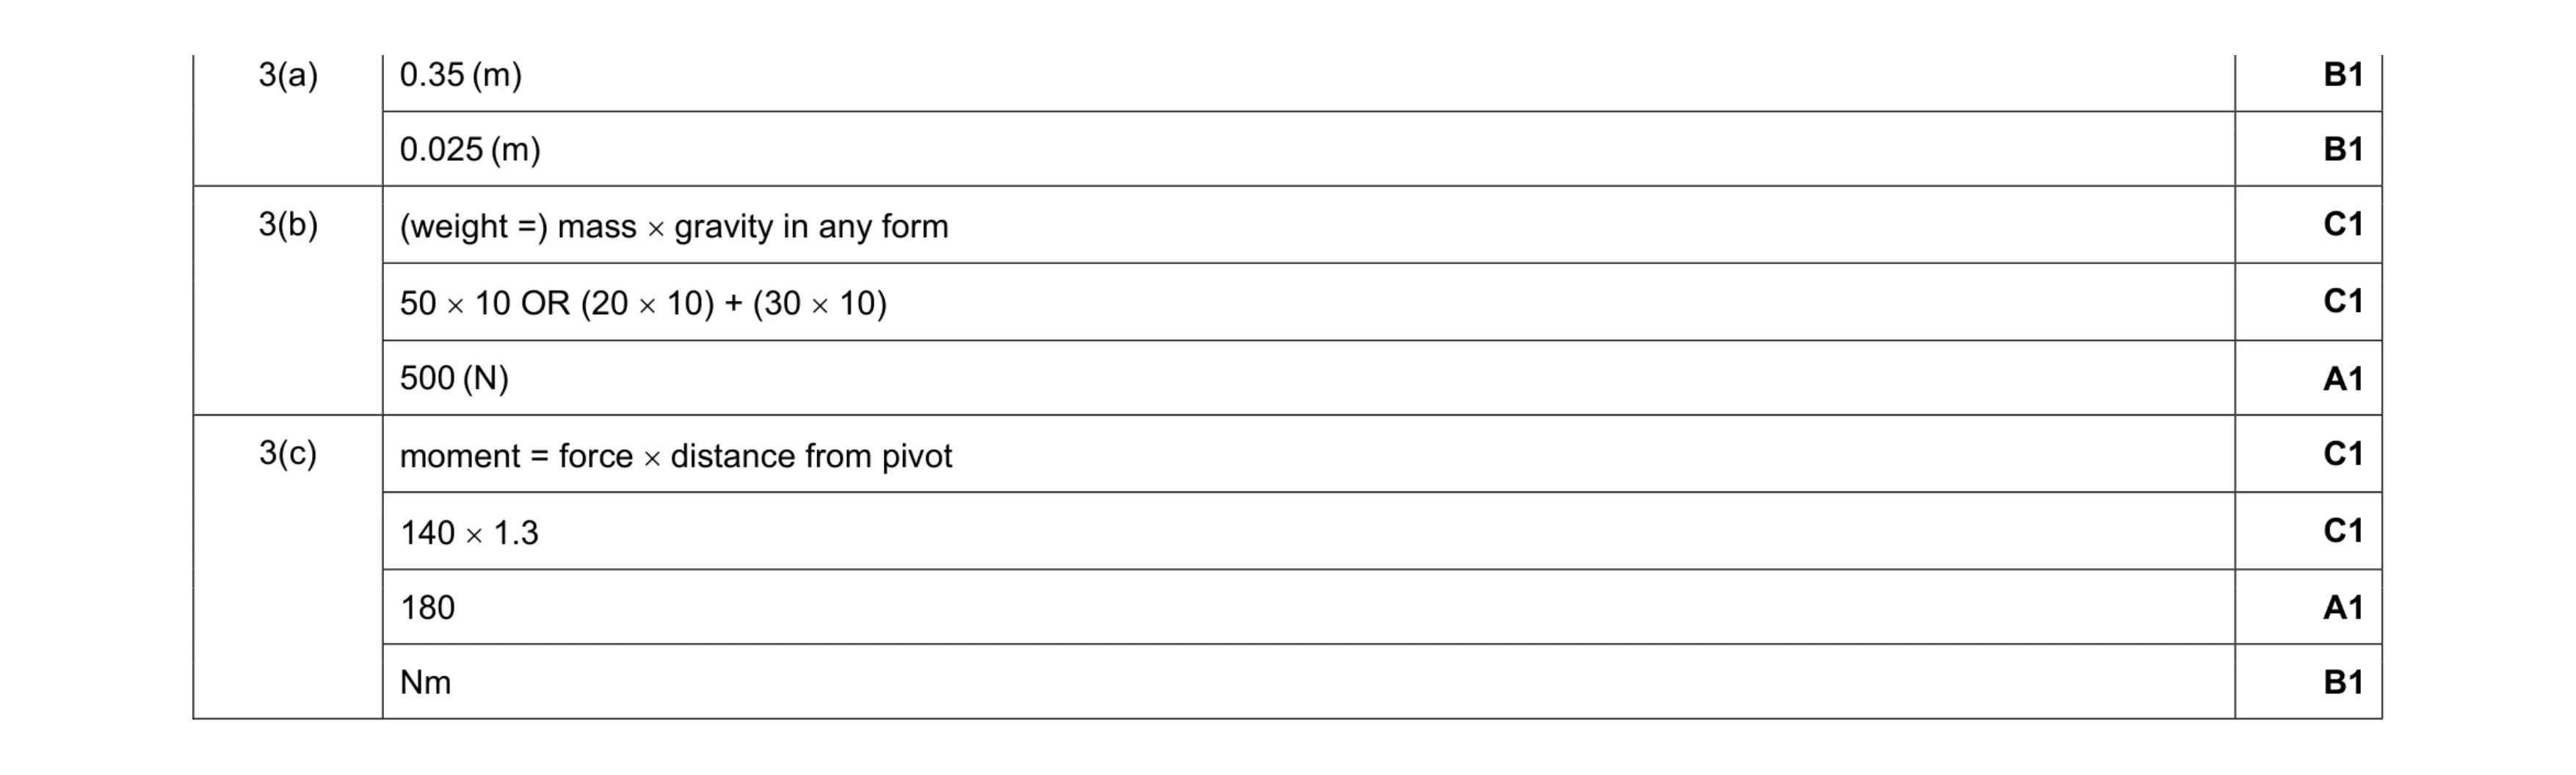 9
9 5
5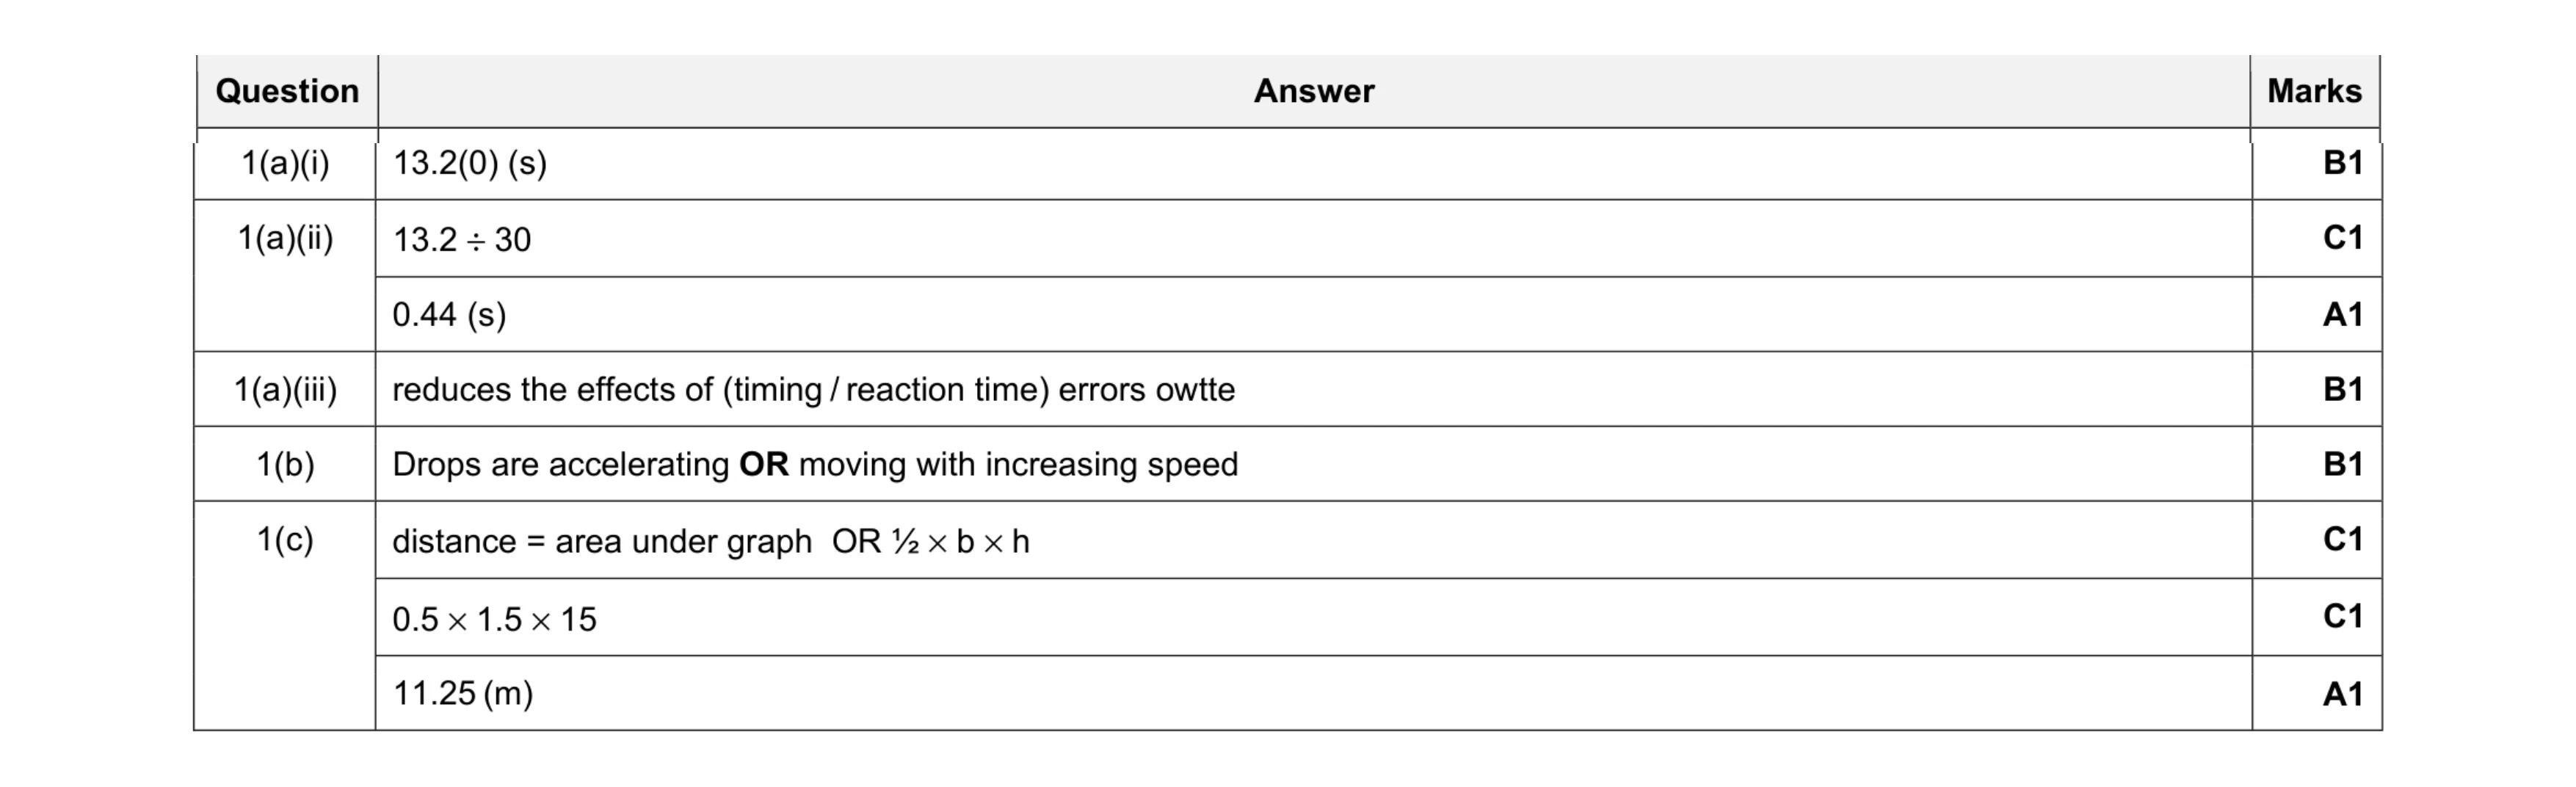 8
8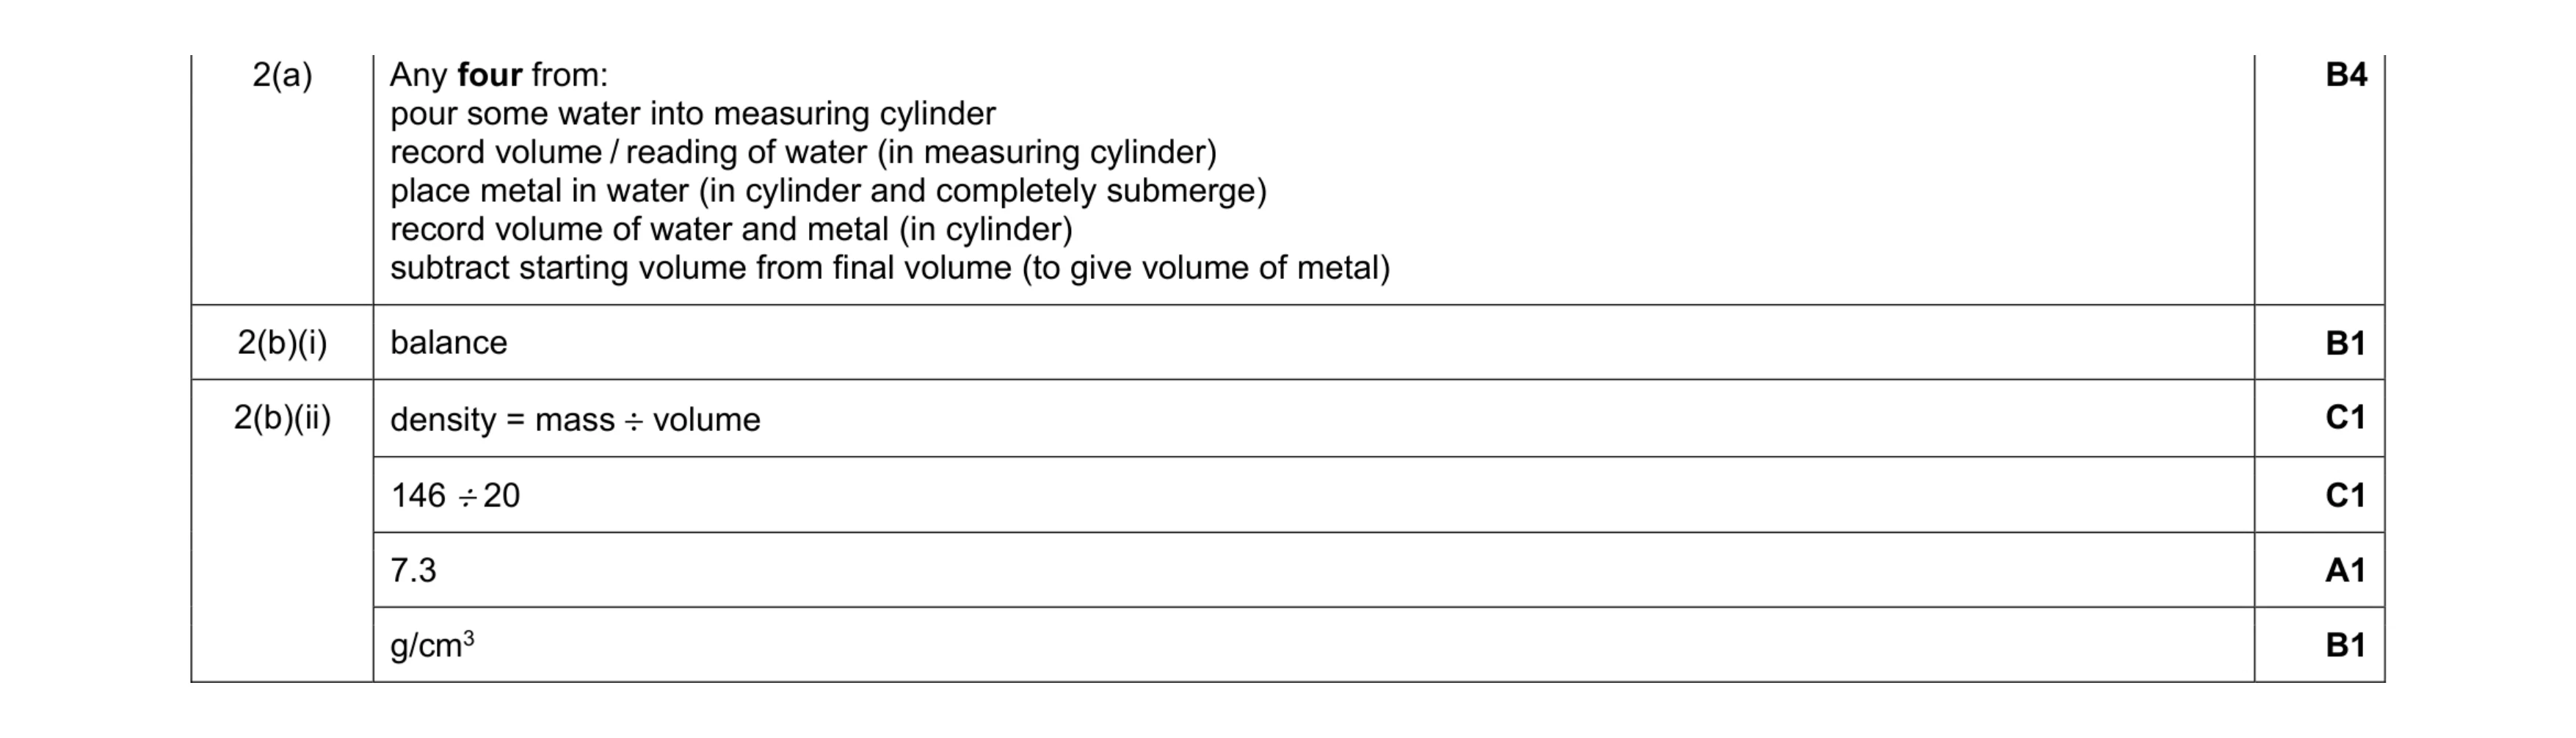 9
9 6
6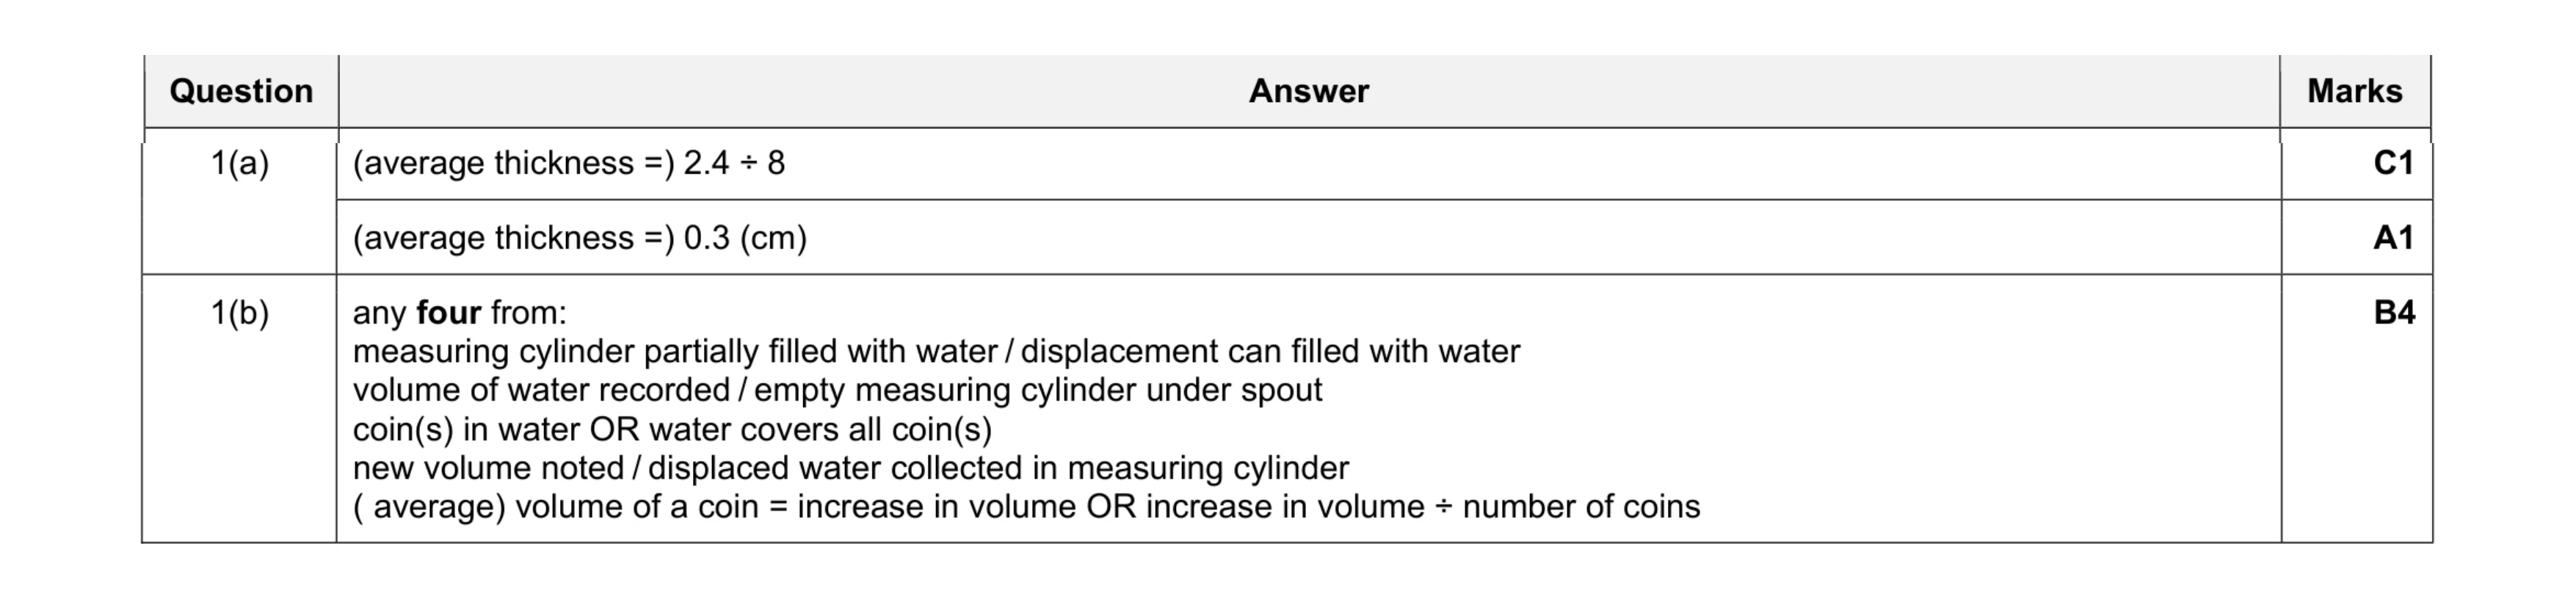 6
6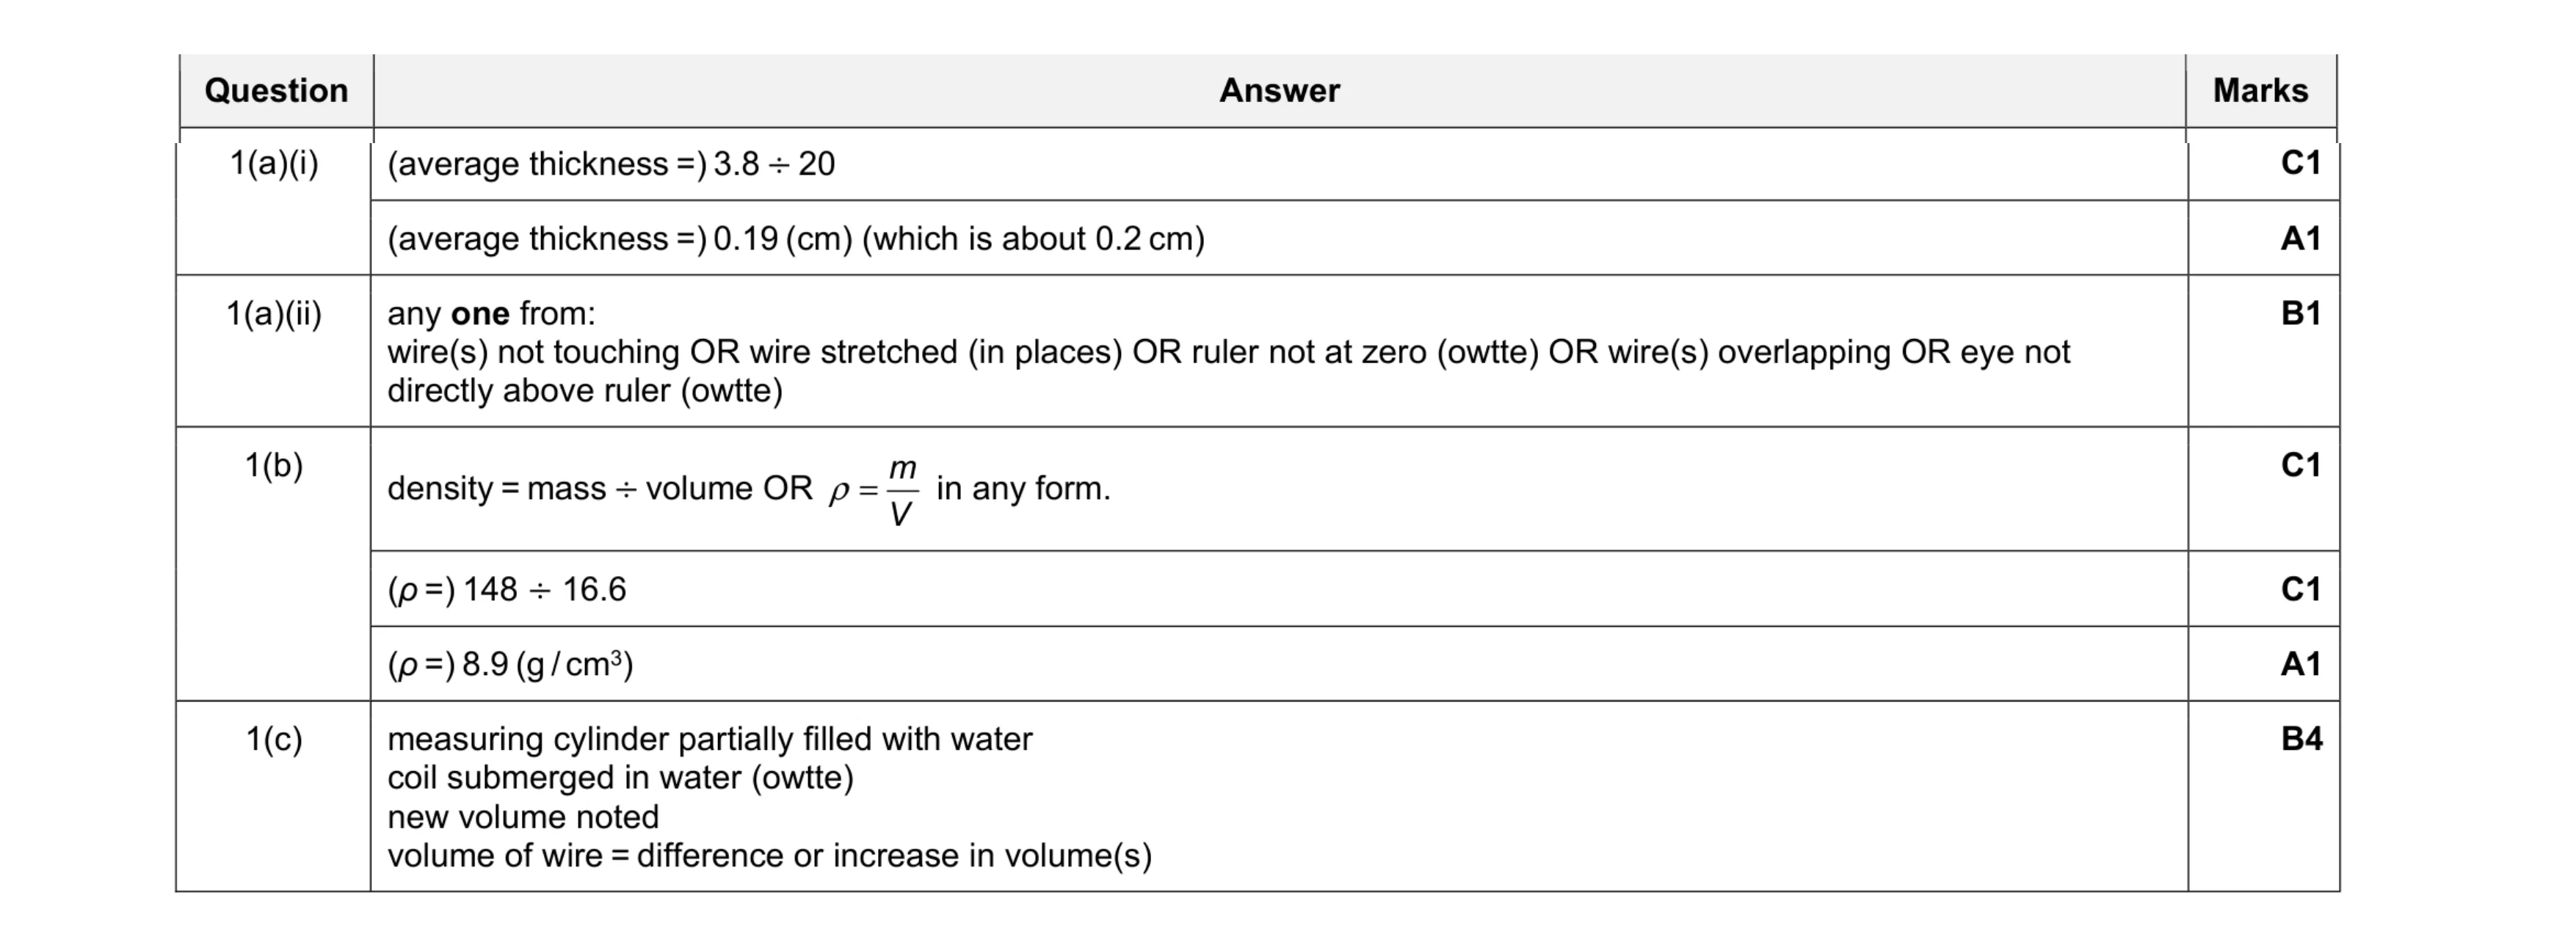 10
10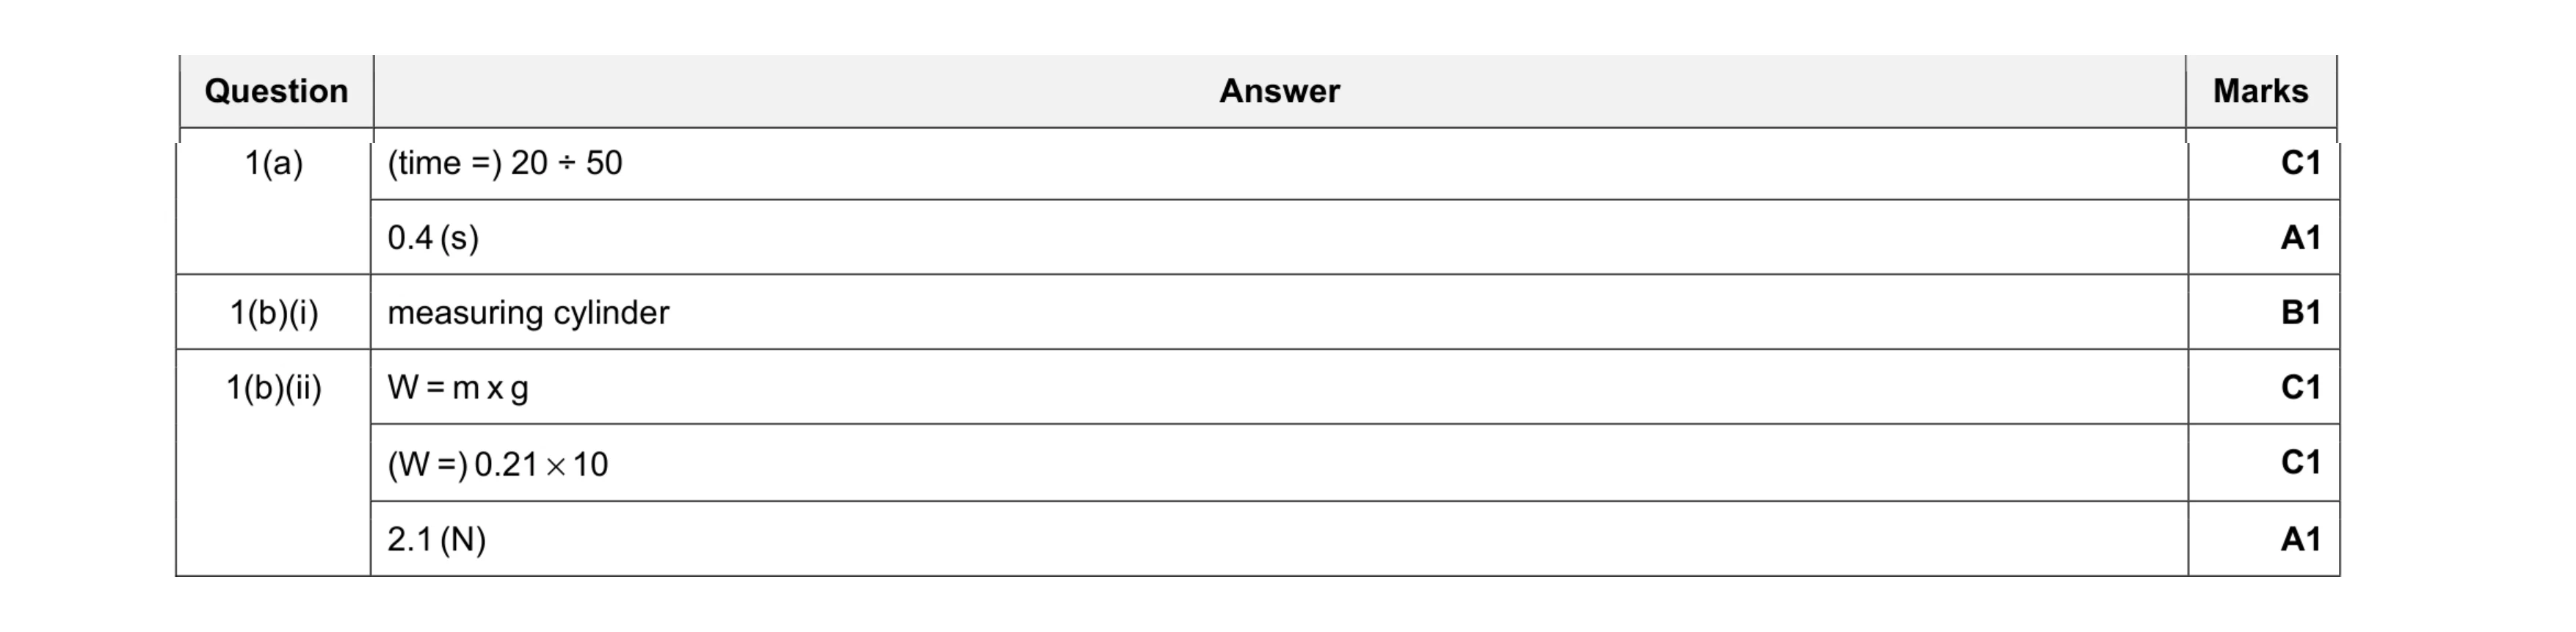 6
6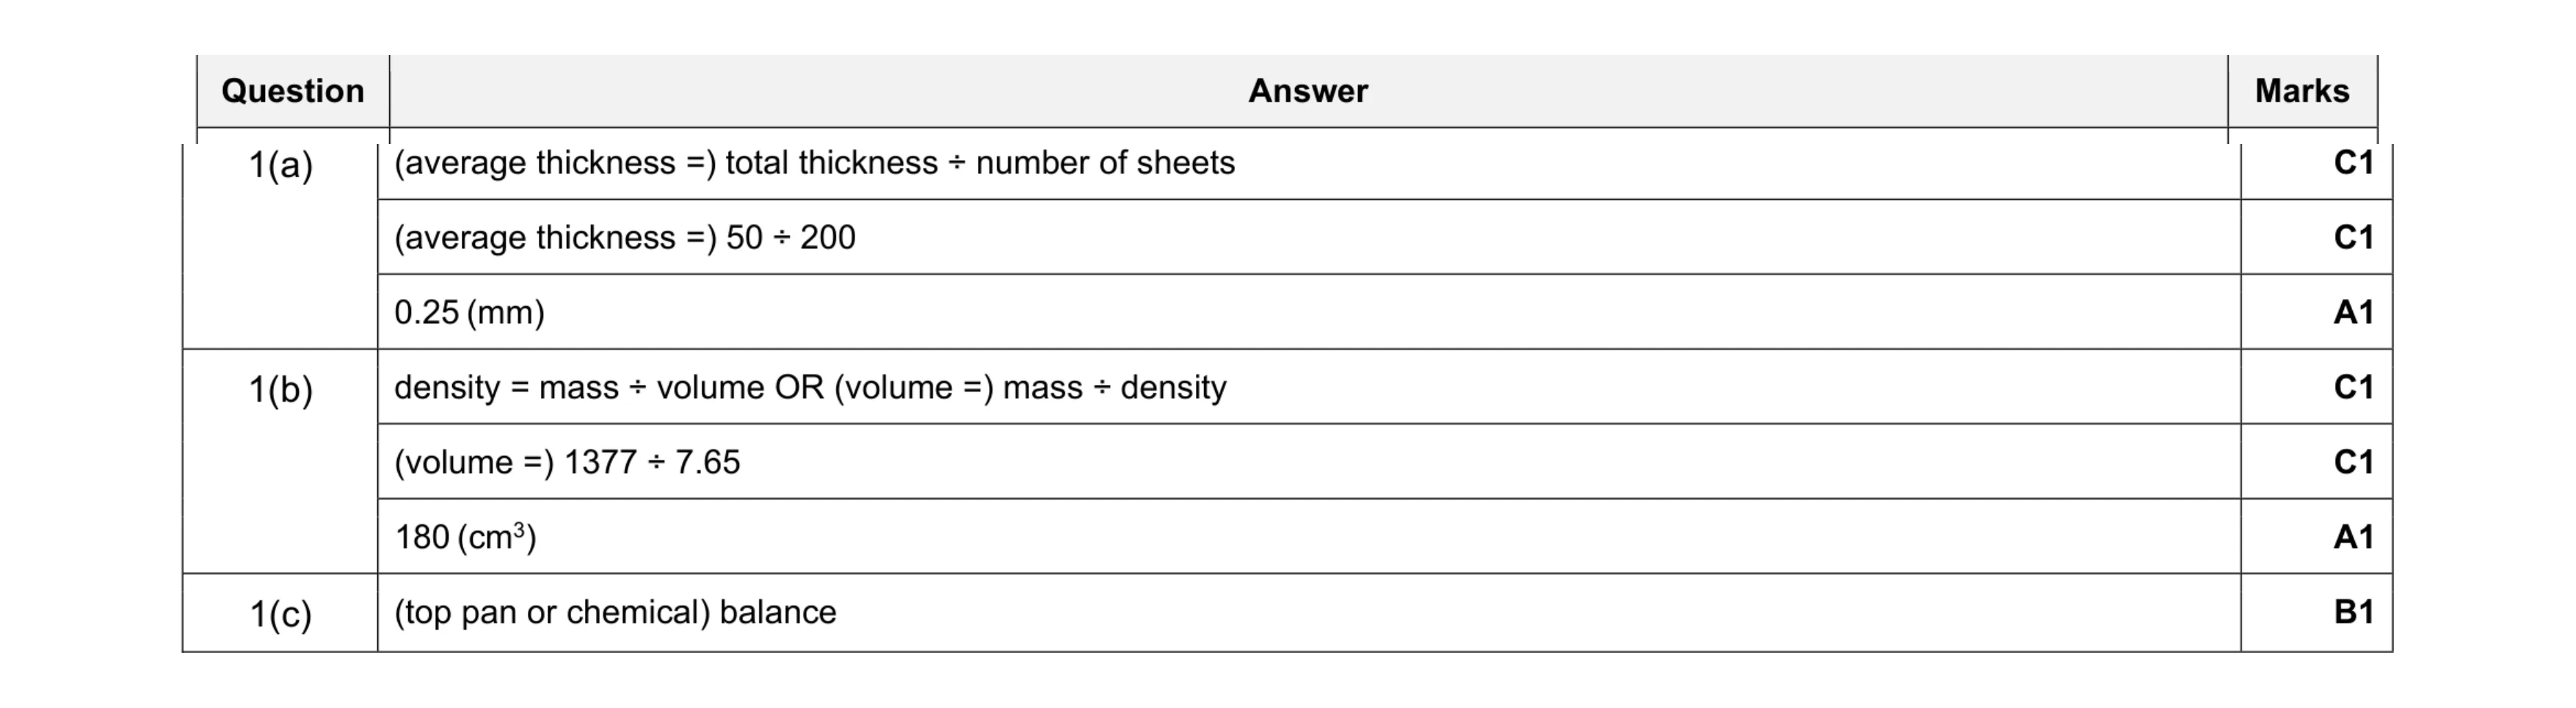 7
7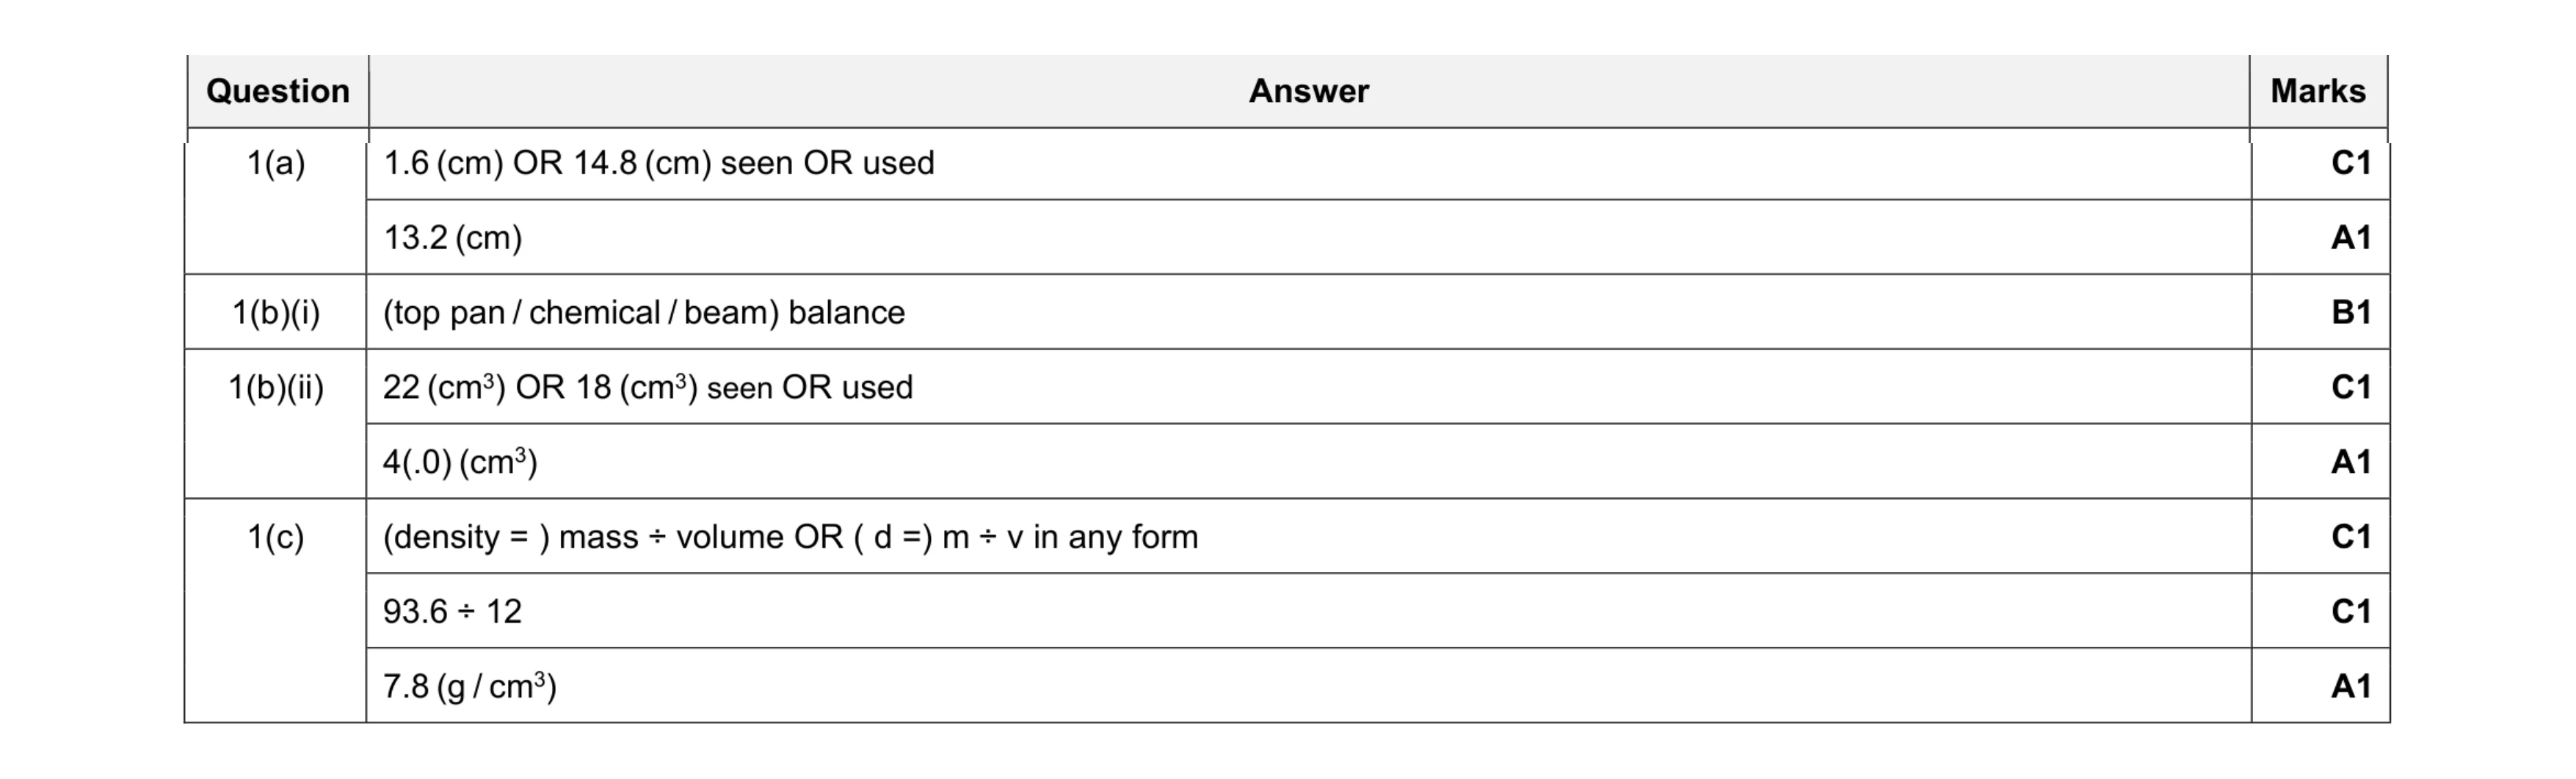 8
8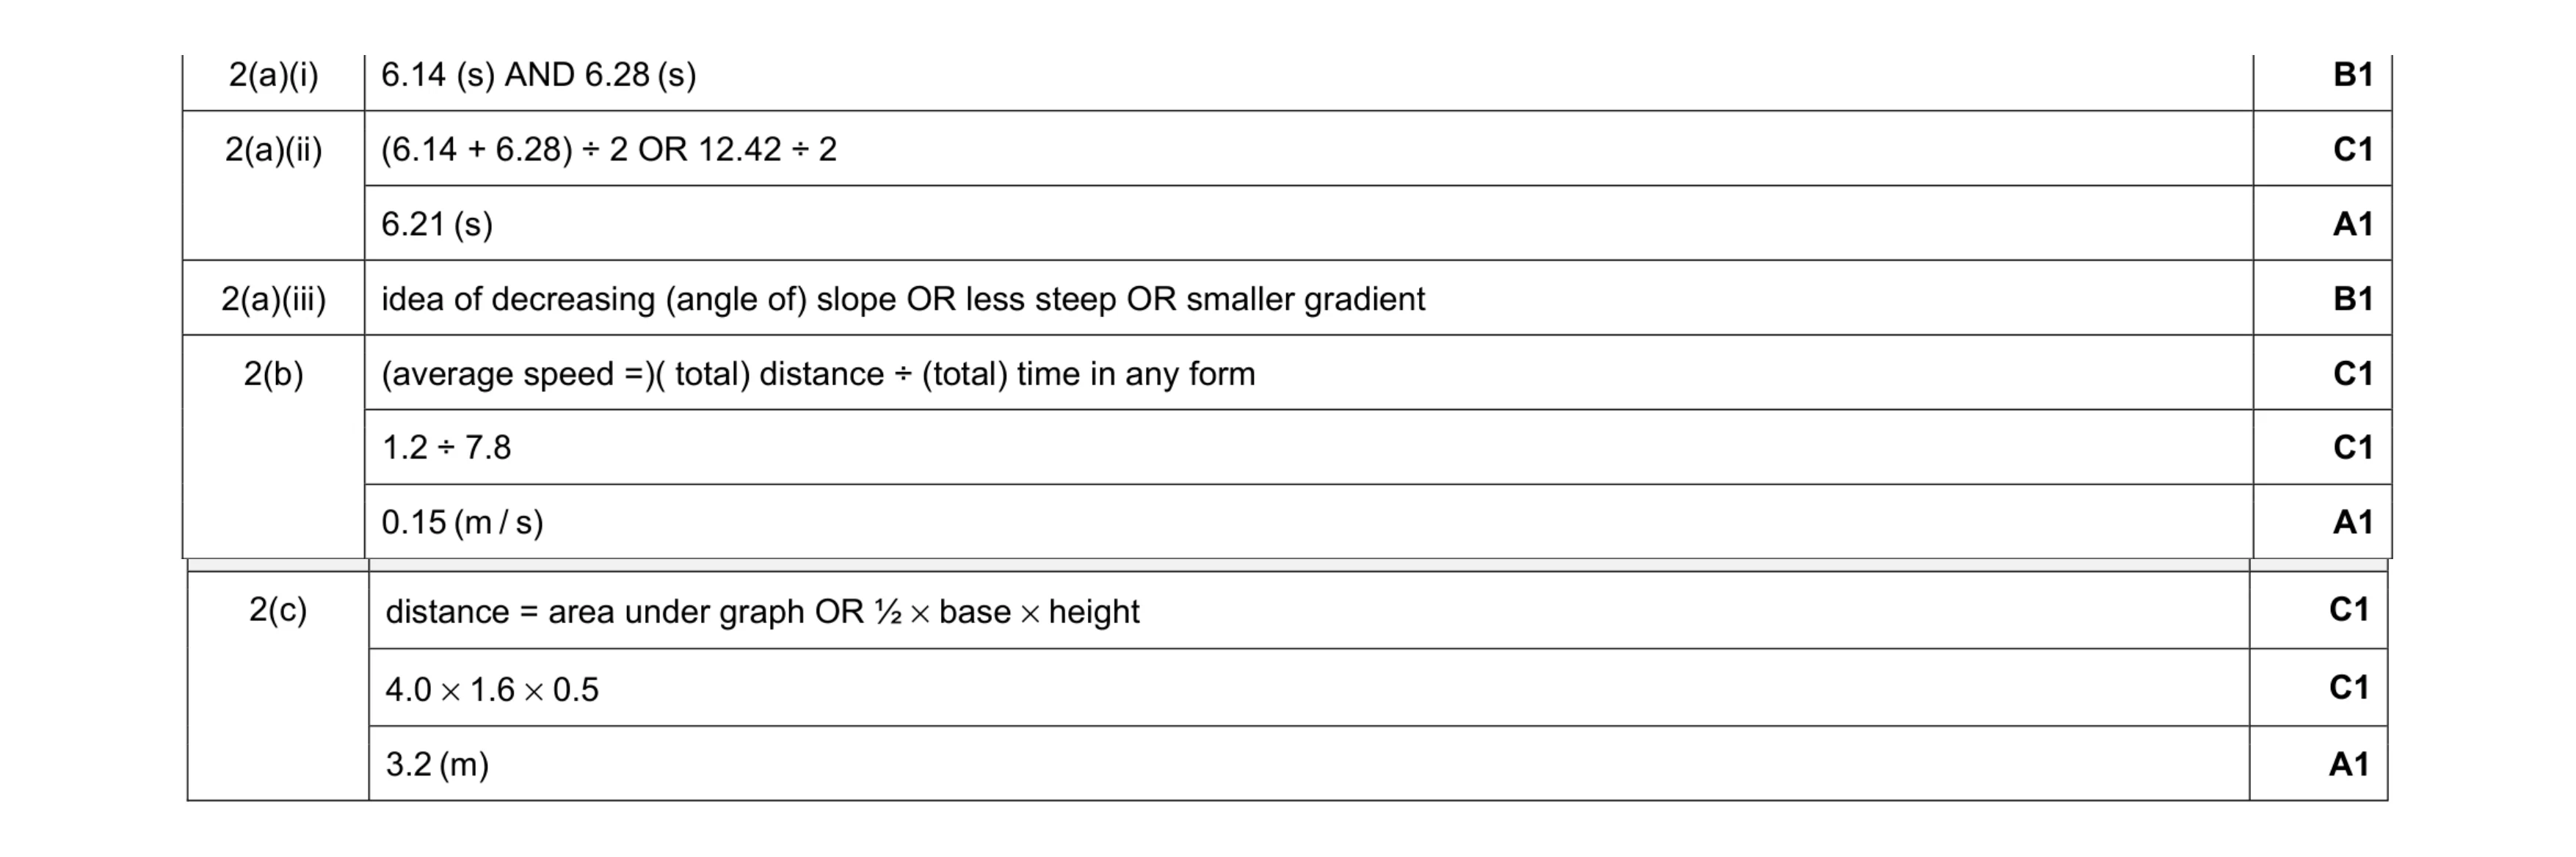 10
10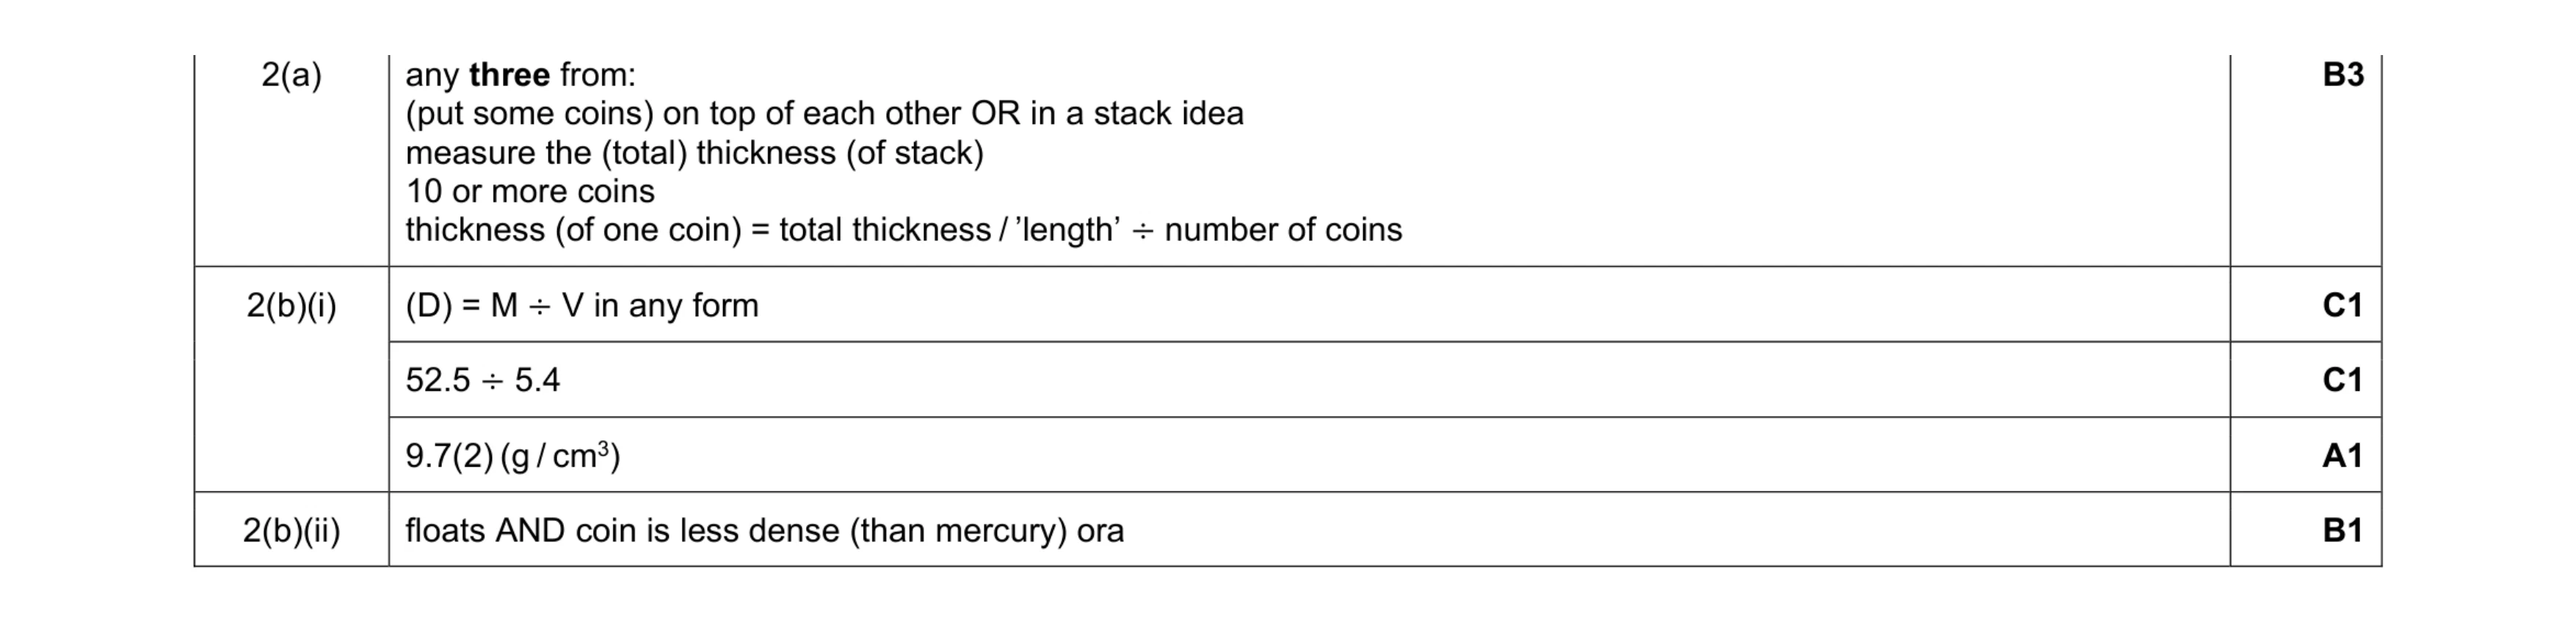 7
7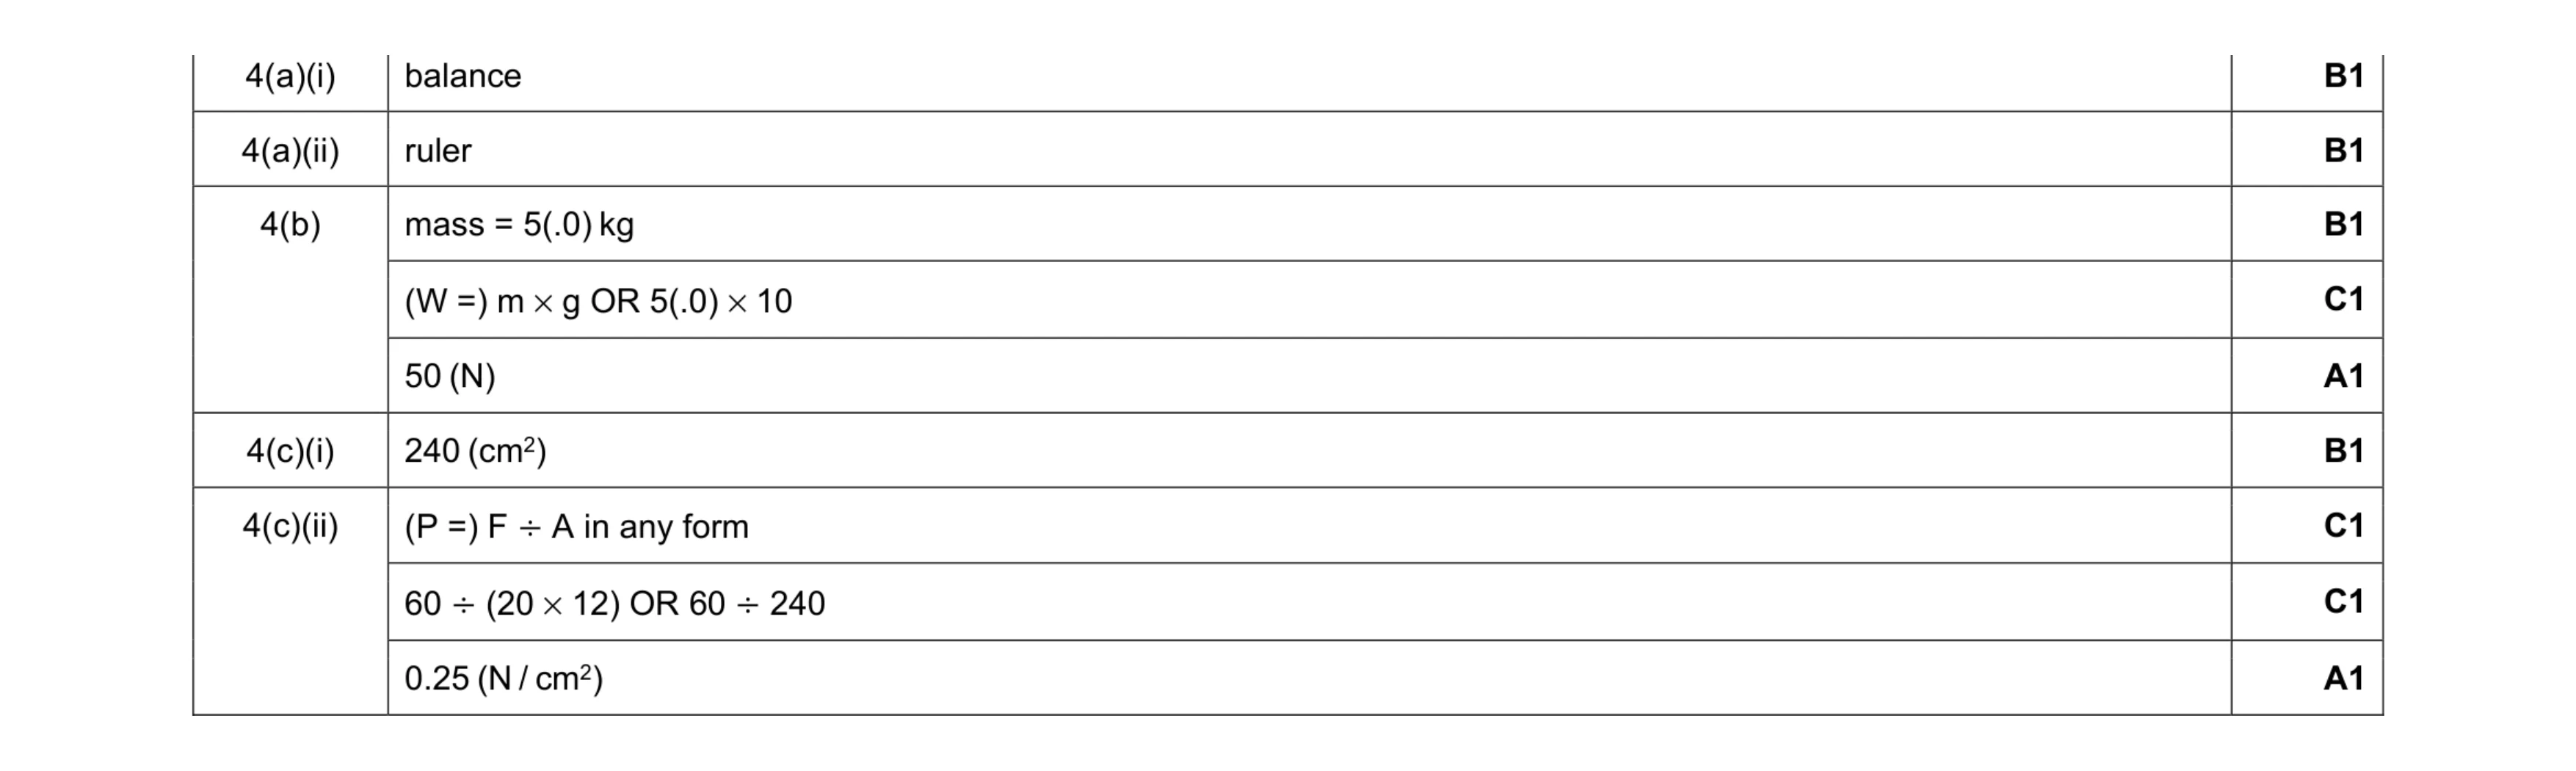 9
9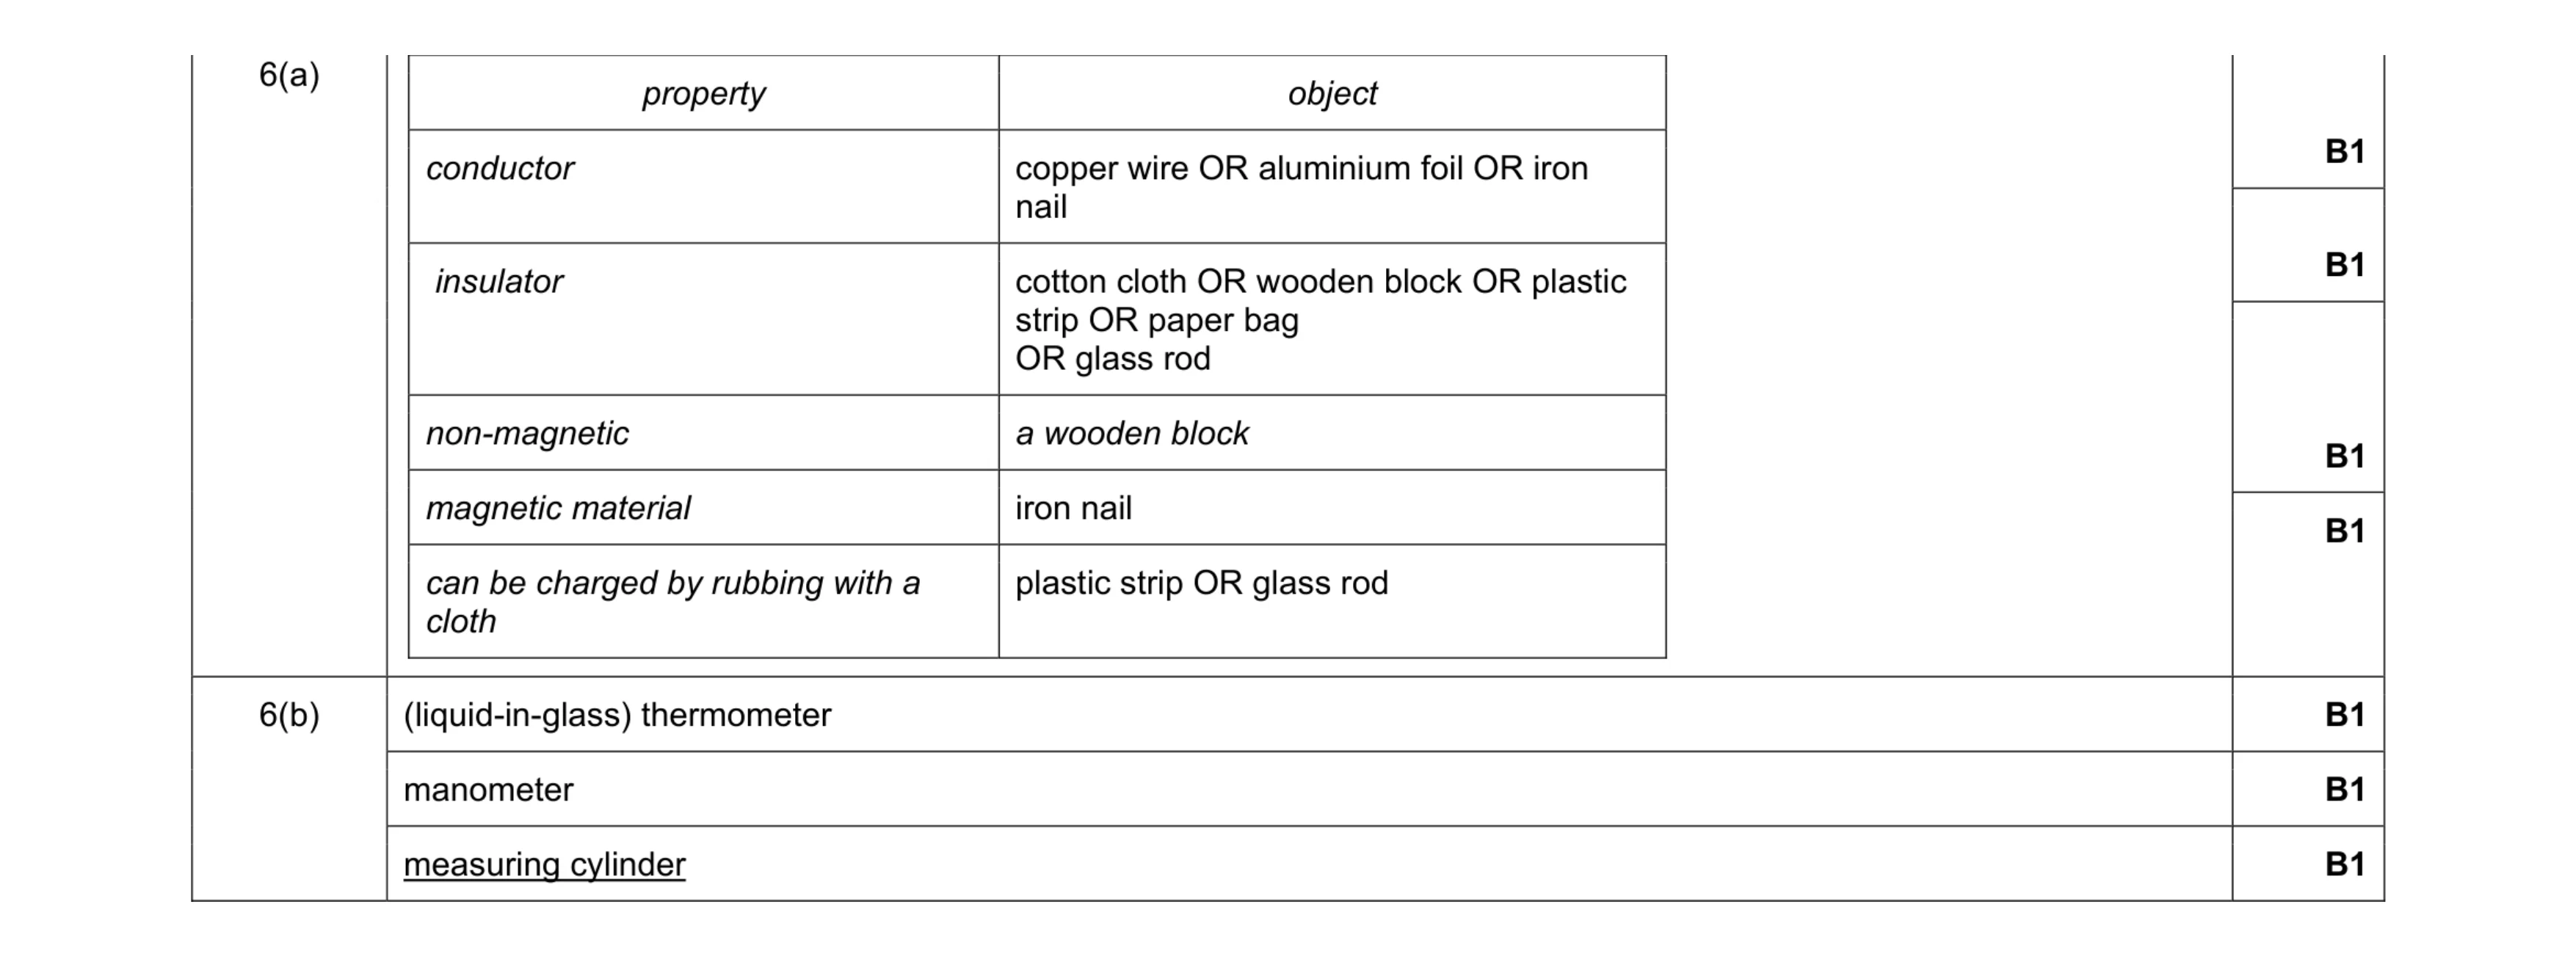 7
7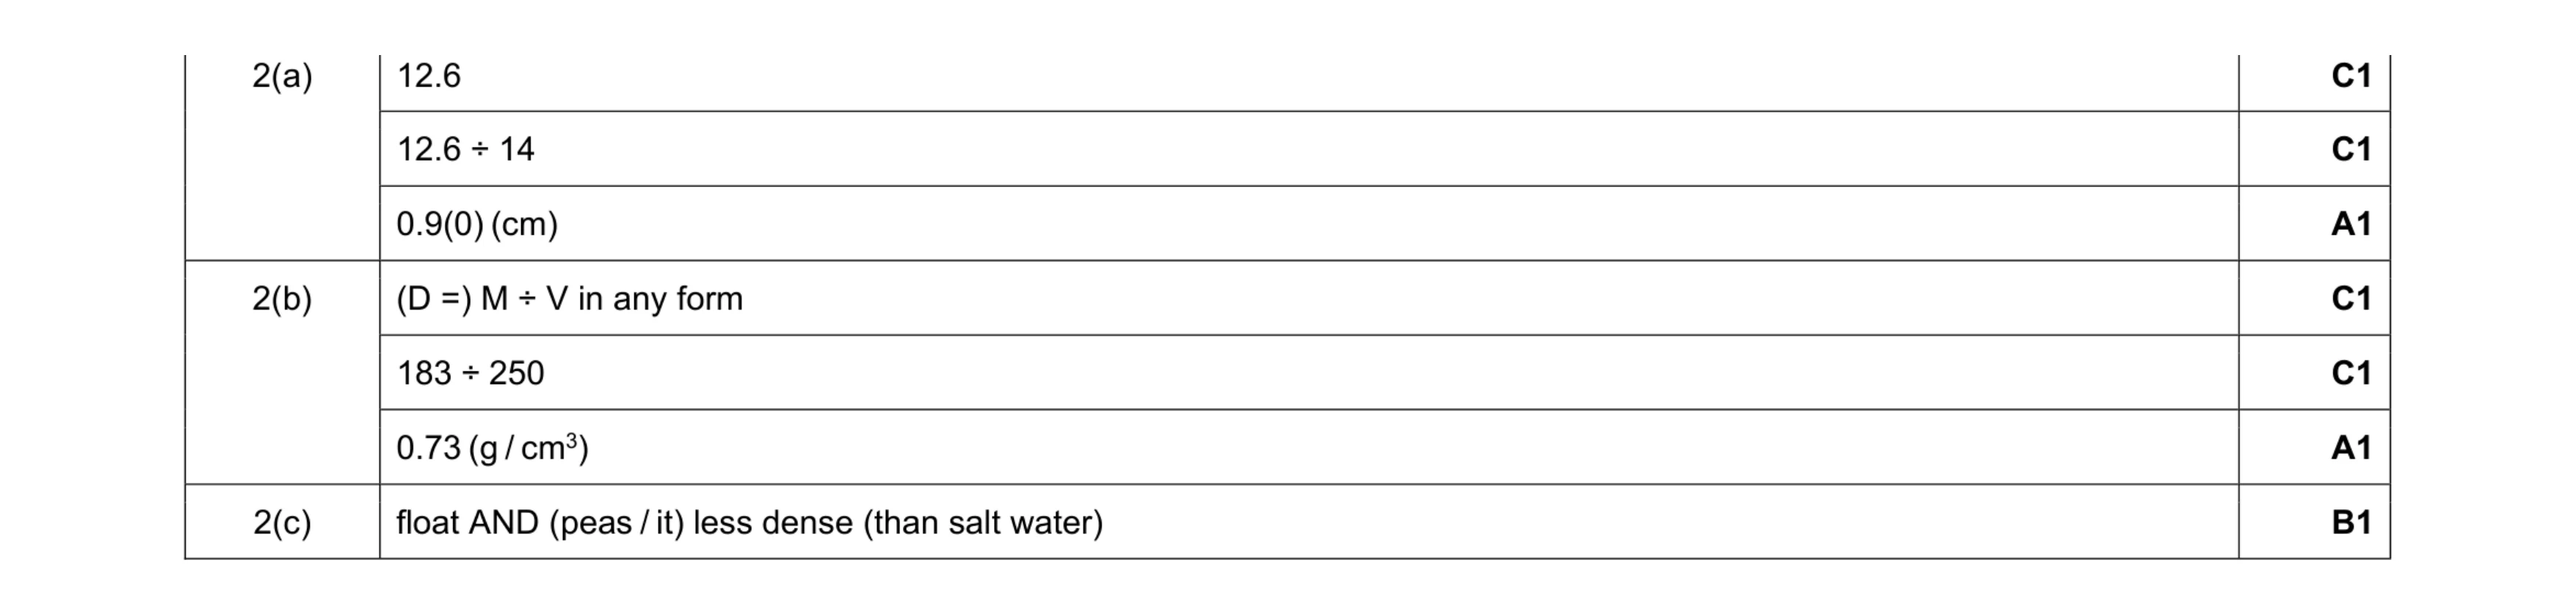 7
7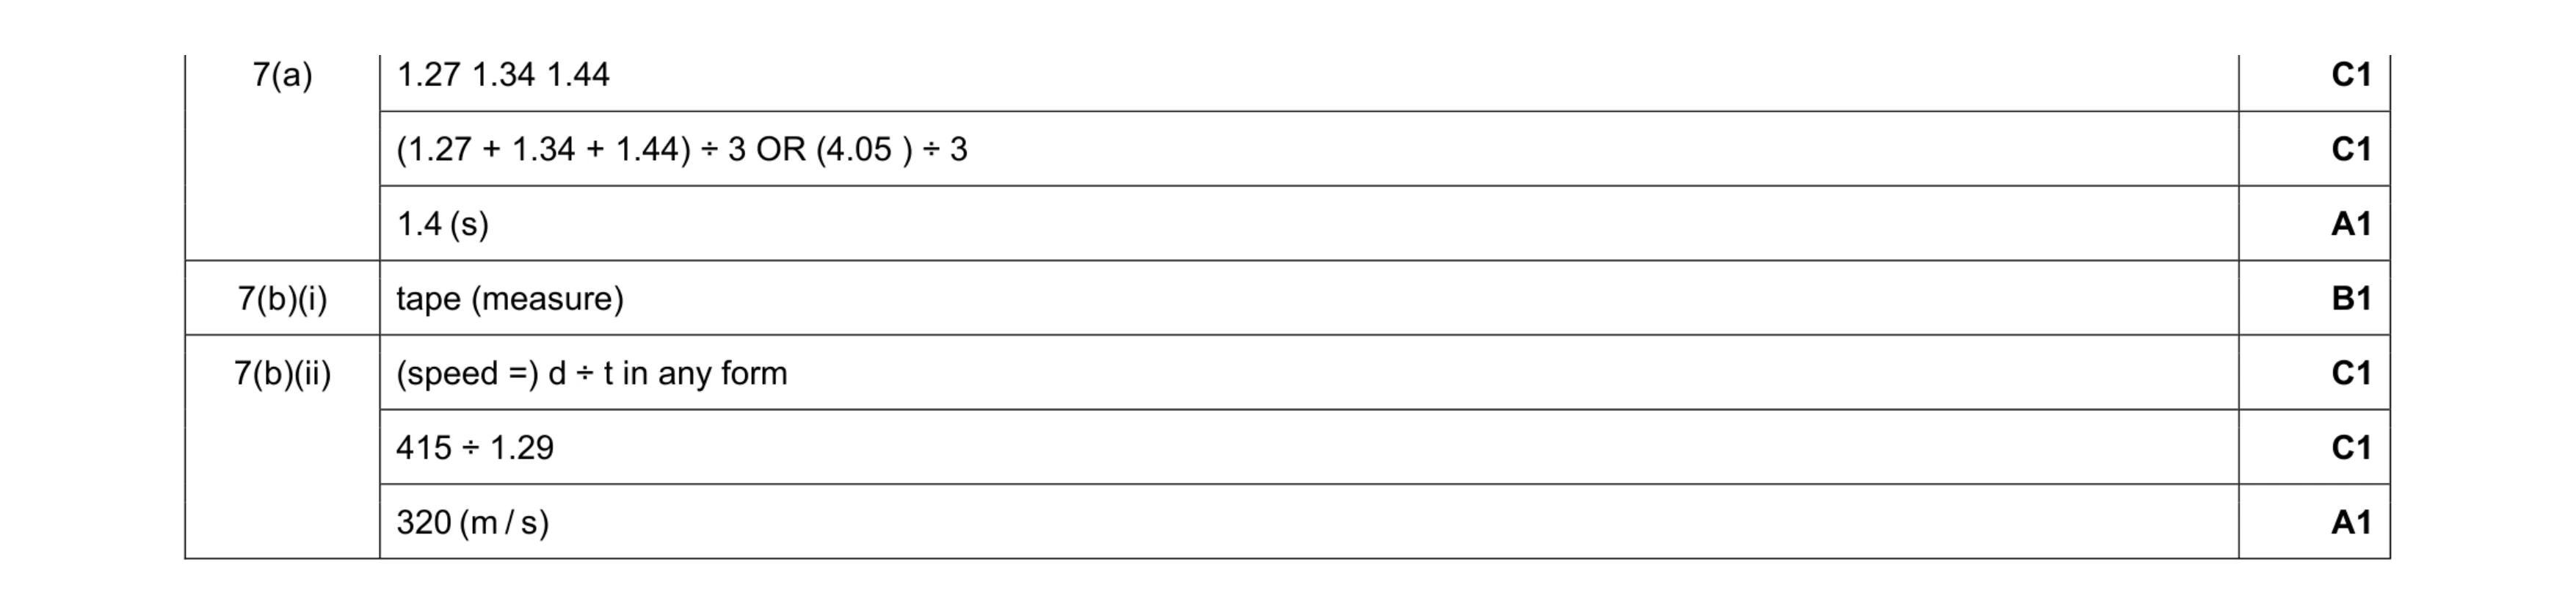 7
7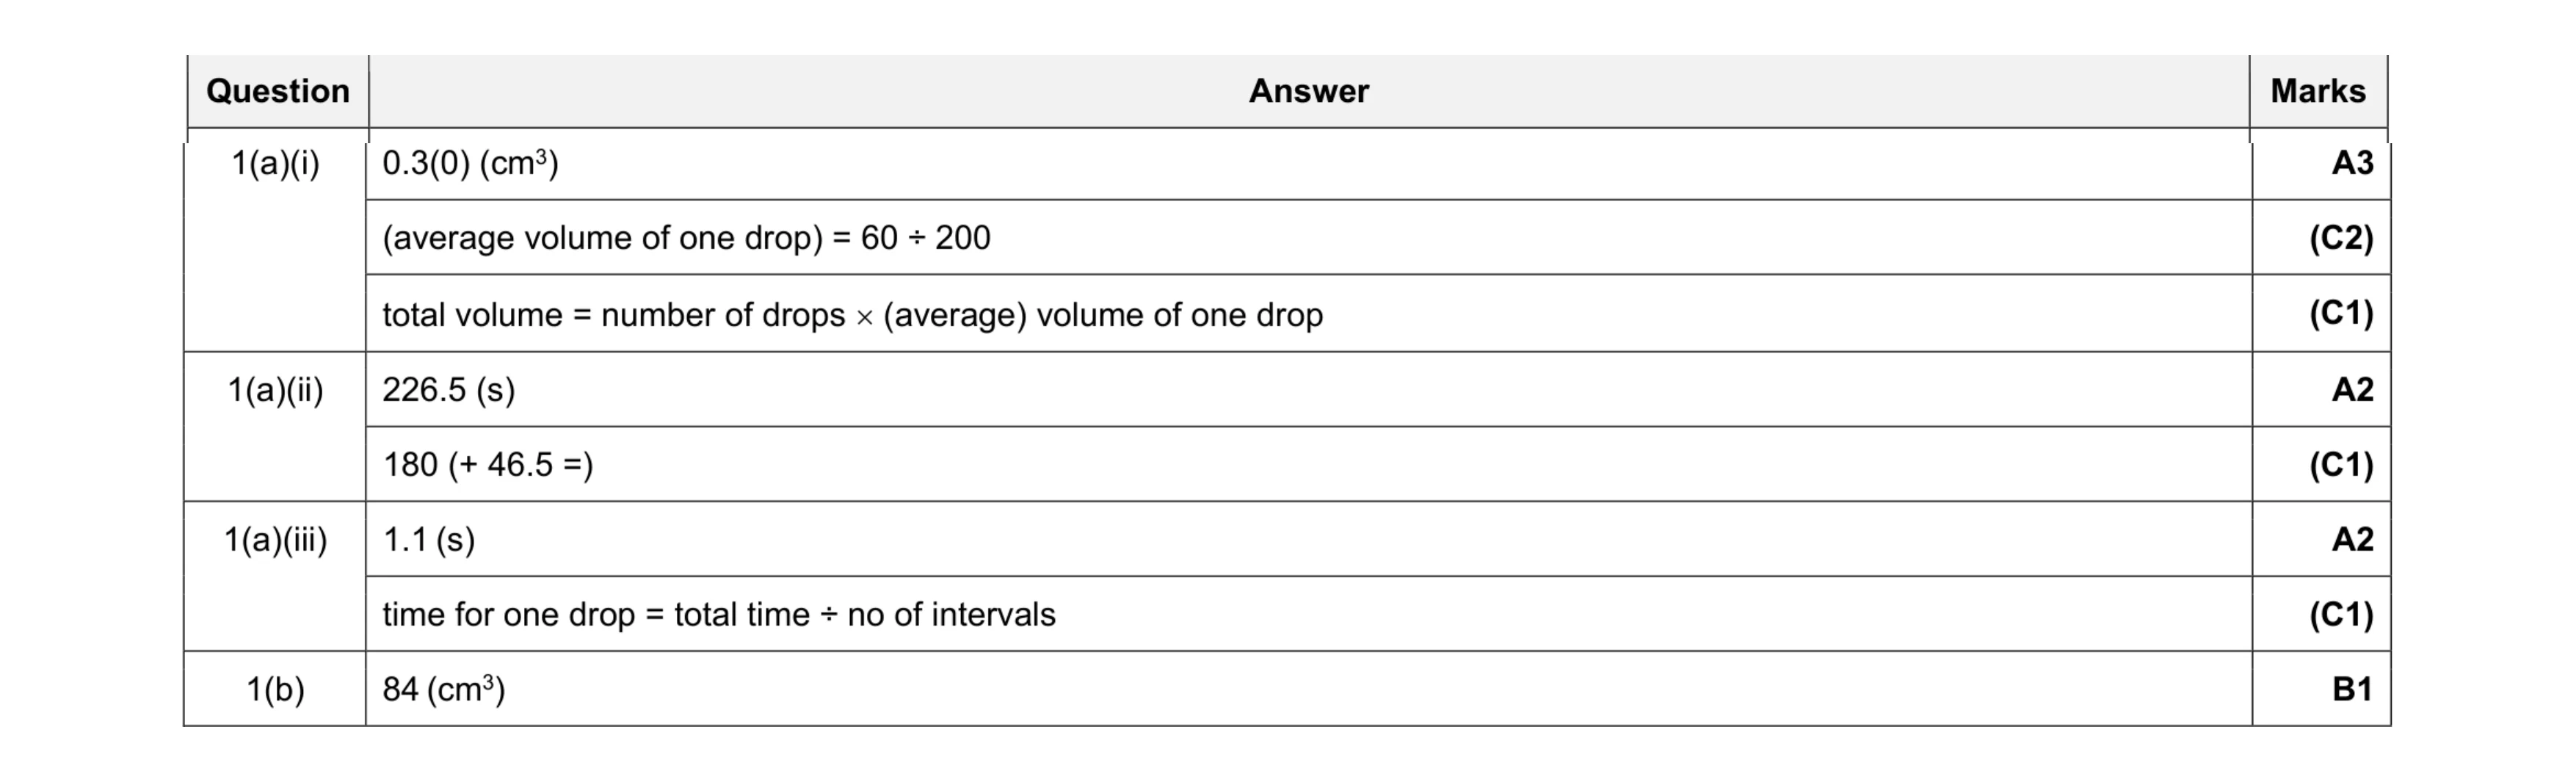 8
8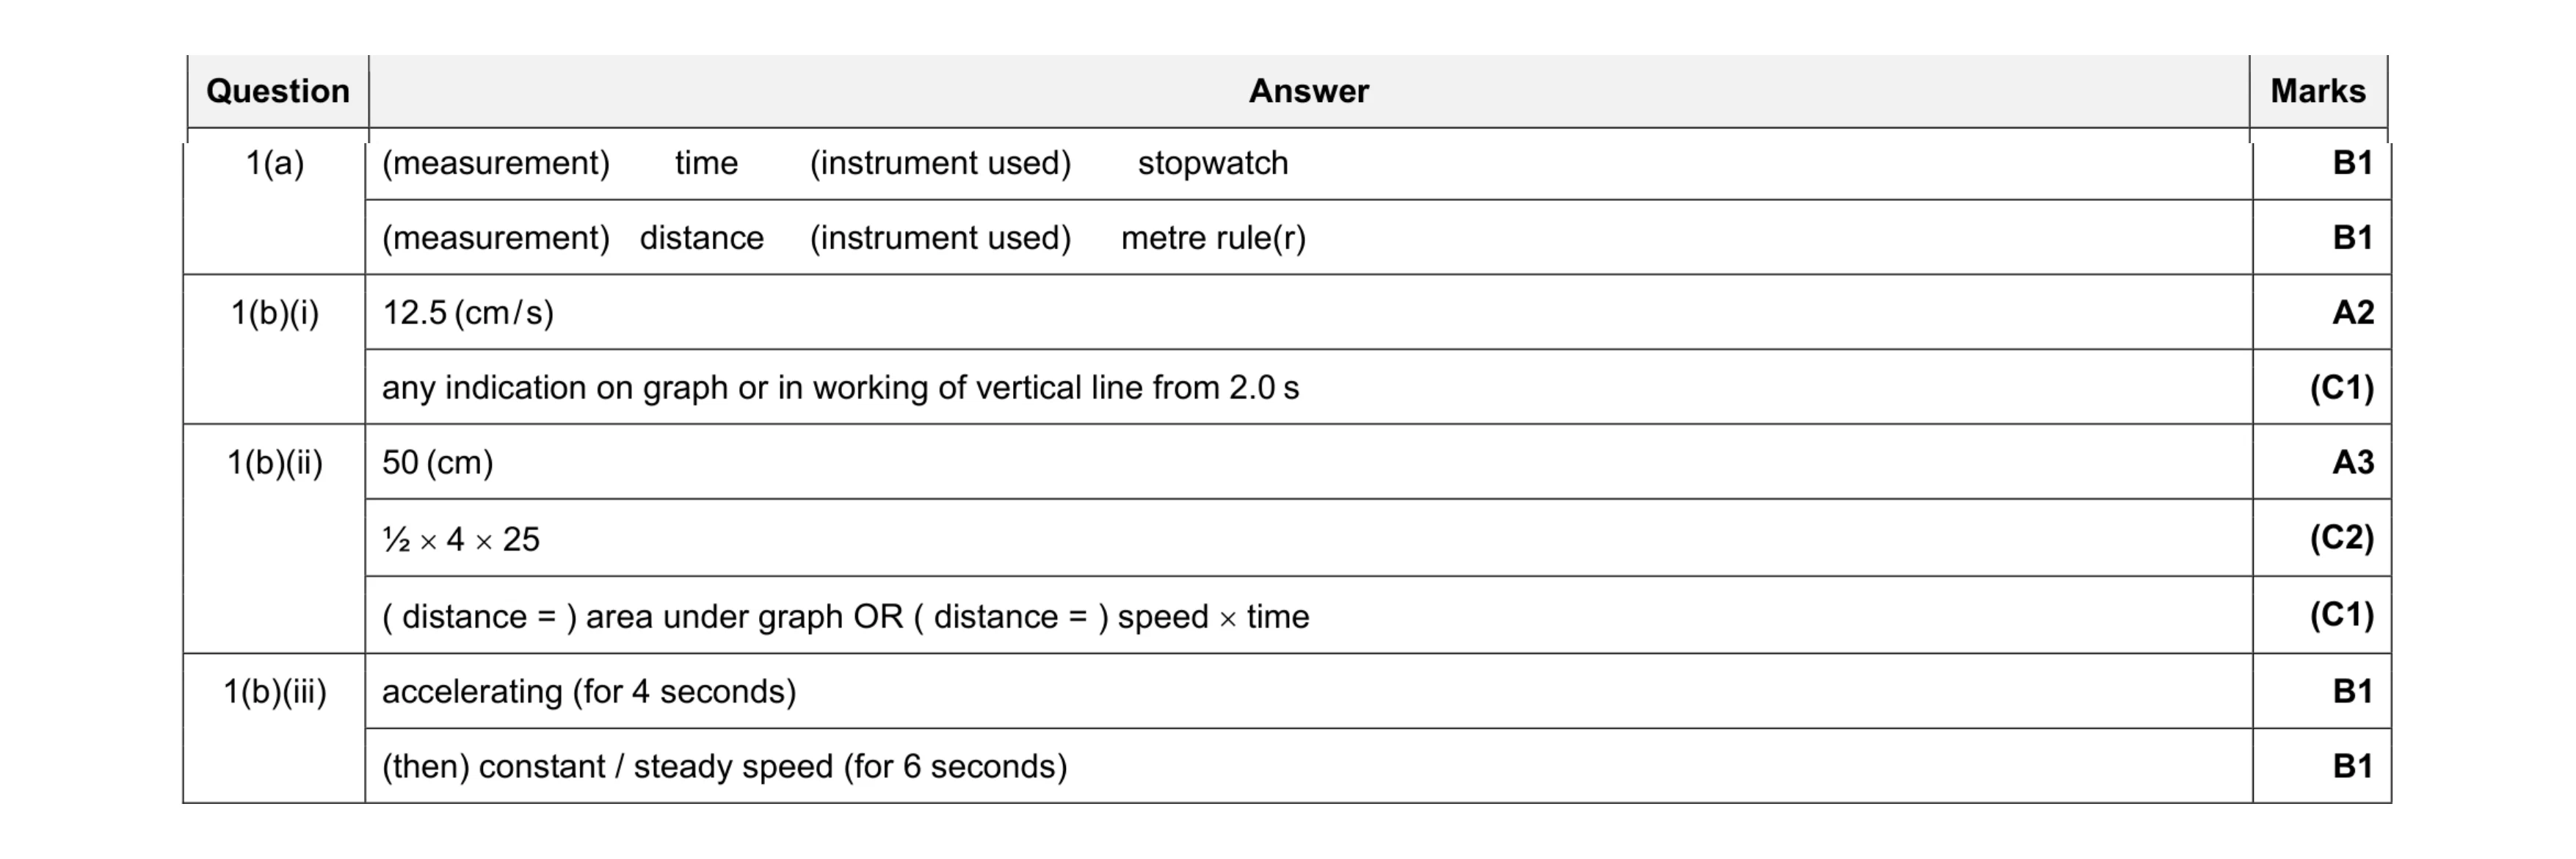 9
9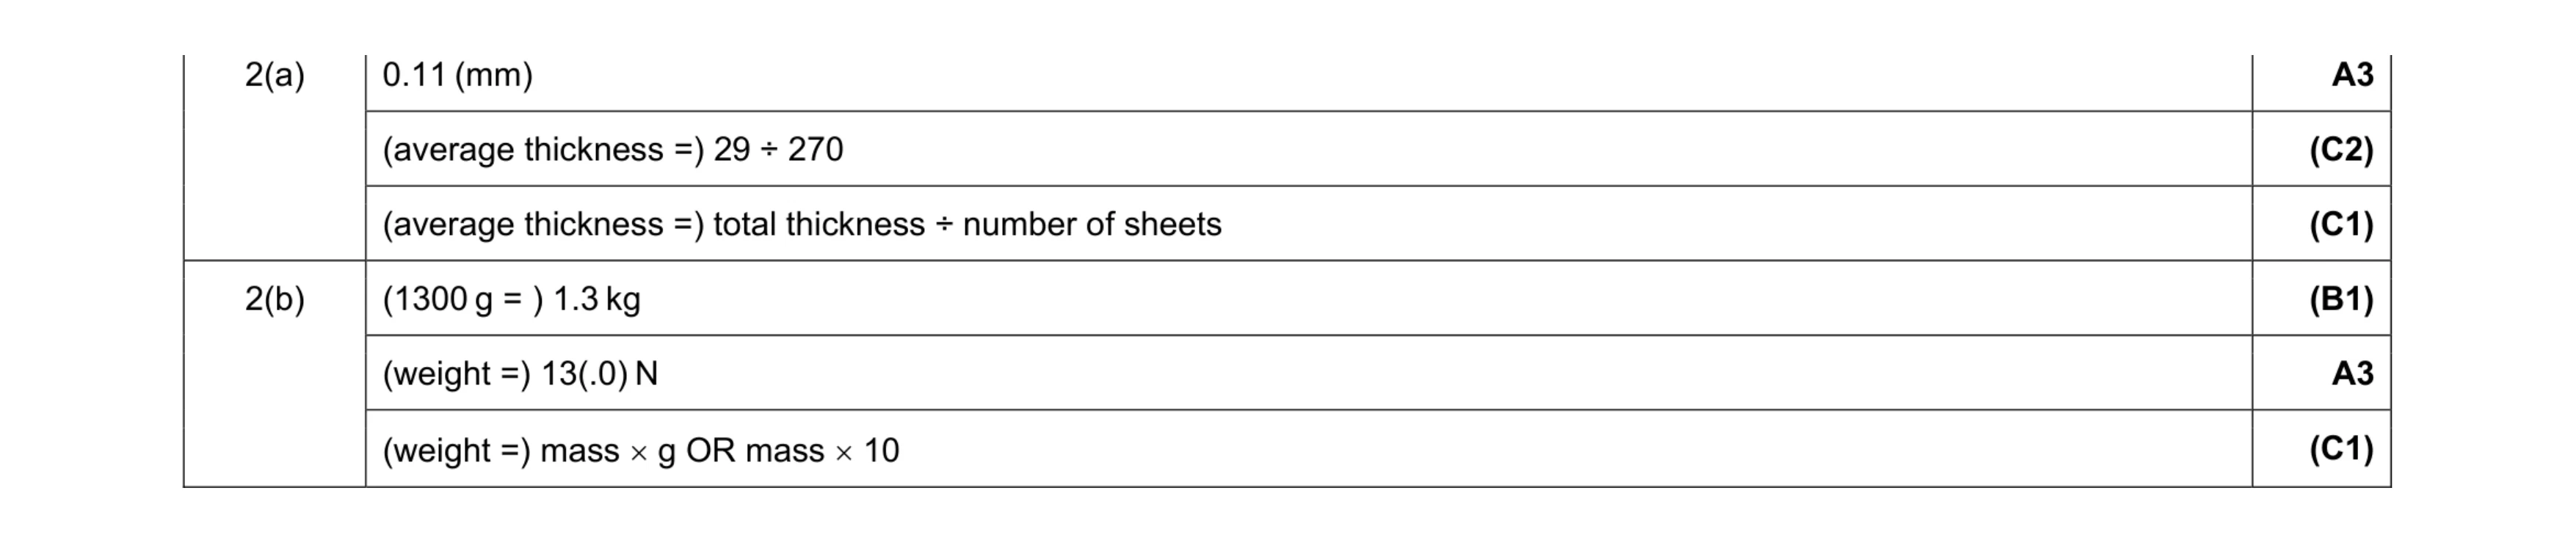 6
6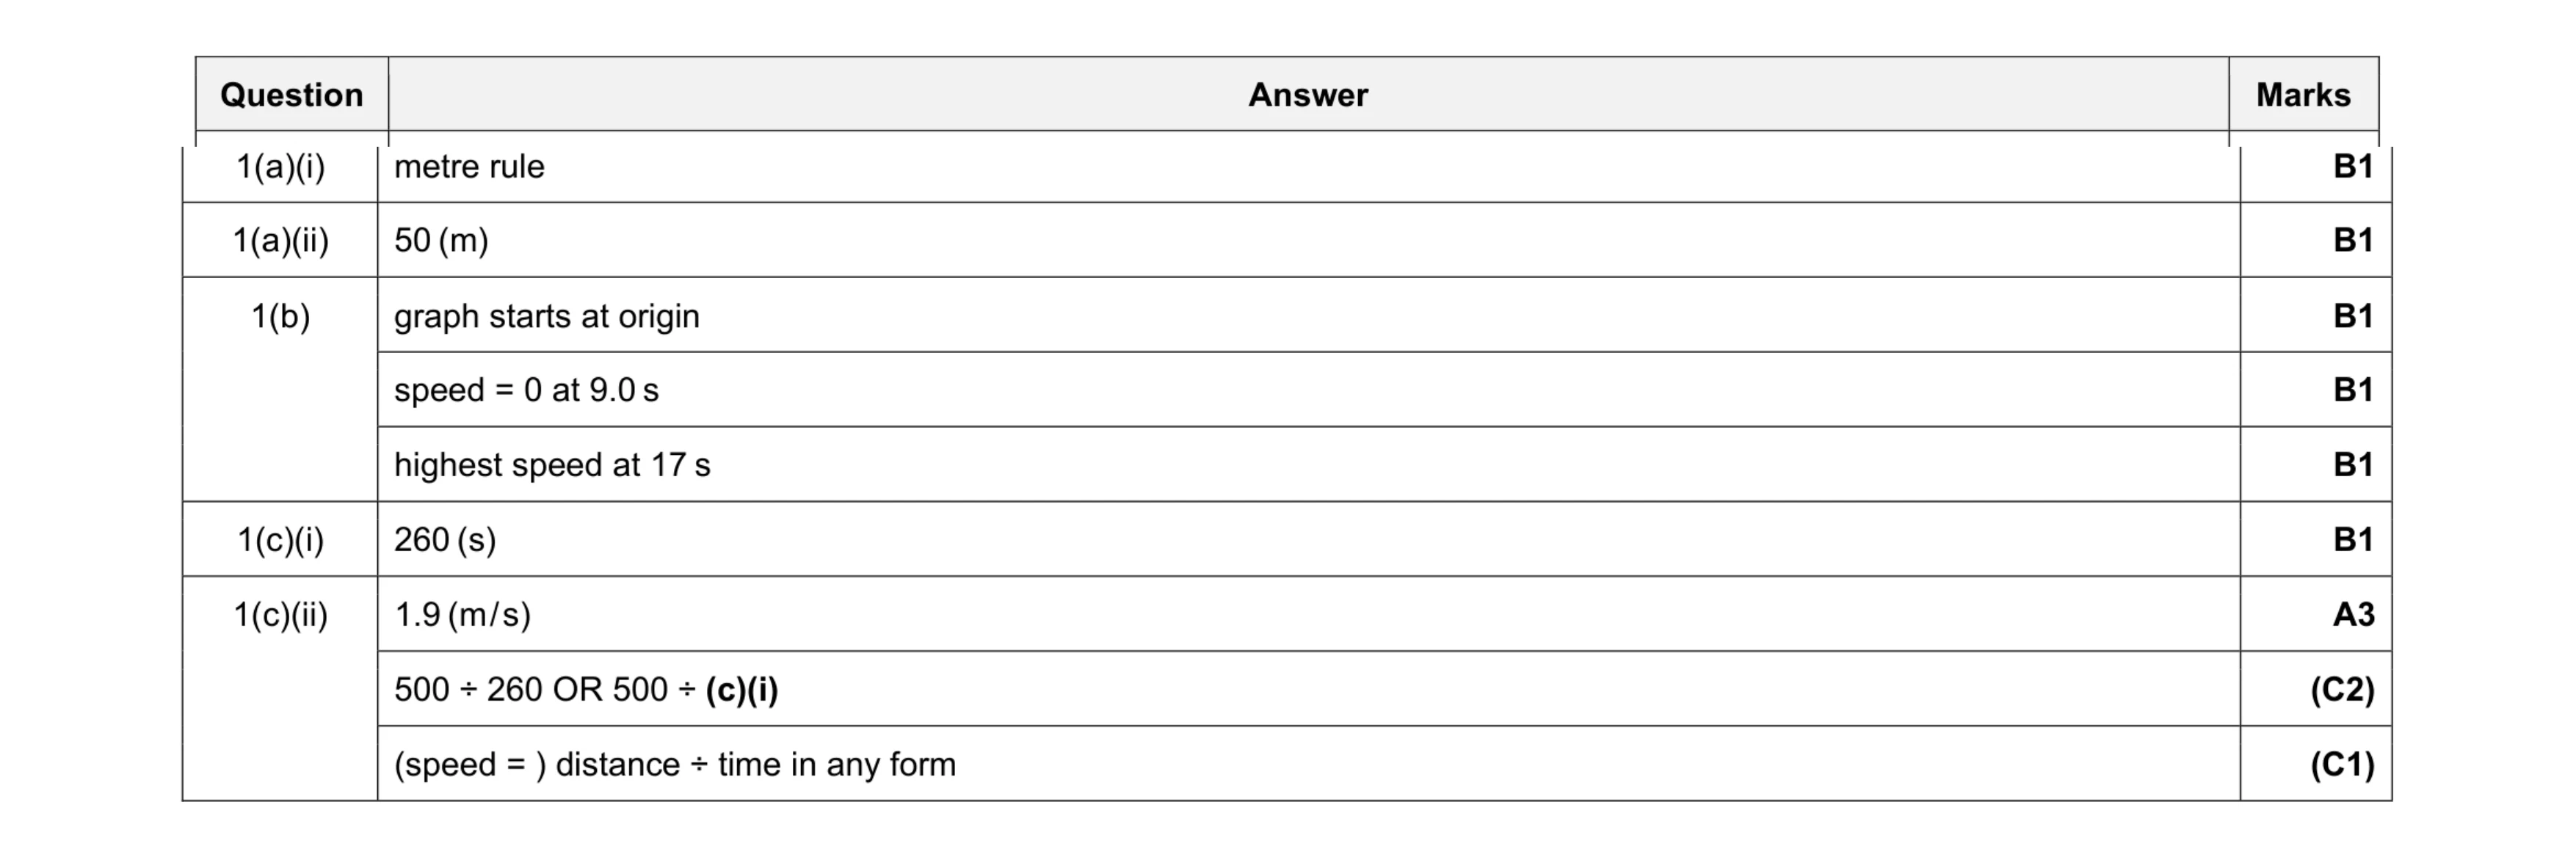 9
9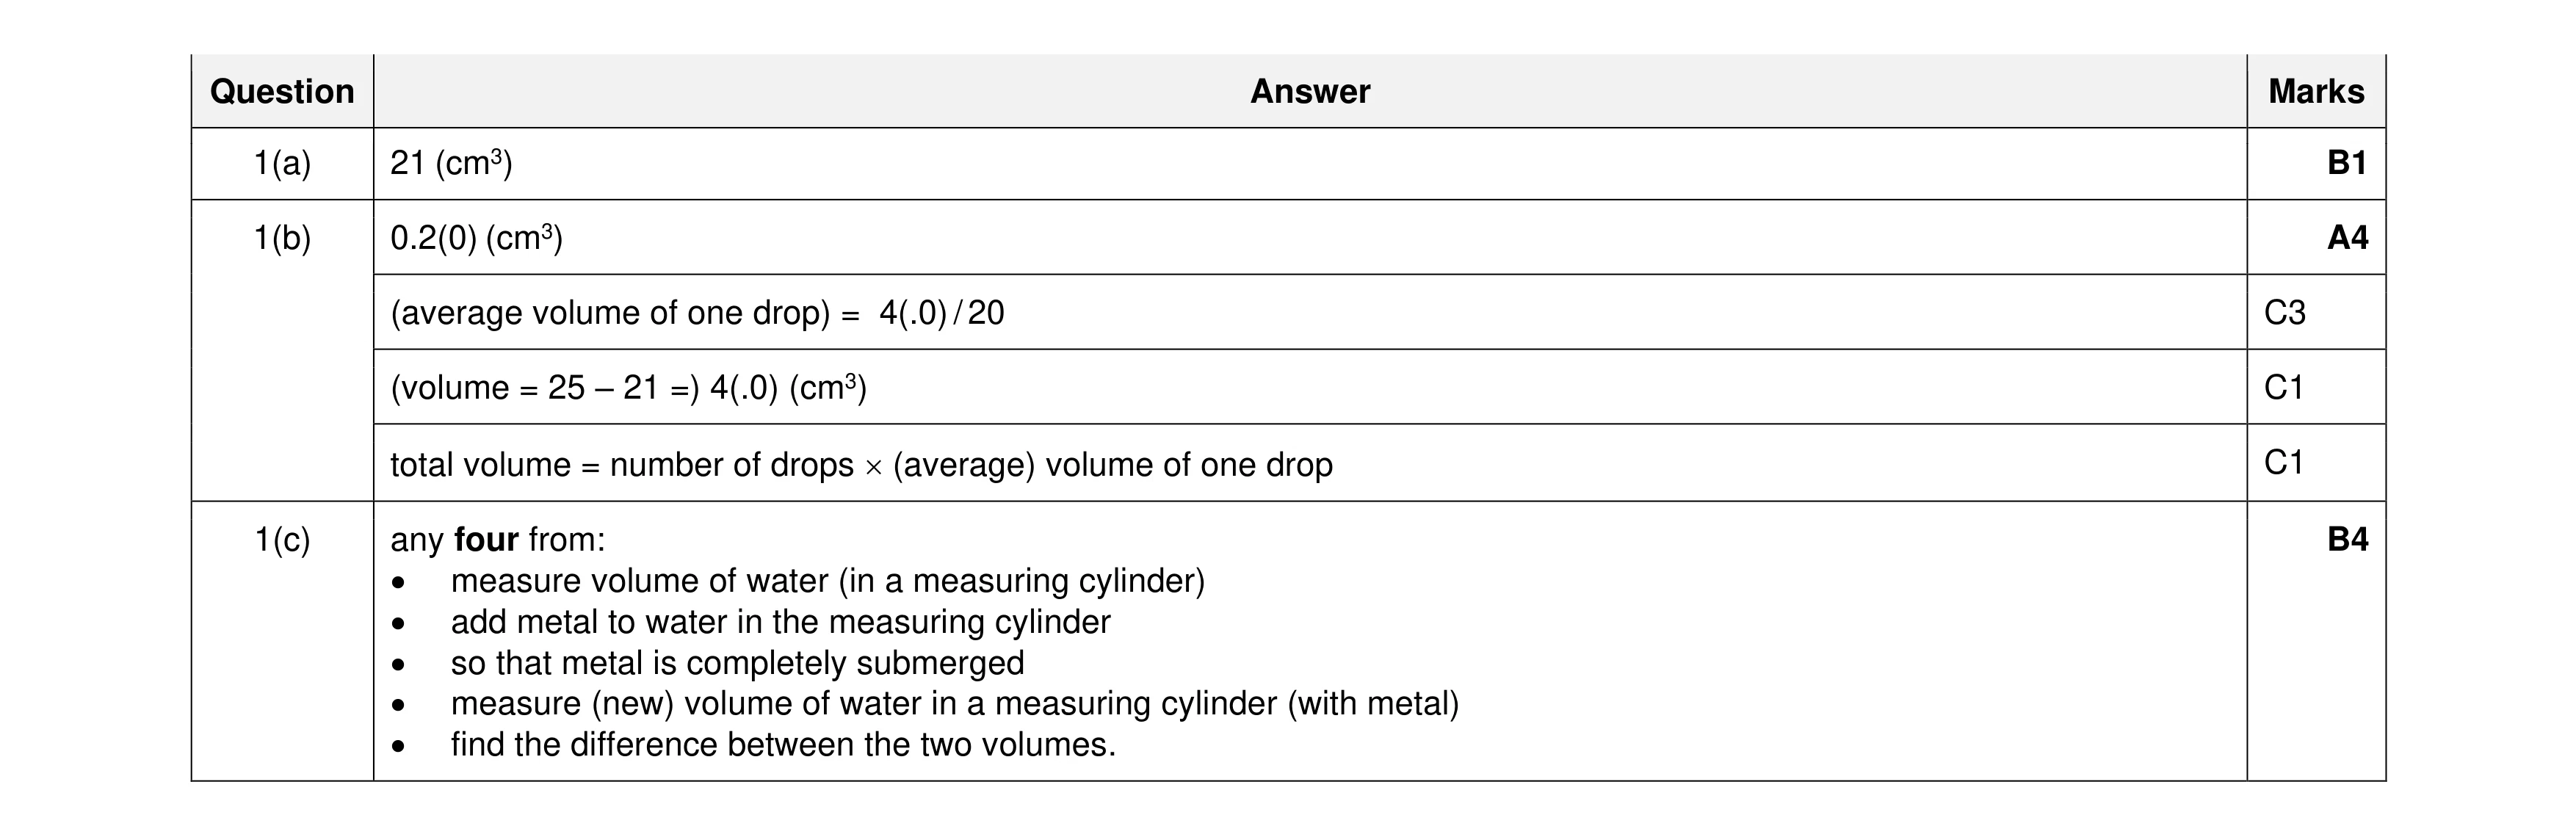 9
9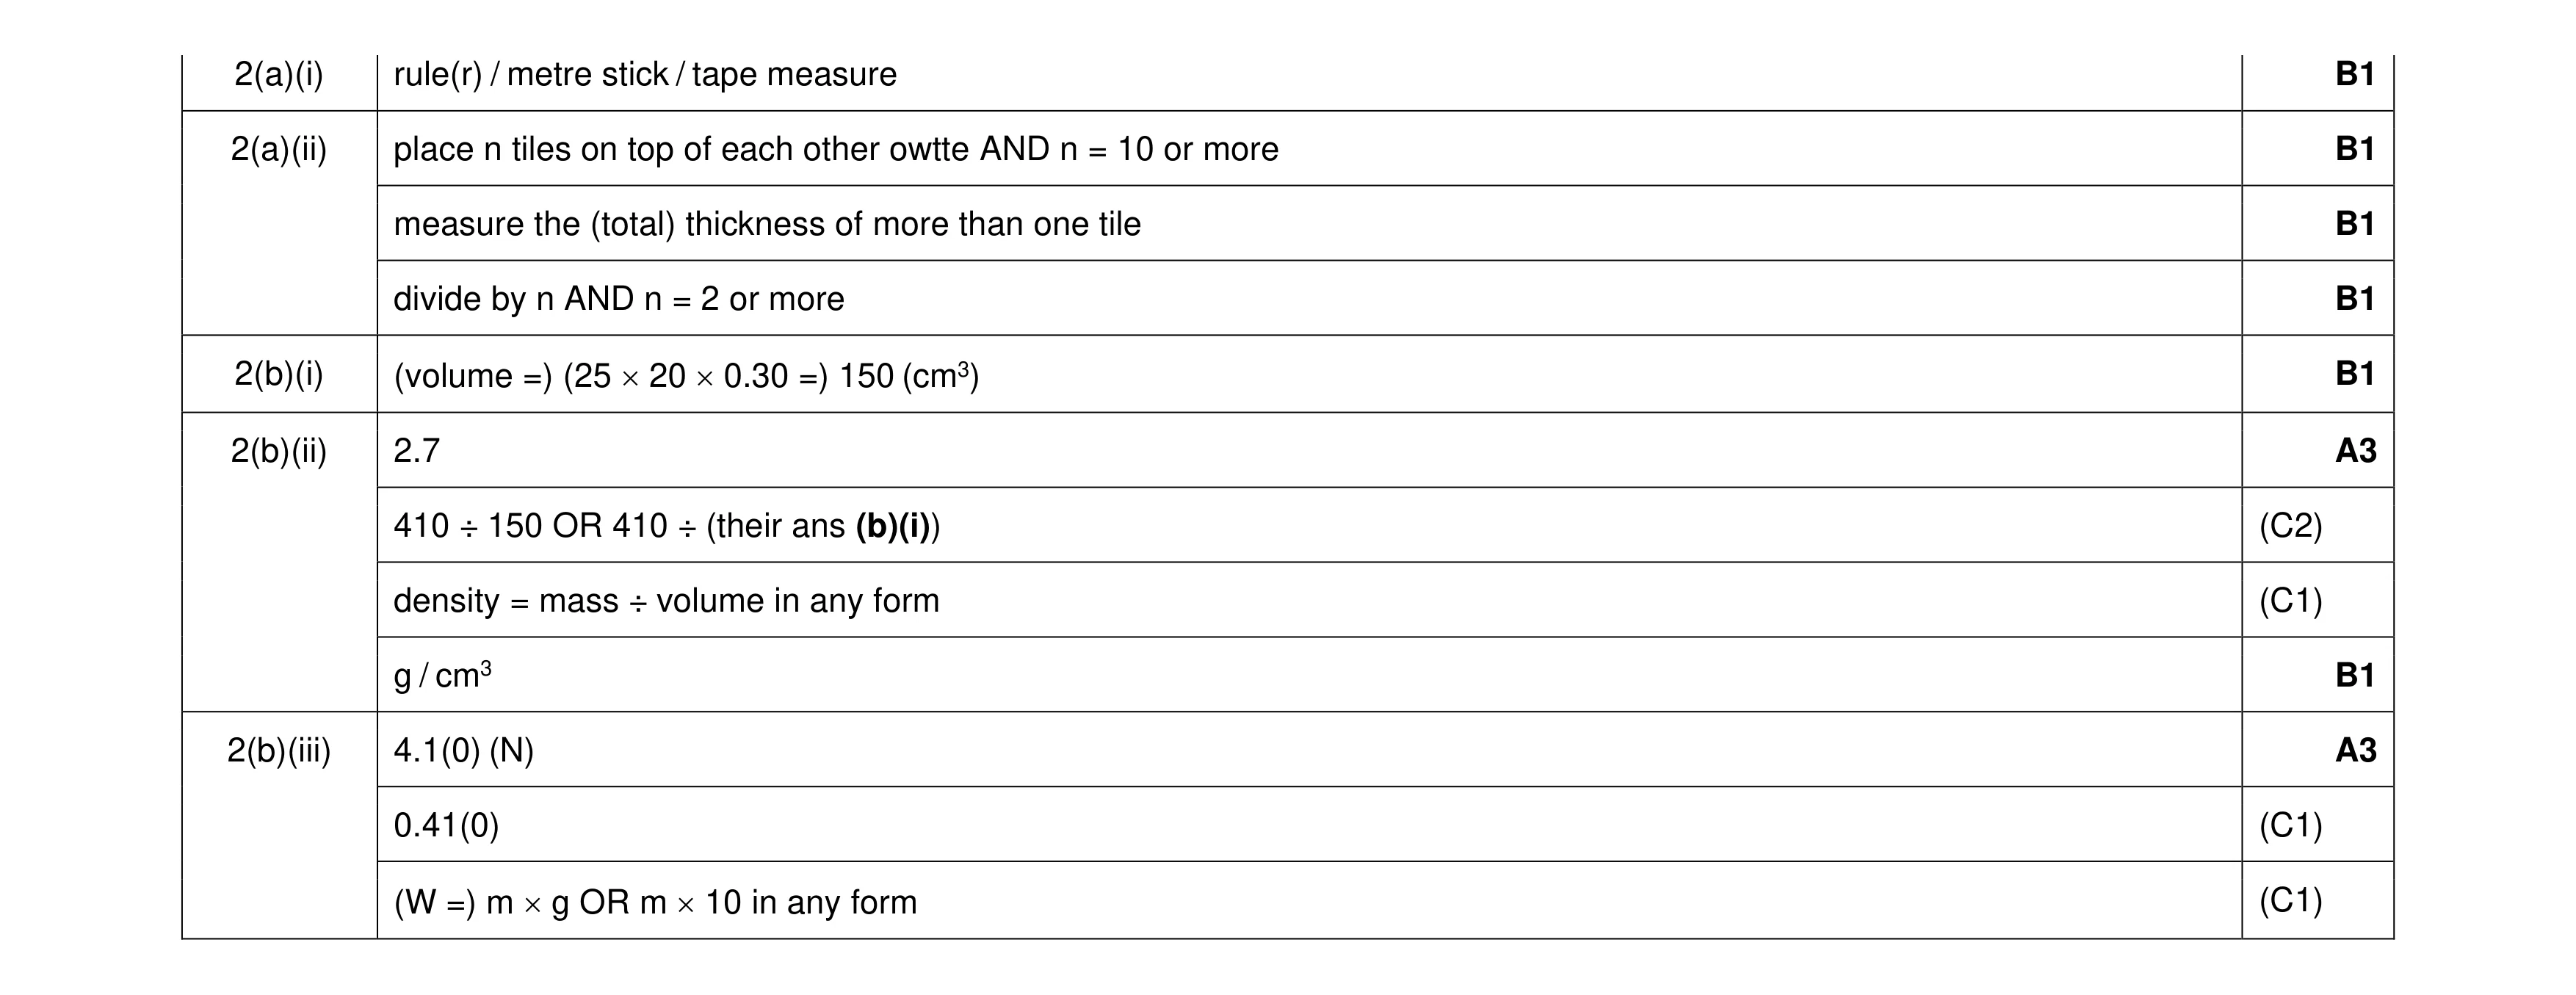 12
12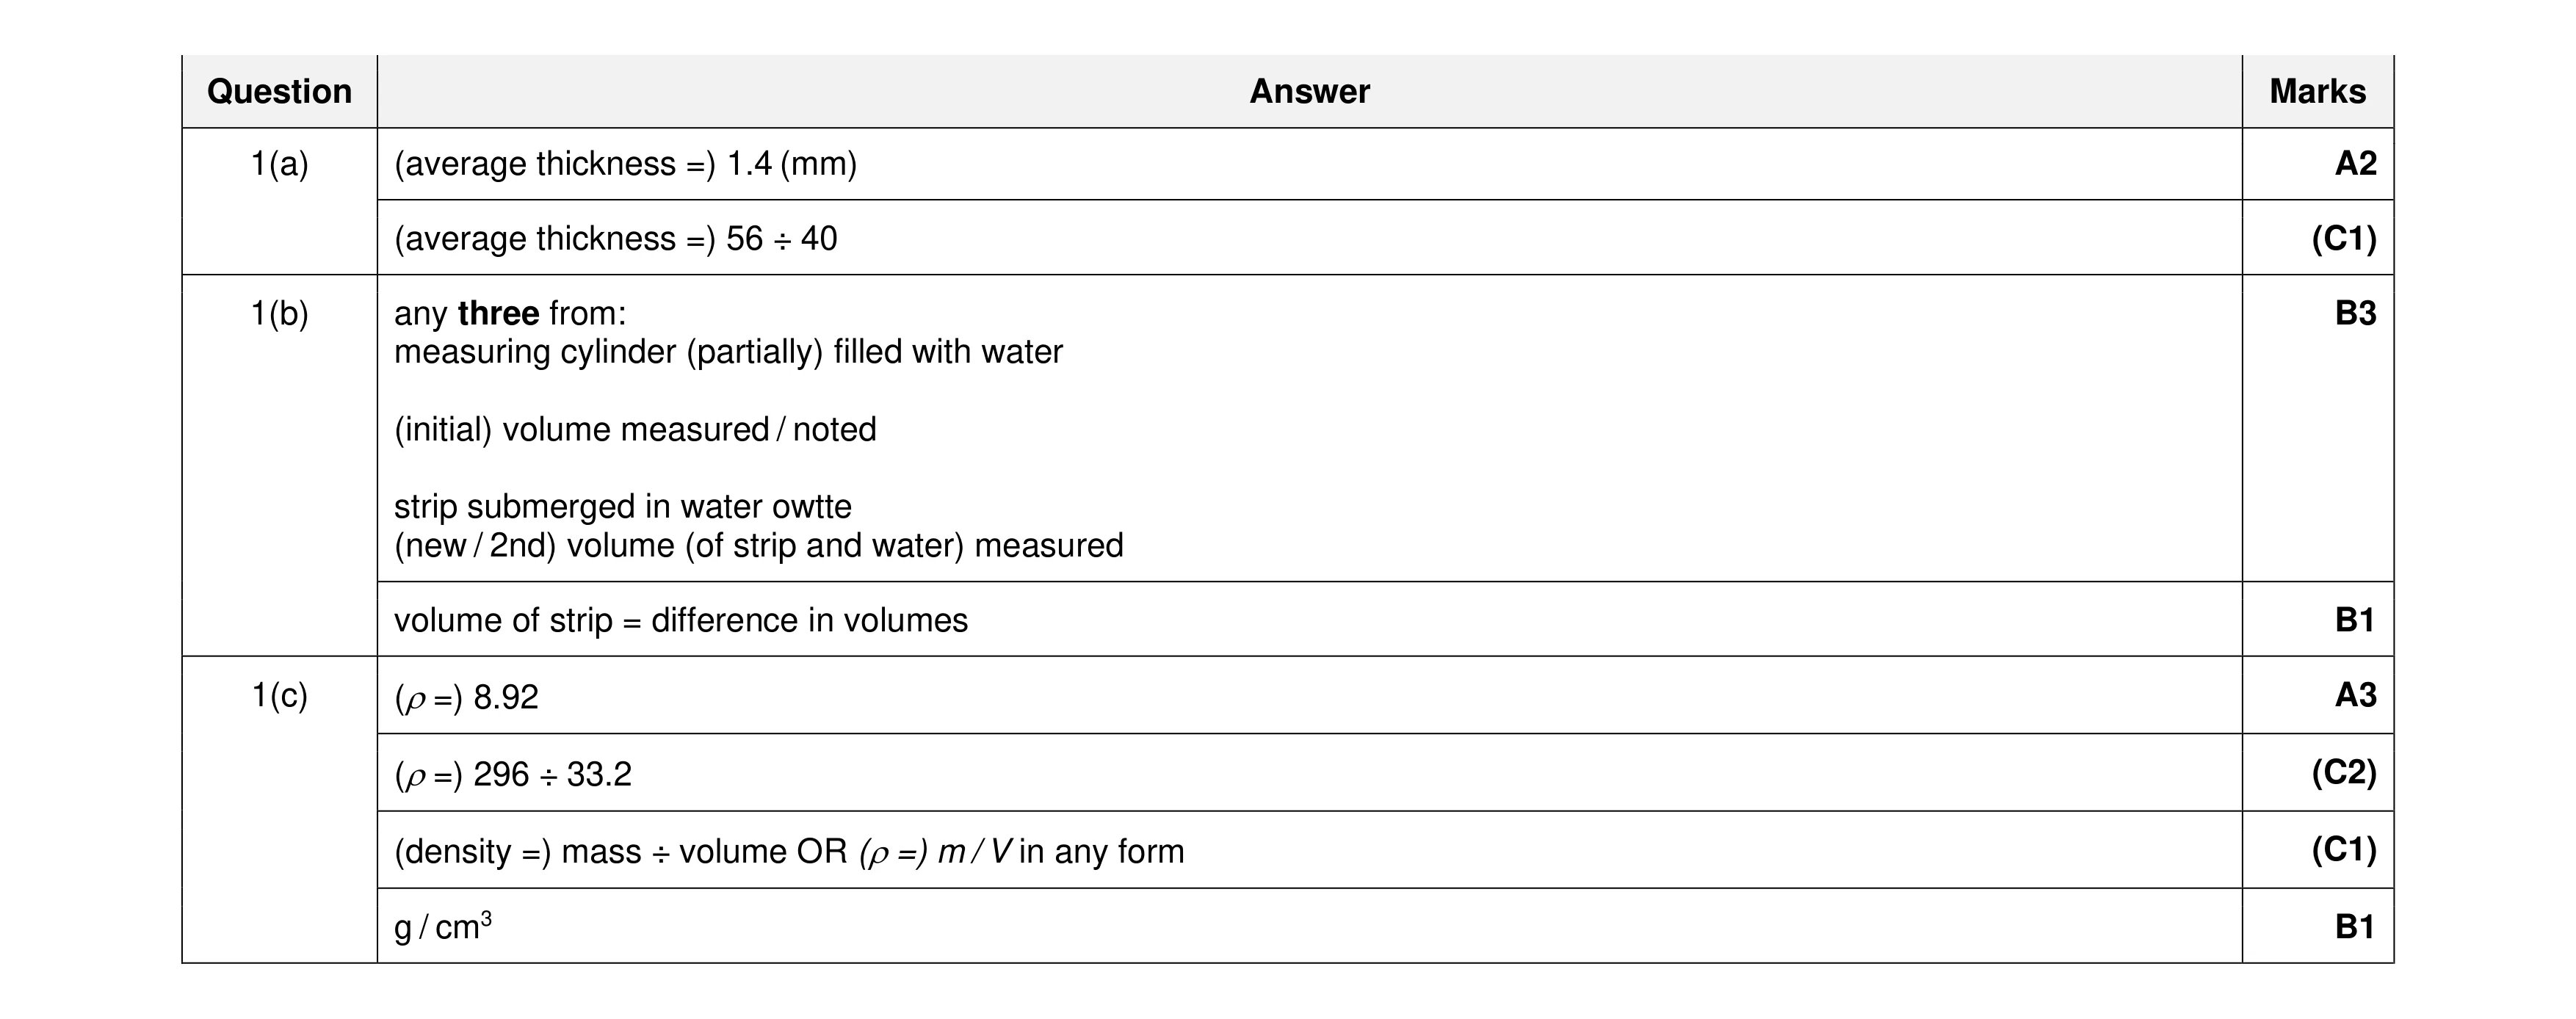 10
10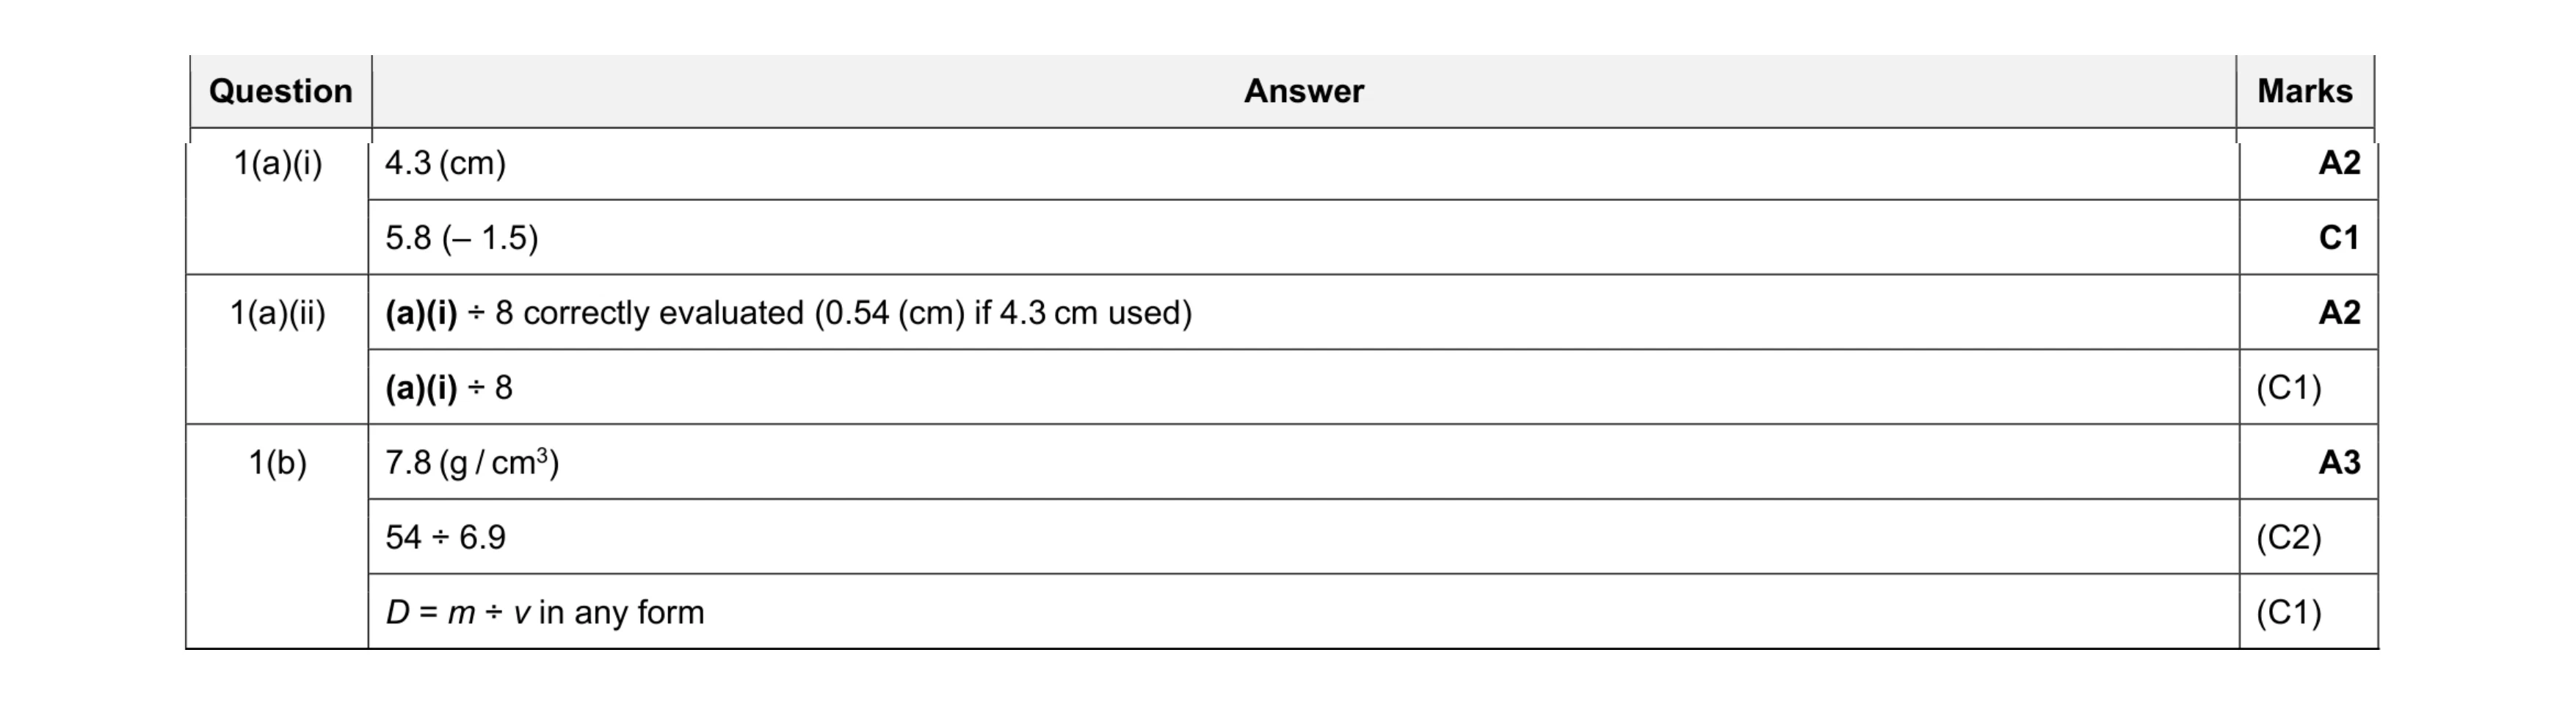 7
7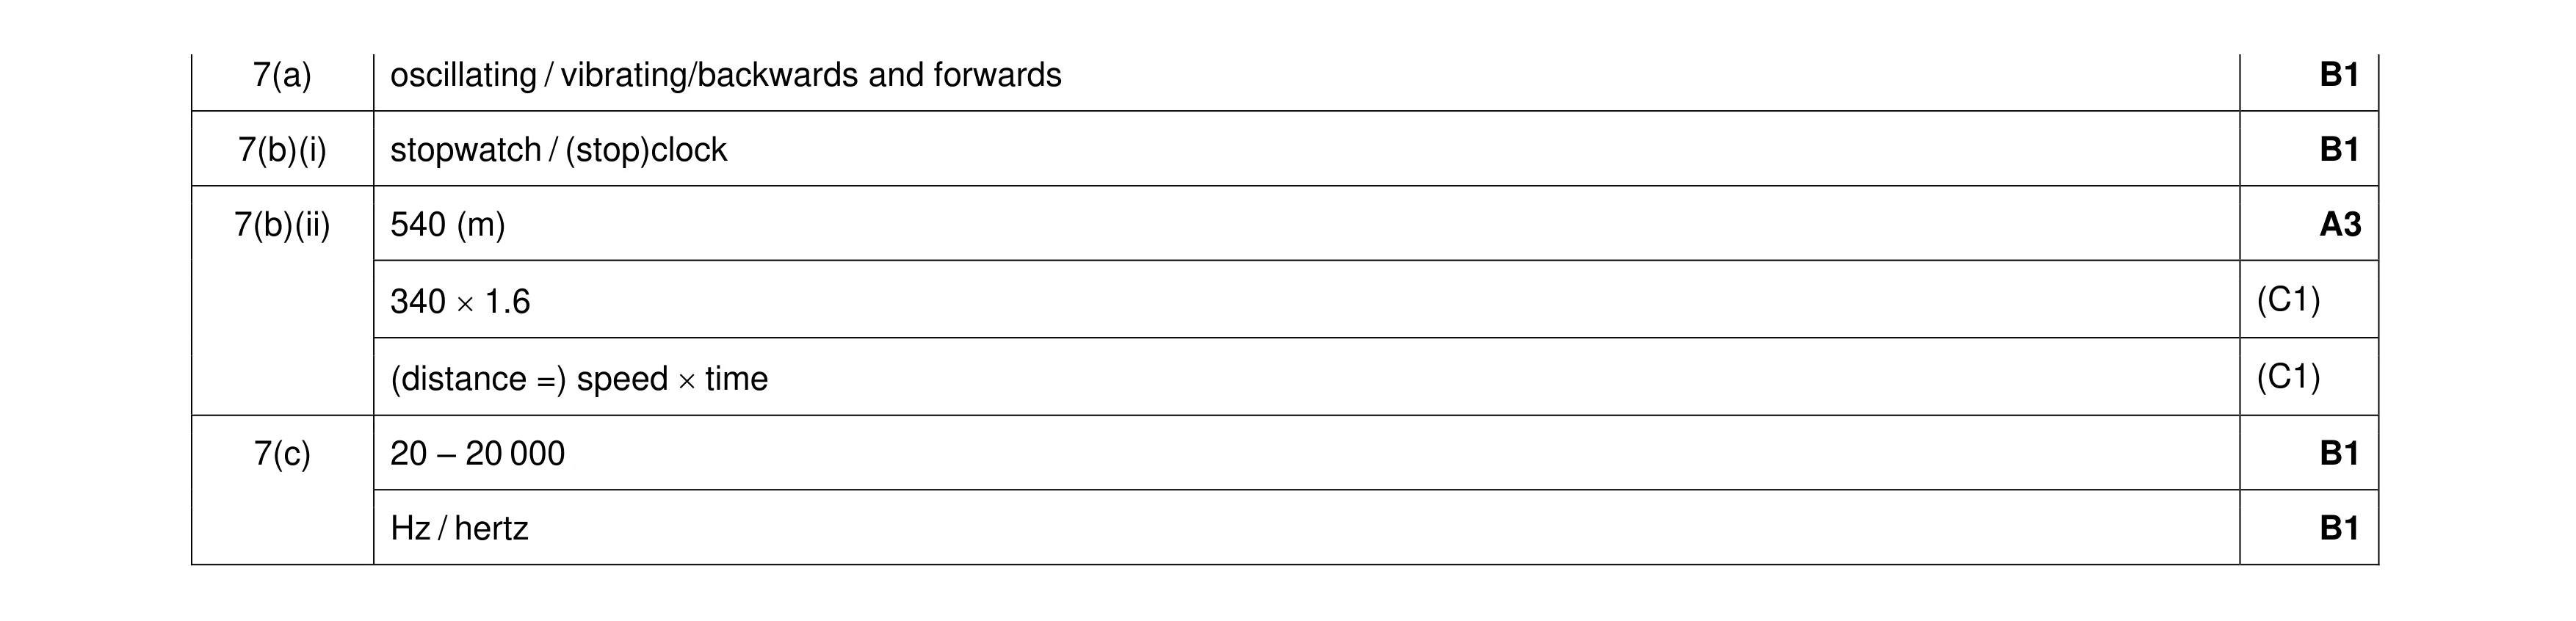 7
7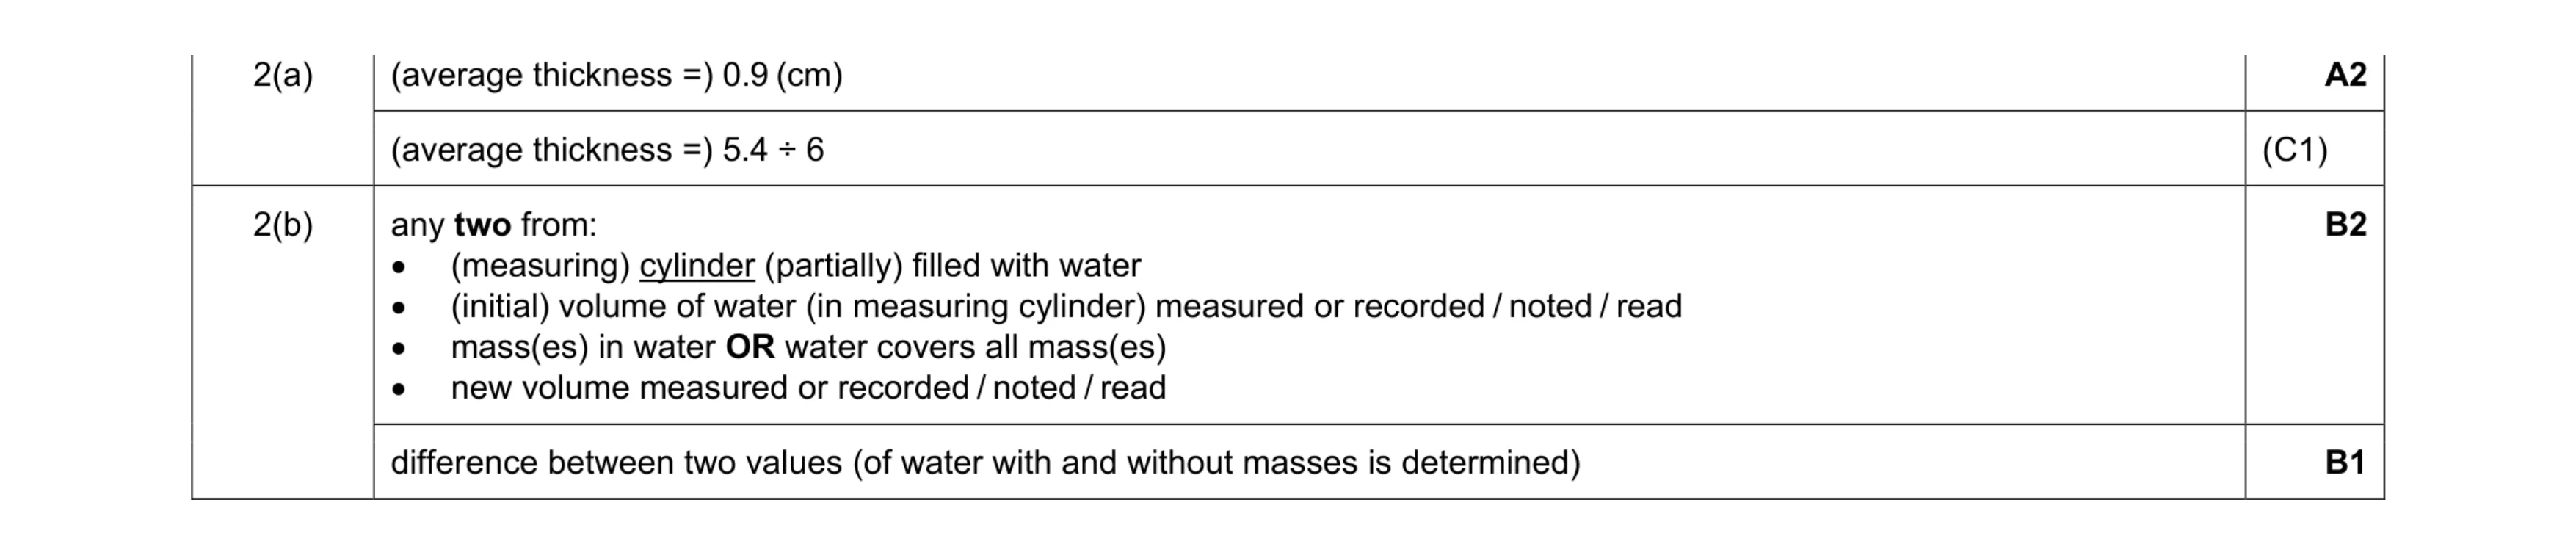 5
5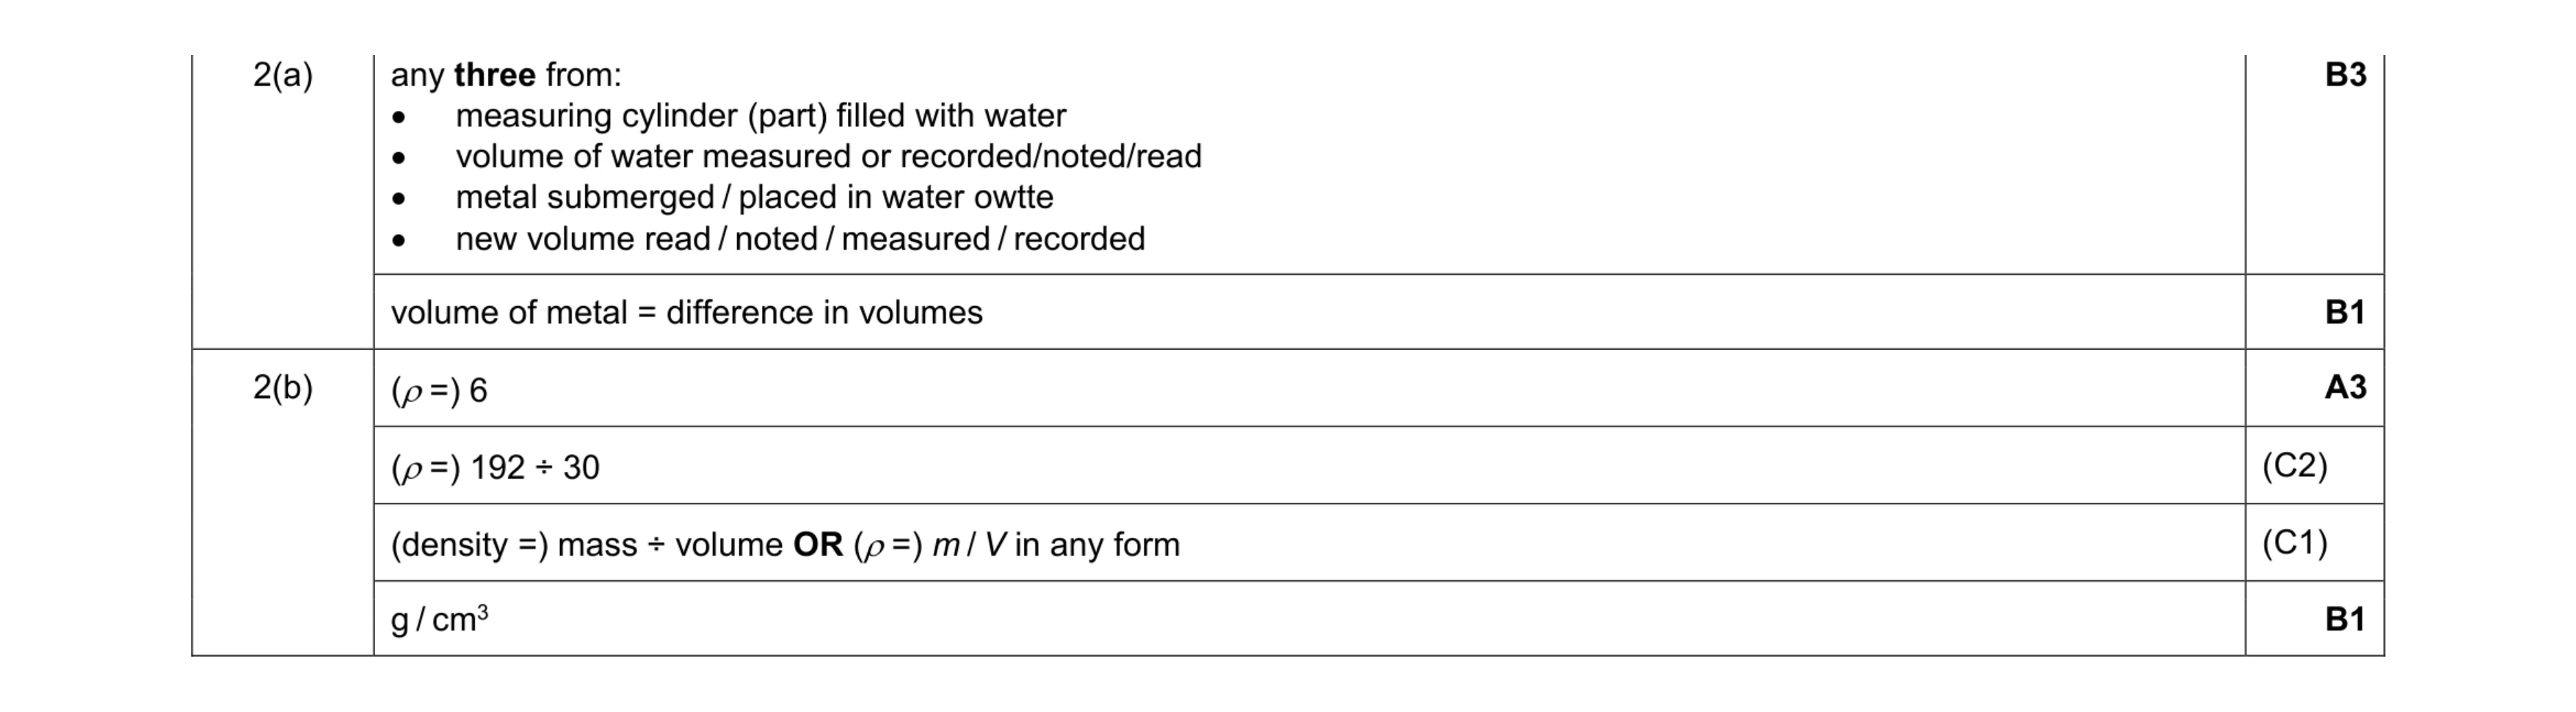 8
8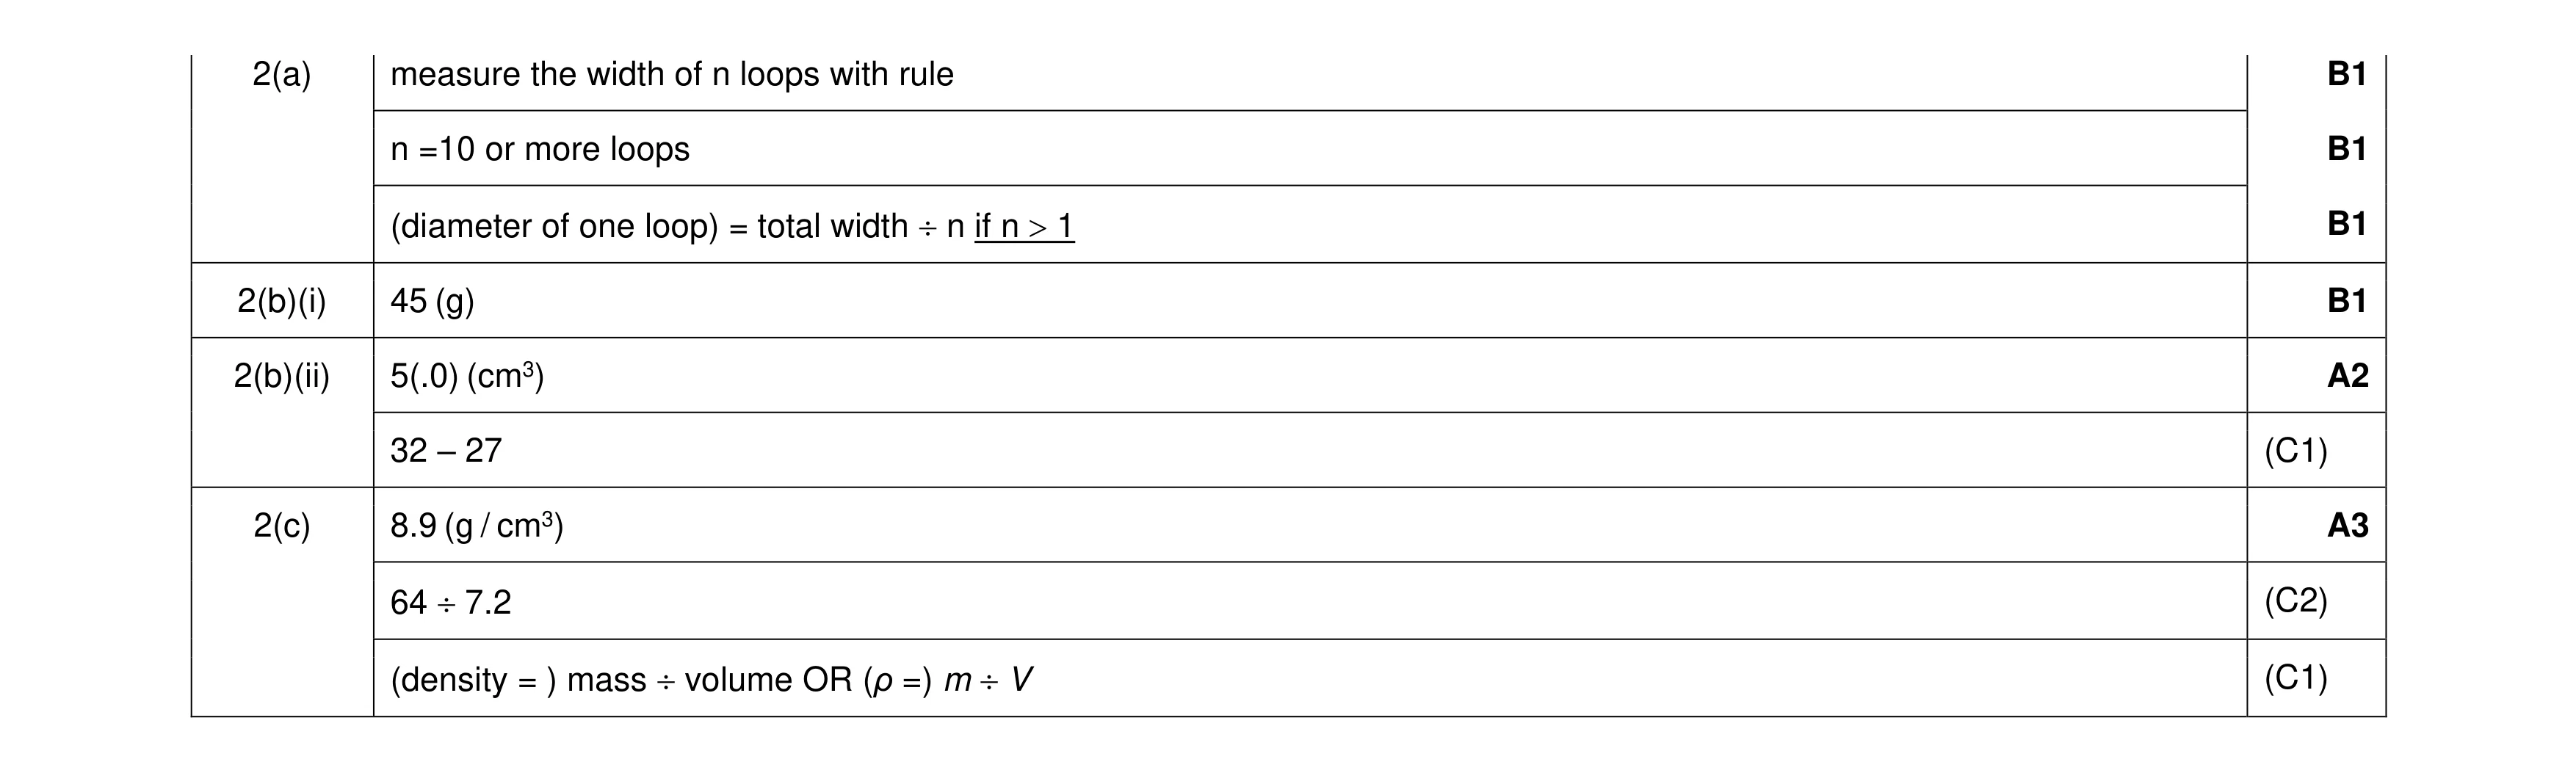 9
9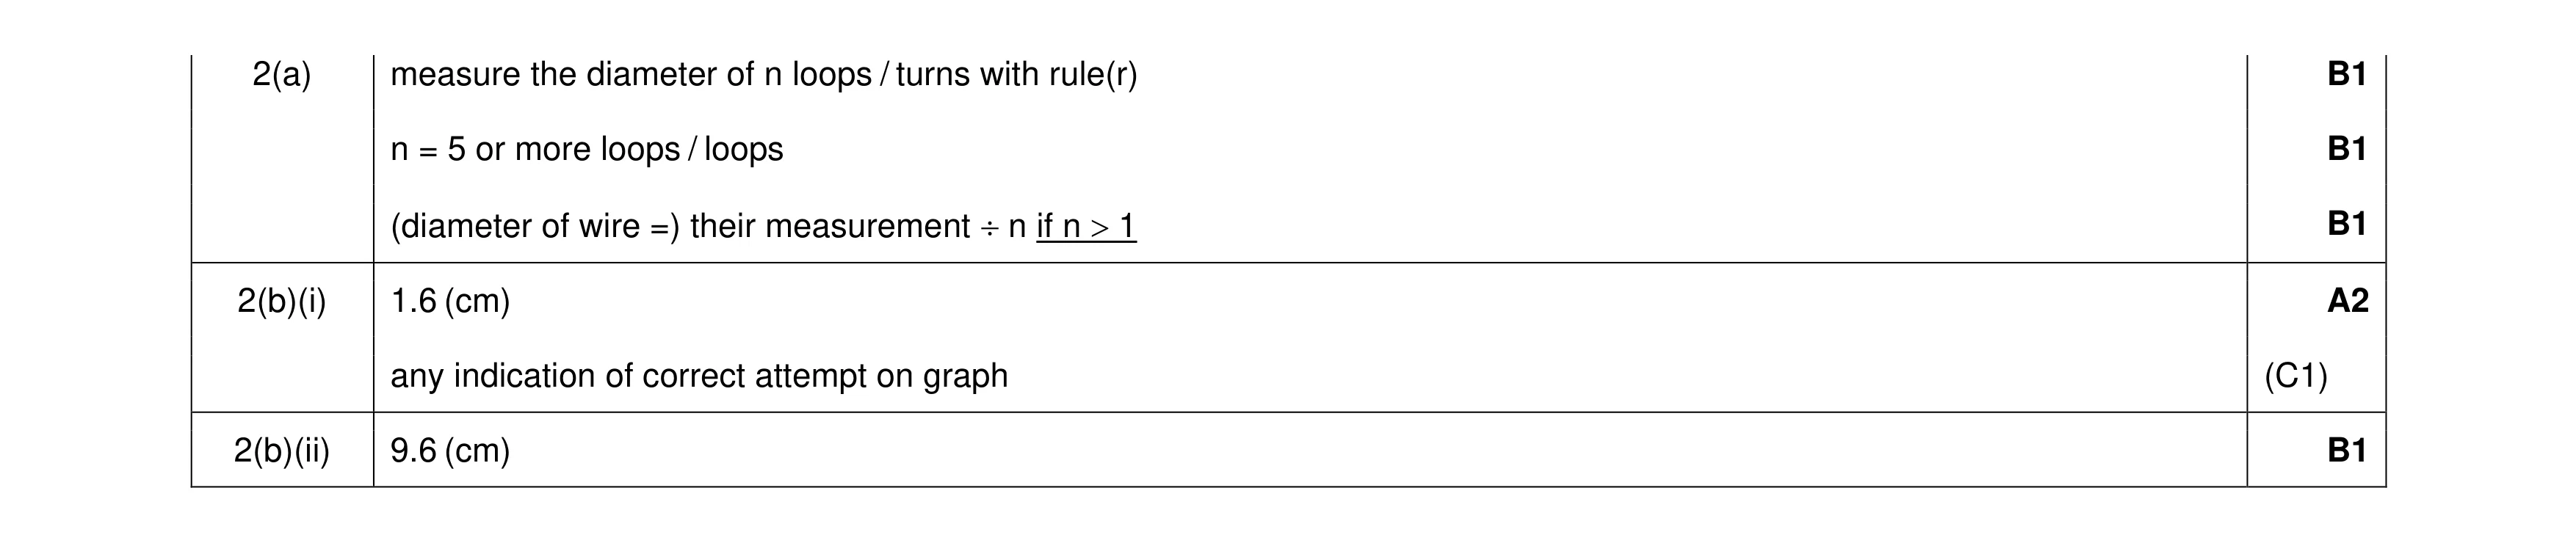 6
6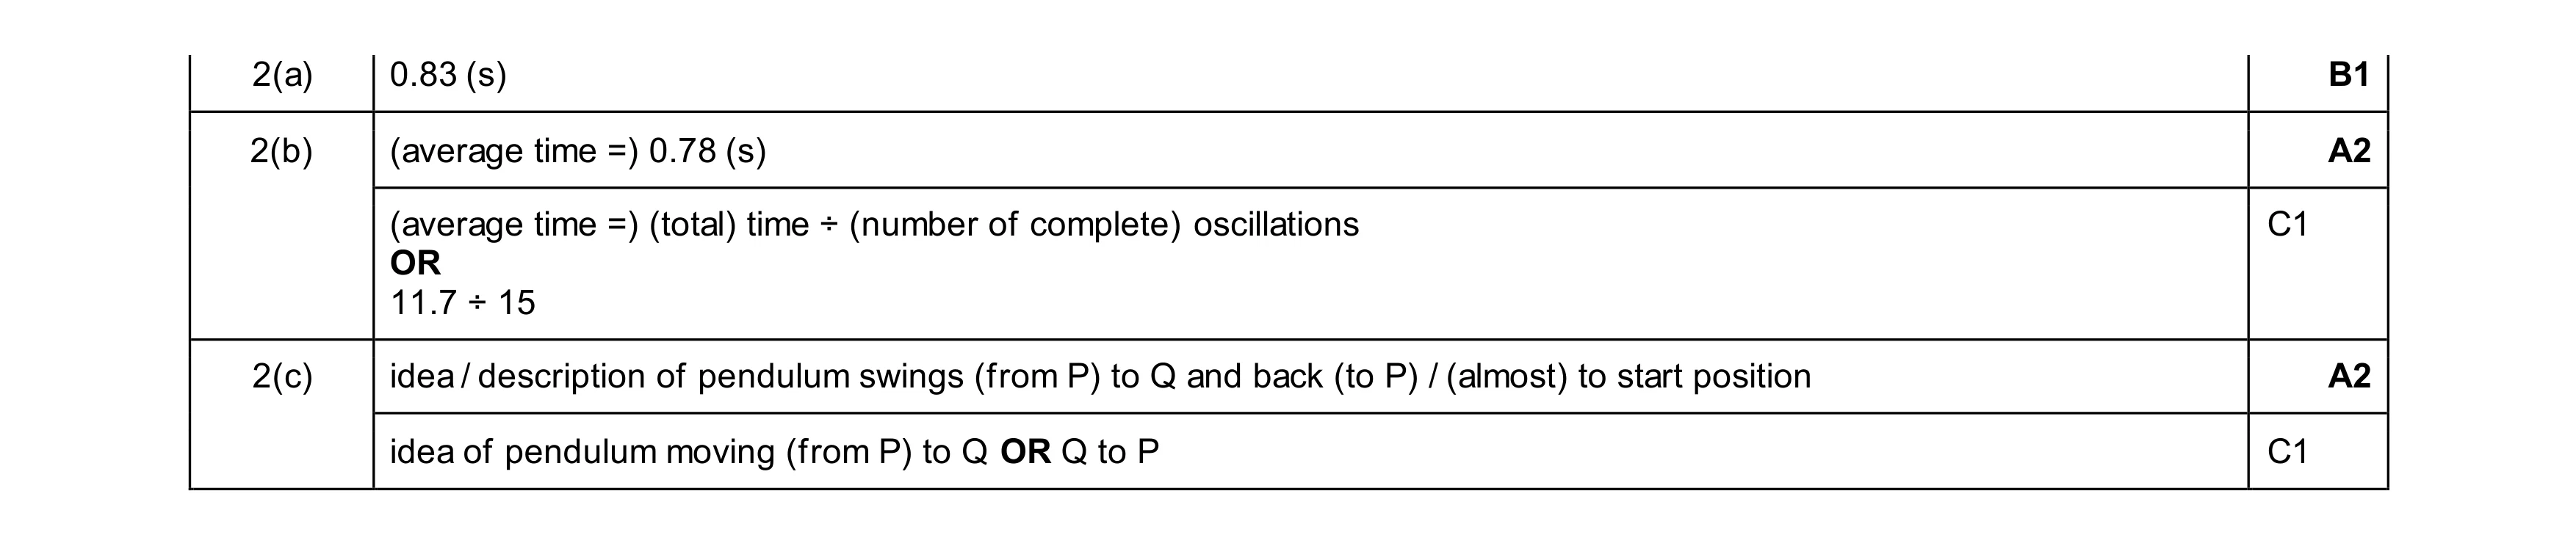 5
5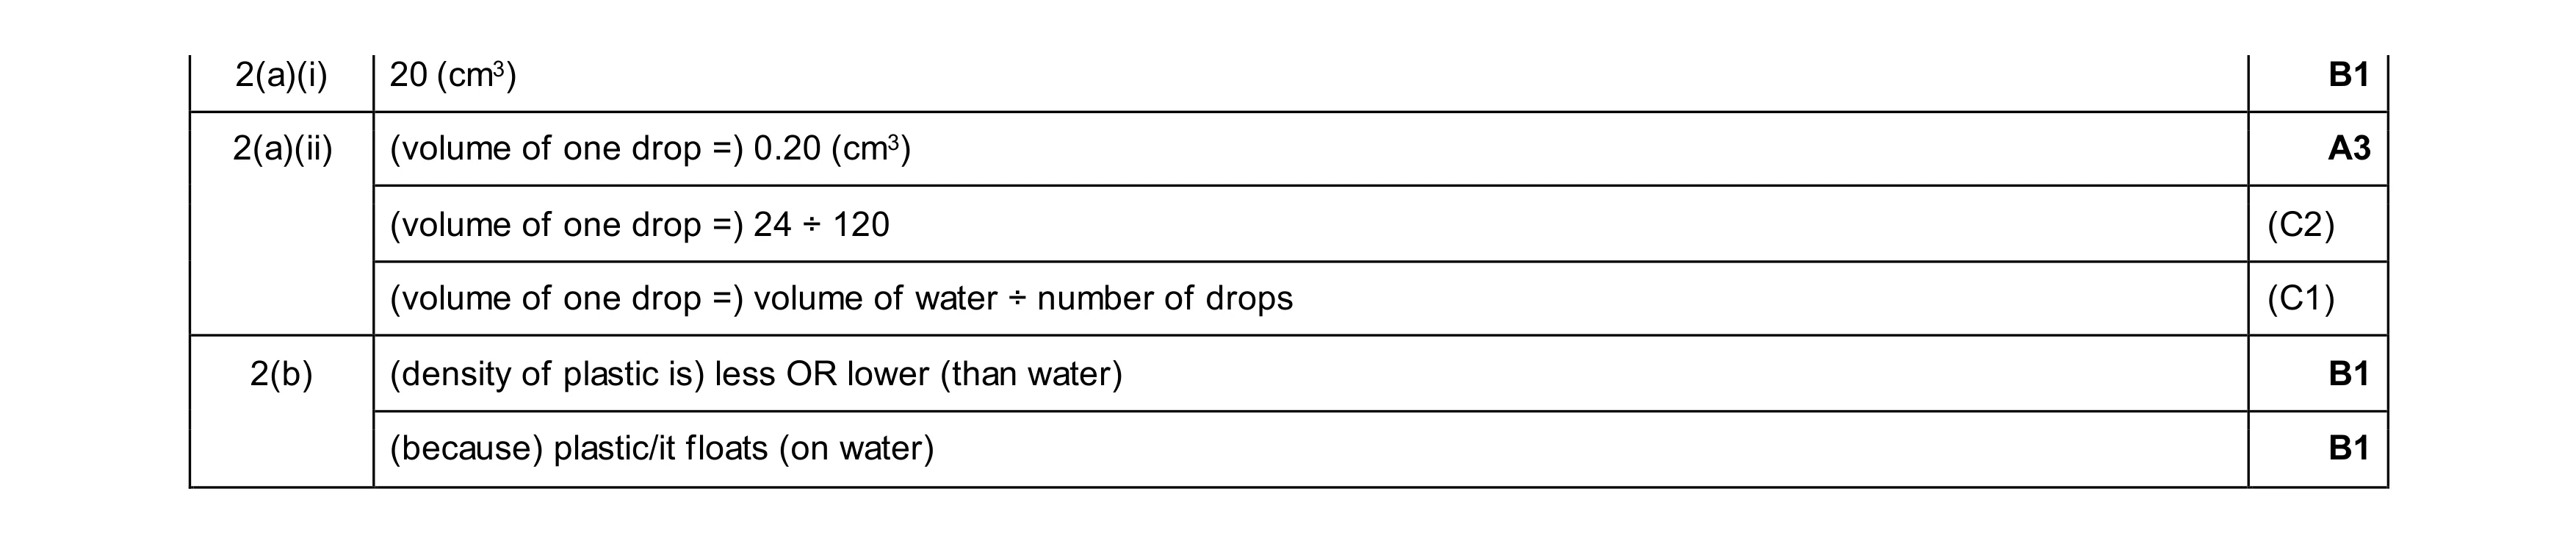 6
6