Questions as text
Q1 · Answer the whole of this question on one sheet of graph paper 0580/41 Oct/Nov 2005
5 Answer the whole of this question on one sheet of graph paper. 1 f(x) = 1 − , x ≠ 0 . x 2 (a) x −3 −2 −1 −0.5 −0.4 −0.3 0.3 0.4 0.5 1 2 3 f(x) p 0.75 0 −3 −5.25 q q −5.25 −3 0 0.75 p Find the values of p and q. [2] (b) (i) Draw an x-axis for −3 x 3 using 2 cm to represent 1 unit and a y-axis for −11 y 2 using 1 cm to represent 1 unit. [1] (ii) Draw the graph of y = f(x) for −3 x −0.3 and for 0.3 x 3. [5] (c) Write down an integer k such that f(x) = k has no solutions. [1] (d) On the same grid, draw the graph of y = 2x – 5 for –3 x 3. [2] 1 (e) (i) Use your graphs to find solutions of the equation 1 − 2 = 2 x − 5 . [3] x 1 3 2 (ii) Rearrange 1 − 2 = 2 x − 5 into the form ax + bx + c = 0 , where a, b and c are integers. [2] x (f) (i) Draw a tangent to the graph of y = f(x) which is parallel to the line y = 2 x − 5 . [1] (ii) Write down the equation of this tangent. [2]
19 marks
Mark scheme: 5 (a) 0.9 or better B1 (0.8888..) –10.1 or better B1 –10.1111..) (b) (i) Correct scales S1 –3 to 3 for x, and –11 to 2 for y possible (ii) 12 points correctly plotted P3ft P2ft for 10 or 11 correct (acc. is 1 mm) P1ft for 8 or 9 correct 1 small square, correct shape, not ruled both branches with correct shape C1ft Acc. 2 Graph does not cross the y-axis B1 (c) Any integer [ 1 B1 (d) Correct ruled line from –3 to +3 B2 SC1 for line with gradient of 2 or passing through (0, –5) but not y = –5. (e) (i) –0.45 to –0.3 B1 0.4 to 0.49 B1 2.9 to 2.99 B1 (ii) x2 – 1 = 2x3 – 5x2 M1 i.e. correct multiplication to remove fraction 2x3 – 6x2 + 1 = 0 A1 www2 (f) (i) Tangent drawn with gradient ≈ 2 B1 Parallel by eye to y = 2x – 5 (ii) Linear eqn. in x and y with gradient 2 B1 c = their intercept B1 within 1 mm, dep on linear eqn in x and y [19]
This question in 0580/41 Oct/Nov 2005
Q2 · Y 15 10 5 x –2 0 2 4 6 8 10 –5 –10 The diagram shows the accurate graph of y = f(x) 0580/41 May/June 2007
4 y 15 10 5 x –2 0 2 4 6 8 10 –5 –10 The diagram shows the accurate graph of y = f(x). (a) Use the graph to find (i) f(0), [1] (ii) f(8). [1] (b) Use the graph to solve (i) f(x) = 0, [2] (ii) f(x) = 5. [1] (c) k is an integer for which the equation f(x) = k has exactly two solutions. Use the graph to find the two values of k. [2] (d) Write down the range of values of x for which the graph of y = f(x) has a negative gradient. [2] (e) The equation f(x) + x – 1 = 0 can be solved by drawing a line on the grid. (i) Write down the equation of this line. [1] (ii) How many solutions are there for f(x) + x – 1 = 0? [1]
11 marks
Mark scheme: 4 (a) (i) 3 B1 (ii) –4.25 to –4 B1 (b) (i) –1.6, 2.0, 8.6 to 8.63 B2 B1 for any one correct (ii) 9.2 B1 (c) –9, 3 B1,B1 –1 each extra incorrect value (d) 0<x<6, ( i.e.0 to 6 only) oe B2 Accept (0,6), [0,6], (0, 3) to (6, –9). SC1 for other inequality errors or answers using 0 and 6 as boundaries (e) (i) 1 – x oe B1 If re-arranged it must be correct equation with y or f(x) in it but exclude f(x) + x – 1 = 0 (ii) 3 B1 [11] IGCSE – May/June 2007 0580 and 0581 04
This question in 0580/41 May/June 2007
Q3 · Y A NOT TO SCALE B C x 0 The diagram shows a sketch of y = x2 + 1 and y = 4 – x 0580/41 Oct/Nov 2007
3 y A NOT TO SCALE B C x 0 The diagram shows a sketch of y = x2 + 1 and y = 4 – x. (a) Write down the co-ordinates of (i) the point C, [1] (ii) the points of intersection of y = 4 – x with each axis. [2] (b) Write down the gradient of the line y = 4 – x. [1] (c) Write down the range of values of x for which the gradient of the graph of y = x2 + 1 is negative. [1] (d) The two graphs intersect at A and B. Show that the x co-ordinates of A and B satisfy the equation x2 + x – 3 = 0. [1] (e) Solve the equation x2 + x – 3 = 0, giving your answers correct to 2 decimal places. [4] (f) Find the co-ordinates of the mid-point of the straight line AB. [2]
12 marks
Mark scheme: 3 (a) (i) (0, 1) B1 Accept w/out brackets/ commas, condone (ii) (4, 0) and (0, 4) B1B1 vectors, or states x = , y = (b) -1 cao B1 (c) (x) < 0 (allow ≤) B1 Any other variable < 0 B0 (d) x 2 + 1 = 4 − x o.e. B1 must be these 4 terms (e) M1 p +(-)√q where p = −1 and r = 2×1 r and q = 1² − 4(1)(-3) o.e. M1 q Allow second mark if in form p± r -2.30 , 1.30 cao www4 A1A1 If ww ans.correct but wrong acc - SC3 After A0, A0, SC1 for -2.3027756 and 1.3027756 rounded or truncated (f) (-0.5, 4.5 or 4.49) B1ft f.t (their –2.30 + their 1.30) ÷2 B1 ft ft (4 – their x co-ord dep on attempt at mid value of x from values in e) [12]
This question in 0580/41 Oct/Nov 2007
Q4 · Answer the whole of this question on a sheet of graph paper 0580/41 May/June 2008
8 Answer the whole of this question on a sheet of graph paper. Use one side for your working and one side for your graphs. Alaric invests $100 at 4% per year compound interest. (a) How many dollars will Alaric have after 2 years? [2] (b) After x years, Alaric will have y dollars. He knows a formula to calculate y. The formula is y = 100 × 1.04x x (Years) 0 10 20 30 40 y (Dollars) 100 p 219 q 480 Use this formula to calculate the values of p and q in the table. [2] (c) Using a scale of 2 cm to represent 5 years on the x-axis and 2 cm to represent $50 on the y-axis, draw an x-axis for 0 Y x Y 40 and a y-axis for 0 Y y Y 500. Plot the five points in the table and draw a smooth curve through them. [5] (d) Use your graph to estimate (i) how many dollars Alaric will have after 25 years, [1] (ii) how many years, to the nearest year, it takes for Alaric to have $200. [1] (e) Beatrice invests $100 at 7% per year simple interest. (i) Show that after 20 years Beatrice has $240. [2] (ii) How many dollars will Beatrice have after 40 years? [1] (iii) On the same grid, draw a graph to show how the $100 which Beatrice invests will increase during the 40 years. [2] (f) Alaric first has more than Beatrice after n years. Use your graphs to find the value of n. [1]
17 marks
Mark scheme: 8 (a) M1 M1 for method of compound interest used 108(.16) (allow 108.2(0)) www2 A1 (b) 148(.02…) 324(.3…) B1 B1 (c) Correct axes full domains S1 Condone absence of labels 5 correct pts 100, 148 ft, 219, 324ft, 480 P3ft P2ft for 4 correct, P1ft for 3 correct Points must be in correct square vertically, including on line Smooth exponential curve, correct shape C1 Scale error – remove that part and try to through 5 points mark the rest (d) (i) 265 – 270 B1ft If out of range, then ft their graph at 25 years (ii) 17 or 18 cao B1 (e) (i) (100) × 7 × 20 o.e. M1 (100) E1 No errors 100 + 7 × 20 or better (ii) 380 B1 (iii) Correct straight ruled line for x – range 0 to L2 P1ft for 2 of (0,100), (20,240) (40,380)ft 35 correctly plotted (f) 27 – 29 cao B1 [17]
This question in 0580/41 May/June 2008
Q5 · X _ 25 (a) The table shows some values for the equation y = for – 4 Y x Y=–0.5 and 0.5 Y… 0580/41 May/June 2009
x _ 25 (a) The table shows some values for the equation y = for – 4 Y x Y=–0.5 and 0.5 Y x Y 4. Examiner'sFor 2 x Use x –4 –3 –2 –1.5 –1 –0.5 0.5 1 1.5 2 3 4 y –1.5 –0.83 0 0.58 –3.75 –0.58 0 0.83 1.5 (i) Write the missing values of y in the empty spaces. [3] x _ 2 for – 4 Y x Y=–0.5 and 0.5 Y x Y 4. (ii) On the grid, draw the graph of y = 2 x y 4 3 2 1 x –4 –3 –2 –1 0 1 2 3 4 –1 –2 –3 –4 [5] x _ 2 For (b) Use your graph to solve the equation = 1 . Examiner's 2 x Use Answer(b) x = or x = [2] (c) (i) By drawing a tangent, work out the gradient of the graph where x = 2. Answer(c)(i) [3] (ii) Write down the gradient of the graph where x = –2. Answer(c)(ii) [1] (d) (i) On the grid, draw the line y = – x for – 4 Y x Y4. [1] x _ 2 _ (ii) Use your graphs to solve the equation = x . 2 x Answer(d)(ii) x = or x = [2] (e) Write down the equation of a straight line which passes through the origin and does not x _ 2 intersect the graph of y = . 2 x Answer(e) [2]
19 marks
Mark scheme: 5 (a) (i) 1.5, 3.75, –1.5 B1,B1,B1 (ii) 12 points plotted ft P3 ft P2 ft for 10 or 11 points, Curve through at least 10 points and correct P1 ft for 8 or 9 points shape over full domain C1 i.s.w. if two branches joined Two separate branches, one on each side of y-axis, neither in contact with y-axis B1 Independent (b) –1.4 ≤ x ≤ –1.1 and 3.1 ≤ x ≤ 3.4 B1,B1 i.s.w. 3rd answer if curve cuts y = 1 again (c) (i) Correct ruled tangent at x = 2 or x = –2 M1 Long enough to be able to find gradient Evidence of rise/run M1 Dependent – check their graph against gradient of 1 – must be correct side of 1 No tangent drawn M0M0 0.8 to 1.2 A1 (ii) 0.8 to 1.2 inc. or same answer as (i) ft B1 ft (d) (i) Correct ruled line to cut curve for all B1 Within ½ square of (–1, 1) and (1, –1) possible intersections (at least 2) (ii) –1.3 to –1.05, 1.05 to 1.3 inclusive B1, B1 i.s.w. any extra answers (e) y = kx with k ≥ 12 o.e. or x = 0 B2 If B0, allow SC1 for y = kx with k < 12 or for y-axis stated [19] IGCSE – May/June 2009 0580, 0581 04
This question in 0580/41 May/June 2009
Q6 · For y Examiner's Use 50 A 40 y = f(x) 30 20 y = g(x) 10 B x –5 –4 –3 –2 –1 0 1 2 –10 –20… 0580/41 Oct/Nov 2009
6 For y Examiner's Use 50 A 40 y = f(x) 30 20 y = g(x) 10 B x –5 –4 –3 –2 –1 0 1 2 –10 –20 –30 The graphs of y = f(x) and y = g(x) are shown above. (a) Find the value of (i) f(−2), Answer(a)(i) [1] (ii) g(0). Answer(a)(ii) [1] (b) Use the graphs to solve For Examiner's (i) the equation f(x) = 20, Use Answer(b)(i) x = or x = [2] (ii) the equation f(x) = g(x), Answer(b)(ii) x = or x = [2] (iii) the inequality f(x) < g(x). Answer(b)(iii) [1] (c) Use the points A and B to find the gradient of y = g(x) as an exact fraction. Answer(c) [2] (d) On the grid, draw the graph of y = g(x) − 10. [2] (e) (i) Draw the tangent to the graph of y = f(x) at ( −3, −27 ). [1] (ii) Write down the equation of this tangent. Answer(e)(ii) [1] (f) A region, R, contains points whose co-ordinates satisfy the inequalities −3 Y x Y −2, y Y 40 and y [ g(x). On the grid, draw suitable lines and label this region R. [2]
15 marks
Mark scheme: 6 (a) (i) –16 B1 (ii) 18 to 19 B1 (b) (i) –4.3 to –4.2, 1.5 to 1.6 B1,B1 (ii) –4.5 to –4.4 , 1.3 to 1.4 B1,B1 (iii) –4.5 to –4.4 < x < 1.3 to 1.4 ft B1ft Ft their (ii). Allow clear worded explanations and condone Y signs (c) − 30 oe isw conversion B2 Accept − 4 2 , 30/–7 7 7 M1 for 30/7 oe fracts, isw conversion or for –30/7 oe soi (d) Ruled line passing within 2 mm of B2 B1 for ruled line parallel to g(x). By eye (21° (–5, 30) and (2, 0) to 25° to horizontal if in doubt) allow broken line (e) (i) Ruled horizontal line through (–3, –27) B1 No daylight, not chord (allow broken) (ii) y = –27 B1 (f) Ruled lines x = –3, x = –2, y = 40 B1 Long enough to be boundary of region – allow broken or solid ruled lines Region enclosed by lines x = –3, x = –2, y = 40 and y = g(x) B1 Allow any clear indication [15] IGCSE – October/November 2009 0580 04
This question in 0580/41 Oct/Nov 2009
Q7 · F(x) = 2x Examiner's Use Complete the table 0580/41 May/June 2010
8 (a) f(x) = 2x Examiner's Use Complete the table. x –2 –1 0 1 2 3 4 y = f(x) 0.5 1 2 4 [3] (b) g(x) = x(4 – x) Complete the table. x –1 0 1 2 3 4 y = g(x) 0 3 3 0 [2] For (c) On the grid, draw the graphs of Examiner's Use (i) y = f(x) for −2 Y x Y 4, [3] (ii) y = g(x) for −1 Y x Y 4. [3] y 16 14 12 10 8 6 4 2 x –2 –1 0 1 2 3 4 –2 –4 –6 (d) Use your graphs to solve the following equations. (i) f(x) = 10 Answer(d)(i) x = [1] (ii) f(x) = g(x) Answer(d)(ii) x = or x = [2] (iii) f -1(x) = 1.7 Answer(d)(iii) x = [1]
15 marks
Mark scheme: 8 (a) 0.25, 8, 16 3 B1 B1 B1 (b) – 5, 4 2 B1 B1 (c) (i) 7 points plotted ft P2ft P1 for 5 or 6 points ft Curve through all 7 points exponential C1ft ft only if exponential shape shape (ii) 6 points plotted ft P2ft P1 for 5 points ft Curve through all 6 points parabola C1ft ft only if parabola shape shape (d) (i) 3.2 to 3.4 1 (ii) 0.3 to 0.4 and 2 2 B1 B1 (iii) 3.1 to 3.4 1
This question in 0580/41 May/June 2010
Q8 · 2 For 7 (a) Complete the table for the function f(x) = − x 0580/42 Oct/Nov 2010
2 2 For 7 (a) Complete the table for the function f(x) = − x . Examiner's x Use x –3 –2 –1 –0.5 –0.2 0.2 0.5 1 2 3 f(x) –9.7 –5 –10.0 10.0 3.75 1 –8.3 [3] (b) On the grid draw the graph of y = f(x) for –3 Y x Y –0.2 and 0.2 Y x Y 3. y 10 8 6 4 2 x –3 –2 –1 0 1 2 3 –2 –4 –6 –8 –10 [5] (c) Use your graph to For Examiner's (i) solve f(x) = 2, Use Answer(c)(i) x = [1] (ii) find a value for k so that f(x) = k has 3 solutions. Answer(c)(ii) k = [1] 2 2(d) Draw a suitable line on the grid and use your graphs to solve the equation − x = 5x. x Answer(d) x = or x = [3] (e) Draw the tangent to the graph of y = f(x) at the point where x = –2. Use it to calculate an estimate of the gradient of y = f(x) when x = –2. Answer(e) [3]
16 marks
Mark scheme: 7 (a) –3, –4.25, –3 1, 1, 1 Allow – 4.2 or – 4.3 for – 4.25 (b) 10 correct points plotted P3ft P2ft for 8 or 9 correct P1ft for 6 or 7 correct Smooth curve through their 10 points C1 Correct shape not ruled, (curves could be joined) and correct shape Two separate branches B1ft Indep but needs two ‘curves’ on either side of y- axis (c) (i) 0.7 to 0.85 1 –1 each extra (ii) Any value of k such that k Y –3 1ft ft consistent with their graph and must be consistent with their (If curves are joined then k = –3 only) graph (d) y = 5x drawn L1 Ruled and long enough to meet curves – 0.6 to –0.75, 0.55 to 0.65 1, 1 Indep –1 each extra (e) Tangent drawn at x = –2 T1 Must be a reasonable tangent, not chord, no clear daylight y change / x change attempt M1 Depend on T and uses scales correctly. Mark intention – allow one slight slip e.g. sign error from coords but not scale misread If no working shown and answer is out of range – check their tangent for method 2.7 to 4.3 A1 Answer in range gets 2 marks after T1 earned 3 k
This question in 0580/42 Oct/Nov 2010
Q9 · X 3 For 7 (a) Complete the table for the function f(x) = + 1 0580/43 Oct/Nov 2010
x 3 For 7 (a) Complete the table for the function f(x) = + 1 . Examiner's 10 Use x –4 –3 –2 –1 0 1 2 3 f(x) –1.7 0.2 0.9 1 1.1 1.8 [2] (b) On the grid, draw the graph of y = f(x) for –4 Y x Y=3. y 4 3 2 1 x –4 –3 –2 –1 0 1 2 3 –1 –2 –3 –4 –5 –6 –7 –8 [4] 4 (c) Complete the table for the function g(x) = , x ≠ 0 . x x –4 –3 –2 –1 1 2 3 g(x) –1 –1.3 2 1.3 [2] (d) On the grid, draw the graph of y = g(x) for –4 Y x Y –1 and 1 Y x Y 3. [3] For Examiner's Use x 3 4 (e) (i) Use your graphs to solve the equation + 1 = . 10 x Answer(e)(i) x = or x = [2] x 3 4 4 (ii) The equation + 1 = can be written as x + ax + b = 0 . 10 x Find the values of a and b. Answer(e)(ii) a = b = [2]
15 marks
Mark scheme: 7 (a) – 5.4 1 3.7 1 (b) 8 points correctly plotted ft P3 P3ft their table. P2ft for 6 or 7 points. P1ft for 4 or 5 points Smooth cubic curve through all 8 C1 Only ft points if shape not affected. points (c) –2, –4, 4 2 B1 for 2 correct (d) 7 points correctly plotted ft P2 P2ft P1ft for 5 or 6 points Two separate smooth branches of C1 Must pass through all 7 points, only ft if shape rectangular hyperbola not affected and no contact with either axis. (e) (i) –2.9 Y x Y– 2.8 1 Not with y coordinates 2.05 Y x Y 2.15 1 (ii) a = 10 1 b = –40 1 IGCSE – October/November 2010 0580 43 2
This question in 0580/43 Oct/Nov 2010
Q10 · For 7 (a) Complete the table of values for the equation y = , x ≠ 0 0580/41 May/June 2011
4 For 7 (a) Complete the table of values for the equation y = , x ≠ 0. Examiner's x 2 Use x O4 O3 O2 O1 O0.6 0.6 1 2 3 4 y 0.25 0.44 11.11 4.00 0.44 [3] 4 (b) On the grid, draw the graph of y = for O4 Y x Y O0.6 and 0.6 Y x Y 4 . x 2 y 12 11 10 9 8 7 6 5 4 3 2 1 x –4 –3 –2 –1 0 1 2 3 4 –1 –2 [5] 4 For (c) Use your graph to solve the equation = 6 . Examiner's x 2 Use Answer(c)x = or x = [2] (d) By drawing a suitable tangent, estimate the gradient of the graph where x = 1.5. Answer(d) [3] 4 (e) (i) The equation O x + 2 = 0 can be solved by finding the intersection of the graph x 2 4 of y = and a straight line. x 2 Write down the equation of this straight line. Answer(e)(i) [1] (ii) On the grid, draw the straight line from your answer to part (e)(i). [2] 4 (iii) Use your graphs to solve the equation O x + 2 = 0. x 2 Answer(e)(iii) x = [1]
17 marks
Mark scheme: 7 (a) 1(.00) 4(.00) 11.1(1) 1(.00) 0.25 3 B2 for 4 correct, B1 for 3 correct (b) 10 points plotted P3 ft B2 for 8 or 9 points correct ft B1 for 6 or 7 points correct ft Correct shaped curve through 10 points C1 ft ft their points if shape correct – ignore anything (condone 2 points slightly missed) between – 0.6 and 0.6 2 separate curves not crossing x-axis and B1 Independent not touching or crossing y-axis (c) −0.85 to – 0.75 cao 1 0.75 to 0.85 cao 1 (d) Tangent drawn (ruled) at x = 1.5 T1 Allow slight daylight – 3 to −2 2 Dep on T1 M1 evidence rise/run dependent on tangent SC1 for answer in range 2 to 3 Answer implies M but not the T mark (e) (i) y = x − 2 oe 1 (ii) line ruled to cross curve 2 ft Dependent on (i) in form y = mx + c, m ≠ 0, c ≠ 0 B1 for gradient ft or y intercept ft but again to cross curve at all possible points (iii) 2.5 to 2.7 cao 1 Dependent on (e)(i) correct
This question in 0580/41 May/June 2011
Q11 · For 5 (a) Complete the table of values for the function f(x), where f(x) = x2 + 2 , x ≠ 0 0580/43 May/June 2011
1 For 5 (a) Complete the table of values for the function f(x), where f(x) = x2 + 2 , x ≠ 0 . Examiner's x Use x O3 O2.5 O2 O1.5 O1 O0.5 0.5 1 1.5 2 2.5 3 f(x) 6.41 2.69 4.25 4.25 2.69 6.41 [3] (b) On the grid, draw the graph of y = f(x) for O3 Y x Y O0.5 and 0.5 Y x Y 3 . y 10 9 8 7 6 5 4 3 2 1 x –3 –2 –1 0 1 2 3 –1 –2 [5] (c) (i) Write down the equation of the line of symmetry of the graph. For Examiner's Use Answer(c)(i) [1] (ii) Draw the tangent to the graph of y = f(x) where x = O1.5. Use the tangent to estimate the gradient of the graph of y = f(x) where x = O1.5. Answer(c)(ii) [3] 1 (iii) Use your graph to solve the equation x2 + 2 = 3. x Answer(c)(iii) x = or x = or x = or x = [2] 1 (iv) Draw a suitable line on the grid and use your graphs to solve the equation x2 + 2 = 2x. x Answer(c)(iv) x = or x = [3]
17 marks
Mark scheme: 5 (a) 9.11, 4.25, 2, …, 2, 4.25, 9.11 3 B2 for 4 or 5 correct and B1 for 2 or 3 correct (b) 12 points plotted 5 P3, ft their (a), P2 for 10 or 11 points, P1 for 8 Smooth curve through 12 points or 9. Two branches, neither touching y-axis C1 correct shape ft their points shape same. Ignore anything between – 0.5 and 0.5. B1 independent (c) (i) x = 0 1 (ii) tangent at –1.5 T1 –3 to –1.8 2 Dependent on tangent M1(also dep on T1) for attempt at rise/run or SC1 for 1.8 to 3 (iii) –1.7 to – 1.55, –0.7 to –0.55, 2 B1 for 1 or more correct 0.55 to 0.7, 1.55 to 1.7 (iv) y = 2x drawn to meet graph twice B1 1 B1 1.8 to 1.9 B1
This question in 0580/43 May/June 2011
Q12 · X For 5 (a) Complete the table for the function f(x) = −x3 − 1 0580/41 Oct/Nov 2011
x For 5 (a) Complete the table for the function f(x) = −x3 − 1 . Examiner's 2 Use x –3 –2 –1.5 –1 0 1 1.5 2 3 3.5 f(x) –5.5 1.8 1.5 –3.5 –3.8 –3 9.9 [3] (b) On the grid draw the graph of y = f(x) for O3 Y x Y 3.5 . y 10 8 6 4 2 x –3 –2 –1 0 1 2 3 4 –2 –4 –6 [4] (c) Use your graph to For Examiner's (i) solve f(x) = 0.5, Use Answer(c)(i) x = or x = or x = [3] (ii) find the inequalities for k, so that f(x) = k has only 1 answer. Answer(c)(ii) k I k K [2] (d) (i) On the same grid, draw the graph of y = 3x – 2 for O1 Y x Y 3.5 . [3] x 3 (ii) The equation −x3 − 1 = 3x – 2 can be written in the form x3 + ax + b = 0. 2 Find the values of a and b. Answer(d)(ii) a = and b = [2] x 3 (iii) Use your graph to find the positive answers to −x3 − 1 = 3x – 2 for O3 Y x Y 3.5 . 2 Answer(d)(iii) x = or x = [2]
19 marks
Mark scheme: 5 (a) 1, –1, 3.5 1,1,1 (b) 10 correct points plotted P3ft P2ft for 8 or 9 correct P1ft for 6 or 7 correct Allow points to be implied from curve Smooth curve through at least 8 C1ft Correct cubic shape, not ruled points and correct shape (c) (i) –2.2 to –2.1 1ft Correct or ft their x values –0.65 to –0.45 1ft 2.5 to 2.7 1ft If ft and more than 3 solns then 2 marks maximum (ii) (k <) –4 to –3.7 1ft Correct or ft their graph for y values at max and min (k >) 1.7 to 2 1ft After 0 scored SC1 for both correct but reversed (d) (i) Ruled line gradient 3 and 3 B2 for correct but freehand or short y-intercept –2 over the range –1 or M1 for a ruled line of gradient 3 or passes to 3.5 through (0, –2) (but not y = –2) (ii) (a =) –12, (b =) 2 1,1 After 0, M1 for x³– 6x– 6x–2 + 4 (=0) or better (iii) 0.1 to 0.2 and 3.3 to 3.4 cao 1,1 2 2
This question in 0580/41 Oct/Nov 2011
Q13 · Complete the table of values for y = 2x 0580/43 Oct/Nov 2011
2 (a) Complete the table of values for y = 2x. For Examiner's Use x –2 –1 0 1 2 3 y 0.25 1 2 8 [2] (b) On the grid, draw the graph of y = 2x for O2 Y x Y 3. y 10 9 8 7 6 5 4 3 2 1 x –2 –1 0 1 2 3 –1 [3] For Examiner's (c) (i) On the grid, draw the straight line which passes through the points (0, 2) and (3, 8). [1] Use (ii) The equation of this line is y = mx + 2. Show that the value of m is 2. Answer(c)(ii) [1] (iii) One answer to the equation 2x =2x + 2 is x = 3. Use your graph to find the other answer. Answer(c)(iii) x = [1] (d) Draw the tangent to the curve at the point where x = 1. Use this tangent to calculate an estimate of the gradient of y = 2x when x = 1. Answer(d) [3]
11 marks
Mark scheme: 2 (a) 0.5, 4 1+1 (b) 6 points plotted ft P2 P1 for 5 points Correct shaped curve through 6 points C1 Ignore to left of x = −2 (exponential) (c) (i) Correct ruled line reaching both L1 points (ii) 6 ÷ 3 oe 1 Allow ‘test’ with a coordinate on the line (not 0, 2) (iii) –0.8 to –0.6 1 Dep on L1 (d) Tangent drawn at (1, 2) T1 Not chord, allow up to 1 mm daylight Rise/run attempt using correct scales M1 Dep on T1 1.2 to 1.6 cao A1
This question in 0580/43 Oct/Nov 2011
Q14 · For 9 f(x) = 1 – 2x g(x) = , x ≠ 0 h(x) = x3 + 1 Examiner's x Use (a) Find the value of… 0580/43 May/June 2012
1 For 9 f(x) = 1 – 2x g(x) = , x ≠ 0 h(x) = x3 + 1 Examiner's x Use (a) Find the value of (i) gf(2), Answer(a)(i) [2] (ii) h(–2). Answer(a)(ii) [1] (b) Find fg(x). Write your answer as a single fraction. Answer(b) fg(x) = [2] (c) Find h –1(x) , the inverse of h(x). Answer(c) h –1(x) = [2] (d) Write down which of these sketches shows the graph of each of y = f(x), y = g(x) and y = h(x). For Examiner's Use y y y 0 x 0 x 0 x Graph A Graph B Graph C y y y 0 x 0 x 0 x Graph D Graph E Graph F Answer(d) y = f(x) Graph y = g(x) Graph y = h(x) Graph [3] (e) k(x) = x5 O=3 Solve the equation k –1 (x) = 2. Answer(e) x = [2]
12 marks
Mark scheme: 9 (a) (i) 2 B1 for f(2) = –3 soi − 1 3 oe (ii) –7 1 x − 2 2 (b) 2 M1 for 1− seen x final answer www x (c) y – 1 = x3 or x = y3 + 1 x = 3 y − 1 or x − 1 = y 3 M1 i.e. two correct steps For M1, accept a correct reverse flowchart 3 x − 1 oe final answer www2 A1 After 0 scored allow SC1 for 3 x − 1 seen then spoilt (d) A, F, D 3 B1 each 5 x + 3 = 2 (Variable can be (e) 29 2 M1 for x = k(2) or y in second method)
This question in 0580/43 May/June 2012
Q15 · For 4 f(x) = O 3x, x ≠ 0 Examiner's 2 x Use (a) Complete the table 0580/43 Oct/Nov 2012
2 For 4 f(x) = O 3x, x ≠ 0 Examiner's 2 x Use (a) Complete the table. x O3 O2.5 O2 O1.5 O1 O0.5 0.5 1 1.5 2 2.5 3 f(x) 9.2 7.8 6.5 5.4 9.5 6.5 O3.6 O5.5 O7.2 O8.8 [2] (b) On the grid, draw the graph of y = f(x), for O3 Y x Y O0.5 and 0.5 Y x Y 3 . y 10 9 8 7 6 5 4 3 2 1 x –3 –2 –1 0 1 2 3 –1 –2 –3 –4 –5 –6 –7 –8 –9 [5] (c) Use your graph to solve the equations. For Examiner's (i) f(x) = 4 Use Answer(c)(i) x = [1] (ii) f(x) = 3x Answer(c)(ii) x = [2] (d) The equation f(x) = 3x can be written as x3 = k. Find the value of k. Answer(d) k = [2] (e) (i) Draw the straight line through the points (–1, 5) and (3, –9). [1] (ii) Find the equation of this line. Answer(e)(ii) [3] (iii) Complete the statement. The straight line in part (e)(ii) is a to the graph of y = f(x). [1]
17 marks
Mark scheme: 4 (a) 5, – 1 2 B1 B1 (b) 12 points plotted ft P3ft P2ft for 10 or 11, P1ft for 8 or 9 Smooth curve through at least 12 C1 In absence of plot[s], allow curve to imply plot[s]. points No ruled sections Two separate branches B1 Not touching y-axis (c) (i) 0.55 to 0.65 1 (ii) 0.65 to 0.75 2 M1 for y = 3x drawn (ruled) to cross curve 1 0.3& (d) 2 Accept 0.333[3….] or 3 2 M1 for 2 − 3 x = 3 x or better x IGCSE – October/November 2012 0580 43 (e) (i) Ruled line through (– 1, 5) 1 and (3, – 9) (ii) y = −5.3 x + 5.1 oe final 3 B2 for y = kx + 5.1 [k ≠ 0] oe or y = −5.3 x + d oe answer B1 for gradient = – 3.5 oe accept integer/integer or y = kx + 4.1[ to 6.1] oe SC2 for answer − 5.3 x + 5.1 [no ‘y =’ ] (iii) Tangent 1 5 (a) 0.57 B4 Condone use of other variables M1 for 2 w + 3l = 6.3 oe and M1 for l = w + .0 25 oe A1 for correct aw = b or cl = d or M2 for 2 w + (3 w + .025) = 6.3 oe or 2(l − .025) + 3l = 6.3 oe or M1 for w + 0.25 or l – 0.25 seen A1 for 2 w + 3w = 6.3 − .075 or better or 2l + 3l = 6.3 + 5.0 or better l = 0.82 implies M2A1 trial & error scores B4 or zero accept answer 57 if written 57 cents after M0, SC3 if answer 57
This question in 0580/43 Oct/Nov 2012
Q16 · – x2, x ¸ 0 0580/43 May/June 2013
1 – x2, x ¸ 0. Examiner′s5 (a) Complete this table of values for the function f(x) = x Use x –3 –2 –1 –0.5 –0.2 0.2 0.5 1 2 3 f(x) –9.33 –4.5 –2 –2.25 4.96 –3.5 –8.67 [3] 1 – x2 for –3 Y x Y –0.2 and 0.2 Y x Y 3. (b) Draw the graph of f(x) = x y 5 4 3 2 1 x –3 –2 –1 0 1 2 3 –1 –2 –3 –4 –5 –6 –7 –8 –9 –10 [5] (c) Use your graph to solve f(x) = –3. For Examiner′s Use Answer(c) x = … or x = … or x = … [3] (d) By drawing a suitable line on your graph, solve the equation f(x) = 2x – 2. Answer(d) x = … or x = … or x = … [3] (e) By drawing a suitable tangent, work out an estimate of the gradient of the curve at the point where x = –2. You must show your working. Answer(e) … [3] _____________________________________________________________________________________
17 marks
Mark scheme: 5 (a) –5.04, 1.75, 0 3 B1 for each correct value (b) Fully correct curve 5 B3FT for 10 correct plots from their (a) B2FT for 8 or 9 correct plots or B1FT for 6 or 7 correct plots and SC1 for two branches not joined (c) –1.6 to – 1.5 1 –0.4 to –0.3 1 1.8 to 1.9 1 (d) –2.6 to –2.5 www 1 –0.4 to –0.3 1 1 1 After 0 scored, M1 for y = 2x – 2 drawn (e) 3.25 to 4.25 with correct tangent 3 B1 for correct tangent B2 for answer in range dep on close attempt at tangent rise M1dep for [–] used with values soi from run tangent, dep on correct or close attempt at tangent IGCSE – May/June 2013 0580 43
This question in 0580/43 May/June 2013
Q17 · For Examiner′s y Use 5 4 3 2 1 x –3 –2 –1 0 1 2 3 –1 –2 –3 –4 –5 The diagram shows the… 0580/41 Oct/Nov 2013
6 (a) For Examiner′s y Use 5 4 3 2 1 x –3 –2 –1 0 1 2 3 –1 –2 –3 –4 –5 The diagram shows the graph of y = f(x) for –3 Ğ x Ğ 3. (i) Find f(2). Answer(a)(i) … [1] (ii) Solve the equation f(x) = 0. Answer(a)(ii) x = … [1] (iii) Write down the value of the largest integer, k, for which the equation f(x) = k has 3 solutions. Answer(a)(iii) k = … [1] (iv) By drawing a suitable straight line, solve the equation f(x) = x. Answer(a)(iv) x = … or x = … or x = … [3] (b) g(x) = 1 – 2x h(x) = x2 – 1 For Examiner′s Use (i) Find gh(3). Answer(b)(i) … [2] (ii) Find g–1(x). Answer(b)(ii) g–1(x) = … [2] (iii) Solve the equation h(x) = 3. Answer(b)(iii) x = … or x = … [3] (iv) Solve the equation g(3x) = 2x. Answer(b)(iv) x = … [3] _____________________________________________________________________________________
16 marks
Mark scheme: 6 (a) (i) 1.4 to 1.6 1 (ii) 1.15 to 1.25 1 (iii) – 1 1 (iv) – 2.25 to – 2.1 3 B2 for 2 correct or B1 for one correct – 0.9 to – 0.75 or B1 for y = x drawn ruled to cut curve 3 times 2.2 to 2.35 (b) (i) – 15 2 B1 for [h(3) =] 8 seen or M1 for 1 – 2(x2 – 1) or better 1 − x 1 x (ii) or − oe final answer 2 M1 for2 x = 1 – y or x = 1–2y or better 2 2 2 (iii) – 2, 2 3 M1 for x2 – 1 = 3 or better B1 for one answer 1 3 M2 for 8x = 1 or 8x – 1 = 0 (iv) oe nfww 8 or M1 for 1 – 2(3x) [= 2x] IGCSE – October/November 2013 0580 41
This question in 0580/41 Oct/Nov 2013
Q18 · 1 - - Examiner′s 3x .5 (a) Complete the table of values for y = Use x2 x x –3 –2 –1 –0.5… 0580/42 Oct/Nov 2013
2 1 - - Examiner′s 3x .5 (a) Complete the table of values for y = Use x2 x x –3 –2 –1 –0.5 –0.3 0.3 0.5 1 2 3 y 9.6 6 26.5 18.0 –2 –6 –9.1 [3] 2 1 - - 3x for –3 Y x Y –0.3 and 0.3 Y x Y 3 . (b) Draw the graph of y = 2 x x y 30 25 20 15 10 5 x –3 –2 –1 0 1 2 3 –5 –10 [5] (c) Use your graph to solve these equations. For Examiner′s Use 2 1 - - (i) 2 3x = 0 x x Answer(c)(i) x = … [1] 2 1 - - - (ii) 2 3x 7. 5 = 0 x x Answer(c)(ii) x = … or x = … or x = … [3] 2 1 - - = - (d) (i) By drawing a suitable straight line on the graph, solve the equation 2 3x 10 3 x . x x Answer(d)(i) x = … or x = … [4] 2 1 - - = - (ii) The equation 2 3x 10 3 x can be written in the form ax2 + bx + c = 0 where x x a, b and c are integers. Find the values of a, b and c. Answer(d)(ii) a = … , b = … , c = … [3] _____________________________________________________________________________________
19 marks
Mark scheme: 5 (a) 7, 11.5, 4.5 1,1,1 (b) Correct curve cao 5 B3FT for 10 correct plots, on correct vertical grid line and within correct 2 mm square vertically Or B2FT for 8 or 9 correct plots Or B1FT for 6 or 7 correct plots and B1 indep for two separate branches on either side of y-axis (c) (i) 0.69 < x < 0.81 1 (ii) –2.3 < x < –2.2 –0.8 < x < –0.6 0.35 < x < 0.5 3 B1 for each correct After 0 scored, allow SC1 for drawing line y = 7.5 long enough to cross curve at least once (d) (i) y = 10 – 3x ruled correctly B2 long enough to cross curve twice. B1 for ruled line gradient –3 or y intercept at 10 but not y = 10 Or B1 for ‘correct’ but freehand –0.55 < x < –0.45 B1dep Dependent on at least B1 scored for line 0.35 < x < 0.45 B1dep After 0 scored, SC2 for –0.5 and 0.4 [from solving equation] (ii) 10 1 –2 3 B2 for 2 – x – 10x2 [= 0] oe or –10 –1 2 2 1 Or B1 for x 2 −x − 10 = 0 oe Correctly eliminating – 3x Or B1 for 2 – x – 3x3 = 10x2 – 3x3 oe Correctly clearing fractions IGCSE – October/November 2013 0580 42 1 1 1
This question in 0580/42 Oct/Nov 2013
Q19 · A rectangular metal sheet measures 9 cm by 7 cm 0580/43 Oct/Nov 2013
3 A rectangular metal sheet measures 9 cm by 7 cm. For Examiner′s A square, of side x cm, is cut from each corner. Use The metal is then folded to make an open box of height x cm. 9 cm NOT TO x cm SCALE 7 cm x cm x cm (a) Write down, in terms of x, the length and width of the box. Answer(a) Length = … Width = … [2] (b) Show that the volume, V, of the box is 4x3 – 32x2 + 63x. Answer(b) [2] (c) Complete this table of values for V = 4x3 – 32x2 + 63x. x 0 0.5 1 1.5 2 2.5 3 3.5 V 0 35 36 30 9 0 [2] (d) On the grid opposite, draw the graph of V = 4x3 – 32x2 + 63x for 0 Y x Y 3.5 . Three of the points have been plotted for you. For V Examiner′s Use 40 35 30 25 20 15 10 5 x 0 0.5 1 1.5 2 2.5 3 3.5 [3] (e) The volume of the box is at least 30 cm3. Write down, as an inequality, the possible values of x. Answer(e) … [2] (f) (i) Write down the maximum volume of the box. Answer(f)(i) … cm3 [1] (ii) Write down the value of x which gives the maximum volume. Answer(f)(ii) … [1] _____________________________________________________________________________________
13 marks
Mark scheme: 3 (a) 9 – 2x, 7 – 2x oe 2 B1 for each, accept in any order (b) x(9 – 2x)(7 – 2x) M1FT 4x3 – 32x2 + 63x A1 Correct expansion and simplification with no errors (c) 24 20 2 B1 for each correct value (d) Correct curve 3 B2FT for 5 correct plots or B1FT for 3 or 4 correct plots (e) 0.65 to 0.75 ≤ x ≤ 2 oe 2 B1 for 0.65 to 0.75 seen (f) (i) 36 to 37 1 (ii) 1.2 to 1.4 1
This question in 0580/43 Oct/Nov 2013
Q20 · Complete the table of values for y = x3 – 3x + 1 0580/41 May/June 2014
8 (a) Complete the table of values for y = x3 – 3x + 1 . x –2.5 –2 –1.5 –1 –0.5 0 0.5 1 1.5 2 2.5 y –7.125 –1 3 1 –0.375 –1 –0.125 3 9.125 [2] (b) Draw the graph of y = x3 – 3x + 1 for –2.5 Ğ x Ğ 2.5 . y 10 9 8 7 6 5 4 3 2 1 x –3 –2 –1 0 1 2 3 –1 –2 –3 –4 –5 –6 –7 –8 [4] (c) By drawing a suitable tangent, estimate the gradient of the curve at the point where x = 2. Answer(c) … [3] (d) Use your graph to solve the equation x3 – 3x + 1 = 1 . Answer(d) x = … or x = … or x = … [2] (e) Use your graph to complete the inequality in k for which the equation x3 – 3x + 1 = k has three different solutions. Answer(e) … < k < … [2] __________________________________________________________________________________________
13 marks
Mark scheme: 8 (a) 2.125 and 2.375 2 B1 for one correct value (b) Correct curve B4 B3FT for 11 correct plots or B2FT for 9 or 10 correct plots or B1FT for 7 or 8 correct plots (c) Ruled tangent at x = 2 B1 No daylight at x = 2. Consider point of contact as midpoint between two vertices of daylight, this must be between x = 1.8 and 2.2 Gradient from 7.8 to 10.2 2 Dep on B1 awarded Allow integer/integer or a mixed number if within range or M1 dep for (change in y) ÷ (change in x) Dependent on any tangent drawn or close attempt at a tangent at any point Must see correct or implied calculation from a drawn tangent (d) 0 and –1.75 to –1.65 and 1.65 to 1.75 2 B1 for two correct values (e) –1.2 to –0.8 < k < 2.8 to 3.2 2 B1 for each correct or SC1 for reversed answers IGCSE – May/June 2014 0580 41 Qu Answers Mark Part Marks
This question in 0580/41 May/June 2014
Q21 · Complete the table of values for y = x2 + , x ≠ 0 0580/41 Oct/Nov 2014
35 (a) Complete the table of values for y = x2 + , x ≠ 0. x x –3 –2 –1 –0.5 0.4 0.6 1 1.5 2 3 y 8 2.5 –5.8 7.7 5.4 4 4.3 10 [2] 3 (b) Draw the graph of y = x2 + for –3 Y x Y –0.5 and 0.4 Y x Y 3. x y 10 8 6 4 2 x –3 –2 –1 0 1 2 3 –2 –4 –6 [5] 3 (c) Use your graph to solve the equation x2 + = 5. x Answer(c) x = … or x = … or x = … [3] 3 (d) By drawing a suitable straight line, solve the equation x2 + = x + 5. x Answer(d) x = … or x = … or x = … [4] __________________________________________________________________________________________
14 marks
Mark scheme: 5 (a) –2, 5.5 2 B1 for each value (b) Correct curve 5 B5 for correct curve over full domain 10 y or B3FT for 9 or 10 points or B2FT for 7 or 8 points 5 or B1FT for 5 or 6 points Point must touch line if exact or be in correct square if not exact (including boundaries) and x −3 −2 −1 1 2 3 B1 independent for one branch on each side of the y-axis and not touching or crossing the y-axis −5 SC4 for correct curve with branches joined (c) –2.6 Y x Y –2.4 3 B1 for each value 0.6 Y x Y 0.7 1.8 Y x Y 1.9 If B0 then SC1 for y = 5 used Qu Answers Mark Part Marks (d) y = x + 5 ruled correctly 4 B1 for y = x + 5 ruled correctly and –2.2 Y x Y –2.0 B1indep for each value 0.5 Y x Y 0.6 2.4 Y x Y 2.6
This question in 0580/41 Oct/Nov 2014
Q22 · F(x) = 5x3 – 8x2 + 10 (a) Complete the table of values 0580/42 Oct/Nov 2014
6 f(x) = 5x3 – 8x2 + 10 (a) Complete the table of values. x –1.5 –1 –0.5 0 0.5 0.75 1 1.5 2 f(x) –24.9 10 8.6 7.6 7 18 [3] (b) Draw the graph of y = f(x) for –1.5 Y x Y 2. y 20 15 10 5 x –1.5 –1 –0.5 0 0.5 1 1.5 2 –5 –10 –15 –20 –25 [4] (c) Use your graph to fi nd an integer value of k so that f(x) = k has (i) exactly one solution, Answer(c)(i) k = … [1] (ii) three solutions. Answer(c)(ii) k = … [1] (d) By drawing a suitable straight line on the graph, solve the equation f(x) = 15x + 2 for –1.5 Y x Y 2. Answer(d) x = … or x = … [4] (e) Draw a tangent to the graph of y = f(x) at the point where x = 1.5 . Use your tangent to estimate the gradient of y = f(x) when x = 1.5 . Answer(e) … [3] __________________________________________________________________________________________
16 marks
Mark scheme: 6 (a) –3, 7.375, 8.875 1, 1, 1 Accept 7.4 or 7.37 or 7.38 for 7.375 and 8.9 or 8.87 or 8.88 for 8.875 (b) Correct curve 4 B3FT for 8 or 9 correct plots B2FT for 6 or 7 correct plots B1FT for 4 or 5 correct plots Point must touch line if exact or be in correct square if not exact (including boundaries) (c) (i) Any integer less than 7 or greater 1 than 10 (ii) 7, 8 or 9 1 (d) y = 15x + 2 ruled and fit for B2 B1 for short line but correct or freehand full purpose length correct line or for ruled line through (0, 2) (but not y = 2) or for ruled line with gradient 15 (acc ±1 mm vertically for 1 horizontal unit) B2 B1 for each –1.45 to –1.35 and 0.4 to 0.5 (e) Tangent ruled at x = 1.5 B1 No daylight at point of contact. Consider point of contact as midpoint between two vertices of daylight, the midpoint must be between x = 1.4 and 1.6 7 to 12 2 Dep on B1 or close attempt at tangent at x = 1.5 M1 for y – step/x – step for their tangent
This question in 0580/42 Oct/Nov 2014
Q23 · A straight line joins the points (–1, –4) and (3, 8) 0580/43 Oct/Nov 2014
8 (a) A straight line joins the points (–1, –4) and (3, 8). (i) Find the midpoint of this line. Answer(a)(i) ( … , … ) [2] (ii) Find the equation of this line. Give your answer in the form y = mx + c. Answer(a)(ii) y = … [3] (b) (i) Factorise x2 + 3x – 10. Answer(b)(i) … [2] (ii) The graph of y = x2 + 3x – 10 is sketched below. y NOT TO SCALE x (a, 0) 0 (b, 0) (0, c) Write down the values of a, b and c. Answer(b)(ii) a = … b = … c = … [3] (iii) Write down the equation of the line of symmetry of the graph of y = x2 + 3x – 10. Answer(b)(iii) … [1] (c) Sketch the graph of y = 18 + 7x – x2 on the axes below. Indicate clearly the values where the graph crosses the x and y axes. y NOT TO SCALE x 0 [4] (d) (i) x2 + 12x – 7 = (x + p)2 – q Find the value of p and the value of q. Answer(d)(i) p = … q = … [3] (ii) Write down the minimum value of y for the graph of y = x2 + 12x – 7. Answer(d)(ii) … [1] __________________________________________________________________________________________
19 marks
Mark scheme: 8 (a) (i) (1, 2) 1+1 8 − −4 (ii) y = 3x – 1 cao final answer 3 M1 for gradient = oe 3 − −1 and M1 for substituting (3, 8) or (–1, –4) into their y = 3x + c or for finding y-intercept is –1 (b) (i) (x + 5)(x – 2) isw solutions 2 SC1 for (x + a)(x + b) where ab = –10 or a + b = 3 (ii) [a =] –5 3FT B1FT for each of their 5 and their –2 from (b)(i) [b =] 2 and B1 for c = –10 [c =] –10 (iii) x = –1.5 1FT FT x = (their (a + b))/2 (c) Inverted parabola B1 x-axis intercepts at –2 and 9 B2 B1 for each After B0 allow SC1 for (9 – x)(2 + x) oe y-axis intercept at 18 B1 (d) (i) p = 6 3 B2 for (x + 6)2 – 43 or p = 6 or q = 43 q = 43 or M1 for (x + 6)2 or x2 + px + px + p2 and M1 for –7 – (their 6)2 or p2 – q = –7 or 2p = 12 (ii) –43 1FT FT – their q 16 × 11 + 17 × 10 + 18 p + 19 × 4 + 20 × 8
This question in 0580/43 Oct/Nov 2014
Q24 · 1 2 The table shows some values for y = x - 2 , x ! 0580/41 May/June 2015
2 1 2 The table shows some values for y = x - 2 , x ! 0 . x x –2 –1.5 –1 –0.5 –0.25 –0.2 0.2 0.25 0.5 1 1.5 2 y 4.25 2.58 2.06 2.54 –2.46 –1.94 1.92 3.75 (a) Complete the table of values. [4] 1 x – 0.2 and 0.2 x 2. (b) On the grid, draw the graph of y = x2 – 2 for – 2 x y 5 4 3 2 1 x –2 –1 0 1 2 –1 –2 –3 [5] 2 1 (c) By drawing a suitable line, use your graph to solve the equation x - 2 = 2 . x Answer(c) x = … or x = … or x = … [3] 2 1 (d) The equation x - 2 = k has only one solution. x Write down the range of values of k for which this is possible. Answer(d) … [2] (e) By drawing a suitable tangent, find an estimate of the gradient of the curve at the point where x = –1. Answer(e) … [3]
17 marks
Mark scheme: 2 (a) 1.5 1.25 −0.75 0.5 4 B1 for each (b) Fully correct curve 5 B5 for correct curve over full domain or B3 FT for 11 or 12 points or B2 FT for 9 or 10 points or B1 FT for 7 or 8 points and B1 independent for one complete branch on each side of the y-axis and not touching or crossing the y-axis SC4 for correct curve with branches joined
This question in 0580/41 May/June 2015
Q25 · 5 y = x2 – 2x + , x ! 0580/42 May/June 2015
12 5 y = x2 – 2x + , x ! 0 x (a) Complete the table of values. x –4 –3 –2 –1 –0.5 0.5 1 2 3 4 y 21 11 –9 –22.75 23.25 11 6 11 [2] 12 (b) On the grid, draw the graph of y = x2 – 2x + for –4 x –0.5 and 0.5 x 4. x y 25 20 15 10 5 x –4 –3 –2 –1 0 1 2 3 4 –5 –10 –15 –20 –25 [5] (c) By drawing a suitable tangent, find an estimate of the gradient of the graph at the point (1, 11). Answer(c) … [3] 12 (d) The equation x2 – 2x + = k has exactly two distinct solutions. x Use the graph to find (i) the value of k, Answer(d)(i) k = … [1] 12 (ii) the solutions of x2 – 2x + = k. x Answer(d)(ii) x = … or x = … [2] (e) The equation x3 + ax2 + bx + c = 0 can be solved by drawing the line y = 3x + 1 on the grid. Find the value of a, the value of b and the value of c. Answer(e) a = … b = … c = … [3] __________________________________________________________________________________________
16 marks
Mark scheme: 5 (a) 2 and 7 2 B1 for each value (b) Complete correct curve 5 B3 FT for their 9 or 10 points or B2 FT for their 7 or 8 points or B1 FT for their 5 or 6 points and B1 independent for one branch on each side of the y-axis and not touching the y-axis SC4 for correct curve with branches joined (c) Correct tangent and 3 B2 for close attempt at tangent at x = 1 and –13 Y grad Y –8 answer in range OR B1 for ruled tangent at x = 1, no daylight at x = 1 Consider point of contact as midpoint between two vertices of daylight, the midpoint must be between x = 0.8 and 1.2 and M1 (dep on B1 or close attempt at tangent rise [at any point ] for run (d) (i) 5 to 6 1 (ii) 2 to 2.35 and –2.55 to –2.35 2FT FT their k B1FT for each correct solution (e) [a =] –5 3 B2 for two correct values [b =] –1 or for x3 – 5x2 – x + 12 [= 0] oe [c =] 12 or 12 M1 for x2 – 2x + = 3x + 1 x 2 2 955. 2 + 831.2 − AB 2 f
This question in 0580/42 May/June 2015
Q26 · The table shows some values for y = x 3 - 3x + 2 0580/42 Oct/Nov 2015
2 The table shows some values for y = x 3 - 3x + 2 . x –2 –1.5 –1 –0.5 0 0.5 1 1.5 2 y 3.125 3.375 2 0 4 (a) Complete the table of values. [4] (b) On the grid, draw the graph of y = x 3 - 3x + 2 for –2 x 2. y 5 4 3 2 1 x –2 –1 0 1 2 –1 [4] (c) By drawing a suitable line, solve the equation x 3 - 3x + 2 = x + 1 for –2 x 2. Answer(c) x = … or x = … [3] (d) By drawing a suitable tangent, find an estimate of the gradient of the curve at the point where x = -1.5 . Answer(d) … [3]
14 marks
Mark scheme: 2 (a) 0 4 0.625 0.875 1,1,1,1 (b) Fully correct smooth curve 4 B3 FT for 8 or 9 points or B2 FT for 6 or 7 points or B1 FT for 4 or 5 points (c) line y = x + 1 ruled 3 Line must be fit for purpose ie at least from x = 0 and to x = 2 0.2 to 0.3 B2 for correct line and 1 correct value and 1.8 to 1.95 or B1 for correct line or SC1 for no/wrong line and 2 correct values (d) Tangent ruled at x = −1.5 B1 No daylight between tangent and curve at point of contact. Consider point of contact as midpoint between two vertices of daylight, the midpoint must be between x = –1.6 and x = –1.4 2 dep on B1 2.2 to 5 rise M1 for also dep on any tangent drawn or run close attempt at tangent at any point Must see correct or implied calculation from a drawn tangent
This question in 0580/42 Oct/Nov 2015
Q27 · F(x) = x – 2 , x 0 2x (a) Complete the table of values 0580/43 Oct/Nov 2015
14 f(x) = x – 2 , x 0 2x (a) Complete the table of values. x –3 –2 –1.5 –1 –0.5 –0.3 0.3 0.5 1 1.5 2 f(x) –3.1 –2.1 –1.7 –2.5 –5.9 –5.3 –1.5 1.3 1.9 [2] (b) On the grid, draw the graph of y = f(x) for –3 x –0.3 and 0.3 x 2. y 5 4 3 2 1 x –3 –2 –1 0 1 2 –1 –2 –3 –4 –5 –6 [5] (c) Use your graph to solve the equation f(x) = 1. Answer(c) x = … [1] (d) There is only one negative integer value, k, for which f(x) = k has only one solution for all real x. Write down this value of k. Answer(d) k = … [1] 1 (e) The equation 2x – 2 – 2 = 0 can be solved using the graph of y = f(x) and a straight line graph. 2x (i) Find the equation of this straight line. Answer(e)(i) y = … [1] 1 (ii) On the grid, draw this straight line and solve the equation 2x – 2 – 2 = 0. 2x Answer(e)(ii) x = … [3] __________________________________________________________________________________________
13 marks
Mark scheme: 4 (a) –1.5, 0.5 2 B1, B1 (b) Correct curve 5 B3 FT for 10 or 11 points or B2FT for 8 or 9 points or B1FT for 6 or 7 points and B1 independent for two branches SC4 for correct curve but branches joined (c) 1.25 to 1.35 1 (d) –1 1 (e) (i) 2 – x 1 (ii) Ruled line with gradient –1 through 2FT SC1 for ruled line, with gradient –1 or through (0, 2) and fit for purpose (0, 2), but not y = 2 FT their y = mx + c from (e)(i), if m ≠ 0 SC1FT for ruled line either with correct gradient or through (0, c), but not y = c 1.15 to 1.25 cao 1
This question in 0580/43 Oct/Nov 2015
Q28 · The table shows some values of y = x + , x ! 0580/42 Feb/March 2016
17 The table shows some values of y = x + , x ! 0 . x 2 x –2 –1.5 –1 –0.75 –0.5 0.5 0.75 1 1.5 2 3 y –1.75 –1.06 0 1.03 4.50 2.53 2 2.25 (a) Complete the table of values. [3] 1 (b) On the grid, draw the graph of y = x + for – 2 x – 0.5 and 0.5 x 3. x 2 y 5 4 3 2 1 x –2 –1 0 1 2 3 –1 –2 [5] 1(c) Use your graph to solve the equation x + = 1.5 . x 2 x = … [1] 1(d) The line y = ax + b can be drawn on the grid to solve the equation = 2.5 - 2 x . x 2 (i) Find the value of a and the value of b. a = … b = … [2] 1 (ii) Draw the line y = ax + b to solve the equation = 2.5 - 2 x . x 2 x = … [3] (e) By drawing a suitable tangent, find an estimate of the gradient of the curve at the point where x = 2. … [3]
17 marks
Mark scheme: 7 (a) 3.5[0] 1.94 3.11 3 B1 for each (b) Fully correct curve 5 B3 FT for 10 or 11 points or B2 FT for 8 or 9 points or B1 FT for 6 or 7 points B1 indep two separate branches not touching or cutting y-axis SC4 for correct curve, but branches joined (c) – 0.7 to – 0.6 1 Qu. Answers Mark Part Marks (d) (i) – 1 1 2.5 1 If 0,0, M1 for y = 2.5 – x oe seen in working (ii) – 0.6 to – 0.5 with correct ruled line 3 B2FT for drawing their ruled line from (d)(i) or M1 for ruled line through (0, 2.5)FT or gradient −1 FT (e) Correct tangent and 3 B2 for close attempt at tangent at x = 2 and 0.5 ⩽ grad ⩽ 0.85 answer in range OR B1 for ruled tangent at x = 2, no daylight at x = 2 Consider point of contact as midpoint between two vertices of daylight, the midpoint must be between x = 1.8 and 2.2 and M1 (dep on B1 or close attempt at tangent rise [at any point ] for run ( )
This question in 0580/42 Feb/March 2016
Q29 · F ()x = 20 + x , x ! 0580/41 May/June 2016
5 f ()x = 20 + x , x ! 0 x (a) Complete the table. x -10 -8 -5 -2 -1.6 1.6 2 5 8 10 f(x) -12 -10.5 -9 -12 -14.1 14.1 12 12 [2] (b) On the grid, draw the graph of y = f(x) for - 10 G x G - 1.6 and 1. 6 G x G 10 . y 18 16 14 12 10 8 6 4 2 x 0 –10 –8 –6 –4 –2 2 4 6 8 10 –2 –4 –6 –8 –10 –12 –14 –16 –18 [5] (c) Using your graph, solve the equation f(x) = 11. x = … or x = … [2] (d) k is a prime number and f(x) = k has no solutions. Find the possible values of k. … [2] (e) The gradient of the graph of y = f(x) at the point (2, 12) is -4. Write down the co-ordinates of the other point on the graph of y = f(x) where the gradient is -4. ( … , … ) [1] (f) (i) The equation f(x) = x2 can be written as x 3 + px 2 + q = 0 . Show that p = -1 and q = -20. [2] (ii) On the grid opposite, draw the graph of y = x2 for - 4 G x G 4 . [2] (iii) Using your graphs, solve the equation x 3 - x 2 - 20 = 0 . x = … [1] (iv) y NOT TO SCALE 0 P x The diagram shows a sketch of the graph of y = x 3 - x 2 - 20 . P is the point (n, 0). Write down the value of n. n = … [1]
18 marks
Mark scheme: 5 (a) 9 1 10.5 1 (b) Fully correct curve 5 SC4 for correct curve, but branches joined B3 FT for 9 or 10 points plotted or B2 FT for 7 or 8 points plotted or B1 FT for 5 or 6 points plotted and B1 for two separate branches not touching or cutting y-axis (c) 2.1 to 2.6 1 8.5 to 9 1 (d) 2, 3, 5, 7 2 SC1 for correct 4 values and no more than one extra positive integer or ±2, ±3, ±5, ±7 or 3 correct values and no extras (e) (– 2, – 12) 1 (f) (i) M1 Multiplication by x 20 + x 2 = x 3 A1 No errors or omissions 3 2 x − x − 20 = 0 (ii) Fully correct curve y = x2 2 SC1 for U – shaped parabola, vertex at origin (iii) 2.5 to 3.5 1 (iv) 3.[0] to 3.1 or FT their answer to (iii) 1FT FT dep on (iii) > 0 1 6 (a) (i) [y = ] (80 − 2 x ) M1 40 – x is enough 2 1 A = their (80 − 2 x ) × x oe M1 2 A = 40x – x2 and x2 – 40x + A = 0 A1 No errors or omissions (ii) ( x − 30)( x − 10) B2 B1 for x(x – 30) –10(x – 30) [= 0] or x(x – 10) – 30(x – 10) [= 0] or SC1 for ( x + a )( x + b ) where ab = 300 or a + b = – 40 B1 30, 10 (iii) ( −40) 2 − 4(1)(200) or better B1 or for (x – 20)2 p + q p − q p = – – 40 and r = 2(1) B1 Must see or or both r r or for 20 ± 200 B1 If B0, SC1 for 5.9 or 5.857 to 5.858 5.86 B1 and 34.1 or 34.14… 34.14 or 5.86 and 34.14 seen in working or –5.86 and –34.14 as final answers 200 200 200 200 (b) (i) – M2 or M1 for or soi x x + 10 x x + 10 200( x + 10) − 200 x 2000 = x ( x + 10) x ( x + 10) A1 No errors or omissions B2 for 0.27 or 0.278 or 0.2777 to 0.2778 (ii) 16 [min] 40 [s] 3 5 or [h] oe 18 50 or 16.6 or 16.7 or 16.66 to 16.67 or 3 [min] or M1 for 200 200 2000 ÷ 80(80+10) or – 80 90
This question in 0580/41 May/June 2016
Q30 · F(x) = x2 – – 4 , x ≠ 0 x (a) (i) Complete the table 0580/42 May/June 2016
14 f(x) = x2 – – 4 , x ≠ 0 x (a) (i) Complete the table. x –3 –2 –1 –0.5 –0.1 0.2 0.5 1 2 3 f(x) 5.3 0.5 –1.8 6.0 –9.0 –5.8 –4 4.7 [2] (ii) On the grid, draw the graph of y = f(x) for –3 G x G –0.1 and 0.2 G x G 3. y 10 9 8 7 6 5 4 3 2 1 x –3 –2 –1 0 1 2 3 –1 –2 –3 –4 –5 –6 –7 –8 –9 –10 [5] (b) Use your graph to solve the equation f(x) = 0. x = … or x = … or x = … [3] (c) Find an integer k, for which f(x) = k has one solution. k = … [1] (d) (i) By drawing a suitable straight line, solve the equation f(x) + 2 = – 5x. x = … or x = … [4] (ii) f(x) + 2 = – 5x can be written as x3 + ax2 + bx – 1 = 0. Find the value of a and the value of b. a = … b = … [2]
17 marks
Mark scheme: 4 (a) (i) 1 2 B1 for each – 2, – 0.5 or – 2 (ii) Complete correct curve 5 SC4 for correct curves but branches joined or touching y-axis 10 y or B3FT 9 or 10 points 9 8 or B2FT for 7 or 8 points 7 or B1FT for 5 or 6 points 6 5 4 3 2 1 x −3 −2 −1 1 2 3 −1 −2 and B1indep two separate branches not −3 −4 touching or crossing y-axis −5 −6 −7 −8 −9 −10 (b) – 1.95 to – 1.8 3 B1 for each – 0.4 to – 0.2 2.05 to 2.2 (c) Any integer k where k ⩽ – 3 1
This question in 0580/42 May/June 2016
Q31 · The diagram shows the graph of y = f(x) for - 3.5 G x G 2.5 0580/43 May/June 2016
3 The diagram shows the graph of y = f(x) for - 3.5 G x G 2.5 . y 16 15 14 13 12 11 10 9 8 7 6 5 4 3 2 1 x –3 –2 –1 0 1 2 –1 –2 –3 –4 (a) (i) Find f(– 2). … [1] (ii) Solve the equation f(x) = 2. x = … or x = … or x = … [3] (iii) Two tangents, each with gradient 0, can be drawn to the graph of y = f(x). Write down the equation of each tangent. … … [2] 2 (b) (i) Complete the table for g(x) = + 3 for - 3. 5 G x G - 0. 5 and 0. 5 G x G 2. 5 . x x –3.5 –3 –2 –1 –0.5 0.5 1 2 2.5 g(x) 2.4 2.3 1 7 5 3.8 [3] (ii) On the grid opposite, draw the graph of y = g(x). [4] (iii) Use your graph to solve the equation f(x) = g(x). x = … or x = … [2] (c) Find gf(–2). … [2] (d) Find g–1(5). … [1]
18 marks
Mark scheme: 3 (a) (i) 10 1 (ii) –3.4 to –3.3 and –0.4 to –0.3 3 B1 for each and 1.6 to 1.7 (iii) y = –2.3 to –2.1oe 2 B1 for each y = 10 to 10.1oe (b) (i) 2, –1, 4 3 B1 for each (ii) Fully correct curve drawn 4 SC3 for correct curves but branches joined or touching y-axis or B2FT for 8 or 9 correct plots or B1FT for 6 or 7 correct plots and B1 indep for two separate branches not touching or crossing y- axis (iii) –3.4 to –3.2 and 1.8 to 1.9 2 B1 for each (c) 3.2 oe 2FT FT 2 ÷ their (a)(i) + 3 M1 for f(–2) = 10 or their (a)(i) used (d) 1 1 1
This question in 0580/43 May/June 2016
Q32 · Y = 1 - 2 , x ! 0580/41 Oct/Nov 2016
24 y = 1 - 2 , x ! 0 x (a) Complete the table. x –5 –4 –3 –2 –1 –0.5 0.5 1 2 3 4 5 y 0.88 0.78 –7 –7 0.78 0.88 [3] 2 (b) On the grid, draw the graph of y = 1 - 2 for - 5 G x G - 0 .5 and 0.5 G x G 5 . x y 2 1 x –5 –4 –3 –2 –1 0 1 2 3 4 5 –1 –2 –3 –4 –5 –6 –7 –8 [5] (c) (i) On the grid, draw the graph of y =- x - 1 for - 3 G x G 5 . [2] 2 (ii) Solve the equation 1 - 2 =- x - 1. x x = … [1] 2 3 2 (iii) The equation 1 - 2 =- x - 1 can be written in the form x + px + q = 0 . x Find the value of p and the value of q. p = … q = … [3] 2(d) The graph of y = 1 - 2 cuts the positive x-axis at A. x B is the point (0, – 2). (i) Write down the co-ordinates of A. ( … , … ) [1] (ii) On the grid, draw the straight line that passes through A and B. [1] (iii) Complete the statement. The straight line that passes through A and B is a … at the point … [2]
18 marks
Mark scheme: 4 (a) 0.92, …., …., 0.5, – 1, …., ….., – 1, 3 B2 for 4 or 5 correct 0.5, …., …., 0.92 or B1 for 2 or 3 correct (b) Fully correct graph 5 B4 for correct graph but branches joined OR B3FT for 11 or 12 correct points or B2FT for 9 or 10 correct points or B1FT for 7 or 8 correct points B1indep for a branch on each side of the y-axis, without touching it (c) (i) Correct ruled line through (–2, 1) and 2 B1 for straight line with gradient –1 or cutting (2, –3) y-axis at –1 or correct line but freehand or short correct ruled line (ii) 0.7 to 0.95 1 (iii) [p = ] 2 and [q = ] – 2 3 B2 for x 3 + 2 x 2 − 2 = 0 oe or B1 for x 2 − 2 = − x 3 − x 2 oe or better 2 or 1 + 1 − + x [ = 0] or better x 2 (d) (i) (1.3 to 1.6, 0) 1 (ii) Ruled line from (0, –2) to intersection 1FT of their graph with positive x-axis (iii) Tangent [ to curve ] 1 A or (1.3 to 1.6, 0) 1
This question in 0580/41 Oct/Nov 2016
Q33 · X 3 22 (a) Complete the table of values for y = - x + 1 0580/42 Oct/Nov 2016
x 3 22 (a) Complete the table of values for y = - x + 1. 3 x –1.5 –1 –0.5 0 0.5 1 1.5 2 2.5 3 y –2.38 –0.33 0.71 0.79 0.33 –0.13 –0.33 –0.04 [2] x 3 2 (b) Draw the graph of y = - x + 1 for -1.5 G x G 3 . 3 The first 3 points have been plotted for you. y 2 1 x –1 0 1 2 3 –1 –2 –3 [4] (c) Using your graph, solve the equations. x 3 2 (i) - x + 1 = 0 3 x = … or x = … or x = … [3] x 3 2 (ii) - x + x + 1 = 0 3 x = … [2] x 3 2(d) Two tangents to the graph of y = - x + 1 can be drawn parallel to the x-axis. 3 (i) Write down the equation of each of these tangents. … … [2] (ii) For 0 G x G 3 , write down the smallest possible value of y. y = … [1]
14 marks
Mark scheme: 2 (a) 1 1 1 1 (b) Fully correct graph 4 B3FT for 6 or 7 points plotted or B2FT for 4 or 5 points plotted or B1FT for 2 or 3 points plotted (c) (i) –1 < ans < –0.8 1 1.25 < ans < 1.45 1 2.5 < ans < 2.6 1 (ii) –0.7 < ans < –0.5 2 x 3 2 M1 for evidence of y = –x or – x + 1 = –x 3 (d) (i) y = 1 to 1.1 oe 1FT FT only if a clear maximum point y = –0.4 to –0.33 oe 1FT FT only if a clear minimum point (ii) –0.4 to –0.33 oe 1FT Correct or FT their graph 240sin85 sin50 sin85
This question in 0580/42 Oct/Nov 2016
Q34 · 2 (a) Complete the table for y = 3x + 2 + 1, x ! 0580/43 Oct/Nov 2016
2 2 (a) Complete the table for y = 3x + 2 + 1, x ! 0 . x x –3 –2 –1 –0.5 –0.3 0.3 0.5 1 2 3 y –7.8 0 7.5 22.3 24.1 6 7.5 10.2 [2] 2 (b) On the grid, draw the graph of y = 3 x + + 1 for -3 G x G -0.3 and 0.3 G x G 3 . x2 y 25 20 15 10 5 x –3 –2 –1 0 1 2 3 –5 –10 [5] 2 (c) Write down the value of the largest integer, k, so that the equation 3x + 2 + 1 = k has exactly one x solution. k = … [1] 2 (d) (i) By drawing a suitable straight line on the grid, solve 3x + 2 + 1 = 15 - 3x . x x = … or x = … or x = … [4] 2 3 2 (ii) The equation 3x + 2 + 1 = 15 - 3x can be written in the form ax + bx + cx + 2 = 0 , x where a, b and c are integers. Find a, b and c. a = … b = … c = … [3]
15 marks
Mark scheme: 2 (a) –4.5 and 10.5 2 B1 for each value (b) Correct curve 5 B4 for correct curve with branches joined OR B3 FT for 9 or 10 points or B2 FT for 7 or 8 points or B1 FT for 5 or 6 points and B1 independent for one branch on each side of the y-axis and not touching or crossing the y-axis (c) 5 1 (d) (i) Line y = 15 – 3x ruled and –0.4 to –0.31 4 B3 for correct line and 2 correct values 0.35 to 0.45 or B2 for correct line 2.2 to 2.3 or M1 for ruled line with gradient –3 or through (0, 15) or SC2 for no/wrong line and three correct values or SC1 for no/wrong line and two correct values or for correct freehand line (ii) [a =] 6 3 B2 for 6x3 – 14x2 + 2 = 0 oe [b =] –14 or [c =] 0 M1 for correct removal of denominator or collection of terms on one side
This question in 0580/43 Oct/Nov 2016
Q35 · The table shows some values for y = 1.5 x - 1 0580/42 Feb/March 2017
3 The table shows some values for y = 1.5 x - 1. x –2 –1 0 1 2 3 4 5 y – 0.56 – 0.33 2.38 4.06 6.59 (a) Complete the table. [3] (b) Draw the graph of y = 1.5 x - 1 for - 2 G x G 5 . y 7 6 5 4 3 2 1 x –2 –1 0 1 2 3 4 5 –1 [4] (c) Use your graph to solve the equation 1.5 x - 1 = 3. 5 . x = … [2] (d) By drawing a suitable straight line, solve the equation 1.5 x - x - 2 = 0 . x = … or x = … [3] (e) (i) On the grid, plot the point A at (5, 5). [1] (ii) Draw the tangent to the graph of y = 1.5 x - 1 that passes through the point A. [1] (iii) Work out the gradient of this tangent. … [2]
16 marks
Mark scheme: 3 (a) 0 0.5 oe 1.25 oe 1, 1, 1 (b) Fully correct smooth curve 4 B3 FT for 7 or 8 points or B2 FT for 5 or 6 points or B1 FT for 3 or 4 points (c) 3.6 to 3.8 2 M1 for y = 3.5 soi (d) line y = x + 1 ruled M1 −1.55 to −1.40 4.55 to 4.8 A1 A1 If 0 scored SC1 for y = x + 1 stated or implied or for 2 correct values given (e) (i) Point plotted at (5, 5) 1 (ii) Tangent ruled from A 1 (iii) 1.2 to 1.4 B2 B2 and M1 dep on reasonable attempt at tangent from (5, 5) M1 for change in y/ change in x of their ruled line 1 1 1 1 1
This question in 0580/42 Feb/March 2017
Q36 · The diagram shows the graph of y = f (x) for - 2.5 G x G 2 0580/41 May/June 2017
4 The diagram shows the graph of y = f (x) for - 2.5 G x G 2 . y 10 9 8 7 6 5 4 3 2 1 x –2 –1 0 1 2 –1 –2 –3 –4 –5 –6 –7 –8 –9 –10 (a) Find f(1). … [1] (b) Solve f (x) = 3 . x = … [1] (c) The equation f ( x) = k has only one solution for - 2.5 G x G 2 . Write down the range of values of k for which this is possible. … [2] (d) By drawing a suitable straight line, solve the equation f(x) = x – 5. x = … or x = … or x = … [3] (e) Draw a tangent to the graph of y = f (x ) at the point where x = 1. Use your tangent to estimate the gradient of y = f (x) when x = 1. … [3]
10 marks
Mark scheme: 4(a) –1.6 to − 1.4 1 4(b) –0.5 1 4(c) k > –4 2 B1 for identifying the –4 or for horizontal line drawn y = –4 4(d) y = x – 5 ruled 3 B2 for correct line and 2 correct values or and no line and 3 correct values –2.3 to –2.1 or B1 for no line and 2 correct values –1.2 to –1.1 or B1 for correct line 1.3 to 1.4 4(e) Tangent ruled at x = 1 B1 No daylight at point of contact. Consider point of contact as midpoint between two vertices of daylight, the midpoint must be between x = 0.8 and 1.2 –6 to –4 2 Dep on B1 or close attempt at tangent at x = 1 M1 for rise/run for their tangent at x = 1
This question in 0580/41 May/June 2017
Q37 · F (x) = 2 x 2 - 1 The graph of y = f (x) , for - 2 G x G 2 , is drawn on the grid 0580/42 May/June 2017
4 f (x) = 2 x 2 - 1 The graph of y = f (x) , for - 2 G x G 2 , is drawn on the grid. y 8 7 6 5 4 3 2 1 x –2 –1 0 1 2 –1 –2 (a) Use the graph to solve the equation f (x) = 5 . x = … or x = … [2] (b) (i) Draw the tangent to the graph of y = f (x) at the point (-1.5, 3.5) . [1] (ii) Use your tangent to estimate the gradient of y = f (x ) when x = -1.5 . … [2] (c) g (x) = 2x (i) Complete the table for y = g (x) . x - 2 - 1 0 1 2 y 0.25 0.5 2 4 [1] (ii) On the grid opposite, draw the graph of y = g (x) for - 2 G x G 2 . [3] (d) Use your graphs to solve (i) the equation f (x) = g ( x) , x = … or x = … [2] (ii) the inequality f (x) 1 g (x) . … [1] (e) (i) Write down the three values. g (-3) = … g ( -5) = … g ( -10) = … [1] (ii) Complete the statement. As x decreases, g(x) approaches the value … [1]
14 marks
Mark scheme: 4(a) –1.75 to –1.7 1 1.7 to 1.75 1 4(b)(i) Correct ruled solid tangent at 1 (–1.5, 3.5) 4(b)(ii) –7 to –5 2 dep dep on close attempt at ruled solid tangent at x = –1.5 in part (b)(i) M1 for rise/run dep on close attempt at ruled solid tangent at x = –1.5 4(c)(i) 1 1 4(c)(ii) Correct curve 3 B2 for 4 or 5 correct points or B1 for 2 or 3 correct points 4(d)(i) –0.95 to –0.8 1 1.1 to 1.45 1 4(d)(ii) their (–0.95 to –0.8 )< x < 1FT correct or FT their (d)(i) their( 1.1 to 1.45) oe 4(e)(i) 0.125 oe and 0.03125 oe and 1 0.000976 to 0.000977 oe 4(e)(ii) 0 1 accept zero, nought, etc
This question in 0580/42 May/June 2017
Q38 · The table shows some values for y = 2x 3 + 4x 2 0580/43 May/June 2017
3 The table shows some values for y = 2x 3 + 4x 2 . x –2.2 –2 –1.5 –1 –0.5 0 0.5 0.8 y –1.94 0.75 0 3.58 (a) Complete the table. [4] (b) Draw the graph of y = 2x 3 + 4x 2 for - 2.2 G x G 0.8 . y 4 3 2 1 x –2.5 –2 –1.5 –1 –0.5 0 0.5 1 –1 –2 [4] (c) Find the number of solutions to the equation 2x 3 + 4x 2 = 3 . … [1] (d) (i) The equation 2x 3 + 4x 2 - x = 1 can be solved by drawing a straight line on the grid. Write down the equation of this straight line. y = … [1] (ii) Use your graph to solve the equation 2x 3 + 4x 2 - x = 1. x = … or x = … or x = … [3] (e) The tangent to the graph of y = 2x 3 + 4x 2 has a negative gradient when x = k . Complete the inequality for k. … 1 k 1 … [2]
15 marks
Mark scheme: 3(a) 0 2.25 2 1.25 4 B1 for each 3(b) Fully correct smooth curve 4 B3 FT for 7 or 8 points or B2 FT for 5 or 6 points or B1 FT for 3 or 4 points 3(c) 1 1 3(d)(i) [y =] x + 1 1 3(d)(ii) −2.2 to −2.1 1 −0.45 to −0.4 1 0.51 to 0.6 1 If zero scored, SC1 for their line in (d)(i) drawn. It must be of the form y = mx + c (m ≠ 0) and drawn ‘fit for purpose’ 3(e) −1.33 < k < 0 to 0.1 2FT FT Strict ft of their max point and min point dep on cubic graph or accept correct answer from calculus B1 for each If zero scored, SC1 for two correct values reversed
This question in 0580/43 May/June 2017
Q39 · F(x) = x3 – 4x2 + 15 (a) Complete the table of values for y = f(x) 0580/41 Oct/Nov 2017
4 f(x) = x3 – 4x2 + 15 (a) Complete the table of values for y = f(x). x –2 –1 –0.5 0 1 2 2.5 3 3.5 4 4.5 y –9 13.9 15 12 5.6 6 8.9 15 25.1 [2] (b) On the grid, draw the graph of y = f(x) for –2 G x G 4.5 . y 30 25 20 15 10 5 x –2 –1 0 1 2 3 4 –5 –10 [4] (c) Use your graph to solve the equation f(x) = 0. x = … [1] (d) By drawing a suitable tangent, estimate the gradient of the graph of y = f(x) when x = 3.5 . … [3] (e) By drawing a suitable straight line on the grid, solve the equation x3 – 4x2 – 2x + 5 = 0. x = … or x = … or x = … [4]
14 marks
Mark scheme: 4(a) 10, 7 2 B1 for each value 4(b) Correct curve 4 B3 FT for 10 or 11 correct points B2 FT for 8 or 9 correct points B1 FT for 6 or 7 correct points FT their table 4(c) –1.7 to –1.55 1 FT their graph if one answer 4(d) Tangent ruled at x = 3.5 B1 No daylight between tangent and curve at point of contact 6.5 to 11 B2 dep on tangent drawn or close attempt at tangent at x = 3.5 M1 for rise/run also dep on tangent or close attempt at x = 3.5 4(e) line y = 2x + 10 ruled 4 B3 for correct line (could be short) and 1 correct AND value −1.3 to −1.1 or B2 for correct line (could be short) 1 or B1 for [y = ] 2x + 10 seen 4.1 to 4.25 If zero scored, SC1 for no/wrong line and 3 correct values
This question in 0580/41 Oct/Nov 2017
Q40 · X 3 25 y = - 2 , x =Y 0 8 x (a) Complete the table of values 0580/42 Oct/Nov 2017
x 3 25 y = - 2 , x =Y 0 8 x (a) Complete the table of values. x 0.5 1 1.5 2 2.5 3 3.5 y – 8.0 – 1.9 – 0.5 0.5 1.6 [2] (b) y 6 5 4 3 2 1 x –3 –2 –1 0 1 2 3 –1 –2 –3 –4 –5 –6 –7 –8 –9 x 3 2 The graph of y = - 2 for - 3.5 G x G - 0. 5 has already been drawn. 8 x x 3 2 On the grid, draw the graph of y = - 2 for 0.5 G x G 3.5 . [4] 8 x x 3 2(c) Use your graph to solve the equation - 2 = 0 . 8 x x = … [1] x 3 2(d) - 2 = k and k is an integer. 8 x x 3 2 Write down a value of k when the equation - 2 = k has 8 x (i) one answer, k = … [1] (ii) three answers. k = … [1] (e) By drawing a suitable tangent, estimate the gradient of the curve where x =- 3 . … [3] x 3 2(f) (i) By drawing a suitable line on the grid, find x when - 2 = 6 - x . 8 x x = … [3] x 3 2 5 3 2 (ii) The equation - 2 = 6 - x can be written as x + ax + bx + c = 0 . 8 x Find the values of a, b and c. a = … b = … c = … [4]
19 marks
Mark scheme: 5(a) 3.2 or 3.15 or 3.152 to 3.153 2 B1 for each 5.2 or 5.19 or 5.20 or 5.196… 5(b) Correct graph for 0.5 ⩽ x ⩽ 3.5 4 B3FT for 6 or 7 correct points or B2FT for 4 or 5 correct points or B1FT for 2 or 3 correct points 5(c) 1.7 to 1.8 1FT FT their graph if one answer 5(d)(i) Any integer k ⩾ −1 1 5(d)(ii) Any integer k < –1 1 5(e) Tangent ruled at x = –3 B1 2.5 to 4 B2 dep on tangent drawn at x = –3 or close attempt at tangent at x = –3 M1 for rise/run also dep on tangent at x = –3 or close attempt at tangent at x = –3 5(f)(i) y = 6 – x ruled accurately M2 M1 for correct line but freehand or ruled line gradient –1.1 to –0.9, or through (0, 6) but not y = 6 2.85 ⩽ x ⩽ 3 A1 5(f)(ii) [a = ] 8 4 B3 for 2 correct [b = ] –48 or x 5 + 8 x 3 − 48 x 2 − 16 = 0 seen [c = ] –16 5 3 2 or − x − 8 x + 48 x + 16 = 0 seen or M2 for correct multiplication by 8x2 or B1 for answers ± 8, ± 48, ± 16 x 2 × x 3 −×8 2 or M1 for = 6 − x x 2 × 8 or M1 for correct multiplication by 8 or M1 for correct multiplication by x2
This question in 0580/42 Oct/Nov 2017
Q41 · The table shows some values of y = 2x 2 + 5x - 3 for -4 G x G 1.5 0580/43 Oct/Nov 2017
7 The table shows some values of y = 2x 2 + 5x - 3 for -4 G x G 1.5 . x -4 -3 -2 -1 0 1 1.5 y 0 -5 -3 4 (a) Complete the table. [3] (b) On the grid, draw the graph of y = 2x 2 + 5x - 3 for -4 G x G 1.5 . y 10 9 8 7 6 5 4 3 2 1 x –4 –3 –2 –1 0 1 –1 –2 –3 –4 –5 –6 –7 [4] (c) Use your graph to solve the equation 2x2 + 5x – 3 = 3. x = … or x = … [2] (d) y = 2x 2 + 5x - 3 can be written in the form y = 2 x + a 2 + b . ^ h Find the value of a and the value of b. a = … b = … [3]
12 marks
Mark scheme: 7(a) 9, – 6, 9 3 B1 for each 7(b) Correct graph 4 B3FT for 6 or 7 correct points or B2FT for 4 or 5 correct points or B1FT for 2 or 3 correct points 7(c) –3.5 to –3.35 and 0.8 to 0.9.. 2FT FT their graph B1FT for either 7(d) 5 1 3 B2 for either correct a = or 1 or 1.25 2 4 4 5 or M1 for [2] x + seen isw 49 1 4 b = − 8 or − 68 or –6.125 or for 2x2 + 4ax + 2a2 + b
This question in 0580/43 Oct/Nov 2017
Q42 · The graph of y = 10 - 8x 2 for - 1.5 G x G 1.5 is drawn on the grid 0580/41 May/June 2018
7 The graph of y = 10 - 8x 2 for - 1.5 G x G 1.5 is drawn on the grid. y 12 10 8 6 4 2 x – 1.5 – 1 – 0.5 0 0.5 1 1.5 – 2 – 4 – 6 – 8 (a) Write down the equation of the line of symmetry of the graph. … [1] (b) On the grid opposite, draw the tangent to the curve at the point where x = 0.5 . Find the gradient of this tangent. … [3] (c) The table shows some values for y = x 3 + 3x + 4 . x - .15 - 1 - .05 0 0.5 1 1.5 y - .39 5.6 8 11.9 (i) Complete the table. [3] (ii) On the grid opposite, draw the graph of y = x 3 + 3x + 4 for - 1.5 G x G 1.5 . [4] (d) Show that the values of x where the two curves intersect are the solutions to the equation x 3 + 8x 2 + 3x - 6 = 0 . [1] (e) By drawing a suitable straight line, solve the equation x 3 + 5x + 2 = 0 for - 1.5 G x G 1.5 . x = … [3]
15 marks
Mark scheme: 7(a) x = 0 1 7(b) Tangent ruled at x = 0.5 B1 No daylight between tangent and curve at point of contact −9 to −6.5 2 dep on ruled tangent or close attempt at tangent at x = 0.5 M1 for rise/run also dep on tangent or close attempt at tangent at x = 0.5 7(c)(i) 0 2.4 or better 4 3 B1 for each 7(c)(ii) Correct smooth curve 4 B3FT for 6 or 7 correct plots or B2 FT for 4 or 5 correct plots or B1 FT for 2 or 3 correct plots FT their table 7(d) x 3 + 3 x + 4 = 10 − 8 x 2 and correctly 1 completed 7(e) line y = −2 x + 2 drawn and 3 B2 for ruled y = −2 x + 2 −0.45 to −0.35 nfww or B1 for − 2 x + 2 seen or for line y = –2x + c drawn or for y = cx + 2 (c ≠ 0) drawn and B1 for −0.45 to − 0.35 nfww
This question in 0580/41 May/June 2018
Q43 · X 3 16 (a) Complete the table of values for y = - 2 , x ! 0580/42 May/June 2018
x 3 16 (a) Complete the table of values for y = - 2 , x ! 0. 3 2x x - 3 - 2 - 1 - 0.5 - 0.3 0.3 0.5 1 2 3 y - 9.1 - 2.8 - 0.8 - 5.6 - 5.5 - 2.0 8.9 [3] x 3 1 (b) On the grid, draw the graph of y = - 2 for - 3 G x G - 0.3 and 0.3 G x G 3. 3 2x y 10 9 8 7 6 5 4 3 2 1 x –3 –2 –1 0 1 2 3 –1 –2 –3 –4 –5 –6 –7 –8 –9 –10 [5] (c) (i) By drawing a suitable tangent, find an estimate of the gradient of the curve at x = - 2. … [3] (ii) Write down the equation of the tangent to the curve at x = - 2. Give your answer in the form y = mx + c. y = … [2] (d) Use your graph to solve the equations. x 3 1 (i) - 2 = 0 3 2x x = … [1] x 3 1 (ii) - 2 + 4 = 0 3 2x x = … or x = … or x = … [3] x 3 1 -3 + bxn - 3 = 0.(e) The equation - 2 + 4 = 0 can be written in the form axn 3 2x Find the value of a, the value of b and the value of n. a = … b = … n = … [3]
20 marks
Mark scheme: 6(a) – 2[.0], – 0.2, 2.5 3 B1 for each 6(b) Fully correct curve 5 B4 for correct curve, but branches joined or B3FT for 9 or 10 correct plots or B2FT for 7 or 8 correct plots or B1FT for 5 or 6 correct plots and B1 indep two separate branches not touching or cutting y-axis 6(c)(i) Correct tangent and 3 B2 for close attempt at tangent to curve 3 ⩽ grad ⩽ 5 at x = – 2 and answer in range OR B1 for ruled tangent at x = – 2, no daylight at x = –2 and M1dep (dep on B1 or close attempt rise at tangent) [at x = –2] for run 6(c)(ii) [y =] their(c)(i) x + their y-intercept final 2 Strict FT their y-intercept for their line answer M1 for y = their(c)(i) x + any value or ‘c’ oe seen or for y = any value(non-zero) x or ‘mx’ + their y-intercept seen oe 6(d)(i) 1.05 to 1.25 1 6(d)(ii) – 2.3 to – 2.2 3 B1 for each – 0.4 to – 0.3 After 0 scored B1 for y = –4 ruled 0.3 to 0.4 6(e) [a =] 2 3 B2 for 2 correct or for [b =] 24 2x5 + 24x2 [–3 = 0] [n =] 5 or B1 for 1 correct or for 2 x 5 − 3 + 4(6 x 2 ) [ = 0] oe 6 x 2 If 0 scored SC1 for 2x5 seen in final line of algebra
This question in 0580/42 May/June 2018
Q44 · Y = 2x Complete the table 0580/43 May/June 2018
2 (a) (i) y = 2x Complete the table. x 0 1 2 3 4 y 2 4 8 [2] (ii) y = 14 - x 2 Complete the table. x 0 1 2 3 4 y 13 10 5 [2] (b) On the grid, draw the graphs of y = 2x and y = 14 - x 2 for 0 G x G 4 . y 16 14 12 10 8 6 4 2 0 x 1 2 3 4 −2 [6] (c) Use your graphs to solve the equations. (i) 2 x = 12 x = … [1] (ii) 2 x = 14 - x 2 x = … [1] (d) (i) On the grid, draw the line from the point (4, 2) that has a gradient of - 4 . [1] (ii) Complete the statement. This straight line is a … to the graph of y = 14 - x 2 at the point ( … , … ). [2]
15 marks
Mark scheme: 2(a)(i) 1, ….., ….., …., 16 2 B1 for each 2(a)(ii) 14, ….., ….., …., – 2 2 B1 for each 2(b) Fully correct smooth curves 6 B3 for correct curve of y = 2 x or B2FT for 4 or 5 correct points or B1FT for 2 or 3 correct points B3 for correct curve of y = 14 − x 2 or B2FT for 4 or 5 correct points or B1FT for 2 or 3 correct points 2(c)(i) 3.5 to 3.7 1 2(c)(ii) 2.65 to 2.8 1 2(d)(i) Correct line 1 Ruled, through (4, 2) and gradient −4 2(d)(ii) Tangent 2 B1 for each (2, 10)
This question in 0580/43 May/June 2018
Q45 · The table shows some values of y = x 3 - 3x 2 + x 0580/41 Oct/Nov 2018
3 The table shows some values of y = x 3 - 3x 2 + x . x -0.75 -0.5 -0.25 0 0.5 1 1.5 2 2.5 2.75 y -2.9 -1.4 -0.5 -0.1 -1 -1.9 -0.6 (a) Complete the table. [3] (b) On the grid, draw the graph of y = x 3 - 3x 2 + x for - 0.75 G x G 2.75 . [4] y 1 0 x –1 1 2 3 –1 –2 –3 (c) Use your graph to complete the inequalities in x for which y 2- 1. … 1 x 1 … and x 2 … [3] (d) The equation x 3 - 3x 2 + 2x - 1 = 0 can be solved by drawing a straight line on the grid. (i) Write down the equation of this line. … [2] (ii) On the grid, draw this line and use it to solve the equation x 3 - 3x 2 + 2x - 1 = 0 . x = … [3] (e) By drawing a suitable tangent, find an estimate for the gradient of the graph of y = x 3 - 3x 2 + x at x =- 0.25 . … [3]
18 marks
Mark scheme: 3(a) 0 −2 0.9 3 B1 for each 3(b) Correct curve 4 B3 FT for 9 or 10 points or B2 FT for 7 or 8 points or B1 FT for 5 or 6 points 3(c) −0.45 to –0.35 3 FT their graph 1 B1 for each in the correct position 2.35 to 2.45 If zero scored, SC1FT for 3 correct values 3(d)(i) y =1 − x oe 2 B1 for y =1 − kx oe, k ≠ 0 or y = k − x oe or 1−x 3(d)(ii) Correct ruled line and 3 B2FTdep for correct ruled line 2.25 to 2.4 or B1 dep for line through (0, 1) when extended but not y = 1 or with gradient –1.1 to –0.9 or correct line but freehand or SC2 for y = x – 1 ruled after answer [y =] x – 1 in (d)(i) and B1 for 2.25 to 2.4 3(e) Correct tangent and 3 No daylight between tangent and curve at 1.7 to 3.7 x = –0.25. Point of contact is the midpoint between two vertices of daylight and this point of contact must be between –0.35 and –0.15 B2 for close attempt at tangent at x = −0.25 and answer in range OR B1 for ruled tangent at x = −0.25, no daylight Consider point of contact as midpoint between two vertices of daylight, the midpoint must be between x = −0.35 and −0.15 and M1 dep on B1 or close attempt at rise tangent at x = –0.25 for run
This question in 0580/41 Oct/Nov 2018
Q46 · The table shows some values of y = x3 – 3x – 1 0580/42 Oct/Nov 2018
5 The table shows some values of y = x3 – 3x – 1. x –3 –2.5 –2 –1.5 –1 0 1 1.5 2 2.5 3 y –19 –9.1 0.1 1 –1 –3 –2.1 1 7.1 (a) Complete the table of values. [2] (b) Draw the graph of y = x 3 - 3x - 1 for - 3 G x G 3 . y 20 15 10 5 0 x –3 –2 –1 1 2 3 –5 –10 –15 –20 [4] (c) A straight line through (0, –17) is a tangent to the graph of y = x 3 - 3x - 1. (i) On the grid, draw this tangent. [1] (ii) Find the co-ordinates of the point where the tangent meets your graph. ( … , … ) [1] (iii) Find the equation of the tangent. Give your answer in the form y = mx + c. y = … [3] (d) By drawing a suitable straight line on the grid, solve the equation x 3 - 6x - 3 = 0 . x = … or x = … or x = … [4]
15 marks
Mark scheme: 5(a) –3, 17 2 B1 for each 5(b) Fully correct curve 4 B3 FT for 10 or 11 points or B2 FT for 8 or 9 points or B1 FT for 6 or 7 points 5(c)(i) Correct ruled tangent for their curve 1 through (0, −17) 5(c)(ii) (1.7 to 2.2, –1 to 2.5) 1 5(c)(iii) [y =] 9x – 17 final answer 3 M2dep for answer [y =] 9x[+] – c OR rise M1dep for gradient = for their tangent run at any point B1 for answer [y =] kx[+] – 17 (k ≠ 0) 5(d) y = 3x + 2 ruled correctly and 4 B2 for y = 3x + 2 ruled –2.2 … to –2.1 or B1 for [y =] 3x + 2 soi –0.6 to –0.4 or y = 3x + k ruled 2.6 to 2.8 or y = kx + 2 but not y = 2 B2 for all 3 values or B1 for 2 values
This question in 0580/42 Oct/Nov 2018
Q47 · X 2 44 f (x) = - , x =Y 0 4 x (a) Complete the table for f ()x 0580/43 Oct/Nov 2018
x 2 44 f (x) = - , x =Y 0 4 x (a) Complete the table for f ()x . x 0.5 1 2 3 4 5 6 f ()x –7.9 –3.8 0.9 5.5 8.3 [2] (b) The graph of y = f (x) for - 6 G x G - 0.5 is drawn on the grid. y 10 8 6 4 2 –6 –5 –4 –3 –2 –1 0 1 2 3 4 5 6 x –2 –4 –6 –8 –10 On the same grid, draw the graph of y = f (x) for 0.5 G x G 6 . [3] (c) By drawing a suitable tangent, estimate the gradient of the graph of y = f (x) at the point (– 4, 5). … [3] 9(d) g (x) = , x =Y 0 x Complete the table for g ()x . x –4 –3 –2 –1 1 2 3 4 g ()x –2.3 –4.5 –9 9 4.5 2.3 [1] (e) On the same grid, draw the graph of y = g (x) for - 4 G x G - 1 and 1 G x G 4 . [4] (f) (i) Use your graphs to find the value of x when f (x) = g ( x) . x = … [1] (ii) Write down an inequality to show the positive values of x for which f (x) 2 g (x) . … [1] (g) The exact answer to part (f)(i) is 3 k . Use algebra to find the value of k. k = … [2]
17 marks
Mark scheme: 4(a) –1, 3 2 B1 for each 4(b) Correct graph 3 B2FT for 6 or 7 correct points or B1FT for 4 or 5 correct points 4(c) Correct ruled tangent 3 B2 for close attempt at tangent at x = –4 and and –2 ⩽ gradient ⩽ –1.5 answer in range OR B1 for ruled tangent at x = –4 with no daylight and M1 for rise/run also dep on close attempt at tangent. Must see correct or implied calculation from a drawn tangent. 4(d) –3, 3 1 4(e) Correct graph 4 B3FT for 7 or 8 correct points or B2FT for 5 or 6 correct points or B1FT for 3 or 4 correct points 4(f)(i) 3.6 to 3.85 1 4(f)(ii) x > their (f)(i) 1 FT 4(g) x 2 9 4 x 3 M1 13 9 4 = + or − 4 = 9 Allow for + 4 x x 4 x x x 52 A1
This question in 0580/43 Oct/Nov 2018
Q48 · 35 The table shows some values for y = x - 2x for - 3 G x G 3 0580/42 Feb/March 2019
3 35 The table shows some values for y = x - 2x for - 3 G x G 3 . 10 x −3 −2 −1.5 −1 0 1 1.5 2 3 y 2.0 1.7 0 −2.0 −1.6 (a) Complete the table. [3] 3 3 (b) On the grid, draw the graph of y = x - 2x for - 3 G x G 3 . 10 y 2 1 –3 –2 –1 0 1 2 3 x –1 –2 [4] 3 3 1(c) On the grid opposite, draw a suitable straight line to solve the equation x - 2x = (1 - x) for 10 2 - 3 G x G 3 . x = … or x = … or x = … [4] 3 3(d) For - 3 G x G 3 , the equation x - 2x = 1 has n solutions. 10 Write down the value of n. n = … [1]
12 marks
Mark scheme: 5(a) −2.1, 1.6, −1.7, 2.1 3 B2 for 3 correct or B1 for 2 correct 5(b) Fully correct curve 4 B3FT for 8 or 9 correct plots or B2FT for 6 or 7 correct plots or B1FT for 4 or 5 correct plots 5(c) 1 M2 line y = (1 − x ) ruled M1 for line with gradient −1 2 2 1 1 M1 for line through (0, ) but not y = 2 2 −2.15 to −2.01 B2 B1 for two correct −0.45 to −0.2 2.25 to 2.45 5(d) number of intersections of their curve and 1 strict FT for their curve the line y = 1
This question in 0580/42 Feb/March 2019
Q49 · The table shows some values for y = x 3 + 3x 2 + 2 0580/41 May/June 2019
2 The table shows some values for y = x 3 + 3x 2 + 2 . x -3.5 -3 -2.5 -2 -1.5 -1 -0.5 0 0.5 1 1.5 y -4.1 5.1 6 5.4 4 2.6 2.9 12.1 (a) Complete the table. [3] (b) On the grid, draw the graph of y = x 3 + 3x 2 + 2 for - 3.5 G x G 1.5 . y 15 10 5 – 3.5 – 3 – 2.5 – 2 – 1.5 – 1 – 0.5 0 0.5 1 1.5 x – 5 [4] (c) Use your graph to solve the equation x 3 + 3x 2 + 2 = 0 for - 3.5 G x G 1.5 . x = … [1] (d) By drawing a suitable straight line, solve the equation x 3 + 3x 2 + 2x + 2 = 0 for - 3.5 G x G 1.5 . x = … [2] (e) For - 3.5 G x G 1.5 , the equation x 3 + 3 x 2 + 2 = k has three solutions and k is an integer. Write down a possible value of k. k = … [1]
11 marks
Mark scheme: 2(a) 2, 2, 6 3 B1 for each 2(b) Correct graph 4 B3FT for 10 or 11 correct plots or B2FT for 8 or 9 correct plots or B1FT for 6 or 7 correct plots 2(c) –3.3 to –3.1 1 FT their graph 2(d) y = –2x ruled M1 or B1 for y = −2 x stated –2.6 to –2.45 A1 2(e) 3 or 4 or 5 1 FT their graph Allow more than one correct value
This question in 0580/41 May/June 2019
Q50 · X5 The table shows some values of y = - for 0.15 G x G 3.5 0580/42 May/June 2019
1 x5 The table shows some values of y = - for 0.15 G x G 3.5 . 2x 4 x 0.15 0.2 0.5 1 1.5 2 2.5 3 3.5 y 3.30 0.88 - 0.04 - 0.43 - 0.58 - 0.73 (a) Complete the table. [3] 1 x (b) On the grid, draw the graph of y = - for 0.15 G x G 3.5 . 2x 4 The last two points have been plotted for you. y 3.5 3.0 2.5 2.0 1.5 1.0 0.5 0 0.5 1.0 1.5 2.0 2.5 3.0 3.5 x – 0.5 – 1.0 [4] 1 x 1(c) Use your graph to solve the equation - = for 0.15 G x G 3.5 . 2x 4 2 x = … [1] (d) (i) On the grid, draw the line y = 2 - x . [2] (ii) Write down the x co-ordinates of the points where the line y = 2 - x crosses the graph of 1 x y = - for 0.15 G x G 3.5 . 2x 4 x = … and x = … [2] 1 x(e) Show that the graph of y = - can be used to find the value of 2 for 0.15 G x G 3.5 . 2x 4 [2]
14 marks
Mark scheme: 5(a) 2.45, 0.25, − 0.25 3 B1 for each 5(b) Fully correct smooth curve 4 B3FT for 6 or 7 points or B2 FT for 4 or 5 points or B1 FT for 2 or 3 points 5(c) 0.7 to 0.8 1 FT their curve 5(d)(i) Correct ruled line 2 M1 for good freehand, or ruled line with gradient −1.05 to −0.95 or ruled line through (0, 2) but not line y = 2 5(d)(ii) Both intersections of their (b) and 2 Strict FT intersection of their (b) and their (d)(i) their (d)(i) B1FT for one correct OR B2 for 0.27 to 0.28 and 2.38 to 2.39 5(e) 1 x M1 Substitutes x = 2 into − 2 x 4 OR Identifies y = 0 oe OR Correctly manipulates to a single fraction 2 − x 2 e.g. oe seen 4 x Concludes ‘read the graph at y = 0’ A1 oe OR 1 x Manipulates 0 = − oe 2 x 4 leading to x 2 = 2 OR 2 − x 2 States oe = 0 leading to 4 x x 2 = 2
This question in 0580/42 May/June 2019
Q51 · 25 The diagram shows the graph of y = f (x) where f ( x) = x - - 2 , x ! 0580/43 May/June 2019
2 25 The diagram shows the graph of y = f (x) where f ( x) = x - - 2 , x ! 0 . x y 12 10 8 6 4 2 – 3 – 2 – 1 0 1 2 3 x – 2 – 4 – 6 – 8 – 10 – 12 (a) Use the graph to find (i) f (1 ) , … [1] (ii) ff (- 2) . … [2] (b) On the grid opposite, draw a suitable straight line to solve the equation 2 2 x - - 7 =- 3x for - 3 G x G 3 . x x = … or x = … [4] (c) By drawing a suitable tangent, find an estimate of the gradient of the curve at x = - 2. … [3] (d) (i) Complete the table for y = g (x) where g ()x = 2 -x for - 3 G x G 3 . x -3 -2 -1 0 1 2 3 y 2 1 0.5 0.125 [3] (ii) On the grid opposite, draw the graph of y = g (x) . [3] (iii) Use your graph to find the positive solution to the equation f (x) = g ( x) . x = … [1]
17 marks
Mark scheme: 5(a)(i) –3 1 5(a)(ii) 6.2 to 6.4 oe 2 M1 for 3 seen or used 5(b) y = 5 – 3x ruled 2 B1 for y = 5 – 3x soi or ruled line with gradient – 3 or with y – intercept at 5 (but not y = 5) or B1FT for incorrect line equation/expression shown in working and their line correctly drawn – 0.3 to – 0.2 2 B1 for each, dep on y = 5 – 3x drawn 1.65 to 1.8 or FT their line provided equation/expression shown in working, dep on B1FT for line 5(c) Tangent ruled at x = −2 1 B1 for correct tangent –4.5 to –2.5 2 Dep on B1 for tangent or close attempt at tangent at x = –2 M1 for rise/run also dep on tangent drawn or close attempt at correct tangent Must see correct or implied calculation from a drawn tangent 5(d)(i) 8, 4, 0.25 oe 3 B1 for each 5(d)(ii) Correct graph 3 B2FT for 6 or 7 correct plots or B1FT for 4 or 5 correct plots 5(d)(iii) 1.8 to 1.9 1
This question in 0580/43 May/June 2019
Q52 · X 2 1 25 The table shows some values of y = + 2 - , x ! 0580/42 Oct/Nov 2019
x 2 1 25 The table shows some values of y = + 2 - , x ! 0 . 2 x x x -3 -2 -1 -0.5 -0.3 0.2 0.3 0.5 1 2 3 y 5.3 3.3 8.1 17.8 4.5 0.1 -0.5 1.3 (a) Complete the table. [3] x 2 1 2 (b) On the grid, draw the graph of y = + 2 - for - 3 G x G - 0 .3 and 0.2 G x G 3 . 2 x x y 18 17 16 15 14 13 12 11 10 9 8 7 6 5 4 3 2 1 x -3 - 2 - 1 0 1 2 3 - 1 - 2 [5] x 2 1 2(c) Use your graph to solve + 2 - G 0 . 2 x x … G x G … [2] x 2 1 2(d) Find the smallest positive integer value of k for which + 2 - = k has two solutions 2 x x for - 3 G x G - 0.3 and 0.2 G x G 3 . … [1] x 2 1 2(e) (i) By drawing a suitable straight line, solve + 2 - = 3x + 1 for - 3 G x G - 0.3 and 2 x x 0.2 G x G 3 . x = … [3] x 2 1 2 4 3 2 (ii) The equation + 2 - = 3x + 1 can be written as x + ax + bx + cx + 2 = 0 . 2 x x Find the values of a, b and c. a = … b = … c = … [3]
17 marks
Mark scheme: 5(a) 3.5, 15, 3.9 3 B1 for each 5(b) Correct graph 5 B4 for correct curves but branches joined or touching y-axis or B3FT 10 or 11 points or B2FT for 8 or 9 points or B1FT for 6 or 7 points B1indep two separate branches not touching or crossing y-axis 5(c) 0.5 to 0.6 and 1.3 to 1.6 2 B1 for each or both correct but in reverse order 5(d) 1 1 5(e)(i) y = 3x + 1 ruled 3 B2 for correct ruled line that crosses their and 0.3 to 0.49 curve or B1 for y = 3x + 1 soi or freehand line or ruled line with gradient 3 or with y – intercept at 1 (but not y = 1) 5(e)(ii) [a = ] –6 3 M2 for x4 + 2 – 4x = 6x3 + 2x2 or better seen [b = ] –2 [c = ] –4 or B1 for each correct value to a maximum of 2 marks If 0 scored, SC1 for answer [a = ] 6,[b = ] 2 and [c = ] 4 or for x5 + 2x – 4x2 = 6x4 + 2x3 or better
This question in 0580/42 Oct/Nov 2019
Q53 · The table shows some values for y = x 3 + x 2 - 5x 0580/43 Oct/Nov 2019
3 The table shows some values for y = x 3 + x 2 - 5x . x -3 -2 -1.5 -1 0 1 1.5 2 2.5 3 y -3 6 6.4 0 -1.9 2 9.4 (a) Complete the table. [3] (b) On the grid, draw the graph of y = x 3 + x 2 - 5x for - 3 G x G 3 . y 25 20 15 10 5 x - 3 - 2 - 1 0 1 2 3 - 5 [4] (c) Use your graph to solve the equation x 3 + x 2 - 5x = 0 . x = … or x = … or x = … [2] (d) By drawing a suitable tangent, find an estimate of the gradient of the curve at x = 2 . … [3] (e) Write down the largest value of the integer, k, so that the equation x 3 + x 2 - 5x = k has three solutions for - 3 G x G 3 . k = … [1]
13 marks
Mark scheme: 3(a) 5, –3, 21 3 B1 for each 3(b) Fully correct curve 4 B3 FT for 9 or 10 points or B2 FT for 7 or 8 points or B1 FT for 5 or 6 points 3(c) –2.9 to –2.7 2 B1 for 2 correct values 0 1.7 to 1.9 3(d) Tangent ruled at x = 2 B1 10 to 14 B2 Dep on correct tangent or close attempt at tangent at x = 2 M1 for rise/run also dep on correct tangent drawn or close attempt at tangent Must see correct or implied calculation from a drawn tangent 3(e) 6 1
This question in 0580/43 Oct/Nov 2019
Q54 · The table shows some values for y = 2x 3 - 4x 2 + 3 0580/42 Feb/March 2020
2 (a) The table shows some values for y = 2x 3 - 4x 2 + 3 . x -1 - 0.5 0 0.5 1 1.5 2 y -3 1.75 0.75 3 (i) Complete the table. [3] (ii) On the grid, draw the graph of y = 2x 3 - 4x 2 + 3 for - 1 G x G 2 . y 3 2 1 – 1 0 1 2 x – 1 – 2 – 3 [4] (iii) Use your graph to solve the equation 2x 3 - 4x 2 + 3 = 1 .5 . x = … or x = … or x = … [3] (iv) The equation 2x 3 - 4x 2 + 3 = k has only one solution for - 1 G x G 2 . Write down a possible integer value of k. … [1] (b) y 6 5 4 3 2 1 – 1 0 1 x – 1 – 2 – 3 – 4 (i) On the grid, draw the tangent to the curve at x = 1. [1] (ii) Use your tangent to estimate the gradient of the curve at x = 1. … [2] (iii) Write down the equation of your tangent in the form y = mx + c . y = … [2]
16 marks
Mark scheme: 2(a)(i) 3 2.25 1 3 B1 for each 2(a)(ii) Fully correct smooth curve 4 B3FT for 7 or 6 correct plots B2FT for 5 or 4 correct plots B1FT for 3 correct plots 2(a)(iii) −0.6 to −0.51, 0.75 to 0.85, 3 B1 for each 1.7 to 1.85 If 0 scored, SC1 for y = 1.5 drawn 2(a)(iv) −3 or −2 or −1 or 0 1 2(b)(i) Tangent ruled at x = 1 1 2(b)(ii) 4.4 to 5.6 2 Dep on tangent at x = 1 or close attempt M1 for rise/run for their line 2(b)(iii) y = (4.4 to 5.6)x – (1.8 to 2.2) 2 FT for any line but not horizontal or vertical or line for 2 marks or B1 [y =] their (b)(ii)x + their(y-intercept) B1FT for [m =] their 5 or for their y-intercept
This question in 0580/42 Feb/March 2020
Q55 · A curve has equation y = 4 x 3 - 3x + 3 0580/43 May/June 2020
12 (a) A curve has equation y = 4 x 3 - 3x + 3 . (i) Find the coordinates of the two stationary points. ( … , … ) and ( … , … ) [5] (ii) Determine whether each of the stationary points is a maximum or a minimum. Give reasons for your answers. [3] (b) The graph of y = x 2 - x + 1 is shown on the grid. y 7 6 5 4 3 2 1 – 3 – 2 – 1 0 1 2 3 4 x – 1 By drawing a suitable line on the grid, solve the equation x 2 - 2x - 2 = 0 . x = … or x = … [3]
11 marks
Mark scheme: 12(a)(i) 1 1 5 B2 for 12 x 2 − 3[ = 0] − , 4 and , 2 2 2 or B1 for 12x2 or – 3 M1 for their derivative = 0 or dy/dx = 0 B1 for [x =] – ½ and ½ or one coordinate pair correct 12(a)(ii) 1 3 B2 for one correct with reason − , 4 Max with reason or M1 for correct attempt to find 2 e.g. 2nd derivative/gradients/sketch 1 , 2 Min with reason 2 12(b) line y = x + 3 ruled M2 B1 for [ y = ] x + 3 identified or rules y = x + k or y = px + 3 −0.7 to −0.8 A1 2.7 to 2.8
This question in 0580/43 May/June 2020
Q56 · The diagram shows the graph of y = f ( x) for - 3 G x G 3 0580/41 Oct/Nov 2020
5 (a) The diagram shows the graph of y = f ( x) for - 3 G x G 3 . y 20 16 12 8 4 – 3 – 2 – 1 0 1 2 3 x – 4 – 8 – 12 (i) Solve f ( x) = 14 . x = … [1] (ii) By drawing a suitable tangent, find an estimate of the gradient of the graph at the point (-2, 4). … [3] (iii) By drawing a suitable straight line on the grid, solve f ( x) = 2 x - 2 for - 3 G x G 3 . . x = … [3] (b) y A NOT TO B SCALE O x The diagram shows a curve with equation y = 2x 2 - 2x - 7 . The straight line with equation y = 3x + 5 intersects the curve at the points A and B. Find the coordinates of the points A and B. A ( … , … ) B ( … , … ) [5]
12 marks
Mark scheme: 5(a)(i) 2.7 to 2.8 1 5(a)(ii) tangent ruled at x = –2 B1 6 to 10 2 dep on B1 or a close attempt at tangent at x = –2 or M1 for rise/run for their tangent, or close attempt, at any point Must see correct or implied calculation from a drawn tangent After M0, SC1 for gradient of tangent (or close attempt) in range embedded in y = mx + c 5(a)(iii) y = 2x – 2 ruled 3 B2 for correct ruled line and x = –2.9 to –2.8 cao or B1 for short line or for freehand line or broken line or ruled line with gradient 2 or with y-intercept at –2 (but not y = –2) 5(b) A (4, 17) B (–1.5, 0.5) 5 B4 for (–1.5, 0.5) and (4, 17), or for x = 4 and x = –1.5 OR B3 for A(4, 17) or B(–1.5, 0.5) OR M1 for 2x2 –2x – 7 = 3x + 5 oe AND either M2 for (2x + 3)(x – 4) or M1 for 2x(x – 4) + 3(x – 4) or x(2x + 3) – 4(2x + 3) or (2x +c)(x + d) where cd = –12 or c + 2d = –5 [c and d are integers] OR M2 for − their b ± (theirb ) 2 − 4( their a )( their c ) 2( their a ) or M1 for ( their b ) 2 − 4( their a )( their c ) or for p = –their b, r = 2(their a) if in the ା √ ି √ form or
This question in 0580/41 Oct/Nov 2020
Q57 · Y NOT TO SCALE B A O x C The diagram shows a sketch of the curve y = x 2 + 3x - 4 0580/41 Oct/Nov 2020
10 (a) y NOT TO SCALE B A O x C The diagram shows a sketch of the curve y = x 2 + 3x - 4 . (i) Find the coordinates of the points A, B and C. A ( … , … ) B ( … , … ) C ( … , … ) [4] (ii) Differentiate x 2 + 3x - 4 . … [2] (iii) Find the equation of the tangent to the curve at the point (2, 6). … [3] (b) y 0 x 90° 180° 270° 360° (i) On the diagram, sketch the graph of y = tan x for 0° G x G 360° . [2] (ii) Solve the equation 5 tanx =- 7 for 0° G x G 360° . x = … or x = … [3]
14 marks
Mark scheme: 10(a)(i) A(–4, 0) 4 B3 for A and B correct B(1, 0) Or B2 for B (–4, 0) and A (1, 0) C(0, –4) Or B1 for (x + 4)(x – 1) or for −±3 32 −×4 1 ×−4 oe 2 and B1 for A or B correct B1 for C(0, –4) OR SC2 for –4, 1 and –4 in correct positions on the graph 10(a)(ii) 2x + 3 [ ± 0] final answer 2 B1 for answer 2x +c or for ax + 3, a ≠ 0 or for correct answer seen 10(a)(iii) y = 7x – 8 oe 3 B2 for answer 7x – 8 OR M1 for [gradient =] 2(2) + 3 FT their part (a)(ii) of the form ax + b M1dep for substitution of (2, 6) into y = their mx + c oe 10(b)(i) Correct sketch 2 B1 for one correct section out of 4 OR B1 for two properties correct from • Crosses x-axis at (0, 0) (180, 0) and (360, 0) only • Correct curvature in each section of 90o • Asymptotes at x = 90 and x = 270 0 90 180 270 360 10(b)(ii) 125.5 or 125.53 to 125.54 3 B2 for one correct angle and or B1 for –54.5 or –54.46… or for 2 angles 305.5 or 305.53 to 305.54 with a difference of 180.
This question in 0580/41 Oct/Nov 2020
Q58 · 17 y = x + , x ! 0580/42 Oct/Nov 2020
2 17 y = x + , x ! 0 x (a) Complete the table. x 0.2 0.3 0.5 1 1.5 2 2.5 y 5.0 3.4 2.3 2.9 6.7 [2] 2 1 (b) On the grid, draw the graph of y = x + for 0.2 G x G 2.5 . x 2 1 The graph of y = x + for - 2.5 G x G - 0.2 has been drawn for you. x y 7 6 5 4 3 2 1 – 2.5 – 2 – 1.5 – 1 – 0.5 0 0.5 1 1.5 2 2.5 x – 1 – 2 – 3 – 4 – 5 [4] (c) By drawing suitable straight lines on the grid, solve the following equations. 2 1 (i) x + =- 2 x x = … [1] 2 1 (ii) x + + x - 1 = 0 x x = … [2] 2 1(d) k is an integer and the equation x + = k has three solutions. x Write down a possible value of k. k = … [1]
10 marks
Mark scheme: 7(a) 2, 4.5 2 B1 for each 7(b) Correct graph 4 B3 FT for 6 or 7 correct points FT their table or B2 FT for 4 or 5 correct points FT their 6666 table 4444 or B1 FT for 2 or 3 correct points FT their 2222 table -2-2-2-2 -1-1-1-1 0000 0000 1111 2222 -2-2-2-2 -4-4-4-4 7(c)(i) –0.5 to –0.4 1 7(c)(ii) y = 1 – x ruled 2 2 1 M1 for [y =] 1 – x or x + = 1 − x soi and x –1.9 to –1.75 or B1 for –1.9 to –1.75 7(d) Any integer > 2 1
This question in 0580/42 Oct/Nov 2020
Q59 · Y 5 4 3 2 1 x – 2 – 1 0 1 2 – 1 – 2 (a) The grid shows the graph of y = a + bx2 0580/42 Feb/March 2021
6 y 5 4 3 2 1 x – 2 – 1 0 1 2 – 1 – 2 (a) The grid shows the graph of y = a + bx2 . The graph passes through the points with coordinates (0, 4) and (1, 1). (i) Find the value of a and the value of b. a = … b = … [2] (ii) Write down the equation of the tangent to the graph at (0, 4). … [1] (iii) The equation of the tangent to the graph at x =- 1 is y = 6x + 7 . Find the equation of the tangent to the graph at x = 1. … [2] 5(b) The table shows some values for y = 1 + for - 2 G x G 1.5 . 3 - x x – 2 – 1.5 – 1 – 0.5 0 0.5 1 1.5 y 2 2.11 2.43 3 4.33 (i) Complete the table. [3] 5 (ii) On the grid, draw the graph of y = 1 + for - 2 G x G 1.5 . [4] 3 - x (c) (i) Write down the values of x where the two graphs intersect. x = … or x = … [2] (ii) The answers to part(c)(i) are two solutions of a cubic equation in terms of x. Find this equation in the form ax 3 + bx 2 + cx + d = 0 , where a, b, c and d are integers. … [4]
18 marks
Mark scheme: 6(a)(i) [a = ] 4 2 B1 for [a = ] 4 B1 for [b = ] – 3 nfww [b = ] – 3 nfww 6(a)(ii) y = 4 oe 1 6(a)(iii) y = − 6x + 7 oe final answer 2 B1 for answer − 6x + 7 or answers y = − 6x + c or y = kx + 7 (k < 0) 6(b)(i) 2.25 2.67 3.5 3 B1 for each 6(b)(ii) correct curve 4 B3 FT for 7 or 8 points or B2 FT for 5 or 6 points or B1 FT for 3 or 4 points 6(c)(i) –0.78 to –0.72 and 0.55 to 0.59 2 B1 for each 6(c)(ii) 3 x 3 − 9 x 2 − 3 x + 4 [ = 0] final answer 4 B3FT for 3 out of 4 correct terms or for bx3 – 3bx2 + (a – 1)x + 8 – 3a [ = 0] oe or B2FT for 2 out of 4 correct terms or for 3 out of 4 terms from bx3 – 3bx2 + (a – 1)x + 8 – 3a [ = 0] 5 2 or M1 for 1 + = their 4 + (their ( −3)) x oe 3 − x
This question in 0580/42 Feb/March 2021
Q60 · The table shows some values of y = 3 + 4x - x 2 for - 1 G x G 5 0580/41 May/June 2021
10 The table shows some values of y = 3 + 4x - x 2 for - 1 G x G 5 . x -1 -0.5 0 1 2 3 4 4.5 5 y -2 6 6 -2 (a) Complete the table. [3] (b) On the grid, draw the graph of y = 3 + 4x - x 2 for - 1 G x G 5 . y 8 6 4 2 – 1 0 1 2 3 4 5 x – 2 [4] (c) Write down an integer value of k for which the equation 3 + 4x - x 2 = k has no solutions. … [1] 9 2 (d) By drawing a suitable straight line on the grid, solve the equation - 1 + x - x = 0 . 2 x = … or x = … [4]
12 marks
Mark scheme: 10(a) 0.75 3 7 3 0.75 3 B2 for 4 or 3 correct or B1 for 2 correct 10(b) correct curve 4 B3FT for 8 or 9 correct plots B2FT for 6 or 7 correct plots B1FT for 4or 5 correct plots 10(c) Accept any integer ≥ 8 1 10(d) 1 B3 1 line y = 4 − x ruled B2 for [ y = ] 4 − x identified 2 2 1 or B1 for ruled line with gradient − 2 or B1 for ruled line through (0, 4) but not y = 4 0.2 to 0.3 4.2 to 4.3 B1
This question in 0580/41 May/June 2021
Q61 · The table shows some values for y = 2 # 0.5 x - 1 0580/42 May/June 2021
2 The table shows some values for y = 2 # 0.5 x - 1. x -1 -0.5 0 0.5 1 1.5 2 y 3 1.83 0.41 0 -0.29 (a) (i) Complete the table. [2] (ii) On the grid, draw the graph of y = 2 # 0.5 x - 1 for - 1 G x G 2 . y 3 2 1 x – 1 – 0.5 0 0.5 1 1.5 2 – 1 – 2 [4] (b) By drawing a suitable straight line, solve the equation 2 # 0.5 x + 2x - 3.5 = 0 for - 1 G x G 2 . x = … [3] (c) There are no solutions to the equation 2 # 0.5 x - 1 = k where k is an integer. Complete the following statements. The highest possible value of k is … The equation of the asymptote to the graph of y = 2 # 0.5 x - 1 is … [2]
11 marks
Mark scheme: 2(a)(i) 1, –0.5 oe 2 B1 for each 2(a)(ii) Correct curve 4 B3FT for 6 or 7 correct plots or B2FT for 4 or 5 correct plots or B1FT for 2 or 3 correct plots 2(b) y = 2.5 − 2x ruled B2 B1 for y = k − 2 x or y = px + 2.5 ruled (p ≠ 0) or for [y =] 2.5 − 2x oe identified 1.3 to 1.4 B1 2(c) –1 B1 y = –1 B1 FT their k (must be negative)
This question in 0580/42 May/June 2021
Q62 · 36 The table shows some values for y = x - , x ! 0580/41 Oct/Nov 2021
2 36 The table shows some values for y = x - , x ! 0 , given correct to 1 decimal place. 2x x -3 -2 -1 -0.5 -0.2 0.2 0.5 1 2 3 y 2.5 3.3 7.5 -7.5 -2.8 -0.5 3.3 (a) (i) Complete the table. [3] 2 3 (ii) On the grid, draw the graph of y = x - for - 3 G x G - 0 .2 and 0.2 G x G 3 . 2x y 10 9 8 7 6 5 4 3 2 1 x – 3 – 2.5 – 2 – 1.5 – 1 – 0.5 0 0.5 1 1.5 2 2.5 3 – 1 – 2 – 3 – 4 – 5 – 6 – 7 – 8 [5] 2 3 24(b) By drawing a suitable straight line on the grid, solve the equation x - = - 2x 2x 5 for - 3 G x G - 0.2 and 0.2 G x G 3 . x = … or x = … [4] 2 3 24(c) The solutions to the equation x - = - 2x are also the solutions to an equation of the 2x 5 form ax 3 + bx 2 + cx - 15 = 0 where a, b and c are integers. Find the values of a, b and c. a = … b = … c = … [4]
16 marks
Mark scheme: 6(a)(i) 9.5, 4.8 and 8.5 3 B1 for each 6(a)(ii) correct curve 5 B4 for correct curve, but branches joined or touching y axis or B3FT for 9 or 10 correct plots or B2FT for 7 or 8 correct plots or B1FT for 5 or 6 correct plots AND B1 indep two separate branches not touching or cutting y-axis 6(b) 24 4 B2 for correct ruled line crossing curve y = − 2 x ruled twice 5 and or B1 for correct freehand or for short – 0.4 to – 0.2 and 1.45 to 1.7 ruled line or for line with negative gradient through (0, 4.8) or for line with gradient – 2 B1 for each value 6(c) [a =] 10 4 B3 for 10x3 – 15 = 48x – 20x2 oe or better [b =] 20 or B2 for 2 correct values [c =] – 48 or B1 for 1 correct value 2 15 or for 5 x − = 24 − 10 x or better 2 x 3 48 2 or for 2 x − 3 = x − 4 x or better 5 3 3 24 2 or for x − = x − 2 x 2 5 After 0 scored SC1 for correct elimination of a denominator of 5, x or 2x from a four term expression.
This question in 0580/41 Oct/Nov 2021
Q63 · The table shows some values for y = x 3 - 3x 2 + 3 0580/42 Oct/Nov 2021
5 The table shows some values for y = x 3 - 3x 2 + 3 . x - 1 - .05 0 0.5 1 1.5 2 2.5 3 y 2.125 3 2.375 1 - 1 - .0125 (a) Complete the table. [3] (b) On the grid, draw the graph of y = x 3 - 3x 2 + 3 for - 1 G x G 3 . y 3.5 3 2.5 2 1.5 1 0.5 – 1 – 0.5 0 0.5 1 1.5 2 2.5 3 x – 0.5 – 1 – 1.5 [4] (c) By drawing a suitable straight line on the grid, solve the equation x 3 - 3x 2 + x + 1 = 0 . x = … or x = … or x = … [4]
11 marks
Mark scheme: 5(a) –1, –0.375, 3 3 B1 for each 5(b) Correct graph 4 B3FT for 8 or 9 correct points or B2FT for 6 or 7 correct points or B1FT for 4 or 5 correct points 5(c) y = 2 – x ruled correctly 4 B2 for y = 2 – x ruled AND or B1 for [y = ] 2 – x soi –0.45 to –0.35 or y = k – x ruled 1 or y = kx + 2 ruled, but not y = 2 2.35 to 2.45 B2 for all three values or B1 for any two values
This question in 0580/42 Oct/Nov 2021
Q64 · F ( x) = x ( x - 1)( x - 2) (a) Find the coordinates of the points where the graph of y =… 0580/43 Oct/Nov 2021
9 f ( x) = x ( x - 1)( x - 2) (a) Find the coordinates of the points where the graph of y = f ( x) crosses the x-axis. ( … , … ) ( … , … ) ( … , … ) [2] (b) Show that (f x) = x 3 - 3x 2 + 2x . [2] (c) Find the coordinates of the turning points of the graph of y = f ( x) . Show all your working and give your answers correct to 1 decimal place. ( … , … ) ( … , … ) [8] (d) Sketch the graph of y = f ( x) . y O x [2]
14 marks
Mark scheme: 9(a) (0, 0), (1, 0), (2, 0) 2 B1 for any two correct If 0 scored, SC1 for all three x values clearly identified 9(b) 2 2 2 2 x x − x − 2 x + 2 or x − x x − x − 2 x + 2 ( ) ( )( x − 2 ) B1 for x ( ) or x − 2 ) or ( x − 1)( x 2 − 2 x ) ( x 2 − x )( leading to x 3 − 3 x 2 + 2 x with no errors or or ( x − 1)( x 2 − 2 x ) omissions 9(c) 3 x 2 − 6 x + 2 B2 B1 for 2 correct terms dy M1 their = 0 dx 2 M2 2 −−( 6) ± ( −6 ) − 4(3)(2) M1 for ( −6) − 4(3)(2) or for their 2(3) p ± q p = –(–6) and r = 2(3) if in form r (0.4, 0.4) B3 B2 for 0.4 or 0.42... and 1.6 or 1.57 to (1.6, –0.4) 1.58 or for one correct pair of coordinates or B1 for 0.4 or 0.42... or 1.6 or 1.57 to 1.58 1 1 If 0 scored SC1 for 1 + and 1 – 3 3 or better or for one correct pair of coordinates in any form 9(d) Correct2222 sketch 2 FT their (c) but must be cubic i.e. correct shape cubic through origin and 1111 max and min in correct quadrants .5.5.5.5 0000 0000 0.50.50.50.5 1111 1.51.51.51.5 2222 2.52.52.52.5 -1-1-1-1 B1 for cubic shape sketch -2-2-2-2
This question in 0580/43 Oct/Nov 2021
Q65 · 12 The table shows some values for y = x - , x ! 0580/42 Feb/March 2022
2 12 The table shows some values for y = x - , x ! 0 . 3x The y-values are rounded to 1 decimal place. x -2 -1.5 -1 -0.75 -0.5 -0.25 -0.1 y 4.2 2.5 1.3 1.4 3.3 (a) Complete the table. [2] 2 1 (b) On the grid, draw the graph of y = x - for - 2 G x G - 0 .1 . 3x 2 1 The graph of y = x - for x 2 0 has been drawn for you. 3x y 4 3 2 1 – 2 – 1 0 1 2 x – 1 – 2 [4] 2 1 (c) By drawing a suitable line on the grid, solve the equation x - + 1 = 0 . 3x x = … [2]
8 marks
Mark scheme: 2(a) 1[.0] 0.9 2 B1 for each 2(b) correct curve 4 B3 FT for 6 or 7 points B2 FT for 4 or 5 points B1 FT for 2 or 3 points 2(c) ruled line at y = − 1 B1 0.3 to 0.32 B1
This question in 0580/42 Feb/March 2022
Q66 · Y 12 11 10 9 8 7 6 5 4 3 2 1 – 1 0 1 2 3 4 5 x – 1 – 2 – 3 – 4 – 5 – 6 – 7 – 8 – 9 – 10… 0580/41 May/June 2022
6 (a) y 12 11 10 9 8 7 6 5 4 3 2 1 – 1 0 1 2 3 4 5 x – 1 – 2 – 3 – 4 – 5 – 6 – 7 – 8 – 9 – 10 The diagram shows the graph of y = f ( x) for - 1.5 G x G 5 . (i) Find f ( 2) . … [1] (ii) Solve the equation f ( x) = 0 for - 1.5 G x G 5 . x = … or x = … or x = … [3] (iii) f ( x) = k has three solutions for - 1.5 G x G 5 where k is an integer. Find the smallest possible value of k. k = … [1] (iv) On the grid, draw a line y = mx so that f ( x) = mx has exactly one solution for - 1.5 G x G 5 . [2] (b) y = 3 x 2 - 12x + 7 dy (i) Find the value of when x = 5 . dx … [3] (ii) Find the coordinates of the point on the graph of y = 3x 2 - 12x + 7 where the gradient is 0. ( … , … ) [2] p 2 dy 6(c) When y = 2x + qx , = 14x + 6x . dx Find the value of p and the value of q. p = … q = … [2]
14 marks
Mark scheme: 6(a)(i) –3 1 6(a)(ii) –1 1.55 to 1.6 4.4 to 4.45 3 B1 for each 6(a)(iii) –8 1 6(a)(iv) Ruled line through origin intersecting curve once 2 B1 for ruled line through origin 6(b)(i) 18 3 B2 for 6x – 12 or B1 for 6x or –12 6(b)(ii) (2, –5) 2 B1 for each. If 0 scored, M1 for their 6x – 12 = 0 or states 0 dy dx 6(c) [p = ] 7 [q = ] 3 2 B1 for each
This question in 0580/41 May/June 2022
Q67 · Y C (1.2, 10) A (– 1.5, 7.9) B (– 1, 7) E (6, 5.5) NOT TO SCALE D (5, 3) 0 x The diagram… 0580/41 Oct/Nov 2022
10 (a) y C (1.2, 10) A (– 1.5, 7.9) B (– 1, 7) E (6, 5.5) NOT TO SCALE D (5, 3) 0 x The diagram shows a sketch of the graph of y = f ( x) for - 1.5 G x G 6 . The coordinates of five points on the graph of y = f ( x) are shown on the diagram. (i) f ( x) = k has two solutions in the interval - 1.5 G x G 6 . Write down a possible integer value of k. k = … [1] (ii) f ( x) = j has no solutions in the interval - 1.5 G x G 6 when j 1 a or j 2 b . Find the maximum value of a and the minimum value of b. a = … b = … [2] (b) Find the coordinates of the two stationary points on the graph of y = x 6 - 6x 5 . You must show all your working. ( … , … ) ( … , … ) [5]
8 marks
Mark scheme: 10(a)(i) 4 or 5 or 7 or 8 or 9 1 10(a)(ii) [a =] 3, [b =] 10 2 B1 for each or for a and b transposed 10(b) 6 x 5 − 30 x 4 B2 B1 for 6x 5 or −30 x 4 their derivative = 0. M1 (0, 0) and (5, –3125) B2 B1 for (5, –3125) or for x = 0 and x = 5
This question in 0580/41 Oct/Nov 2022
Q68 · All the lengths in this question are measured in centimetres 0580/42 Oct/Nov 2022
2 All the lengths in this question are measured in centimetres. NOT TO 9 – x SCALE x x The diagram shows a solid cuboid with a square base. (a) The volume, V cm 3, of the cuboid is V = x 2 ( 9 - x) . The table shows some values of V for 0 G x G 9 . x 0 1 2 3 4 5 6 7 8 9 V 0 8 54 80 100 108 98 64 0 (i) Complete the table. [1] (ii) On the grid on the opposite page, draw the graph of V = x 2 ( 9 - x) for 0 G x G 9 . [4] (iii) Find the values of x when the volume of the cuboid is 44 cm 3. x = … or x = … [2] V 110 100 90 80 70 60 50 40 30 20 10 0 x 0 1 2 3 4 5 6 7 8 9 (b) (i) Show that the total surface area of the cuboid is ( 36x - 2x 2 )cm 2 . [2] (ii) Find the surface area when the volume of the cuboid is a maximum. … cm2 [3]
12 marks
Mark scheme: 2(a)(i) 28 1 2(a)(ii) Correct curve 4 B3FT for 9 or 10 correct points or B2FT for 7 or 8 correct points or B1FT for 5 or 6 correct points 2(a)(iii) 2.5 to 2.8 8.2 to 8.5 2 B1 for each value 2(b)(i) 2x2 + 4x(9 – x) oe M1 Accept the sum of individual areas if done in smaller parts 2x2 + 36x – 4x2 oe A1 With intermediate step shown and brackets removed with no Leading to 36x – 2x2 errors or omissions 2(b)(ii) 144 3 B1 for x = 6 identified from graph or using calculus M1 for 36 their6 – 2 (their 6)2
This question in 0580/42 Oct/Nov 2022
Q69 · Sketch the following graphs 0580/43 Oct/Nov 2022
9 (a) Sketch the following graphs. On each sketch, indicate any intercepts with the axes. (i) 3x - 4y = 12 y O x [2] (ii) y = x 2 - 3x - 4 y O x [4] (iii) y = 6x y O x [2] dy 4 3(b) (i) Find the derivative, , of y = 5 + 8x - x . dx 3 … [2] 4 3 (ii) Find the gradient of y = 5 + 8 x - x at x =- 1. 3 … [2] 4 3 (iii) A tangent is drawn to the graph of y = 5 + 8x - x . 3 The gradient of the tangent is - 28 . Find the coordinates of the two possible points where this tangent meets the graph. ( … , … ) ( … , … ) [5]
17 marks
Mark scheme: 9(a)(i) Correct sketch of 3x – 4y = 12 with 2 B1 for line with positive gradient y = –3 and x = 4 indicated on axes 4 –3 9(a)(ii) Correct sketch of y = x2 – 3x – 4 4 B3 for correct sketch with one value omitted or incorrect or for a with (0, – 4) indicated as y – intercept and x = – 1 and x = 4 poor sketch with all 3 intercepts correct. indicated as roots or B2 for roots x = – 1 and x = 4 soi with no extra roots -1 4 or for correct shape with y = – 4 indicated or B1 for correct shape -4 or for (x – 4) (x + 1) shown or for incorrect sketch with (0, – 4 ) indicated as y – intercept Minimum in fourth quadrant, not at x = 0 9(a)(iii) Correct sketch of y = 6x 2 B1 for increasing exponential graph seen on both sides of the with y-intercept indicated at (0, 1) y-axis. 1 9(b)(i) 8 – 4x2 [+ 0] 2 B1 for two terms correct and one extra incorrect term or for one of two terms correct or for correct answer seen and spoilt 9(b)(ii) 4 2 M1 for substitution of x = –1 into their (b)(i) 9(b)(iii) (3, –7) and (–3, 17) 5 B4 for (3, –7) or (–3, 17) or B3 for x = ± 3 or M2 for x2 = 9 or k(x – 3)(x + 3) = 0 oe or for correct method for solving their (b)(i) = – 28 or M1 for their (b)(i) = – 28
This question in 0580/43 Oct/Nov 2022
Q70 · A tailor makes x dresses and y shirts in one week 0580/41 May/June 2023
8 A tailor makes x dresses and y shirts in one week. In one week • he makes at least 4 dresses • he makes no more than 7 shirts • he makes less than 14 dresses and shirts altogether 2 • the number of shirts he makes is more than of the number of dresses. 3 One of the inequalities that shows this information is x H 4 . (a) Write down the other three inequalities in x and/or y. … … … [3] (b) y 14 13 12 11 10 9 8 7 6 5 4 3 2 1 x 0 1 2 3 4 5 6 7 8 9 10 11 12 13 14 On the grid, draw 4 straight lines and shade the unwanted regions to show these inequalities. Label the region R that satisfies the 4 inequalities. [6] (c) Use your diagram to find the smallest number of dresses and the smallest number of shirts the tailor makes in one week. … dresses and … shirts [1] (d) The profit the tailor makes on one dress is $10 and the profit on one shirt is $6. Use your diagram to find the largest profit the tailor can make in one week. $ … [2]
12 marks
Mark scheme: 8(a) y 7 oe 3 B1 for each x y 14 oe 2 y x oe 3 8(b) x 4 solid M4 B1 for each y 7 solid x y 14 dashed 2 y x dashed 3 correct shading everywhere but A2 M1dep (dependent on M4 or B1B1B1B0 where region R the only error is wrong use of solid/dashed lines) for shading the correct side of 3 of the 4 lines. R 8(c) 4 dresses and 3 shirts 1 8(d) 106 2 M1 for 10 x 6 y evaluated for (x, y) in their region R or B1 for (7, 6) After 0 scored, SC1 for answer 112 or 116
This question in 0580/41 May/June 2023
Q71 · The diagram shows the graph of a function 0580/43 May/June 2023
7 (a) The diagram shows the graph of a function. y x O Put a ring around the word which correctly identifies the type of function. reciprocal quadratic cubic exponential linear [1] (b) (i) y x O 1 On the diagram, sketch the graph of y = , x ! 0 . [2] 2 x 1 (ii) Solve the equation = 2x . 2 x x = … and x = … [2] (c) (i) y 1 0 180° 360° x – 1 On the diagram, sketch the graph of y = sin x for 0° G x G 360 ° . [2] (ii) Solve the equation 3 sinx + 1 = 0 for 0° G x G 360° . x = … and x = … [3]
10 marks
Mark scheme: 7(a) Cubic 1 7(b)(i) Correct sketch 2 B1 for one branch correct or an attempt at the correct shape y Maximum 1 mark if sketch crosses x- axis or y-axis O x 7(b)(ii) 1 2 M1 for 4 x 2 1 oe nfww 2 1 1 or B1 for or nfww 2 2 7(c)(i) Correct sketch through (0, 0) (180, 0) and 2 B1 for correct sine curve shape, starting (360, 0) with max and min at 1 and –1 resp. at the origin, with minimum of 1 cycle. 180 360 7(c)(ii) 199.5 or 199.47... 3 B2 for one correct 1 and or M1 for sin x = oe 3 340.5... If 0 scored, SC1 for two reflex angles with a sum of 540 or 2 non-reflex angles with a sum of 180
This question in 0580/43 May/June 2023
Q72 · The table shows some values for y = 2 x - 3 0580/43 May/June 2023
10 The table shows some values for y = 2 x - 3 . x -2 -1 0 0.5 1 1.5 2 2.5 y -2.75 -1.58 -0.17 1 2.66 (a) Complete the table. [3] (b) On the grid, draw the graph of y = 2 x - 3 for - 2 G x G 2.5 . y 3 2 1 – 2 – 1 0 1 2 x – 1 – 2 – 3 [4] (c) Use your graph to solve the equation 2 x - 3 = 2 . x = … [1] (d) By drawing a suitable straight line, solve the equation 2 x - x - 1.5 = 0 . x = … or x = … [4]
12 marks
Mark scheme: 10(a) 2.5 2 1 3 B1 for each 10(b) Correct curve 4 B3 FT for 8 or 7 correct plots B2 FT for 6 or 5 correct plots B1 FT for 4 or 3 correct plots y O x 10(c) 2.3 to 2.4 1 10(d) ruled line y x 1.5 M2 M1 for y = x – 1.5 soi or for 2x – 3 = x – 1.5 seen. or y x k or y kx 1.5 drawn Do not accept y = –1.5 1 and 1.55 to 1.7 A2 A1 for each
This question in 0580/43 May/June 2023
Q73 · Complete the table of values for y = 3 cos 2x° 0580/43 Oct/Nov 2023
7 (a) Complete the table of values for y = 3 cos 2x° . Values are given correct to 1 decimal place. x 0 10 20 30 40 45 50 60 70 80 90 y 3.0 2.8 2.3 1.5 0.5 - .05 - .23 - .30 [3] (b) Draw the graph of y = 3 cos 2x° for 0 G x G 90 . y 3 2 1 0 x 10 20 30 40 50 60 70 80 90 - 1 - 2 - 3 [4] (c) Use your graph to solve the equation 3 cos 2x° =- 2 for 0 G x G 90 . x = … [1] (d) By drawing a suitable straight line, solve the equation 120 cos 2x° = 80 - x for 0 G x G 90 . x = … [3]
11 marks
Mark scheme: 7(a) 0, –1.5 oe, –2.8 3 B1 for each 7(b) Correct graph 4 B3 FT for 10 or 11 correct points FT their table or B2 FT for 8 or 9 correct points FT their table or B1 FT for 6 or 7 correct points FT their table 7(c) 65 to 67 1 FT intersection of their graph with y = – 2 7(d) M2 y = 2 −x oe ruled M1 for [ y =] 2 −x oe soi 40 40 or for 3 cos 2x = 2 −x oe soi 40 32 to 36 B1
This question in 0580/43 Oct/Nov 2023
Q74 · The table shows some values for y = 2x 3 + 6x 2 - 2.5 0580/42 Feb/March 2024
10 The table shows some values for y = 2x 3 + 6x 2 - 2.5 . x -3 -2.5 -2 -1.5 -1 -0.5 0 0.5 1 y 3.75 5.5 4.25 1.5 -2.5 -0.75 (a) Complete the table. [3] (b) On the grid, draw the graph of y = 2x 3 + 6x 2 - 2.5 for - 3 G x G 1 . y 6 5 4 3 2 1 – 3 – 2 – 1 0 1 x – 1 – 2 – 3 – 4 [4] (c) By drawing a suitable line on the graph, solve the equation 2x 3 + 6x 2 = 4.5 . x = … or x = … or x = … [3] (d) The equation 2x 3 + 6x 2 - 2.5 = k has exactly two solutions. Write down the two possible values of k. k = … or k = … [2]
12 marks
Mark scheme: 10(a) −2.5 −1.25 5.5 3 B1 for each 10(b) Correct graph 4 B3FT for 8 or 9 correct points or B2FT for 6 or 7 correct points or B1FT for 4 or 5 correct points 10(c) y = 2 drawn M1 −2.75 to –2.65 A2 A1 for 1 solution –1.1 to −1.05 0.75 to 0.85 10(d) –2.5 5.5 2 B1 for each
This question in 0580/42 Feb/March 2024
Q75 · On the axes, sketch the graph of y = x 2 + 7x - 18 0580/41 May/June 2024
8 (a) On the axes, sketch the graph of y = x 2 + 7x - 18 . On your sketch, write the values where the graph meets the x-axis and the y-axis. y O x [4] (b) (i) Find the derivative of y = x 2 - 3x - 28 . … [2] (ii) Find the coordinates of the turning point of y = x 2 - 3x - 28 . ( … , … ) [3] (c) The line y = 5 - 2x intersects the graph of y = x 2 - 3x - 28 at point P and point Q. Find the coordinates of P and Q. You must show all your working and give your answers correct to 2 decimal places. ( … , … ) ( … , … ) [6]
15 marks
Mark scheme: 8(a) Correct sketch with roots indicated at 4 B1 for U shaped parabola x = –9 and x = 2 and y intercept = –18 Minimum should be in 3rd quadrant B2 for roots at –9 and 2 on diagram or M1 for (x + 9) (x – 2) [= 0] B1 for y – intercept at –18 on diagram Maximum 3 marks if sketch not fully correct 8(b)(i) 2x – 3 2 B1 for 2x + k or kx[p] – 3 8(b)(ii) (1.5, –30.25) oe 3 B2 for x = 1.5 or M1 for their (b)(i) = 0 or for (x – 1.5)2 8(c) x2 – x – 33 [ = 0] seen B1 2 B2FT FT their quadratic dep on no factors [ ]1 [ ]1 4 1 33 oe 2 1 2 B1 for [ ]1 4 1 33 or better [ ]1 q [ ]1 q or B1 for oe or 2(1) 2(1) oe –5.27 or –5.267 to –5.266 and B2 B1 for each 6.27 or 6.266 to 6.267 If 0 scored, SC1 for –6.27 and 5.27 (–5.27, 15.53 or 15.54) and B1 (6.27, –7.53 or 7.54)
This question in 0580/41 May/June 2024
Q76 · Y 10 9 8 7 6 5 4 3 2 1 – 3 – 2 – 1 0 1 2 3 x – 1 – 2 – 3 – 4 – 5 – 6 – 7 – 8 The diagram… 0580/43 May/June 2024
5 y 10 9 8 7 6 5 4 3 2 1 – 3 – 2 – 1 0 1 2 3 x – 1 – 2 – 3 – 4 – 5 – 6 – 7 – 8 The diagram shows the graph of y = f ( x) for values of x from -3 to 3. (a) (i) Use the graph to find f ( 2) . … [1] (ii) Use the graph to solve the equation f ( x) = 5 . x = … or x = … or x = … [3] (iii) The equation f ( x) = k has exactly two solutions. Write down the value of k. k = … [1] (iv) tangent asymptote root perpendicular Choose the correct word from the box to complete the statement. The line x = 0 is the … to the graph of y = f ( x) . [1] (b) (i) On the grid, draw the graph of y = x - 2 for values of x from -3 to 3. [2] (ii) Find x when f ( x) = x - 2 . x = … [1] 2 c (c) f ( x) = x - , x ! 0 x Use the graph to show that c = 2 . [2] (d) The equation f ( x) = x - 2 can be written as x 3 + px 2 + qx = 2 . Find the value of p and the value of q. p = … q = … [2]
13 marks
Mark scheme: 5(a)(i) 3 cao 1 5(a)(ii) –2, –0.45 to –0.4, 2.40 to 2.45 3 B1 each 5(a)(iii) 3 cao 1 5(a)(iv) Asymptote 1 5(b)(i) Correct ruled line 2 B1 for ruled line through (0, –2) but not y = –2 or for ruled line with gradient 1 5(b)(ii) 1 cao 1 5(c) Substituting values of x and y into M1 2 c y = x for an exact point on graph x of y = f(x) or substituting their value of x from 5b(ii) 2 c into x = x – 2 x leading to c = 2 with no errors A1 5(d) [p = ] –1 and [q = ] 2 nfww 2 M1 for x3 – x2 + 2x = 2 seen or B1 for each nfww
This question in 0580/43 May/June 2024
Q77 · The table shows some values for y = x 3 + 4x 2 - 4 0580/42 Oct/Nov 2024
2 The table shows some values for y = x 3 + 4x 2 - 4 . x -4.5 -4 -3 -2 -1 0 1 1.5 y -14.1 5 4 -4 1 8.4 (a) Complete the table. [2] (b) On the grid, draw the graph of y = x 3 + 4x 2 - 4 for - 4.5 G x G 1. 5 . y 10 5 x –5 – 4 –3 –2 –1 0 1 2 –5 –10 –15 [4] (c) (i) Draw the tangent to the graph at the point (1, 1). [1] (ii) Use your tangent to estimate the gradient of the curve at the point (1, 1). … [2] (d) By drawing a suitable straight line on the grid, solve the equation x 3 + 4x 2 - x - 6 = 0 . x = … or x = … or x = … [4]
13 marks
Mark scheme: 2(a) –4, –1 2 B1 for each correct value 2(b) Correct graph 4 B3FT for 7 or 8 correct points or B2FT for 5 or 6 correct points or B1FT for 3 or 4 correct points 2(c)(i) Ruled tangent at x = 1 1 2(c)(ii) 6 to 14 nfww 2 dep on correct tangent or a close attempt at the tangent at x = 1 M1 for rise/run for their tangent, or close attempt at tangent at any point. Must see correct or implied calculation from a drawn tangent. 2(d) y = x + 2 ruled M2 M1 for [y =] x + 2 soi or y = x + k ruled or y = kx + 2 ruled, but not y = 2 x = –3.95 to –3.75 A2 A1 for any two values x = –1.4 to –1.25 x = 1.1 to 1.25 If A0, SC1 for three correct values
This question in 0580/42 Oct/Nov 2024
Q78 · Sketch the graph of y = sin x for 0° G x G 360° 0580/43 May/June 2025
25 (a) Sketch the graph of y = sin x for 0° G x G 360° . y 1 0 360° x – 1 [2] (b) Solve the equation 2 + 5 sinx = 1 for 0° G x G 360° . x = … and x = … [3]
5 marks
Mark scheme: 25(a) Correct sketch to go through 2 B1 for correct sine curve shape through the (0, 0), (180, 0) and (360, 0) origin (minimum one cycle) 25(b) 191.5, 348.5 and no others 3 B2 for one correct 1 or M1 for sin x = – oe 5 If M1 or 0 scored, SC1 for two reflex angles with a sum that rounds to 540.0 or two non- reflex angles with a sum that rounds to 180.0
This question in 0580/43 May/June 2025
Q79 · The table shows some values for y = x 3 - 2x + 3 0580/42 Oct/Nov 2025
11 The table shows some values for y = x 3 - 2x + 3 . Where appropriate, values of y are given correct to 2 decimal places. x -2 -1.5 -1 -0.5 0 0.5 1 1.5 2 y -1 4 3.88 3 2.13 2 7 (a) Complete the table. [2] (b) Draw the graph of y = x 3 -2x + 3 for - 2 G x G 2 . y 7 6 5 4 3 2 1 x 0 – 2 – 1 1 2 – 1 [4] (c) By drawing a suitable straight line on the grid, solve the equation x 3 - 2.5 x + 1 = 0 . x = … or x = … or x = … [4]
10 marks
Mark scheme: 11(a) 2.63 and 3.38 2 B1 for each 11(b) Correct graph 4 B3FT for 8 correct plots or B2FT for 6 correct plots or B1FT for 4 correct plots 11(c) y = 2 + 0.5x ruled M2 M1 for [y =] 2 + 0.5x oe soi e.g. x3 – 2x + 3 = 2 + 0.5x or y = k + 0.5x ruled or y = kx + 2 ruled, but not y = 2 –1.85 to –1.7 , 0.4 to 0.5, A2 A1 for two correct values dep on M2 1.25 to 1.4 If M0 or M1 scored, SC1 for three correct values
This question in 0580/42 Oct/Nov 2025
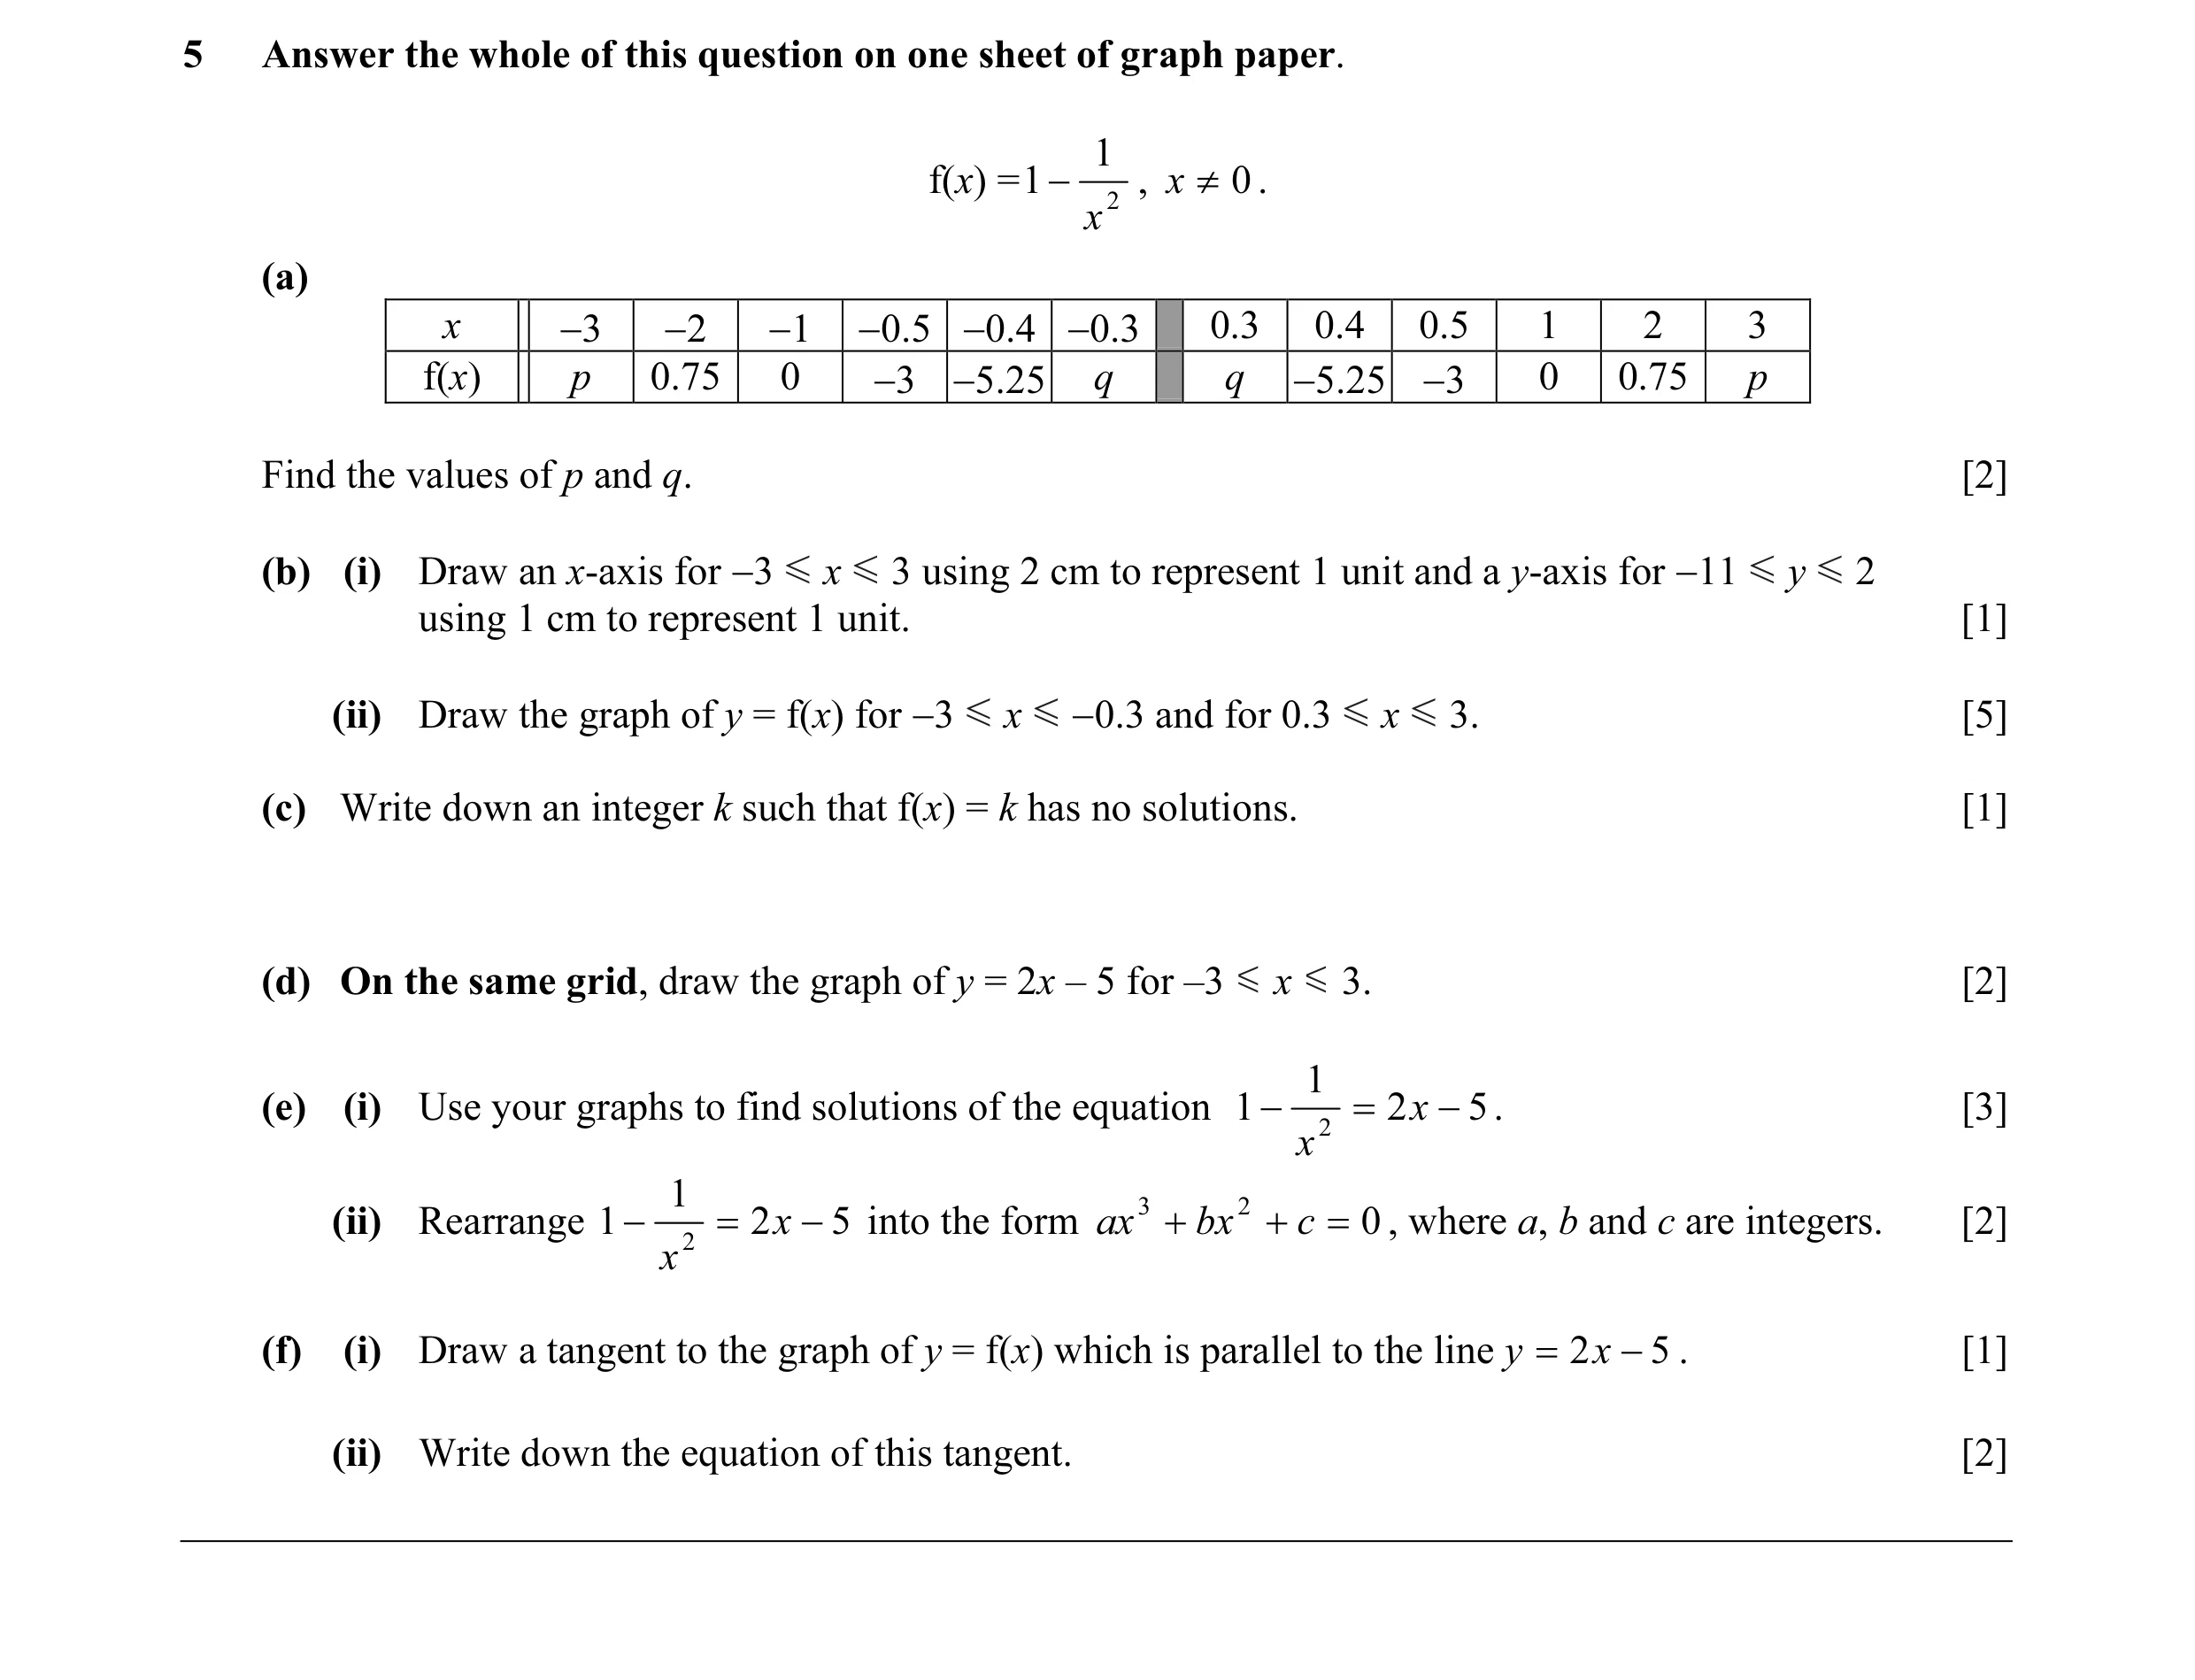 1 / 126
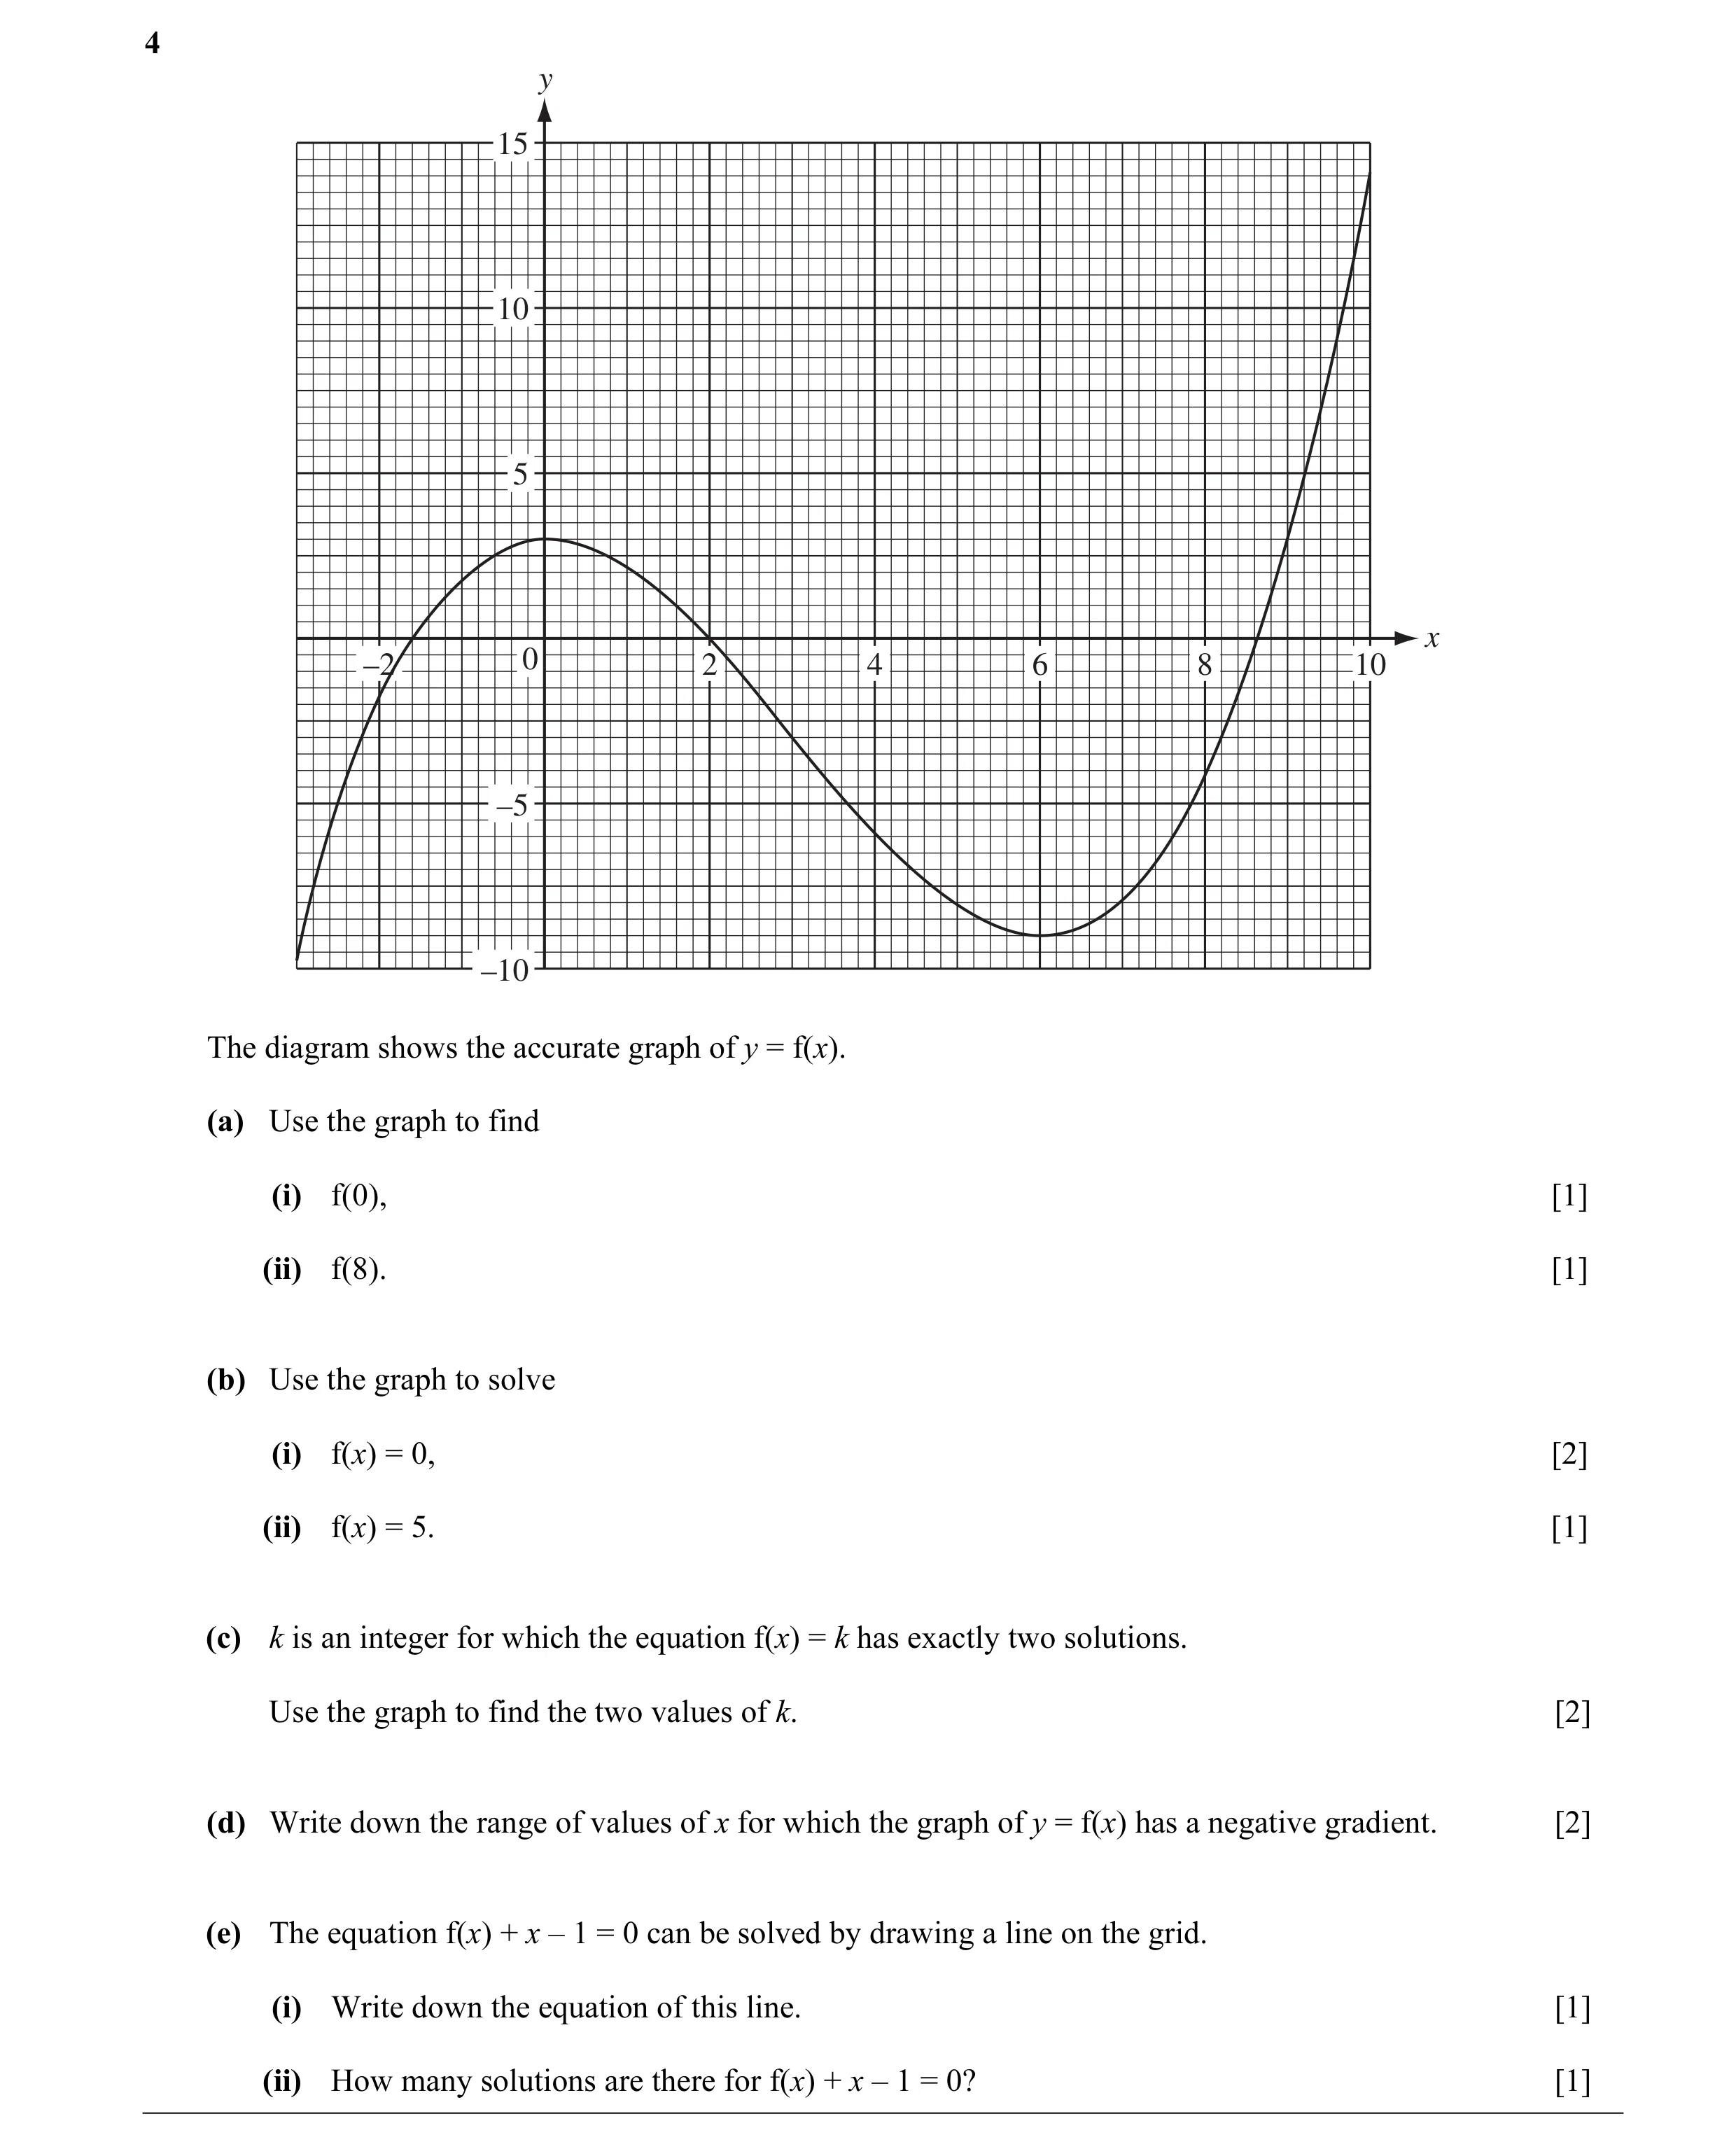 2 / 126
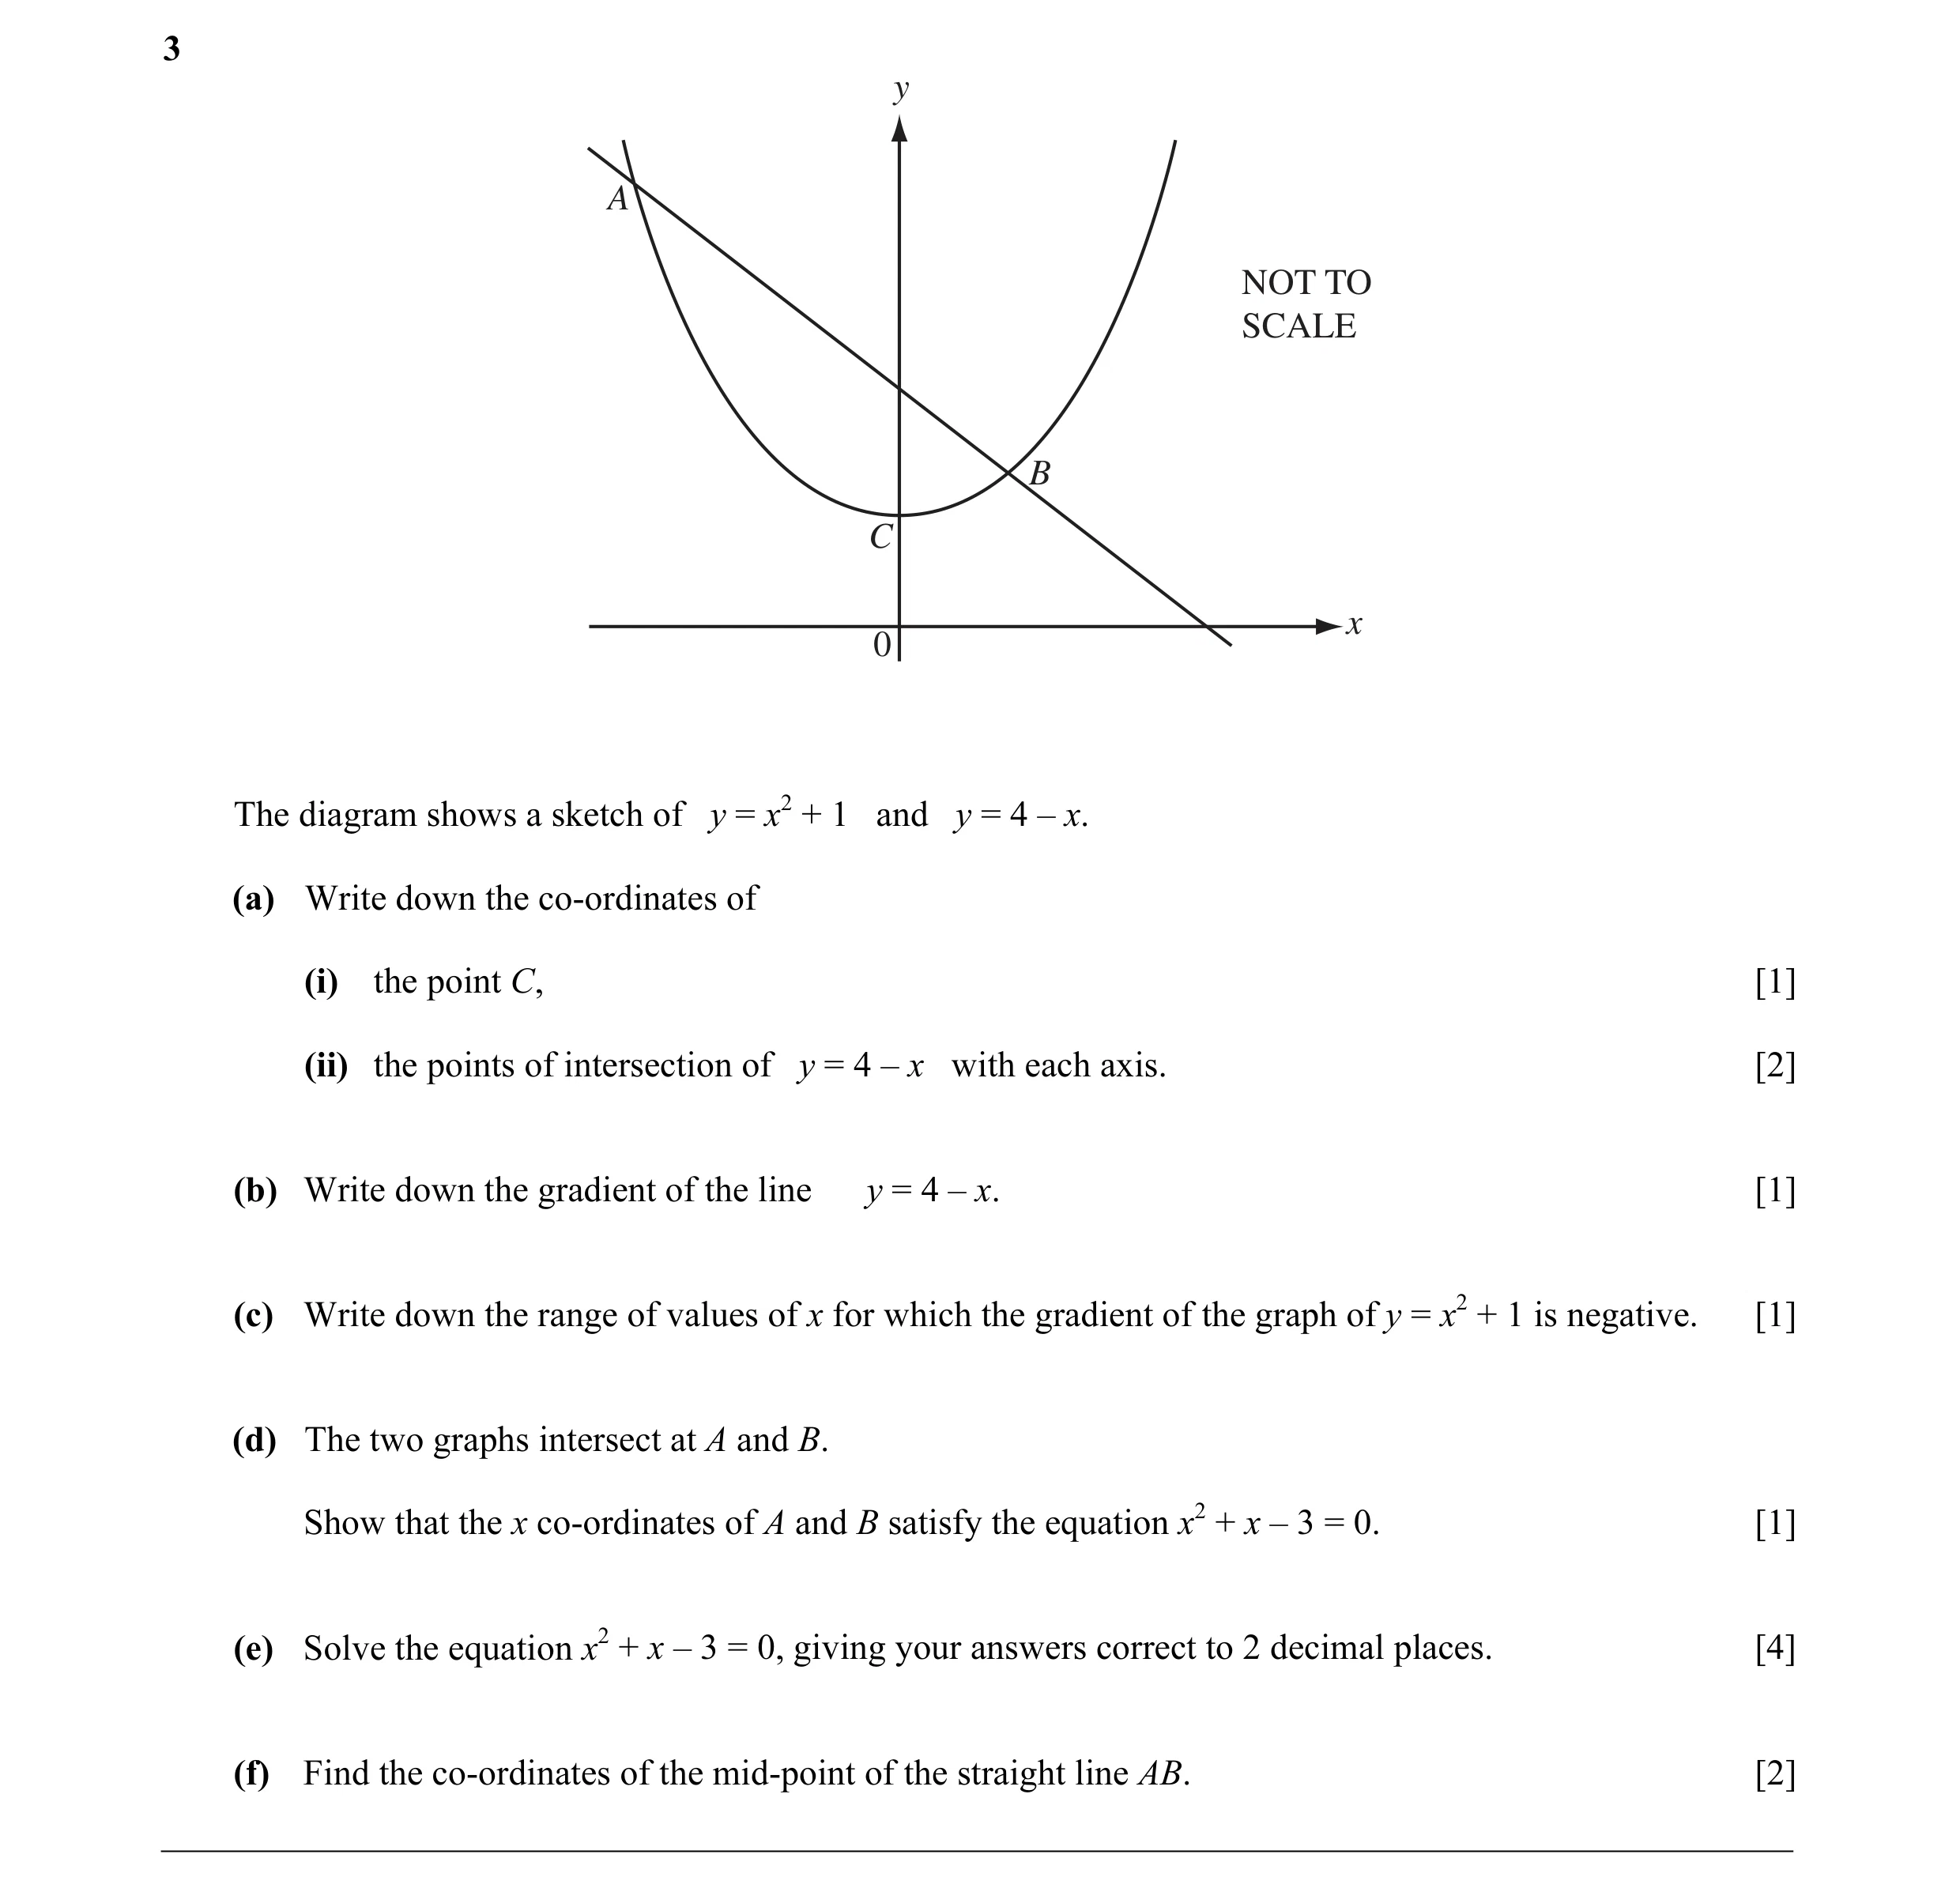 3 / 126
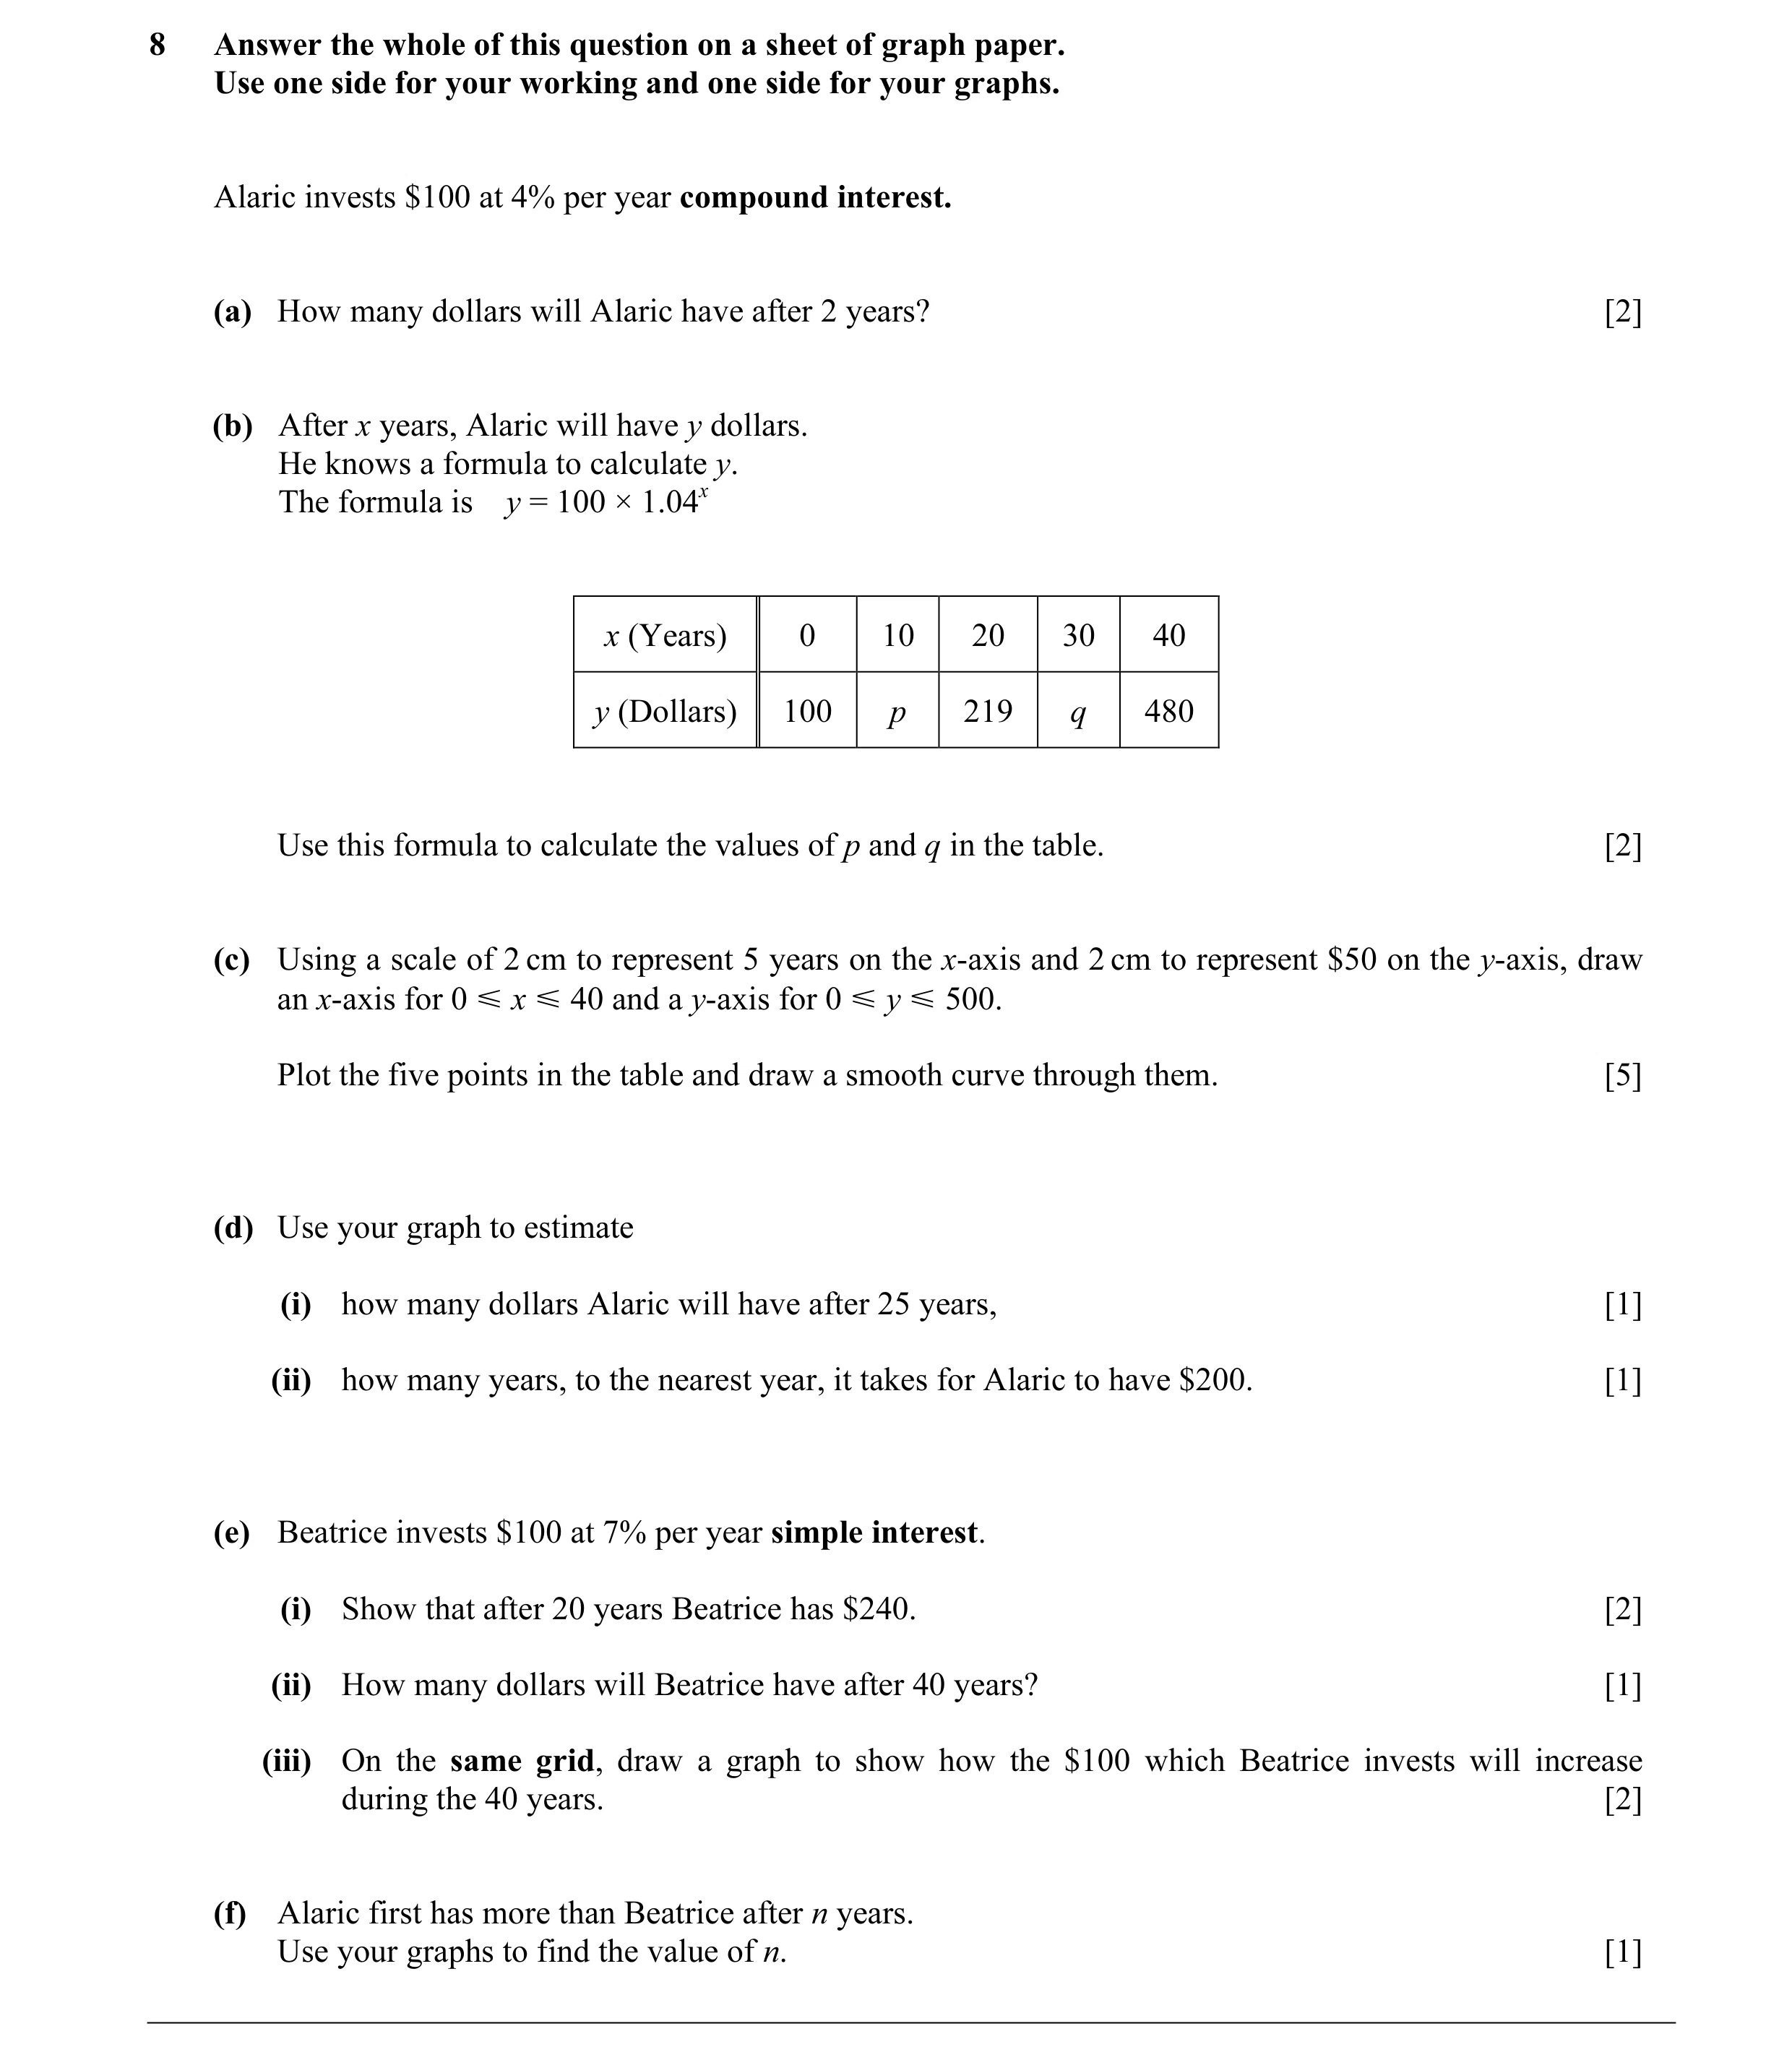 4 / 126
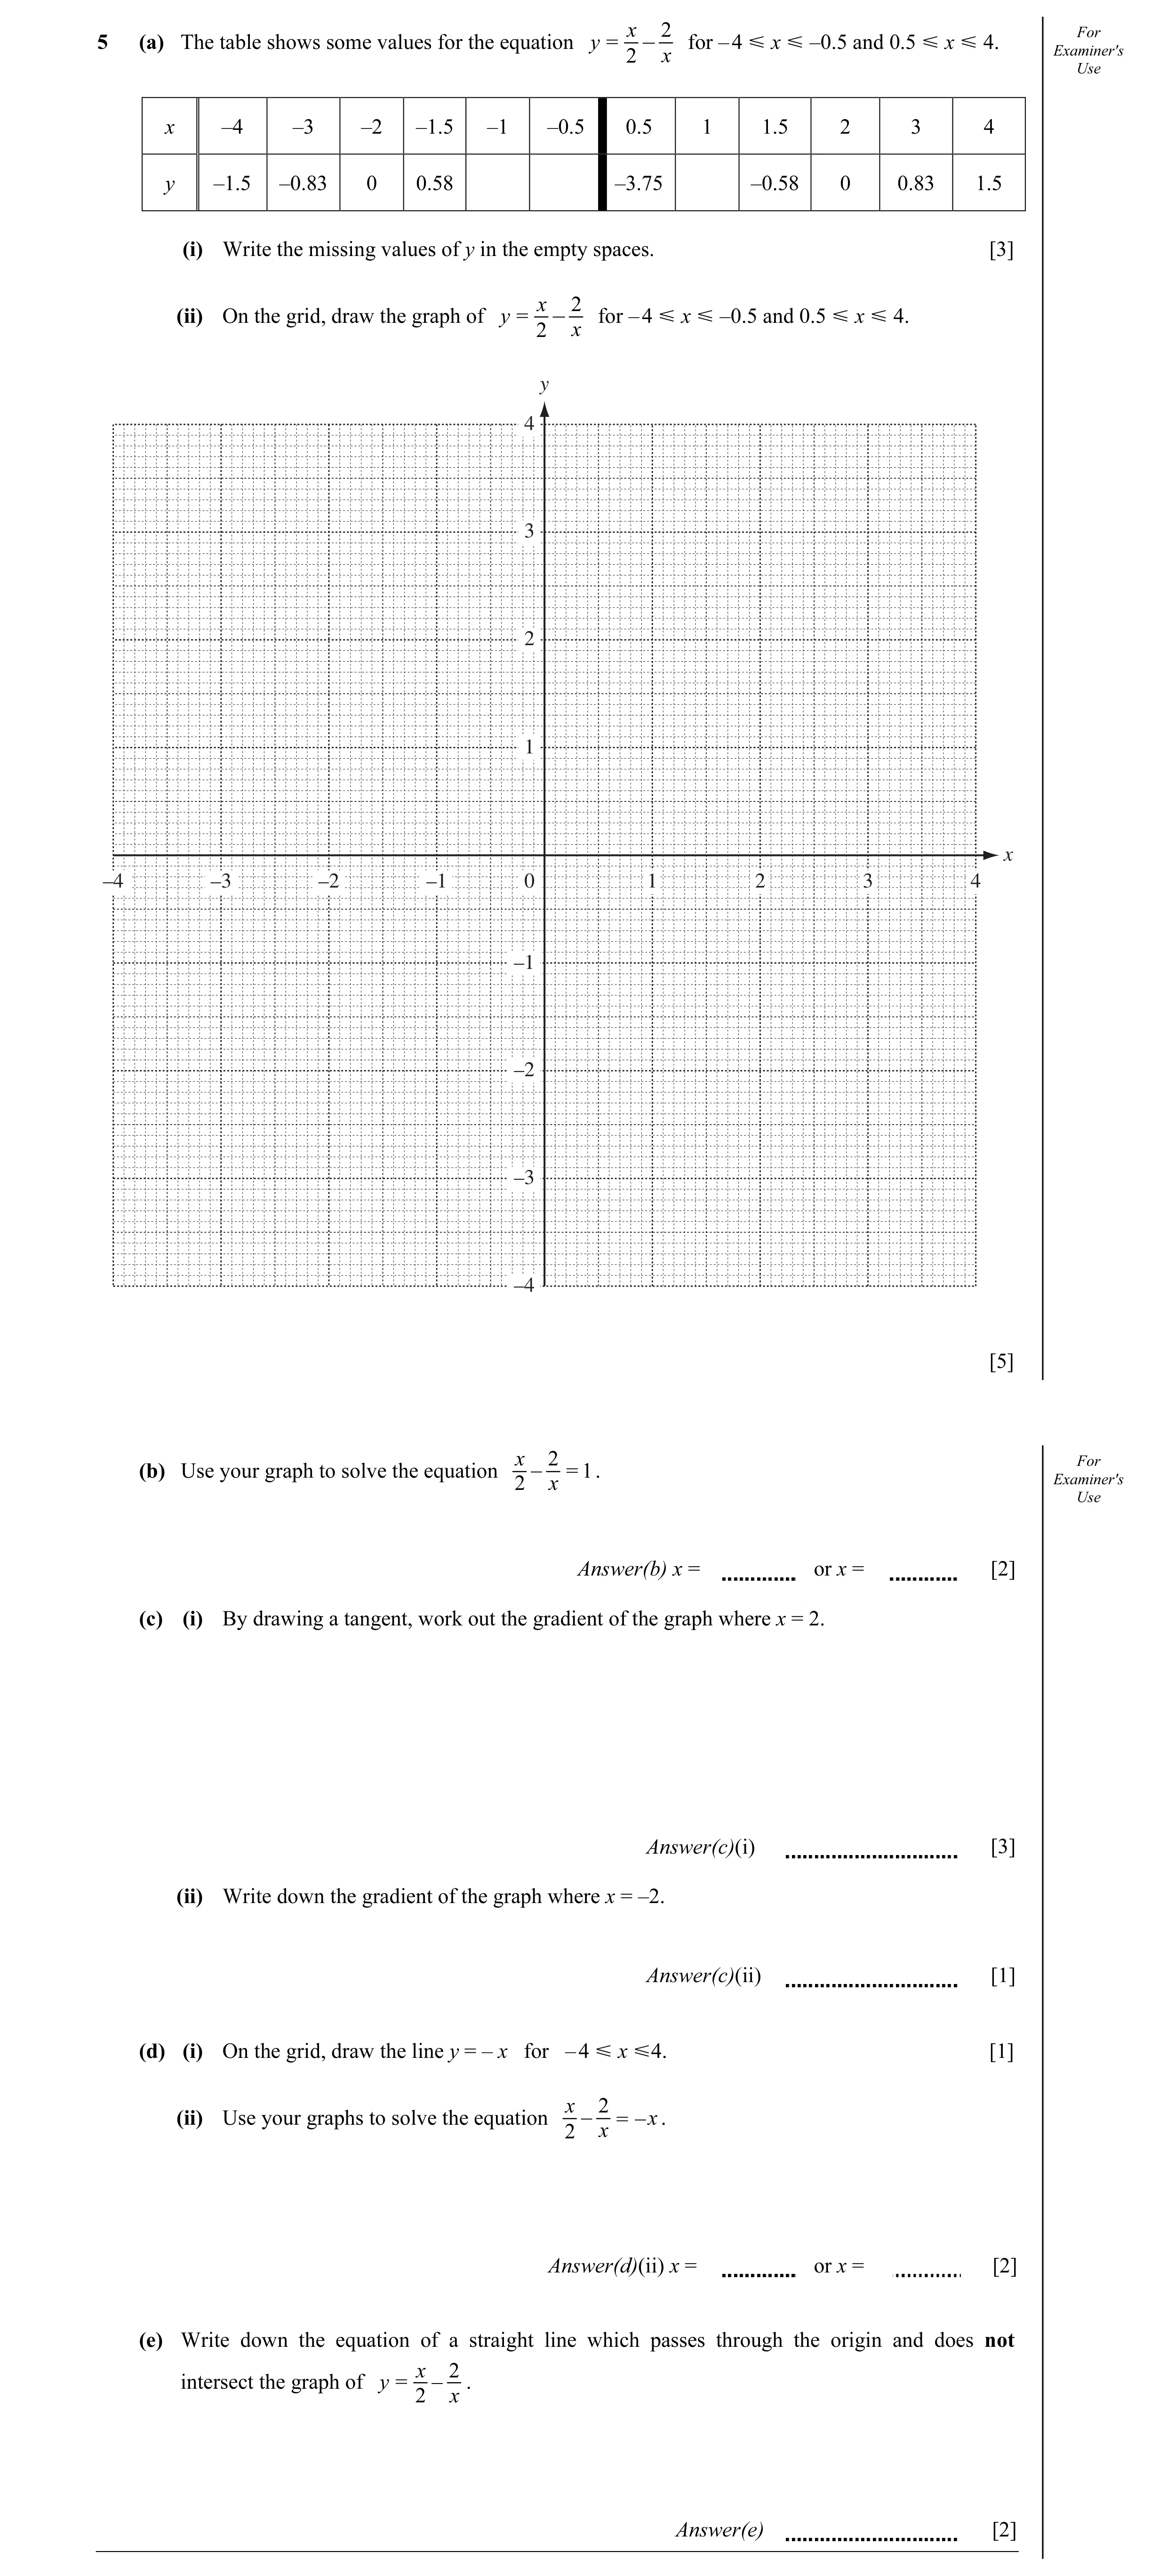
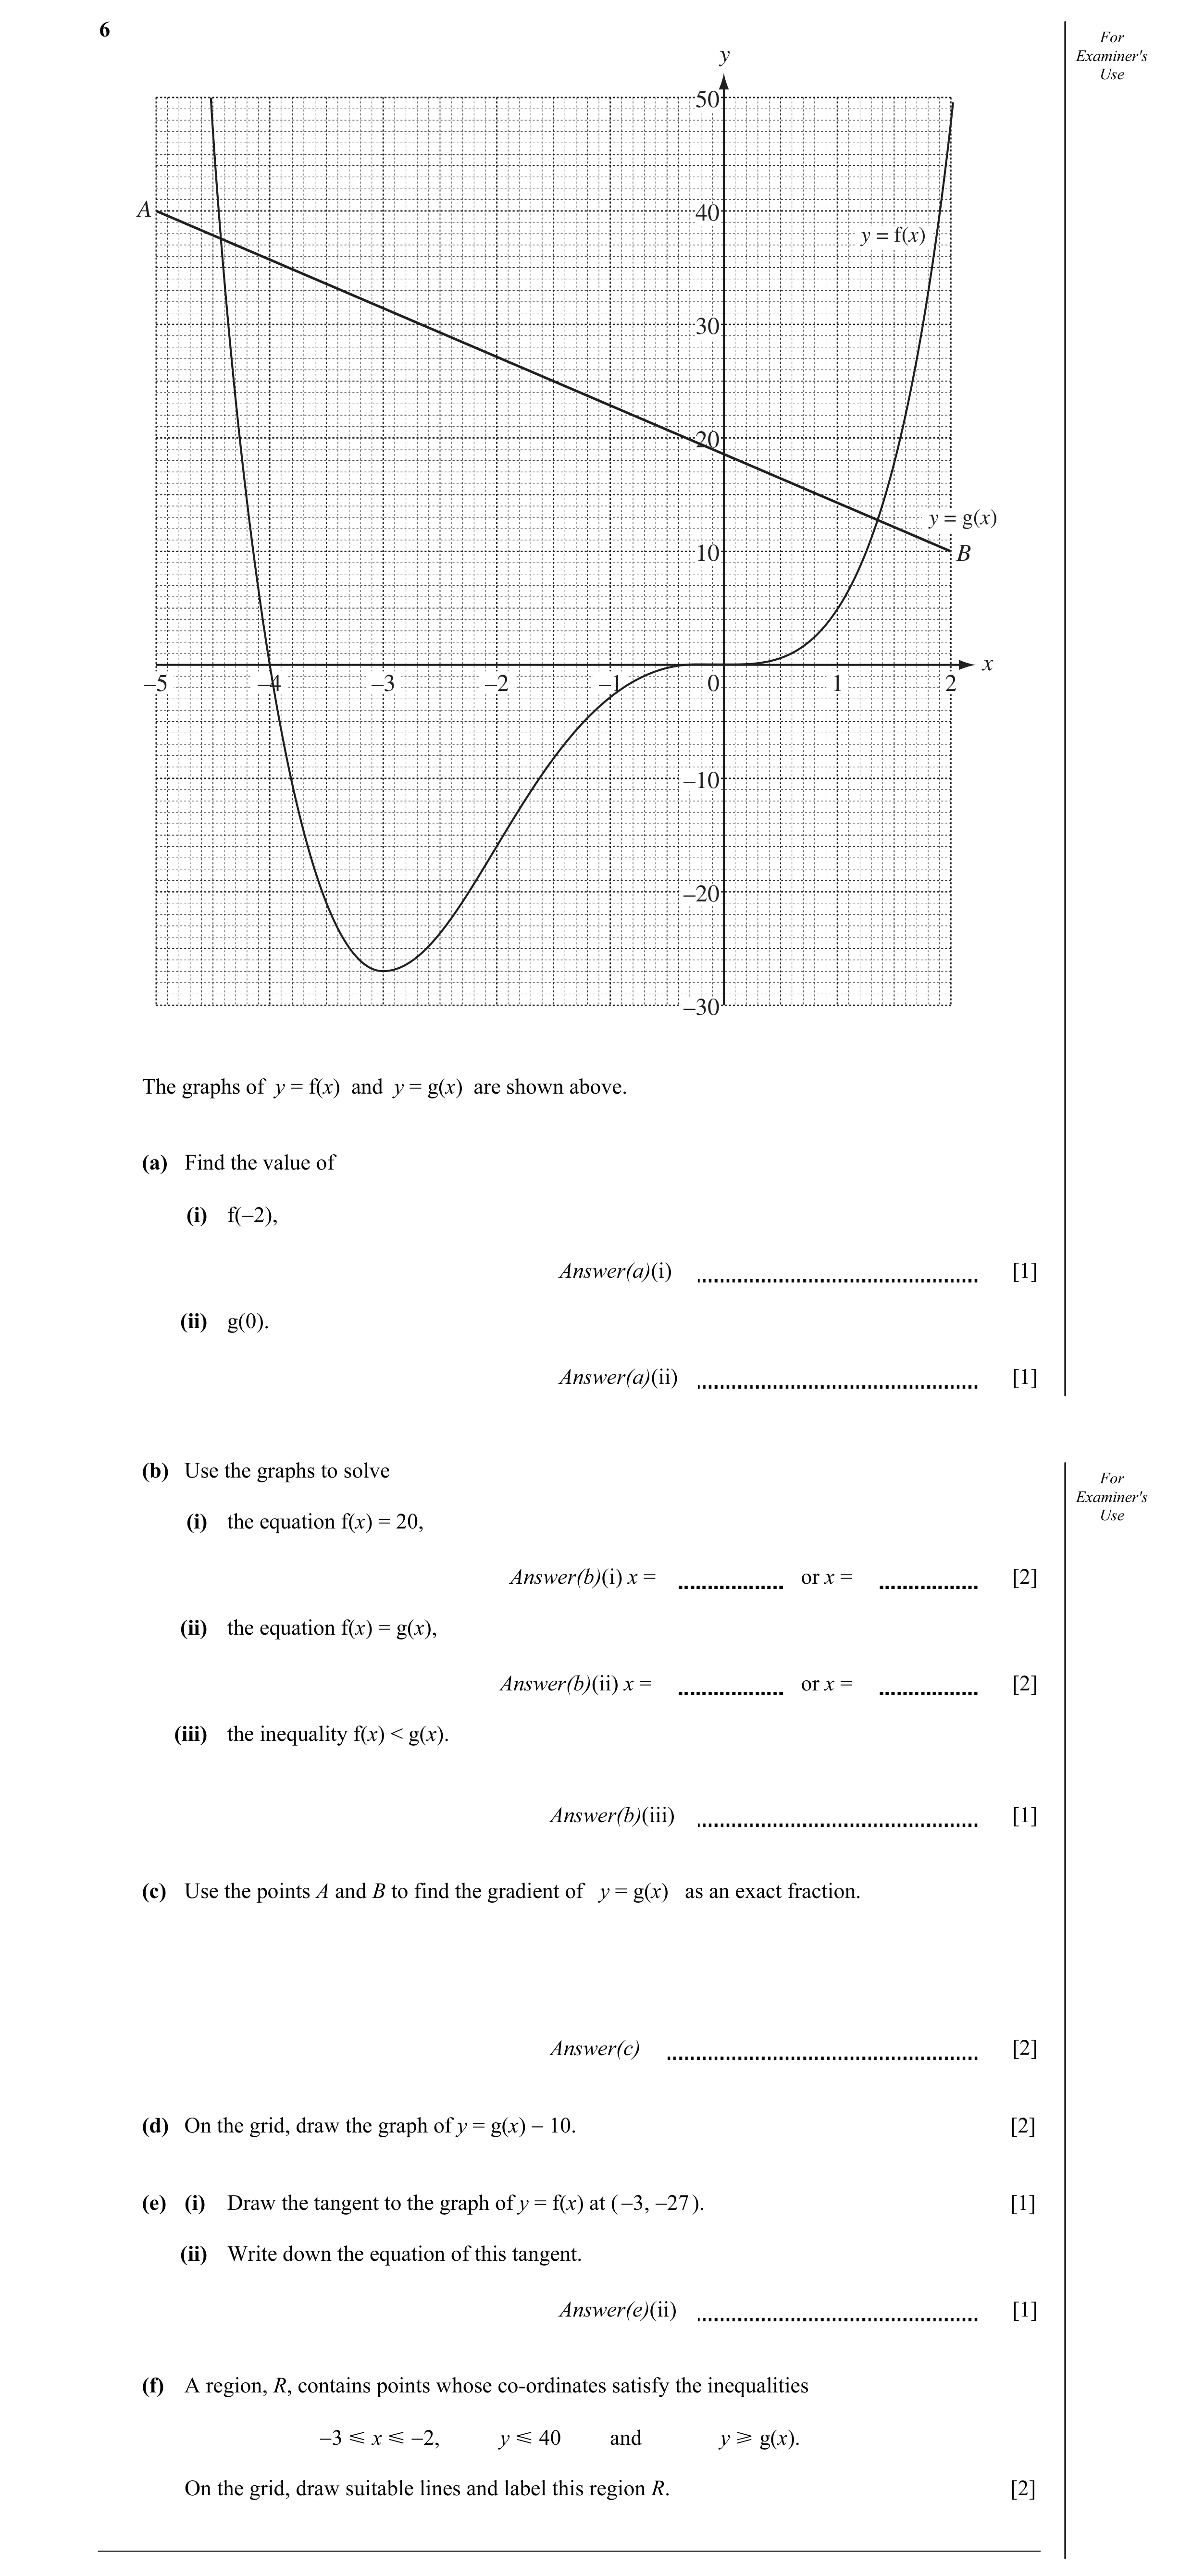
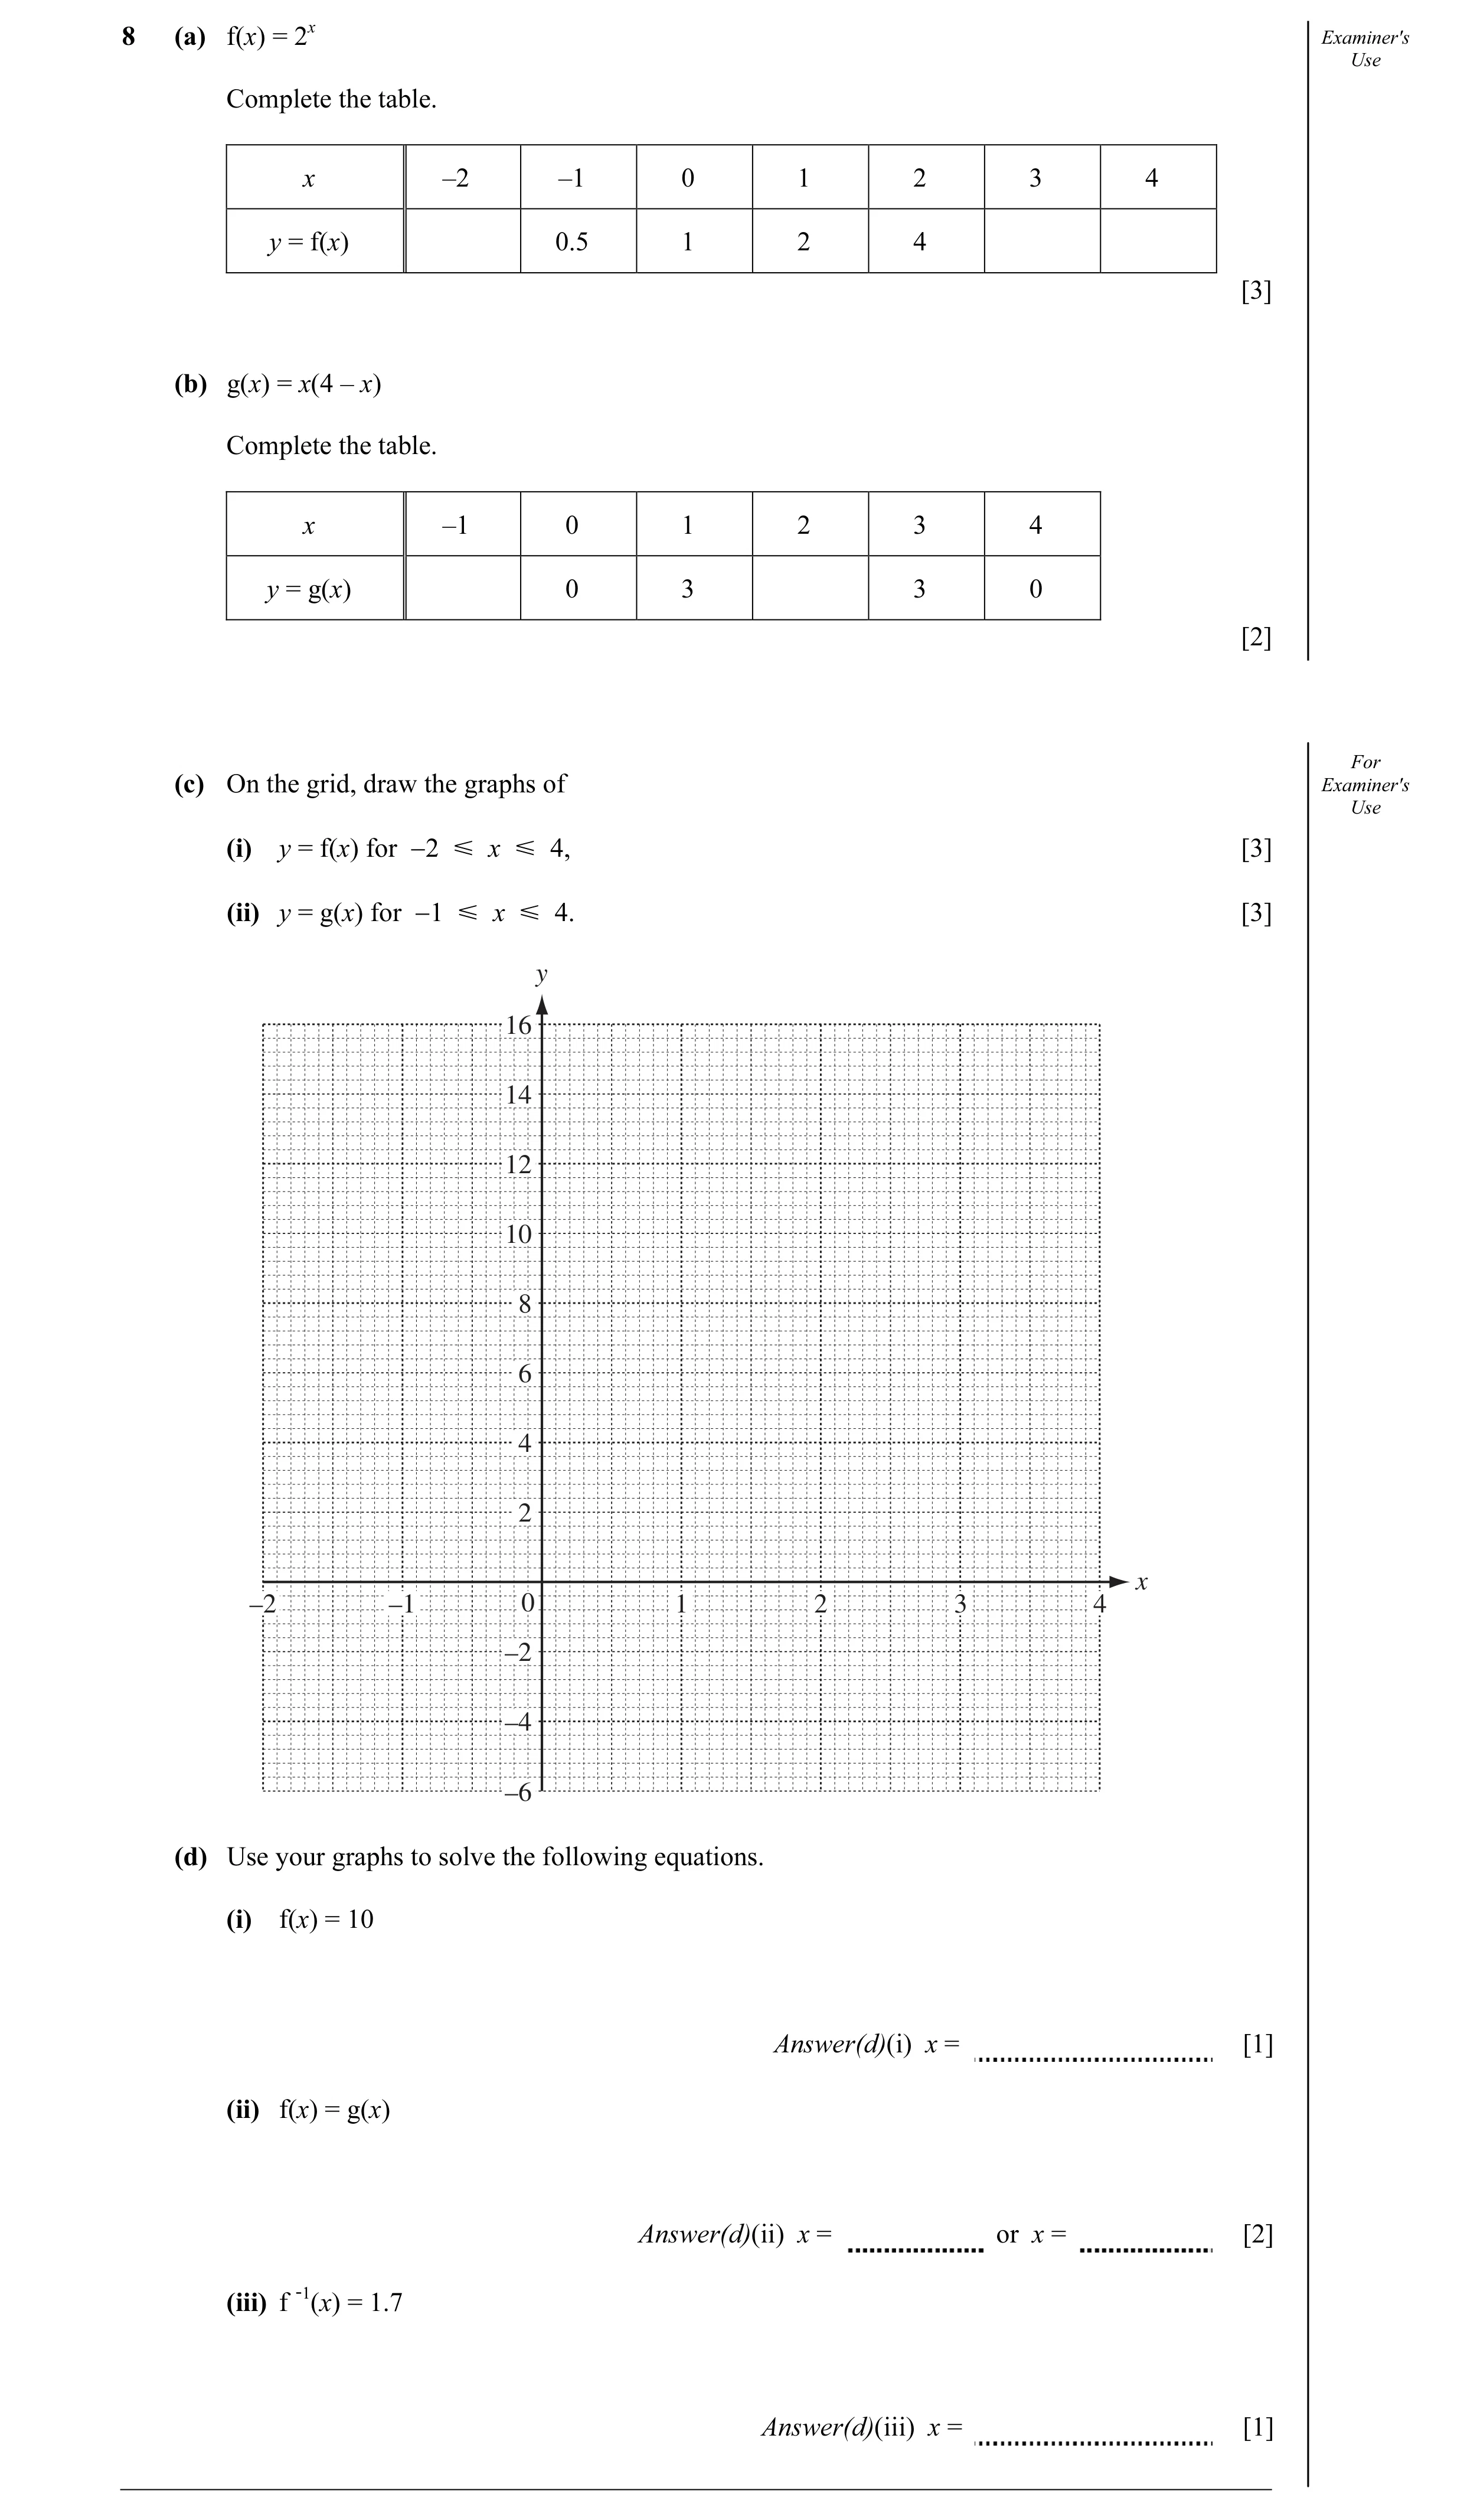
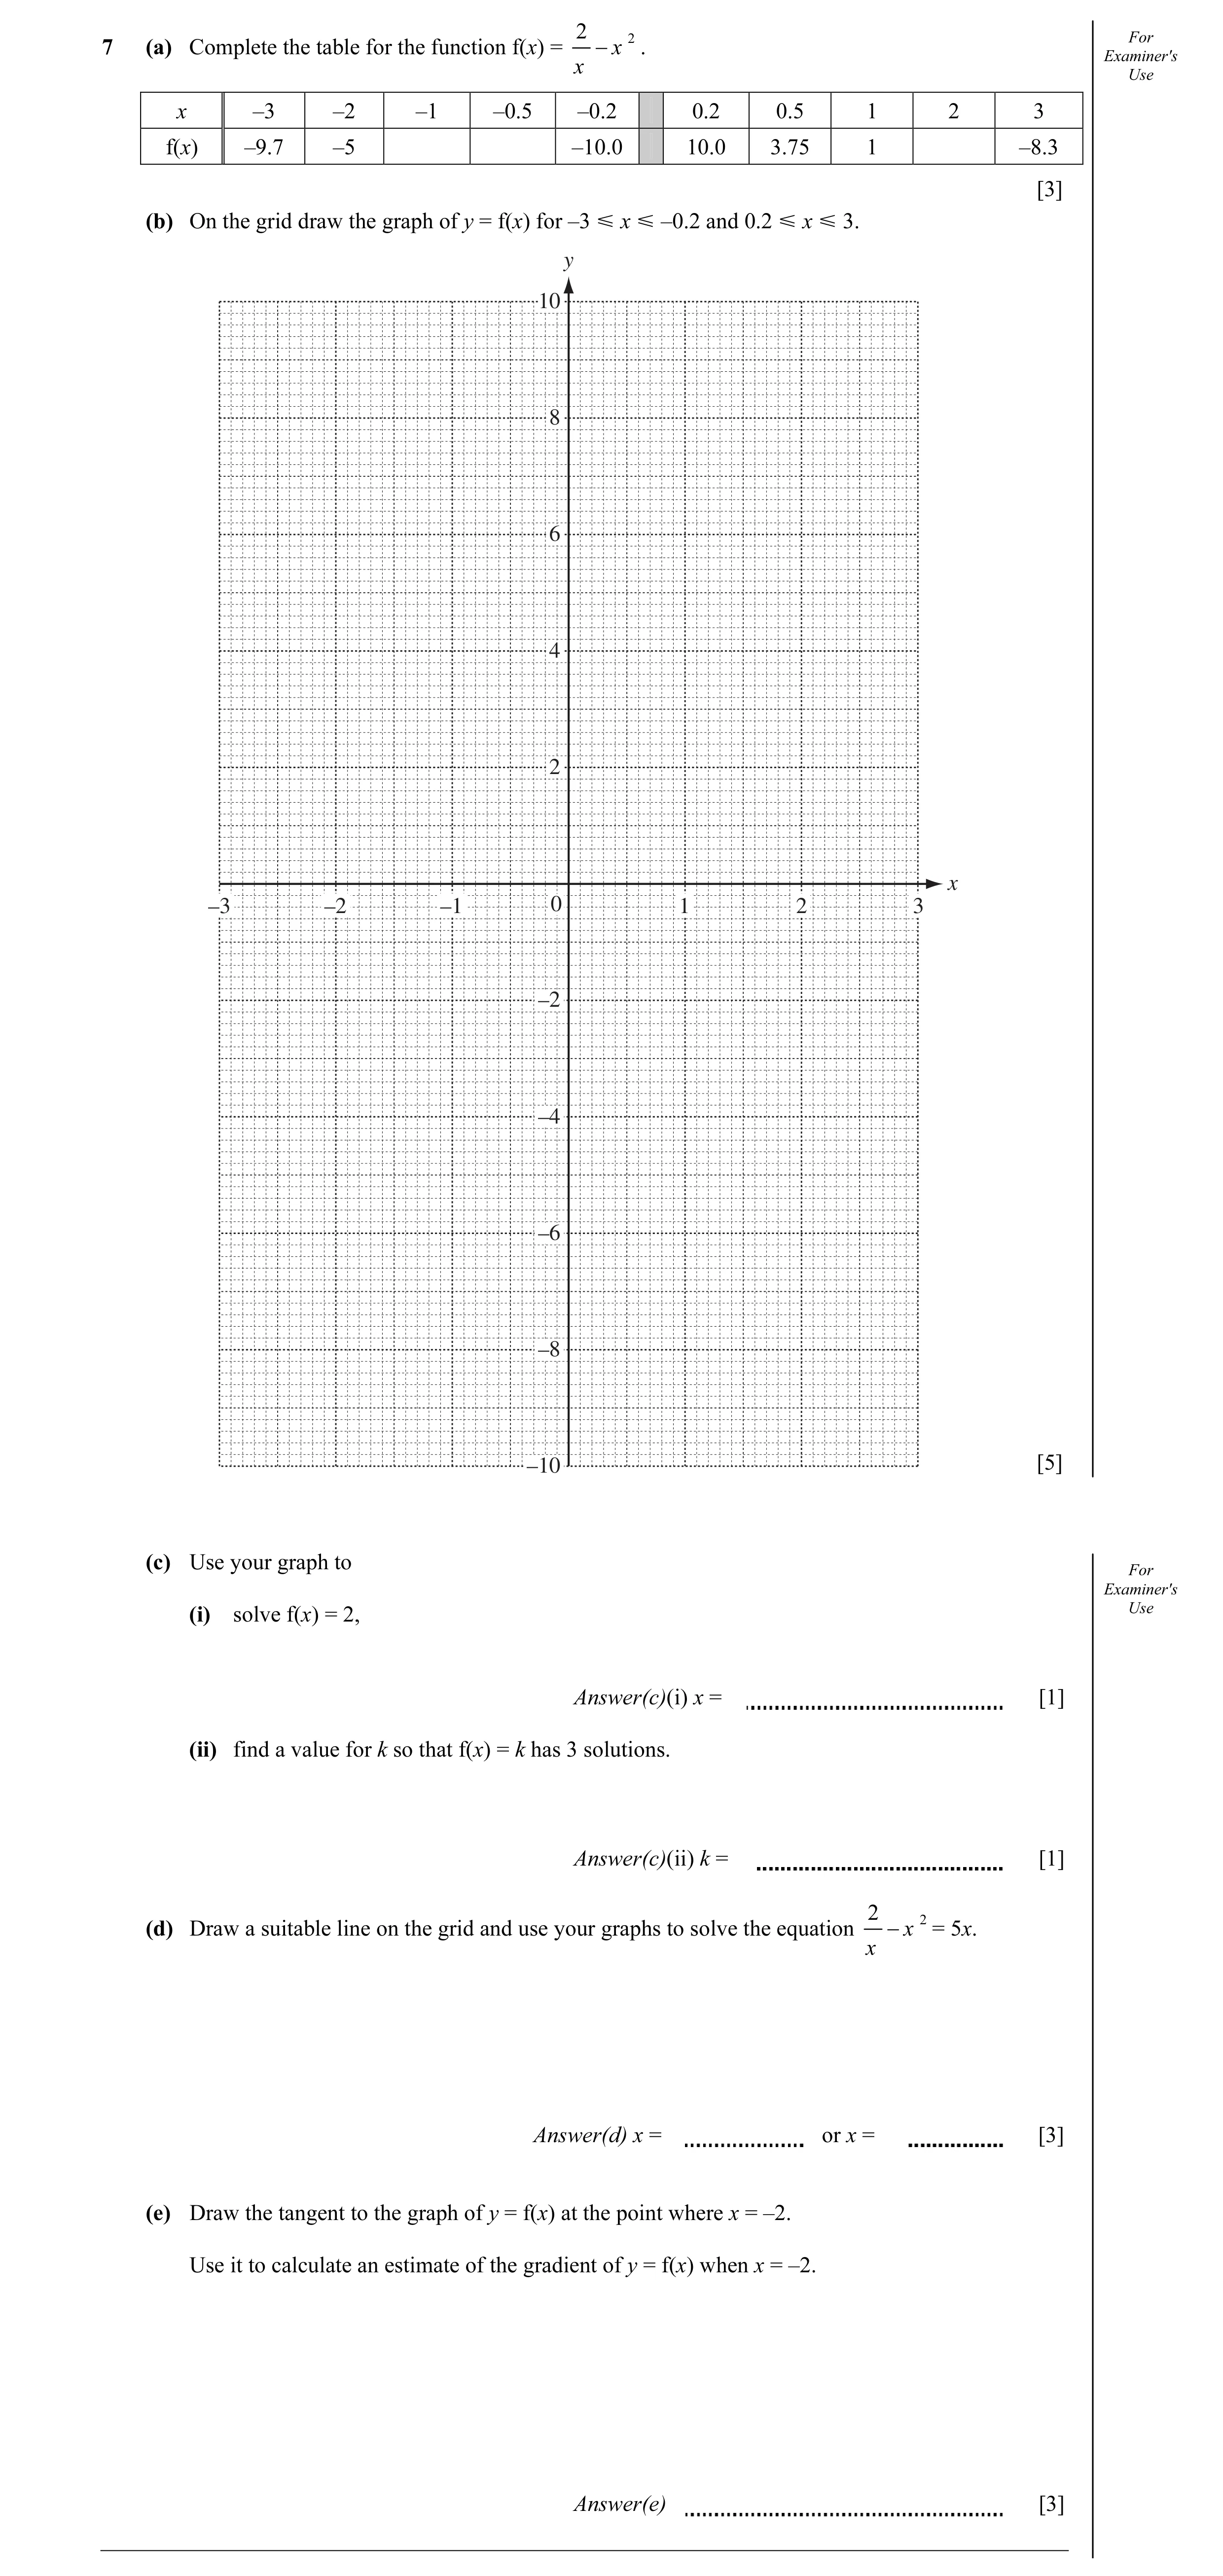
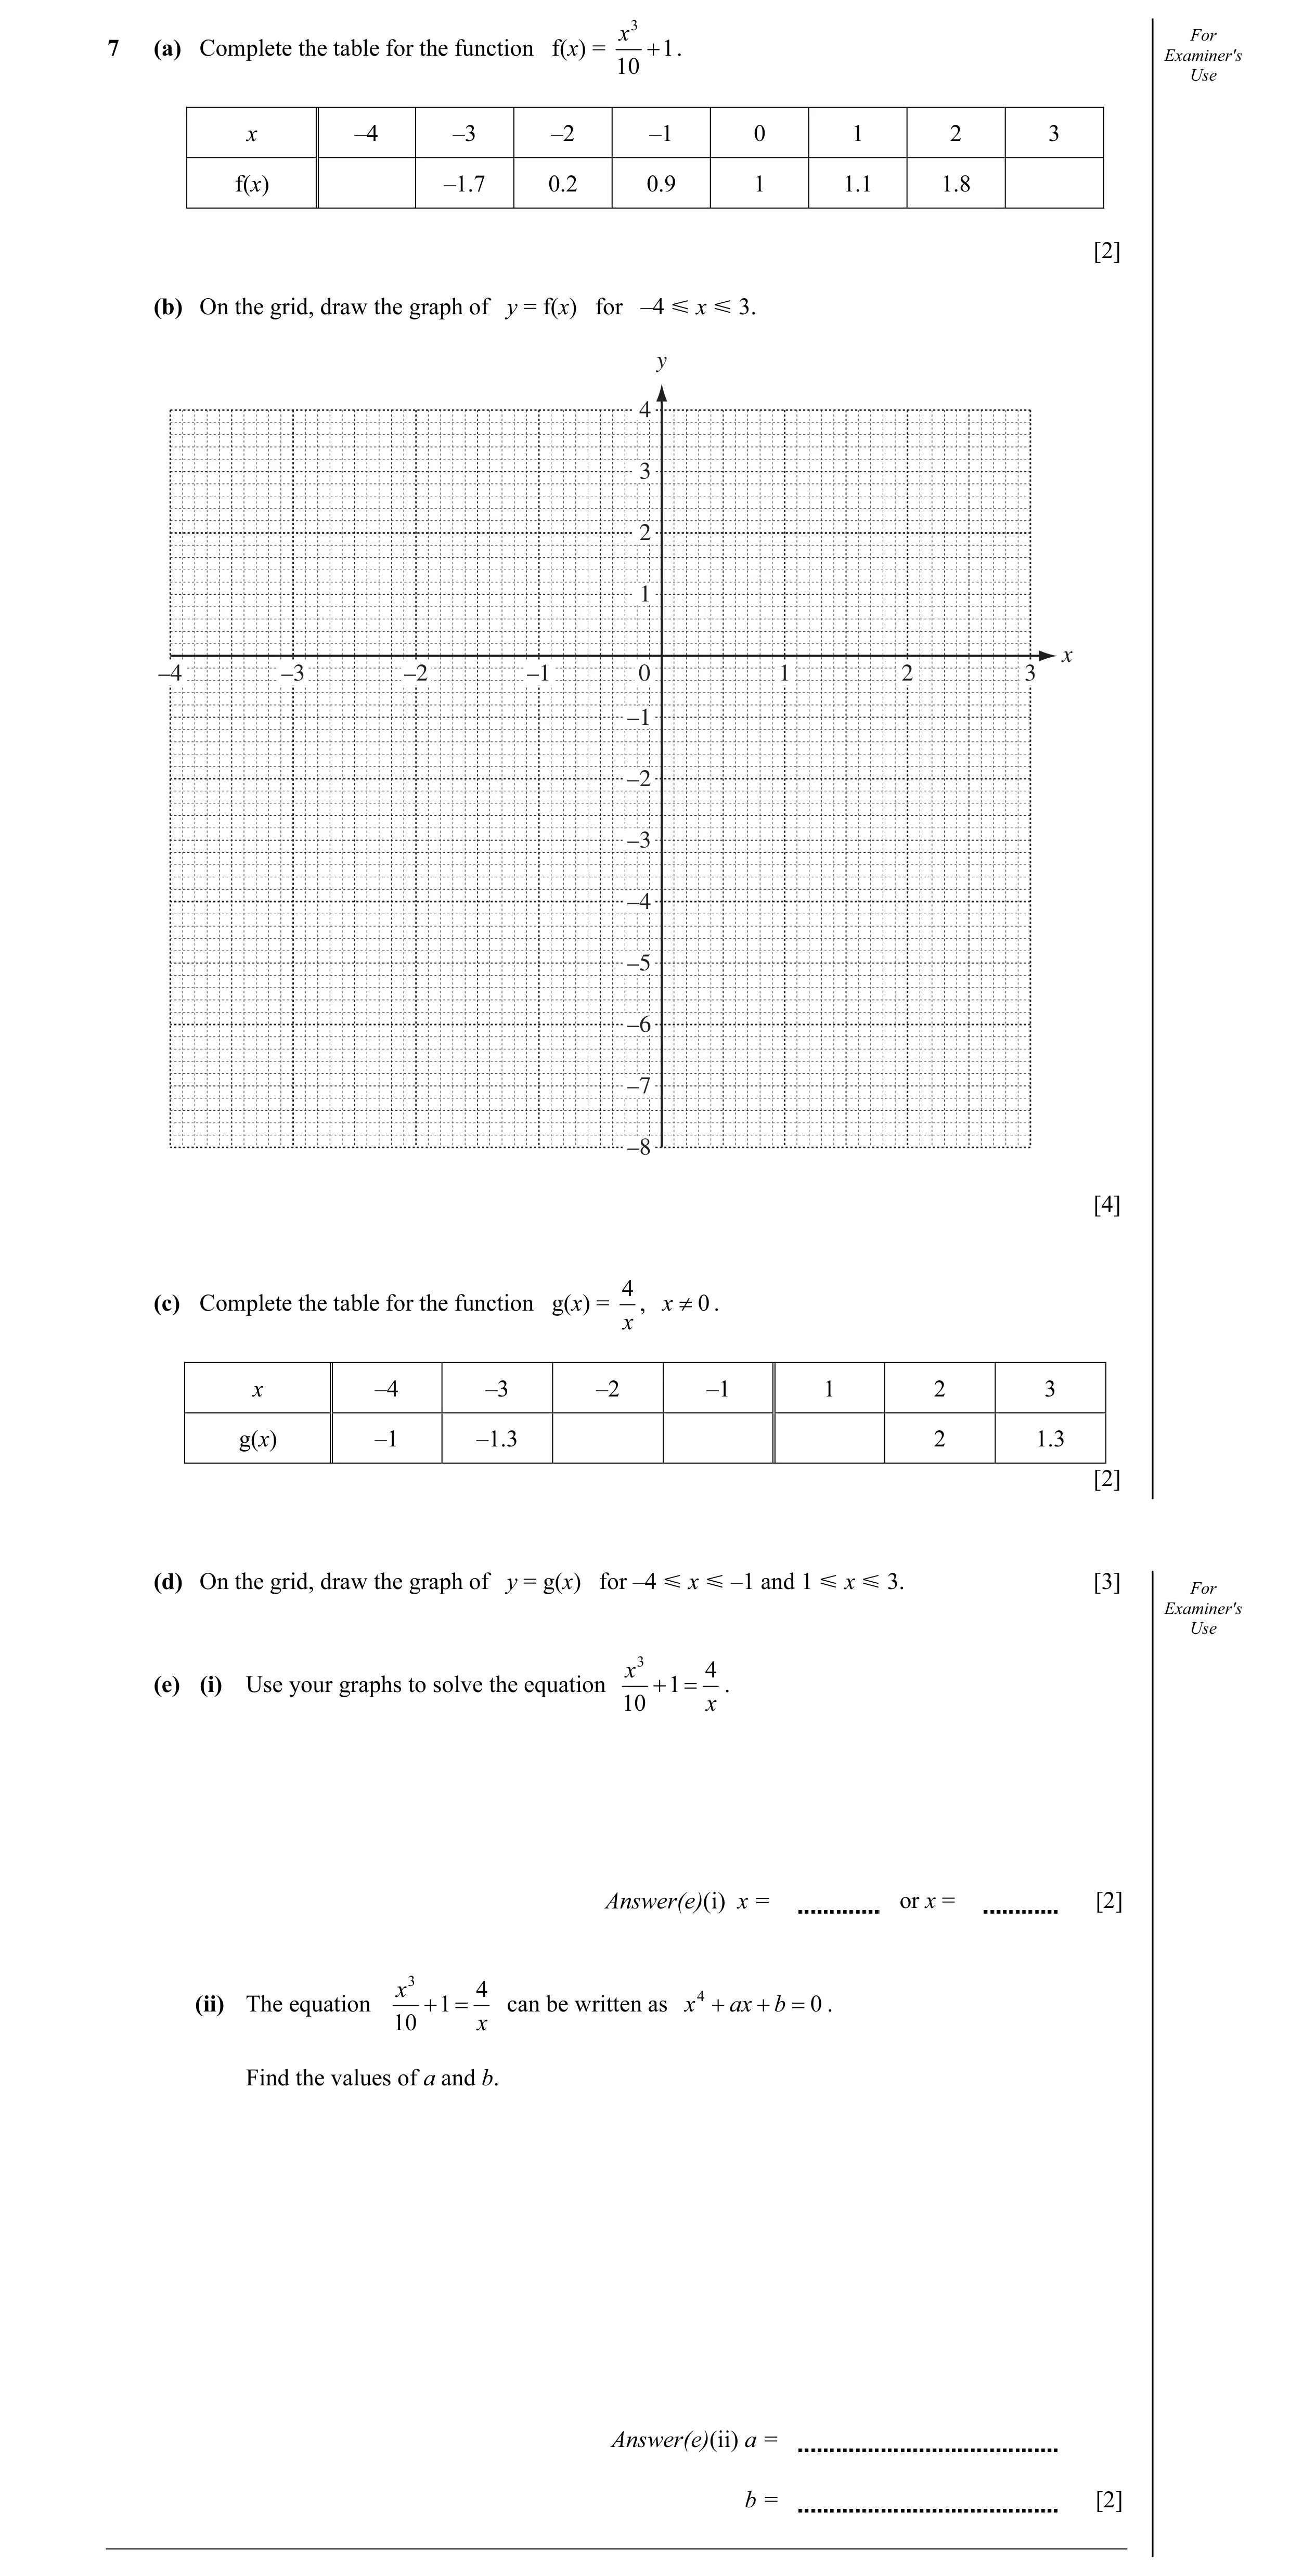
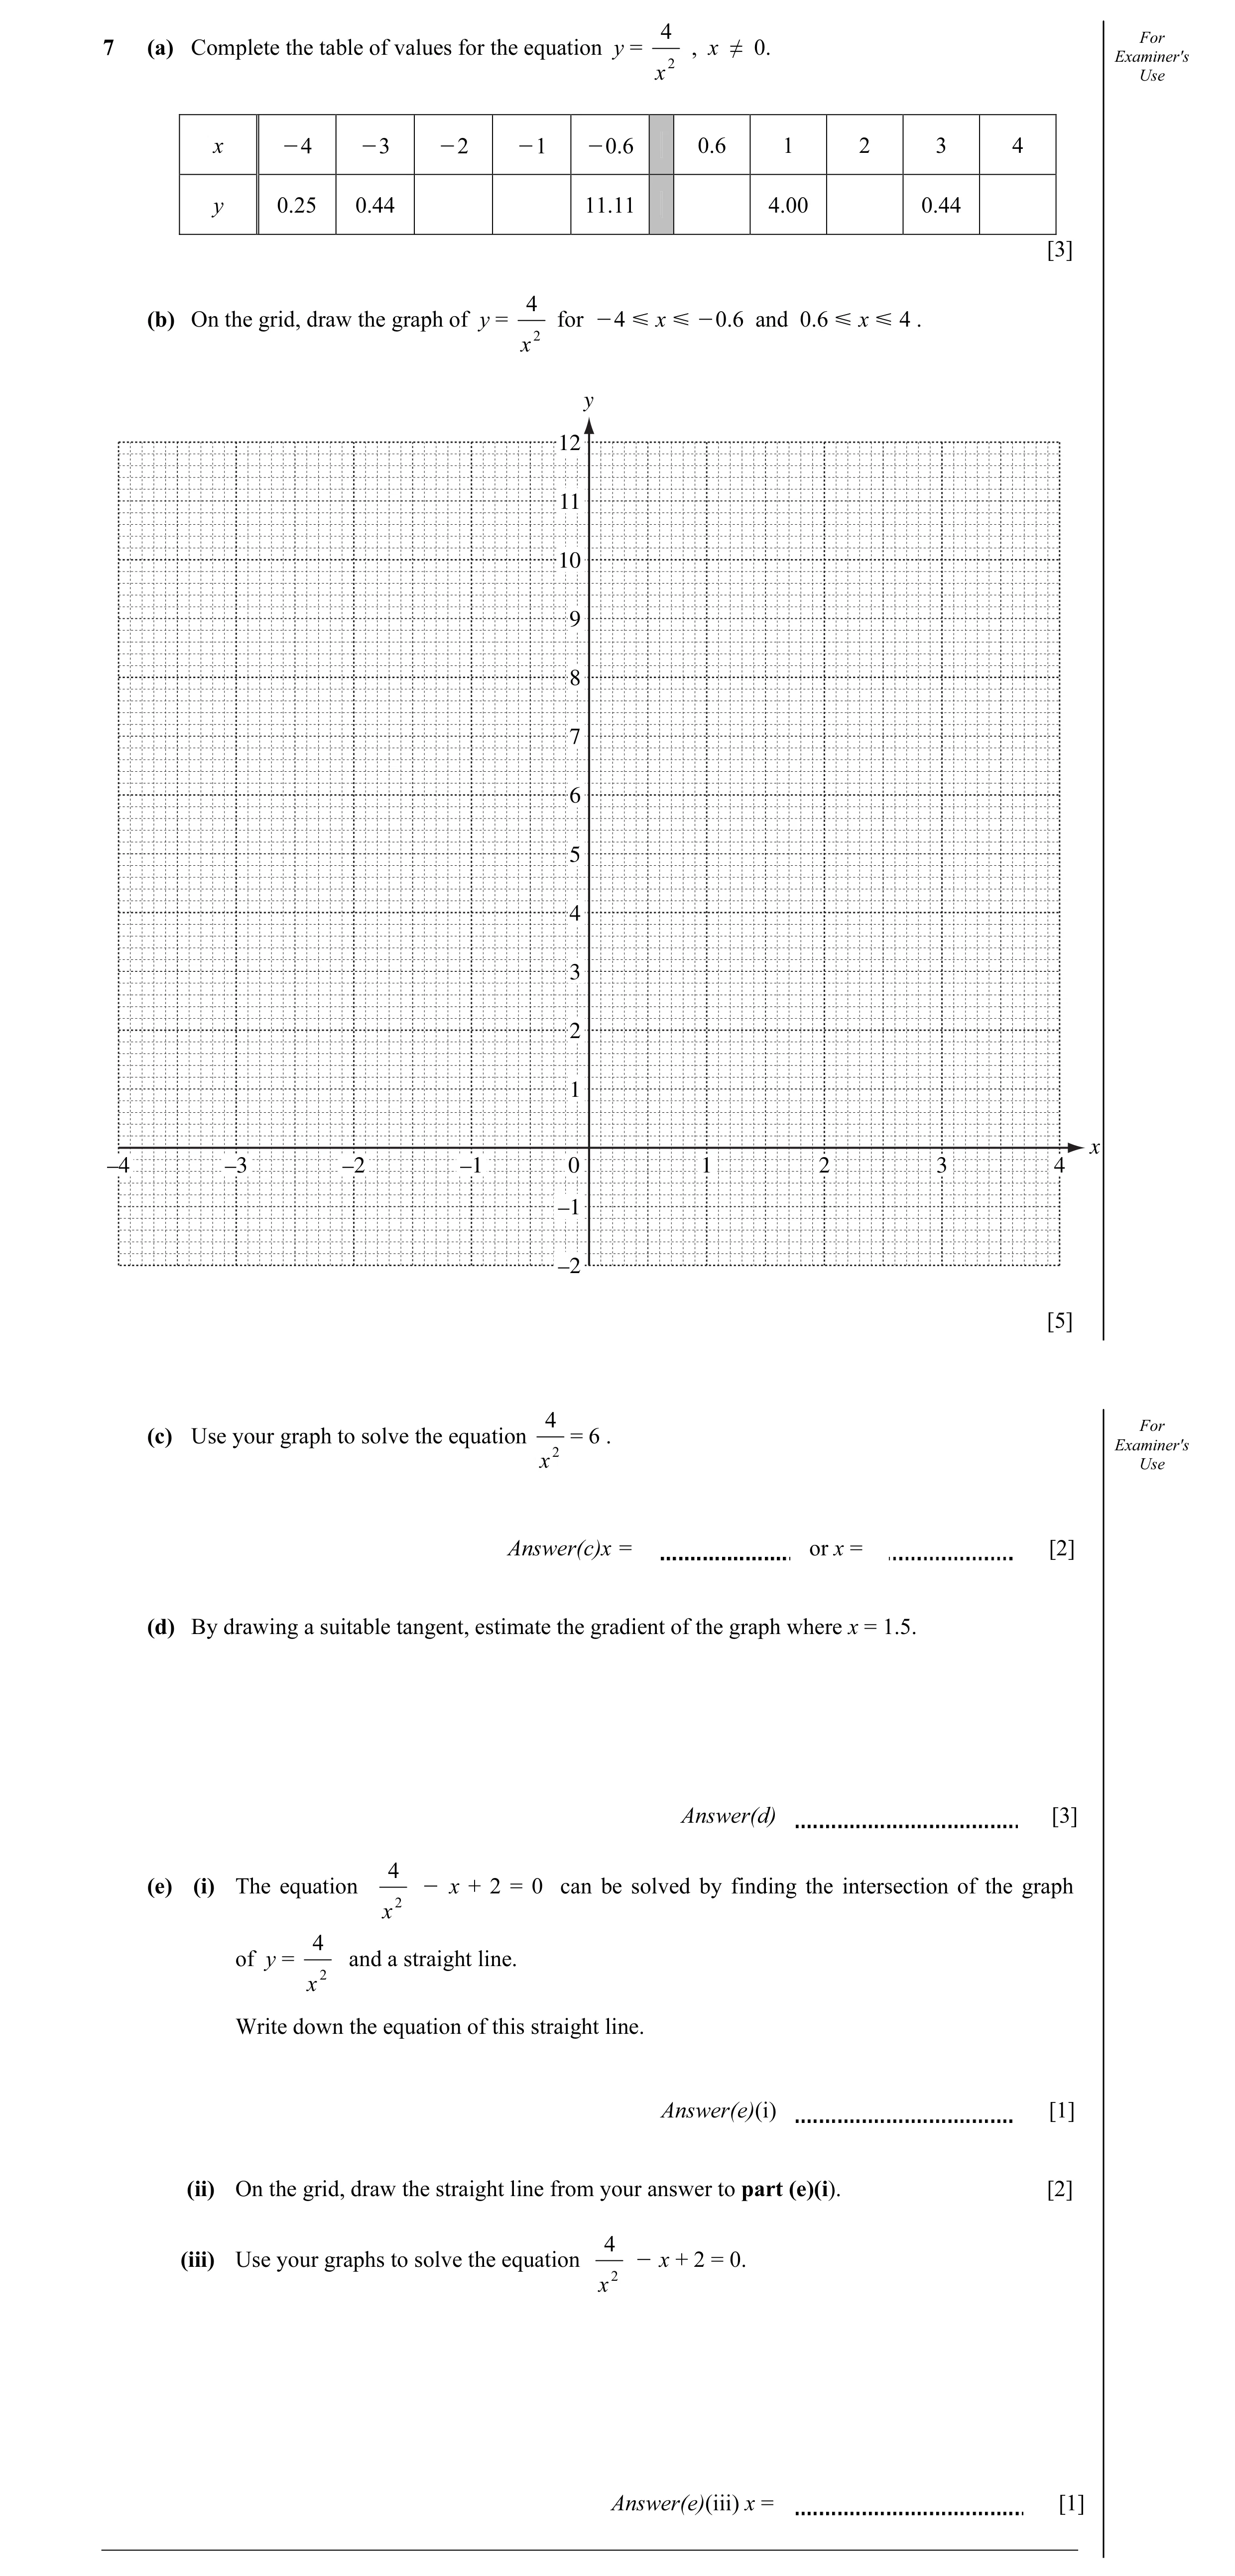
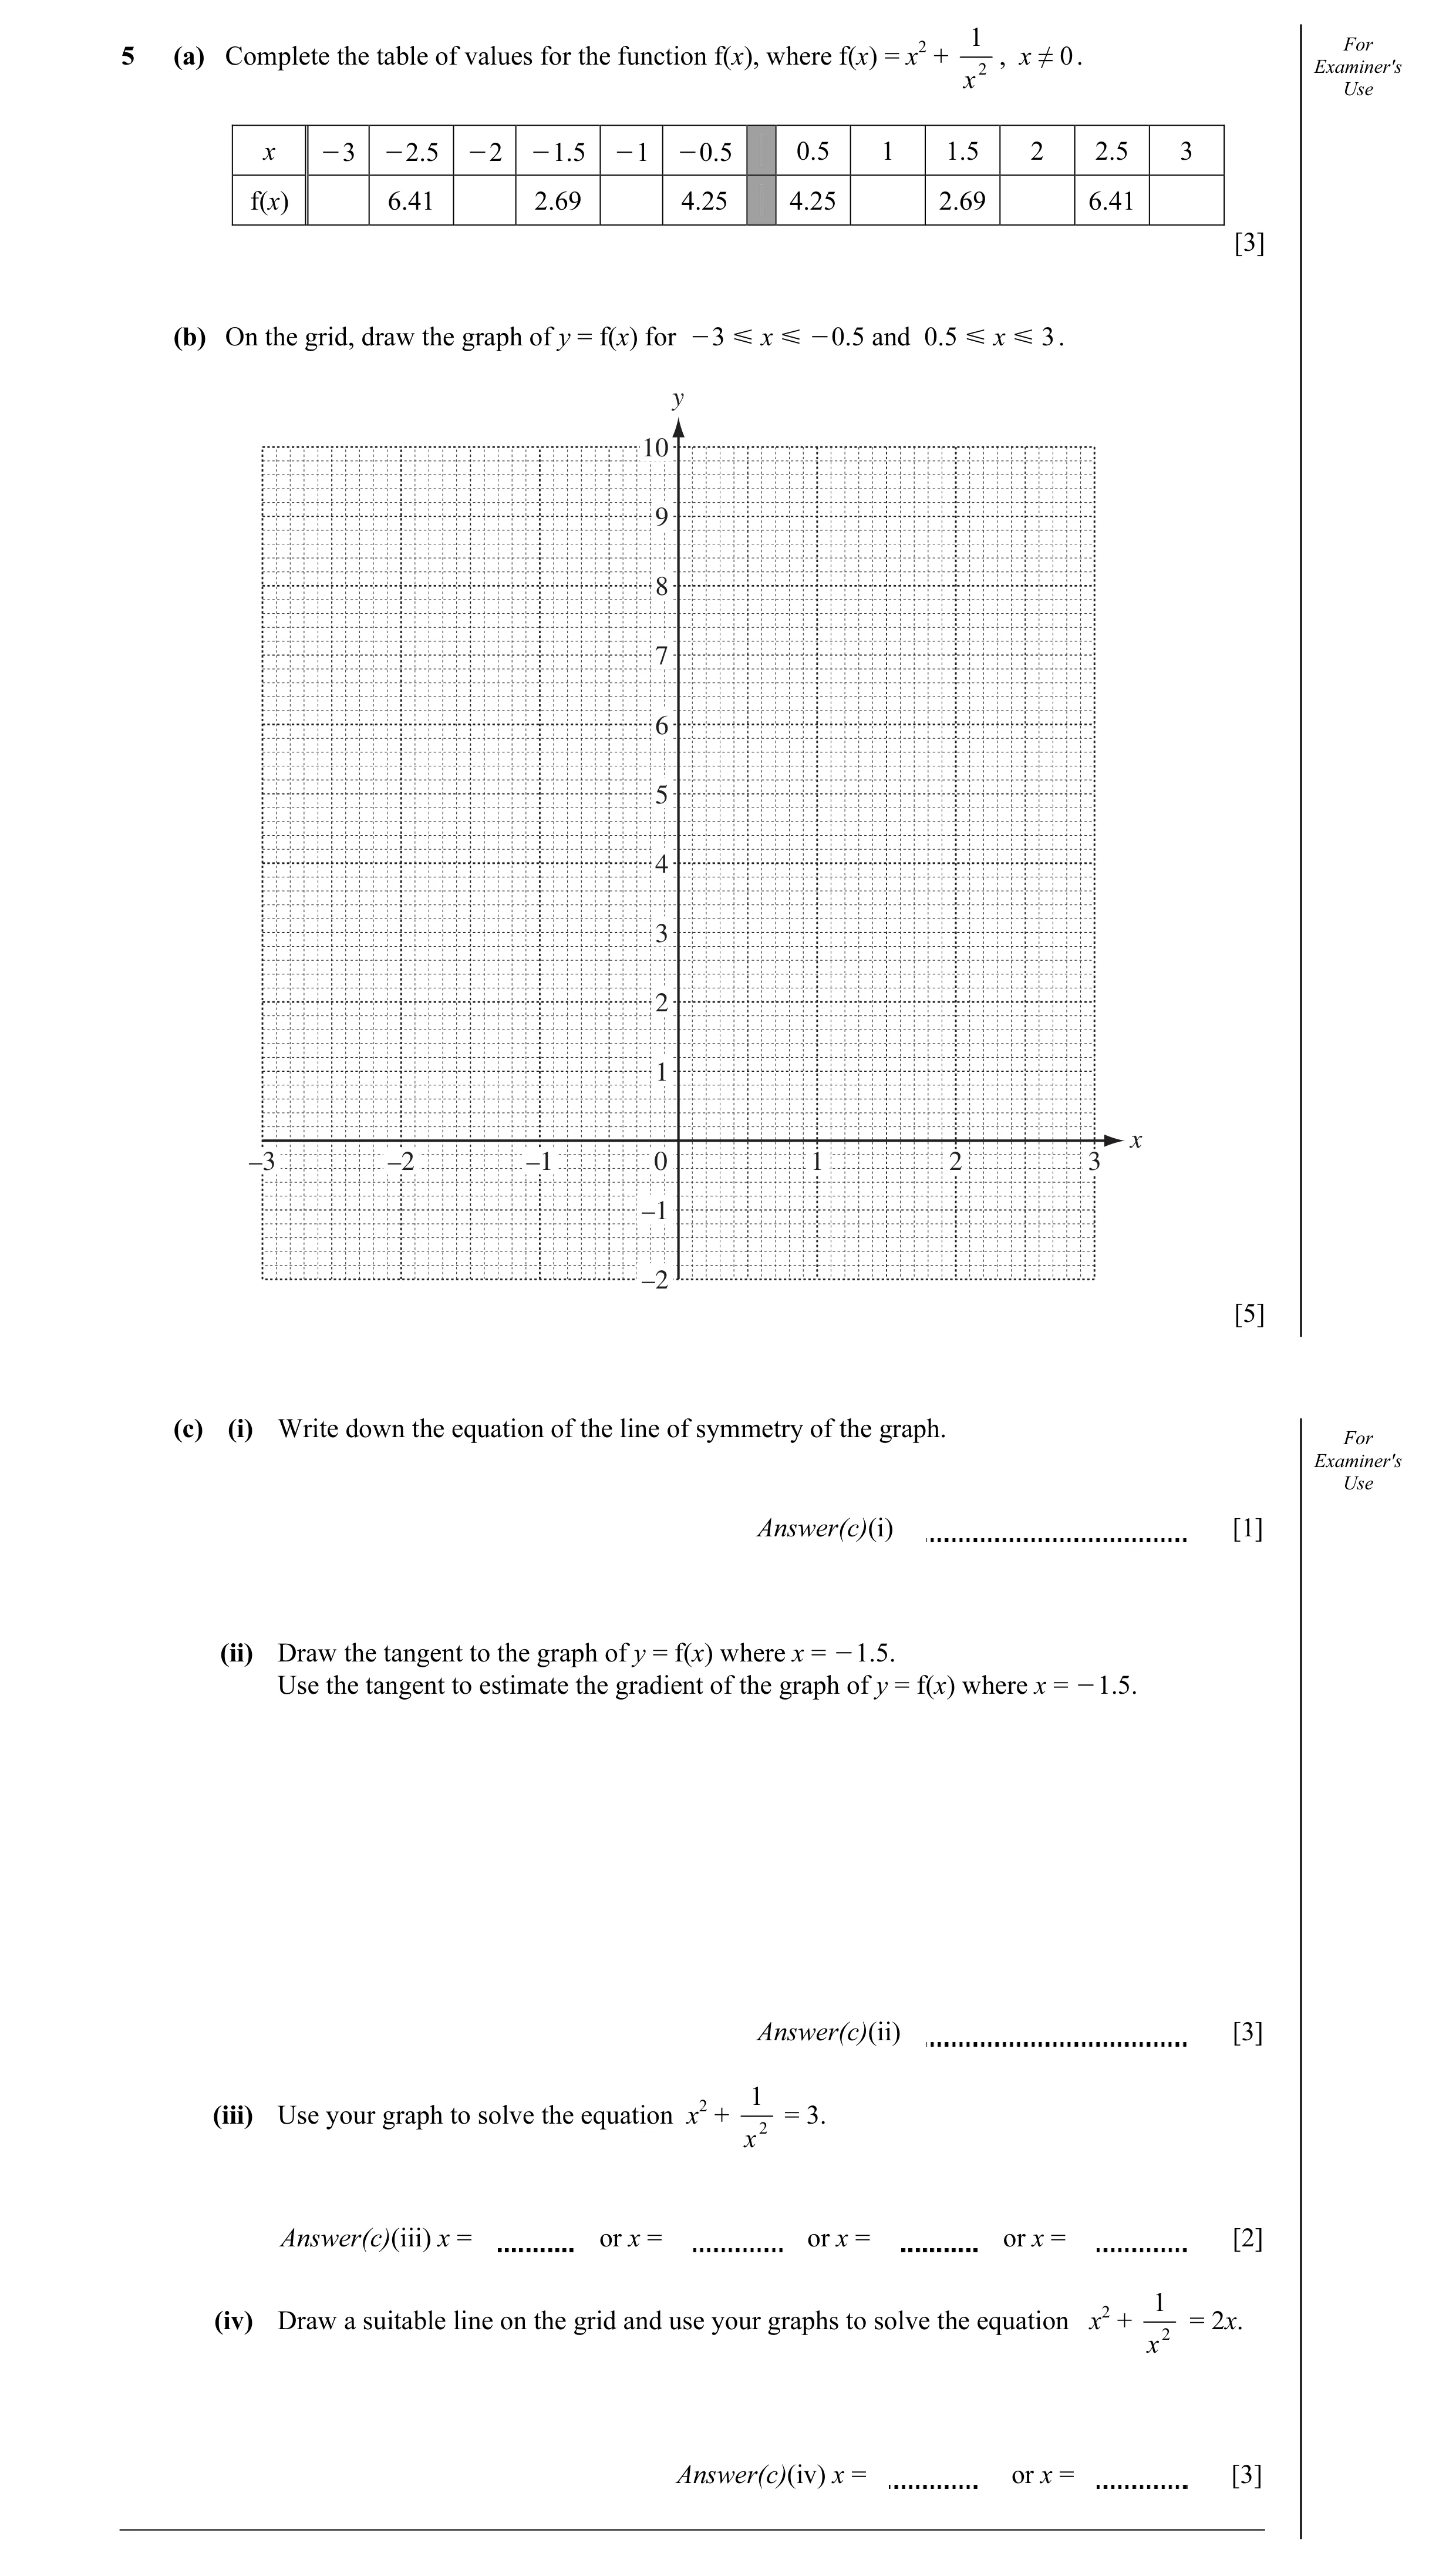
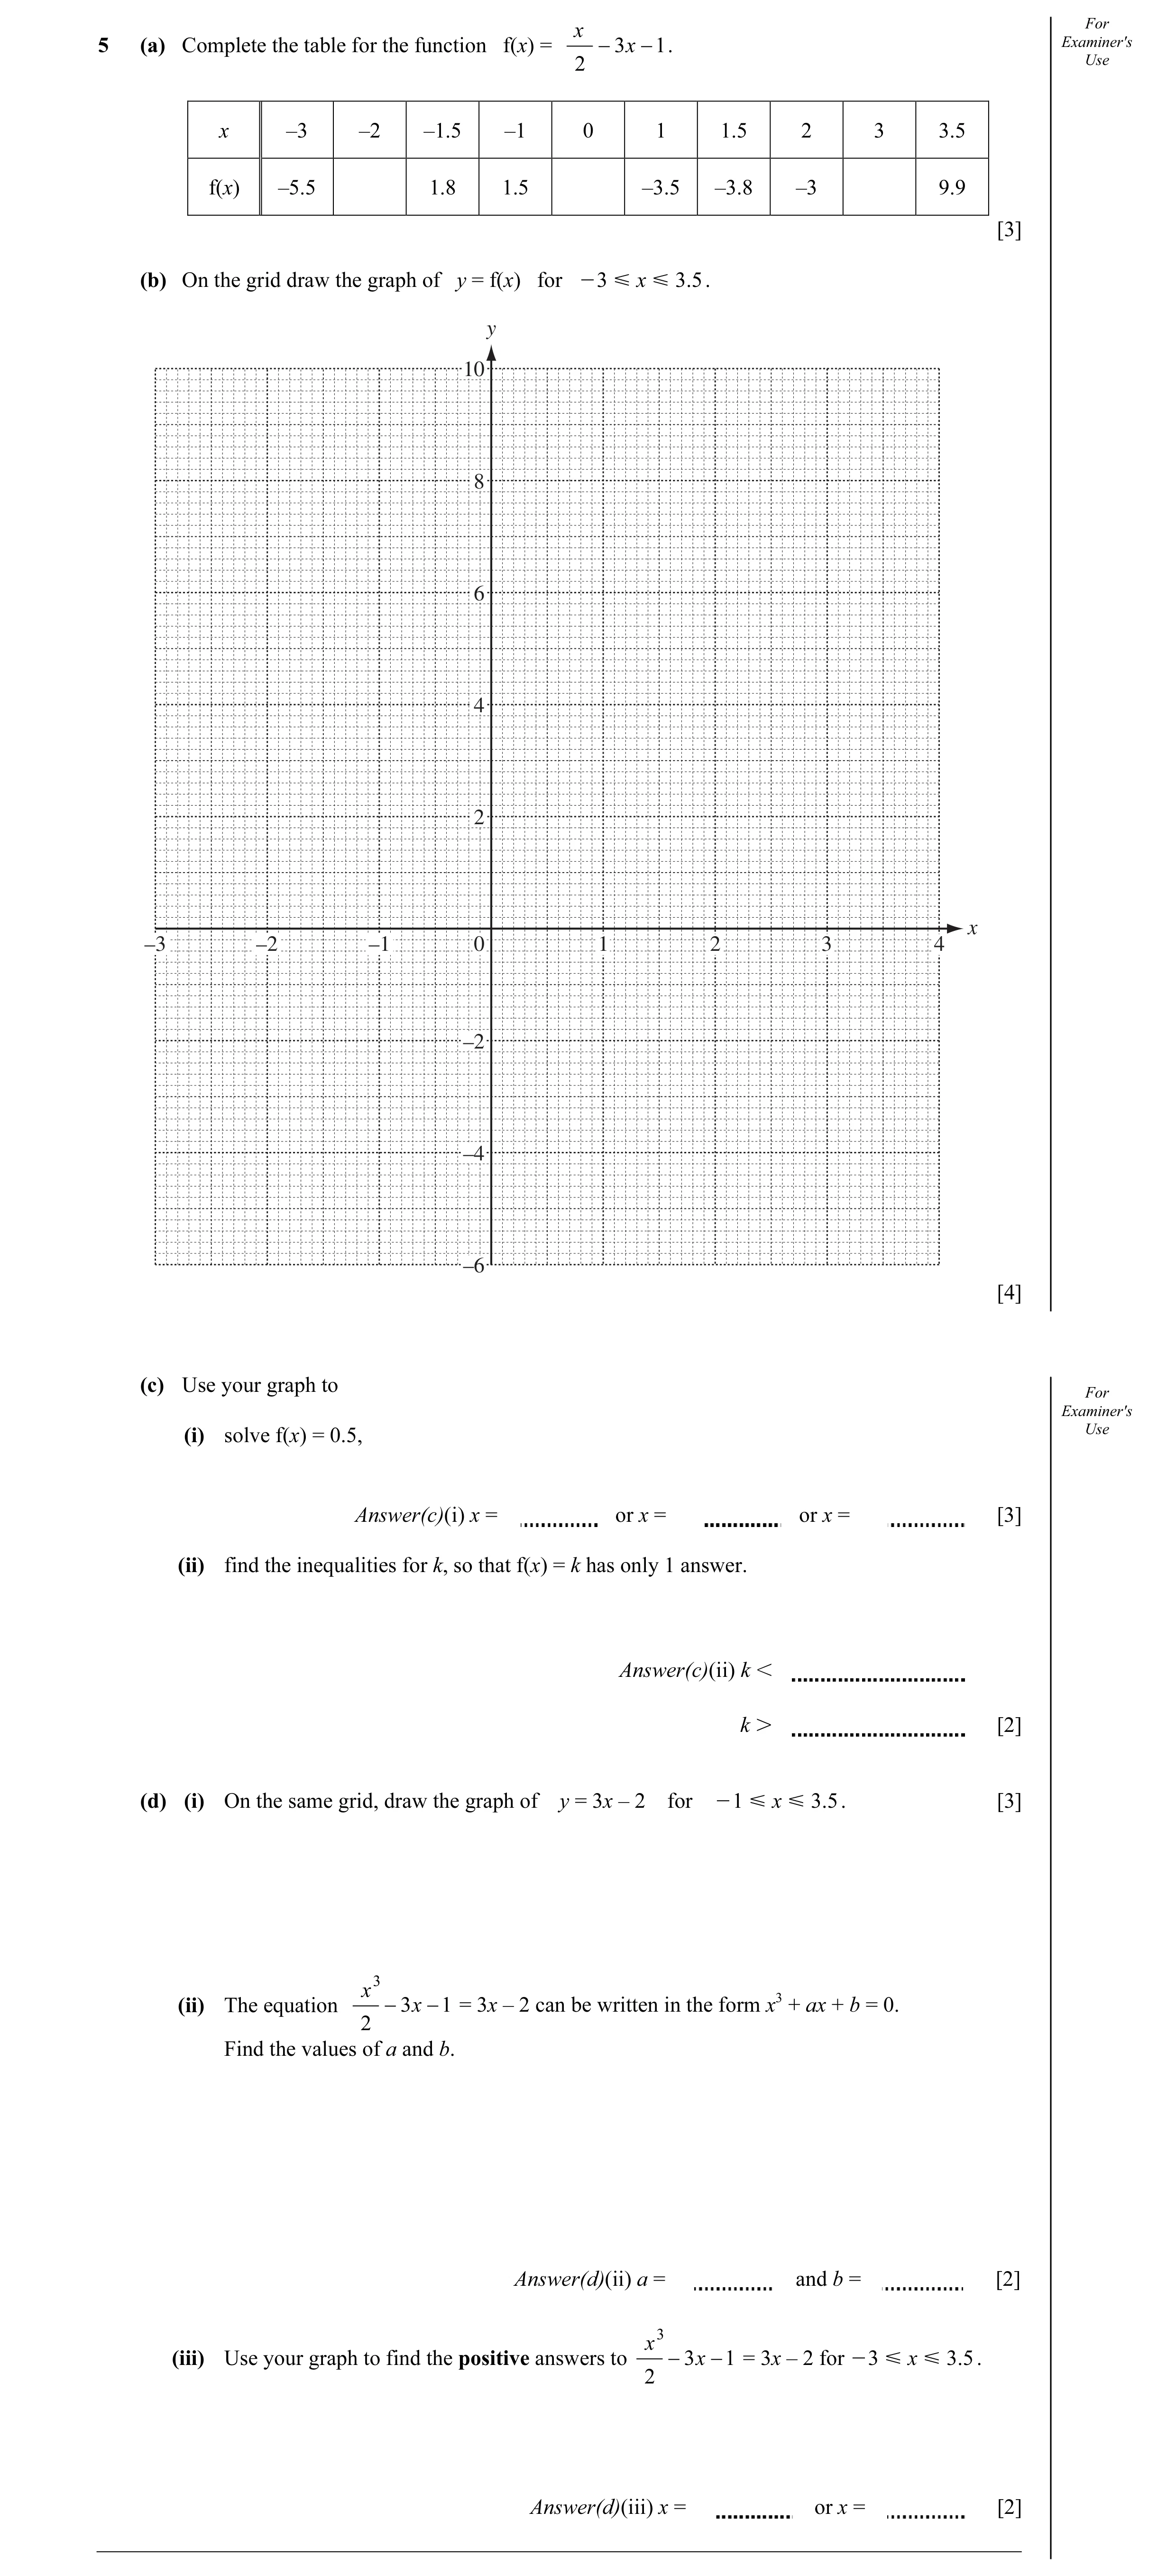
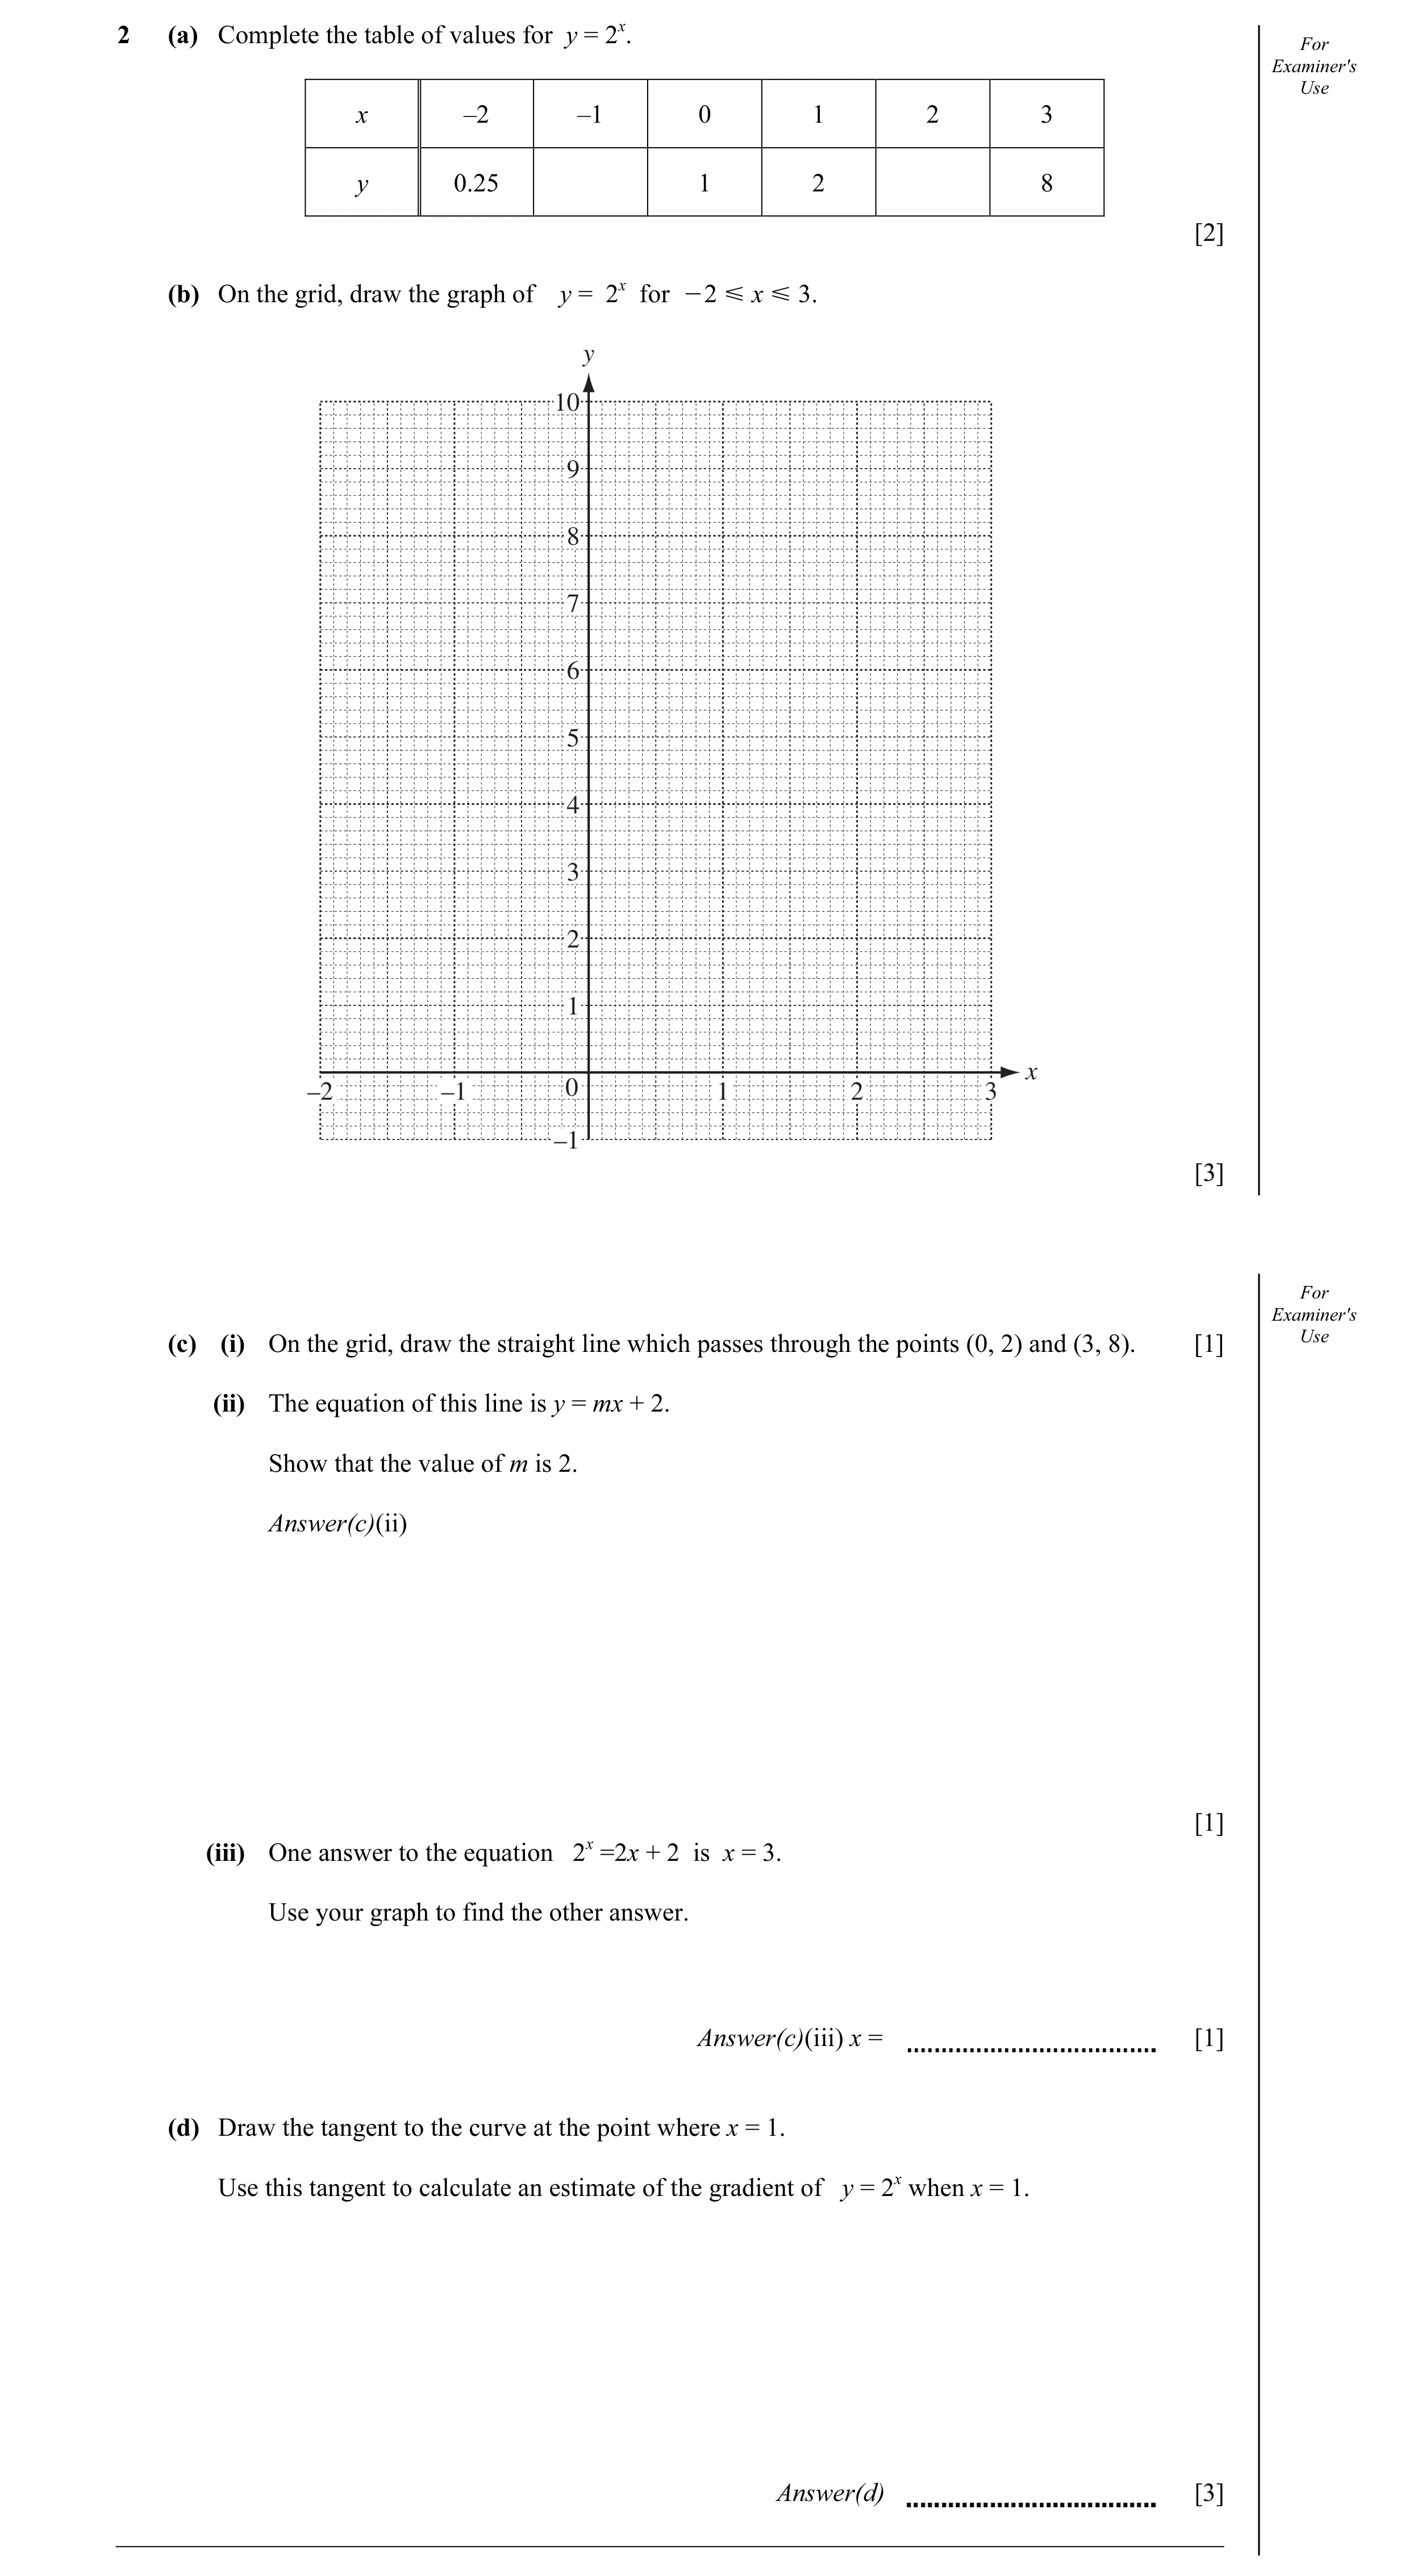
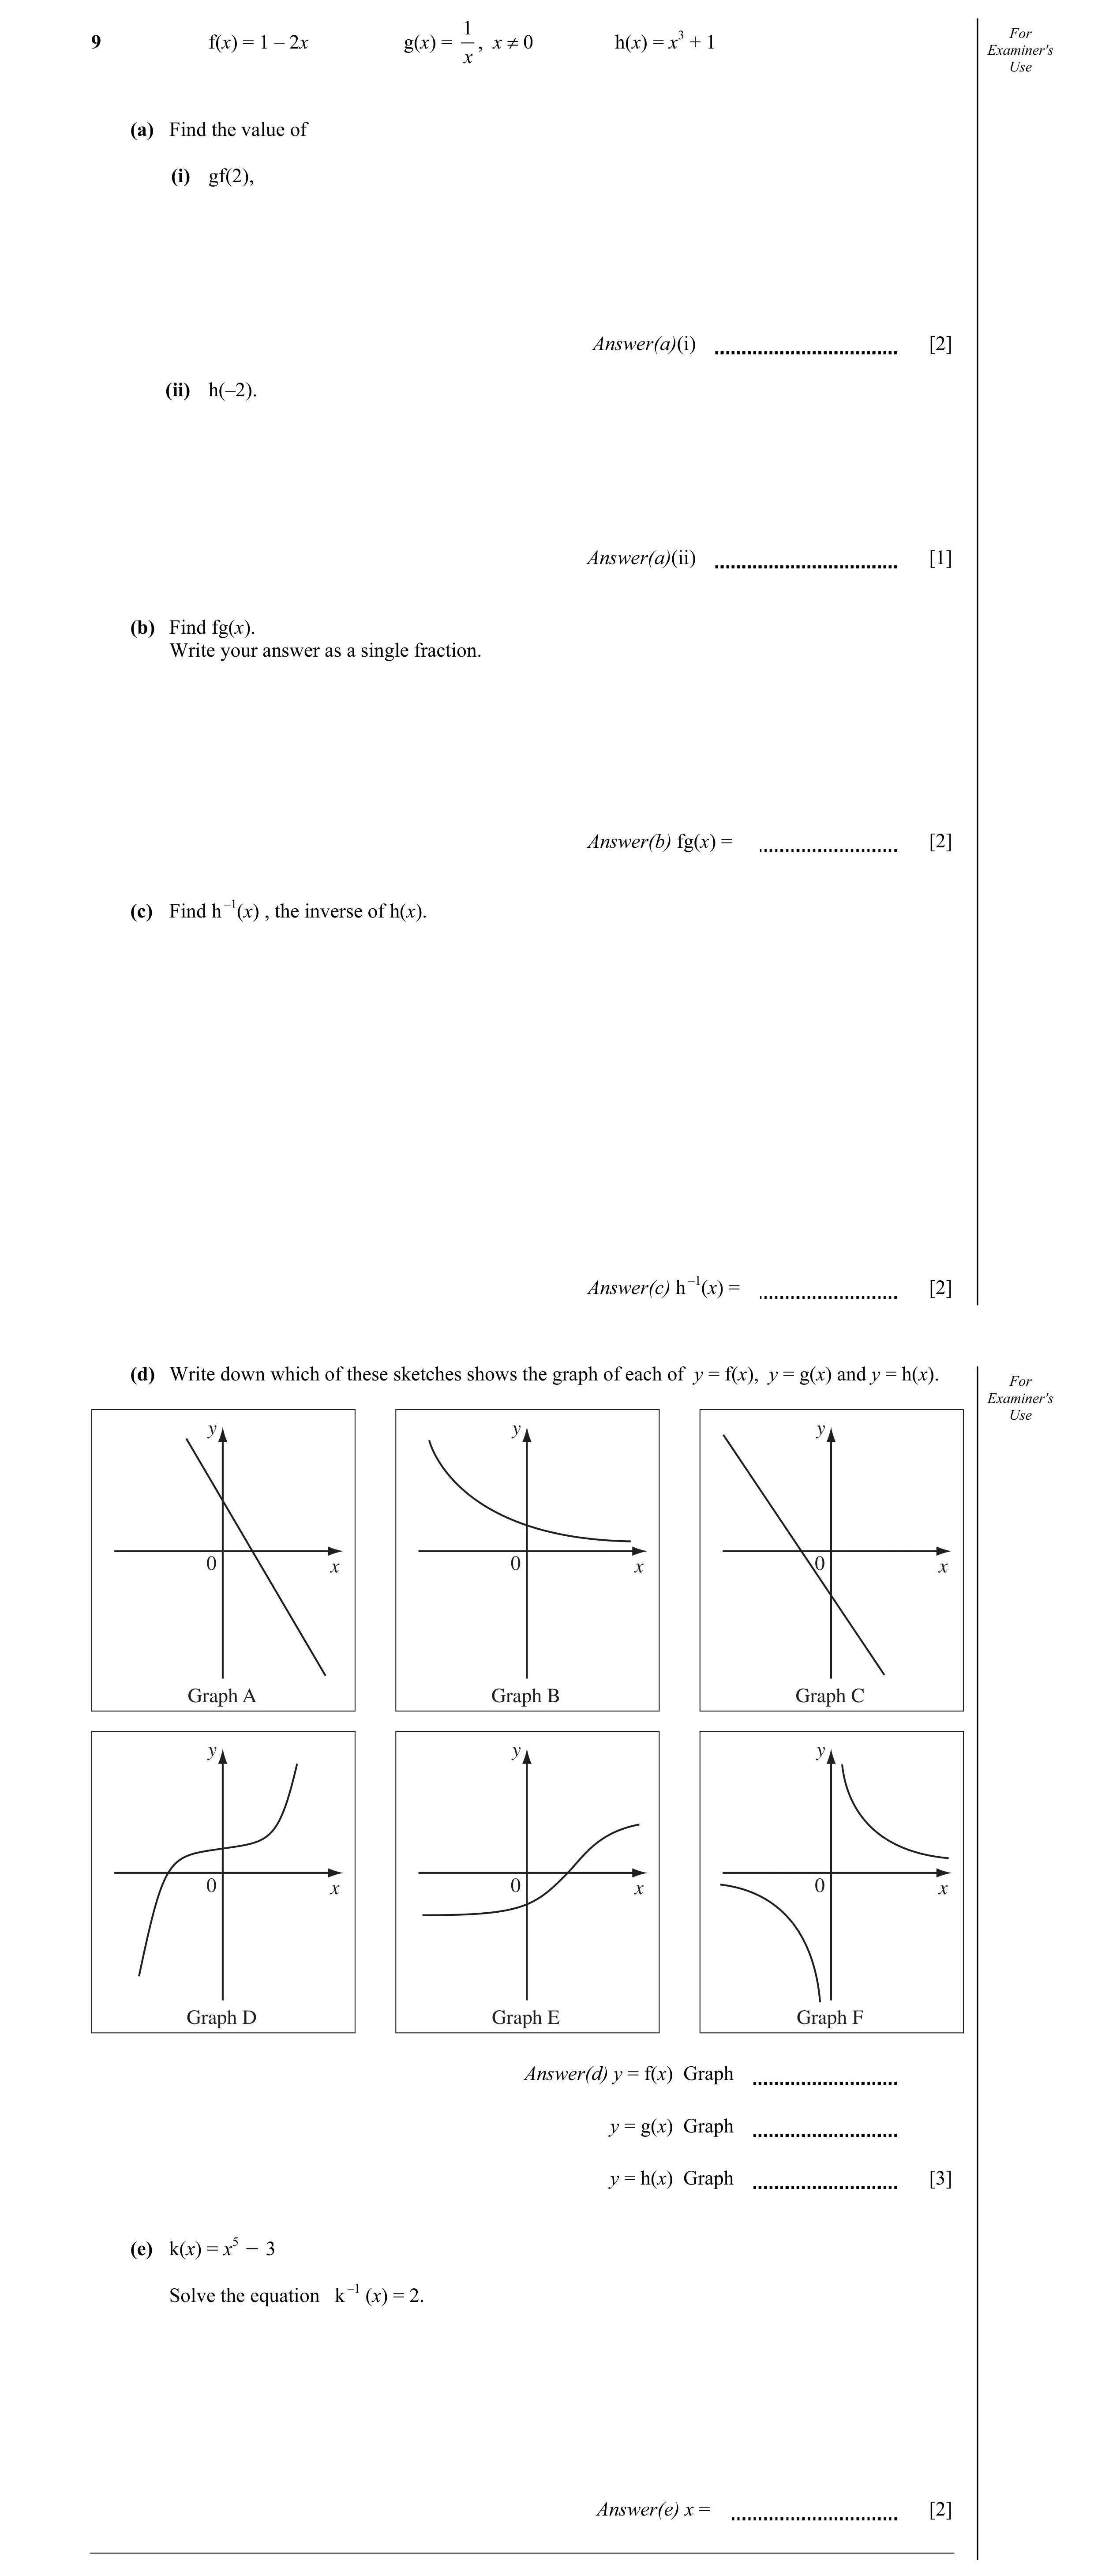
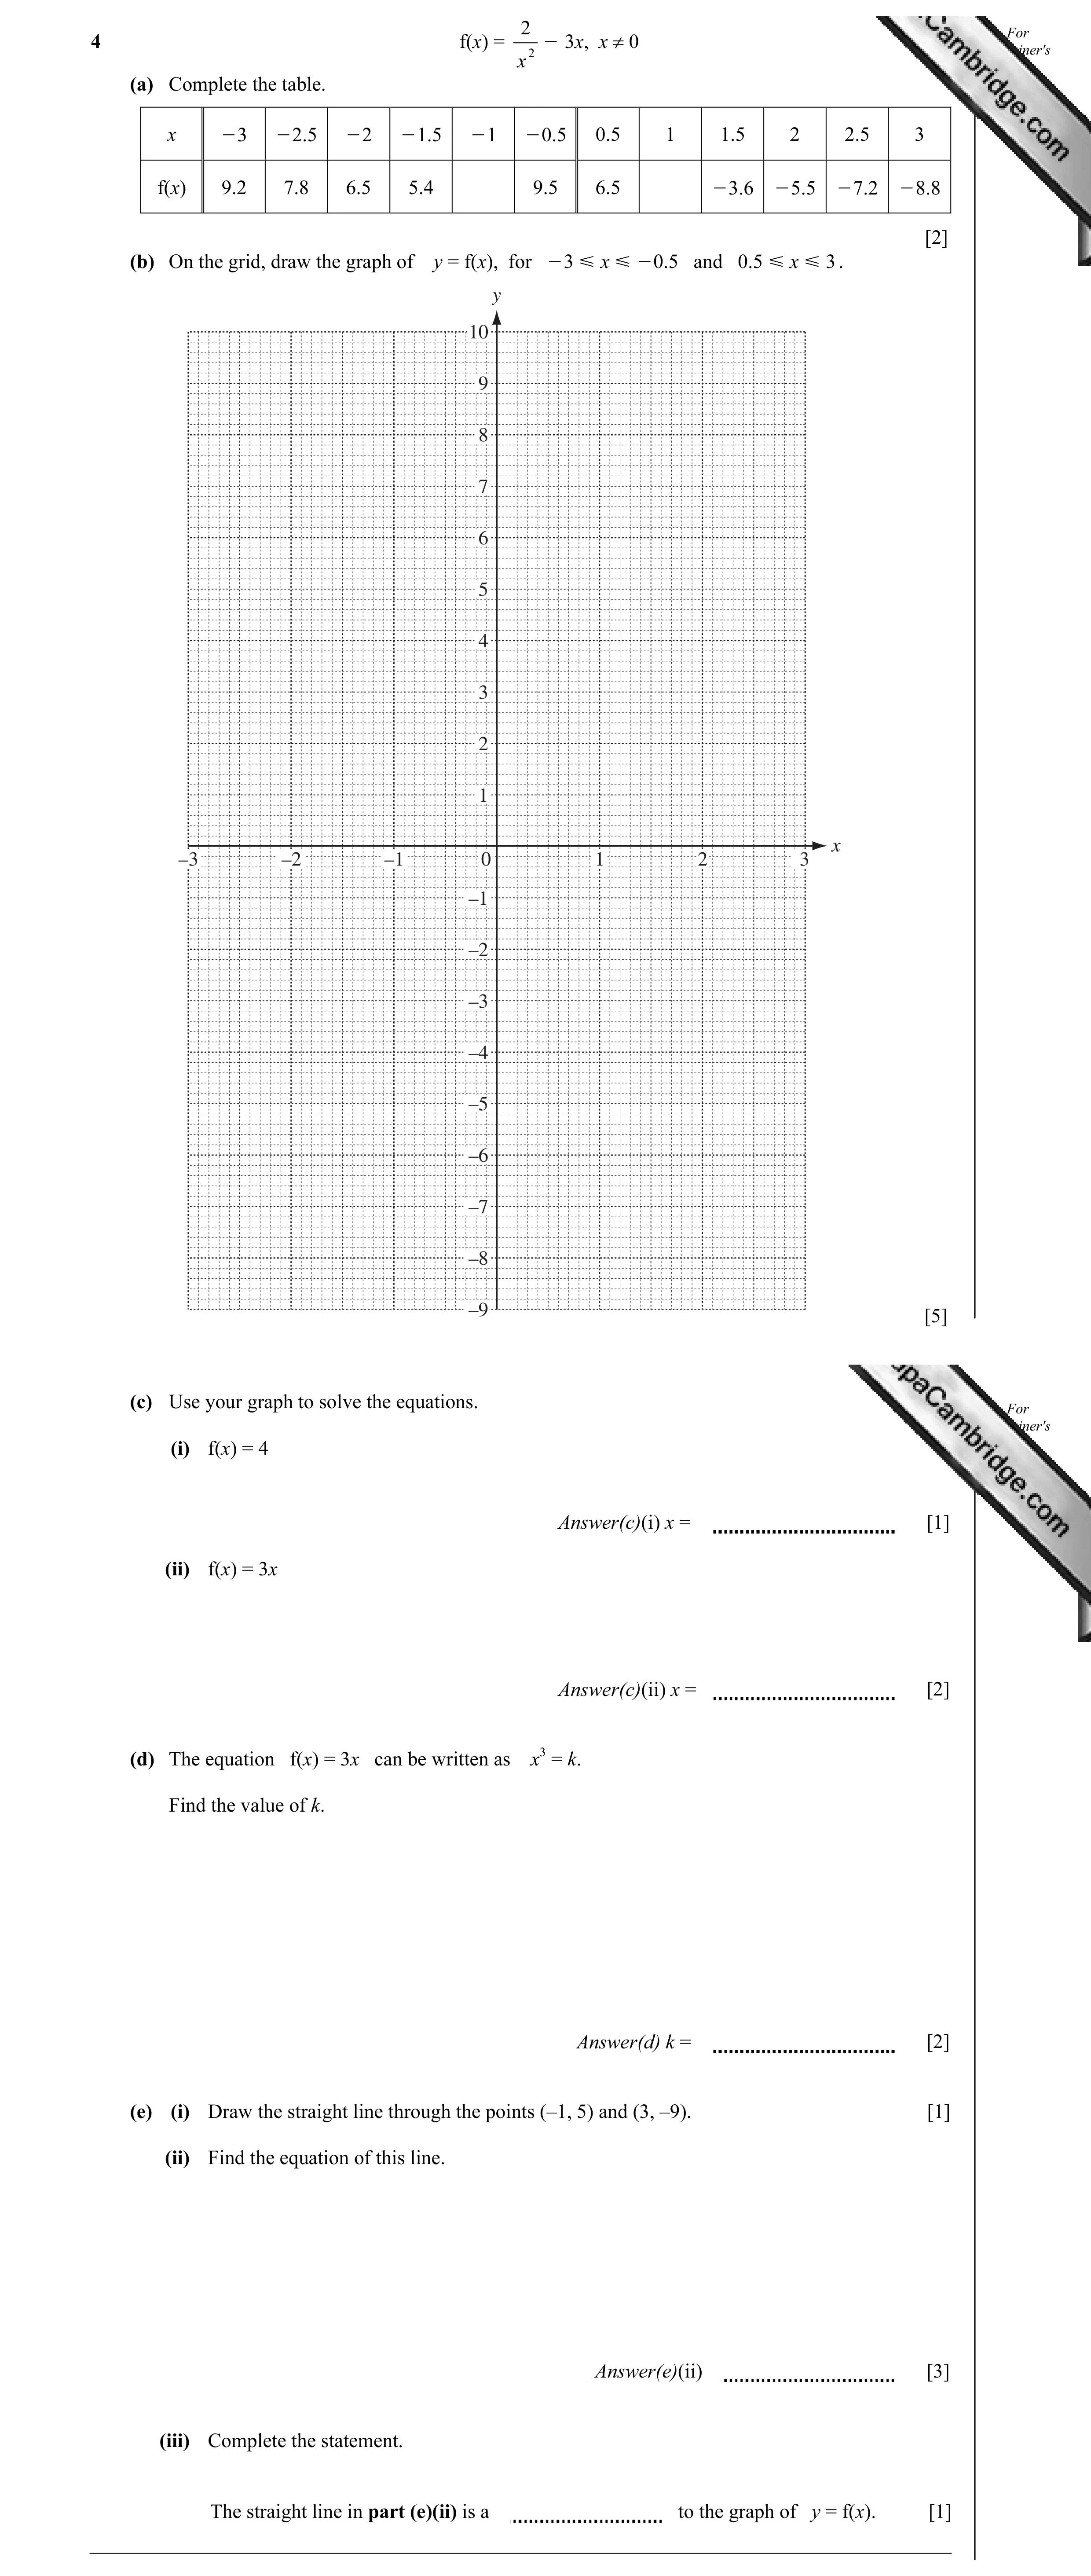
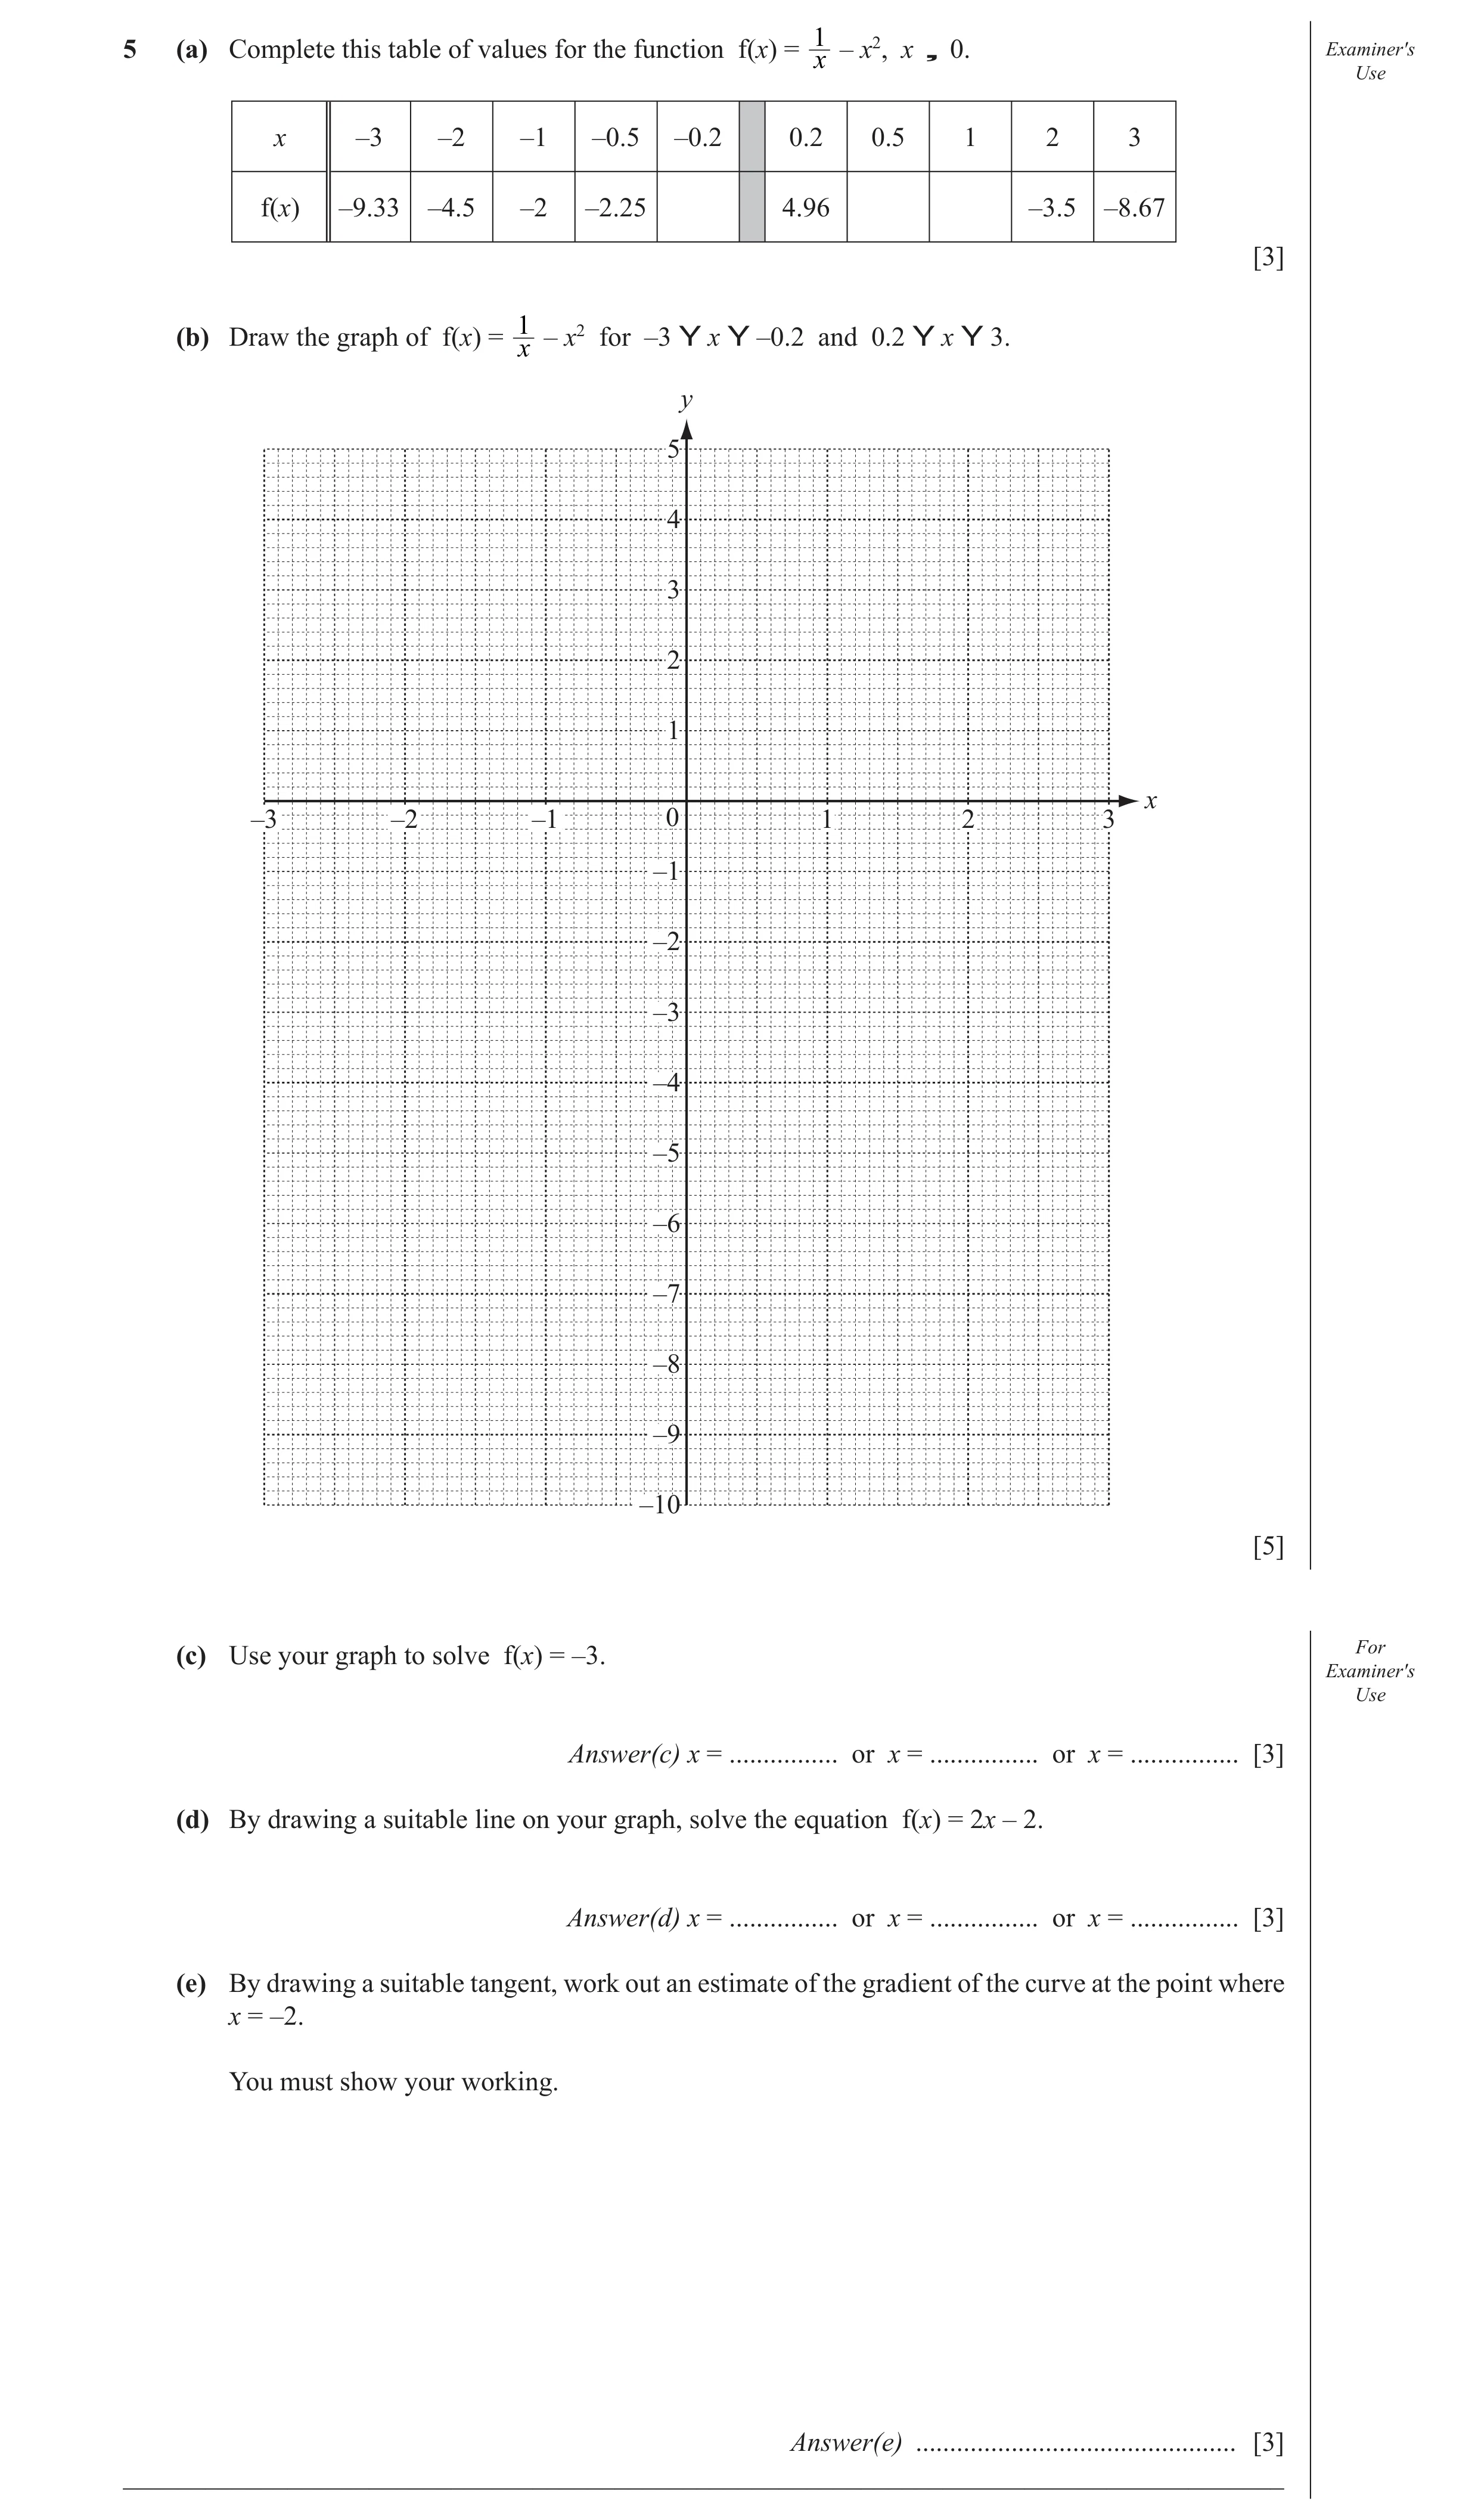
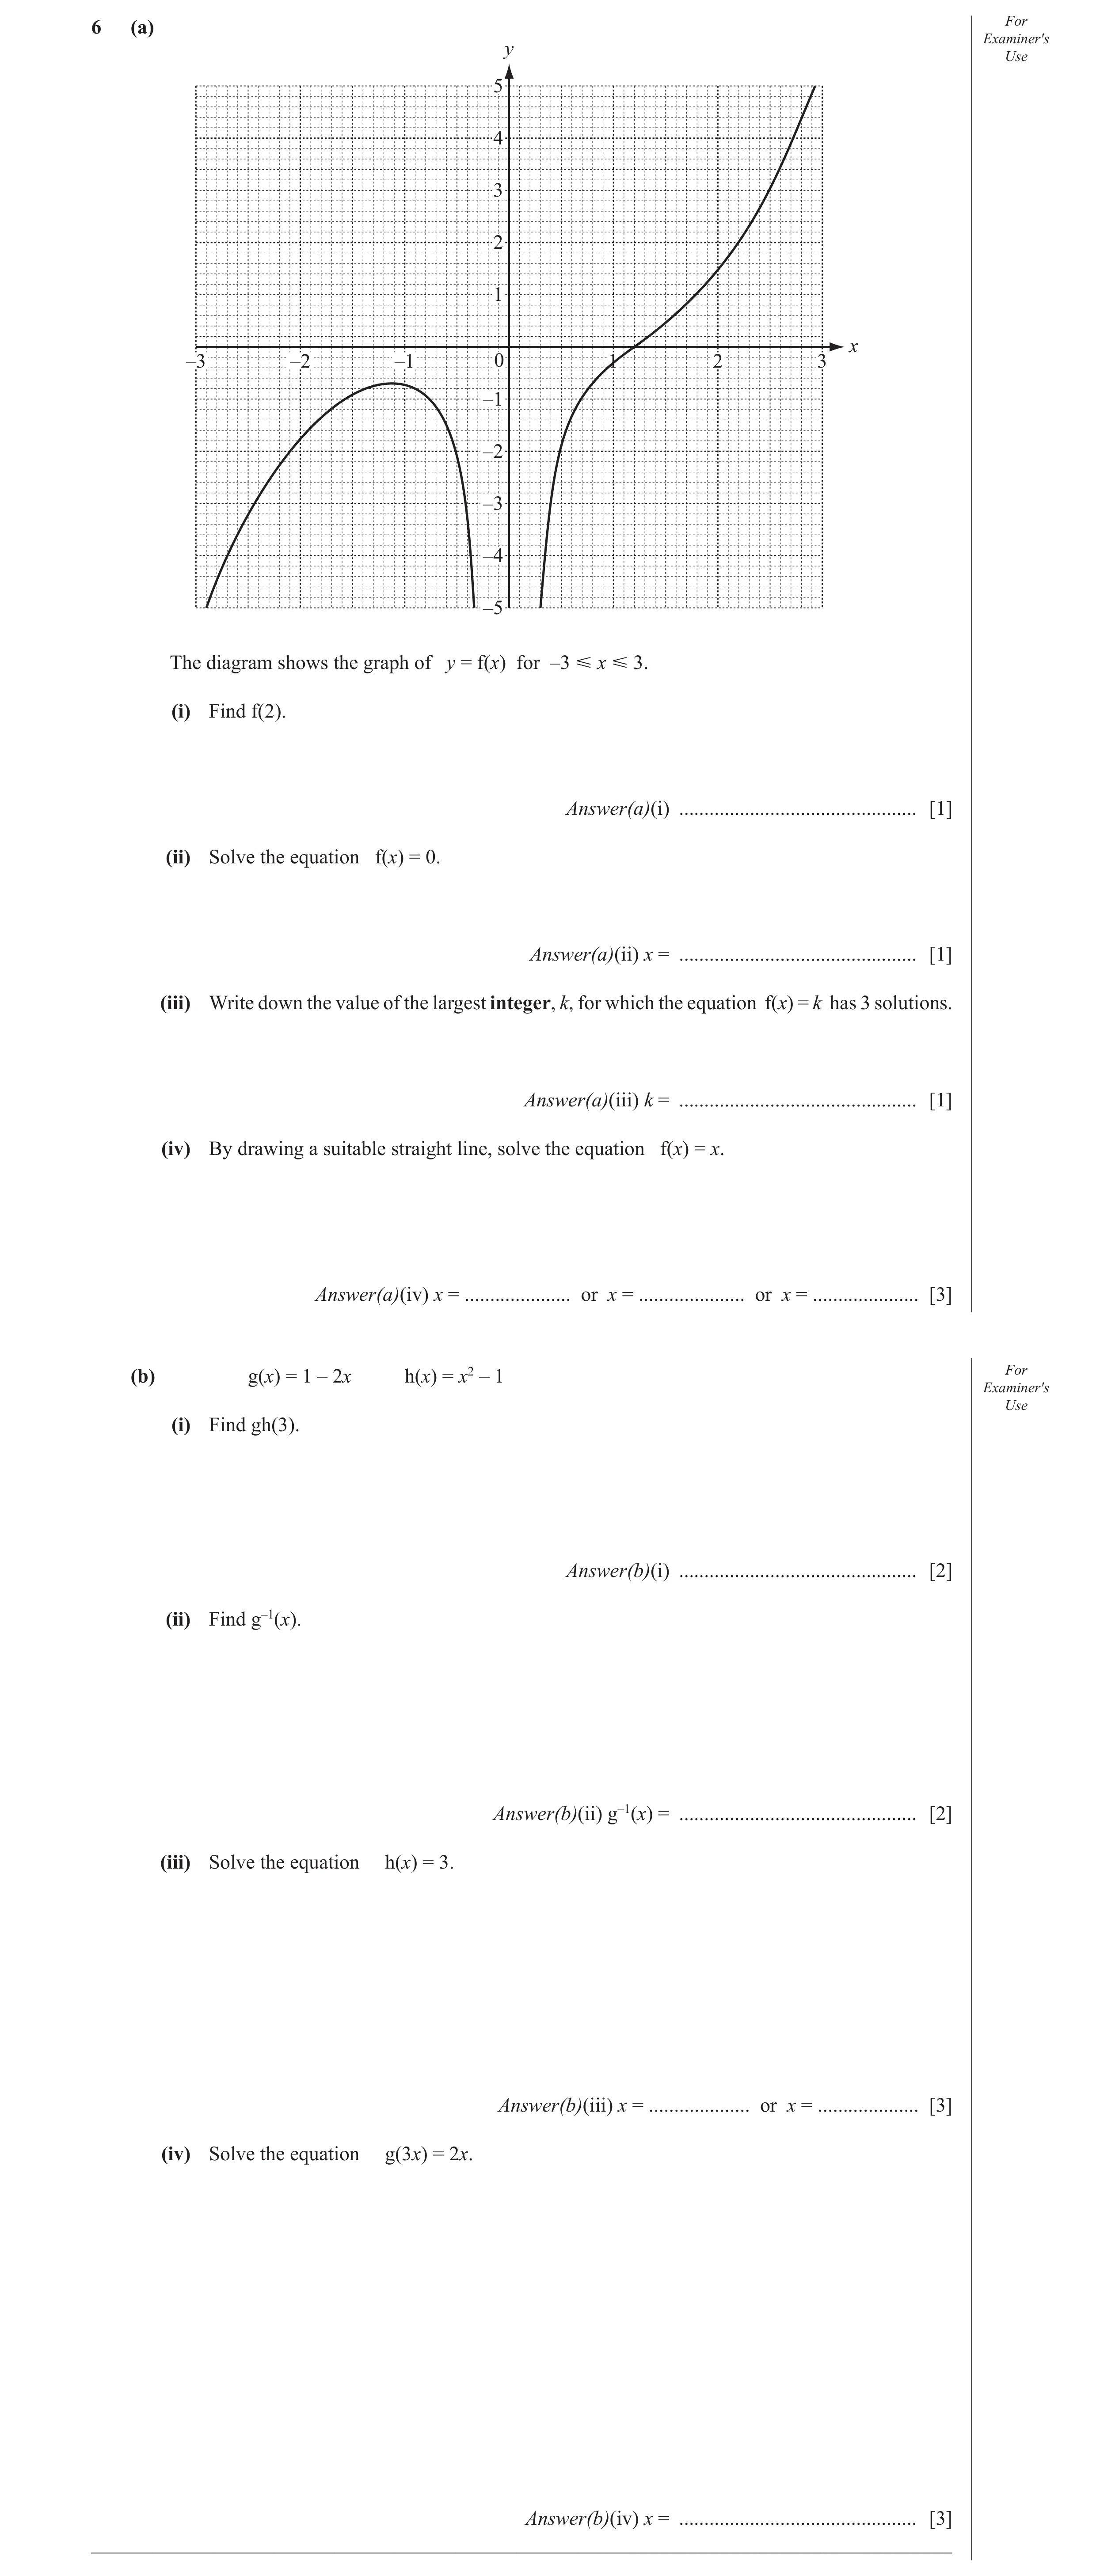
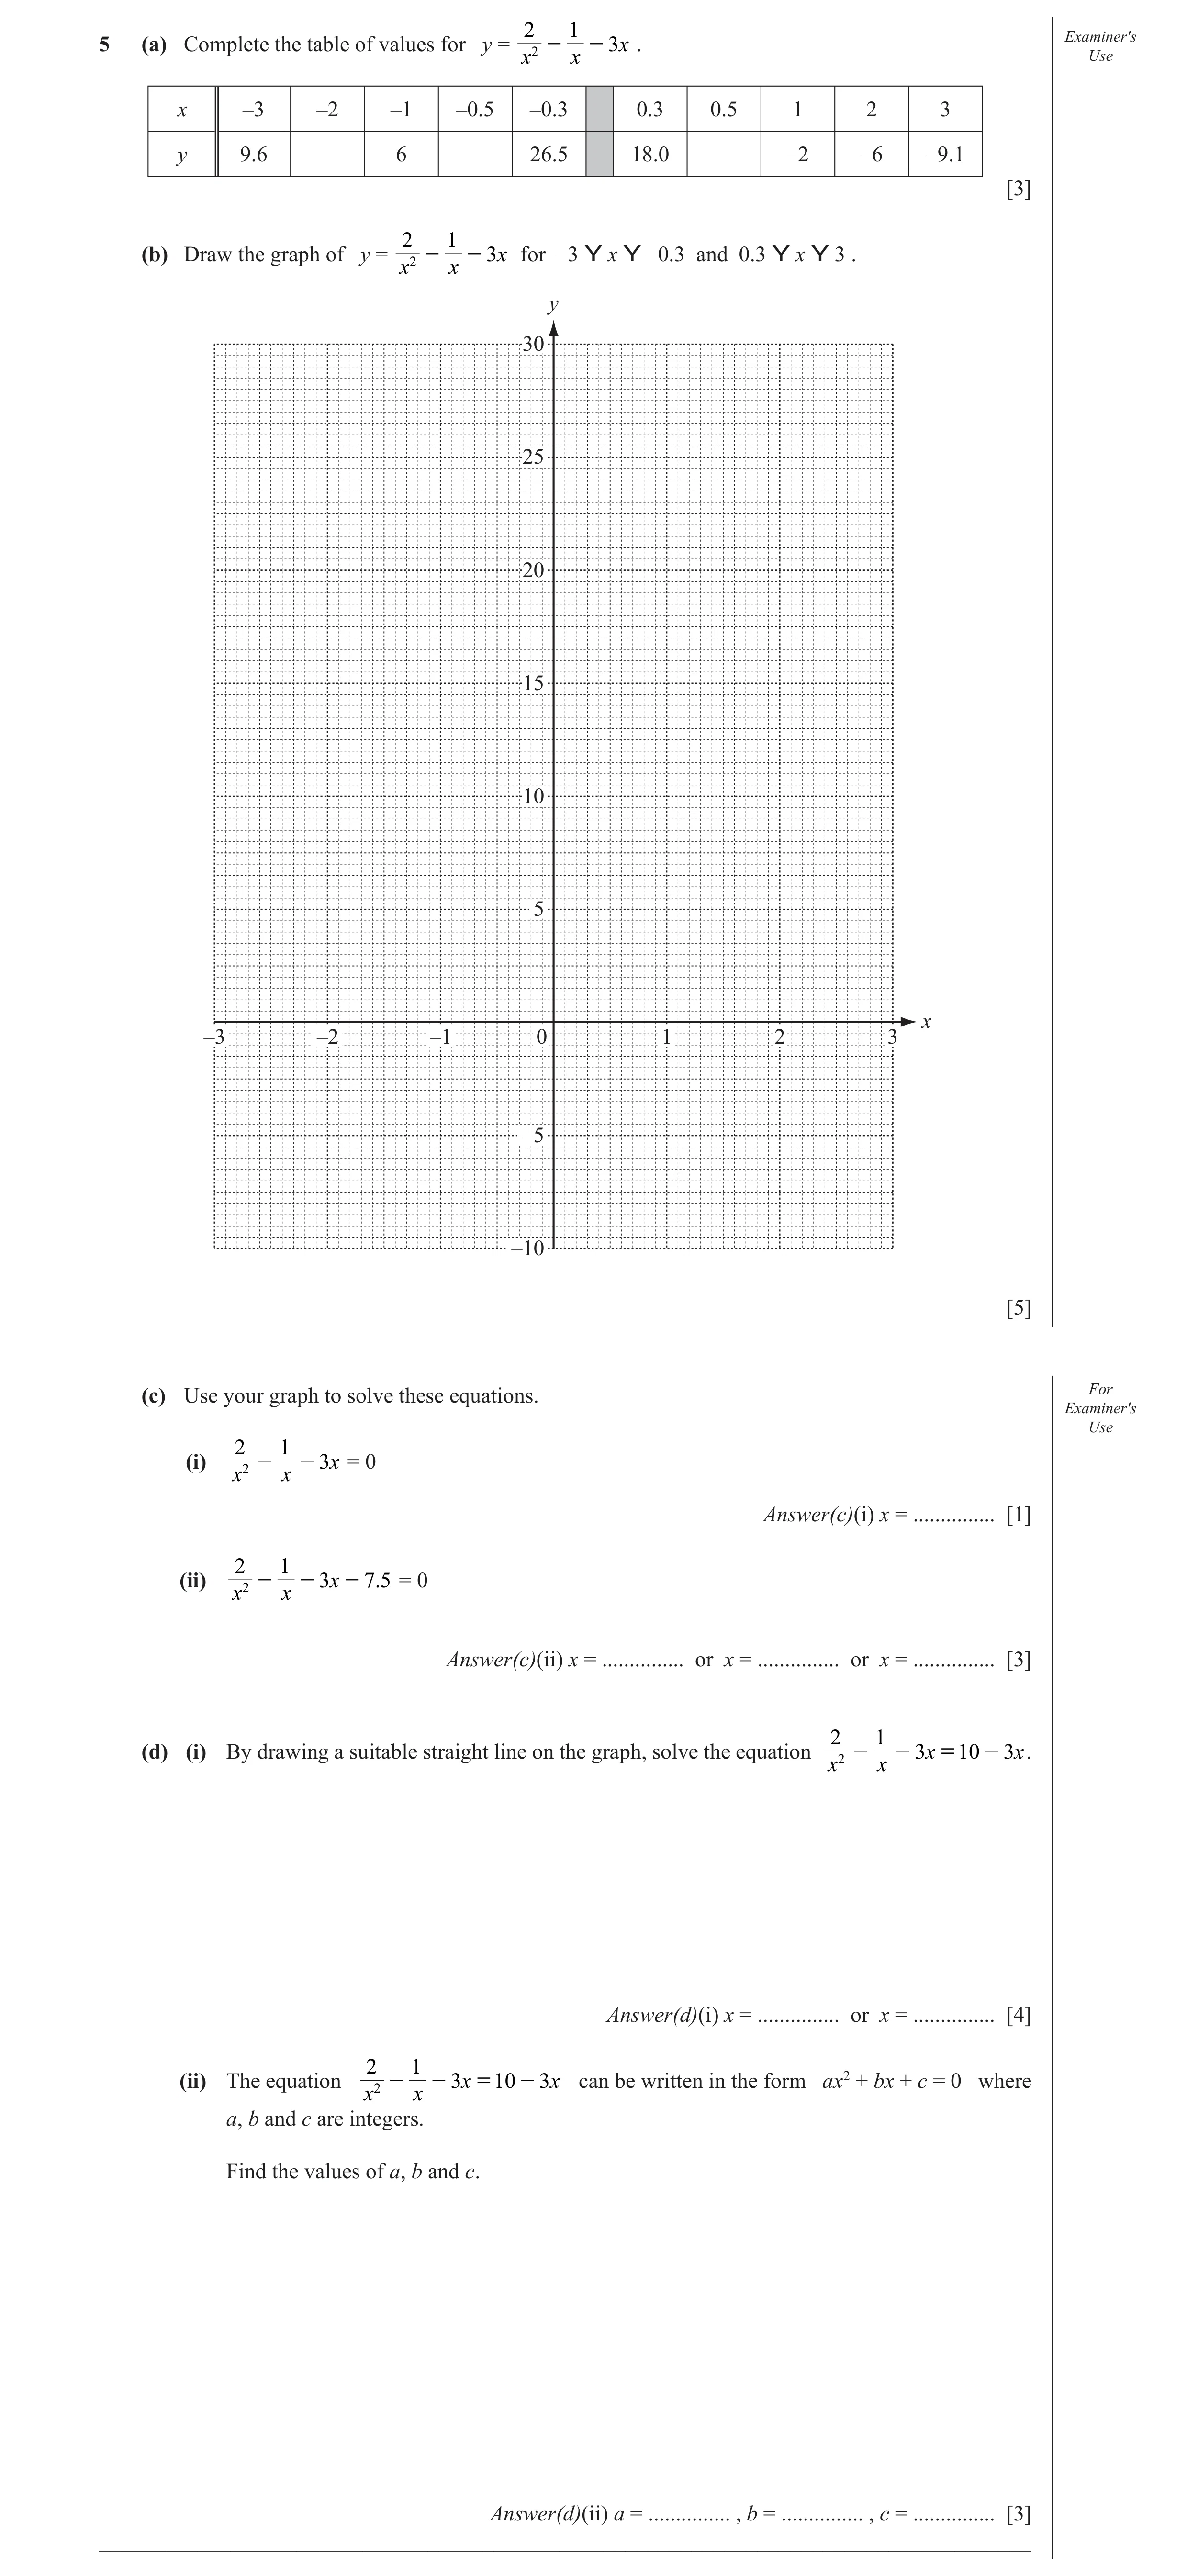
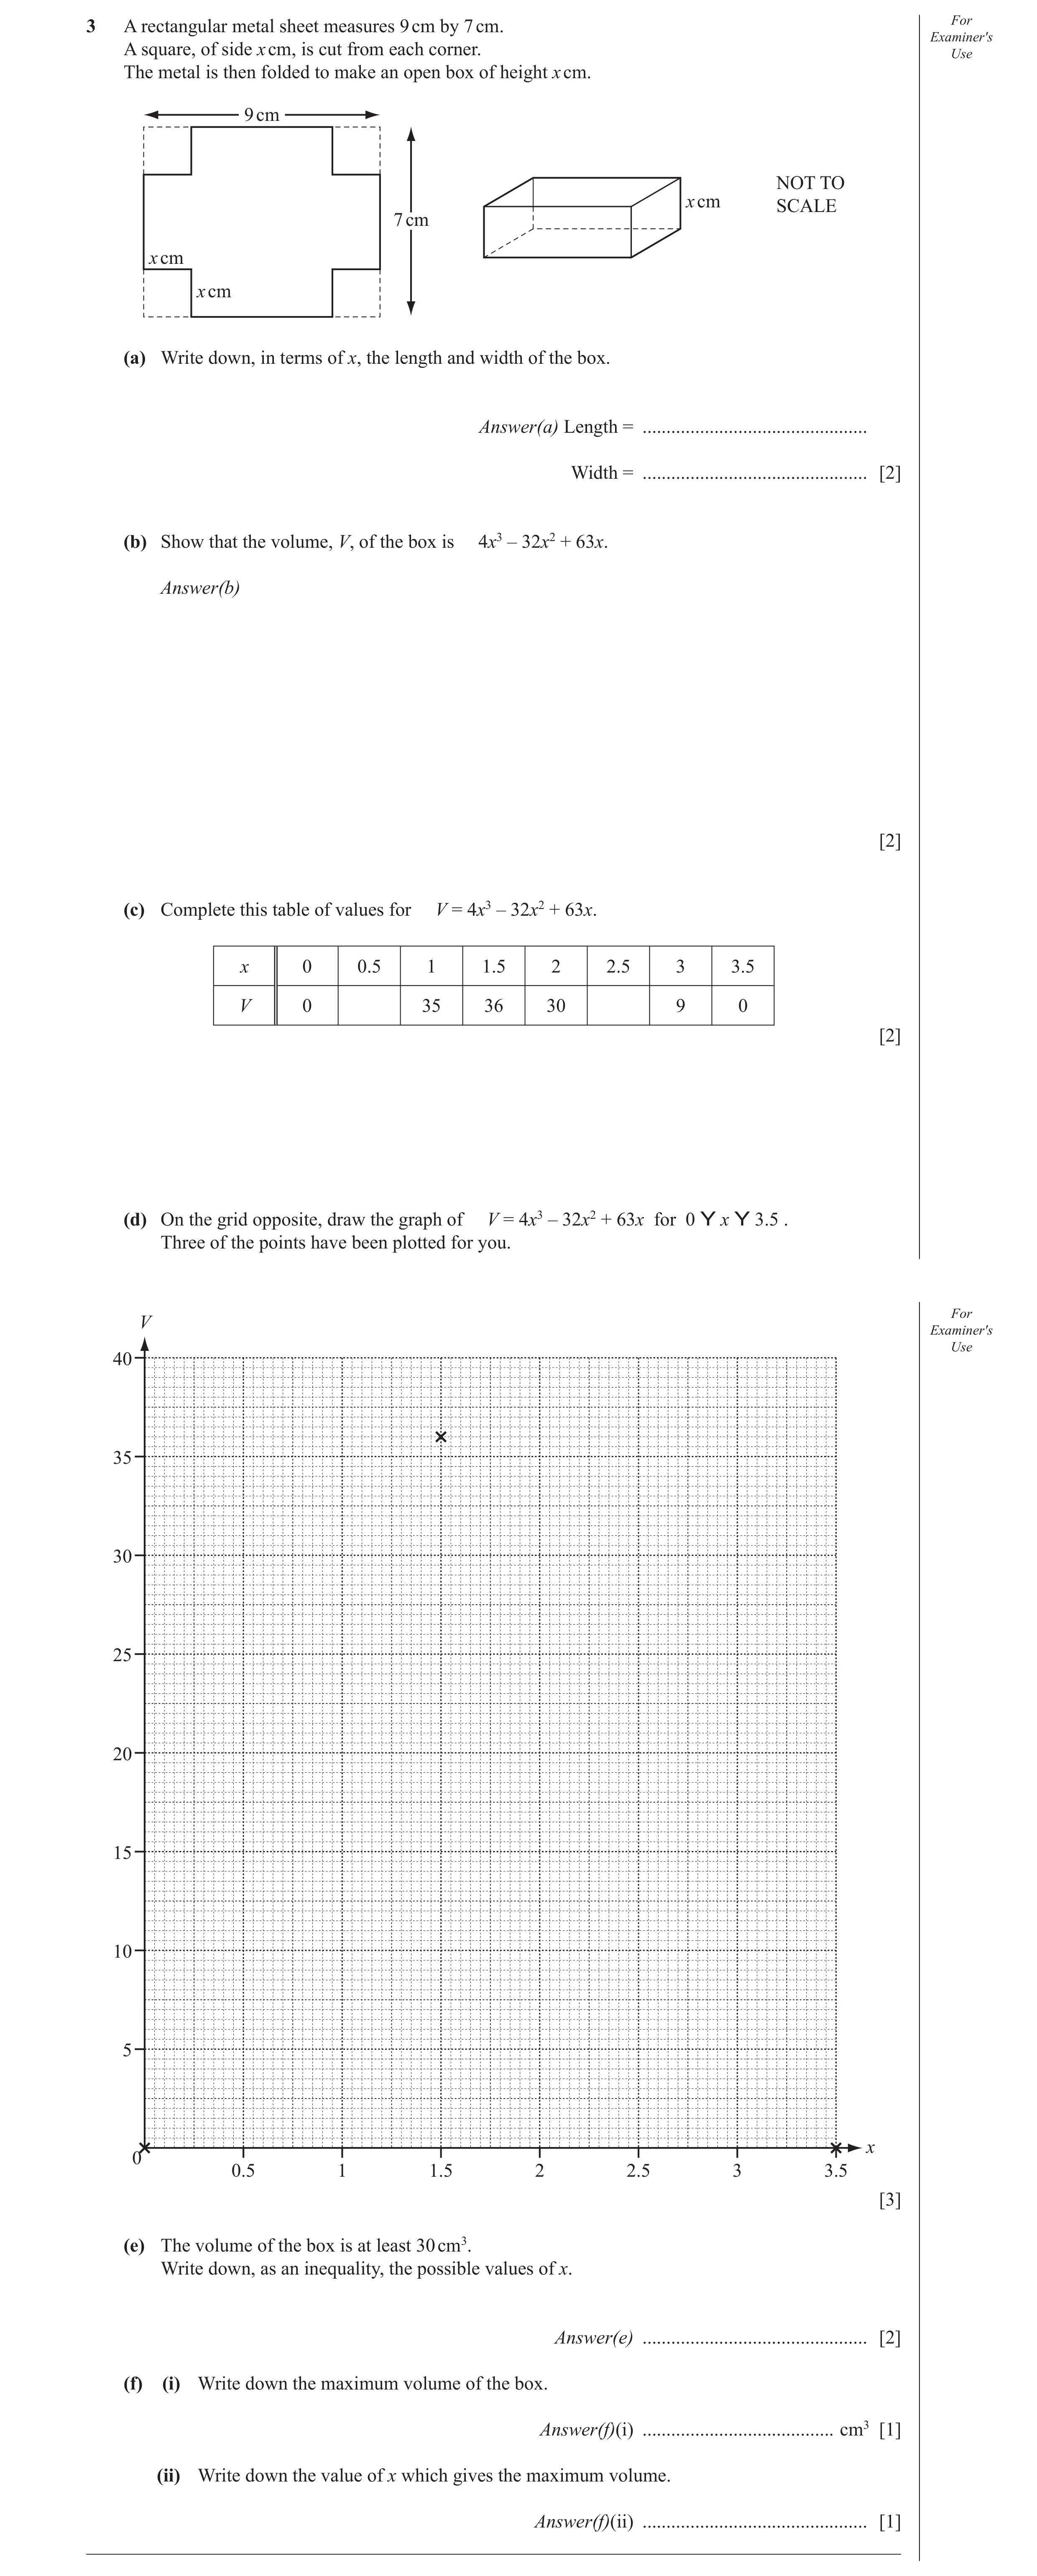
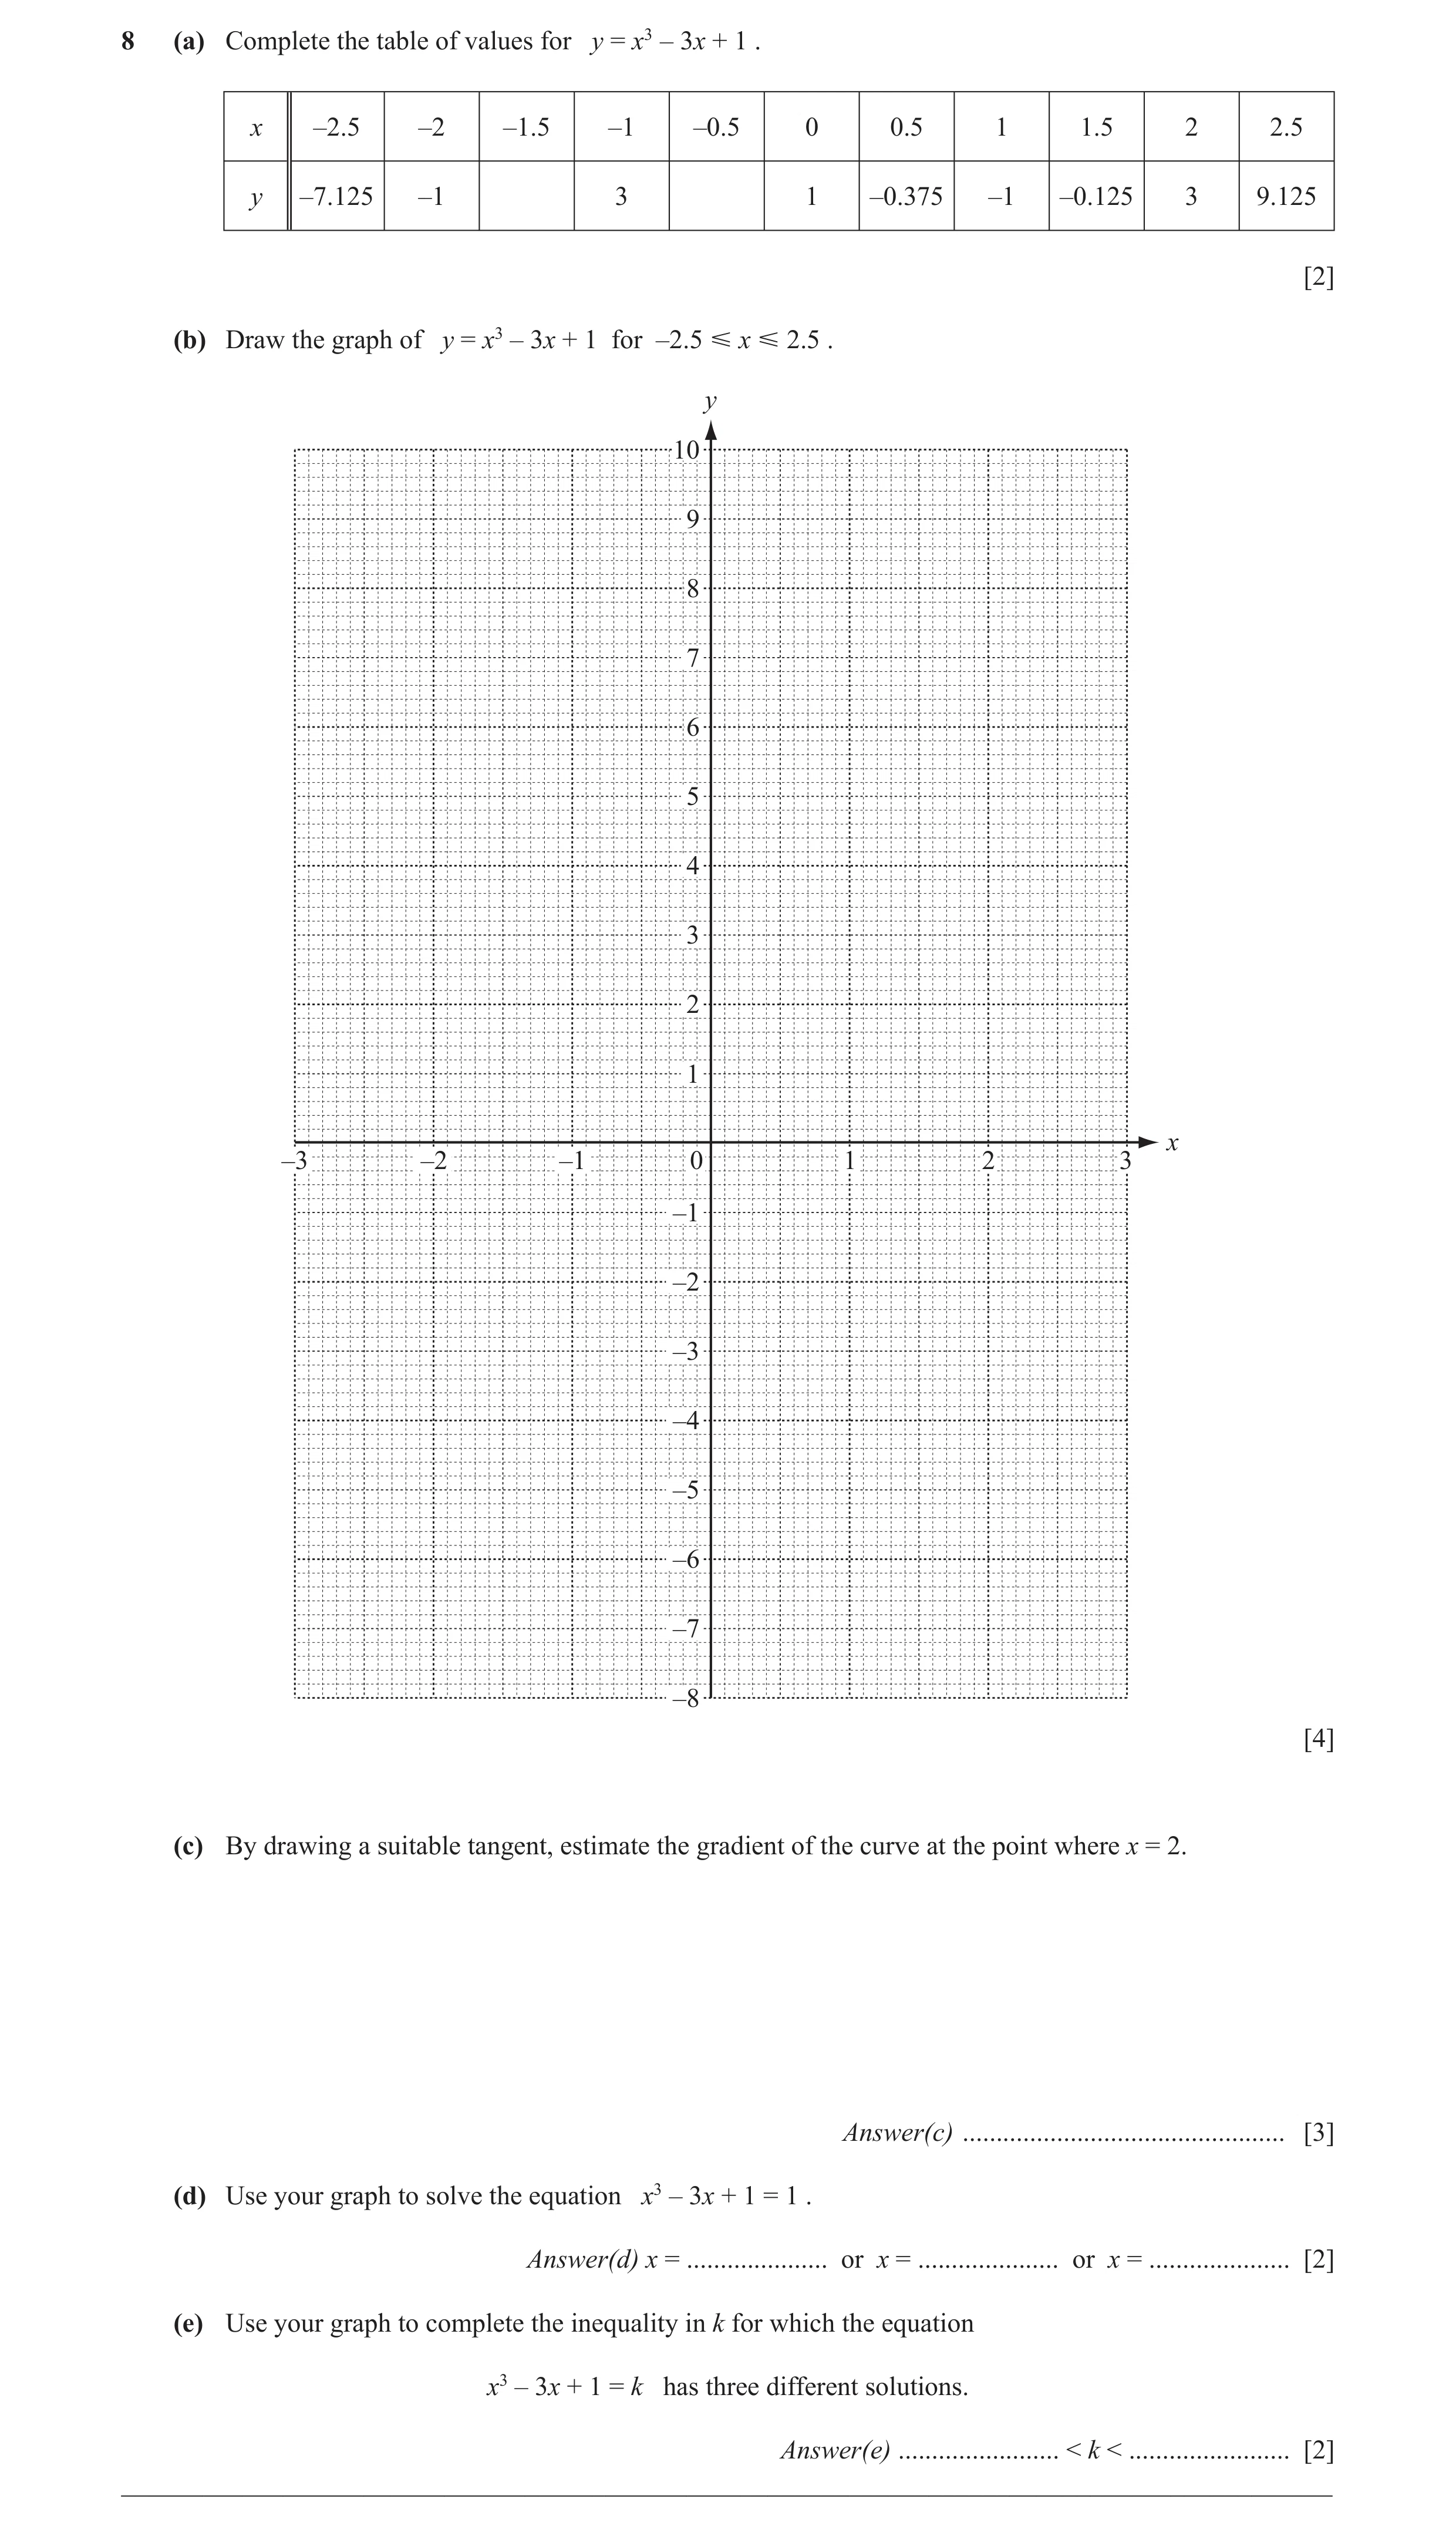
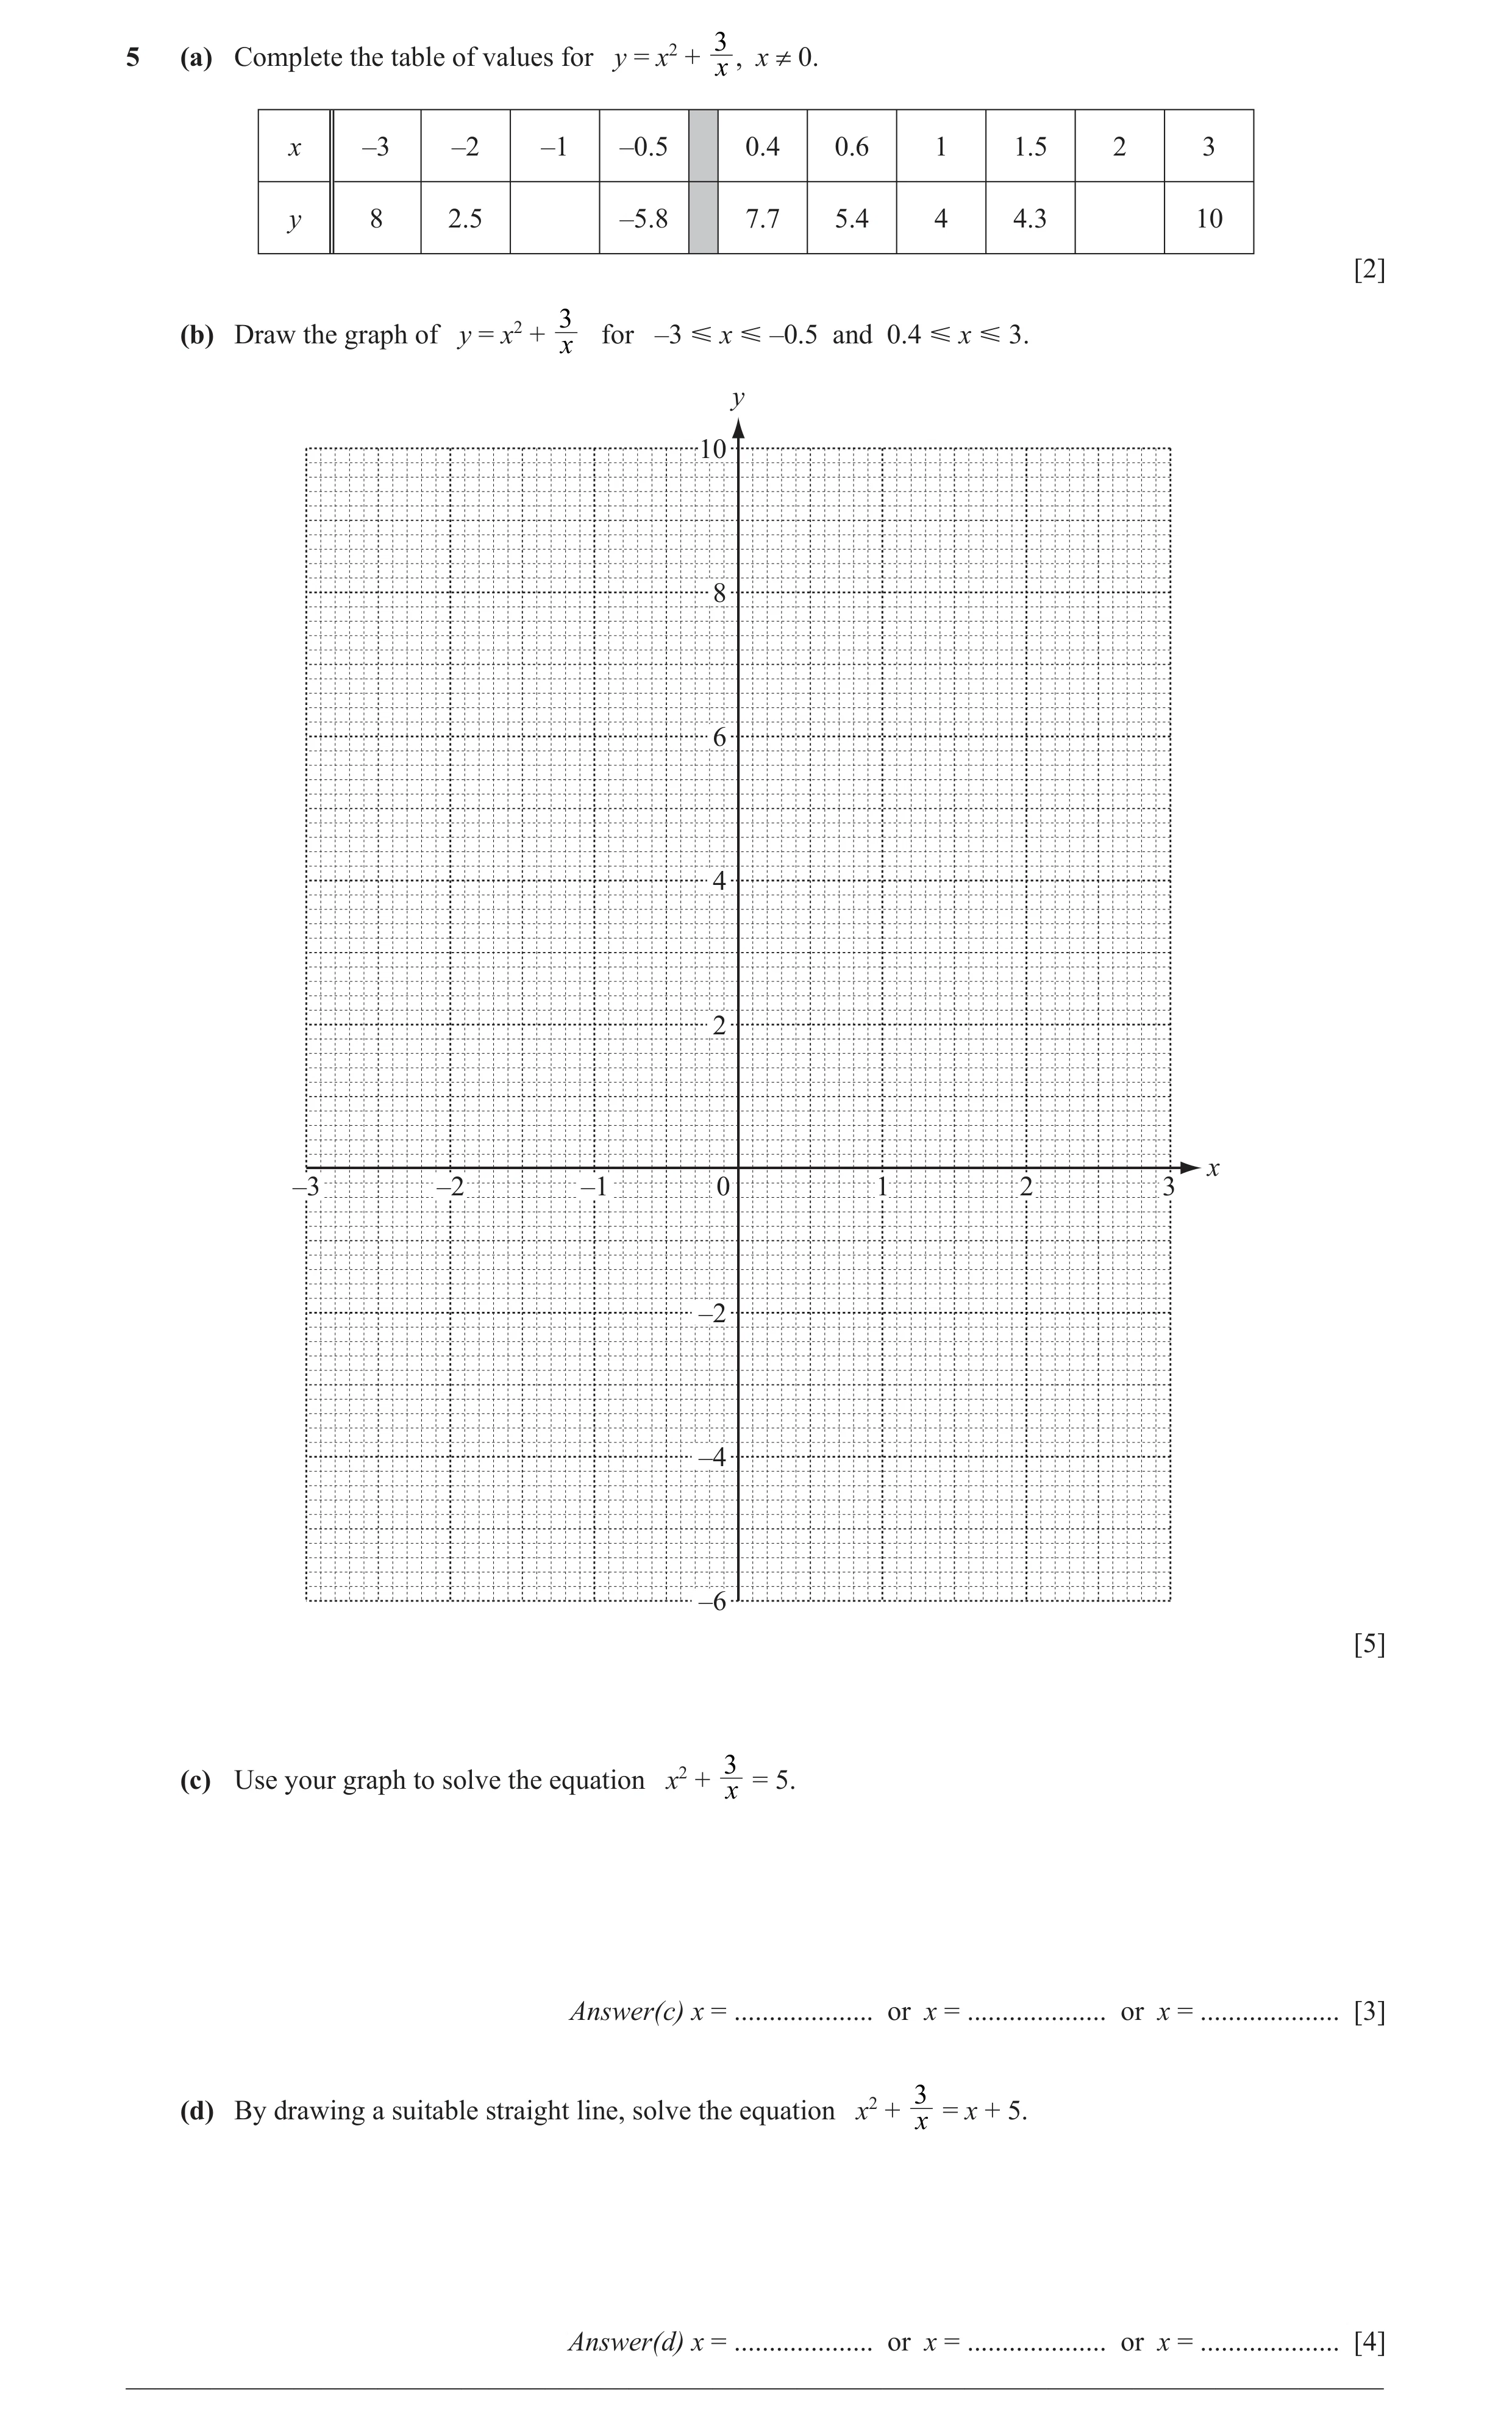
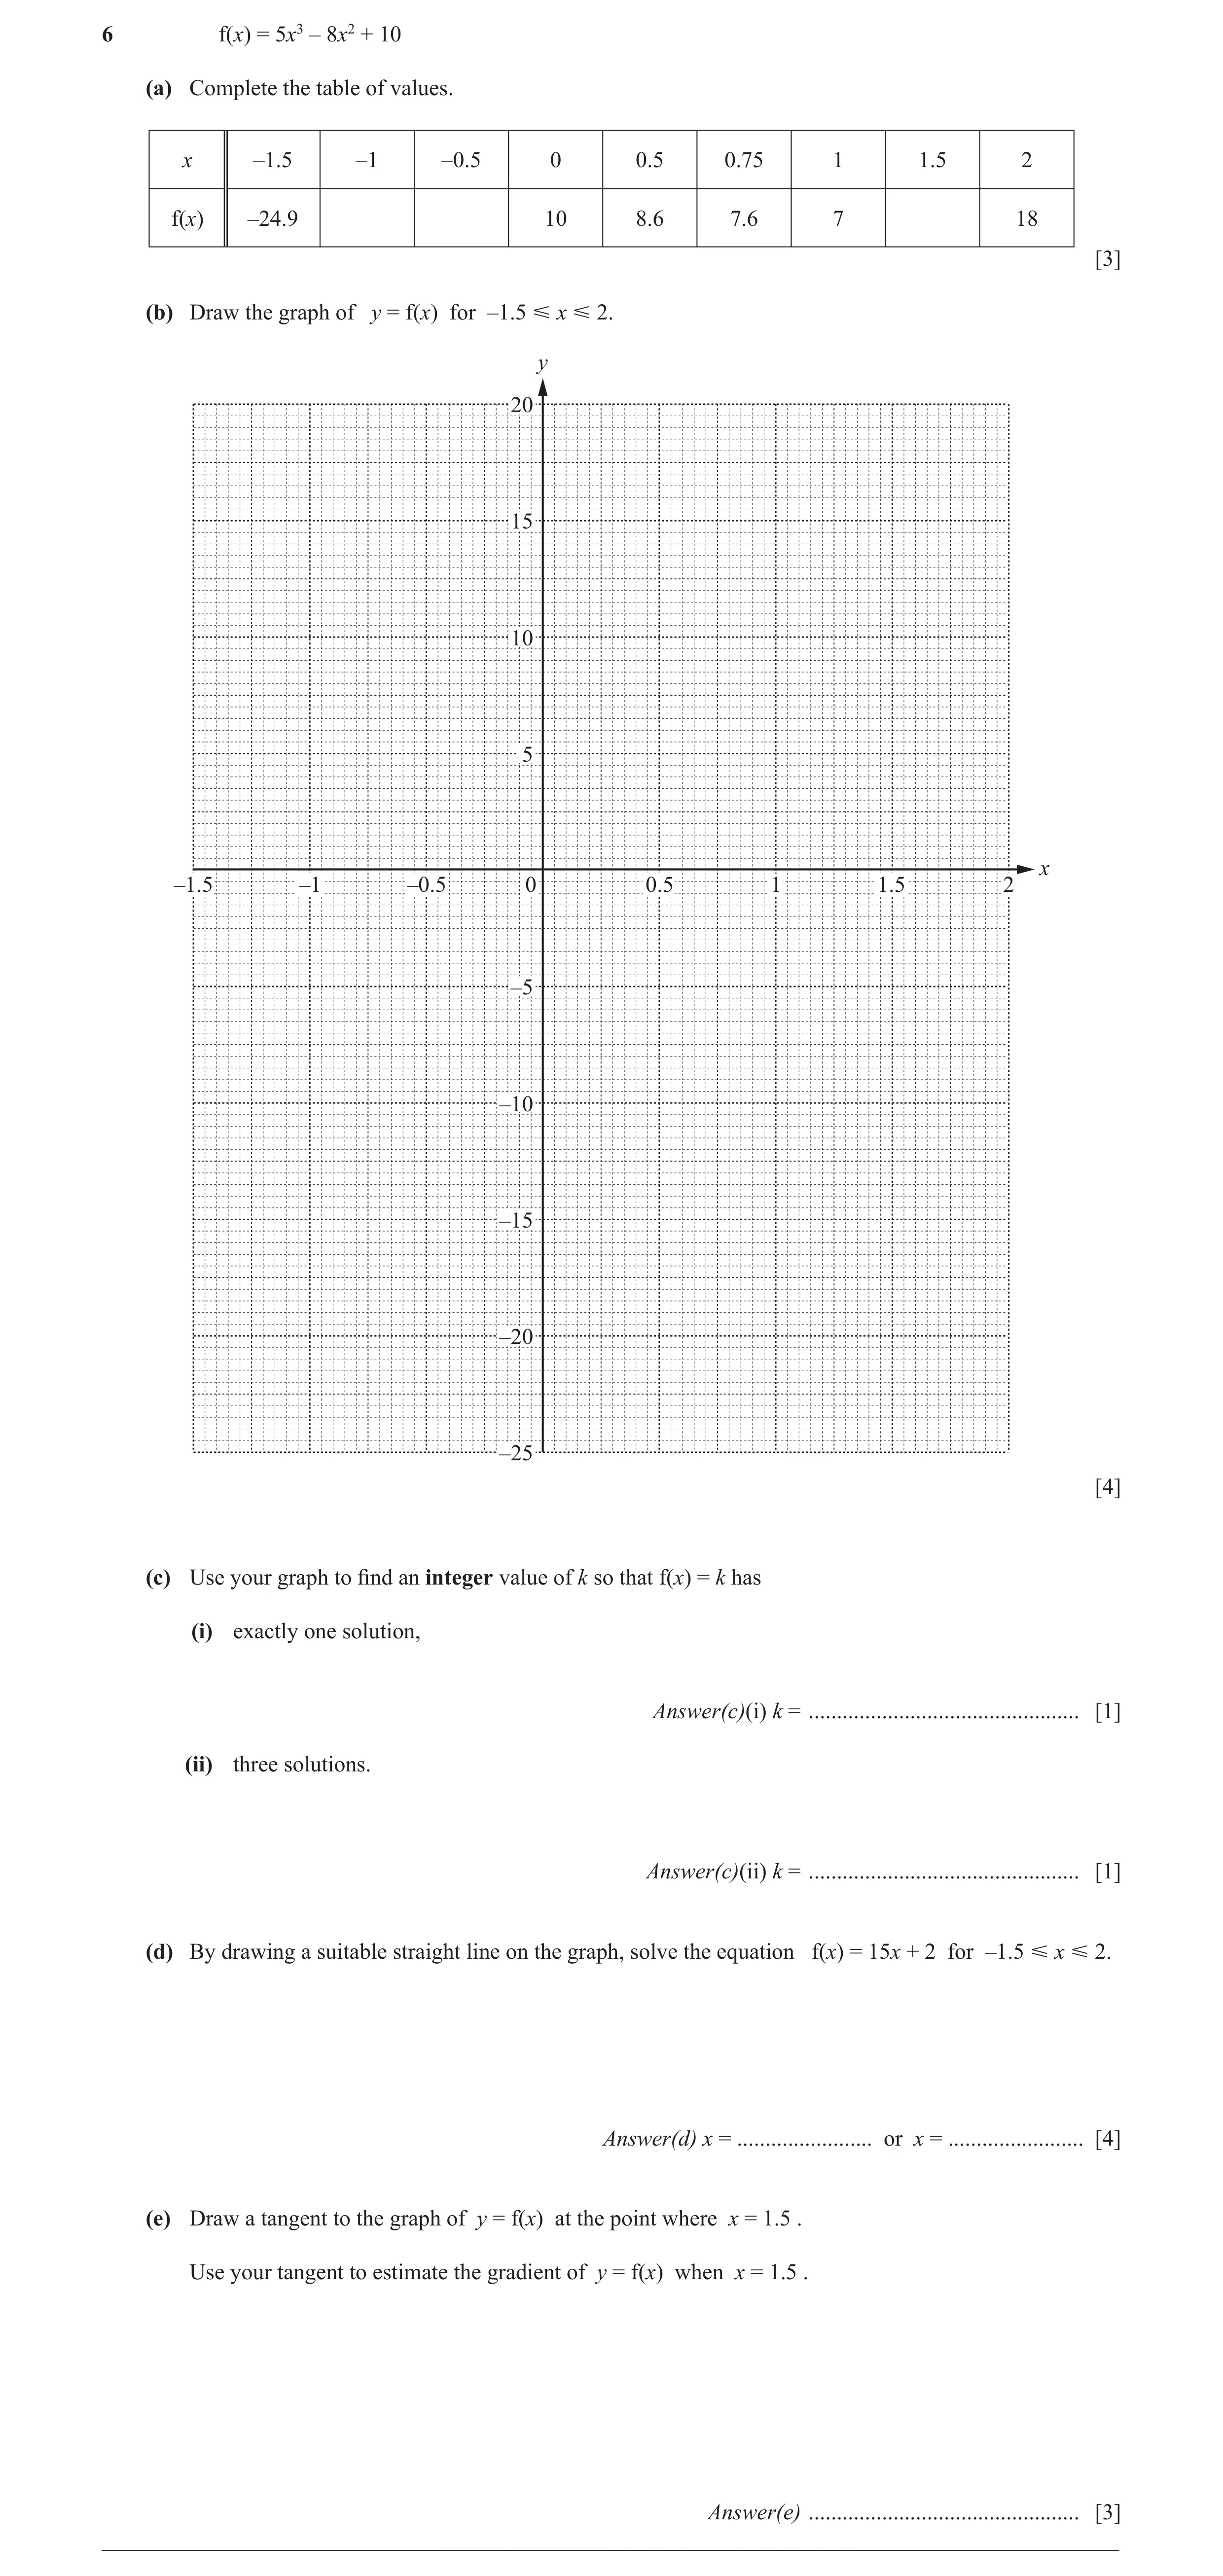
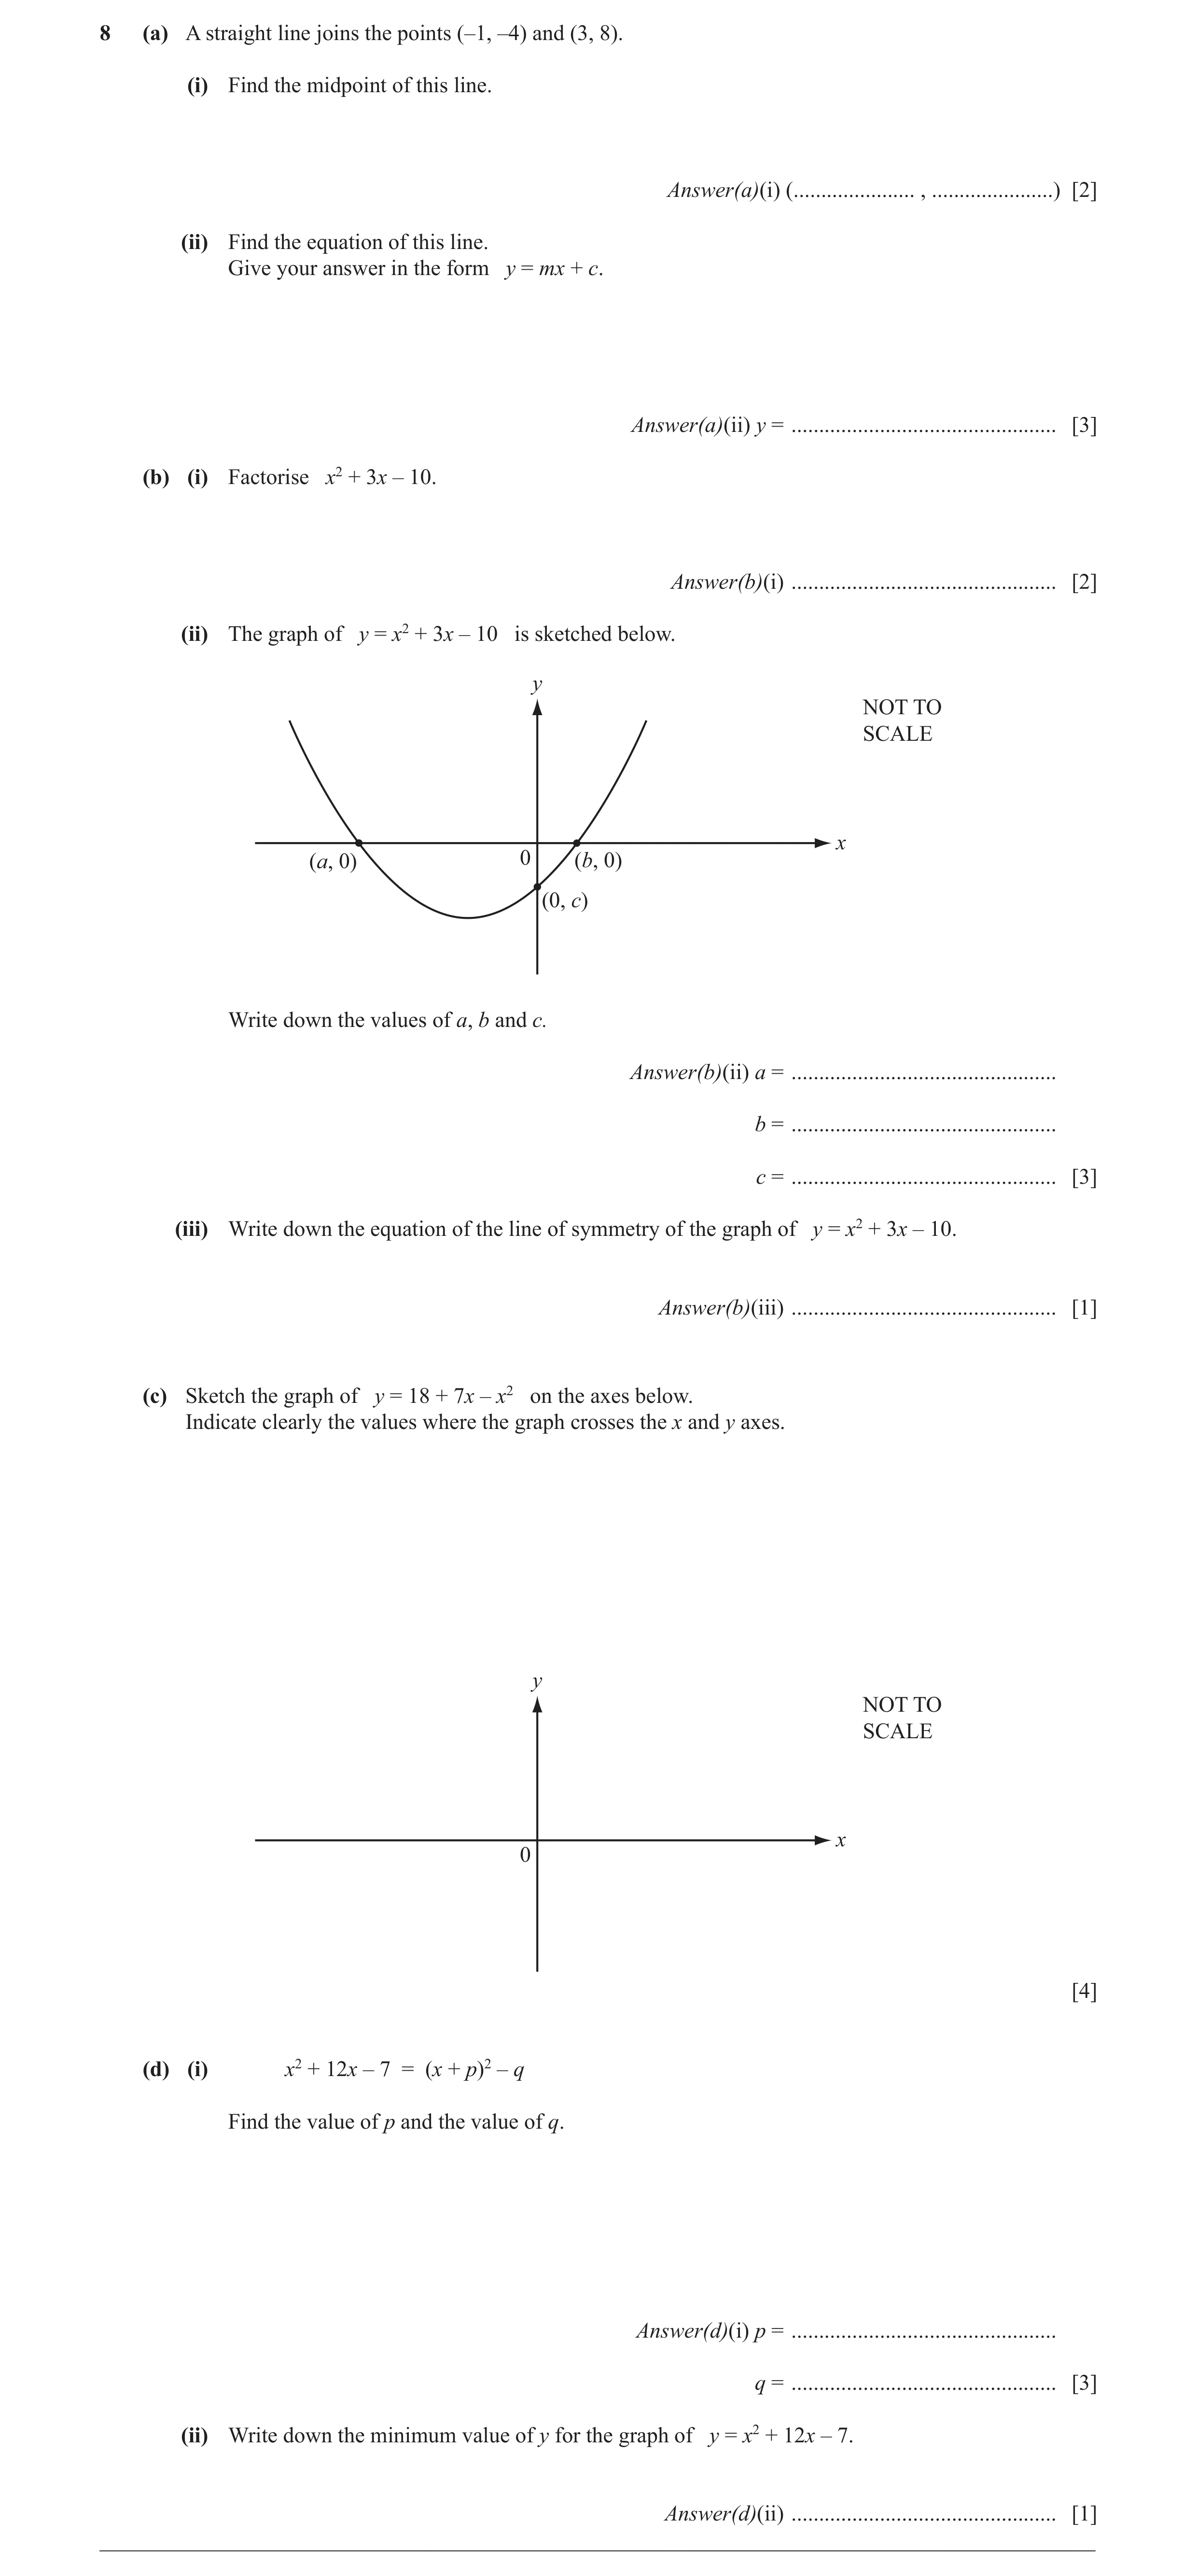
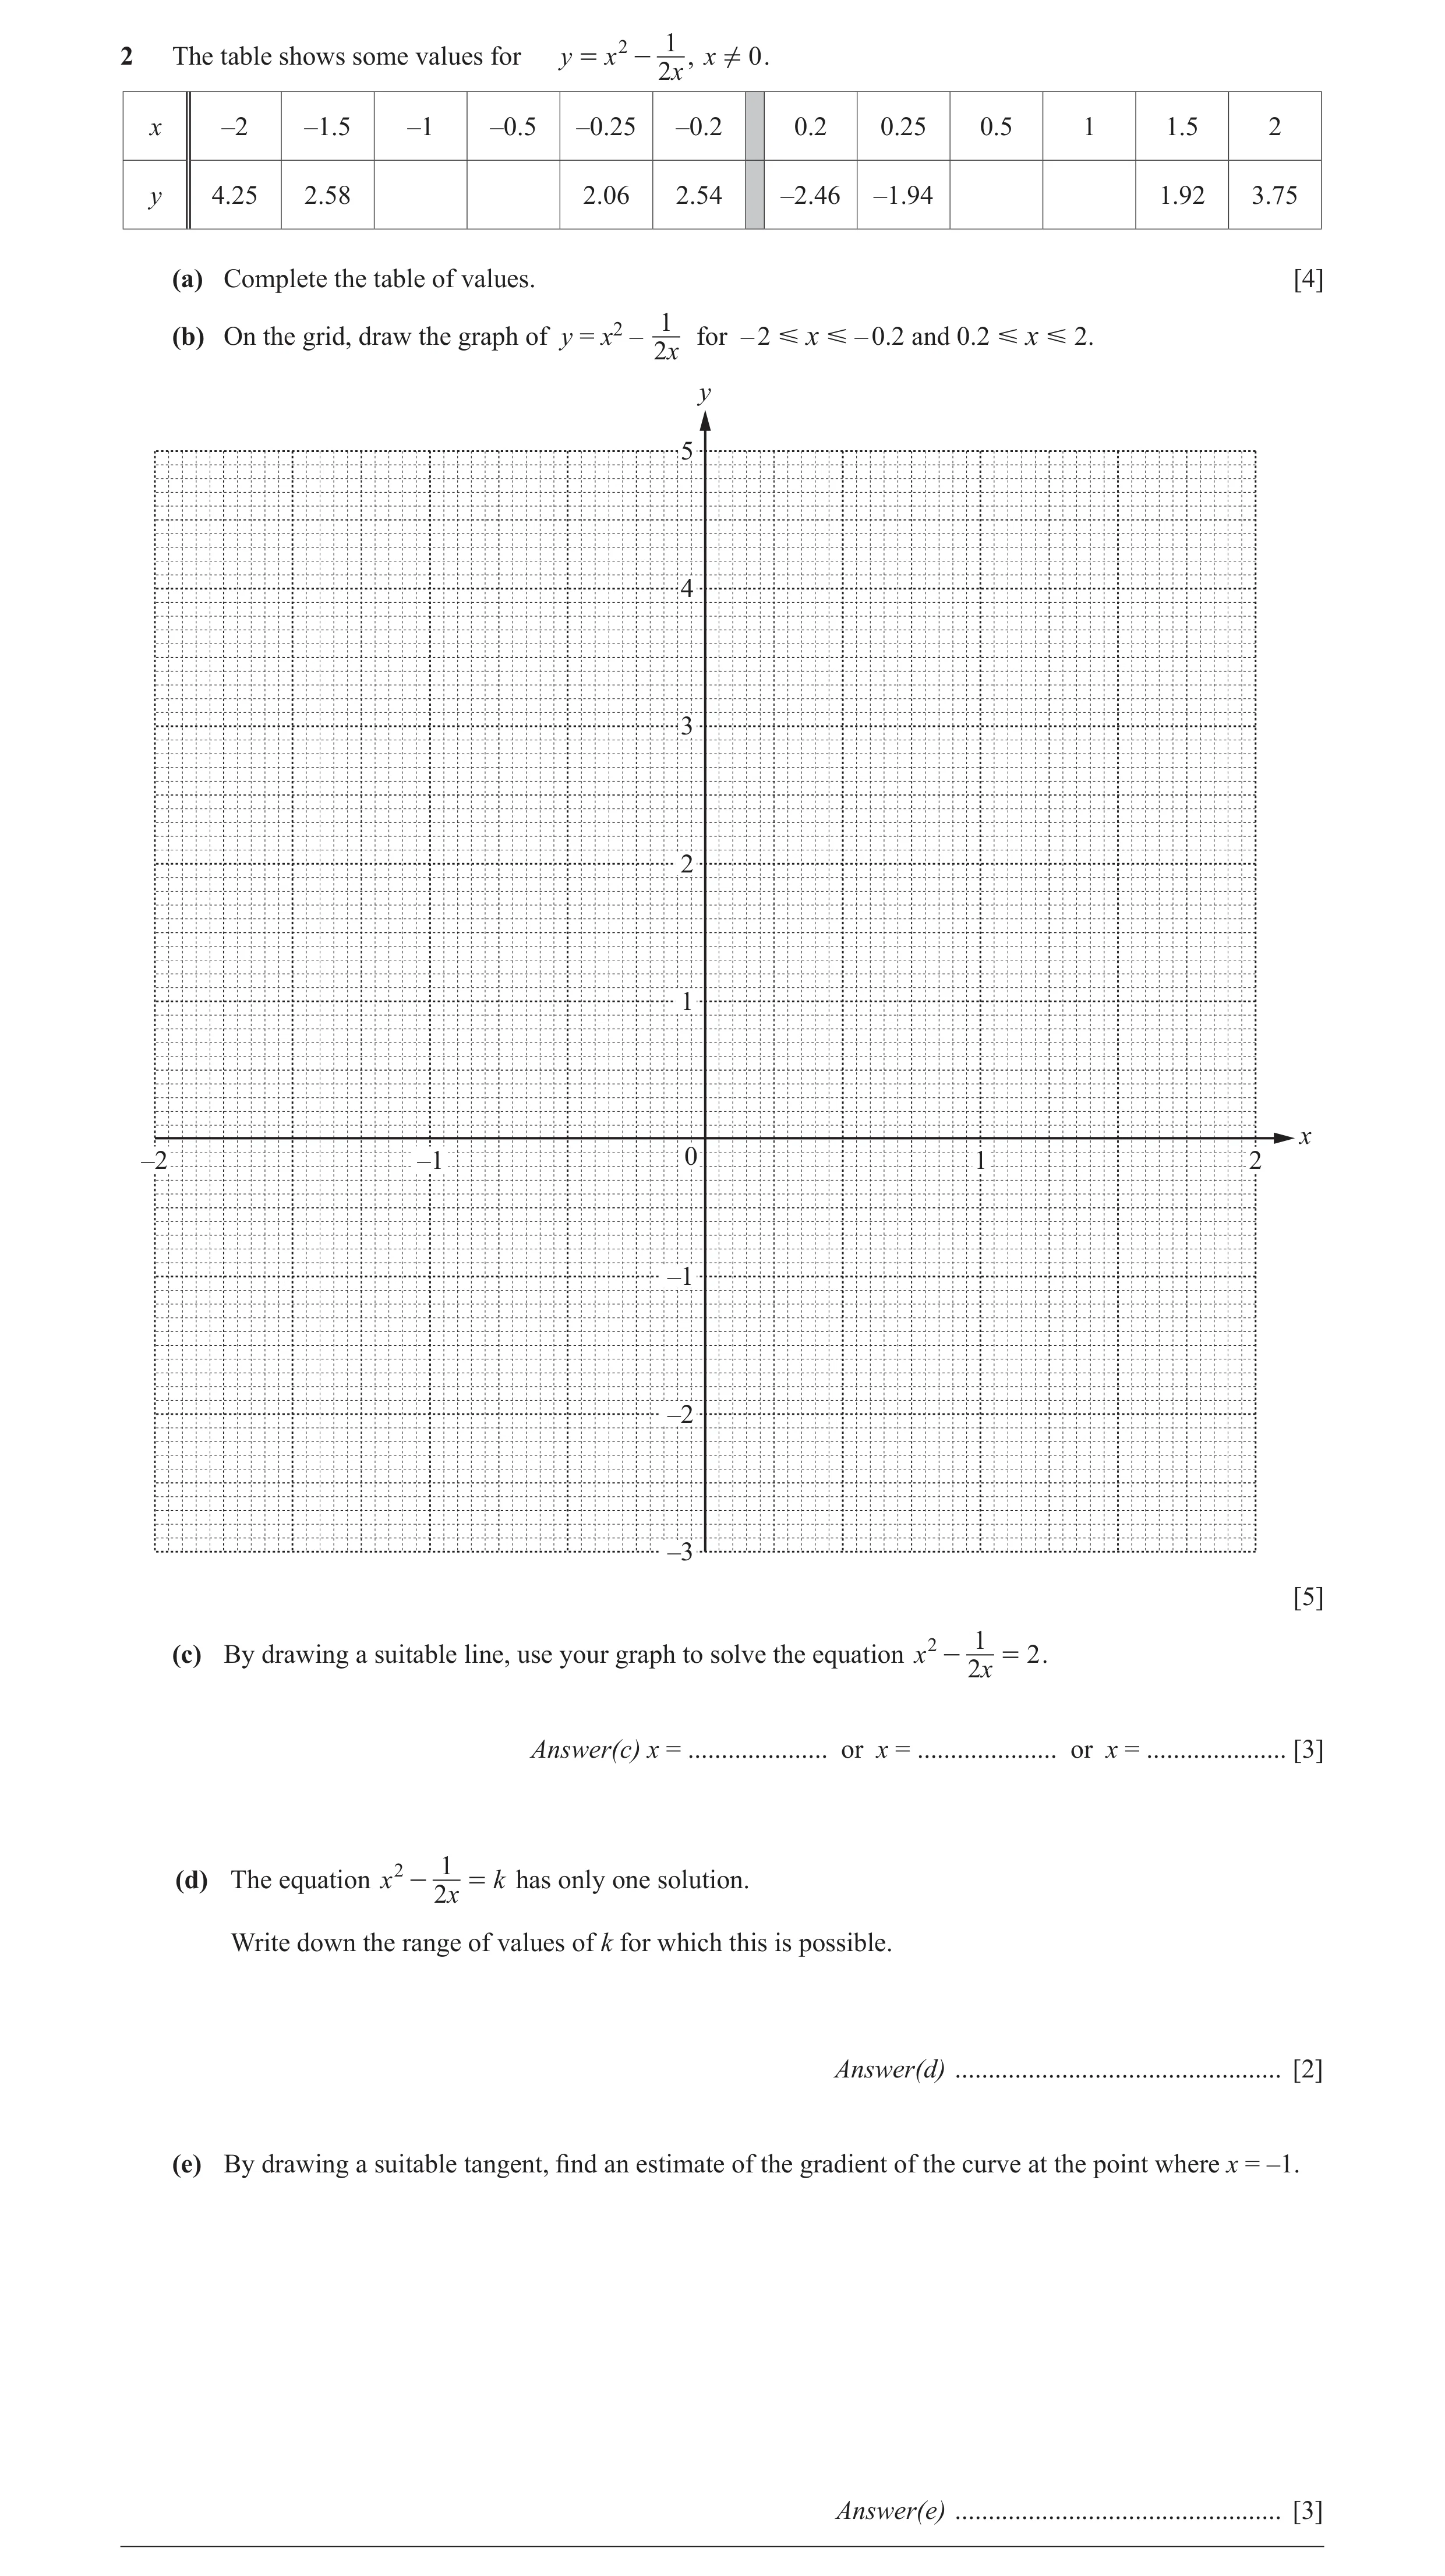
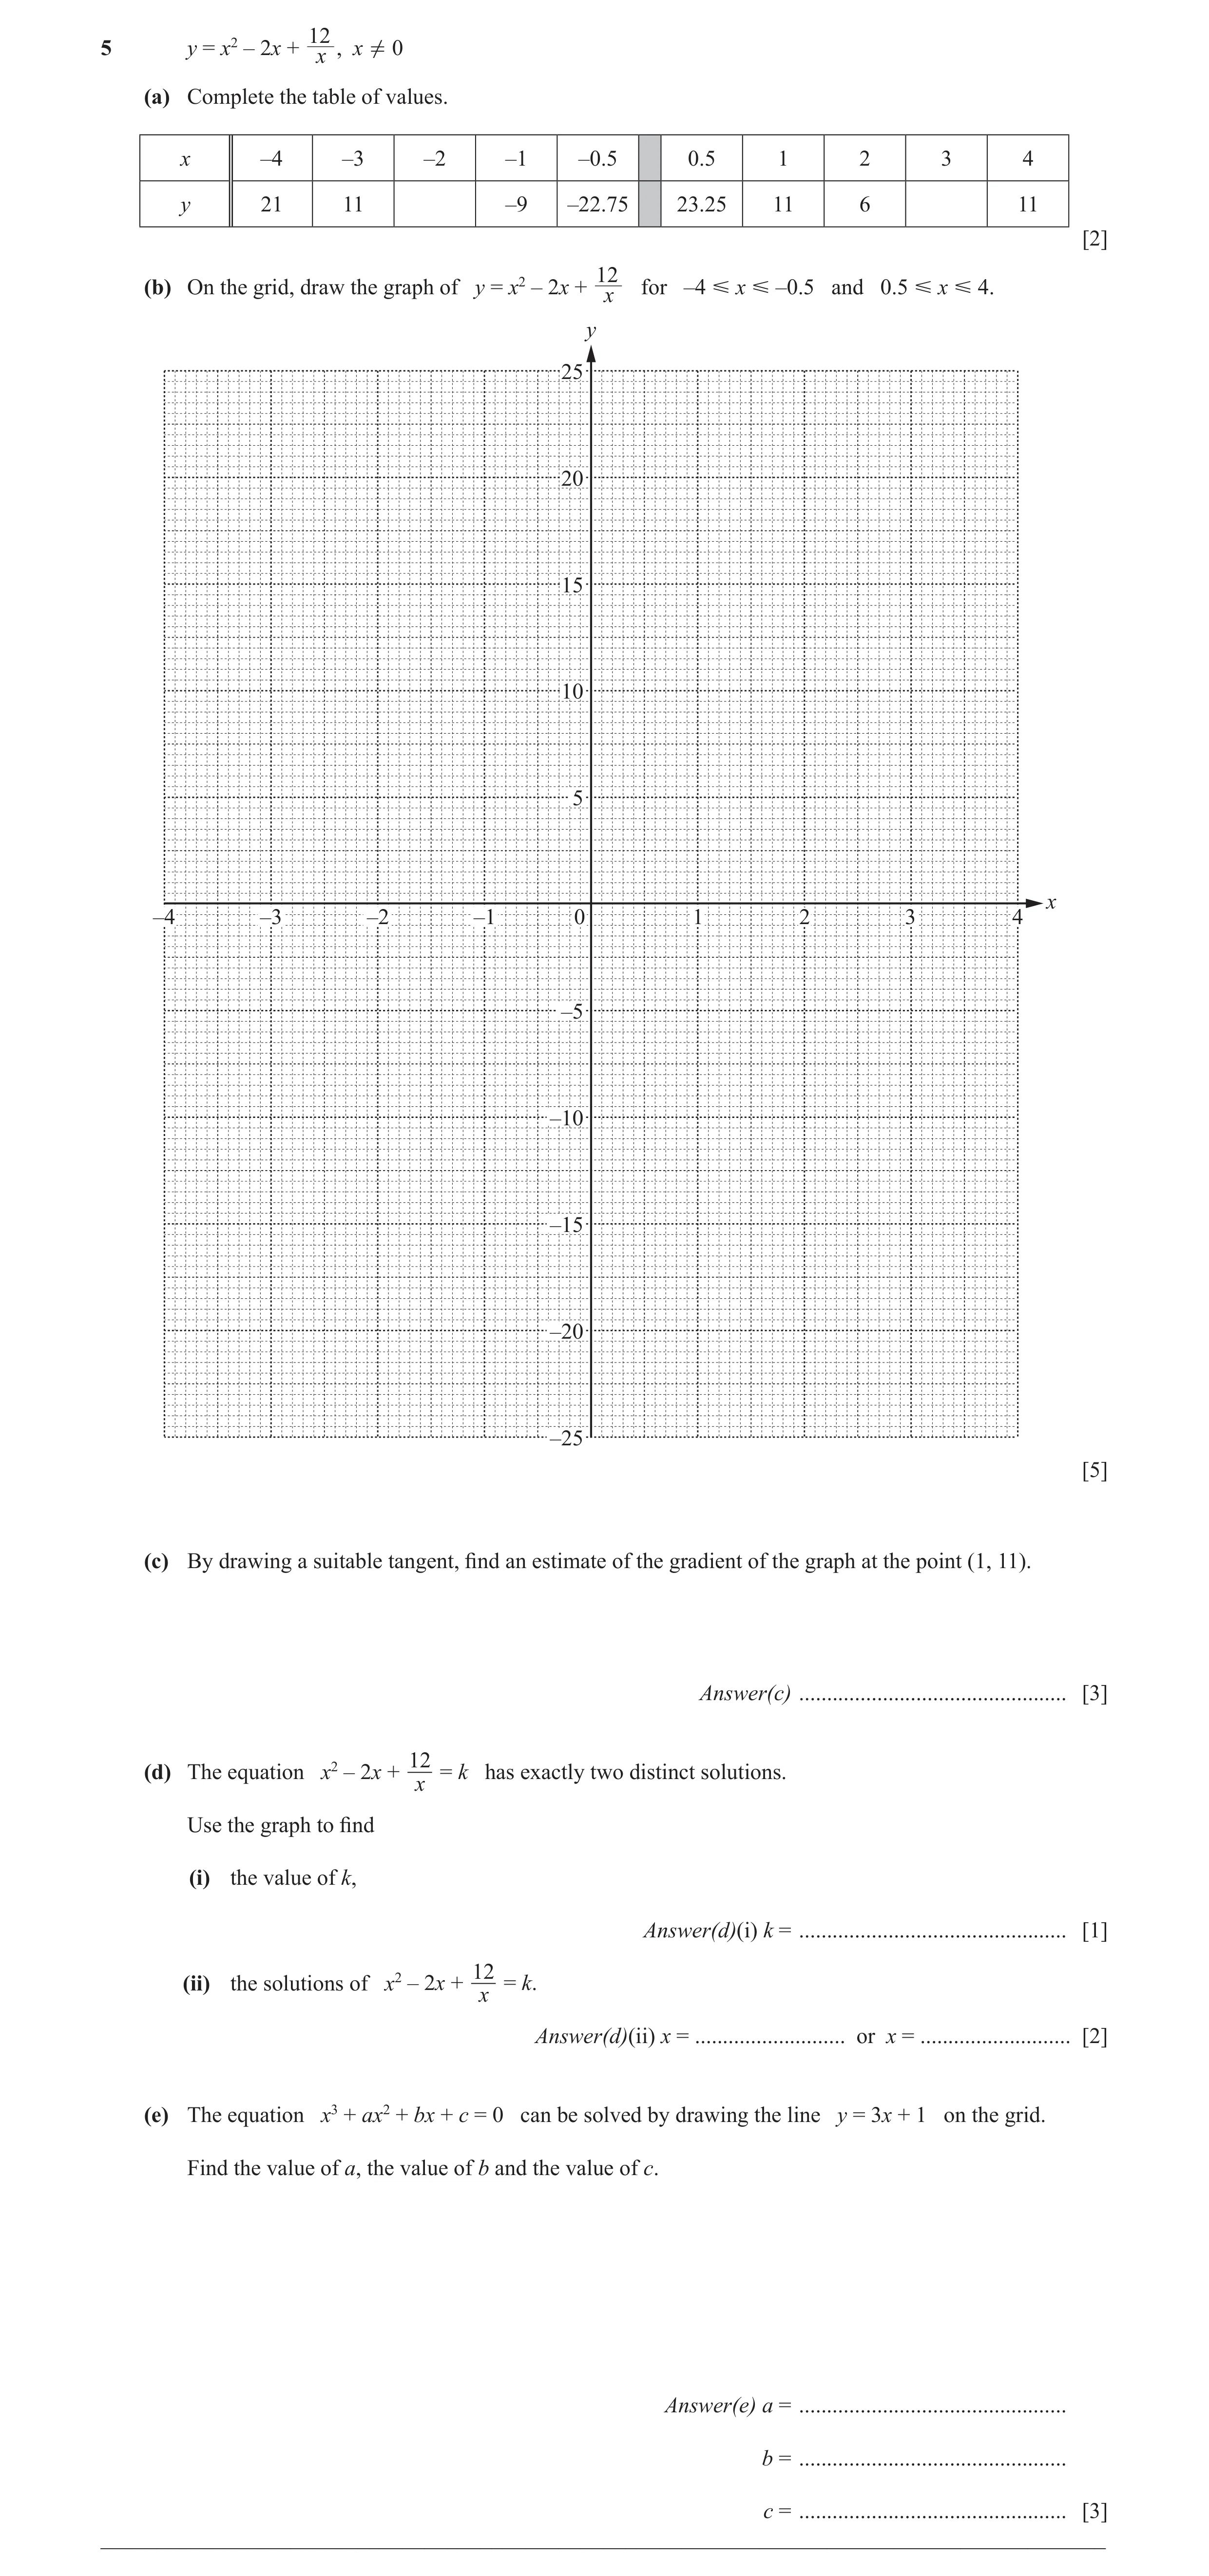
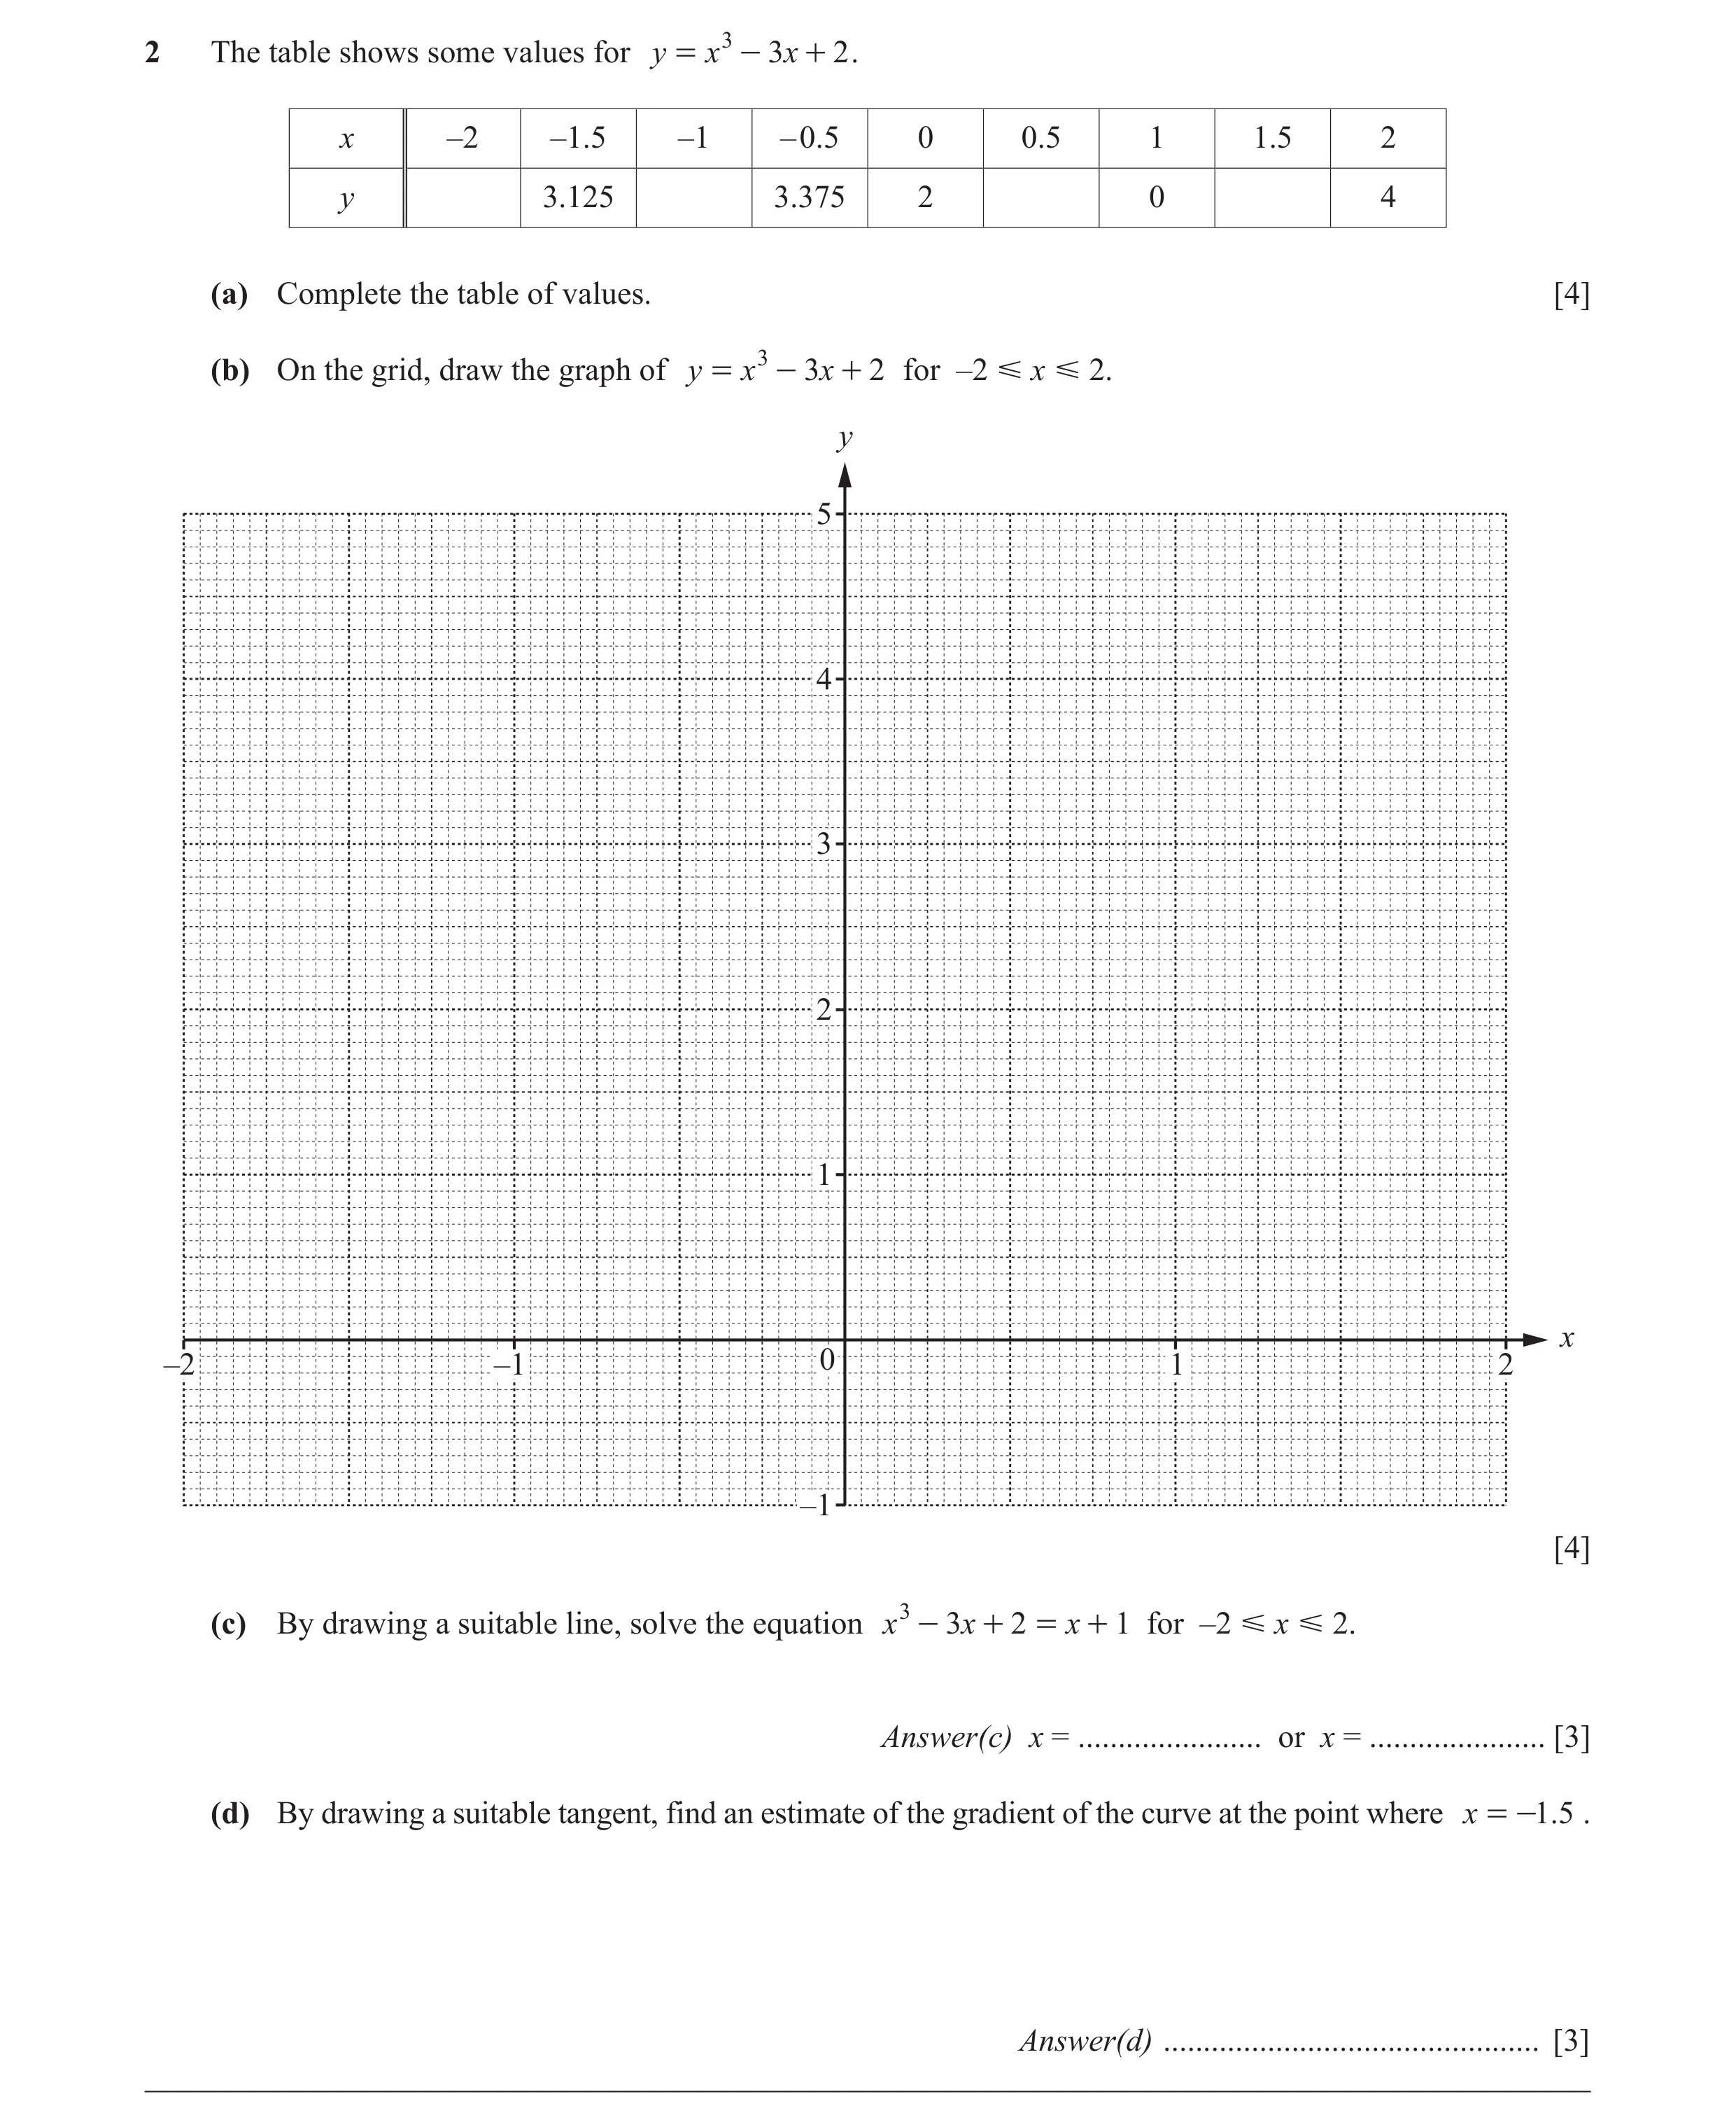 45 / 126
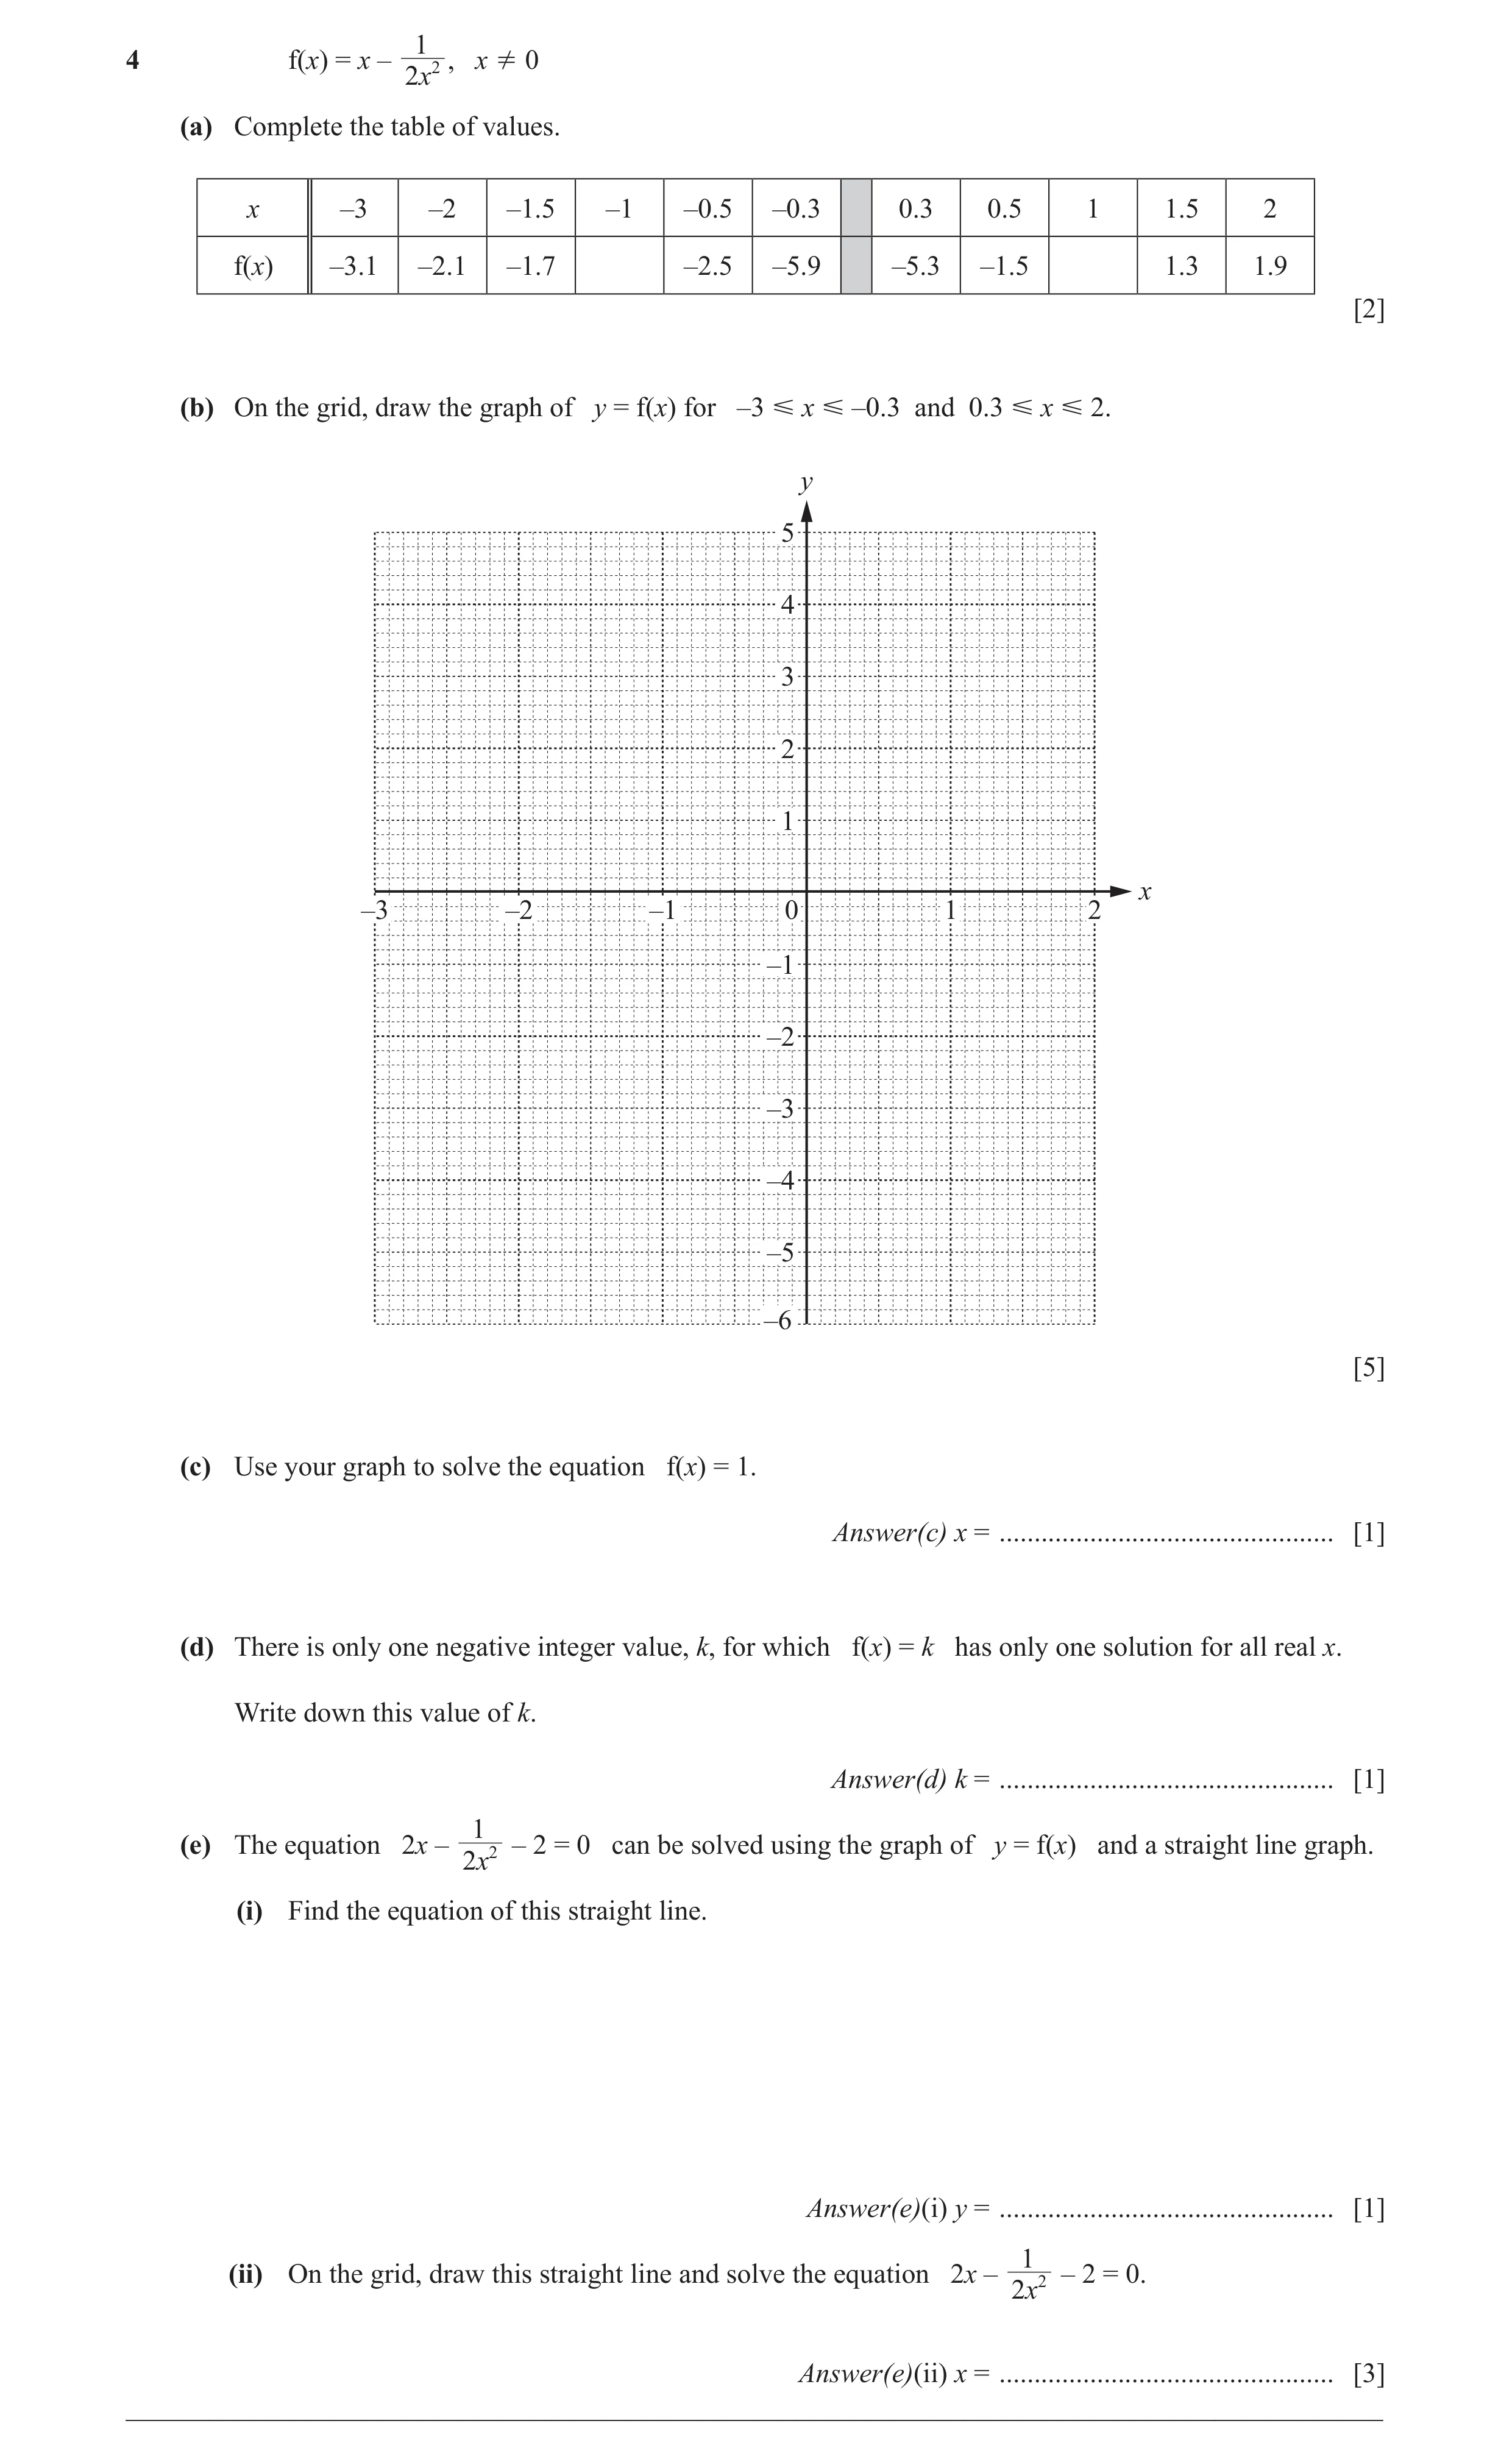
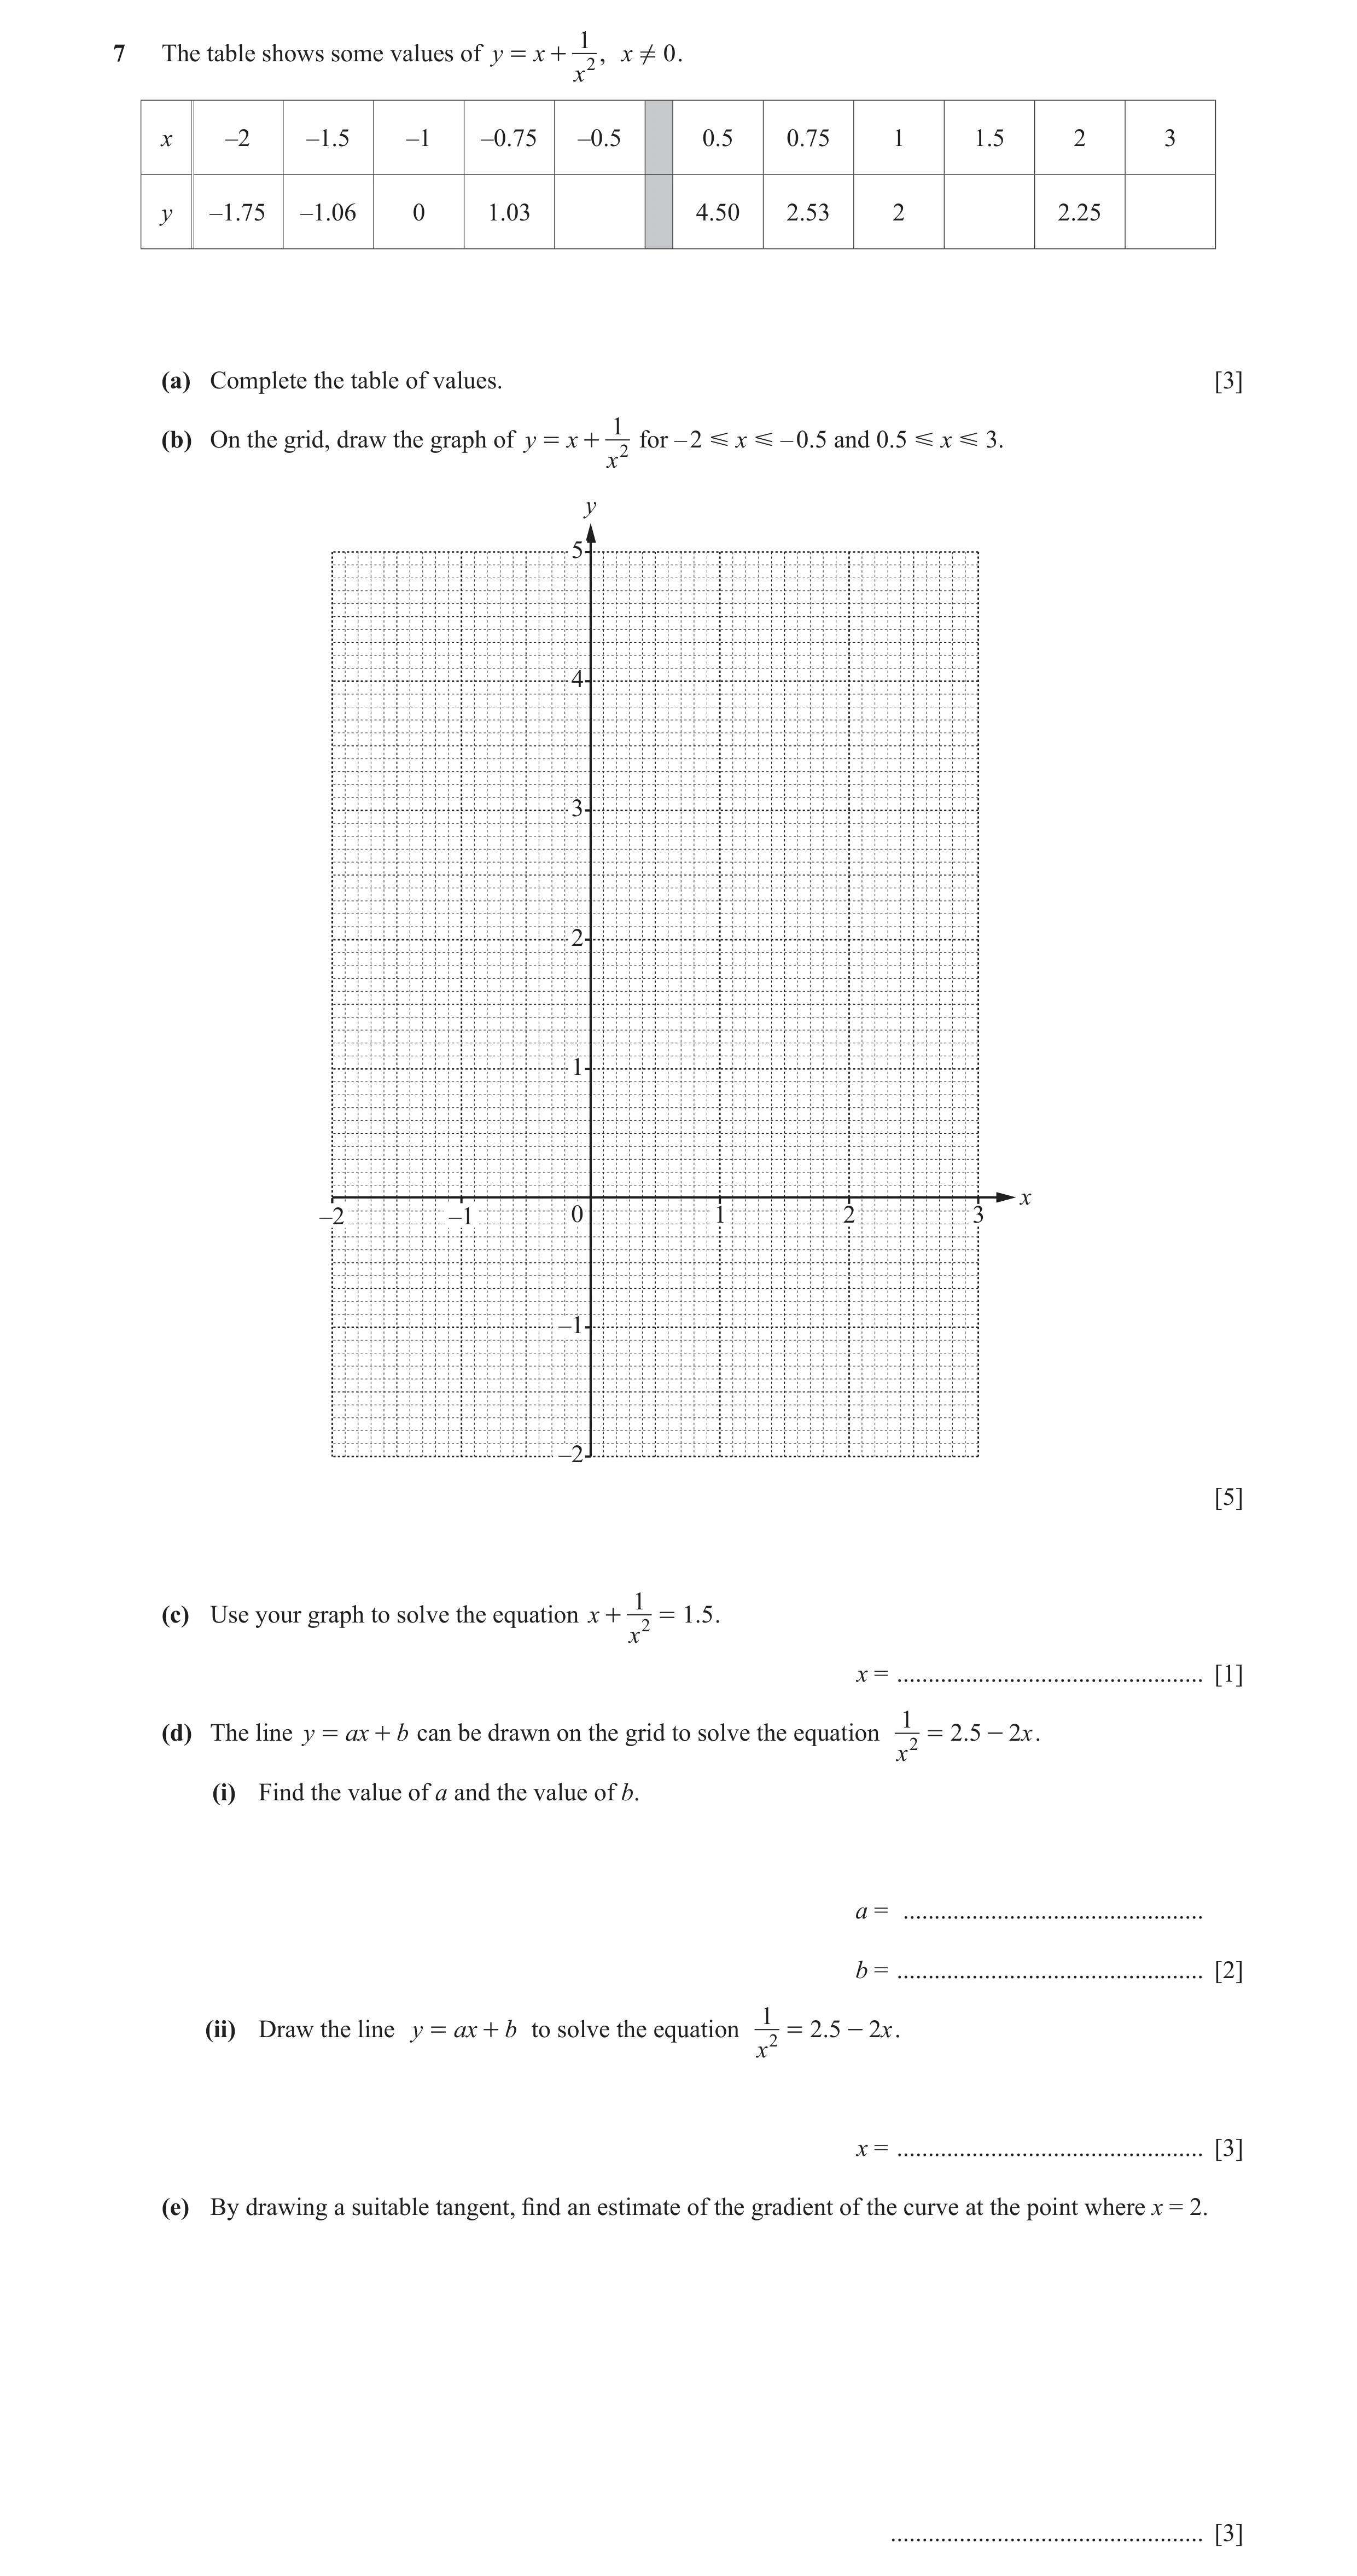
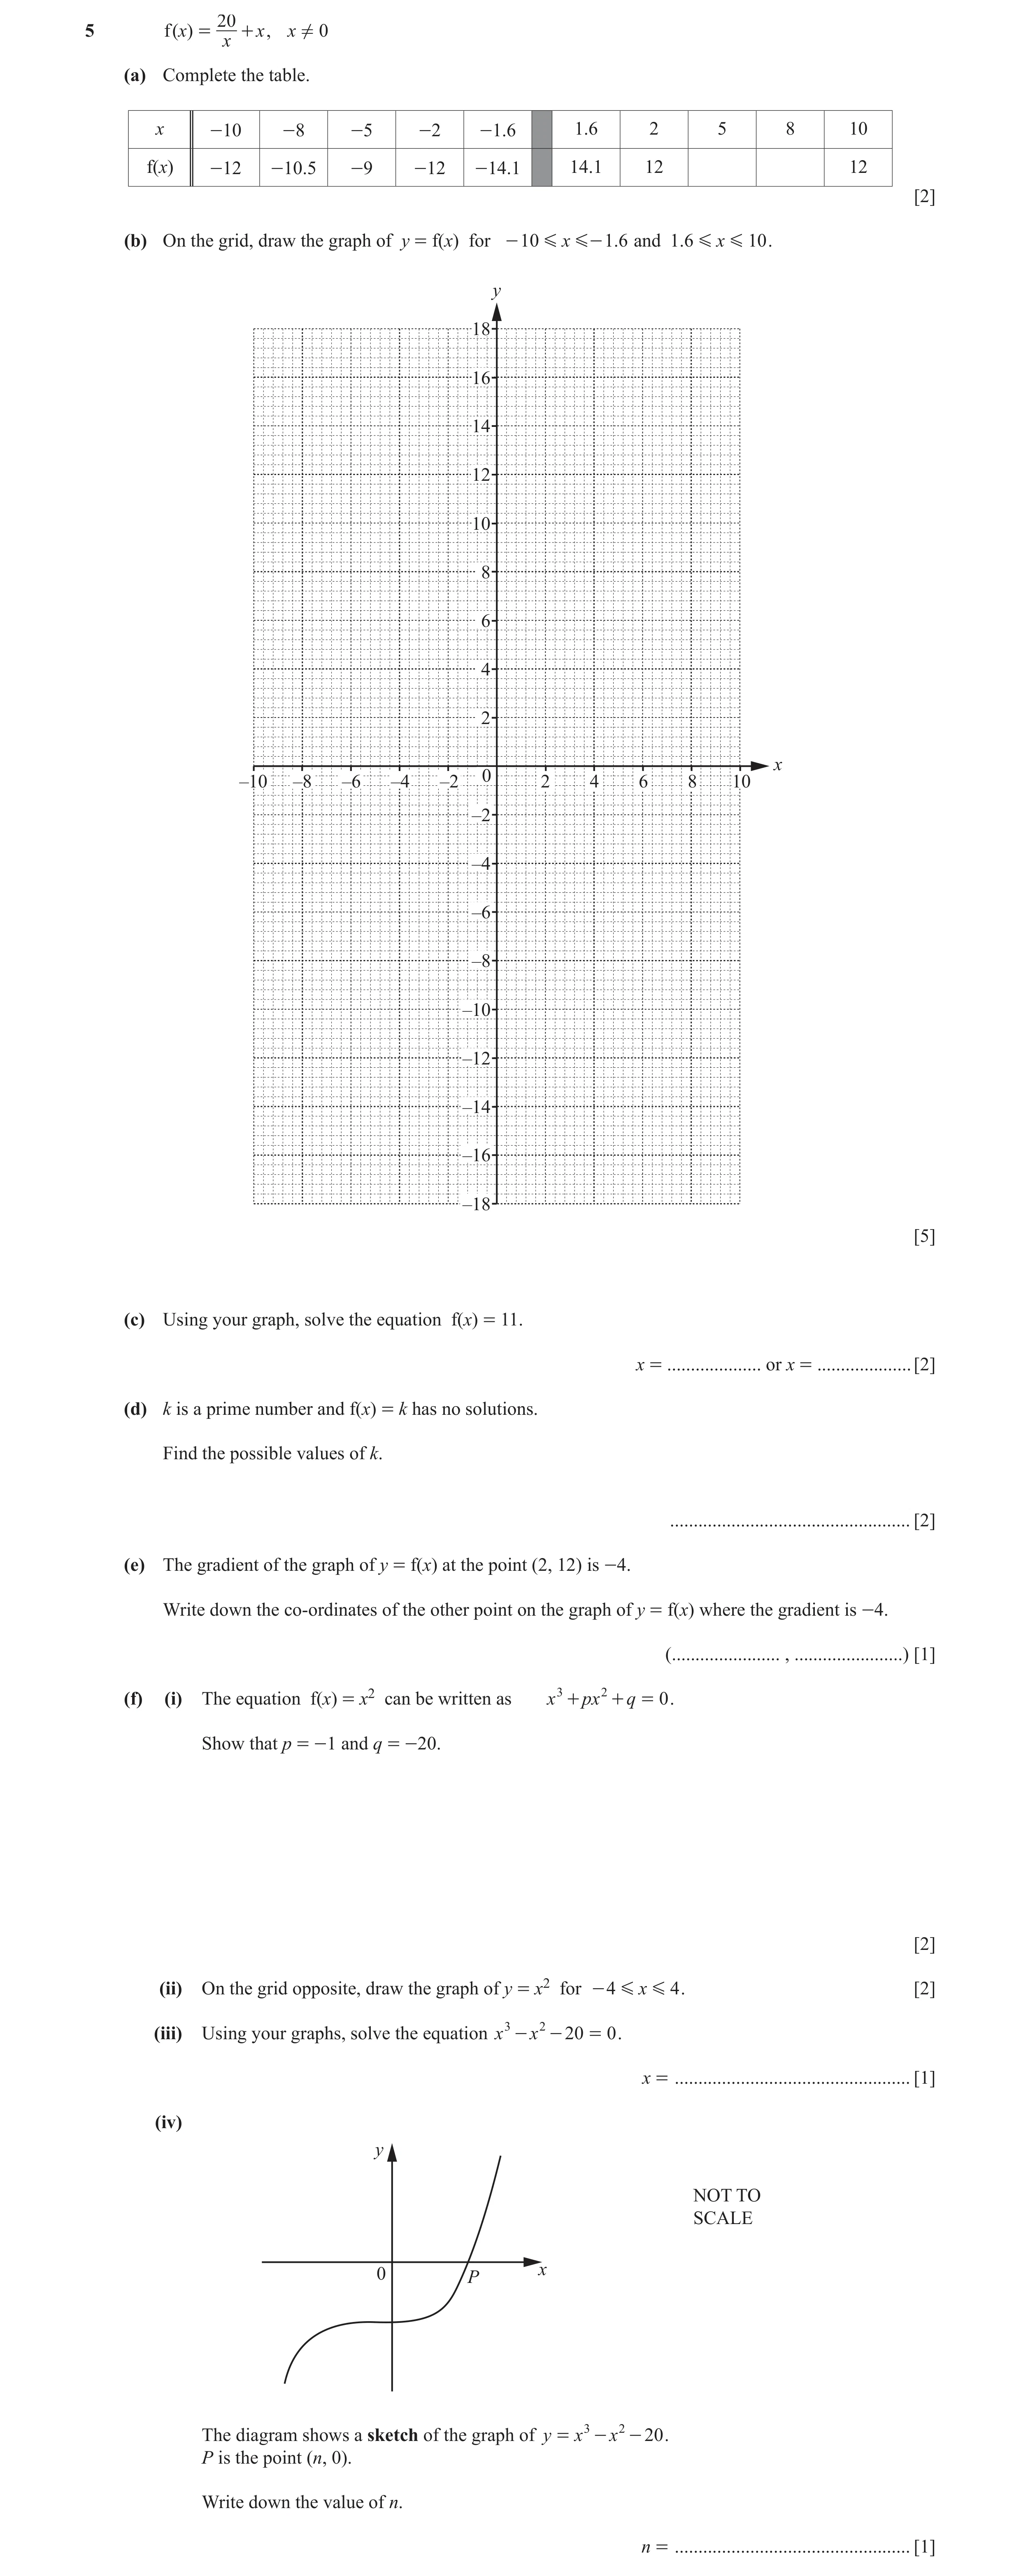
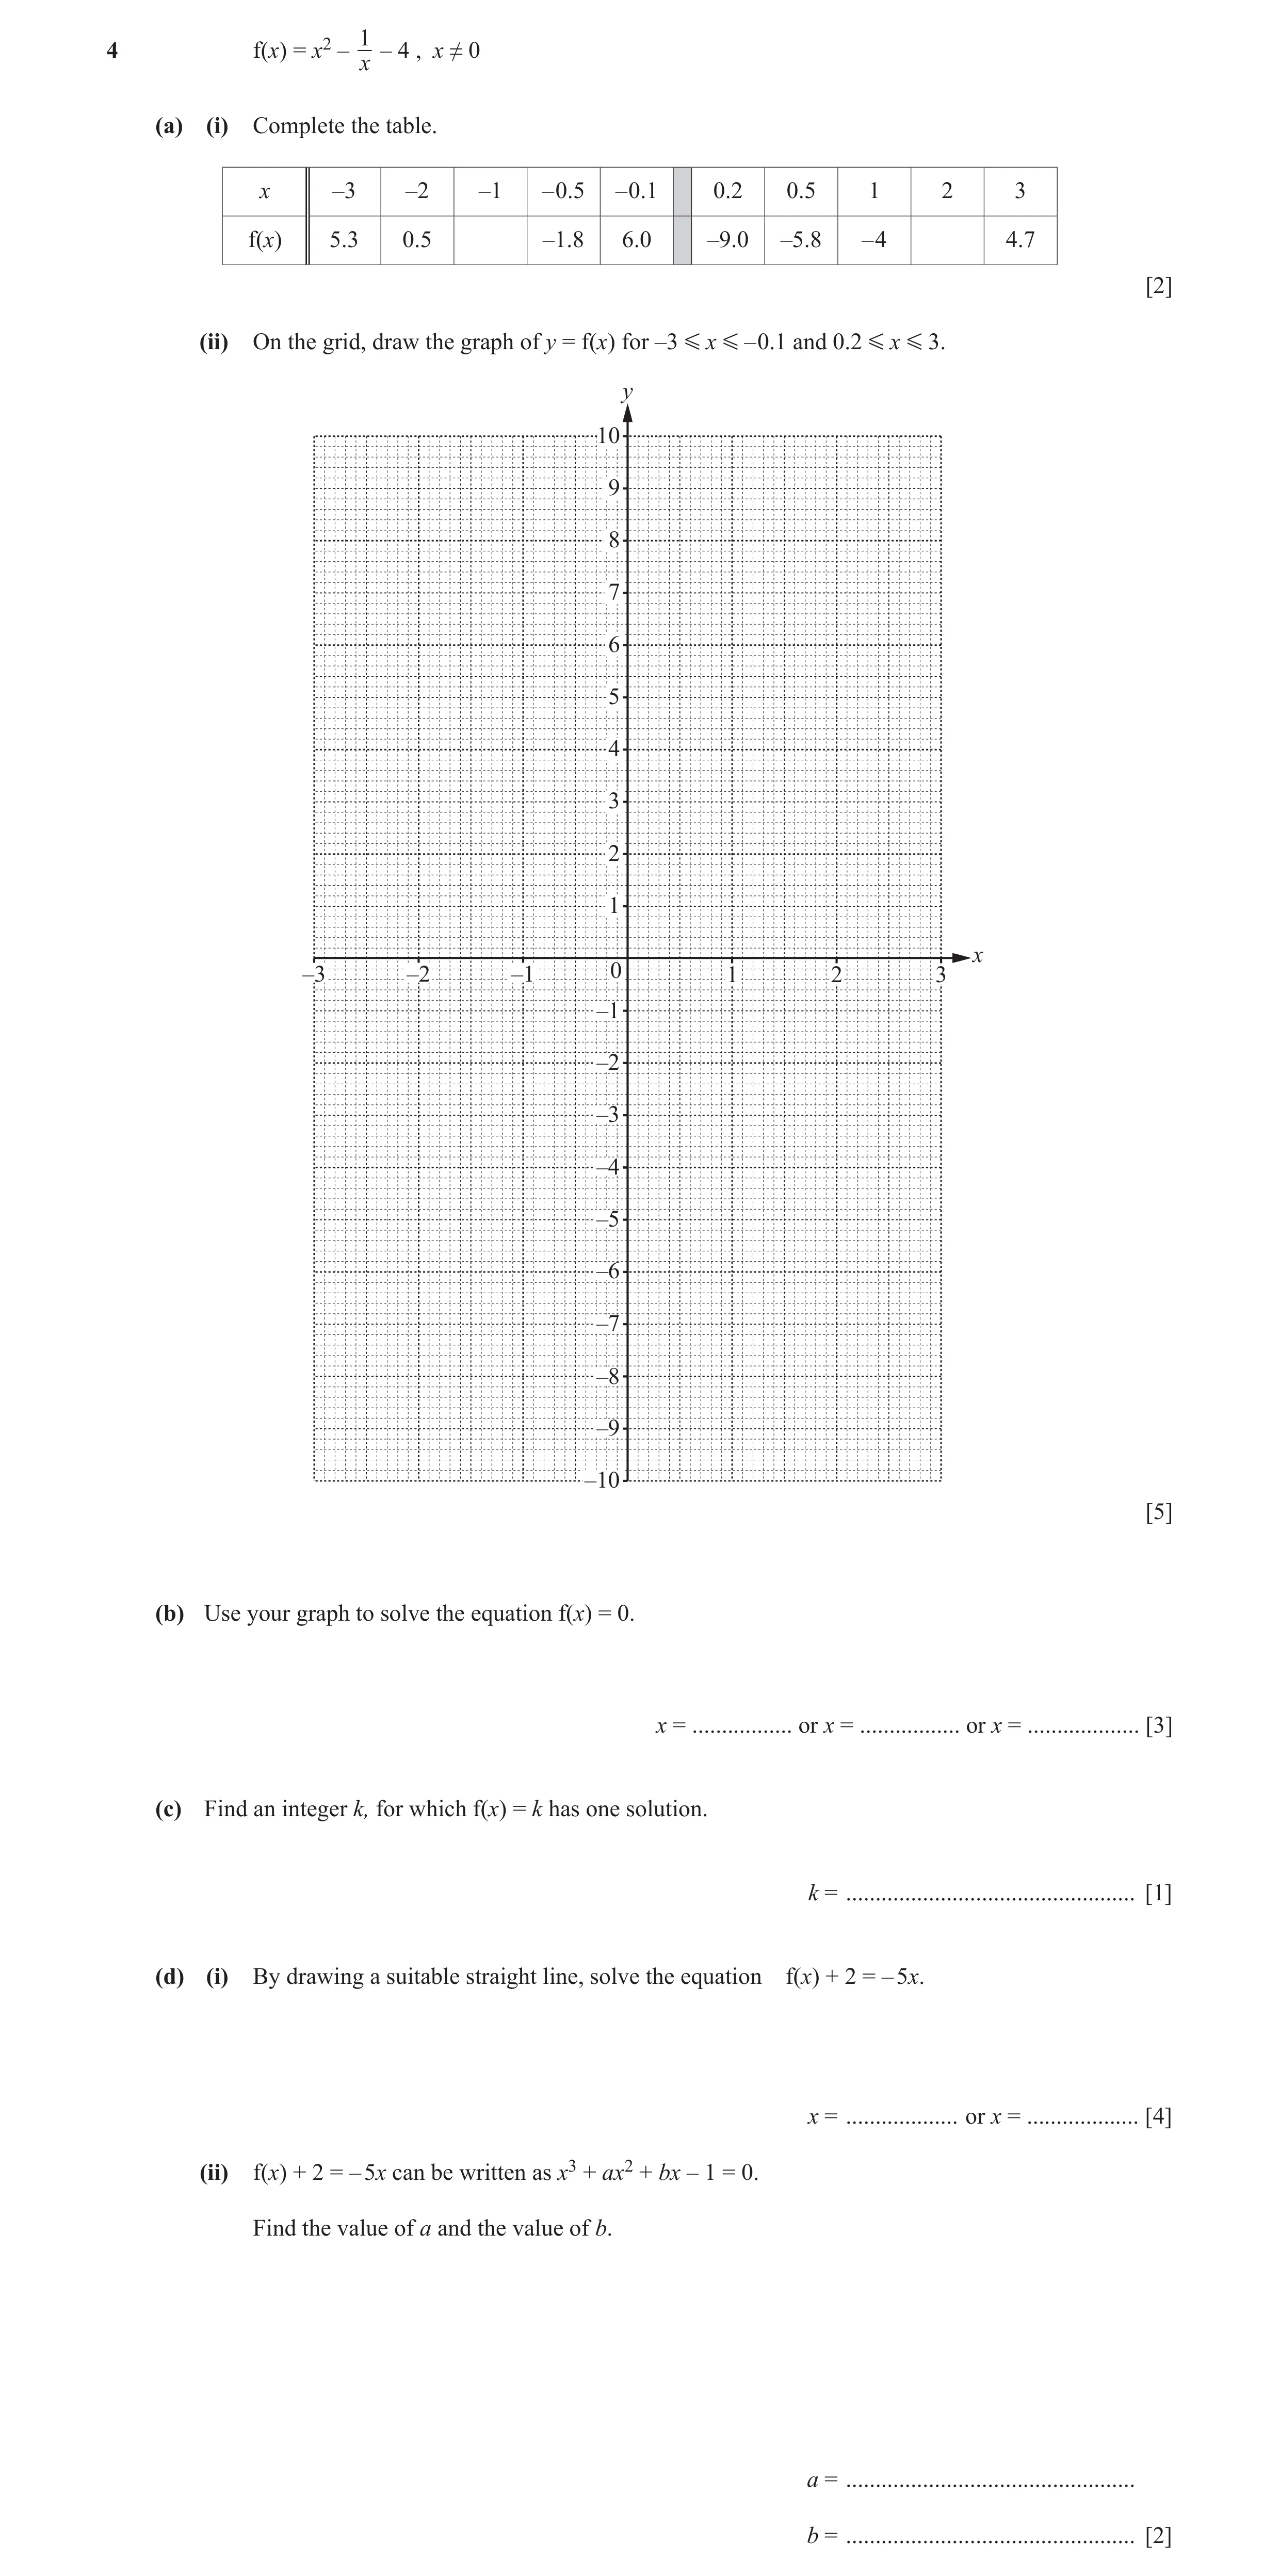
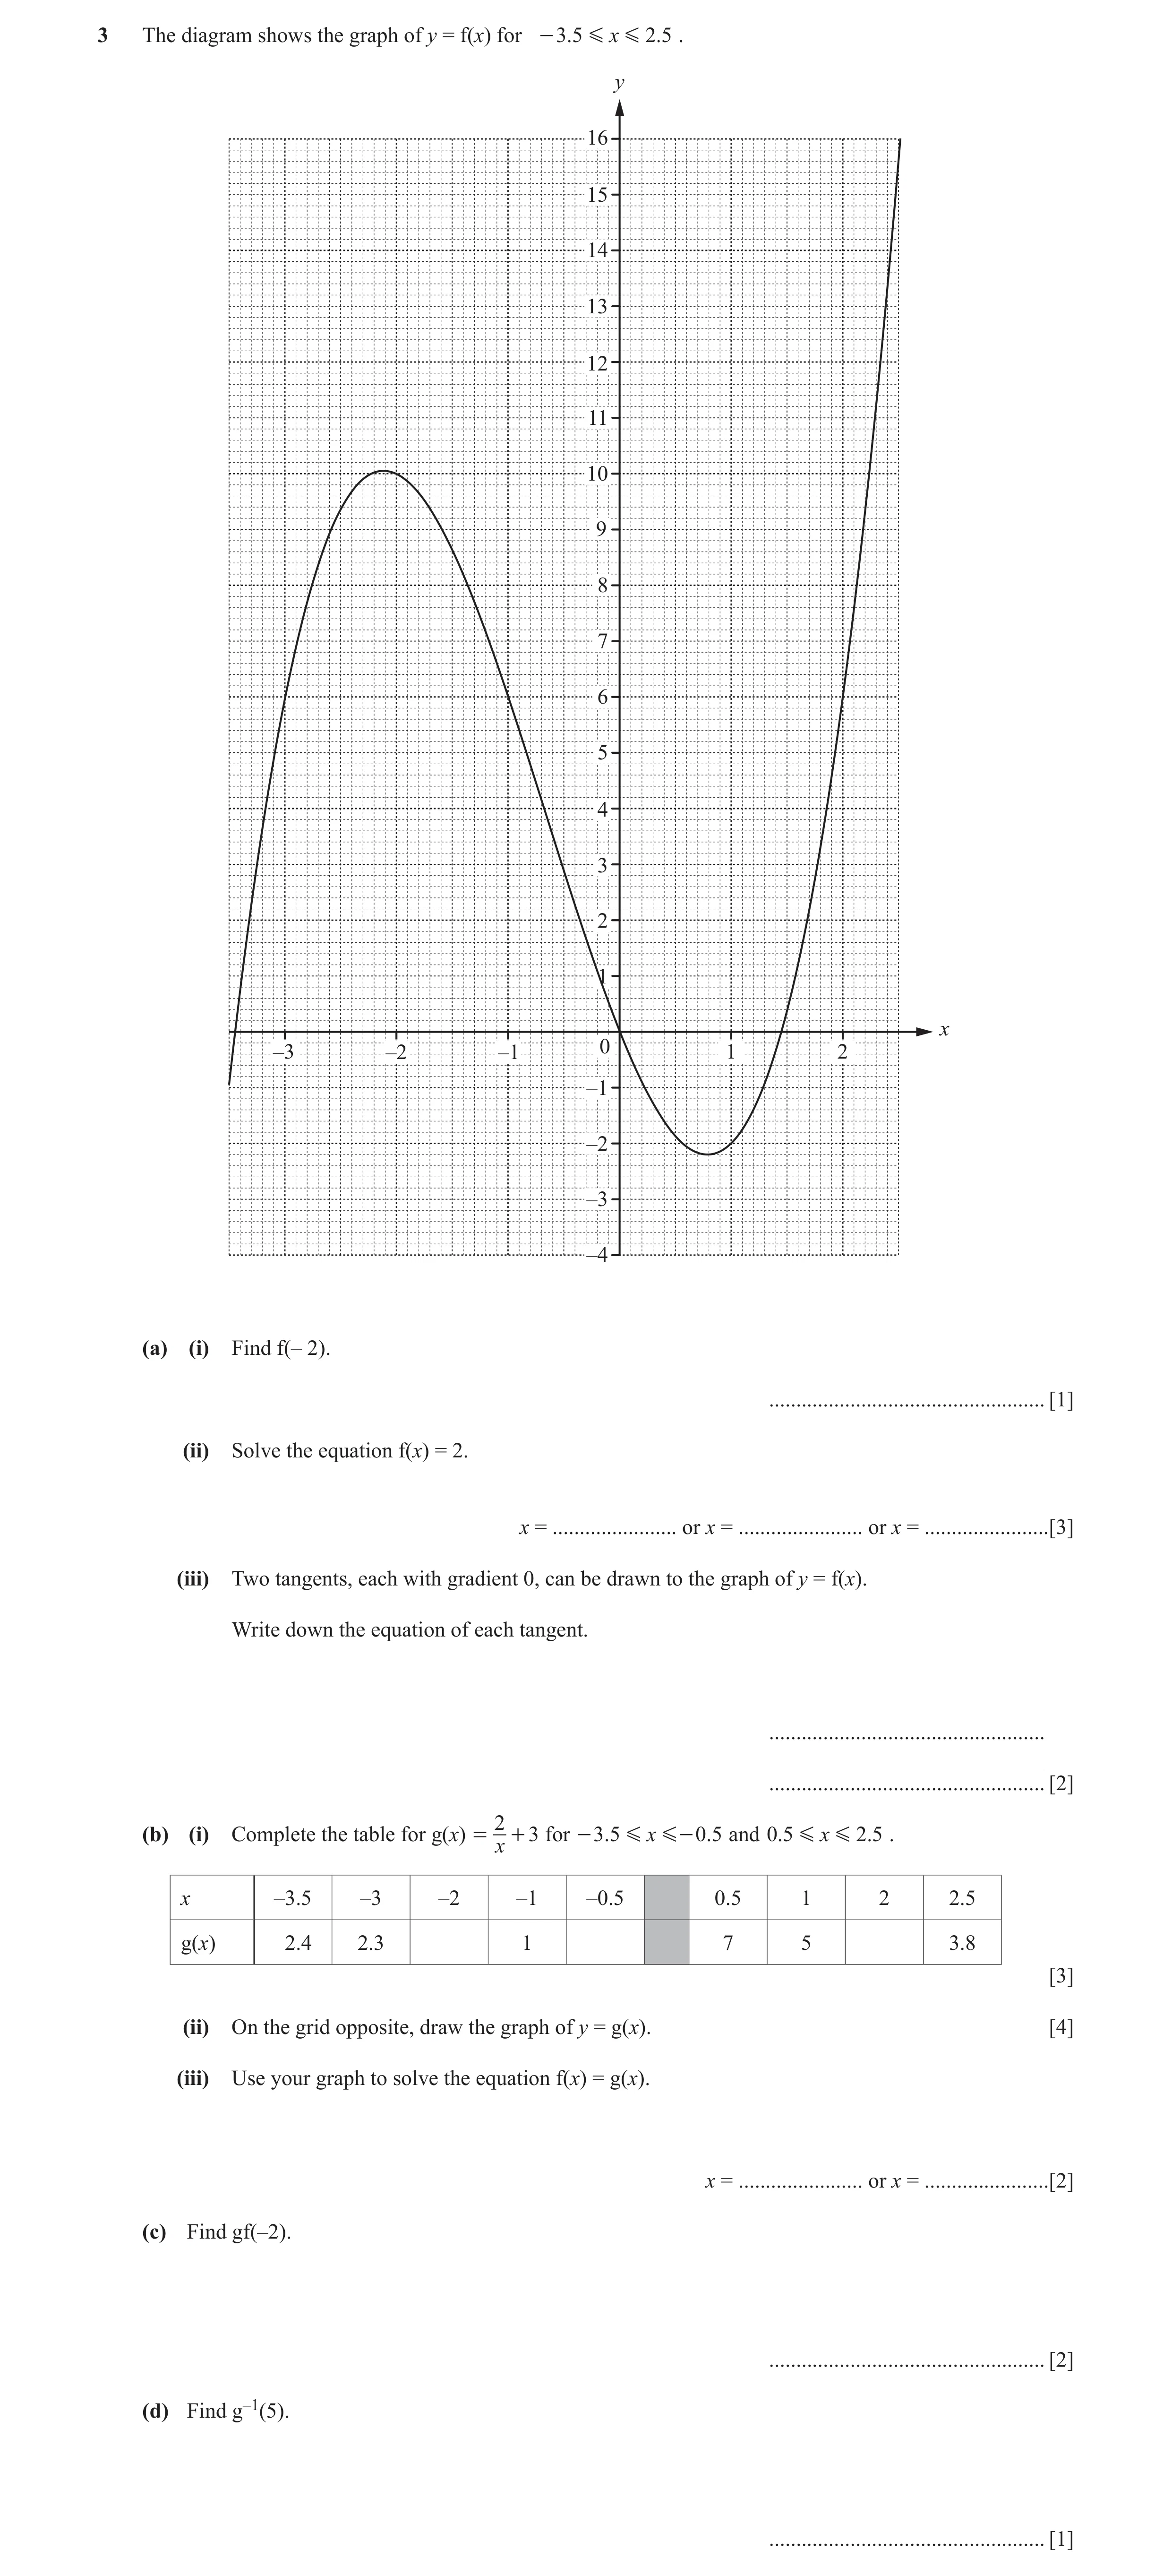
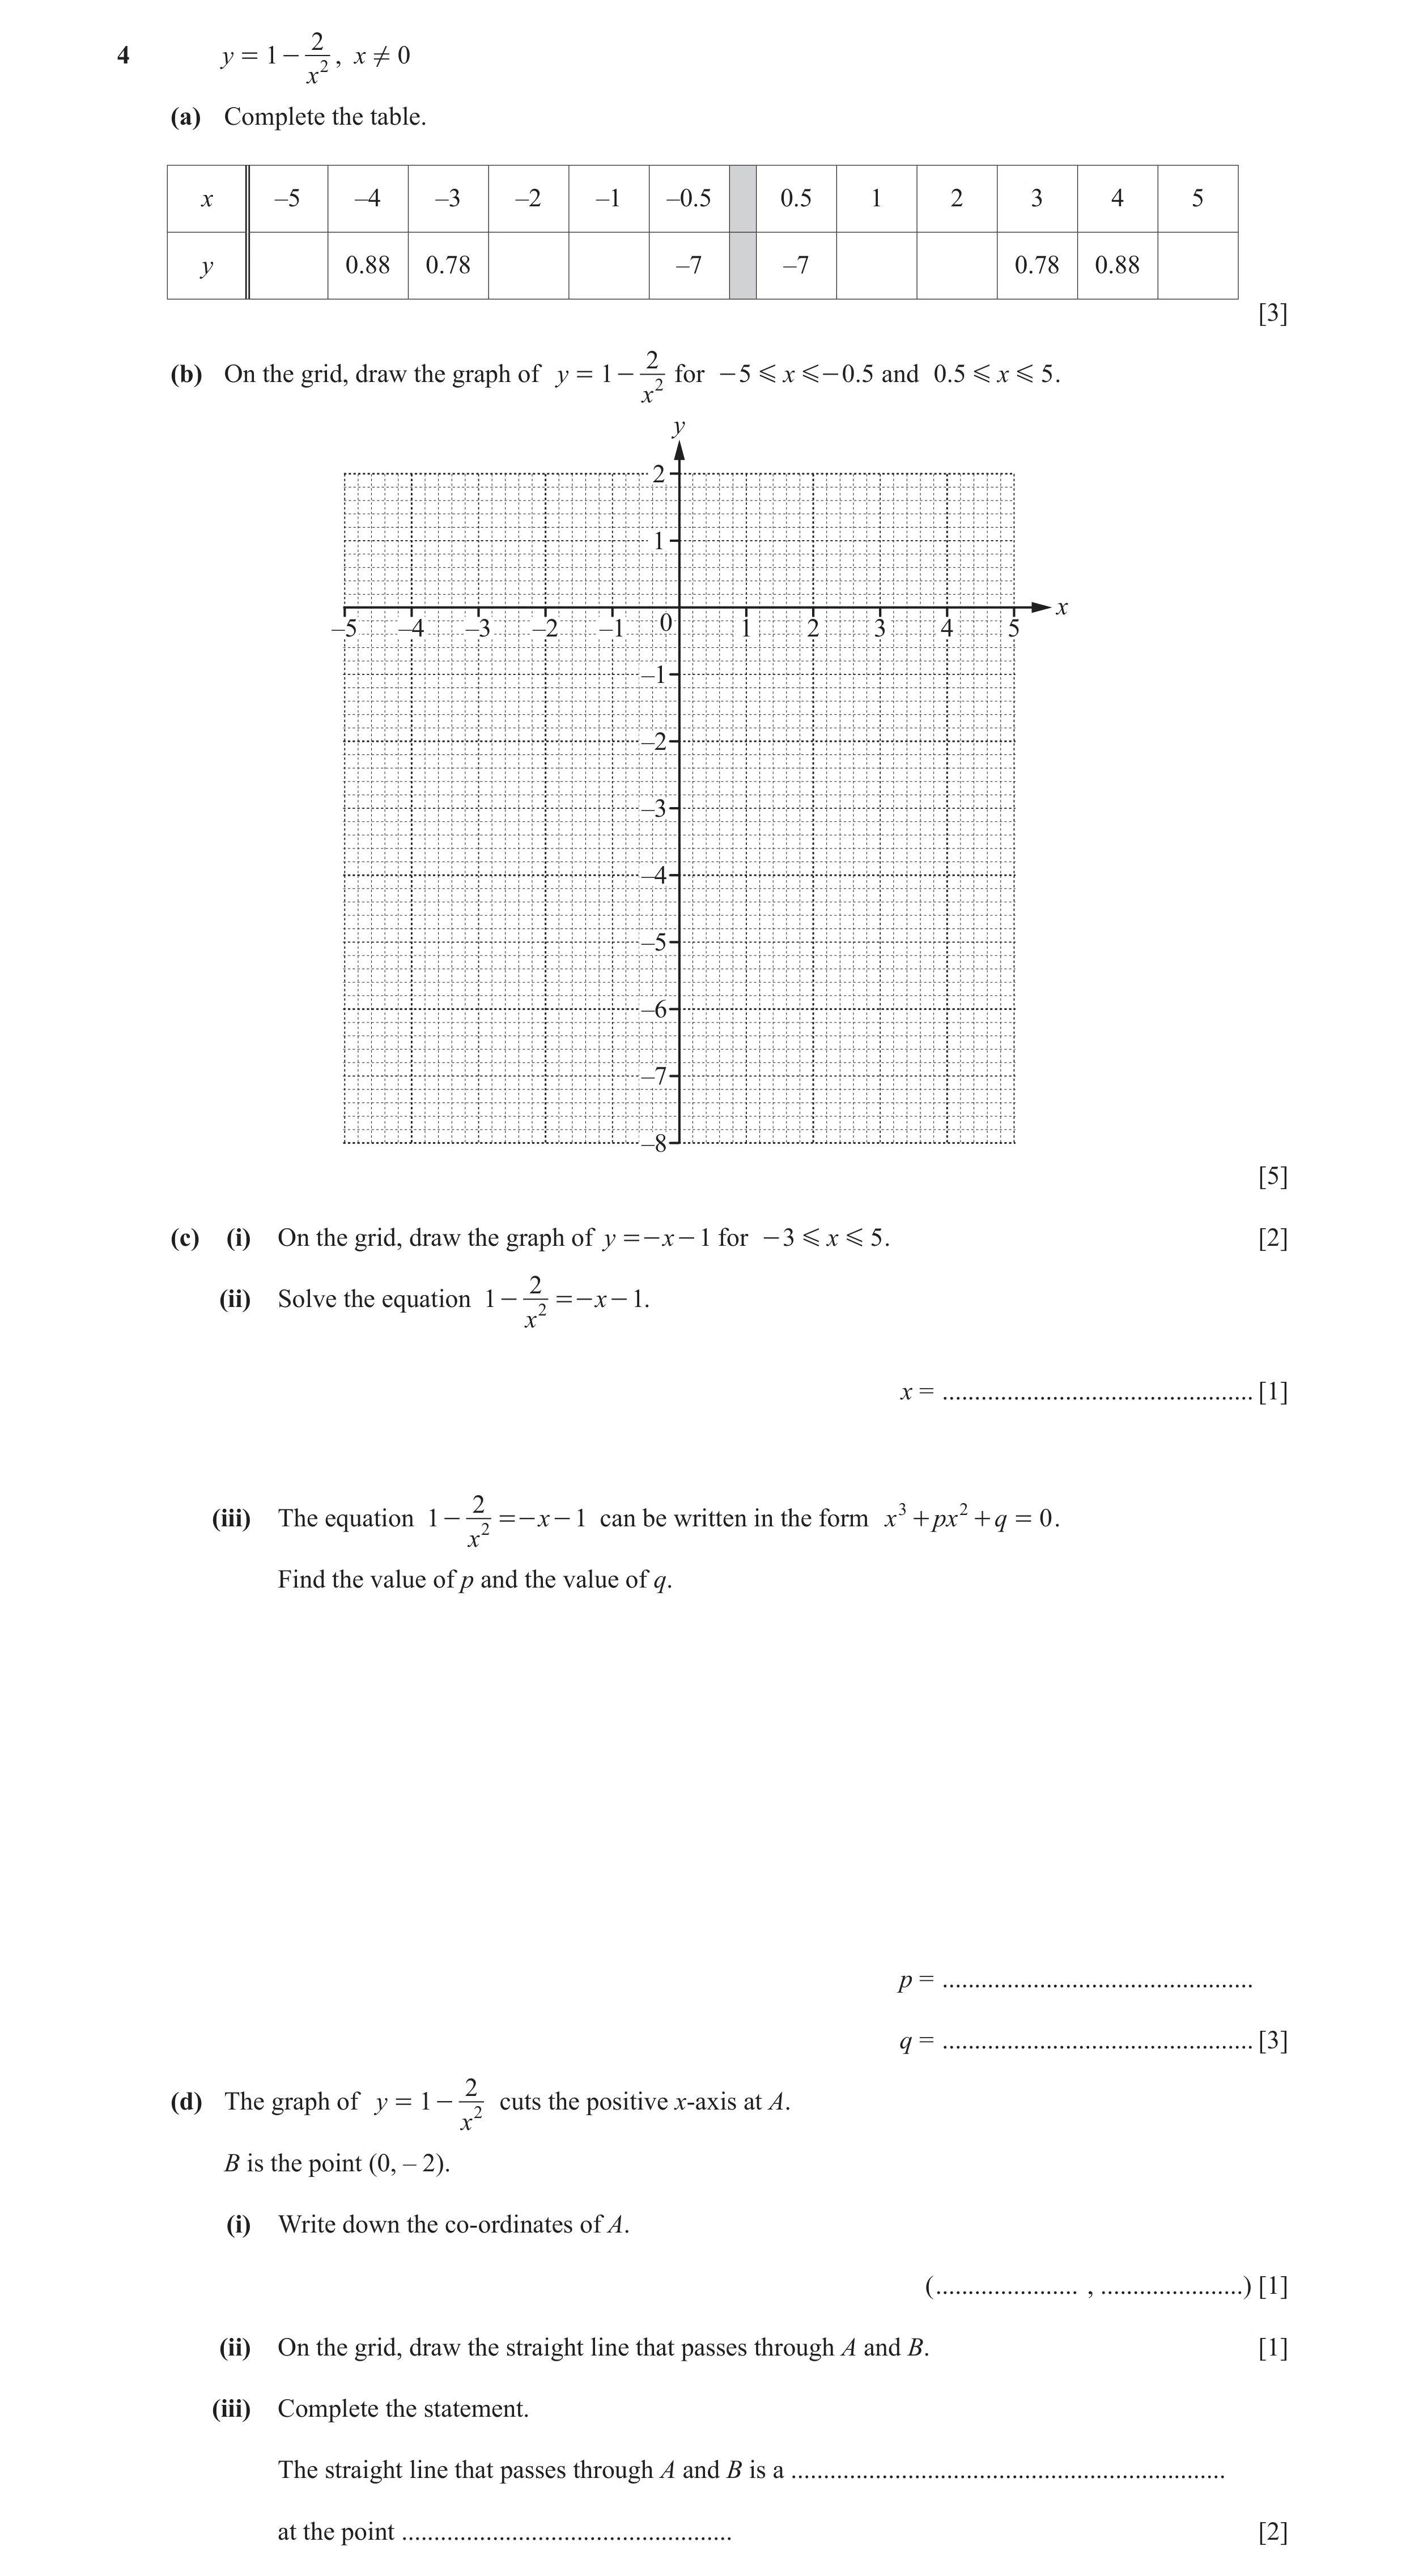
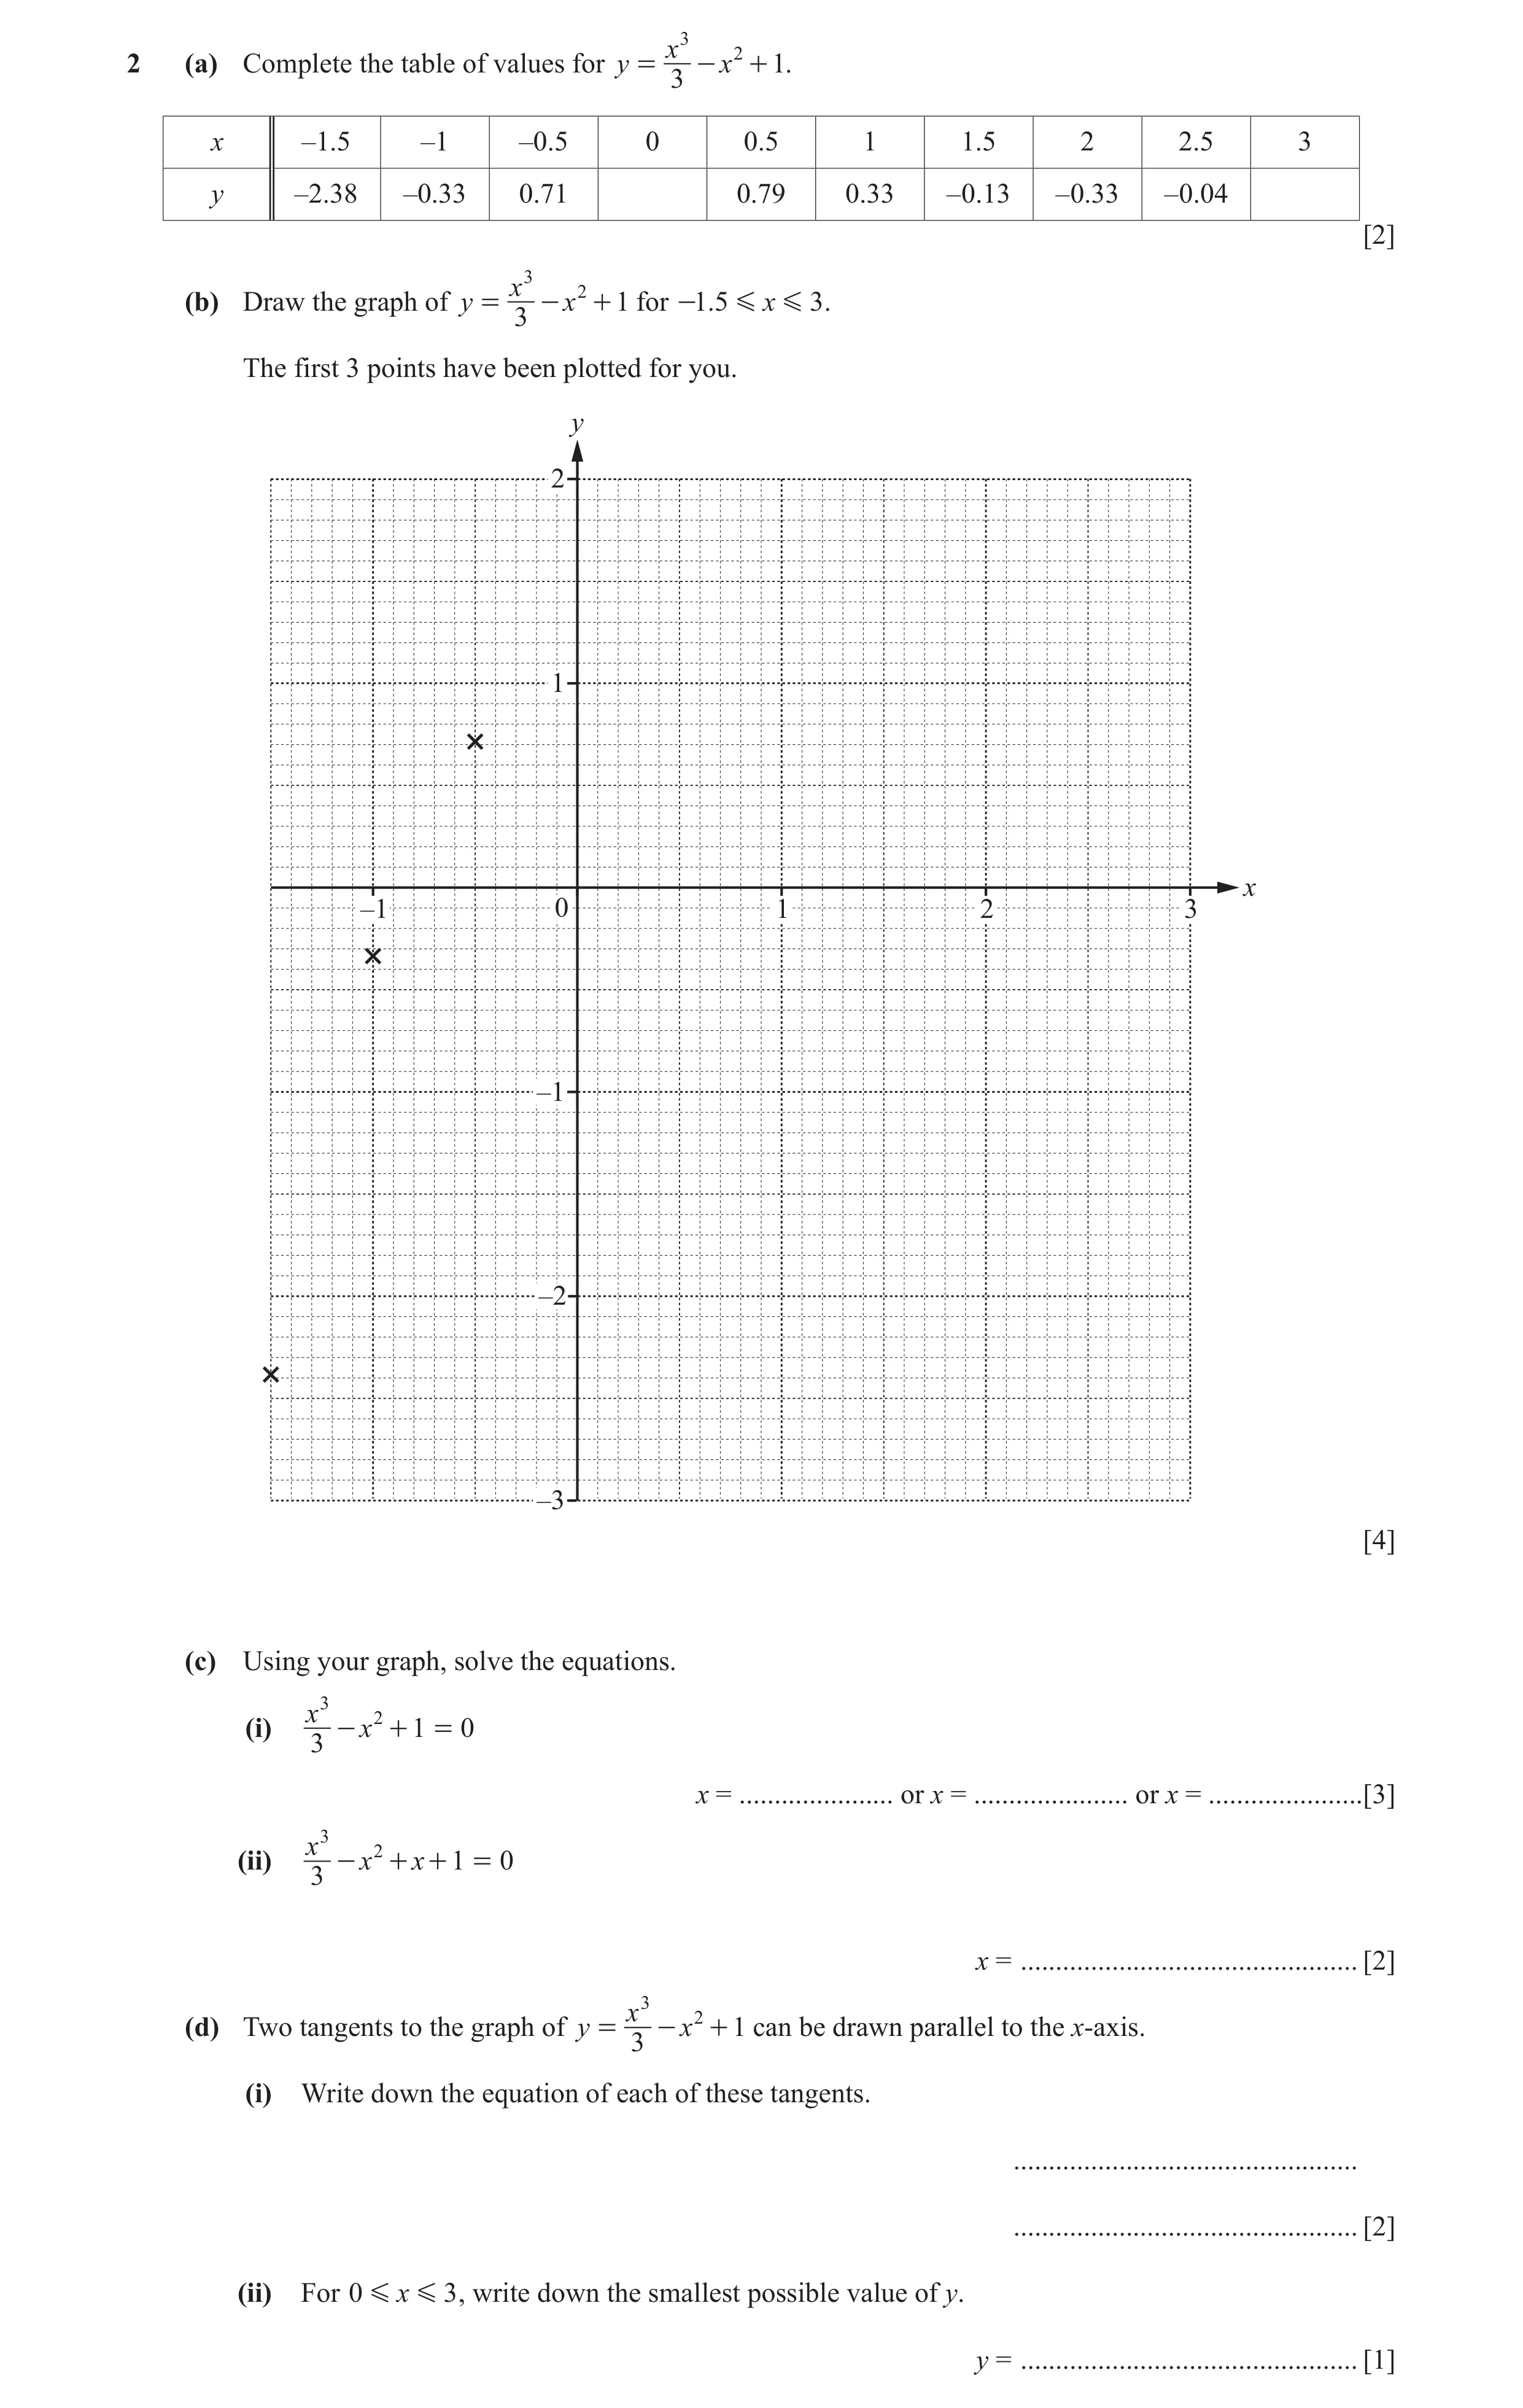
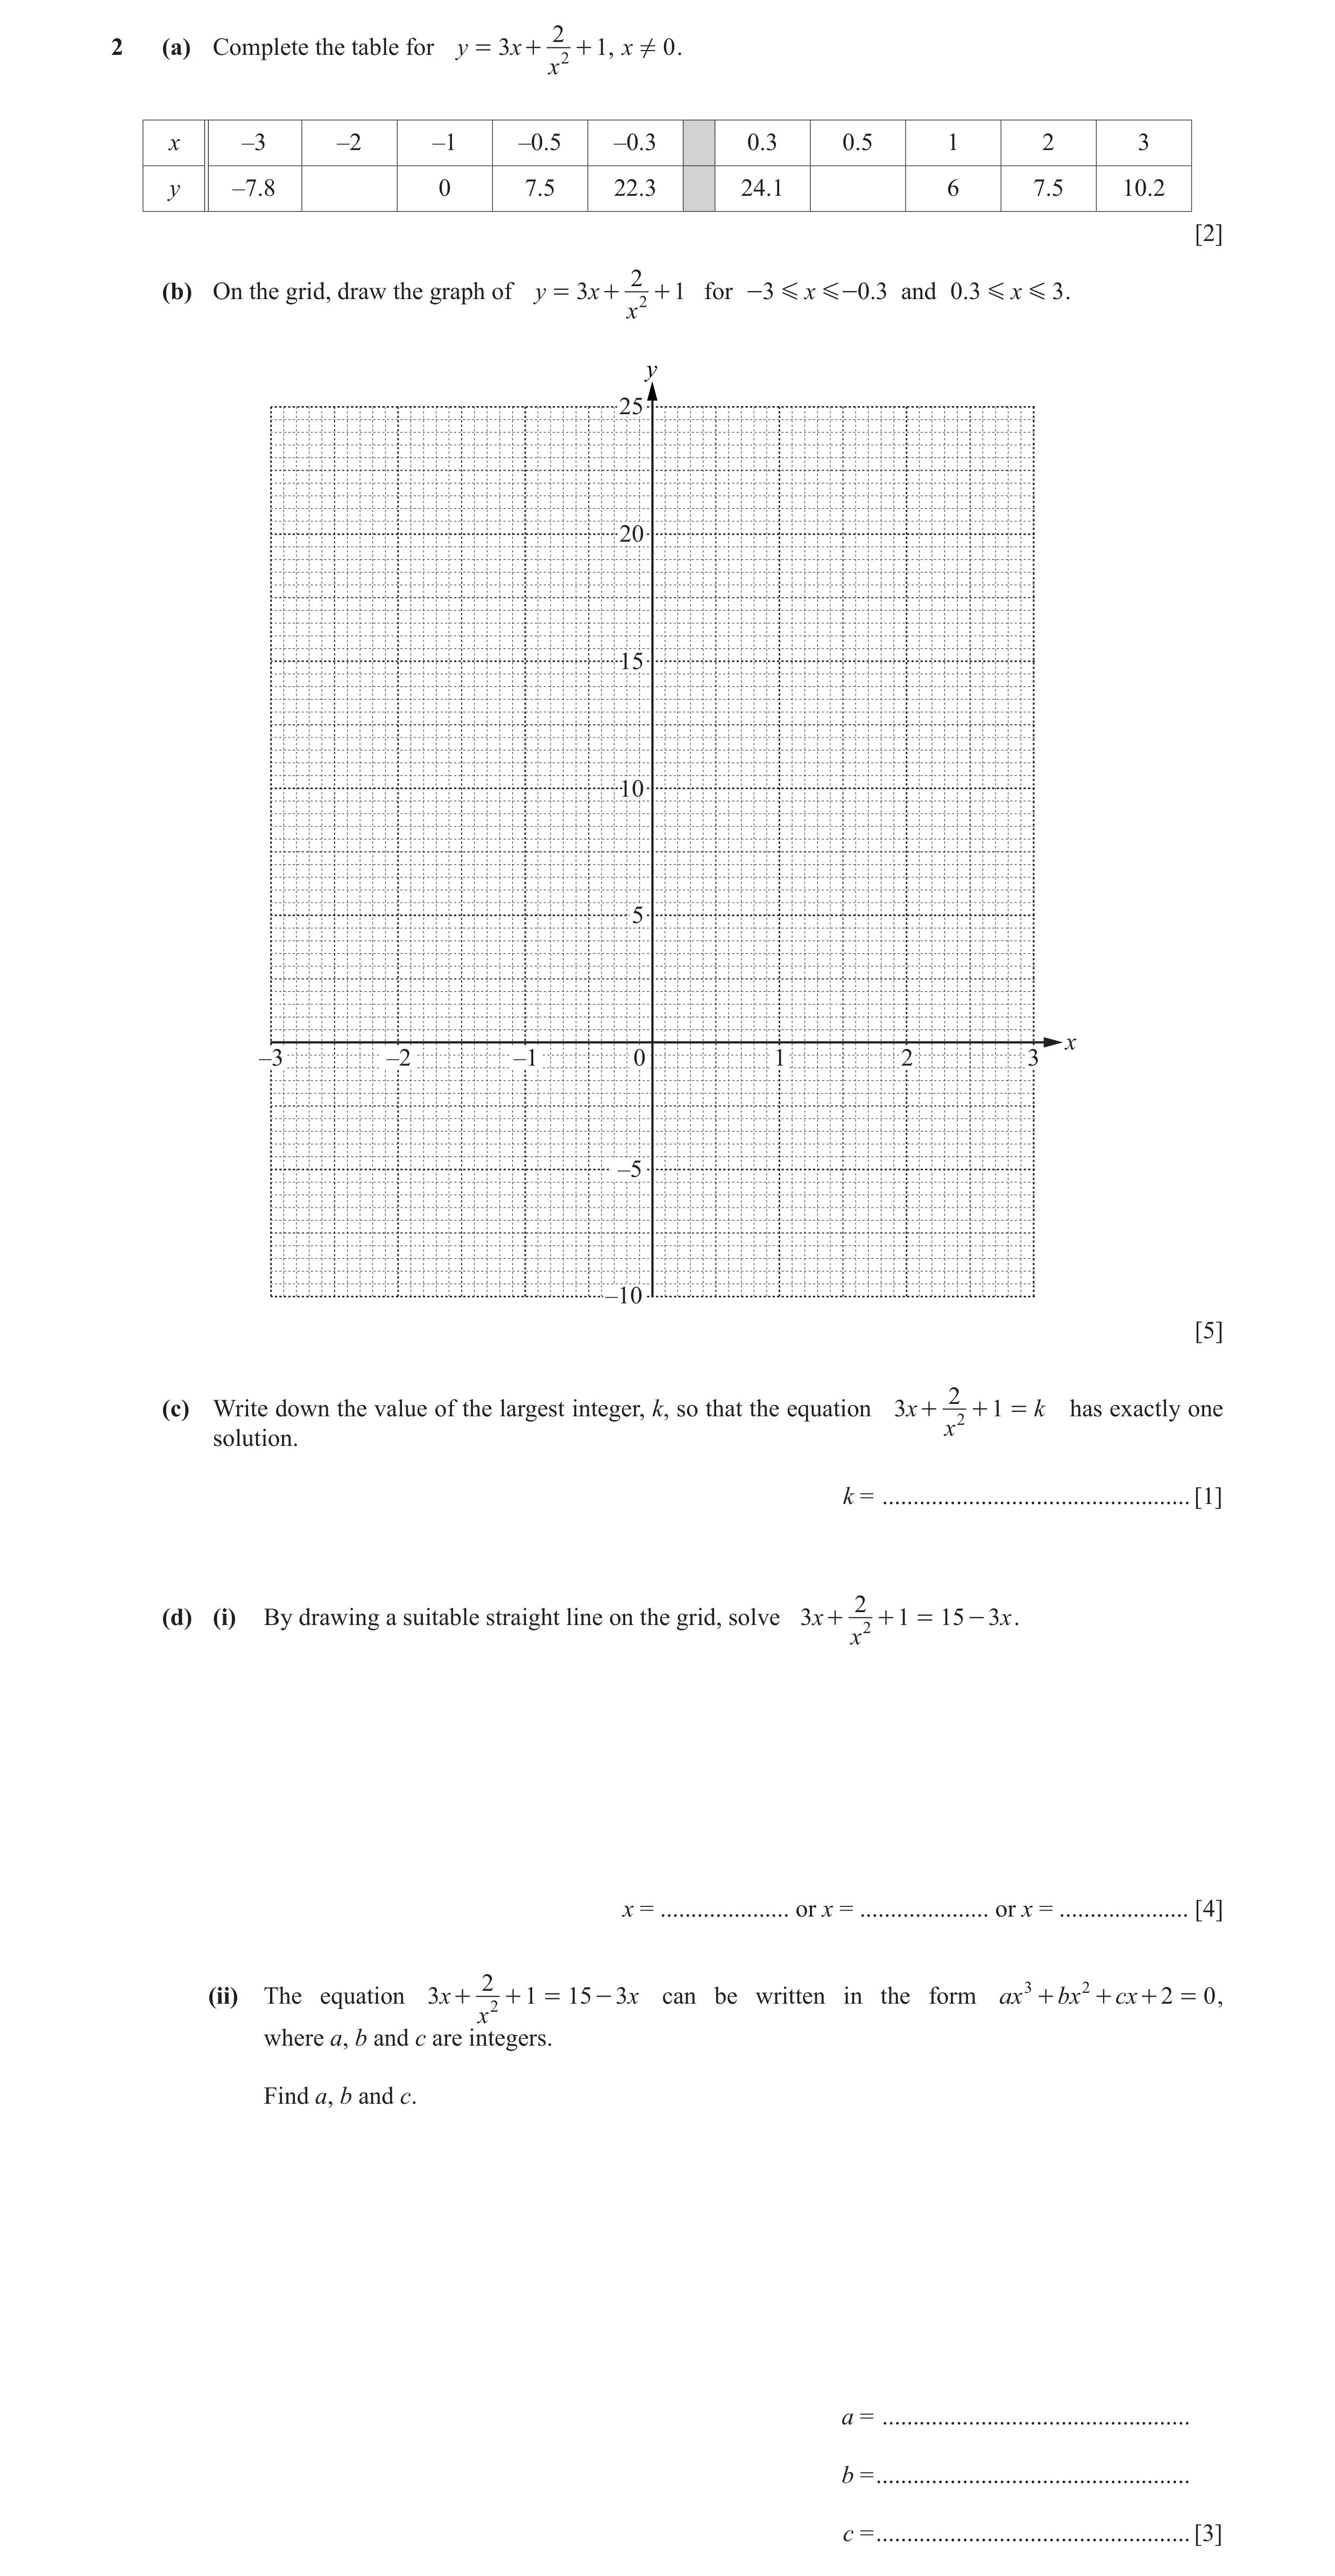
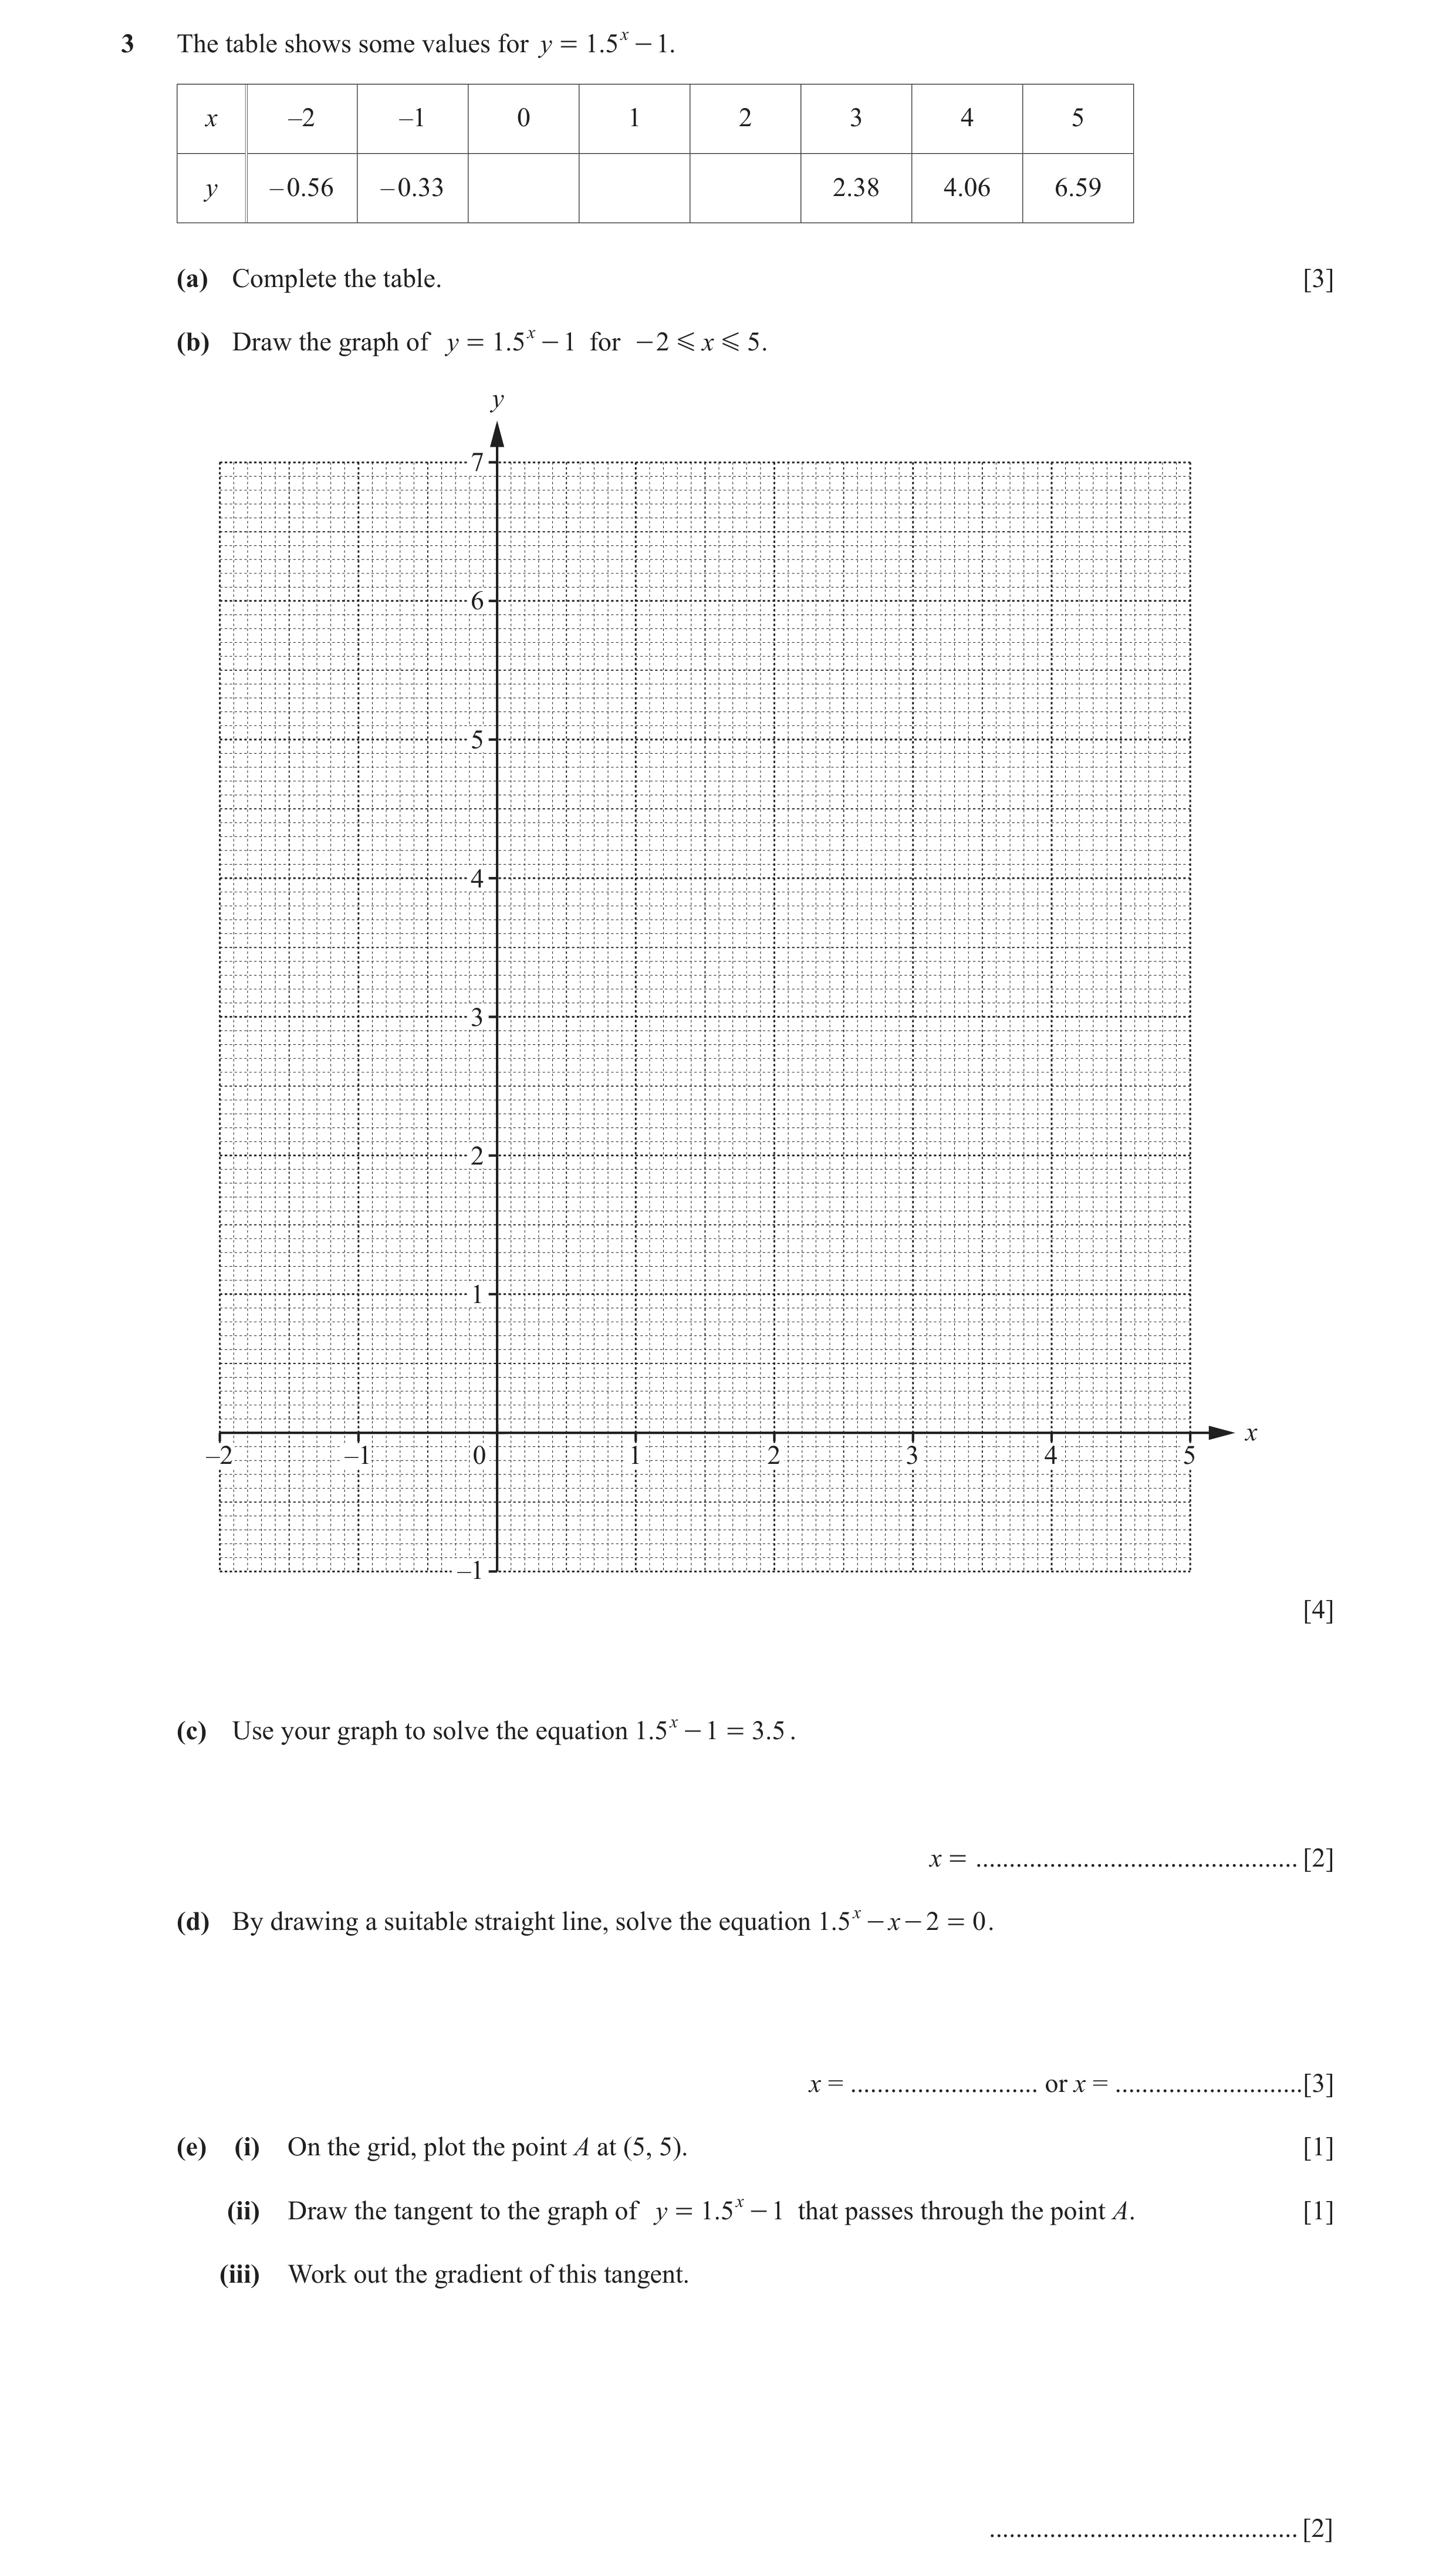
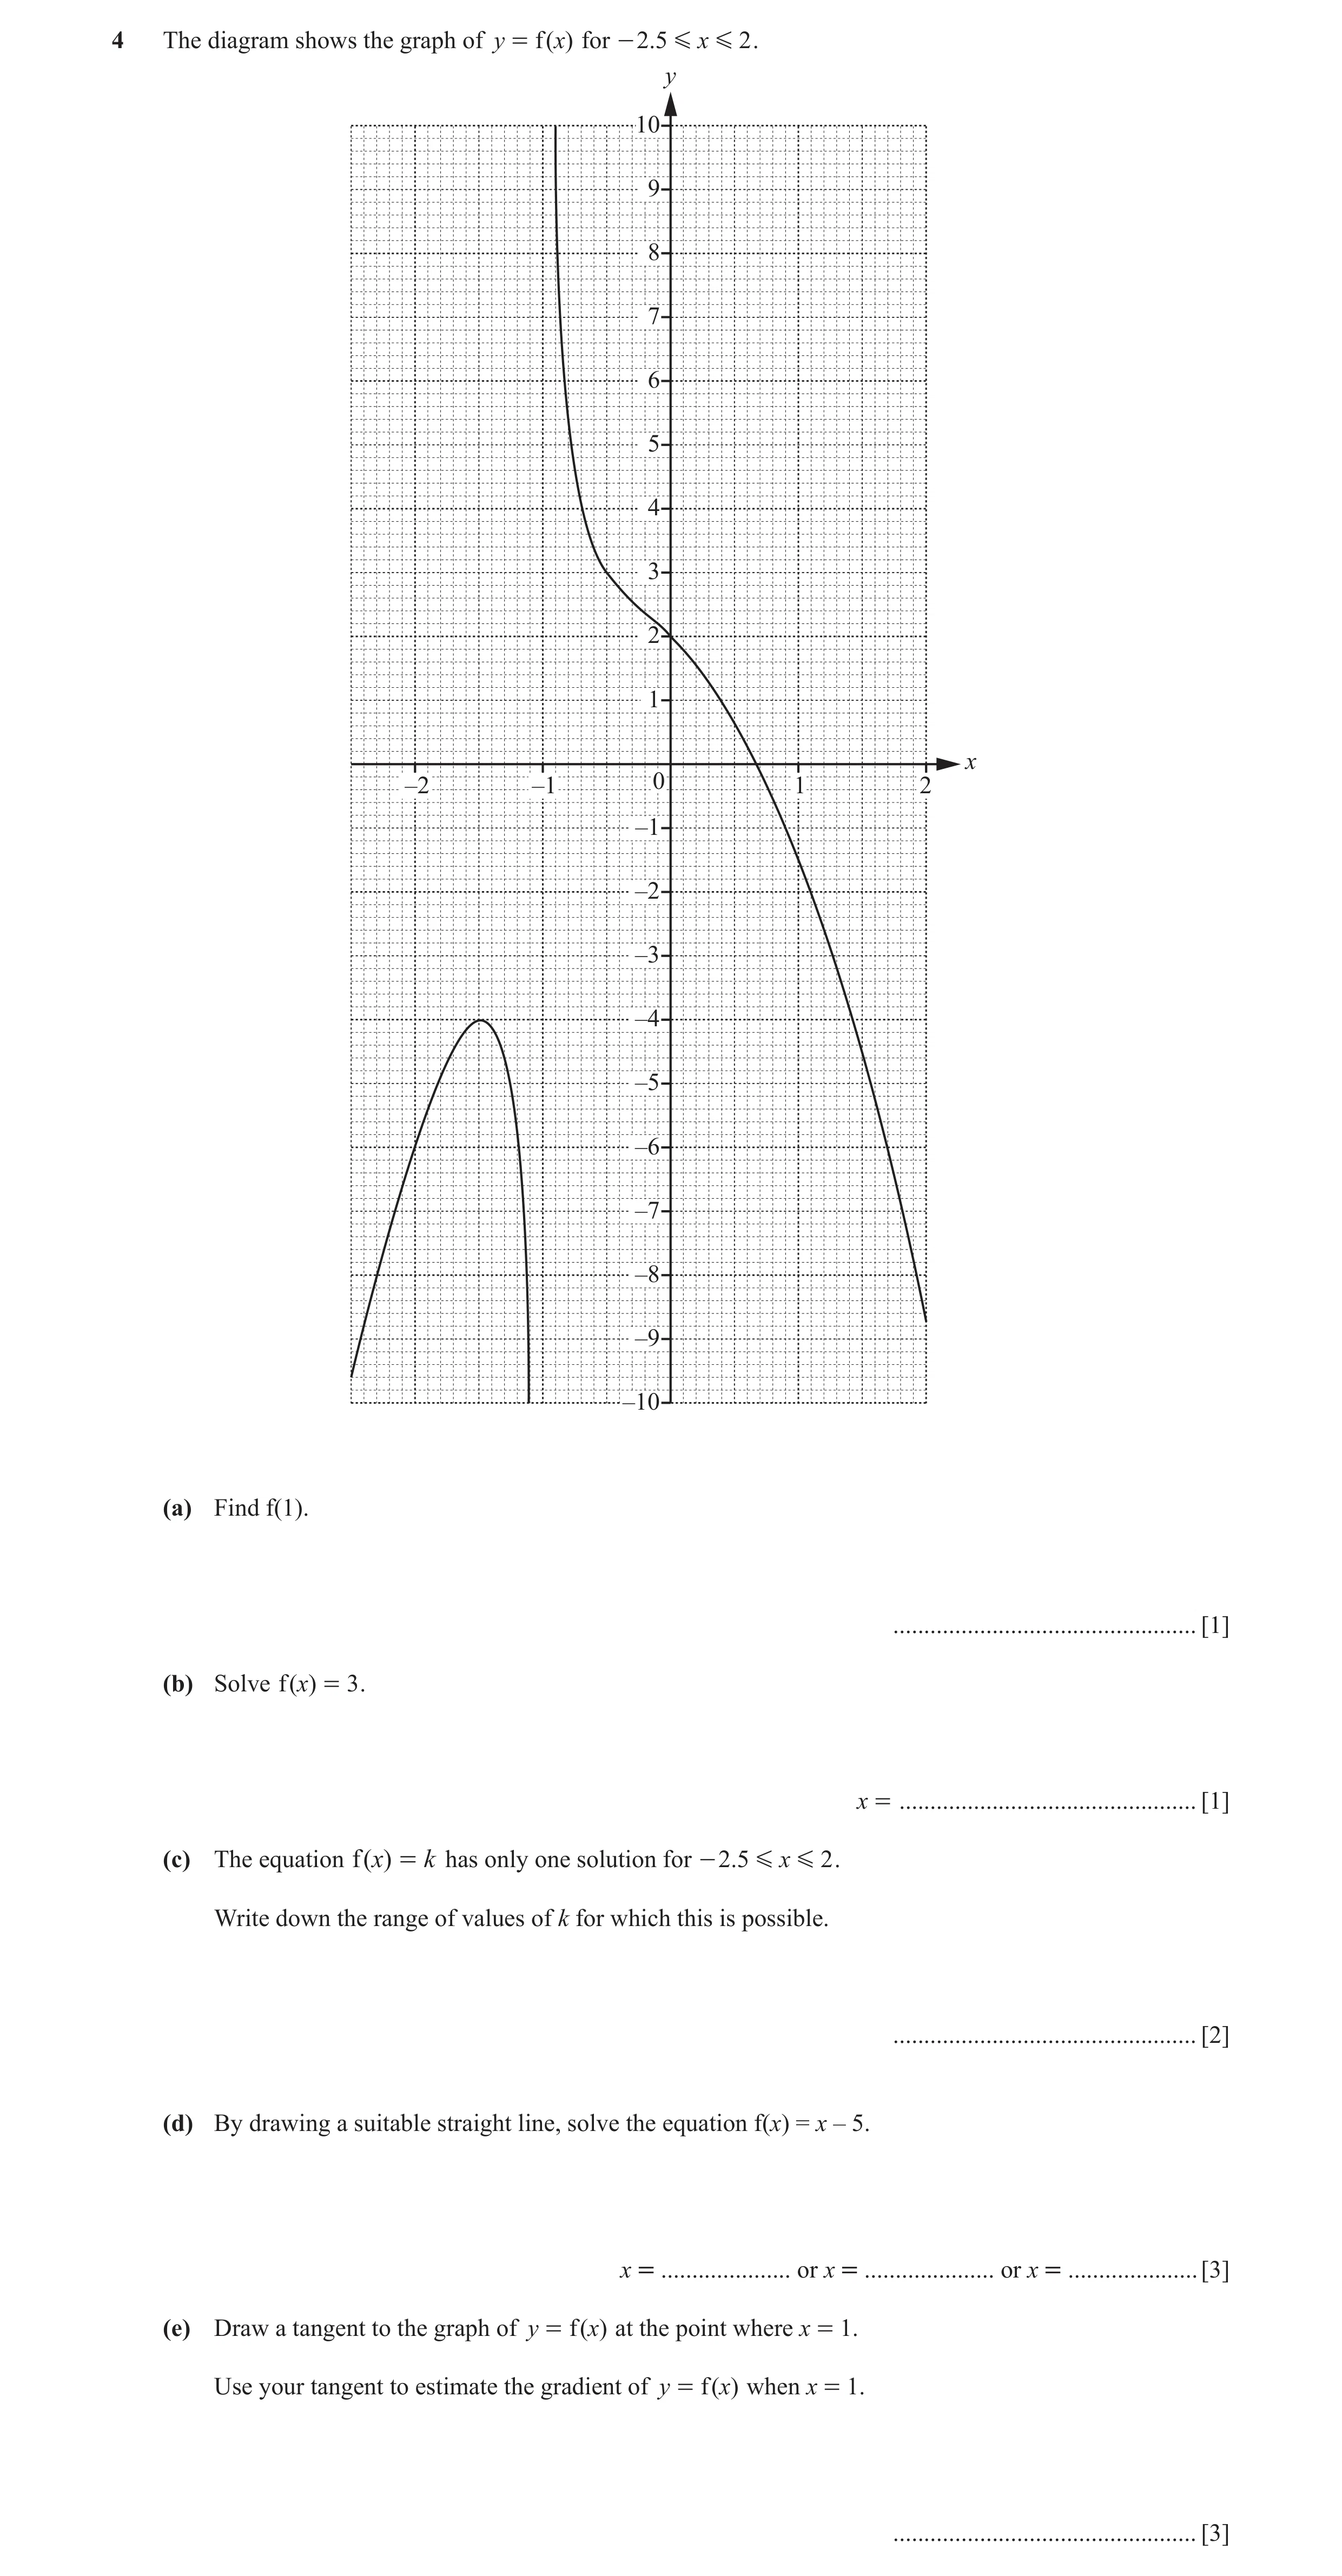
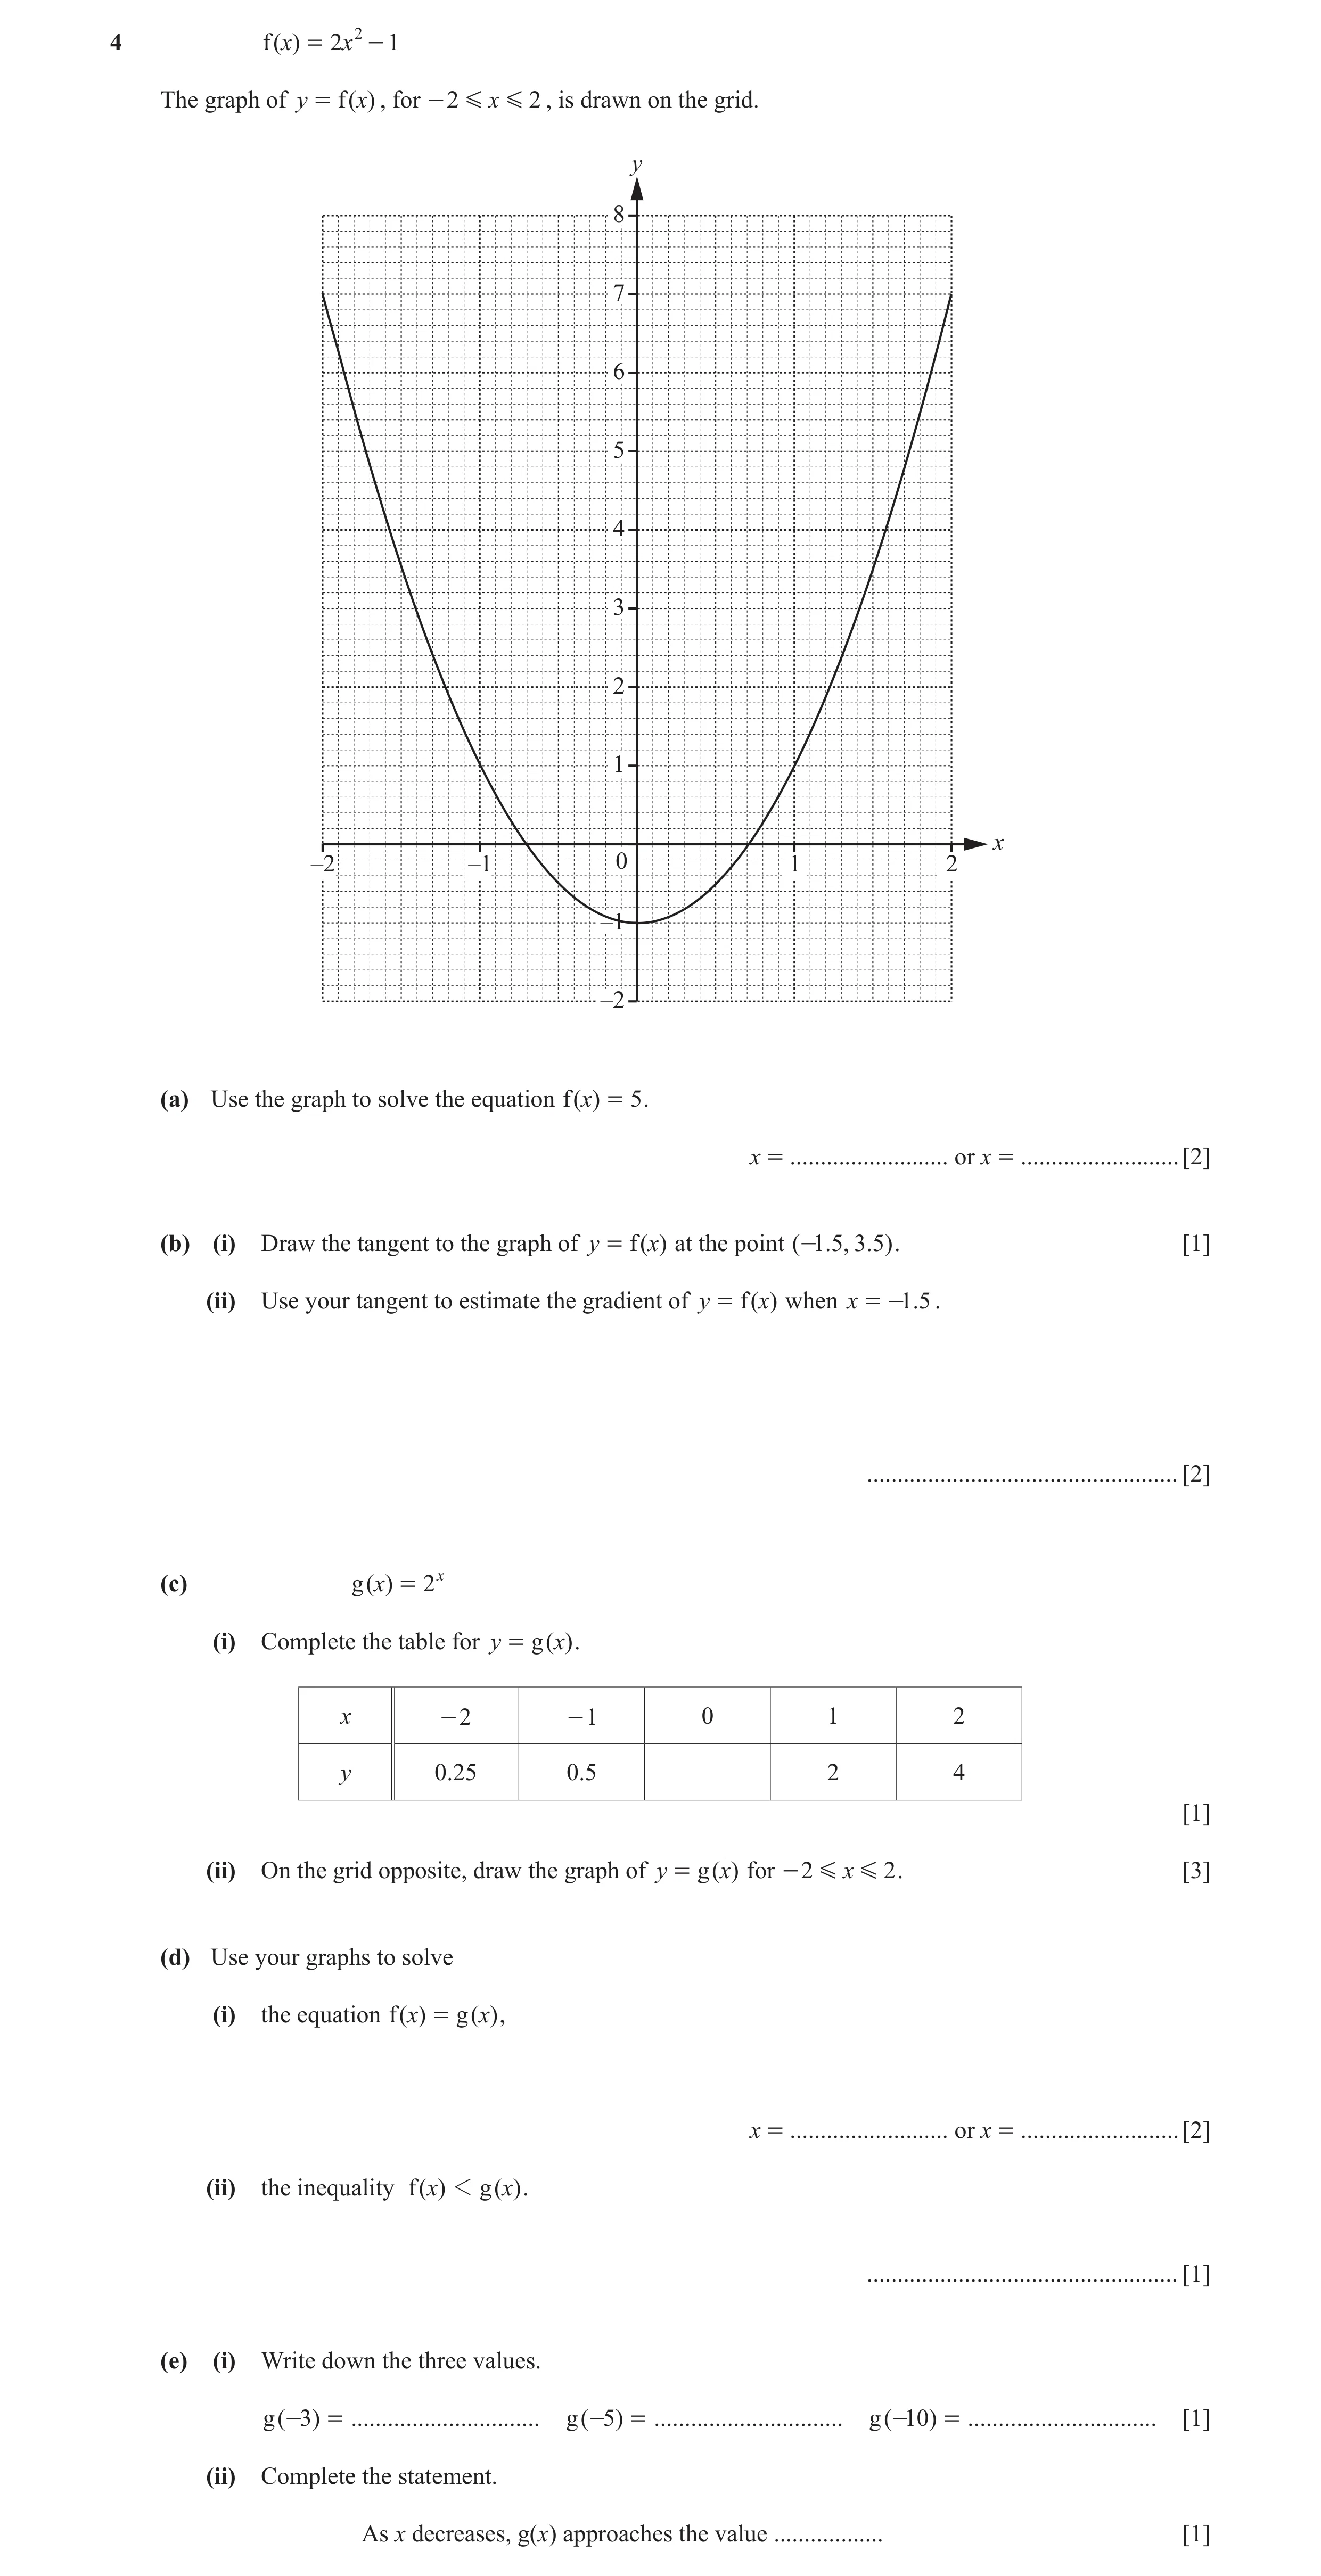
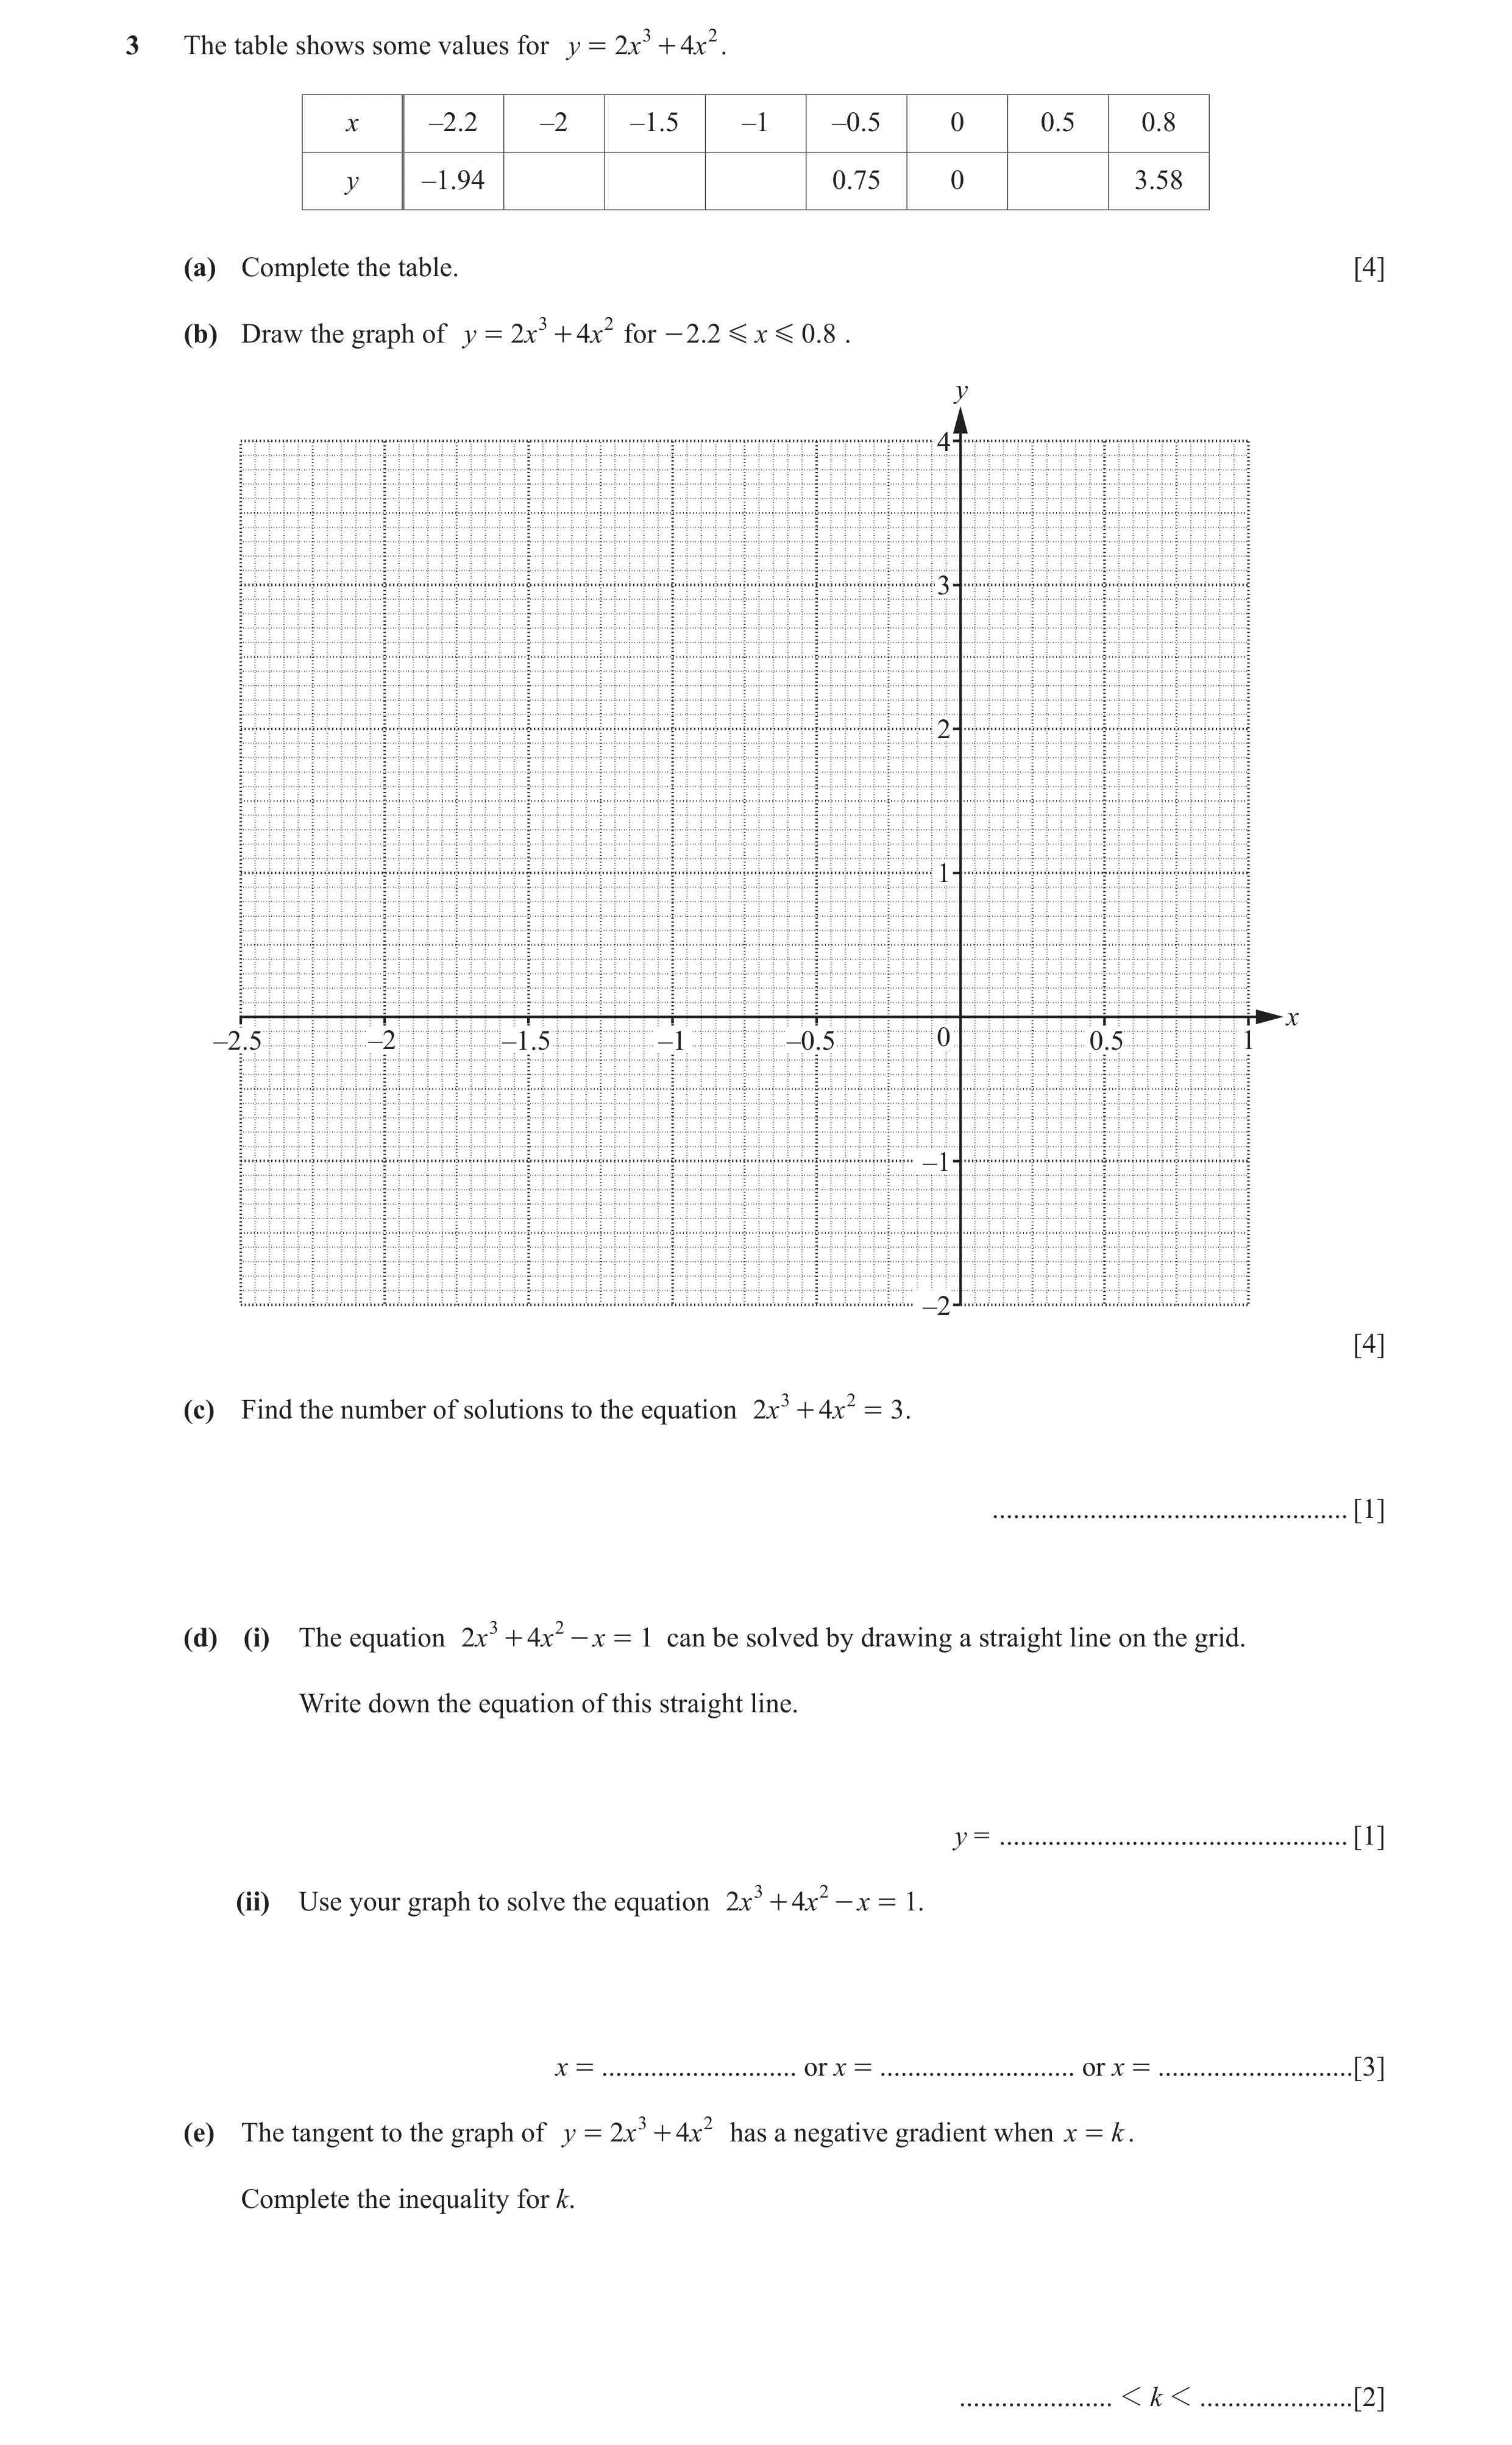
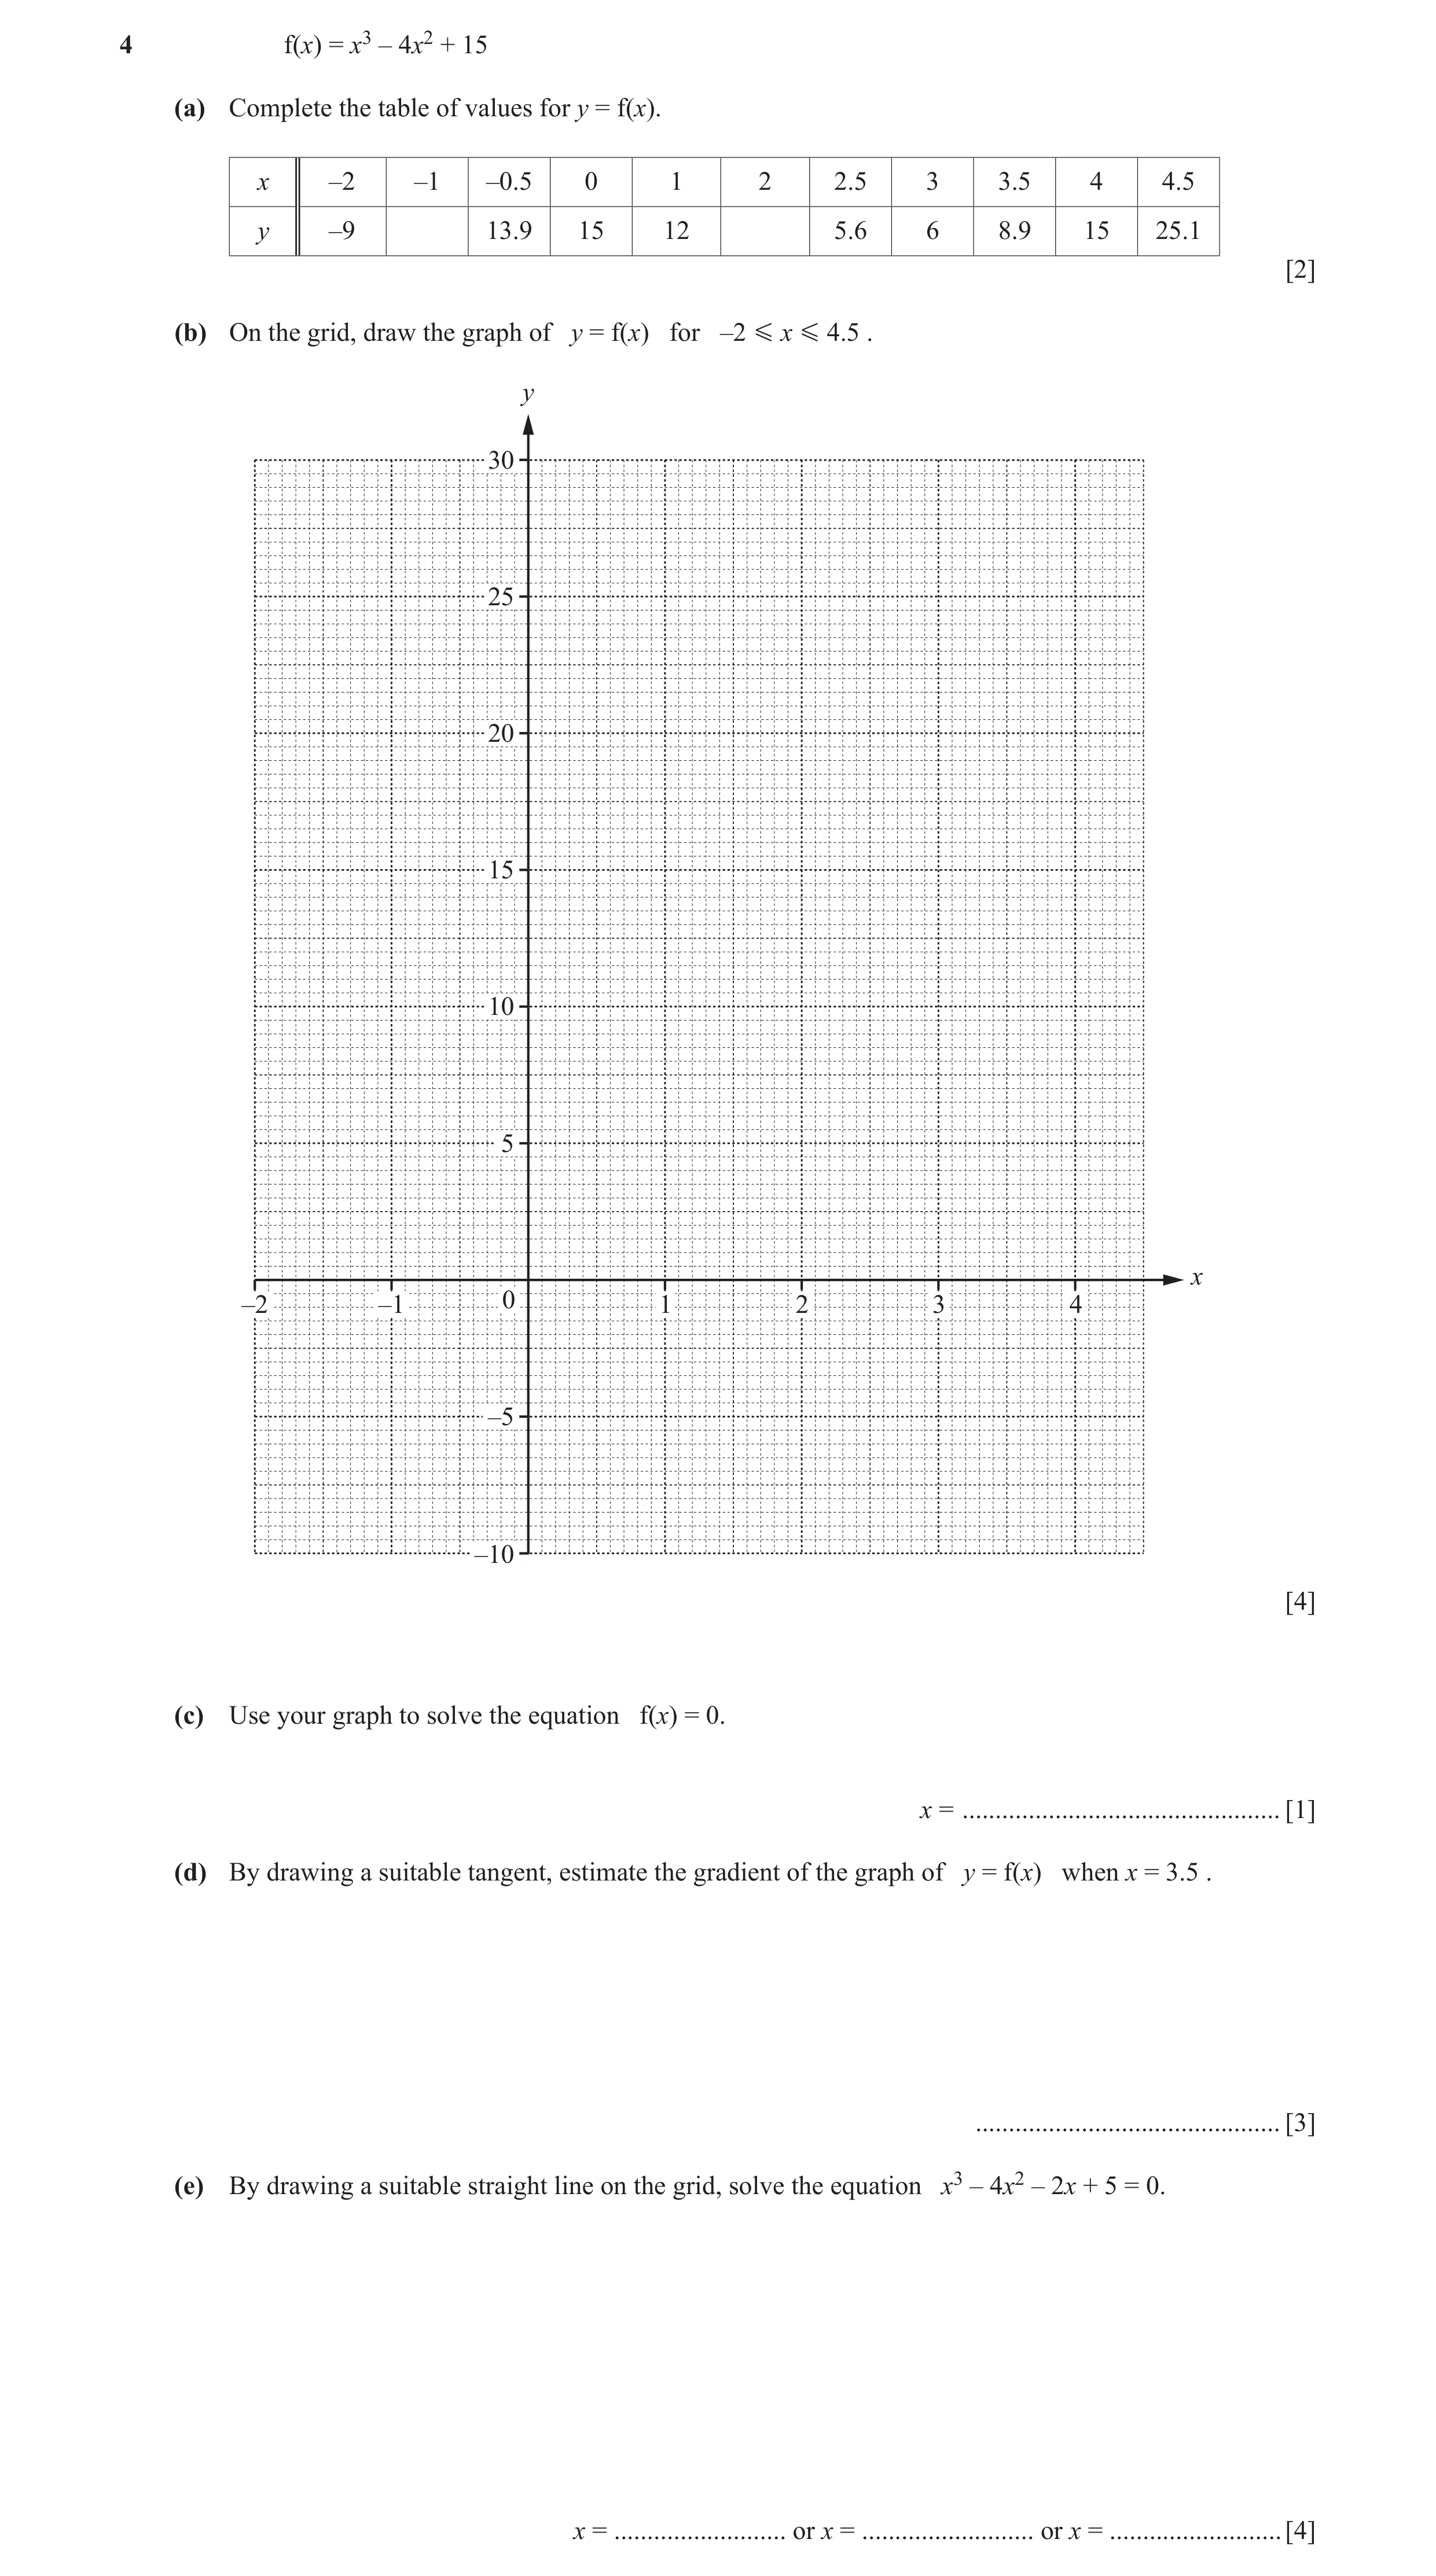
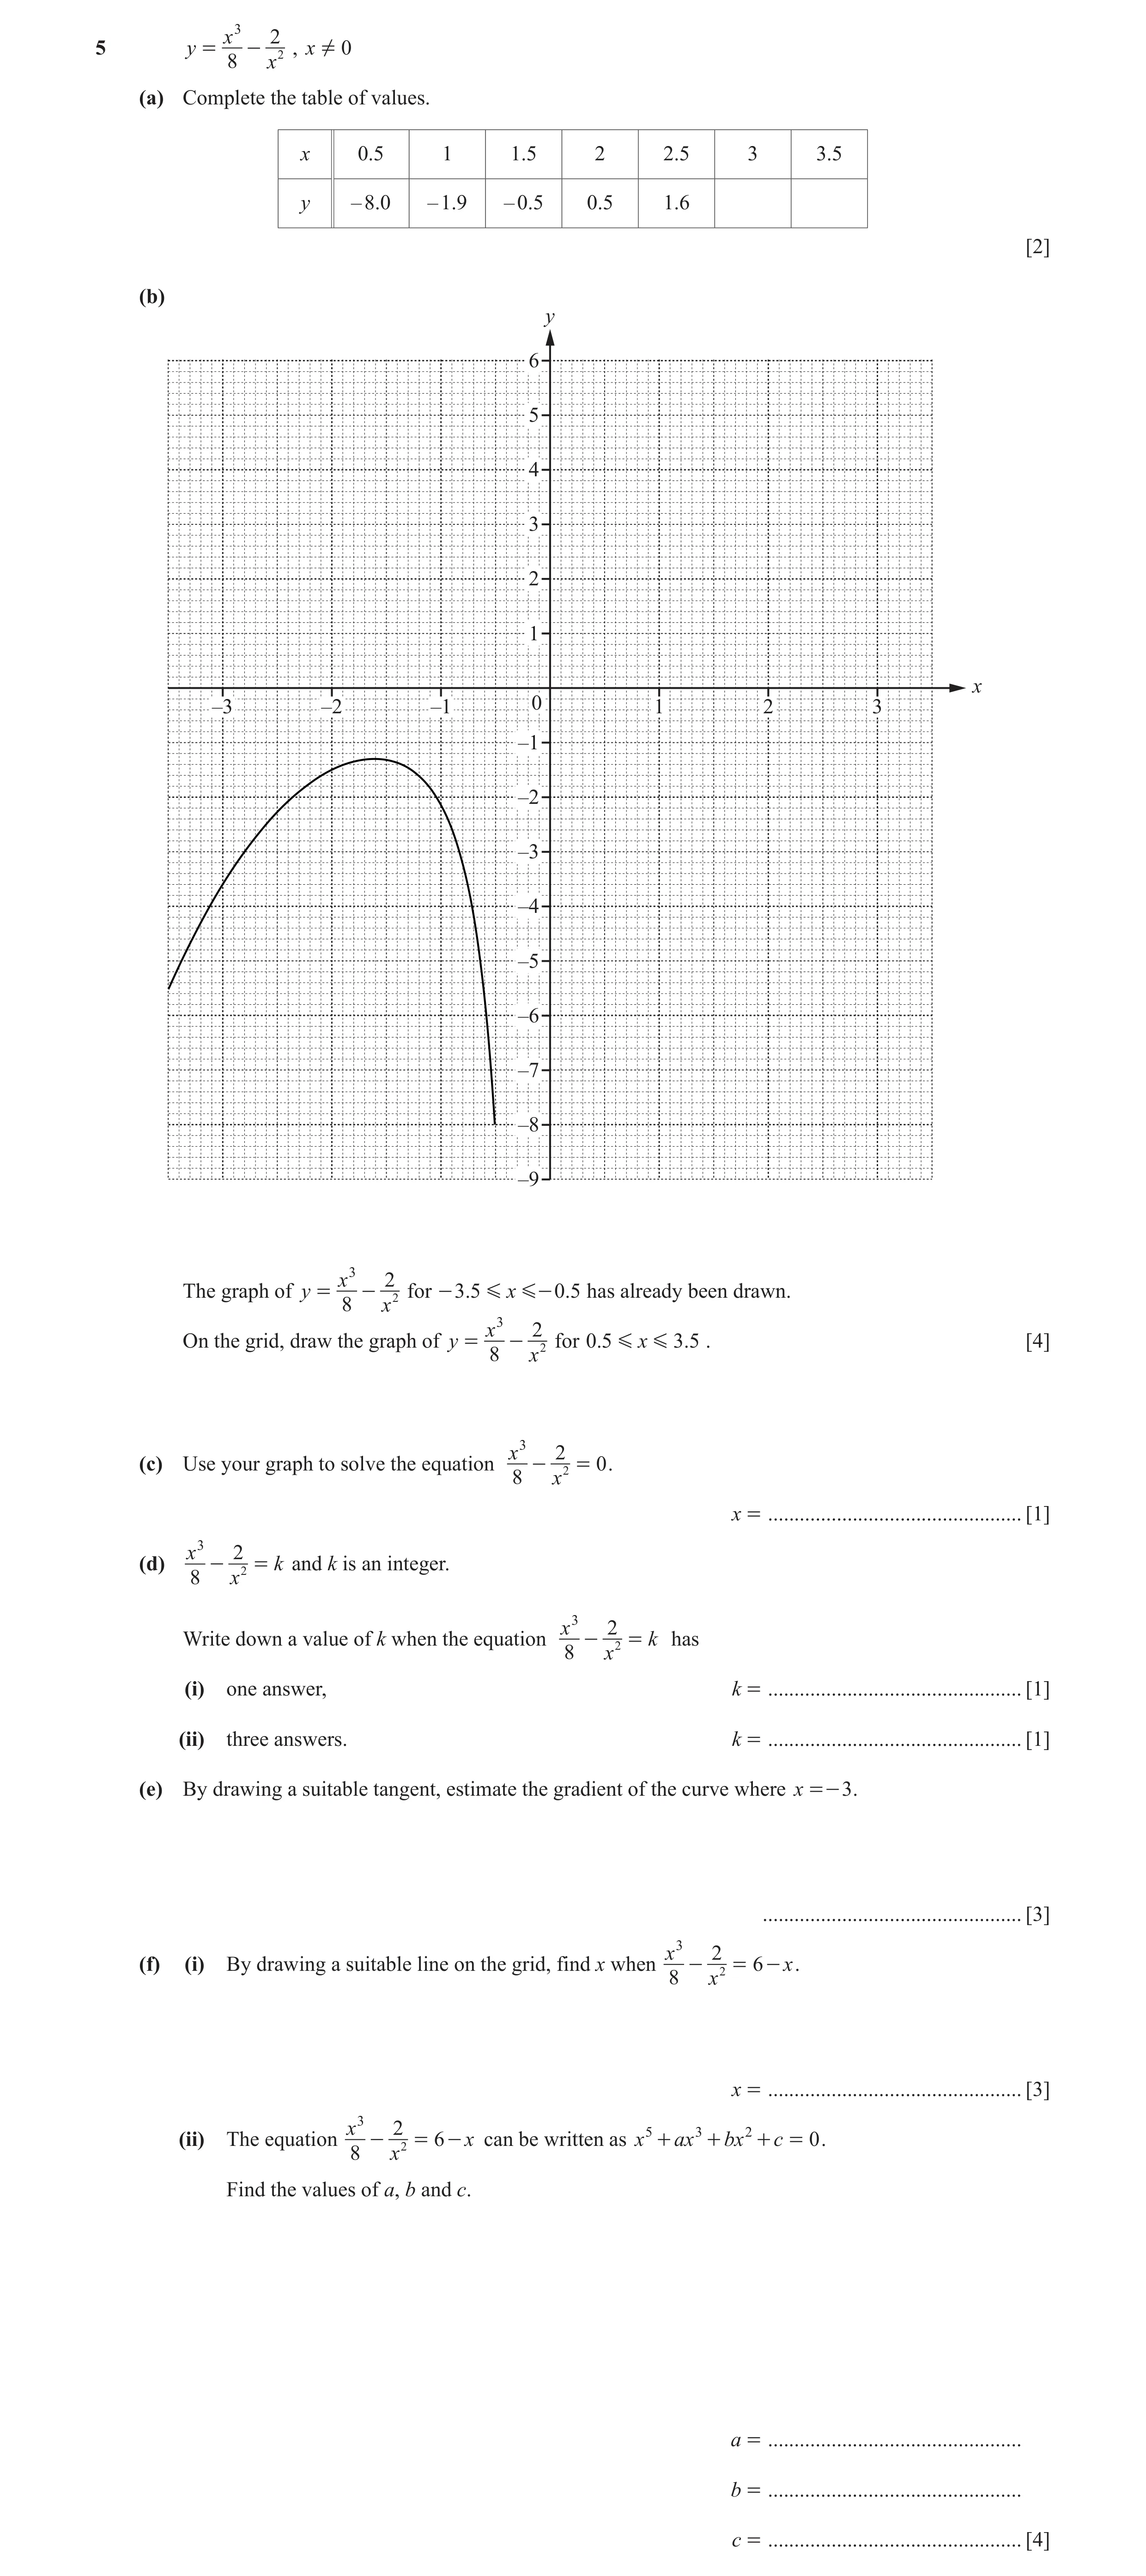
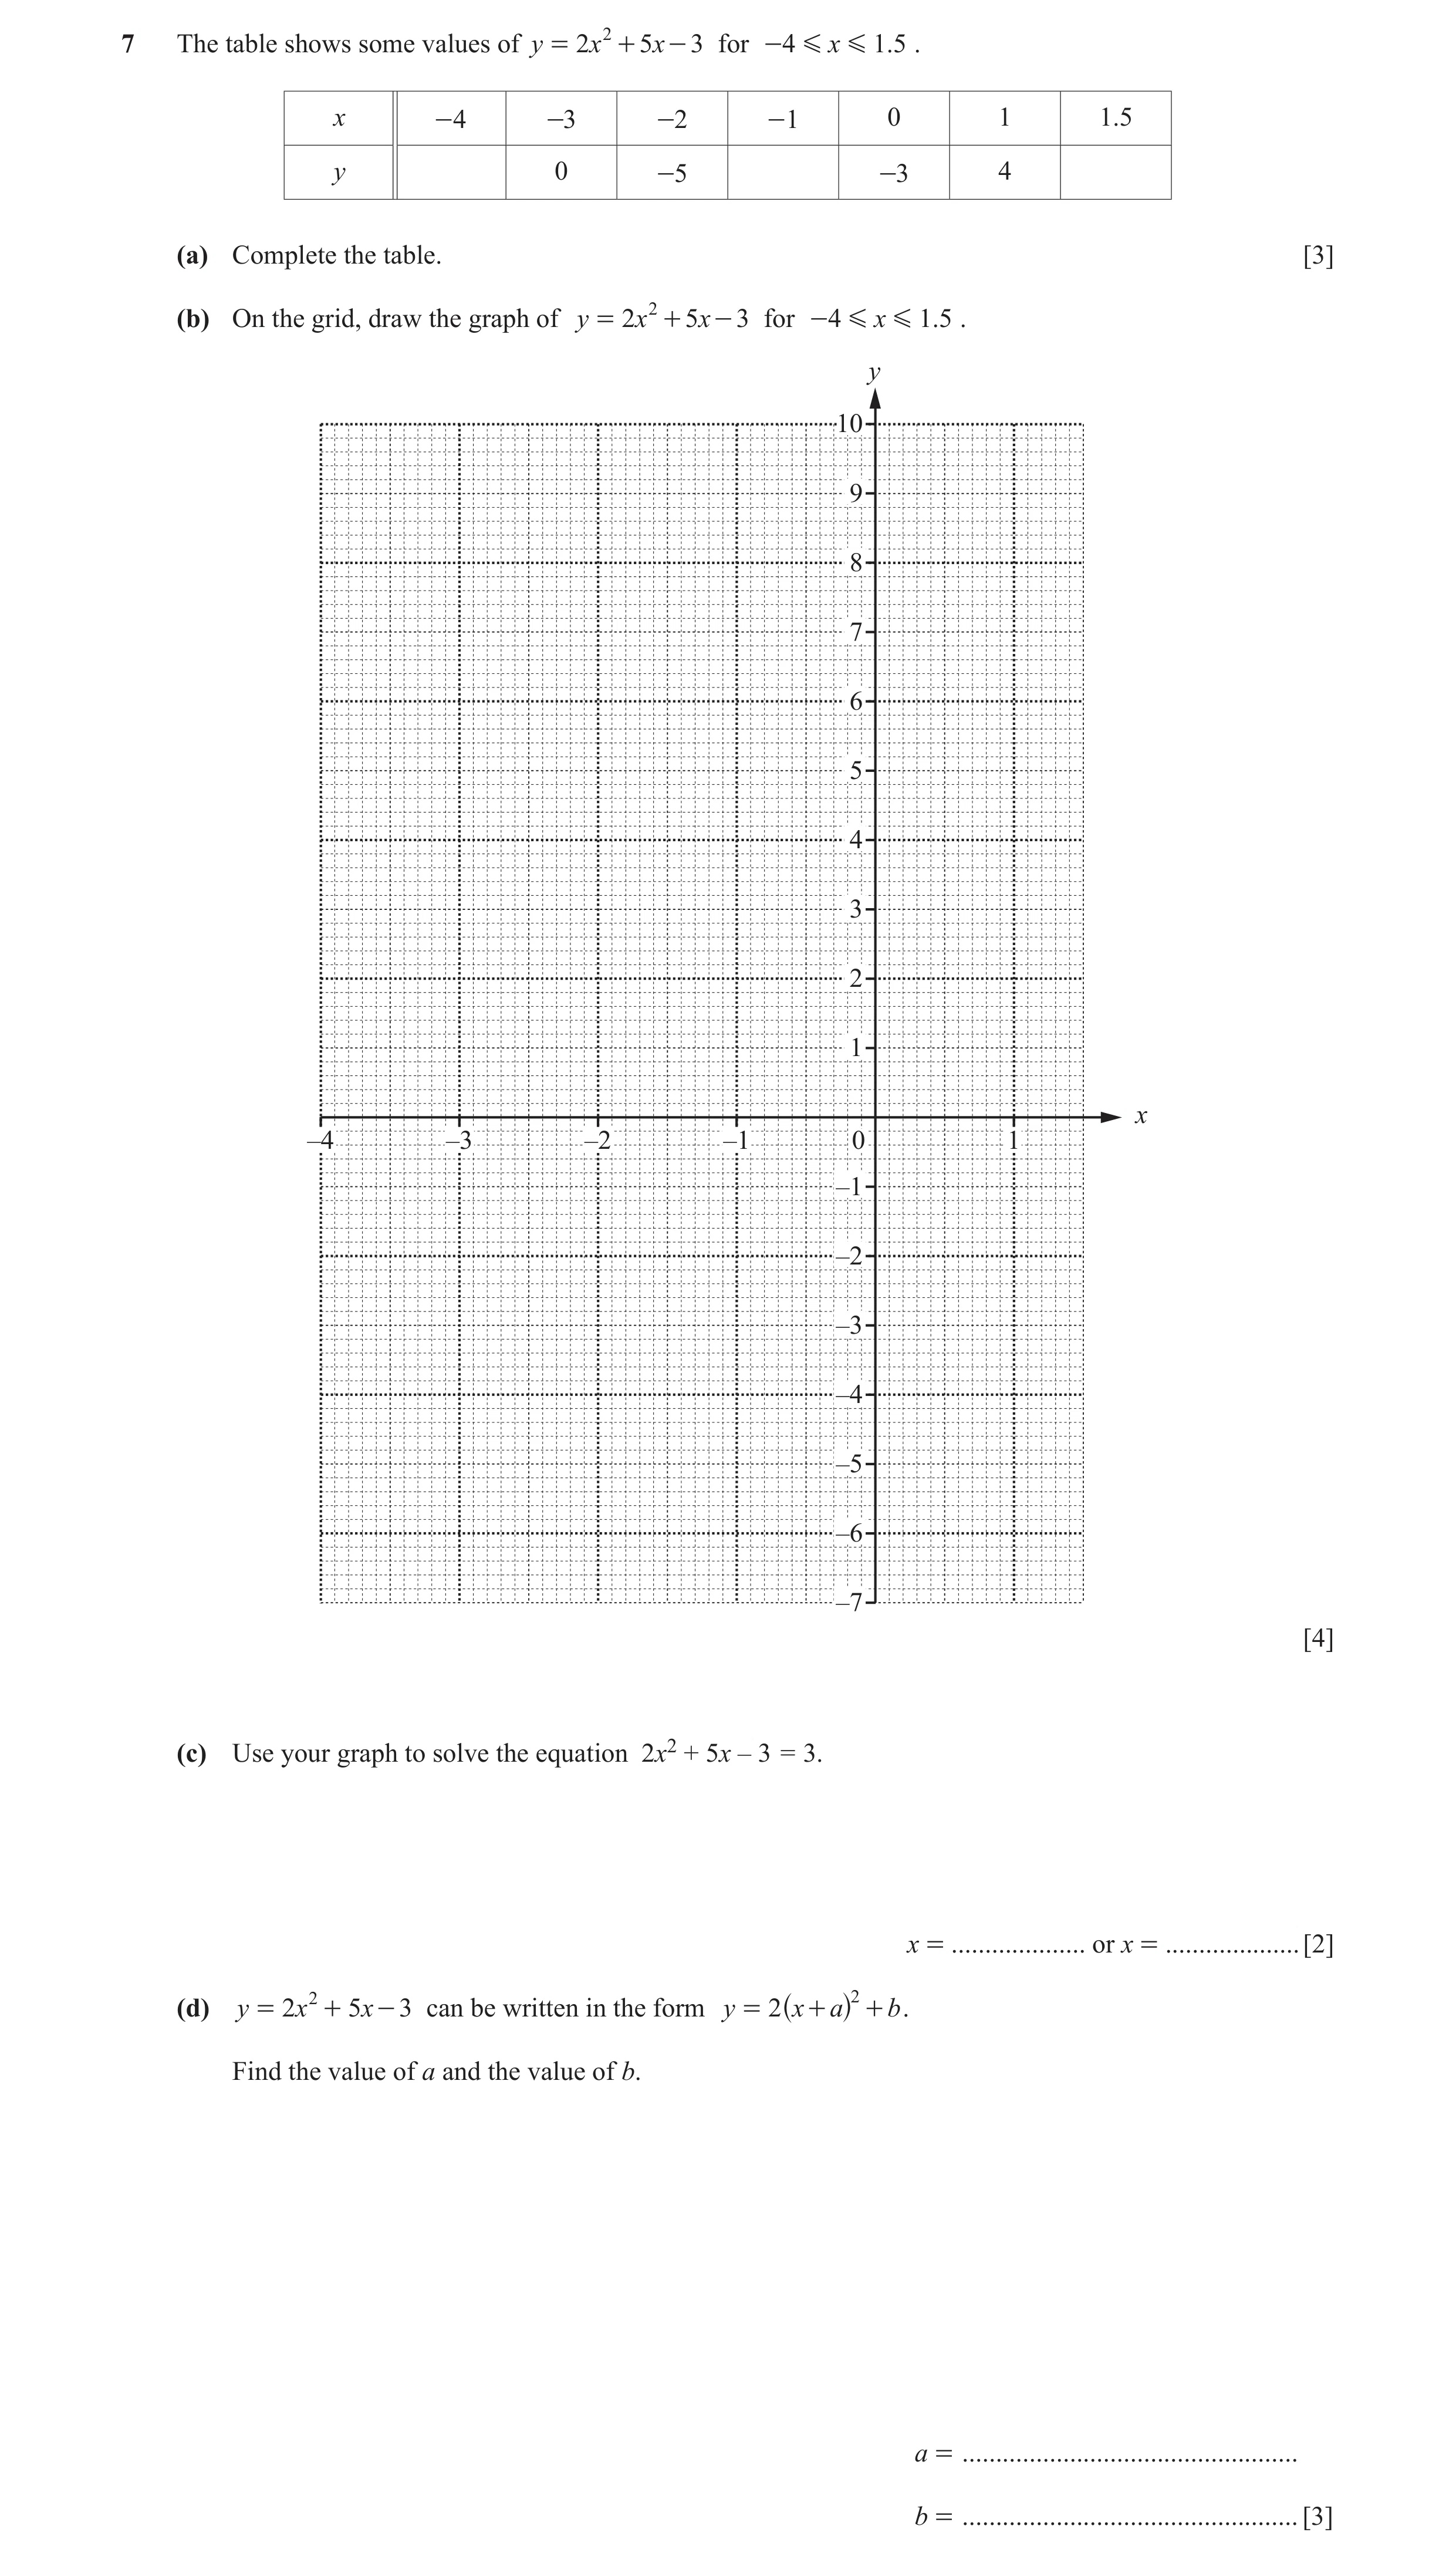
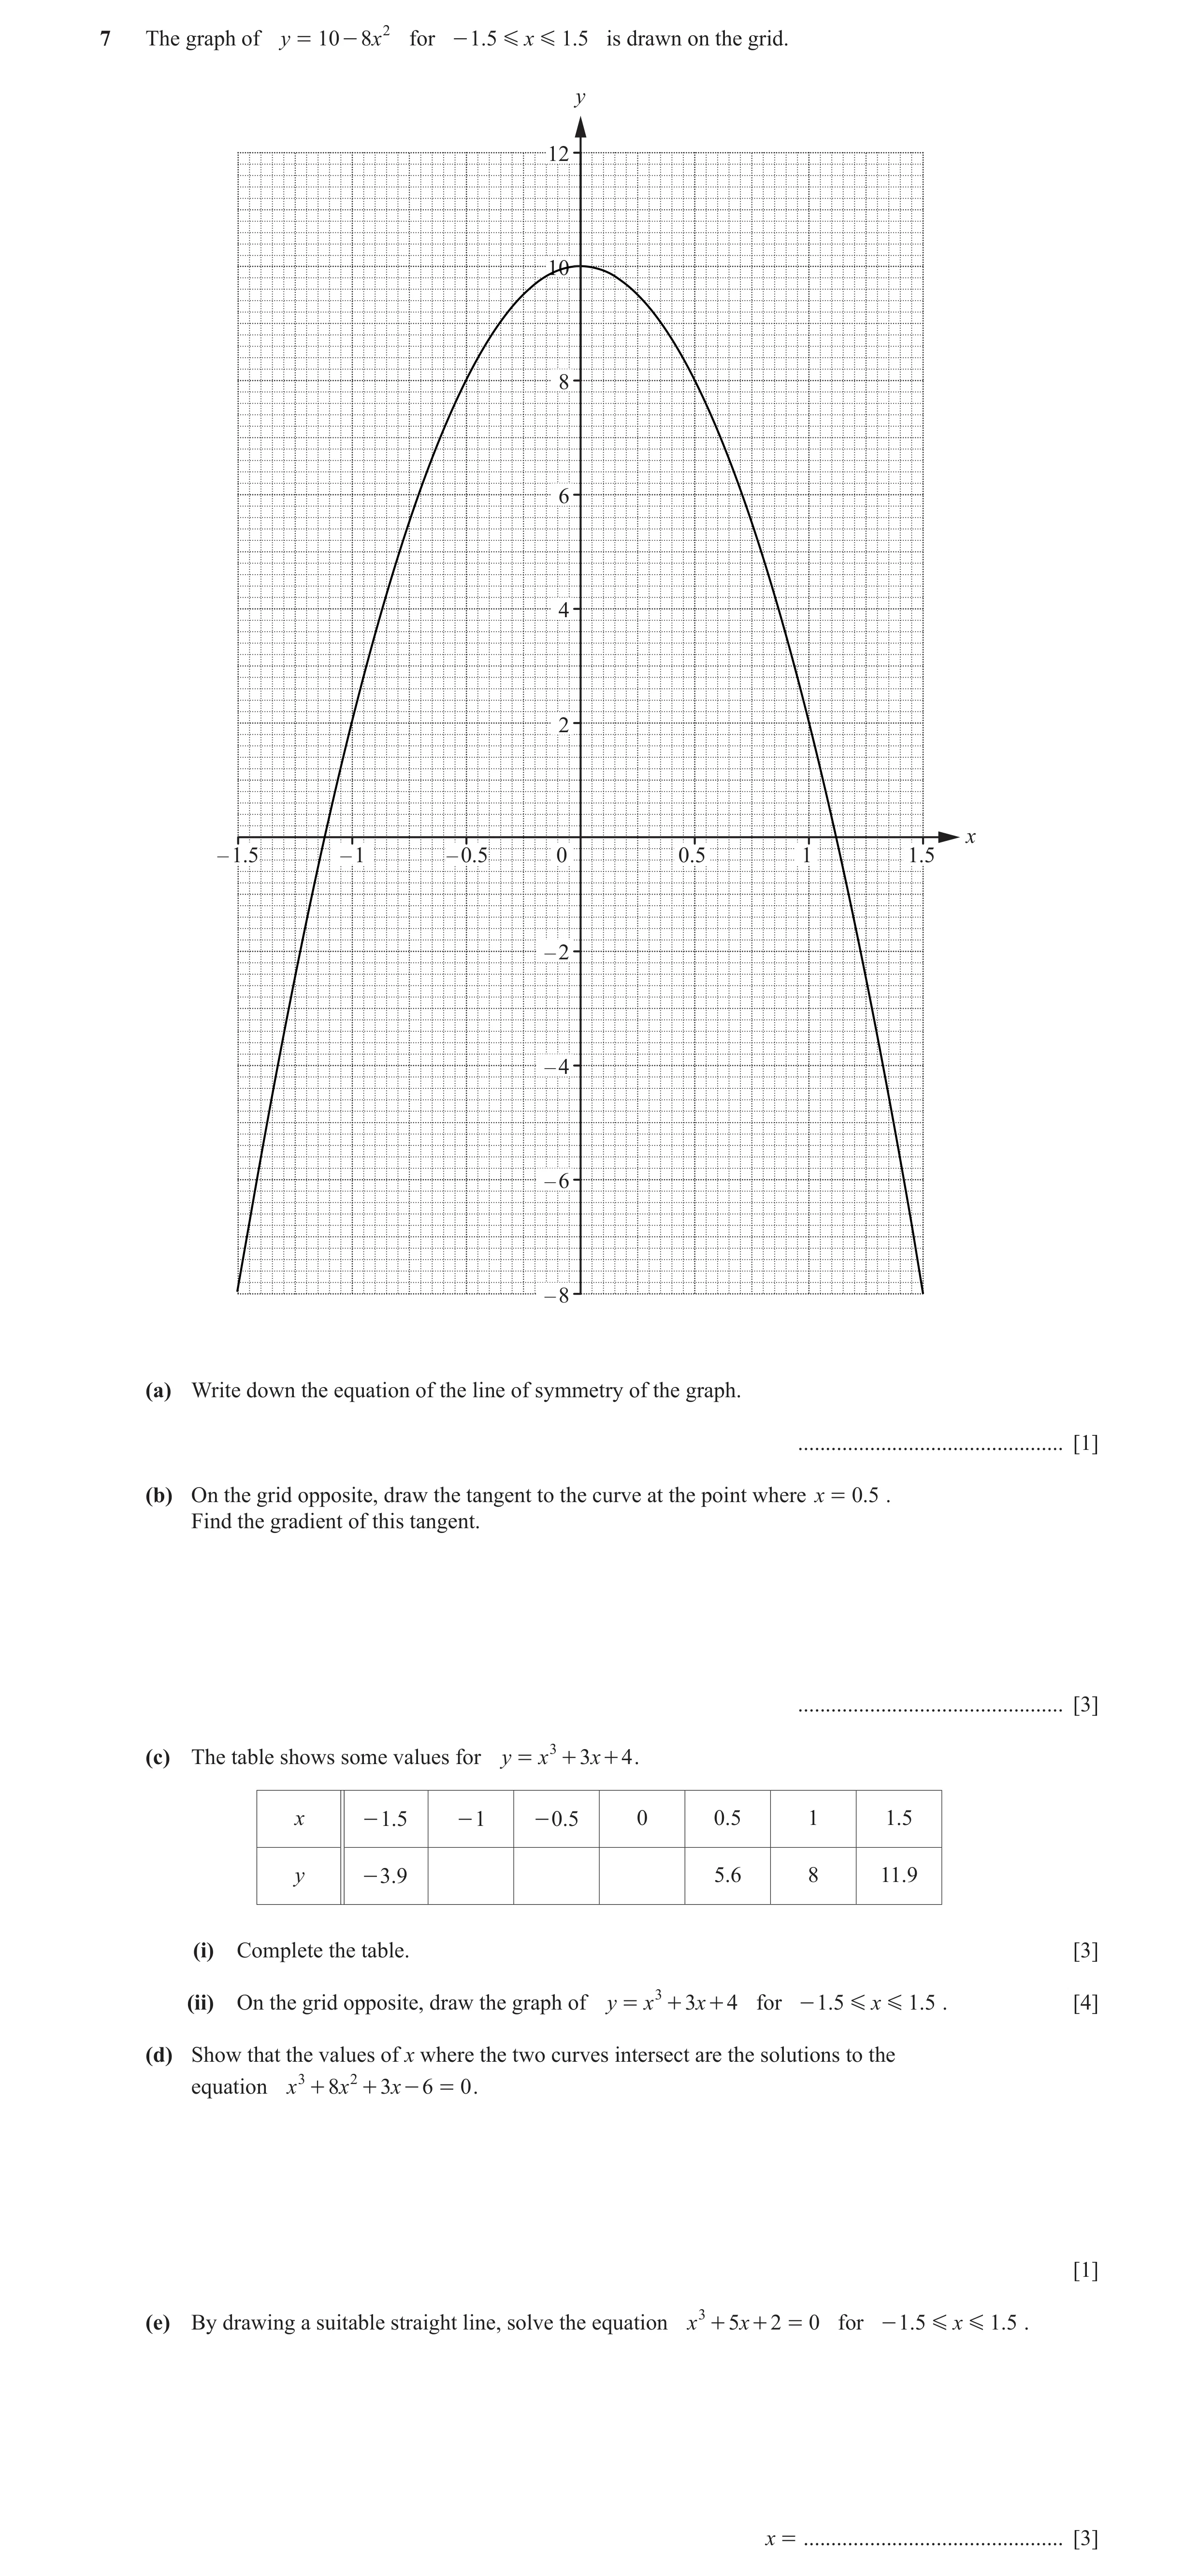
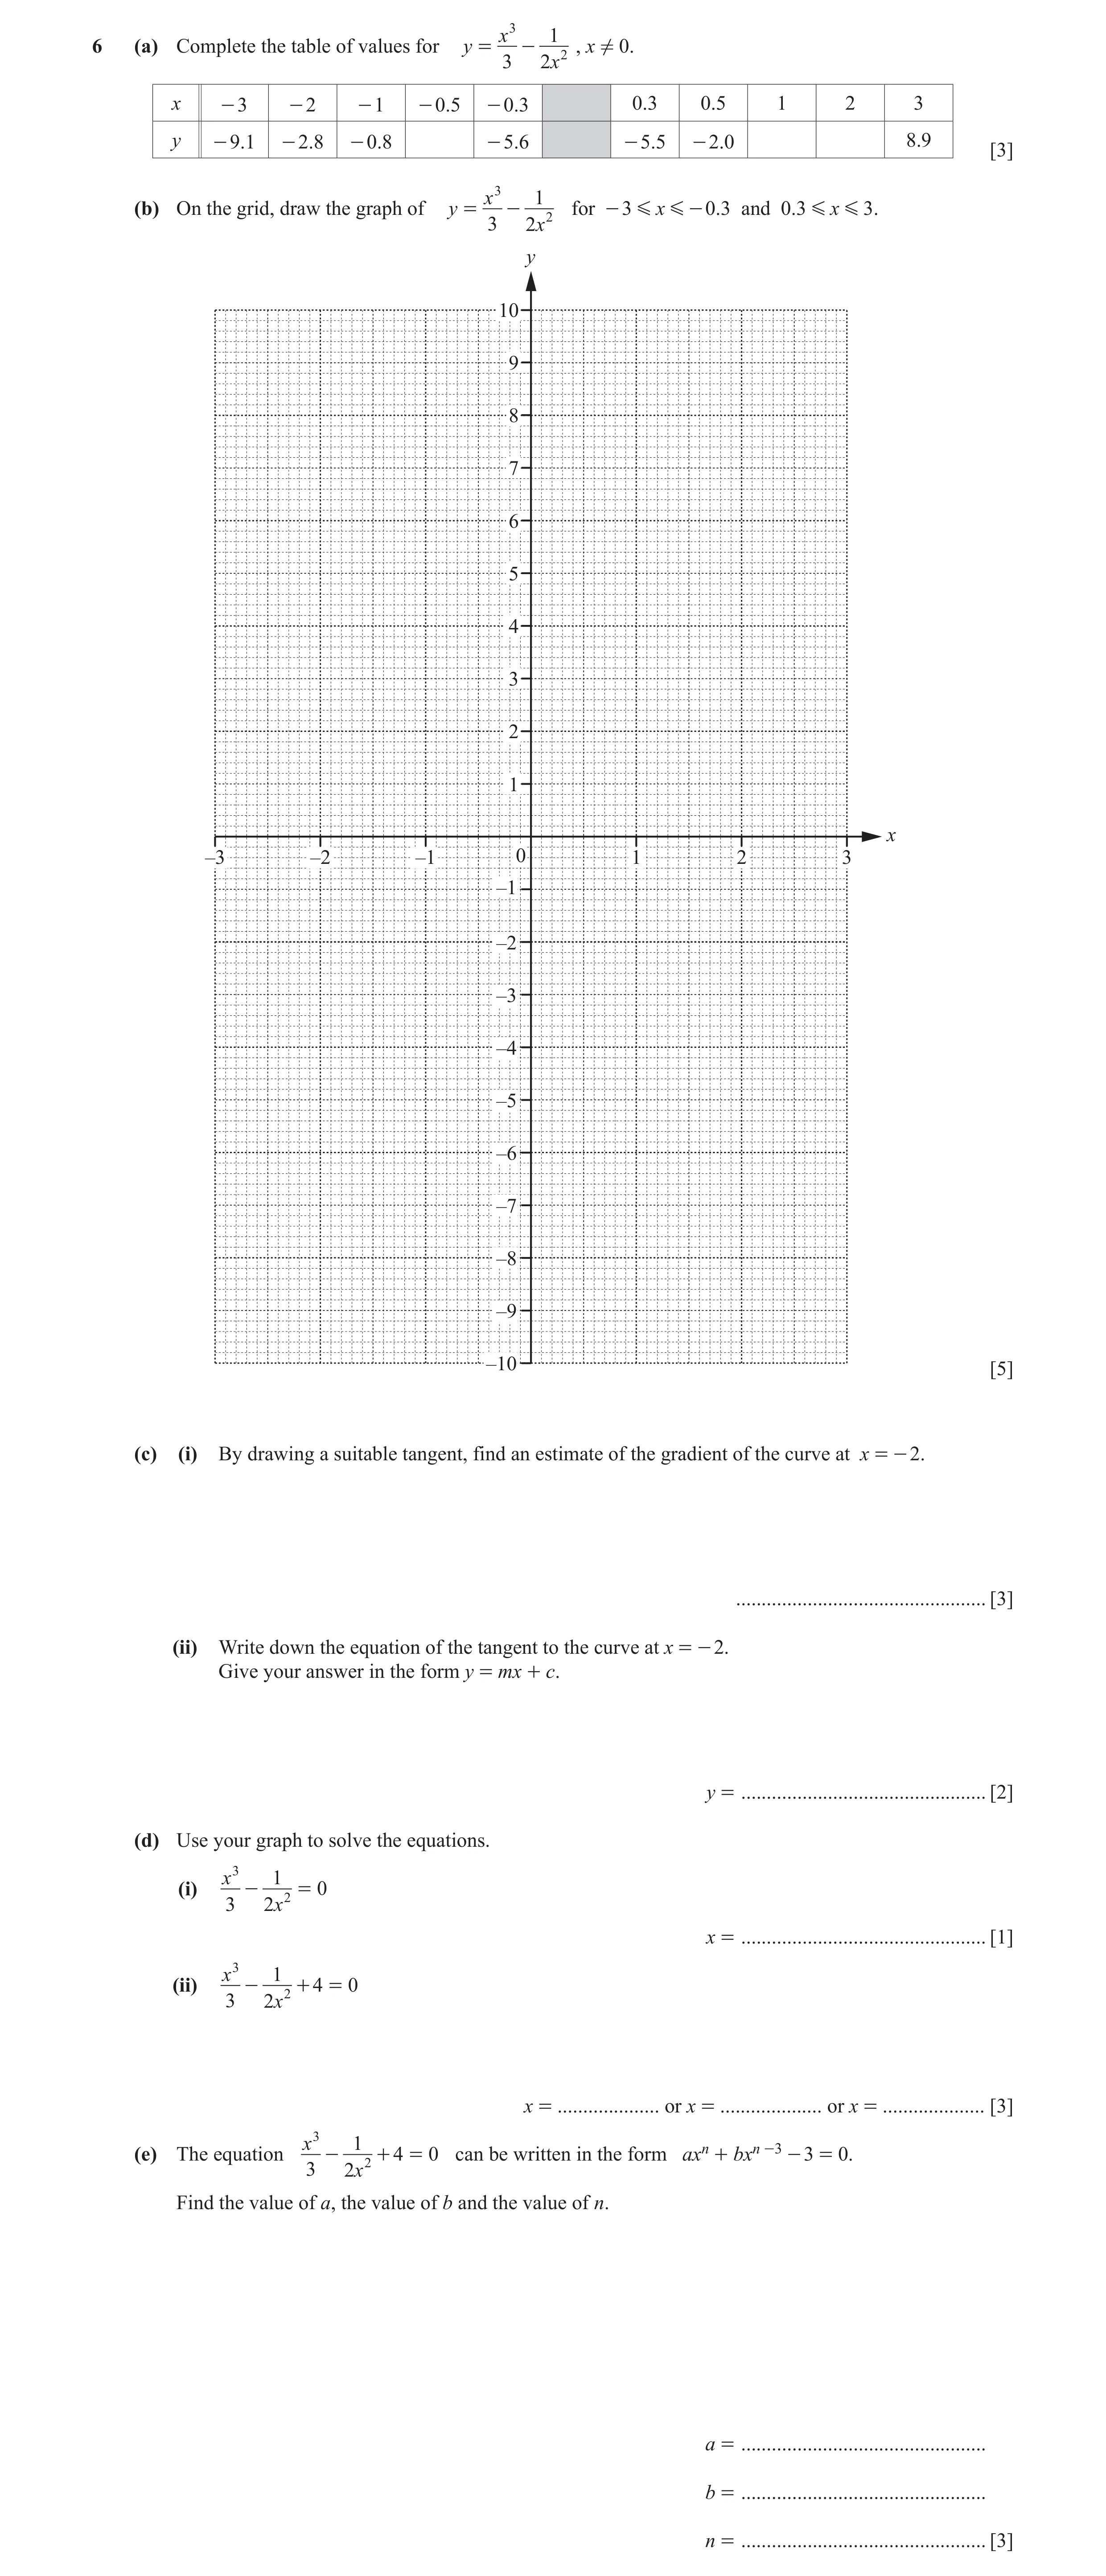
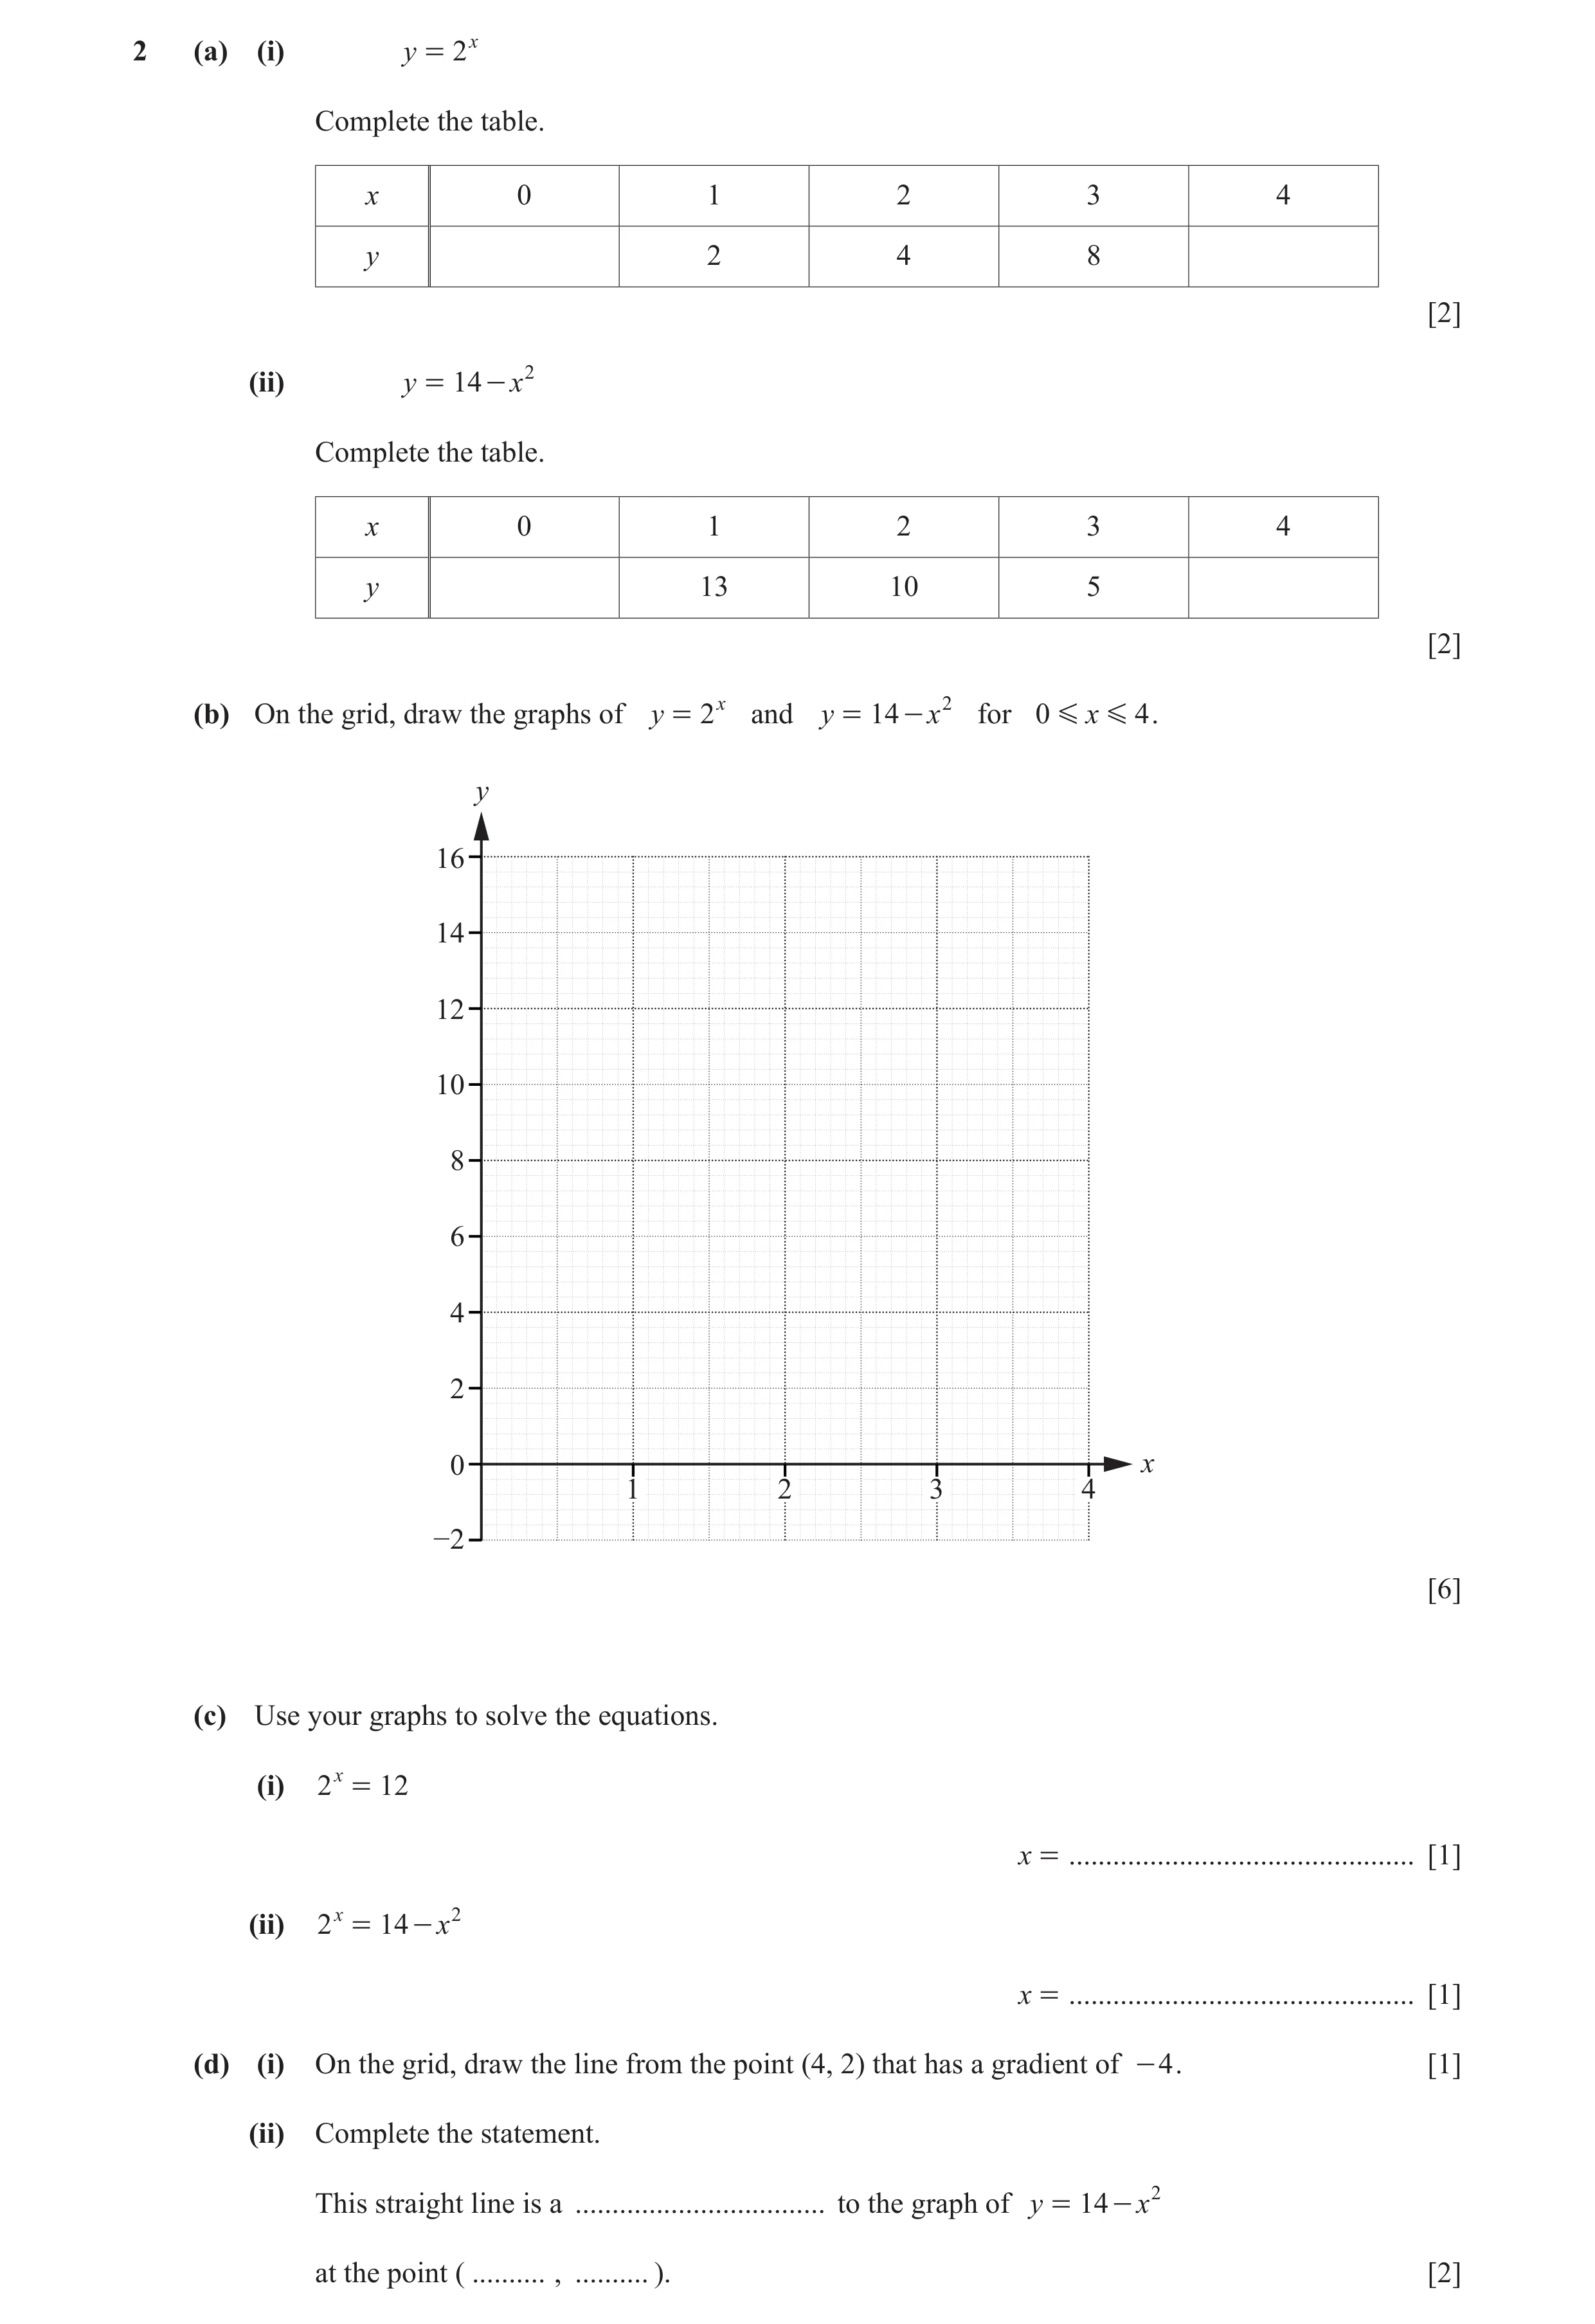
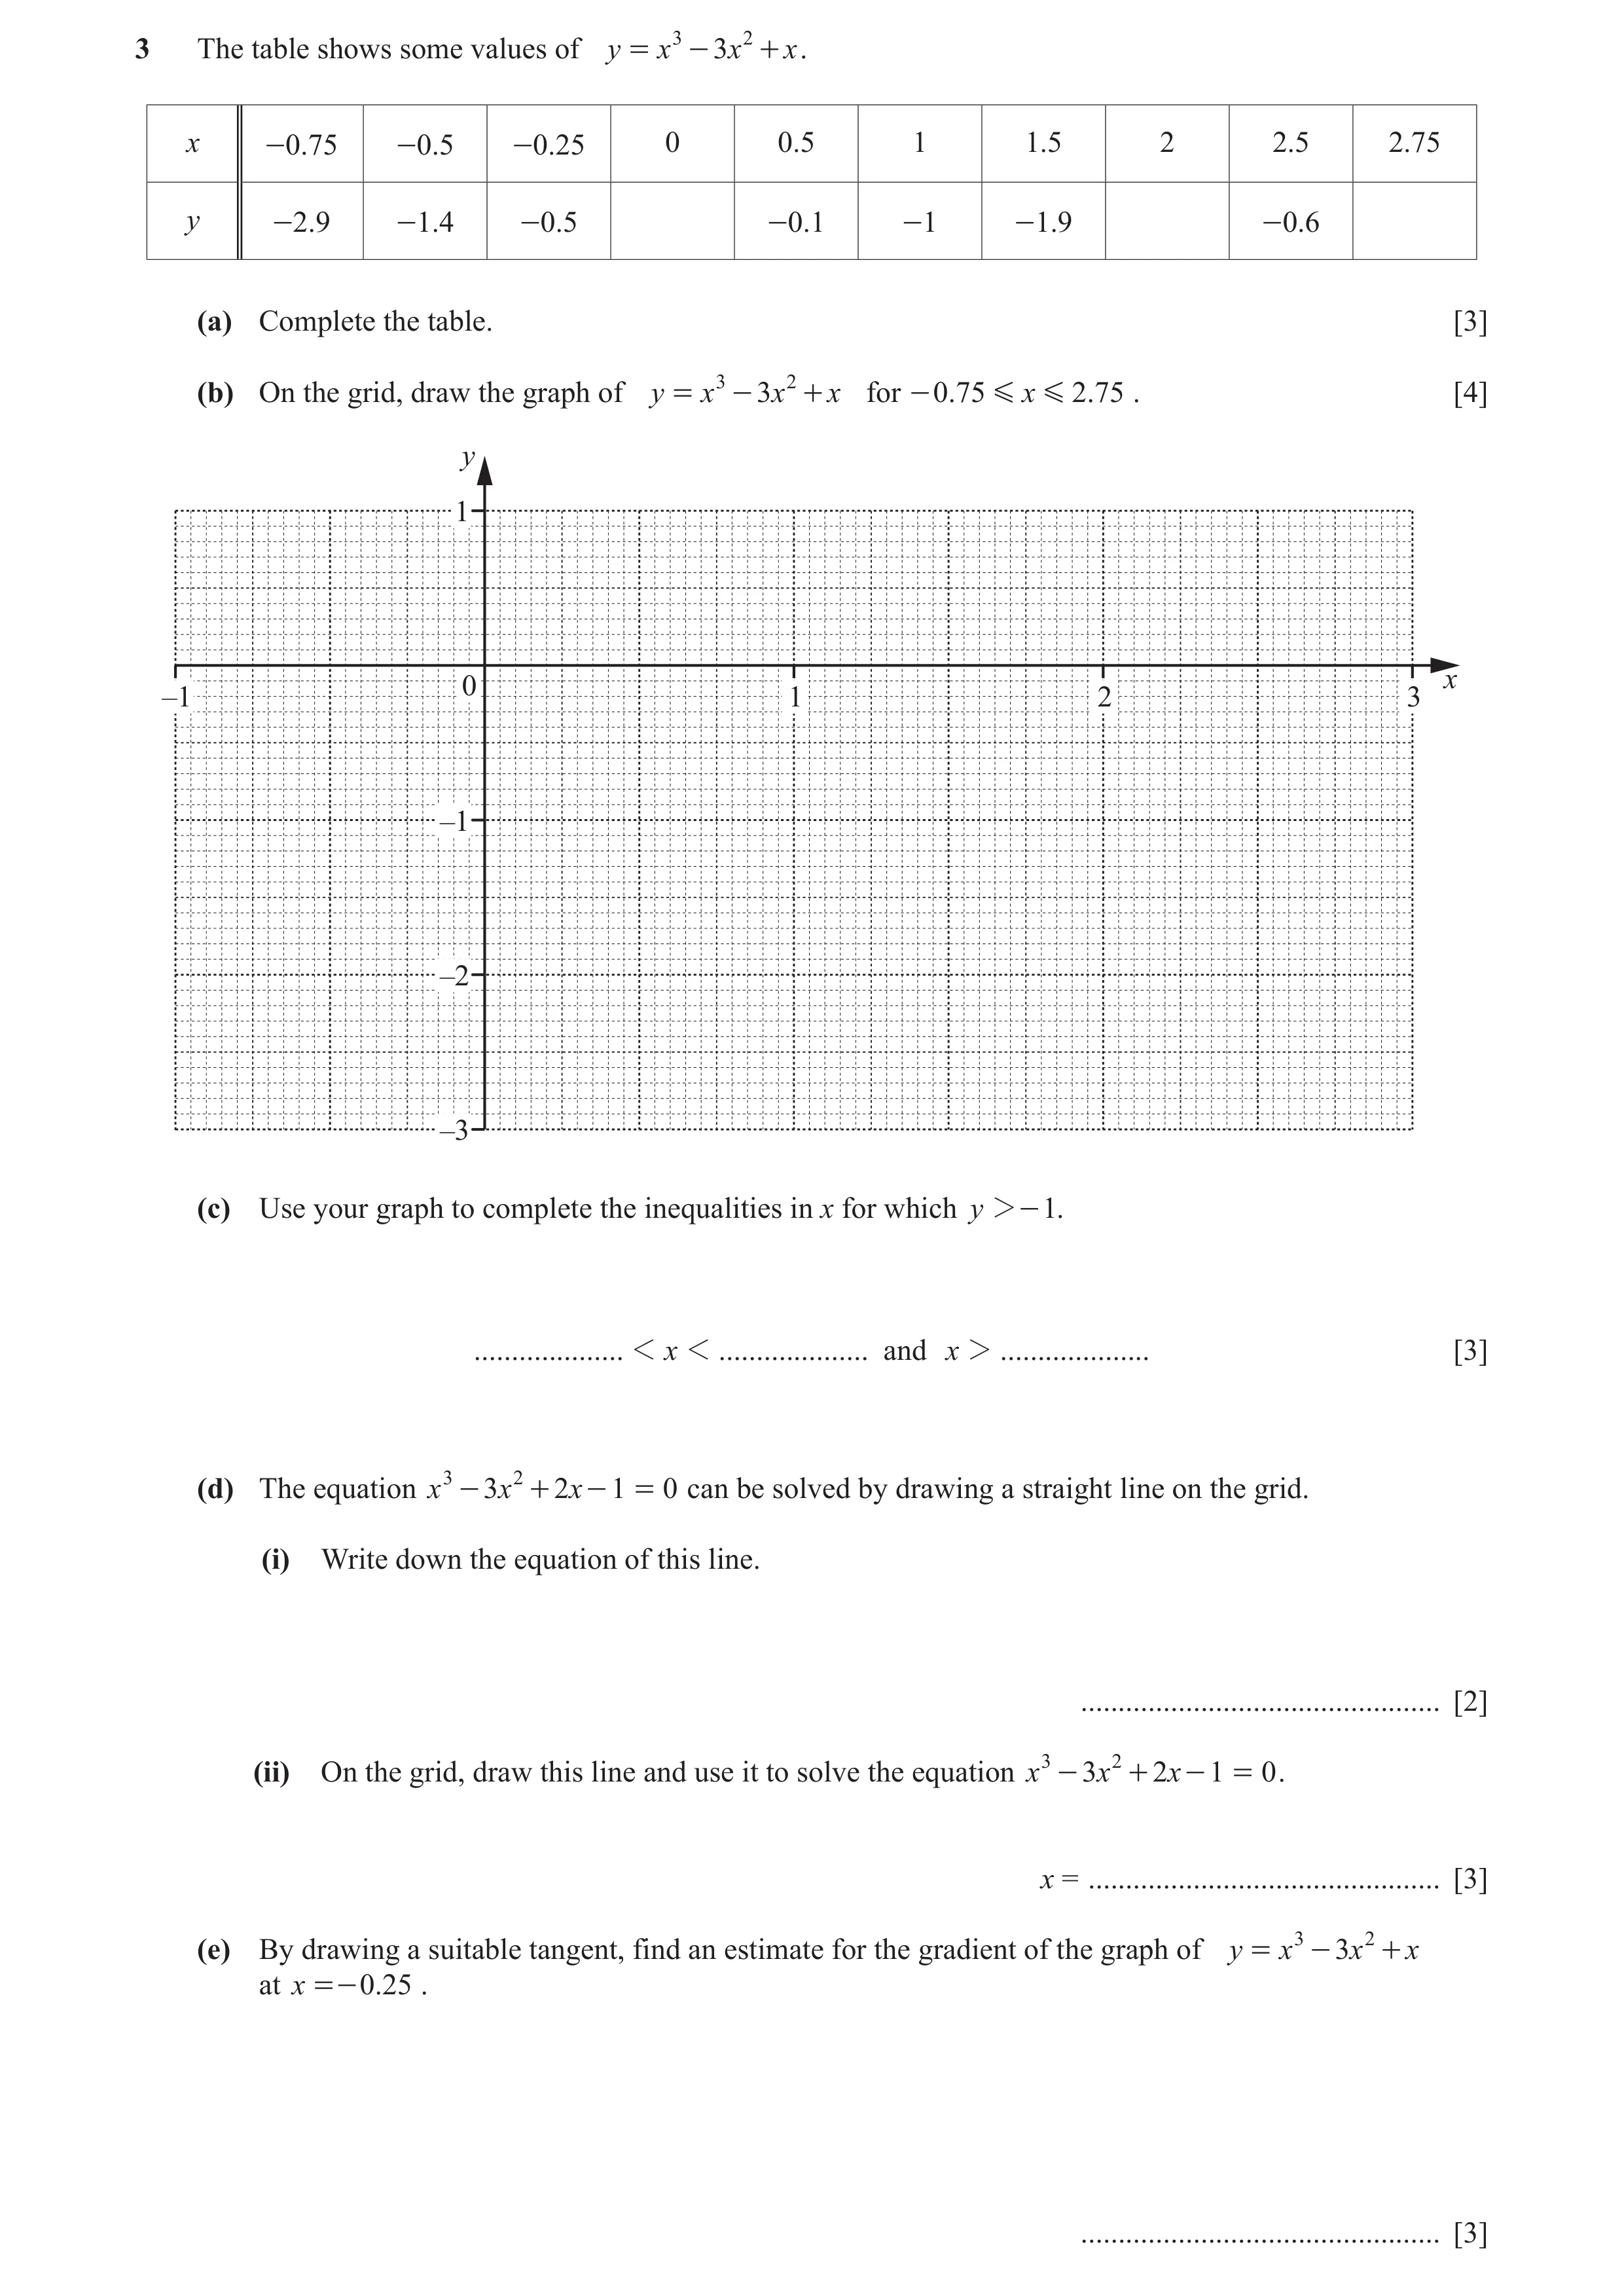 76 / 126
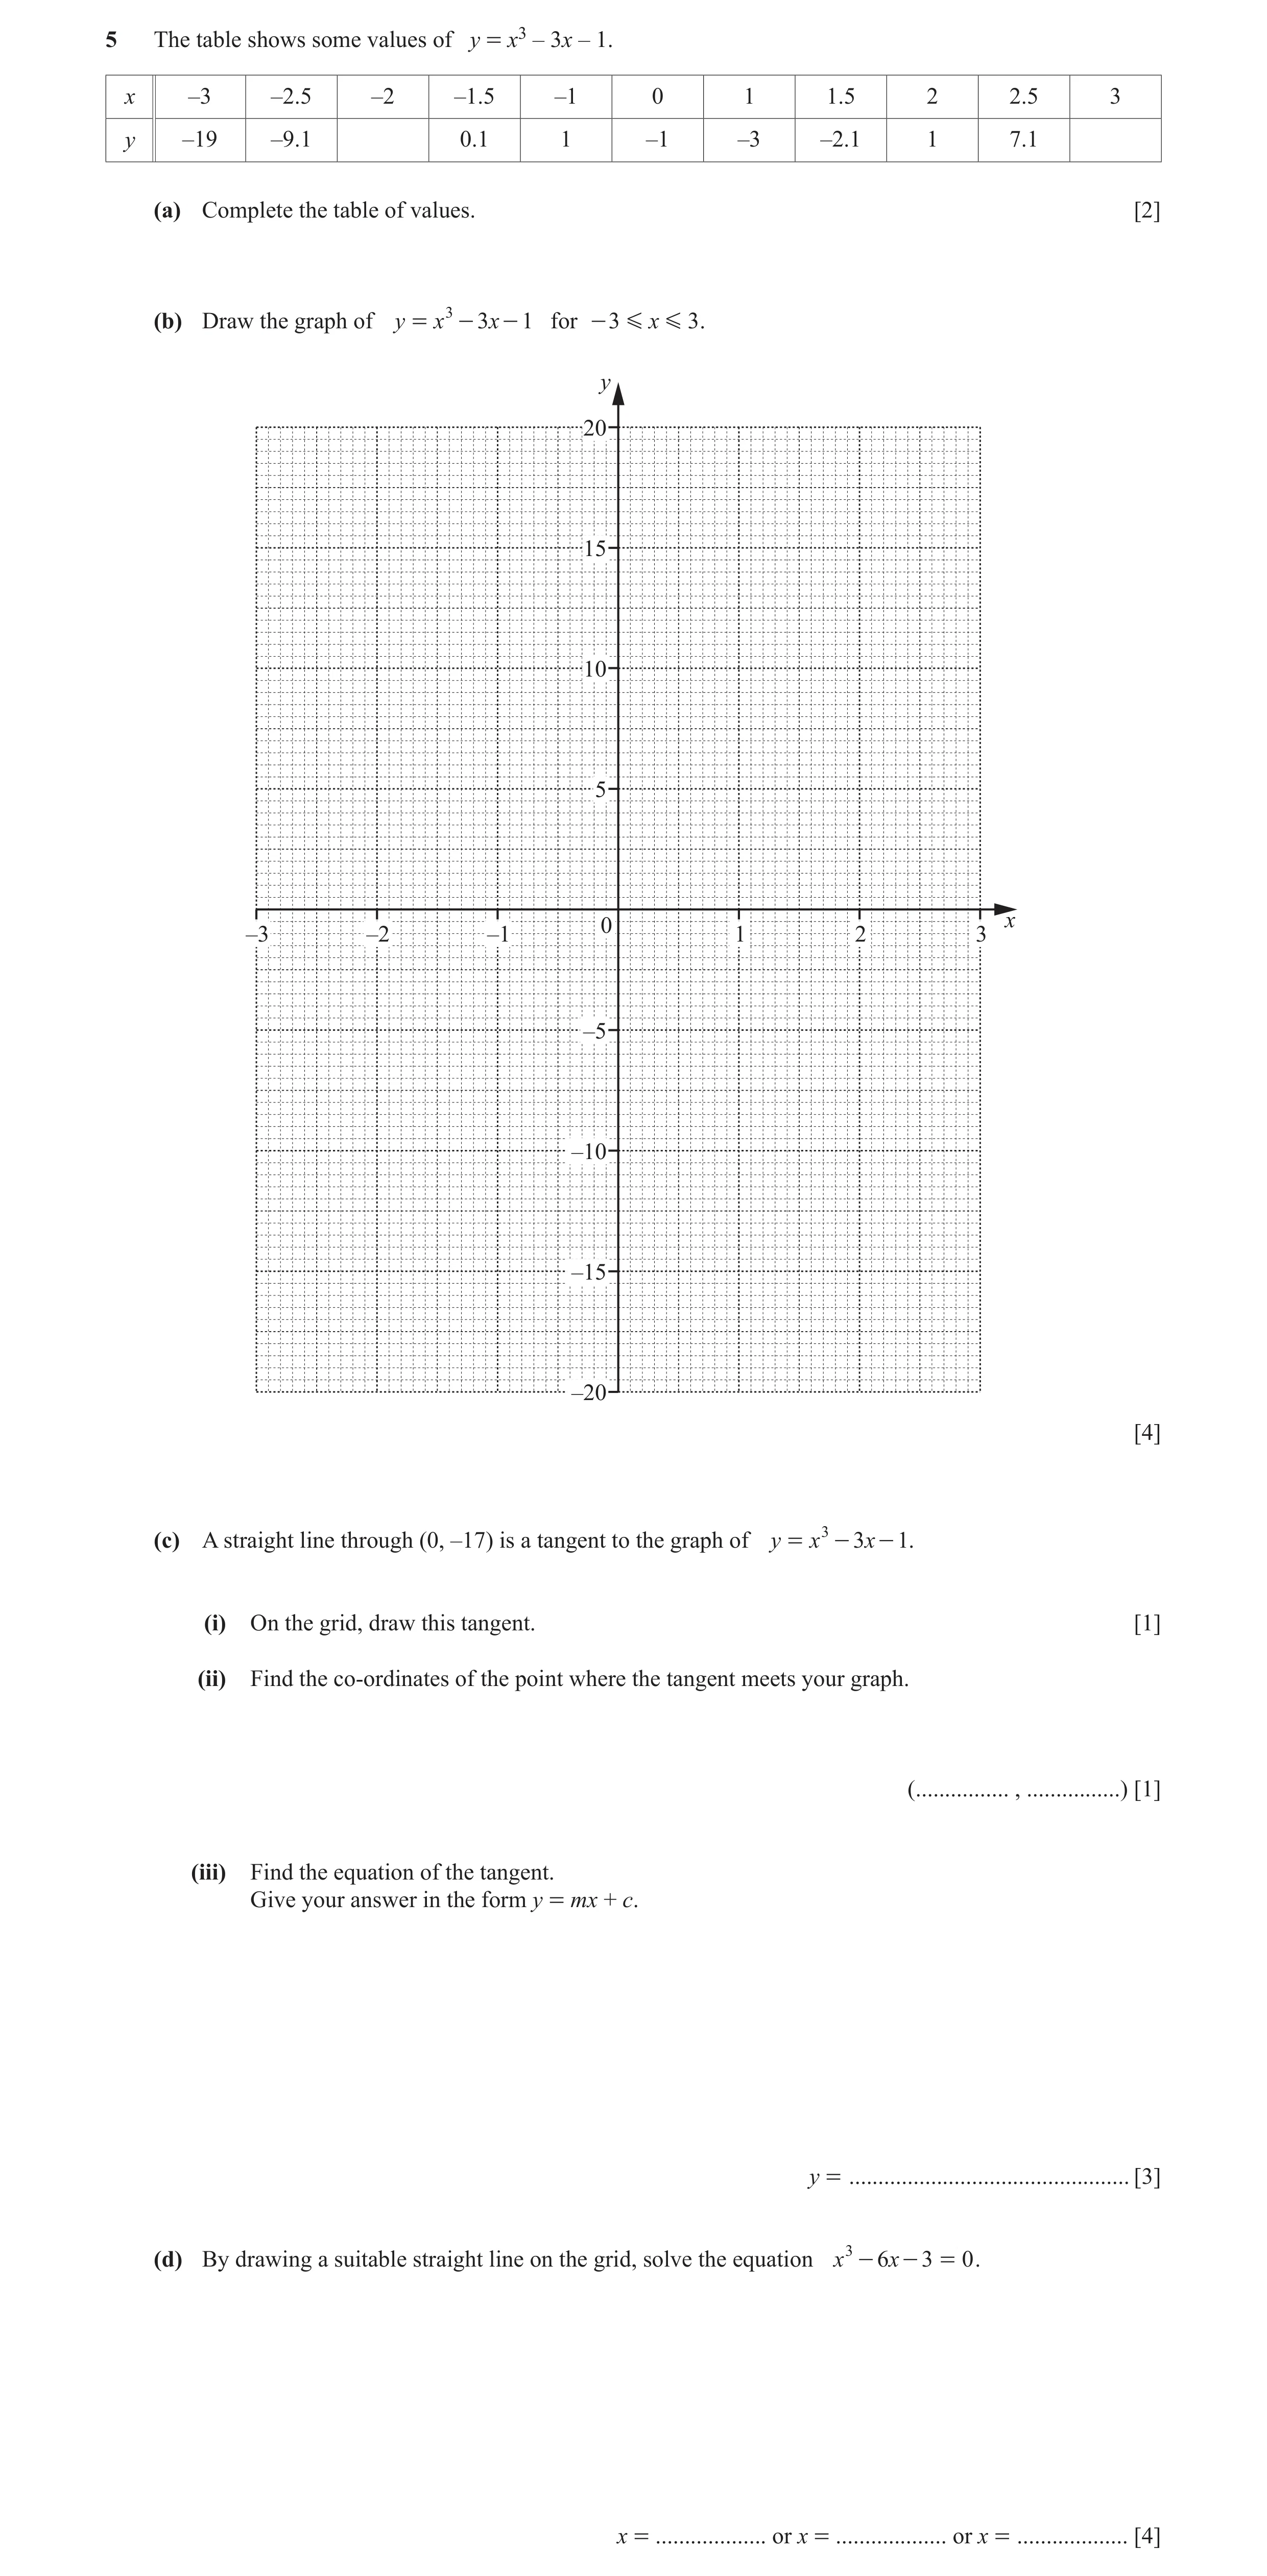
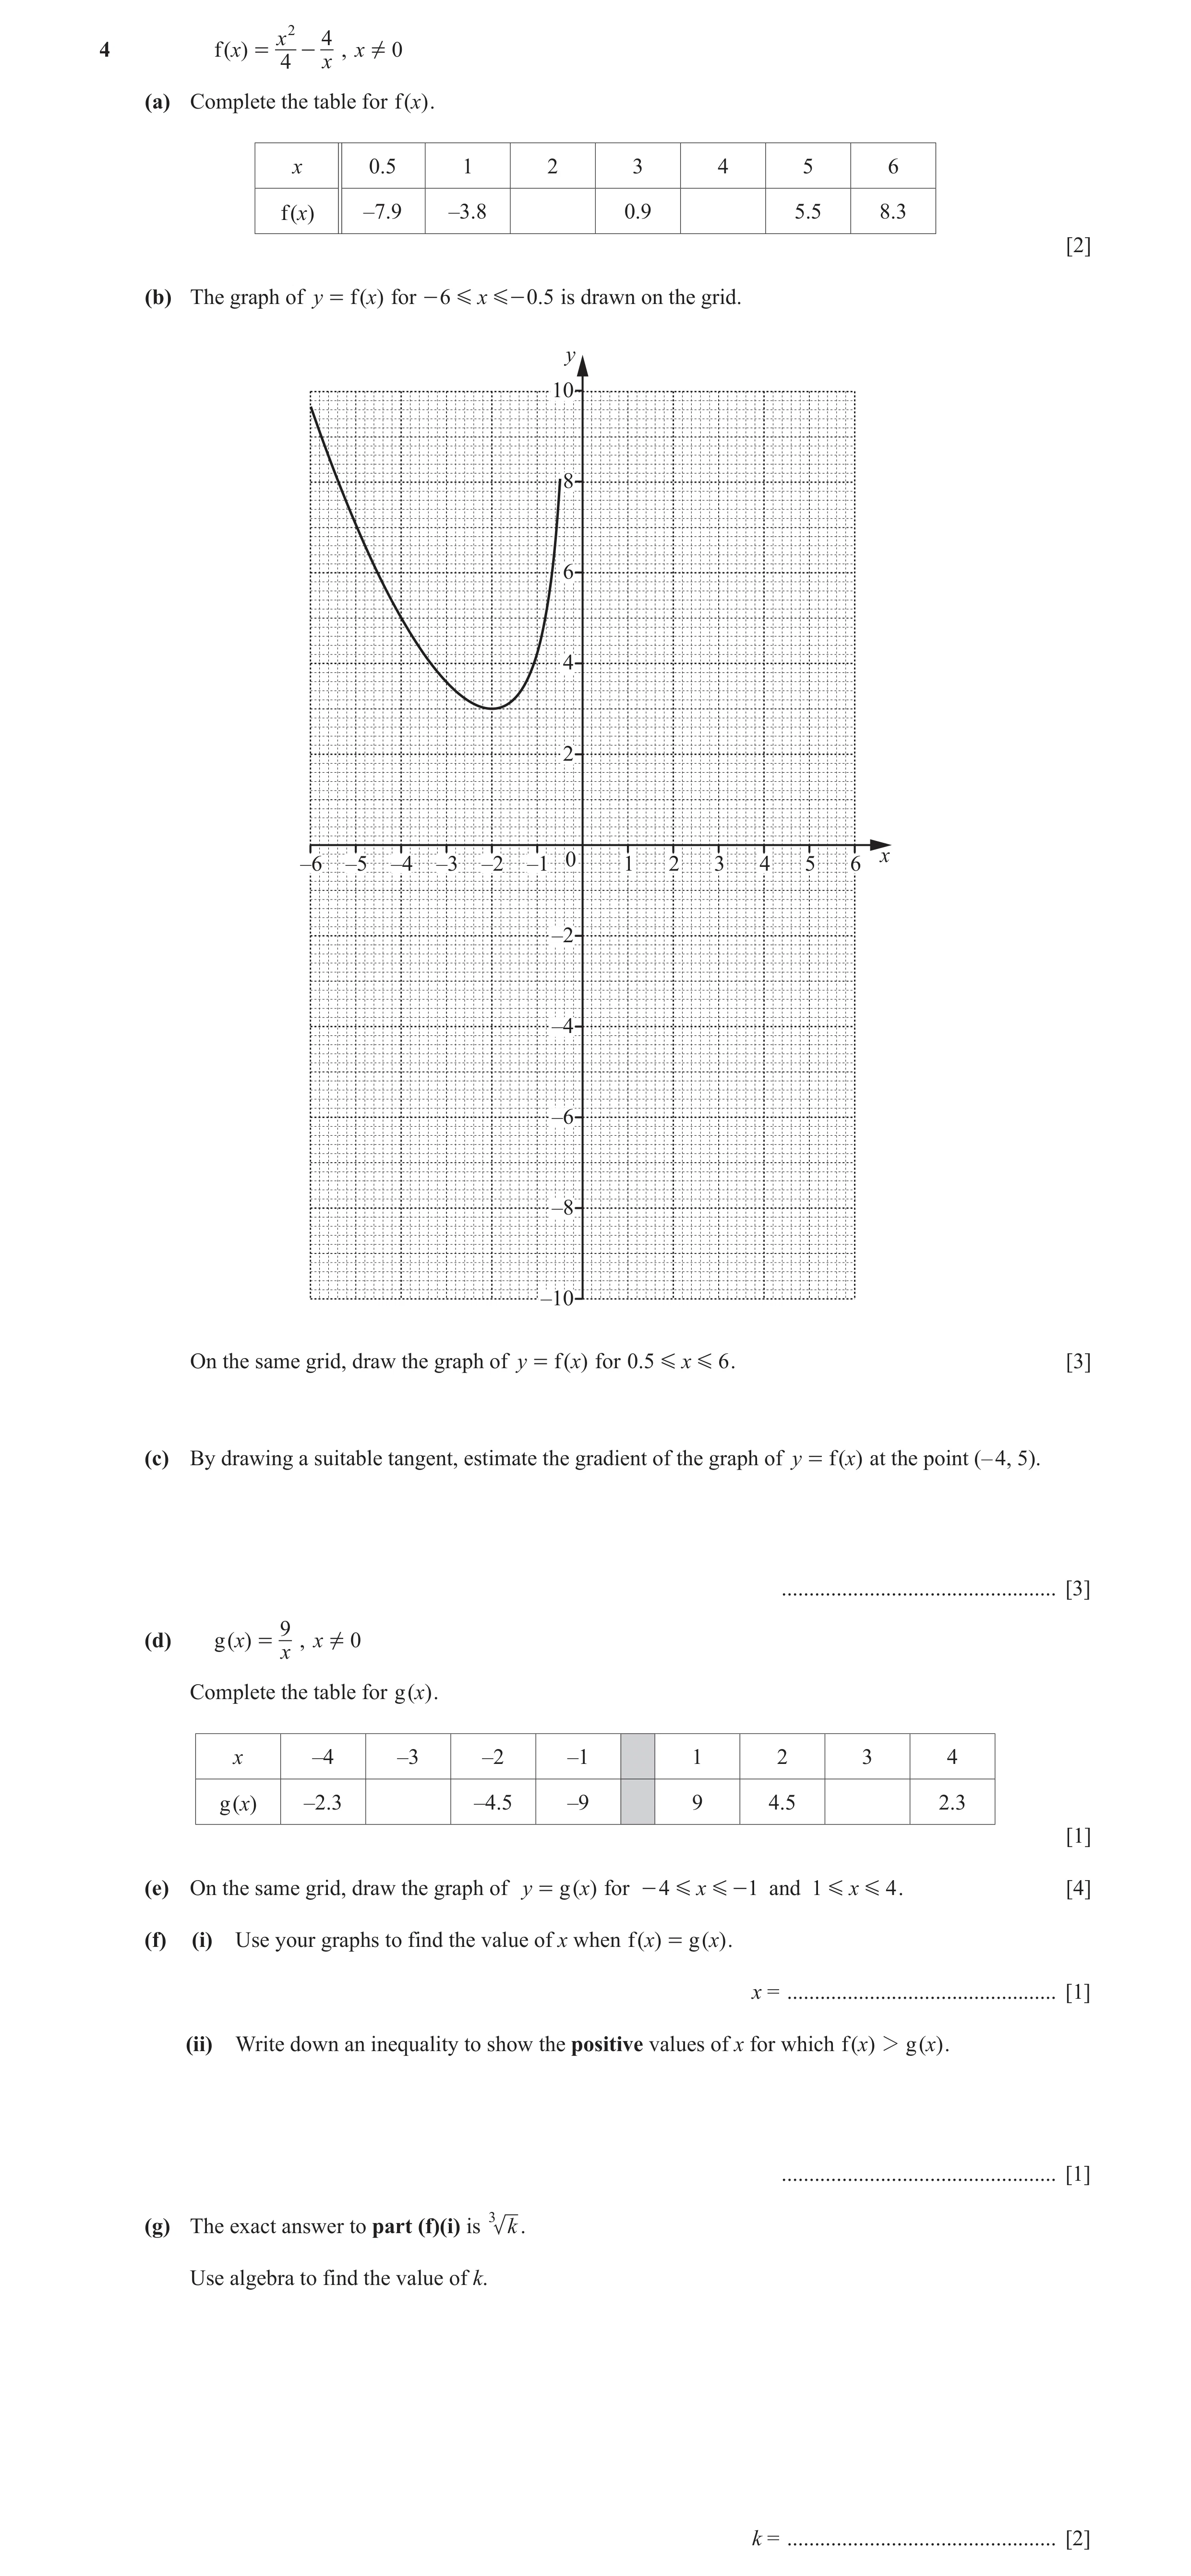
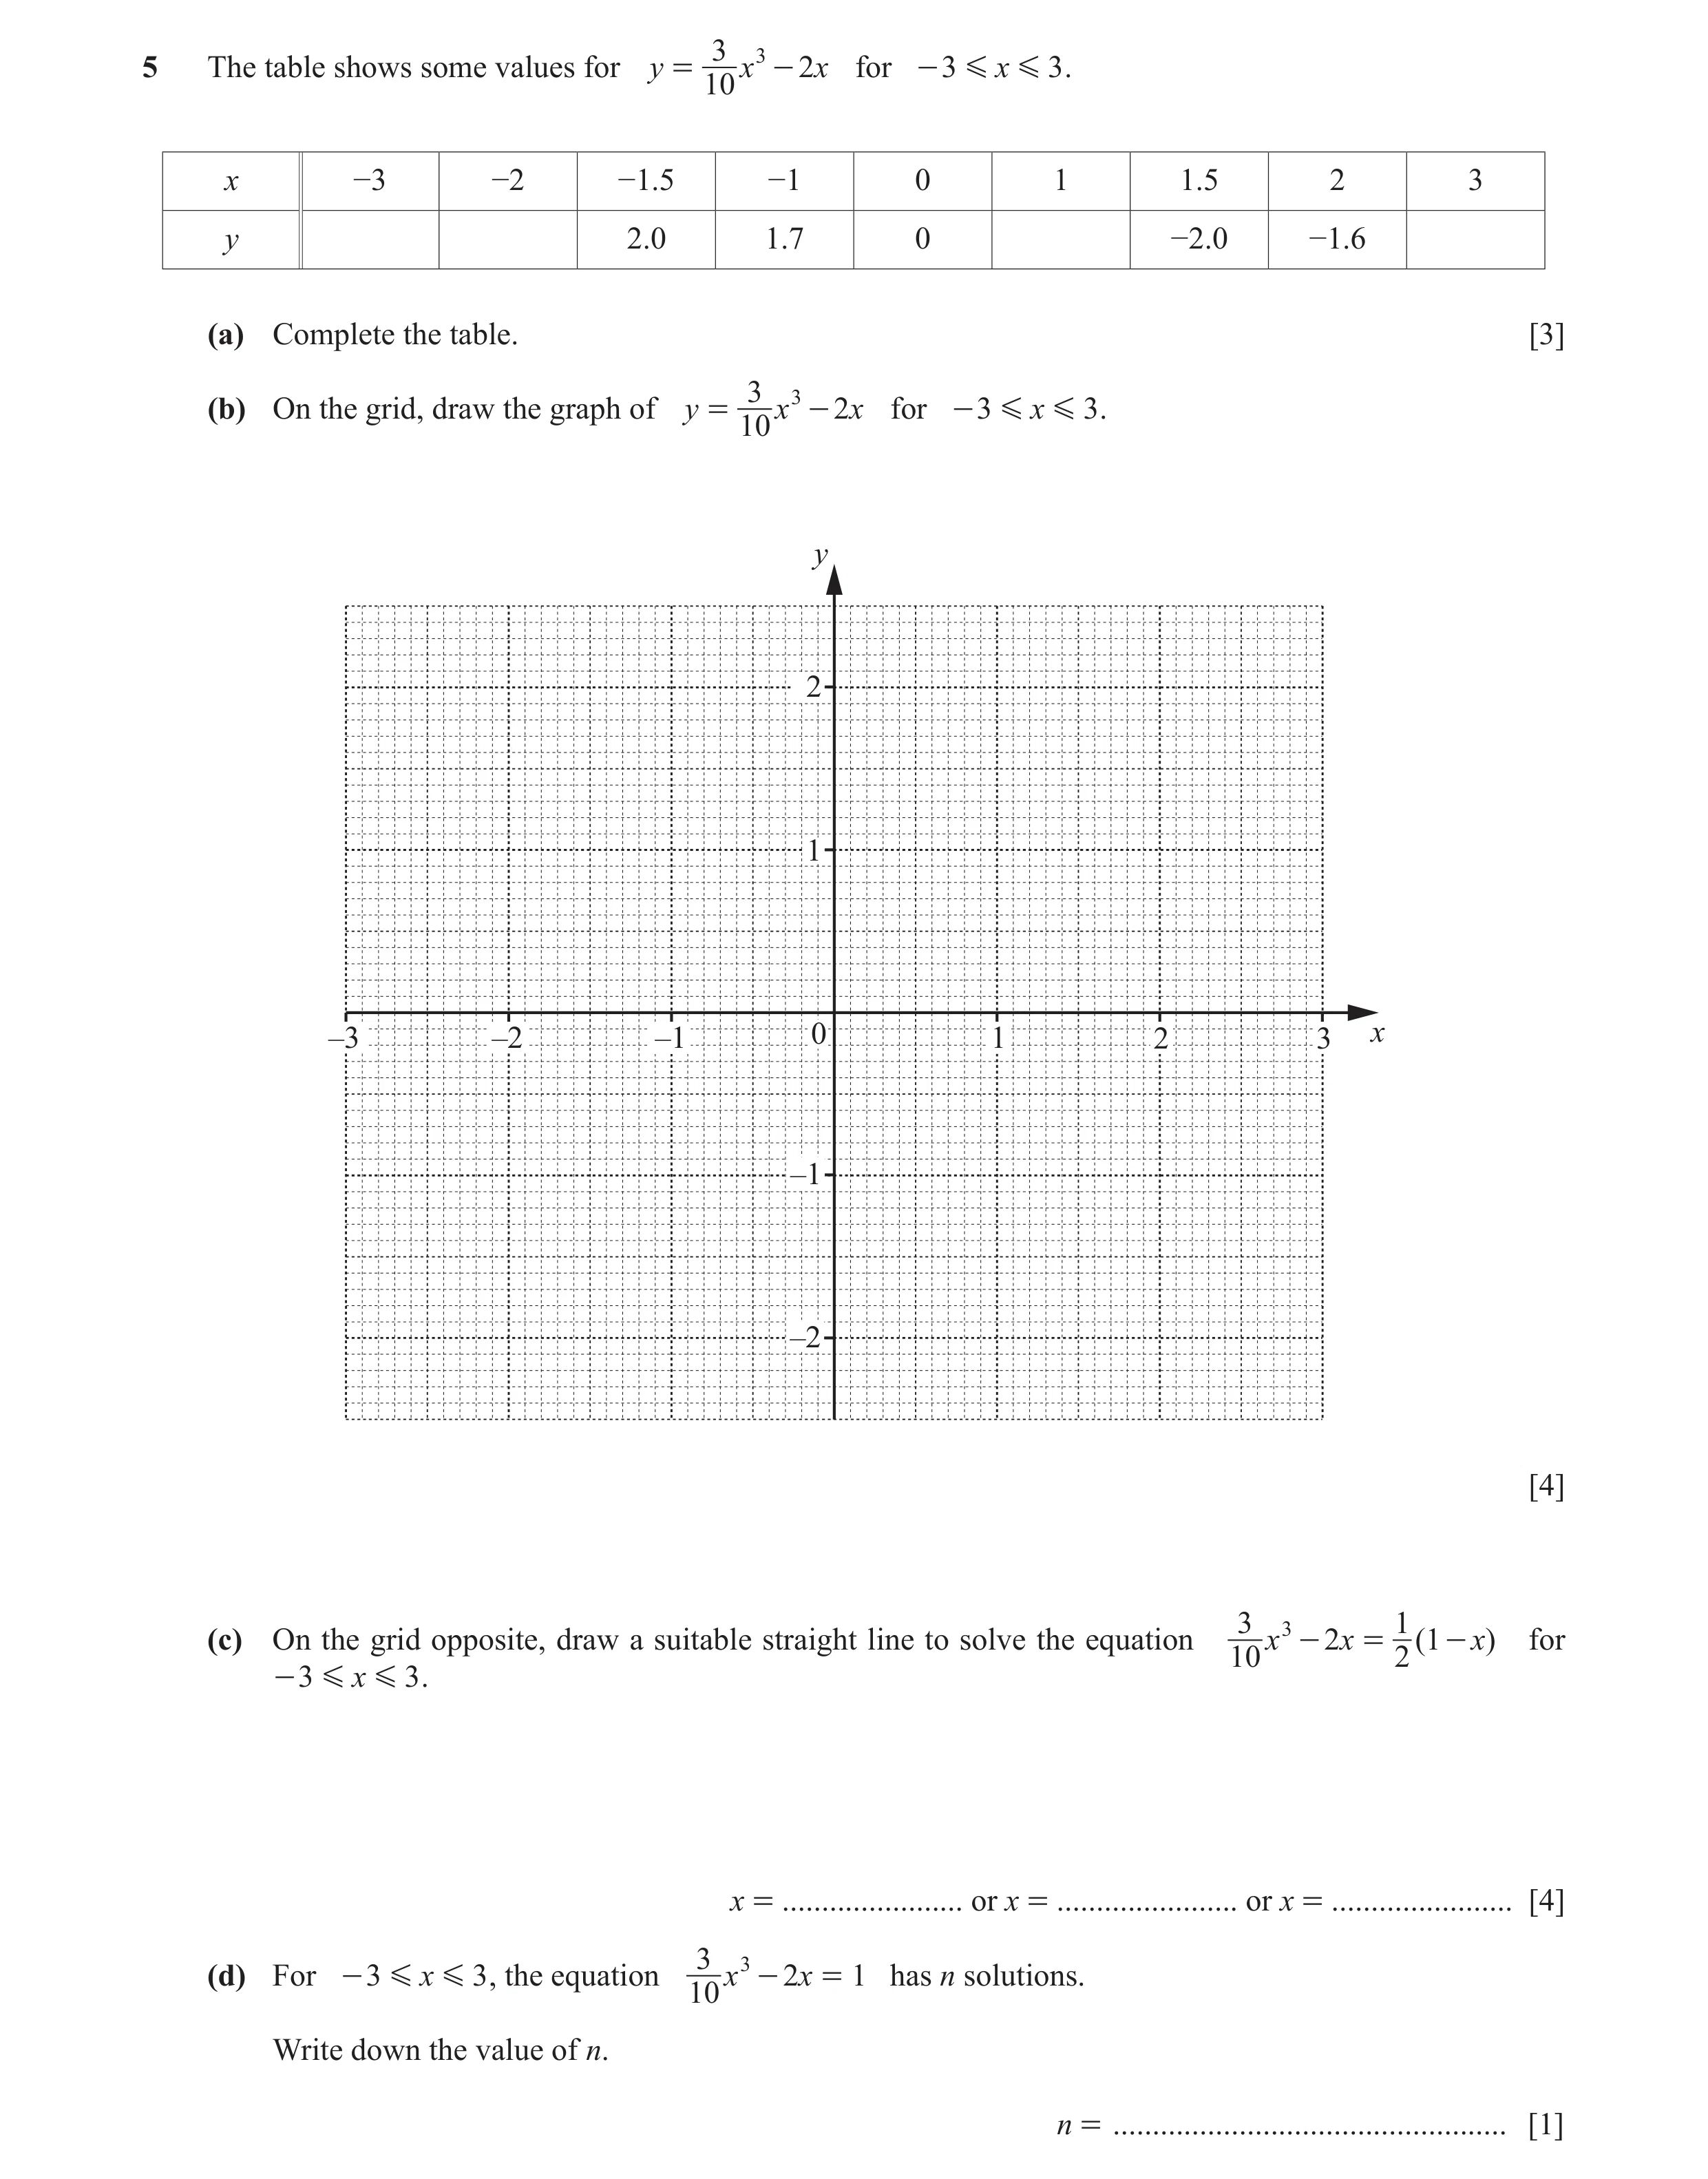 81 / 126
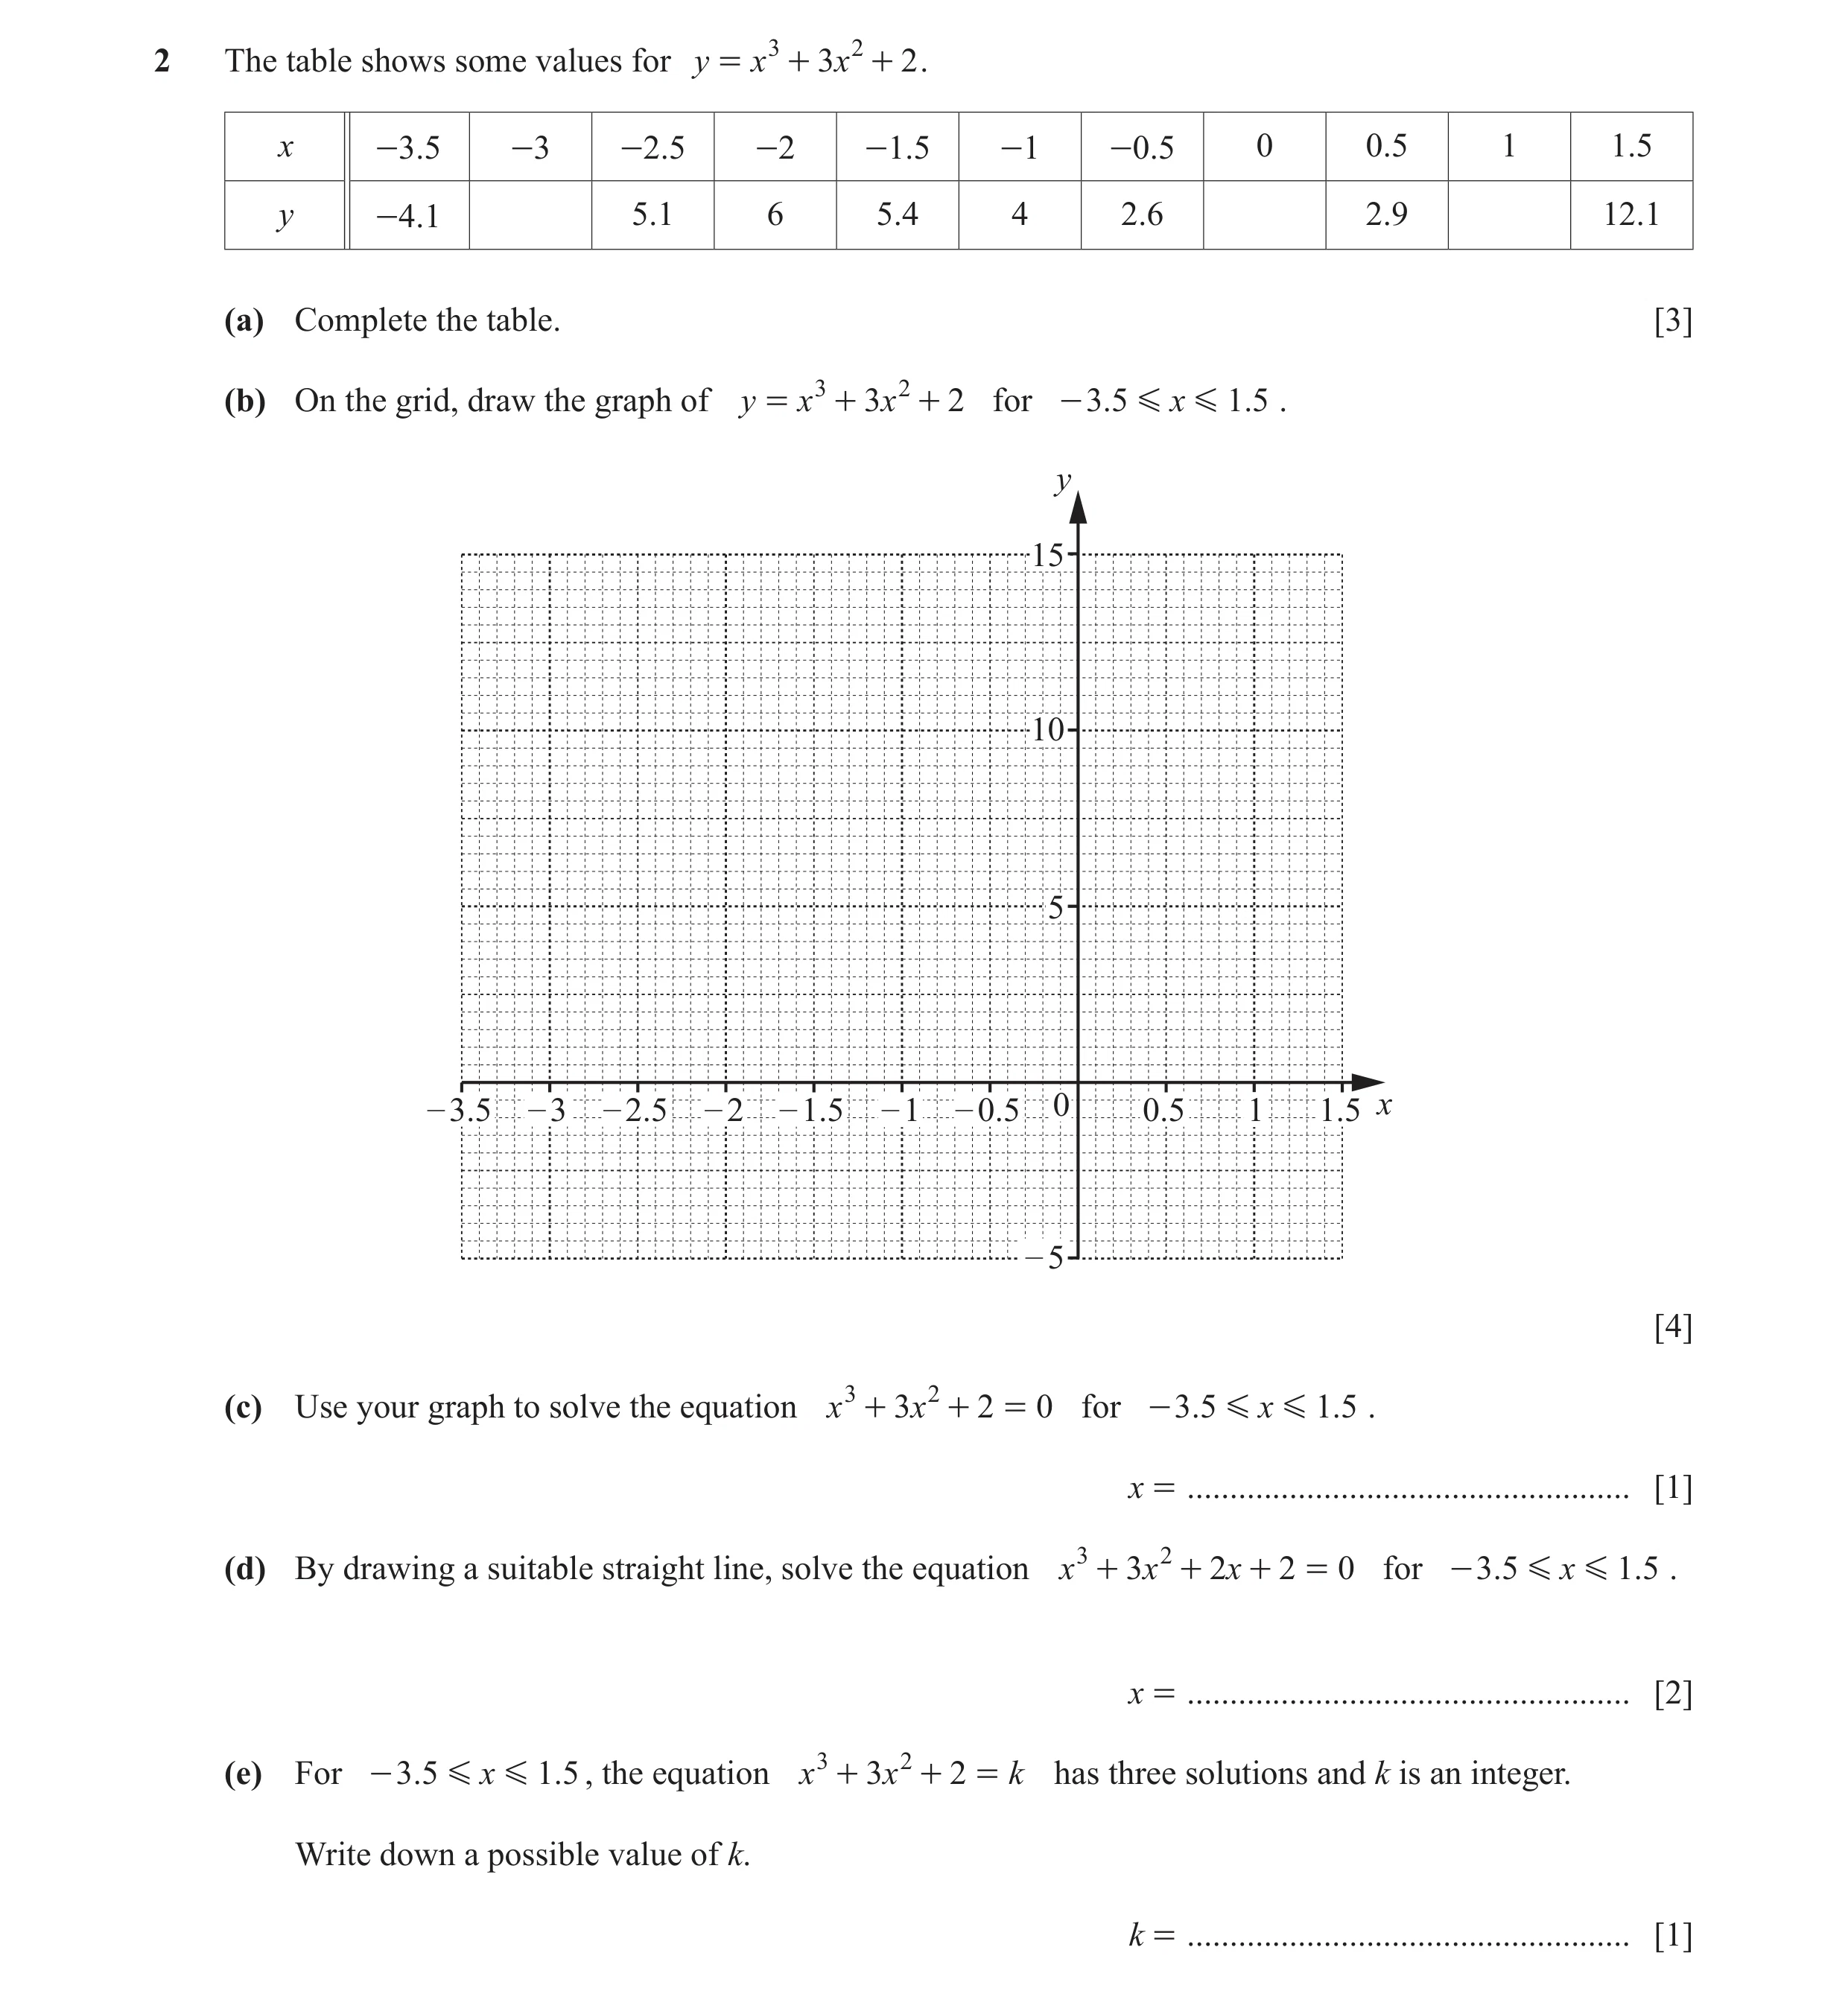 82 / 126
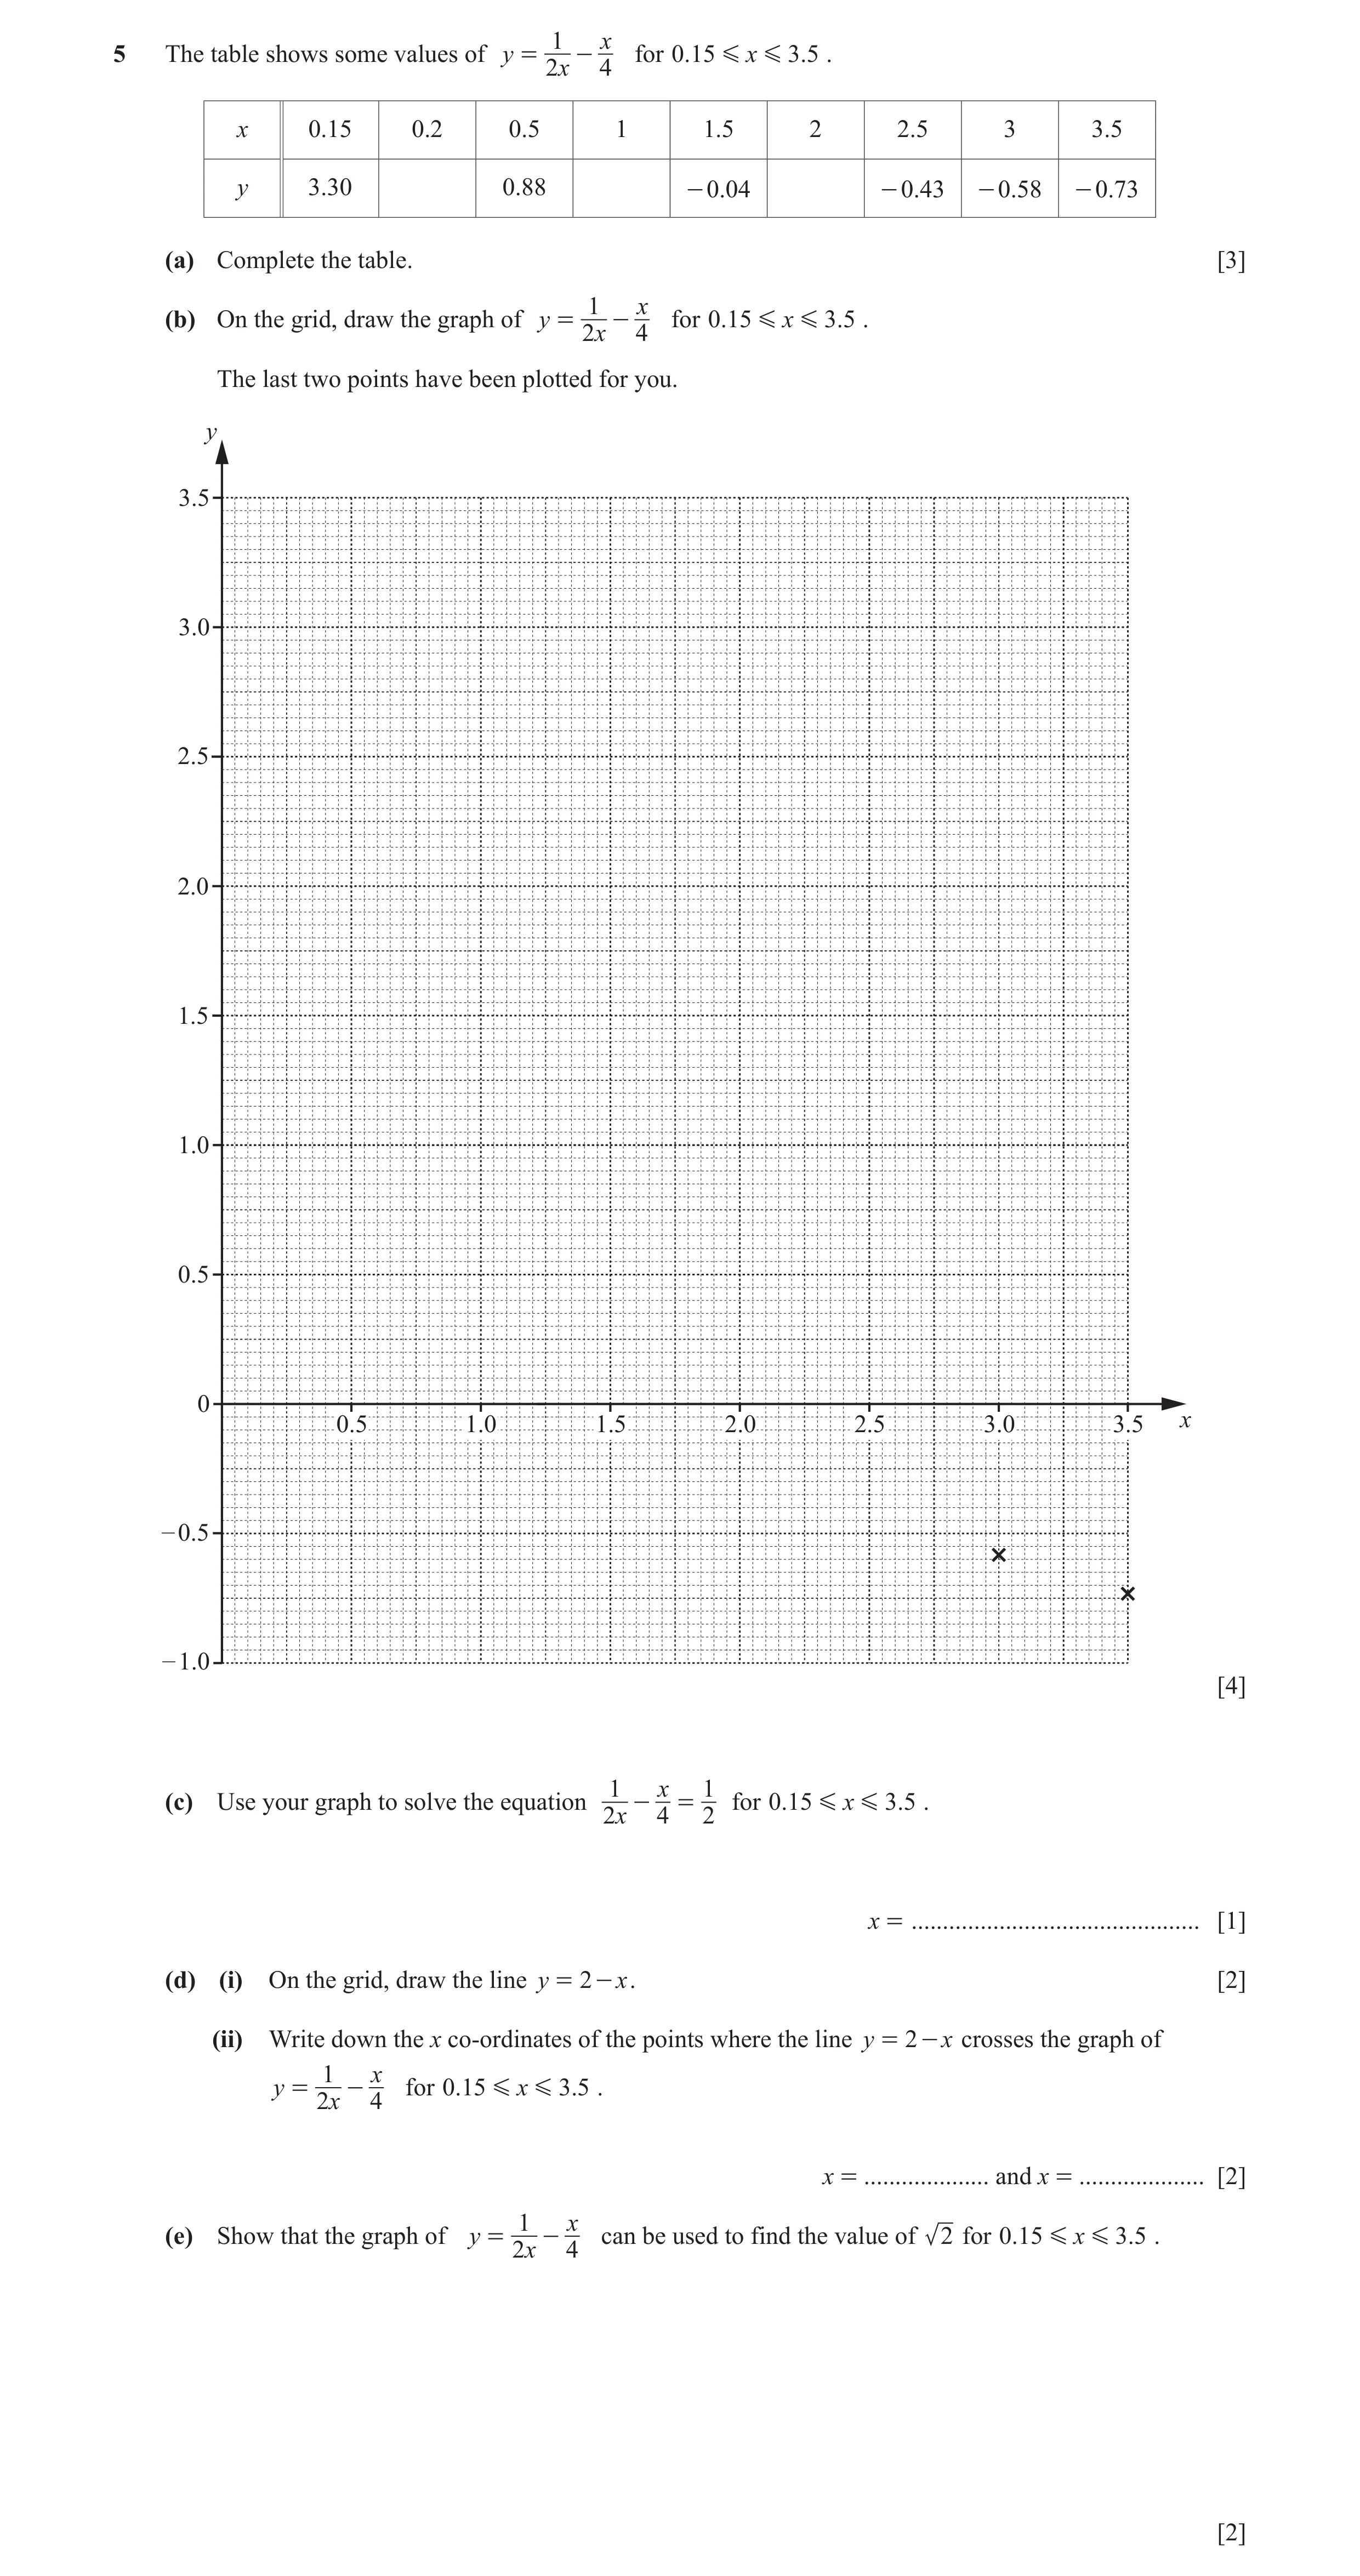
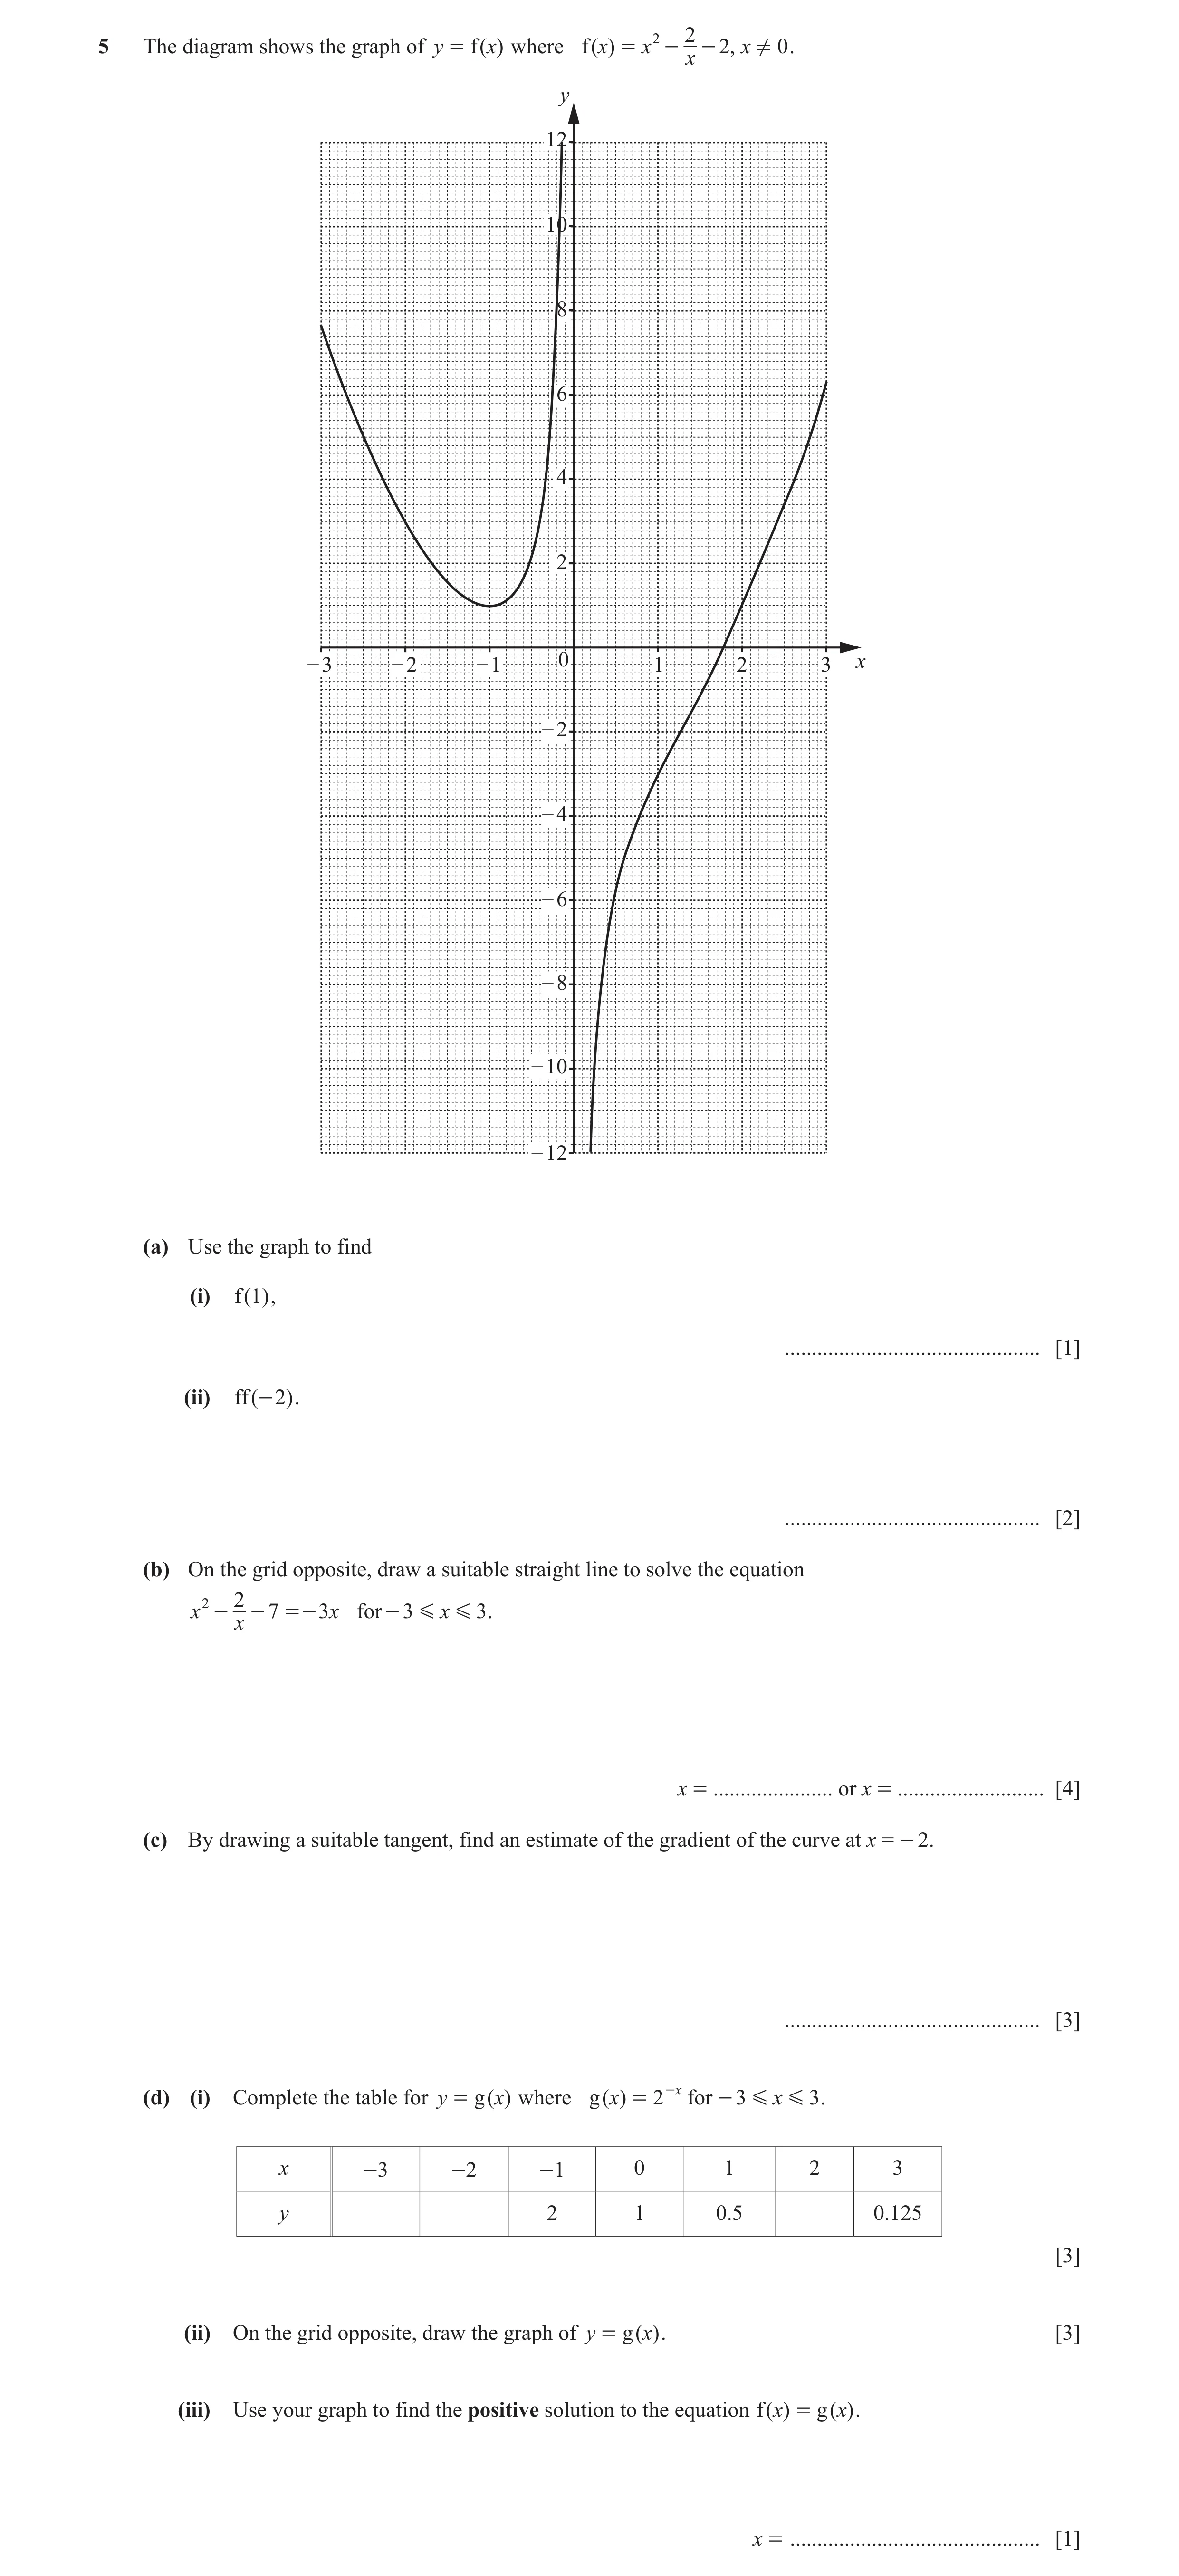
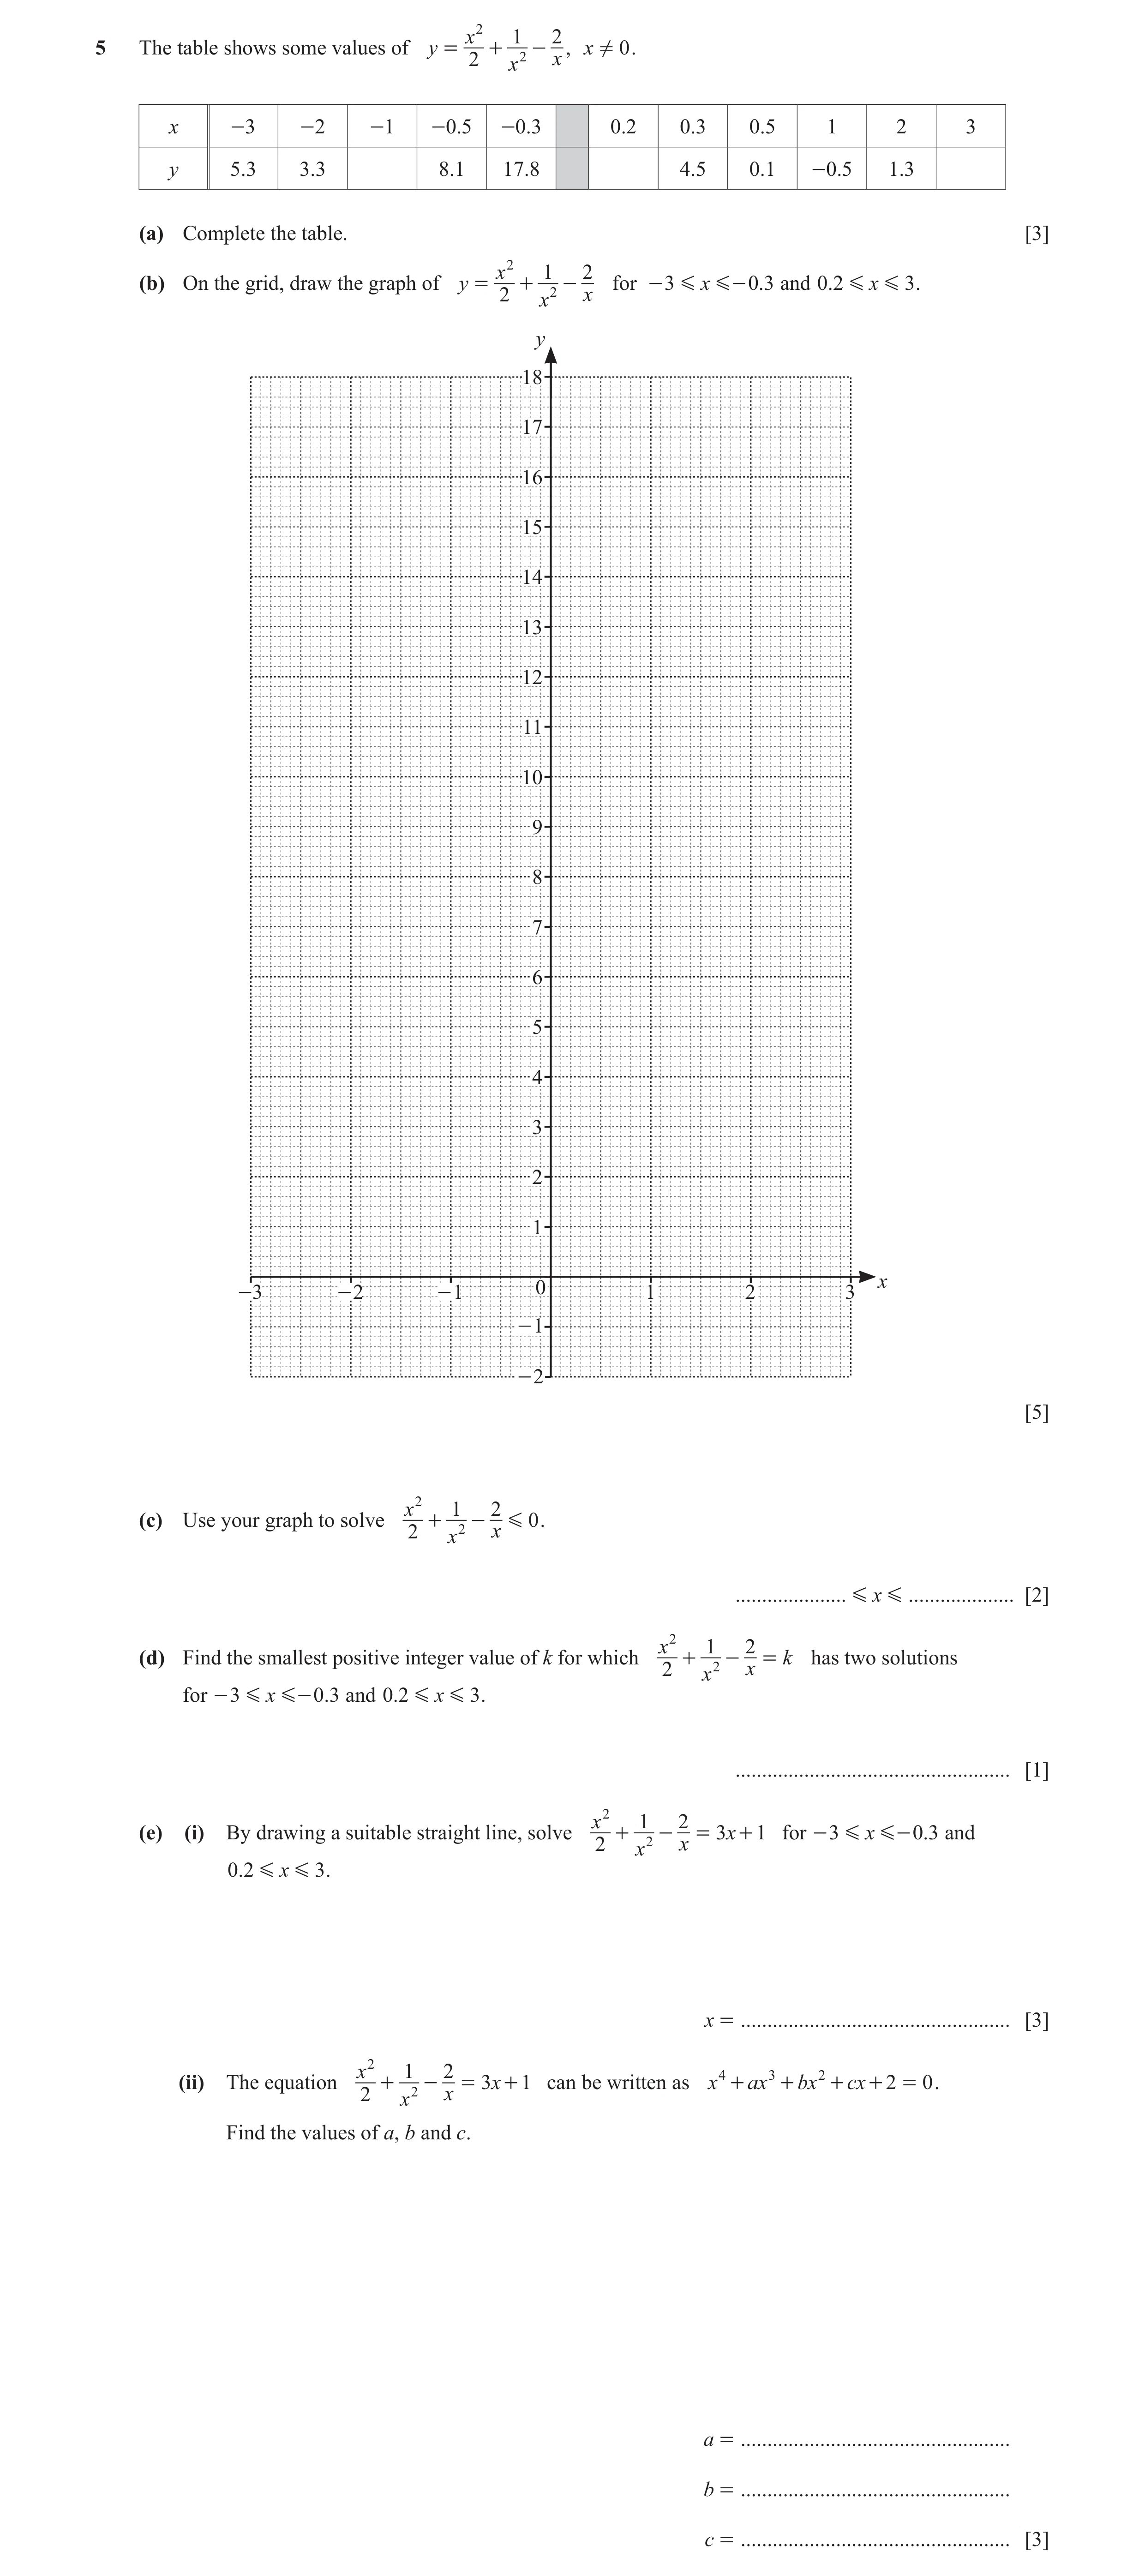
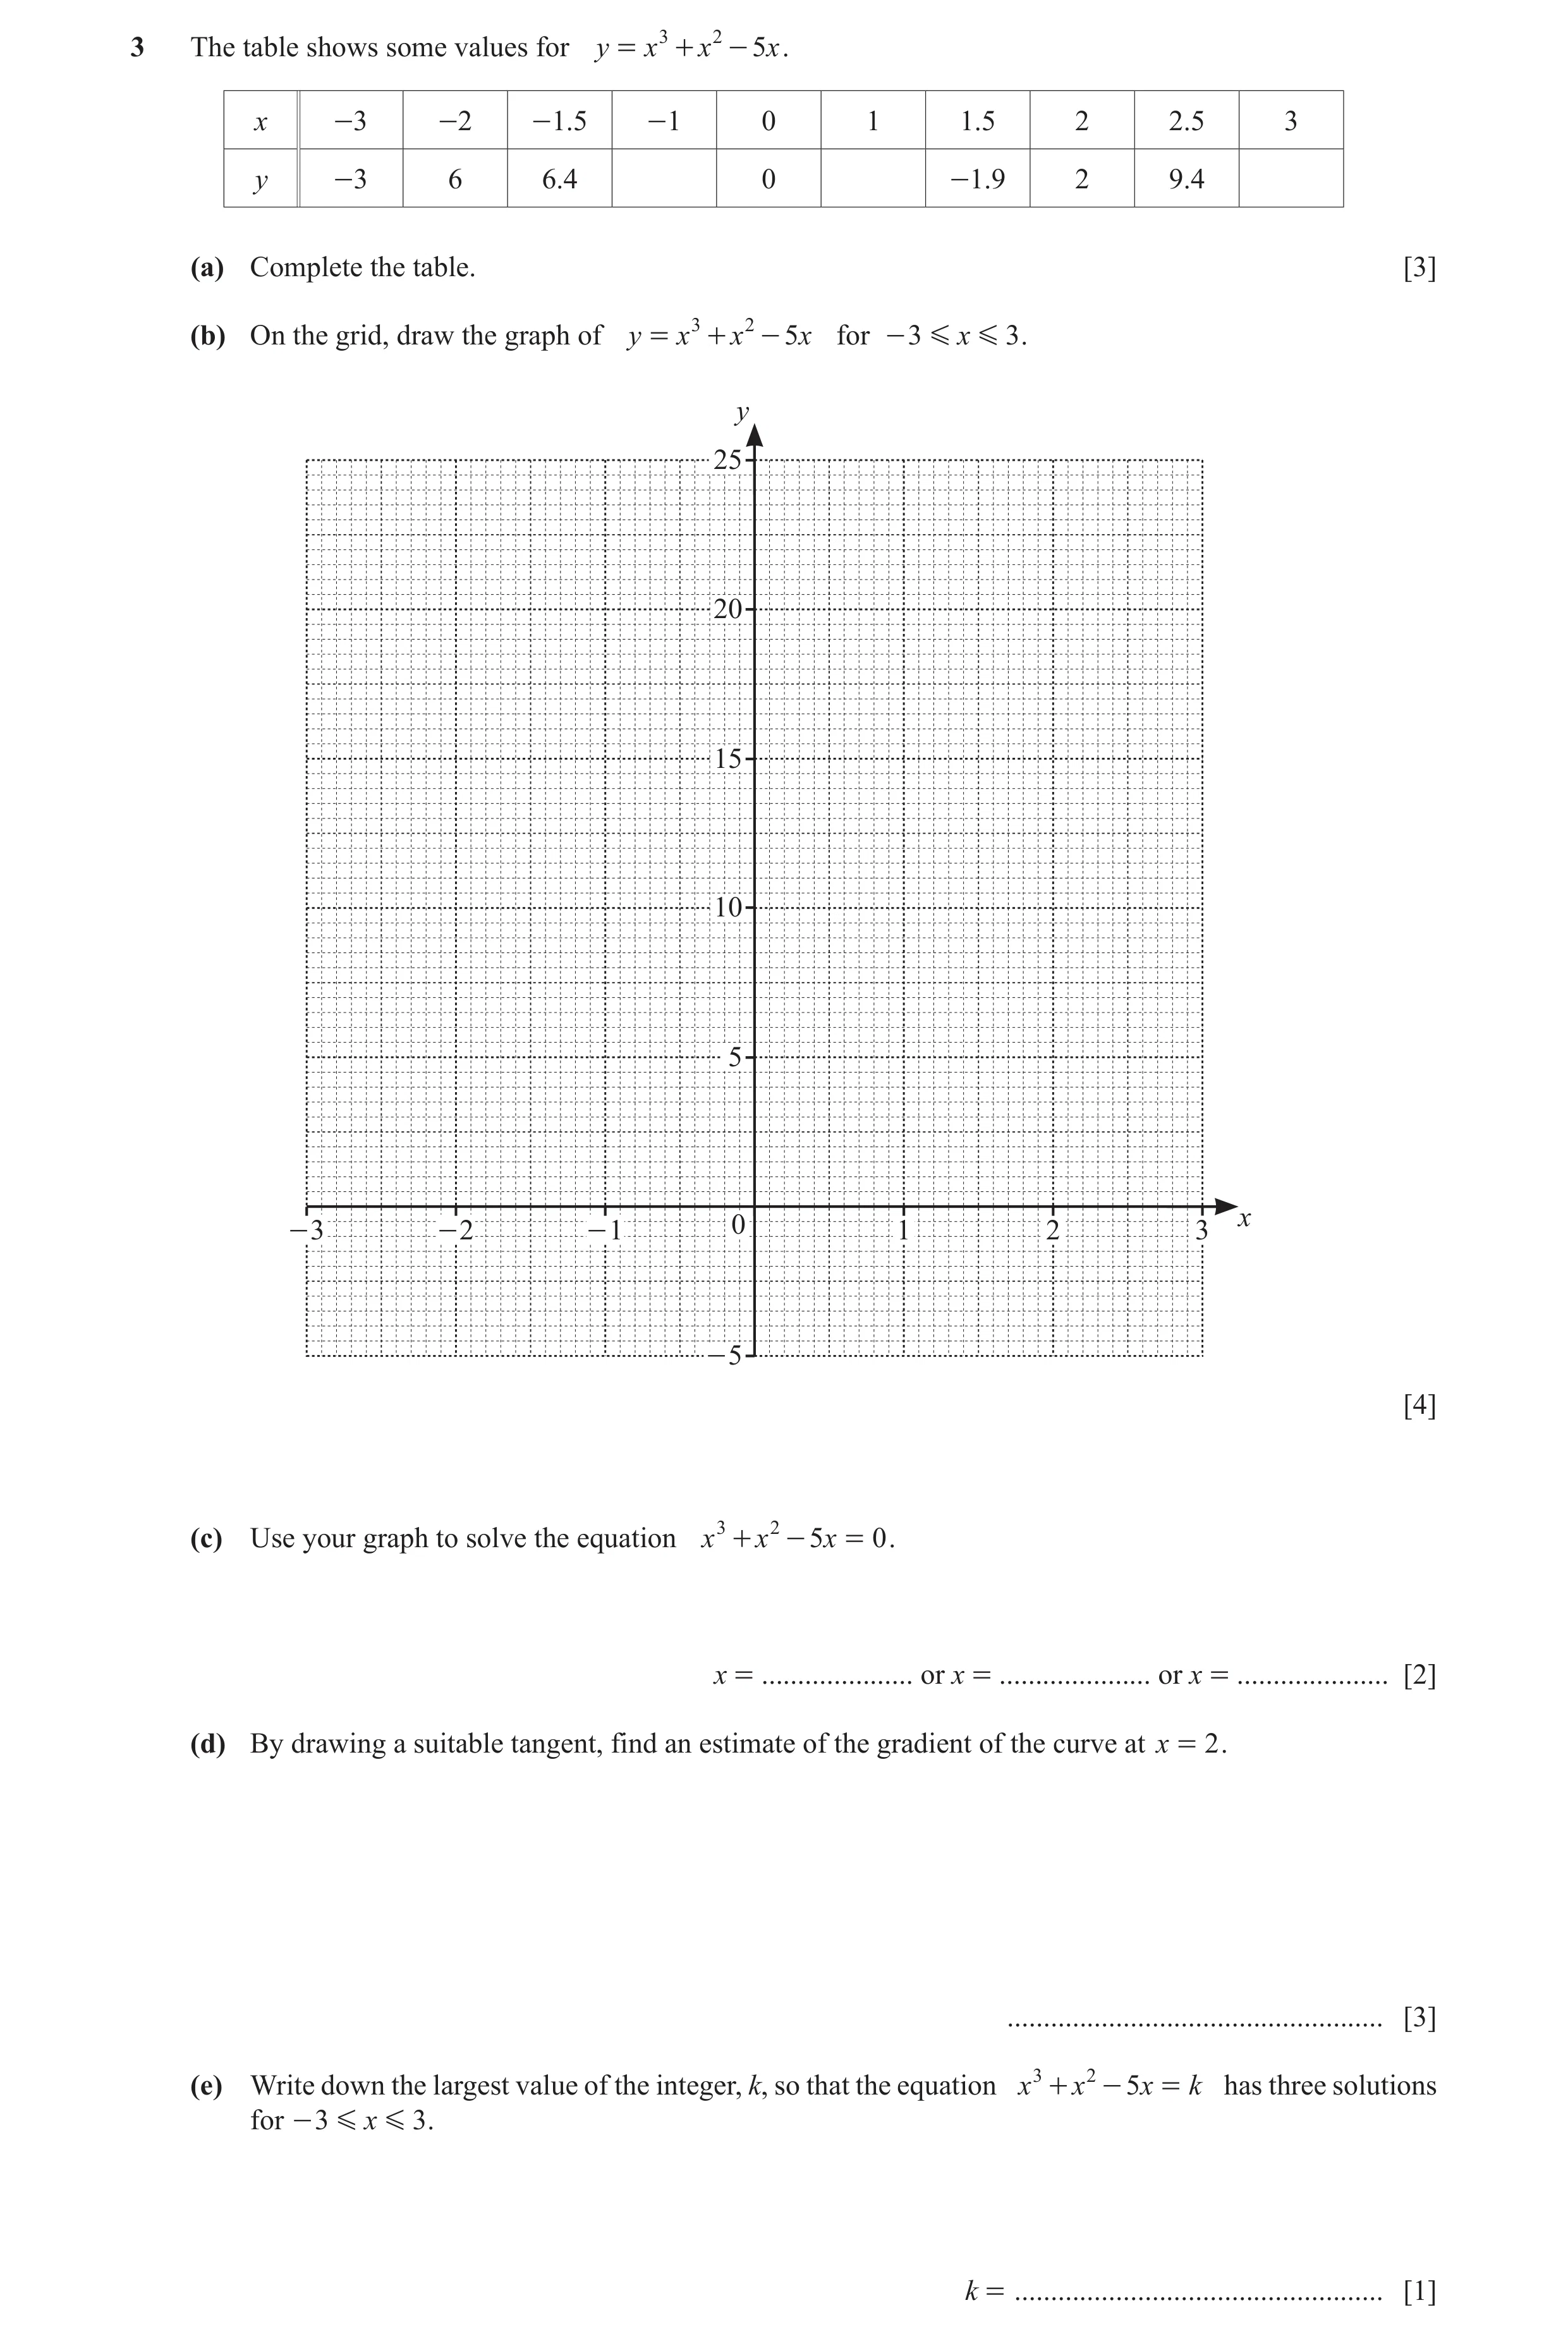
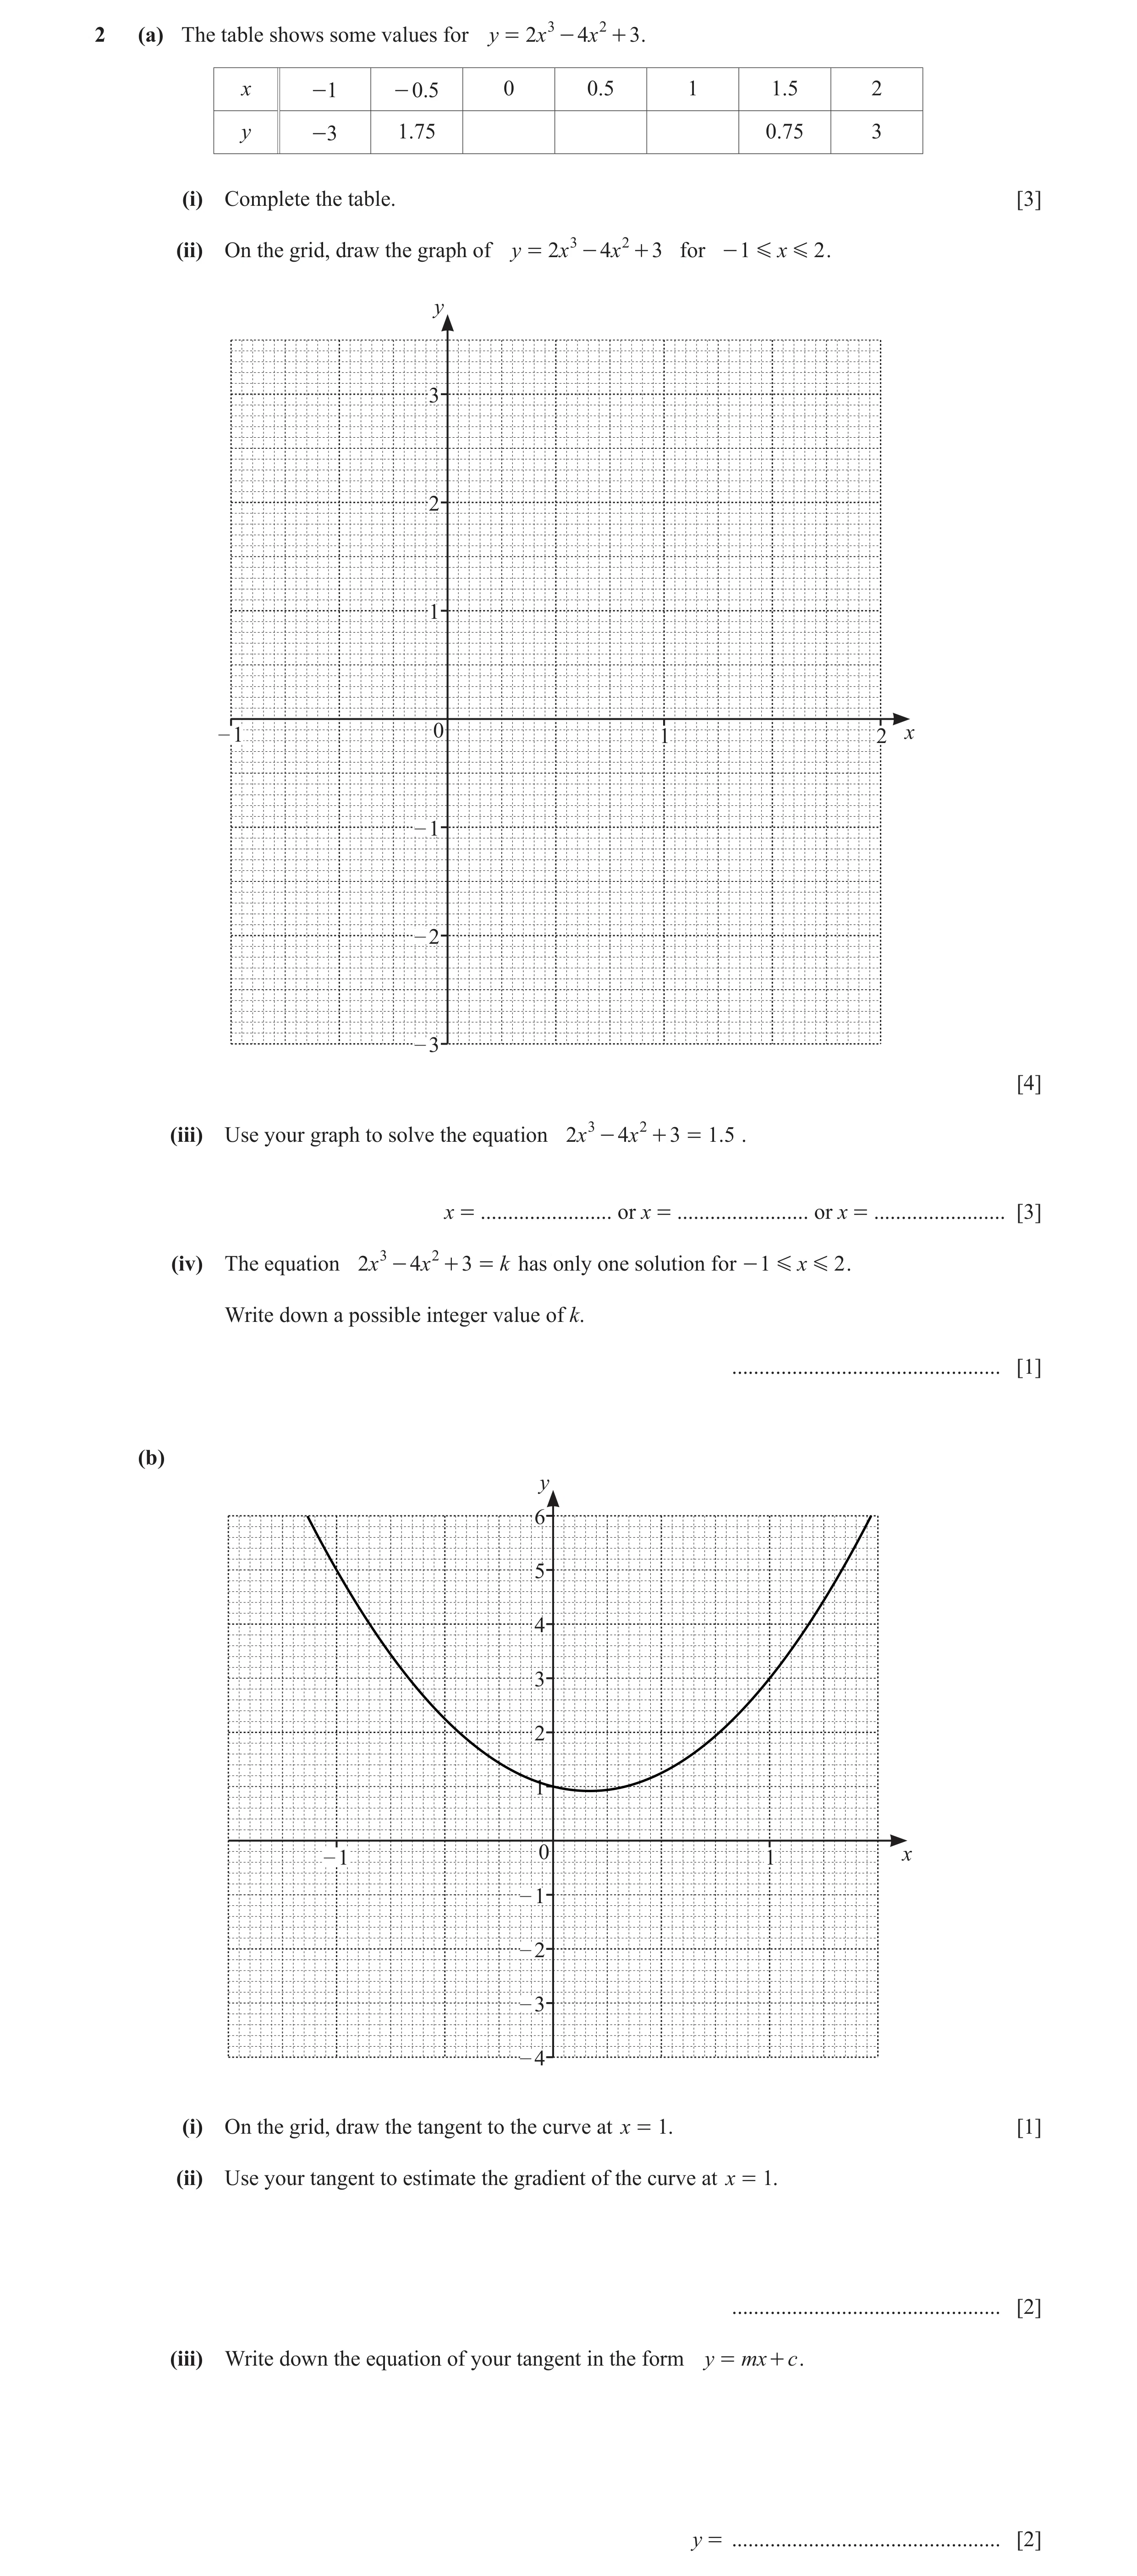
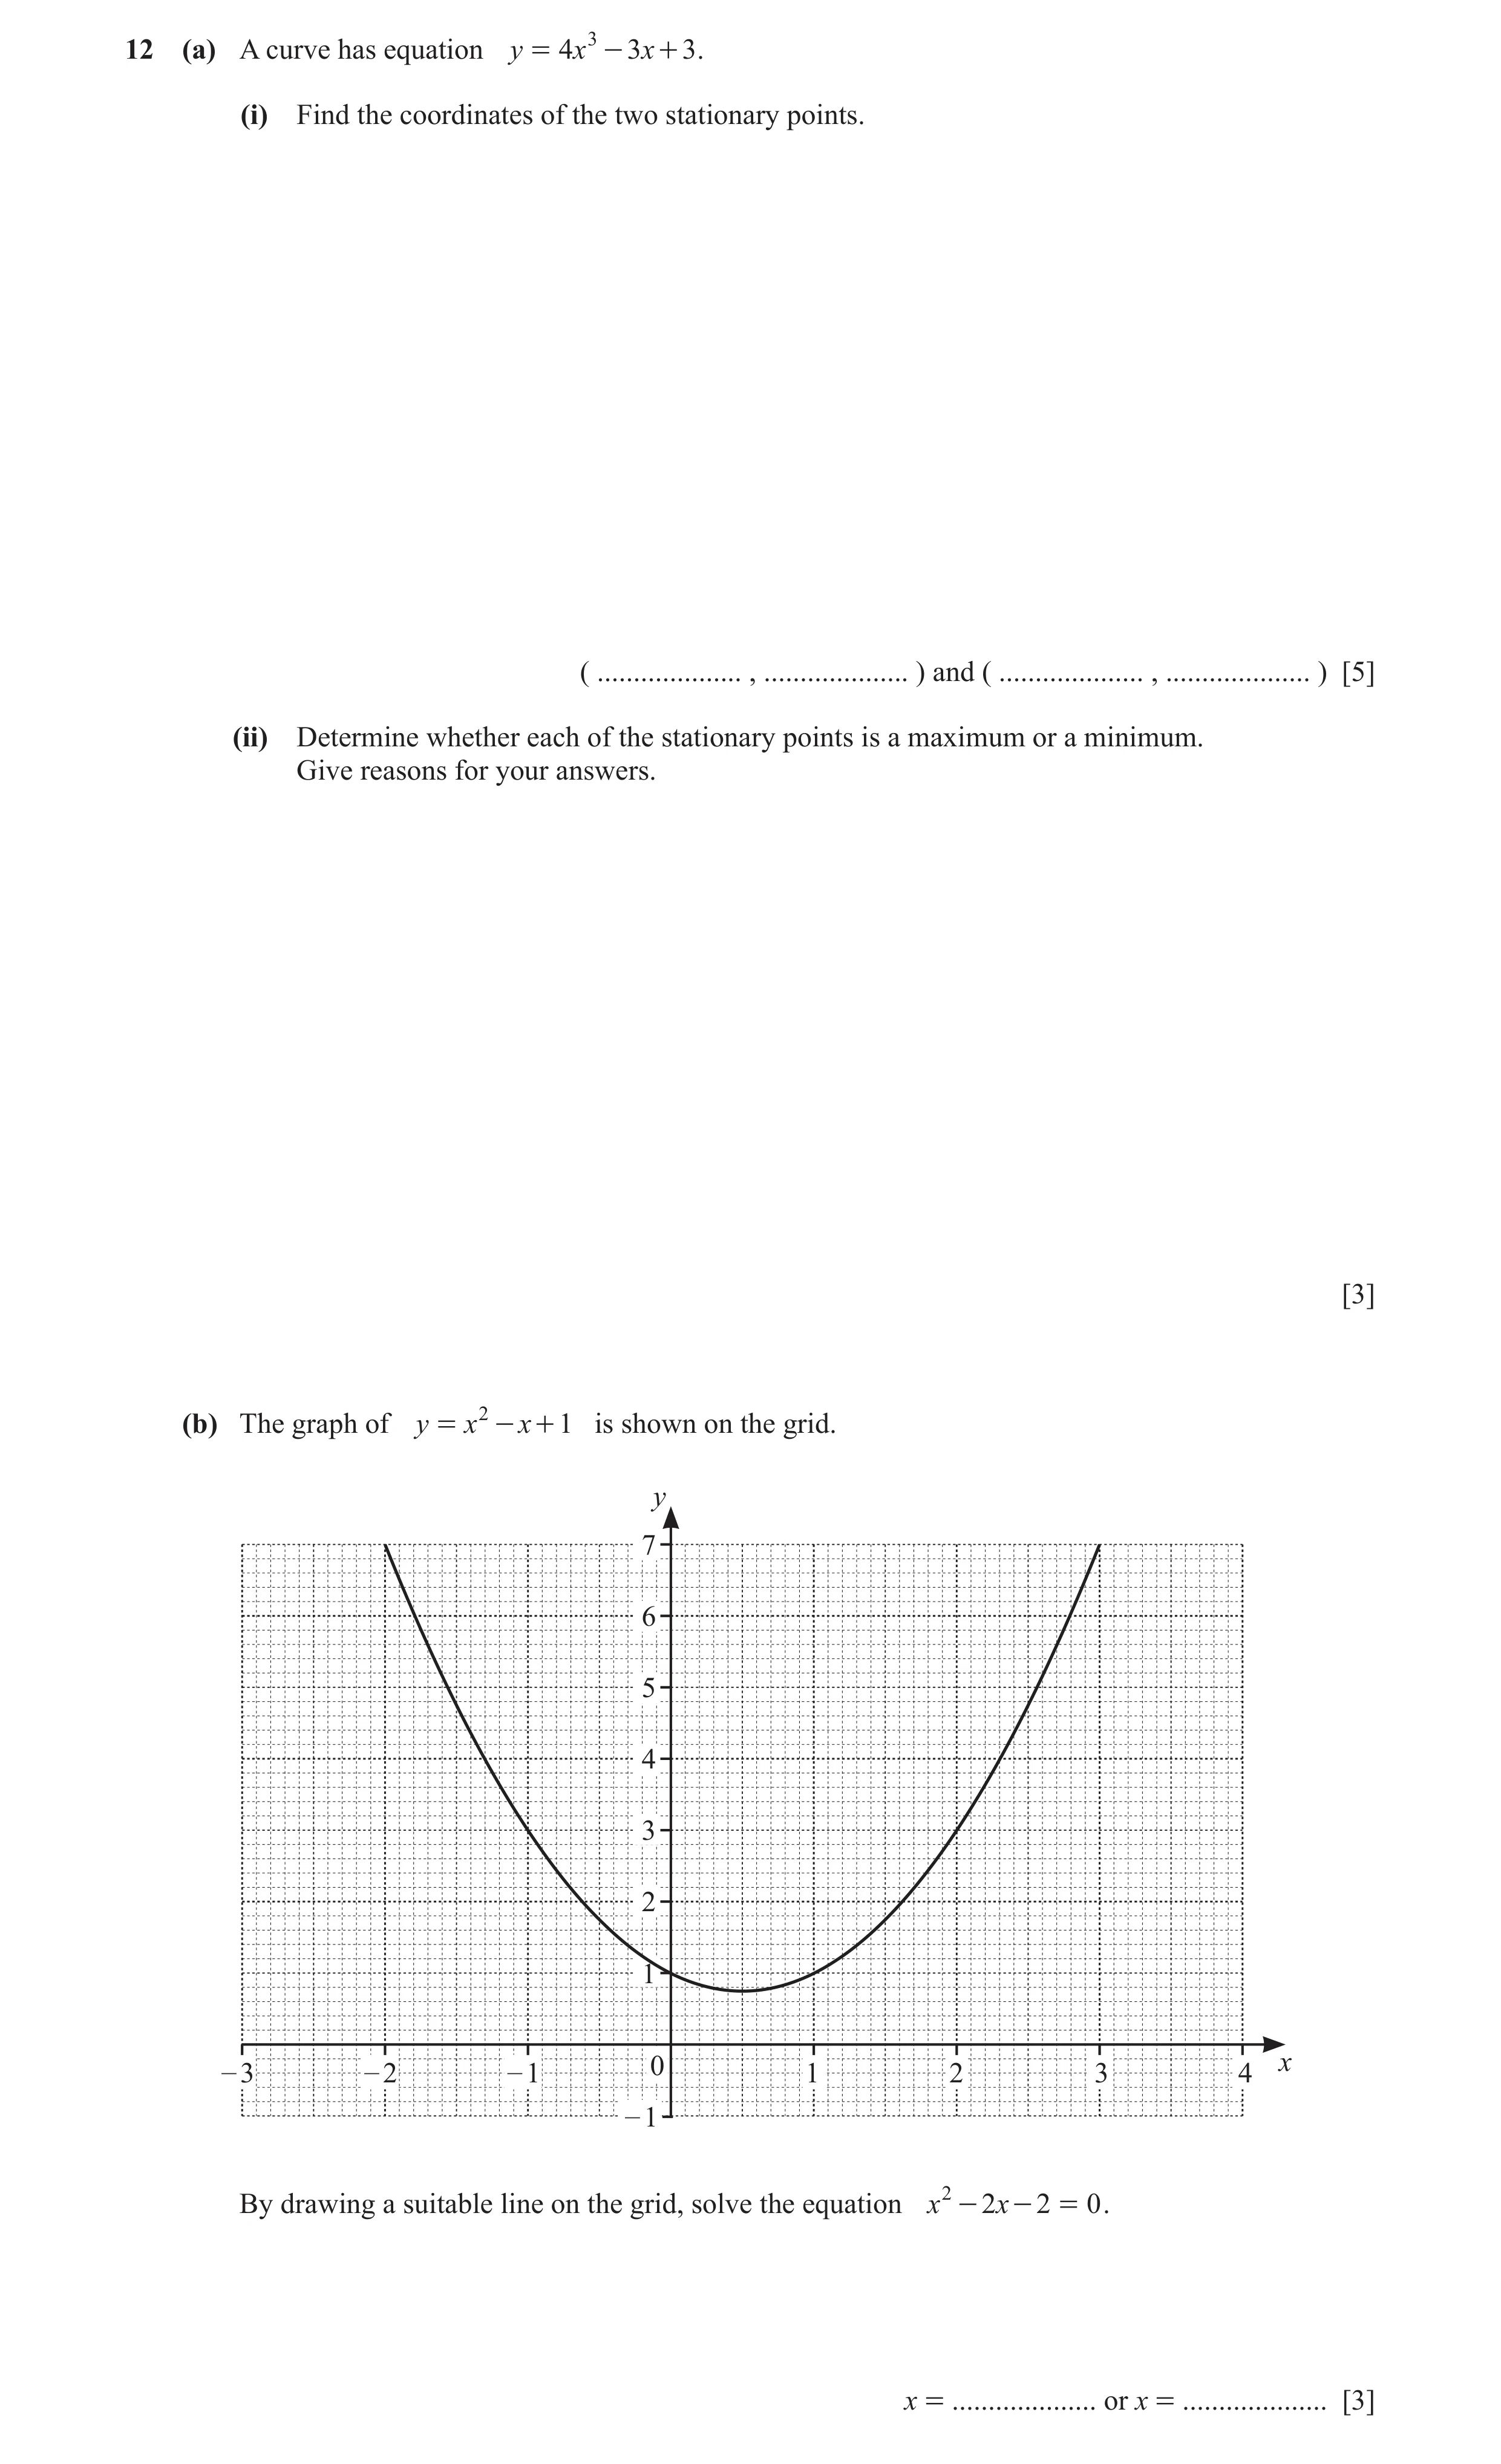
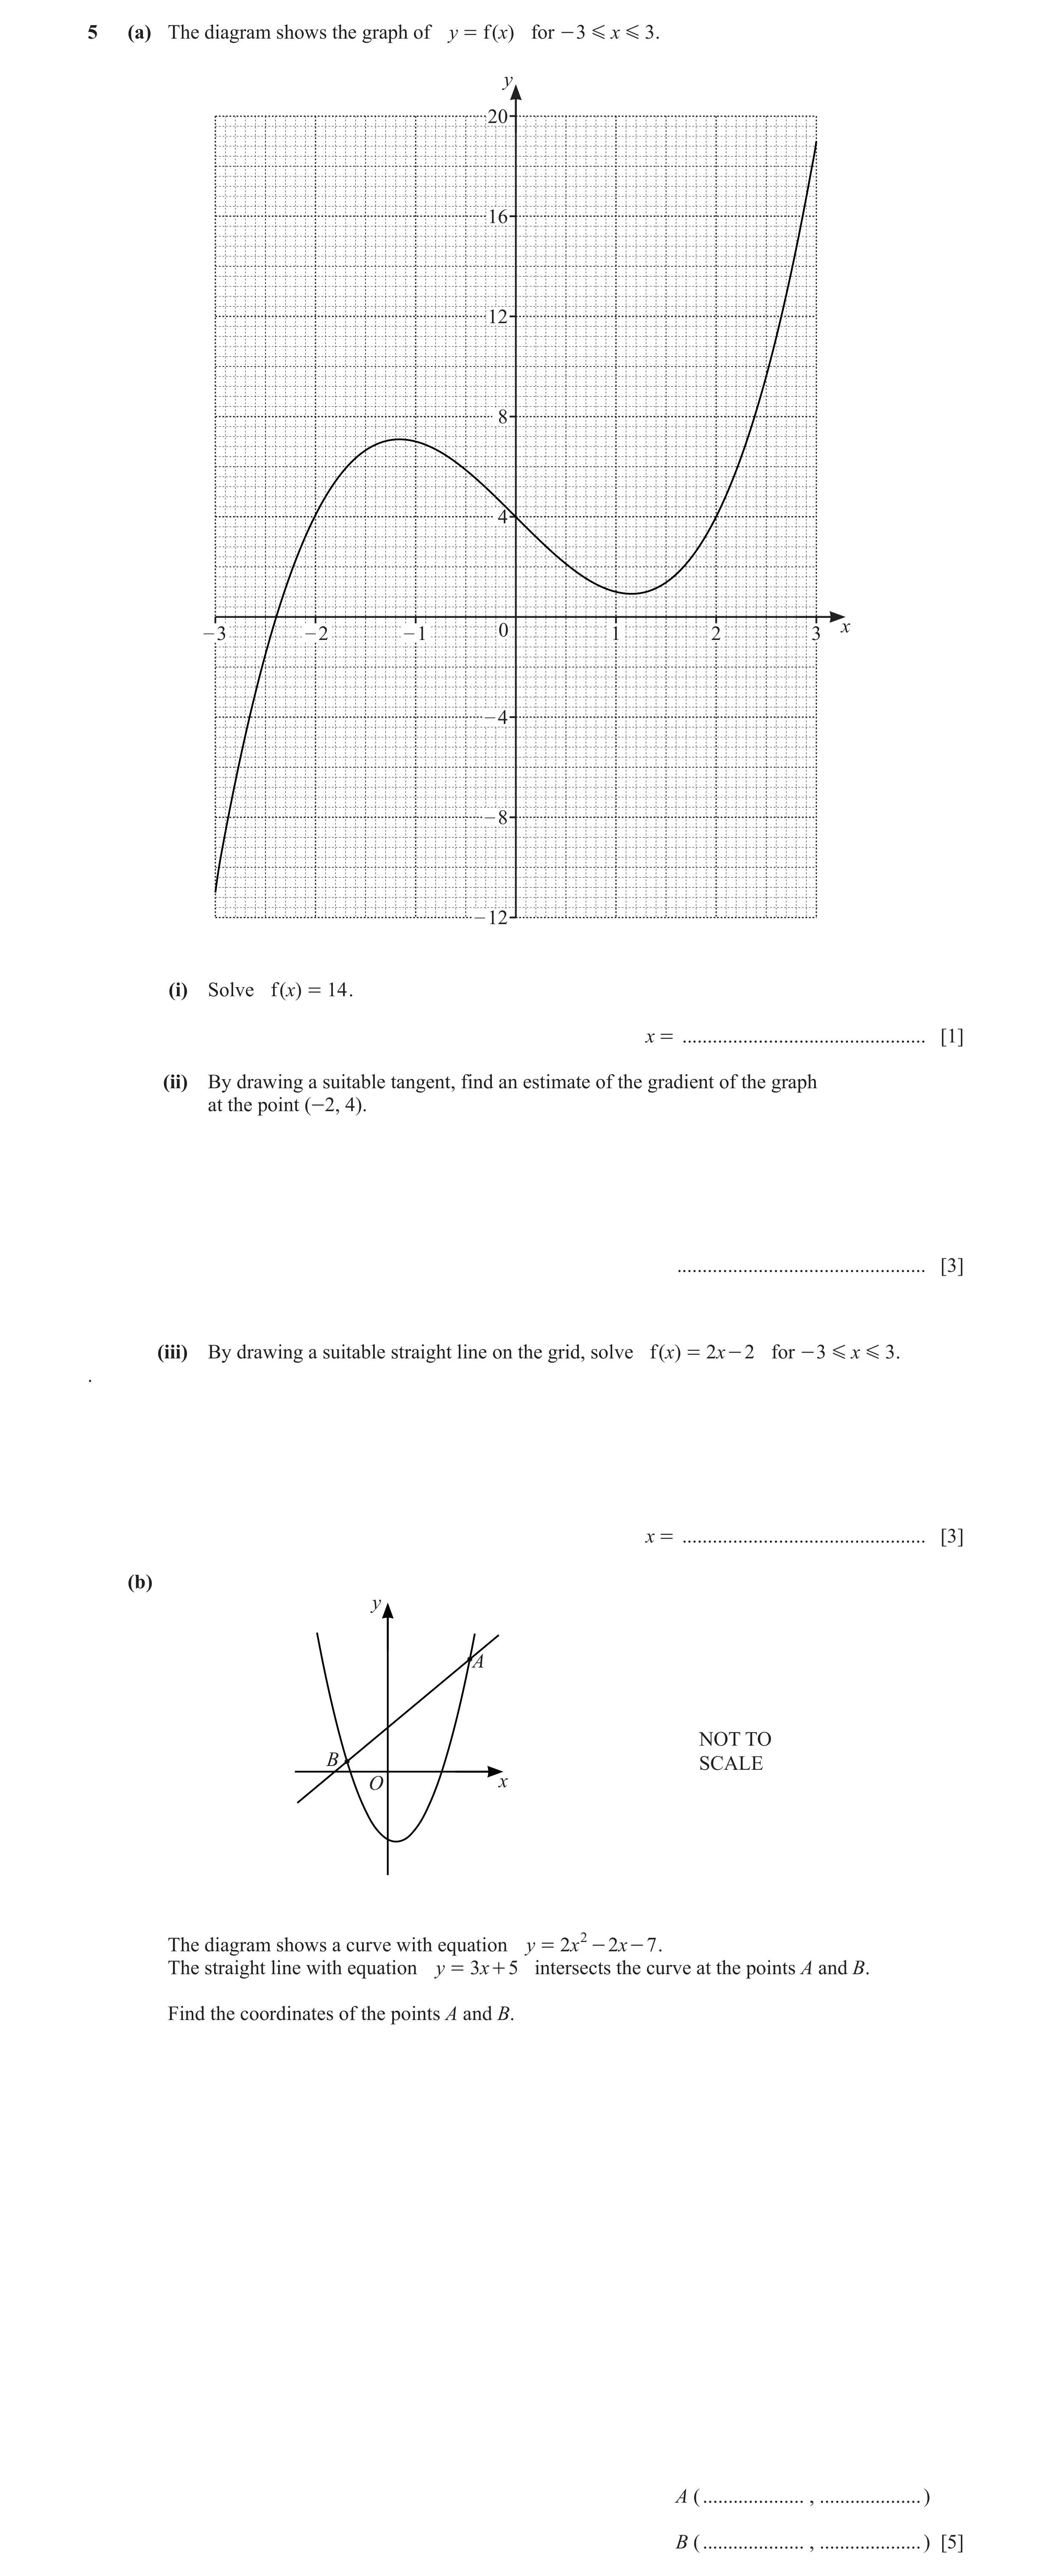
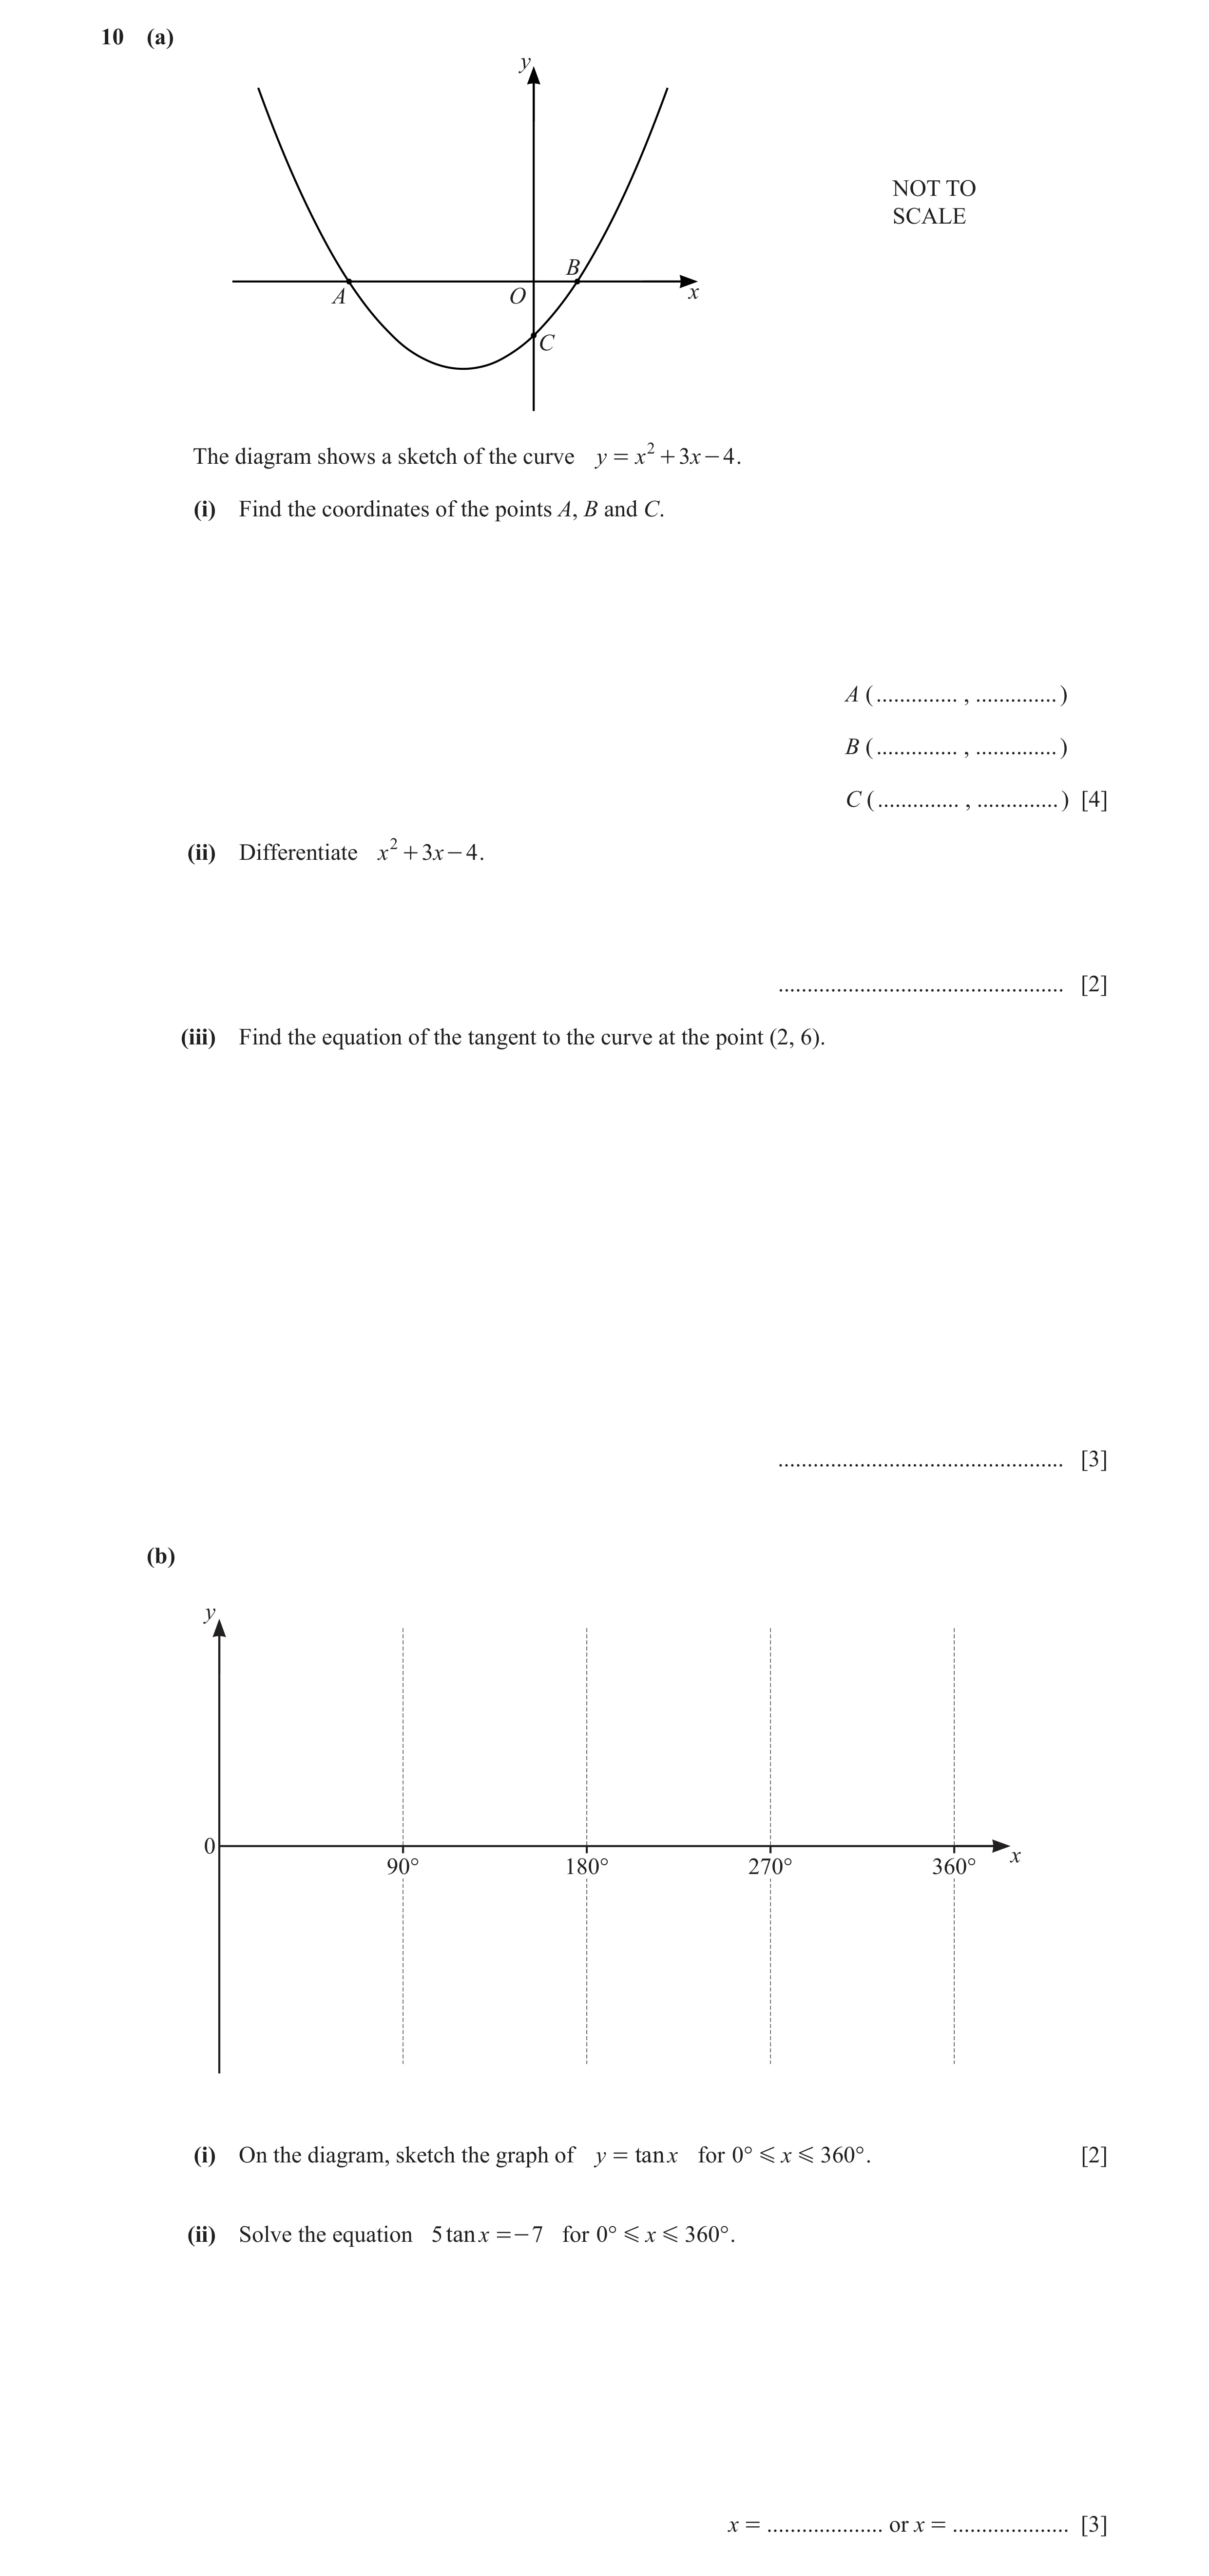
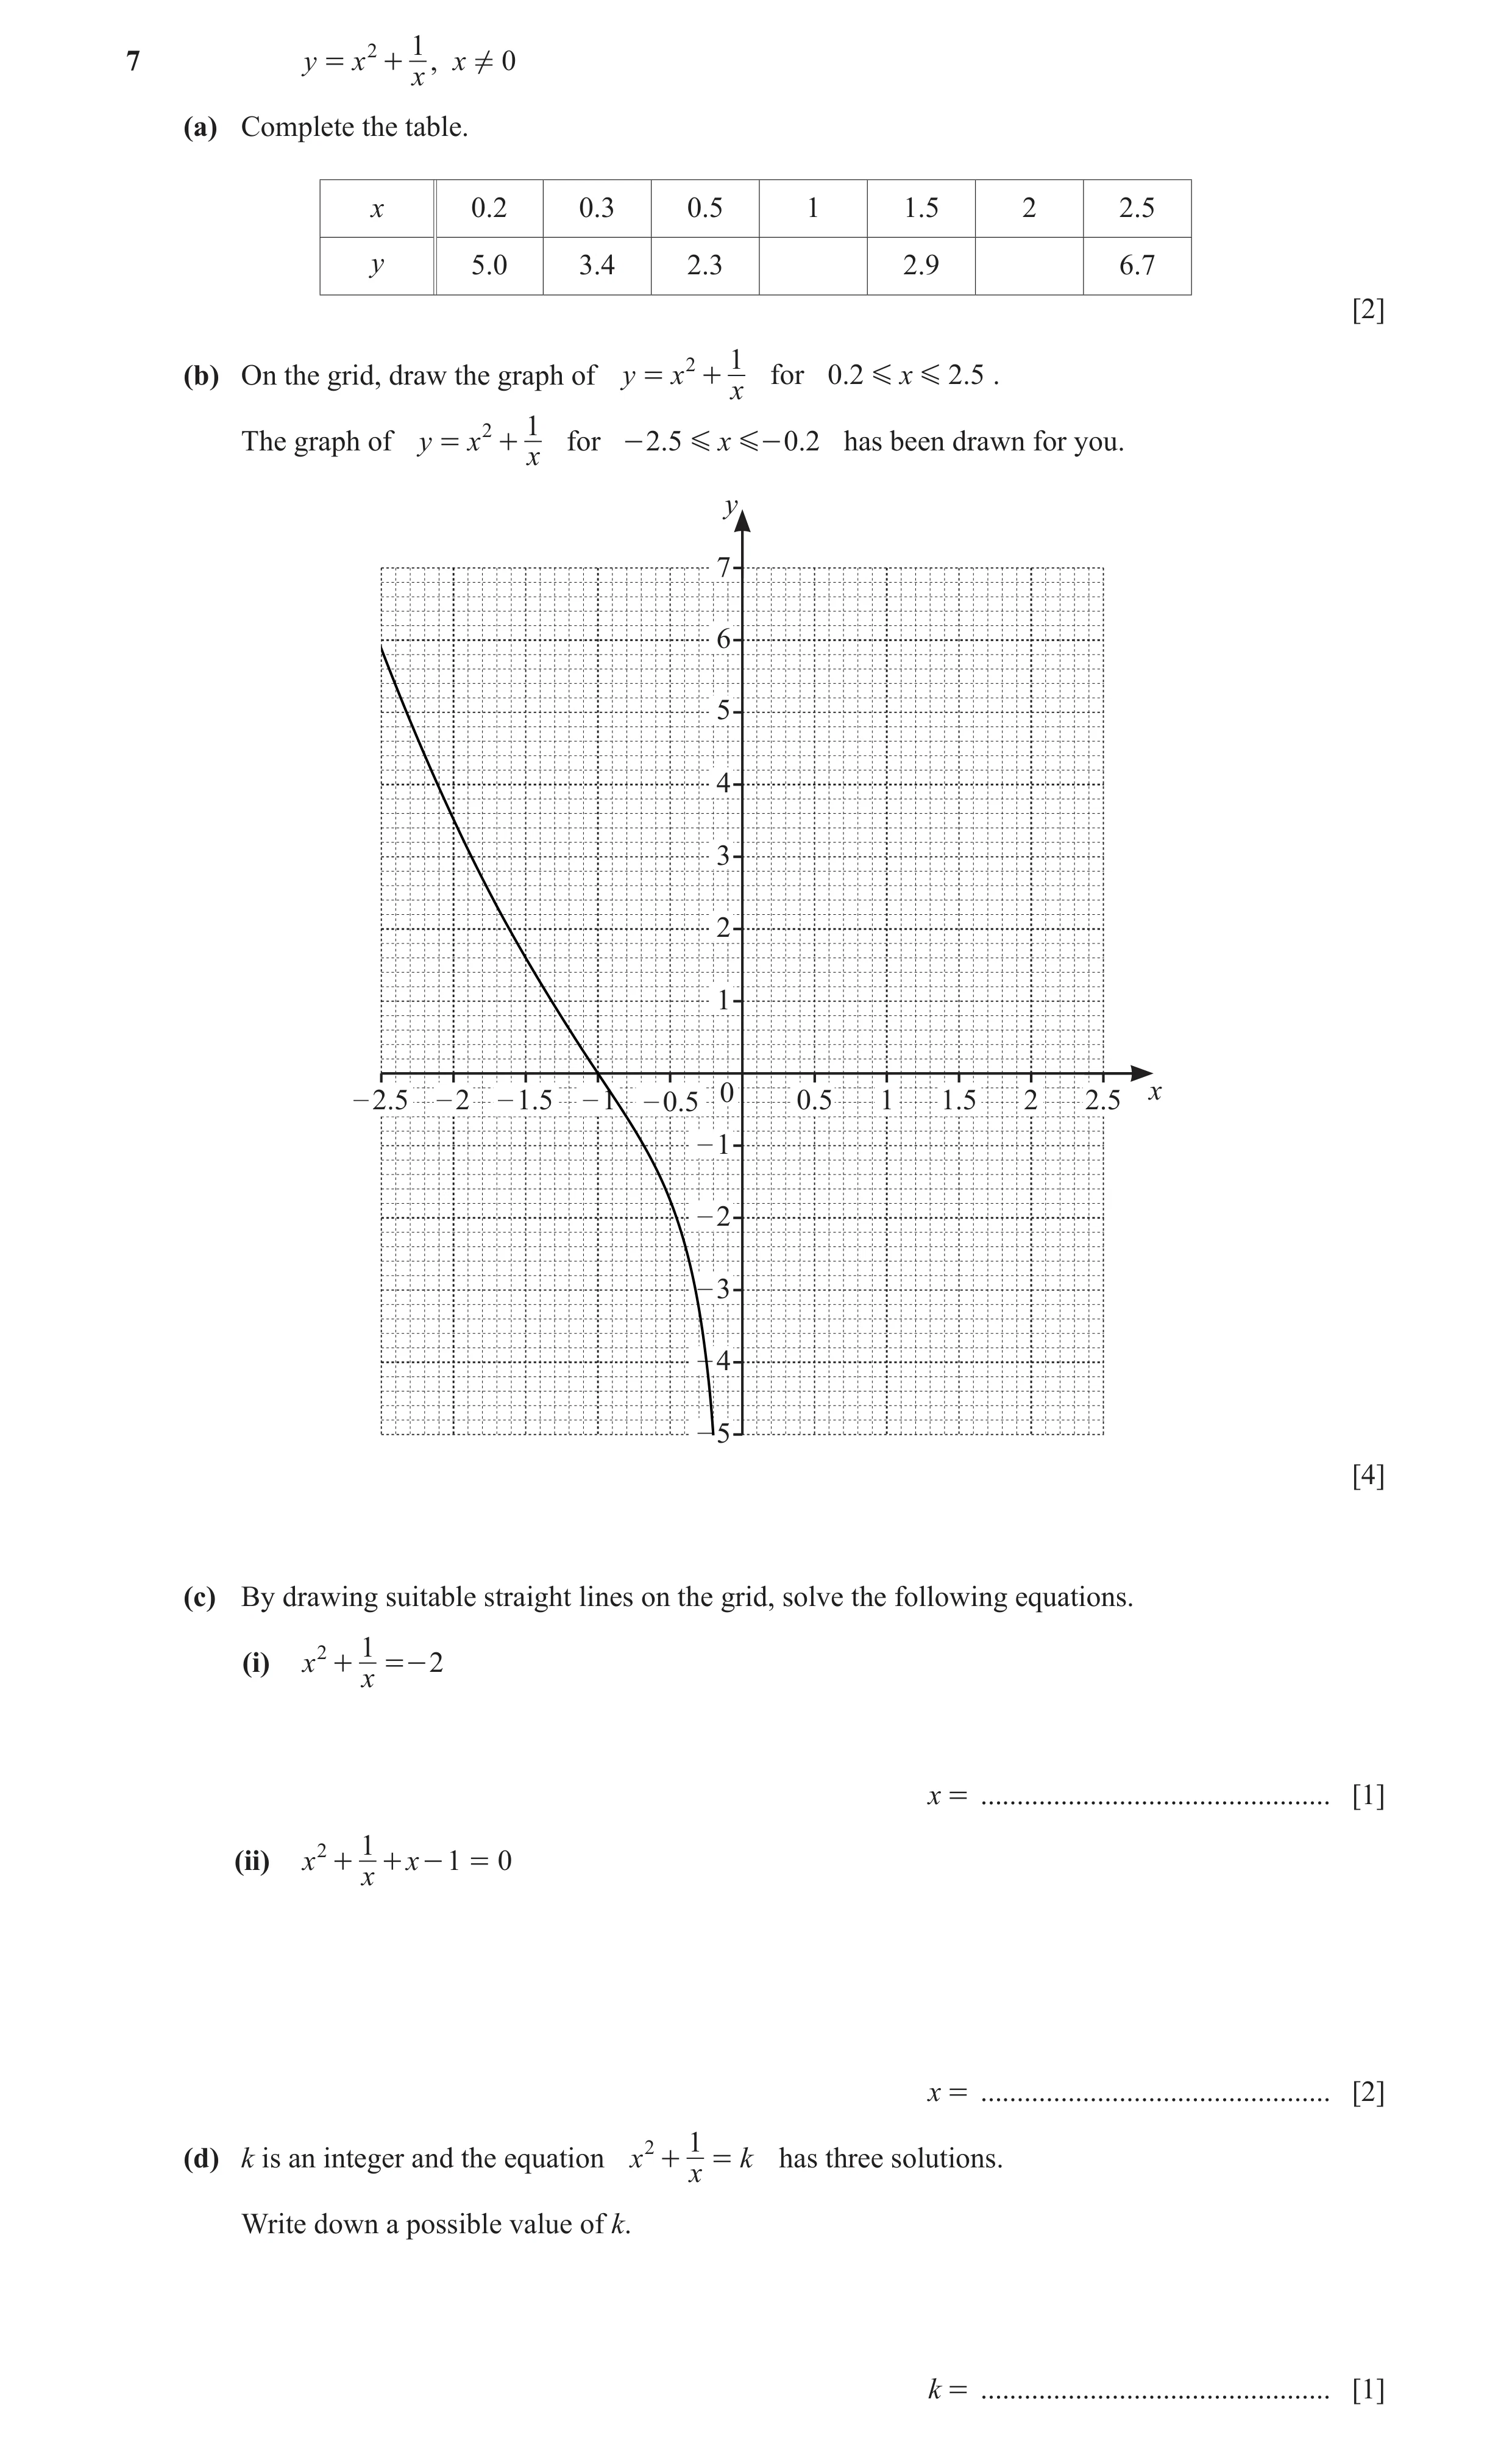
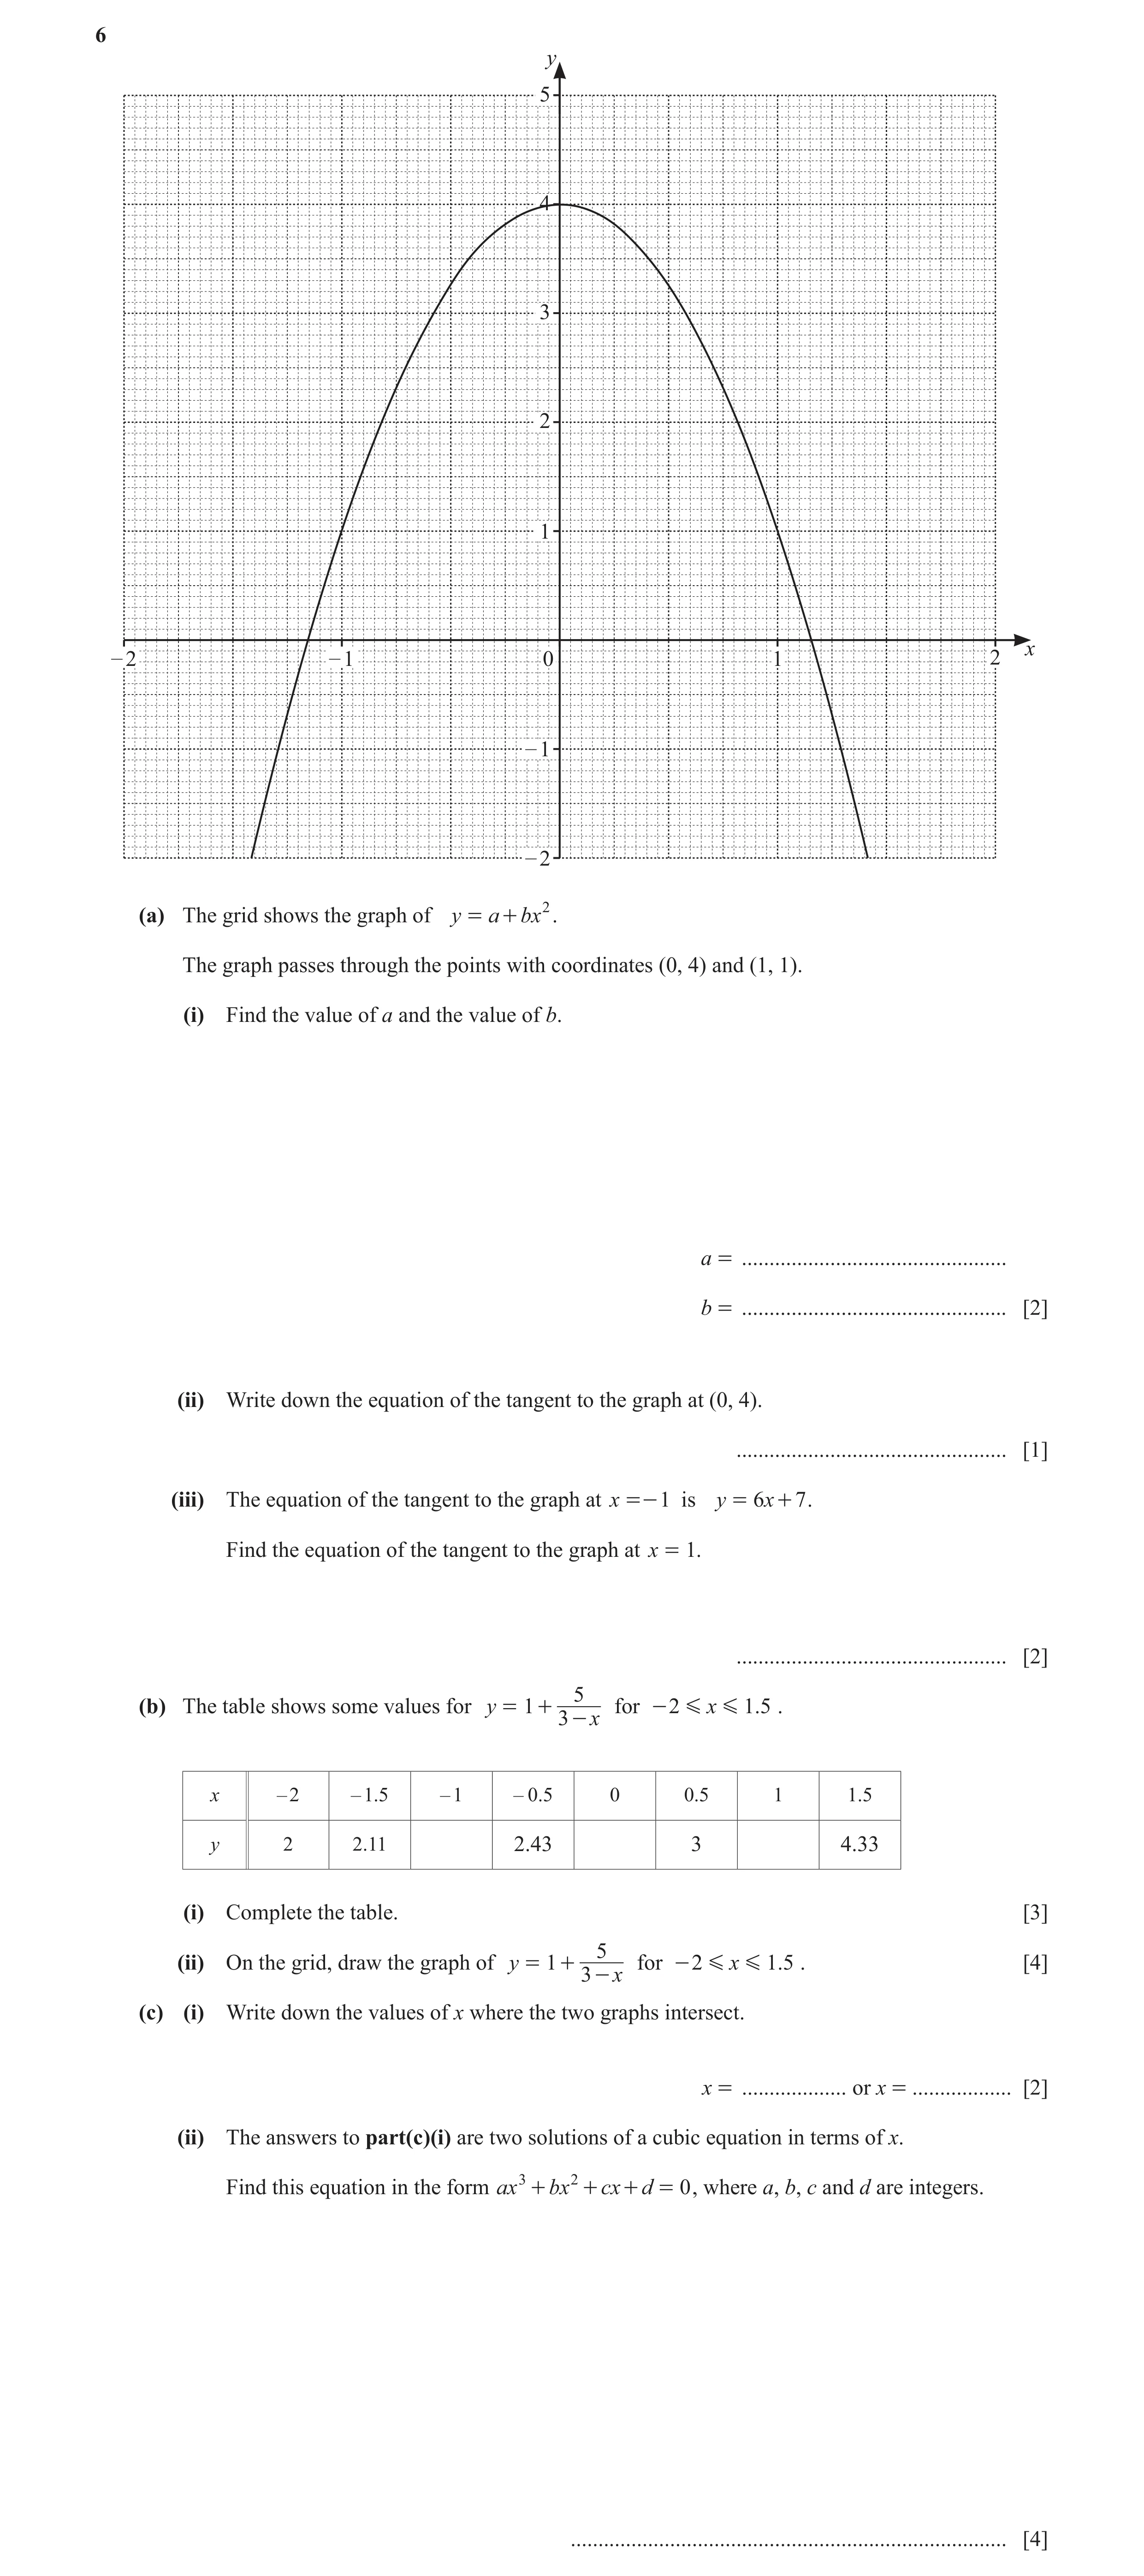
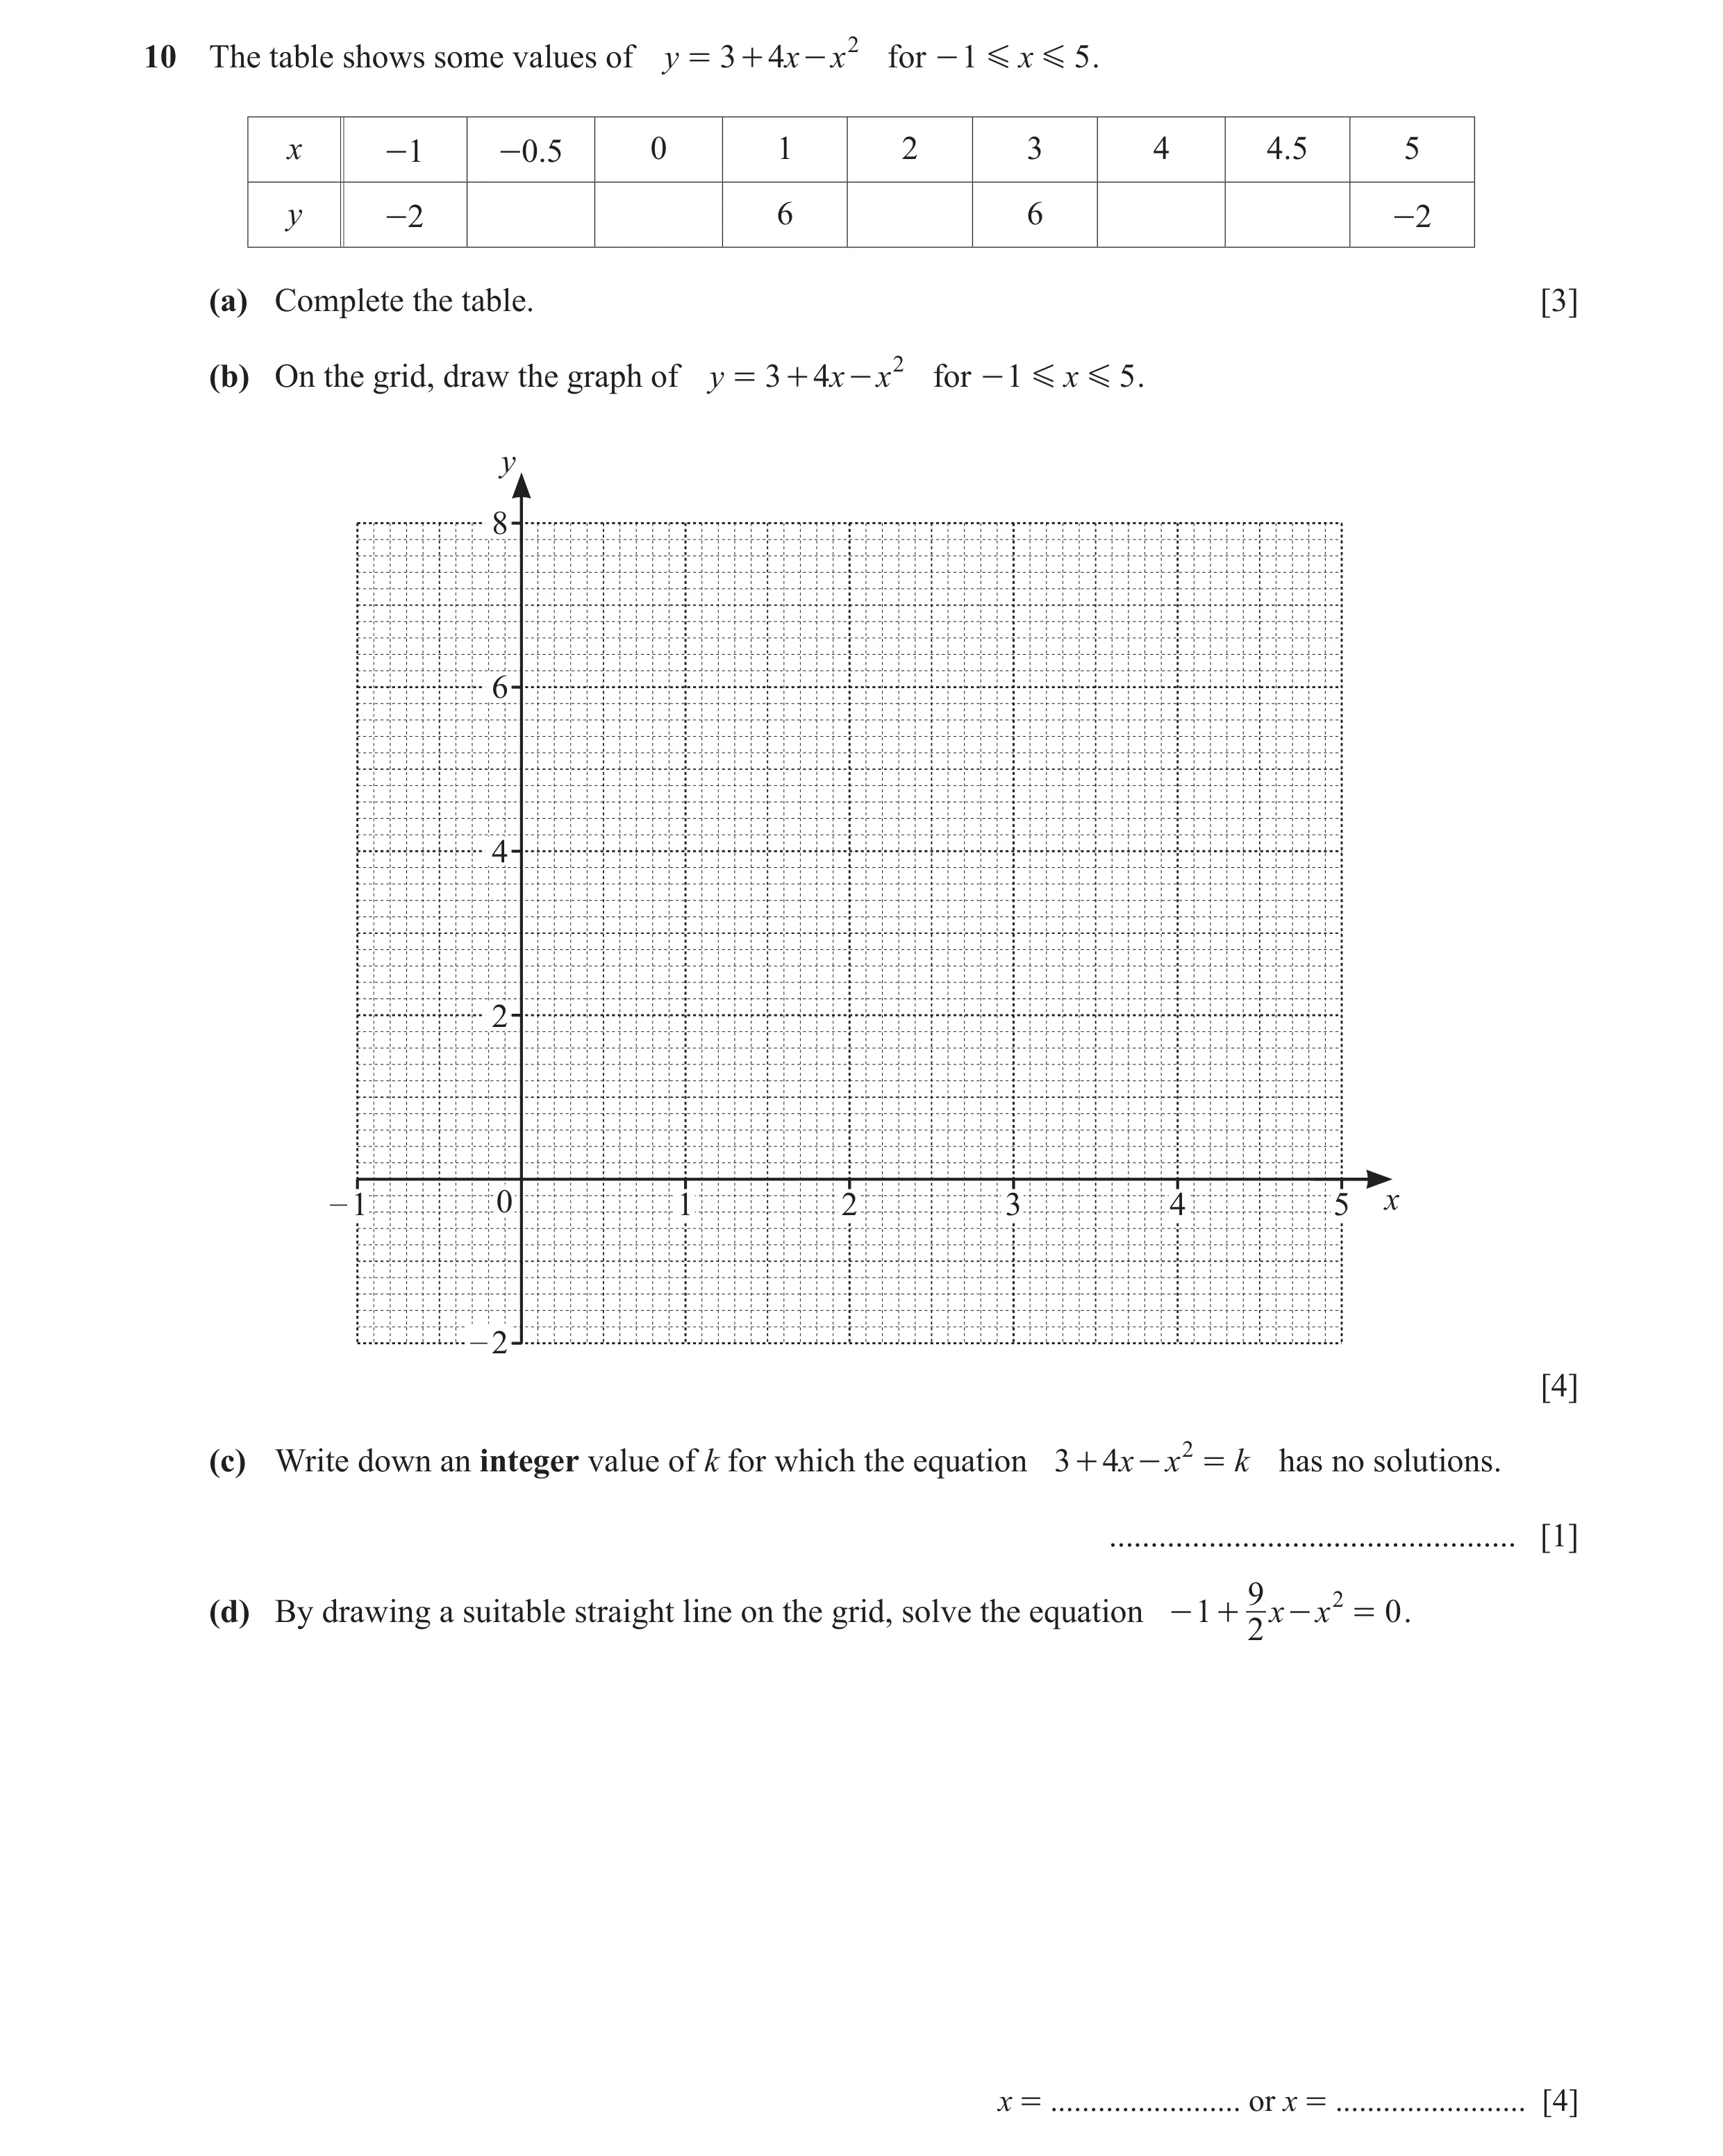 99 / 126
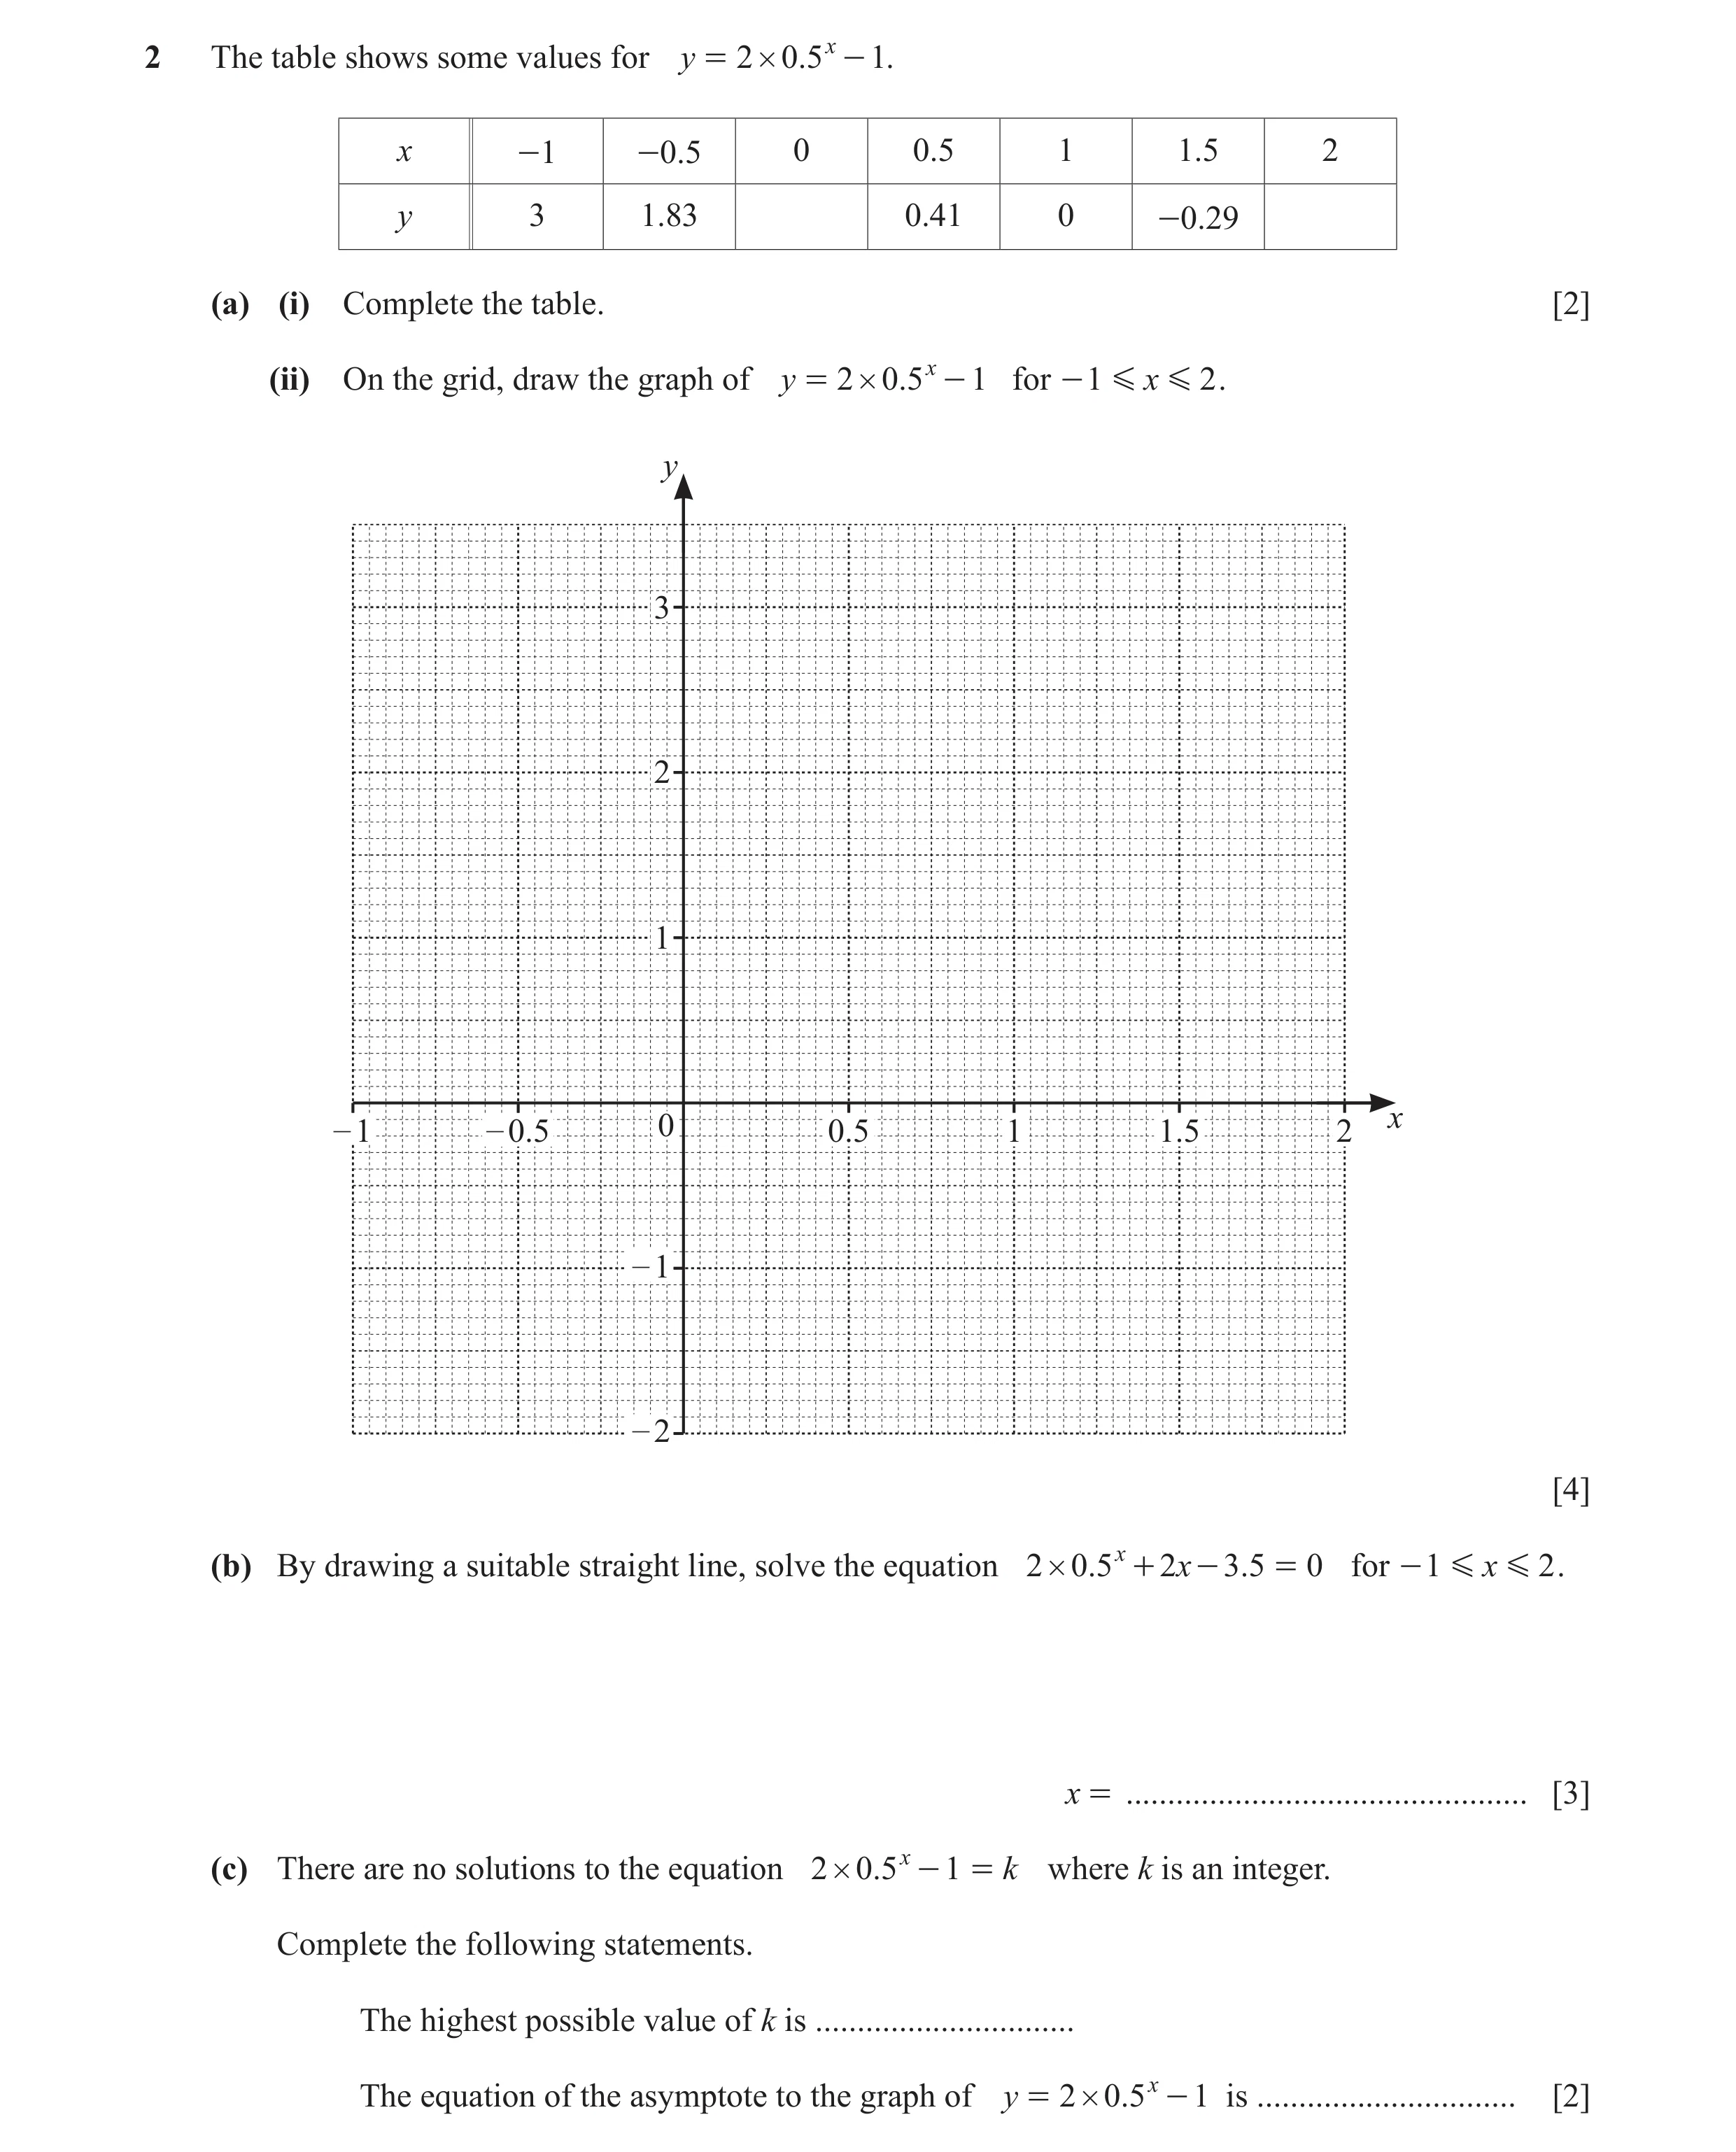 100 / 126
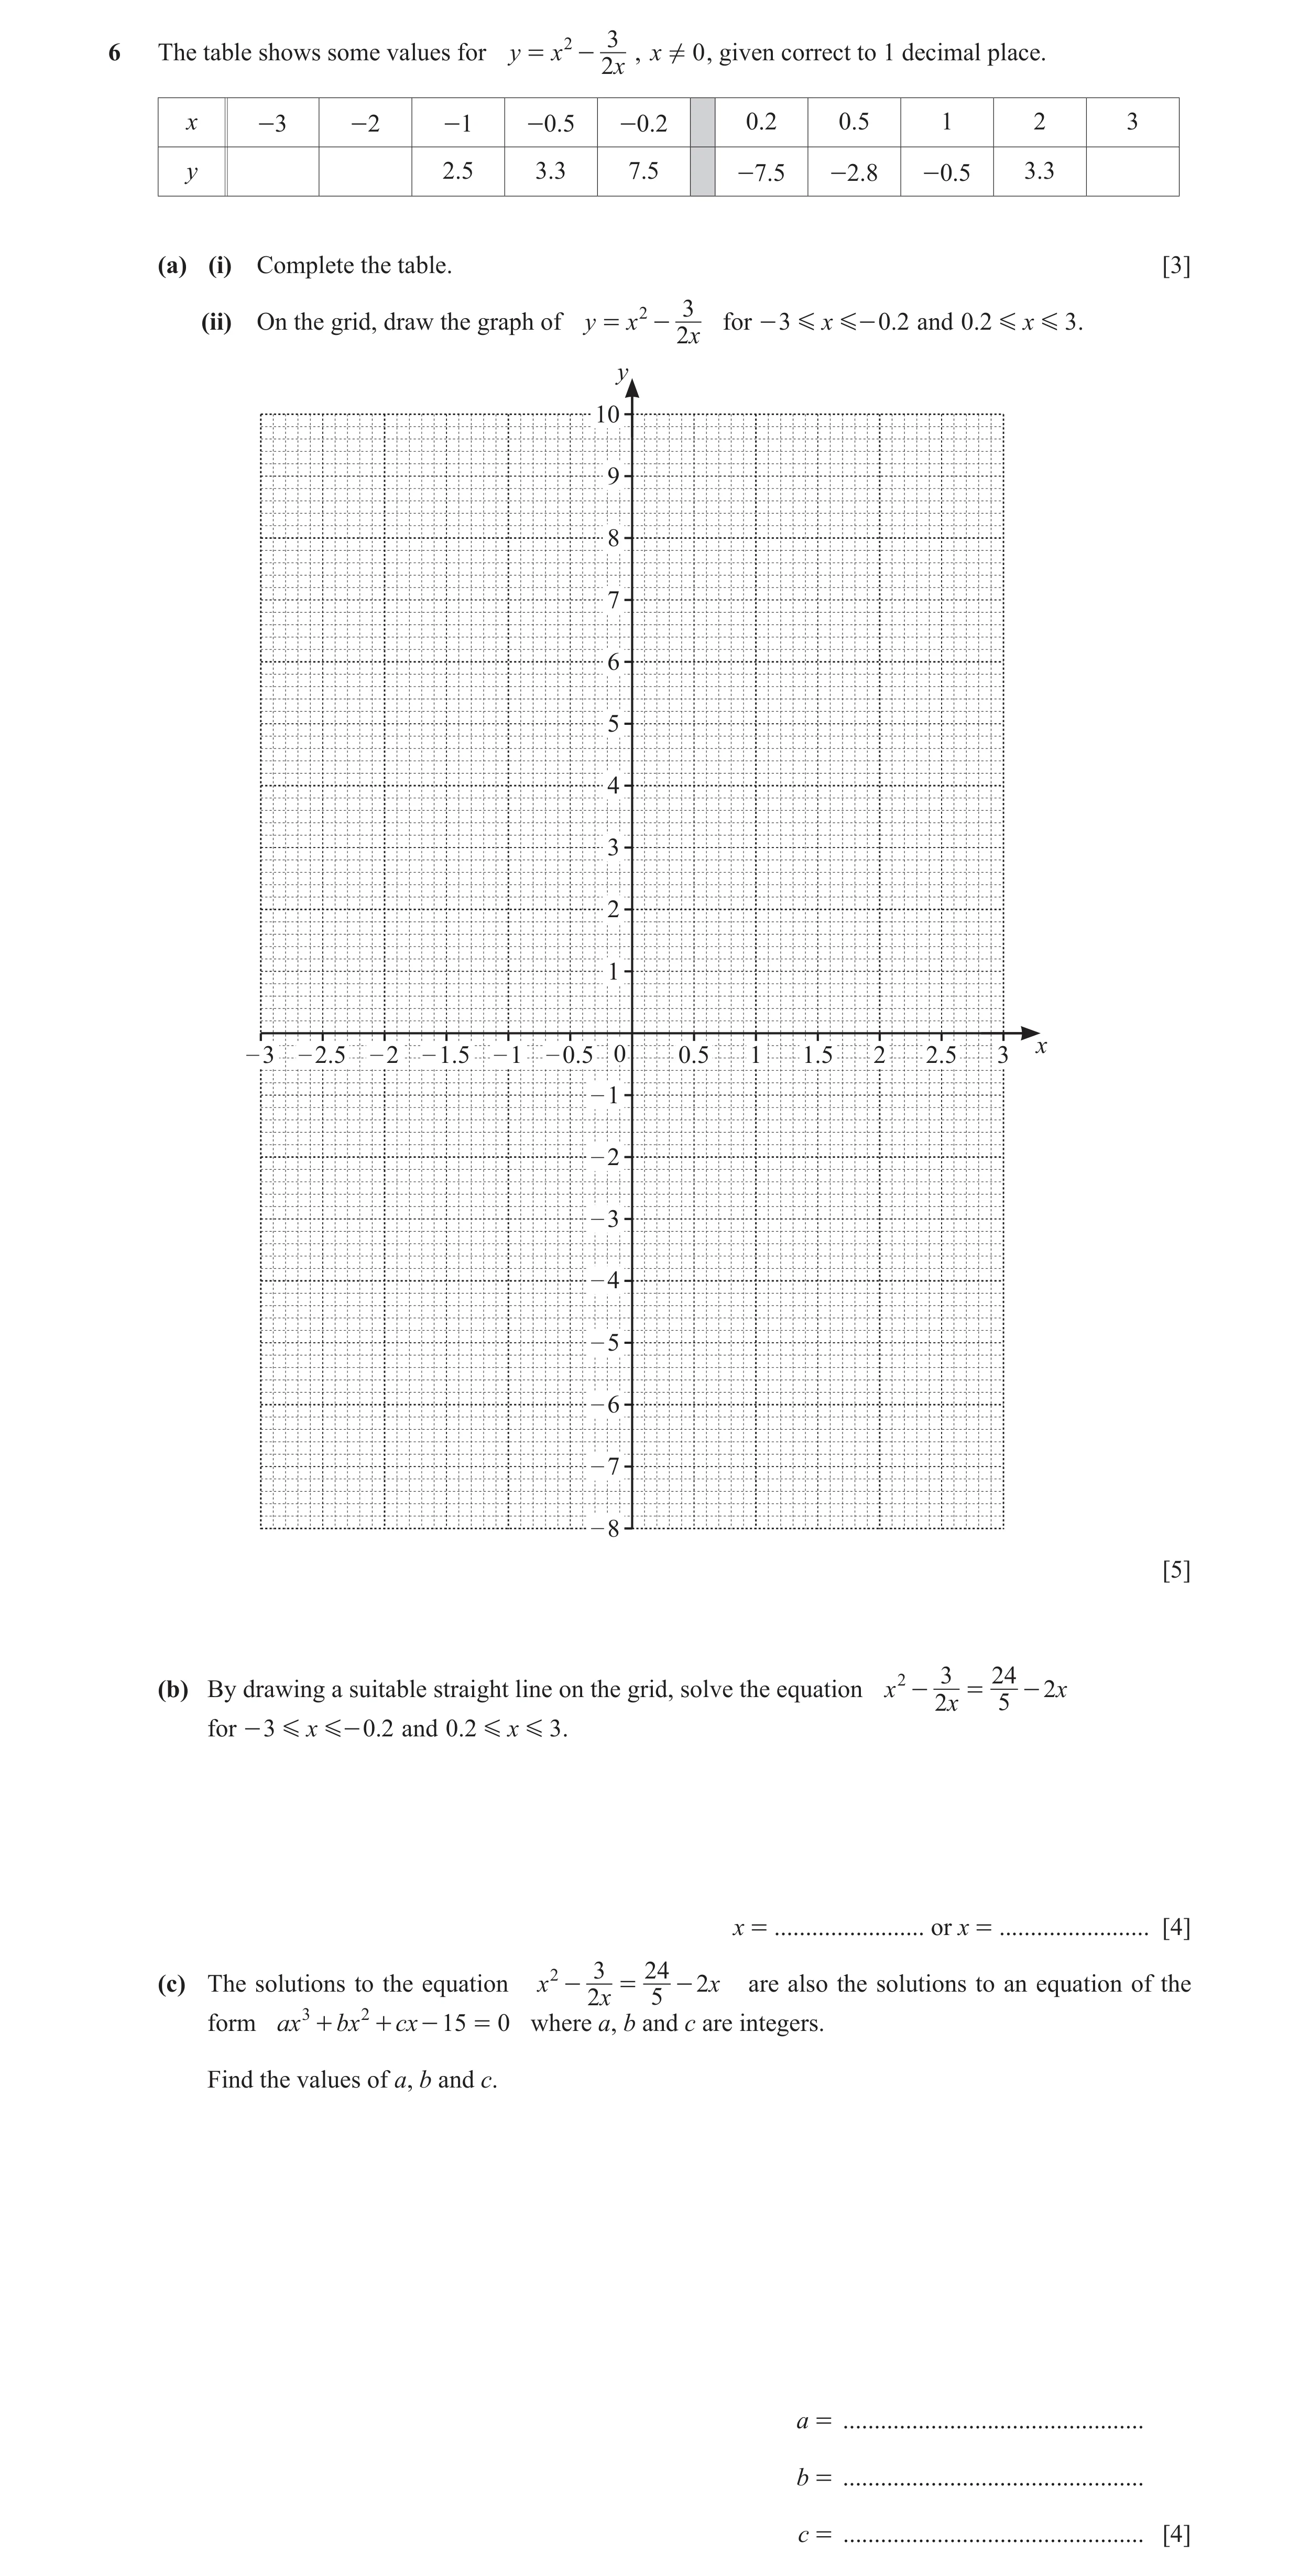
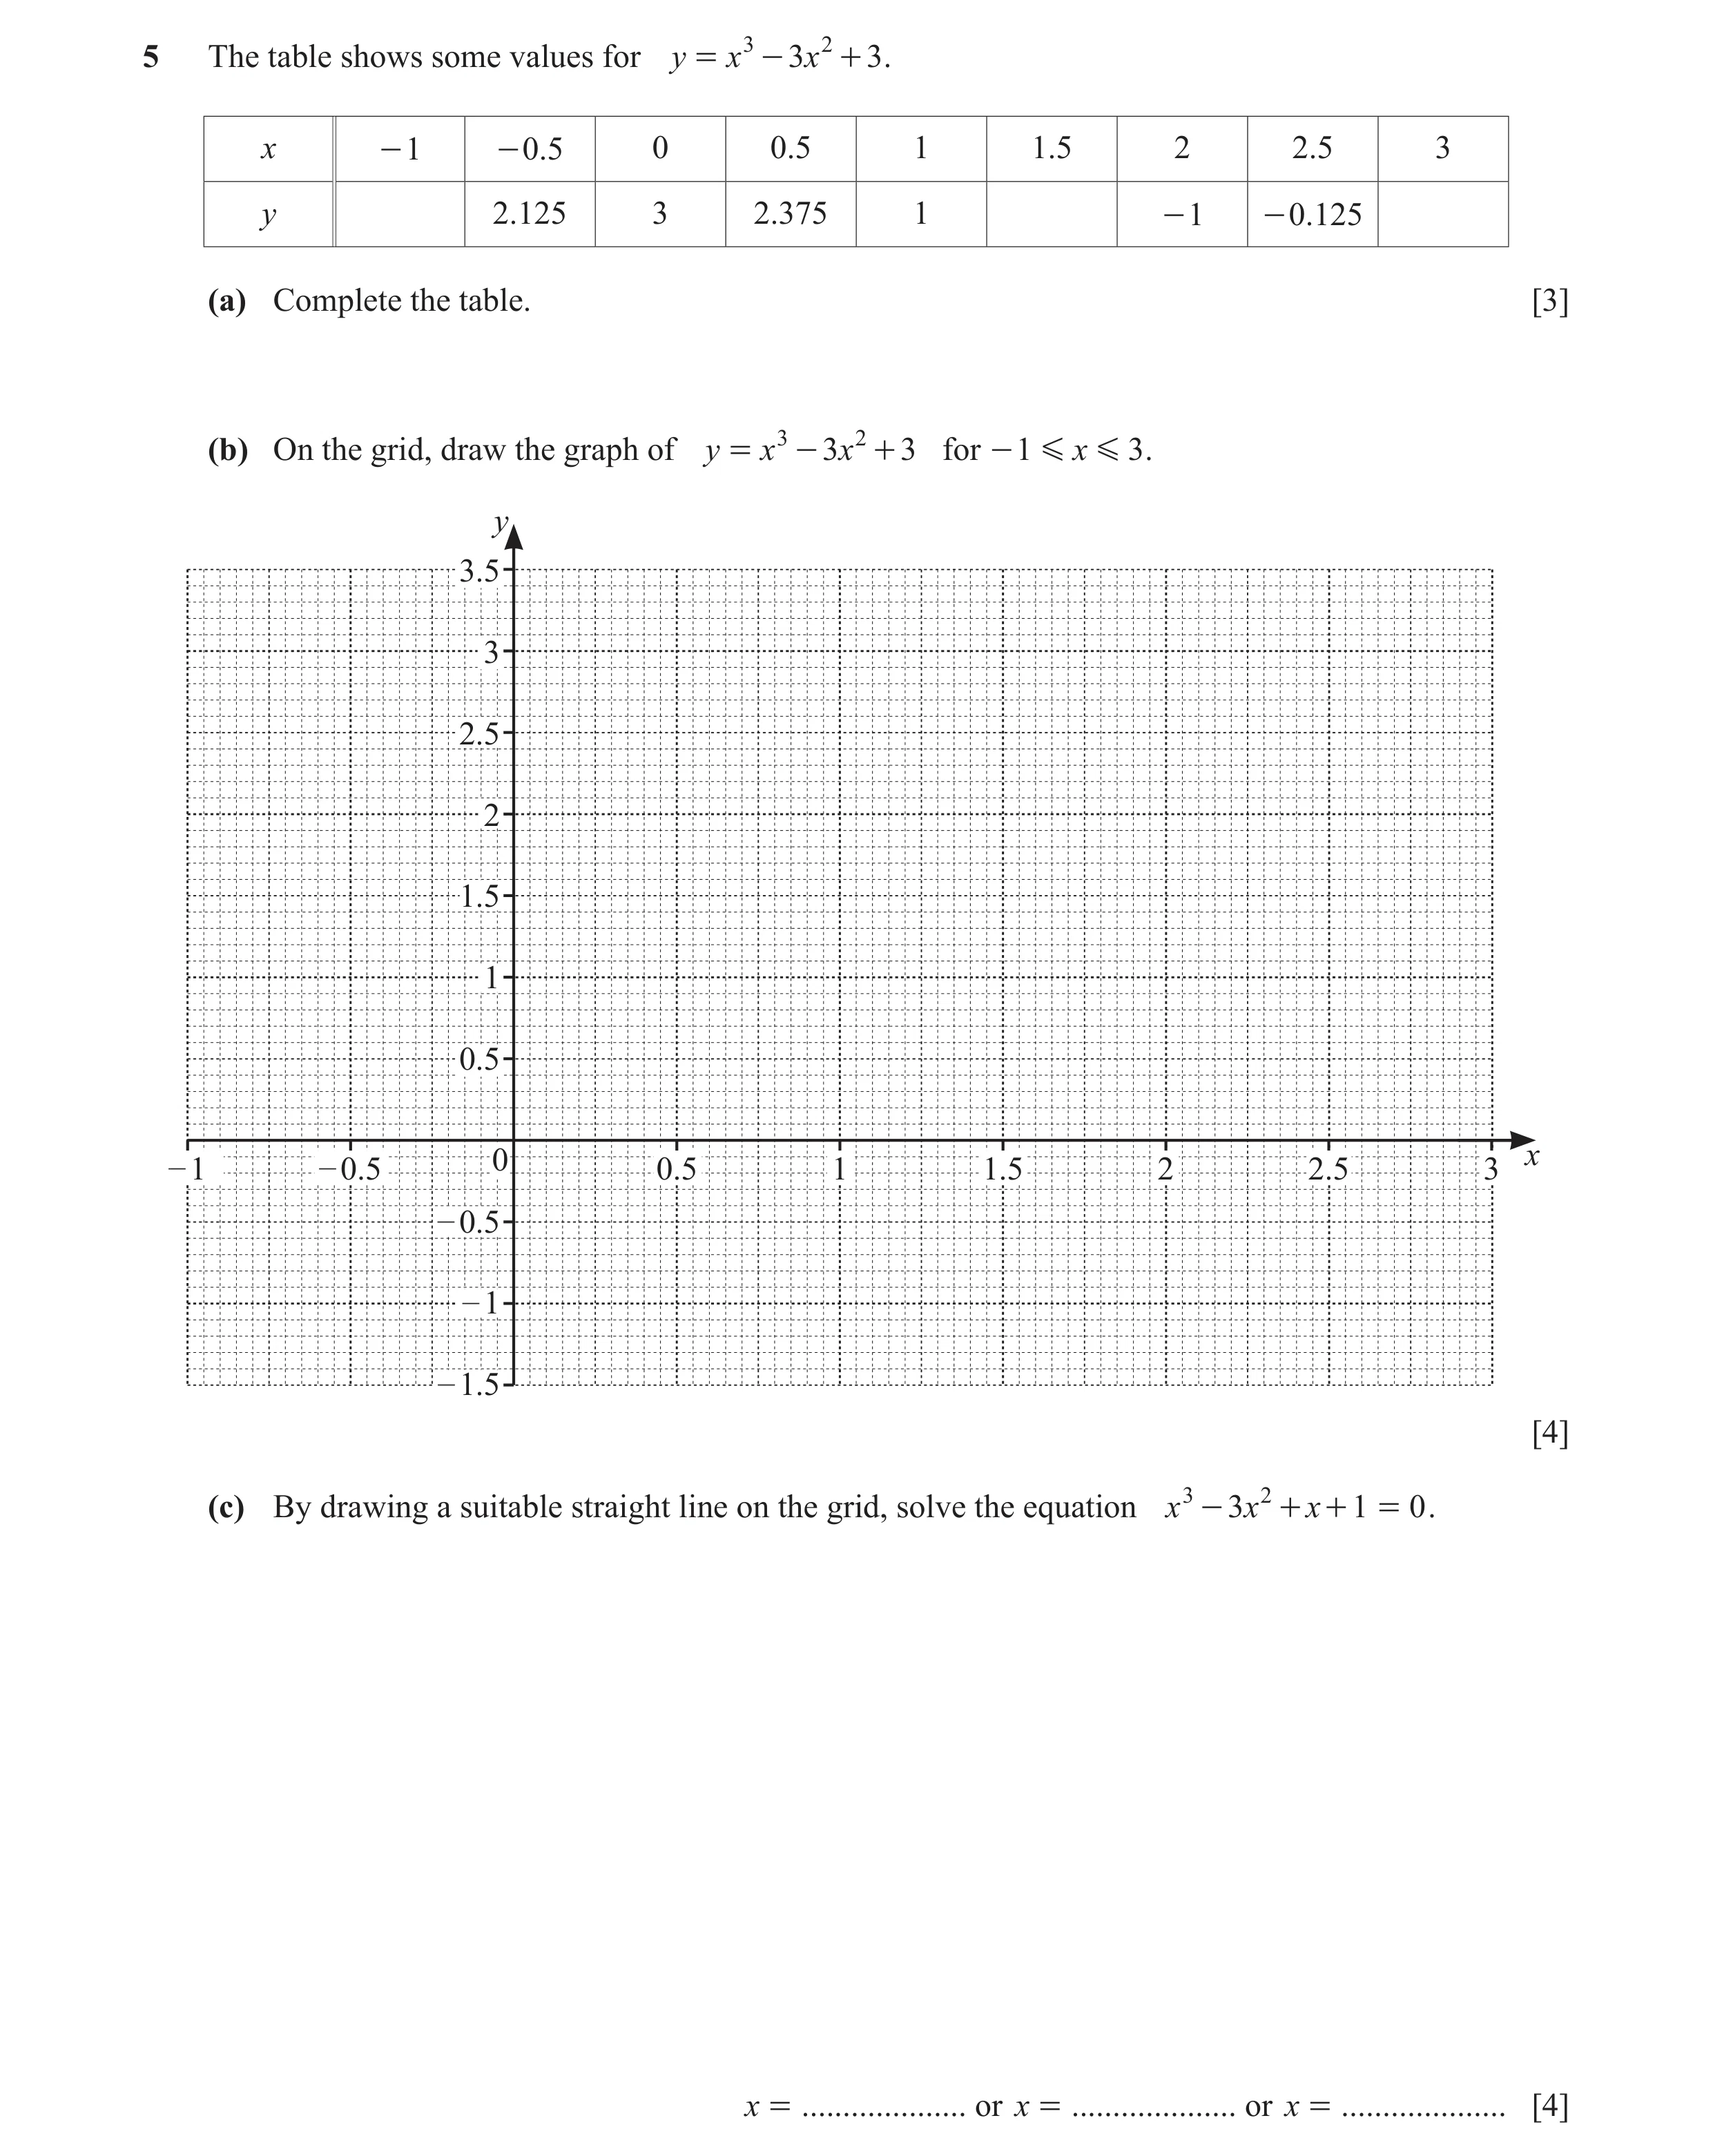 103 / 126
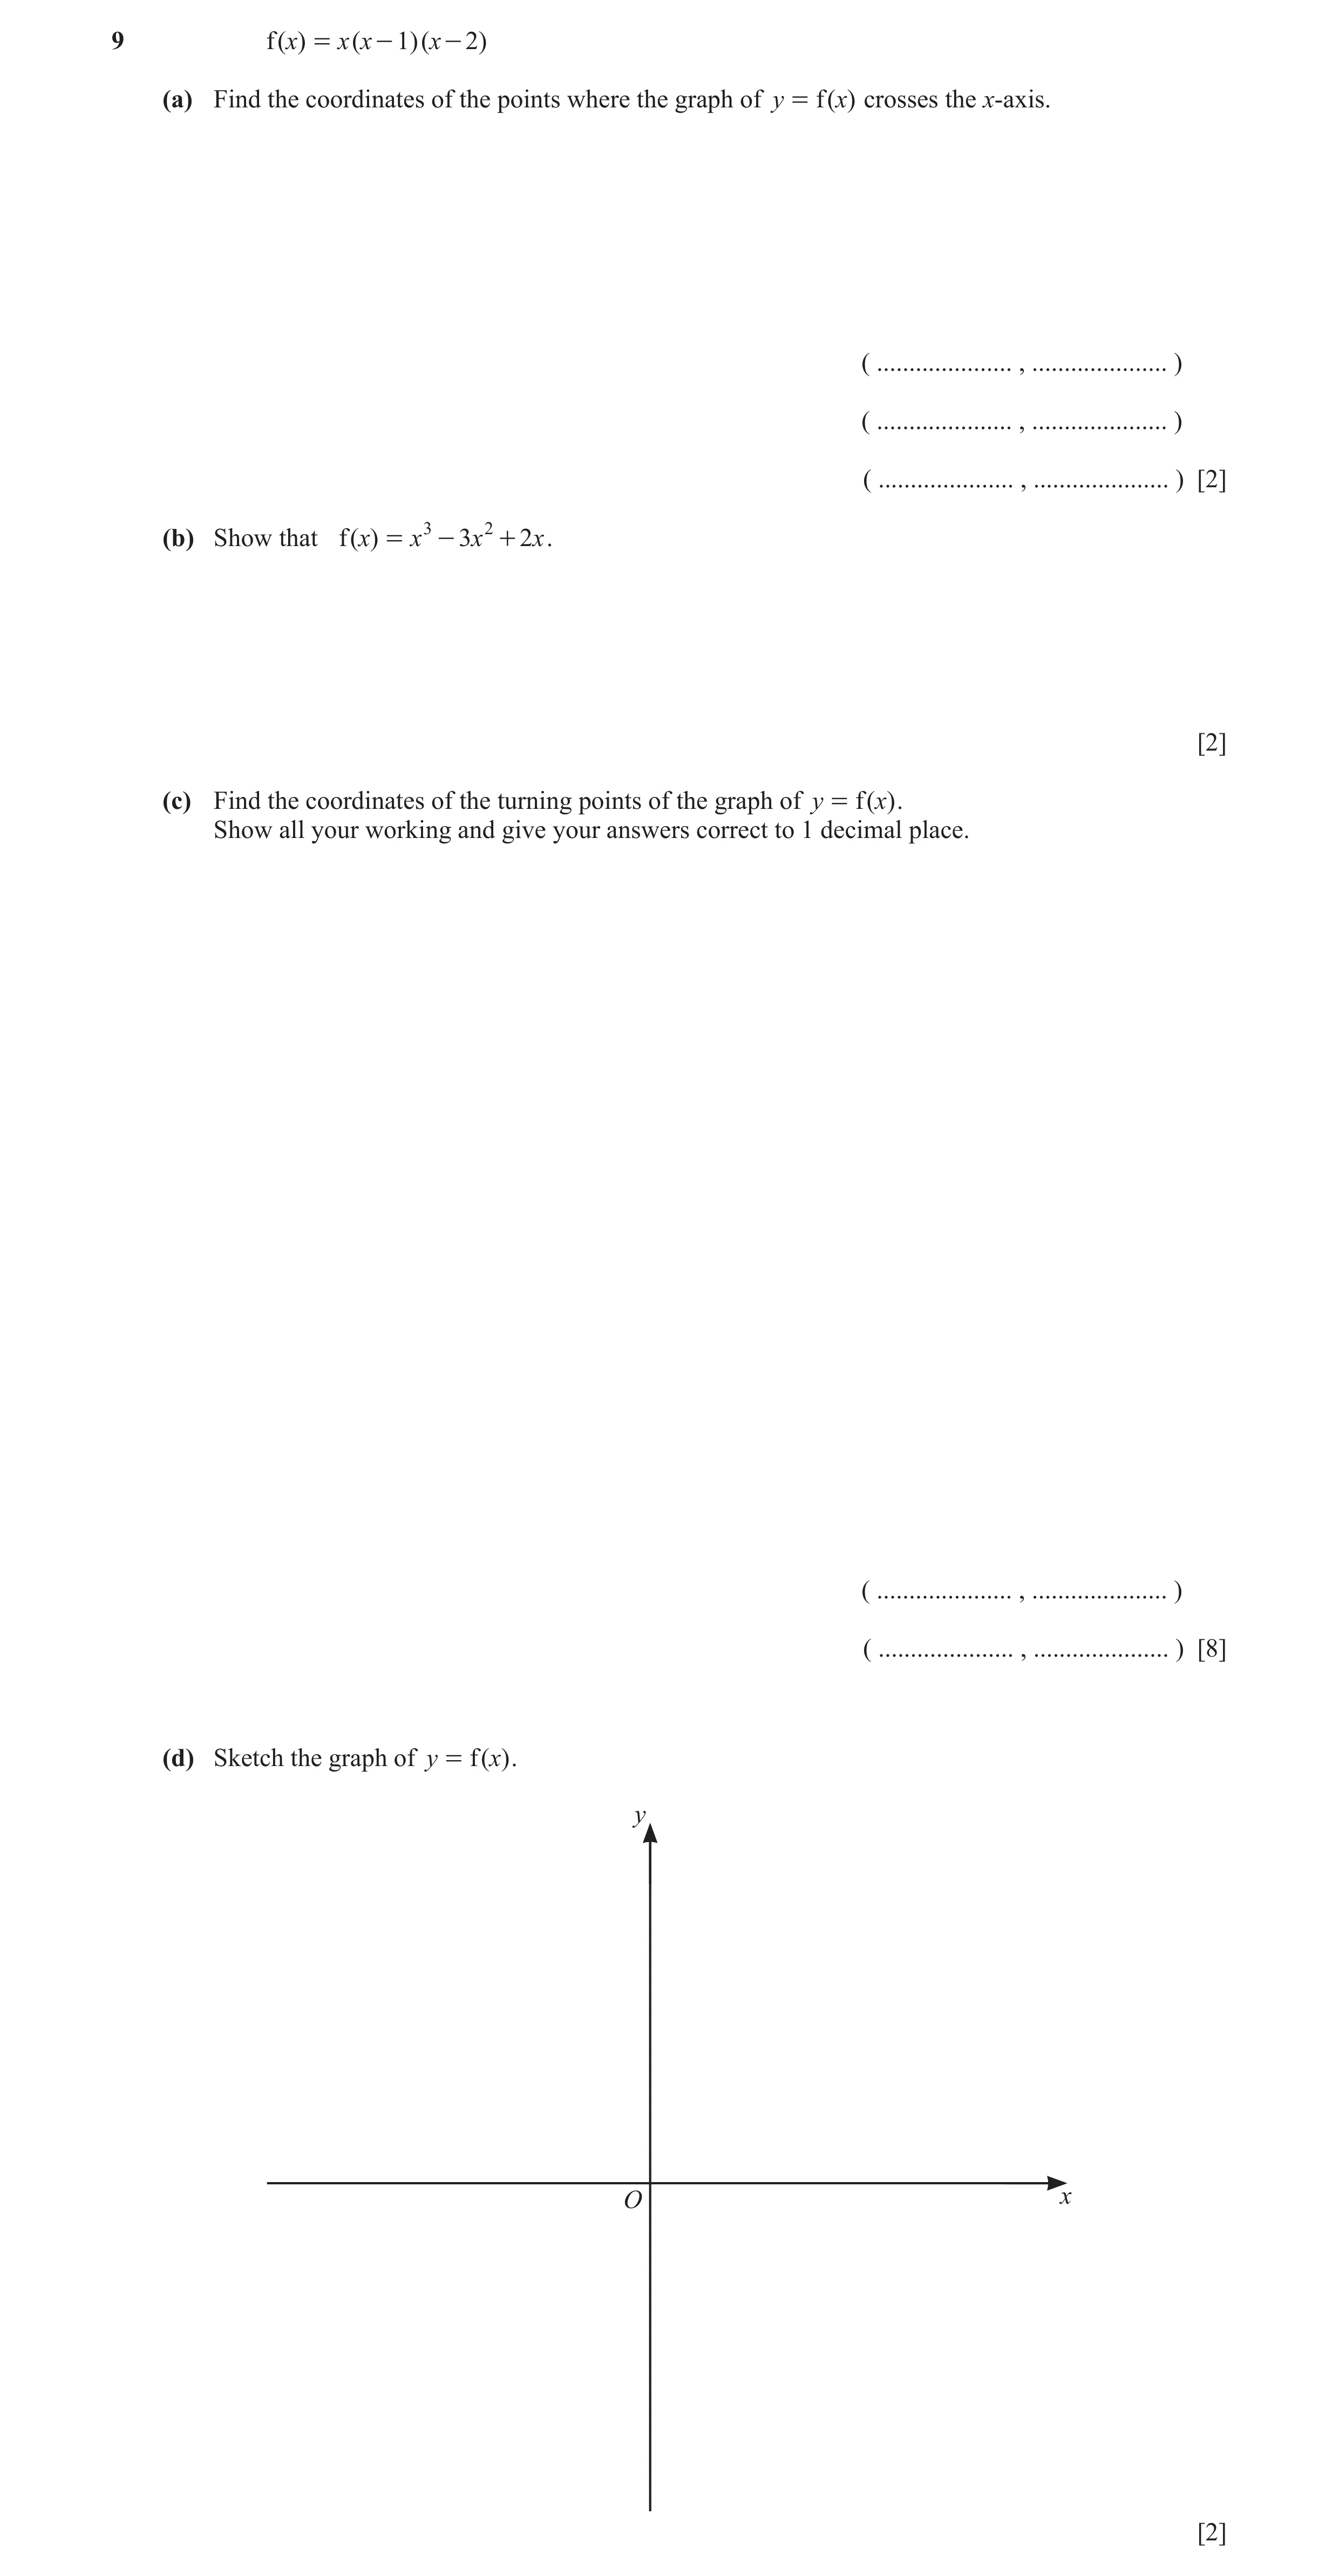
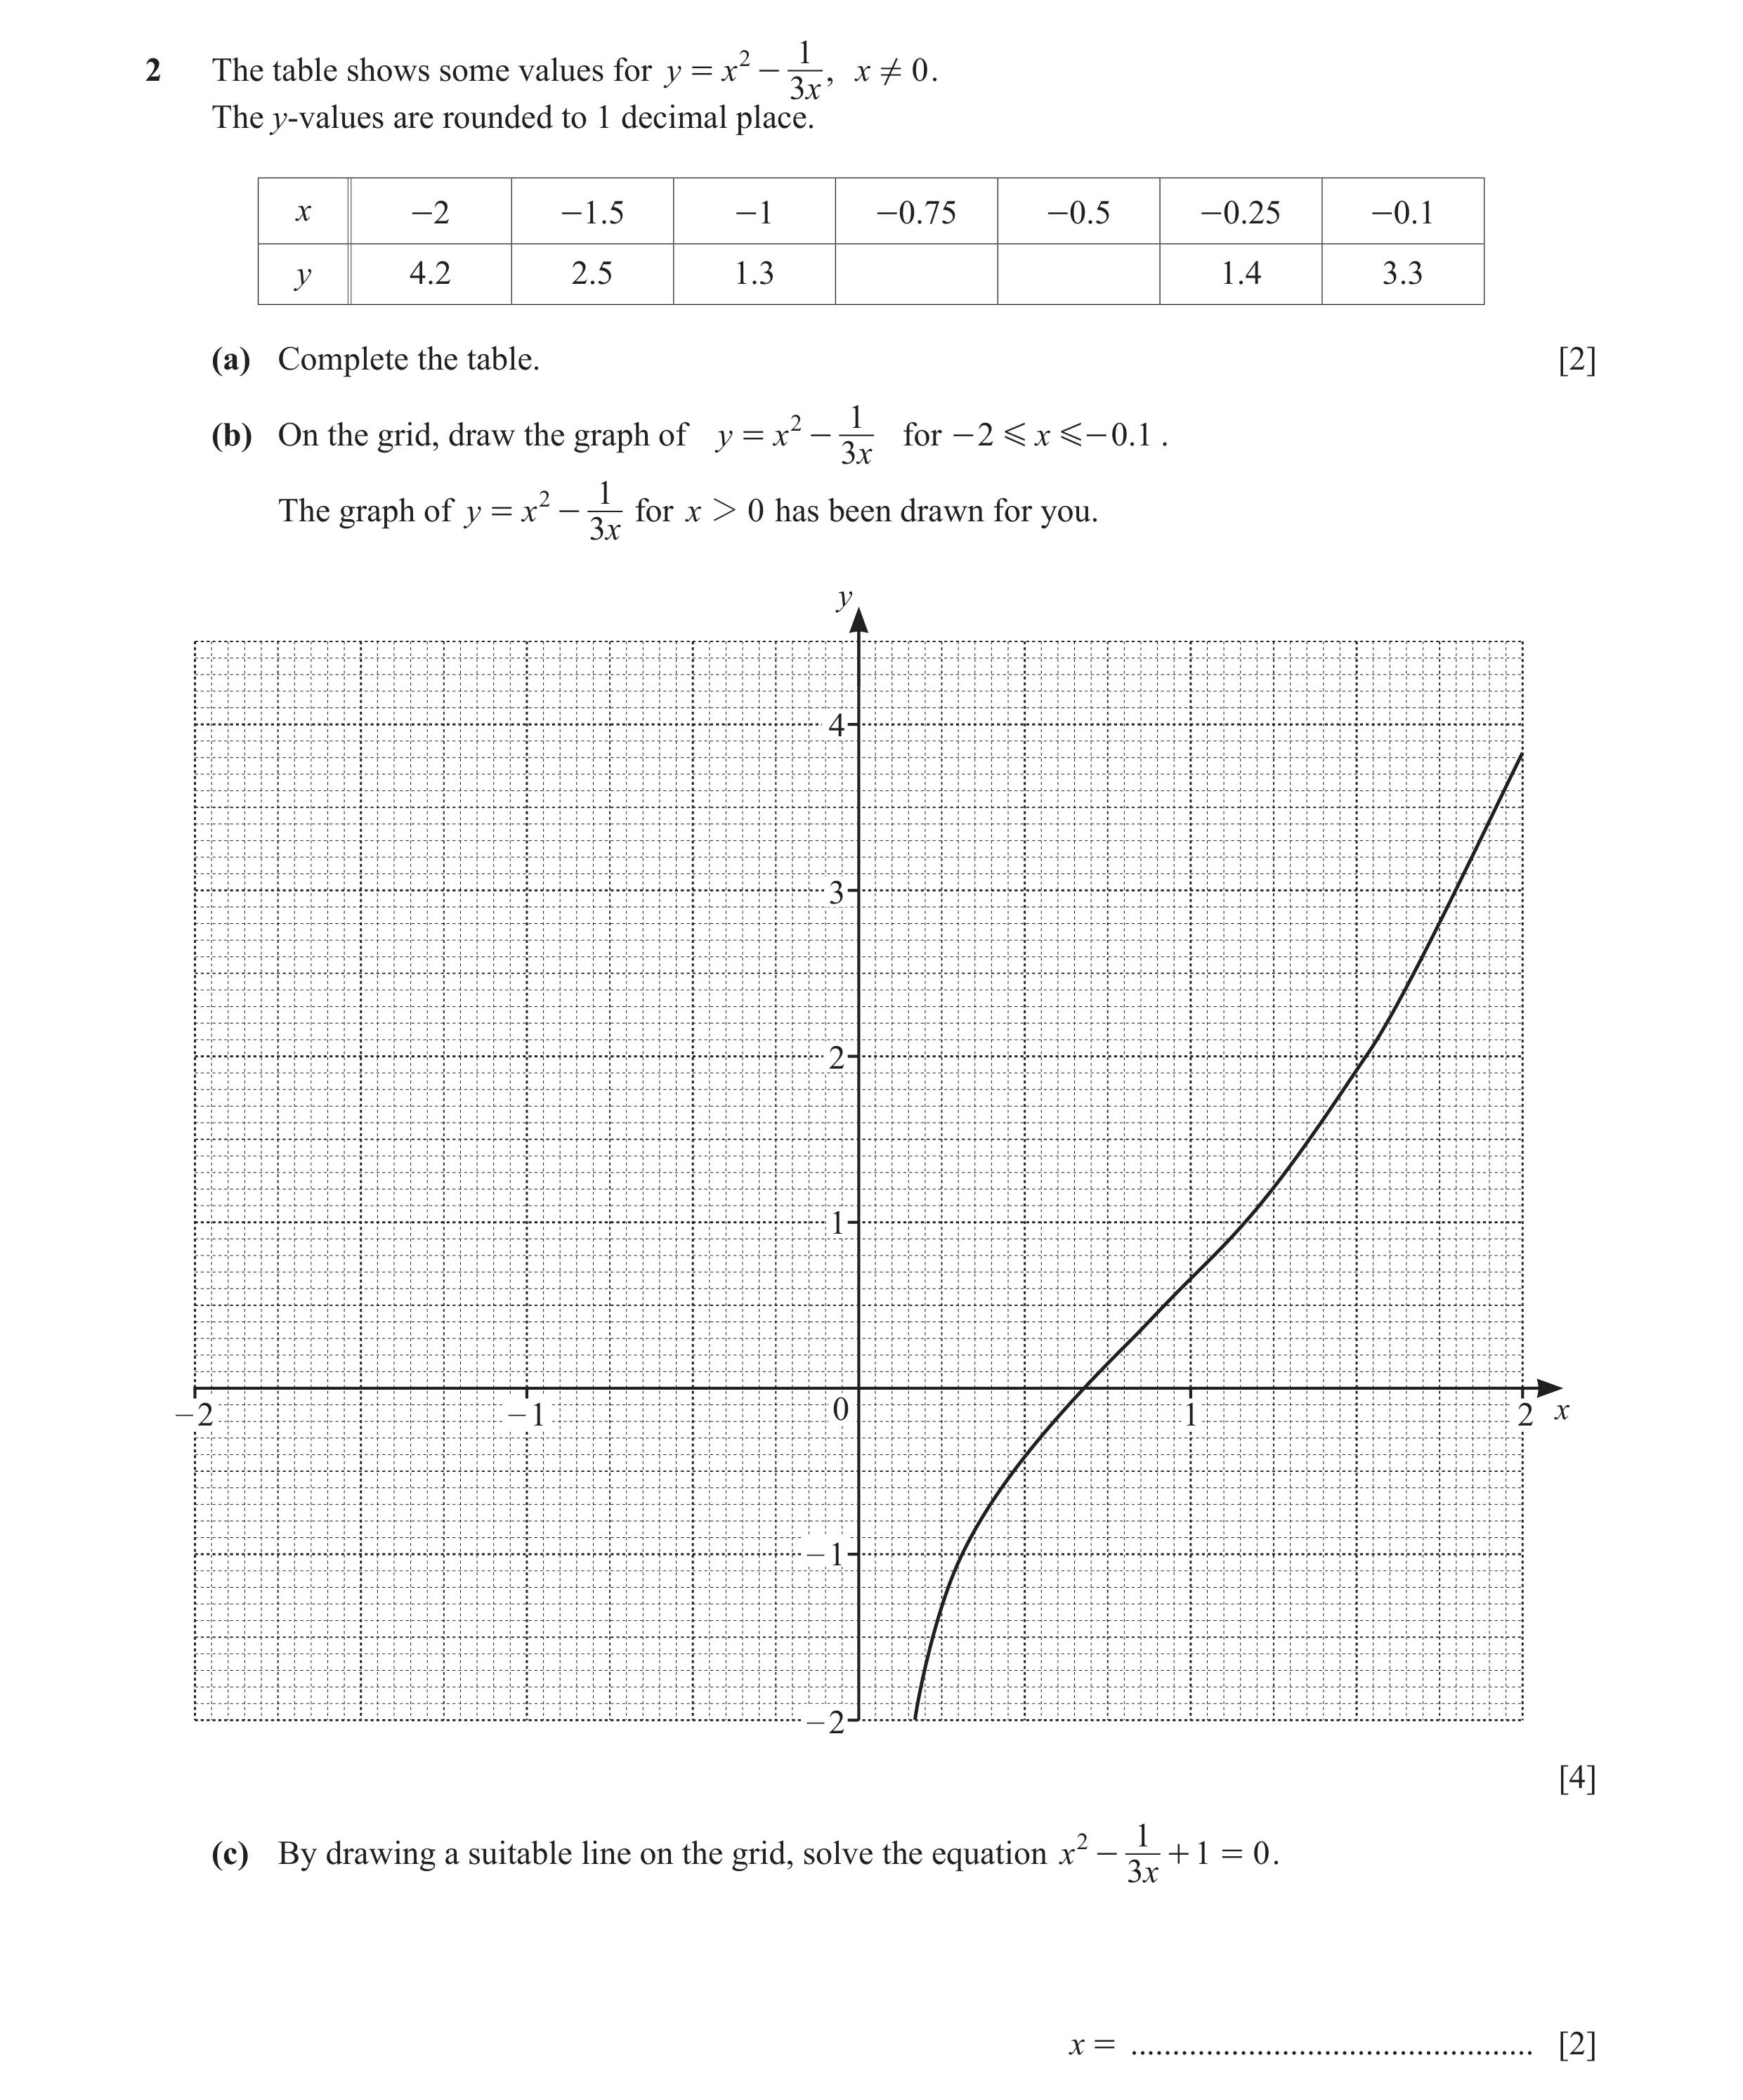 106 / 126
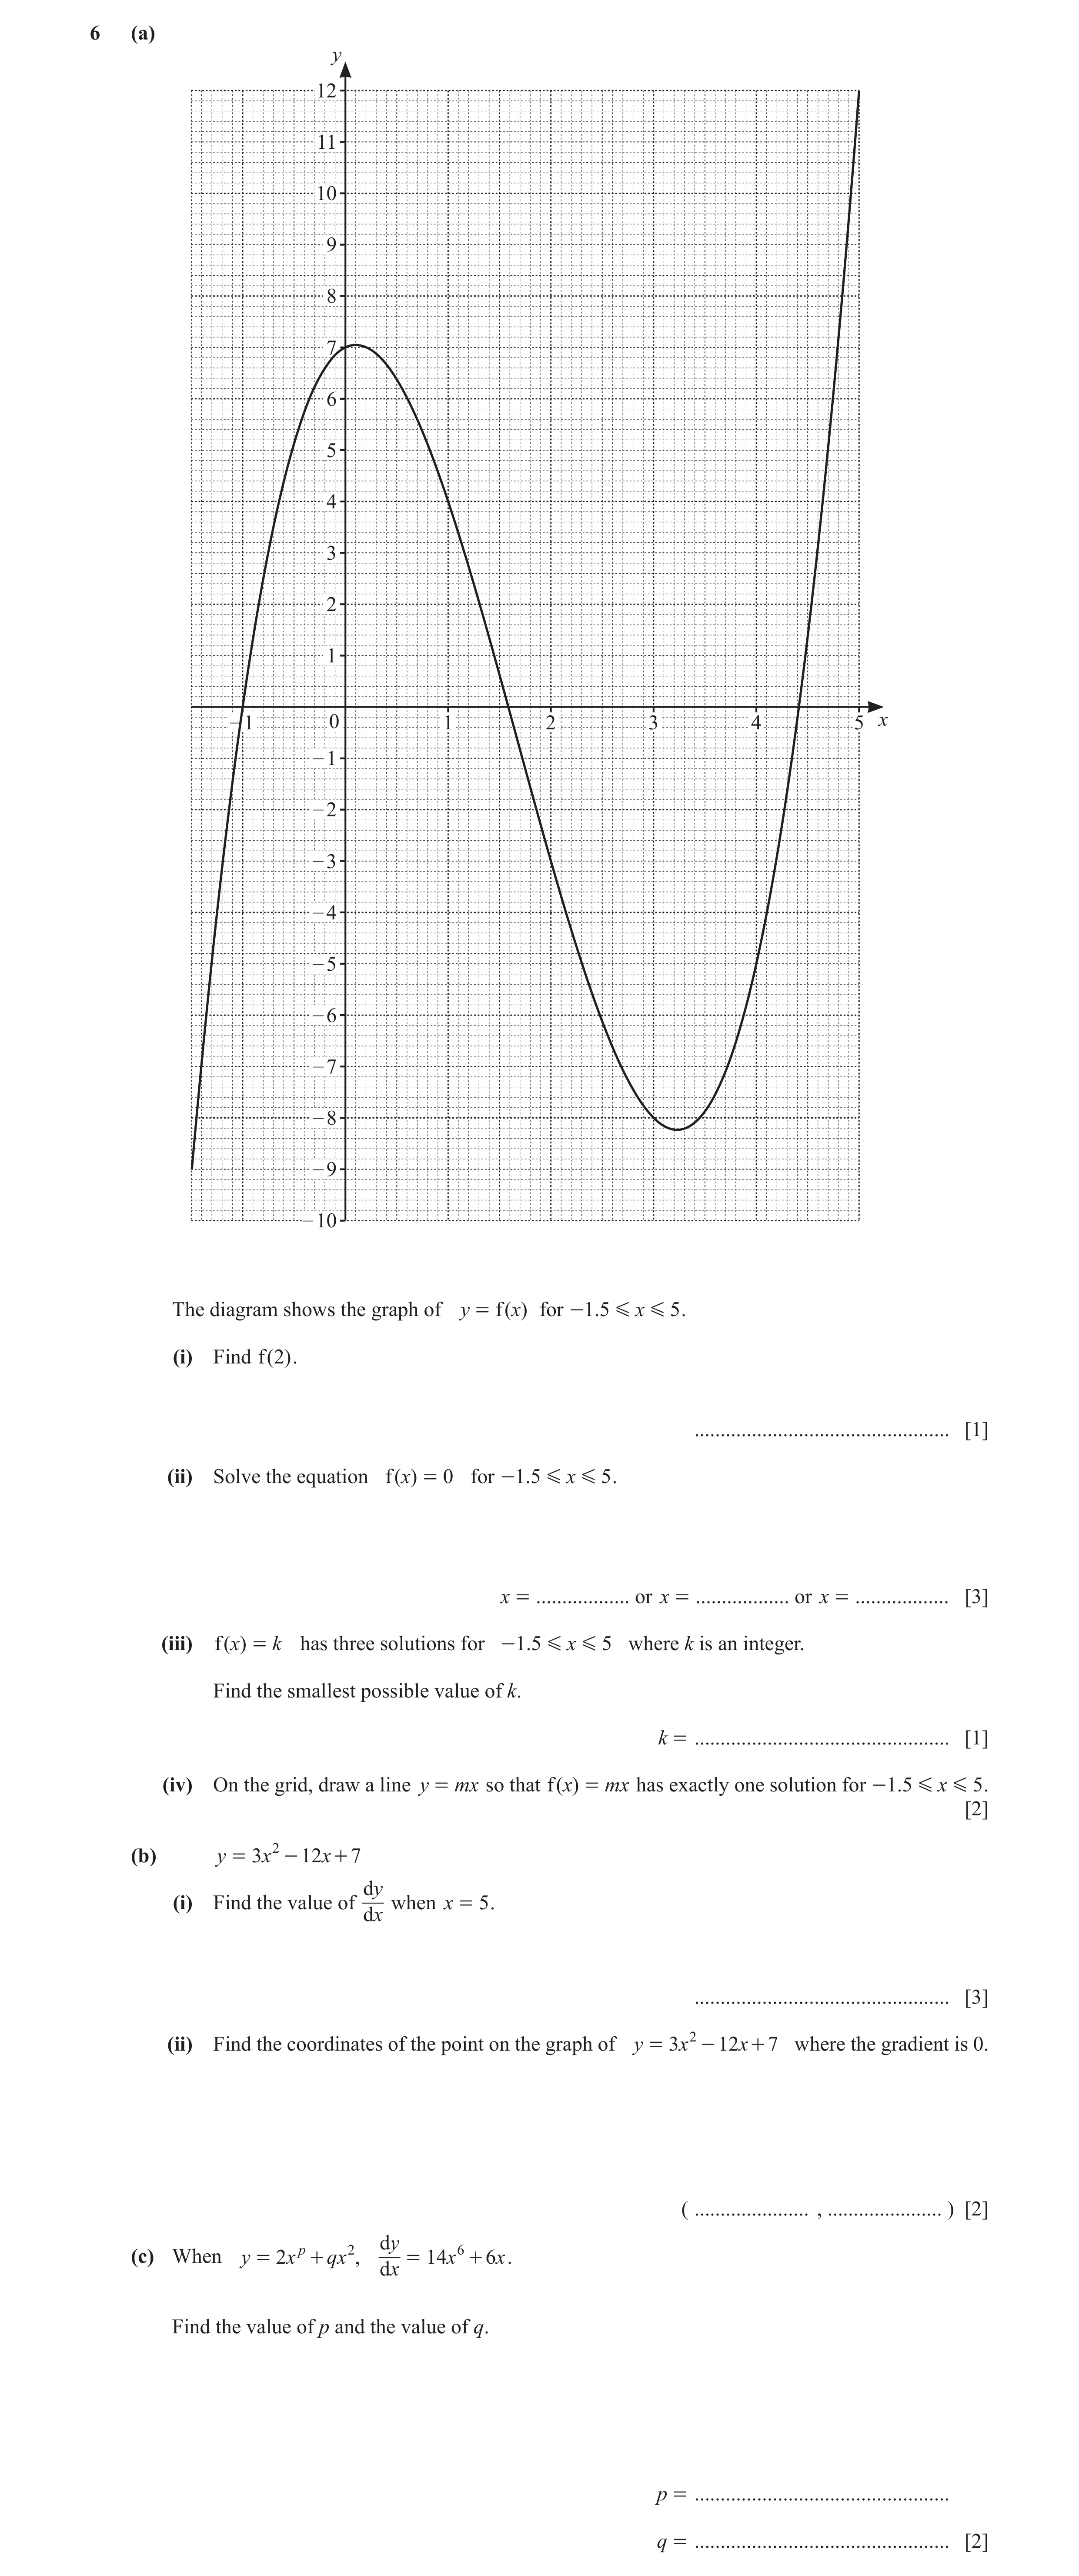
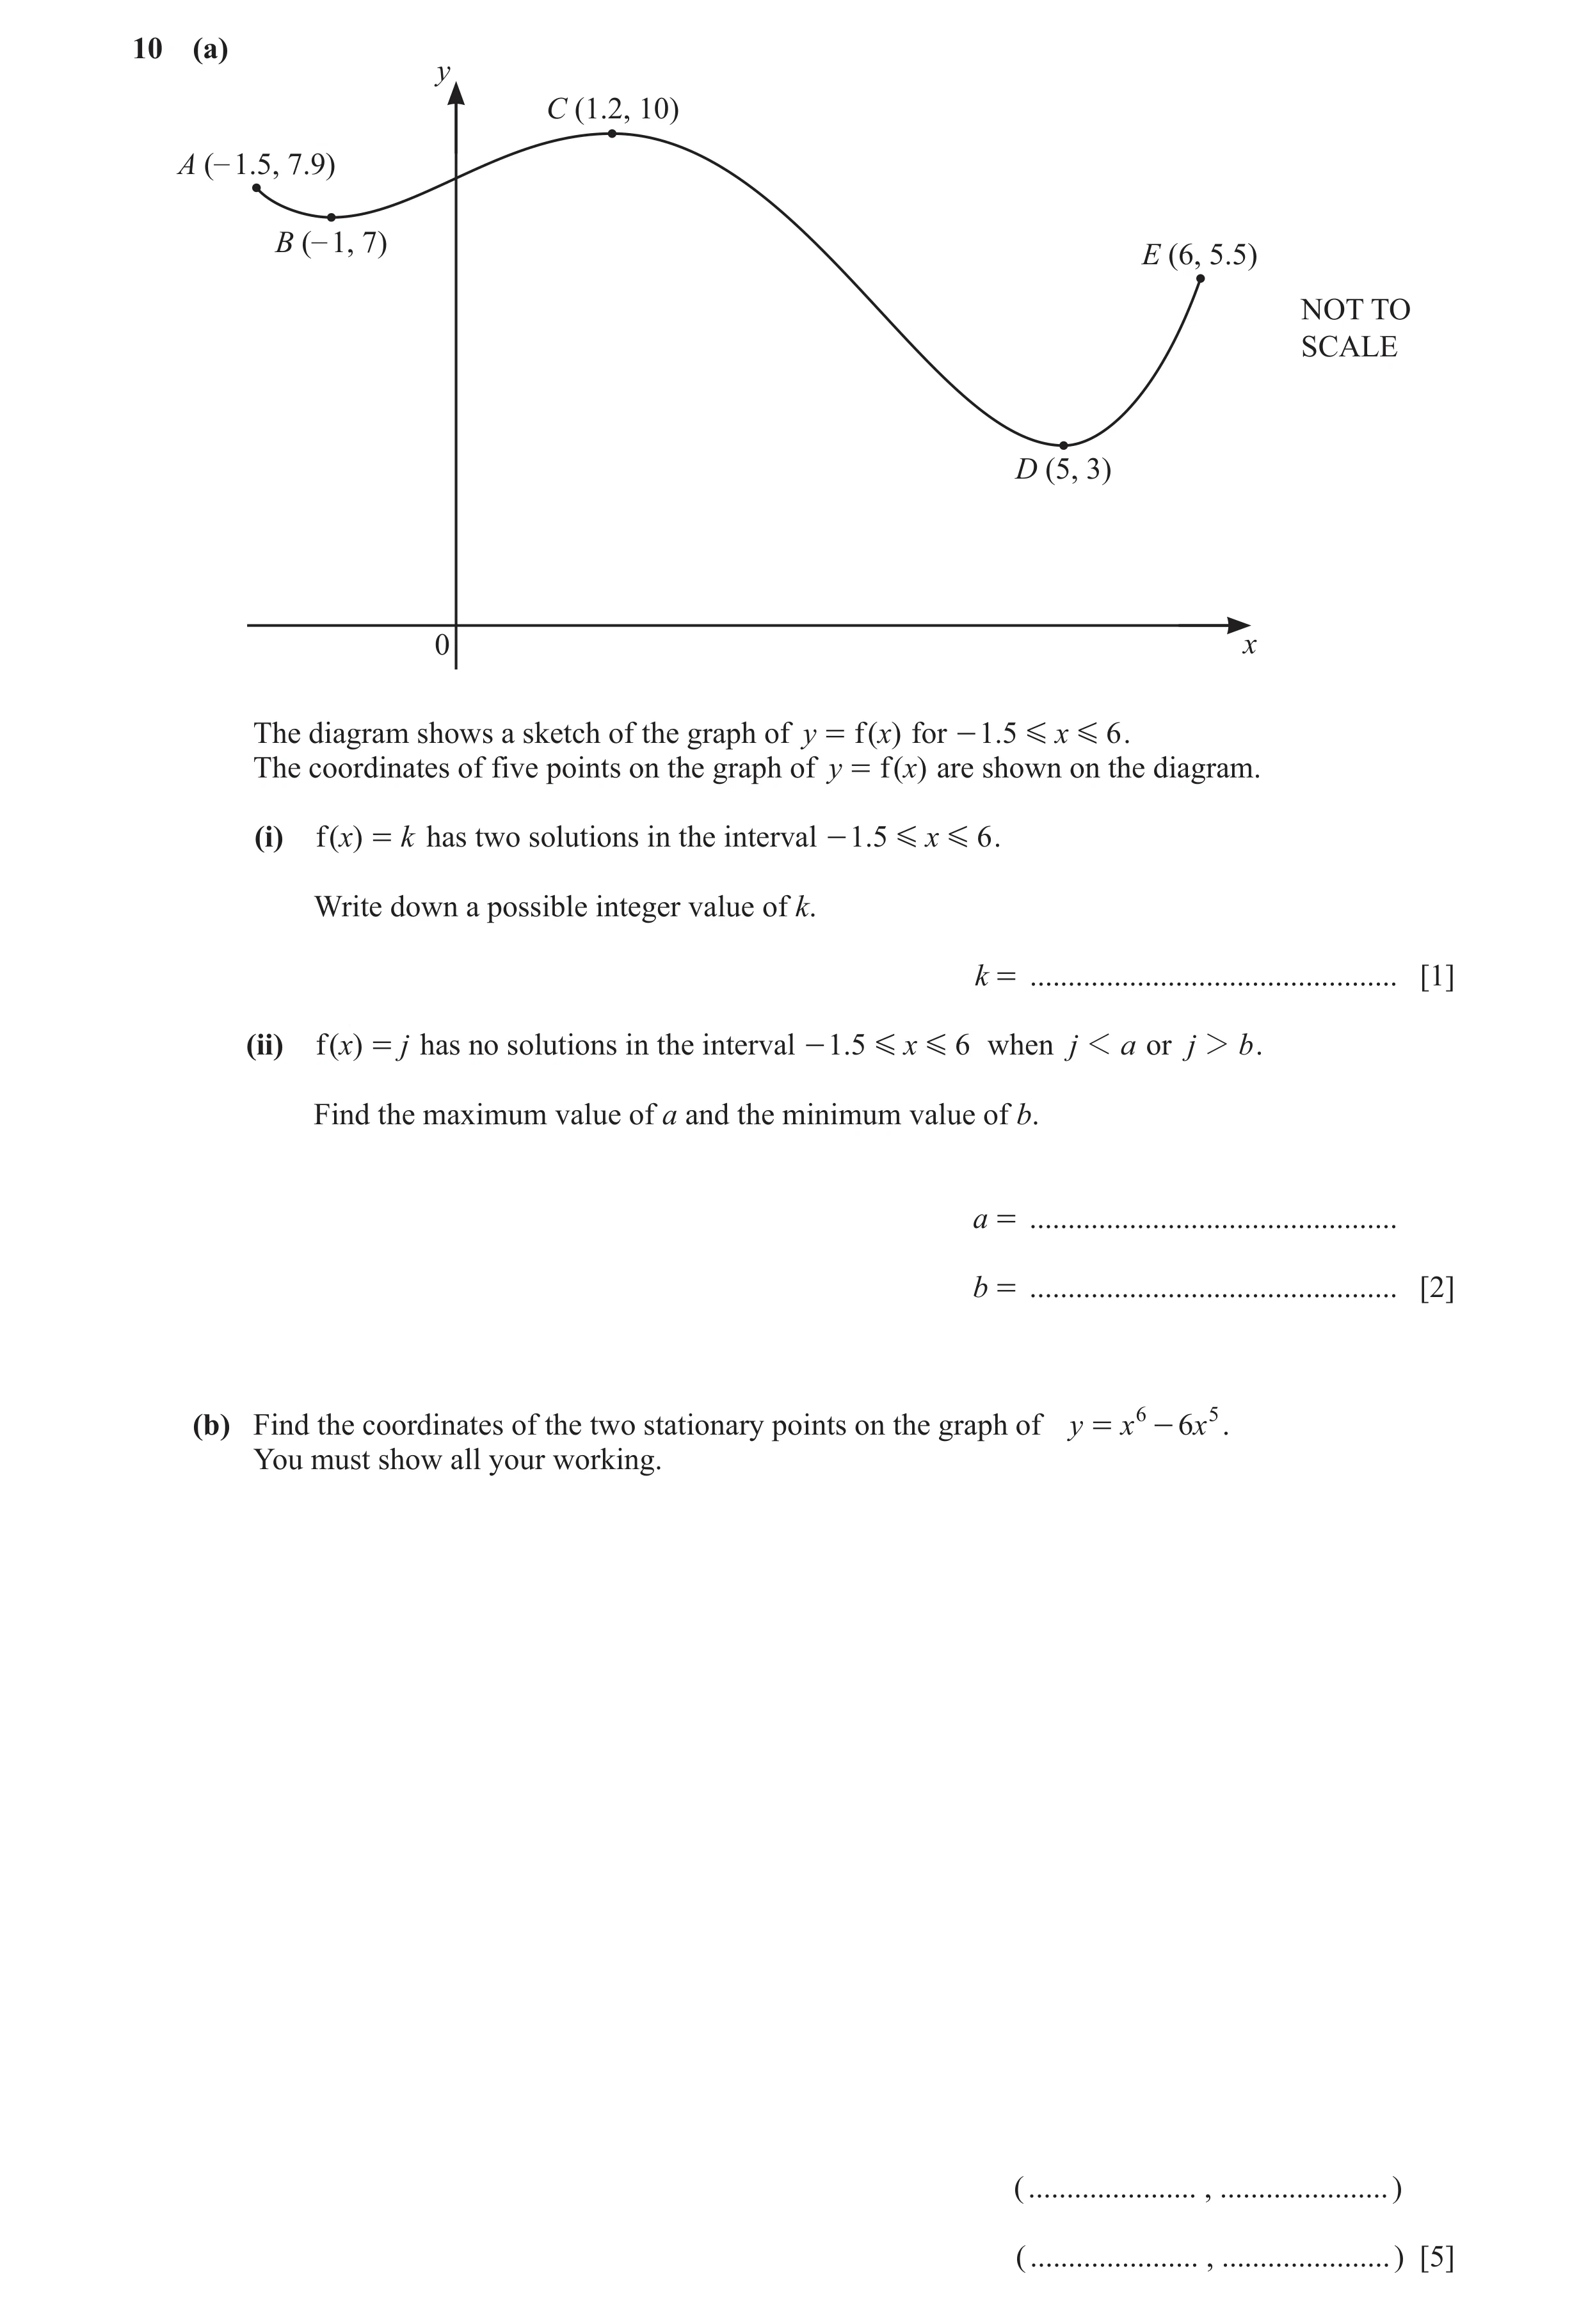
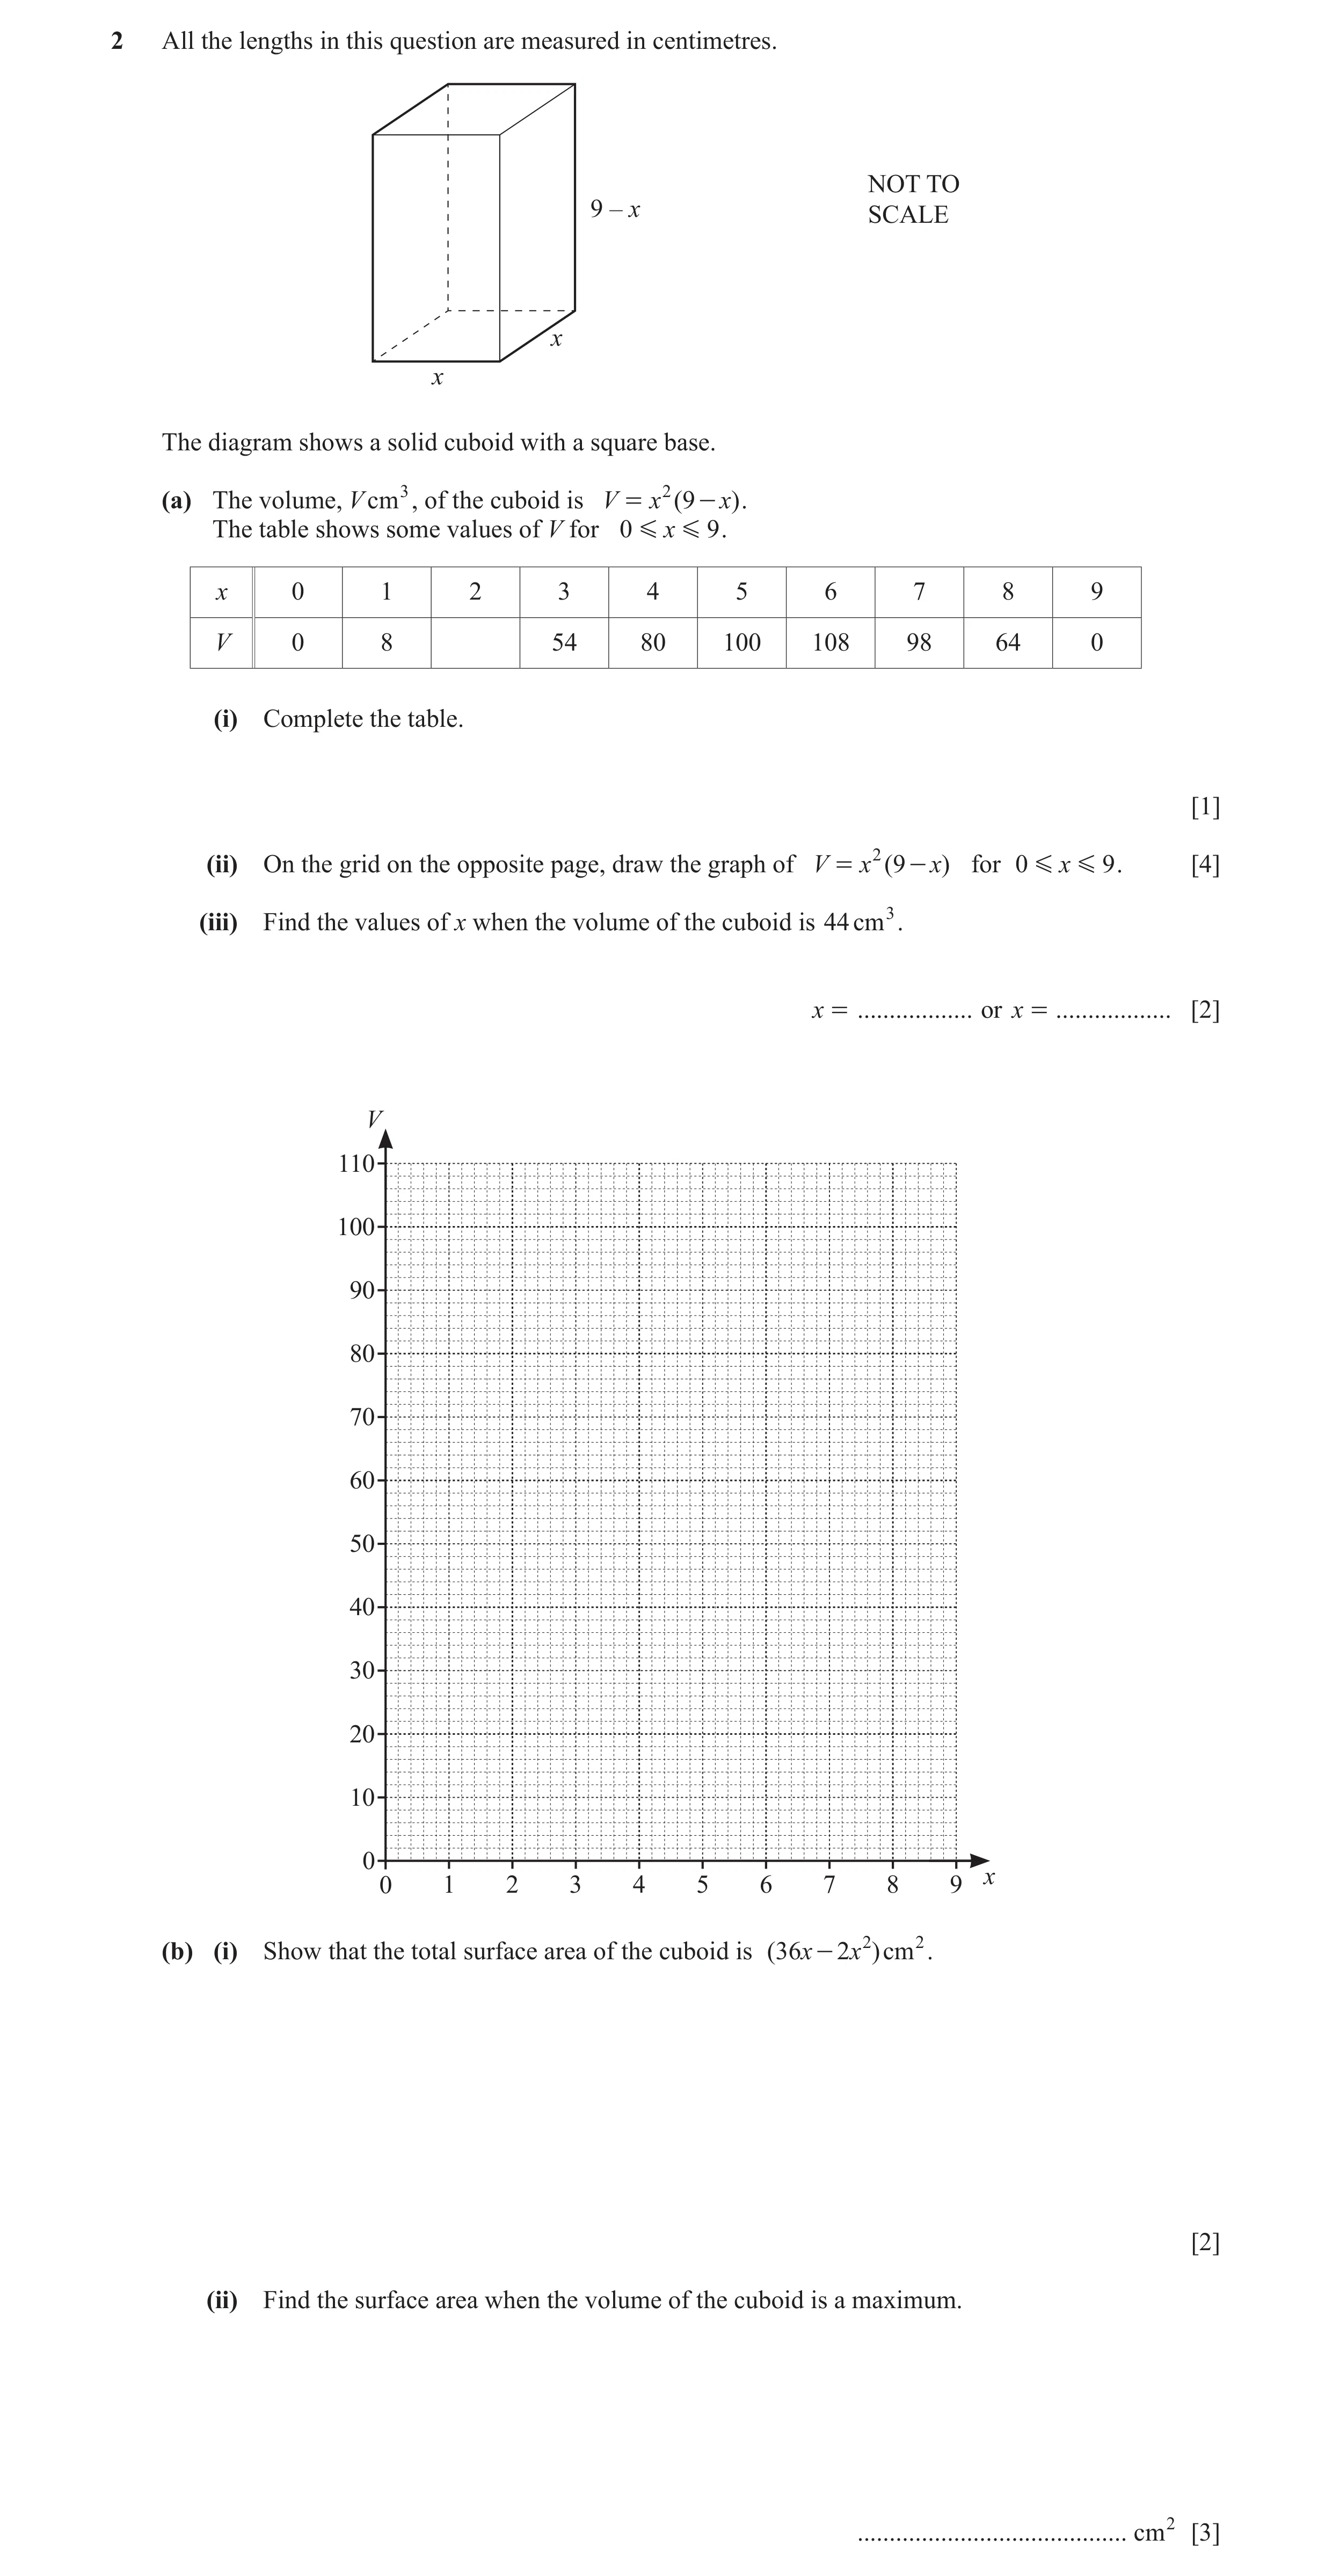
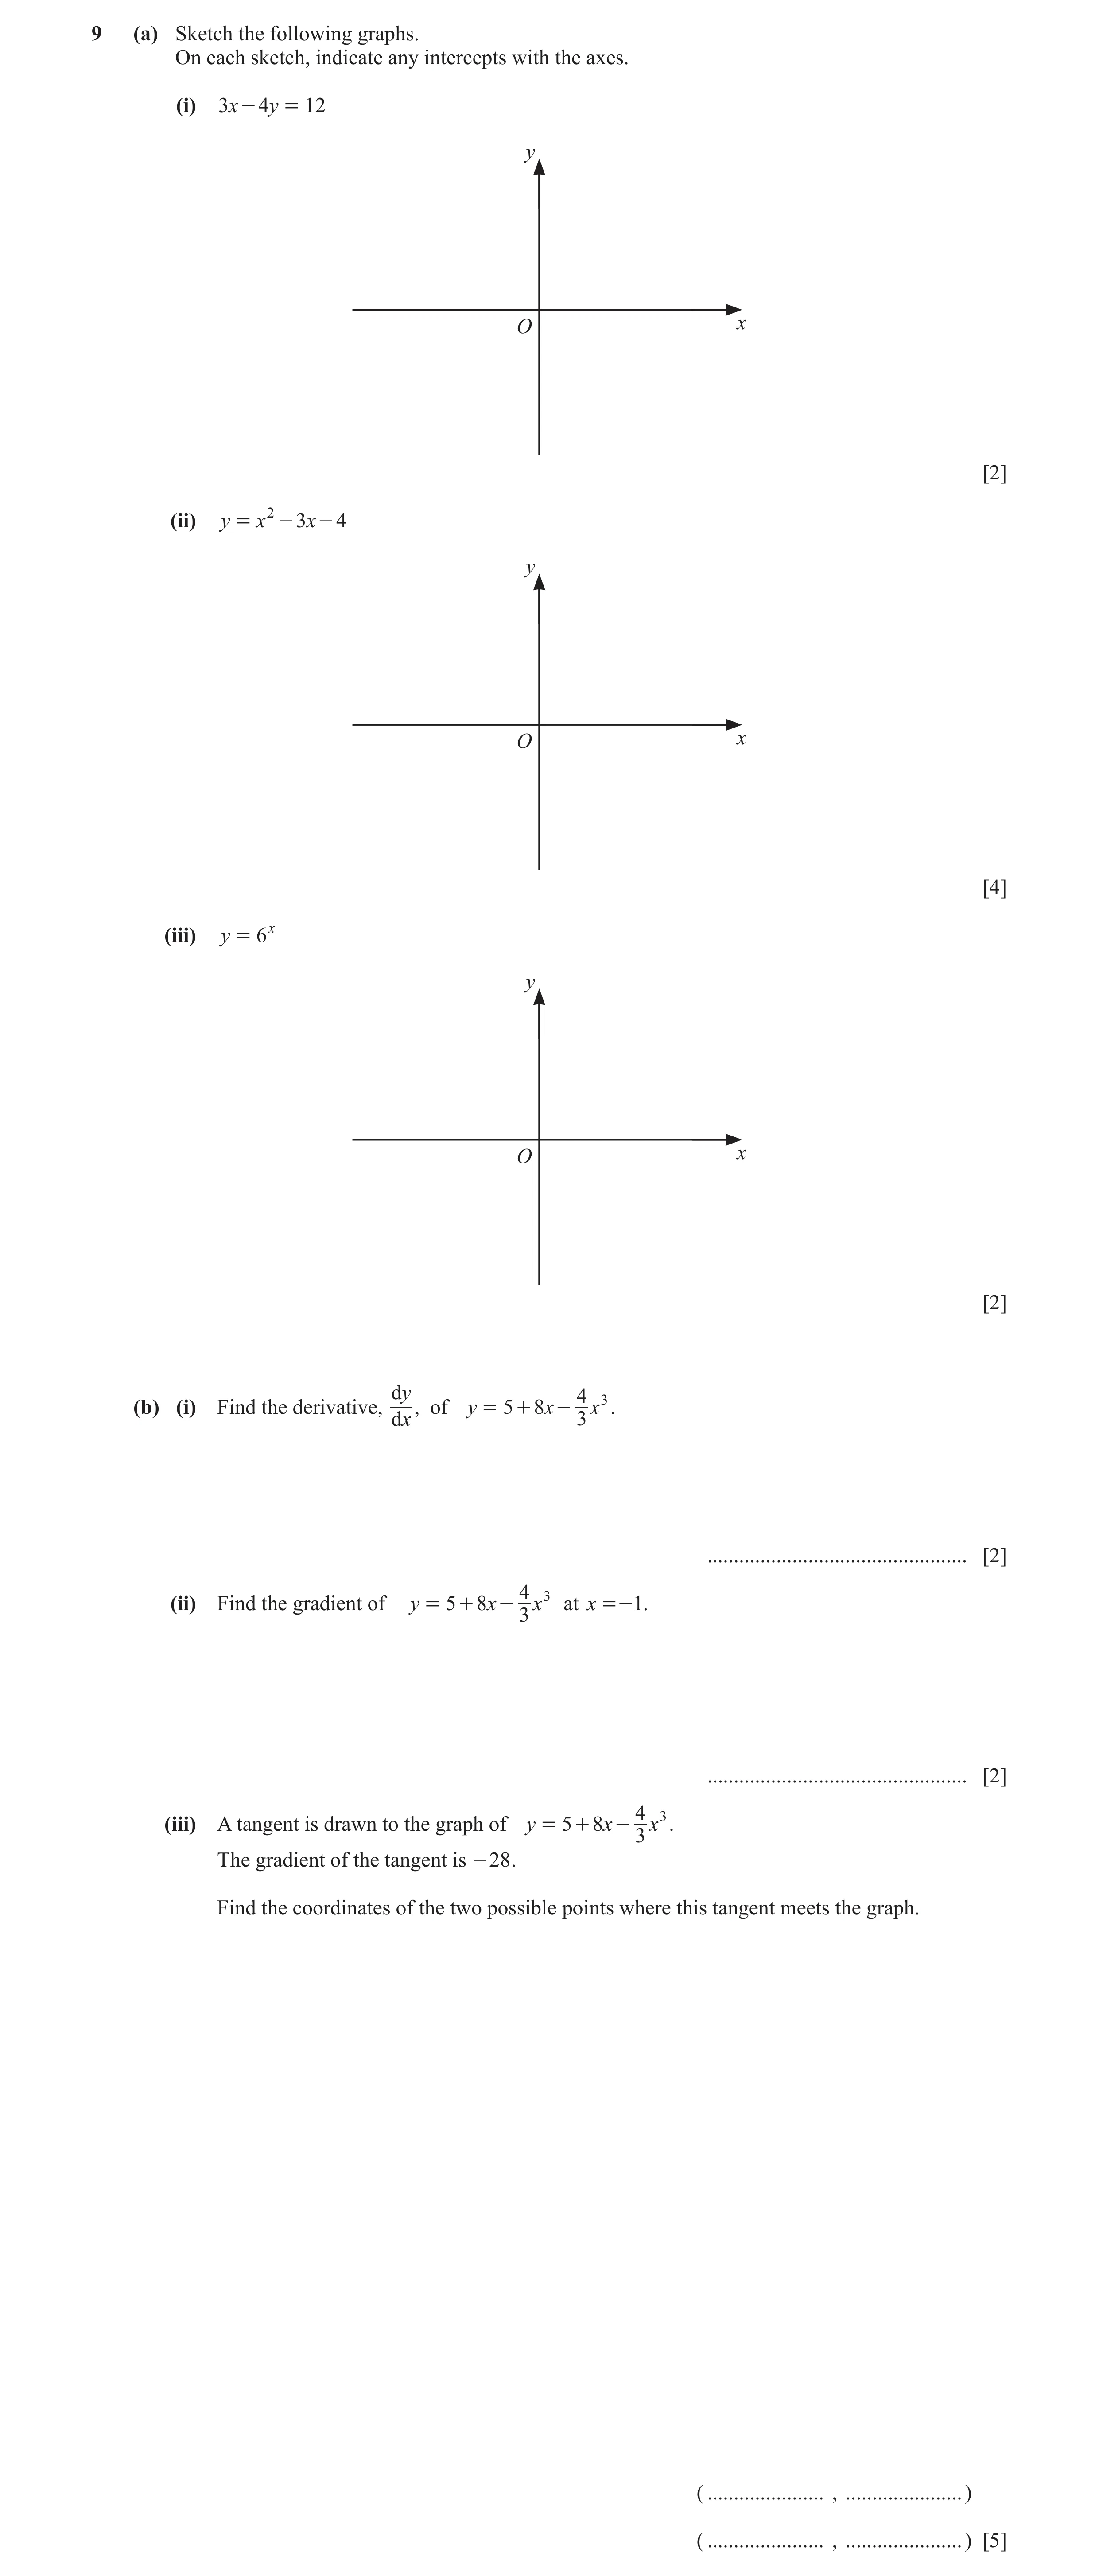
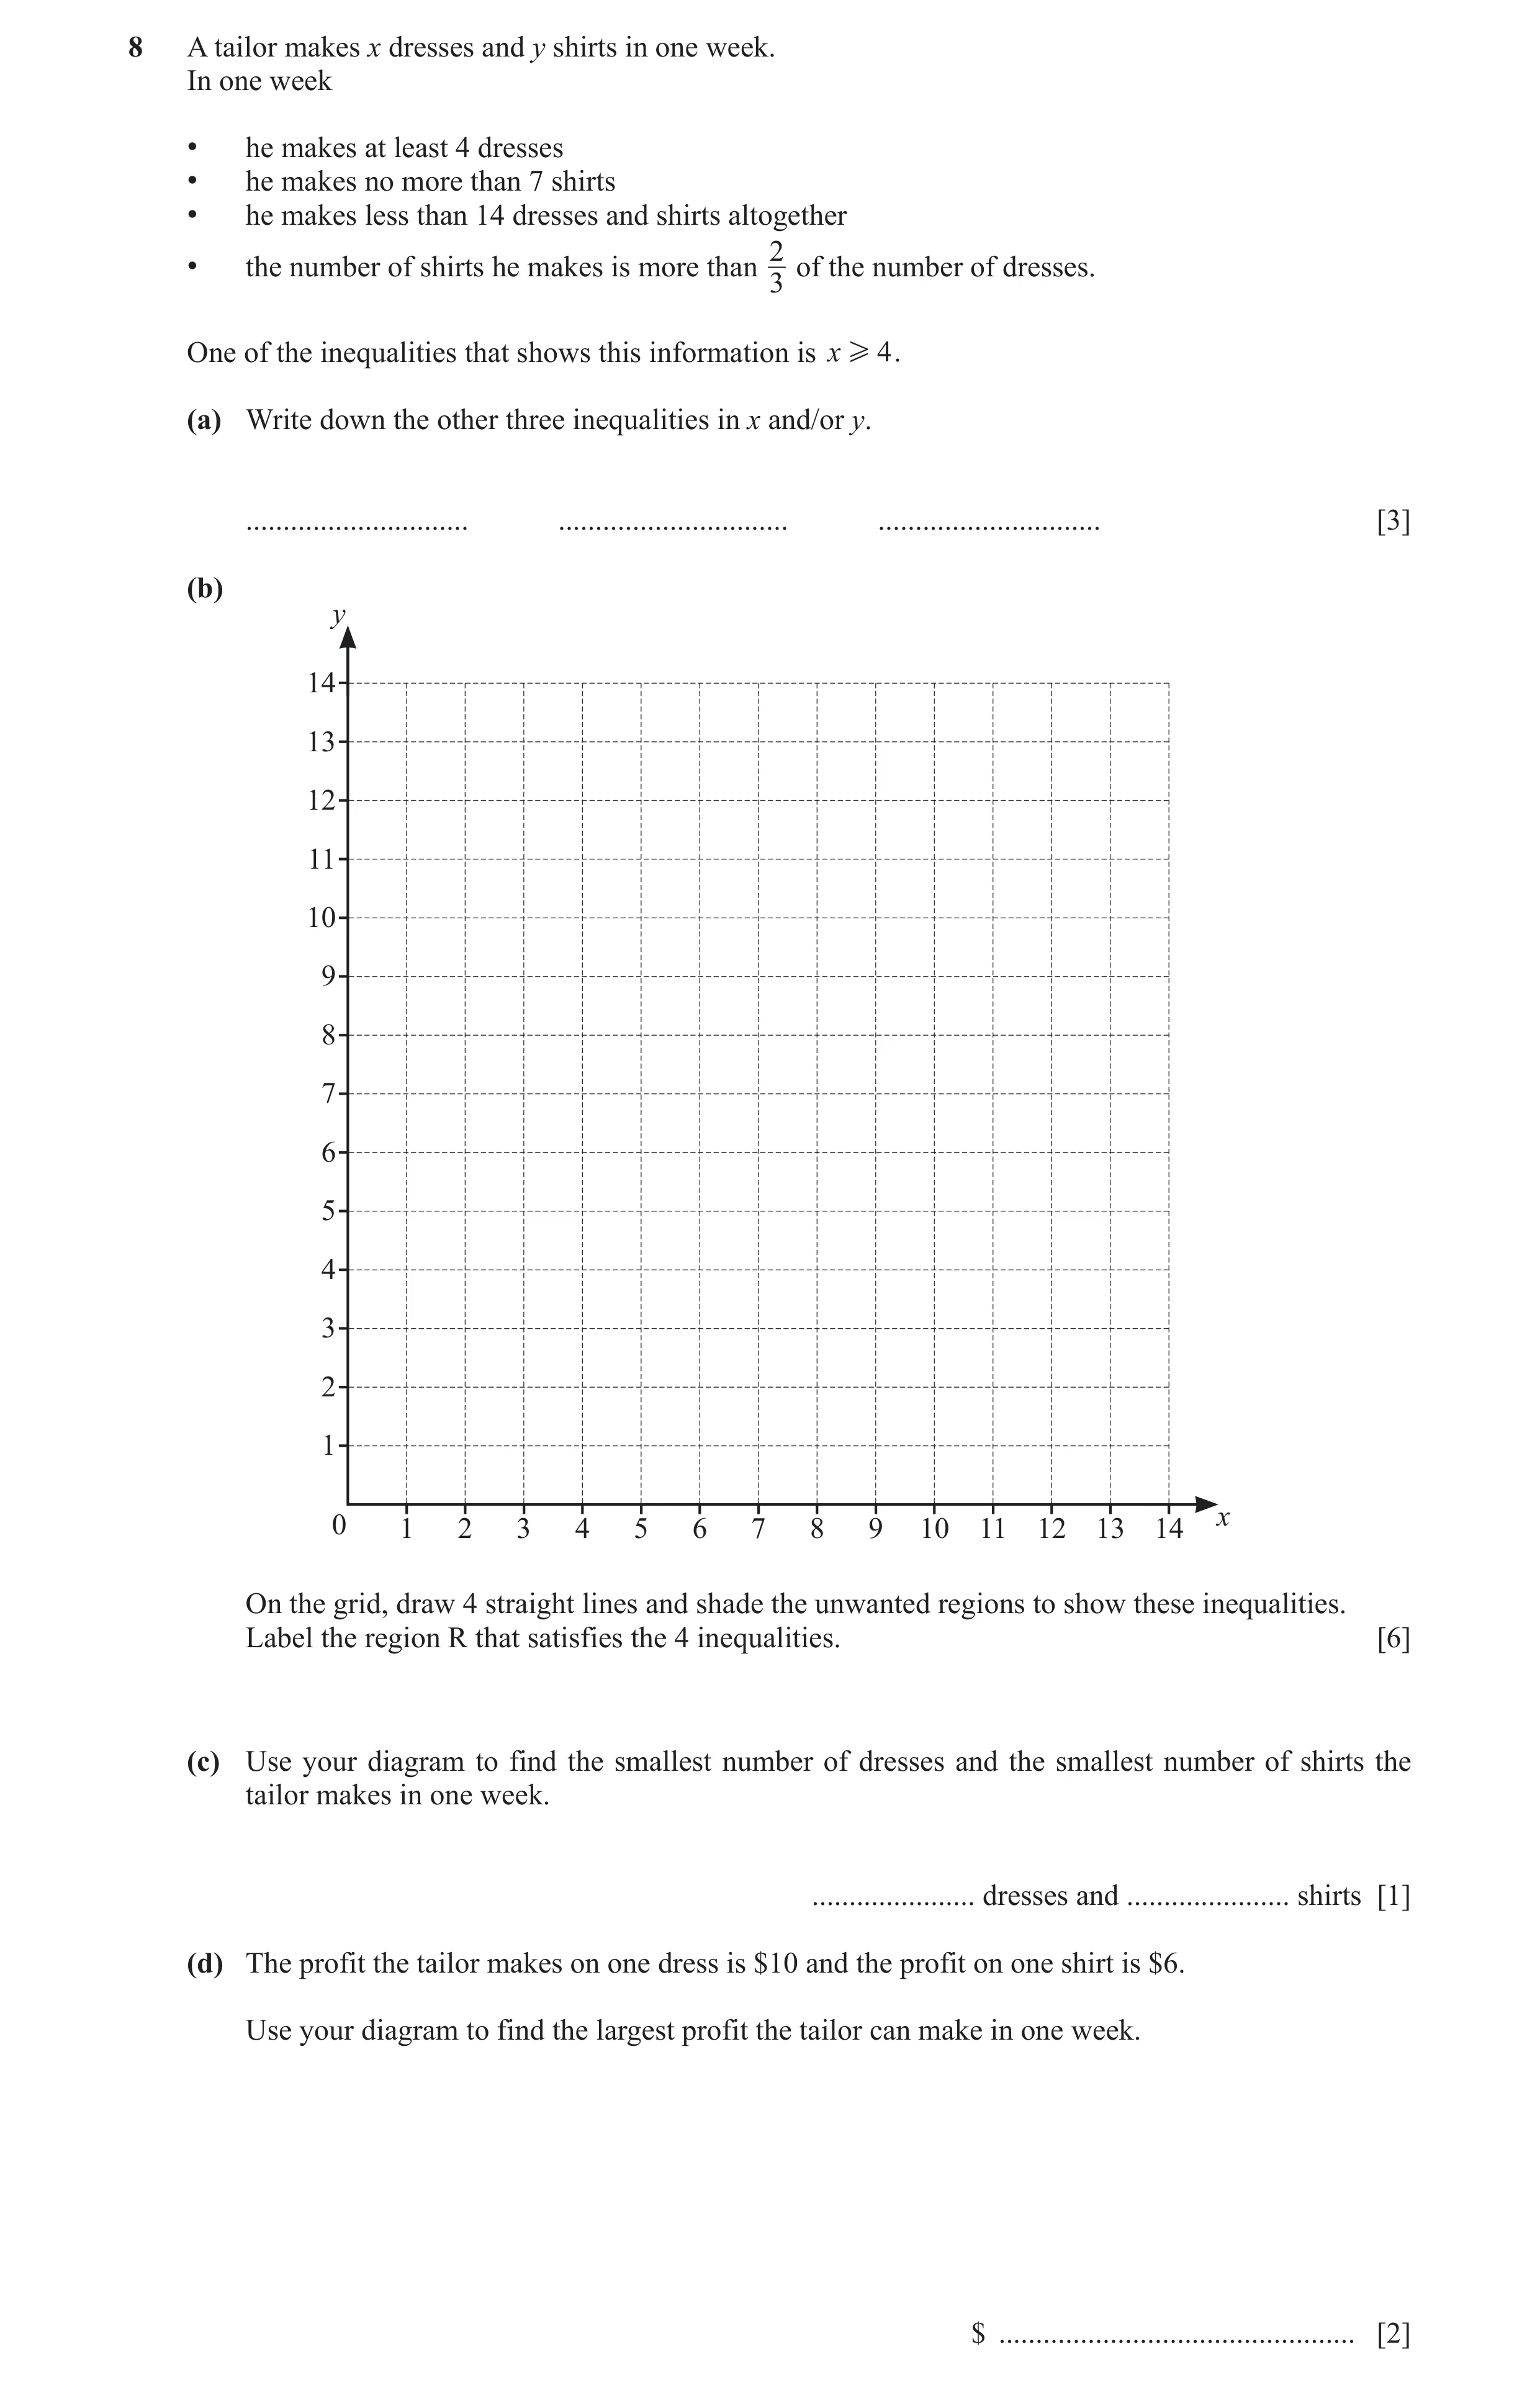
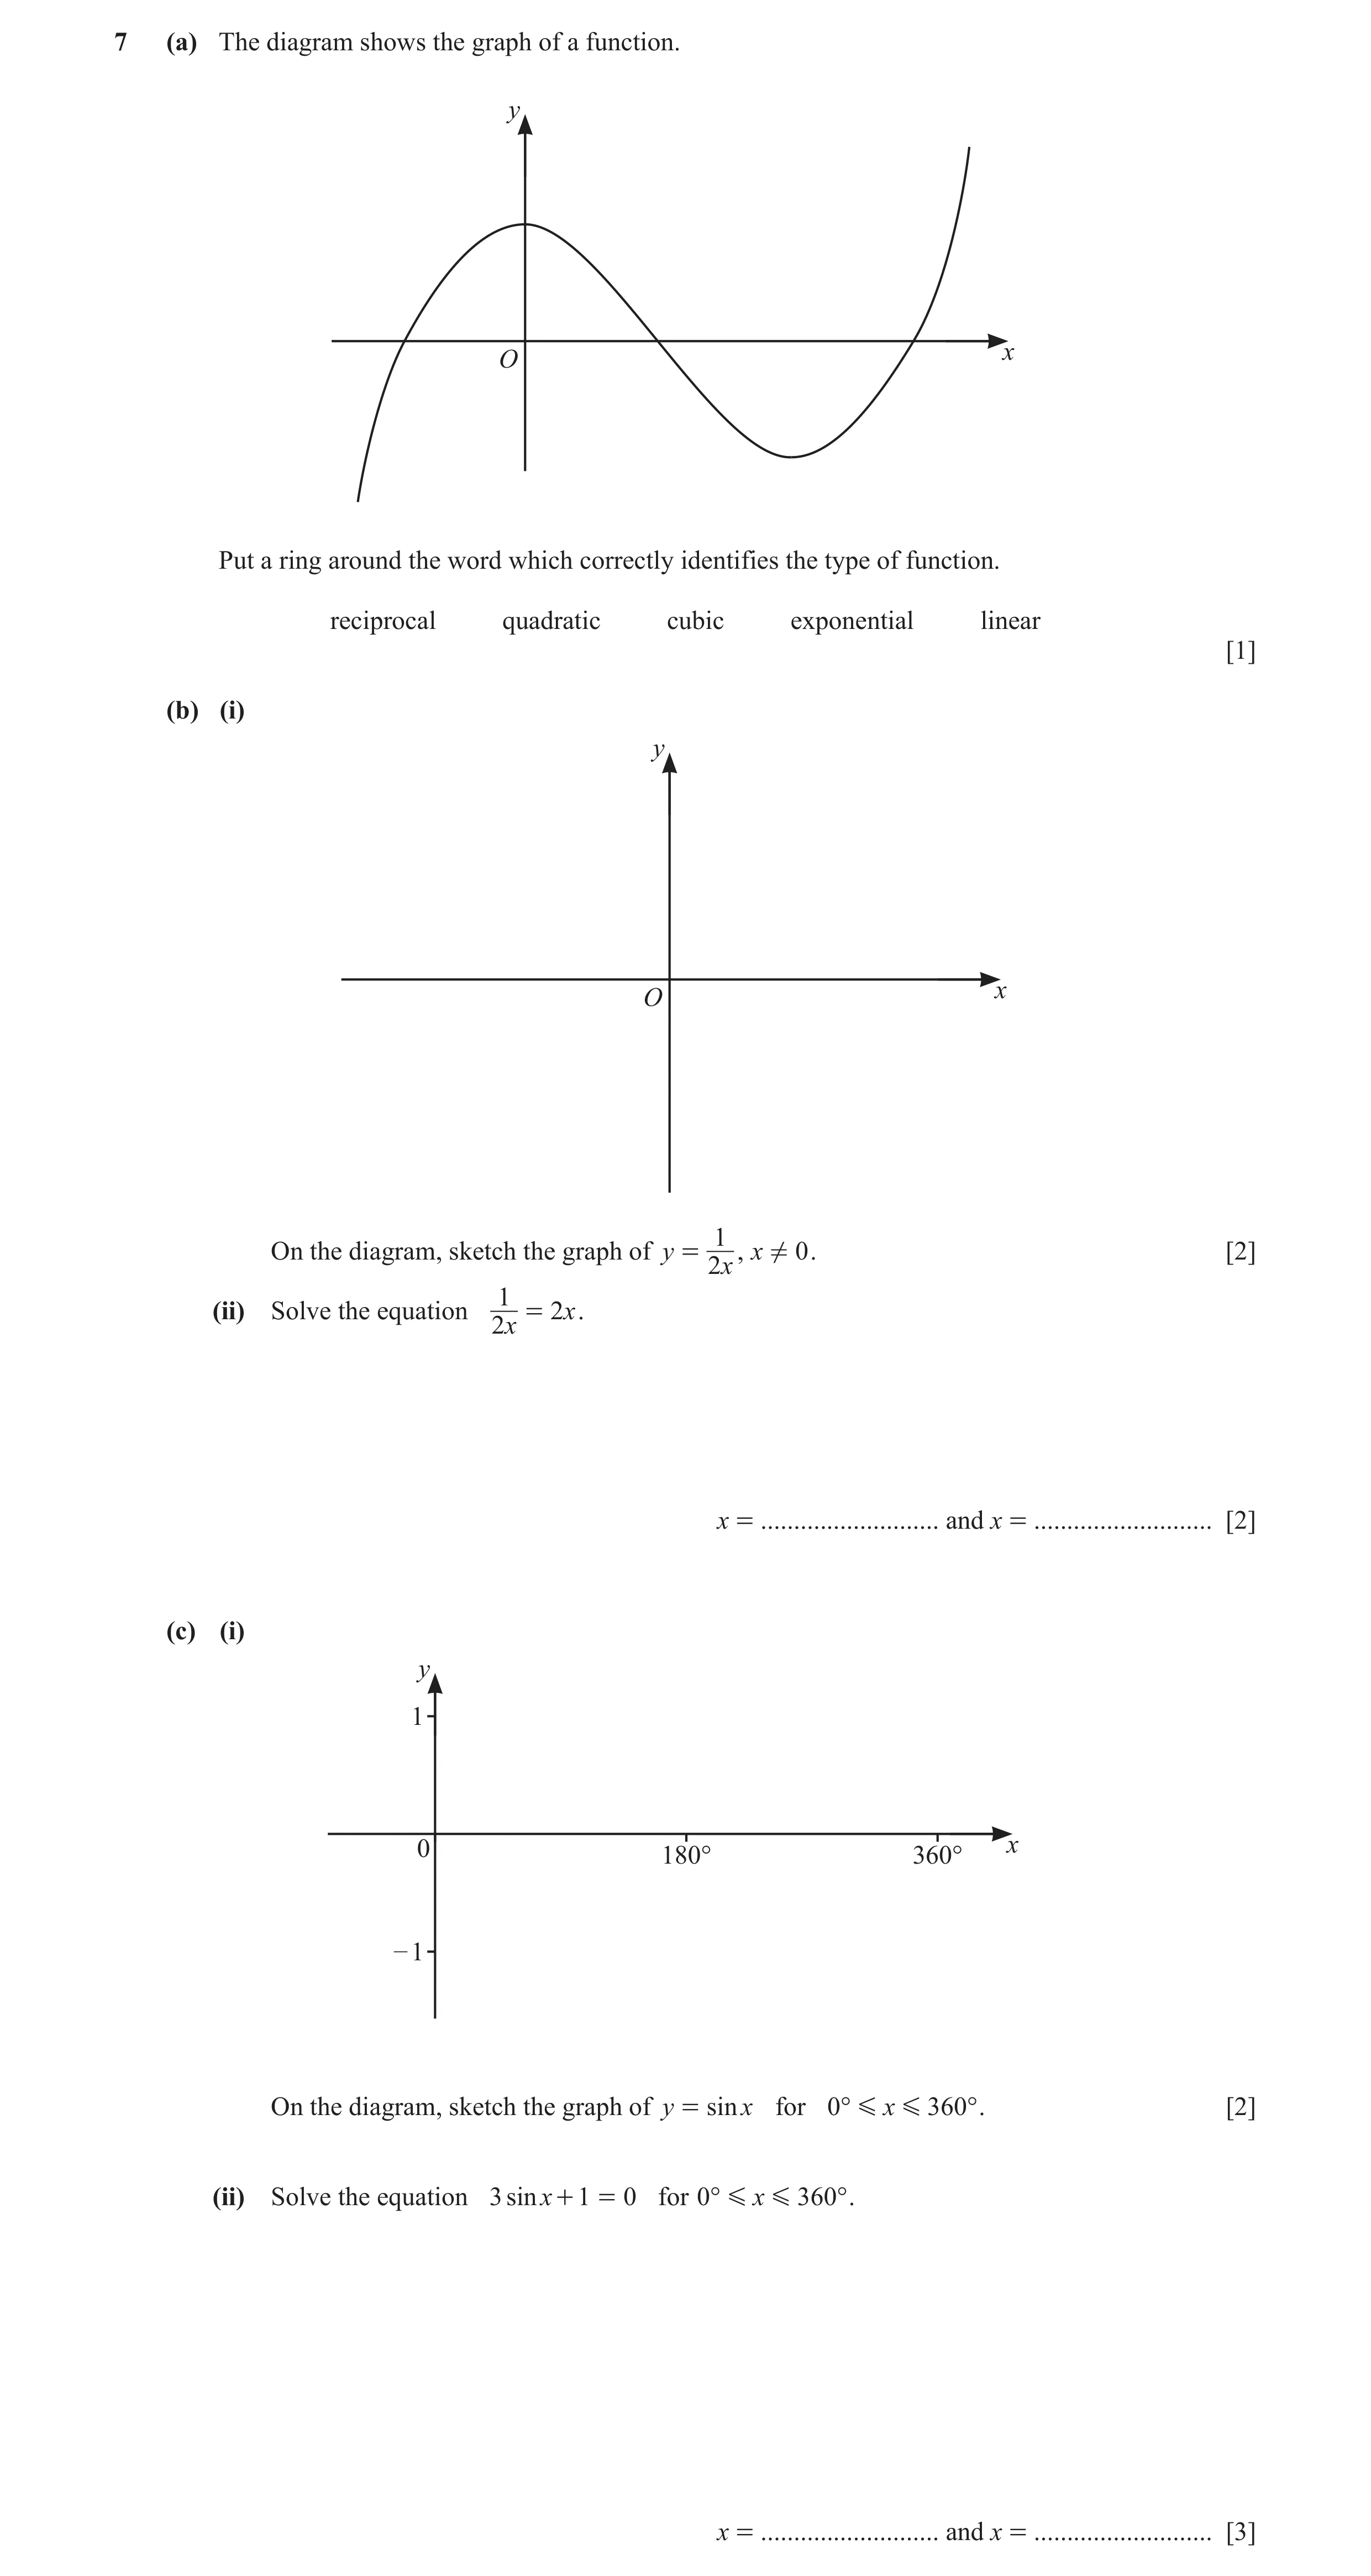
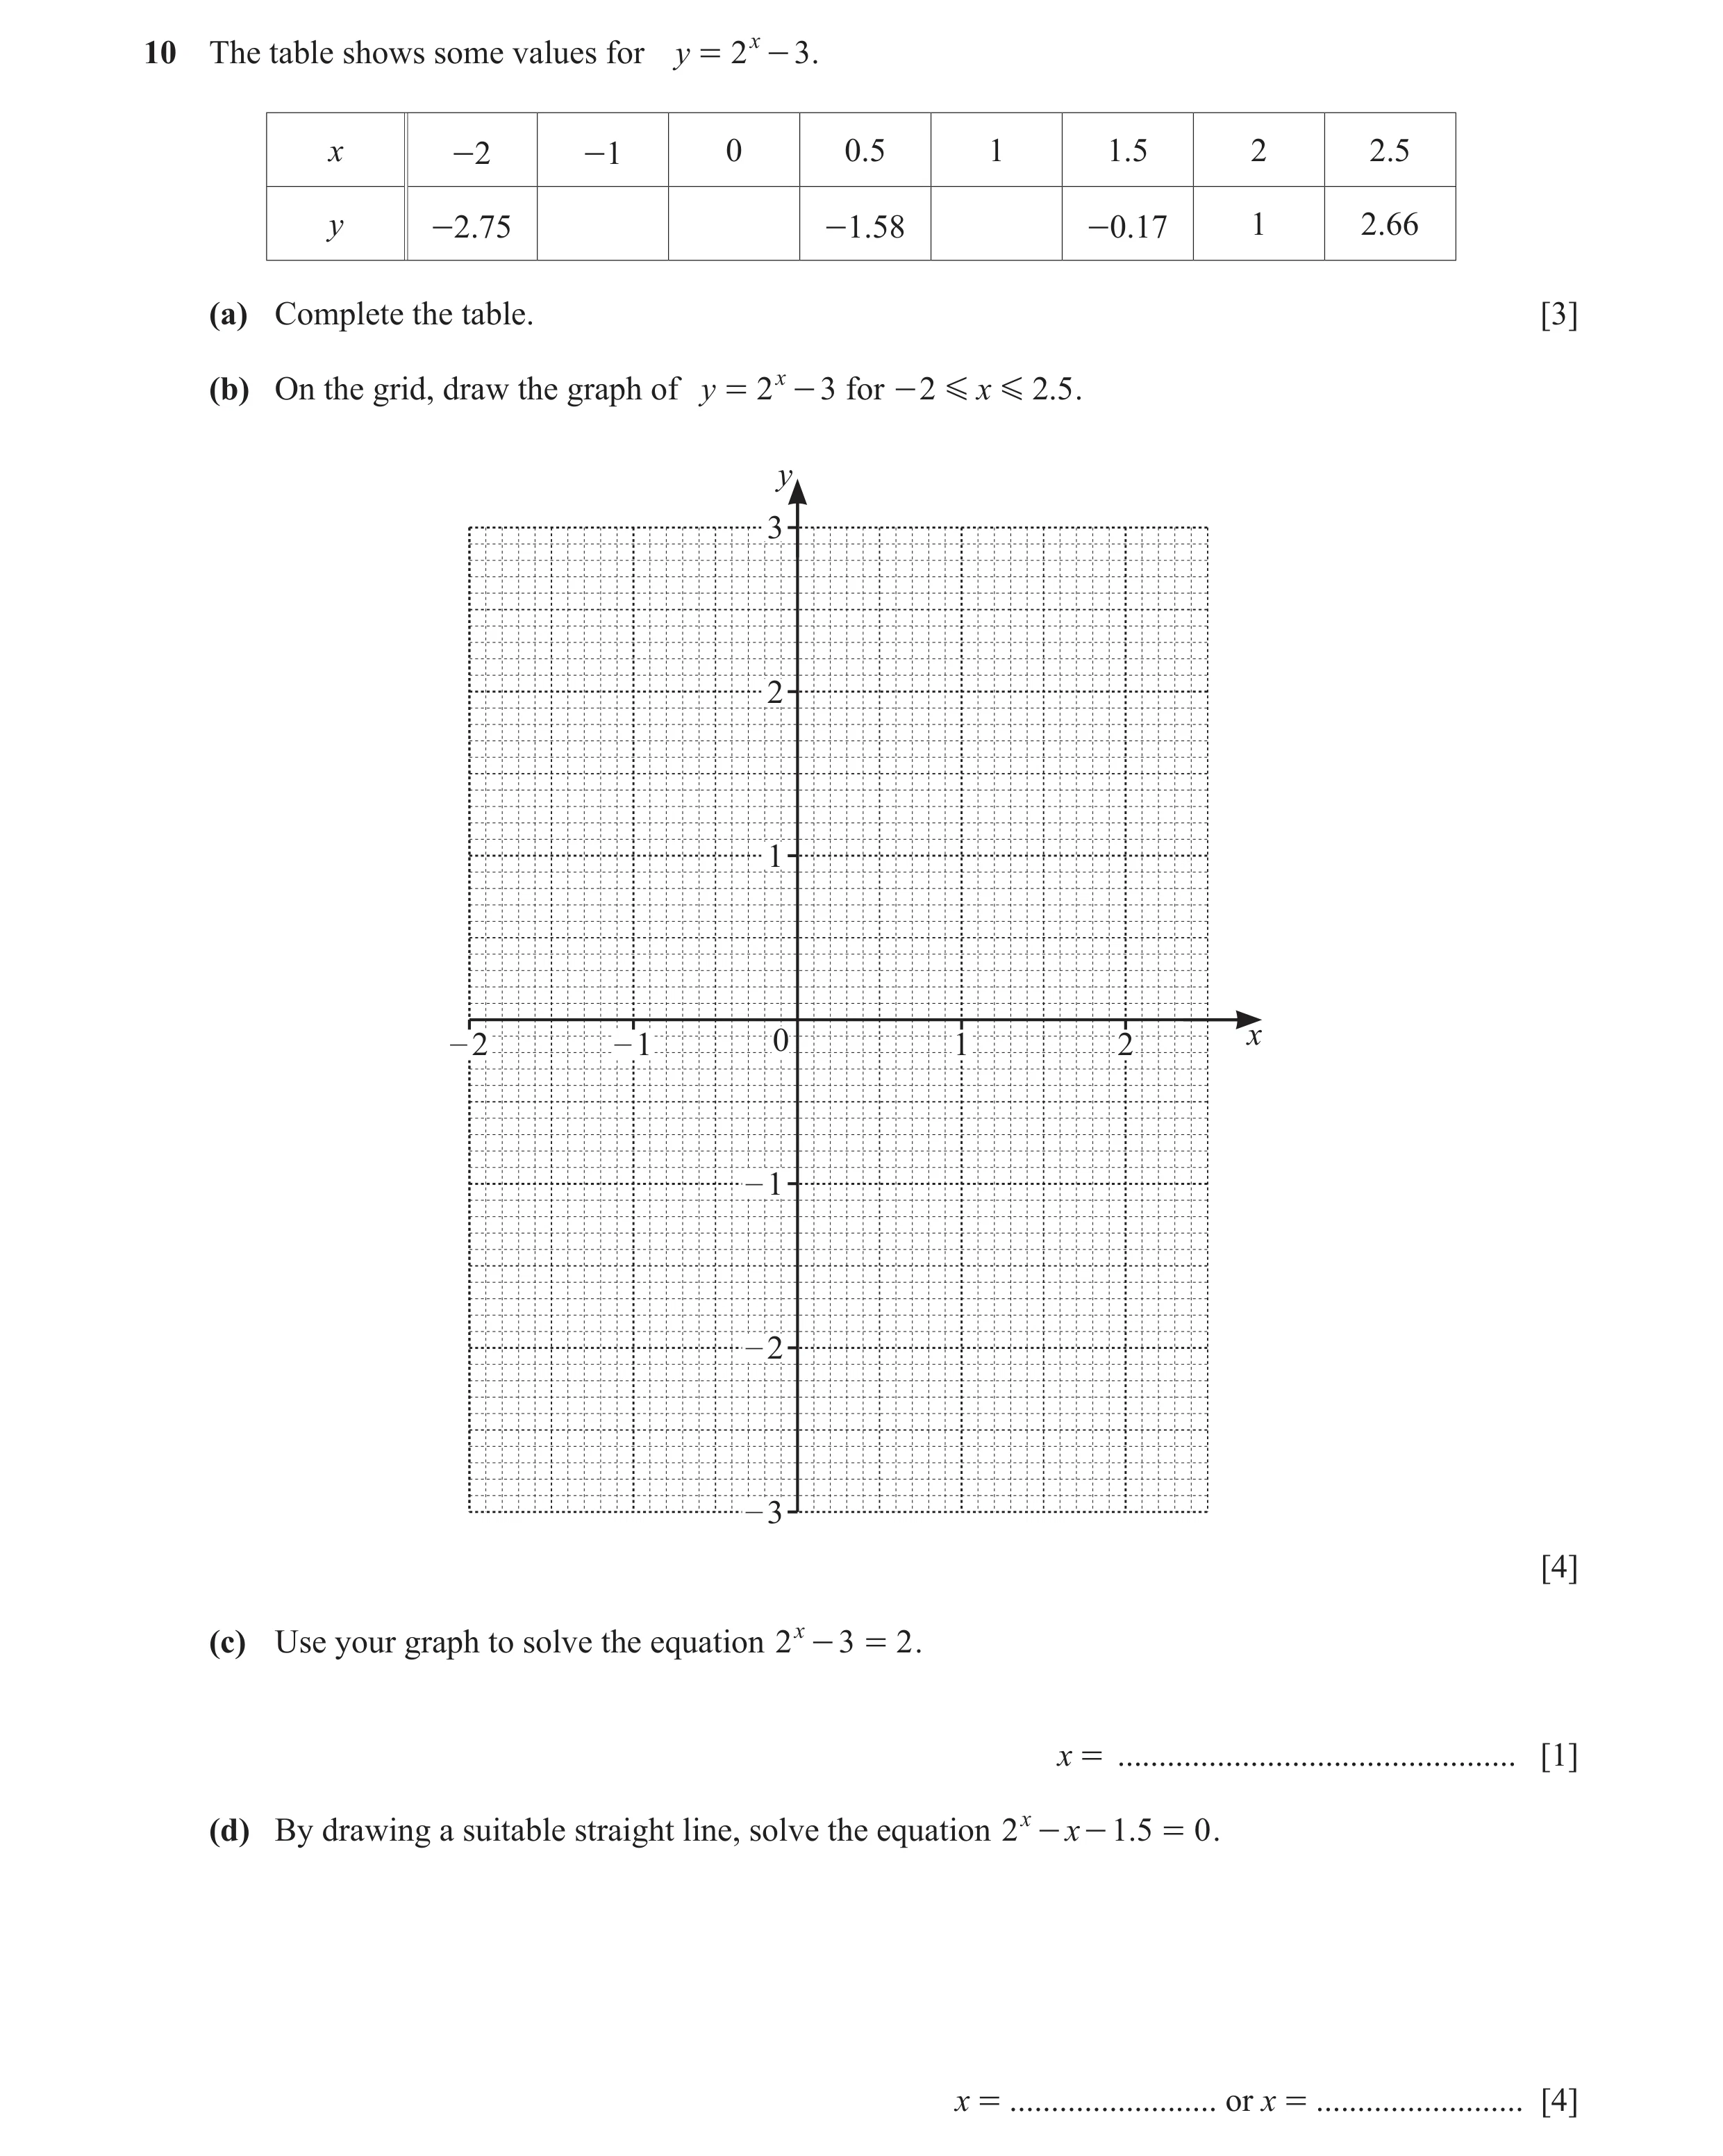 116 / 126
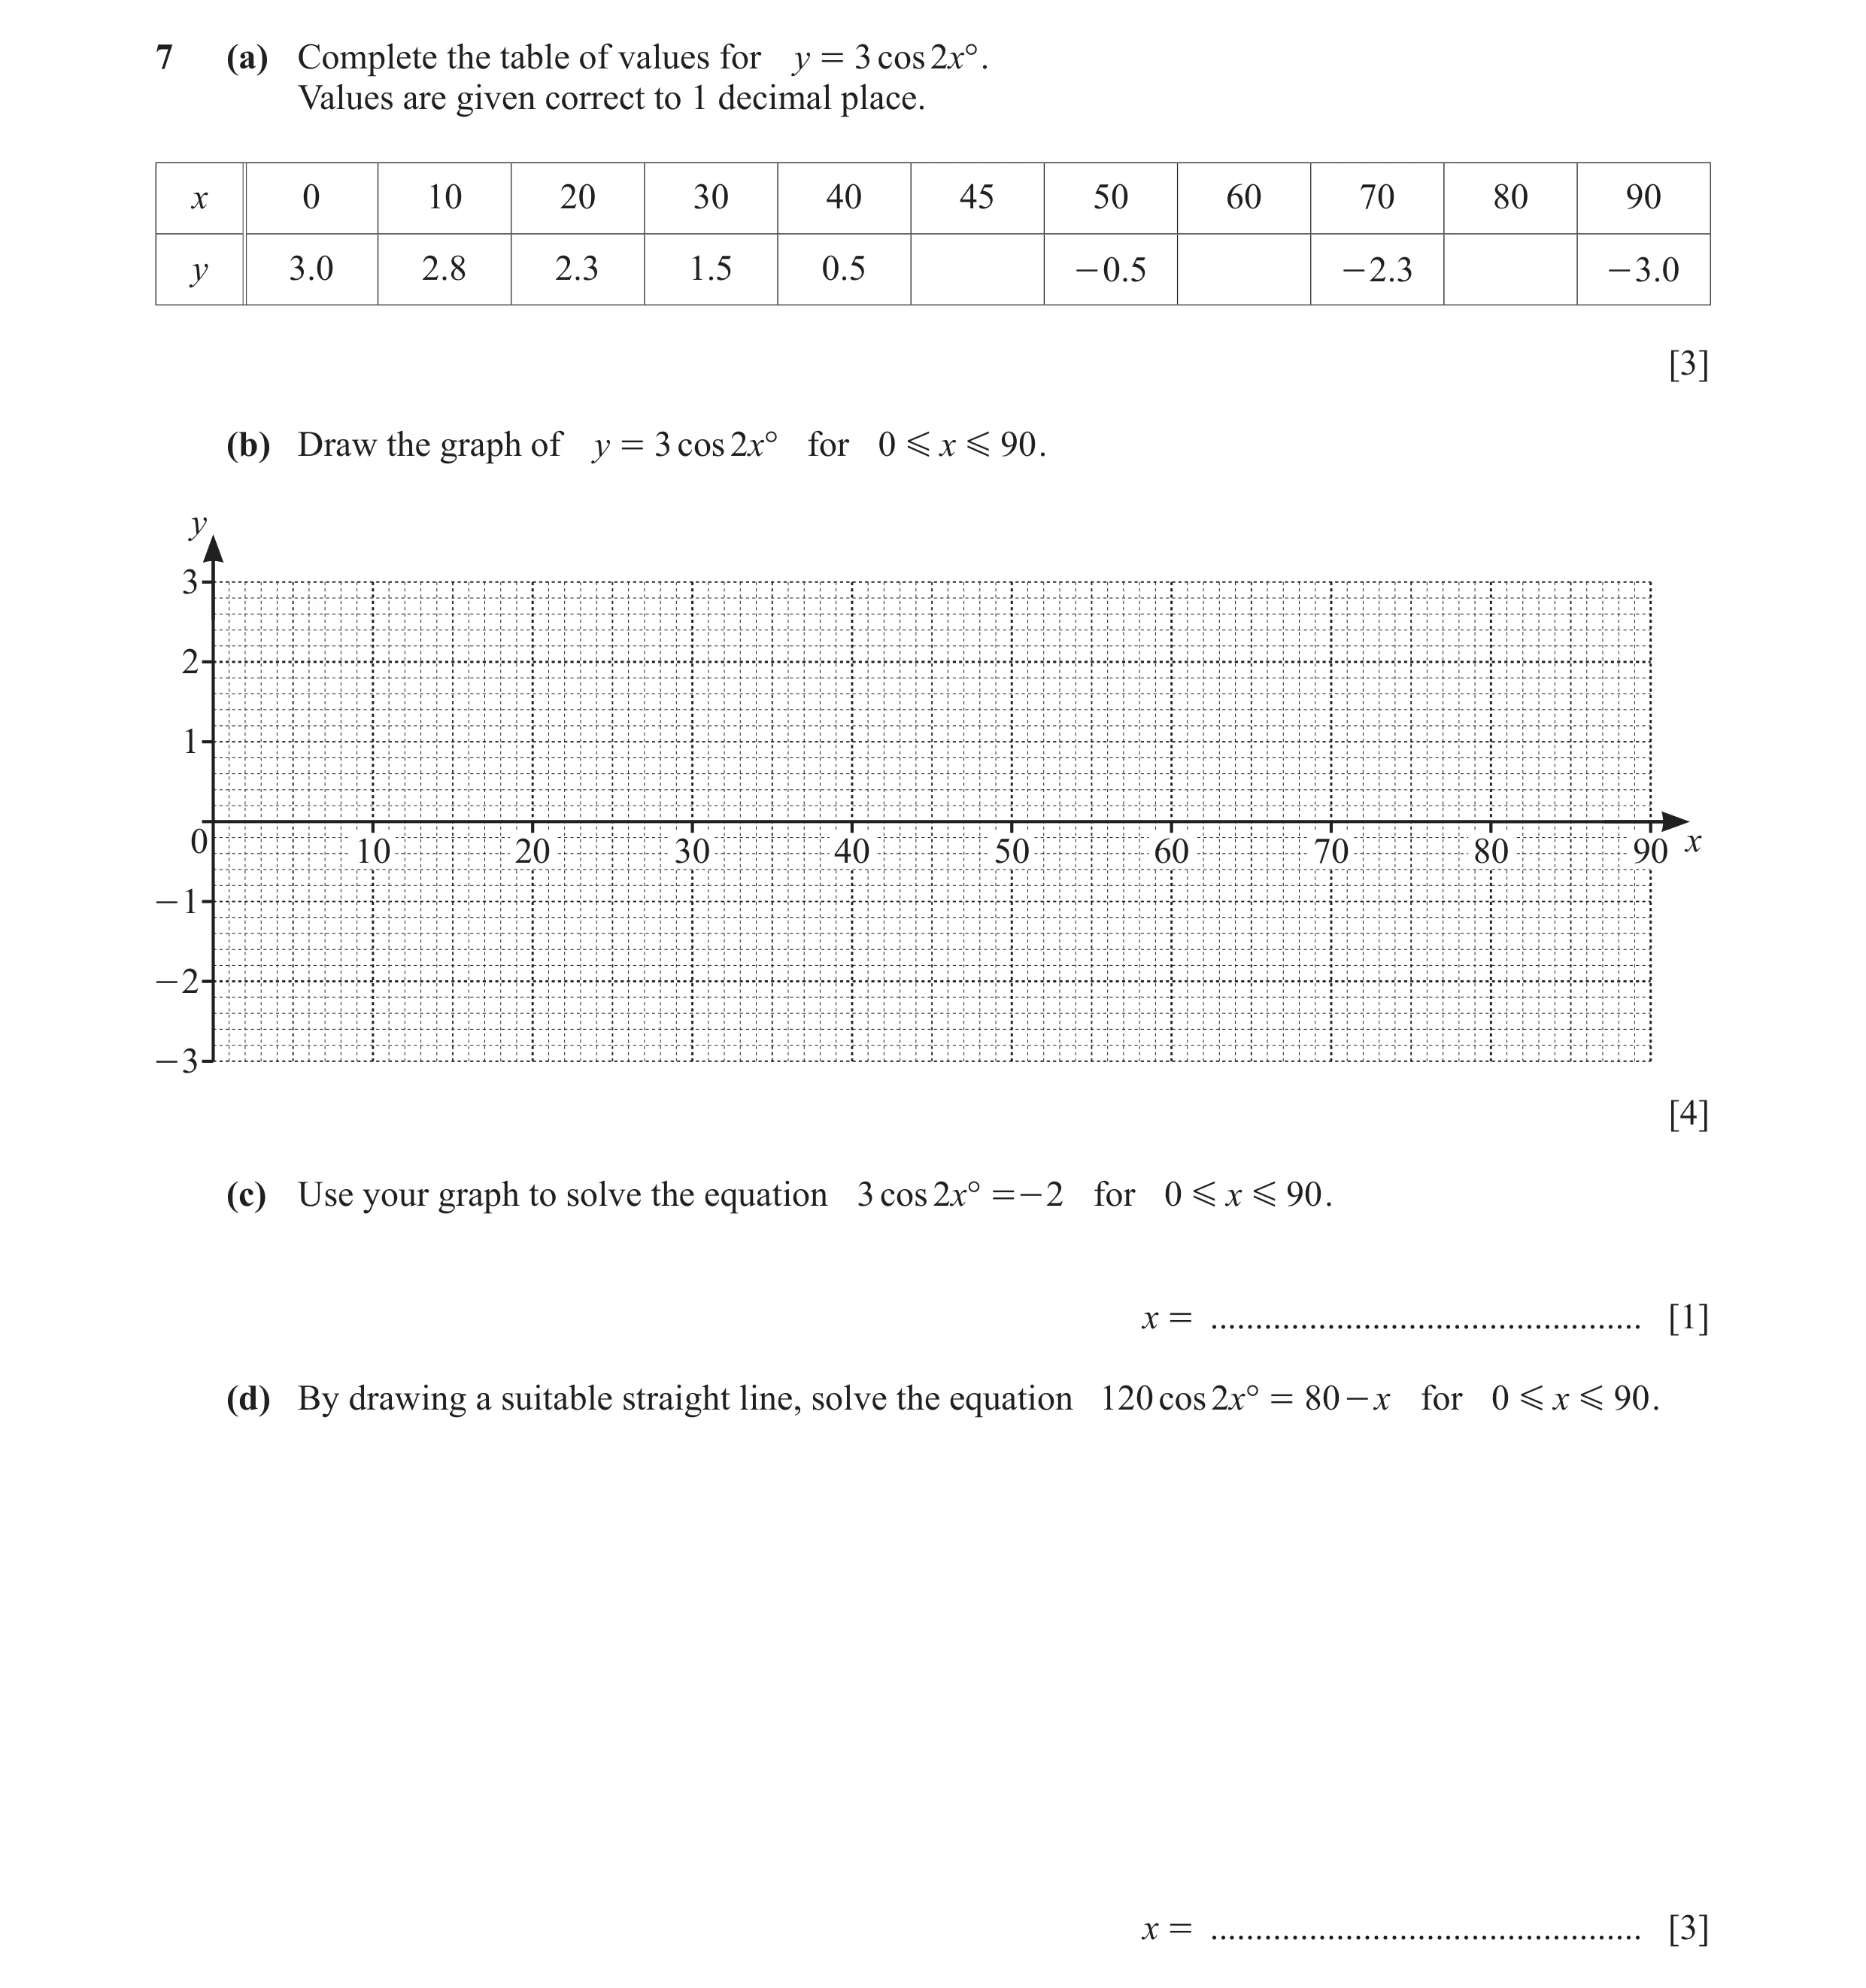 117 / 126
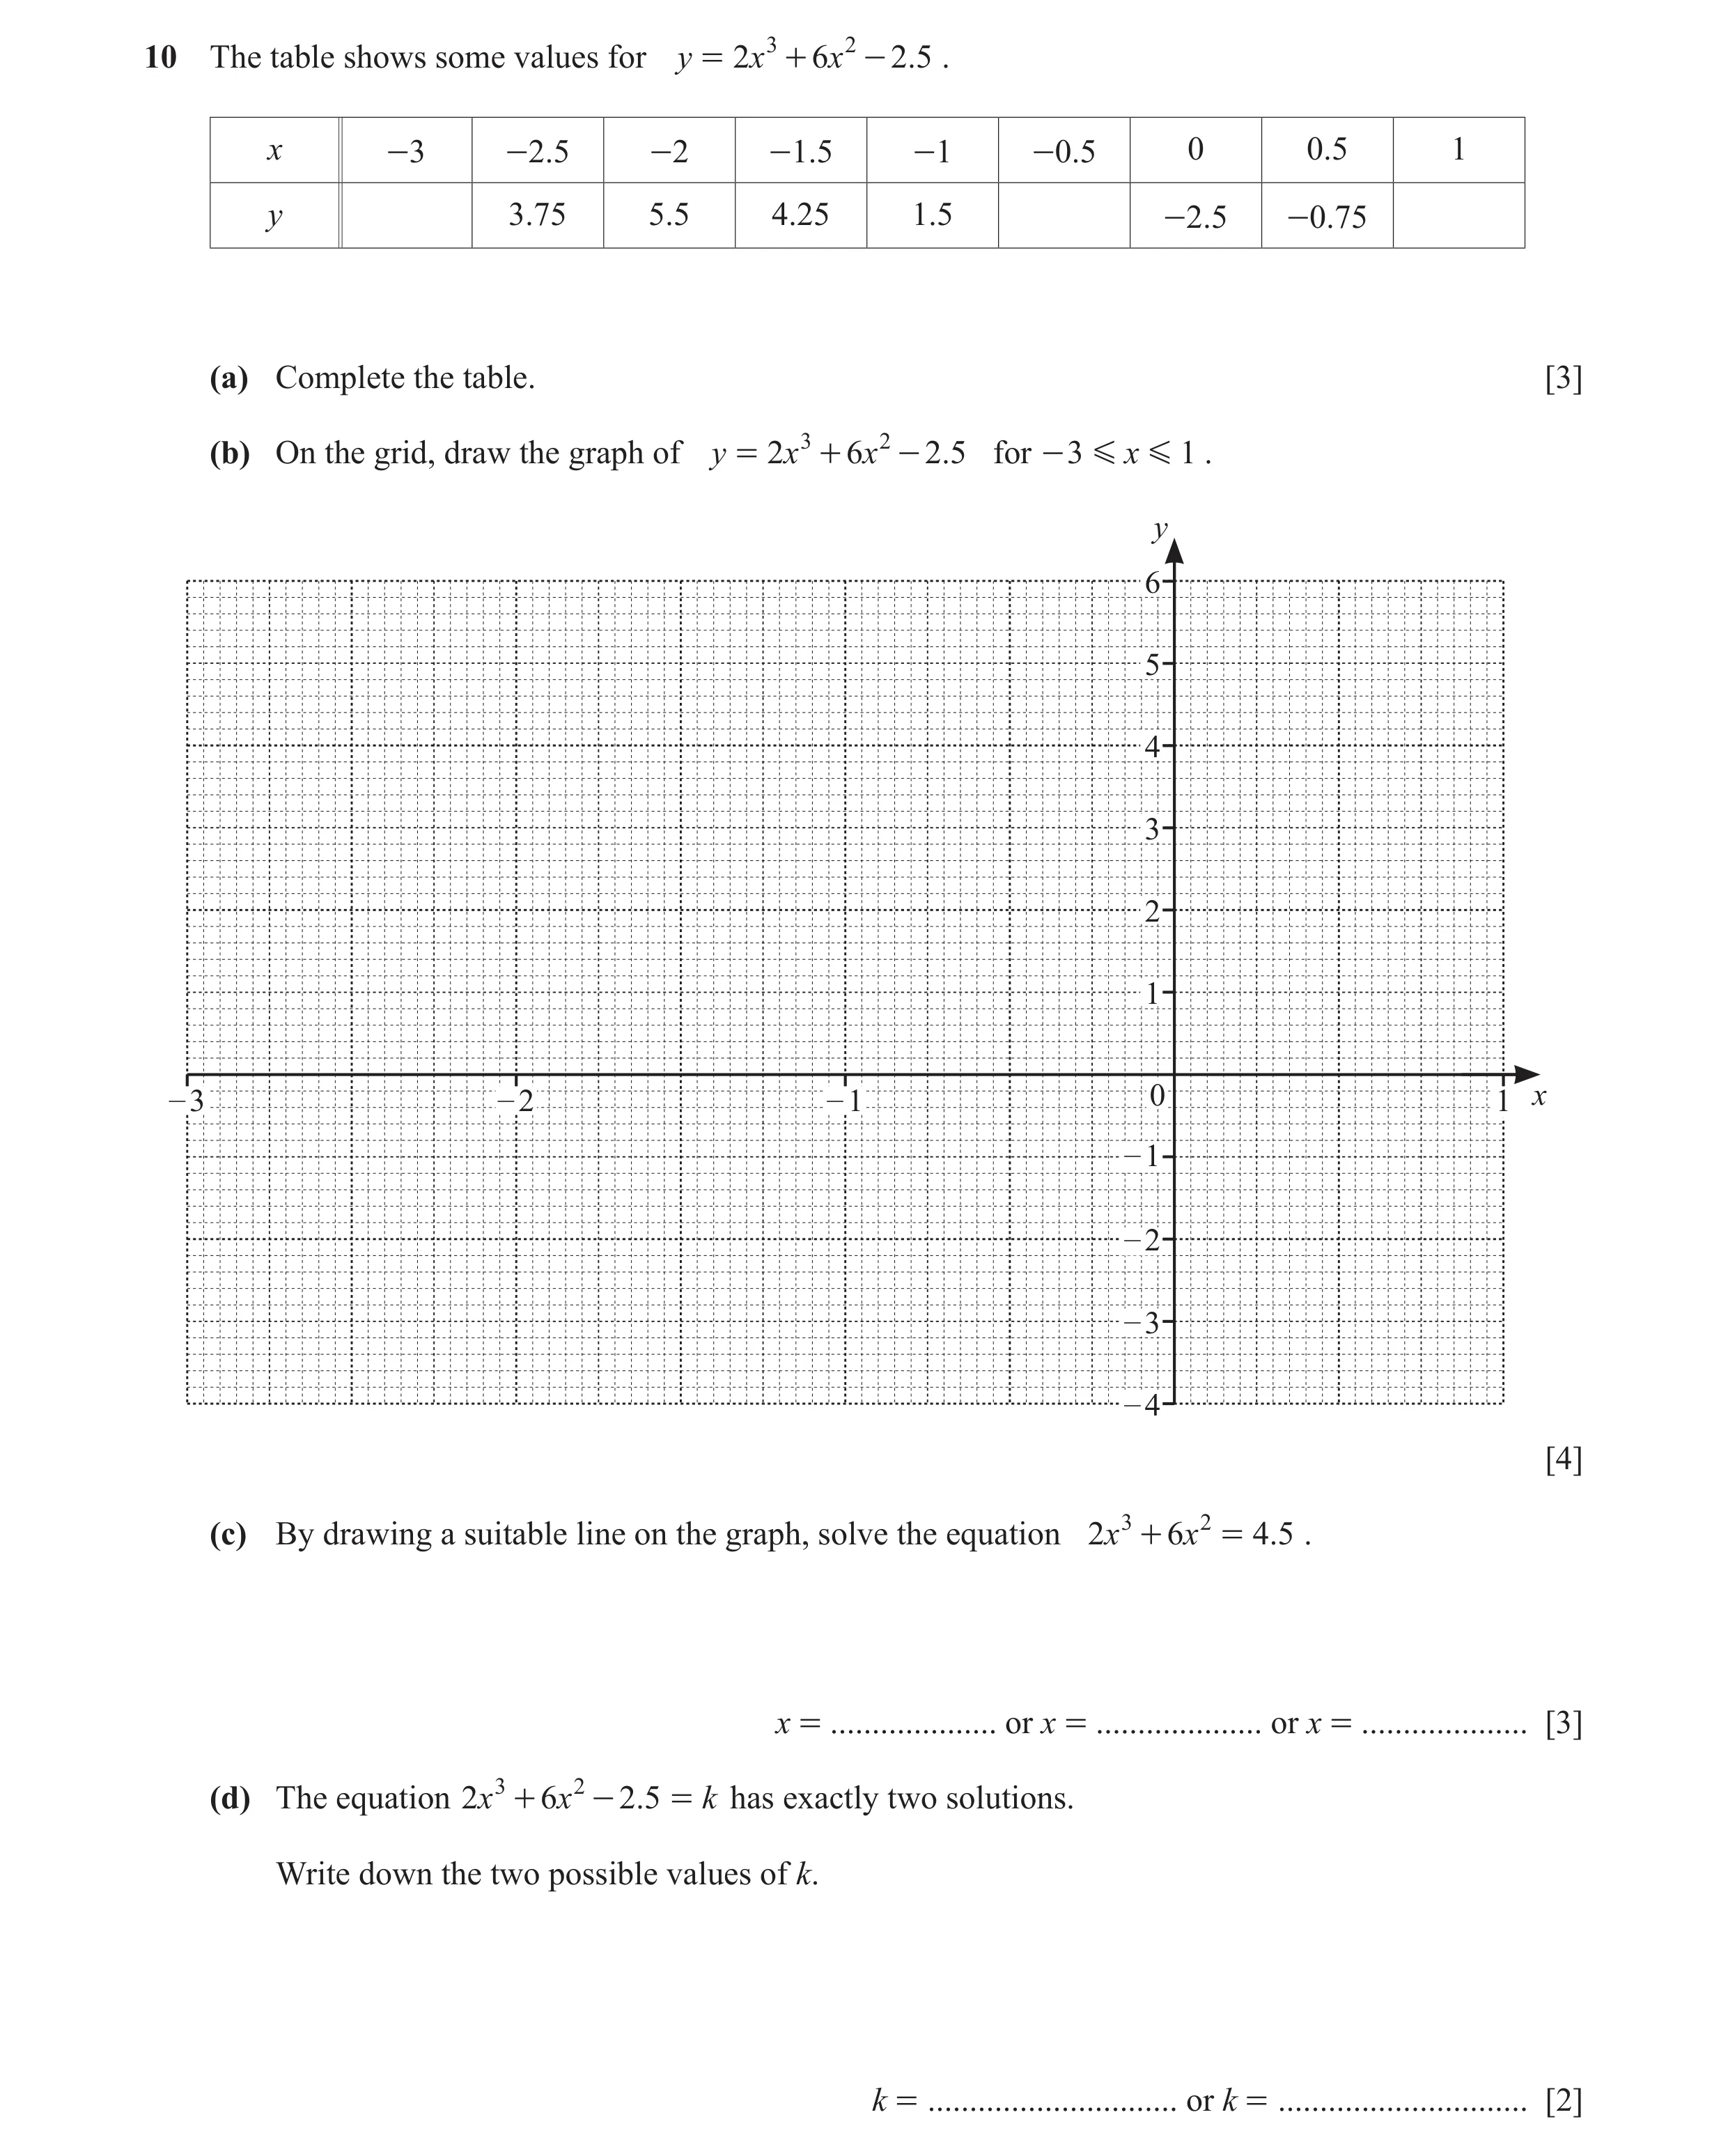 118 / 126
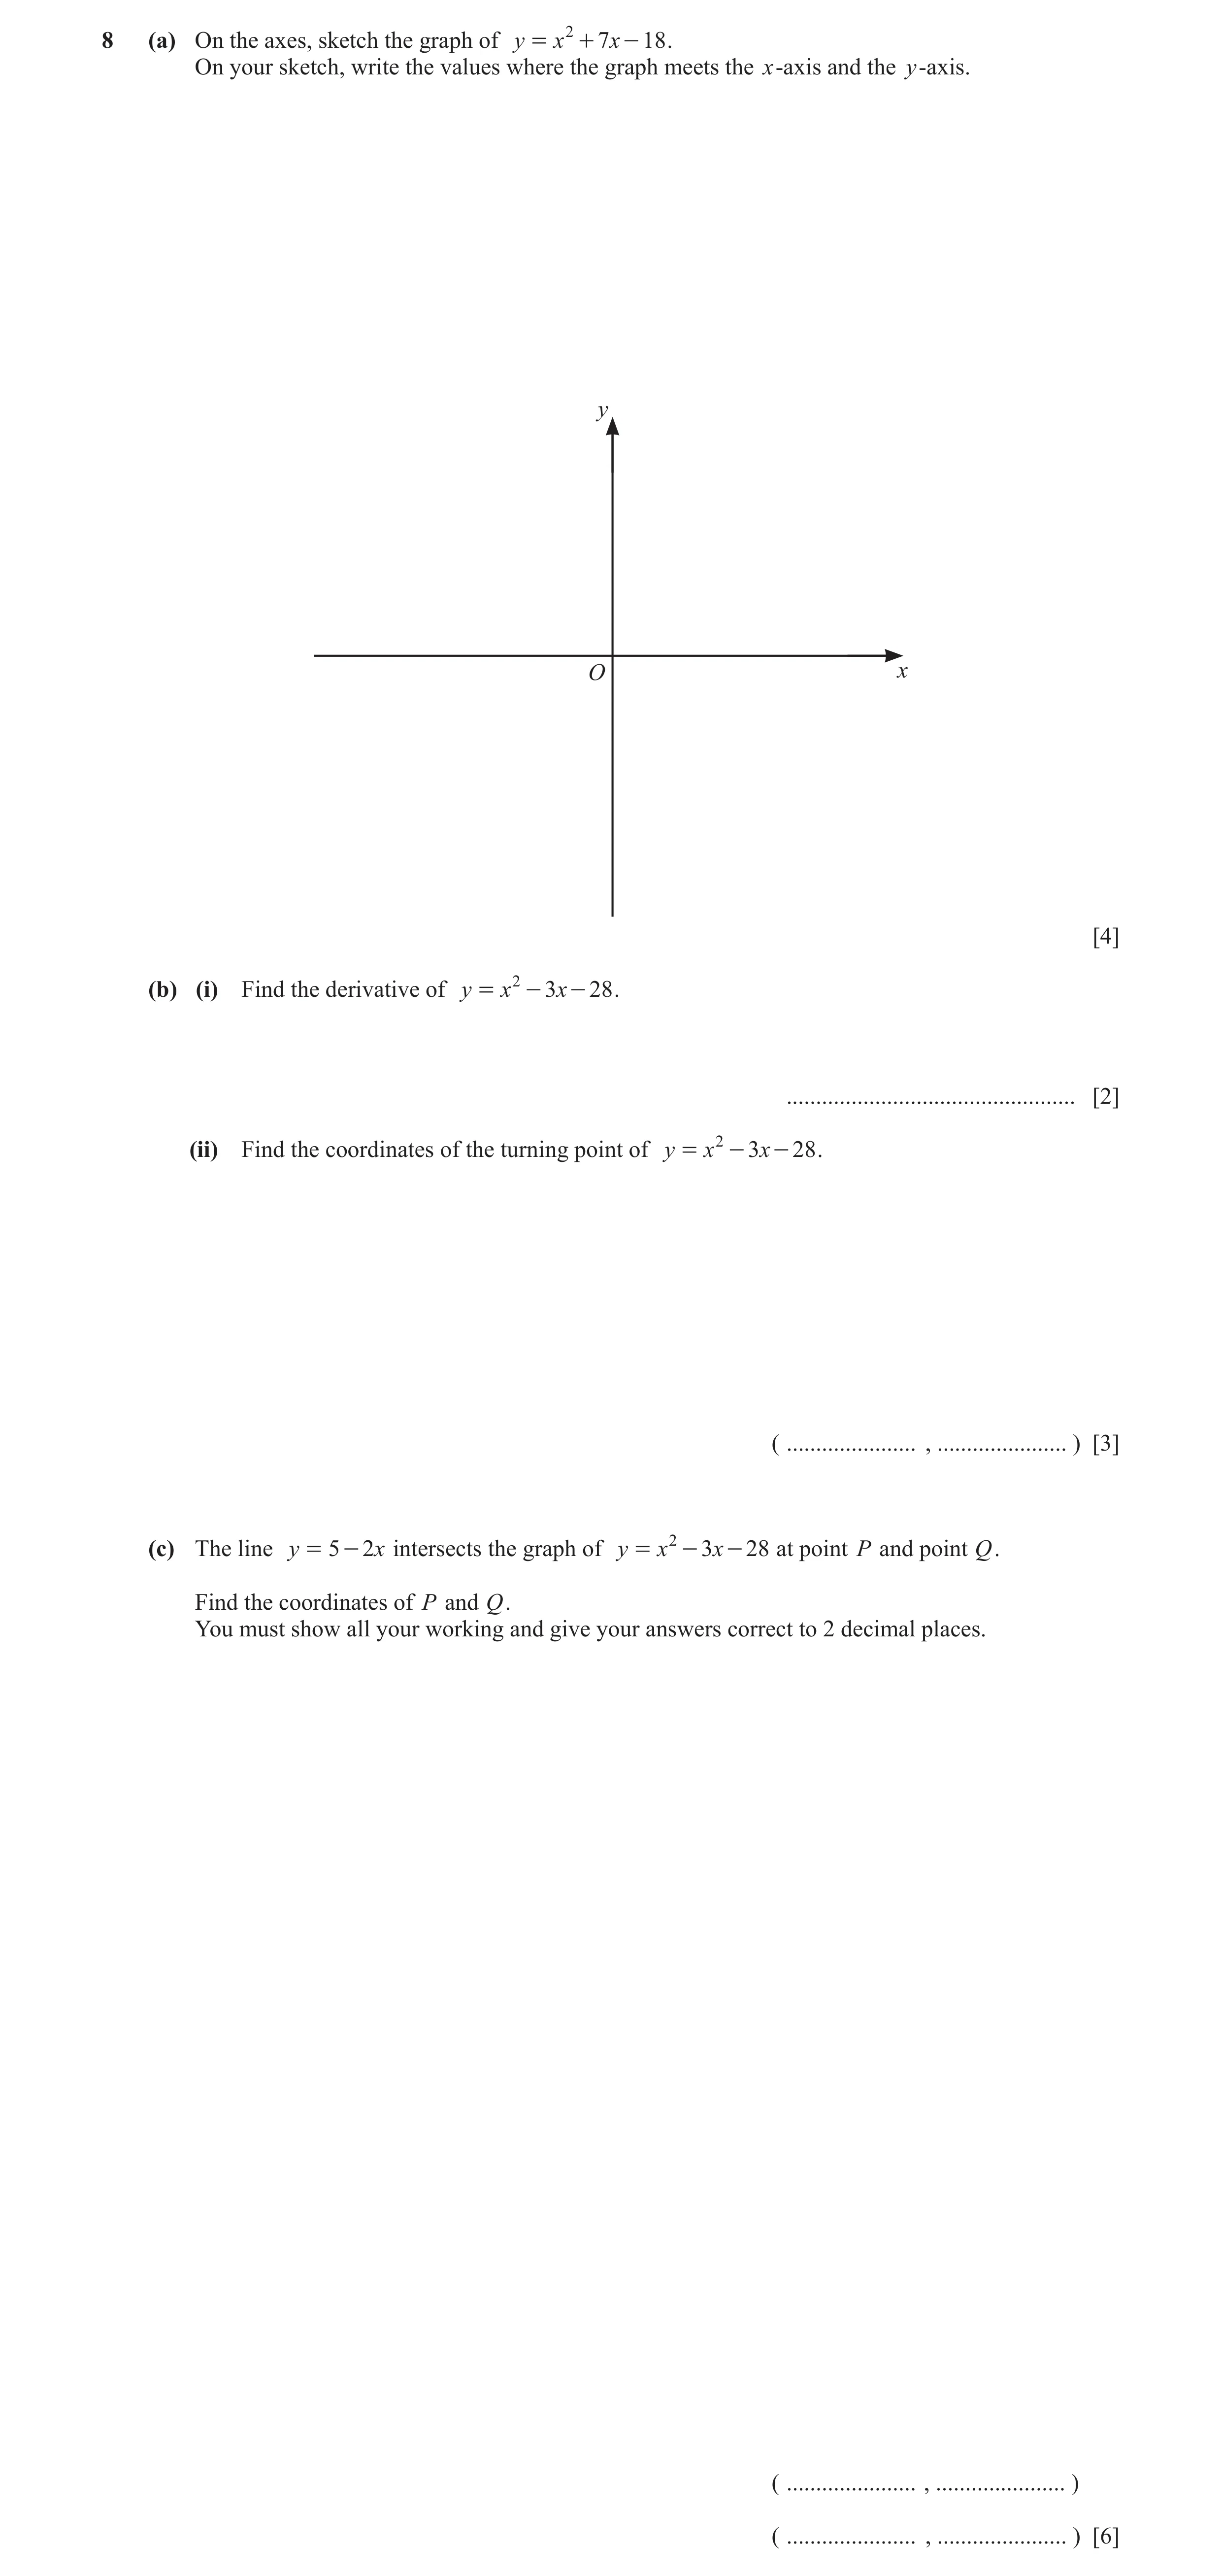
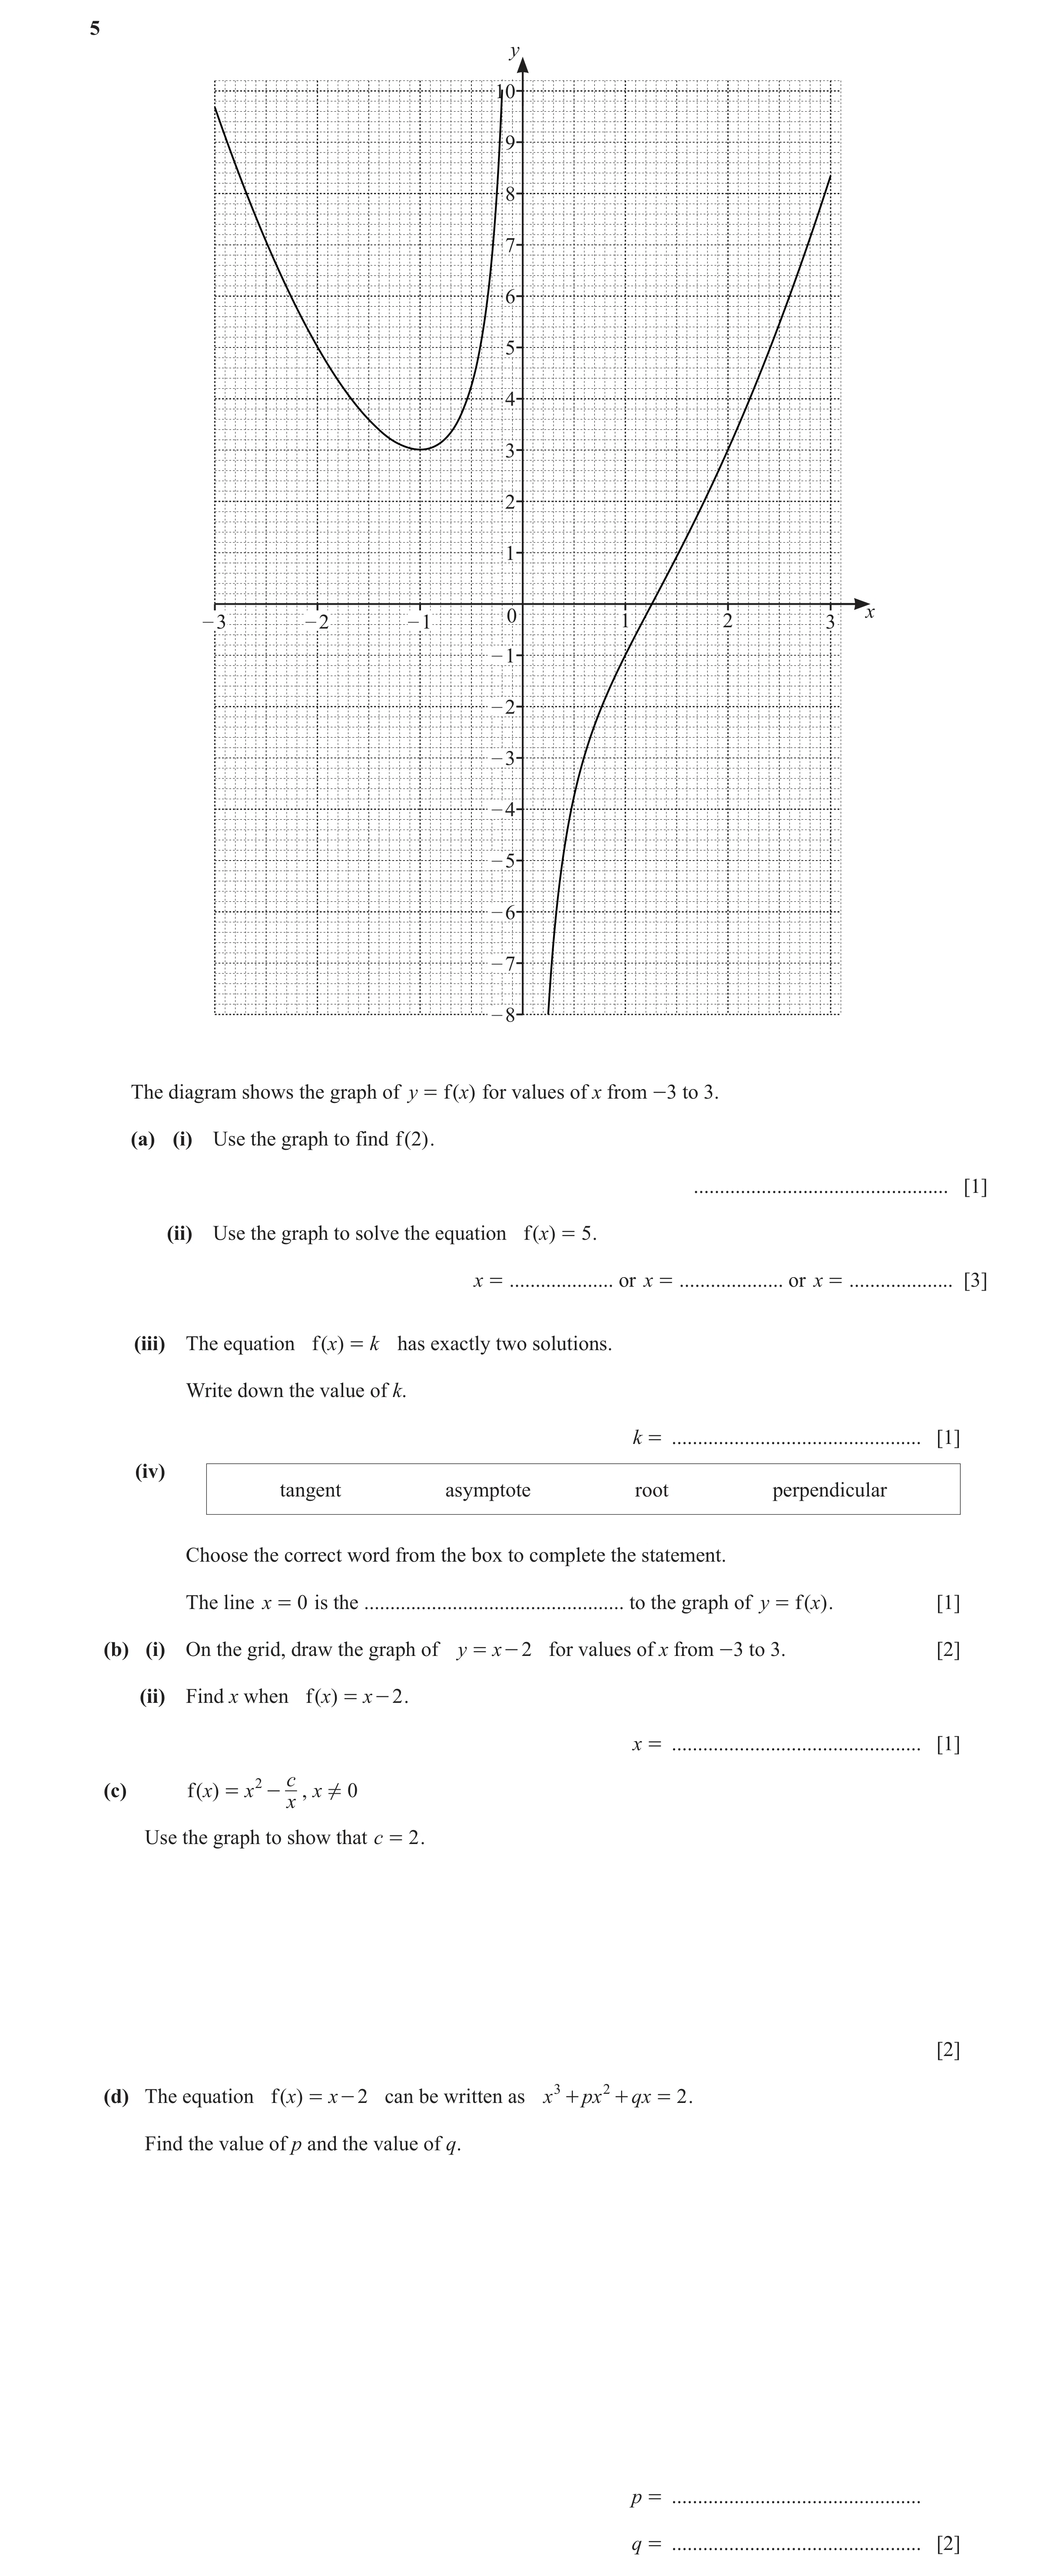
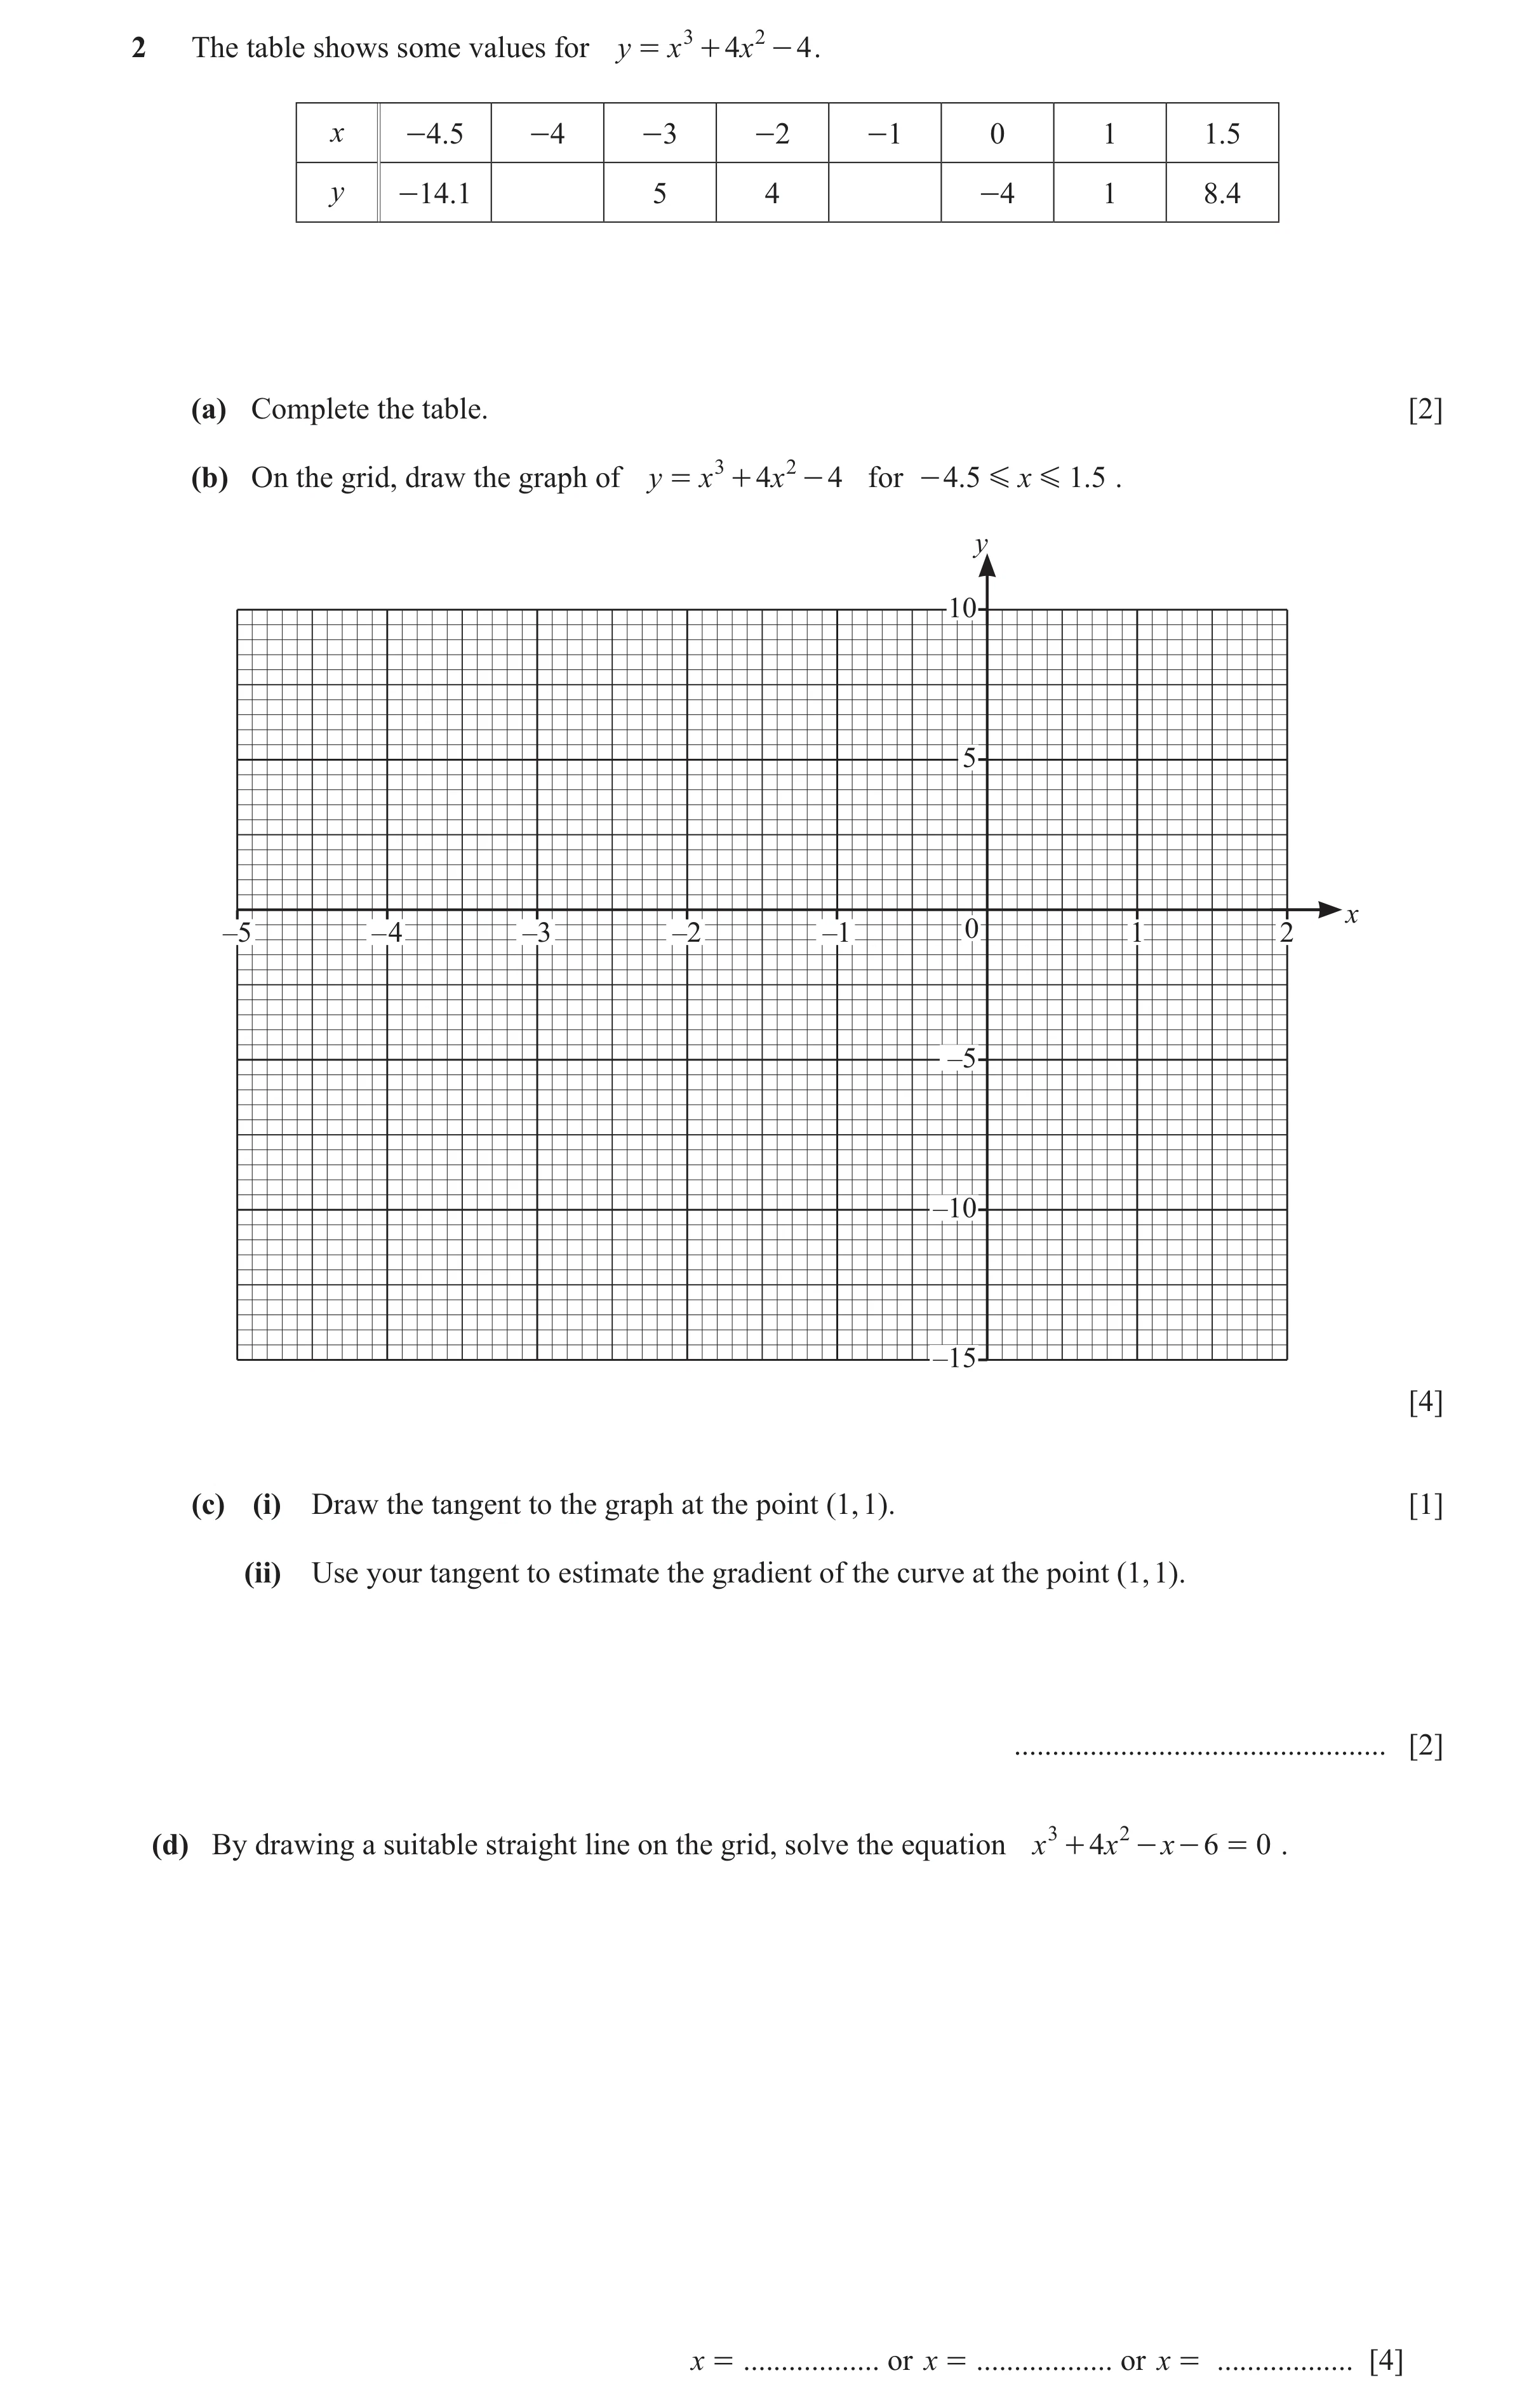
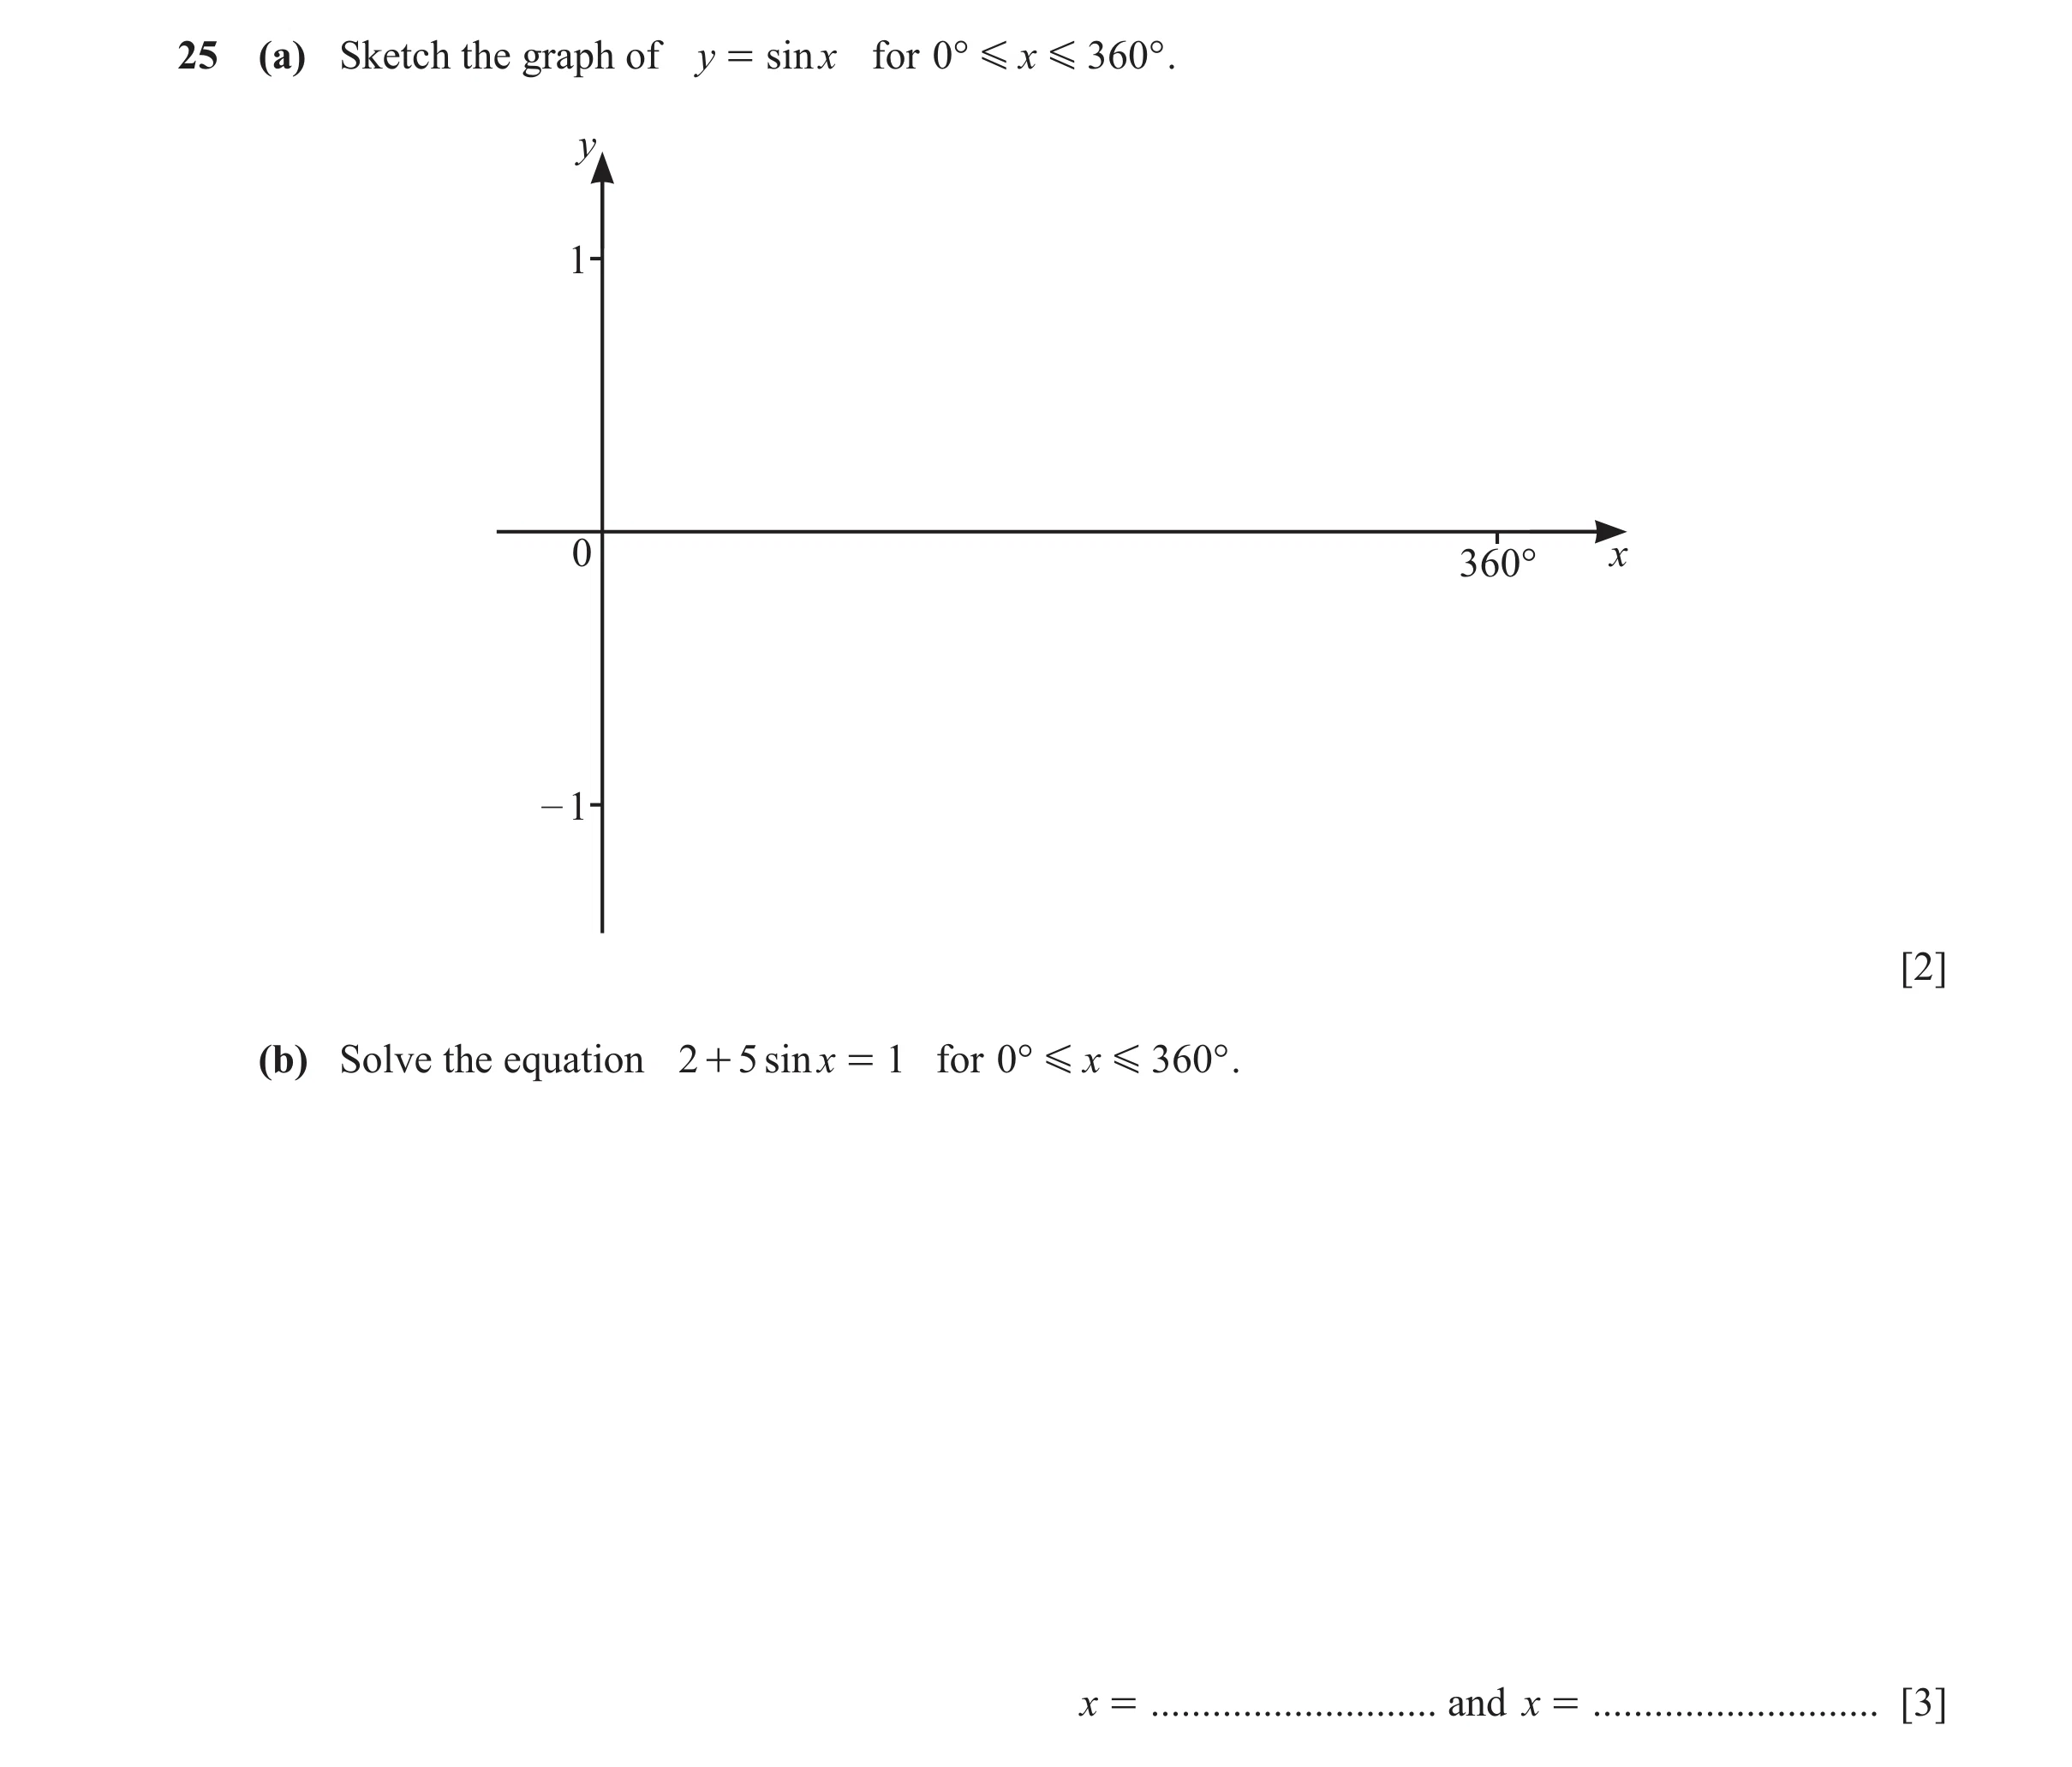 124 / 126
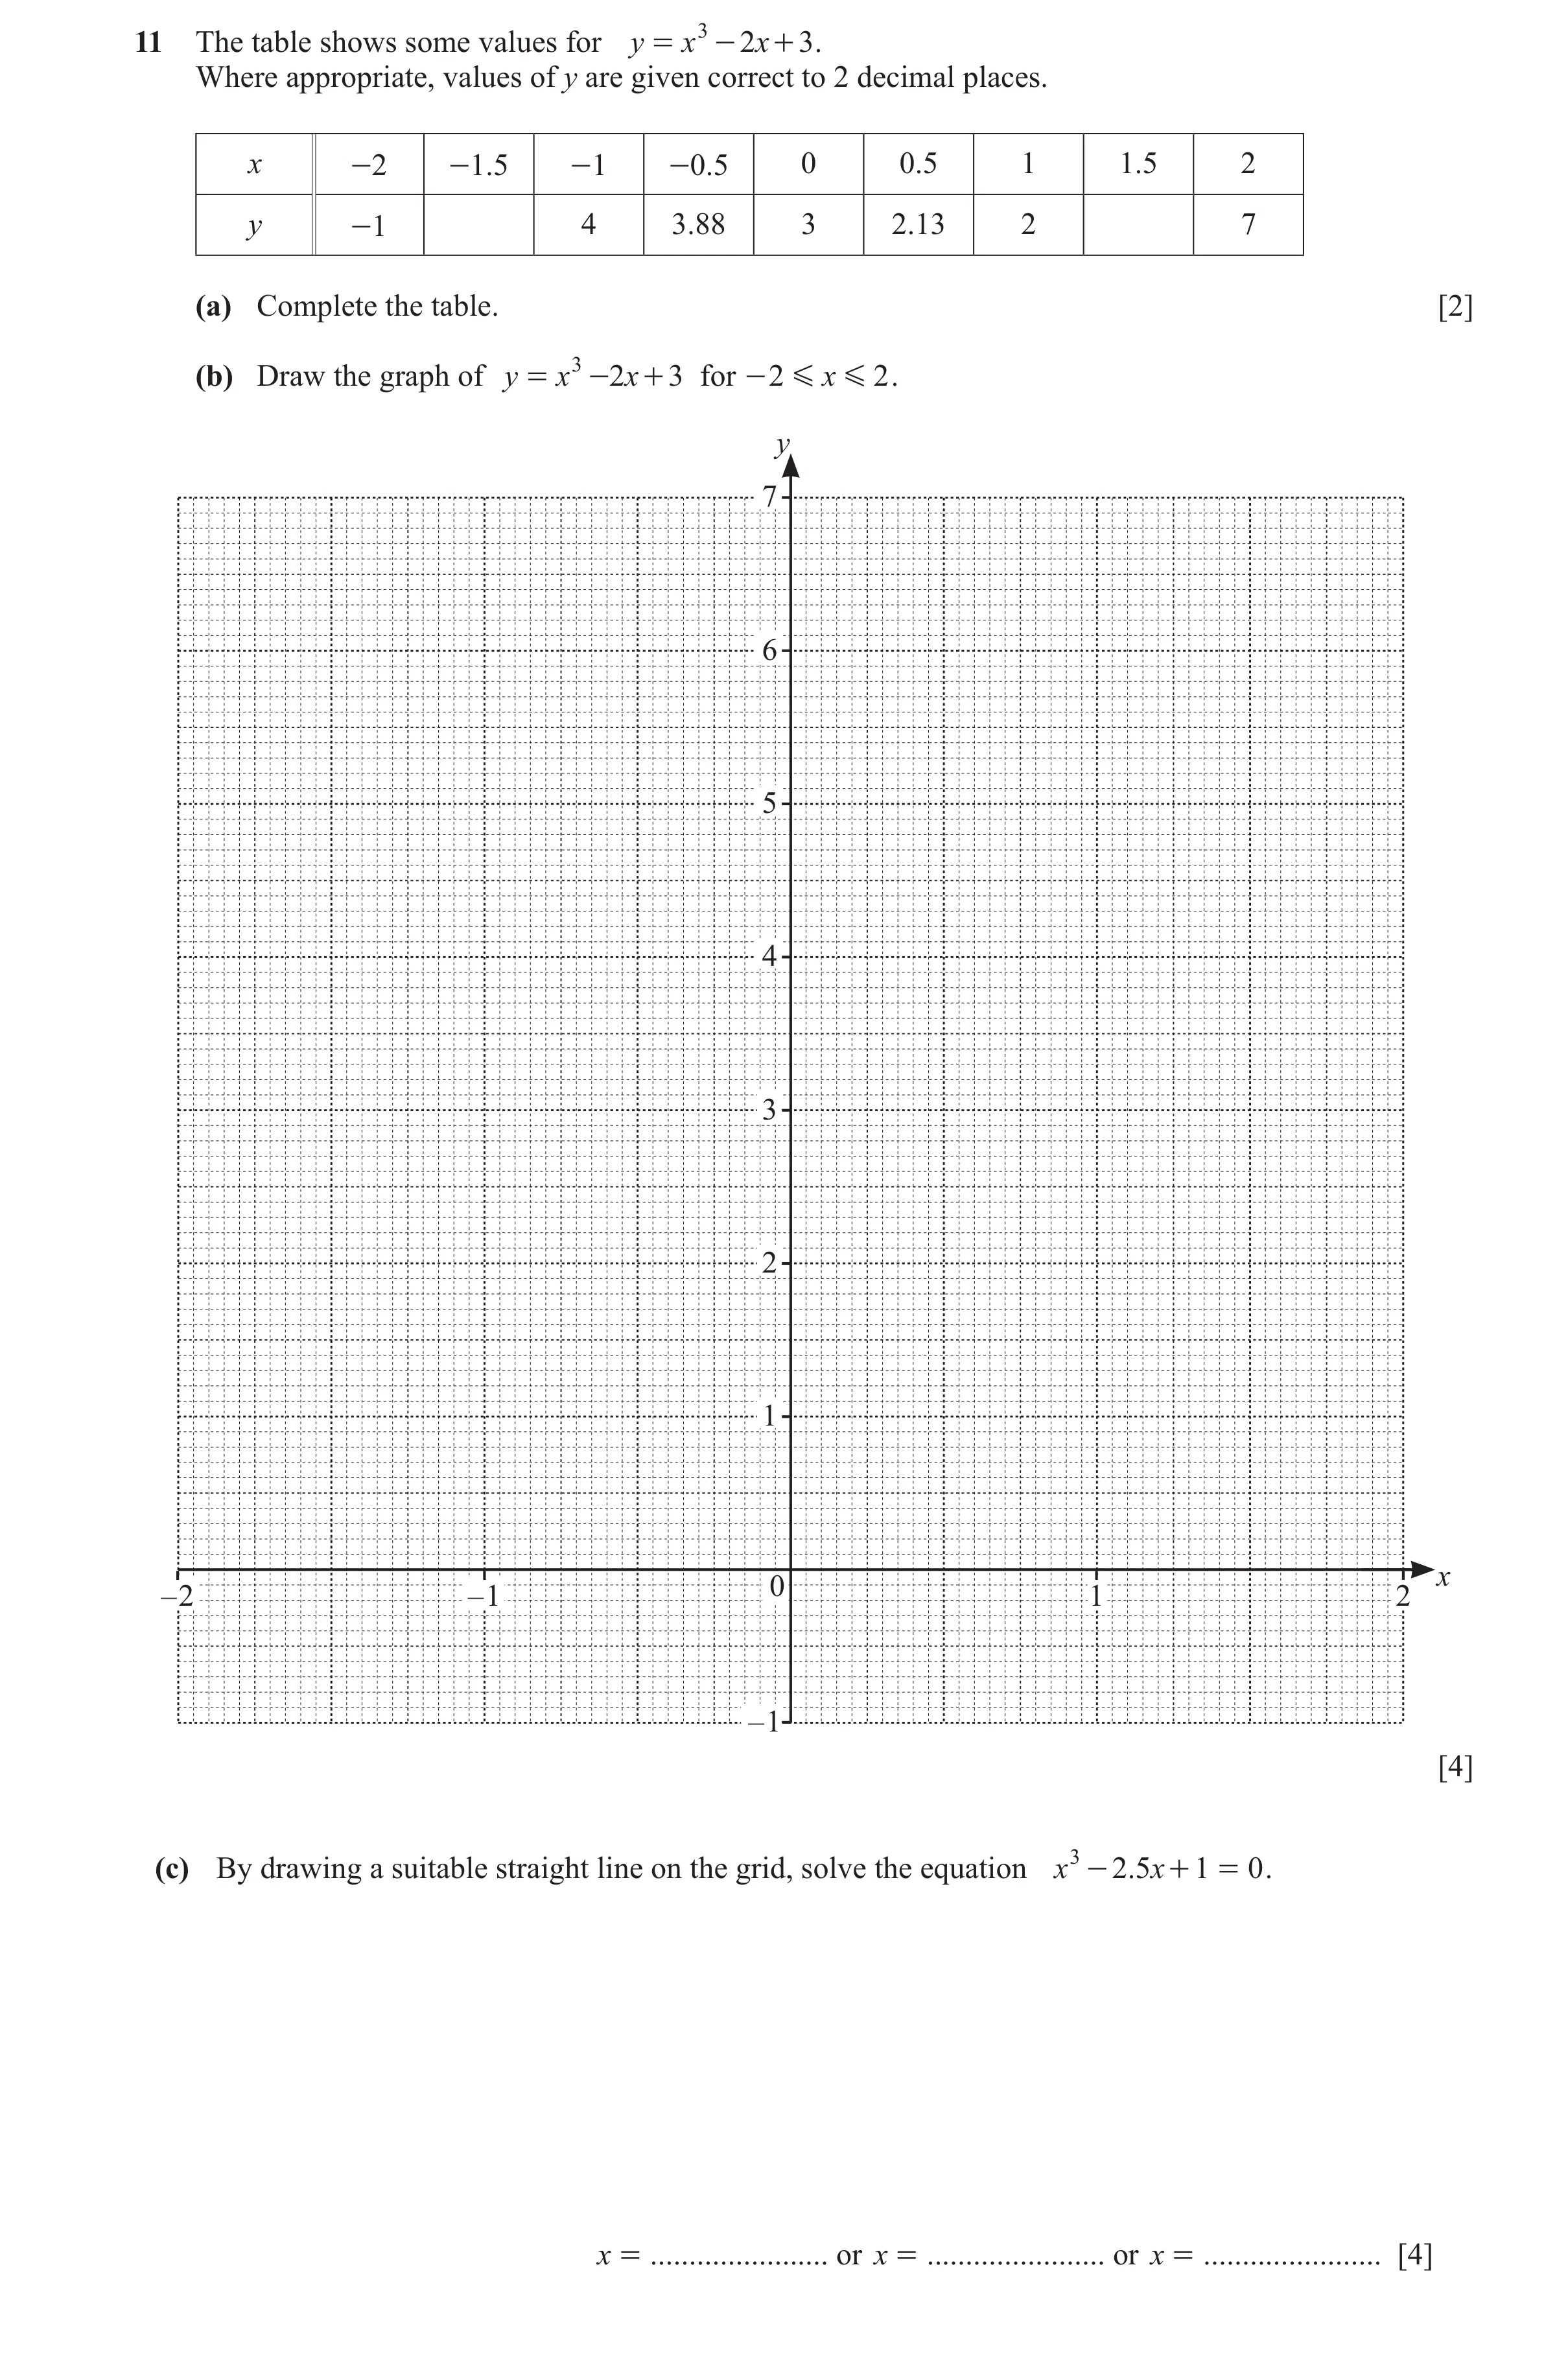
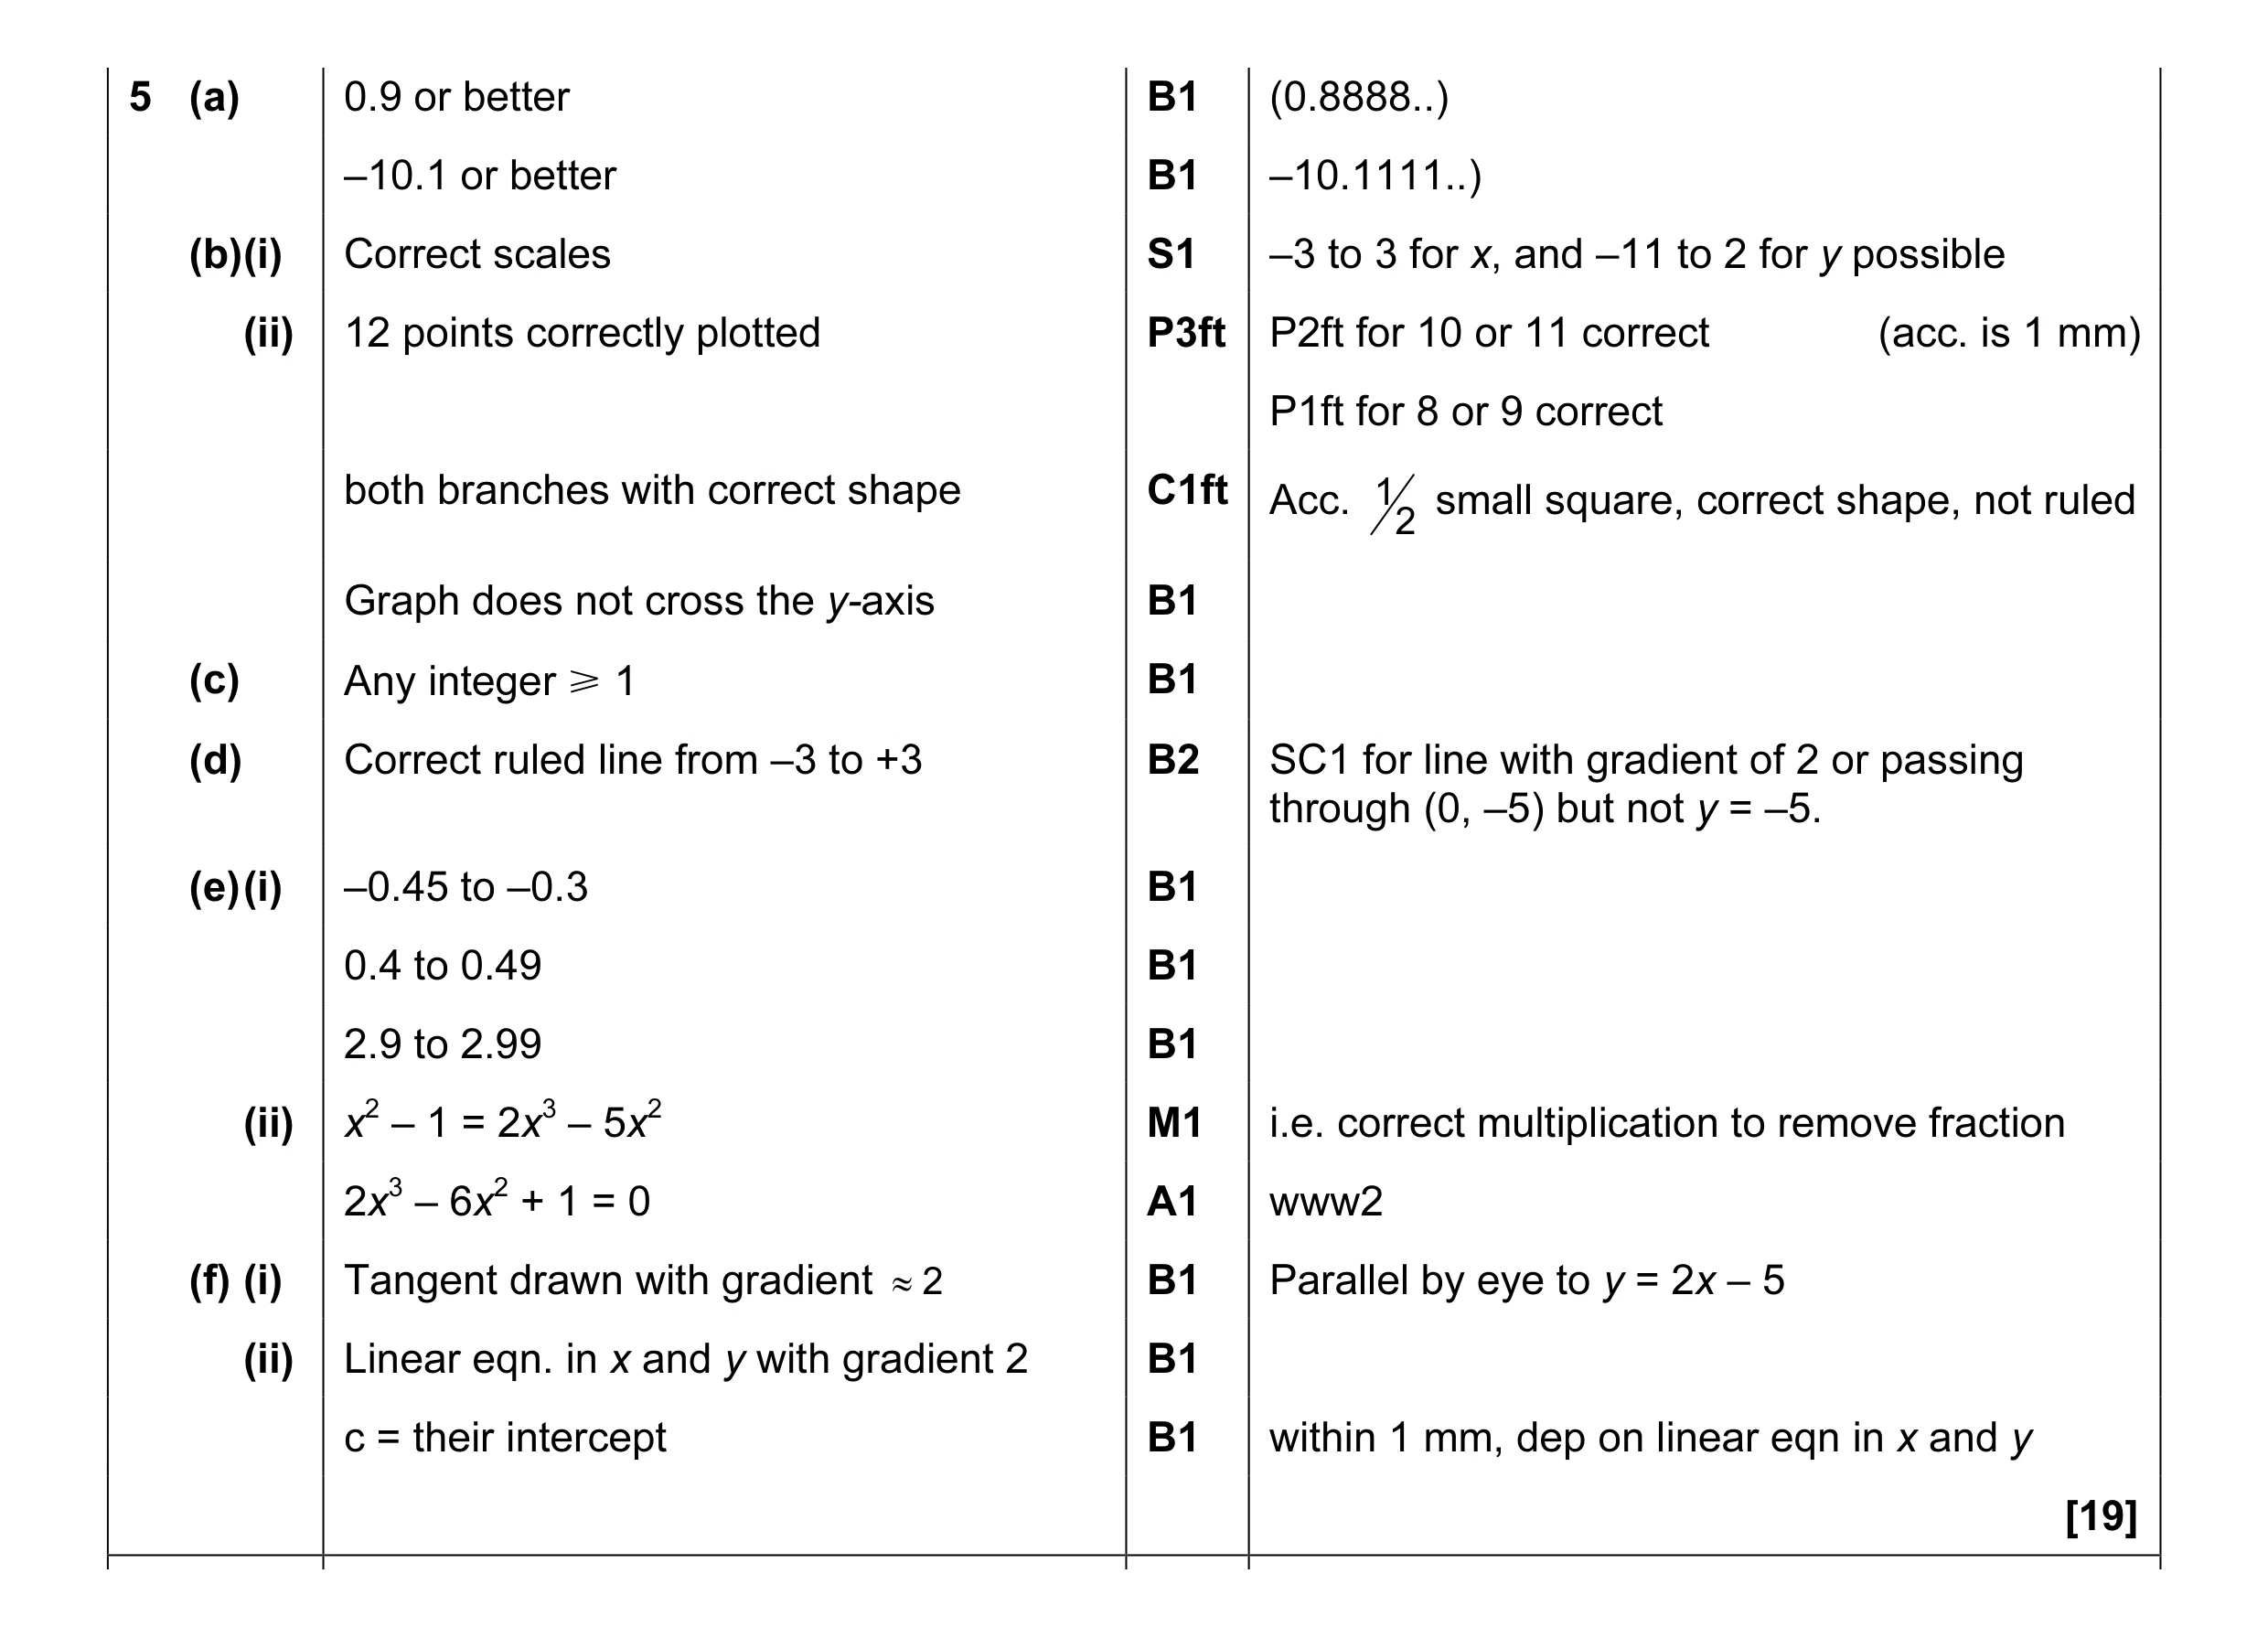 19
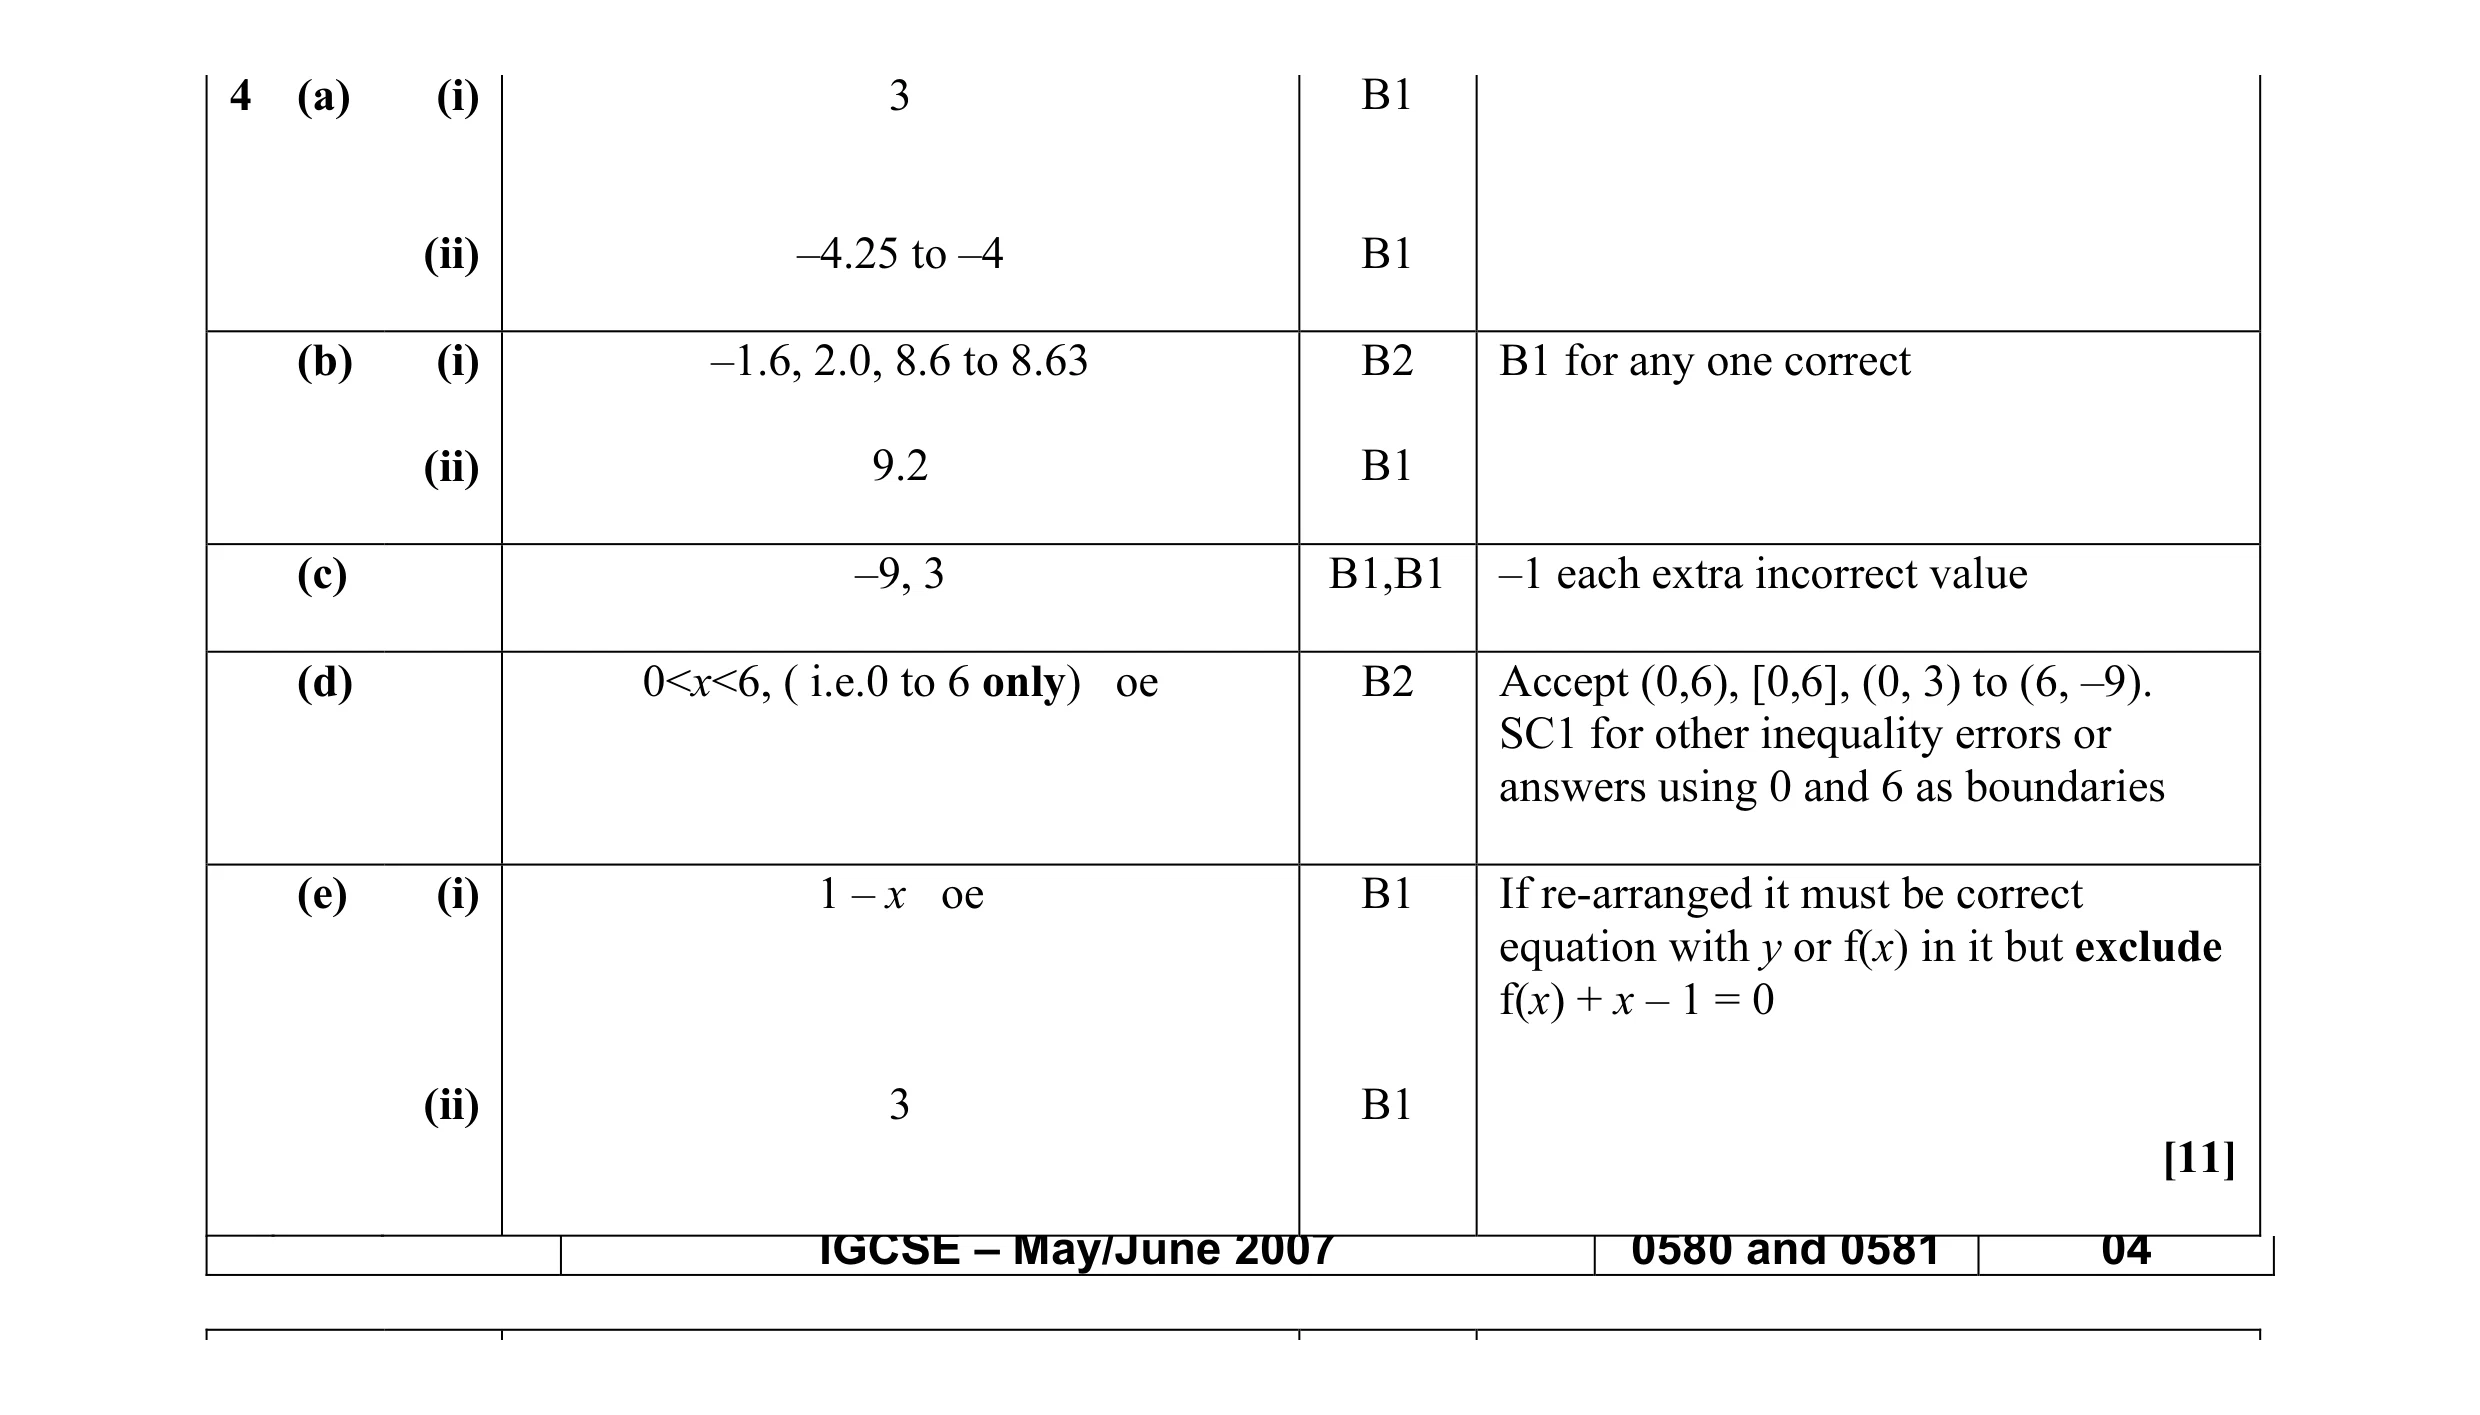 11
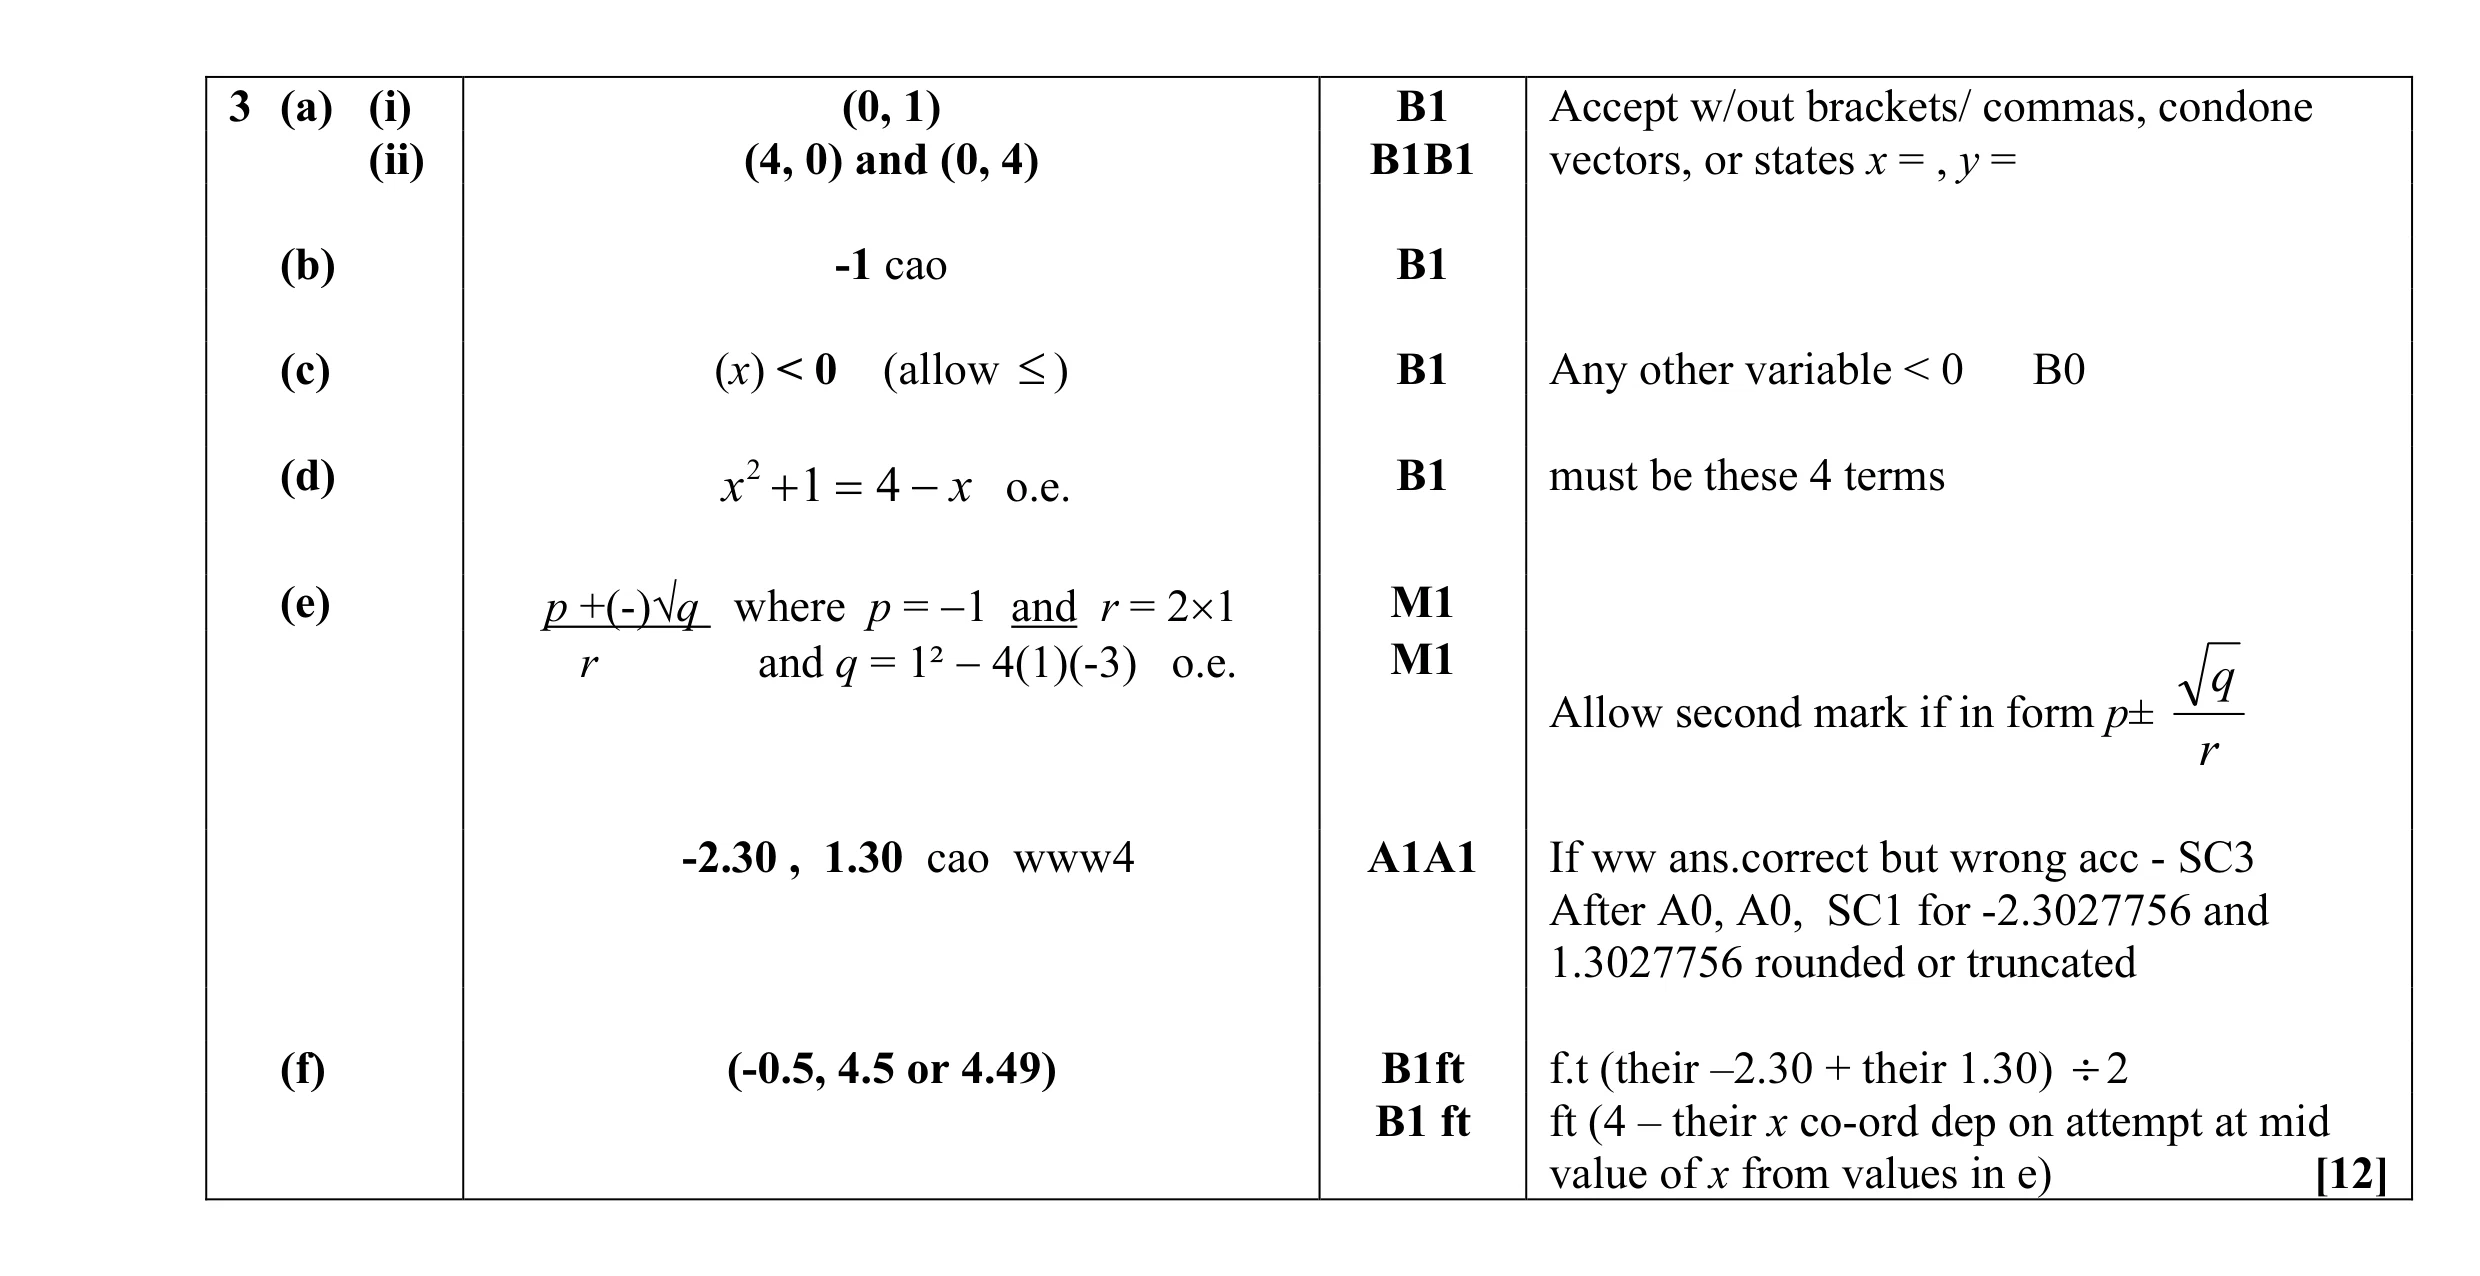 12
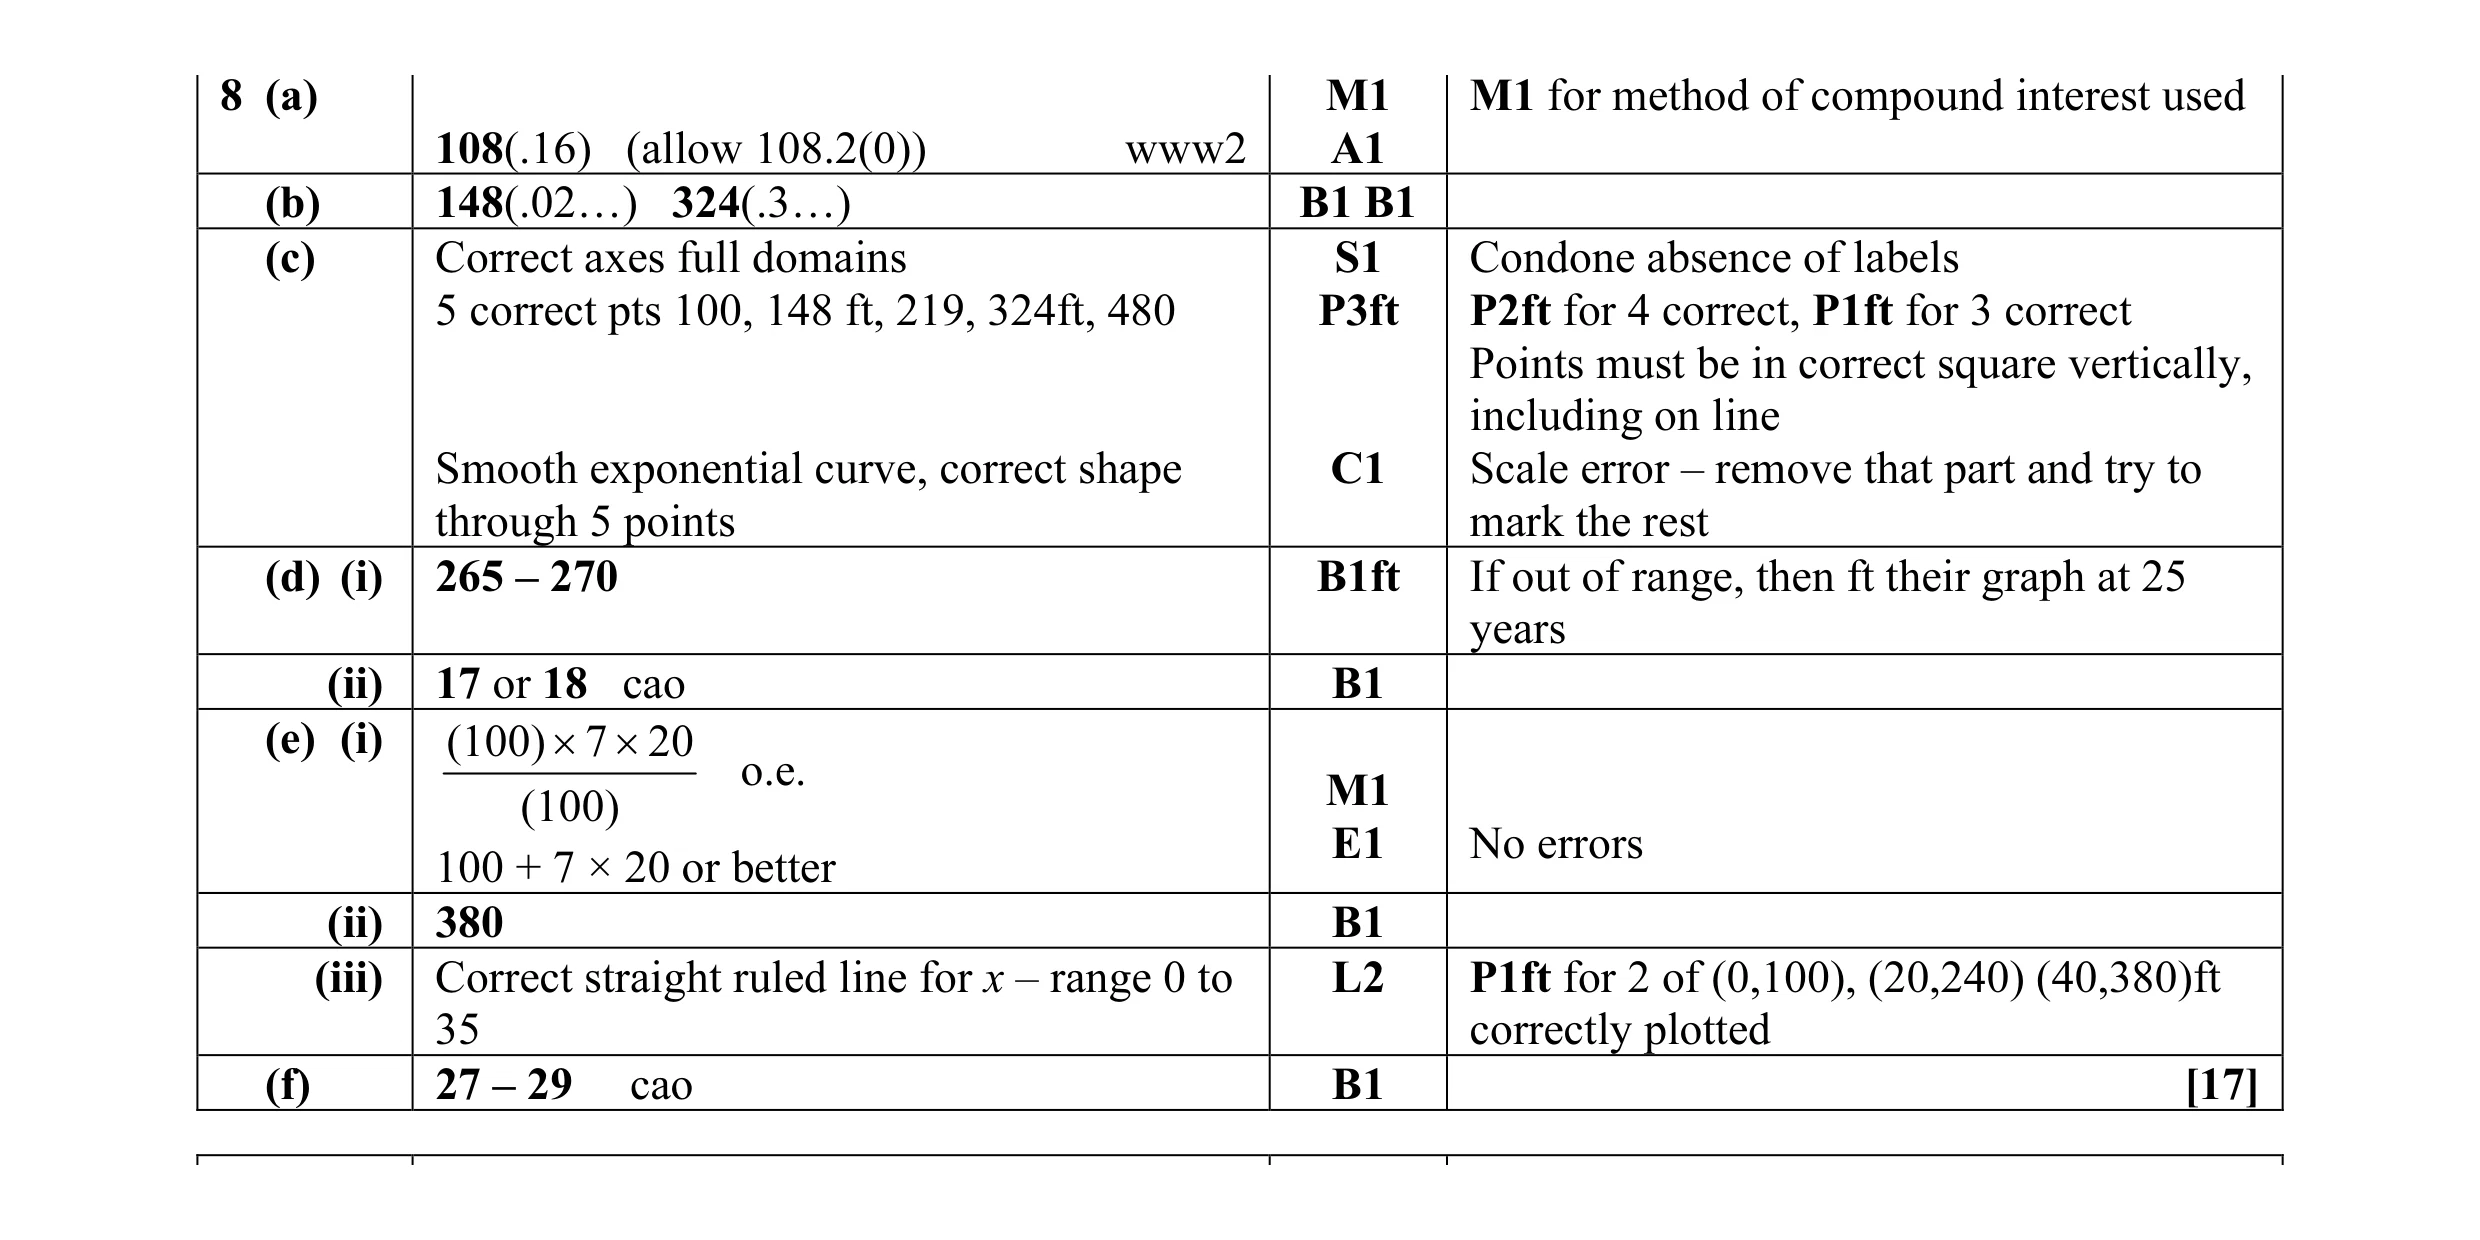 17
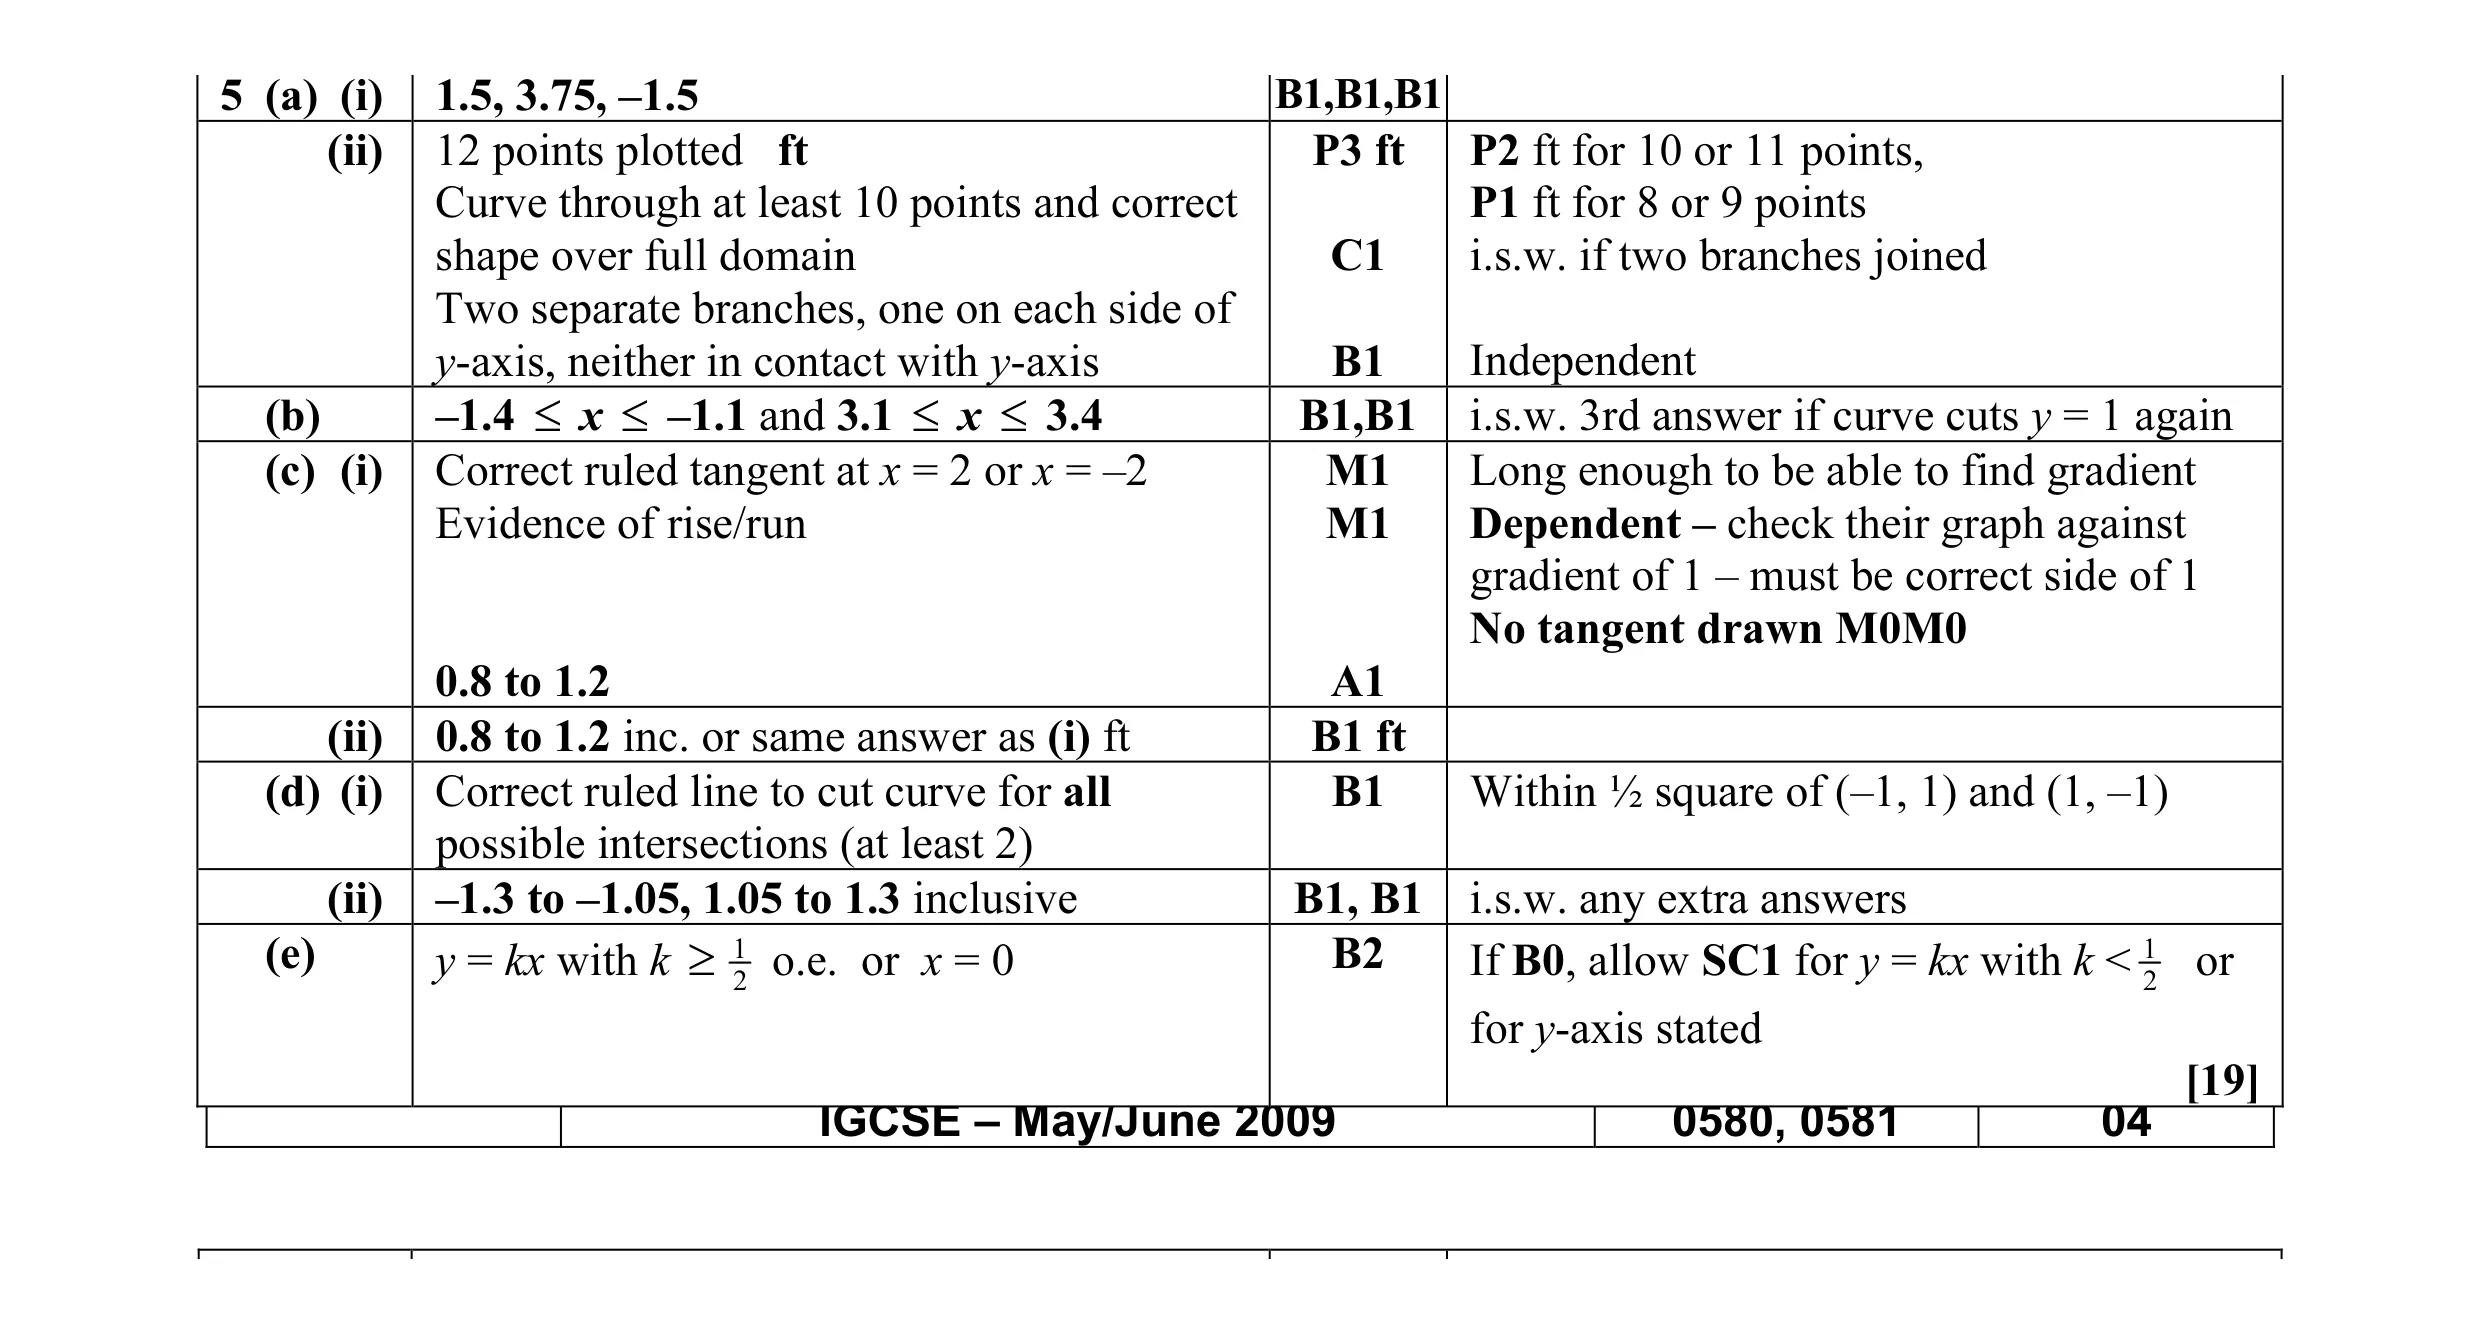 19
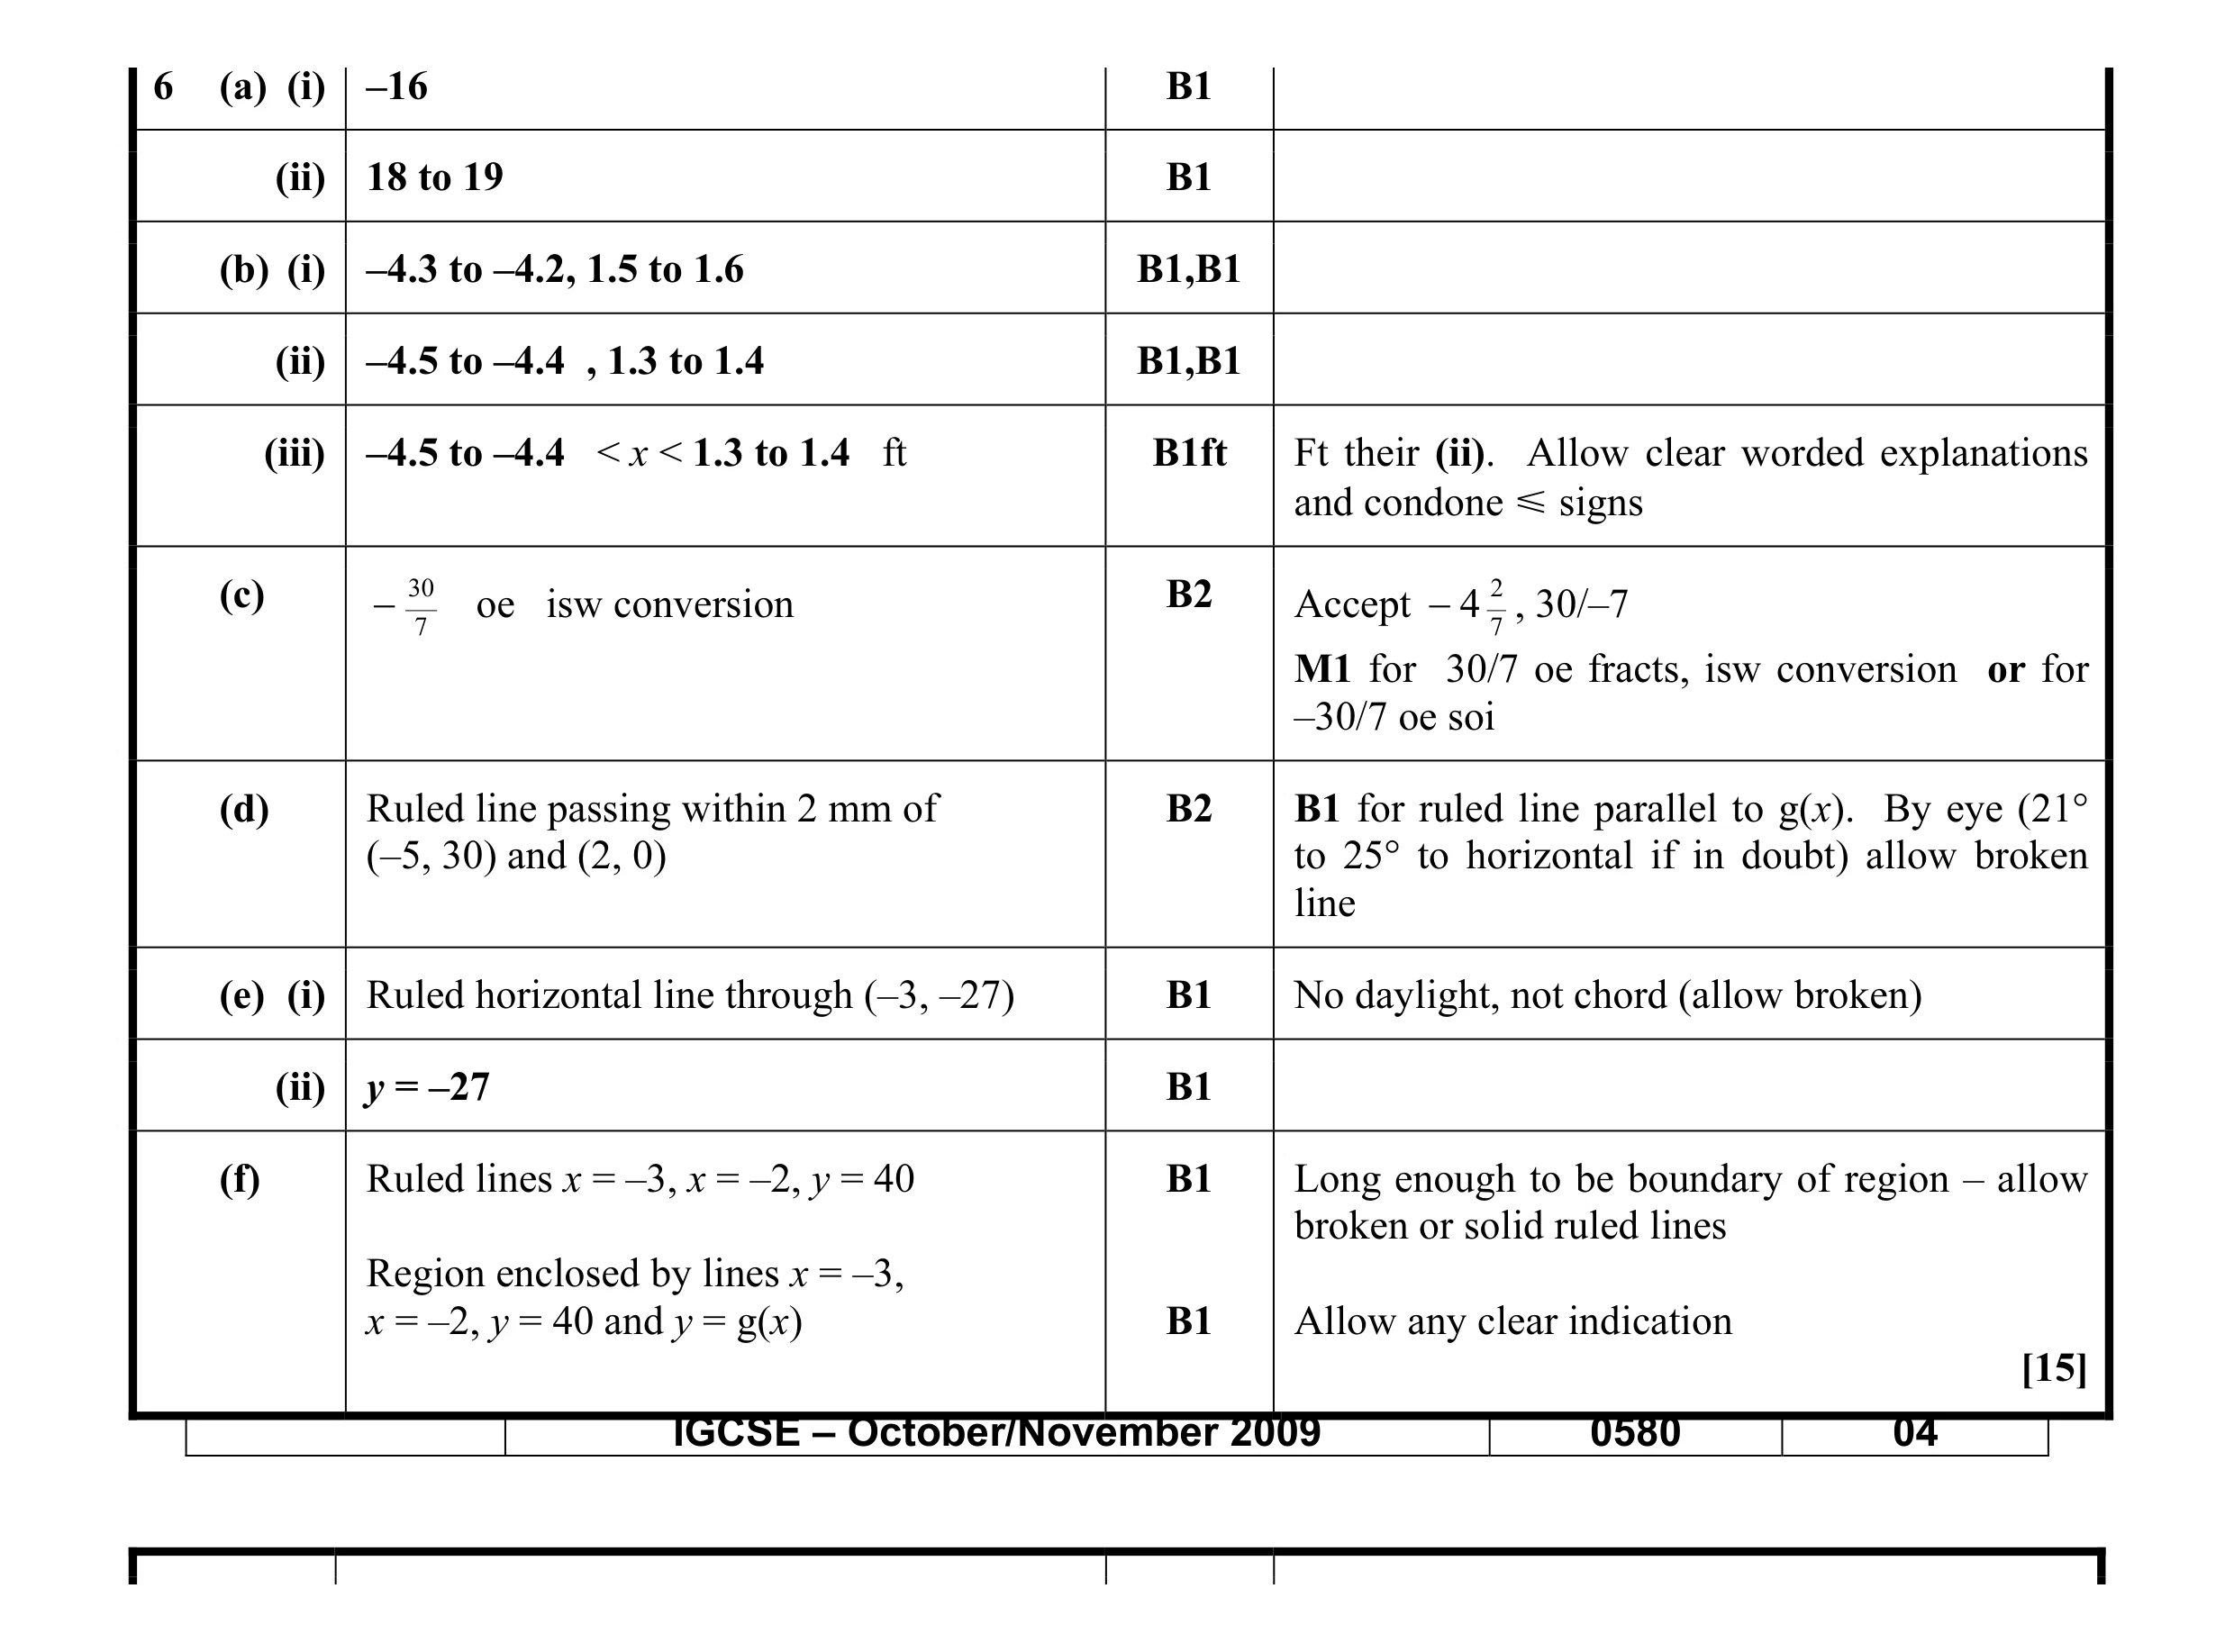 15
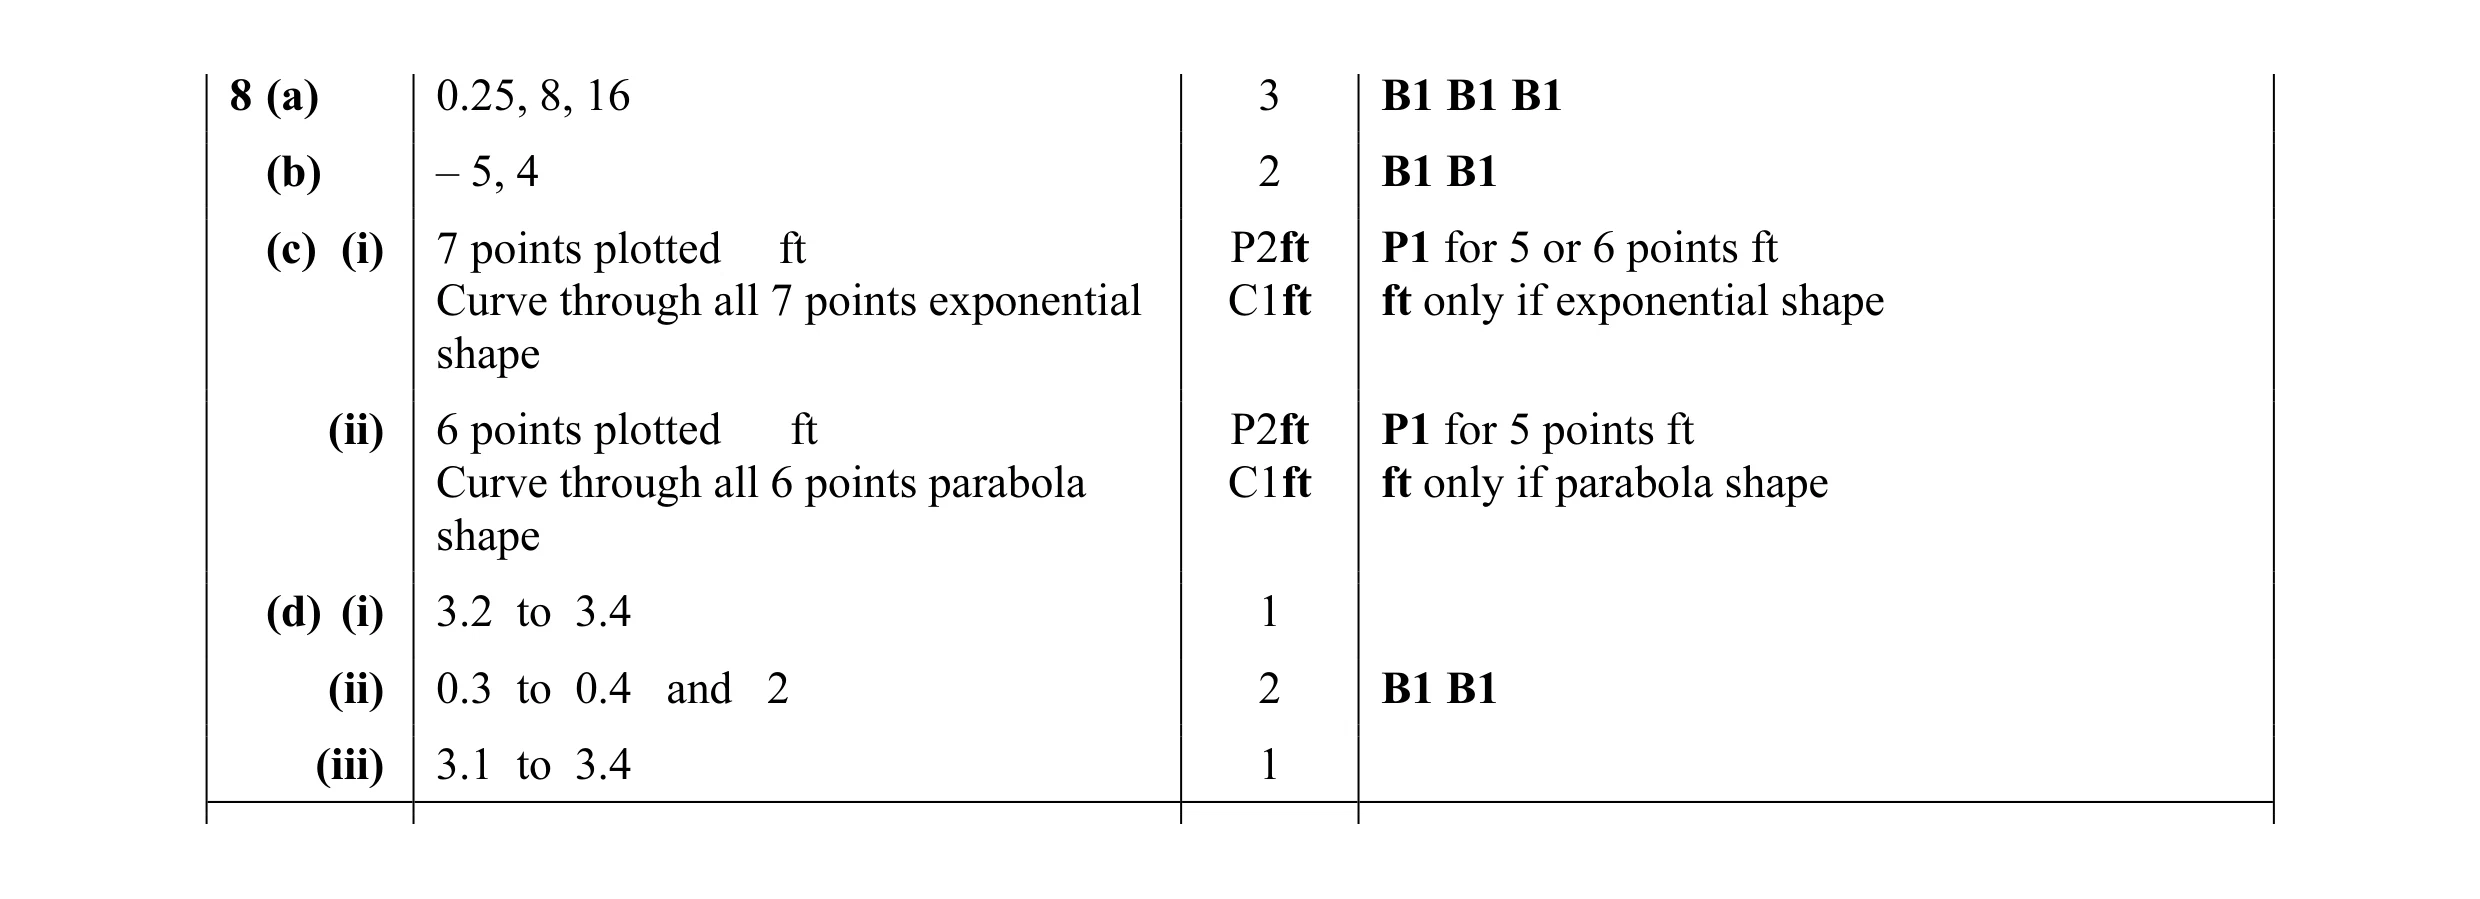 15
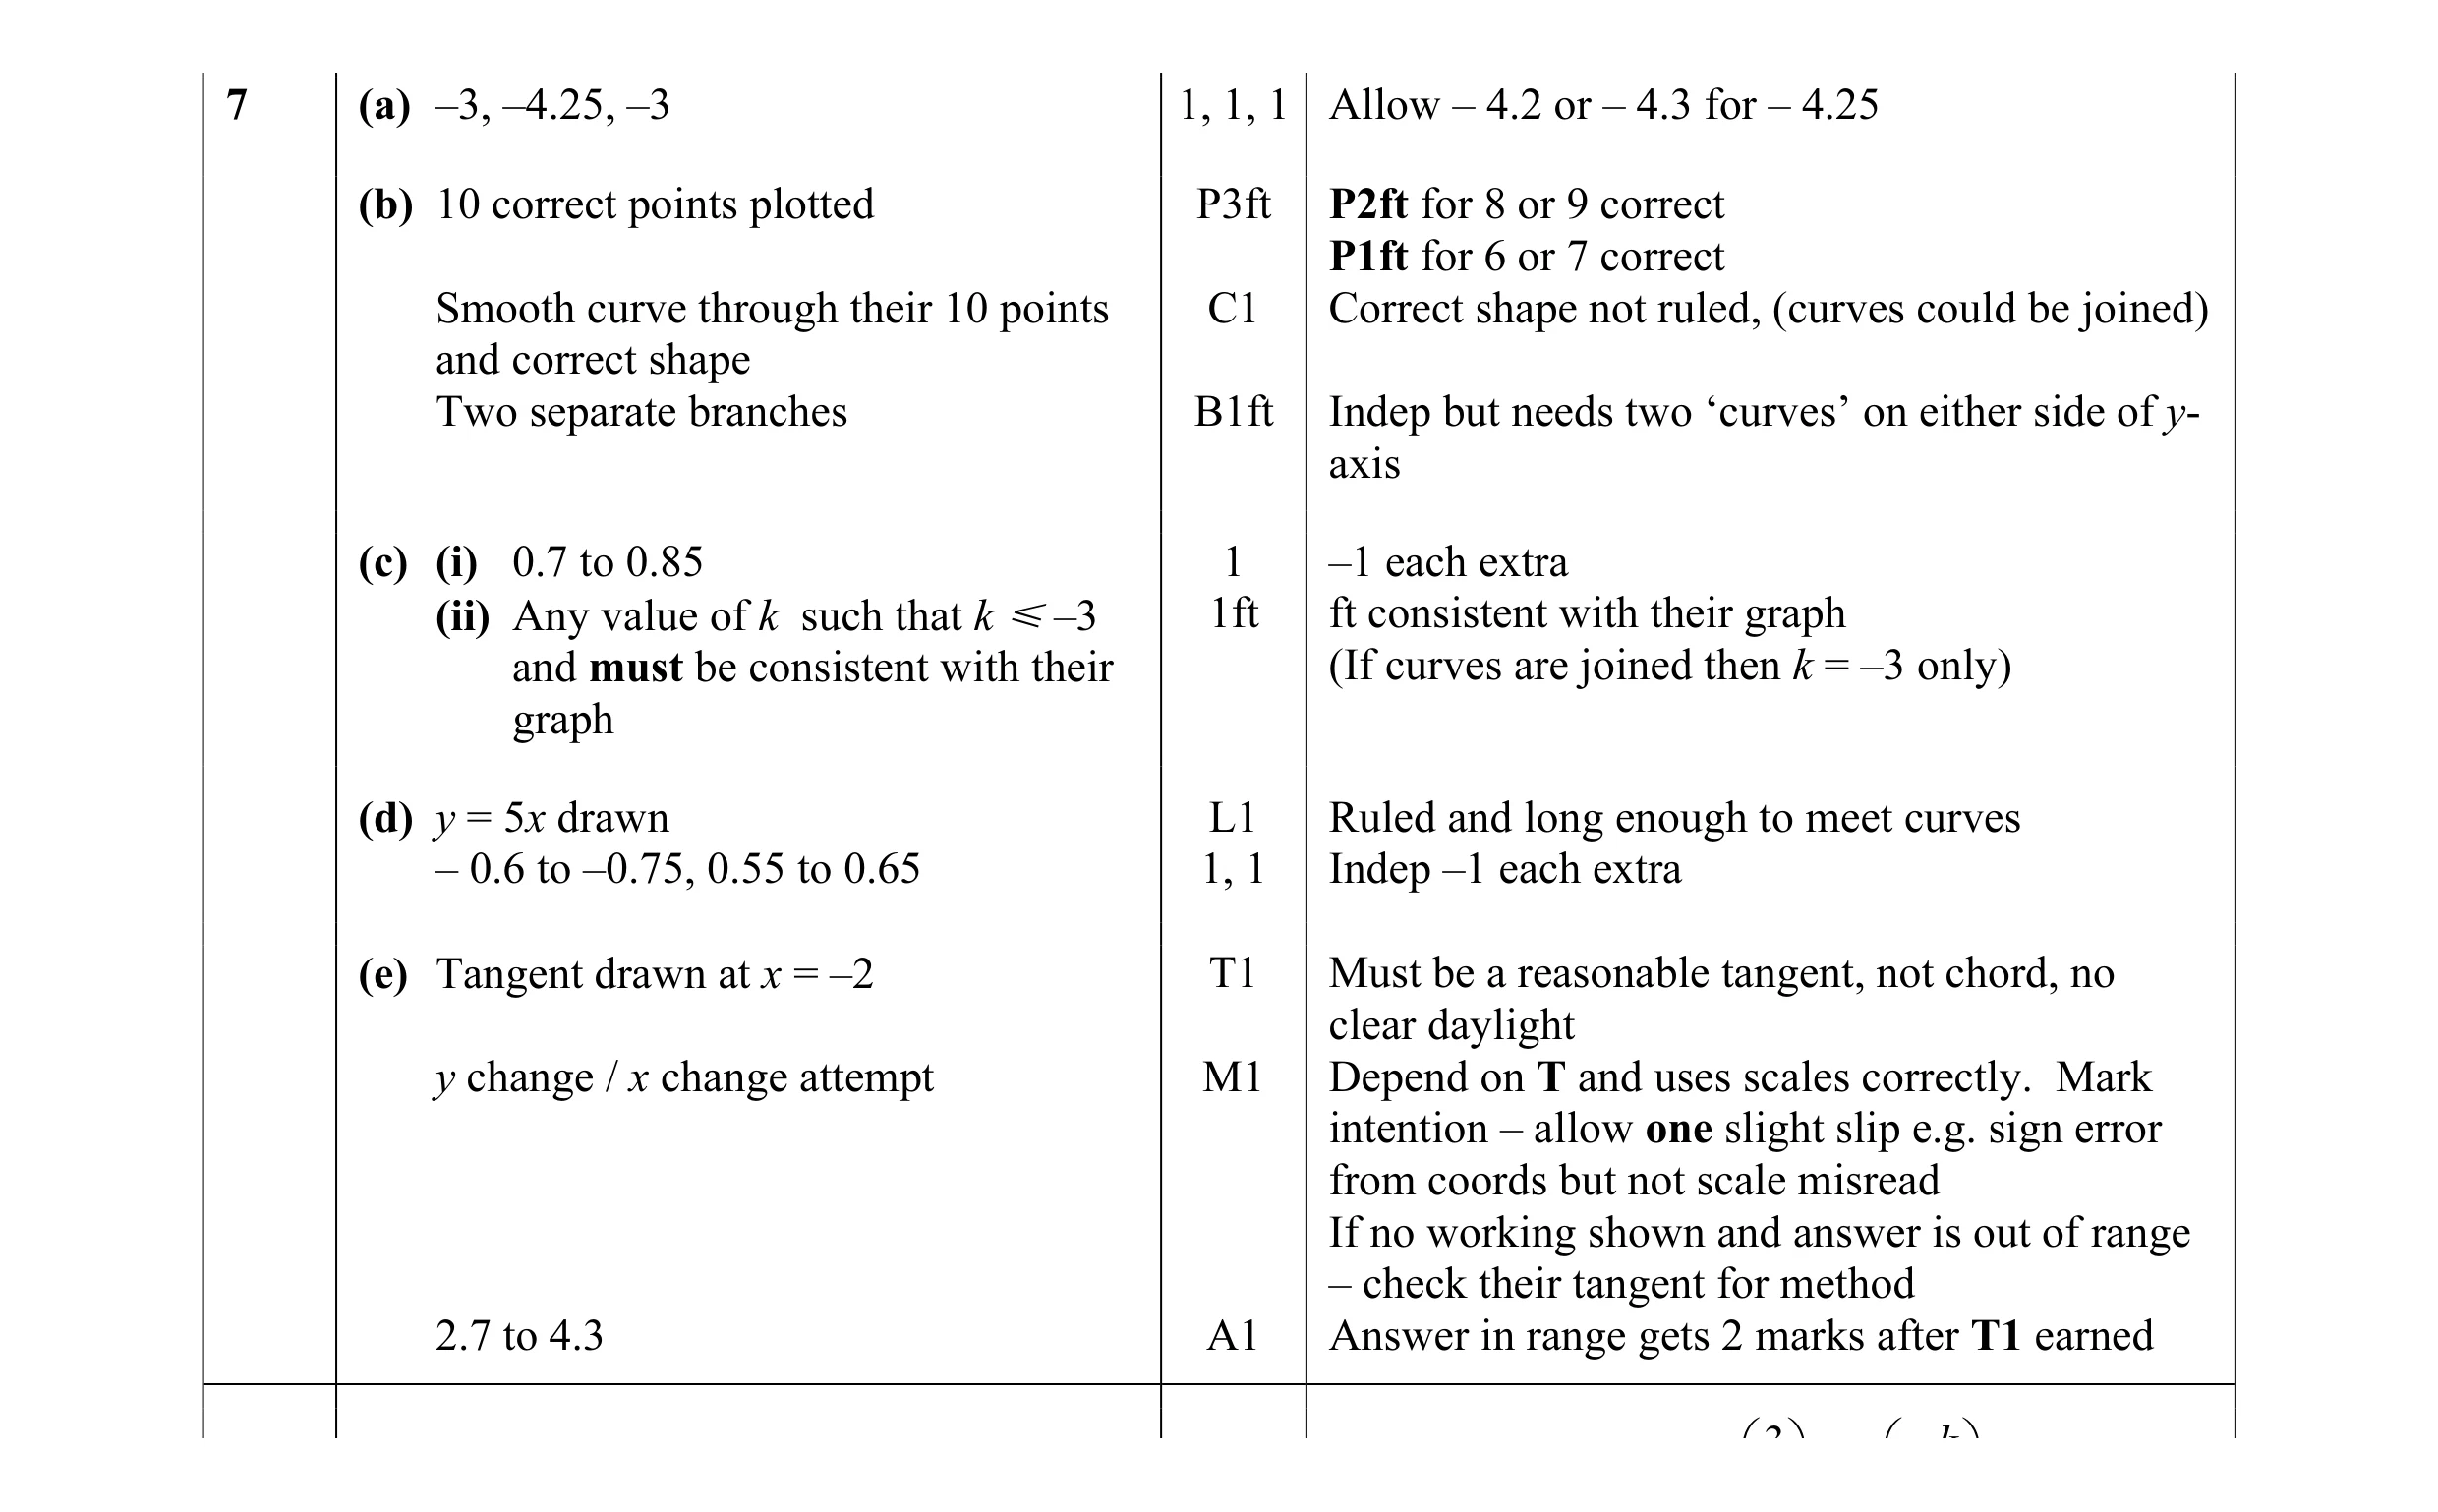 16
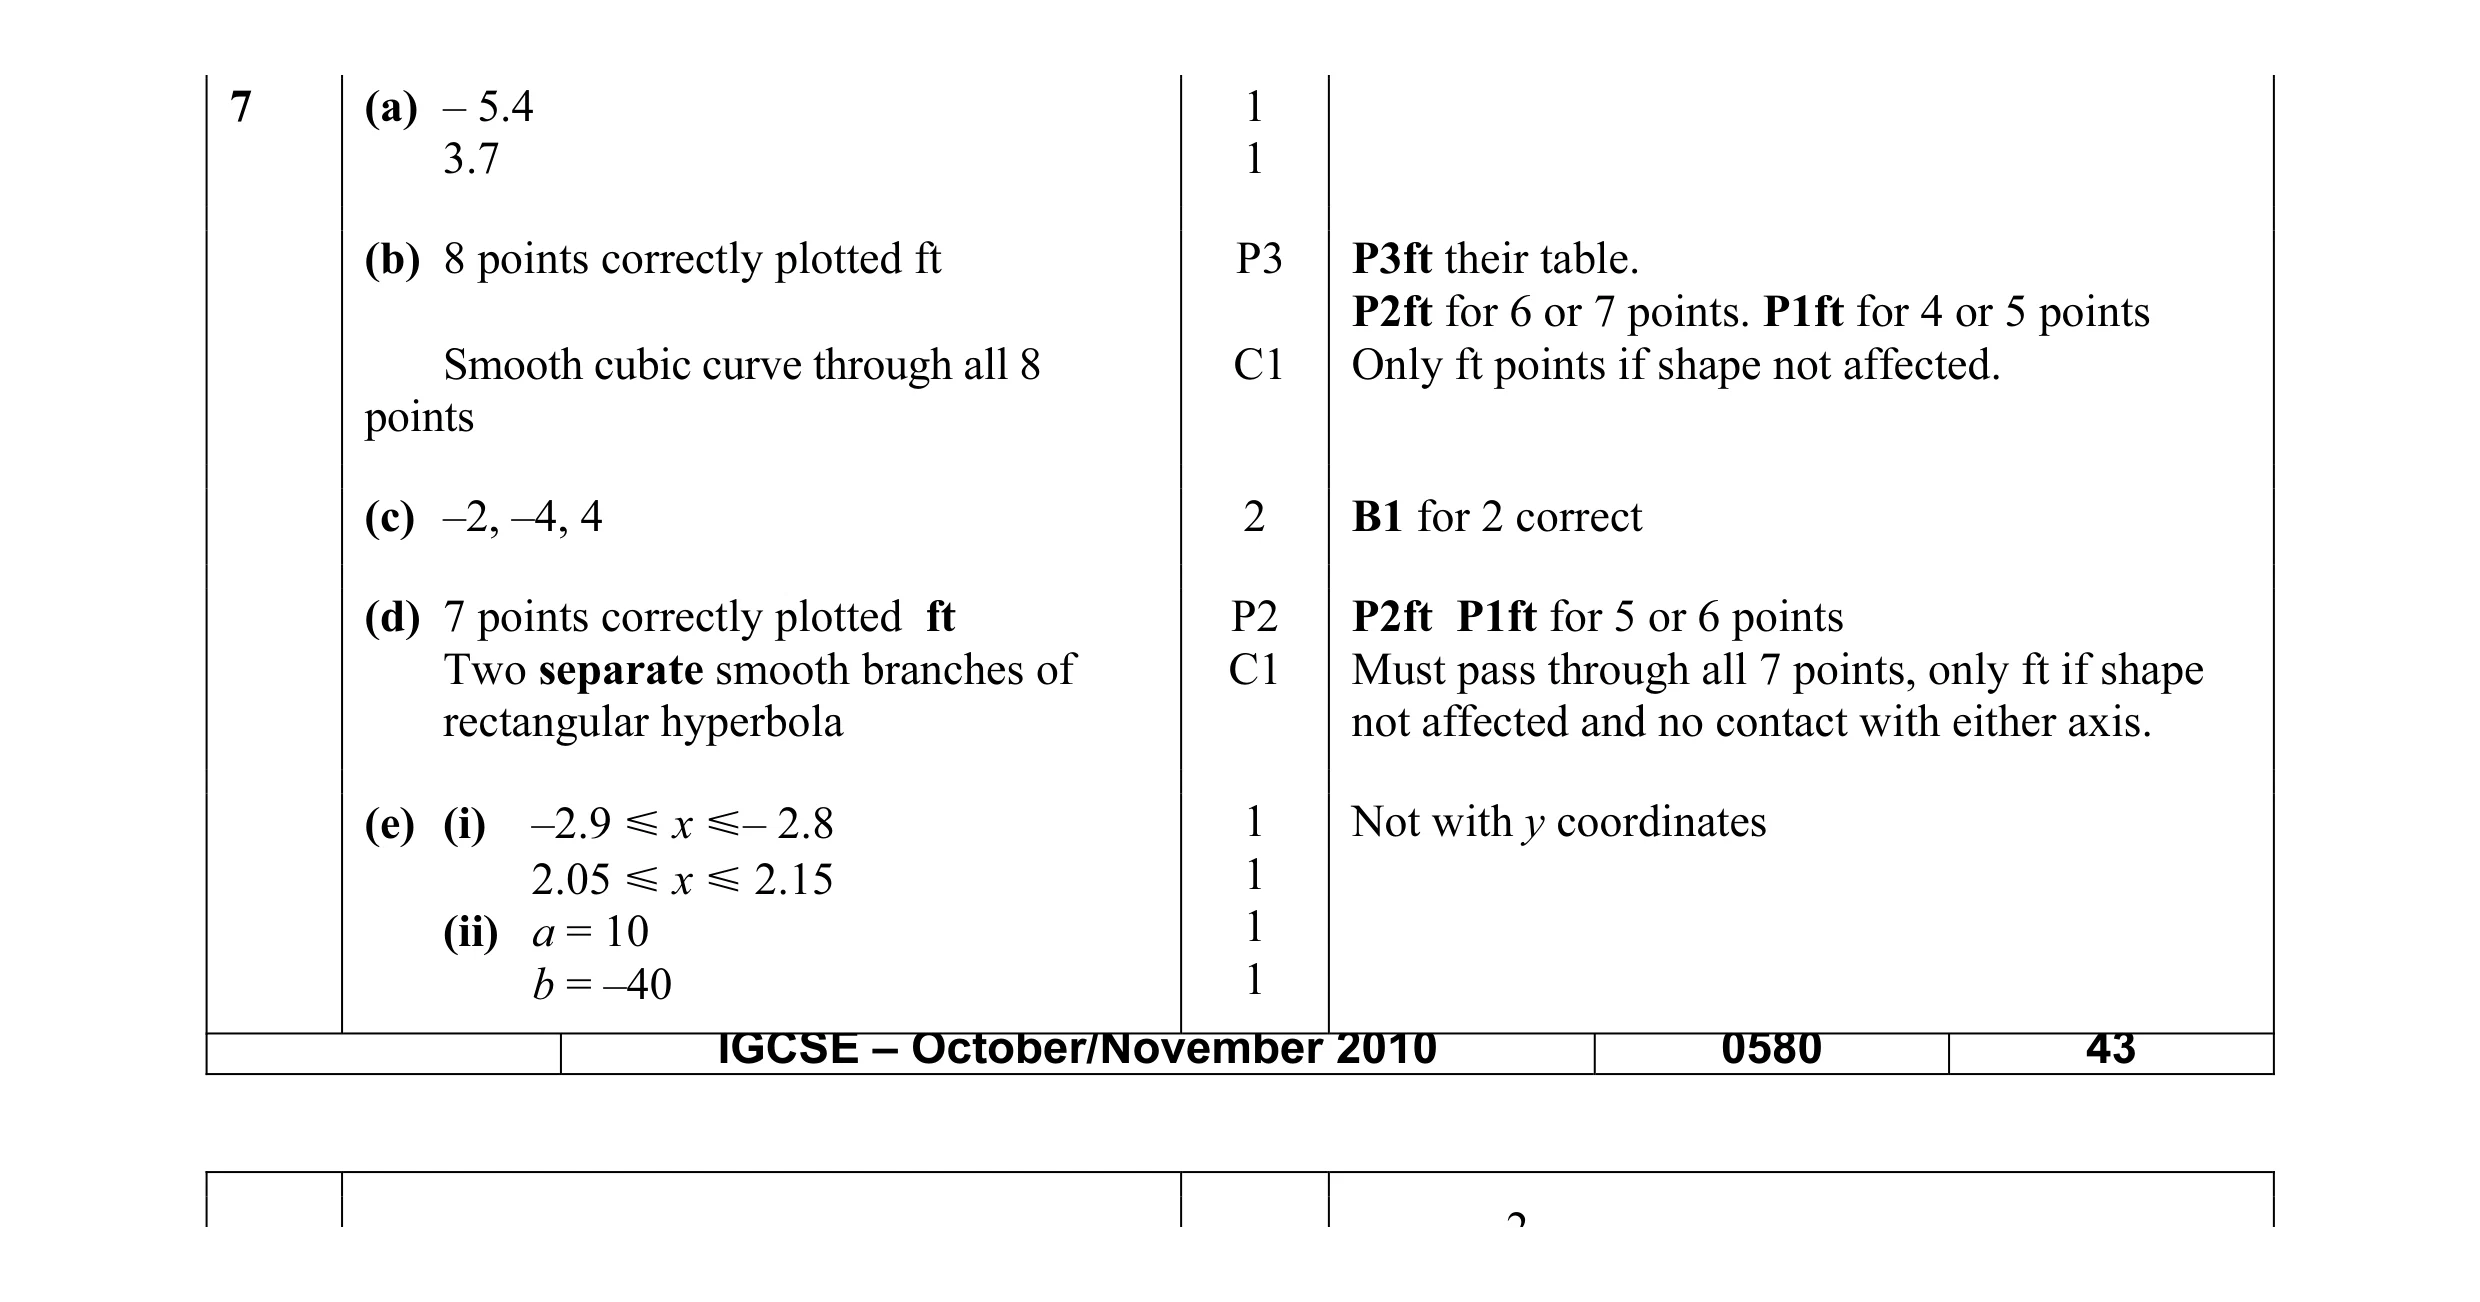 15
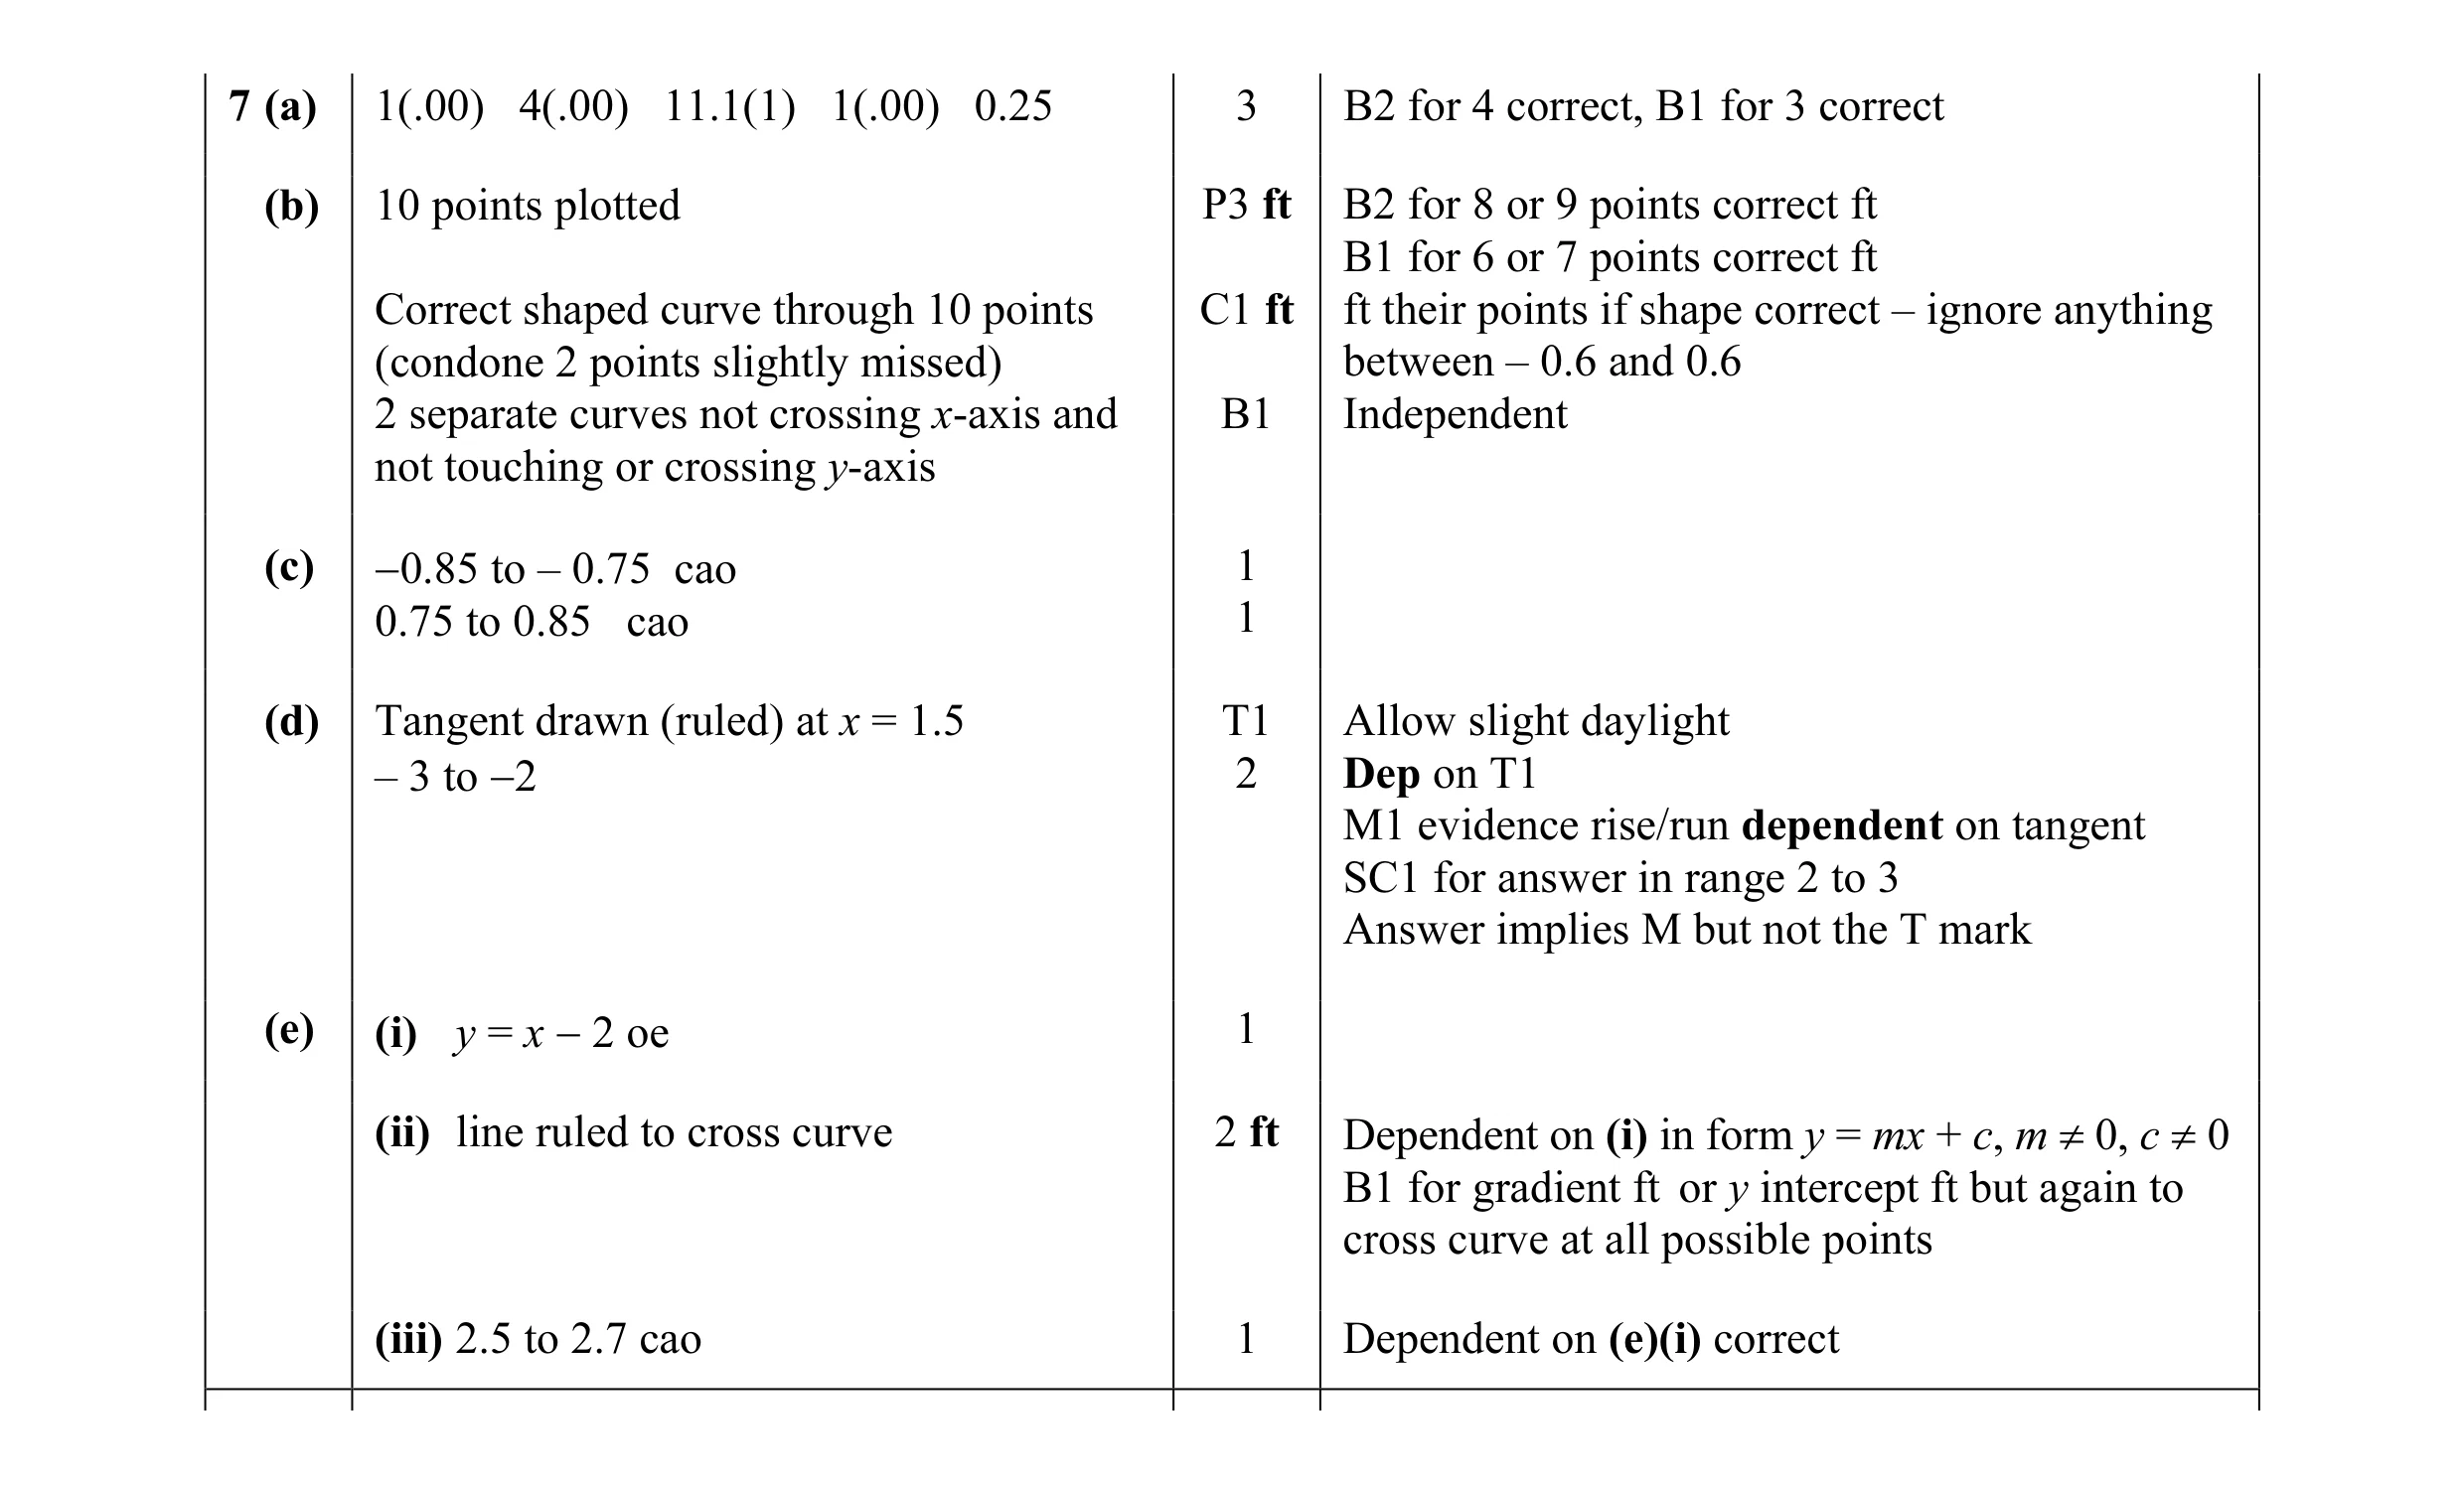 17
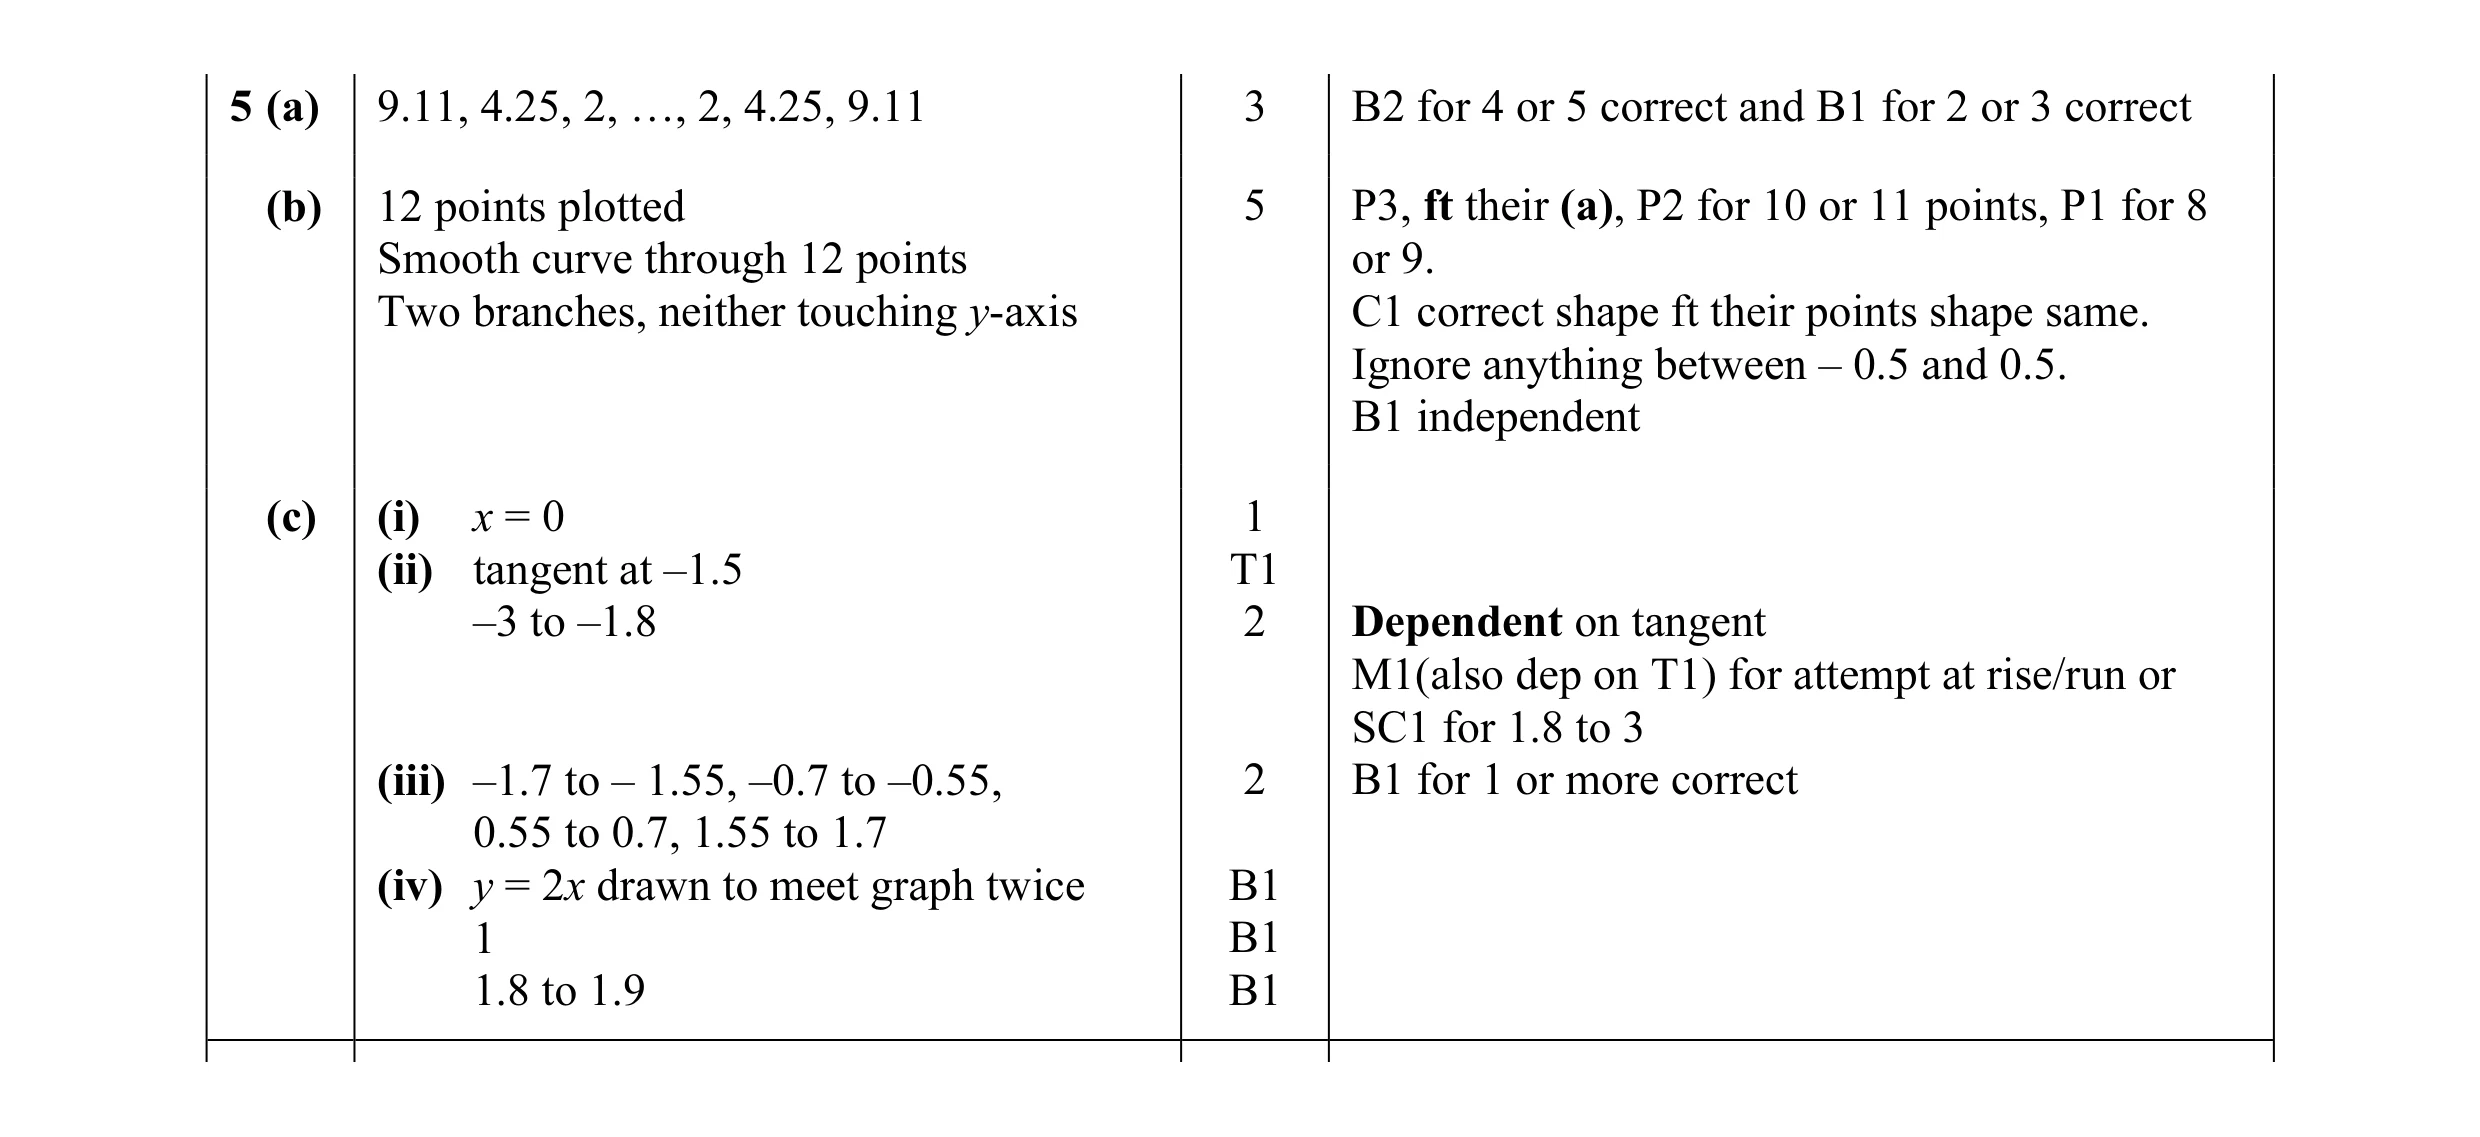 17
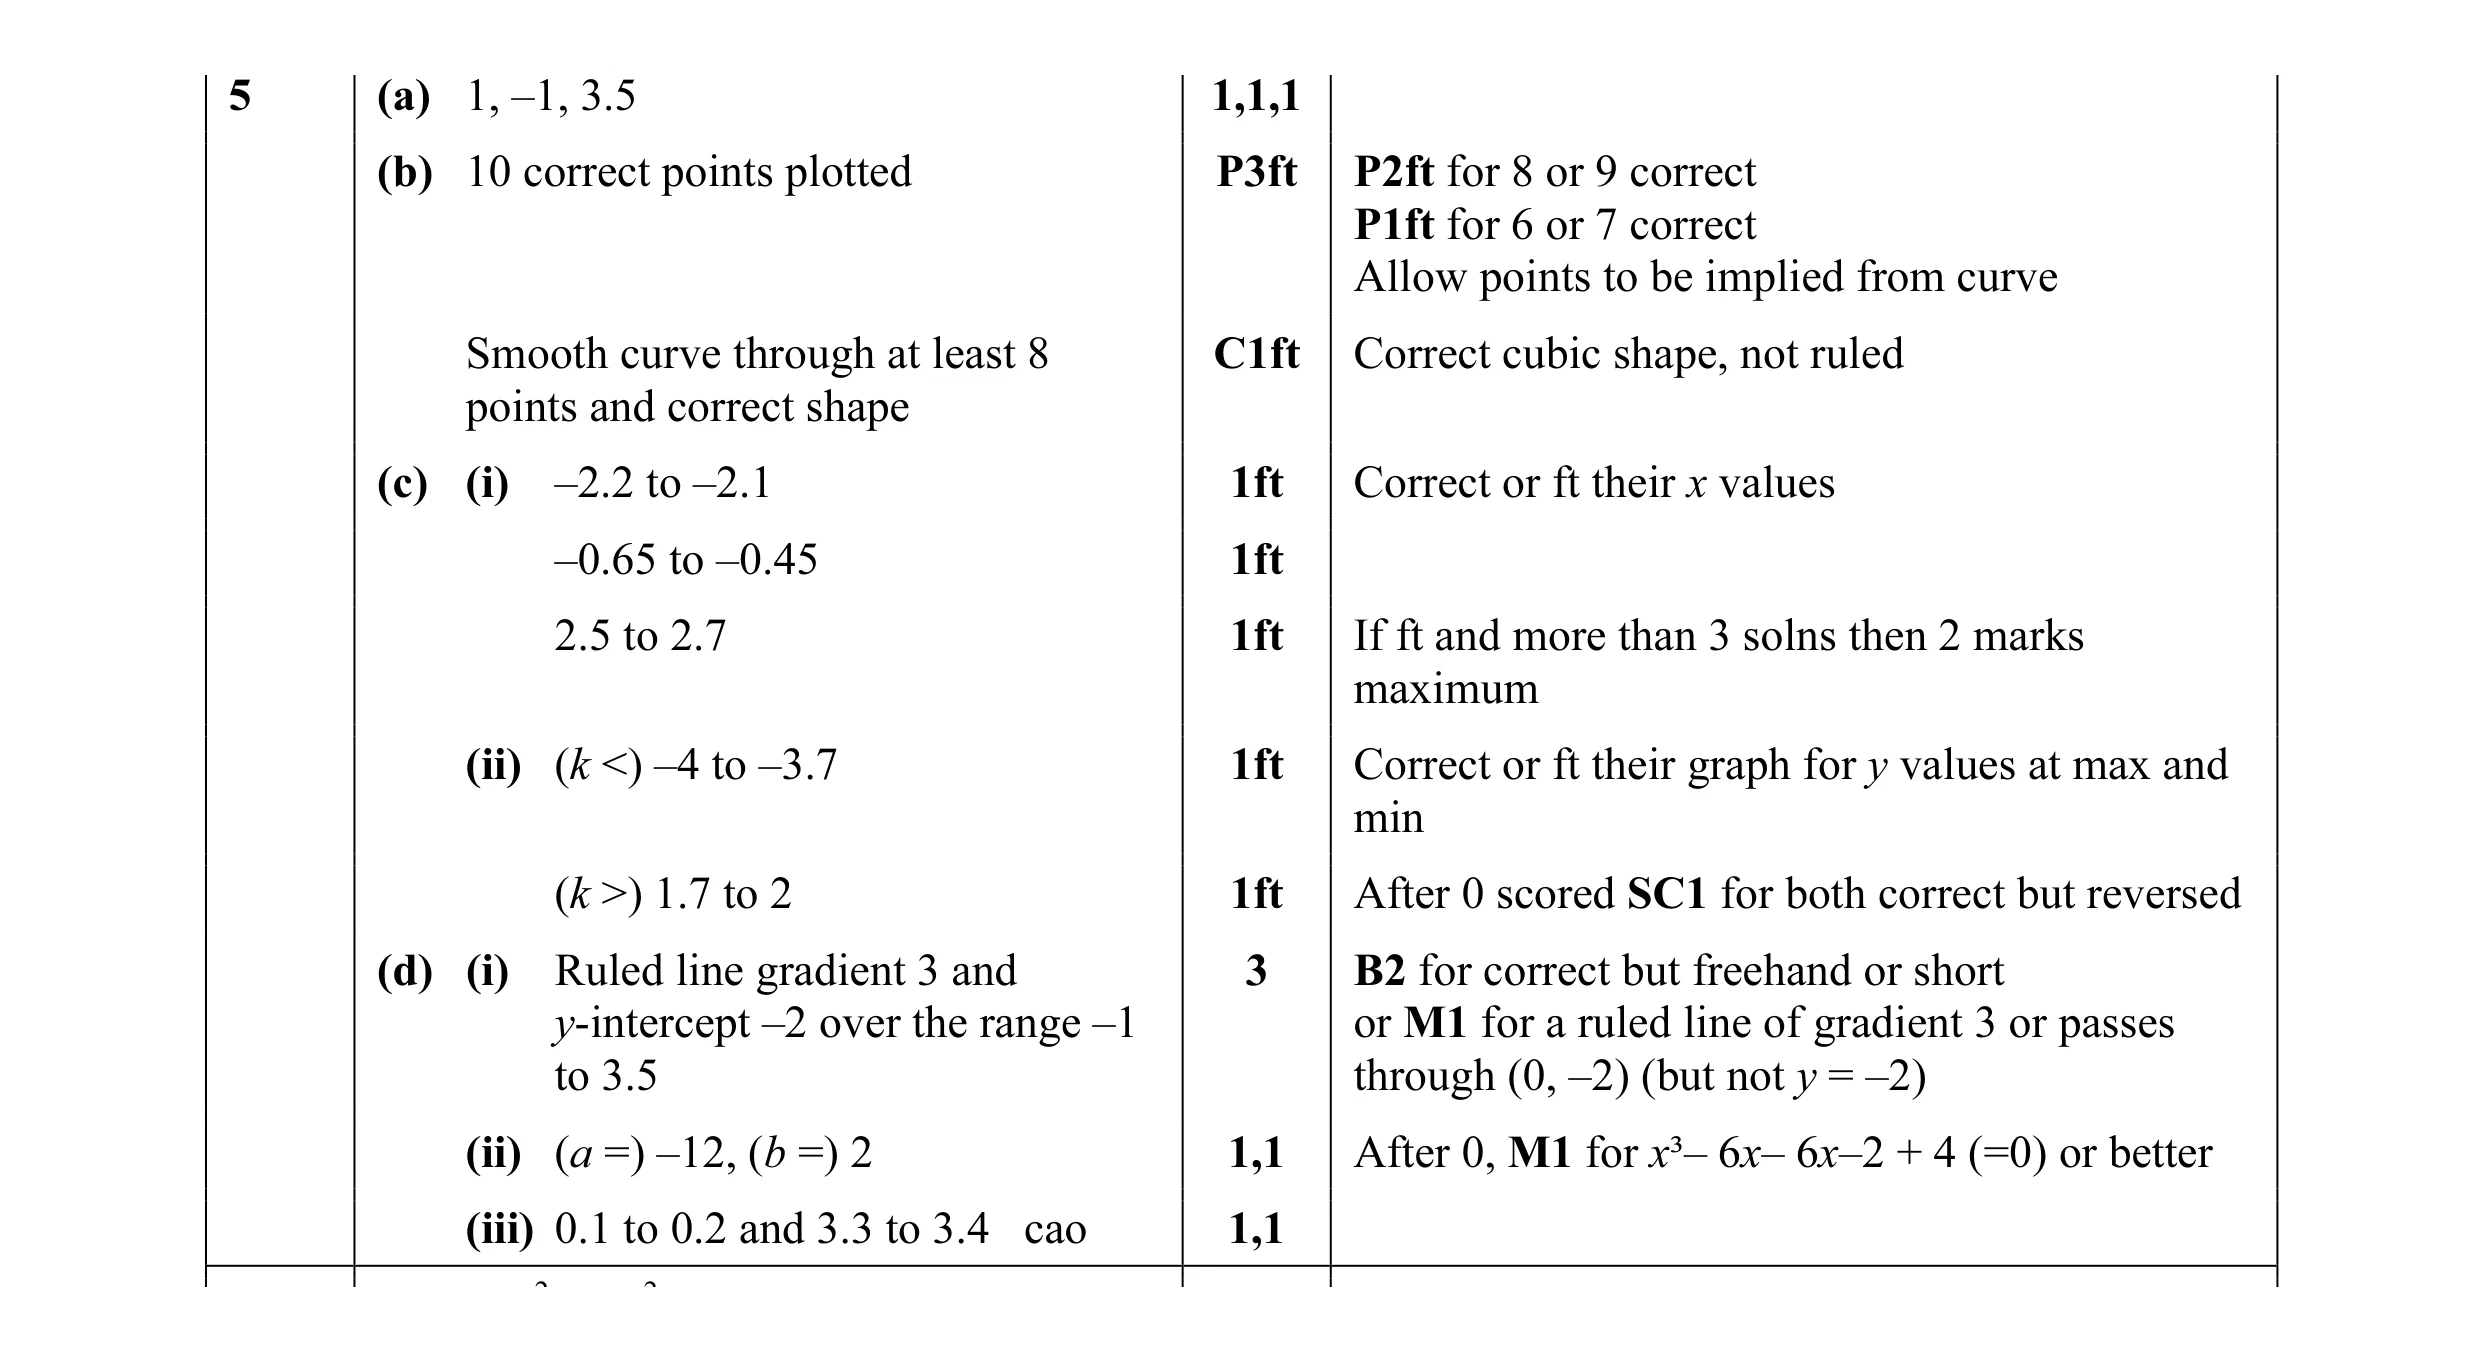 19
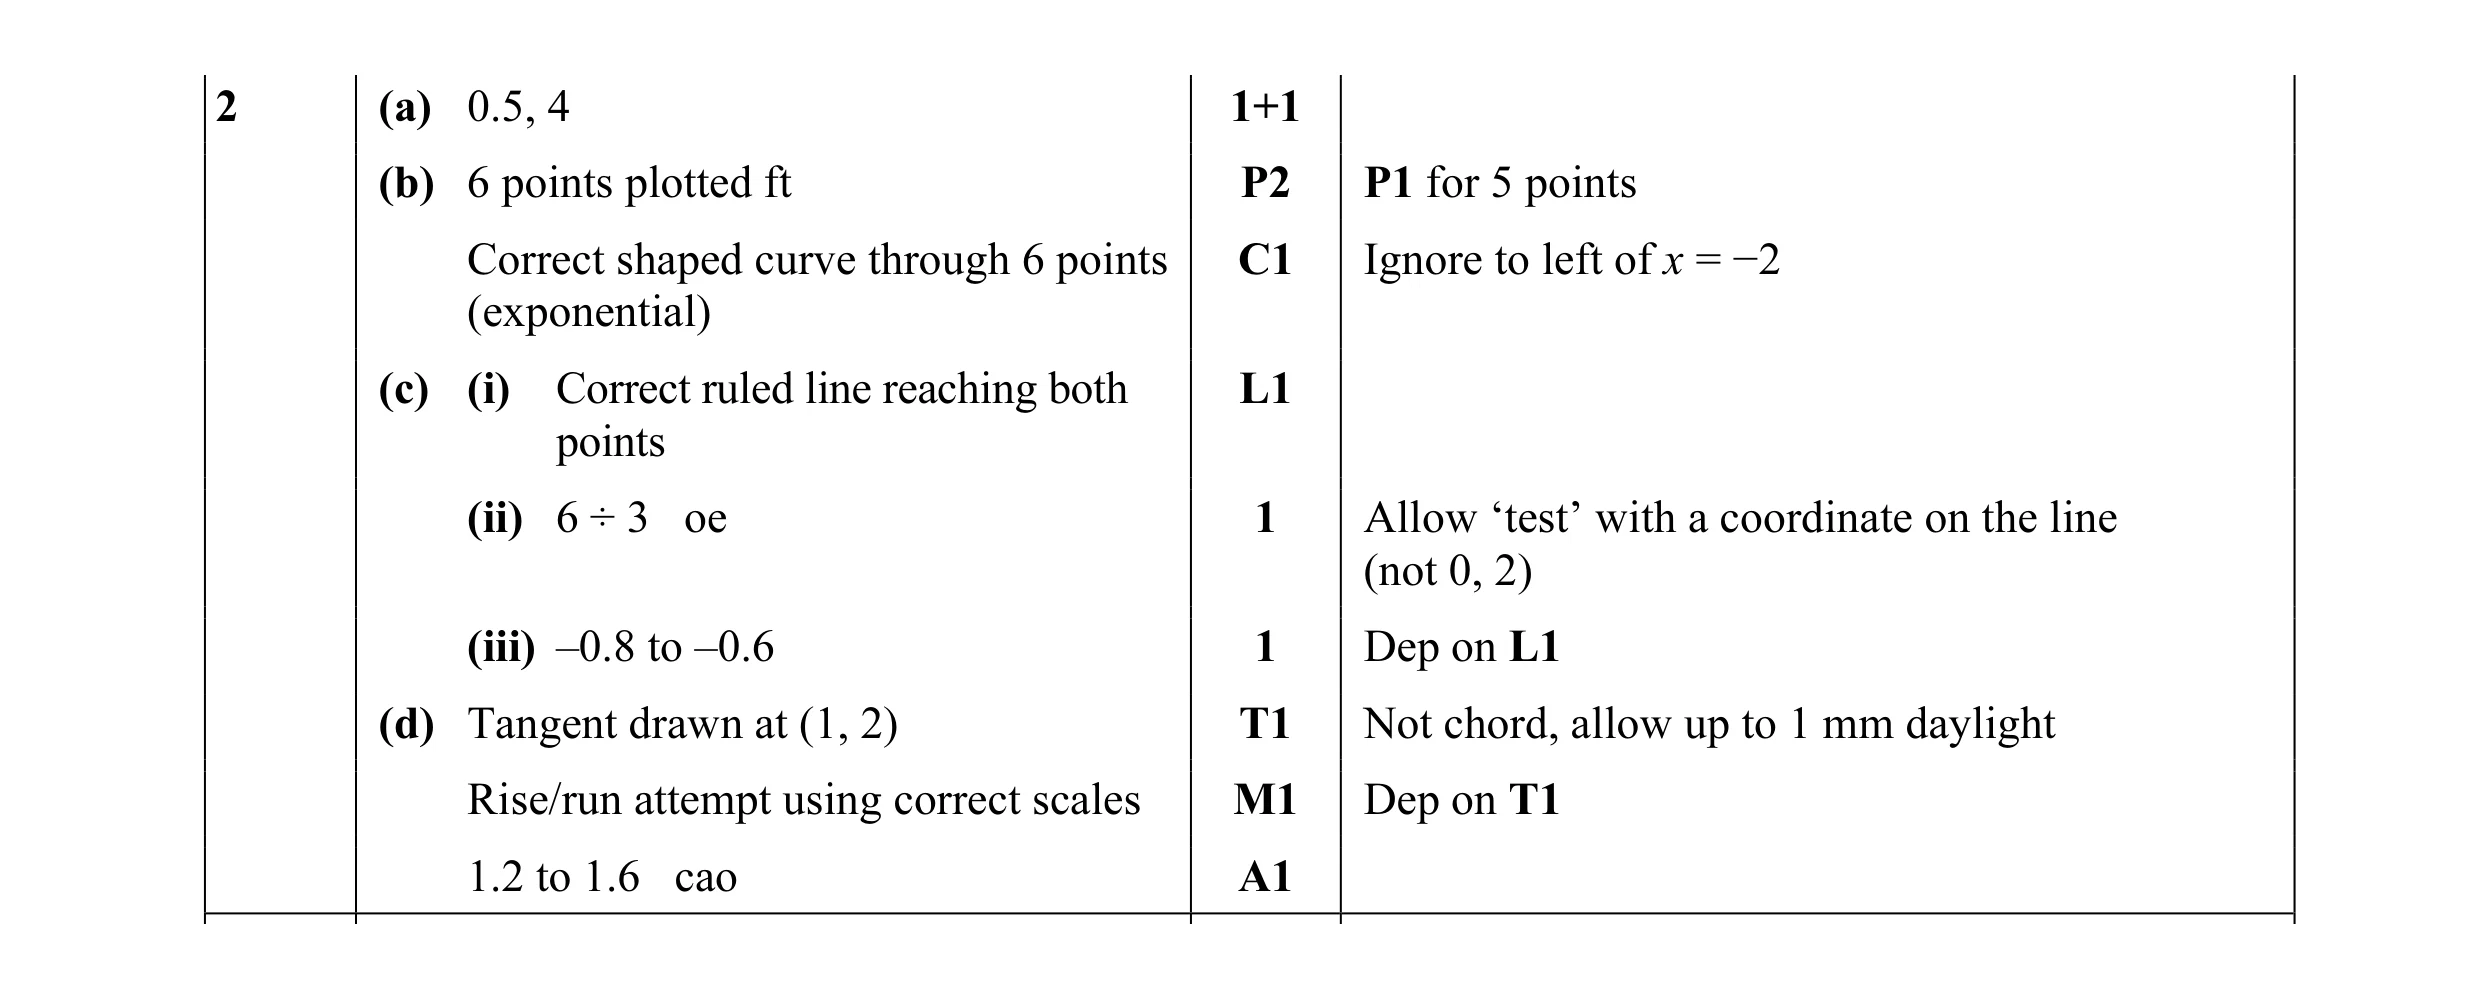 11
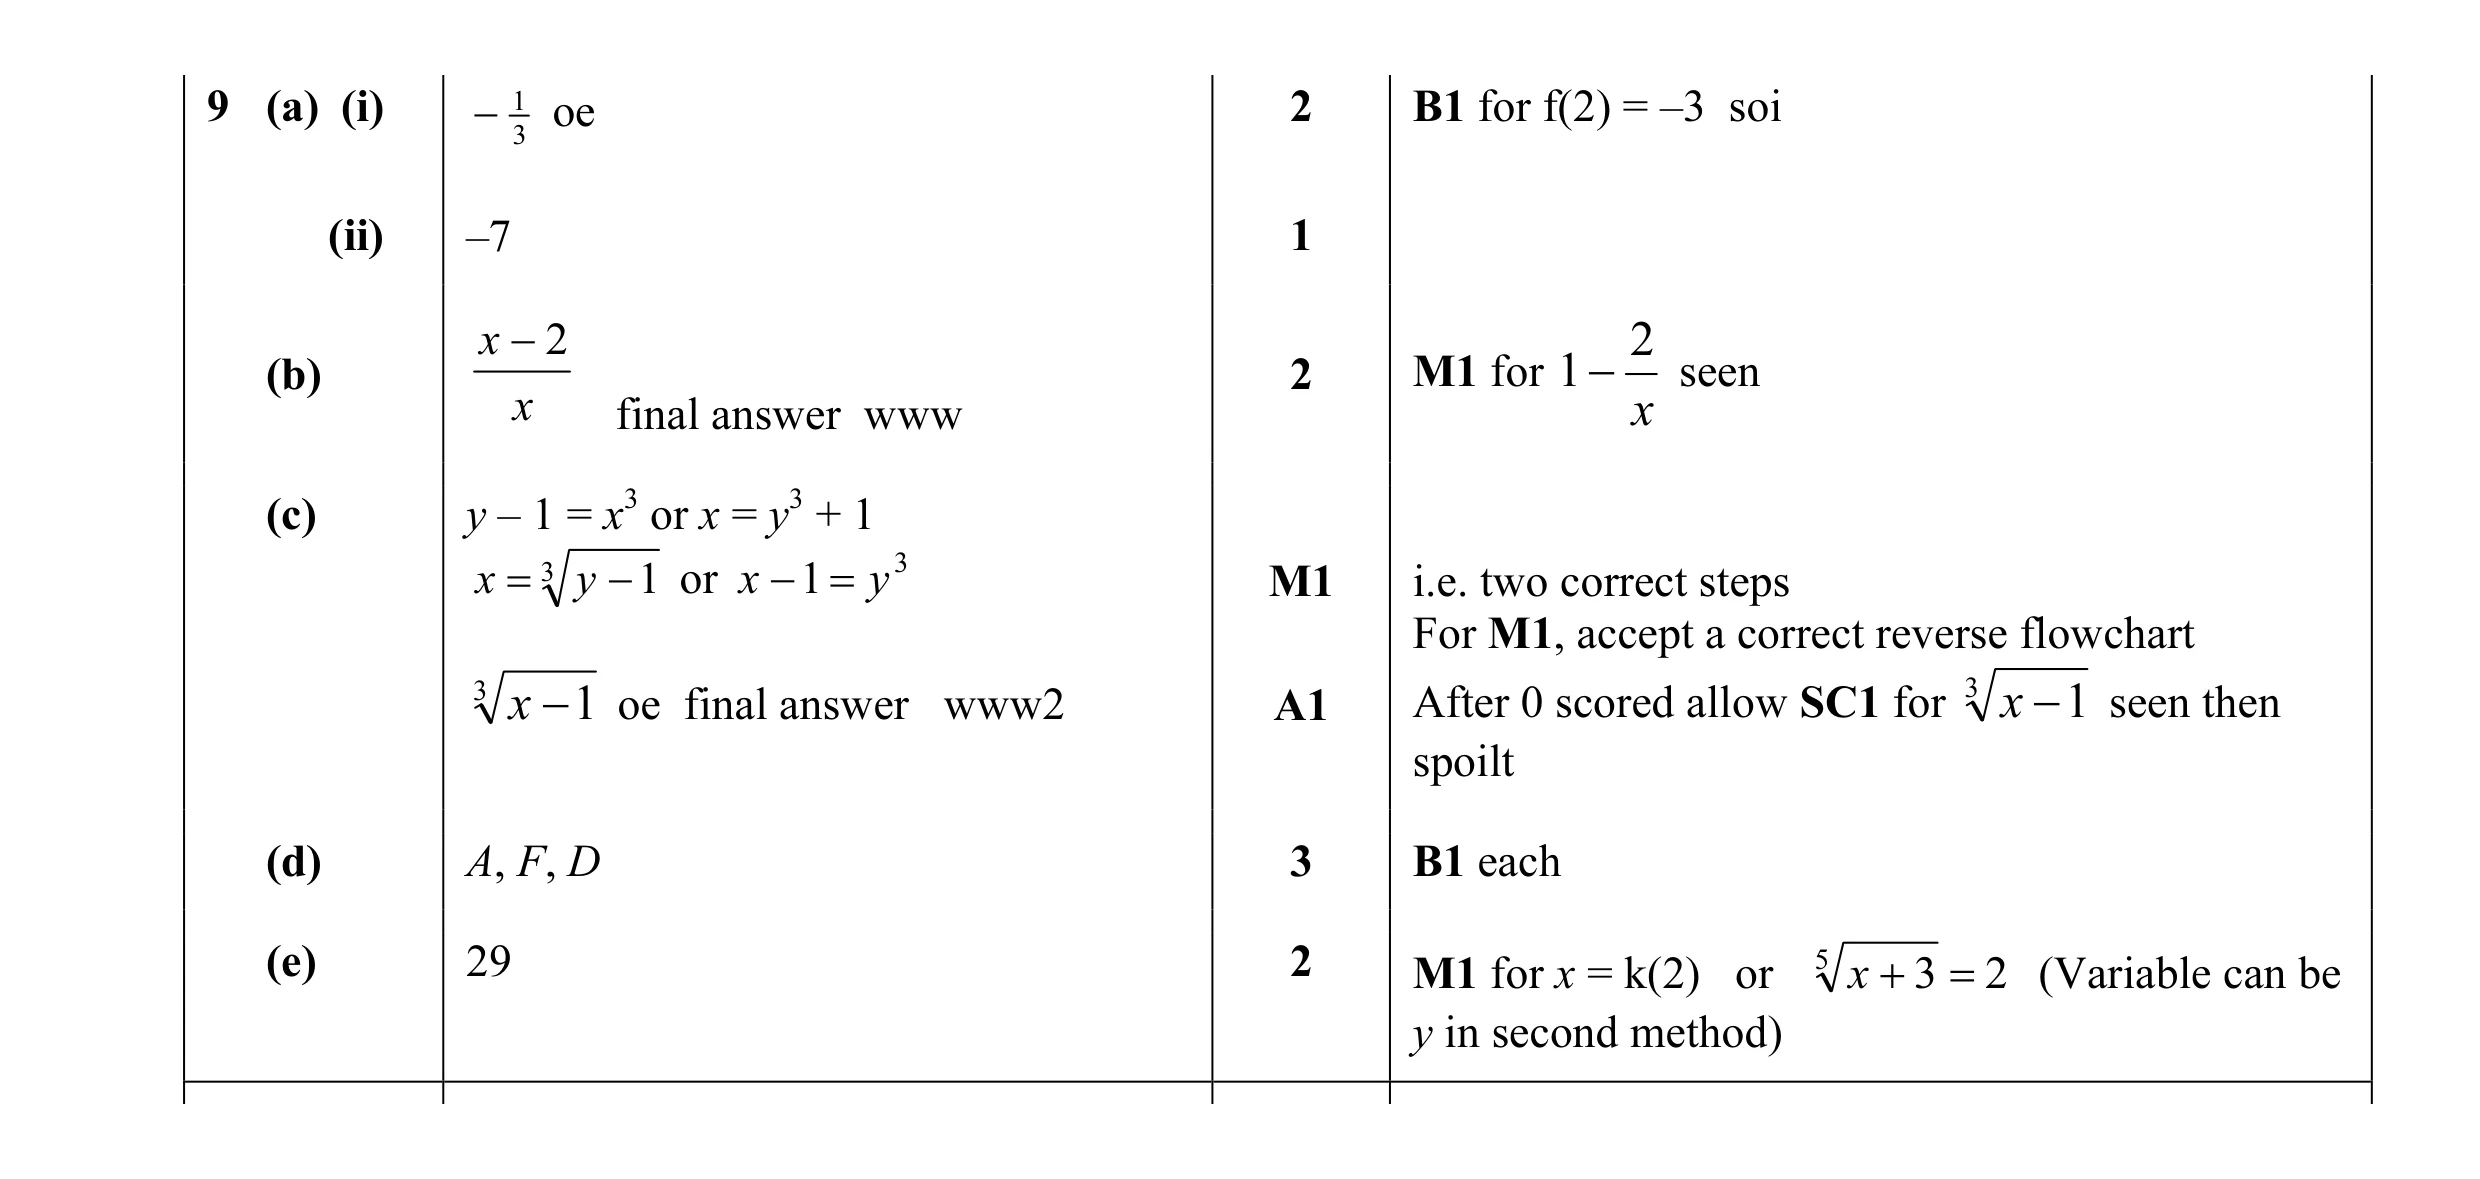 12
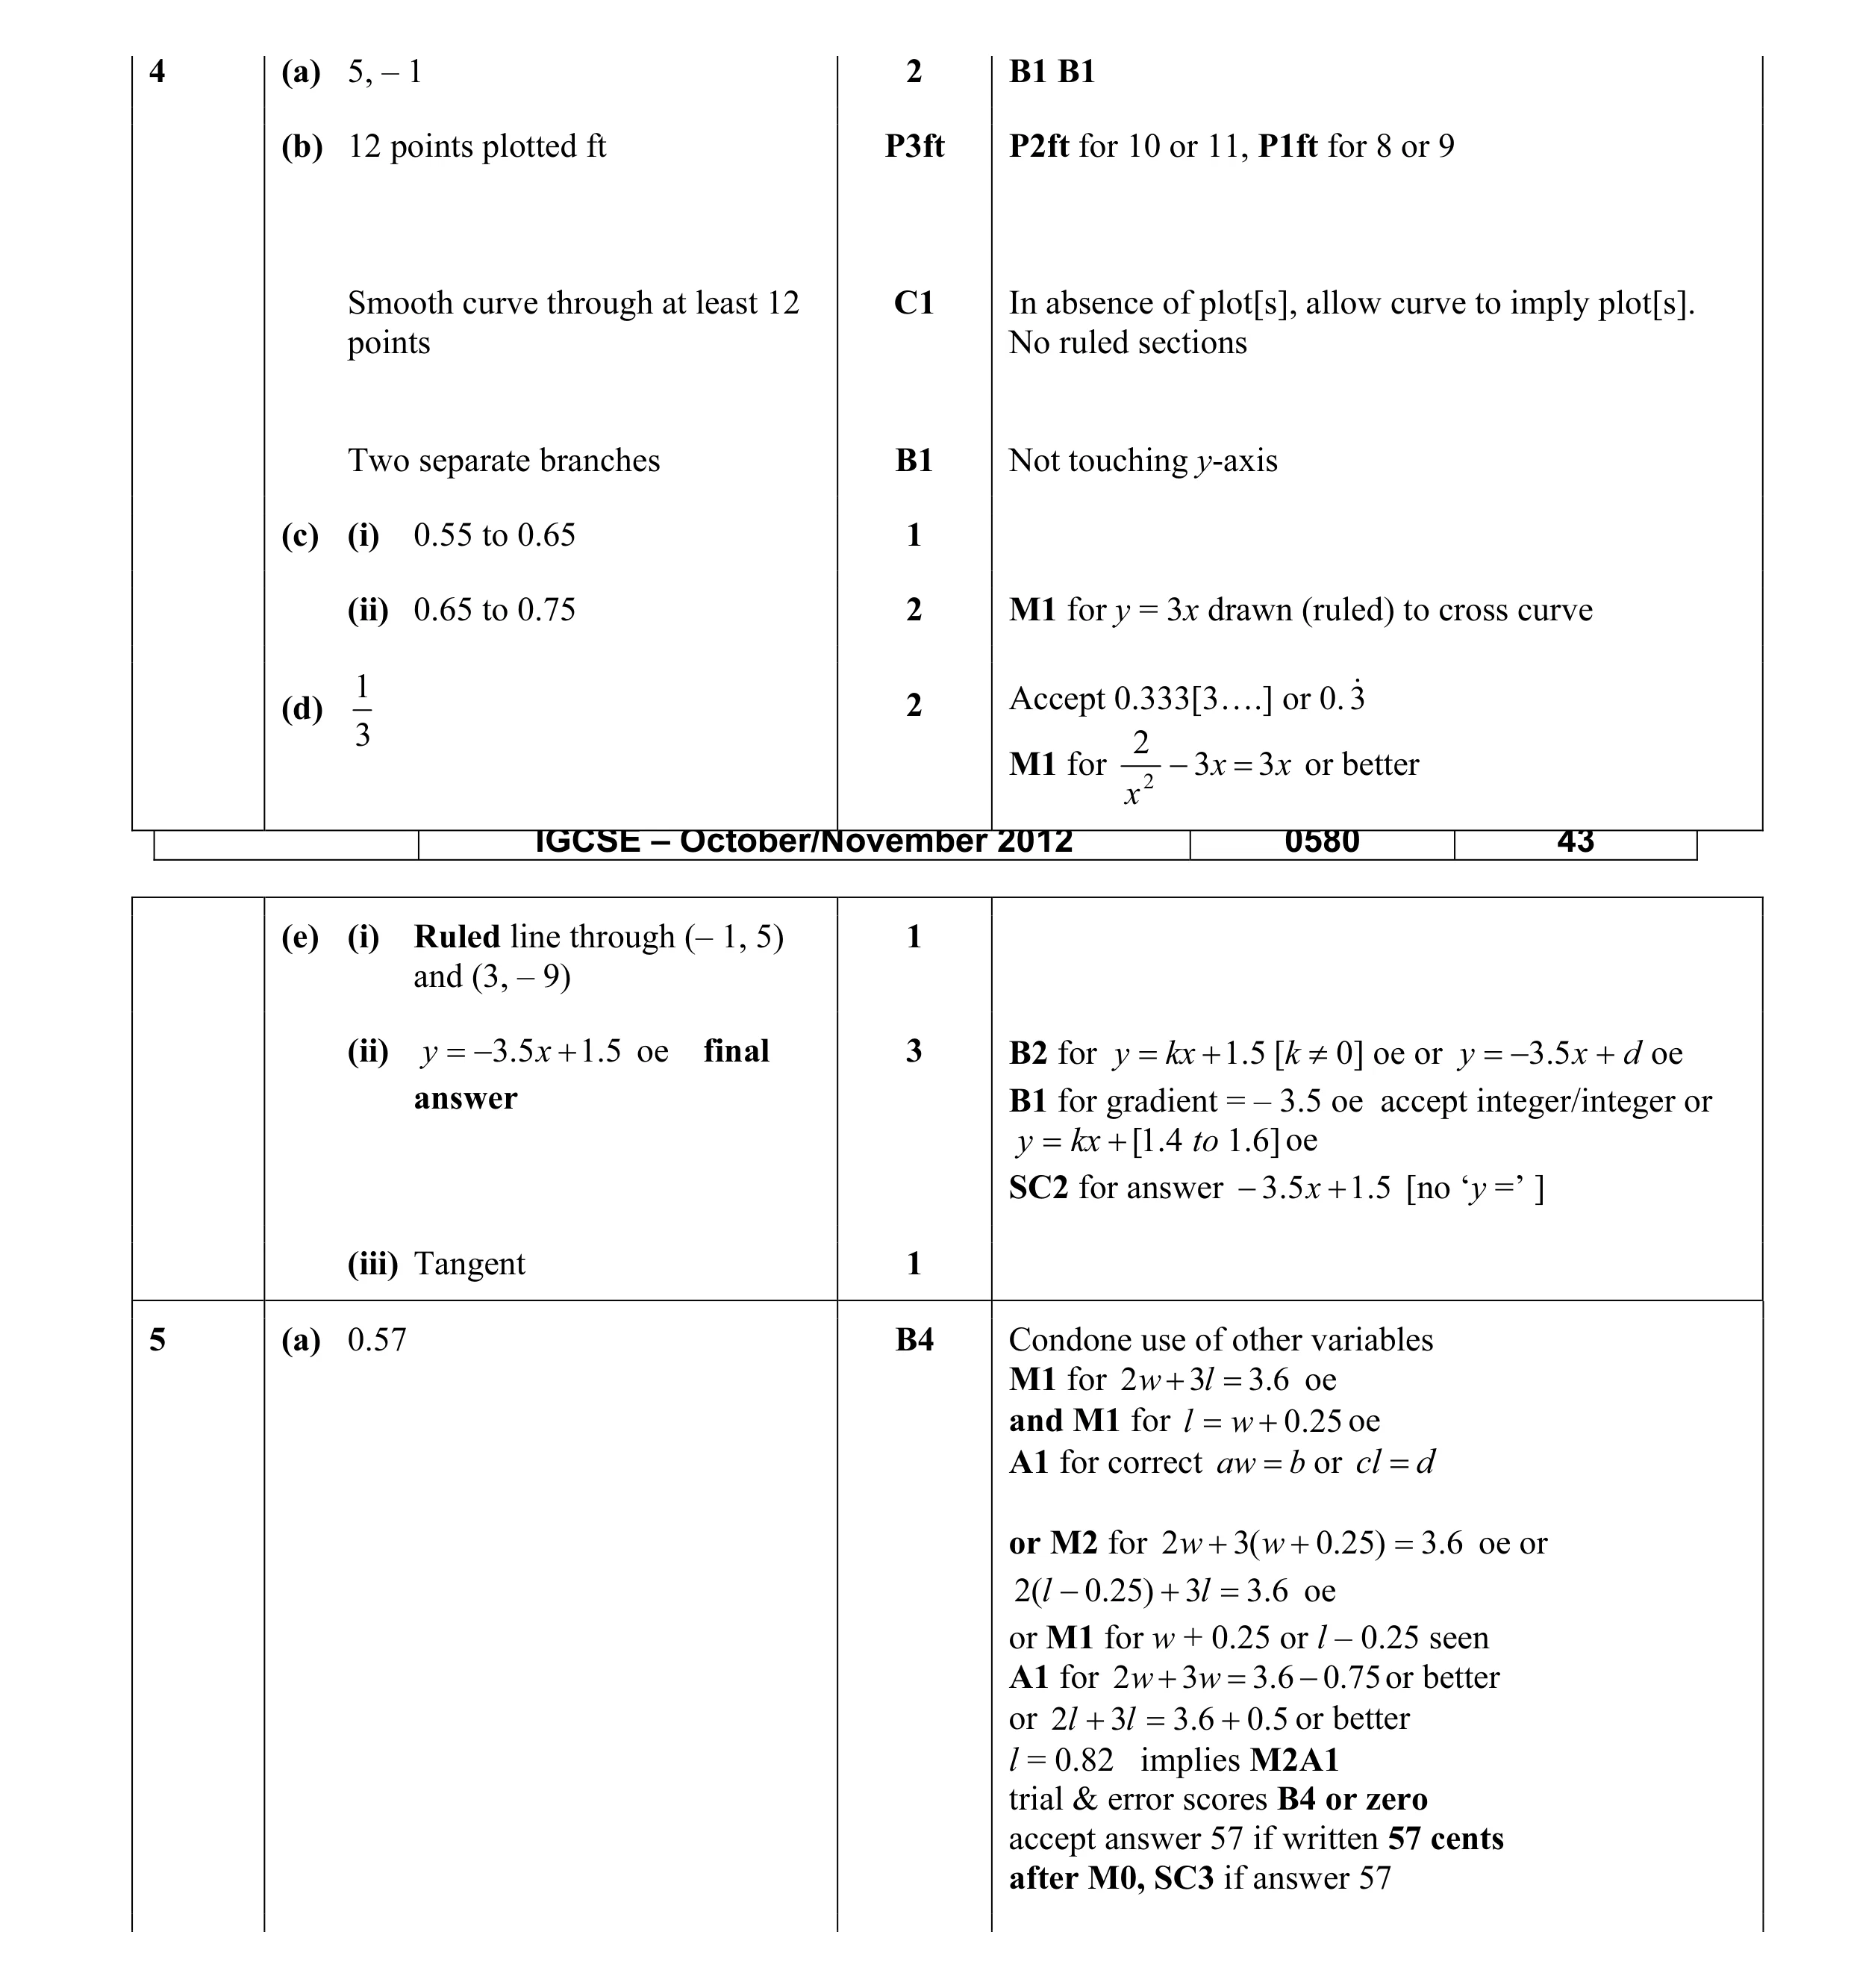 17
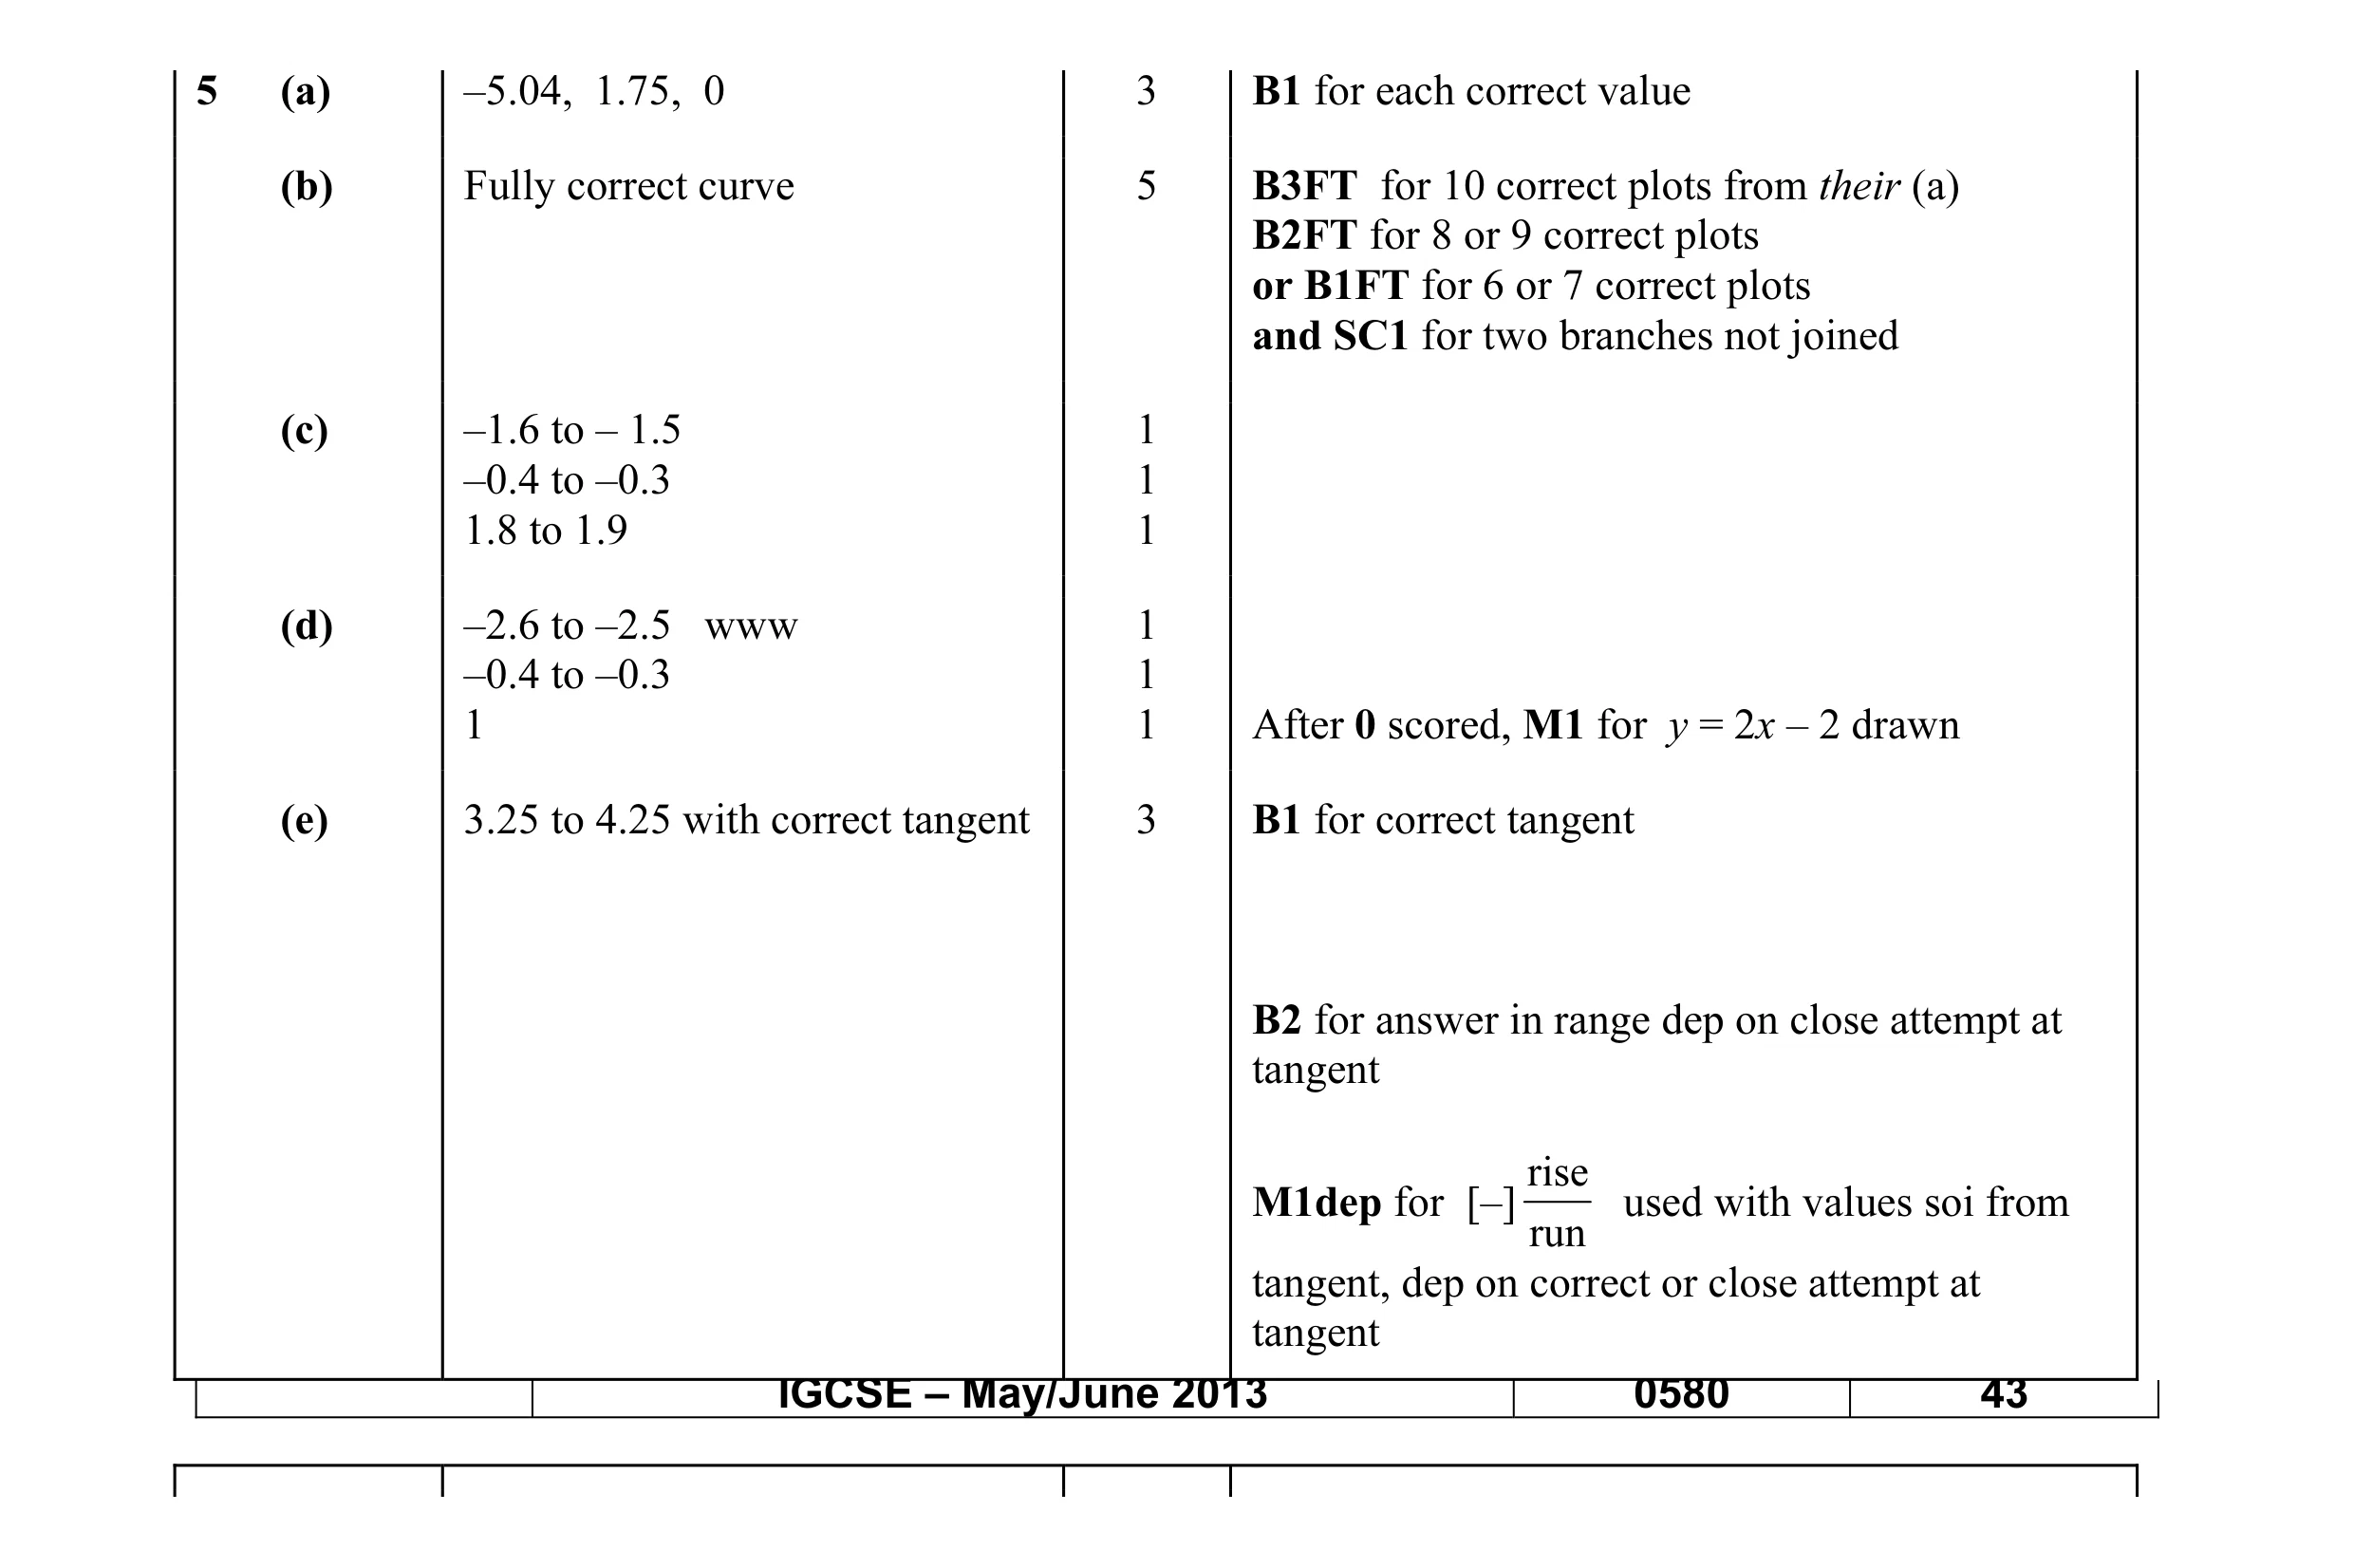 17
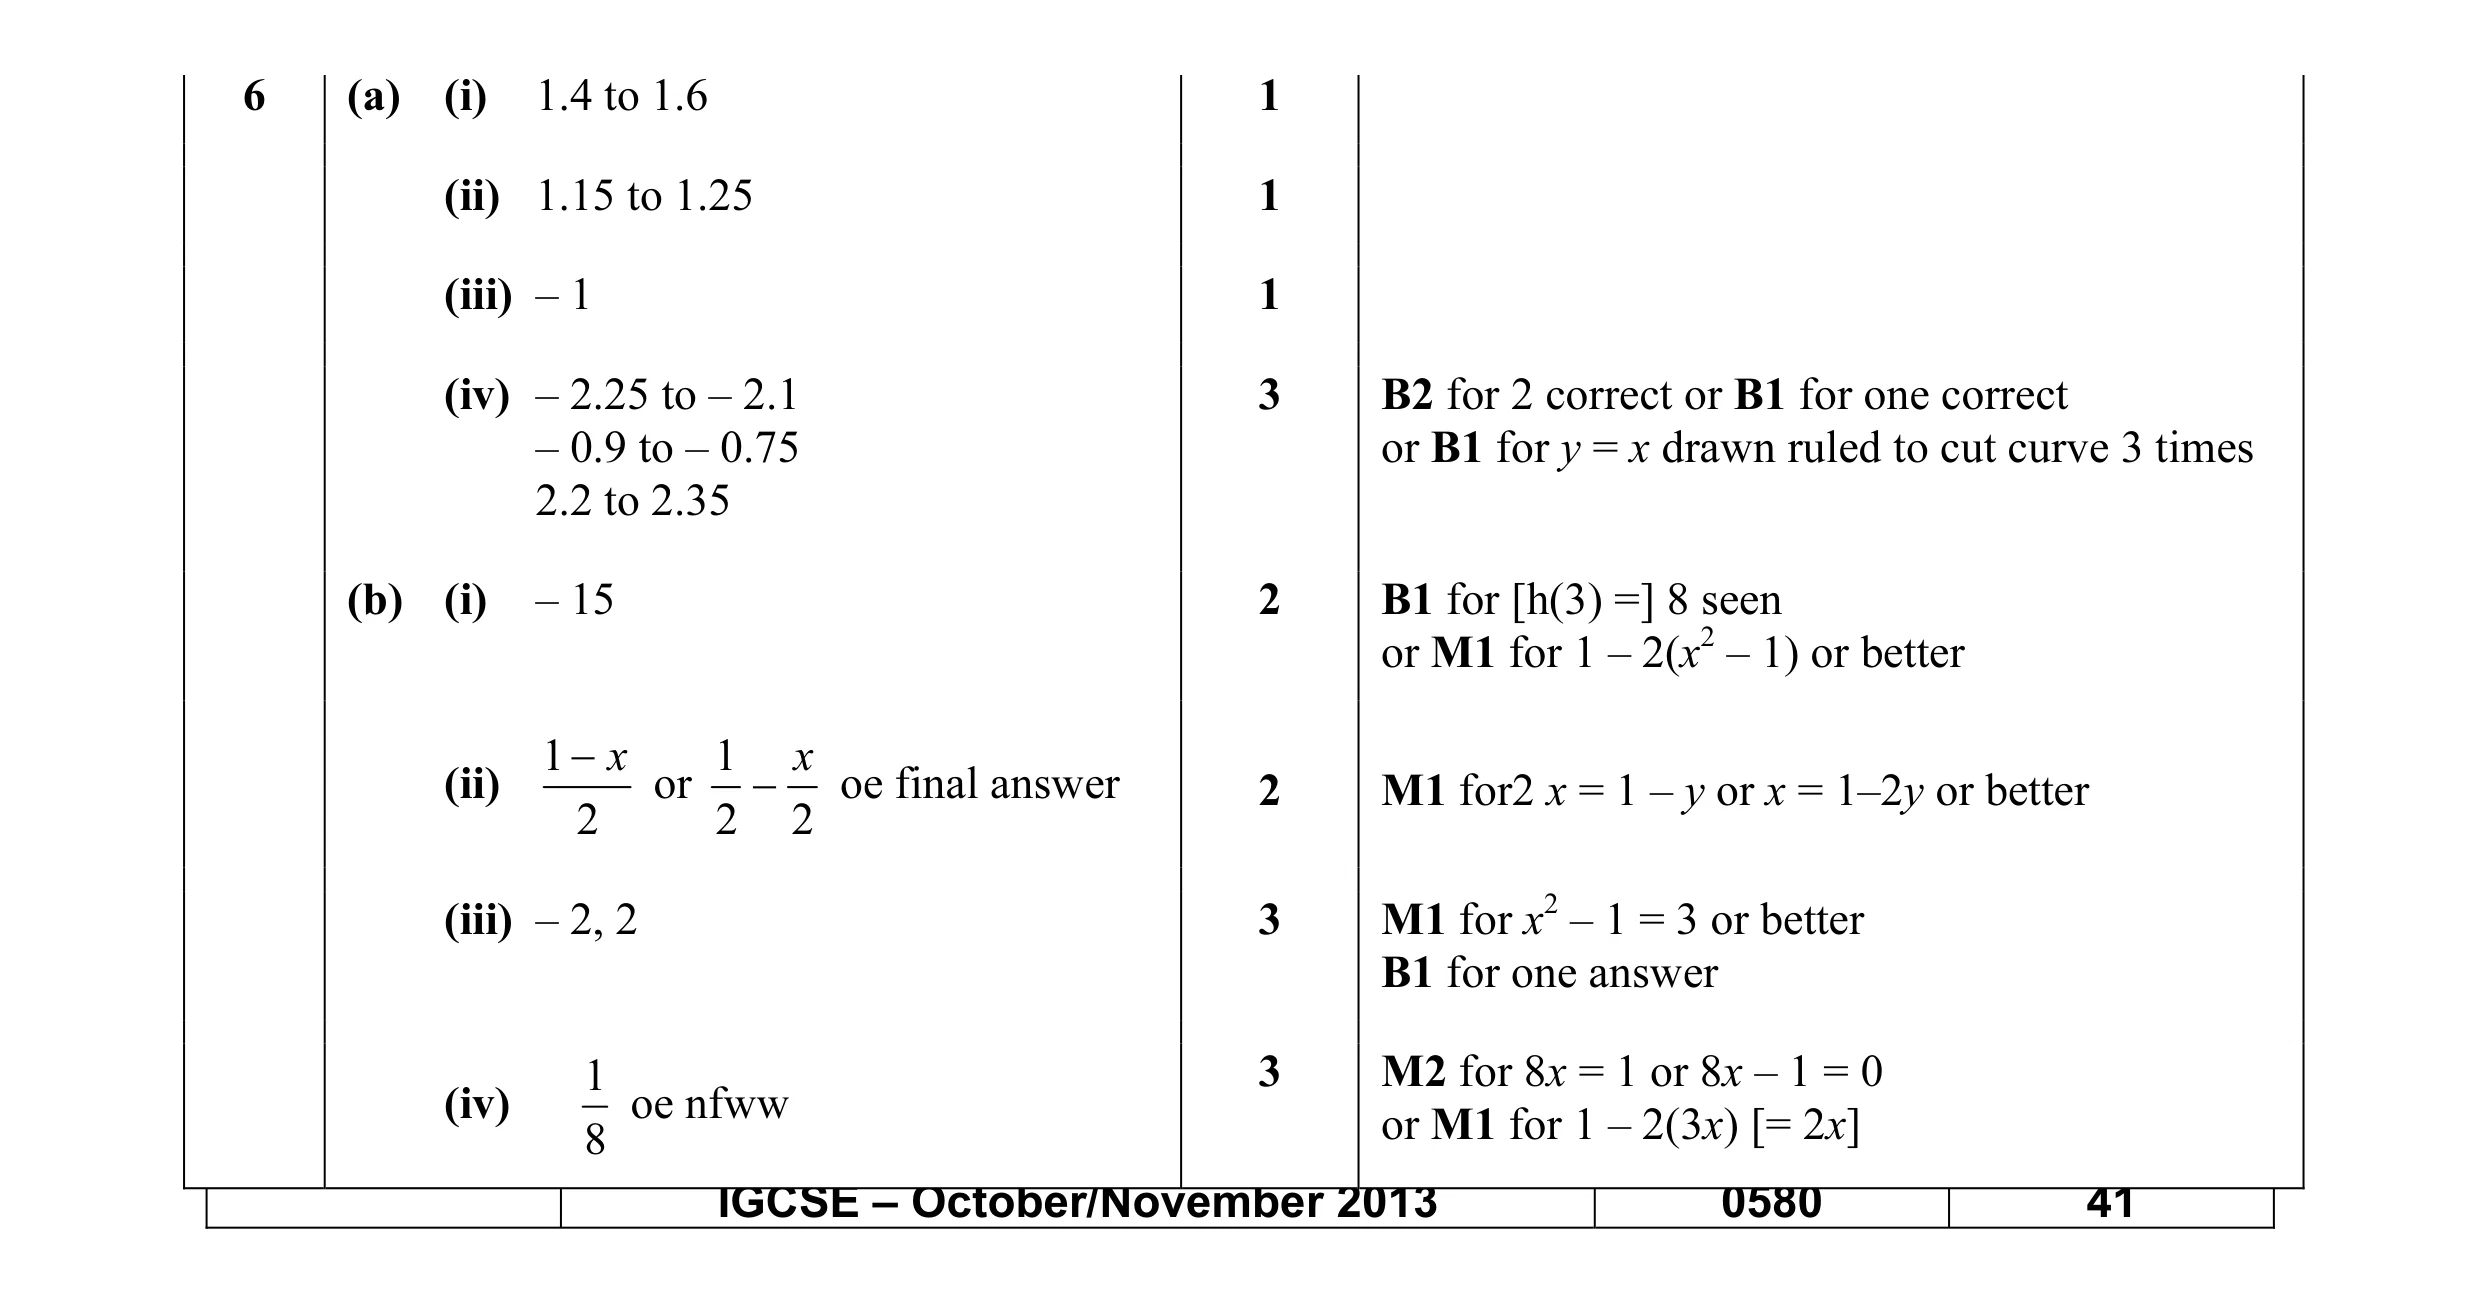 16
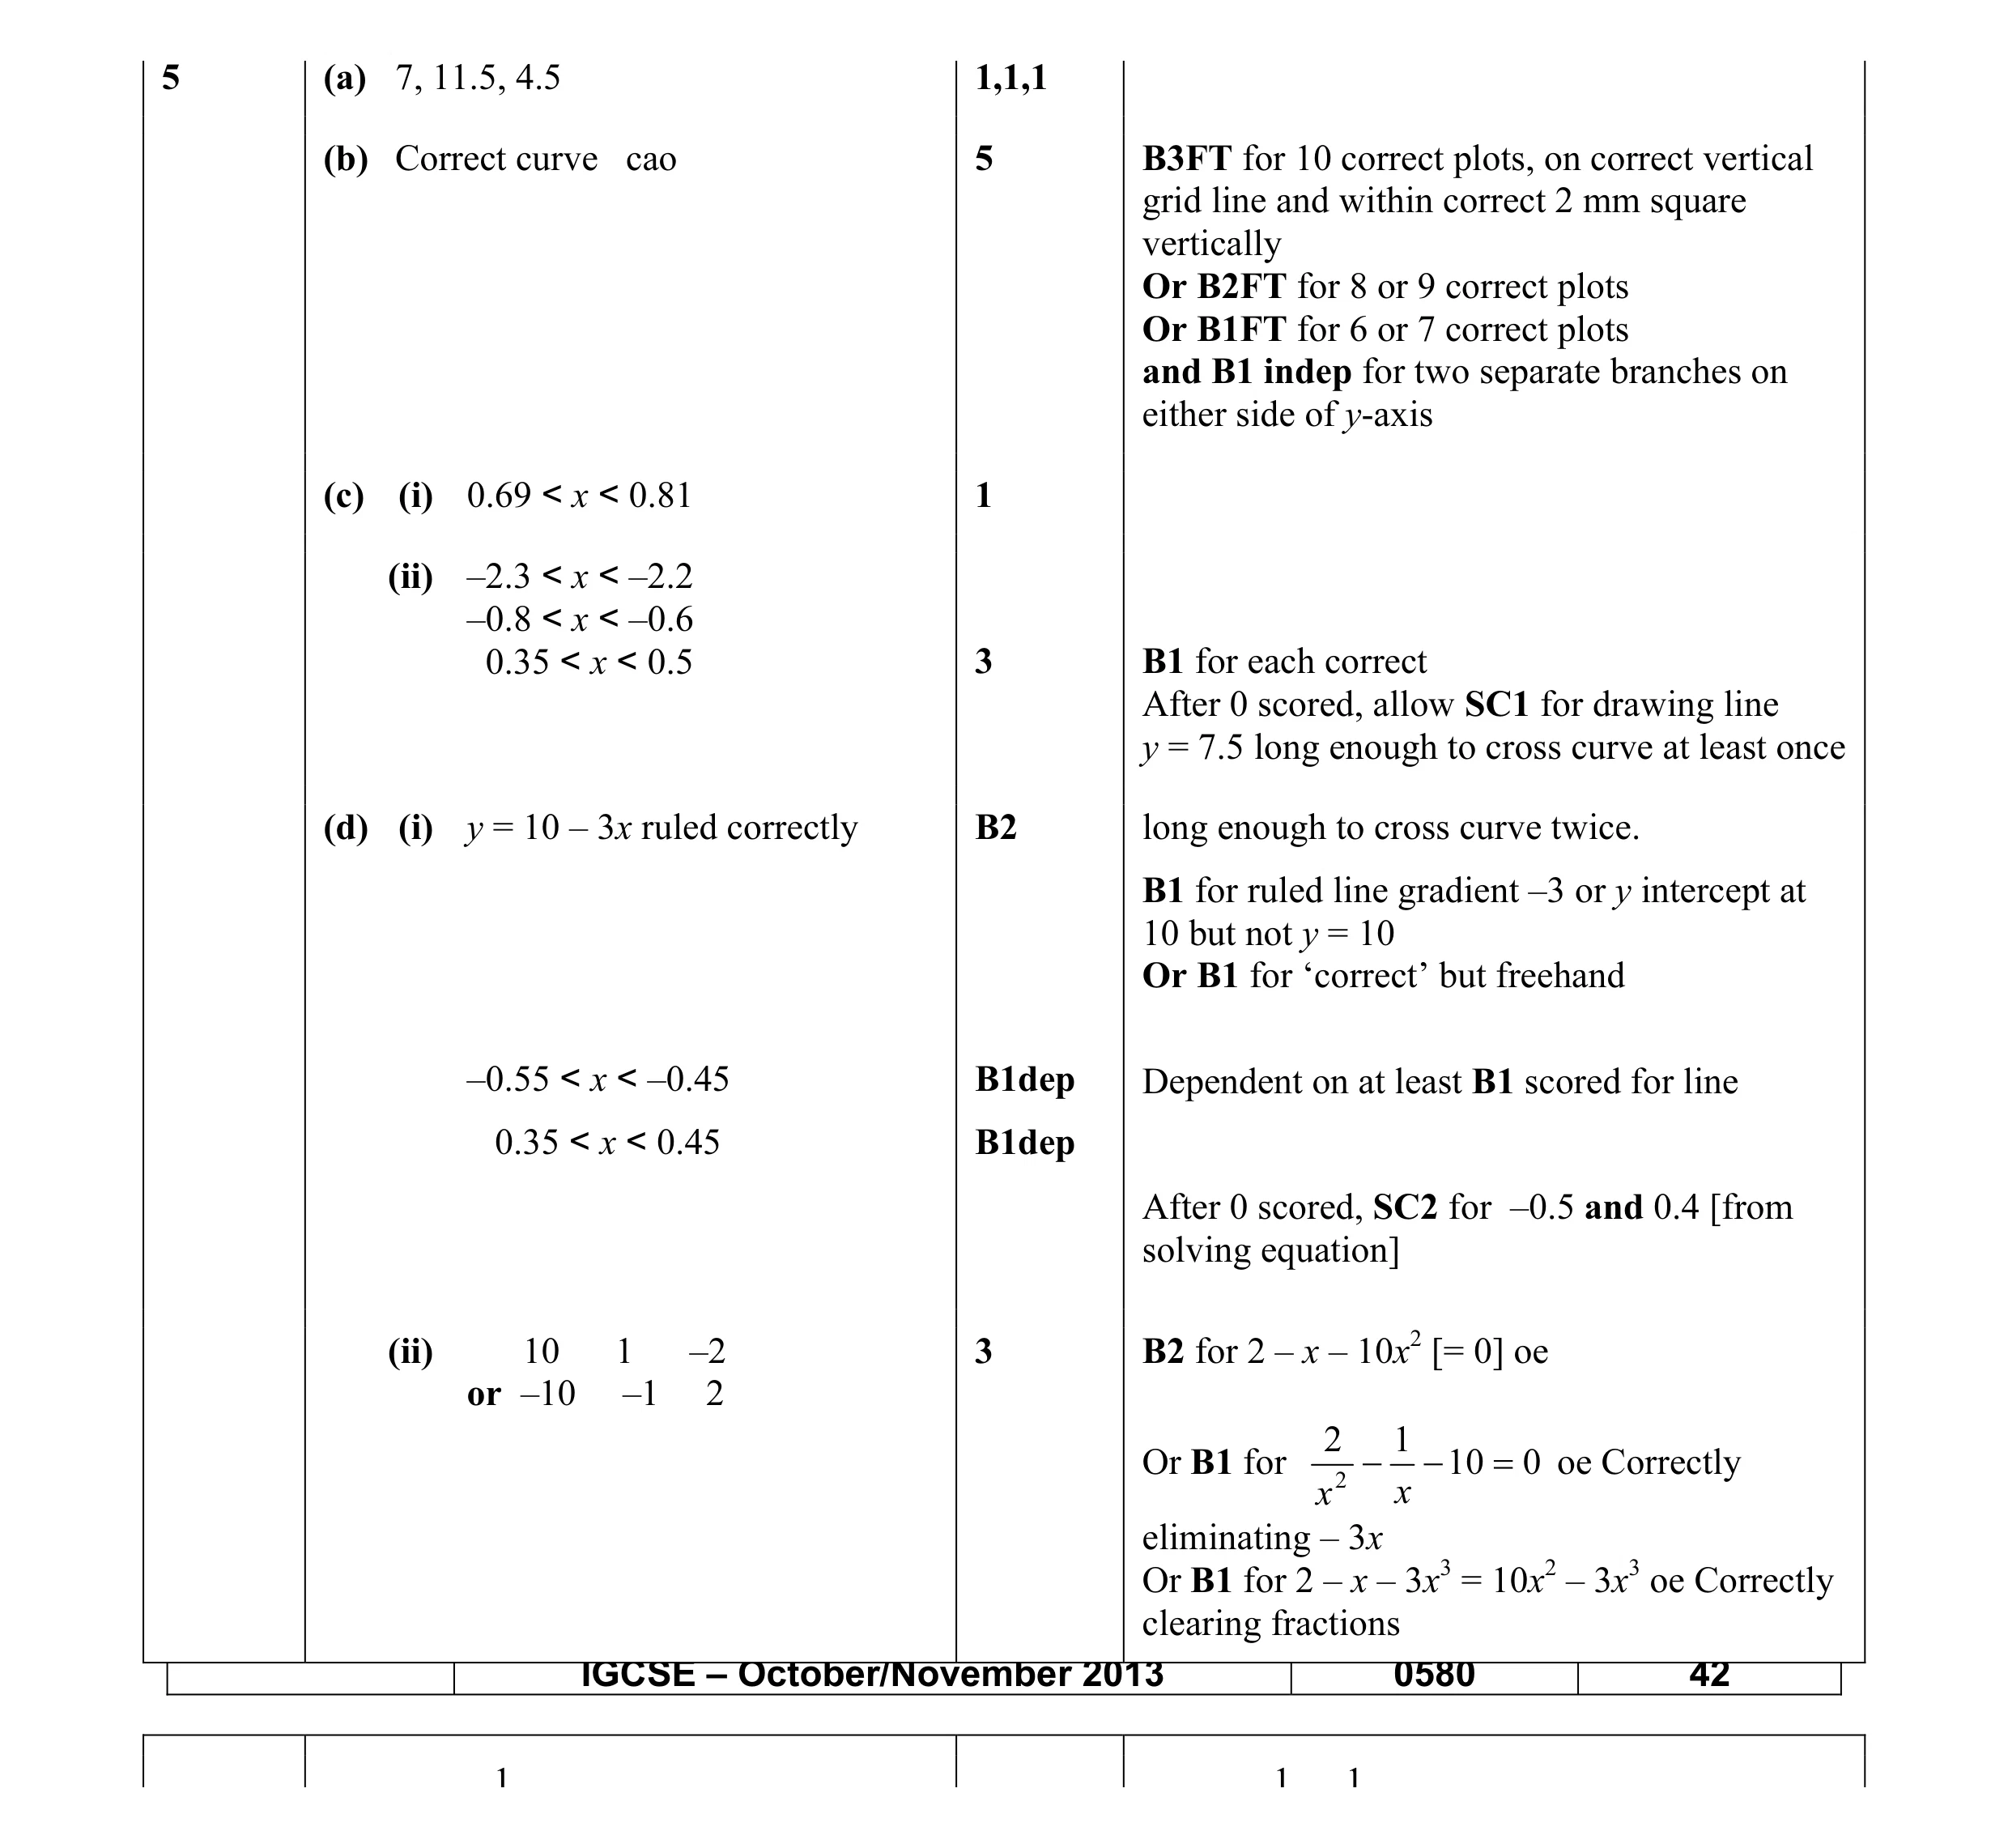 19
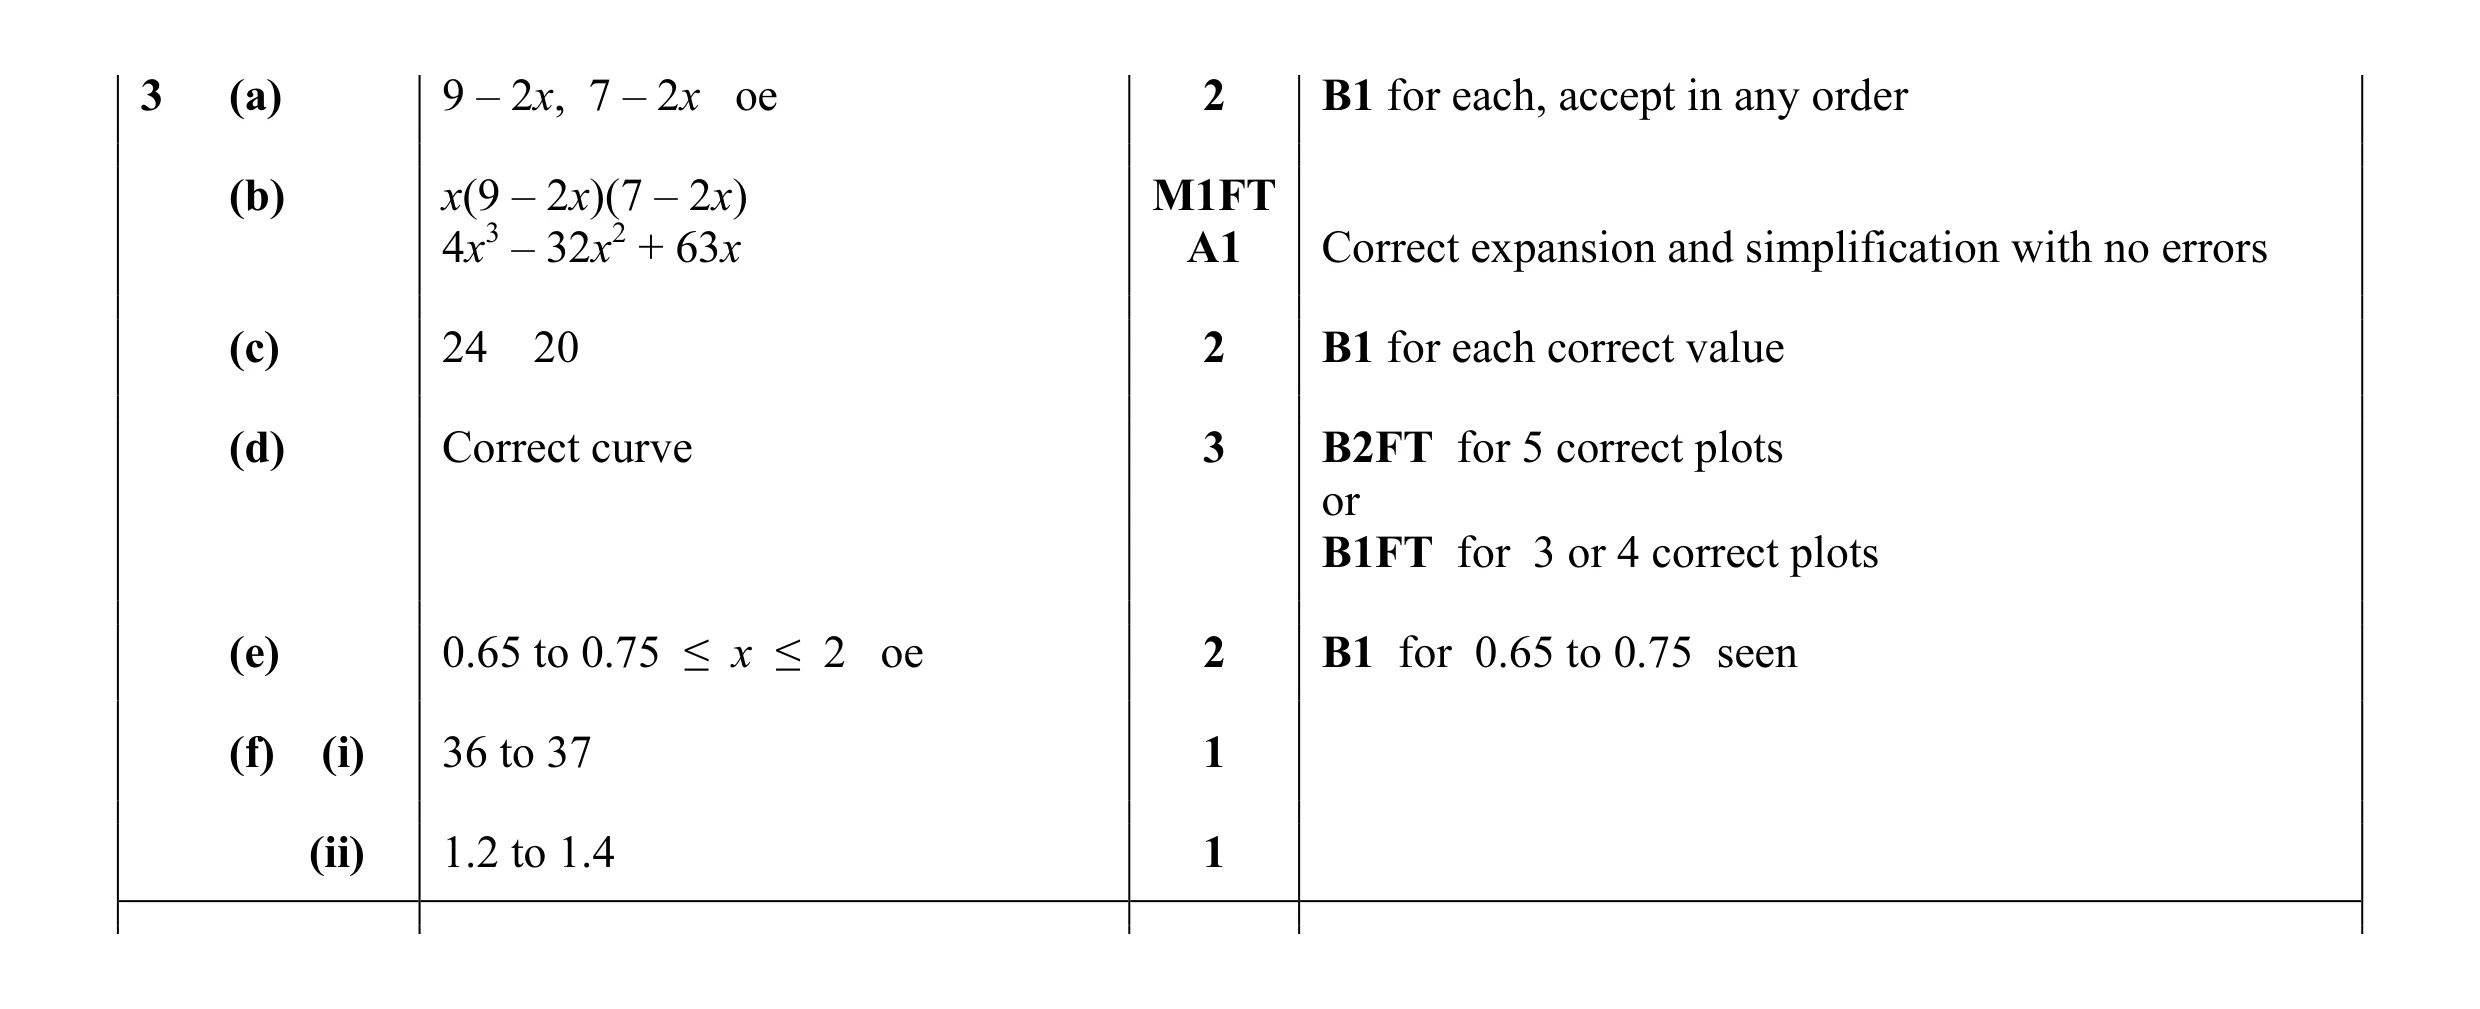 13
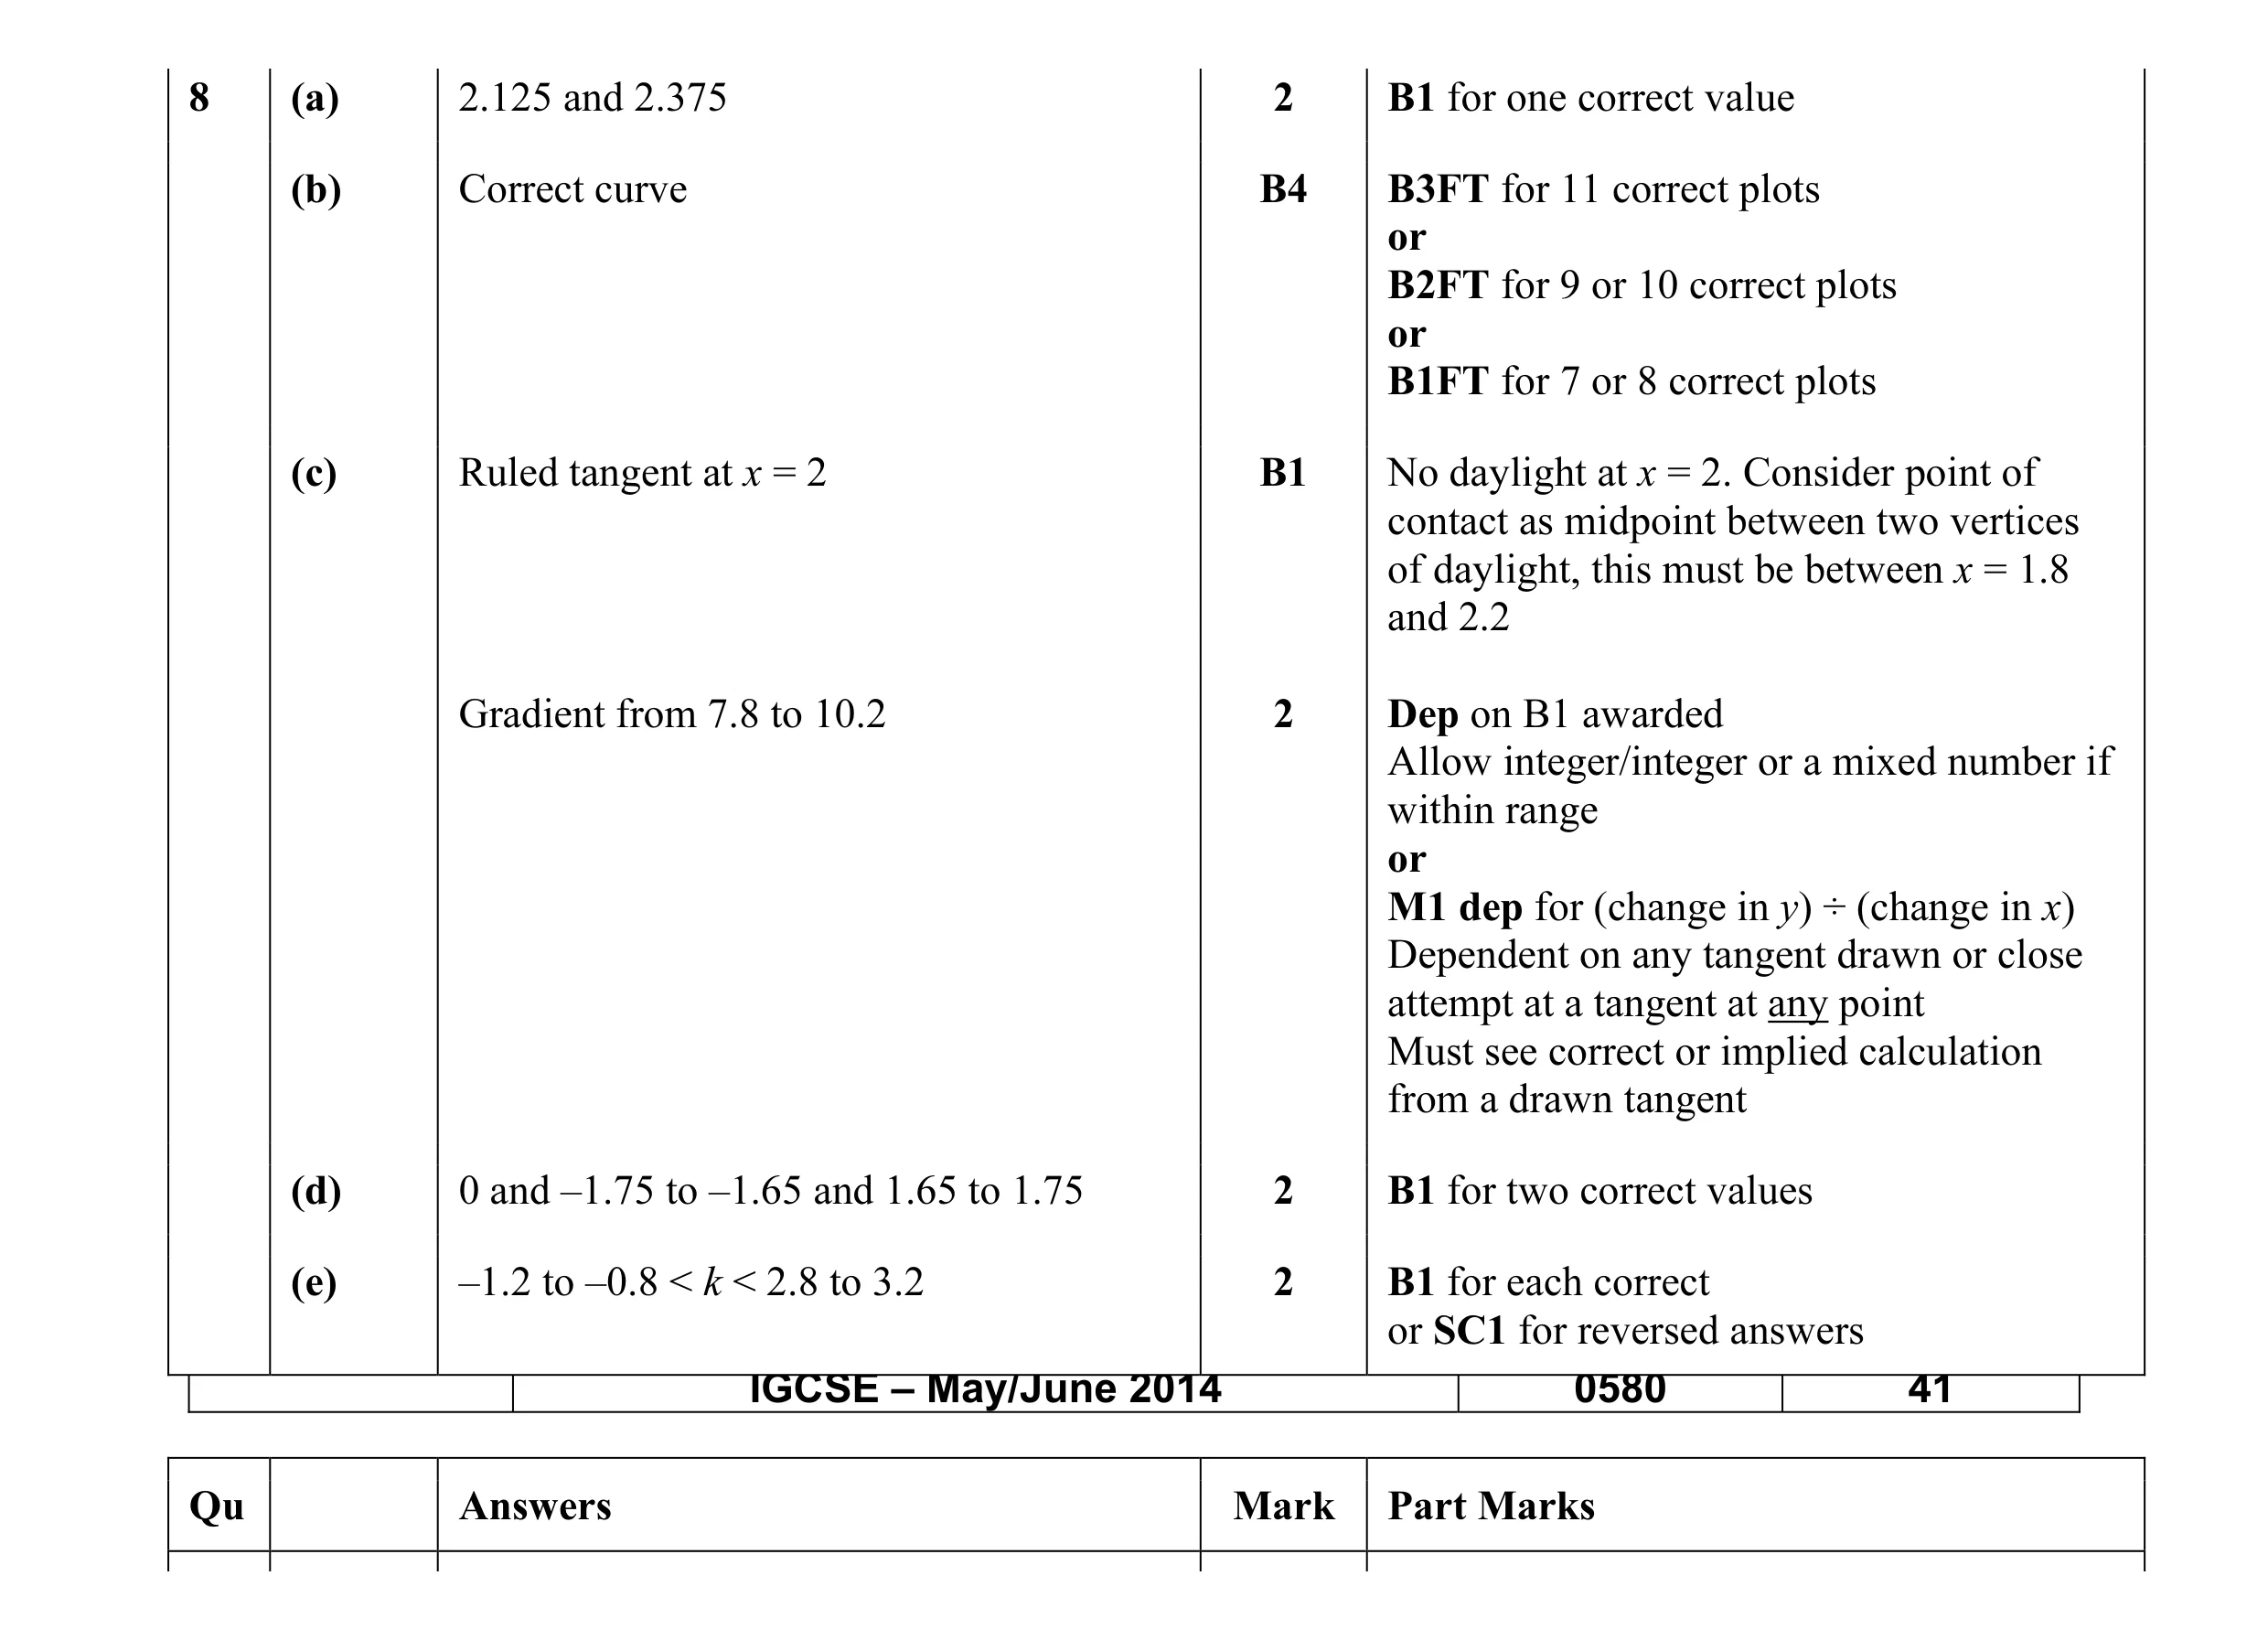 13
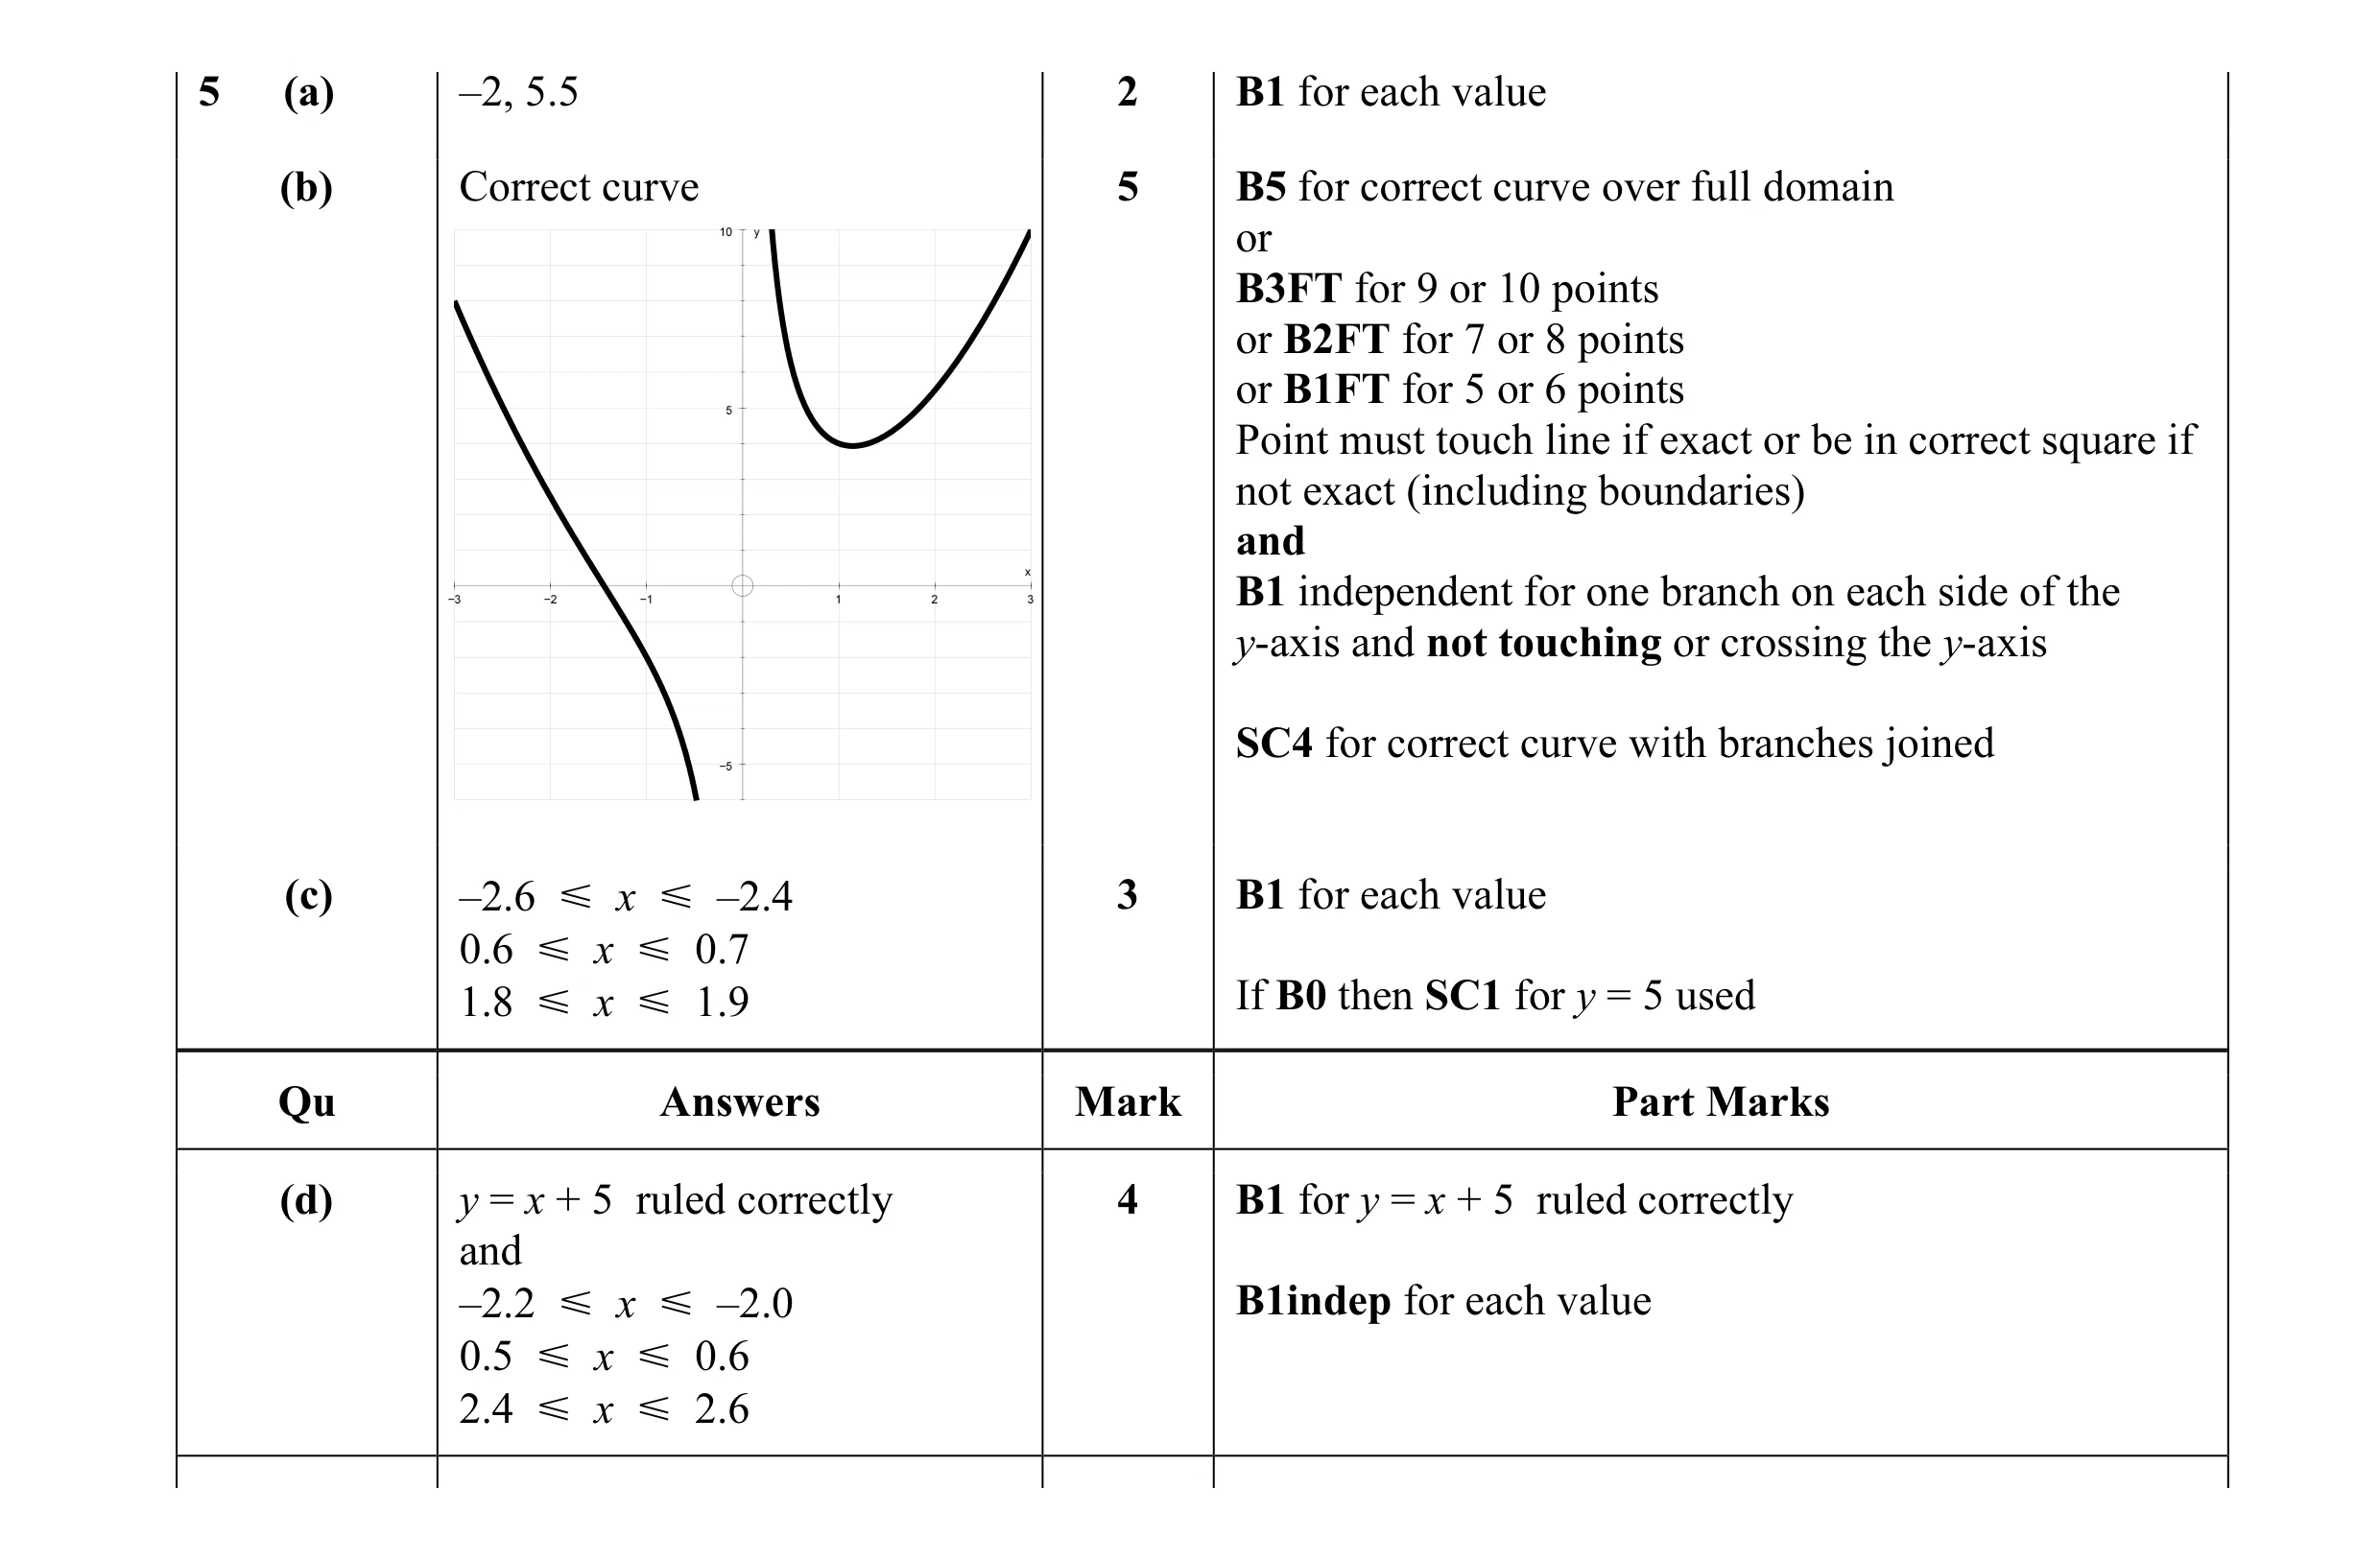 14
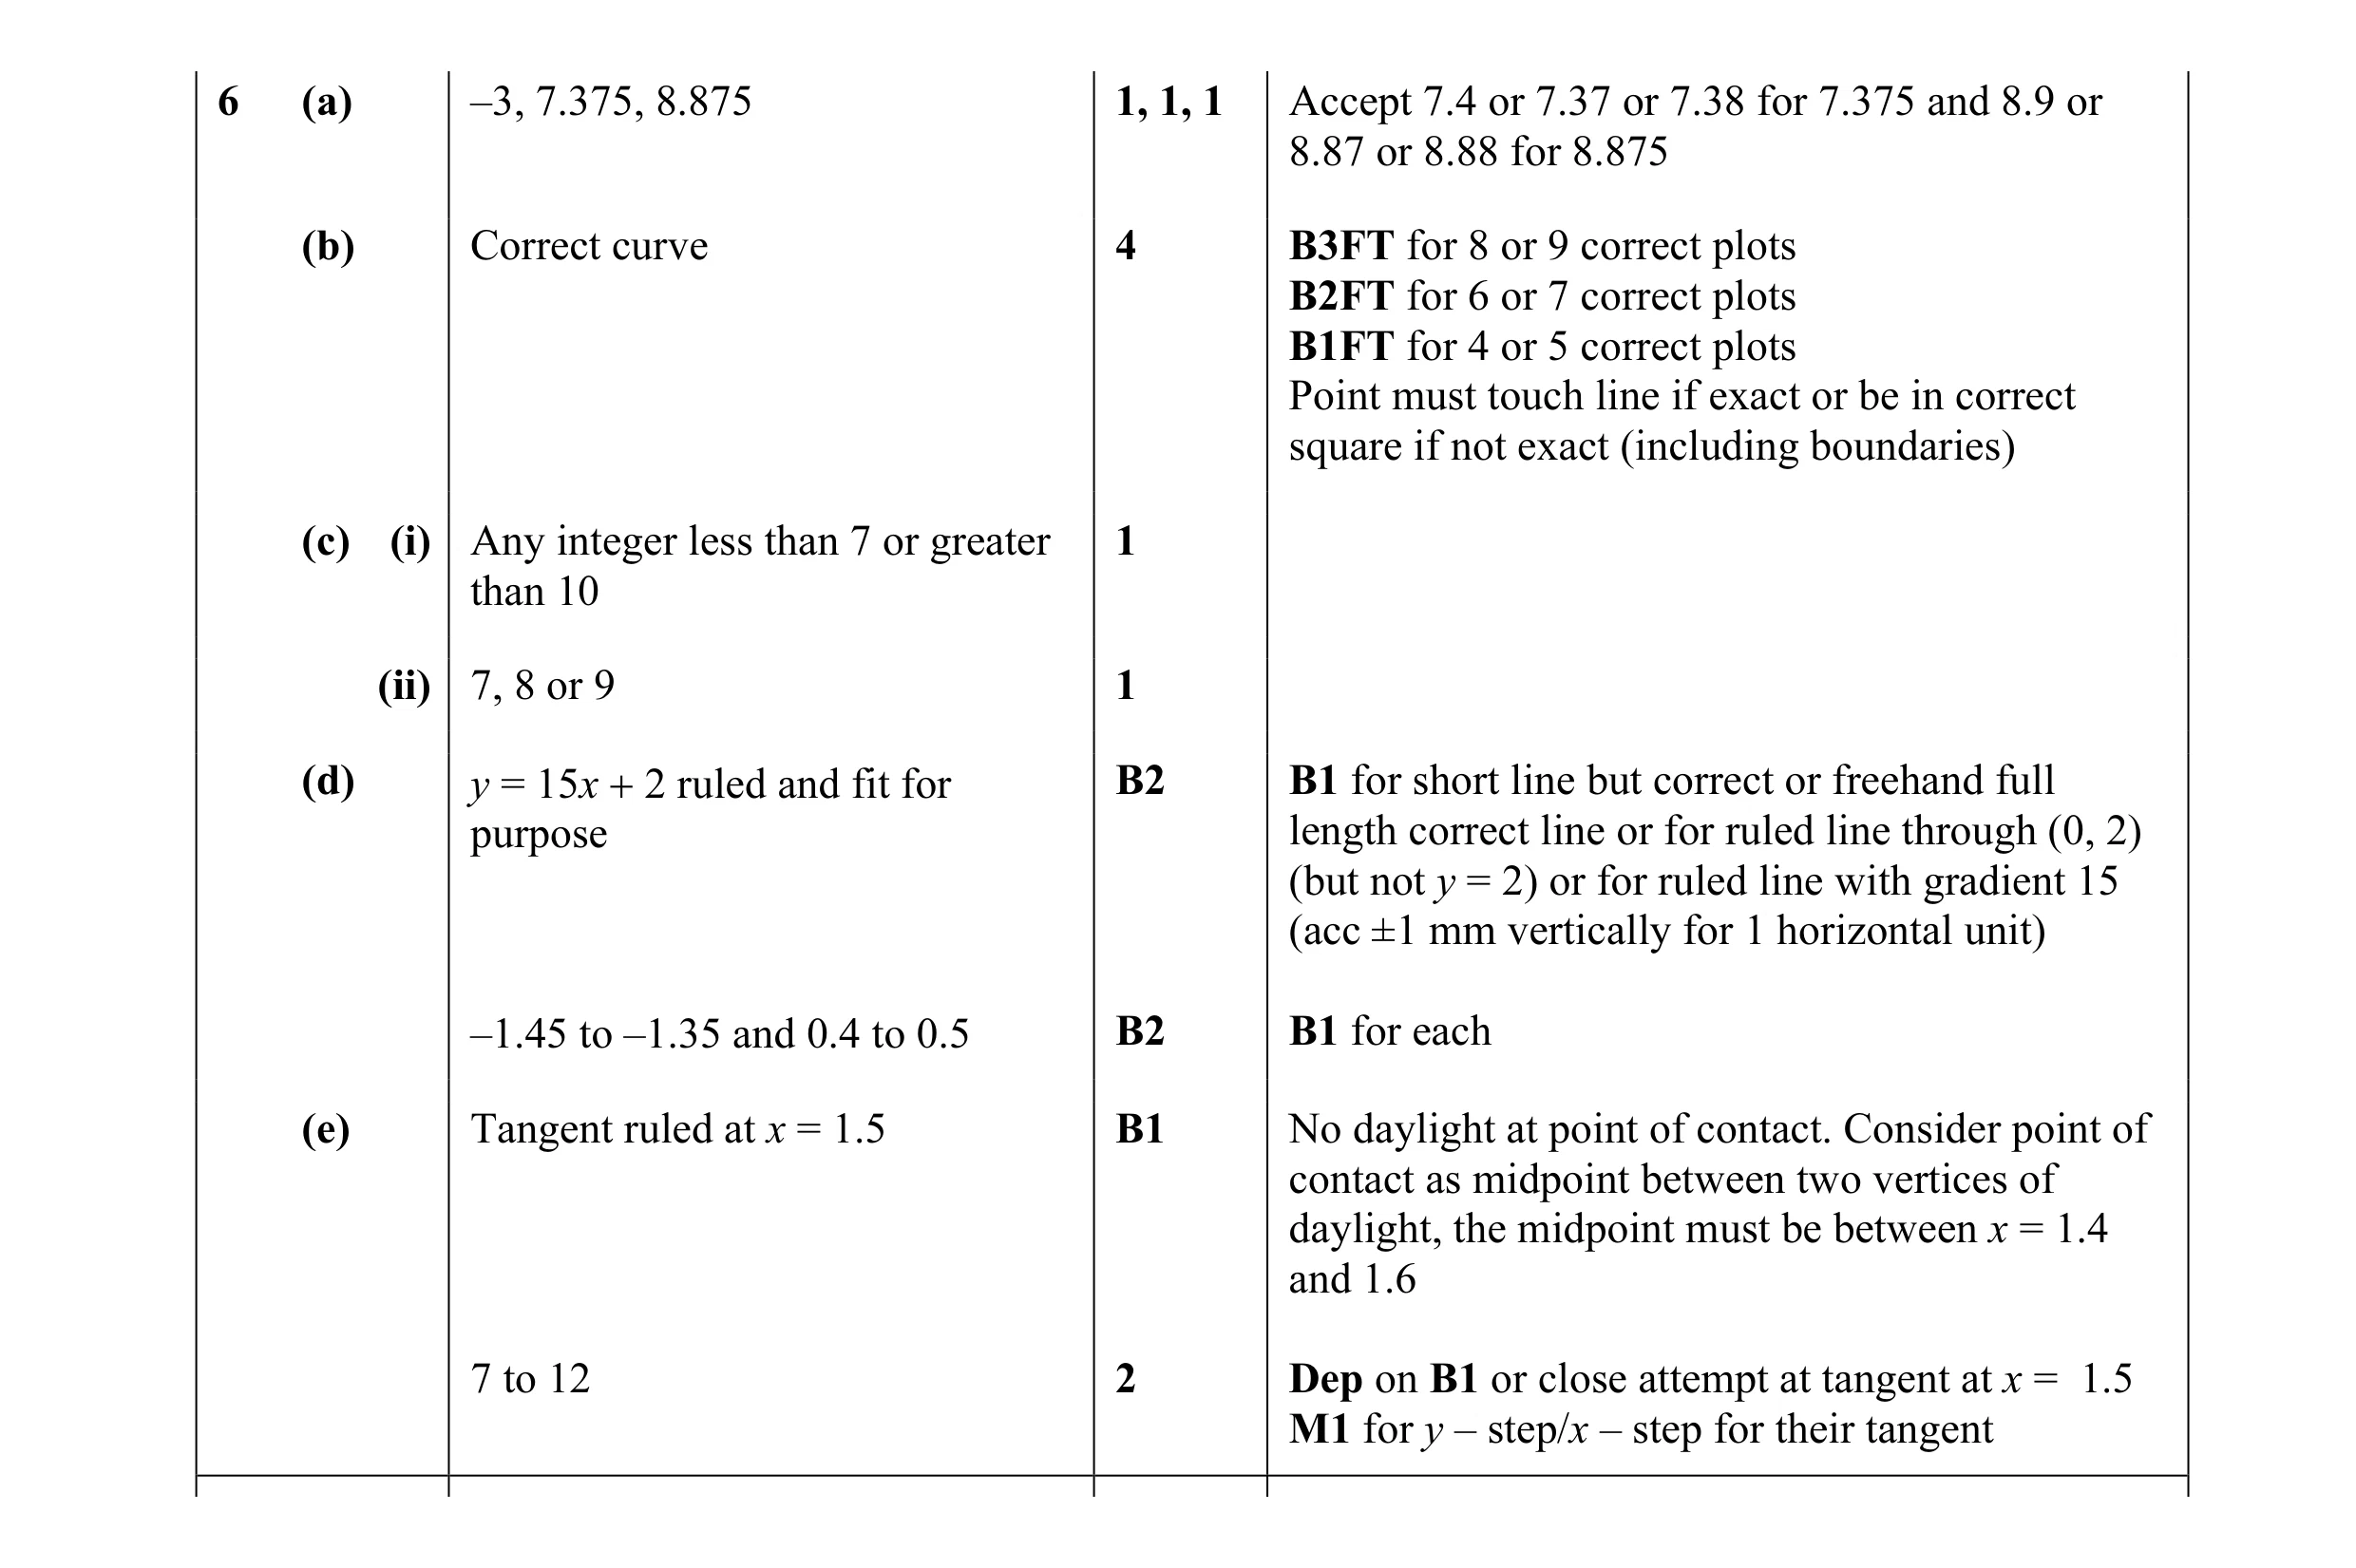 16
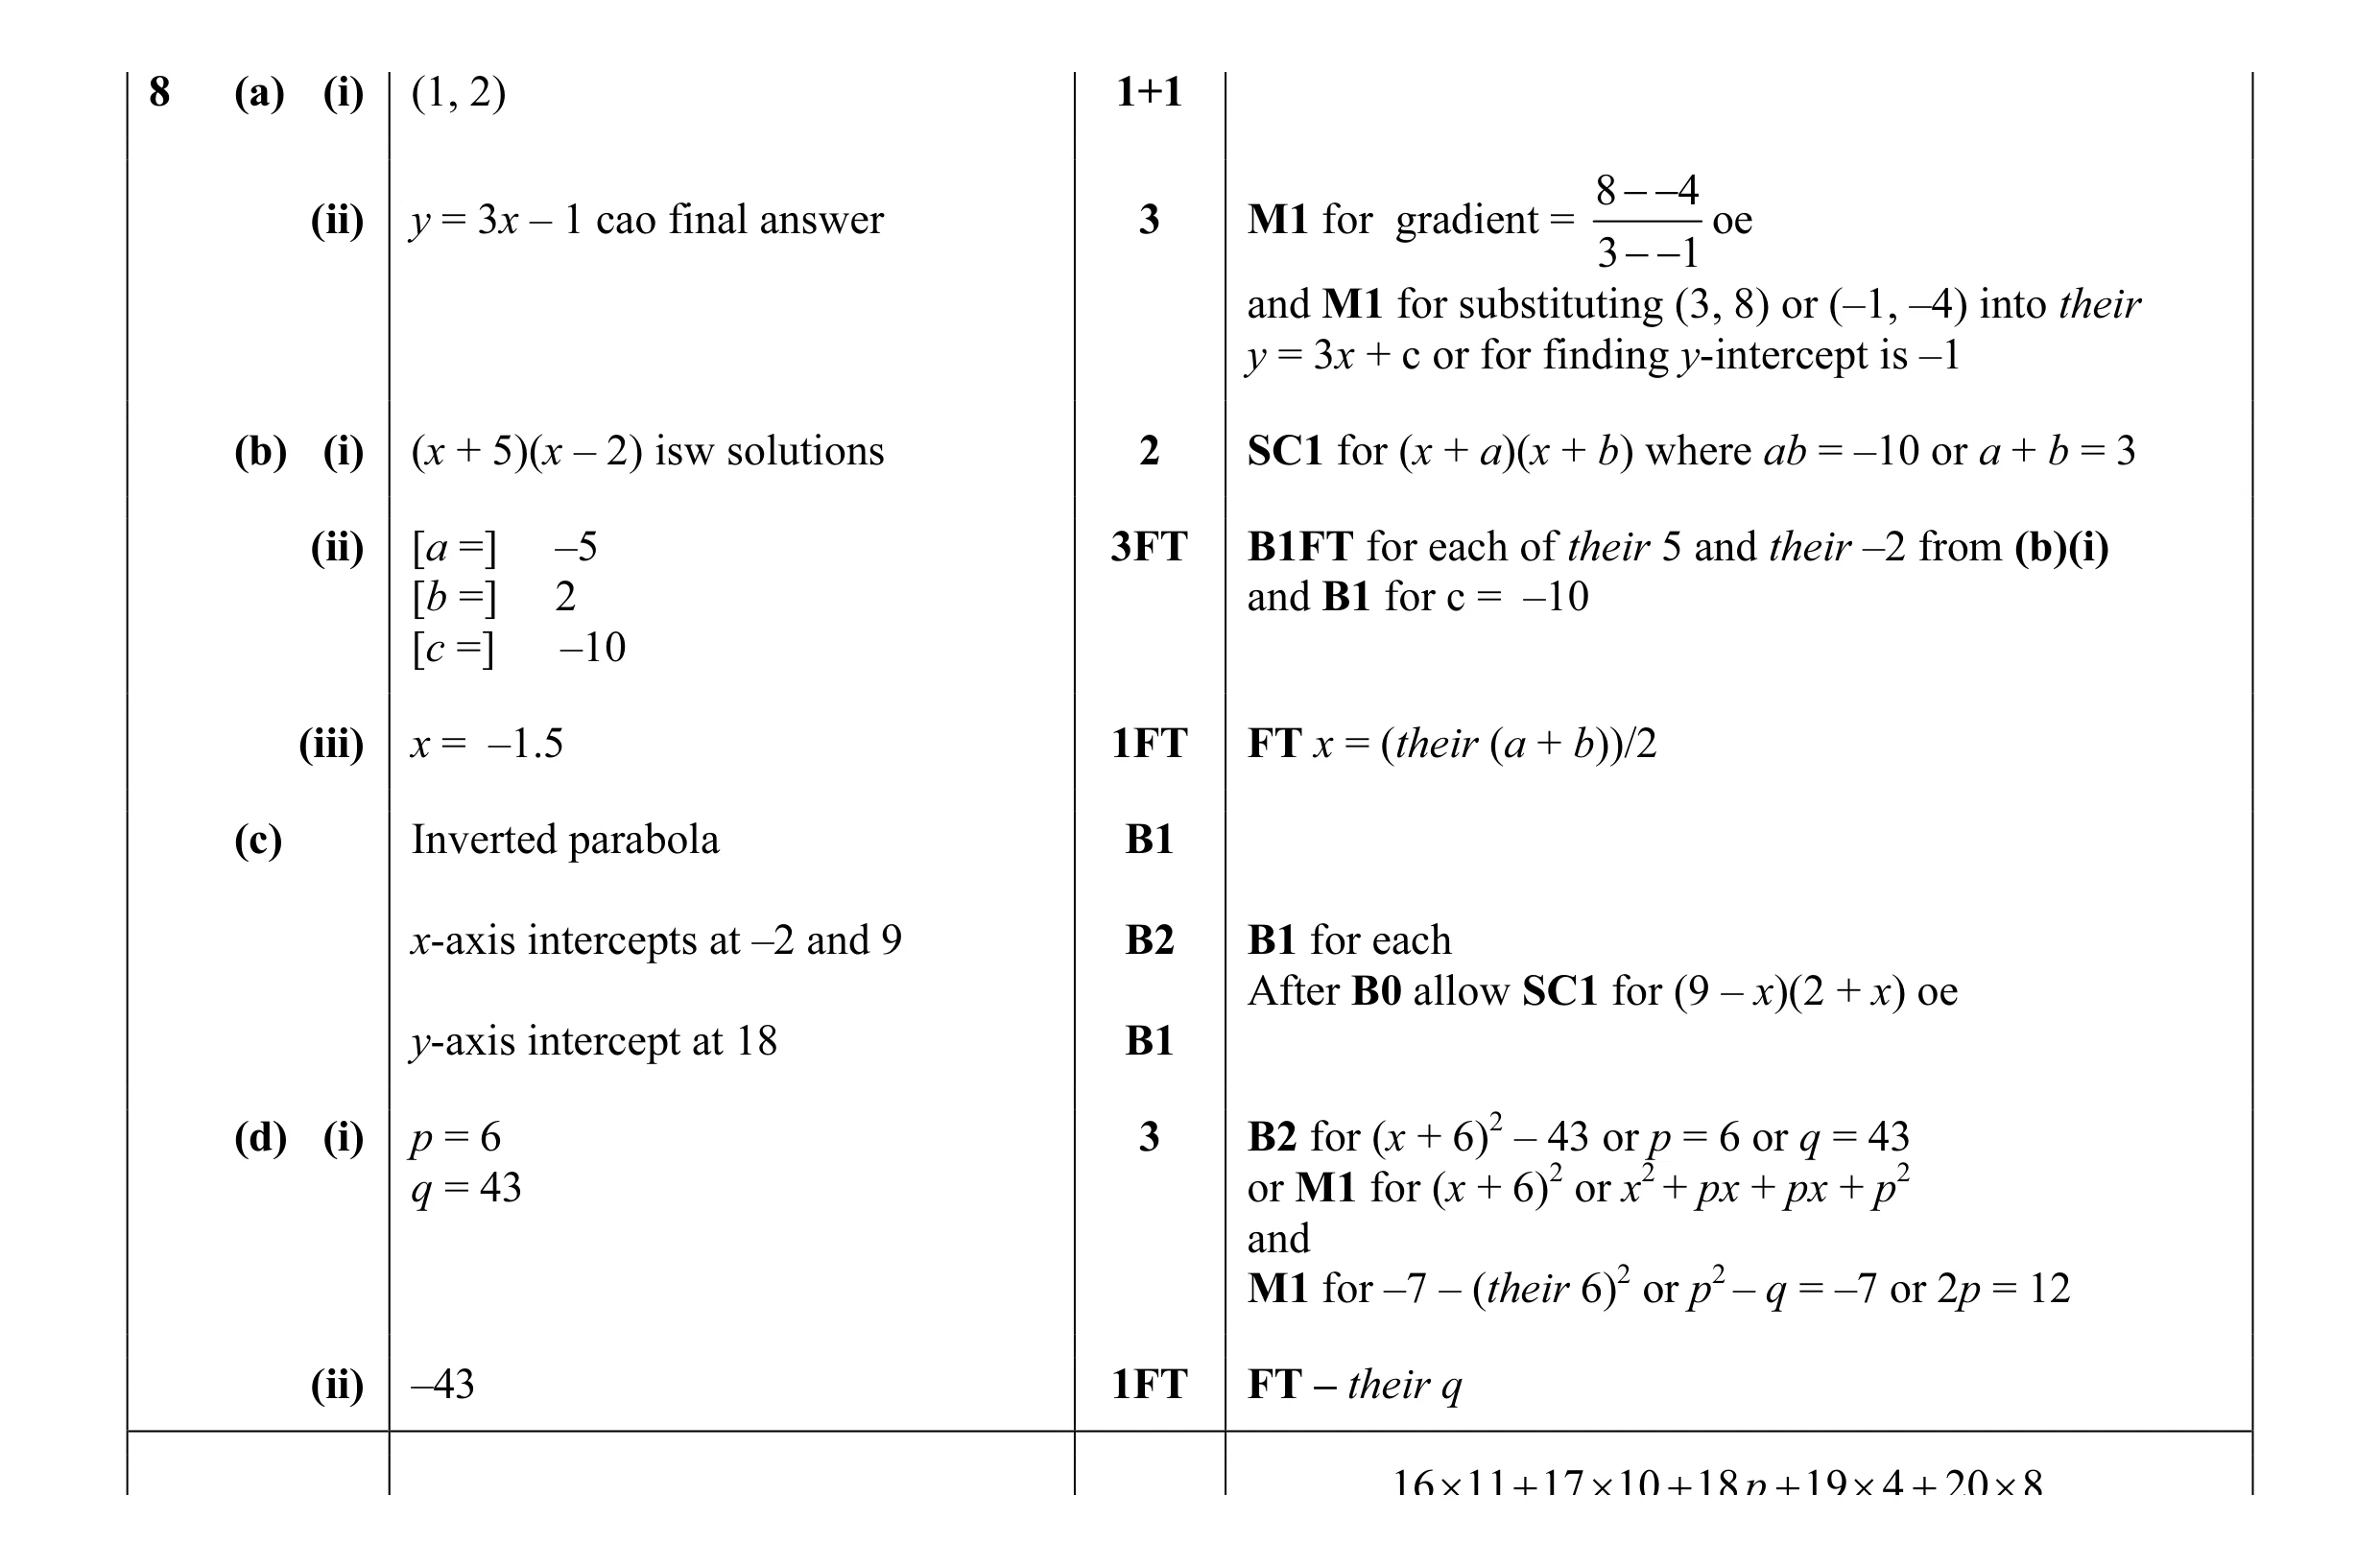 19
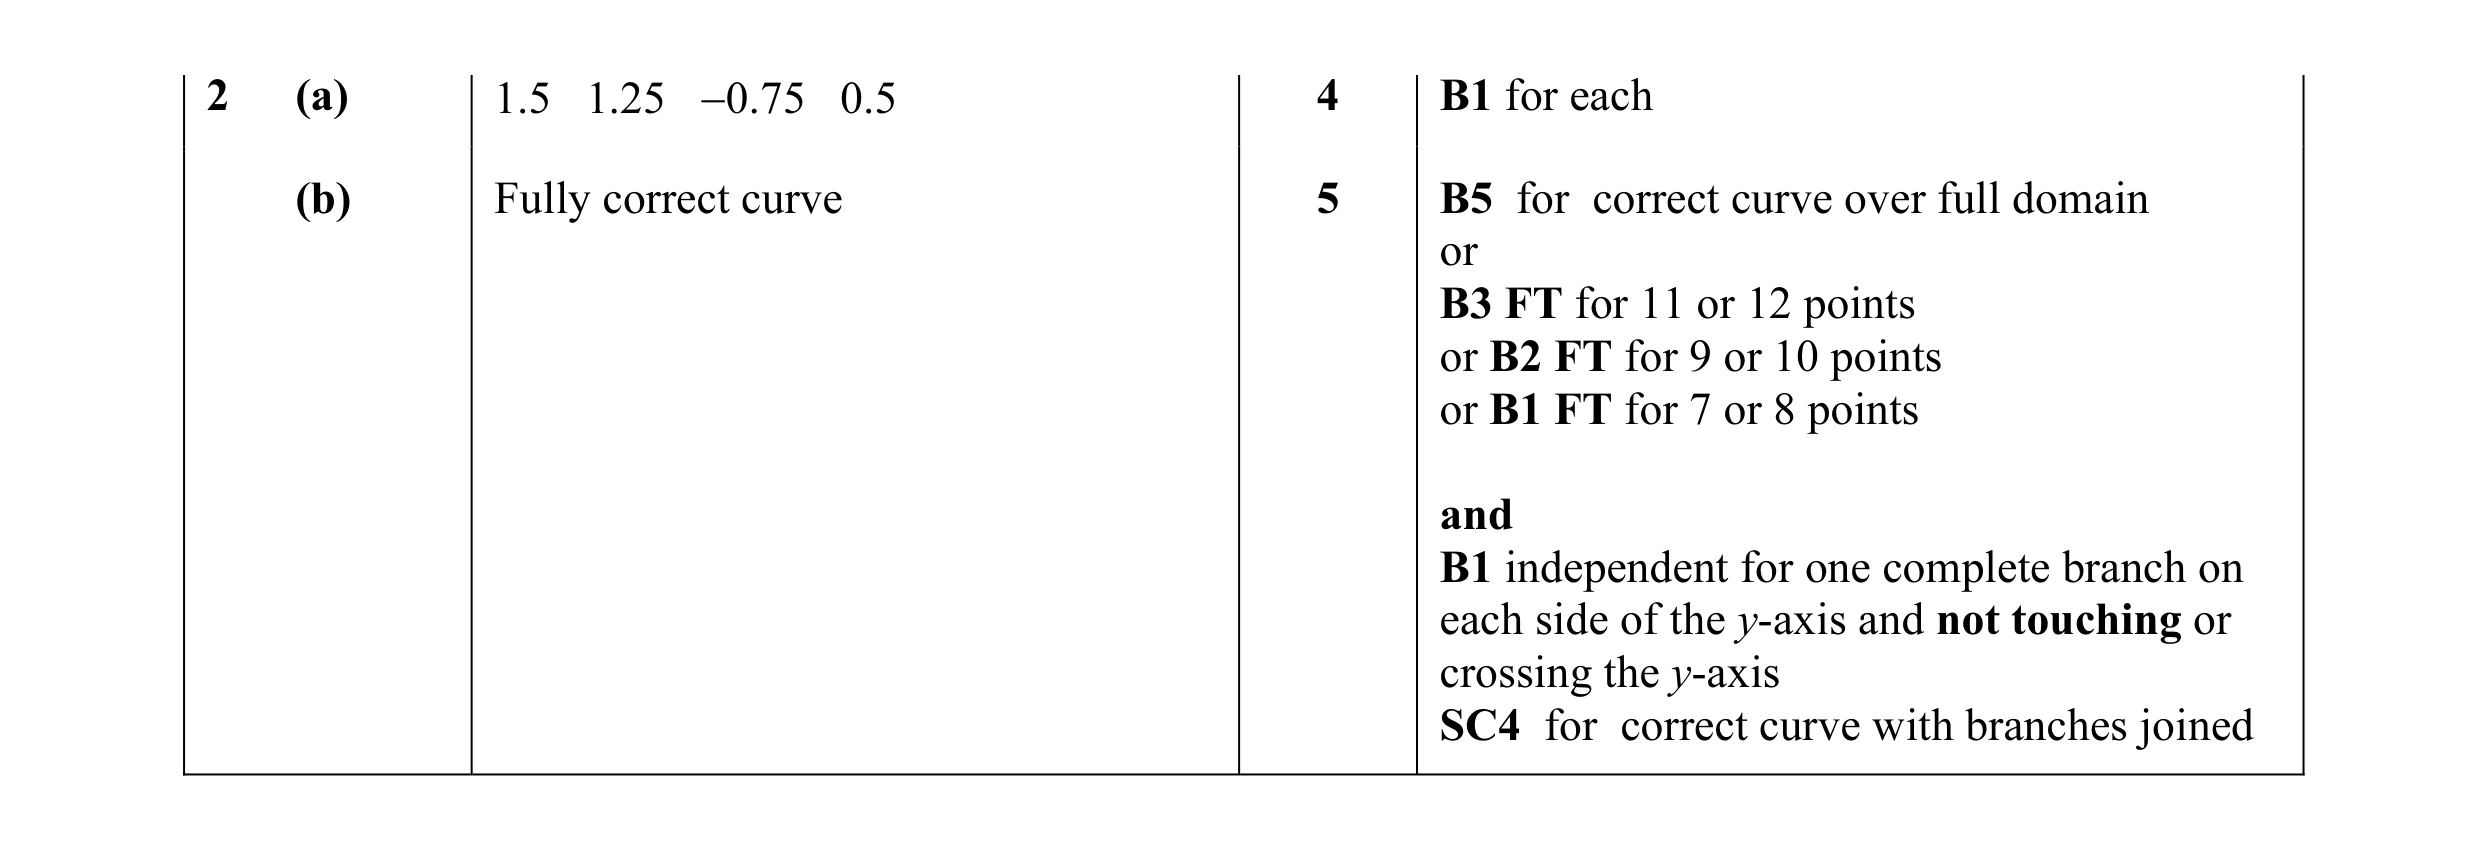 17
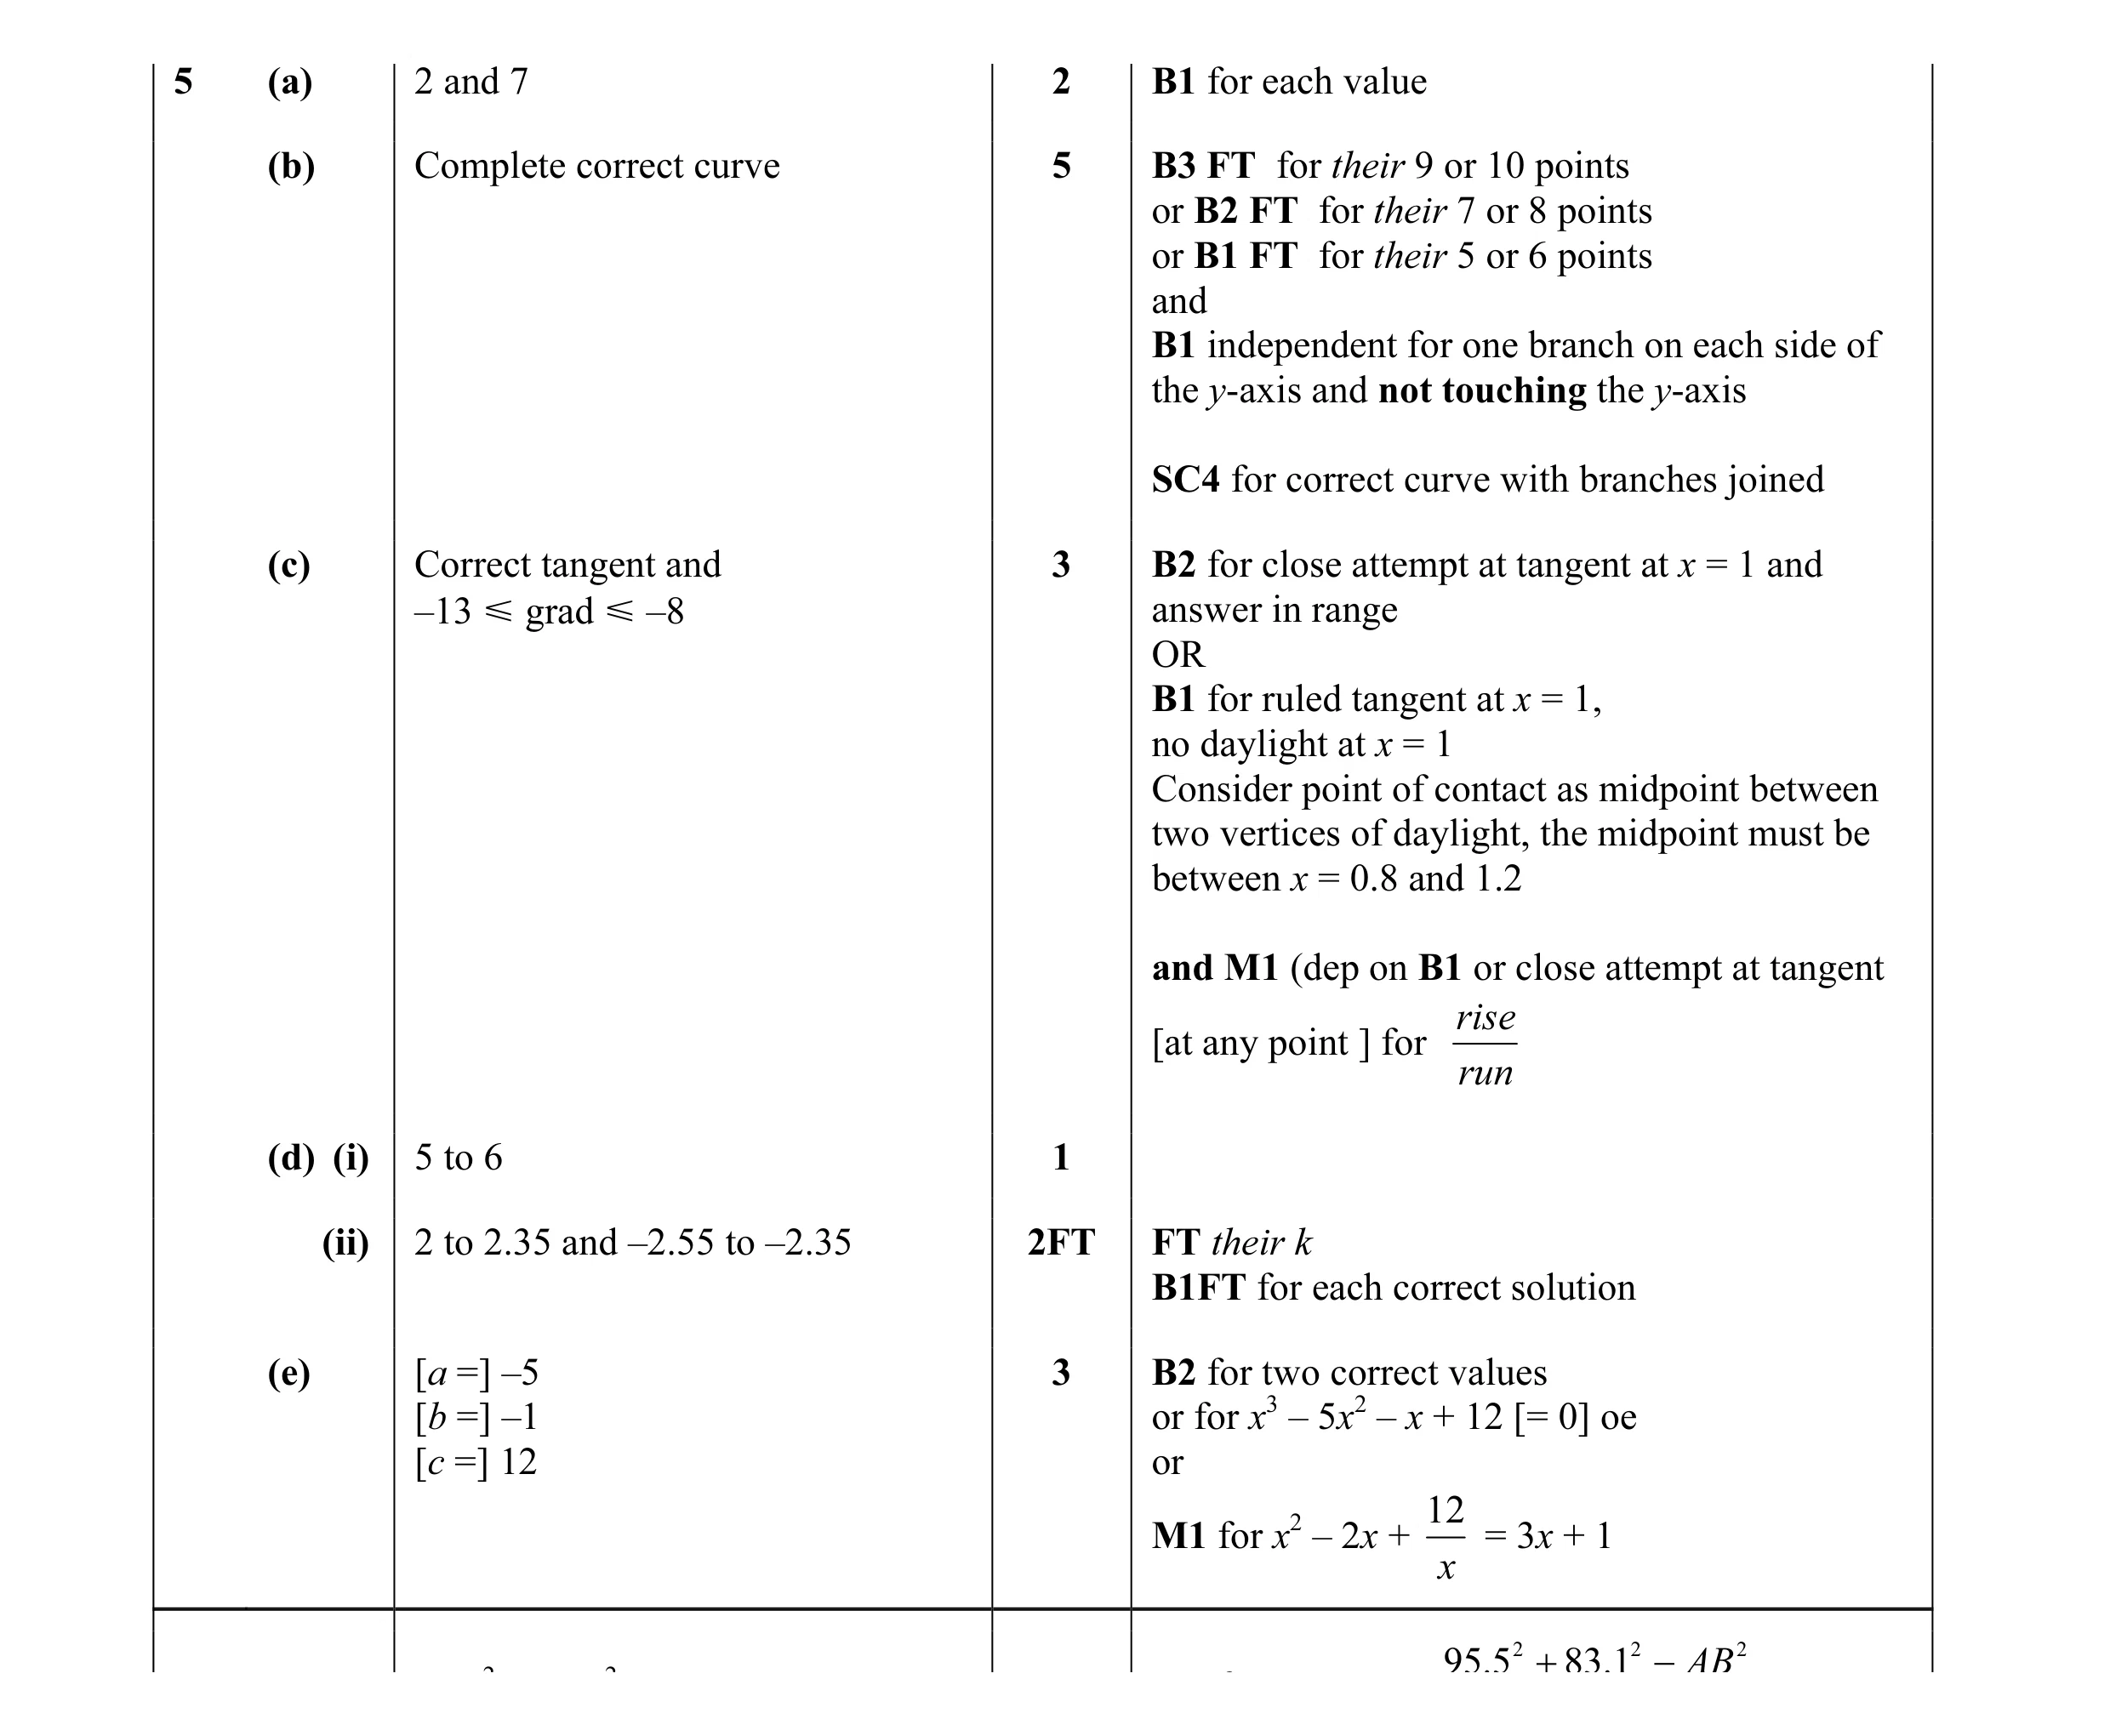 16
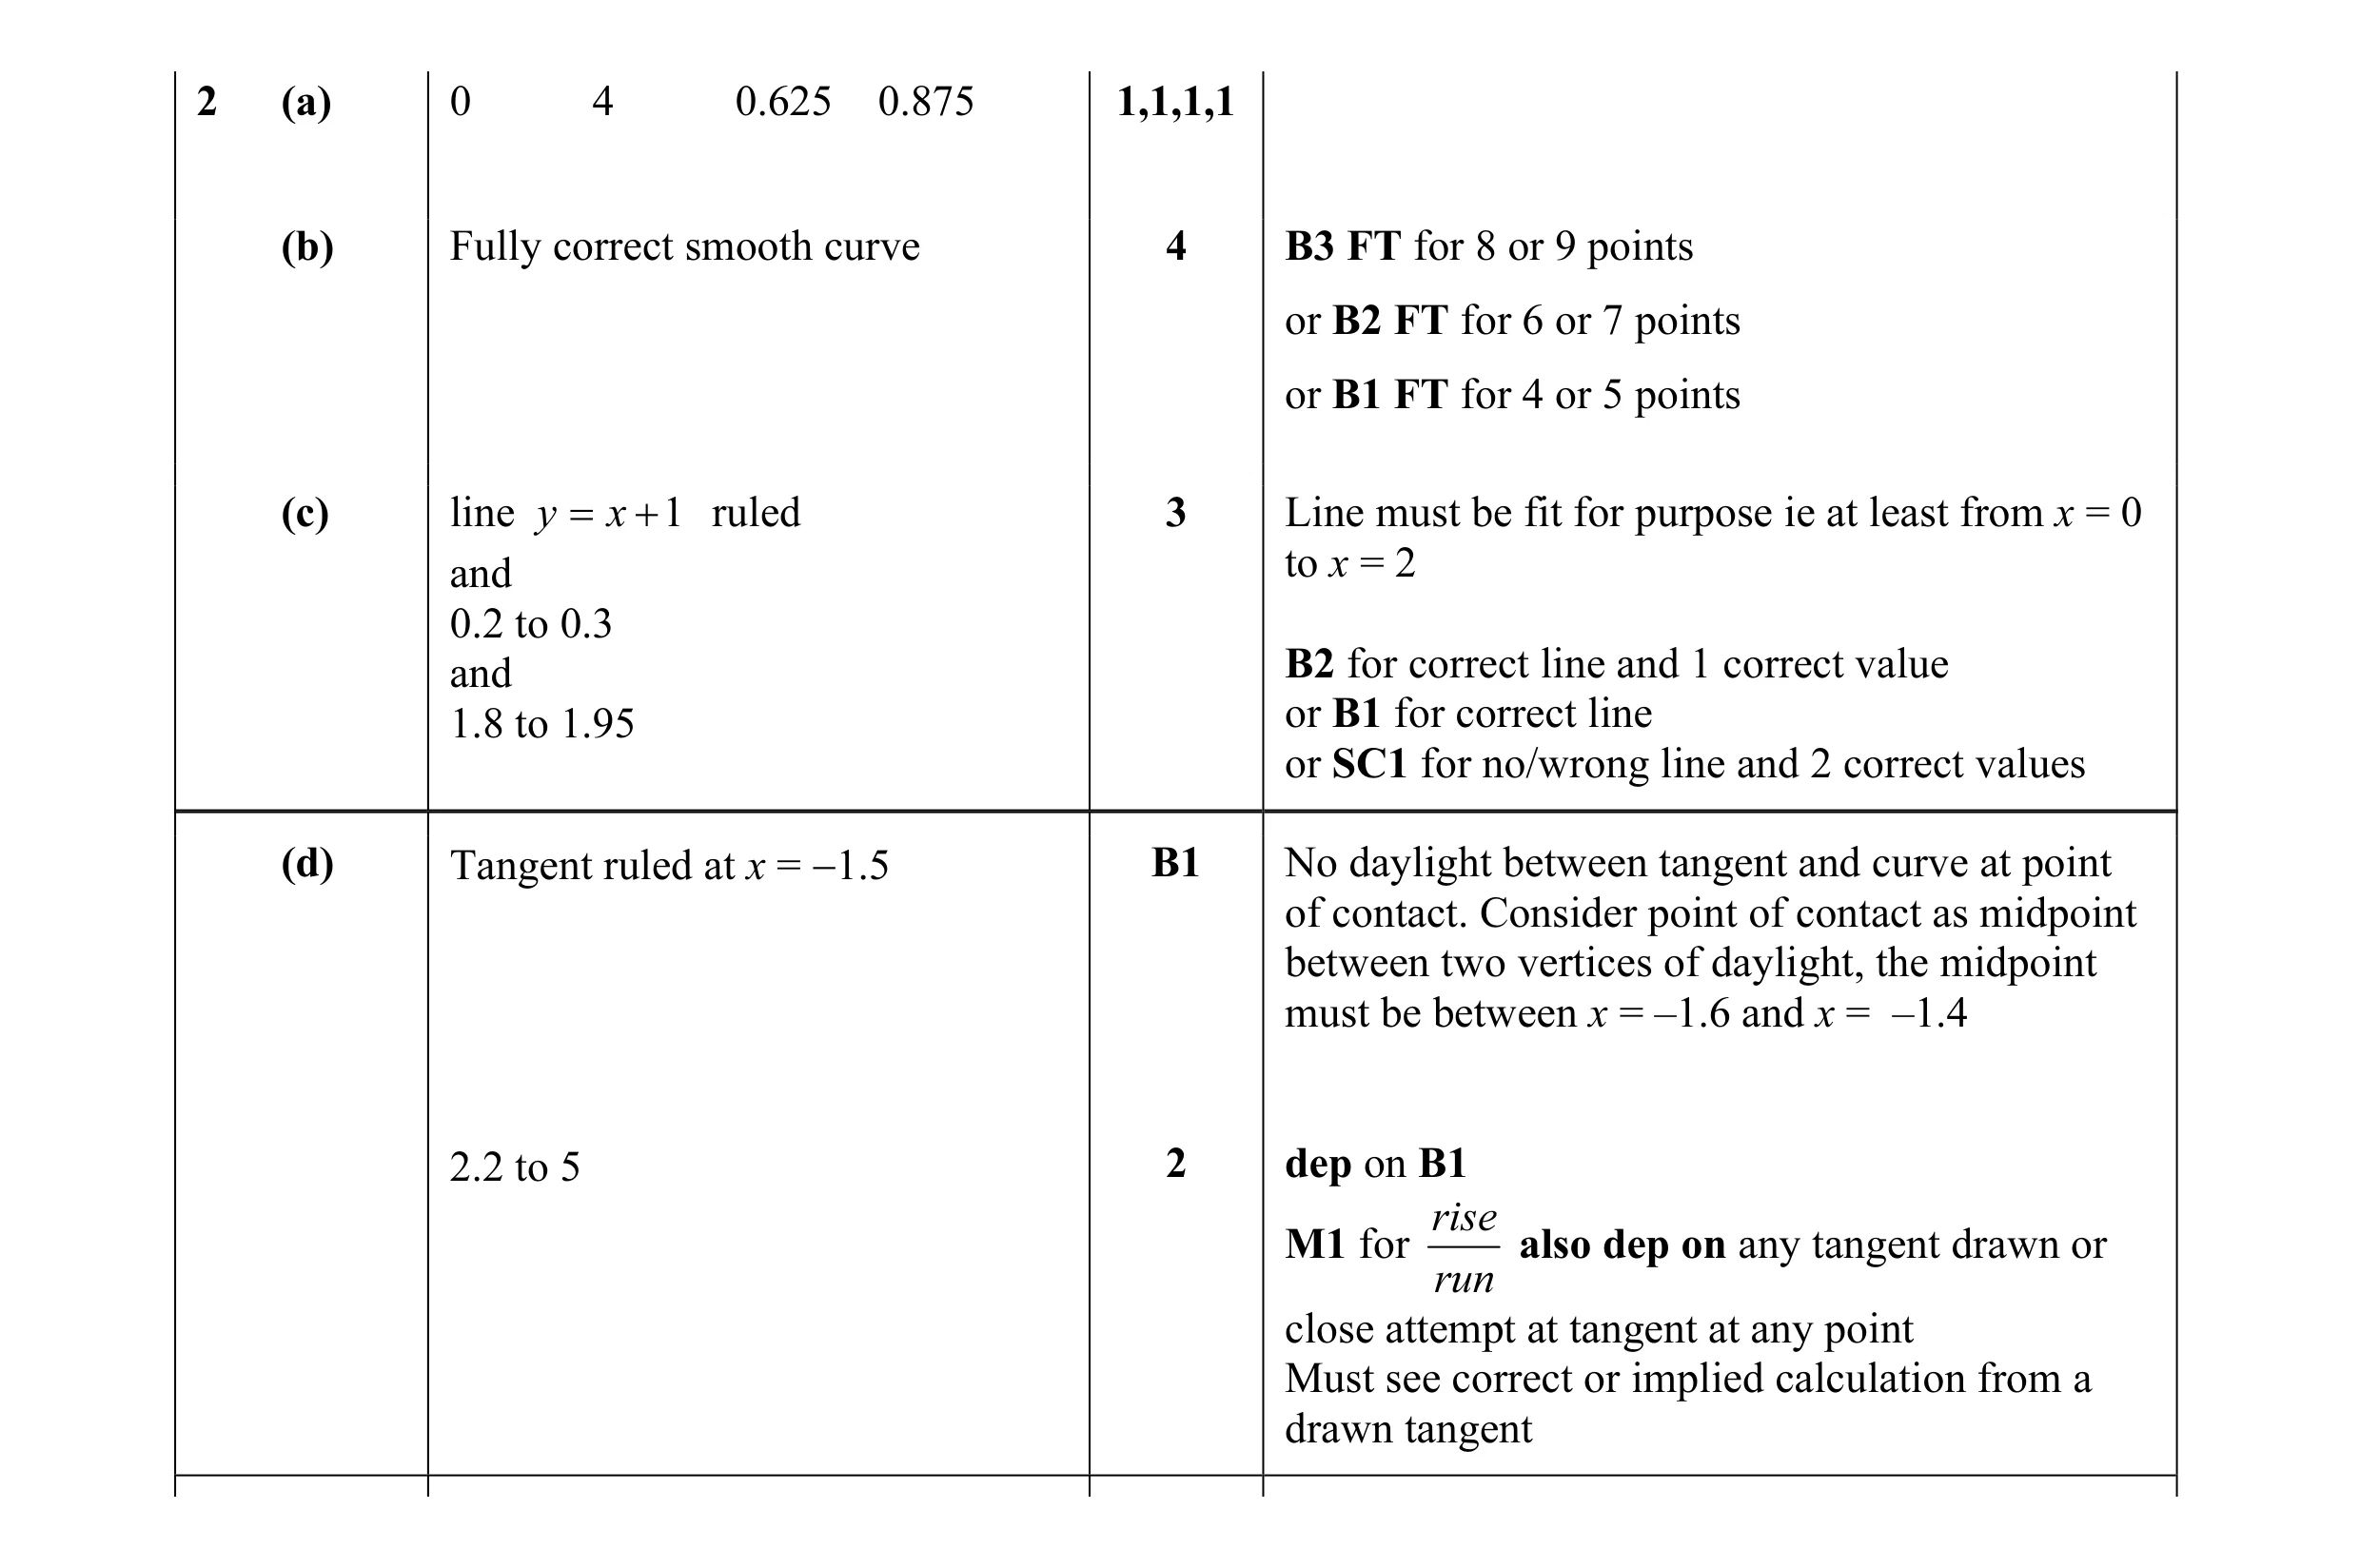 14
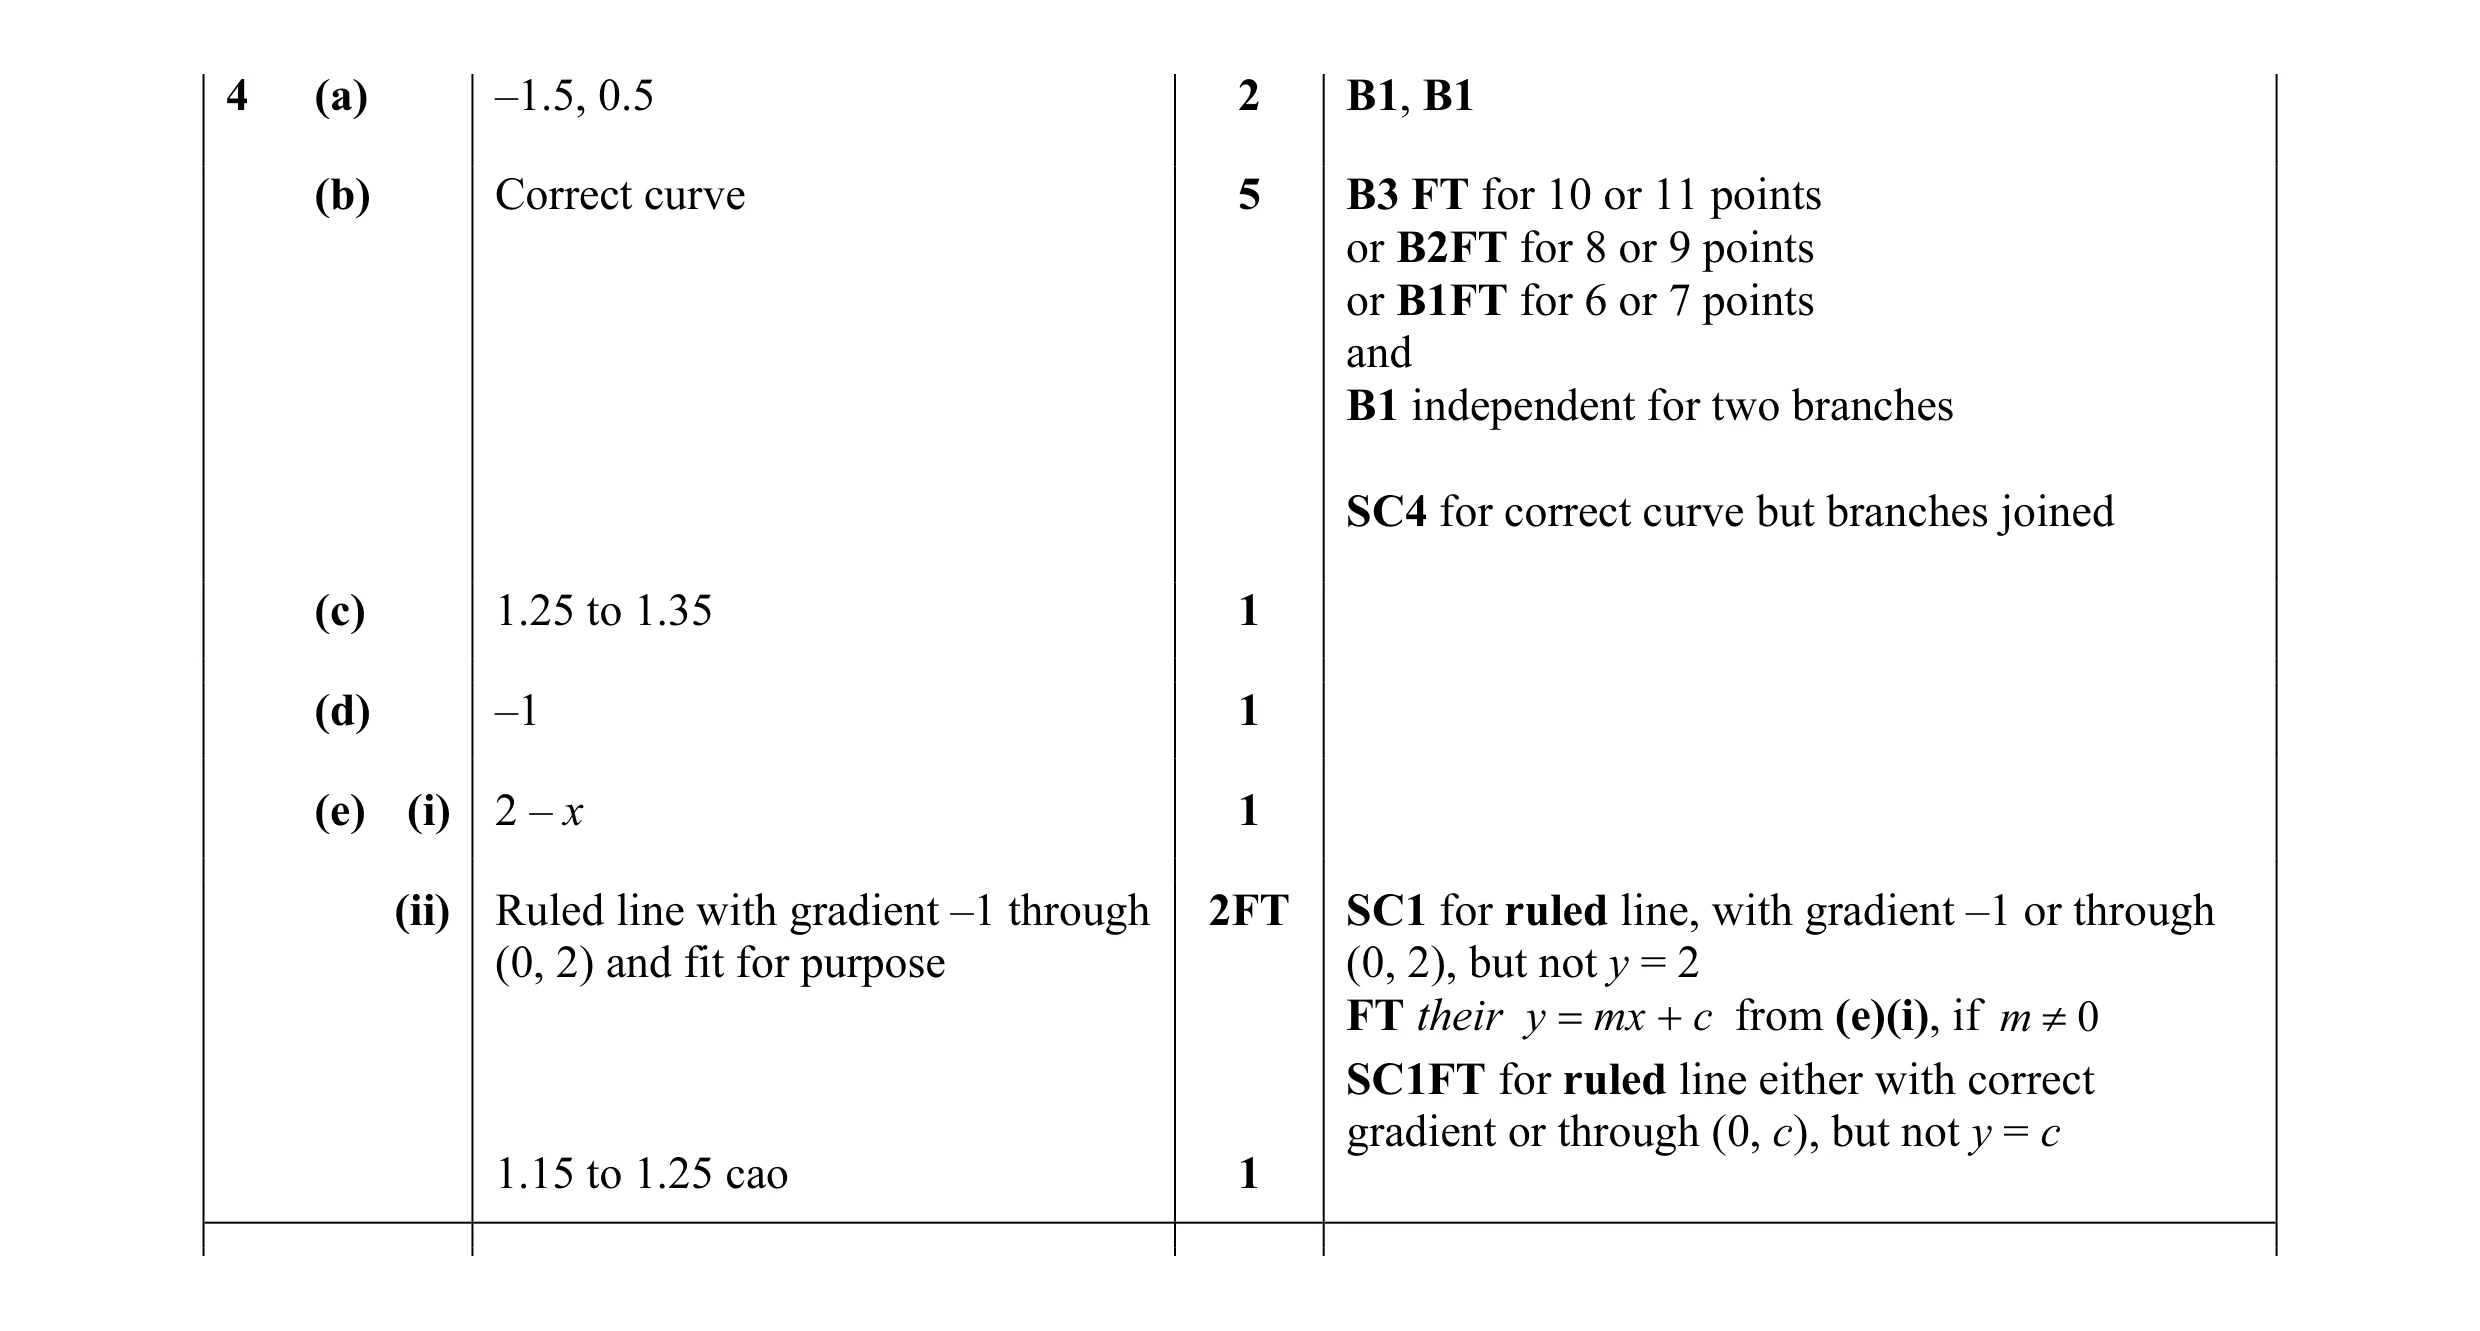 13
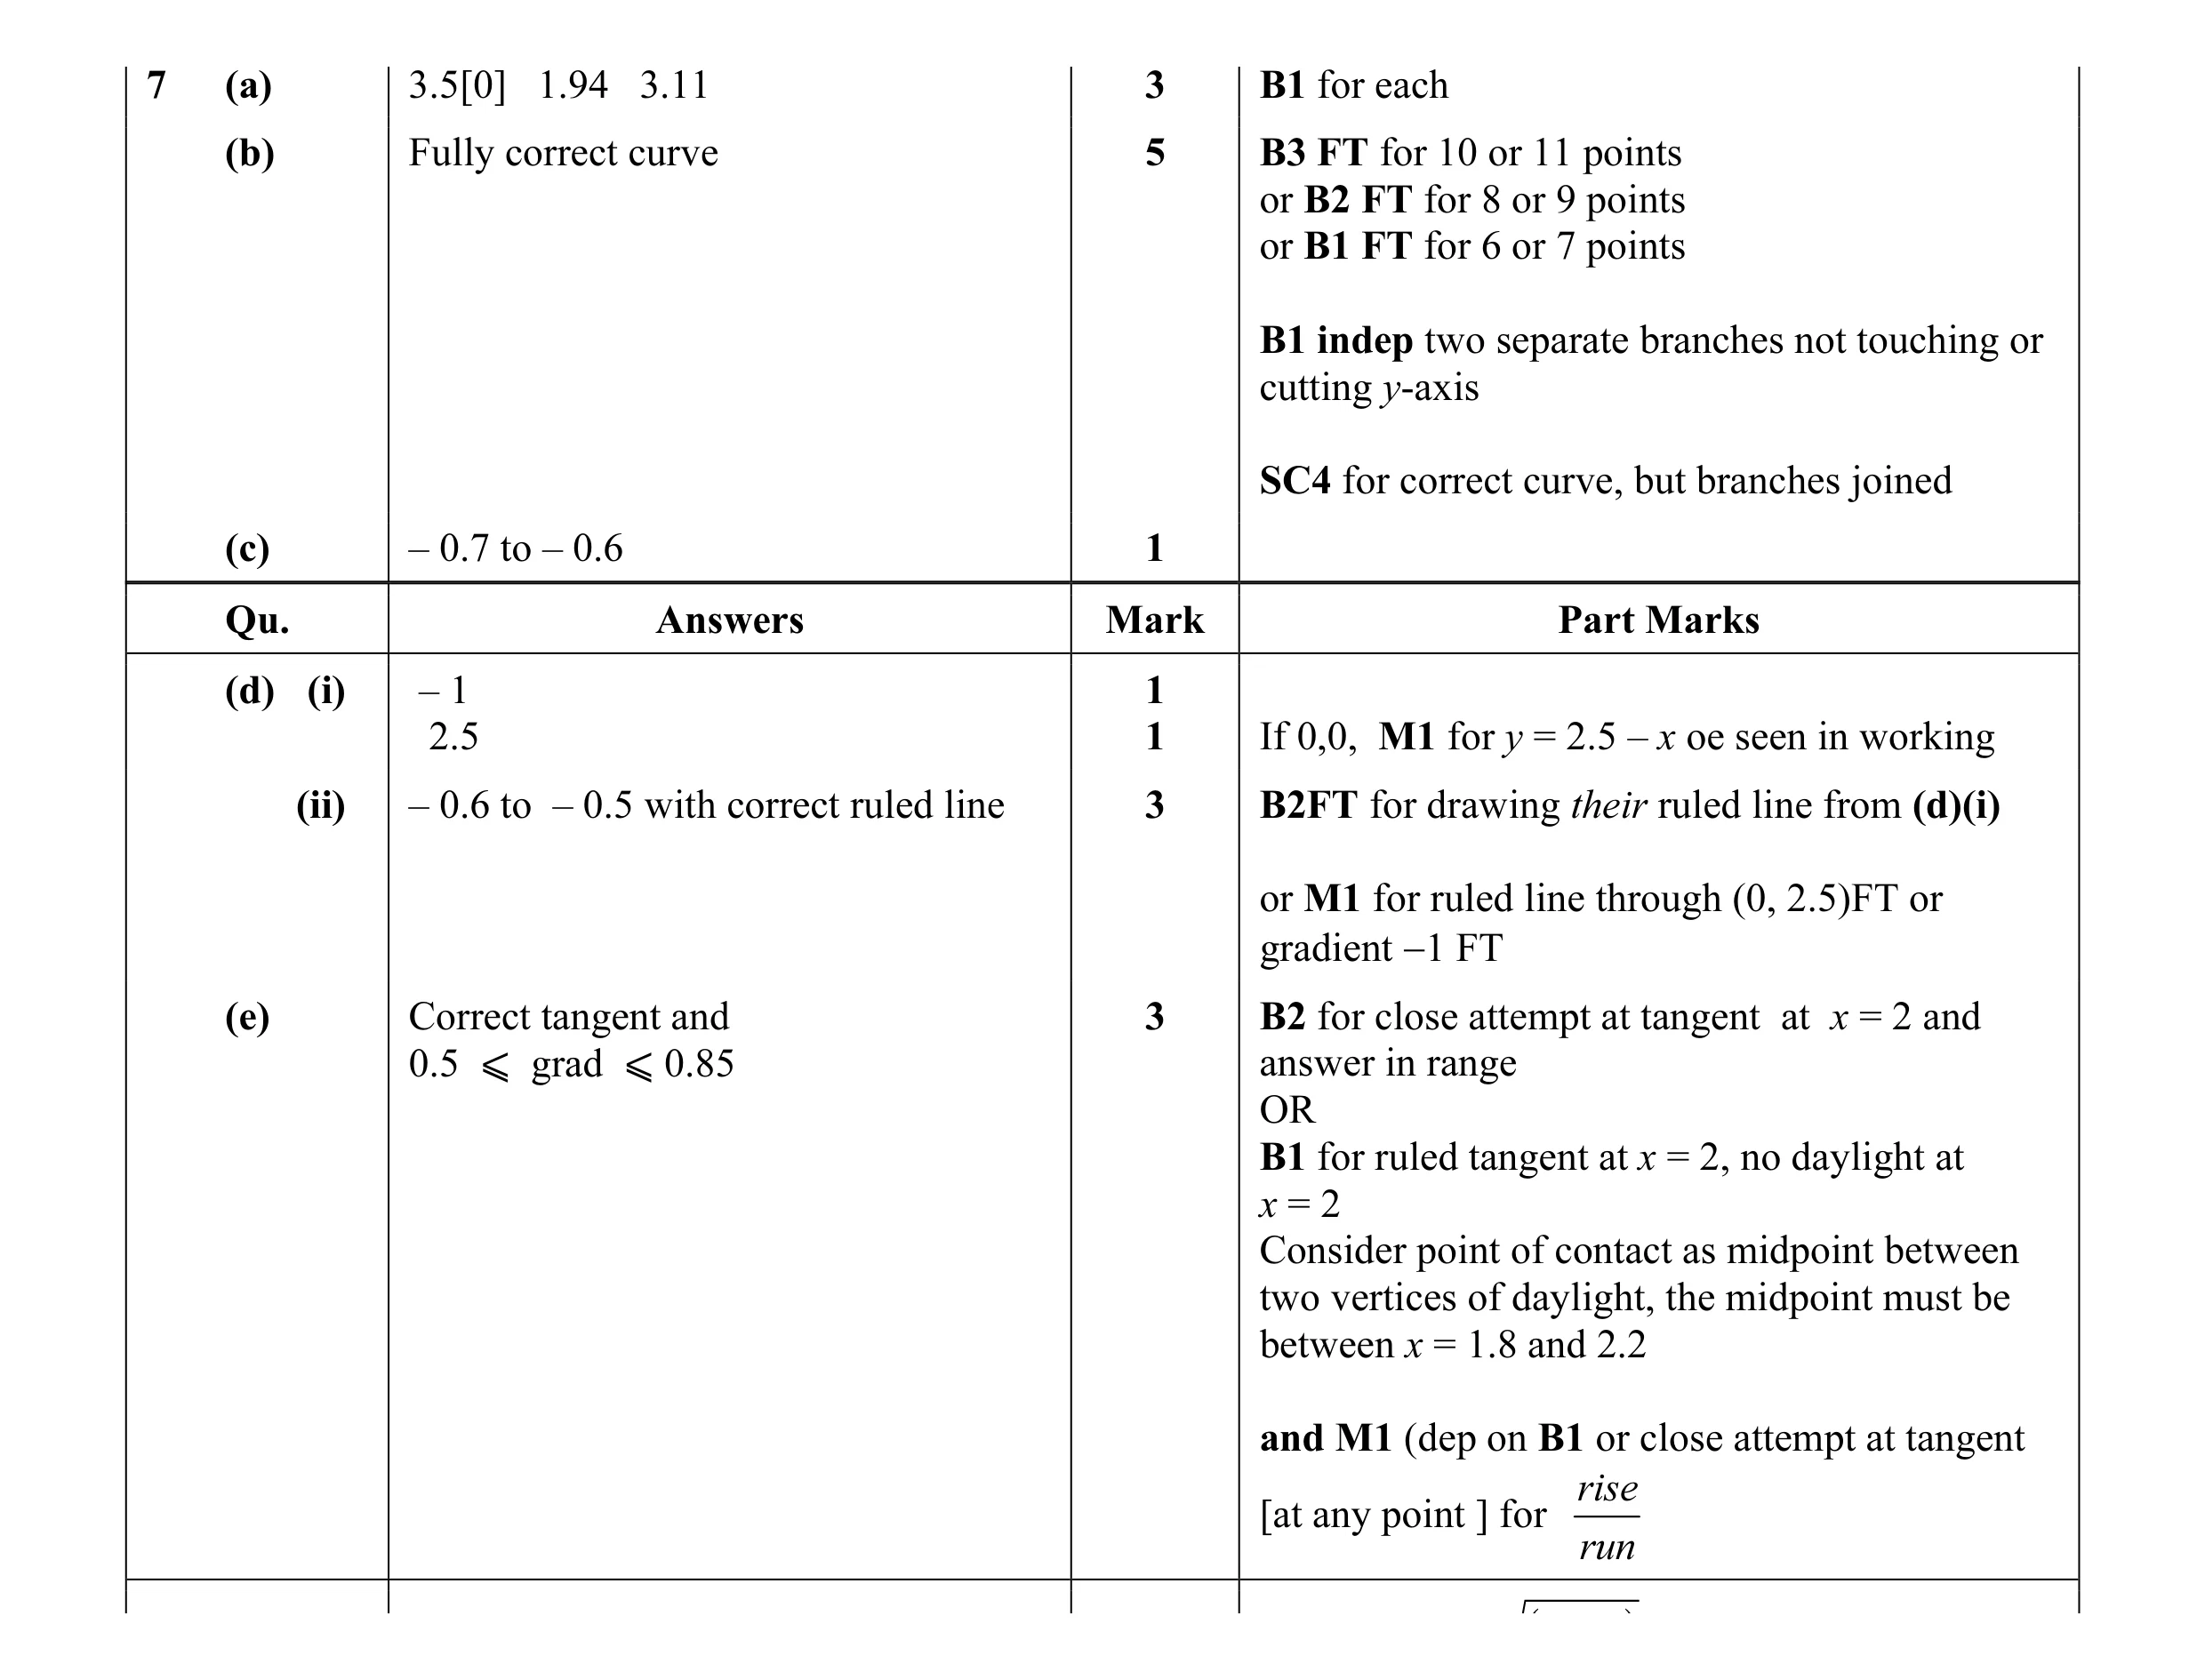 17
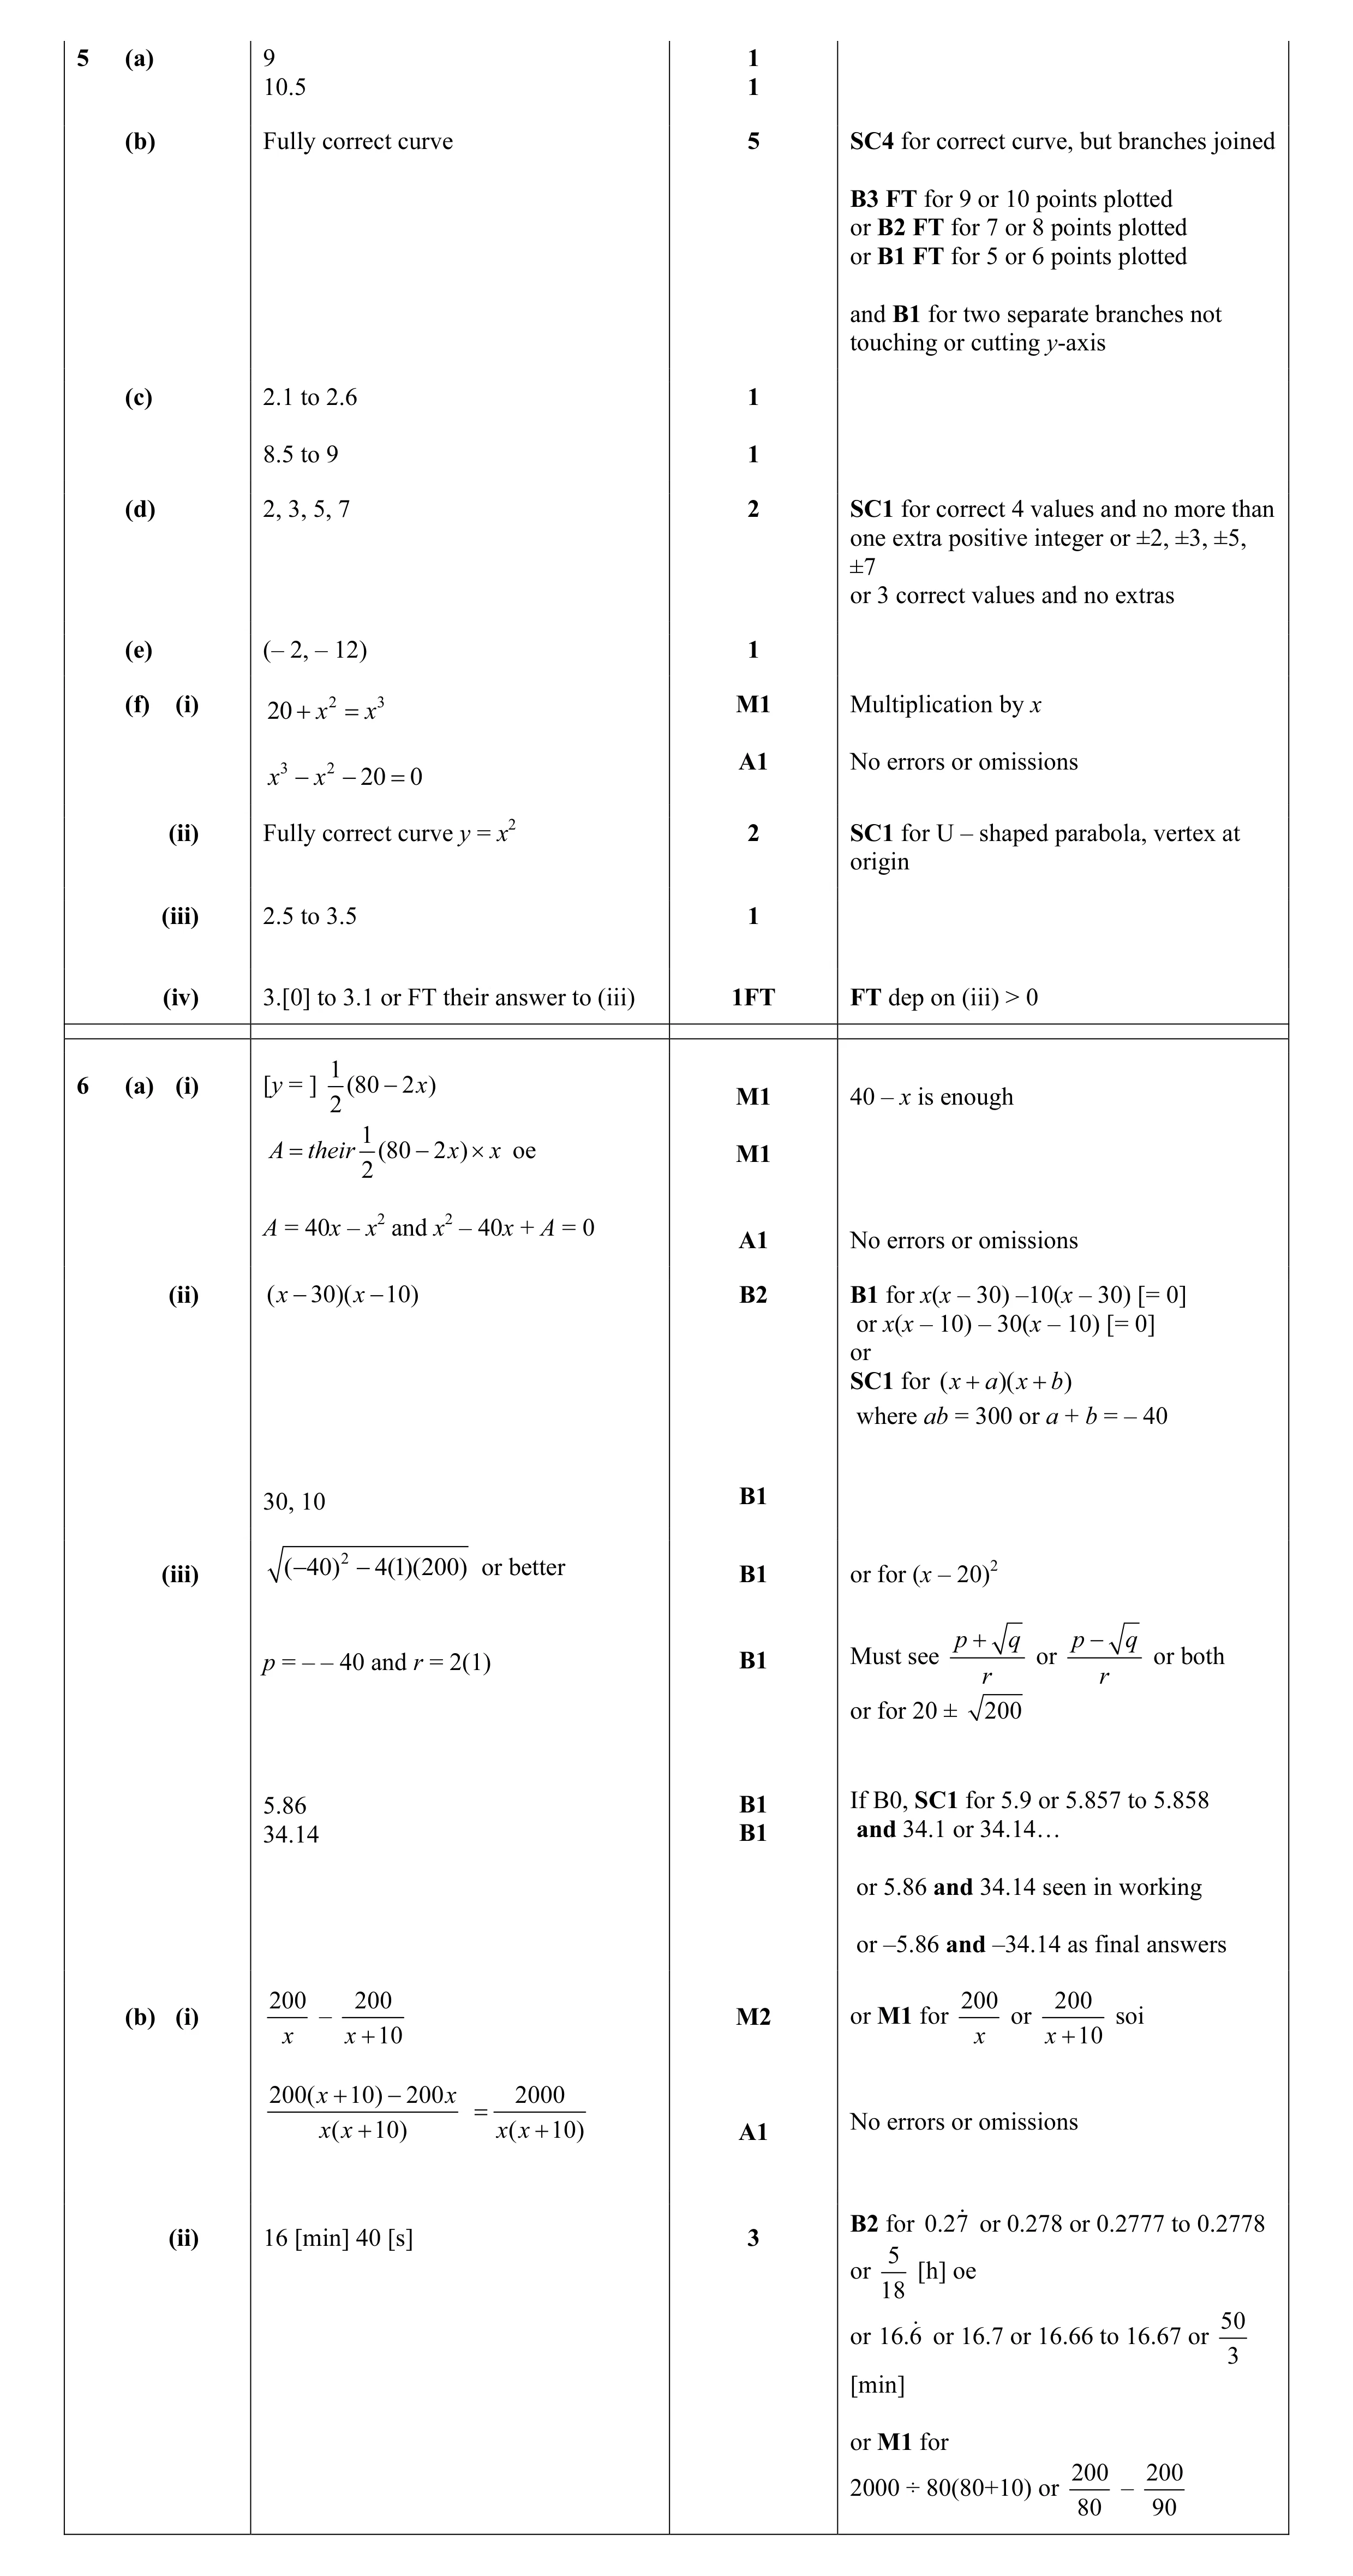 18
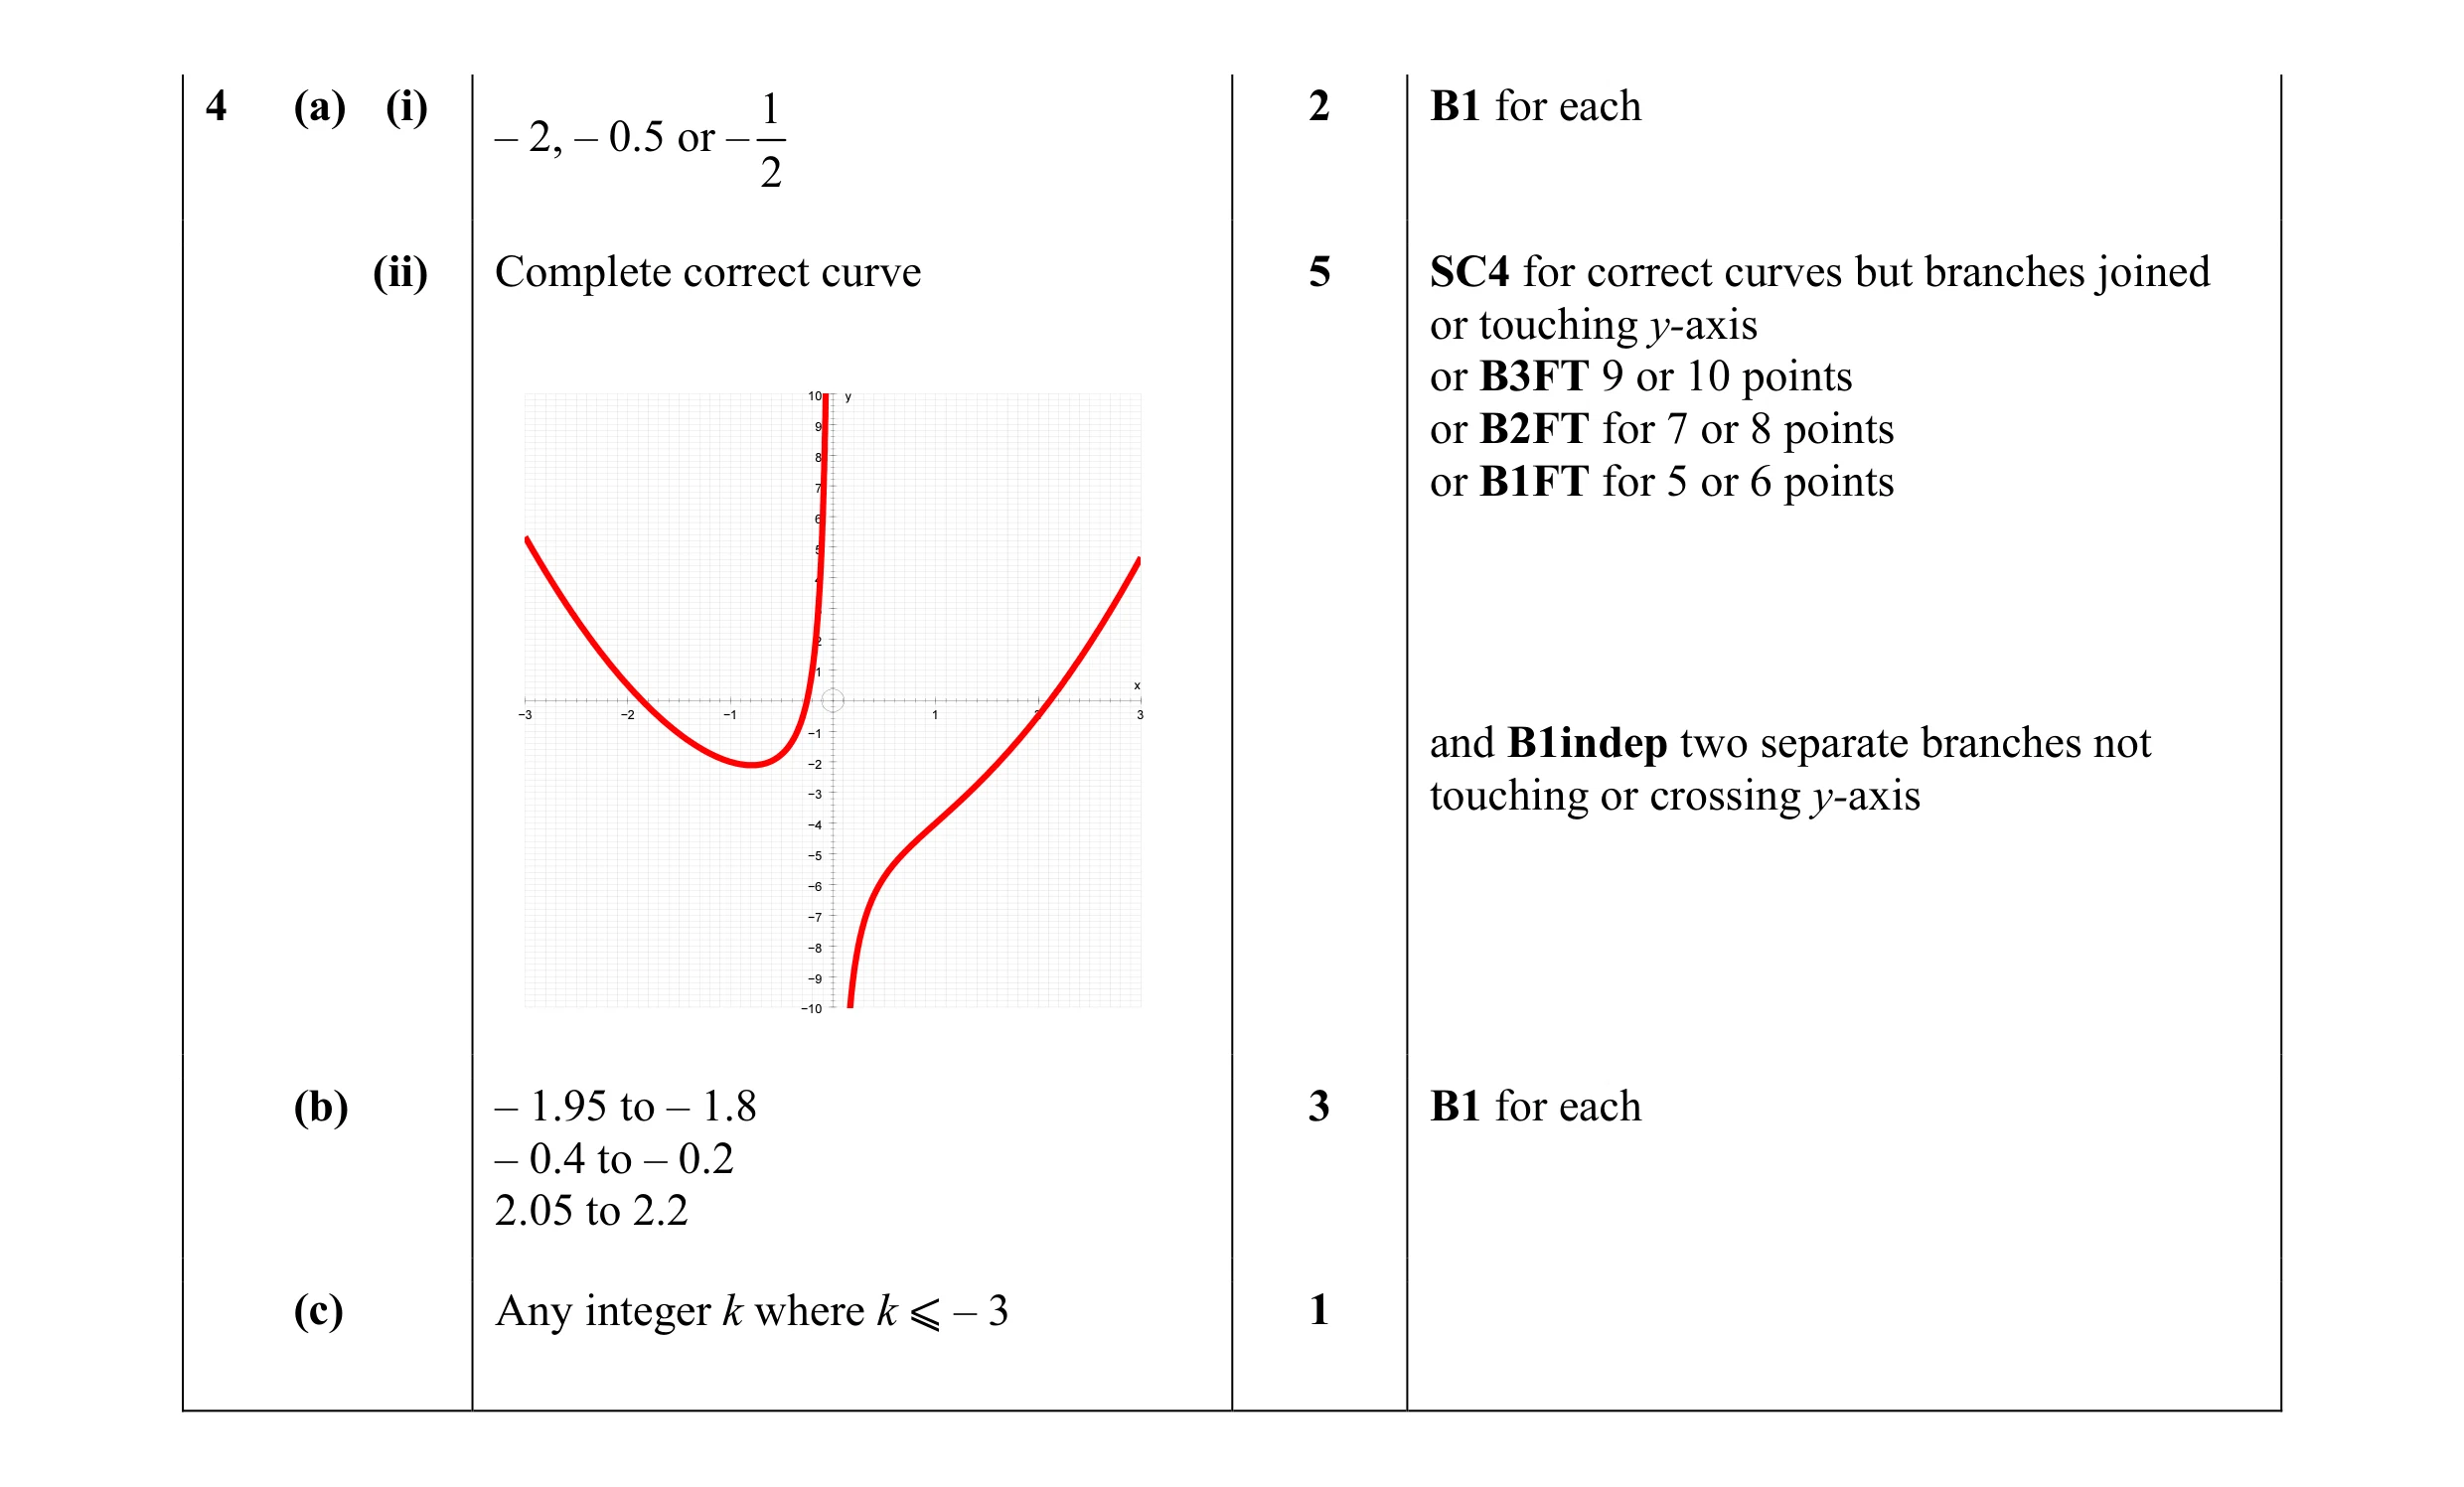 17
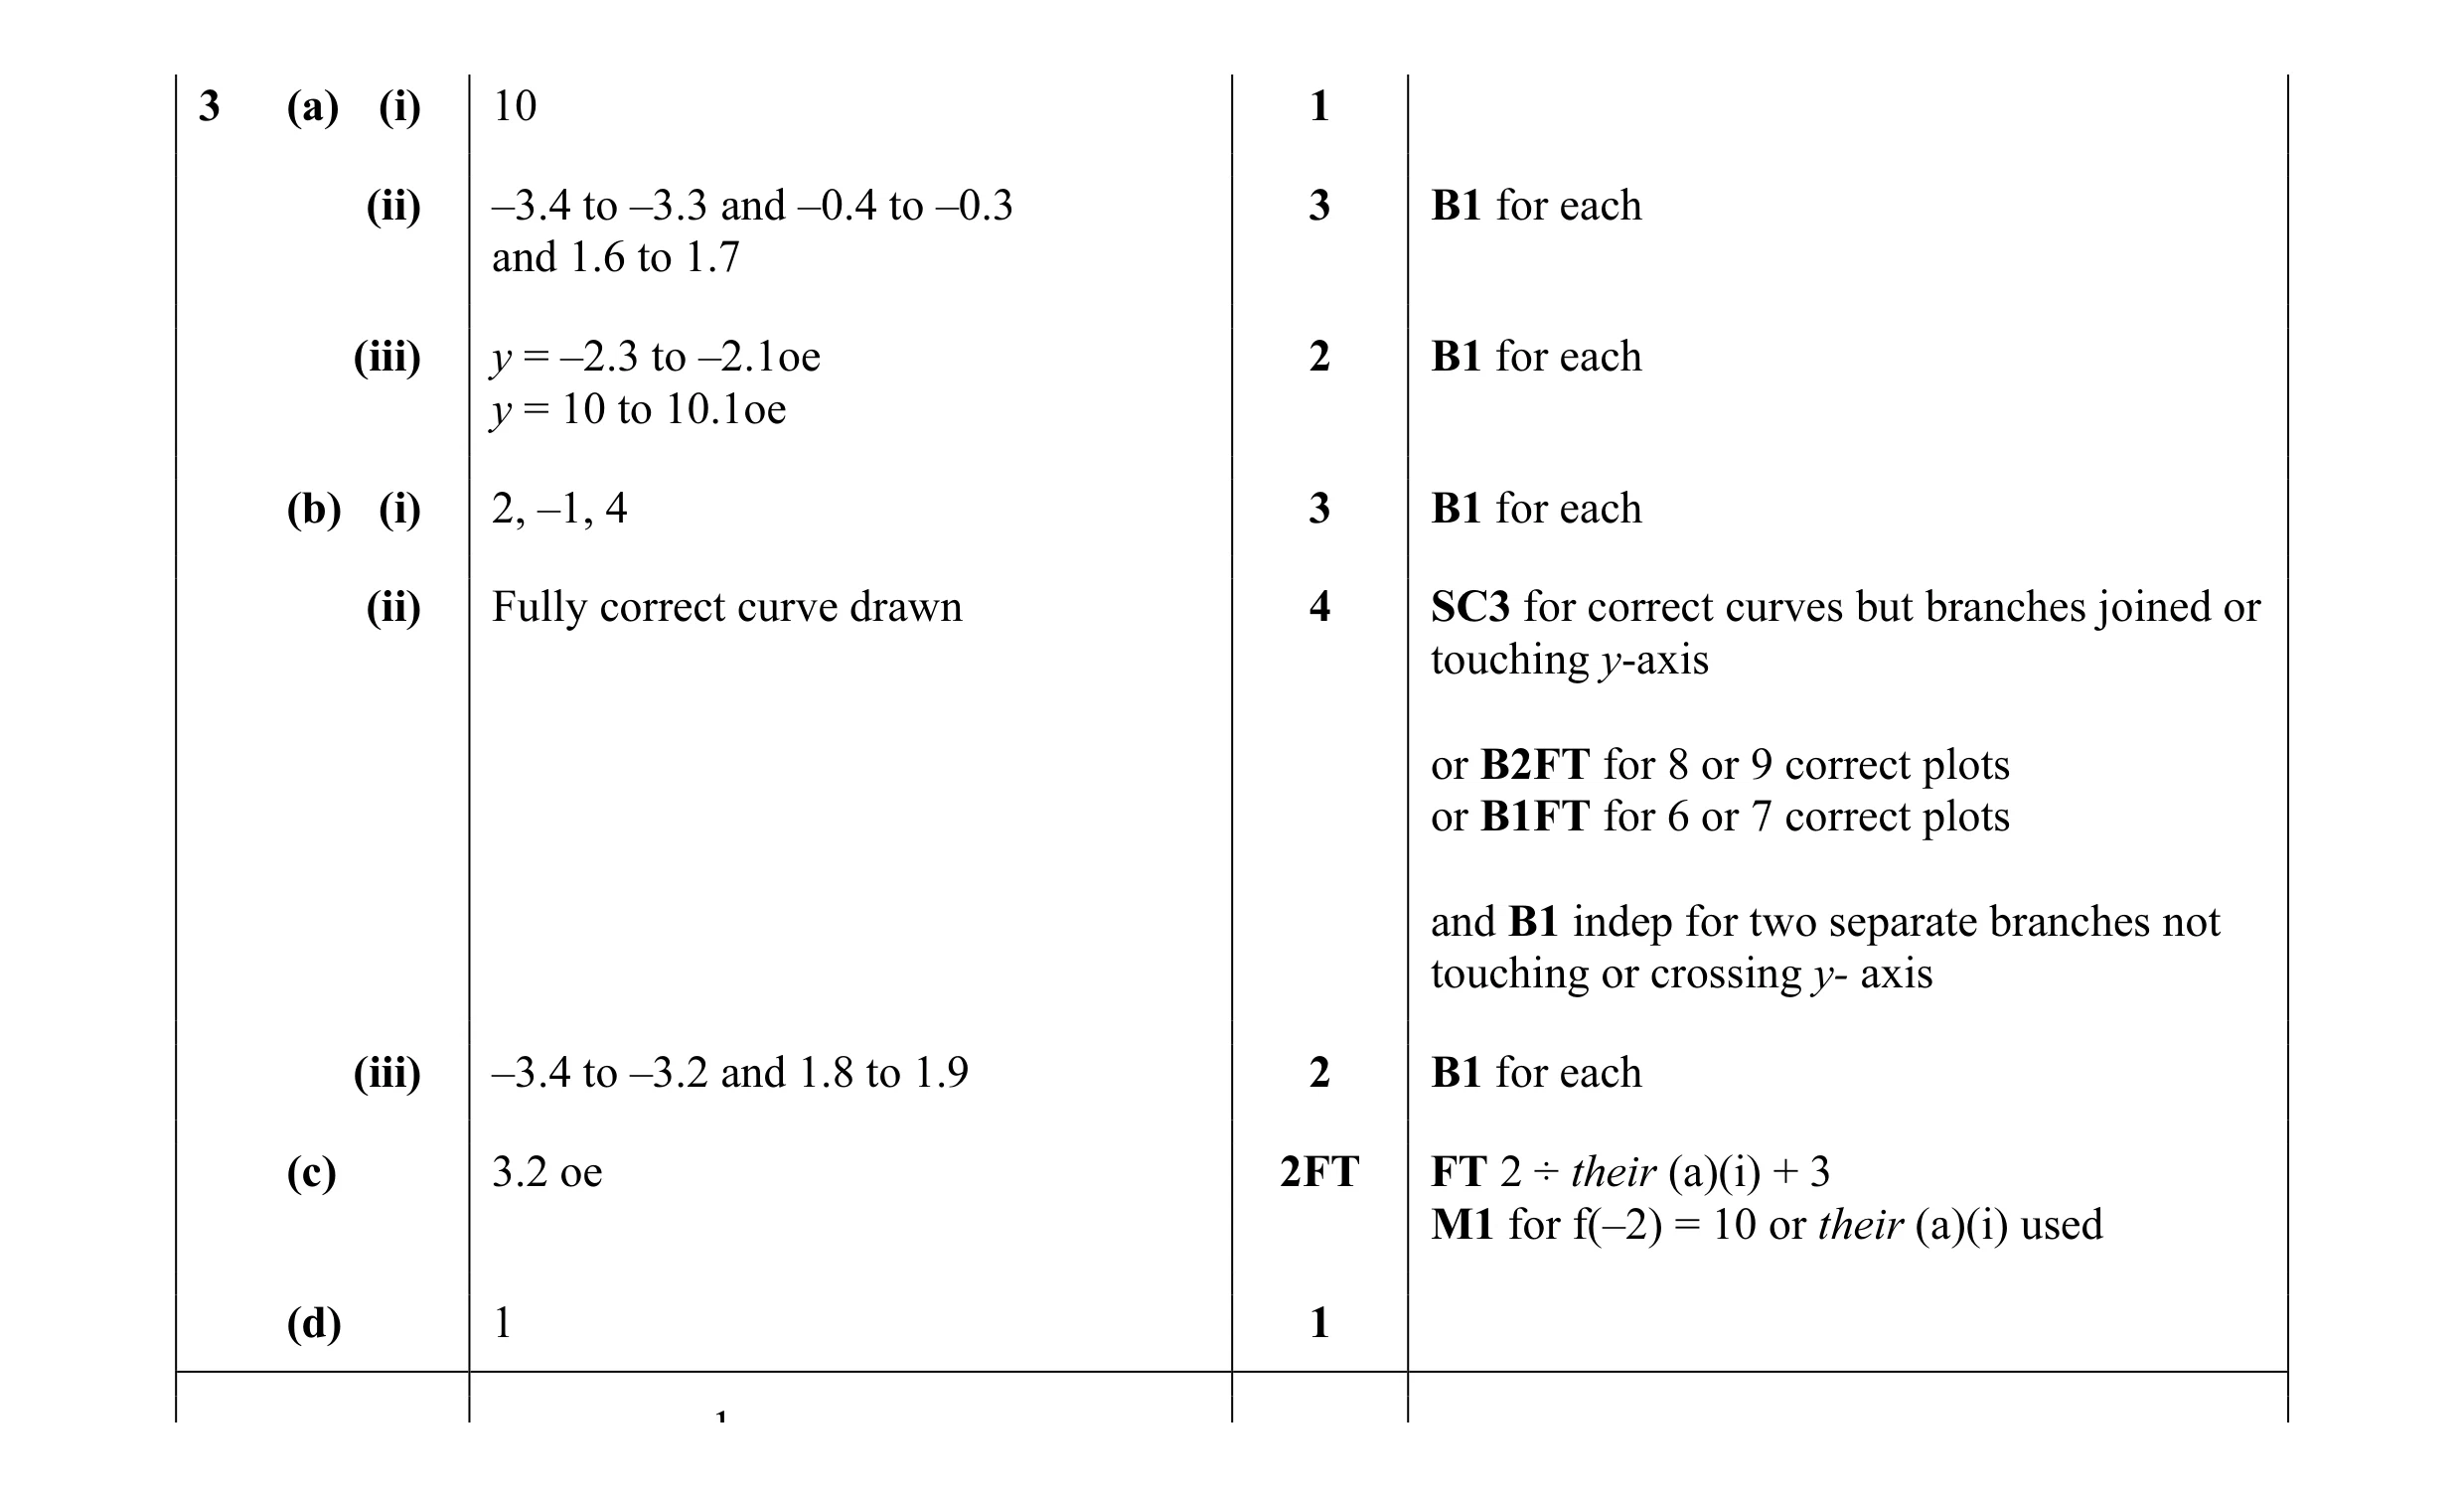 18
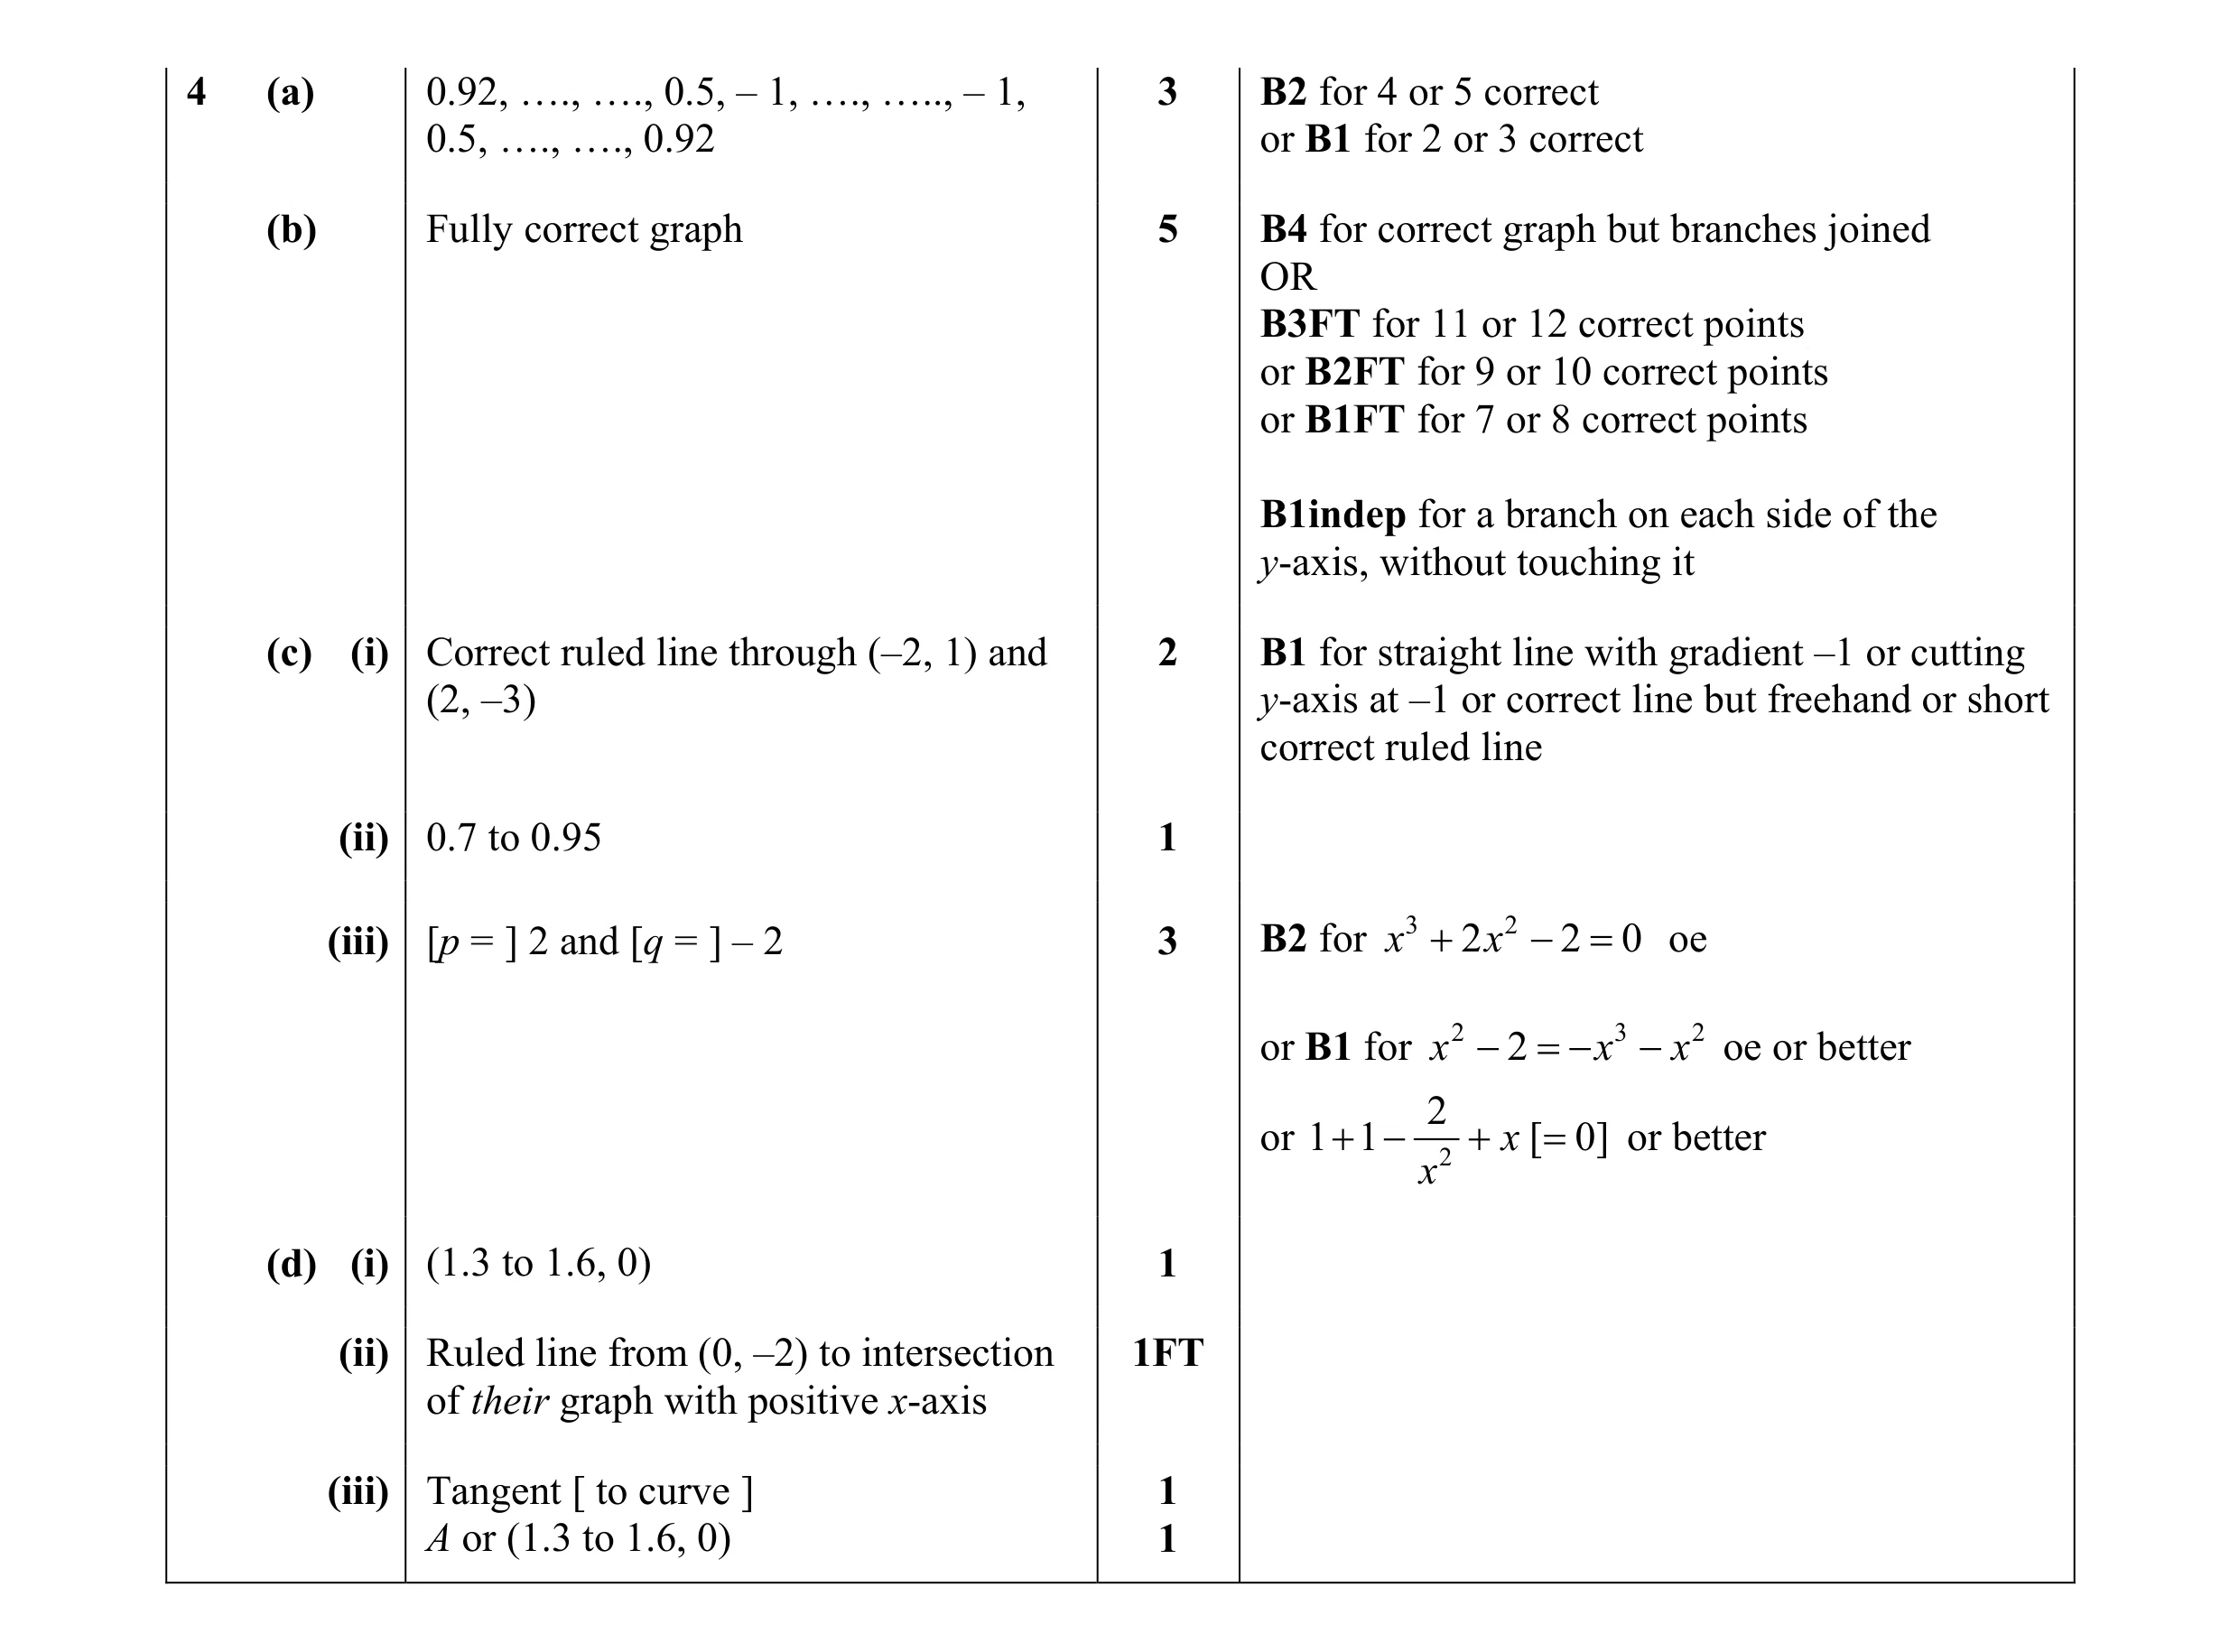 18
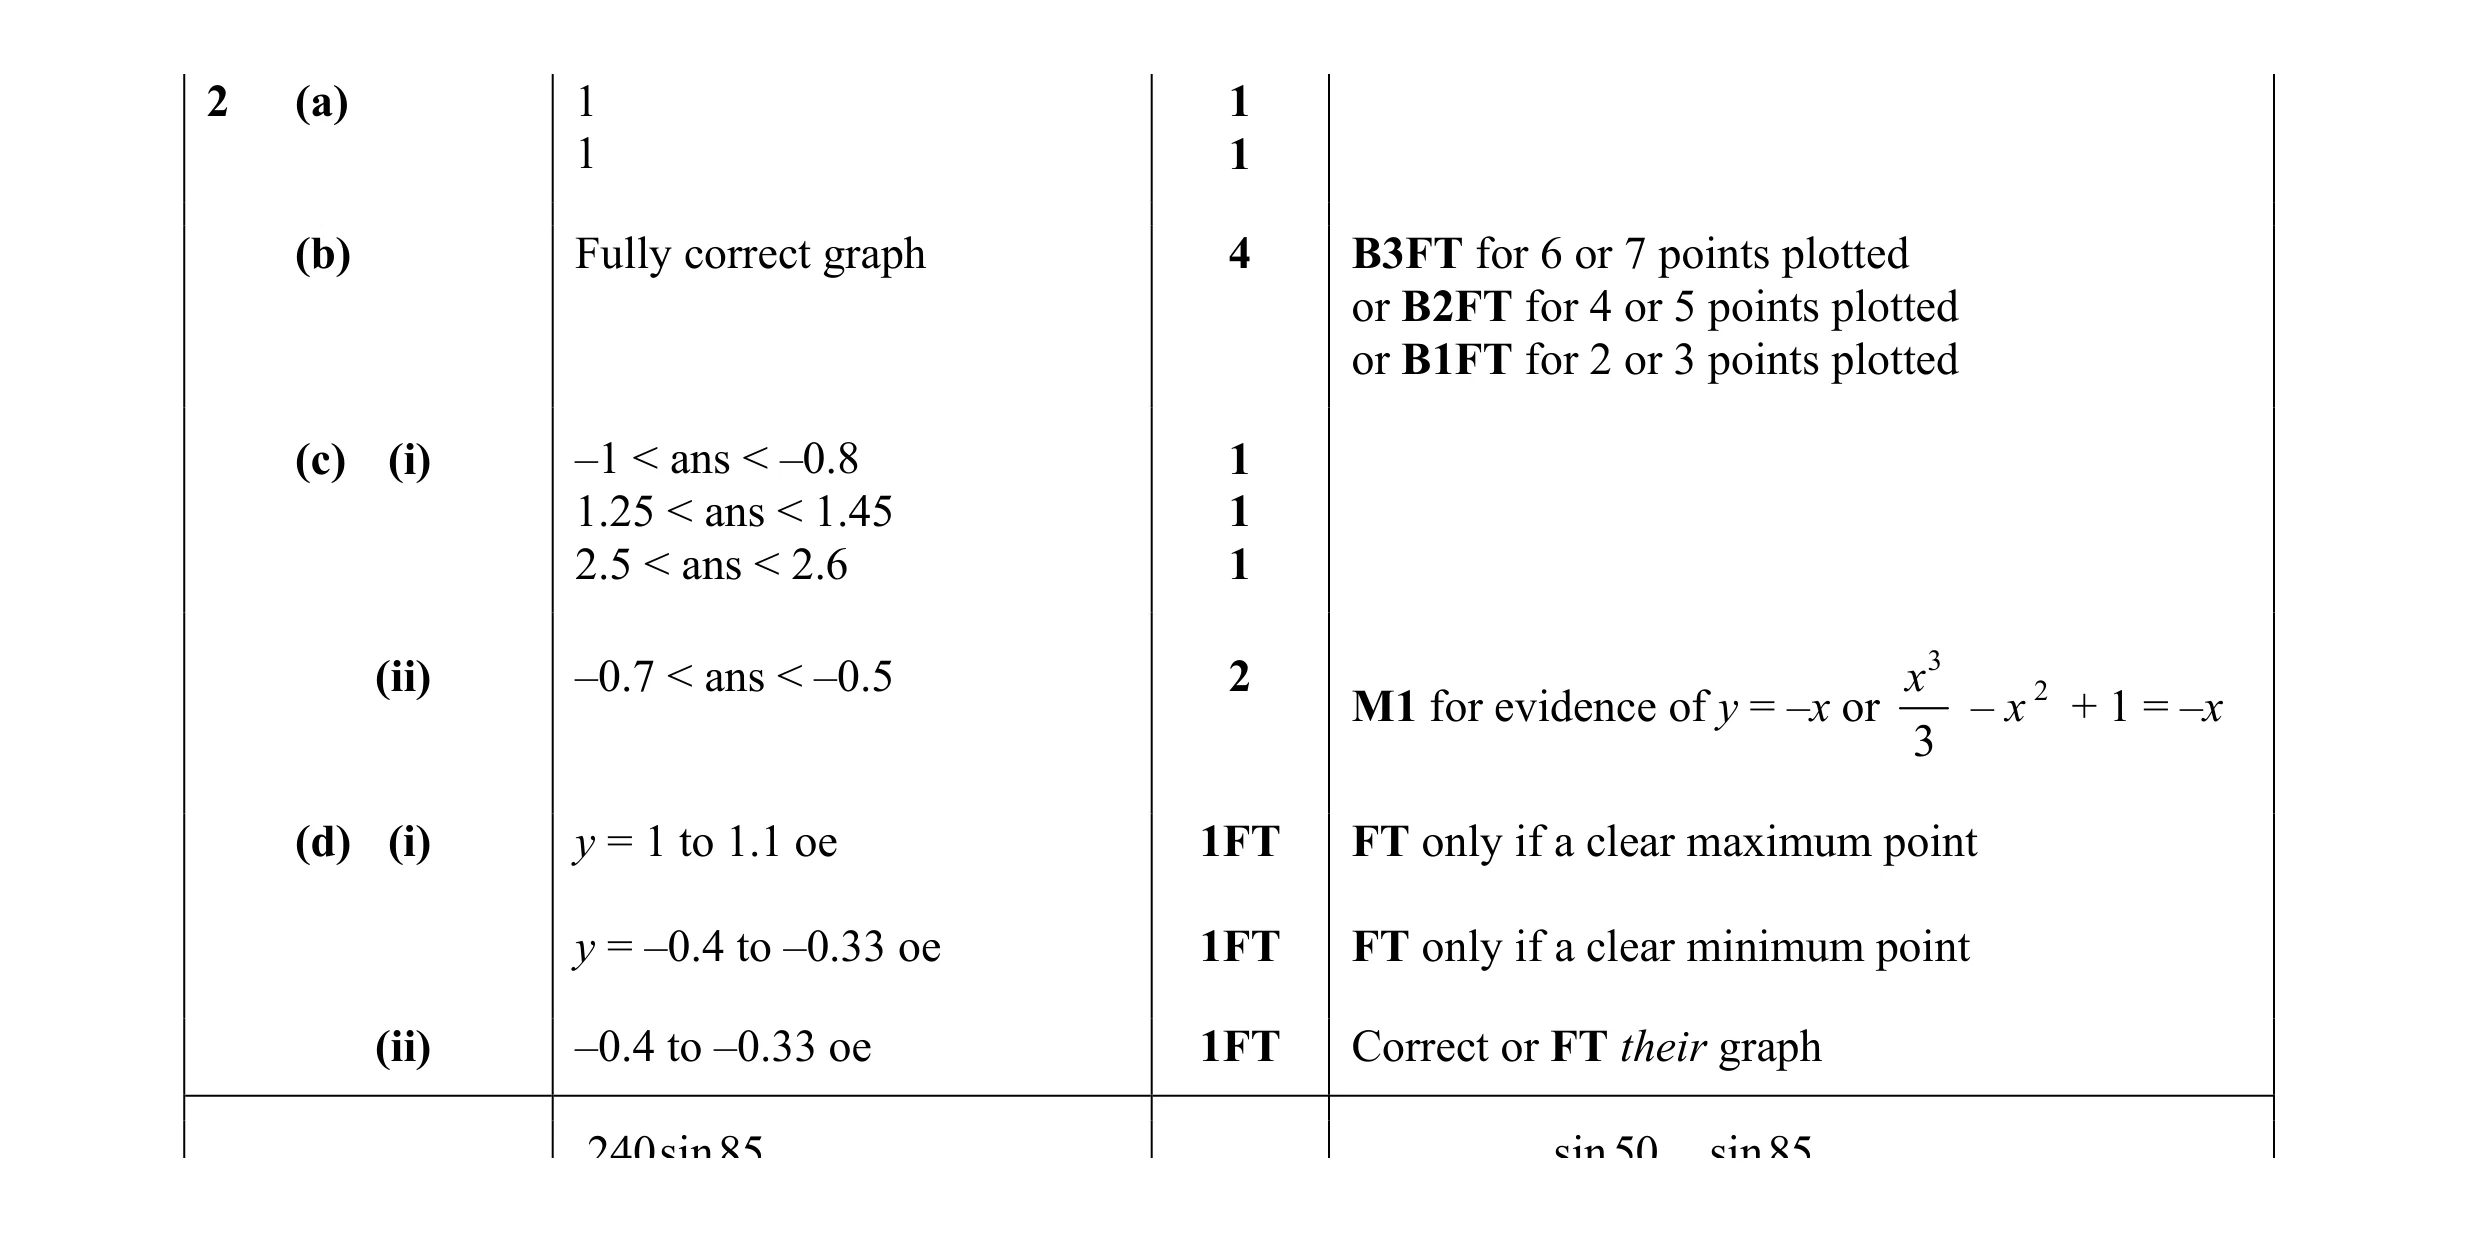 14
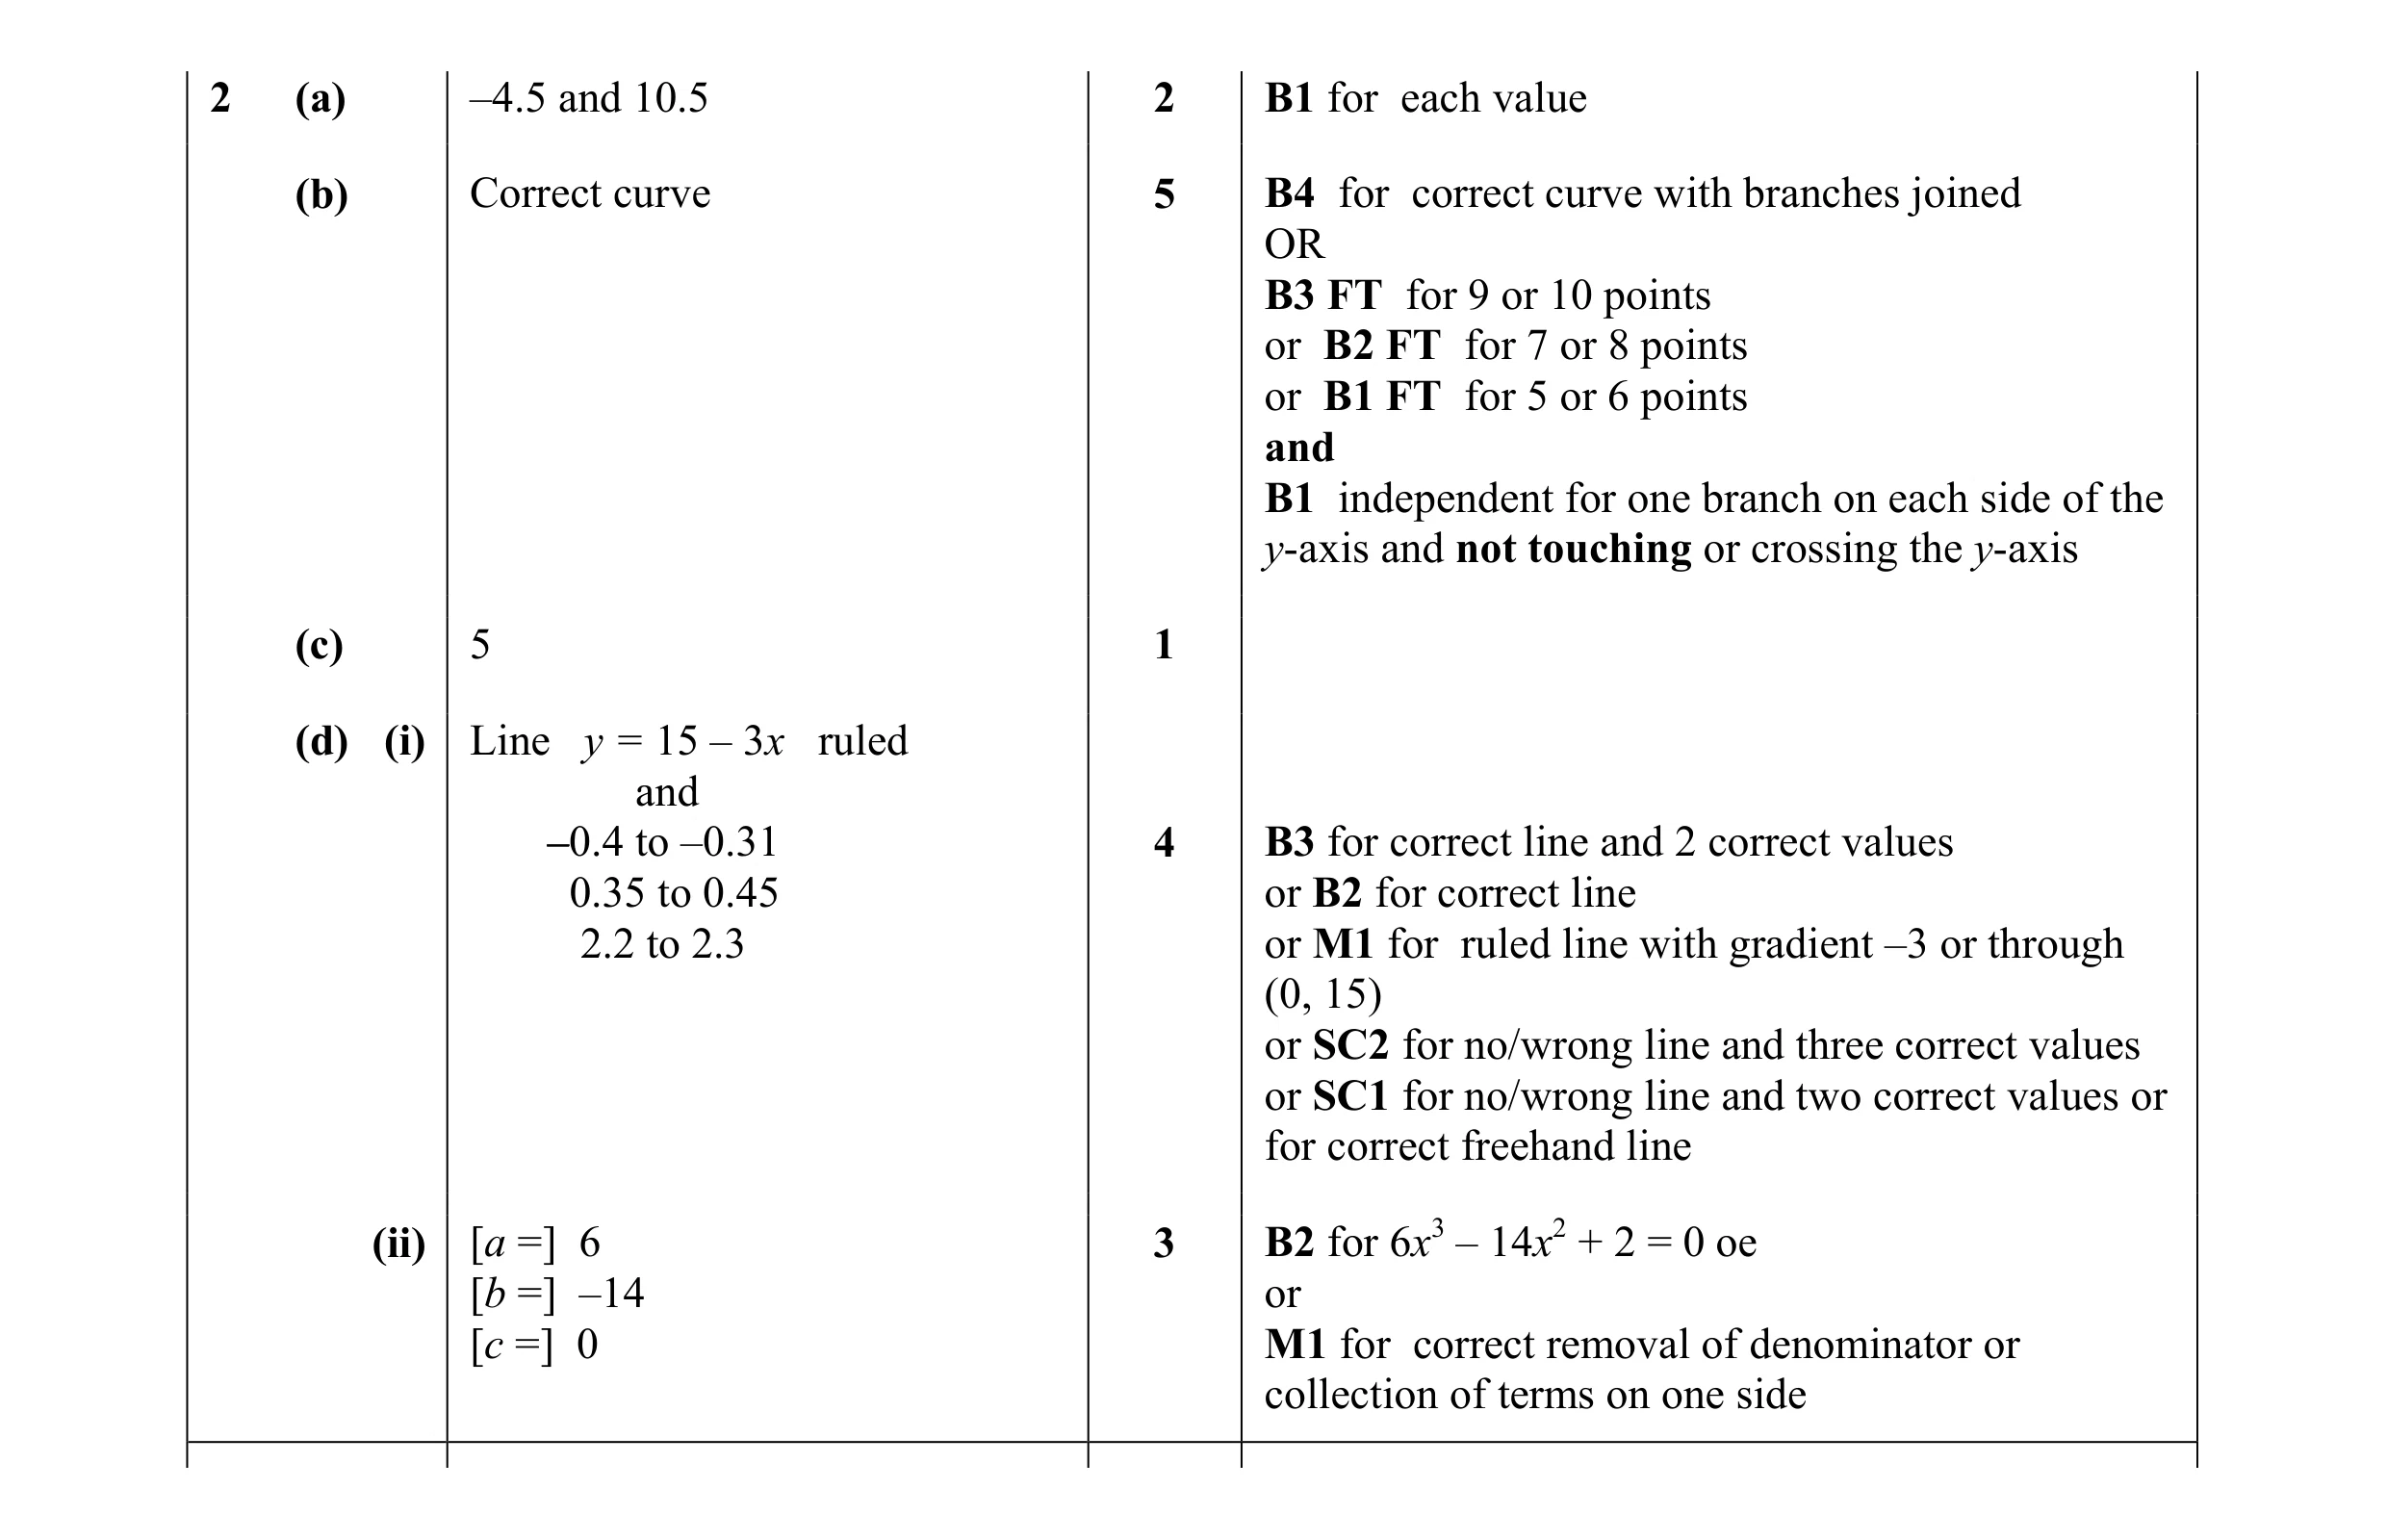 15
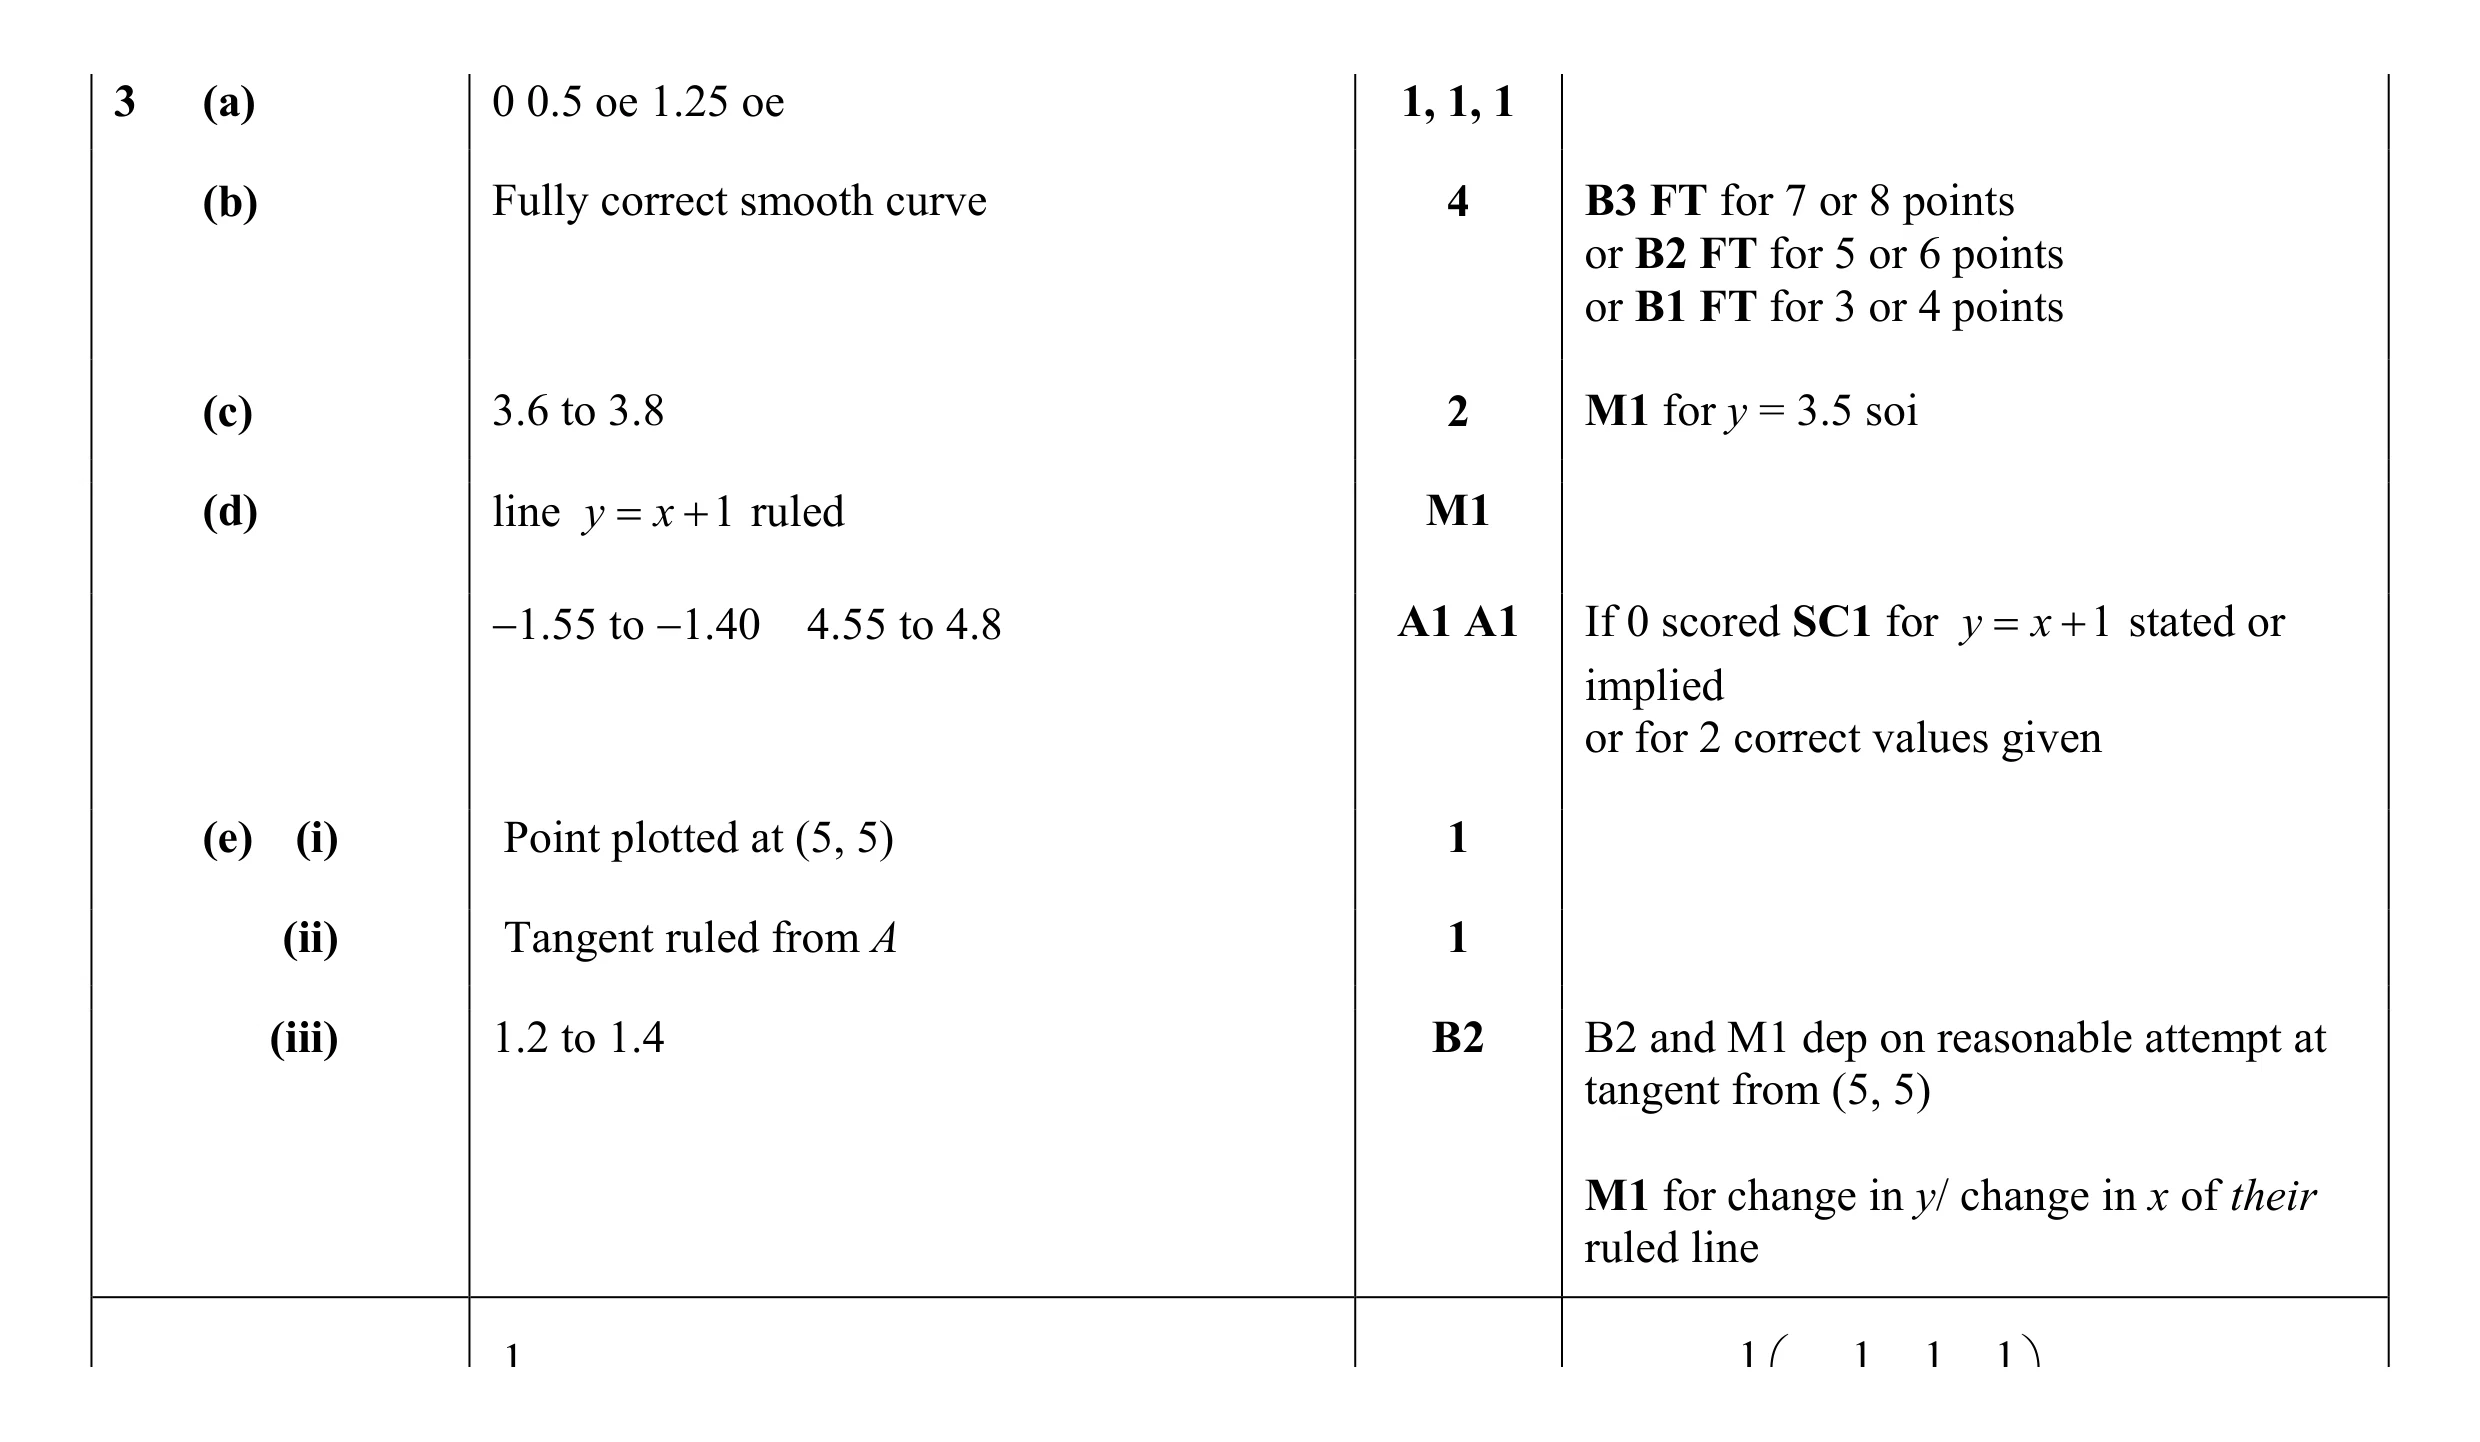 16
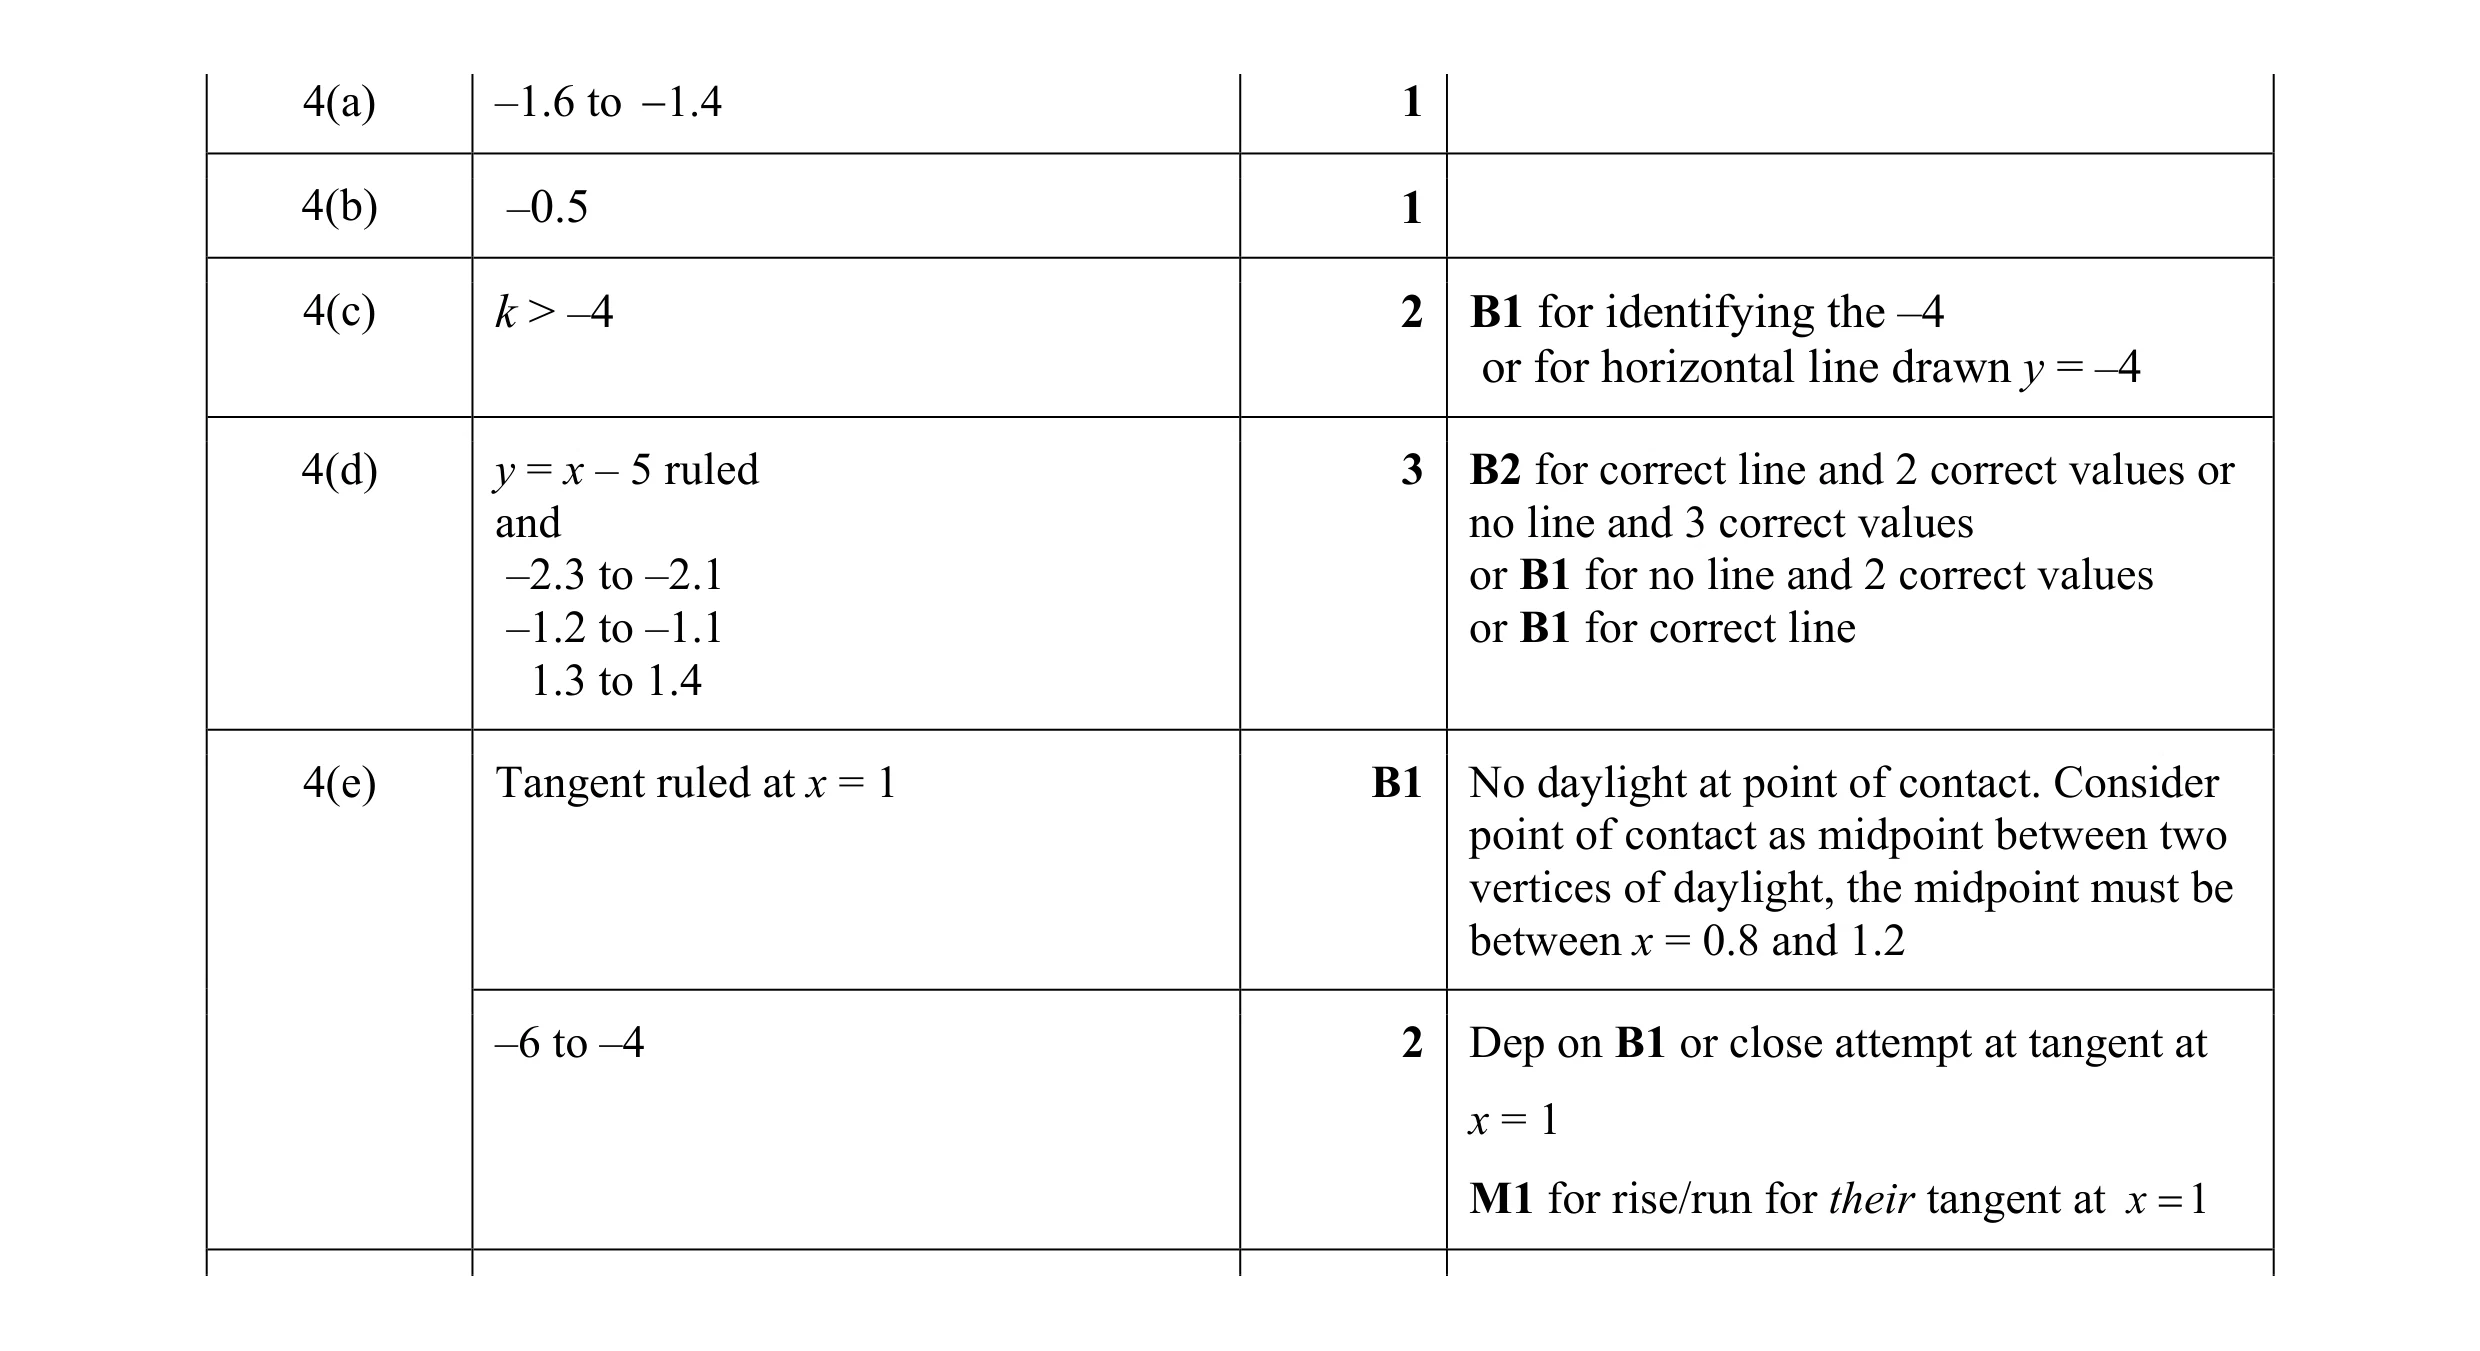 10
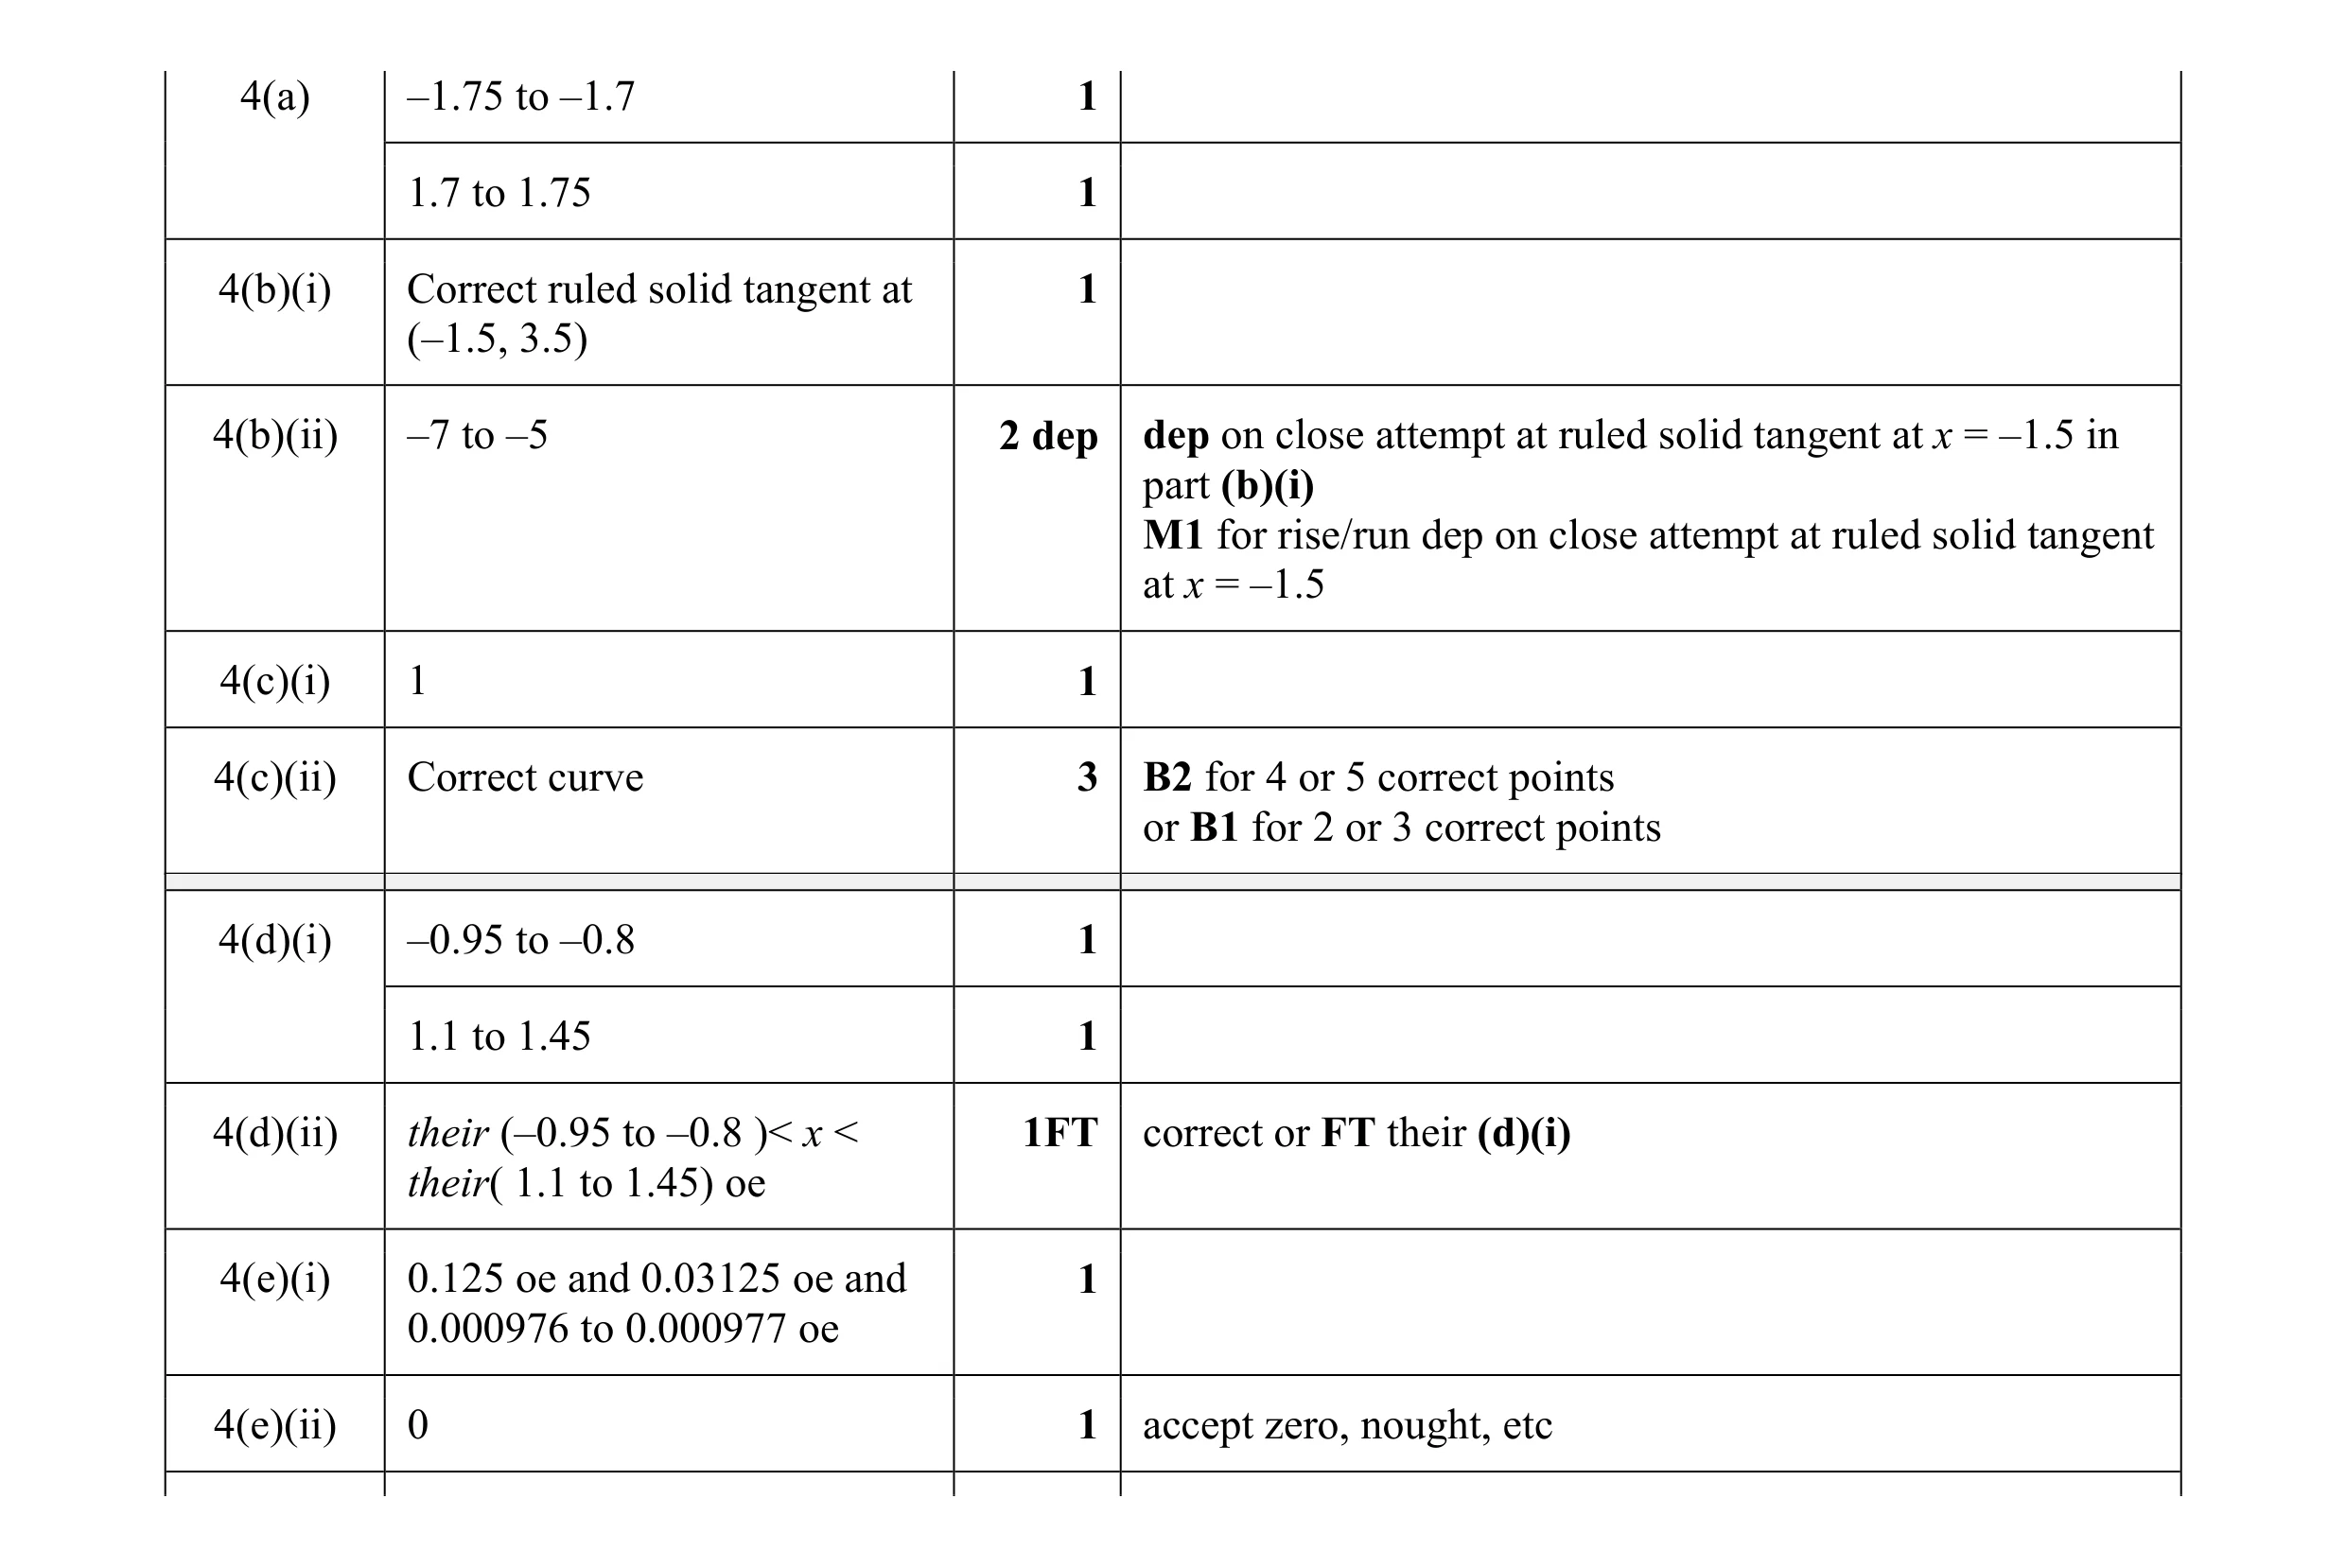 14
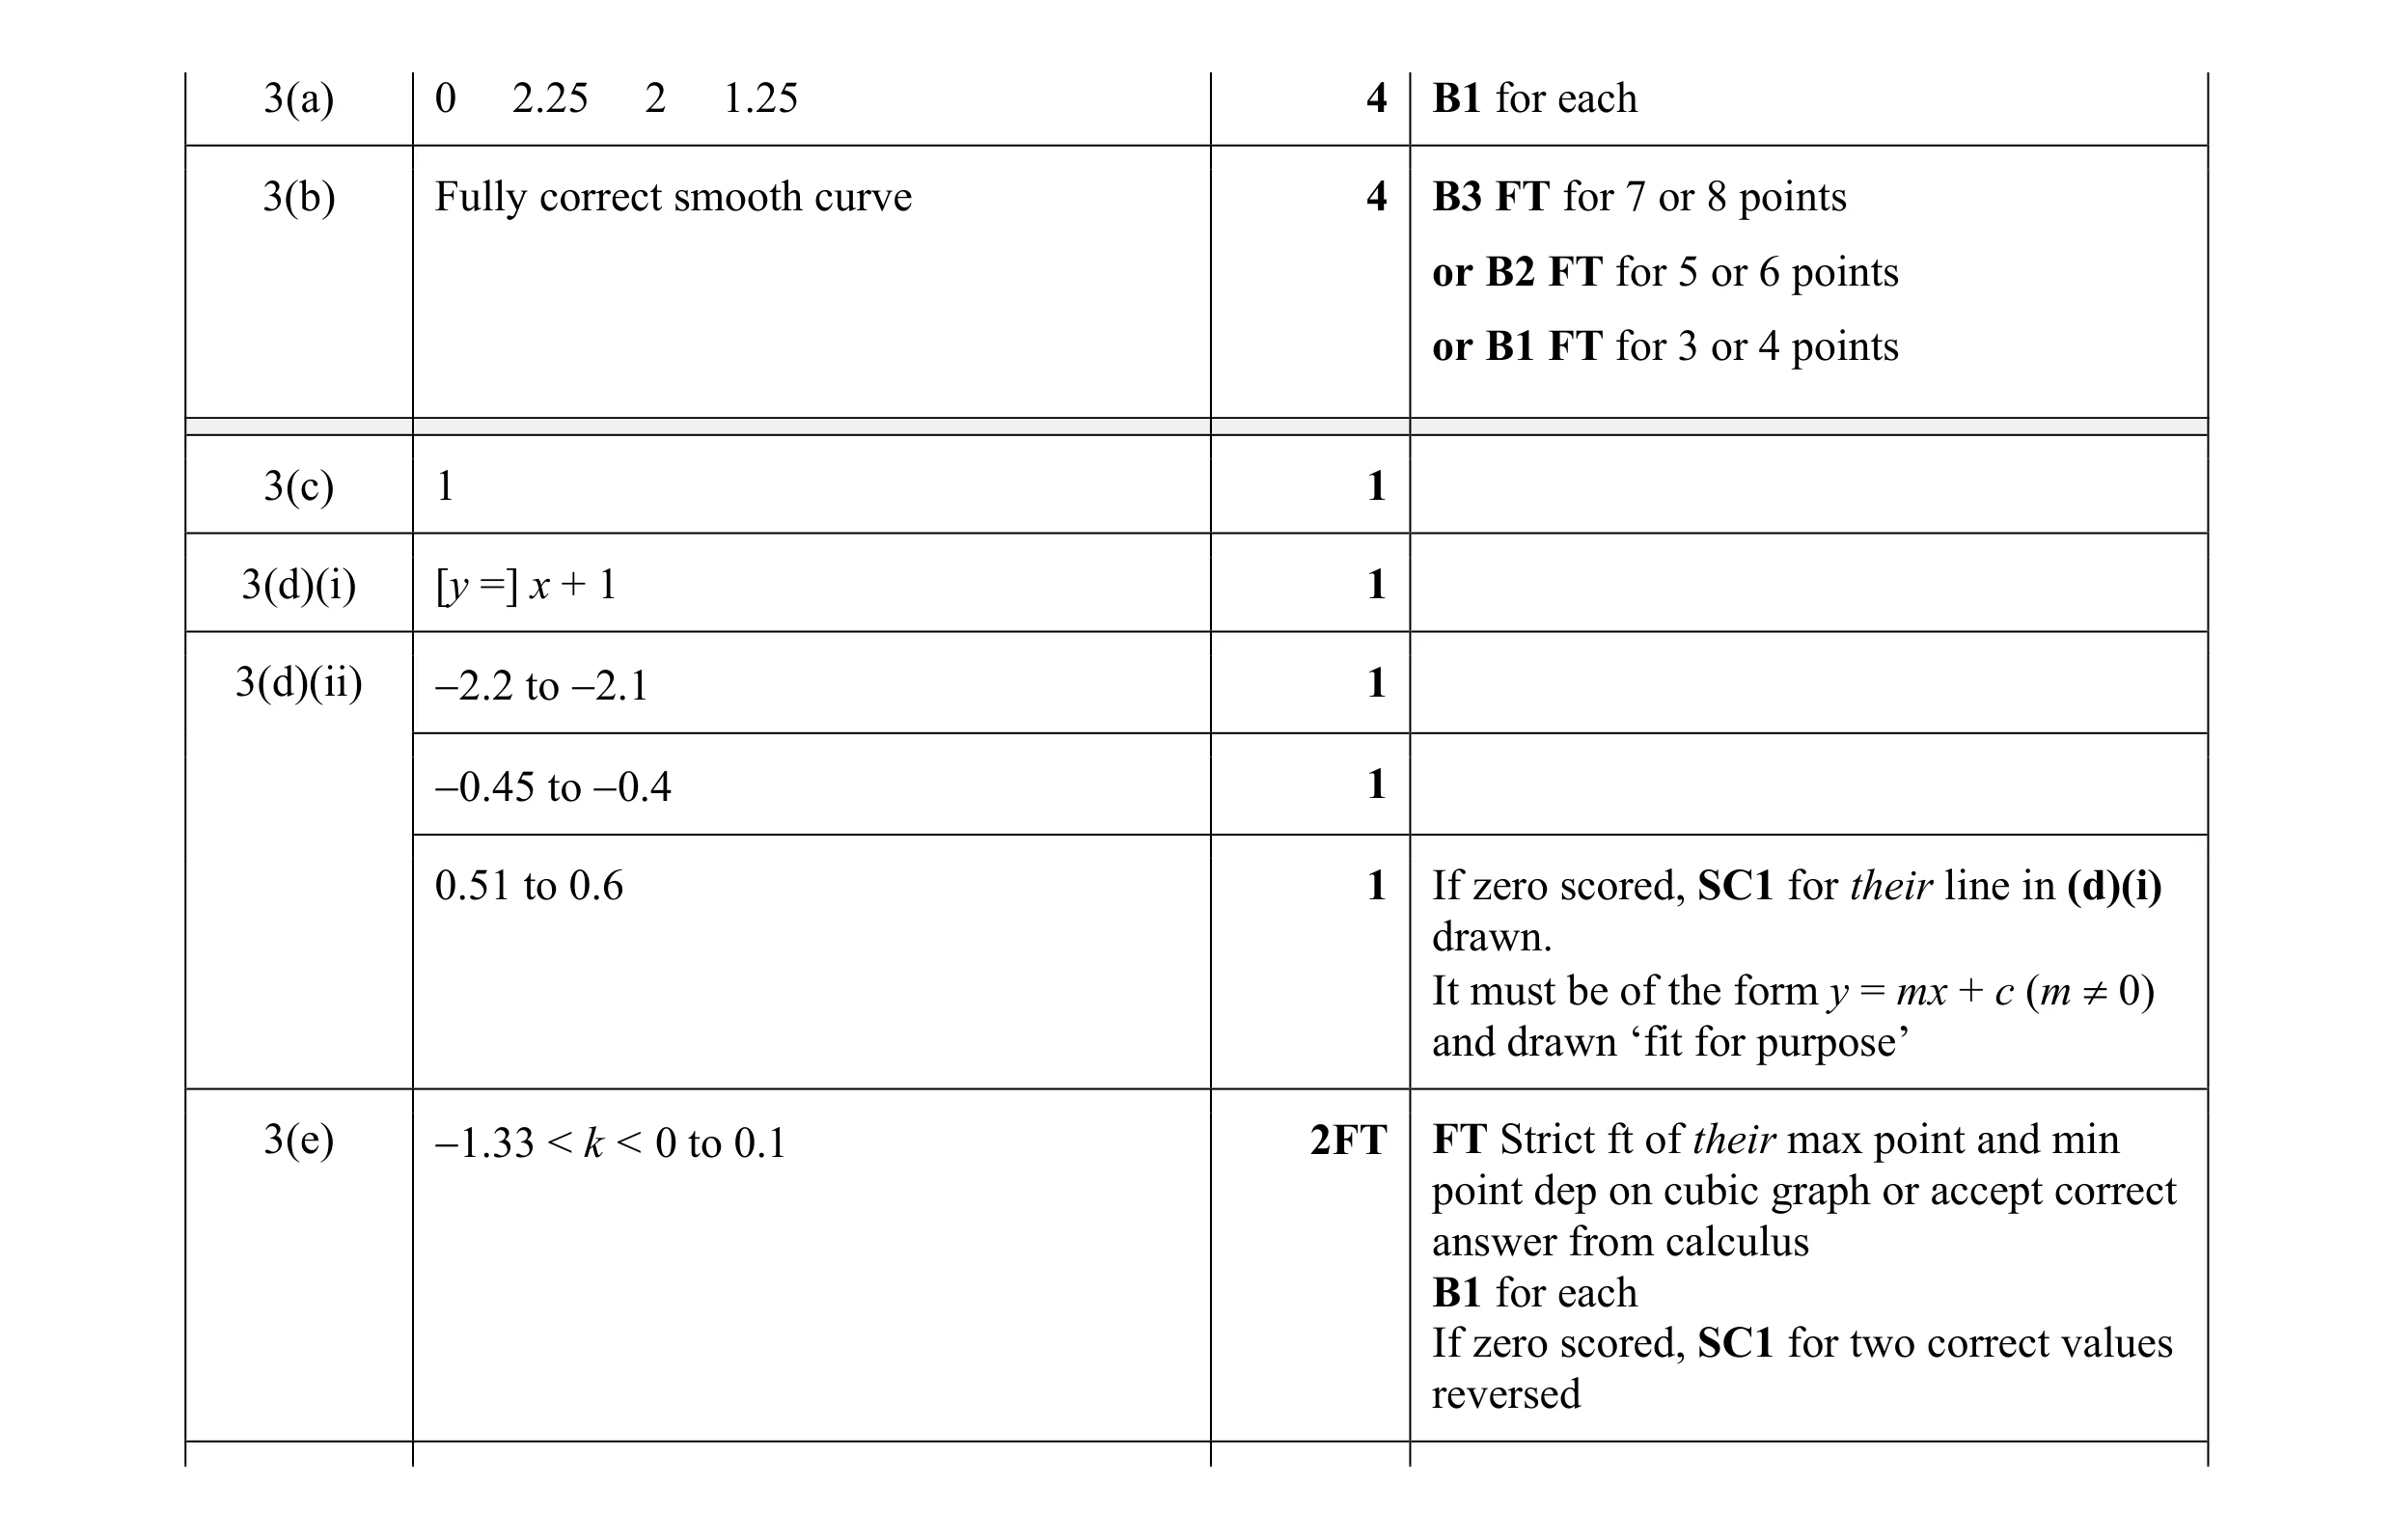 15
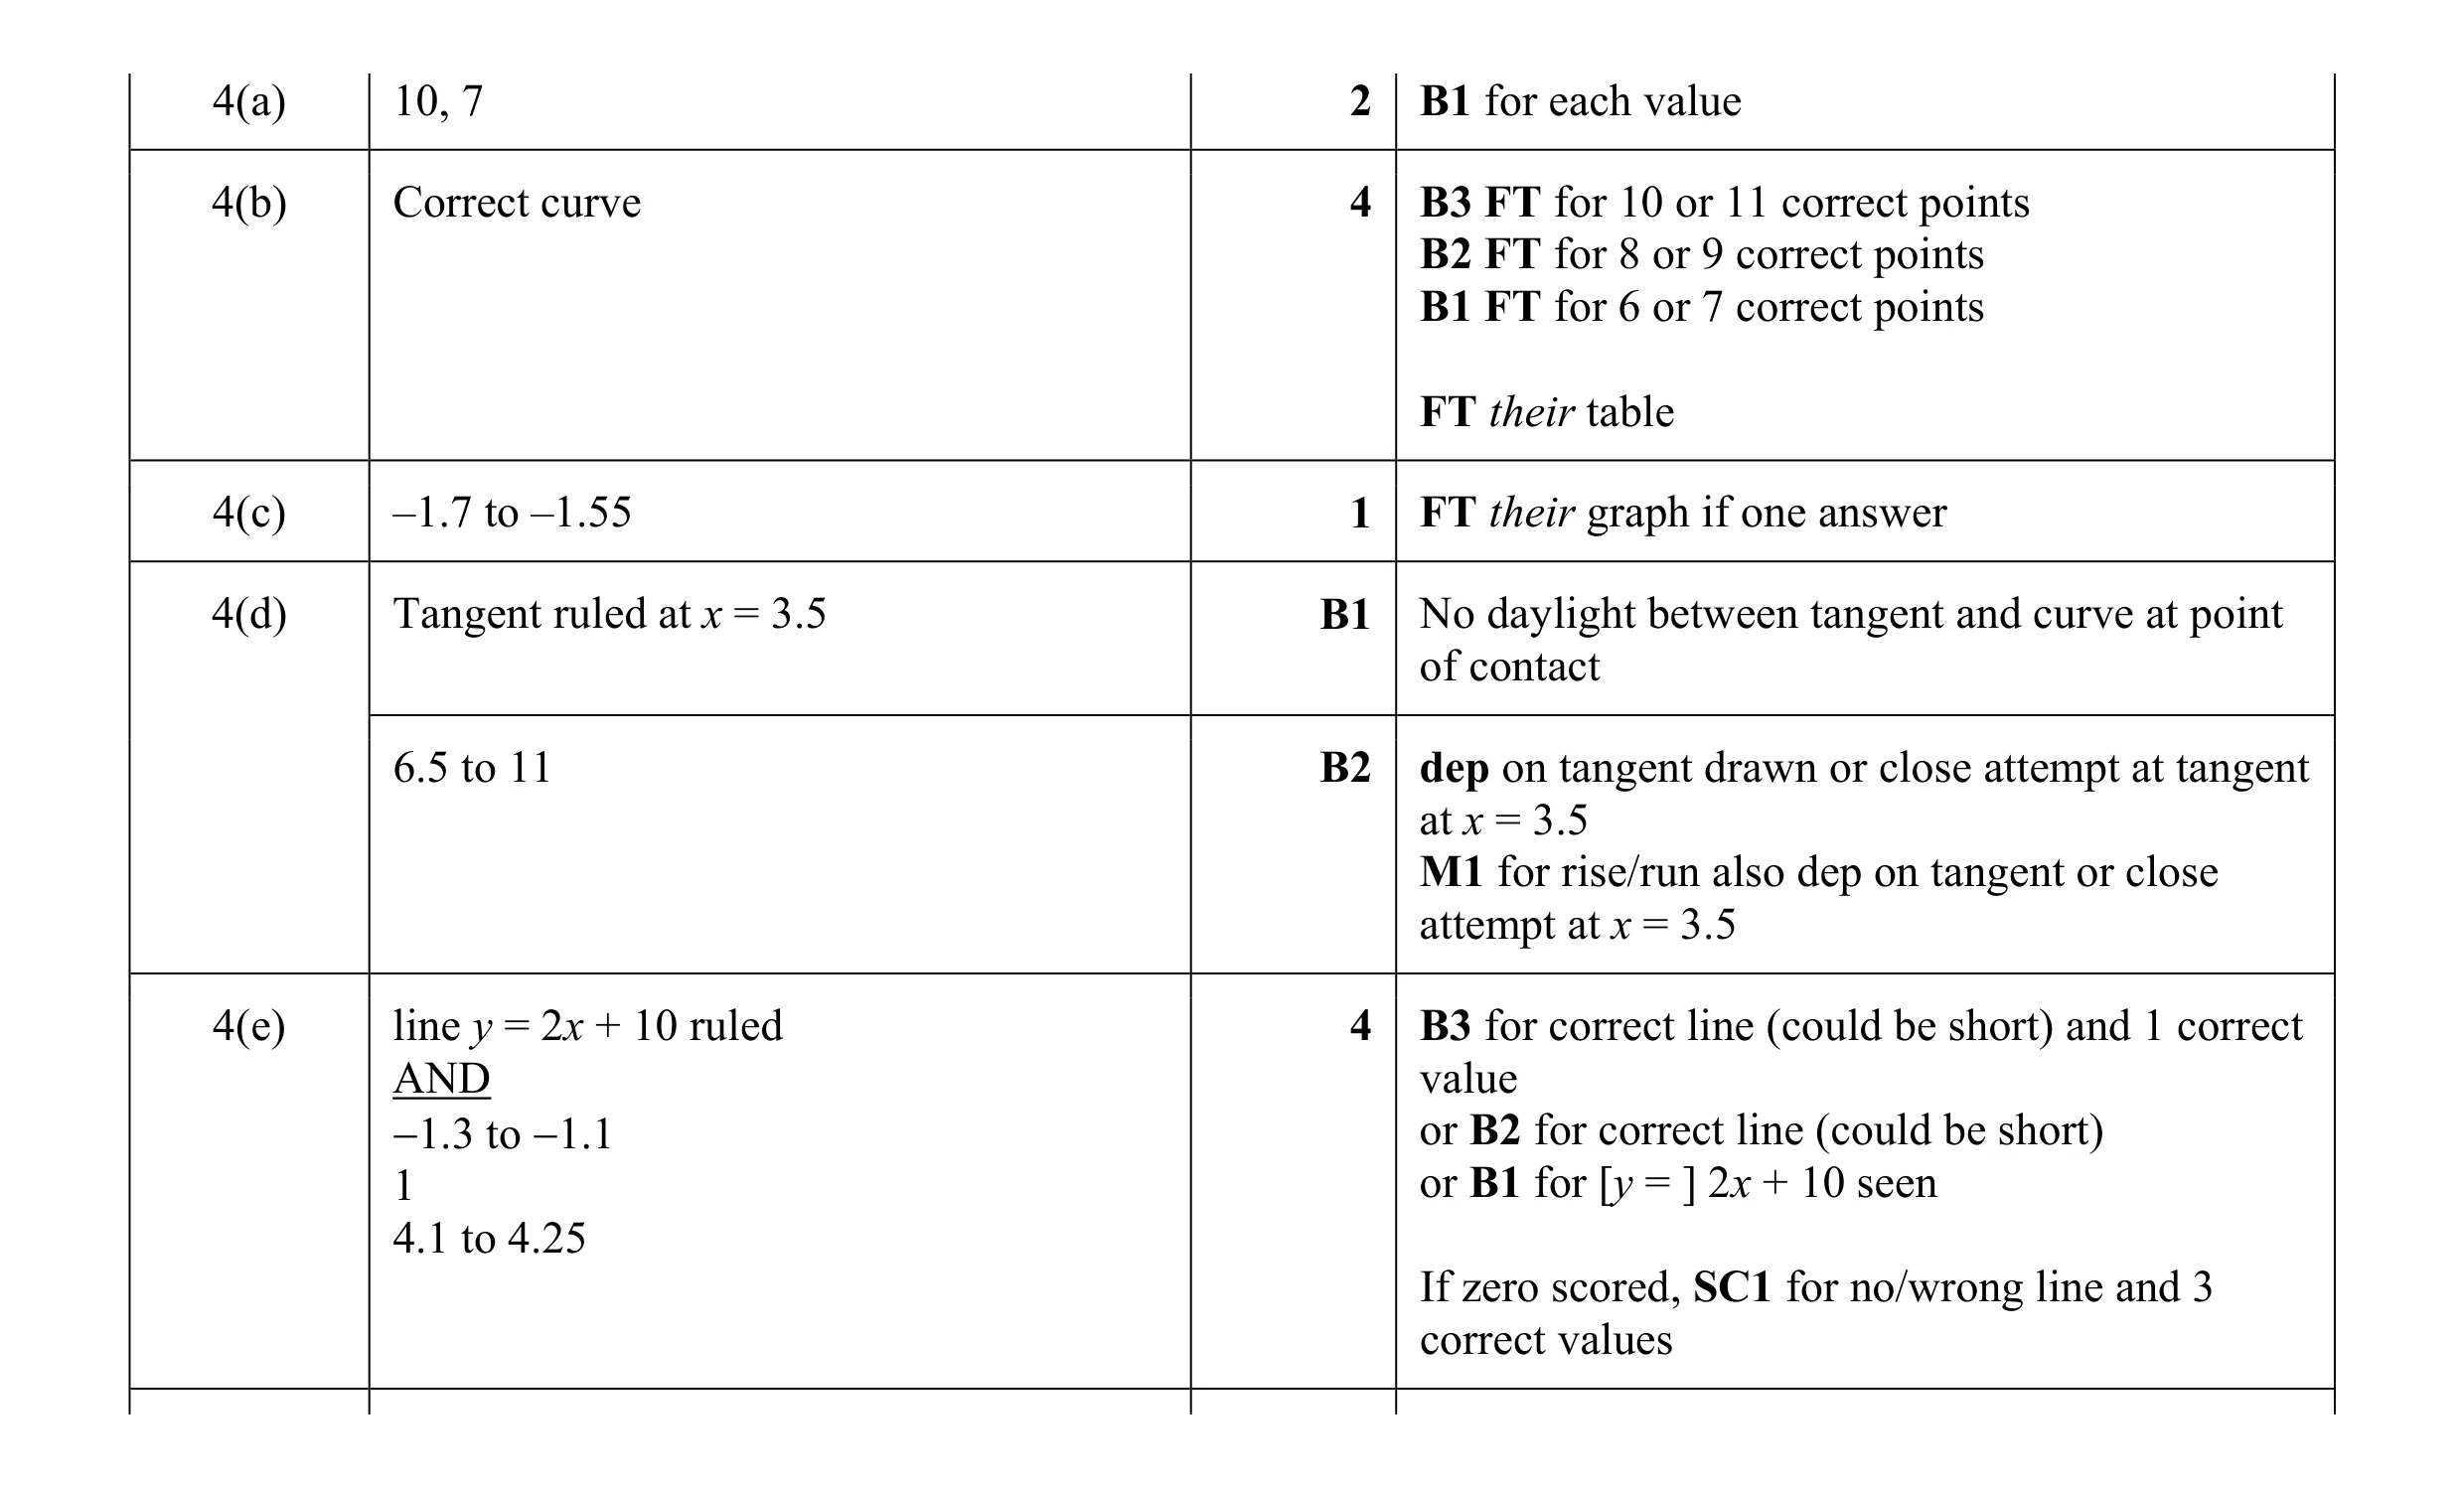 14
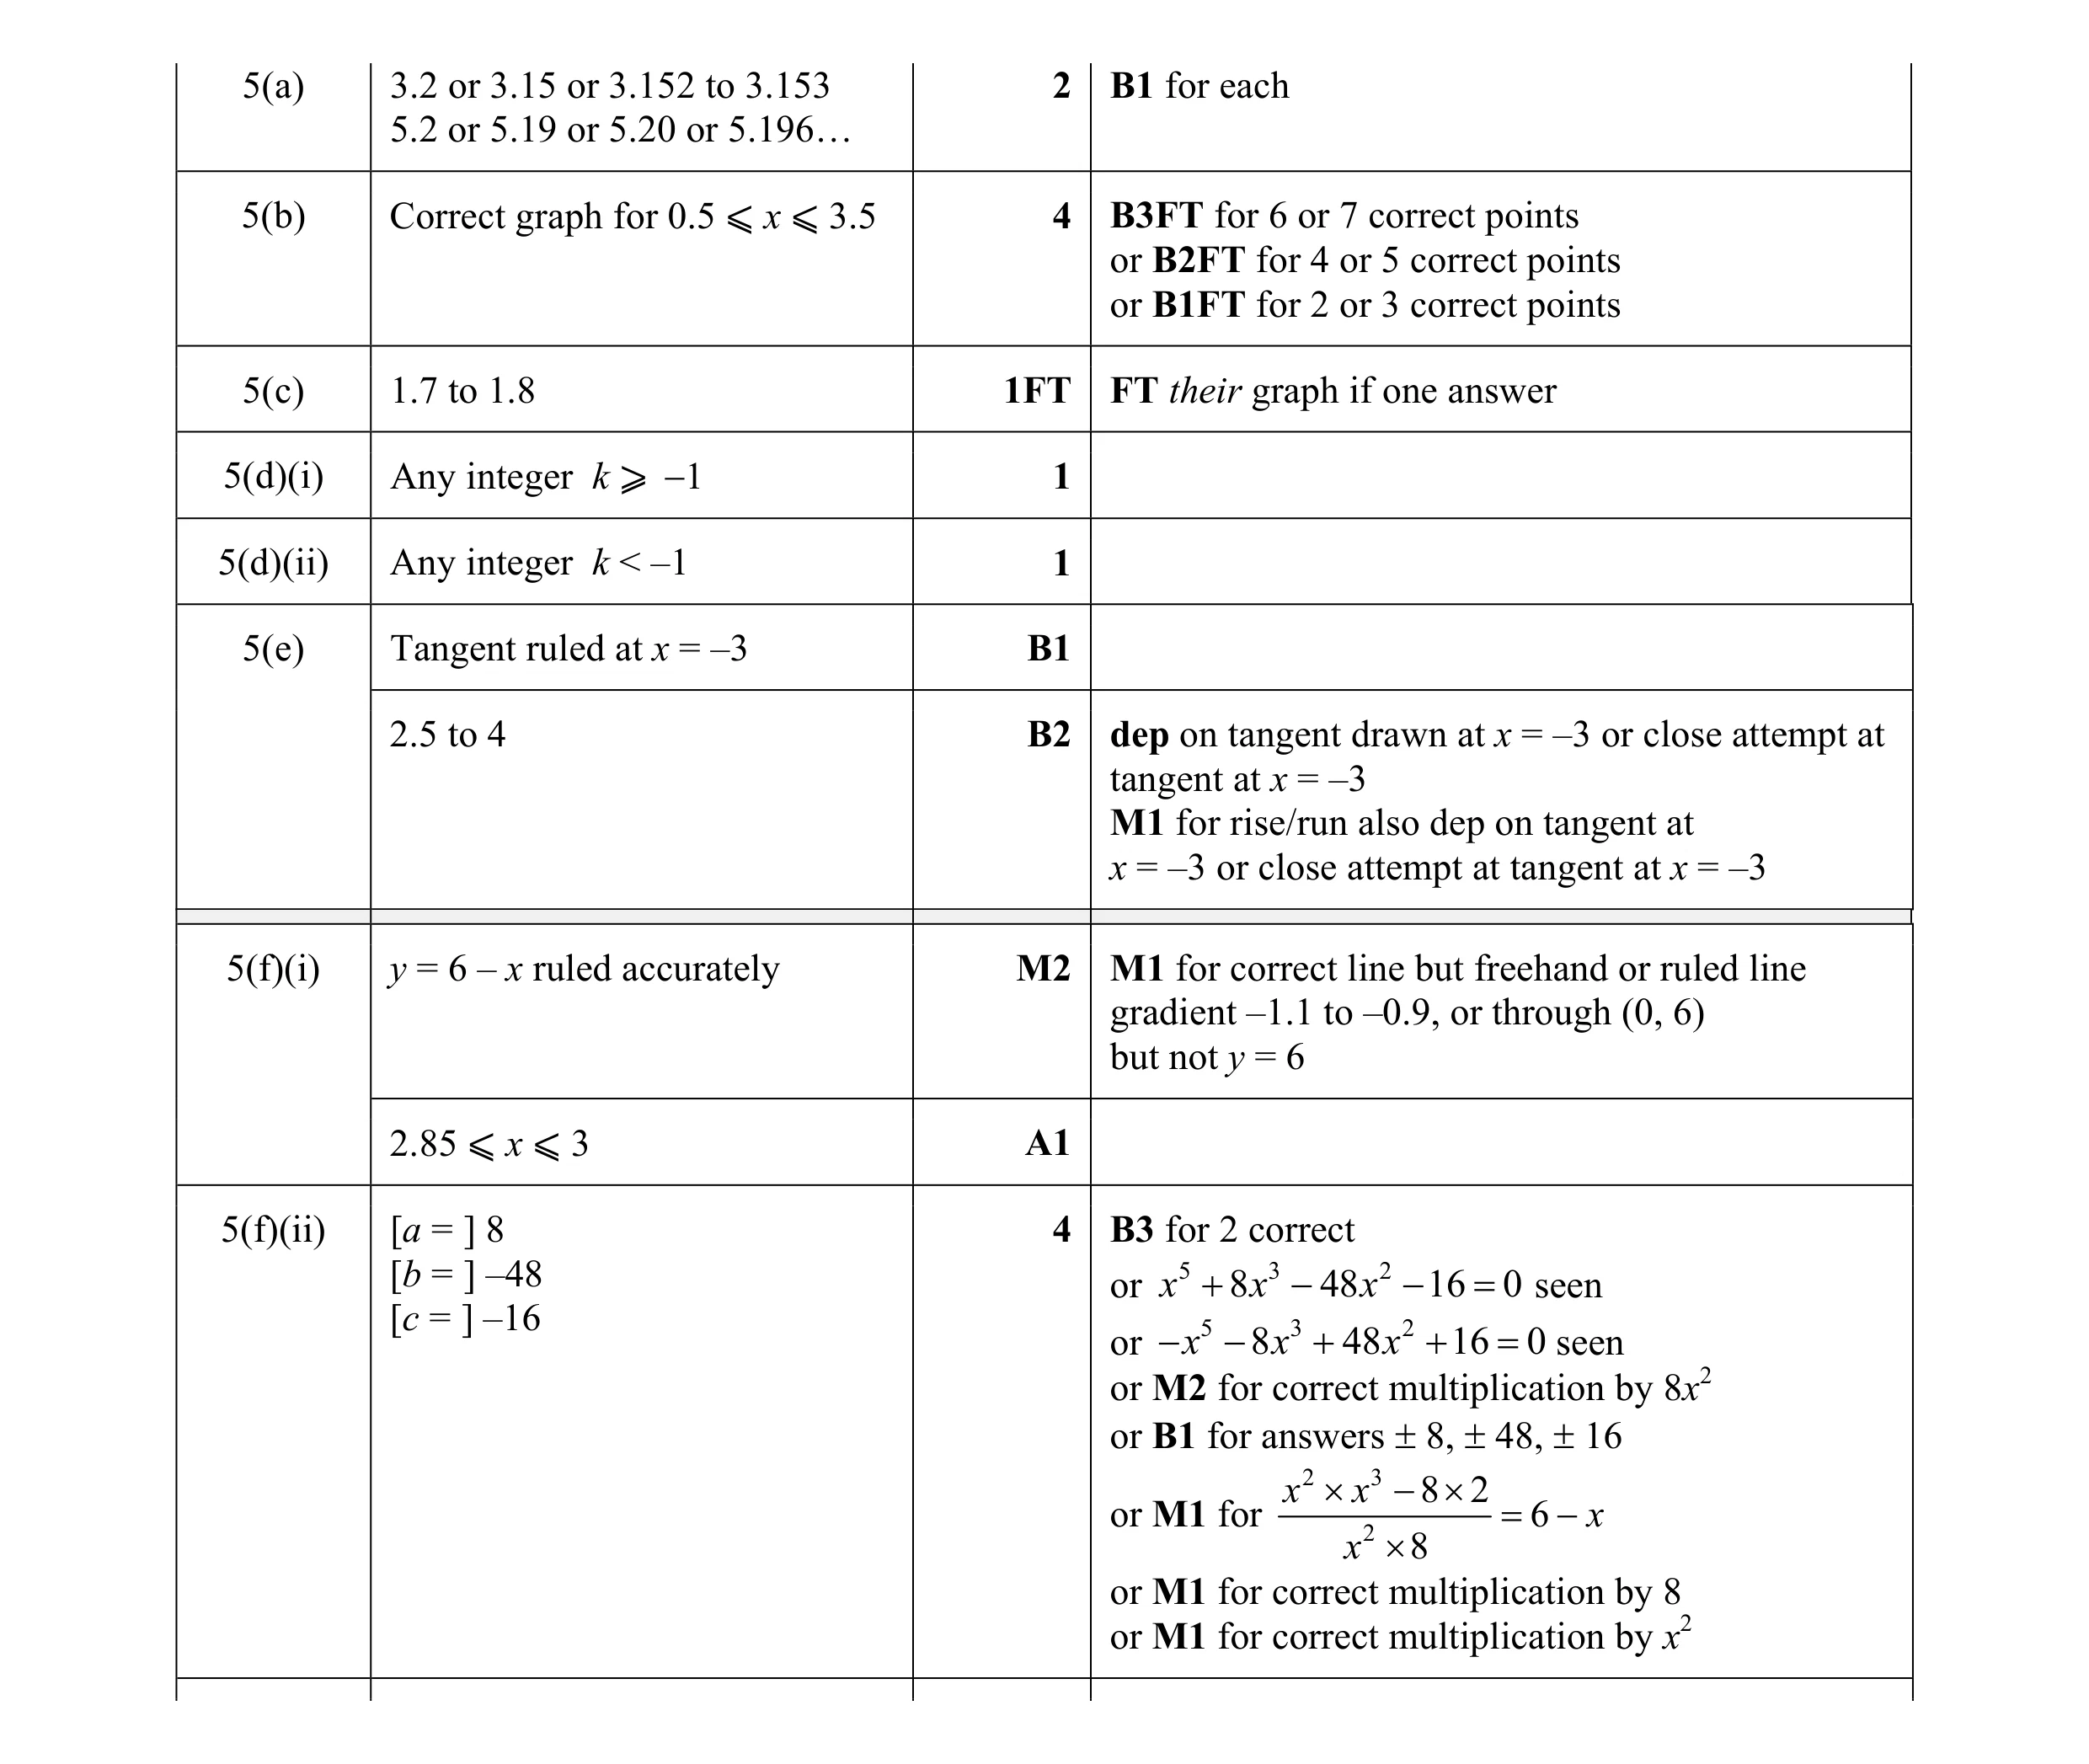 19
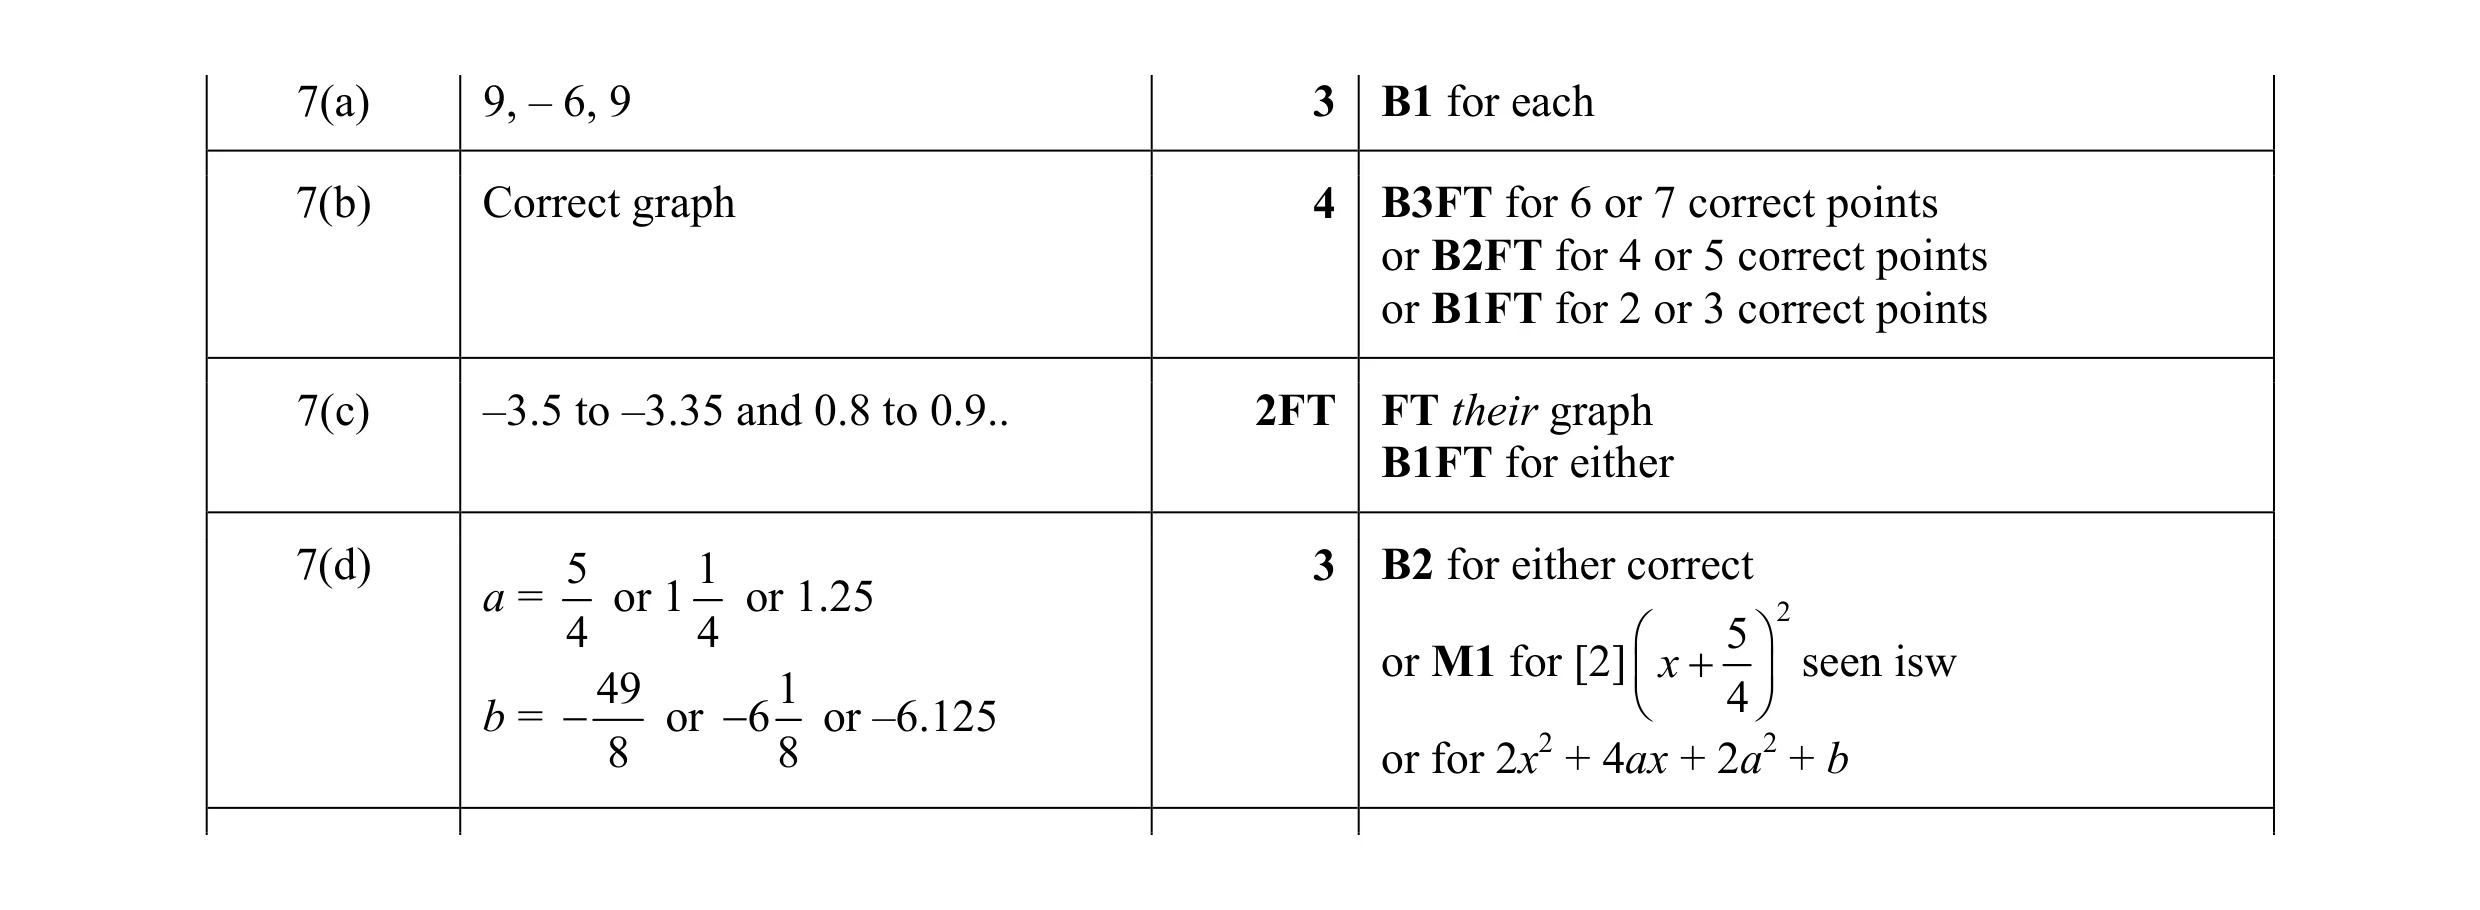 12
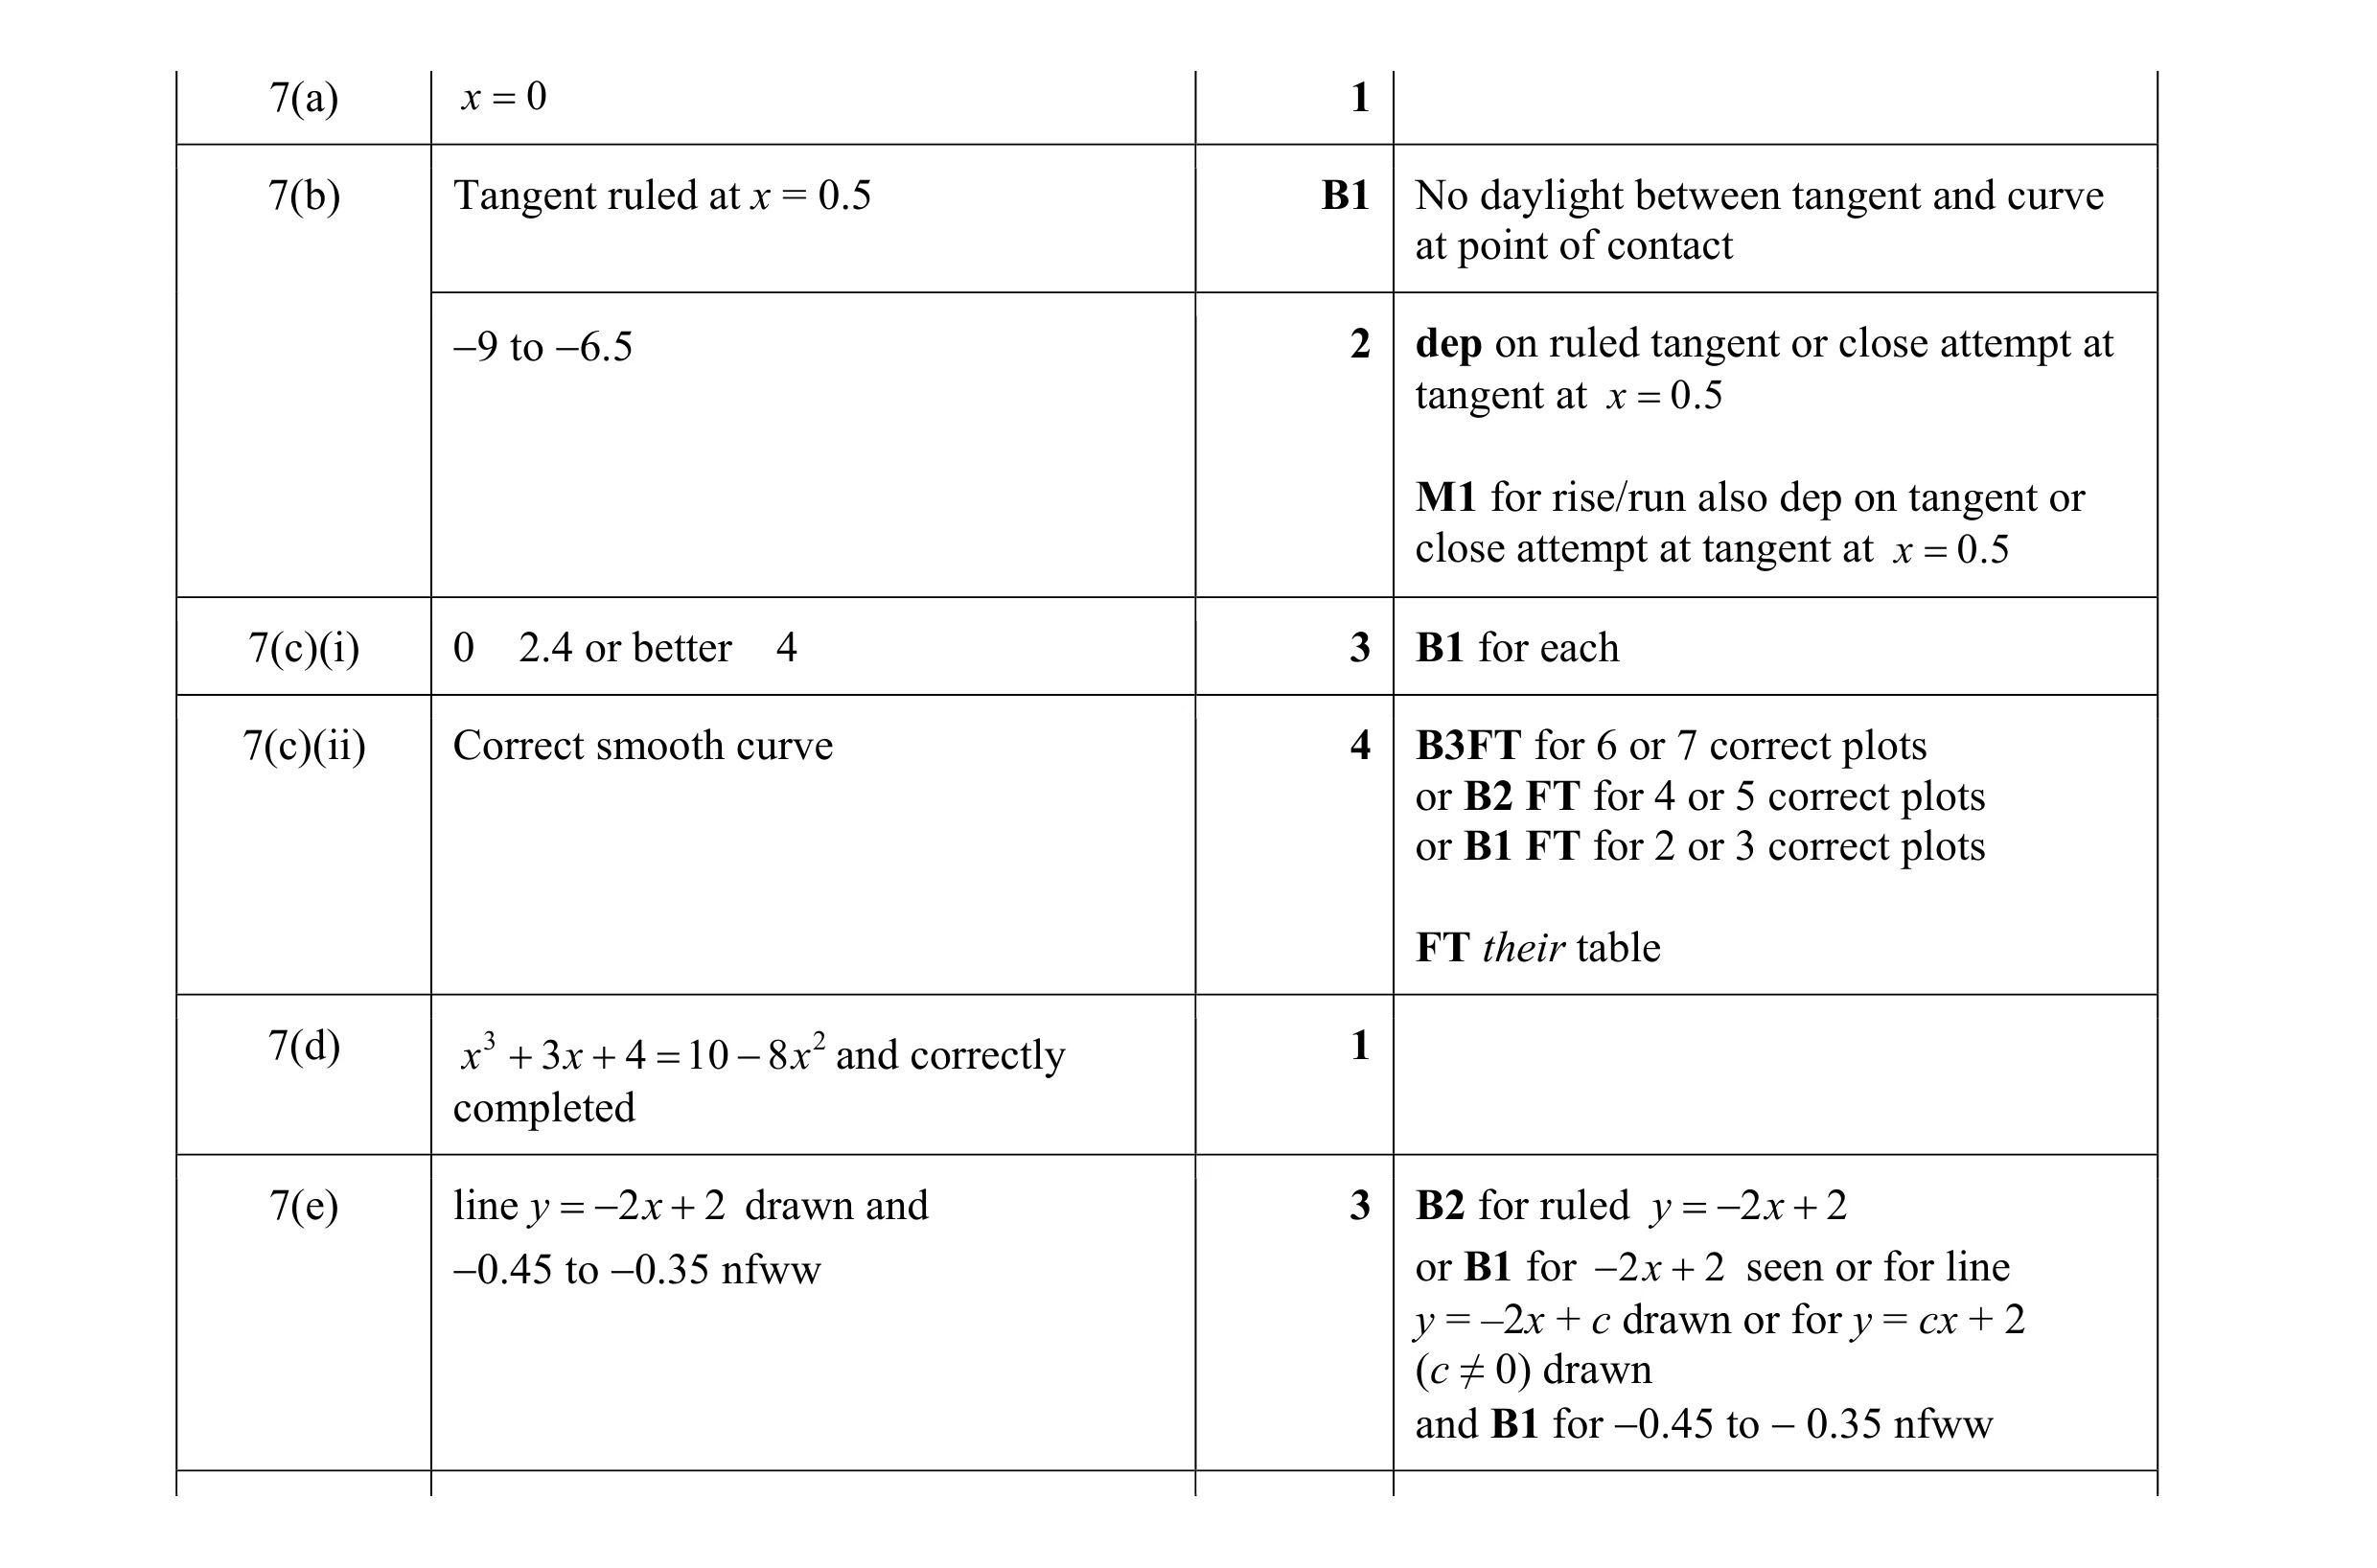 15
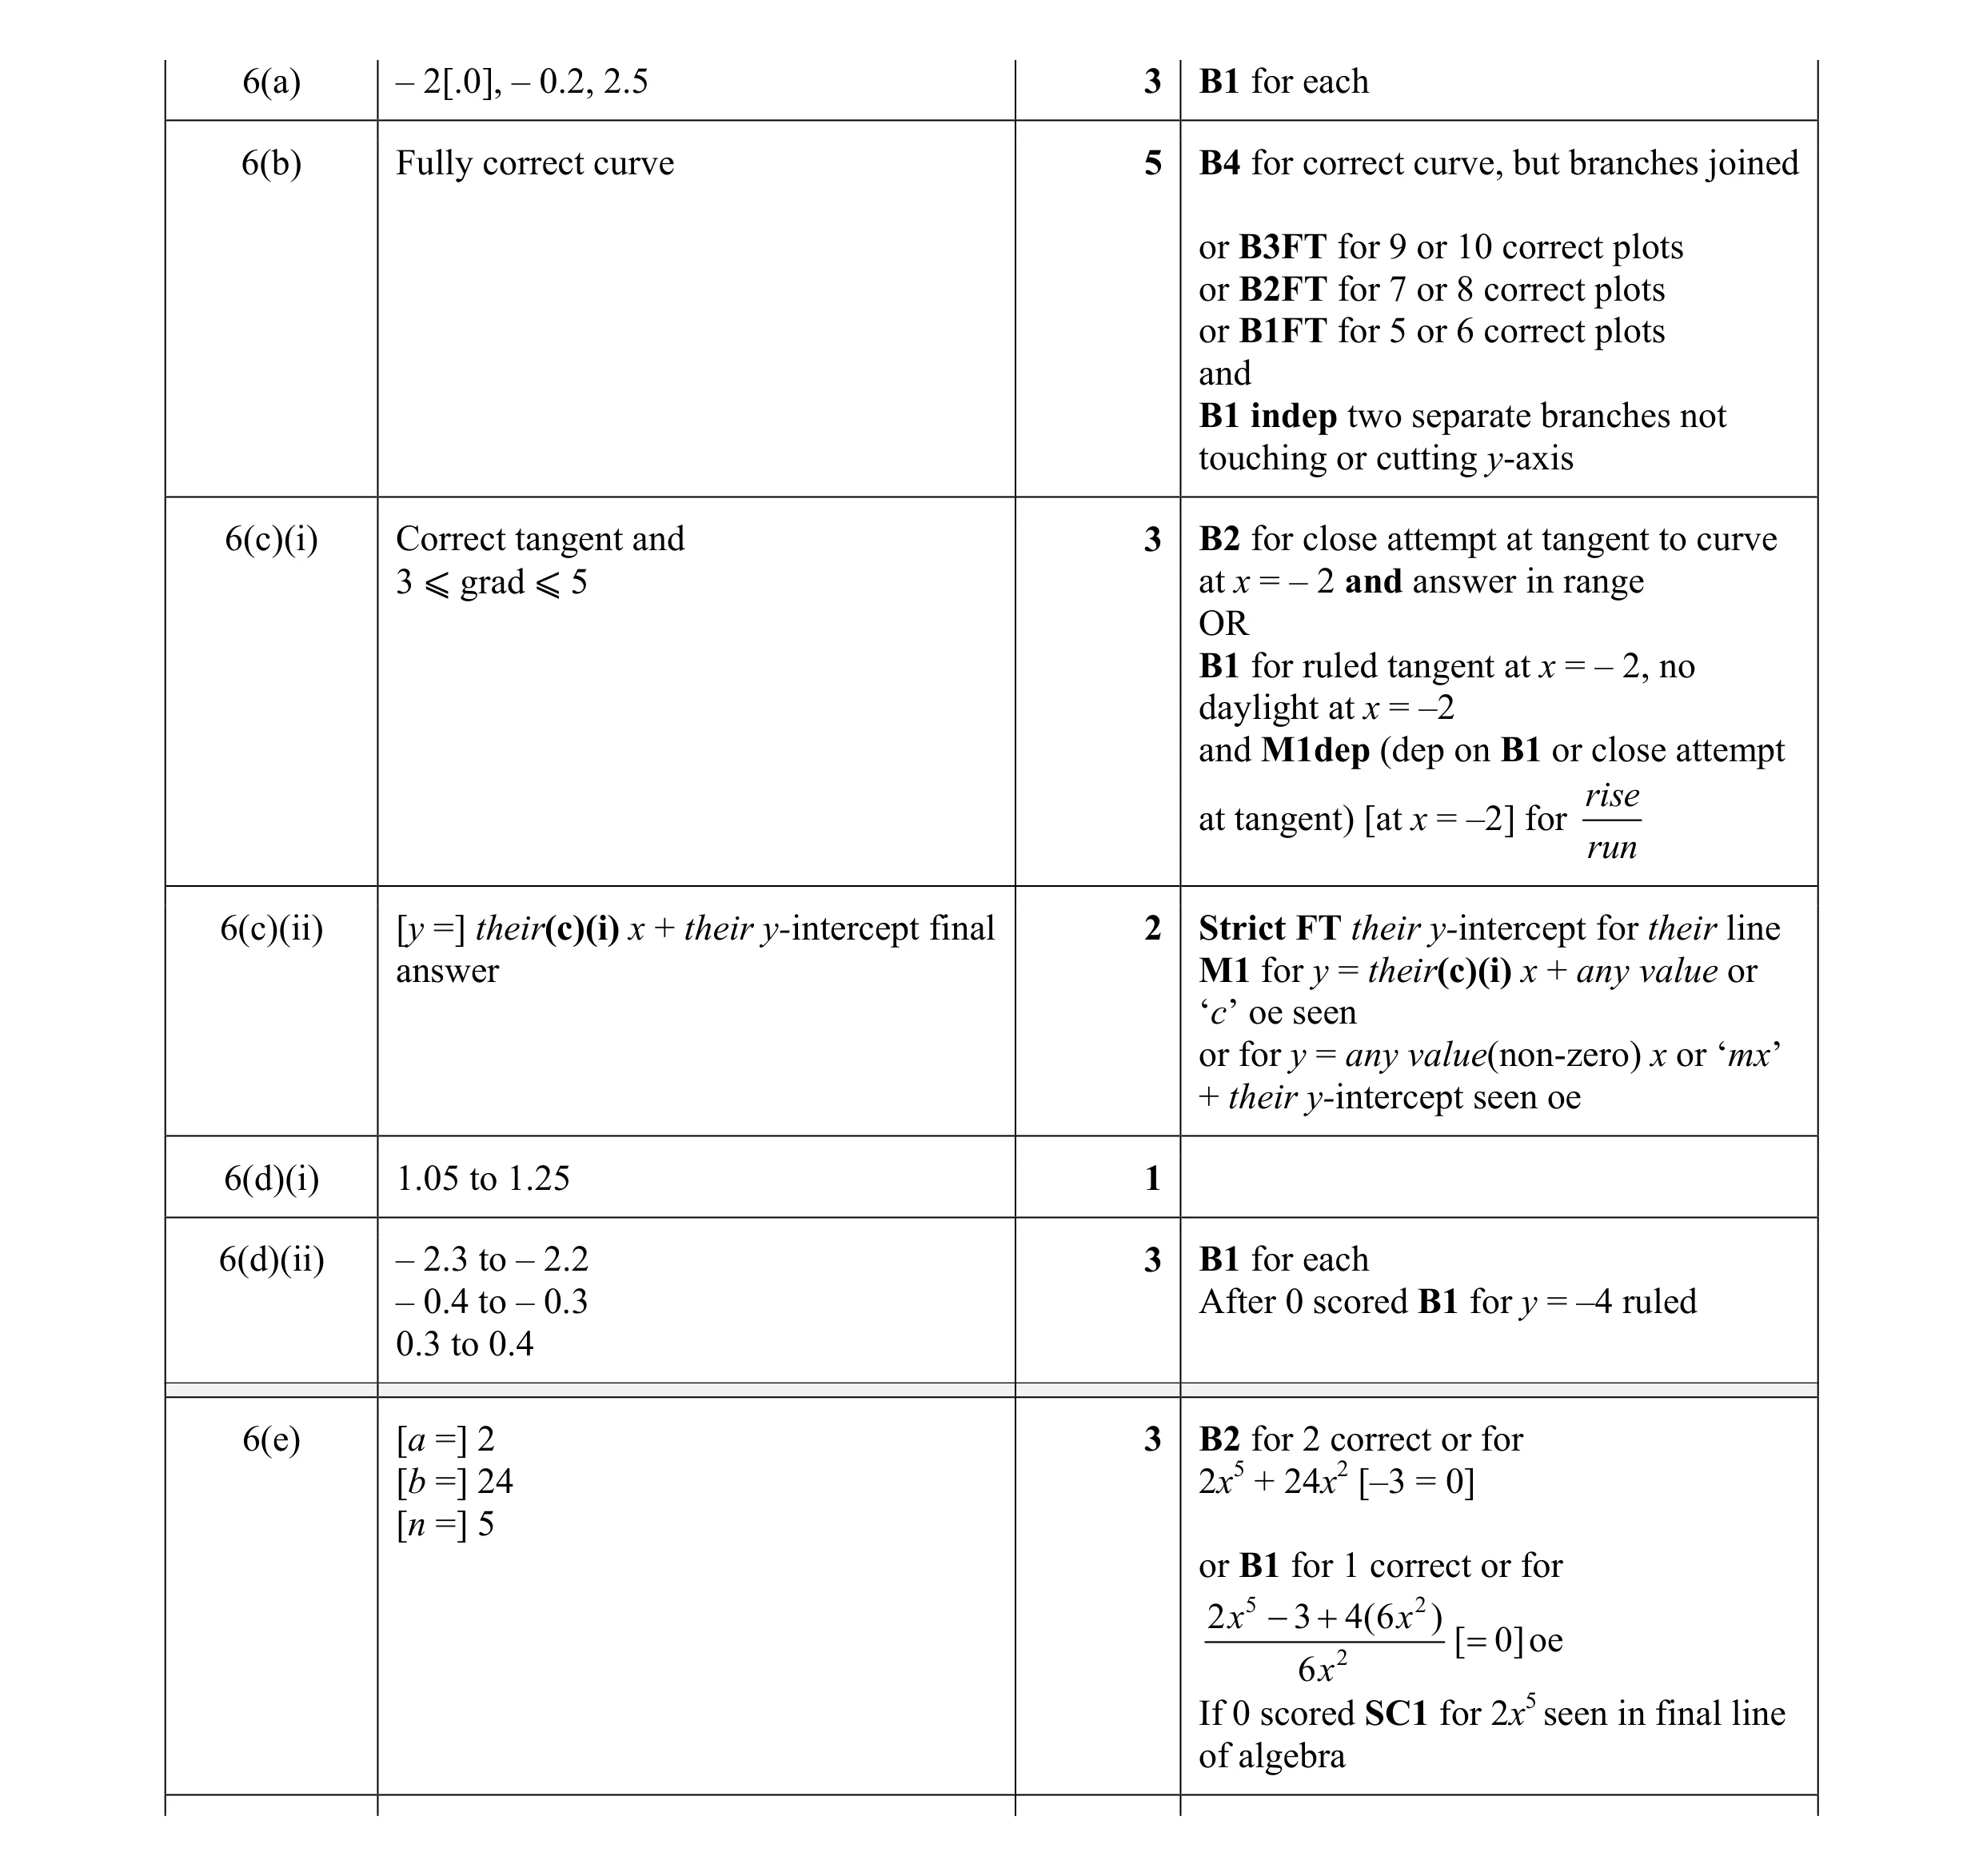 20
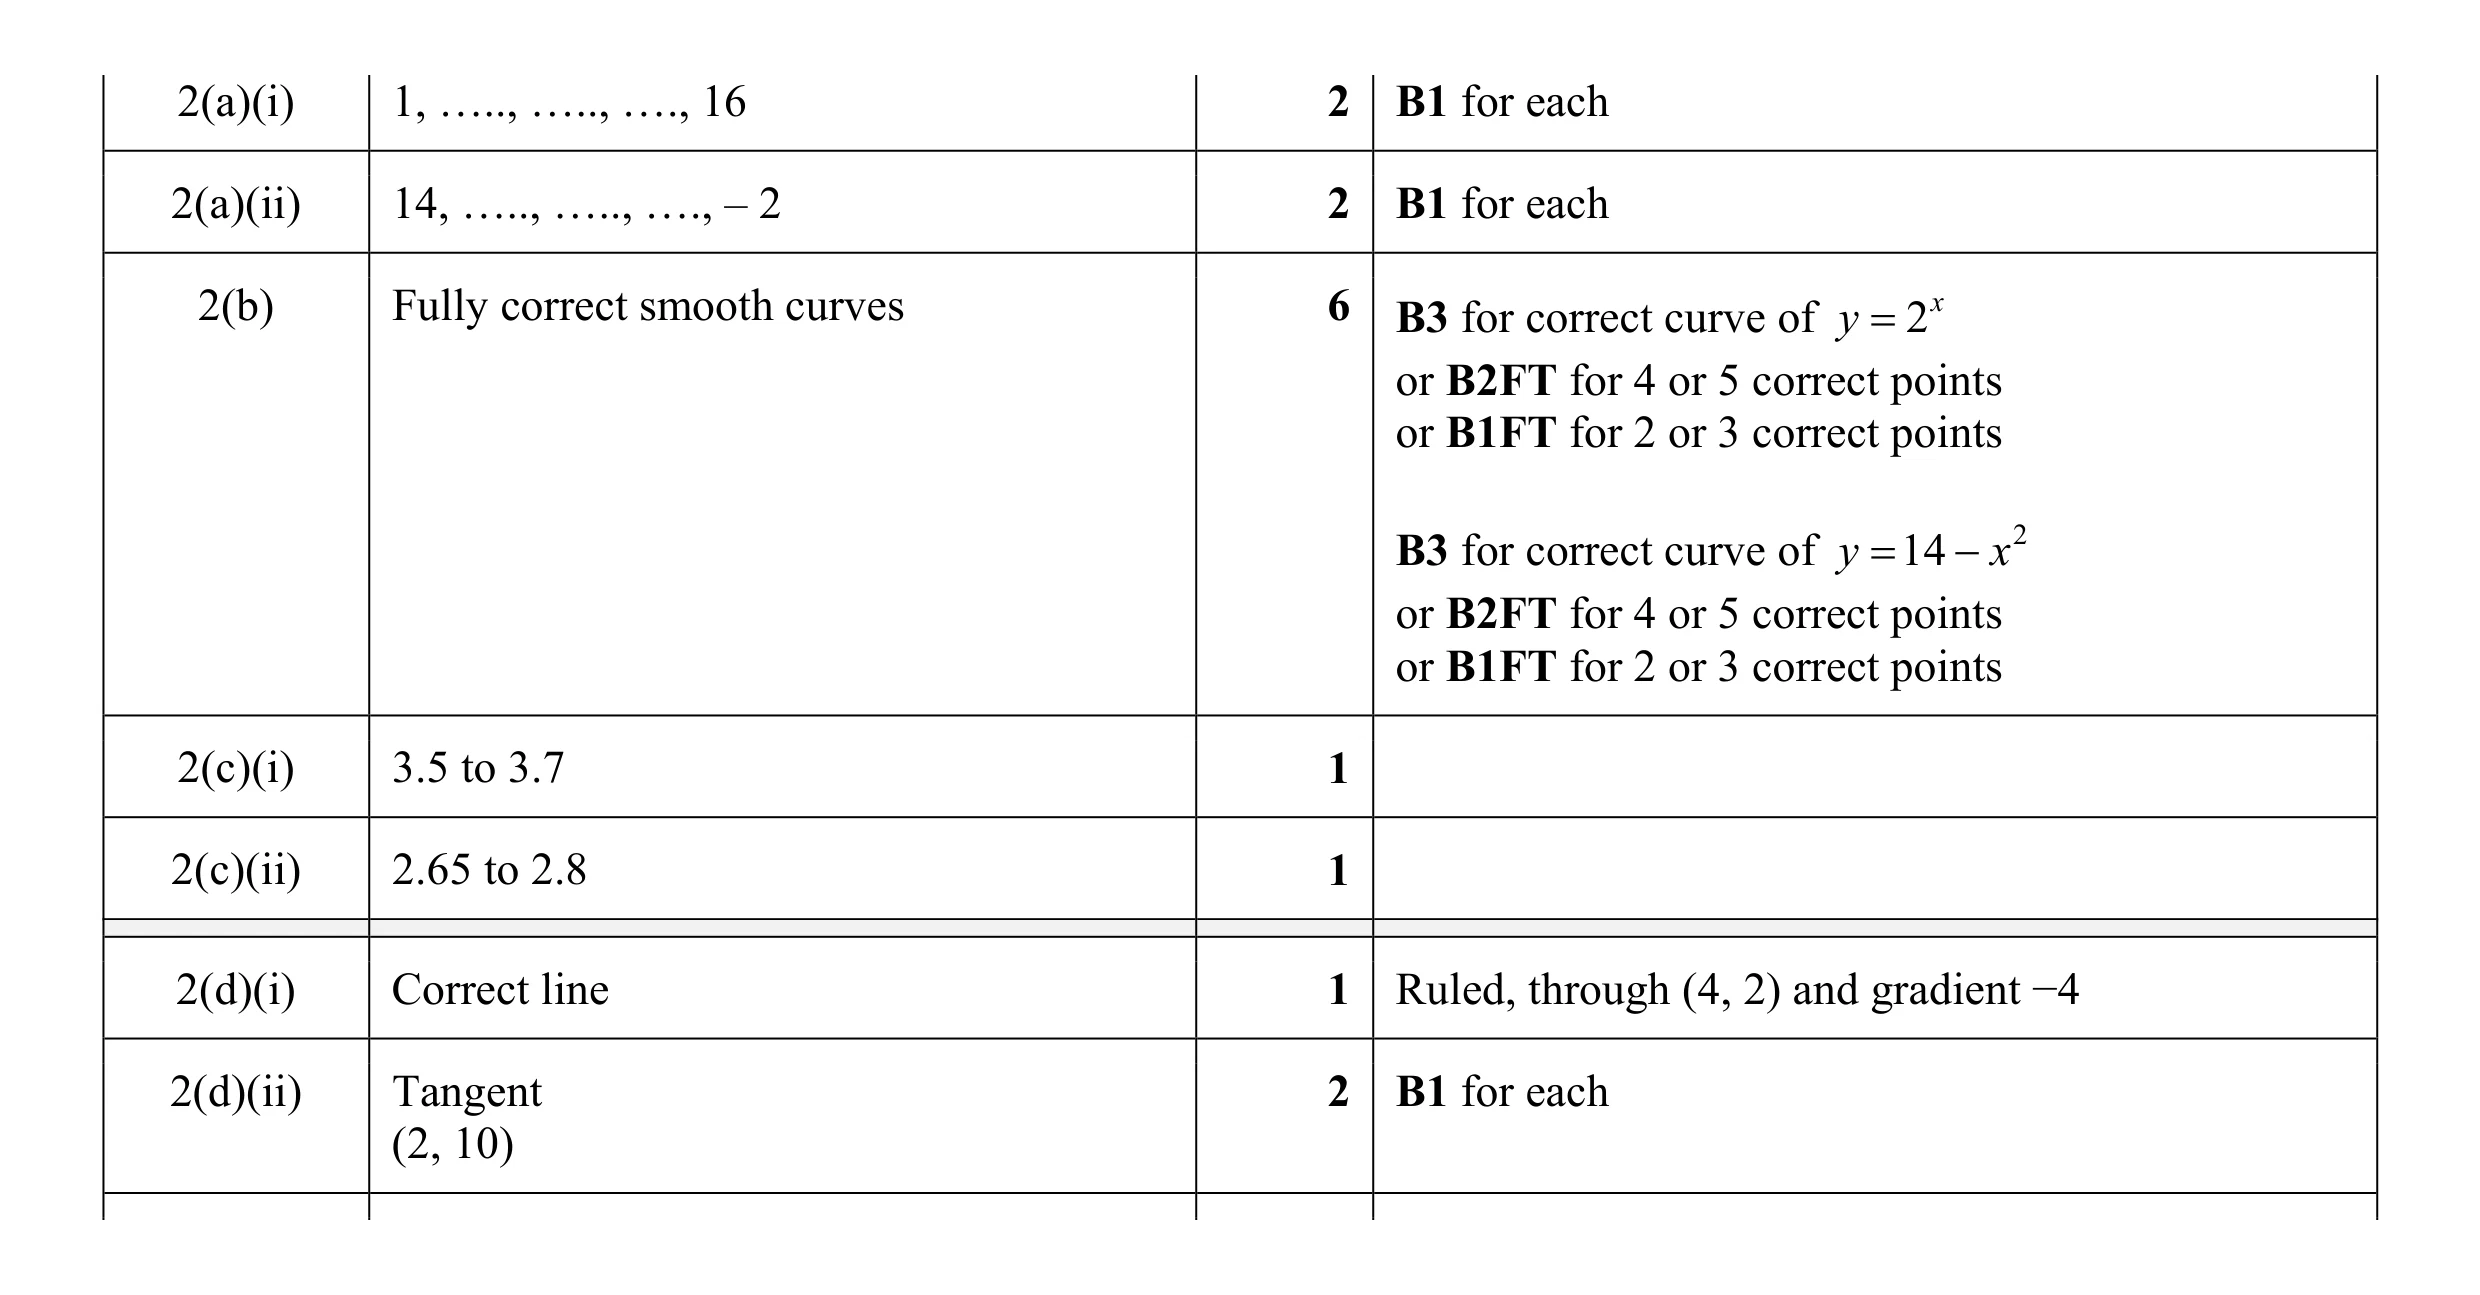 15
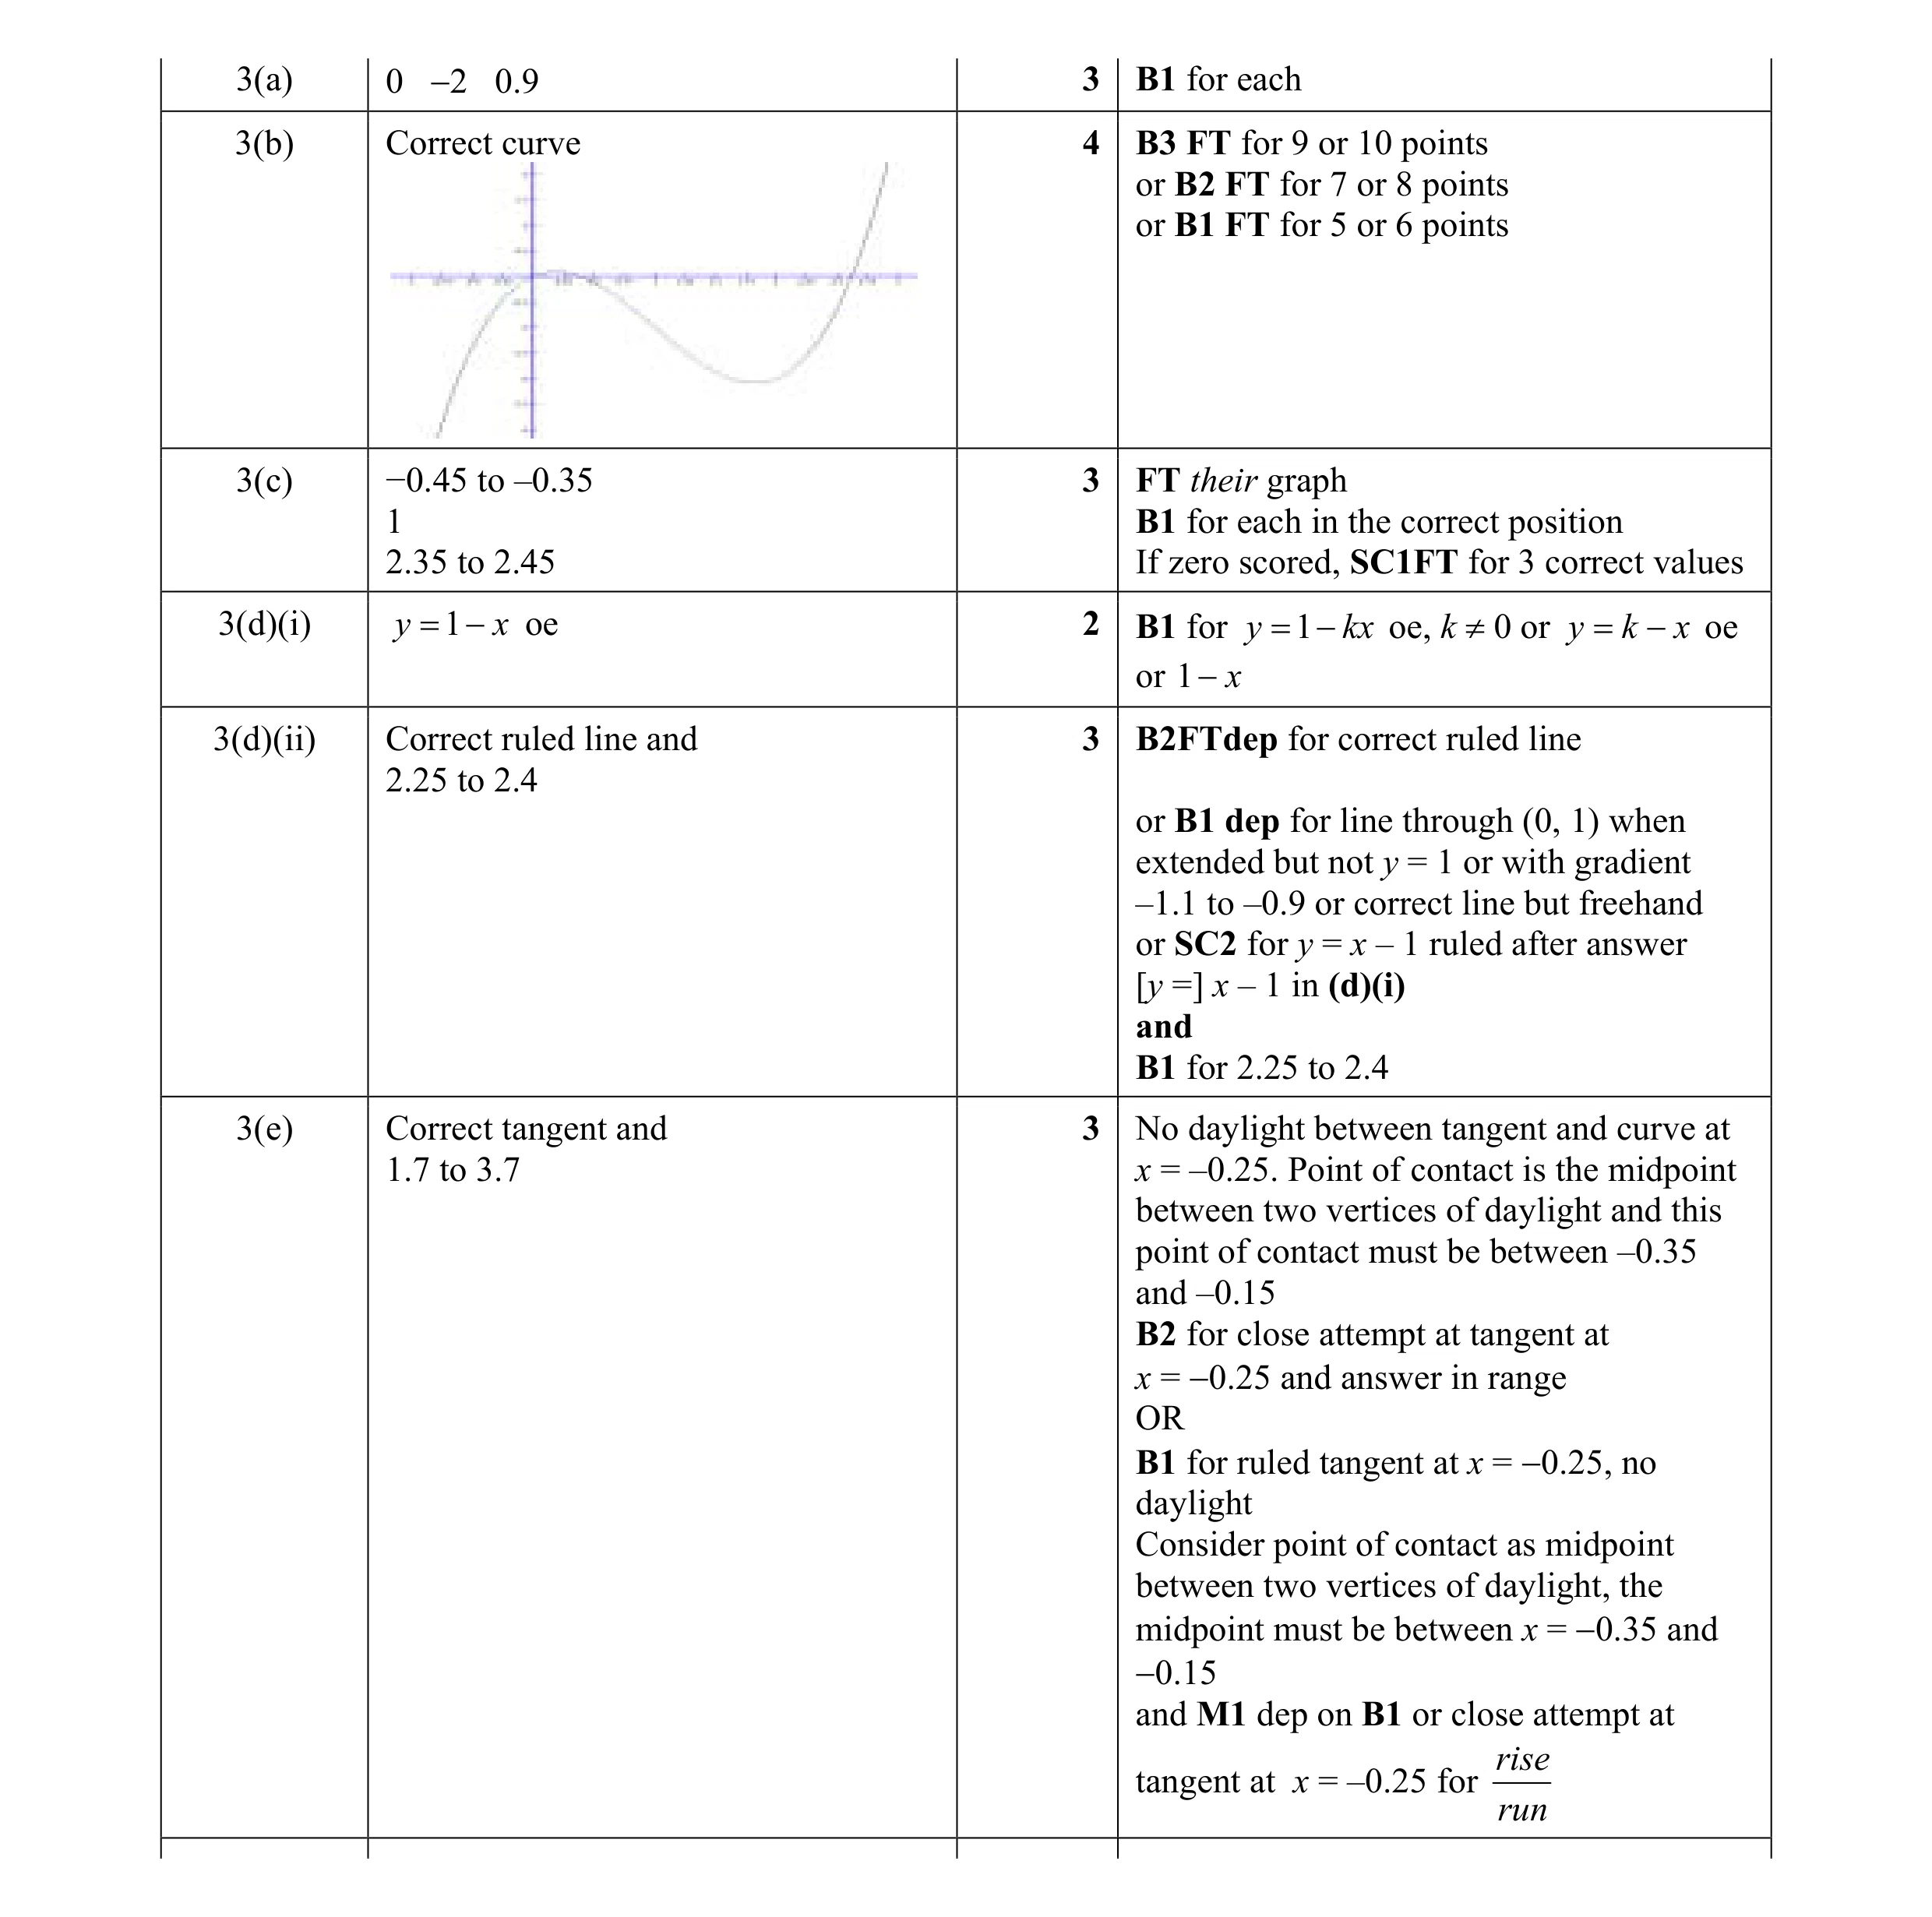 18
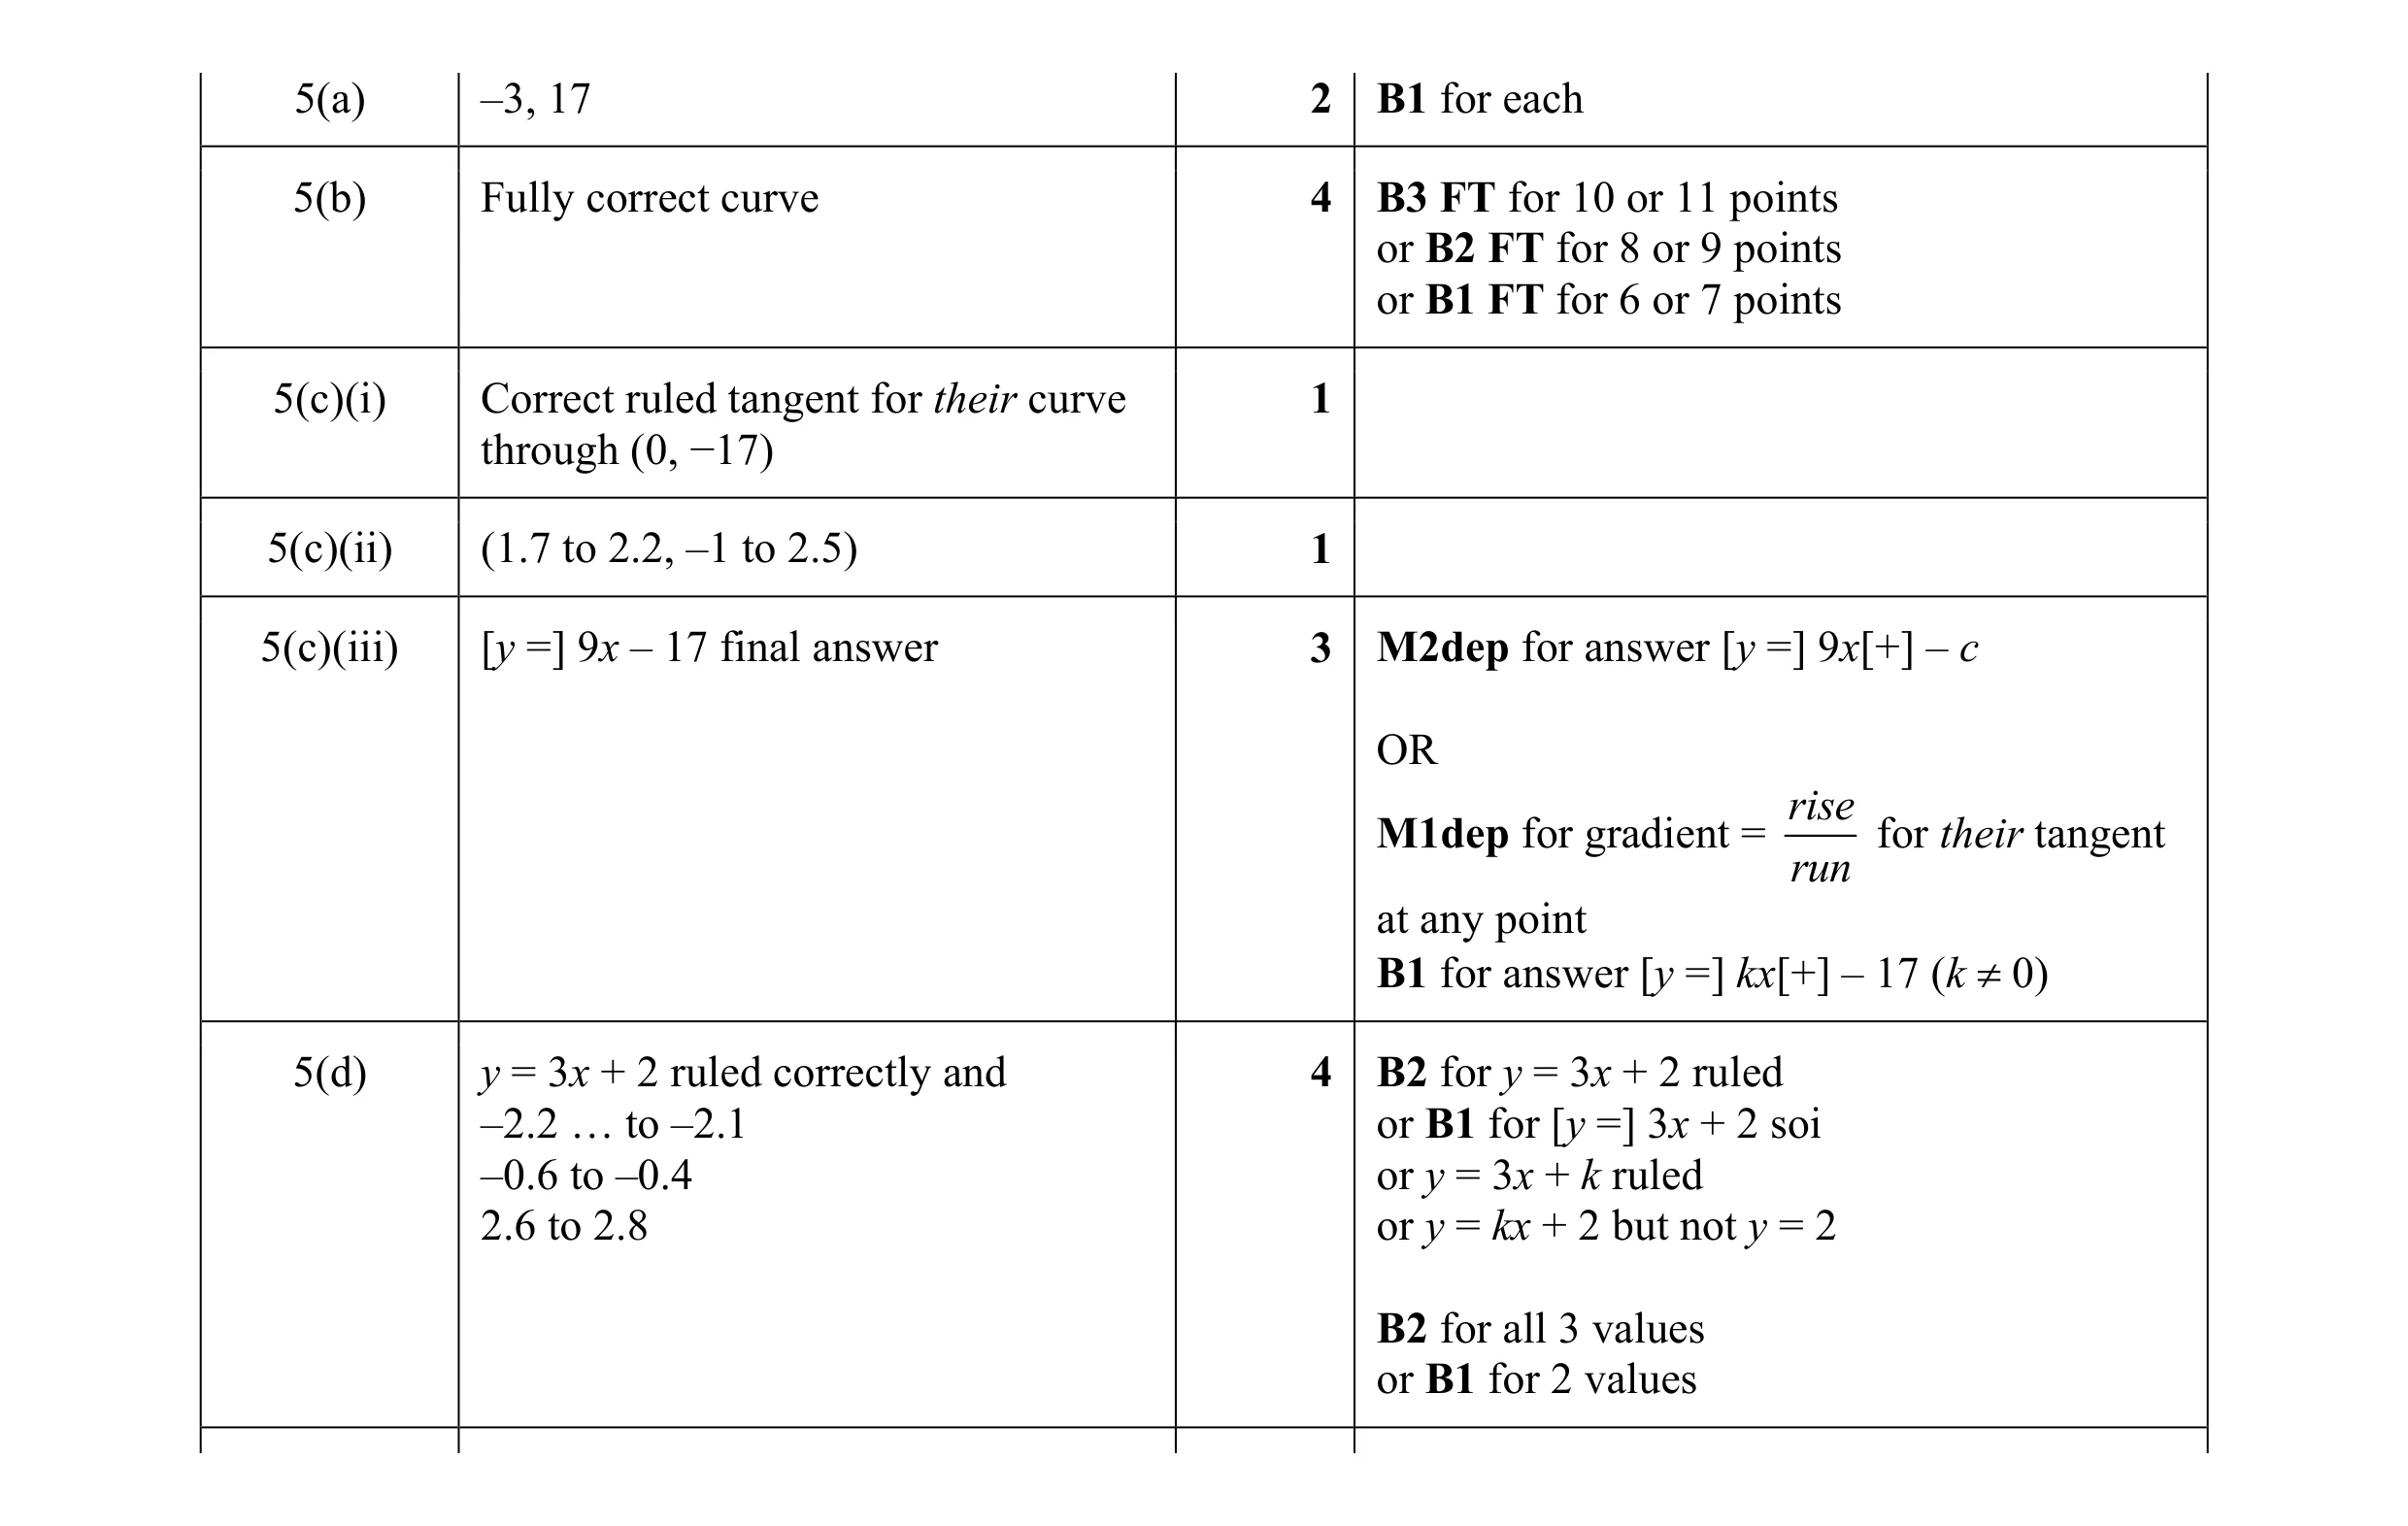 15
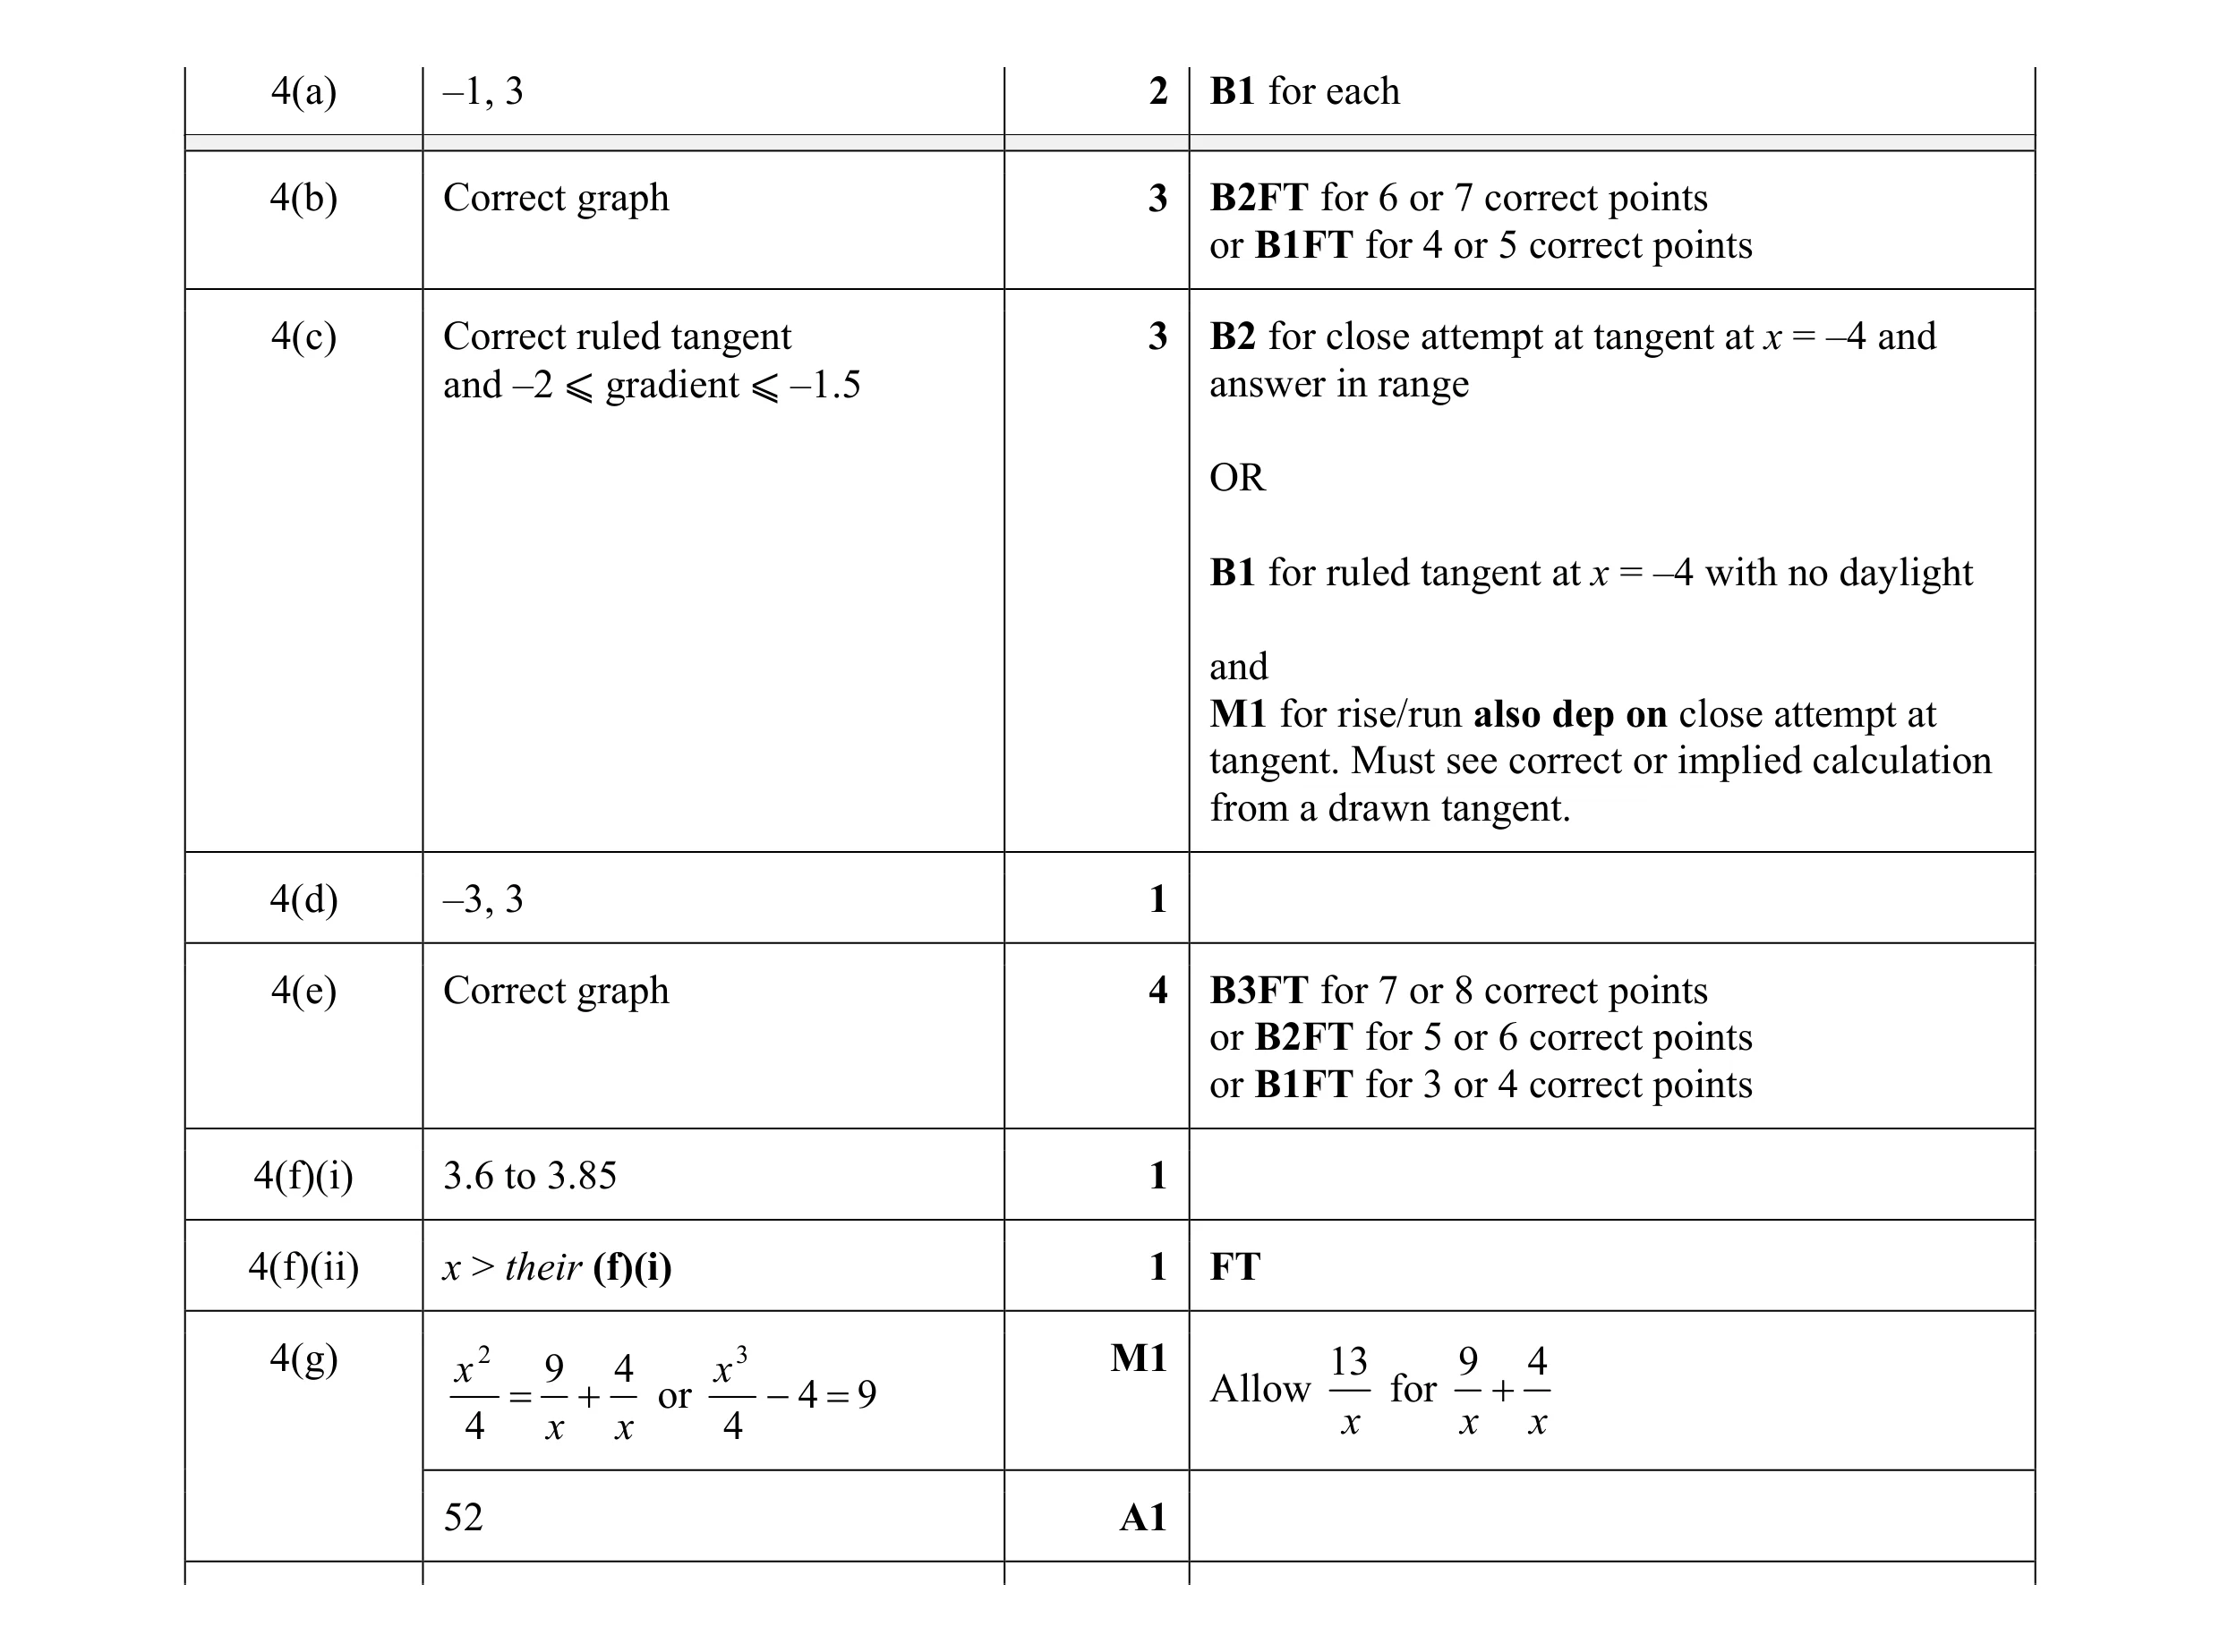 17
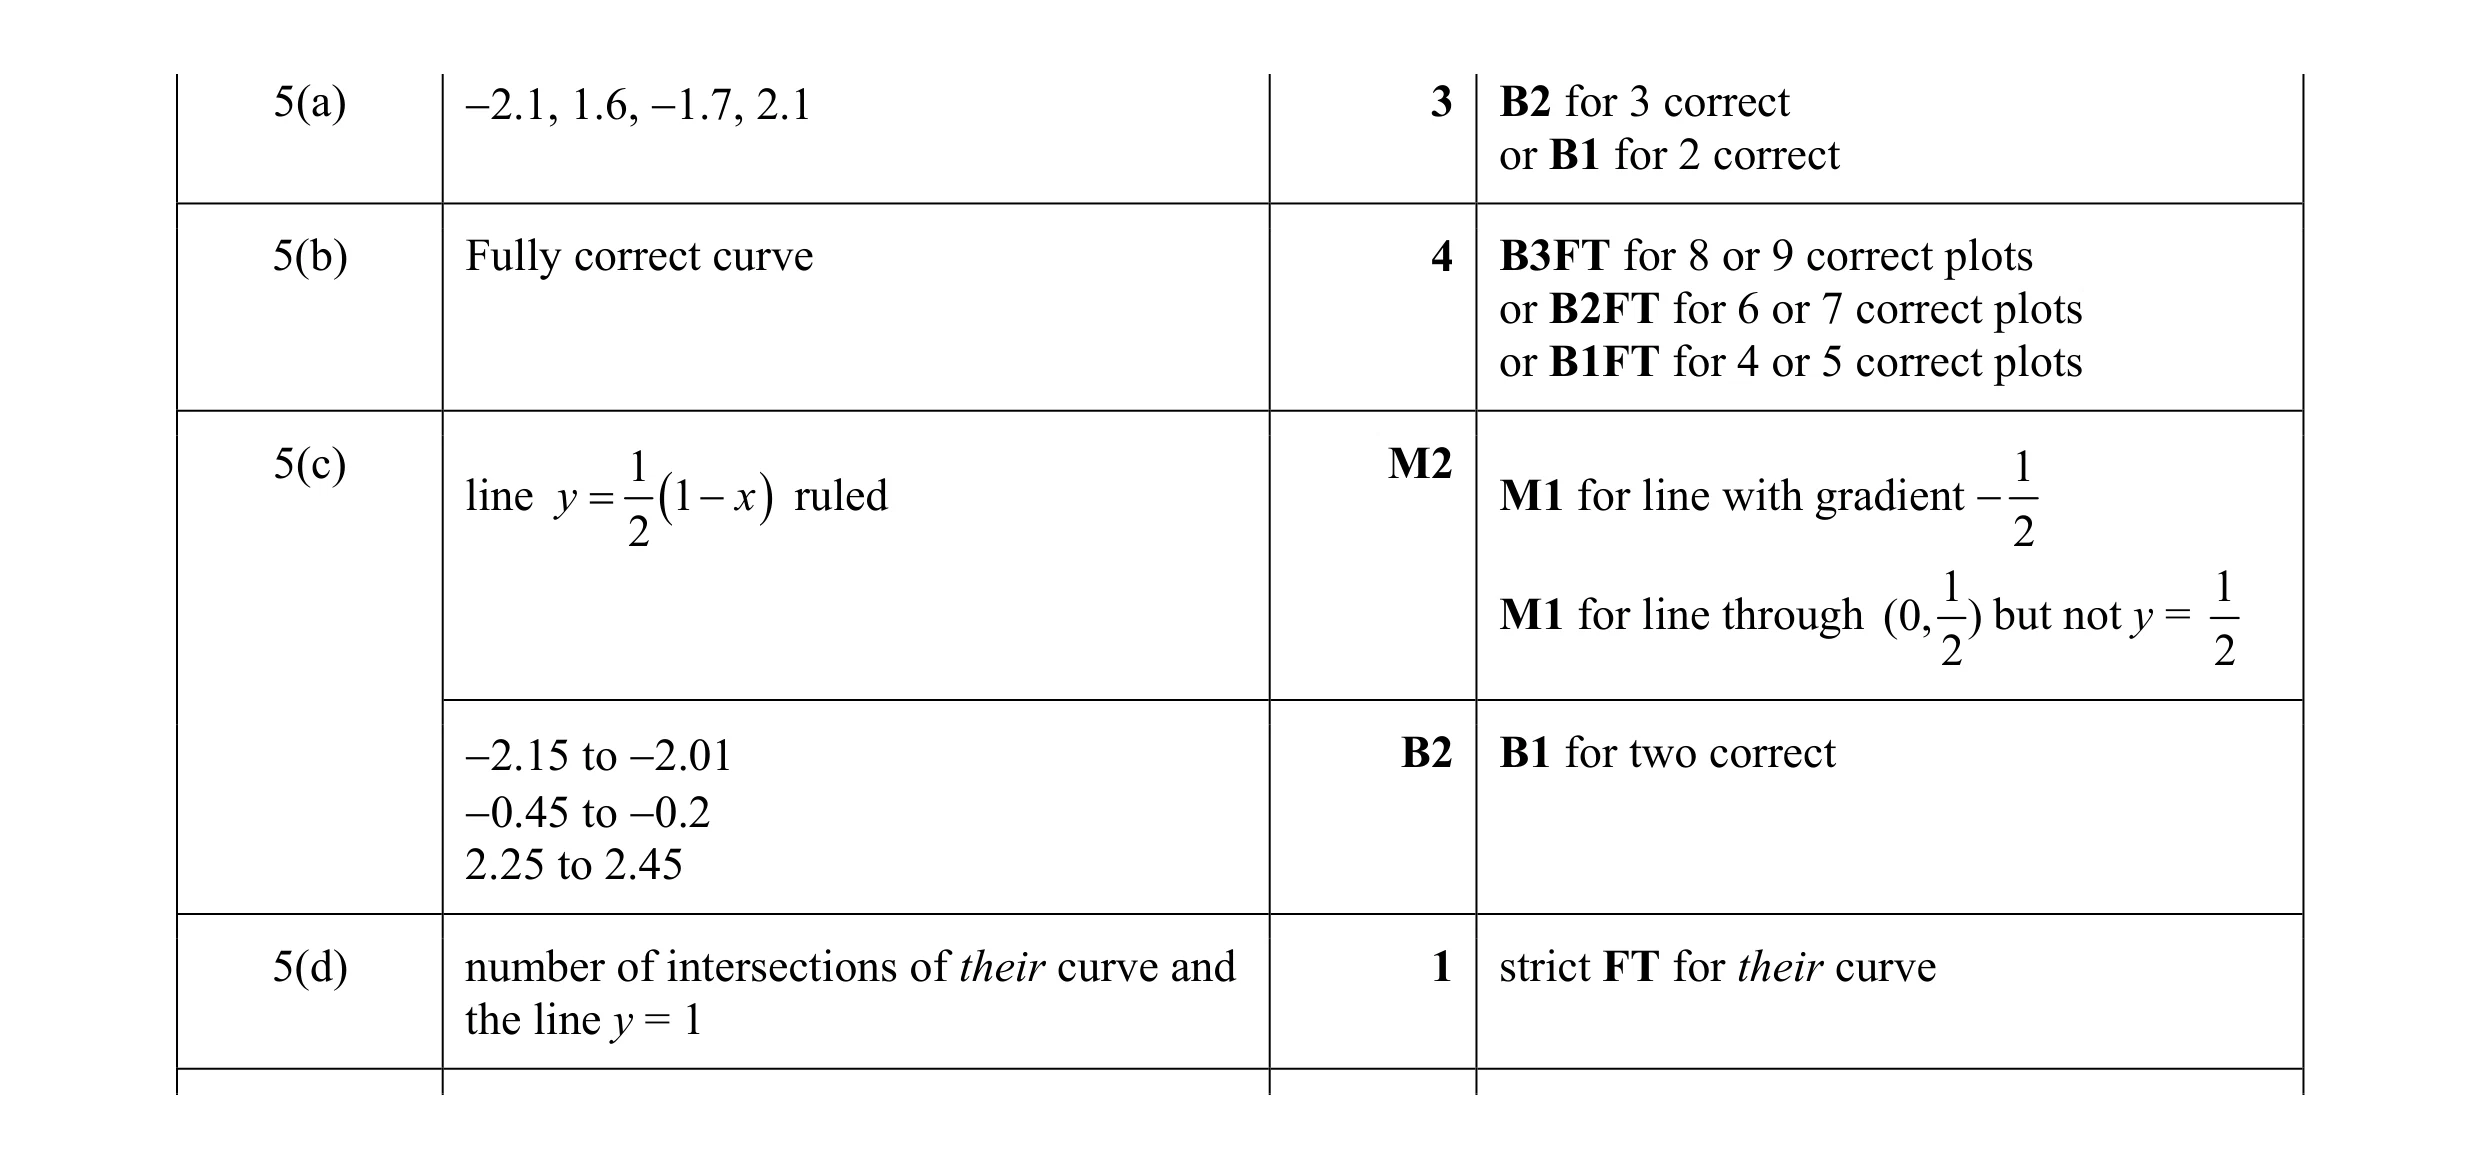 12
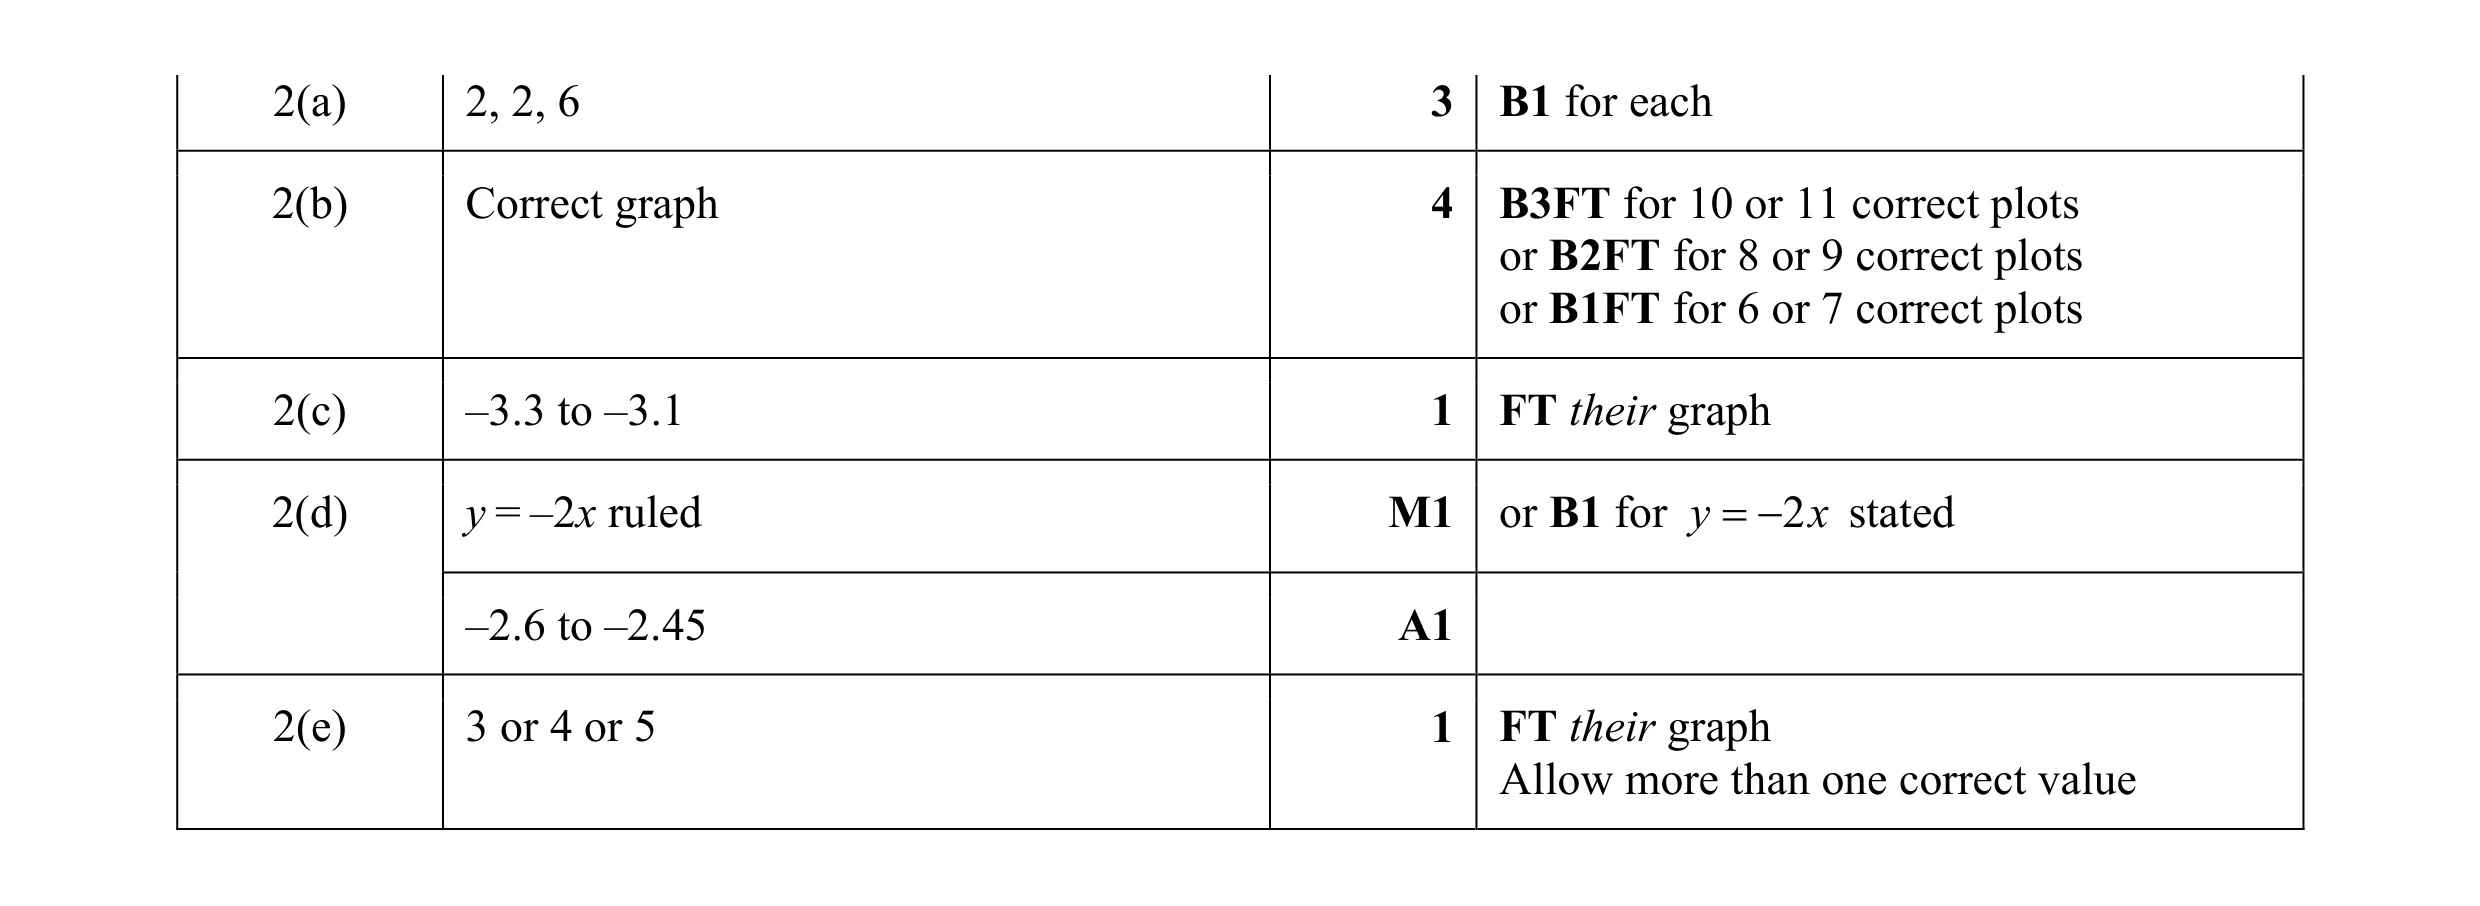 11
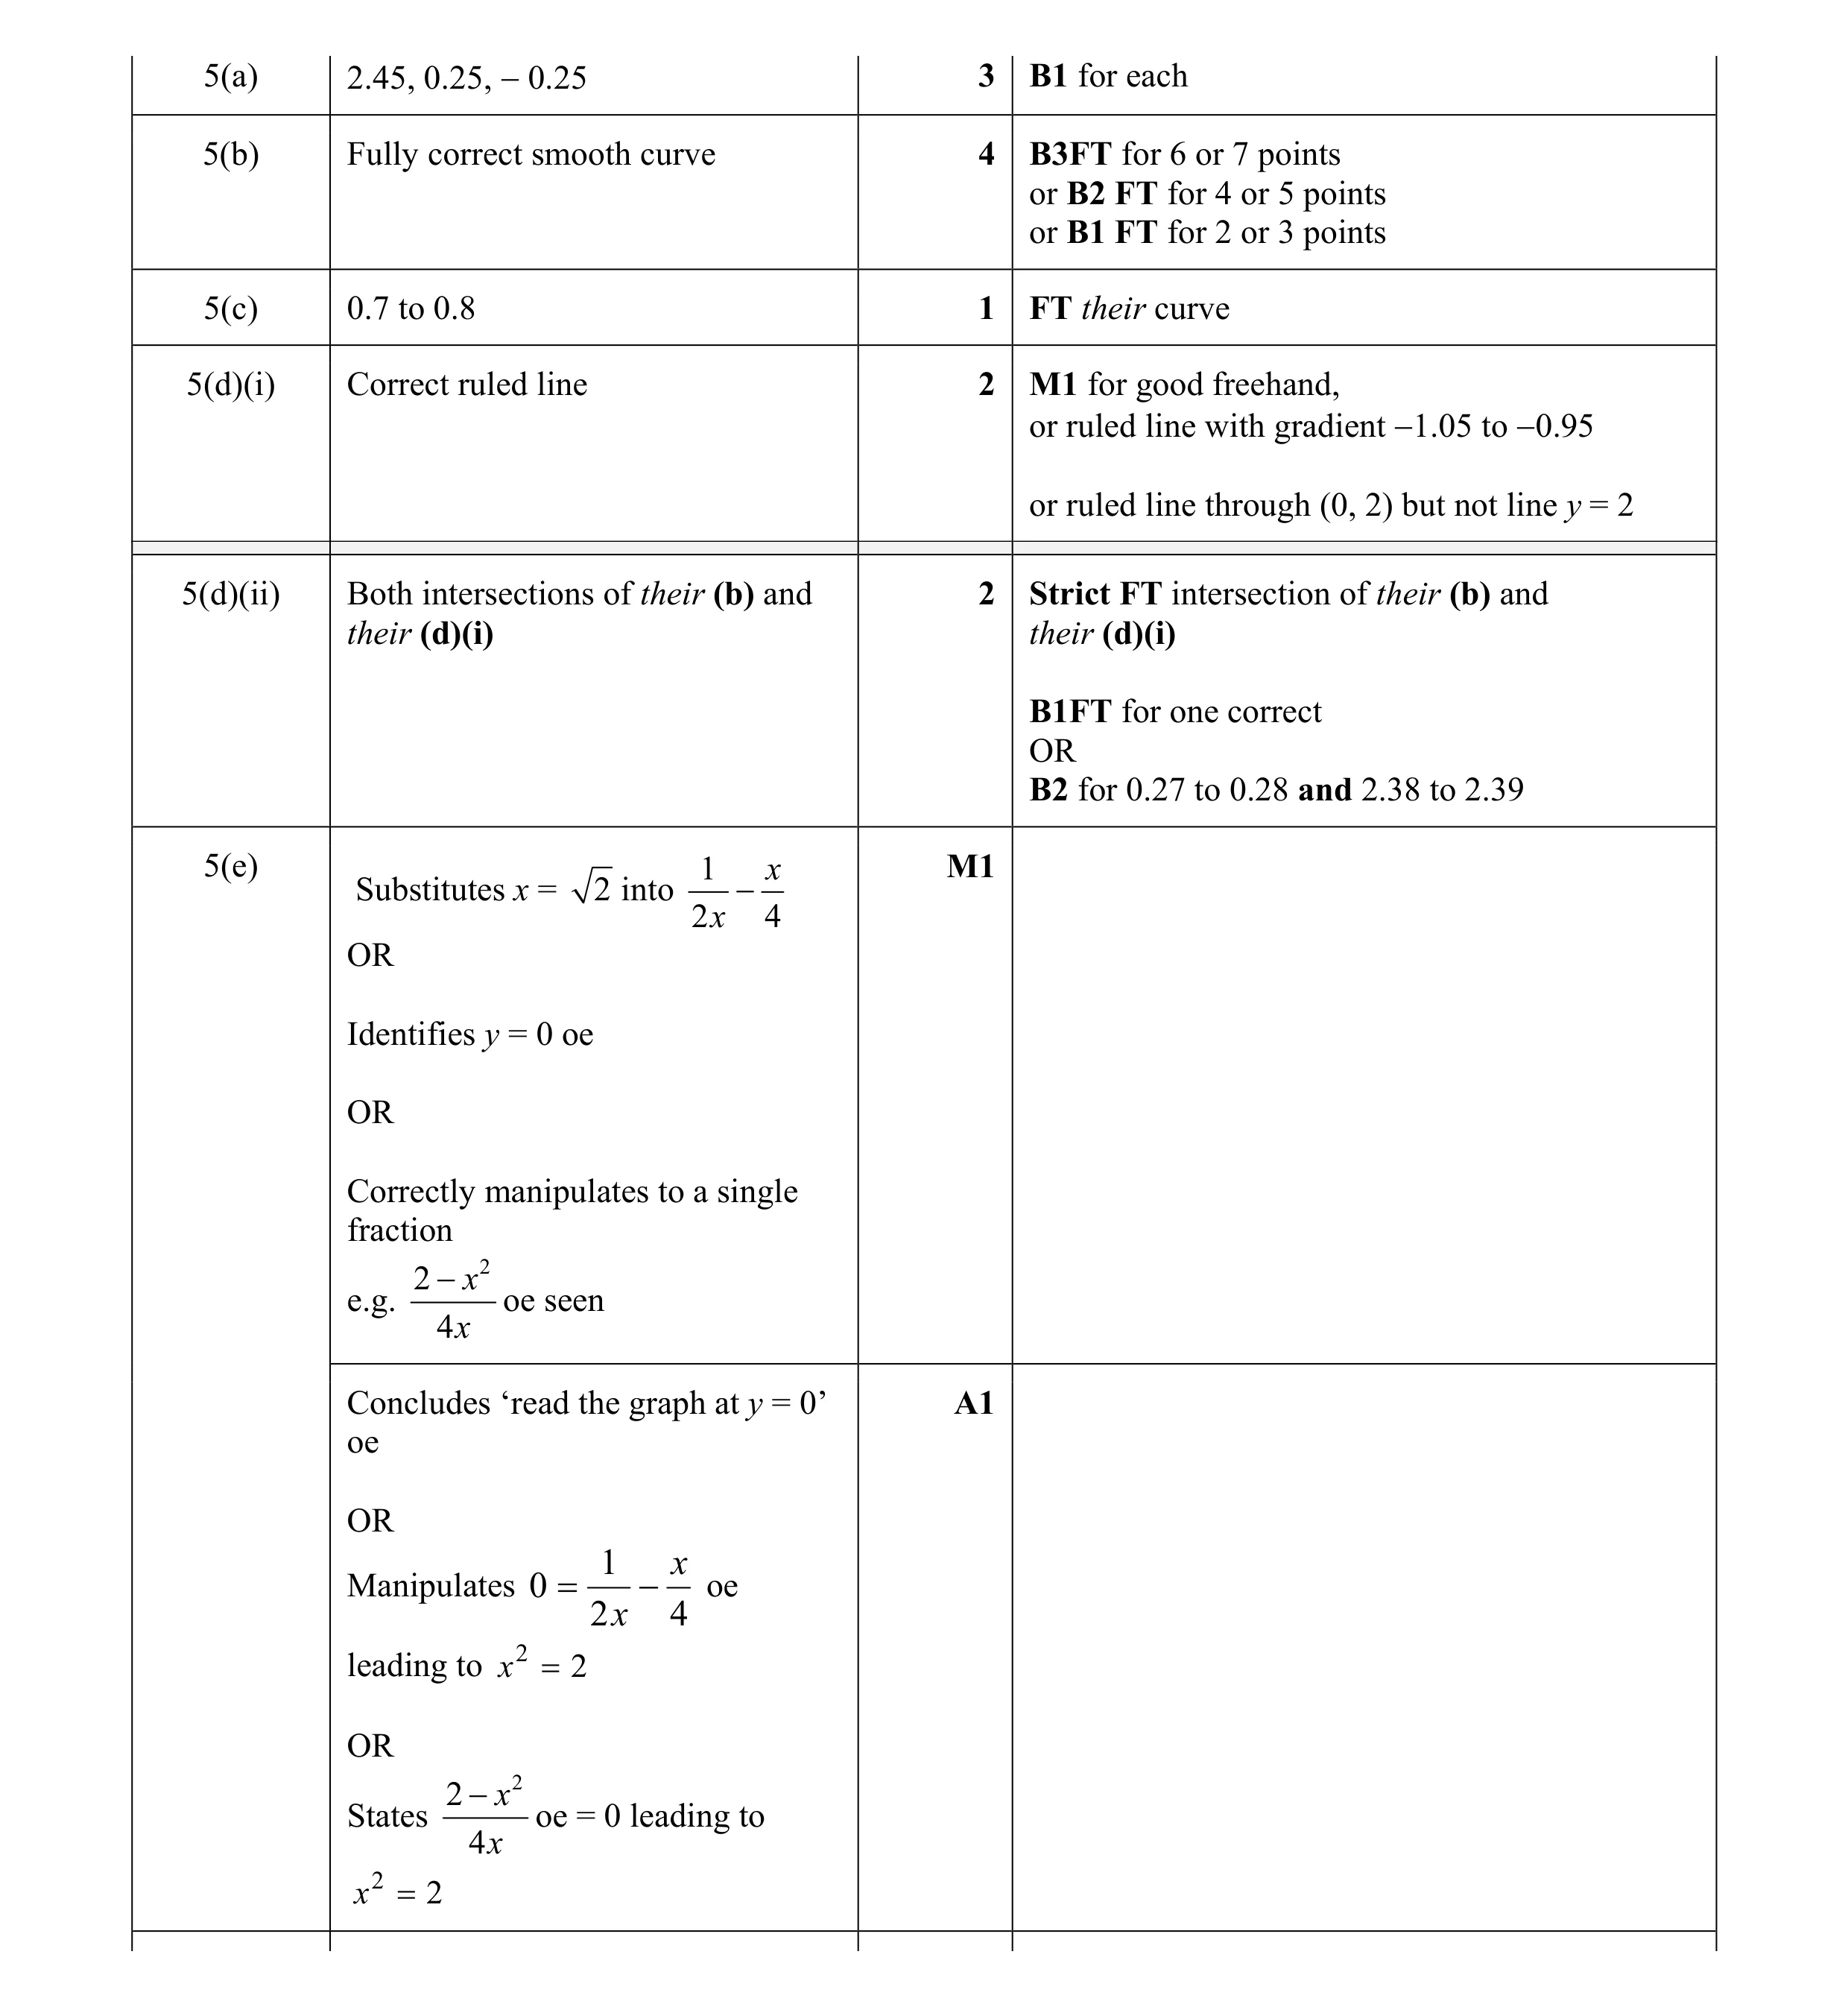 14
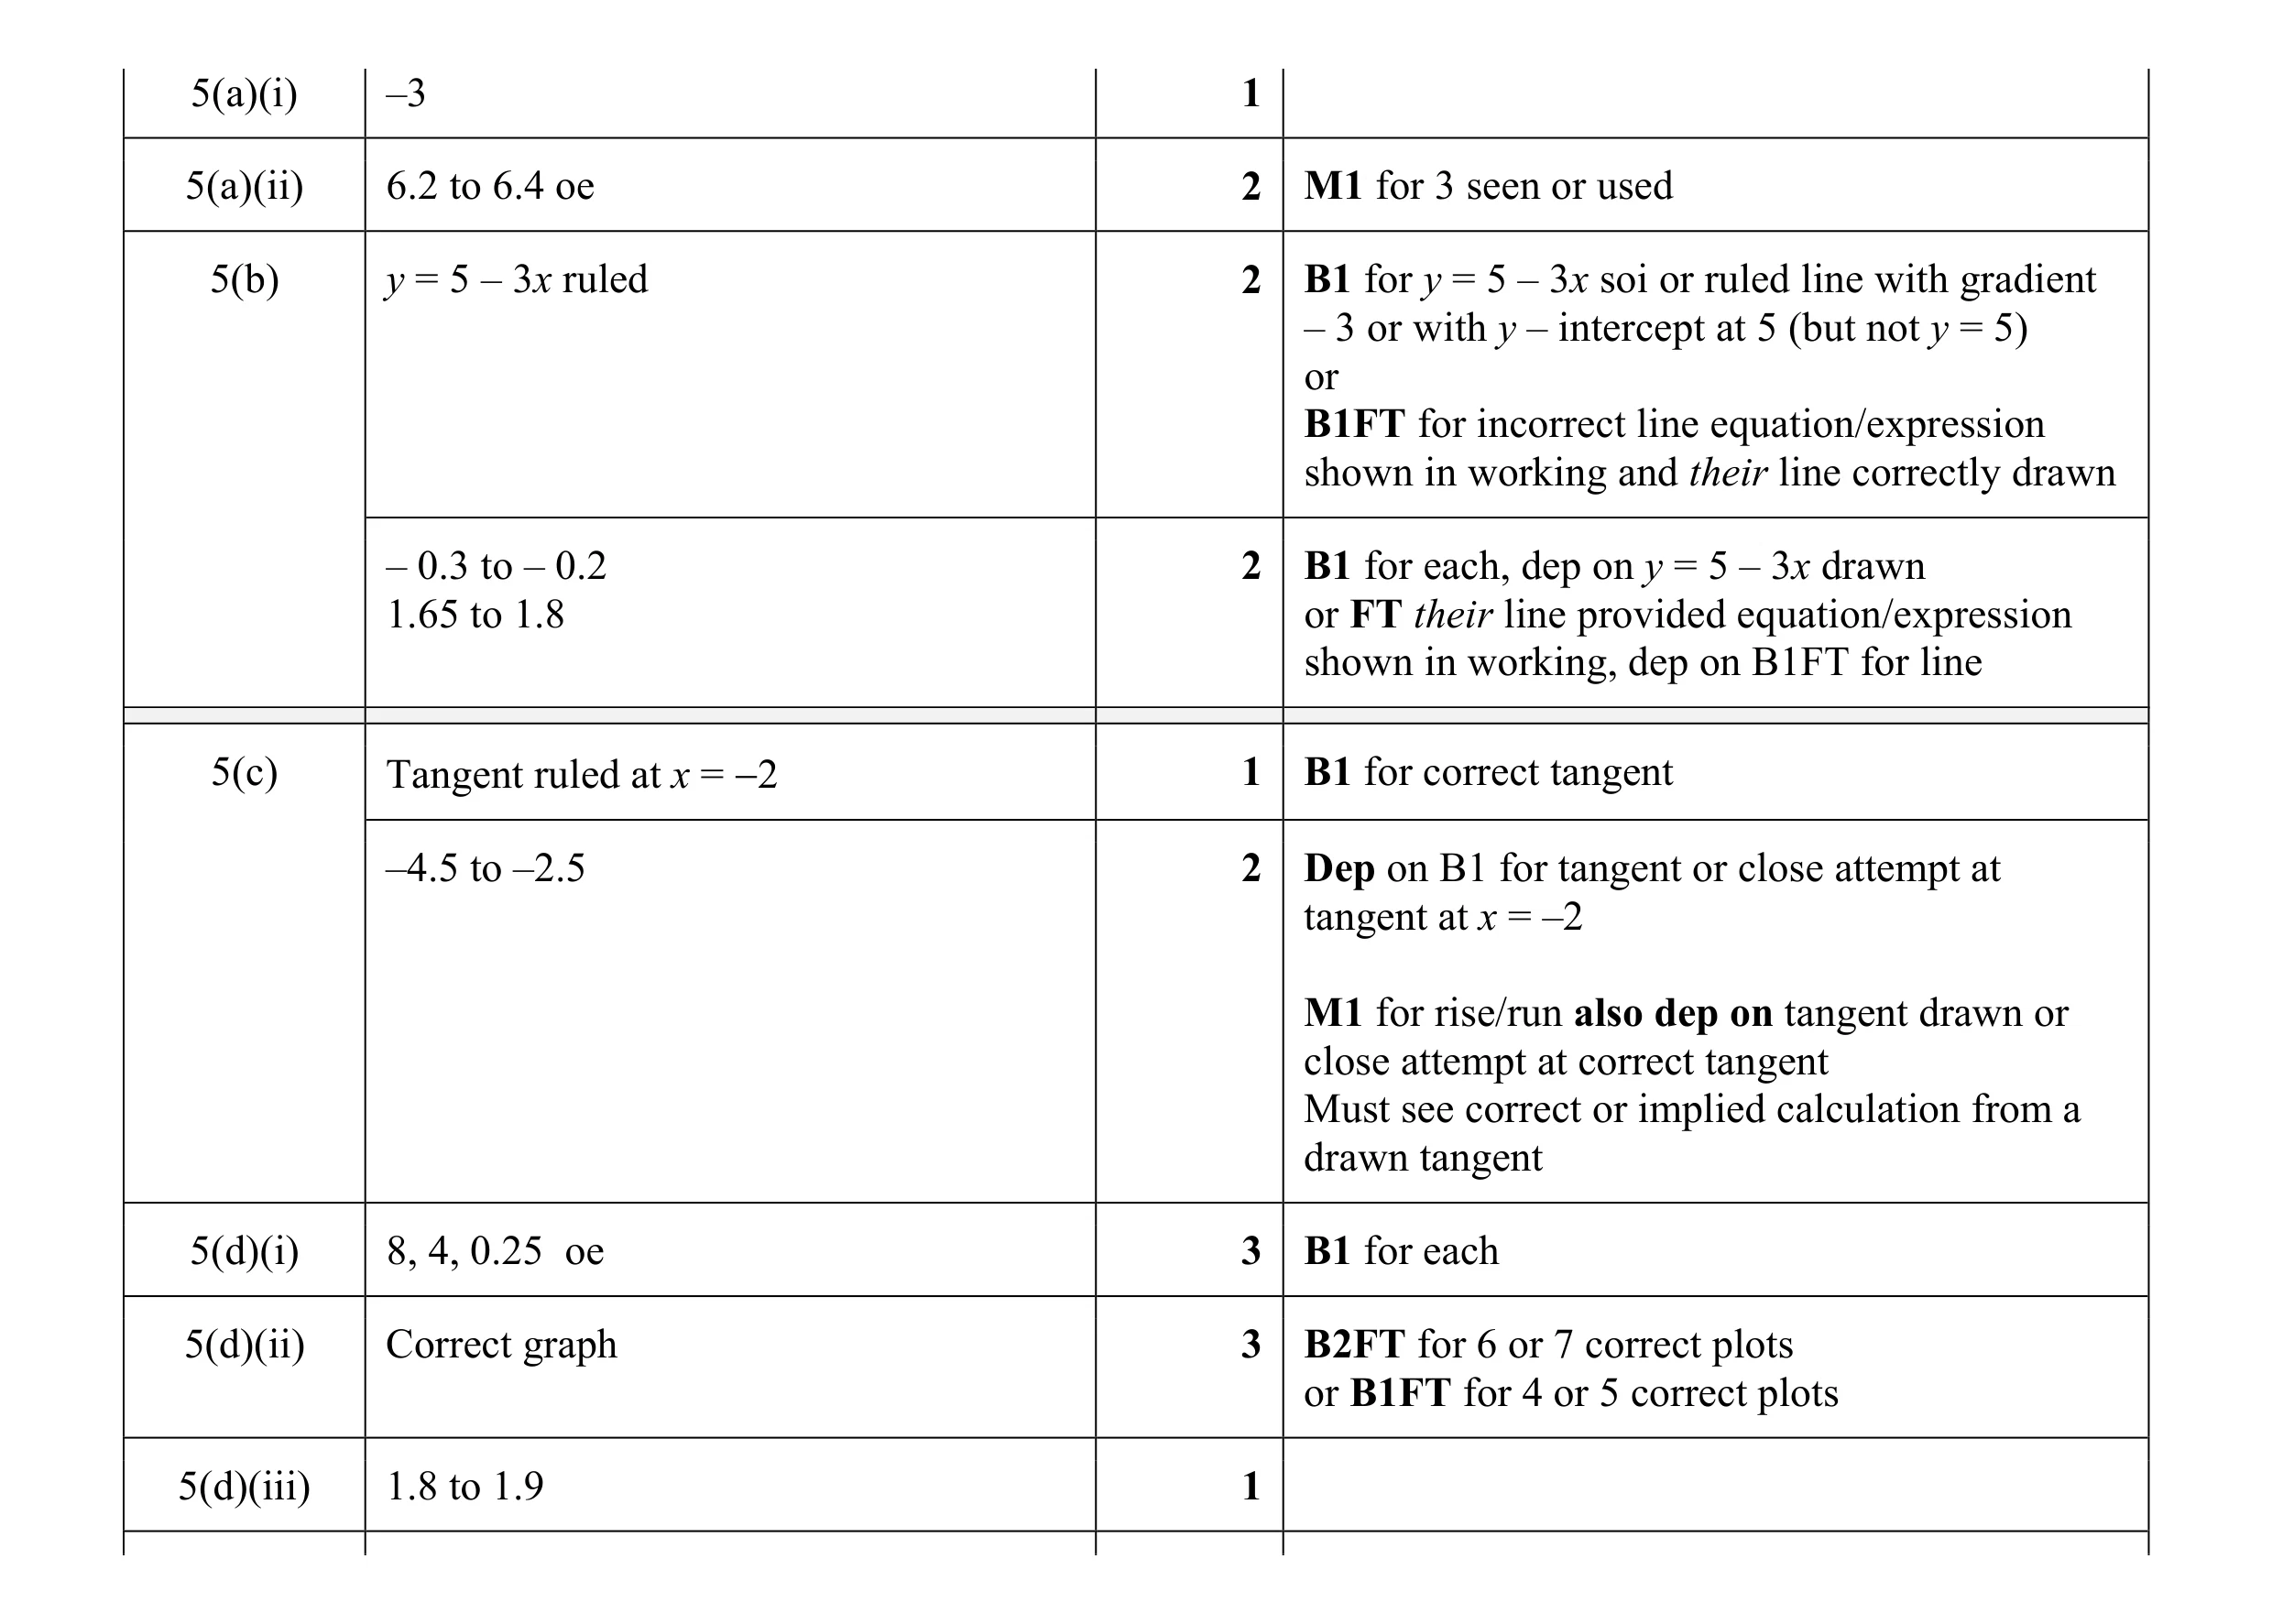 17
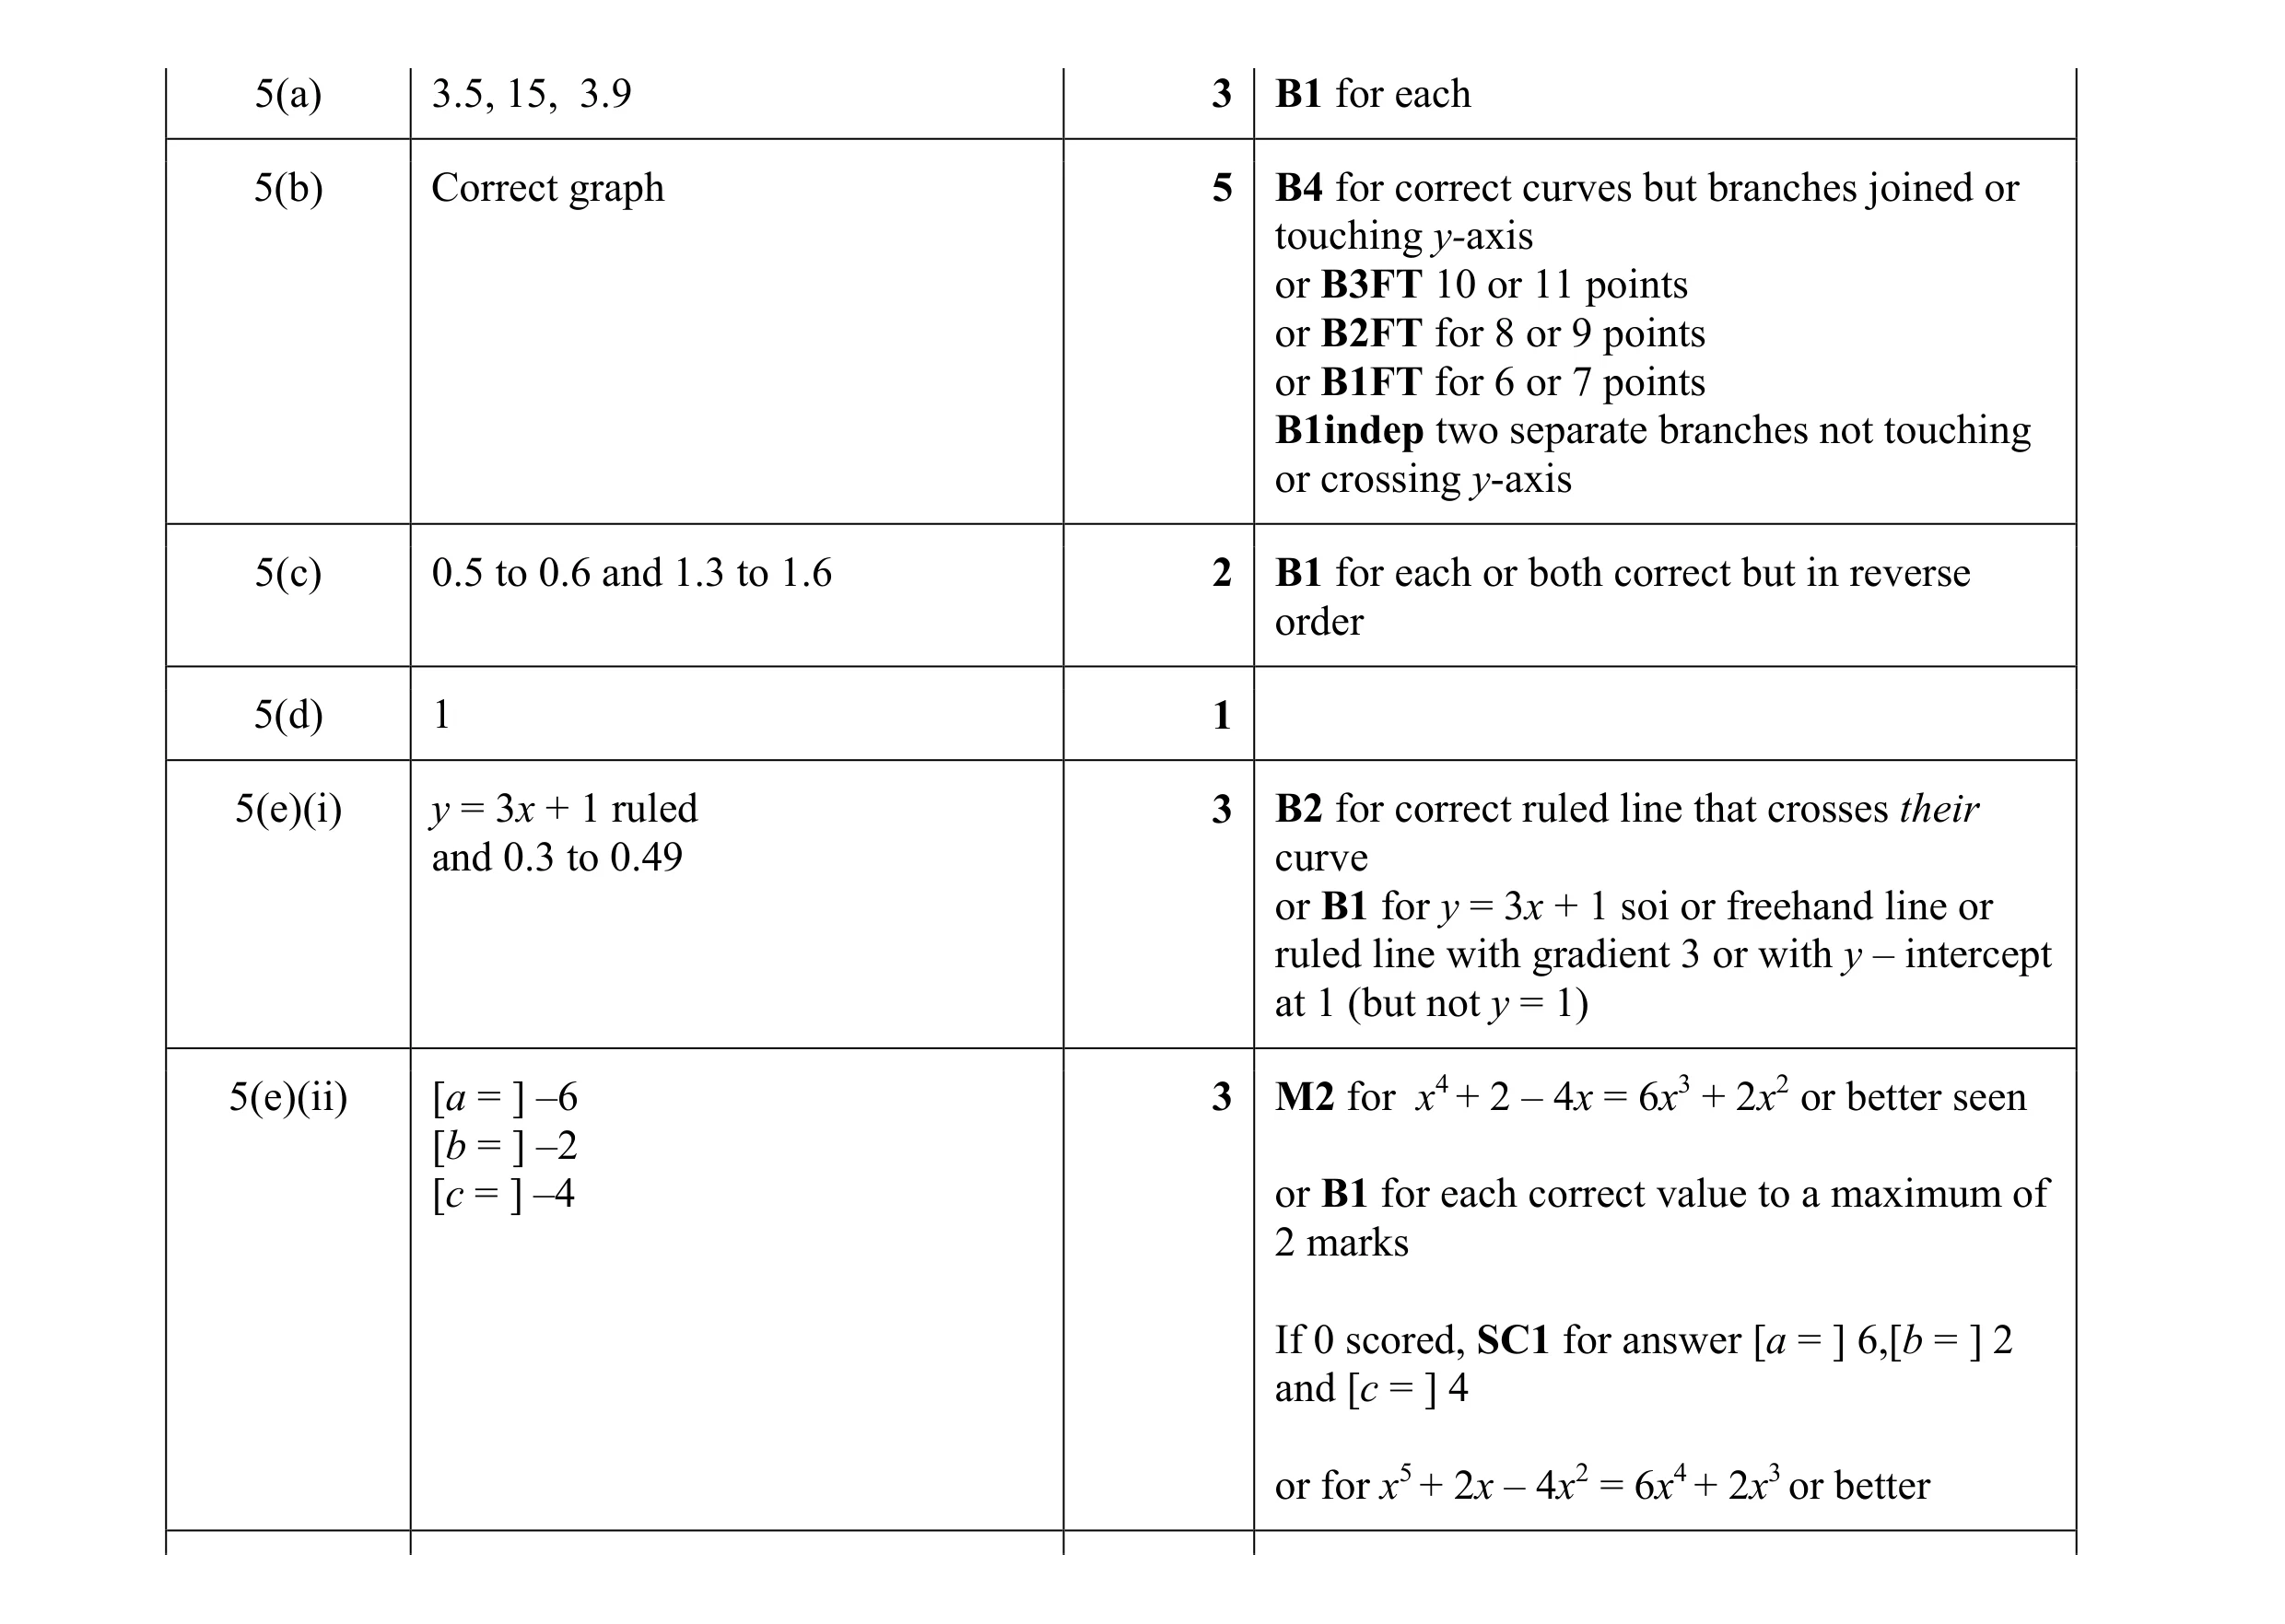 17
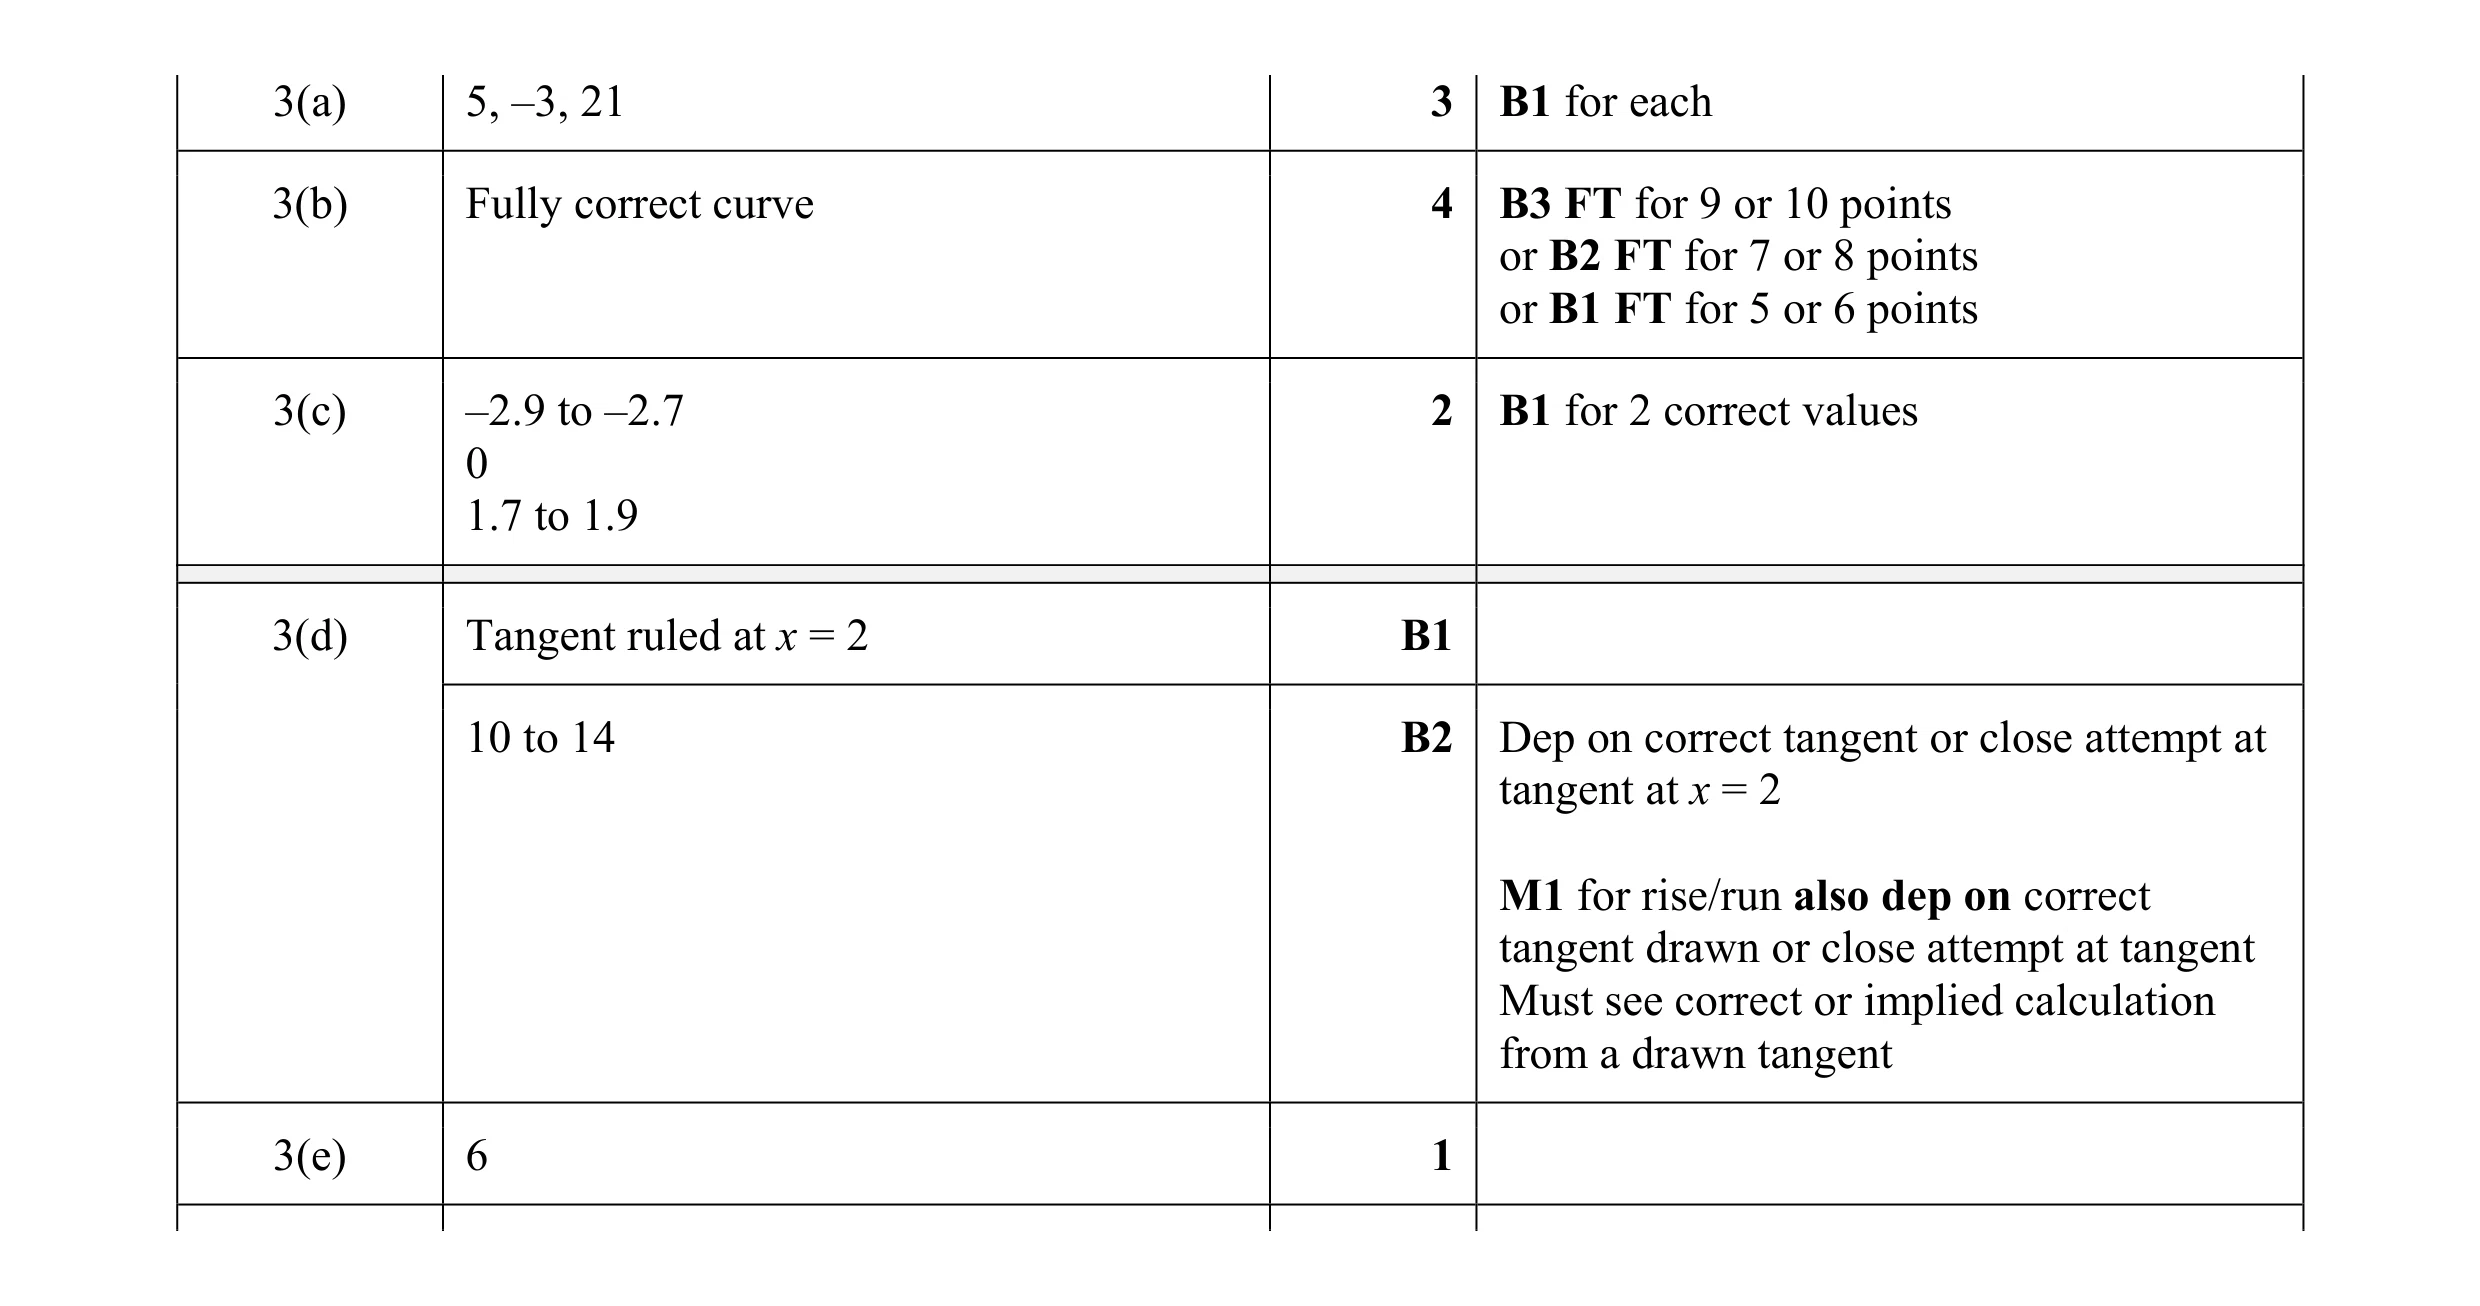 13
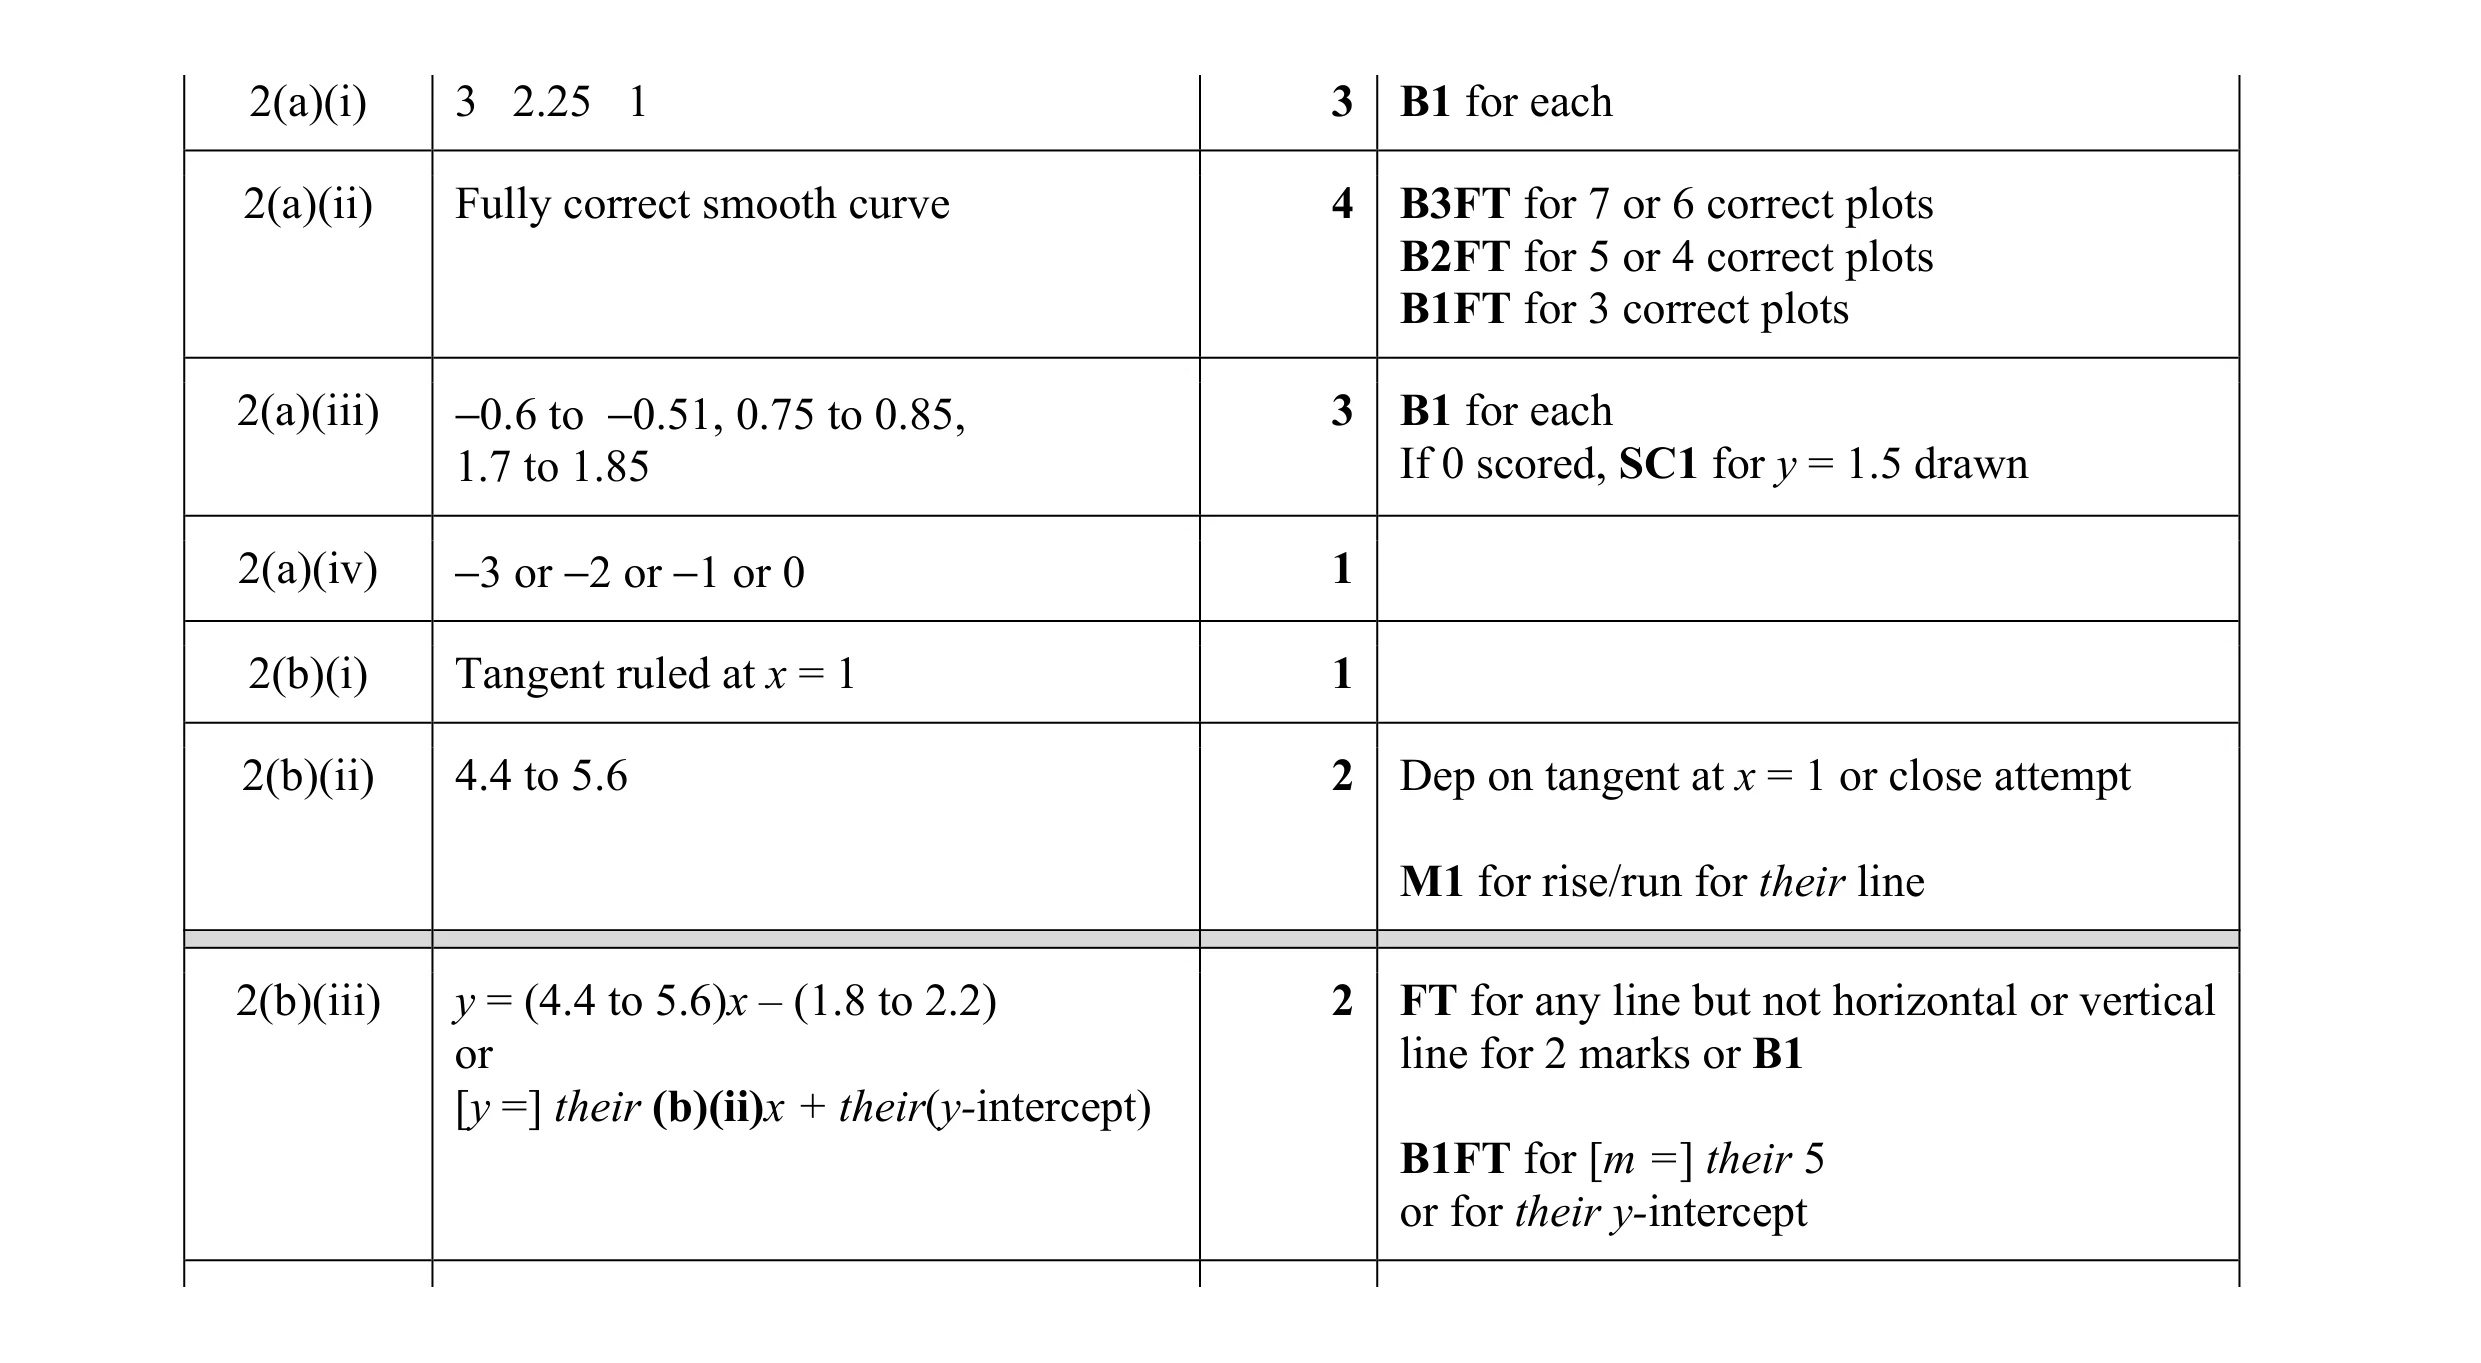 16
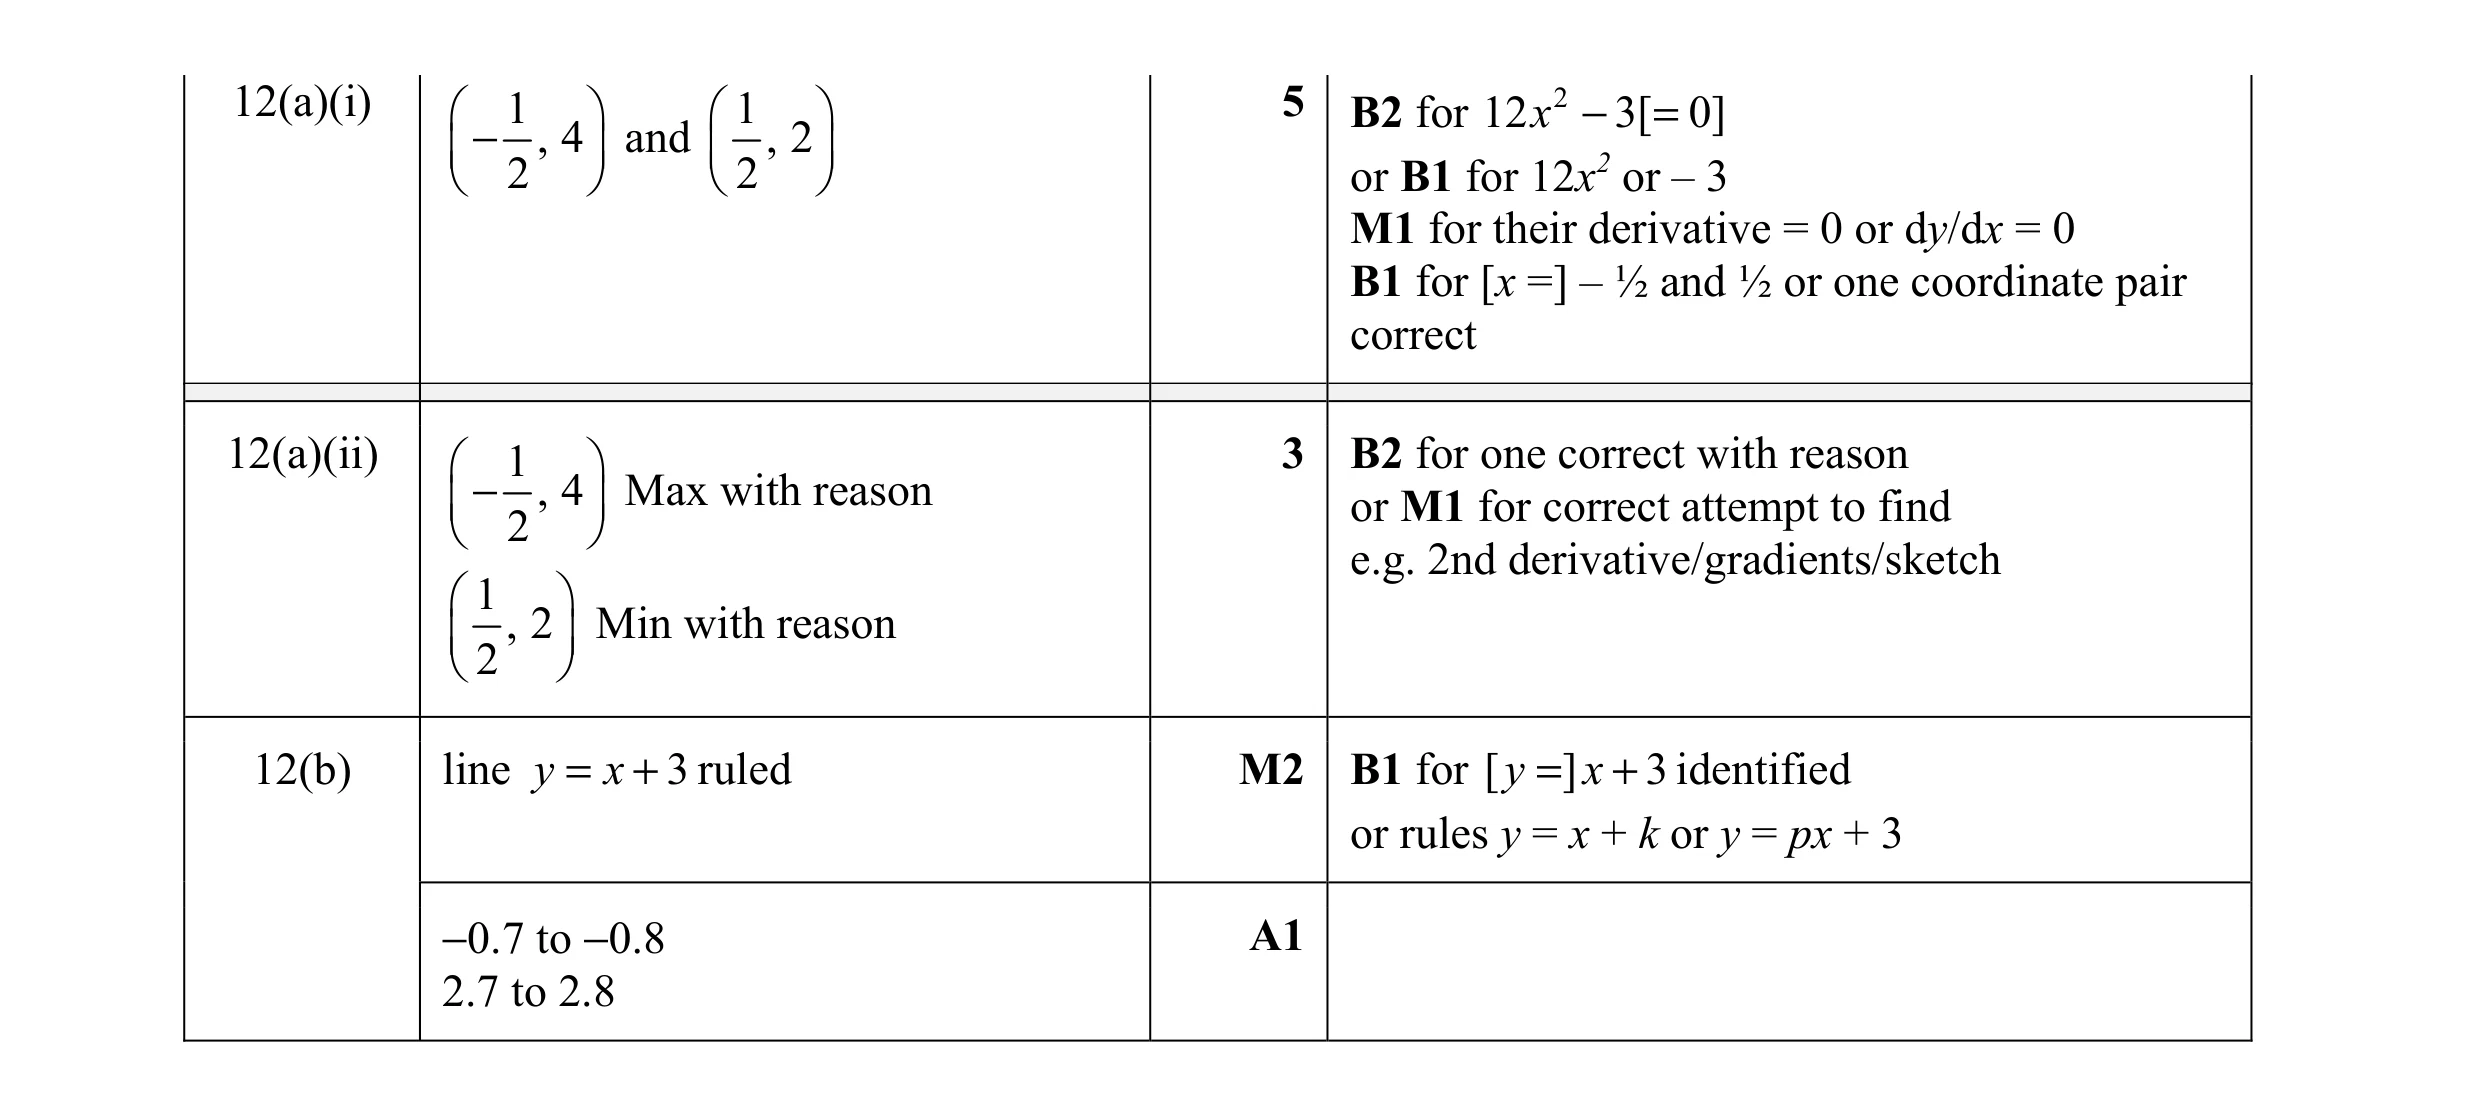 11
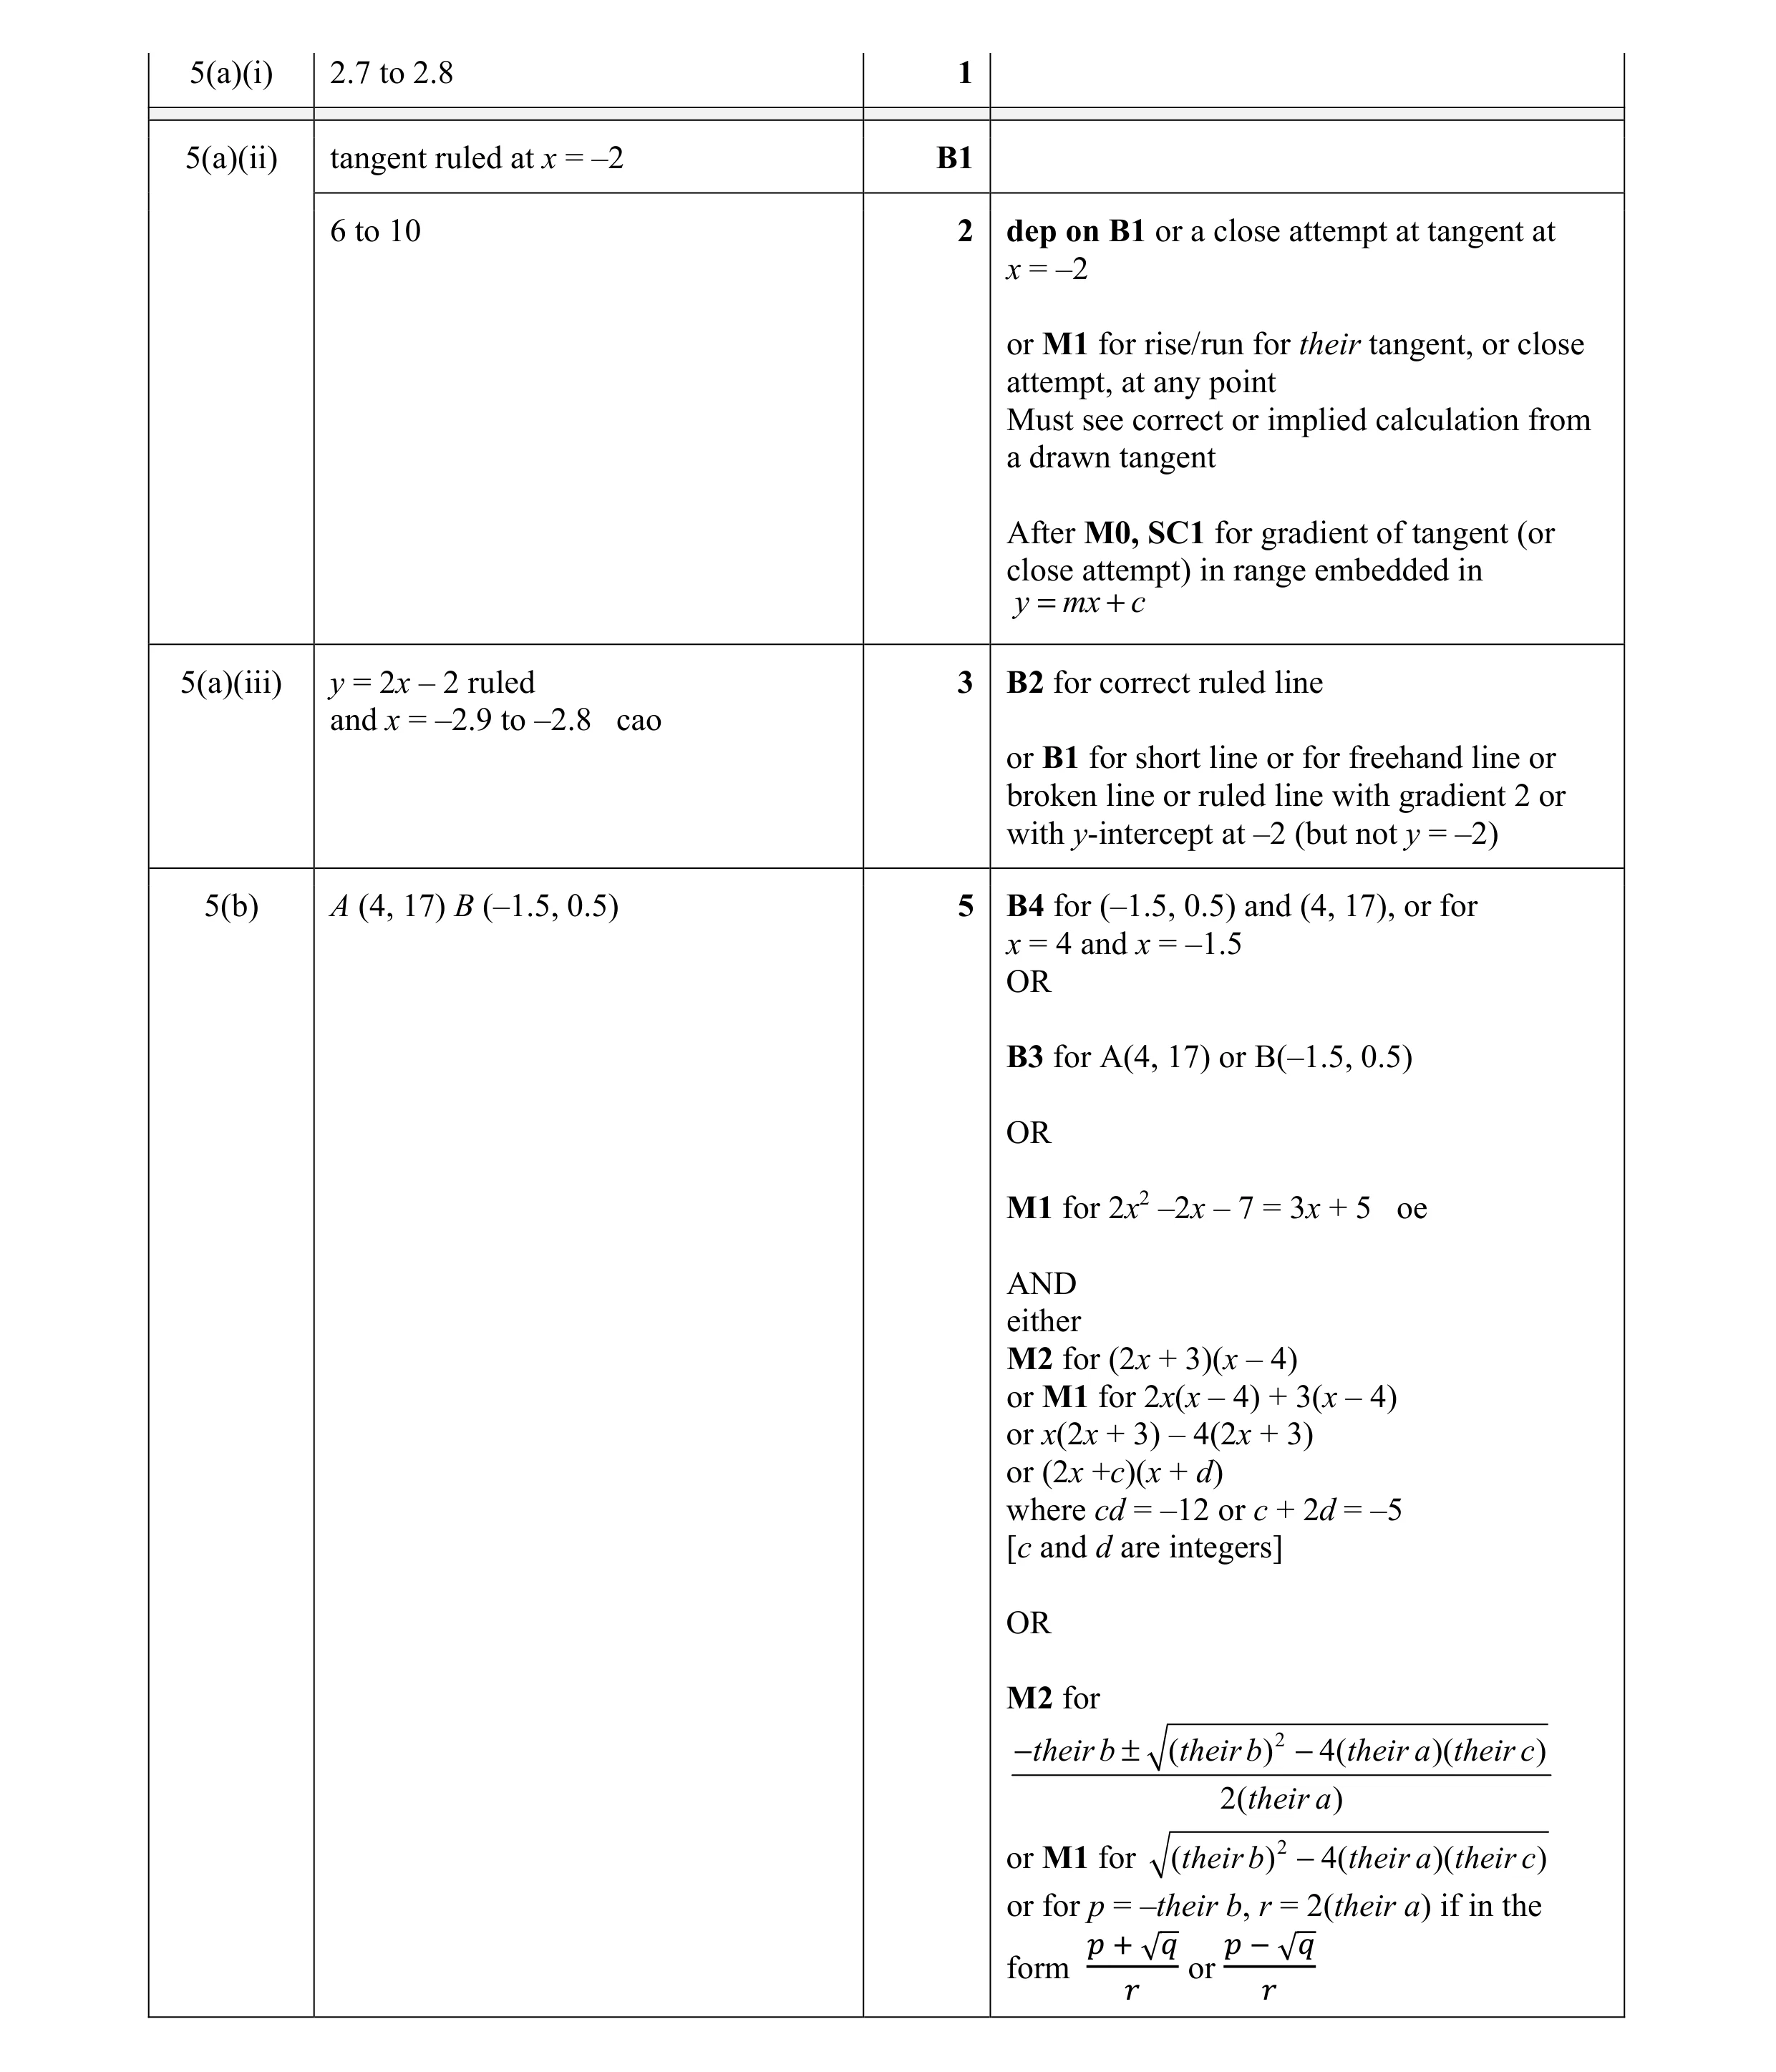 12
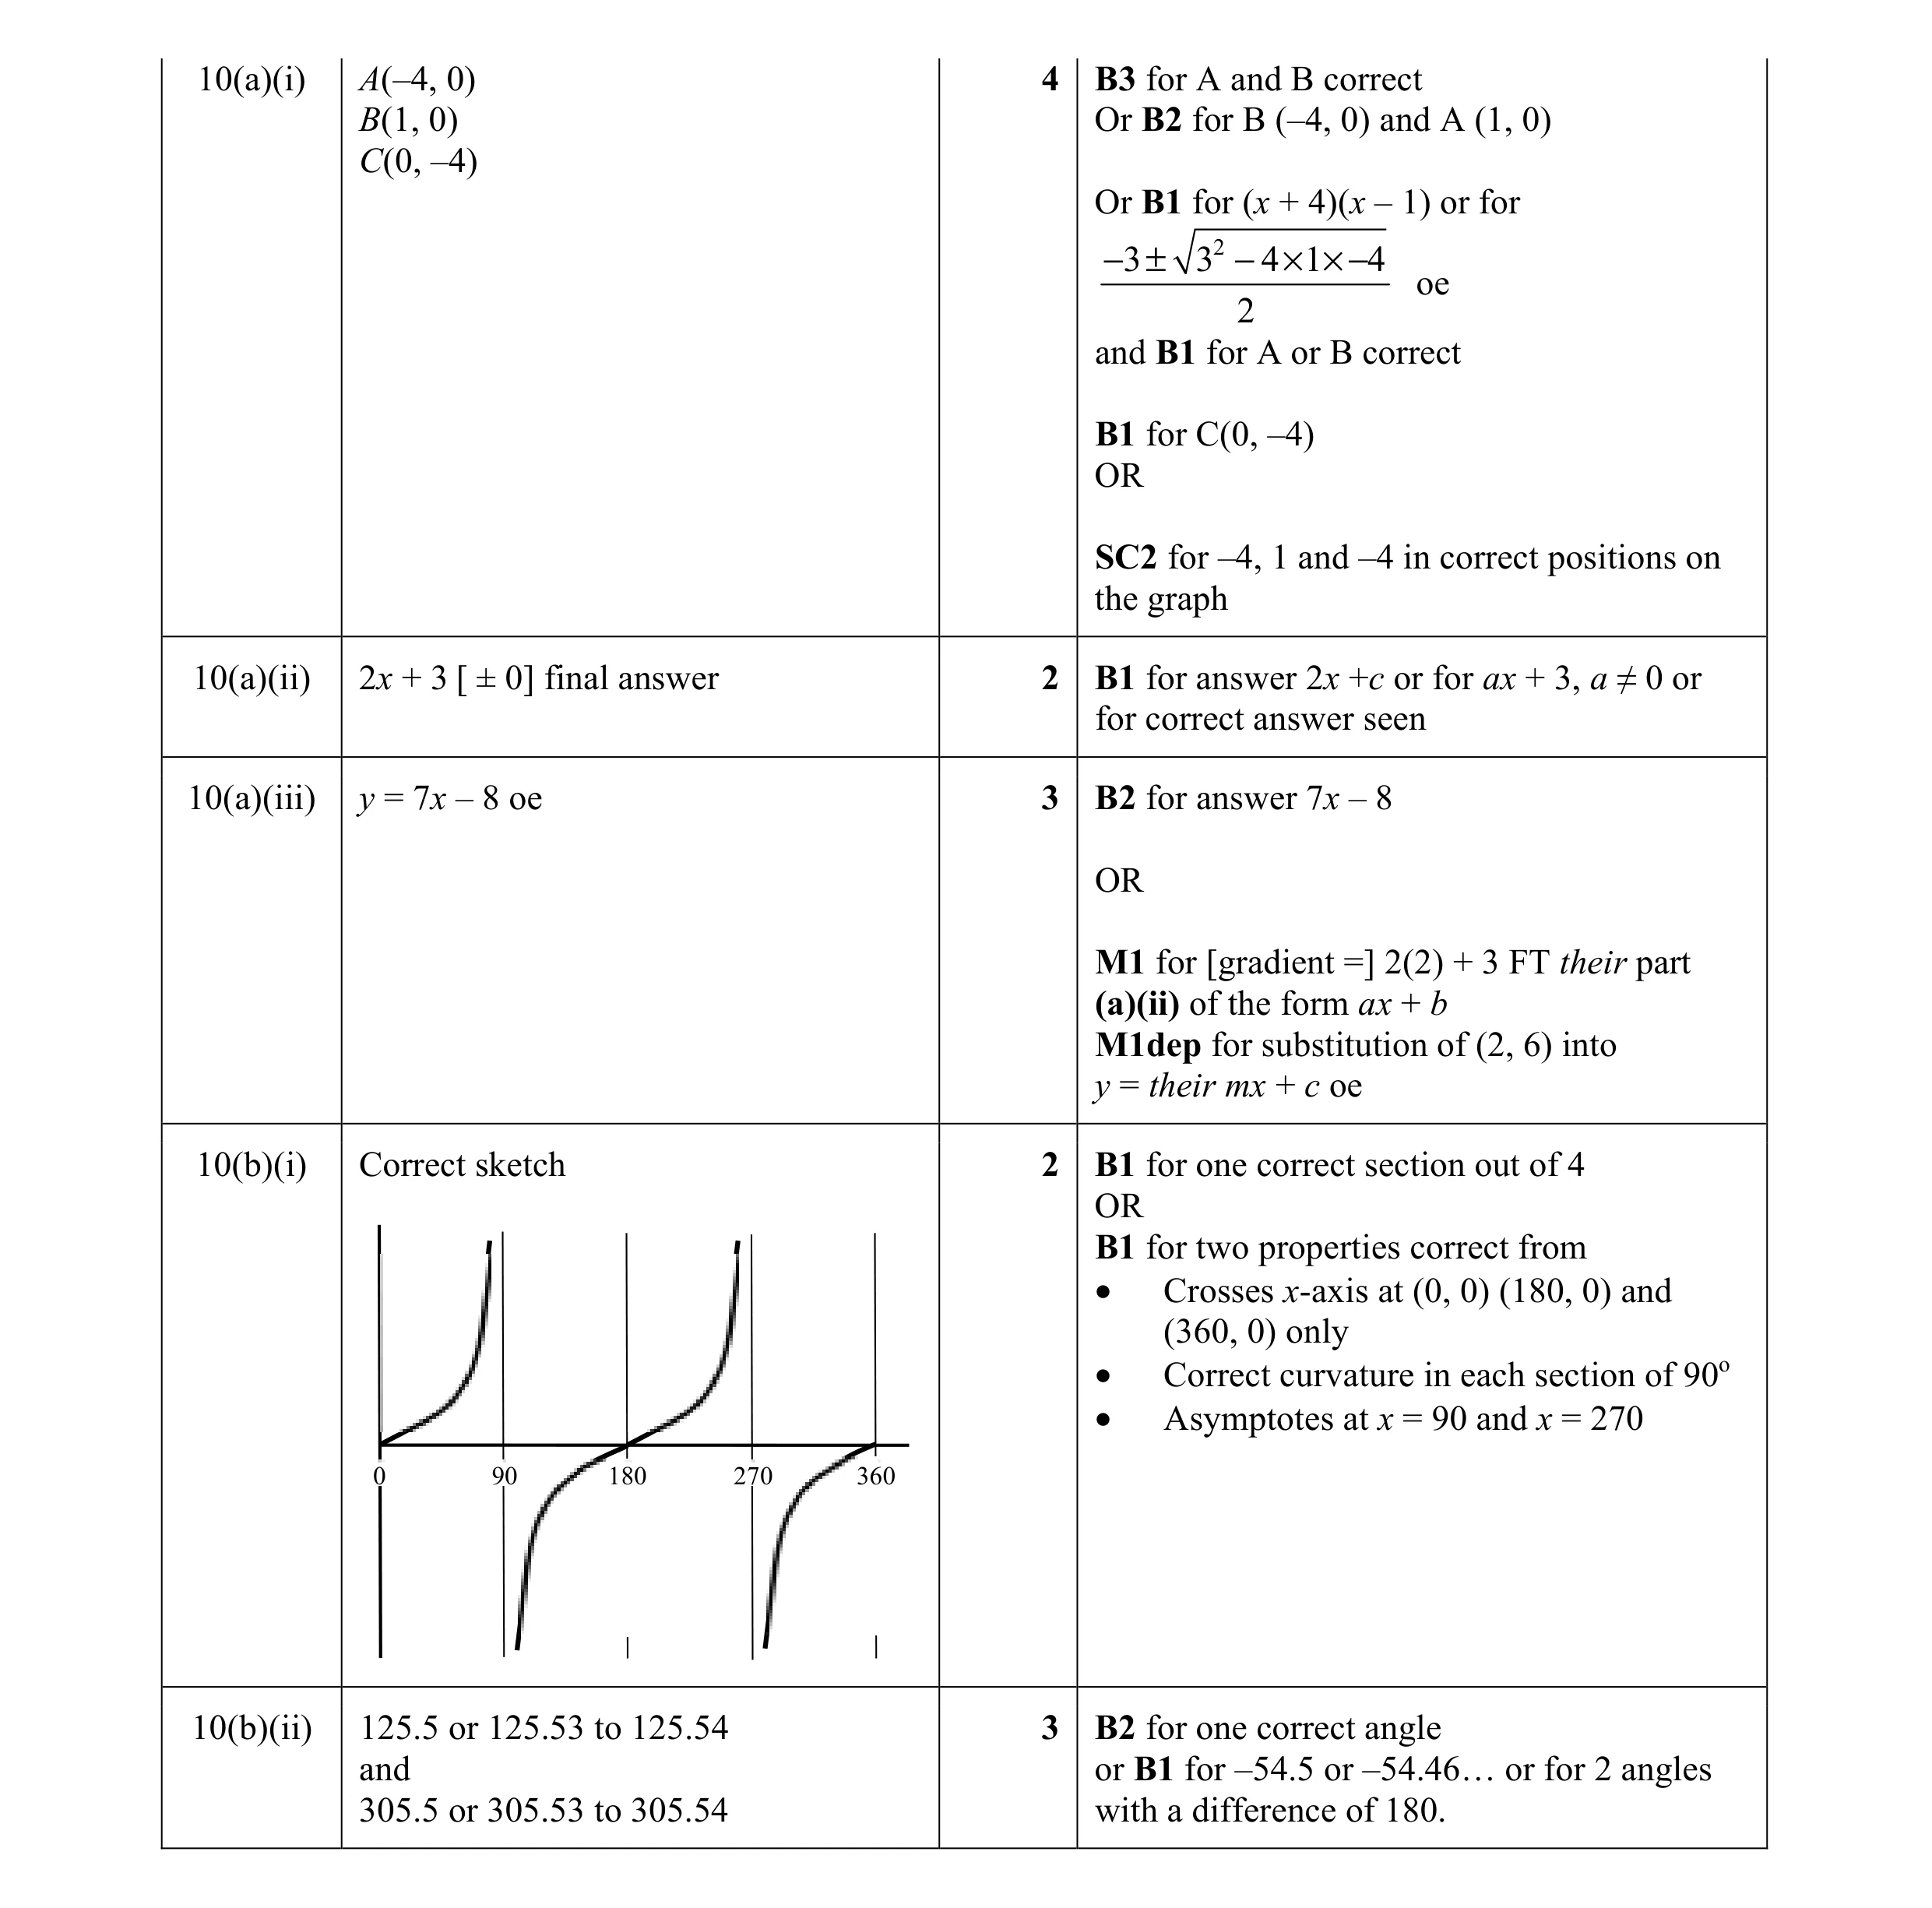 14
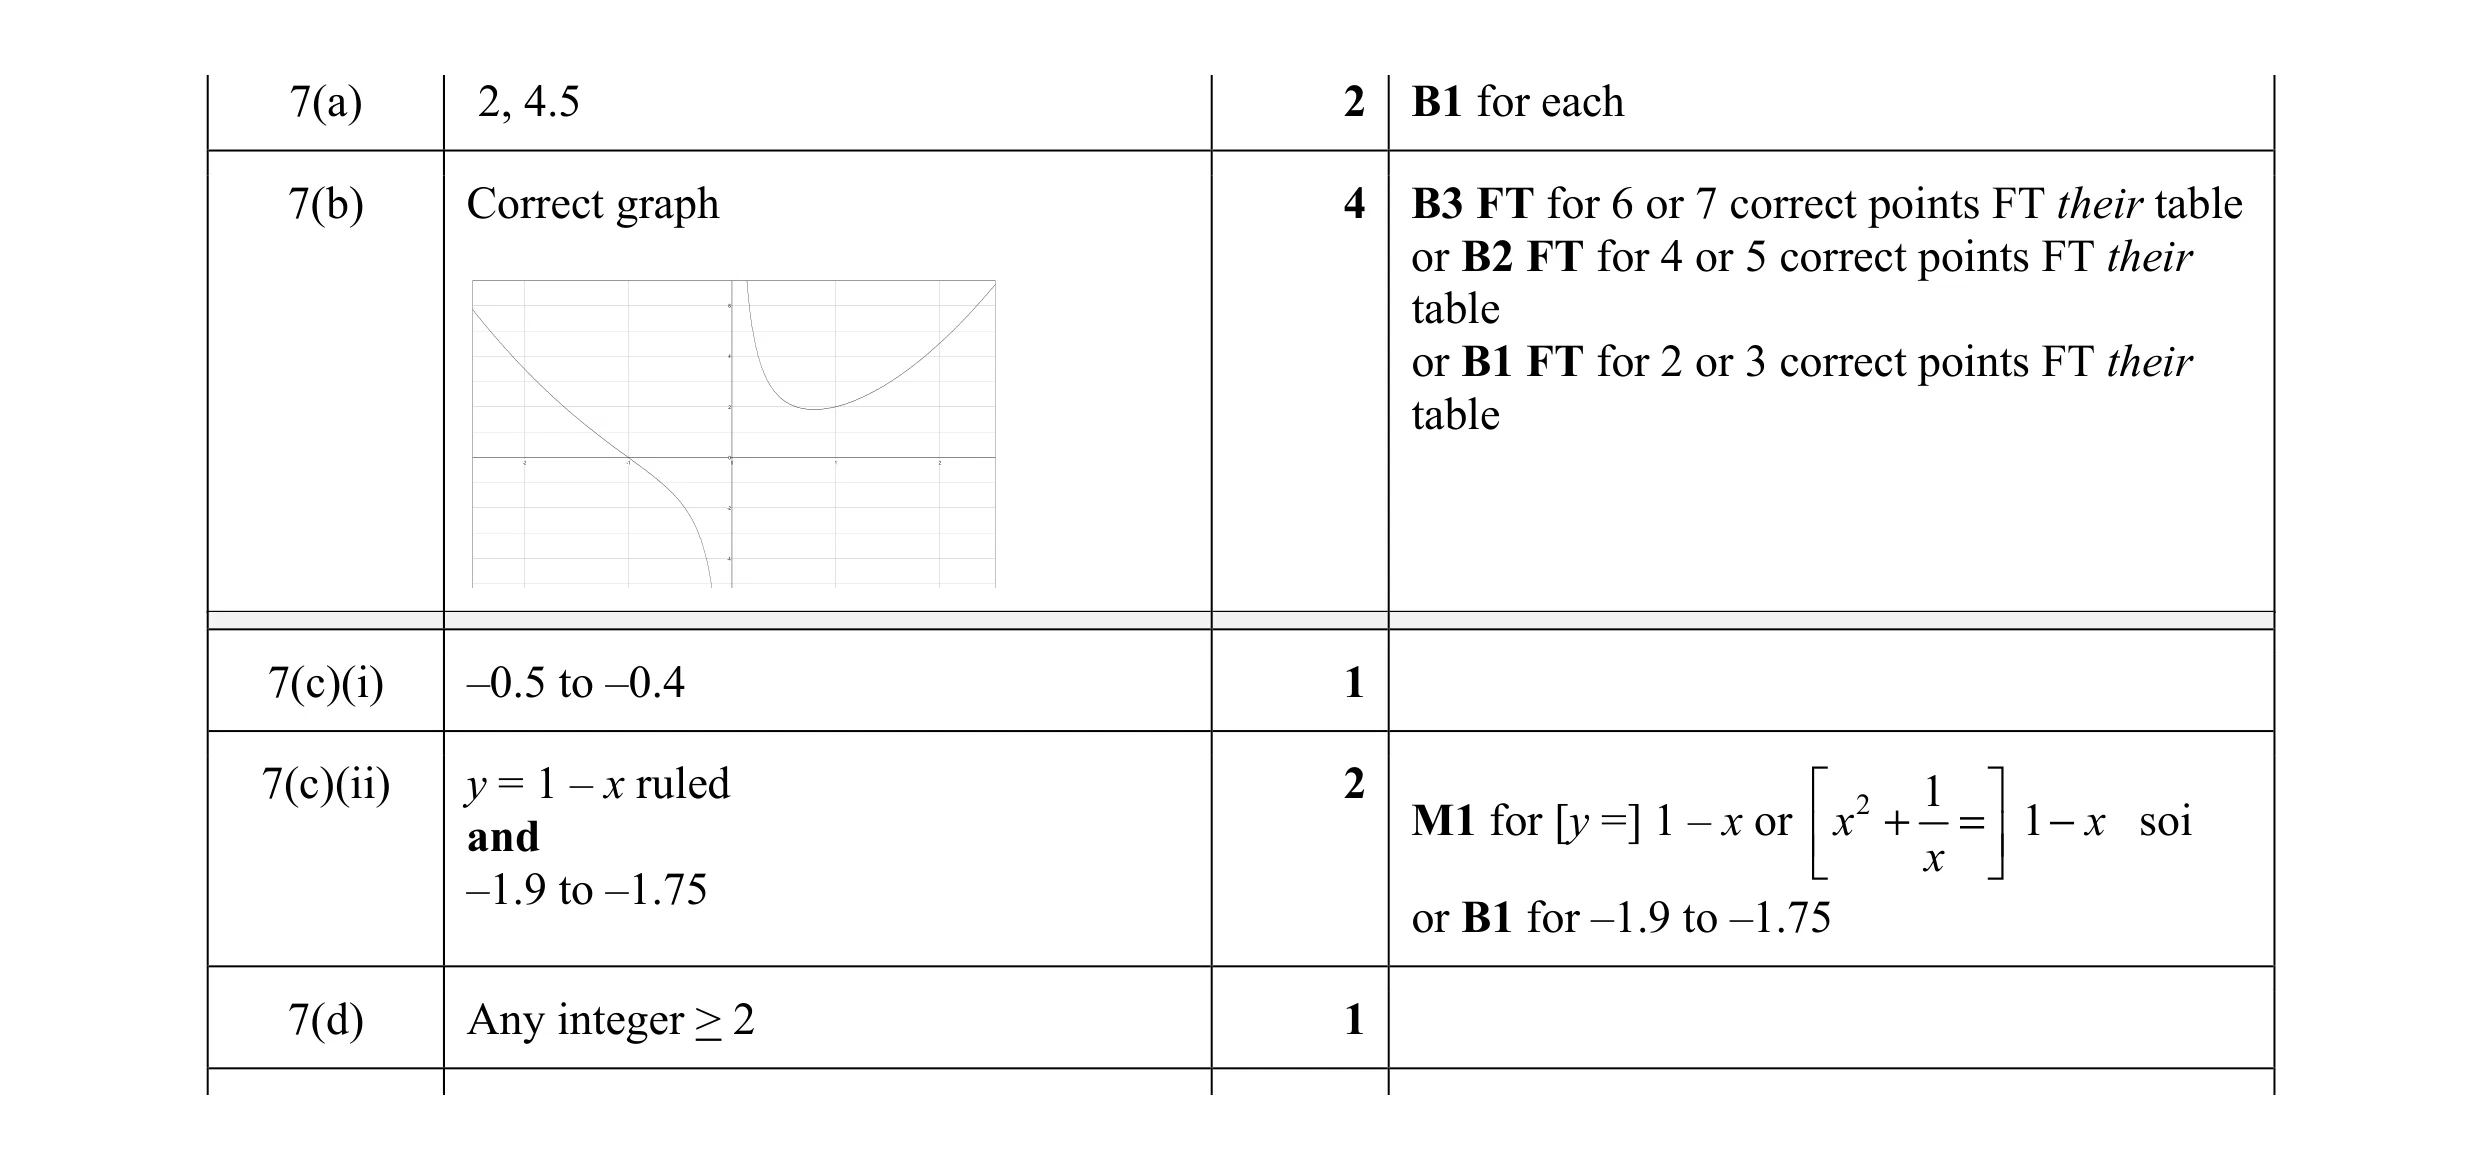 10
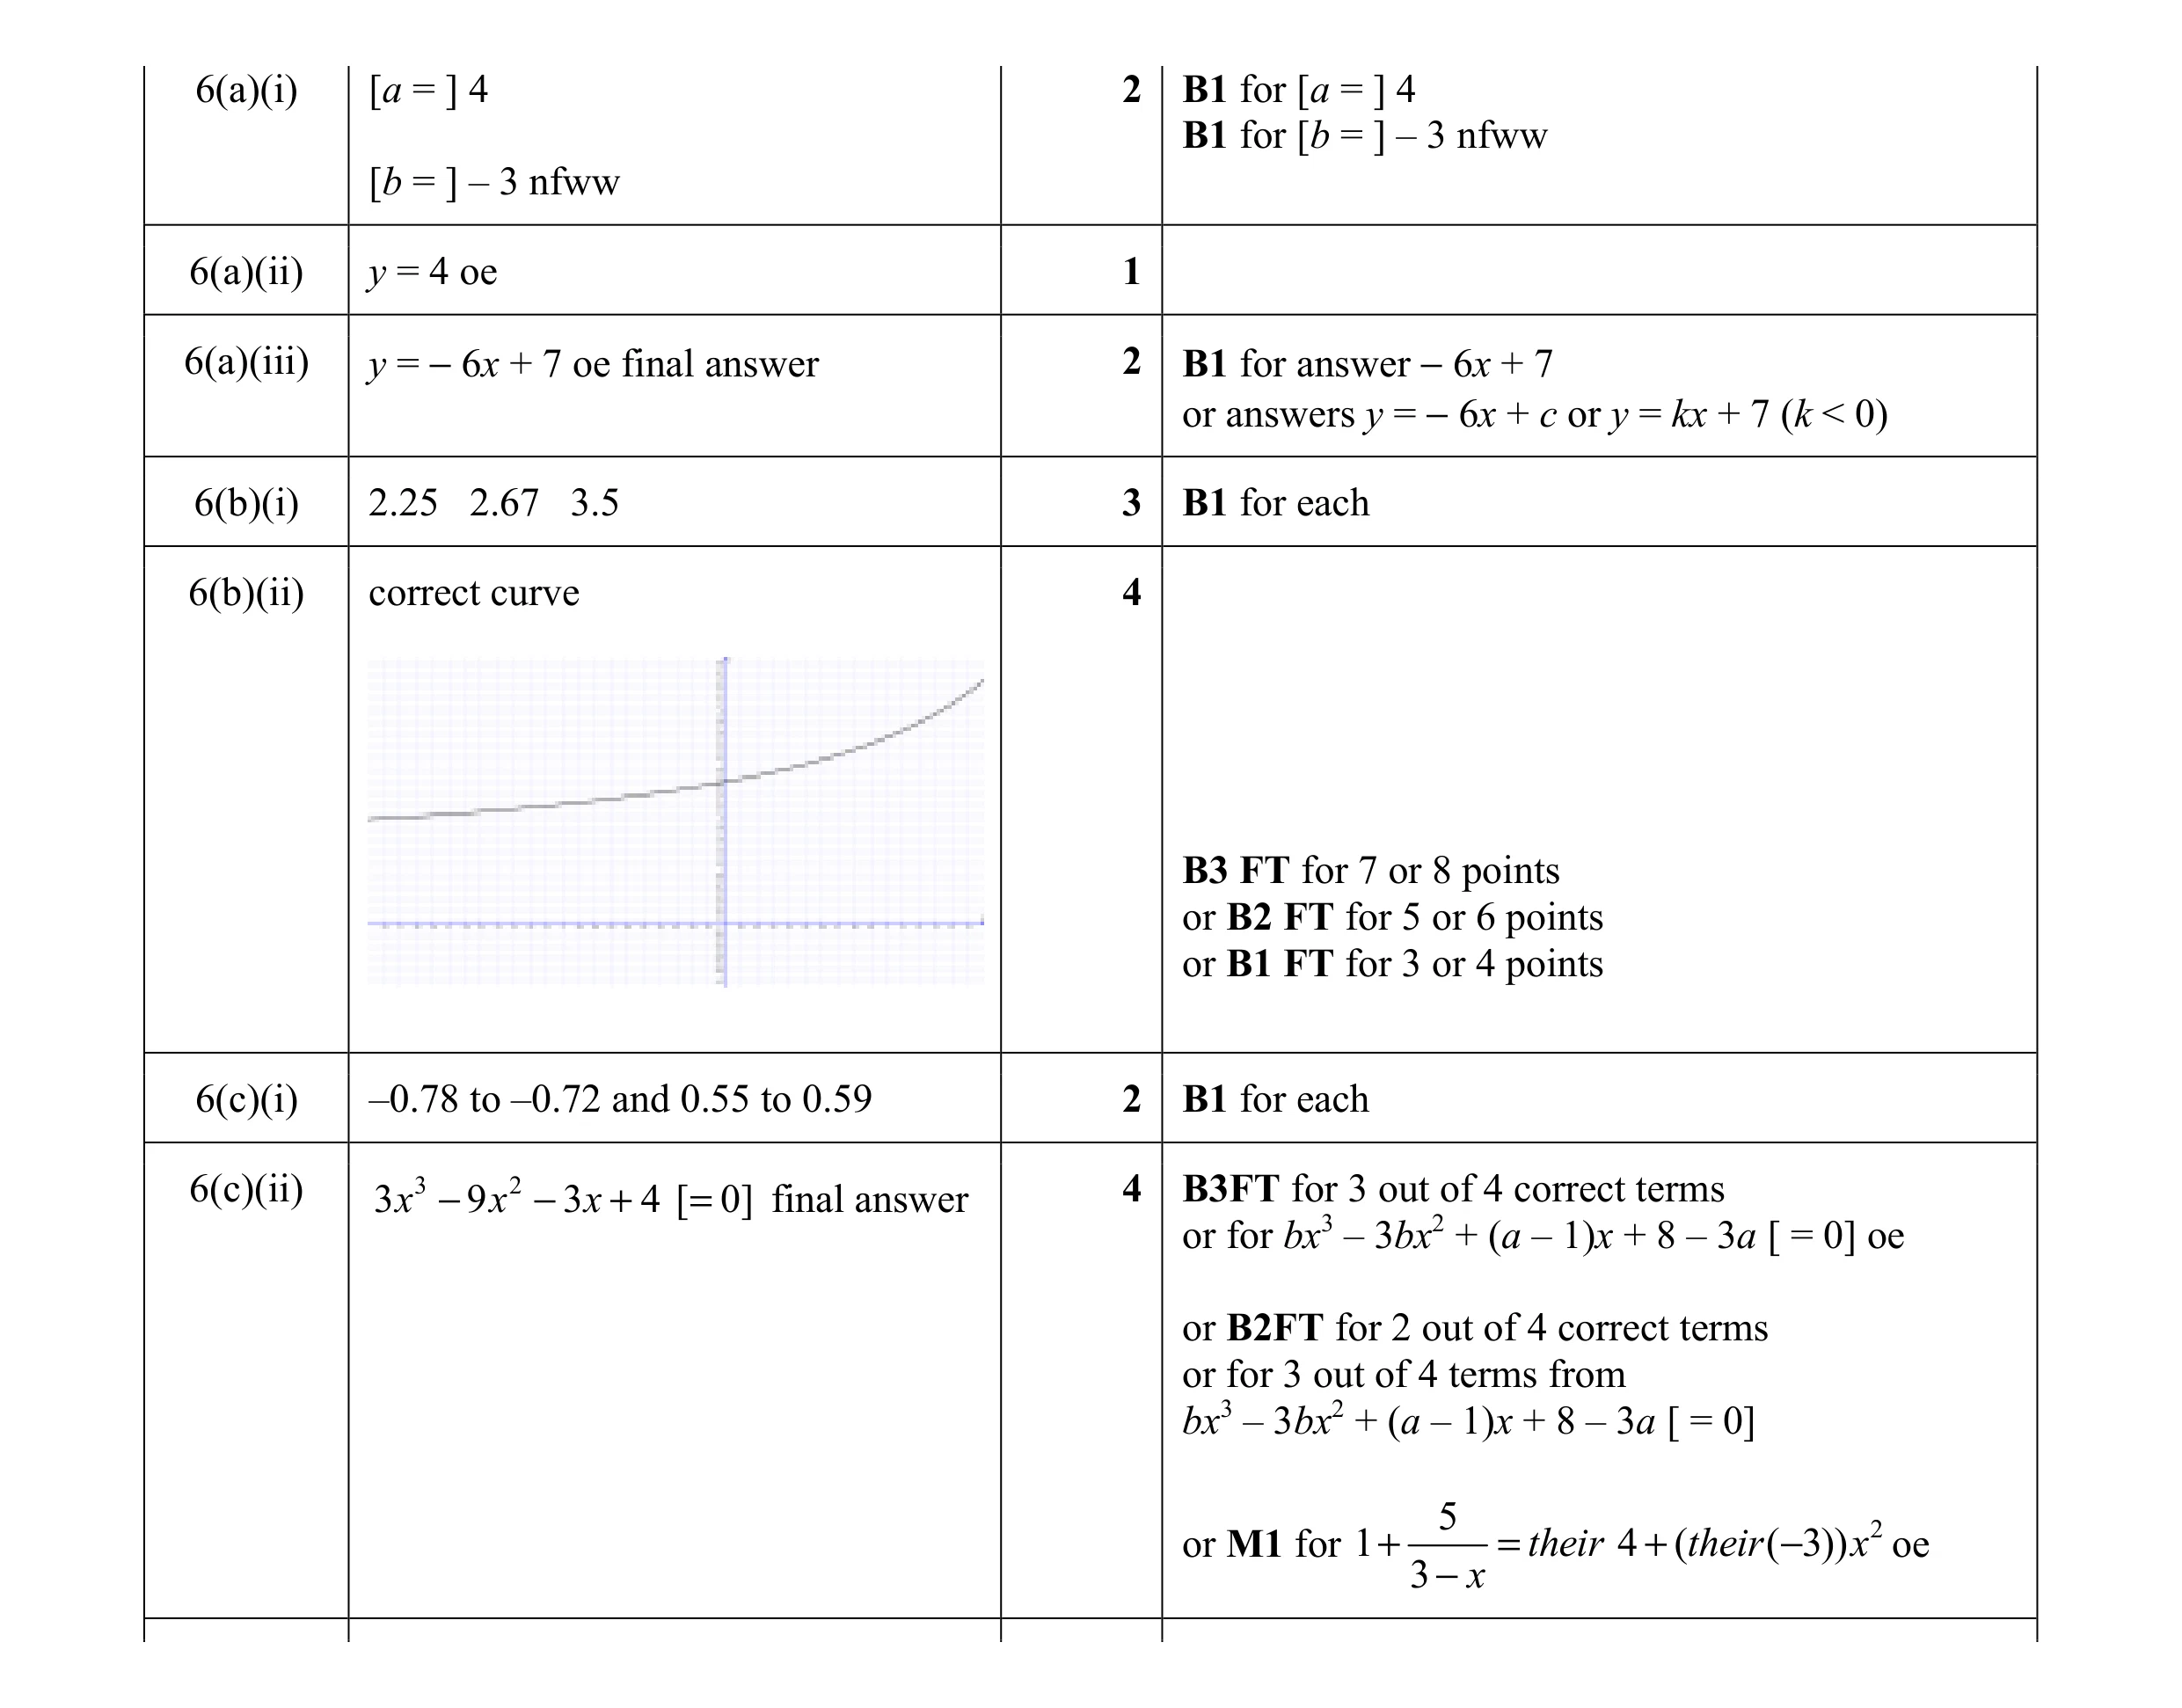 18
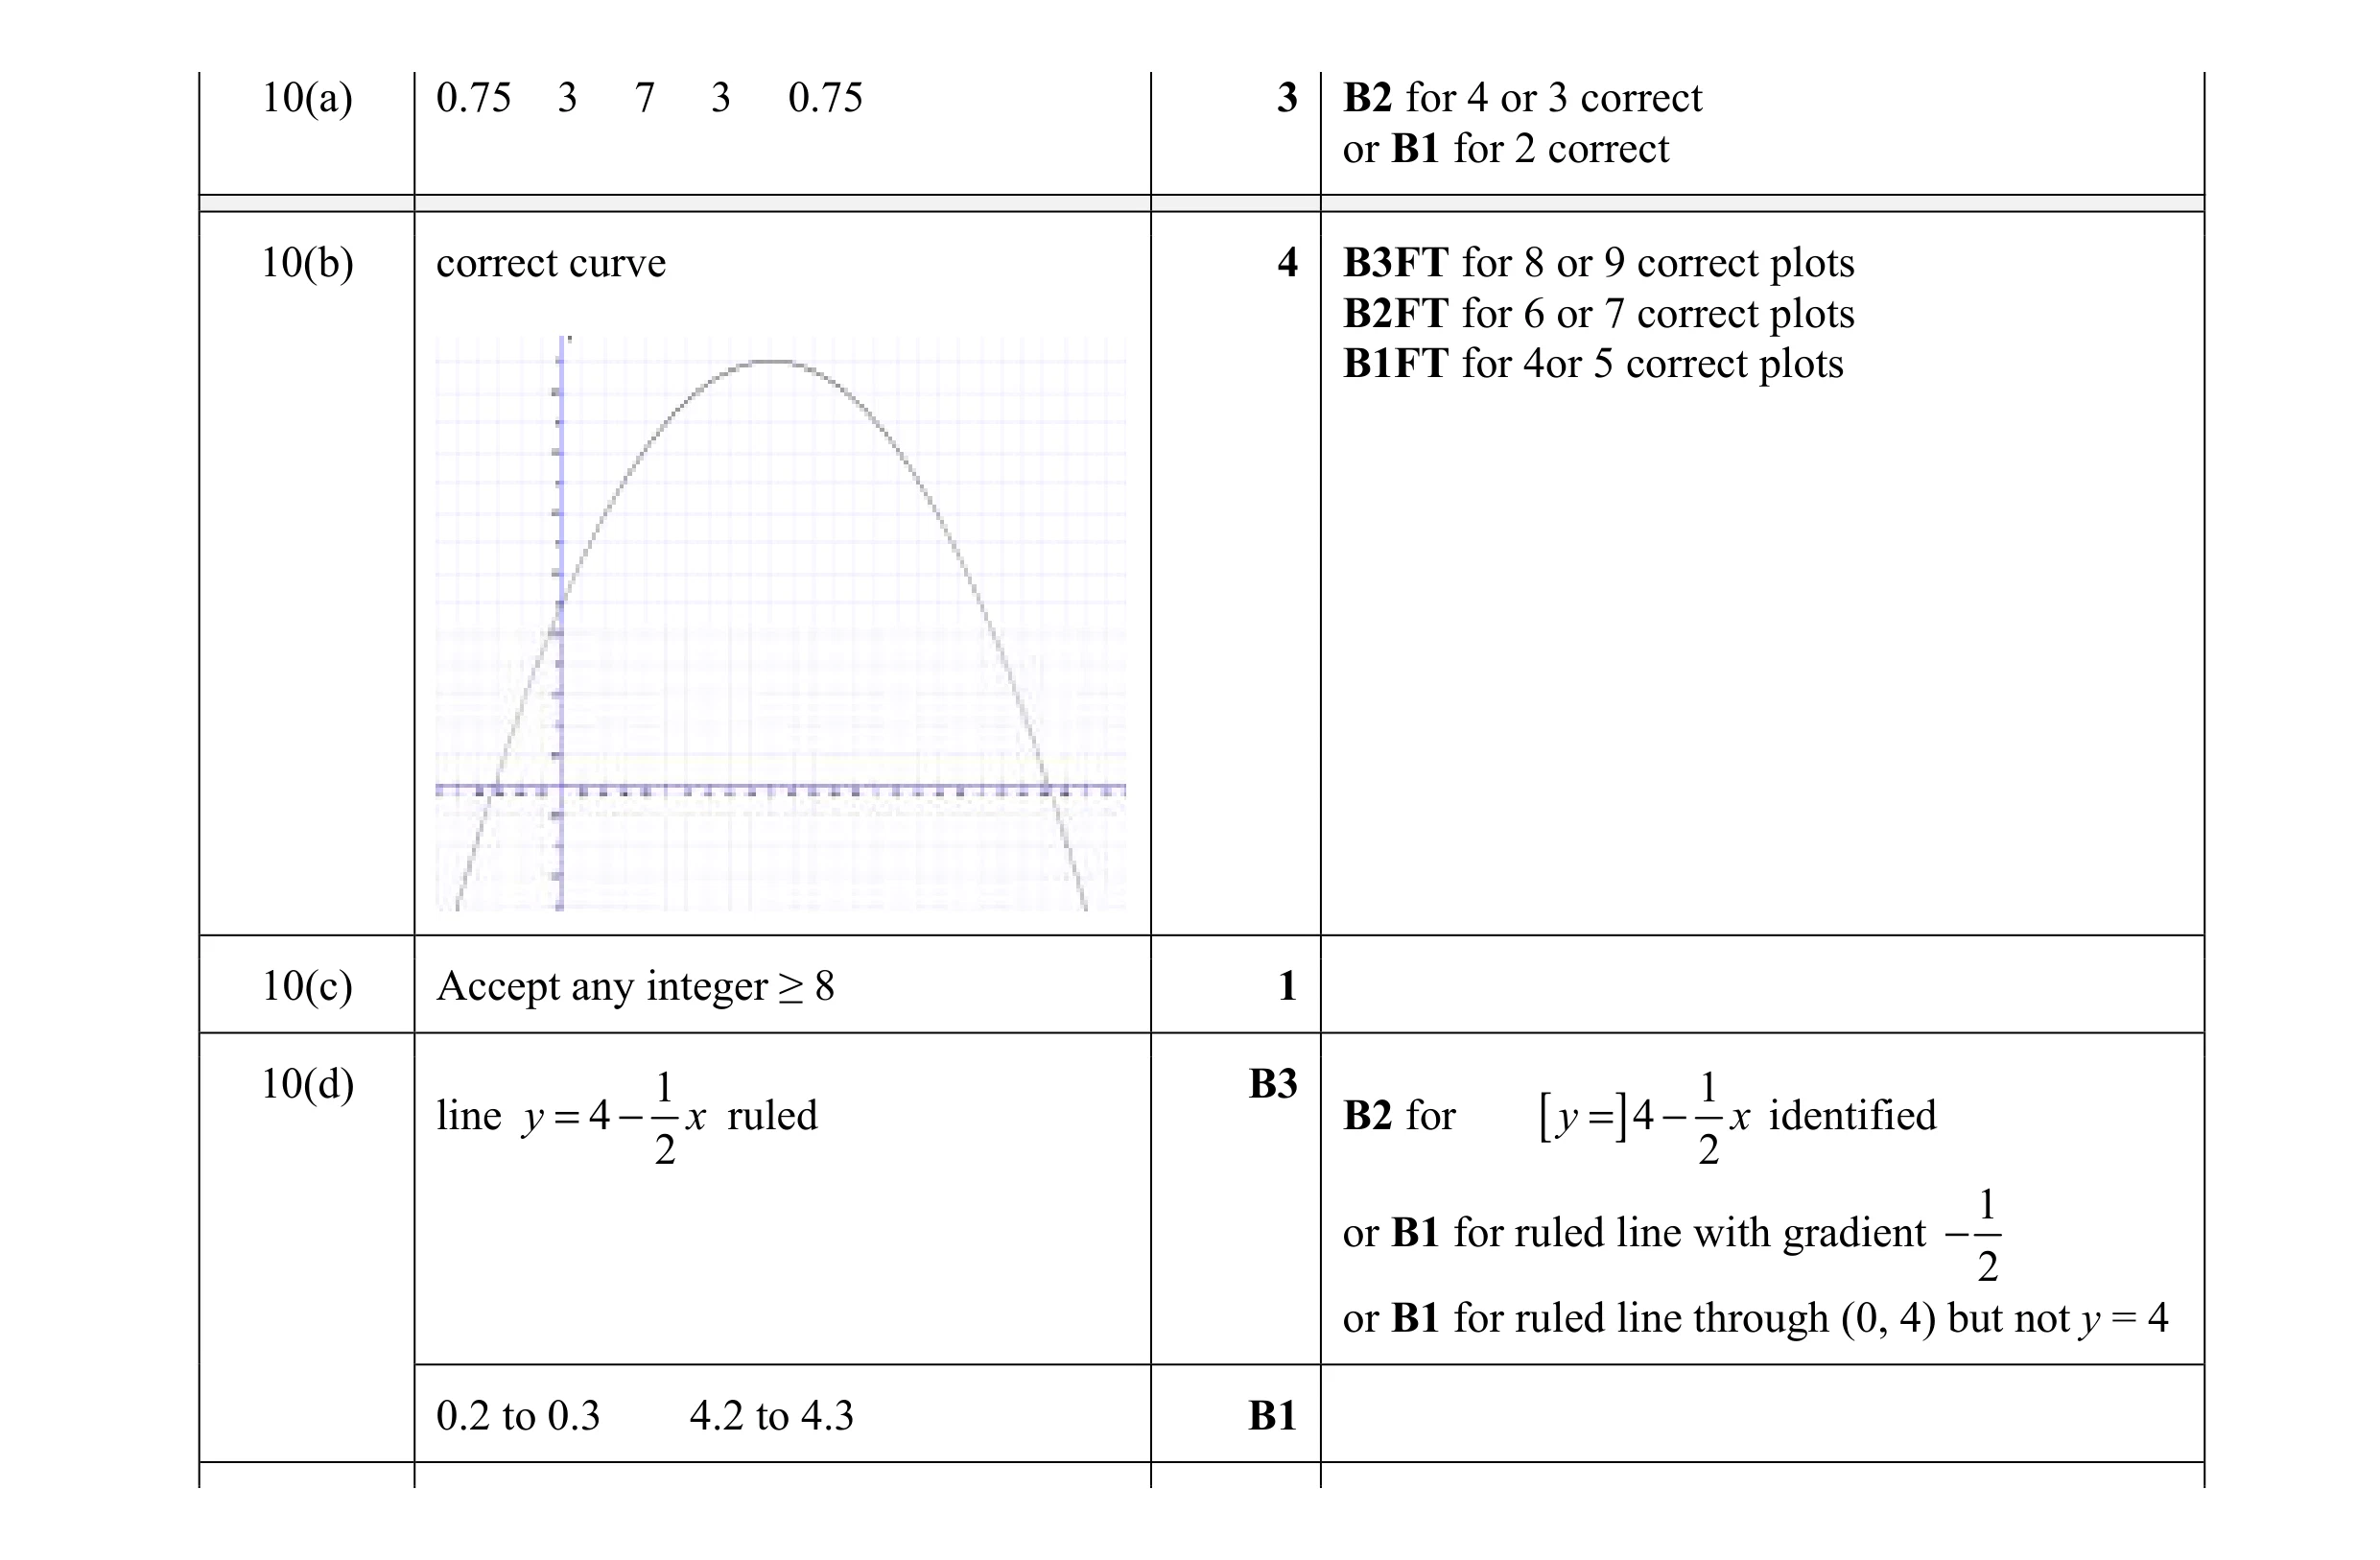 12
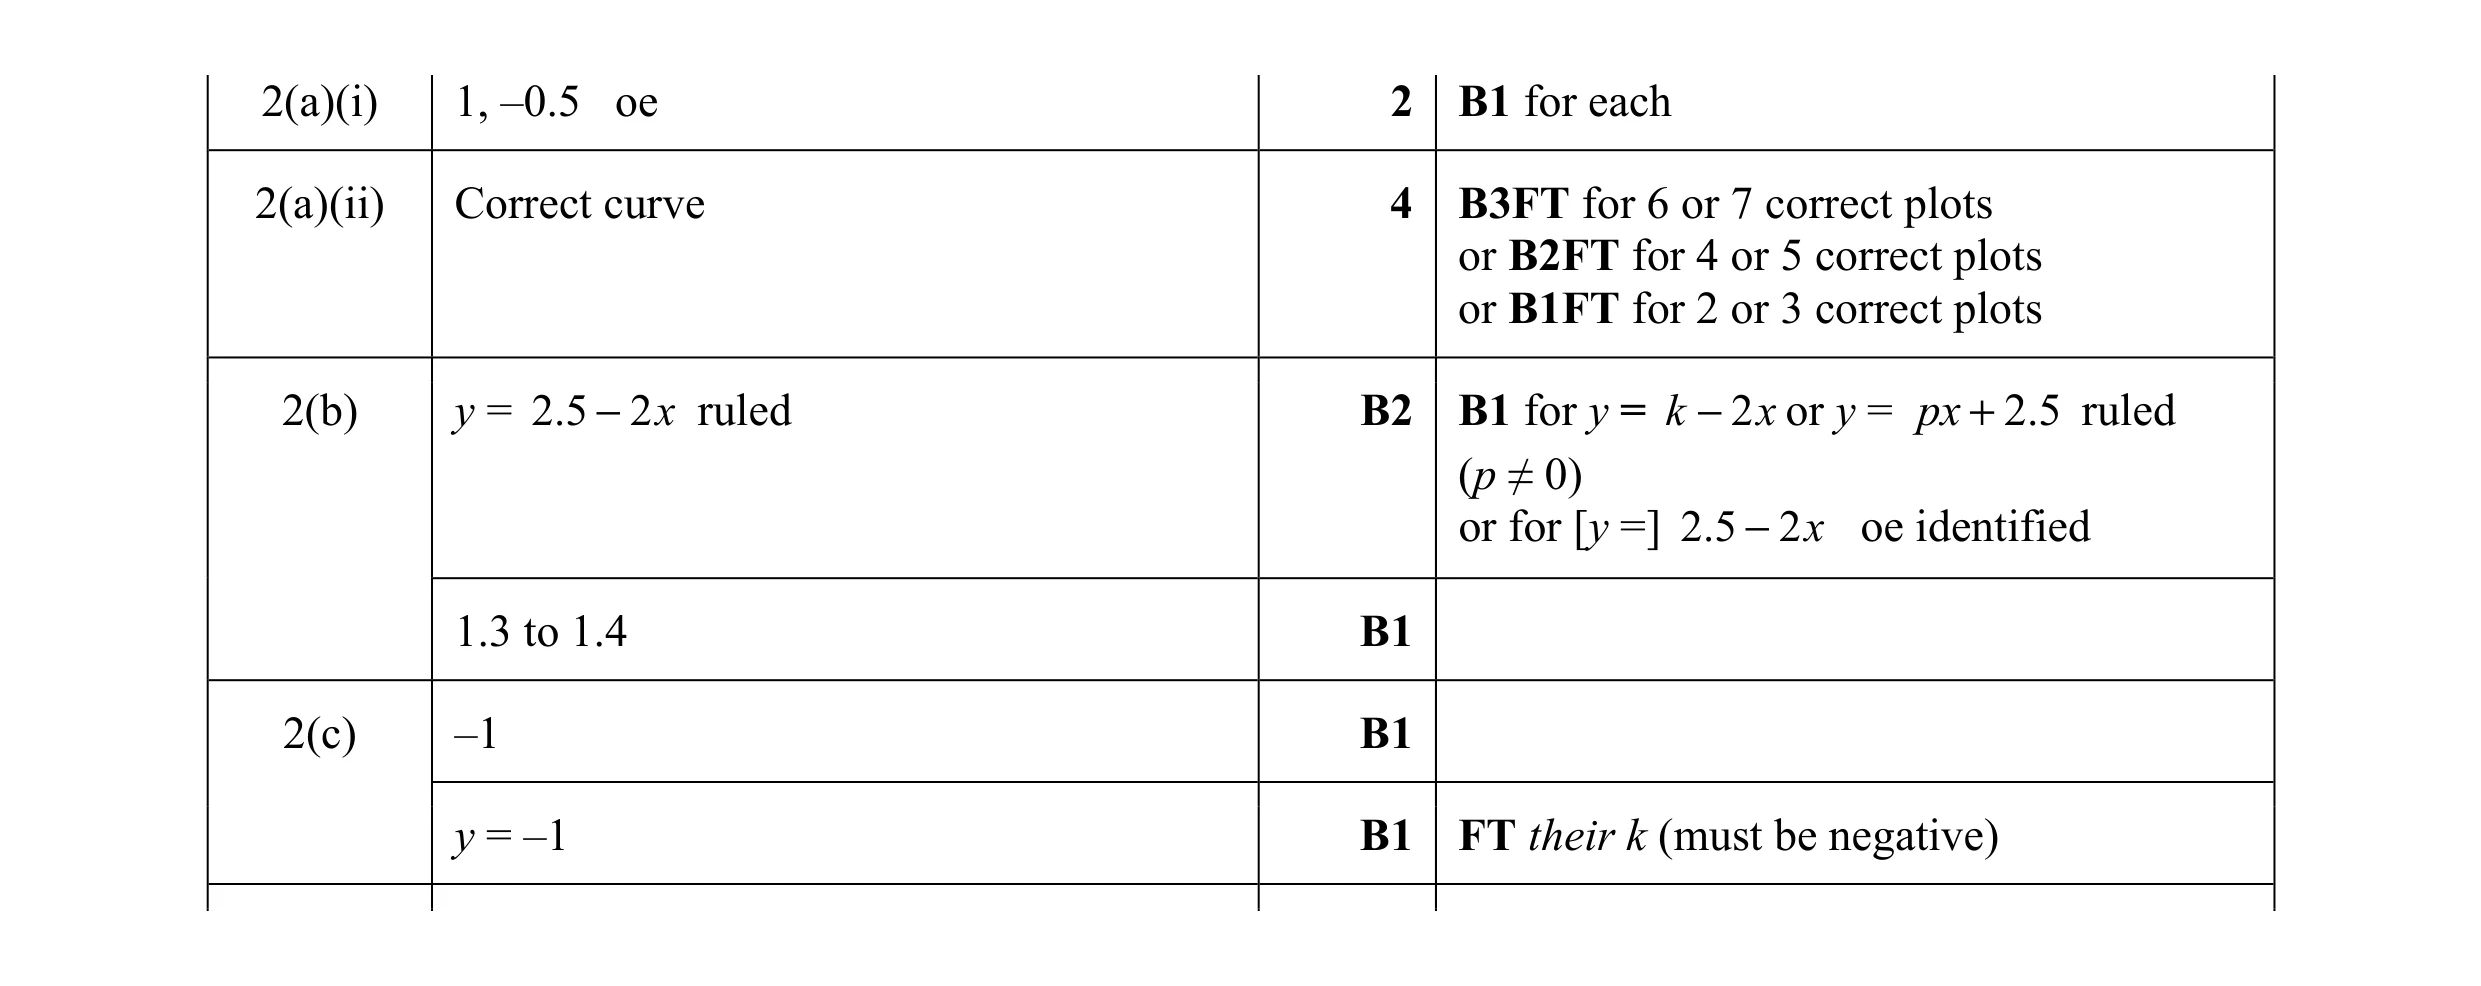 11
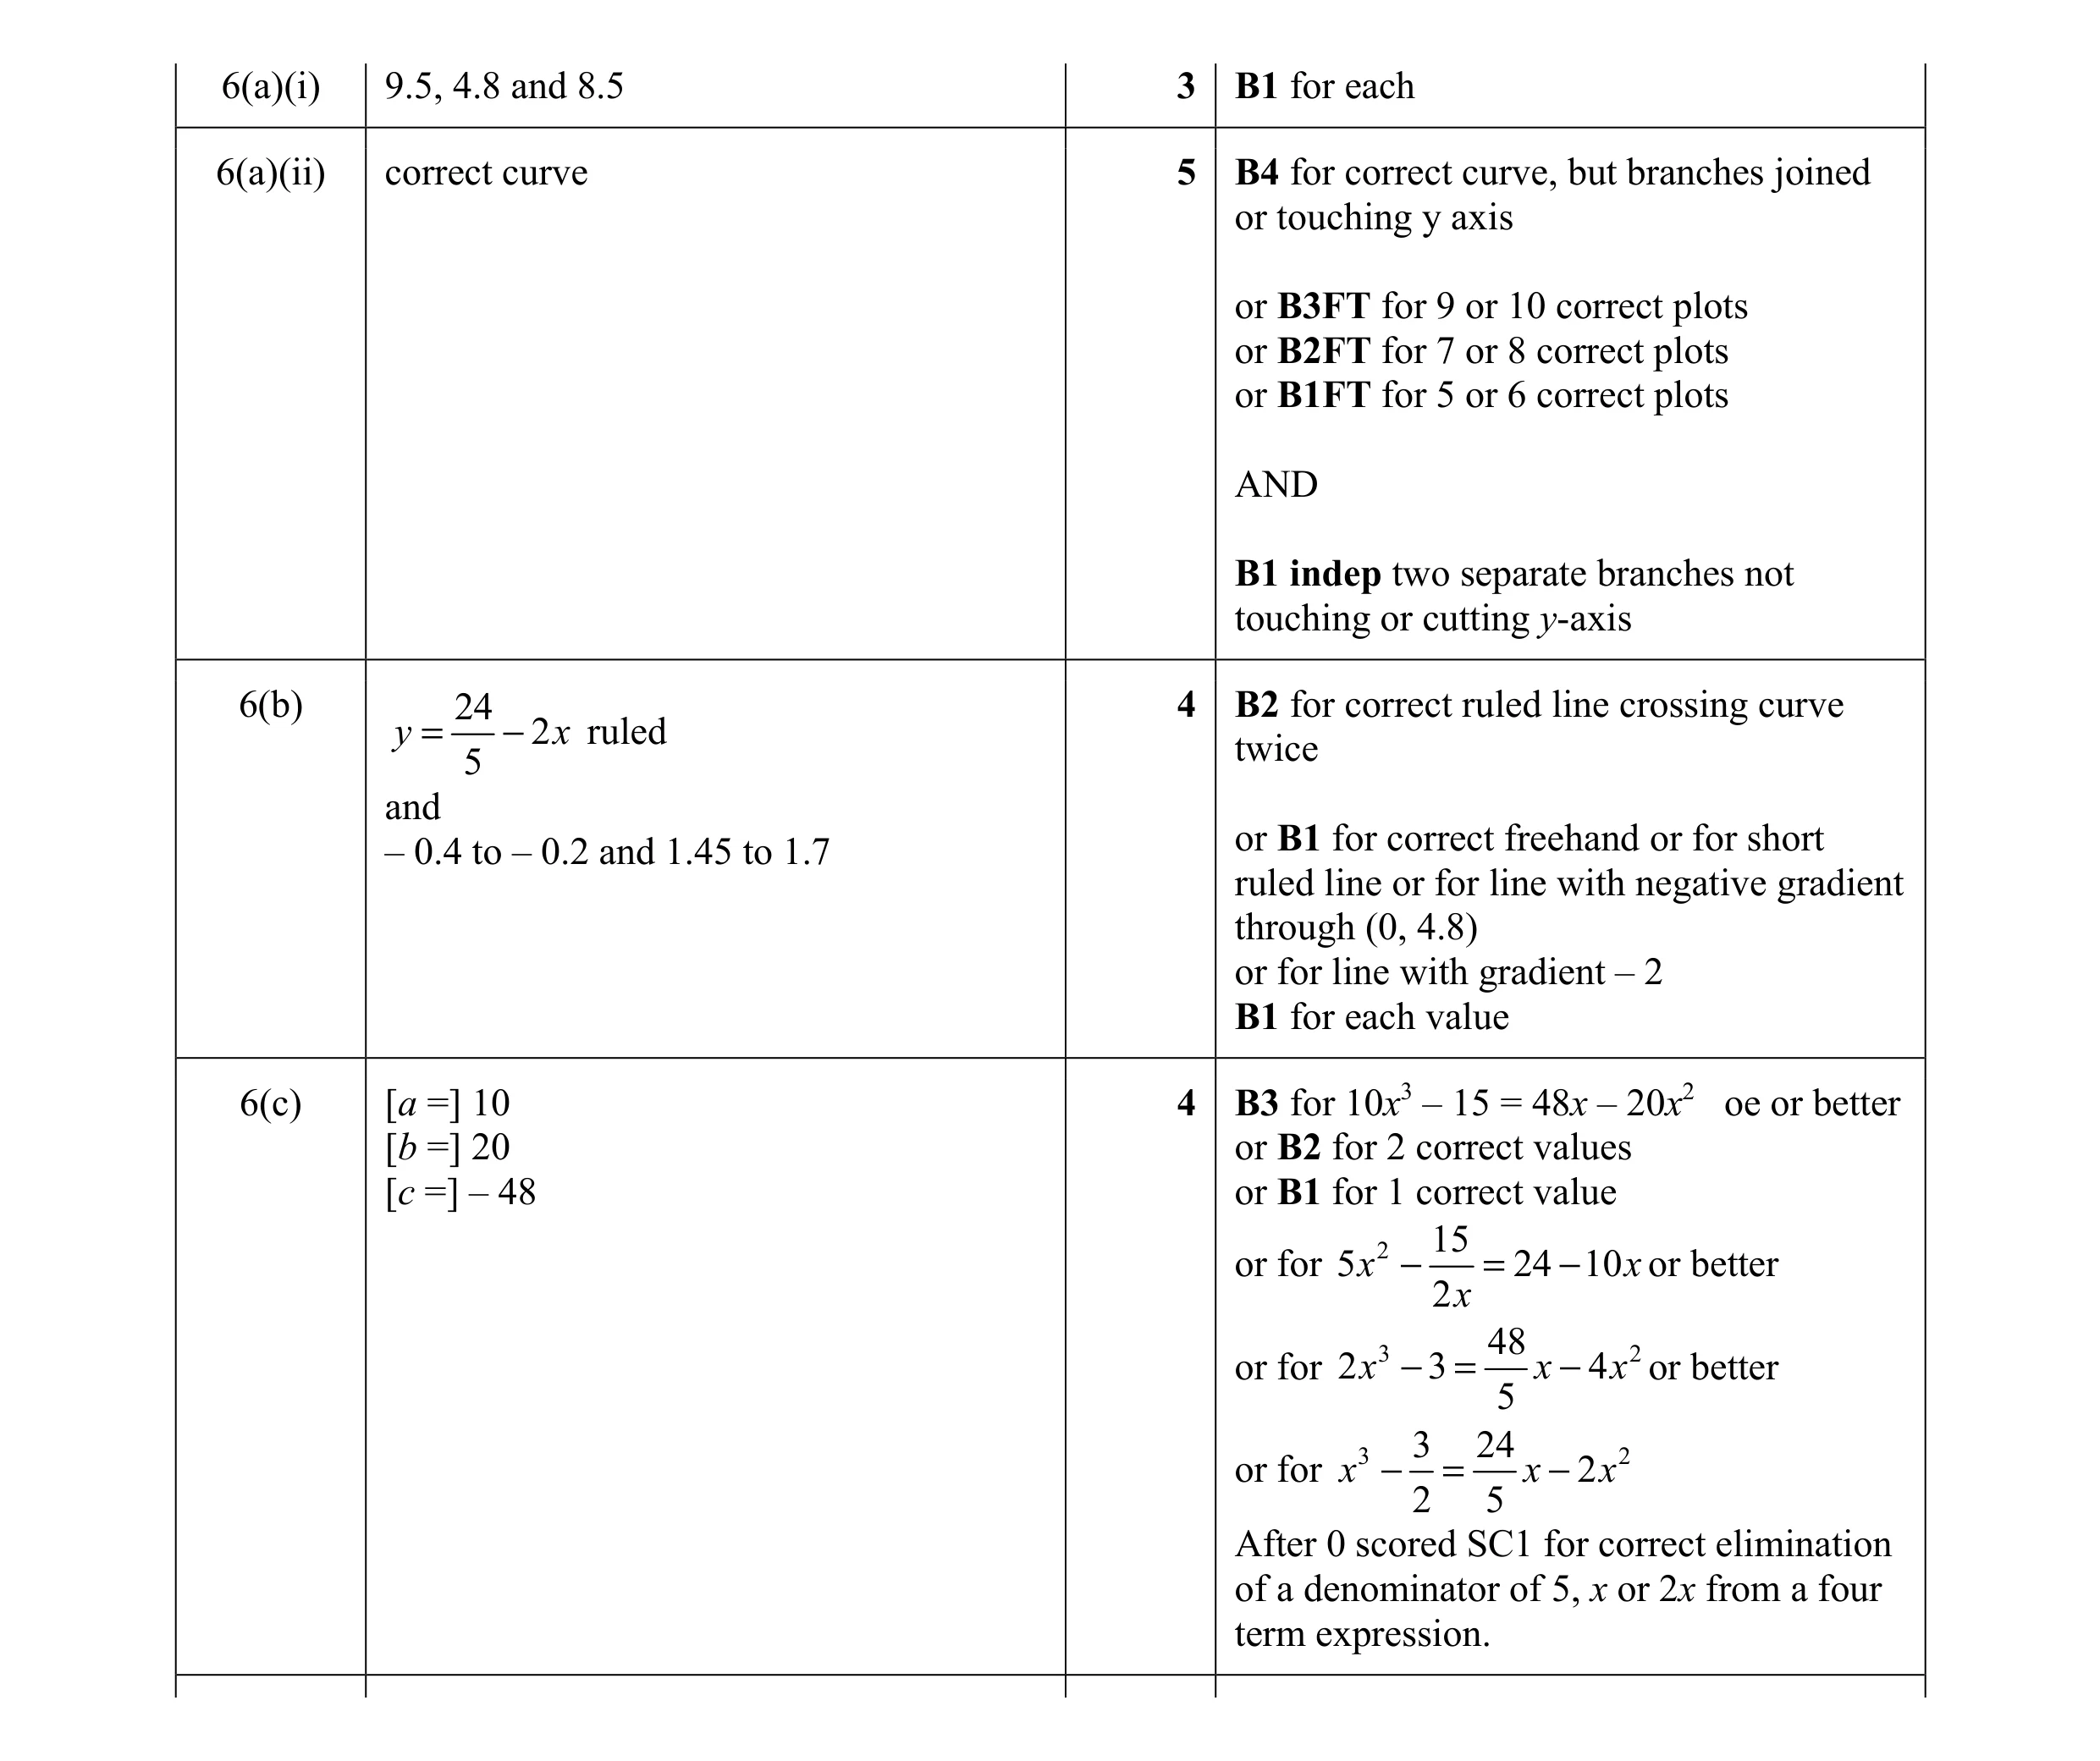 16
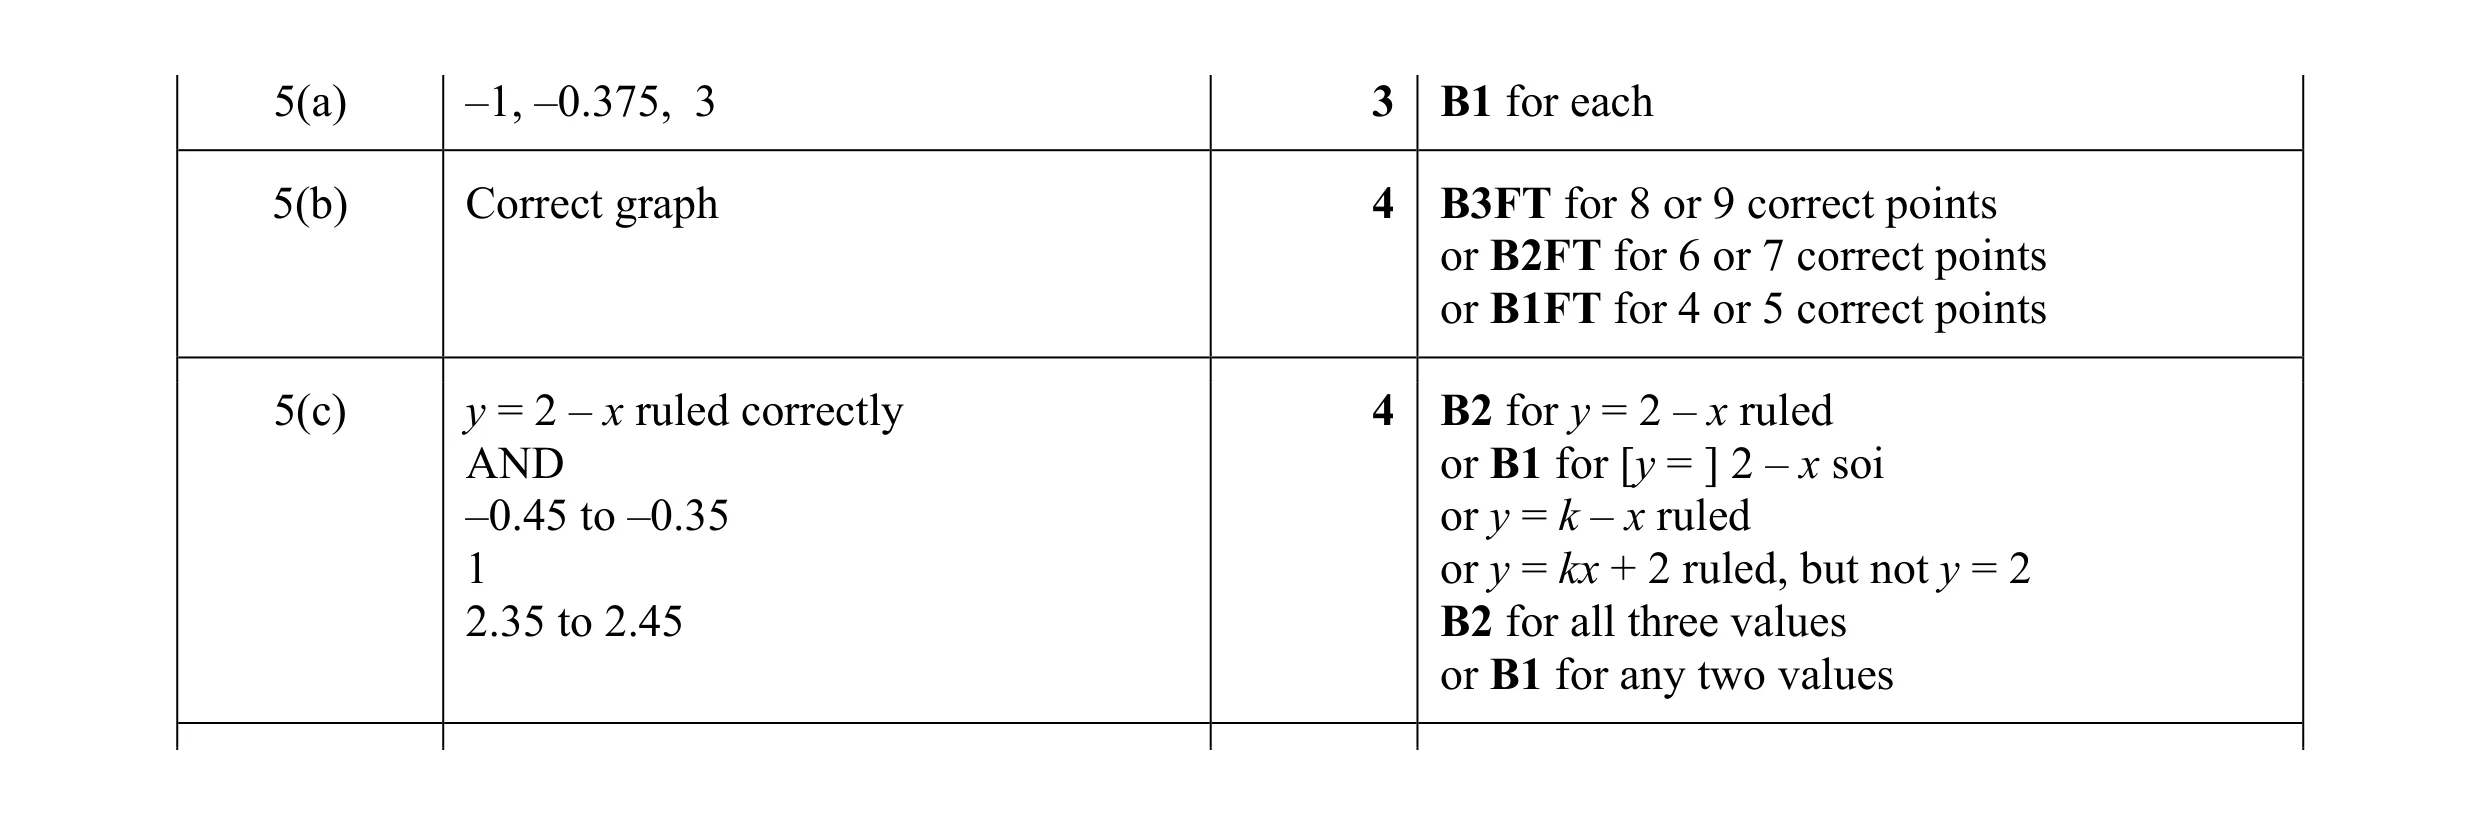 11
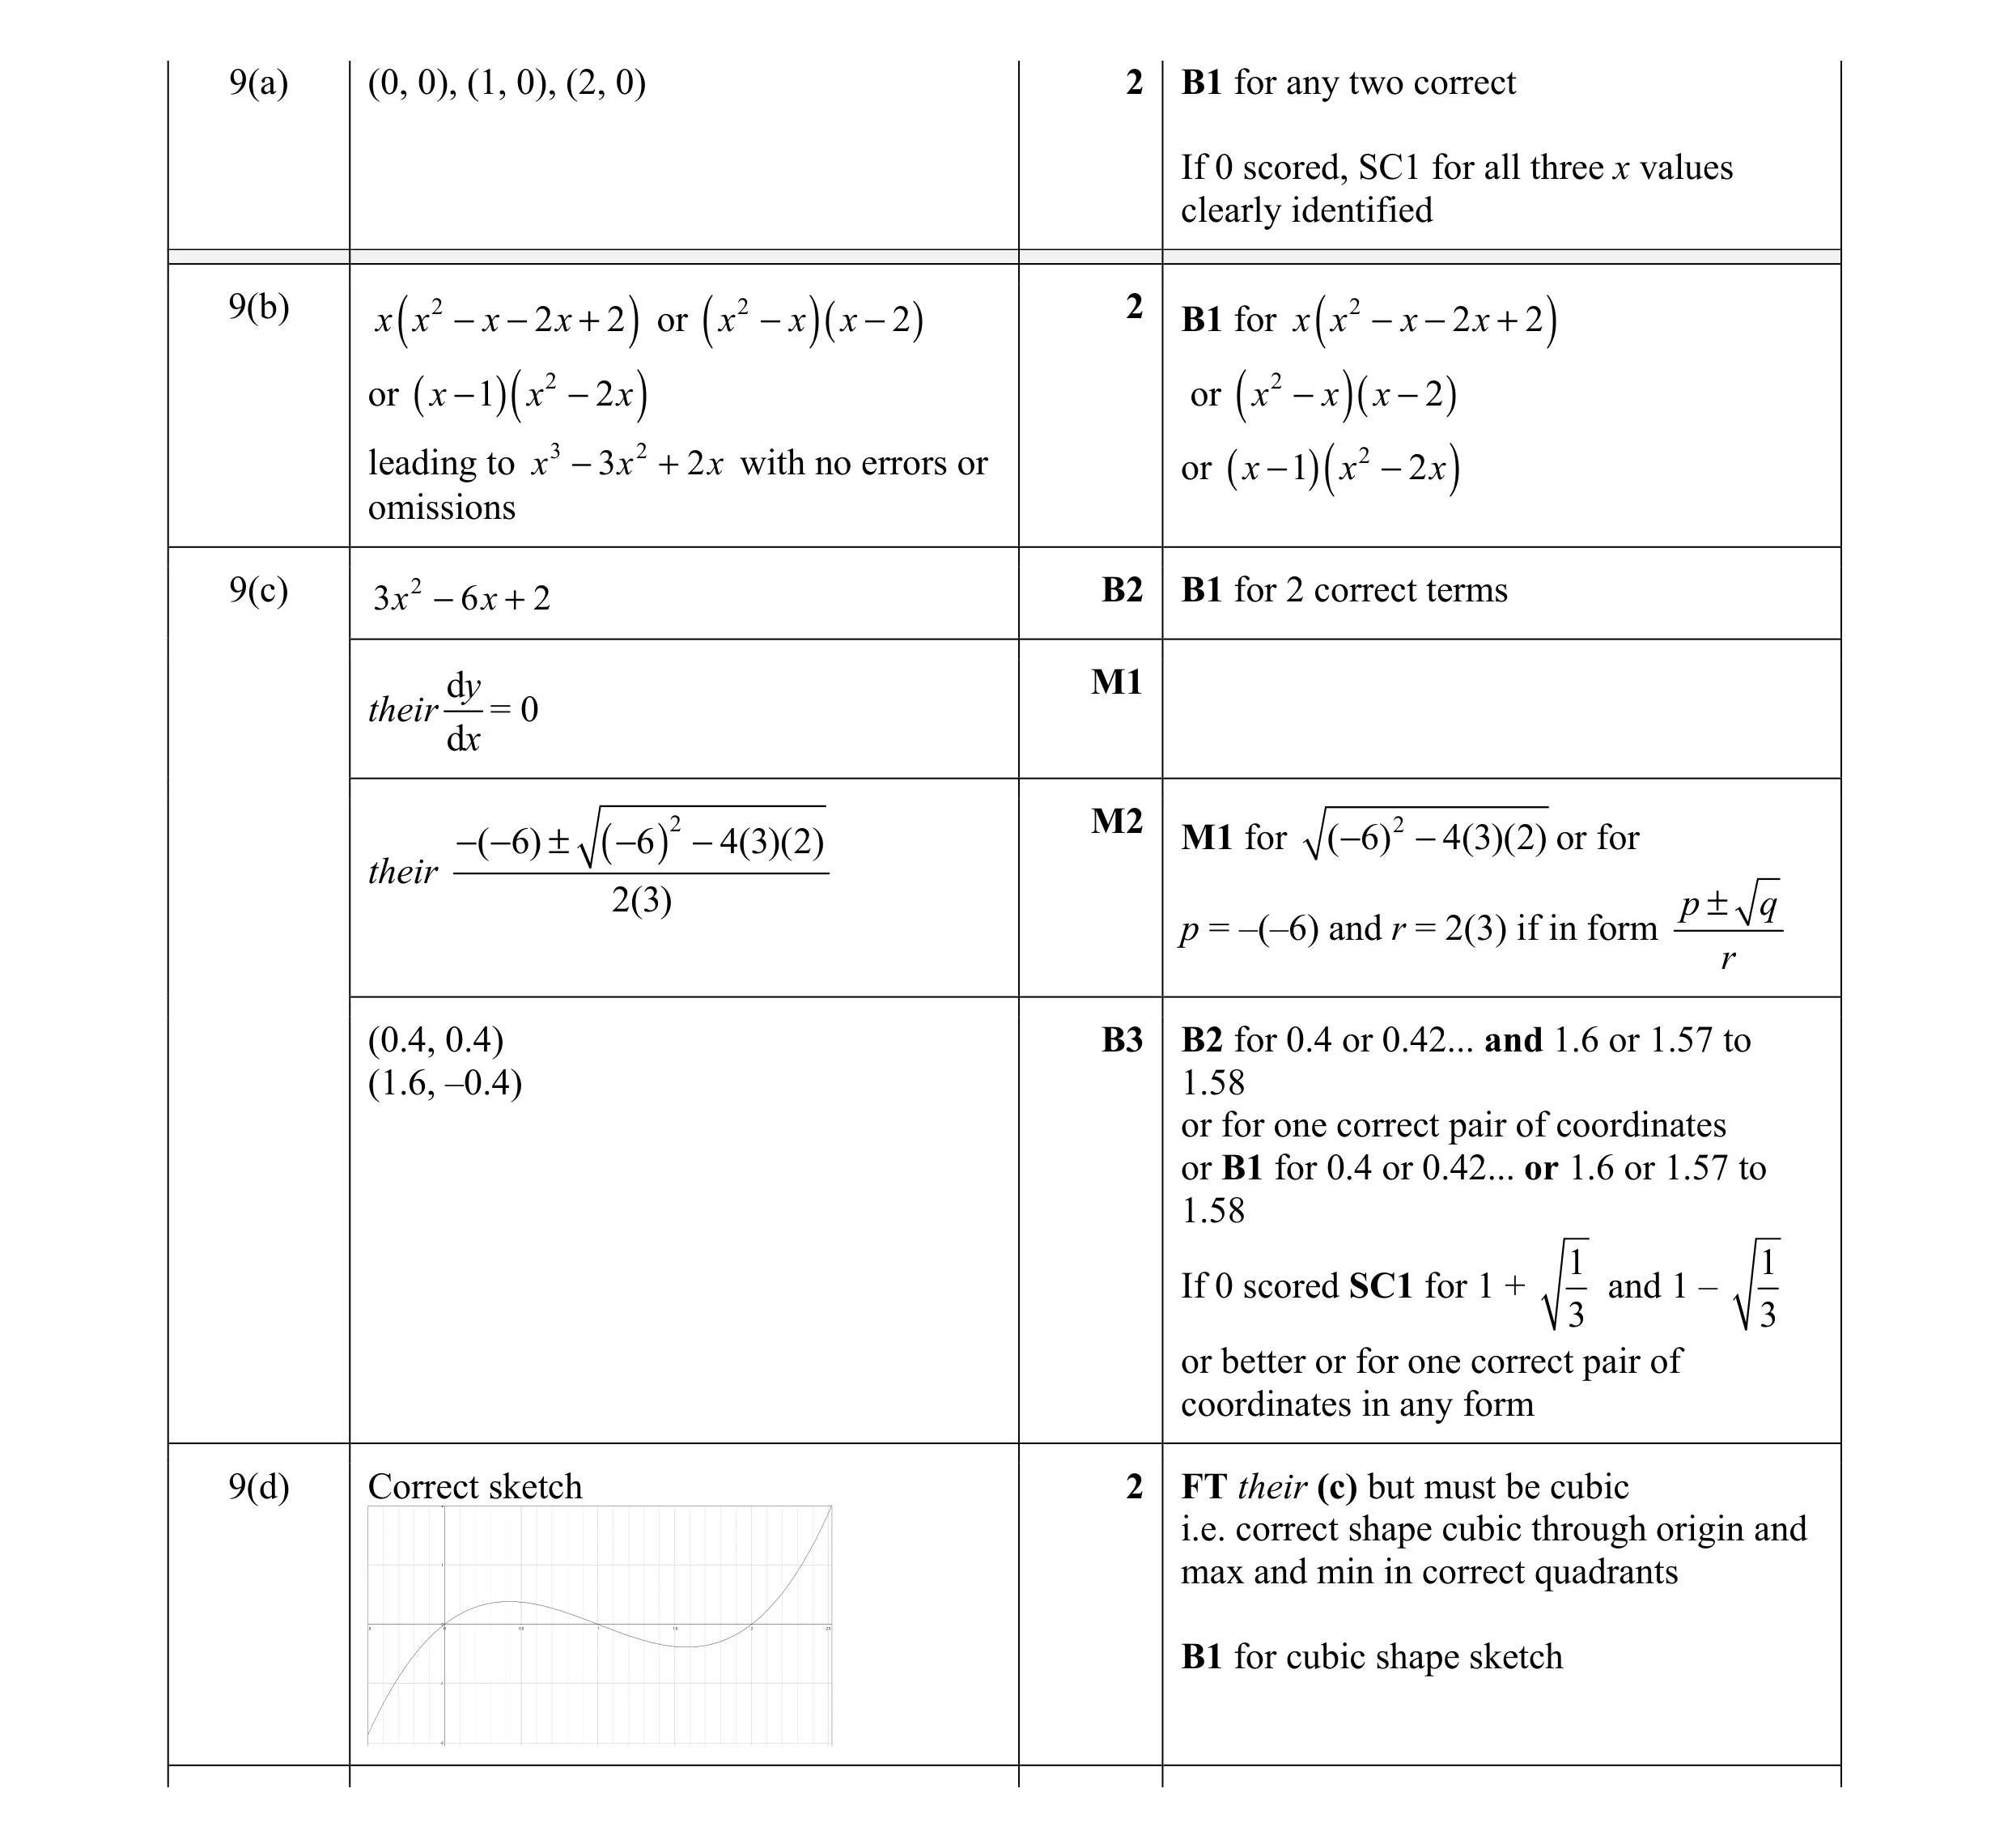 14
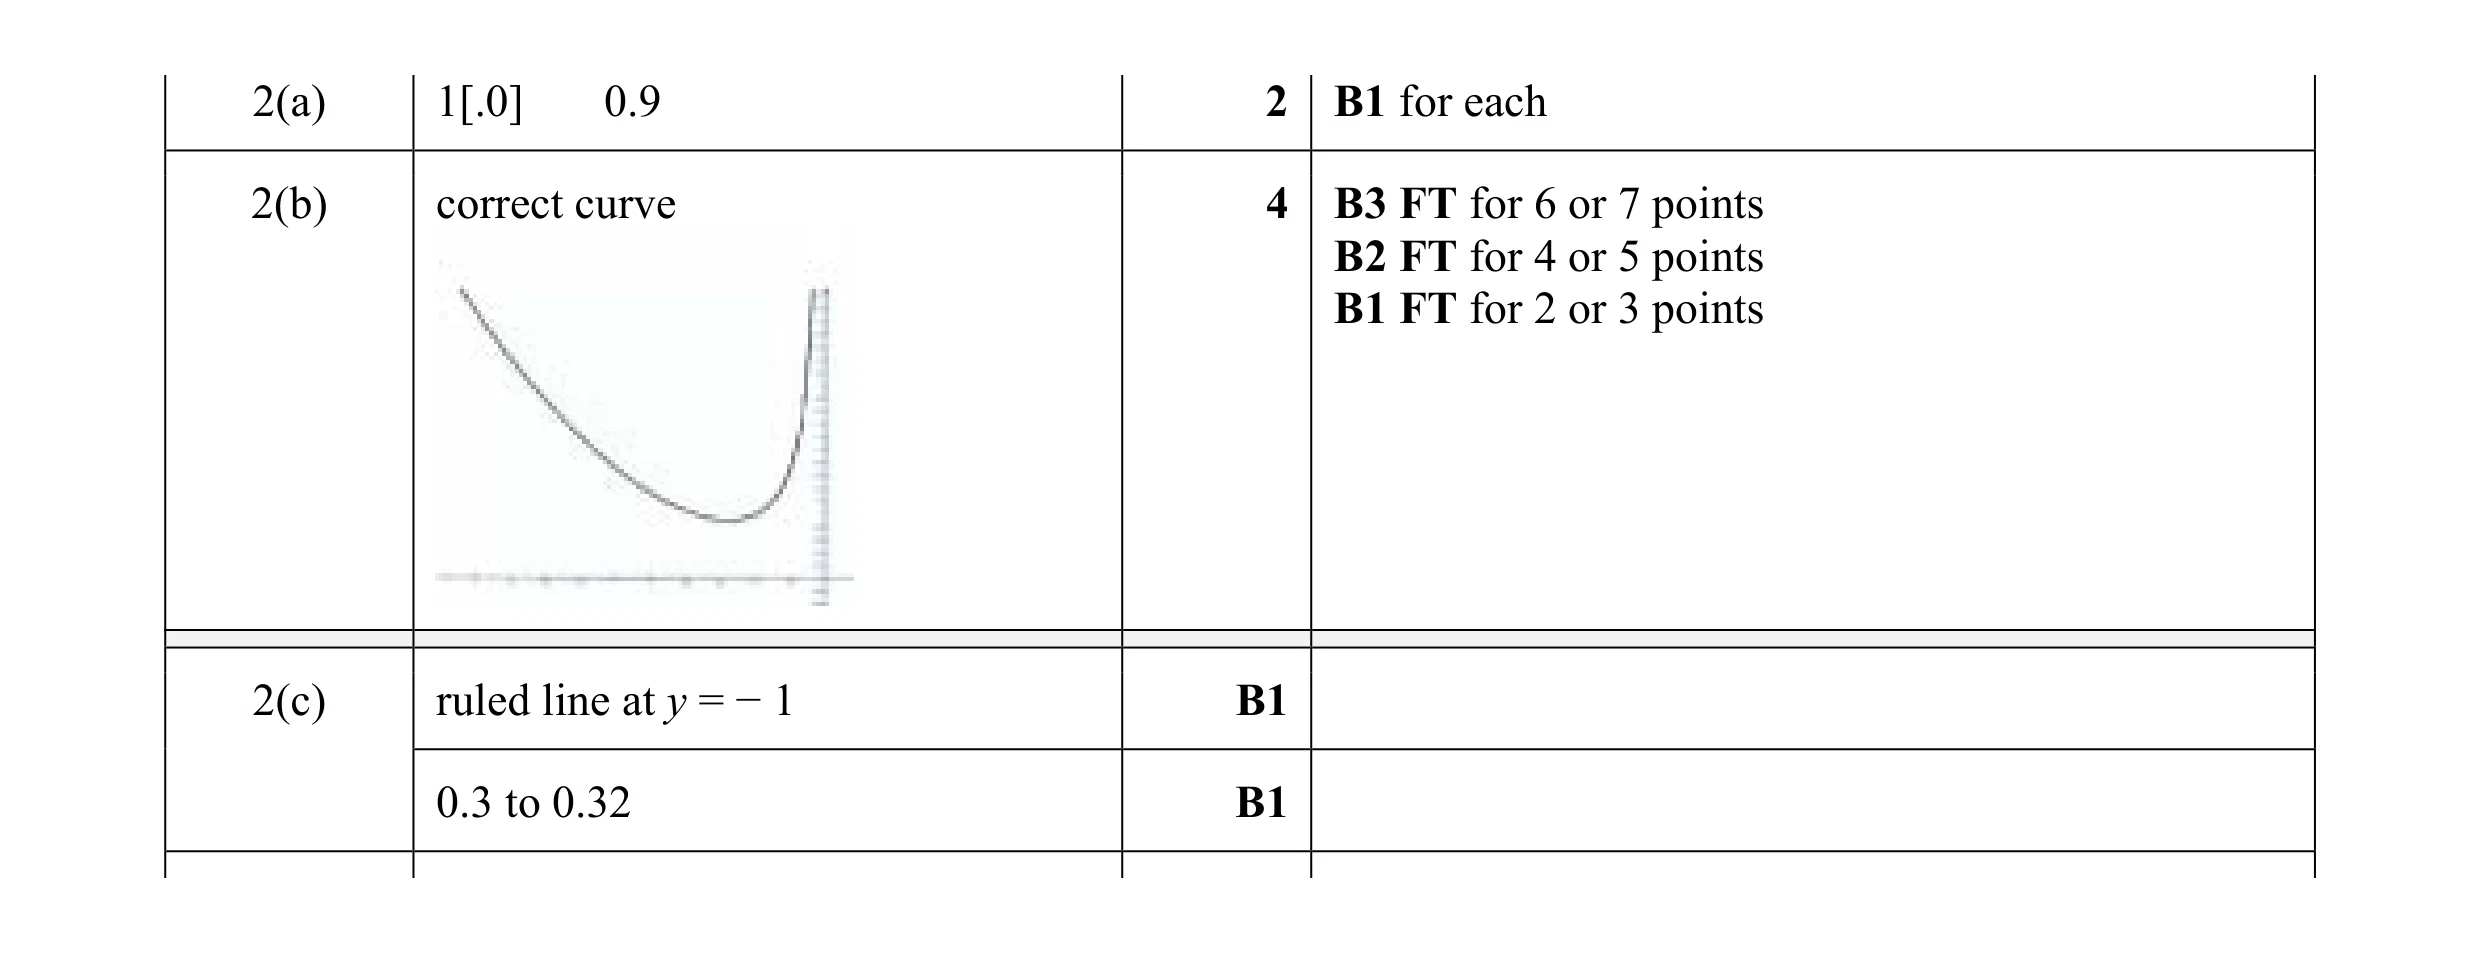 8
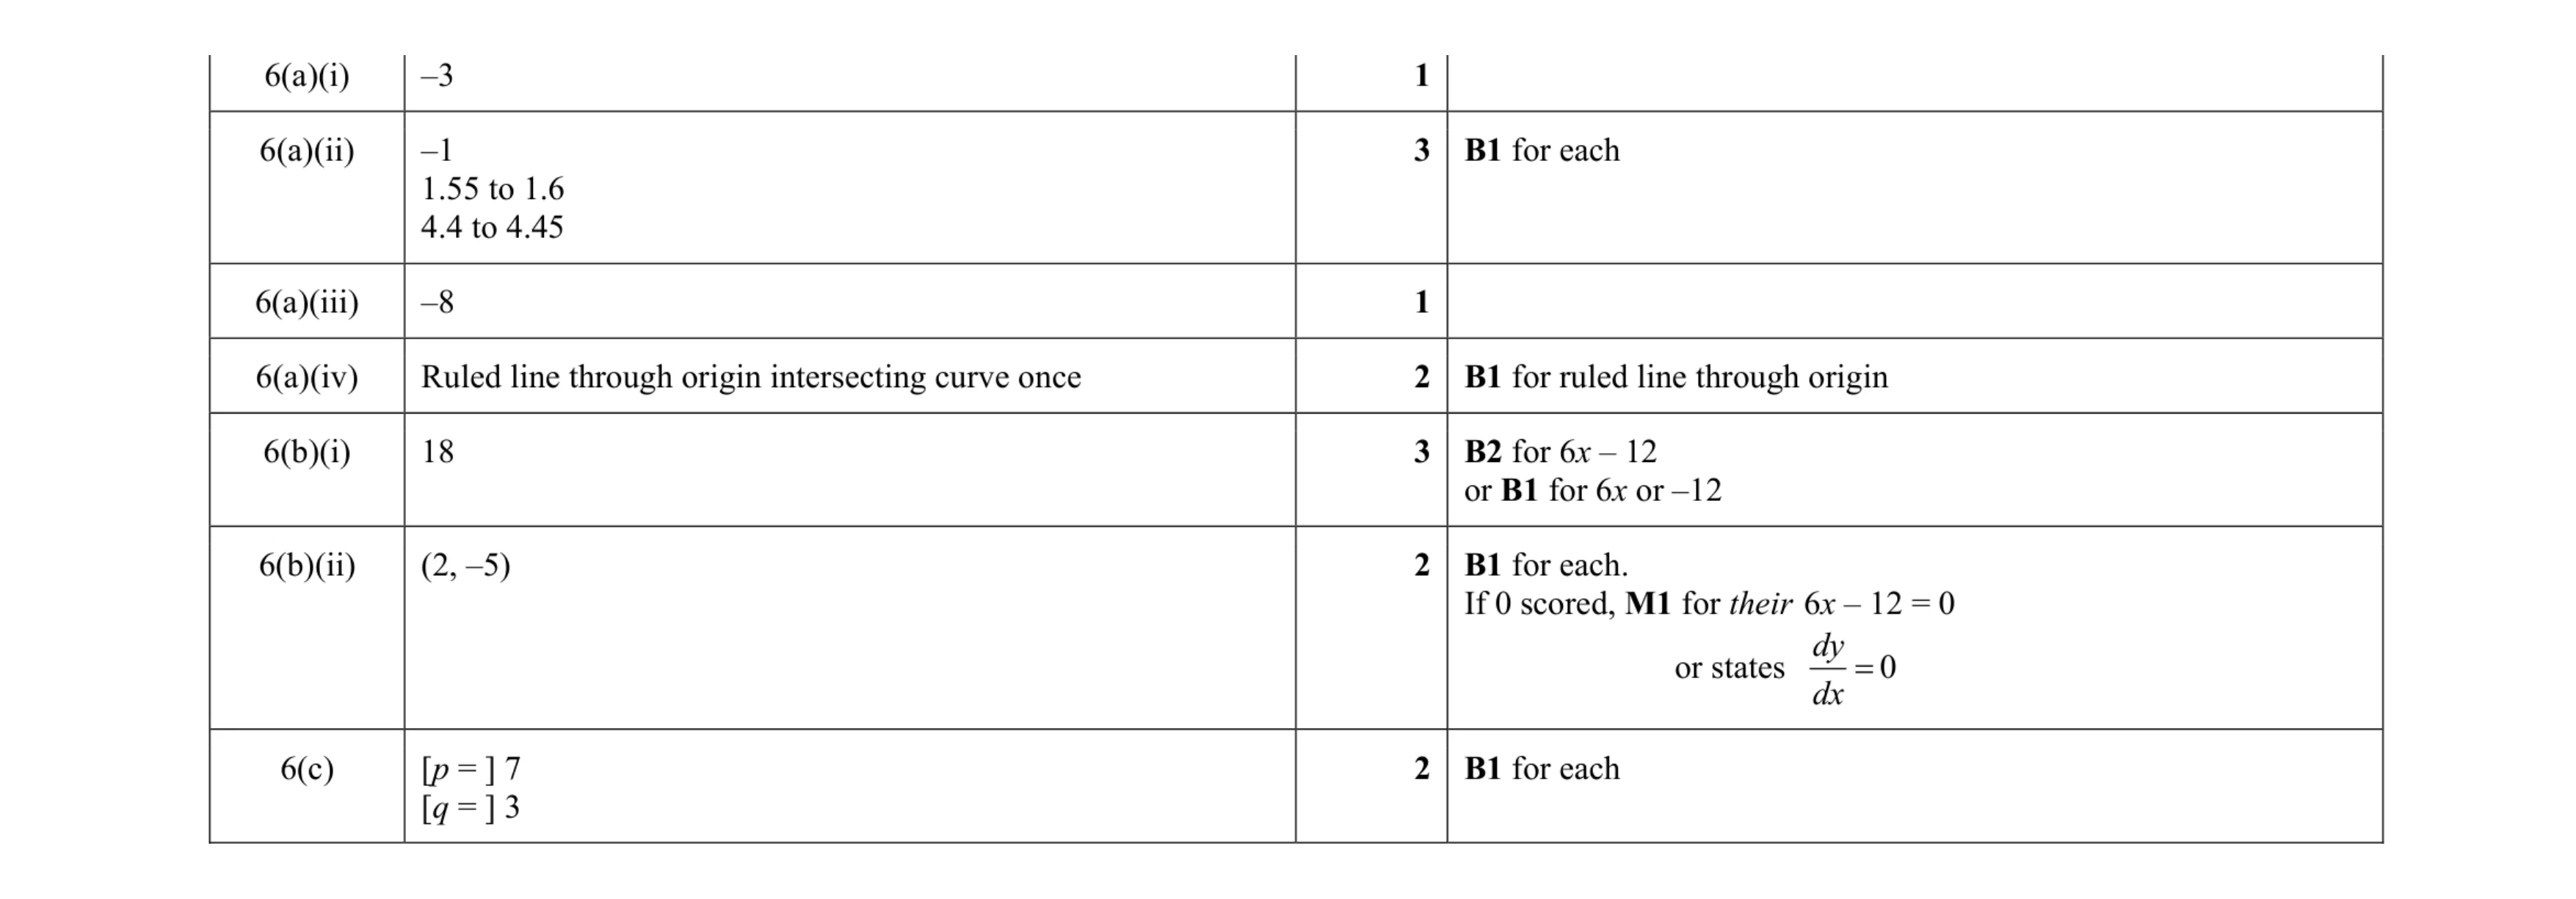 14
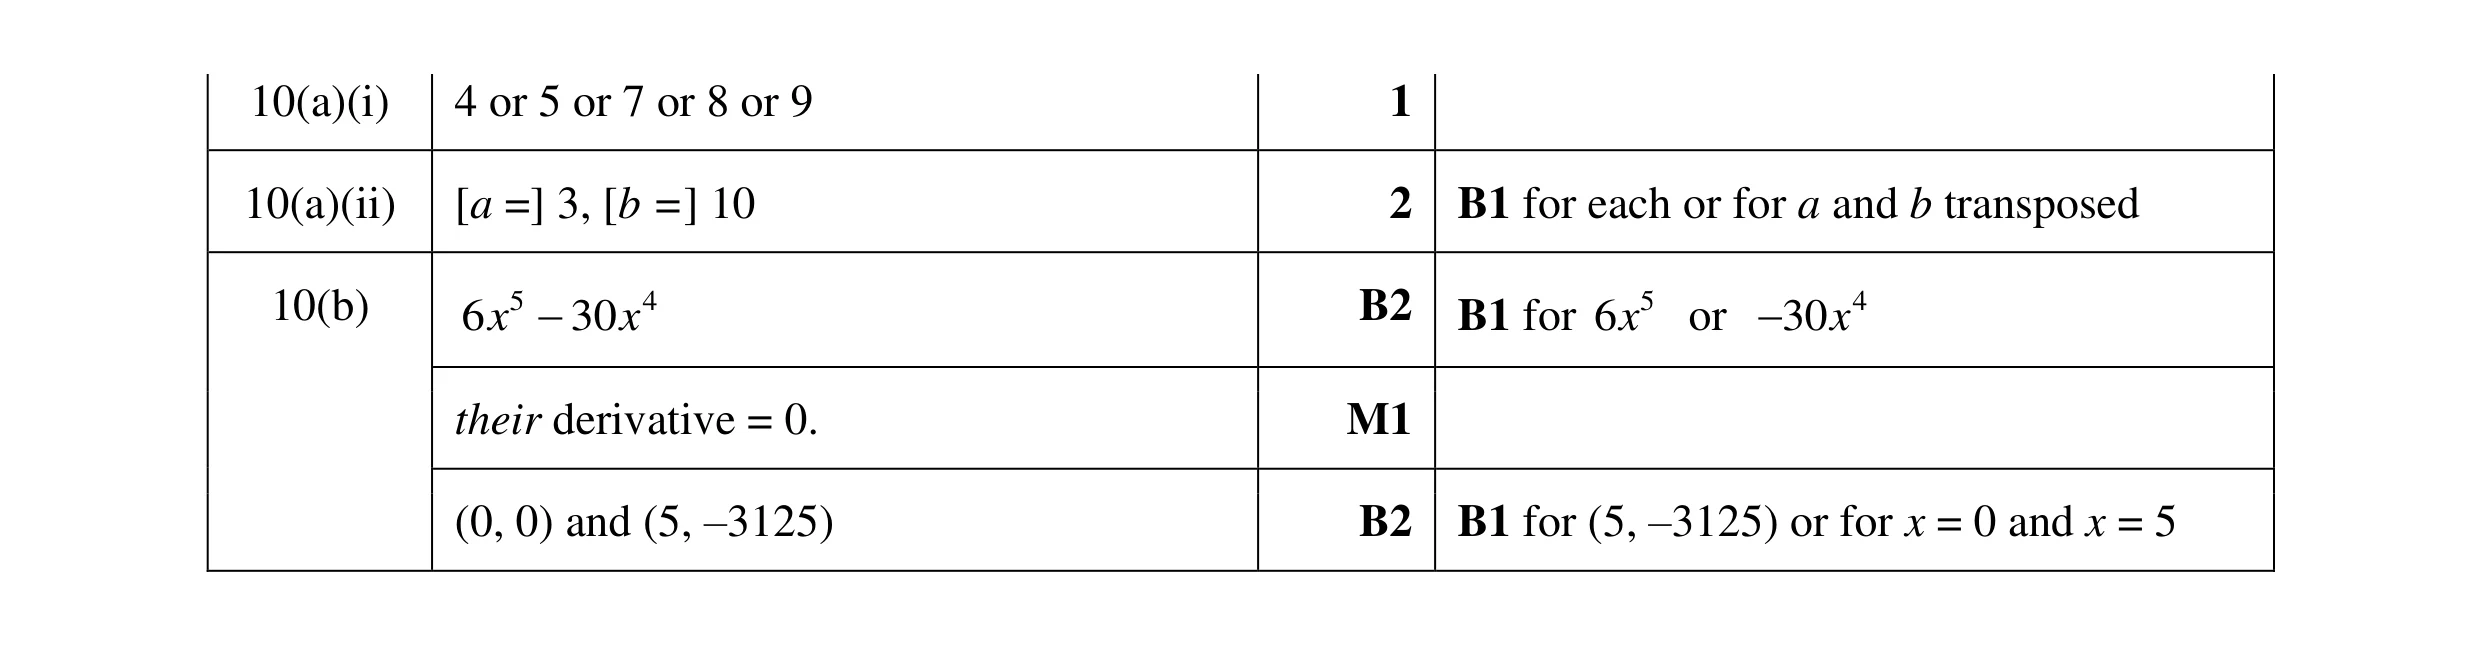 8
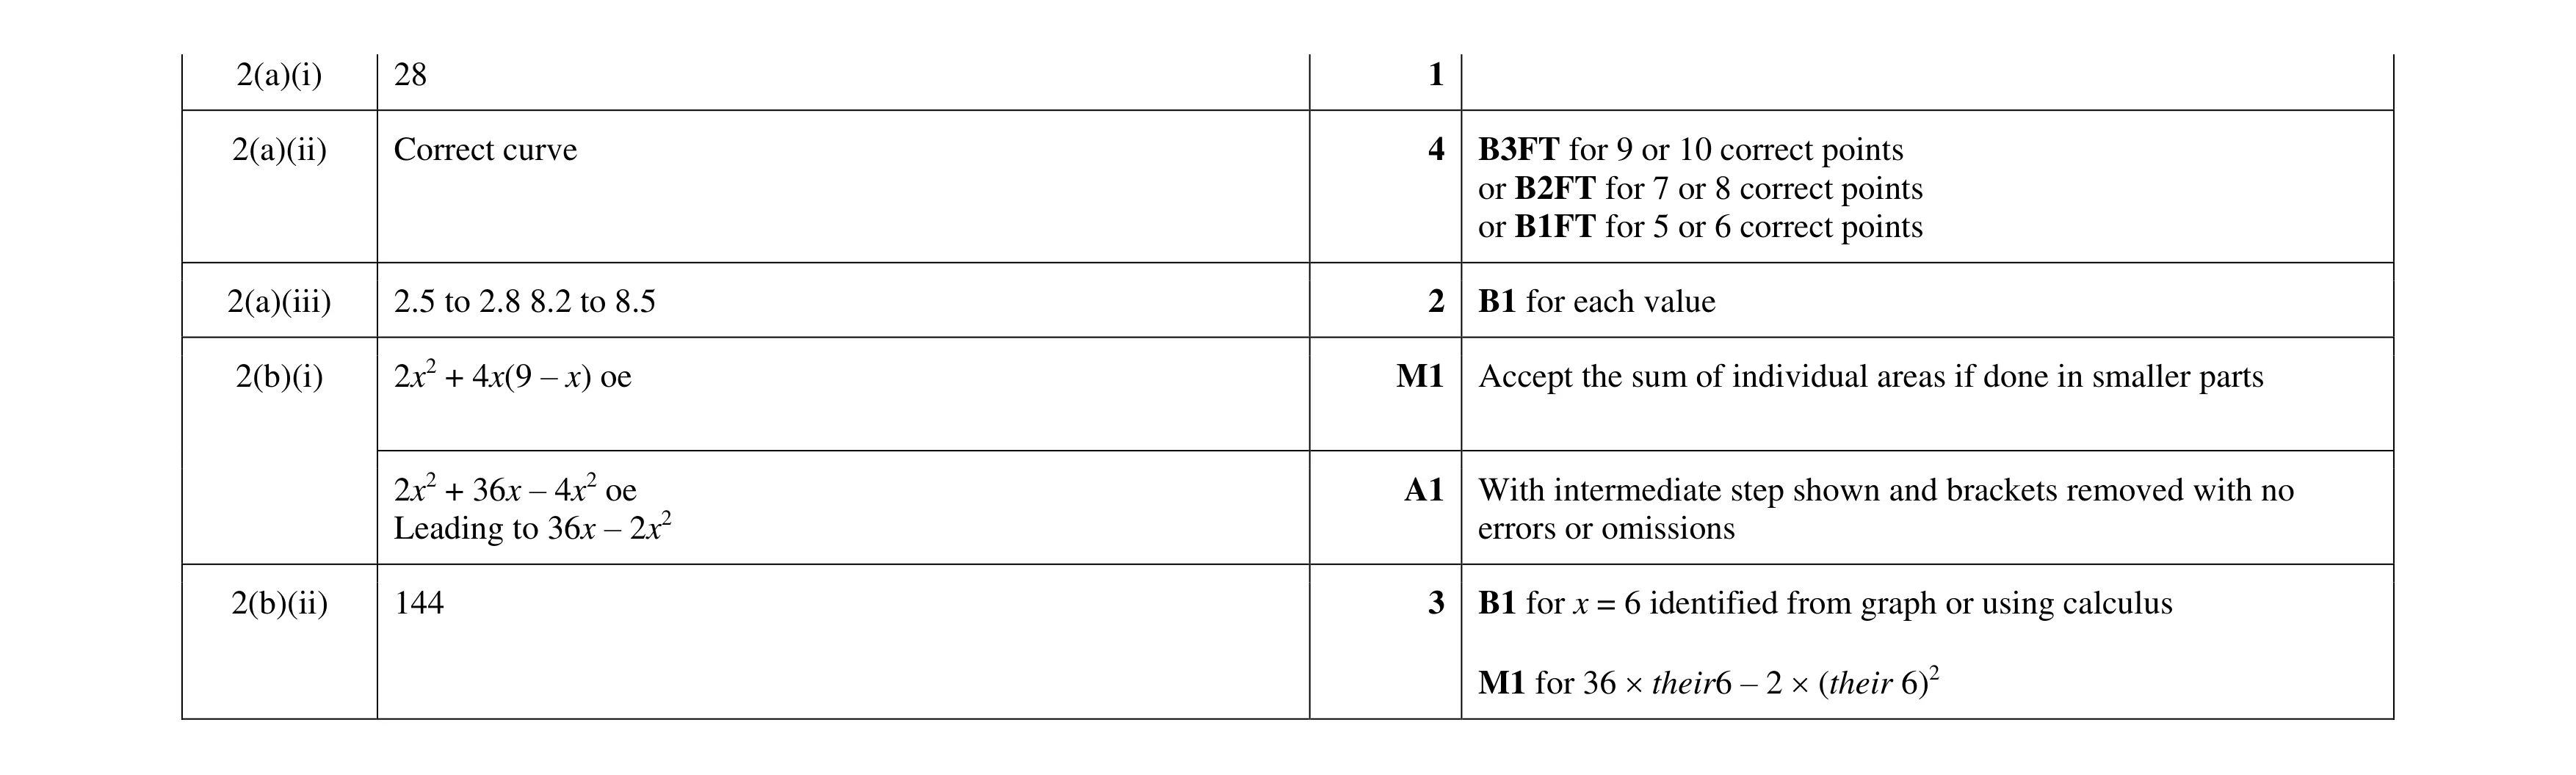 12
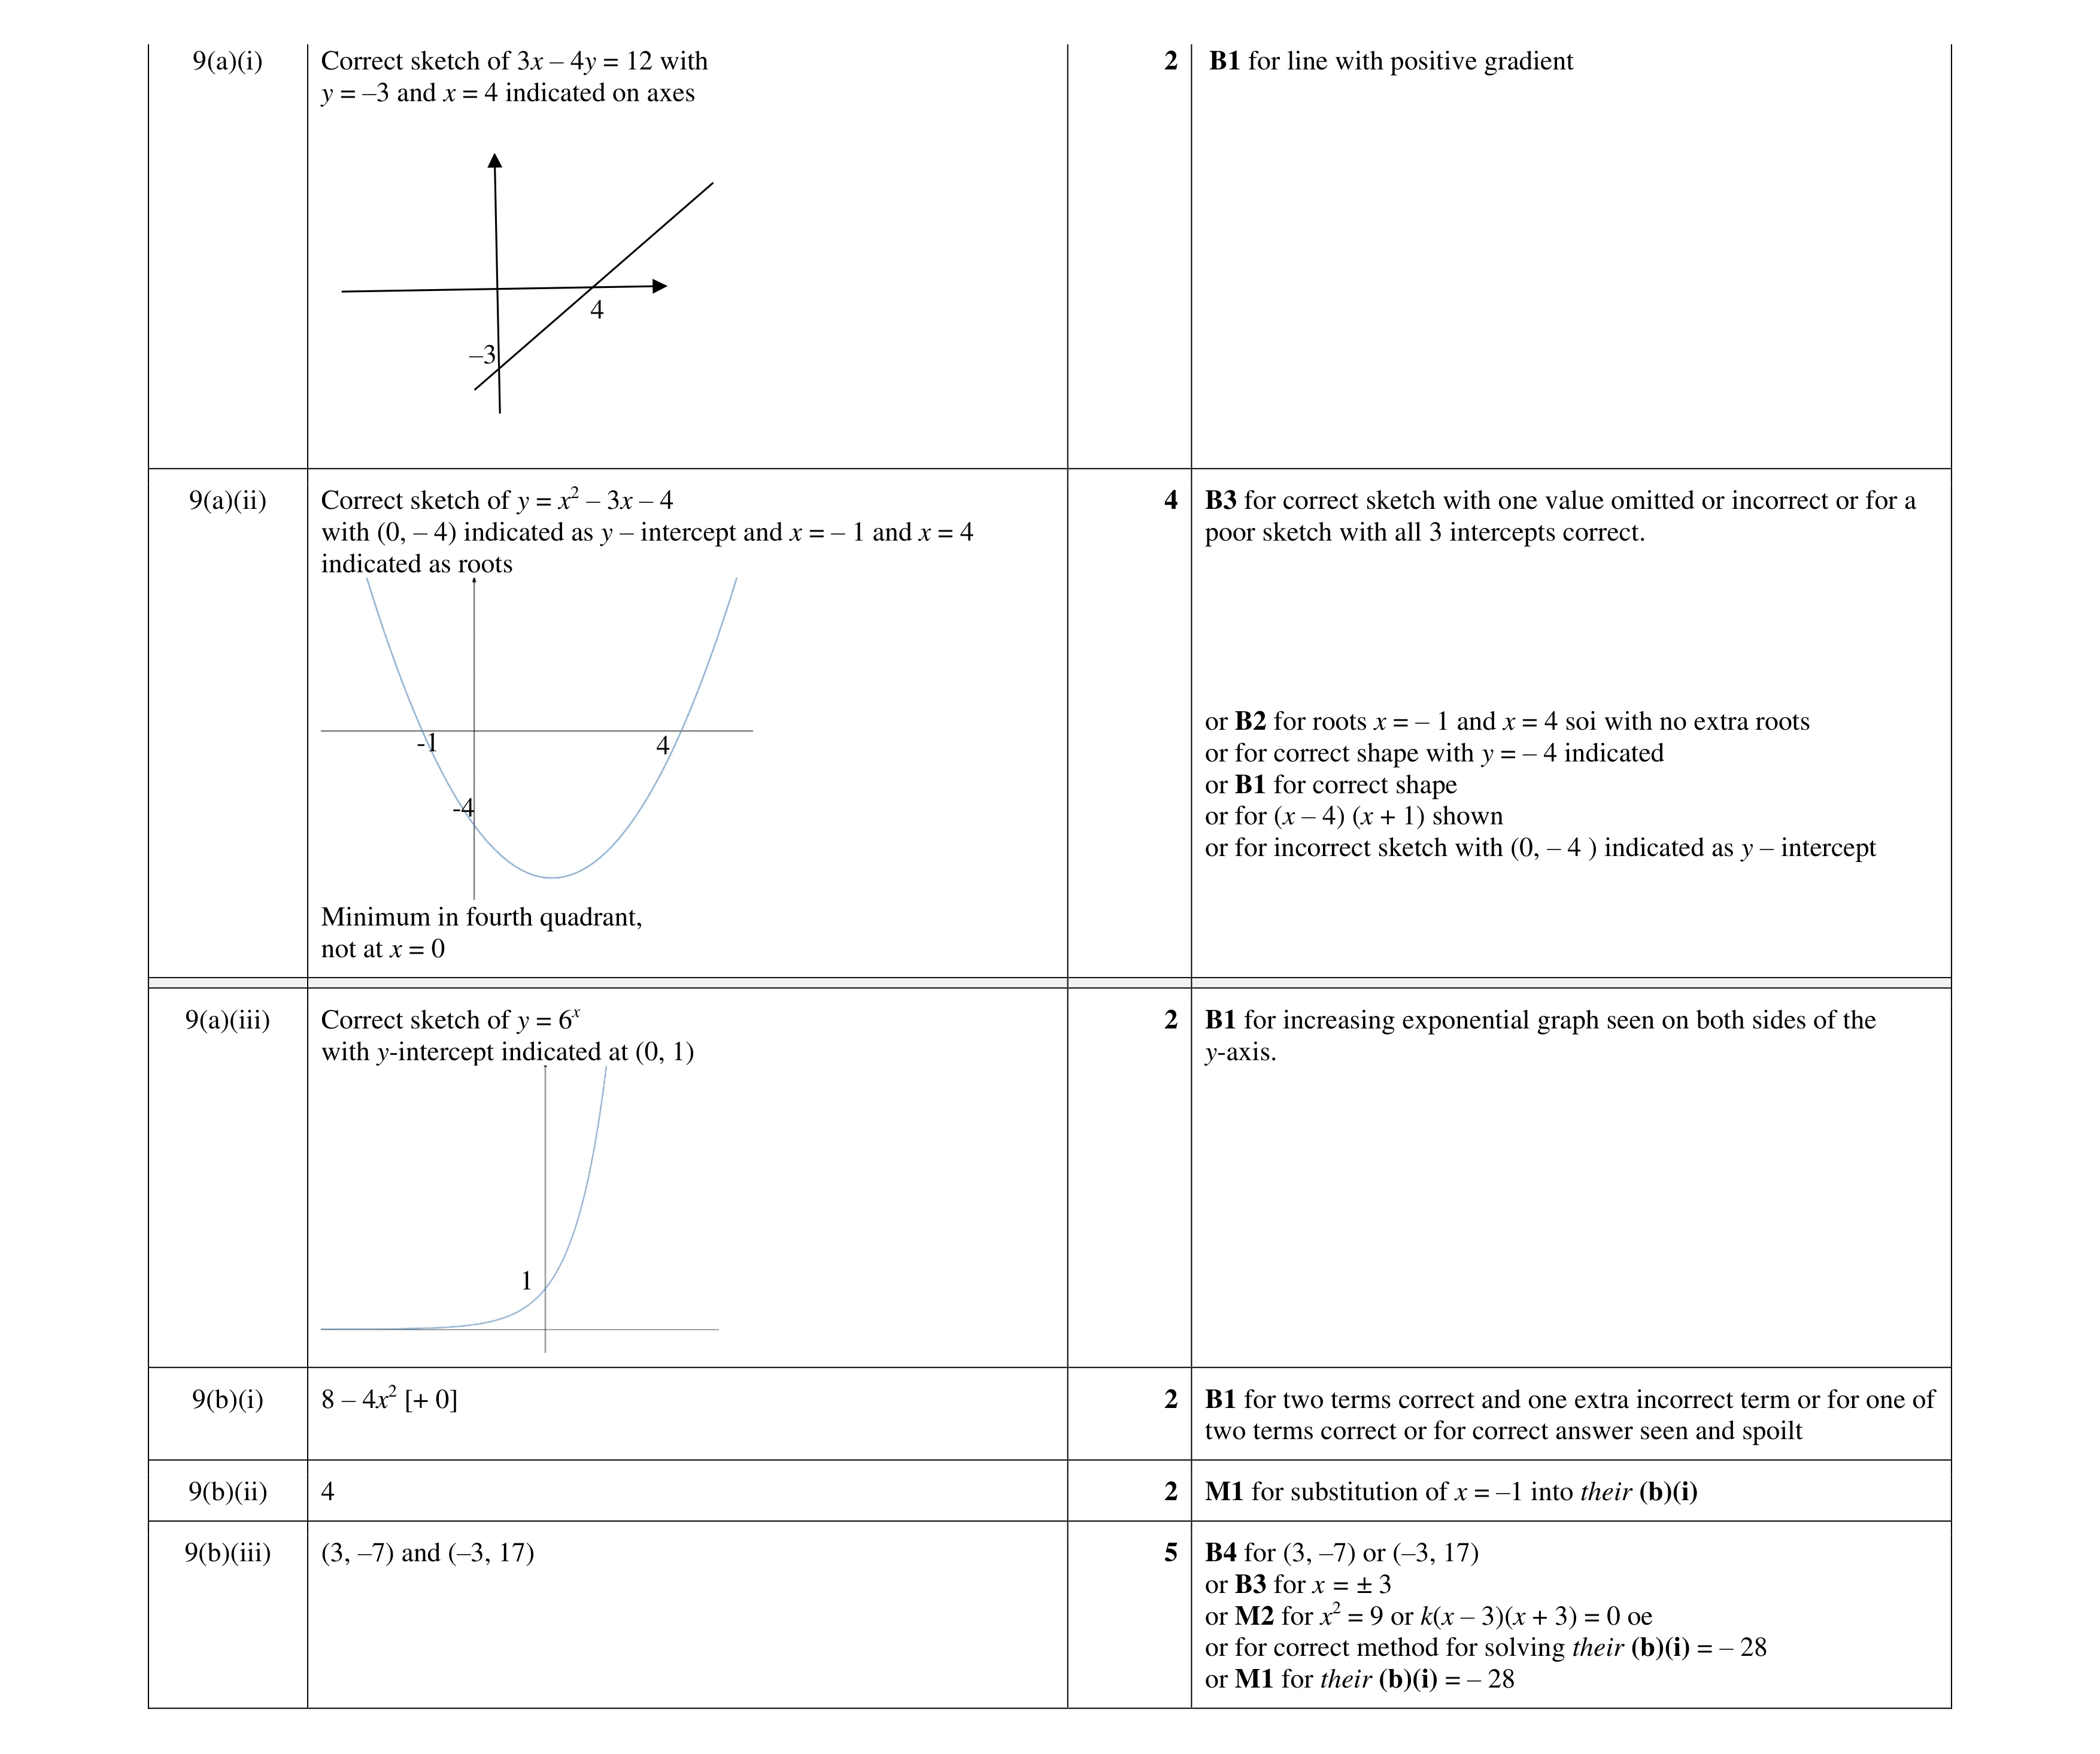 17
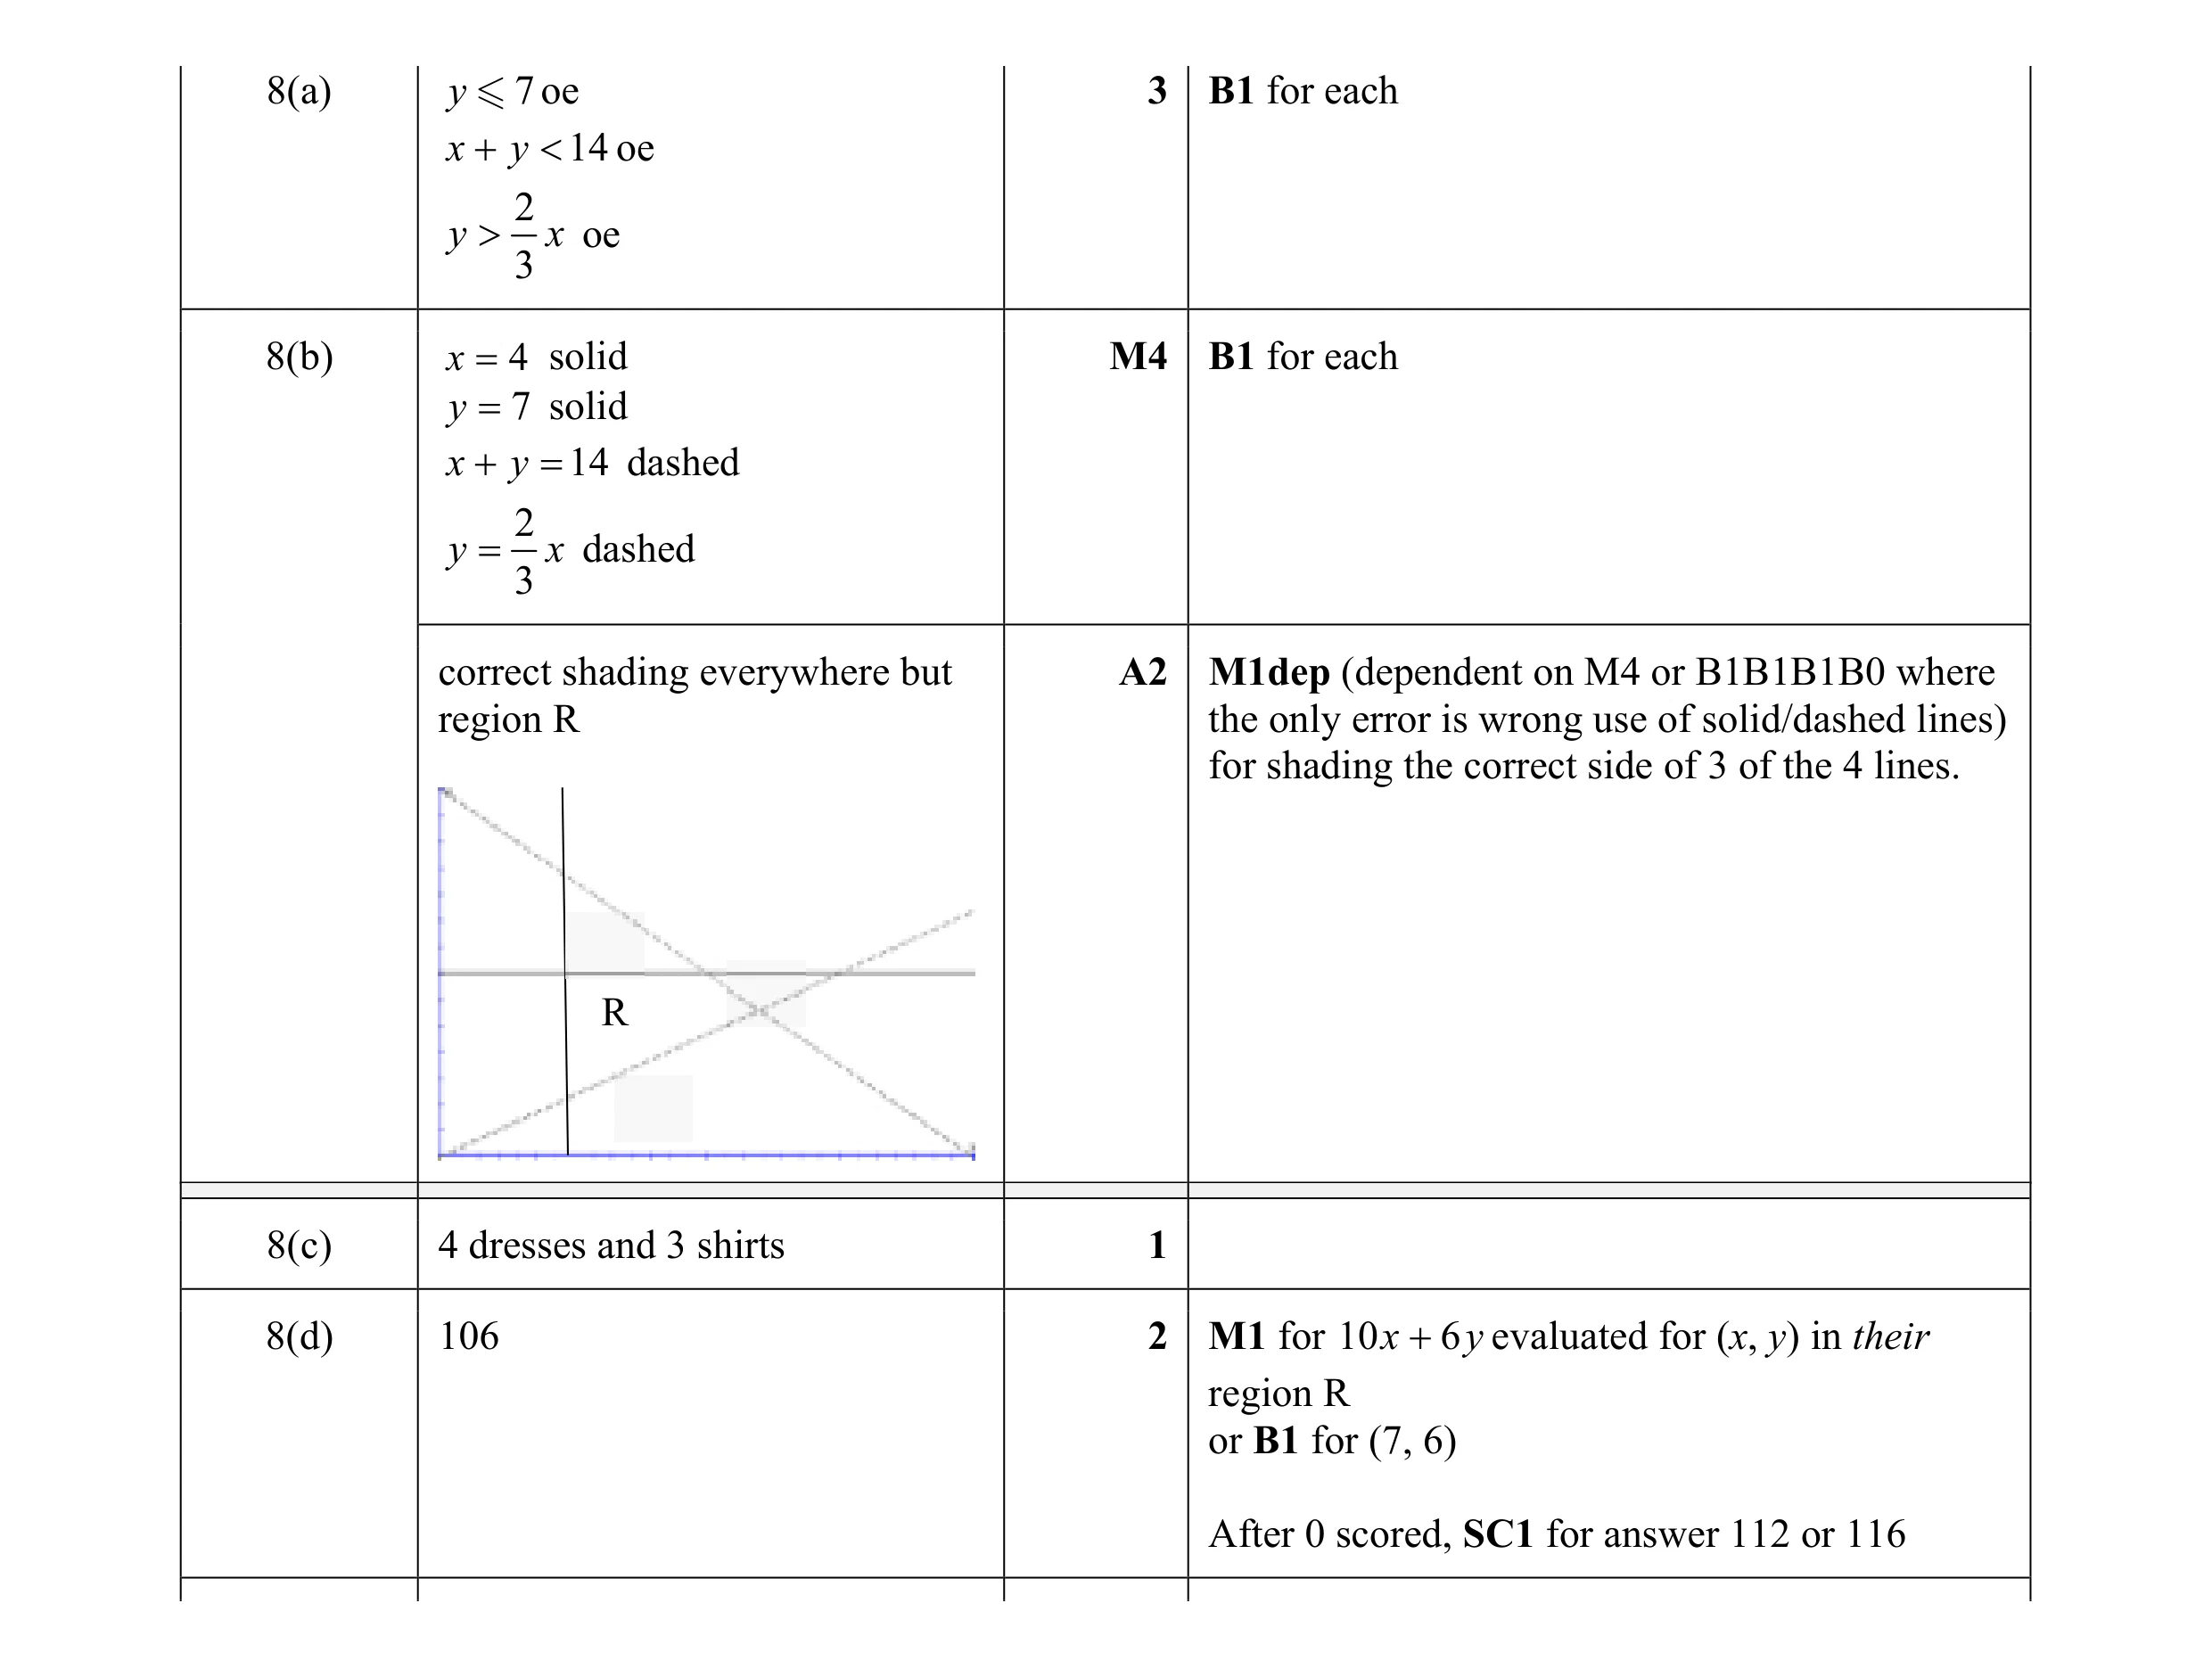 12
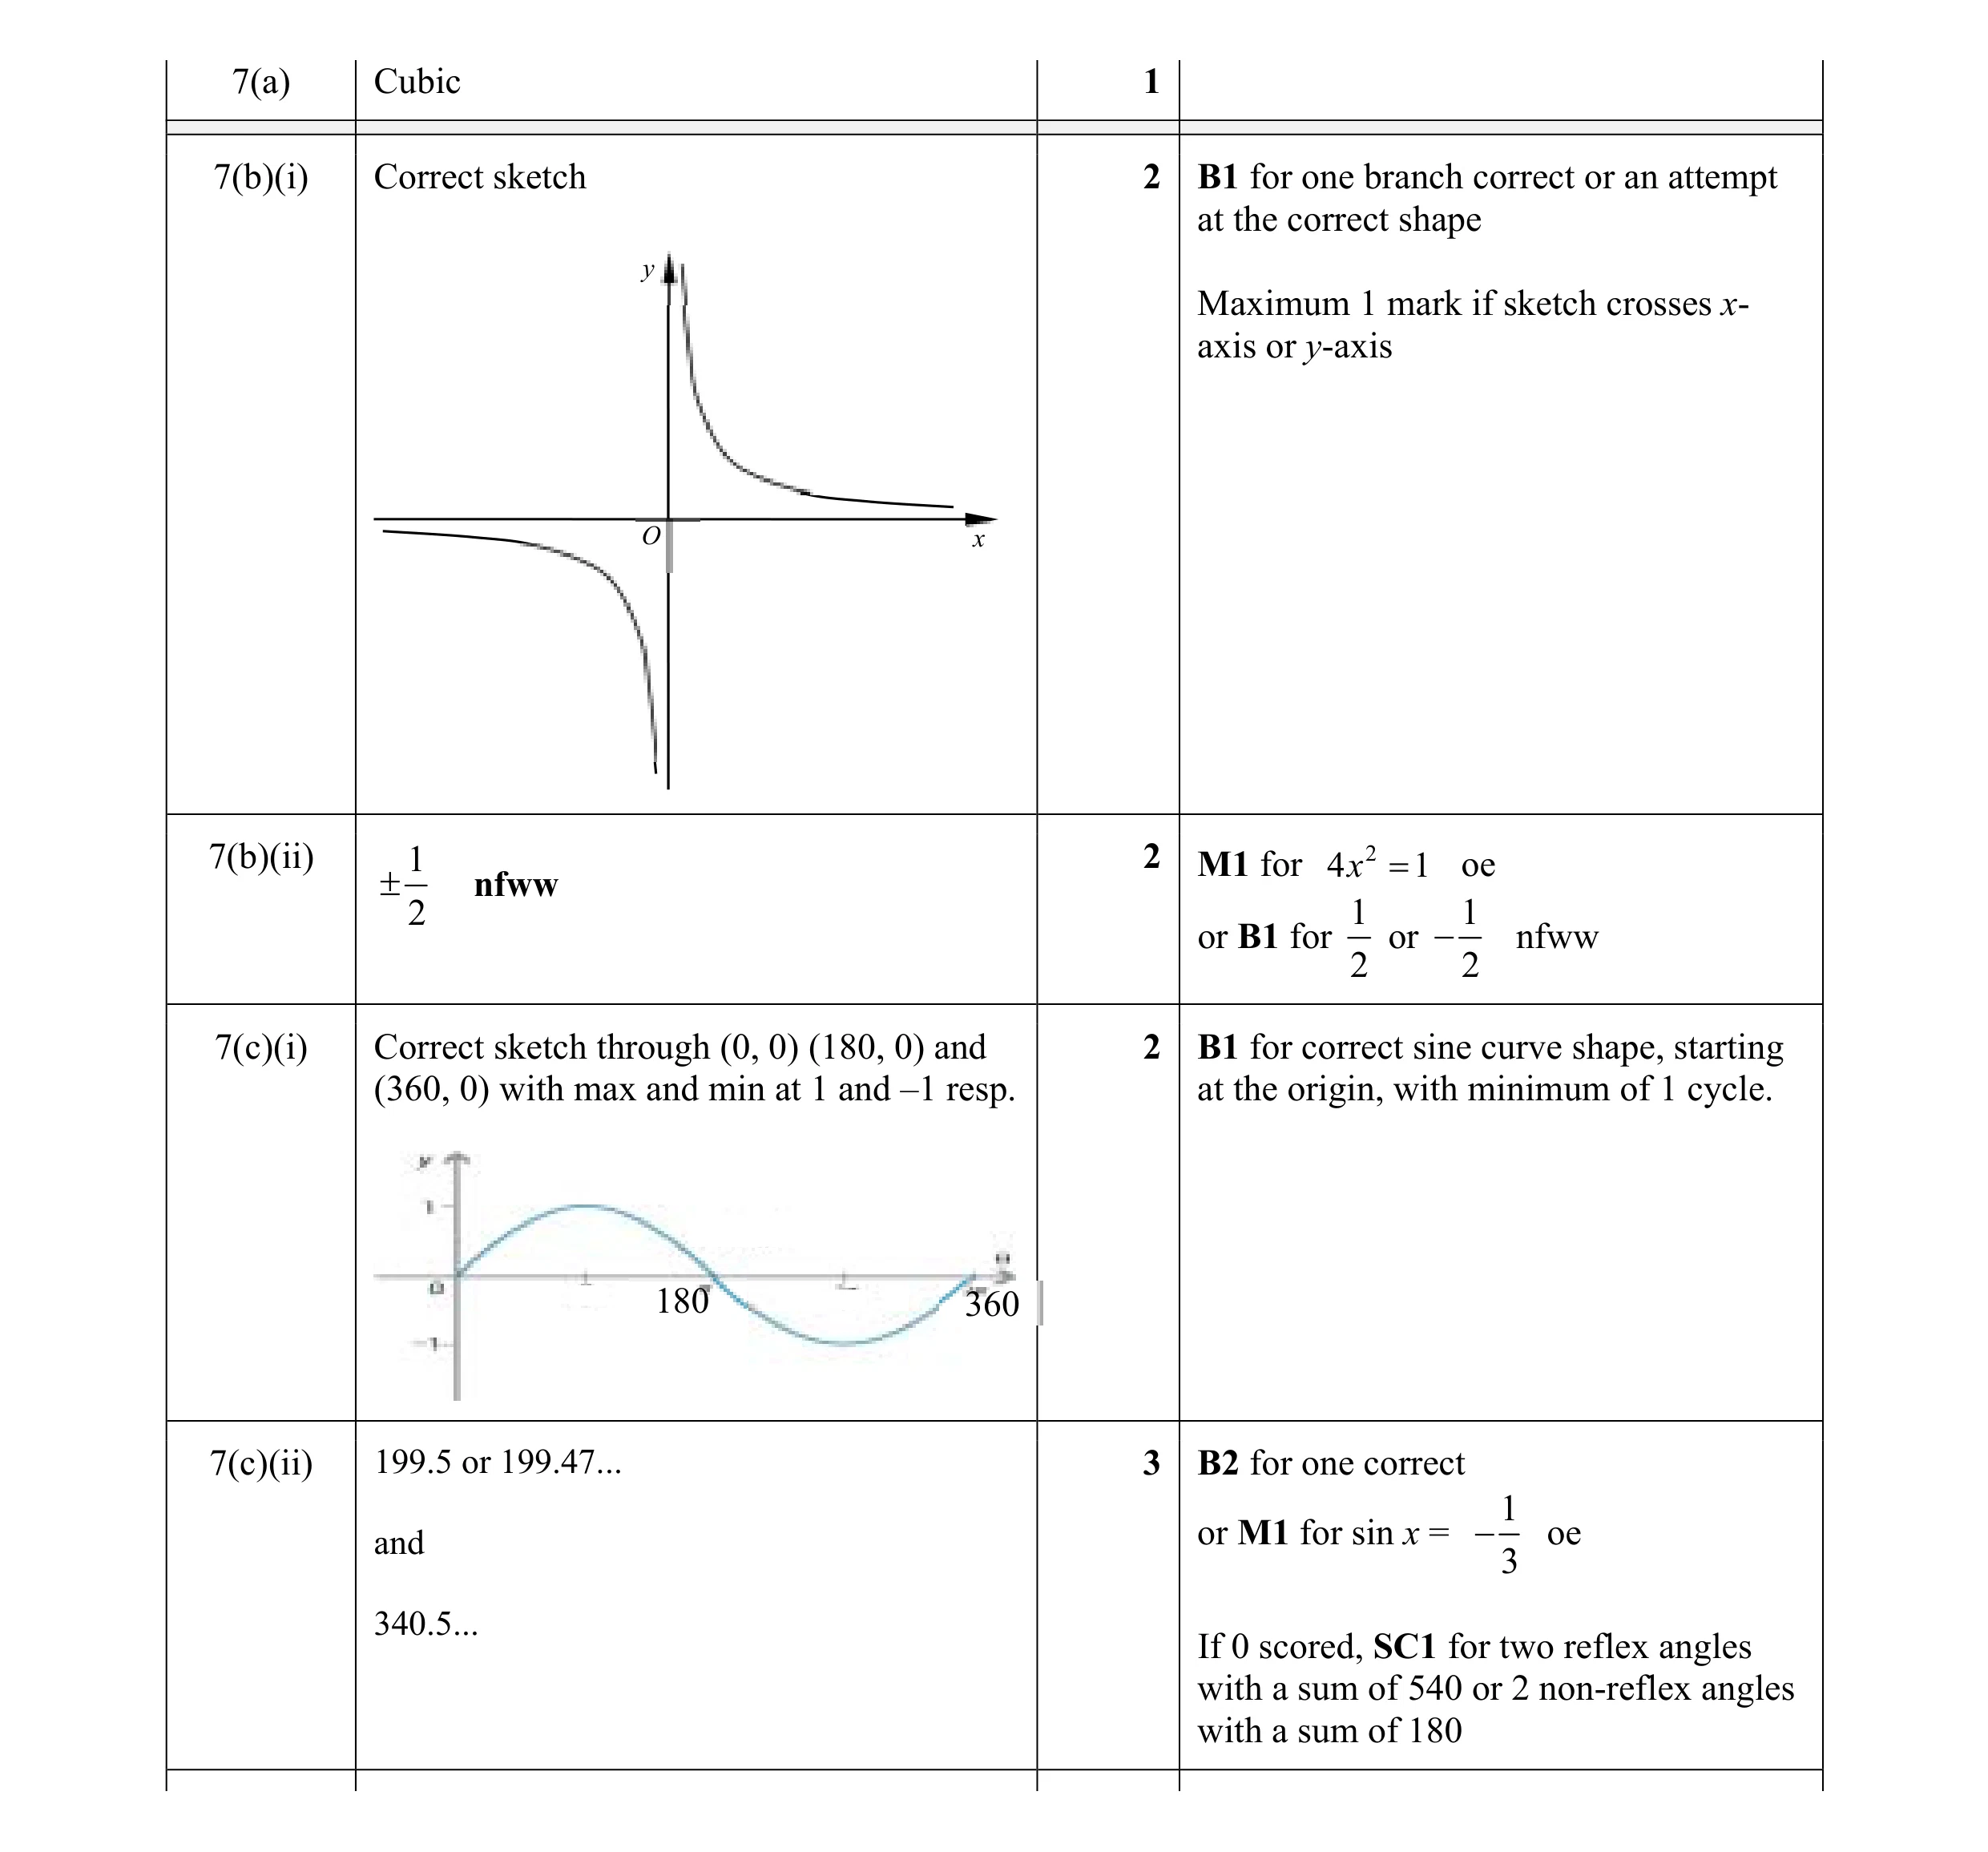 10
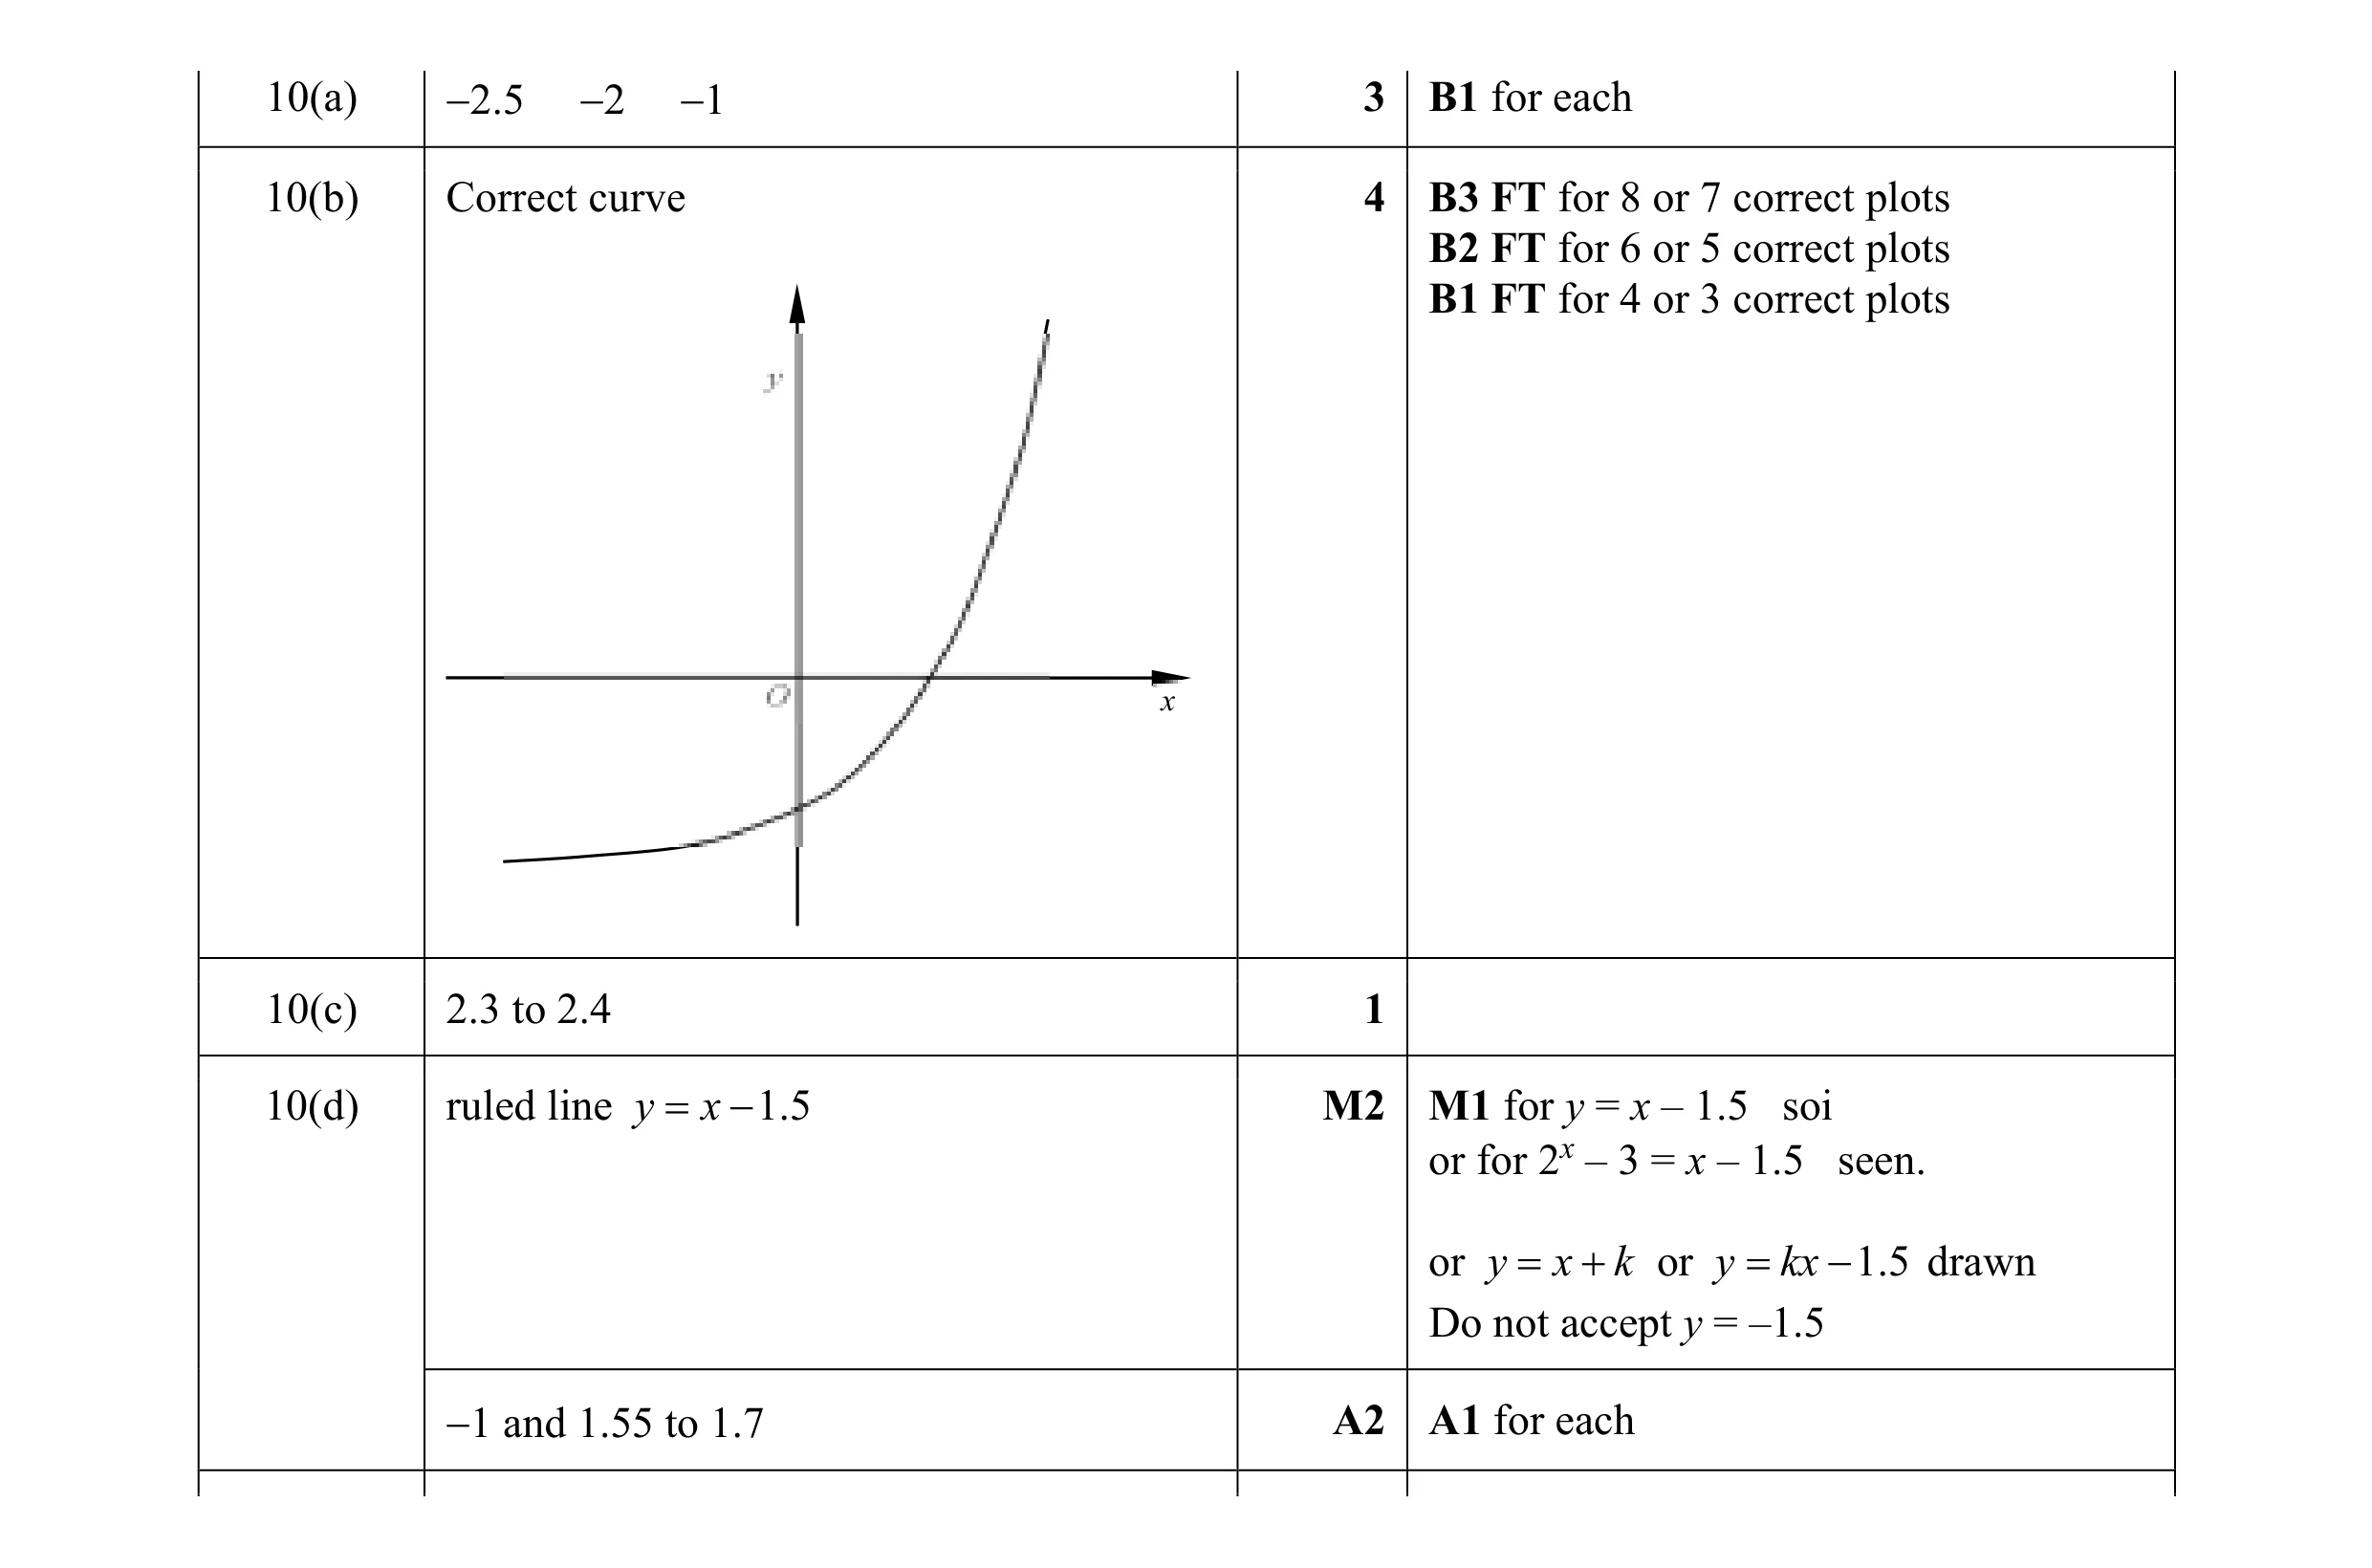 12
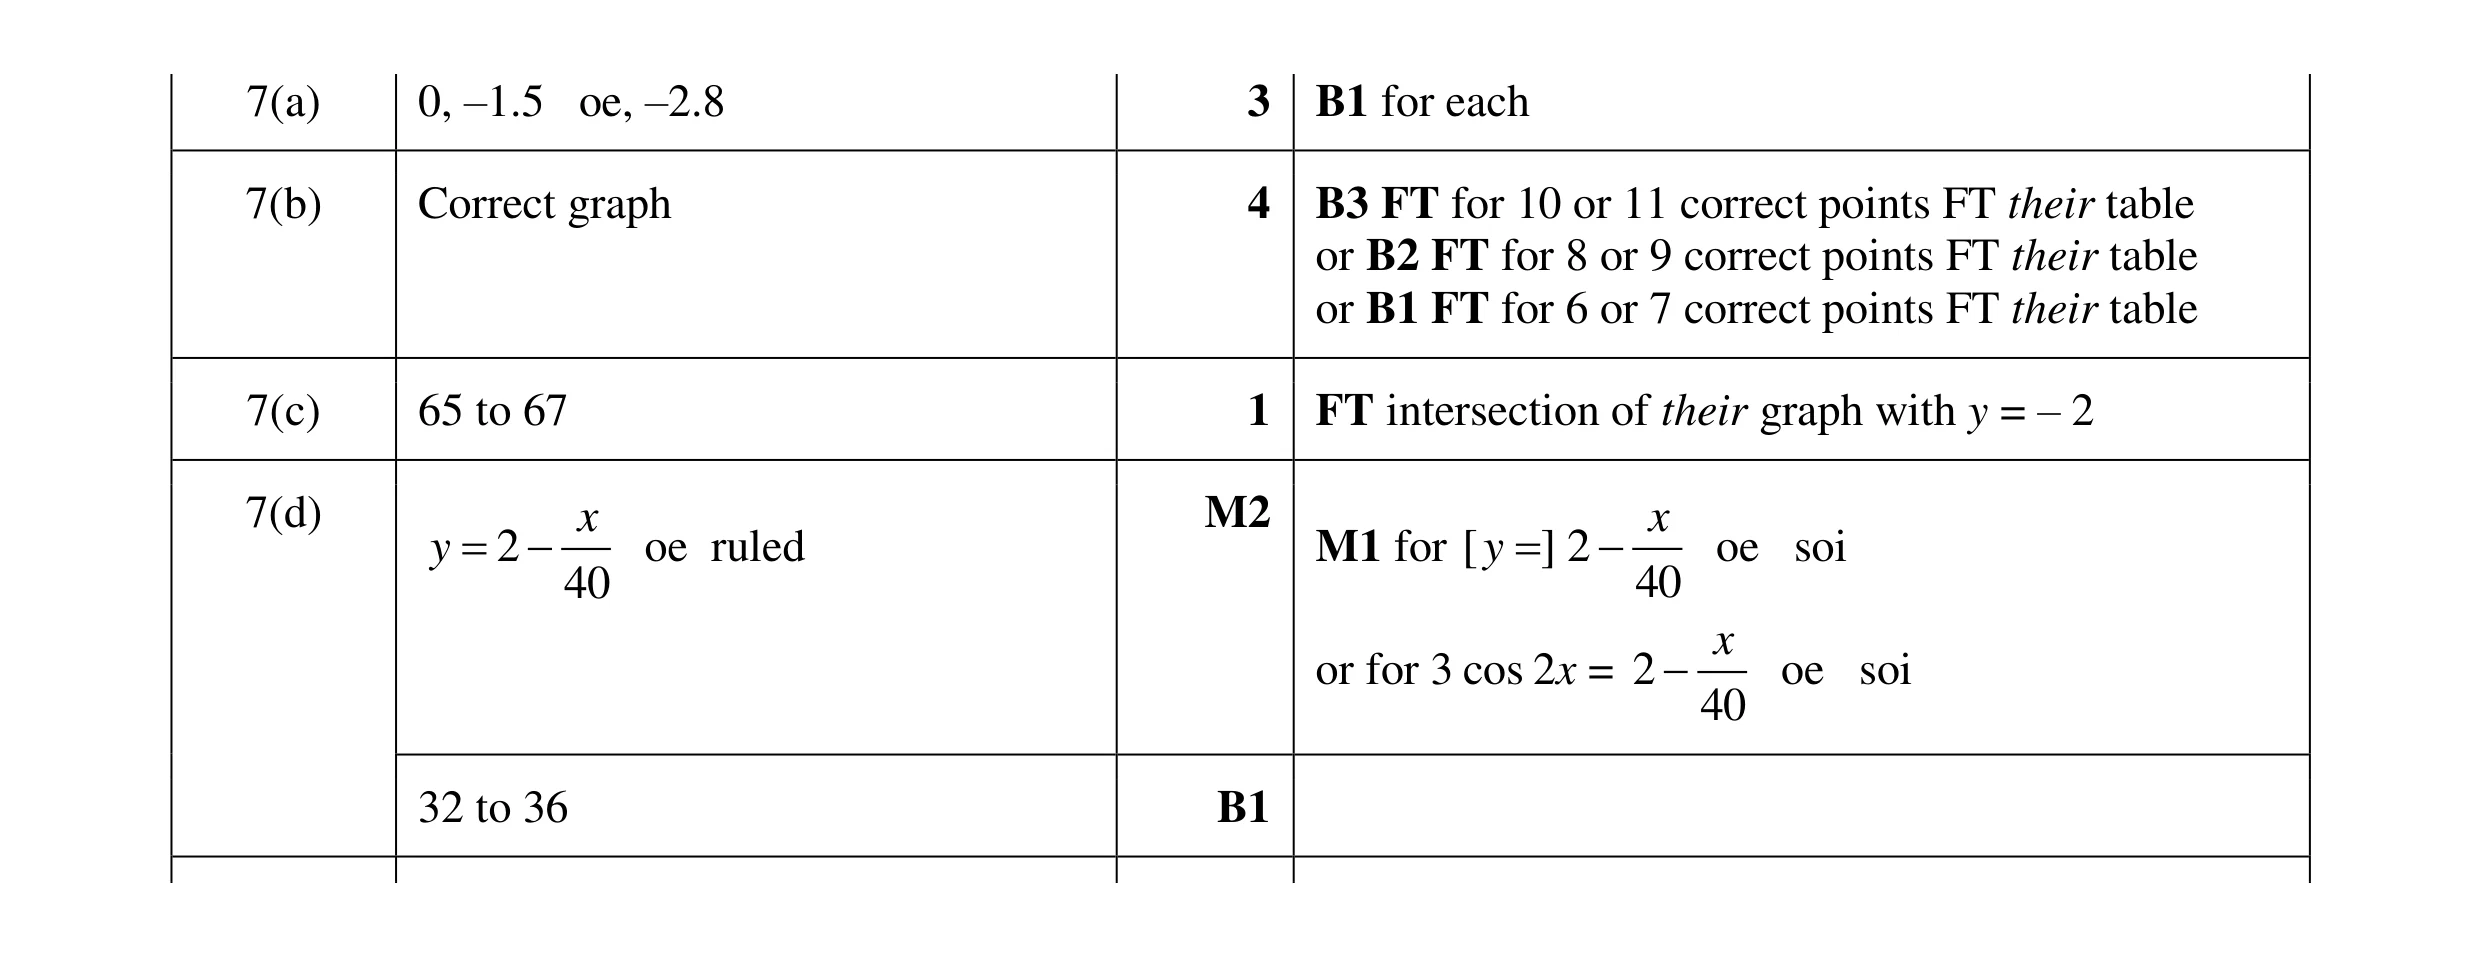 11
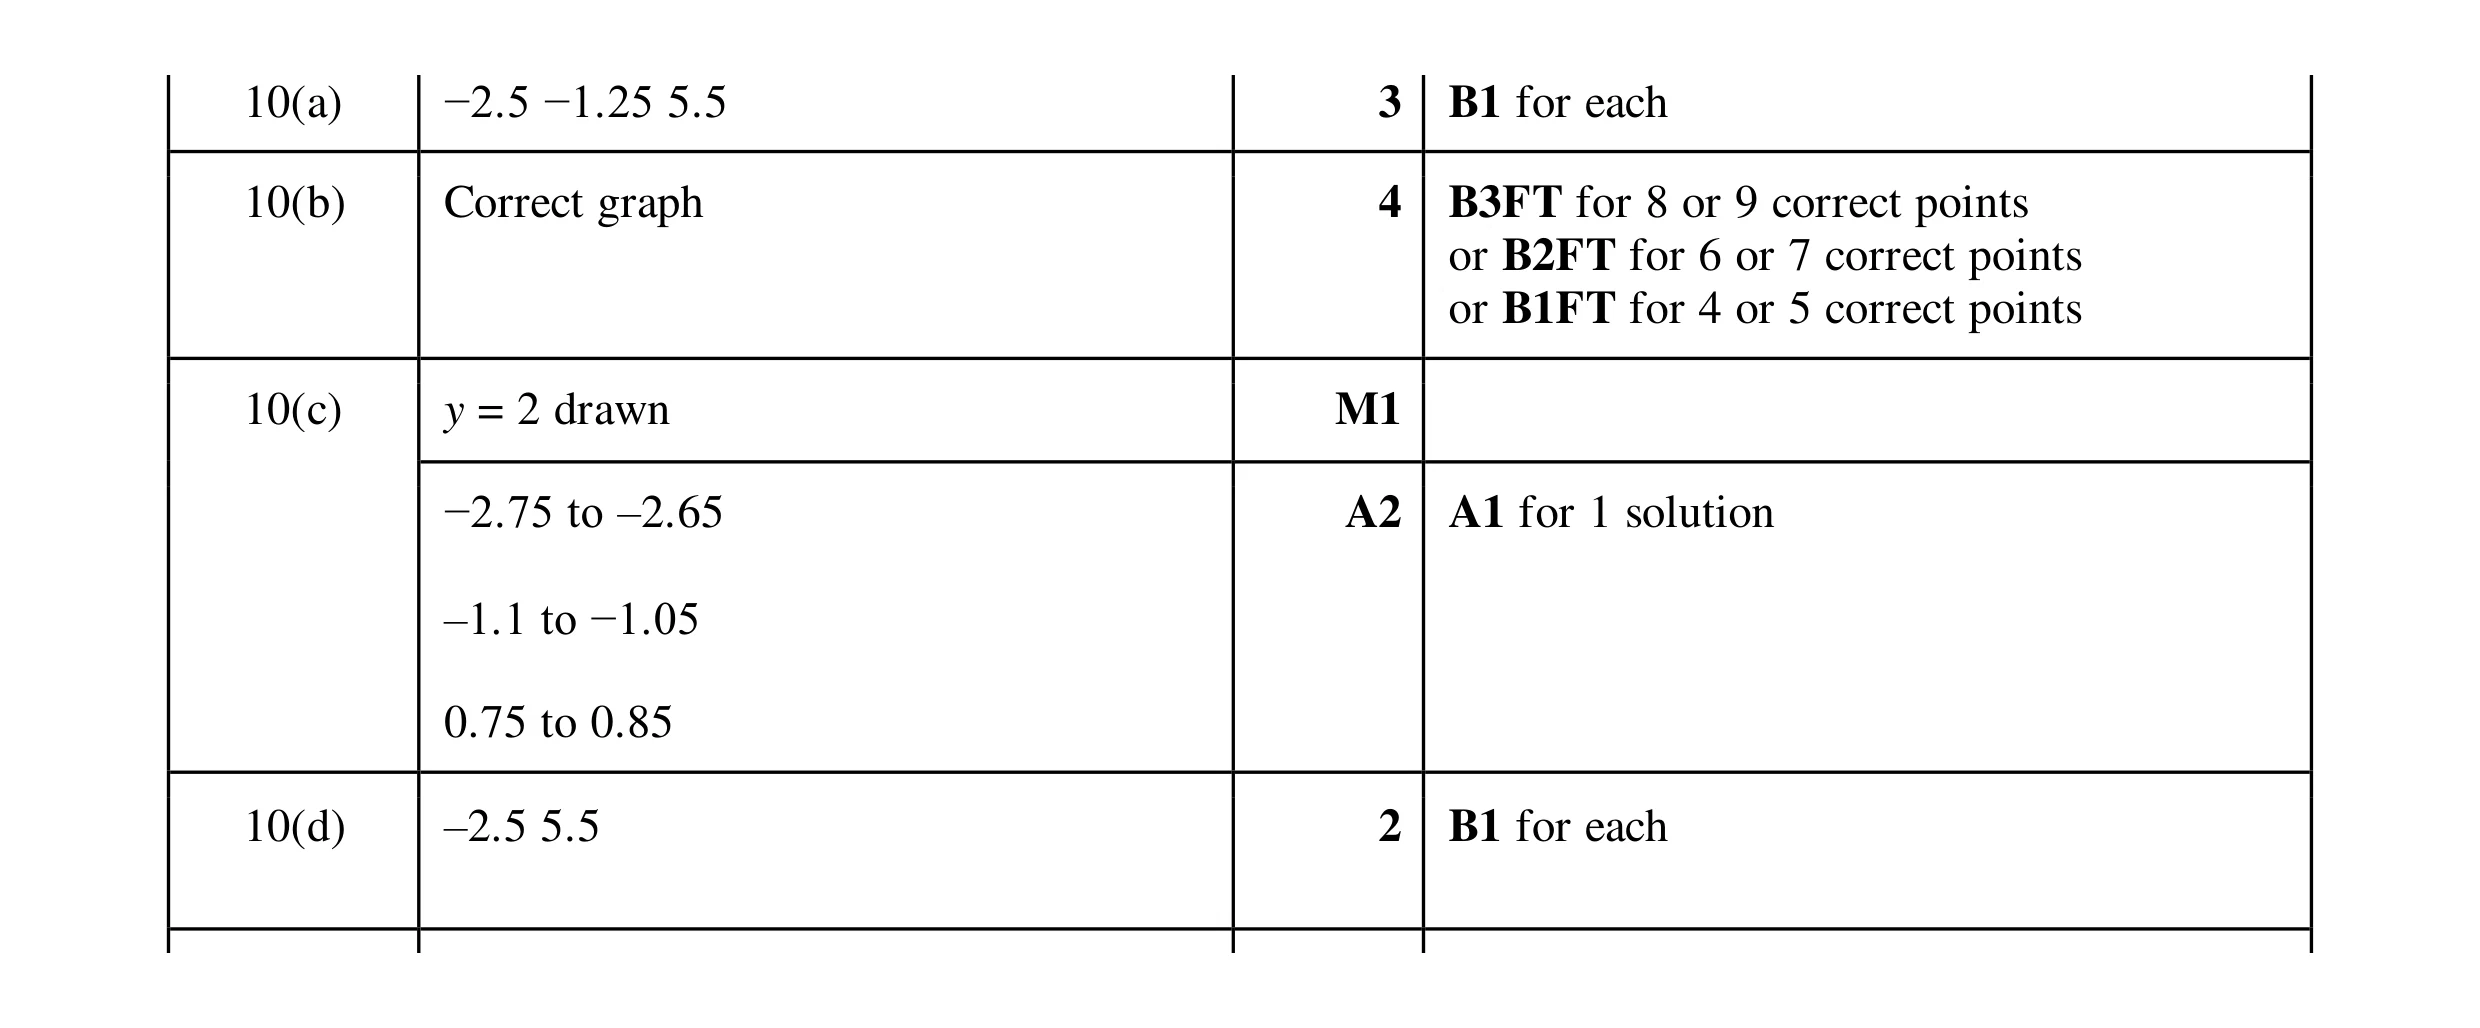 12
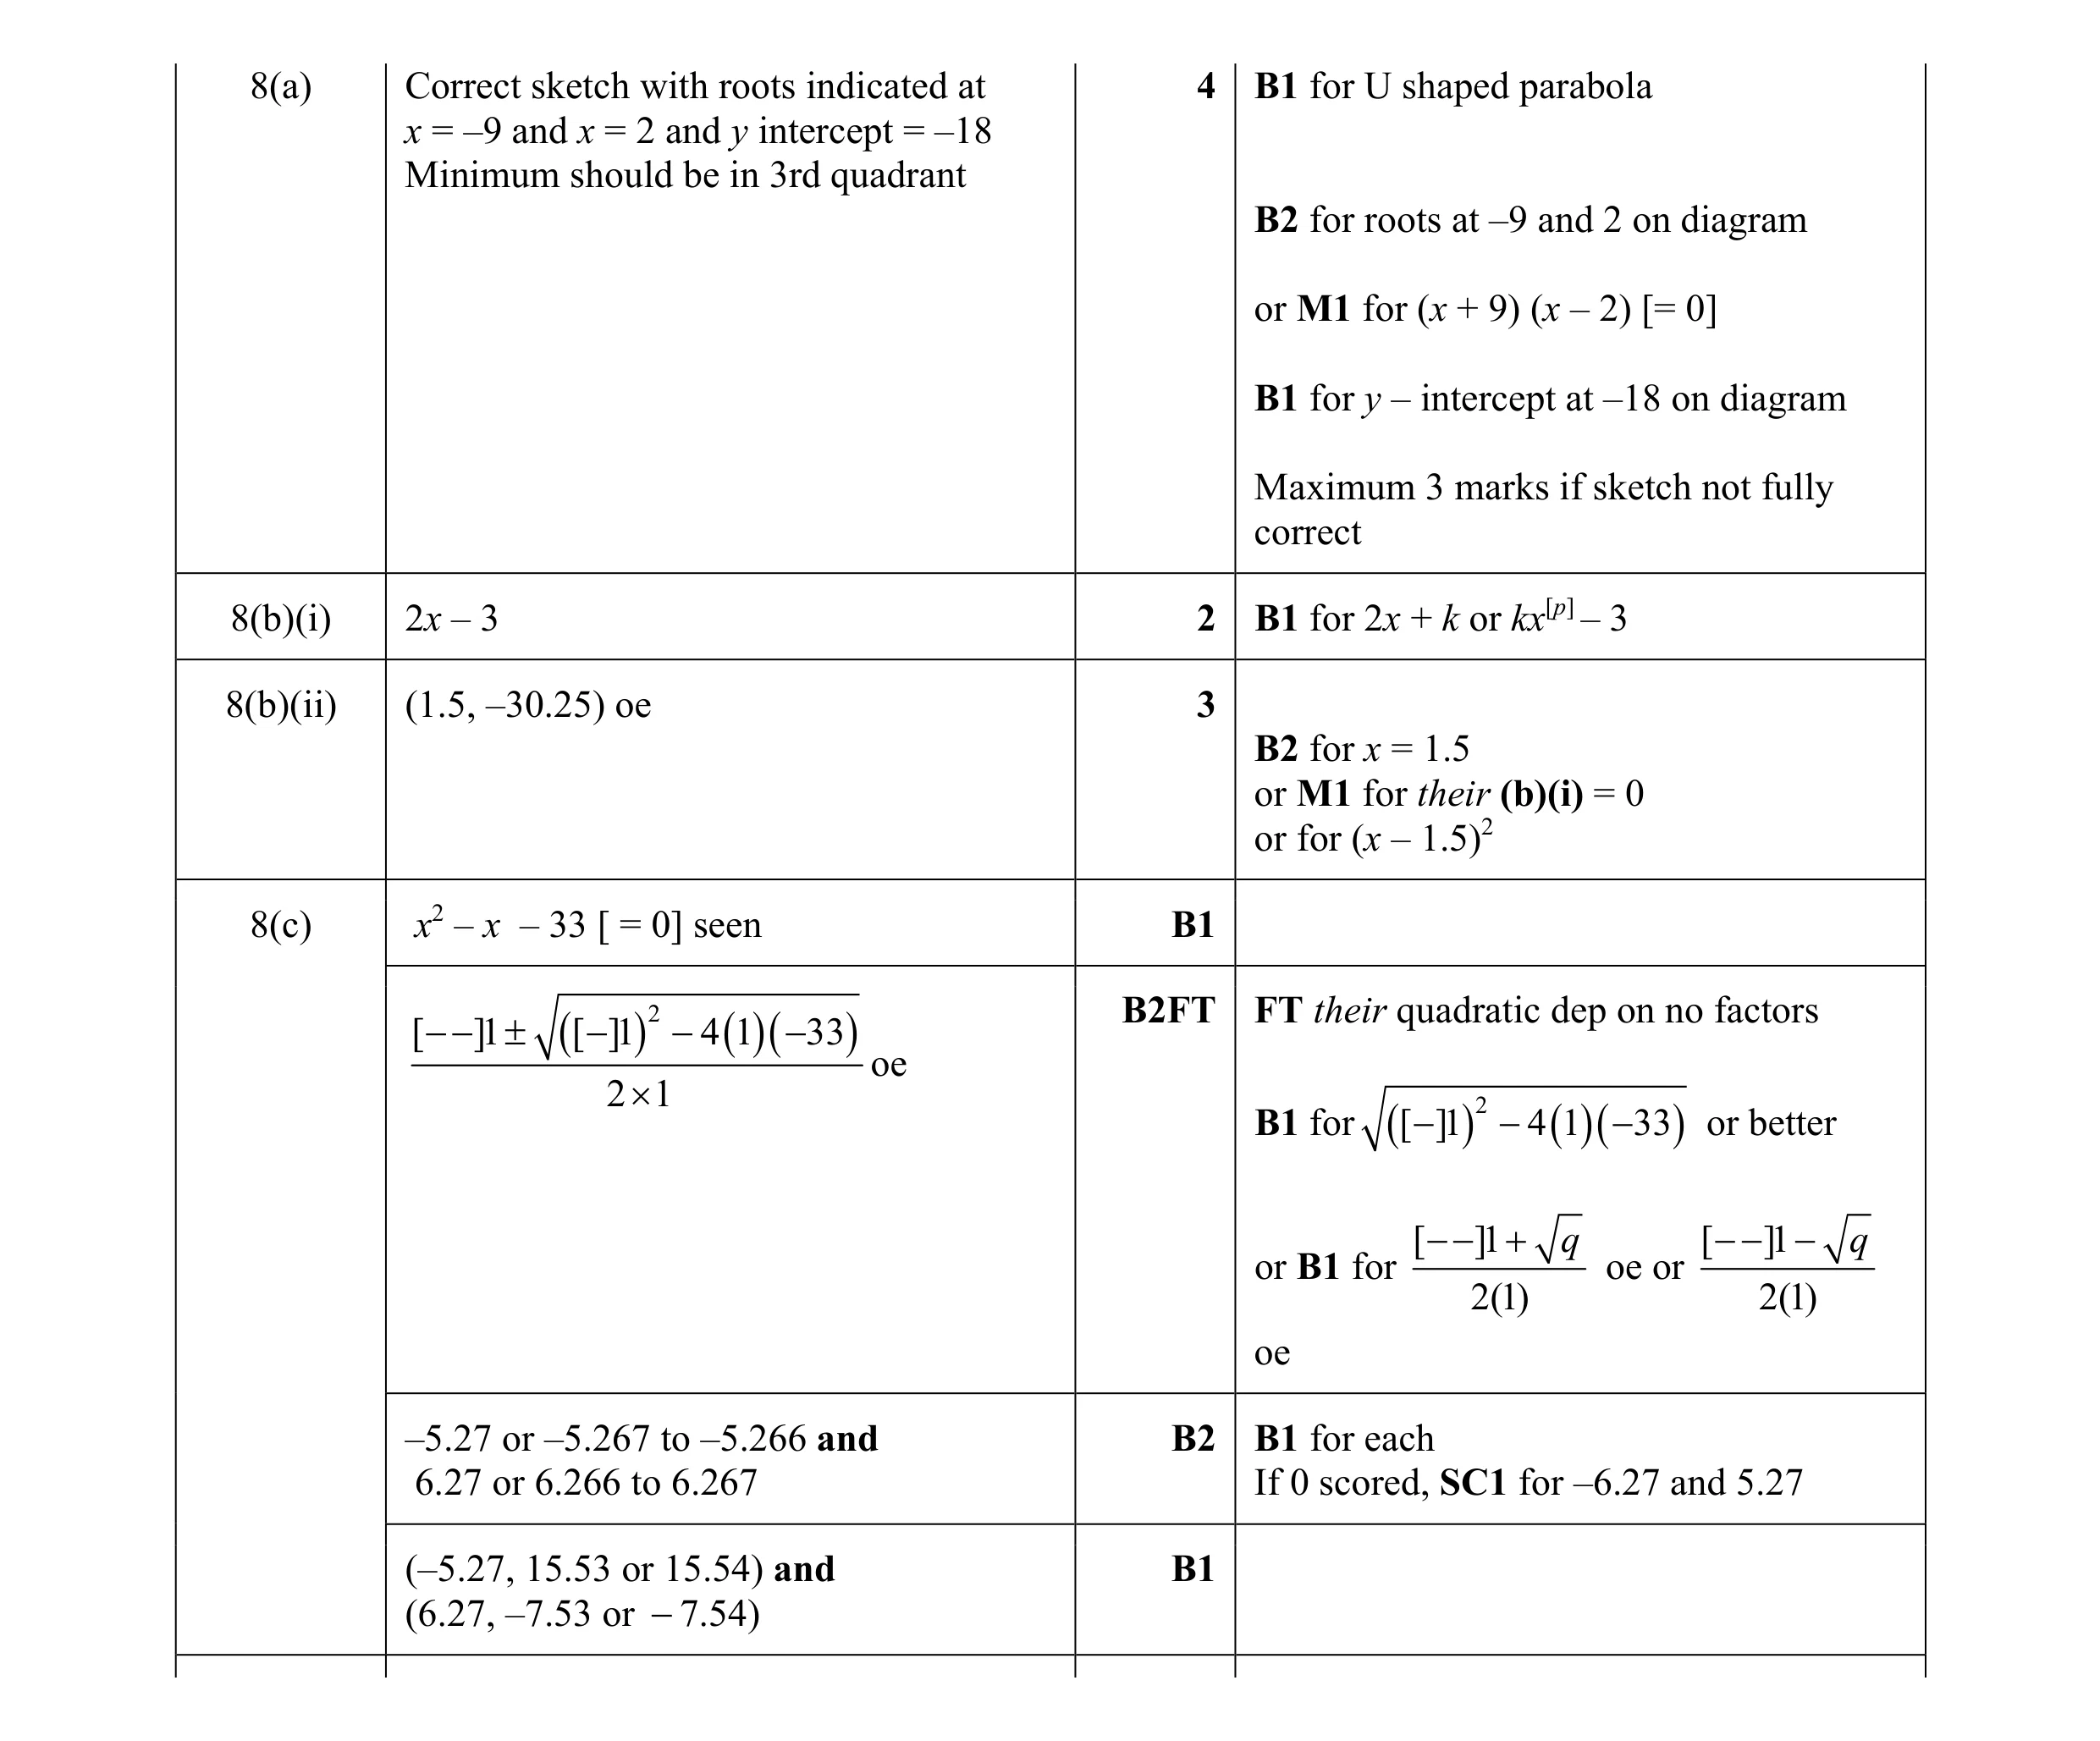 15
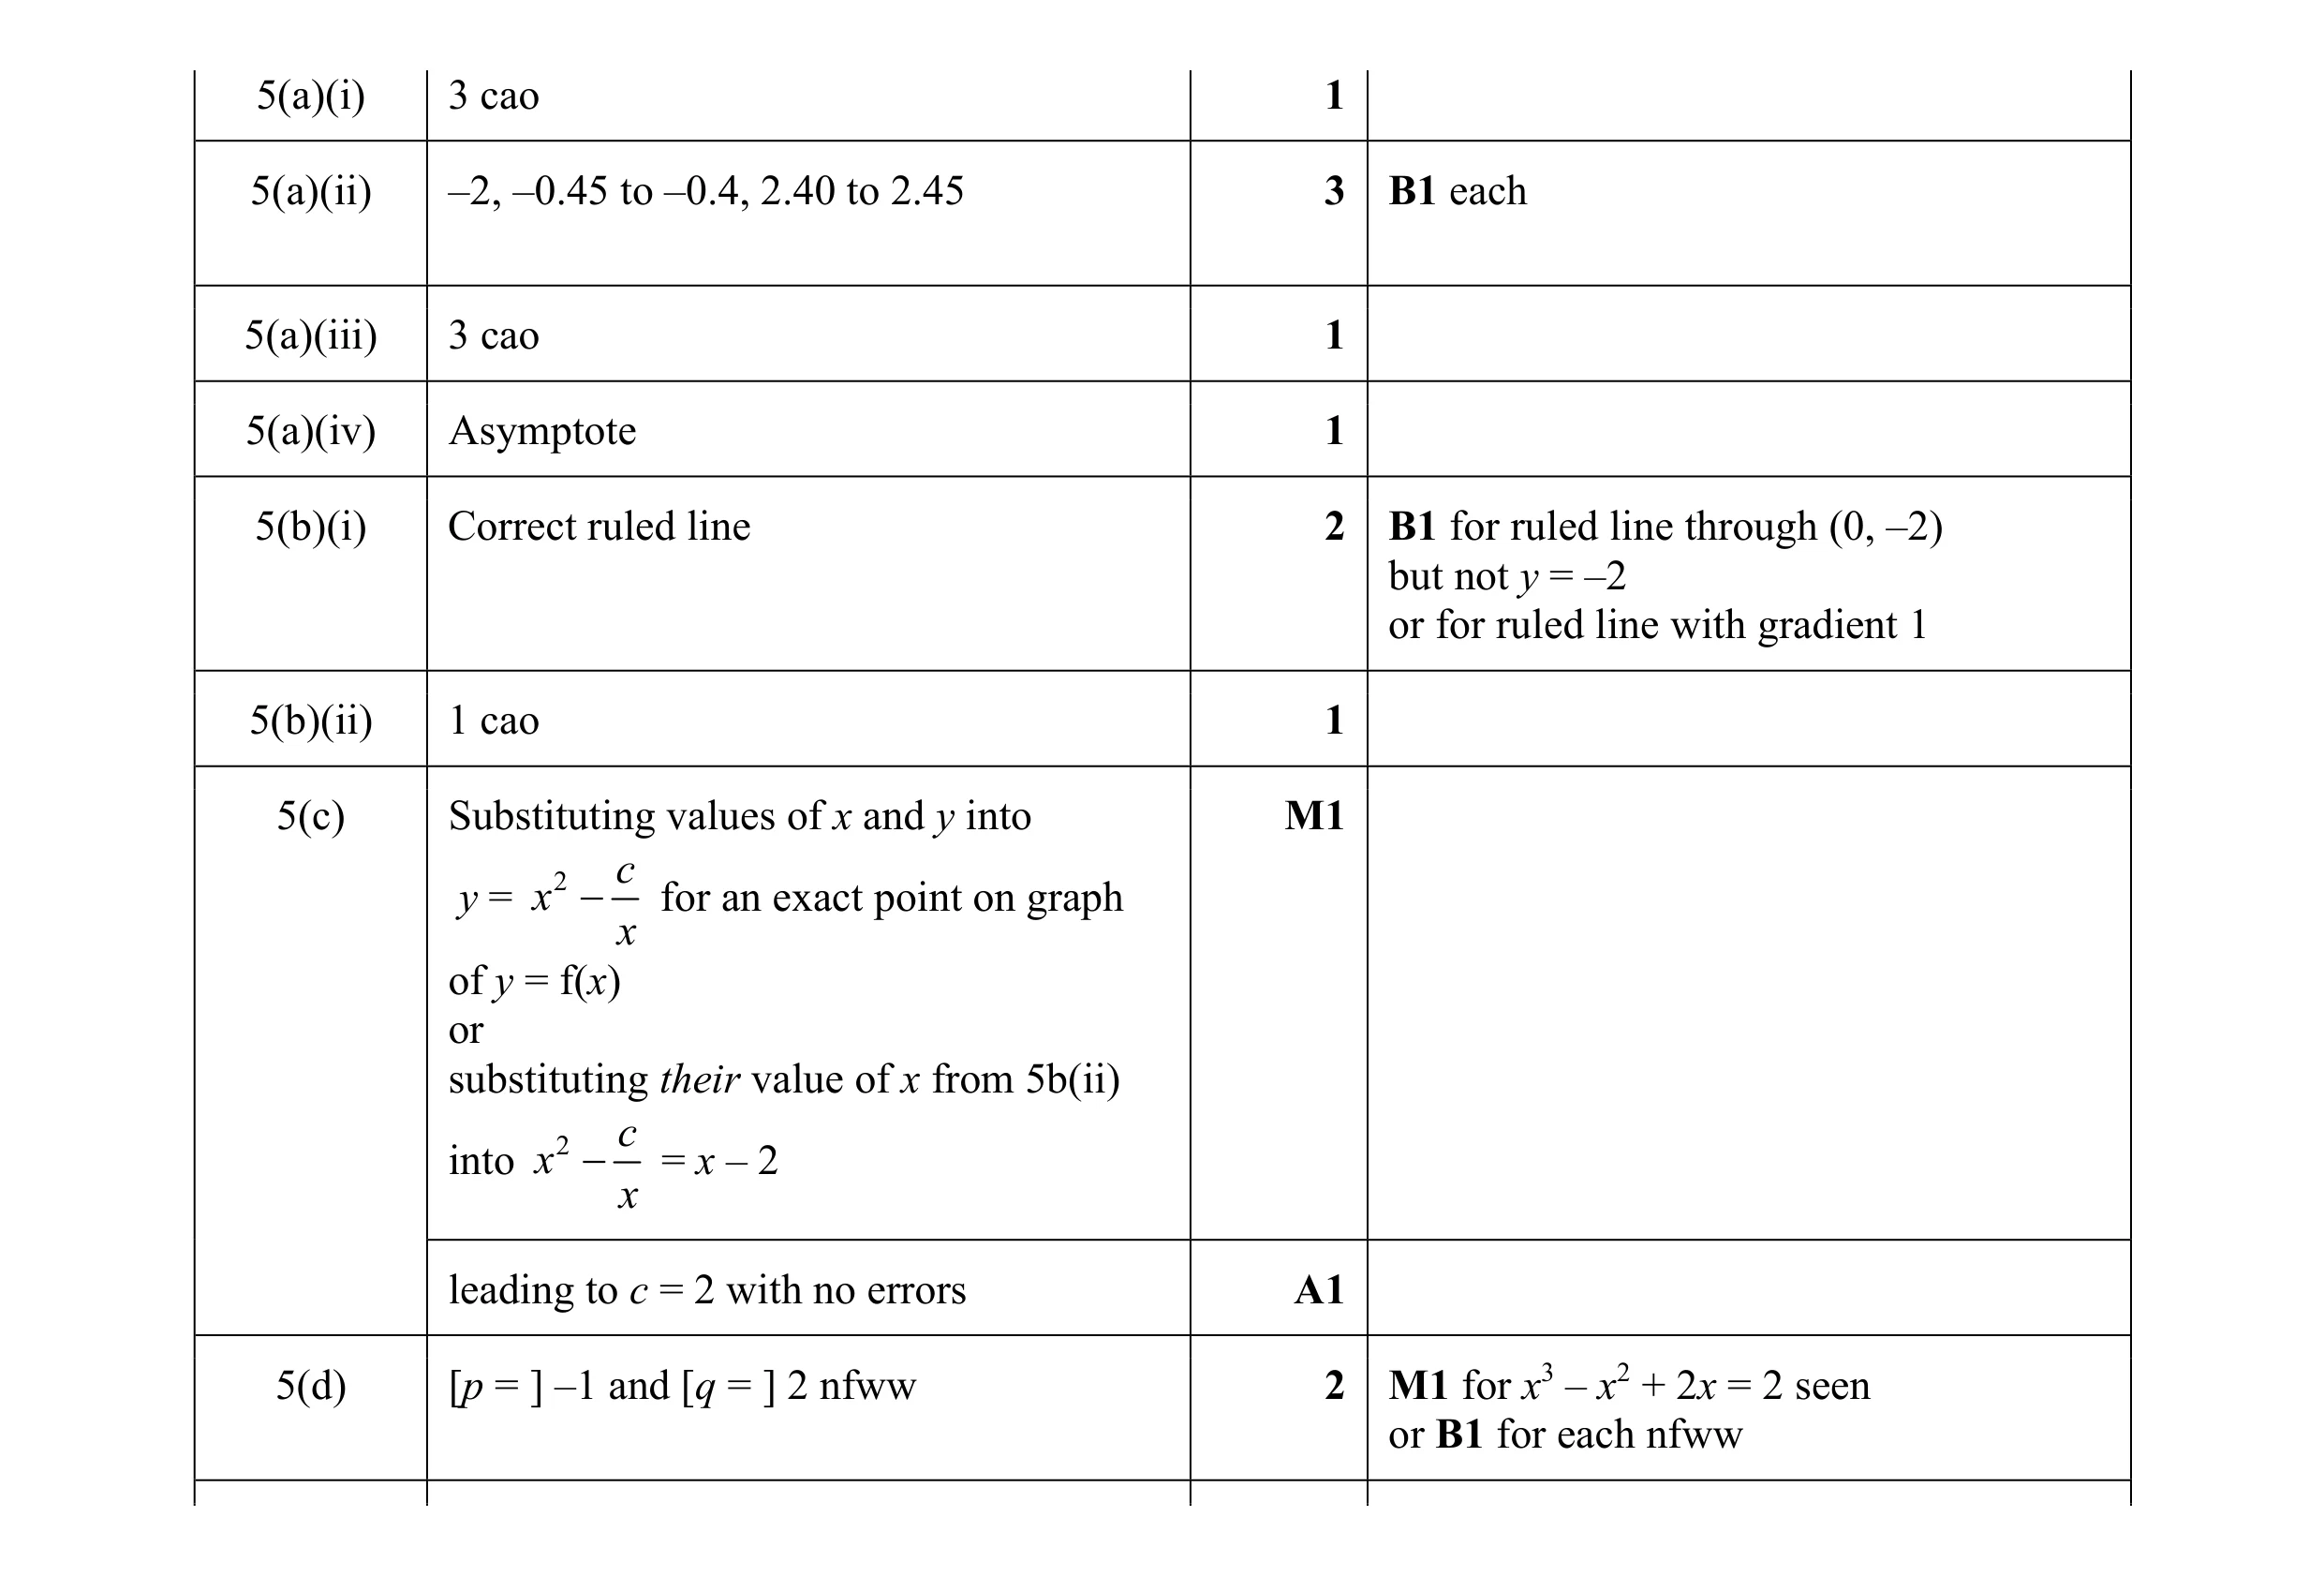 13
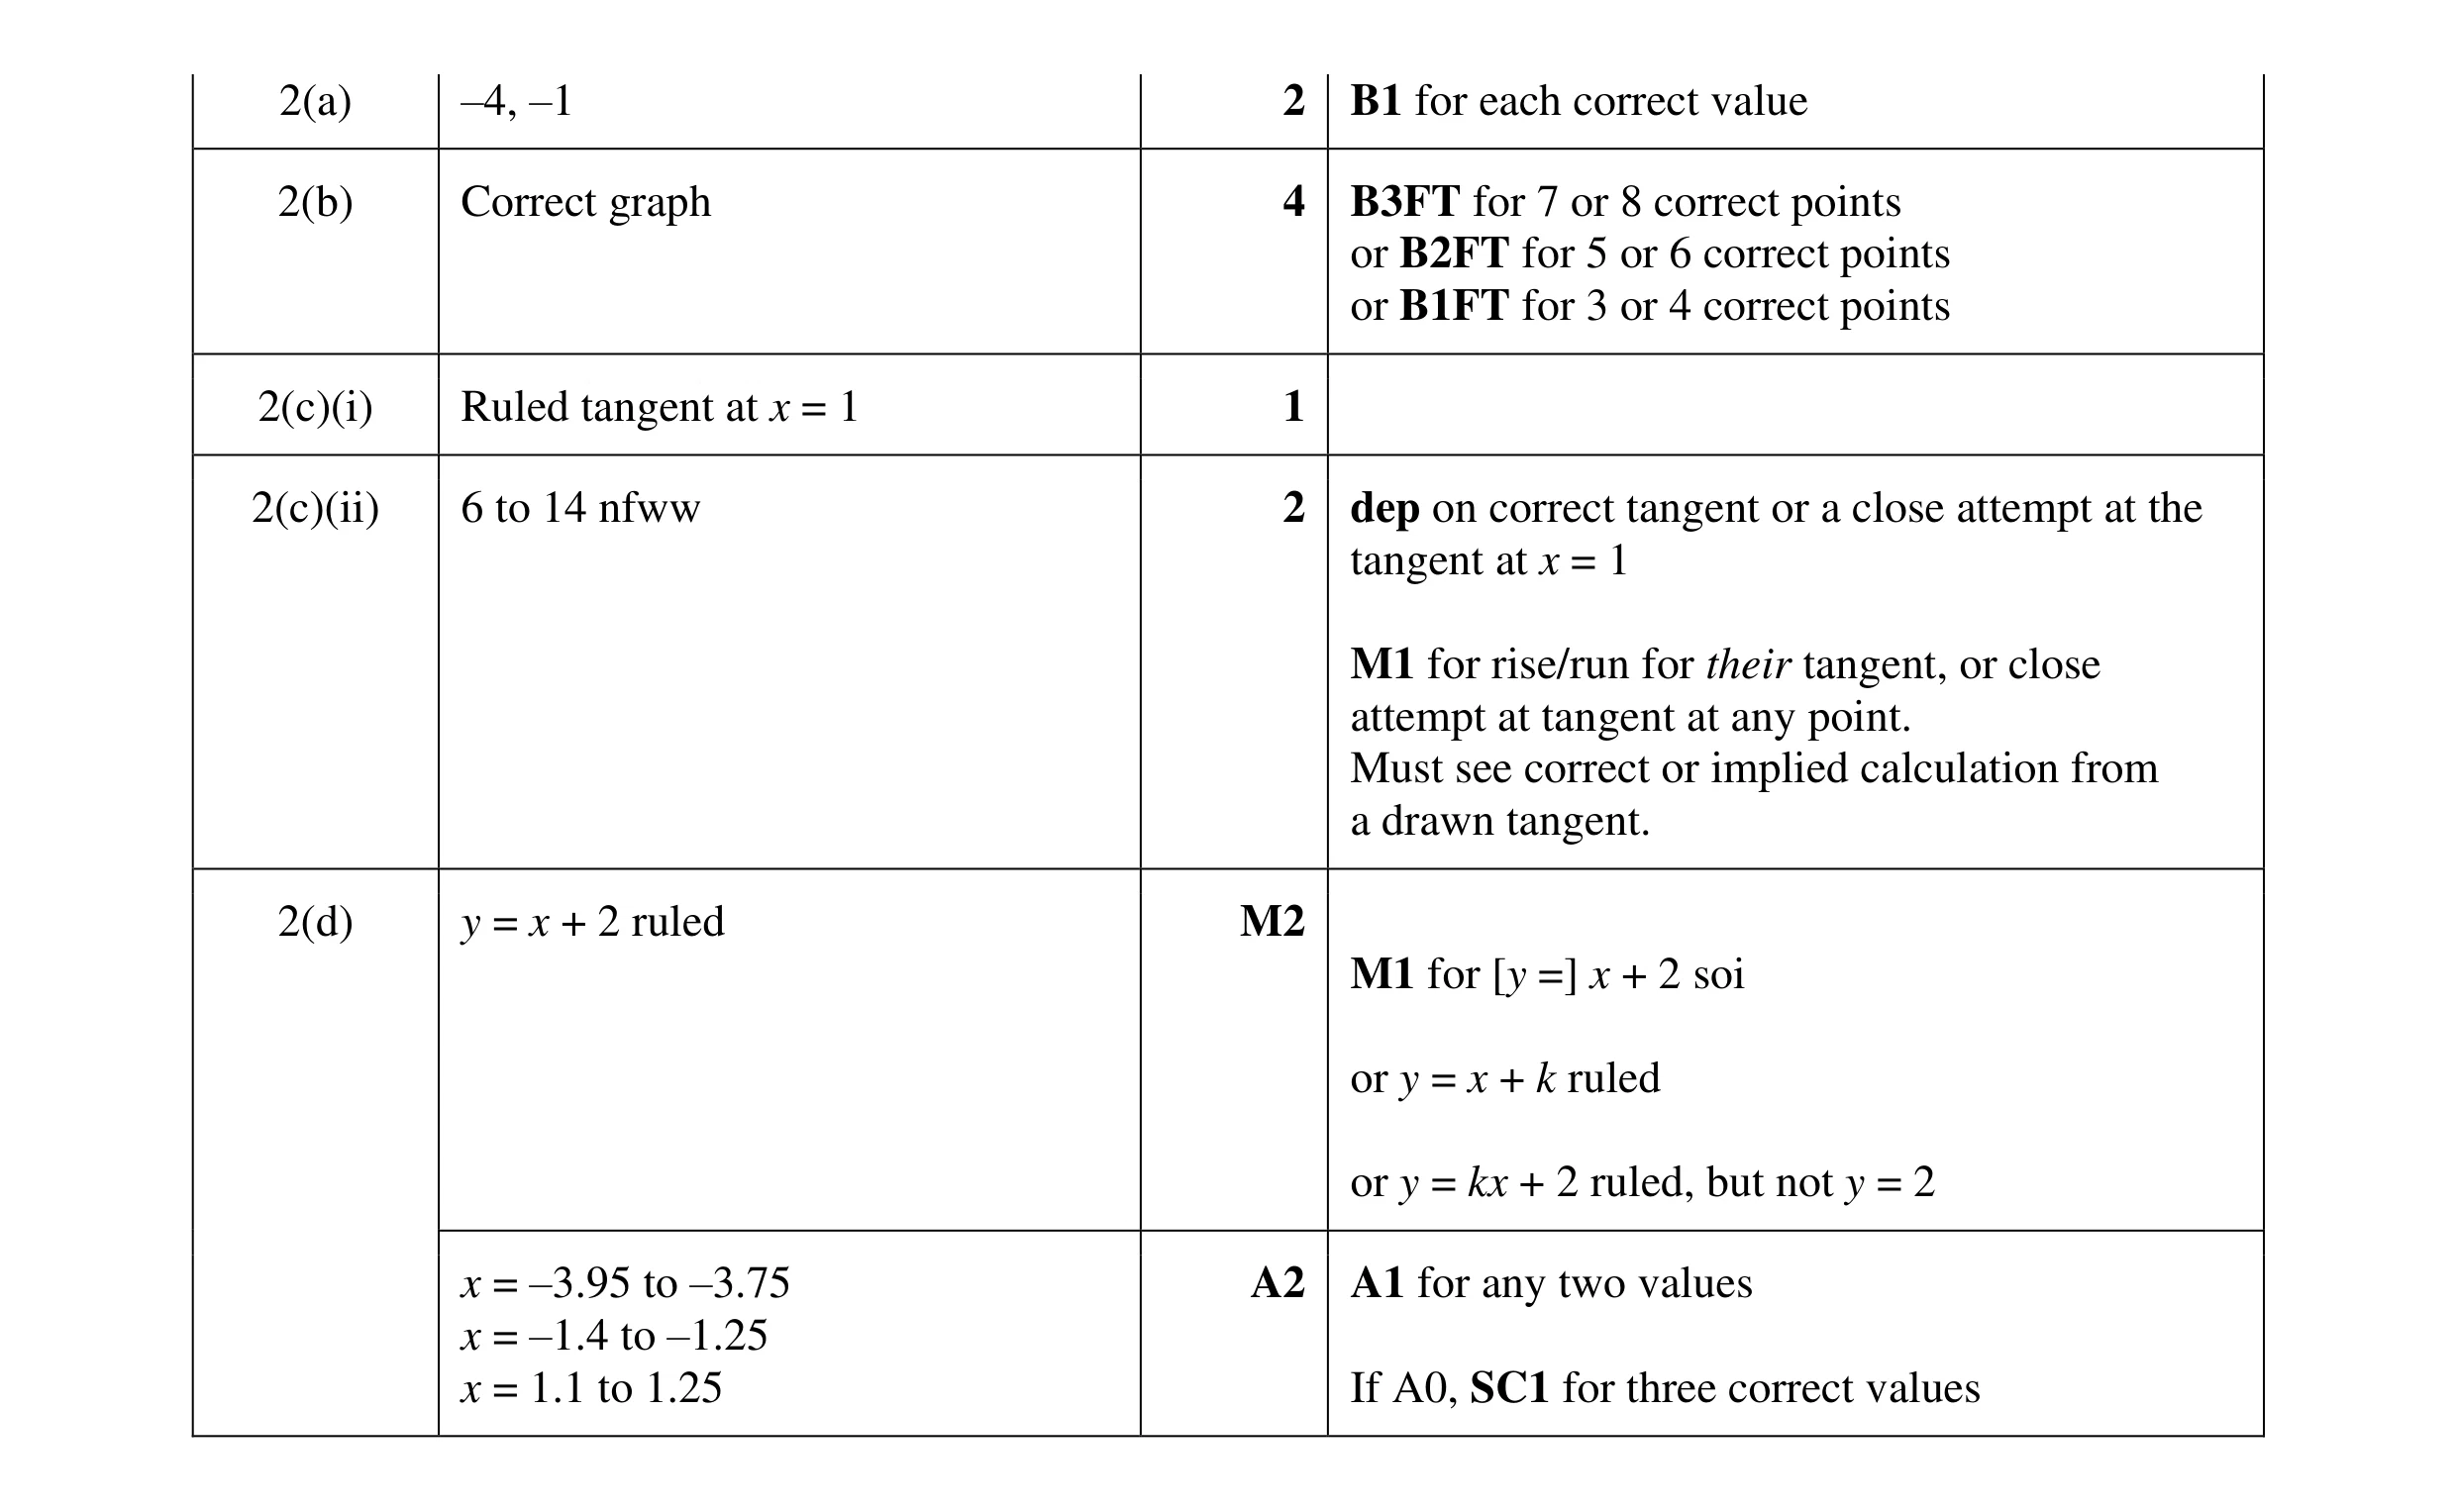 13
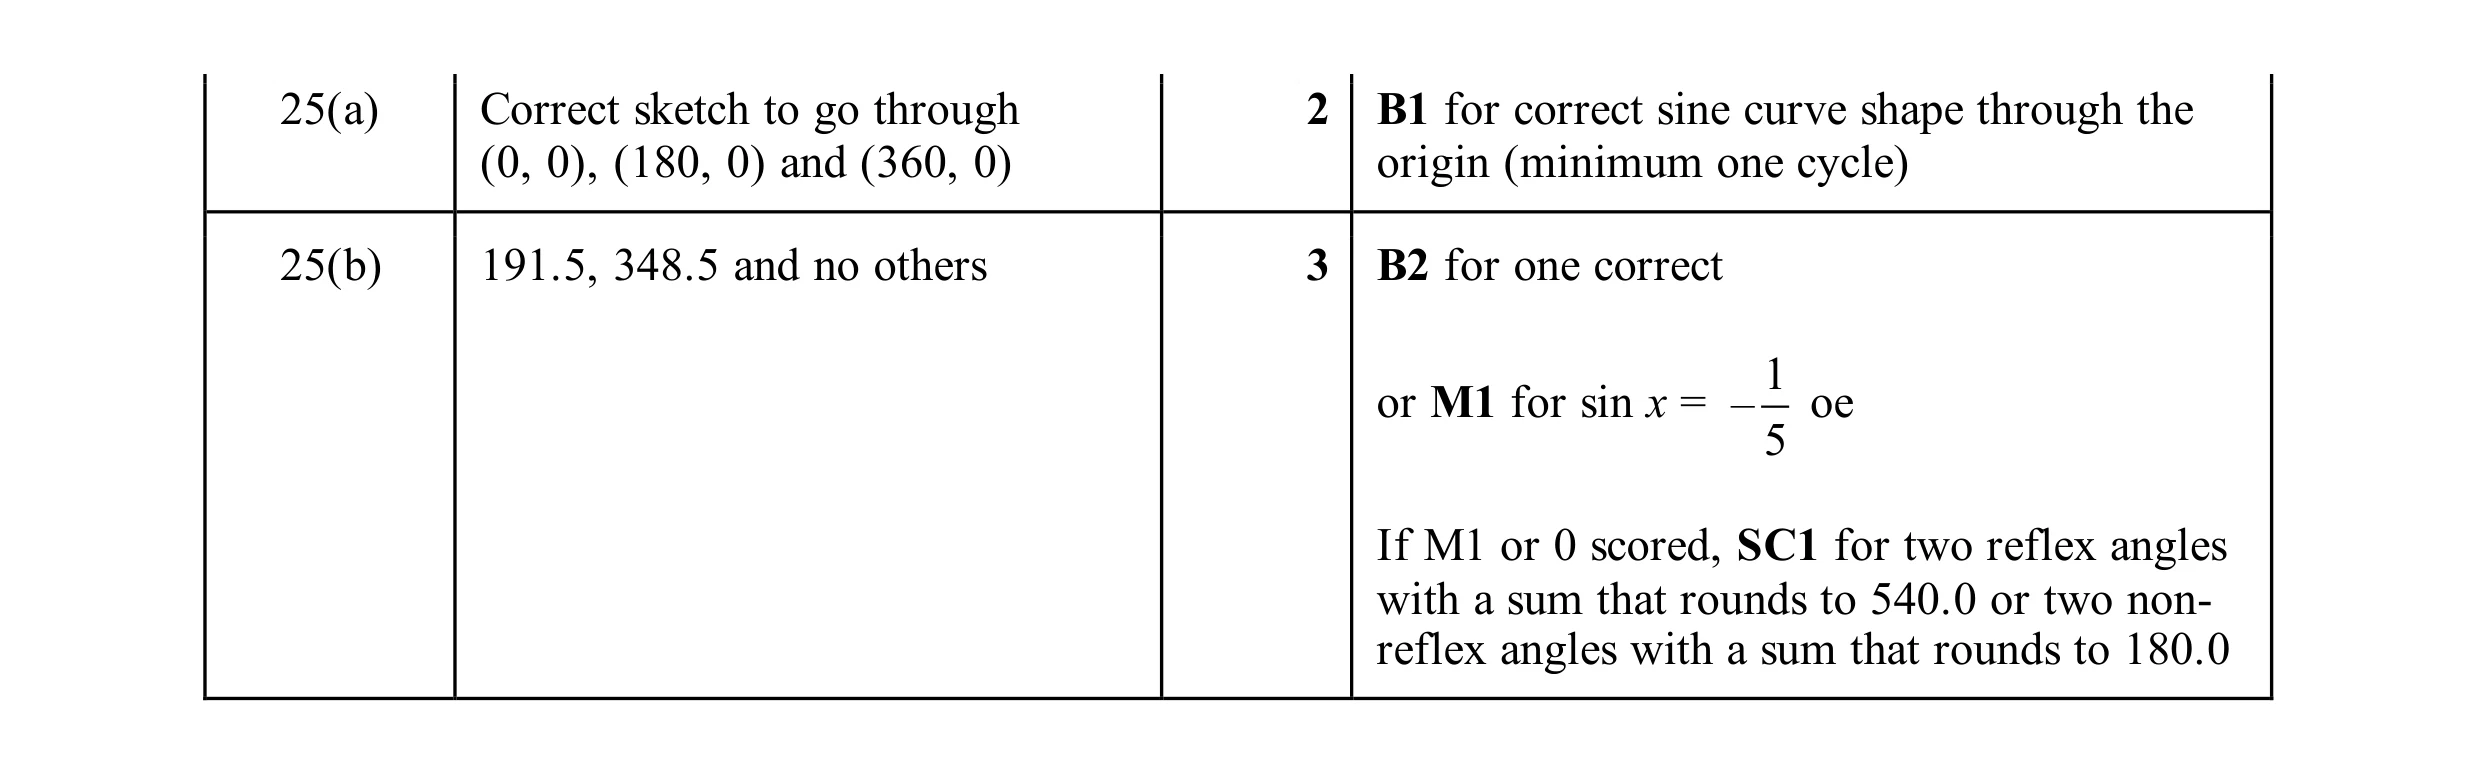 5
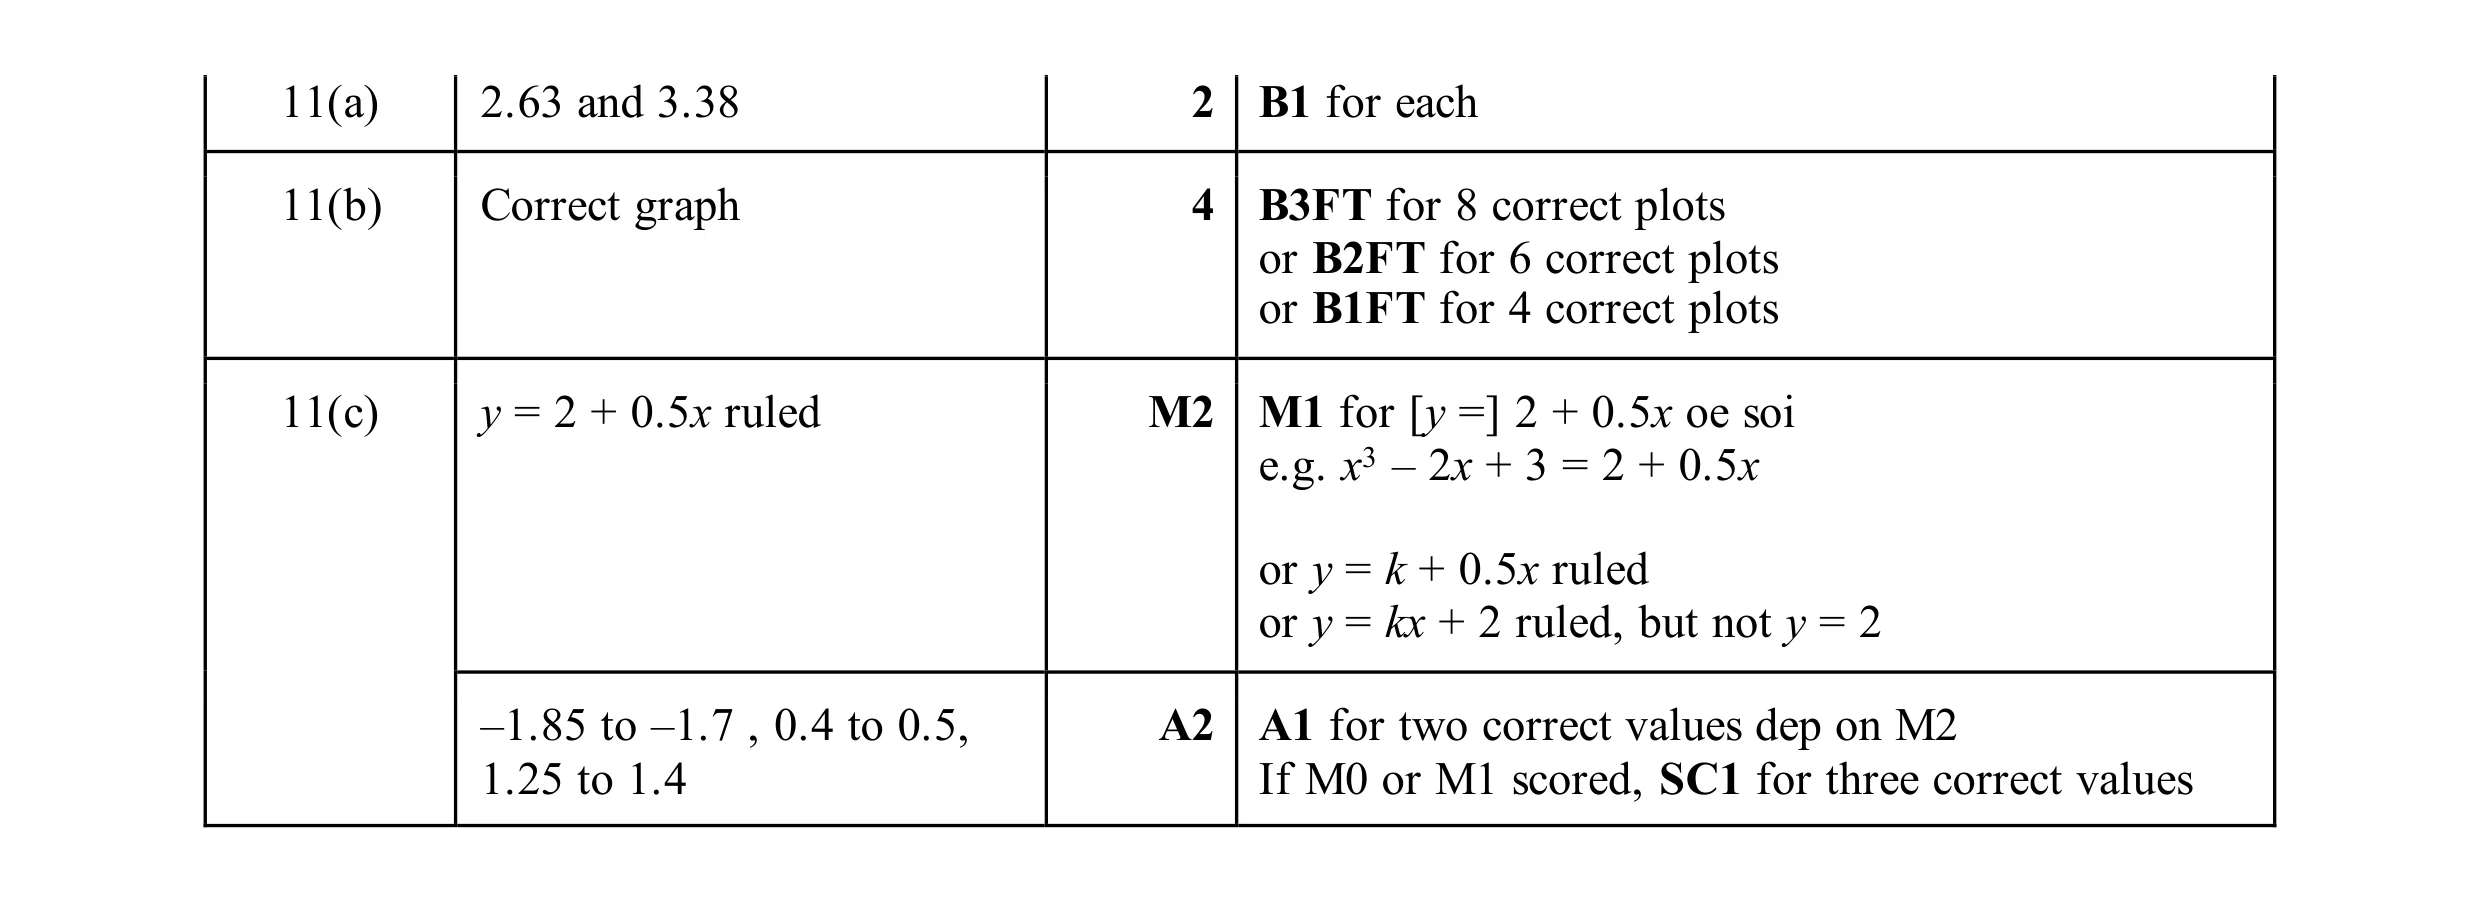 10