Questions as text
Q1 · Jane records the number of telephone calls she receives each day for two weeks 0580/31 Oct/Nov 2005
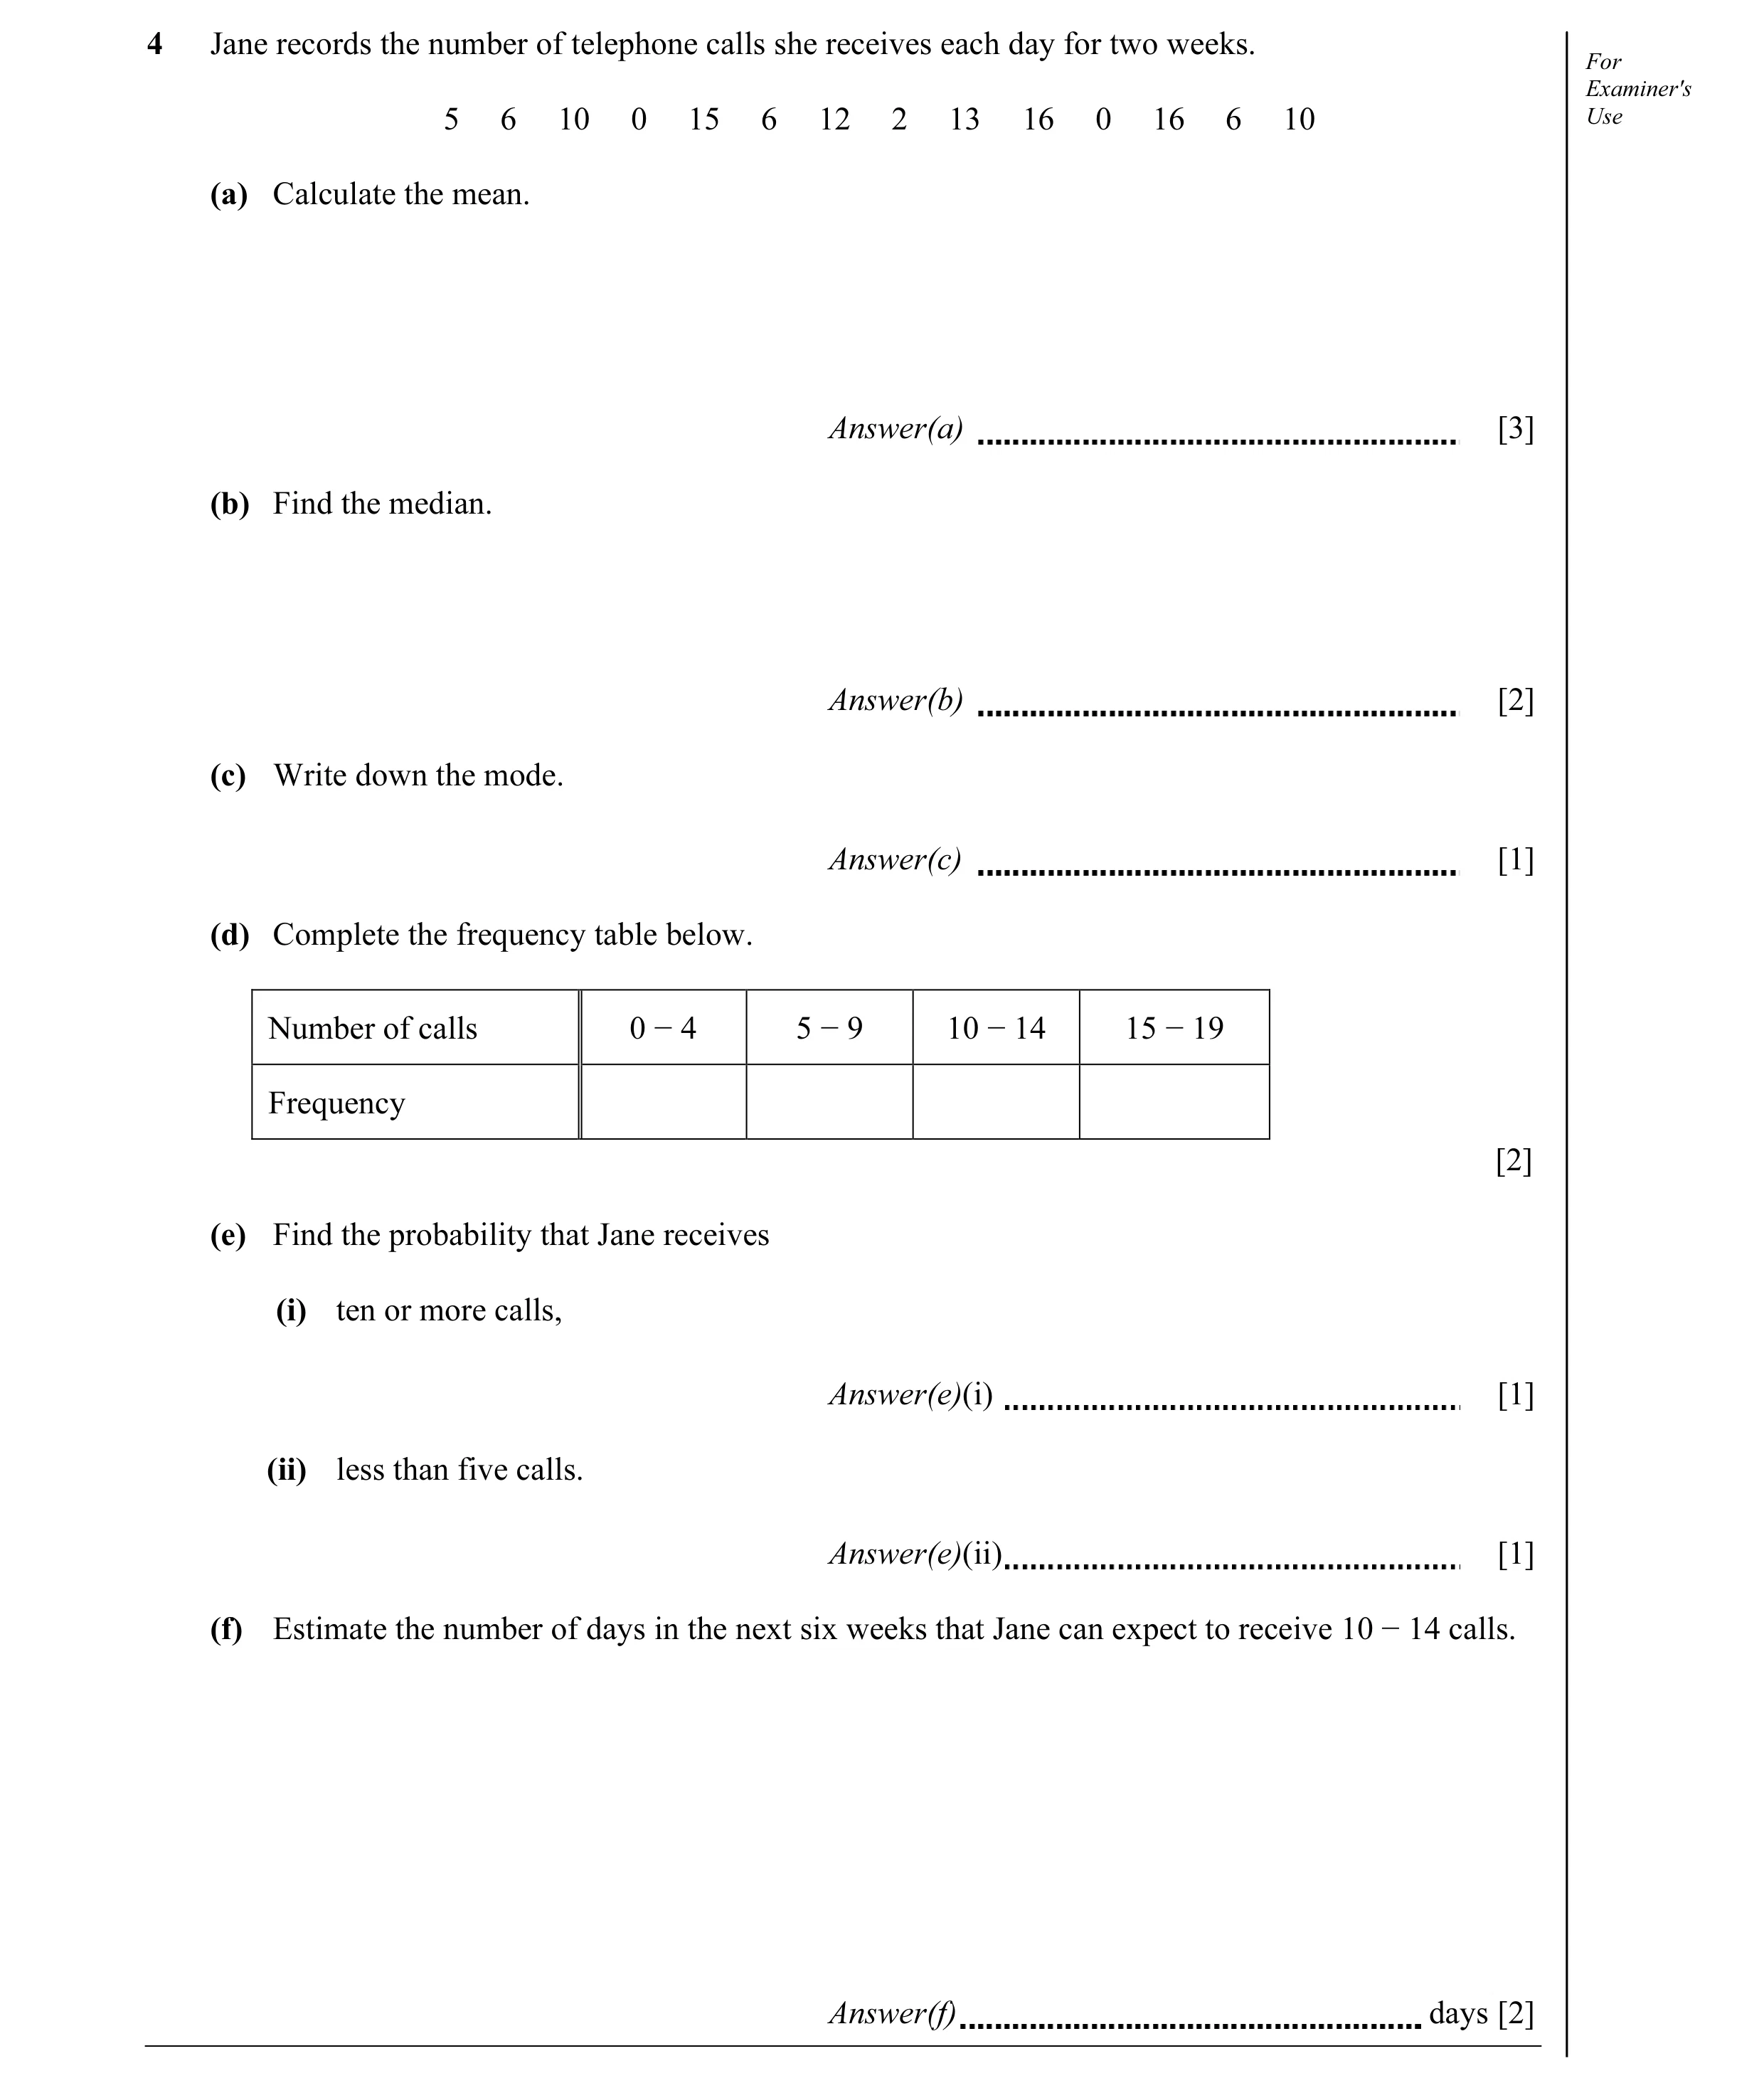
4 Jane records the number of telephone calls she receives each day for two weeks. For Examiner's 5 6 10 0 15 6 12 2 13 16 0 16 6 10 Use (a) Calculate the mean. Answer(a) [3] (b) Find the median. Answer(b) [2] (c) Write down the mode. Answer(c) [1] (d) Complete the frequency table below. Number of calls 0 − 4 5 − 9 10 − 14 15 − 19 Frequency [2] (e) Find the probability that Jane receives (i) ten or more calls, Answer(e)(i) [1] (ii) less than five calls. Answer(e)(ii) [1] (f) Estimate the number of days in the next six weeks that Jane can expect to receive 10 − 14 calls. Answer(f) days [2]
12 marks
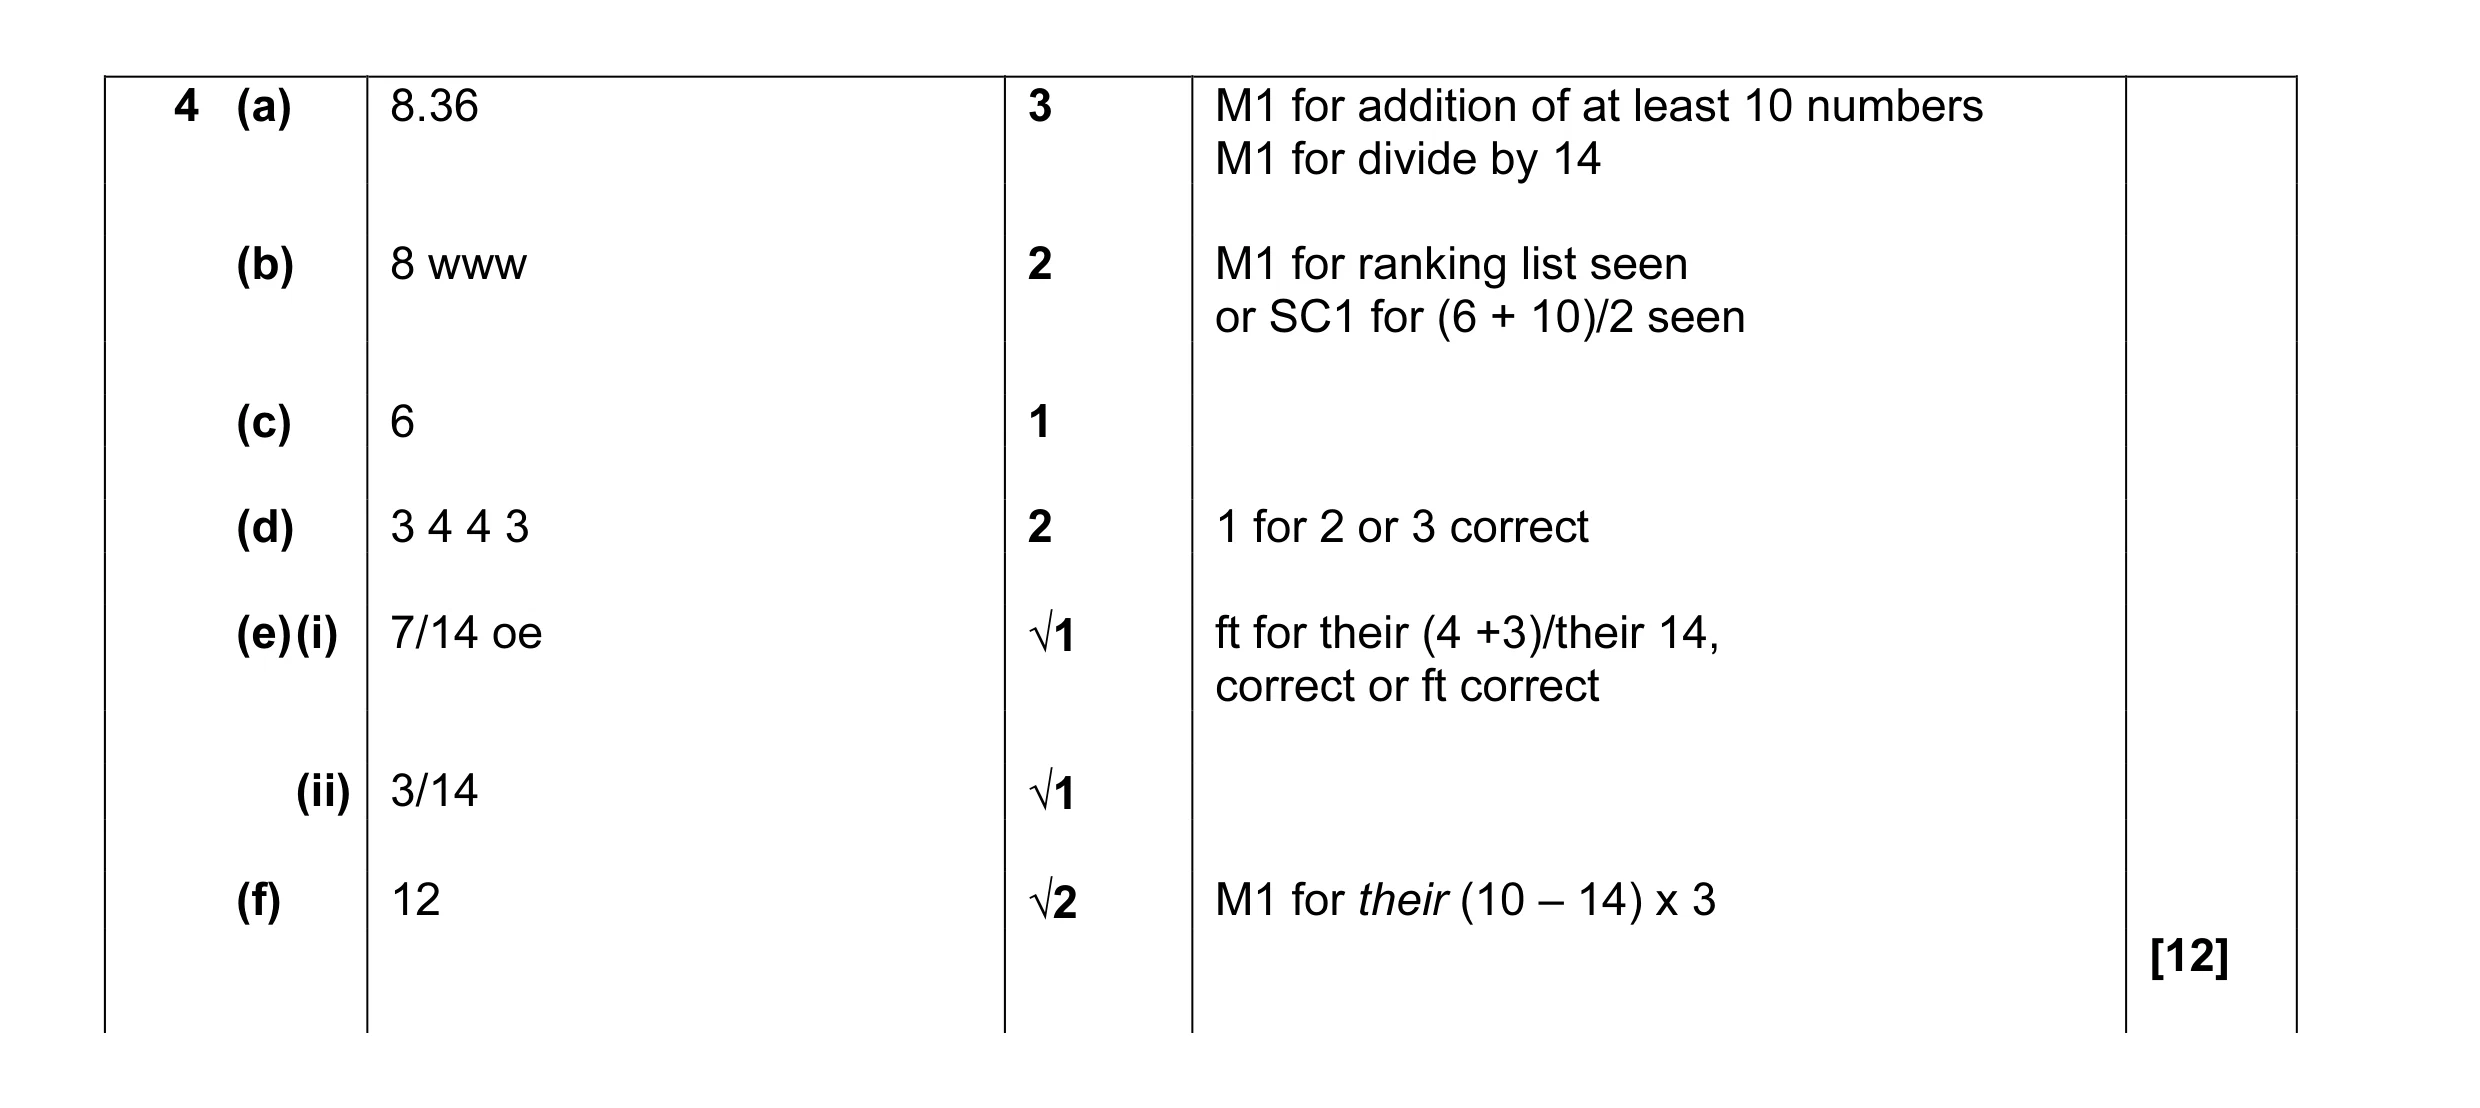
Mark scheme: 4 (a) 8.36 3 M1 for addition of at least 10 numbers M1 for divide by 14 (b) 8 www 2 M1 for ranking list seen or SC1 for (6 + 10)/2 seen (c) 6 1 (d) 3 4 4 3 2 1 for 2 or 3 correct (e) (i) 7/14 oe √1 ft for their (4 +3)/their 14, correct or ft correct (ii) 3/14 √1 (f) 12 √2 M1 for their (10 – 14) x 3 [12]
This question in 0580/31 Oct/Nov 2005
Q2 · A bag contains 24 discs 0580/31 May/June 2007
5 A bag contains 24 discs. For 10 discs are red, 9 discs are green and 5 discs are yellow. Examiner's Use (a) The number of discs of each colour can be shown by three sectors on a pie chart. The sector angle for the red discs is 150°. Work out the sector angle for (i) the green discs, Answer(a)(i) [1] (ii) the yellow discs. Answer(a)(ii) [1] (iii) Complete the pie chart below and label the sectors. [2] (b) A disc is chosen at random. For Examiner's Find, as a fraction, the probability of each of the following events. Use (i) Event A: the disc is red. Answer(b)(i) [1] (ii) Event B: the disc is red or yellow. Answer(b)(ii) [1] (iii) Event C: the disc is not yellow. Answer(b)(iii) [1] (c) Probability Scale Impossible Certain (c)(i) … (c)(ii) … The diagram shows a horizontal probability scale. Write on the dotted lines in the diagram, the probability of (i) an impossible event, [1] (ii) a certain event. [1] (d) Using the notation, A, B and C, mark the positions of your three answers in part (b) on the Probability Scale diagram in part (c). [3]
12 marks
Mark scheme: 5 (a) (i) 135 (green) B1 (ii) 75 (yellow) B1 (iii) Ruled lines correct to 2° B1ft Only if (a)(i) + (a)(ii) = 210°. 3 correctly labelled sectors B1 Independent of previous marks 10 (b) (i) oe B1 Accept decimals, percentages 24 15 (ii) oe B1 24 19 (iii) oe B1 24 0 12 0 24 (c) (i) 0 B1 SC1 for and or and 12 12 24 24 (ii) 1 B1 (d) Labelled arrows correctly B3ft 1 mark for each. positioned by eye ft their probabilities from (b). [12]
This question in 0580/31 May/June 2007
Q3 · Carlos is in a class of 12 students 0580/31 Oct/Nov 2007
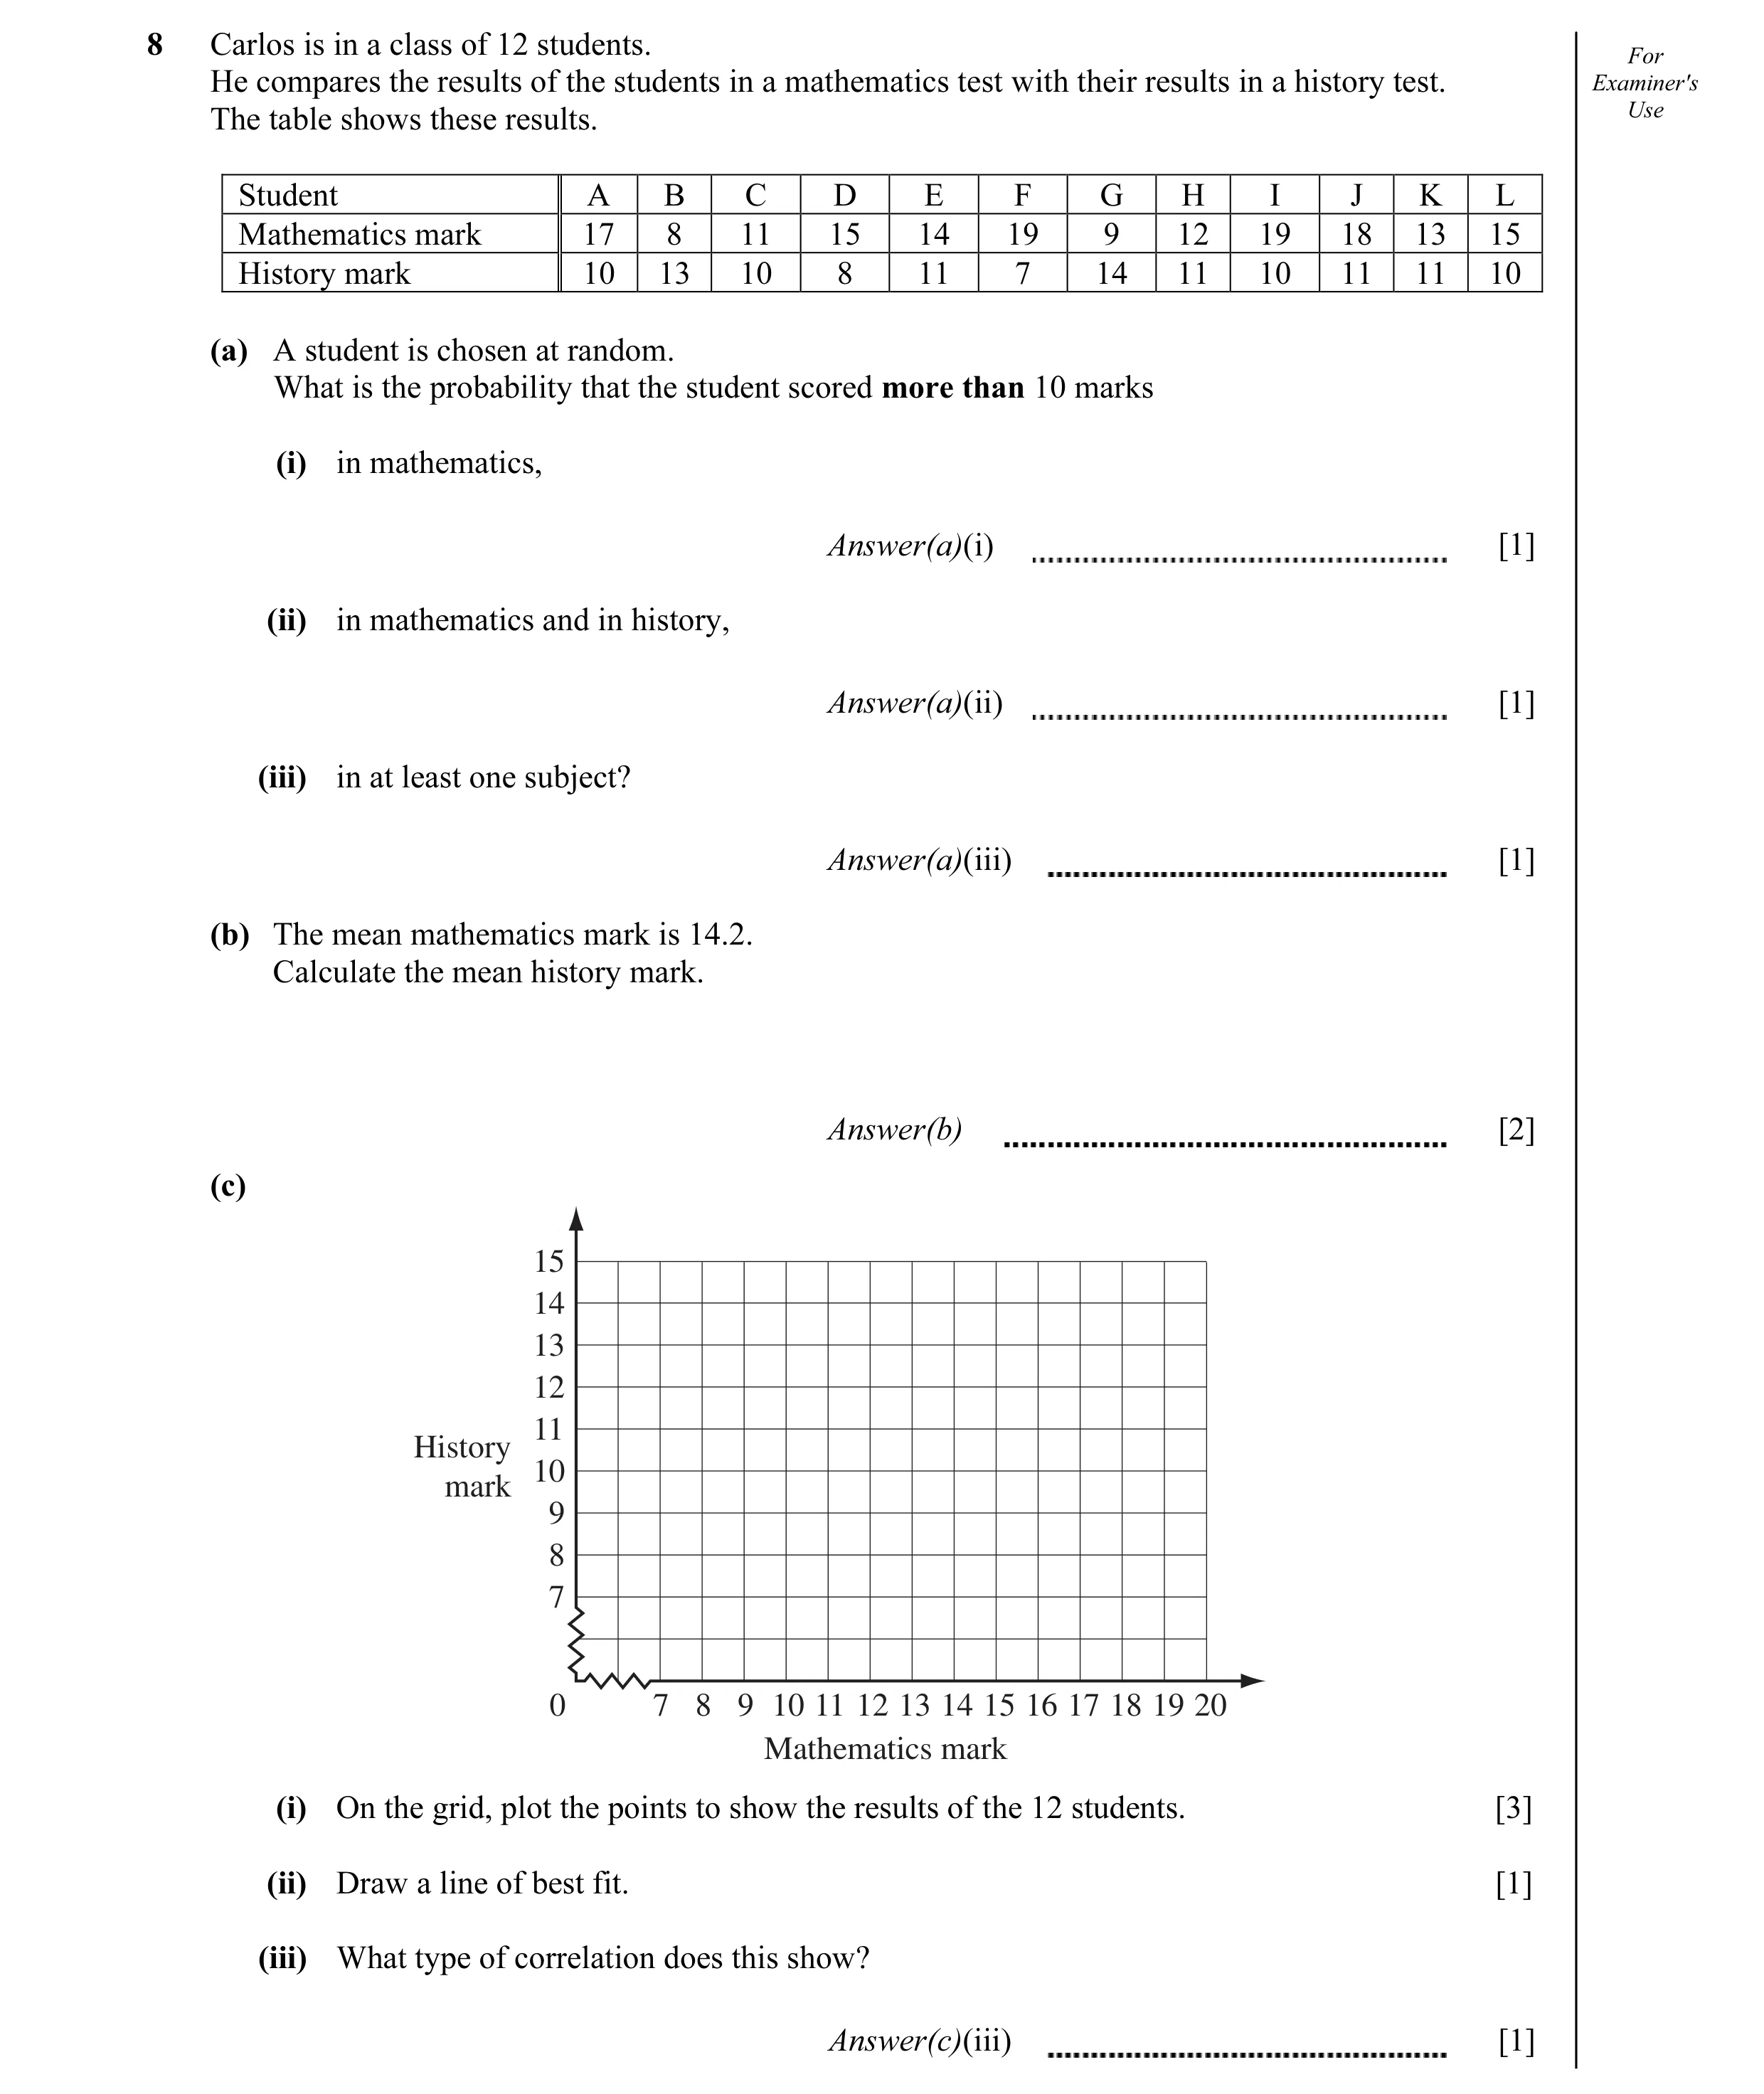
8 Carlos is in a class of 12 students. For He compares the results of the students in a mathematics test with their results in a history test. Examiner's The table shows these results. Use Student A B C D E F G H I J K L Mathematics mark 17 8 11 15 14 19 9 12 19 18 13 15 History mark 10 13 10 8 11 7 14 11 10 11 11 10 (a) A student is chosen at random. What is the probability that the student scored more than 10 marks (i) in mathematics, Answer(a)(i) [1] (ii) in mathematics and in history, Answer(a)(ii) [1] (iii) in at least one subject? Answer(a)(iii) [1] (b) The mean mathematics mark is 14.2. Calculate the mean history mark. Answer(b) [2] (c) 15 14 13 12 11 History 10 mark 9 8 7 0 7 8 9 10 11 12 13 14 15 16 17 18 19 20 Mathematics mark (i) On the grid, plot the points to show the results of the 12 students. [3] (ii) Draw a line of best fit. [1] (iii) What type of correlation does this show? Answer(c)(iii) [1]
10 marks
Mark scheme: 8 (a) (i) 10 / 12. B1 oe 2 sf for decimals and %'s (with sign) throughout (ii) 4 / 12. B1 oe (iii) 12 / 12. B1 oe (b) 10.5 B2 M1 for (10+13+10+8+ ) / 12 or 126 / 12 (c) (i) 12 points plotted B3 B2 for 11, B1 for 10 (ii) ruled line B1 reasonable, at least from 8 to 19 (iii) negative B1 cao [10] IGCSE – October/November 2007 0580 and 0581 3
This question in 0580/31 Oct/Nov 2007
Q4 · Jon spins this 6-sided spinner 0580/31 May/June 2012
3 (a) Jon spins this 6-sided spinner. For 2 Examiner's 2 10 Use 4 8 6 The probability that the spinner lands on any of the six sides is equally likely. Write down the probability that the spinner lands on (i) the number 6, Answer(a)(i) [1] (ii) a prime number, Answer(a)(ii) [1] (iii) a number less than 11. Answer(a)(iii) [1] (b) Felix has a 12-sided spinner with the numbers 2, 4, 5, 7 and 9 written on it. It is equally likely to land on any side. The table shows the probability of the spinner landing on each number. Number on spinner 2 4 5 7 9 1 1 1 1 1 Probability 4 3 6 6 12 The diagram of the spinner has been completed for the number 2. Complete the diagram for the numbers 4, 5, 7 and 9. 2 2 2 [3] (c) Felix says that his spinner is more likely to land on a 2 than Jon’s spinner. Explain why he is wrong. Answer(c) [1] (d) Felix spins his 12-sided spinner 60 times and records the results. For Examiner's Use Number on spinner Frequency Pie chart sector angle 2 15 90° 4 20 120° 5 5 30° 7 12 9 8 (i) Complete the table by working out the sector angles for the numbers 7 and 9 . [3] (ii) Complete the pie chart. 2 4 [2] (iii) Write down the mode. Answer(d)(iii) [1] (iv) Calculate the mean. Answer(d)(iv) [3]
16 marks
Mark scheme: 1 3 (a) (i) oe 1 Accept 0.167 or 16.7% or better 6 2 1 (ii) oe 1 Accept or 0.333 or 33.3% or better 6 3 (iii) 1 1 Accept “one” or 100% (b) (2,2,2), 4,4,4,4,5,5,7,7,9 seen on 3 B1 for 4,4,4,4 seen spinner B1 for 5,5 AND 7,7 seen B1 for ONE 9 seen. 3 (c) Felix’s probability is which is 1 Accept equivalent reasoning 12 2 less than Jon’s probability (of ) 6 4 which is oe 12 360 (d) (i) (90°, 120°, 30°), 72°, 48° 3 M1 for × f for one ‘Number’ correct 60 A1 for 1 correct answer If zero scored SC1 for their two answers totalling 120° (ii) 30° angle correct 1 72°, 48° 1ft (iii) 4 1 (iv) 4.85 3 M1 2 × 15 + 4 × 20 + 5 × 5 + 7 × 12 + 9 × 8 (allow 1 error) Σfx M1 dep for their 60
This question in 0580/31 May/June 2012
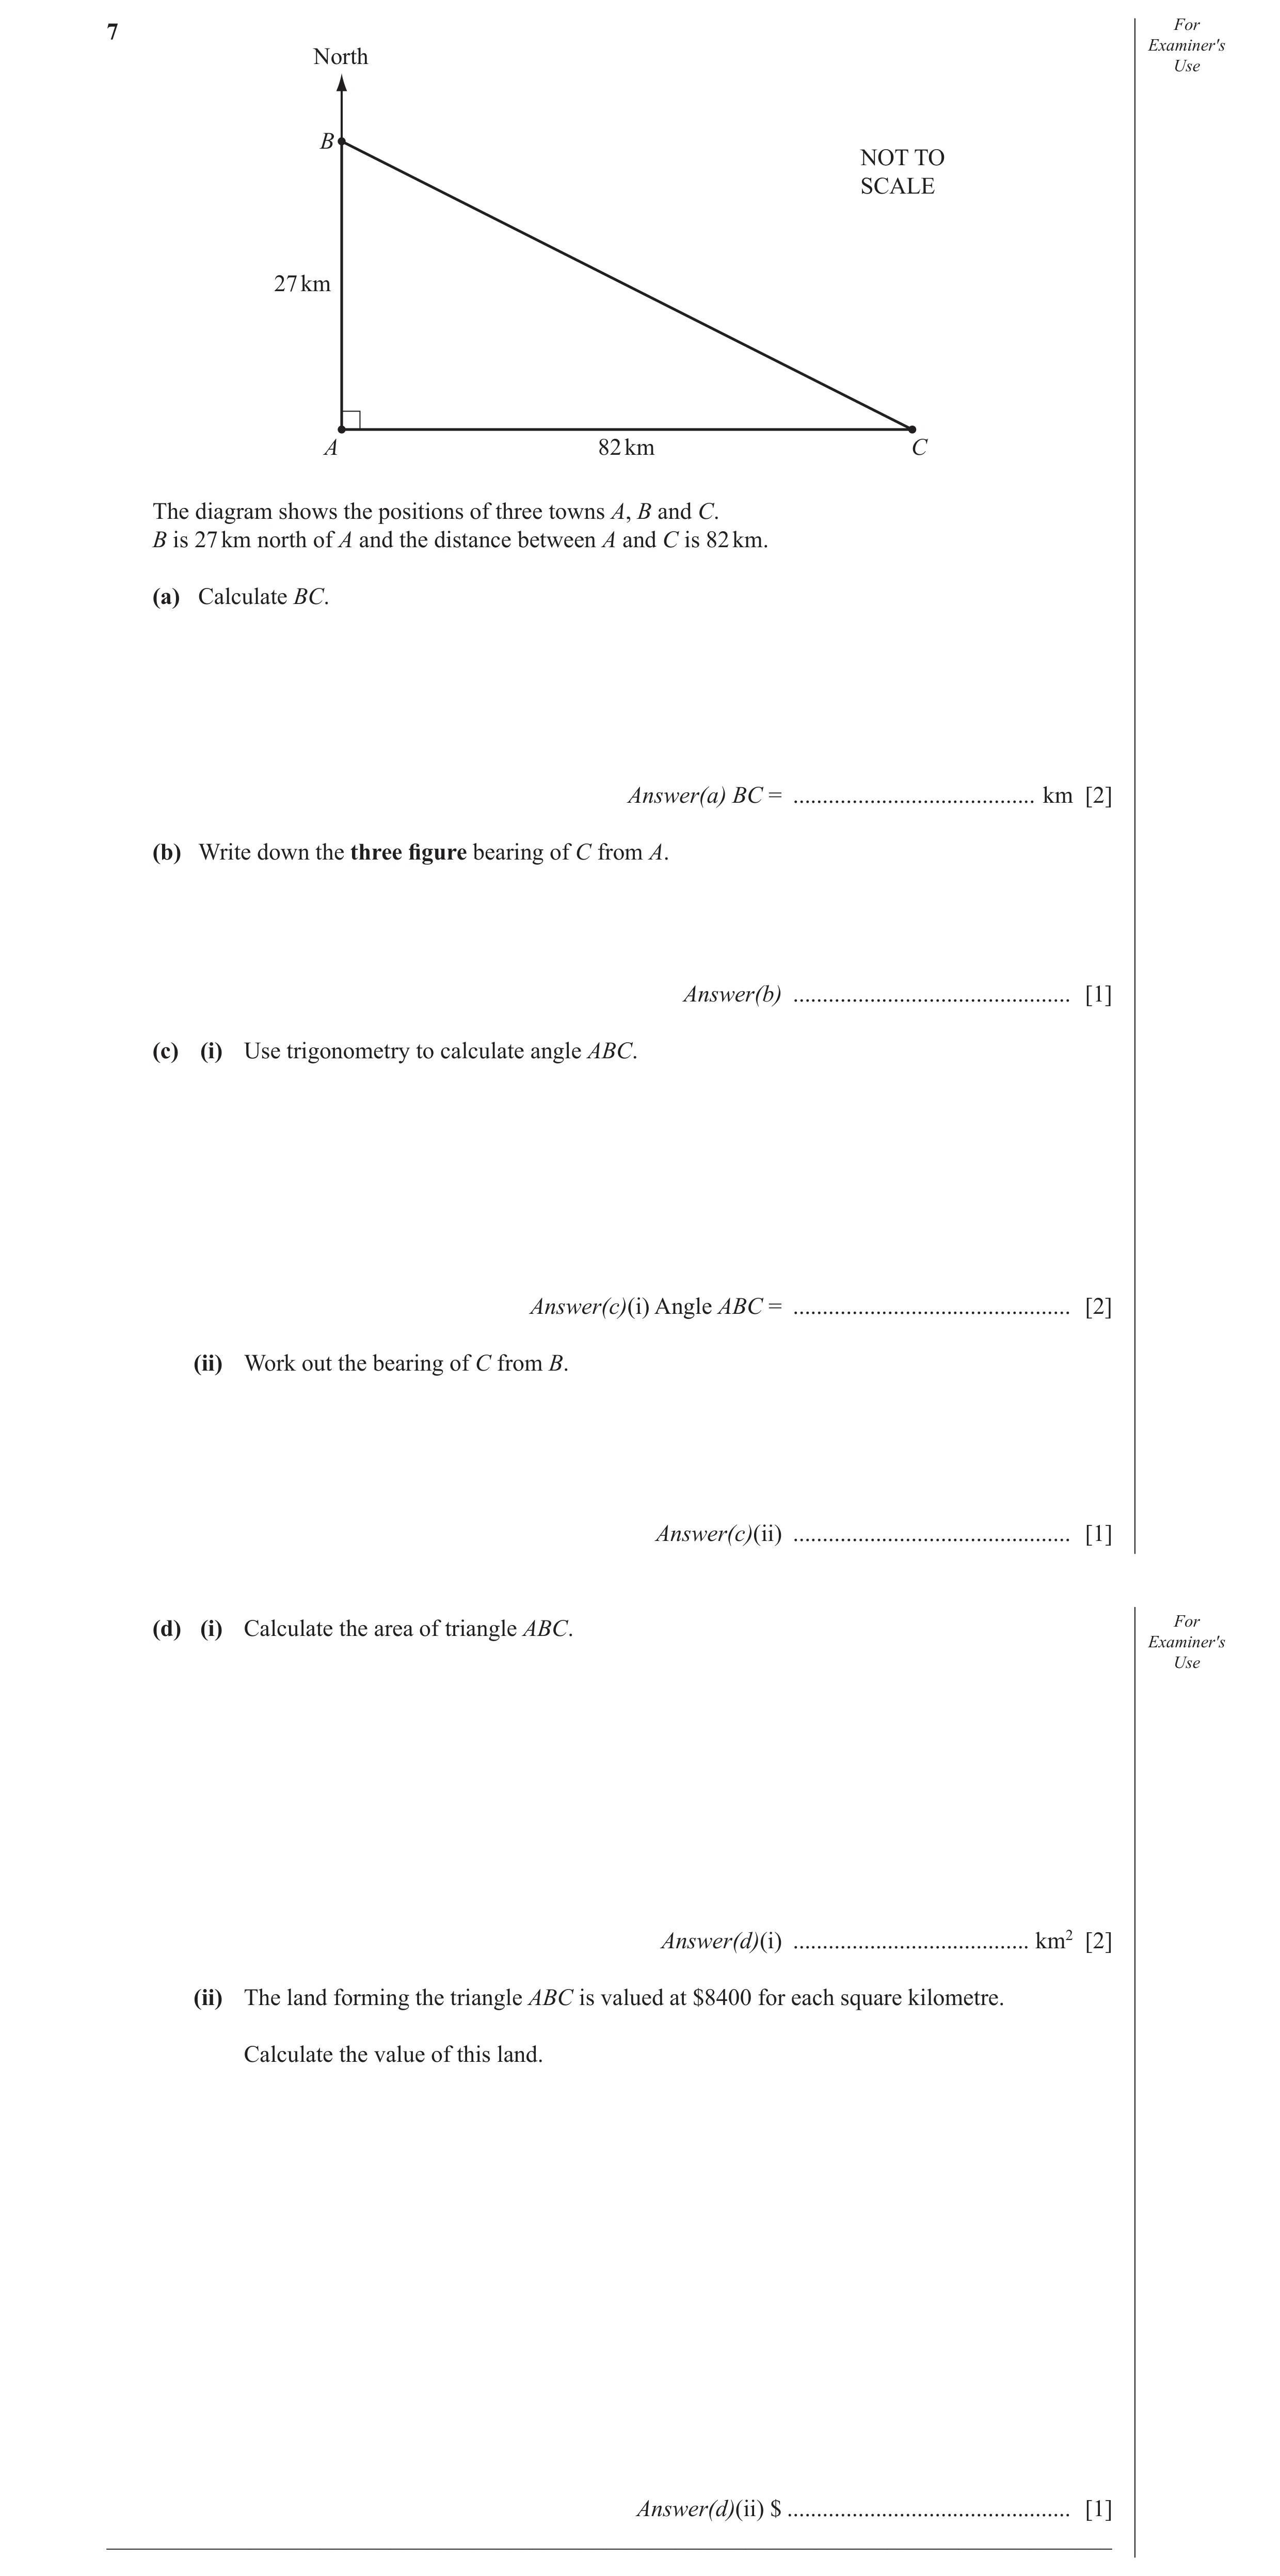
Q5 · For Examiner′s North Use B NOT TO SCALE 27 km A 82 km C The diagram shows the positions… 0580/31 May/June 2013
7 For Examiner′s North Use B NOT TO SCALE 27 km A 82 km C The diagram shows the positions of three towns A, B and C. B is 27 km north of A and the distance between A and C is 82 km. (a) Calculate BC. Answer(a) BC = … km [2] (b) Write down the three fi gure bearing of C from A. Answer(b) … [1] (c) (i) Use trigonometry to calculate angle ABC. Answer(c)(i) Angle ABC = … [2] (ii) Work out the bearing of C from B. Answer(c)(ii) … [1] (d) (i) Calculate the area of triangle ABC. For Examiner′s Use Answer(d)(i) … km2 [2] (ii) The land forming the triangle ABC is valued at $8400 for each square kilometre. Calculate the value of this land. Answer(d)(ii) $ … [1] _____________________________________________________________________________________
9 marks
Mark scheme: 7 (a) 86.3 or 86.33075….. 2 M1 for [BC =] 27 2 + 82 2 or 729+ 6724 or 7453 (b) 090 cao 1 (c) (i) 71.8 or 71.77492….. 2 M1 for tan [x=] (82÷27) or better oe (ii) 108.2 or 108 1ft (d) (i) 1107 2 M1 for 27×82÷2 or better, imp by 1110 (ii) 9 298 800 1ft
This question in 0580/31 May/June 2013
Q6 · 120 people are asked how they travel to work 0580/31 May/June 2014
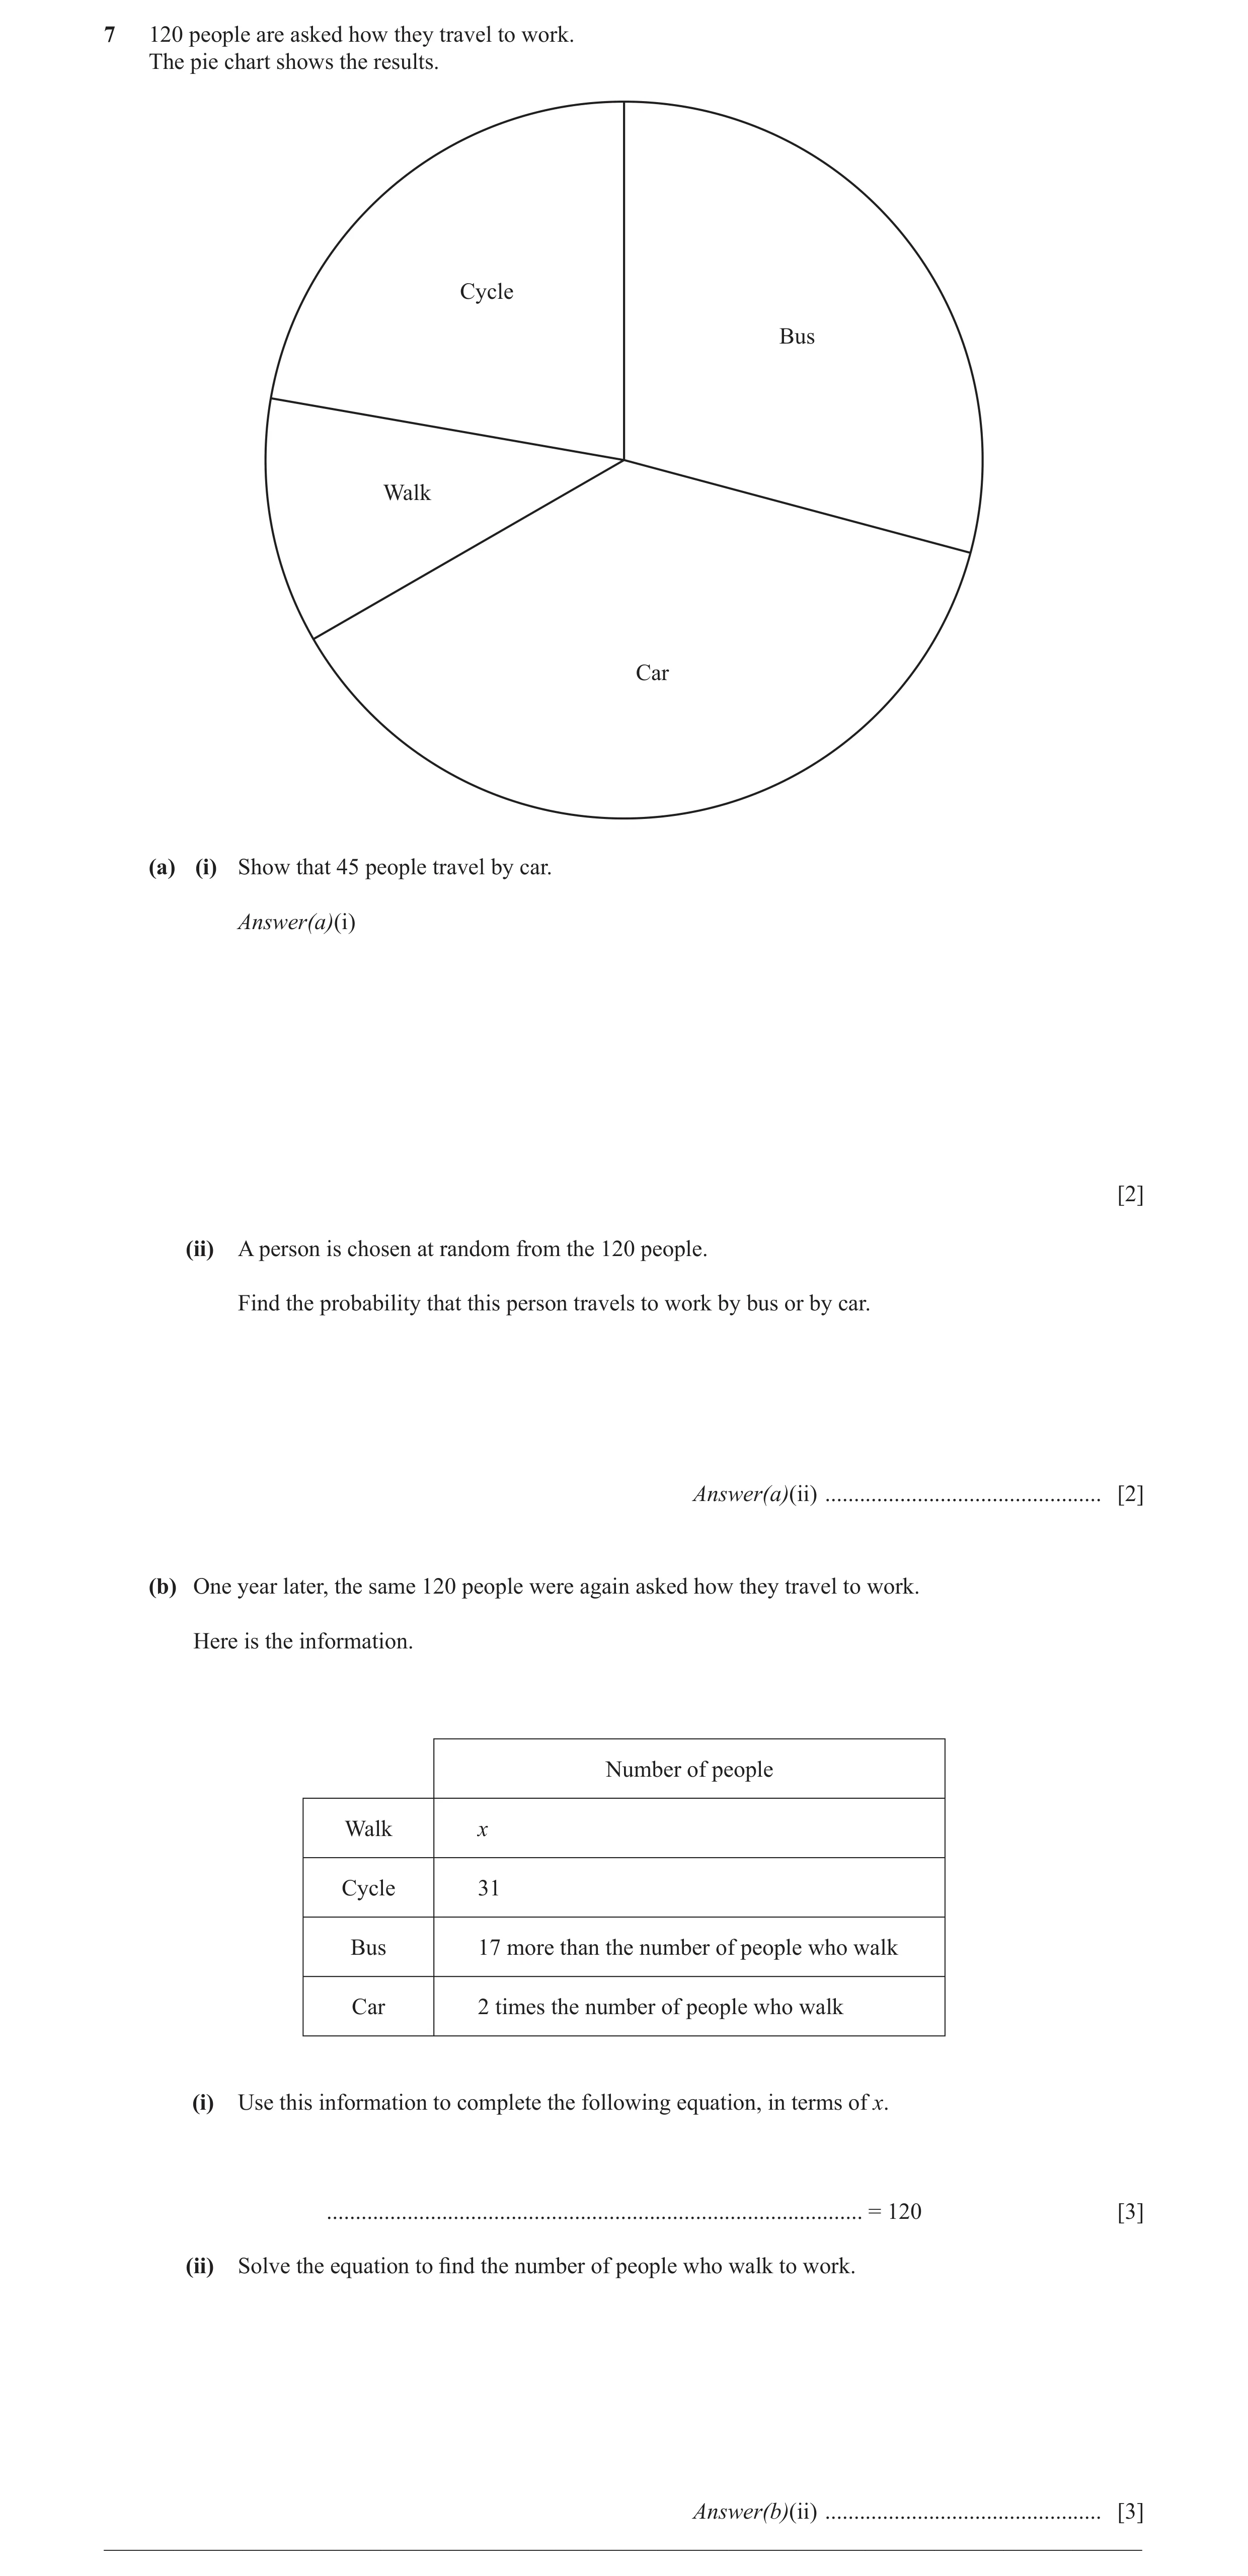
7 120 people are asked how they travel to work. The pie chart shows the results. Cycle Bus Walk Car (a) (i) Show that 45 people travel by car. Answer(a)(i) [2] (ii) A person is chosen at random from the 120 people. Find the probability that this person travels to work by bus or by car. Answer(a)(ii) … [2] (b) One year later, the same 120 people were again asked how they travel to work. Here is the information. Number of people Walk x Cycle 31 Bus 17 more than the number of people who walk Car 2 times the number of people who walk (i) Use this information to complete the following equation, in terms of x. … = 120 [3] (ii) Solve the equation to fi nd the number of people who walk to work. Answer(b)(ii) … [3] __________________________________________________________________________________________
10 marks
Mark scheme: 7 (a) (i) [Car angle =] 135 (± 2°) B1 135 ÷ 360 × 120 ( = 45 ) M1 (ii) 2 2 B1 for angles of 238° to 242° or value from 0.658 to 0.675 or 79 to 81 people 3 (b) (i) x + 31 + x + 17 + 2x [= 120] or better 3 B1 for x + 17 – seen together B1 for 2x (ii) 18 cao 3 M1 FT for their (4x + 48) [=120] or their 2x + x + x = 120 – 31 – 17 or better. M1FT for their (4x = 72) If zero SC2 for a correct numerical solution of their equation of equivalent difficulty.
This question in 0580/31 May/June 2014
Q7 · One day a survey is taken of the ages of 120 children at a fairground 0580/31 Oct/Nov 2014
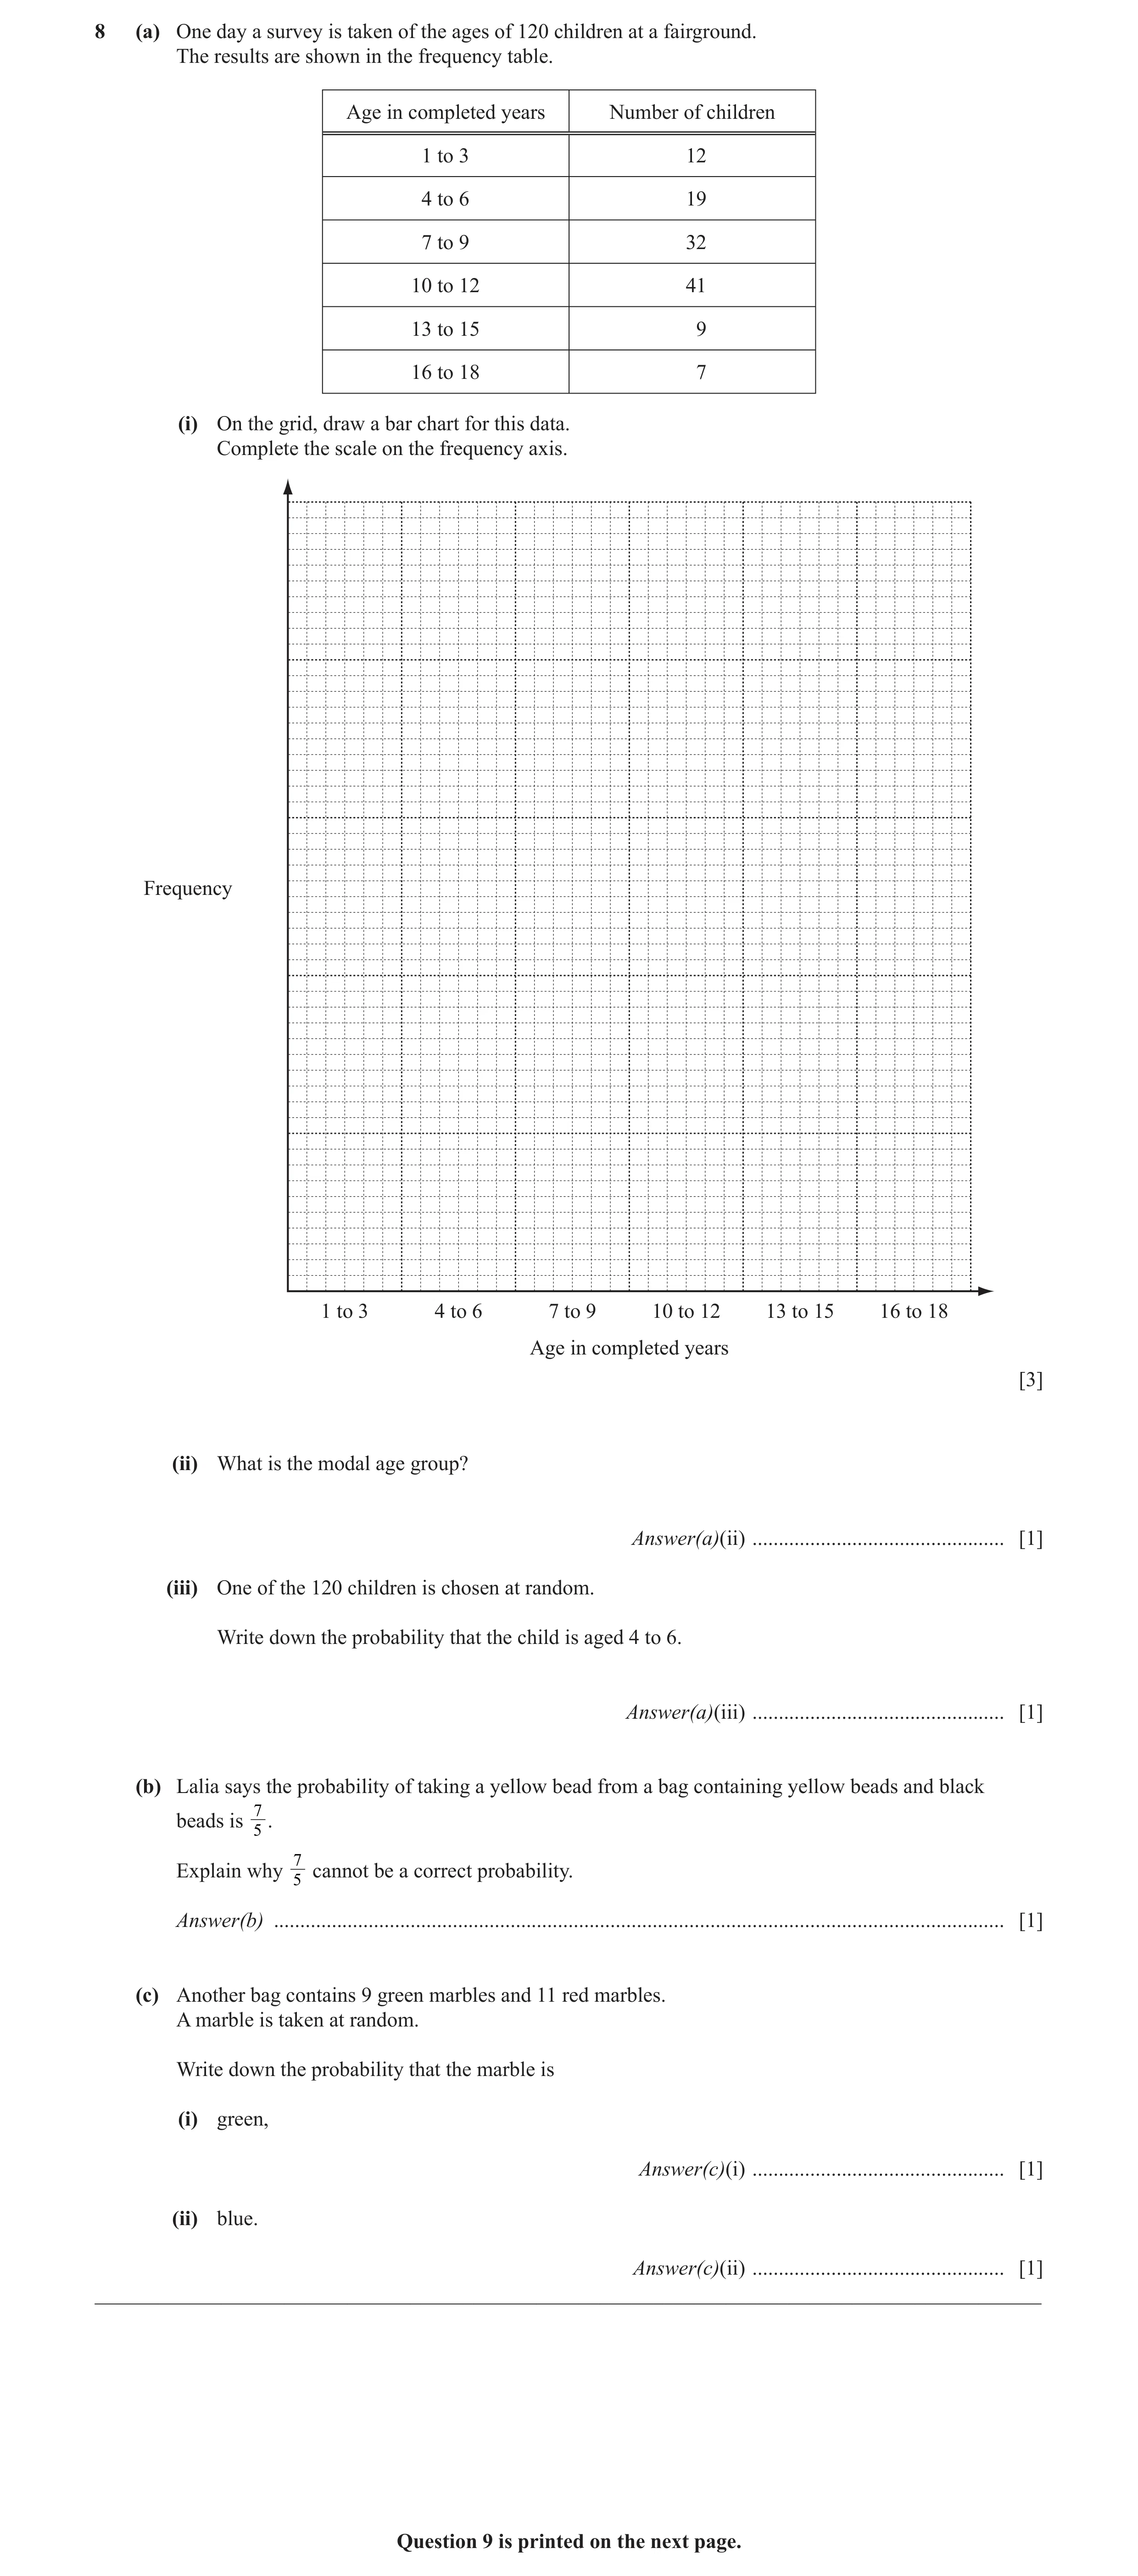
8 (a) One day a survey is taken of the ages of 120 children at a fairground. The results are shown in the frequency table. Age in completed years Number of children 1 to 3 12 4 to 6 19 7 to 9 32 10 to 12 41 13 to 15 9 16 to 18 7 (i) On the grid, draw a bar chart for this data. Complete the scale on the frequency axis. Frequency 1 to 3 4 to 6 7 to 9 10 to 12 13 to 15 16 to 18 Age in completed years [3] (ii) What is the modal age group? Answer(a)(ii) … [1] (iii) One of the 120 children is chosen at random. Write down the probability that the child is aged 4 to 6. Answer(a)(iii) … [1] (b) Lalia says the probability of taking a yellow bead from a bag containing yellow beads and black 7 beads is . 5 7 Explain why cannot be a correct probability. 5 Answer(b) … [1] (c) Another bag contains 9 green marbles and 11 red marbles. A marble is taken at random. Write down the probability that the marble is (i) green, Answer(c)(i) … [1] (ii) blue. Answer(c)(ii) … [1] __________________________________________________________________________________________ Question 9 is printed on the next page.
8 marks
Mark scheme: 8 (a) (i) Correct diagram with scale 3 B1 scale correct. B1 for all widths the same B1 for all 6 heights correct (ii) 10 to 12 cao 1 19 (iii) or 0.158[3 … ] or 15.8[3 … ]% 1 120 (b) Probability must be between 0 and 1 oe 1 9 (c) (i) or 0.45 or 45% 1 20 (ii) 0 oe 1
This question in 0580/31 Oct/Nov 2014
Q8 · The Patel family flies from their home town, H, to Kiruna, K, in Lapland 0580/31 May/June 2015
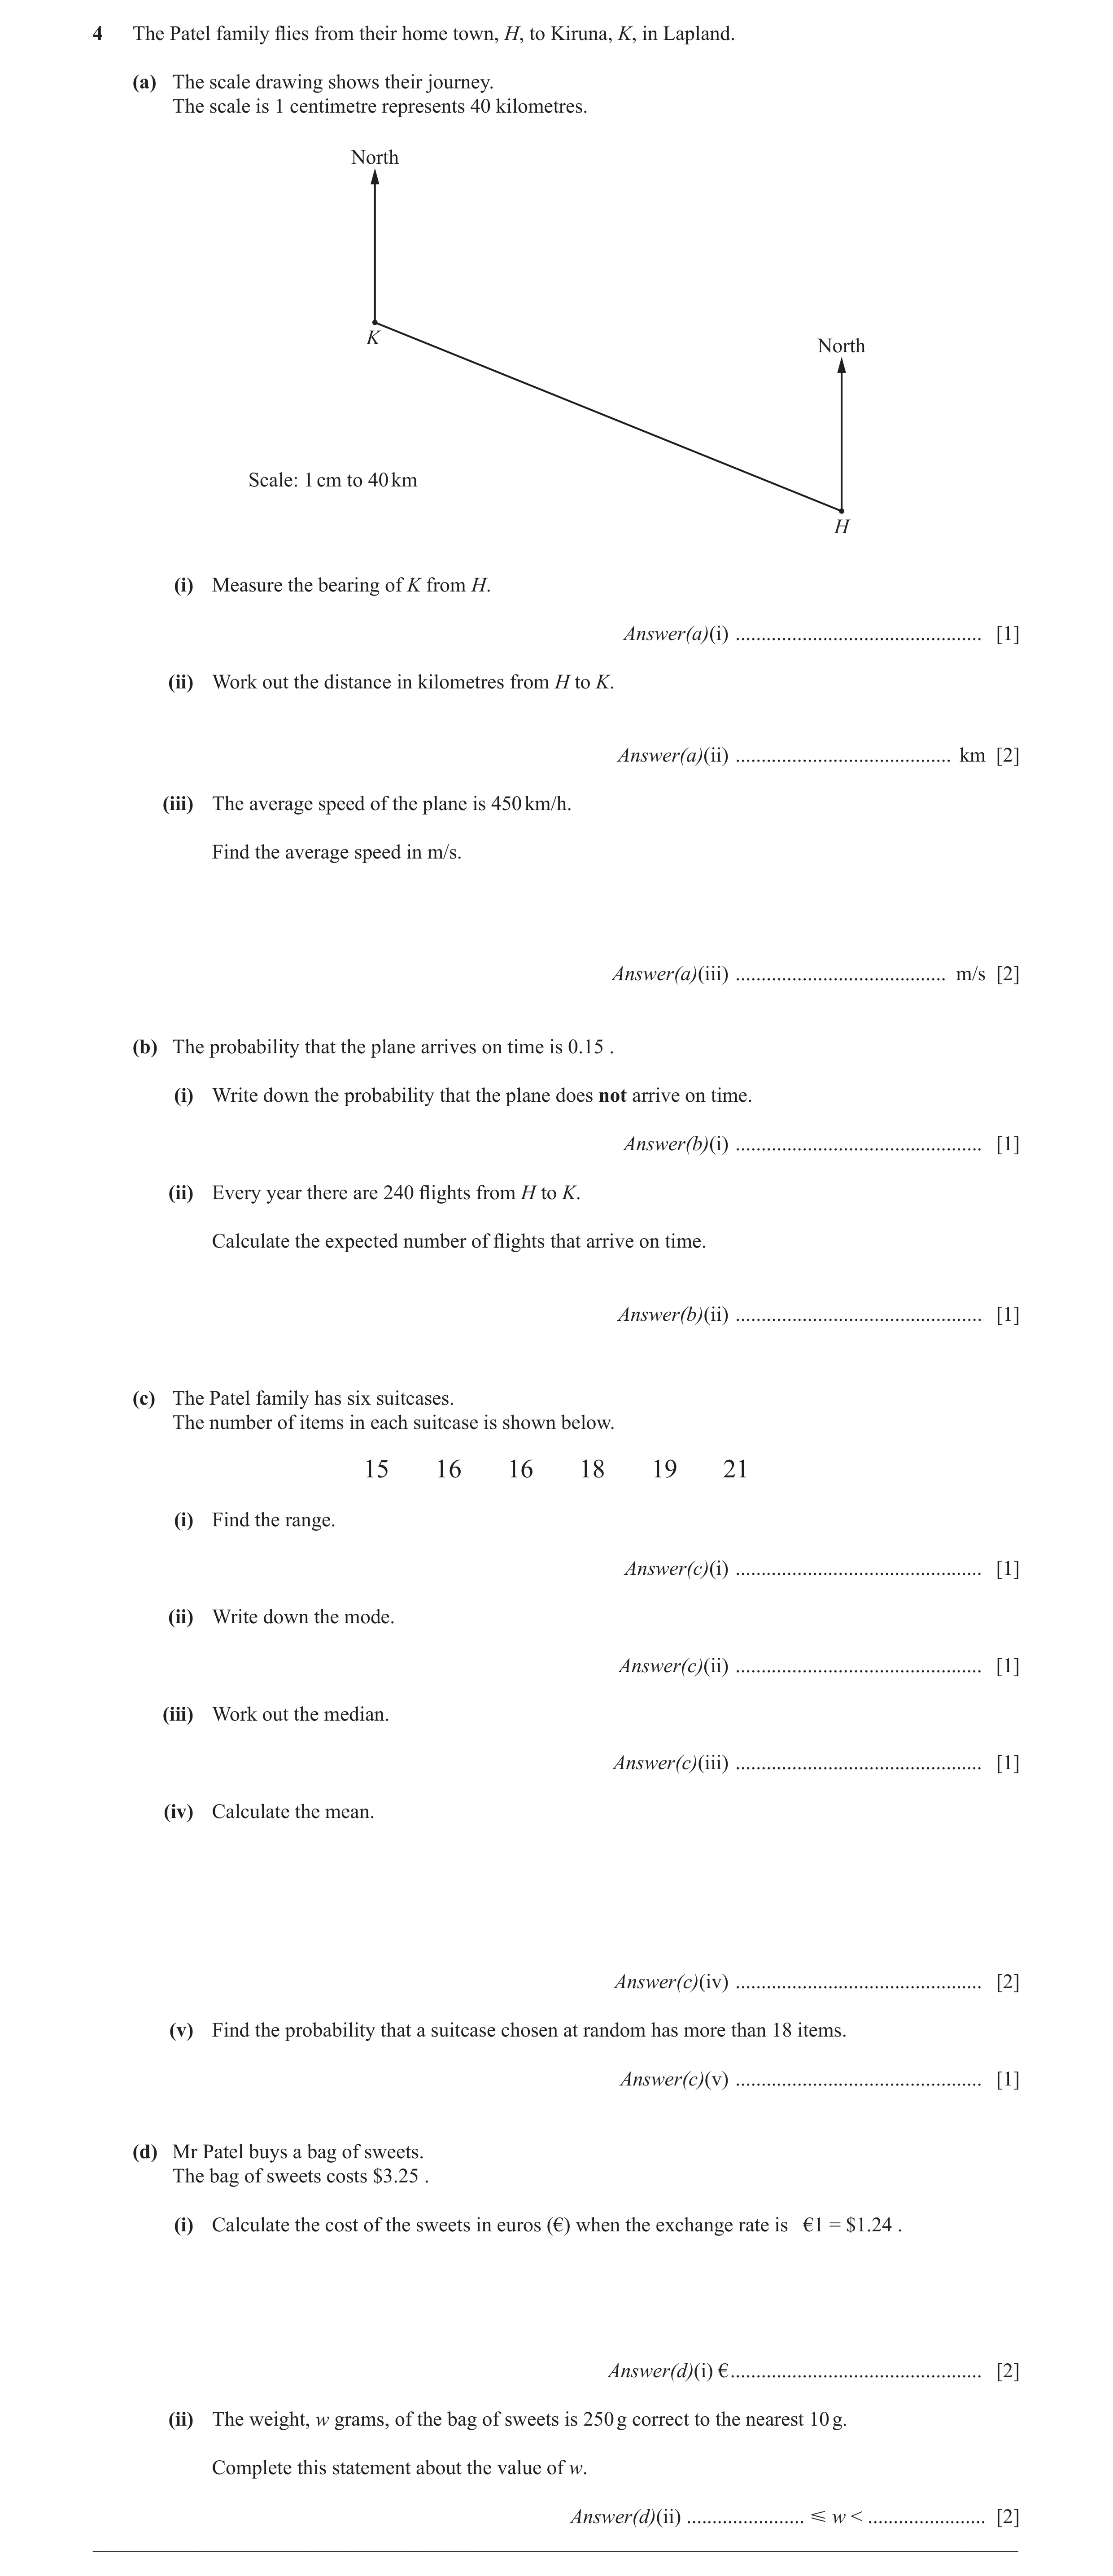
4 The Patel family flies from their home town, H, to Kiruna, K, in Lapland. (a) The scale drawing shows their journey. The scale is 1 centimetre represents 40 kilometres. North K North Scale: 1 cm to 40 km H (i) Measure the bearing of K from H. Answer(a)(i) … [1] (ii) Work out the distance in kilometres from H to K. Answer(a)(ii) … km [2] (iii) The average speed of the plane is 450 km/h. Find the average speed in m/s. Answer(a)(iii) … m/s [2] (b) The probability that the plane arrives on time is 0.15 . (i) Write down the probability that the plane does not arrive on time. Answer(b)(i) … [1] (ii) Every year there are 240 flights from H to K. Calculate the expected number of flights that arrive on time. Answer(b)(ii) … [1] (c) The Patel family has six suitcases. The number of items in each suitcase is shown below. 15 16 16 18 19 21 (i) Find the range. Answer(c)(i) … [1] (ii) Write down the mode. Answer(c)(ii) … [1] (iii) Work out the median. Answer(c)(iii) … [1] (iv) Calculate the mean. Answer(c)(iv) … [2] (v) Find the probability that a suitcase chosen at random has more than 18 items. Answer(c)(v) … [1] (d) Mr Patel buys a bag of sweets. The bag of sweets costs $3.25 . (i) Calculate the cost of the sweets in euros (€) when the exchange rate is €1 = $1.24 . Answer(d)(i) € … [2] (ii) The weight, w grams, of the bag of sweets is 250 g correct to the nearest 10 g. Complete this statement about the value of w. Answer(d)(ii) … w < … [2] __________________________________________________________________________________________
17 marks
Mark scheme: 4 (a) (i) 292 1 (ii) 380 2 B1 for ( 9.5 ± 0.2 ) If zero scored, SC1 for figs ‘372 to 388’ 450 × 1000 (iii) 125 2 M1 for or better 60 × 60 (b) (i) 0.85 1 (ii) 36 1 (c) (i) 6 1 (ii) 16 1 (iii) 17 1 (iv) 17.5 2 M1 for (15+16+16+18+19+21) ÷ 6
This question in 0580/31 May/June 2015
Q9 · One day Raphael asked 90 people at a station the reason for their train journey 0580/33 May/June 2015
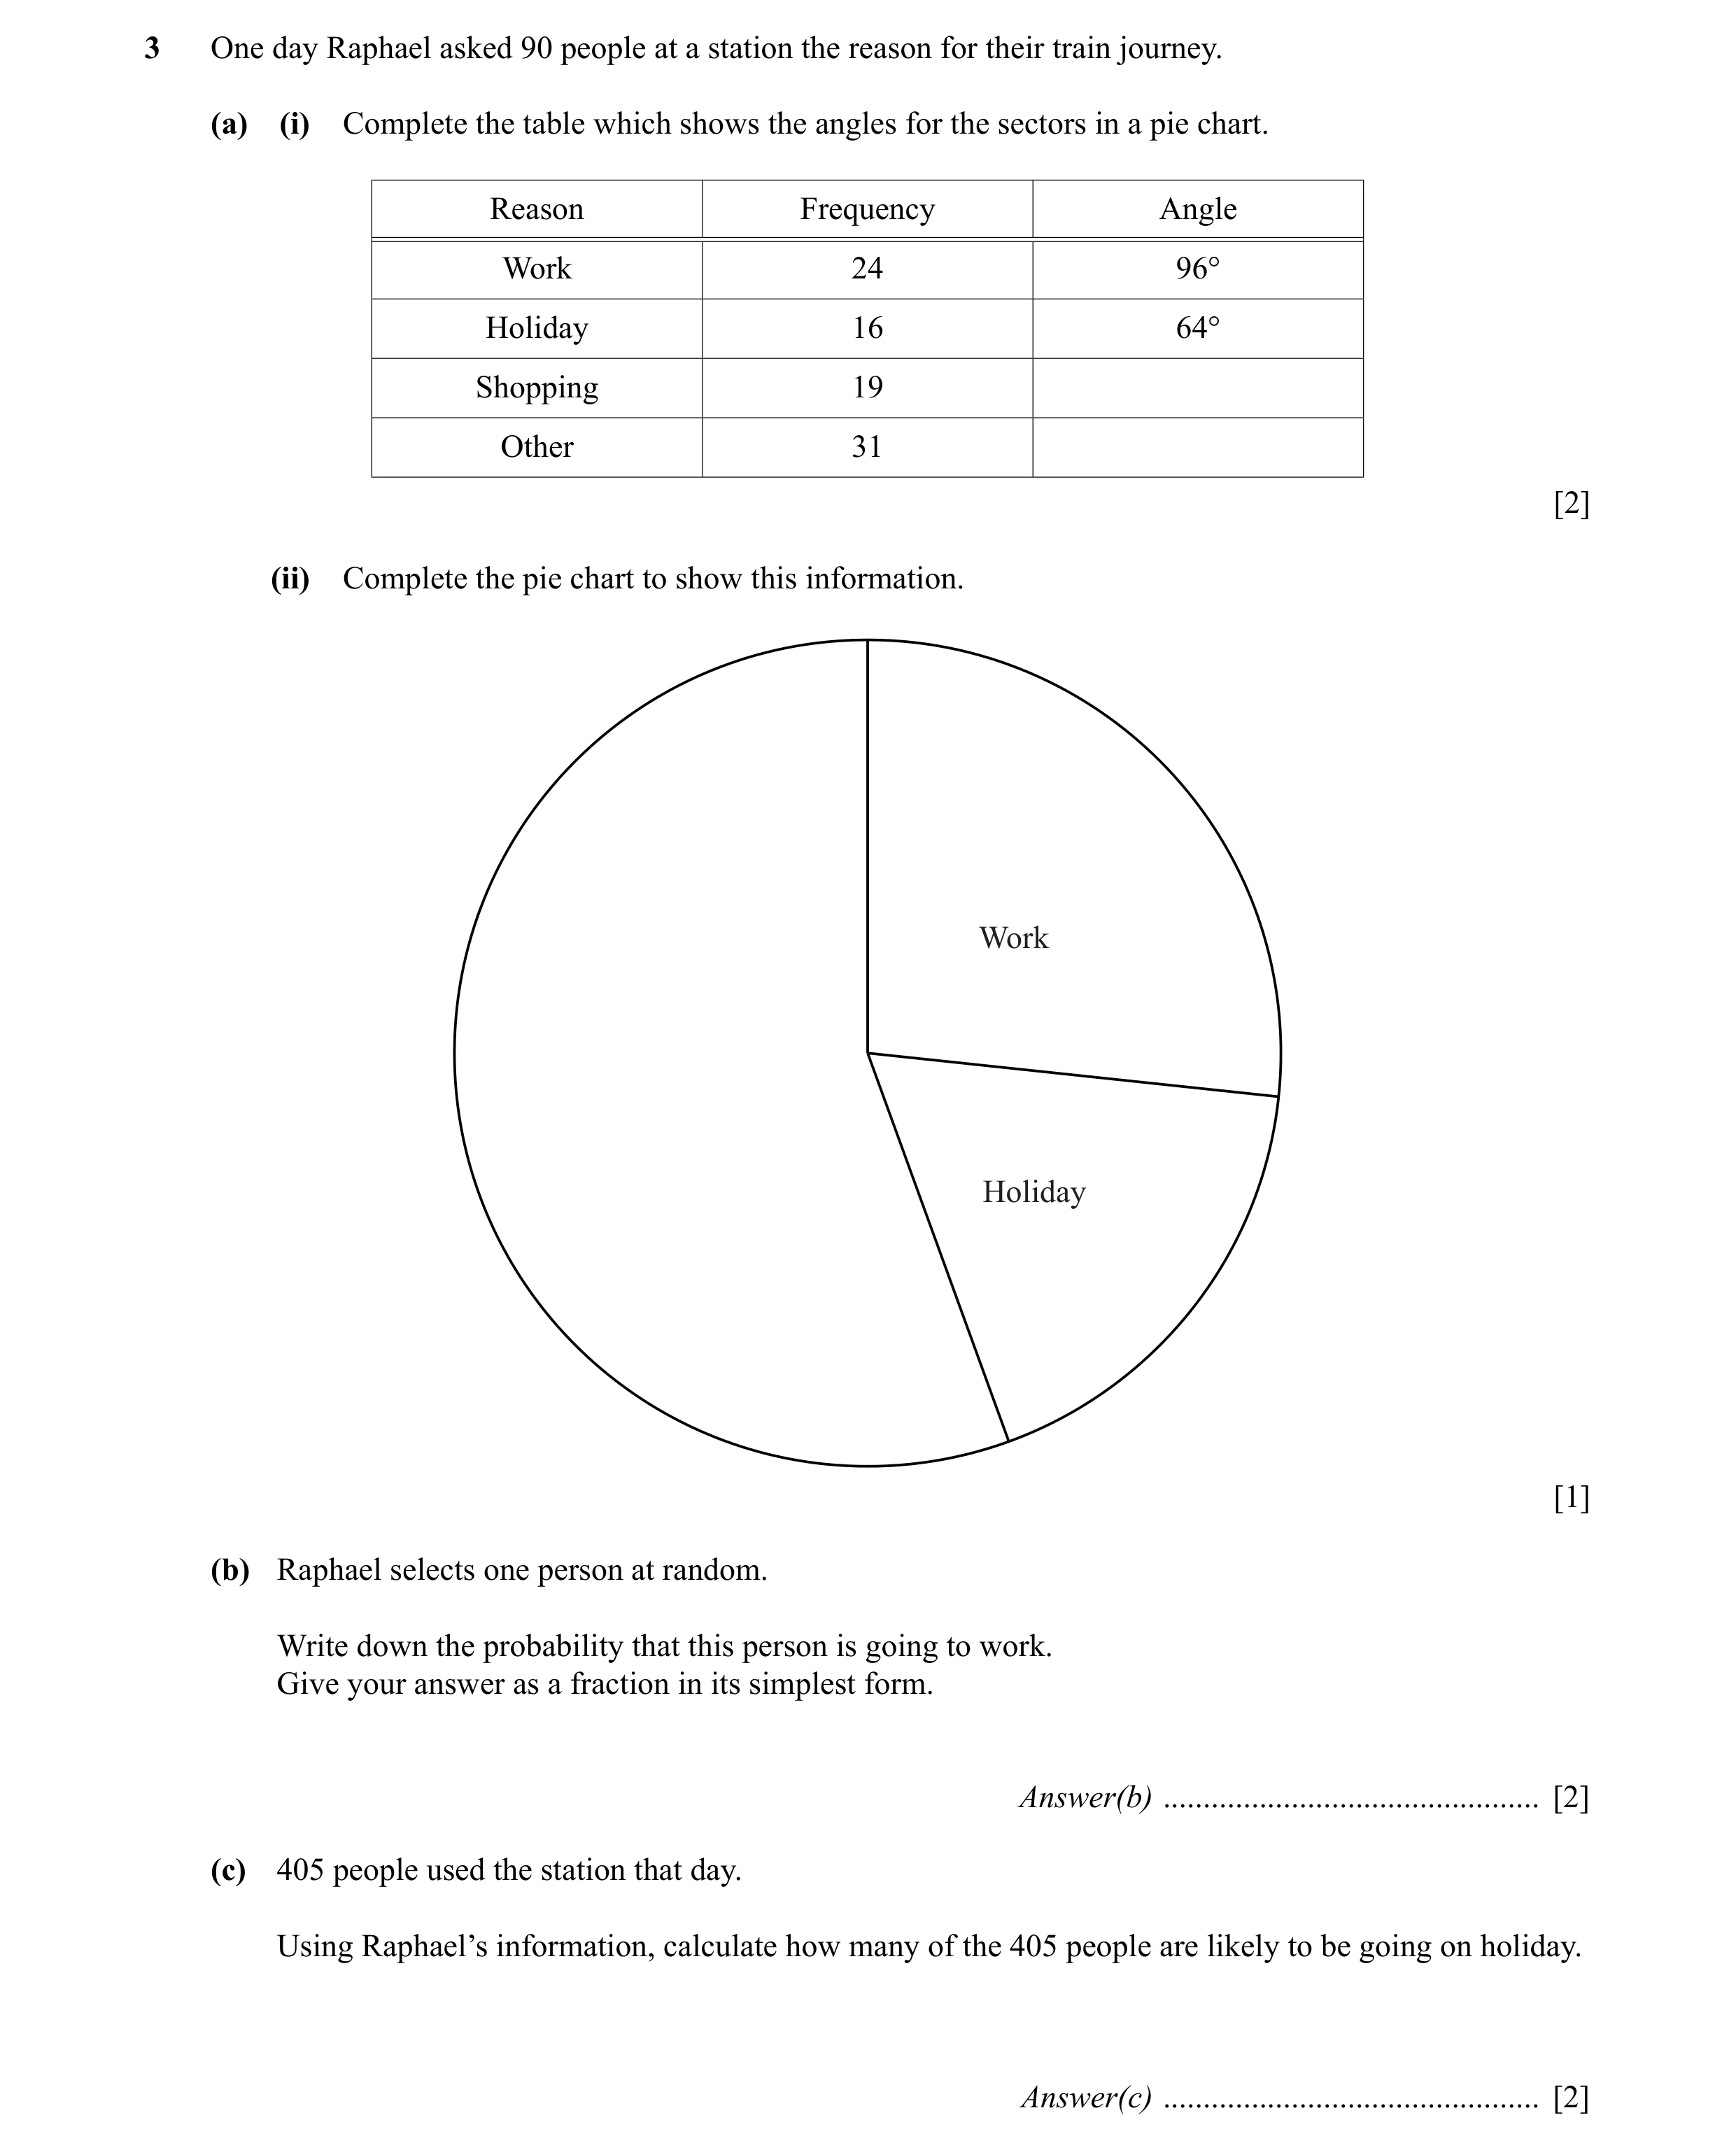
3 One day Raphael asked 90 people at a station the reason for their train journey. (a) (i) Complete the table which shows the angles for the sectors in a pie chart. Reason Frequency Angle Work 24 96° Holiday 16 64° Shopping 19 Other 31 [2] (ii) Complete the pie chart to show this information. Work Holiday [1] (b) Raphael selects one person at random. Write down the probability that this person is going to work. Give your answer as a fraction in its simplest form. Answer(b) … [2] (c) 405 people used the station that day. Using Raphael’s information, calculate how many of the 405 people are likely to be going on holiday. Answer(c) … [2]
7 marks
Mark scheme: 3 (a) (i) 76, 124 2 B1 for each or SC1 for two angles adding to 200 (ii) pie chart with two correct sectors 1 FT their table providing two angles adding to 200 4 96 24 (b) final answer cao 2 M1 for or isw oe 15 360 90 405× 64 405× 16 (c) 72 2 M1 for or oe 360 90
This question in 0580/33 May/June 2015
Q10 · 120 children take part in an athletics competition 0580/31 Oct/Nov 2015
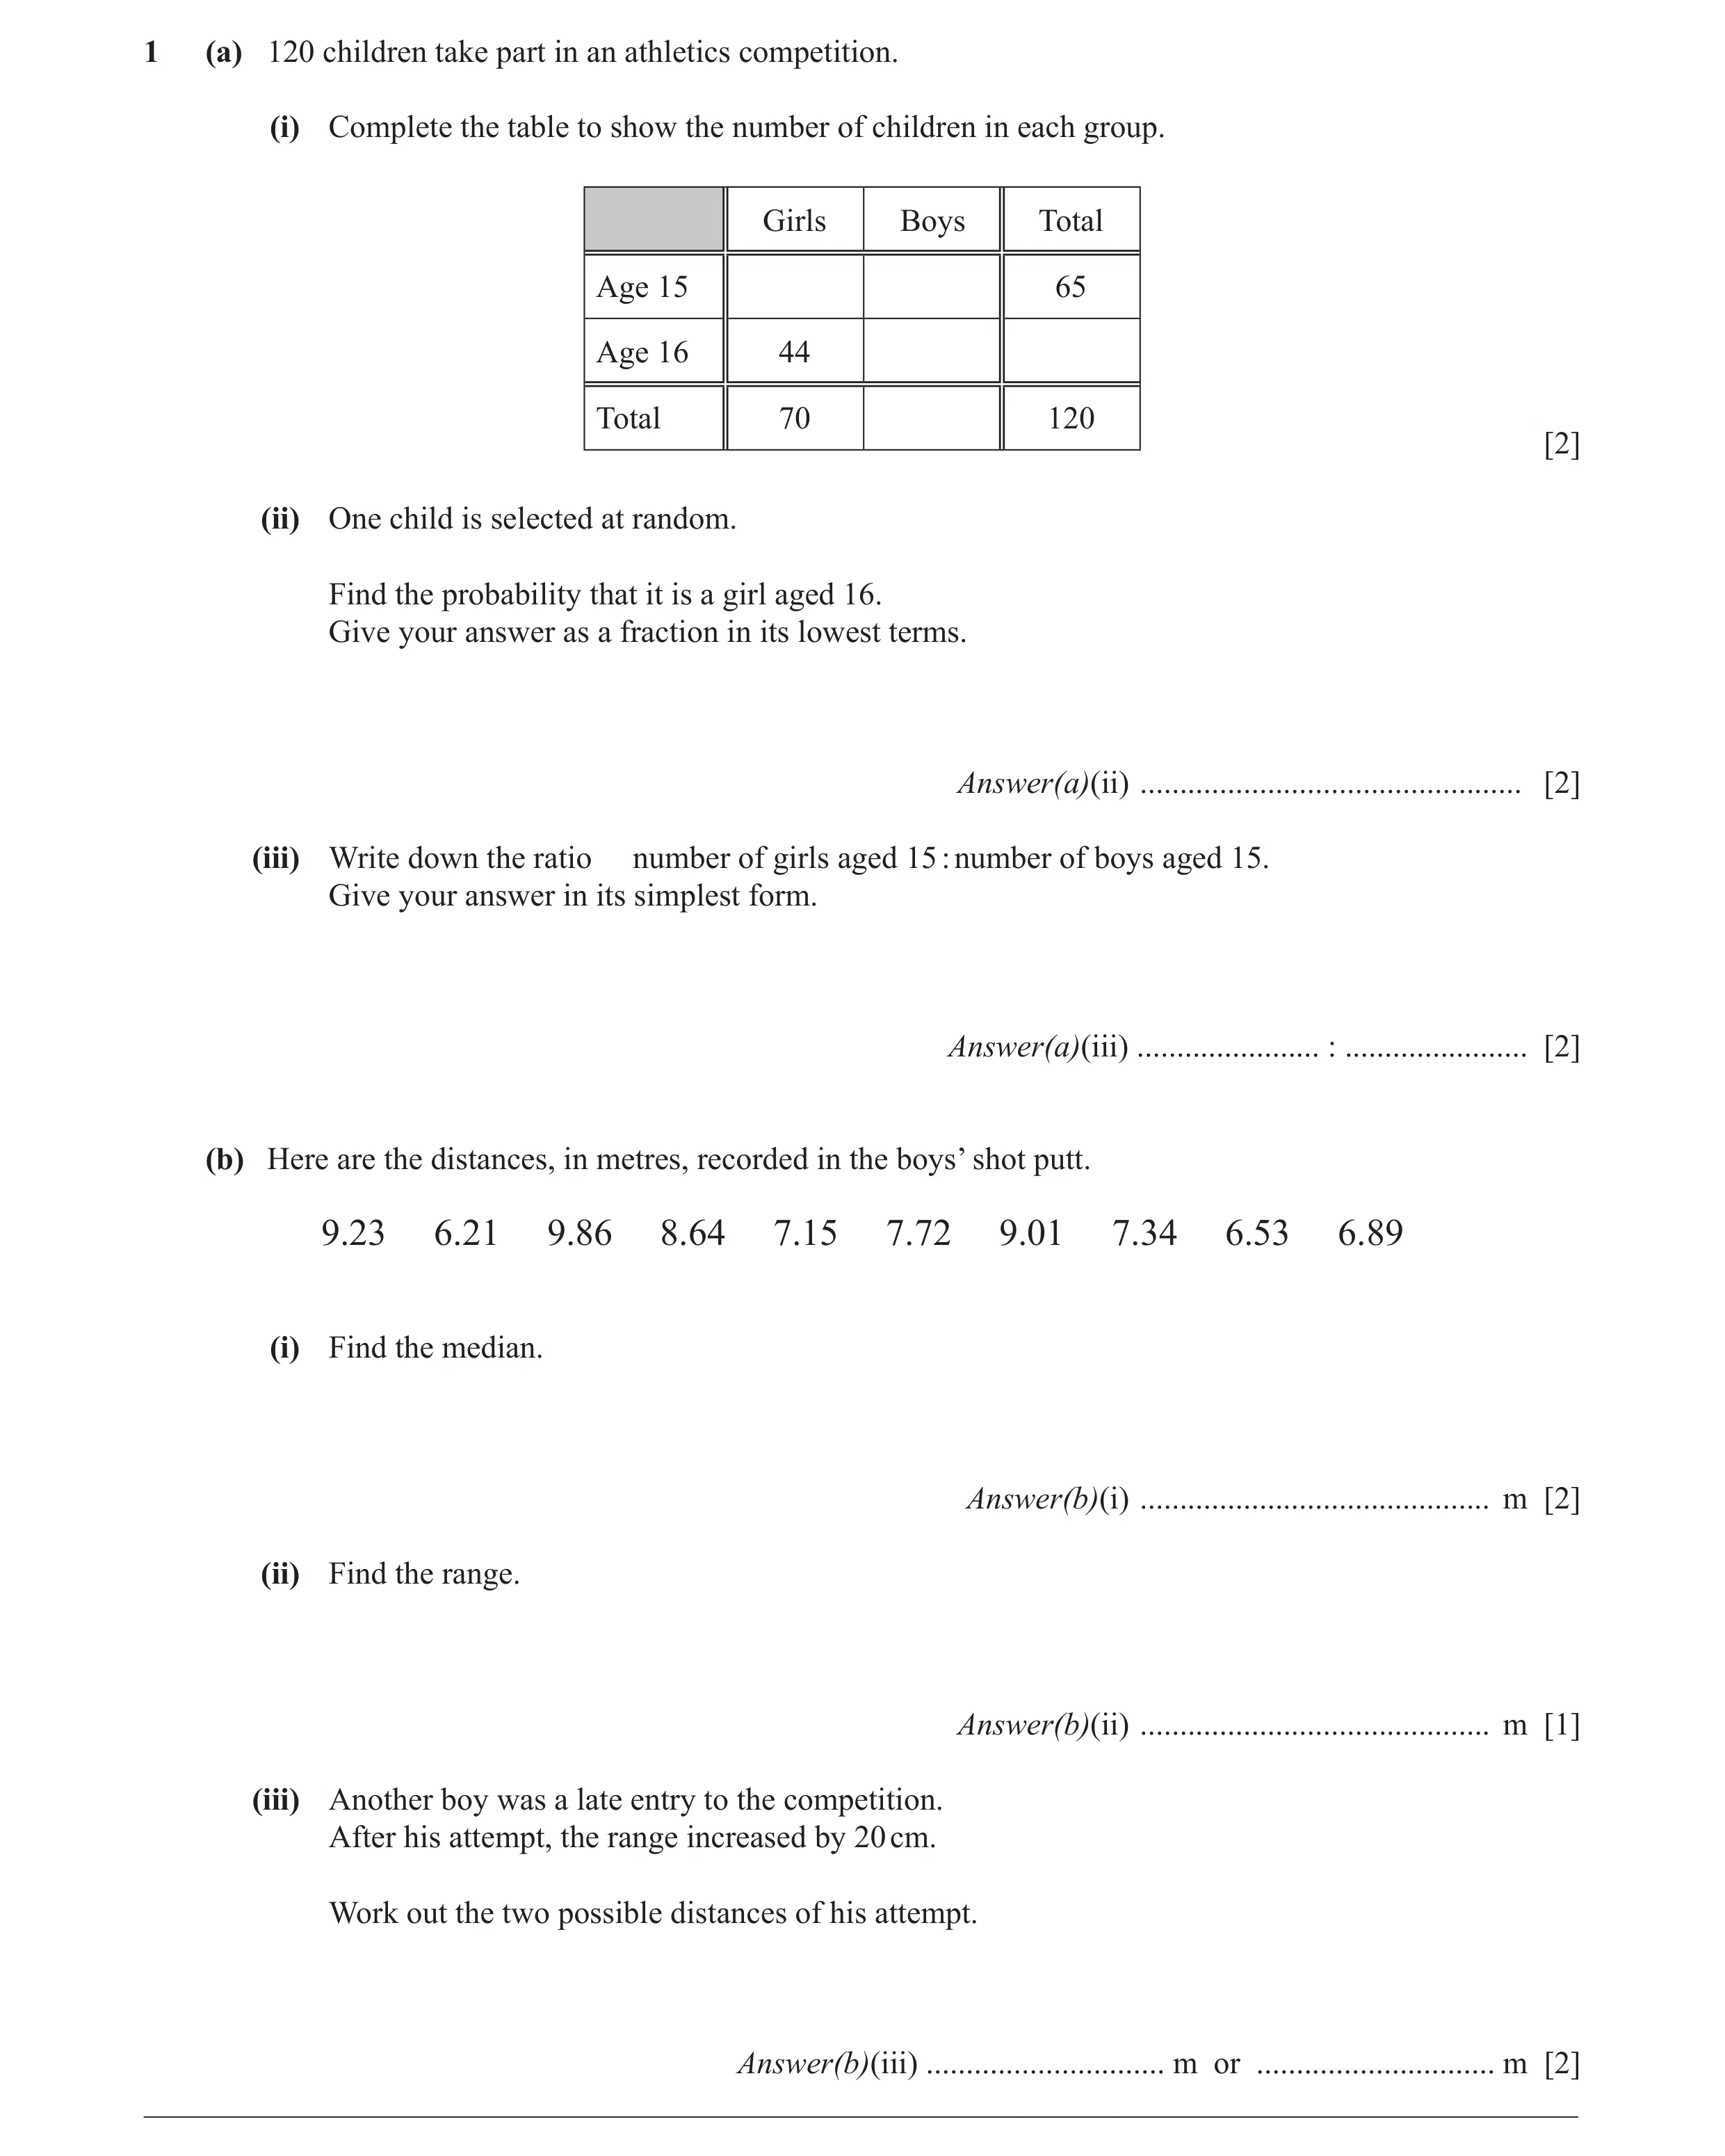
1 (a) 120 children take part in an athletics competition. (i) Complete the table to show the number of children in each group. Girls Boys Total Age 15 65 Age 16 44 Total 70 120 [2] (ii) One child is selected at random. Find the probability that it is a girl aged 16. Give your answer as a fraction in its lowest terms. Answer(a)(ii) … [2] (iii) Write down the ratio number of girls aged 15 : number of boys aged 15. Give your answer in its simplest form. Answer(a)(iii) … : … [2] (b) Here are the distances, in metres, recorded in the boys’ shot putt. 9.23 6.21 9.86 8.64 7.15 7.72 9.01 7.34 6.53 6.89 (i) Find the median. Answer(b)(i) … m [2] (ii) Find the range. Answer(b)(ii) … m [1] (iii) Another boy was a late entry to the competition. After his attempt, the range increased by 20 cm. Work out the two possible distances of his attempt. Answer(b)(iii) … m or … m [2] __________________________________________________________________________________________
11 marks
Mark scheme: Question Answer Mark Part marks 1 (a) (i) 2 B1 for 3 or 4 correct 26 39 65 44 11 55 70 50 120 (ii) 11 cao 2 B1 for 44 or 22 30 120 60 (iii) 2 : 3 cao 2 B1FT for 2k : 3k where k is an integer or their 26 : their 39 or better with integer values (b) (i) 7.53 2 M1 for attempt at ordered list, or 7.34 and 7.72 identified (ii) 3.65 1 (iii) 10.06 6.01 2 B1 for 1 correct
This question in 0580/31 Oct/Nov 2015
Q11 · Natalia has 16 reels of cotton 0580/33 Oct/Nov 2015
6 (a) Natalia has 16 reels of cotton. 6 reels are blue, 4 are white, 3 are red, 2 are black and 1 is green. Natalia picks a reel at random. (i) Write down the colour she is most likely to pick. Answer(a)(i) … [1] (ii) Find the probability that she picks a black reel. Answer(a)(ii) … [1] (b) Natalia is making a circular tablecloth of radius 1.5 m using blue and white material. The diagram shows this tablecloth. White NOT TO SCALE 0.9 m 1.5 m Blue (i) The radius of the blue circle is 0.9 m. Work out the area of the white material shown in the diagram. Answer(b)(i) … m2 [3] (ii) Natalia puts ribbon around the edge of the tablecloth. Calculate the length of ribbon used. Answer(b)(ii) … m [2] (iii) Natalia buys 12 m of ribbon costing $1.45 per metre. Calculate the amount of change she receives from a $20 note. Answer(b)(iii) $ … [2] __________________________________________________________________________________________
9 marks
Mark scheme: 6 (a) (i) Blue 1 2 (ii) oe 1 16 (b) (i) 4.52 or 4.523 to 4.524… 3 M2 for 1.52π – 0.92π or better or M1 for either 1.52π or 0.92π or better (ii) 9.42 or 9.43 or 9.424 to 9.426 2 M1 for 2 ×1.5π or better (iii) 2.6[0] 2 M1 for 20 – (12 × 1.45)
This question in 0580/33 Oct/Nov 2015
Q12 · Ten students each take two French tests 0580/32 Feb/March 2016
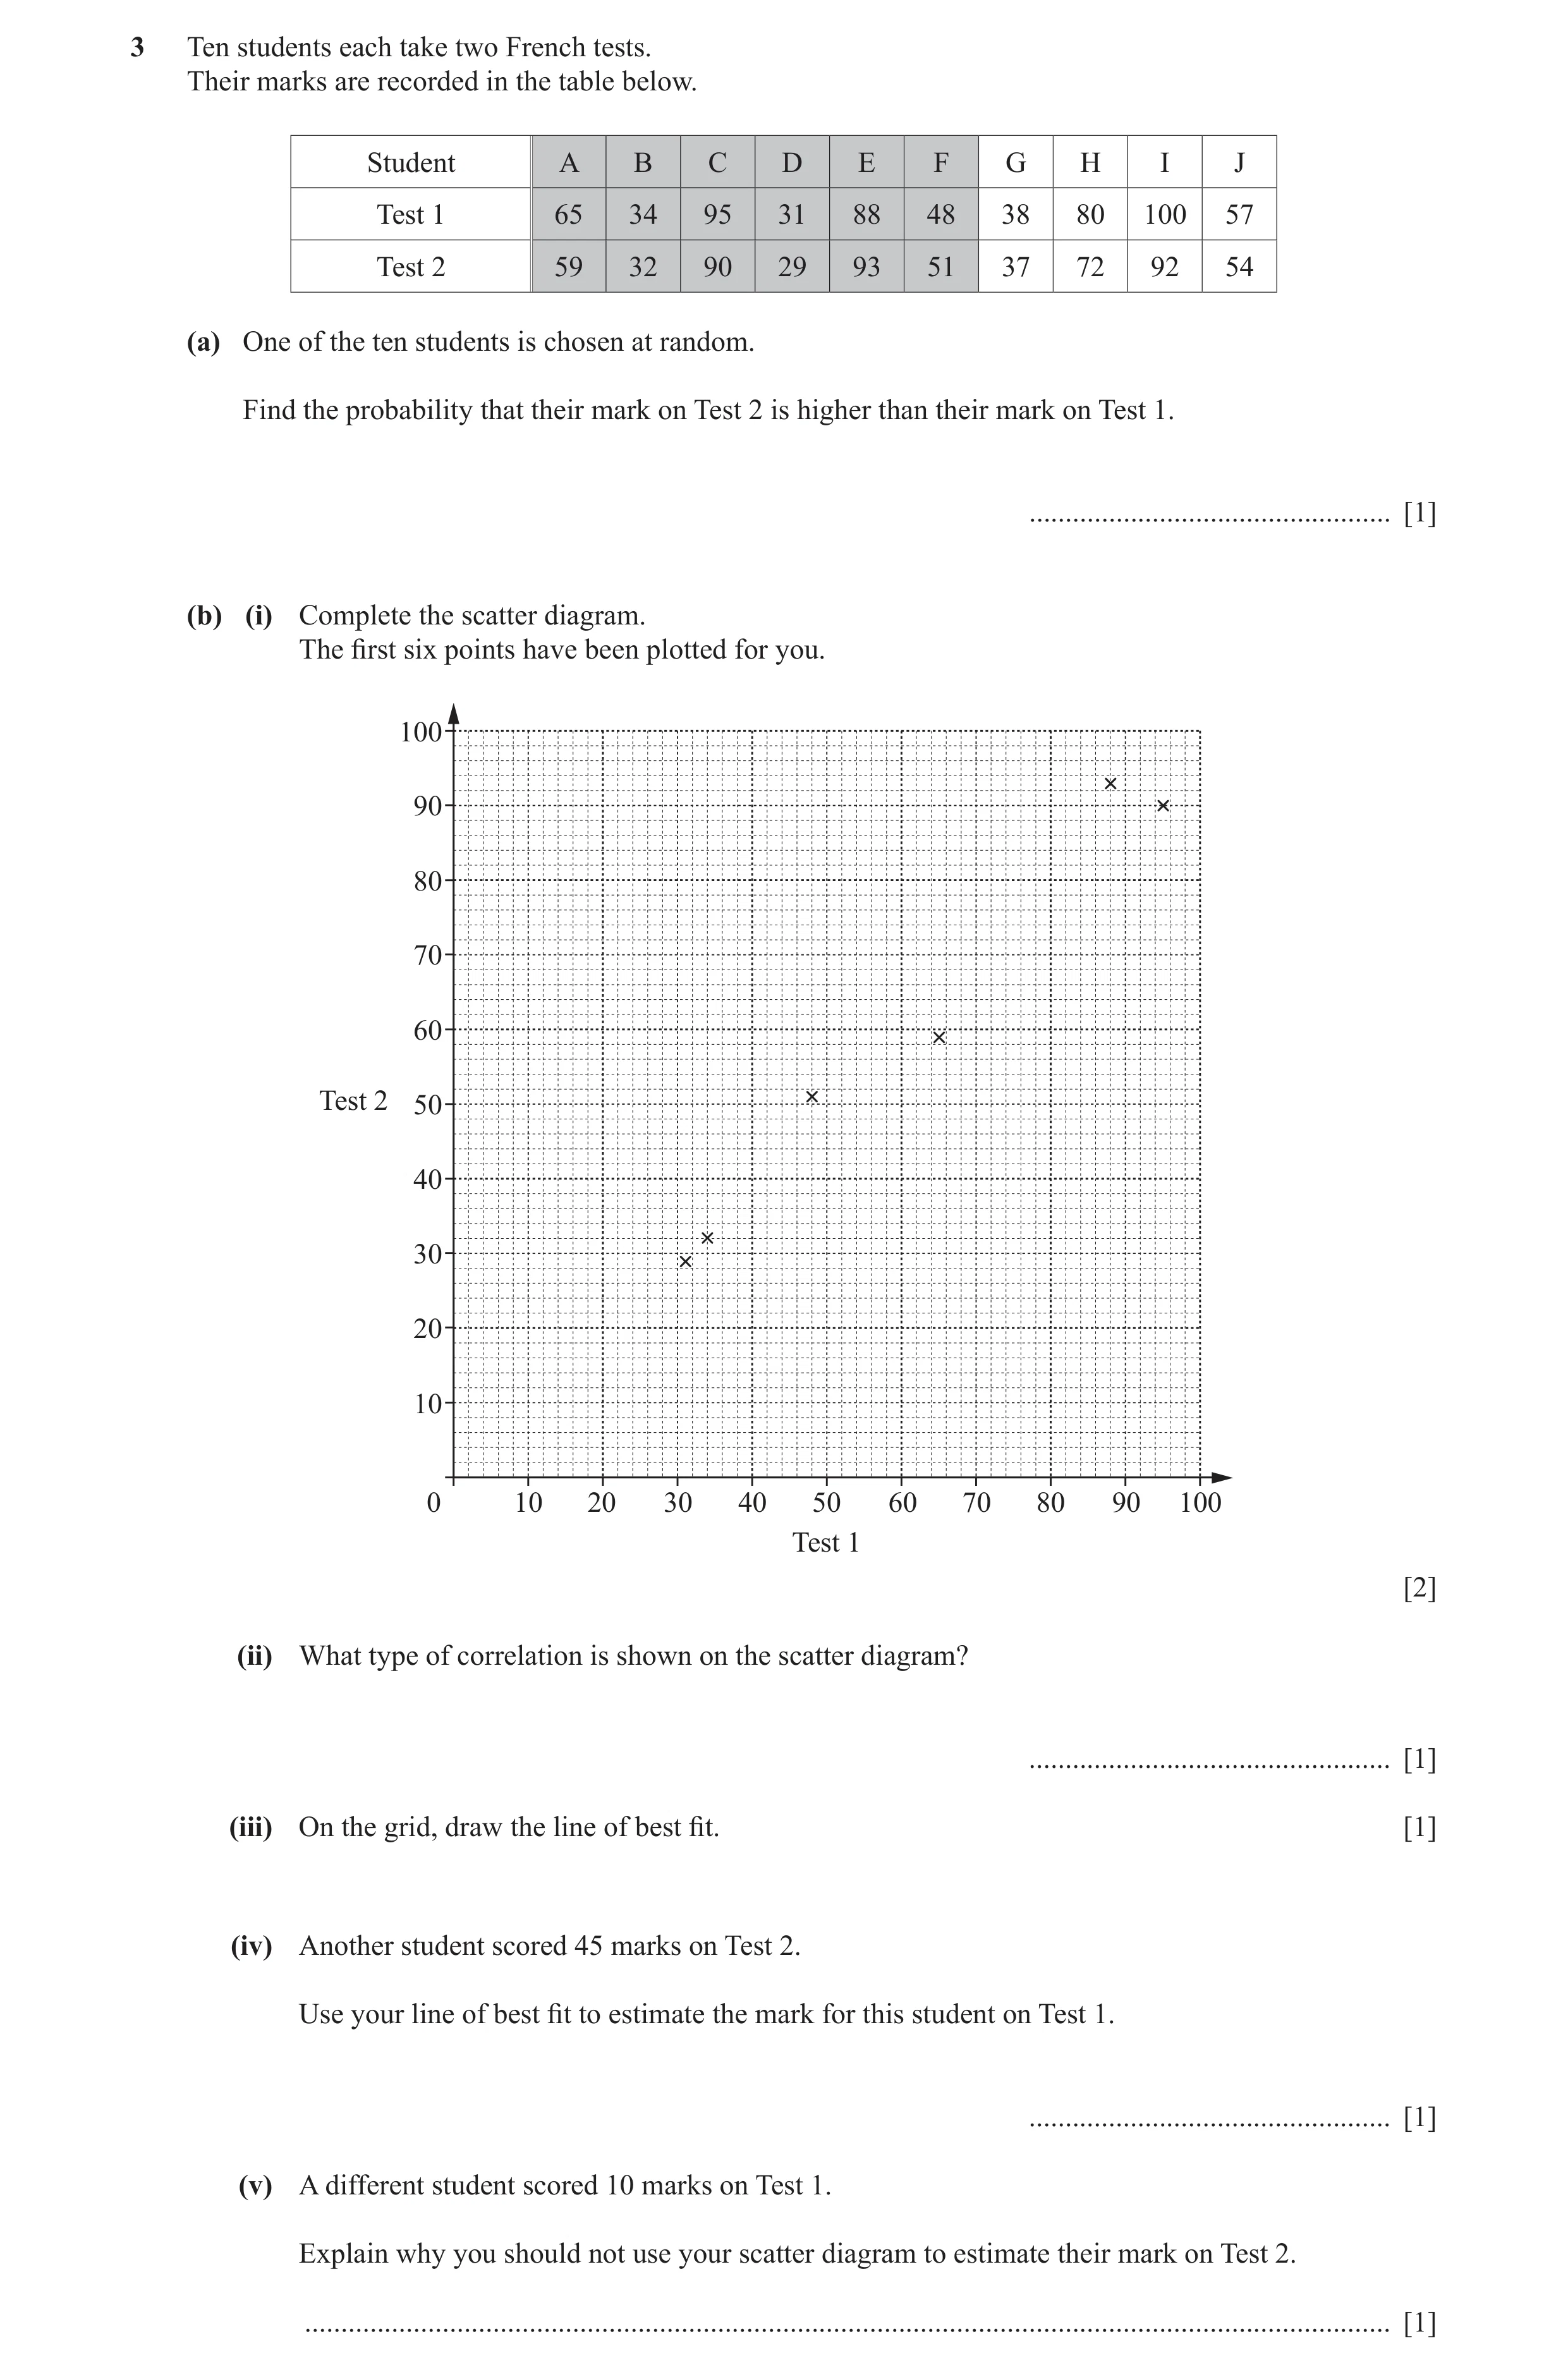
3 Ten students each take two French tests. Their marks are recorded in the table below. Student A B C D E F G H I J Test 1 65 34 95 31 88 48 38 80 100 57 Test 2 59 32 90 29 93 51 37 72 92 54 (a) One of the ten students is chosen at random. Find the probability that their mark on Test 2 is higher than their mark on Test 1. … [1] (b) (i) Complete the scatter diagram. The first six points have been plotted for you. 100 90 80 70 60 Test 2 50 40 30 20 10 0 10 20 30 40 50 60 70 80 90 100 Test 1 [2] (ii) What type of correlation is shown on the scatter diagram? … [1] (iii) On the grid, draw the line of best fit. [1] (iv) Another student scored 45 marks on Test 2. Use your line of best fit to estimate the mark for this student on Test 1. … [1] (v) A different student scored 10 marks on Test 1. Explain why you should not use your scatter diagram to estimate their mark on Test 2. … [1]
7 marks
Mark scheme: 2 3 (a) oe 1 10 (b) (i) 4 points correctly plotted 2 B1 for 3 correct points (ii) positive 1 (iii) correct ruled line 1 (iv) 46 to 48 1FT strict FT from their line if positive (v) 10 is not in range of recorded 1 test 1 results
This question in 0580/32 Feb/March 2016
Q13 · Javier went to a carnival with his friends 0580/31 Oct/Nov 2016
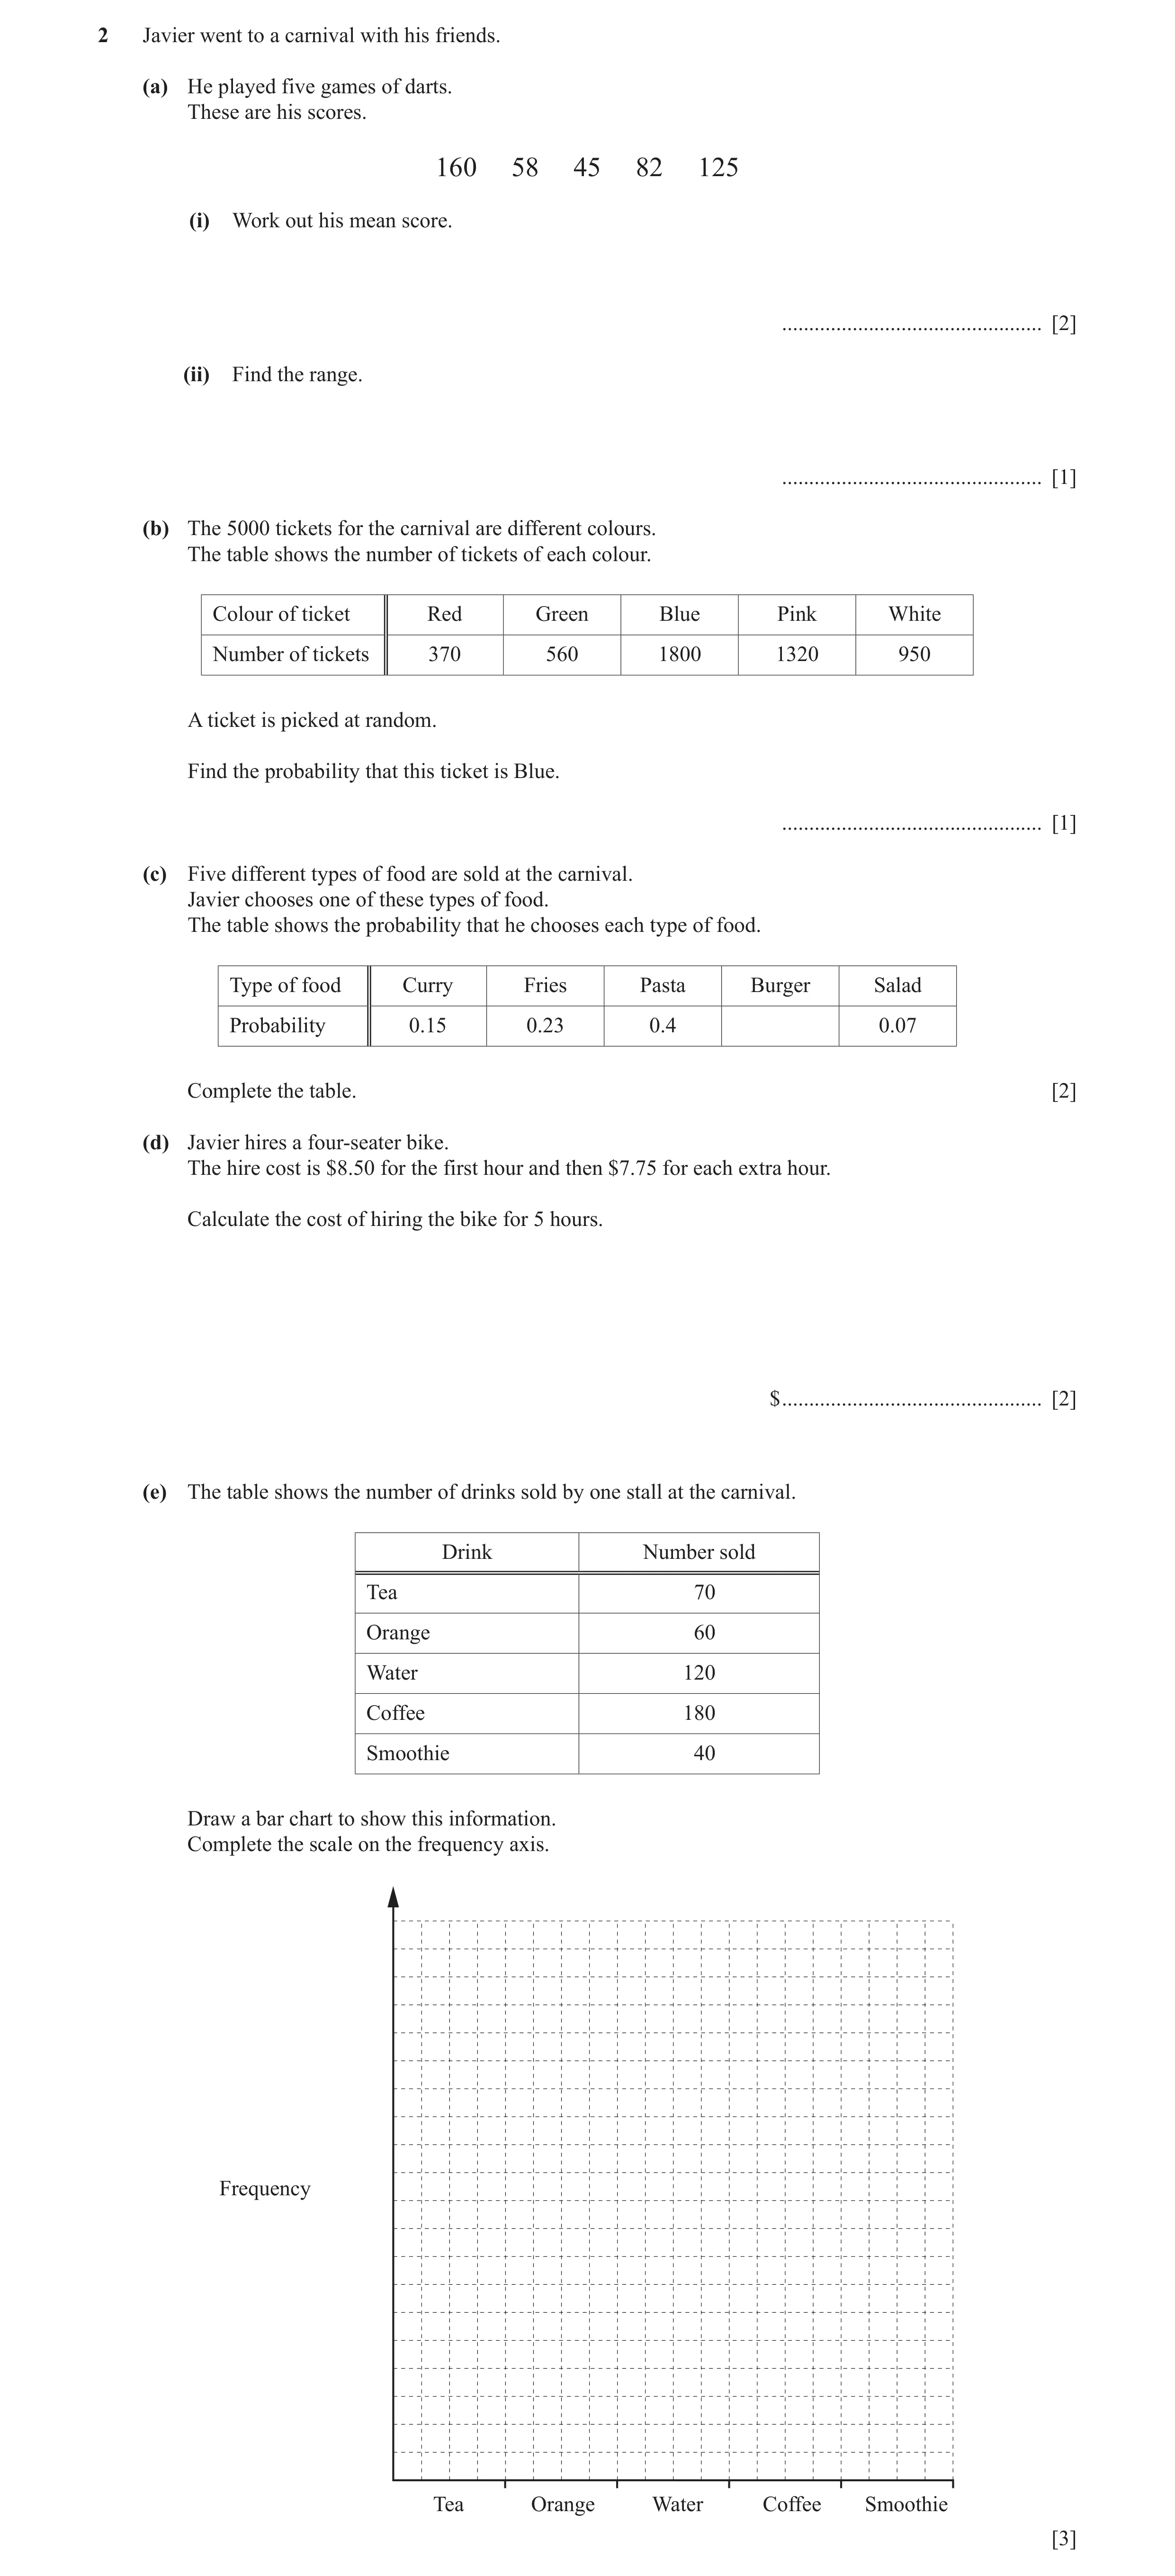
2 Javier went to a carnival with his friends. (a) He played five games of darts. These are his scores. 160 58 45 82 125 (i) Work out his mean score. … [2] (ii) Find the range. … [1] (b) The 5000 tickets for the carnival are different colours. The table shows the number of tickets of each colour. Colour of ticket Red Green Blue Pink White Number of tickets 370 560 1800 1320 950 A ticket is picked at random. Find the probability that this ticket is Blue. … [1] (c) Five different types of food are sold at the carnival. Javier chooses one of these types of food. The table shows the probability that he chooses each type of food. Type of food Curry Fries Pasta Burger Salad Probability 0.15 0.23 0.4 0.07 Complete the table. [2] (d) Javier hires a four-seater bike. The hire cost is $8.50 for the first hour and then $7.75 for each extra hour. Calculate the cost of hiring the bike for 5 hours. $ … [2] (e) The table shows the number of drinks sold by one stall at the carnival. Drink Number sold Tea 70 Orange 60 Water 120 Coffee 180 Smoothie 40 Draw a bar chart to show this information. Complete the scale on the frequency axis. Frequency Tea Orange Water Coffee Smoothie [3]
11 marks
Mark scheme: 160 + 58 + 45 + 82 + 125 470 2 (a) (i) 94 2 M1 for or 5 5 (ii) 115 1 1800 (b) oe isw 1 5000 (c) [0].15 oe 2 M1 for 1 – ( 0.15 + 0.23 + 0.4 + 0.07) or 1 – 0.85 (d) 39.5[0] 2 M1 for [8.50 +] (7.75 × 4) soi by 31 If zero scored, SC1 for 47.25 (e) Correct bar chart 3 B1 for any correct linear scale starting at zero soi B2 for all bars correct height and equal width, with equal gaps or no gaps or B1 for all bars correct height with unequal widths and/or gaps or at least three bars correct height with equal width, with equal gaps or no gaps
This question in 0580/31 Oct/Nov 2016
Q14 · Mrs Singh and Mr Patel are teachers 0580/32 Feb/March 2017
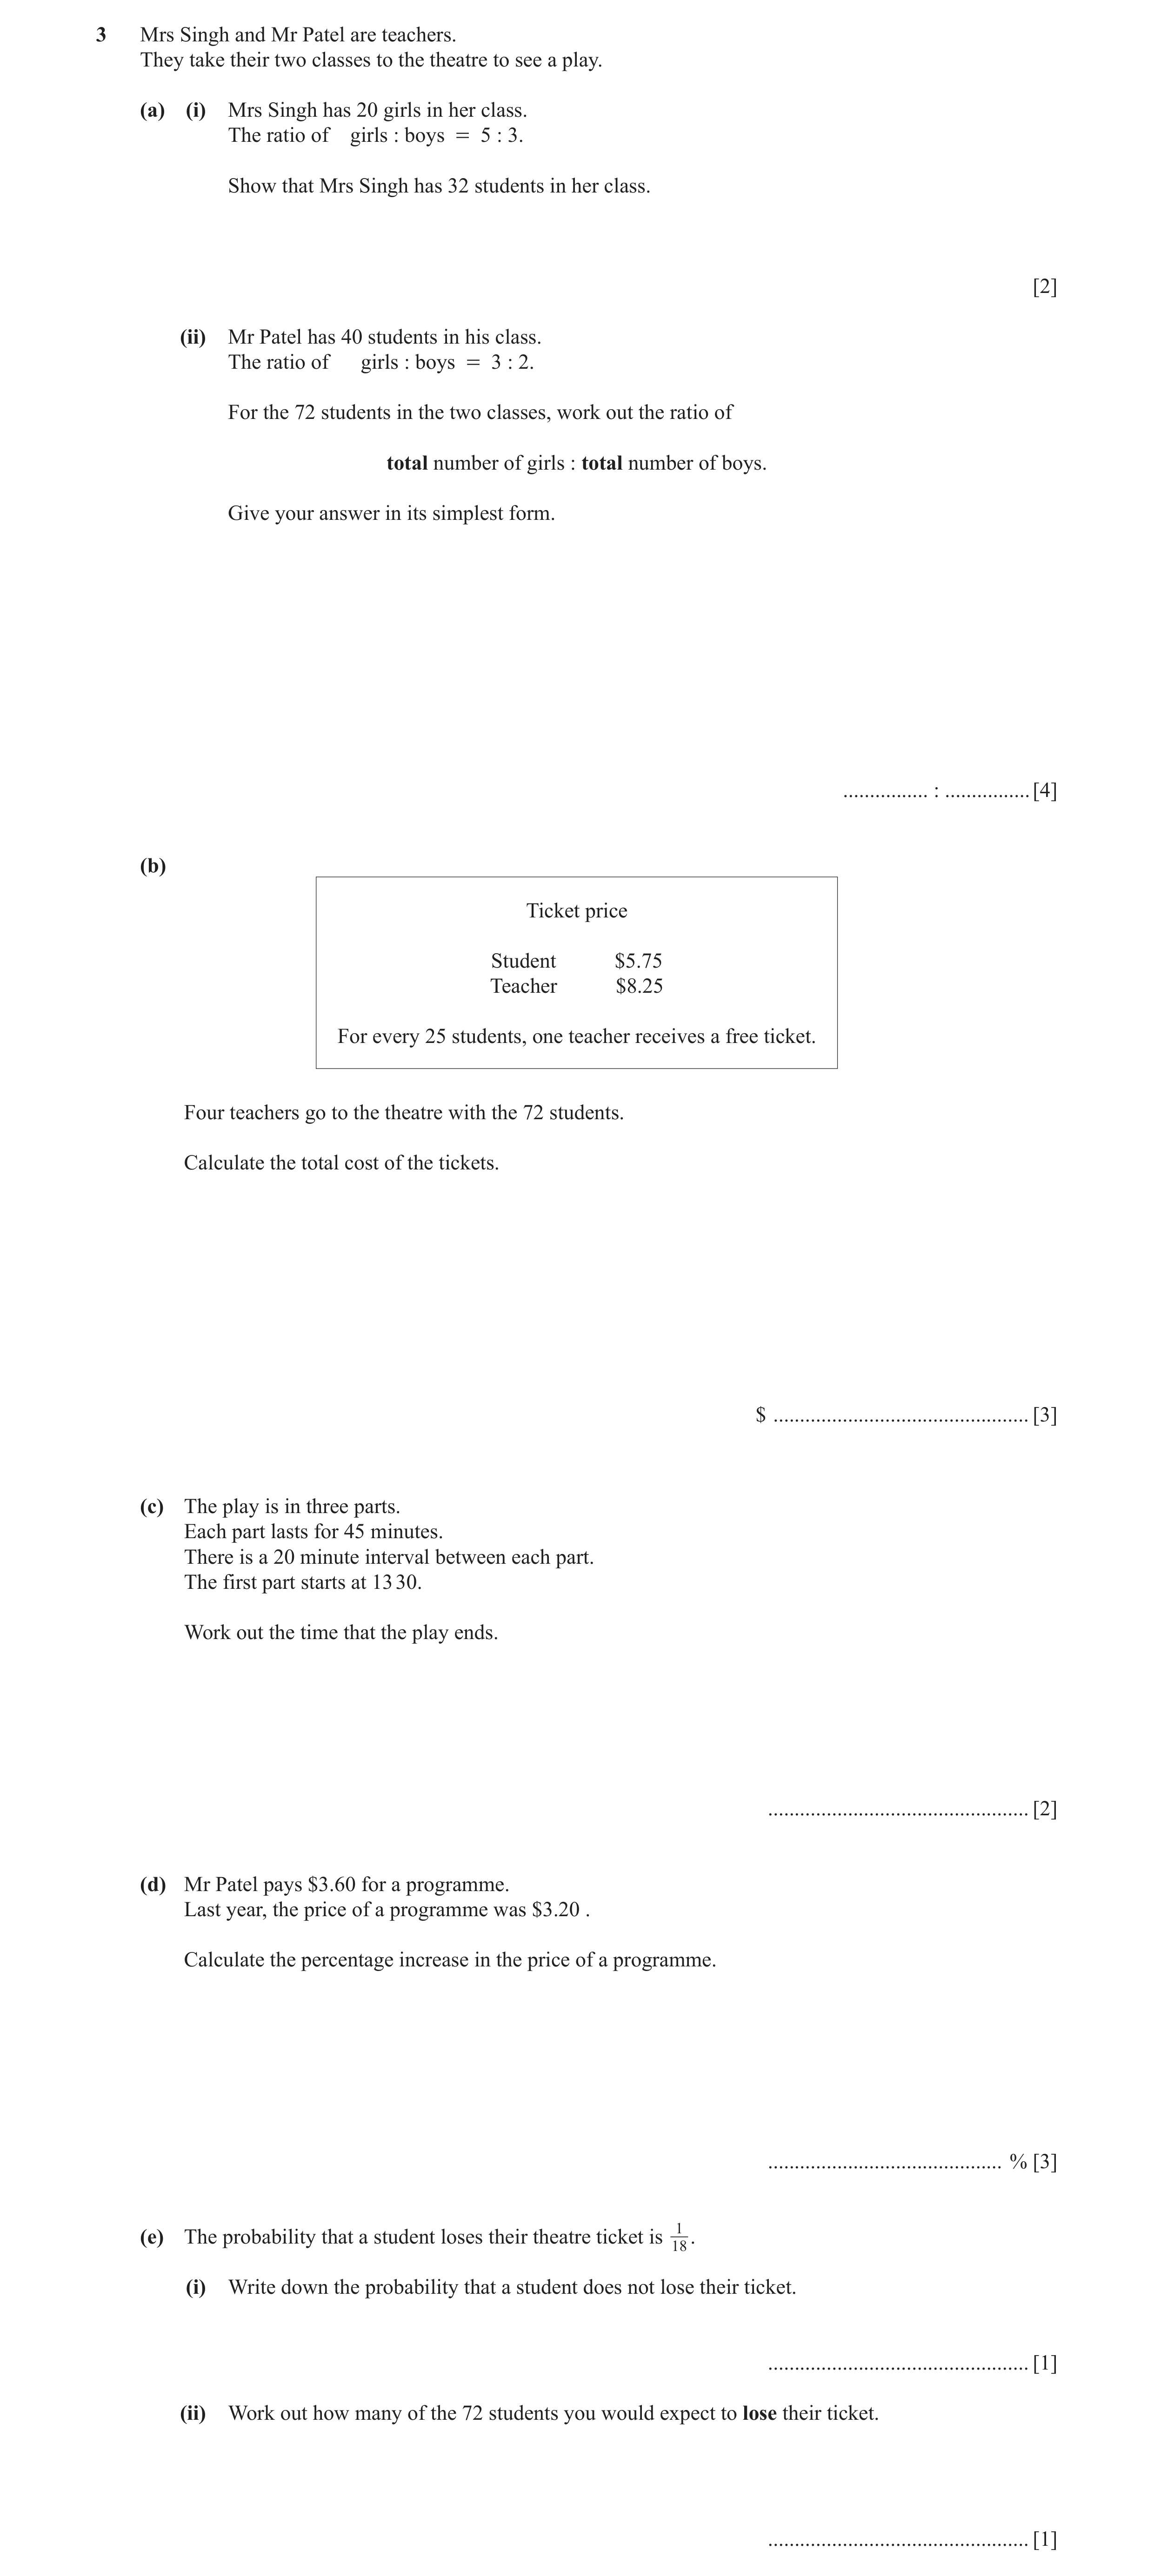
3 Mrs Singh and Mr Patel are teachers. They take their two classes to the theatre to see a play. (a) (i) Mrs Singh has 20 girls in her class. The ratio of girls : boys = 5 : 3. Show that Mrs Singh has 32 students in her class. [2] (ii) Mr Patel has 40 students in his class. The ratio of girls : boys = 3 : 2. For the 72 students in the two classes, work out the ratio of total number of girls : total number of boys. Give your answer in its simplest form. … : … [4] (b) Ticket price Student $5.75 Teacher $8.25 For every 25 students, one teacher receives a free ticket. Four teachers go to the theatre with the 72 students. Calculate the total cost of the tickets. $ … [3] (c) The play is in three parts. Each part lasts for 45 minutes. There is a 20 minute interval between each part. The first part starts at 13 30. Work out the time that the play ends. … [2] (d) Mr Patel pays $3.60 for a programme. Last year, the price of a programme was $3.20 . Calculate the percentage increase in the price of a programme. … % [3] (e) The probability that a student loses their theatre ticket is 181 . (i) Write down the probability that a student does not lose their ticket. … [1] (ii) Work out how many of the 72 students you would expect to lose their ticket. … [1]
16 marks
Mark scheme: 20 20 203 (a) (i) × ( 5 + 3 ) or × 8 M2 M1 for 5 5 5 (ii) 11 : 7 4 B2 for [girls=]24 and [boys=]16 or B1 for 24 or 16 40 or M1 for 5 B1FT for 44:28 or their24+ 20: their16+ their (32–20) Only FT provided total is 72 before simplifying (b) 430.5[0] 3 M2 for 72 × 5.75 + 2 × 8.25 oe or M1 for 72 × 5.75 or 2 × 8.25 (c) 16 25 or 4.25pm 2 M1 for 45 × 3 + 2 × 20 3.6 − 3.2 (d) 12.5 3 M2 for × [100 ] oe 3.2 3.6 or M1 for 3.6 − 3.2 or [×100] or better 3.2 17 (e) (i) oe 1 18 (ii) 4 1
This question in 0580/32 Feb/March 2017
Q15 · A bag contains 5 white and 6 black marbles 0580/32 Feb/March 2017
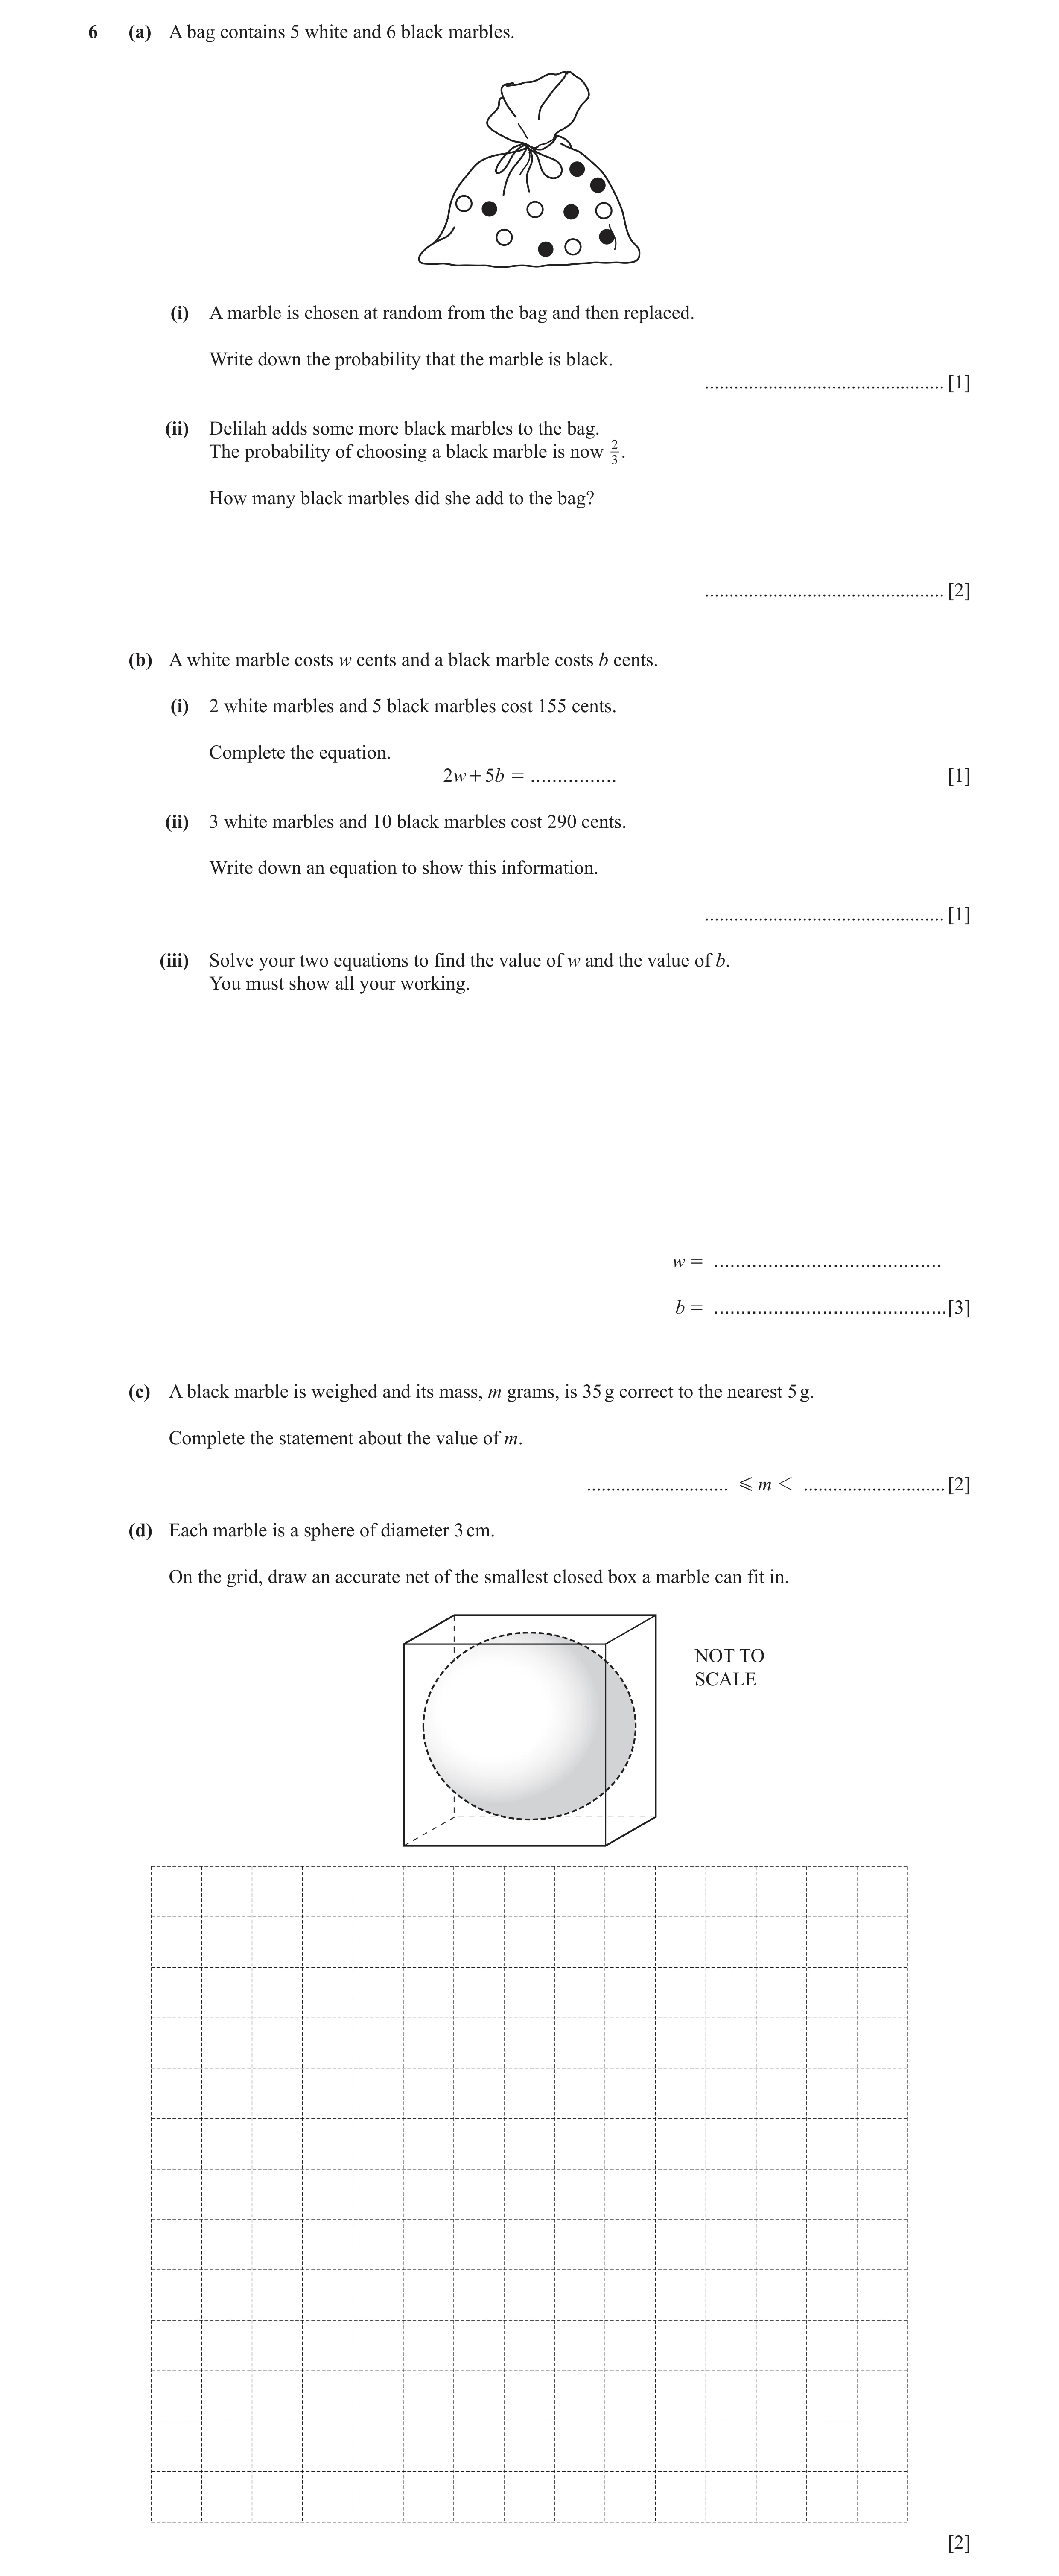
6 (a) A bag contains 5 white and 6 black marbles. (i) A marble is chosen at random from the bag and then replaced. Write down the probability that the marble is black. … [1] (ii) Delilah adds some more black marbles to the bag. The probability of choosing a black marble is now 23 . How many black marbles did she add to the bag? … [2] (b) A white marble costs w cents and a black marble costs b cents. (i) 2 white marbles and 5 black marbles cost 155 cents. Complete the equation. 2w + 5b = … [1] (ii) 3 white marbles and 10 black marbles cost 290 cents. Write down an equation to show this information. … [1] (iii) Solve your two equations to find the value of w and the value of b. You must show all your working. w = … b = … [3] (c) A black marble is weighed and its mass, m grams, is 35 g correct to the nearest 5 g. Complete the statement about the value of m. … G m 1 … [2] (d) Each marble is a sphere of diameter 3 cm. On the grid, draw an accurate net of the smallest closed box a marble can fit in. NOT TO SCALE [2]
12 marks
Mark scheme: 6 6 (a) (i) oe 1 11 1 (ii) 4 2 M1 for 10 black marbles or is 5 marbles 3 (b) (i) 155 1 (ii) 3 w + 10b = 290 oe 1 (iii) [w] 20 3 M1FT for correct method to eliminate one [b] 23 variable A1 for w = 20 A1 for b = 23 If zero scored, SC1 for either: 2 correct answers given or 2 values satisfying one of their original equations (c) 32.5 , 37.5 1,1 SC1 for both answers correct but reversed (d) correct net 2 M1 for 5 correctly placed 3 cm by 3 cm squares and one incorrect or missing
This question in 0580/32 Feb/March 2017
Q16 · The table shows the results of a survey in a village 0580/32 May/June 2017
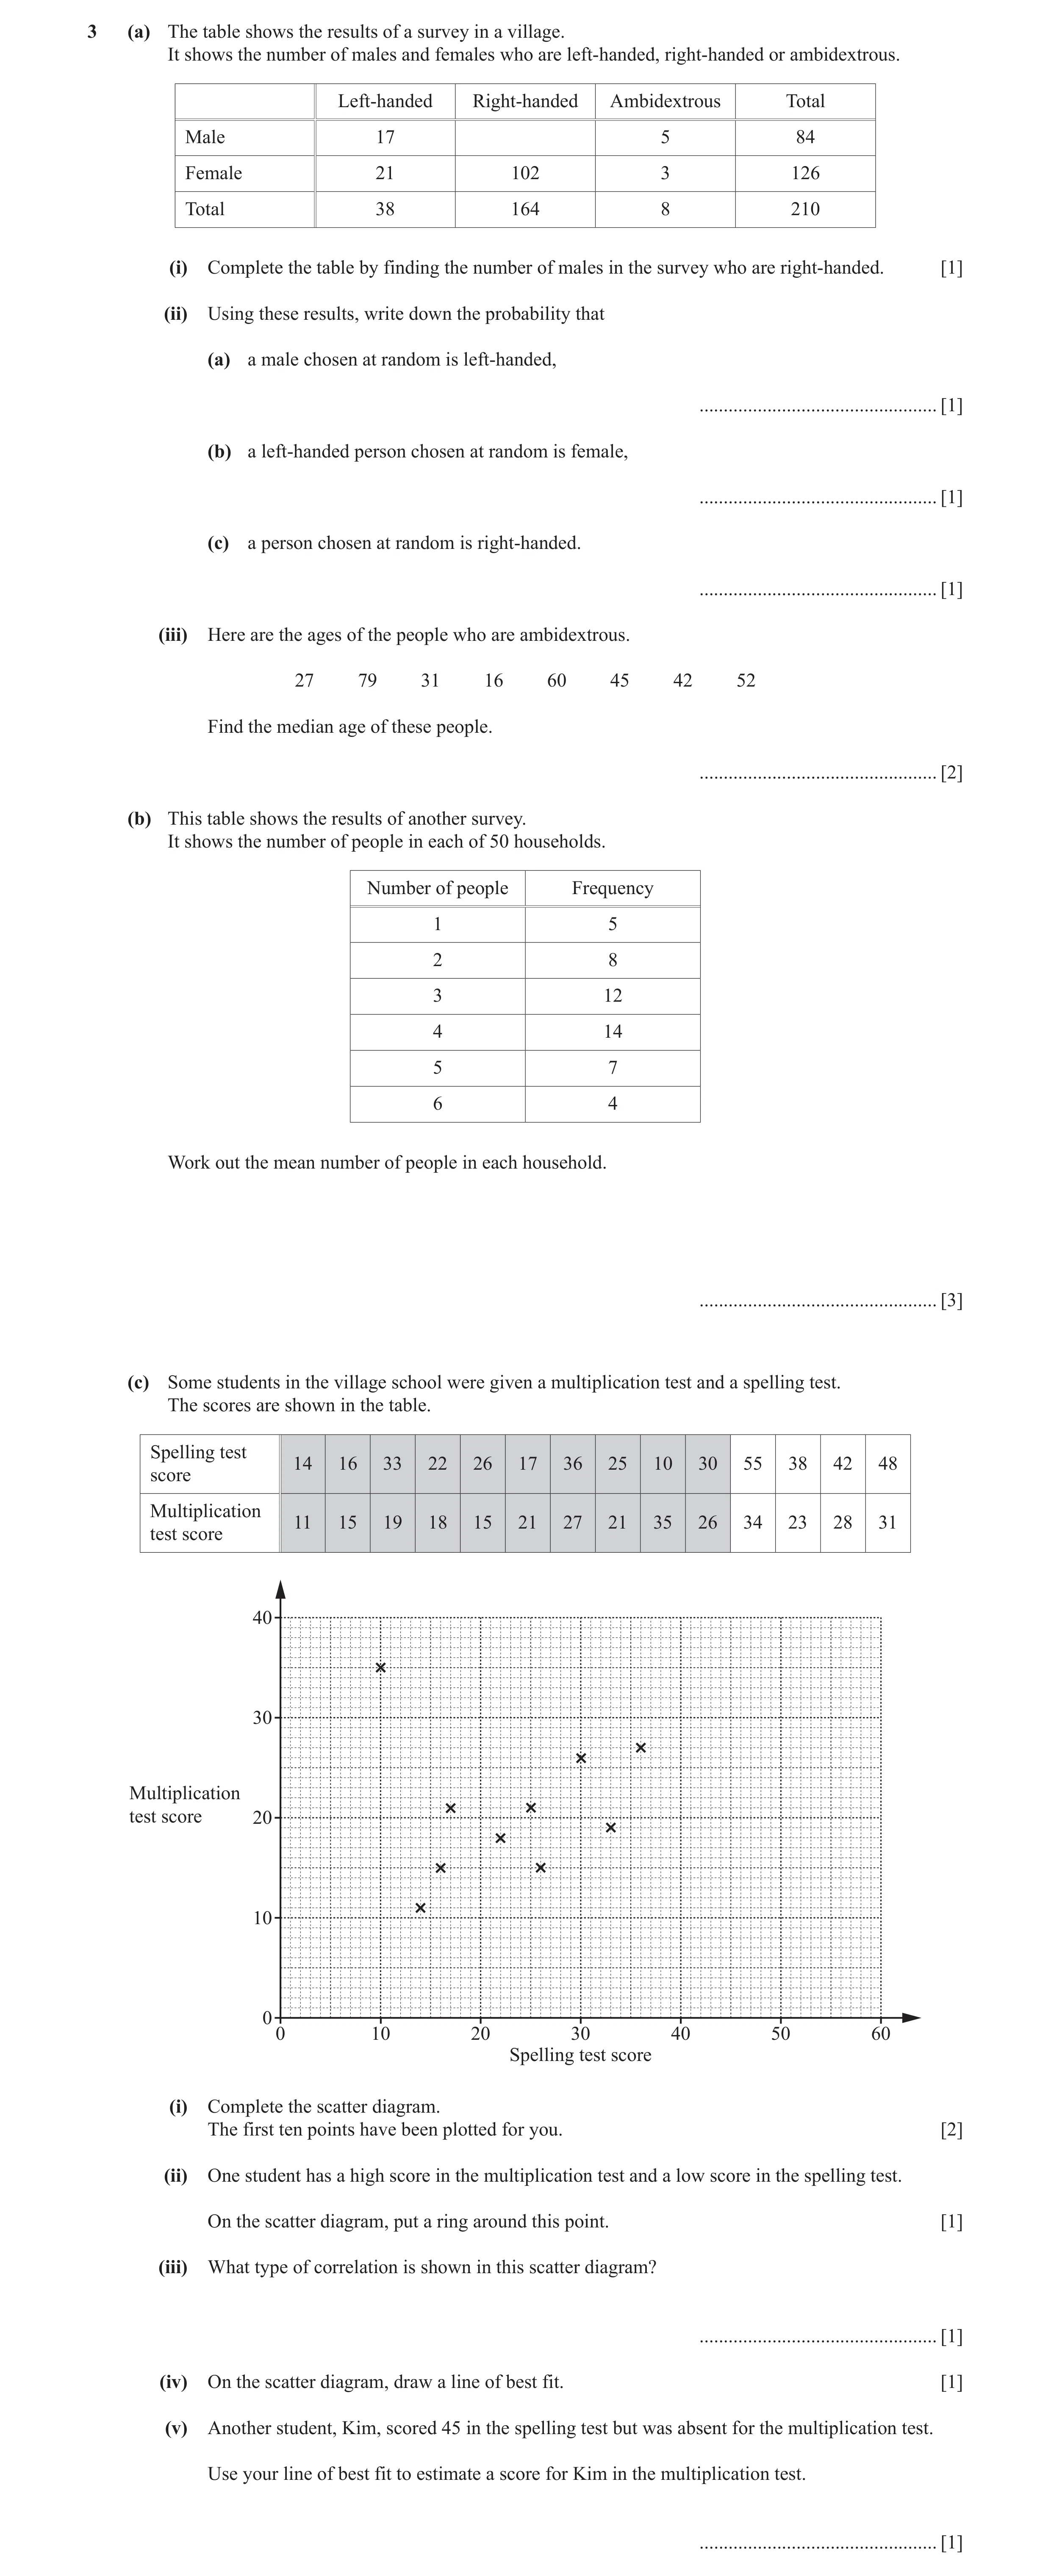
3 (a) The table shows the results of a survey in a village. It shows the number of males and females who are left-handed, right-handed or ambidextrous. Left-handed Right-handed Ambidextrous Total Male 17 5 84 Female 21 102 3 126 Total 38 164 8 210 (i) Complete the table by finding the number of males in the survey who are right-handed. [1] (ii) Using these results, write down the probability that (a) a male chosen at random is left-handed, … [1] (b) a left-handed person chosen at random is female, … [1] (c) a person chosen at random is right-handed. … [1] (iii) Here are the ages of the people who are ambidextrous. 27 79 31 16 60 45 42 52 Find the median age of these people. … [2] (b) This table shows the results of another survey. It shows the number of people in each of 50 households. Number of people Frequency 1 5 2 8 3 12 4 14 5 7 6 4 Work out the mean number of people in each household. … [3] (c) Some students in the village school were given a multiplication test and a spelling test. The scores are shown in the table. Spelling test 14 16 33 22 26 17 36 25 10 30 55 38 42 48 score Multiplication 11 15 19 18 15 21 27 21 35 26 34 23 28 31 test score 40 30 Multiplication test score 20 10 0 0 10 20 30 40 50 60 Spelling test score (i) Complete the scatter diagram. The first ten points have been plotted for you. [2] (ii) One student has a high score in the multiplication test and a low score in the spelling test. On the scatter diagram, put a ring around this point. [1] (iii) What type of correlation is shown in this scatter diagram? … [1] (iv) On the scatter diagram, draw a line of best fit. [1] (v) Another student, Kim, scored 45 in the spelling test but was absent for the multiplication test. Use your line of best fit to estimate a score for Kim in the multiplication test. … [1]
15 marks
Mark scheme: 3(a)(i) 62 1 3(a)(ii)(a) 17 1 oe isw 84 3(a)(ii)(b) 21 1 oe isw 38 3(a)(ii)(c) 164 1 oe isw 210 3(a)(iii) 43.5 oe 2 M1 for an ordered list giving at least the first 5 or the last 5 numbers in order or 42 and 45 identified 3(b) 3.44 3 M2 for (1 × 5 + 2×8 + 3 × 12 + 4 × 14 + 5 × 7 + 6 × 4) ÷ 50 implied by 172 ÷ 50 or M1 for (1 × 5) + (2 × 8) + (3 × 12) + (4 × 14) + (5 × 7) + (6 × 4) or 172 3(c)(i) 4 points plotted within tolerance 2 B1 for 2 or 3 points plotted within tolerance 3(c)(ii) (10, 35) indicated 1 3(c)(iii) Positive 1 3(c)(iv) Correct ruled line 1 3(c)(v) 28 to 32 1 If zero scored, FT their line of best fit if positive
This question in 0580/32 May/June 2017
Q17 · Bag A contains 20 counters 0580/31 Oct/Nov 2017
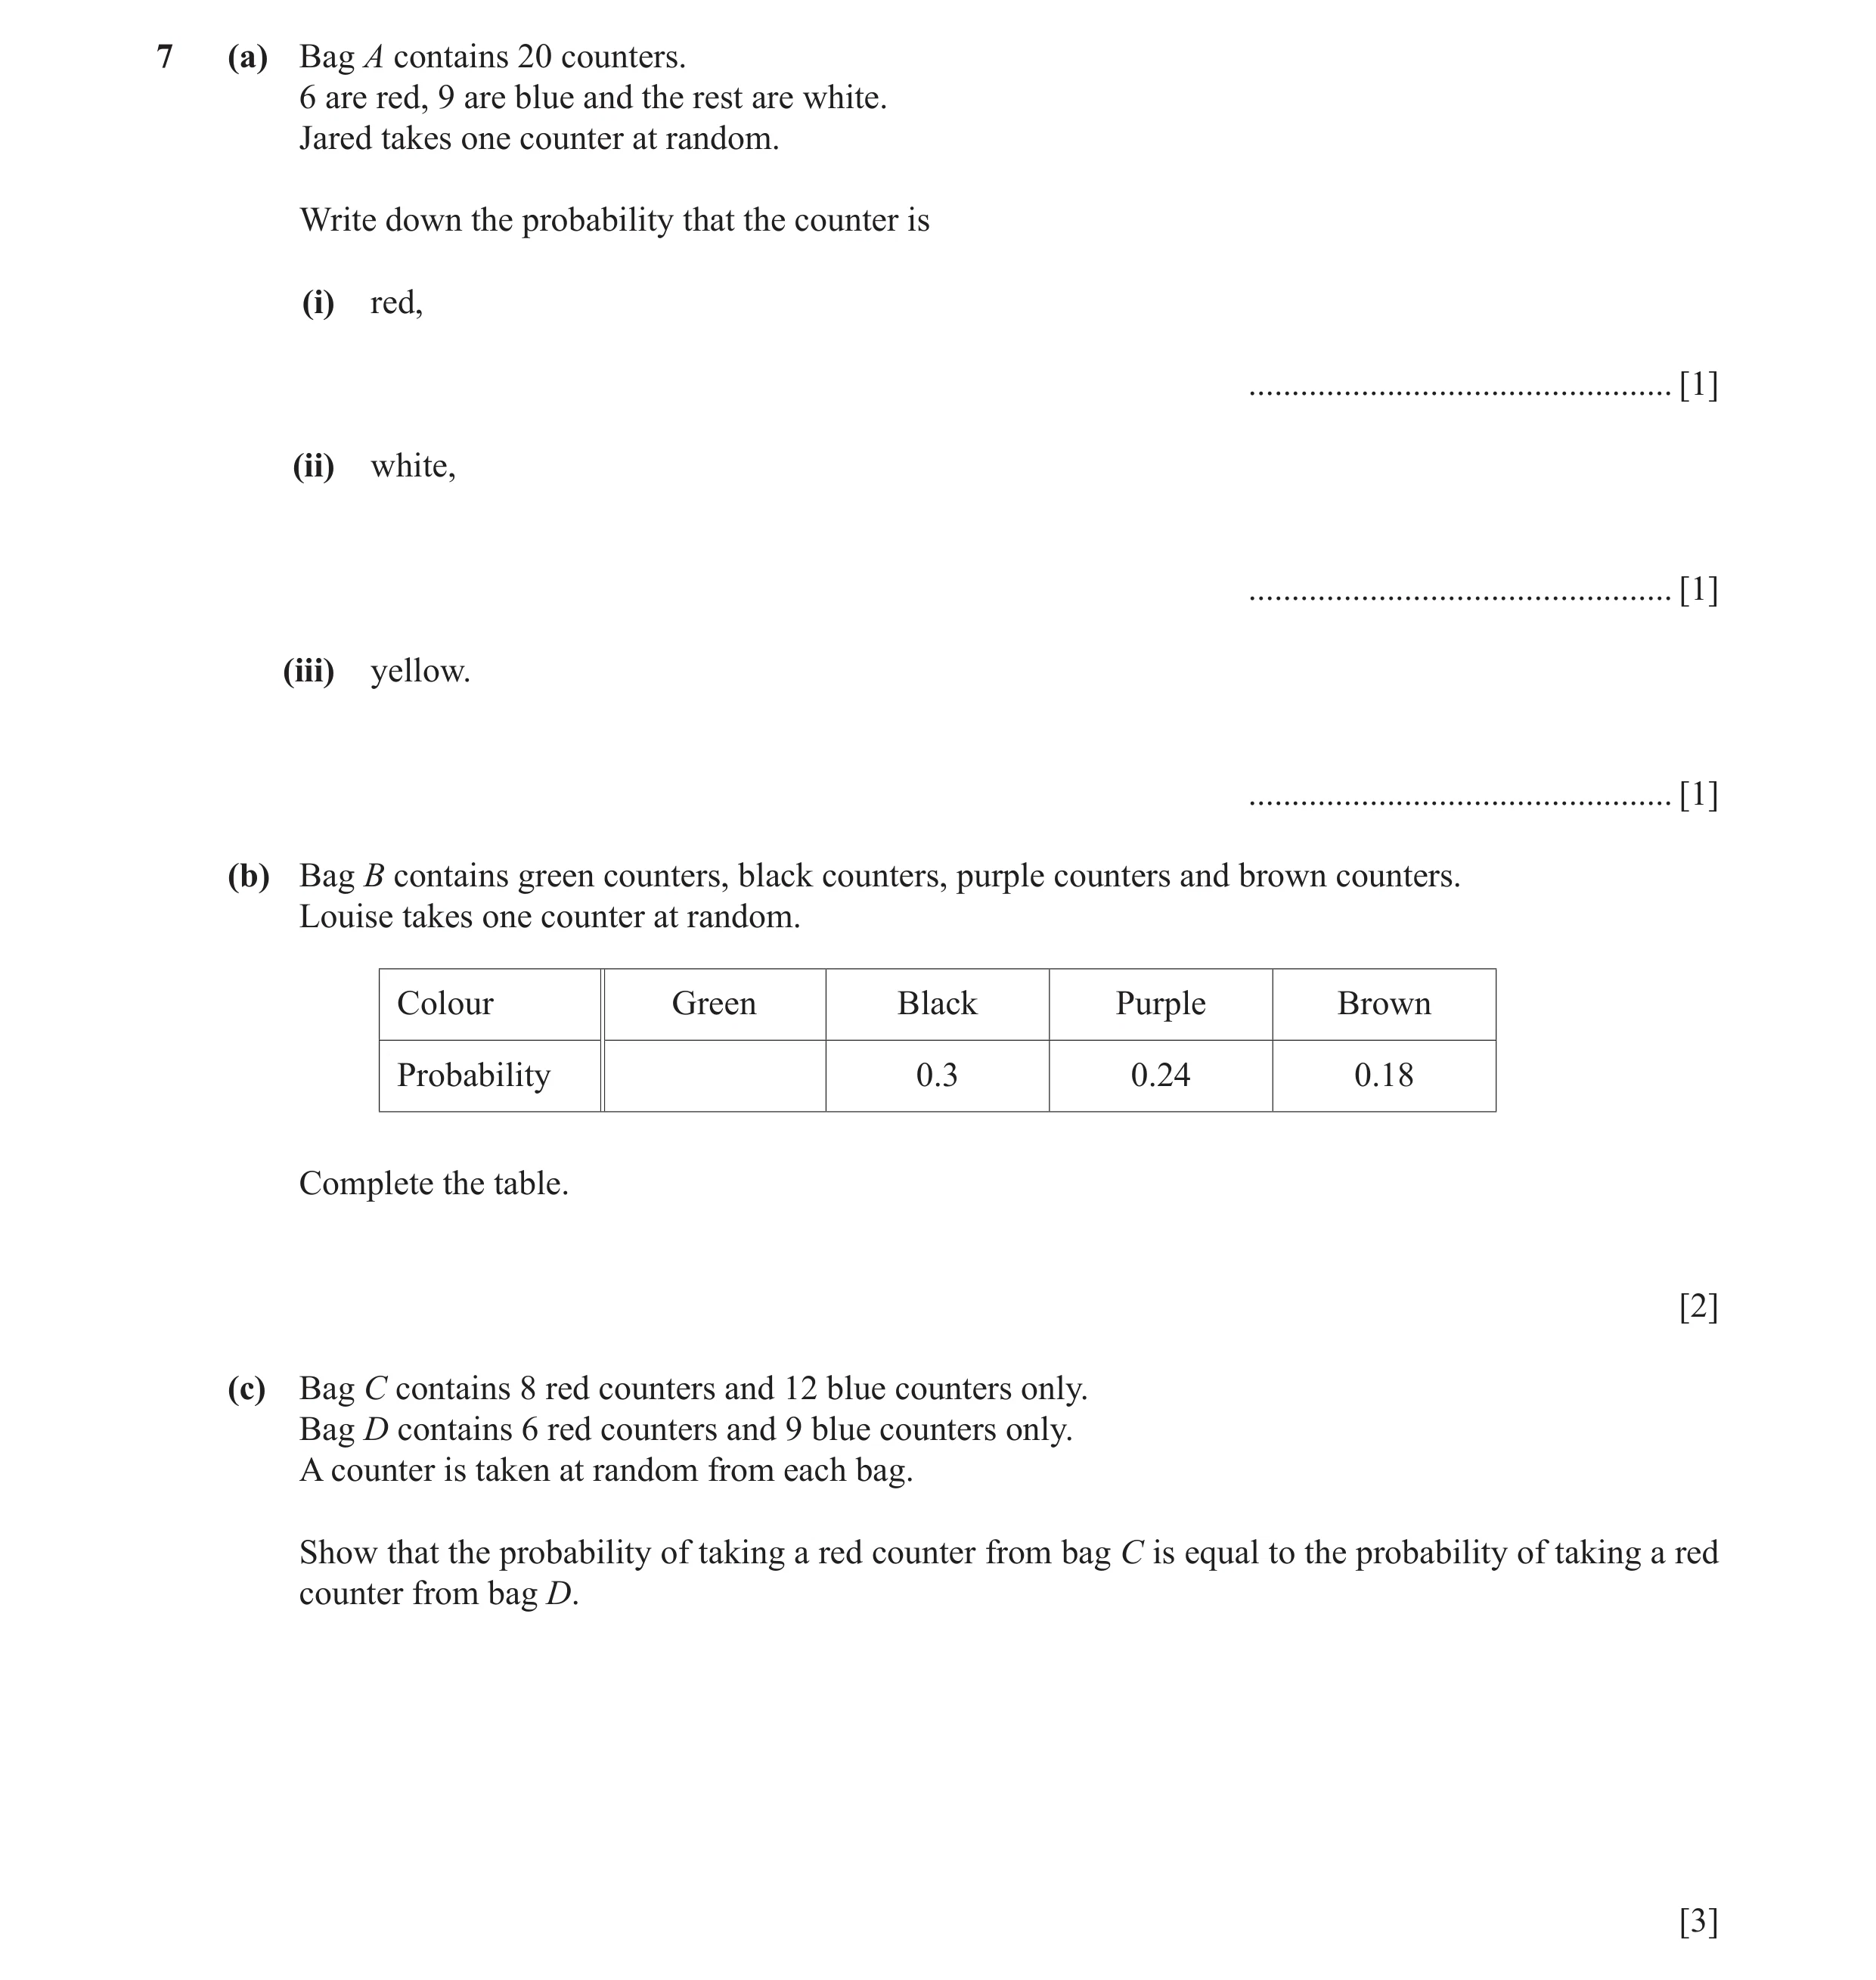
7 (a) Bag A contains 20 counters. 6 are red, 9 are blue and the rest are white. Jared takes one counter at random. Write down the probability that the counter is (i) red, … [1] (ii) white, … [1] (iii) yellow. … [1] (b) Bag B contains green counters, black counters, purple counters and brown counters. Louise takes one counter at random. Colour Green Black Purple Brown Probability 0.3 0.24 0.18 Complete the table. [2] (c) Bag C contains 8 red counters and 12 blue counters only. Bag D contains 6 red counters and 9 blue counters only. A counter is taken at random from each bag. Show that the probability of taking a red counter from bag C is equal to the probability of taking a red counter from bag D. [3]
8 marks
Mark scheme: 7(a)(i) 6 1 oe 20 7(a)(ii) 5 1 oe 20 7(a)(iii) 0 1 7(b) [0].28 oe 2 M1 for 1 – 0.3 – 0.24 – 0.18 oe or 1 – 0.72 oe 7(c) 8 1 Accept 8 ÷ 20 20 6 1 Accept 6 ÷ 15 15 Comparing the two fractions 1 8 24 6 24 e.g. = and = with equal denominators or as 20 60 15 60 decimals 2 or both shown equal to or [0] .4 or 40% 5
This question in 0580/31 Oct/Nov 2017
Q18 · Nico asked each of 900 students at her school what their favourite subject is 0580/32 Oct/Nov 2017
5 Nico asked each of 900 students at her school what their favourite subject is. The students only chose Science, Art, Mathematics, History or Geography. The pie chart shows some of this information. Science 18° Art Mathematics (a) Show that 225 students chose Science. [1] (b) Find how many students chose Art. … [2] (c) 125 students chose History and 140 chose Geography. Complete the pie chart to show this information. [2] (d) One of the 900 students is selected at random. (i) Write down the probability that their favourite subject is French. … [1] (ii) Find the probability that their favourite subject is Art. Give your answer as a fraction in its lowest terms. … [2] (e) The total number of students in the school is 2520. Estimate how many students you would expect to choose History as their favourite subject. … [2]
10 marks
Mark scheme: 5(a) 90 1 × 900 [= 225] 360 5(b) 45 2 18 M1 for × 900 oe 360 5(c) Correct pie chart 2 B1 for 56° or 50° soi 5(d)(i) 0 1 5(d)(ii) 1 18 their(b) cao 2 M1 for or oe 20 360 900 5(e) 350 2 125 50 M1 for × 2520 or × 2520 oe 900 360
This question in 0580/32 Oct/Nov 2017
Q19 · The 262 students at a college each study one of the languages shown in the table 0580/32 May/June 2018
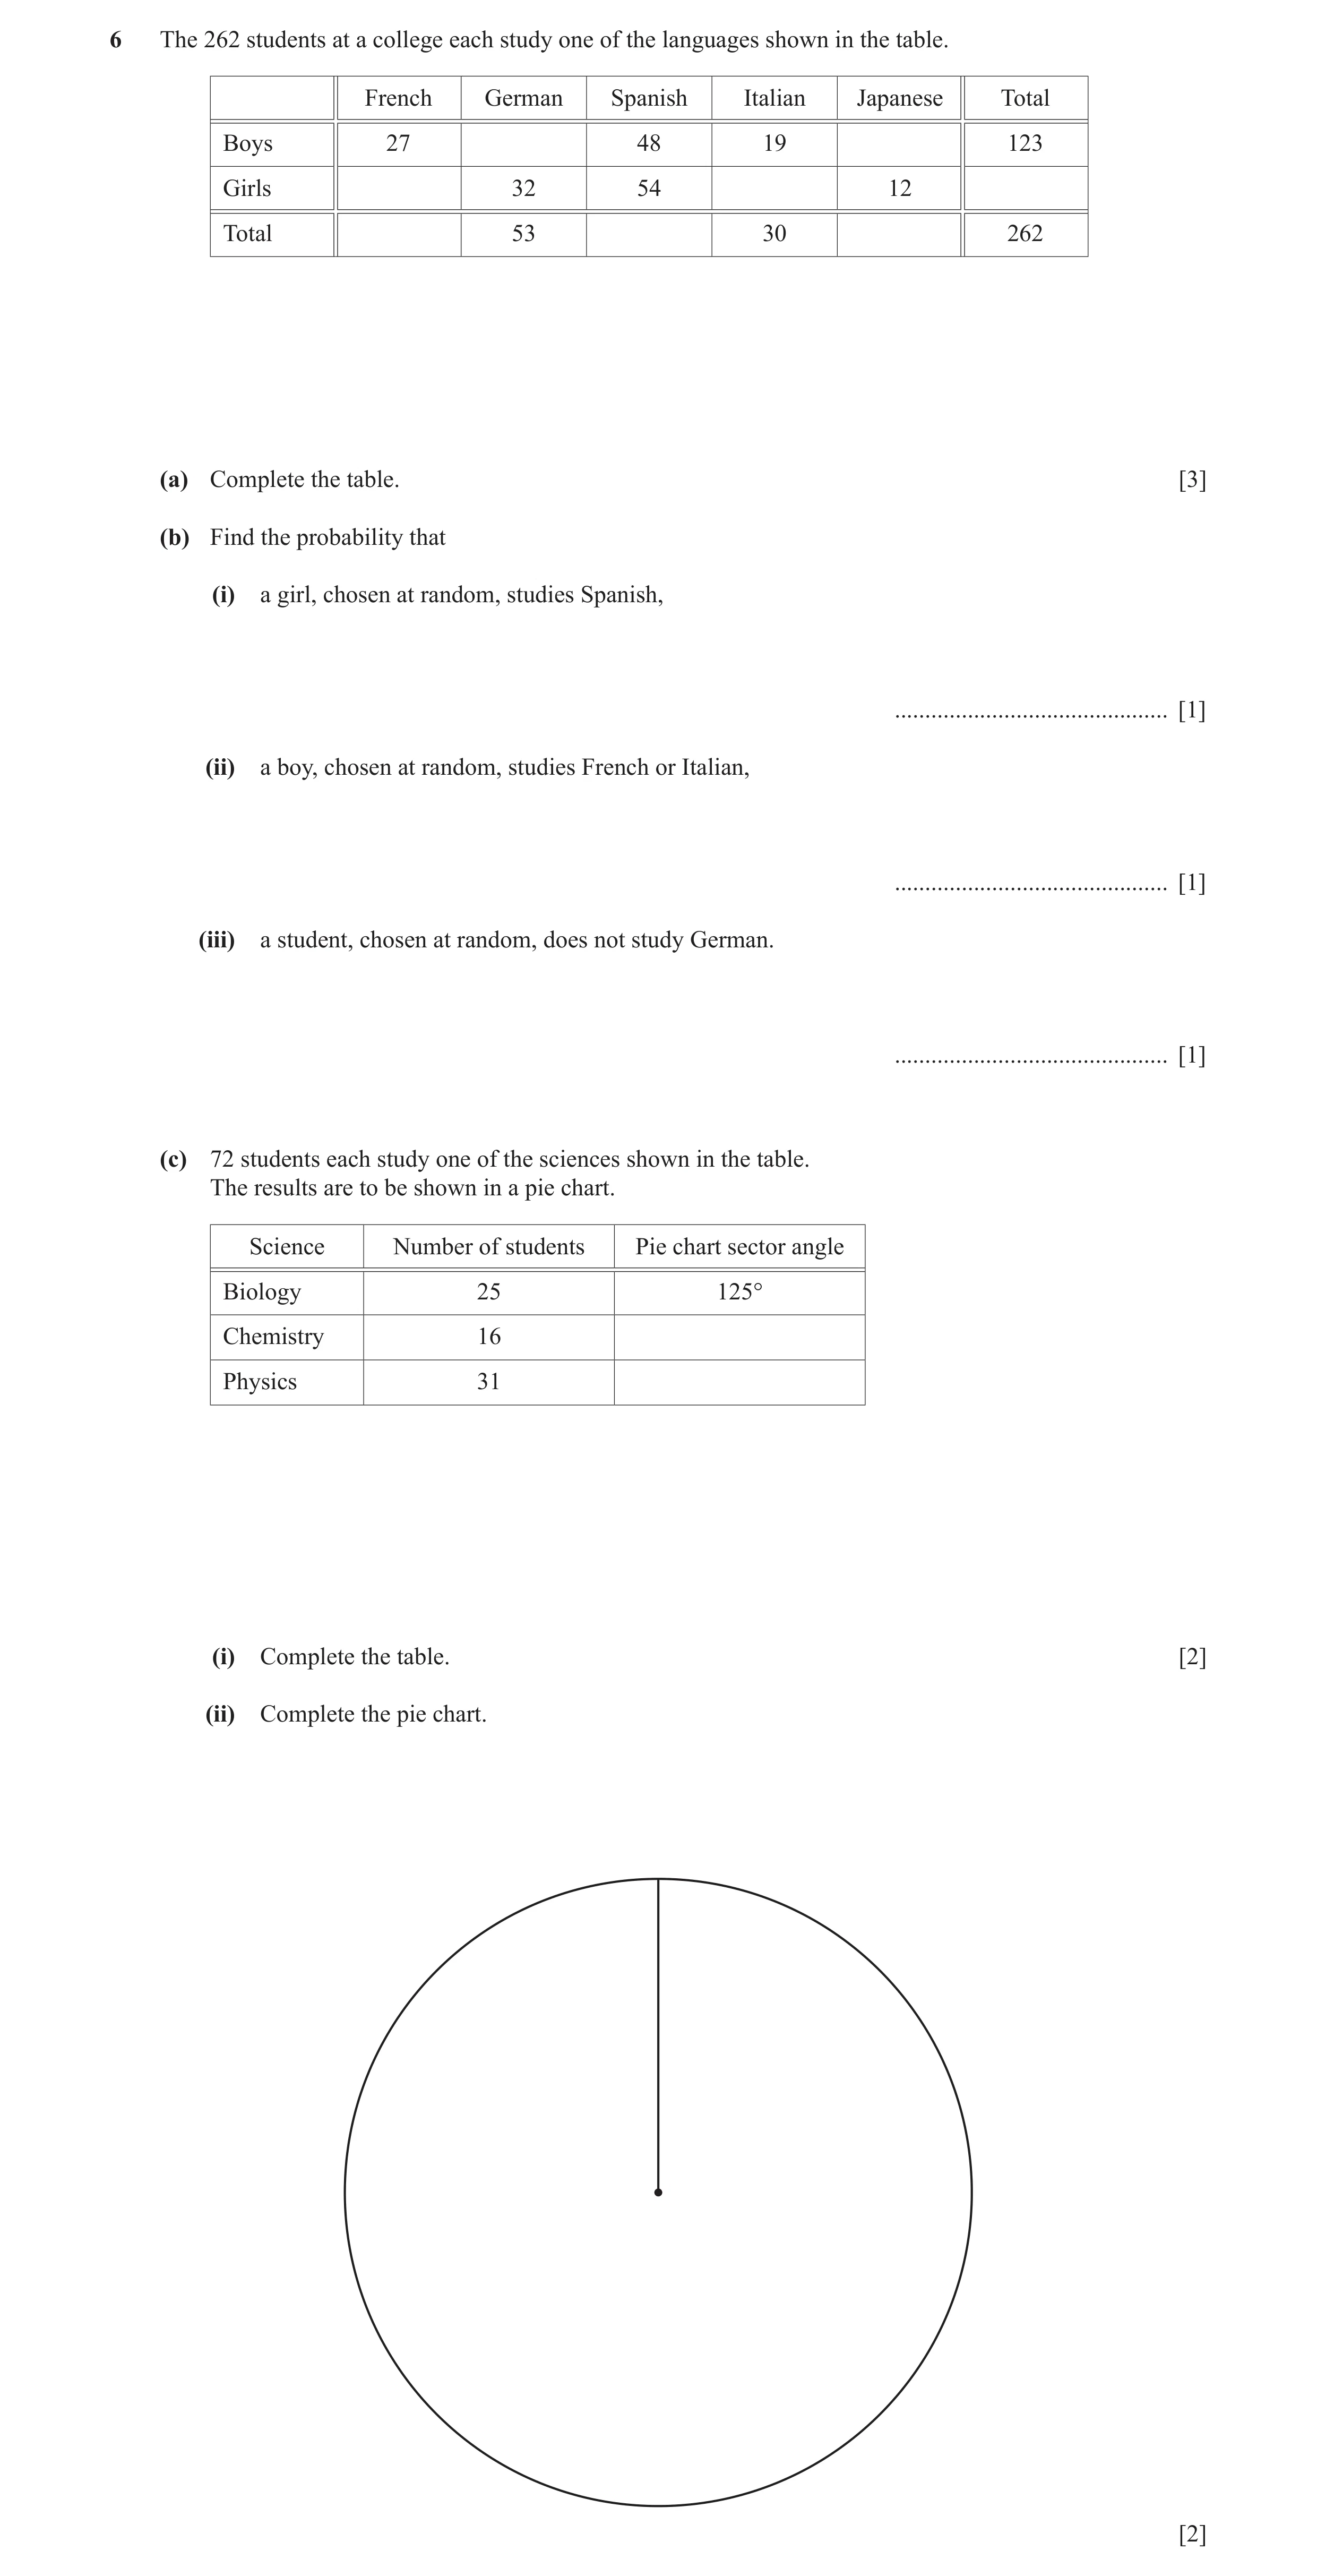
6 The 262 students at a college each study one of the languages shown in the table. French German Spanish Italian Japanese Total Boys 27 48 19 123 Girls 32 54 12 Total 53 30 262 (a) Complete the table. [3] (b) Find the probability that (i) a girl, chosen at random, studies Spanish, … [1] (ii) a boy, chosen at random, studies French or Italian, … [1] (iii) a student, chosen at random, does not study German. … [1] (c) 72 students each study one of the sciences shown in the table. The results are to be shown in a pie chart. Science Number of students Pie chart sector angle Biology 25 125° Chemistry 16 Physics 31 (i) Complete the table. [2] (ii) Complete the pie chart. [2]
10 marks
Mark scheme: 6(a) 3 B2 for 6 or 7 correct F G S I J Tot B 21 8 or B1 for 3, 4 or 5 correct G 30 11 139 Tot 57 102 20 6(b)(i) 54 1 FT their table oe isw their139 6(b)(ii) 46 1 oe isw 123 6(b)(iii) 209 1 oe isw 262 6(c)(i) [Chemistry] 80° 2 B1 for each [Physics] 155° or if 0 scored M1 for 125 ÷ 25 or 360 ÷ 72 or 5 If 0 scored SC1 for the two angles adding to 235° 6(c)(ii) Two correct lines on the pie chart 2 2FT only if (c)(i) angles total 235° B1 for a correct sector of 125° or 80° or 155°
This question in 0580/32 May/June 2018
Q20 · A bag contains 6 green balls, 5 red balls and 3 blue balls only 0580/33 May/June 2018
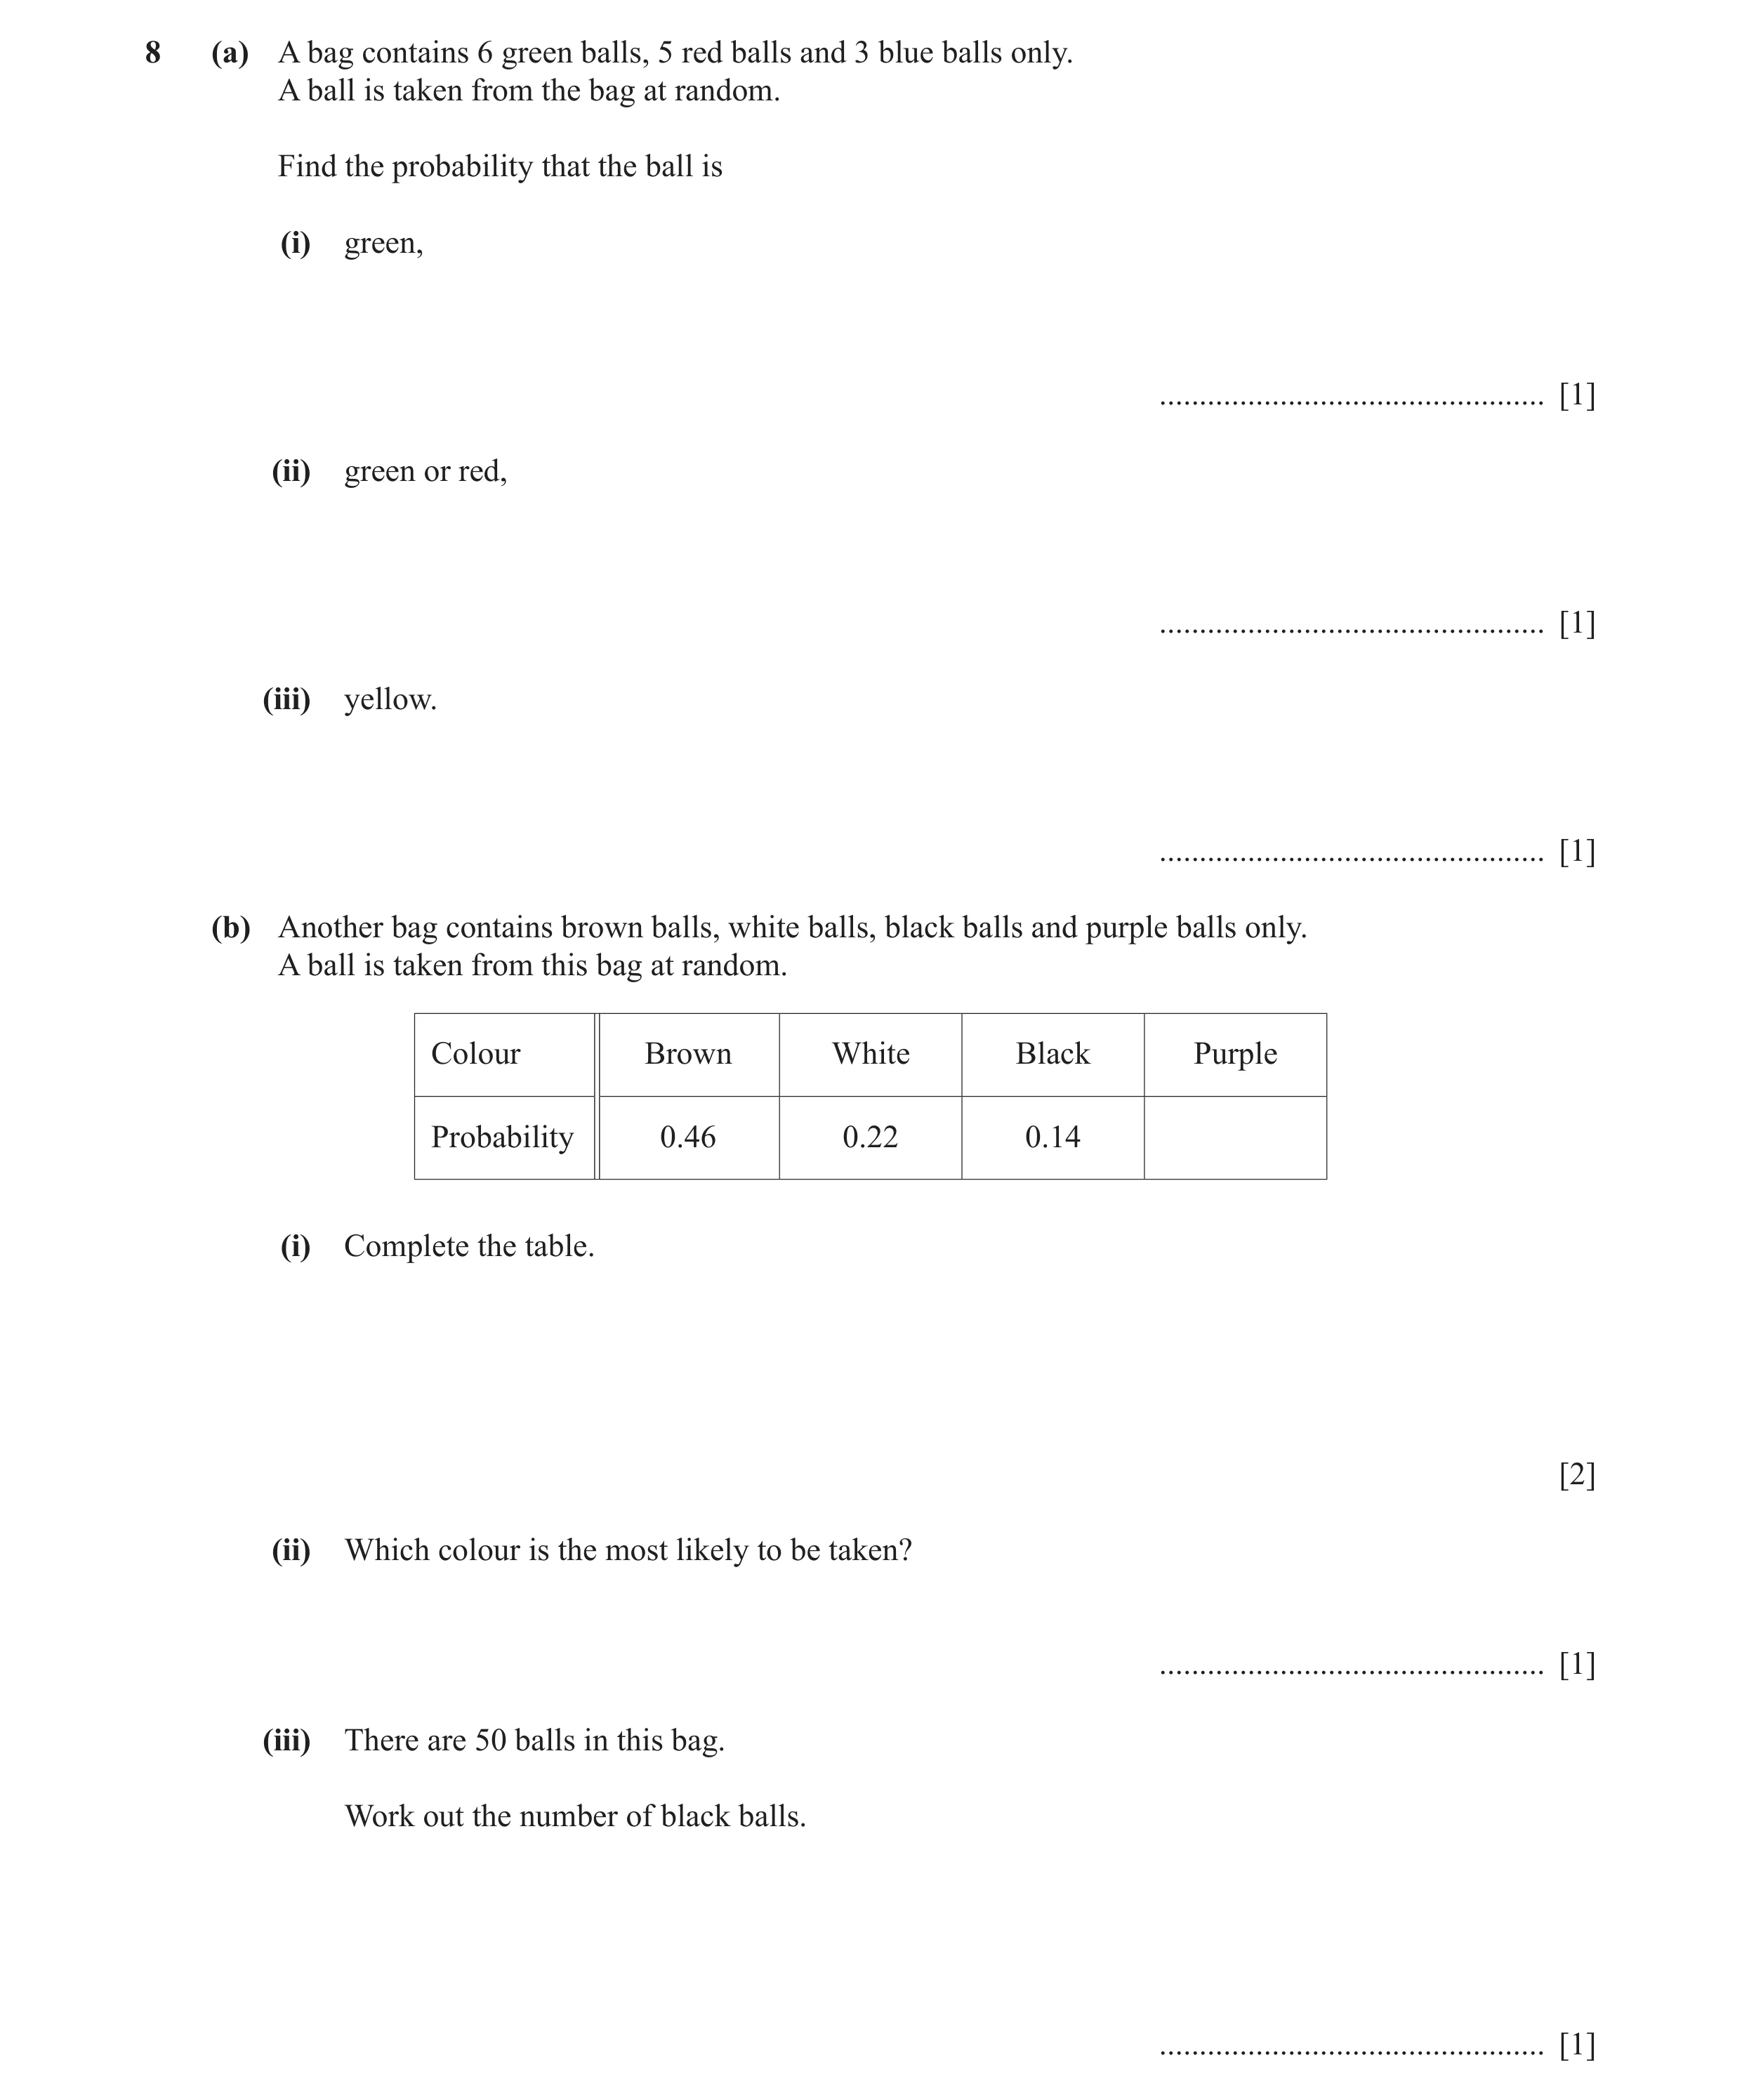
8 (a) A bag contains 6 green balls, 5 red balls and 3 blue balls only. A ball is taken from the bag at random. Find the probability that the ball is (i) green, … [1] (ii) green or red, … [1] (iii) yellow. … [1] (b) Another bag contains brown balls, white balls, black balls and purple balls only. A ball is taken from this bag at random. Colour Brown White Black Purple Probability 0.46 0.22 0.14 (i) Complete the table. [2] (ii) Which colour is the most likely to be taken? … [1] (iii) There are 50 balls in this bag. Work out the number of black balls. … [1]
7 marks
Mark scheme: 8(a)(i) 6 1 oe isw 14 8(a)(ii) 11 1 oe isw 14 8(a)(iii) 0 isw 1 8(b)(i) [0].18 oe 2 M1 for [1 –] (0.46 + 0.22 + 0.14) oe 8(b)(ii) Brown 1 8(b)(iii) 7 1
This question in 0580/33 May/June 2018
Q21 · A bag contains 20 bulbs 0580/33 Oct/Nov 2018
8 (a) A bag contains 20 bulbs. 8 are yellow, 5 are red, 4 are white and 3 are pink. Sam takes one bulb at random. Find the probability that the bulb he takes is (i) white, … [1] (ii) blue, … [1] (iii) not pink. … [1] (b) Sam has a rectangular pond, ABCD. A D NOT TO 12 m SCALE 7 m B C (i) Calculate BC. BC = … m [3] (ii) He puts a fence around the edge of the pond. Calculate the length of the fence. … m [1] (c) A scale drawing of Sam’s garden, PQRS, is shown below. The scale is 1 centimetre represents 4 metres. P S Q R Scale : 1 cm to 4 m Sam plants some bulbs so that they are • less than 30 metres from P and • nearer to PQ than to PS. Using a ruler and compasses only, construct and shade the region where he plants the bulbs. [5]
12 marks
Mark scheme: 8(a)(i) 4 1 oe 20 8(a)(ii) 0 1 8(a)(iii) 17 1 oe 20 8(b)(i) 9.75 or 9.746 to 9.747 3 2 2 M2 for 12 − 7 soi or M1 for 7 2 + BC 2 = 12 2 soi 8(b)(ii) 33.5 or 33.49 or 33.492 to 33.494 1 B1 FT their (b)(i) × 2 + 14 8(c) Correct construction and region shaded 5 B2 for arc radius 7.5 cm, centre P or B1 for short arc radius 7.5 cm, centre P or B1 for arc, any radius centre P B2 for angle bisector with correct arcs or B1 for angle bisector with incorrect or no arcs B1 for region dep on B1(arc) and B1(bisector)
This question in 0580/33 Oct/Nov 2018
Q22 · 80 students each record the name of their mathematics teacher 0580/32 May/June 2019
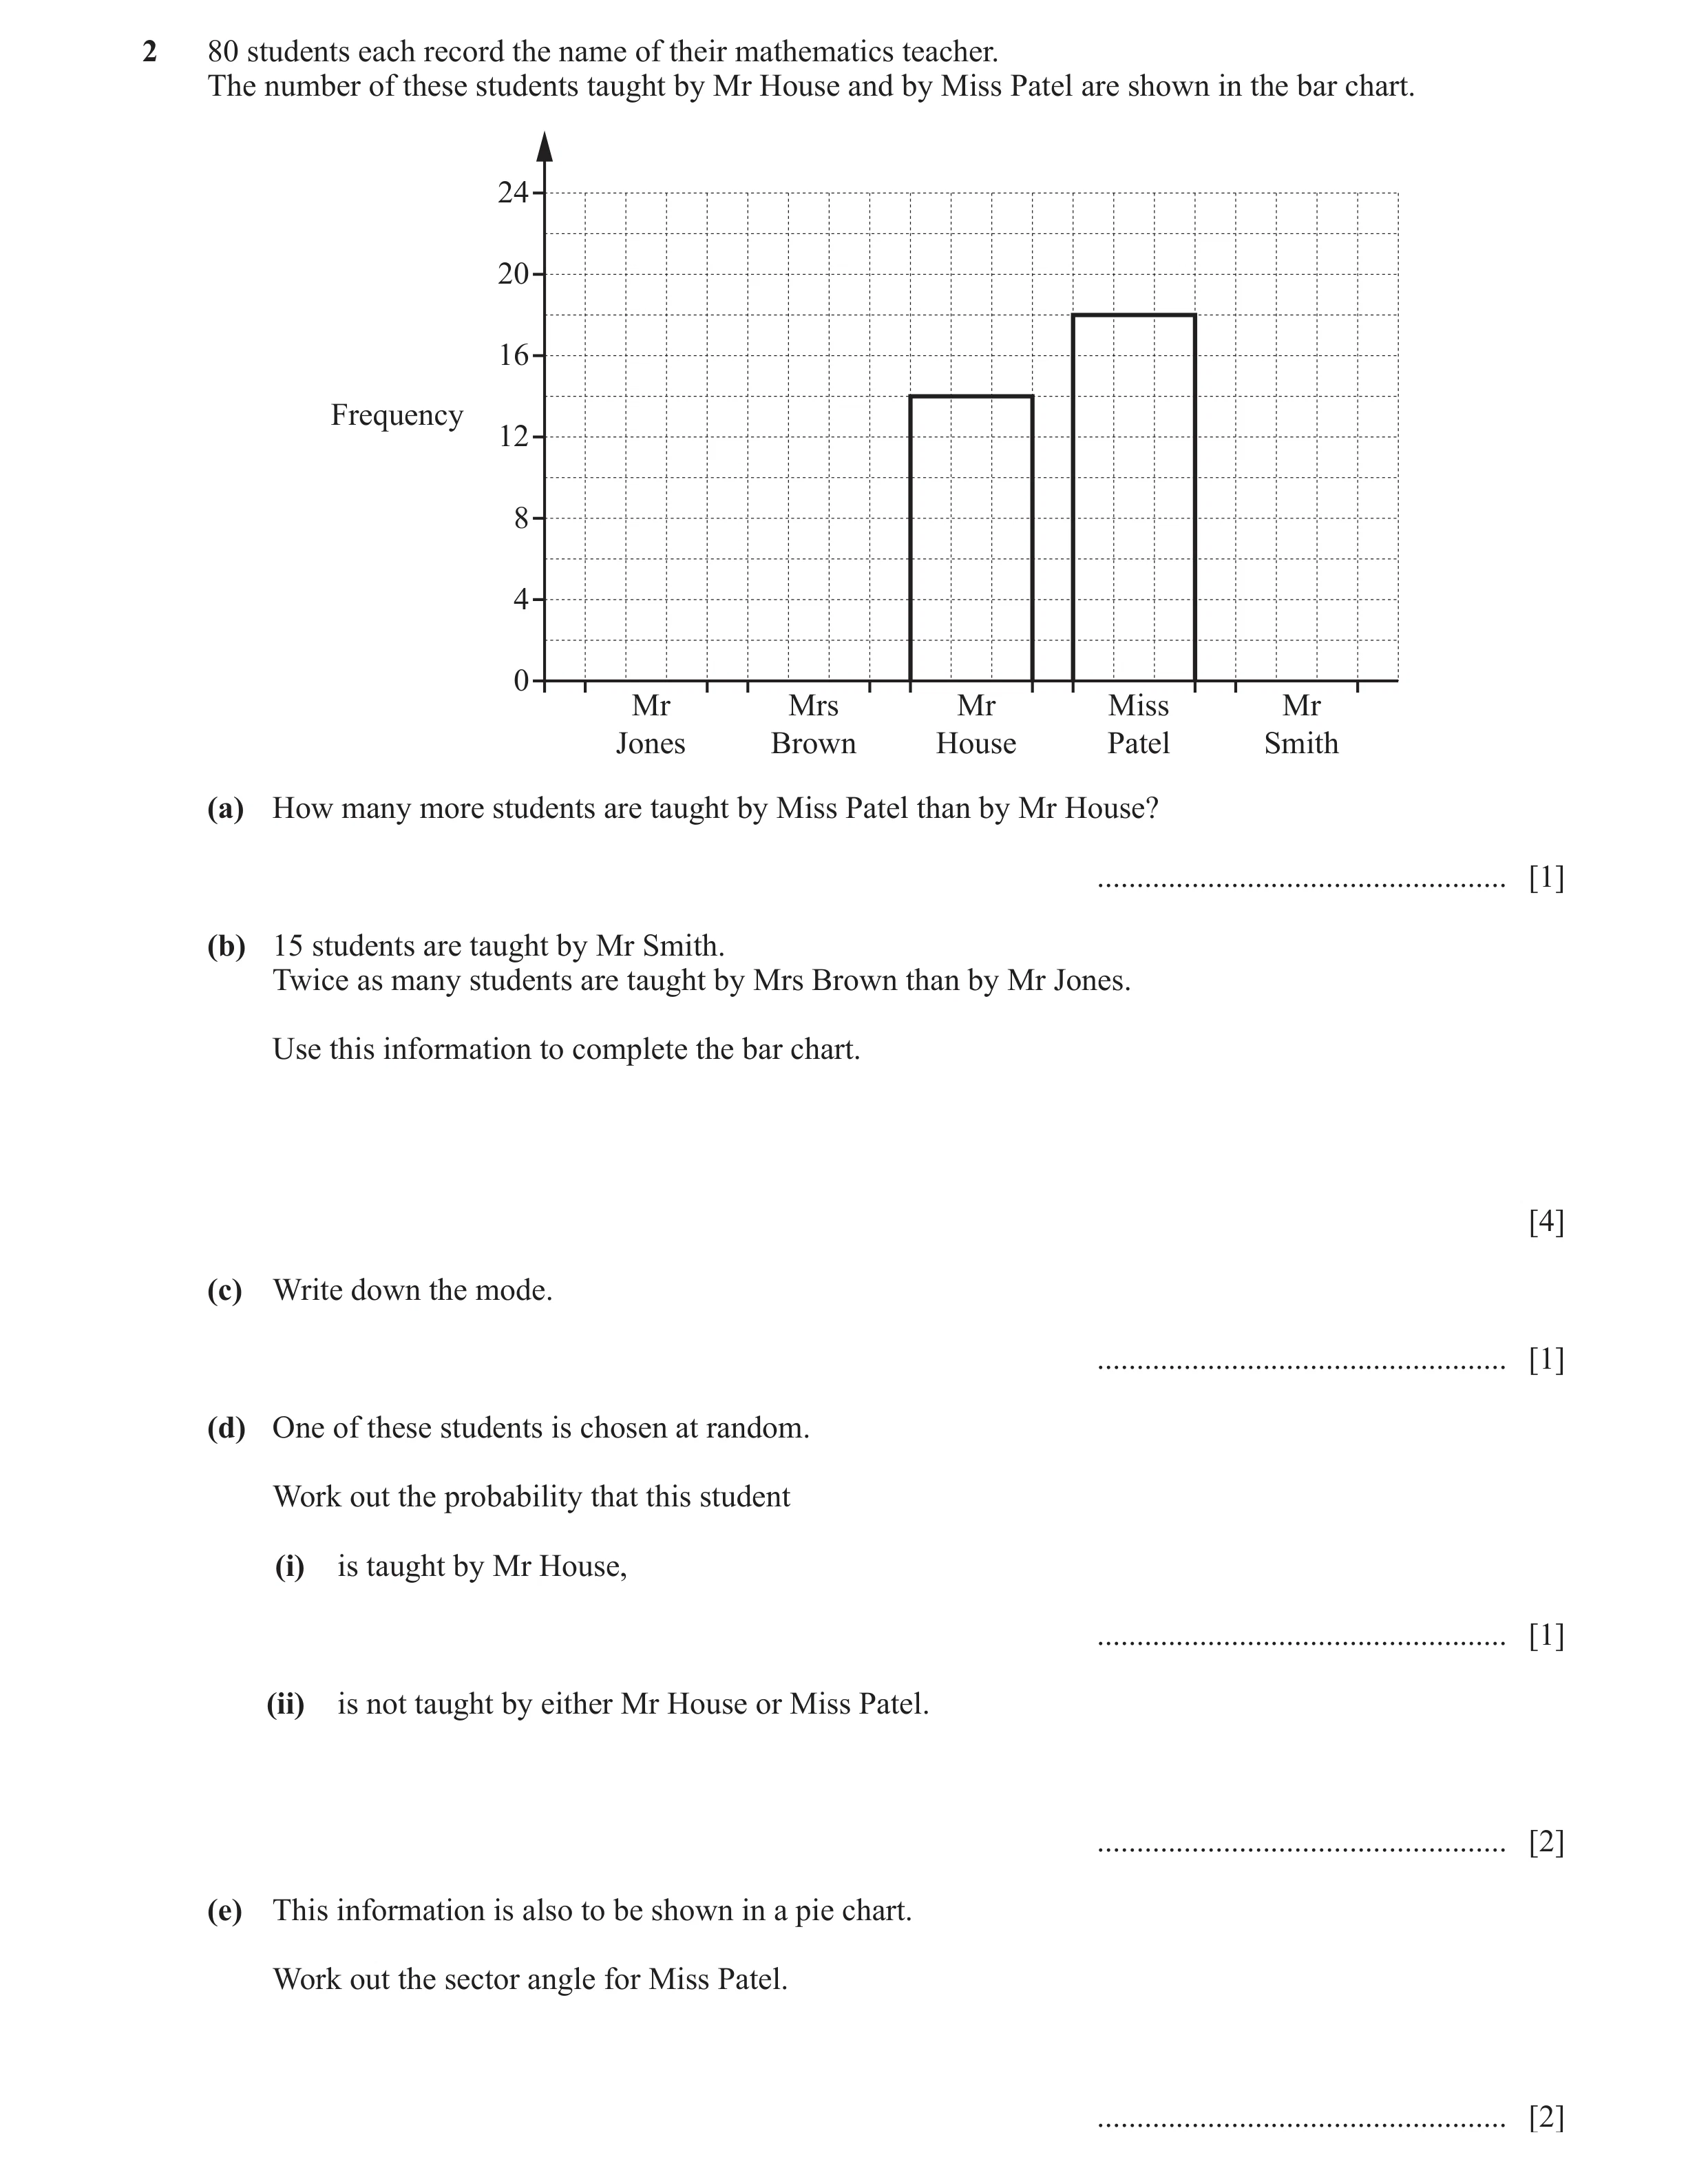
2 80 students each record the name of their mathematics teacher. The number of these students taught by Mr House and by Miss Patel are shown in the bar chart. 24 20 16 Frequency 12 8 4 0 Mr Mrs Mr Miss Mr Jones Brown House Patel Smith (a) How many more students are taught by Miss Patel than by Mr House? … [1] (b) 15 students are taught by Mr Smith. Twice as many students are taught by Mrs Brown than by Mr Jones. Use this information to complete the bar chart. [4] (c) Write down the mode. … [1] (d) One of these students is chosen at random. Work out the probability that this student (i) is taught by Mr House, … [1] (ii) is not taught by either Mr House or Miss Patel. … [2] (e) This information is also to be shown in a pie chart. Work out the sector angle for Miss Patel. … [2]
11 marks
Mark scheme: 2(a) 4 1 2(b) 3 correct bars drawn on bar chart 4 B1 for Mr Smith bar drawn height 15 M2 for their ( 80 − (18 + 14 + 15 ) ) ÷ 3 [× 2 ] or M1 for 80 − (18 + 14 + 15 ) oe 2(c) Mrs Brown 1 FT their bar chart provided 5 bars drawn 2(d)(i) 14 1 oe 80 2(d)(ii) 48 2 FT their bar chart oe 80 18 + 14 M1 for 80 − (18 + 14 ) or oe 80 OR M1FT for adding heights of bars for (Mr Jones, Mrs Brown and Mr Smith) 2(e) 81 2 360 18 M1 for [× 18 ] or [× 360 ] 80 80
This question in 0580/32 May/June 2019
Q23 · Soraya makes rectangular flags 0580/31 Oct/Nov 2019
7 (a) Soraya makes rectangular flags. (i) On the rectangle, draw the lines of symmetry. [2] (ii) Each flag measures 1.2 m by 1.8 m. Calculate the area of one flag. … m2 [2] (b) Each flag costs $15 to make. Soraya sells one flag for $21. Calculate the percentage profit. … % [3] (c) Soraya makes 30 flags. 11 flags are pink, 7 are yellow, 5 are blue, 4 are silver and 3 are green. Soraya takes a flag at random. Find the probability that the flag she takes is (i) pink, … [1] (ii) not blue, … [1] (iii) red. … [1] (d) Soraya decides to make a mathematically similar flag. 1.8 m 2.4 m 1.2 m h NOT TO SCALE Calculate the height, h, of the new flag. h = … m [2] (e) NOT TO 25 m SCALE 8 m The diagram shows a flagpole in Soraya’s garden. The flagpole has height 25 m. A rope from the top of the flagpole is tied to the ground 8 m from its base. Calculate the length of this rope. … m [2]
14 marks
Mark scheme: 7(a)(i) Two correct lines drawn 2 B1 for one correct, no extras or two correct and one extra 7(a)(ii) 2.16 2 M1 for 1.2 × 1.8 7(b) 40 3 21 − 15 M2 for [× 100] or 15 21 − 1 [×100] 15 21 or × 100 [−100] oe 15 21 or M1 for or 21−15 15 7(c)(i) 11 1 oe 30 7(c)(ii) 25 1 oe 30 7(c)(iii) 0 1 7(d) 1.6 2 2.4 1.8 1.8 1.2 M1 for or or or soi 1.8 2.4 1.2 1.8 7(e) 26.2 or 26.24 to 26.25 2 M1 for 252 + 82 or better
This question in 0580/31 Oct/Nov 2019
Q24 · Paul has a set of 8 cards, each with a number written on it 0580/32 May/June 2020
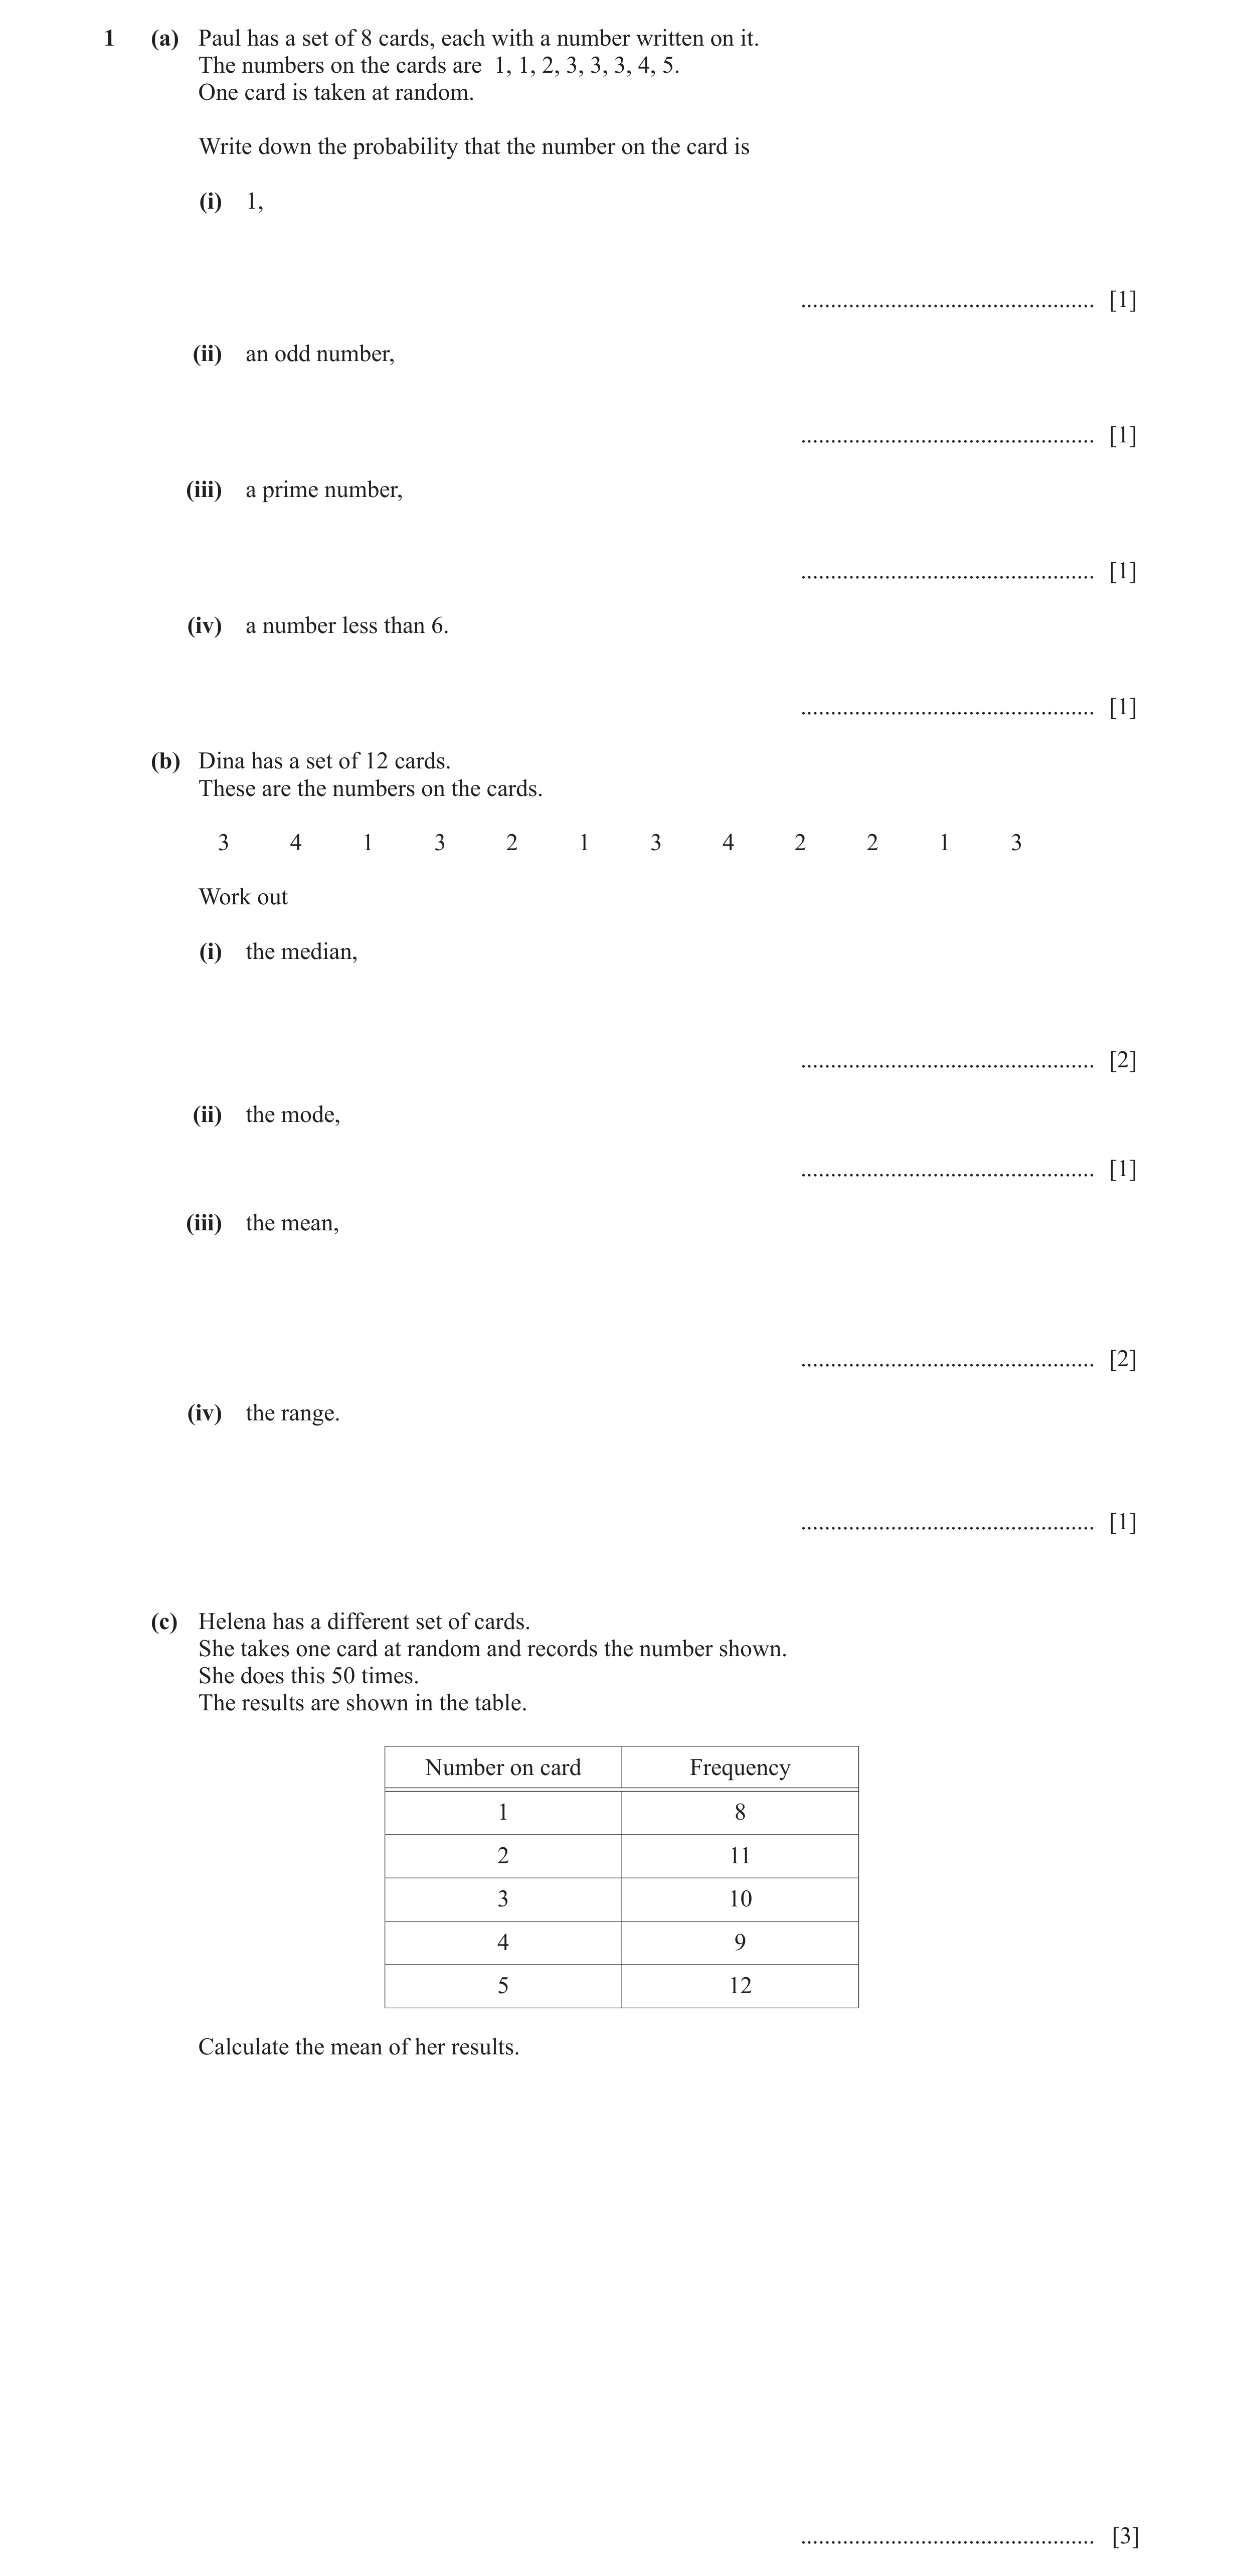
1 (a) Paul has a set of 8 cards, each with a number written on it. The numbers on the cards are 1, 1, 2, 3, 3, 3, 4, 5. One card is taken at random. Write down the probability that the number on the card is (i) 1, … [1] (ii) an odd number, … [1] (iii) a prime number, … [1] (iv) a number less than 6. … [1] (b) Dina has a set of 12 cards. These are the numbers on the cards. 3 4 1 3 2 1 3 4 2 2 1 3 Work out (i) the median, … [2] (ii) the mode, … [1] (iii) the mean, … [2] (iv) the range. … [1] (c) Helena has a different set of cards. She takes one card at random and records the number shown. She does this 50 times. The results are shown in the table. Number on card Frequency 1 8 2 11 3 10 4 9 5 12 Calculate the mean of her results. … [3]
13 marks
Mark scheme: Question Answer Marks Partial Marks 1(a)(i) 1 1 oe 4 1(a)(ii) 3 1 oe 4 1(a)(iii) 5 1 8 1(a)(iv) 1 1 1(b)(i) 2.5 2 M1 for ordering the numbers to the middle two e.g. 1 1 1 2 2 2 3 or 2 3 3 3 3 4 4 or B1 for 2 and 3 identified 1(b)(ii) 3 1 1(b)(iii) 5 2 M1 for (1 + 1 + 1 + 2 + 2 + 2 + 3 + 3 + 3 + 3 2.42 or 2.416 to 2.417 or + 4 + 4) ÷ 12 212 1(b)(iv) 3 1 1(c) 3.12 3 M1 for 1 × 8 + 2 × 11 + 3 × 10 + 4 × 9 + 5 × 12 soi 156 M1dep for their 156 ÷ 50
This question in 0580/32 May/June 2020
Q25 · The Venn diagram shows information about the number of students in a class who like… 0580/33 May/June 2020
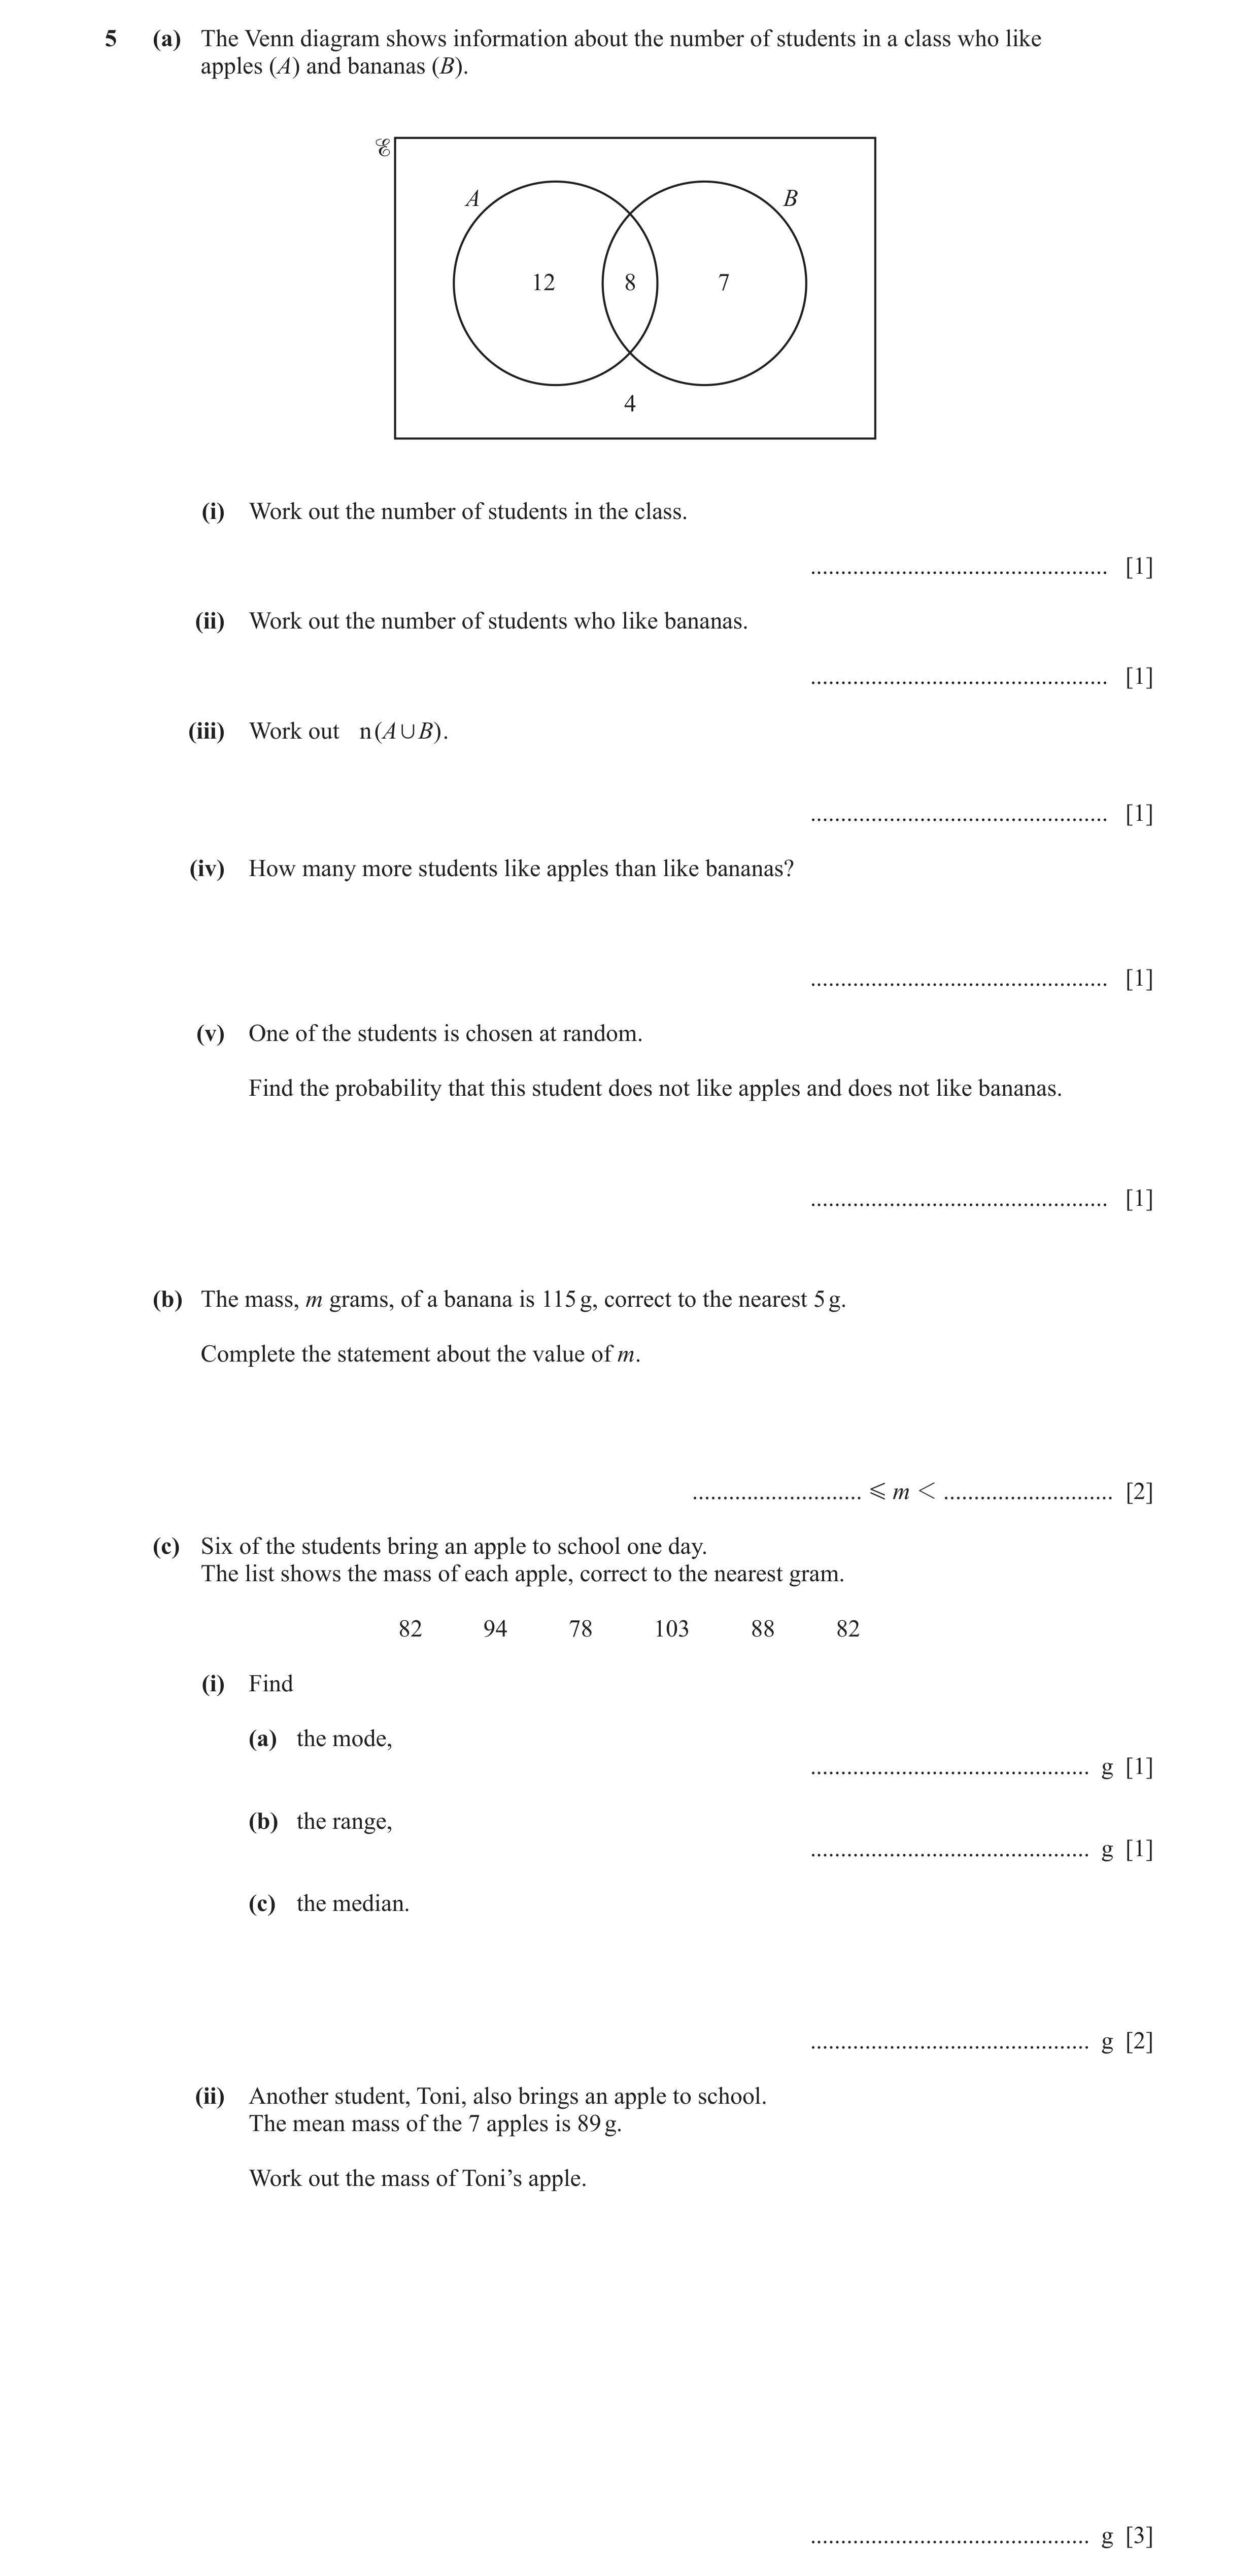
5 (a) The Venn diagram shows information about the number of students in a class who like apples (A) and bananas (B). A B 12 8 7 4 (i) Work out the number of students in the class. … [1] (ii) Work out the number of students who like bananas. … [1] (iii) Work out n ( A , B ) . … [1] (iv) How many more students like apples than like bananas? … [1] (v) One of the students is chosen at random. Find the probability that this student does not like apples and does not like bananas. … [1] (b) The mass, m grams, of a banana is 115 g, correct to the nearest 5 g. Complete the statement about the value of m. … G m 1 … [2] (c) Six of the students bring an apple to school one day. The list shows the mass of each apple, correct to the nearest gram. 82 94 78 103 88 82 (i) Find (a) the mode, … g [1] (b) the range, … g [1] (c) the median. … g [2] (ii) Another student, Toni, also brings an apple to school. The mean mass of the 7 apples is 89 g. Work out the mass of Toni’s apple. … g [3]
14 marks
Mark scheme: 5(a)(i) 31 1 5(a)(ii) 15 1 5(a)(iii) 27 1 5(a)(iv) 5 1 5(a)(v) 4 1 4 oe FT 31 their(a)(i) 5(b) 112.5 117.5 2 B1 for each If 0 scored, SC1 for both correct but reversed 5(c)(i)(a) 82 1 5(c)(i)(b) 25 1 5(c)(i)(c) 85 2 M1 for 78, 82, 82, 88, 94, 103 or for first 4 or last 4 numbers seen in order with no errors or for 82 and 88 both selected 5(c)(ii) 96 3 M2 for 7 × 89 − (82 + 94 + 78 + 103 + 88 + 82) or for 7 × 89 = 527 + x or M1 for 7 × 89 or for 89 = (82 + 94 + 78 + 103 + 88 + 82 + x) ÷ 7 or B1 for 527
This question in 0580/33 May/June 2020
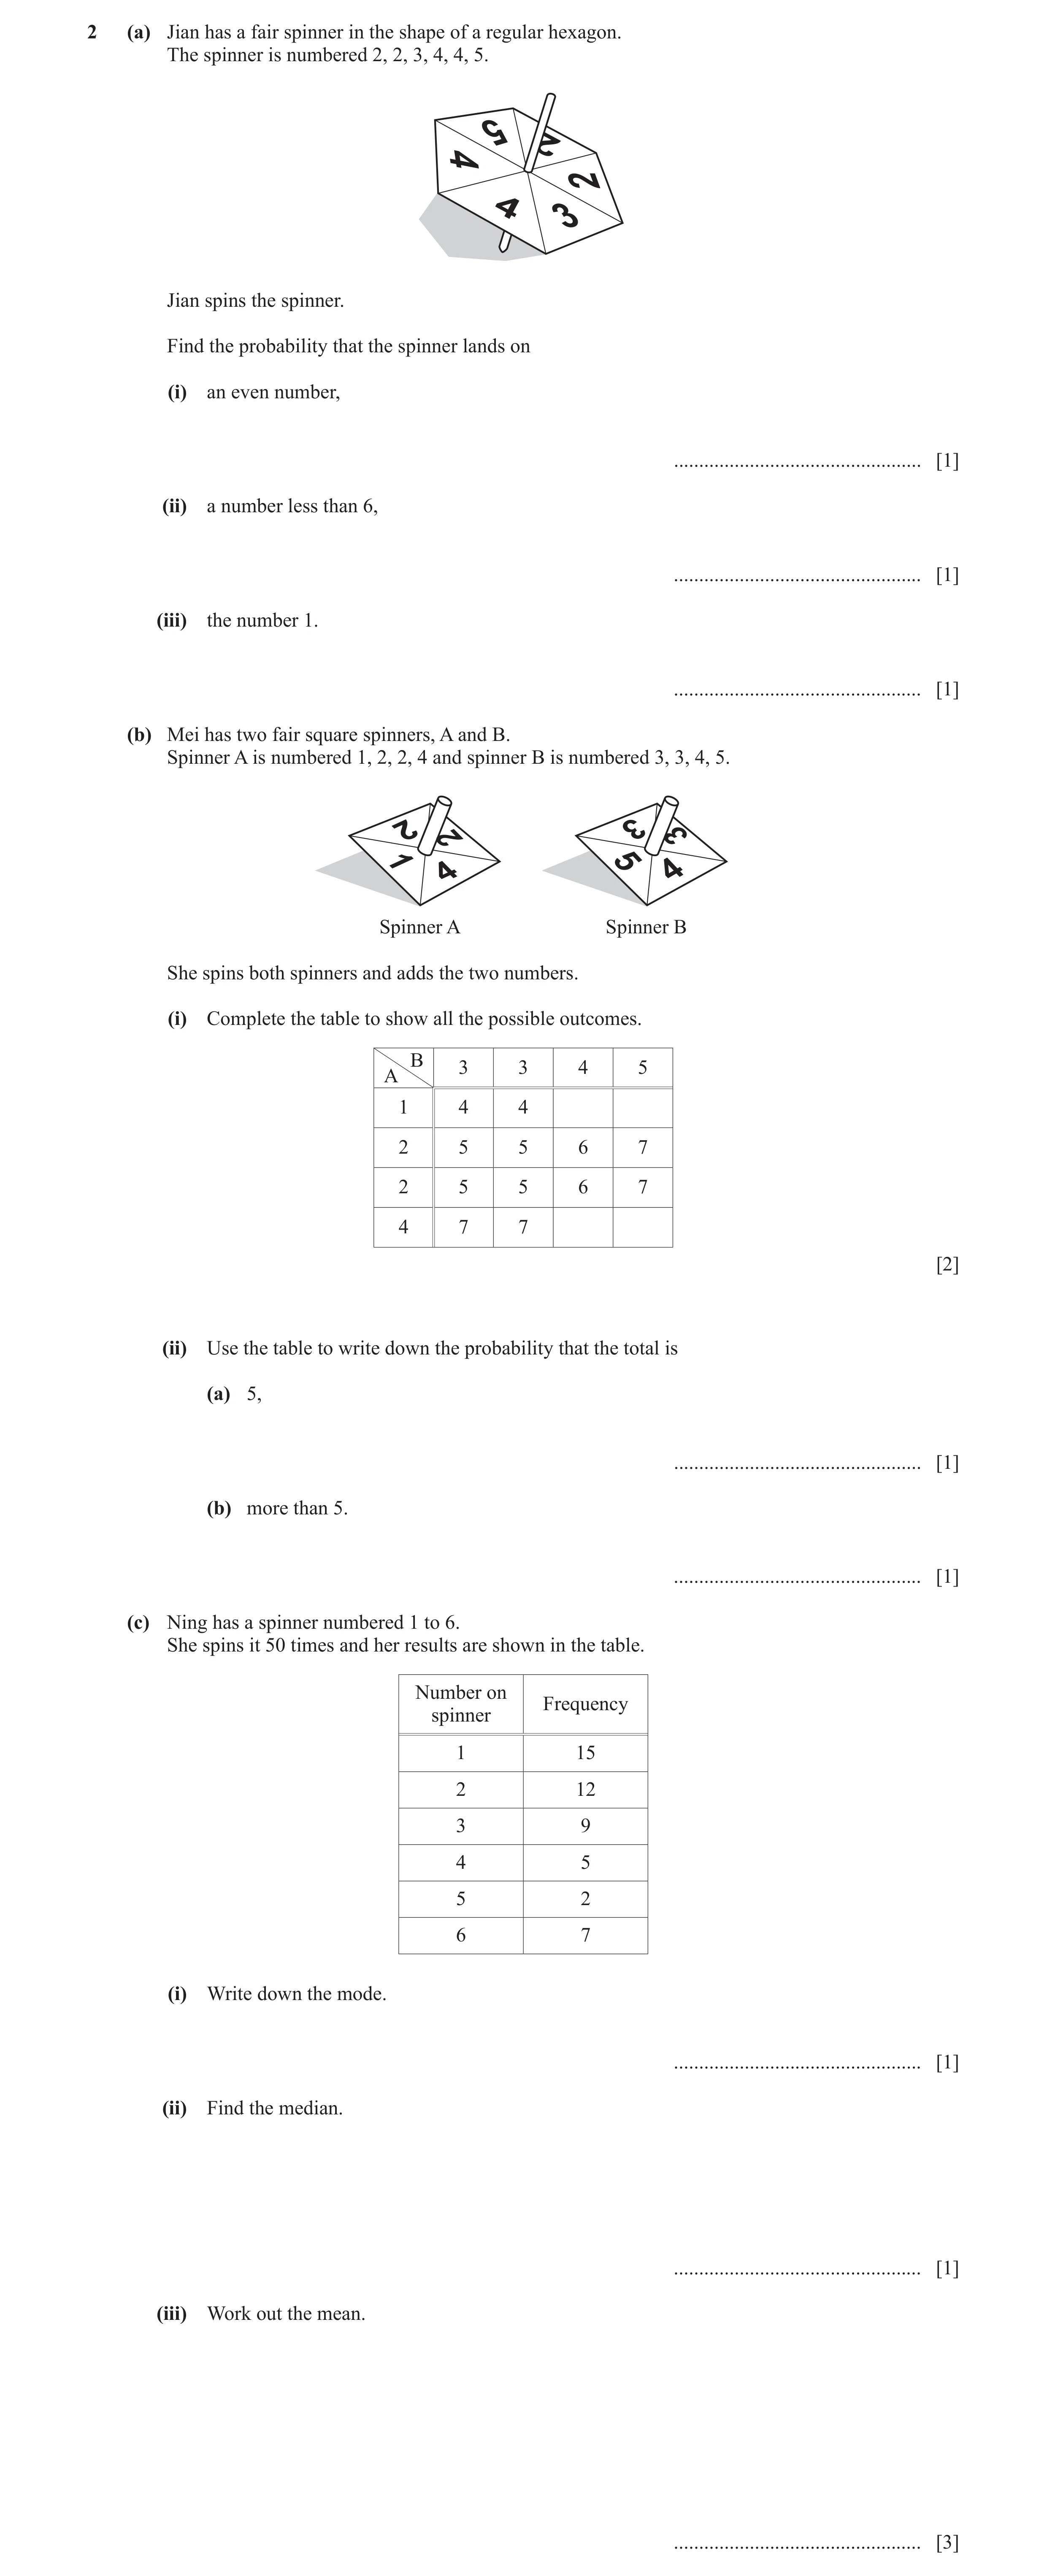
Q26 · Jian has a fair spinner in the shape of a regular hexagon 0580/31 Oct/Nov 2020
2 (a) Jian has a fair spinner in the shape of a regular hexagon. The spinner is numbered 2, 2, 3, 4, 4, 5. Jian spins the spinner. Find the probability that the spinner lands on (i) an even number, … [1] (ii) a number less than 6, … [1] (iii) the number 1. … [1] (b) Mei has two fair square spinners, A and B. Spinner A is numbered 1, 2, 2, 4 and spinner B is numbered 3, 3, 4, 5. Spinner A Spinner B She spins both spinners and adds the two numbers. (i) Complete the table to show all the possible outcomes. B 3 3 4 5 A 1 4 4 2 5 5 6 7 2 5 5 6 7 4 7 7 [2] (ii) Use the table to write down the probability that the total is (a) 5, … [1] (b) more than 5. … [1] (c) Ning has a spinner numbered 1 to 6. She spins it 50 times and her results are shown in the table. Number on Frequency spinner 1 15 2 12 3 9 4 5 5 2 6 7 (i) Write down the mode. … [1] (ii) Find the median. … [1] (iii) Work out the mean. … [3]
12 marks
Mark scheme: 2(a)(i) 2 1 oe 3 2(a)(ii) 1 1 2(a)(iii) 0 1 2(b)(i) 5 6 2 B1 for 2 or 3 correct, in correct places 8 9 in the correct places 2(b)(ii)(a) 5 1 FT their table oe 16 2(b)(ii)(b) 9 1 FT their table oe 16 2(c)(i) 1 1 2(c)(ii) 2 1 2(c)(iii) 2.76 3 M1 for 1 × 15 + 2 × 12 + 3 × 9 + 4 × 5 + 5 × 2 + 6 × 7 oe M1dep for their 138 ÷ 50
This question in 0580/31 Oct/Nov 2020
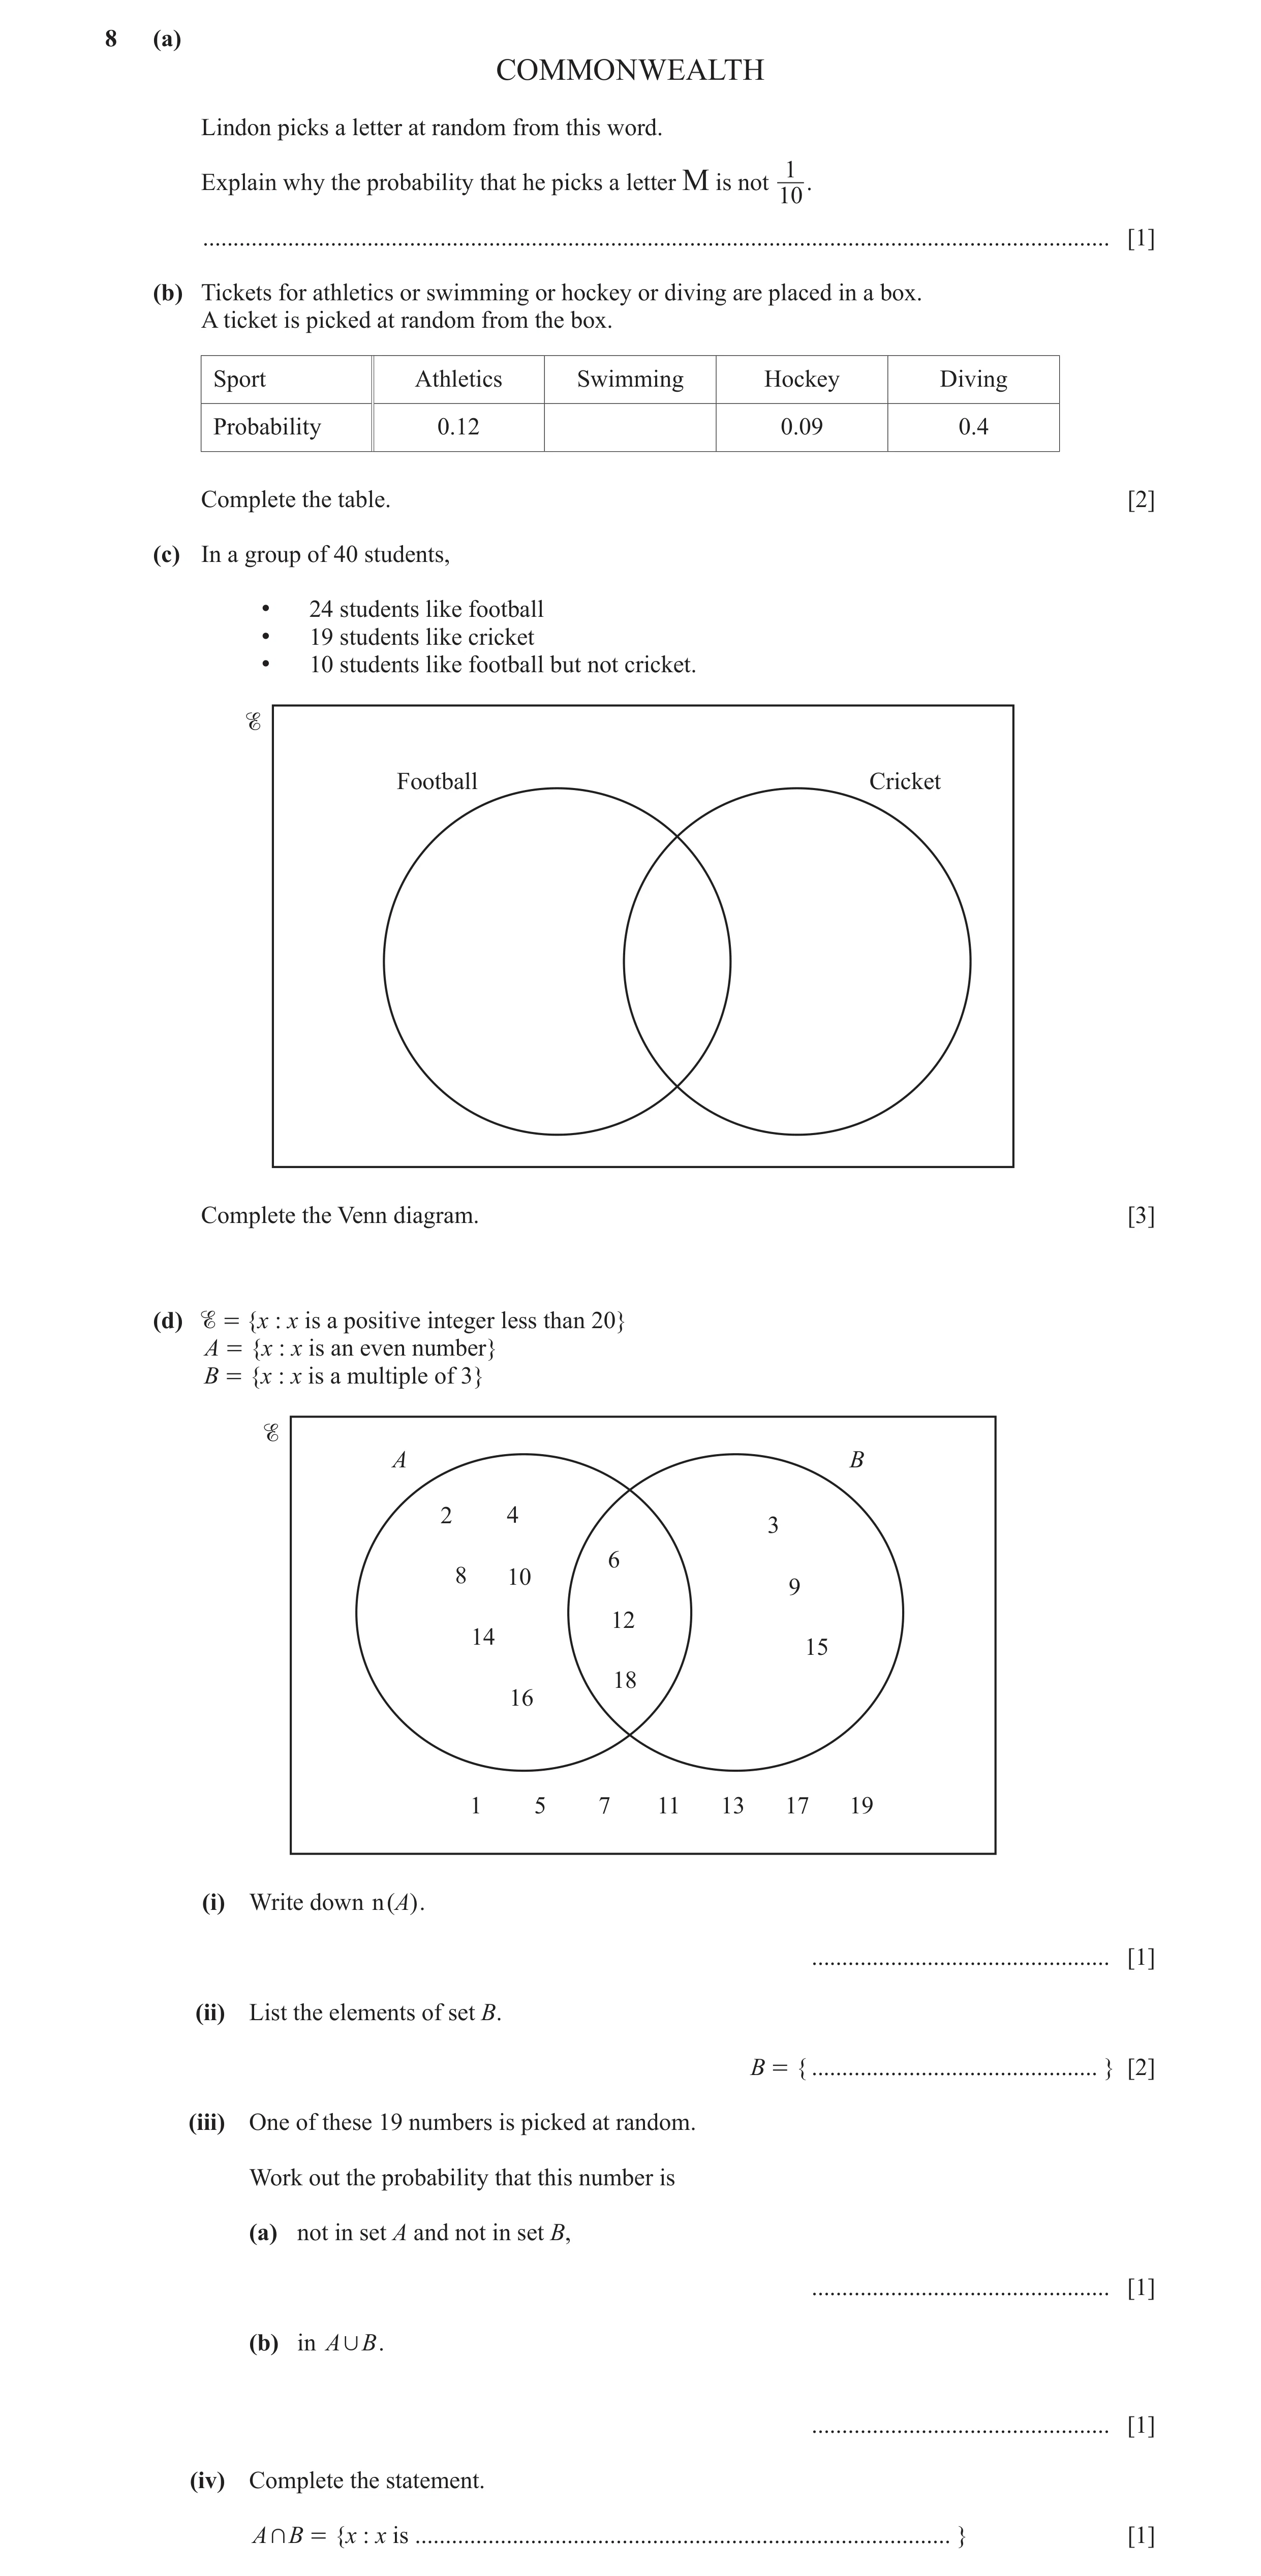
Q27 · COMMONWEALTH Lindon picks a letter at random from this word 0580/32 Oct/Nov 2020
8 (a) COMMONWEALTH Lindon picks a letter at random from this word. 1 Explain why the probability that he picks a letter M is not . 10 … [1] (b) Tickets for athletics or swimming or hockey or diving are placed in a box. A ticket is picked at random from the box. Sport Athletics Swimming Hockey Diving Probability 0.12 0.09 0.4 Complete the table. [2] (c) In a group of 40 students, • 24 students like football • 19 students like cricket • 10 students like football but not cricket. Football Cricket Complete the Venn diagram. [3] (d) = {x : x is a positive integer less than 20} A = {x : x is an even number} B = {x : x is a multiple of 3} A B 2 4 3 6 8 10 9 12 14 15 18 16 1 5 7 11 13 17 19 (i) Write down n ( A ) . … [1] (ii) List the elements of set B. B = { … } [2] (iii) One of these 19 numbers is picked at random. Work out the probability that this number is (a) not in set A and not in set B, … [1] (b) in A , B . … [1] (iv) Complete the statement. A + B = {x : x is … } [1]
12 marks
Mark scheme: 8(a) There are 2 M’s or 12 letters 1 8(b) 0.39 oe 2 M1 for 1– (0.12 + 0.09 + 0.4) oe 8(c) Football Cricket 3 B1 for 10 B1FT for 14 and 5 10 14 5 or their 10 + their 14 = 24 and their 14 + their 5 = 19 11 B1FT for 11 or 40 – (their 10 + their 14 + their 5) 8(d)(i) 9 cao 1 8(d)(ii) 3 6 9 12 15 18 2 B1 for 4 or 5 correct and no extras 8(d)(iii)(a) 7 1 oe 19 8(d)(iii)(b) 12 1 oe 19 8(d)(iv) Even and a multiple of 3 1 or a multiple of 6 oe
This question in 0580/32 Oct/Nov 2020
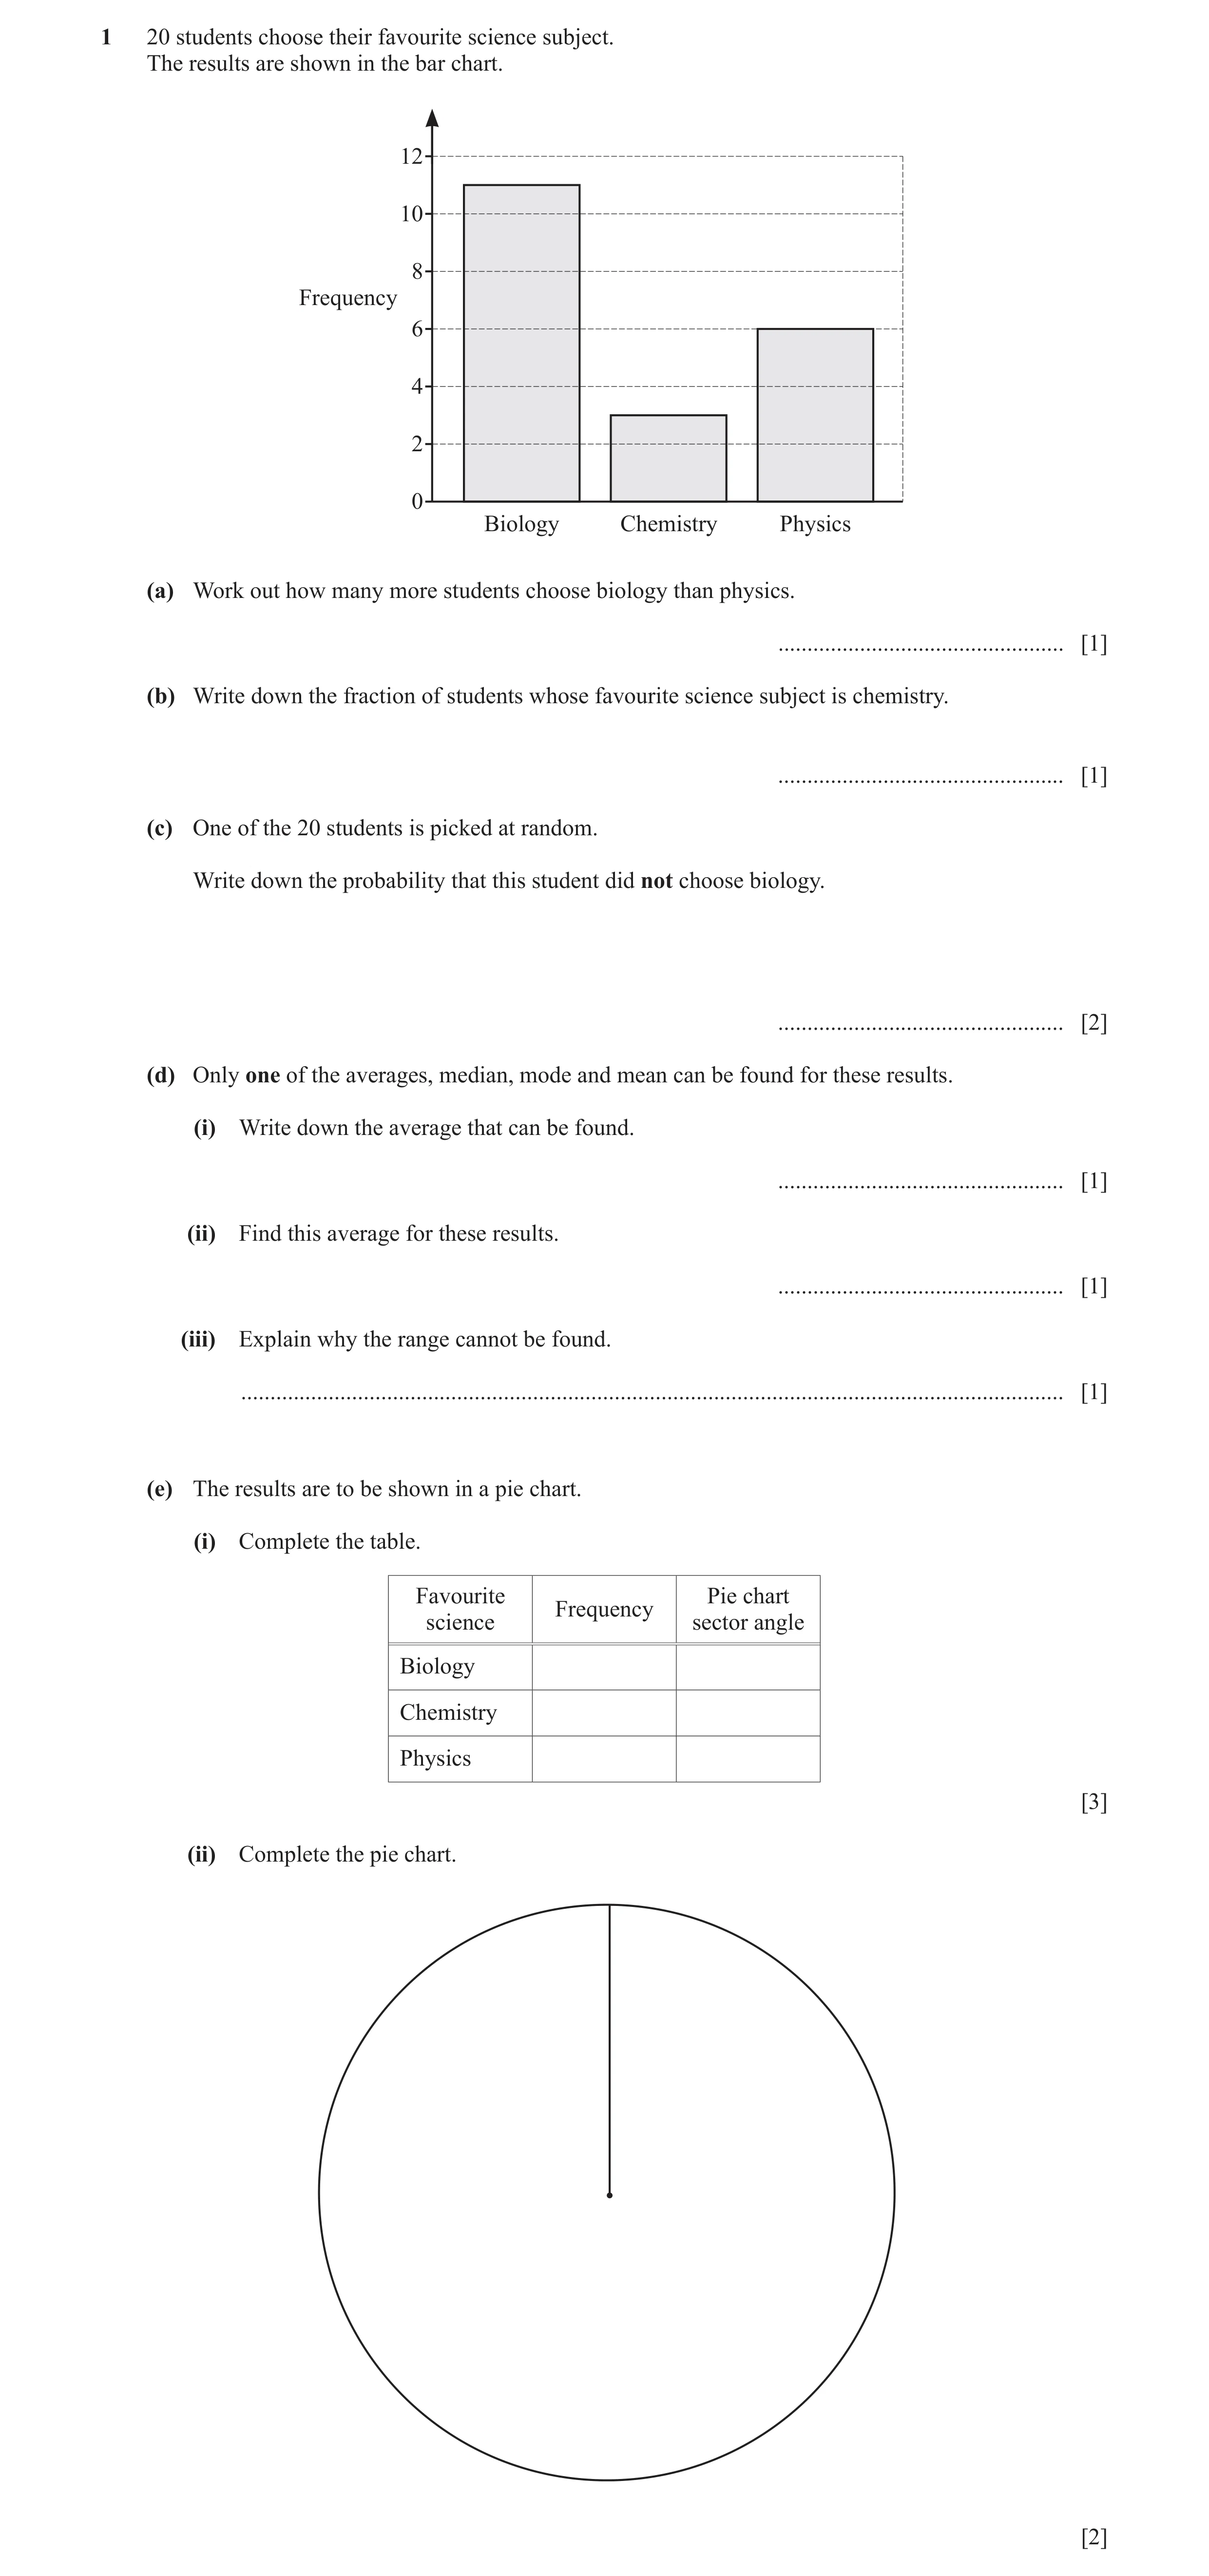
Q28 · 20 students choose their favourite science subject 0580/32 Feb/March 2021
1 20 students choose their favourite science subject. The results are shown in the bar chart. 12 10 8 Frequency 6 4 2 0 Biology Chemistry Physics (a) Work out how many more students choose biology than physics. … [1] (b) Write down the fraction of students whose favourite science subject is chemistry. … [1] (c) One of the 20 students is picked at random. Write down the probability that this student did not choose biology. … [2] (d) Only one of the averages, median, mode and mean can be found for these results. (i) Write down the average that can be found. … [1] (ii) Find this average for these results. … [1] (iii) Explain why the range cannot be found. … [1] (e) The results are to be shown in a pie chart. (i) Complete the table. Favourite Pie chart Frequency science sector angle Biology Chemistry Physics [3] (ii) Complete the pie chart. [2]
12 marks
Mark scheme: Question Answer Marks Partial Marks 1(a) 5 1 1(b) 3 1 cao 20 1(c) 9 2 11 oe M1 for 1 − or 20 − 11 or 3 + 6 oe 20 20 1(d)(i) Mode 1 1(d)(ii) Biology 1 1(d)(iii) Correct reason 1 1(e)(i) 11 198 3 B2 for 2 correct angles 3 54 OR 6 108 B1 for 11, 3, 6 k M1 for × 360 seen, 20 k =1,11,3,6 or one of their frequencies 1(e)(ii) Correct pie chart drawn 2 B1FT for one correct sector drawn, provided sum of their 3 angles is 360
This question in 0580/32 Feb/March 2021
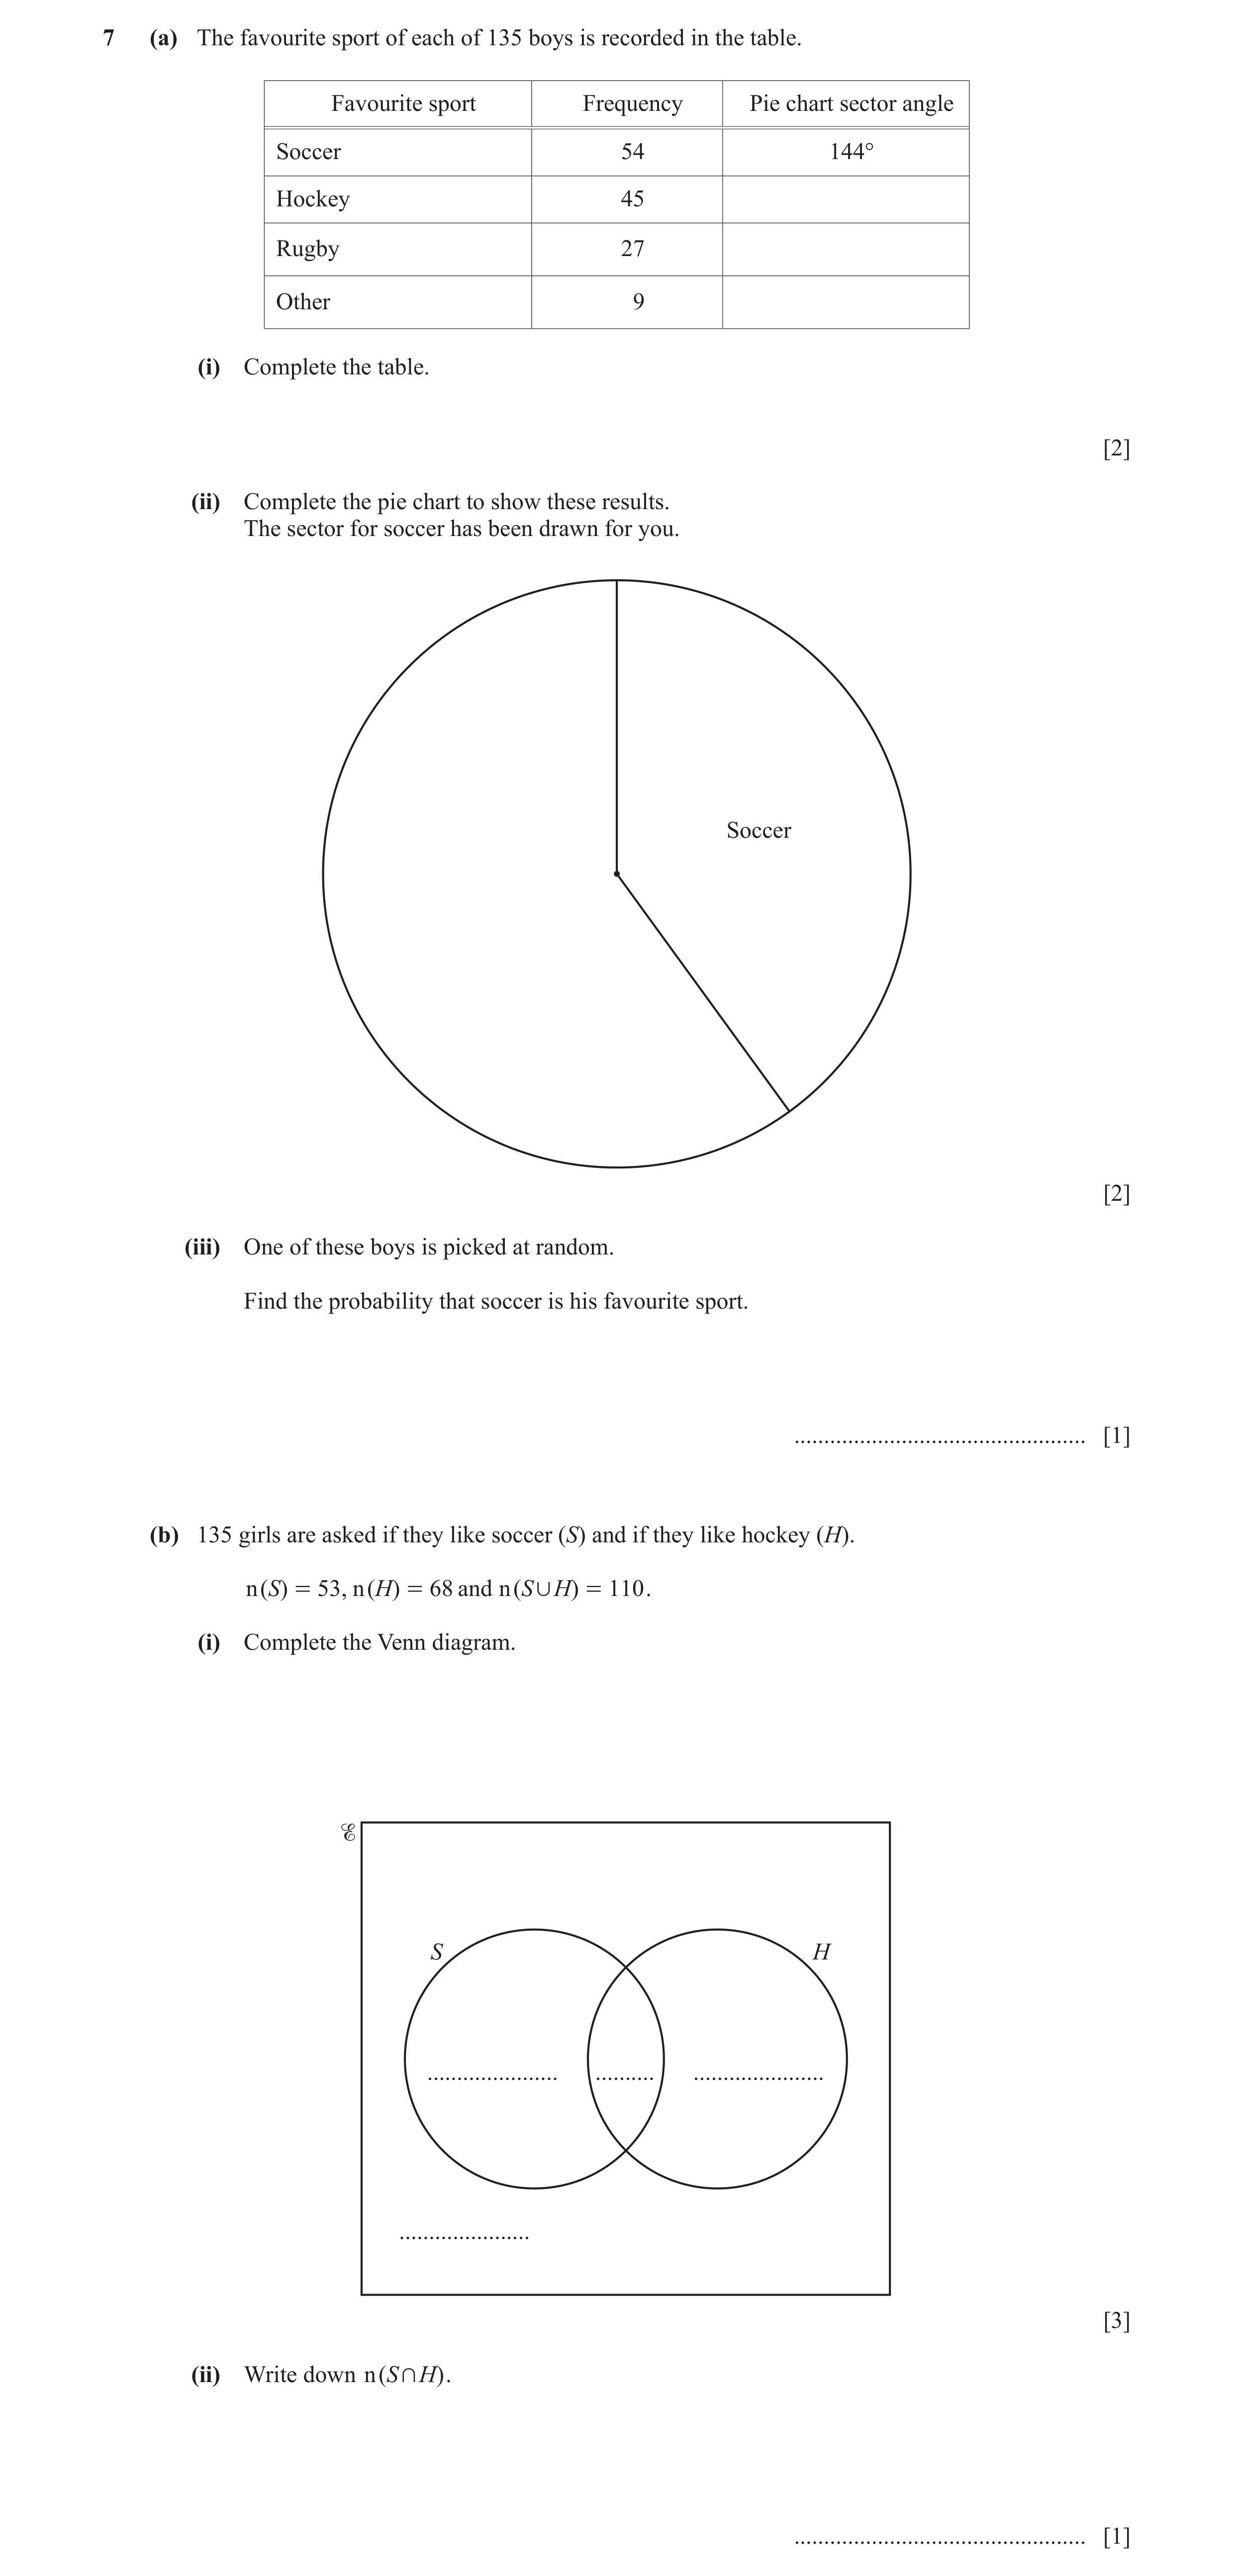
Q29 · The favourite sport of each of 135 boys is recorded in the table 0580/32 May/June 2021
7 (a) The favourite sport of each of 135 boys is recorded in the table. Favourite sport Frequency Pie chart sector angle Soccer 54 144° Hockey 45 Rugby 27 Other 9 (i) Complete the table. [2] (ii) Complete the pie chart to show these results. The sector for soccer has been drawn for you. Soccer [2] (iii) One of these boys is picked at random. Find the probability that soccer is his favourite sport. … [1] (b) 135 girls are asked if they like soccer (S) and if they like hockey (H). n ( S) = 53, n ( H ) = 68 and n ( S , H) = 110 . (i) Complete the Venn diagram. S H … … … … [3] (ii) Write down n ( S + H ) . … [1]
9 marks
Mark scheme: 7(a)(i) 120 72 24 2 B1 for one correct angle 7(a)(ii) Correct pie chart 2 FT their table if angles add up to 360° B1FT for one sector correctly drawn 7(a)(iii) 2 1 oe 5 7(b)(i) 3 B1 for 11 S H B1 for 25 42 11 57 B1 for total in S equals 53 and total in H equals 68 provided S ∩ H ≠ Ø 25 7(b)(ii) 11 1 FT their S ∩ H
This question in 0580/32 May/June 2021
Q30 · 360 people go on a school trip to one of four places 0580/31 Oct/Nov 2021
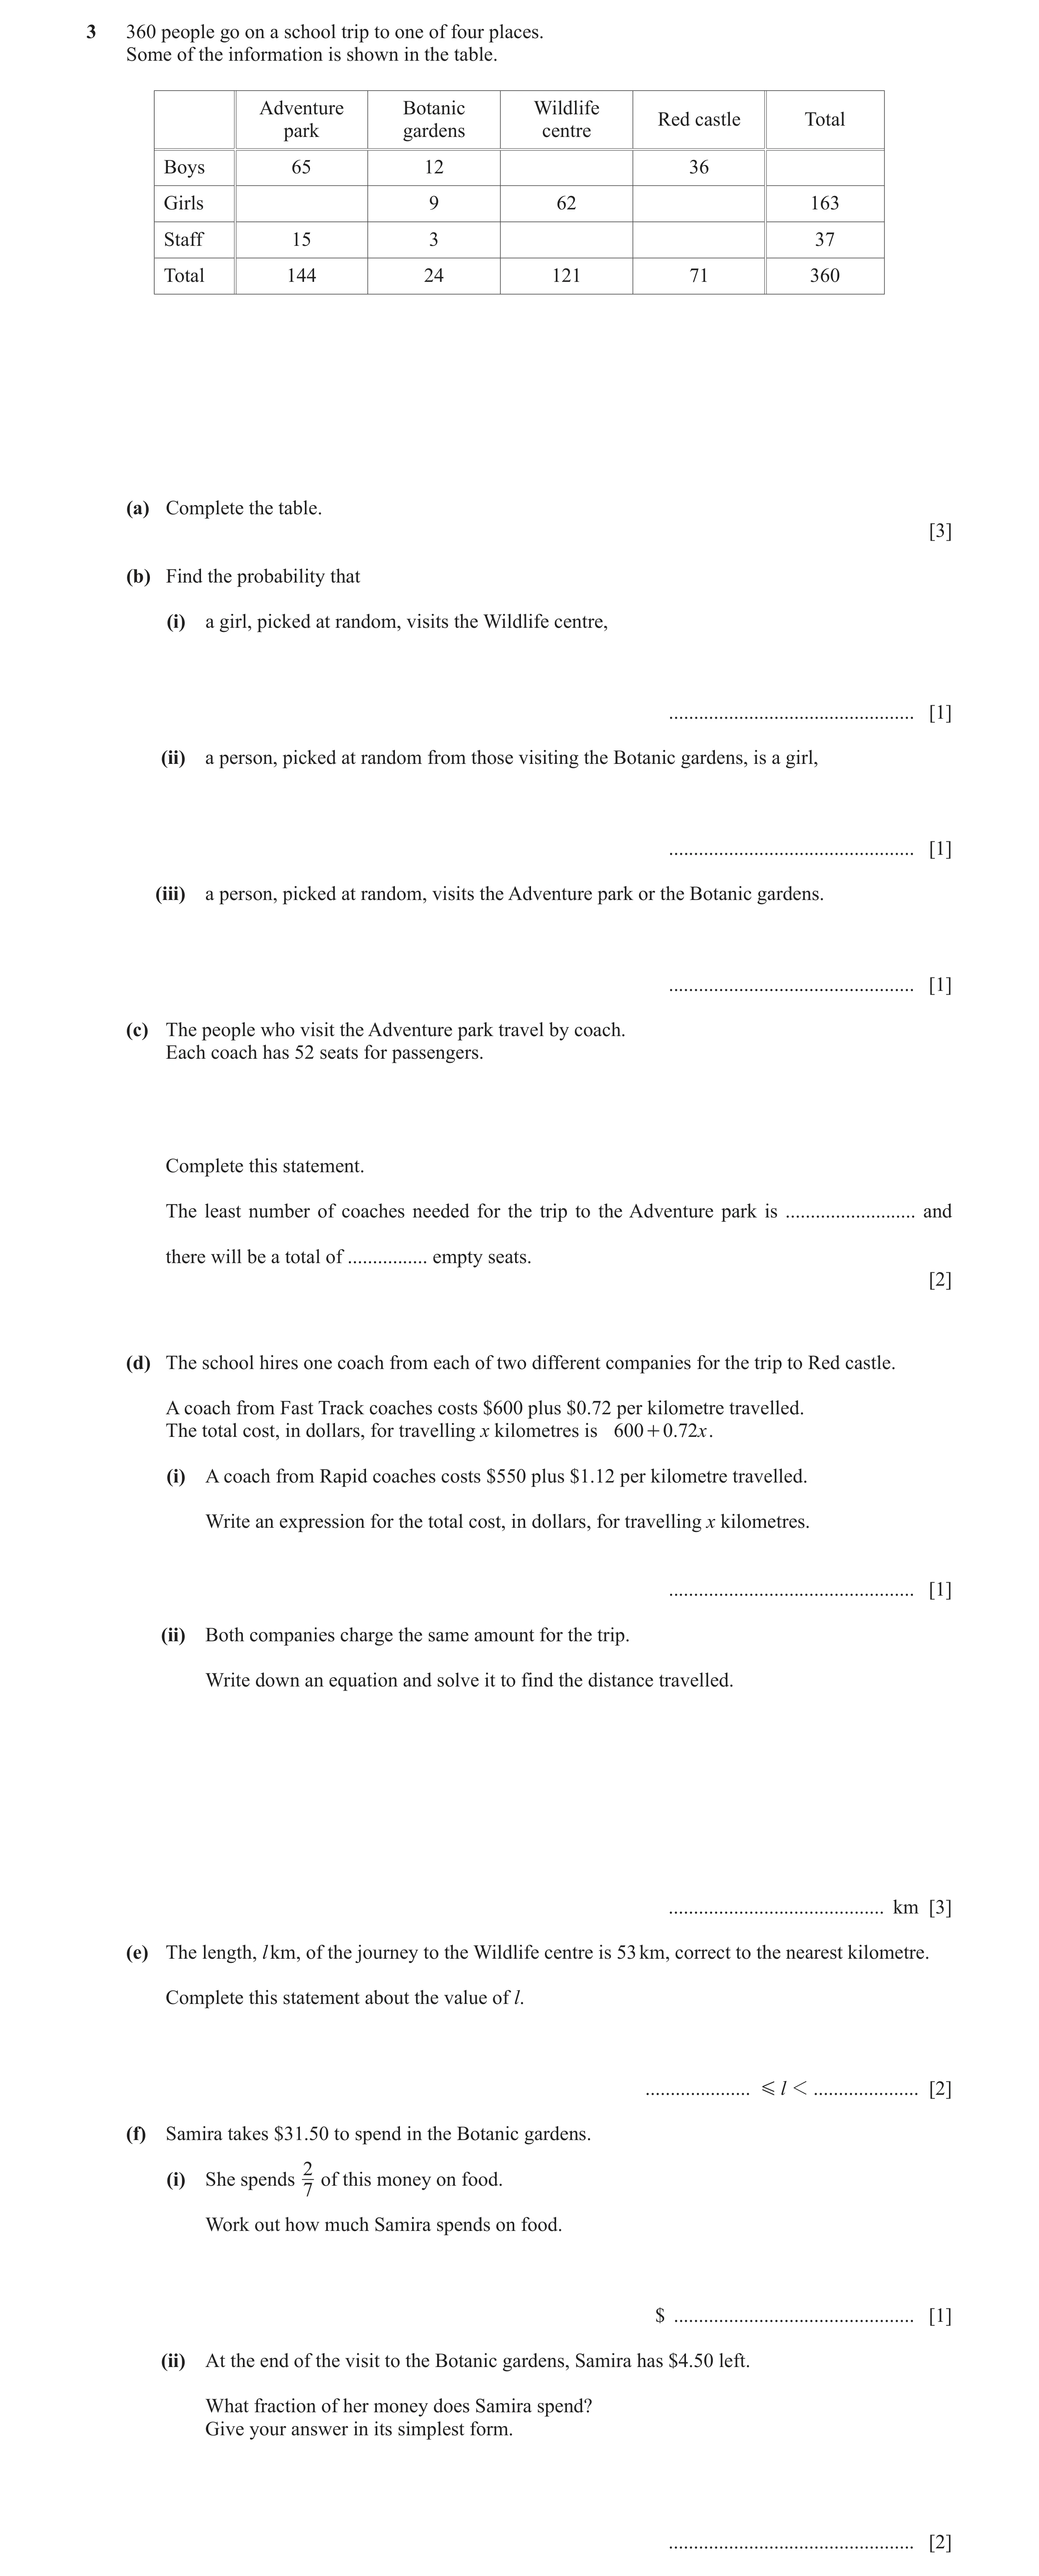
3 360 people go on a school trip to one of four places. Some of the information is shown in the table. Adventure Botanic Wildlife Red castle Total park gardens centre Boys 65 12 36 Girls 9 62 163 Staff 15 3 37 Total 144 24 121 71 360 (a) Complete the table. [3] (b) Find the probability that (i) a girl, picked at random, visits the Wildlife centre, … [1] (ii) a person, picked at random from those visiting the Botanic gardens, is a girl, … [1] (iii) a person, picked at random, visits the Adventure park or the Botanic gardens. … [1] (c) The people who visit the Adventure park travel by coach. Each coach has 52 seats for passengers. Complete this statement. The least number of coaches needed for the trip to the Adventure park is … and there will be a total of … empty seats. [2] (d) The school hires one coach from each of two different companies for the trip to Red castle. A coach from Fast Track coaches costs $600 plus $0.72 per kilometre travelled. The total cost, in dollars, for travelling x kilometres is 600 + 0.72x . (i) A coach from Rapid coaches costs $550 plus $1.12 per kilometre travelled. Write an expression for the total cost, in dollars, for travelling x kilometres. … [1] (ii) Both companies charge the same amount for the trip. Write down an equation and solve it to find the distance travelled. … km [3] (e) The length, l km, of the journey to the Wildlife centre is 53 km, correct to the nearest kilometre. Complete this statement about the value of l. … G l 1 … [2] (f) Samira takes $31.50 to spend in the Botanic gardens. 2 (i) She spends of this money on food. 7 Work out how much Samira spends on food. $ … [1] (ii) At the end of the visit to the Botanic gardens, Samira has $4.50 left. What fraction of her money does Samira spend? Give your answer in its simplest form. … [2]
17 marks
Mark scheme: 3(a) 3 B2 for 4 or 5 correct A B W R Tot or B1 for 2 or 3 correct B 47 160 G 64 28 S 12 7 Tot 3(b)(i) 62 1 oe 163 3(b)(ii) 3 1 oe 8 3(b)(iii) 7 1 oe 15 3(c) 3, 12 2 B1 for 3 (coaches) nfww or M1 for 144 ÷ 52 3(d)(i) 550 + 1.12x 1 3(d)(ii) 600 + 0.72x = 550 + 1.12x 1 FT 600 + 0.72x = their (d)(i) 125 2 M1FT for isolating x terms and constant terms or better for their linear equation DEP on their (d)(i) of the form ax + b (a ≠ 0) 3(e) 52.5, 53.5 2 B1 for each If zero scored, SC1 for both values correct but reversed 3f(i) 9 1 3(f)(ii) 6 2 31.5 [ 0 ] − 4.5 [ 0 ] cao M1 for oe 7 31.5 [ 0 ]
This question in 0580/31 Oct/Nov 2021
Q31 · Simone completes one lap of a 400 metre running track in 79 seconds 0580/32 Oct/Nov 2021
3 (a) Simone completes one lap of a 400 metre running track in 79 seconds. Work out how long it will take her to run 6 km at the same rate. Give your answer in minutes and seconds. … minutes … seconds [4] (b) The probability that she does not win a race is 0.94 . Find the probability that she wins a race. … [1] (c) Each day she records the number of laps she runs. Here is her record for one week. 15 42 28 16 24 15 32 (i) Write down the mode. … [1] (ii) Find the median. … [2] (iii) Find the range. … [1] (d) Wilfred records his times, in seconds, for each of 5 laps. 59 74 69 63 65 After running a 6th lap his mean time is 67 seconds. Find his time for the 6th lap. … seconds [3]
12 marks
Mark scheme: 3(a) 19 [min] 45 [secs] 4 6000 79 M3 for × oe 400 60 or B2 for figs 1975 6000 or M2 for 79 × oe 400 or B1 for figs 1185 6000 400 79 79 or M1 for or or or 400 79 400 0.4 oe 3(b) 0.06 oe 1 3(c)(i) 15 1 3(c)(ii) 24 2 M1 for full list or 15 15 16 24 or 42 32 28 24 3(c)(iii) 27 1 3(d) 72 3 M2 for 6 × 67 – (59 + 74 + 69 + 63 + 65) oe or M1 for (59 + 74 + 69 + 63 + 65 + x) ÷ 6 = 67 or 6 × 67 oe
This question in 0580/32 Oct/Nov 2021
Q32 · Roberto and his family fly from London to Los Angeles on a holiday 0580/33 Oct/Nov 2021
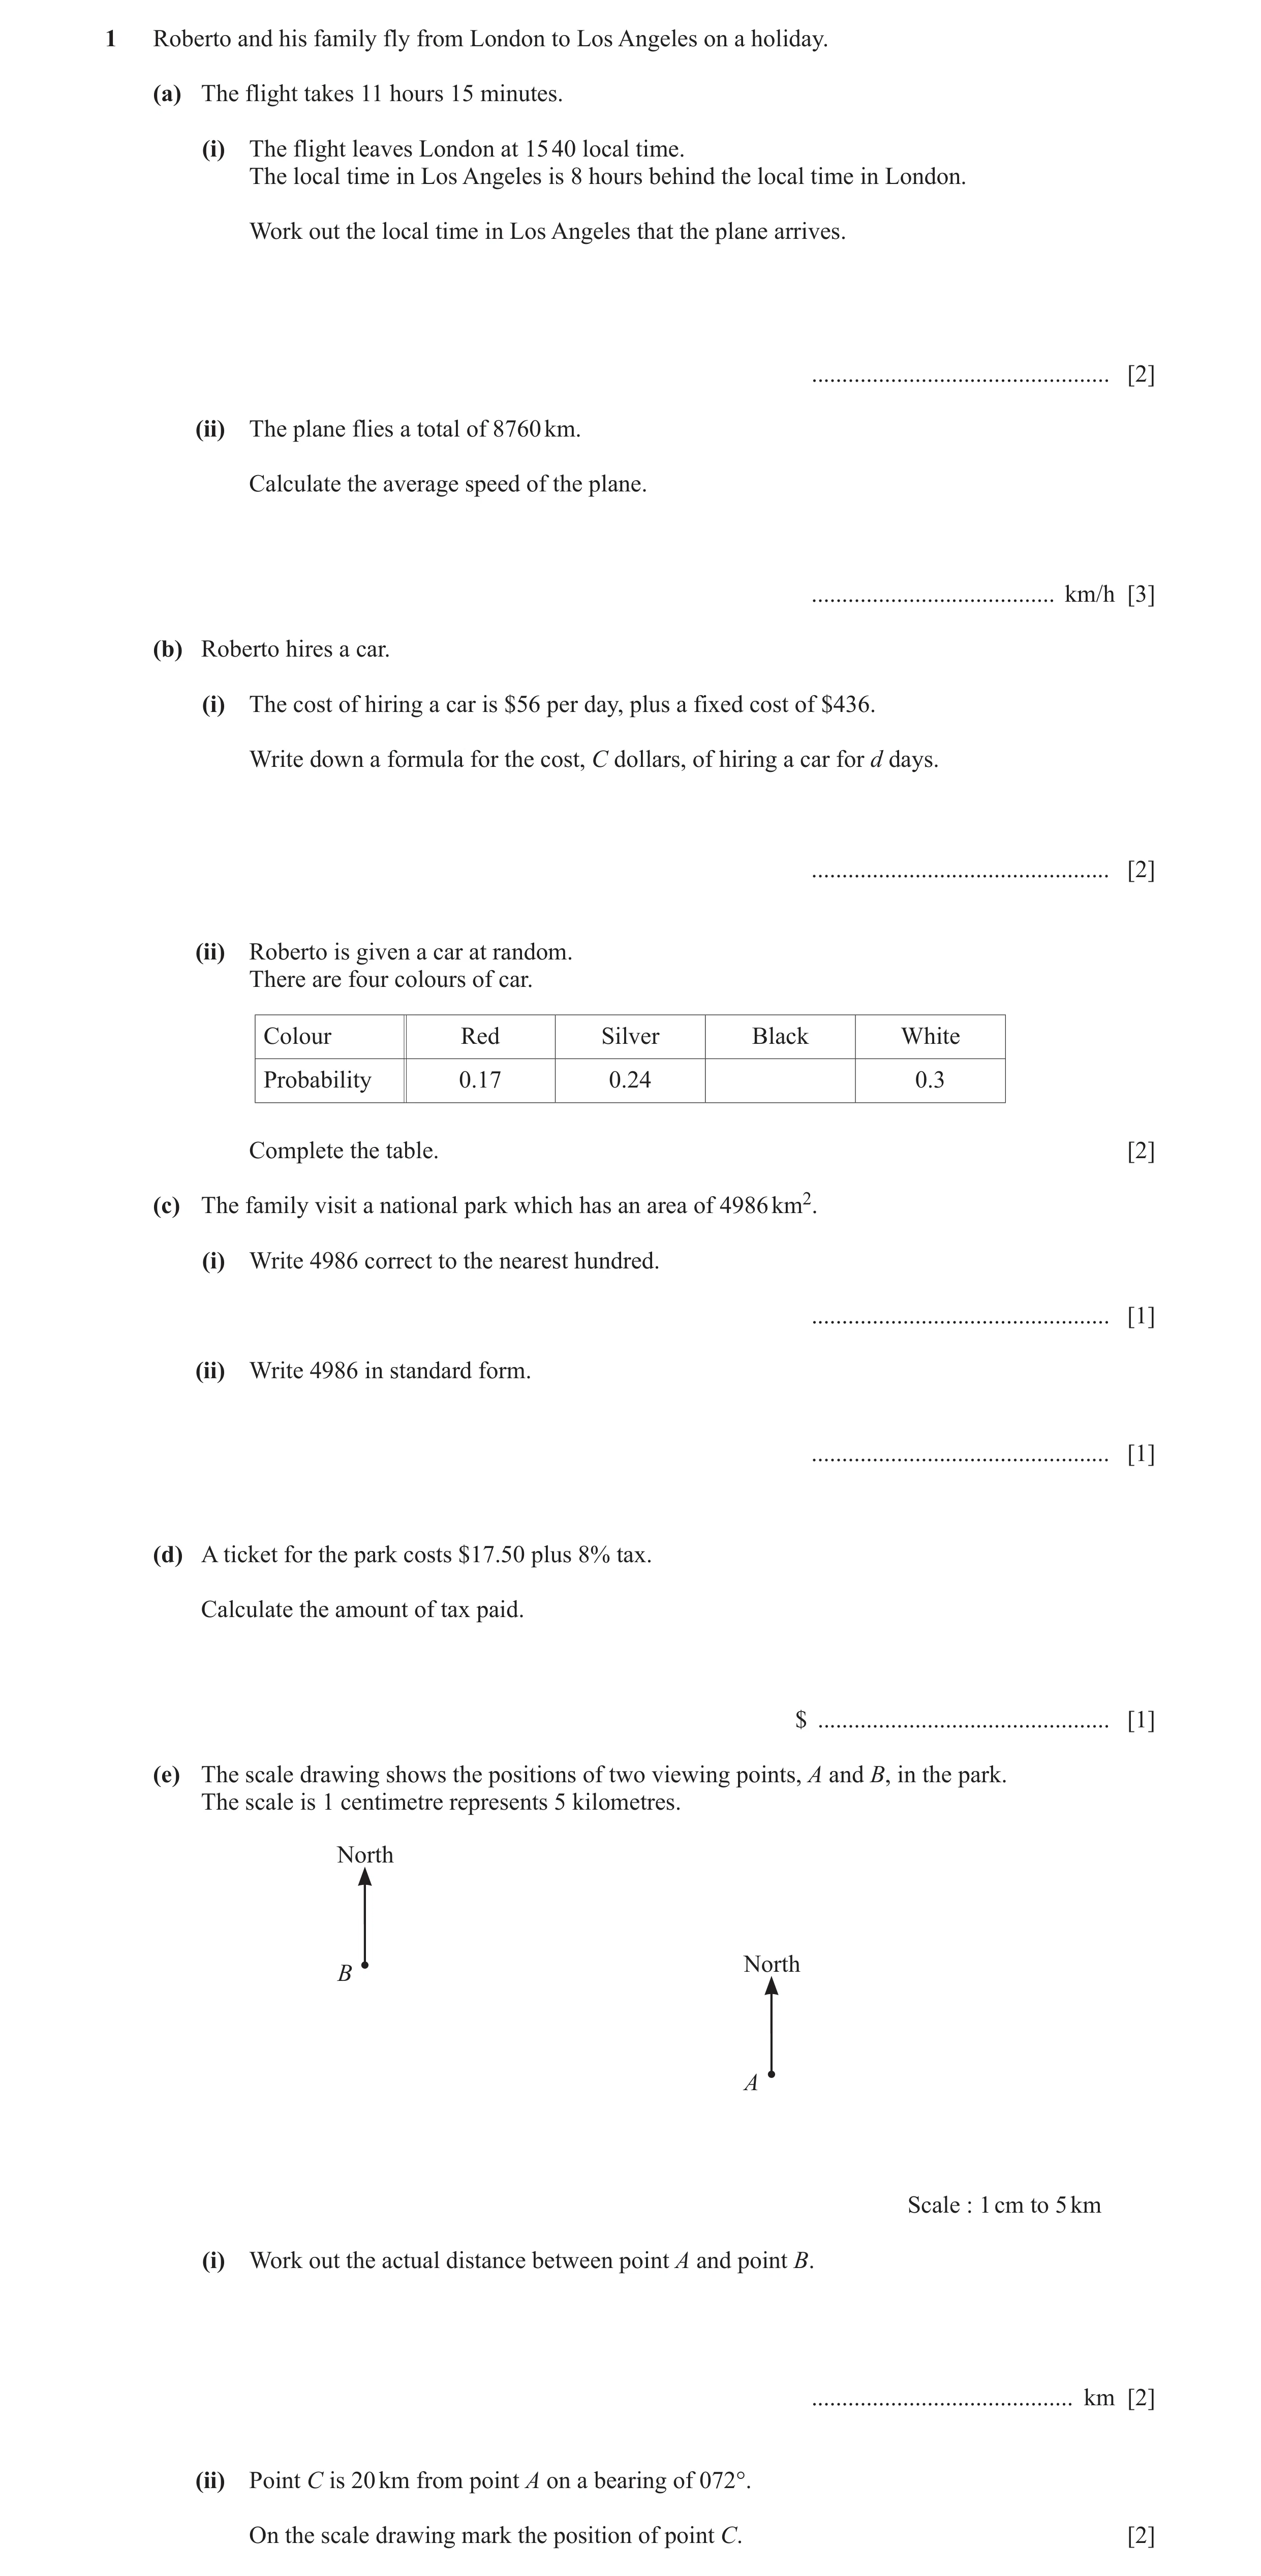
1 Roberto and his family fly from London to Los Angeles on a holiday. (a) The flight takes 11 hours 15 minutes. (i) The flight leaves London at 15 40 local time. The local time in Los Angeles is 8 hours behind the local time in London. Work out the local time in Los Angeles that the plane arrives. … [2] (ii) The plane flies a total of 8760 km. Calculate the average speed of the plane. … km/h [3] (b) Roberto hires a car. (i) The cost of hiring a car is $56 per day, plus a fixed cost of $436. Write down a formula for the cost, C dollars, of hiring a car for d days. … [2] (ii) Roberto is given a car at random. There are four colours of car. Colour Red Silver Black White Probability 0.17 0.24 0.3 Complete the table. [2] (c) The family visit a national park which has an area of 4986 km2. (i) Write 4986 correct to the nearest hundred. … [1] (ii) Write 4986 in standard form. … [1] (d) A ticket for the park costs $17.50 plus 8% tax. Calculate the amount of tax paid. $ … [1] (e) The scale drawing shows the positions of two viewing points, A and B, in the park. The scale is 1 centimetre represents 5 kilometres. North North B A Scale : 1 cm to 5 km (i) Work out the actual distance between point A and point B. … km [2] (ii) Point C is 20 km from point A on a bearing of 072°. On the scale drawing mark the position of point C. [2]
16 marks
Mark scheme: Question Answer Marks Partial Marks 1(a)(i) 18 55 2 B1 for 07 40 or 02 55 or 3[h] 15 [min] or M1 for departure time + 11h 15 min −8h evaluated as a time with one interval correctly added 1(a)(ii) 779 or 778.6 to 778.7 3 8760 M2 for 8760 ÷ 11.25 oe × 60 675 or B1 for 11.25 or M1 for 8760 ÷ their time 1(b)((i) C = 56d + 436 cao 2 B1 for C = 56d + 436 seen and spoilt or 56d + 436 as final answer 1(b)(ii) 0.29 2 M1 for 1 – (0.17 + 0.24 + 0.3) oe or better 1(c)(i) 5000 1 1(c)(ii) 4.986 × 10³ 1 1(d) 1.4[0] 1 1(e)(i) 35 2 B1 for 7 1(e)(ii) Correct length and bearing 2 B1 for length 4 cm from A B1 for bearing 072° from A
This question in 0580/33 Oct/Nov 2021
Q33 · 6 5 6 5 5 7 3 8 2 The diagram shows a fair 9-sided spinner 0580/32 Feb/March 2022
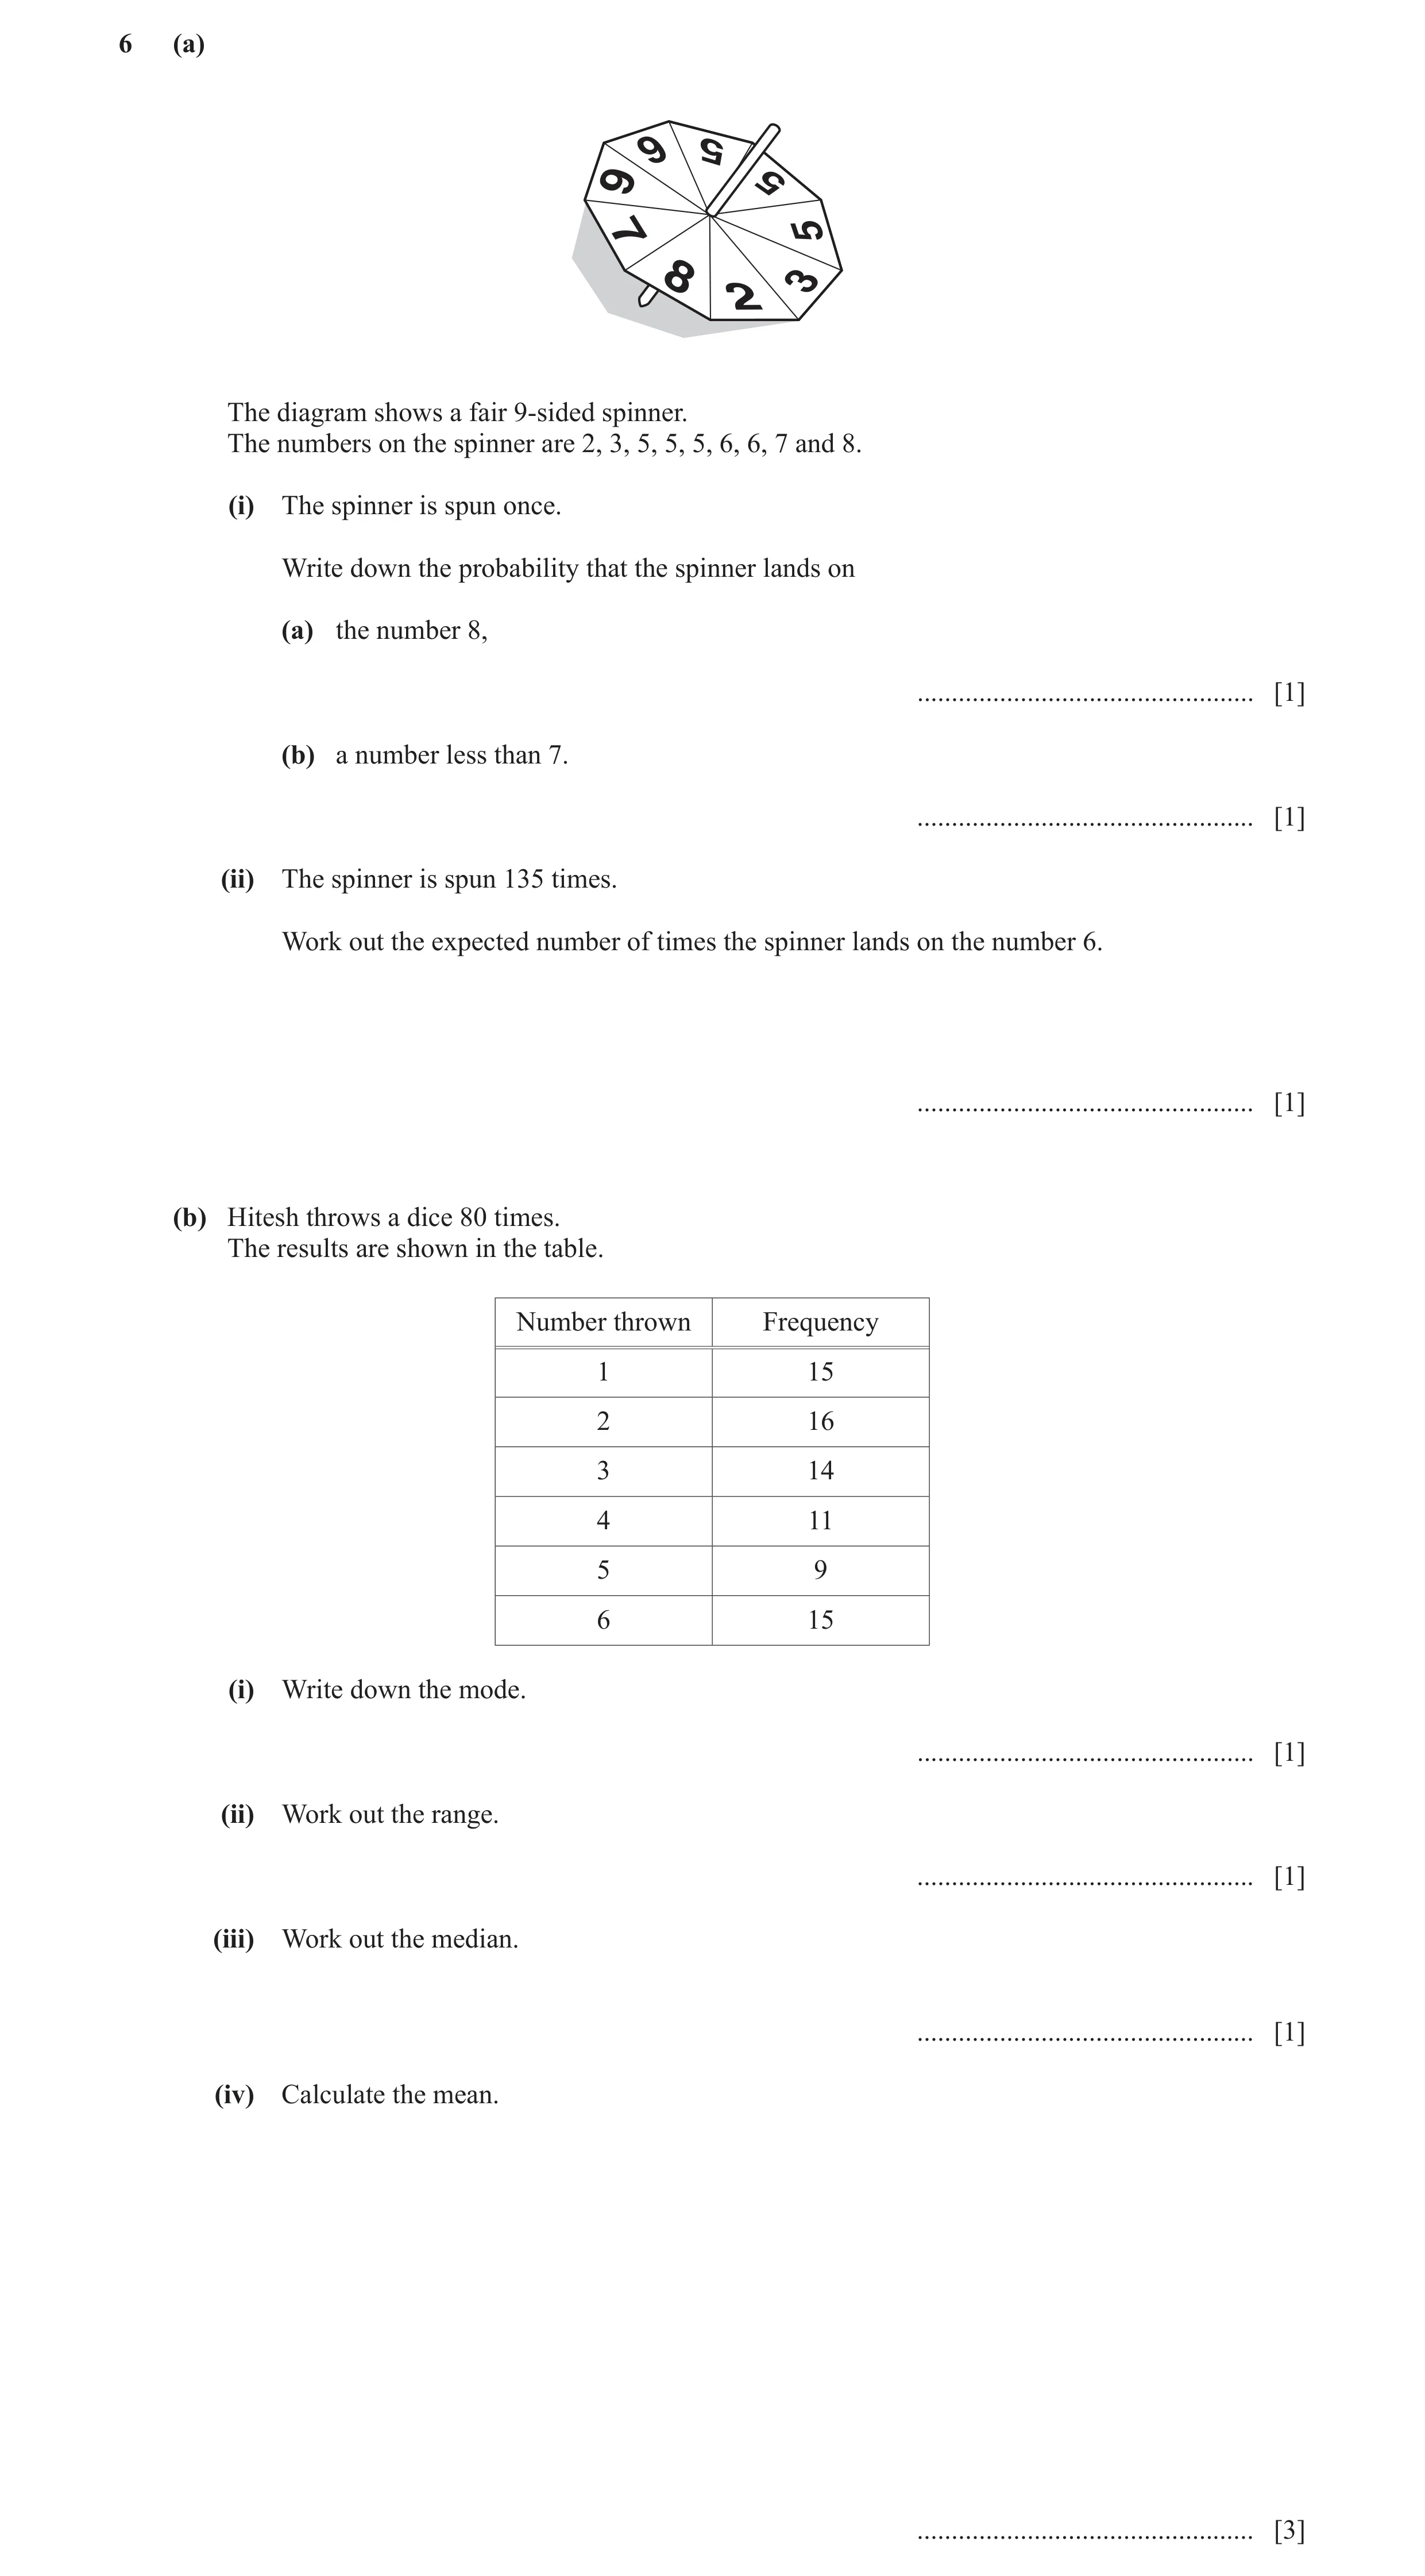
6 (a) 6 5 6 5 5 7 3 8 2 The diagram shows a fair 9-sided spinner. The numbers on the spinner are 2, 3, 5, 5, 5, 6, 6, 7 and 8. (i) The spinner is spun once. Write down the probability that the spinner lands on (a) the number 8, … [1] (b) a number less than 7. … [1] (ii) The spinner is spun 135 times. Work out the expected number of times the spinner lands on the number 6. … [1] (b) Hitesh throws a dice 80 times. The results are shown in the table. Number thrown Frequency 1 15 2 16 3 14 4 11 5 9 6 15 (i) Write down the mode. … [1] (ii) Work out the range. … [1] (iii) Work out the median. … [1] (iv) Calculate the mean. … [3]
9 marks
Mark scheme: 6(a)(i)(a) 1 1 oe 9 6(a)(i)(b) 7 1 oe 9 6(a)(ii) 30 1 6(b)(i) 2 1 6(b)(ii) 5 1 6(b)(iii) 3 1 6(b)(iv) 3.35 3 M1 for 1 × 15 + 2 × 16 + 3 × 14 + 4 × 11 + 5 × 9 + 6 × 15 M1dep for their fx ÷ 80
This question in 0580/32 Feb/March 2022
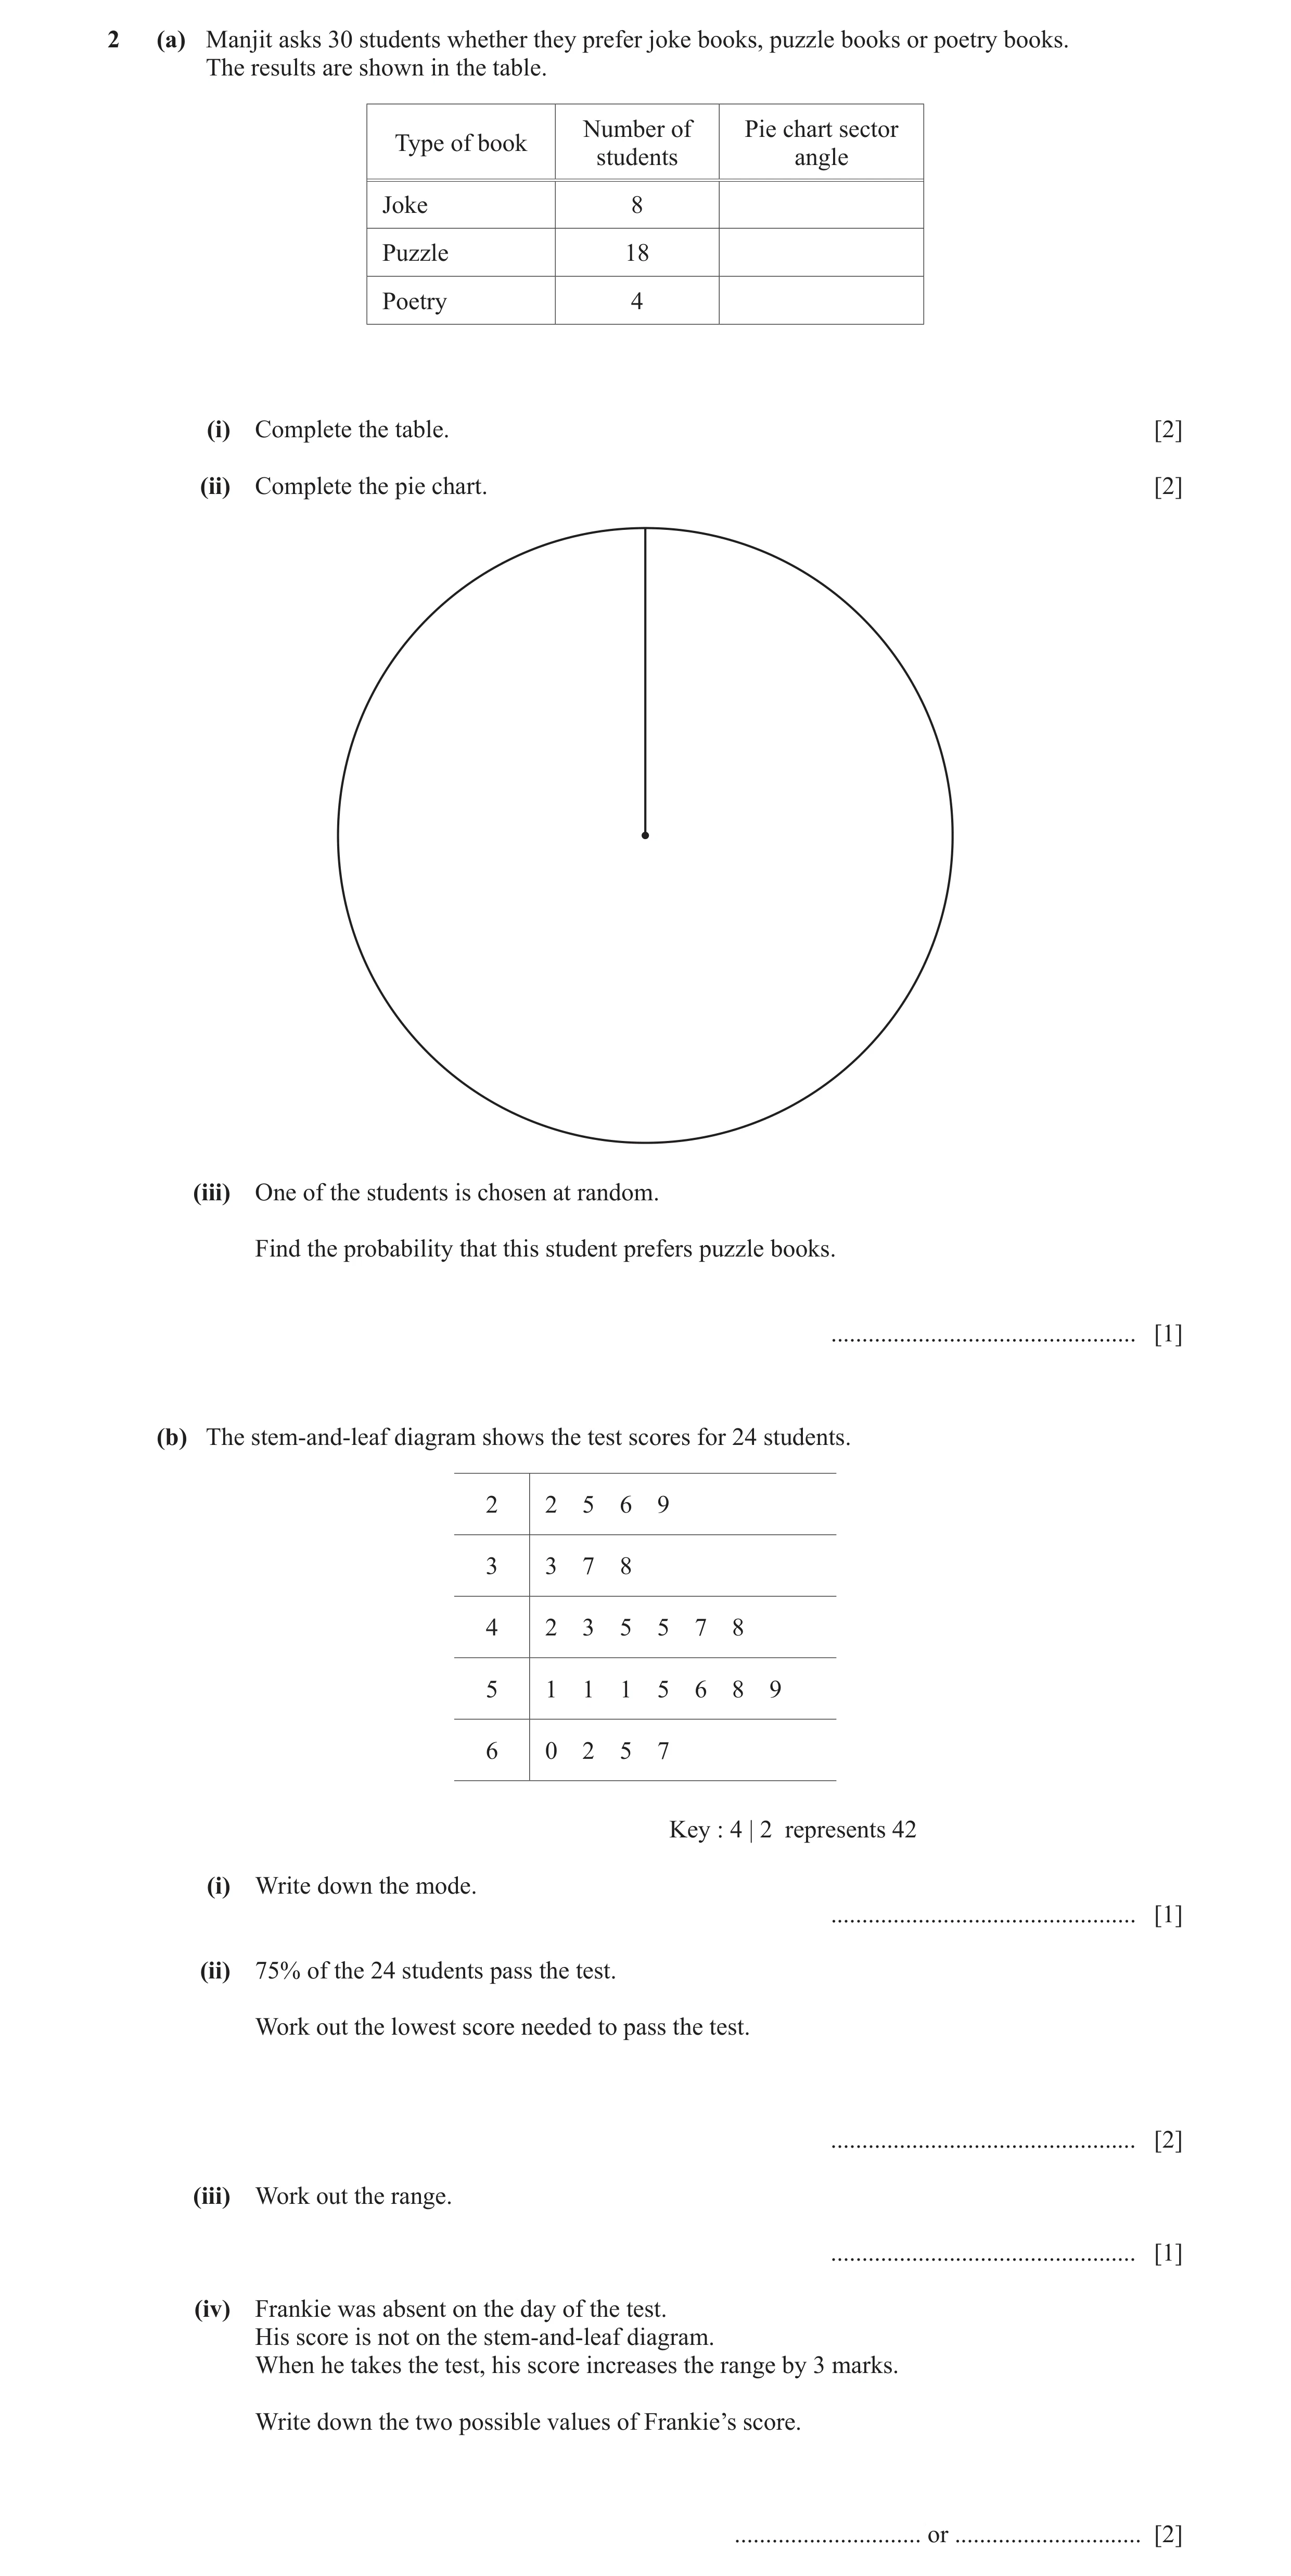
Q34 · Manjit asks 30 students whether they prefer joke books, puzzle books or poetry books 0580/32 Feb/March 2023
2 (a) Manjit asks 30 students whether they prefer joke books, puzzle books or poetry books. The results are shown in the table. Number of Pie chart sector Type of book students angle Joke 8 Puzzle 18 Poetry 4 (i) Complete the table. [2] (ii) Complete the pie chart. [2] (iii) One of the students is chosen at random. Find the probability that this student prefers puzzle books. … [1] (b) The stem-and-leaf diagram shows the test scores for 24 students. 2 2 5 6 9 3 3 7 8 4 2 3 5 5 7 8 5 1 1 1 5 6 8 9 6 0 2 5 7 Key : 4 | 2 represents 42 (i) Write down the mode. … [1] (ii) 75% of the 24 students pass the test. Work out the lowest score needed to pass the test. … [2] (iii) Work out the range. … [1] (iv) Frankie was absent on the day of the test. His score is not on the stem-and-leaf diagram. When he takes the test, his score increases the range by 3 marks. Write down the two possible values of Frankie’s score. … or … [2]
11 marks
Mark scheme: 2(a)(i) 96, 216, 48 2 B1 for one correct sector angle 360 or M1 for k k=1, 4, 8 or 18 30 2(a)(ii) Correct pie chart drawn 2 FT their table if angles add up to 360° B1FT for one correct sector drawn 2(a)(iii) 18 1 oe 30 2(b)(i) 51 1 2(b)(ii) 38 2 75 100 − 75 M1 for 24 or 24 100 100 2(b)(iii) 45 1 2(b)(iv) 19, 70 2 B1 for each
This question in 0580/32 Feb/March 2023
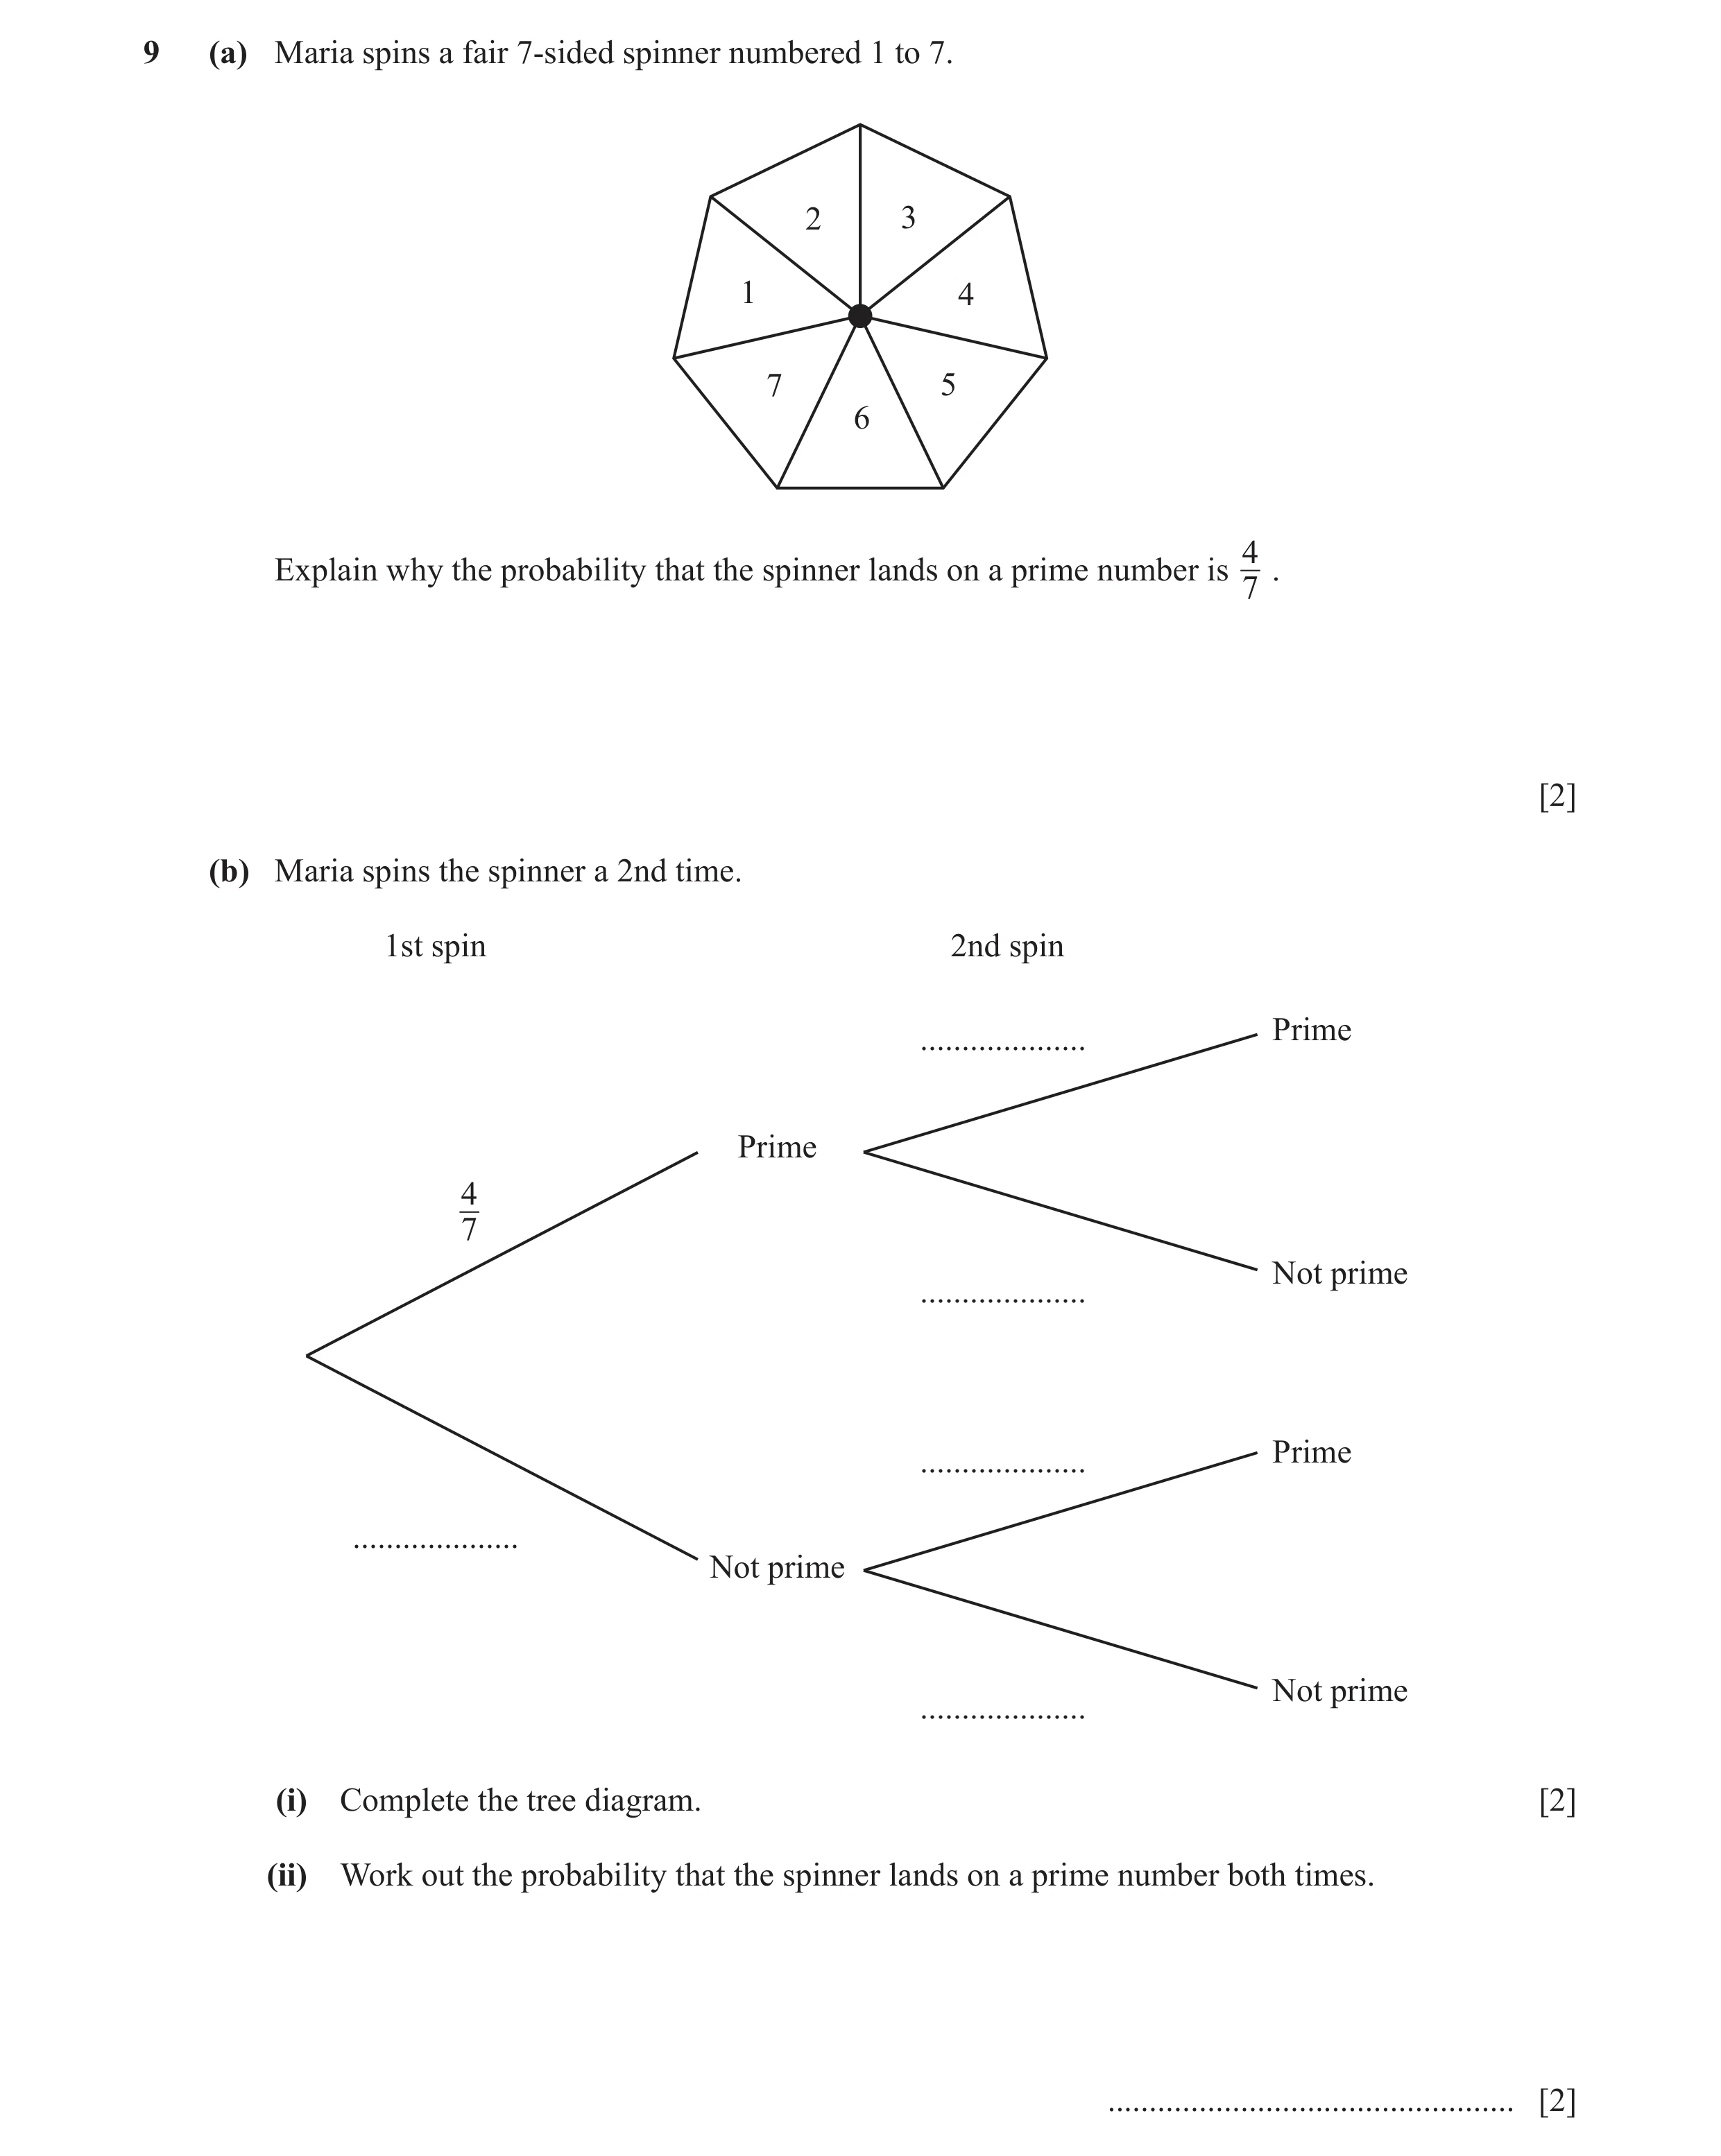
Q35 · Maria spins a fair 7-sided spinner numbered 1 to 7 0580/31 May/June 2023
9 (a) Maria spins a fair 7-sided spinner numbered 1 to 7. 2 3 1 4 7 5 6 4 Explain why the probability that the spinner lands on a prime number is . 7 [2] (b) Maria spins the spinner a 2nd time. 1st spin 2nd spin Prime … Prime 4 7 Not prime … Prime … … Not prime Not prime … (i) Complete the tree diagram. [2] (ii) Work out the probability that the spinner lands on a prime number both times. … [2]
6 marks
Mark scheme: 9(a) Primes 2, 3, 5 and 7 and no others in the 2 B1 for each explanation There are 7 possible outcomes oe 9(b)(i) 4 2 B1 for 2, 3 or 4 correct 7 Prime Prime [74 ] 3 Not Prime 7 4 7 Prime 3 7 Not Prime 3 7 Not Prime 9(b)(ii) 16 2 FT their tree diagram oe 49 4 4 M1 for their 7 7
This question in 0580/31 May/June 2023
Q36 · Pure gold costs $42 per gram 0580/31 Oct/Nov 2023
9 (a) Pure gold costs $42 per gram. The fraction of pure gold in an object is measured in carats. 1 One carat means of the mass of an object is pure gold. 24 Henry buys a 9-carat gold bracelet weighing 16 g. The price of the bracelet is $204. Is the price of the bracelet more or less than the cost of the pure gold in it? You must show your working. [4] (b) A clock made of metals has a mass of 1080 g. The mass of each metal in the clock is in the ratio copper : zinc : other metals = 21 : 14 : 1. Calculate the mass of copper in this clock. … g [2] (c) There are 110 people in a group. G = { people who own gold jewellery } S = { people who own silver jewellery } 18 people own both gold jewellery and silver jewellery. 46 people own gold jewellery. 11 people own no gold jewellery and no silver jewellery. G S (i) Complete the Venn diagram. [2] (ii) Write down n ( G + S ) . … [1] (iii) One of the 110 people is chosen at random. Write down the probability that this person owns gold jewellery but not silver jewellery. … [1] (d) E F Use set notation to describe the shaded region. … [1]
11 marks
Mark scheme: 9(a) Less 4 1 M3 for 9 16 42 oe with working leading to 252 24 or M2 for three of these multiplied or M1 for any two of these multiplied 9(b) 630 2 1080 M1 for [ k] oe 21 + 14 + 1 where k =1,14 or 21 oe 9(c)(i) 2 B1 for two or three in the correct places 9(c)(ii) 18 1 FT their diagram 9(c)(iii) 28 1 FT their 28 from their diagram oe 110 9(d) E F cao 1
This question in 0580/31 Oct/Nov 2023
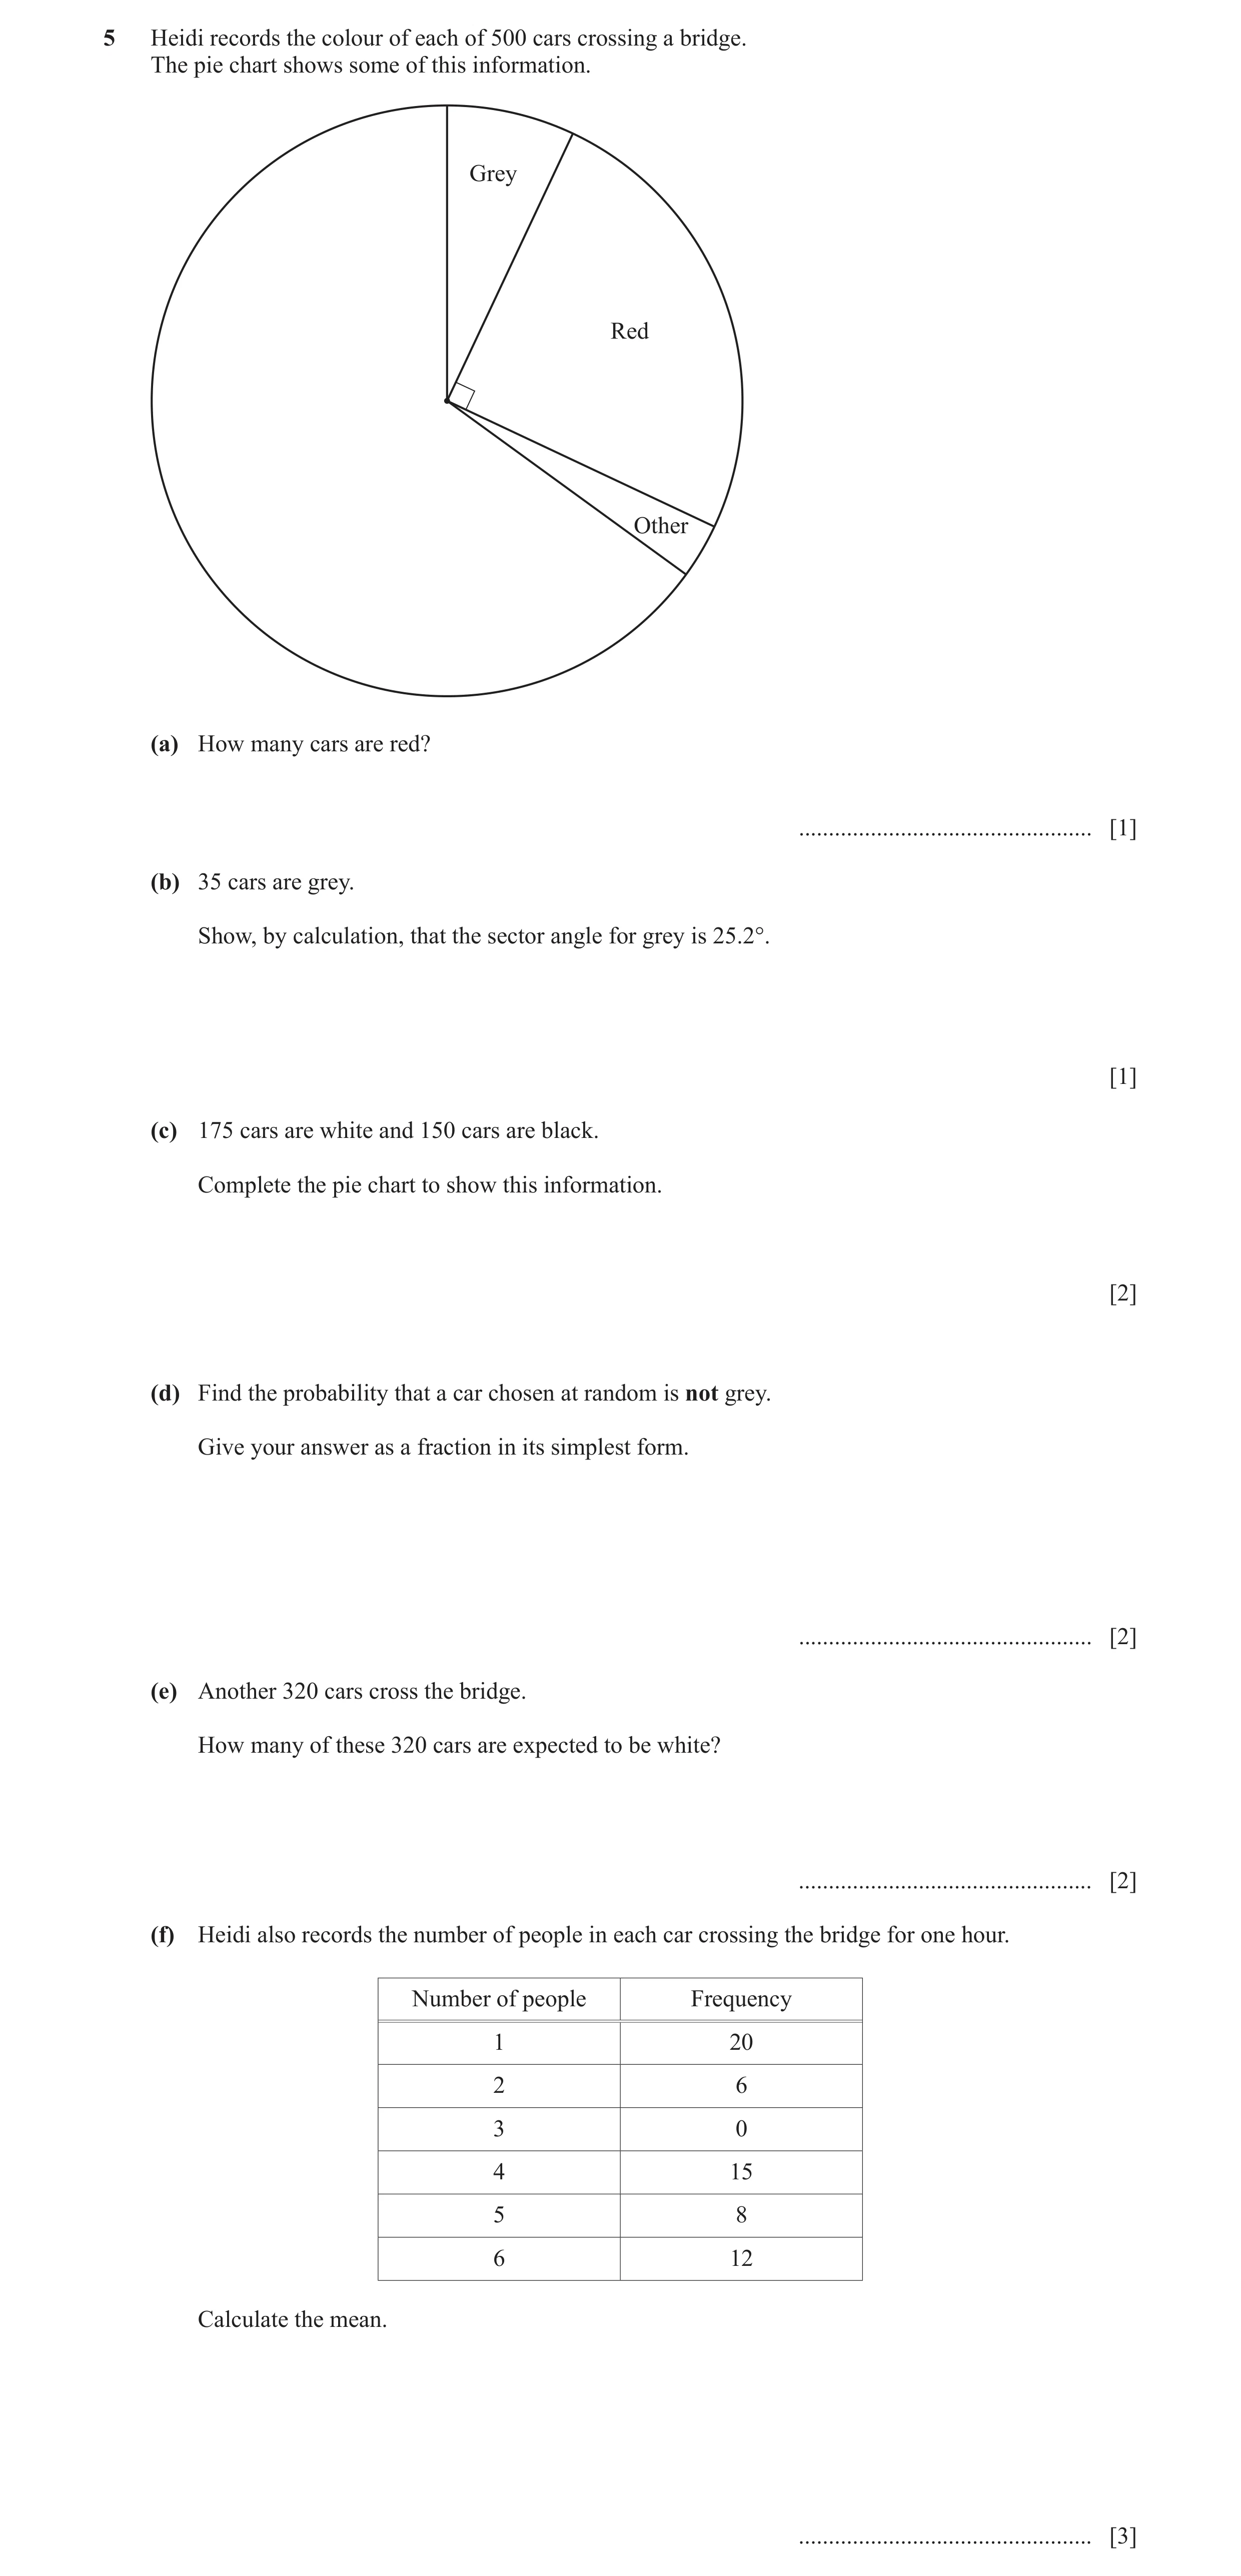
Q37 · Heidi records the colour of each of 500 cars crossing a bridge 0580/32 Oct/Nov 2023
5 Heidi records the colour of each of 500 cars crossing a bridge. The pie chart shows some of this information. Grey Red Other (a) How many cars are red? … [1] (b) 35 cars are grey. Show, by calculation, that the sector angle for grey is 25.2°. [1] (c) 175 cars are white and 150 cars are black. Complete the pie chart to show this information. [2] (d) Find the probability that a car chosen at random is not grey. Give your answer as a fraction in its simplest form. … [2] (e) Another 320 cars cross the bridge. How many of these 320 cars are expected to be white? … [2] (f) Heidi also records the number of people in each car crossing the bridge for one hour. Number of people Frequency 1 20 2 6 3 0 4 15 5 8 6 12 Calculate the mean. … [3]
11 marks
Mark scheme: 5(a) 125 1 5(b) 35 M1 360 500 5(c) Correct pie chart 2 B1 for 126º or 108º 5(d) 93 2 500 – 35 360 – 25.2 cao M1 for oe or oe 100 500 360 7 If 0 scored, then SC1 for final answer of 100 5(e) 112 2 175 126 M1 for 320 oe or 320 oe 500 360 5(f) 21 3 M1 for (1 20) + (2 6) + [3 0] + (4 15) + 3.34 or 3.344… or 3 61 (5 8) + (6 12) M1dep for their fx ( 20 + 6 + 0 + 15 + 8 +12 ) oe
This question in 0580/32 Oct/Nov 2023
Q38 · Elize, Lily and Marco start a business 0580/32 Oct/Nov 2023
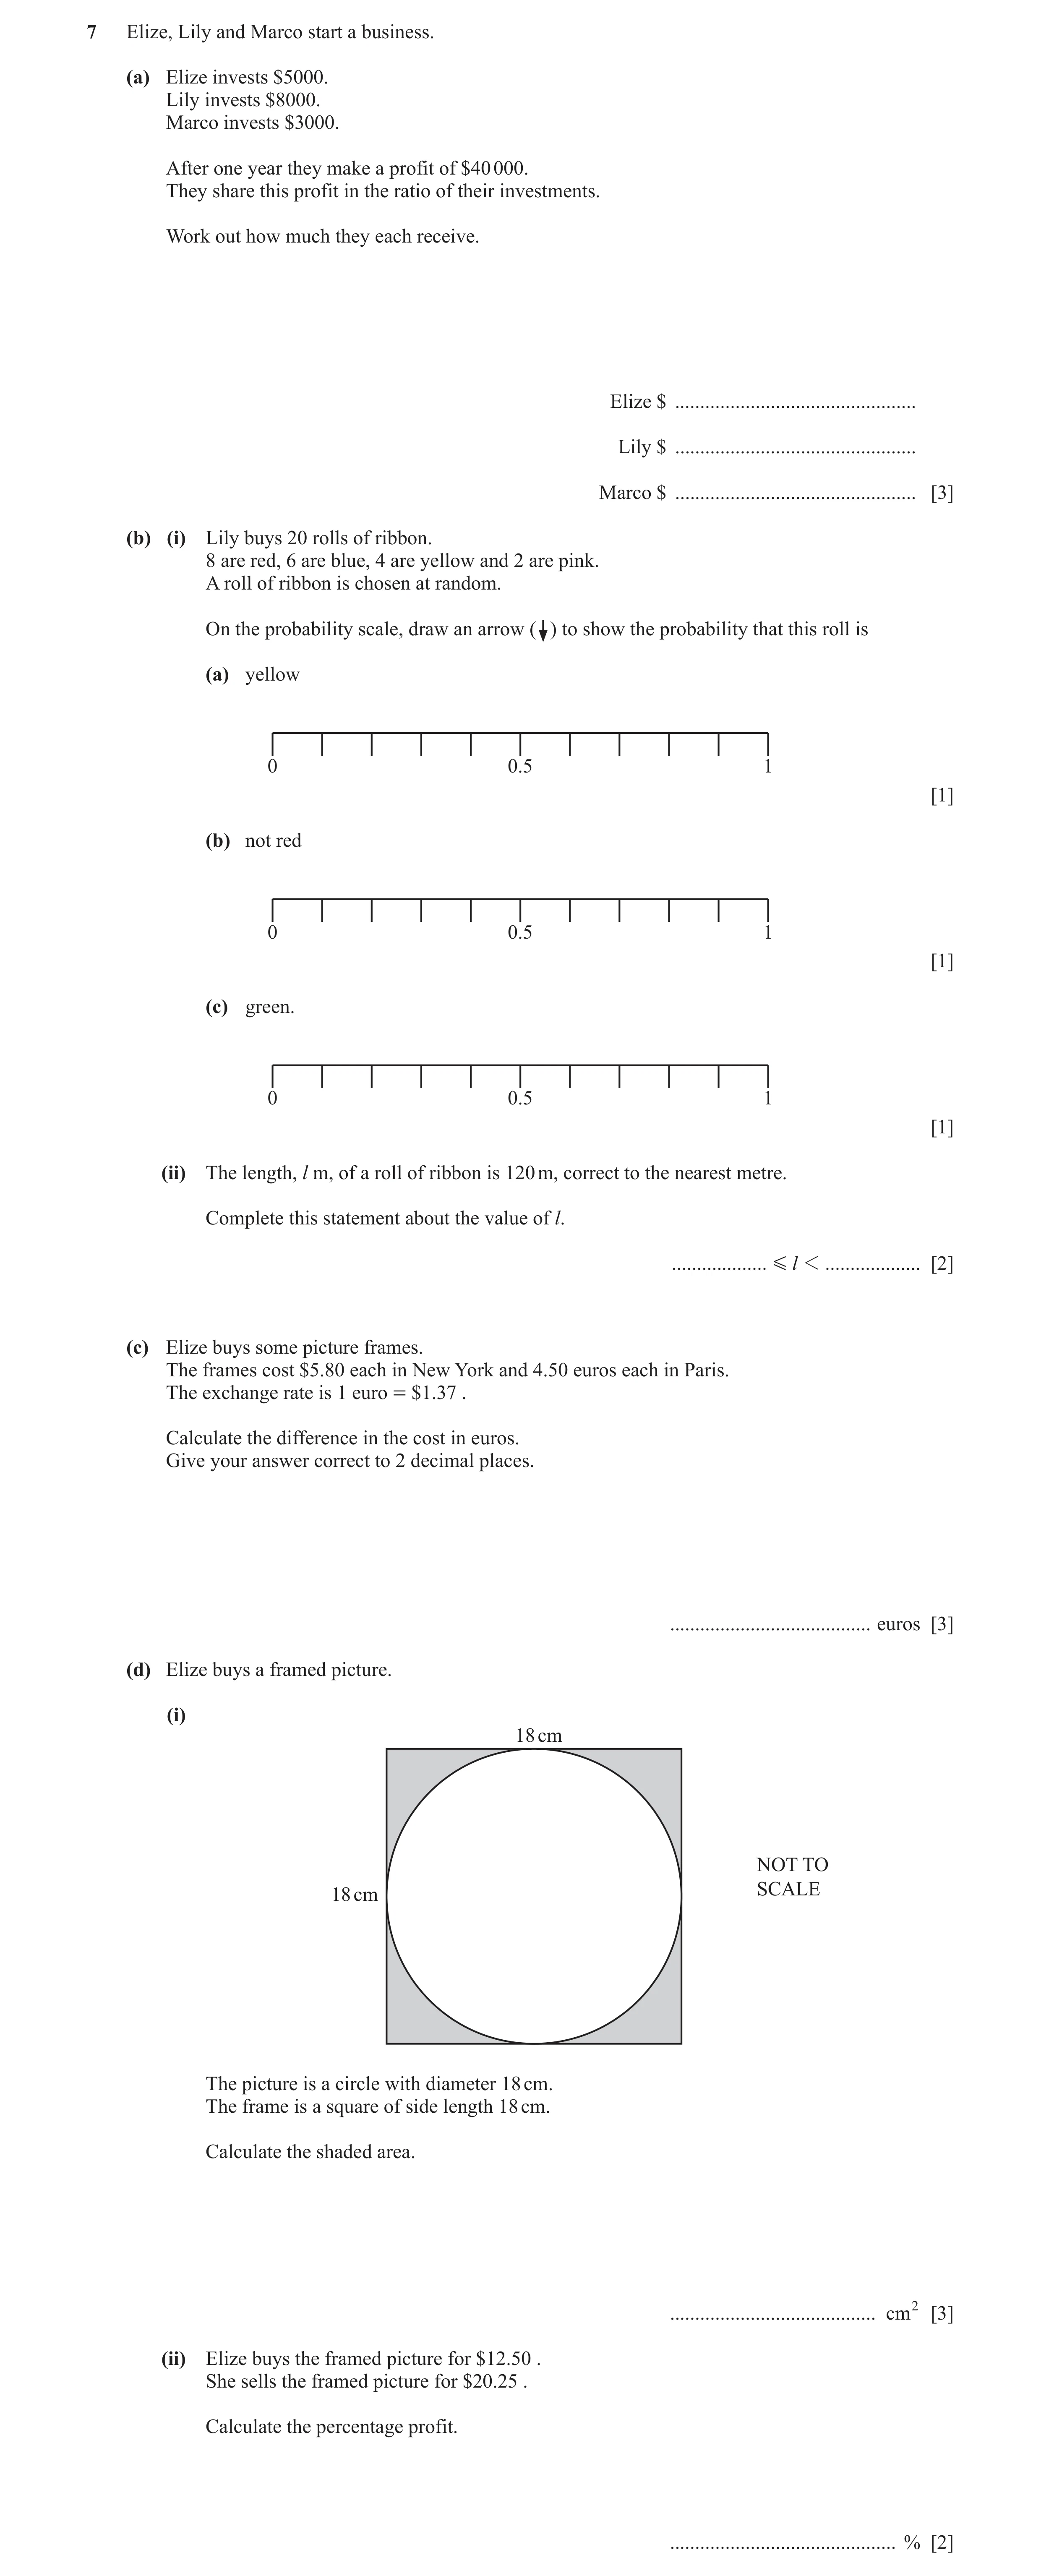
7 Elize, Lily and Marco start a business. (a) Elize invests $5000. Lily invests $8000. Marco invests $3000. After one year they make a profit of $40 000. They share this profit in the ratio of their investments. Work out how much they each receive. Elize $ … Lily $ … Marco $ … [3] (b) (i) Lily buys 20 rolls of ribbon. 8 are red, 6 are blue, 4 are yellow and 2 are pink. A roll of ribbon is chosen at random. On the probability scale, draw an arrow ( ) to show the probability that this roll is (a) yellow 0 0.5 1 [1] (b) not red 0 0.5 1 [1] (c) green. 0 0.5 1 [1] (ii) The length, l m, of a roll of ribbon is 120 m, correct to the nearest metre. Complete this statement about the value of l. … G l 1 … [2] (c) Elize buys some picture frames. The frames cost $5.80 each in New York and 4.50 euros each in Paris. The exchange rate is 1 euro = $1.37 . Calculate the difference in the cost in euros. Give your answer correct to 2 decimal places. … euros [3] (d) Elize buys a framed picture. (i) 18 cm NOT TO SCALE 18 cm The picture is a circle with diameter 18 cm. The frame is a square of side length 18 cm. Calculate the shaded area. … cm2 [3] (ii) Elize buys the framed picture for $12.50 . She sells the framed picture for $20.25 . Calculate the percentage profit. … % [2]
16 marks
Mark scheme: 7(a) 12 500, 20 000, 7500 3 B2 for 12 500 or 7500 in correct place 40000 or M1 for k where k = 1, 5, 8 or 3 5 + 8 + 3 7(b)(i)(a) Arrow at 0.2 1 7(b)(i)(b) Arrow at 0.6 1 7(b)(i)(c) Arrow at 0 1 7(b)(ii) 119.5 120.5 2 B1 for each or both correct but reversed 7(c) 0.27 3 B2 for 0.266… or 5.80 5.80 M2 for 4.50 – oe or −4.50 oe 1.37 1.37 5.80 or M1 for soi by 4.23… 1.37 If 0 or 1 scored, SC1 for correct rounding to 2dp from their more accurate answer 7(d)(i) 69.5 or 69.49 to 69.531 3 M2 for 182 – 92 π oe or M1 for 92 π oe 7(d)(ii) 62 2 20.25 − 12.50 M1 for [ 100] oe 12.50 20.25 or 100 [– 100] oe 12.50 20.25 or –1 [ 100] oe 12.50
This question in 0580/32 Oct/Nov 2023
Q39 · Here is part of the timetable for trains from Hinton to Jarmouth 0580/31 May/June 2024
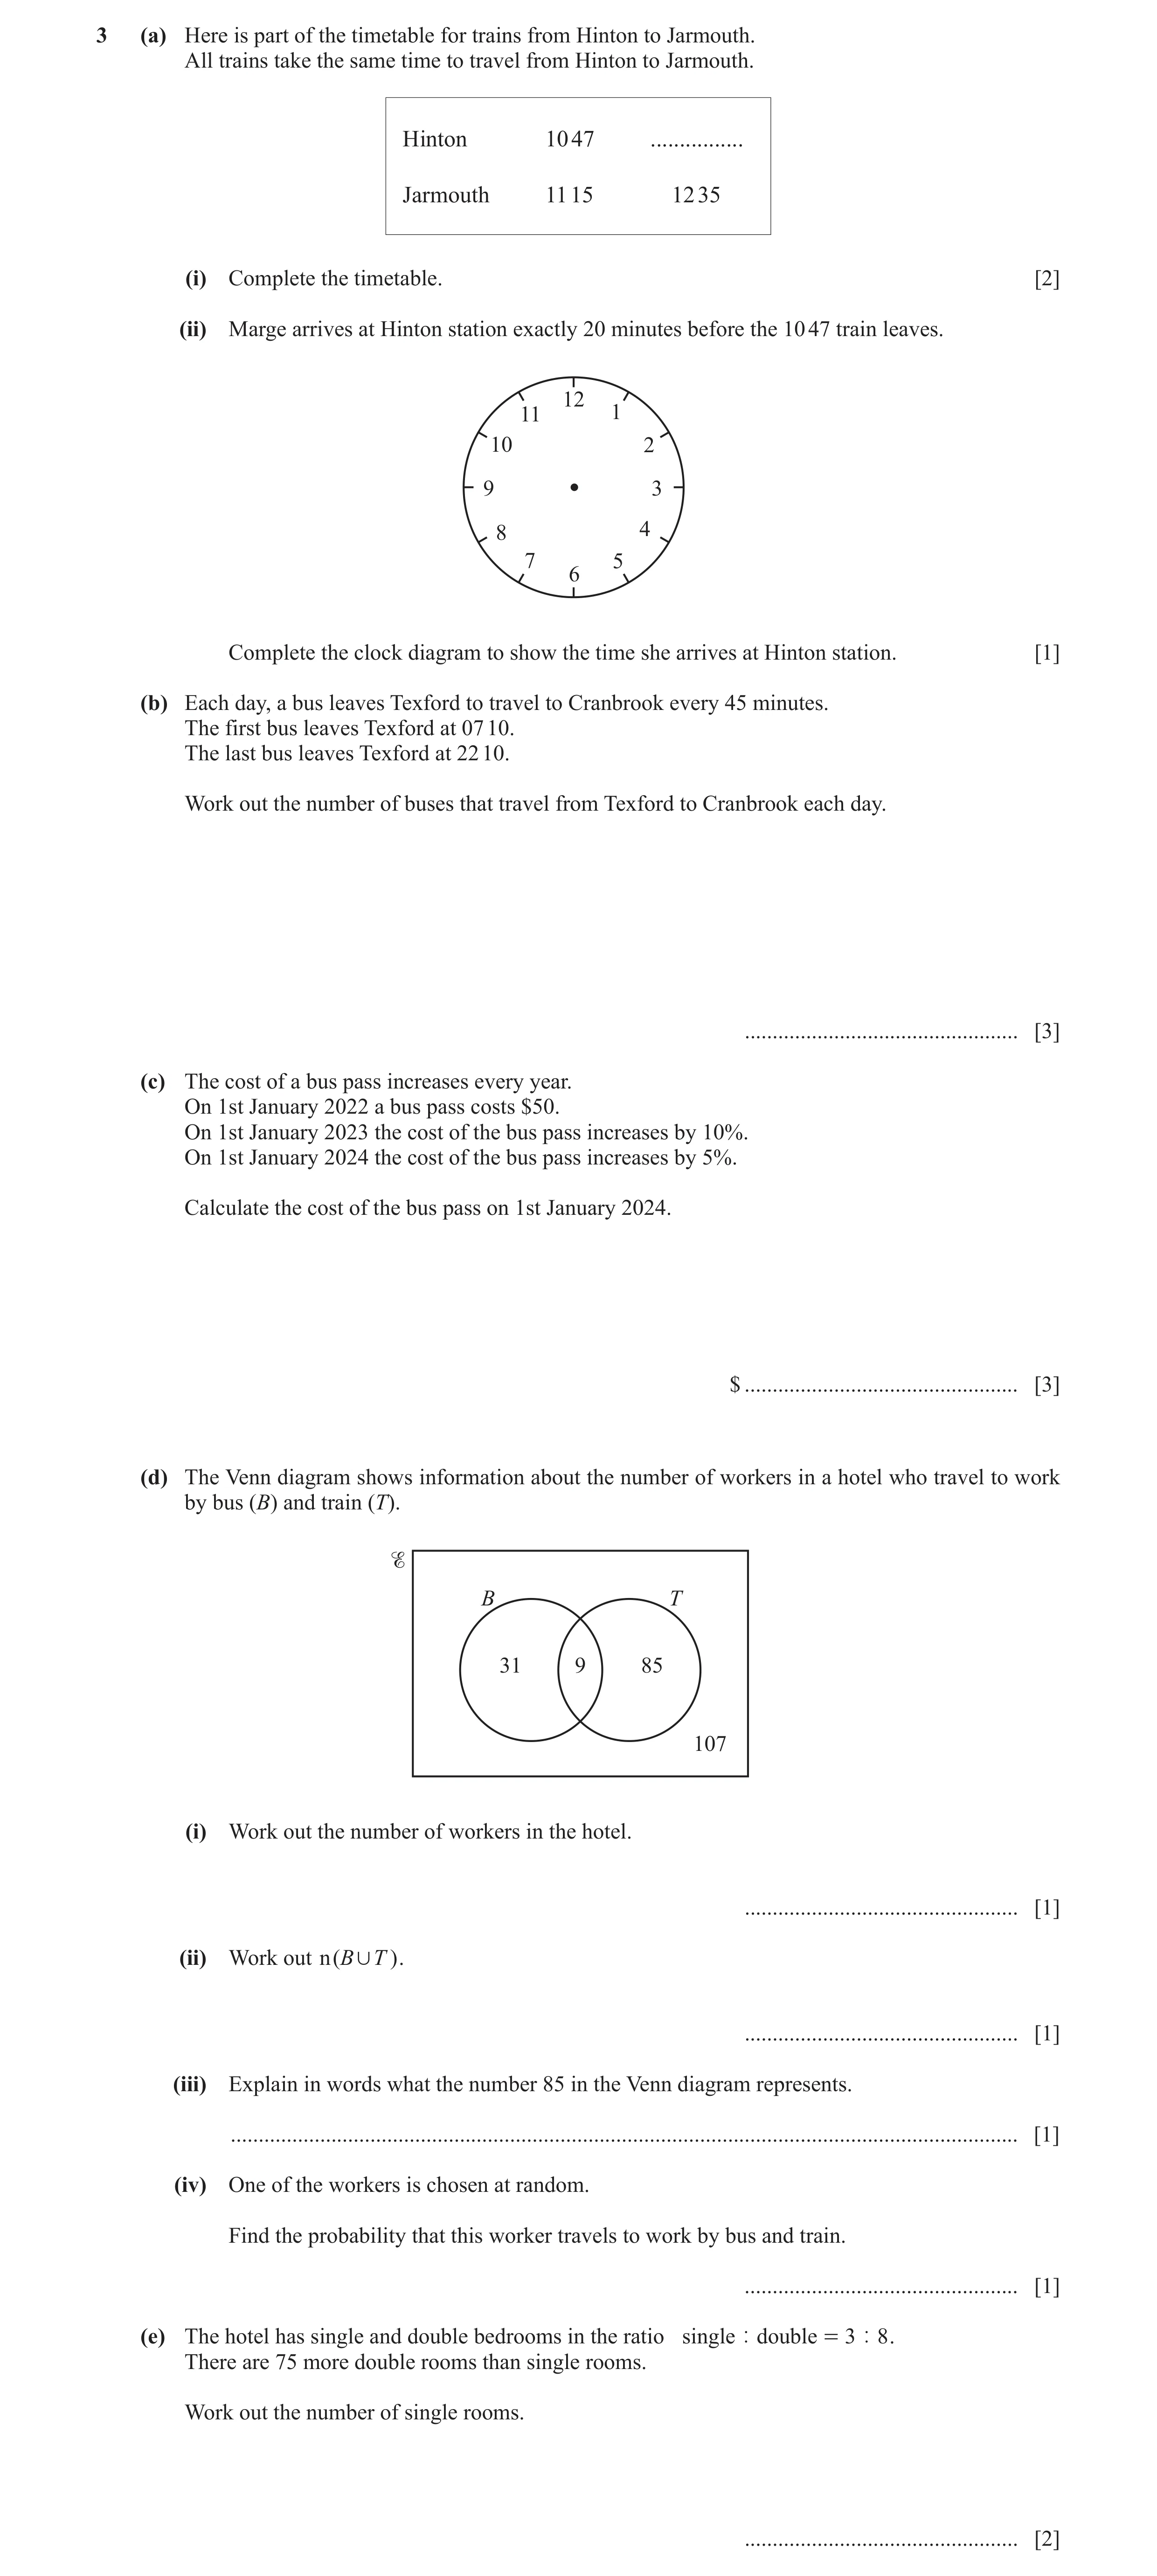
3 (a) Here is part of the timetable for trains from Hinton to Jarmouth. All trains take the same time to travel from Hinton to Jarmouth. Hinton 10 47 … Jarmouth 11 15 12 35 (i) Complete the timetable. [2] (ii) Marge arrives at Hinton station exactly 20 minutes before the 10 47 train leaves. 12 11 1 10 2 9 3 8 4 7 5 6 Complete the clock diagram to show the time she arrives at Hinton station. [1] (b) Each day, a bus leaves Texford to travel to Cranbrook every 45 minutes. The first bus leaves Texford at 07 10. The last bus leaves Texford at 22 10. Work out the number of buses that travel from Texford to Cranbrook each day. … [3] (c) The cost of a bus pass increases every year. On 1st January 2022 a bus pass costs $50. On 1st January 2023 the cost of the bus pass increases by 10%. On 1st January 2024 the cost of the bus pass increases by 5%. Calculate the cost of the bus pass on 1st January 2024. $ … [3] (d) The Venn diagram shows information about the number of workers in a hotel who travel to work by bus (B) and train (T). B T 31 9 85 107 (i) Work out the number of workers in the hotel. … [1] (ii) Work out n ( B , T ) . … [1] (iii) Explain in words what the number 85 in the Venn diagram represents. … [1] (iv) One of the workers is chosen at random. Find the probability that this worker travels to work by bus and train. … [1] (e) The hotel has single and double bedrooms in the ratio single | double = 3 | 8 . There are 75 more double rooms than single rooms. Work out the number of single rooms. … [2]
15 marks
Mark scheme: 3(a)(i) 12 07 2 B1 for 1 [hour] 20 [min] or 80[min] or 28 [min] seen 3(a)(ii) 10 27 drawn correctly on clock 1 face. 3(b) 21 3 B2 for 20 as final answer 22:10 07:10 or M2 for 60 oe 45 or M1 for 22:10 07:10 60 oe 3(c) 57.75 3 10 5 M2 for 50 1 1 oe 100 100 or B2 for 1.155 10 or M1for 50 1 oe 100 5 or 50 1 oe 100 5 or their 55 1 oe 100 10 5 or 1 1 oe 100 100 3(d)(i) 232 1 3(d)(ii) 125 1 3(d)(iii) The number of workers who travel 1 to work by train but who do not travel on a bus oe. 3(d)(iv) 9 1 FT their 3(d)(i) in denominator. oe 232 3(e) 45 2 75 M1 for k oe k 1, 3, 8 8 3
This question in 0580/31 May/June 2024
Q40 · Li spins a fair 6-sided spinner numbered 1 to 6 0580/33 May/June 2024
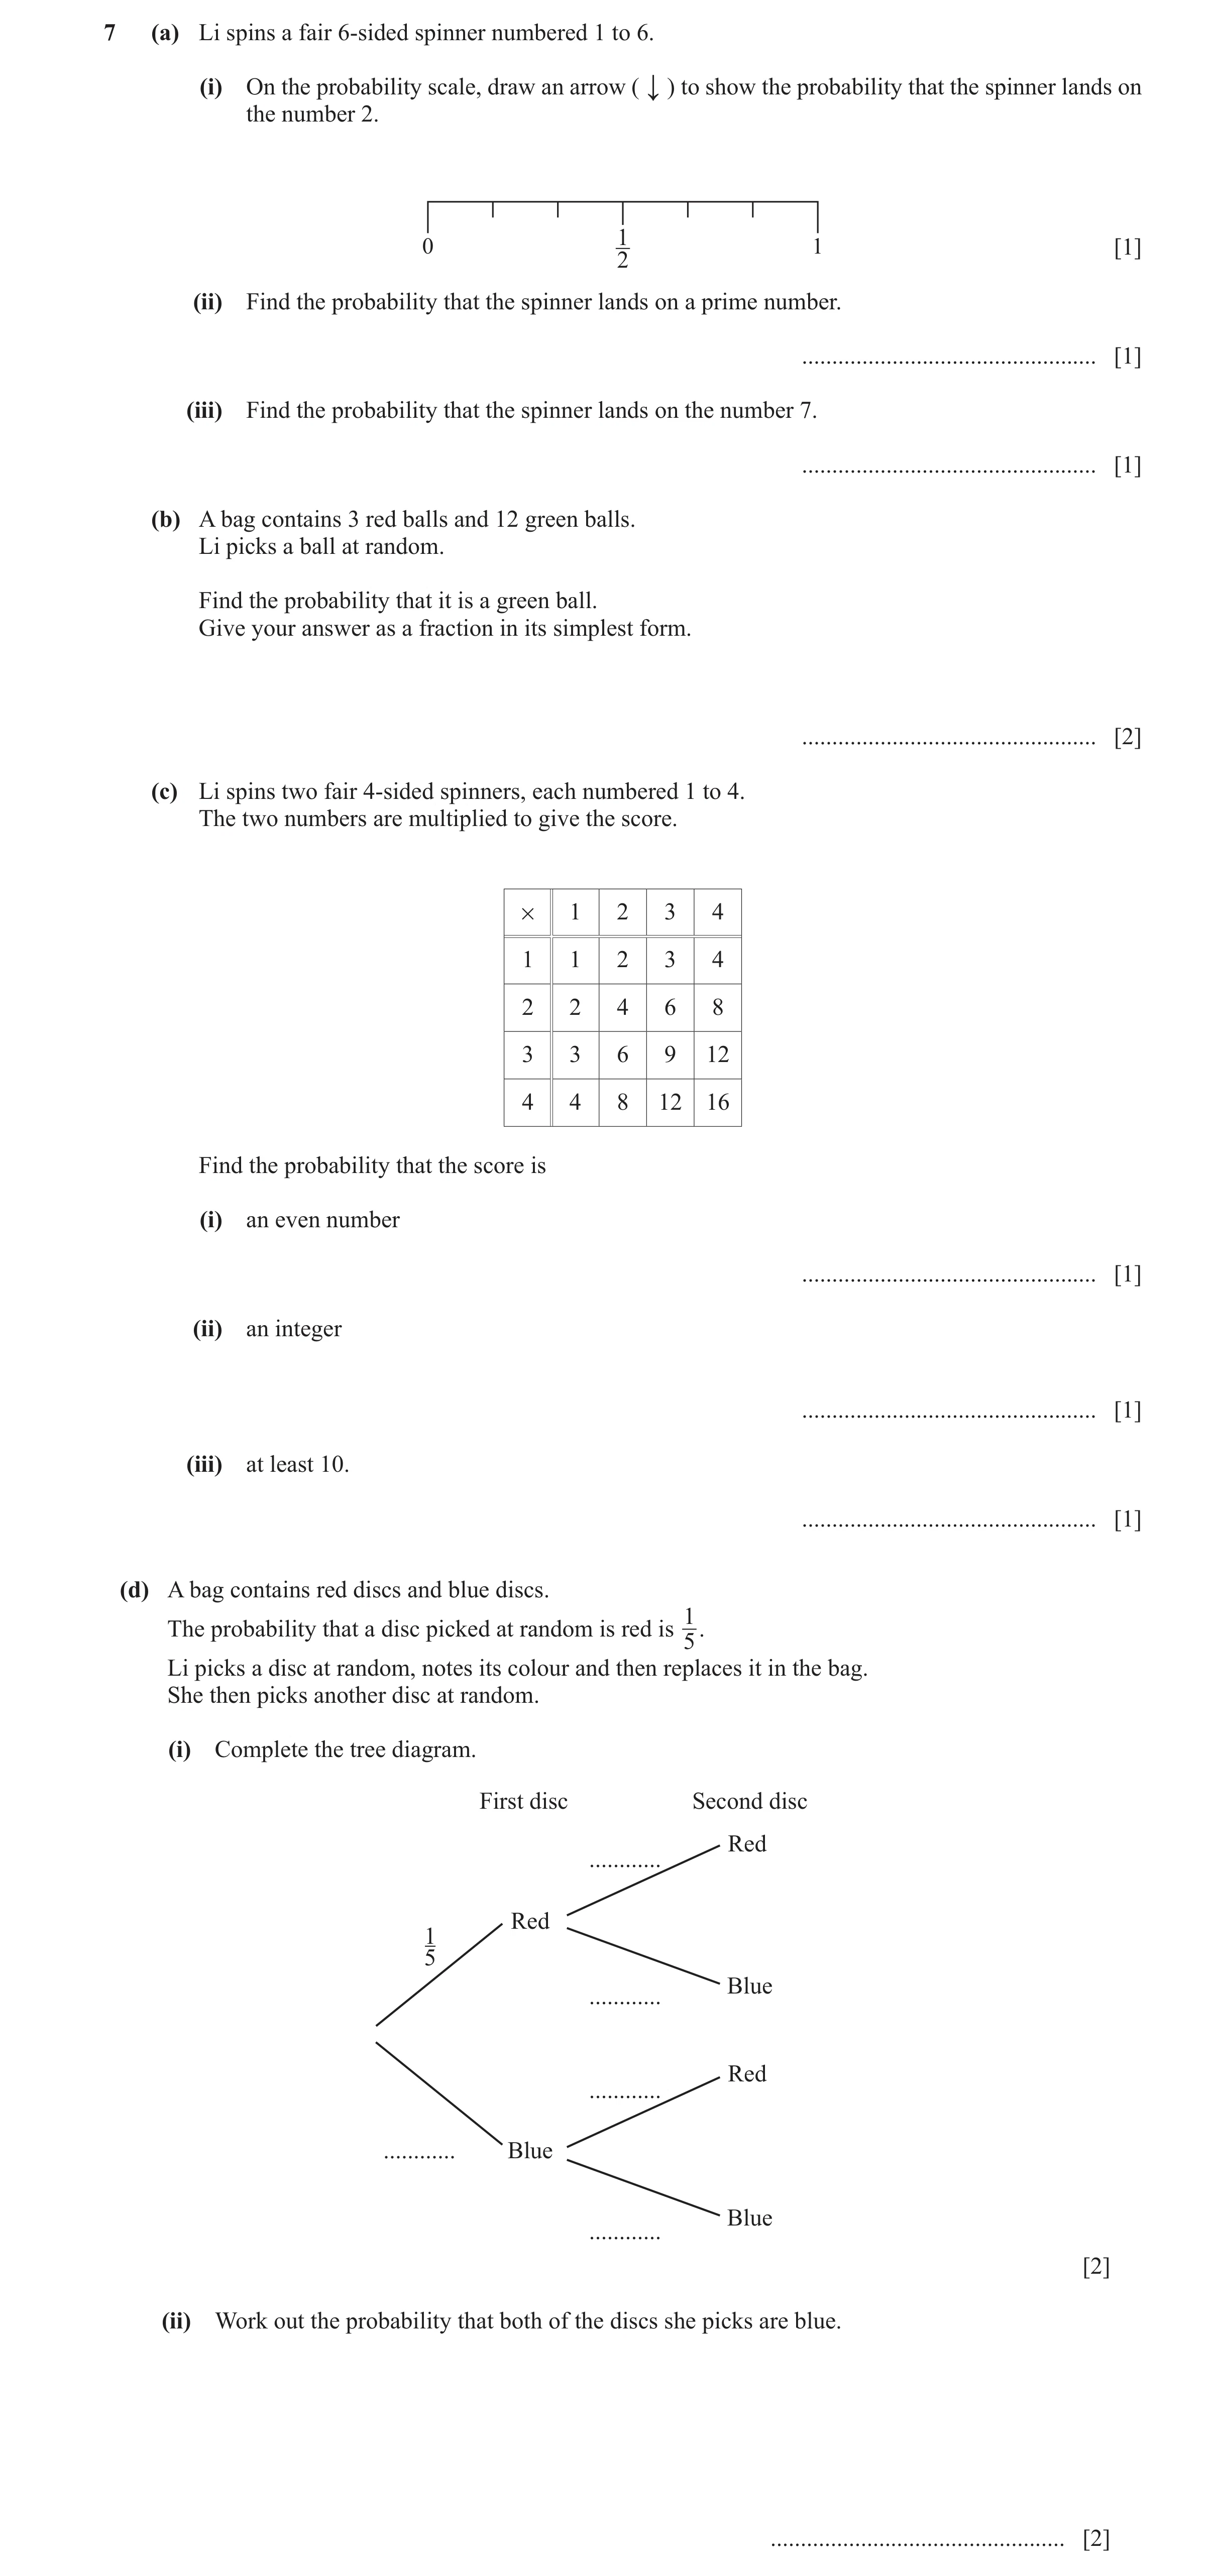
7 (a) Li spins a fair 6-sided spinner numbered 1 to 6. (i) On the probability scale, draw an arrow (↓) to show the probability that the spinner lands on the number 2. 1 0 1 [1] 2 (ii) Find the probability that the spinner lands on a prime number. … [1] (iii) Find the probability that the spinner lands on the number 7. … [1] (b) A bag contains 3 red balls and 12 green balls. Li picks a ball at random. Find the probability that it is a green ball. Give your answer as a fraction in its simplest form. … [2] (c) Li spins two fair 4-sided spinners, each numbered 1 to 4. The two numbers are multiplied to give the score. # 1 2 3 4 1 1 2 3 4 2 2 4 6 8 3 3 6 9 12 4 4 8 12 16 Find the probability that the score is (i) an even number … [1] (ii) an integer … [1] (iii) at least 10. … [1] (d) A bag contains red discs and blue discs. The probability that a disc picked at random is red is 1. 5 Li picks a disc at random, notes its colour and then replaces it in the bag. She then picks another disc at random. (i) Complete the tree diagram. First disc Second disc Red … Red 1 5 Blue … Red … … Blue Blue … [2] (ii) Work out the probability that both of the discs she picks are blue. … [2]
12 marks
Mark scheme: 7(a)(i) Arrow at 16 1 7(a)(ii) 1 2 oe 1 7(a)(iii) 0 1 7(b) 4 2 12 cao B1 for oe 5 15 7(c)(i) 3 4 oe 1 7(c)(ii) 1 1 7(c)(iii) 3 oe 1 16 7(d)(i) 2 4 B1 for on the first branch 5 1 or in both correct places in second 5 branches 7(d)(ii) 16 2 FT for 2 marks or 1 mark for 2 fractions oe less than 1 25 4 4 M1FT for 5 5
This question in 0580/33 May/June 2024
Q41 · % = {students in a group} M = {students who pass the mathematics test} S = {students who… 0580/32 Oct/Nov 2024
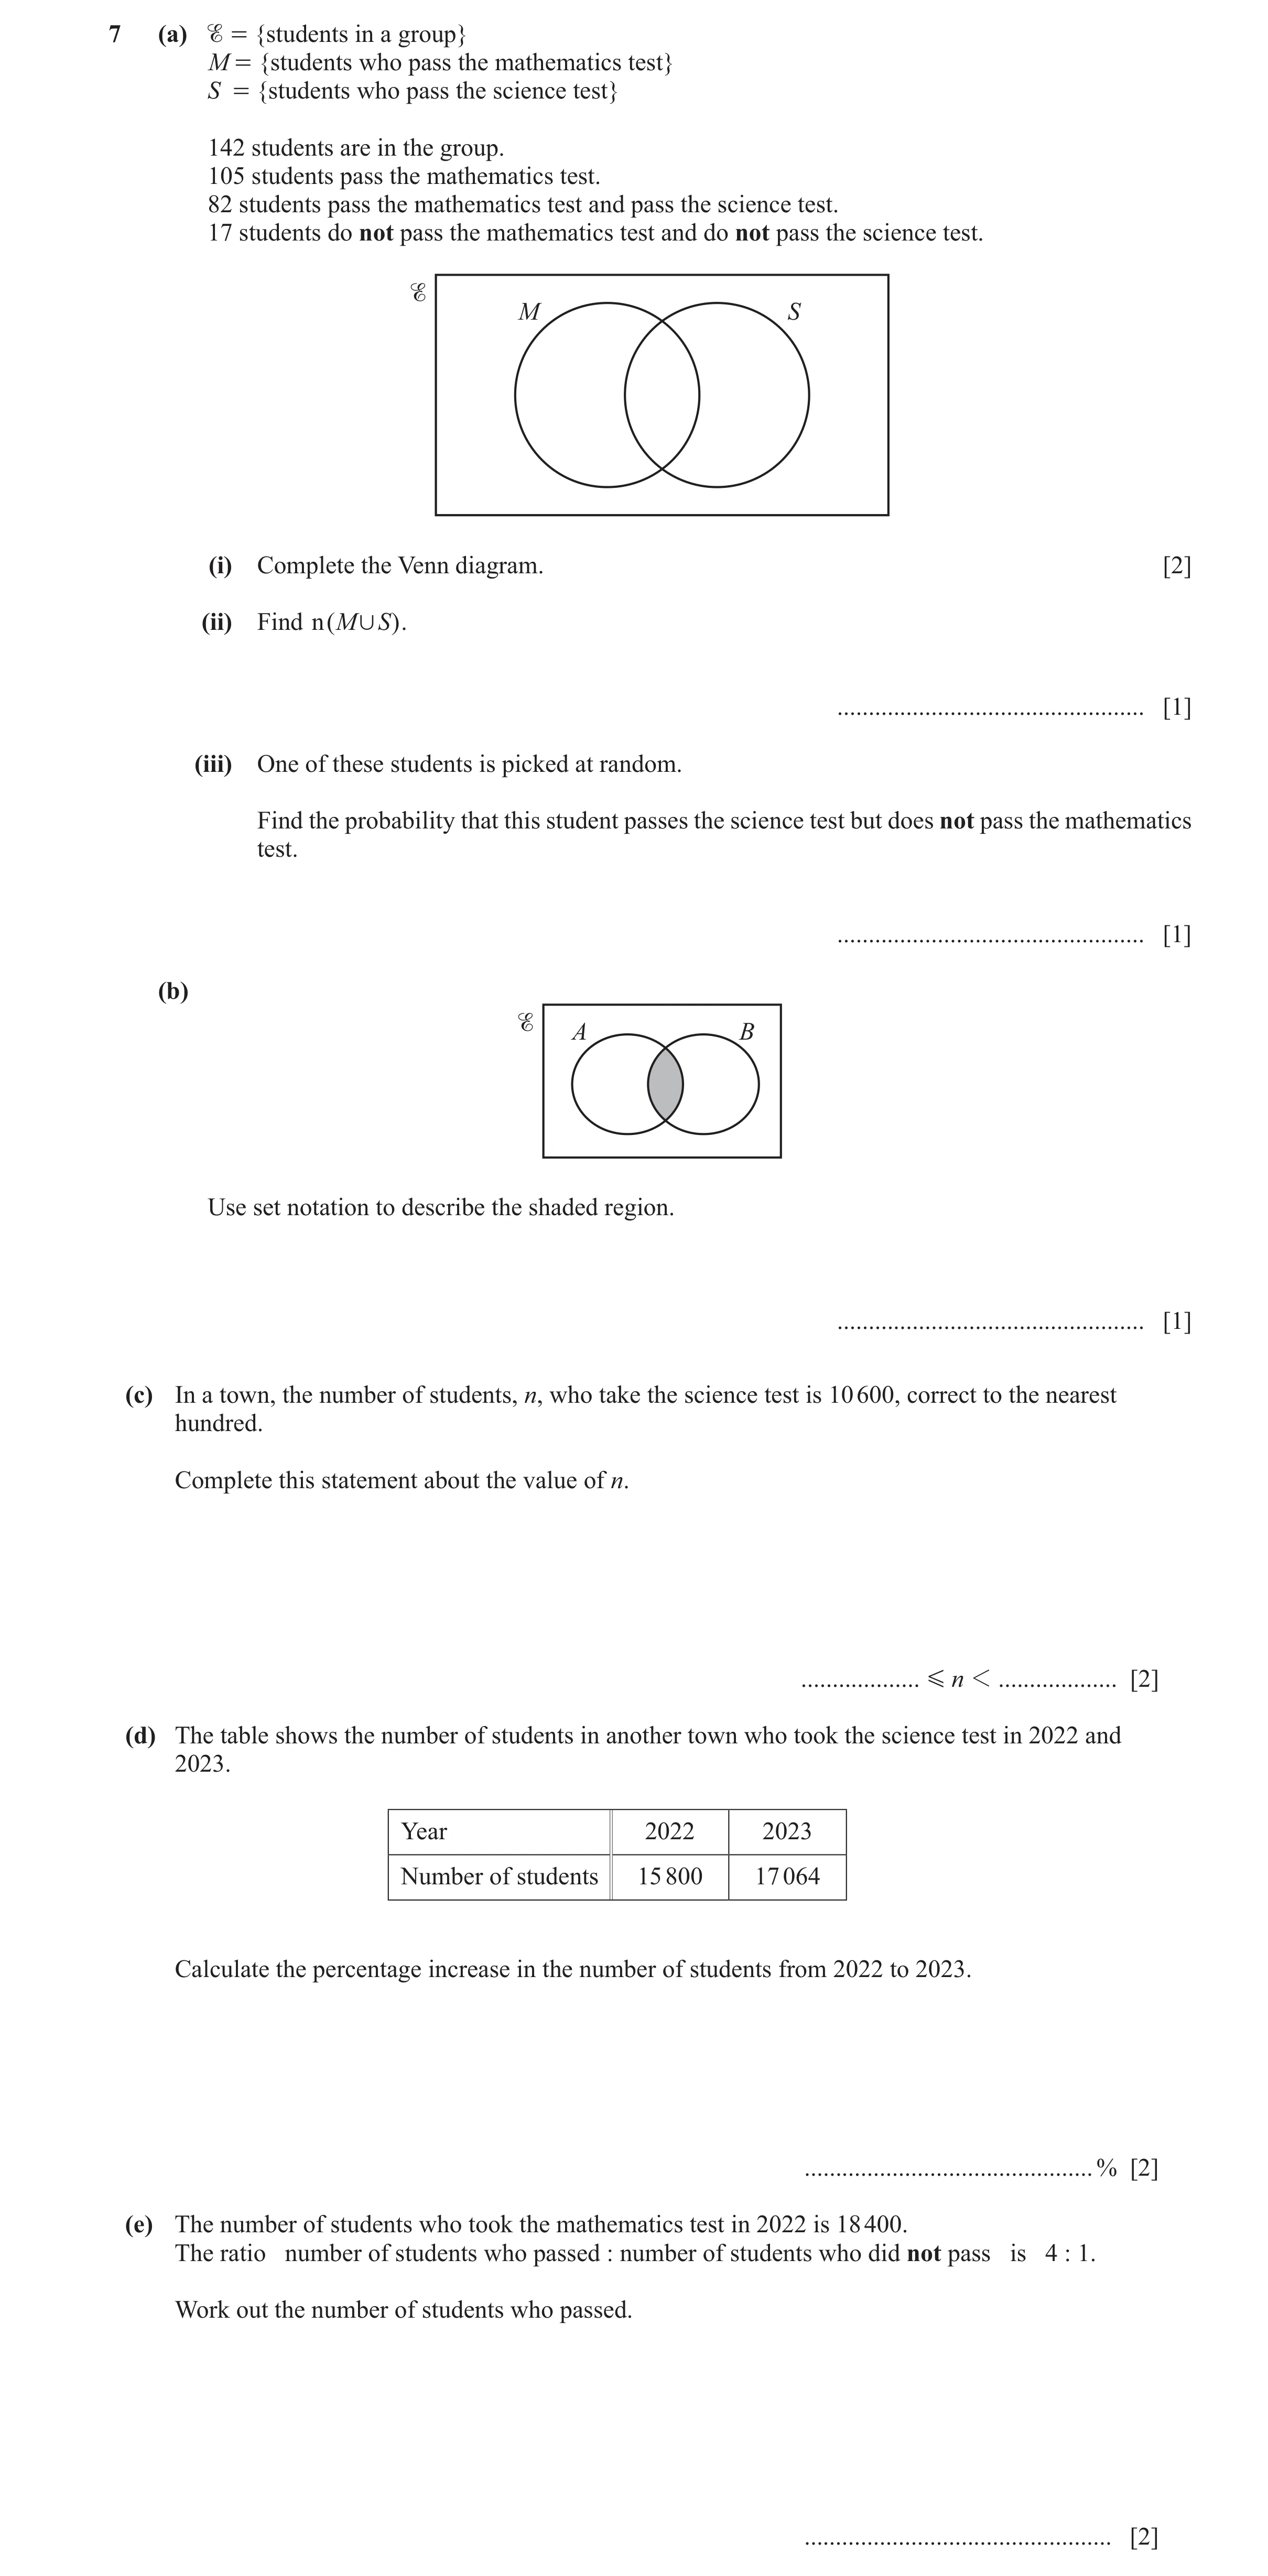
7 (a) % = {students in a group} M = {students who pass the mathematics test} S = {students who pass the science test} 142 students are in the group. 105 students pass the mathematics test. 82 students pass the mathematics test and pass the science test. 17 students do not pass the mathematics test and do not pass the science test. M S (i) Complete the Venn diagram. [2] (ii) Find n ( M , S ). … [1] (iii) One of these students is picked at random. Find the probability that this student passes the science test but does not pass the mathematics test. … [1] (b) A B Use set notation to describe the shaded region. … [1] (c) In a town, the number of students, n, who take the science test is 10 600, correct to the nearest hundred. Complete this statement about the value of n. … G n 1 … [2] (d) The table shows the number of students in another town who took the science test in 2022 and 2023. Year 2022 2023 Number of students 15 800 17 064 Calculate the percentage increase in the number of students from 2022 to 2023. … % [2] (e) The number of students who took the mathematics test in 2022 is 18 400. The ratio number of students who passed : number of students who did not pass is 4 : 1. Work out the number of students who passed. … [2]
11 marks
Mark scheme: 7(a)(i) 2 B1 for 2 or 3 numbers in the correct places 7(a)(ii) 125 1 FT their diagram with one value in each of the 3 regions of M and S, providing total <142 7(a)(iii) 20 1 their 20 oe FT providing their 20 < 142 142 142 7(b) A ∩ B 1 7(c) 10 550 10 650 2 B1 for one correct or SC1 for both correct and reversed 7(d) 8 nfww 2 17 064 − 15 800 M1 for [× 100] 15 800 17 064 or − 1 [× 100] 15 800 17 064 or 100 [- 100] oe 15 800 7(e) 14 720 2 18400 M1 for [× k] (where k = 1 or 4) oe 1 + 4
This question in 0580/32 Oct/Nov 2024
Q42 · A wedding invitation is in the shape of a rectangle 0580/33 Oct/Nov 2024
3 (a) A wedding invitation is in the shape of a rectangle. Draw the lines of symmetry on this rectangle. [2] (b) There are 98 adults and 56 children at the wedding. Find the fraction of people who are children. Give your fraction in its simplest form. … [2] (c) The wedding meal starts at 13 15 and lasts for 2 hours 50 minutes. Find the time the meal ends. … [1] (d) The probability that it will rain at the wedding is 0.12 . Find the probability that it will not rain. … [1] (e) (i) These are the ages of the staff at the wedding. 16 24 39 28 17 48 31 33 17 29 40 25 Complete the stem-and-leaf diagram. 1 2 3 4 Key: 1|6 represents 16 [2] (ii) Find the range. … [1]
9 marks
Mark scheme: 3(a) 2 correct lines only 2 B1 for one correct line with no extras or 2 correct and 1 extra 3(b) 4 2 M1 for 98 + 56 cao 11 3(c) 16 05 1 3(d) 0.88 1 3(e)(i) 1 6 7 7 2 B1 for two or three rows correct or a fully 2 4 5 8 9 correct unordered stem-and-leaf diagram 3 1 3 9 4 0 8 3(e)(ii) 32 1 FT their (e)(i) dep. on an ordered table
This question in 0580/33 Oct/Nov 2024
Q43 · A tin contains red, yellow, green and brown sweets 0580/31 May/June 2025
20 A tin contains red, yellow, green and brown sweets. The table shows some of the probabilities of picking a sweet of each colour at random. Colour Red Yellow Green Brown Probability 0.68 0.05 0.14 Complete the table. [2]
2 marks
Mark scheme: 20 [0].13 2 B1 for 0.87 or M1 for 1 – (0.68 + 0.05 + 0.14) oe
This question in 0580/31 May/June 2025
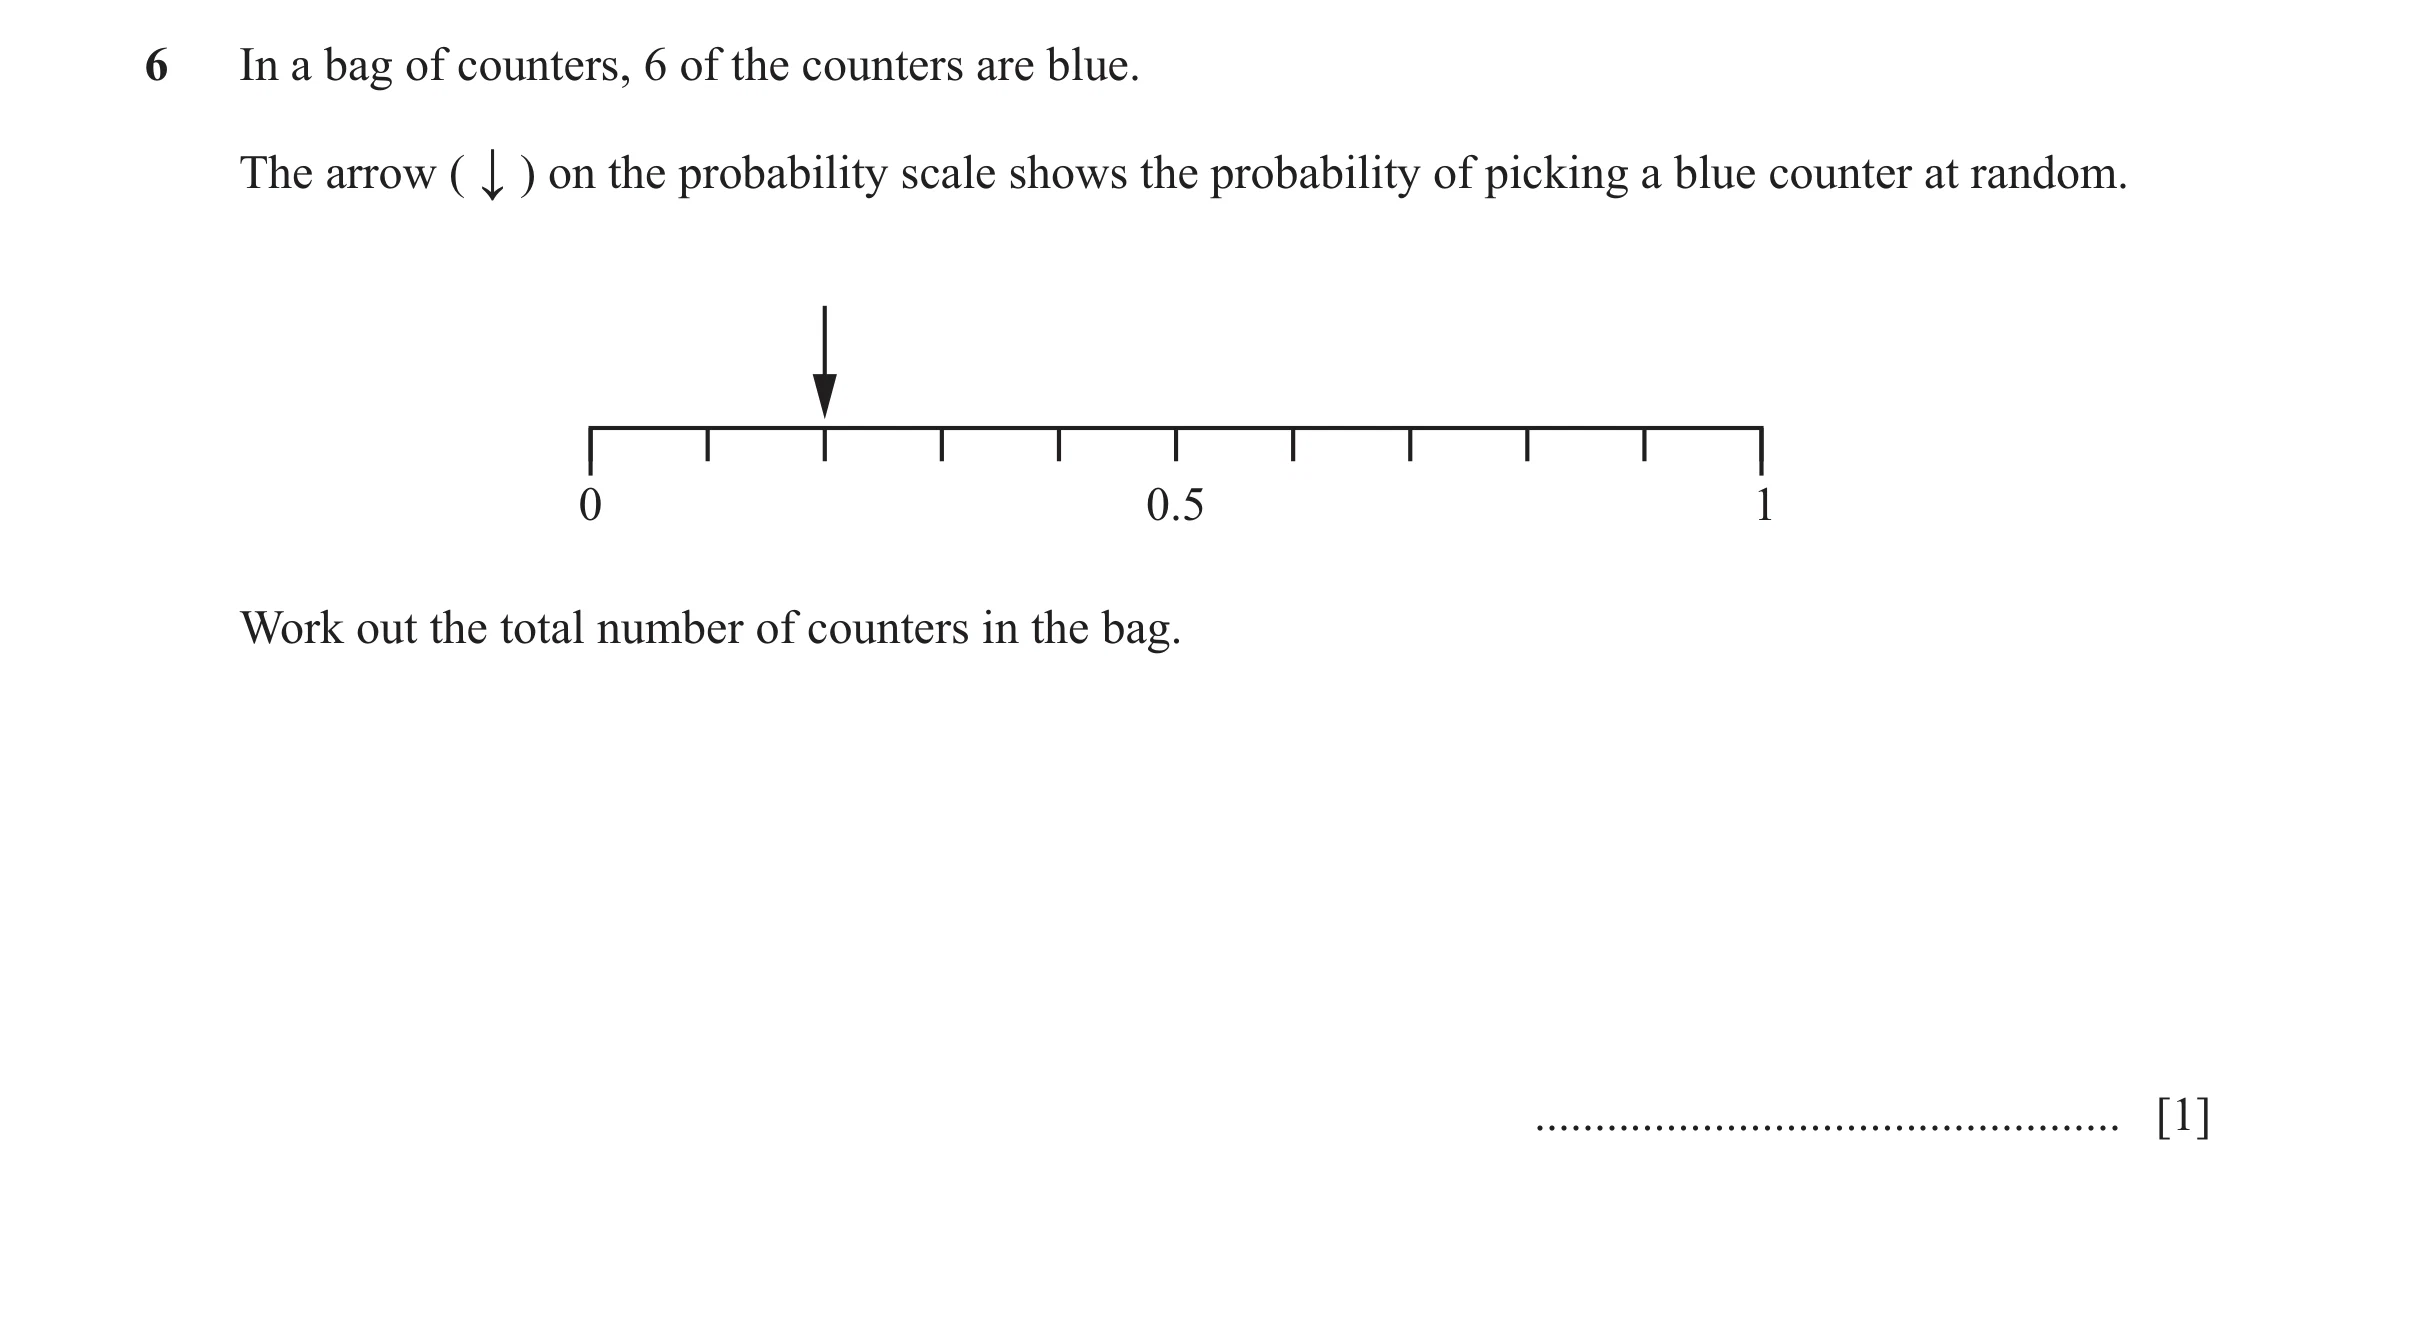
Q44 · In a bag of counters, 6 of the counters are blue 0580/33 May/June 2025
6 In a bag of counters, 6 of the counters are blue. The arrow (↓) on the probability scale shows the probability of picking a blue counter at random. 0 0.5 1 Work out the total number of counters in the bag. … [1]
1 marks
Mark scheme: 6 30 1
This question in 0580/33 May/June 2025
Q45 · A bag contains 6 red balls, 4 green balls and 2 blue balls 0580/31 Oct/Nov 2025
7 A bag contains 6 red balls, 4 green balls and 2 blue balls. Zia takes a ball from the bag at random. The diagram shows a probability scale. A B C D E F G 0 1 Which arrow shows the probability that, (a) Zia takes a green ball … [1] (b) Zia takes a yellow ball … [1] (c) Zia does not take a blue ball. … [1]
3 marks
Mark scheme: 7(a) C 1 7(b) A 1 7(c) F 1
This question in 0580/31 Oct/Nov 2025
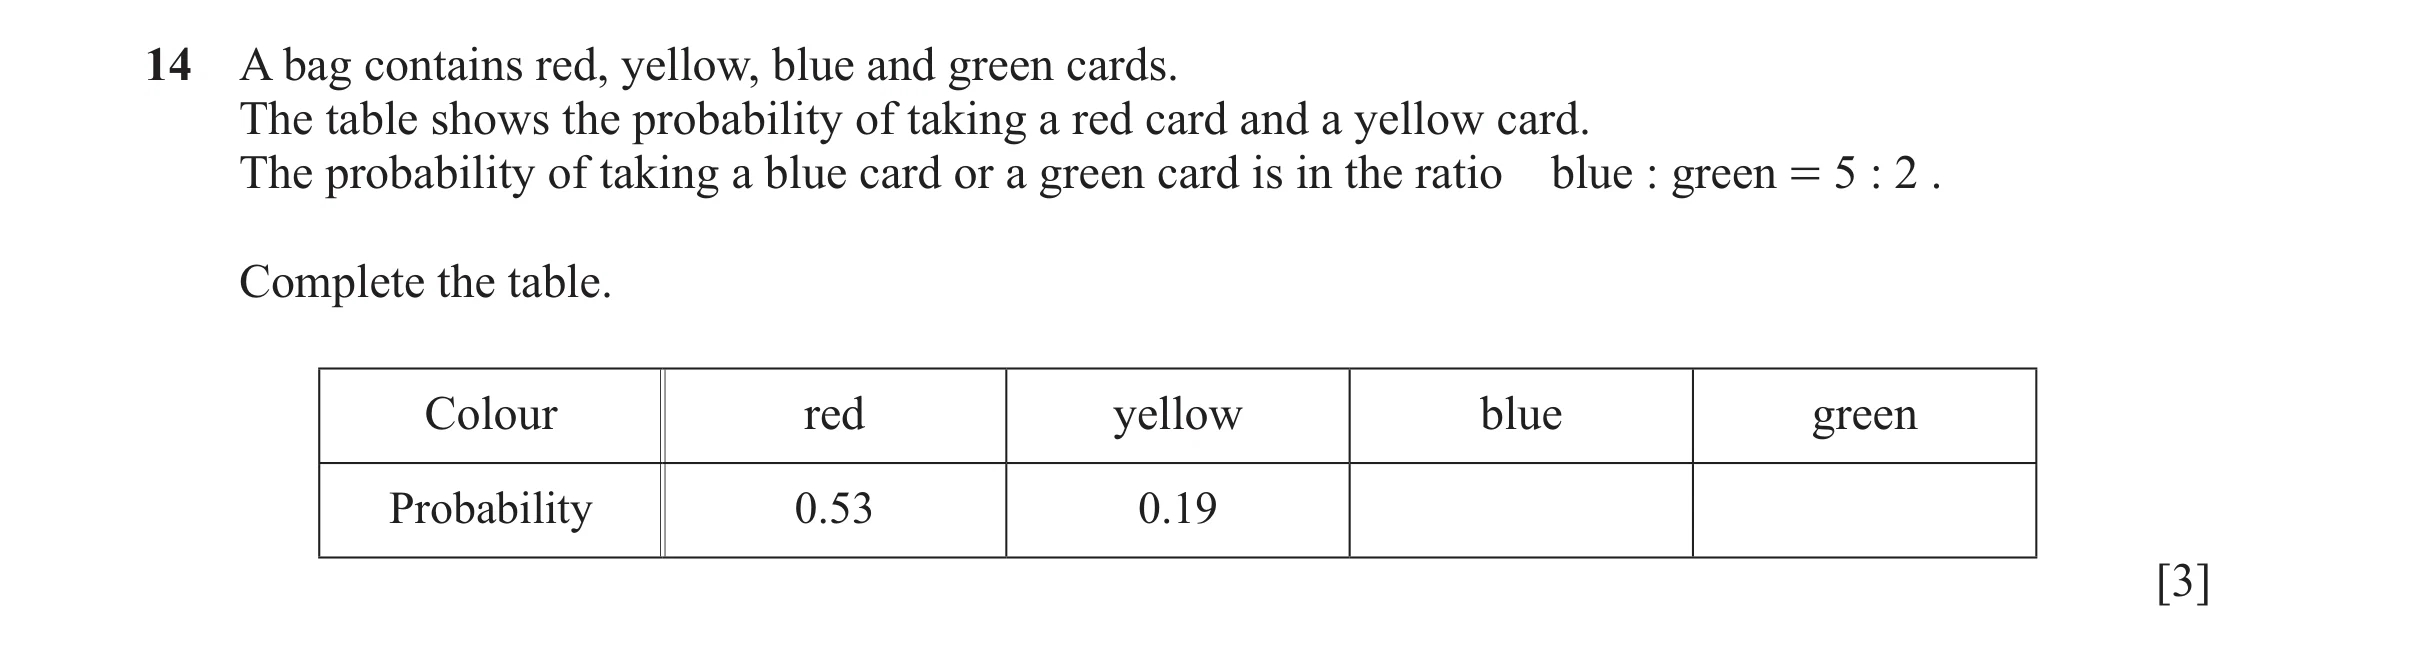
Q46 · A bag contains red, yellow, blue and green cards 0580/31 Oct/Nov 2025
14 A bag contains red, yellow, blue and green cards. The table shows the probability of taking a red card and a yellow card. The probability of taking a blue card or a green card is in the ratio blue : green = 5 : 2 . Complete the table. Colour red yellow blue green Probability 0.53 0.19 [3]
3 marks
Mark scheme: 14 0.2[0] 0.08 oe 3 1 − ( 0.53 + 0.19 ) M2 for oe 7 or M1 for 1 – (0.53 + 0.19) oe
This question in 0580/31 Oct/Nov 2025
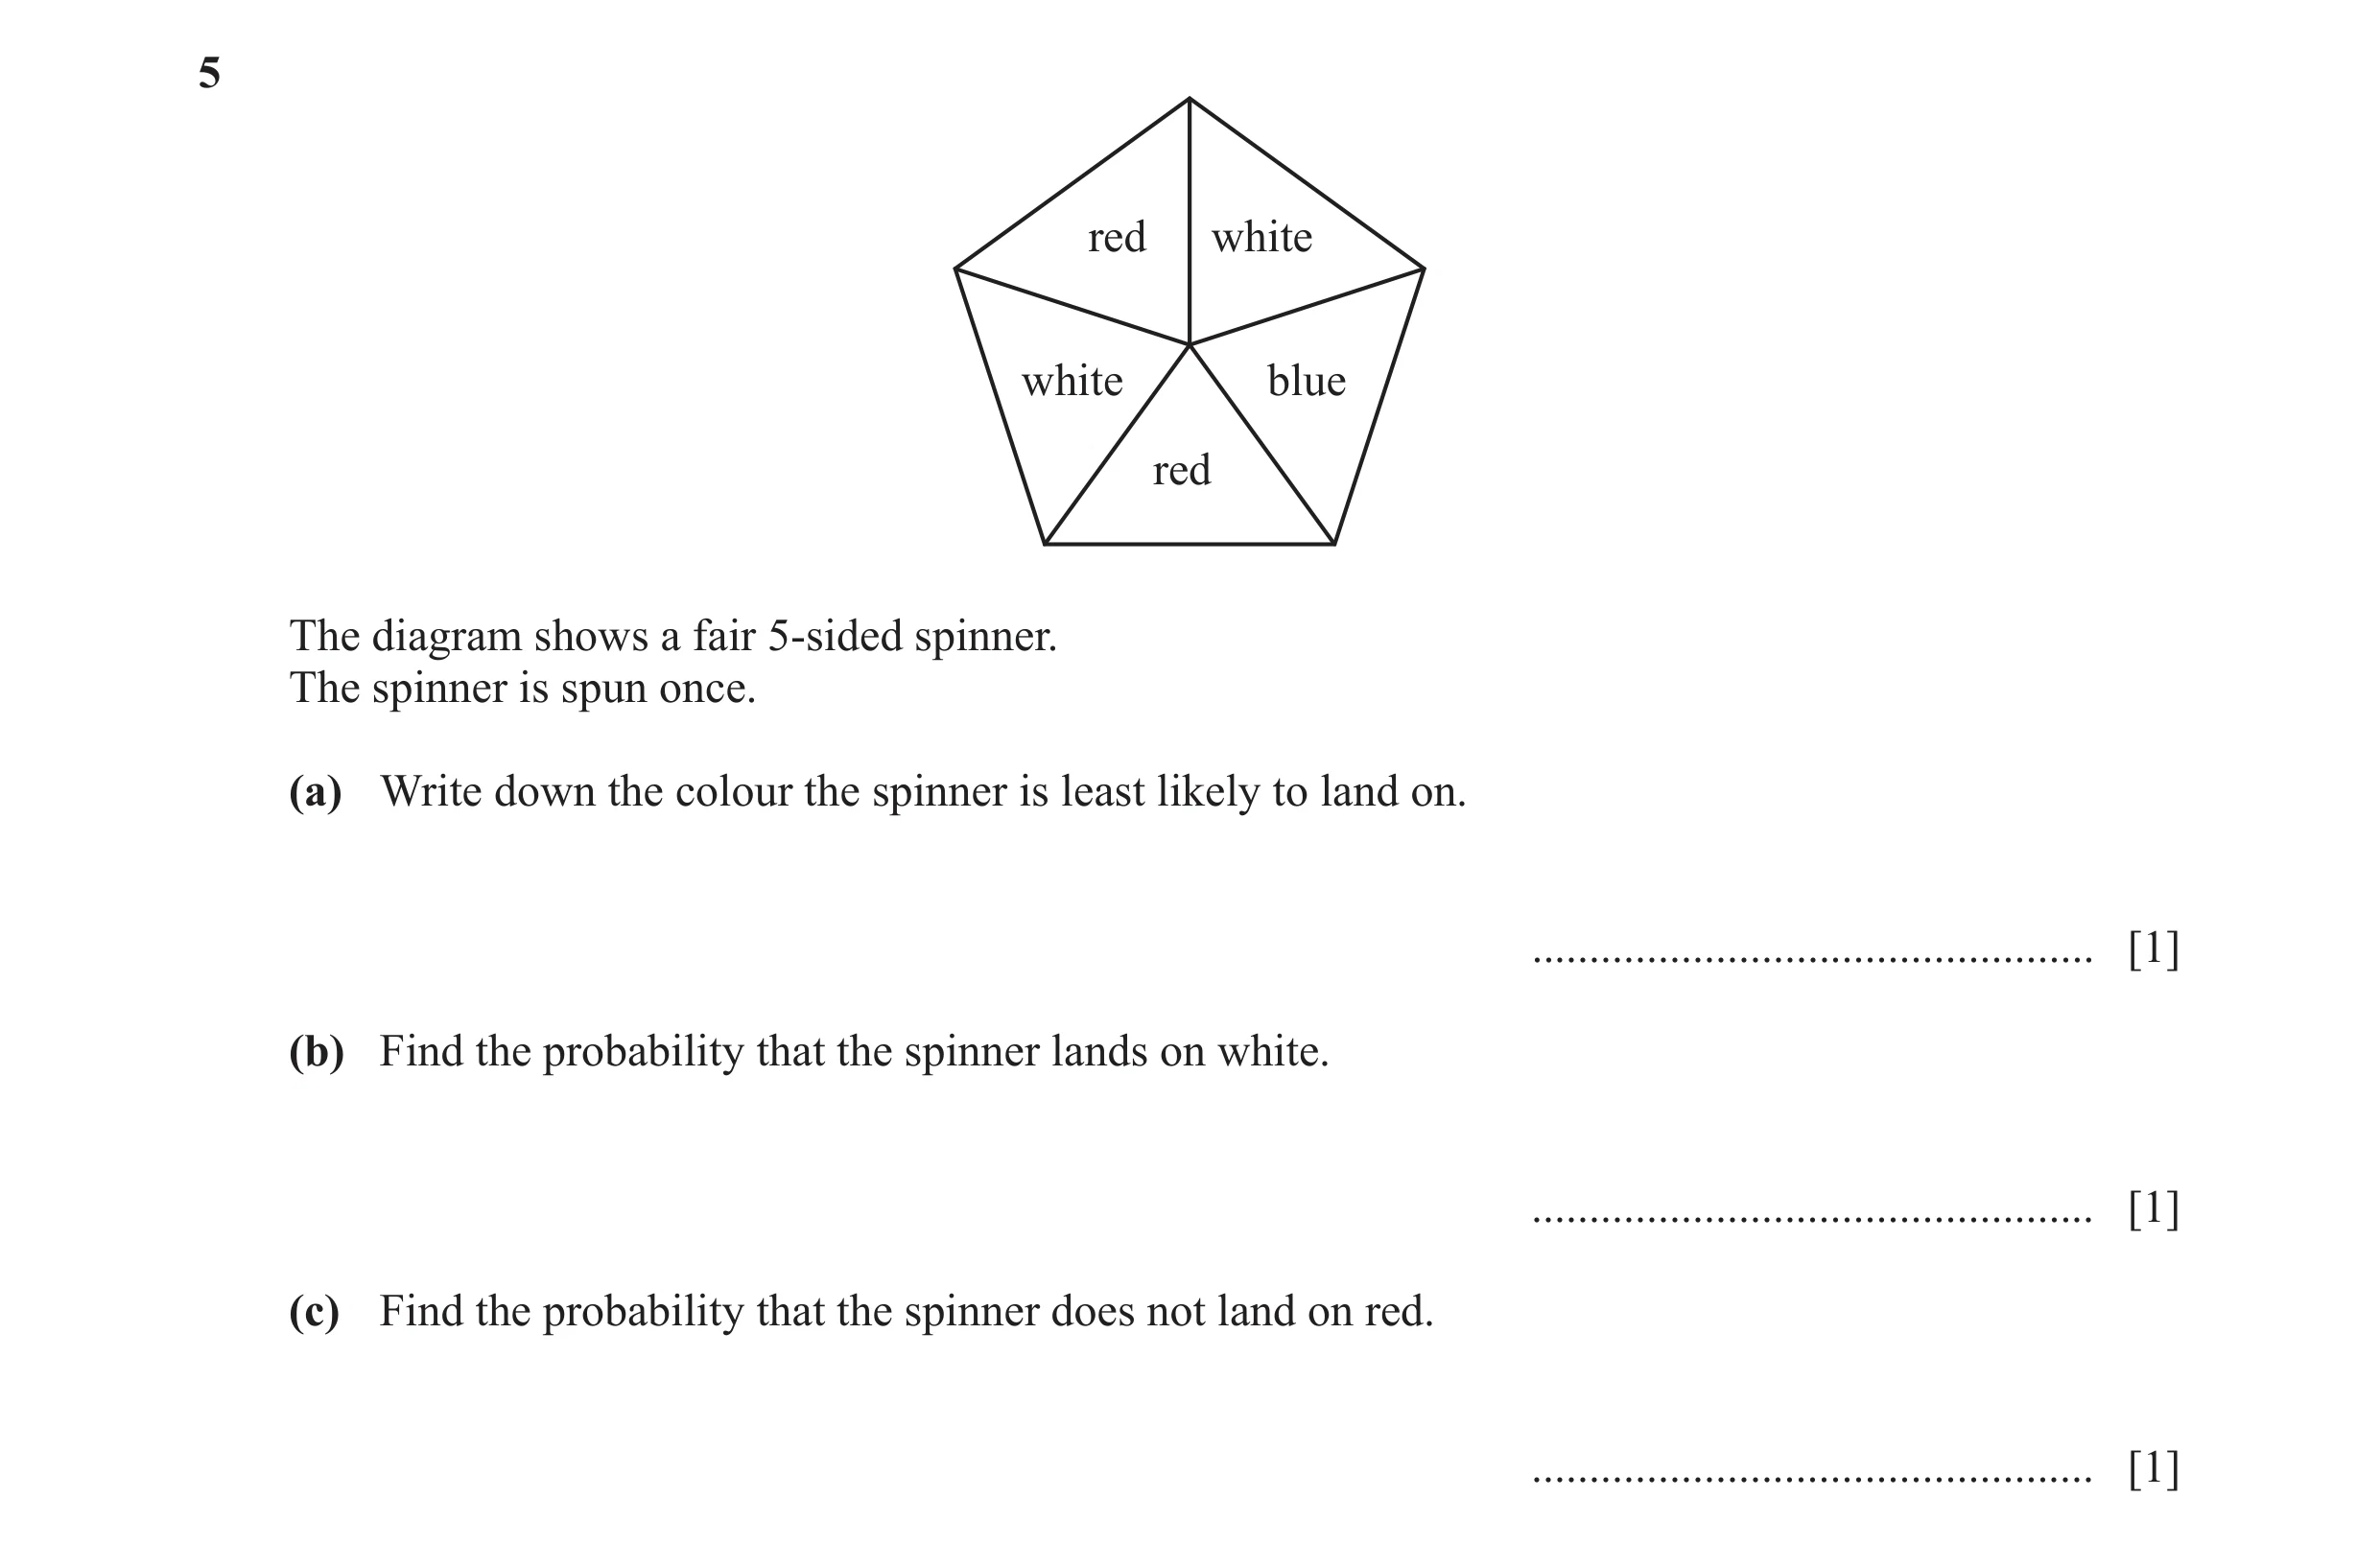
Q47 · Red white white blue red The diagram shows a fair 5-sided spinner 0580/33 Oct/Nov 2025
5 red white white blue red The diagram shows a fair 5-sided spinner. The spinner is spun once. (a) Write down the colour the spinner is least likely to land on. … [1] (b) Find the probability that the spinner lands on white. … [1] (c) Find the probability that the spinner does not land on red. … [1]
3 marks
Mark scheme: 5(a) Blue 1 5(b) 2 1 oe 5 5(c) 3 1 oe 5
This question in 0580/33 Oct/Nov 2025
 1 / 68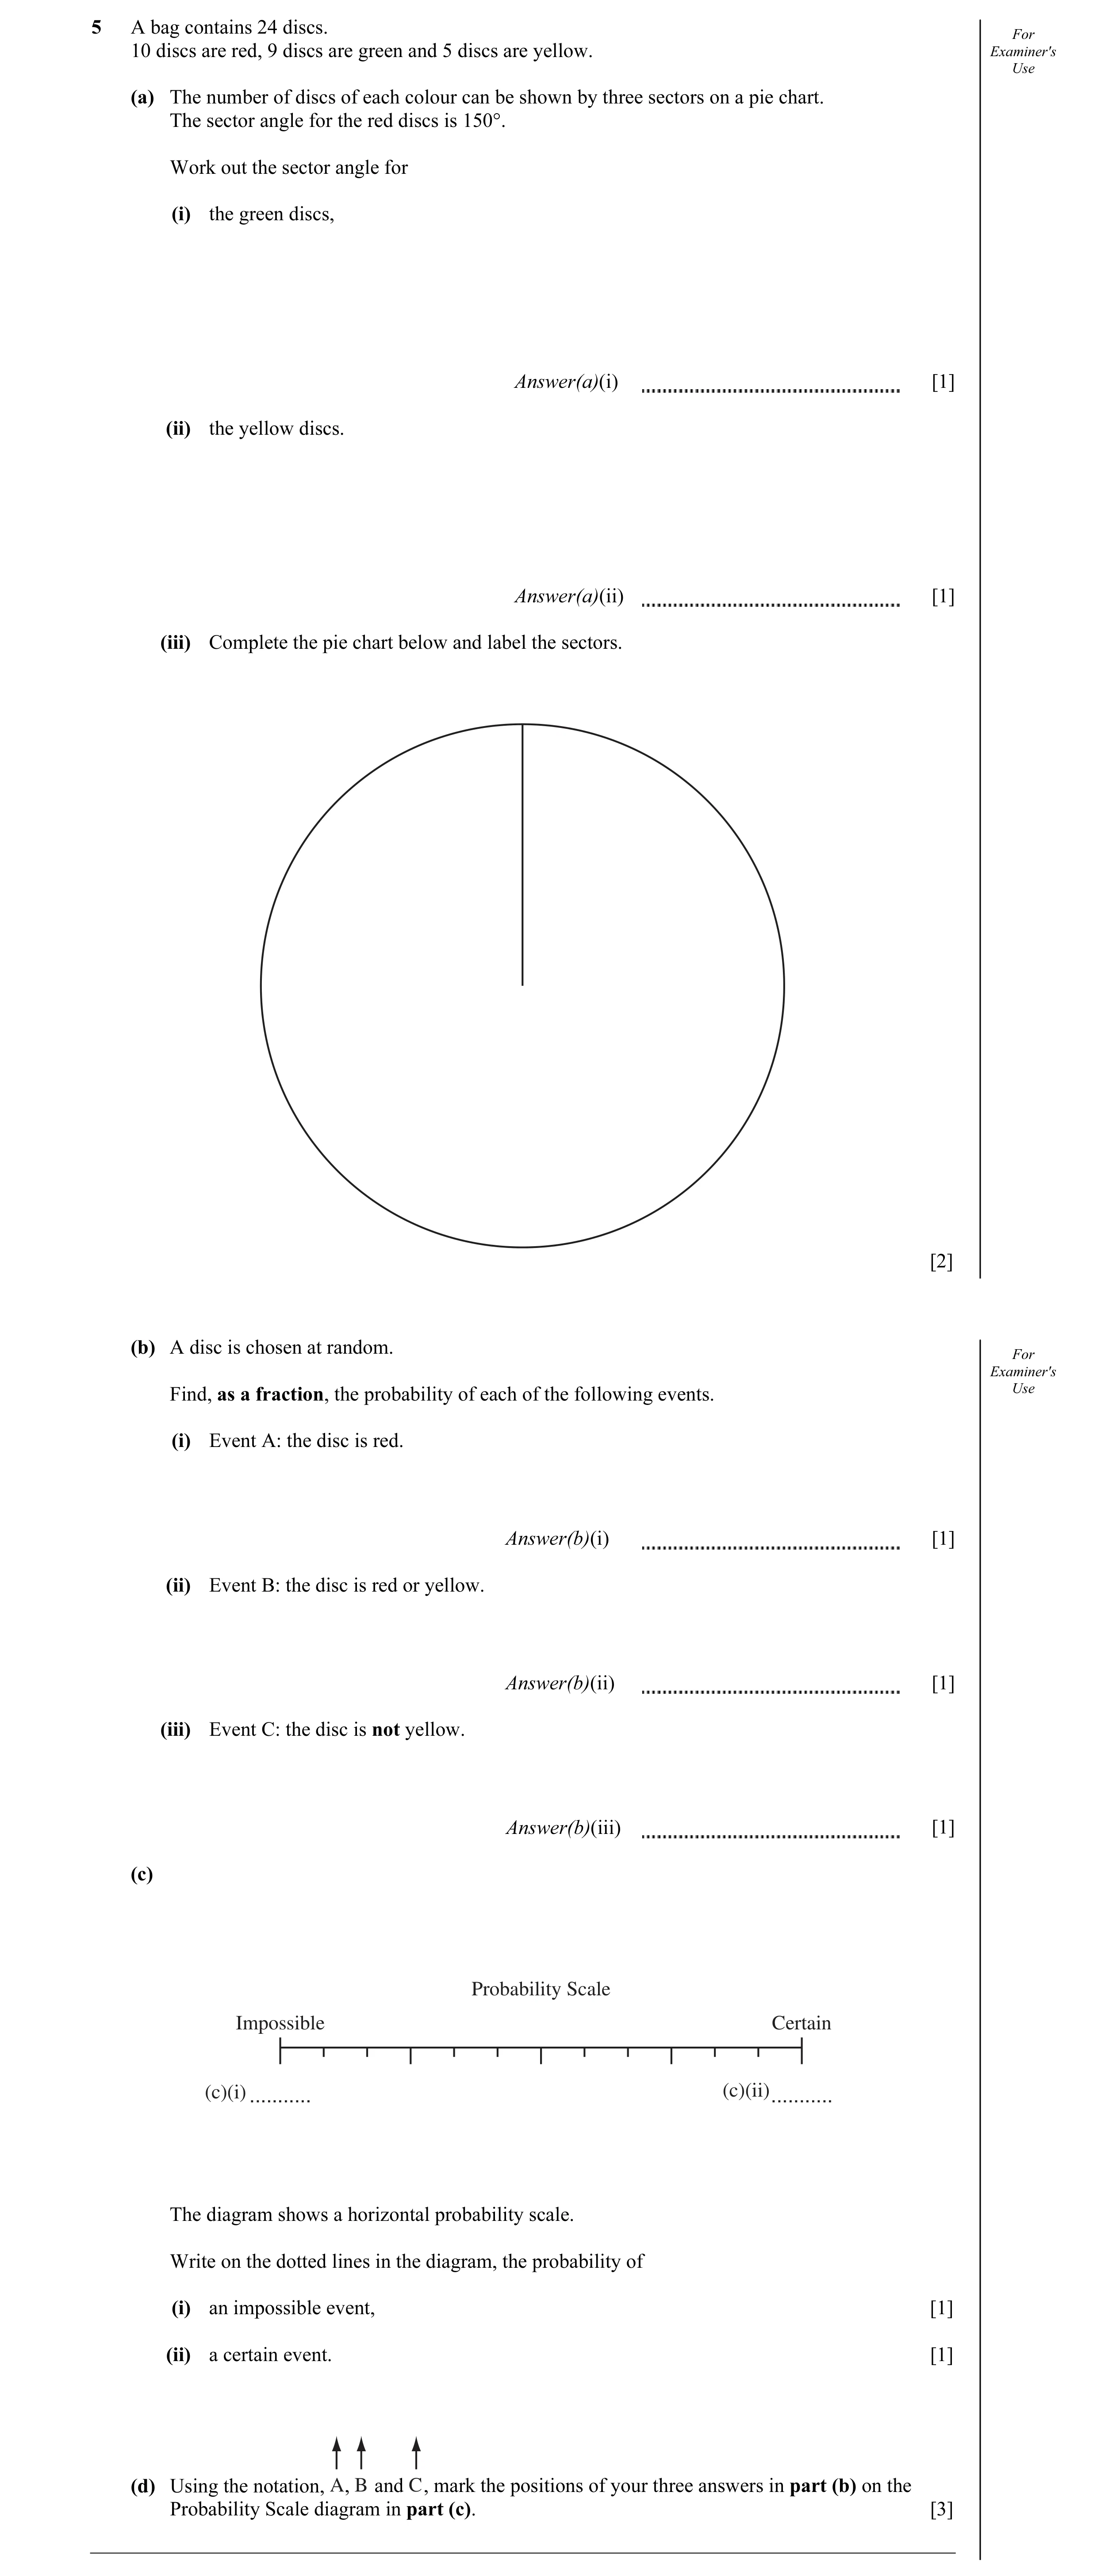
 4 / 68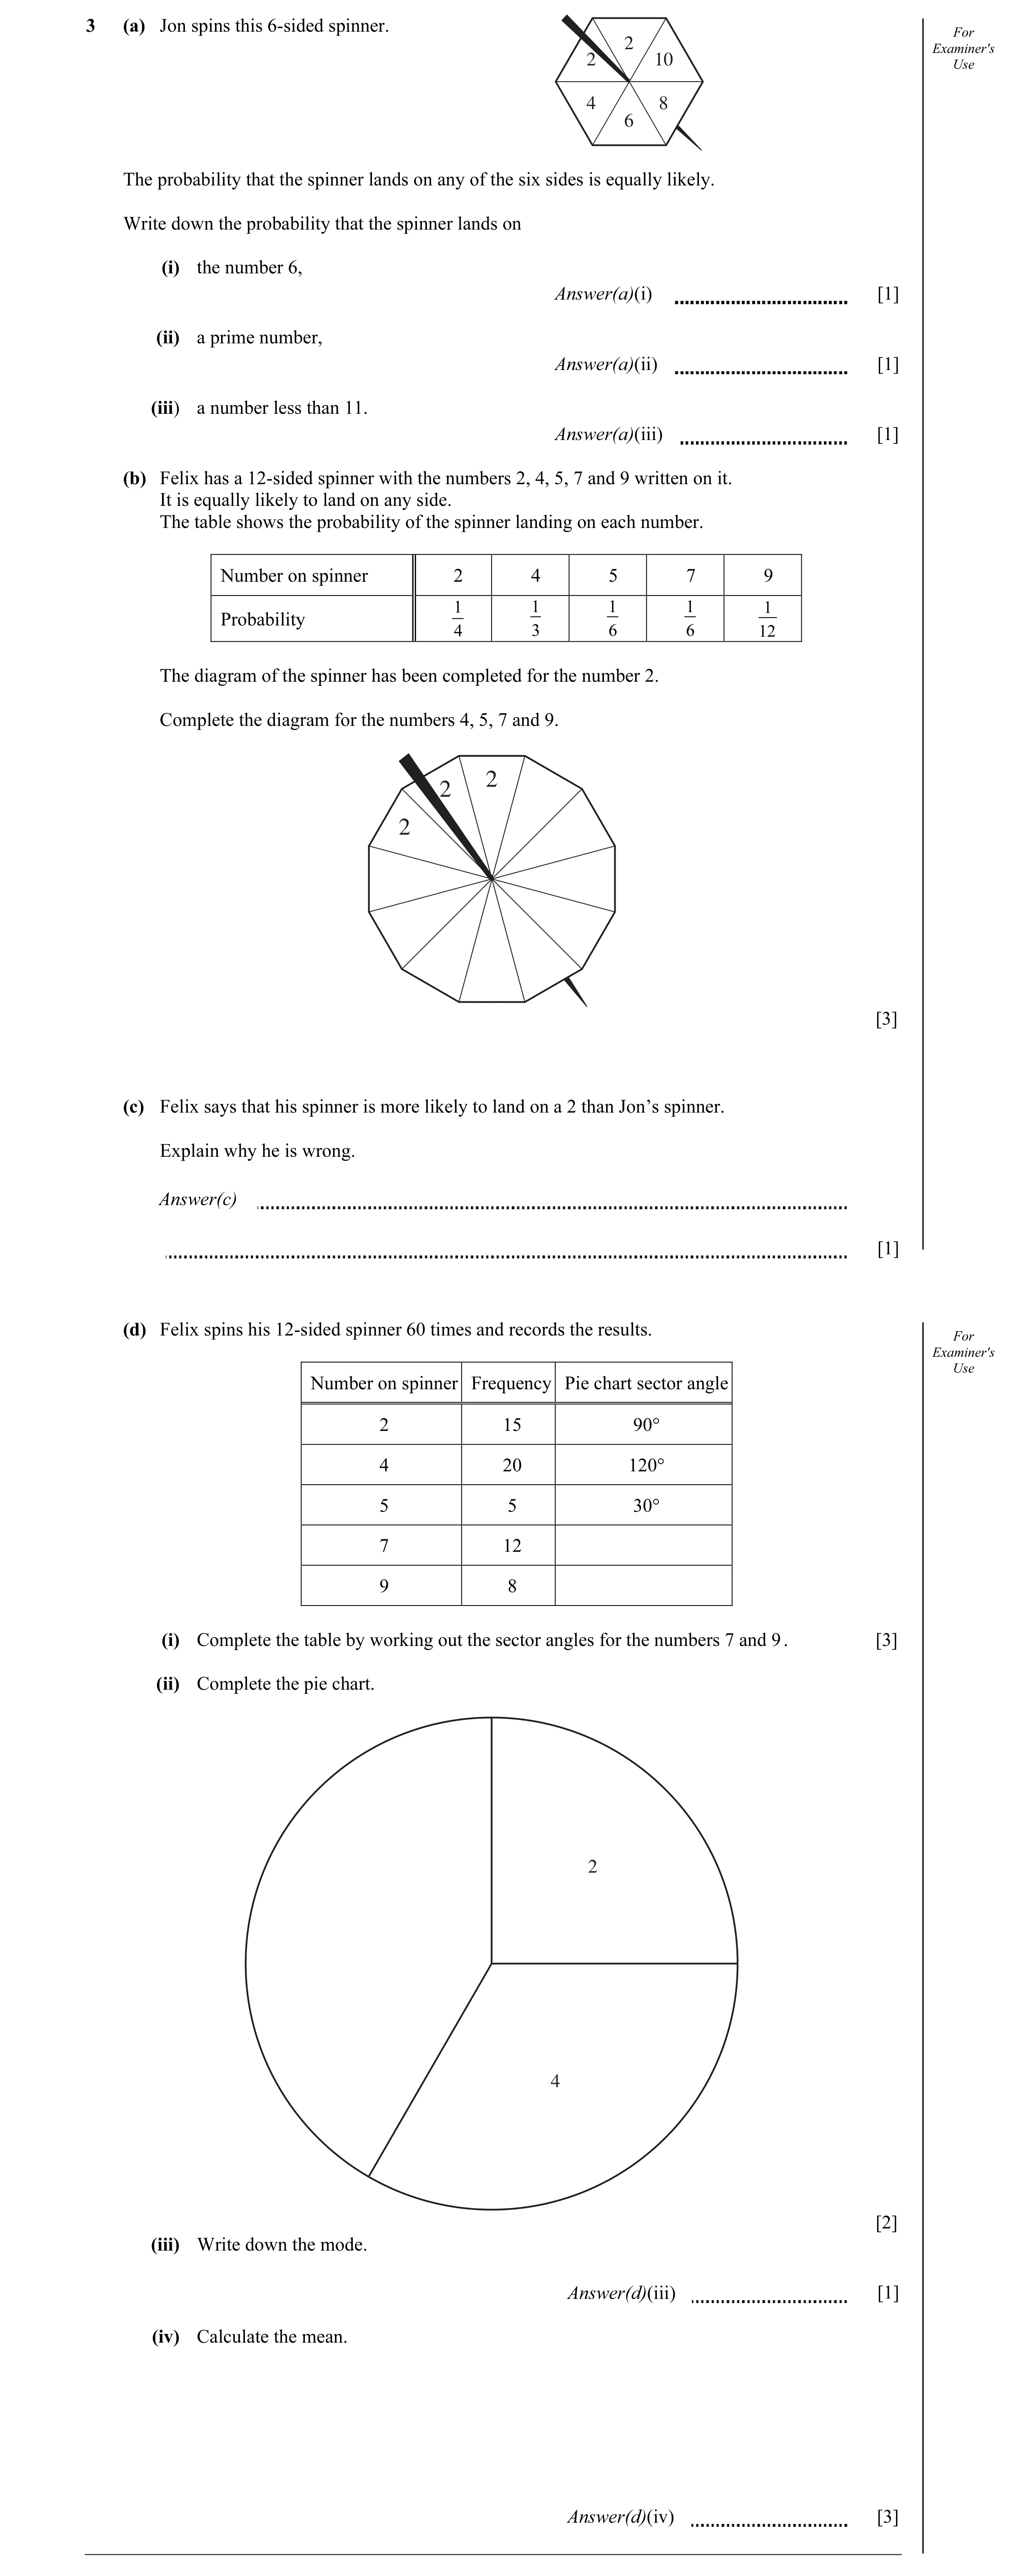
 15 / 68
 16 / 68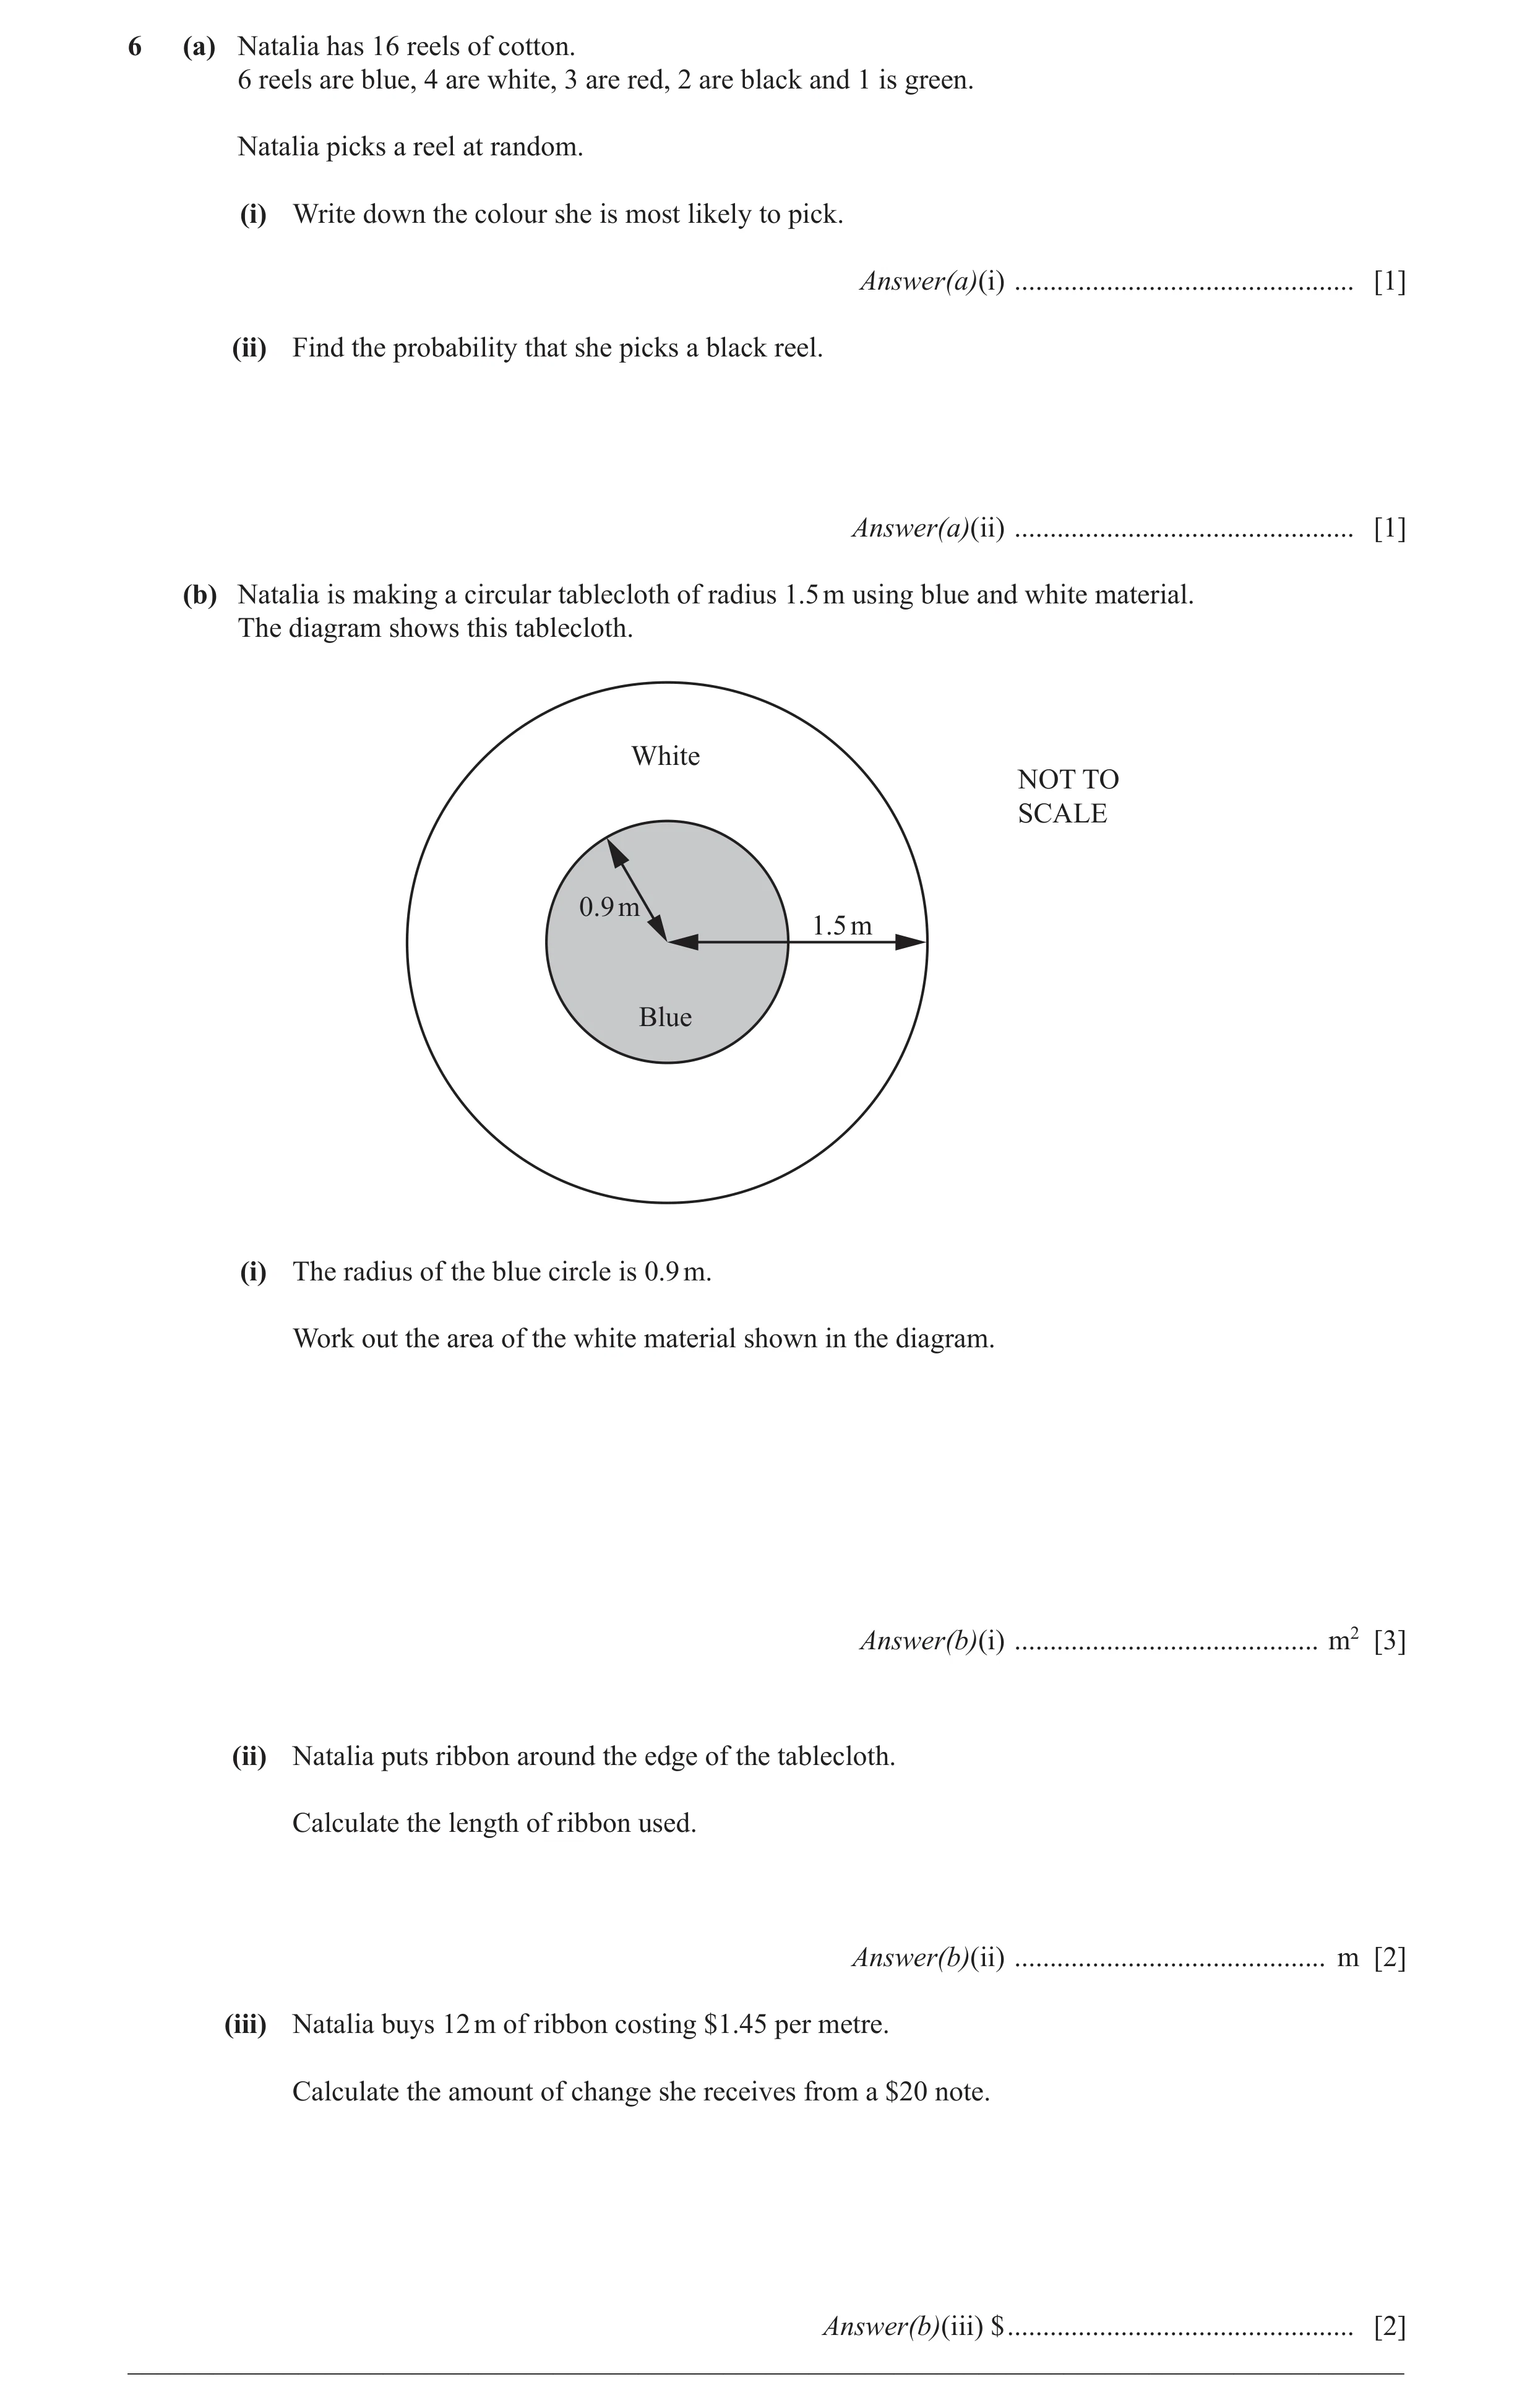
 27 / 68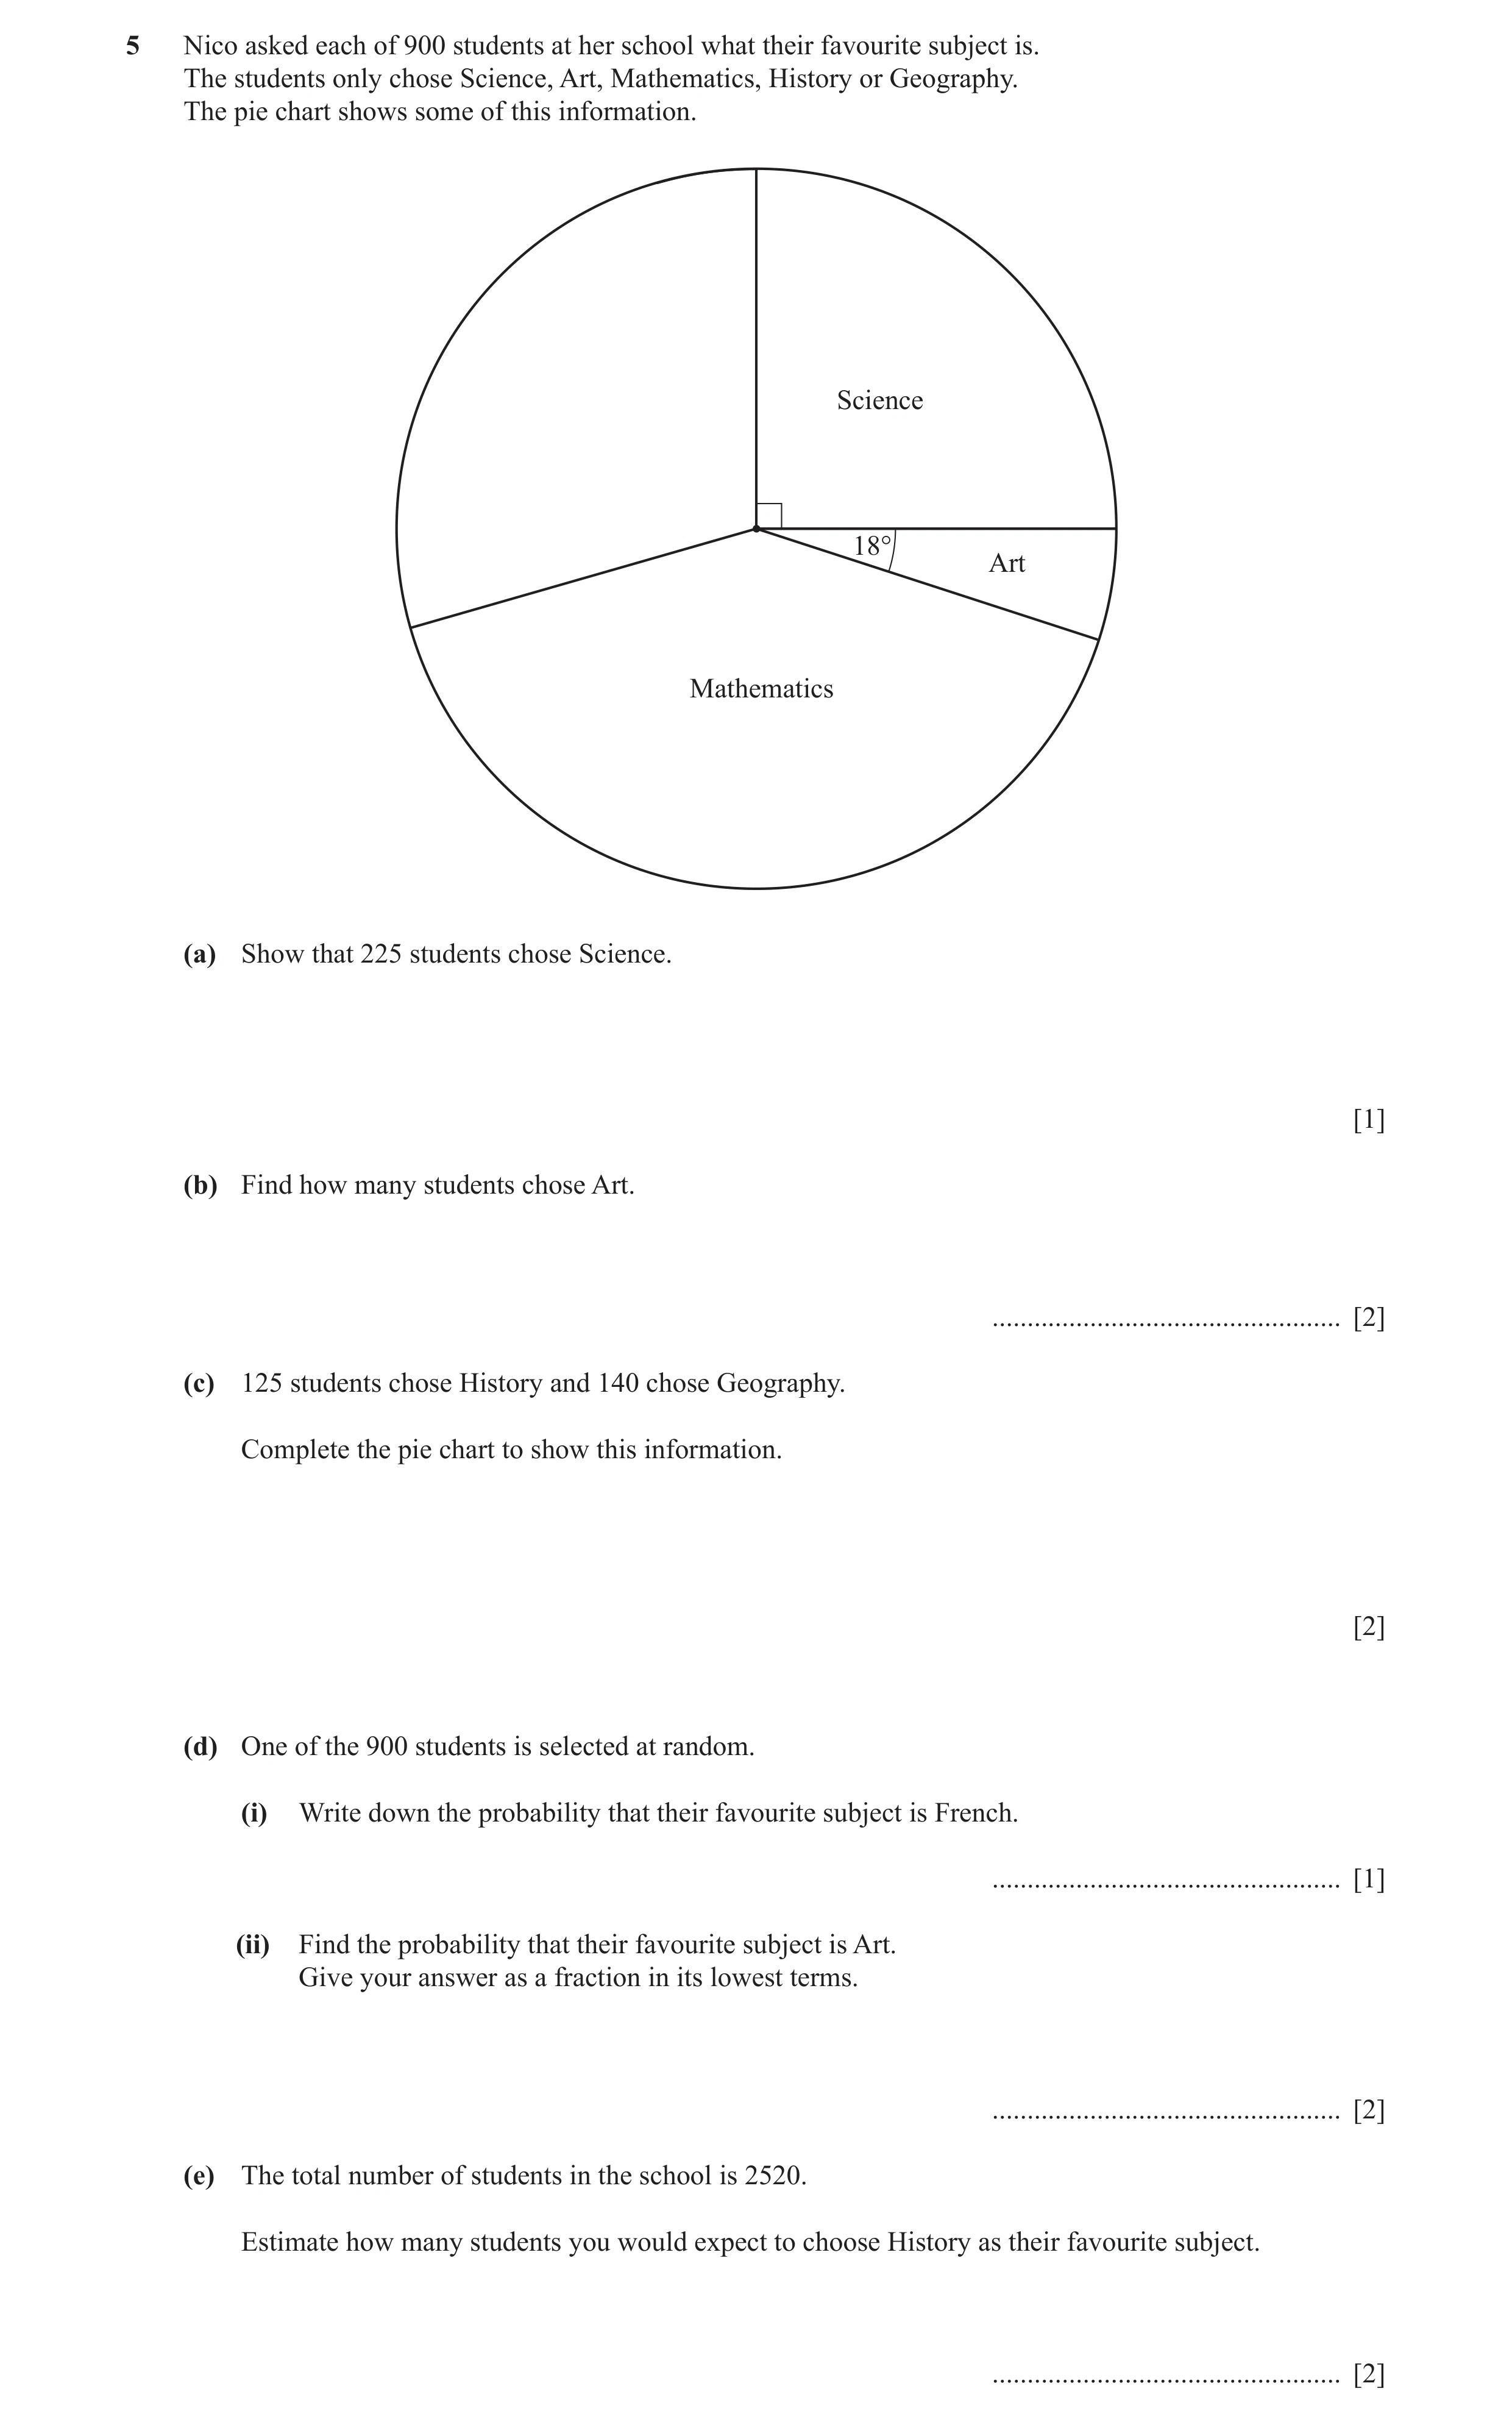
 31 / 68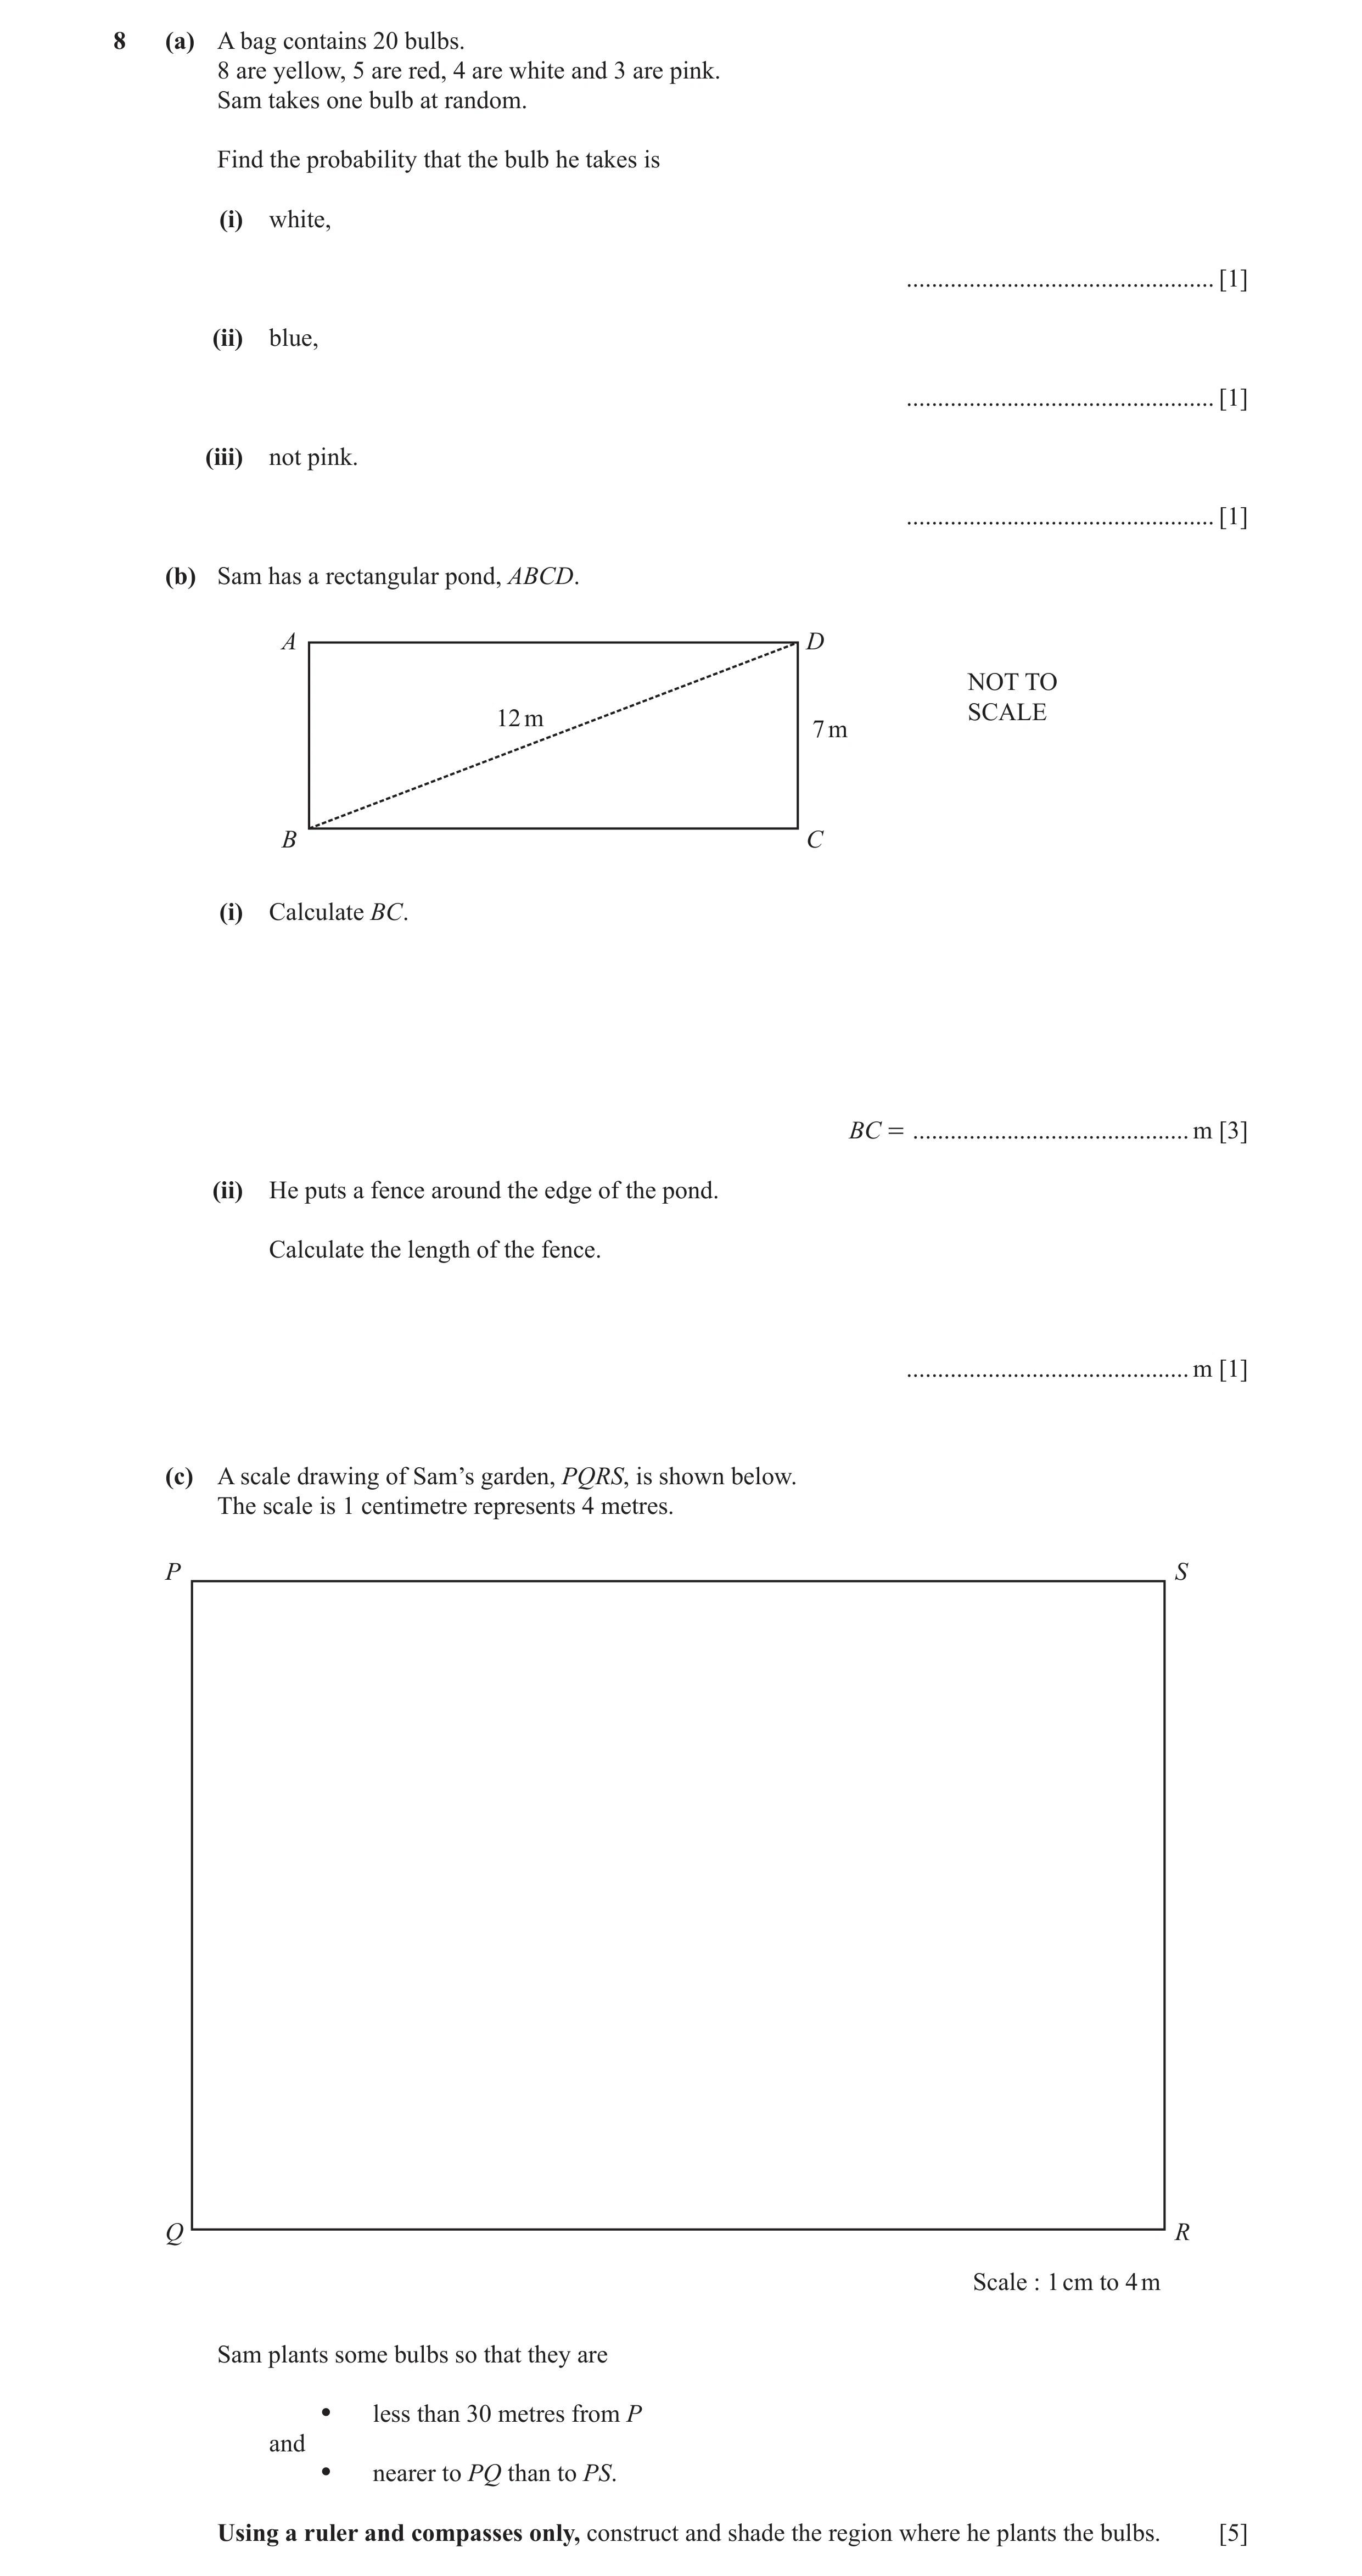
 34 / 68
![Question 23: (a) Soraya makes rectangular flags. (i) On the rectangle, draw the lines of symmetry. [2] (ii) Each flag measures 1.2 m by 1.8 m. Calculate…](https://img.pastlit.com/crops/2bc5a897-a38d-4956-9610-c7c5234b5dec/q7.webp)
 54 / 68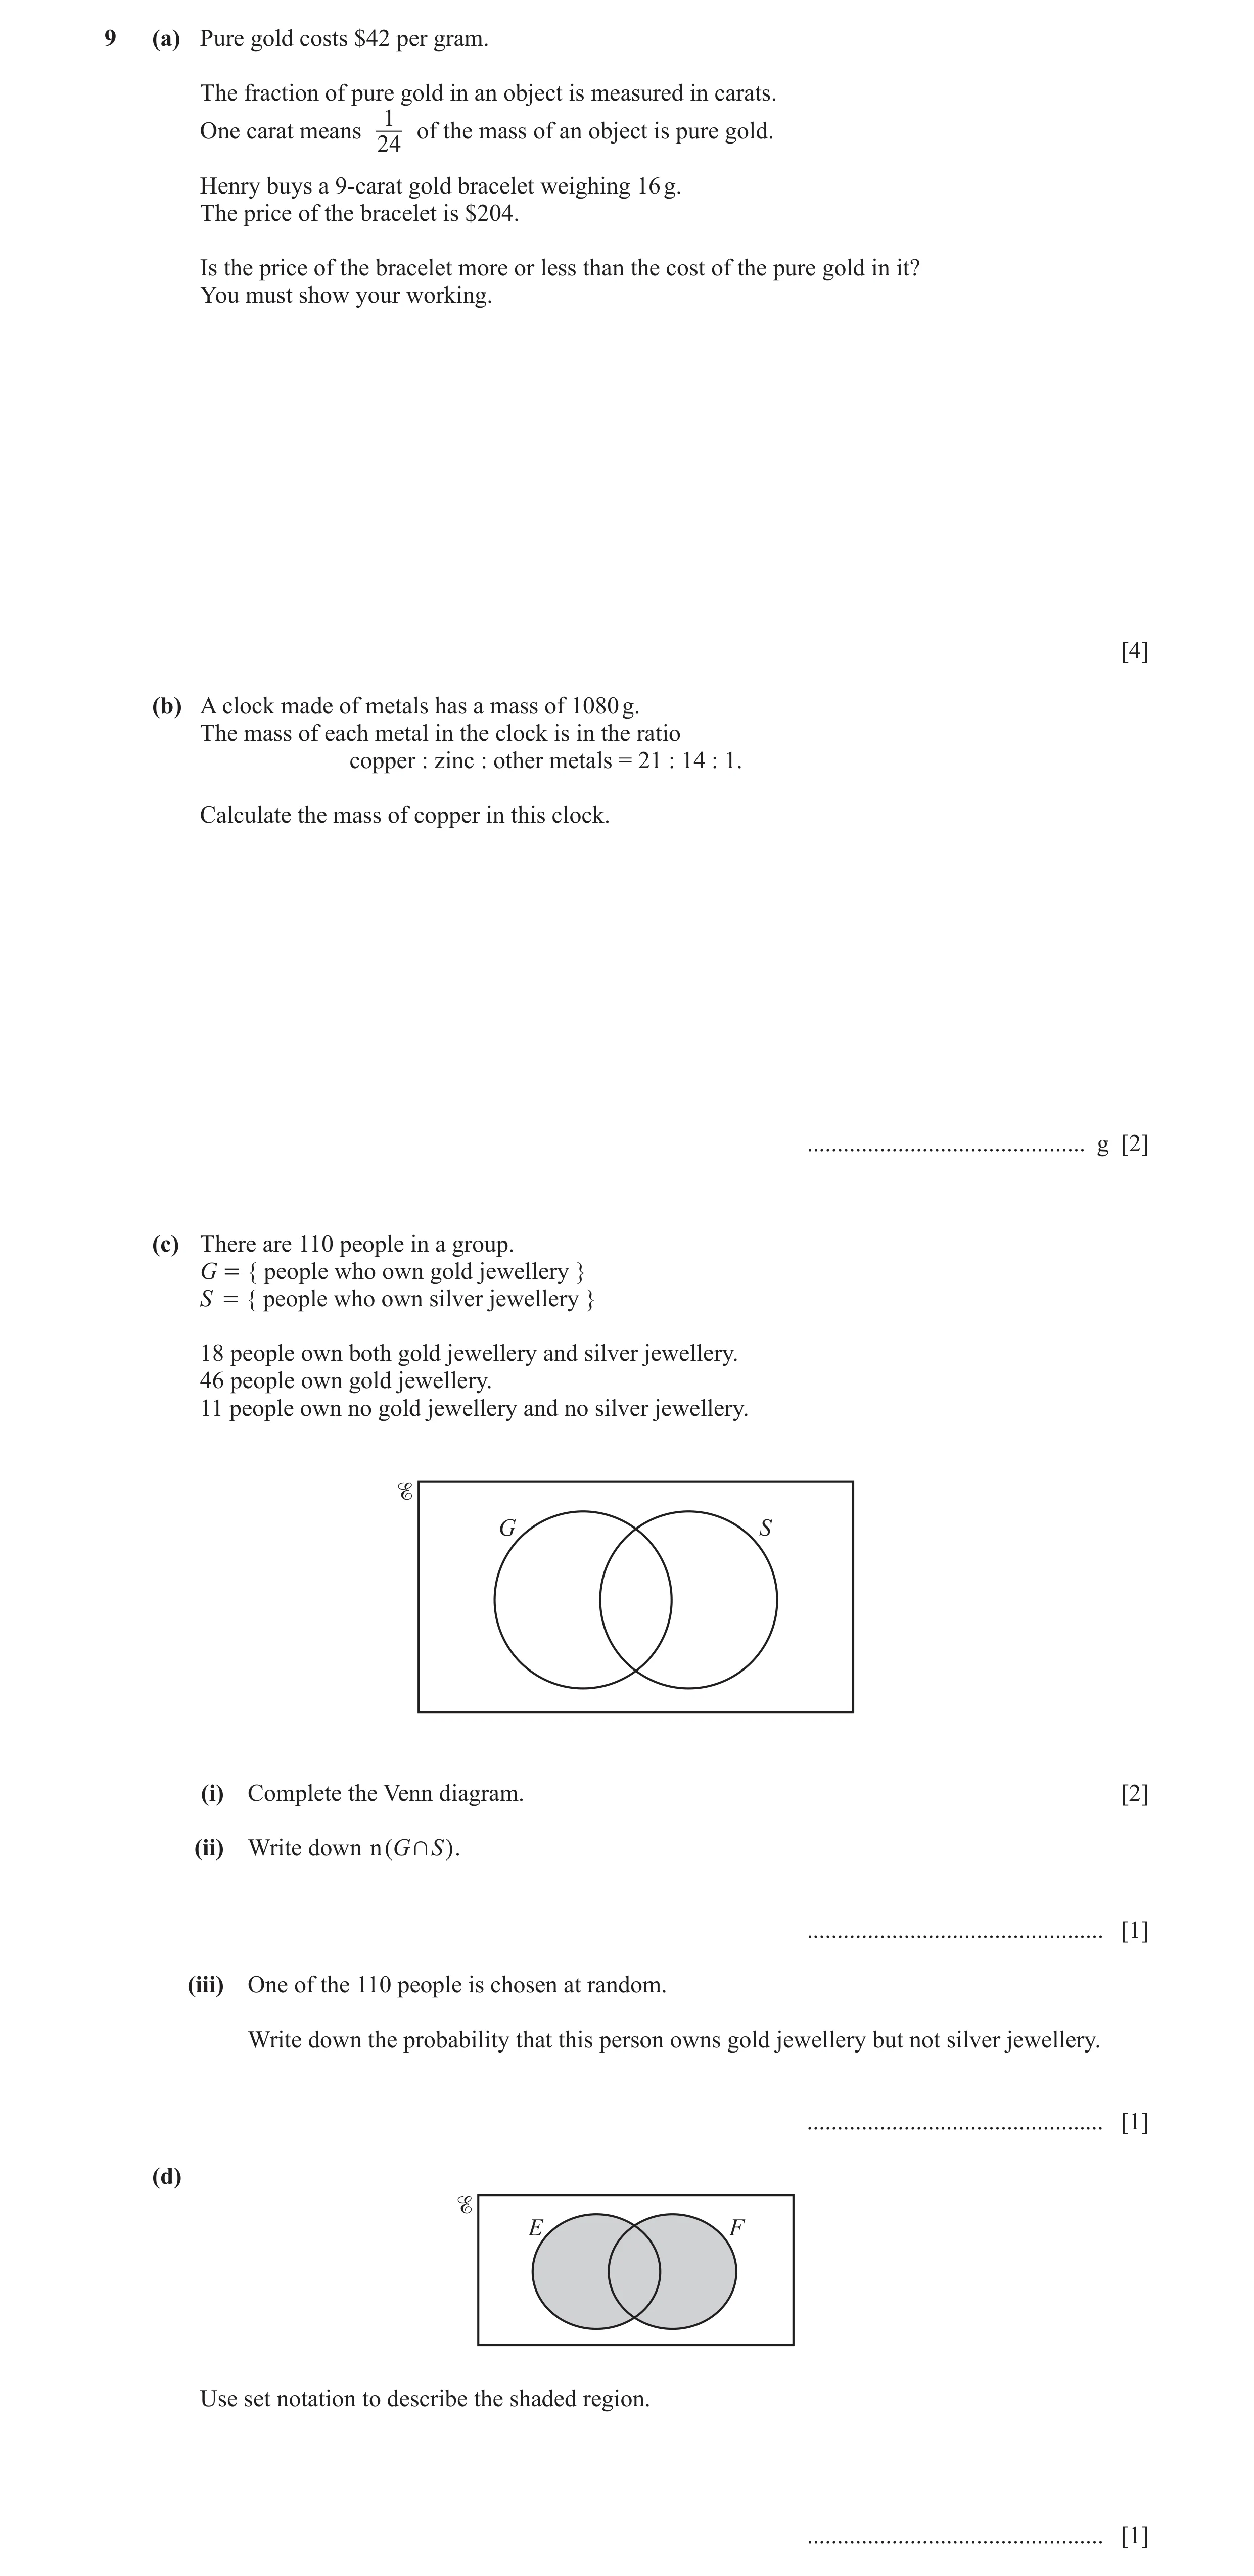
![Question 42: (a) A wedding invitation is in the shape of a rectangle. Draw the lines of symmetry on this rectangle. [2] (b) There are 98 adults and 56 c…](https://img.pastlit.com/crops/03a0551c-488d-4968-a0a8-acea063e832e/q3.webp) 65 / 68
65 / 68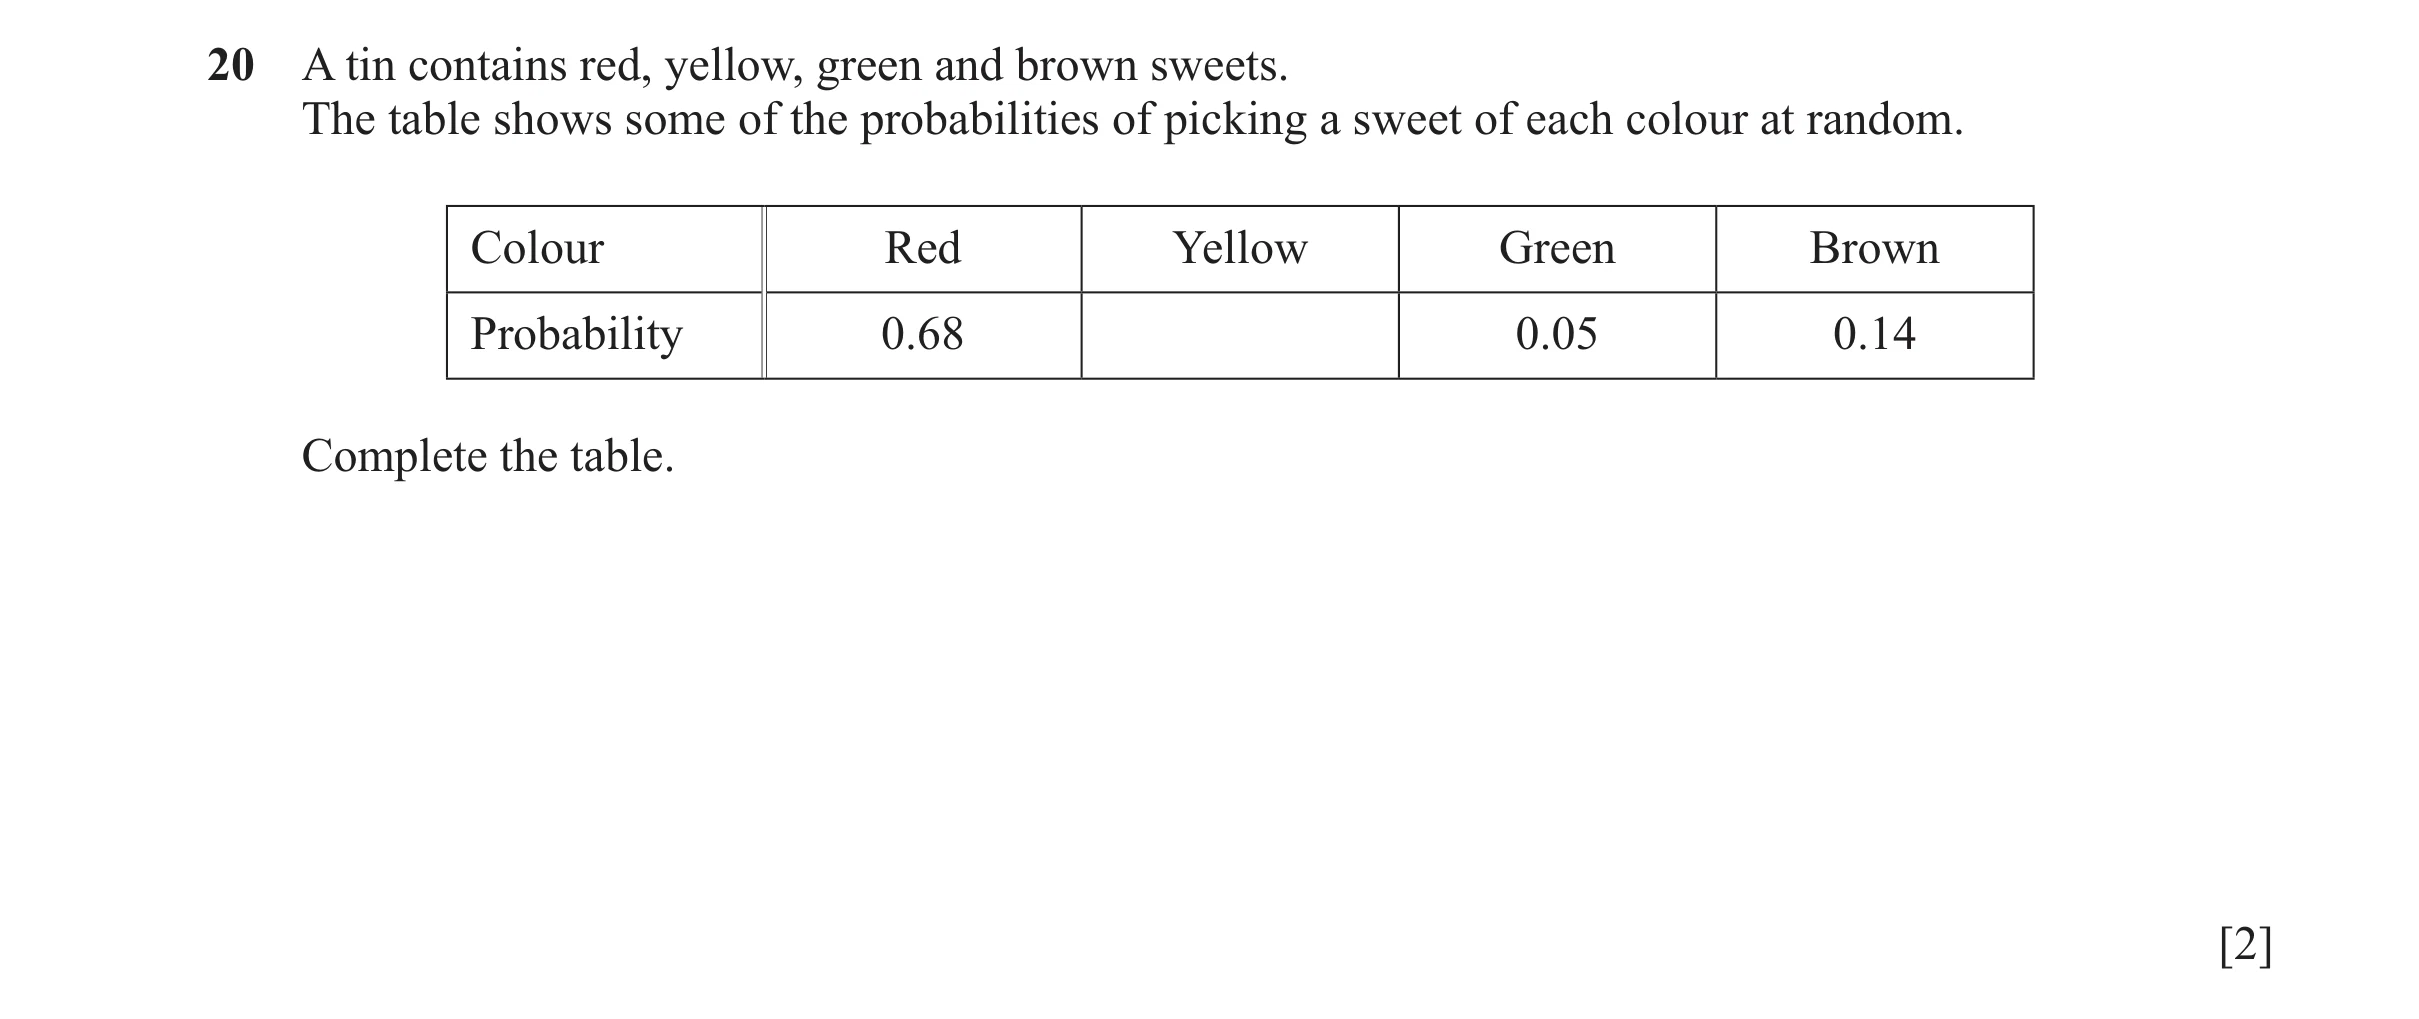
 66 / 68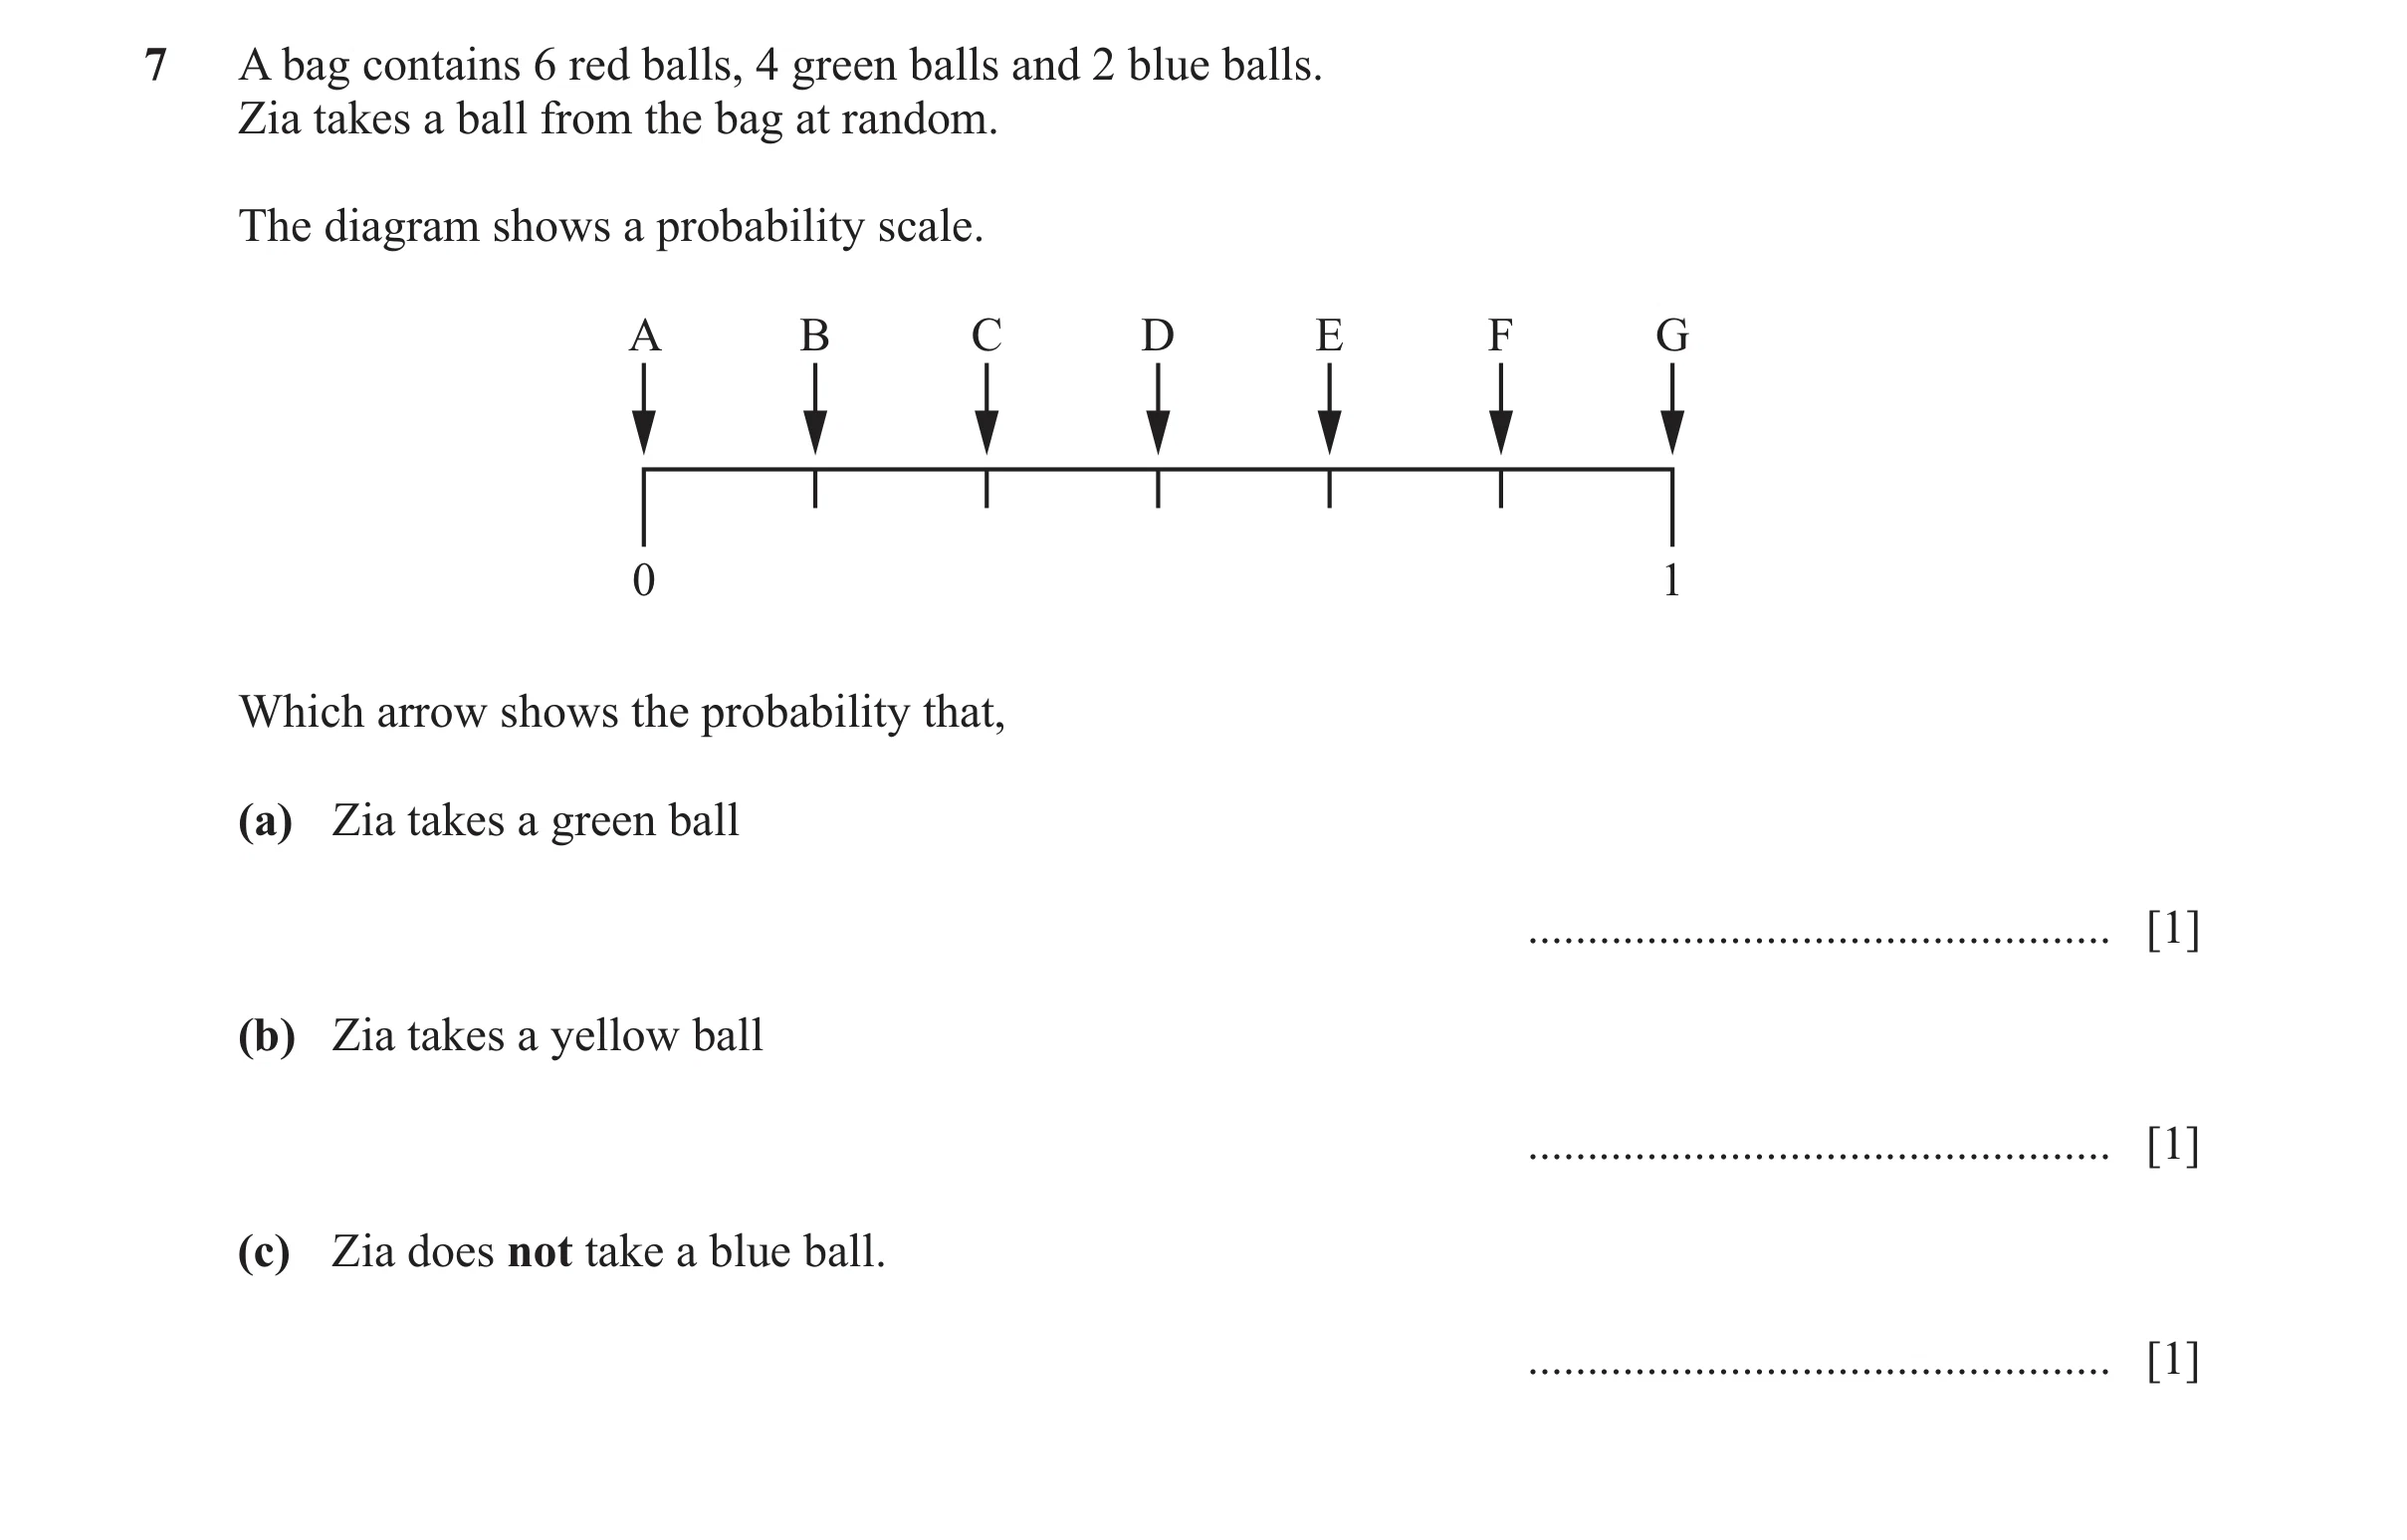
 67 / 68
 68 / 68
 12
12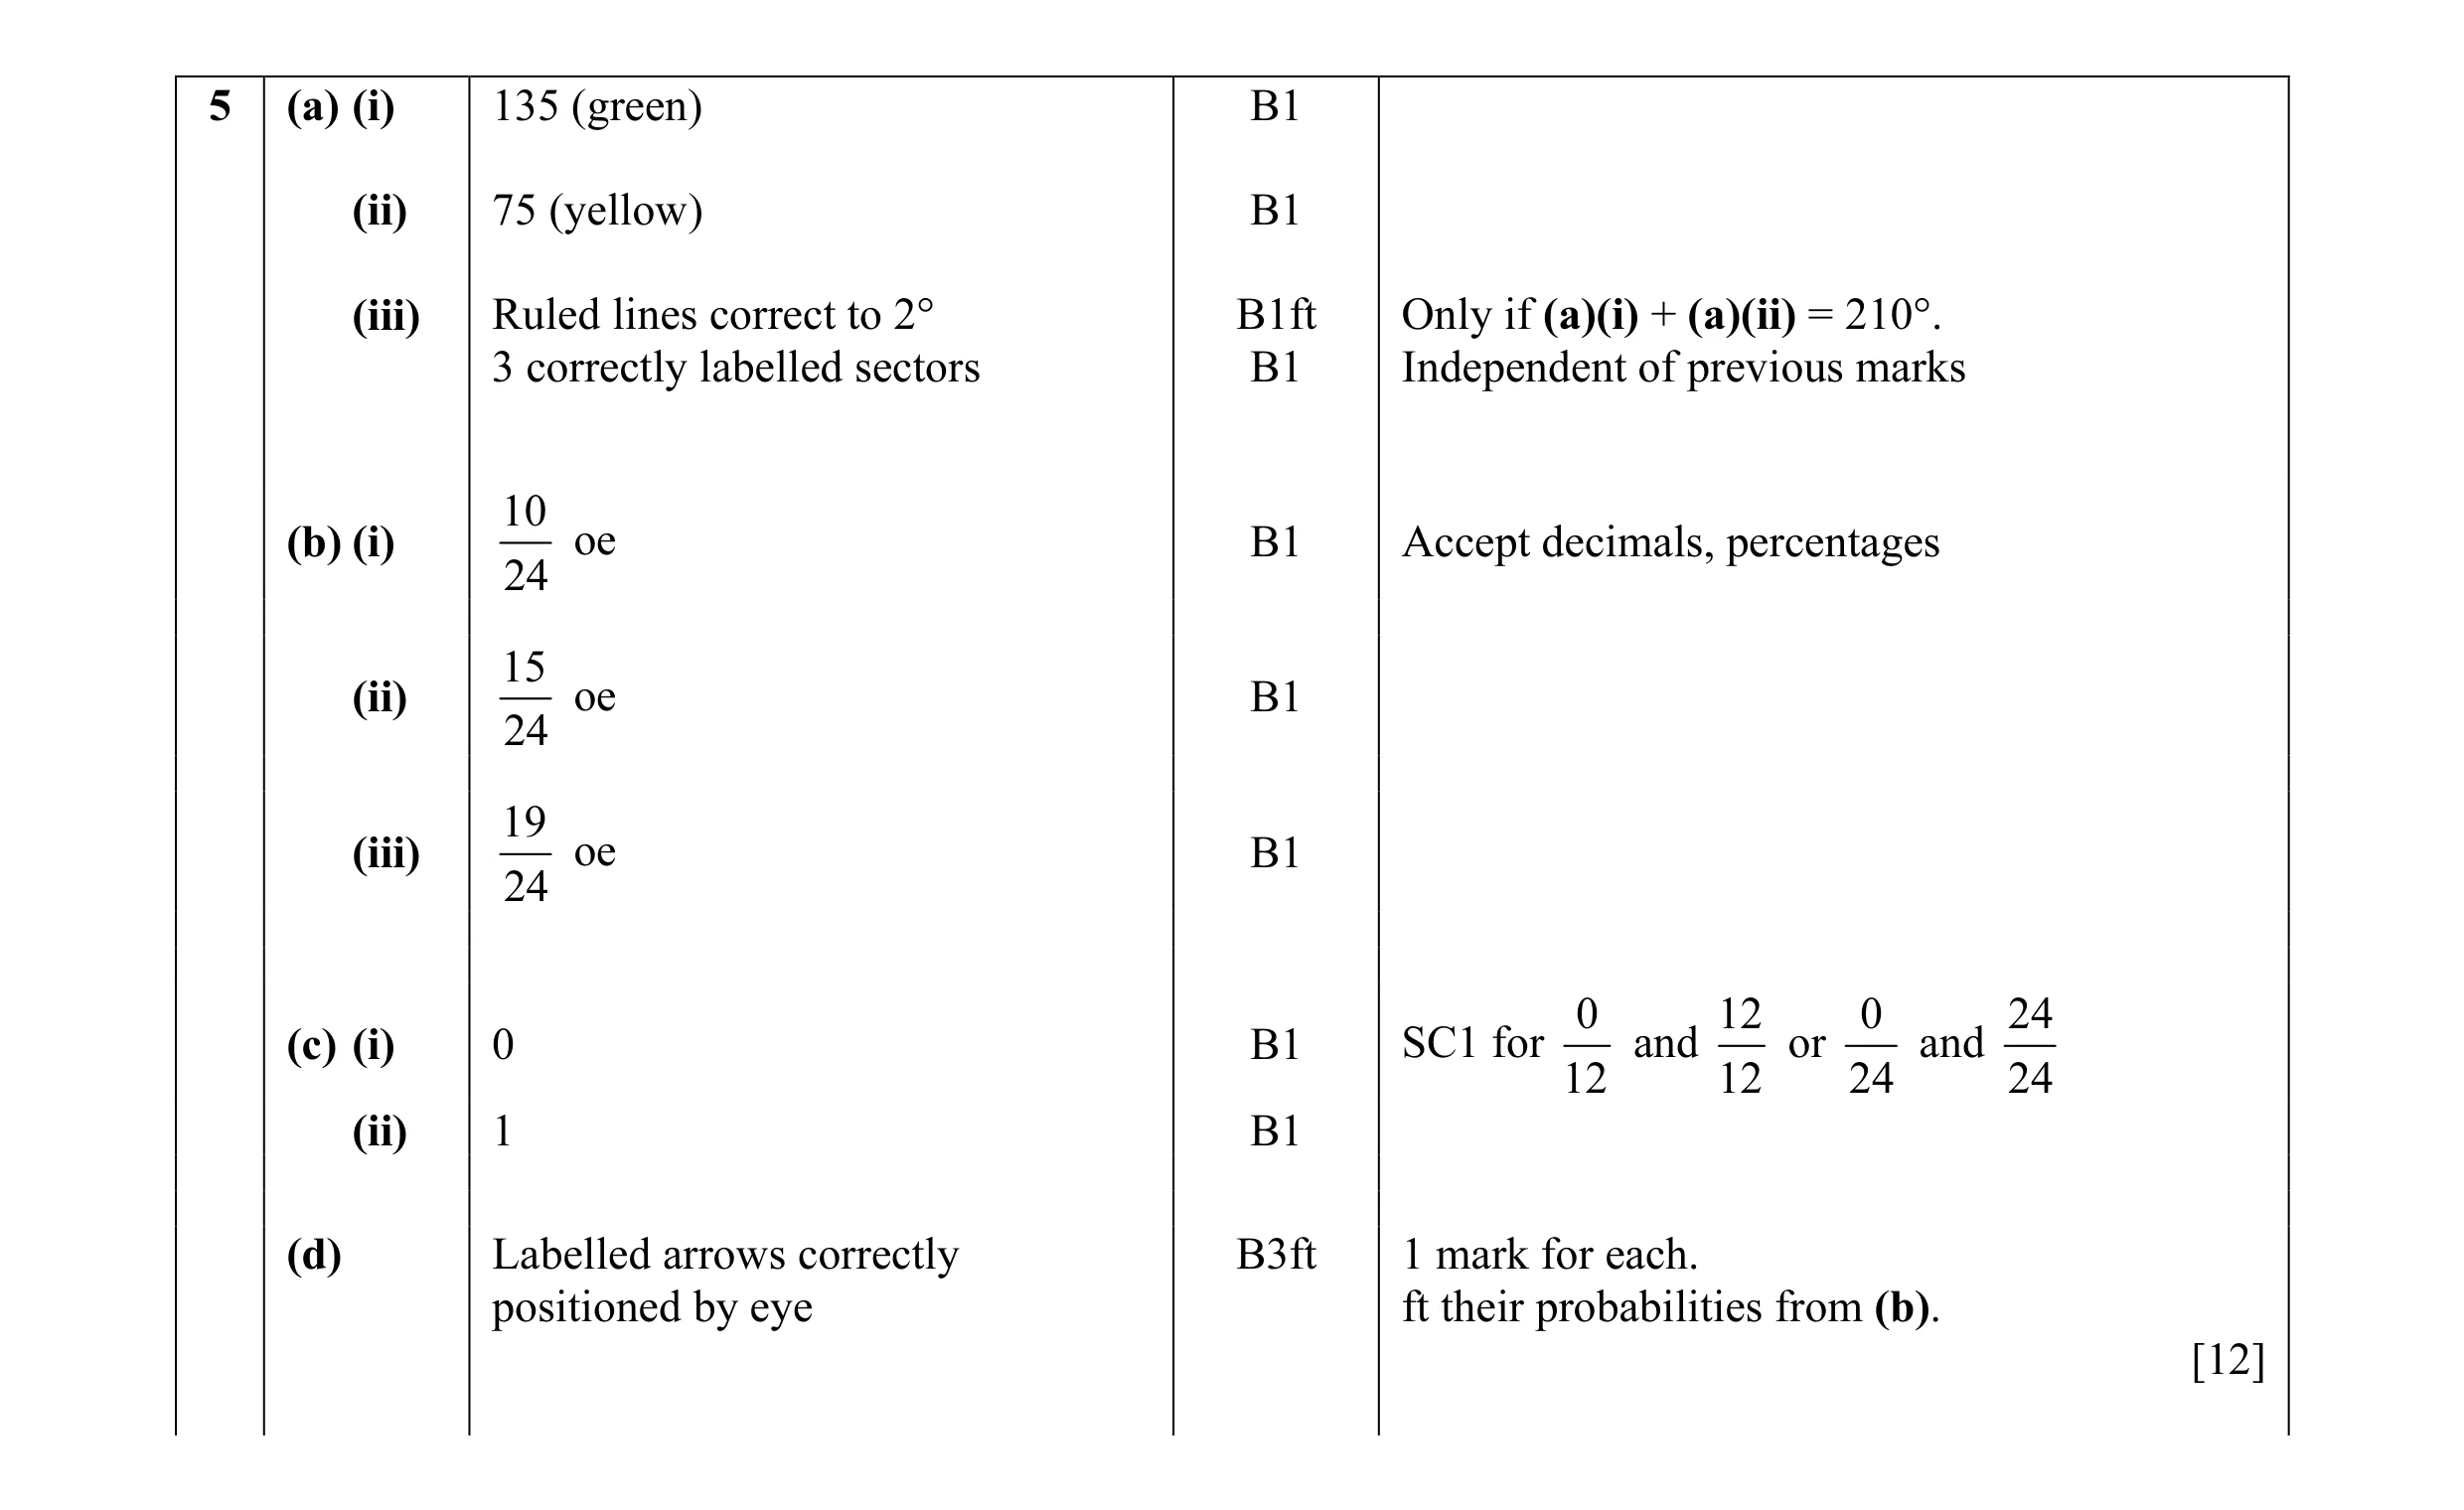 12
12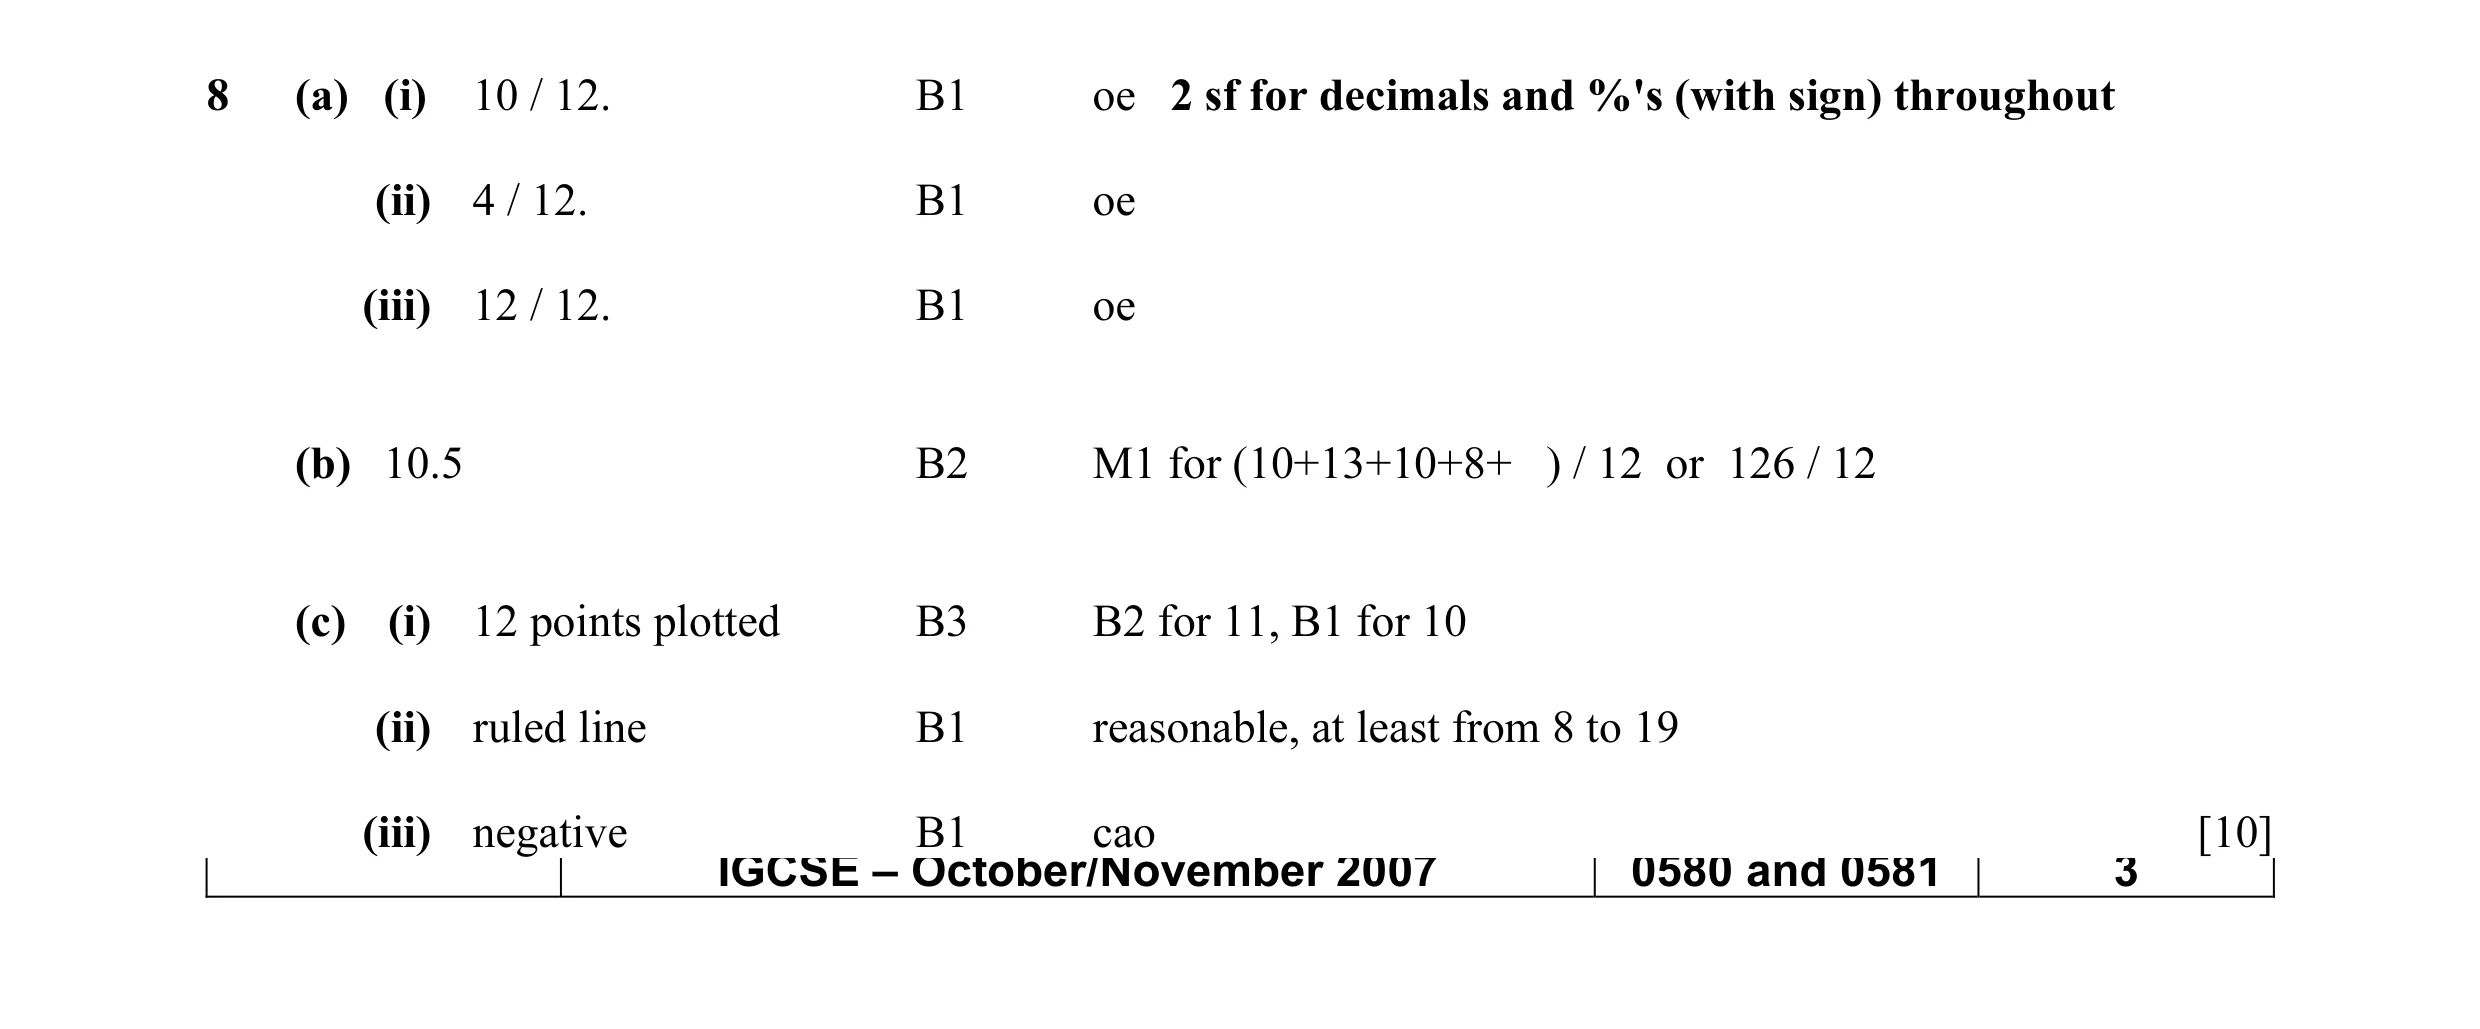 10
10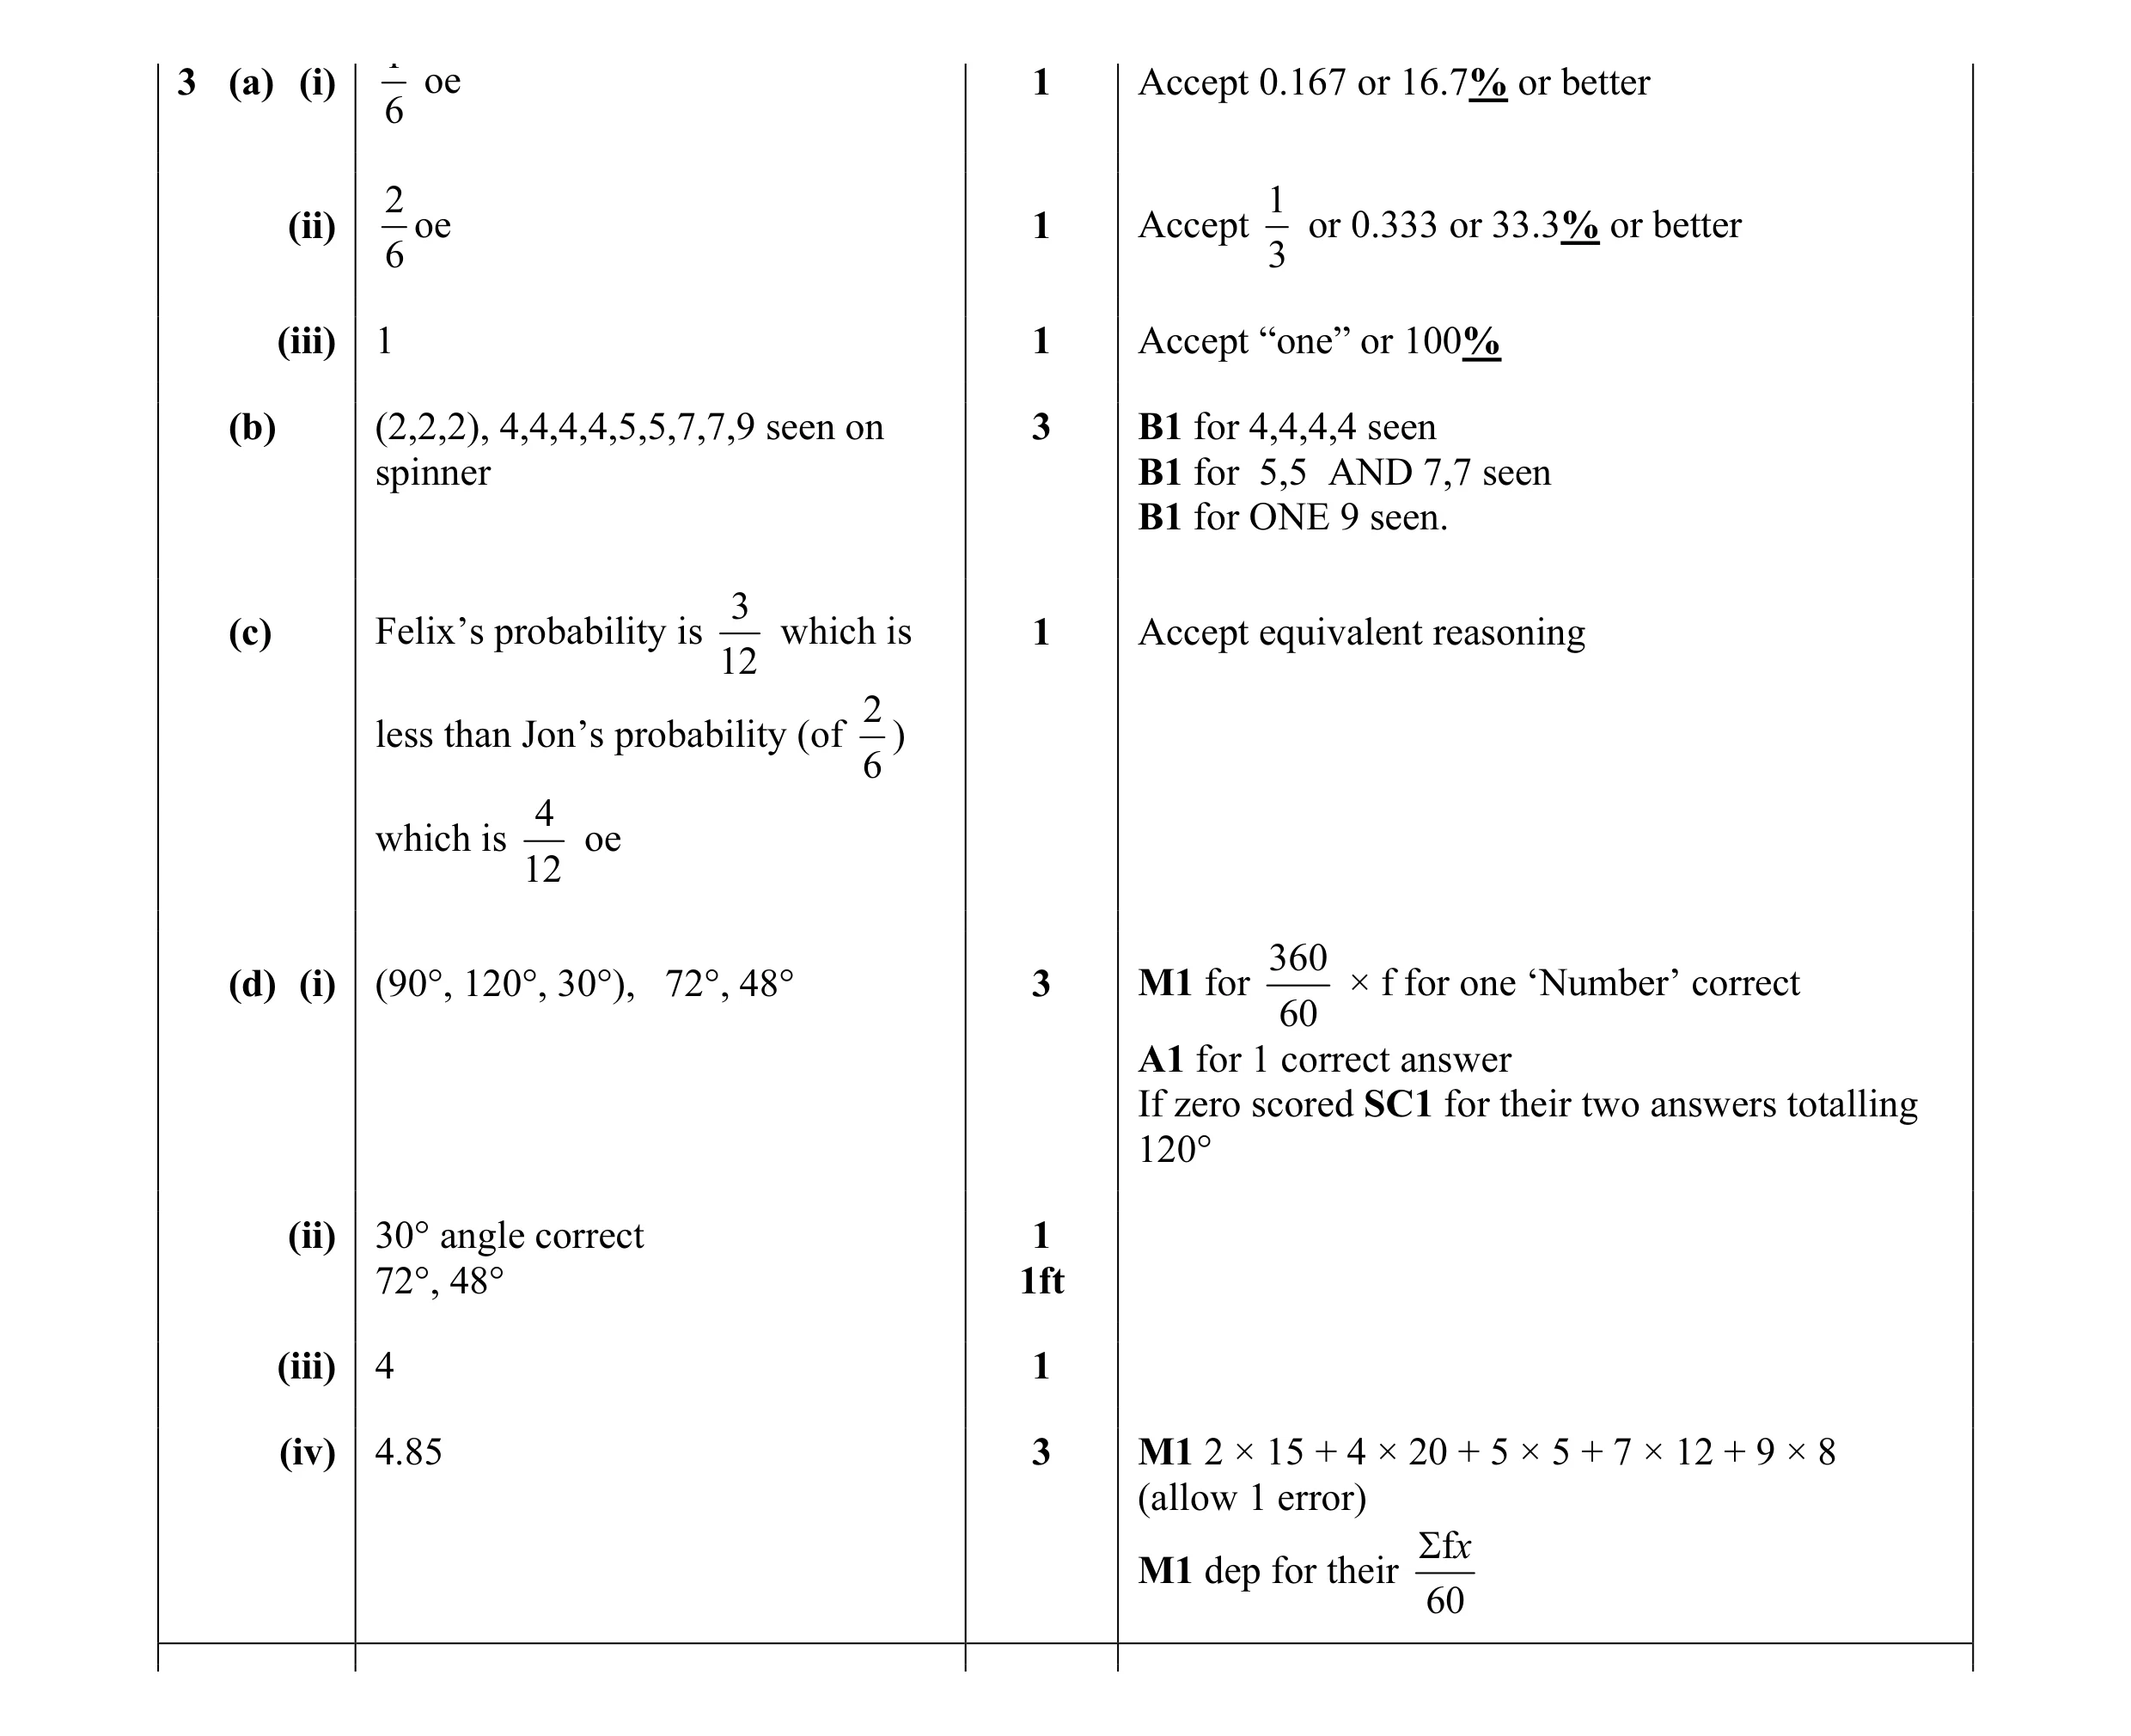 16
16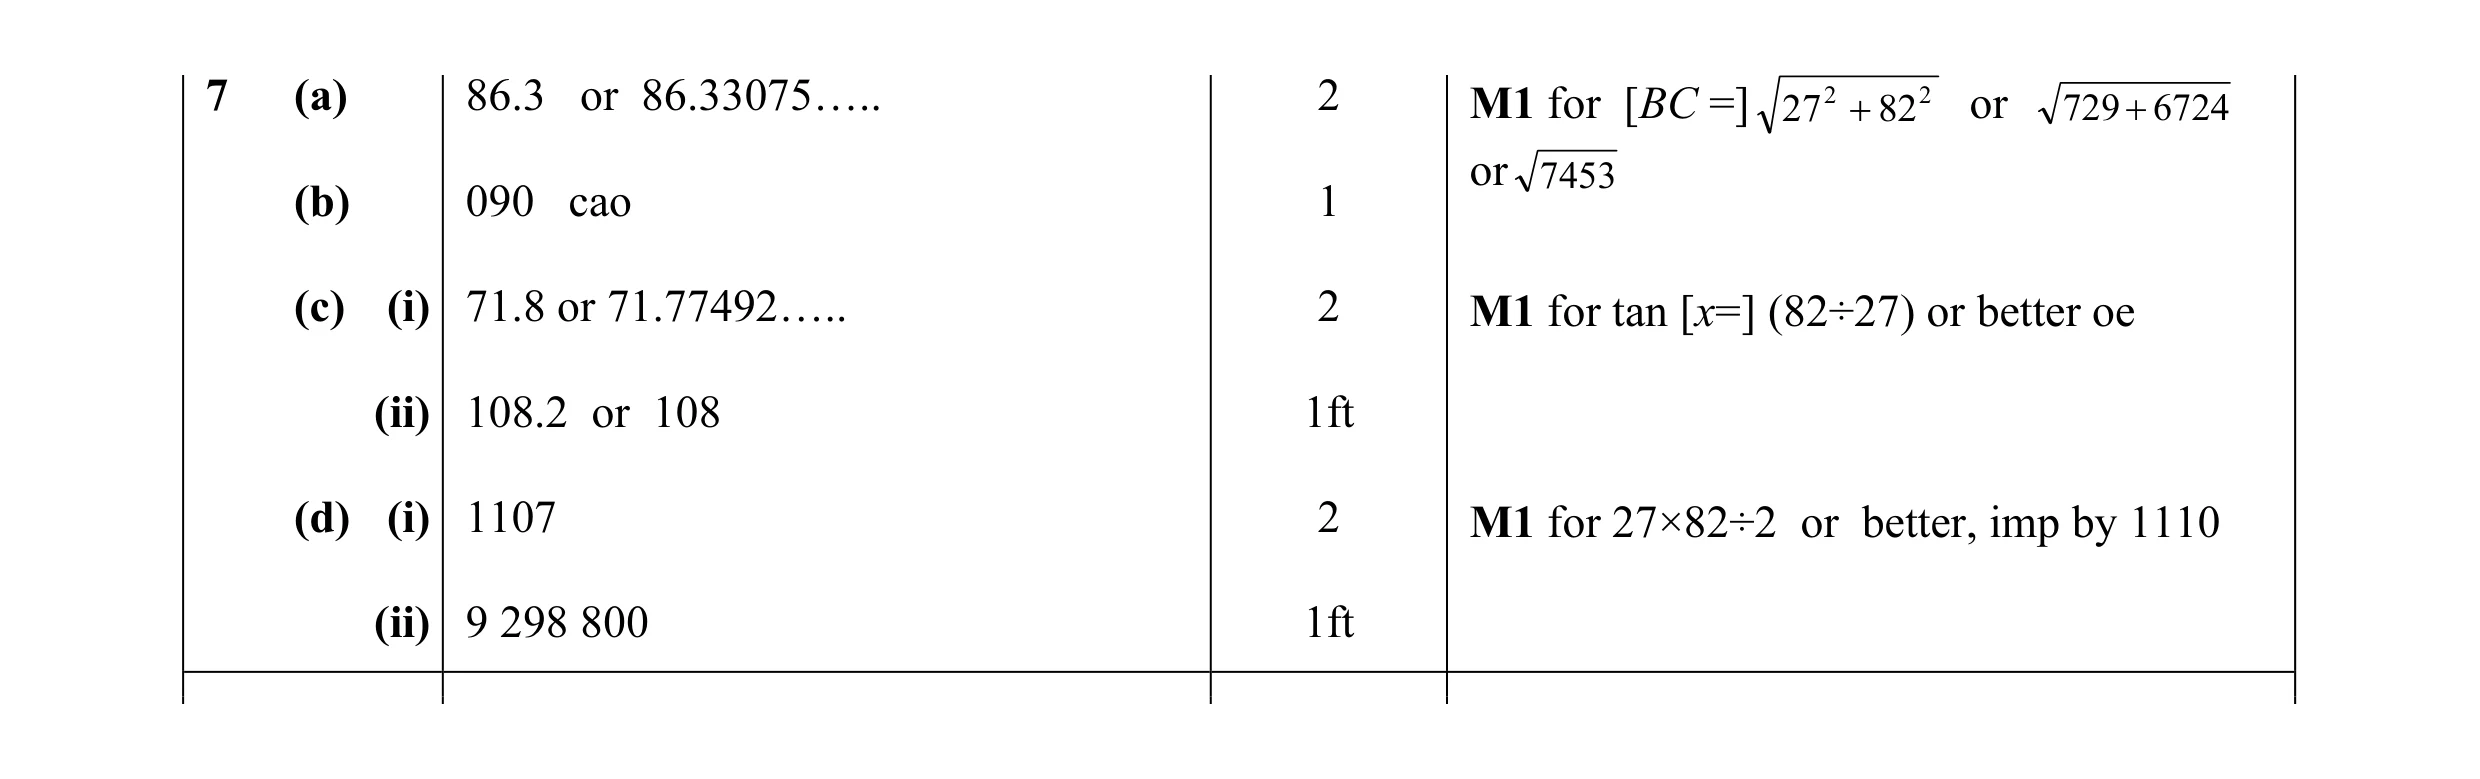 9
9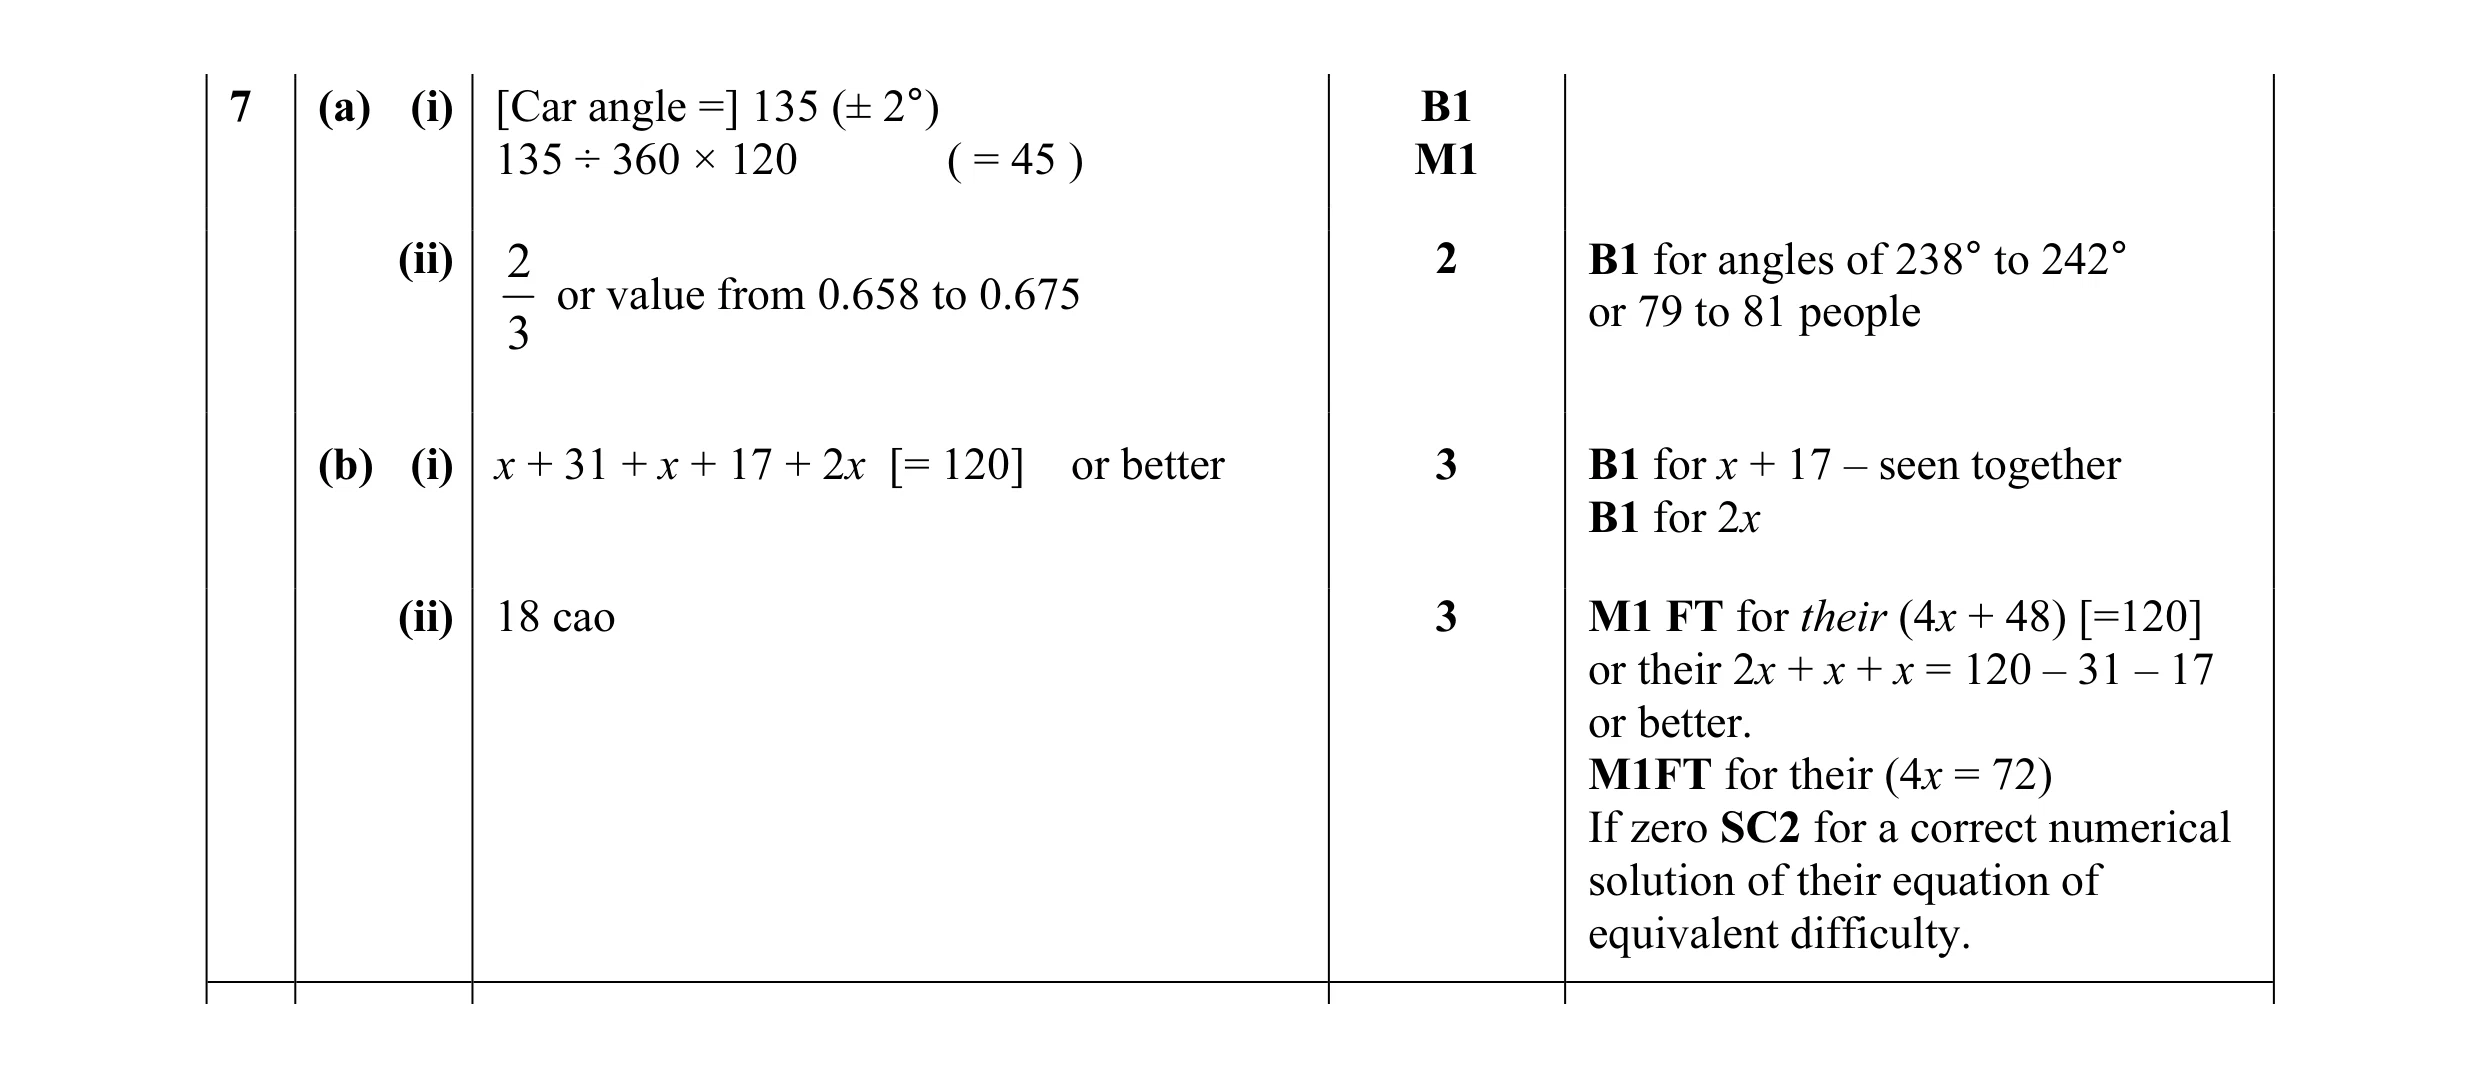 10
10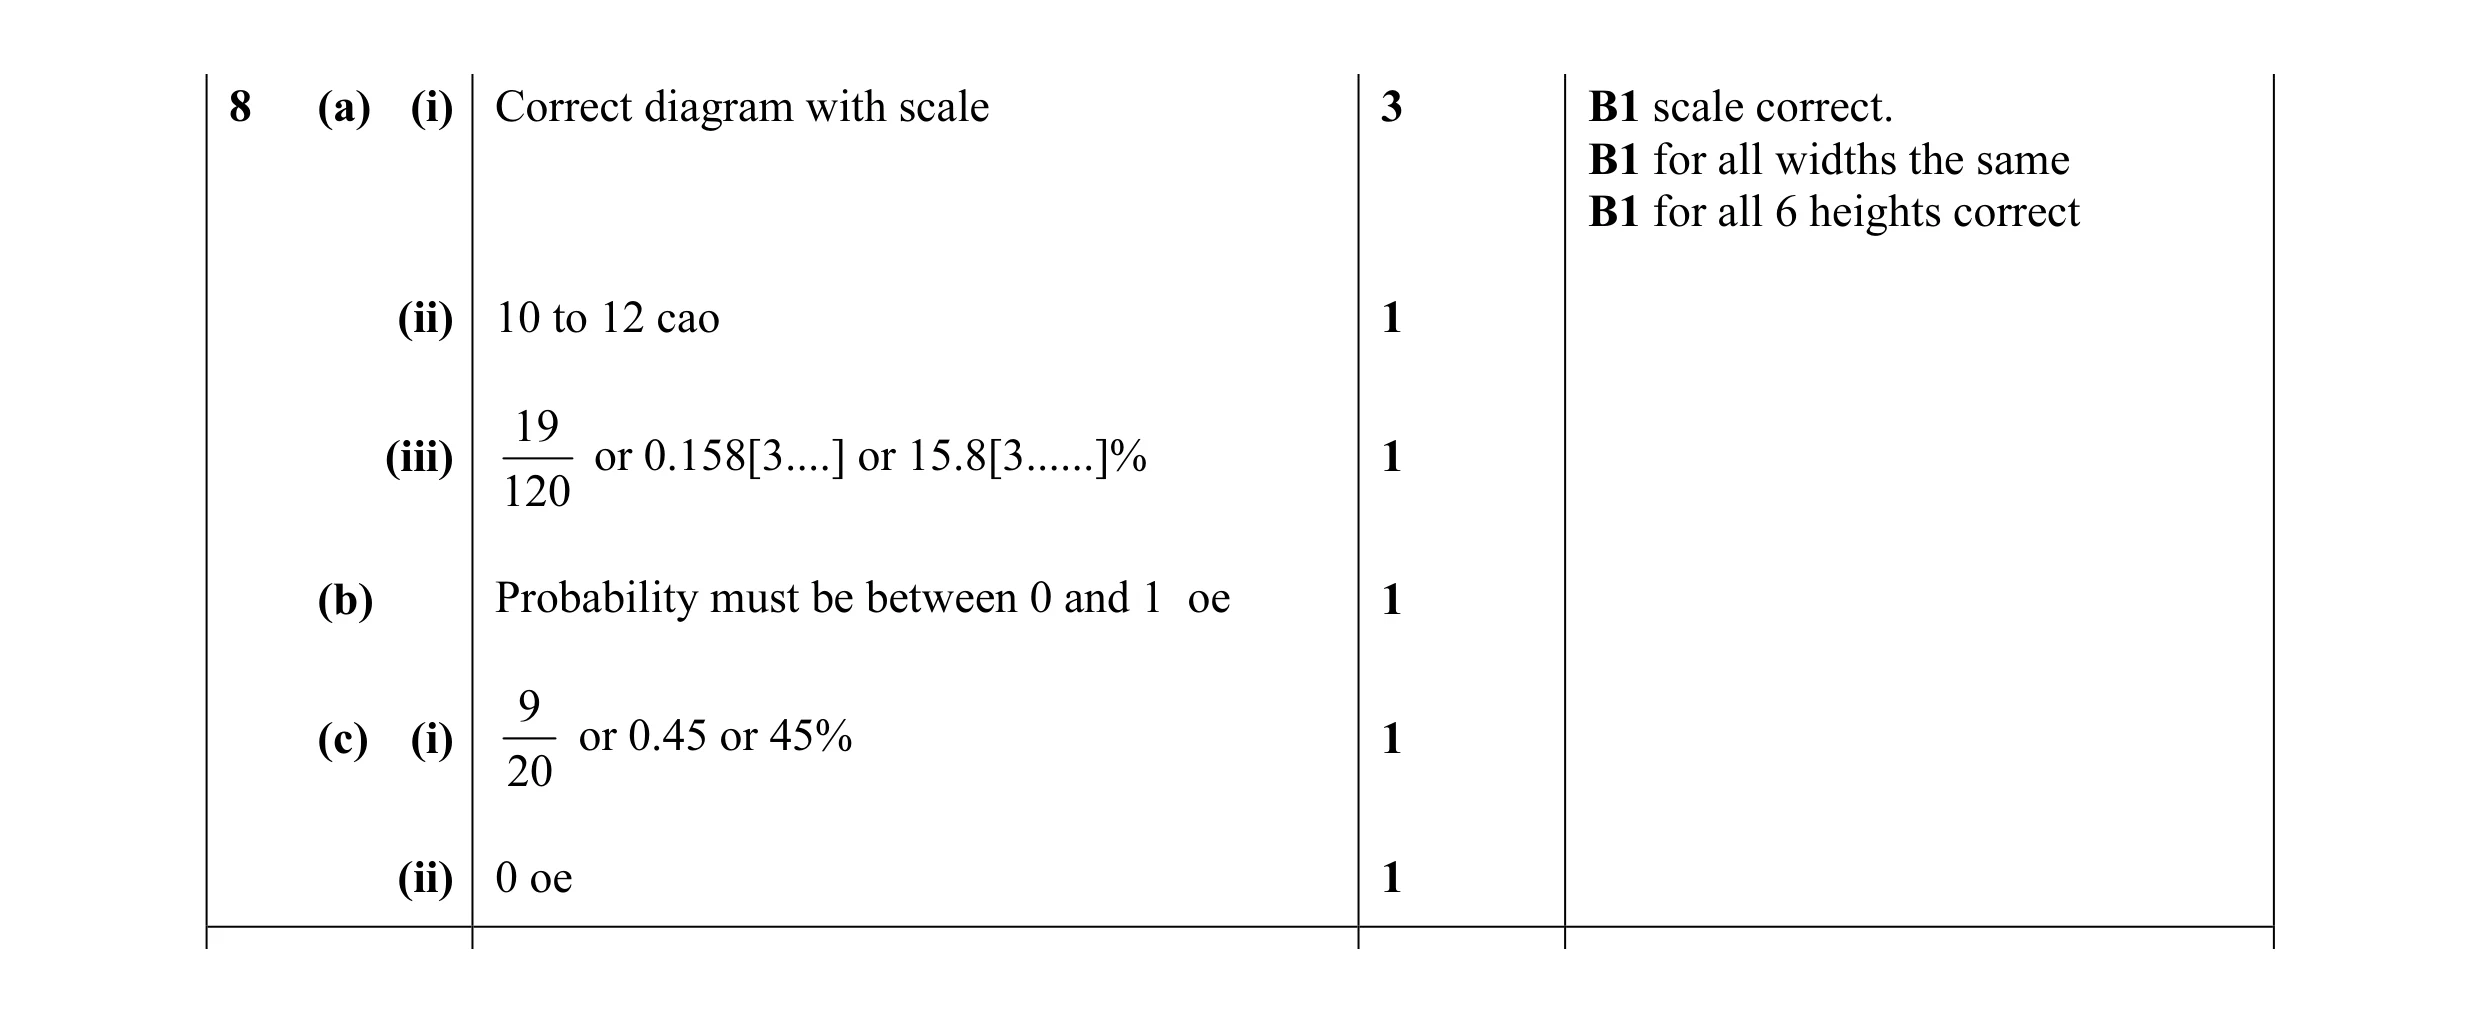 8
8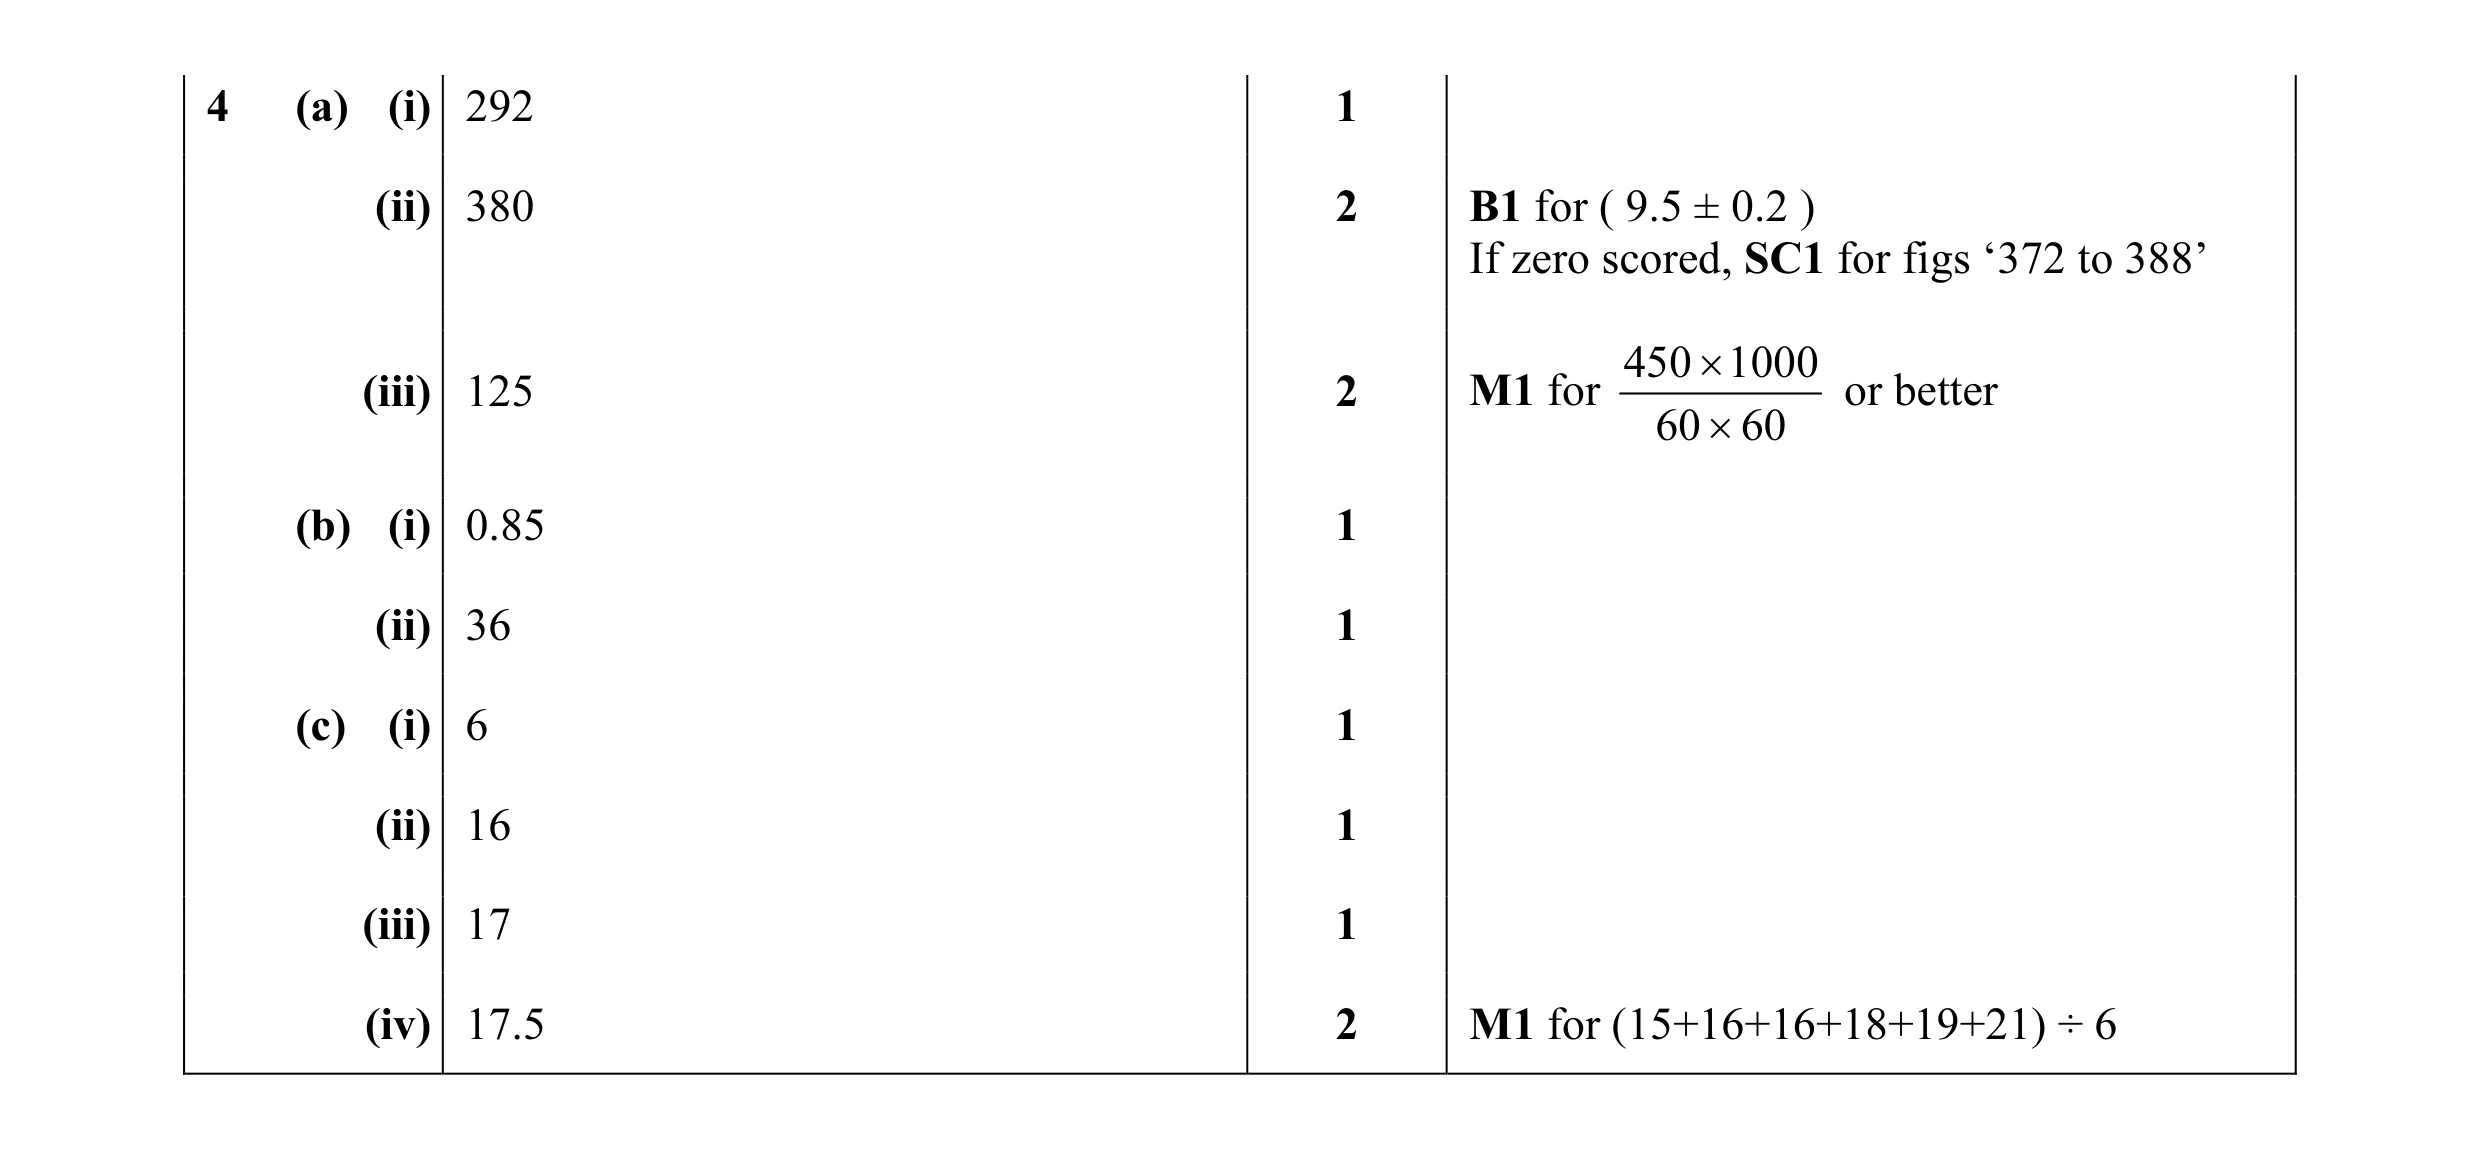 17
17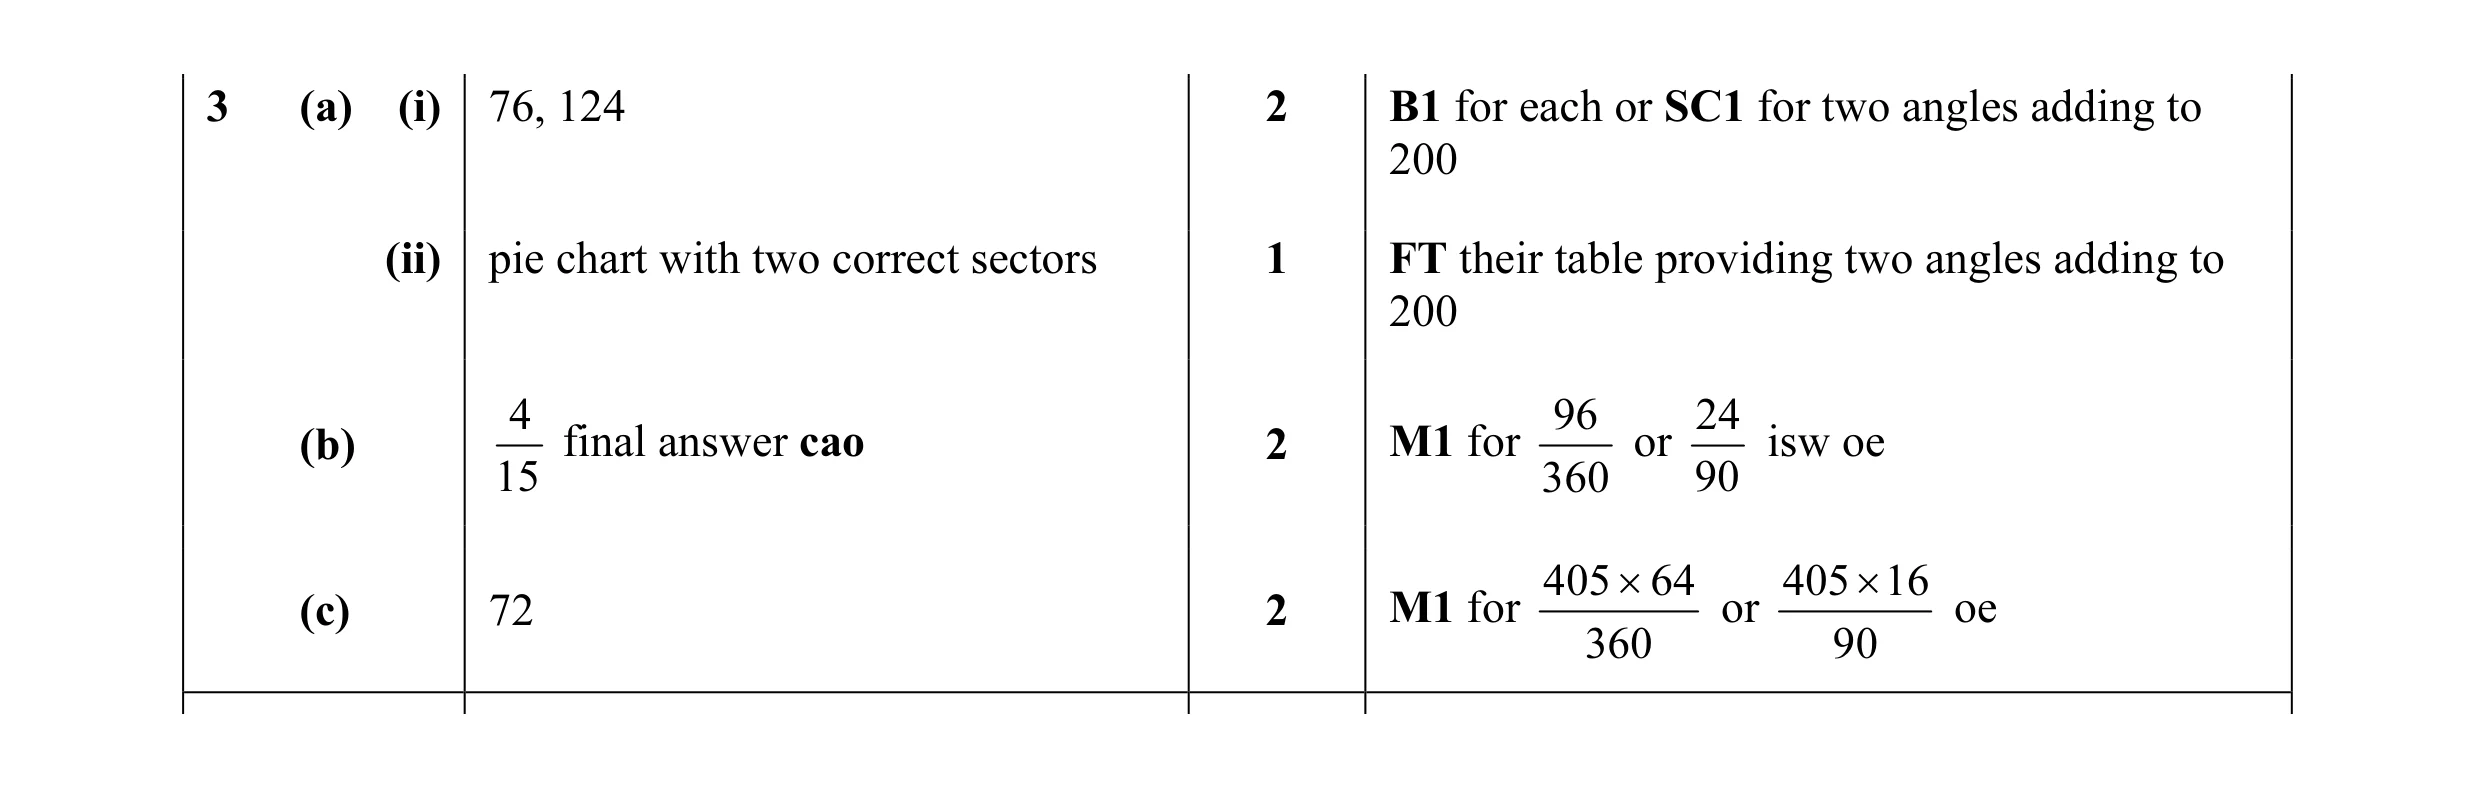 7
7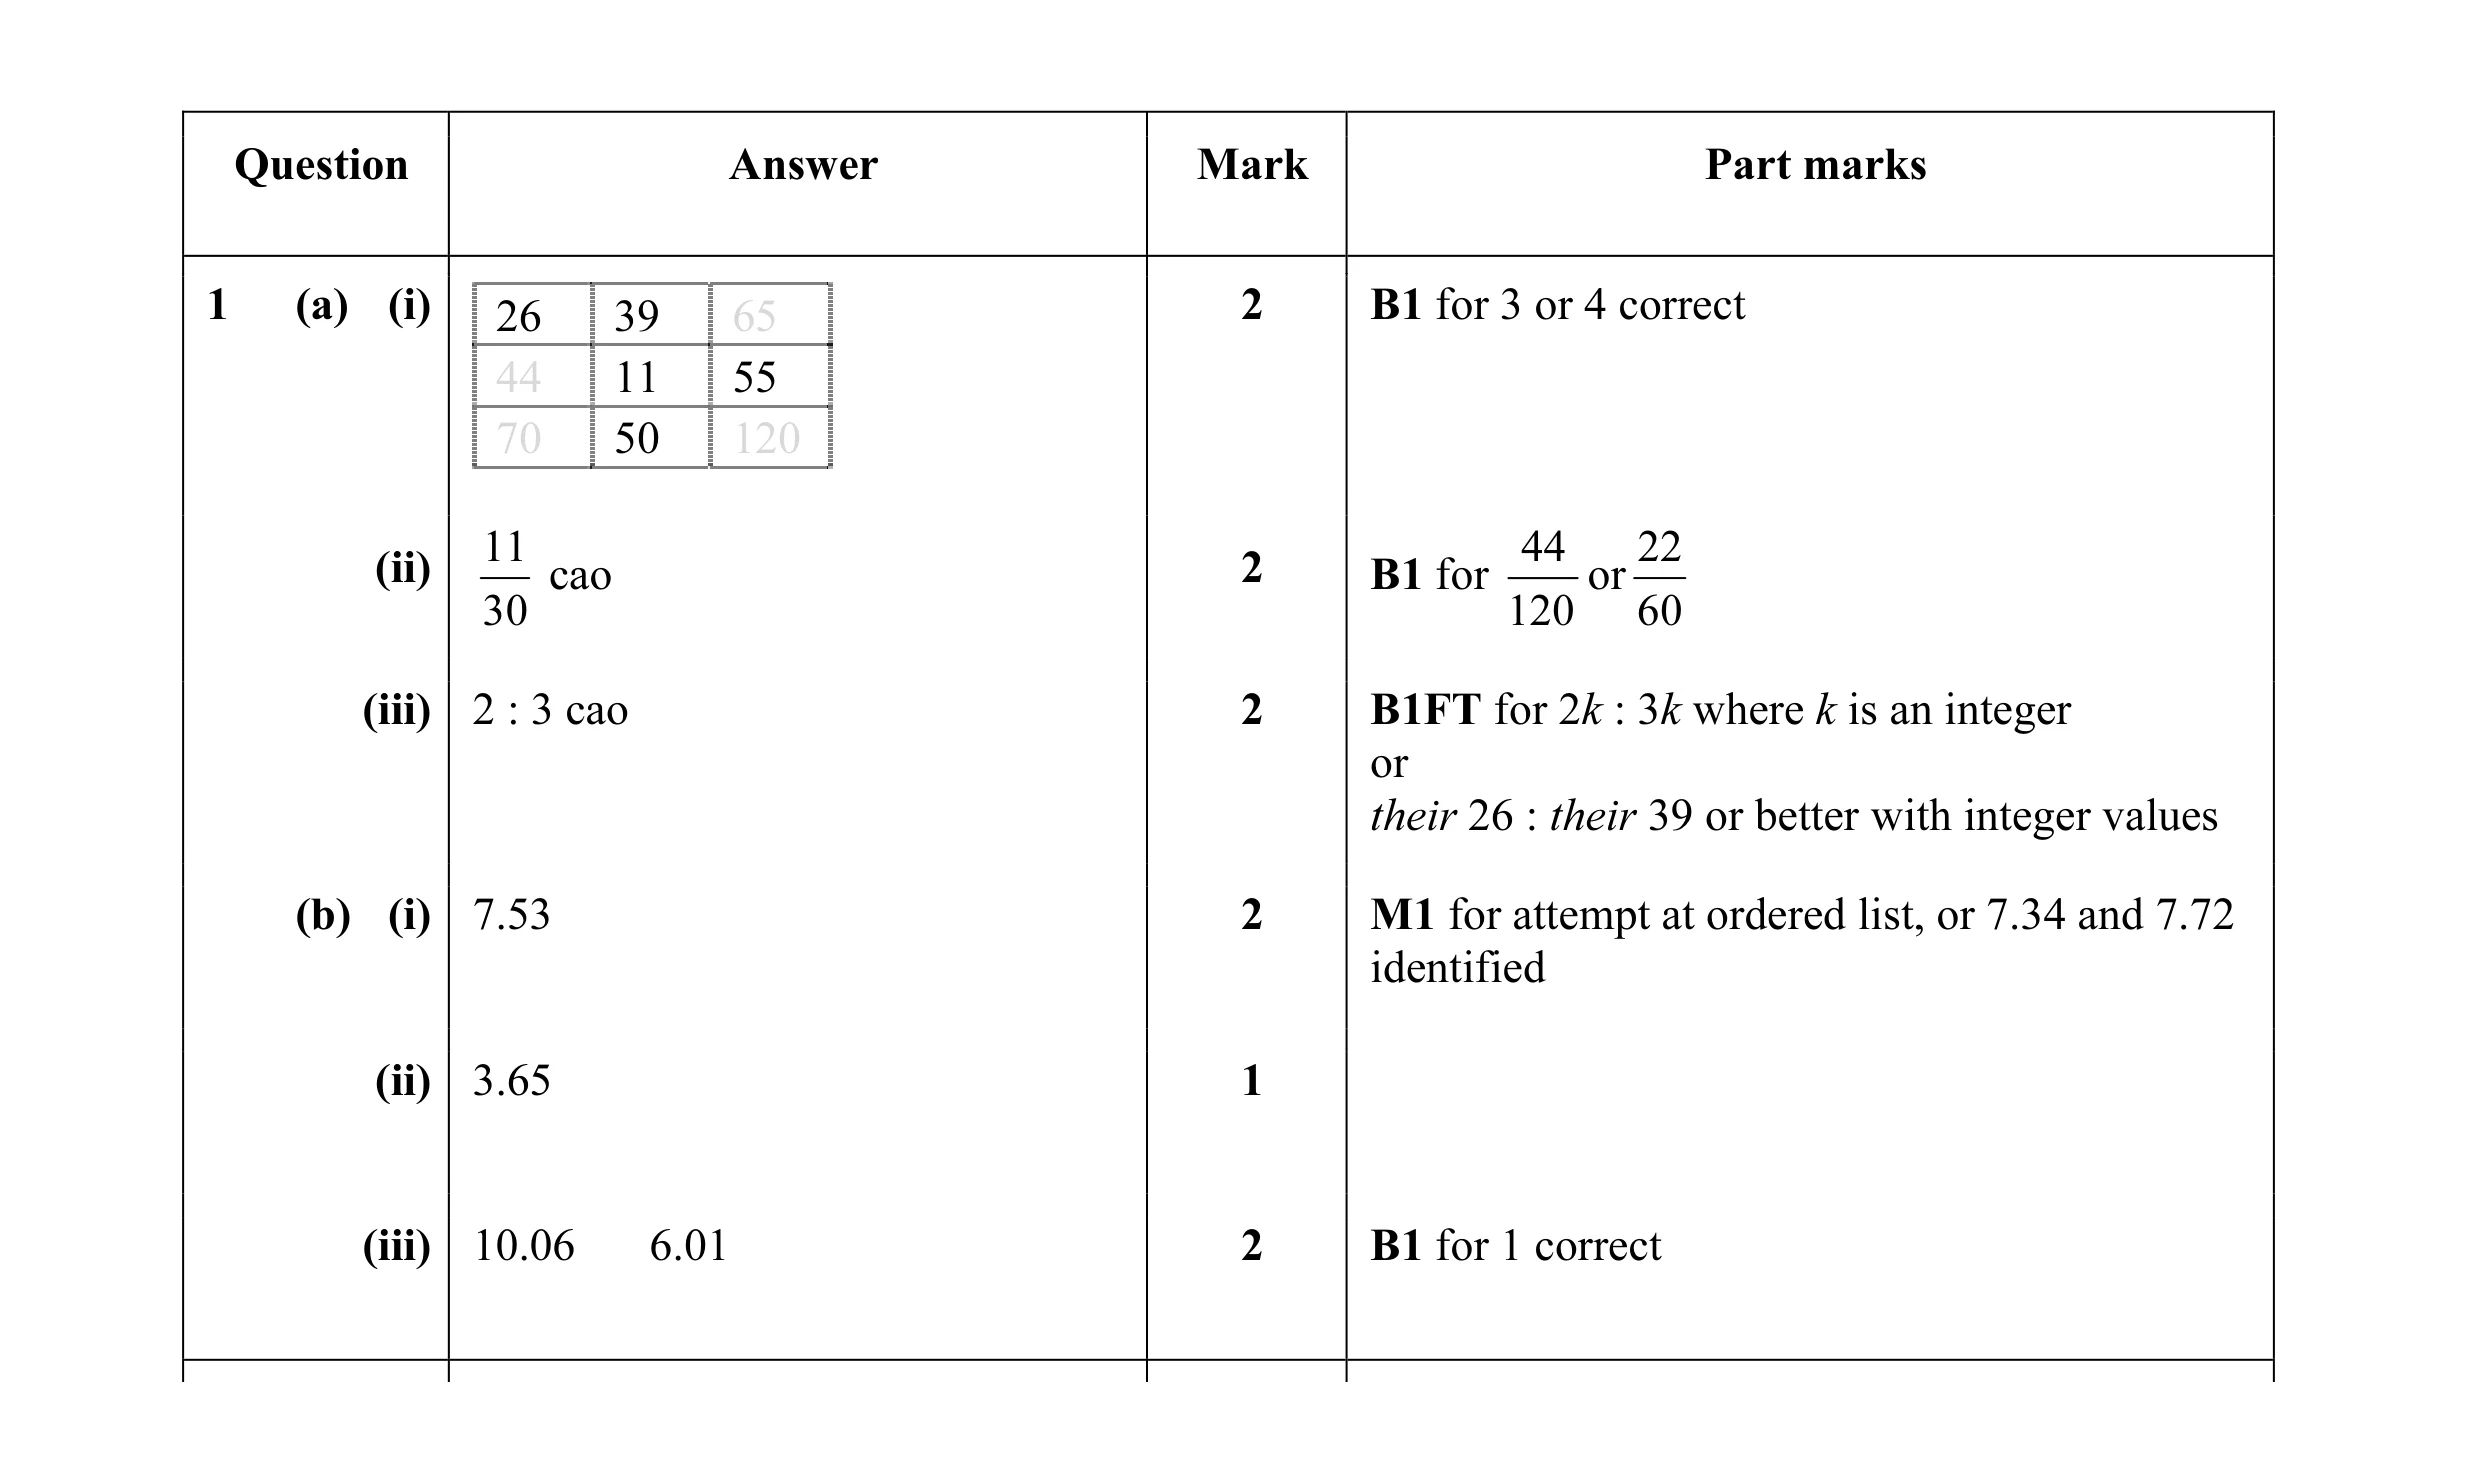 11
11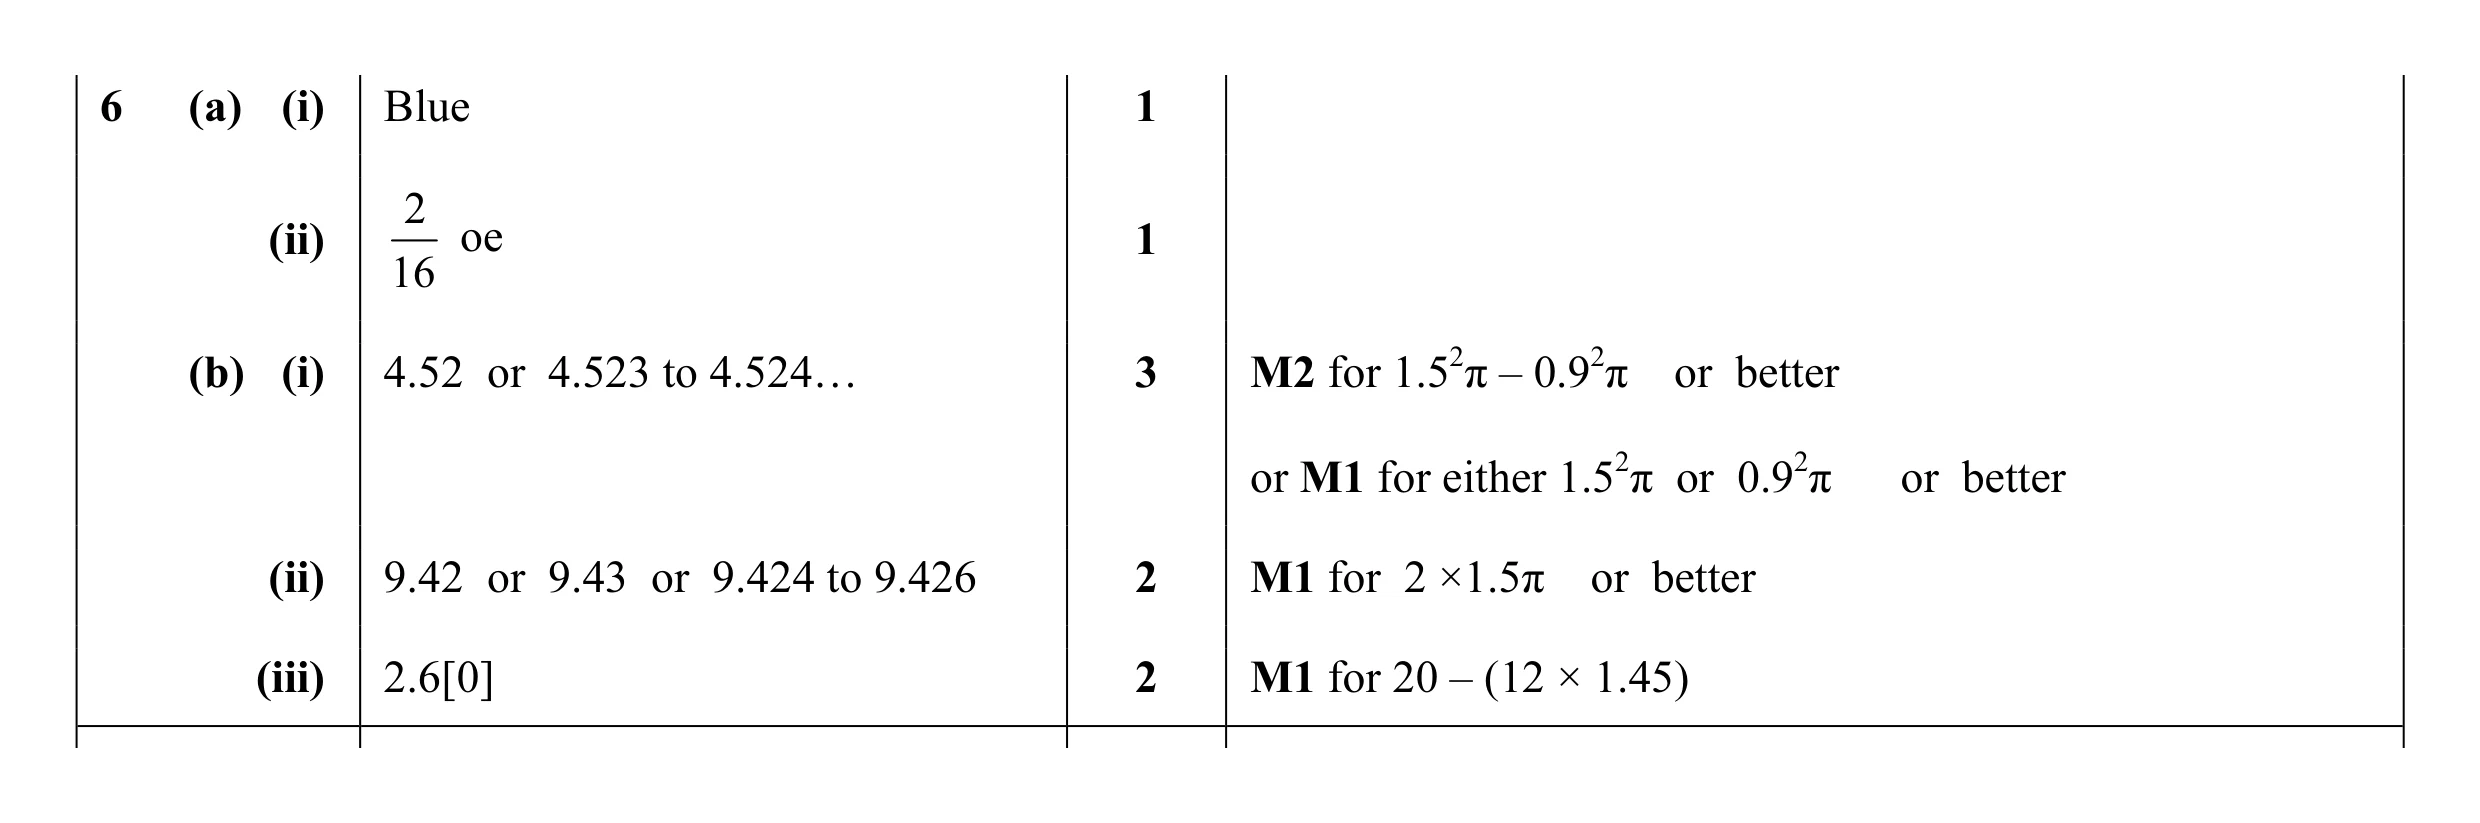 9
9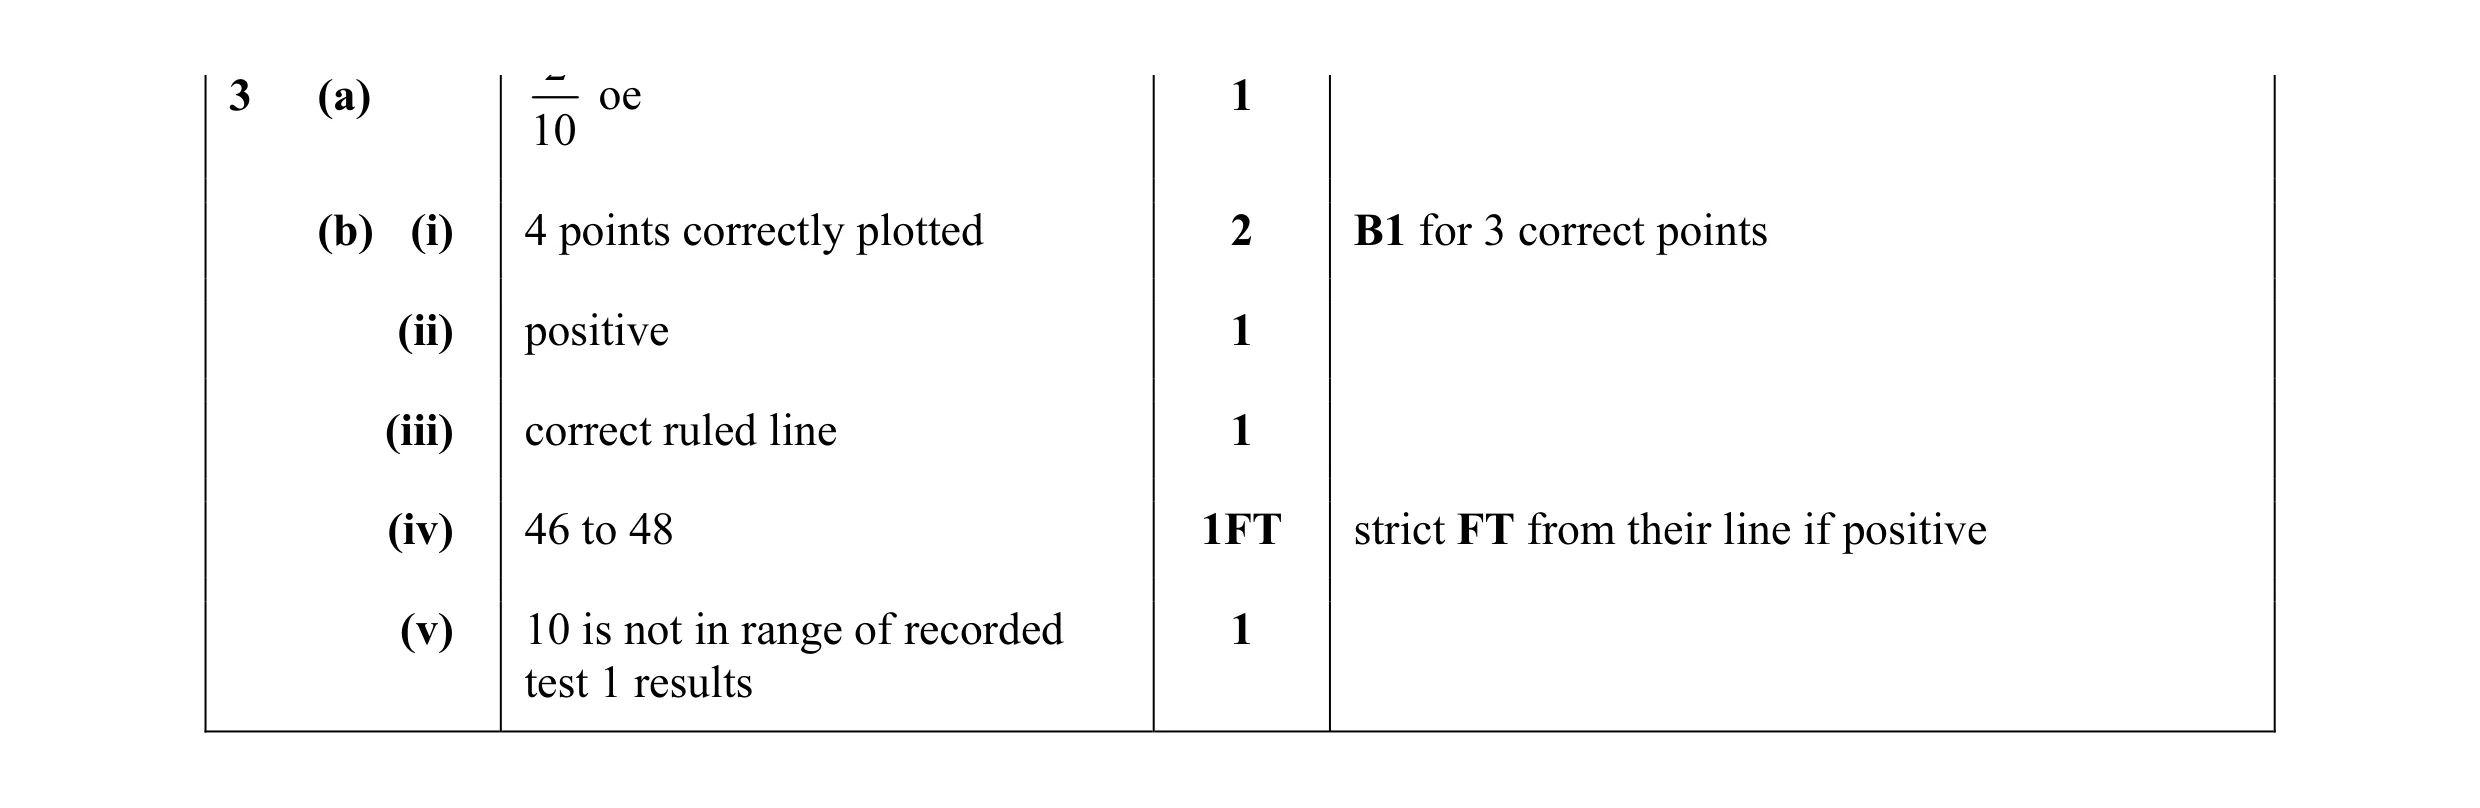 7
7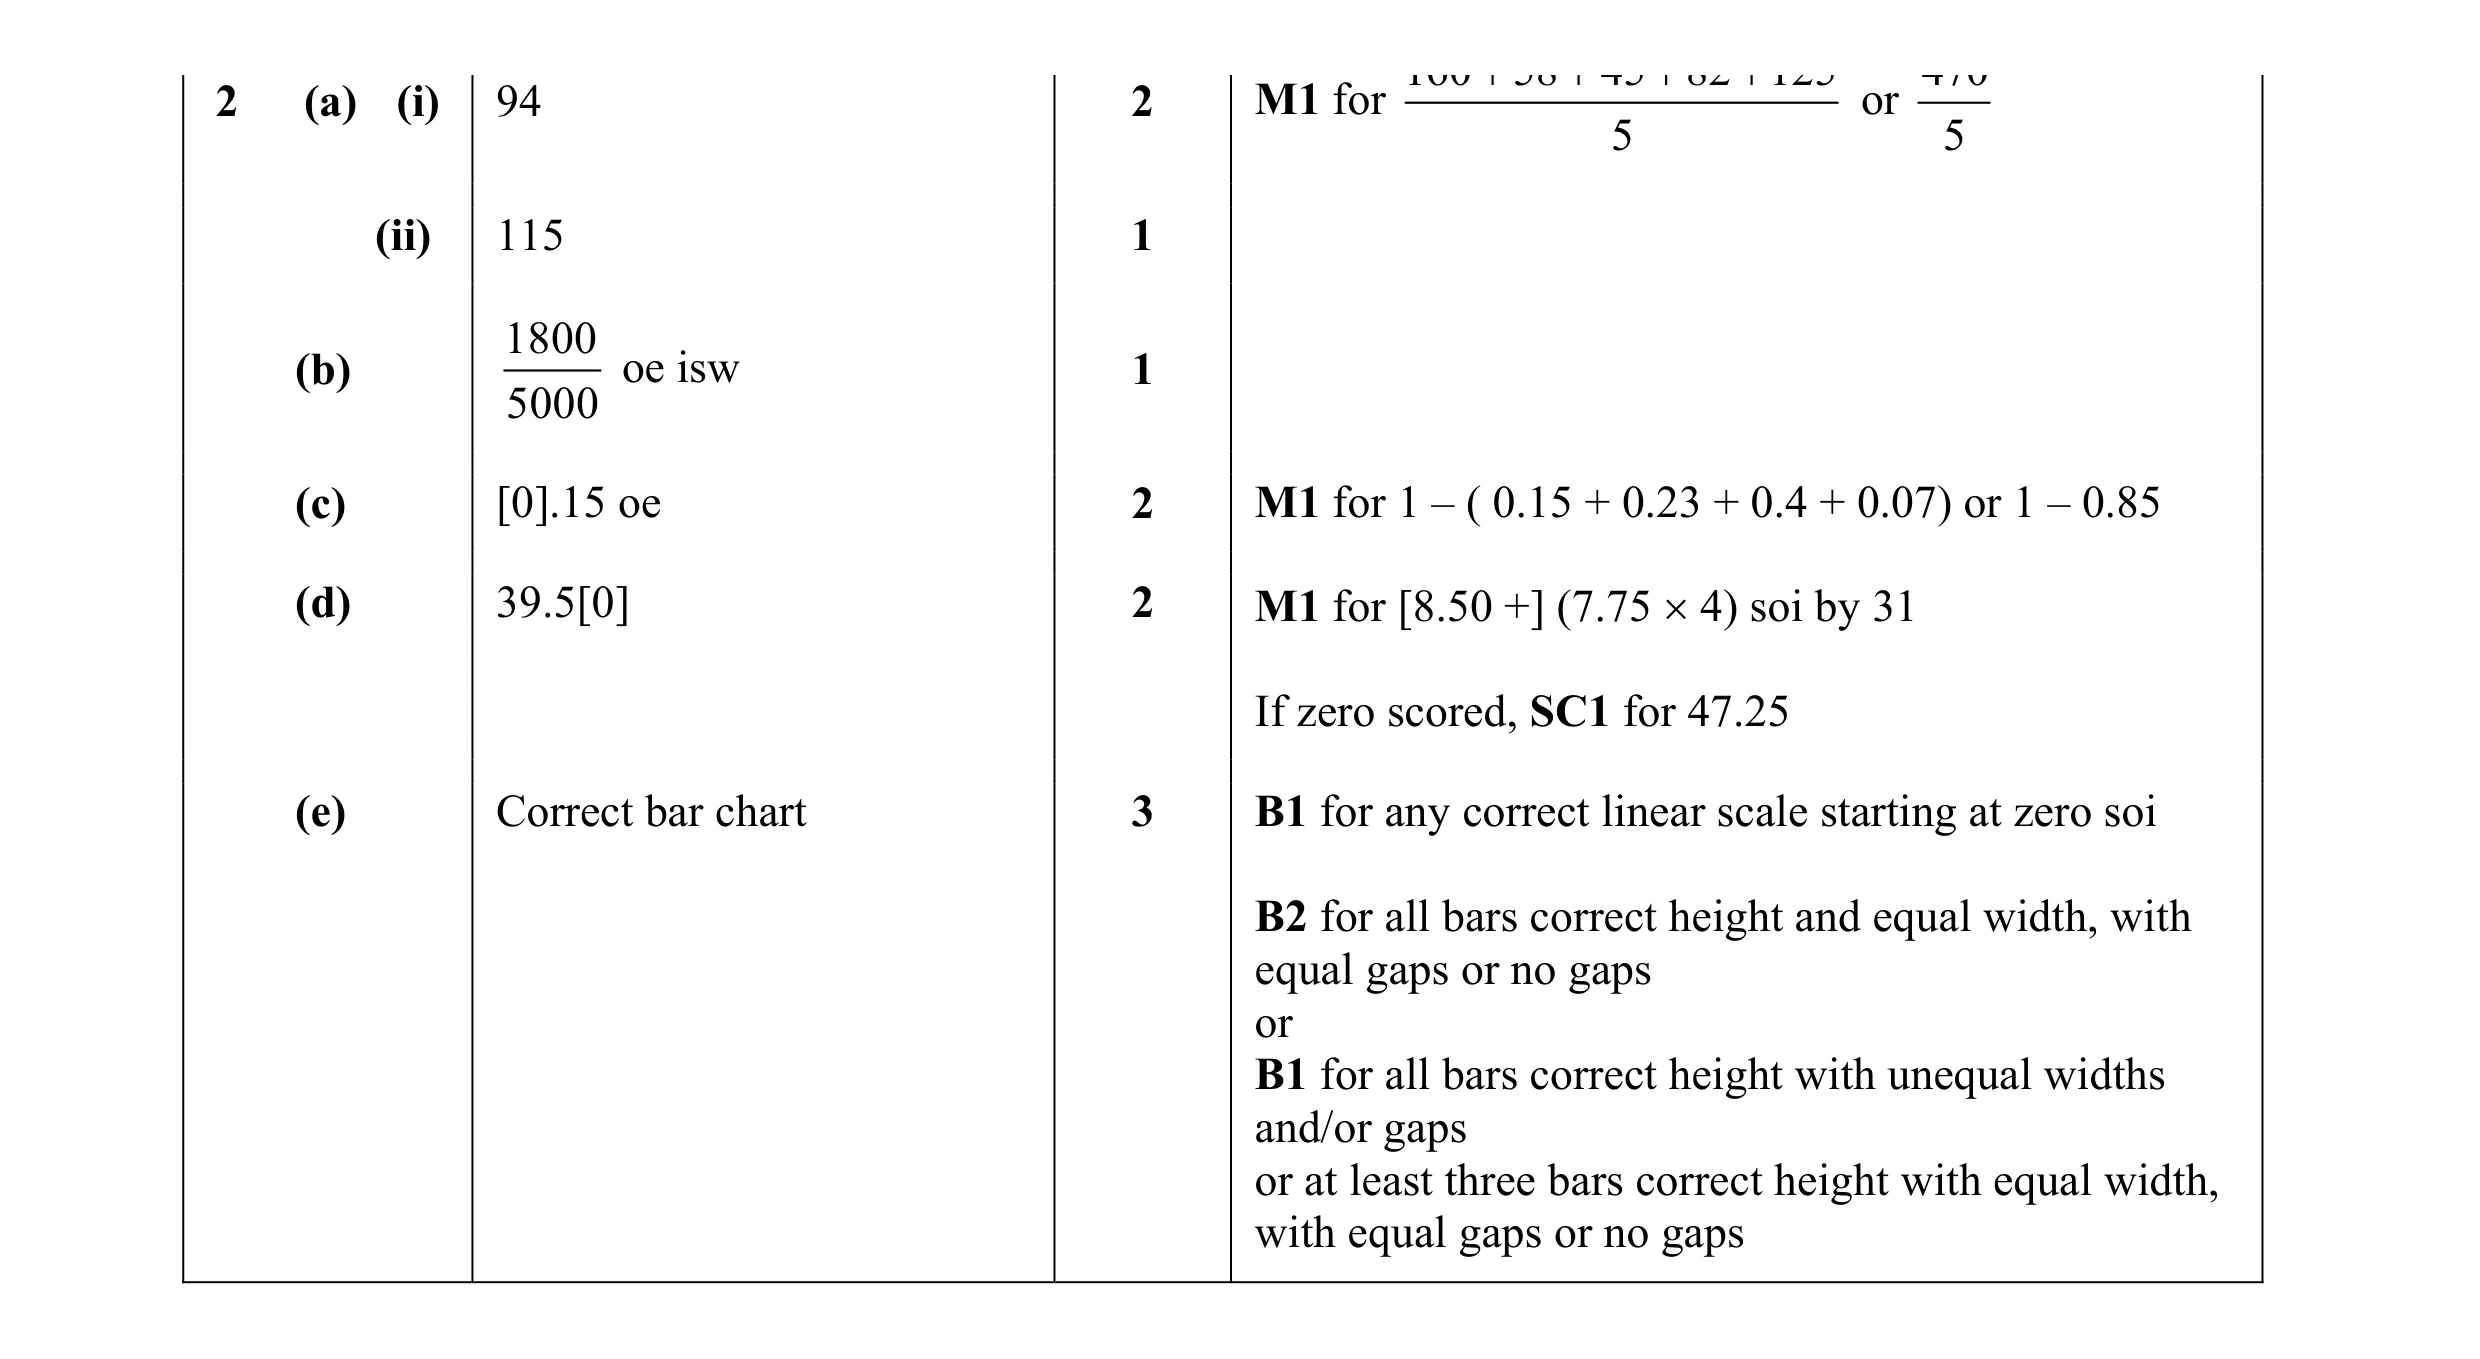 11
11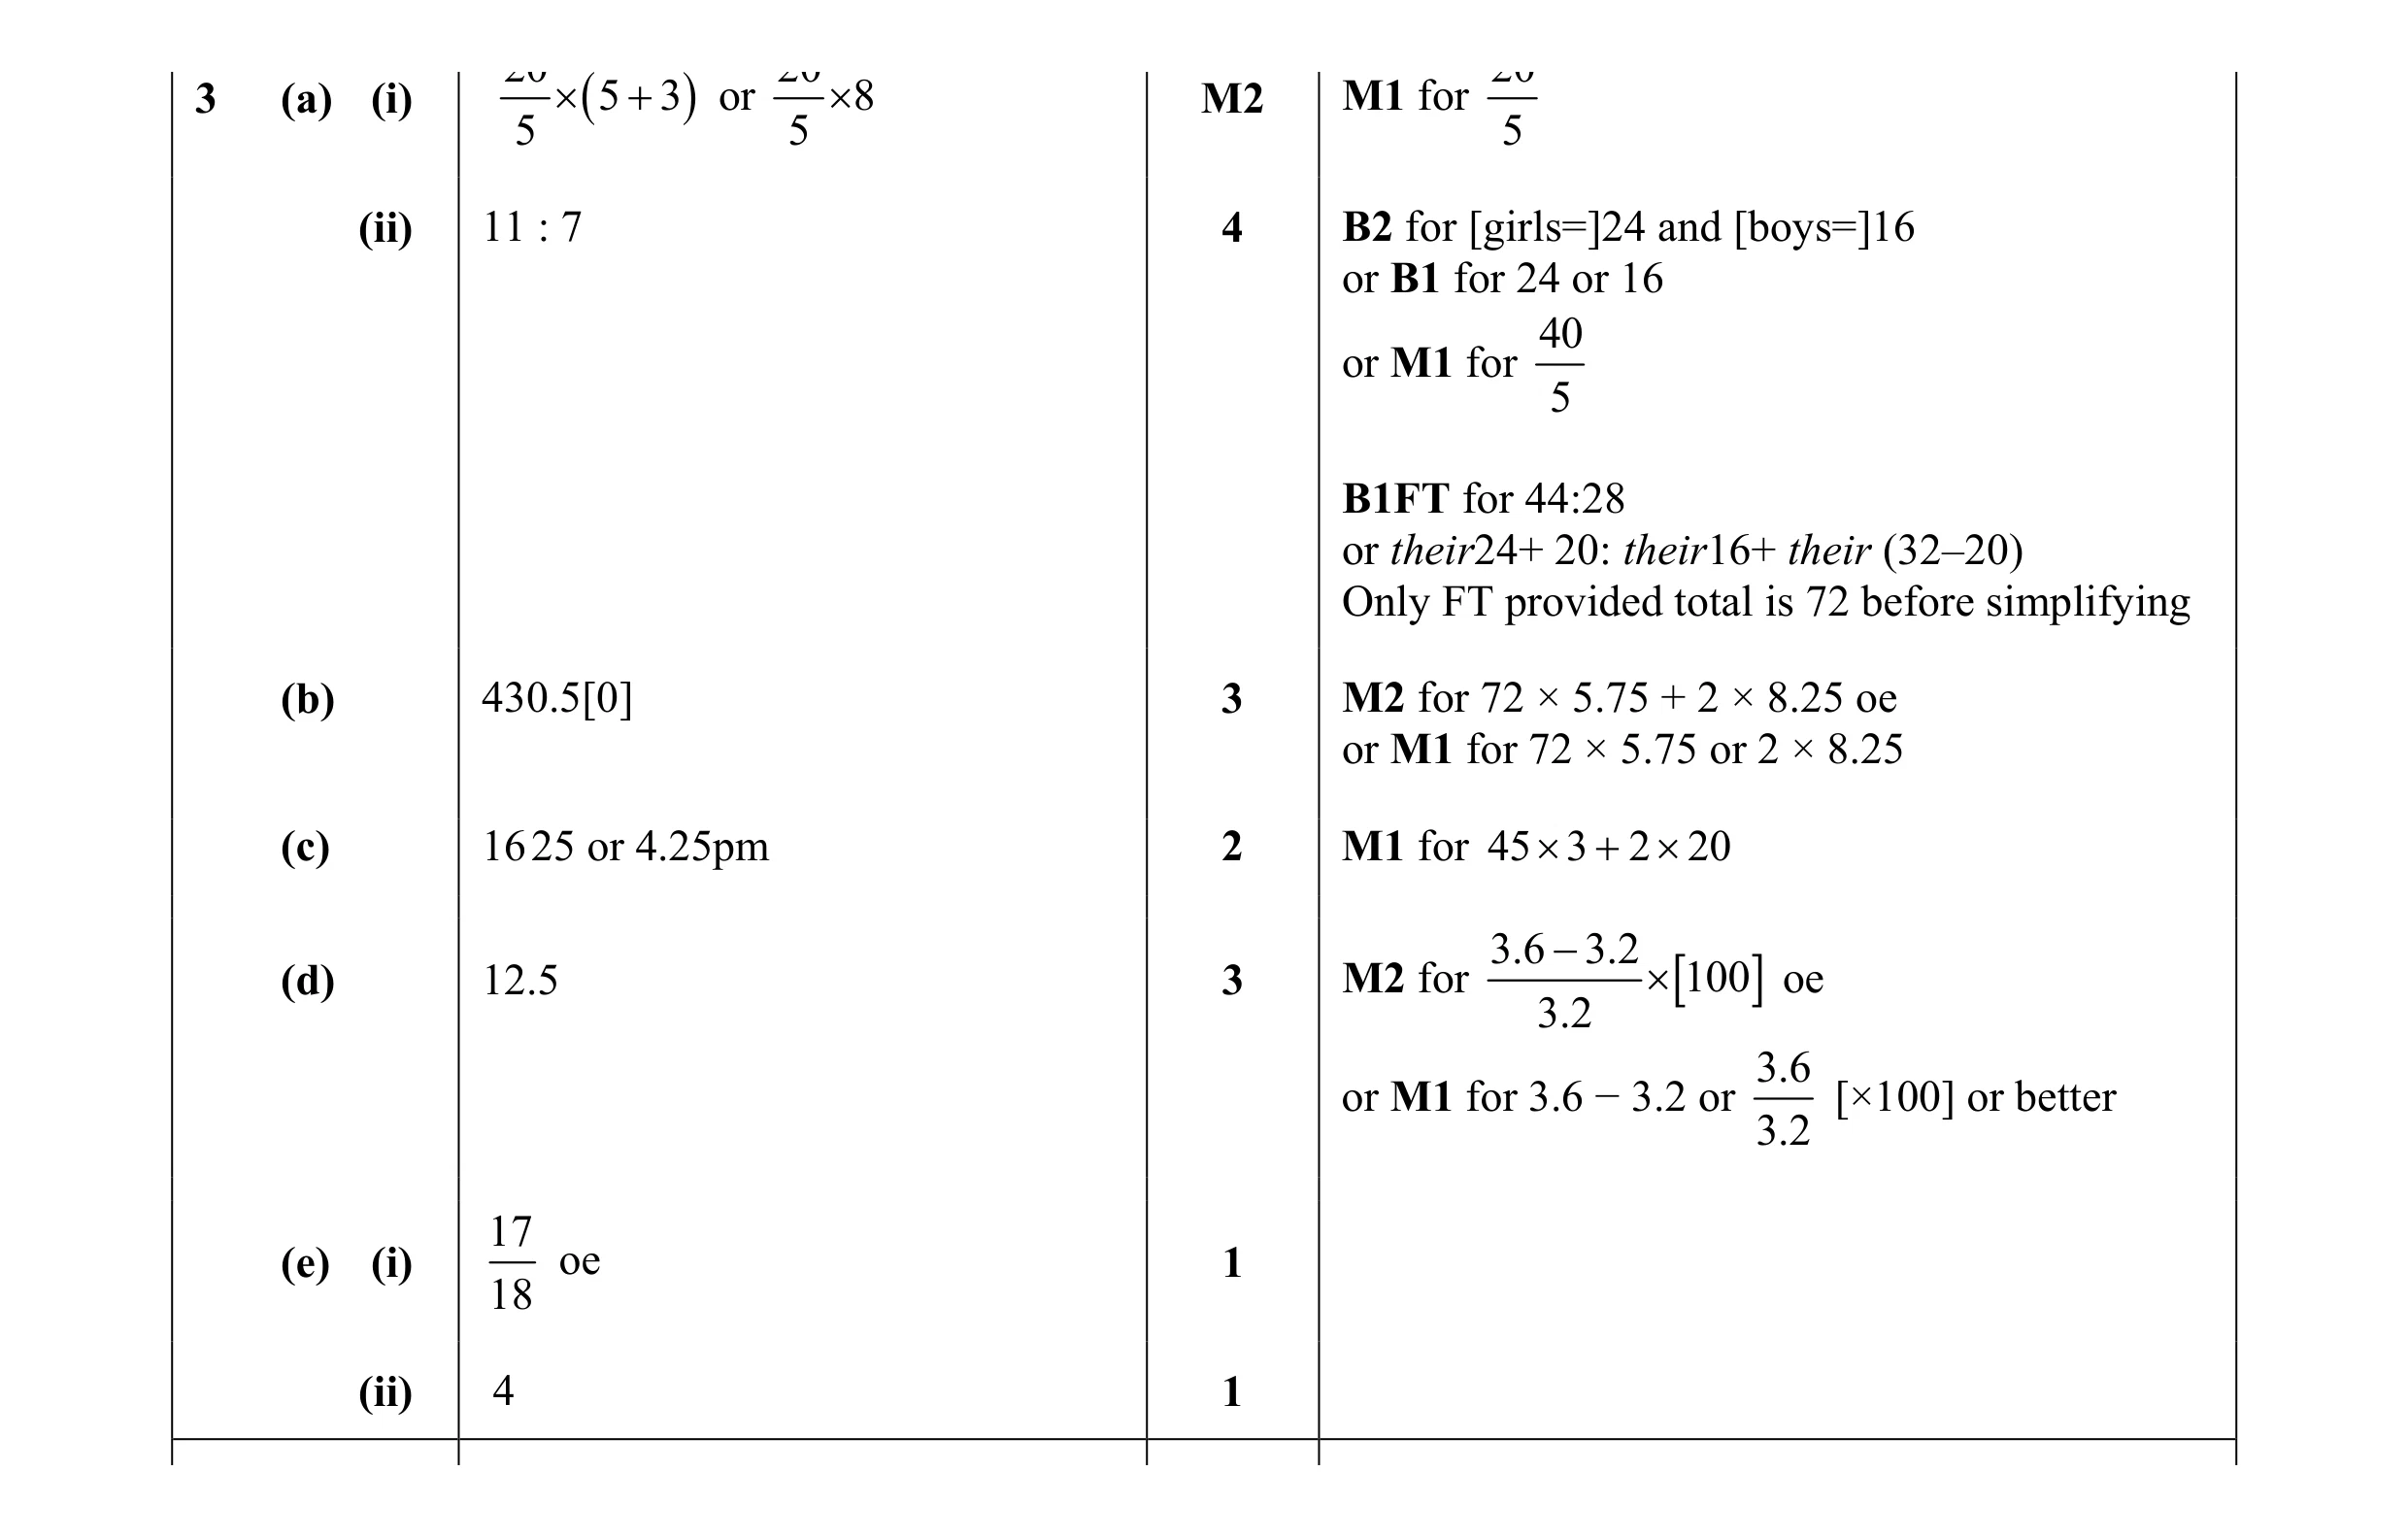 16
16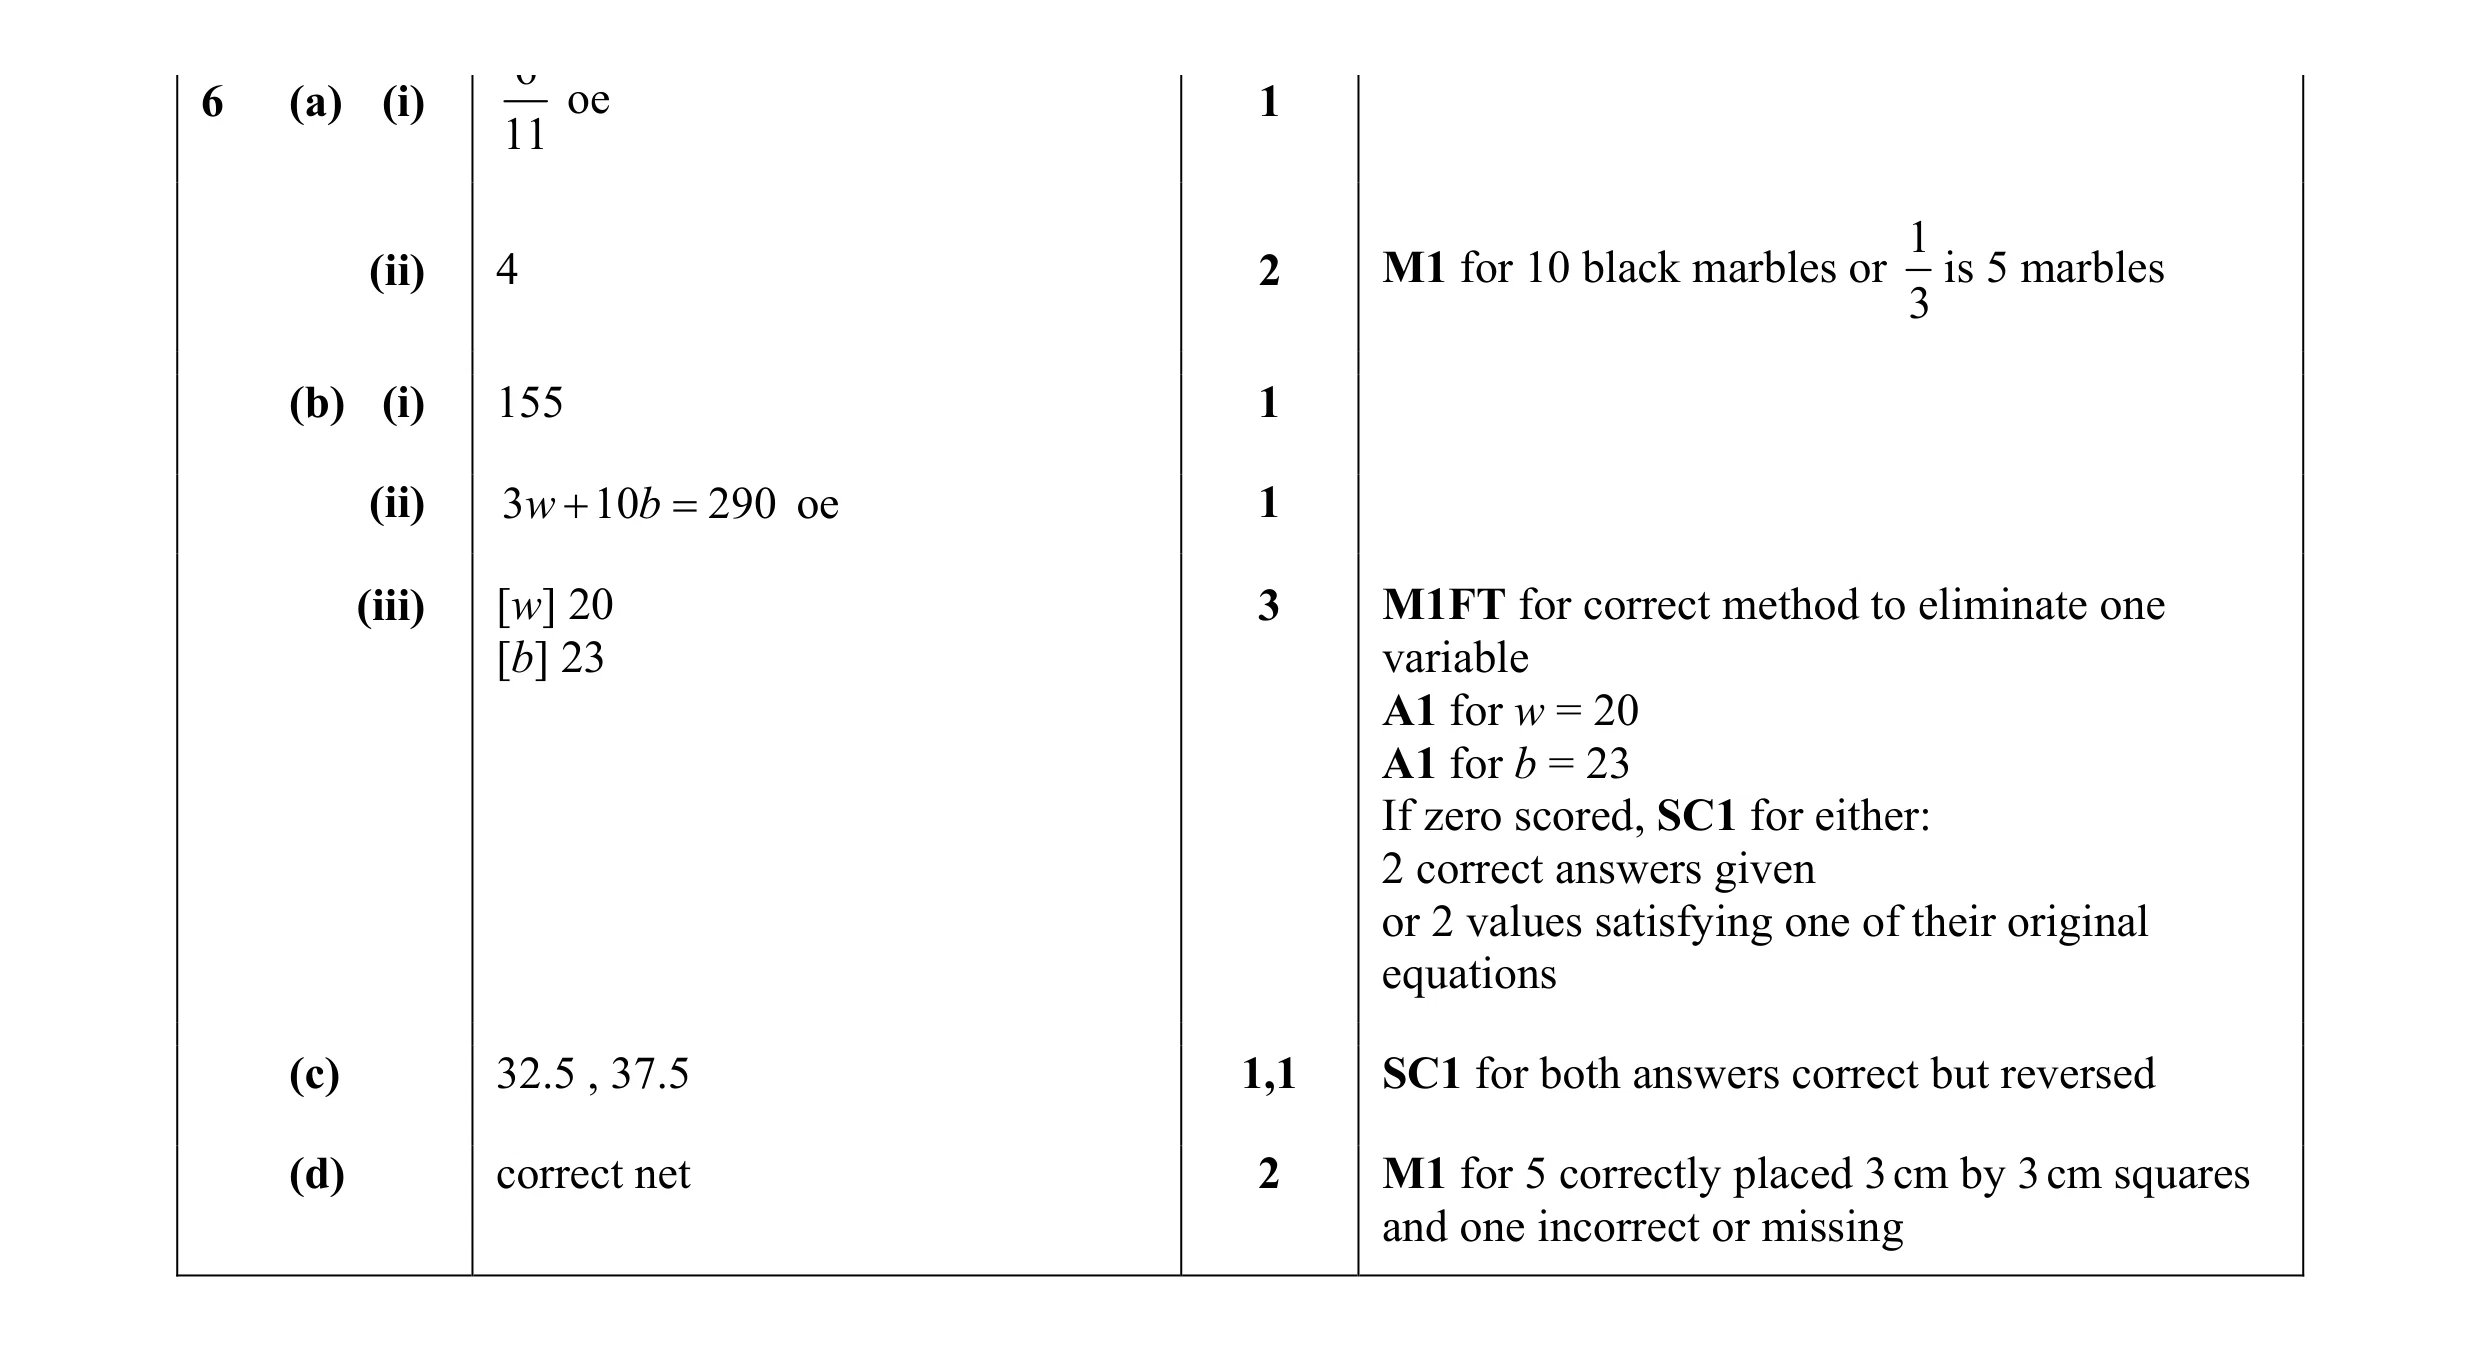 12
12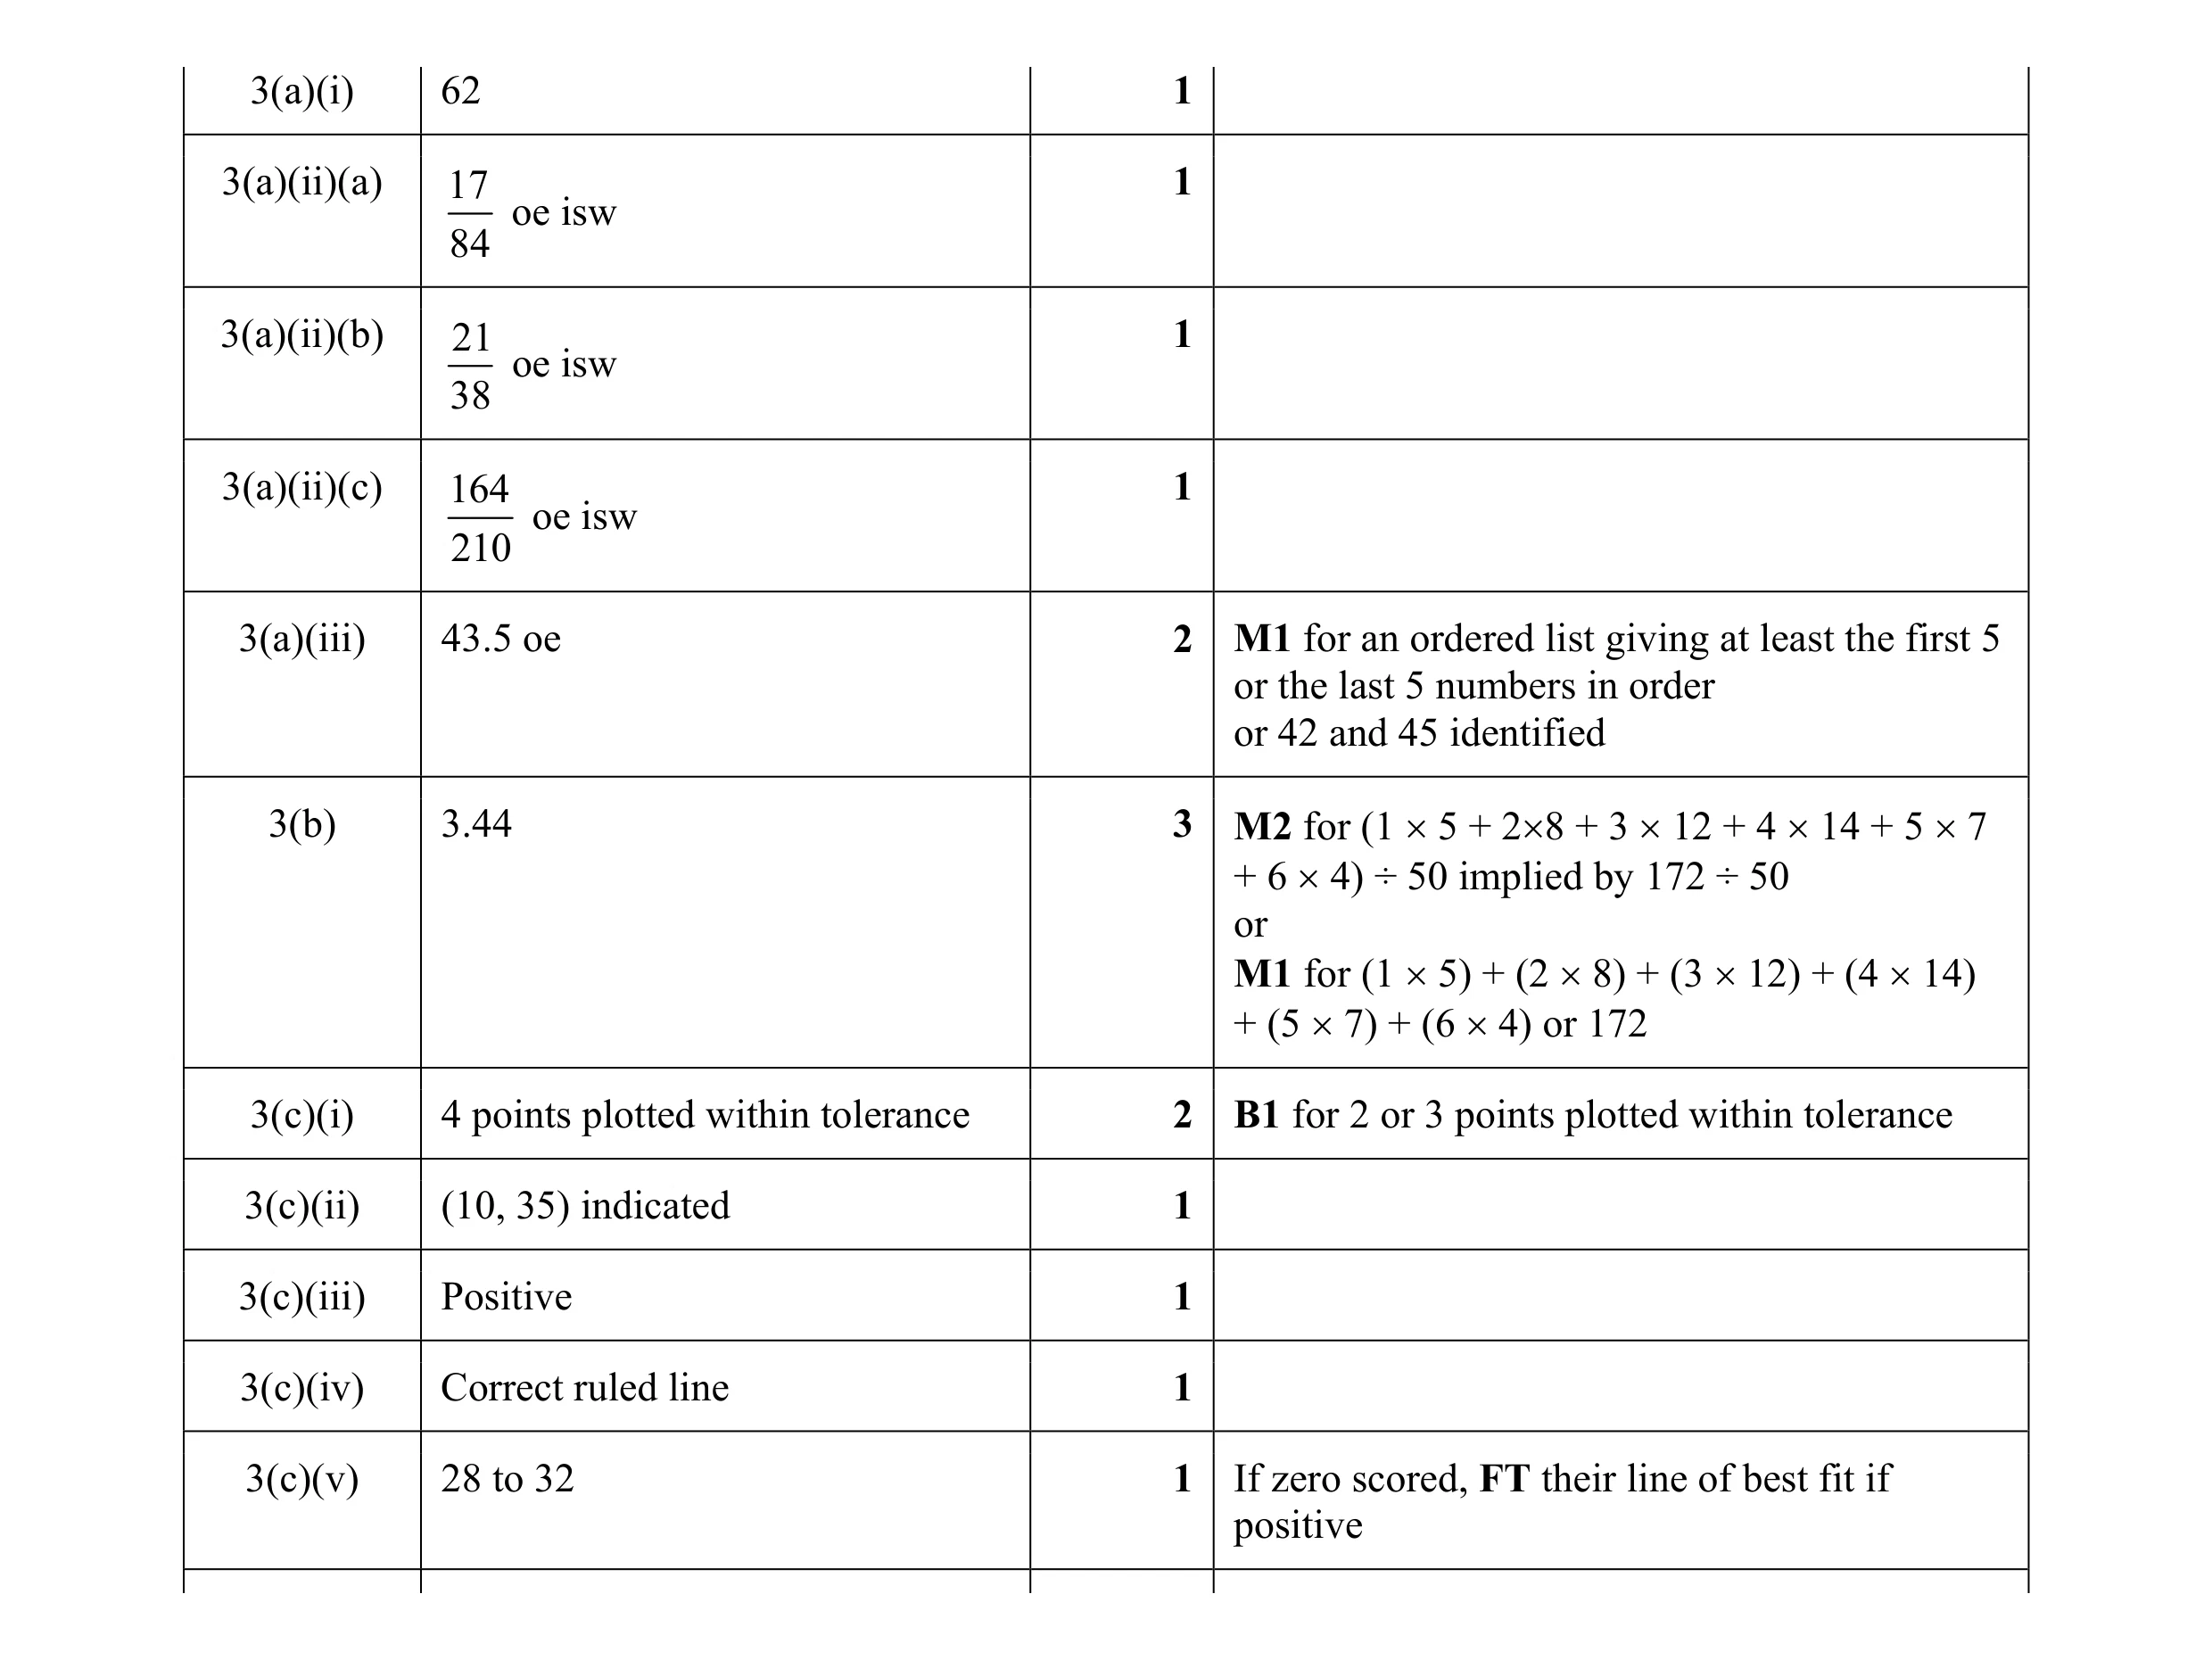 15
15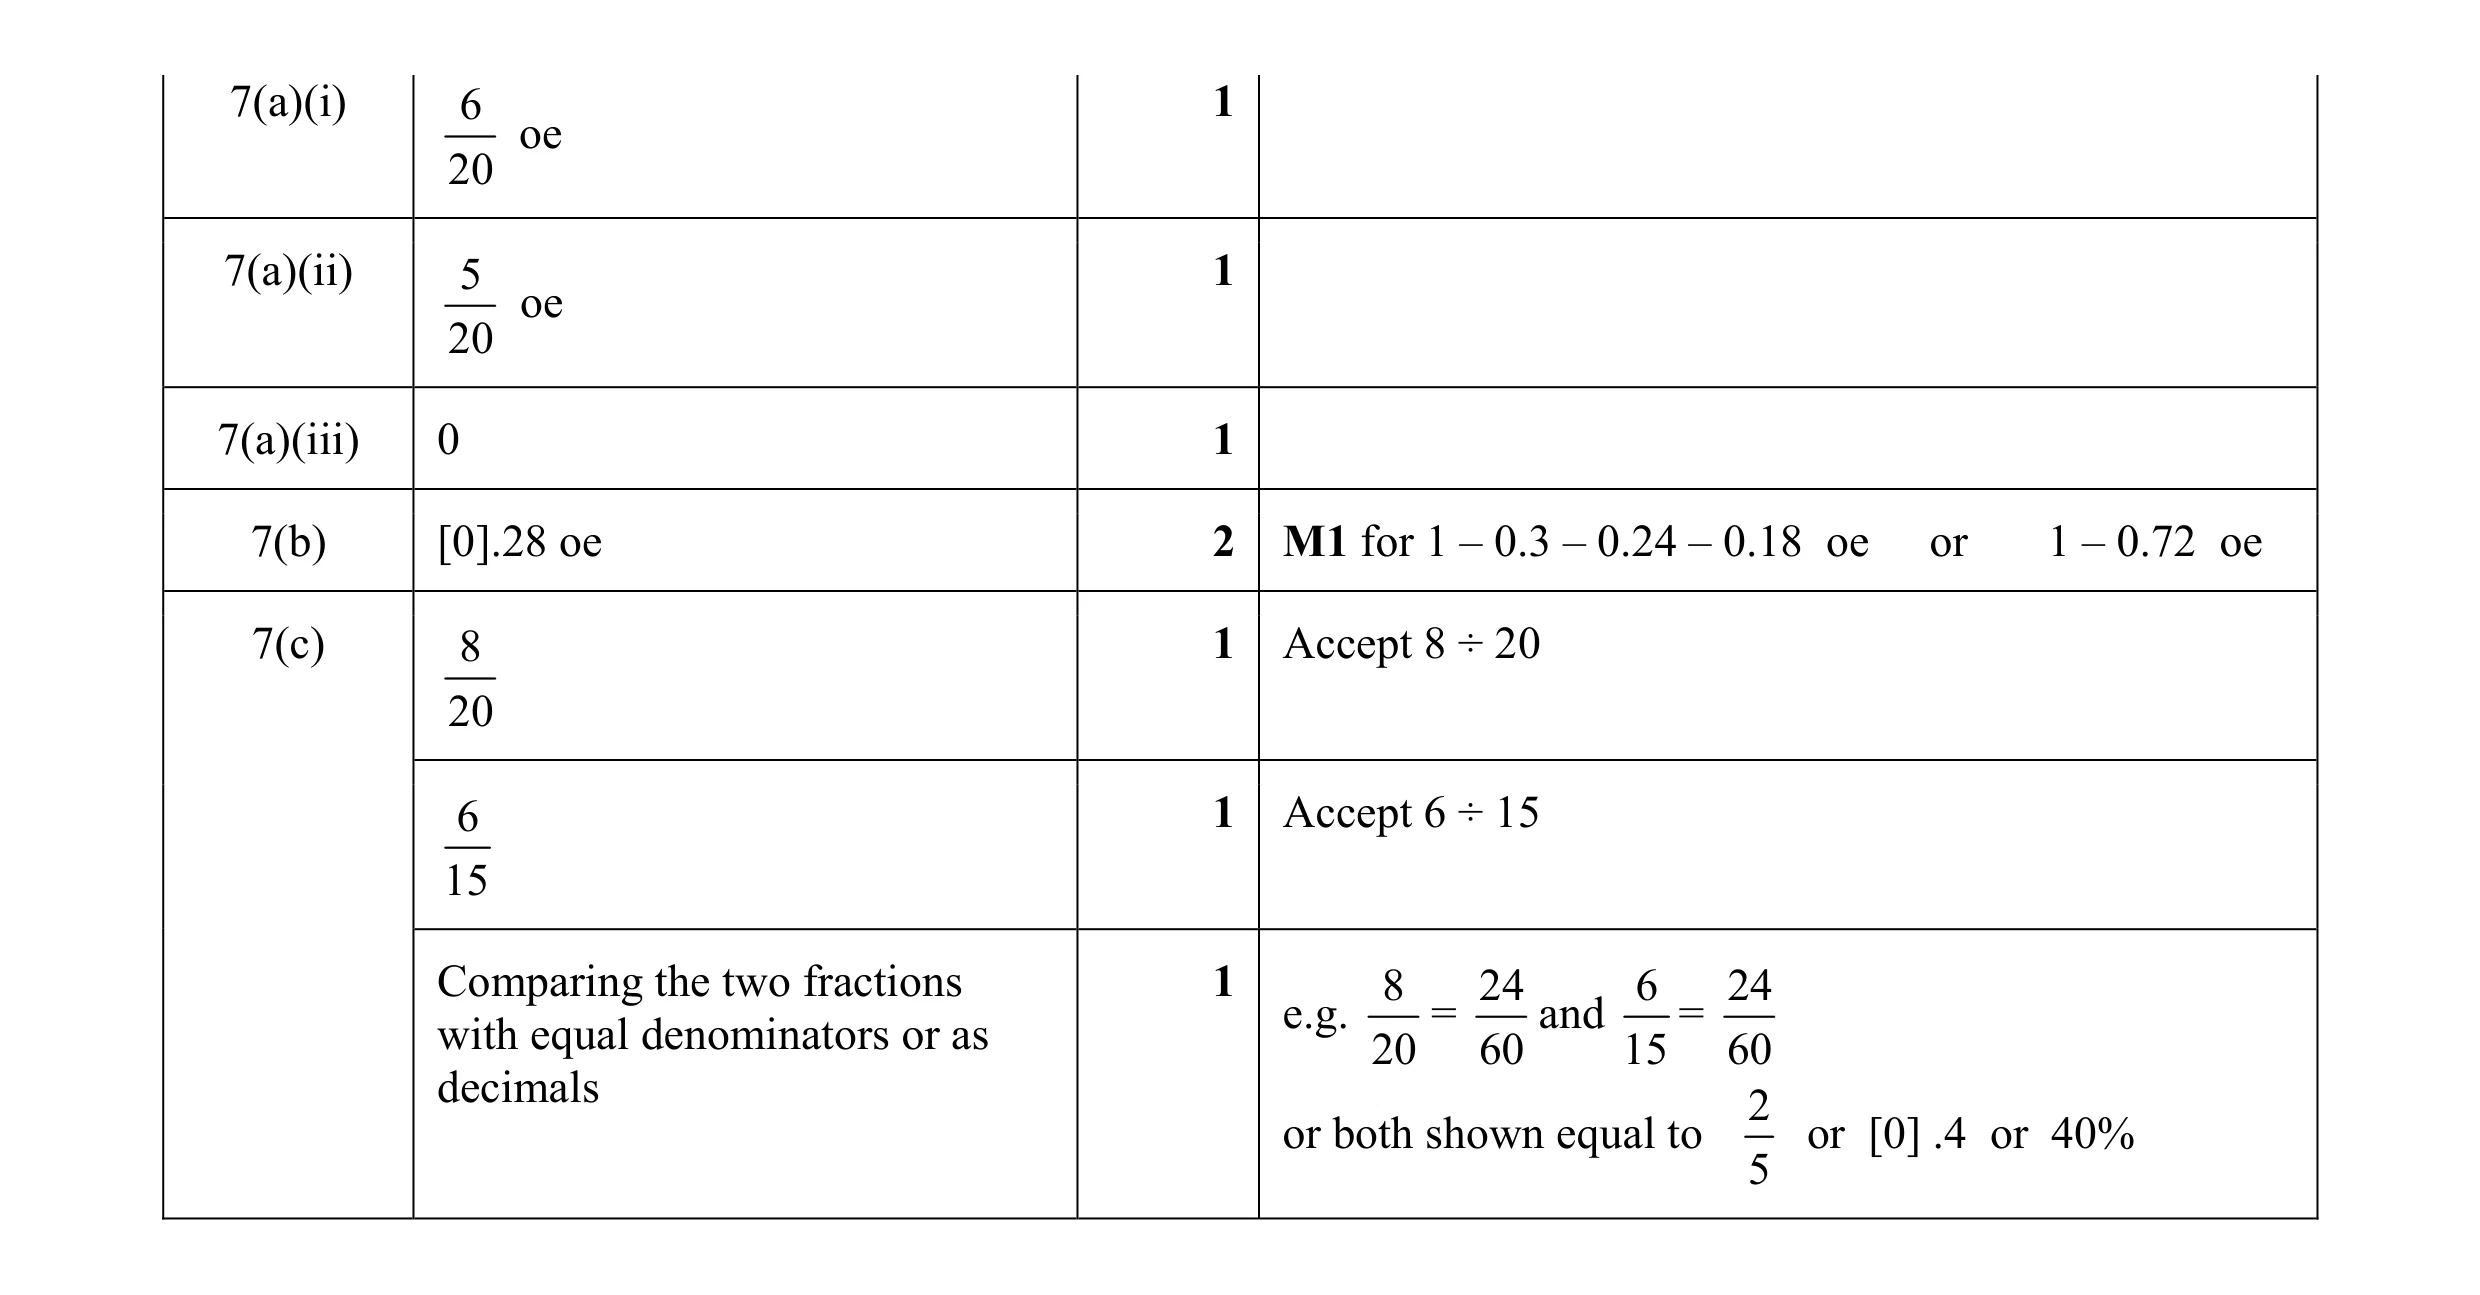 8
8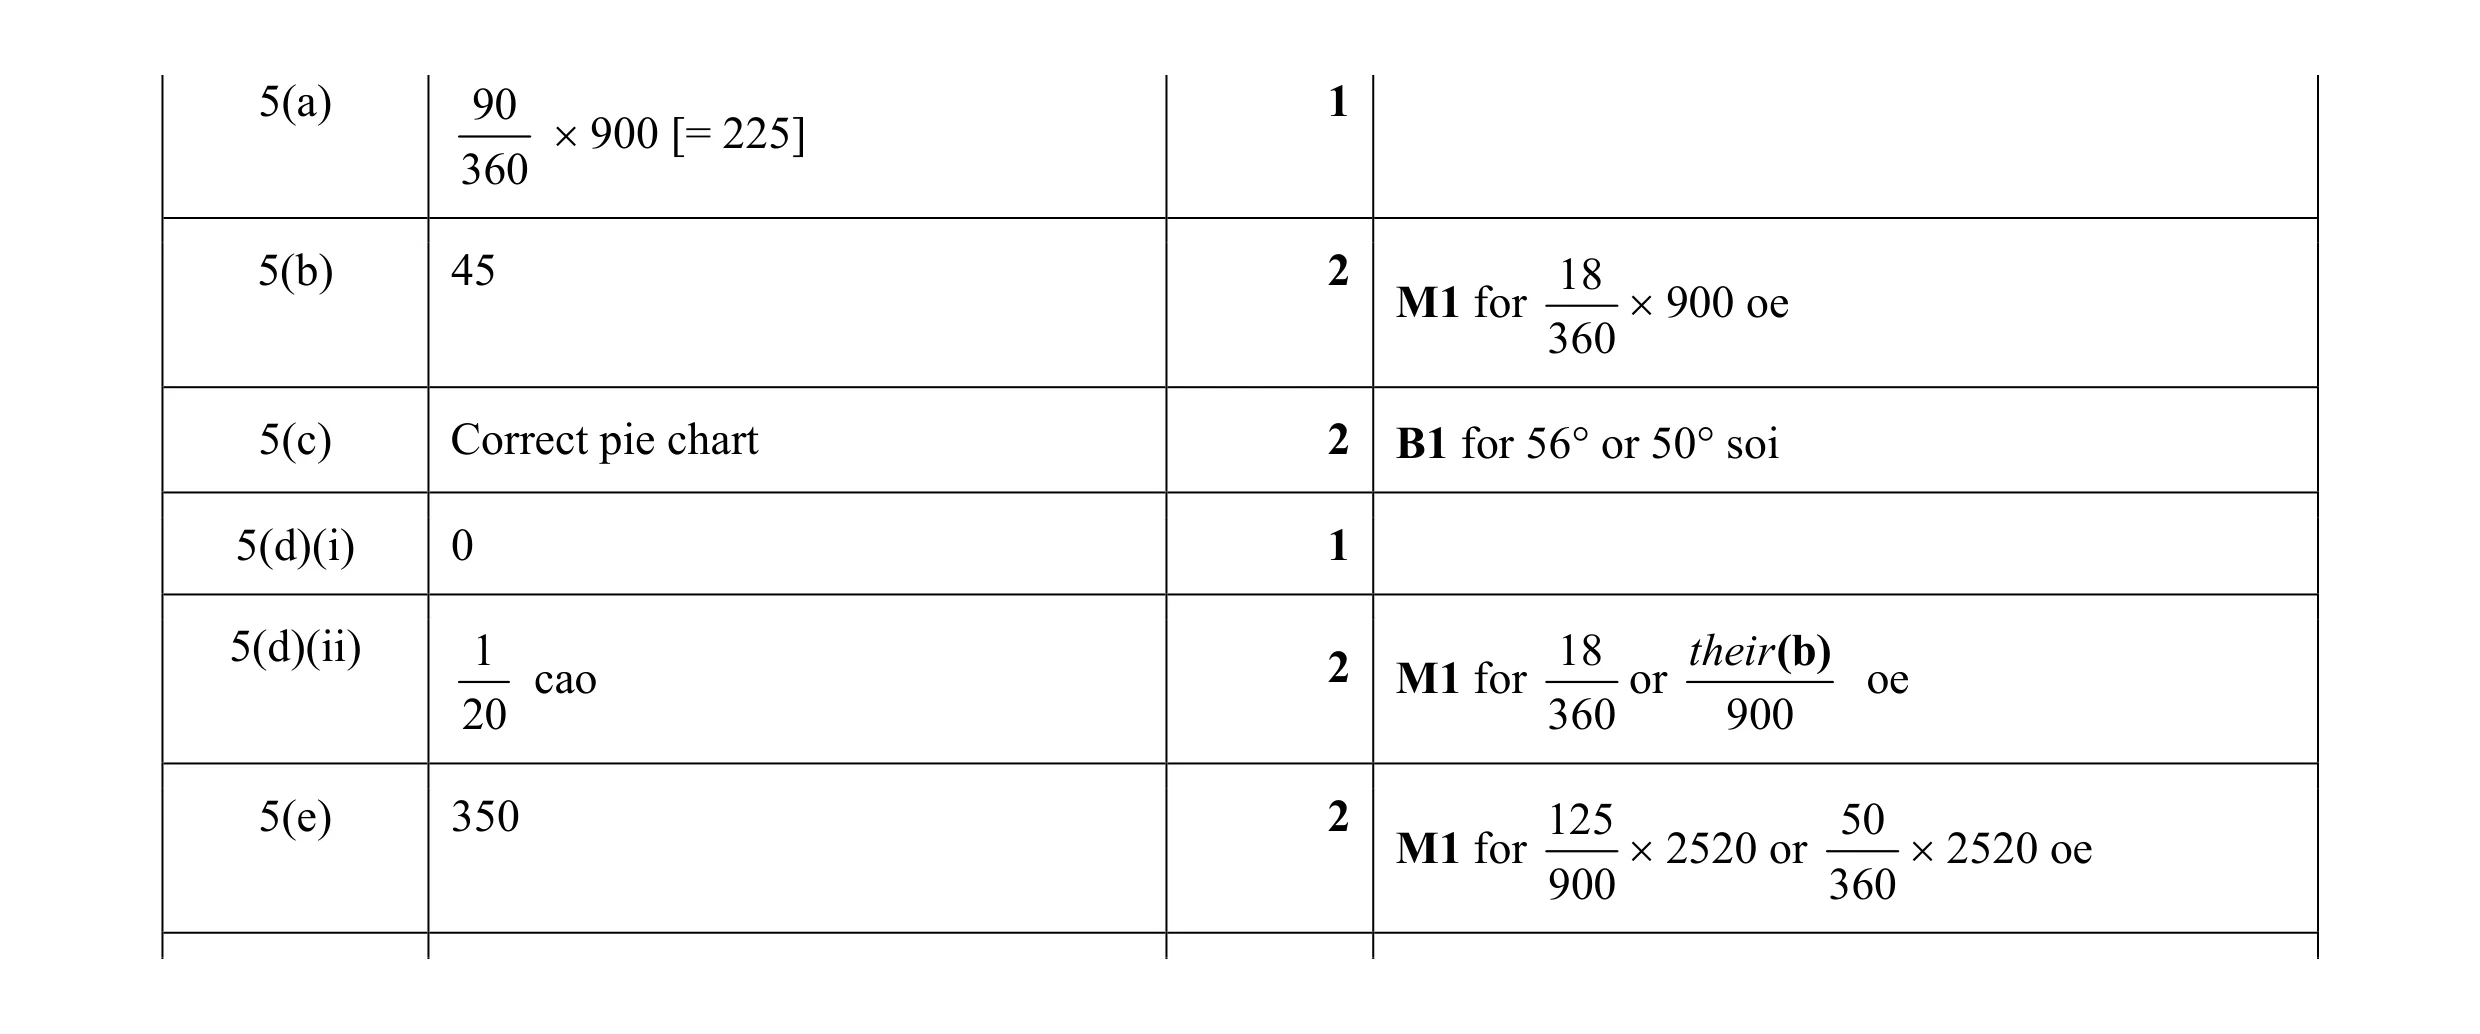 10
10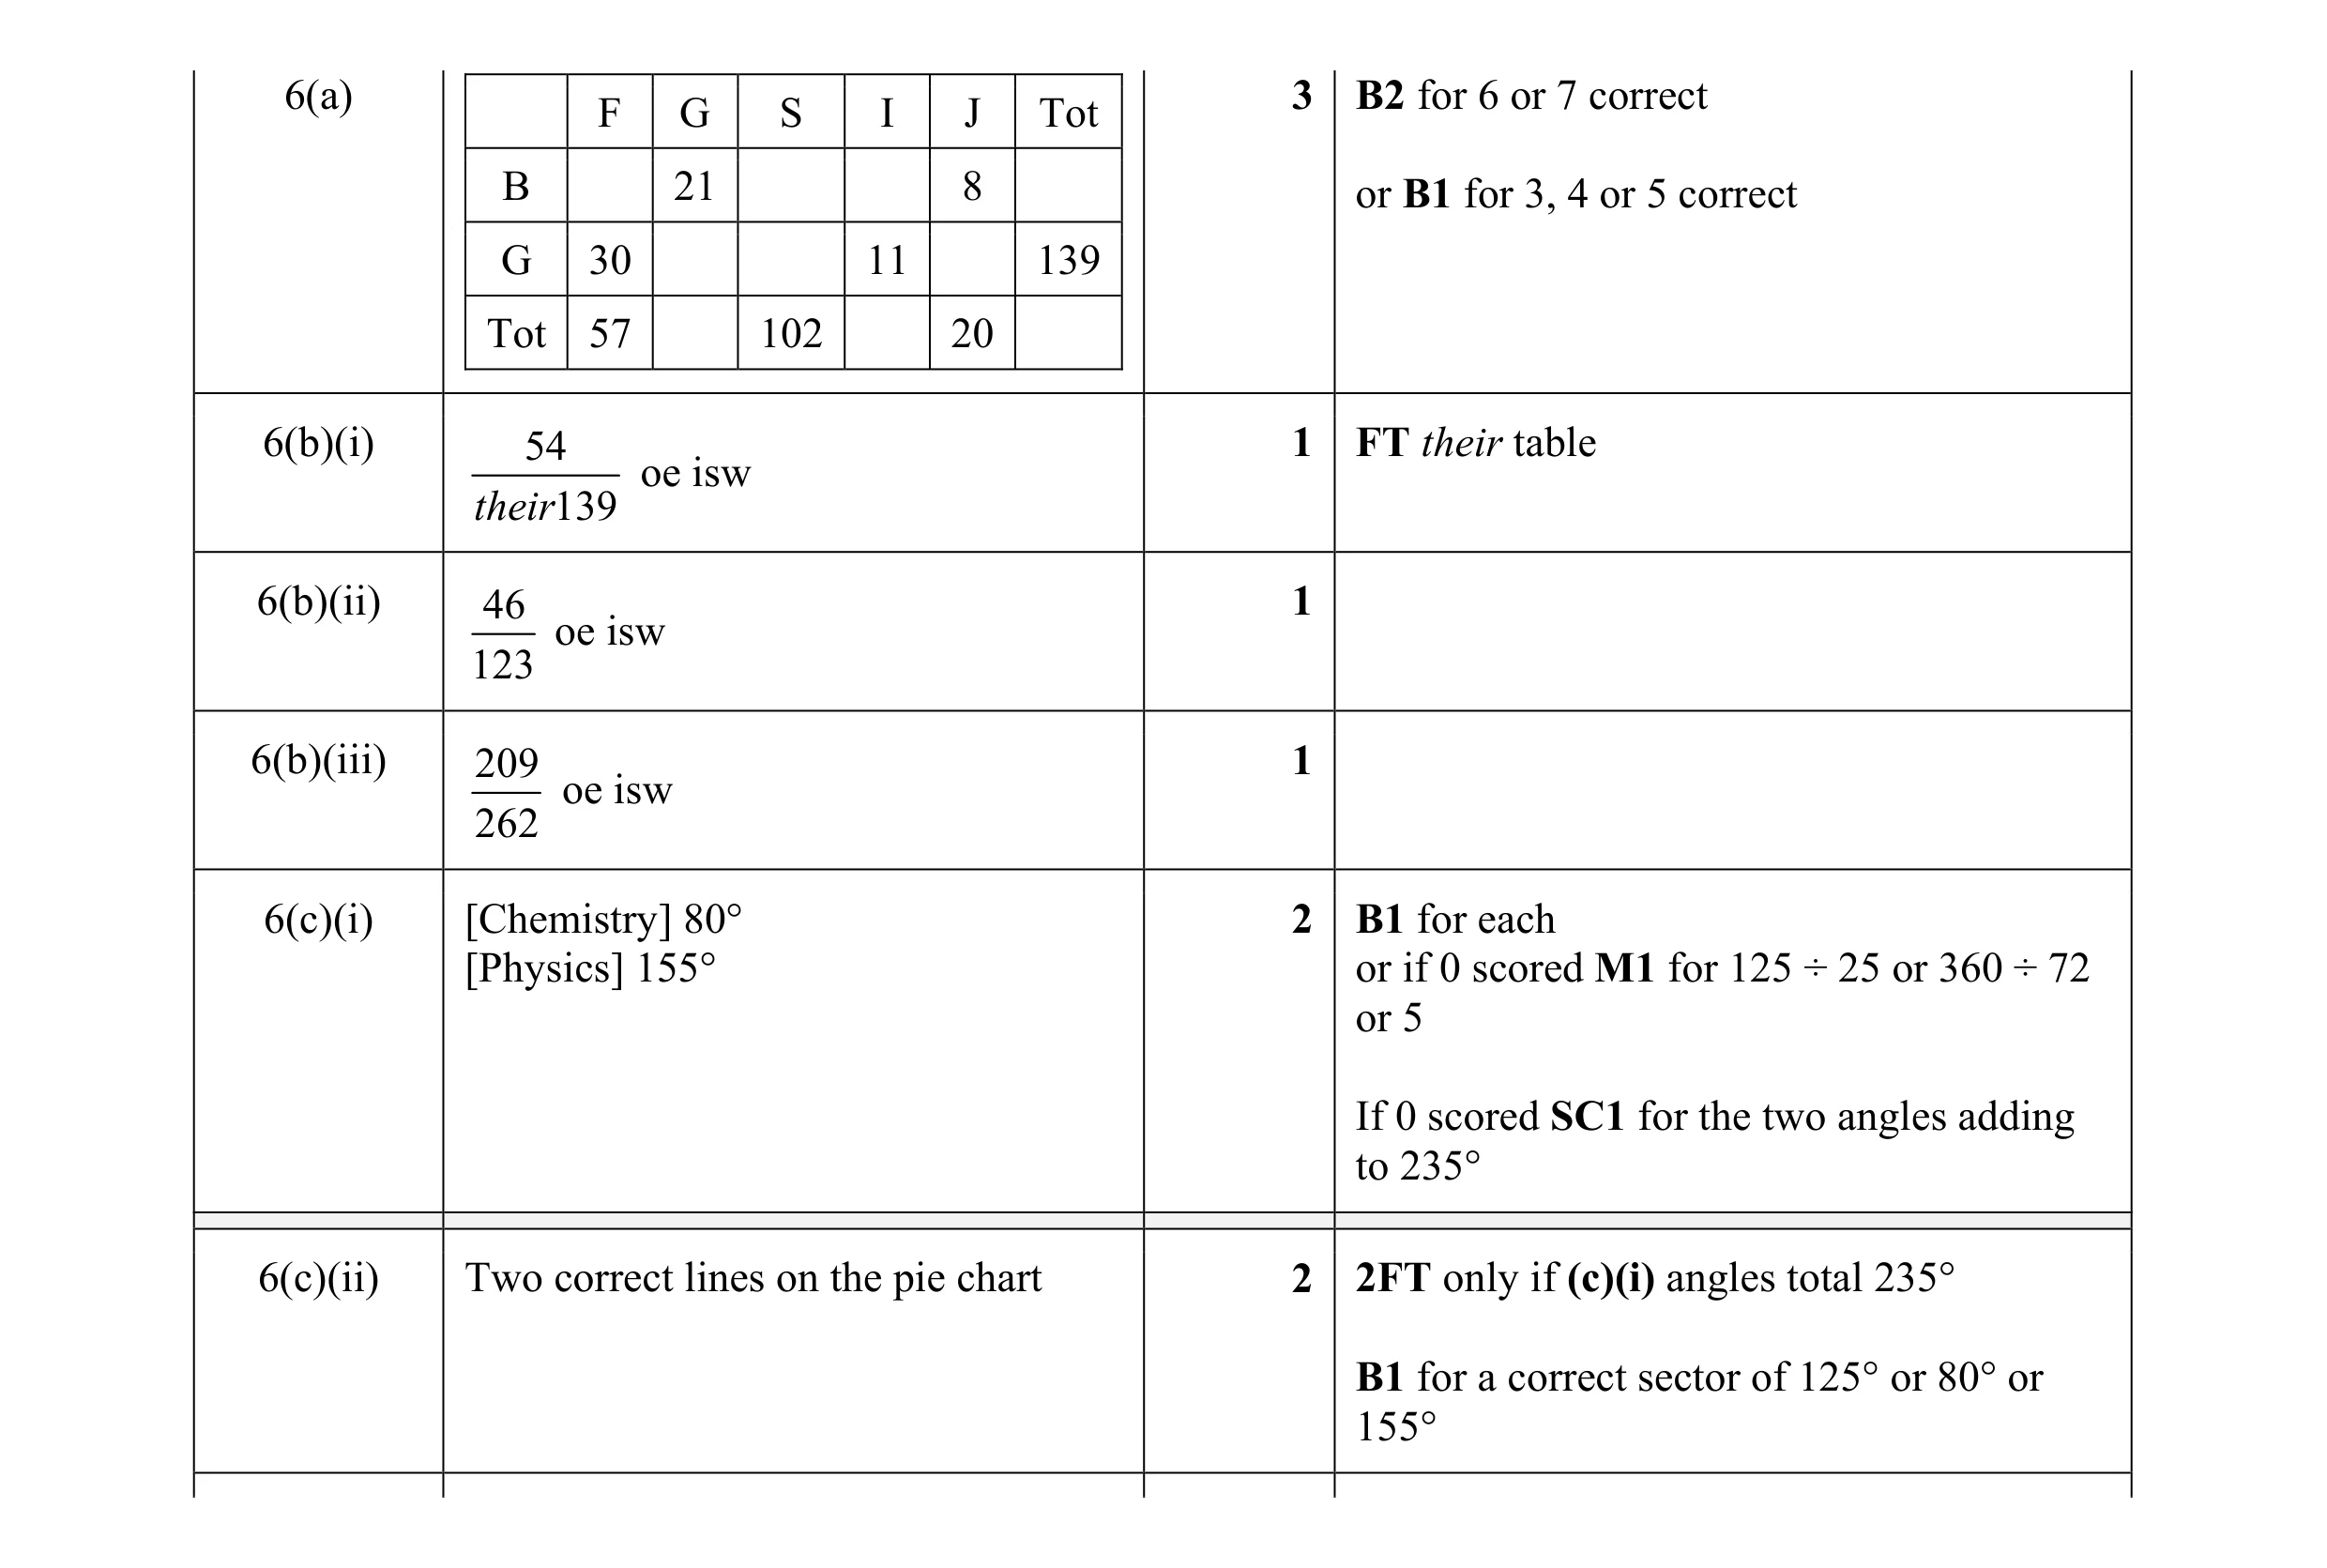 10
10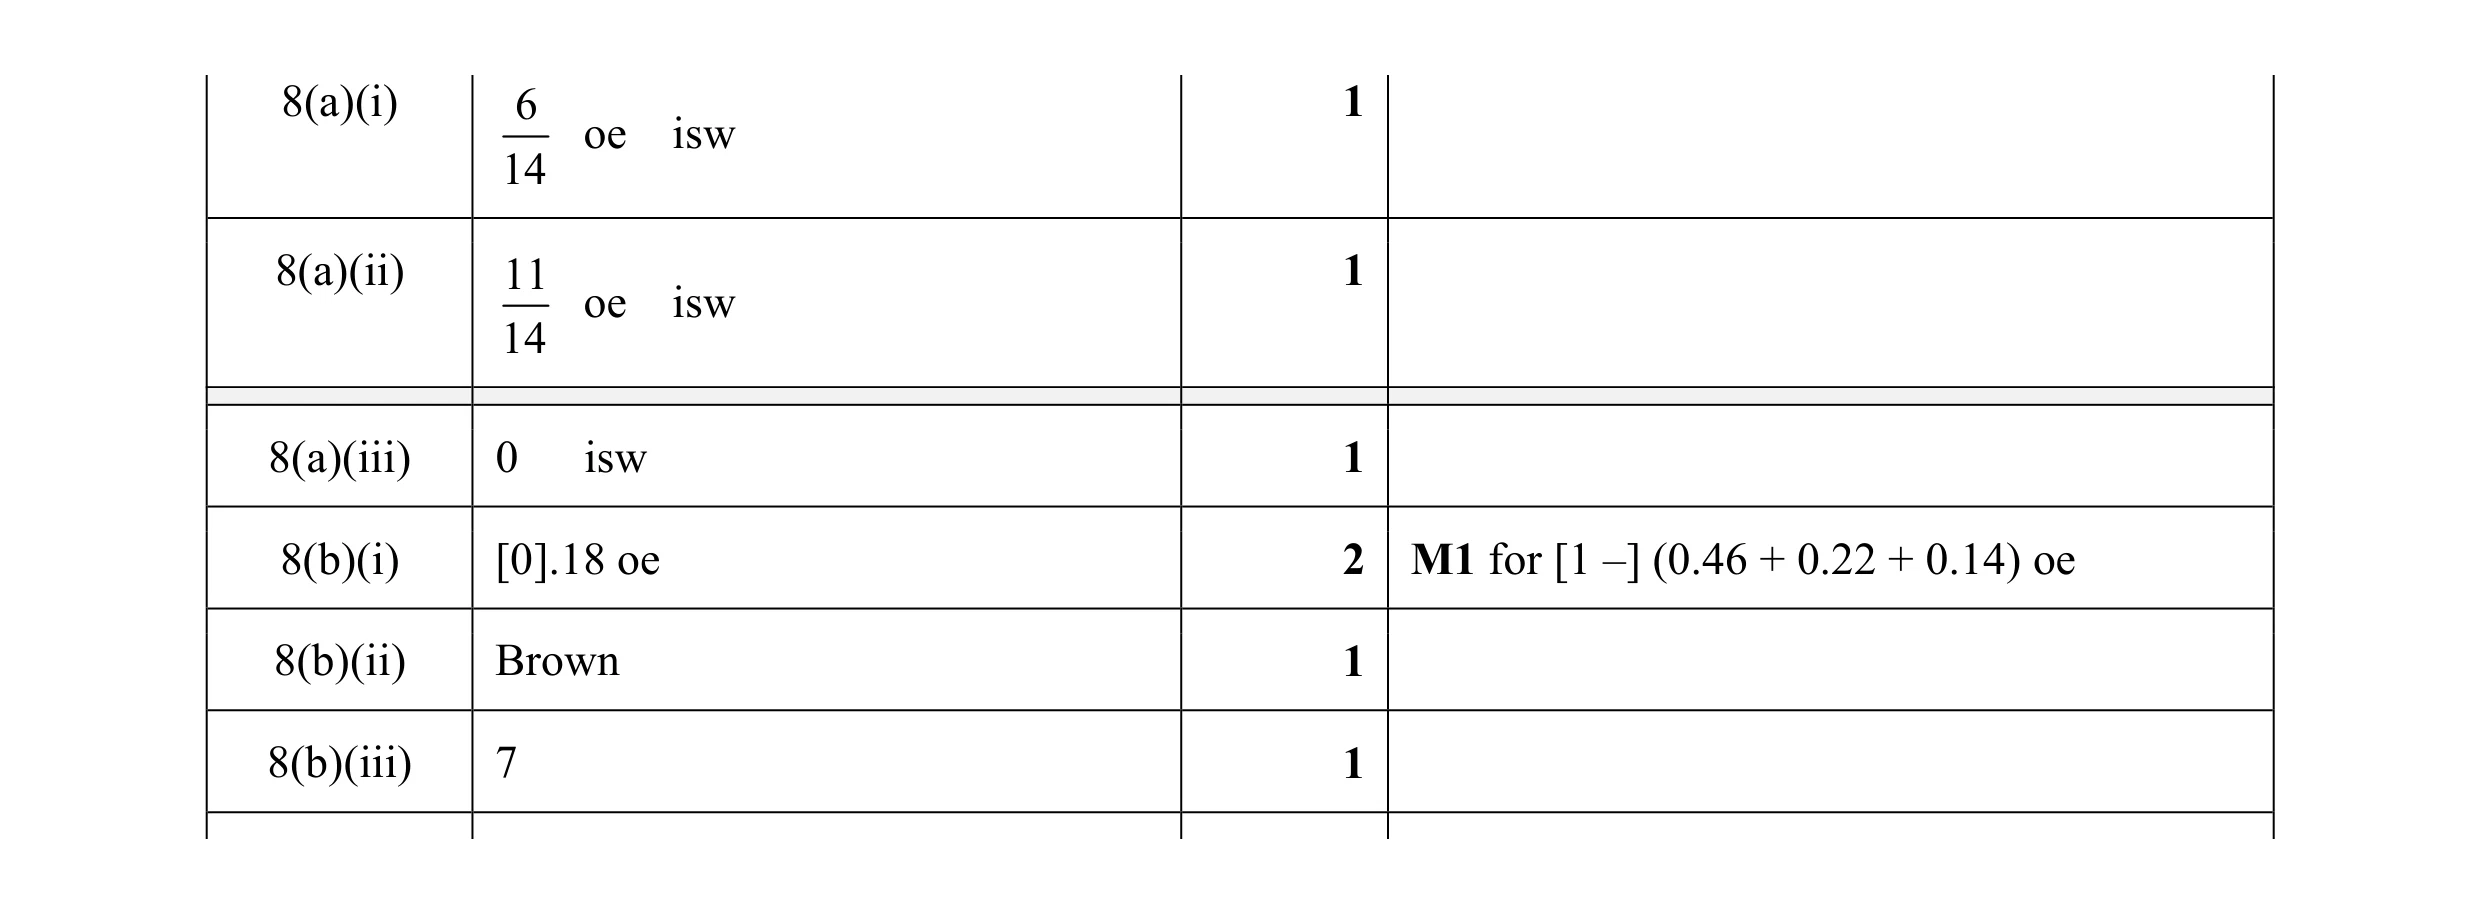 7
7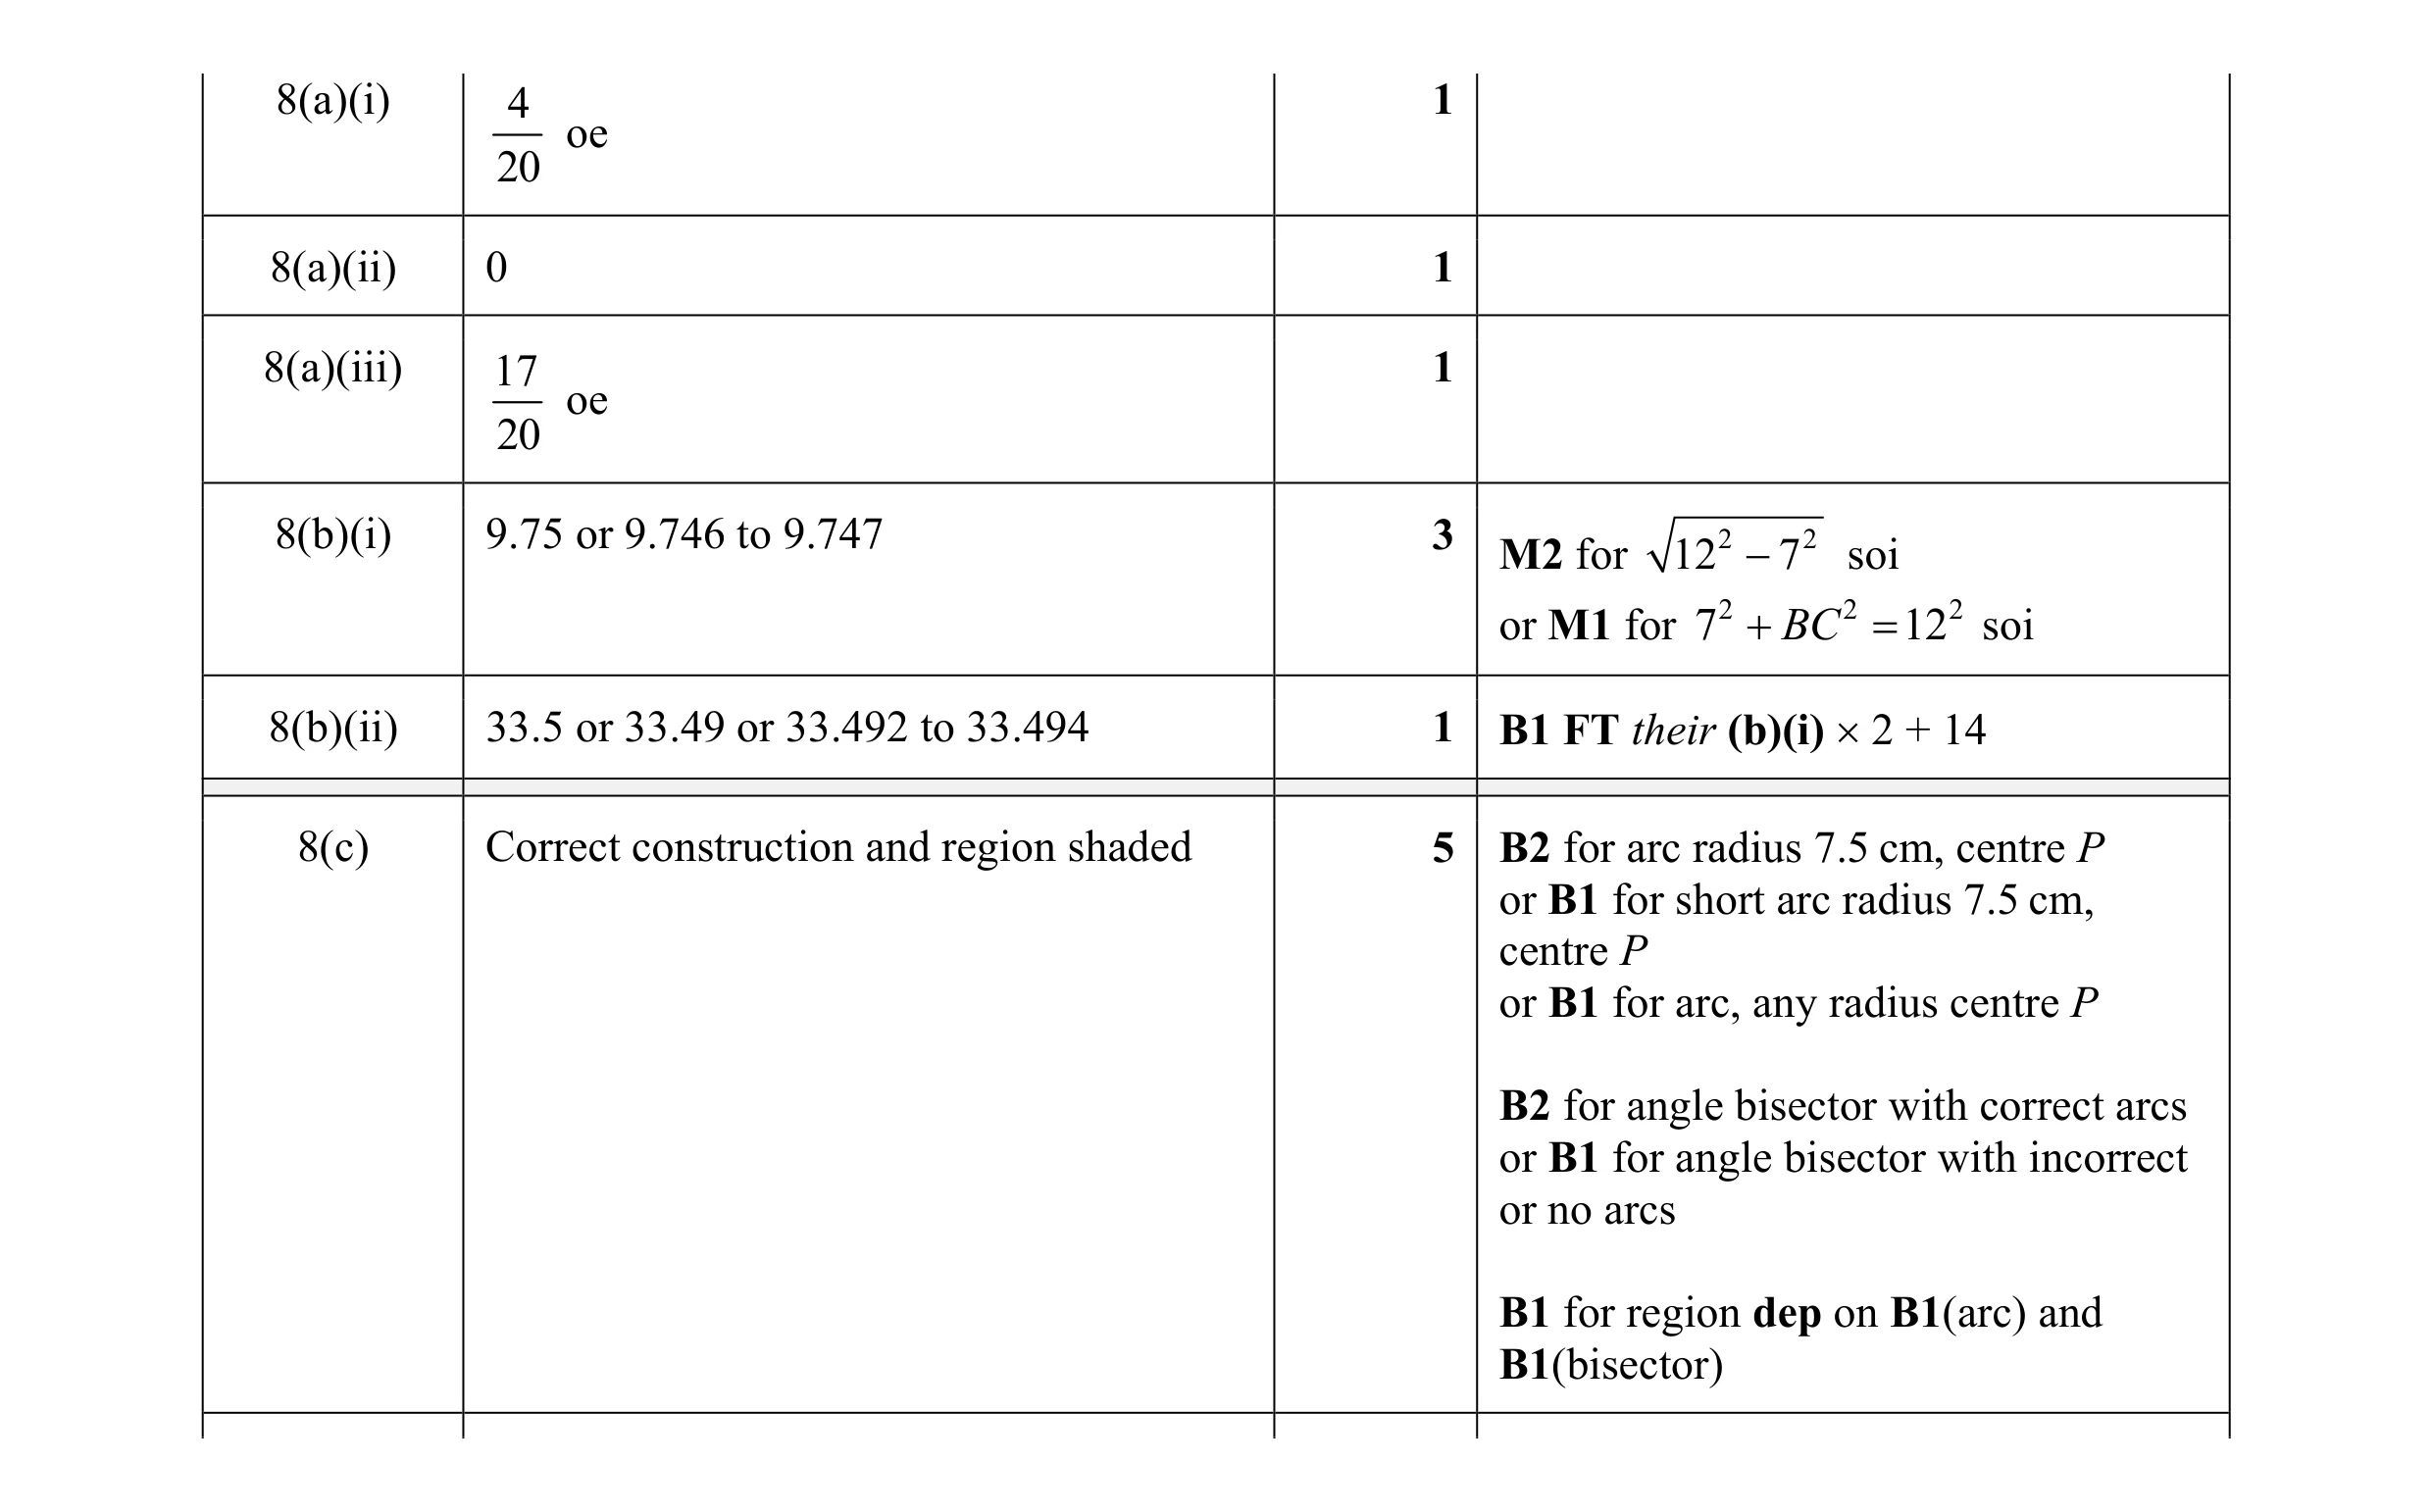 12
12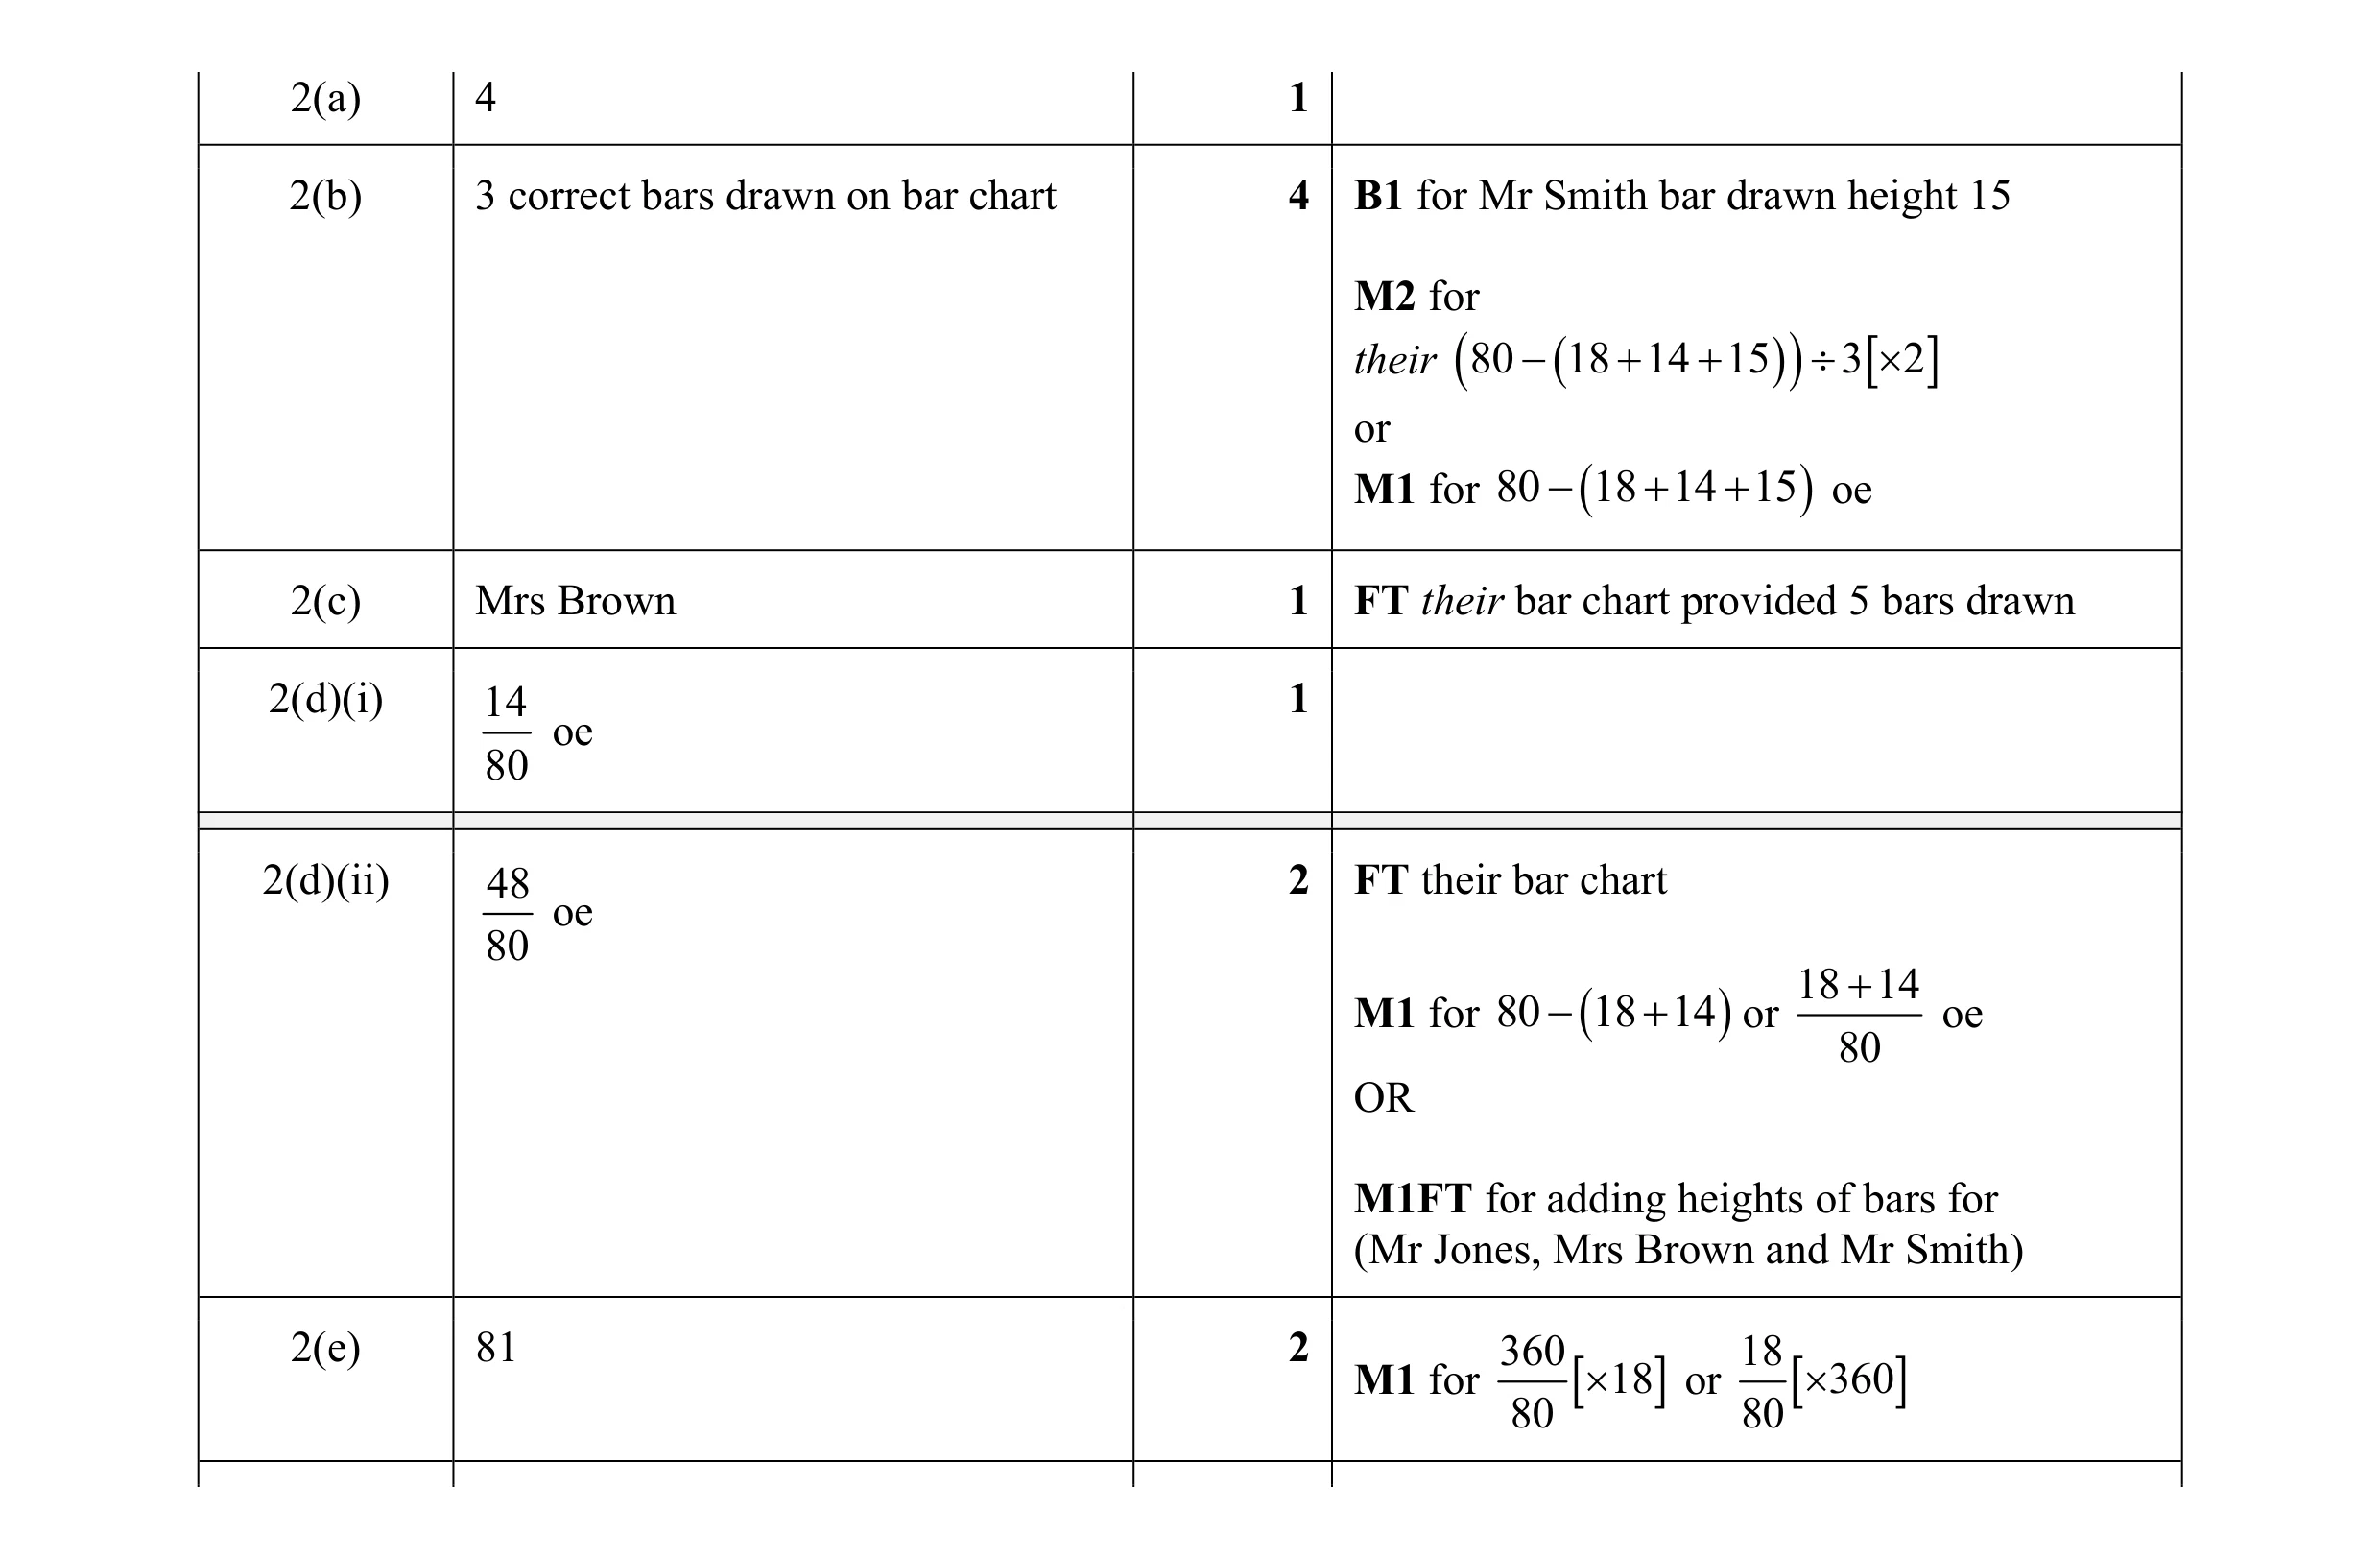 11
11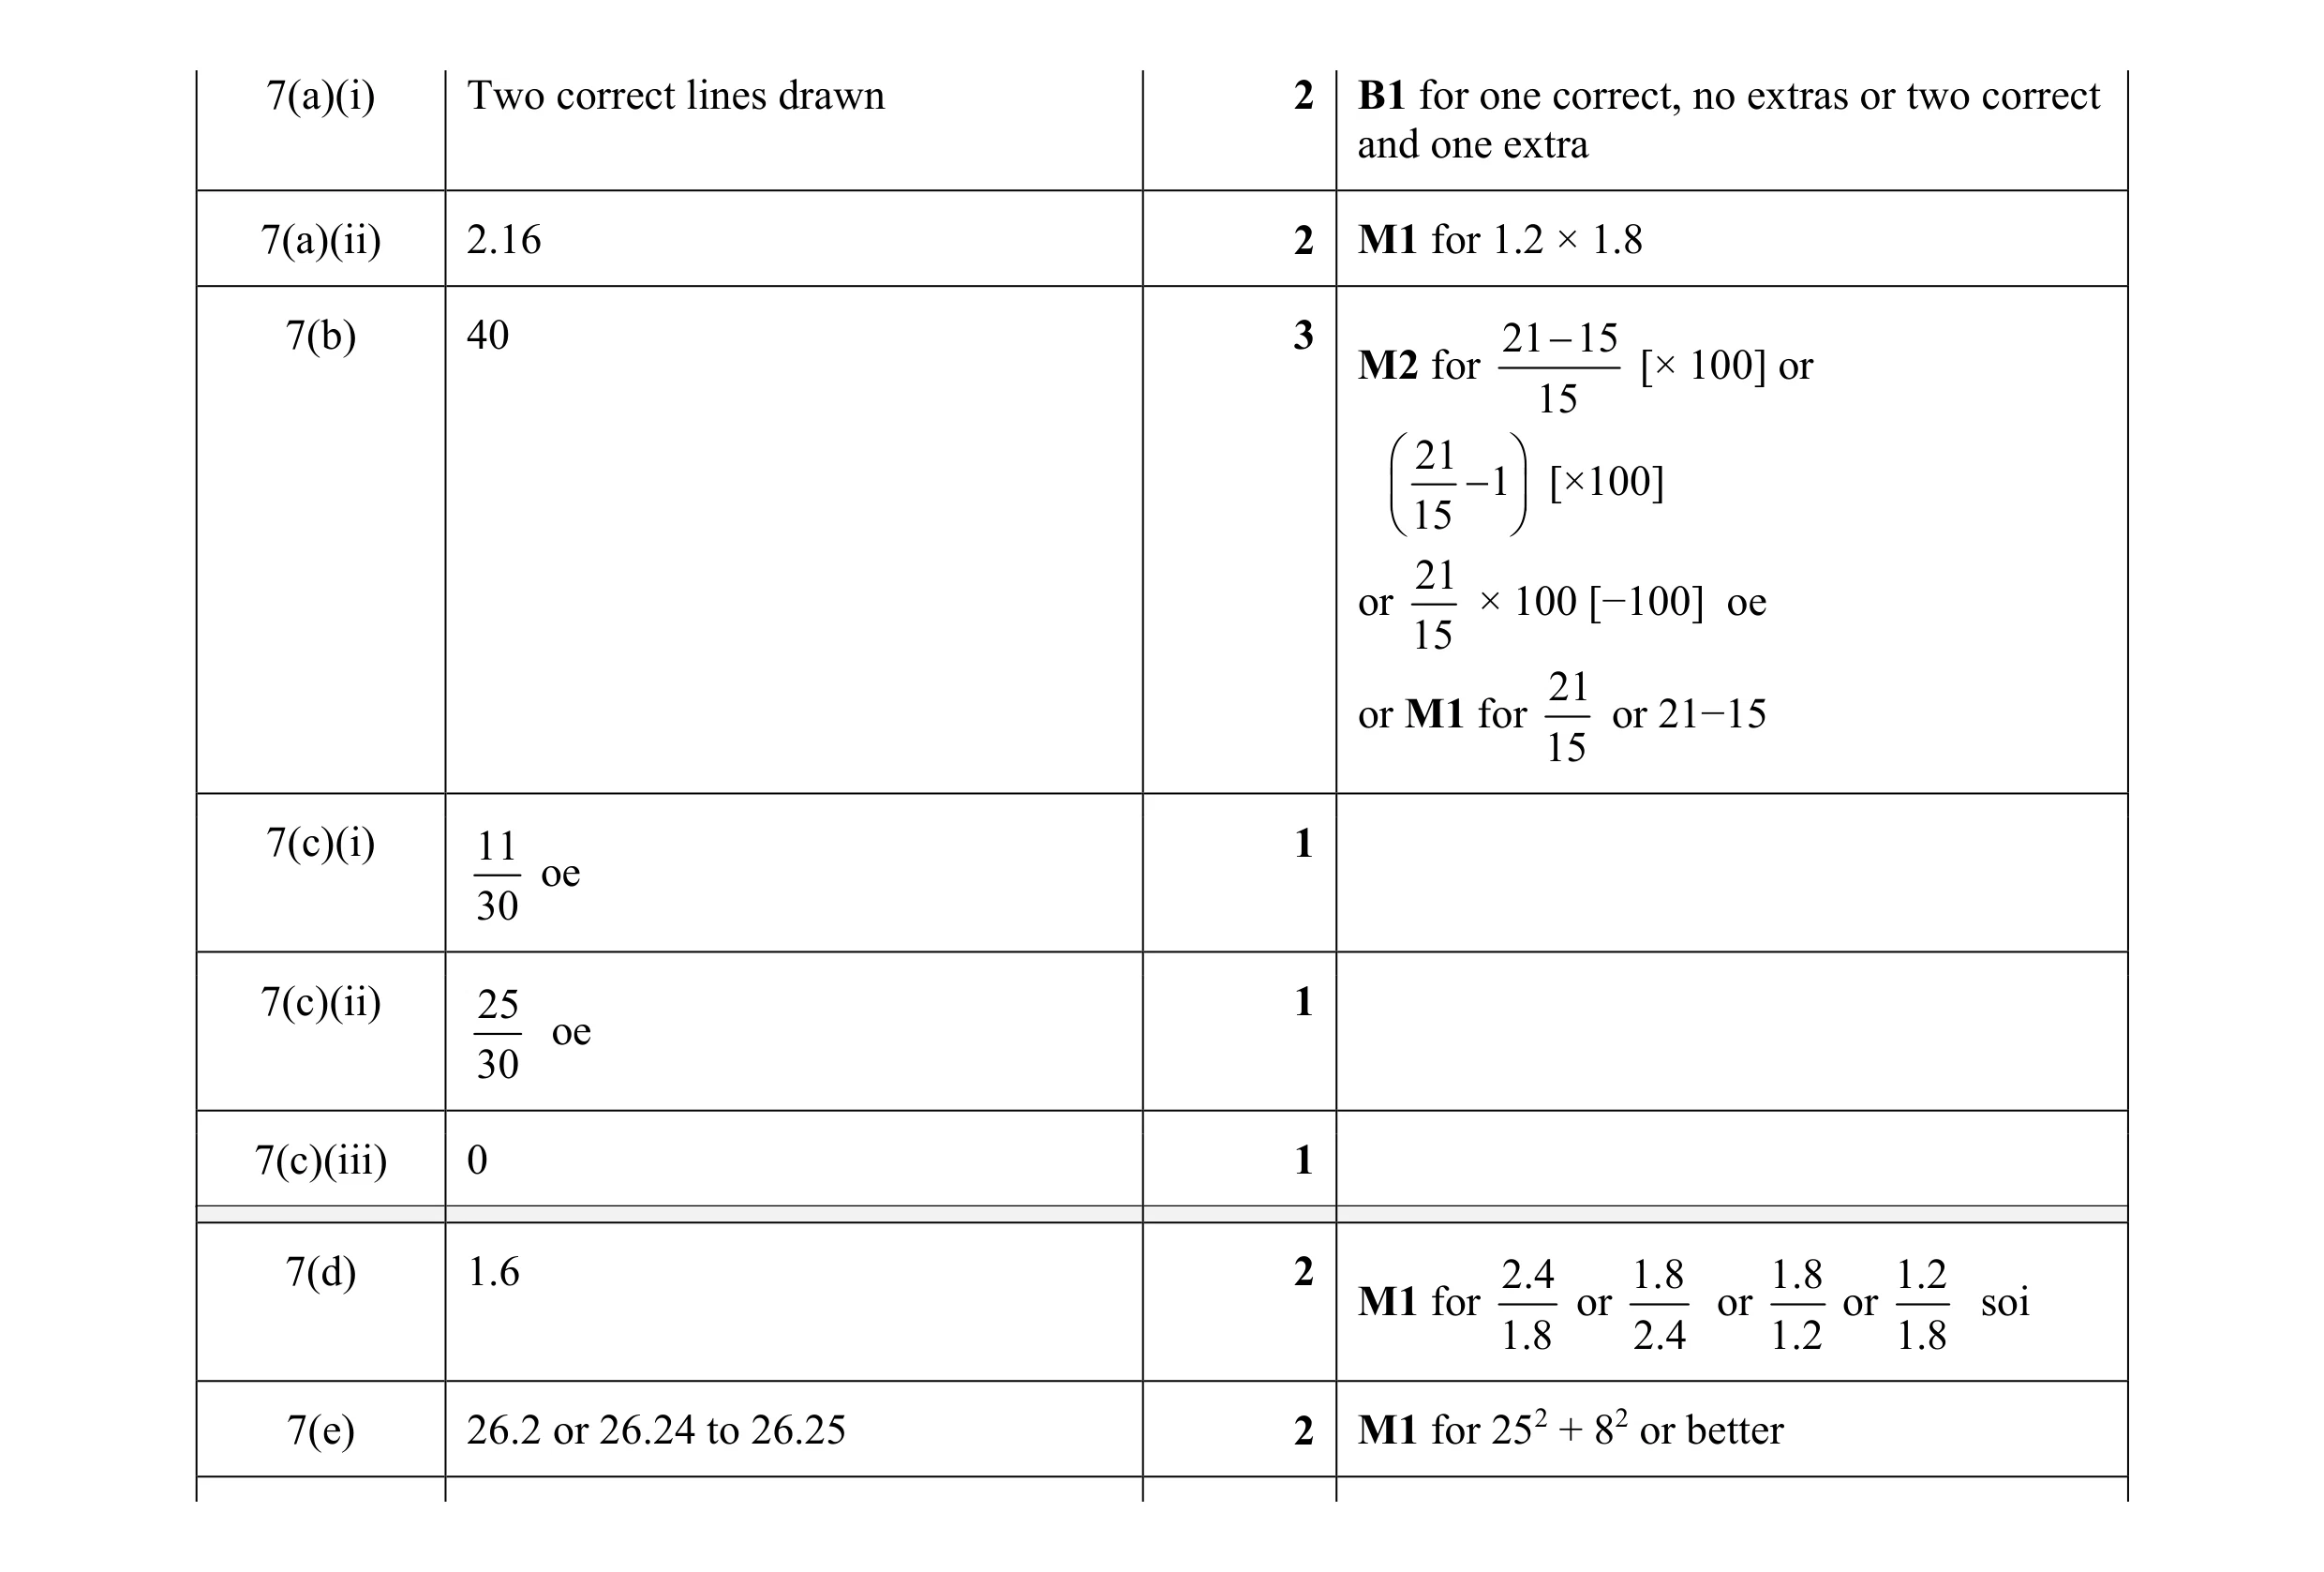 14
14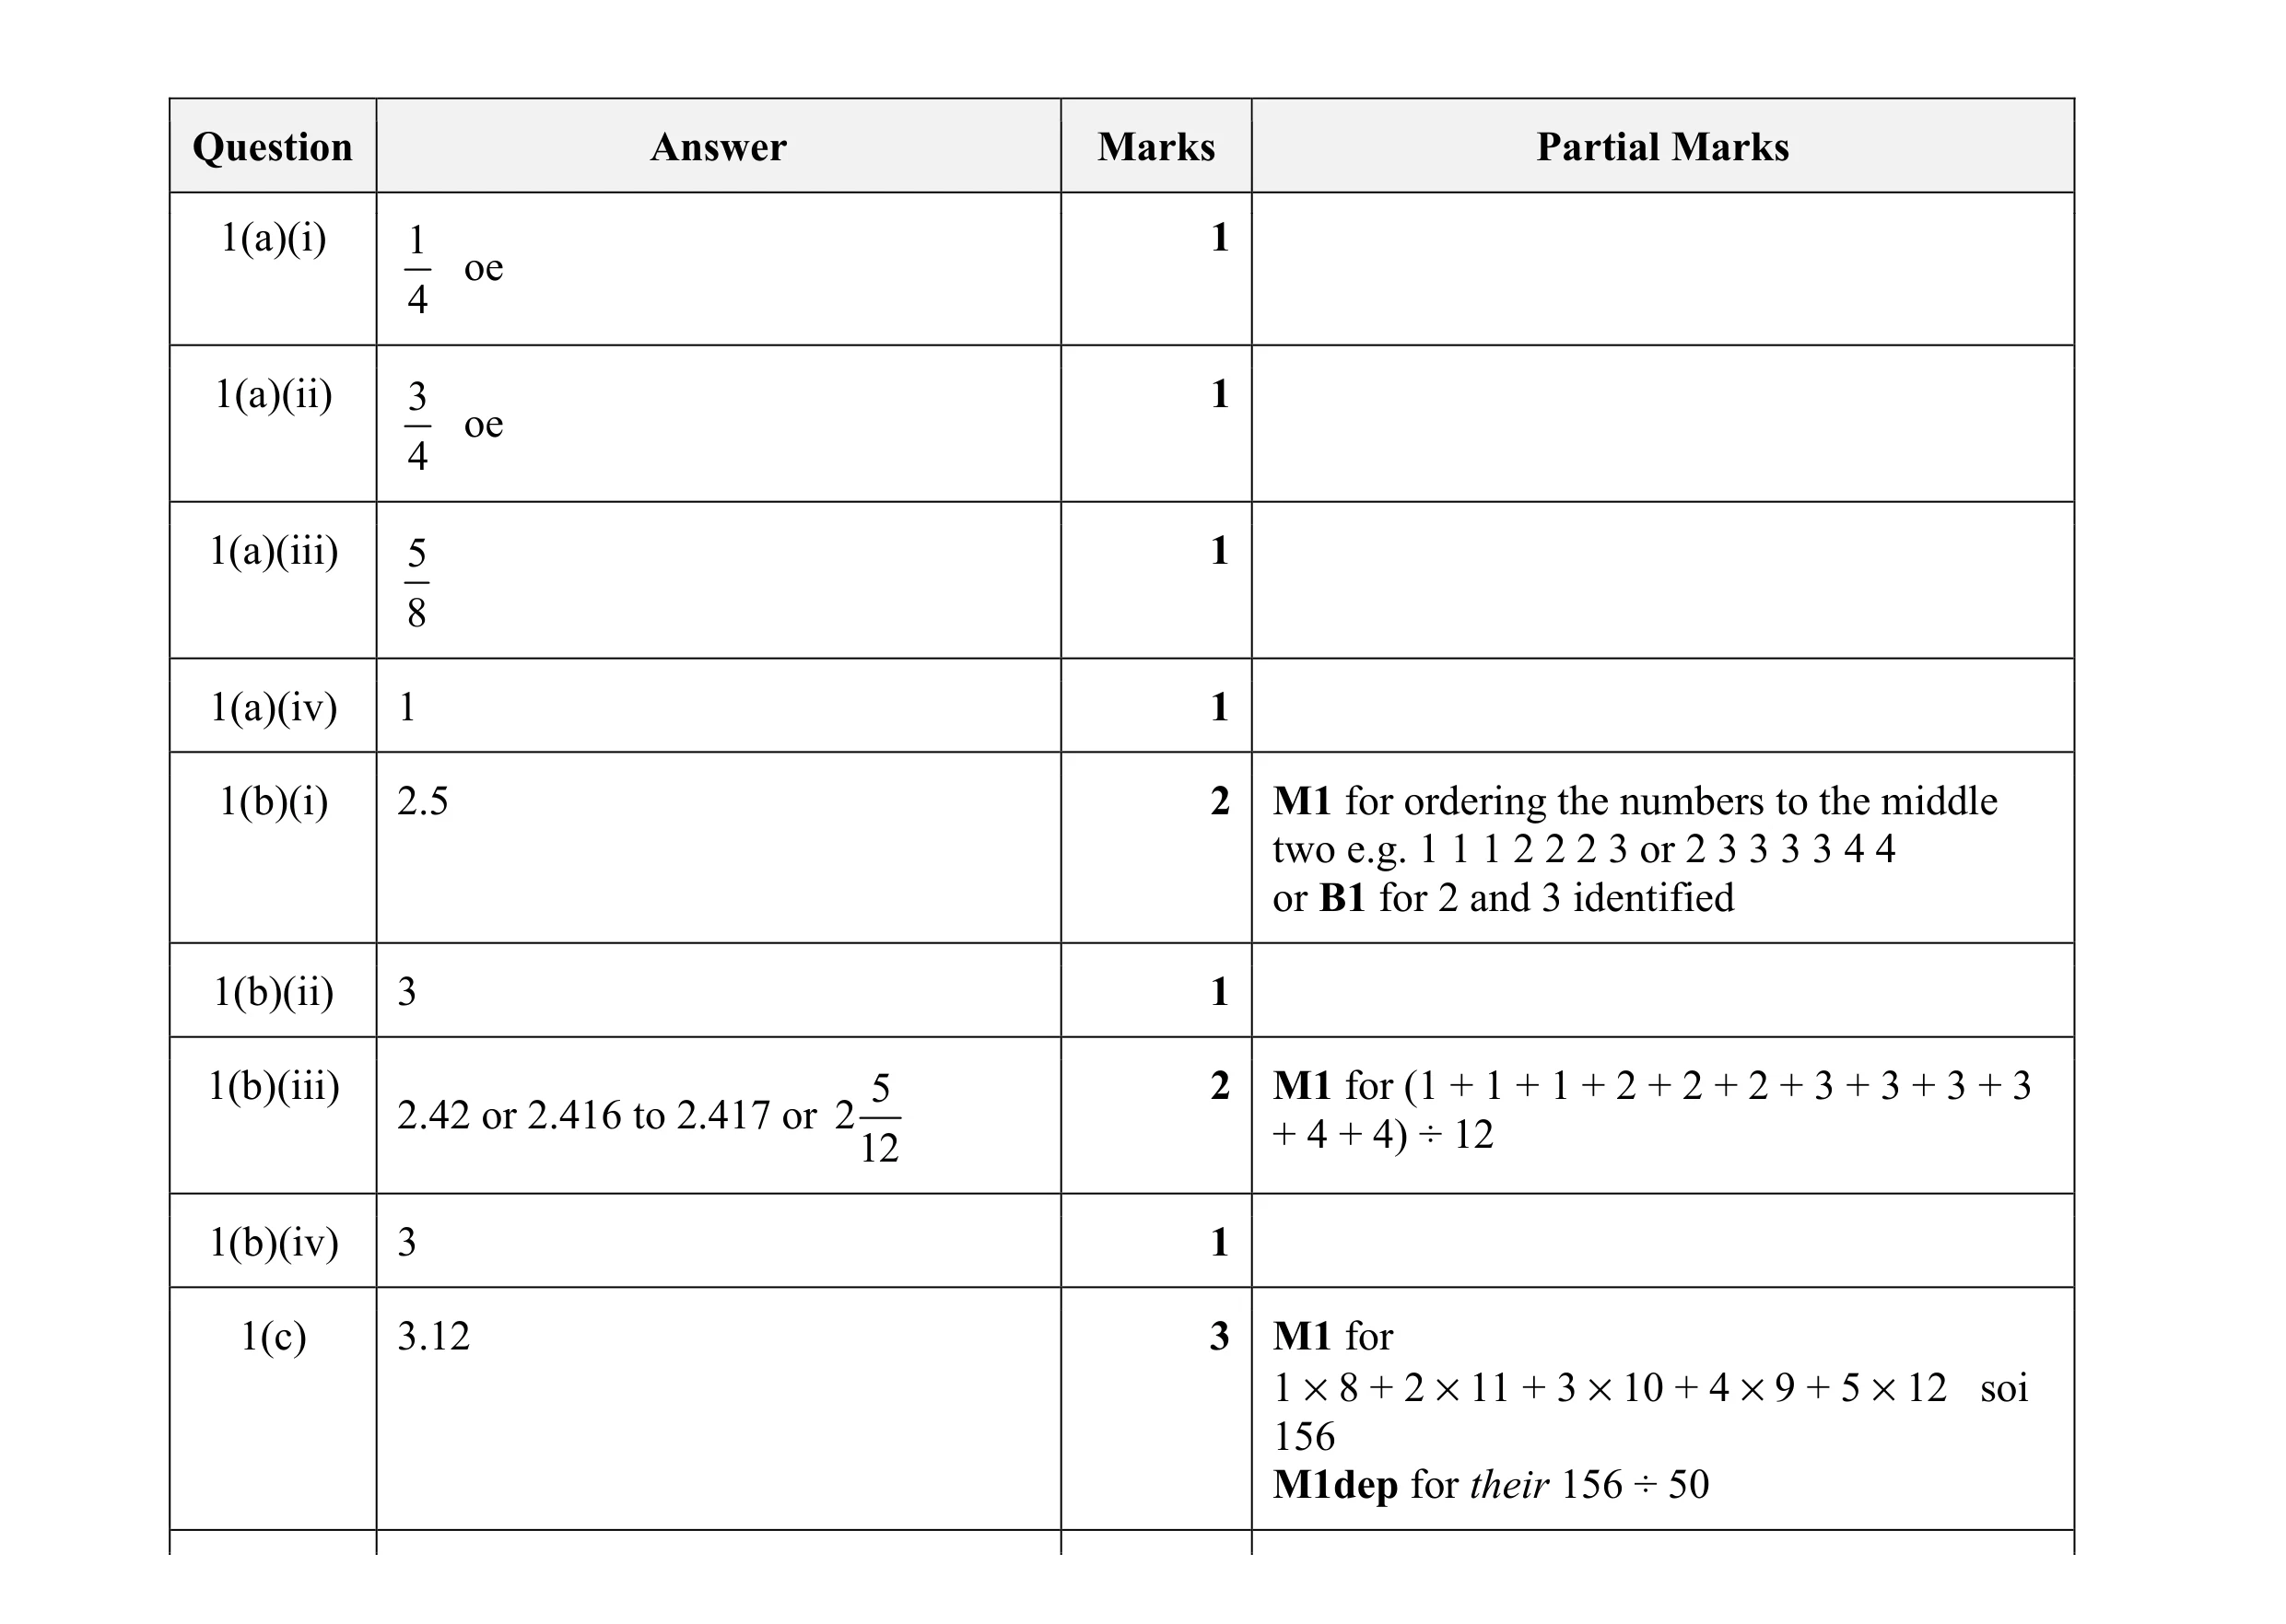 13
13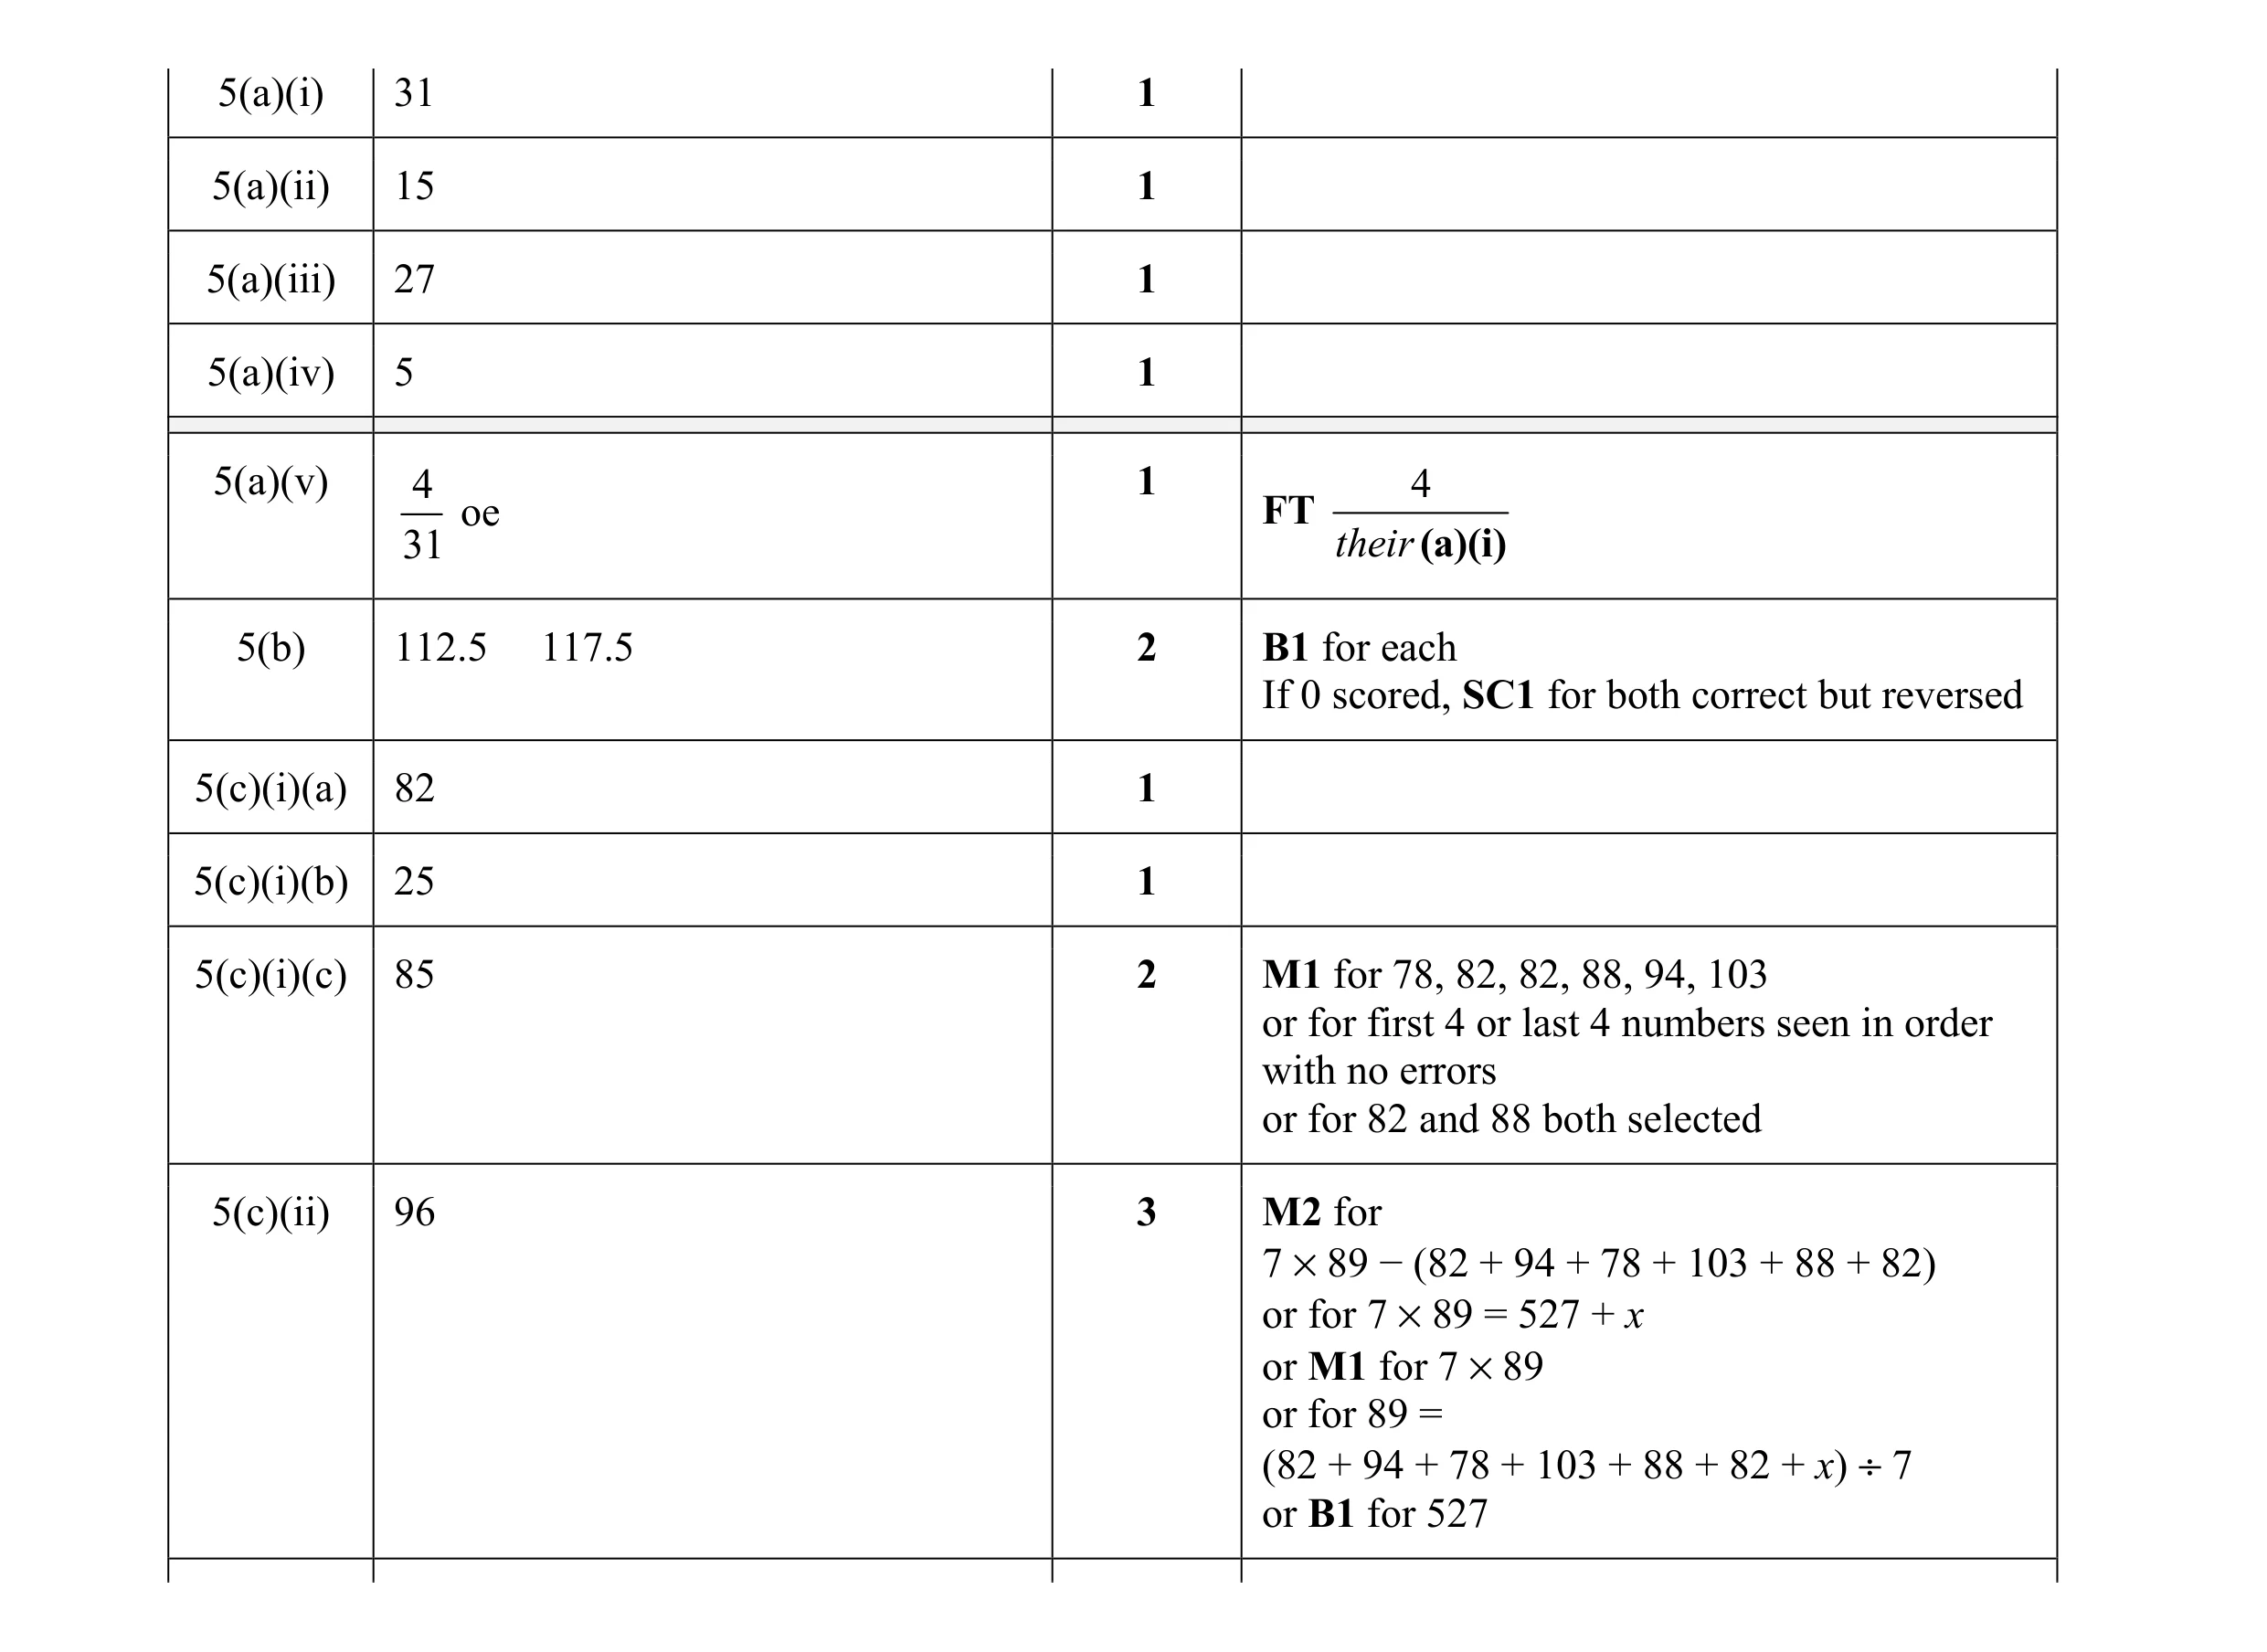 14
14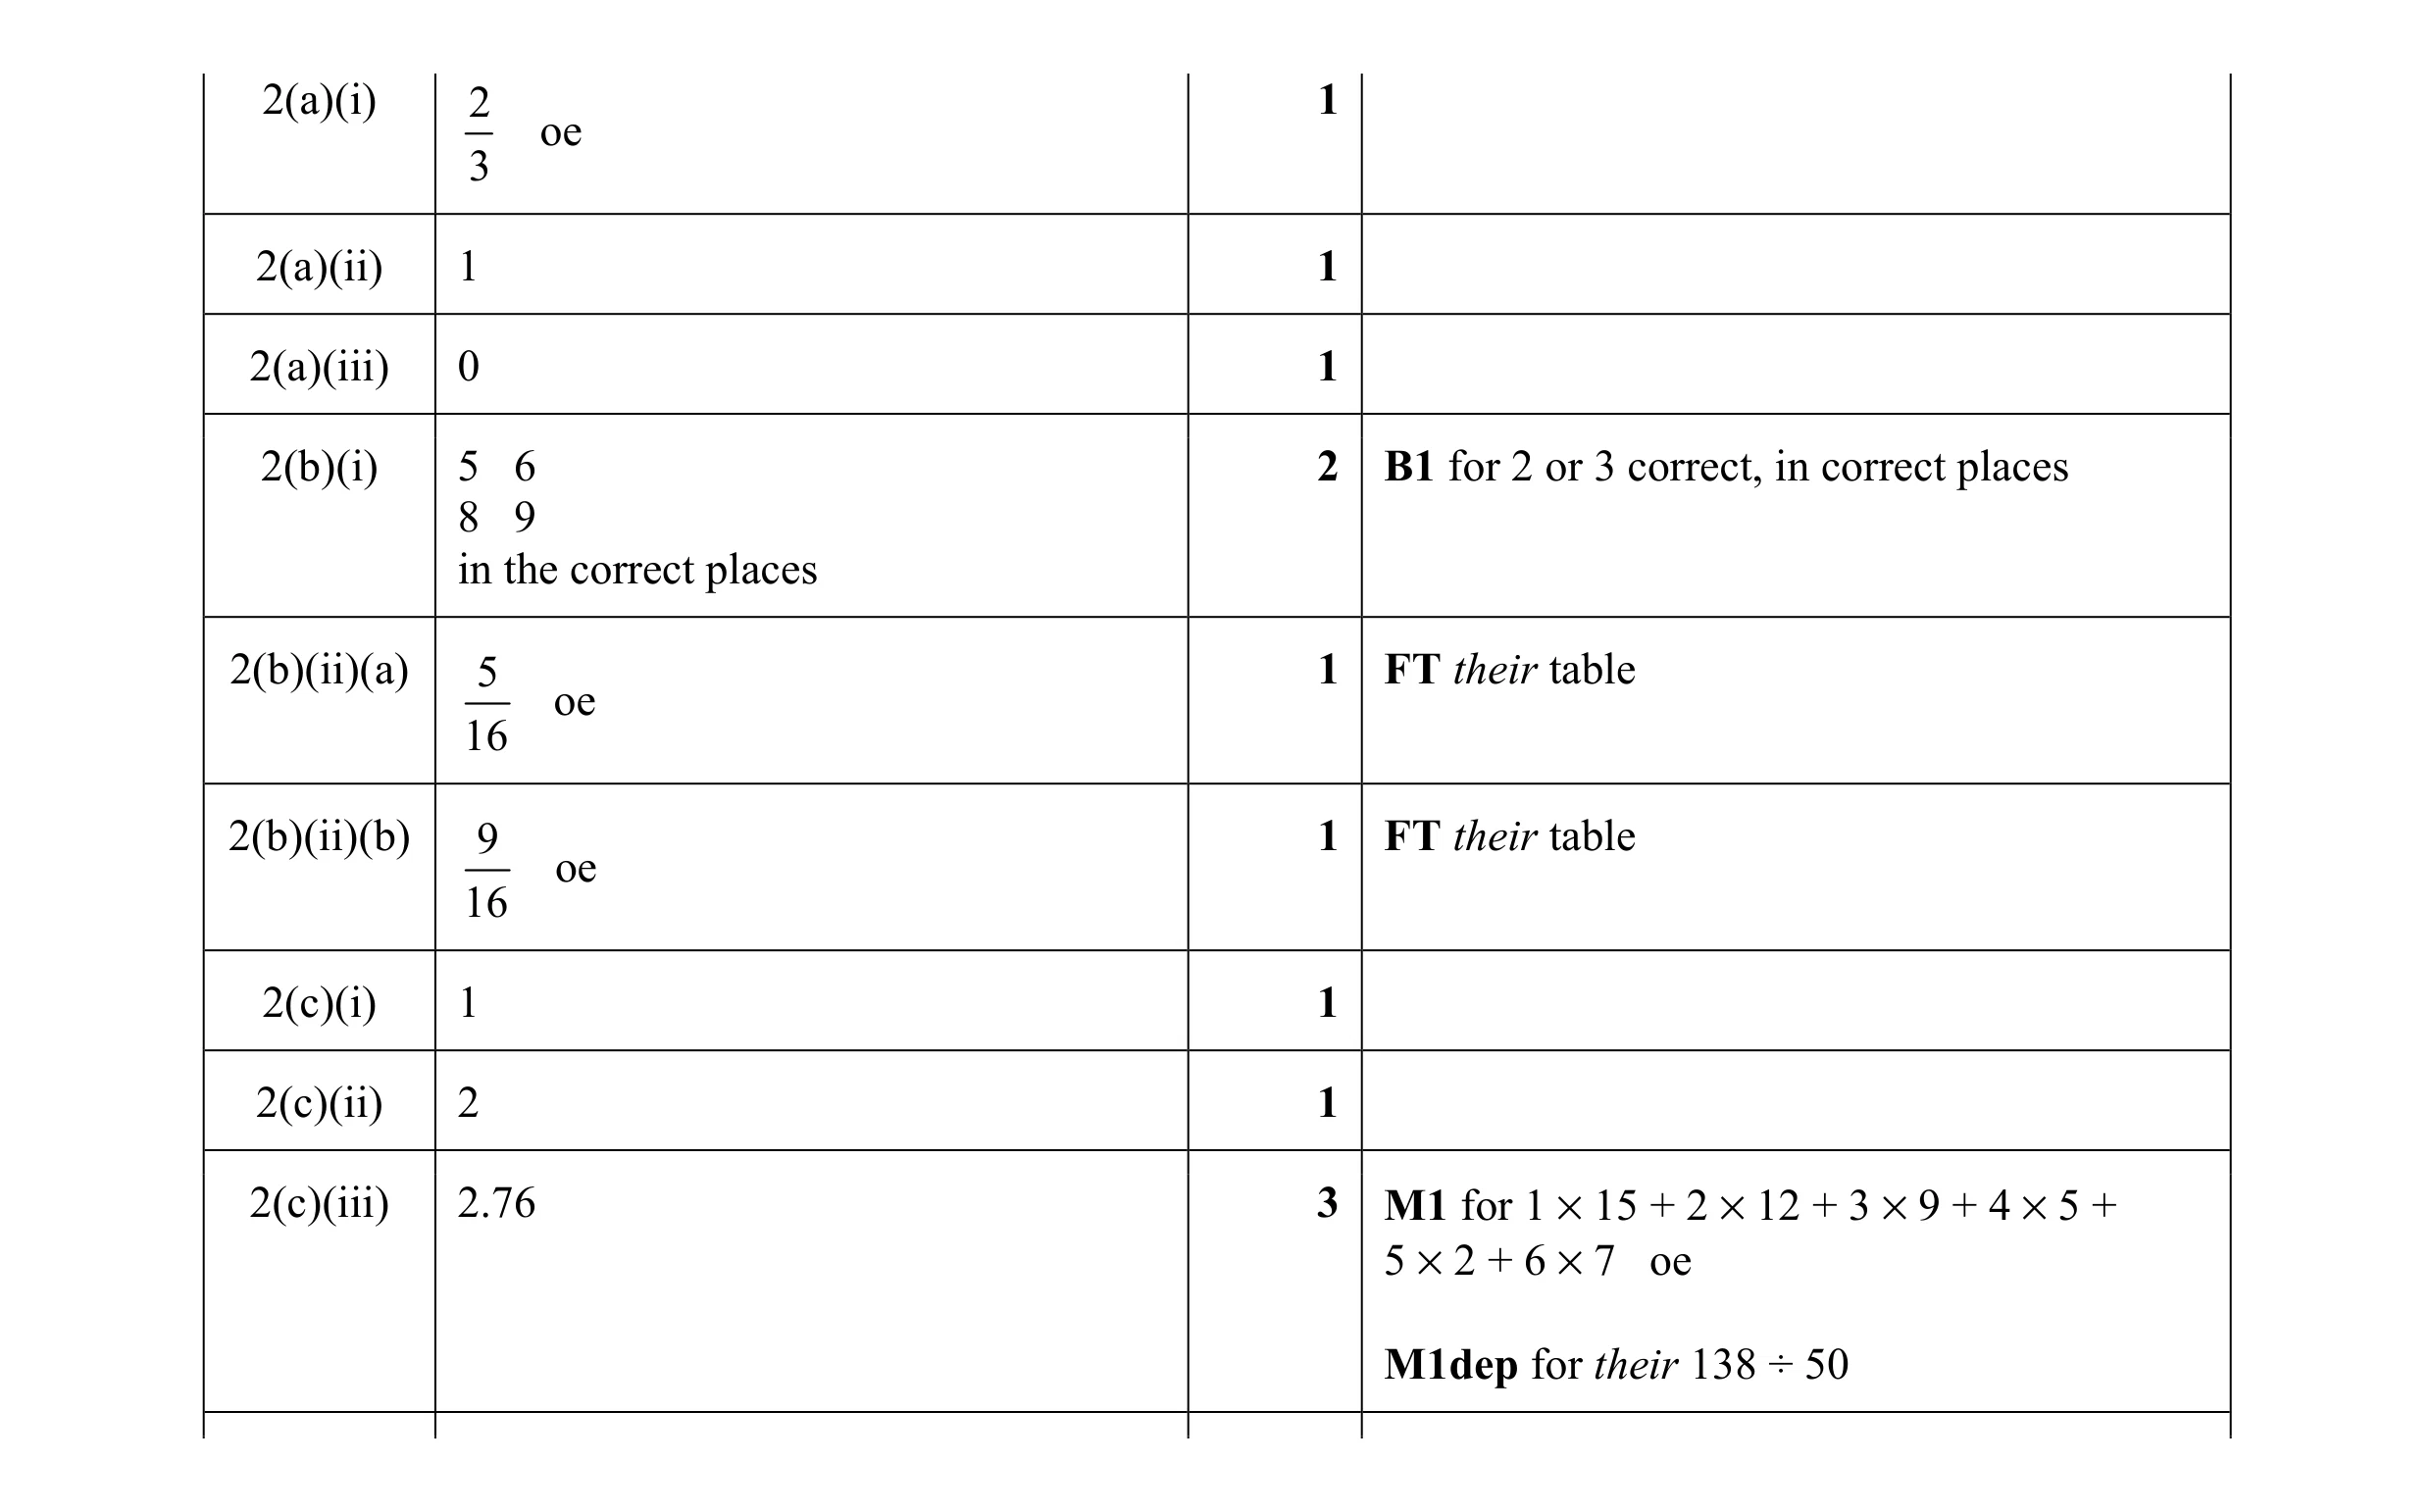 12
12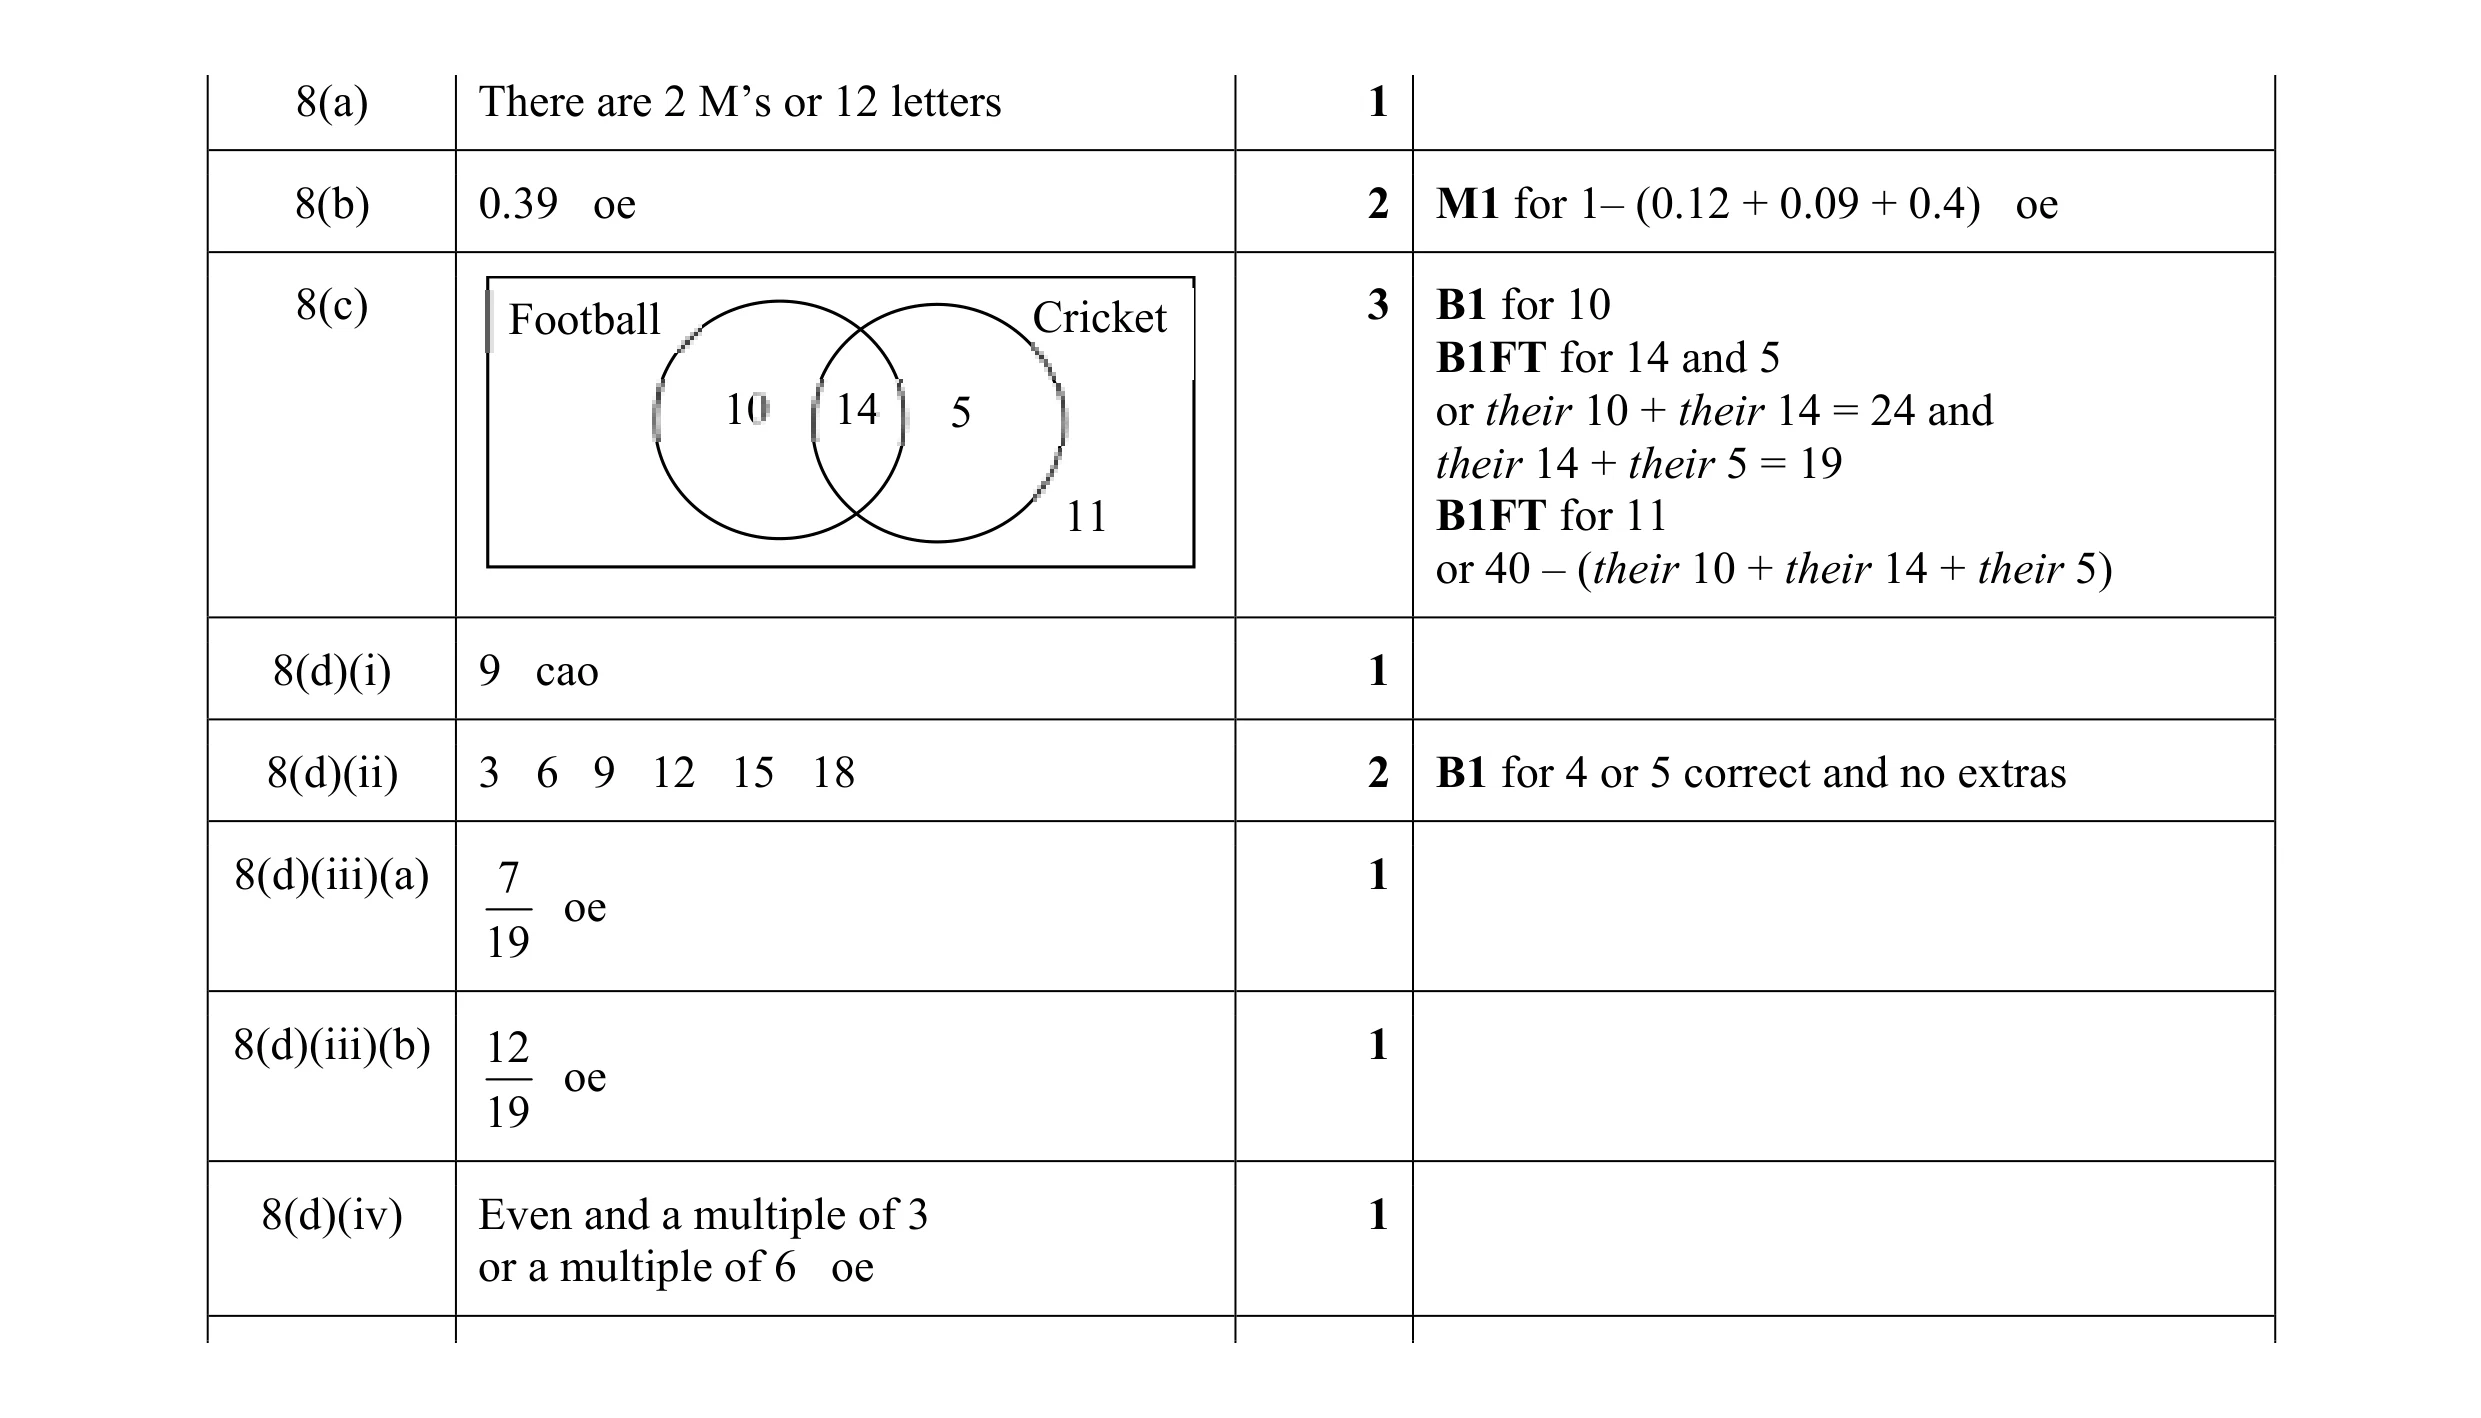 12
12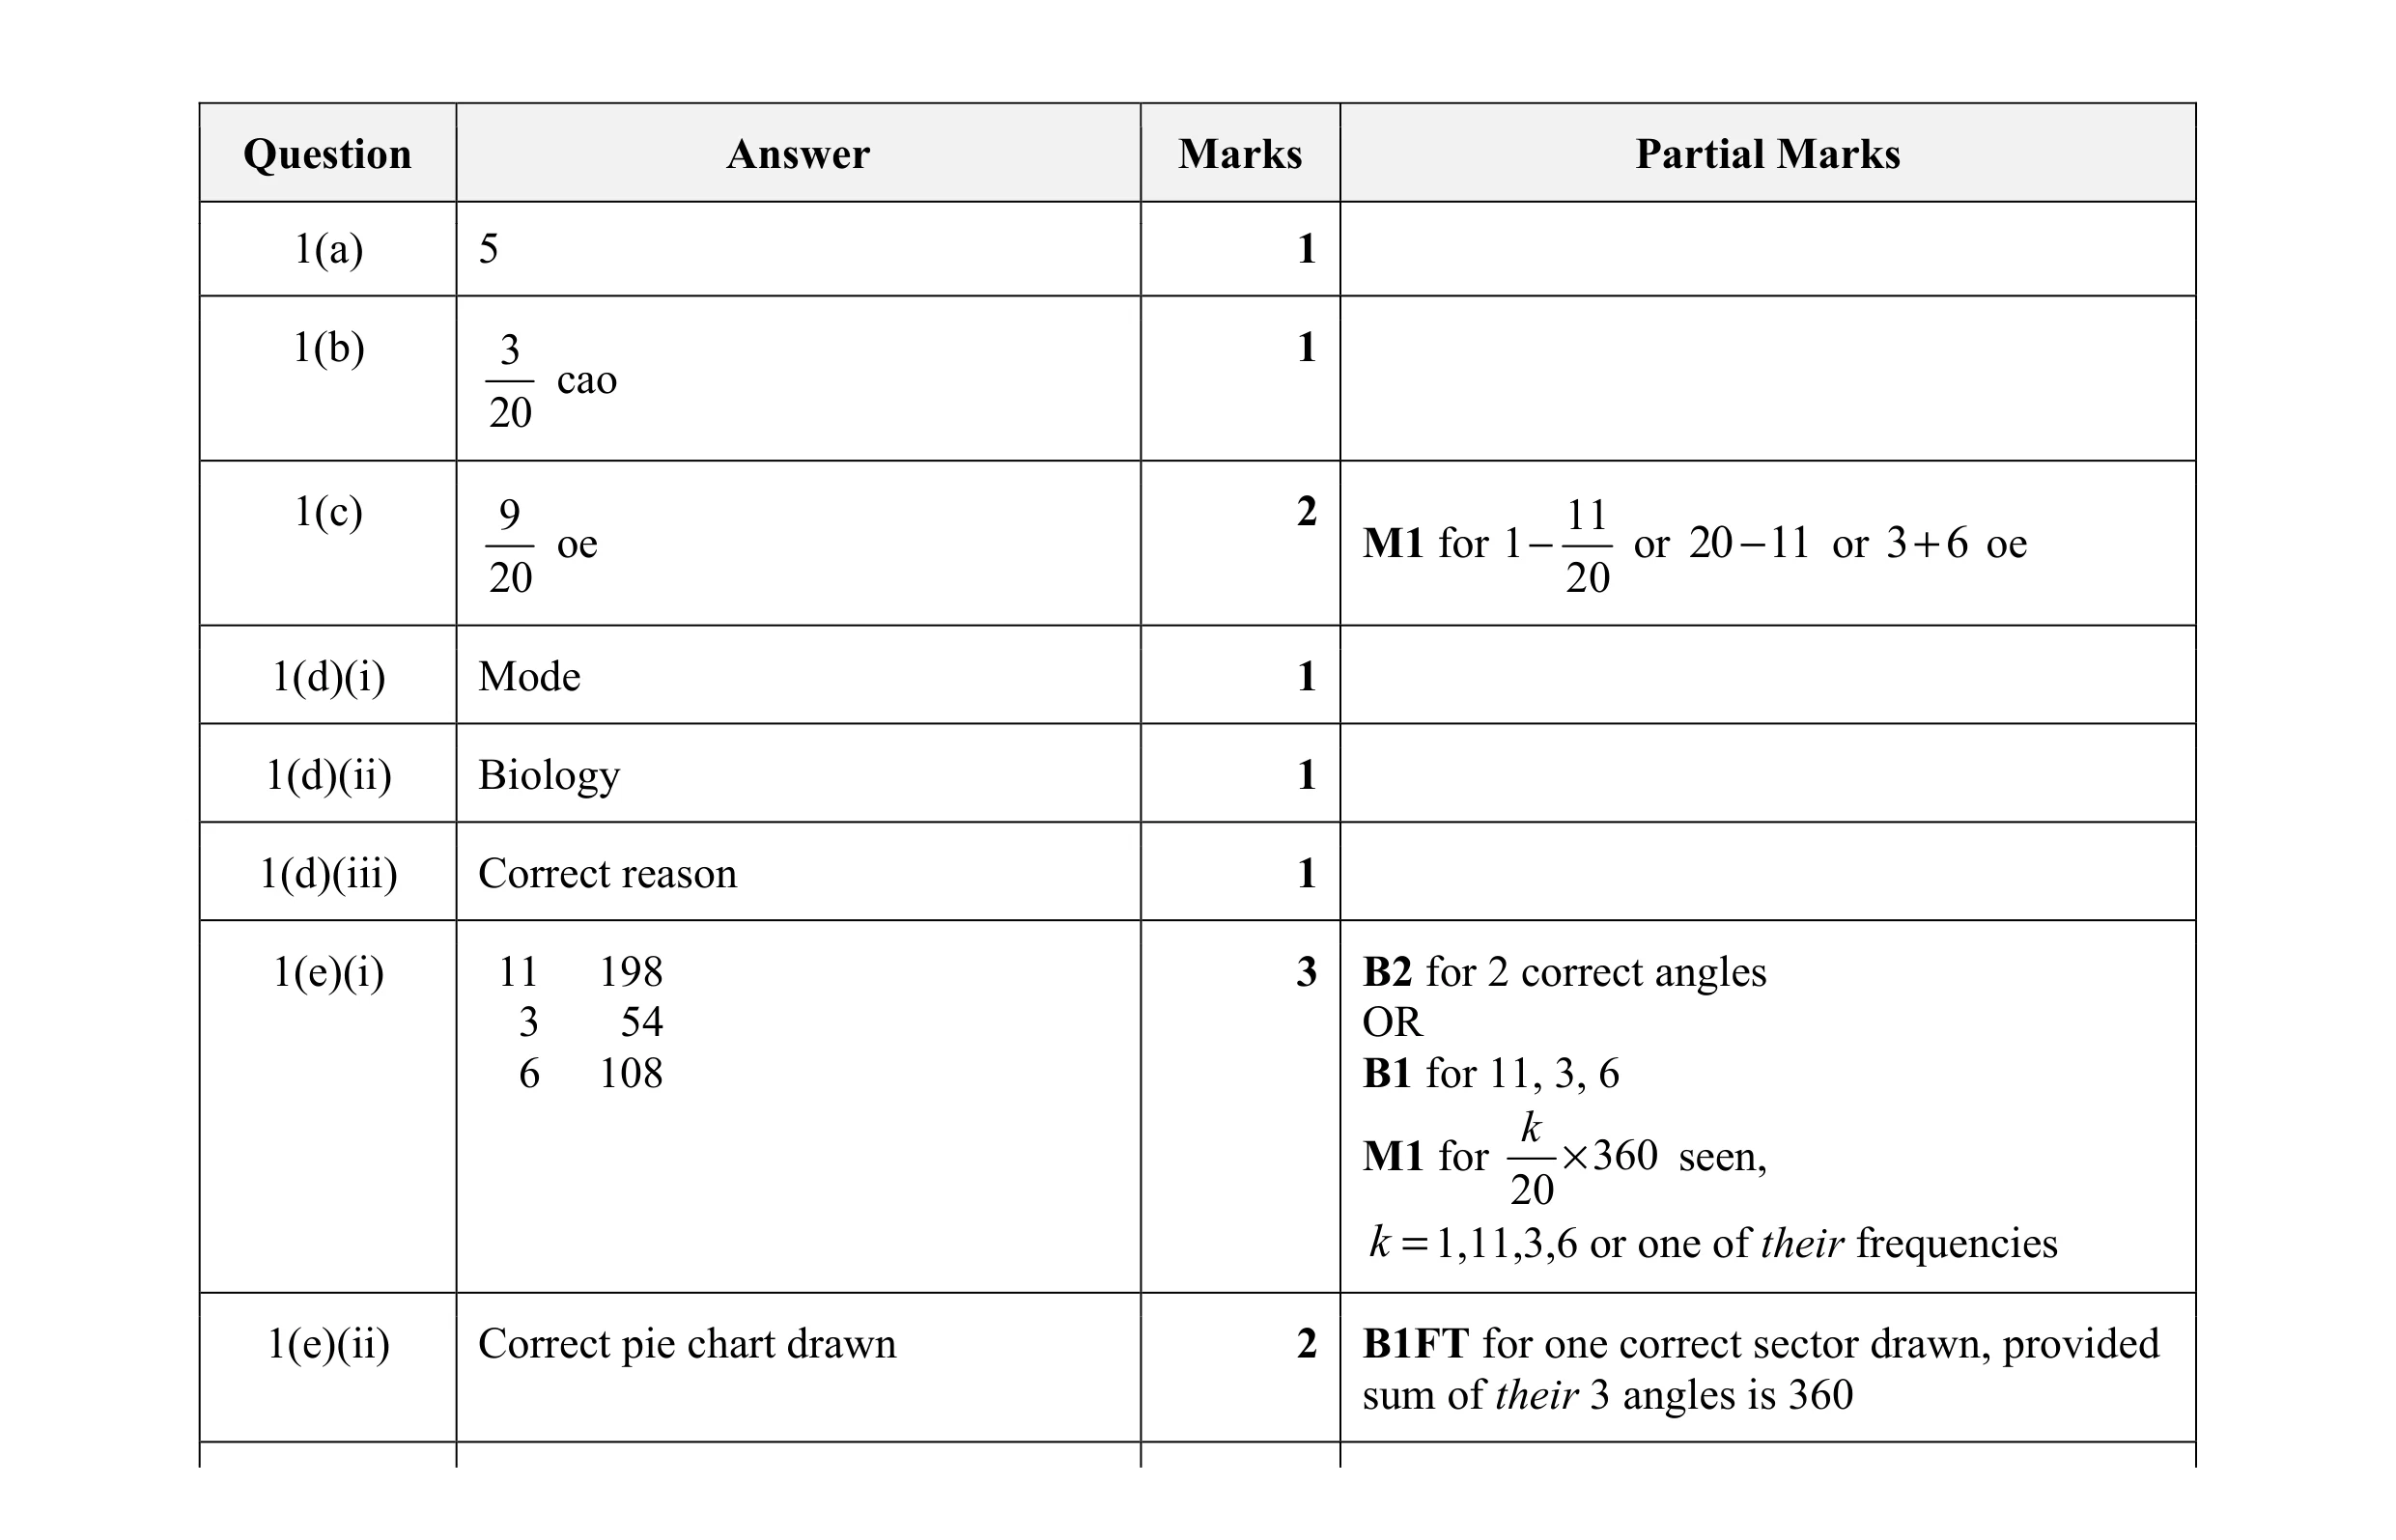 12
12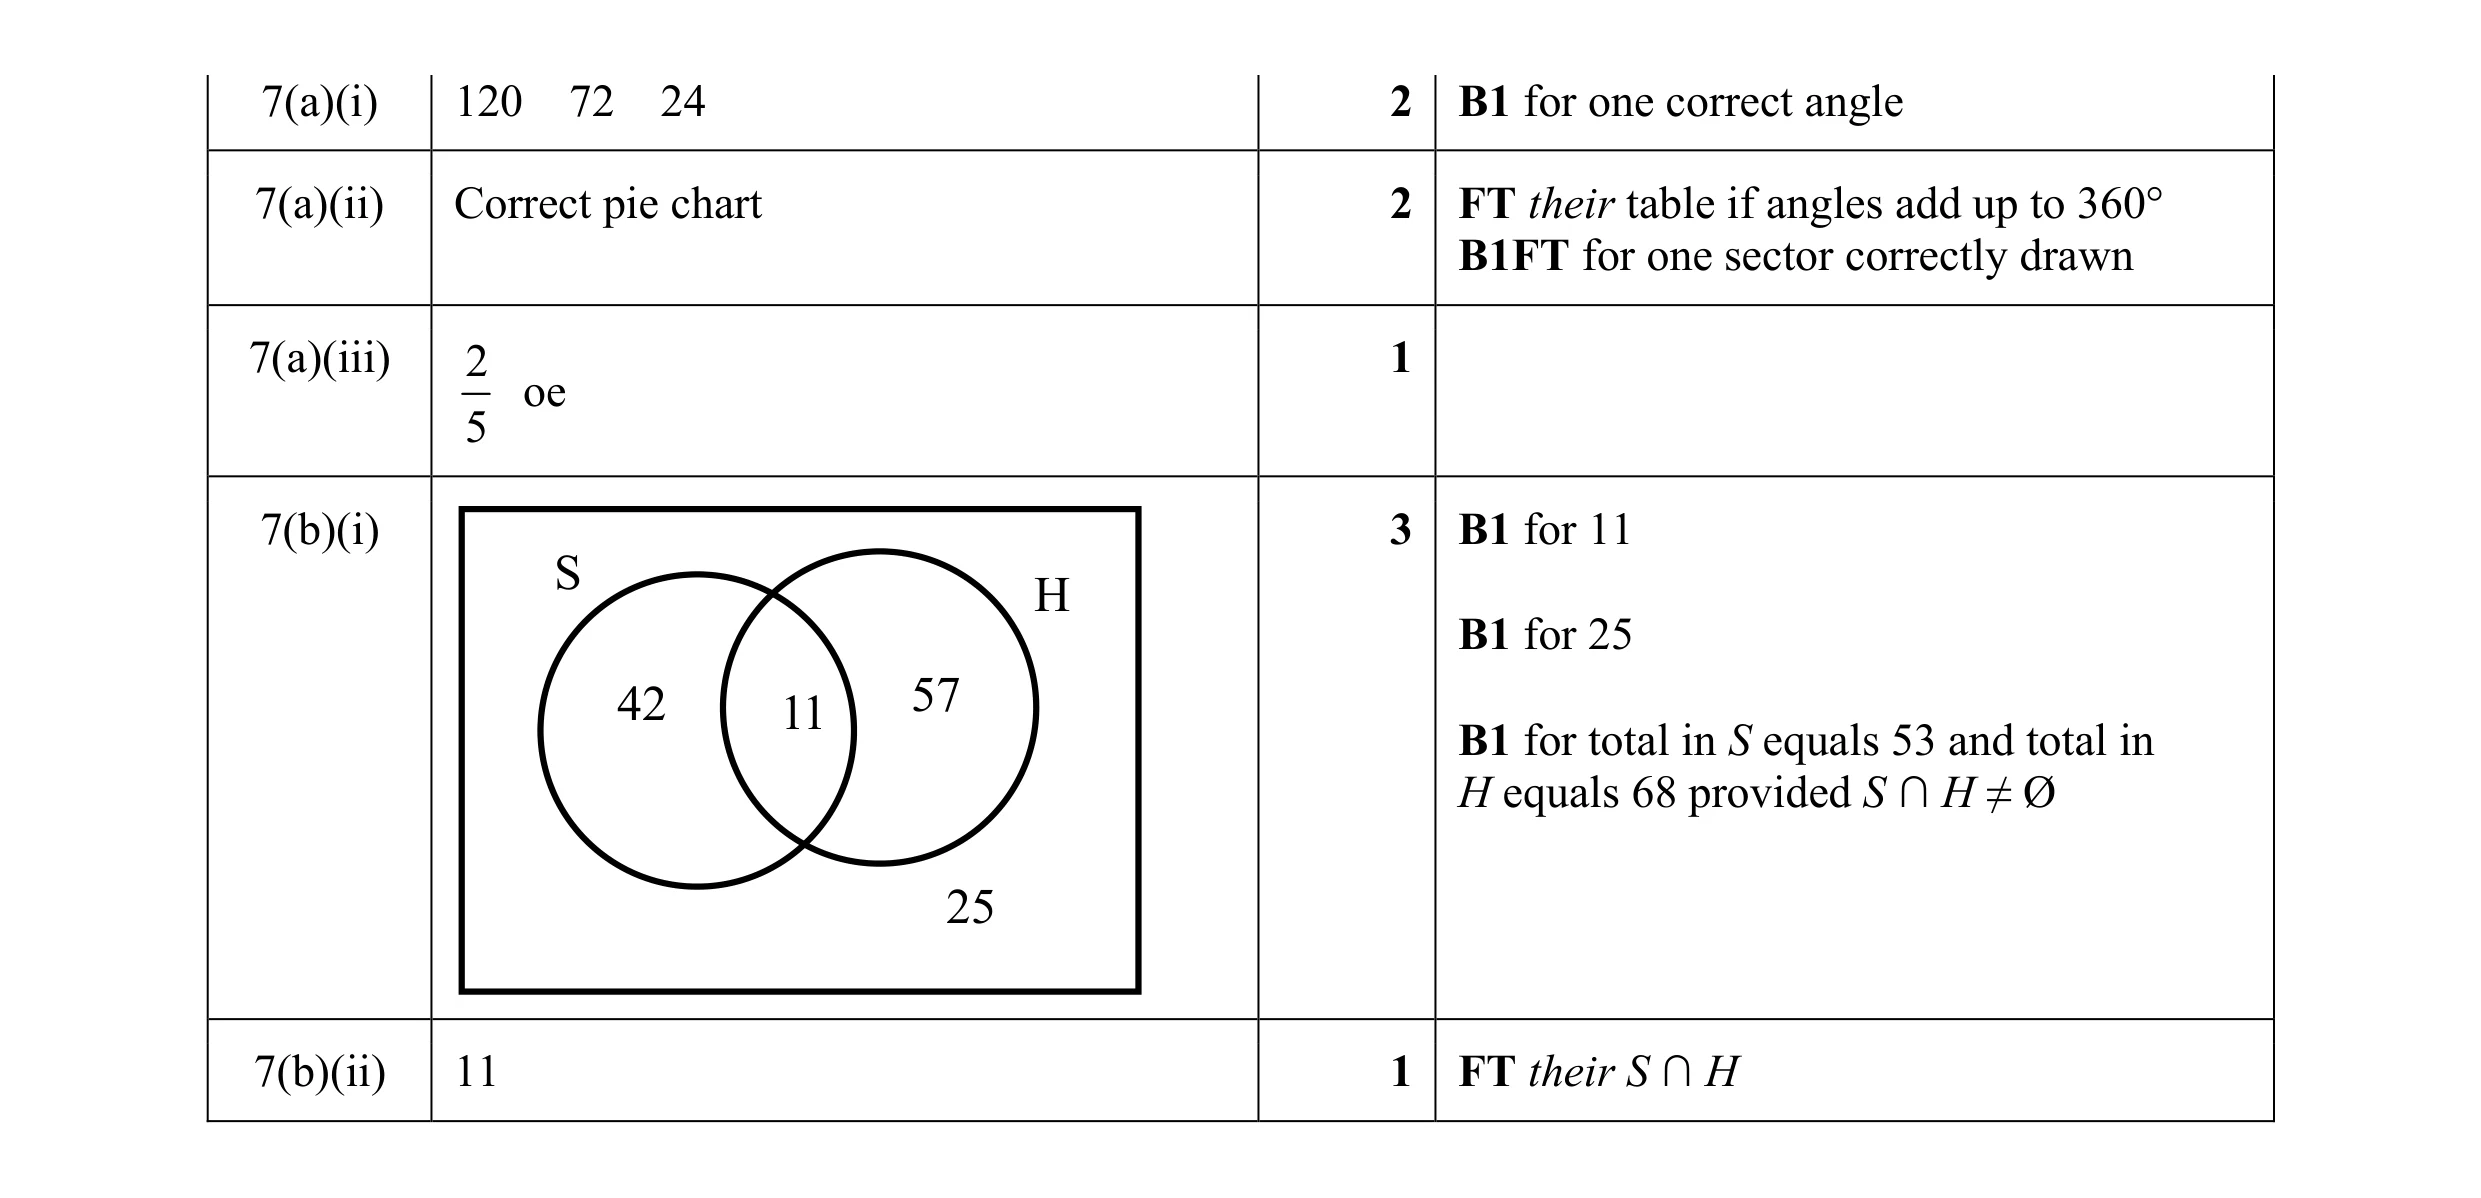 9
9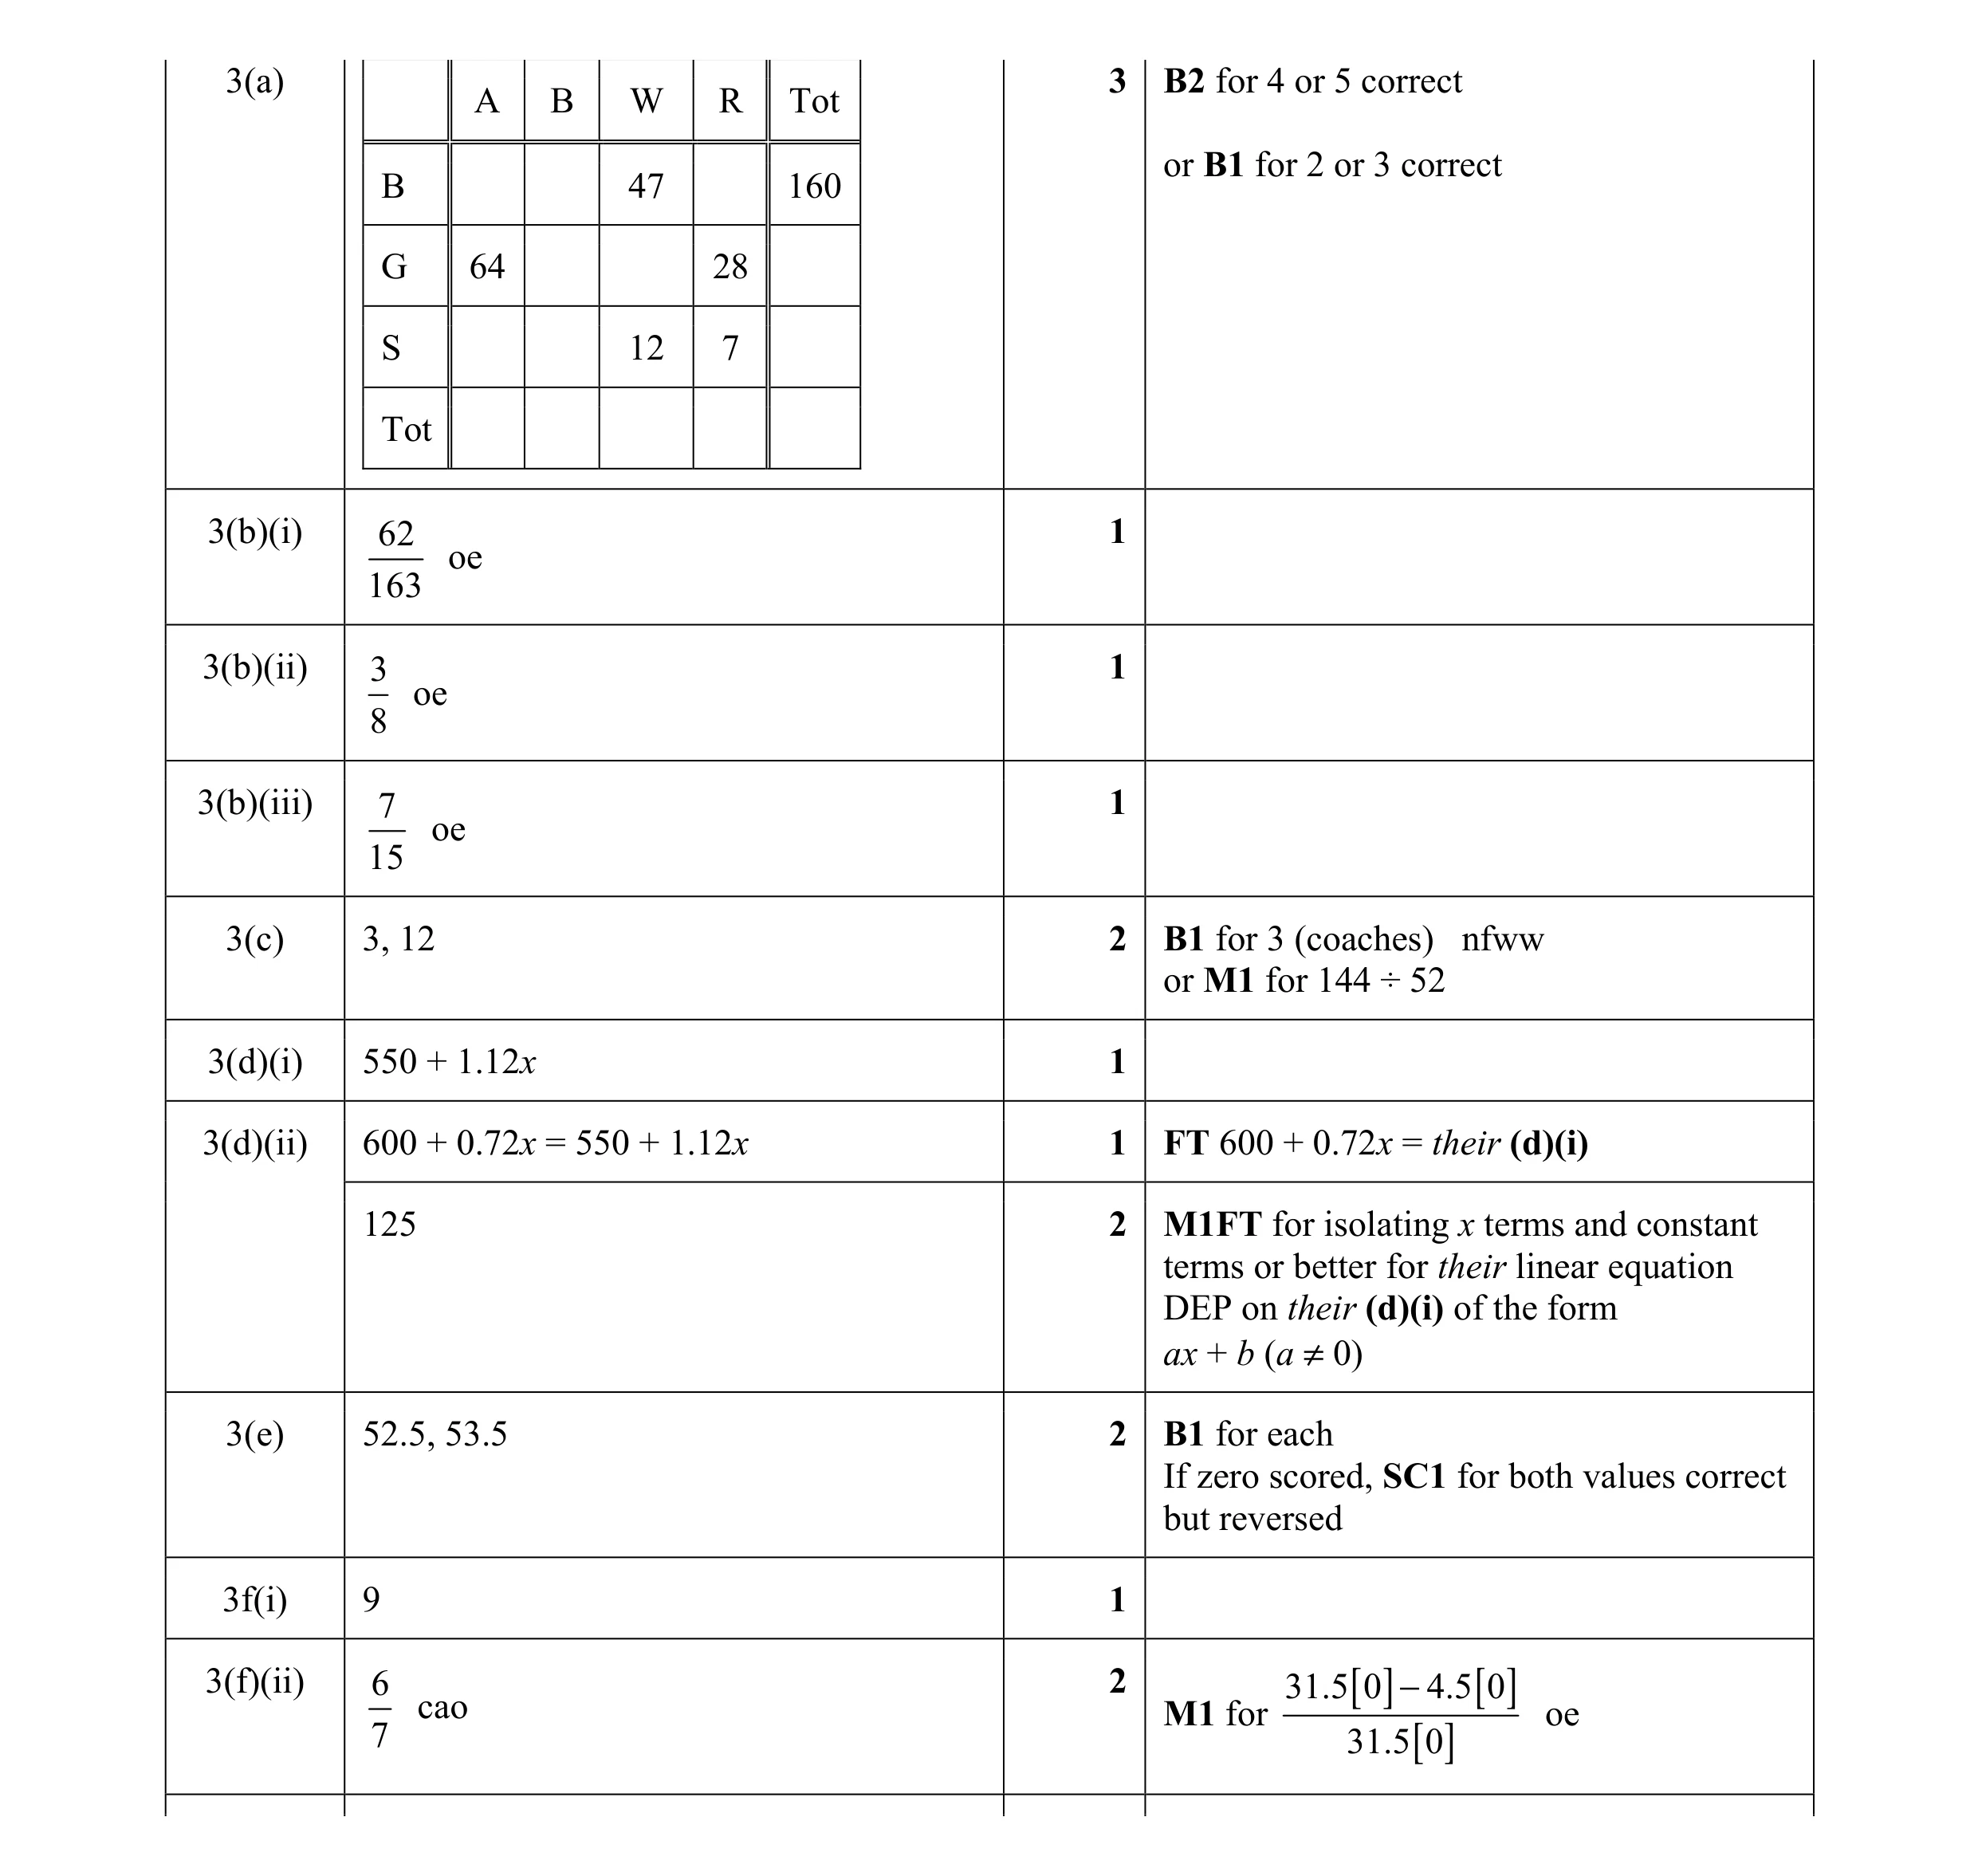 17
17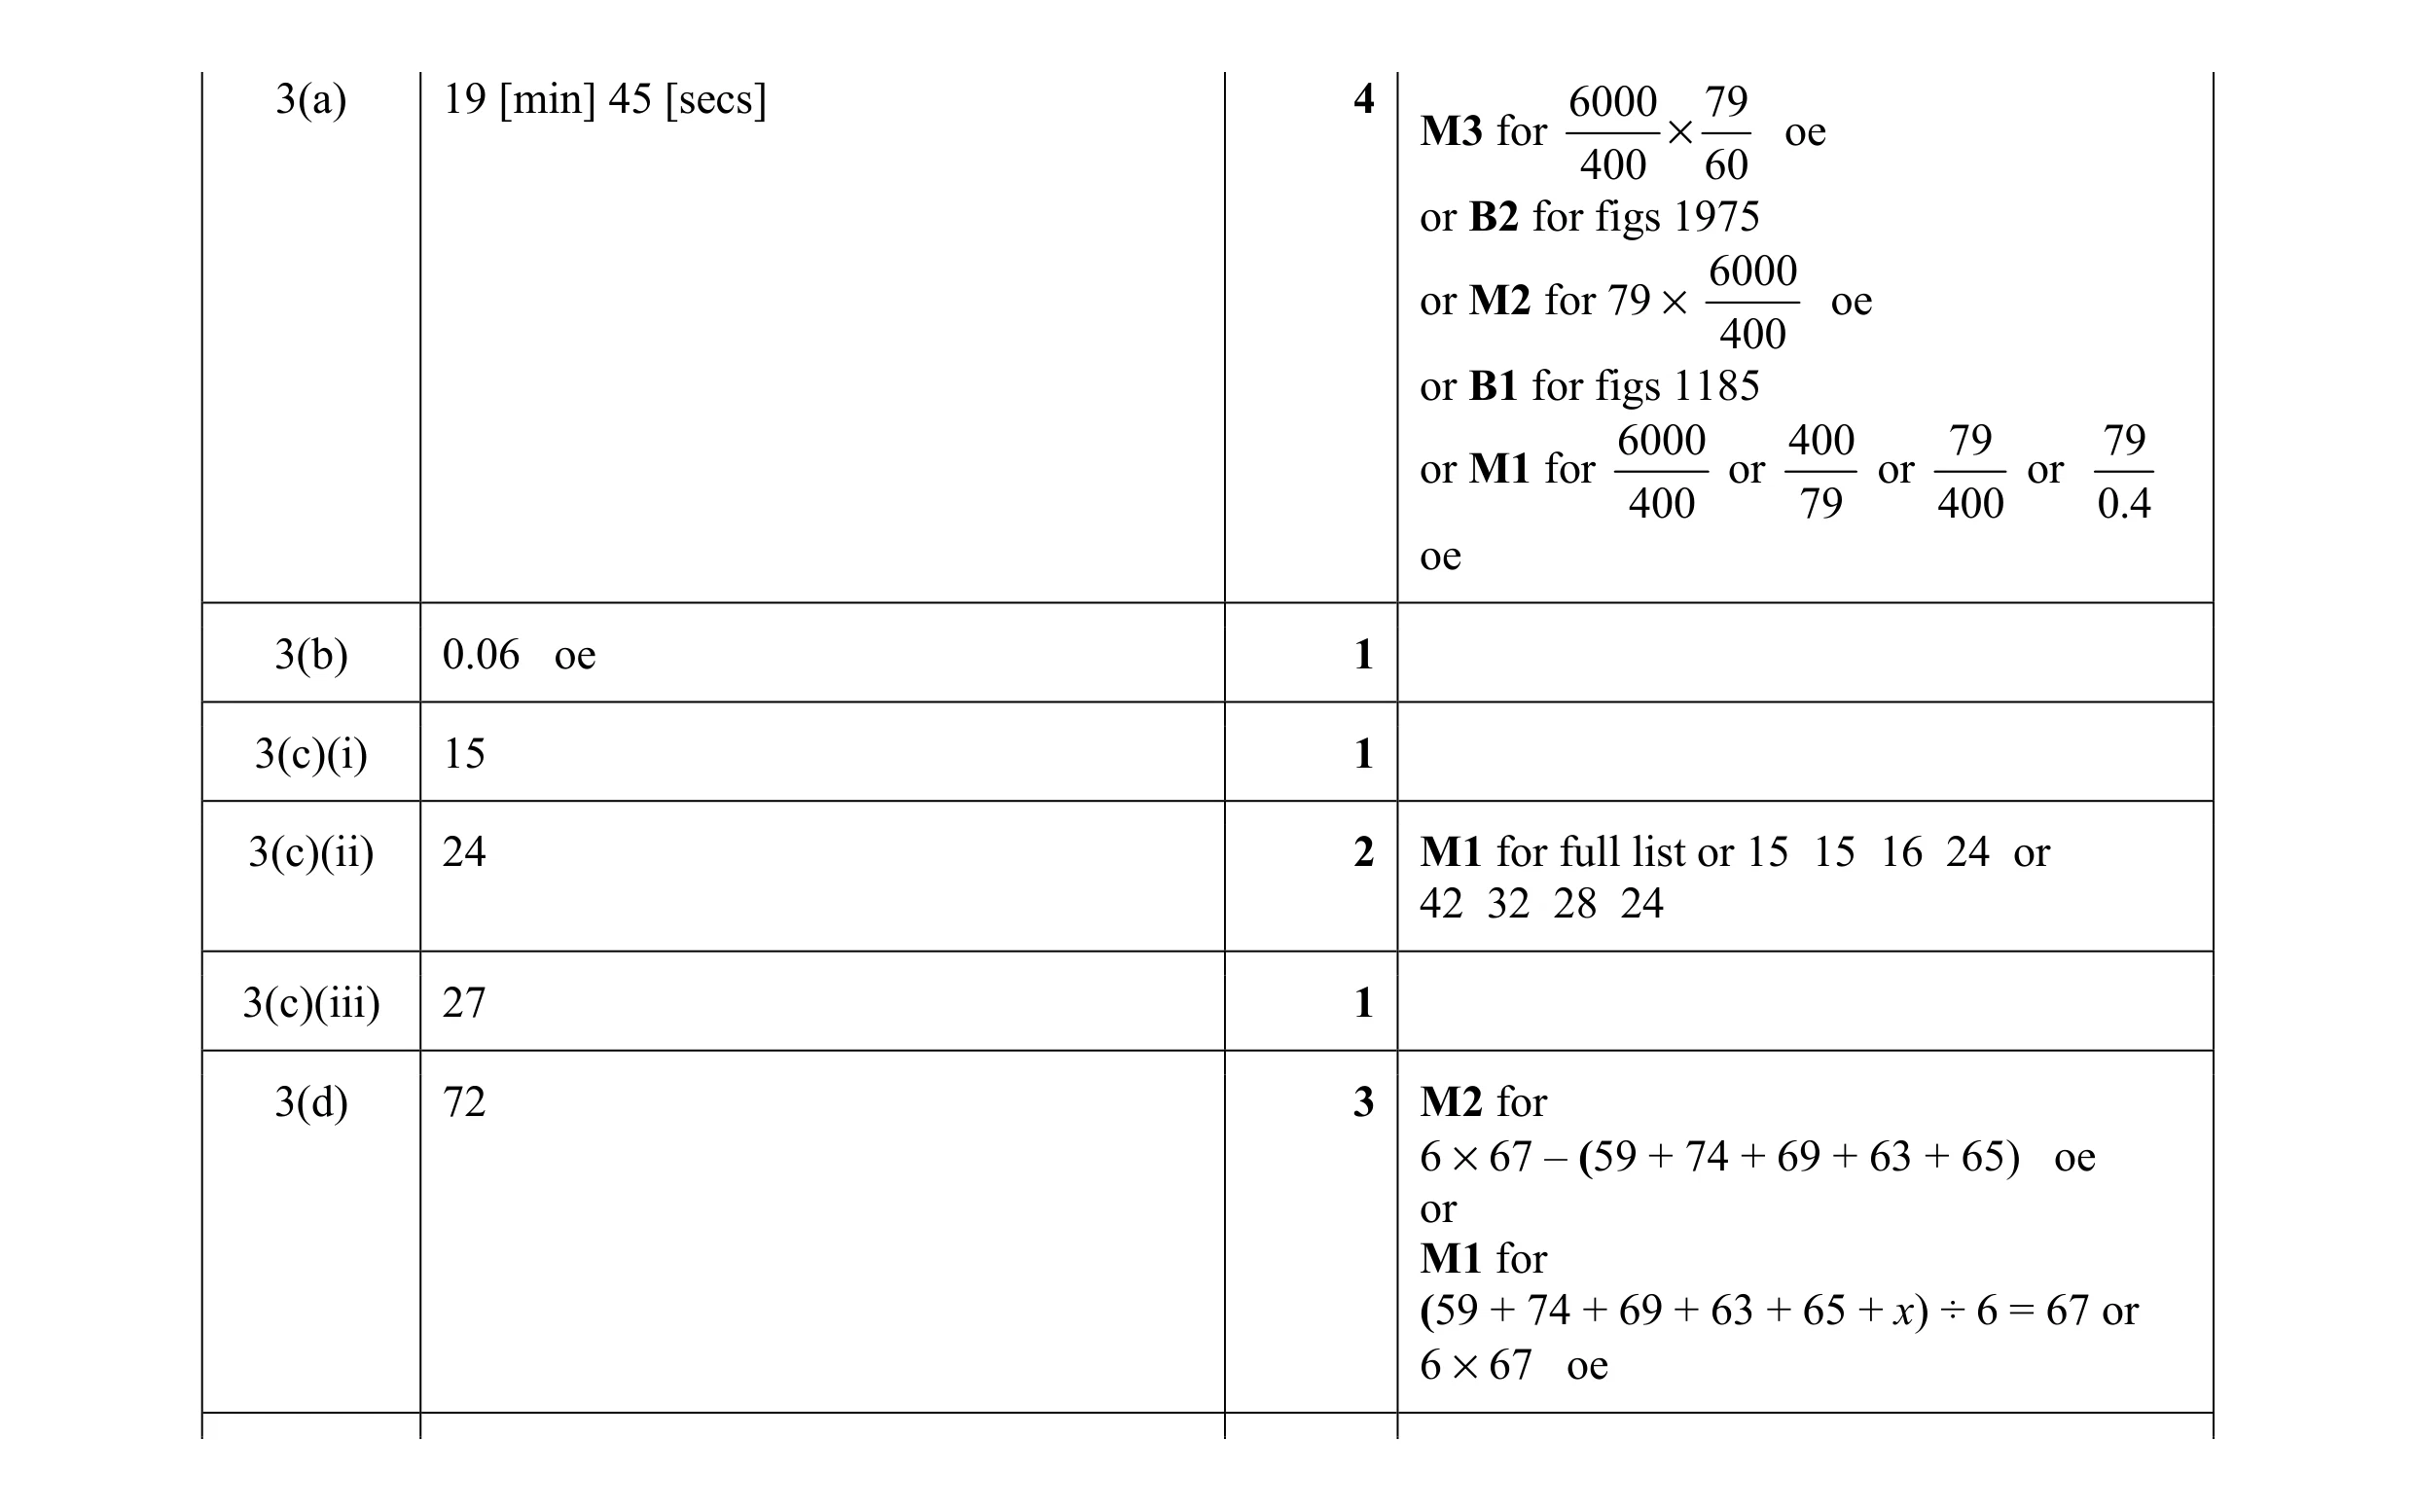 12
12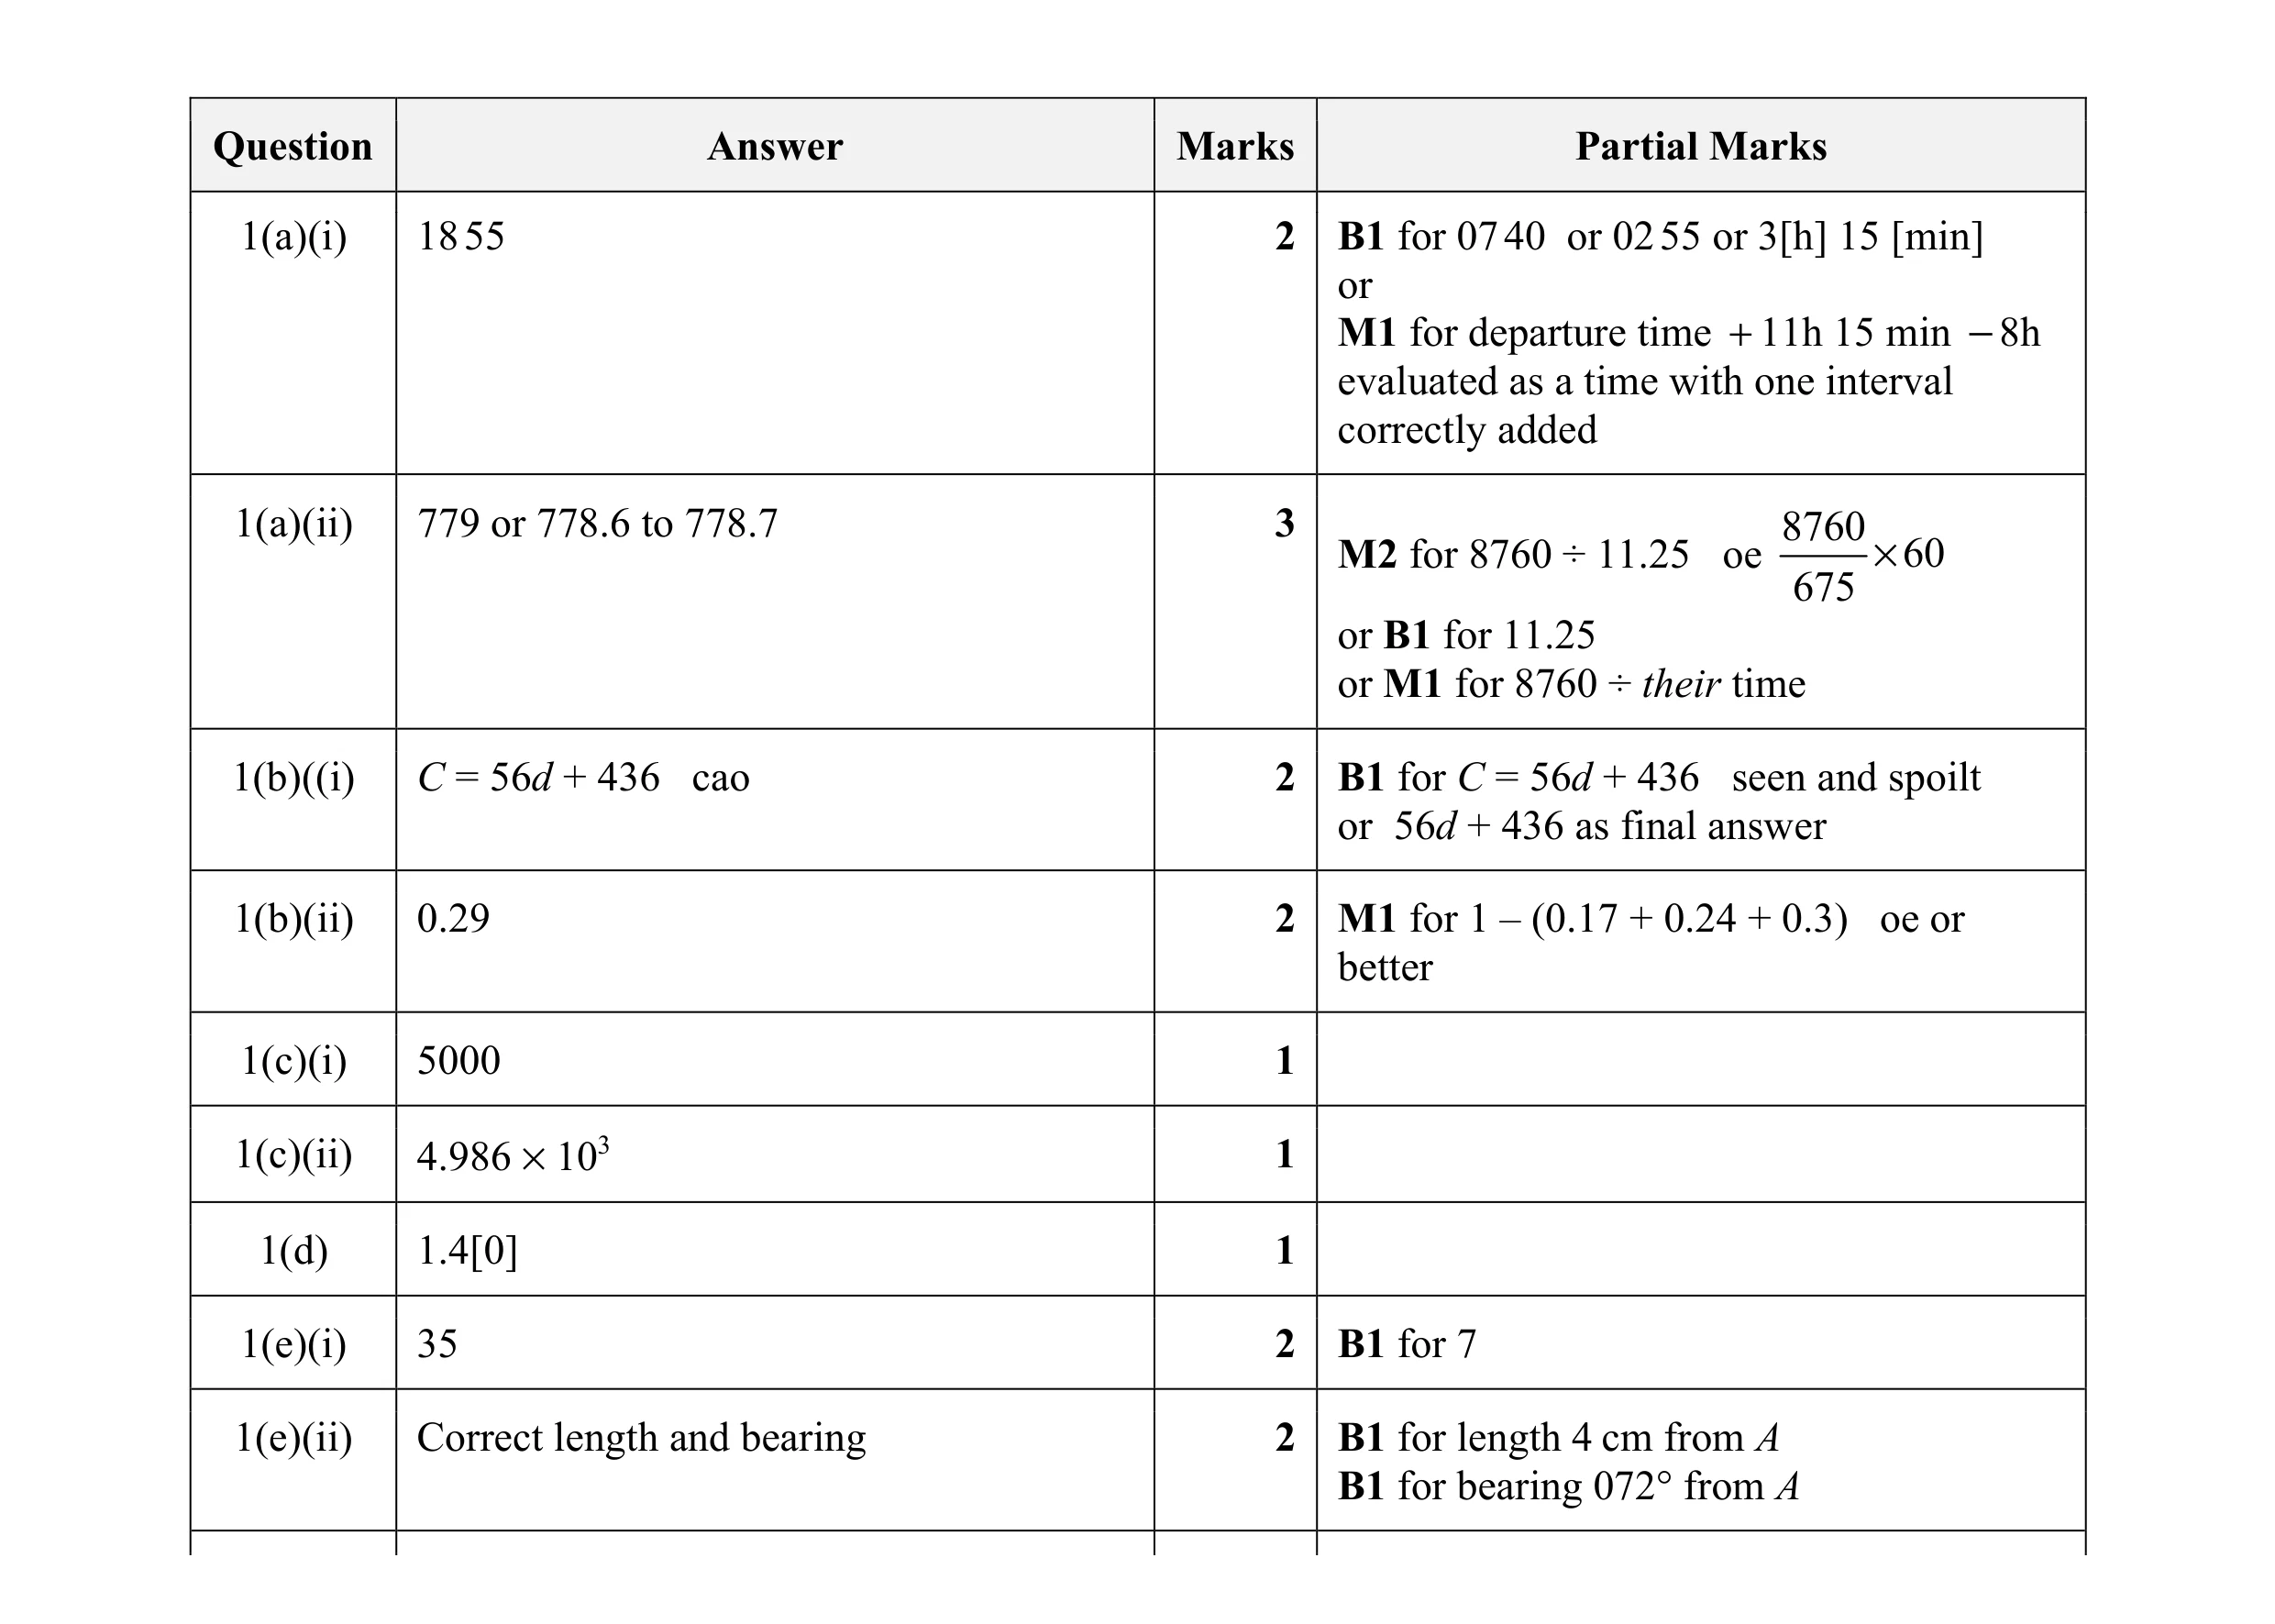 16
16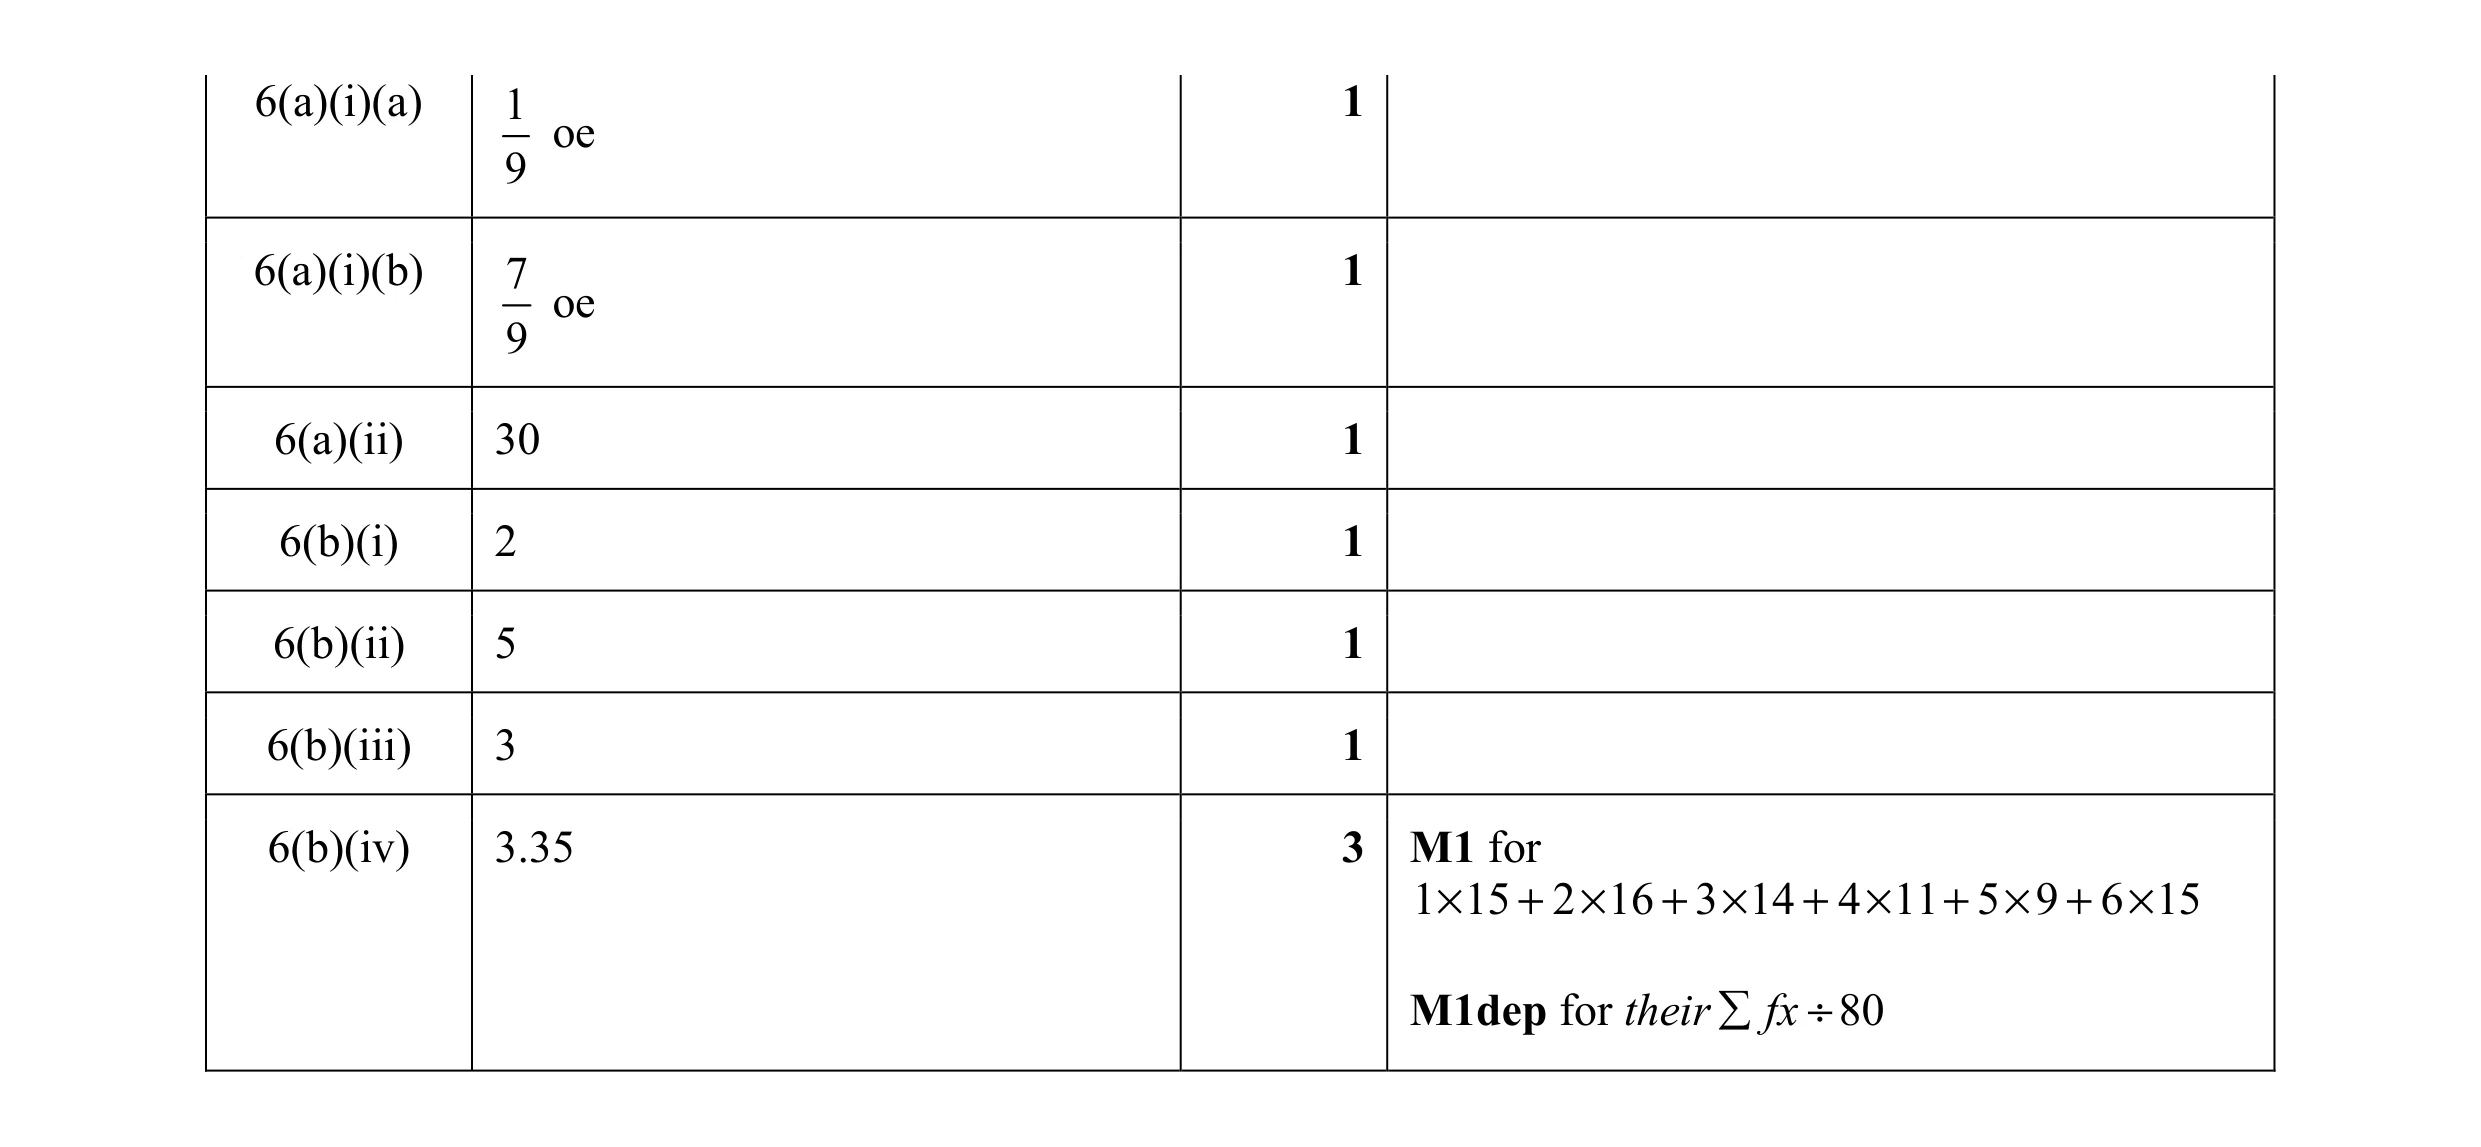 9
9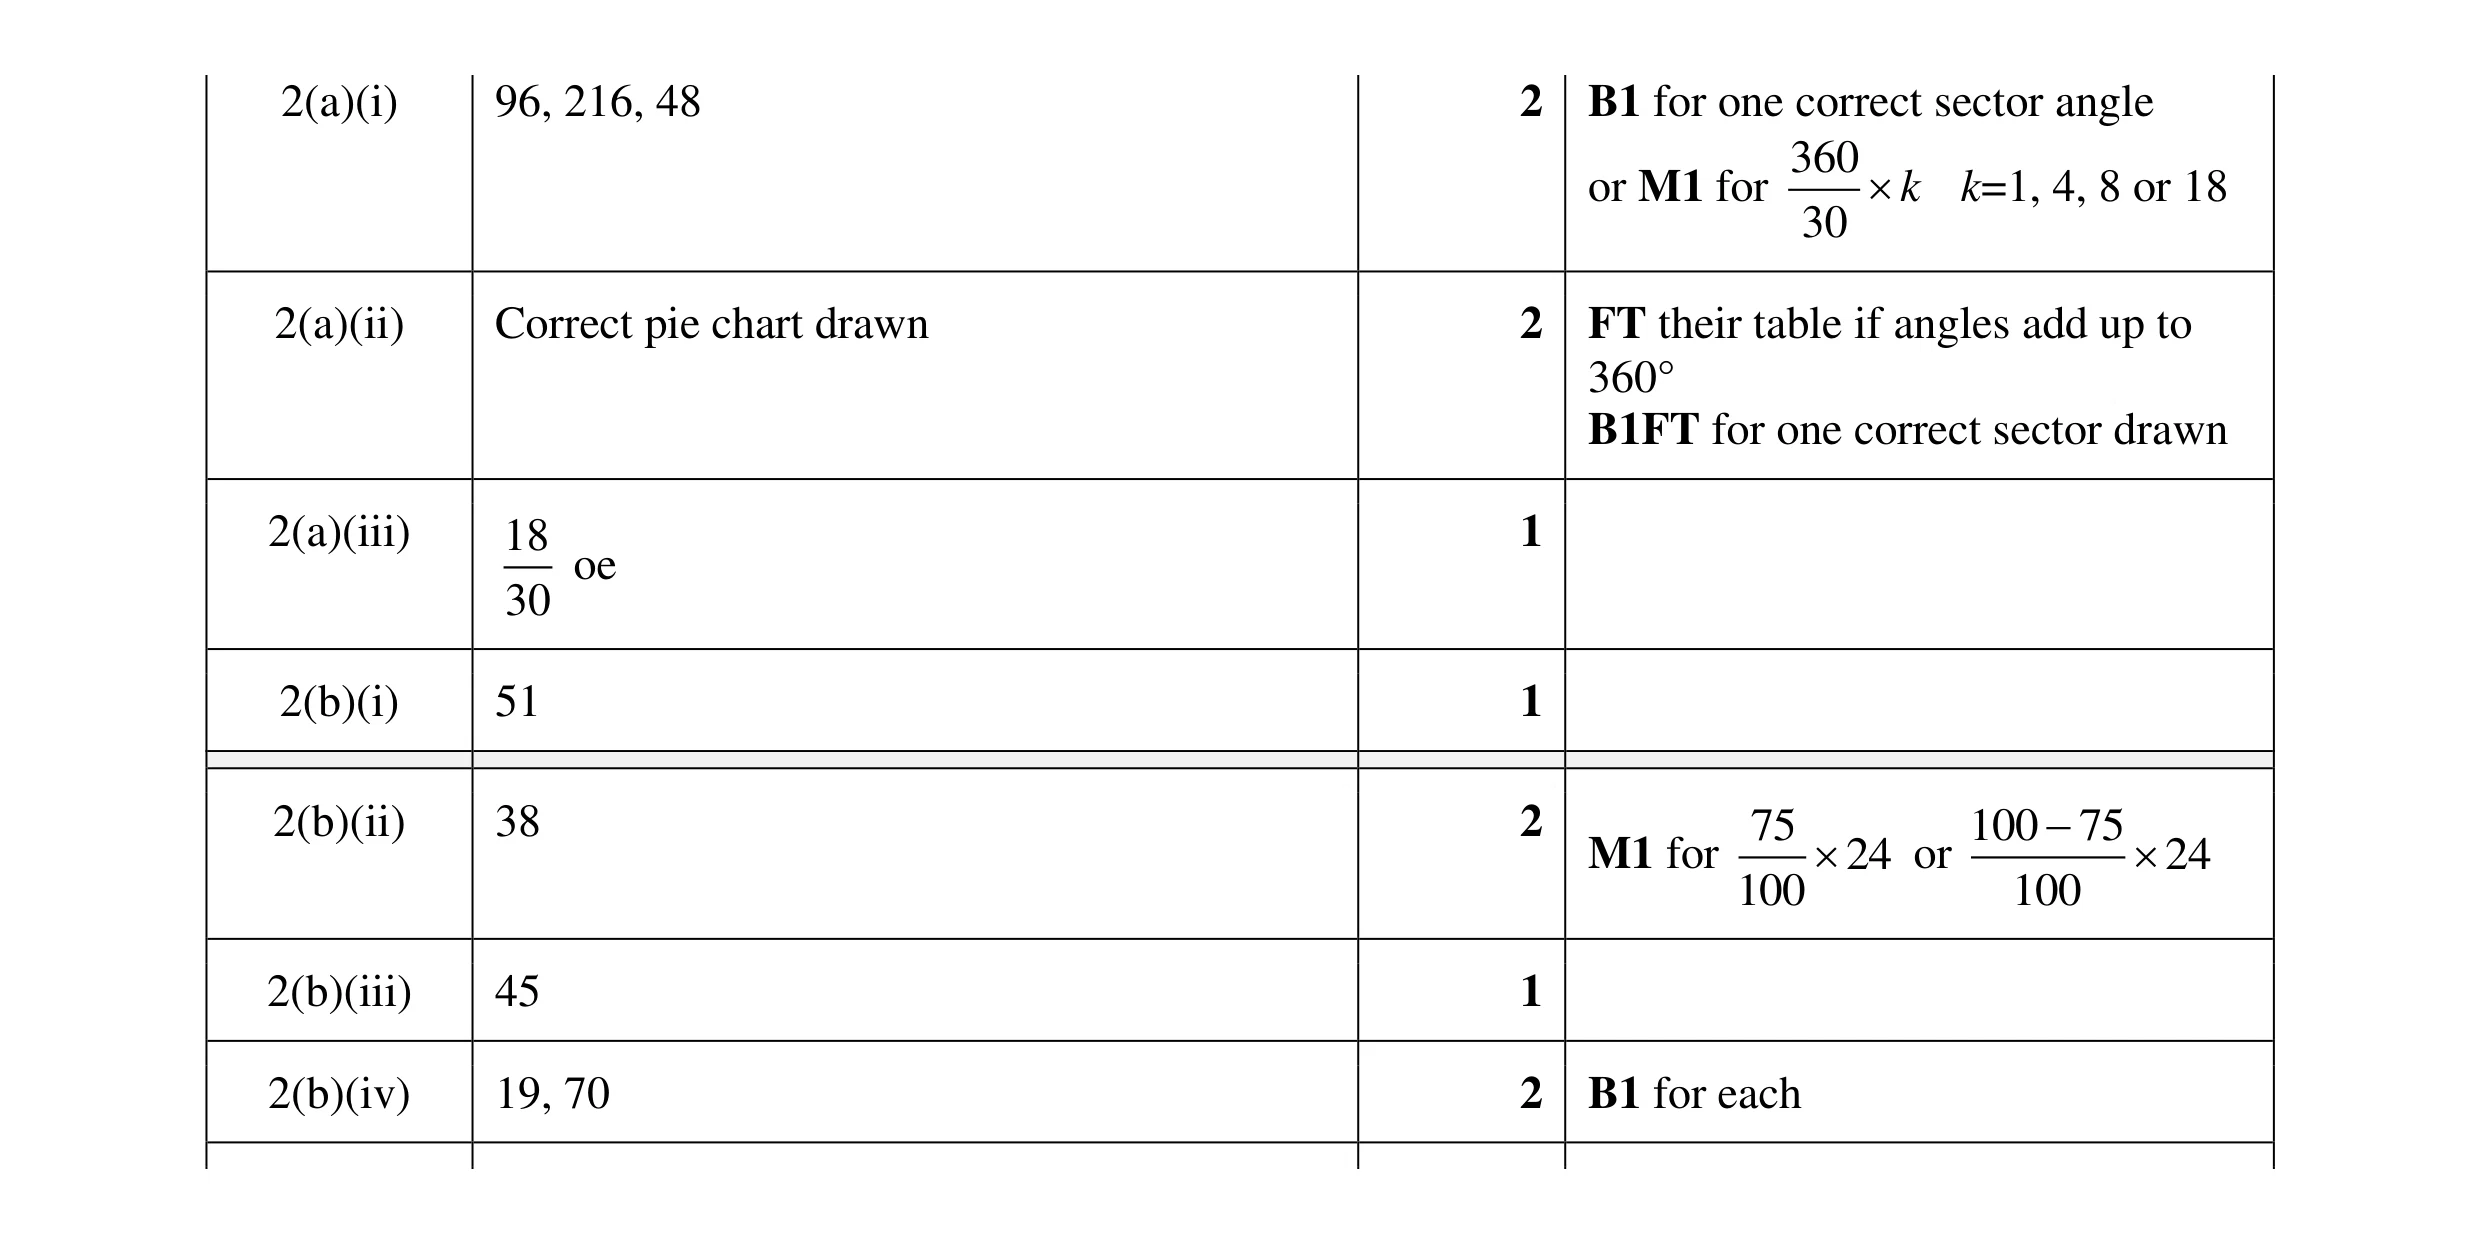 11
11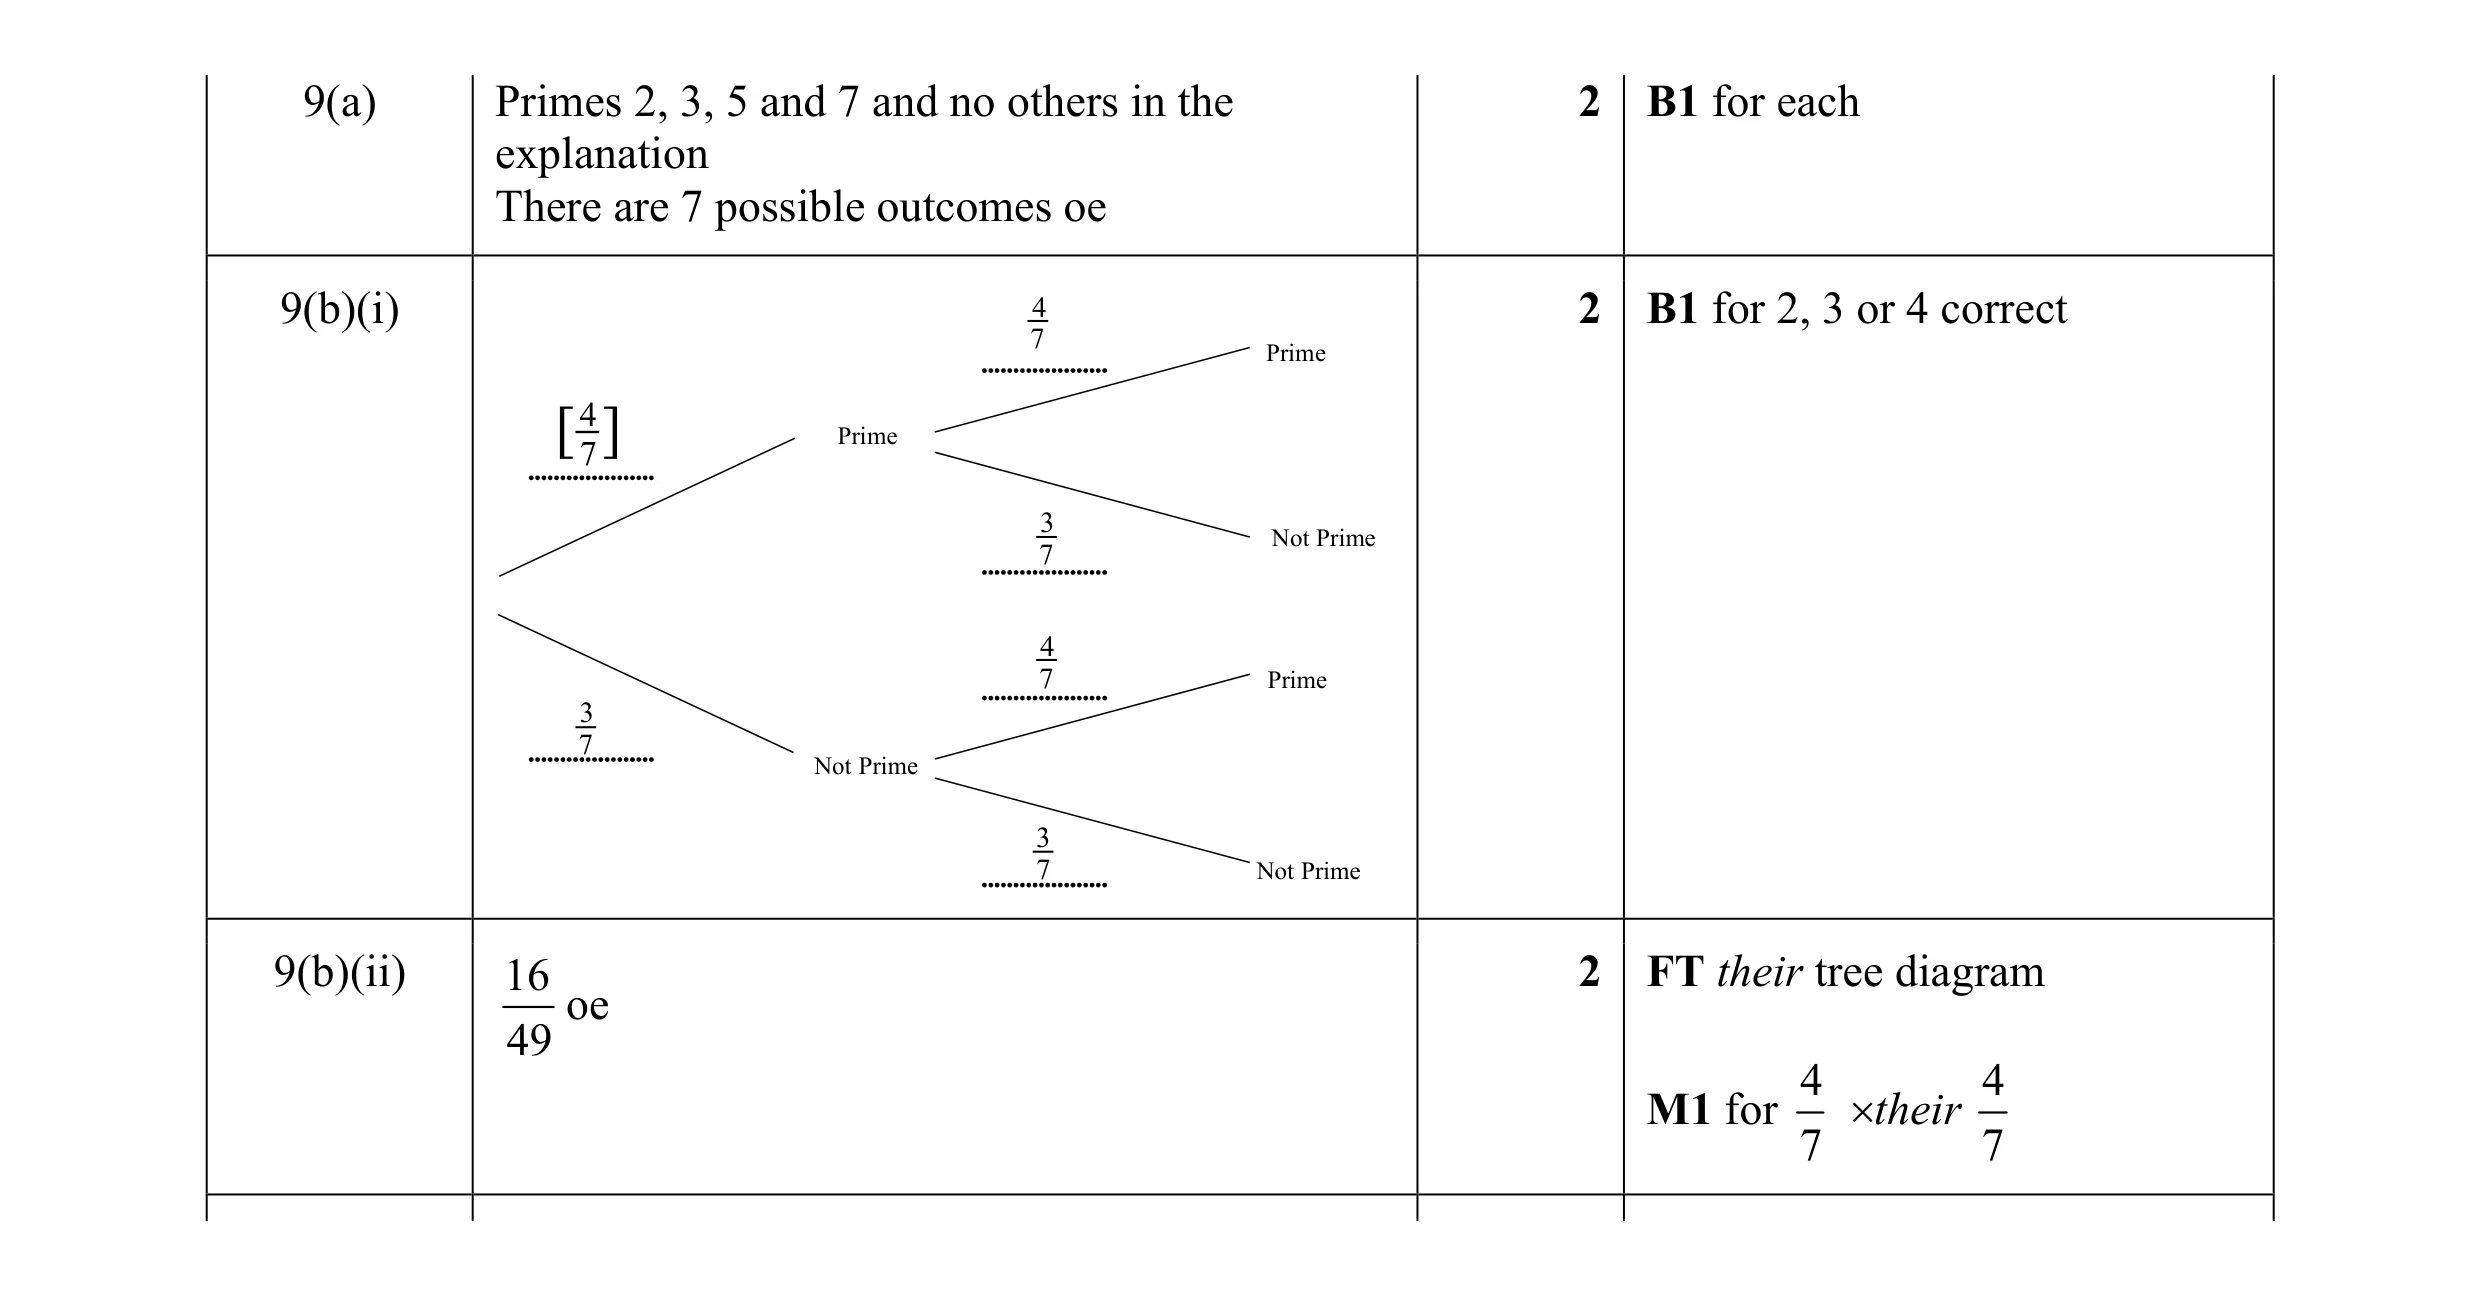 6
6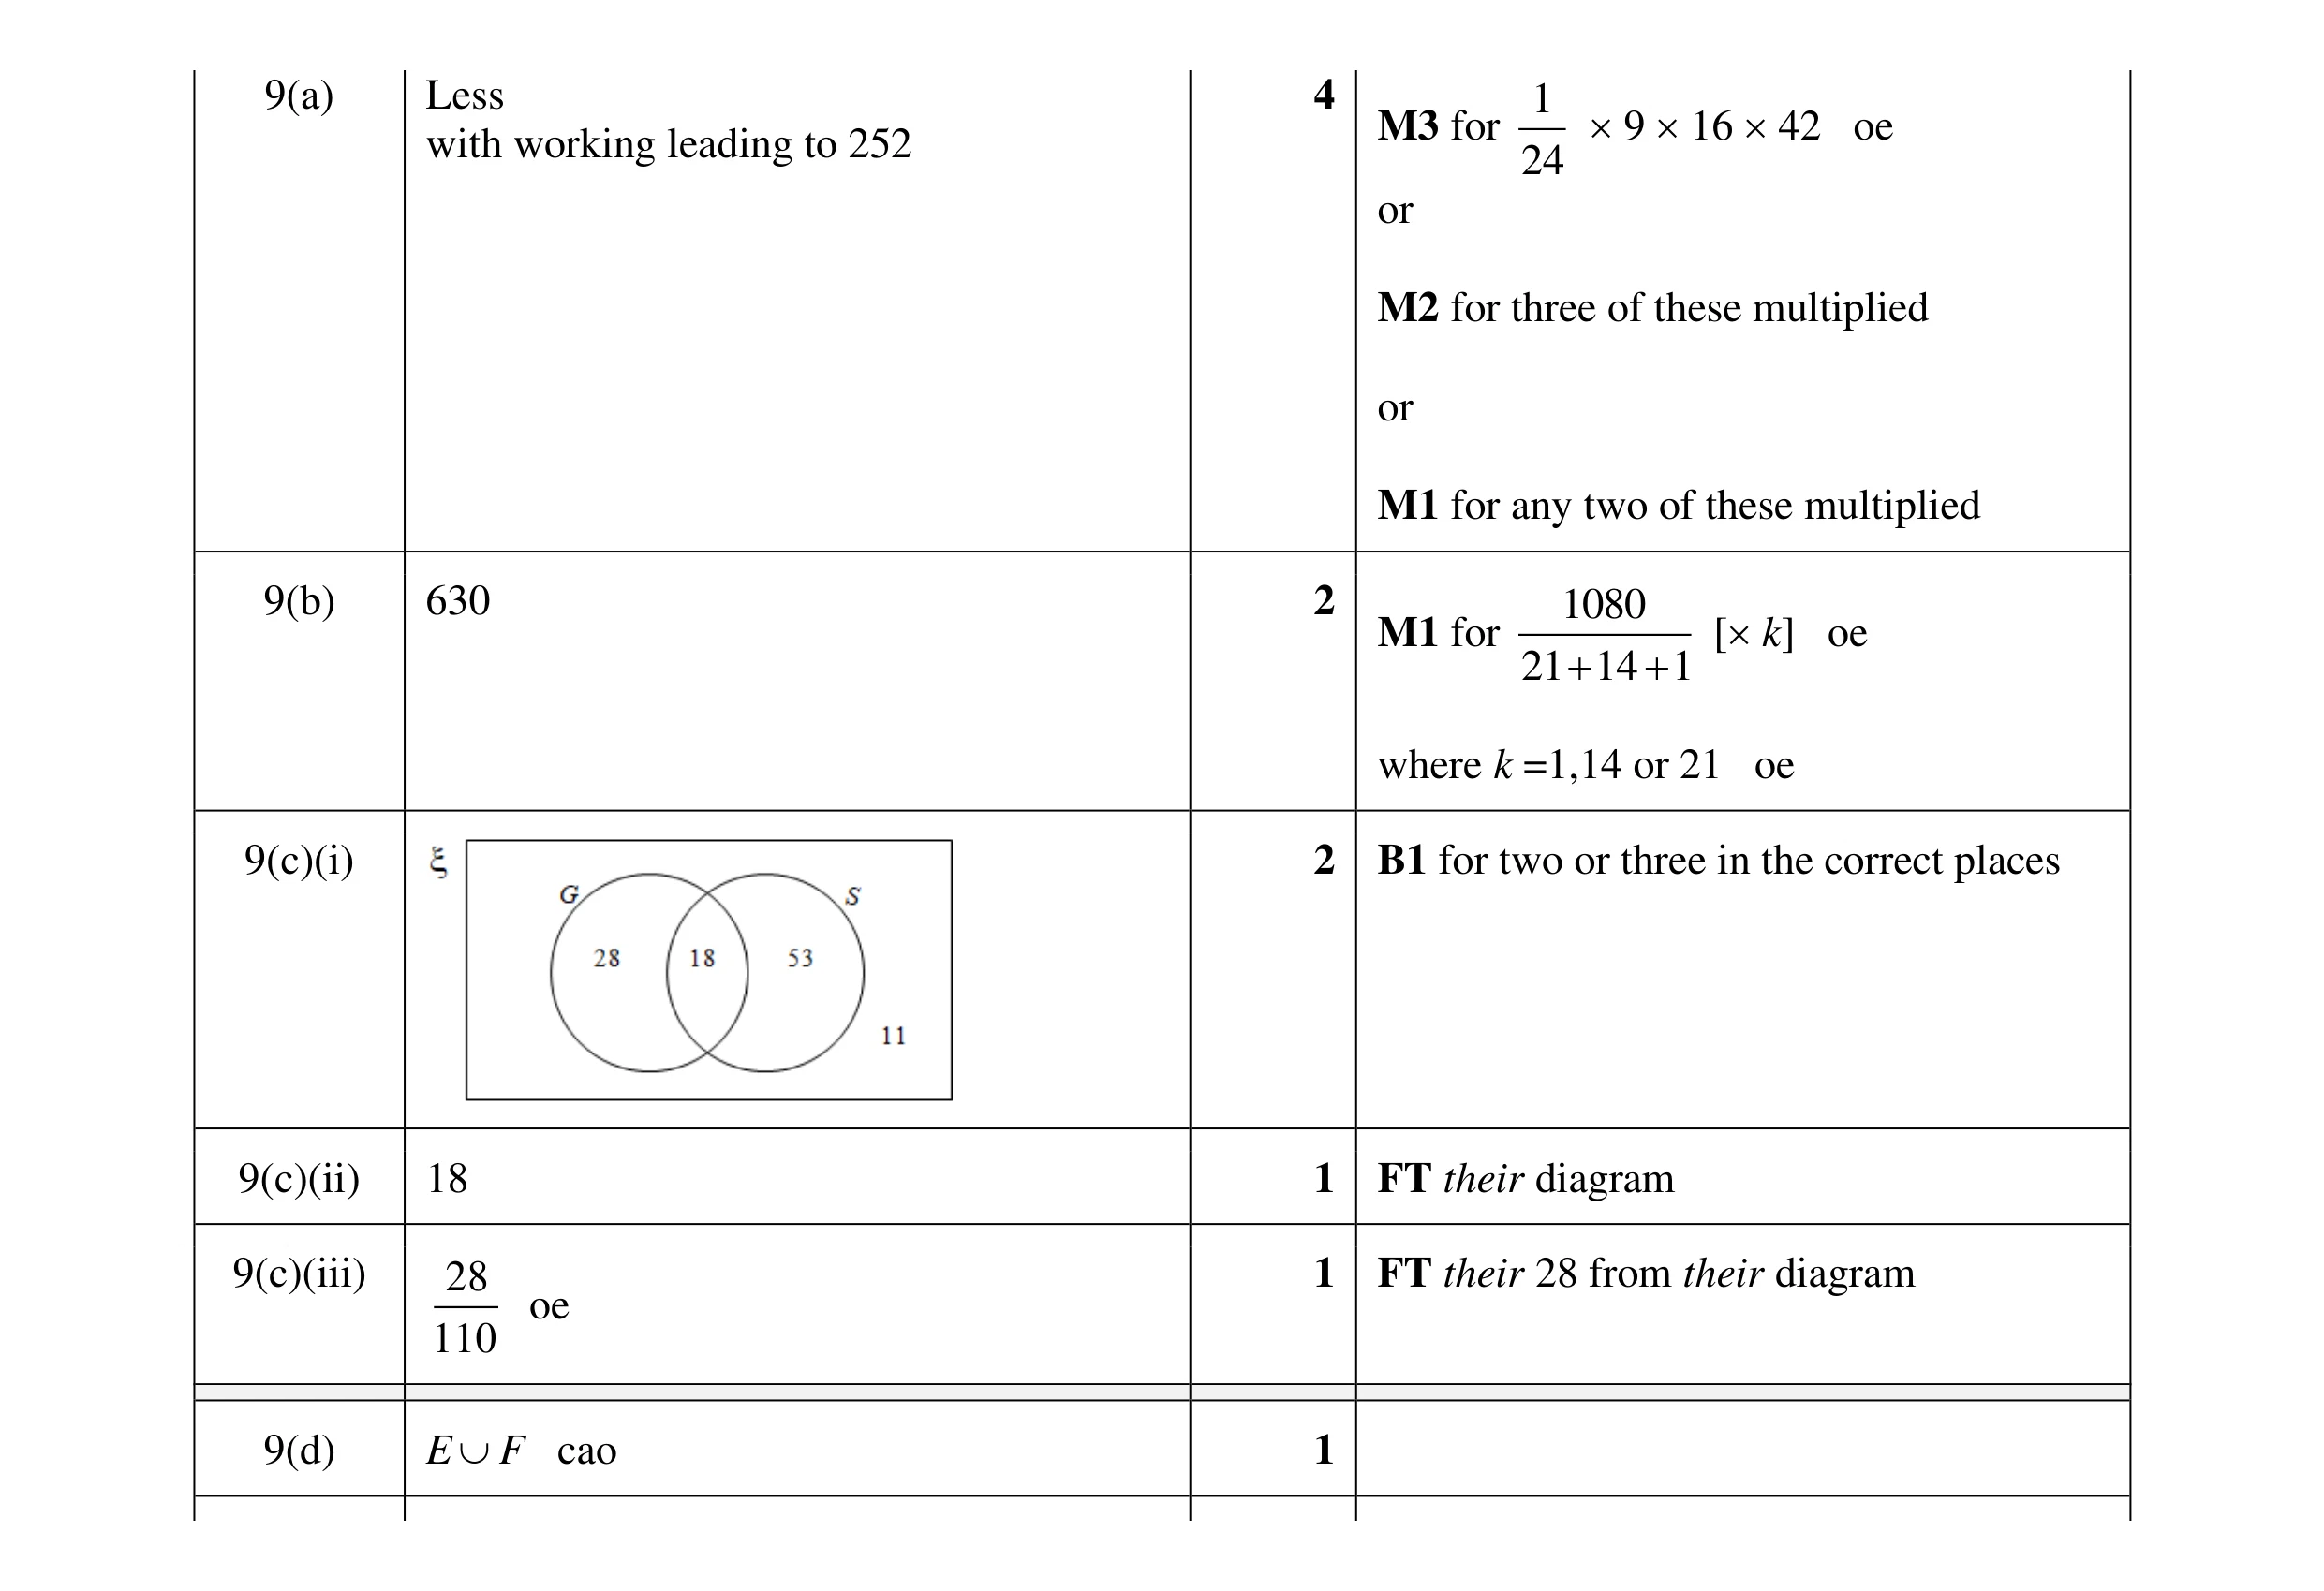 11
11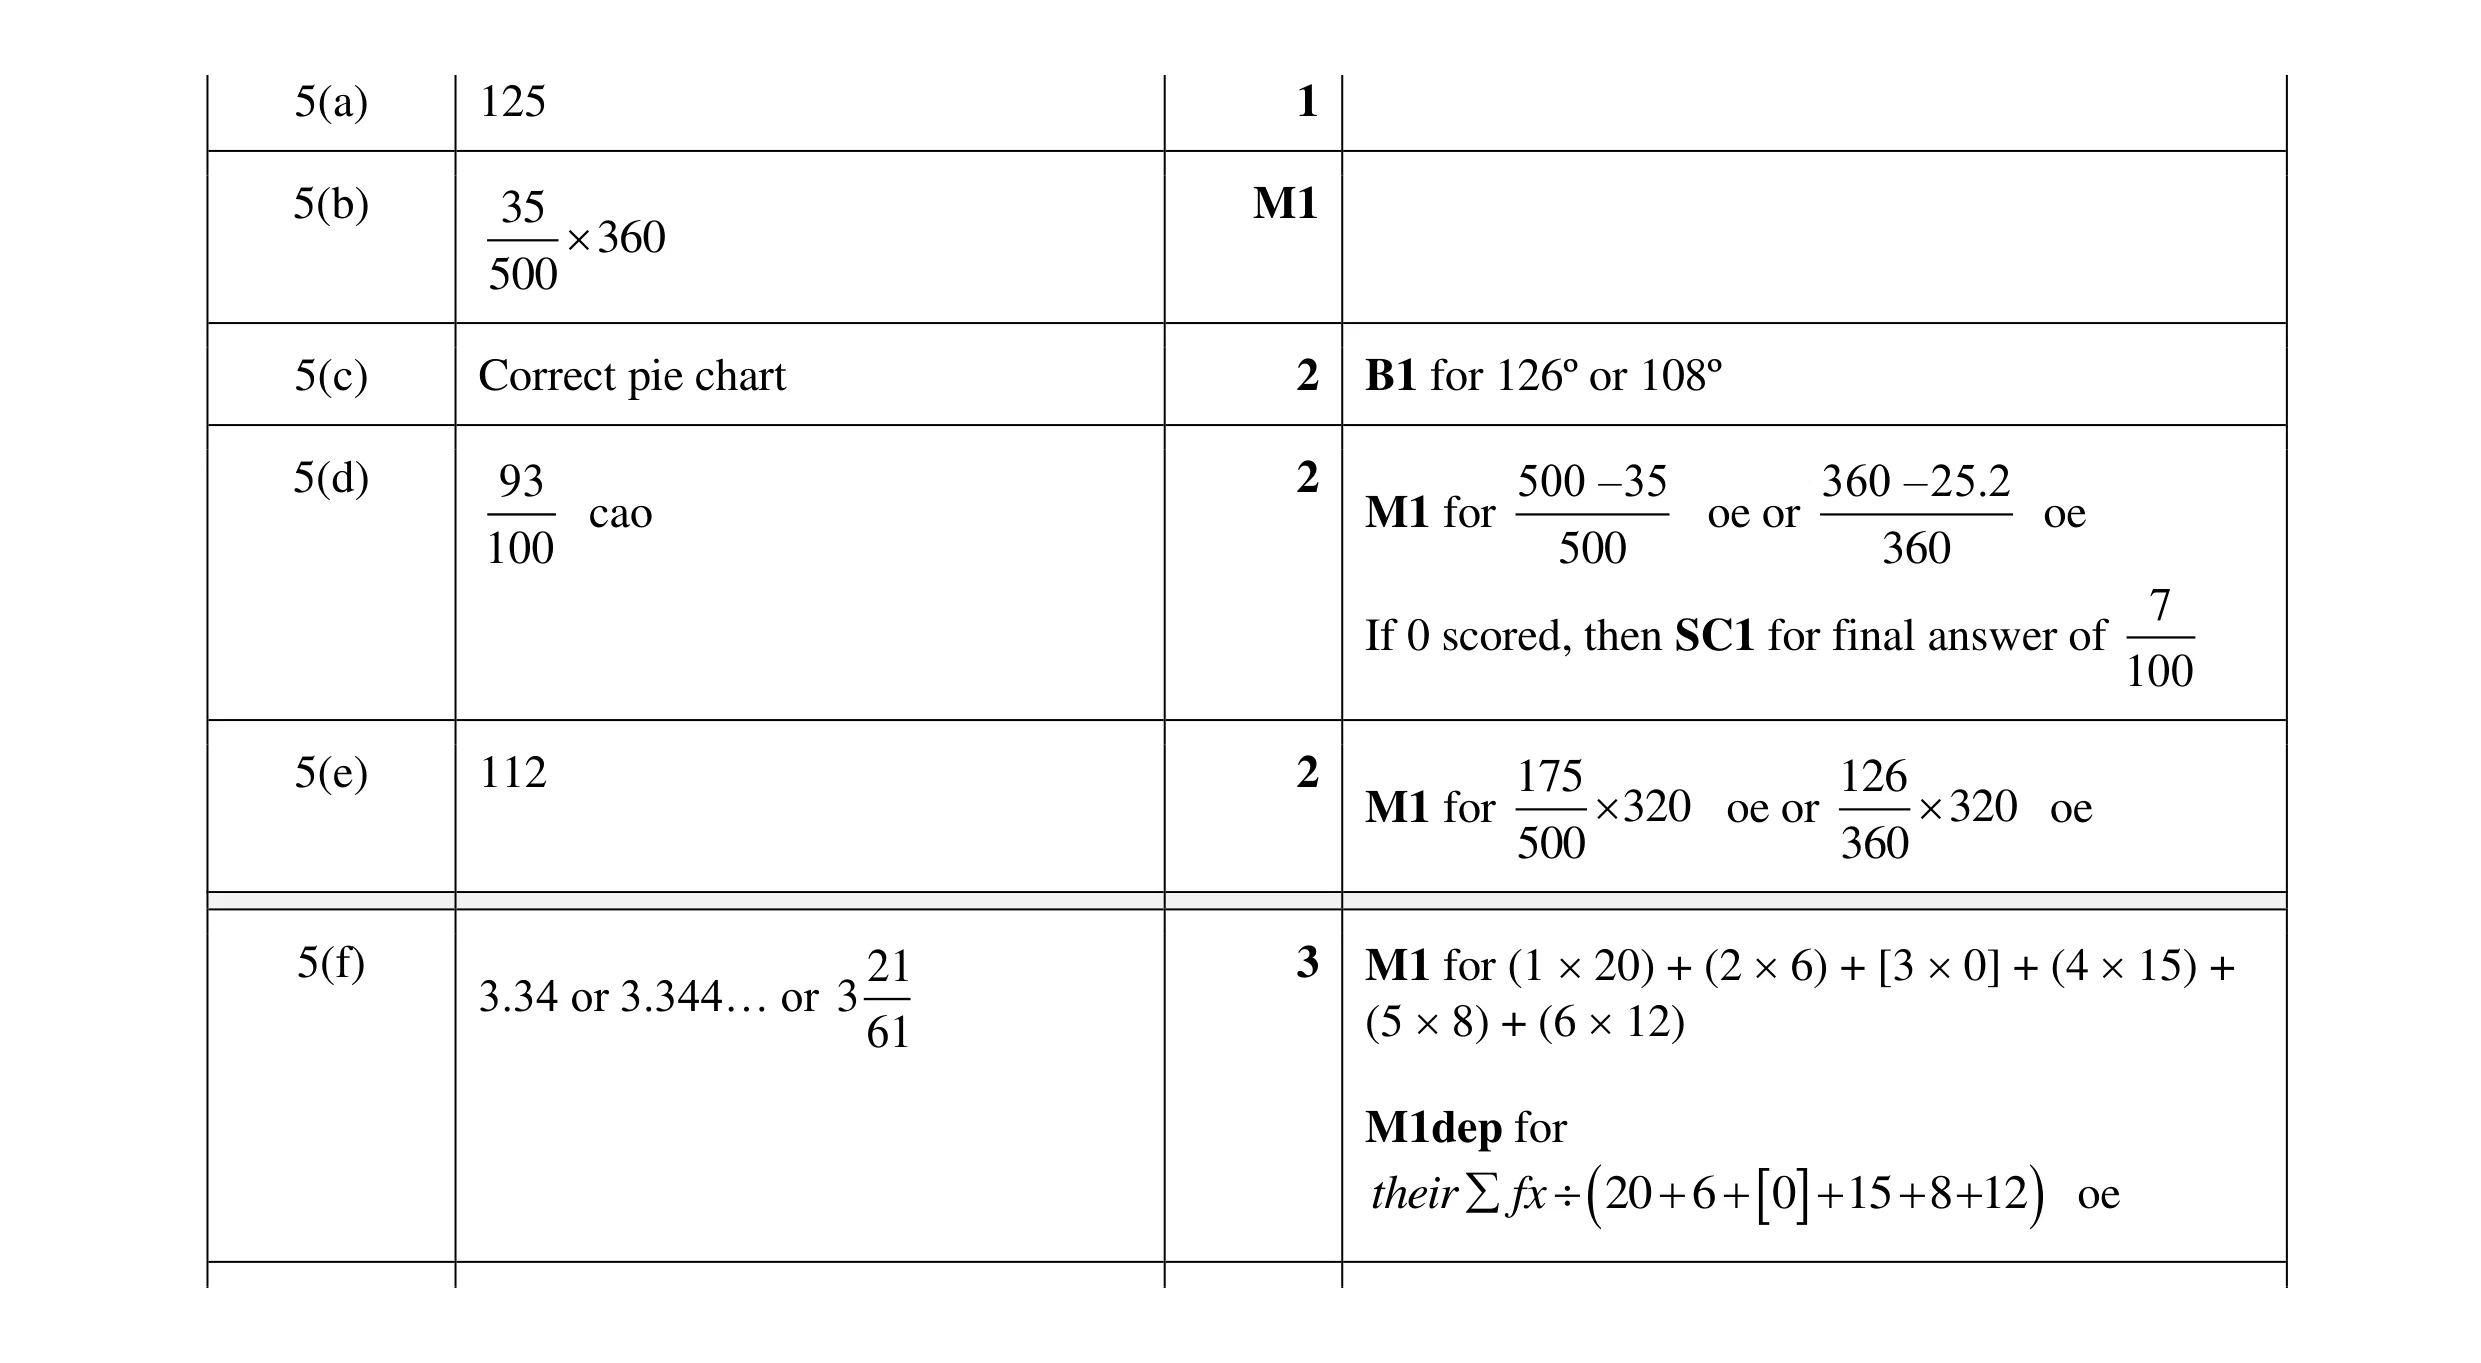 11
11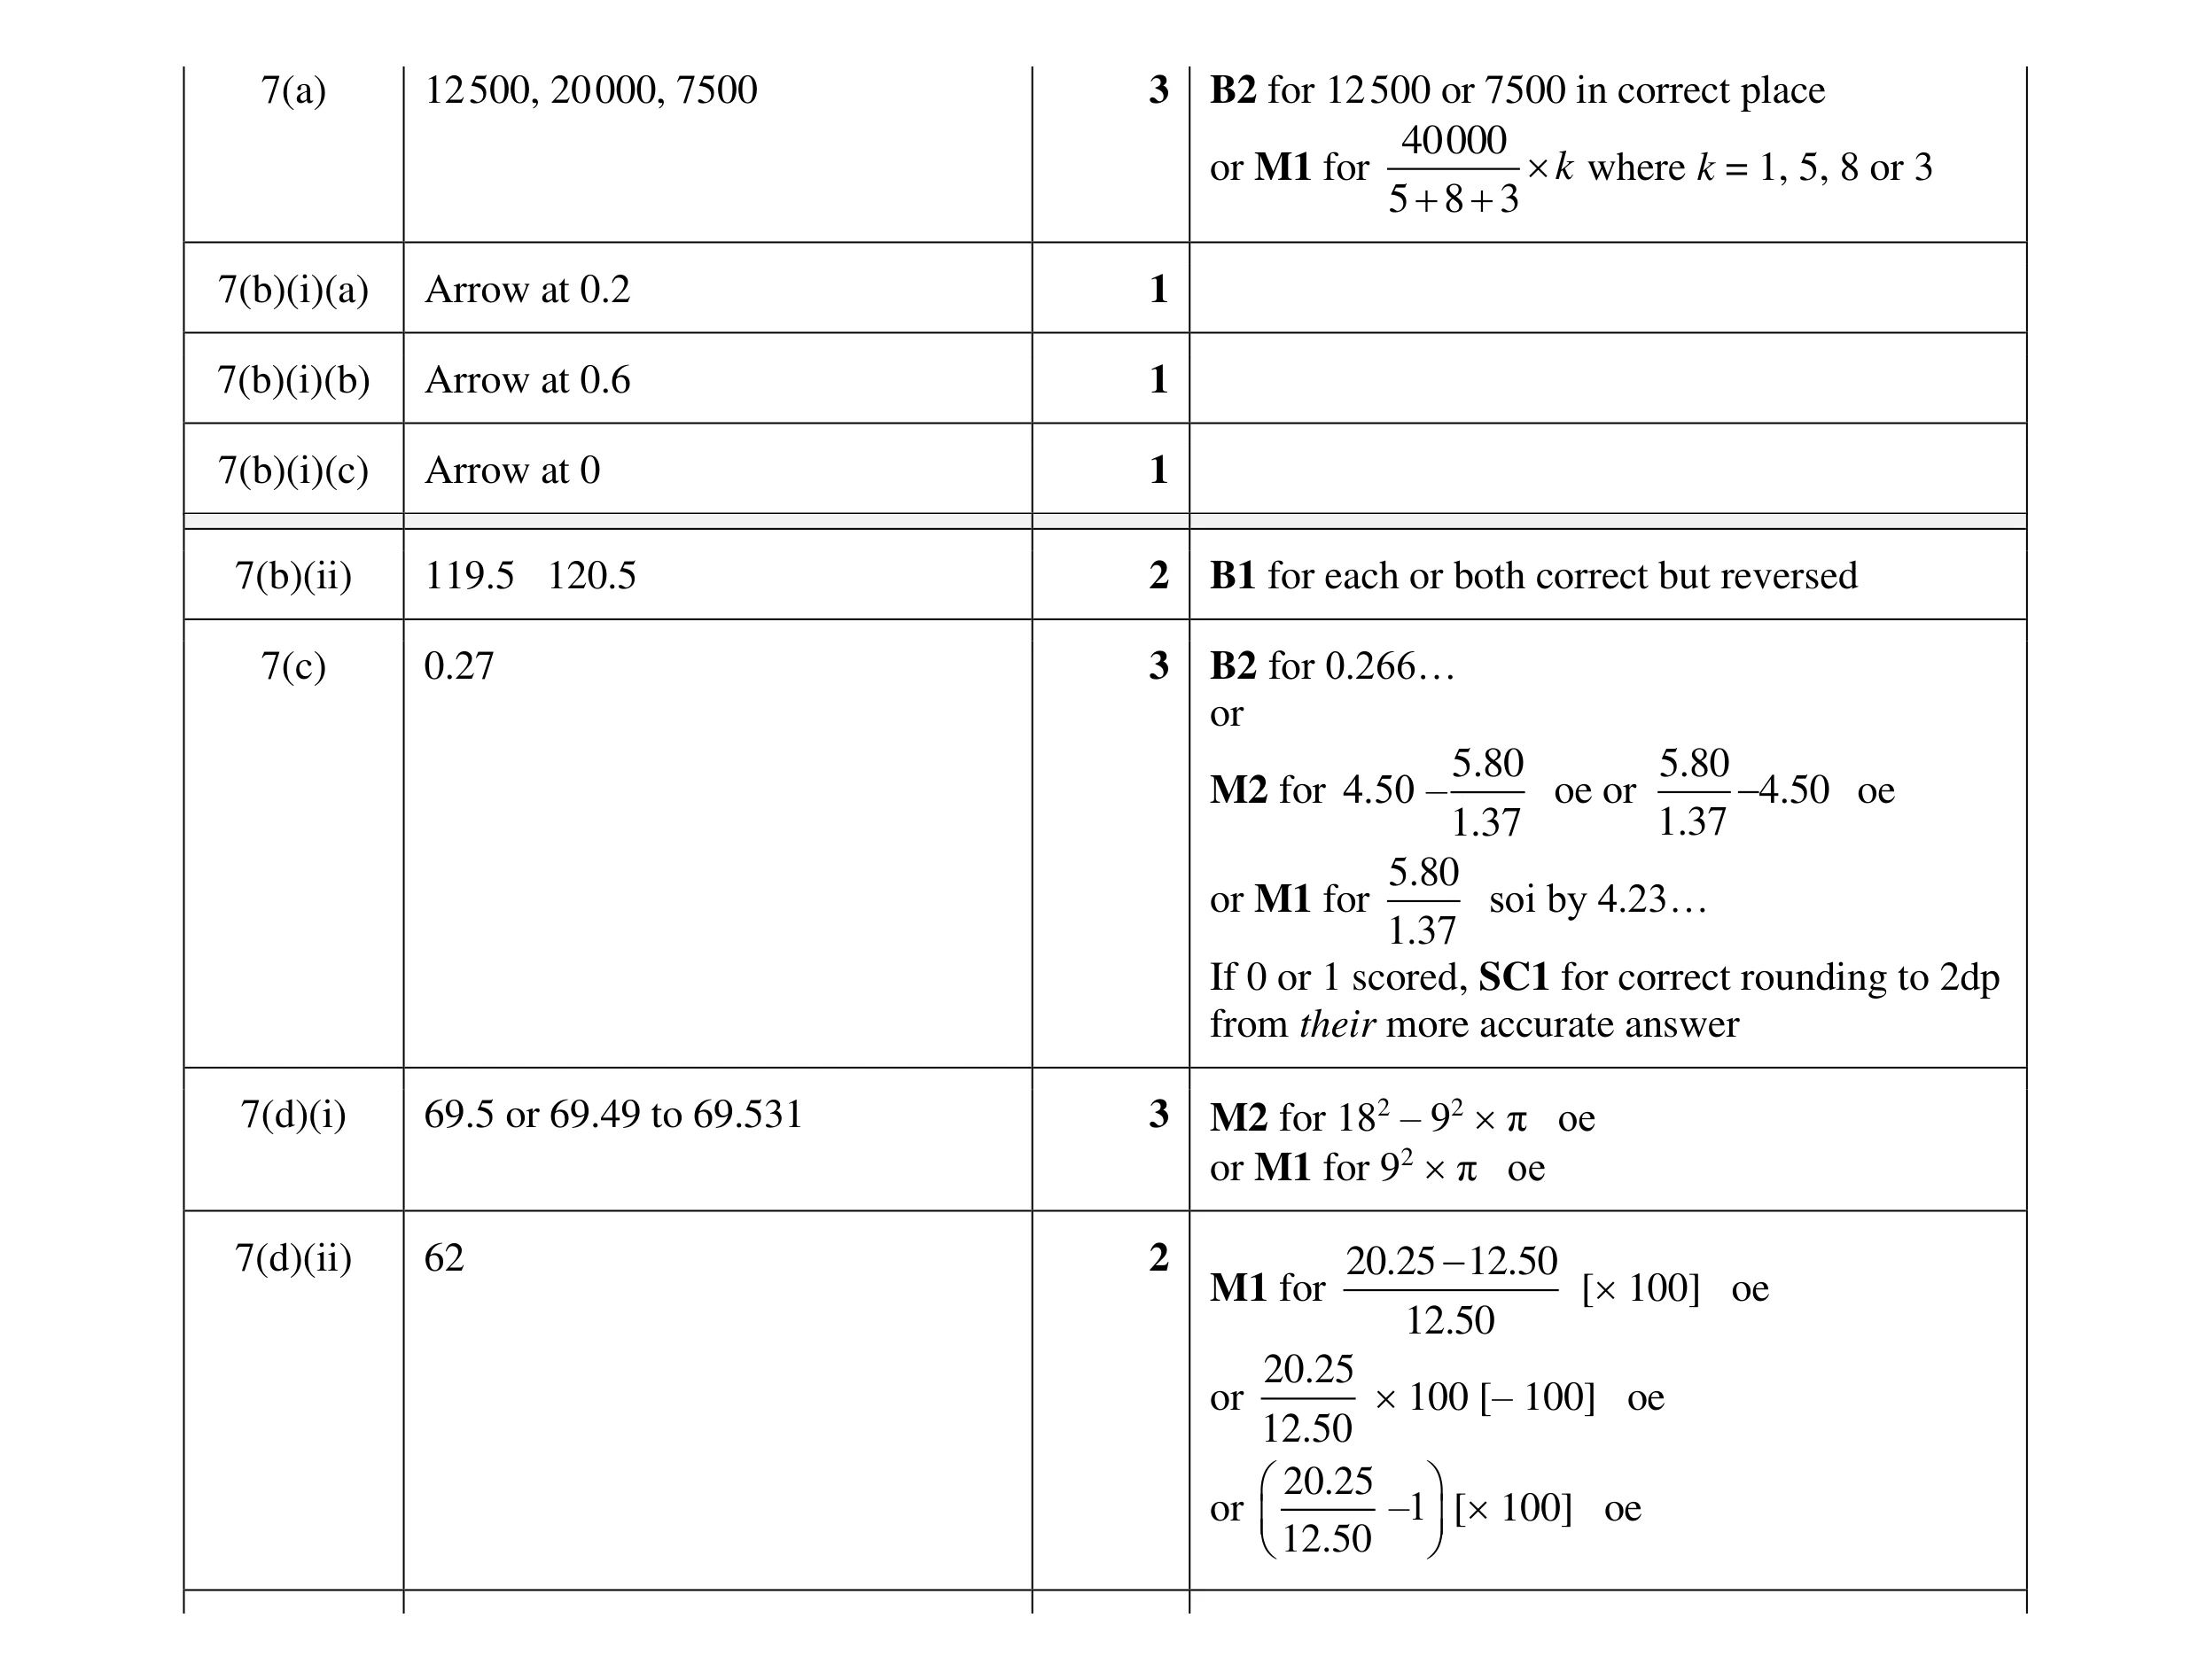 16
16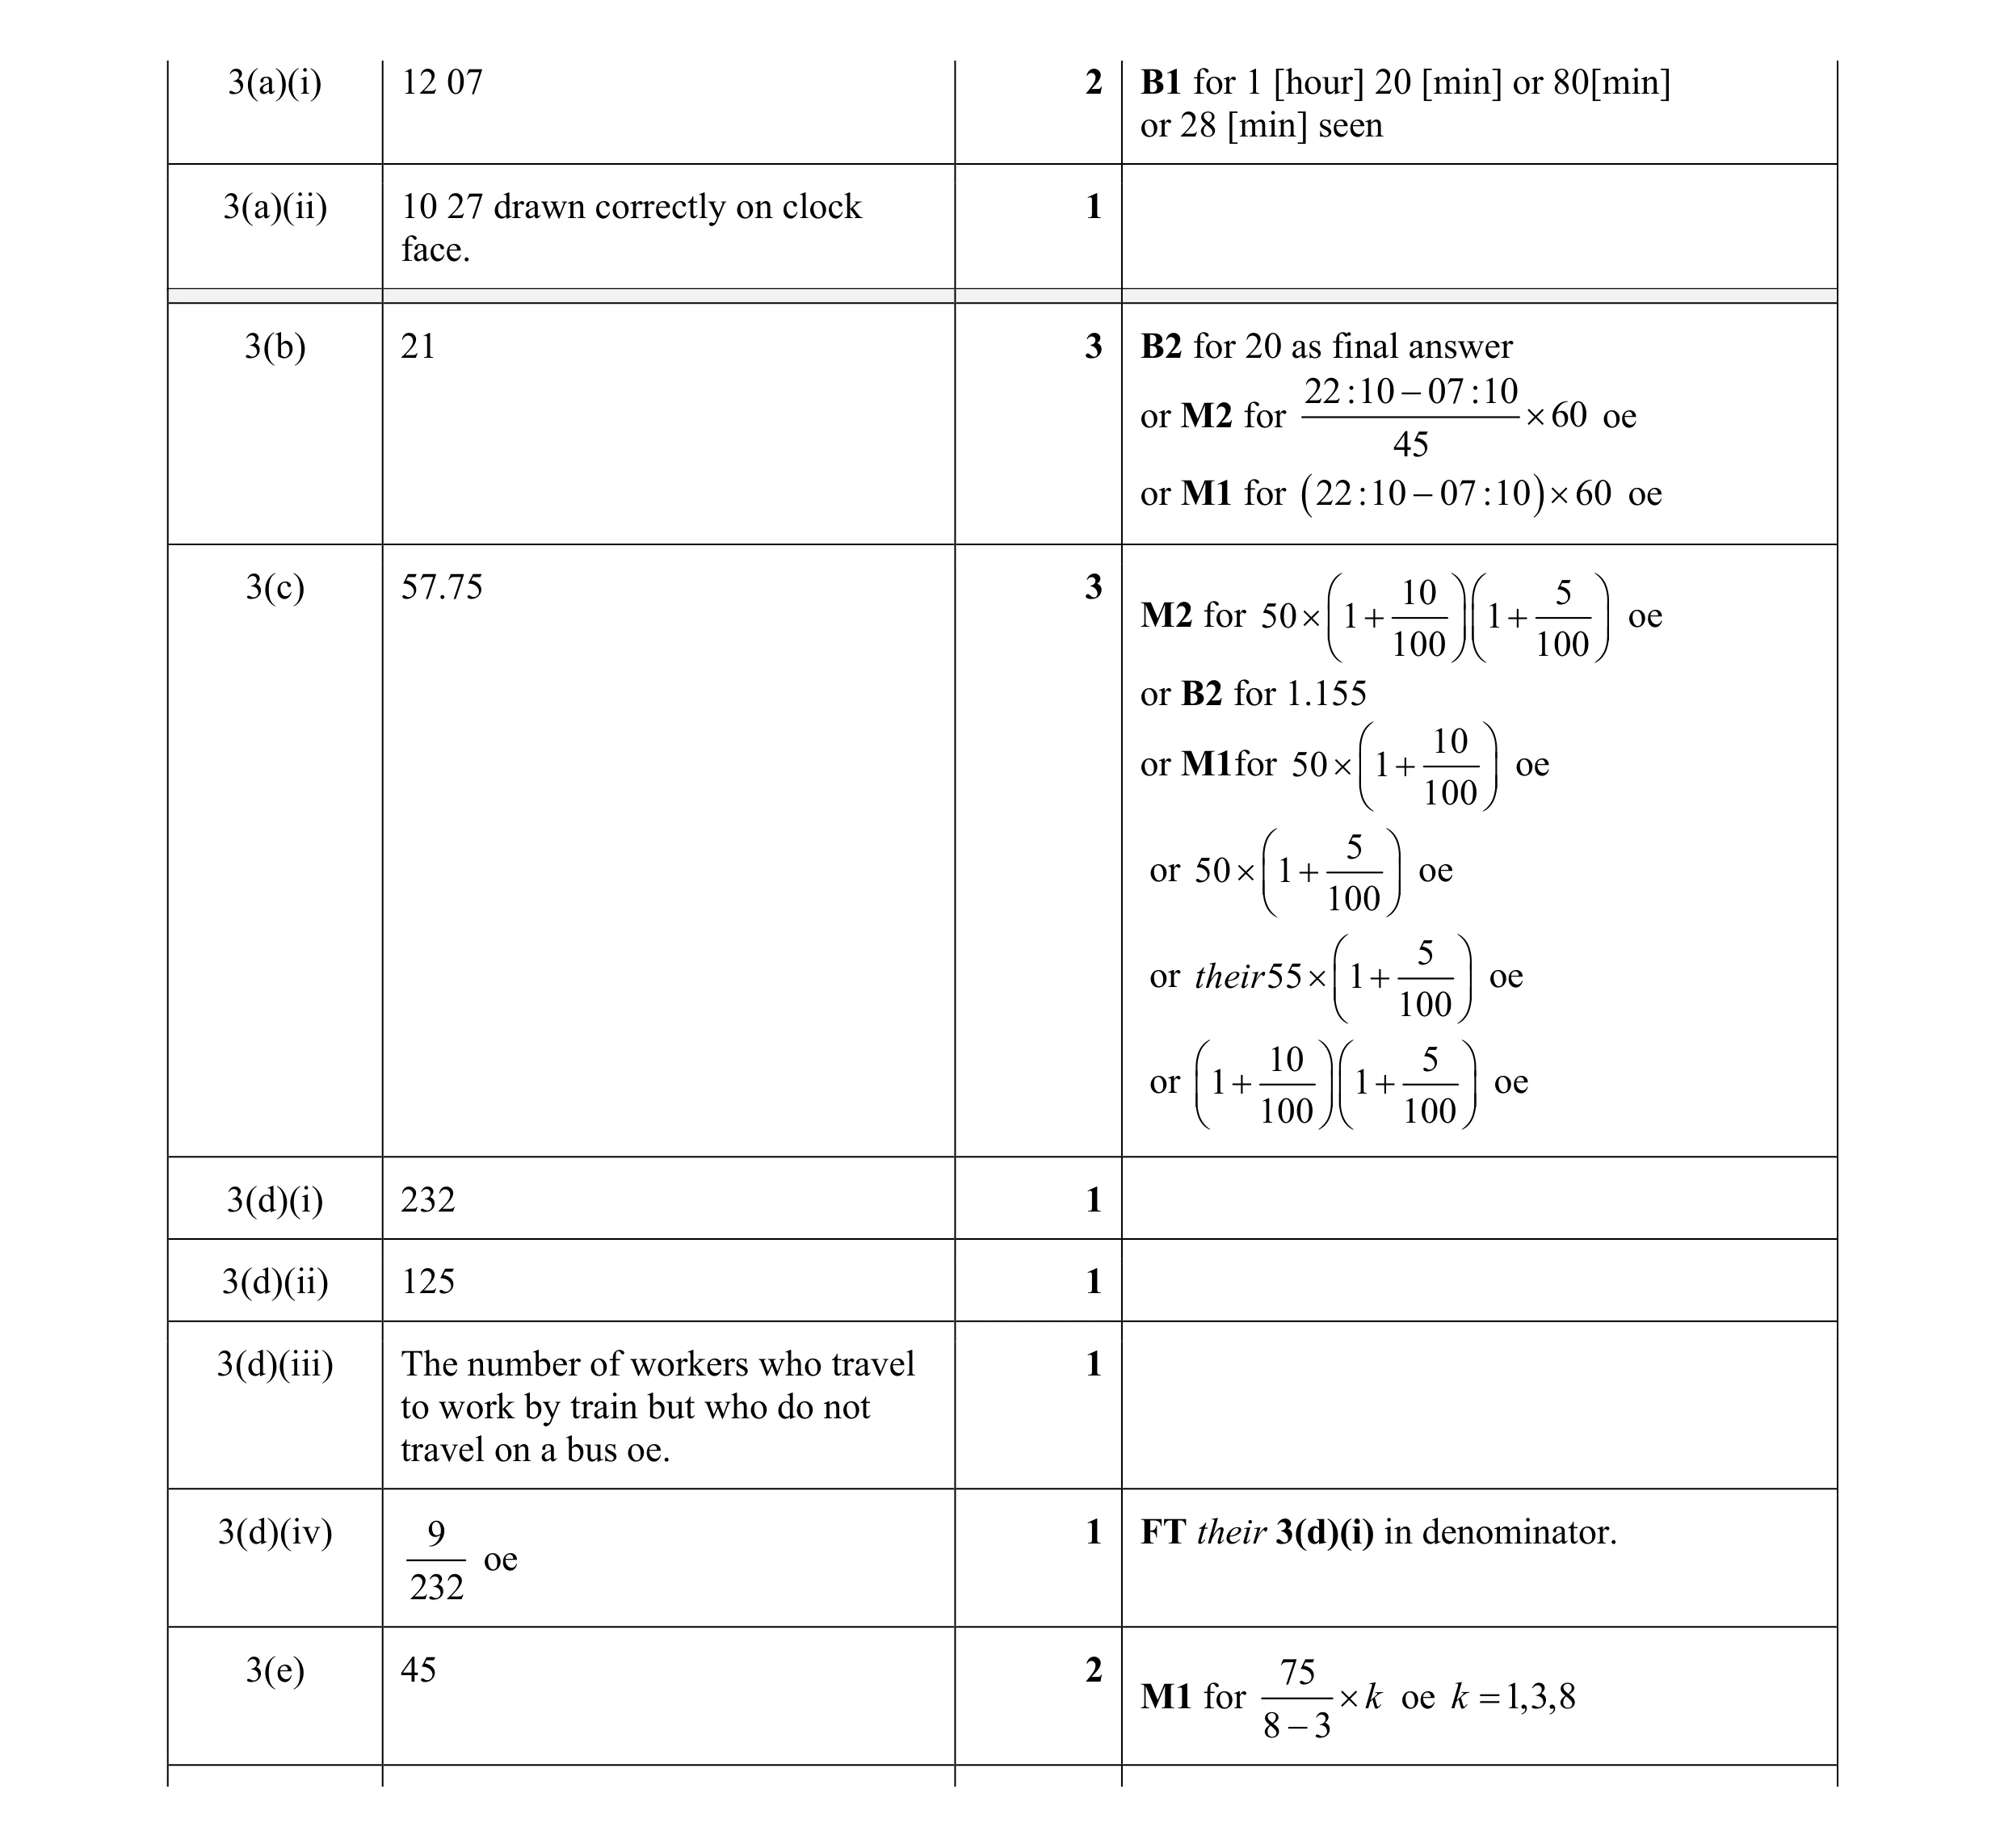 15
15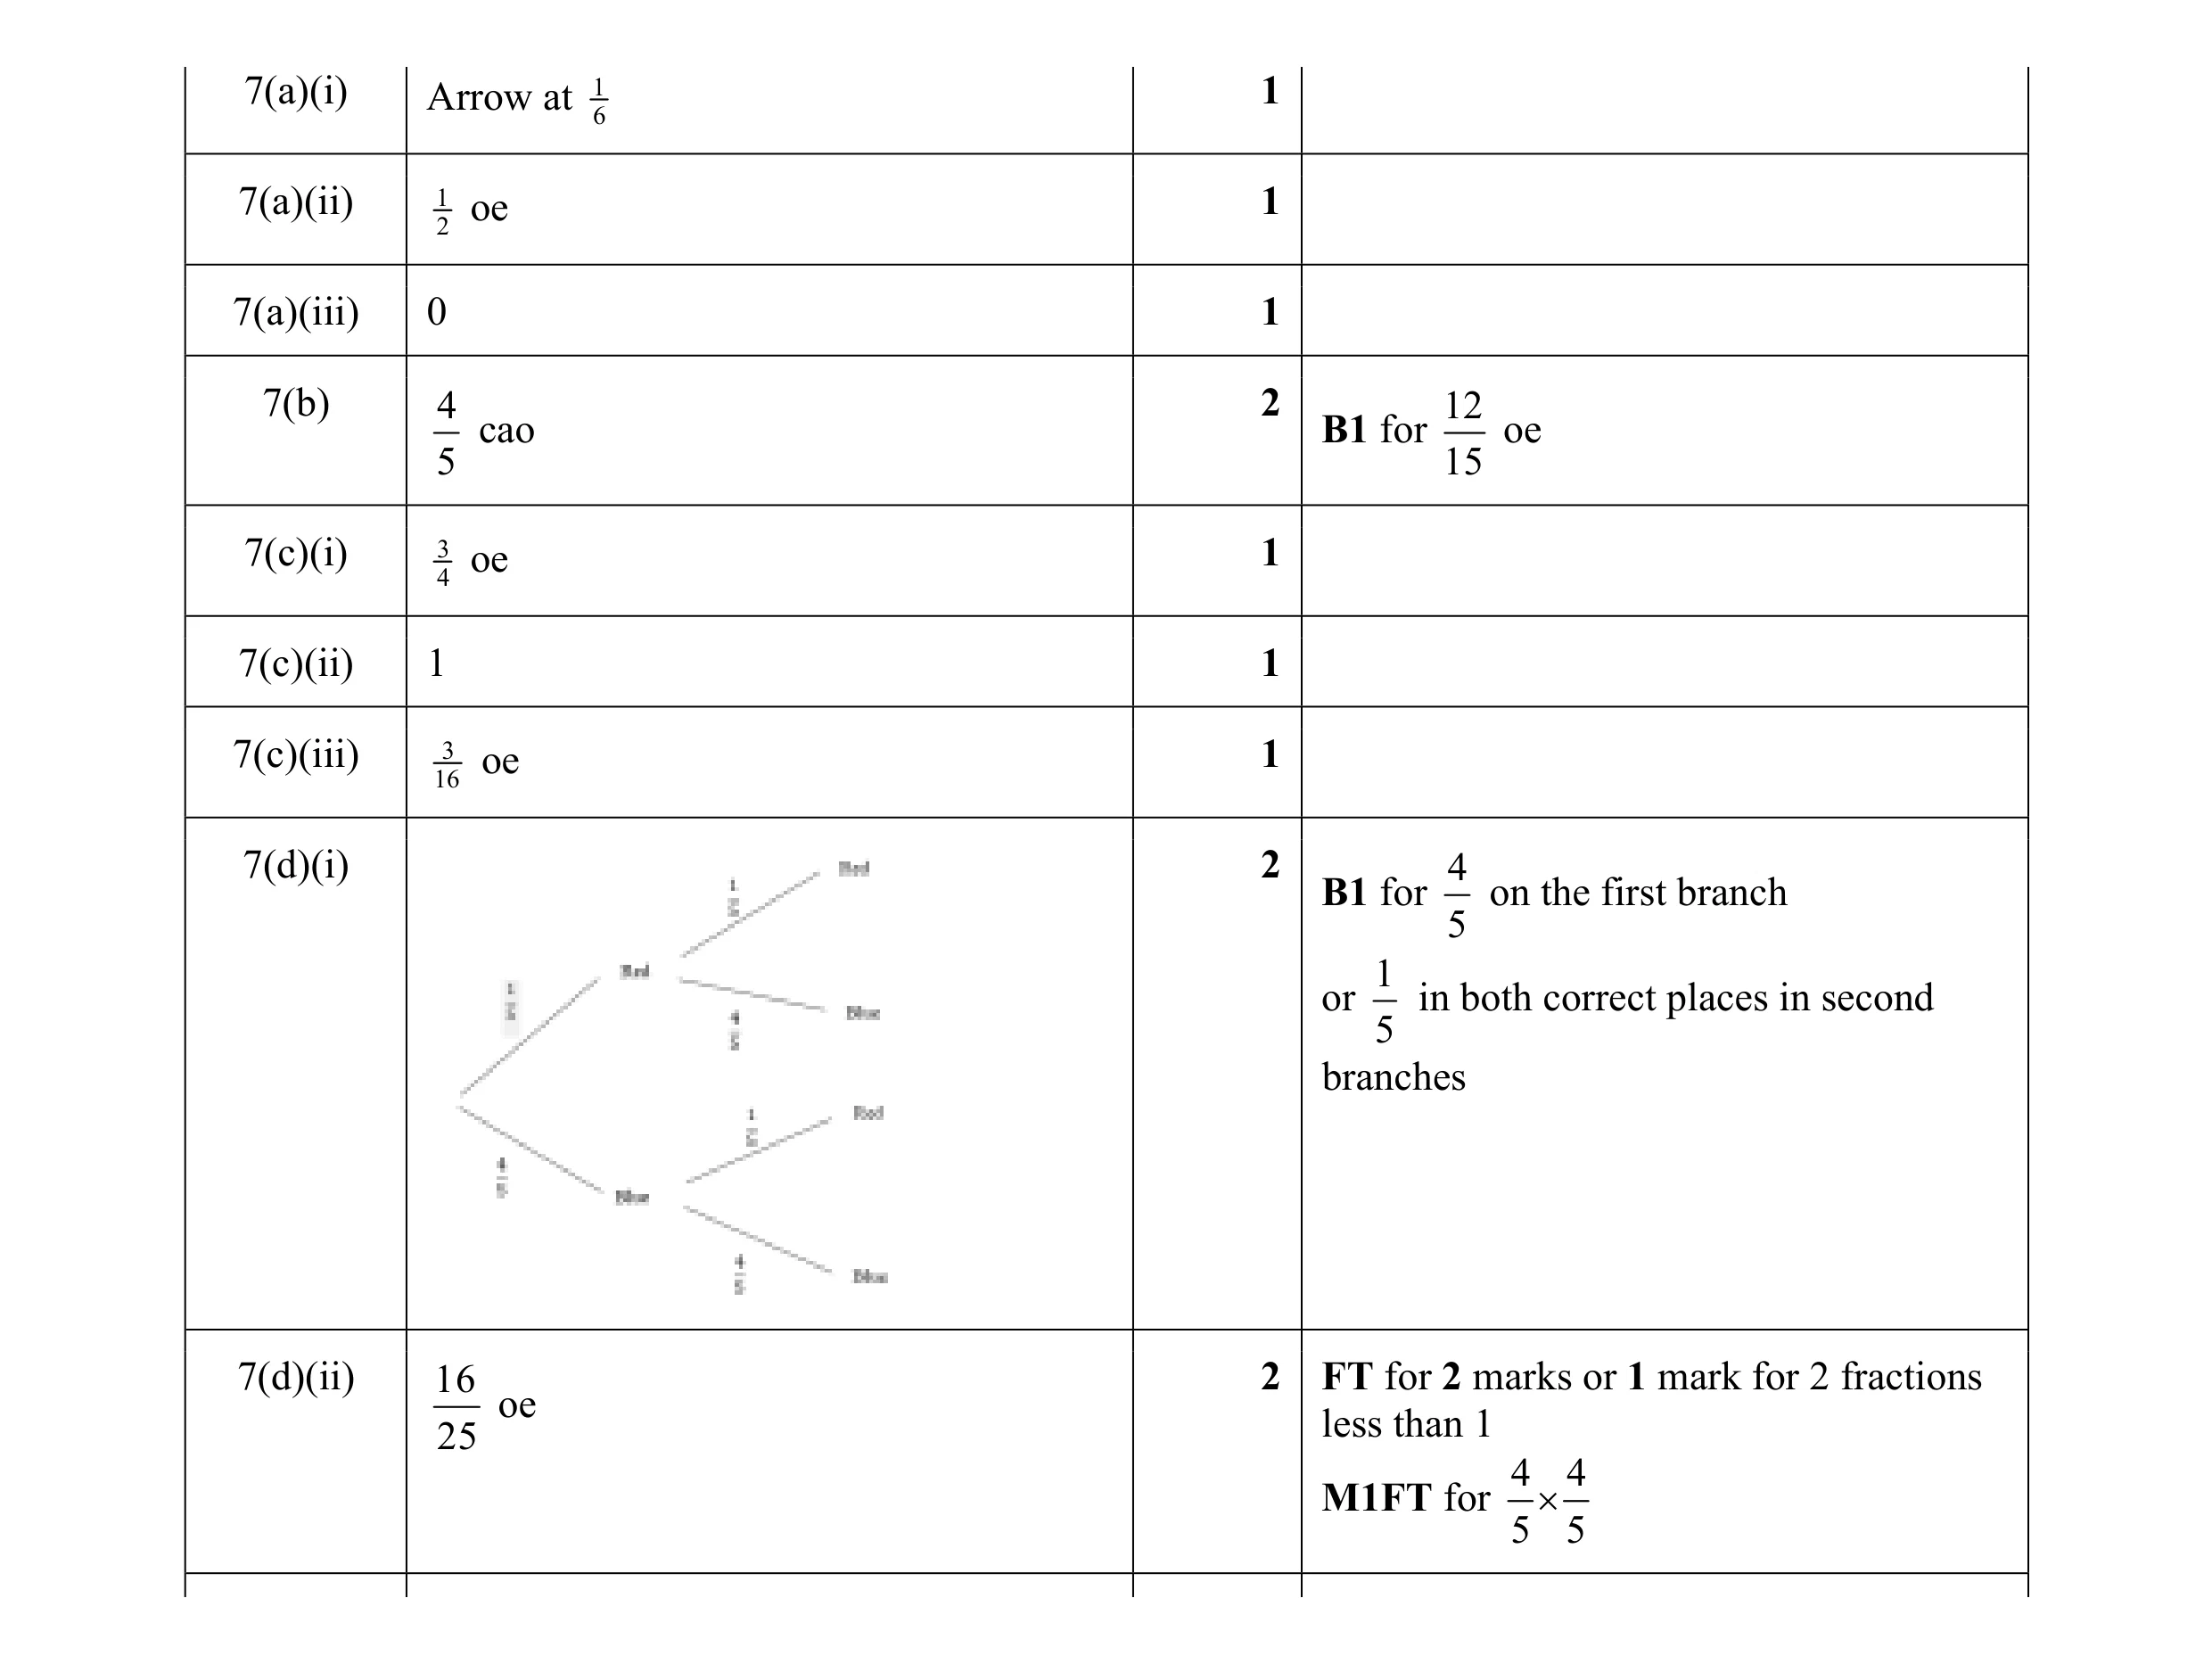 12
12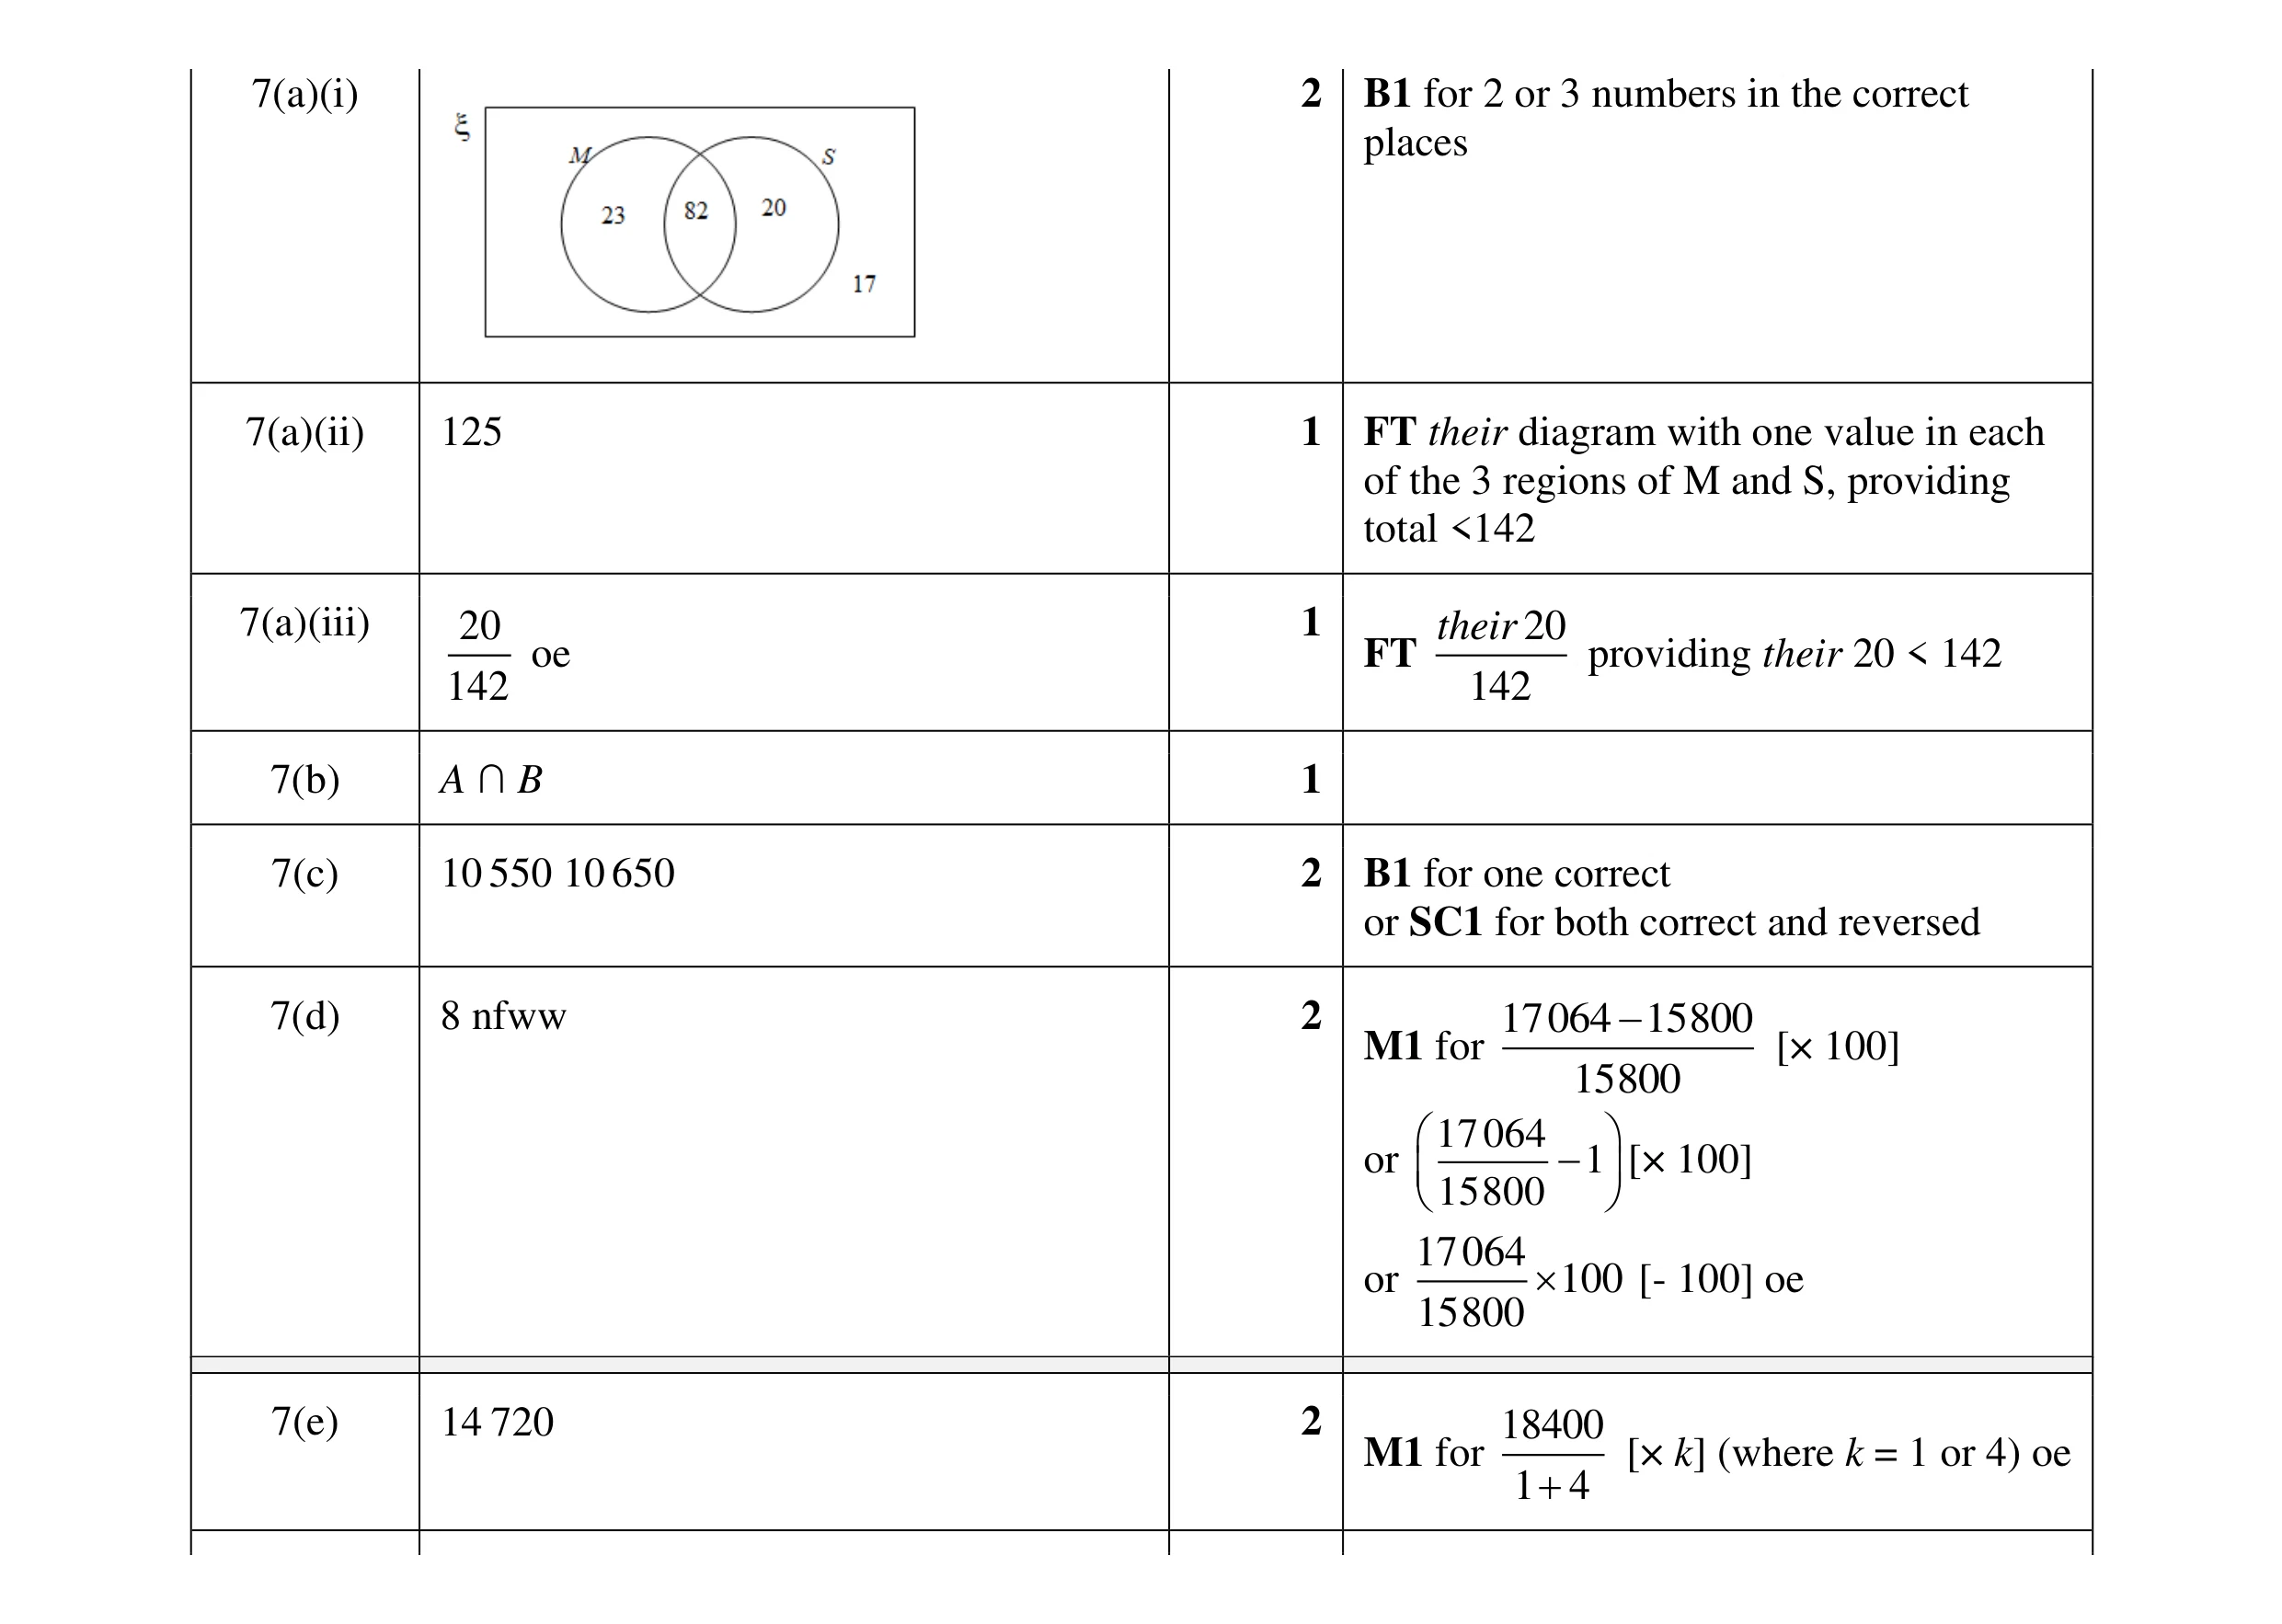 11
11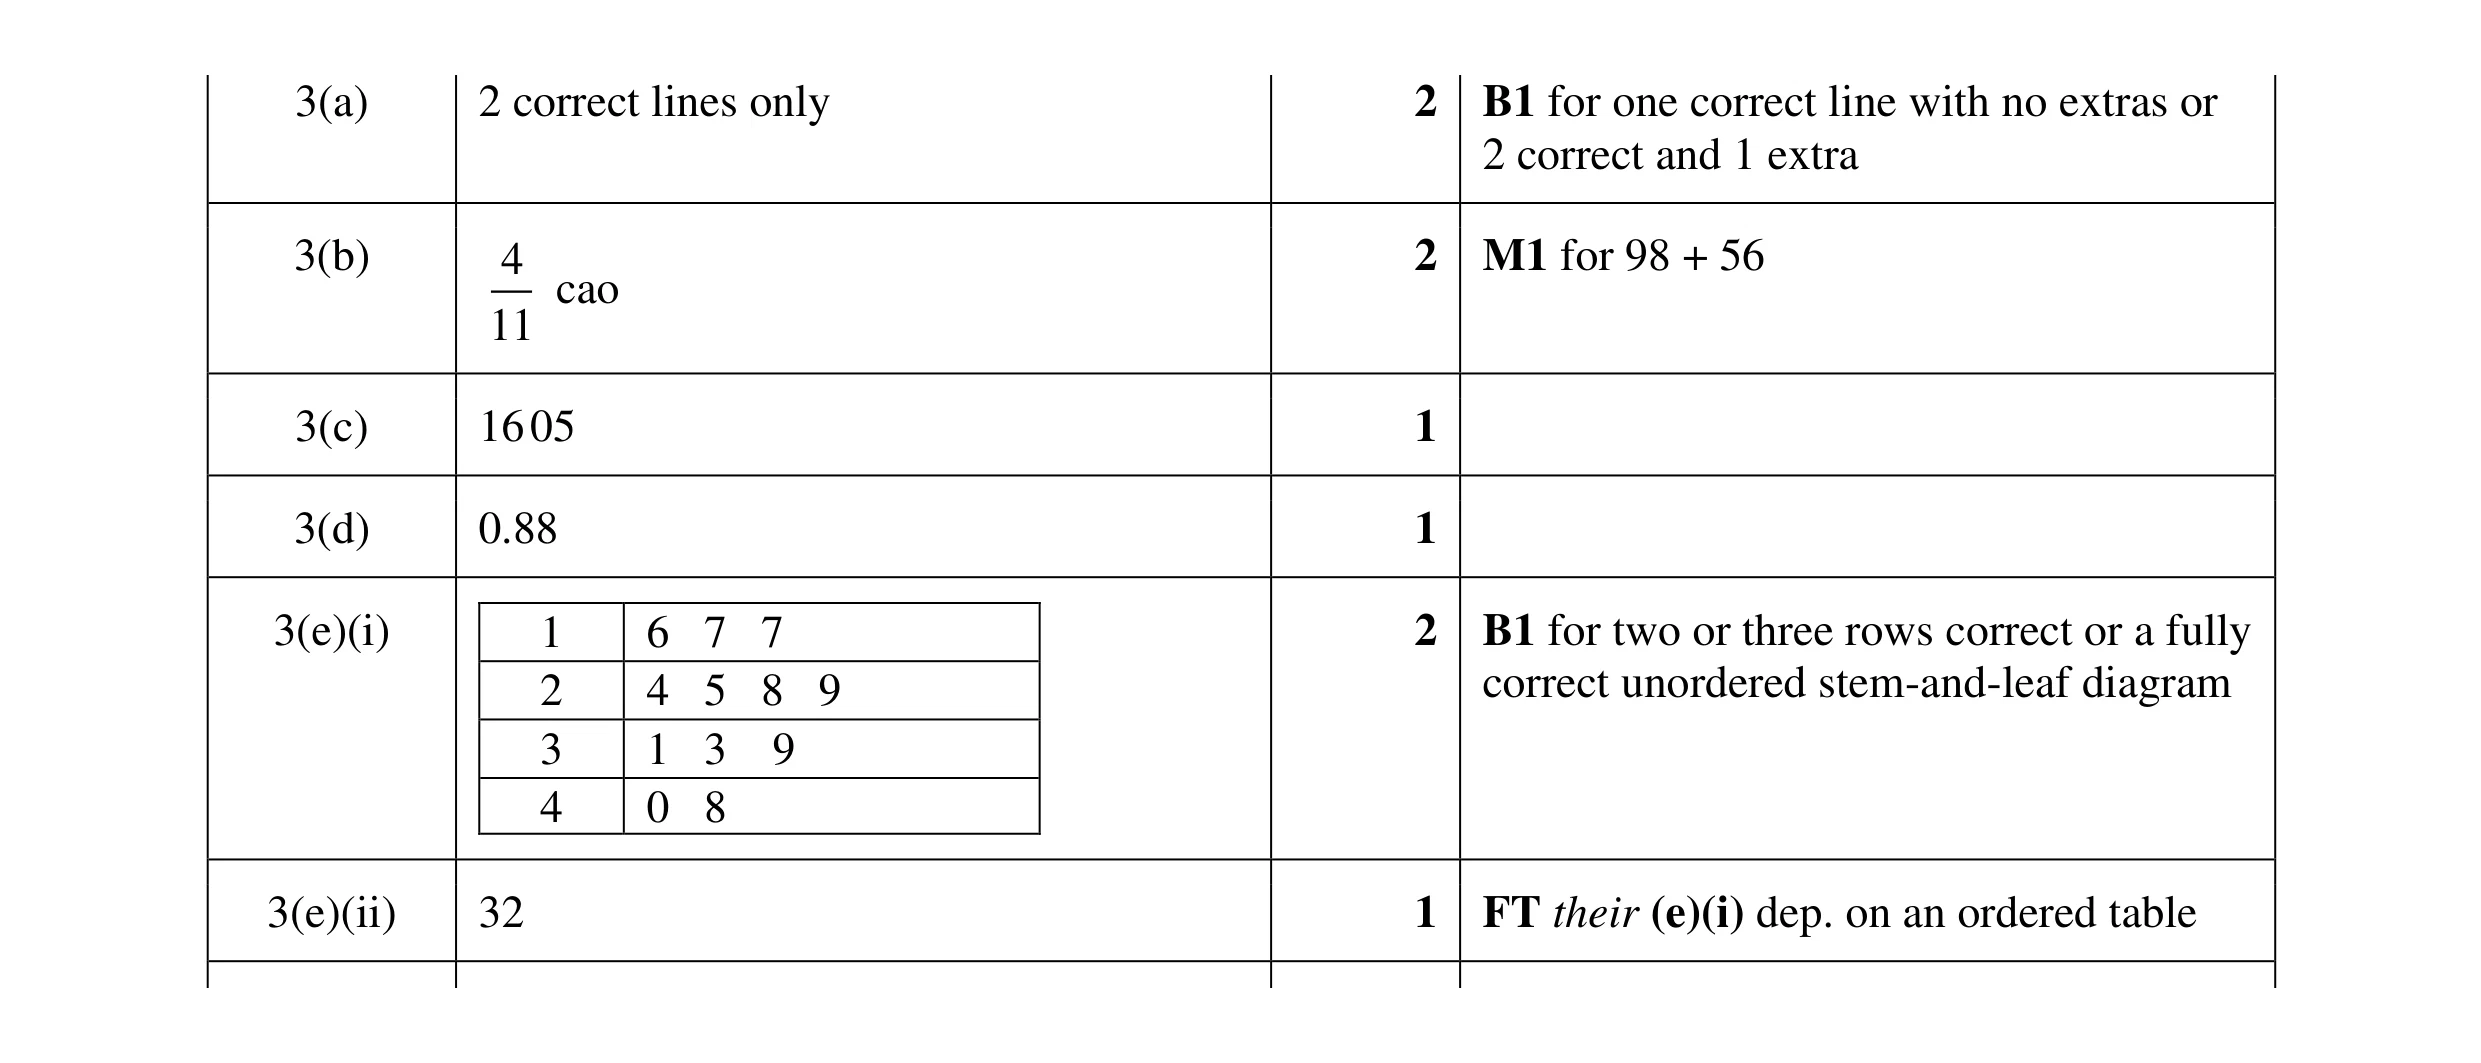 9
9 2
2 1
1 3
3 3
3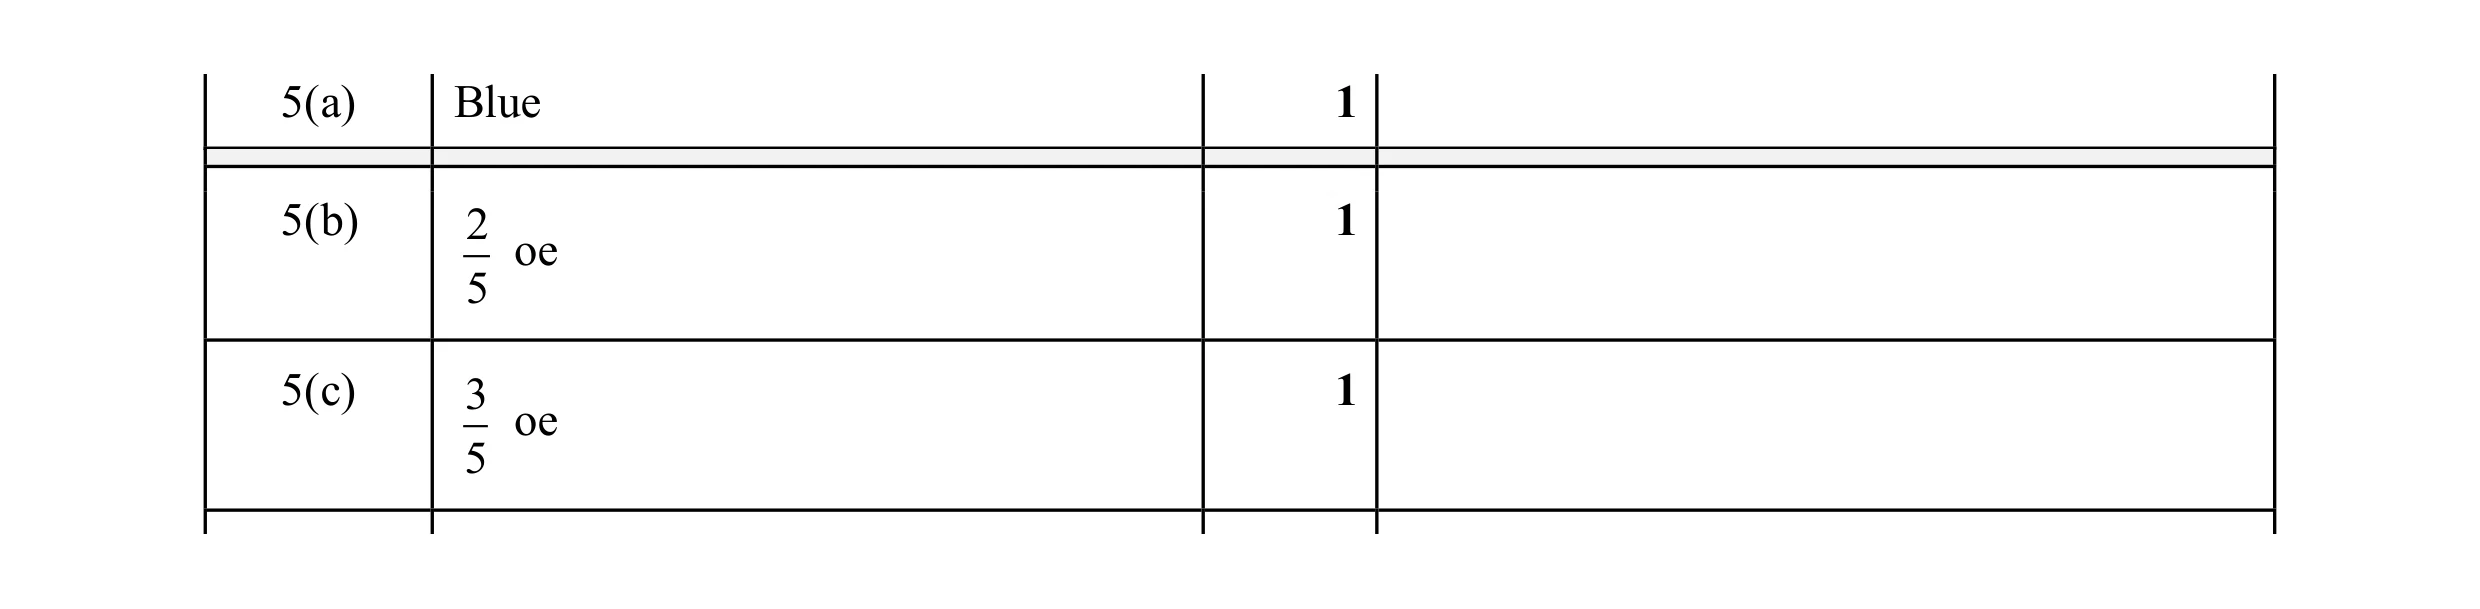 3
3