Cambridge IGCSE Mathematics 0580 — 2016 Feb/March Paper 3 · Variant 2
0580/32/F/M/16 · 9 questions · 104 marks · ≈117 min
The question paper and its mark scheme, free to read here and free to download. This is Cambridge’s own paper, exactly as it was sat.
Question paper16 pages
Mark scheme5 pages
Answers below. Sit the paper first if you are practising.
Questions as text
Q1 · Whisper is a horse
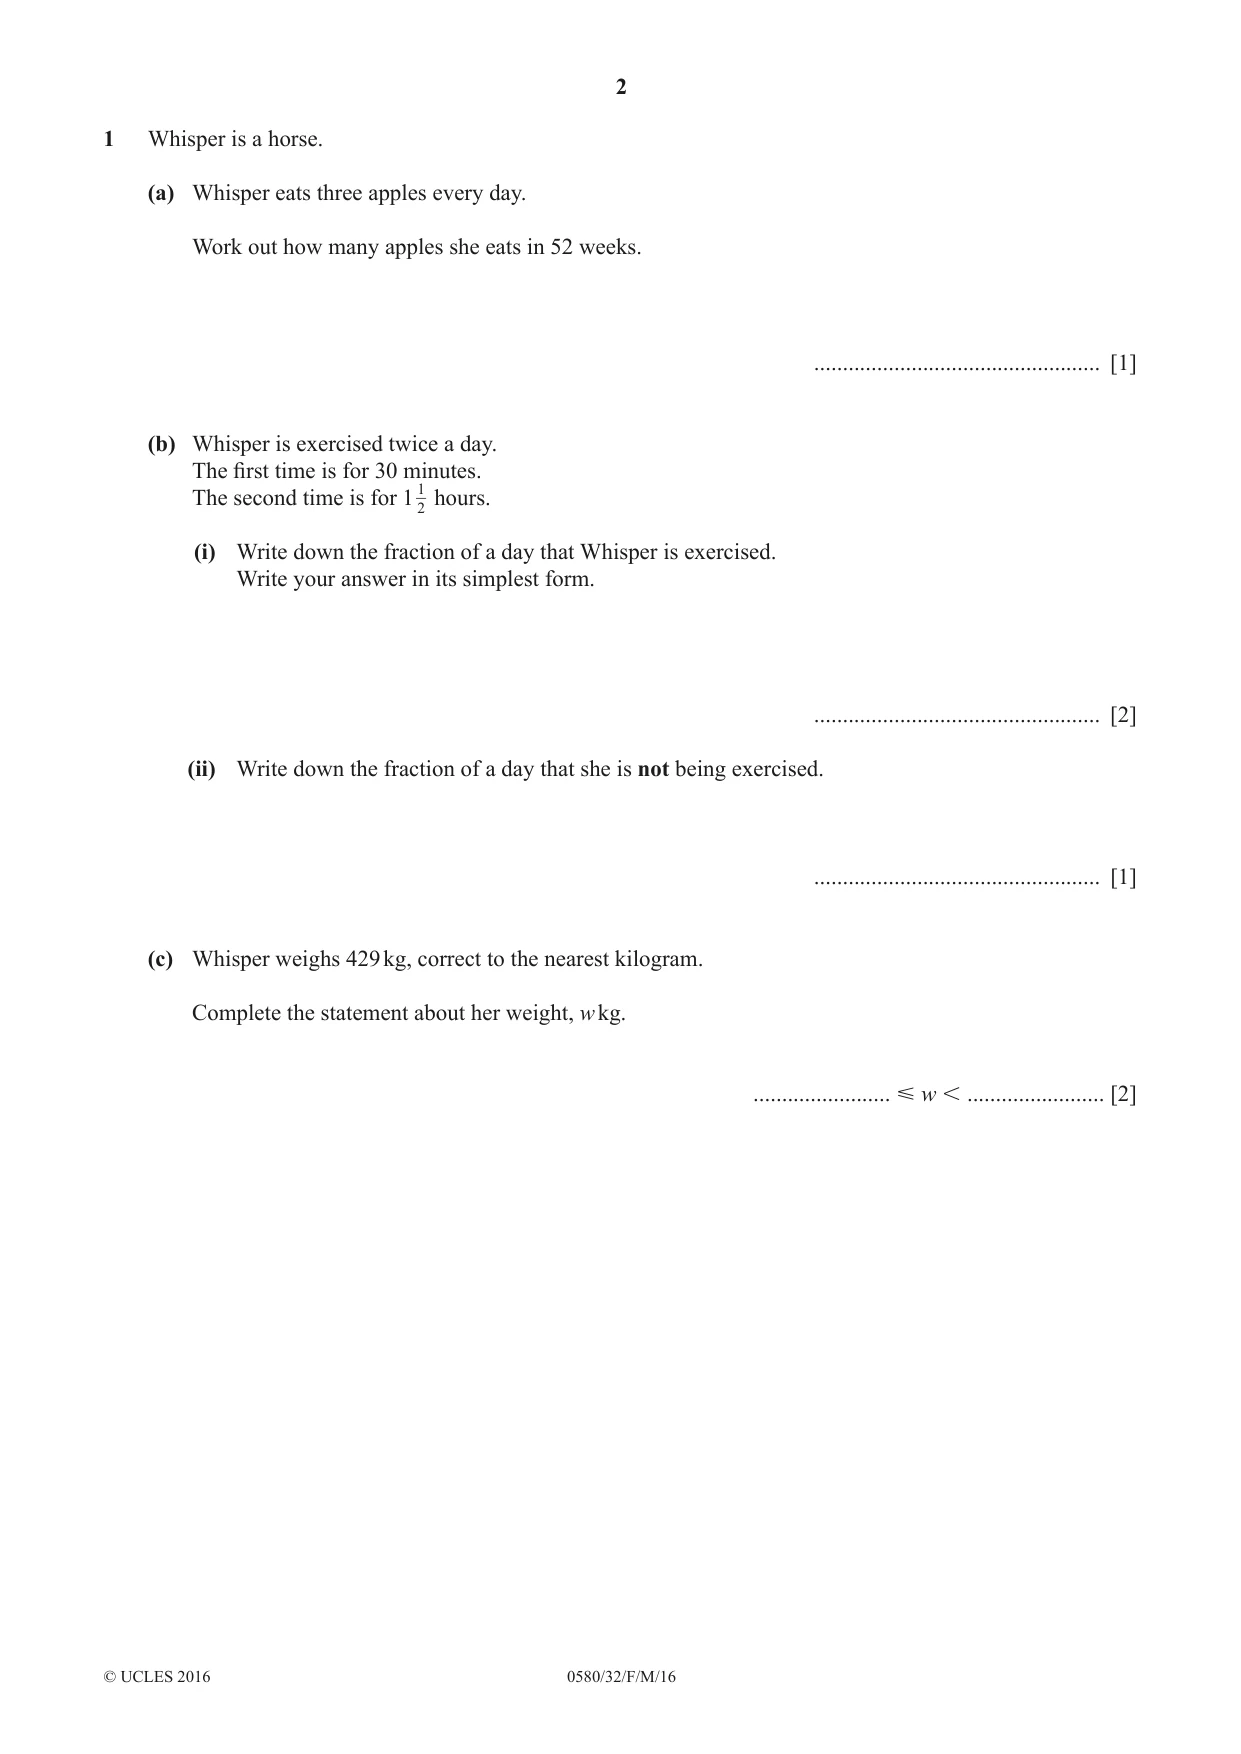
1 Whisper is a horse. (a) Whisper eats three apples every day. Work out how many apples she eats in 52 weeks. .................................................. [1] (b) Whisper is exercised twice a day. The first time is for 30 minutes. The second time is for 1 12 hours. (i) Write down the fraction of a day that Whisper is exercised. Write your answer in its simplest form. .................................................. [2] (ii) Write down the fraction of a day that she is not being exercised. .................................................. [1] (c) Whisper weighs 429 kg, correct to the nearest kilogram. Complete the statement about her weight, w kg. ........................ w ........................ [2]
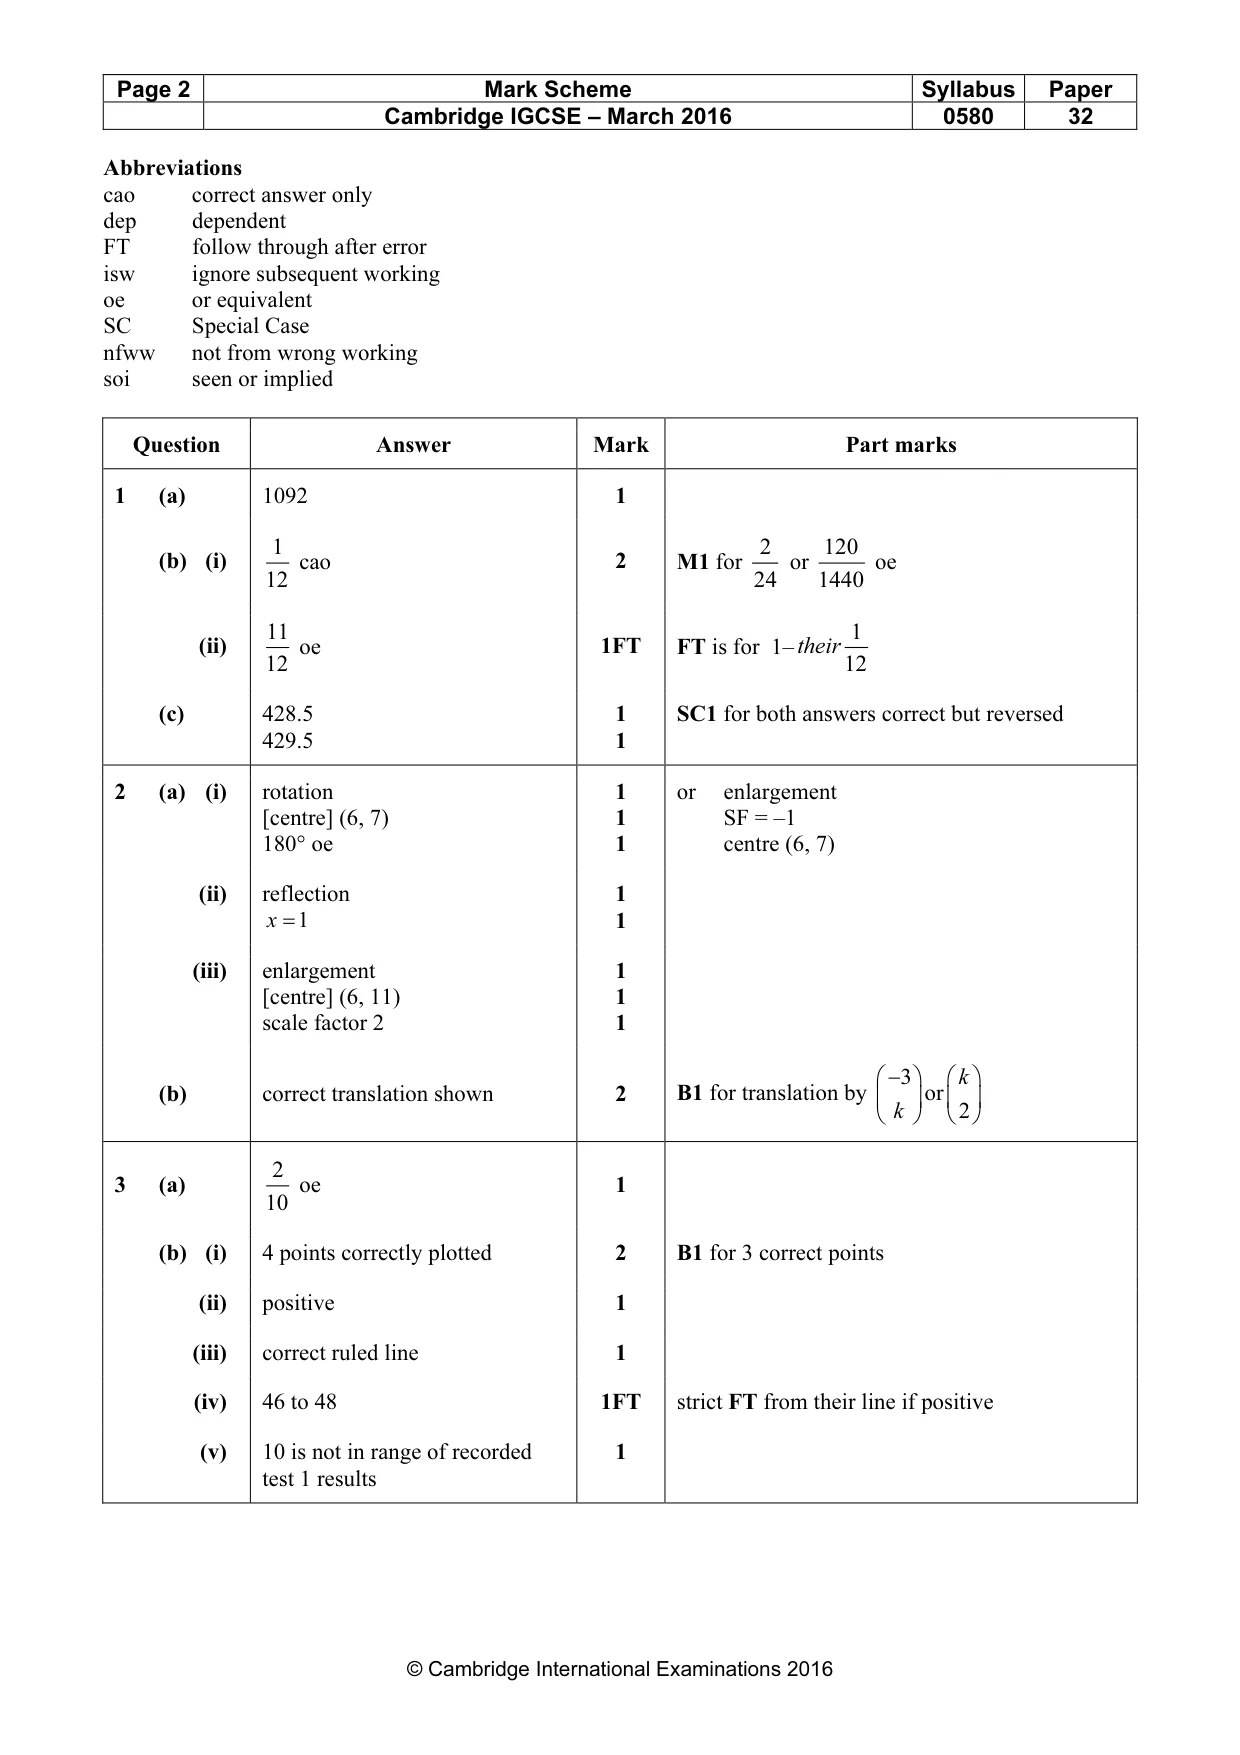
Mark scheme: Question Answer Mark Part marks 1 (a) 1092 1 1 2 120 (b) (i) cao 2 M1 for or oe 12 24 1440 11 1 (ii) oe 1FT FT is for 1– their 12 12 (c) 428.5 1 SC1 for both answers correct but reversed 429.5 1
Q2 · Y 12 11 10 9 8 B 7 C A 6 5 4 3 2 D 1 x –5 –4 –3 –2 –1 0 1 2 3 4 5 6 7 8 9 10 The diagram…
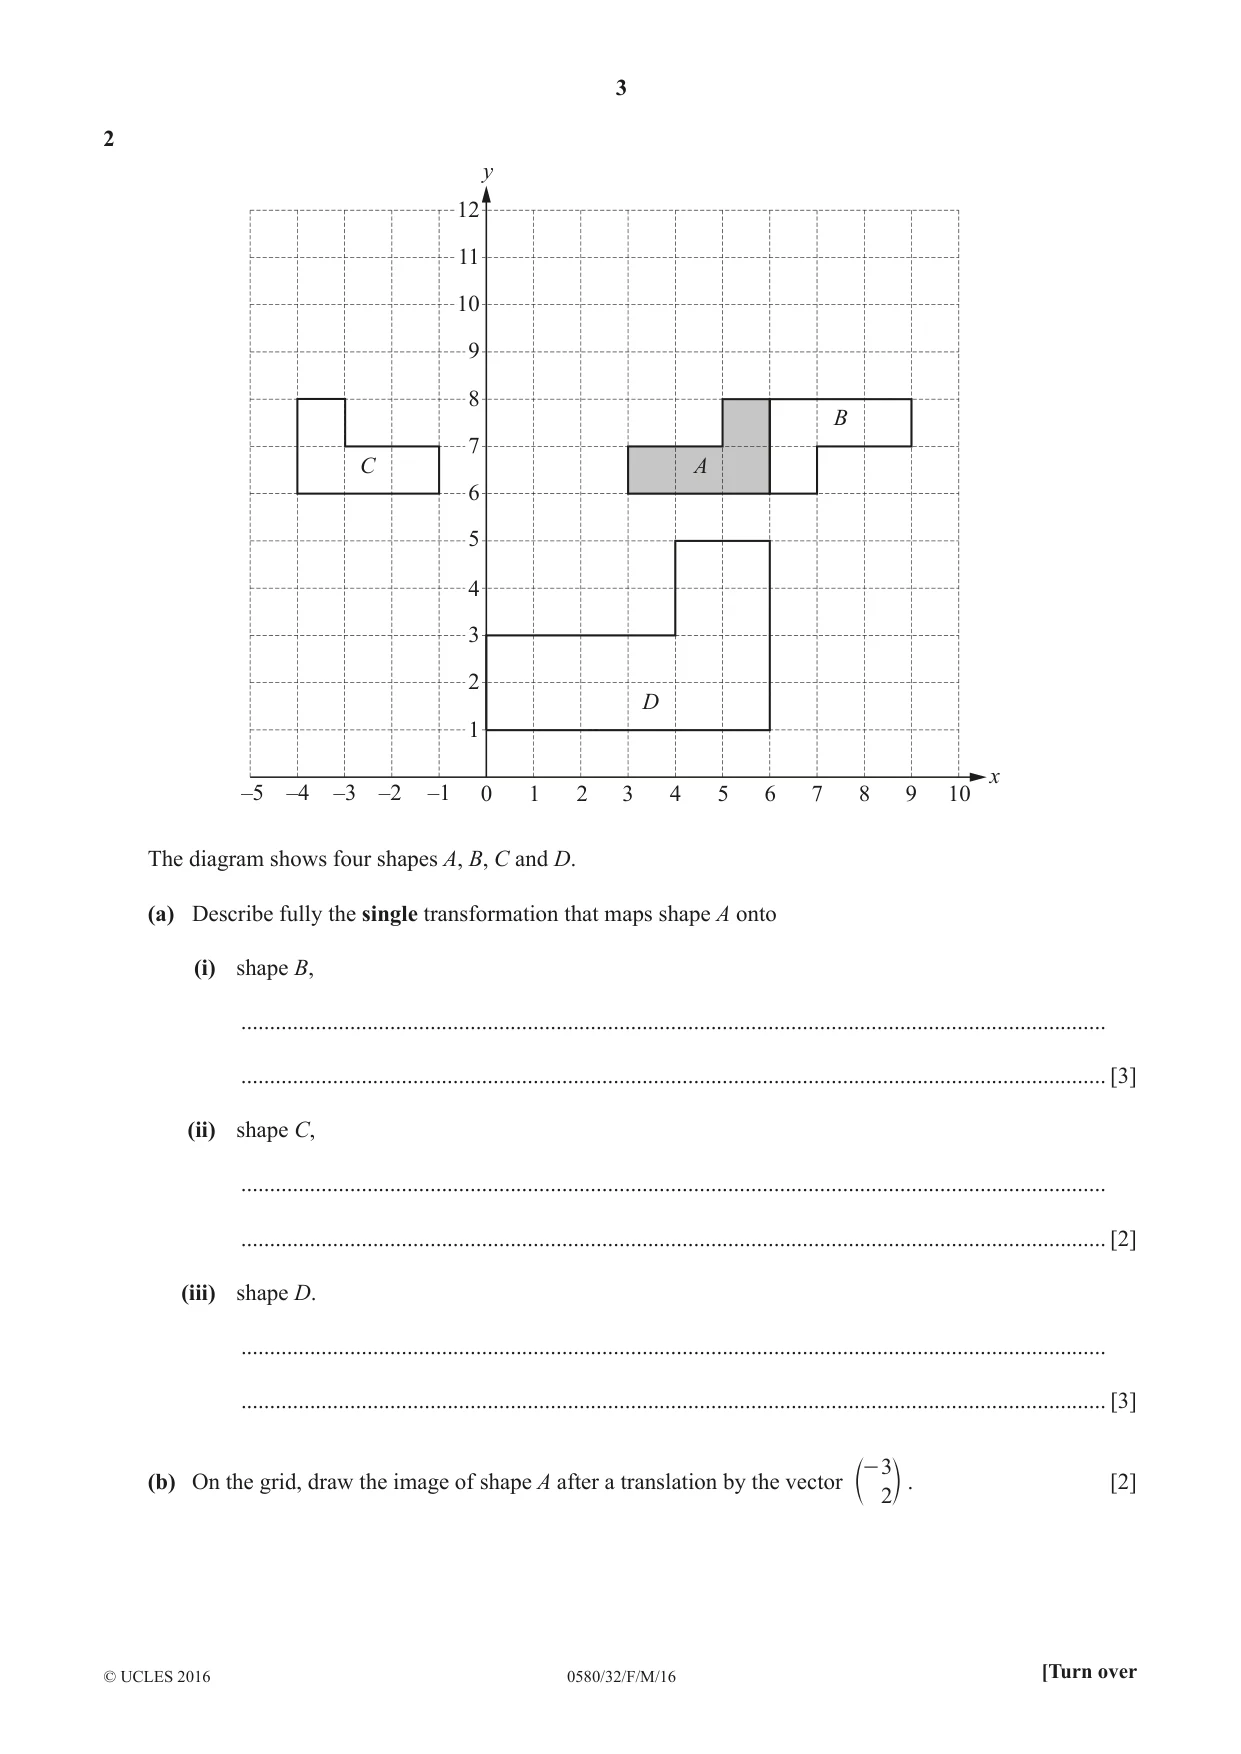
2 y 12 11 10 9 8 B 7 C A 6 5 4 3 2 D 1 x –5 –4 –3 –2 –1 0 1 2 3 4 5 6 7 8 9 10 The diagram shows four shapes A, B, C and D. (a) Describe fully the single transformation that maps shape A onto (i) shape B, ....................................................................................................................................................... ....................................................................................................................................................... [3] (ii) shape C, ....................................................................................................................................................... ....................................................................................................................................................... [2] (iii) shape D. ....................................................................................................................................................... ....................................................................................................................................................... [3] - 3 (b) On the grid, draw the image of shape A after a translation by the vector . [2] c 2m
Mark scheme: 2 (a) (i) rotation 1 or enlargement [centre] (6, 7) 1 SF = –1 180° oe 1 centre (6, 7) (ii) reflection 1 x = 1 1 (iii) enlargement 1 [centre] (6, 11) 1 scale factor 2 1 −3 k (b) correct translation shown 2 B1 for translation by or k 2 2
Q3 · Ten students each take two French tests
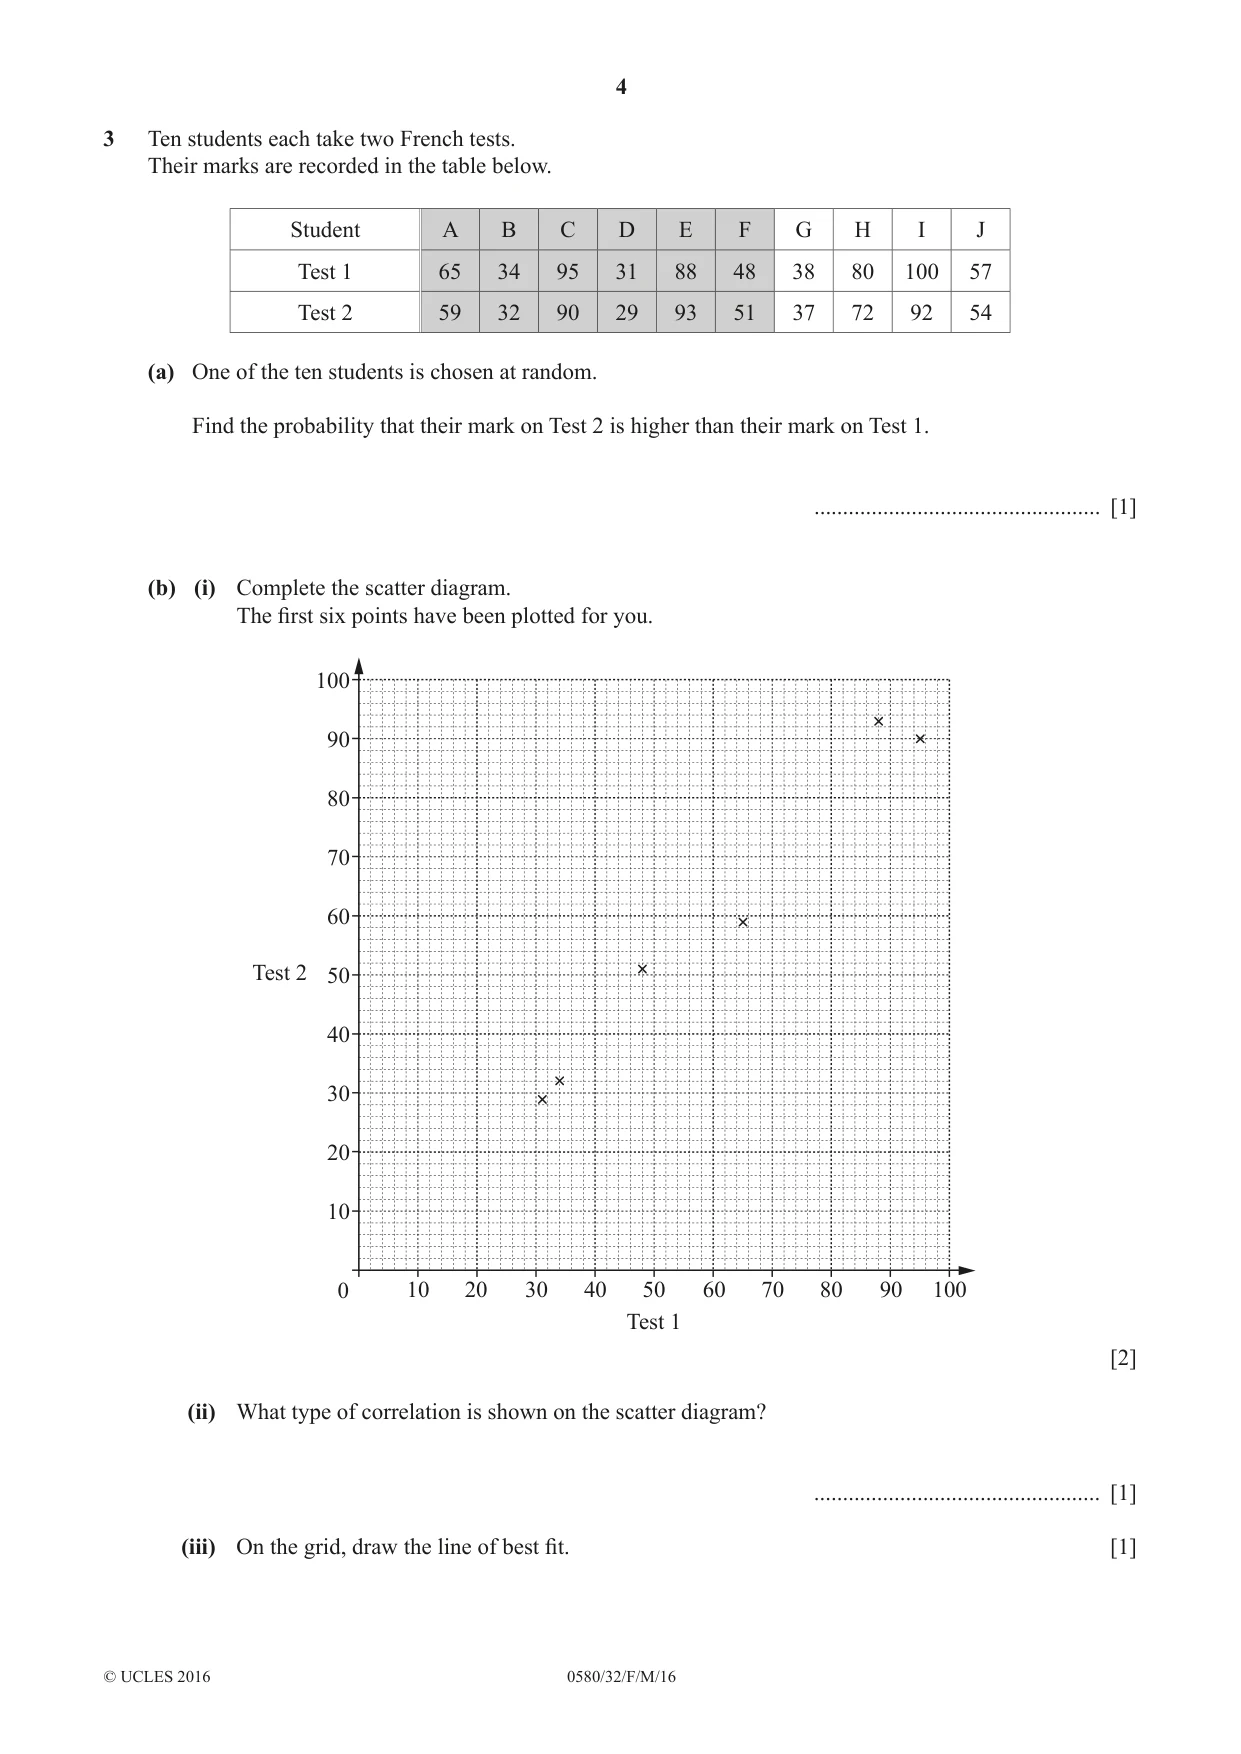
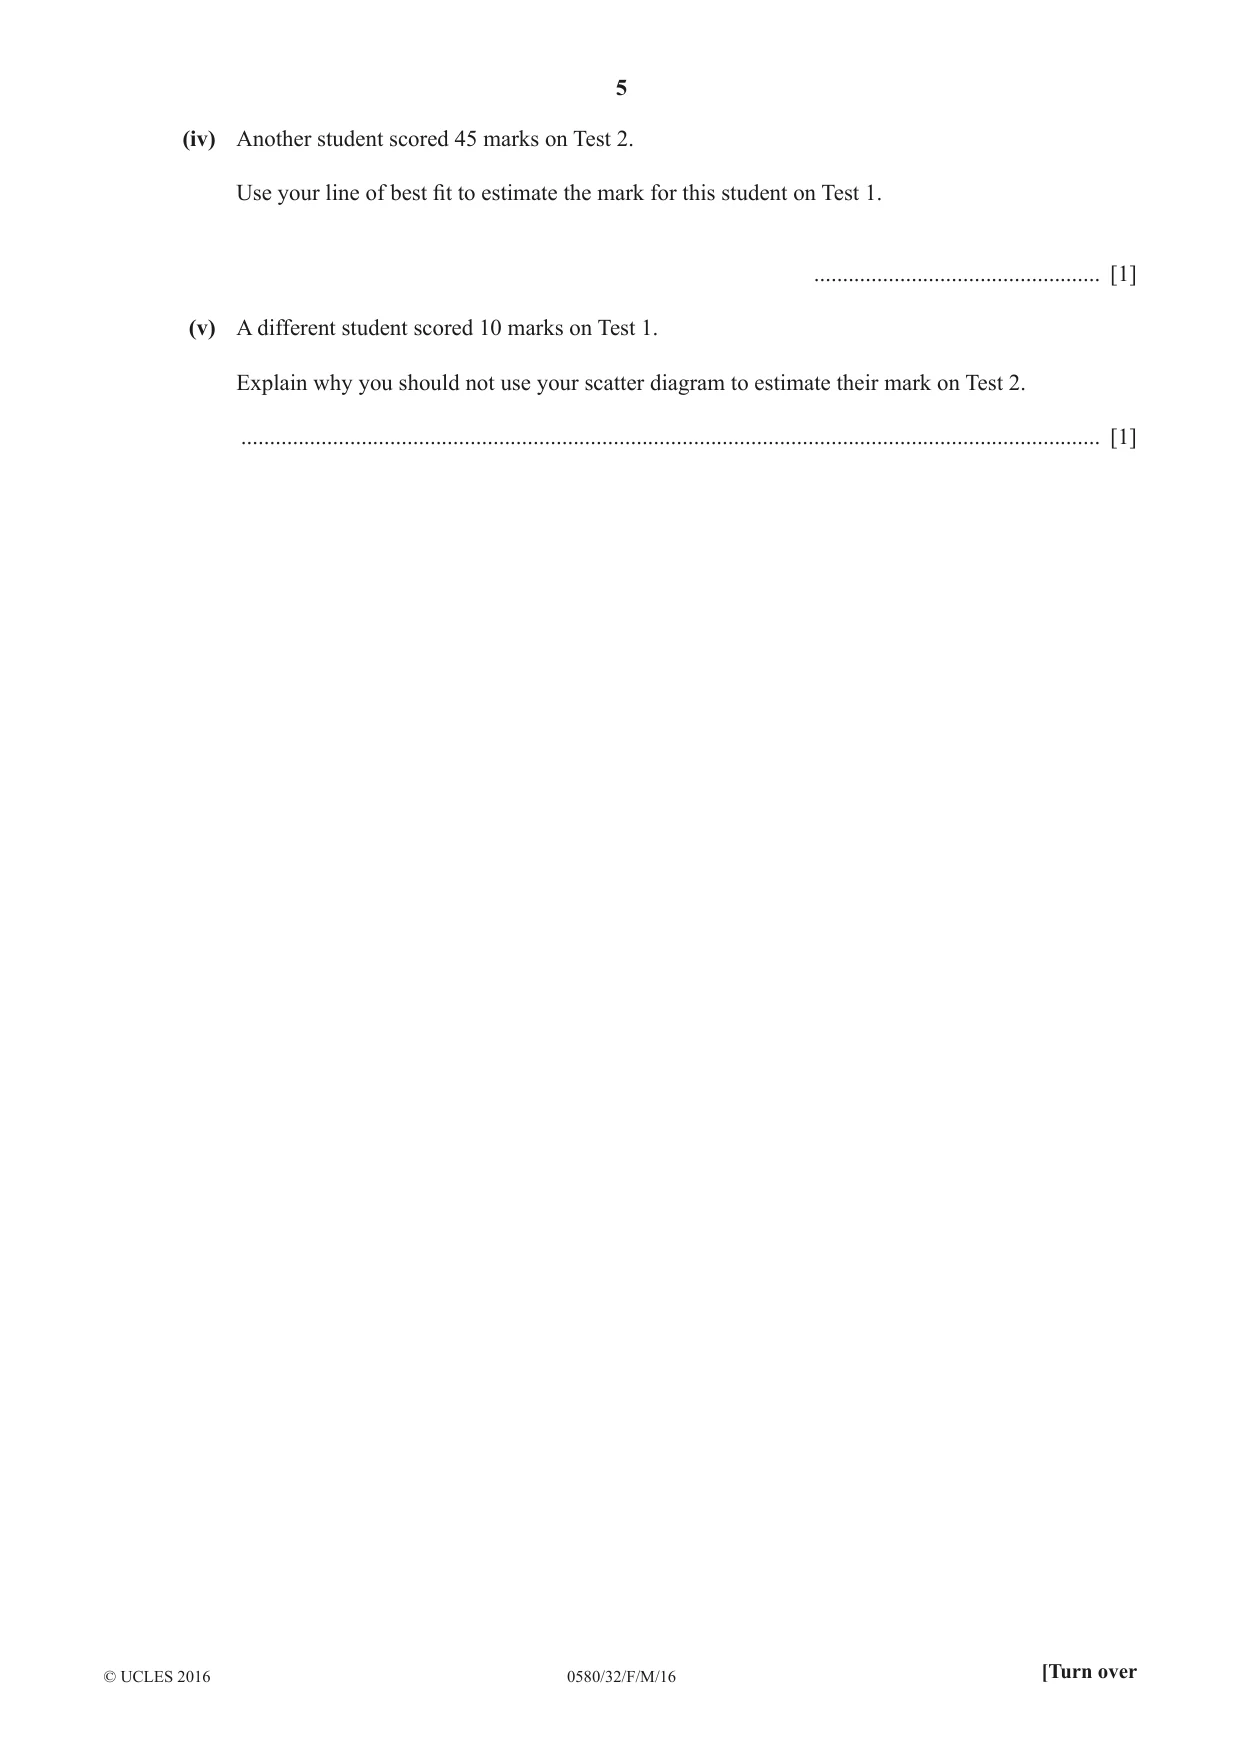
3 Ten students each take two French tests. Their marks are recorded in the table below. Student A B C D E F G H I J Test 1 65 34 95 31 88 48 38 80 100 57 Test 2 59 32 90 29 93 51 37 72 92 54 (a) One of the ten students is chosen at random. Find the probability that their mark on Test 2 is higher than their mark on Test 1. .................................................. [1] (b) (i) Complete the scatter diagram. The first six points have been plotted for you. 100 90 80 70 60 Test 2 50 40 30 20 10 0 10 20 30 40 50 60 70 80 90 100 Test 1 [2] (ii) What type of correlation is shown on the scatter diagram? .................................................. [1] (iii) On the grid, draw the line of best fit. [1] (iv) Another student scored 45 marks on Test 2. Use your line of best fit to estimate the mark for this student on Test 1. .................................................. [1] (v) A different student scored 10 marks on Test 1. Explain why you should not use your scatter diagram to estimate their mark on Test 2. ...................................................................................................................................................... [1]
Mark scheme: 2 3 (a) oe 1 10 (b) (i) 4 points correctly plotted 2 B1 for 3 correct points (ii) positive 1 (iii) correct ruled line 1 (iv) 46 to 48 1FT strict FT from their line if positive (v) 10 is not in range of recorded 1 test 1 results
Q4 · A farmer has 45 horses and 20 cows
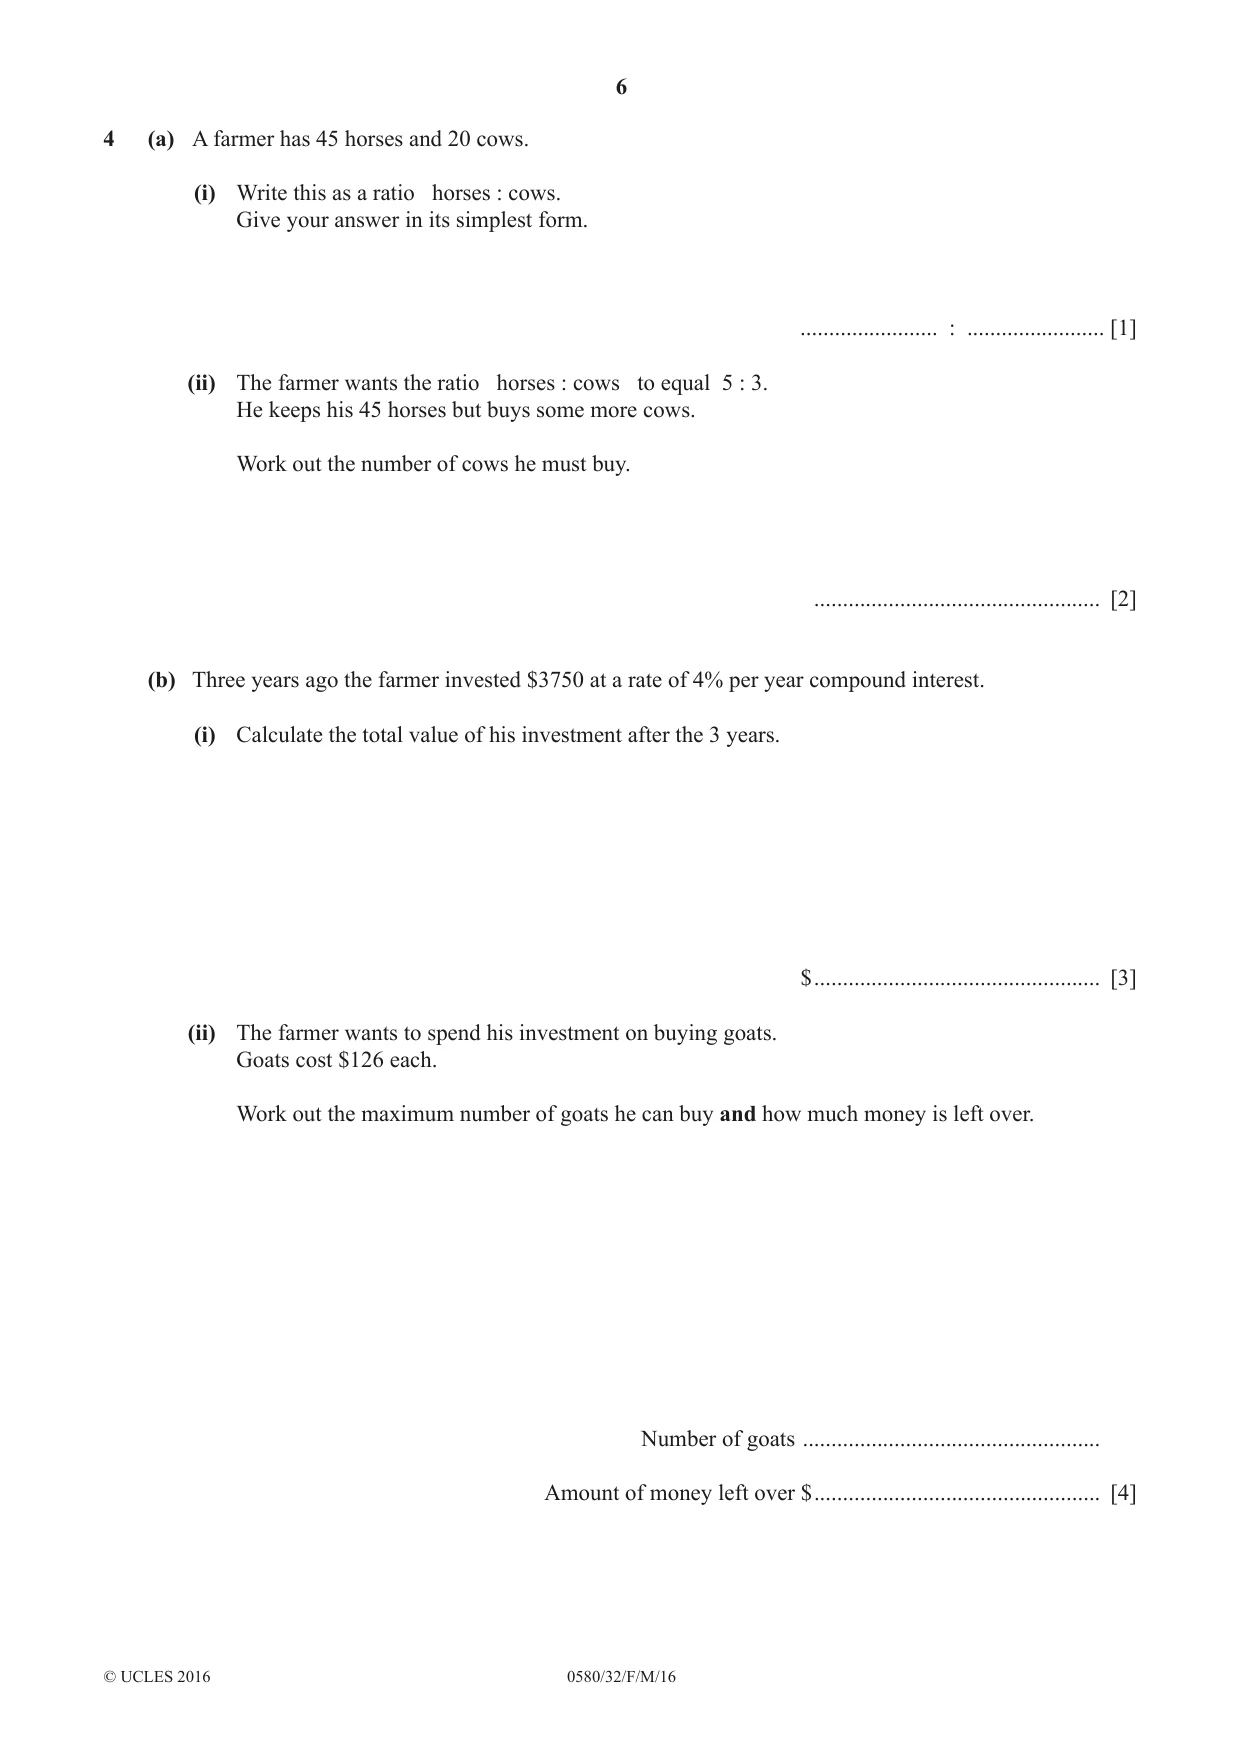
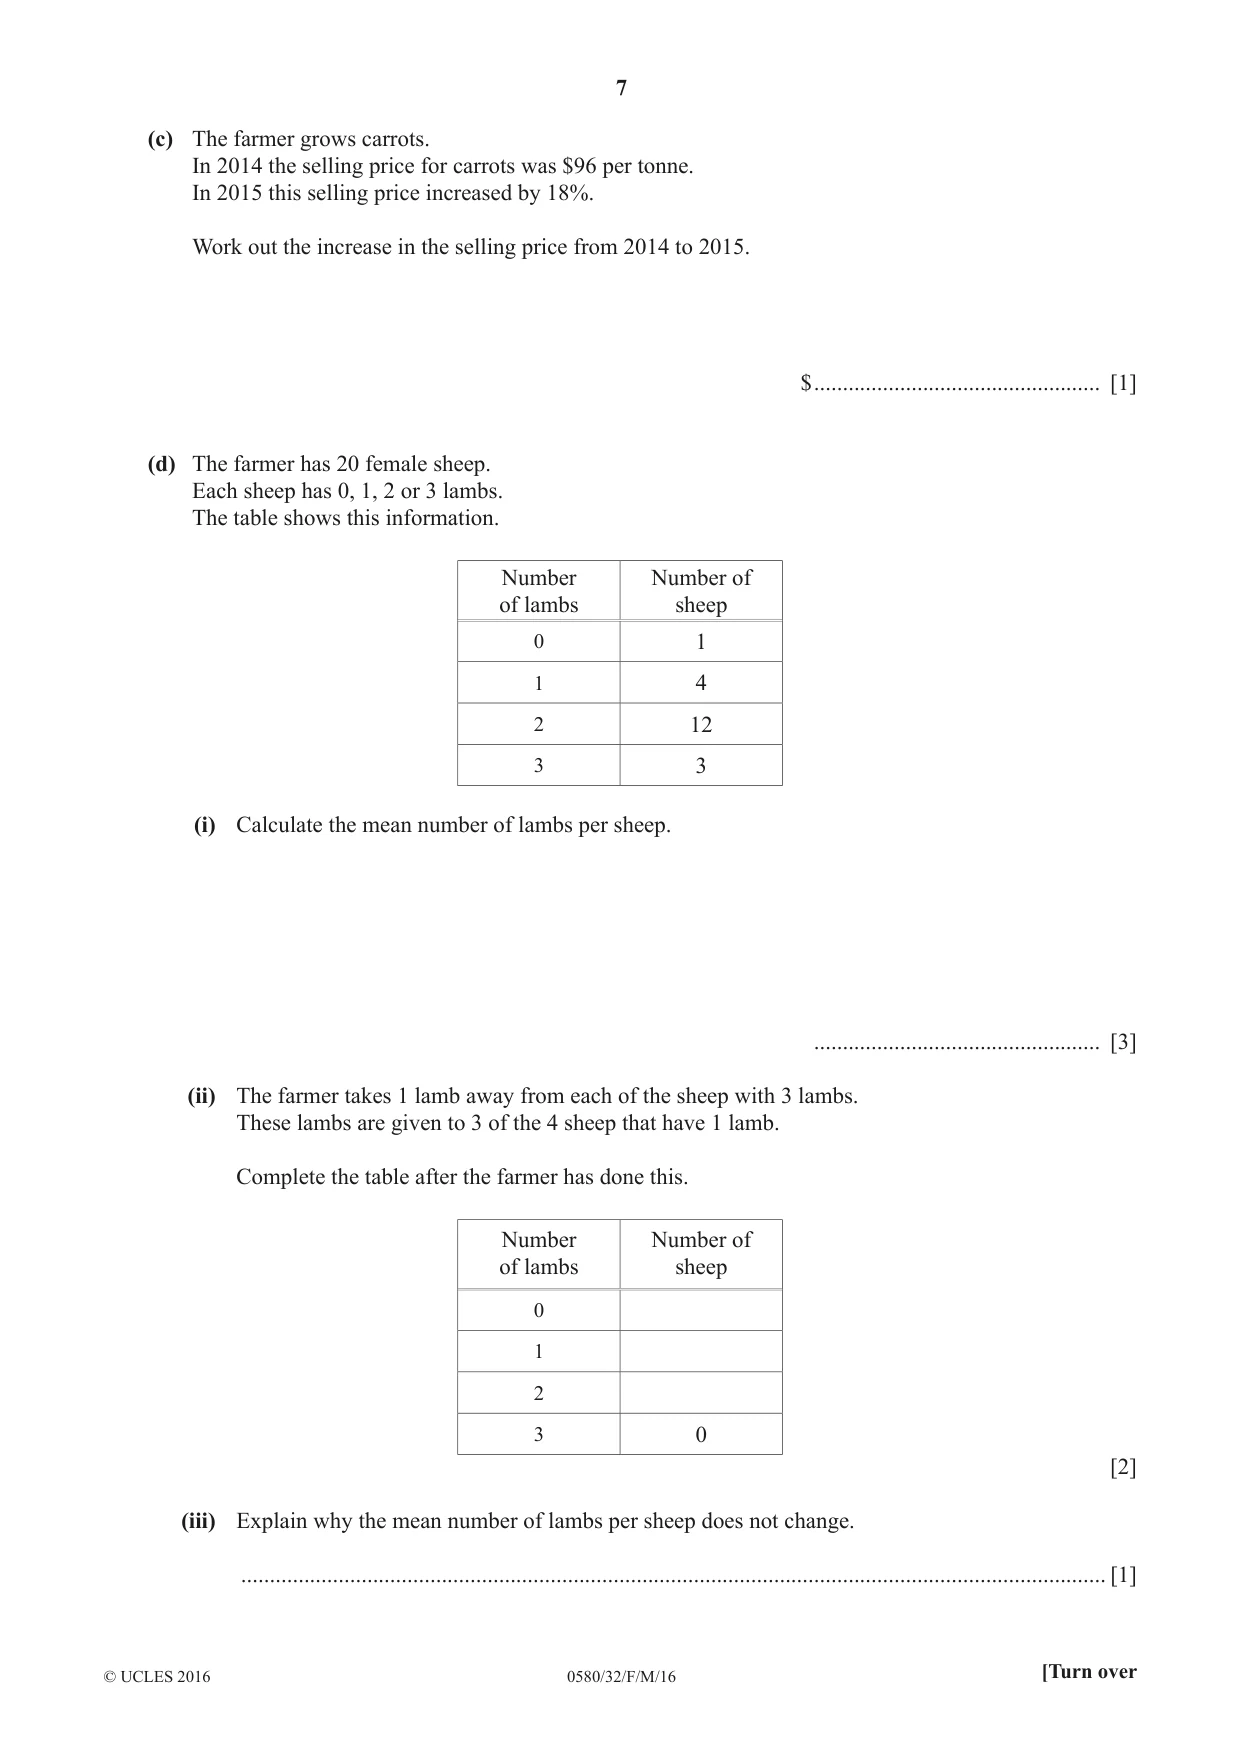
4 (a) A farmer has 45 horses and 20 cows. (i) Write this as a ratio horses : cows. Give your answer in its simplest form. ........................ : ........................ [1] (ii) The farmer wants the ratio horses : cows to equal 5 : 3. He keeps his 45 horses but buys some more cows. Work out the number of cows he must buy. .................................................. [2] (b) Three years ago the farmer invested $3750 at a rate of 4% per year compound interest. (i) Calculate the total value of his investment after the 3 years. $ .................................................. [3] (ii) The farmer wants to spend his investment on buying goats. Goats cost $126 each. Work out the maximum number of goats he can buy and how much money is left over. Number of goats .................................................... Amount of money left over $ .................................................. [4] (c) The farmer grows carrots. In 2014 the selling price for carrots was $96 per tonne. In 2015 this selling price increased by 18%. Work out the increase in the selling price from 2014 to 2015. $ .................................................. [1] (d) The farmer has 20 female sheep. Each sheep has 0, 1, 2 or 3 lambs. The table shows this information. Number Number of of lambs sheep 0 1 1 4 2 12 3 3 (i) Calculate the mean number of lambs per sheep. .................................................. [3] (ii) The farmer takes 1 lamb away from each of the sheep with 3 lambs. These lambs are given to 3 of the 4 sheep that have 1 lamb. Complete the table after the farmer has done this. Number Number of of lambs sheep 0 1 2 3 0 [2] (iii) Explain why the mean number of lambs per sheep does not change. ....................................................................................................................................................... [1]
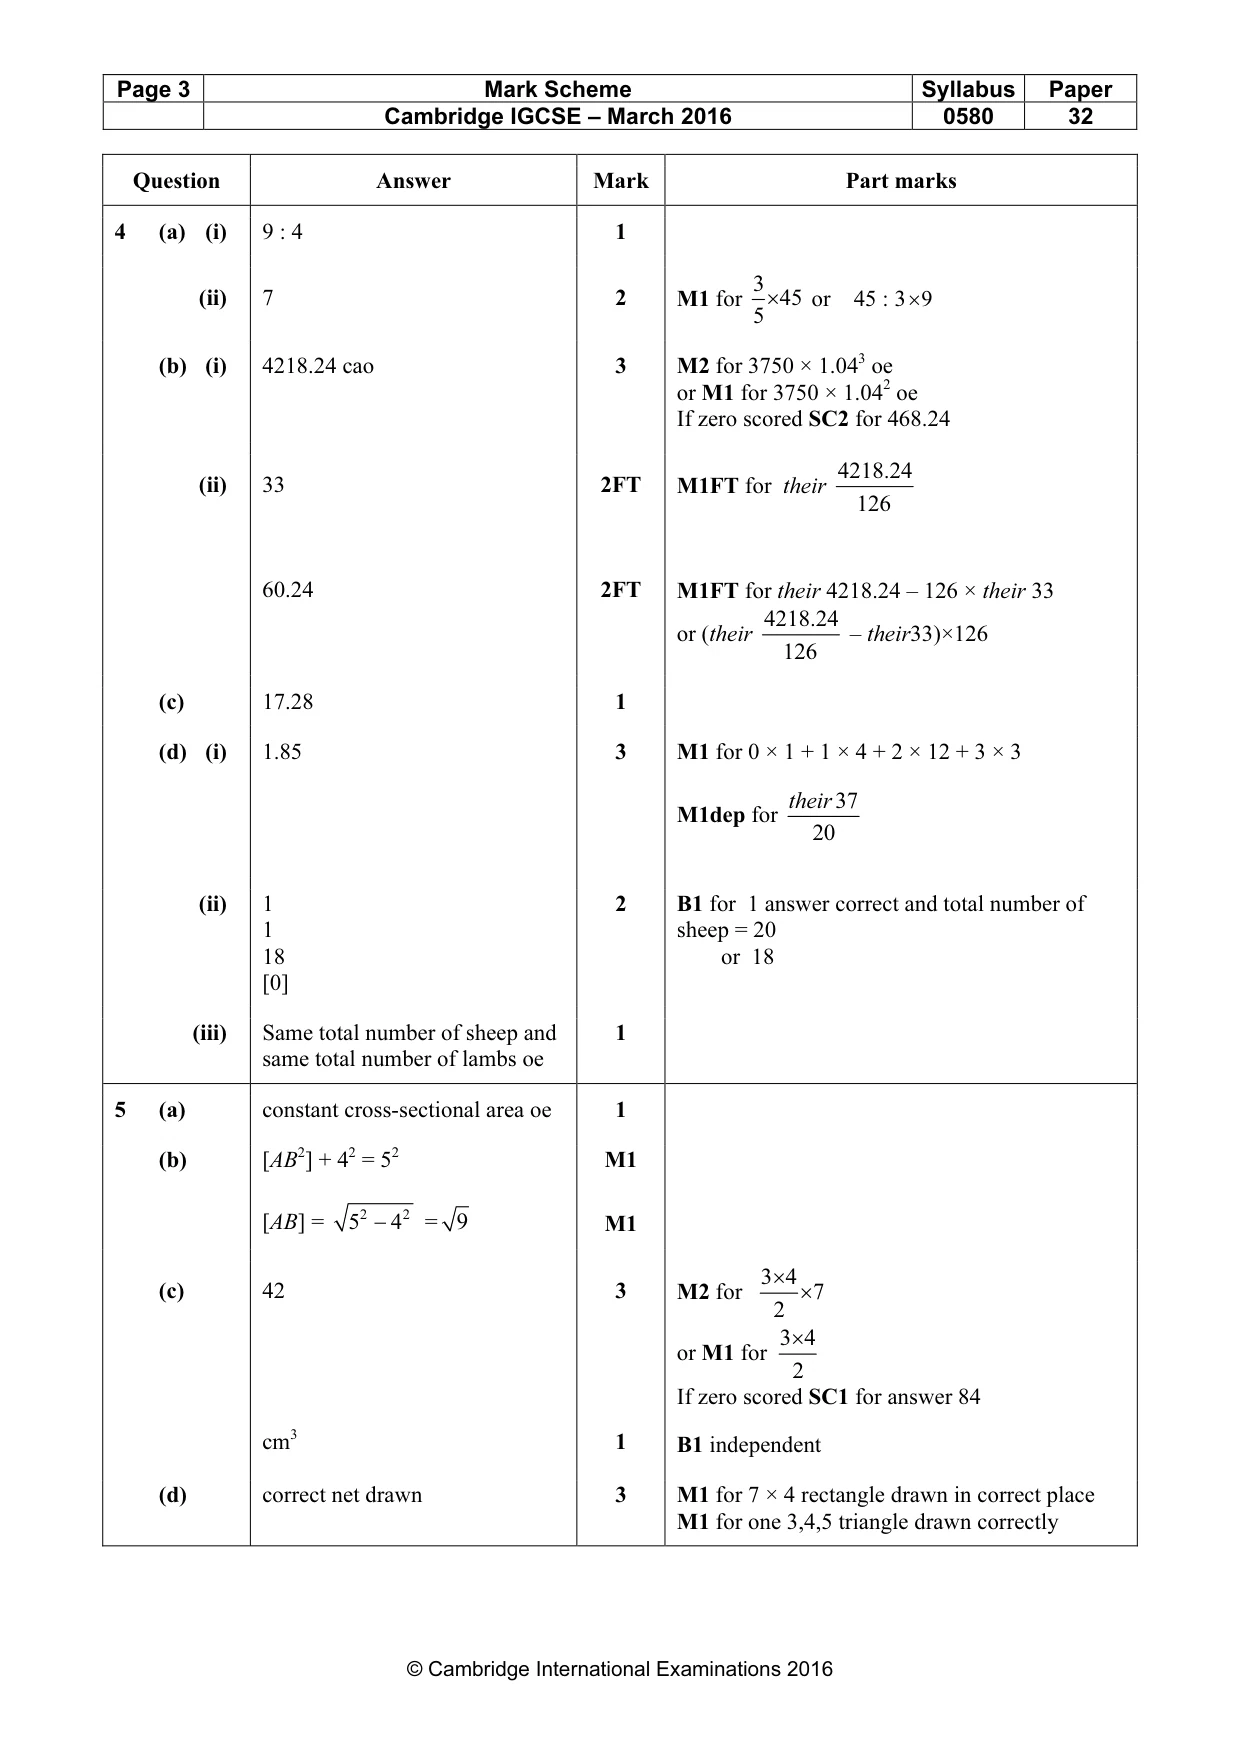
Mark scheme: 4 (a) (i) 9 : 4 1 3 (ii) 7 2 M1 for 5× 45 or 45 : 3 × 9 (b) (i) 4218.24 cao 3 M2 for 3750 × 1.043 oe or M1 for 3750 × 1.042 oe If zero scored SC2 for 468.24 4218.24 (ii) 33 2FT M1FT for their 126 60.24 2FT M1FT for their 4218.24 – 126 × their 33 4218.24 or (their – their33)×126 126 (c) 17.28 1 (d) (i) 1.85 3 M1 for 0 × 1 + 1 × 4 + 2 × 12 + 3 × 3 their 37 M1dep for 20 (ii) 1 2 B1 for 1 answer correct and total number of 1 sheep = 20 18 or 18 [0] (iii) Same total number of sheep and 1 same total number of lambs oe
Q5 · E F D A NOT TO 7 cm SCALE 5 cm B 4 cm C The diagram shows a solid in the shape of a…
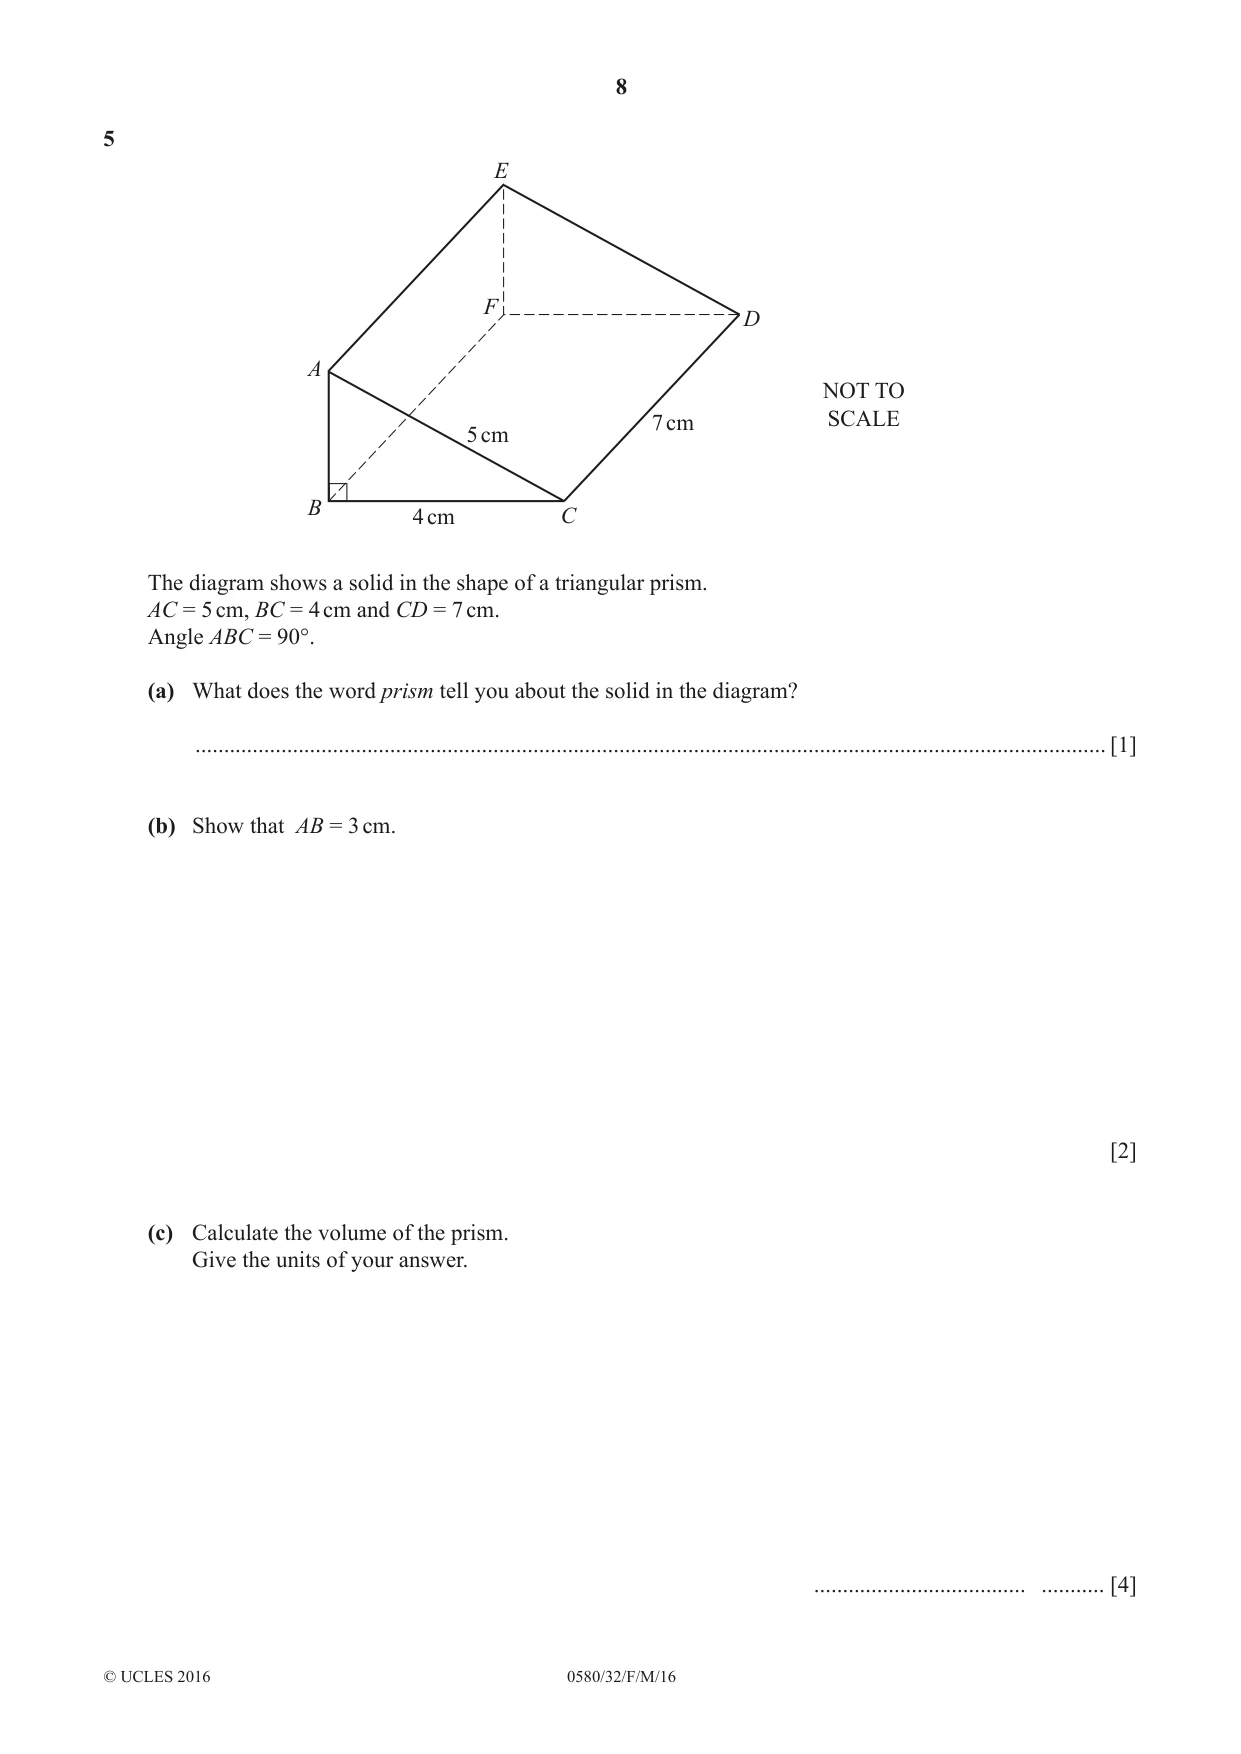
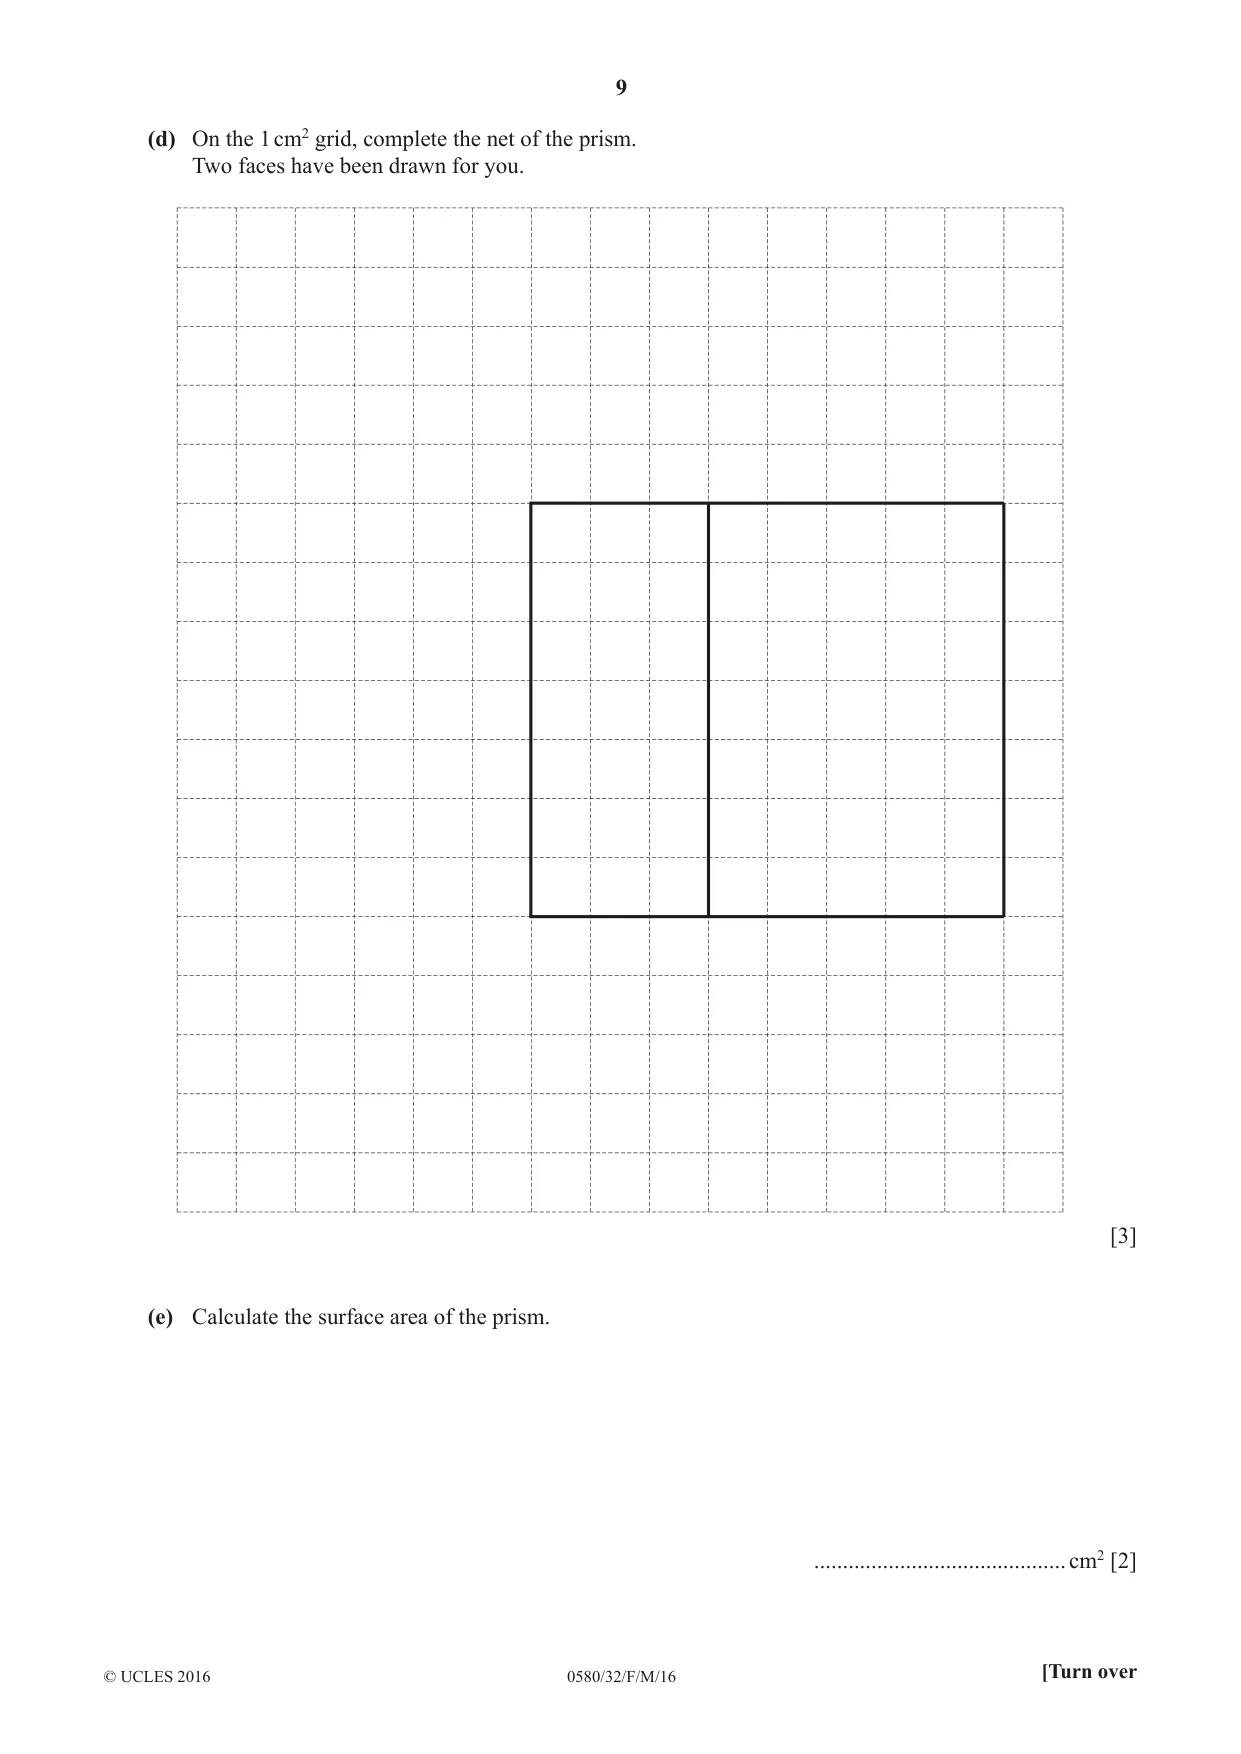
5 E F D A NOT TO 7 cm SCALE 5 cm B 4 cm C The diagram shows a solid in the shape of a triangular prism. AC = 5 cm, BC = 4 cm and CD = 7 cm. Angle ABC = 90°. (a) What does the word prism tell you about the solid in the diagram? ............................................................................................................................................................... [1] (b) Show that AB = 3 cm. [2] (c) Calculate the volume of the prism. Give the units of your answer. ..................................... ........... [4] (d) On the 1 cm2 grid, complete the net of the prism. Two faces have been drawn for you. [3] (e) Calculate the surface area of the prism. ............................................cm2 [2]
Mark scheme: 5 (a) constant cross-sectional area oe 1 (b) [AB2] + 42 = 52 M1 [AB] = 5 2 − 4 2 = 9 M1 3 × 4 (c) 42 3 M2 for × 7 2 3 × 4 or M1 for 2 If zero scored SC1 for answer 84 cm3 1 B1 independent (d) correct net drawn 3 M1 for 7 × 4 rectangle drawn in correct place M1 for one 3,4,5 triangle drawn correctly
Q6 · Swimming pool Shop Distance from home (km) Cinema Home 0 10 00 10 10 10 20 10 30 10 40 10…
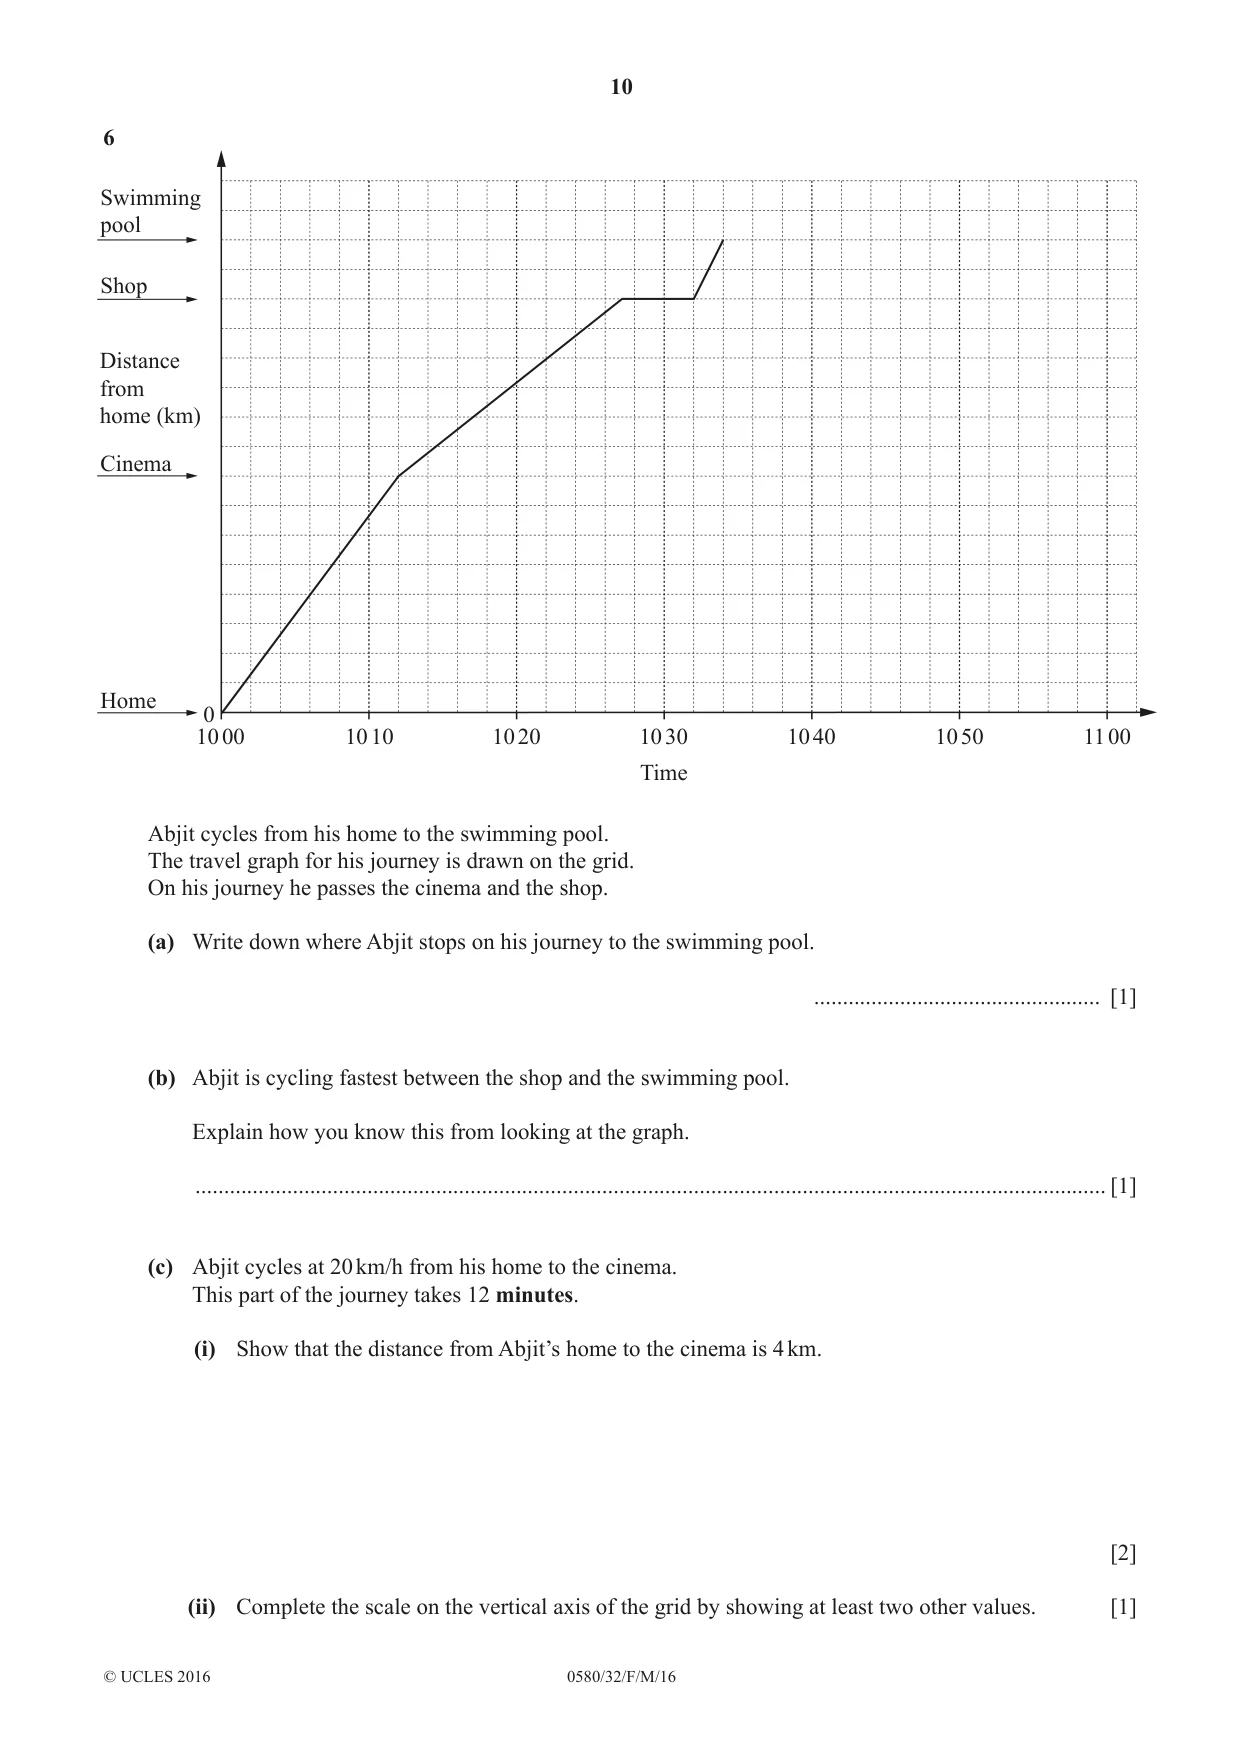
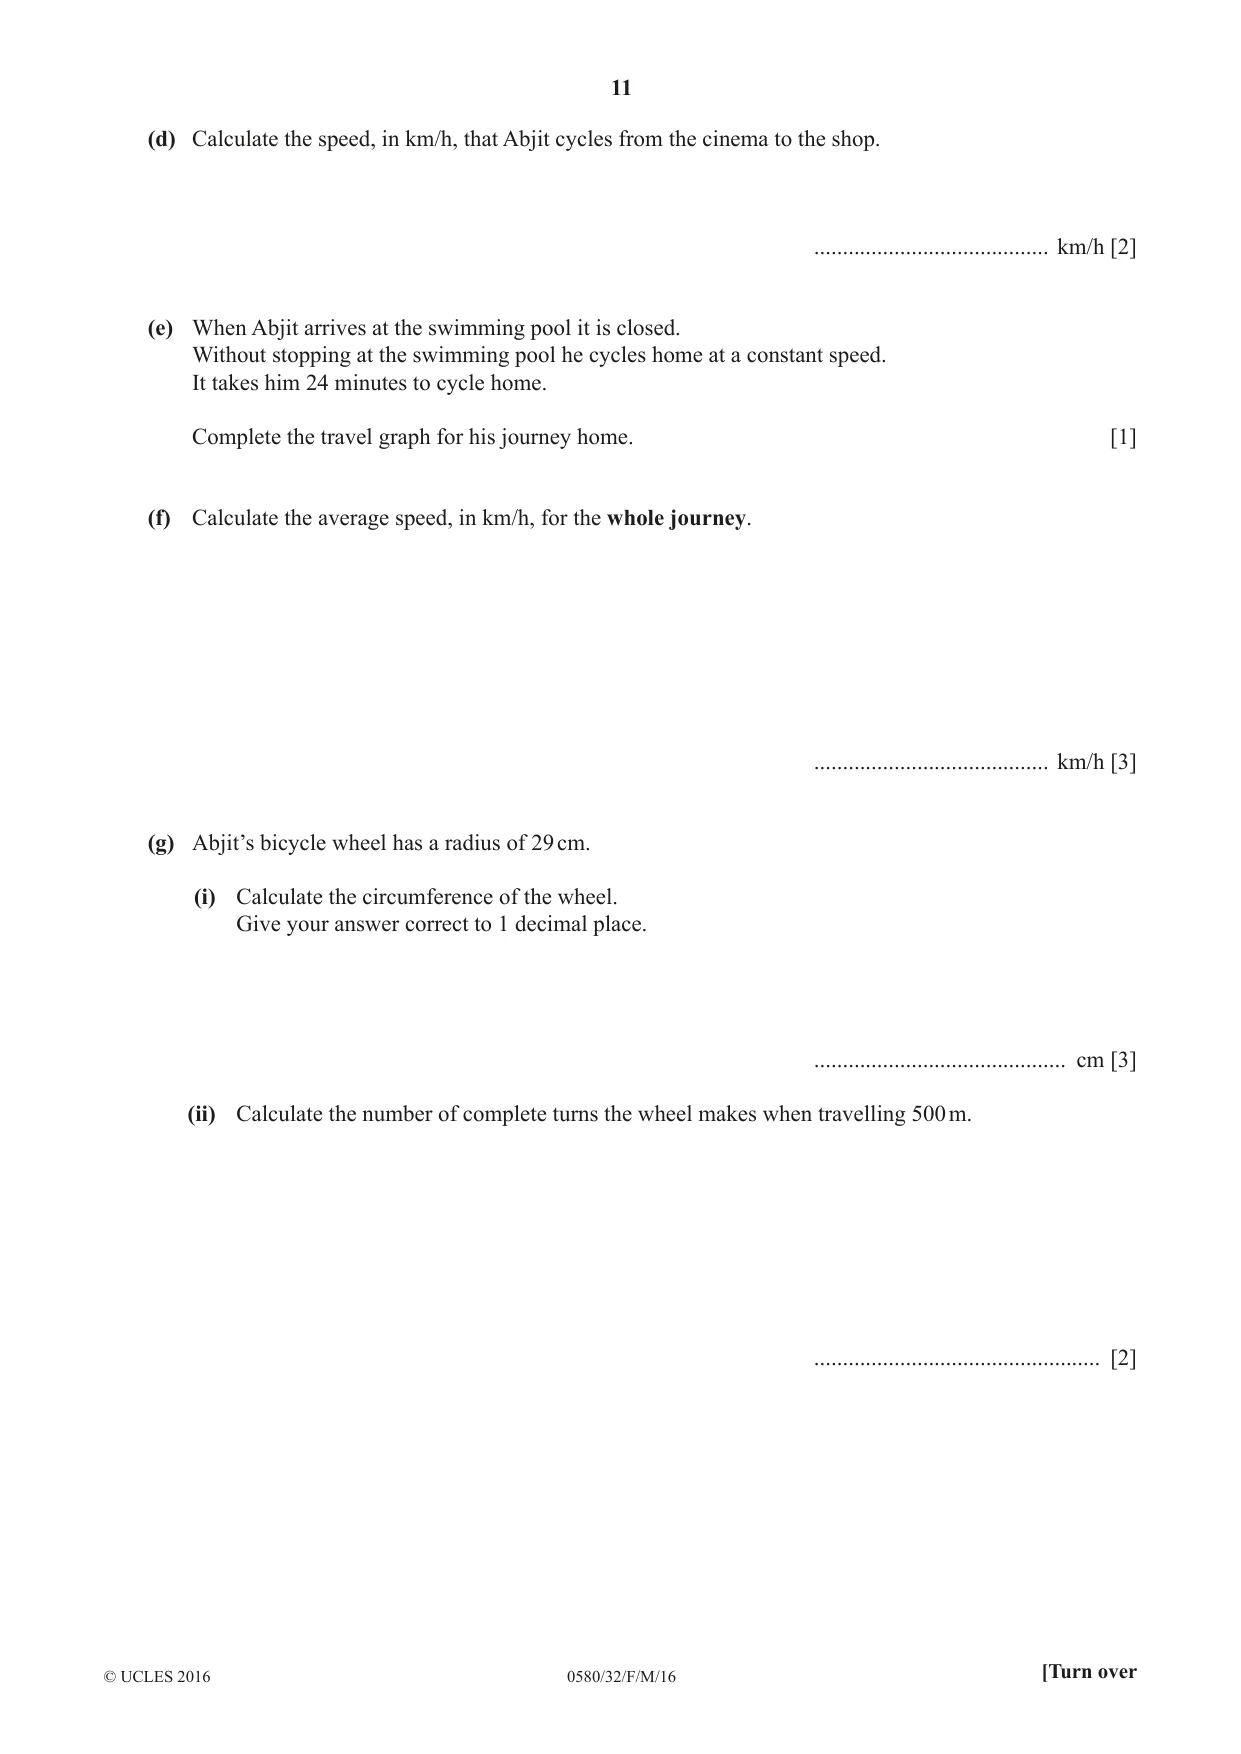
6 Swimming pool Shop Distance from home (km) Cinema Home 0 10 00 10 10 10 20 10 30 10 40 10 50 11 00 Time Abjit cycles from his home to the swimming pool. The travel graph for his journey is drawn on the grid. On his journey he passes the cinema and the shop. (a) Write down where Abjit stops on his journey to the swimming pool. .................................................. [1] (b) Abjit is cycling fastest between the shop and the swimming pool. Explain how you know this from looking at the graph. ............................................................................................................................................................... [1] (c) Abjit cycles at 20 km/h from his home to the cinema. This part of the journey takes 12 minutes. (i) Show that the distance from Abjit’s home to the cinema is 4 km. [2] (ii) Complete the scale on the vertical axis of the grid by showing at least two other values. [1] (d) Calculate the speed, in km/h, that Abjit cycles from the cinema to the shop. ......................................... km/h [2] (e) When Abjit arrives at the swimming pool it is closed. Without stopping at the swimming pool he cycles home at a constant speed. It takes him 24 minutes to cycle home. Complete the travel graph for his journey home. [1] (f) Calculate the average speed, in km/h, for the whole journey. ......................................... km/h [3] (g) Abjit’s bicycle wheel has a radius of 29 cm. (i) Calculate the circumference of the wheel. Give your answer correct to 1 decimal place. ............................................ cm [3] (ii) Calculate the number of complete turns the wheel makes when travelling 500 m. .................................................. [2]
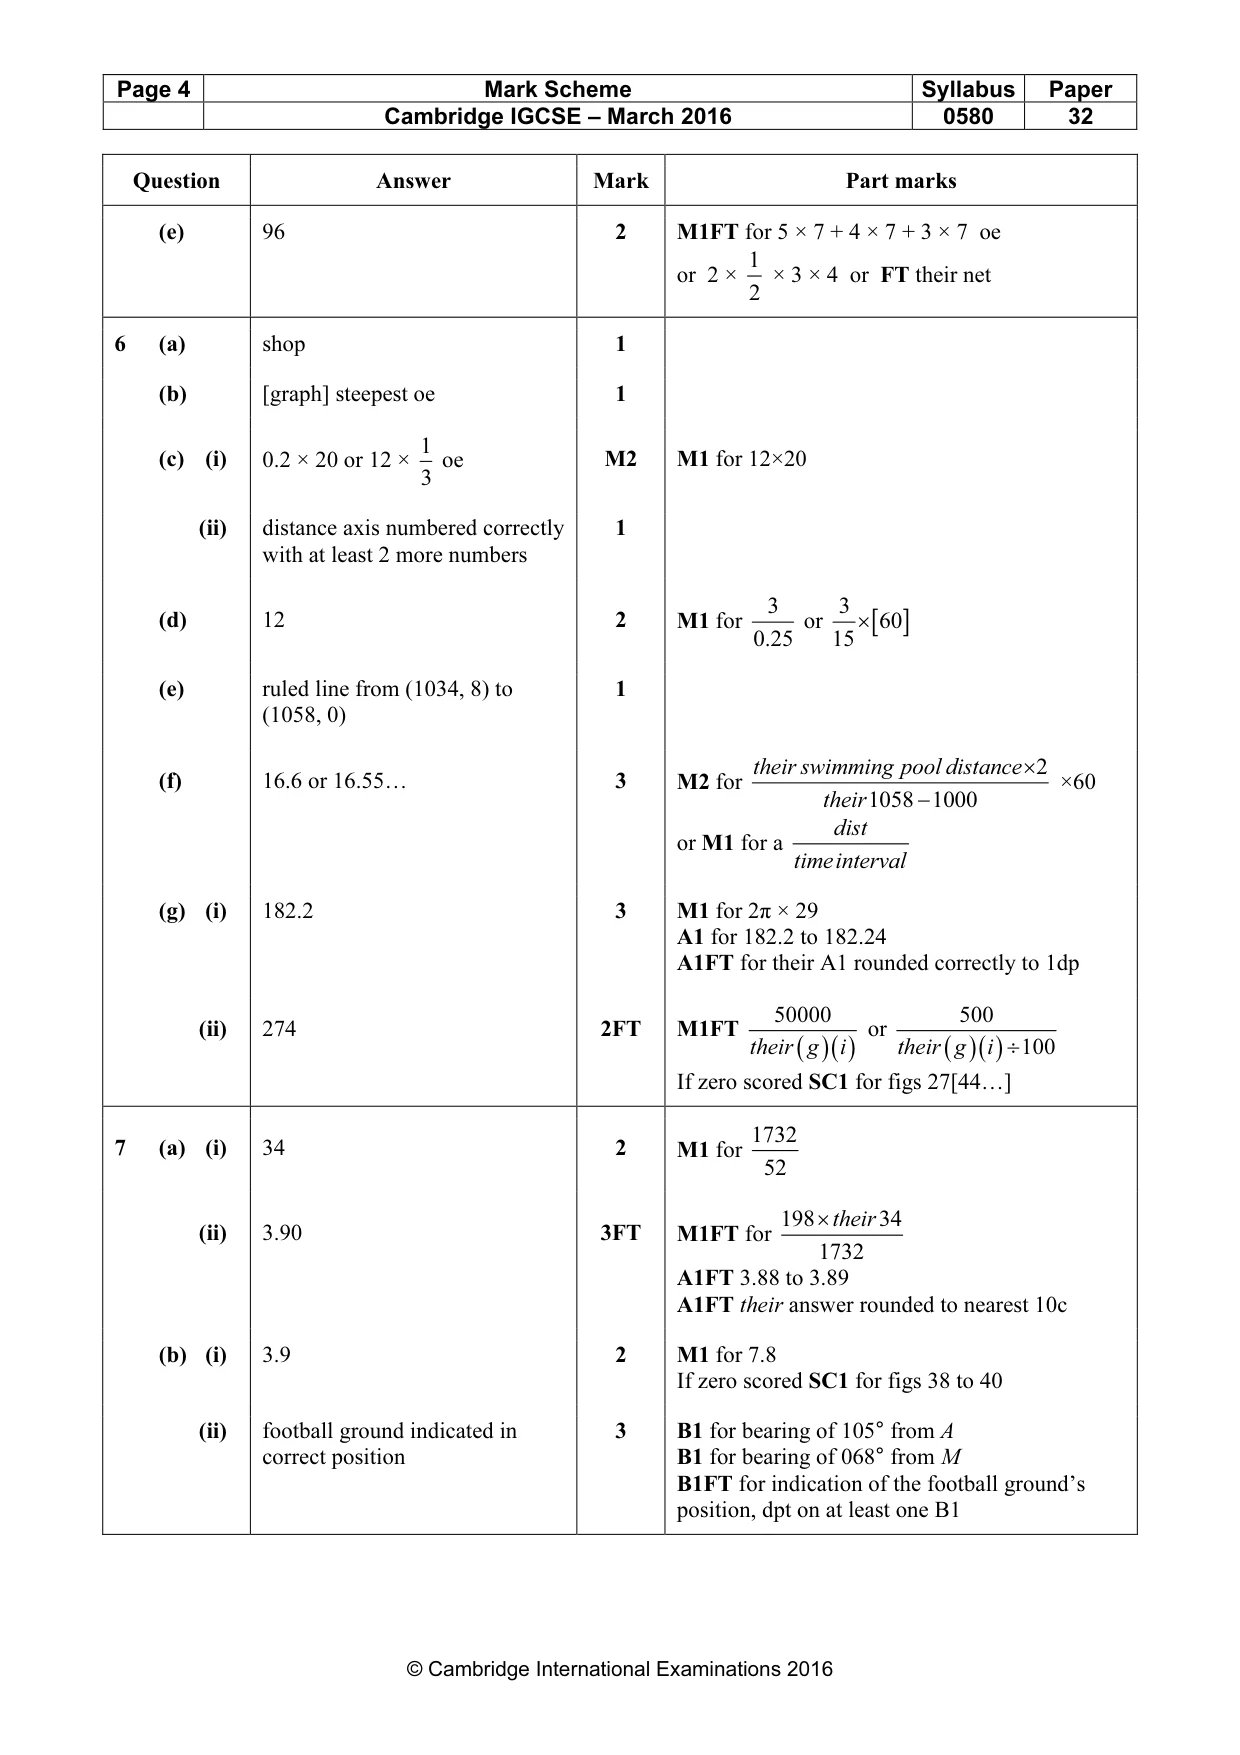
Mark scheme: 6 (a) shop 1 (b) [graph] steepest oe 1 1 (c) (i) 0.2 × 20 or 12 × oe M2 M1 for 12×20 3 (ii) distance axis numbered correctly 1 with at least 2 more numbers 3 3 (d) 12 2 M1 for or [ 60 ] 0.25 15× (e) ruled line from (1034, 8) to 1 (1058, 0) their swimming pool distance × 2 (f) 16.6 or 16.55… 3 M2 for ×60 their 1058 − 1000 dist or M1 for a timeinterval (g) (i) 182.2 3 M1 for 2π × 29 A1 for 182.2 to 182.24 A1FT for their A1 rounded correctly to 1dp 50000 500 (ii) 274 2FT M1FT or their ( g )( i ) their ( g )( i ) ÷ 100 If zero scored SC1 for figs 27[44…] 1732
Q7 · Burton City is a football team
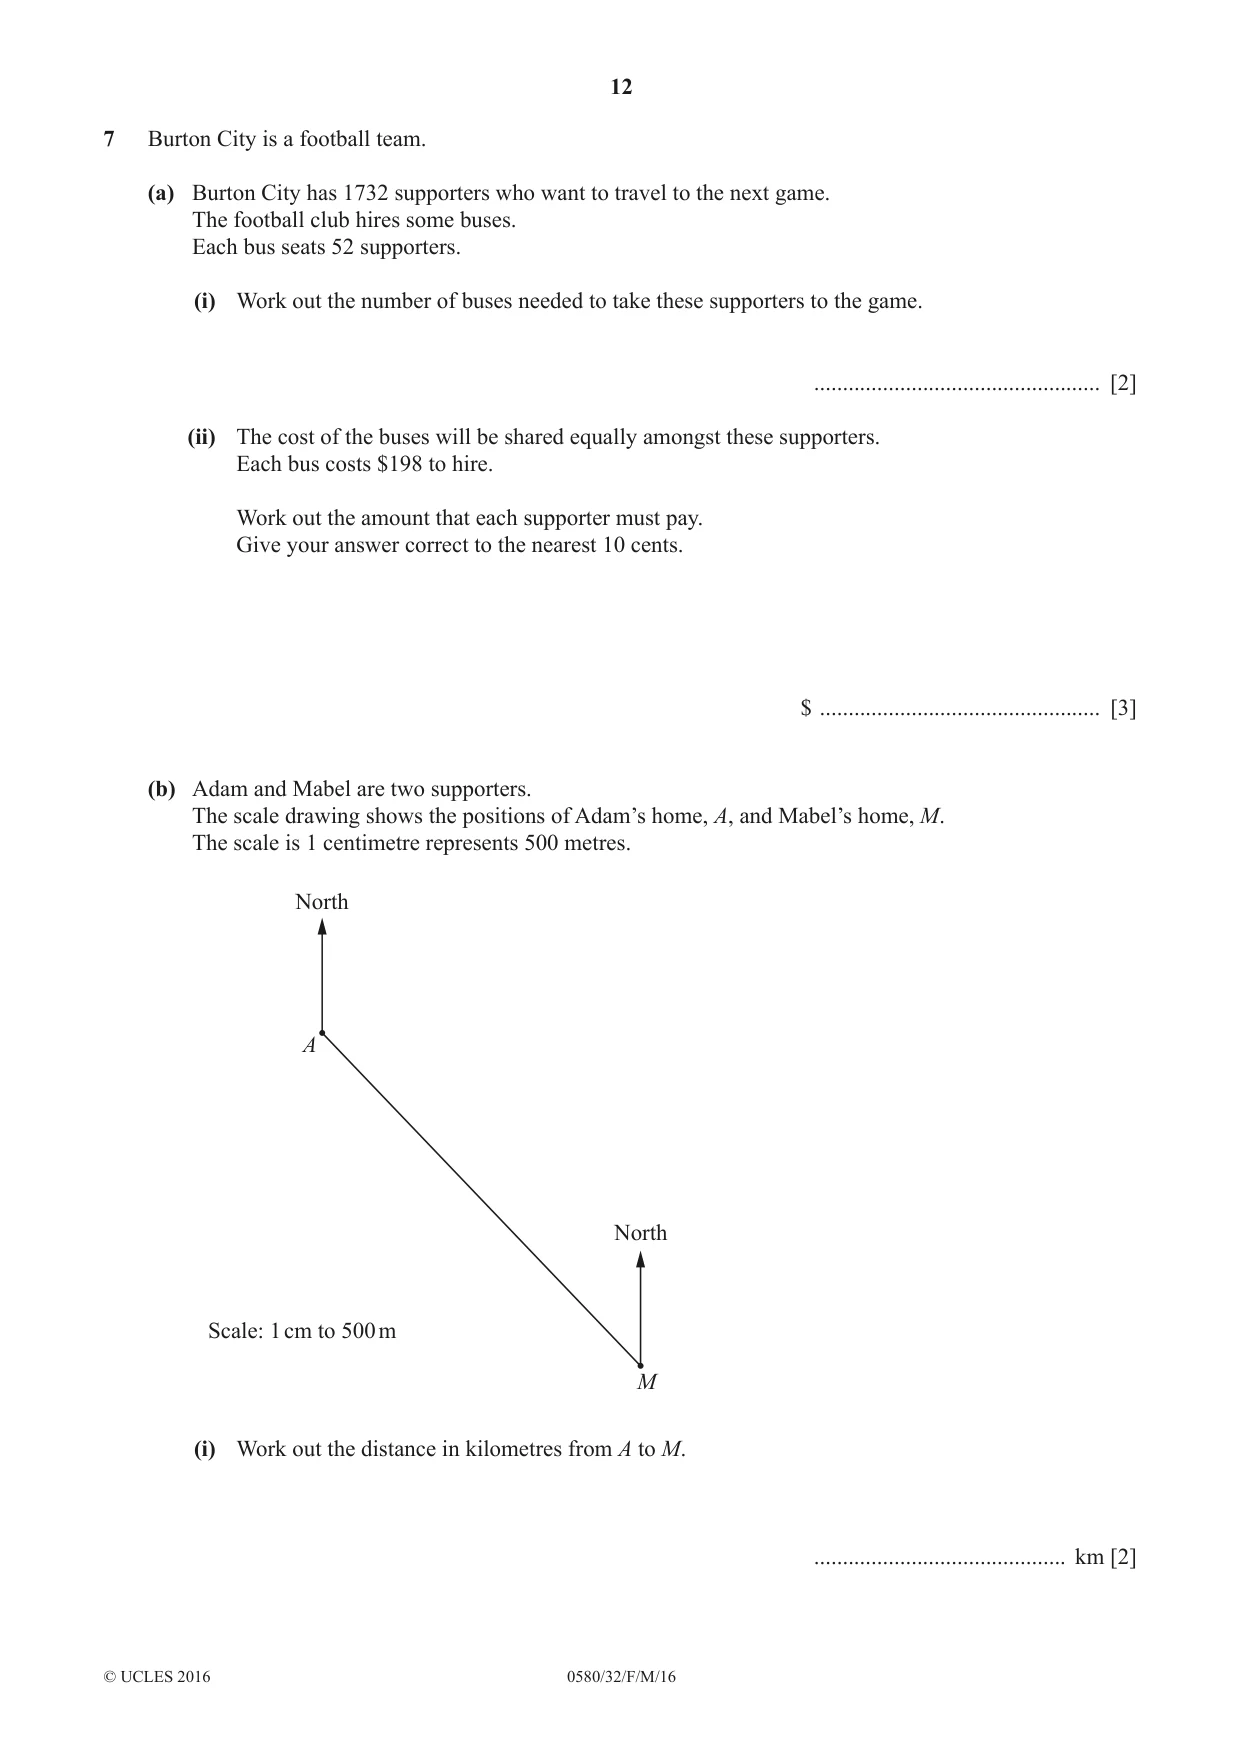
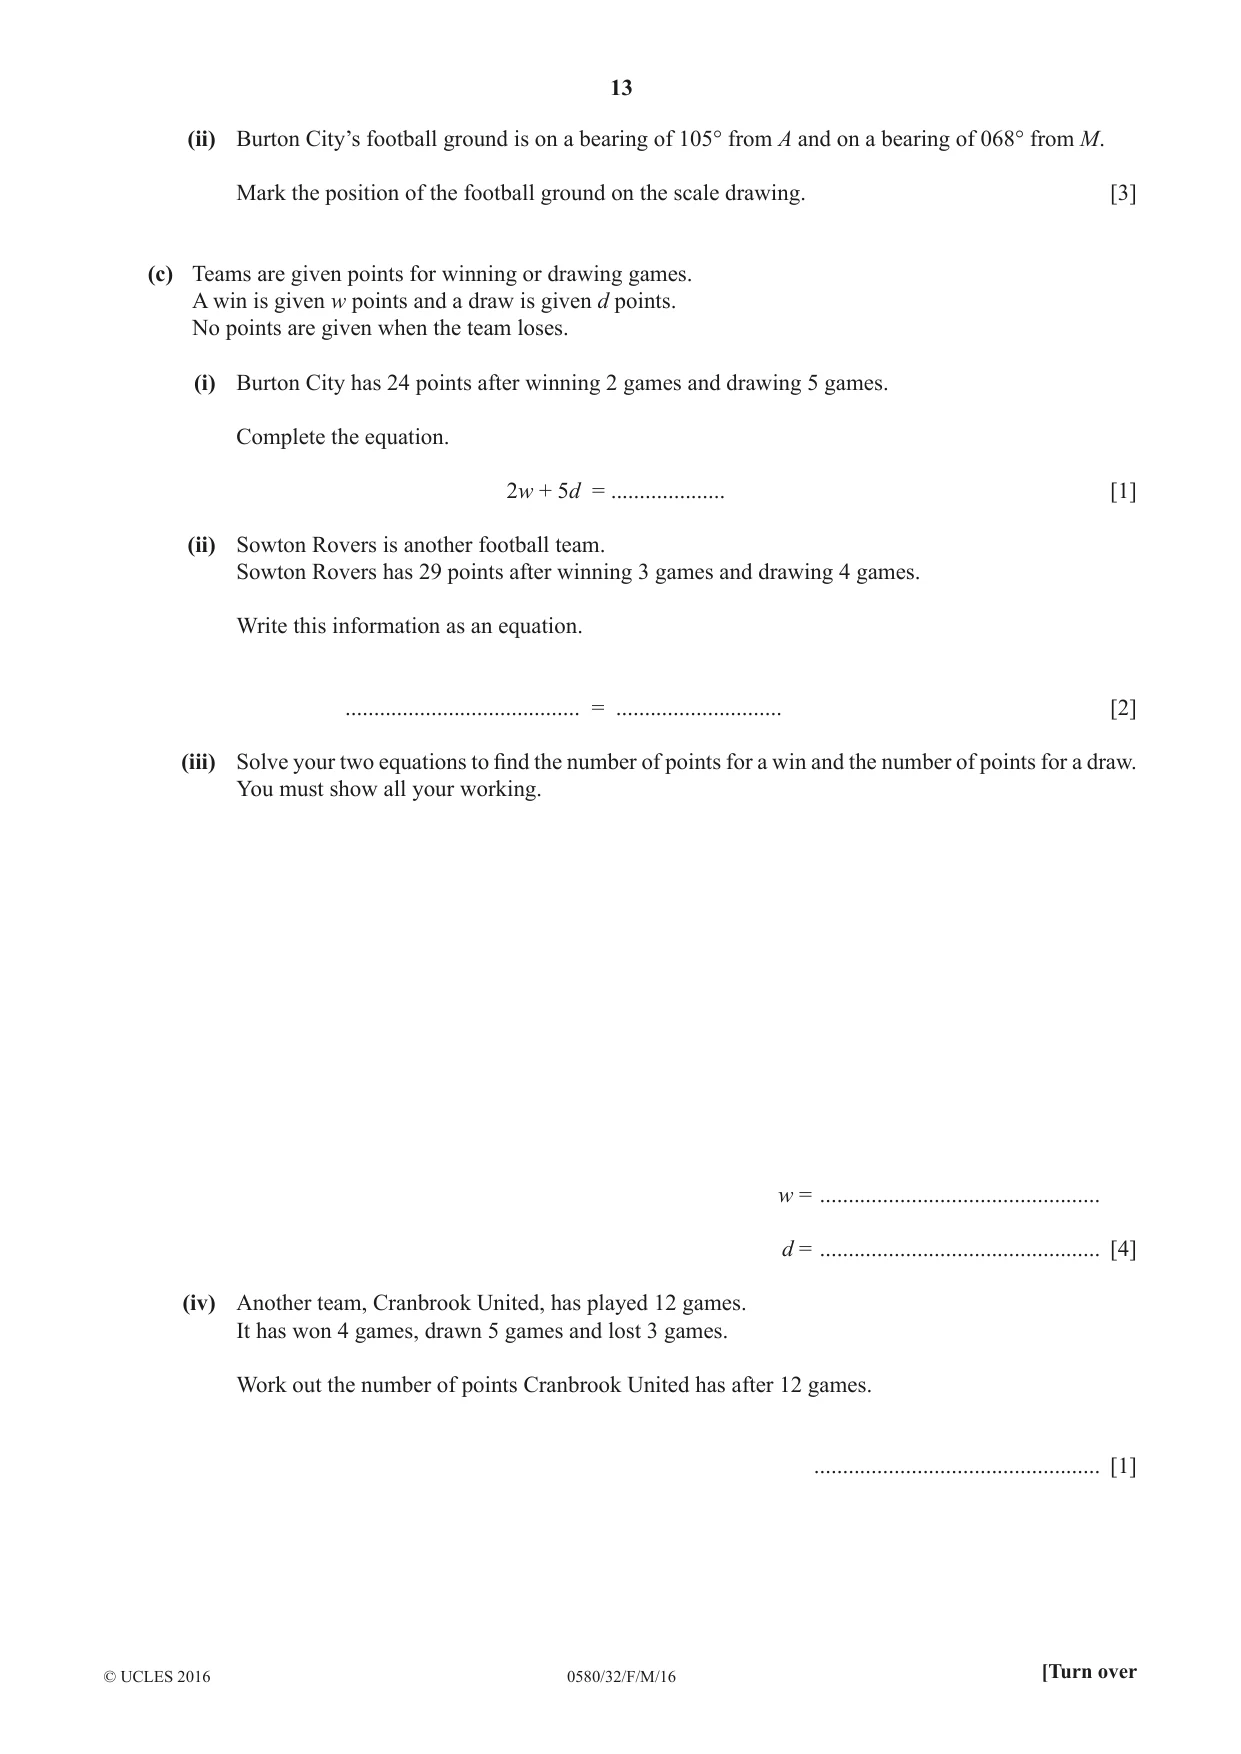
7 Burton City is a football team. (a) Burton City has 1732 supporters who want to travel to the next game. The football club hires some buses. Each bus seats 52 supporters. (i) Work out the number of buses needed to take these supporters to the game. .................................................. [2] (ii) The cost of the buses will be shared equally amongst these supporters. Each bus costs $198 to hire. Work out the amount that each supporter must pay. Give your answer correct to the nearest 10 cents. $ ................................................. [3] (b) Adam and Mabel are two supporters. The scale drawing shows the positions of Adam’s home, A, and Mabel’s home, M. The scale is 1 centimetre represents 500 metres. North A North Scale: 1 cm to 500 m M (i) Work out the distance in kilometres from A to M. ............................................ km [2] (ii) Burton City’s football ground is on a bearing of 105° from A and on a bearing of 068° from M. Mark the position of the football ground on the scale drawing. [3] (c) Teams are given points for winning or drawing games. A win is given w points and a draw is given d points. No points are given when the team loses. (i) Burton City has 24 points after winning 2 games and drawing 5 games. Complete the equation. 2w + 5d = .................... [1] (ii) Sowton Rovers is another football team. Sowton Rovers has 29 points after winning 3 games and drawing 4 games. Write this information as an equation. ......................................... = ............................. [2] (iii) Solve your two equations to find the number of points for a win and the number of points for a draw. You must show all your working. w = ................................................. d = ................................................. [4] (iv) Another team, Cranbrook United, has played 12 games. It has won 4 games, drawn 5 games and lost 3 games. Work out the number of points Cranbrook United has after 12 games. .................................................. [1]
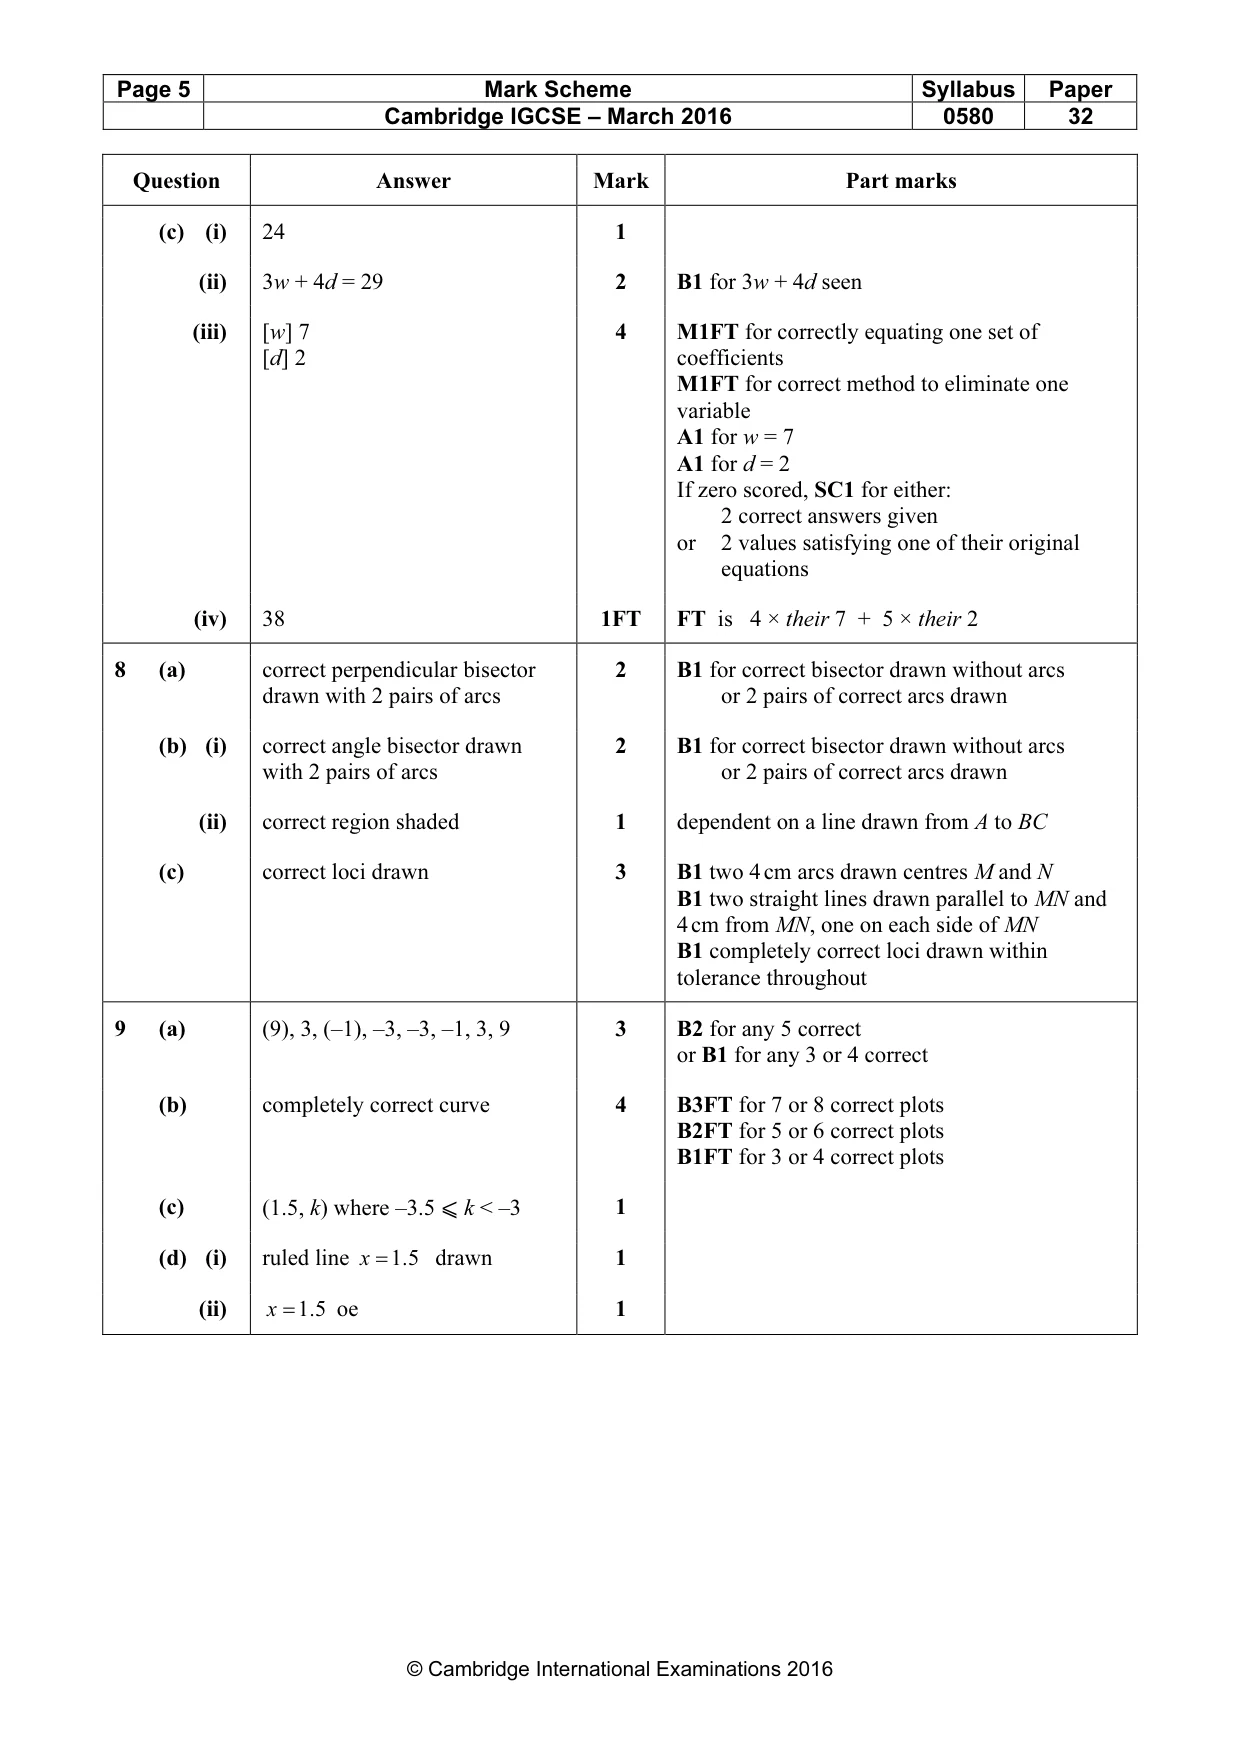
Mark scheme: 1732 7 (a) (i) 34 2 M1 for 52 198 ×their 34 (ii) 3.90 3FT M1FT for 1732 A1FT 3.88 to 3.89 A1FT their answer rounded to nearest 10c (b) (i) 3.9 2 M1 for 7.8 If zero scored SC1 for figs 38 to 40 (ii) football ground indicated in 3 B1 for bearing of 105° from A correct position B1 for bearing of 068° from M B1FT for indication of the football ground’s position, dpt on at least one B1
Q8 · Complete part (a) and part (b) using a straight edge and compasses only
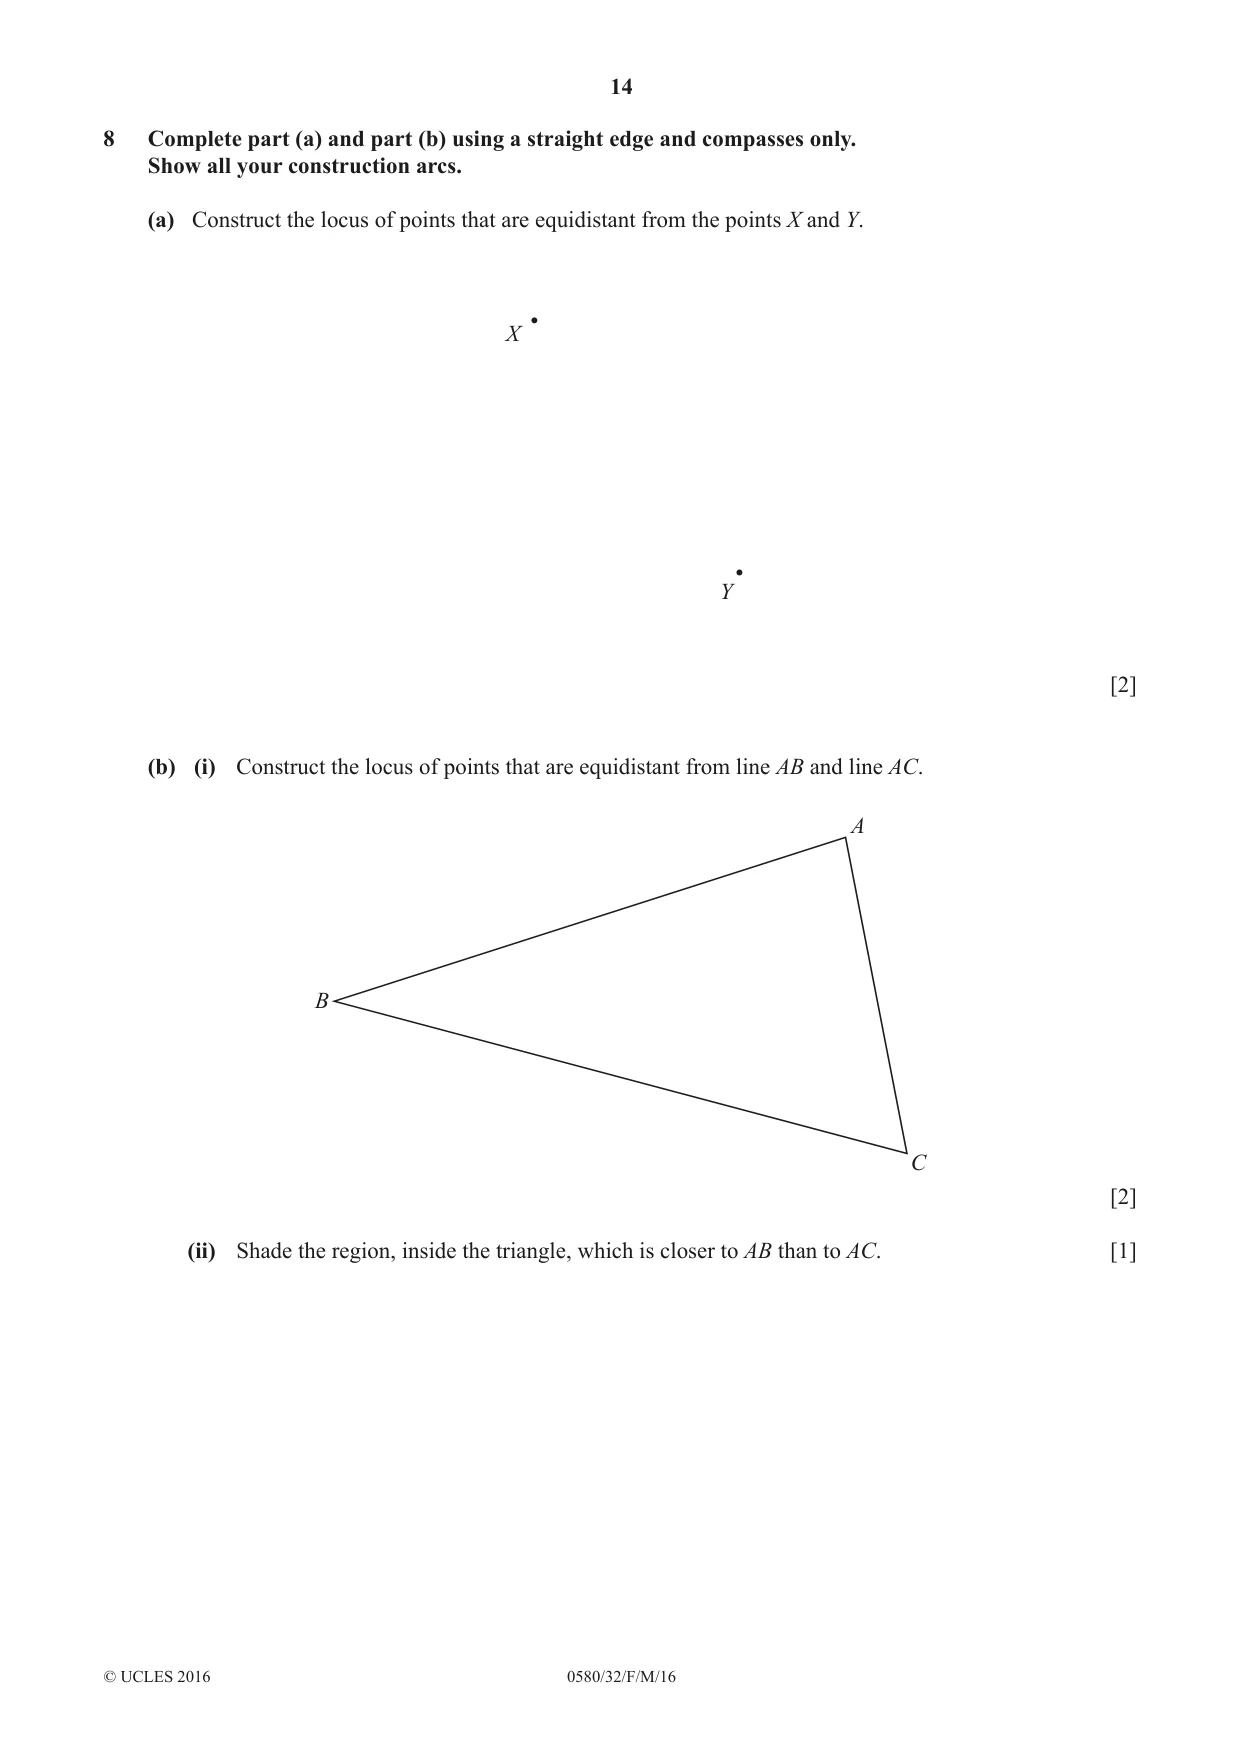
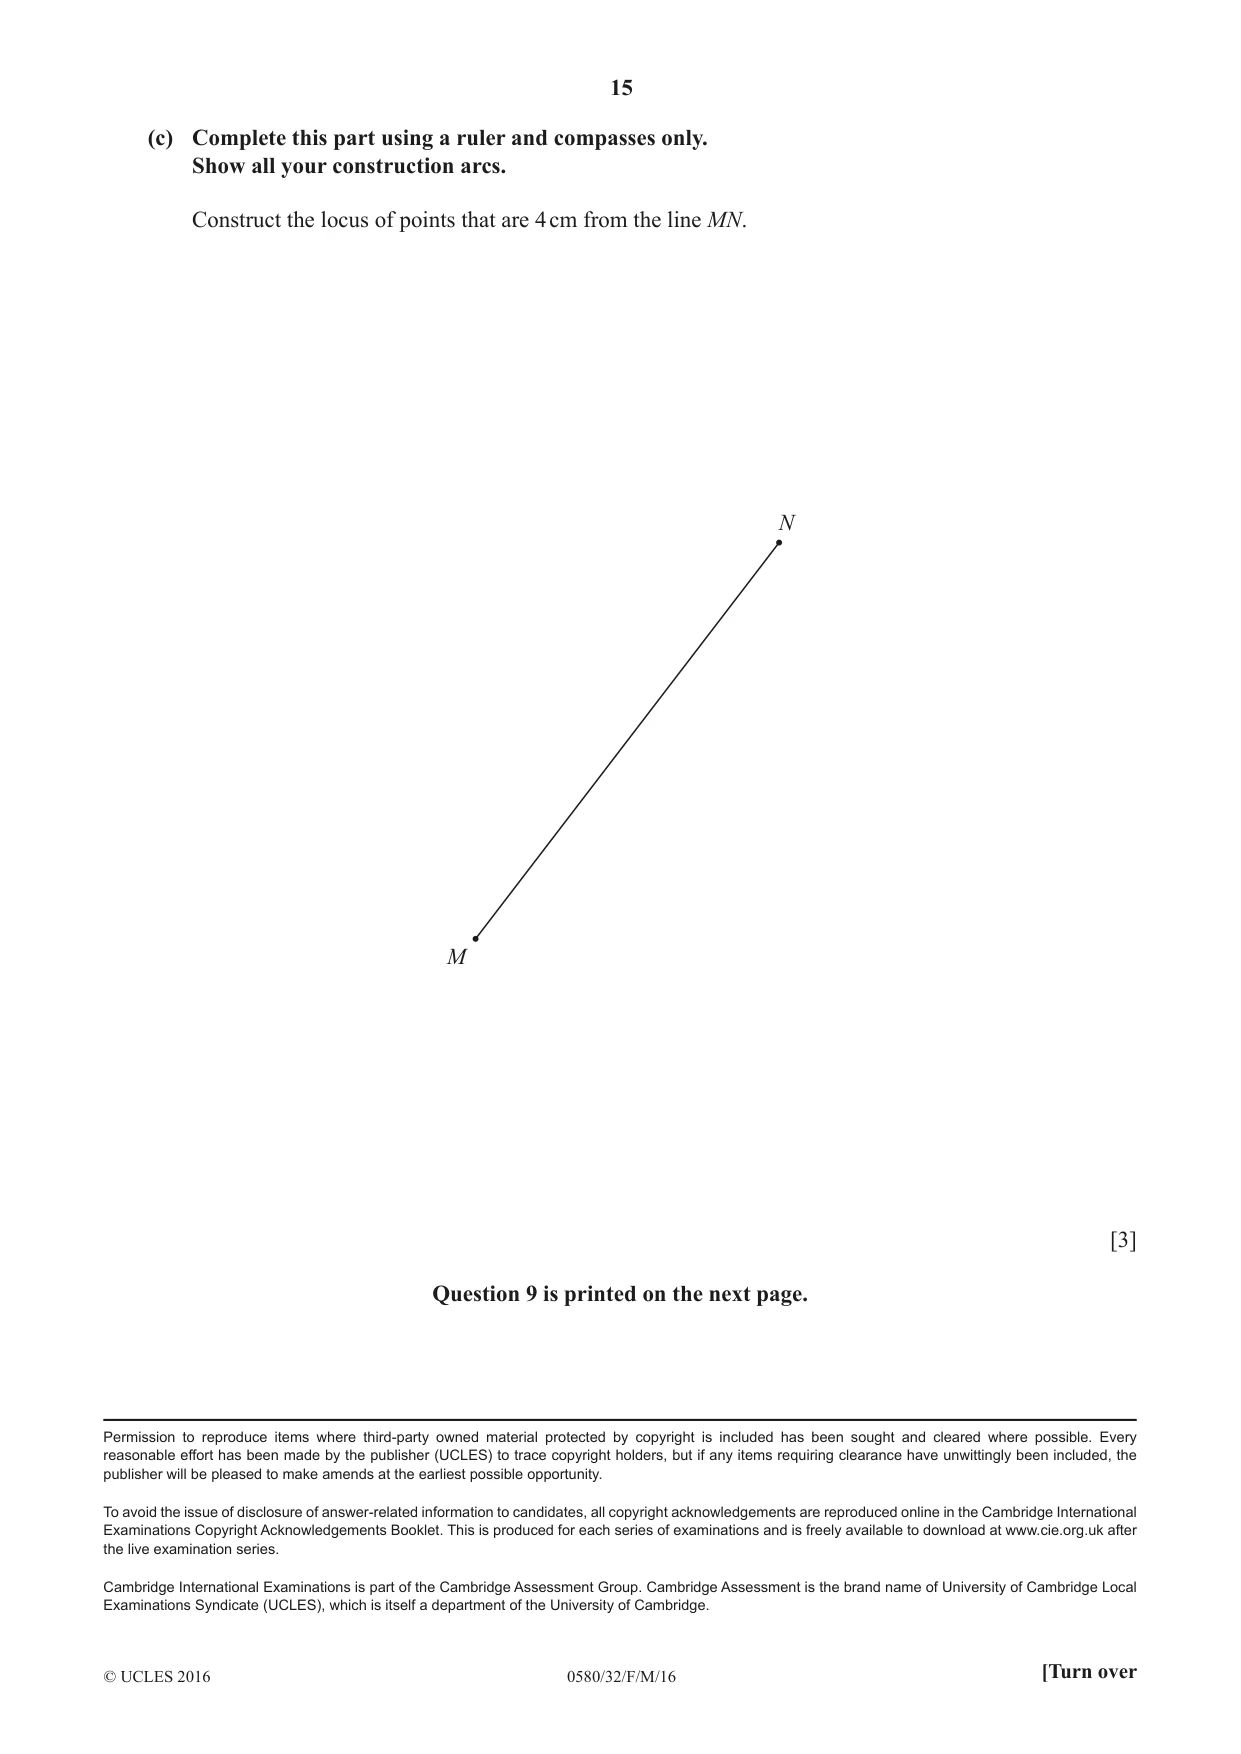
8 Complete part (a) and part (b) using a straight edge and compasses only. Show all your construction arcs. (a) Construct the locus of points that are equidistant from the points X and Y. X Y [2] (b) (i) Construct the locus of points that are equidistant from line AB and line AC. A B C [2] (ii) Shade the region, inside the triangle, which is closer to AB than to AC. [1] (c) Complete this part using a ruler and compasses only. Show all your construction arcs. Construct the locus of points that are 4 cm from the line MN. N M [3] Question 9 is printed on the next page.
Mark scheme: 8 (a) correct perpendicular bisector 2 B1 for correct bisector drawn without arcs drawn with 2 pairs of arcs or 2 pairs of correct arcs drawn (b) (i) correct angle bisector drawn 2 B1 for correct bisector drawn without arcs with 2 pairs of arcs or 2 pairs of correct arcs drawn (ii) correct region shaded 1 dependent on a line drawn from A to BC (c) correct loci drawn 3 B1 two 4 cm arcs drawn centres M and N B1 two straight lines drawn parallel to MN and 4 cm from MN, one on each side of MN B1 completely correct loci drawn within tolerance throughout
Q9 · Complete the table of values for y = x 2 - 3x - 1
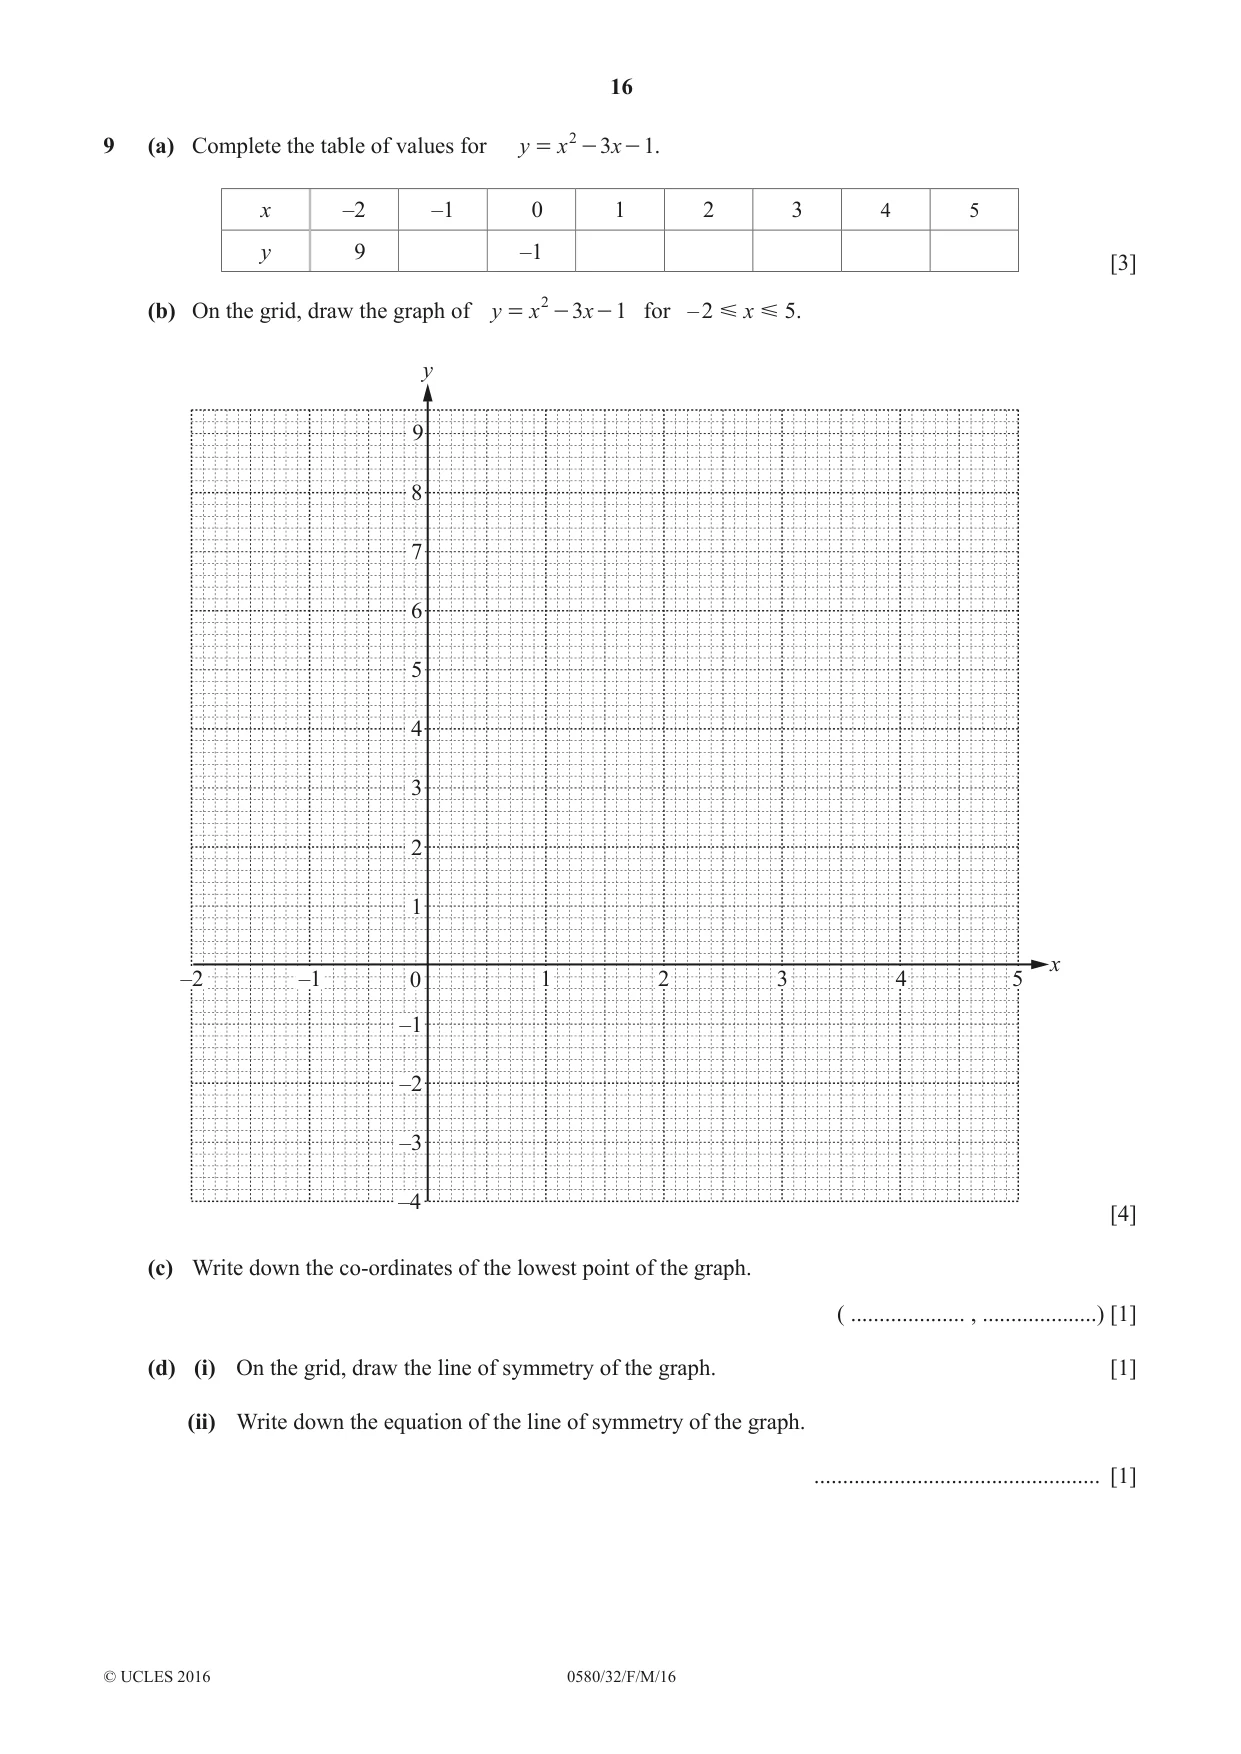
9 (a) Complete the table of values for y = x 2 - 3x - 1. x –2 –1 0 1 2 3 4 5 y 9 –1 [3] (b) On the grid, draw the graph of y = x 2 - 3x - 1 for – 2 x 5. y 9 8 7 6 5 4 3 2 1 x –2 –1 0 1 2 3 4 5 –1 –2 –3 –4 [4] (c) Write down the co-ordinates of the lowest point of the graph. ( .................... , ....................) [1] (d) (i) On the grid, draw the line of symmetry of the graph. [1] (ii) Write down the equation of the line of symmetry of the graph. .................................................. [1]
Mark scheme: 9 (a) (9), 3, (–1), –3, –3, –1, 3, 9 3 B2 for any 5 correct or B1 for any 3 or 4 correct (b) completely correct curve 4 B3FT for 7 or 8 correct plots B2FT for 5 or 6 correct plots B1FT for 3 or 4 correct plots (c) (1.5, k) where –3.5 ⩽ k < –3 1 (d) (i) ruled line x = 1.5 drawn 1 (ii) x = 1.5 oe 1
What was in this paper
The subtopics covered by these 9 questions, and how many questions each got. Open one in a new tab to see every Cambridge question on it.
What you needed in this session
Cambridge’s own grade thresholds for 2016 Feb/March, Paper 3 · Variant 2. A higher threshold means an easier paper — the bar moves with how the cohort did.