Cambridge IGCSE Mathematics 0580 — 2015 Oct/Nov Paper 3 · Variant 3
0580/33/O/N/15 · 10 questions · 104 marks · ≈117 min
The question paper and its mark scheme, free to read here and free to download. This is Cambridge’s own paper, exactly as it was sat.
Question paper16 pages
Mark scheme5 pages
Answers below. Sit the paper first if you are practising.
Questions as text
Q1 · Chip flies from New York to St Petersburg
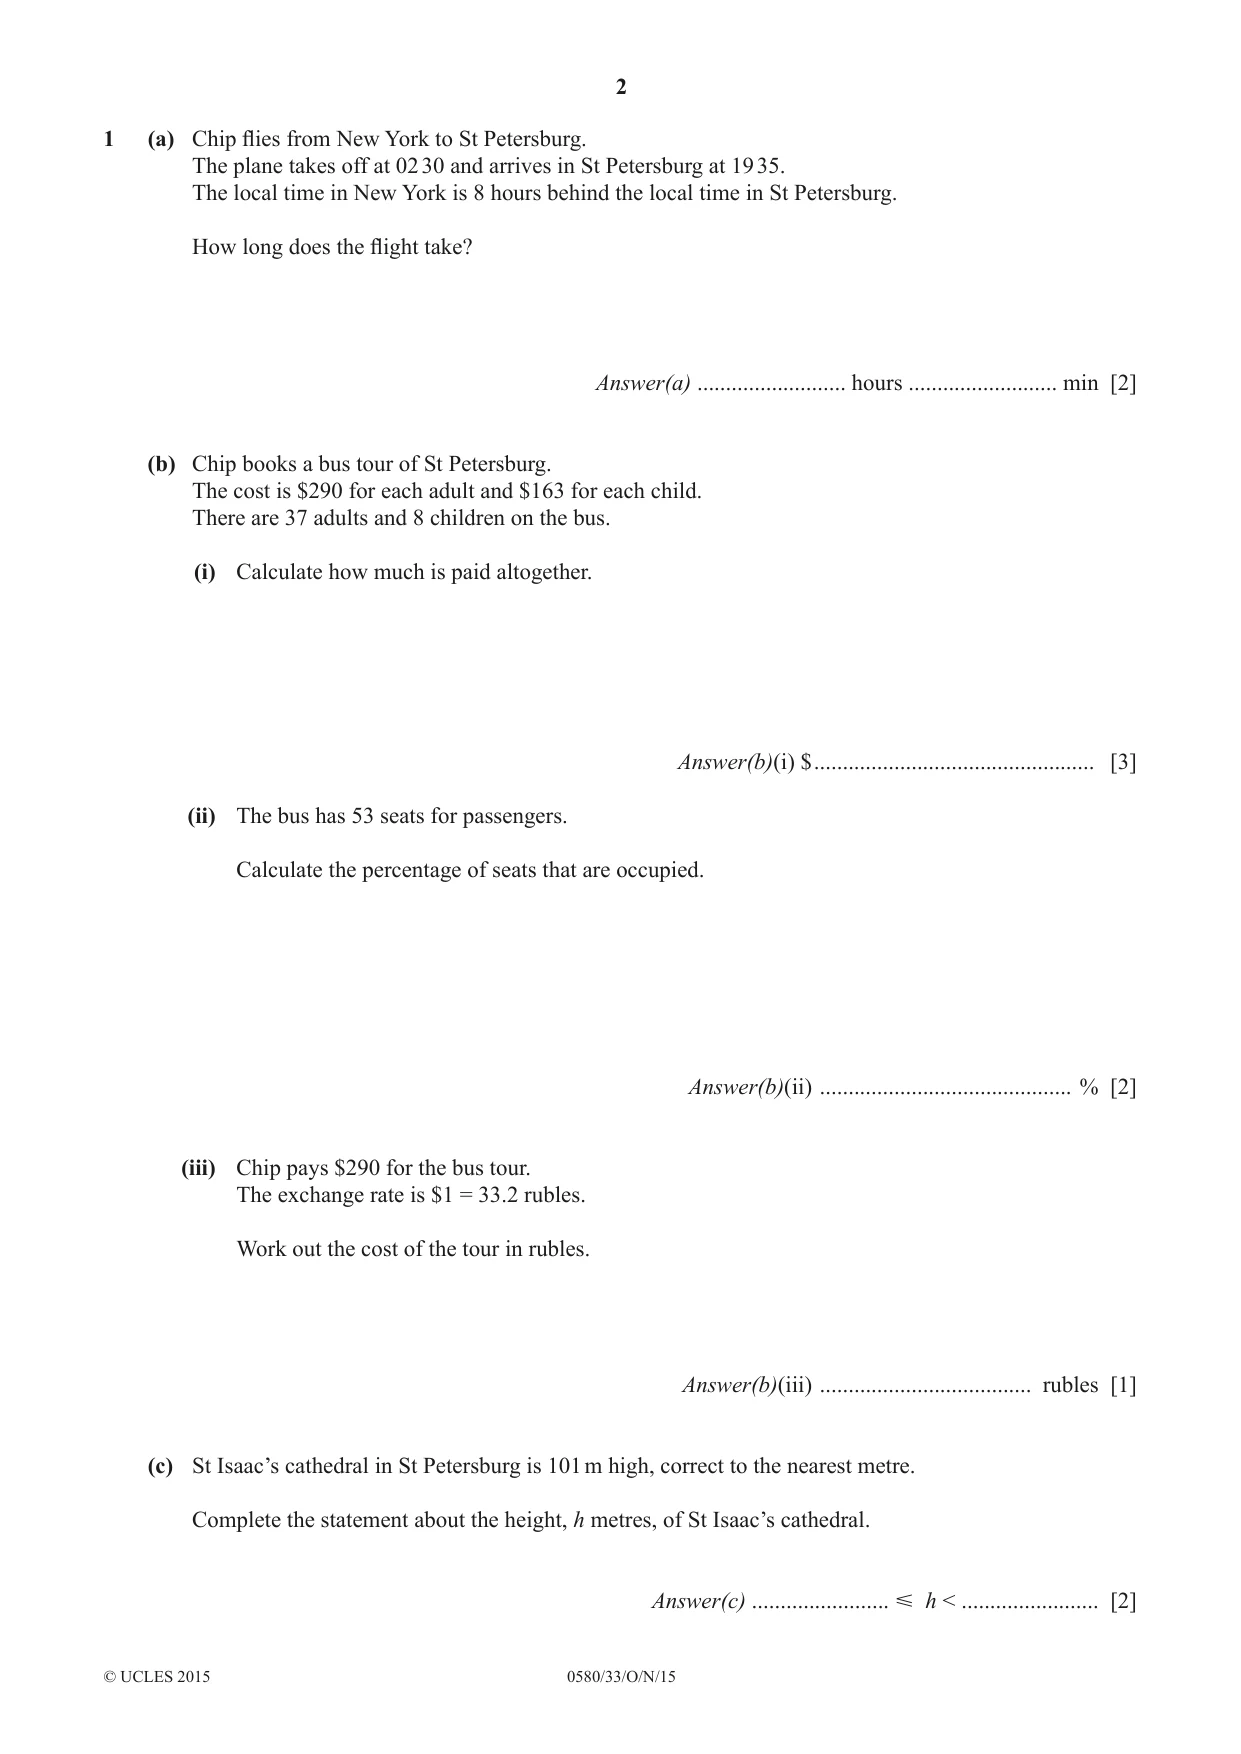
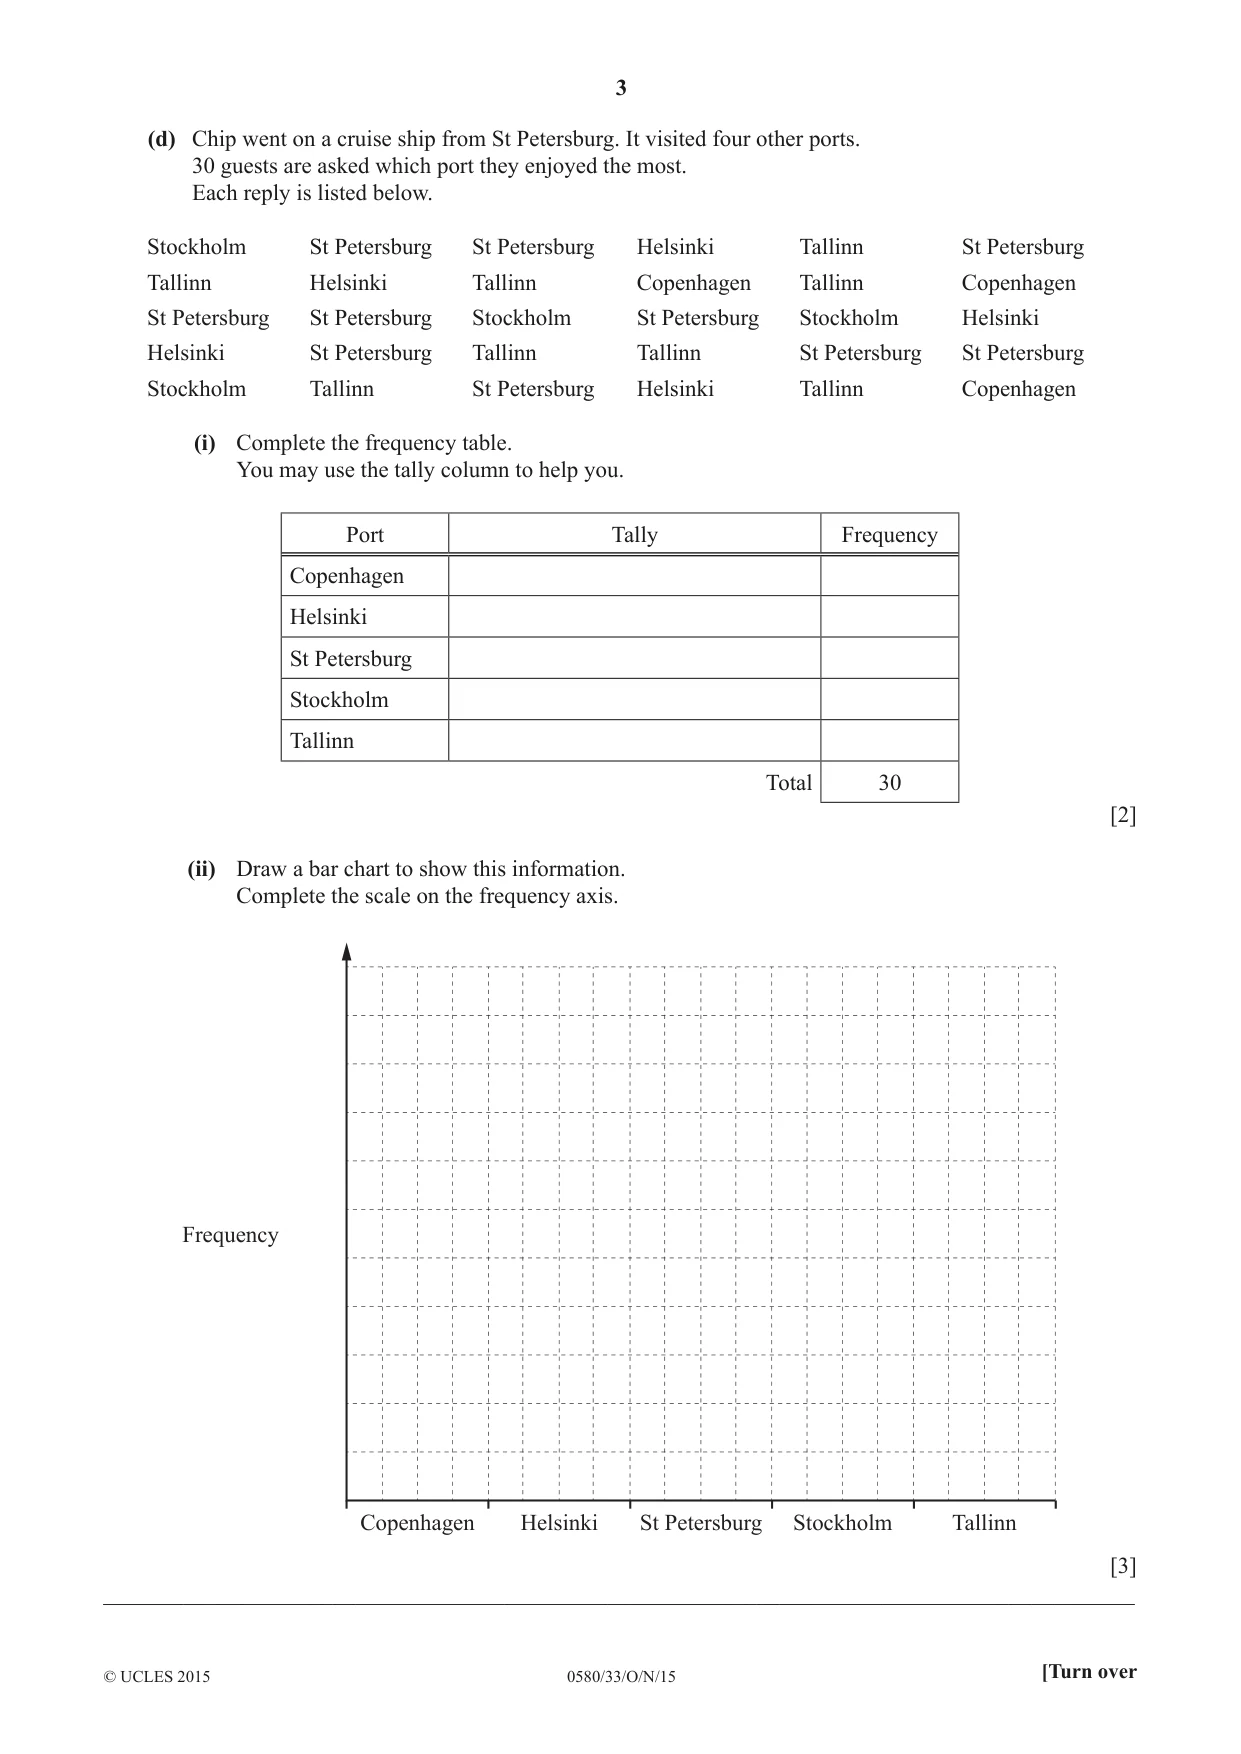
1 (a) Chip flies from New York to St Petersburg. The plane takes off at 02 30 and arrives in St Petersburg at 19 35. The local time in New York is 8 hours behind the local time in St Petersburg. How long does the flight take? Answer(a) .......................... hours .......................... min [2] (b) Chip books a bus tour of St Petersburg. The cost is $290 for each adult and $163 for each child. There are 37 adults and 8 children on the bus. (i) Calculate how much is paid altogether. Answer(b)(i) $ ................................................. [3] (ii) The bus has 53 seats for passengers. Calculate the percentage of seats that are occupied. Answer(b)(ii) ............................................ % [2] (iii) Chip pays $290 for the bus tour. The exchange rate is $1 = 33.2 rubles. Work out the cost of the tour in rubles. Answer(b)(iii) ..................................... rubles [1] (c) St Isaac’s cathedral in St Petersburg is 101 m high, correct to the nearest metre. Complete the statement about the height, h metres, of St Isaac’s cathedral. Answer(c) ........................ h < ........................ [2] (d) Chip went on a cruise ship from St Petersburg. It visited four other ports. 30 guests are asked which port they enjoyed the most. Each reply is listed below. Stockholm St Petersburg St Petersburg Helsinki Tallinn St Petersburg Tallinn Helsinki Tallinn Copenhagen Tallinn Copenhagen St Petersburg St Petersburg Stockholm St Petersburg Stockholm Helsinki Helsinki St Petersburg Tallinn Tallinn St Petersburg St Petersburg Stockholm Tallinn St Petersburg Helsinki Tallinn Copenhagen (i) Complete the frequency table. You may use the tally column to help you. Port Tally Frequency Copenhagen Helsinki St Petersburg Stockholm Tallinn Total 30 [2] (ii) Draw a bar chart to show this information. Complete the scale on the frequency axis. Frequency Copenhagen Helsinki St Petersburg Stockholm Tallinn [3] __________________________________________________________________________________________
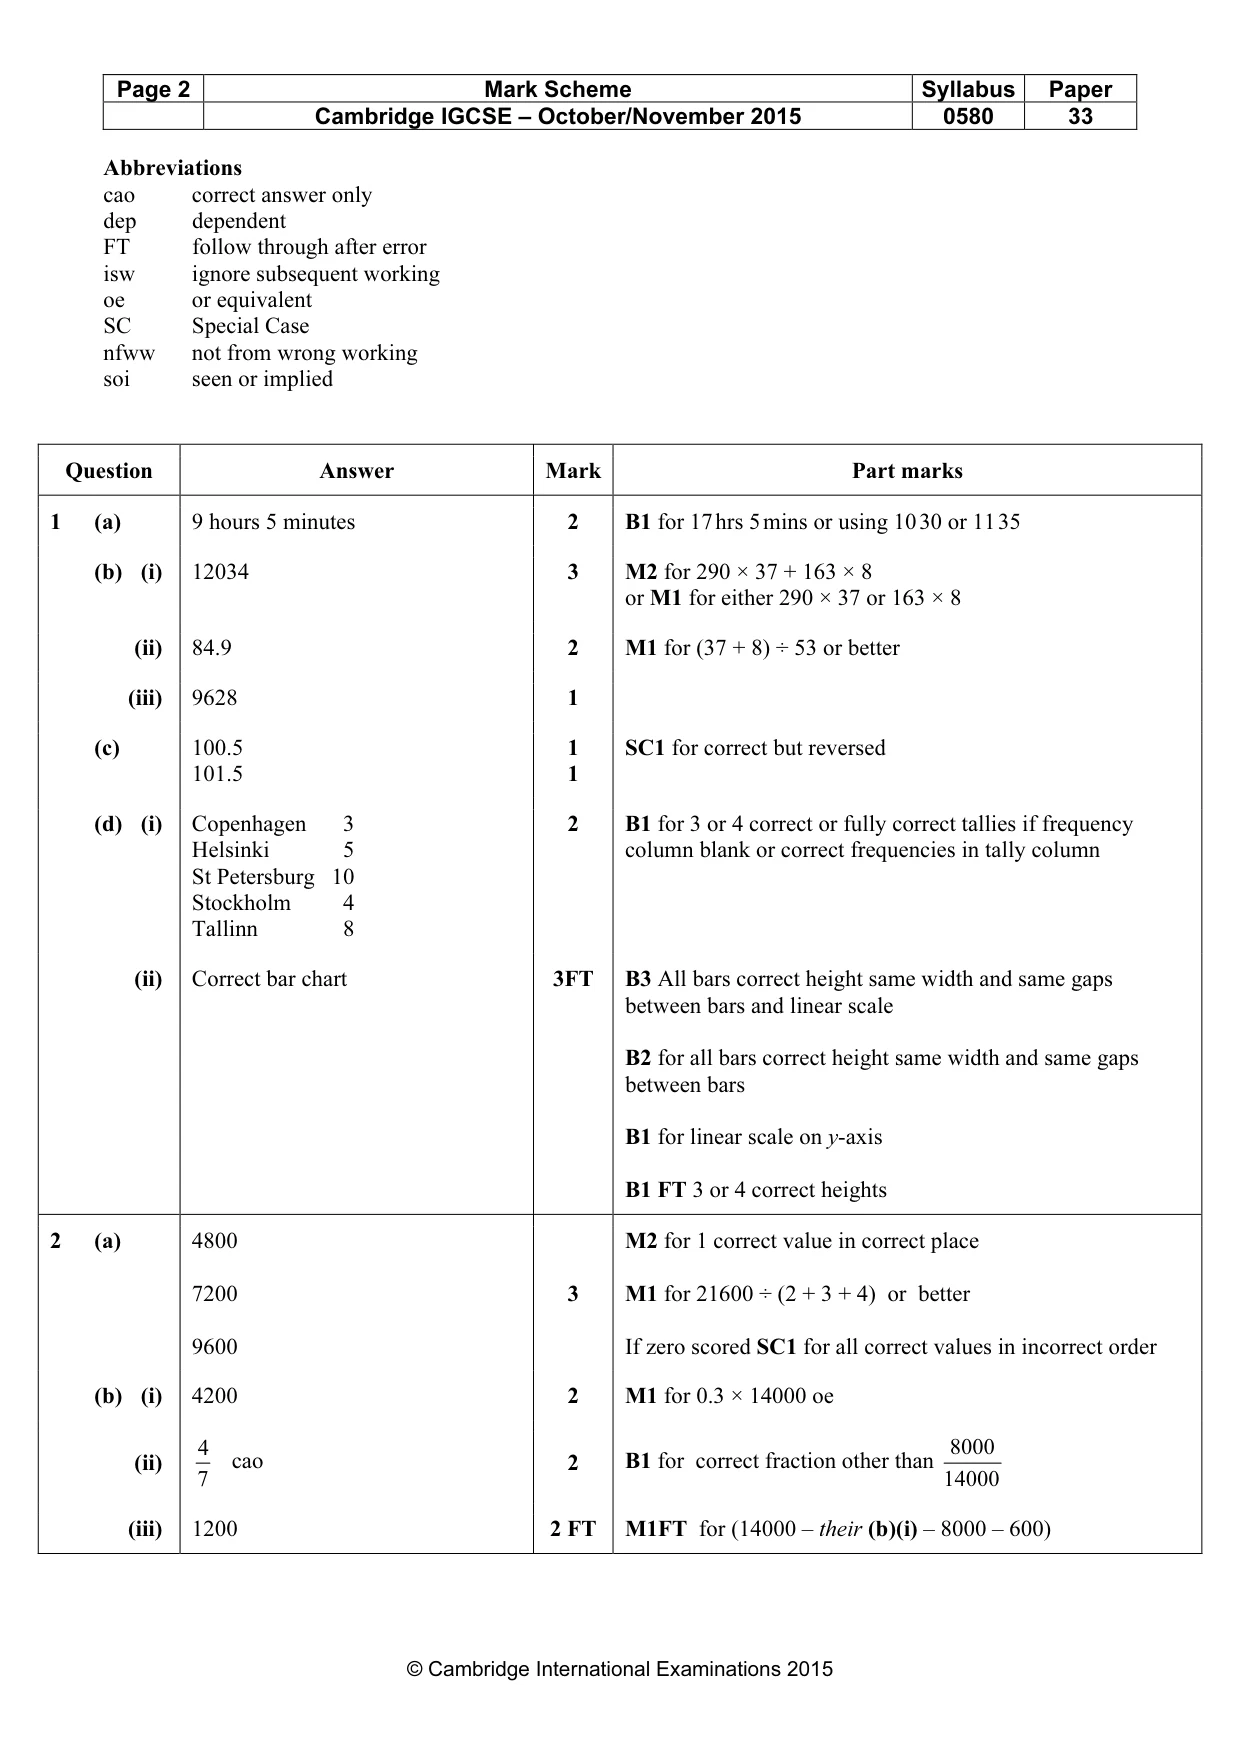
Mark scheme: Question Answer Mark Part marks 1 (a) 9 hours 5 minutes 2 B1 for 17 hrs 5 mins or using 10 30 or 11 35 (b) (i) 12034 3 M2 for 290 × 37 + 163 × 8 or M1 for either 290 × 37 or 163 × 8 (ii) 84.9 2 M1 for (37 + 8) ÷ 53 or better (iii) 9628 1 (c) 100.5 1 SC1 for correct but reversed 101.5 1 (d) (i) Copenhagen 3 2 B1 for 3 or 4 correct or fully correct tallies if frequency Helsinki 5 column blank or correct frequencies in tally column St Petersburg 10 Stockholm 4 Tallinn 8 (ii) Correct bar chart 3FT B3 All bars correct height same width and same gaps between bars and linear scale B2 for all bars correct height same width and same gaps between bars B1 for linear scale on y-axis B1 FT 3 or 4 correct heights
Q2 · Kylie, Rio and Choi buy a horse for $21 600
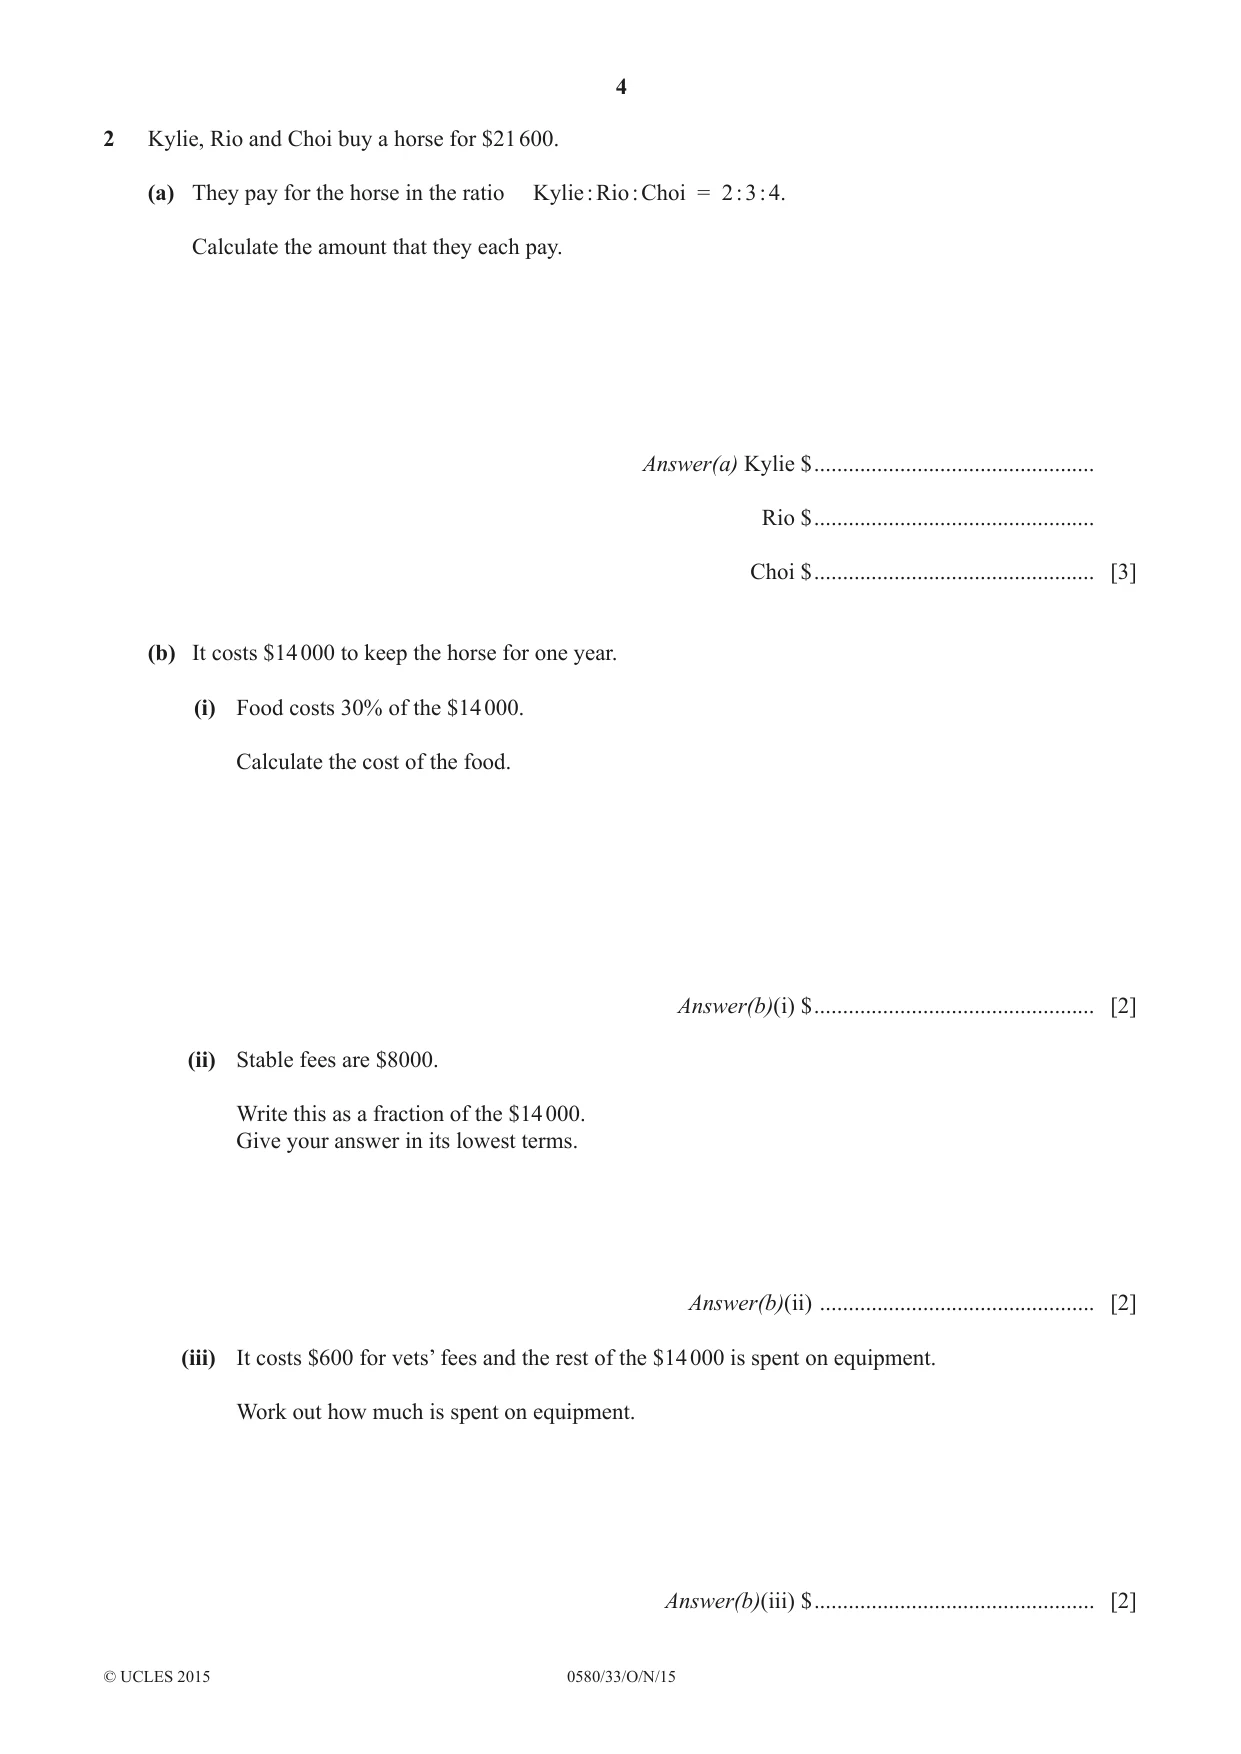
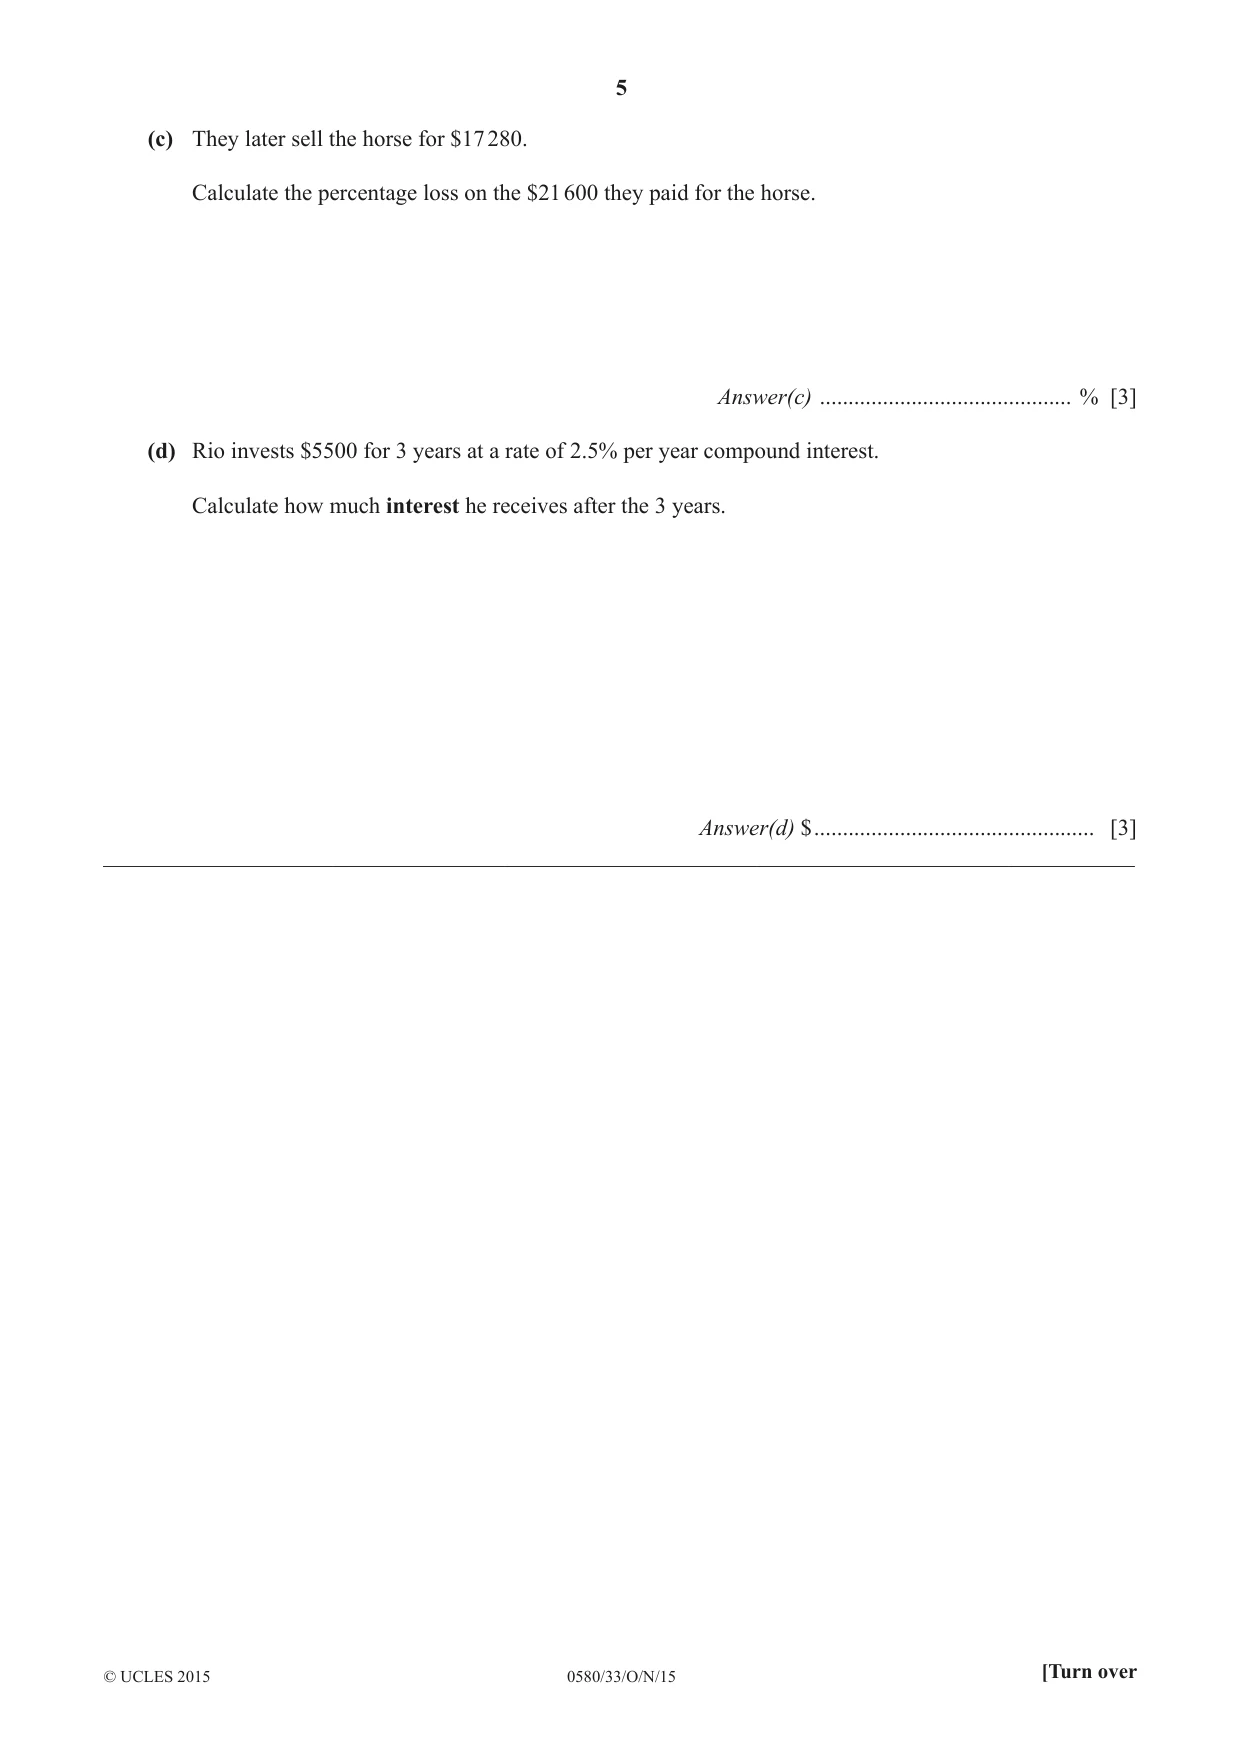
2 Kylie, Rio and Choi buy a horse for $21 600. (a) They pay for the horse in the ratio Kylie : Rio : Choi = 2 : 3 : 4. Calculate the amount that they each pay. Answer(a) Kylie $ ................................................. Rio $ ................................................. Choi $ ................................................. [3] (b) It costs $14 000 to keep the horse for one year. (i) Food costs 30% of the $14 000. Calculate the cost of the food. Answer(b)(i) $ ................................................. [2] (ii) Stable fees are $8000. Write this as a fraction of the $14 000. Give your answer in its lowest terms. Answer(b)(ii) ................................................ [2] (iii) It costs $600 for vets’ fees and the rest of the $14 000 is spent on equipment. Work out how much is spent on equipment. Answer(b)(iii) $ ................................................. [2] (c) They later sell the horse for $17 280. Calculate the percentage loss on the $21 600 they paid for the horse. Answer(c) ............................................ % [3] (d) Rio invests $5500 for 3 years at a rate of 2.5% per year compound interest. Calculate how much interest he receives after the 3 years. Answer(d) $ ................................................. [3] __________________________________________________________________________________________
Mark scheme: 2 (a) 4800 M2 for 1 correct value in correct place 7200 3 M1 for 21600 ÷ (2 + 3 + 4) or better 9600 If zero scored SC1 for all correct values in incorrect order (b) (i) 4200 2 M1 for 0.3 × 14000 oe 4 8000 (ii) cao 2 B1 for correct fraction other than 7 14000 (iii) 1200 2 FT M1FT for (14000 – their (b)(i) – 8000 – 600)
Q3 · Bataar is comparing the engine size of a car with the distance it travels on one gallon…
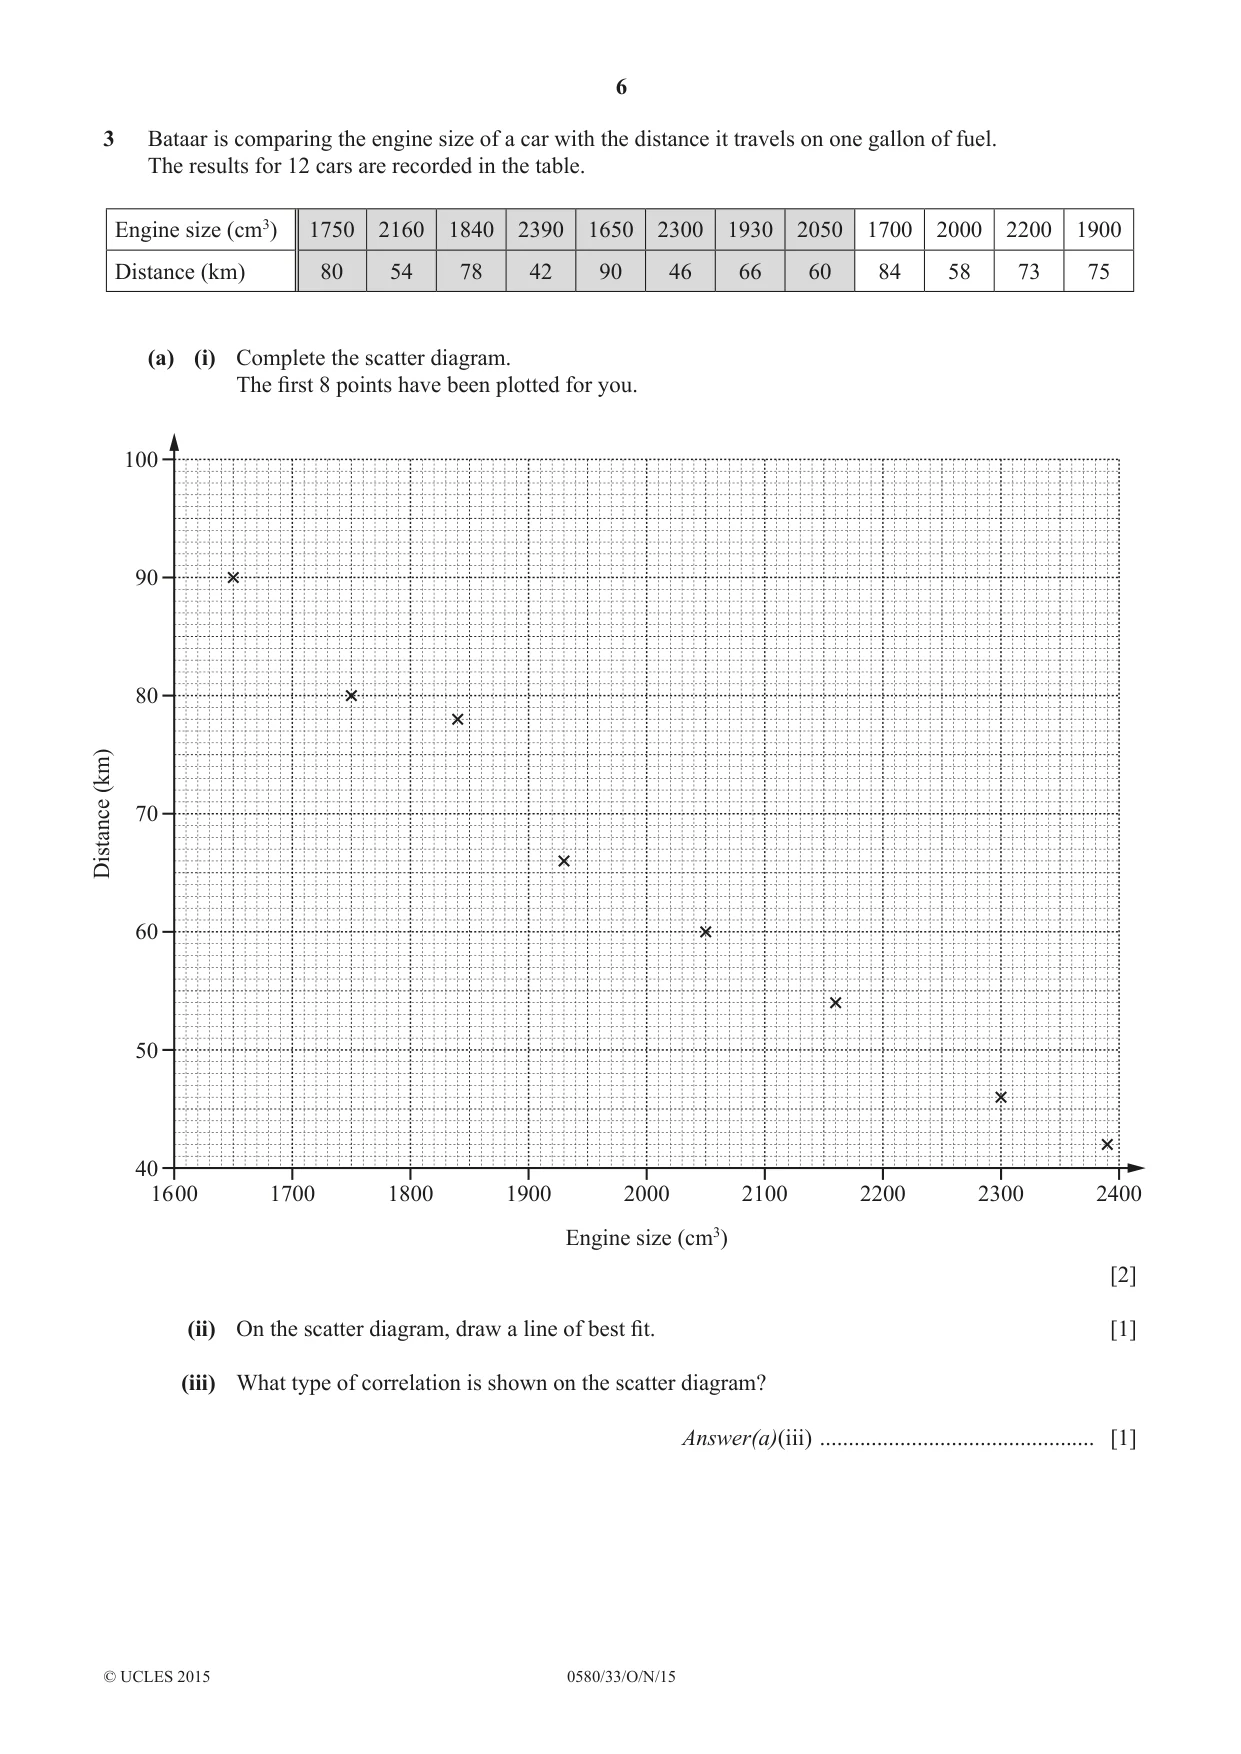
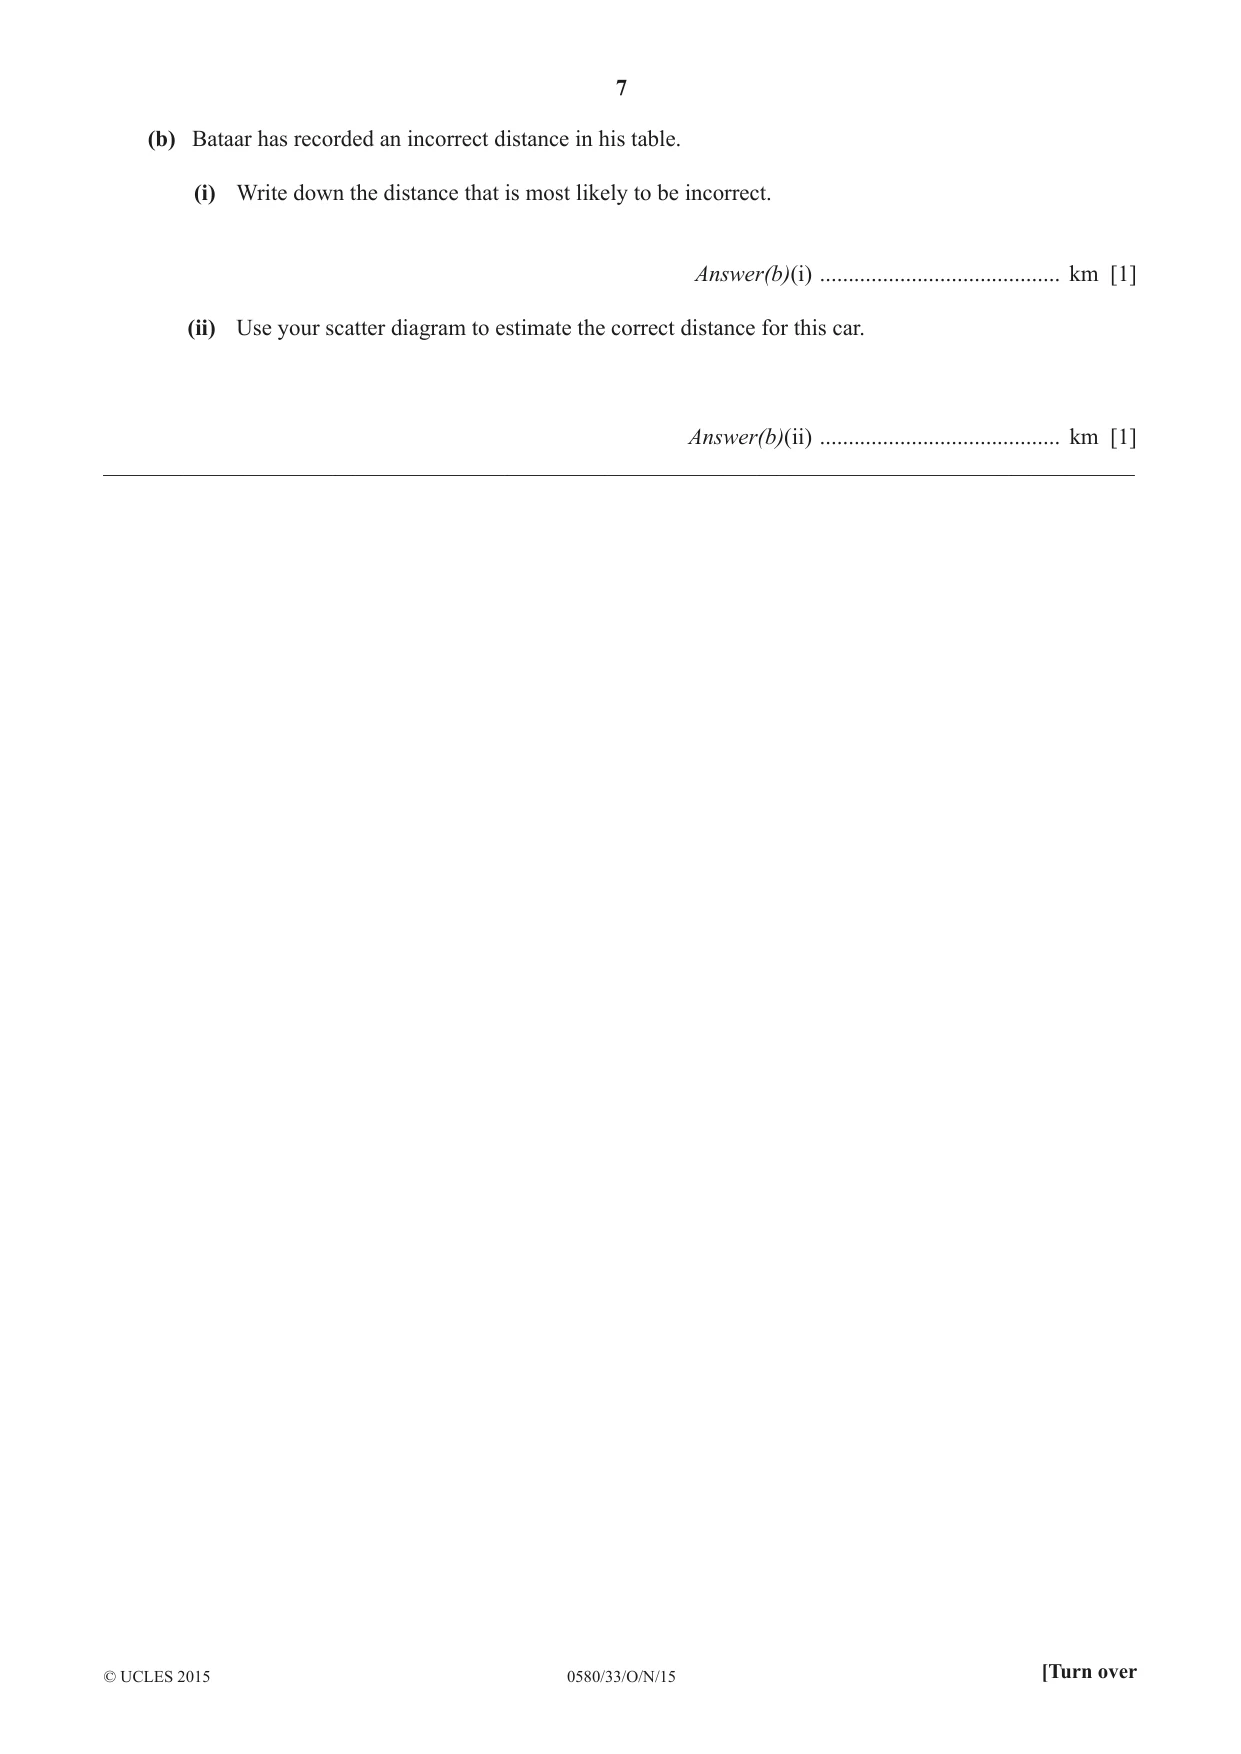
3 Bataar is comparing the engine size of a car with the distance it travels on one gallon of fuel. The results for 12 cars are recorded in the table. Engine size (cm3) 1750 2160 1840 2390 1650 2300 1930 2050 1700 2000 2200 1900 Distance (km) 80 54 78 42 90 46 66 60 84 58 73 75 (a) (i) Complete the scatter diagram. The first 8 points have been plotted for you. 100 90 80 (km) Distance 70 60 50 40 16 00 1700 1800 1900 2000 2100 2200 2300 2400 Engine size (cm3) [2] (ii) On the scatter diagram, draw a line of best fit. [1] (iii) What type of correlation is shown on the scatter diagram? Answer(a)(iii) ................................................ [1] (b) Bataar has recorded an incorrect distance in his table. (i) Write down the distance that is most likely to be incorrect. Answer(b)(i) .......................................... km [1] (ii) Use your scatter diagram to estimate the correct distance for this car. Answer(b)(ii) .......................................... km [1] __________________________________________________________________________________________
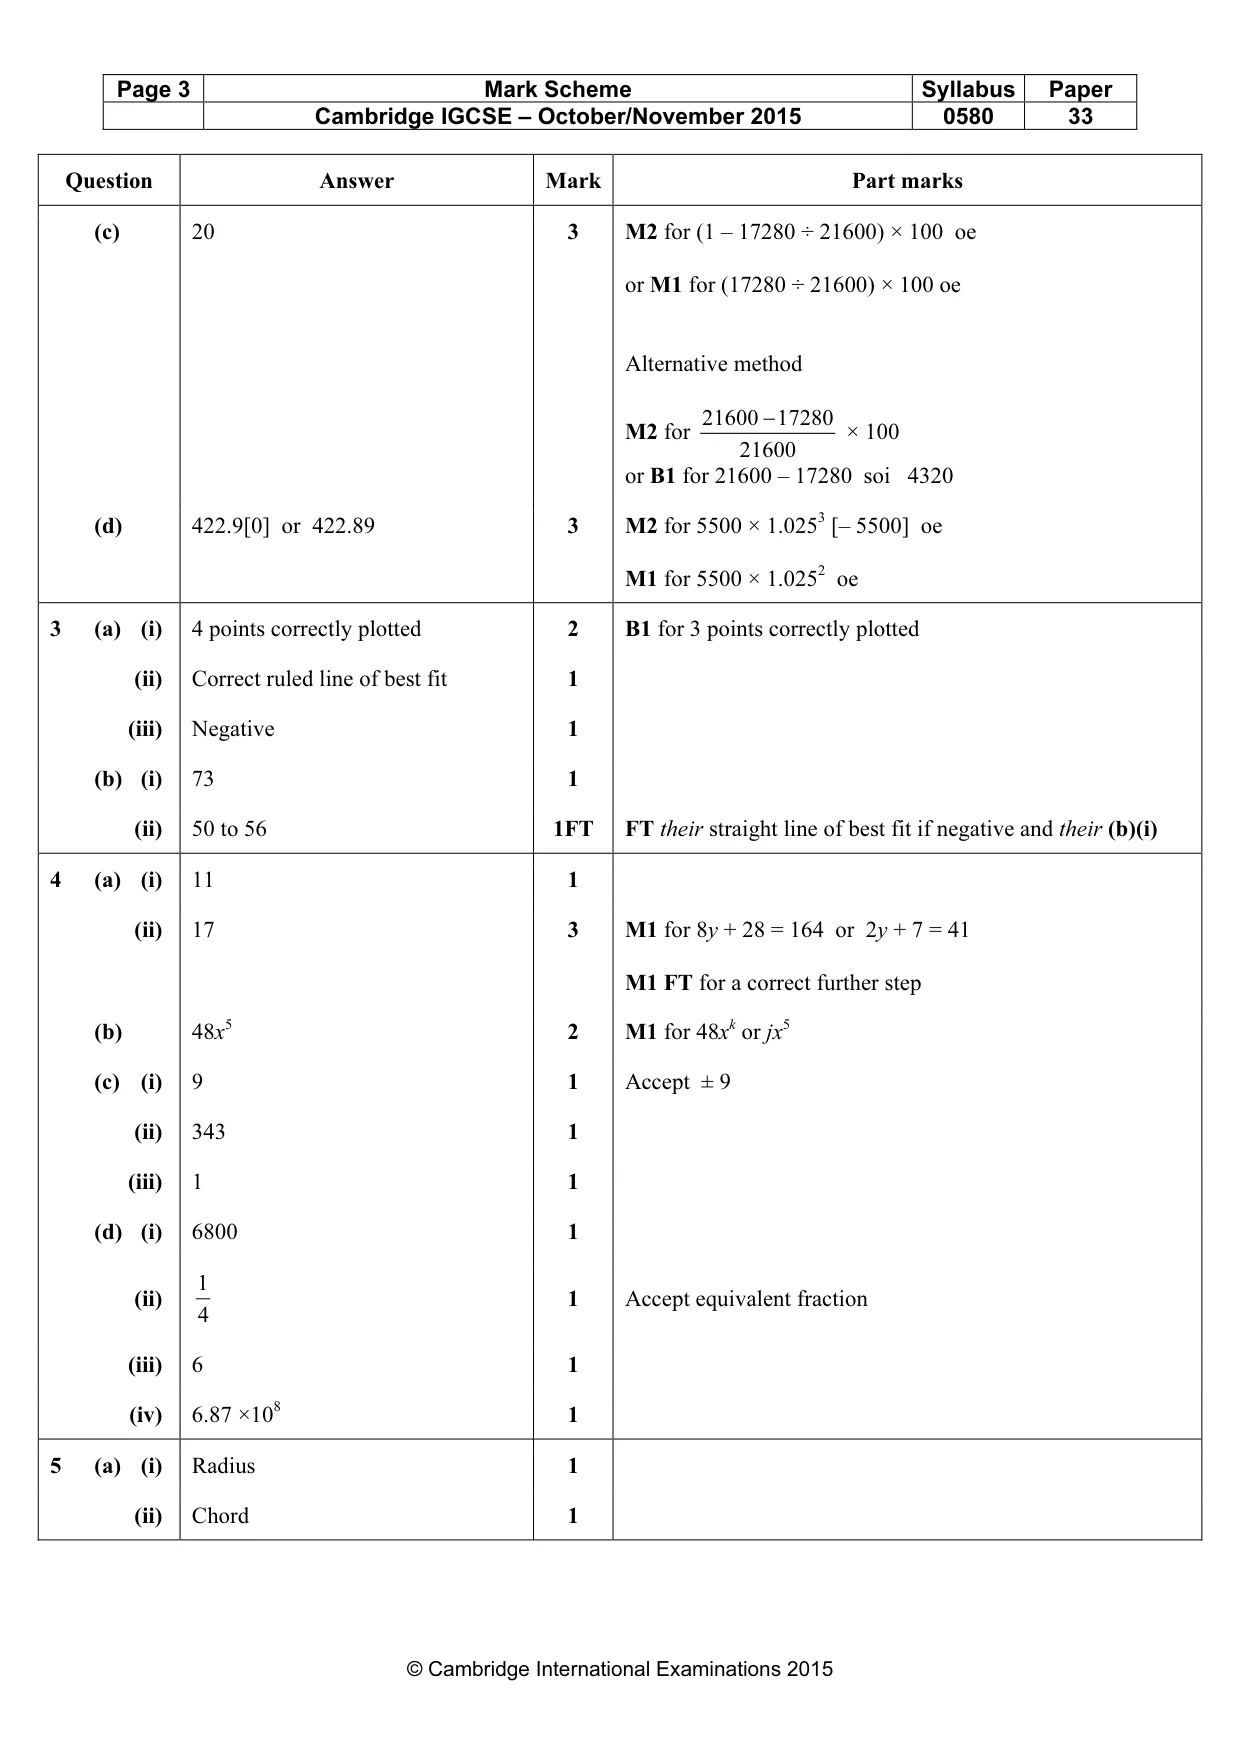
Mark scheme: 3 (a) (i) 4 points correctly plotted 2 B1 for 3 points correctly plotted (ii) Correct ruled line of best fit 1 (iii) Negative 1 (b) (i) 73 1 (ii) 50 to 56 1FT FT their straight line of best fit if negative and their (b)(i)
Question 4
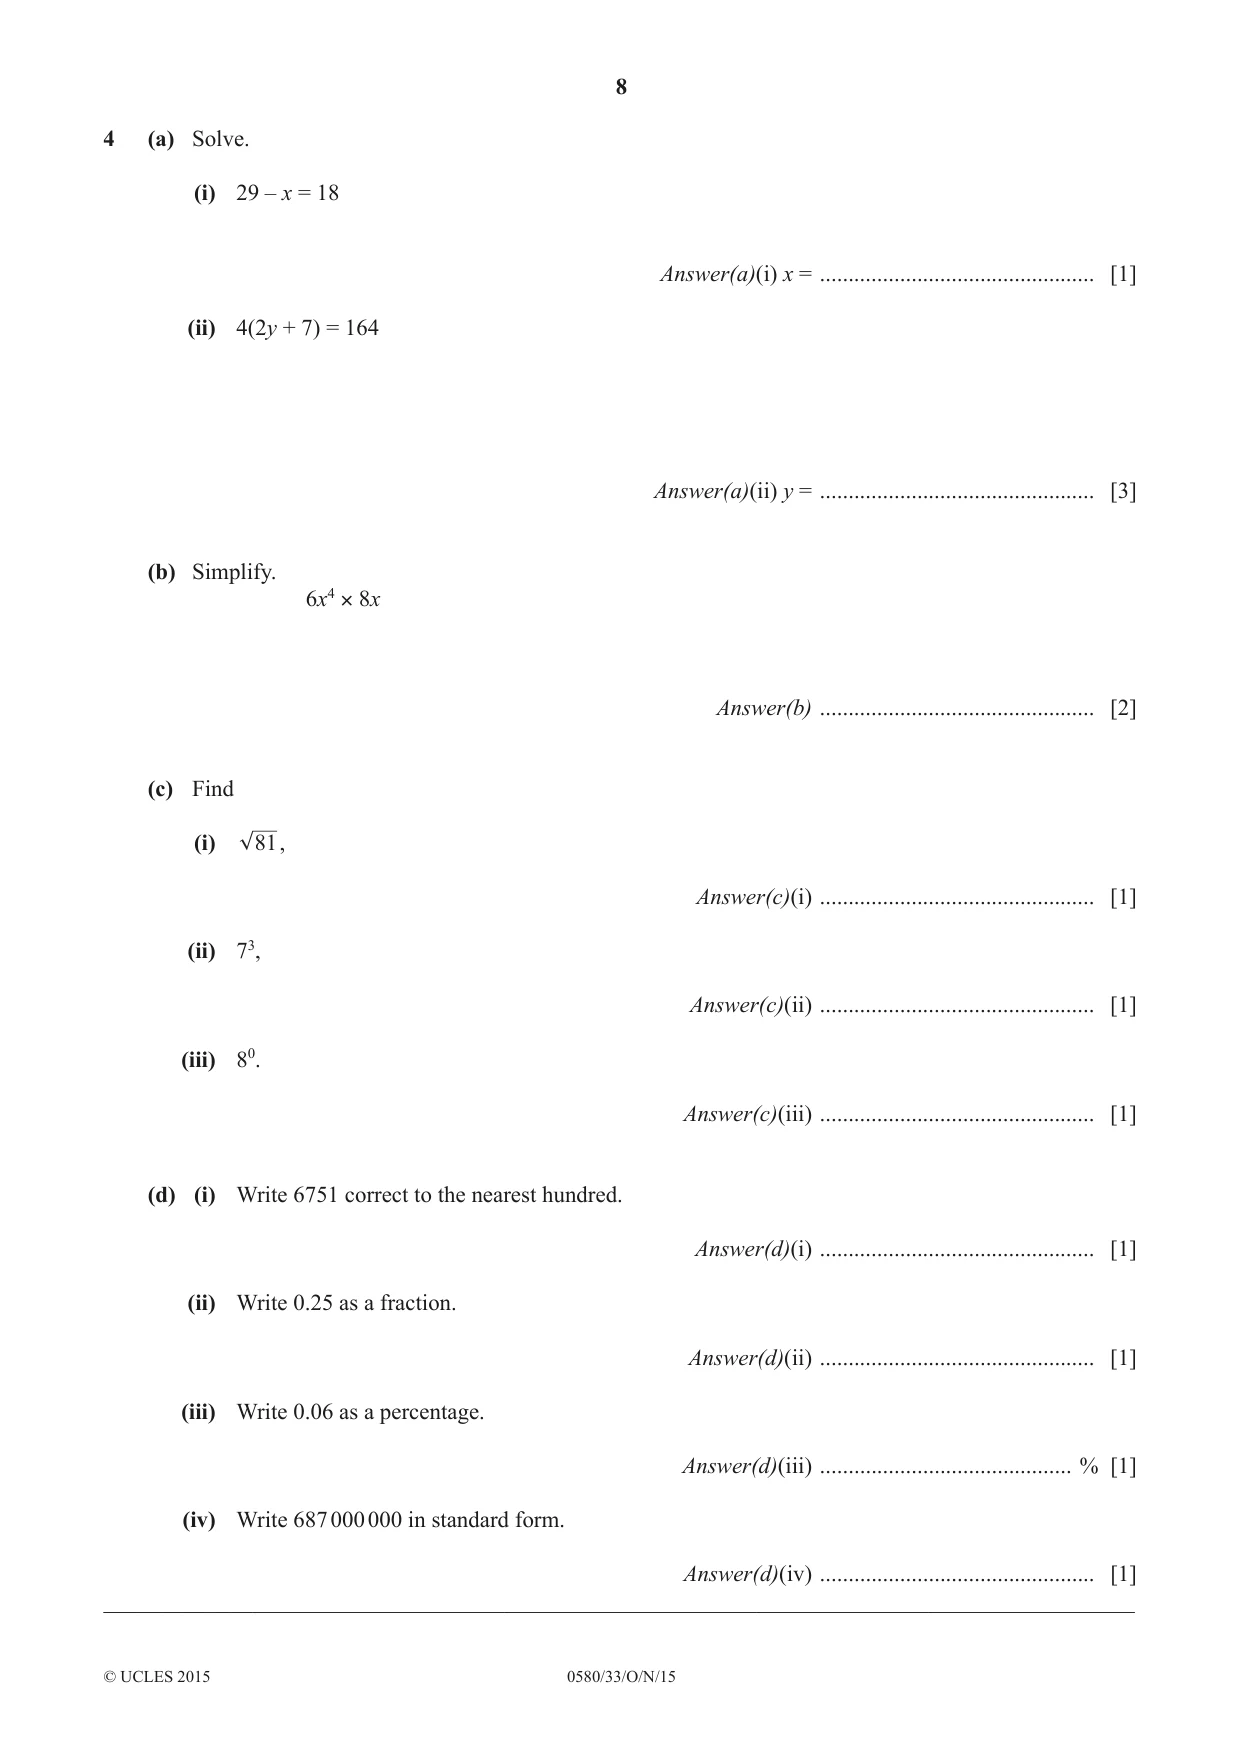
4 (a) Solve. (i) 29 – x = 18 Answer(a)(i) x = ................................................ [1] (ii) 4(2y + 7) = 164 Answer(a)(ii) y = ................................................ [3] (b) Simplify. 6x4 × 8x Answer(b) ................................................ [2] (c) Find (i) 81, Answer(c)(i) ................................................ [1] (ii) 73, Answer(c)(ii) ................................................ [1] (iii) 80. Answer(c)(iii) ................................................ [1] (d) (i) Write 6751 correct to the nearest hundred. Answer(d)(i) ................................................ [1] (ii) Write 0.25 as a fraction. Answer(d)(ii) ................................................ [1] (iii) Write 0.06 as a percentage. Answer(d)(iii) ............................................ % [1] (iv) Write 687 000 000 in standard form. Answer(d)(iv) ................................................ [1] __________________________________________________________________________________________
Mark scheme: 4 (a) (i) 11 1 (ii) 17 3 M1 for 8y + 28 = 164 or 2y + 7 = 41 M1 FT for a correct further step (b) 48x5 2 M1 for 48xk or jx5 (c) (i) 9 1 Accept ± 9 (ii) 343 1 (iii) 1 1 (d) (i) 6800 1 1 (ii) 1 Accept equivalent fraction 4 (iii) 6 1 (iv) 6.87 ×10⁸ 1
Q5 · The diagram shows a circle, centre O
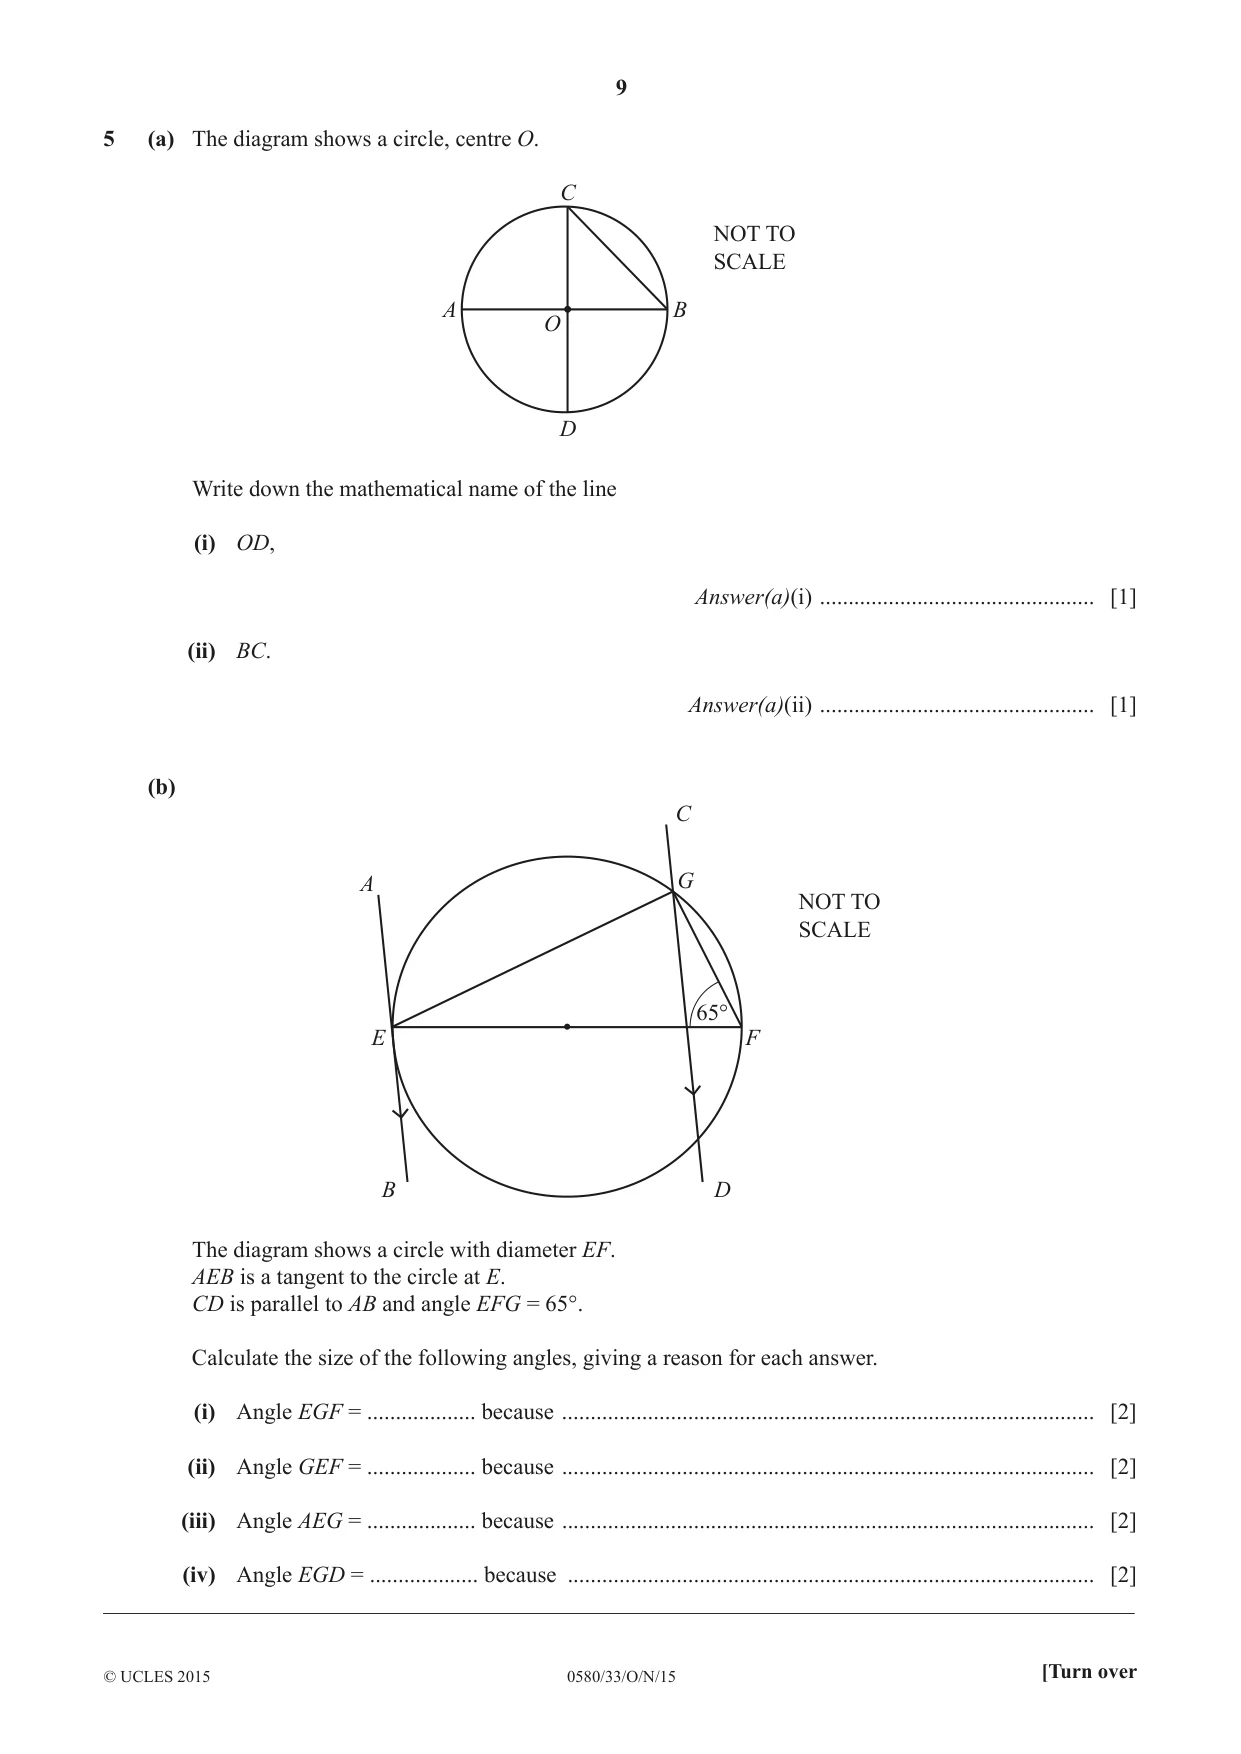
5 (a) The diagram shows a circle, centre O. C NOT TO SCALE A B O D Write down the mathematical name of the line (i) OD, Answer(a)(i) ................................................ [1] (ii) BC. Answer(a)(ii) ................................................ [1] (b) C A G NOT TO SCALE 65° E F B D The diagram shows a circle with diameter EF. AEB is a tangent to the circle at E. CD is parallel to AB and angle EFG = 65°. Calculate the size of the following angles, giving a reason for each answer. (i) Angle EGF = ................... because ............................................................................................. [2] (ii) Angle GEF = ................... because ............................................................................................. [2] (iii) Angle AEG = ................... because ............................................................................................. [2] (iv) Angle EGD = ................... because ............................................................................................ [2] __________________________________________________________________________________________
Mark scheme: 5 (a) (i) Radius 1 (ii) Chord 1
Q6 · Natalia has 16 reels of cotton
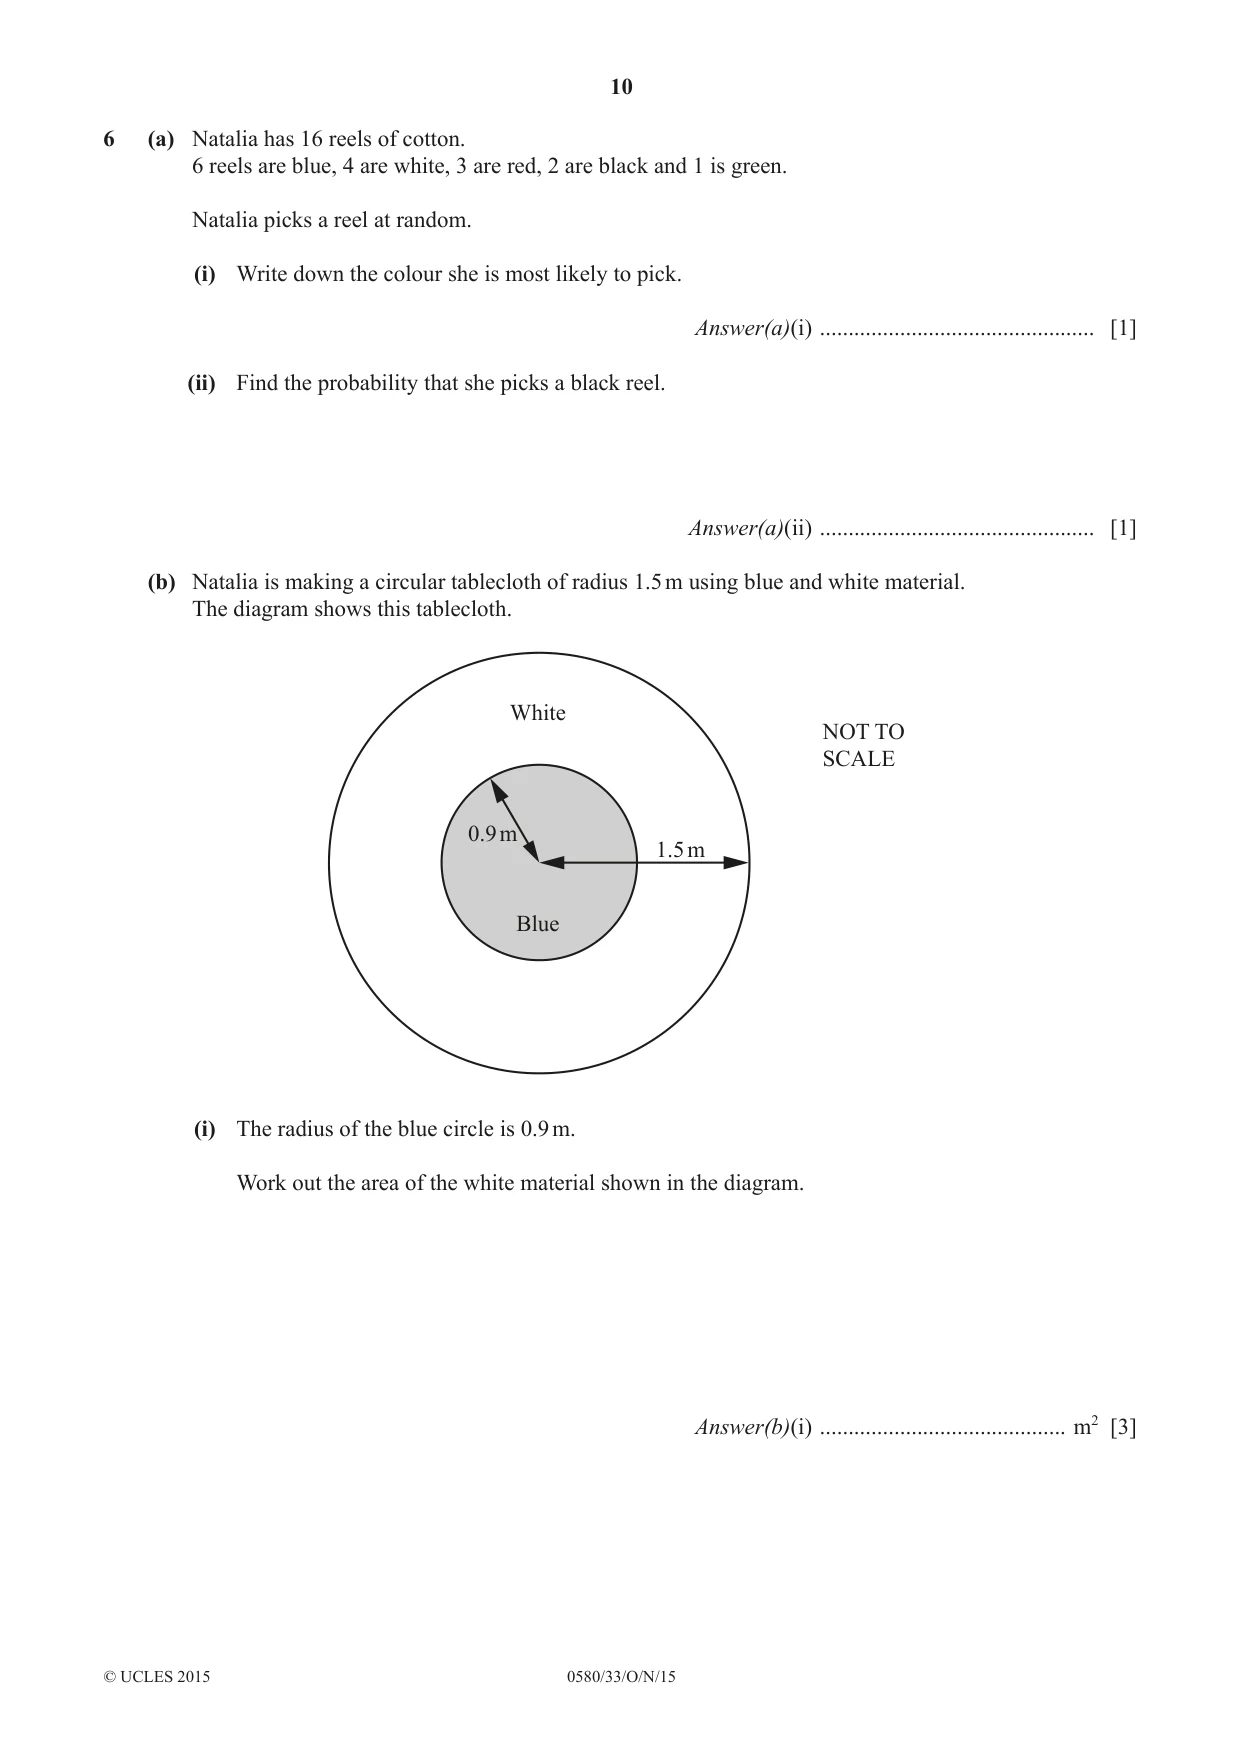
6 (a) Natalia has 16 reels of cotton. 6 reels are blue, 4 are white, 3 are red, 2 are black and 1 is green. Natalia picks a reel at random. (i) Write down the colour she is most likely to pick. Answer(a)(i) ................................................ [1] (ii) Find the probability that she picks a black reel. Answer(a)(ii) ................................................ [1] (b) Natalia is making a circular tablecloth of radius 1.5 m using blue and white material. The diagram shows this tablecloth. White NOT TO SCALE 0.9 m 1.5 m Blue (i) The radius of the blue circle is 0.9 m. Work out the area of the white material shown in the diagram. Answer(b)(i) ........................................... m2 [3] (ii) Natalia puts ribbon around the edge of the tablecloth. Calculate the length of ribbon used. Answer(b)(ii) ............................................ m [2] (iii) Natalia buys 12 m of ribbon costing $1.45 per metre. Calculate the amount of change she receives from a $20 note. Answer(b)(iii) $ ................................................. [2] __________________________________________________________________________________________
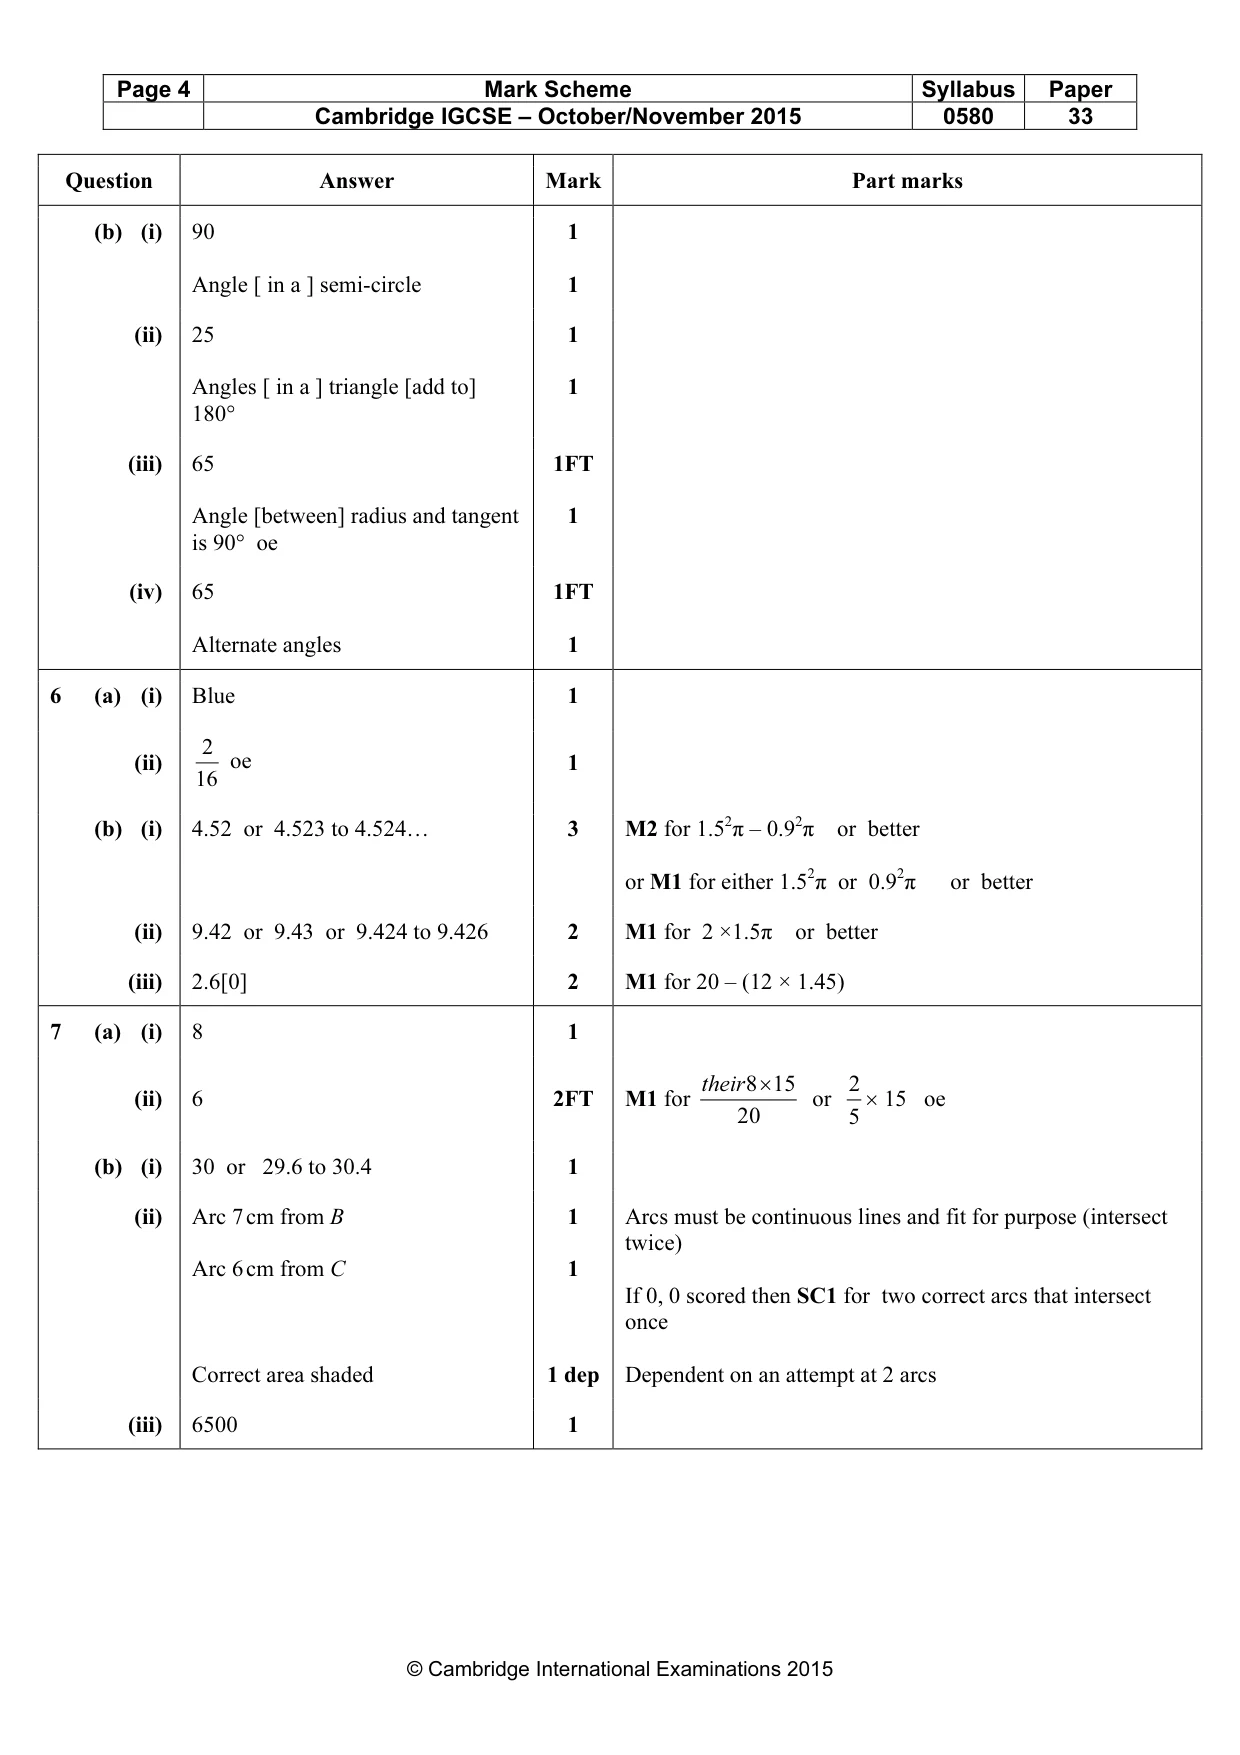
Mark scheme: 6 (a) (i) Blue 1 2 (ii) oe 1 16 (b) (i) 4.52 or 4.523 to 4.524… 3 M2 for 1.52π – 0.92π or better or M1 for either 1.52π or 0.92π or better (ii) 9.42 or 9.43 or 9.424 to 9.426 2 M1 for 2 ×1.5π or better (iii) 2.6[0] 2 M1 for 20 – (12 × 1.45)
Q7 · Goat food is sold in 20 kg bags
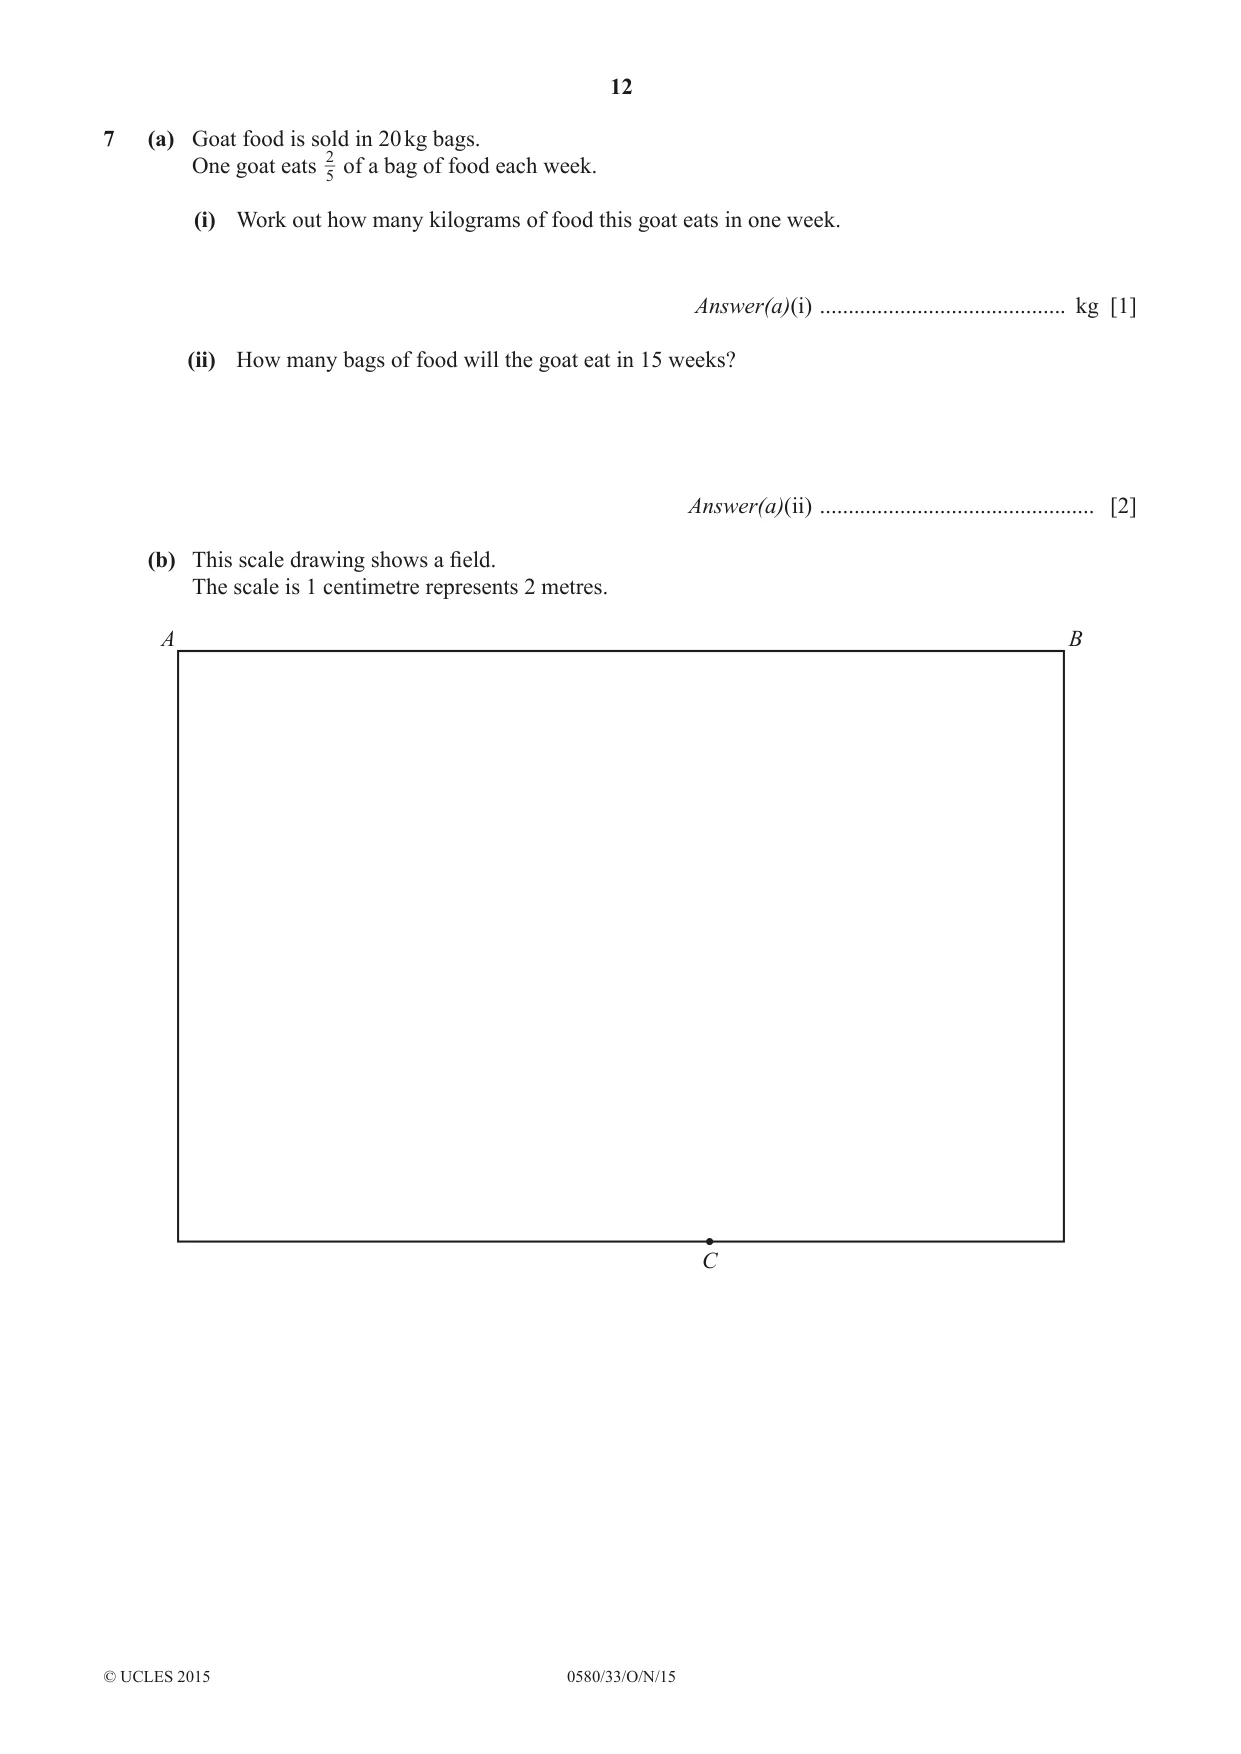
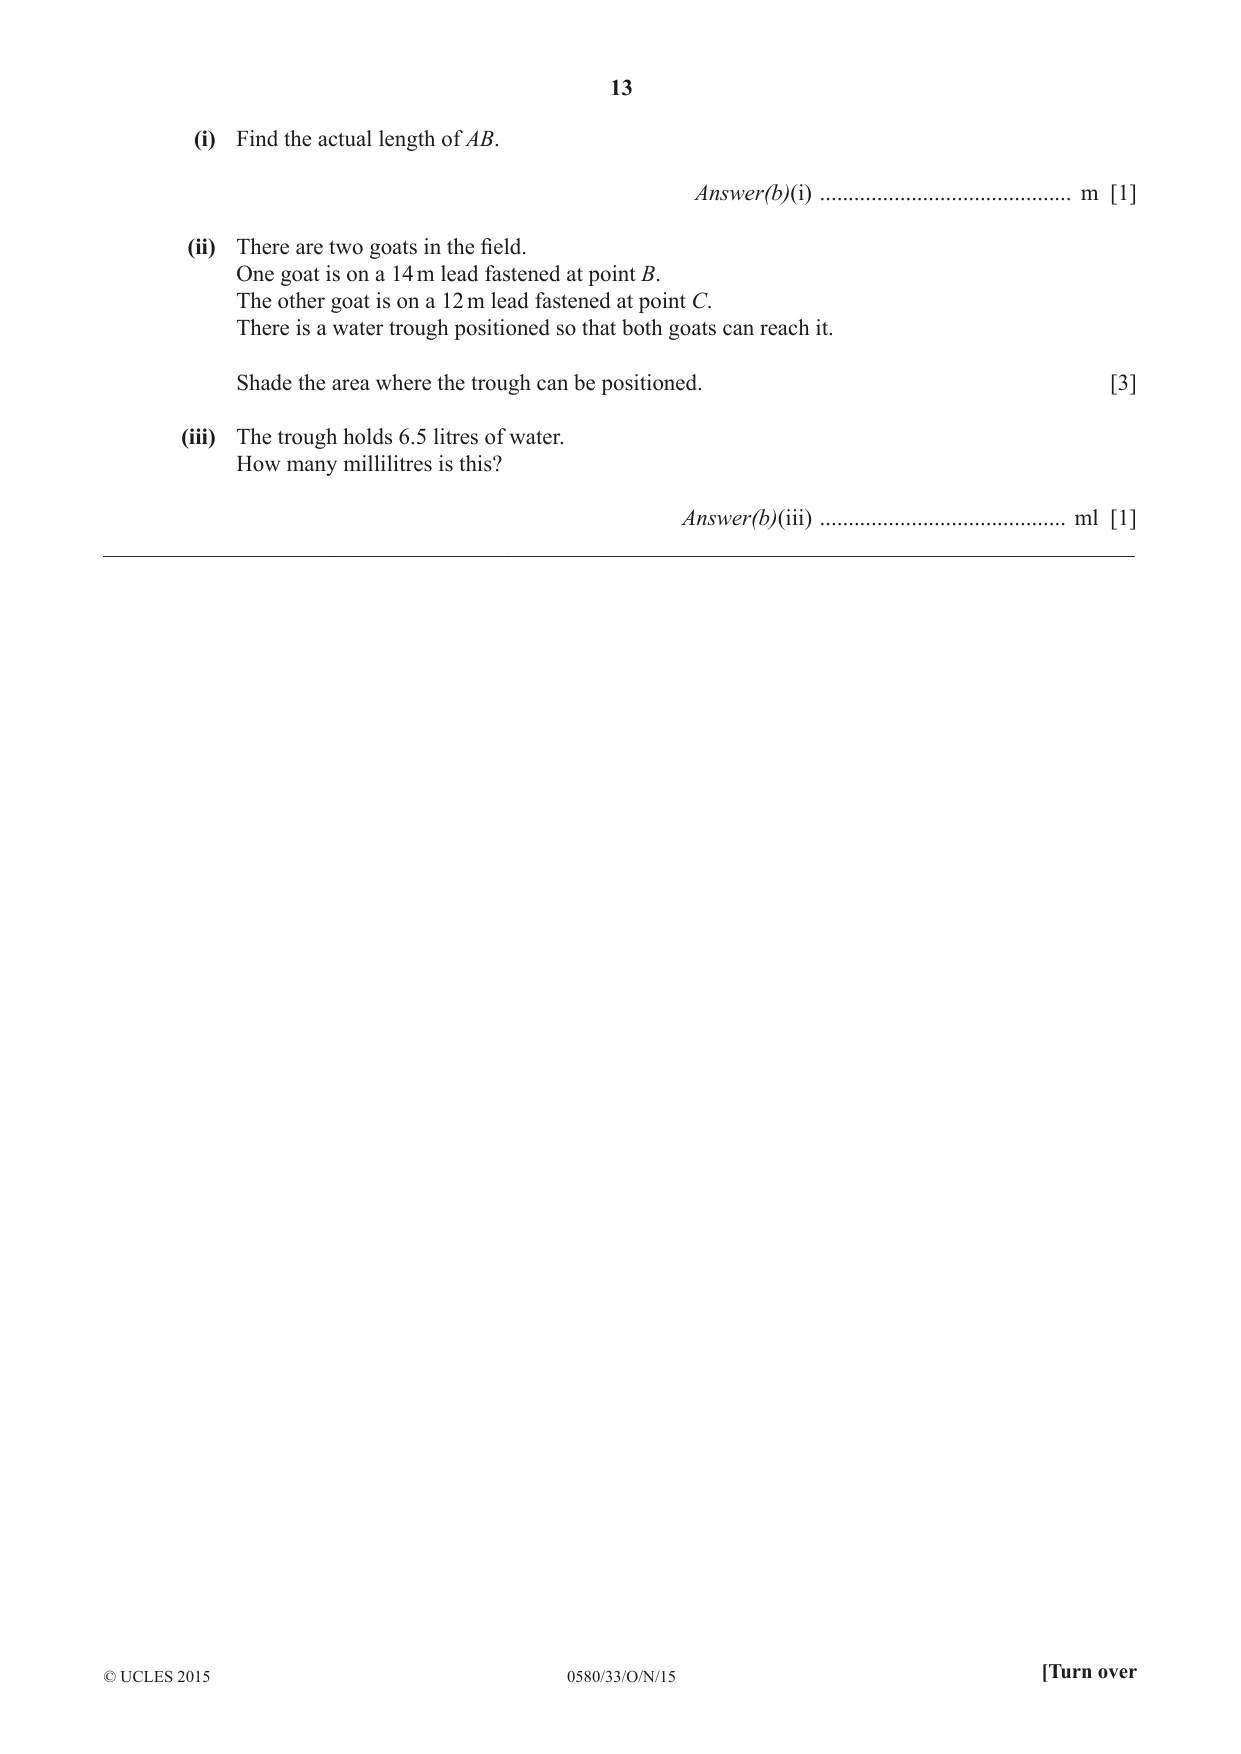
7 (a) Goat food is sold in 20 kg bags. One goat eats 25 of a bag of food each week. (i) Work out how many kilograms of food this goat eats in one week. Answer(a)(i) ........................................... kg [1] (ii) How many bags of food will the goat eat in 15 weeks? Answer(a)(ii) ................................................ [2] (b) This scale drawing shows a field. The scale is 1 centimetre represents 2 metres. A B C (i) Find the actual length of AB. Answer(b)(i) ............................................ m [1] (ii) There are two goats in the field. One goat is on a 14 m lead fastened at point B. The other goat is on a 12 m lead fastened at point C. There is a water trough positioned so that both goats can reach it. Shade the area where the trough can be positioned. [3] (iii) The trough holds 6.5 litres of water. How many millilitres is this? Answer(b)(iii) ........................................... ml [1] __________________________________________________________________________________________
Mark scheme: 7 (a) (i) 8 1 their 8× 15 2 (ii) 6 2FT M1 for or × 15 oe 20 5 (b) (i) 30 or 29.6 to 30.4 1 (ii) Arc 7 cm from B 1 Arcs must be continuous lines and fit for purpose (intersect twice) Arc 6 cm from C 1 If 0, 0 scored then SC1 for two correct arcs that intersect once Correct area shaded 1 dep Dependent on an attempt at 2 arcs (iii) 6500 1
Q8 · Y L 18 16 14 12 10 8 6 4 2 x –2 –1 0 1 2 3 4 5 –2 –4 –6 –8 (a) The line L is drawn on the…
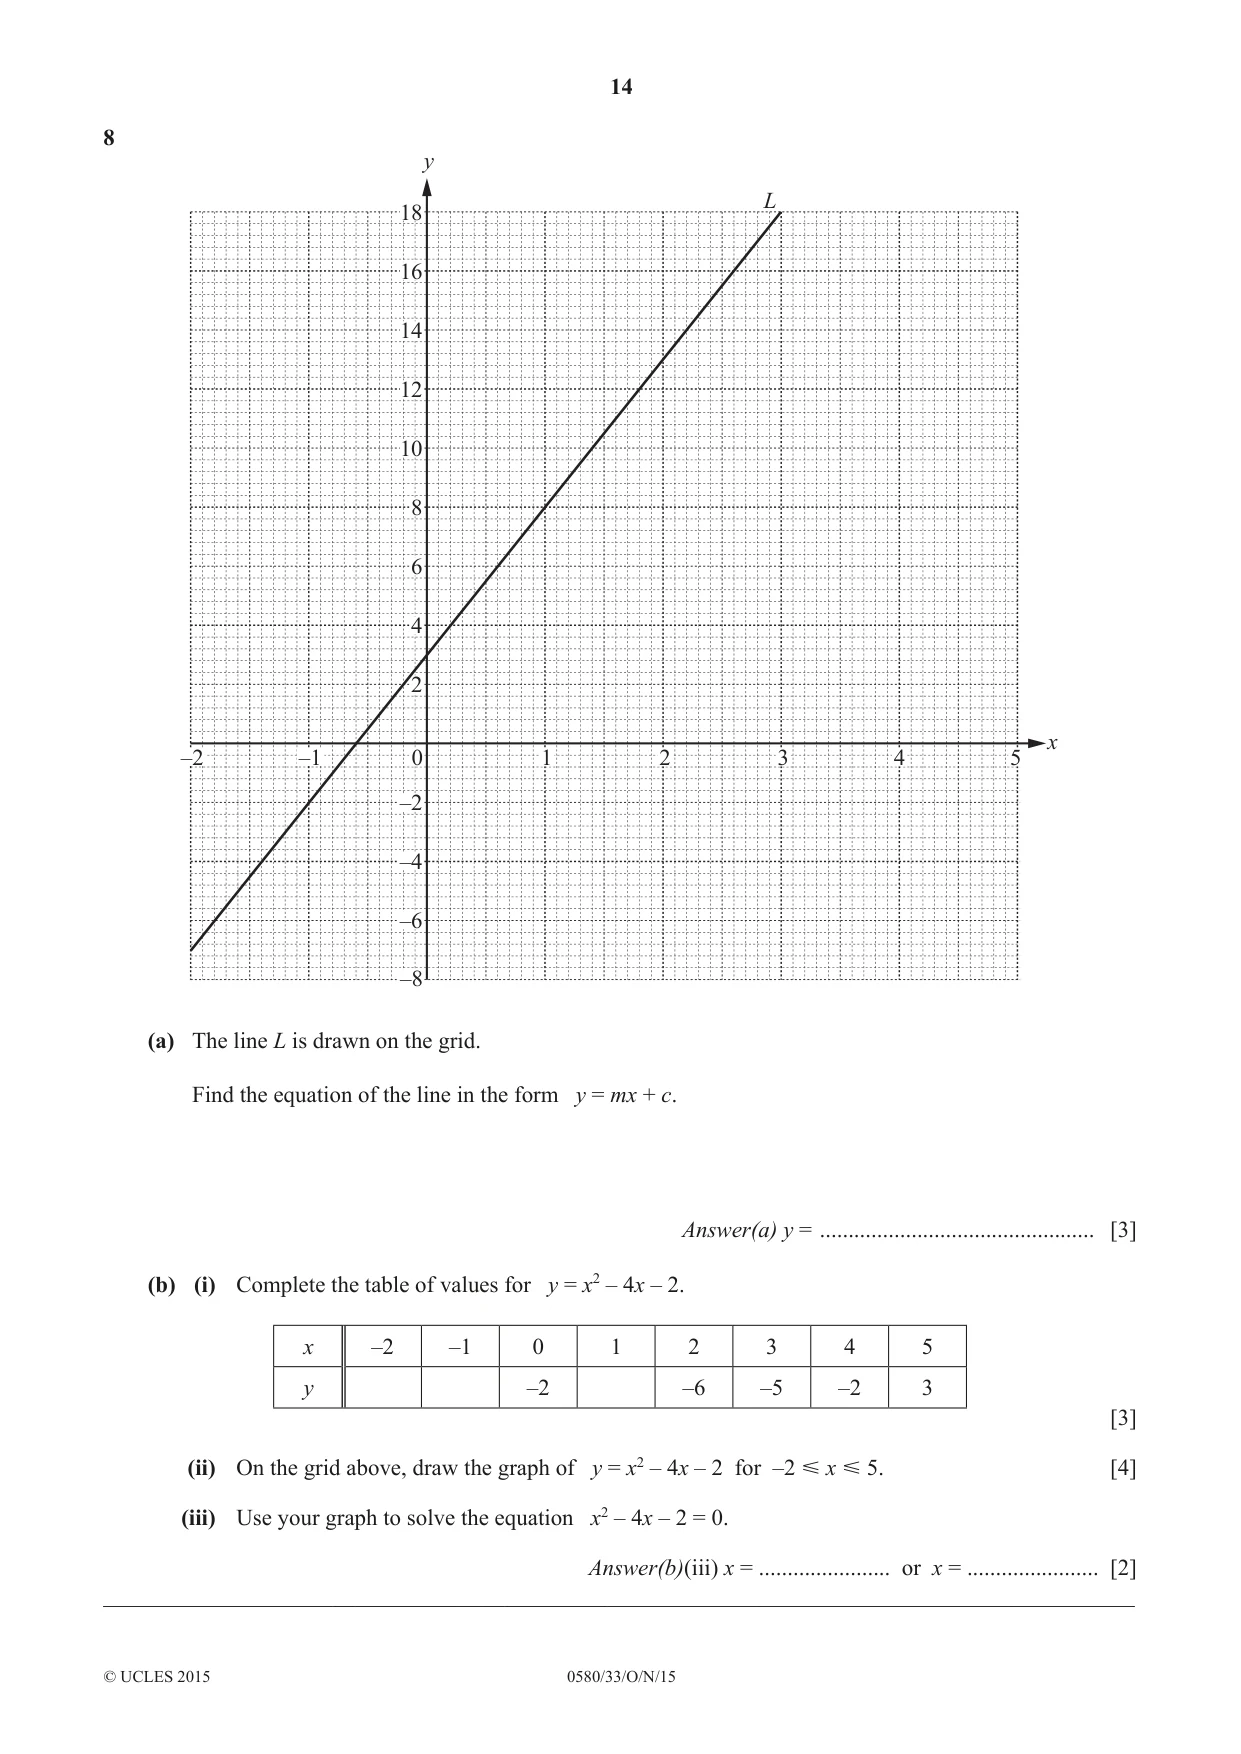
8 y L 18 16 14 12 10 8 6 4 2 x –2 –1 0 1 2 3 4 5 –2 –4 –6 –8 (a) The line L is drawn on the grid. Find the equation of the line in the form y = mx + c. Answer(a) y = ................................................ [3] (b) (i) Complete the table of values for y = x2 – 4x – 2. x –2 –1 0 1 2 3 4 5 y –2 –6 –5 –2 3 [3] (ii) On the grid above, draw the graph of y = x2 – 4x – 2 for –2 x 5. [4] (iii) Use your graph to solve the equation x2 – 4x – 2 = 0. Answer(b)(iii) x = ....................... or x = ....................... [2] __________________________________________________________________________________________
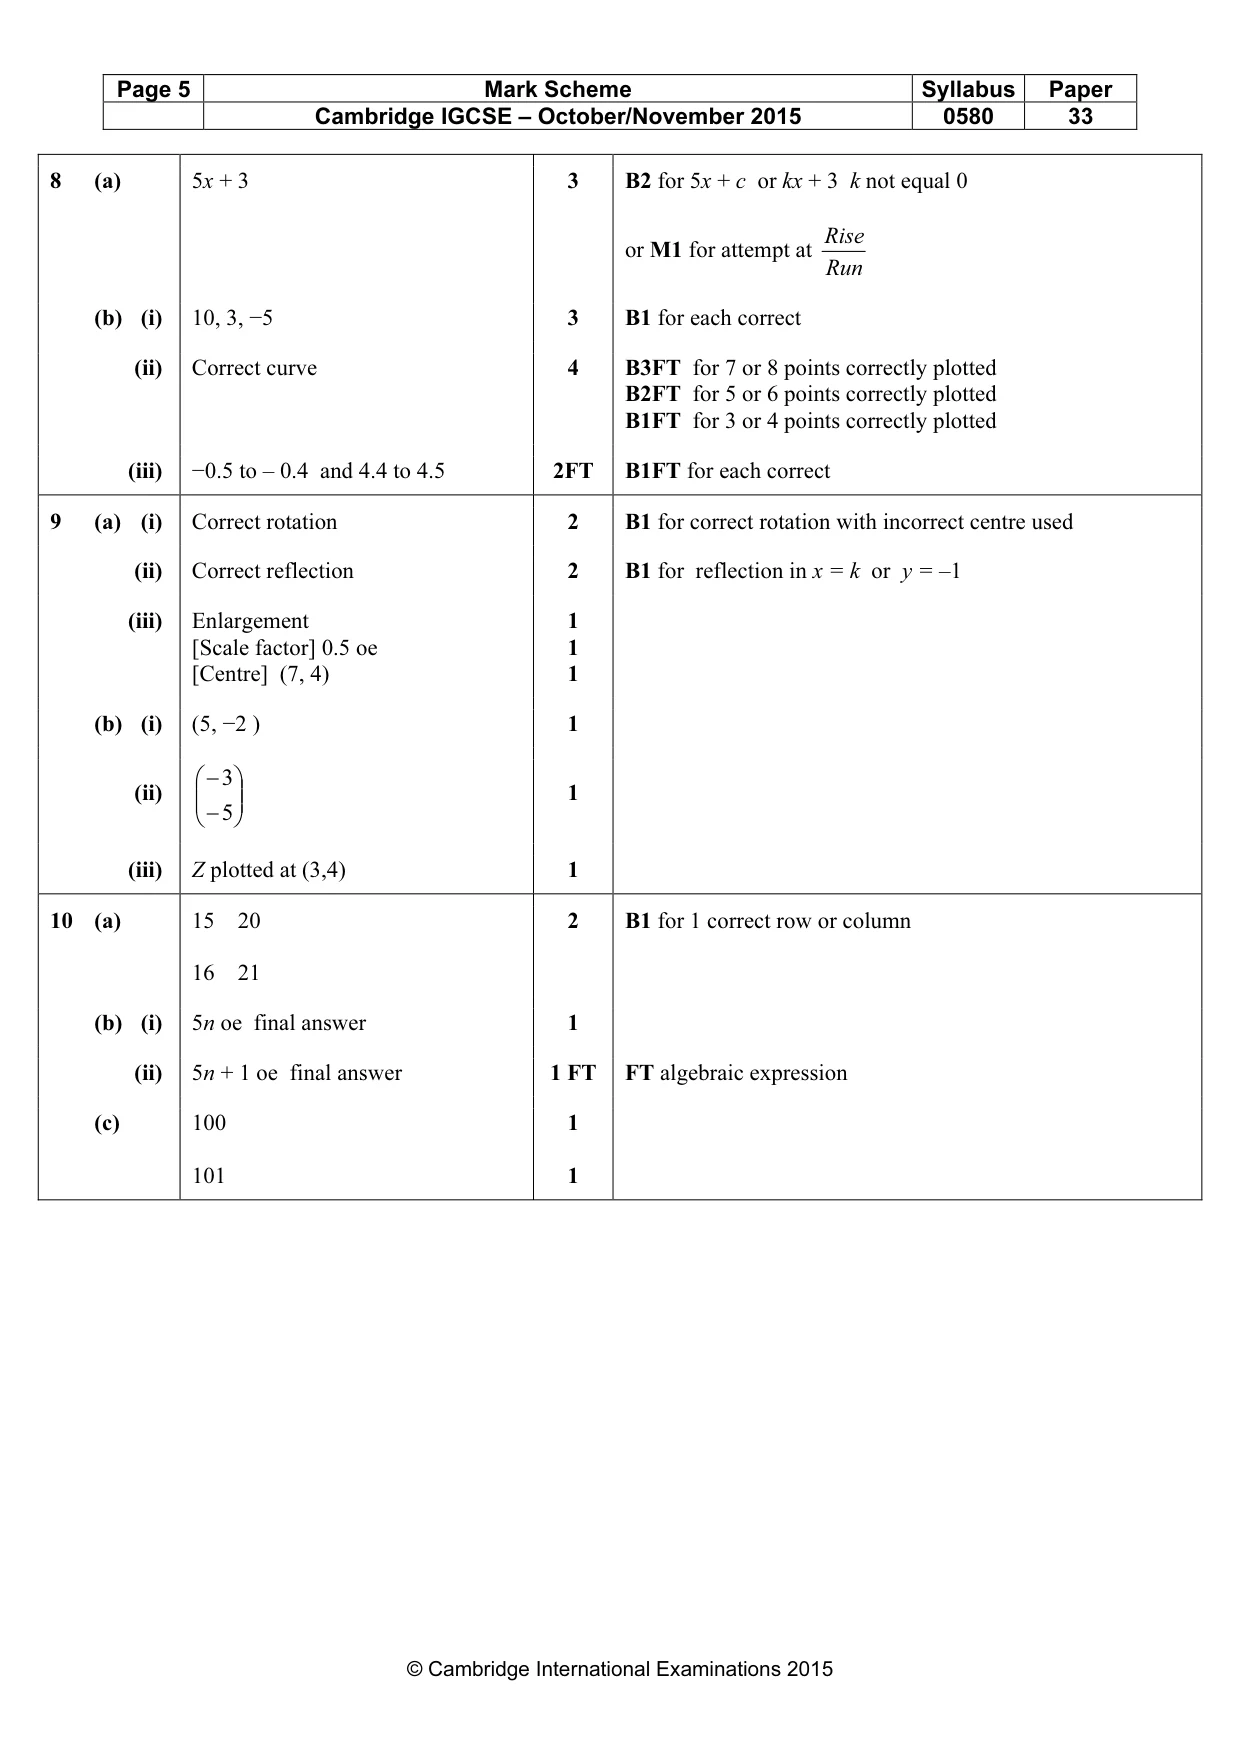
Mark scheme: 8 (a) 5x + 3 3 B2 for 5x + c or kx + 3 k not equal 0 Rise or M1 for attempt at Run (b) (i) 10, 3, −5 3 B1 for each correct (ii) Correct curve 4 B3FT for 7 or 8 points correctly plotted B2FT for 5 or 6 points correctly plotted B1FT for 3 or 4 points correctly plotted (iii) −0.5 to – 0.4 and 4.4 to 4.5 2FT B1FT for each correct
Q9 · Y 5 4 X 3 2 1 B x –6 –5 –4 –3 –2 –1 0 1 2 3 4 5 6 7 8 9 –1 Y –2 A –3 –4 –5 (a) (i) Rotate…
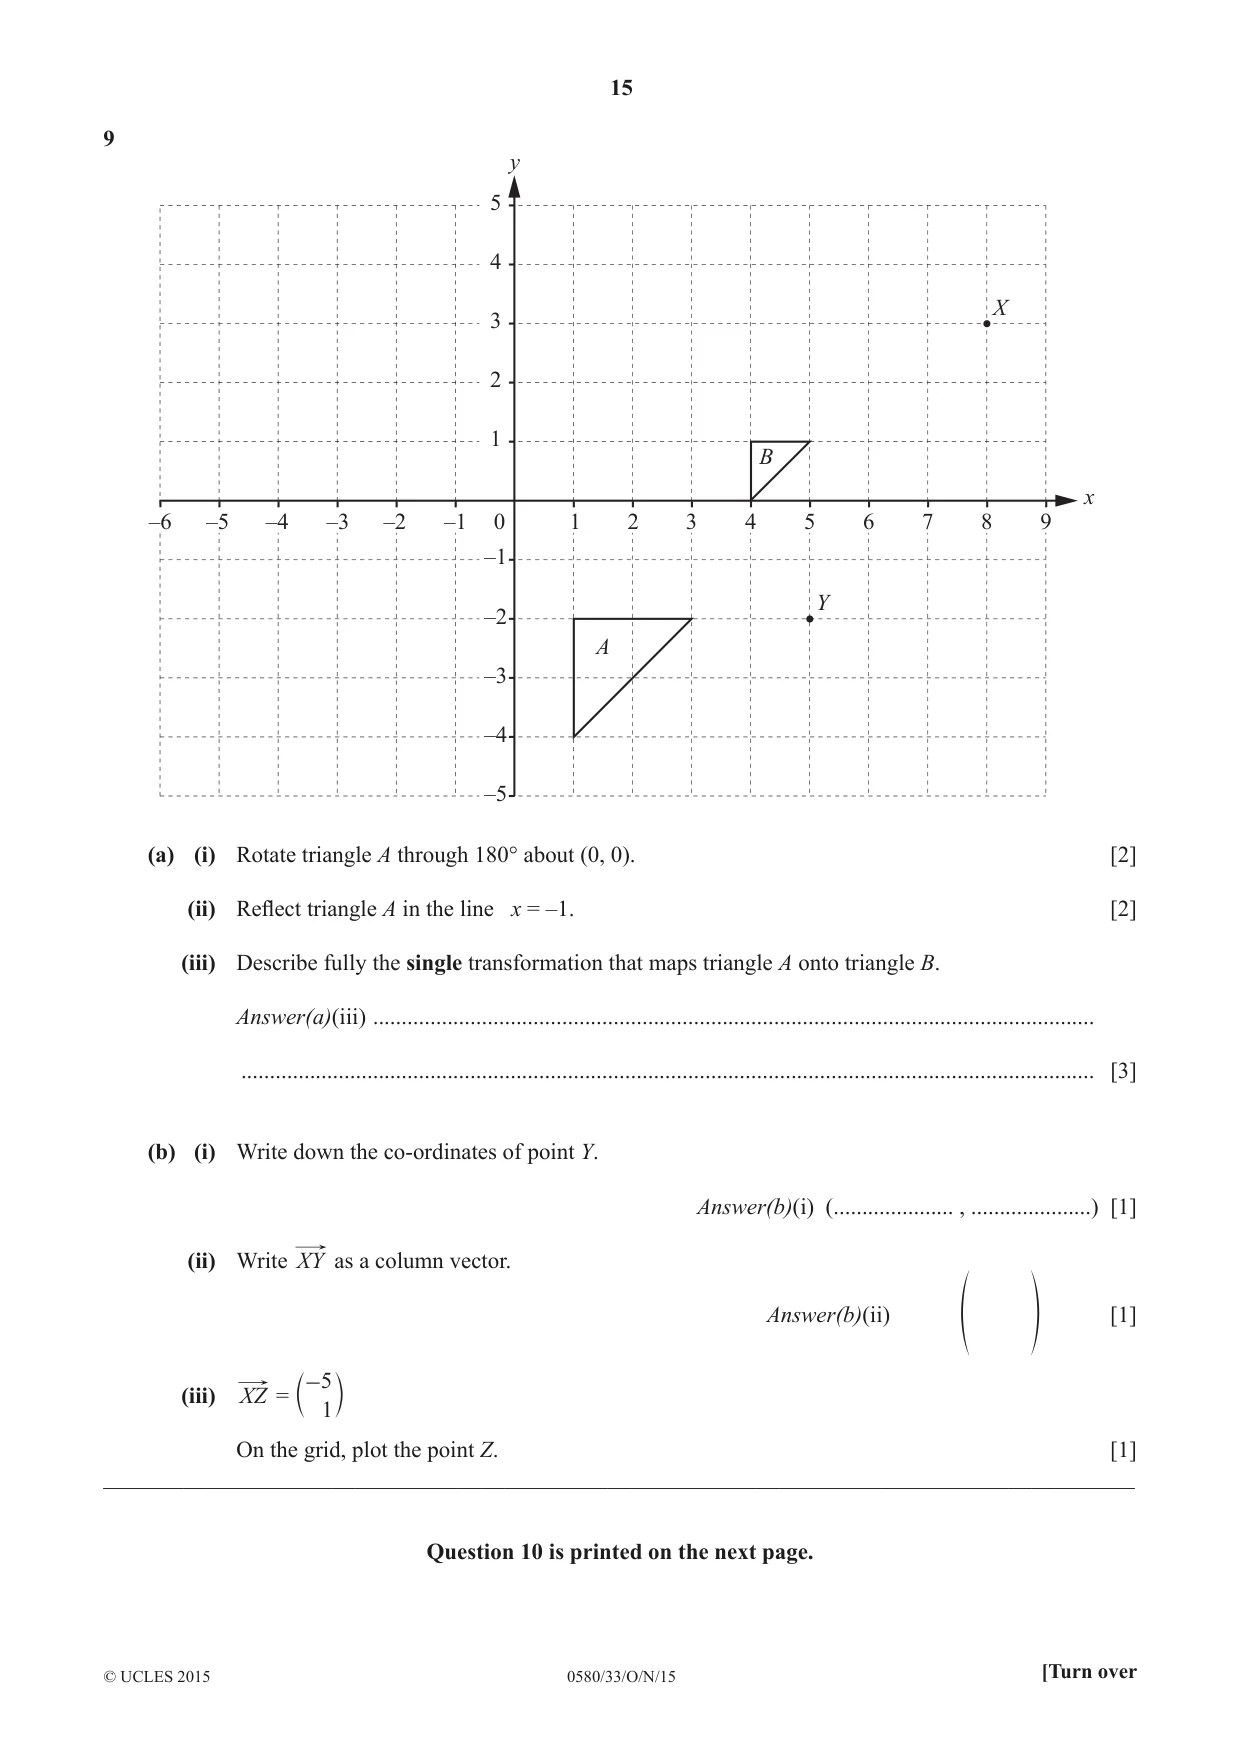
9 y 5 4 X 3 2 1 B x –6 –5 –4 –3 –2 –1 0 1 2 3 4 5 6 7 8 9 –1 Y –2 A –3 –4 –5 (a) (i) Rotate triangle A through 180° about (0, 0). [2] (ii) Reflect triangle A in the line x = –1. [2] (iii) Describe fully the single transformation that maps triangle A onto triangle B. Answer(a)(iii) .............................................................................................................................. ..................................................................................................................................................... [3] (b) (i) Write down the co-ordinates of point Y. Answer(b)(i) (..................... , .....................) [1] (ii) Write XY as a column vector. Answer(b)(ii) [1] f p -5 (iii) XZ = c 1 m On the grid, plot the point Z. [1] __________________________________________________________________________________________ Question 10 is printed on the next page.
Mark scheme: 9 (a) (i) Correct rotation 2 B1 for correct rotation with incorrect centre used (ii) Correct reflection 2 B1 for reflection in x = k or y = –1 (iii) Enlargement 1 [Scale factor] 0.5 oe 1 [Centre] (7, 4) 1 (b) (i) (5, −2 ) 1 − 3 (ii) 1 − 5 (iii) Z plotted at (3,4) 1
Q10 · The first three diagrams in a sequence are shown below
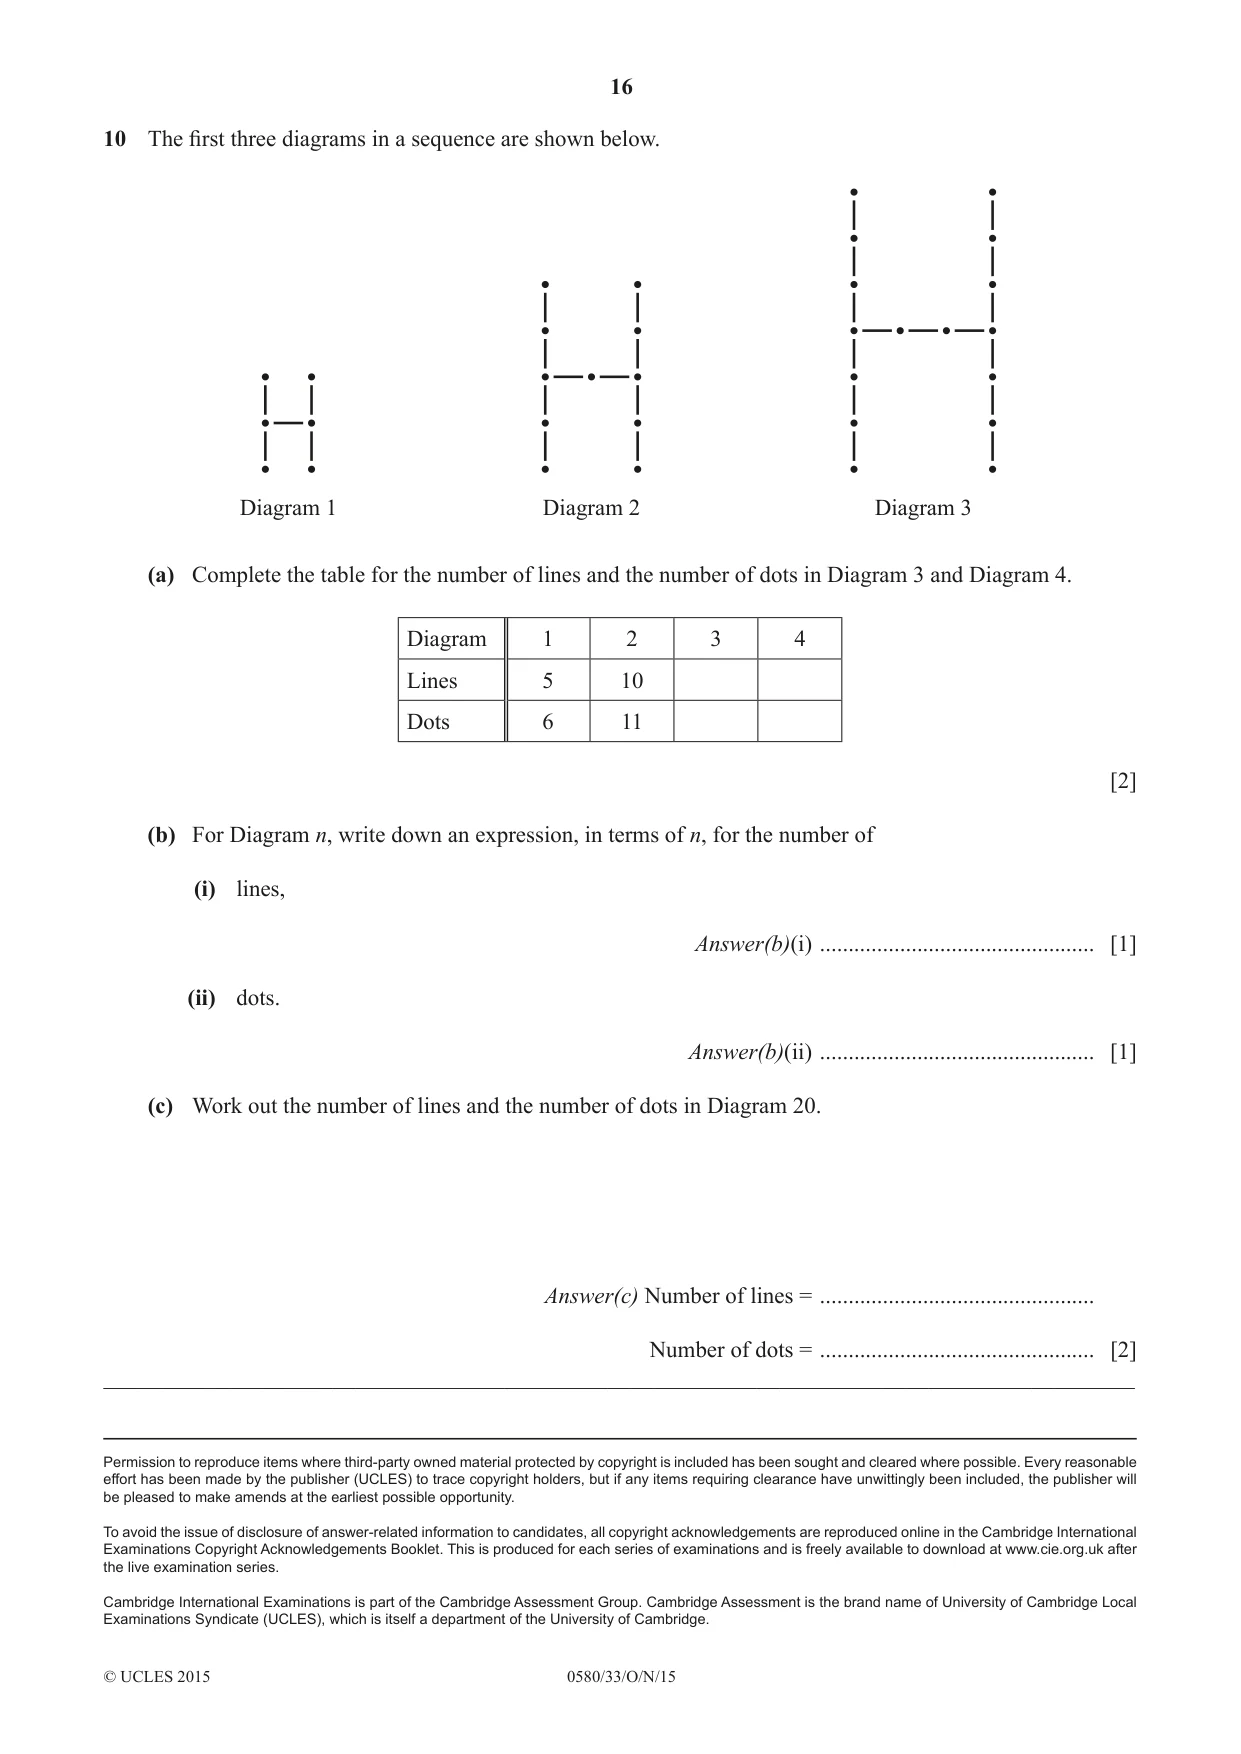
10 The first three diagrams in a sequence are shown below. Diagram 1 Diagram 2 Diagram 3 (a) Complete the table for the number of lines and the number of dots in Diagram 3 and Diagram 4. Diagram 1 2 3 4 Lines 5 10 Dots 6 11 [2] (b) For Diagram n, write down an expression, in terms of n, for the number of (i) lines, Answer(b)(i) ................................................ [1] (ii) dots. Answer(b)(ii) ................................................ [1] (c) Work out the number of lines and the number of dots in Diagram 20. Answer(c) Number of lines = ................................................ Number of dots = ................................................ [2] __________________________________________________________________________________________
Mark scheme: 10 (a) 15 20 2 B1 for 1 correct row or column 16 21 (b) (i) 5n oe final answer 1 (ii) 5n + 1 oe final answer 1 FT FT algebraic expression (c) 100 1 101 1
What was in this paper
The subtopics covered by these 10 questions, and how many questions each got. Open one in a new tab to see every Cambridge question on it.
What you needed in this session
Cambridge’s own grade thresholds for 2015 Oct/Nov, Paper 3 · Variant 3. A higher threshold means an easier paper — the bar moves with how the cohort did.