Cambridge IGCSE Mathematics 0580 — 2014 Oct/Nov Paper 3 · Variant 1
0580/31/O/N/14 · 9 questions · 104 marks · ≈117 min
The question paper and its mark scheme, free to read here and free to download. This is Cambridge’s own paper, exactly as it was sat.
Question paper16 pages
Mark scheme5 pages
Answers below. Sit the paper first if you are practising.
Questions as text
Q1 · A carton of fruit juice contains apple, orange, pineapple and tropical juices
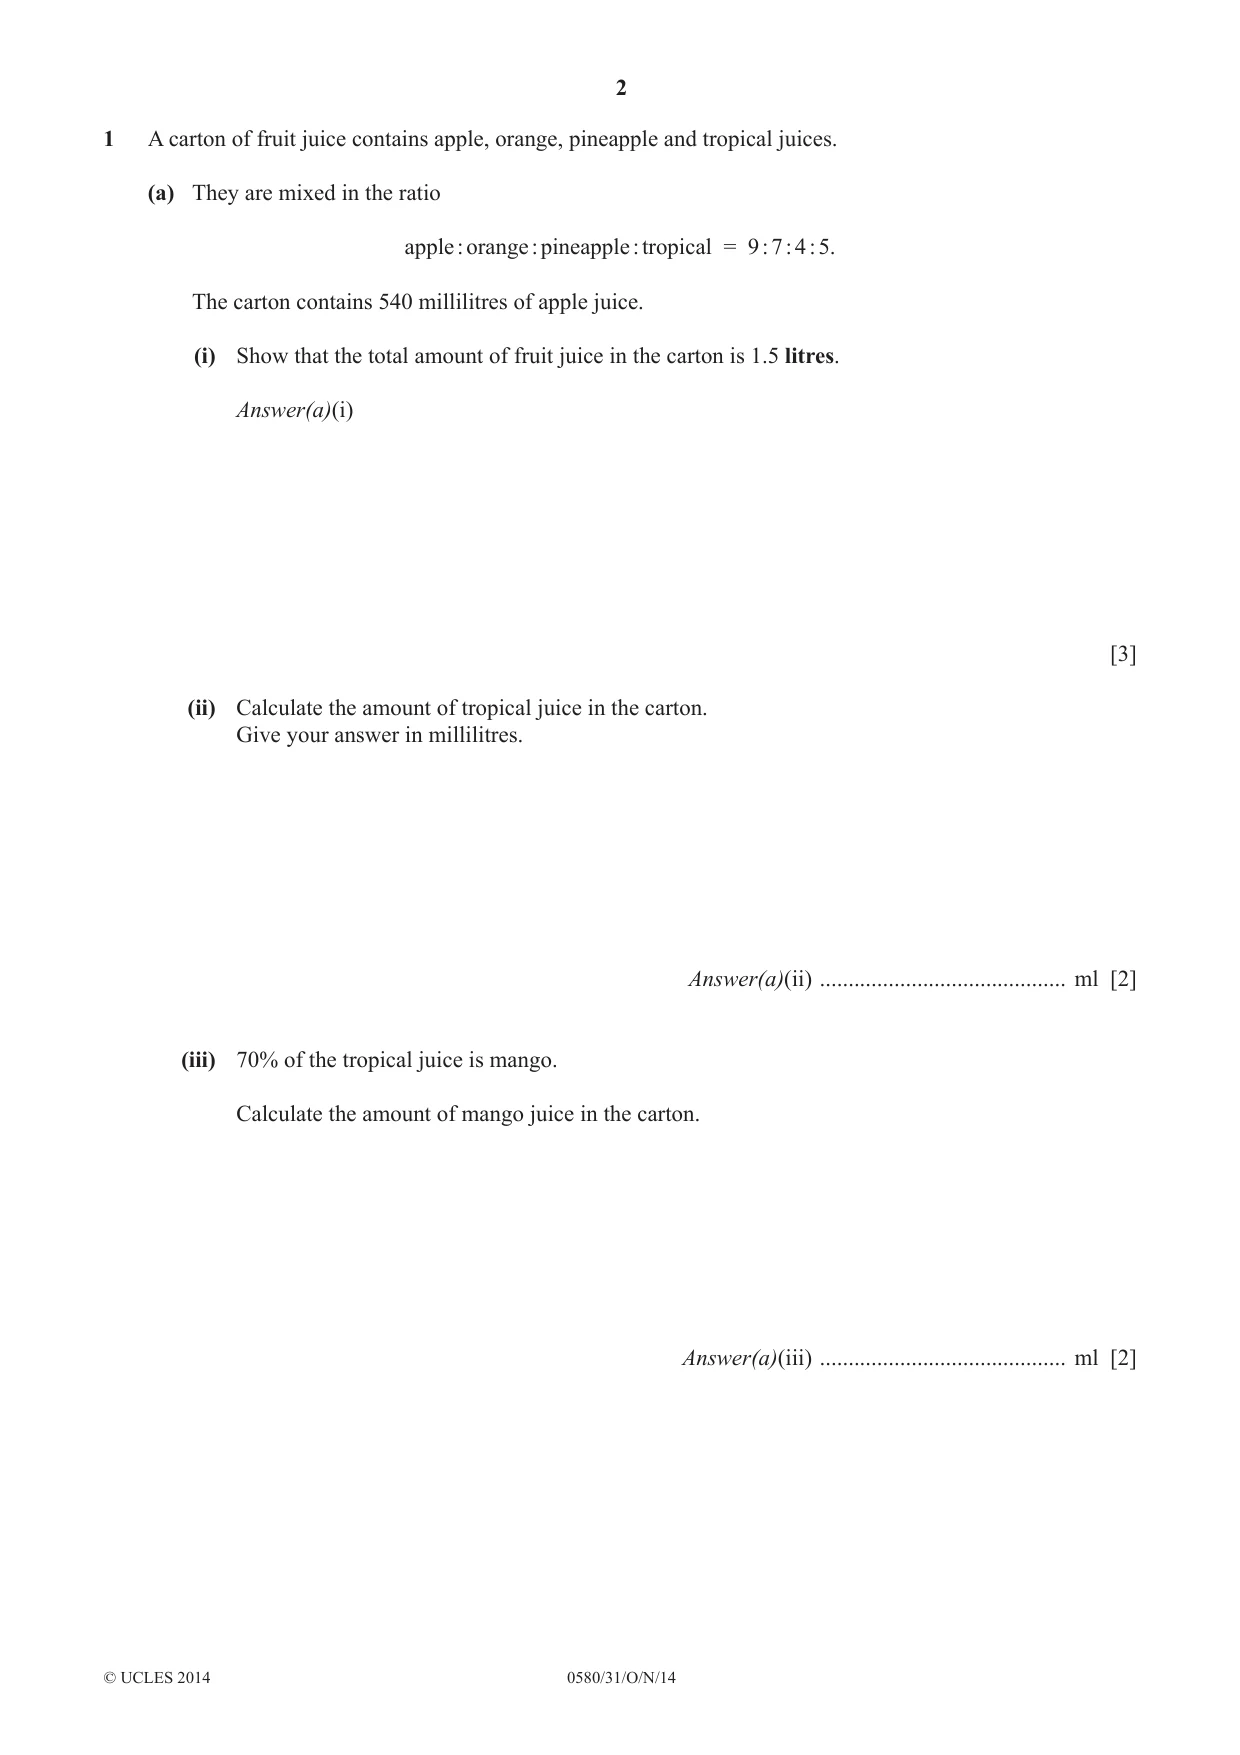
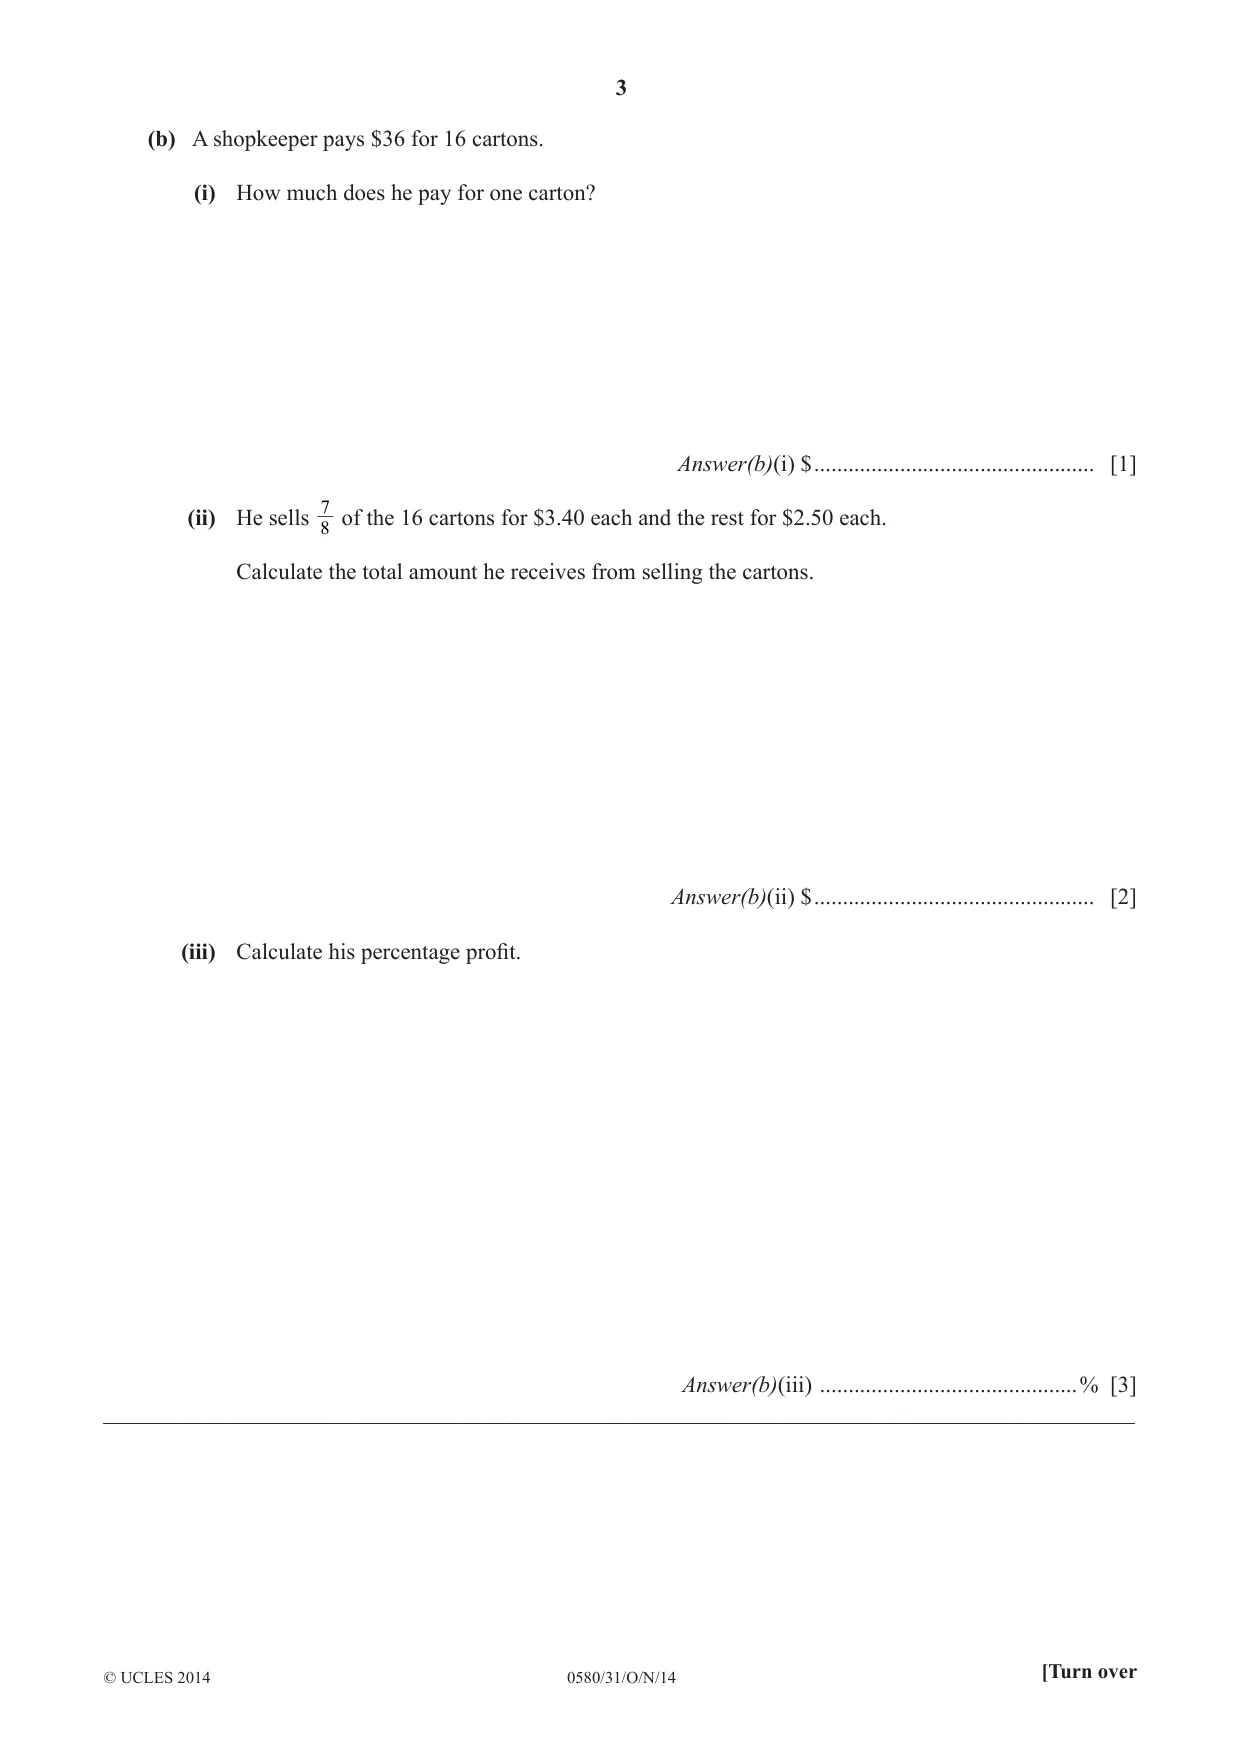
1 A carton of fruit juice contains apple, orange, pineapple and tropical juices. (a) They are mixed in the ratio apple : orange : pineapple : tropical = 9 : 7 : 4 : 5. The carton contains 540 millilitres of apple juice. (i) Show that the total amount of fruit juice in the carton is 1.5 litres. Answer(a)(i) [3] (ii) Calculate the amount of tropical juice in the carton. Give your answer in millilitres. Answer(a)(ii) ........................................... ml [2] (iii) 70% of the tropical juice is mango. Calculate the amount of mango juice in the carton. Answer(a)(iii) ........................................... ml [2] (b) A shopkeeper pays $36 for 16 cartons. (i) How much does he pay for one carton? Answer(b)(i) $ ................................................. [1] 7 (ii) He sells of the 16 cartons for $3.40 each and the rest for $2.50 each. 8 Calculate the total amount he receives from selling the cartons. Answer(b)(ii) $ ................................................. [2] (iii) Calculate his percentage profi t. Answer(b)(iii) .............................................% [3] __________________________________________________________________________________________
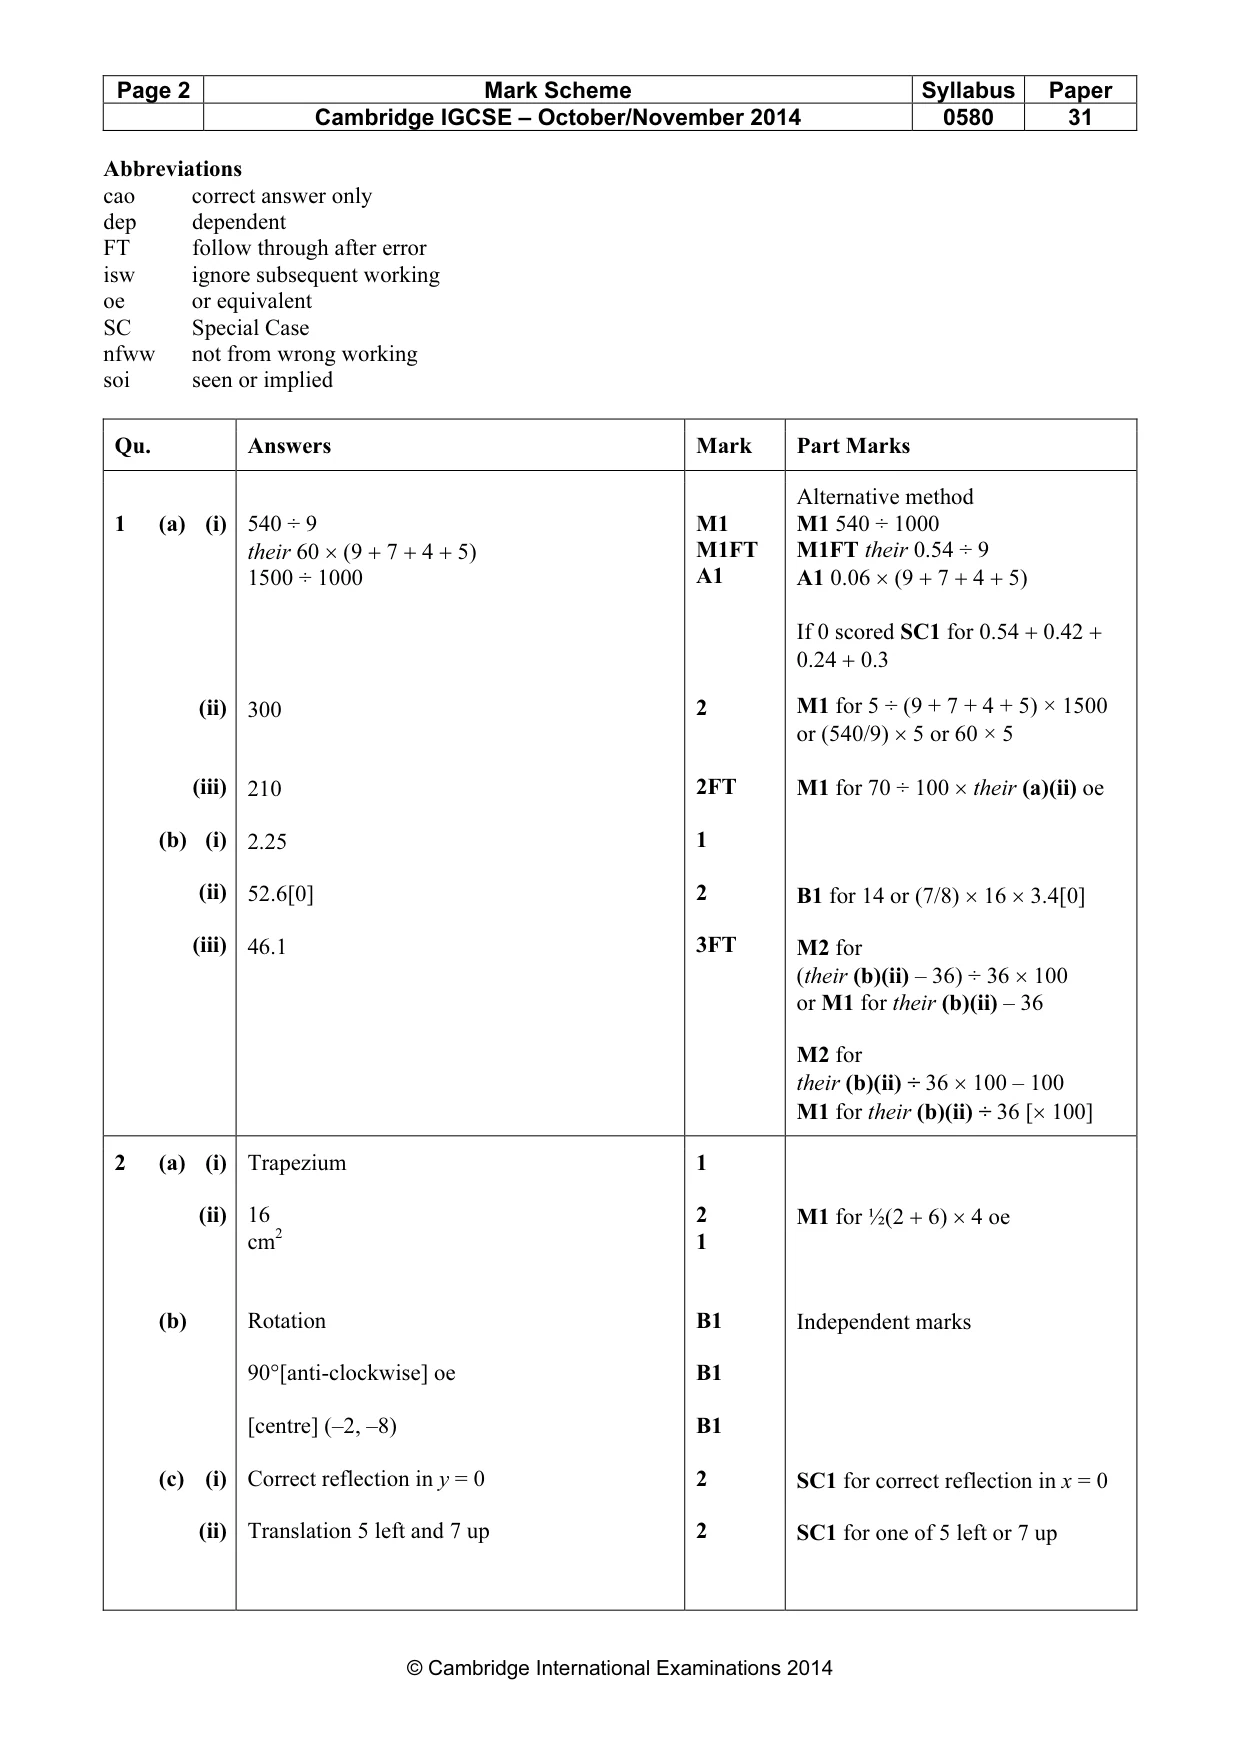
Mark scheme: Qu. Answers Mark Part Marks Alternative method 1 (a) (i) 540 ÷ 9 M1 M1 540 ÷ 1000 their 60 × (9 + 7 + 4 + 5) M1FT M1FT their 0.54 ÷ 9 A1 A1 0.06 × (9 + 7 + 4 + 5) 1500 ÷ 1000 If 0 scored SC1 for 0.54 + 0.42 + 0.24 + 0.3 (ii) 2 M1 for 5 ÷ (9 + 7 + 4 + 5) × 1500 300 or (540/9) × 5 or 60 × 5 (iii) 2FT M1 for 70 ÷ 100 × their (a)(ii) oe 210 (b) (i) 1 2.25 (ii) 52.6[0] 2 B1 for 14 or (7/8) × 16 × 3.4[0] (iii) 46.1 3FT M2 for (their (b)(ii) – 36) ÷ 36 × 100 or M1 for their (b)(ii) – 36 M2 for their (b)(ii) ÷ 36 × 100 – 100 M1 for their (b)(ii) ÷ 36 [× 100]
Q2 · Y 9 8 7 6 5 4 3 P 2 1 x –8 –7 –6 –5 –4 –3 –2 –1 0 1 2 3 4 5 6 –1 –2 –3 –4 –5 H –6 G –7 –8…
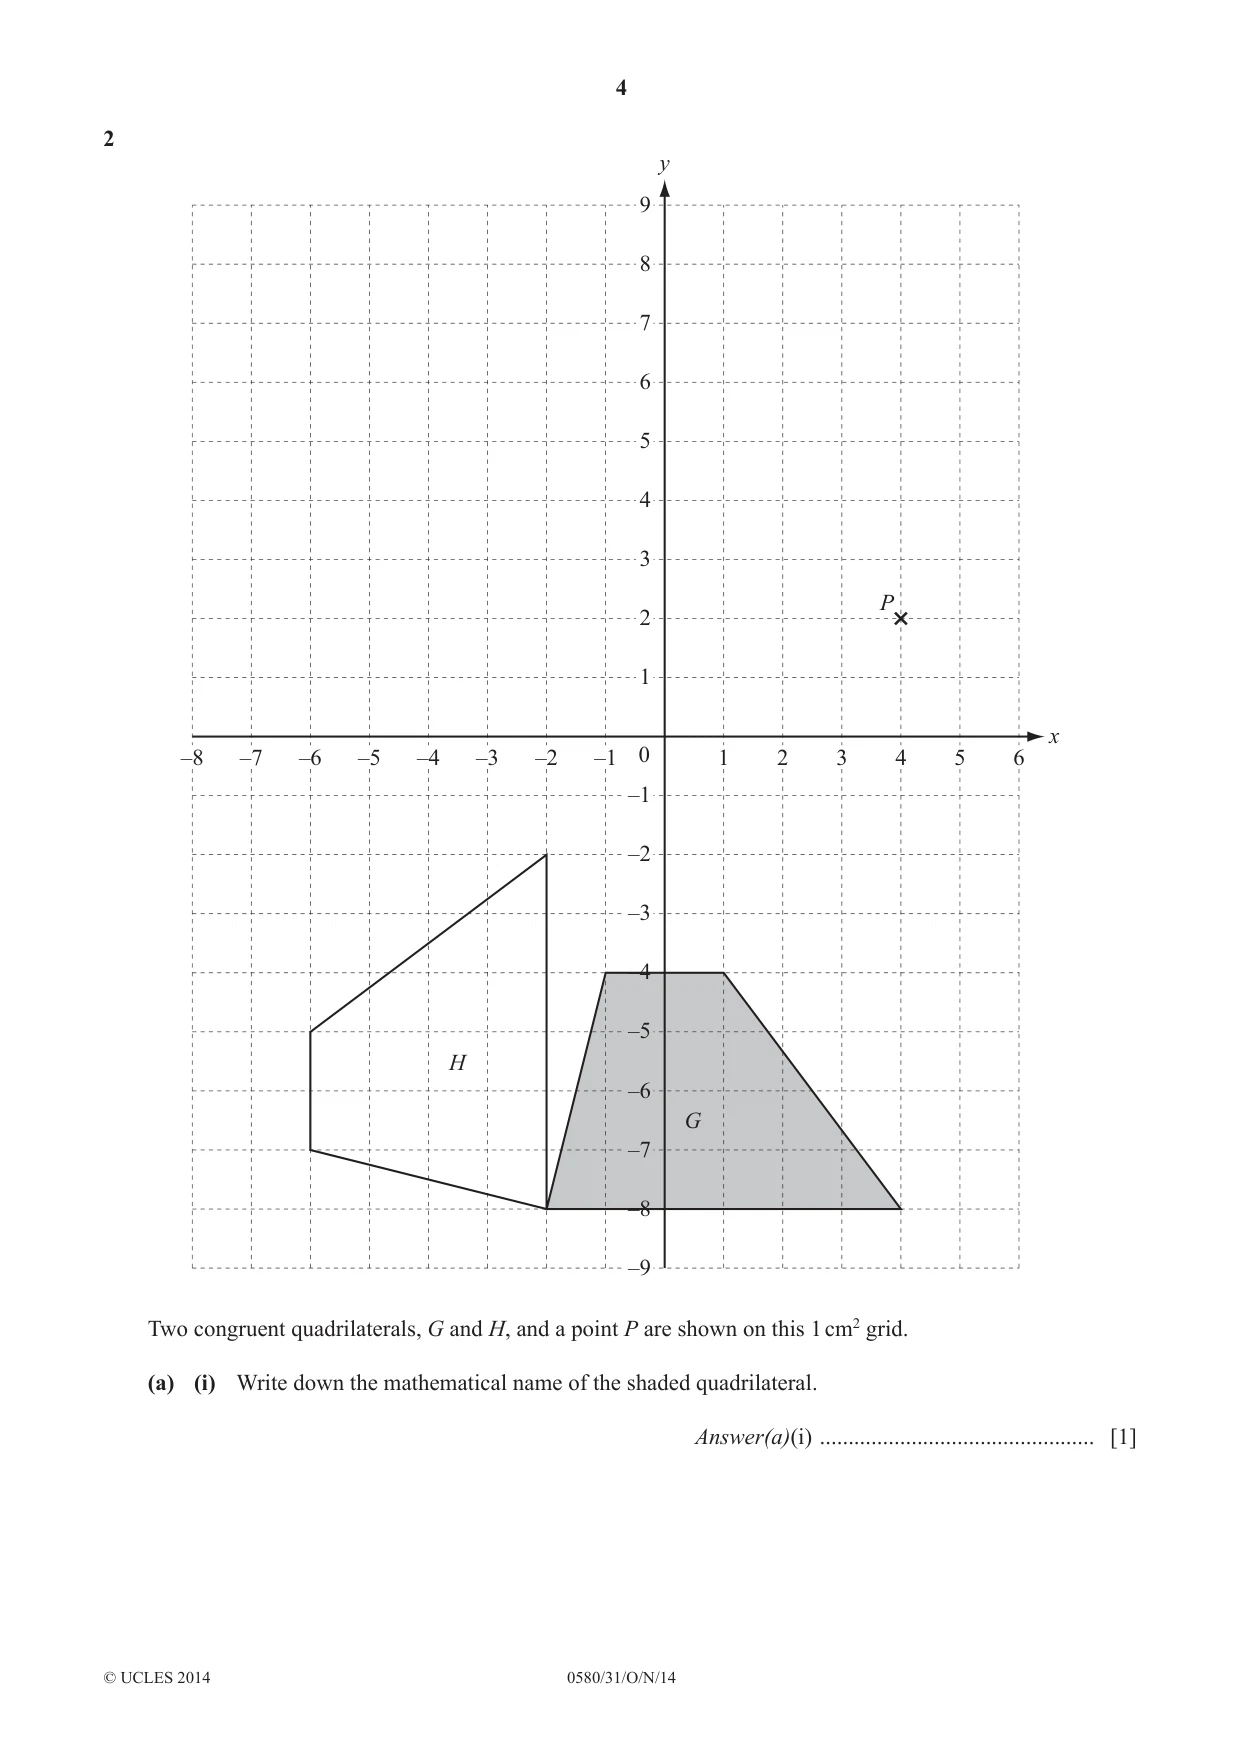
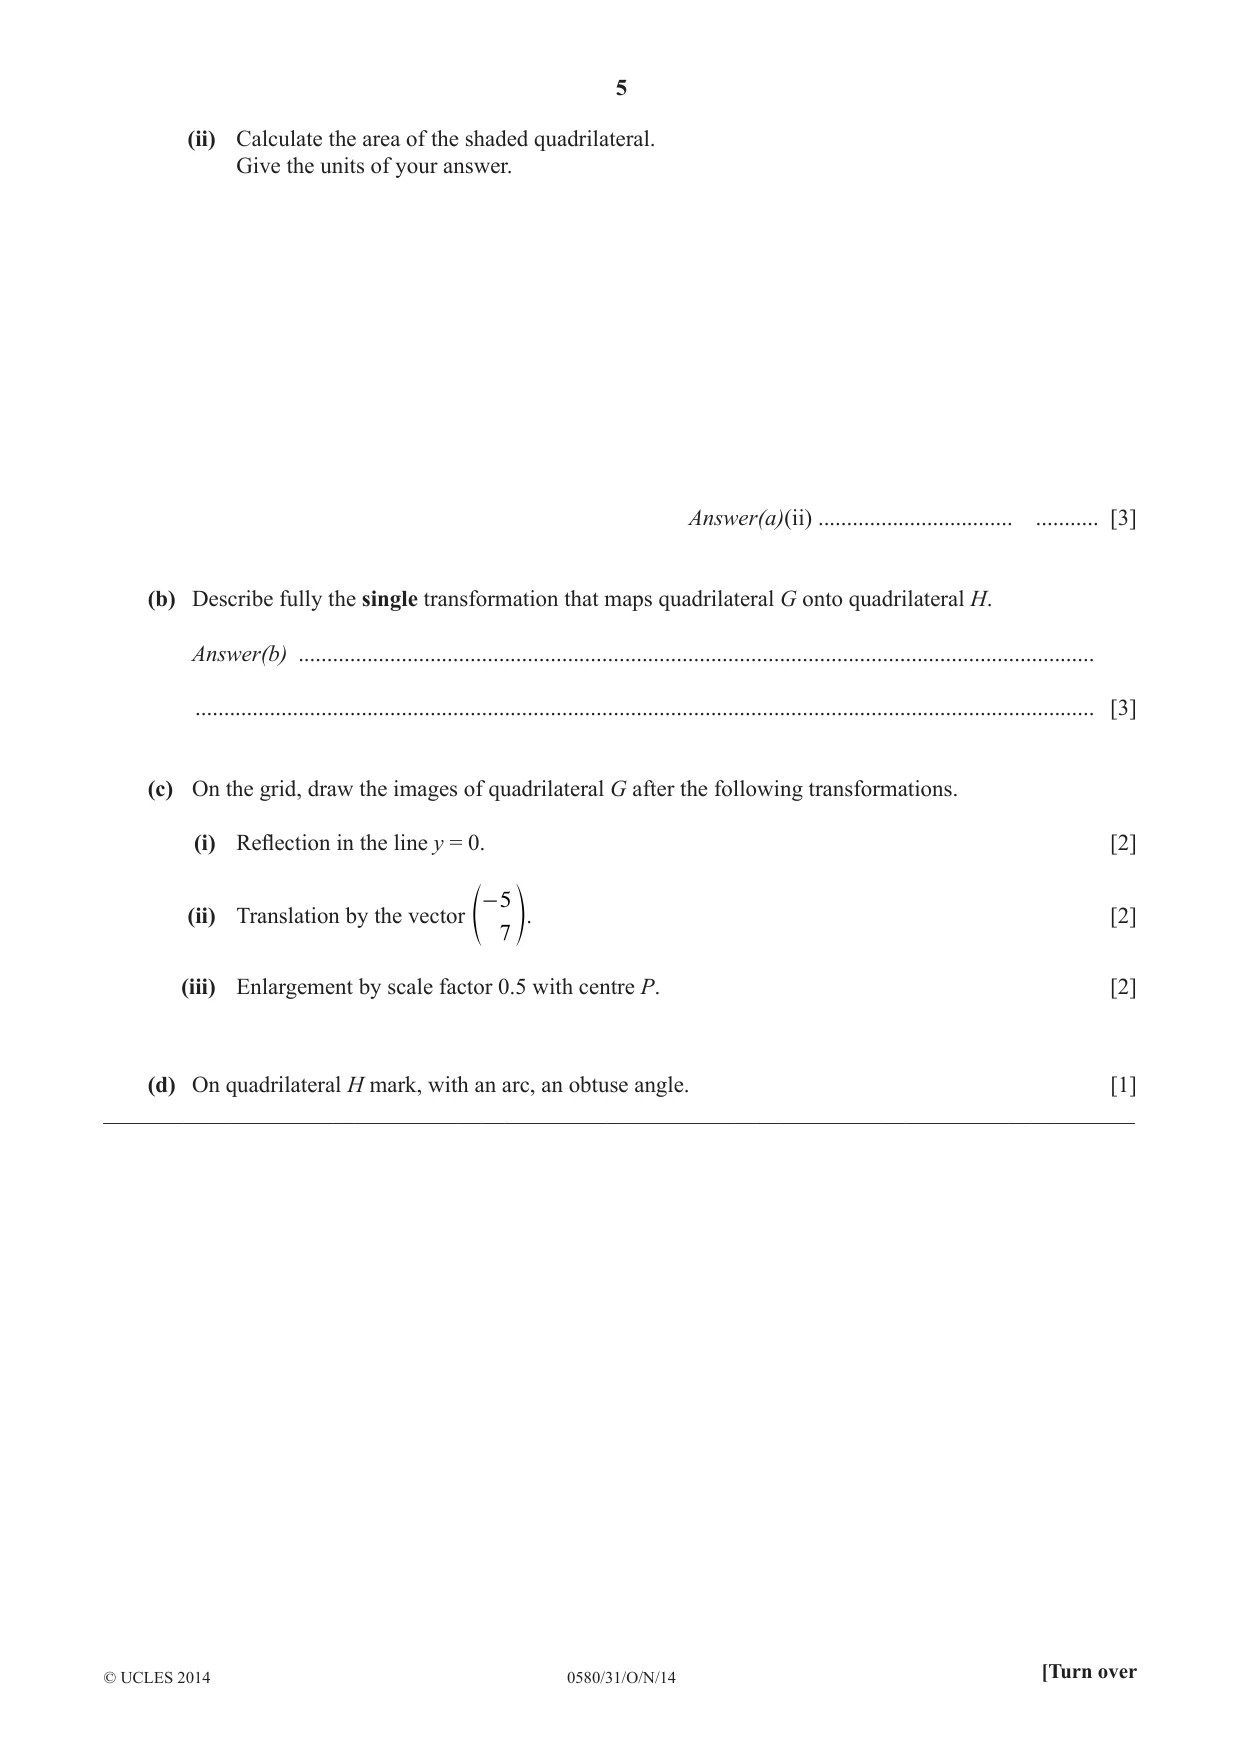
2 y 9 8 7 6 5 4 3 P 2 1 x –8 –7 –6 –5 –4 –3 –2 –1 0 1 2 3 4 5 6 –1 –2 –3 –4 –5 H –6 G –7 –8 –9 Two congruent quadrilaterals, G and H, and a point P are shown on this 1 cm2 grid. (a) (i) Write down the mathematical name of the shaded quadrilateral. Answer(a)(i) ................................................ [1] (ii) Calculate the area of the shaded quadrilateral. Give the units of your answer. Answer(a)(ii) .................................. ........... [3] (b) Describe fully the single transformation that maps quadrilateral G onto quadrilateral H. Answer(b) ........................................................................................................................................... ............................................................................................................................................................. [3] (c) On the grid, draw the images of quadrilateral G after the following transformations. (i) Refl ection in the line y = 0. [2] -5 (ii) Translation by the vector [2] e 7 o. (iii) Enlargement by scale factor 0.5 with centre P. [2] (d) On quadrilateral H mark, with an arc, an obtuse angle. [1] __________________________________________________________________________________________
Mark scheme: 2 (a) (i) Trapezium 1 (ii) 16 2 M1 for ½(2 + 6) × 4 oe cm2 1 (b) Rotation B1 Independent marks 90°[anti-clockwise] oe B1 [centre] (–2, –8) B1 (c) (i) Correct reflection in y = 0 2 SC1 for correct reflection in x = 0 (ii) Translation 5 left and 7 up 2 SC1 for one of 5 left or 7 up (iii) Correct Enlargement 2 SC1 for enlargement, SF ½, but incorrectly placed. (d) Obtuse angle marked 1
Q3 · 12 athletes took part in the 100 metres race
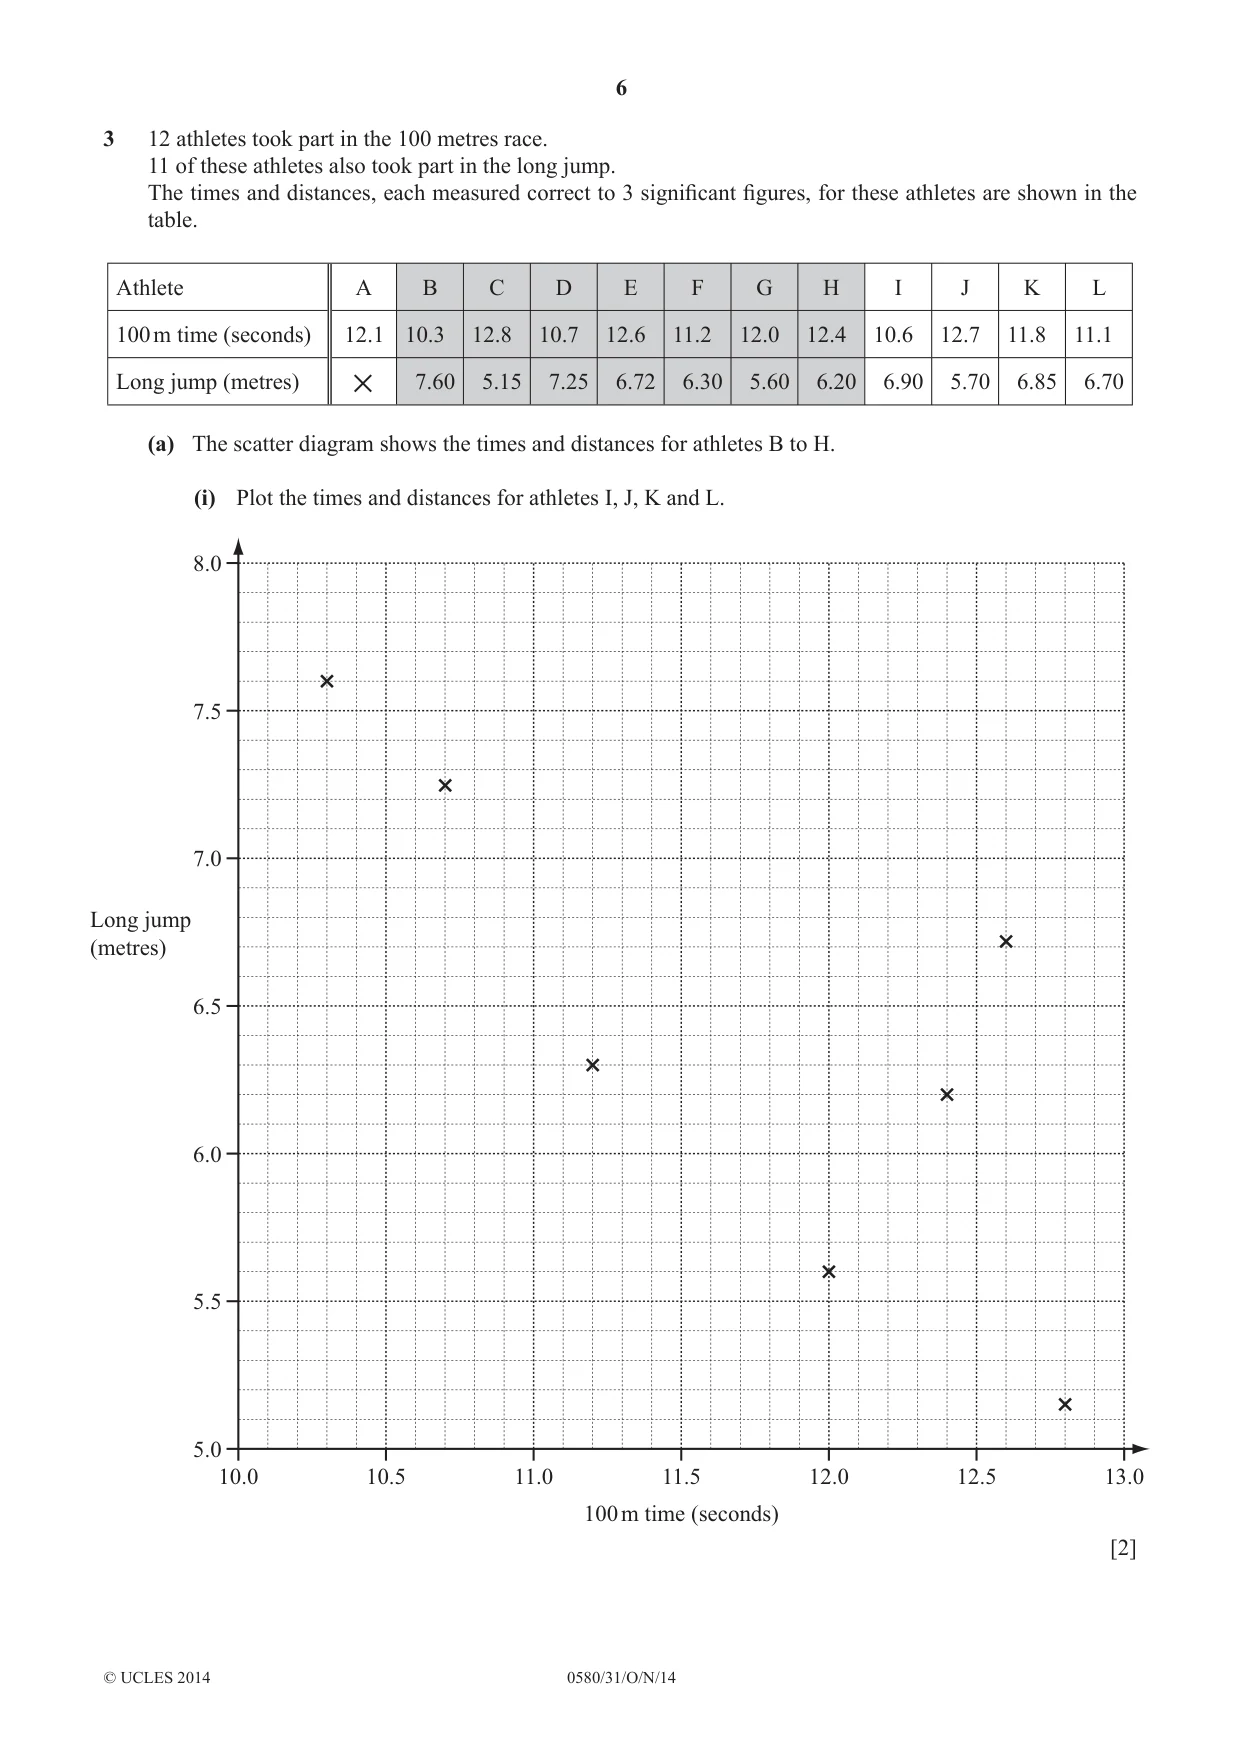
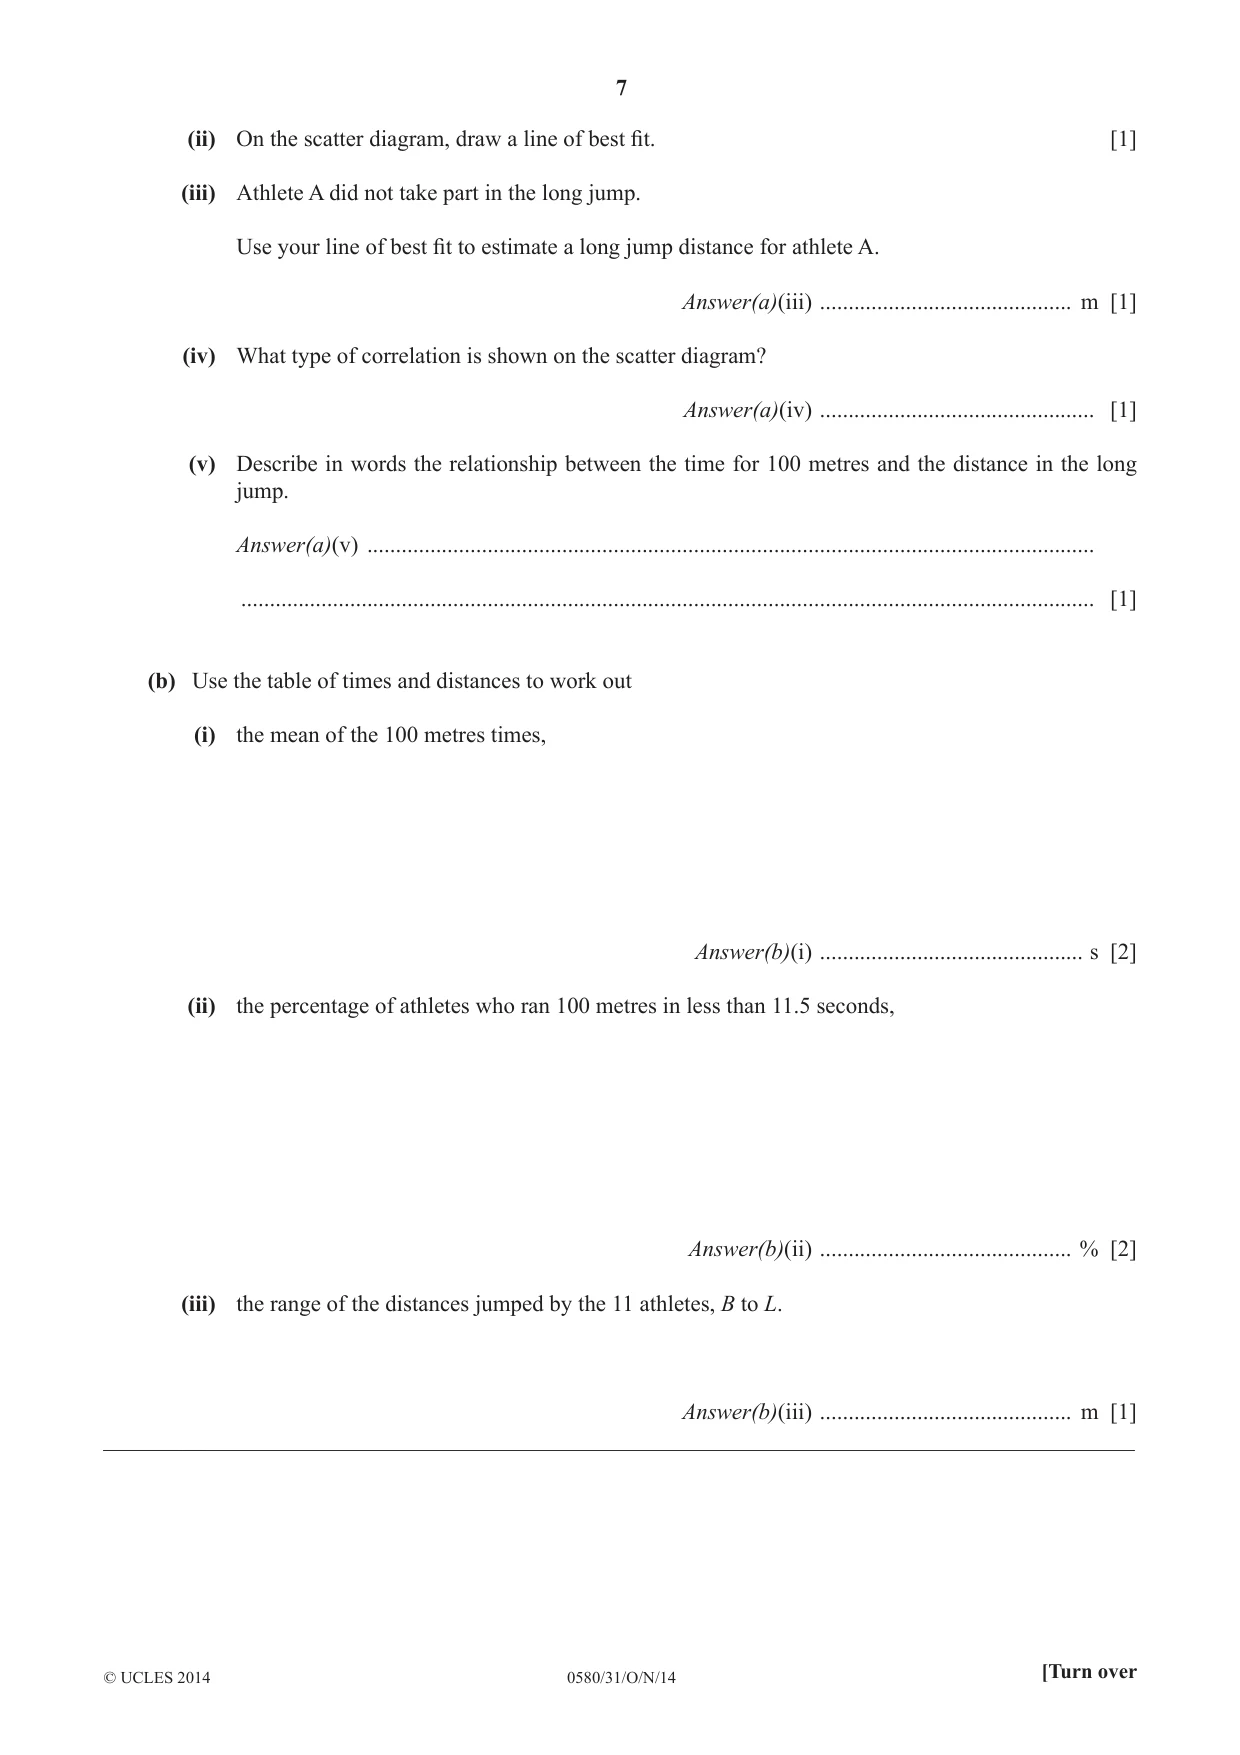
3 12 athletes took part in the 100 metres race. 11 of these athletes also took part in the long jump. The times and distances, each measured correct to 3 signifi cant fi gures, for these athletes are shown in the table. Athlete A B C D E F G H I J K L 100 m time (seconds) 12.1 10.3 12.8 10.7 12.6 11.2 12.0 12.4 10.6 12.7 11.8 11.1 Long jump (metres) 7.60 5.15 7.25 6.72 6.30 5.60 6.20 6.90 5.70 6.85 6.70 × (a) The scatter diagram shows the times and distances for athletes B to H. (i) Plot the times and distances for athletes I, J, K and L. 8.0 7.5 7.0 Long jump (metres) 6.5 6.0 5.5 5.0 10.0 10.5 11.0 11.5 12.0 12.5 13.0 100 m time (seconds) [2] (ii) On the scatter diagram, draw a line of best fi t. [1] (iii) Athlete A did not take part in the long jump. Use your line of best fi t to estimate a long jump distance for athlete A. Answer(a)(iii) ............................................ m [1] (iv) What type of correlation is shown on the scatter diagram? Answer(a)(iv) ................................................ [1] (v) Describe in words the relationship between the time for 100 metres and the distance in the long jump. Answer(a)(v) ............................................................................................................................... ..................................................................................................................................................... [1] (b) Use the table of times and distances to work out (i) the mean of the 100 metres times, Answer(b)(i) .............................................. s [2] (ii) the percentage of athletes who ran 100 metres in less than 11.5 seconds, Answer(b)(ii) ............................................ % [2] (iii) the range of the distances jumped by the 11 athletes, B to L. Answer(b)(iii) ............................................ m [1] __________________________________________________________________________________________
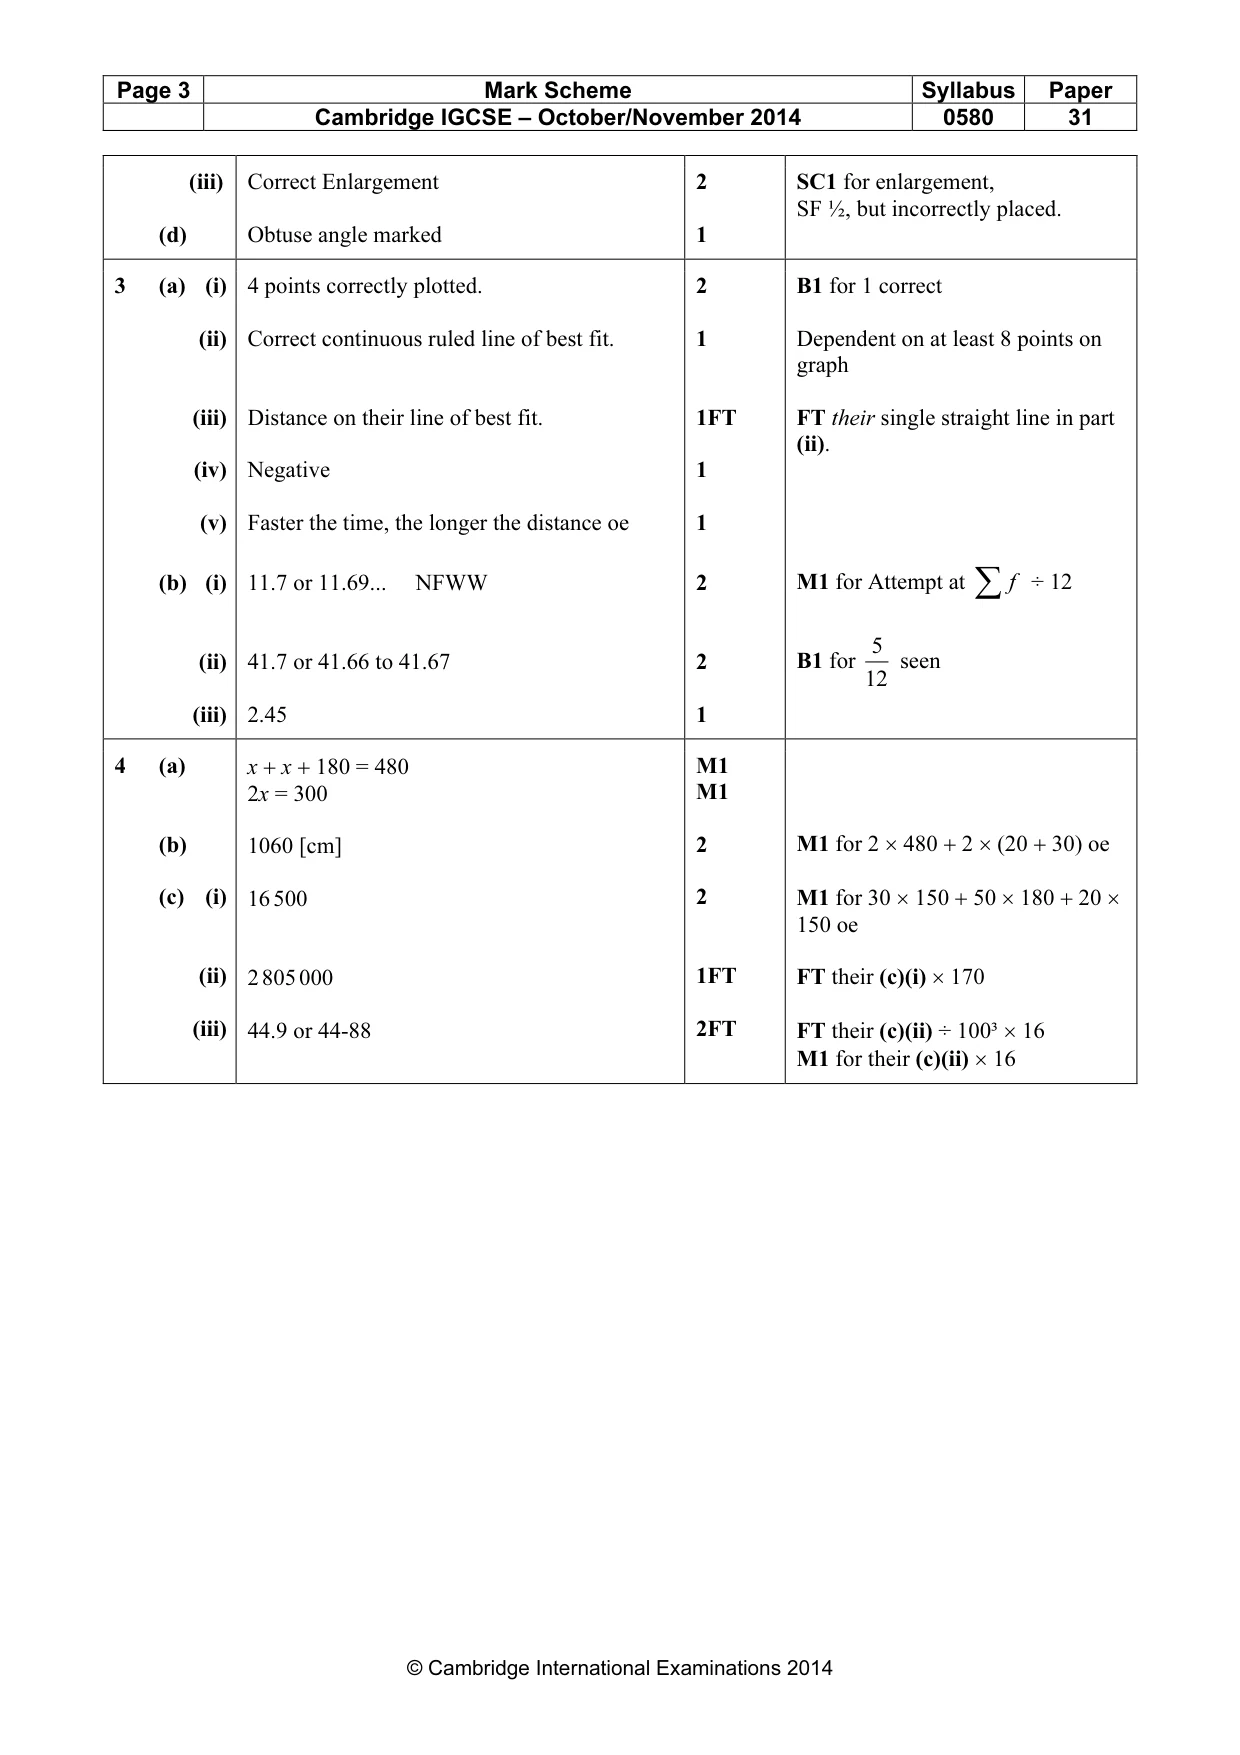
Mark scheme: 3 (a) (i) 4 points correctly plotted. 2 B1 for 1 correct (ii) Correct continuous ruled line of best fit. 1 Dependent on at least 8 points on graph (iii) Distance on their line of best fit. 1FT FT their single straight line in part (ii). (iv) Negative 1 (v) Faster the time, the longer the distance oe 1 ÷ 12 (b) (i) 11.7 or 11.69... NFWW 2 M1 for Attempt at ∑f 5 (ii) 41.7 or 41.66 to 41.67 2 B1 for seen 12 (iii) 2.45 1
Q4 · 180 cm NOT TO SCALE x cm 50 cm x cm 30 cm 20 cm 480 cm The diagram shows the cross…
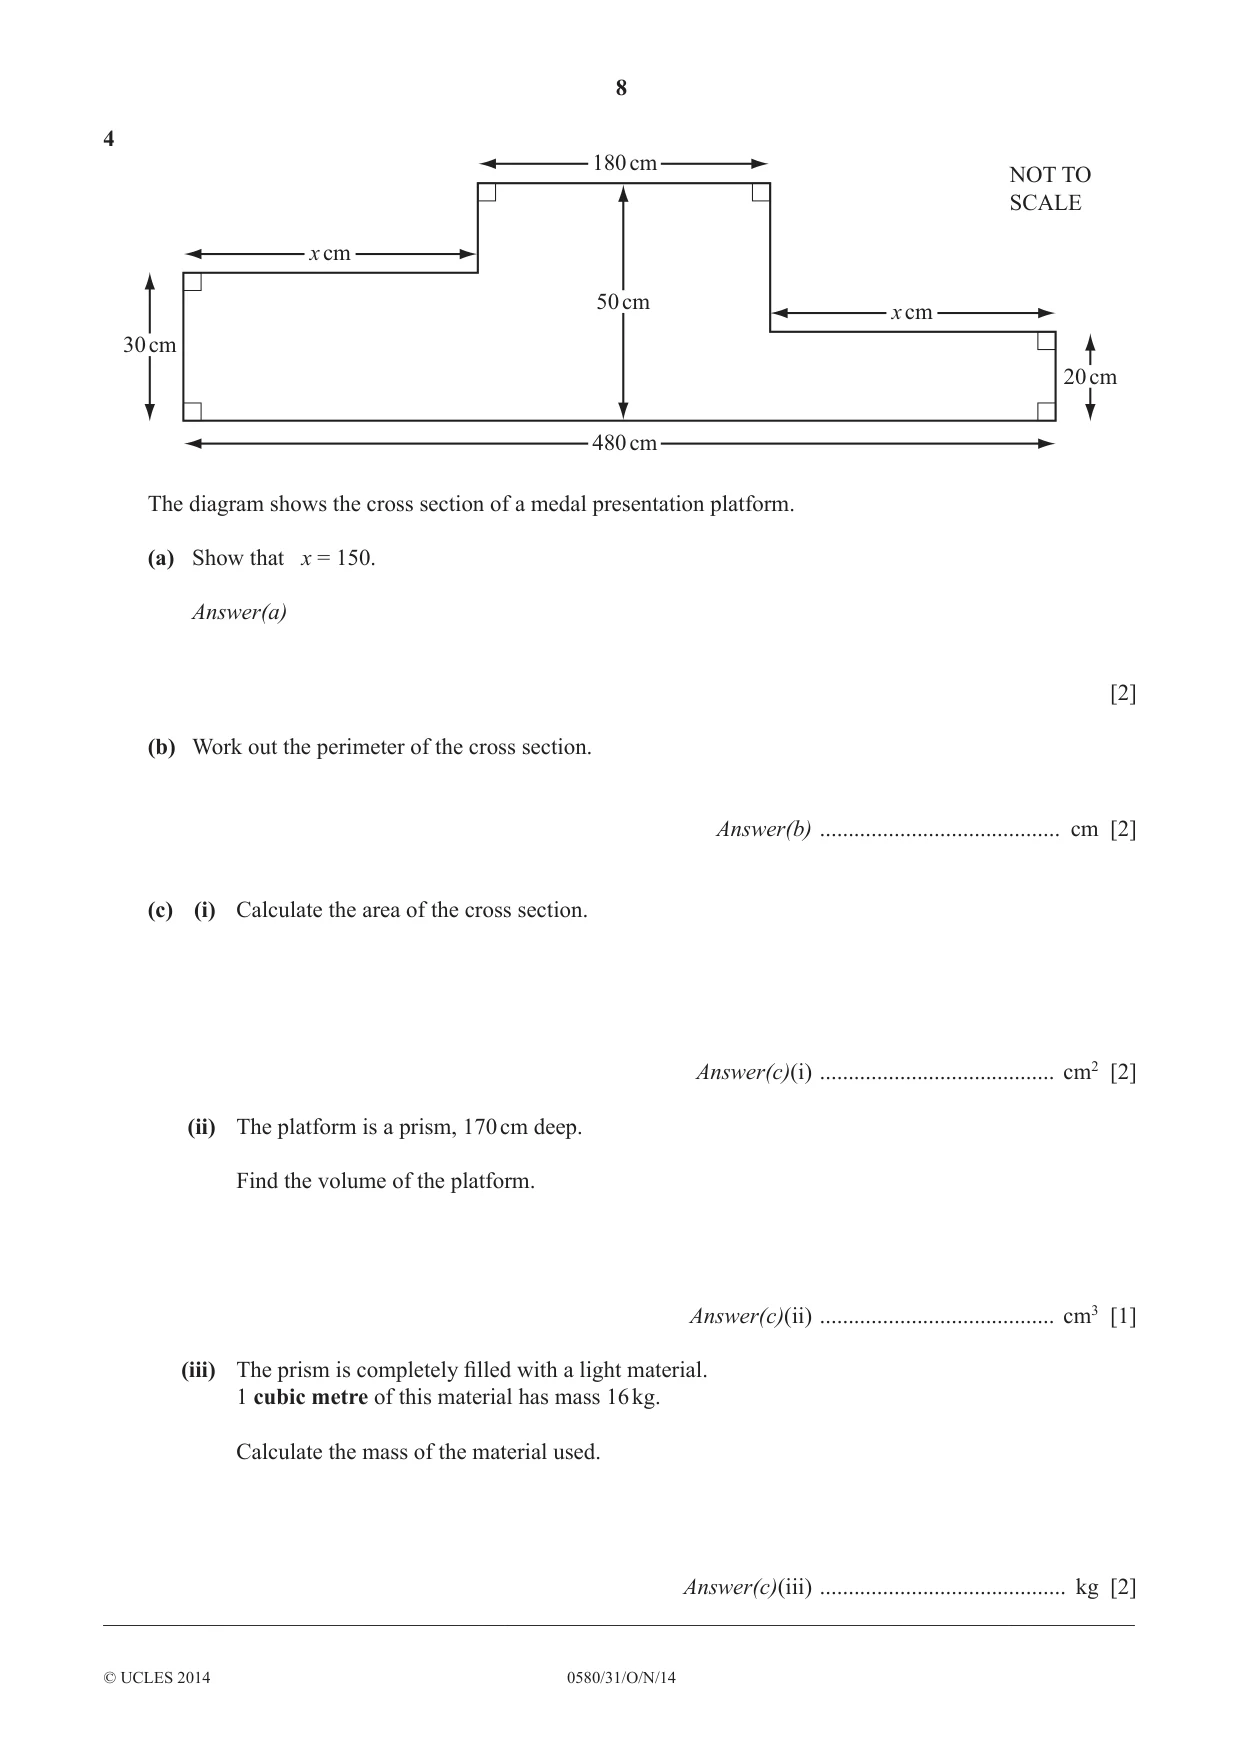
4 180 cm NOT TO SCALE x cm 50 cm x cm 30 cm 20 cm 480 cm The diagram shows the cross section of a medal presentation platform. (a) Show that x = 150. Answer(a) [2] (b) Work out the perimeter of the cross section. Answer(b) .......................................... cm [2] (c) (i) Calculate the area of the cross section. Answer(c)(i) ......................................... cm2 [2] (ii) The platform is a prism, 170 cm deep. Find the volume of the platform. Answer(c)(ii) ......................................... cm3 [1] (iii) The prism is completely fi lled with a light material. 1 cubic metre of this material has mass 16 kg. Calculate the mass of the material used. Answer(c)(iii) ........................................... kg [2] __________________________________________________________________________________________
Mark scheme: 4 (a) x + x + 180 = 480 M1 M1 2x = 300 (b) 2 M1 for 2 × 480 + 2 × (20 + 30) oe 1060 [cm] (c) (i) 2 M1 for 30 × 150 + 50 × 180 + 20 × 16 500 150 oe (ii) 1FT FT their (c)(i) × 170 2 805 000 (iii) 44.9 or 44-88 2FT FT their (c)(ii) ÷ 100³ × 16 M1 for their (c)(ii) × 16
Q5 · Write in fi gures six million three thousand and seventy six
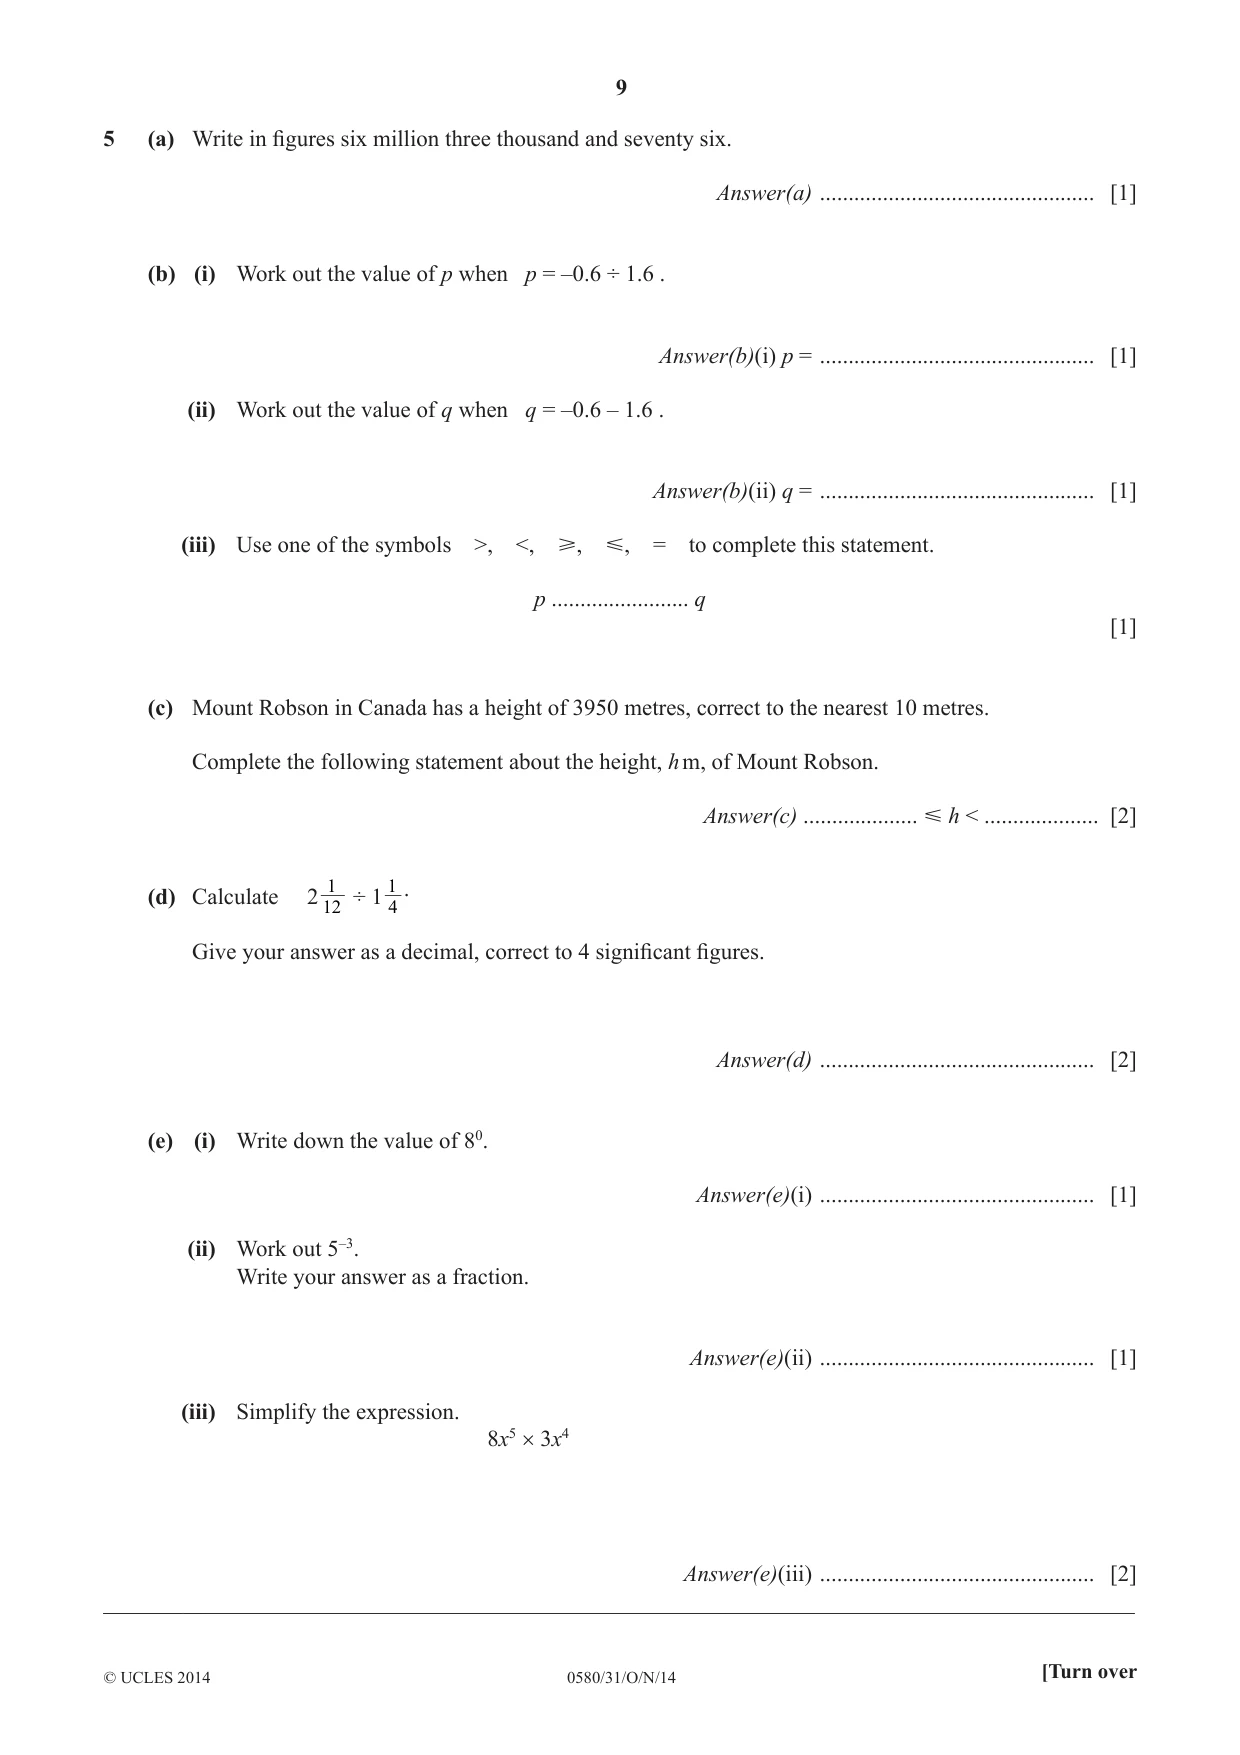
5 (a) Write in fi gures six million three thousand and seventy six. Answer(a) ................................................ [1] (b) (i) Work out the value of p when p = –0.6 ÷ 1.6 . Answer(b)(i) p = ................................................ [1] (ii) Work out the value of q when q = –0.6 – 1.6 . Answer(b)(ii) q = ................................................ [1] (iii) Use one of the symbols >, <, [, Y, = to complete this statement. p ........................ q [1] (c) Mount Robson in Canada has a height of 3950 metres, correct to the nearest 10 metres. Complete the following statement about the height, h m, of Mount Robson. Answer(c) .................... Y h < .................... [2] 1 1 . (d) Calculate 2 ÷ 1 12 4 Give your answer as a decimal, correct to 4 signifi cant fi gures. Answer(d) ................................................ [2] (e) (i) Write down the value of 80. Answer(e)(i) ................................................ [1] (ii) Work out 5–3. Write your answer as a fraction. Answer(e)(ii) ................................................ [1] (iii) Simplify the expression. 8x5 × 3x4 Answer(e)(iii) ................................................ [2] __________________________________________________________________________________________
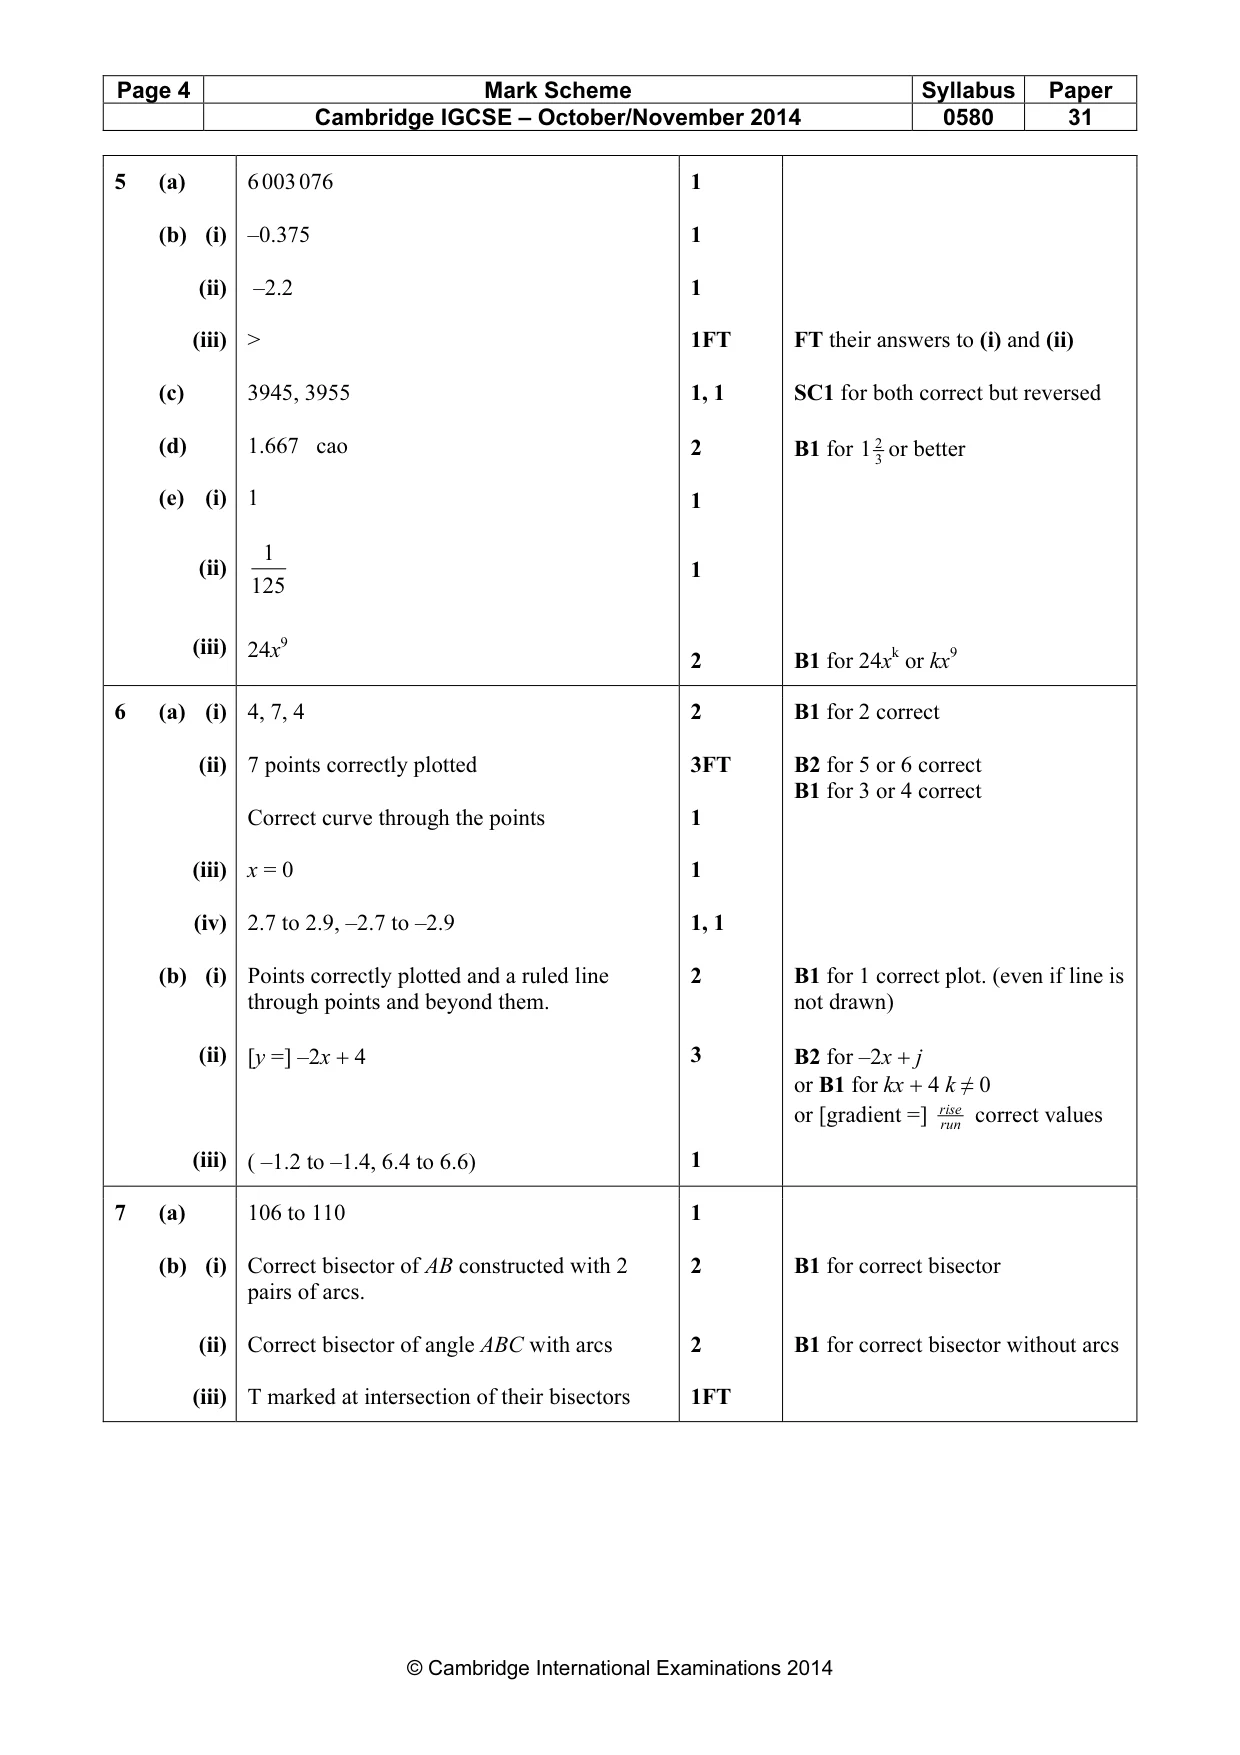
Mark scheme: 5 (a) 6 003 076 1 (b) (i) –0.375 1 (ii) –2.2 1 (iii) > 1FT FT their answers to (i) and (ii) (c) 3945, 3955 1, 1 SC1 for both correct but reversed 2 (d) 1.667 cao 2 B1 for 1 3 or better (e) (i) 1 1 1 (ii) 1 125 (iii) 24x9 2 B1 for 24xk or kx9
Q6 · Complete the table of values for y = 8 – x2
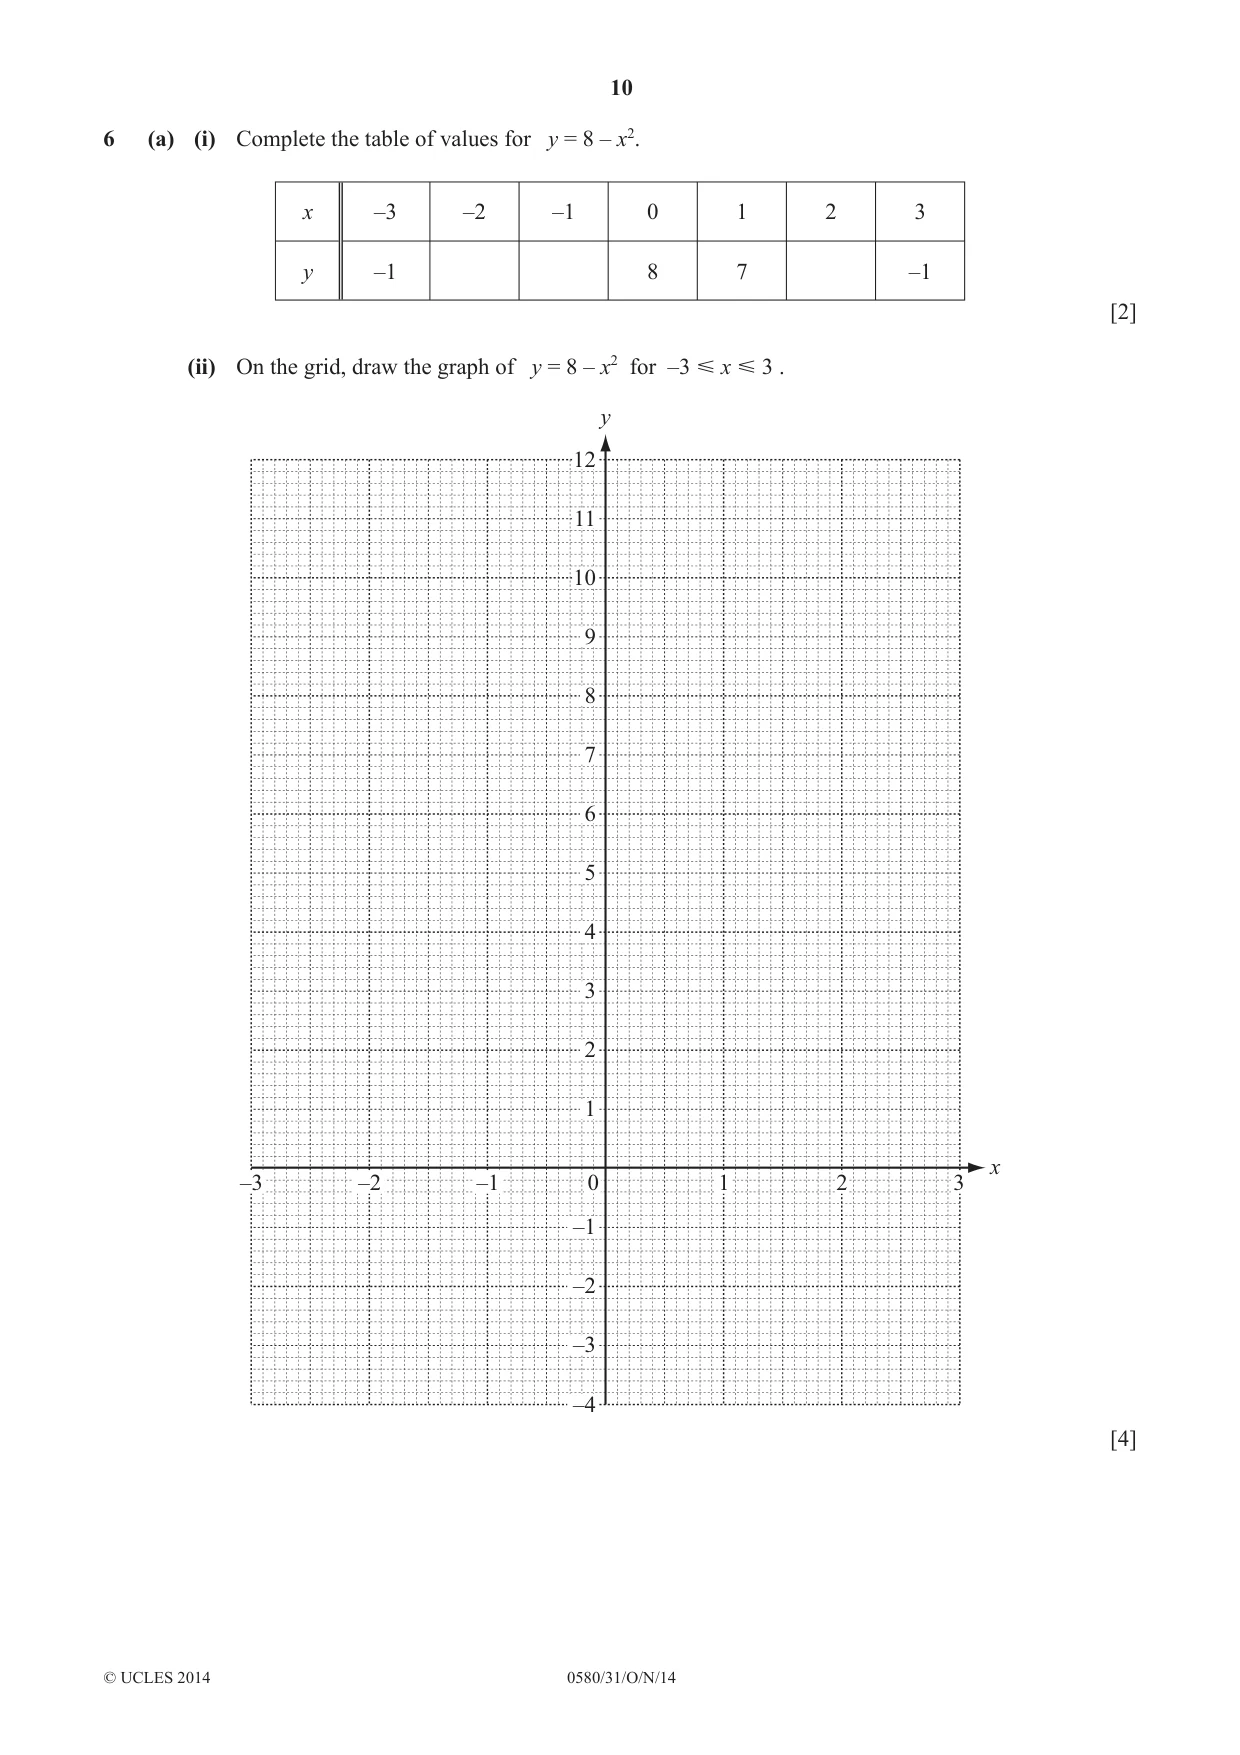
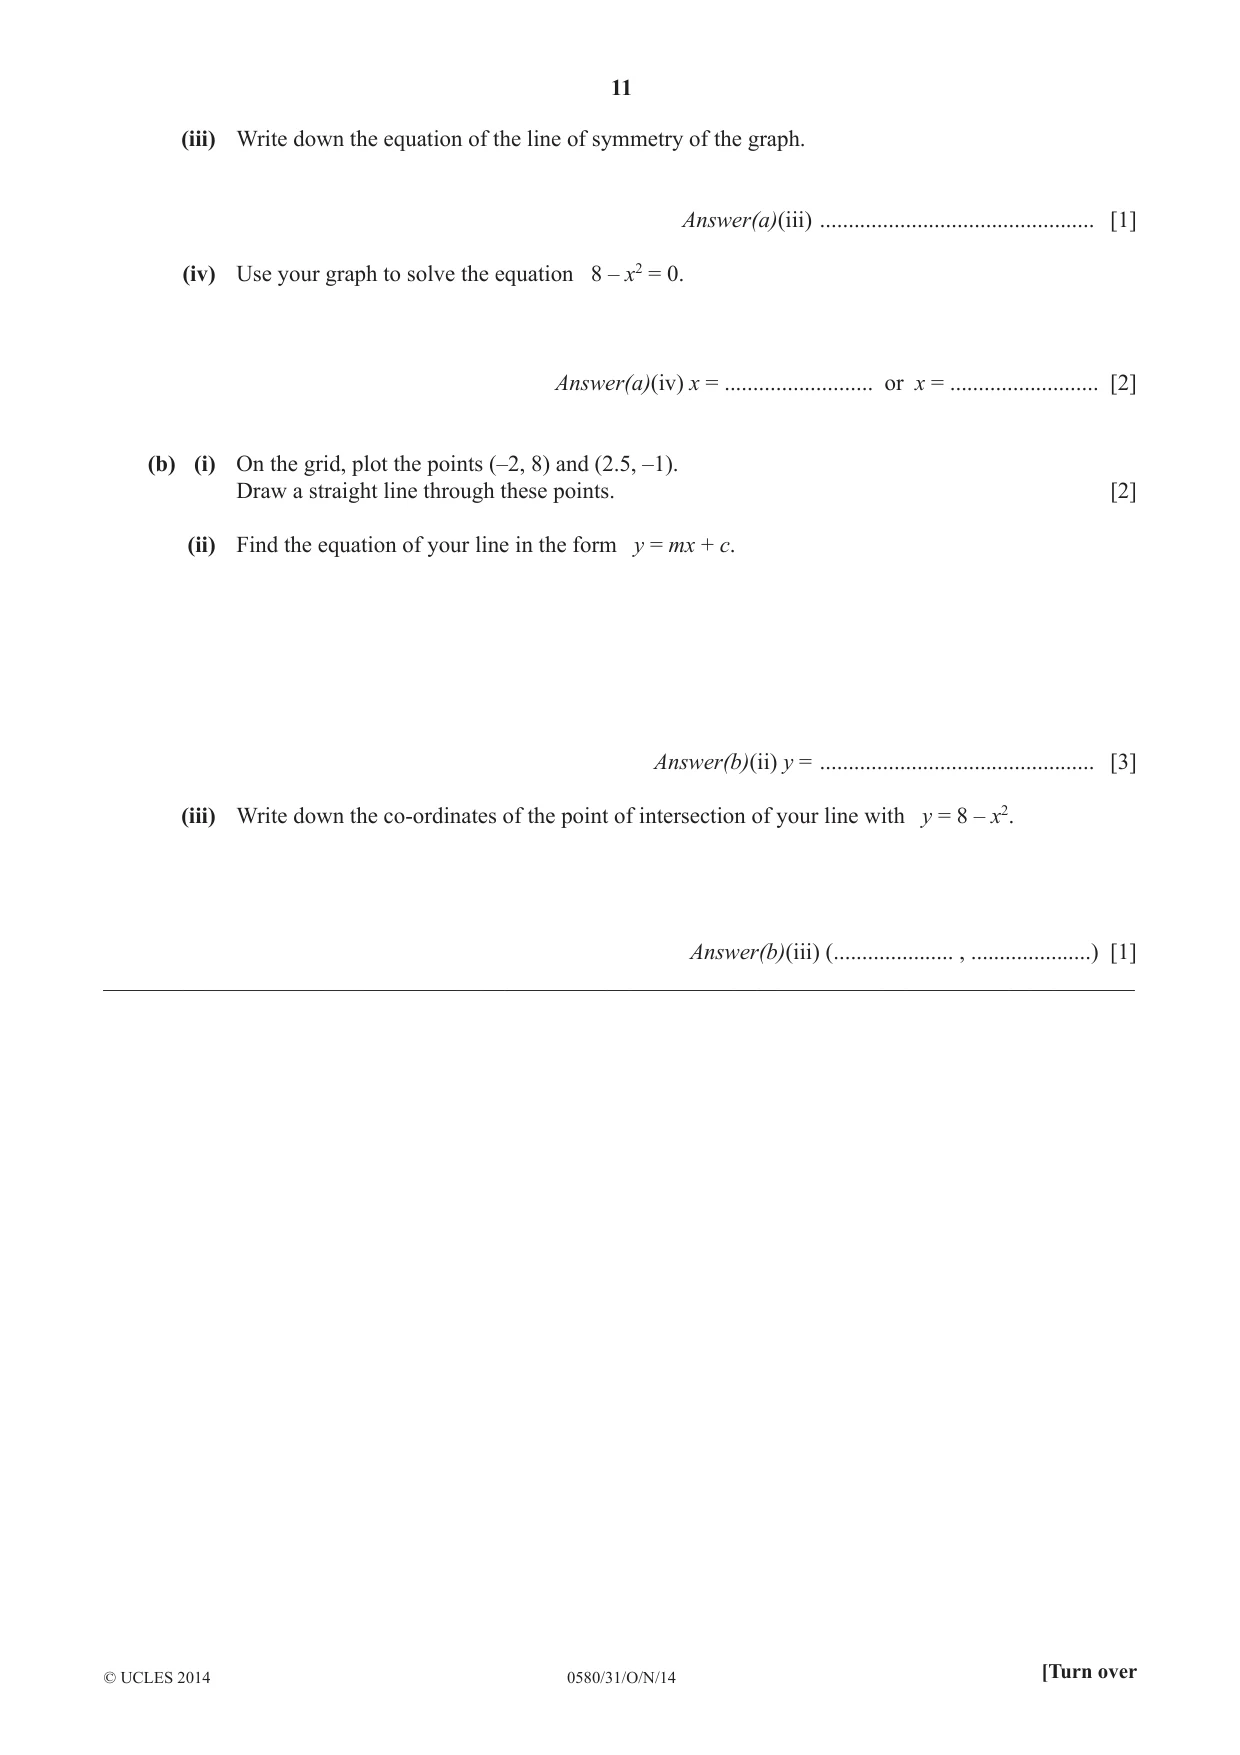
6 (a) (i) Complete the table of values for y = 8 – x2. x –3 –2 –1 0 1 2 3 y –1 8 7 –1 [2] (ii) On the grid, draw the graph of y = 8 – x2 for –3 Y x Y 3 . y 12 11 10 9 8 7 6 5 4 3 2 1 x –3 –2 –1 0 1 2 3 –1 –2 –3 –4 [4] (iii) Write down the equation of the line of symmetry of the graph. Answer(a)(iii) ................................................ [1] (iv) Use your graph to solve the equation 8 – x2 = 0. Answer(a)(iv) x = .......................... or x = .......................... [2] (b) (i) On the grid, plot the points (–2, 8) and (2.5, –1). Draw a straight line through these points. [2] (ii) Find the equation of your line in the form y = mx + c. Answer(b)(ii) y = ................................................ [3] (iii) Write down the co-ordinates of the point of intersection of your line with y = 8 – x2. Answer(b)(iii) (..................... , .....................) [1] __________________________________________________________________________________________
Mark scheme: 6 (a) (i) 4, 7, 4 2 B1 for 2 correct (ii) 7 points correctly plotted 3FT B2 for 5 or 6 correct B1 for 3 or 4 correct Correct curve through the points 1 (iii) x = 0 1 (iv) 2.7 to 2.9, –2.7 to –2.9 1, 1 (b) (i) Points correctly plotted and a ruled line 2 B1 for 1 correct plot. (even if line is through points and beyond them. not drawn) (ii) [y =] –2x + 4 3 B2 for –2x + j or B1 for kx + 4 k ≠ 0 or [gradient =] riserun correct values (iii) 1 ( –1.2 to –1.4, 6.4 to 6.6)
Q7 · The scale drawing represents the positions of 3 towns, A, B and C
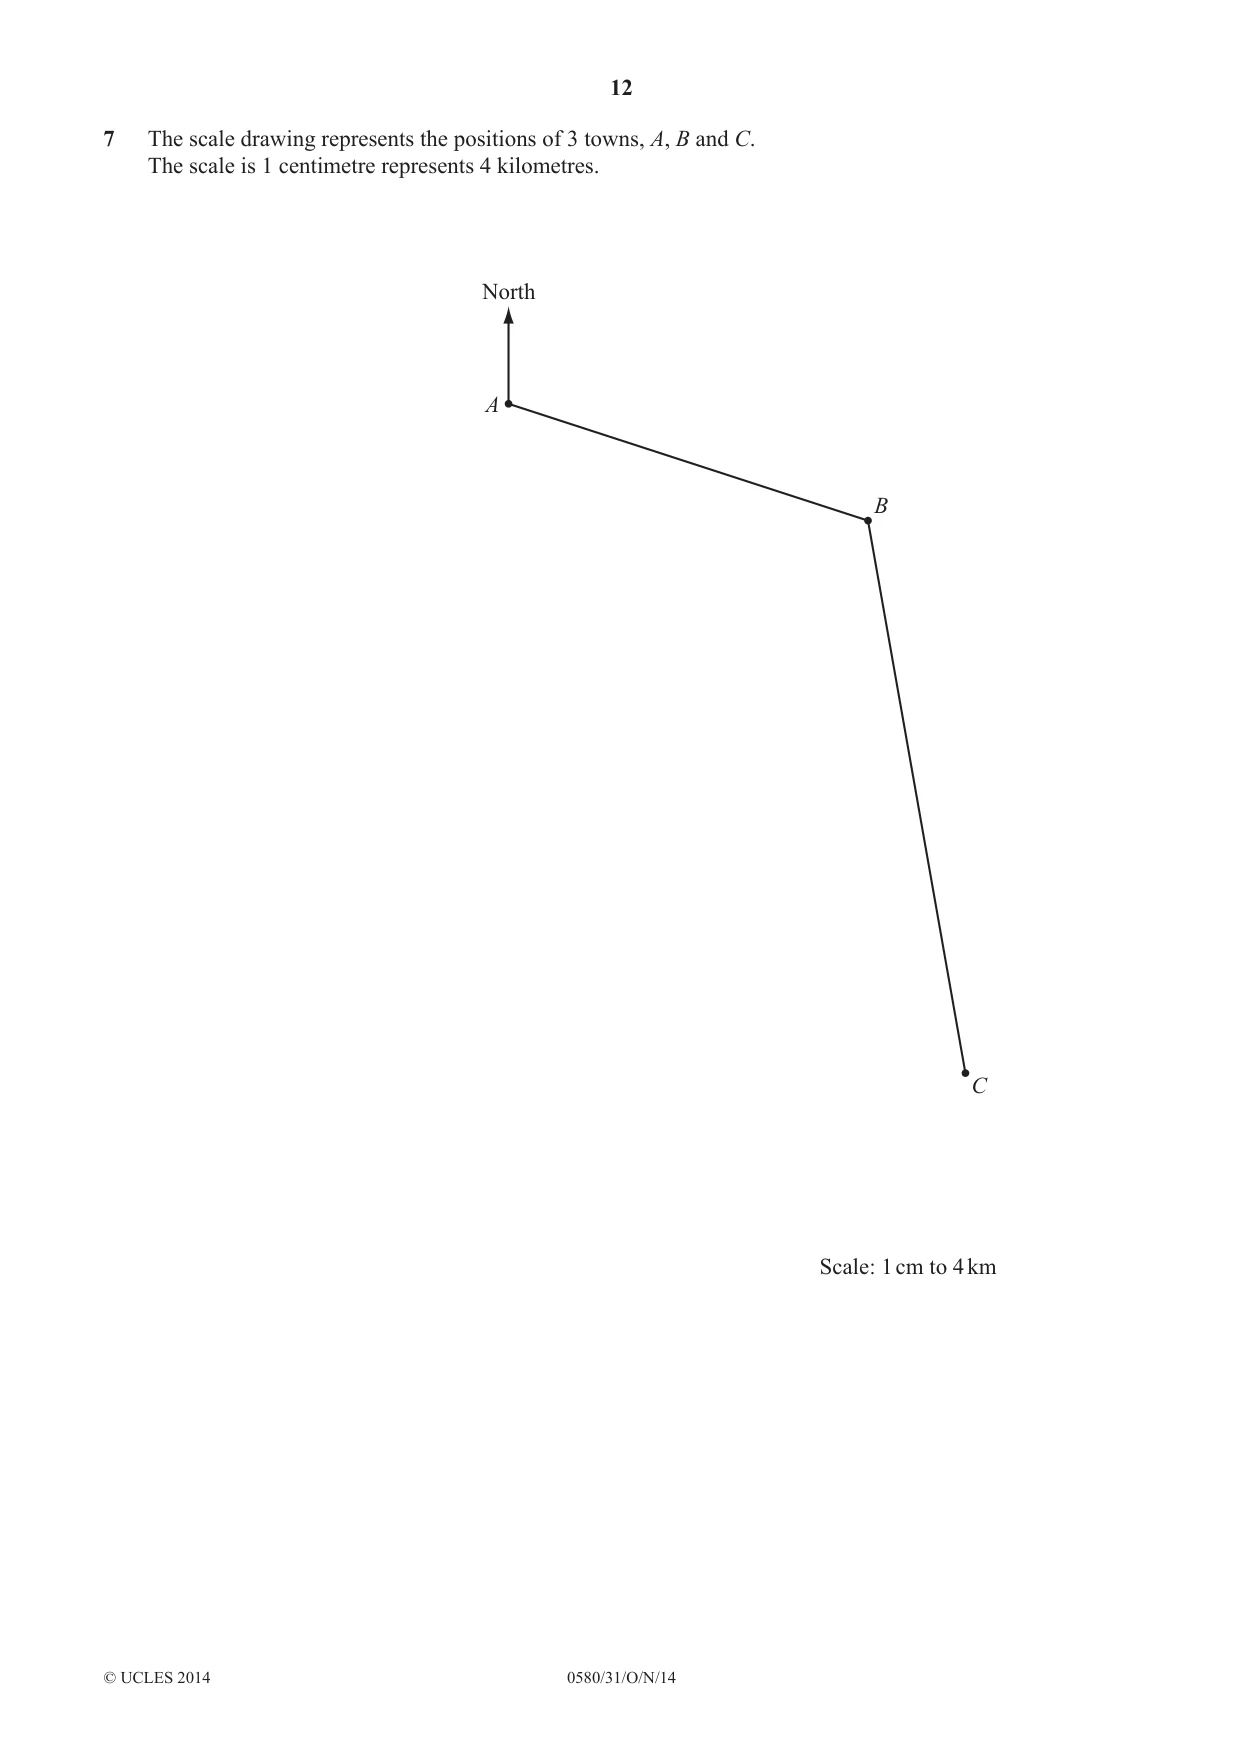
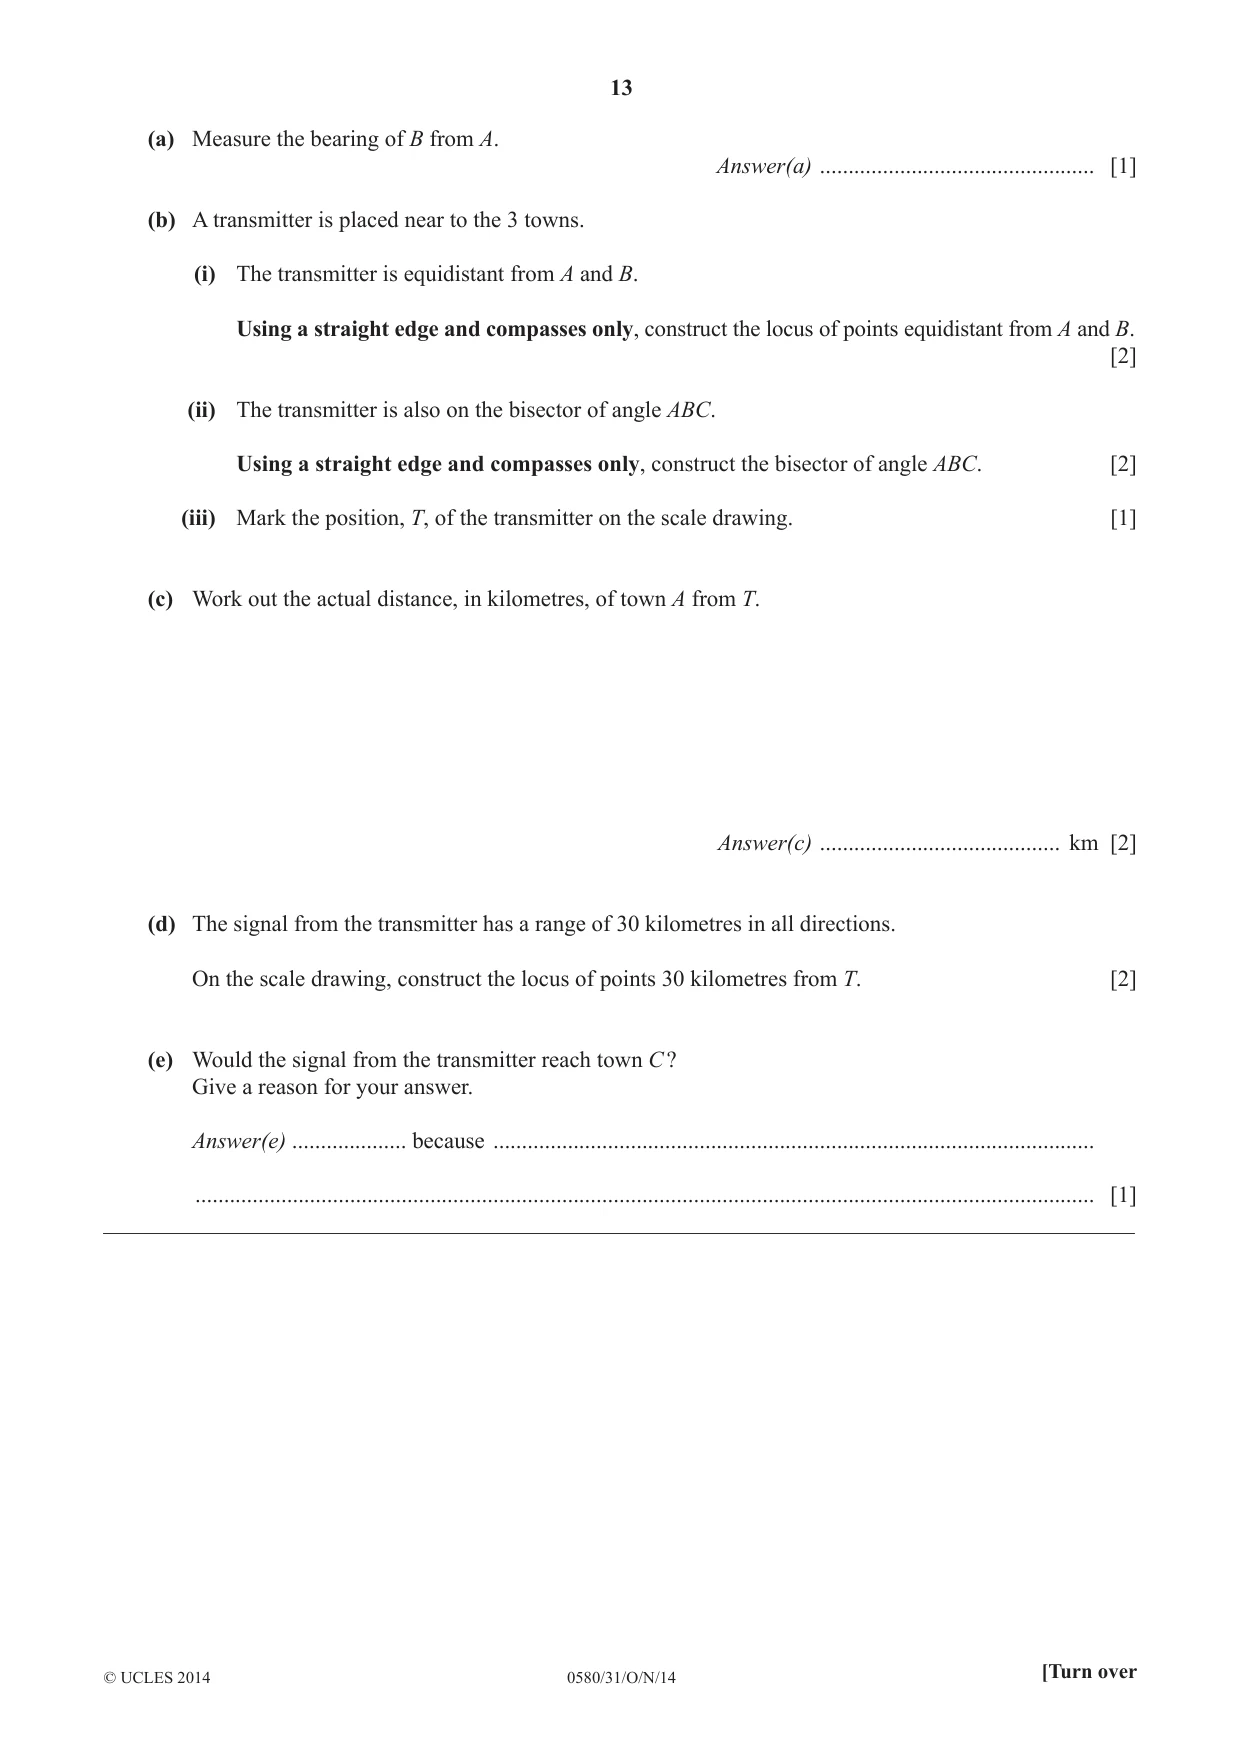
7 The scale drawing represents the positions of 3 towns, A, B and C. The scale is 1 centimetre represents 4 kilometres. North A B C Scale: 1 cm to 4 km (a) Measure the bearing of B from A. Answer(a) ................................................ [1] (b) A transmitter is placed near to the 3 towns. (i) The transmitter is equidistant from A and B. Using a straight edge and compasses only, construct the locus of points equidistant from A and B. [2] (ii) The transmitter is also on the bisector of angle ABC. Using a straight edge and compasses only, construct the bisector of angle ABC. [2] (iii) Mark the position, T, of the transmitter on the scale drawing. [1] (c) Work out the actual distance, in kilometres, of town A from T. Answer(c) .......................................... km [2] (d) The signal from the transmitter has a range of 30 kilometres in all directions. On the scale drawing, construct the locus of points 30 kilometres from T. [2] (e) Would the signal from the transmitter reach town C ? Give a reason for your answer. Answer(e) .................... because ......................................................................................................... ............................................................................................................................................................. [1] __________________________________________________________________________________________
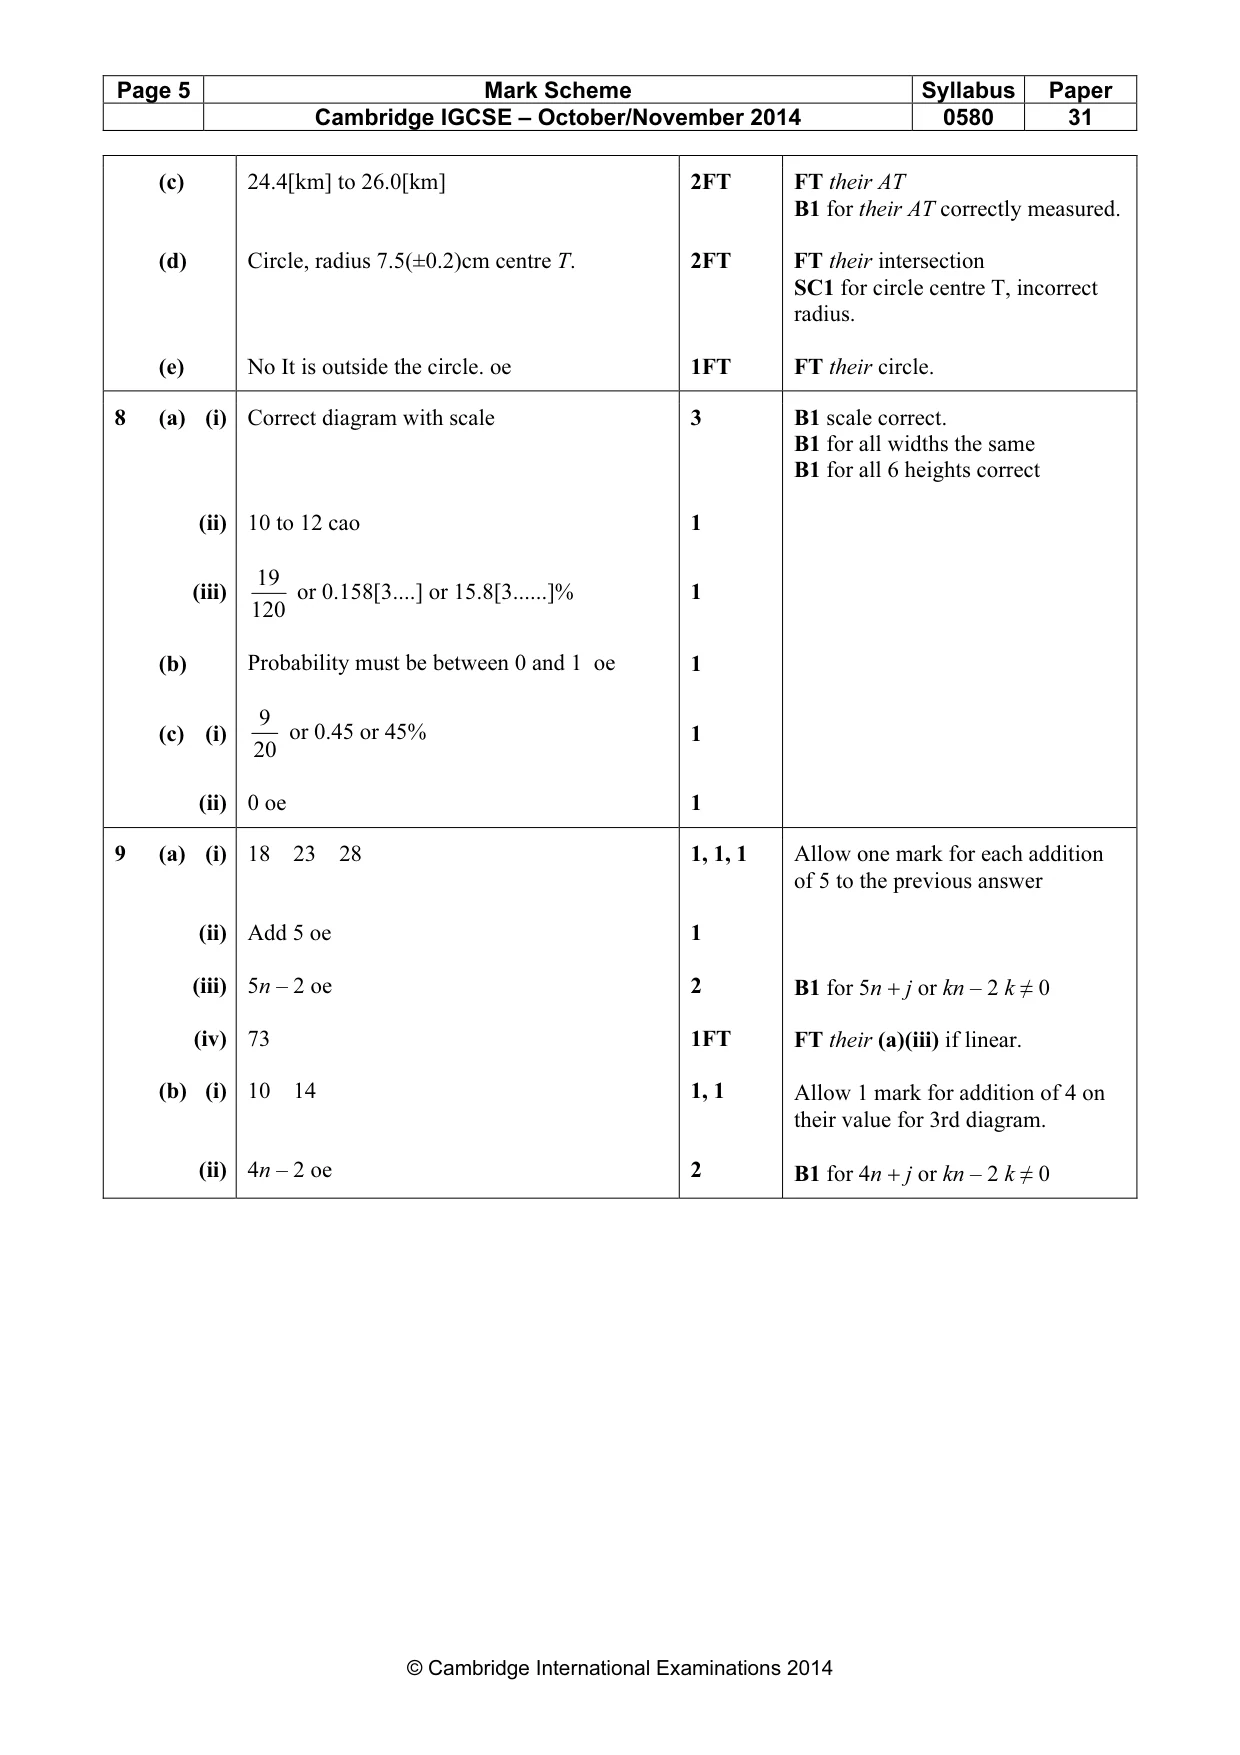
Mark scheme: 7 (a) 106 to 110 1 (b) (i) Correct bisector of AB constructed with 2 2 B1 for correct bisector pairs of arcs. (ii) Correct bisector of angle ABC with arcs 2 B1 for correct bisector without arcs (iii) T marked at intersection of their bisectors 1FT (c) 24.4[km] to 26.0[km] 2FT FT their AT B1 for their AT correctly measured. (d) Circle, radius 7.5(±0.2)cm centre T. 2FT FT their intersection SC1 for circle centre T, incorrect radius. (e) No It is outside the circle. oe 1FT FT their circle.
Q8 · One day a survey is taken of the ages of 120 children at a fairground
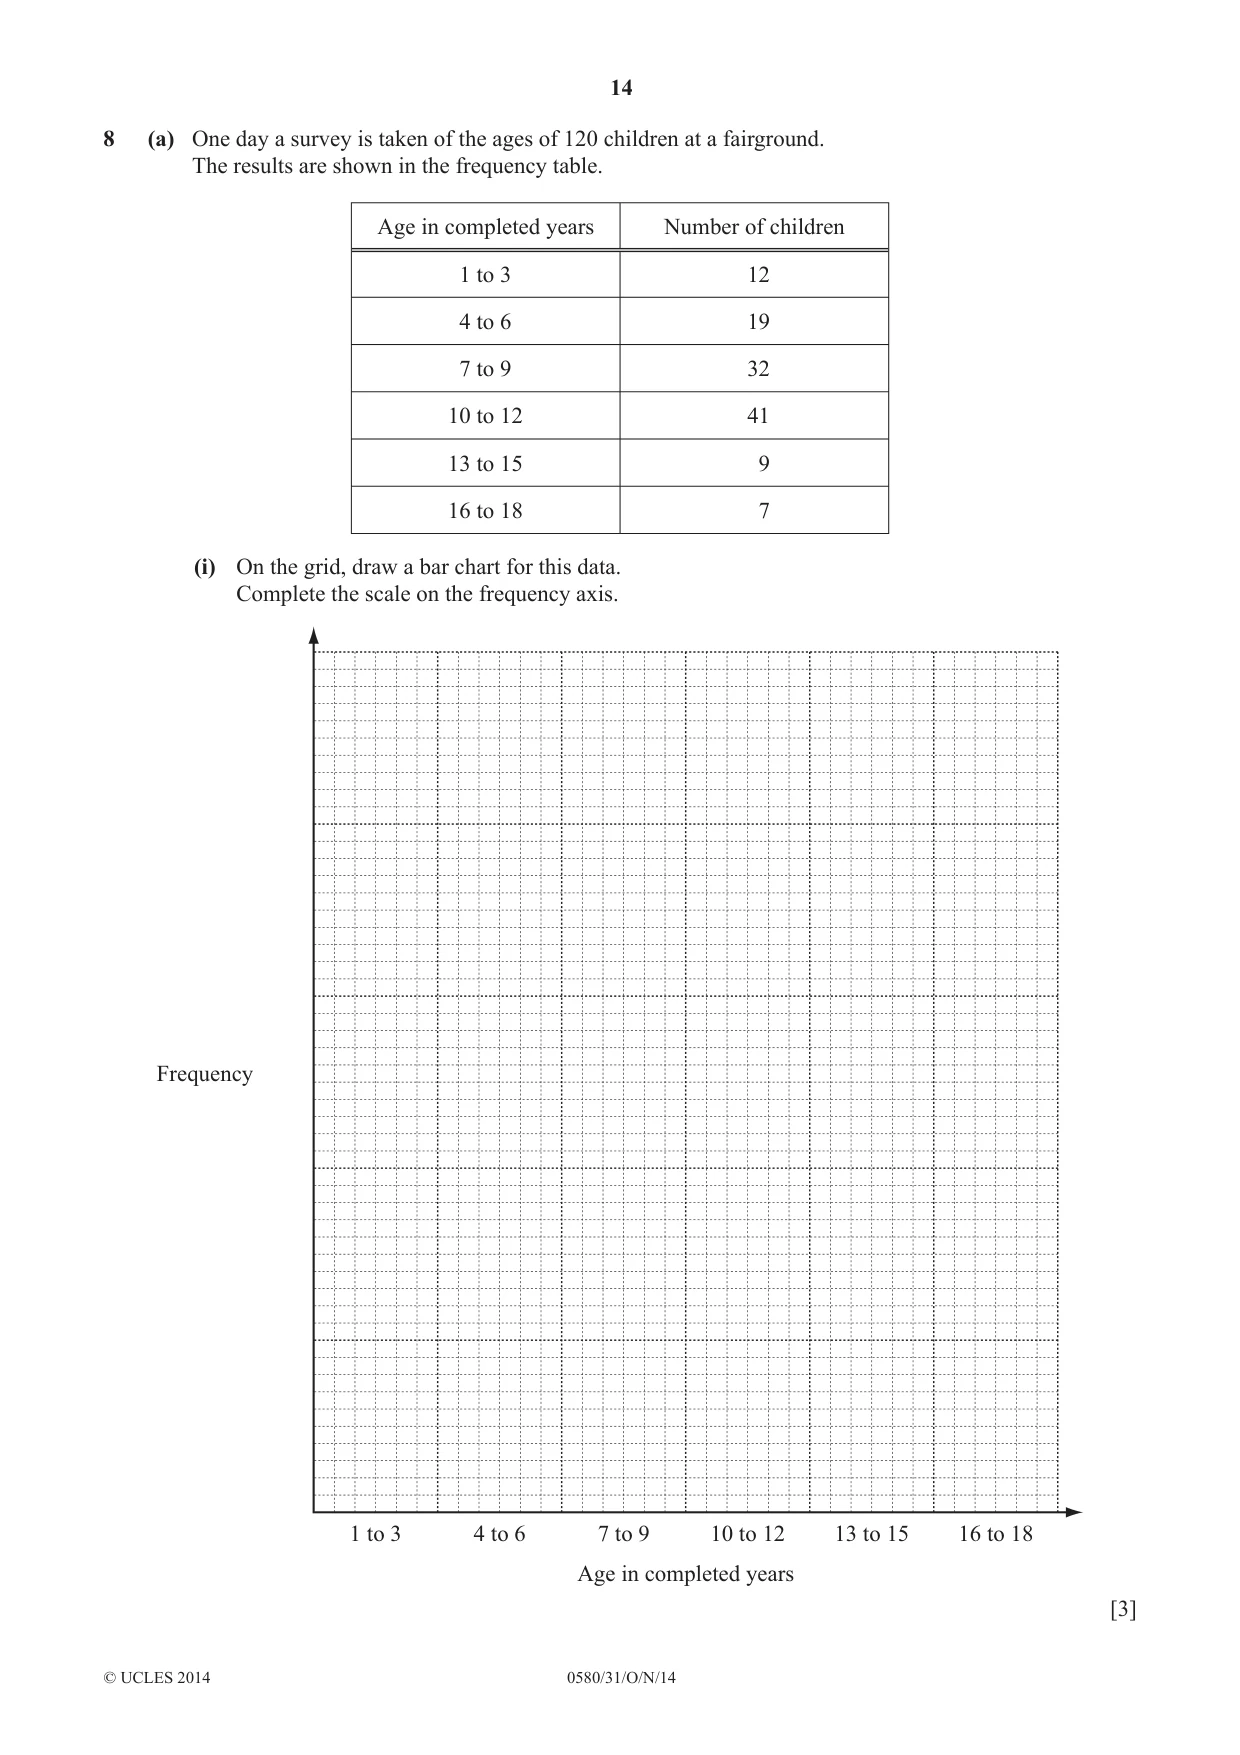
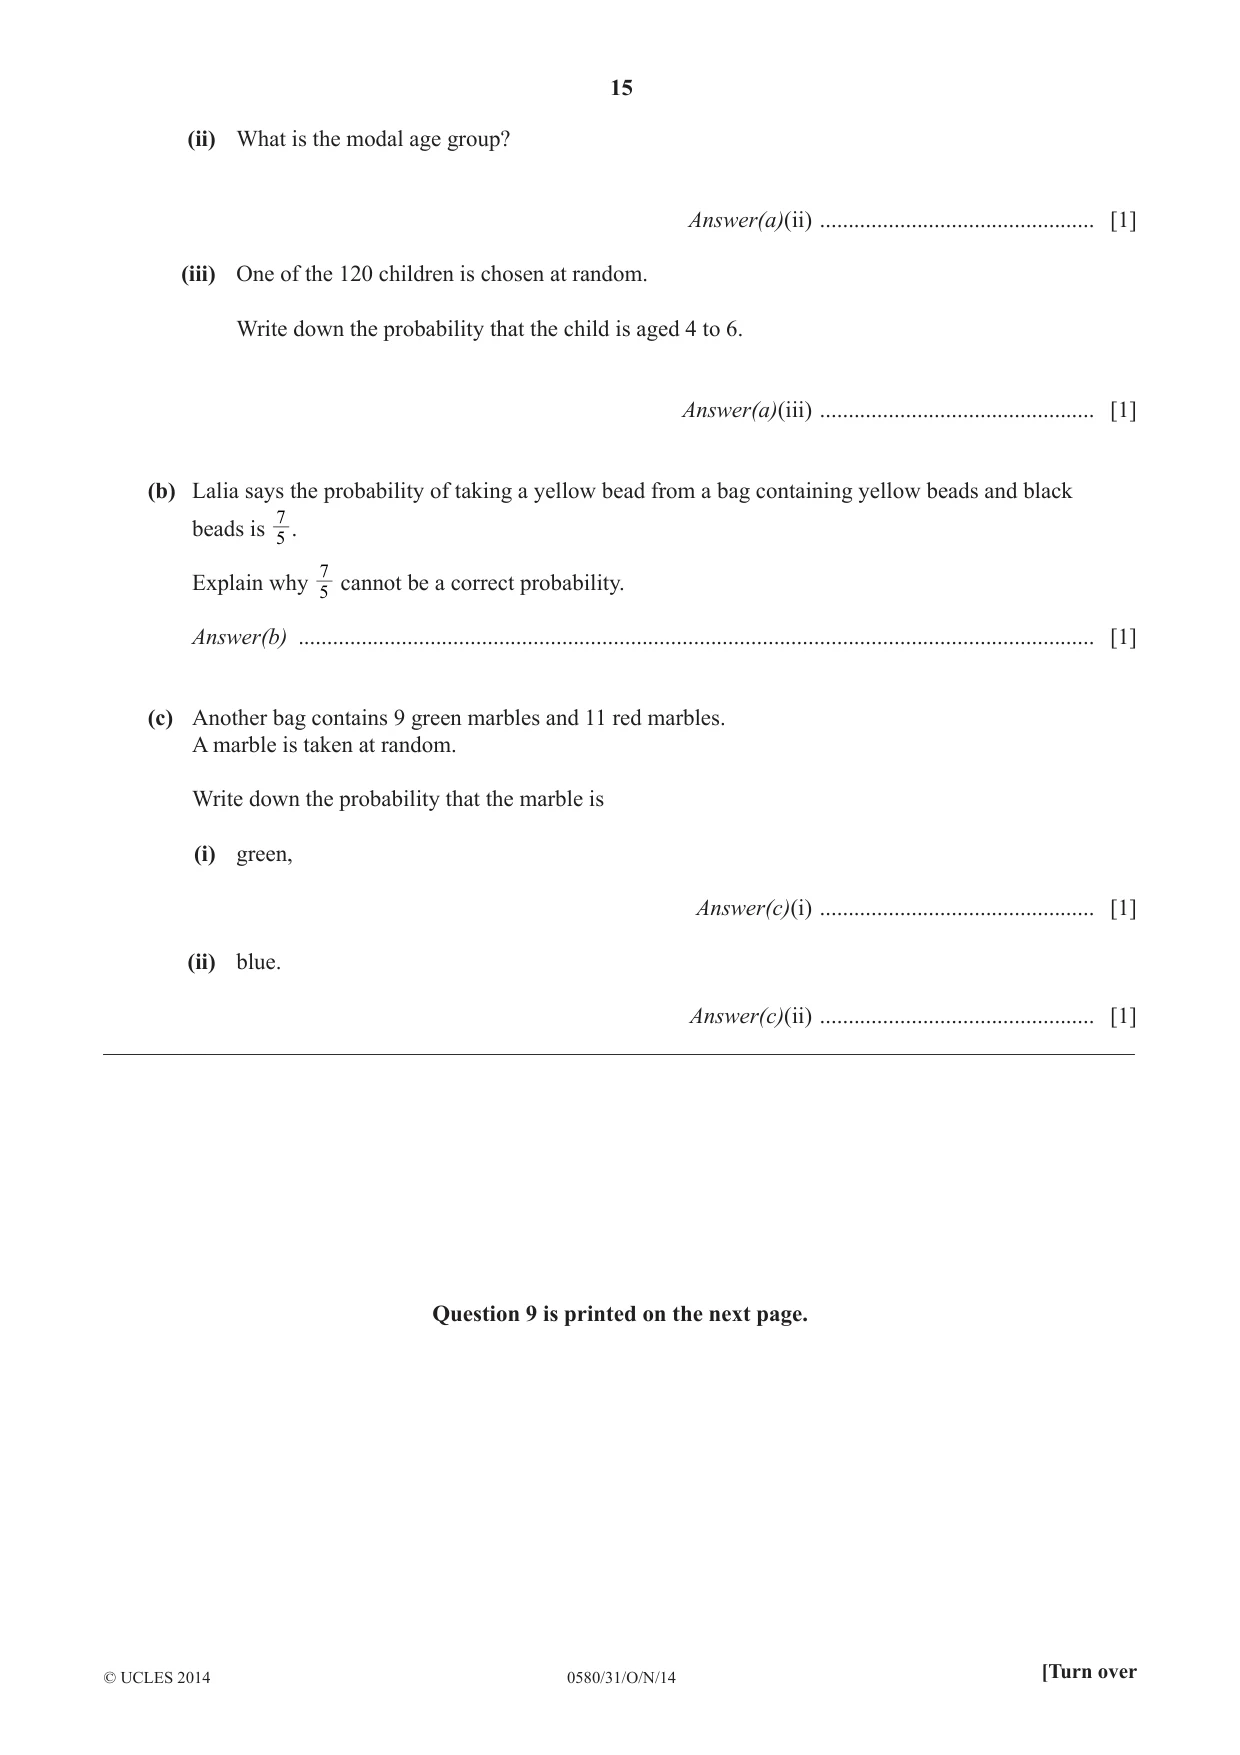
8 (a) One day a survey is taken of the ages of 120 children at a fairground. The results are shown in the frequency table. Age in completed years Number of children 1 to 3 12 4 to 6 19 7 to 9 32 10 to 12 41 13 to 15 9 16 to 18 7 (i) On the grid, draw a bar chart for this data. Complete the scale on the frequency axis. Frequency 1 to 3 4 to 6 7 to 9 10 to 12 13 to 15 16 to 18 Age in completed years [3] (ii) What is the modal age group? Answer(a)(ii) ................................................ [1] (iii) One of the 120 children is chosen at random. Write down the probability that the child is aged 4 to 6. Answer(a)(iii) ................................................ [1] (b) Lalia says the probability of taking a yellow bead from a bag containing yellow beads and black 7 beads is . 5 7 Explain why cannot be a correct probability. 5 Answer(b) ........................................................................................................................................... [1] (c) Another bag contains 9 green marbles and 11 red marbles. A marble is taken at random. Write down the probability that the marble is (i) green, Answer(c)(i) ................................................ [1] (ii) blue. Answer(c)(ii) ................................................ [1] __________________________________________________________________________________________ Question 9 is printed on the next page.
Mark scheme: 8 (a) (i) Correct diagram with scale 3 B1 scale correct. B1 for all widths the same B1 for all 6 heights correct (ii) 10 to 12 cao 1 19 (iii) or 0.158[3....] or 15.8[3......]% 1 120 (b) Probability must be between 0 and 1 oe 1 9 (c) (i) or 0.45 or 45% 1 20 (ii) 0 oe 1
Q9 · Diagram 1 Diagram 2 Diagram 3 Diagram 4 Diagrams 1 to 4 show a sequence of shapes made up…
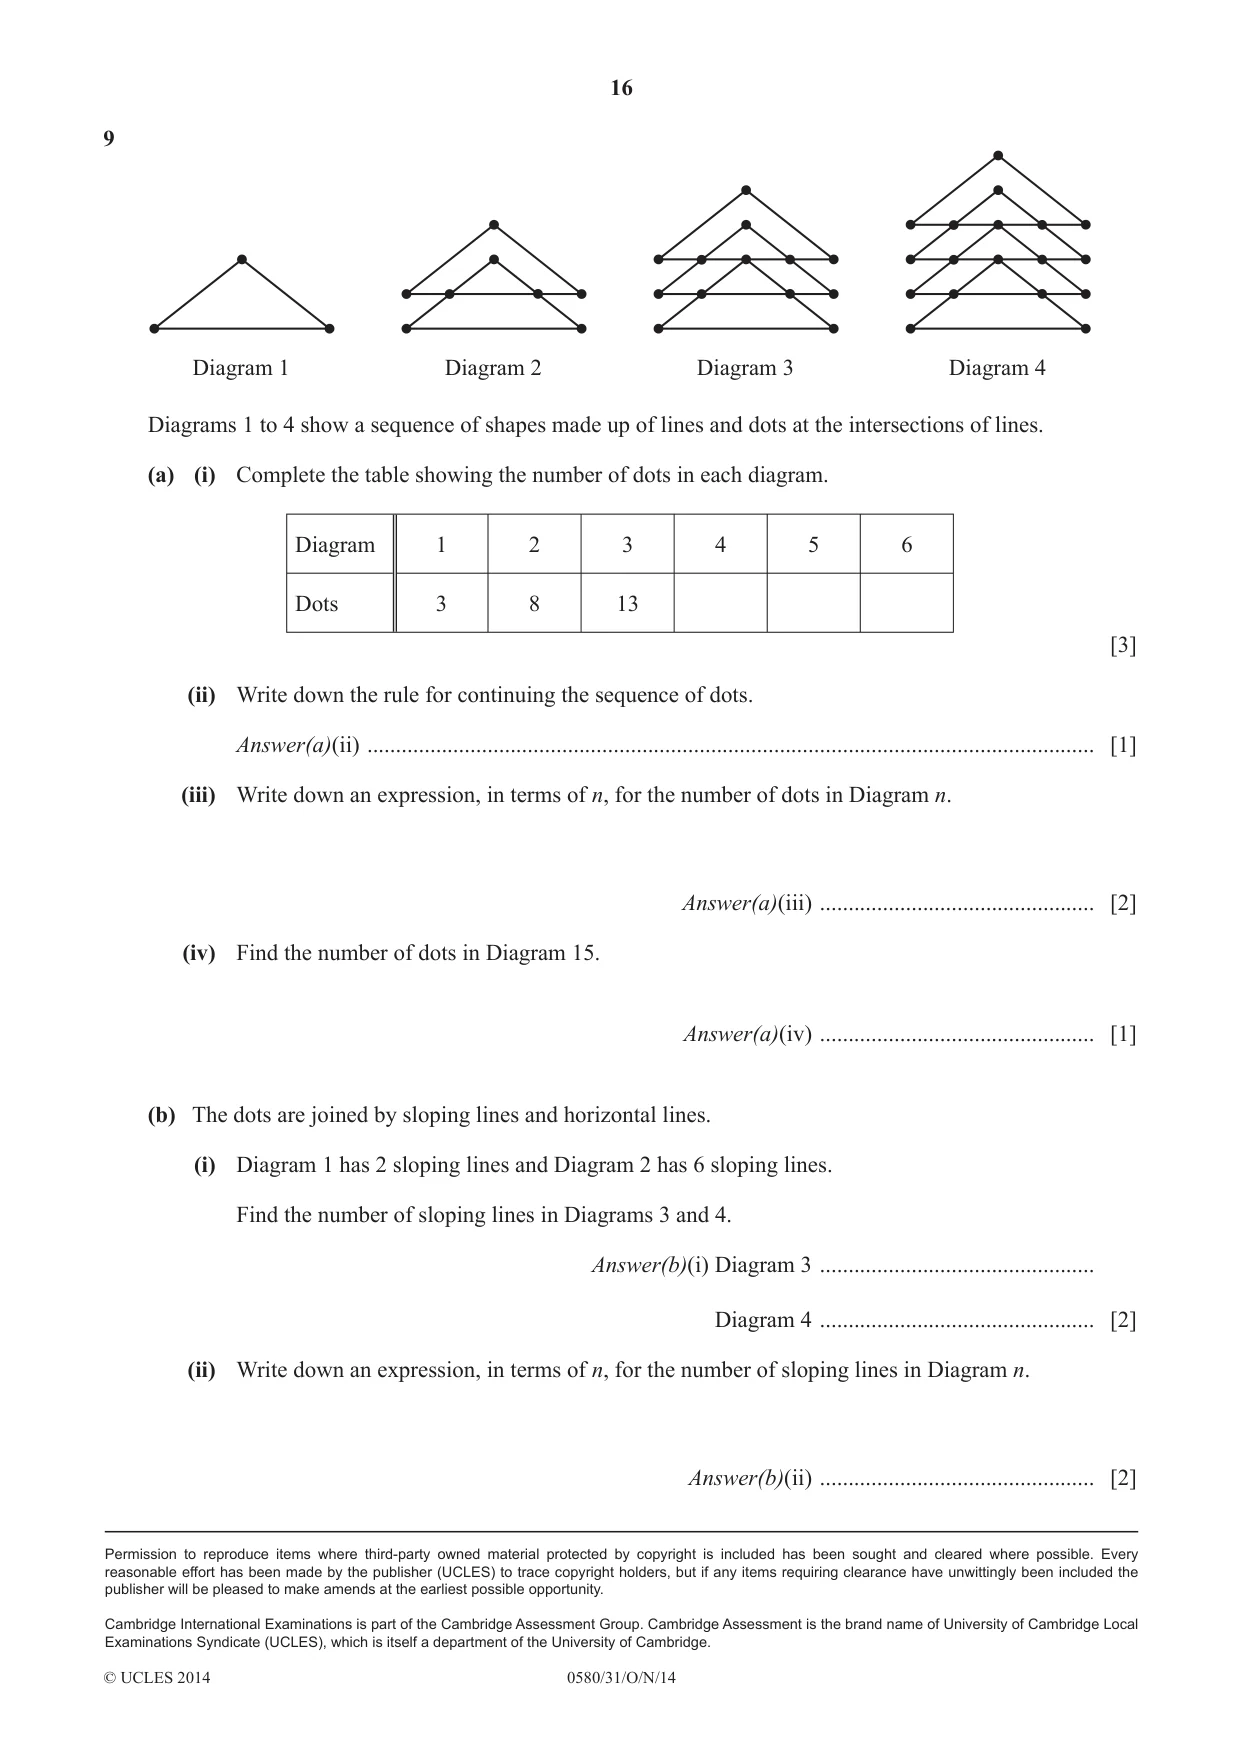
9 Diagram 1 Diagram 2 Diagram 3 Diagram 4 Diagrams 1 to 4 show a sequence of shapes made up of lines and dots at the intersections of lines. (a) (i) Complete the table showing the number of dots in each diagram. Diagram 1 2 3 4 5 6 Dots 3 8 13 [3] (ii) Write down the rule for continuing the sequence of dots. Answer(a)(ii) ............................................................................................................................... [1] (iii) Write down an expression, in terms of n, for the number of dots in Diagram n. Answer(a)(iii) ................................................ [2] (iv) Find the number of dots in Diagram 15. Answer(a)(iv) ................................................ [1] (b) The dots are joined by sloping lines and horizontal lines. (i) Diagram 1 has 2 sloping lines and Diagram 2 has 6 sloping lines. Find the number of sloping lines in Diagrams 3 and 4. Answer(b)(i) Diagram 3 ................................................ Diagram 4 ................................................ [2] (ii) Write down an expression, in terms of n, for the number of sloping lines in Diagram n. Answer(b)(ii) ................................................ [2]
Mark scheme: 9 (a) (i) 18 23 28 1, 1, 1 Allow one mark for each addition of 5 to the previous answer (ii) Add 5 oe 1 (iii) 5n – 2 oe 2 B1 for 5n + j or kn – 2 k ≠ 0 (iv) 73 1FT FT their (a)(iii) if linear. (b) (i) 10 14 1, 1 Allow 1 mark for addition of 4 on their value for 3rd diagram. (ii) 4n – 2 oe 2 B1 for 4n + j or kn – 2 k ≠ 0
What was in this paper
The subtopics covered by these 9 questions, and how many questions each got. Open one in a new tab to see every Cambridge question on it.
What you needed in this session
Cambridge’s own grade thresholds for 2014 Oct/Nov, Paper 3 · Variant 1. A higher threshold means an easier paper — the bar moves with how the cohort did.