Cambridge IGCSE Mathematics 0580 — 2007 Oct/Nov Paper 3 · Variant 1
0580/31/O/N/07 · 10 questions · 104 marks · ≈117 min
The question paper and its mark scheme, free to read here and free to download. This is Cambridge’s own paper, exactly as it was sat.
Question paper12 pages
Mark scheme5 pages
Answers below. Sit the paper first if you are practising.
Questions as text
Q1 · Margarita keeps a record of all her marks for science experiments, as shown in the table…
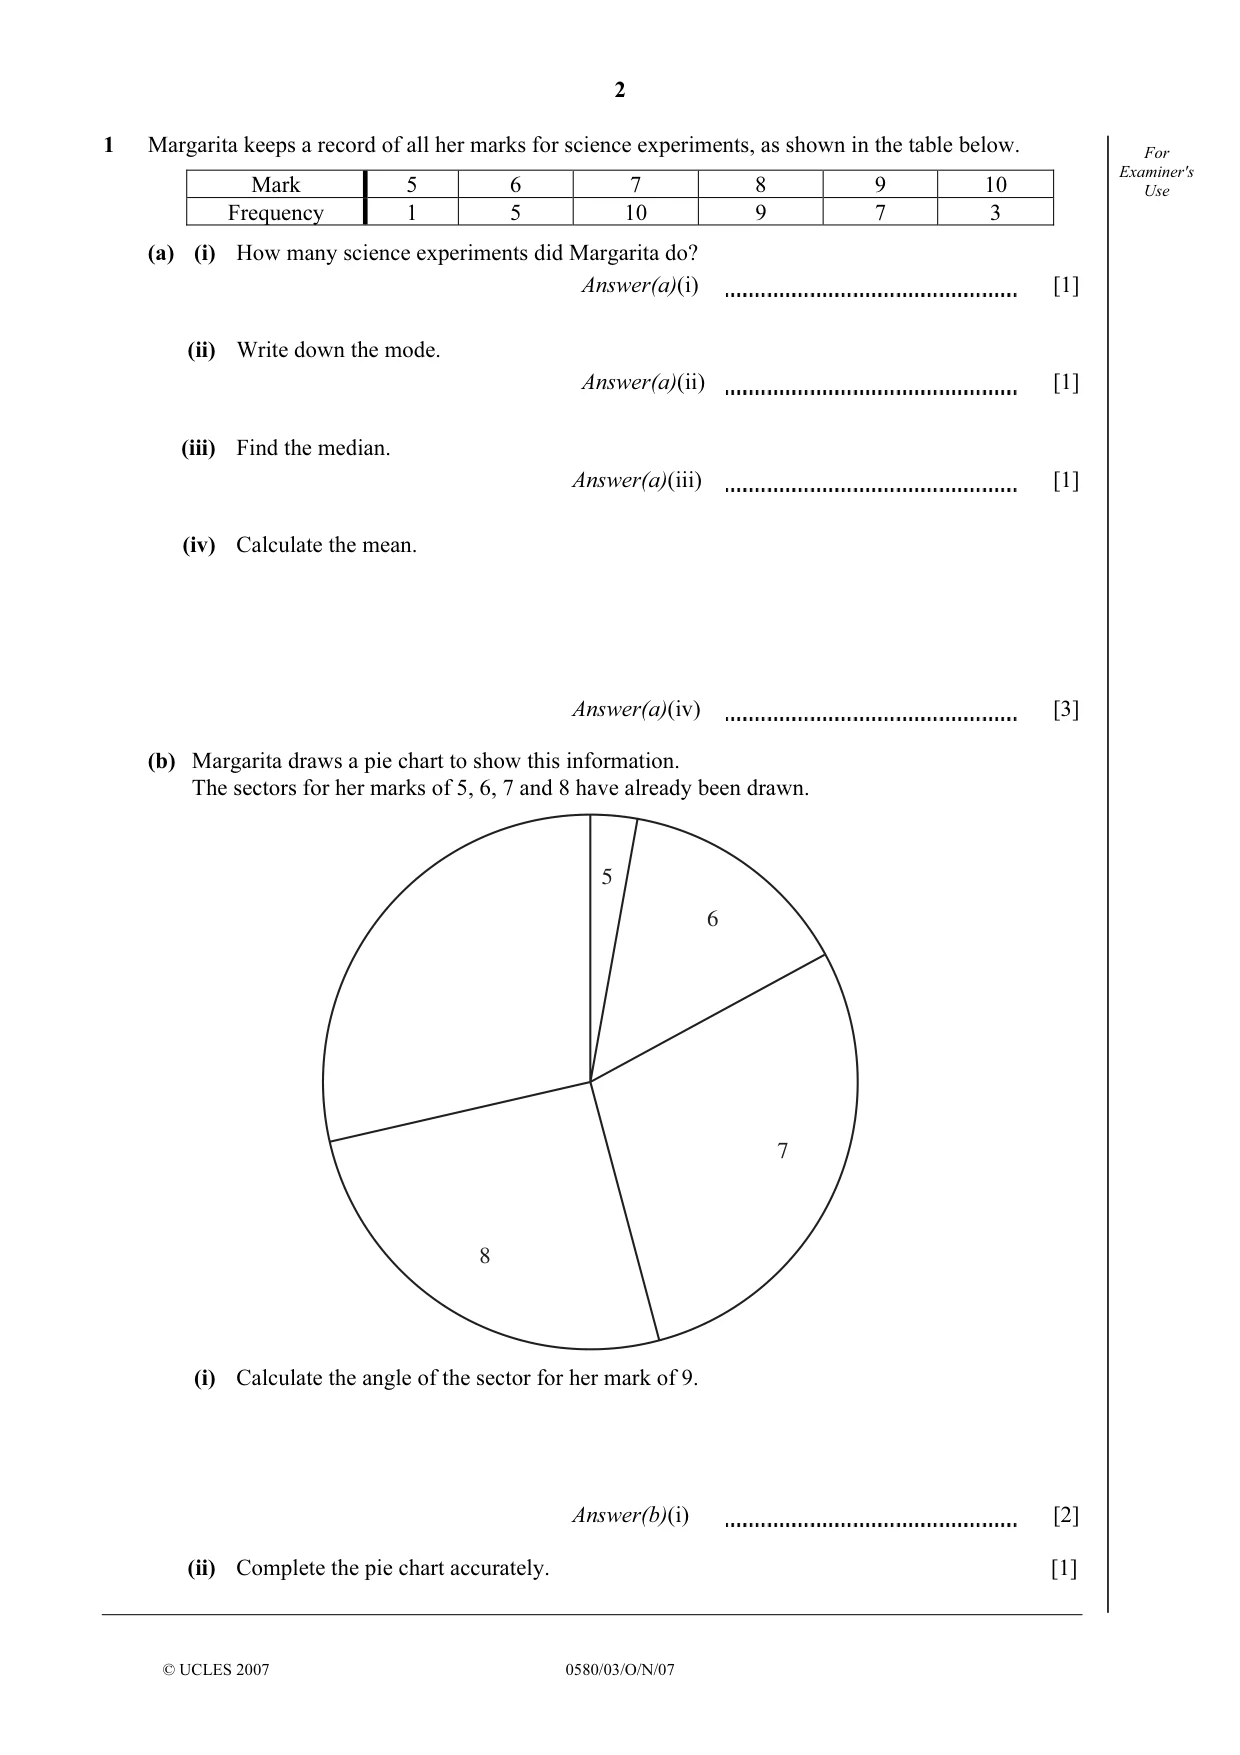
1 Margarita keeps a record of all her marks for science experiments, as shown in the table below. For Examiner's Mark 5 6 7 8 9 10 Use Frequency 1 5 10 9 7 3 (a) (i) How many science experiments did Margarita do? Answer(a)(i) [1] (ii) Write down the mode. Answer(a)(ii) [1] (iii) Find the median. Answer(a)(iii) [1] (iv) Calculate the mean. Answer(a)(iv) [3] (b) Margarita draws a pie chart to show this information. The sectors for her marks of 5, 6, 7 and 8 have already been drawn. 5 6 7 8 (i) Calculate the angle of the sector for her mark of 9. Answer(b)(i) [2] (ii) Complete the pie chart accurately. [1]
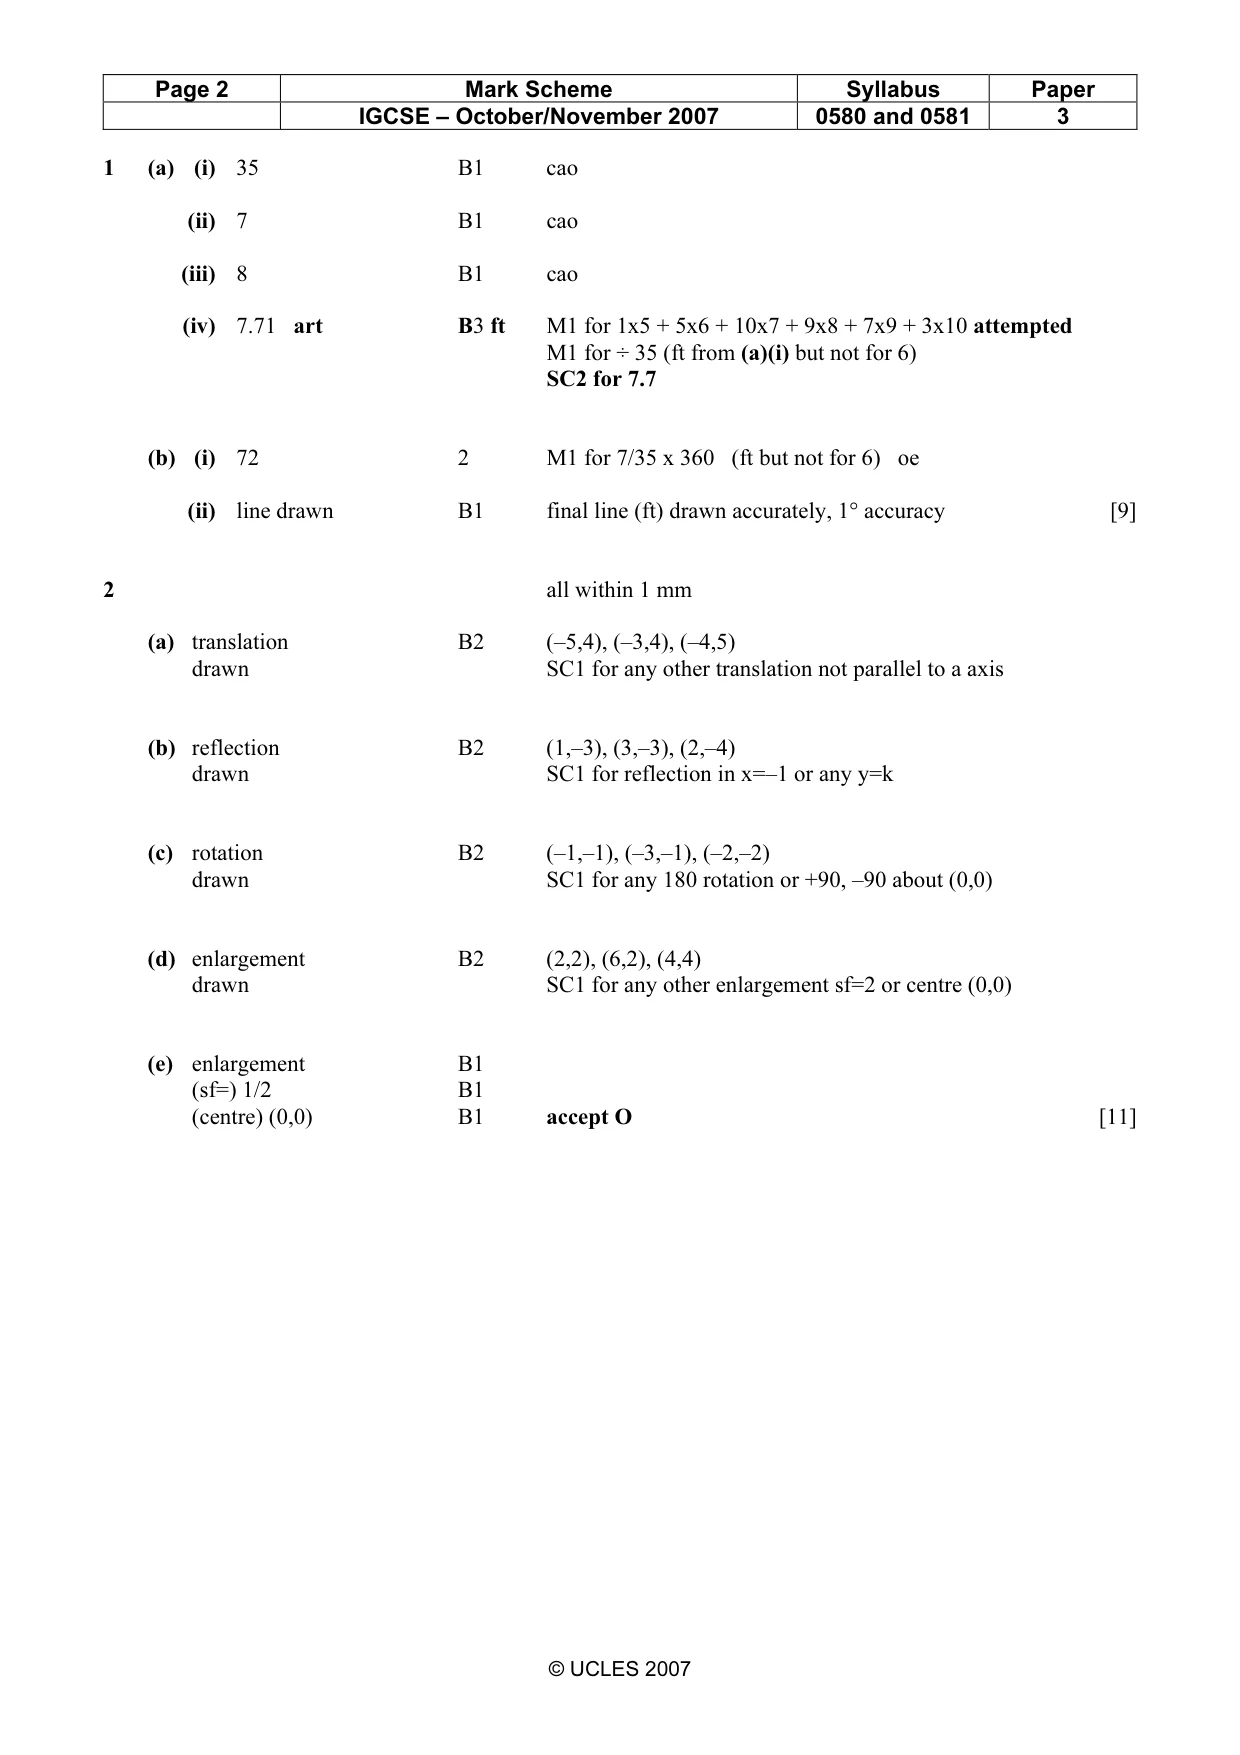
Mark scheme: 1 (a) (i) 35 B1 cao (ii) 7 B1 cao (iii) 8 B1 cao (iv) 7.71 art B3 ft M1 for 1x5 + 5x6 + 10x7 + 9x8 + 7x9 + 3x10 attempted M1 for ÷ 35 (ft from (a)(i) but not for 6) SC2 for 7.7 (b) (i) 72 2 M1 for 7/35 x 360 (ft but not for 6) oe (ii) line drawn B1 final line (ft) drawn accurately, 1° accuracy [9]
Q2 · For y Examiner's Use 7 6 5 4 3 2 T 1 x –7 –6 –5 –4 –3 –2 –1 0 1 2 3 4 5 6 7 –1 –2 –3 –4…
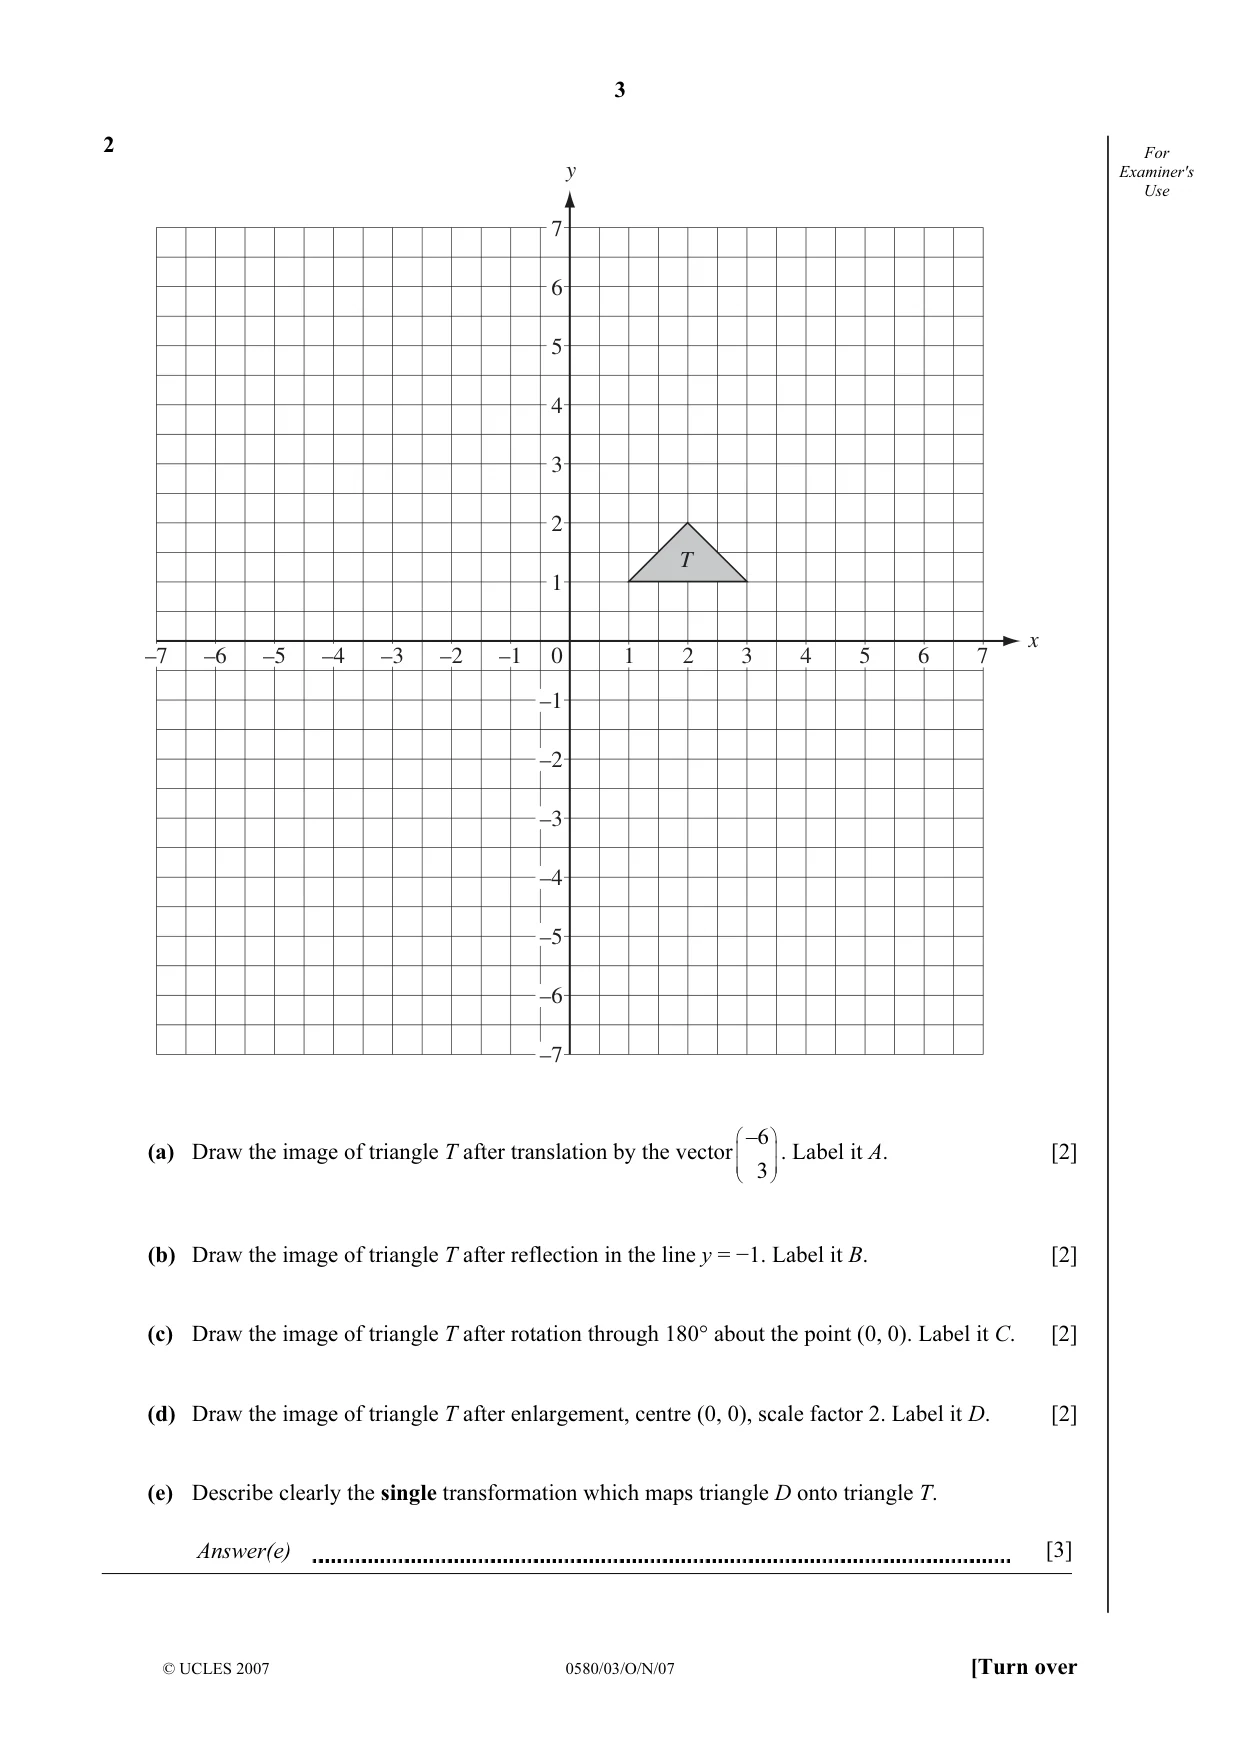
2 For y Examiner's Use 7 6 5 4 3 2 T 1 x –7 –6 –5 –4 –3 –2 –1 0 1 2 3 4 5 6 7 –1 –2 –3 –4 –5 –6 –7 _6 (a) Draw the image of triangle T after translation by the vector . Label it A. [2] 3 (b) Draw the image of triangle T after reflection in the line y = −1. Label it B. [2] (c) Draw the image of triangle T after rotation through 180° about the point (0, 0). Label it C. [2] (d) Draw the image of triangle T after enlargement, centre (0, 0), scale factor 2. Label it D. [2] (e) Describe clearly the single transformation which maps triangle D onto triangle T. Answer(e) [3]
Mark scheme: 2 all within 1 mm (a) translation B2 (–5,4), (–3,4), (–4,5) drawn SC1 for any other translation not parallel to a axis (b) reflection B2 (1,–3), (3,–3), (2,–4) drawn SC1 for reflection in x=–1 or any y=k (c) rotation B2 (–1,–1), (–3,–1), (–2,–2) drawn SC1 for any 180 rotation or +90, –90 about (0,0) (d) enlargement B2 (2,2), (6,2), (4,4) drawn SC1 for any other enlargement sf=2 or centre (0,0) (e) enlargement B1 (sf=) 1/2 B1 (centre) (0,0) B1 accept O [11] IGCSE – October/November 2007 0580 and 0581 3
Q3 · , (x ≠ 0)
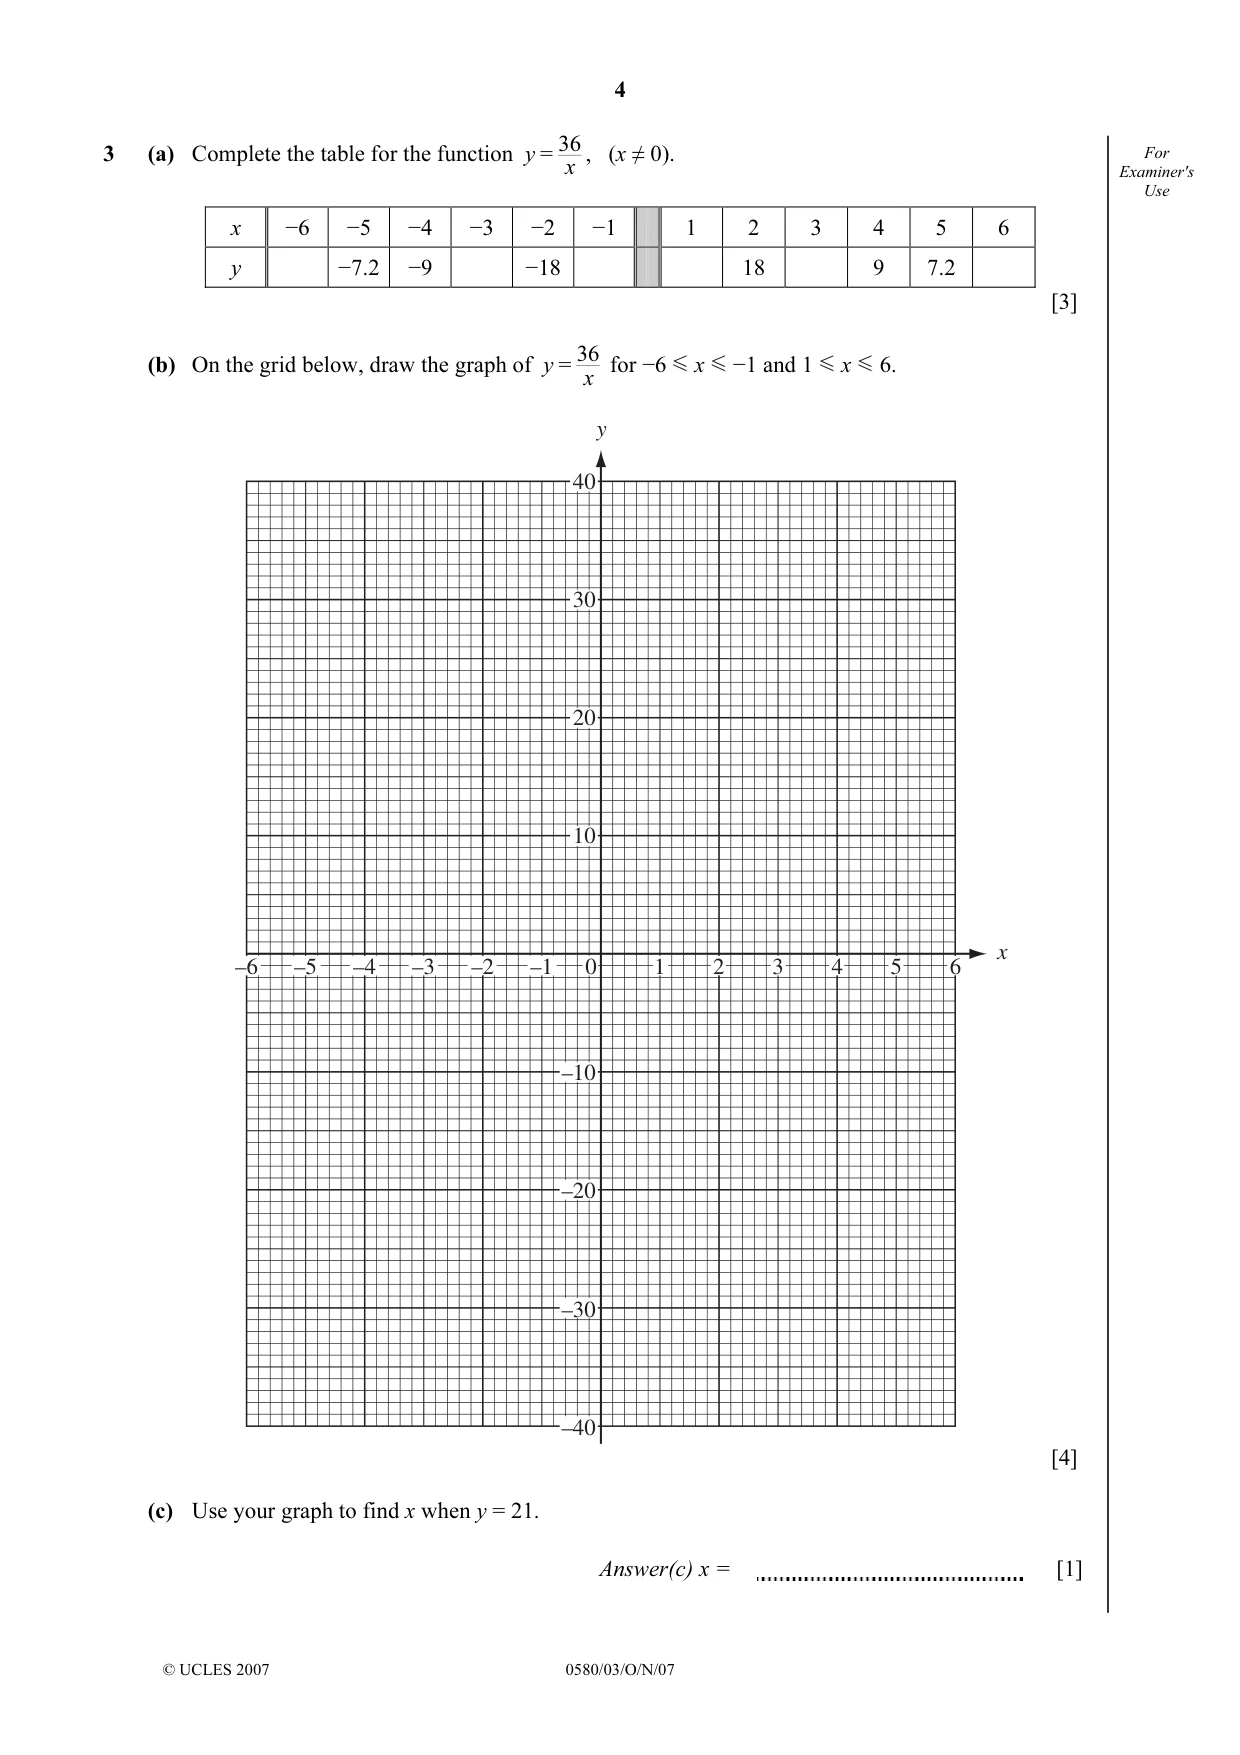
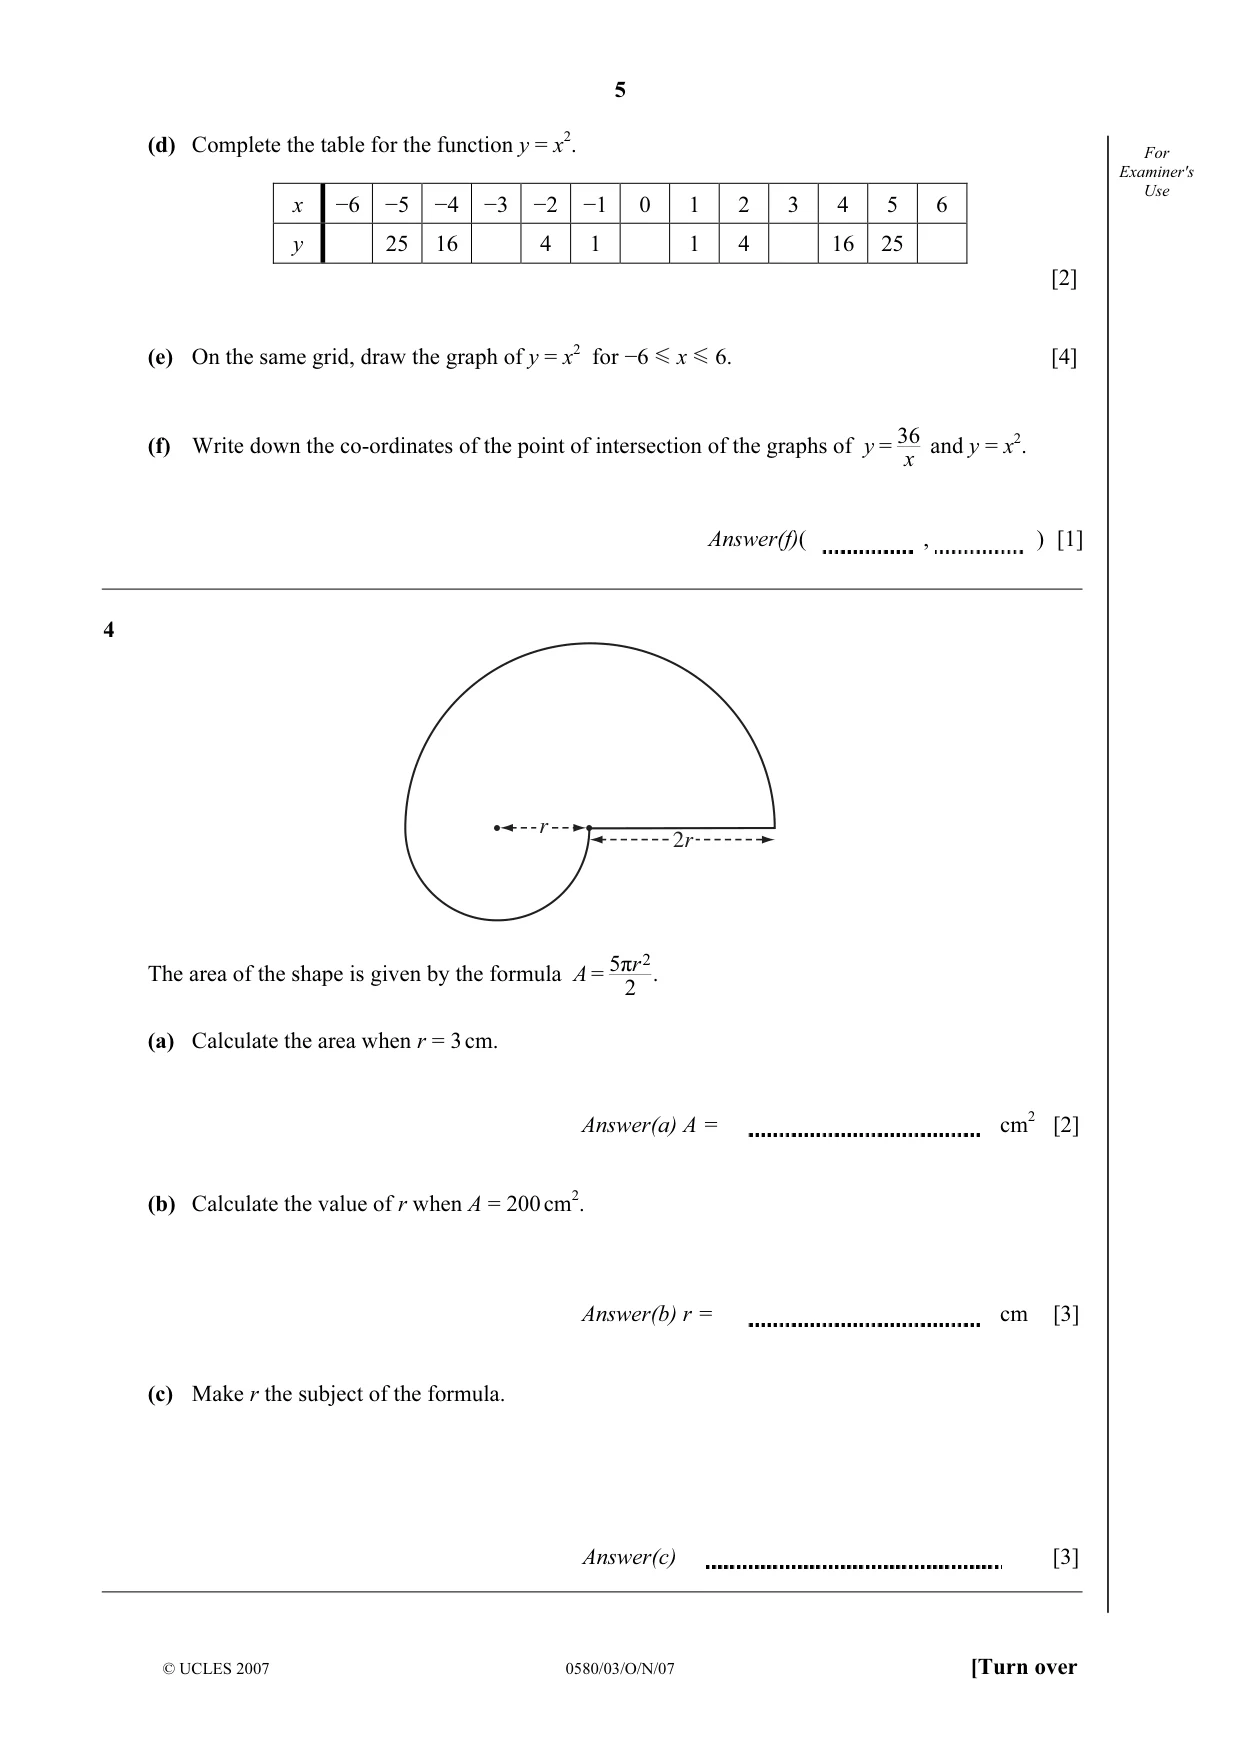
36 , (x ≠ 0). For3 (a) Complete the table for the function y = x Examiner's Use x −6 −5 −4 −3 −2 −1 1 2 3 4 5 6 y −7.2 −9 −18 18 9 7.2 [3] 36 (b) On the grid below, draw the graph of y = for −6 x −1 and 1 x 6. x y 40 30 20 10 x –6 –5 –4 –3 –2 –1 0 1 2 3 4 5 6 –10 –20 –30 –40 [4] (c) Use your graph to find x when y = 21. Answer(c) x = [1] (d) Complete the table for the function y = x2. For Examiner's Use x −6 −5 −4 −3 −2 −1 0 1 2 3 4 5 6 y 25 16 4 1 1 4 16 25 [2] (e) On the same grid, draw the graph of y = x2 for −6 x 6. [4] 36(f) Write down the co-ordinates of the point of intersection of the graphs of y = and y = x2. x Answer(f)( , ) [1]
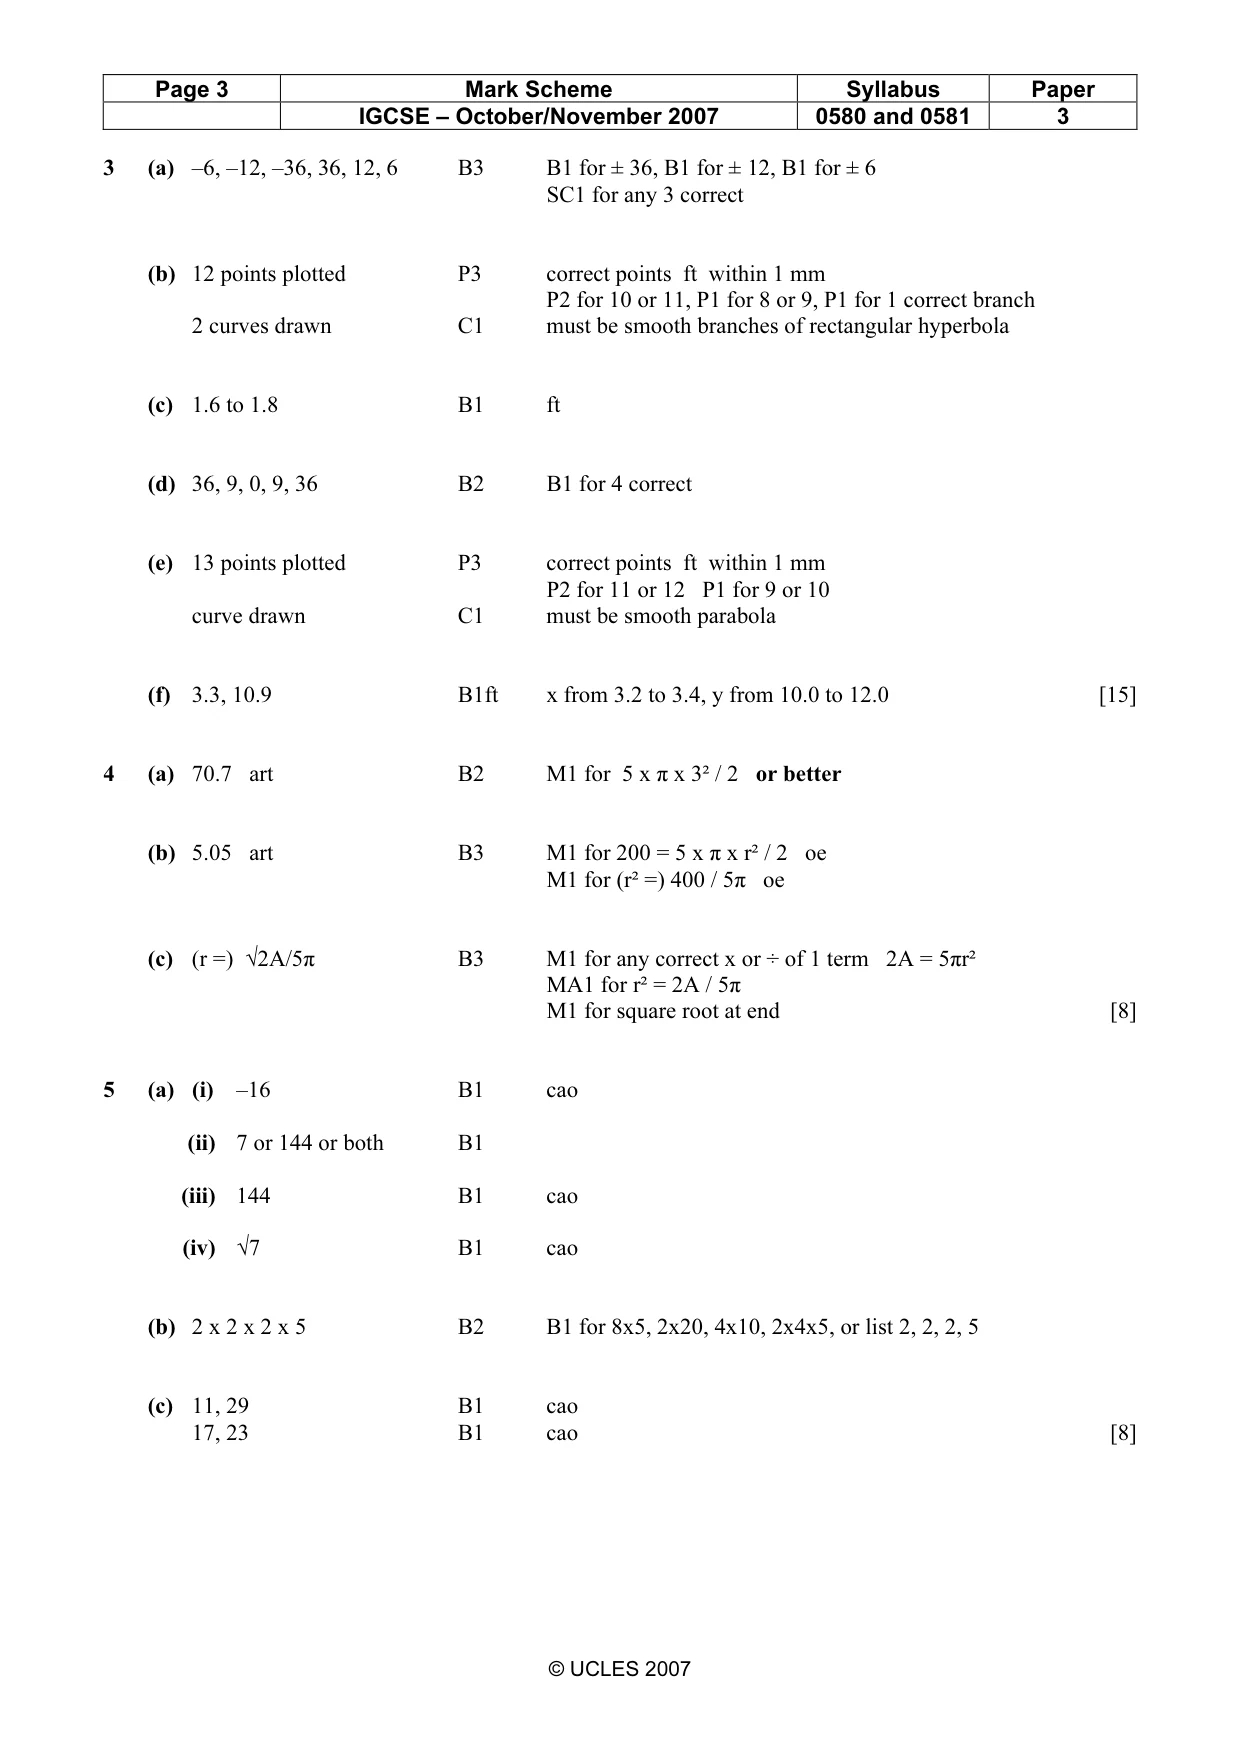
Mark scheme: 3 (a) –6, –12, –36, 36, 12, 6 B3 B1 for ± 36, B1 for ± 12, B1 for ± 6 SC1 for any 3 correct (b) 12 points plotted P3 correct points ft within 1 mm P2 for 10 or 11, P1 for 8 or 9, P1 for 1 correct branch 2 curves drawn C1 must be smooth branches of rectangular hyperbola (c) 1.6 to 1.8 B1 ft (d) 36, 9, 0, 9, 36 B2 B1 for 4 correct (e) 13 points plotted P3 correct points ft within 1 mm P2 for 11 or 12 P1 for 9 or 10 curve drawn C1 must be smooth parabola (f) 3.3, 10.9 B1ft x from 3.2 to 3.4, y from 10.0 to 12.0 [15]
Q4 · R 2r 5πr 2 The area of the shape is given by the formula A =
4 r 2r 5πr 2 The area of the shape is given by the formula A = . 2 (a) Calculate the area when r = 3 cm. Answer(a) A = cm2 [2] (b) Calculate the value of r when A = 200 cm2. Answer(b) r = cm [3] (c) Make r the subject of the formula. Answer(c) [3]
Mark scheme: 4 (a) 70.7 art B2 M1 for 5 x π x 3² / 2 or better (b) 5.05 art B3 M1 for 200 = 5 x π x r² / 2 oe M1 for (r² =) 400 / 5π oe (c) (r =) √2A/5π B3 M1 for any correct x or ÷ of 1 term 2A = 5πr² MA1 for r² = 2A / 5π M1 for square root at end [8]
Q5 · 5 (a) –4 –16 0.12 7 144 7 2 For 3 Examiner's Use From this list of numbers, write down…
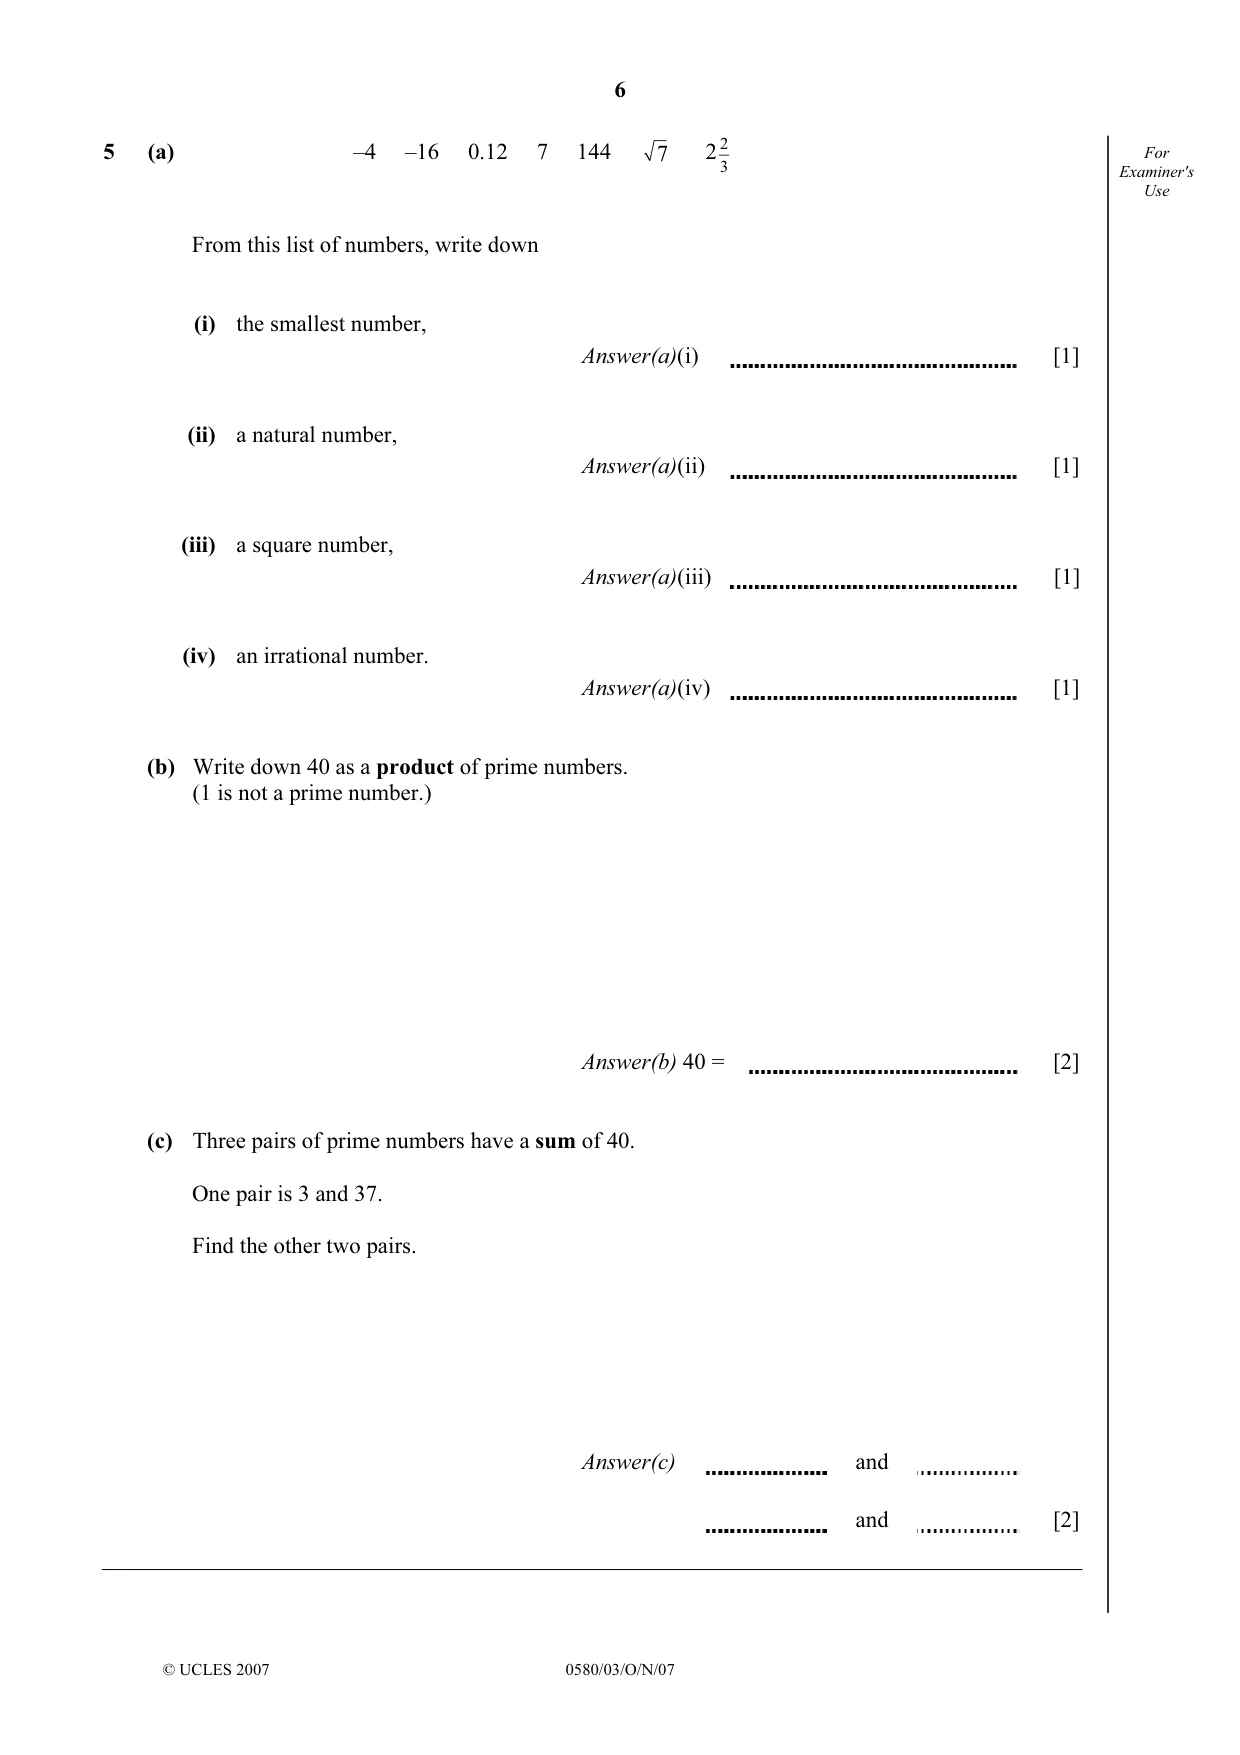
2 5 (a) –4 –16 0.12 7 144 7 2 For 3 Examiner's Use From this list of numbers, write down (i) the smallest number, Answer(a)(i) [1] (ii) a natural number, Answer(a)(ii) [1] (iii) a square number, Answer(a)(iii) [1] (iv) an irrational number. Answer(a)(iv) [1] (b) Write down 40 as a product of prime numbers. (1 is not a prime number.) Answer(b) 40 = [2] (c) Three pairs of prime numbers have a sum of 40. One pair is 3 and 37. Find the other two pairs. Answer(c) and and [2]
Mark scheme: 5 (a) (i) –16 B1 cao (ii) 7 or 144 or both B1 (iii) 144 B1 cao (iv) √7 B1 cao (b) 2 x 2 x 2 x 5 B2 B1 for 8x5, 2x20, 4x10, 2x4x5, or list 2, 2, 2, 5 (c) 11, 29 B1 cao 17, 23 B1 cao [8] IGCSE – October/November 2007 0580 and 0581 3
Q6 · Pencils cost 5 cents each and erasers cost 4 cents each
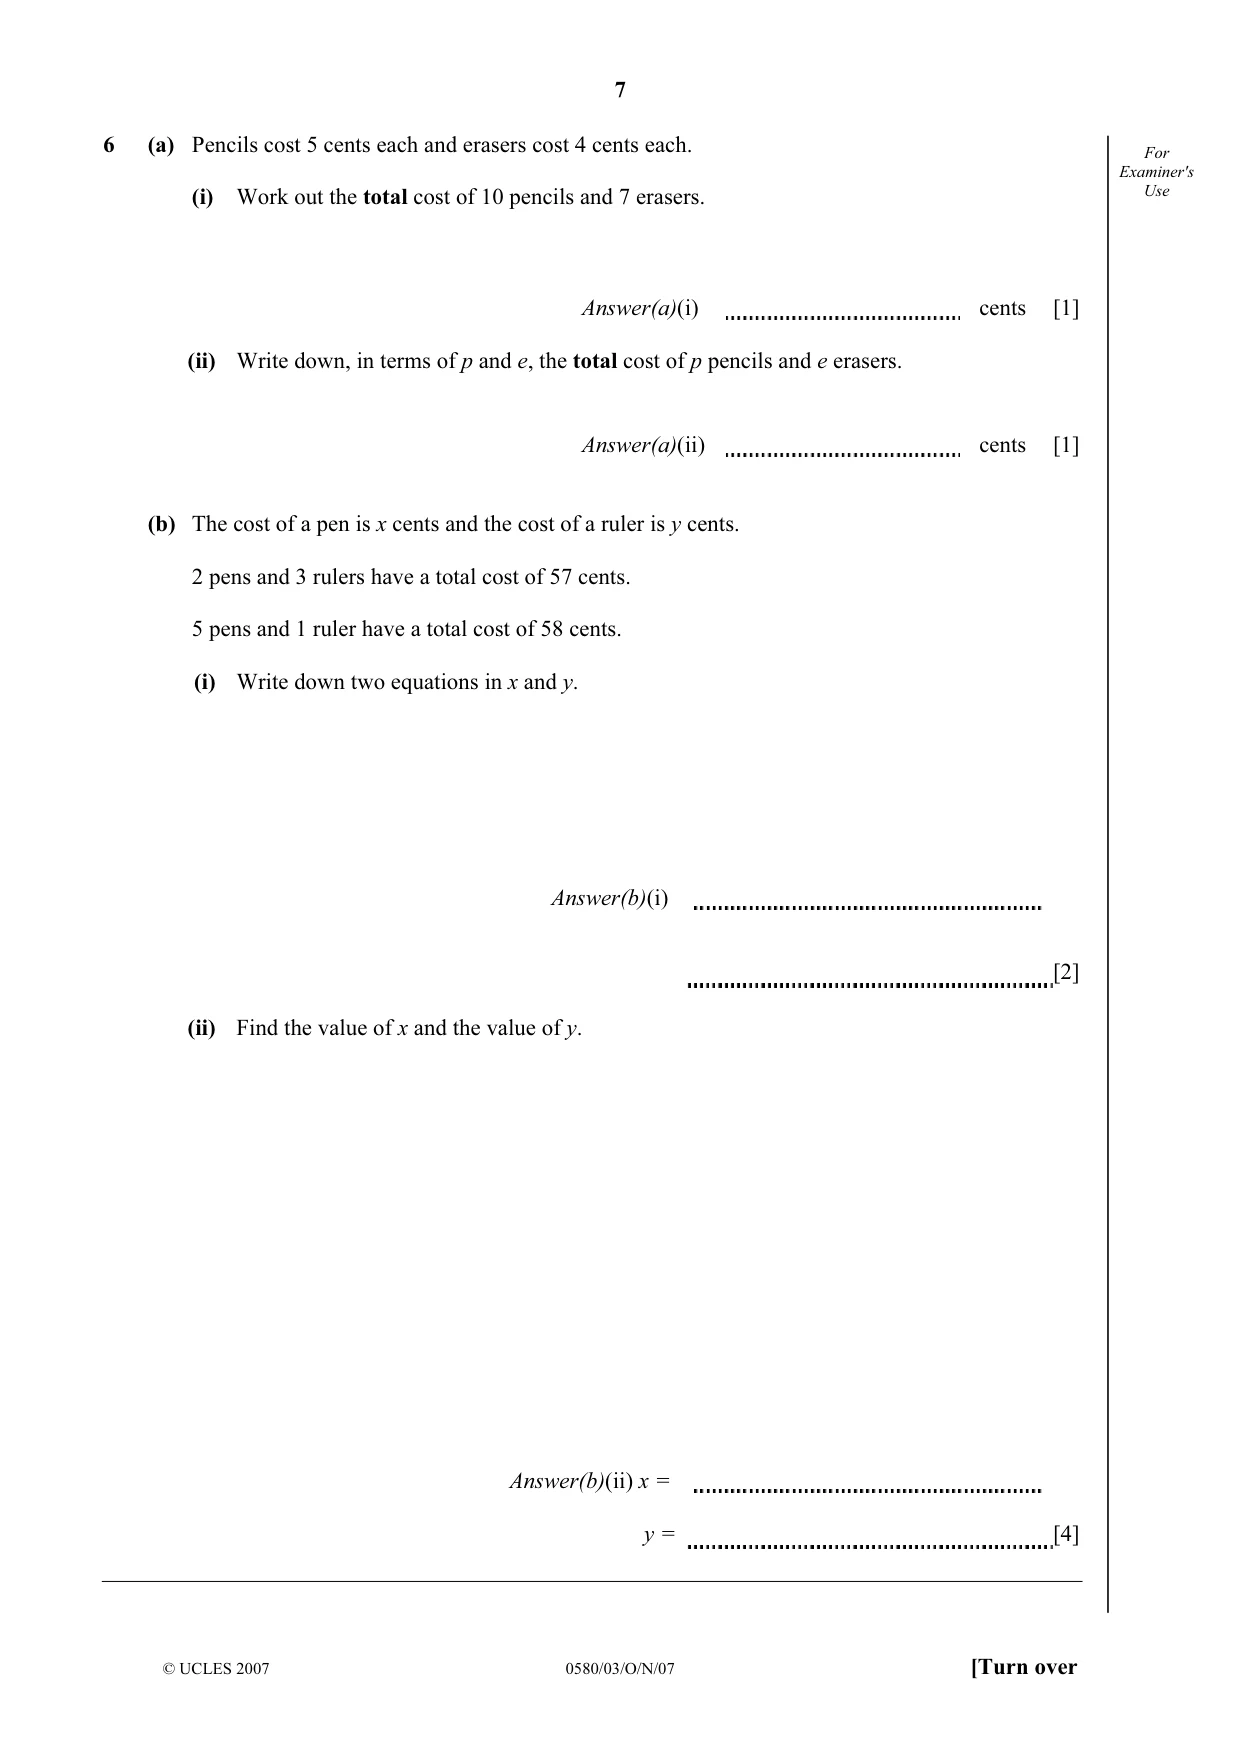
6 (a) Pencils cost 5 cents each and erasers cost 4 cents each. For Examiner's (i) Work out the total cost of 10 pencils and 7 erasers. Use Answer(a)(i) cents [1] (ii) Write down, in terms of p and e, the total cost of p pencils and e erasers. Answer(a)(ii) cents [1] (b) The cost of a pen is x cents and the cost of a ruler is y cents. 2 pens and 3 rulers have a total cost of 57 cents. 5 pens and 1 ruler have a total cost of 58 cents. (i) Write down two equations in x and y. Answer(b)(i) [2] (ii) Find the value of x and the value of y. Answer(b)(ii) x = y = [4]
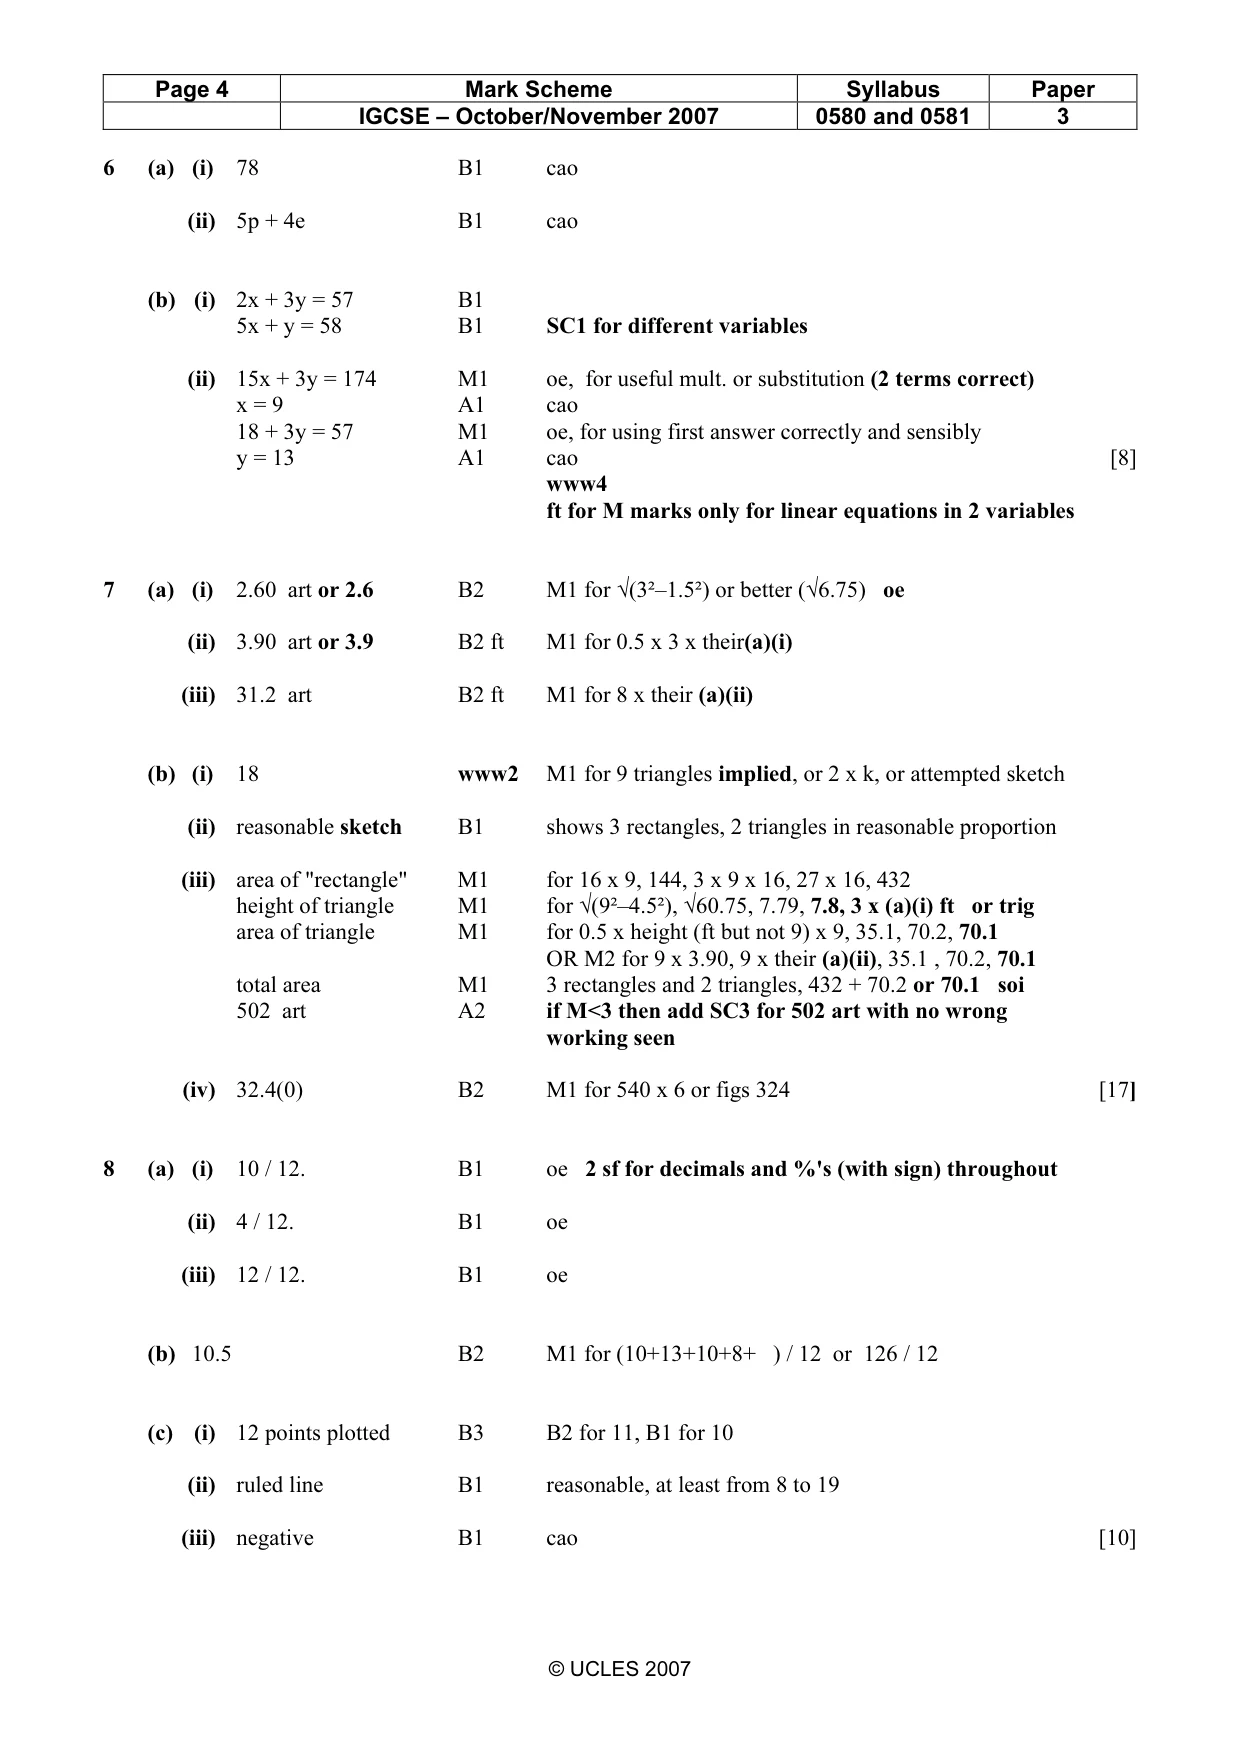
Mark scheme: 6 (a) (i) 78 B1 cao (ii) 5p + 4e B1 cao (b) (i) 2x + 3y = 57 B1 5x + y = 58 B1 SC1 for different variables (ii) 15x + 3y = 174 M1 oe, for useful mult. or substitution (2 terms correct) x = 9 A1 cao 18 + 3y = 57 M1 oe, for using first answer correctly and sensibly y = 13 A1 cao [8] www4 ft for M marks only for linear equations in 2 variables √ √
Q7 · For NOT TO Examiner's SCALE Use A A 3 cm 3 cm 3 cm 3 cm 8 cm B D C B 3 cm C 3 cm Diagram…
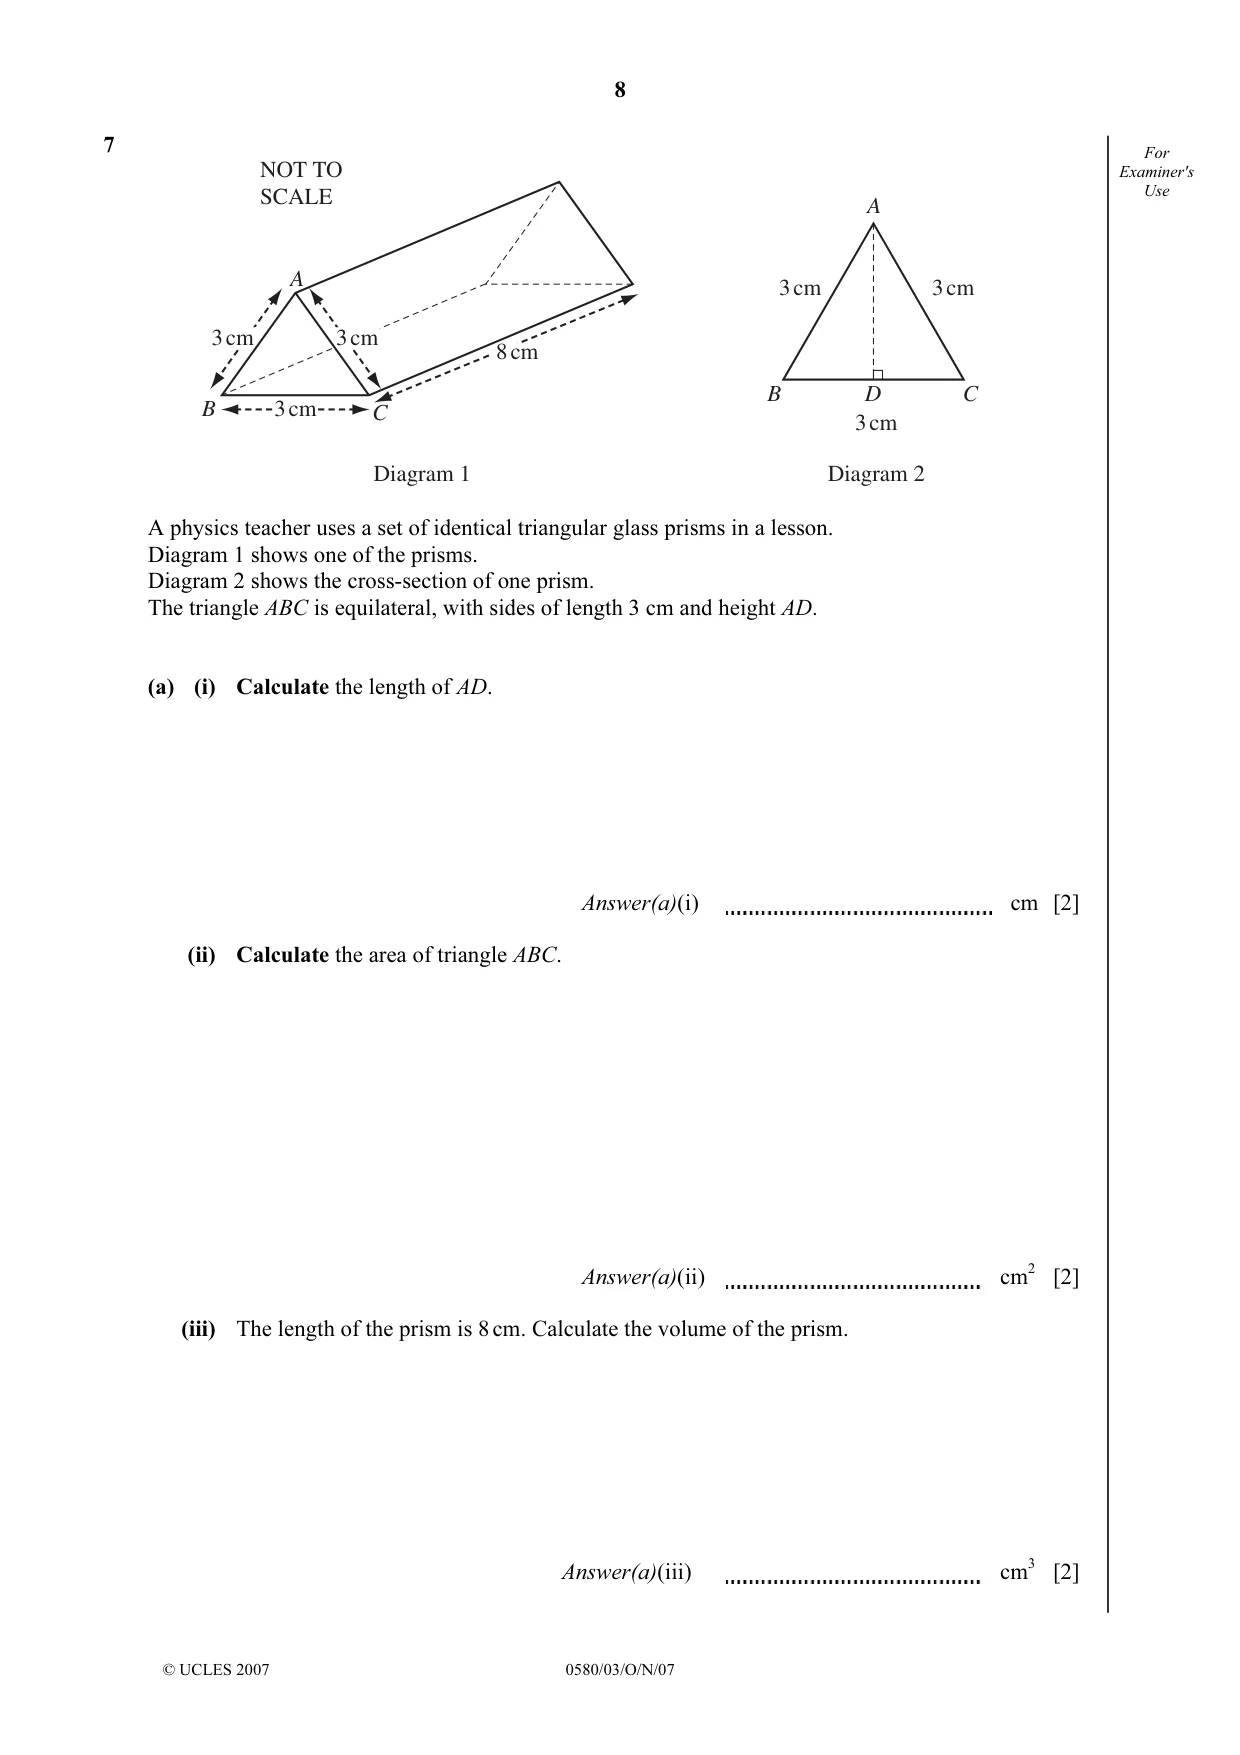
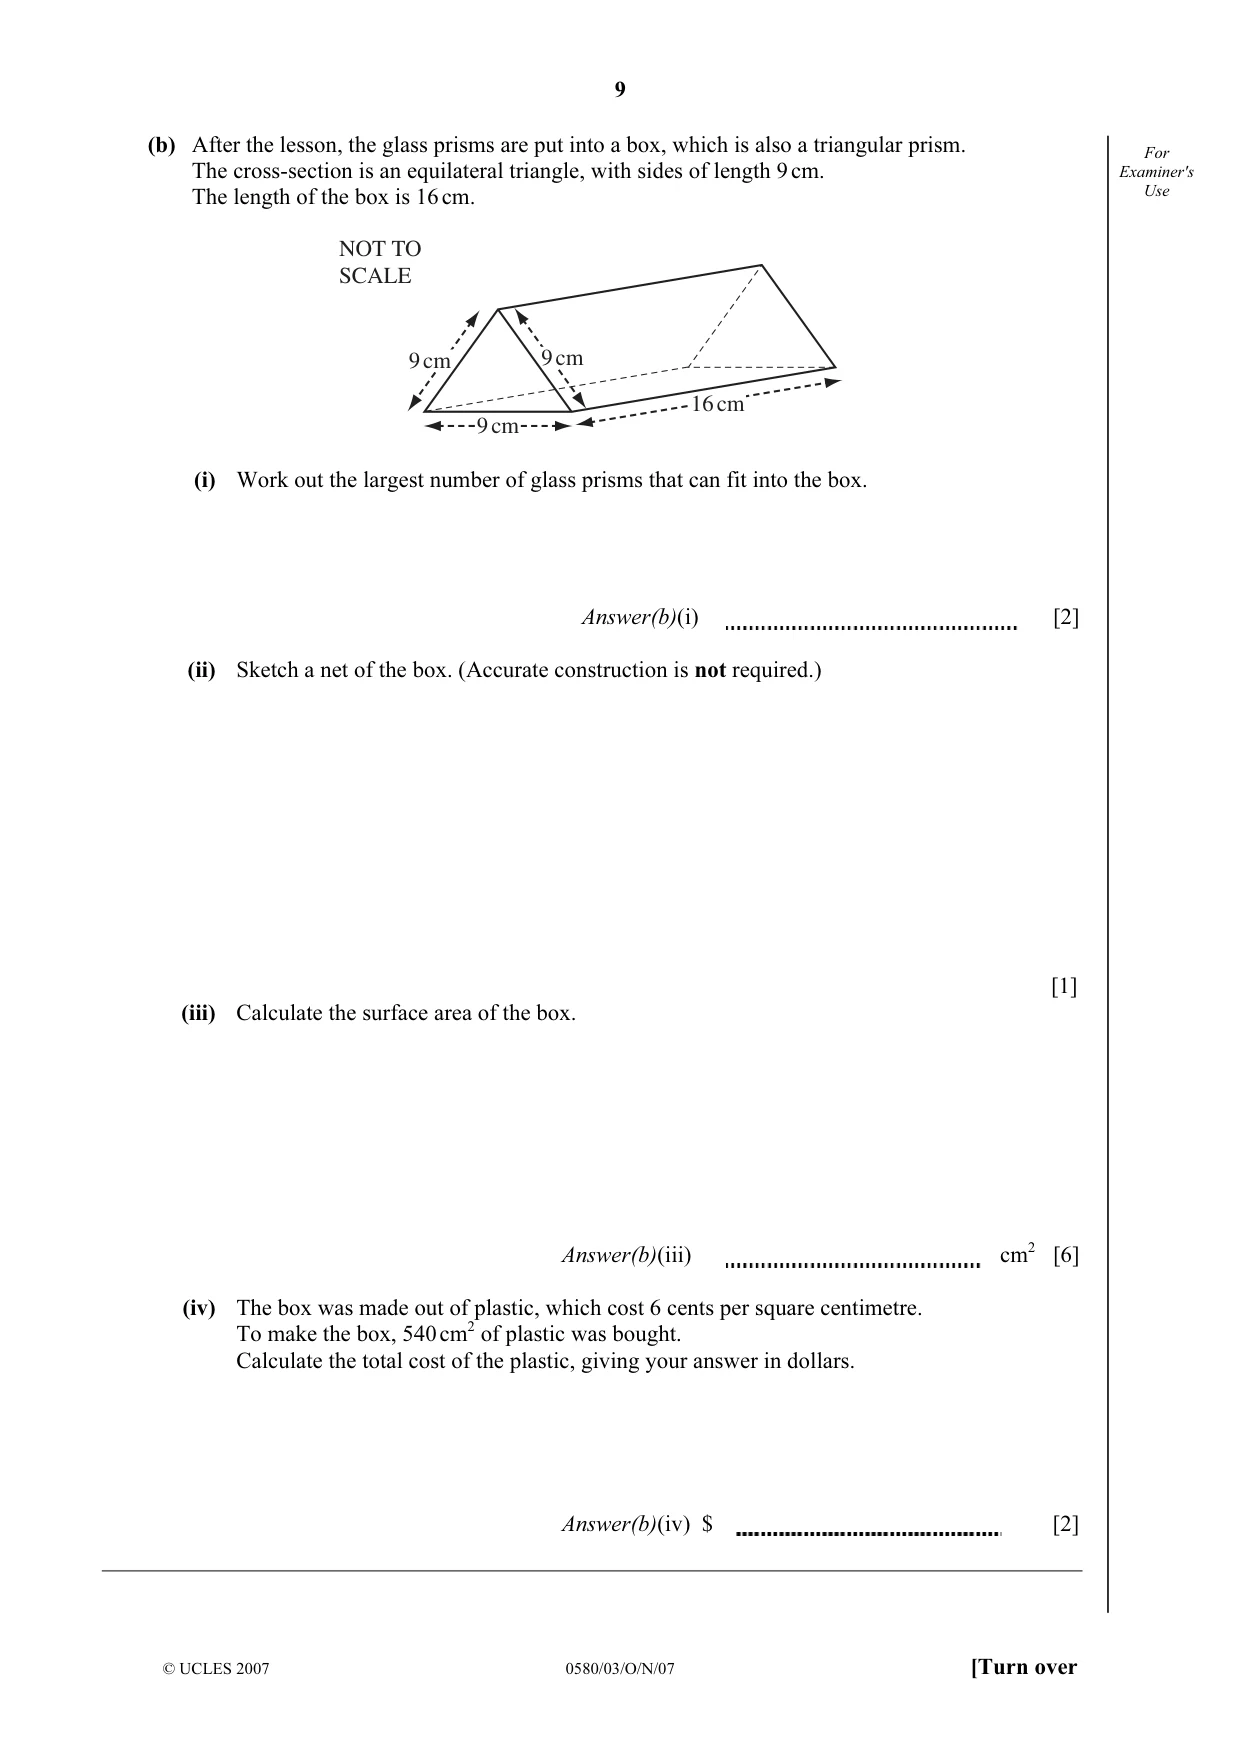
7 For NOT TO Examiner's SCALE Use A A 3 cm 3 cm 3 cm 3 cm 8 cm B D C B 3 cm C 3 cm Diagram 1 Diagram 2 A physics teacher uses a set of identical triangular glass prisms in a lesson. Diagram 1 shows one of the prisms. Diagram 2 shows the cross-section of one prism. The triangle ABC is equilateral, with sides of length 3 cm and height AD. (a) (i) Calculate the length of AD. Answer(a)(i) cm [2] (ii) Calculate the area of triangle ABC. Answer(a)(ii) cm2 [2] (iii) The length of the prism is 8 cm. Calculate the volume of the prism. Answer(a)(iii) cm3 [2] (b) After the lesson, the glass prisms are put into a box, which is also a triangular prism. For The cross-section is an equilateral triangle, with sides of length 9 cm. Examiner's The length of the box is 16 cm. Use NOT TO SCALE 9 cm 9 cm 16 cm 9 cm (i) Work out the largest number of glass prisms that can fit into the box. Answer(b)(i) [2] (ii) Sketch a net of the box. (Accurate construction is not required.) [1] (iii) Calculate the surface area of the box. Answer(b)(iii) cm2 [6] (iv) The box was made out of plastic, which cost 6 cents per square centimetre. To make the box, 540 cm2 of plastic was bought. Calculate the total cost of the plastic, giving your answer in dollars. Answer(b)(iv) $ [2]
Mark scheme: 7 (a) (i) 2.60 art or 2.6 B2 M1 for √(3²–1.5²) or better (√6.75) oe (ii) 3.90 art or 3.9 B2 ft M1 for 0.5 x 3 x their(a)(i) (iii) 31.2 art B2 ft M1 for 8 x their (a)(ii) (b) (i) 18 www2 M1 for 9 triangles implied, or 2 x k, or attempted sketch (ii) reasonable sketch B1 shows 3 rectangles, 2 triangles in reasonable proportion (iii) area of "rectangle" M1 for 16 x 9, 144, 3 x 9 x 16, 27 x 16, 432 height of triangle M1 for √(9²–4.5²), √60.75, 7.79, 7.8, 3 x (a)(i) ft or trig area of triangle M1 for 0.5 x height (ft but not 9) x 9, 35.1, 70.2, 70.1 OR M2 for 9 x 3.90, 9 x their (a)(ii), 35.1 , 70.2, 70.1 total area M1 3 rectangles and 2 triangles, 432 + 70.2 or 70.1 soi 502 art A2 if M<3 then add SC3 for 502 art with no wrong working seen (iv) 32.4(0) B2 M1 for 540 x 6 or figs 324 [17]
Q8 · Carlos is in a class of 12 students
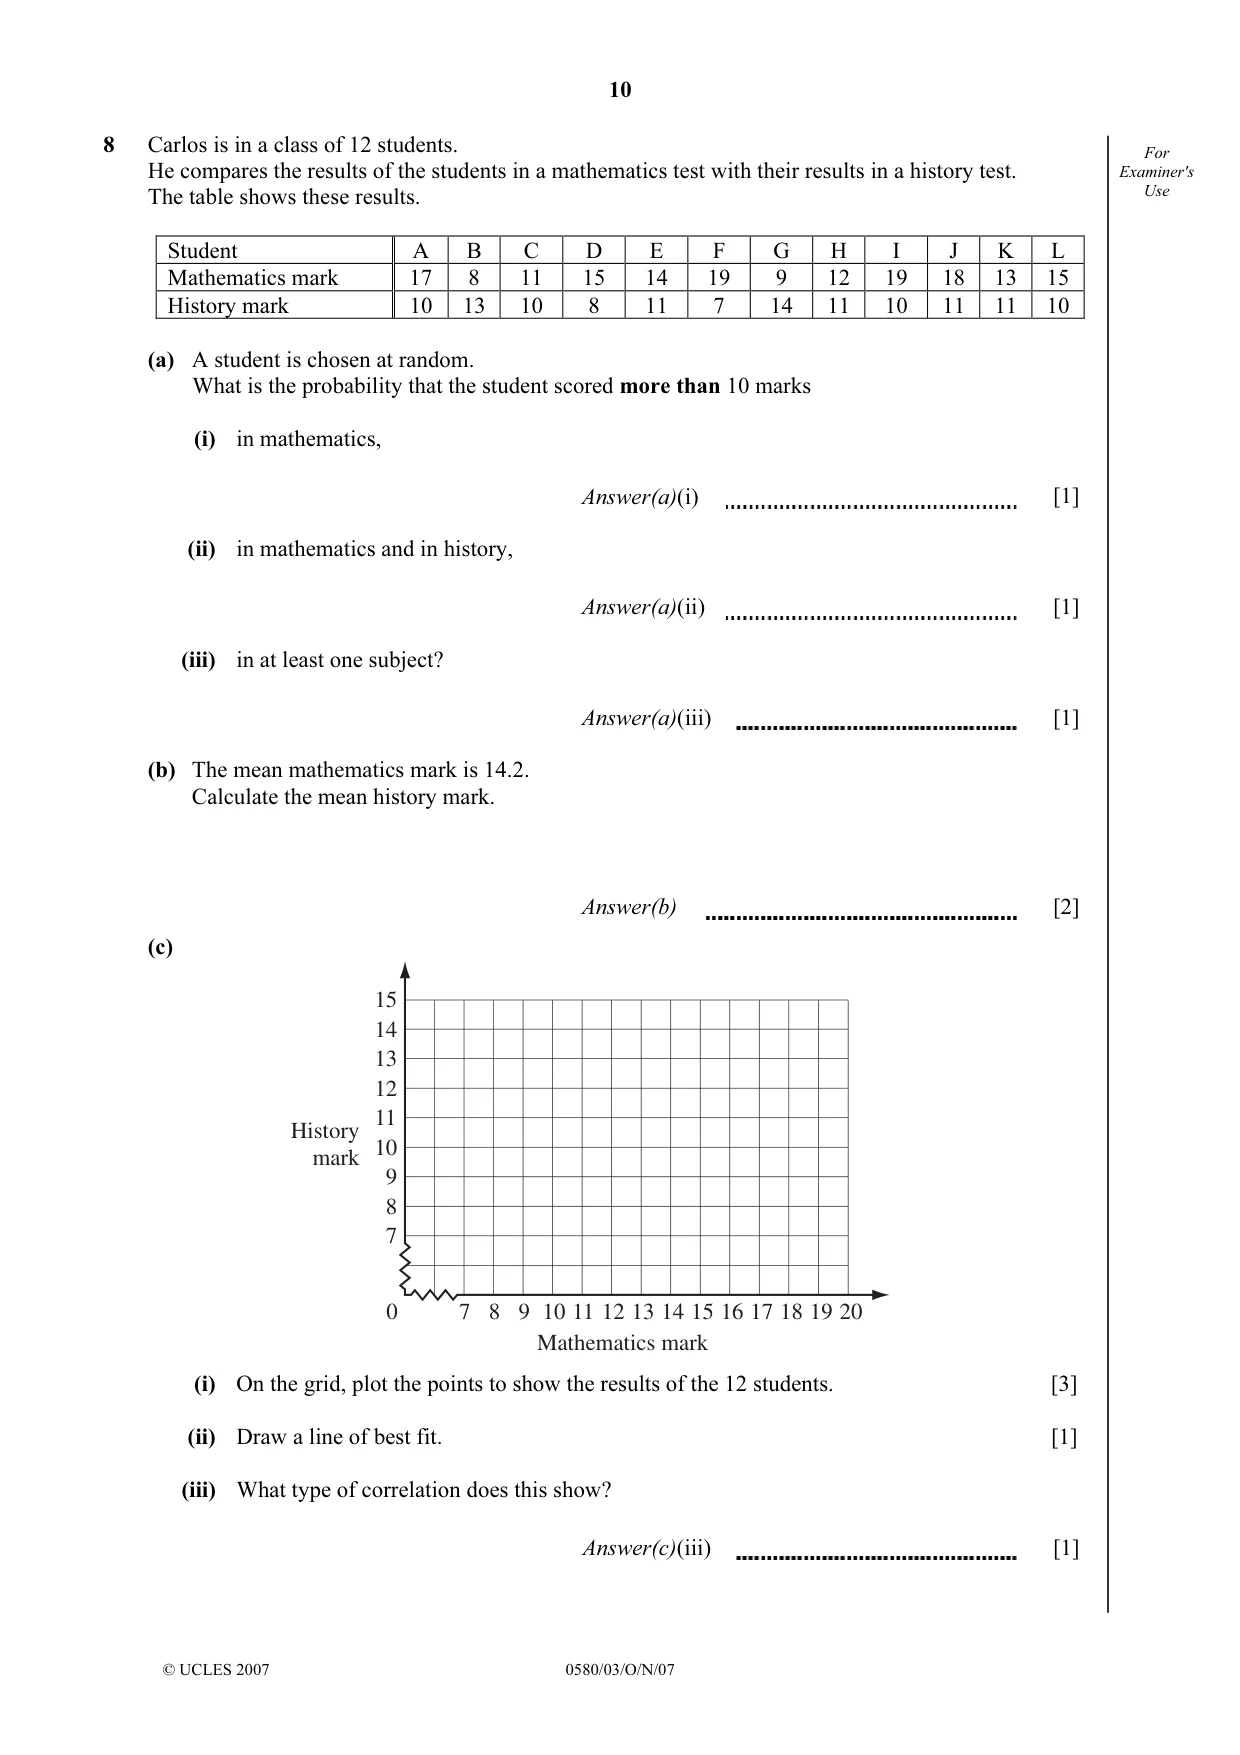
8 Carlos is in a class of 12 students. For He compares the results of the students in a mathematics test with their results in a history test. Examiner's The table shows these results. Use Student A B C D E F G H I J K L Mathematics mark 17 8 11 15 14 19 9 12 19 18 13 15 History mark 10 13 10 8 11 7 14 11 10 11 11 10 (a) A student is chosen at random. What is the probability that the student scored more than 10 marks (i) in mathematics, Answer(a)(i) [1] (ii) in mathematics and in history, Answer(a)(ii) [1] (iii) in at least one subject? Answer(a)(iii) [1] (b) The mean mathematics mark is 14.2. Calculate the mean history mark. Answer(b) [2] (c) 15 14 13 12 11 History 10 mark 9 8 7 0 7 8 9 10 11 12 13 14 15 16 17 18 19 20 Mathematics mark (i) On the grid, plot the points to show the results of the 12 students. [3] (ii) Draw a line of best fit. [1] (iii) What type of correlation does this show? Answer(c)(iii) [1]
Mark scheme: 8 (a) (i) 10 / 12. B1 oe 2 sf for decimals and %'s (with sign) throughout (ii) 4 / 12. B1 oe (iii) 12 / 12. B1 oe (b) 10.5 B2 M1 for (10+13+10+8+ ) / 12 or 126 / 12 (c) (i) 12 points plotted B3 B2 for 11, B1 for 10 (ii) ruled line B1 reasonable, at least from 8 to 19 (iii) negative B1 cao [10] IGCSE – October/November 2007 0580 and 0581 3
Q9 · For Examiner's Use Q T P The scale drawing shows a map of a town
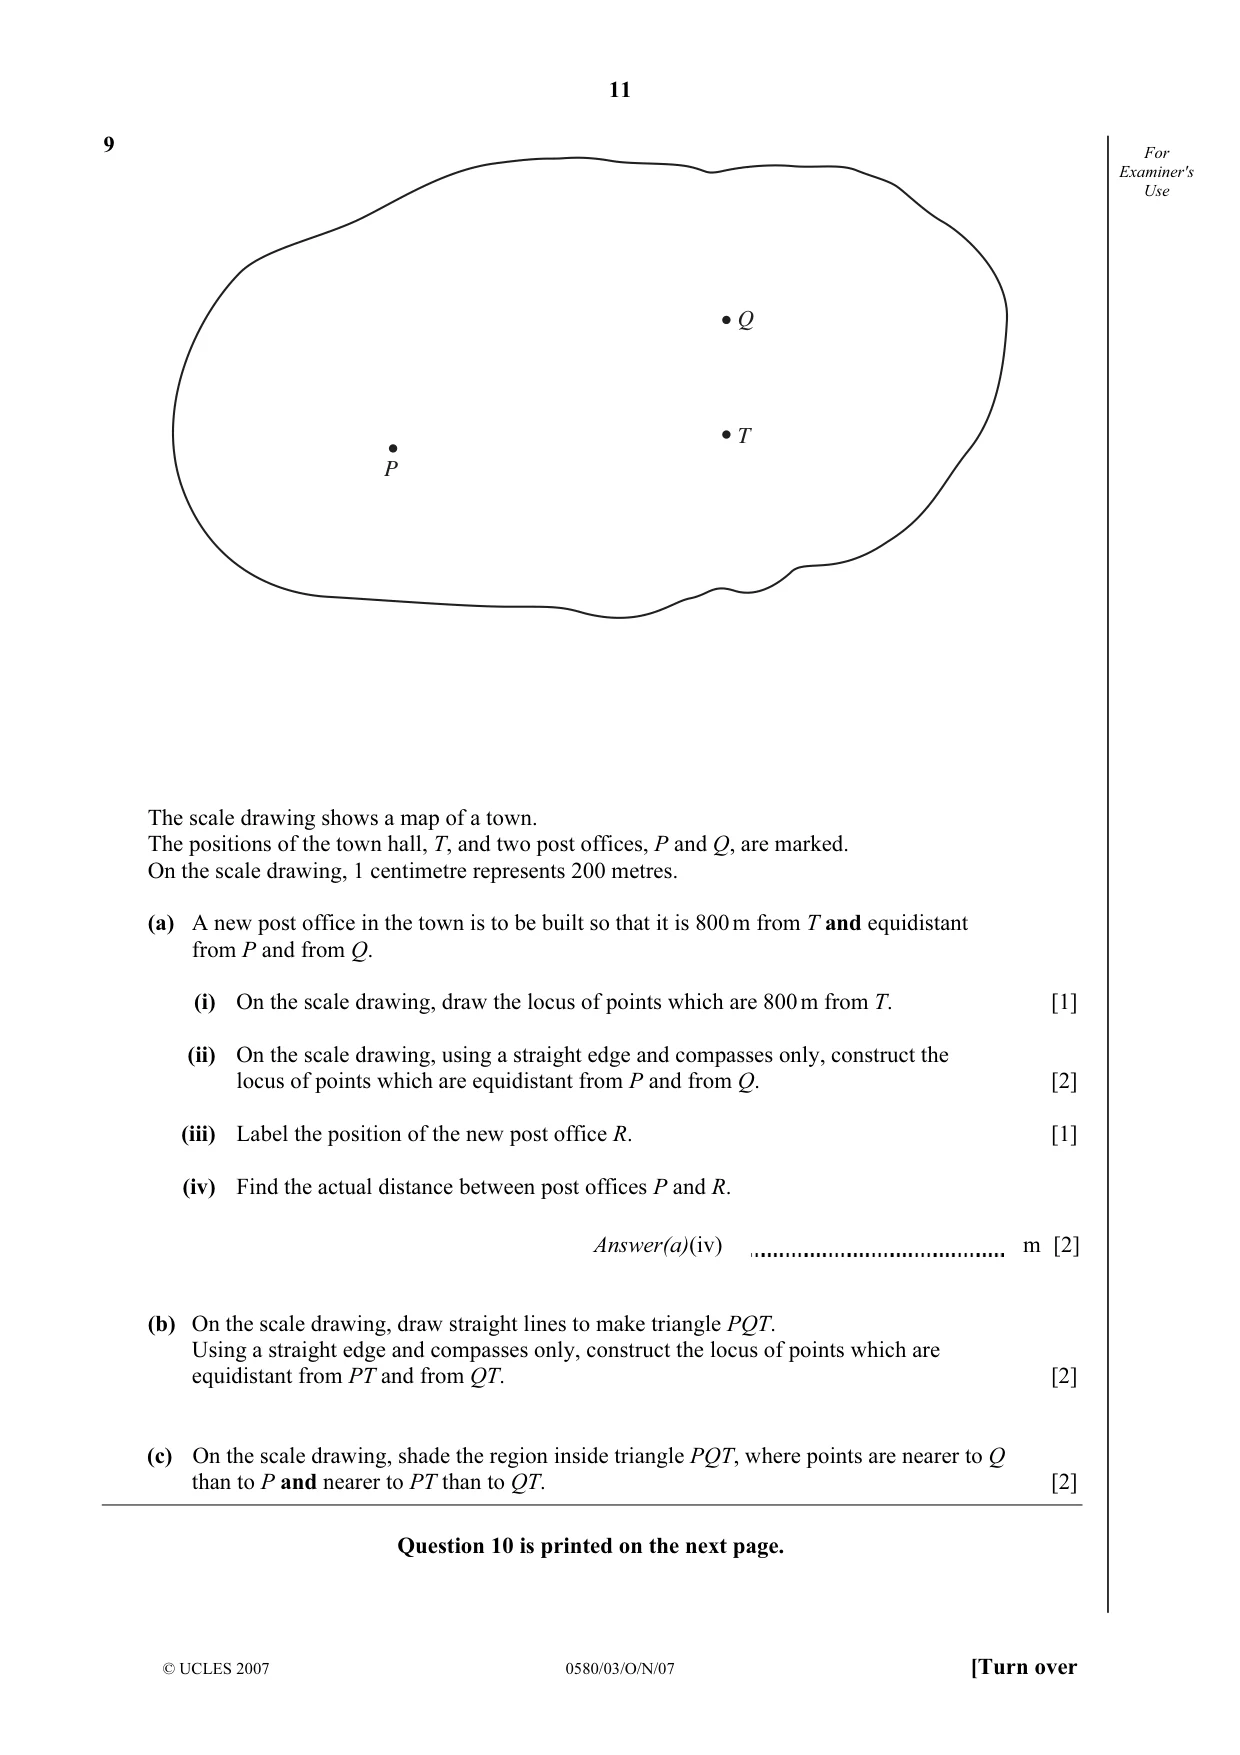
9 For Examiner's Use Q T P The scale drawing shows a map of a town. The positions of the town hall, T, and two post offices, P and Q, are marked. On the scale drawing, 1 centimetre represents 200 metres. (a) A new post office in the town is to be built so that it is 800 m from T and equidistant from P and from Q. (i) On the scale drawing, draw the locus of points which are 800 m from T. [1] (ii) On the scale drawing, using a straight edge and compasses only, construct the locus of points which are equidistant from P and from Q. [2] (iii) Label the position of the new post office R. [1] (iv) Find the actual distance between post offices P and R. Answer(a)(iv) m [2] (b) On the scale drawing, draw straight lines to make triangle PQT. Using a straight edge and compasses only, construct the locus of points which are equidistant from PT and from QT. [2] (c) On the scale drawing, shade the region inside triangle PQT, where points are nearer to Q than to P and nearer to PT than to QT. [2] Question 10 is printed on the next page.
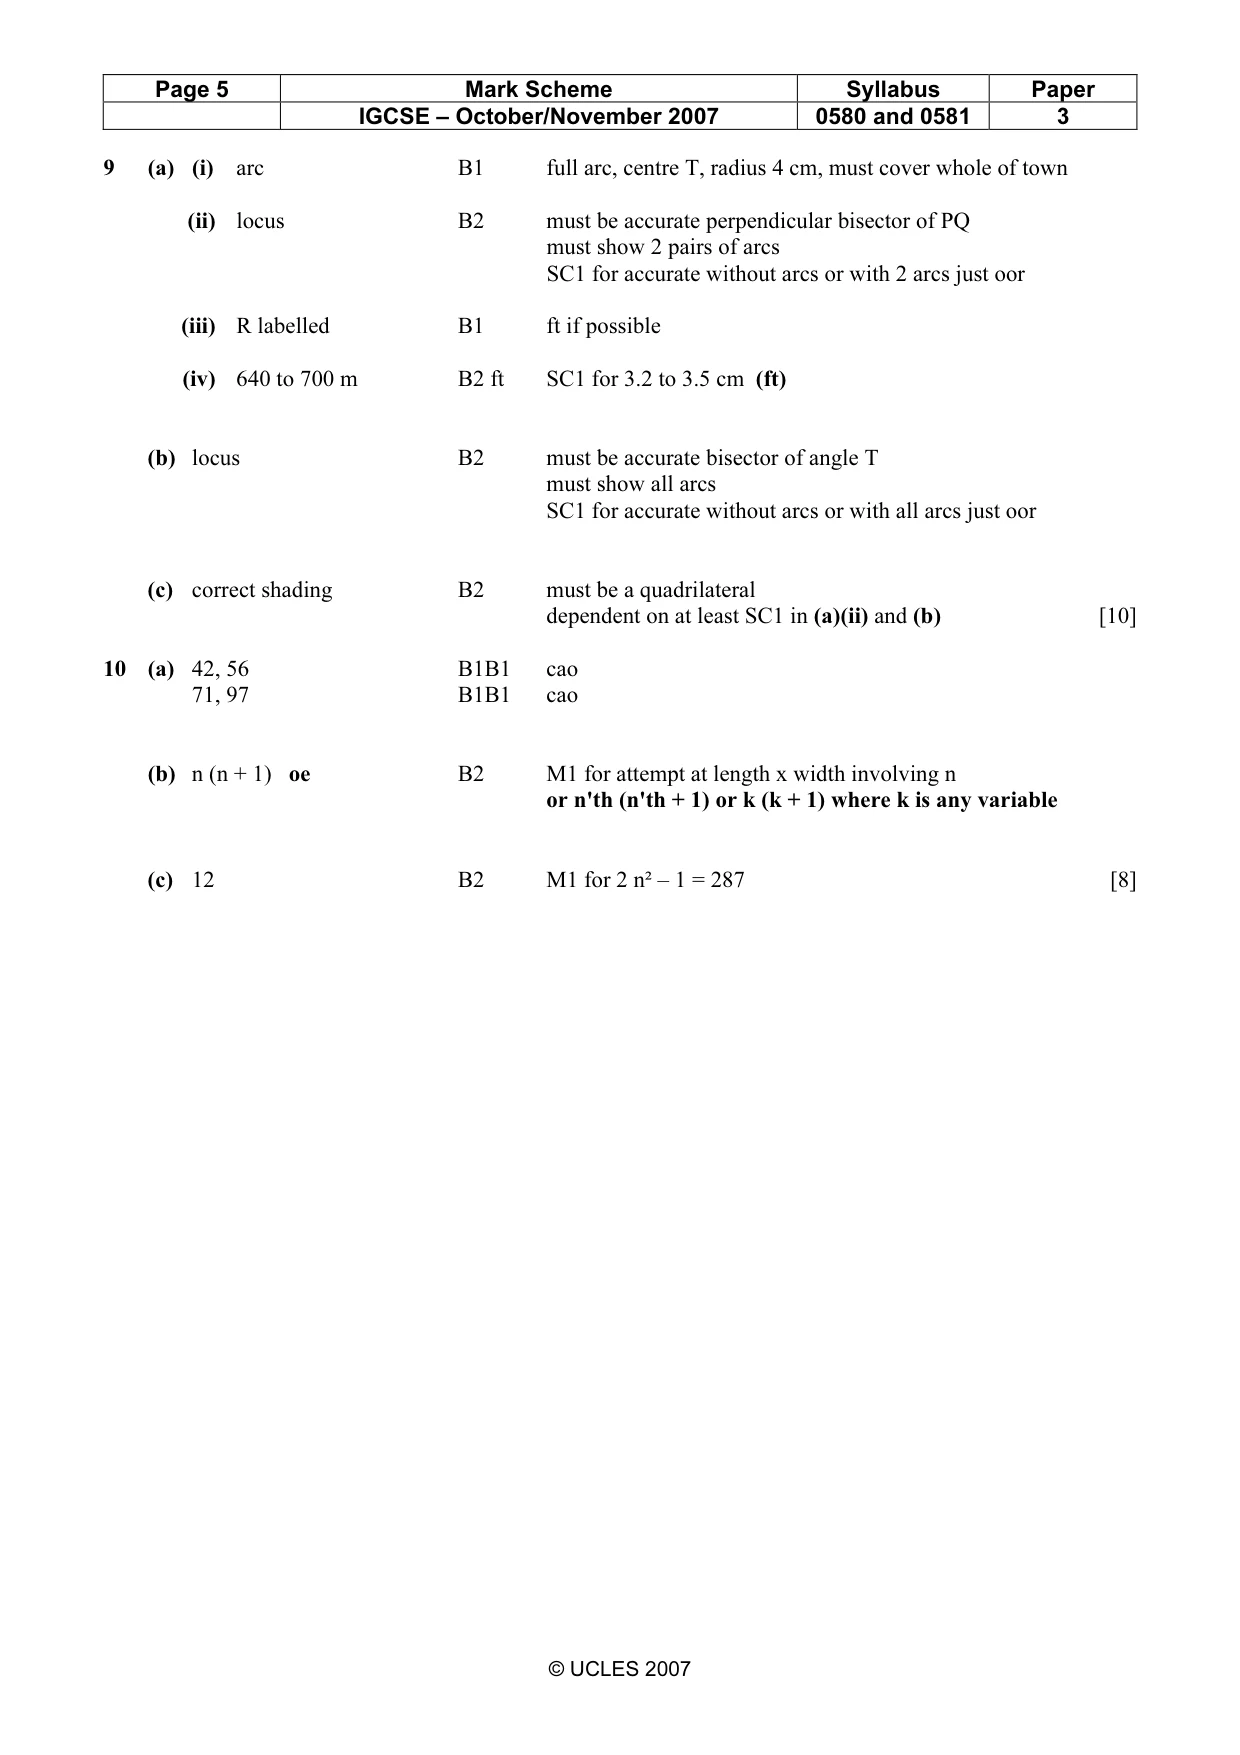
Mark scheme: 9 (a) (i) arc B1 full arc, centre T, radius 4 cm, must cover whole of town (ii) locus B2 must be accurate perpendicular bisector of PQ must show 2 pairs of arcs SC1 for accurate without arcs or with 2 arcs just oor (iii) R labelled B1 ft if possible (iv) 640 to 700 m B2 ft SC1 for 3.2 to 3.5 cm (ft) (b) locus B2 must be accurate bisector of angle T must show all arcs SC1 for accurate without arcs or with all arcs just oor (c) correct shading B2 must be a quadrilateral dependent on at least SC1 in (a)(ii) and (b) [10]
Q10 · For Examiner's Use Diagram 1 Diagram 2 Diagram 3 Diagram 4 Diagram 5 Look at the sequence…
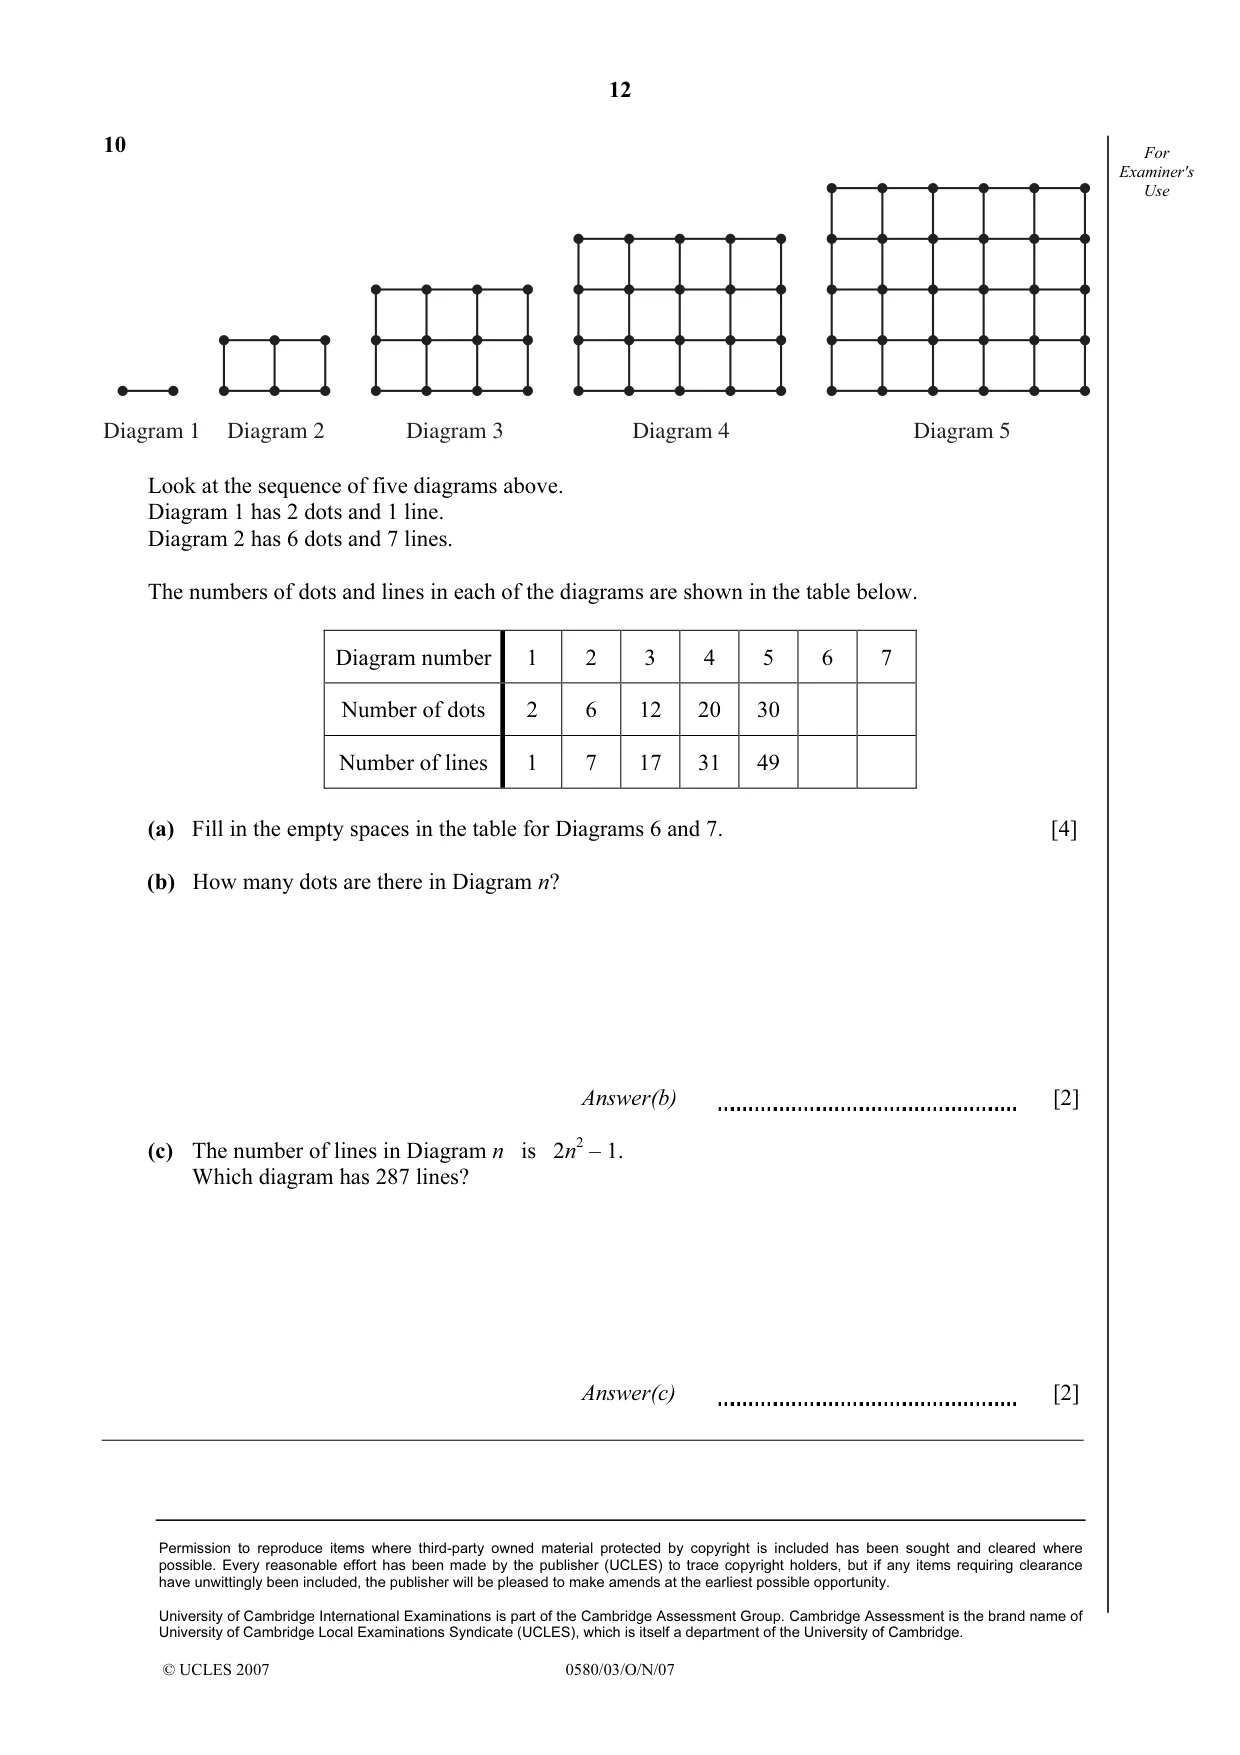
10 For Examiner's Use Diagram 1 Diagram 2 Diagram 3 Diagram 4 Diagram 5 Look at the sequence of five diagrams above. Diagram 1 has 2 dots and 1 line. Diagram 2 has 6 dots and 7 lines. The numbers of dots and lines in each of the diagrams are shown in the table below. Diagram number 1 2 3 4 5 6 7 Number of dots 2 6 12 20 30 Number of lines 1 7 17 31 49 (a) Fill in the empty spaces in the table for Diagrams 6 and 7. [4] (b) How many dots are there in Diagram n? Answer(b) [2] (c) The number of lines in Diagram n is 2n2 – 1. Which diagram has 287 lines? Answer(c) [2]
Mark scheme: 10 (a) 42, 56 B1B1 cao 71, 97 B1B1 cao (b) n (n + 1) oe B2 M1 for attempt at length x width involving n or n'th (n'th + 1) or k (k + 1) where k is any variable (c) 12 B2 M1 for 2 n² – 1 = 287 [8]
What was in this paper
The subtopics covered by these 10 questions, and how many questions each got. Open one in a new tab to see every Cambridge question on it.
What you needed in this session
Cambridge’s own grade thresholds for 2007 Oct/Nov, Paper 3 · Variant 1. A higher threshold means an easier paper — the bar moves with how the cohort did.