Questions as text
Q1 · Photograph B (Insert) shows an area of commercial farming 0460/21 May/June 2017
6 (a) Photograph B (Insert) shows an area of commercial farming. (i) Which one of the following statements describes the farming system shown in the photograph? Tick one box below. Tick (3) large-scale arable large-scale pastoral small-scale arable small-scale pastoral [1] (ii) Photograph B shows two methods used to prevent soil erosion. Identify each method and explain how it prevents soil erosion. Method 1 … … … … Method 2 … … … … [4] (b) Study Fig. 9, which gives information about sugar. Sugar is traded across the world and used in many processed foods and drinks. Most of the world’s sugar is produced from sugar cane, a grass-like plant grown mainly in tropical countries. The remaining 20% is produced from sugar beet, a root crop grown in temperate areas. The European Union (EU) gives farmers in Europe US$28 for each tonne of sugar beet grown. In the past, the EU limited the amount of sugar beet that farmers in Europe were allowed to grow. In 2015, the EU removed this limit. Fig. 9 Suggest the effect on the following people and organisations of removing the limit on the amount of sugar beet produced in Europe. (i) A sugar beet farmer in Europe. … … … [1] (ii) A sugar cane farmer in Jamaica, an LEDC. … … … [1] (iii) A transnational drinks company. … … … [1] [Total: 8 marks] Additional Pages If you use the following lined pages to complete the answer(s) to any question(s), the question number(s) must be clearly shown. … … … … … … … … … … … … … … … … … … … … … … … … …
8 marks
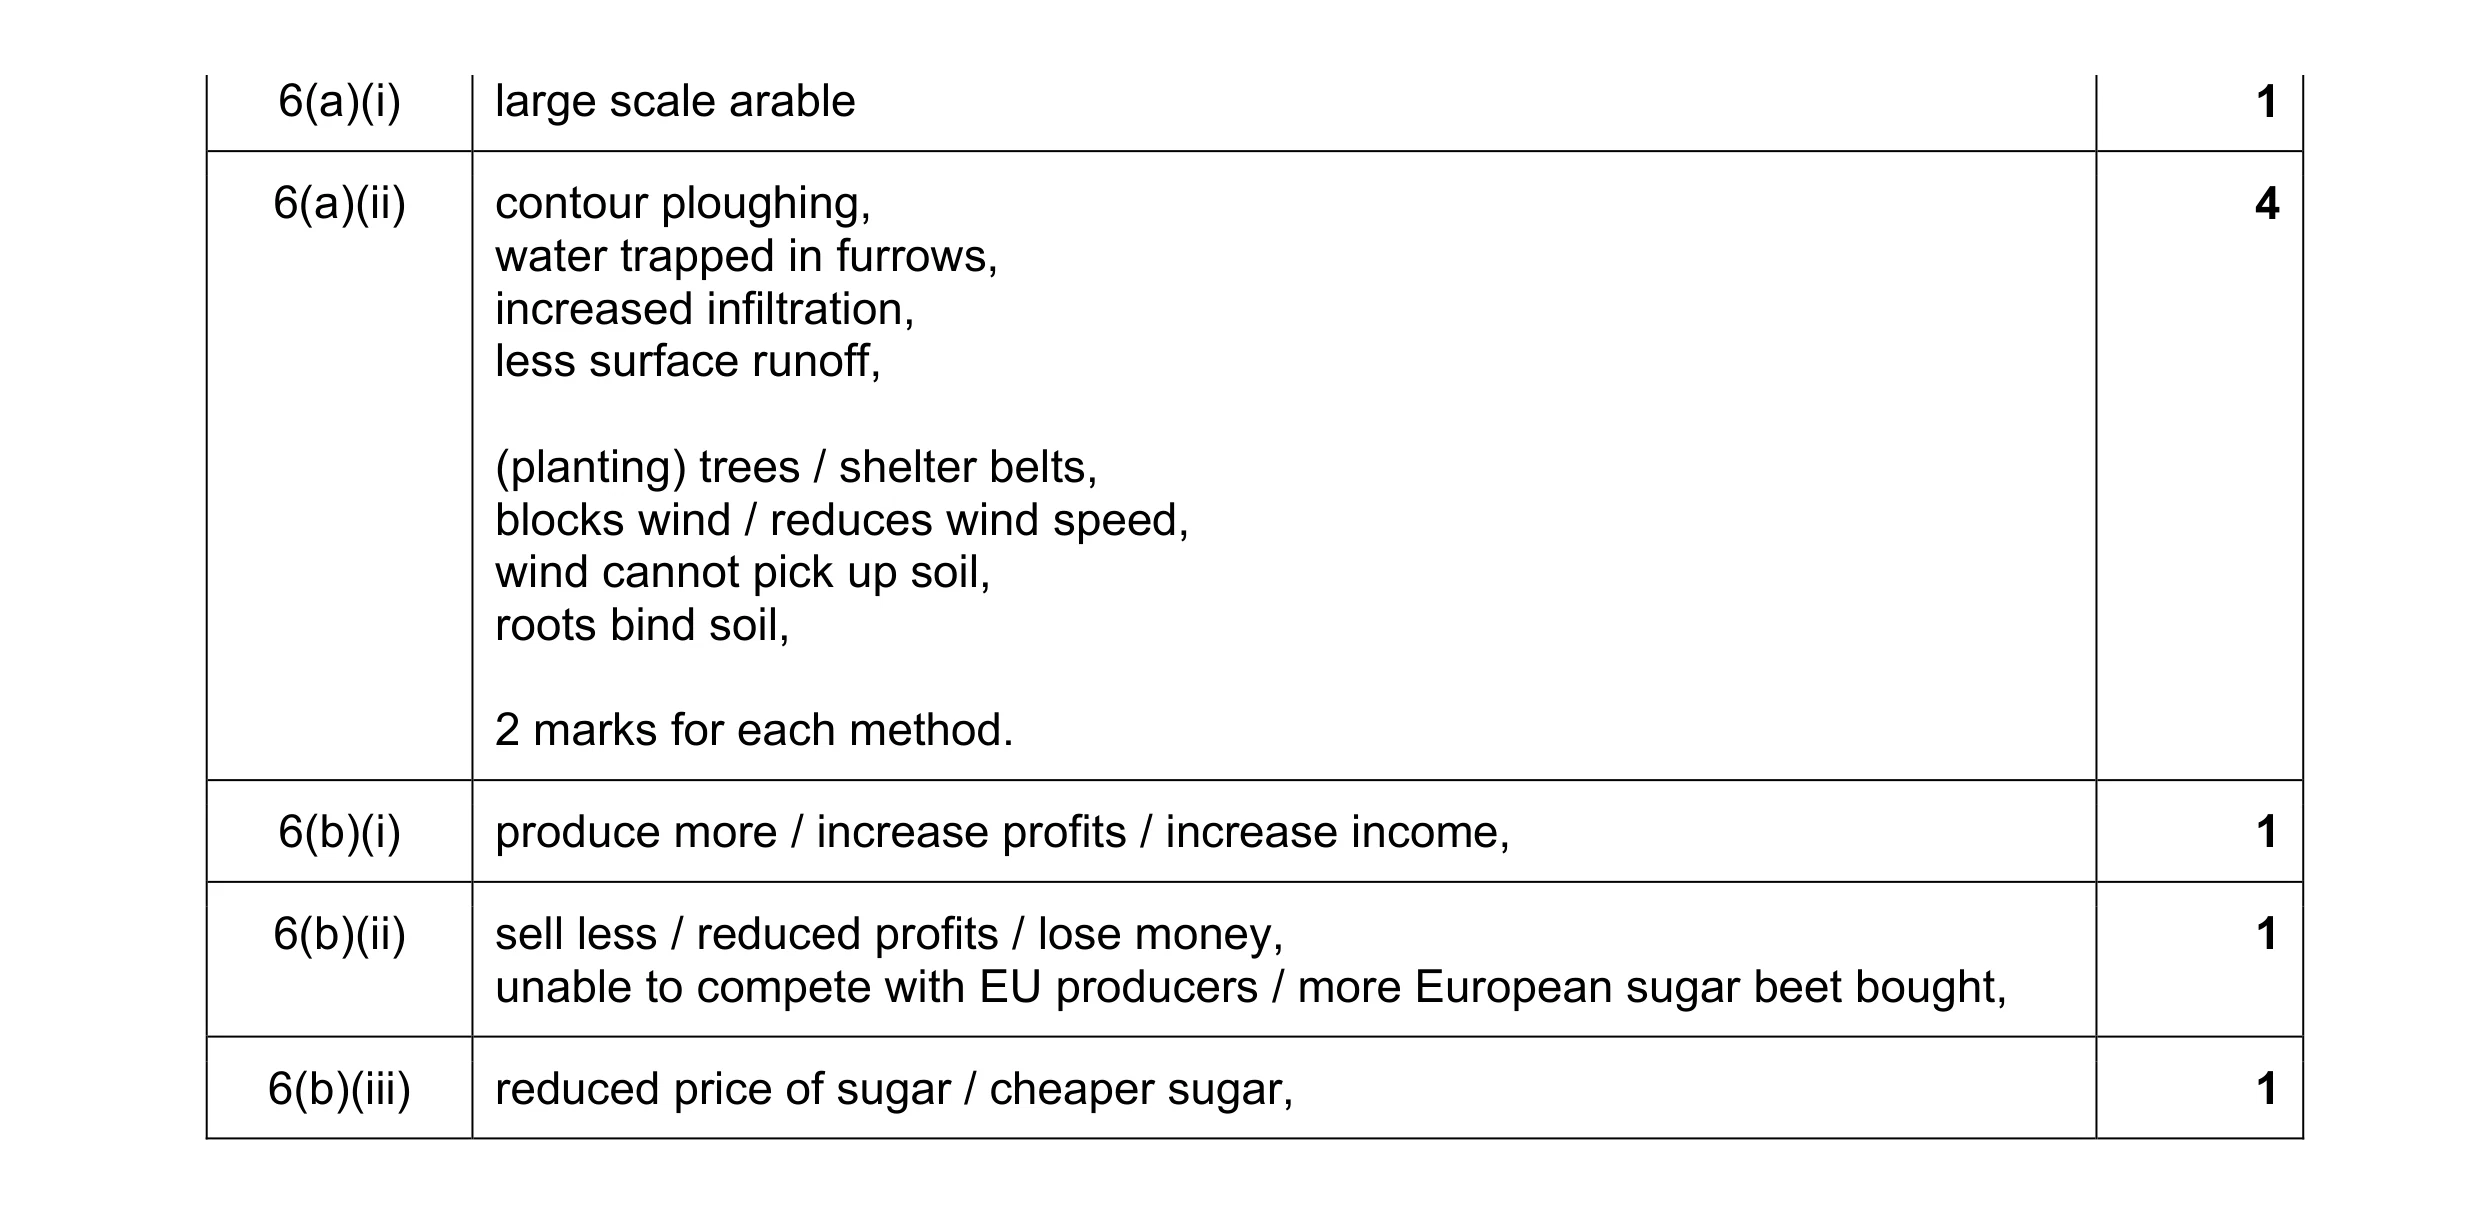
Mark scheme: 6(a)(i) large scale arable 1 6(a)(ii) contour ploughing, 4 water trapped in furrows, increased infiltration, less surface runoff, (planting) trees / shelter belts, blocks wind / reduces wind speed, wind cannot pick up soil, roots bind soil, 2 marks for each method. 6(b)(i) produce more / increase profits / increase income, 1 6(b)(ii) sell less / reduced profits / lose money, 1 unable to compete with EU producers / more European sugar beet bought, 6(b)(iii) reduced price of sugar / cheaper sugar, 1
This question in 0460/21 May/June 2017
Q2 · Information about the number of under-nourished people in the world 0460/21 Oct/Nov 2017
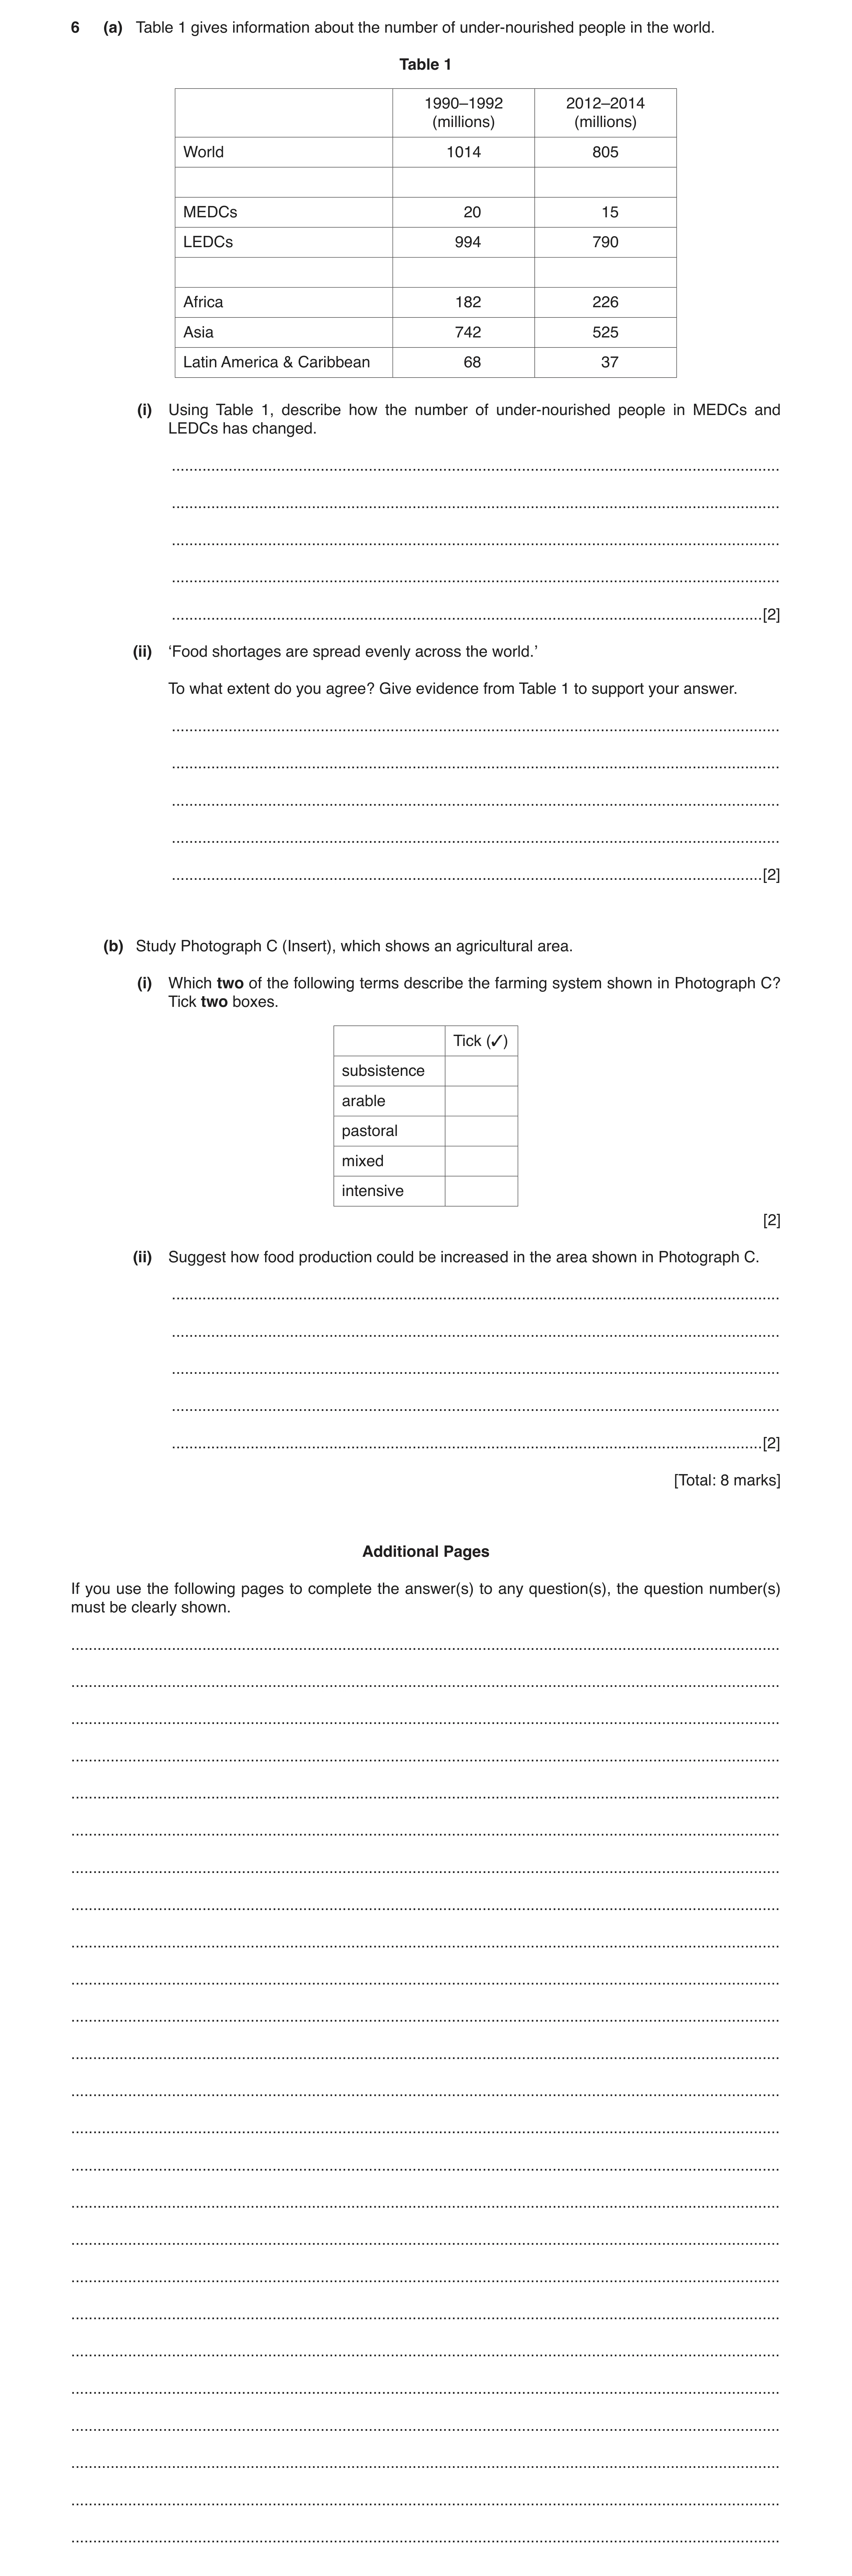
6 (a) Table 1 gives information about the number of under-nourished people in the world. Table 1 1990–1992 2012–2014 (millions) (millions) World 1014 805 MEDCs 20 15 LEDCs 994 790 Africa 182 226 Asia 742 525 Latin America & Caribbean 68 37 (i) Using Table 1, describe how the number of under-nourished people in MEDCs and LEDCs has changed. … … … … … [2] (ii) ‘Food shortages are spread evenly across the world.’ To what extent do you agree? Give evidence from Table 1 to support your answer. … … … … … [2] (b) Study Photograph C (Insert), which shows an agricultural area. (i) Which two of the following terms describe the farming system shown in Photograph C? Tick two boxes. Tick (3) subsistence arable pastoral mixed intensive [2] (ii) Suggest how food production could be increased in the area shown in Photograph C. … … … … … [2] [Total: 8 marks] Additional Pages If you use the following pages to complete the answer(s) to any question(s), the question number(s) must be clearly shown. … … … … … … … … … … … … … … … … … … … … … … … … …
8 marks
Mark scheme: 6(a)(i) number reduced, 2 by 209 million, except in Africa, bigger decrease in LEDCs/most of decrease in LEDCs, 204 million in LEDCs and 5 million in MEDCs, 6(a)(ii) less in MEDCs/more in LEDCs, 2 more/most in Asia, Asia/Latin America improving/decreasing, Africa getting worse/increasing, 6(b)(i) arable, 2 intensive, 6(b)(ii) extend cultivation/farming area (to hills), 2 (extend) irrigation, clear woodland, diversify crops, add pastoral, increase intensity, use more fertiliser, mechanisation, increase labour force, new crop varieties/GM, pesticides/herbicides, Reserve one mark for the first list, directly from the photograph.
This question in 0460/21 Oct/Nov 2017
Question 3 0460/23 Oct/Nov 2017
6 Study Fig. 8, which shows information about world food supplies, and answer the questions that follow. In 2012 the World Hunger Education Service stated that the world had enough food to feed everyone. This was because food supplies had continued to increase in MEDCs and had increased enormously in the previous four years in LEDCs. Access to food had also improved in some areas, as had the distribution of food supplies. Between 1982 and 2012, the percentage of undernourished (not having enough food to be healthy) people in LEDCs fell from 34% to 15%. However, many people still do not have enough land on which to grow the crops they need. Fig. 8 (a) (i) Suggest why many people do not have sufficient land on which to grow crops to feed their families. … … … … [2] (ii) Explain why 15% of the world’s people are undernourished, even though there is enough food to feed everybody. Do not write about lack of land. … … … … … … [3] (b) Explain how food shortages can be caused by natural events. … … … … … … [3] [Total: 8 marks] Additional Pages If you use the following lined pages to complete the answer(s) to any question(s), the question number(s) must be clearly shown. … … … … … … … … … … … … … … … … … … … … … … … … … … … … … … … … … … … … … … … … … … … … … … … … … … … … …
8 marks
Mark scheme: 6(a)(i) too poor to purchase land/land expensive, 2 (too little land because of) increasing population, (too little land because of) land used for housing/other developments, poor quality land/ infertile land (left), land degradation/soil erosion, land used for cash crops/commercial agriculture, they live in urban areas, forced migration/land taken away, 6(a)(ii) surplus is not where need is/uneven distribution of food/food controlled 3 by a few people, poor transport/inaccessibility, poor organisation, food prices too high/too poor to buy food, food not sufficiently nutritious, 6(b) drought, 3 floods, tropical storms/high winds, hail, pests, diseases, soil erosion, soil exhaustion/infertility, volcanic deposits on farmland/lava/ash cover, mudflows/landslides, earthquakes disrupt transport, tsunami, Maximum 2 if no explanation of the points.
This question in 0460/23 Oct/Nov 2017
Q4 · Information about milk production from cattle in four villages in Tanzania, East Africa 0460/21 May/June 2018
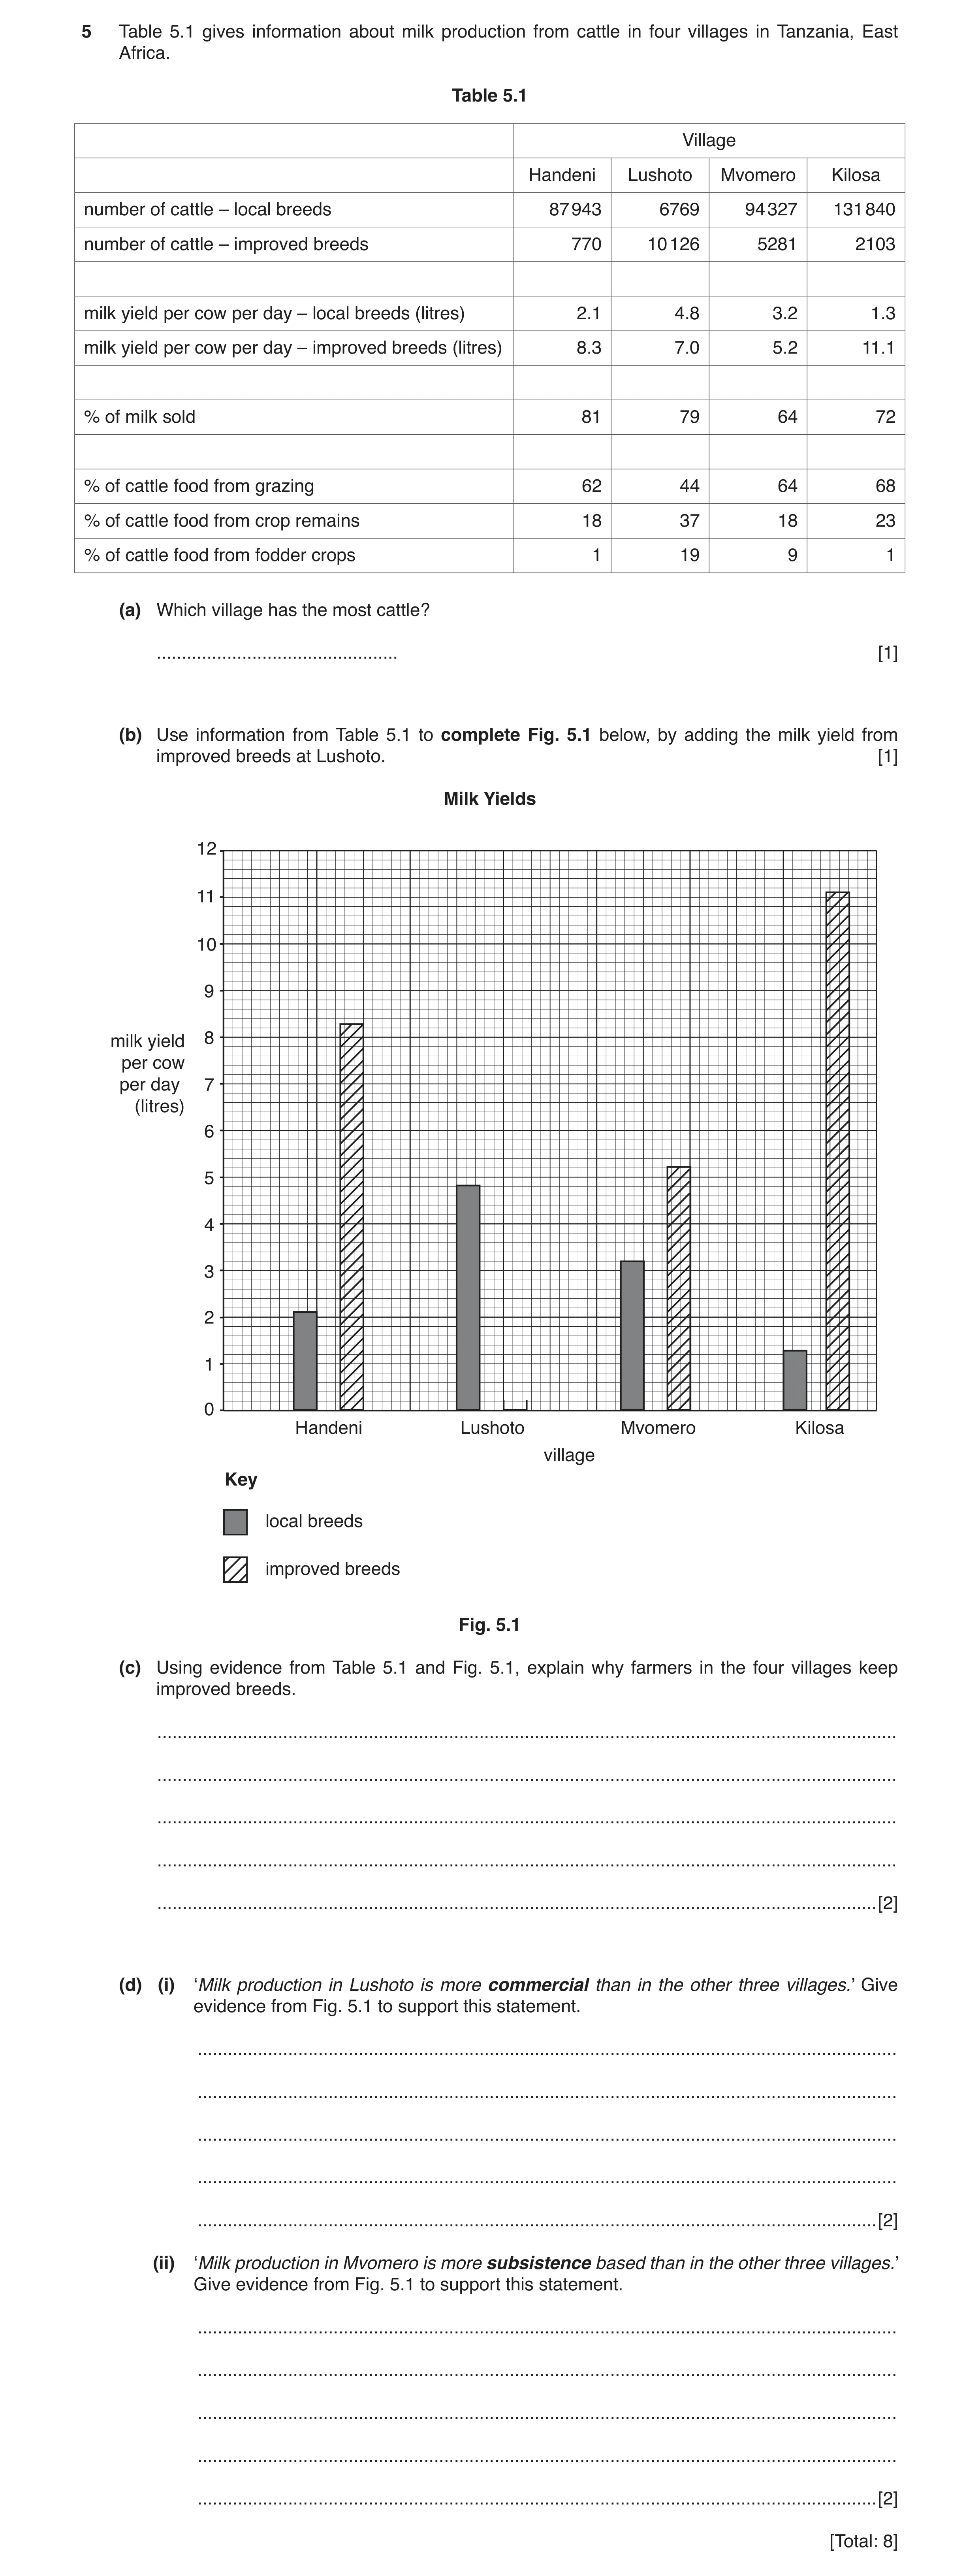
5 Table 5.1 gives information about milk production from cattle in four villages in Tanzania, East Africa. Table 5.1 Village Handeni Lushoto Mvomero Kilosa number of cattle – local breeds 87 943 6769 94 327 131 840 number of cattle – improved breeds 770 10 126 5281 2103 milk yield per cow per day – local breeds (litres) 2.1 4.8 3.2 1.3 milk yield per cow per day – improved breeds (litres) 8.3 7.0 5.2 11.1 % of milk sold 81 79 64 72 % of cattle food from grazing 62 44 64 68 % of cattle food from crop remains 18 37 18 23 % of cattle food from fodder crops 1 19 9 1 (a) Which village has the most cattle? … [1] (b) Use information from Table 5.1 to complete Fig. 5.1 below, by adding the milk yield from improved breeds at Lushoto. [1] Milk Yields 12 11 10 9 milk yield 8 per cow per day 7 (litres) 6 5 4 3 2 1 0 Handeni Lushoto Mvomero Kilosa village Key local breeds improved breeds Fig. 5.1 (c) Using evidence from Table 5.1 and Fig. 5.1, explain why farmers in the four villages keep improved breeds. … … … … … [2] (d) (i) ‘Milk production in Lushoto is more commercial than in the other three villages.’ Give evidence from Fig. 5.1 to support this statement. … … … … … [2] (ii) ‘Milk production in Mvomero is more subsistence based than in the other three villages.’ Give evidence from Fig. 5.1 to support this statement. … … … … … [2] [Total: 8]
8 marks
Mark scheme: 5(a) Kilosa, 1 5(b) correct plot and shading of 7 litres for Lushoto, 1 5(c) higher milk yields, 2 in all four villages, much/several times higher in Kilosa/Handeni, make more money, 5(d)(i) sells more milk than Mvomero and Kilosa but not Handeni/2nd highest 2 sales, has most improved breed cattle/fewer local breeds, only one with more improved breeds than local breeds, feeds more crop remains/fodder crops, highest yield from local breeds, 5(d)(ii) has large number of local breed cattle, (but not largest) 2 sells least milk, gets lowest yield from improved breeds, uses little crop remains/fodder crops,
This question in 0460/21 May/June 2018
Question 5 0460/21 Oct/Nov 2018
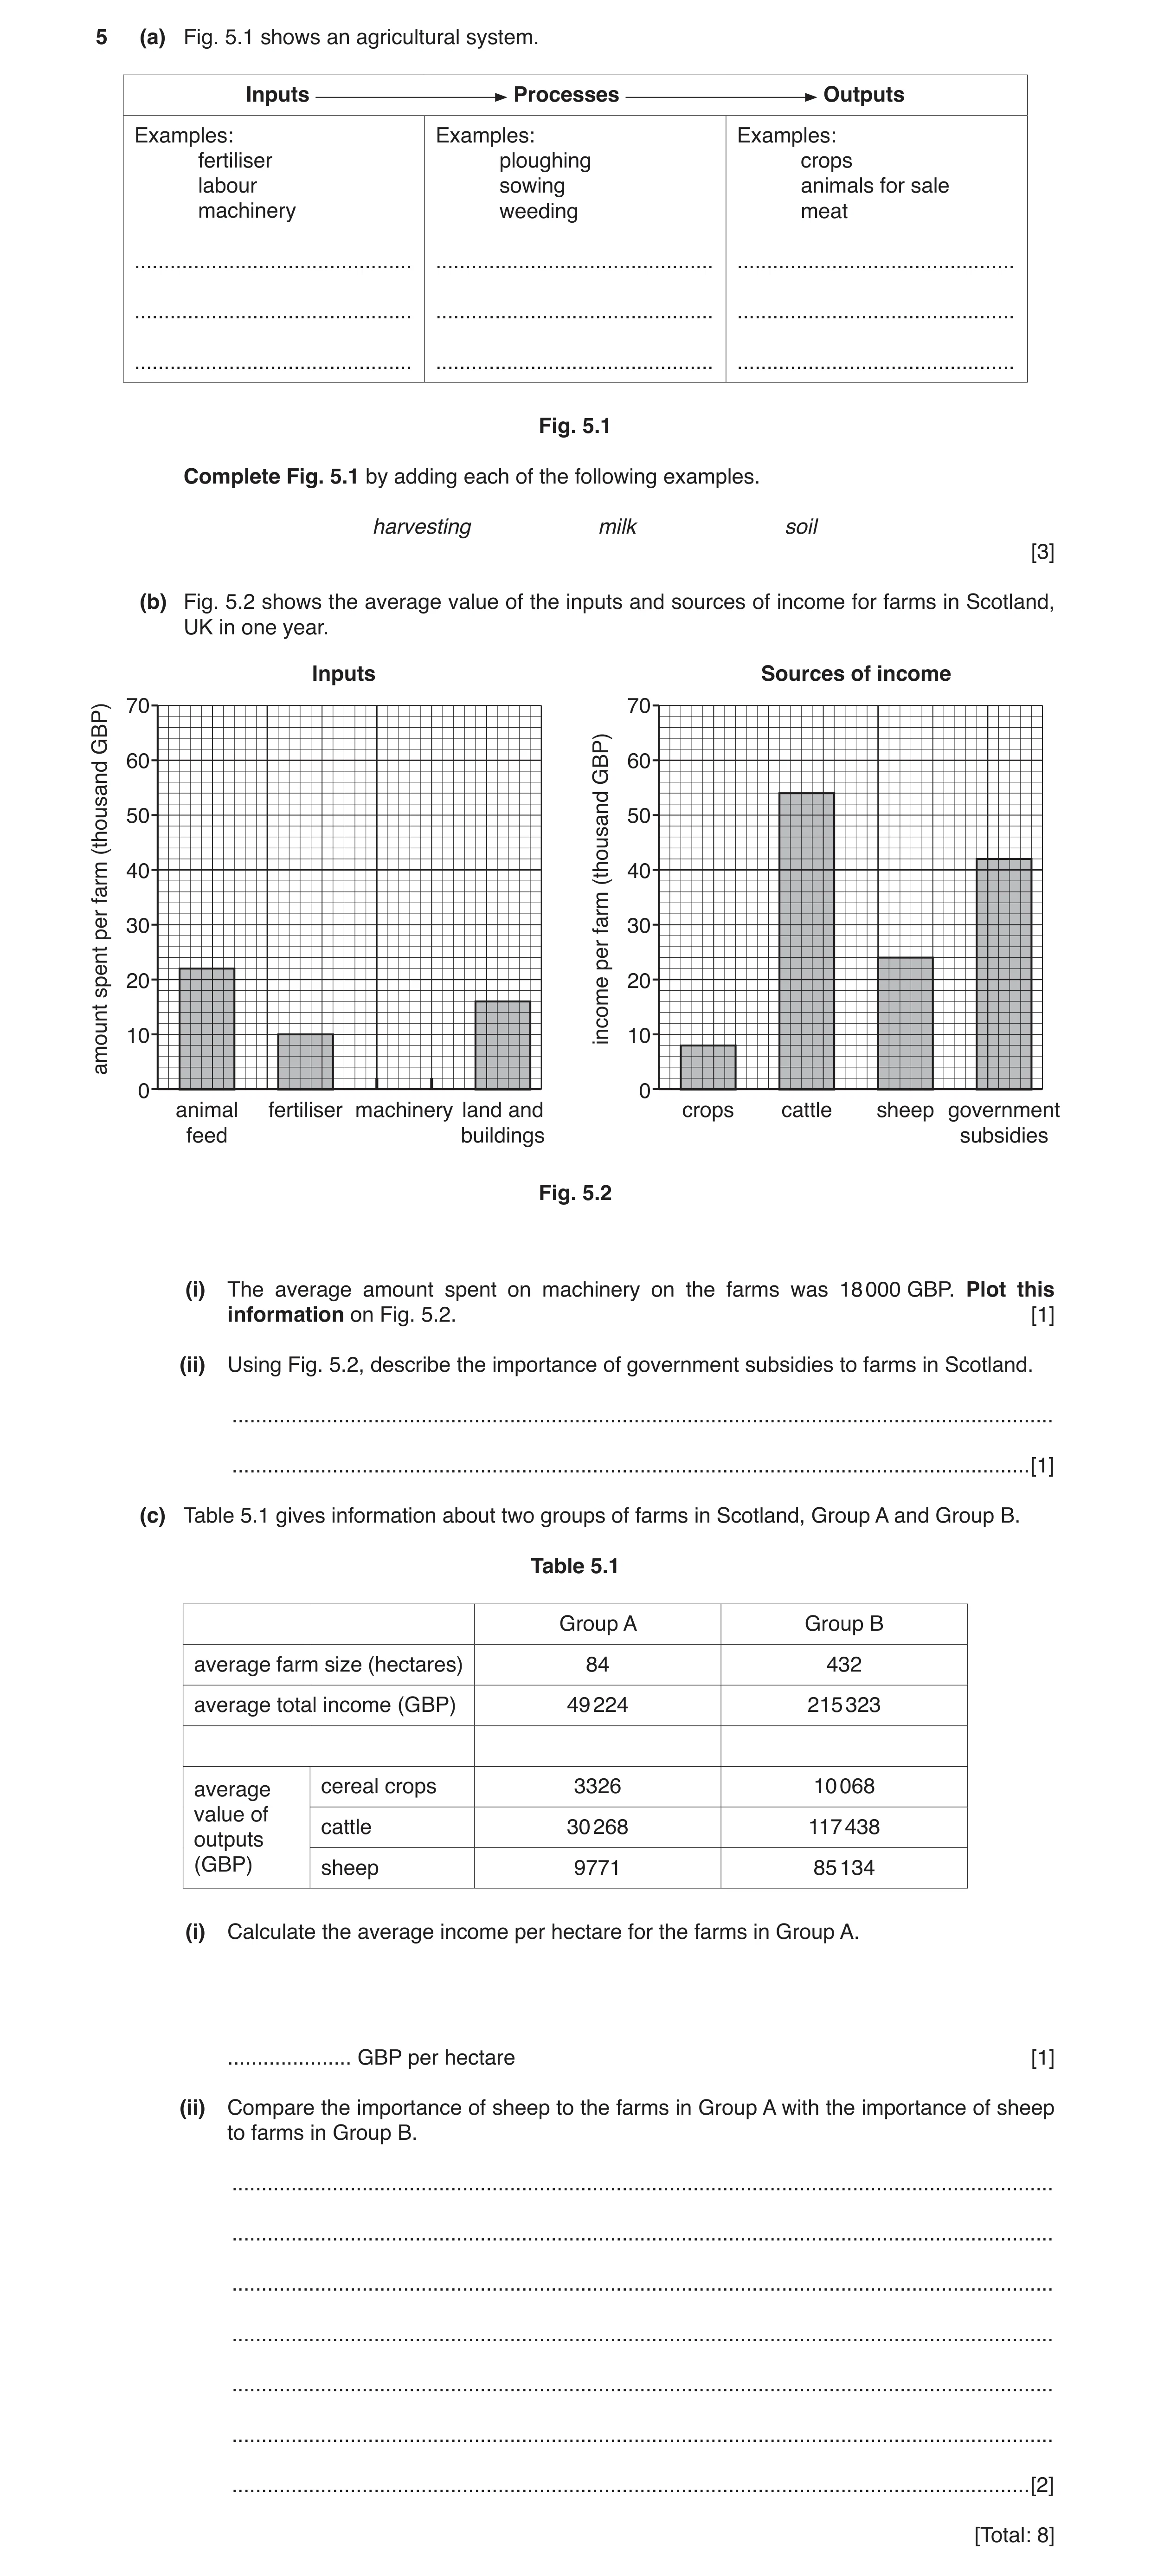
5 (a) Fig. 5.1 shows an agricultural system. Inputs Processes Outputs Examples: Examples: Examples: fertiliser ploughing crops labour sowing animals for sale machinery weeding meat … … … … … … … … … Fig. 5.1 Complete Fig. 5.1 by adding each of the following examples. harvesting milk soil [3] (b) Fig. 5.2 shows the average value of the inputs and sources of income for farms in Scotland, UK in one year. Inputs Sources of income 70 70 GBP) 60 60 GBP) 50 50(thousand 40 (thousand 40farm farmper 30 30 per spent 20 20 income 10 10amount 0 0 animal fertiliser machinery land and crops cattle sheep government feed buildings subsidies Fig. 5.2 (i) The average amount spent on machinery on the farms was 18 000 GBP. Plot this information on Fig. 5.2. [1] (ii) Using Fig. 5.2, describe the importance of government subsidies to farms in Scotland. … … [1] (c) Table 5.1 gives information about two groups of farms in Scotland, Group A and Group B. Table 5.1 Group A Group B average farm size (hectares) 84 432 average total income (GBP) 49 224 215 323 average cereal crops 3326 10 068 value of cattle 30 268 117 438 outputs (GBP) sheep 9771 85 134 (i) Calculate the average income per hectare for the farms in Group A. … GBP per hectare [1] (ii) Compare the importance of sheep to the farms in Group A with the importance of sheep to farms in Group B. … … … … … … … [2] [Total: 8]
8 marks
Mark scheme: 5(a) soil 3 harvesting milk 5(b)(i) correct plot of 18 000 1 5(b)(ii) very important 1 second most important source about ⅓/32%/33% of income 5(c)(i) 586 1 5(c)(ii) less important in Group A/more important in Group B = 1 2 one piece of statistical evidence = 1 e.g. less than ¼ / ⅕/0.2/0.19/19%/20% of income in Group A between ⅓ and ½ /0.39/0.4/39%/40% of income in Group B
This question in 0460/21 Oct/Nov 2018
Q6 · In recent years people have become more concerned about global warming 0460/22 Oct/Nov 2018
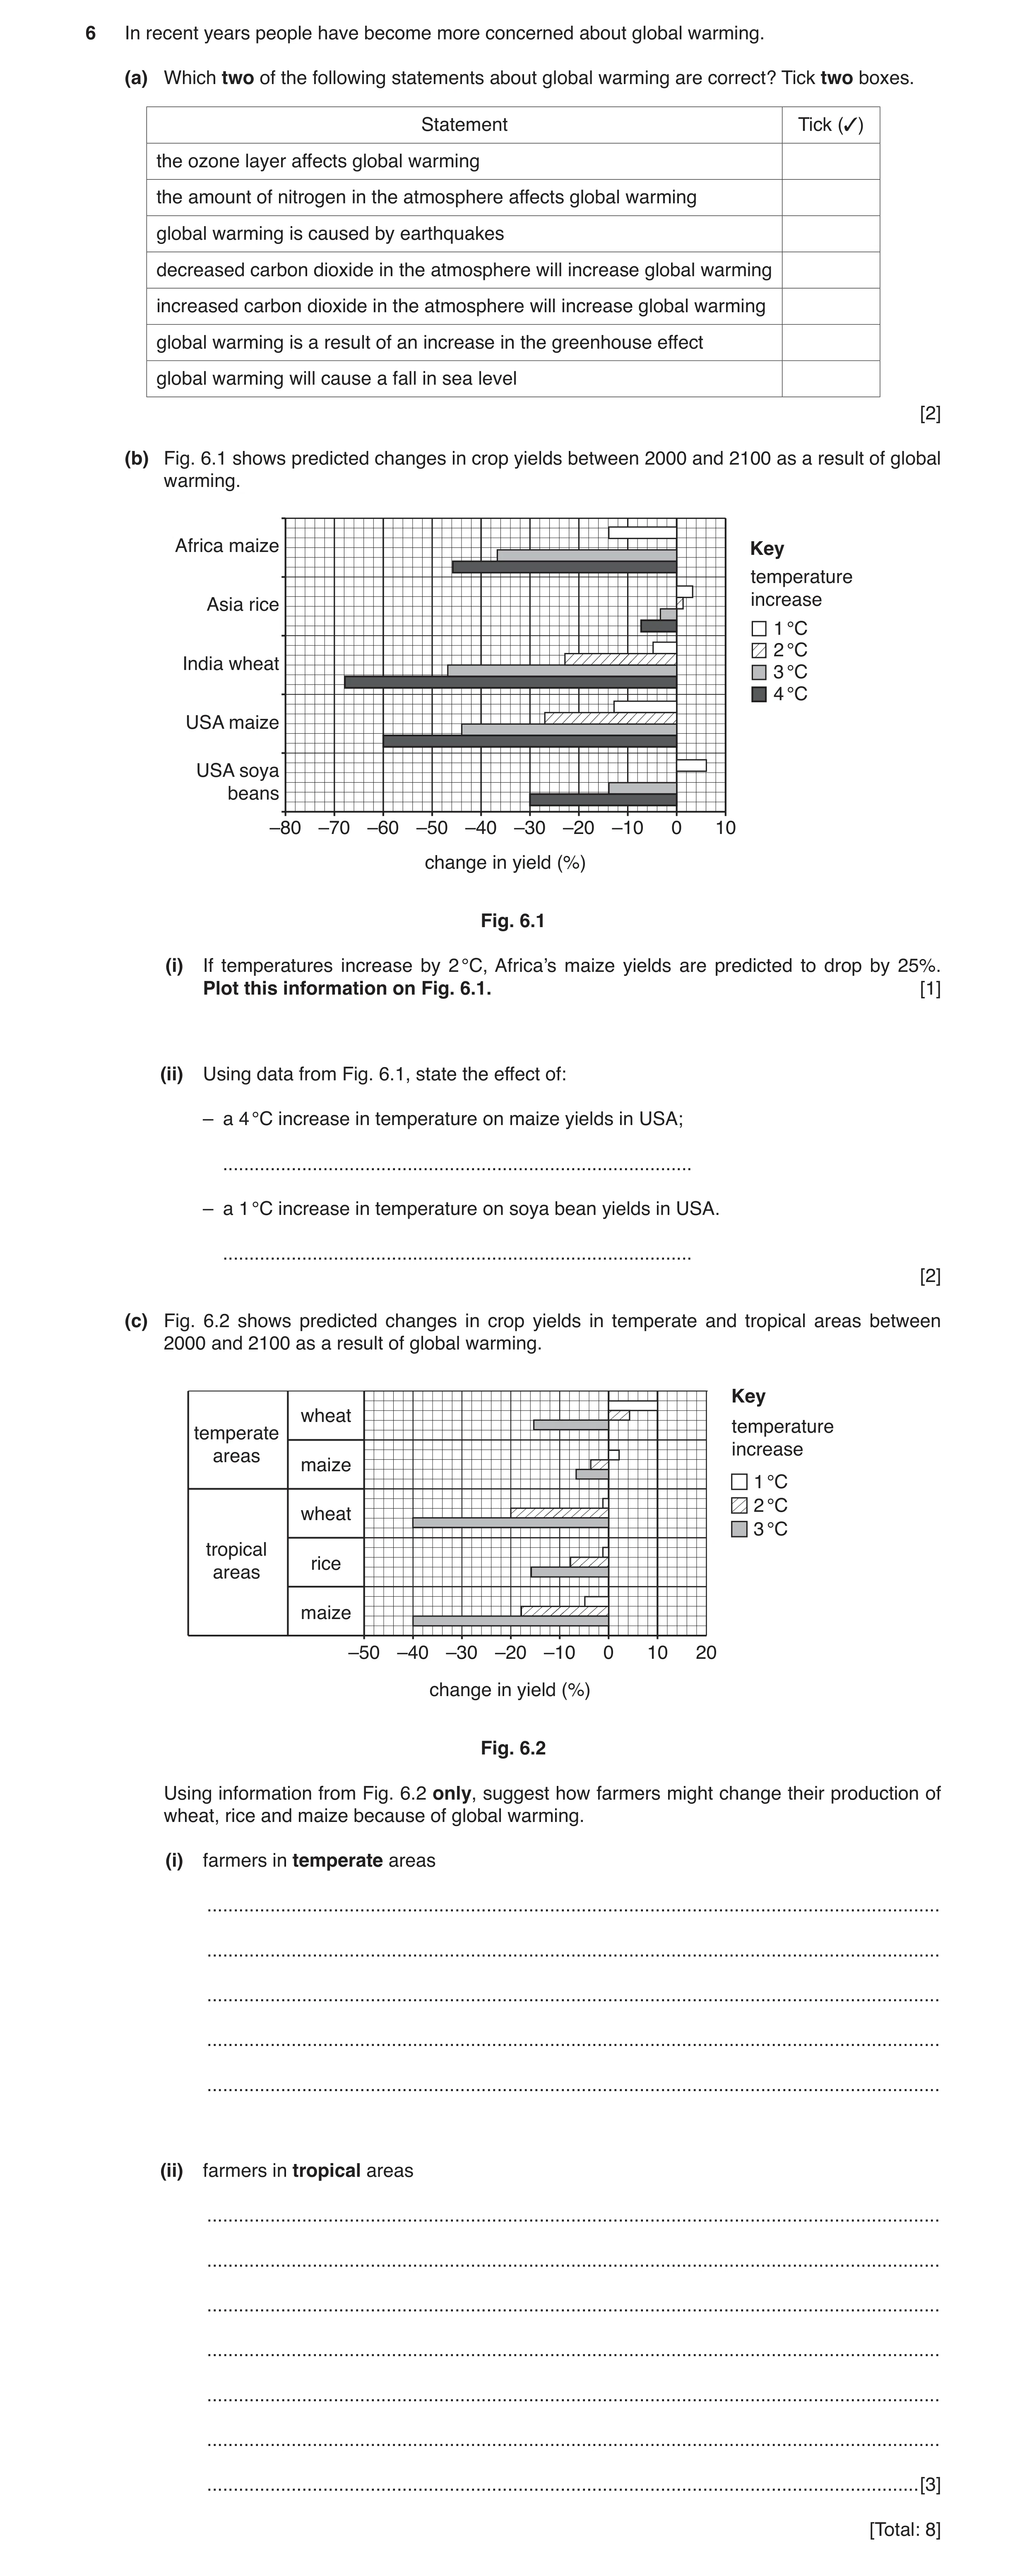
6 In recent years people have become more concerned about global warming. (a) Which two of the following statements about global warming are correct? Tick two boxes. Statement Tick (✓) the ozone layer affects global warming the amount of nitrogen in the atmosphere affects global warming global warming is caused by earthquakes decreased carbon dioxide in the atmosphere will increase global warming increased carbon dioxide in the atmosphere will increase global warming global warming is a result of an increase in the greenhouse effect global warming will cause a fall in sea level [2] (b) Fig. 6.1 shows predicted changes in crop yields between 2000 and 2100 as a result of global warming. Africa maize Key temperature Asia rice increase 1 °C 2 °C India wheat 3 °C 4 °C USA maize USA soya beans –80 –70 –60 –50 –40 –30 –20 –10 0 10 change in yield (%) Fig. 6.1 (i) If temperatures increase by 2 °C, Africa’s maize yields are predicted to drop by 25%. Plot this information on Fig. 6.1. [1] (ii) Using data from Fig. 6.1, state the effect of: – a 4 °C increase in temperature on maize yields in USA; … – a 1 °C increase in temperature on soya bean yields in USA. … [2] (c) Fig. 6.2 shows predicted changes in crop yields in temperate and tropical areas between 2000 and 2100 as a result of global warming. Key wheat temperature temperate increase areas maize 1 °C 2 °C wheat 3 °C tropical rice areas maize –50 –40 –30 –20 –10 0 10 20 change in yield (%) Fig. 6.2 Using information from Fig. 6.2 only, suggest how farmers might change their production of wheat, rice and maize because of global warming. (i) farmers in temperate areas … … … … … (ii) farmers in tropical areas … … … … … … … [3] [Total: 8]
8 marks
Mark scheme: 6(a) increased carbon dioxide in the atmosphere will increase global warming 2 global warming is a result of an increase in the greenhouse effect 6(b)(i) 25% drop correctly plotted on Fig. 10 1 6(b)(ii) 60% decrease 2 6% increase 6(c)(i) grow (more)/increase wheat if temperature increases low/1 °C/2 °C 3 grow (more)/increase maize if temperature increase high/3 °C 6(c)(ii) grow less maize/more wheat and rice if temperature increase low/1 °C grow less wheat and maize grow (more)/increase rice Answers must be describing farmers’ decisions and not just repeating data about yields from Fig. 6.2. Allow ‘move to other crops (apart from wheat, rice and maize)’ once. No marks for other farming practices.
This question in 0460/22 Oct/Nov 2018
Question 7 0460/23 Oct/Nov 2018
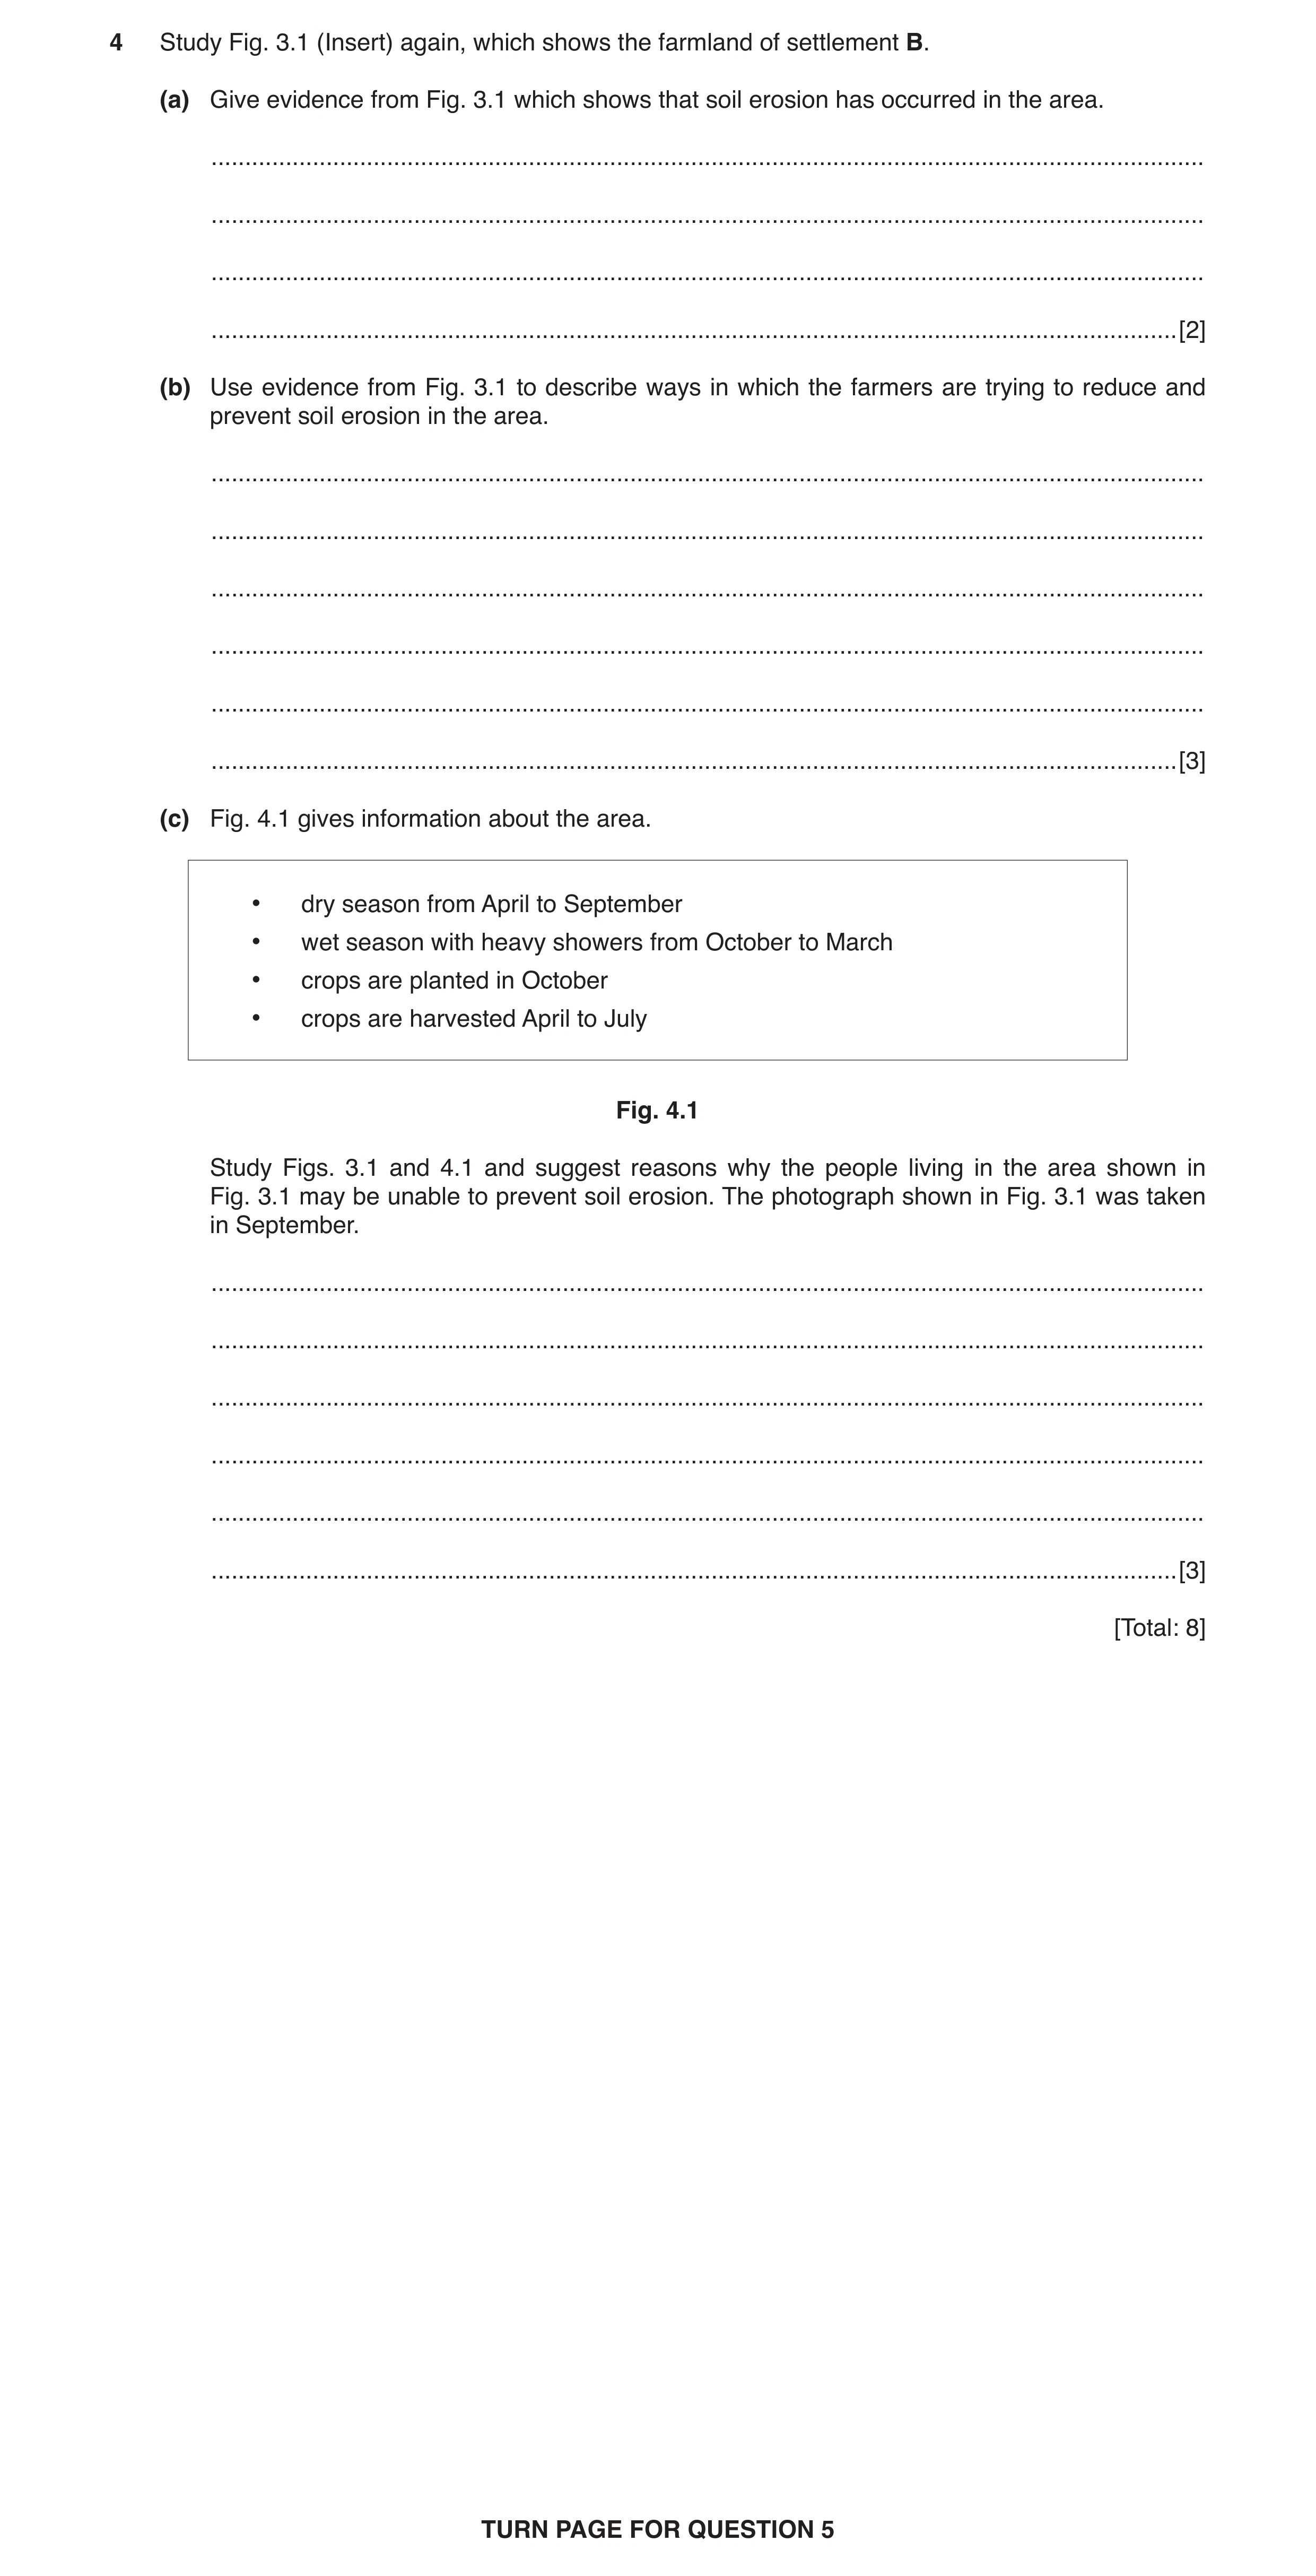
4 Study Fig. 3.1 (Insert) again, which shows the farmland of settlement B. (a) Give evidence from Fig. 3.1 which shows that soil erosion has occurred in the area. … … … … [2] (b) Use evidence from Fig. 3.1 to describe ways in which the farmers are trying to reduce and prevent soil erosion in the area. … … … … … … [3] (c) Fig. 4.1 gives information about the area. • dry season from April to September • wet season with heavy showers from October to March • crops are planted in October • crops are harvested April to July Fig. 4.1 Study Figs. 3.1 and 4.1 and suggest reasons why the people living in the area shown in Fig. 3.1 may be unable to prevent soil erosion. The photograph shown in Fig. 3.1 was taken in September. … … … … … … [3] [Total: 8] TURN PAGE FOR QUESTION 5
8 marks
Mark scheme: 4(a) bare rock 2 gullies/description of gullies bare soil/lack of vegetation 4(b) terracing 3 contour ploughing strip farming windbreaks/lines of trees to reduce the force of the wind trees/vegetation to bind soil/cover cropping hedges to prevent animal movement trees planted in gullies 4(c) dry season/June – October vegetation dies/soil bare/no crops 3 harvesting leaves soil bare heavy rain causes erosion/washes away soil young crops cannot hold soil slope leads to erosion/soil washed downhill no/limited source of irrigation water conservation expensive/people poor/lack of machinery lack of labour no alternative employment population growth/pressure
This question in 0460/23 Oct/Nov 2018
Question 8 0460/22 Feb/March 2019
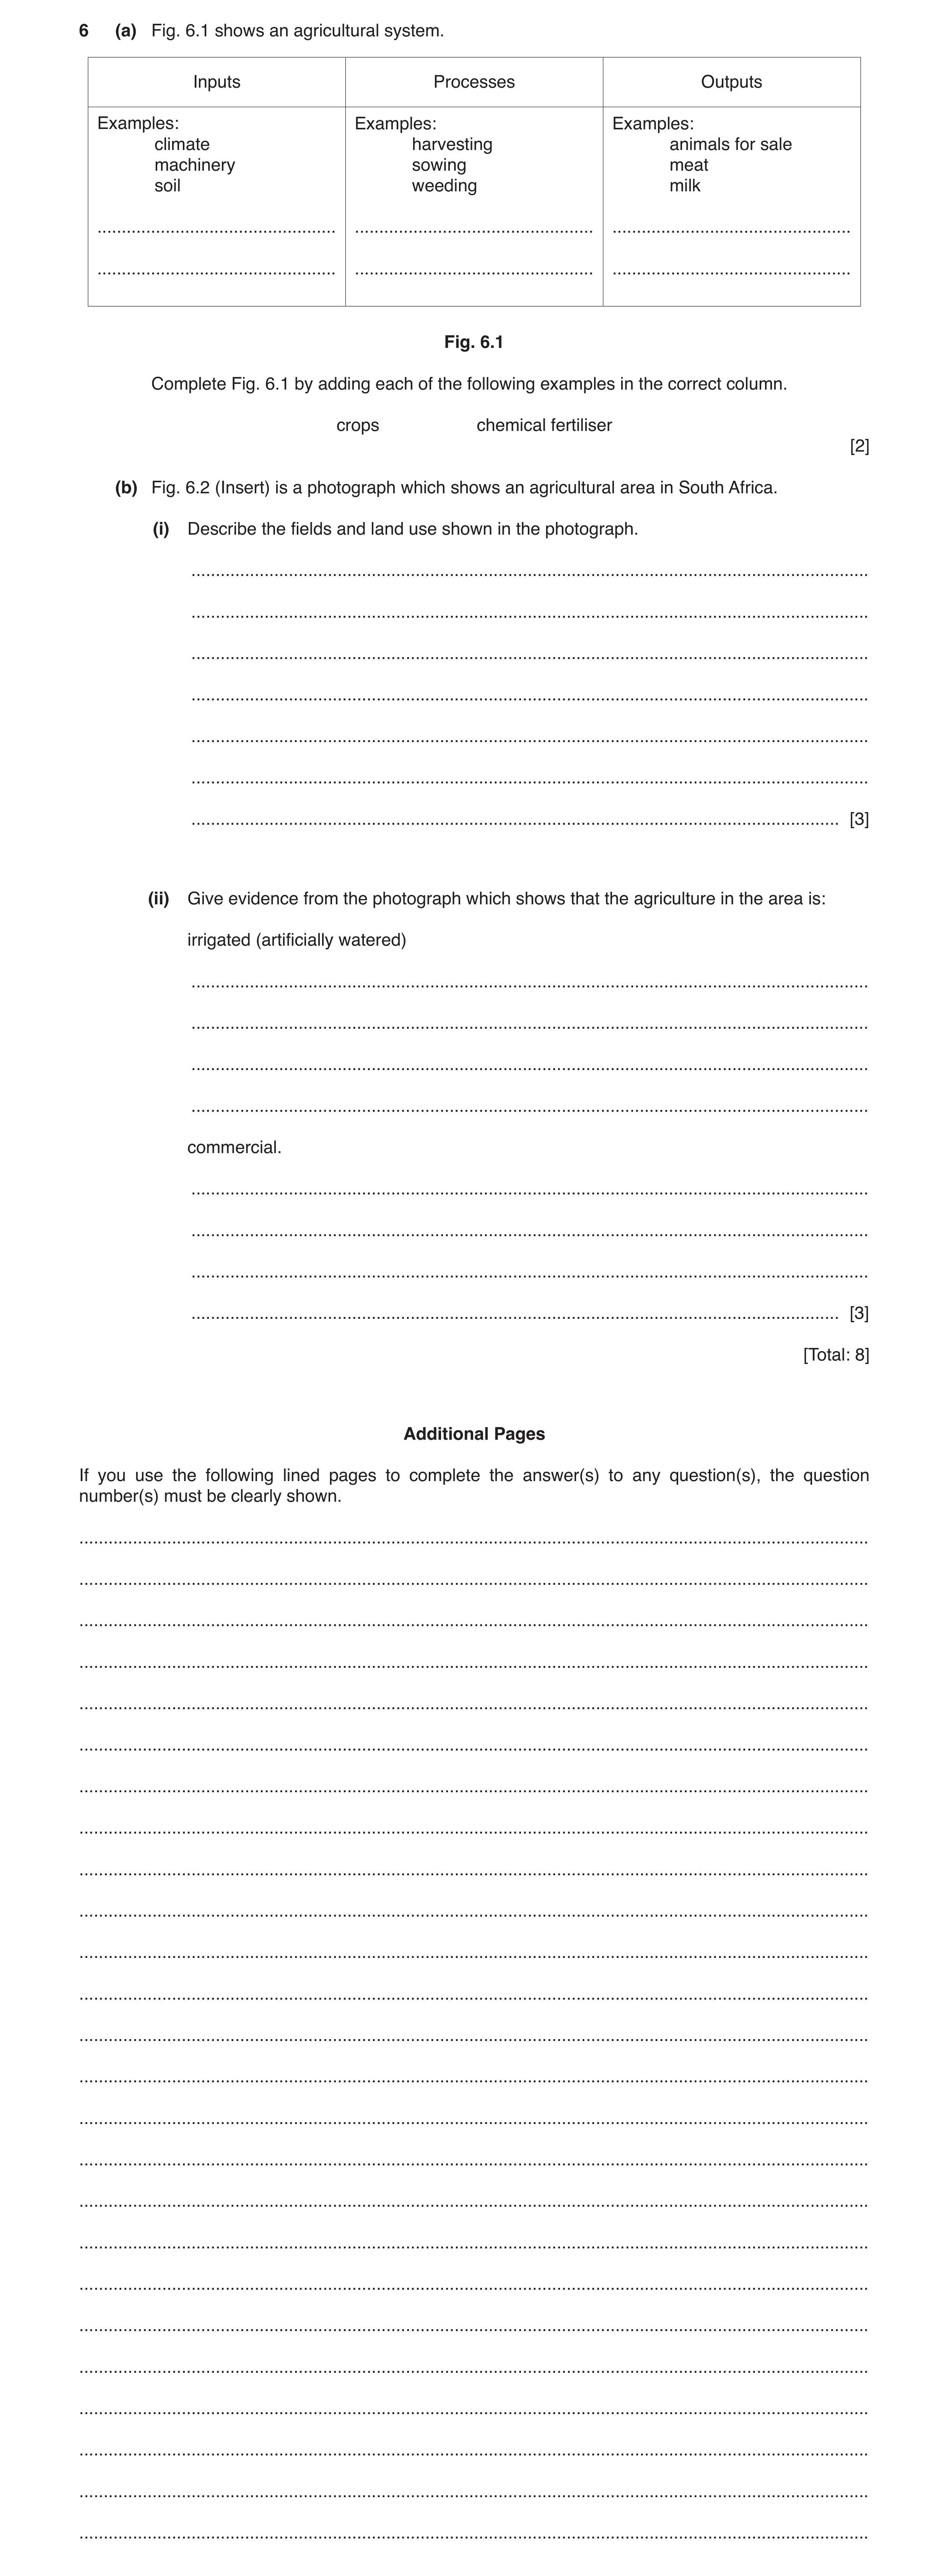
6 (a) Fig. 6.1 shows an agricultural system. Inputs Processes Outputs Examples: Examples: Examples: climate harvesting animals for sale machinery sowing meat soil weeding milk … … … … … … Fig. 6.1 Complete Fig. 6.1 by adding each of the following examples in the correct column. crops chemical fertiliser [2] (b) Fig. 6.2 (Insert) is a photograph which shows an agricultural area in South Africa. (i) Describe the fields and land use shown in the photograph. … … … … … … … [3] (ii) Give evidence from the photograph which shows that the agriculture in the area is: irrigated (artificially watered) … … … … commercial. … … … … [3] [Total: 8] Additional Pages If you use the following lined pages to complete the answer(s) to any question(s), the question number(s) must be clearly shown. … … … … … … … … … … … … … … … … … … … … … … … … …
8 marks
Mark scheme: 6(a) fertiliser input, 2 crops output 6(b)(i) Fields 3 rectangles/squares, crops/arable/cultivated, large, flat, variable size, some bare/ploughed/harvested, some with trees round/lines of trees, crops in rows Other land use roads, buildings, ponds/lakes/reservoirs/water bodies, area of trees 6(b)(ii) Irrigation 3 ponds/reservoirs/dams Commercial large/storage buildings/factory, areas with no houses/settlement, large fields/areas of land/large scale, crops in rows for machinery, machinery visible
This question in 0460/22 Feb/March 2019
Question 9 0460/21 May/June 2019
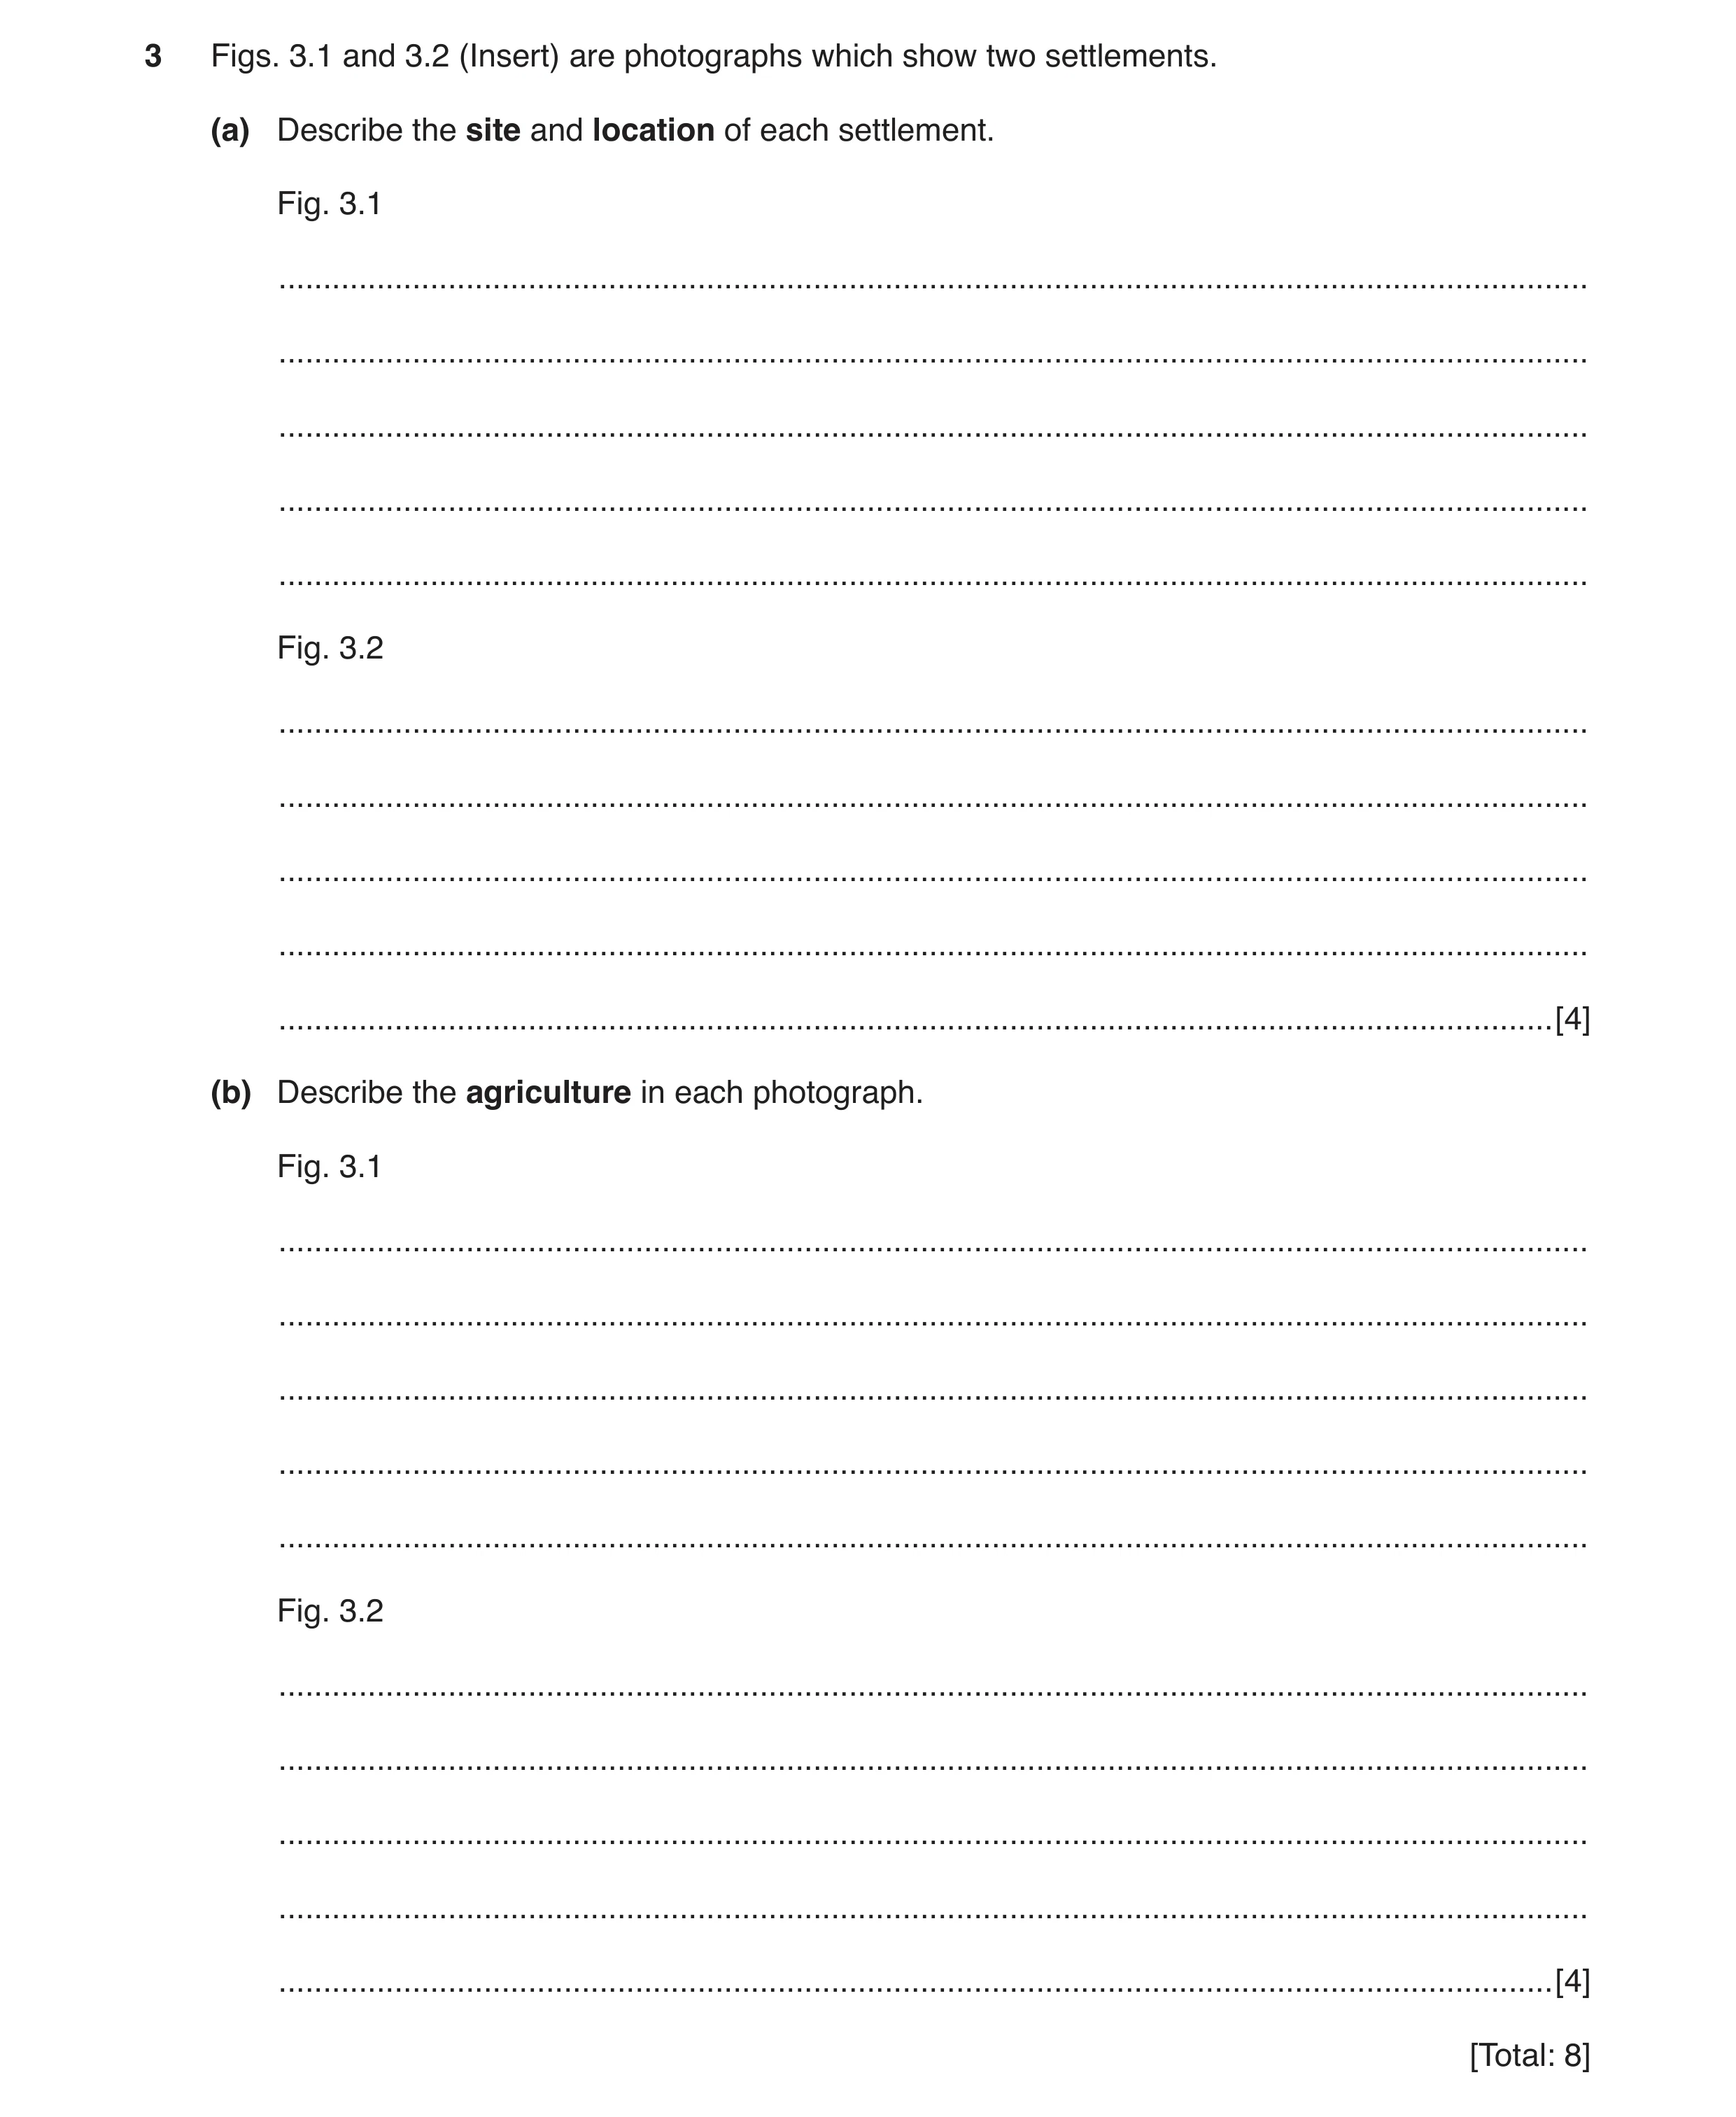
3 Figs. 3.1 and 3.2 (Insert) are photographs which show two settlements. (a) Describe the site and location of each settlement. Fig. 3.1 … … … … … Fig. 3.2 … … … … … [4] (b) Describe the agriculture in each photograph. Fig. 3.1 … … … … … Fig. 3.2 … … … … … [4] [Total: 8]
8 marks
Mark scheme: 3(a) Fig. 3.1 4 gentle slopes / flat / avoids steep, lower land / avoids high / foot of mountains (near mountains = 0), in valley, near lake Fig. 3.2 gentle slope, raised/higher/on hill, avoids floods/marsh Maximum three on each photograph. 3(b) Fig. 3.1 4 fields / plots, in rows, unused land, reservoir / dam for irrigation Fig. 3.2 fields / plots, flooded / padi / rice, raised banks, young / new crop Allow ‘arable/crops/plantations’ once in either part. Maximum three on each photograph.
This question in 0460/21 May/June 2019
Q10 · Information about Farm R, a farm in Canada and Farm S, a farm in South Africa 0460/23 May/June 2019
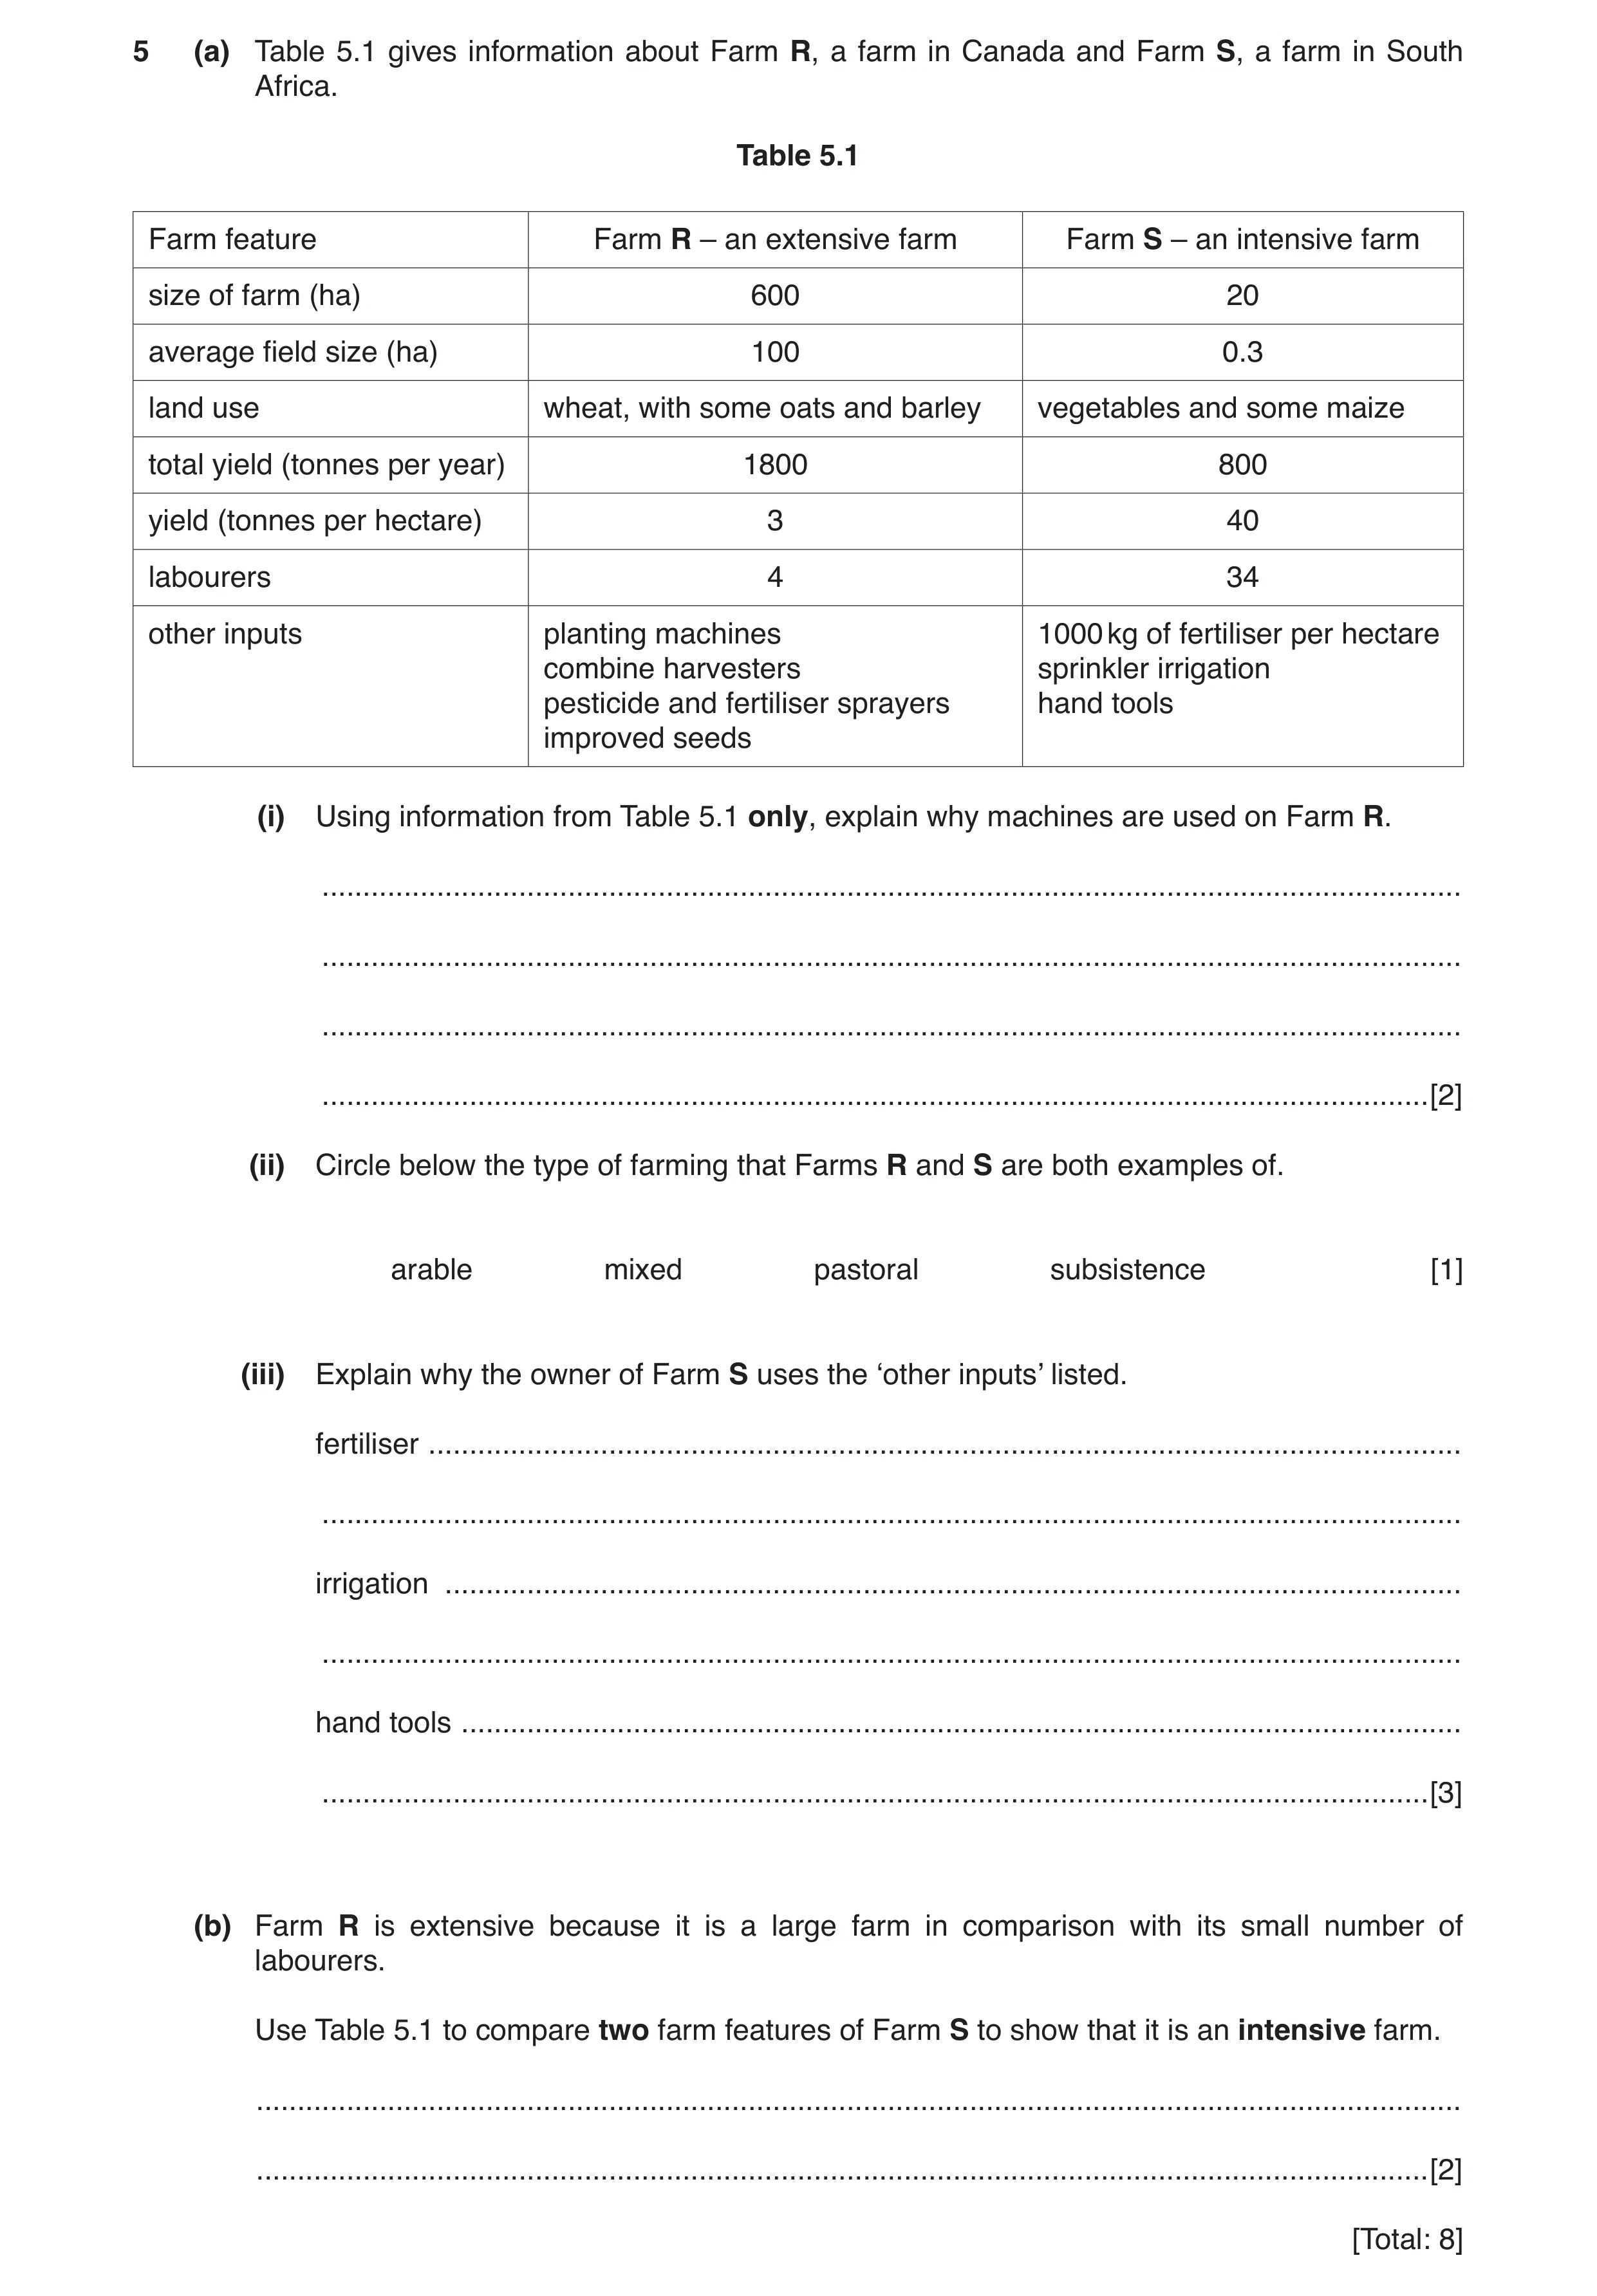
5 (a) Table 5.1 gives information about Farm R, a farm in Canada and Farm S, a farm in South Africa. Table 5.1 Farm feature Farm R – an extensive farm Farm S – an intensive farm size of farm (ha) 600 20 average field size (ha) 100 0.3 land use wheat, with some oats and barley vegetables and some maize total yield (tonnes per year) 1800 800 yield (tonnes per hectare) 3 40 labourers 4 34 other inputs planting machines 1000 kg of fertiliser per hectare combine harvesters sprinkler irrigation pesticide and fertiliser sprayers hand tools improved seeds (i) Using information from Table 5.1 only, explain why machines are used on Farm R. … … … … [2] (ii) Circle below the type of farming that Farms R and S are both examples of. arable mixed pastoral subsistence [1] (iii) Explain why the owner of Farm S uses the ‘other inputs’ listed. fertiliser … … irrigation … … hand tools … … [3] (b) Farm R is extensive because it is a large farm in comparison with its small number of labourers. Use Table 5.1 to compare two farm features of Farm S to show that it is an intensive farm. … … [2] [Total: 8]
8 marks
Mark scheme: 5(a)(i) small labour force, 2 large farm, large fields make machine use easy, cereals / wheat / oats / barley cultivated / harvested by machine / combine harvester, Allow comparatives with Farm S. 5(a)(ii) arable, 1 5(a)(iii) fertilisers to increase yield / shorten growing time, 3 irrigation because climate is dry / drought, hand tools because the fields too small for machinery, hand tools because can’t afford machines, hand tools because crops not suitable for machines / avoid damage to crop, One mark for each of the three inputs. 5(b) Any complete statement = 2 marks: 2 large labour force for size of farm = 2, small farm for number of workers = 2, small farm for spending on inputs = 2, high spending on inputs / fertiliser / irrigation / labour / tools for size of farm = 2, high yield per hectare = 2, Incomplete statement = max 1: large labour force = 1, small farm = 1, high spending on inputs = 1, high yield = 1, Allow comparatives as in (a)(i)
This question in 0460/23 May/June 2019
Question 11 0460/22 Oct/Nov 2019
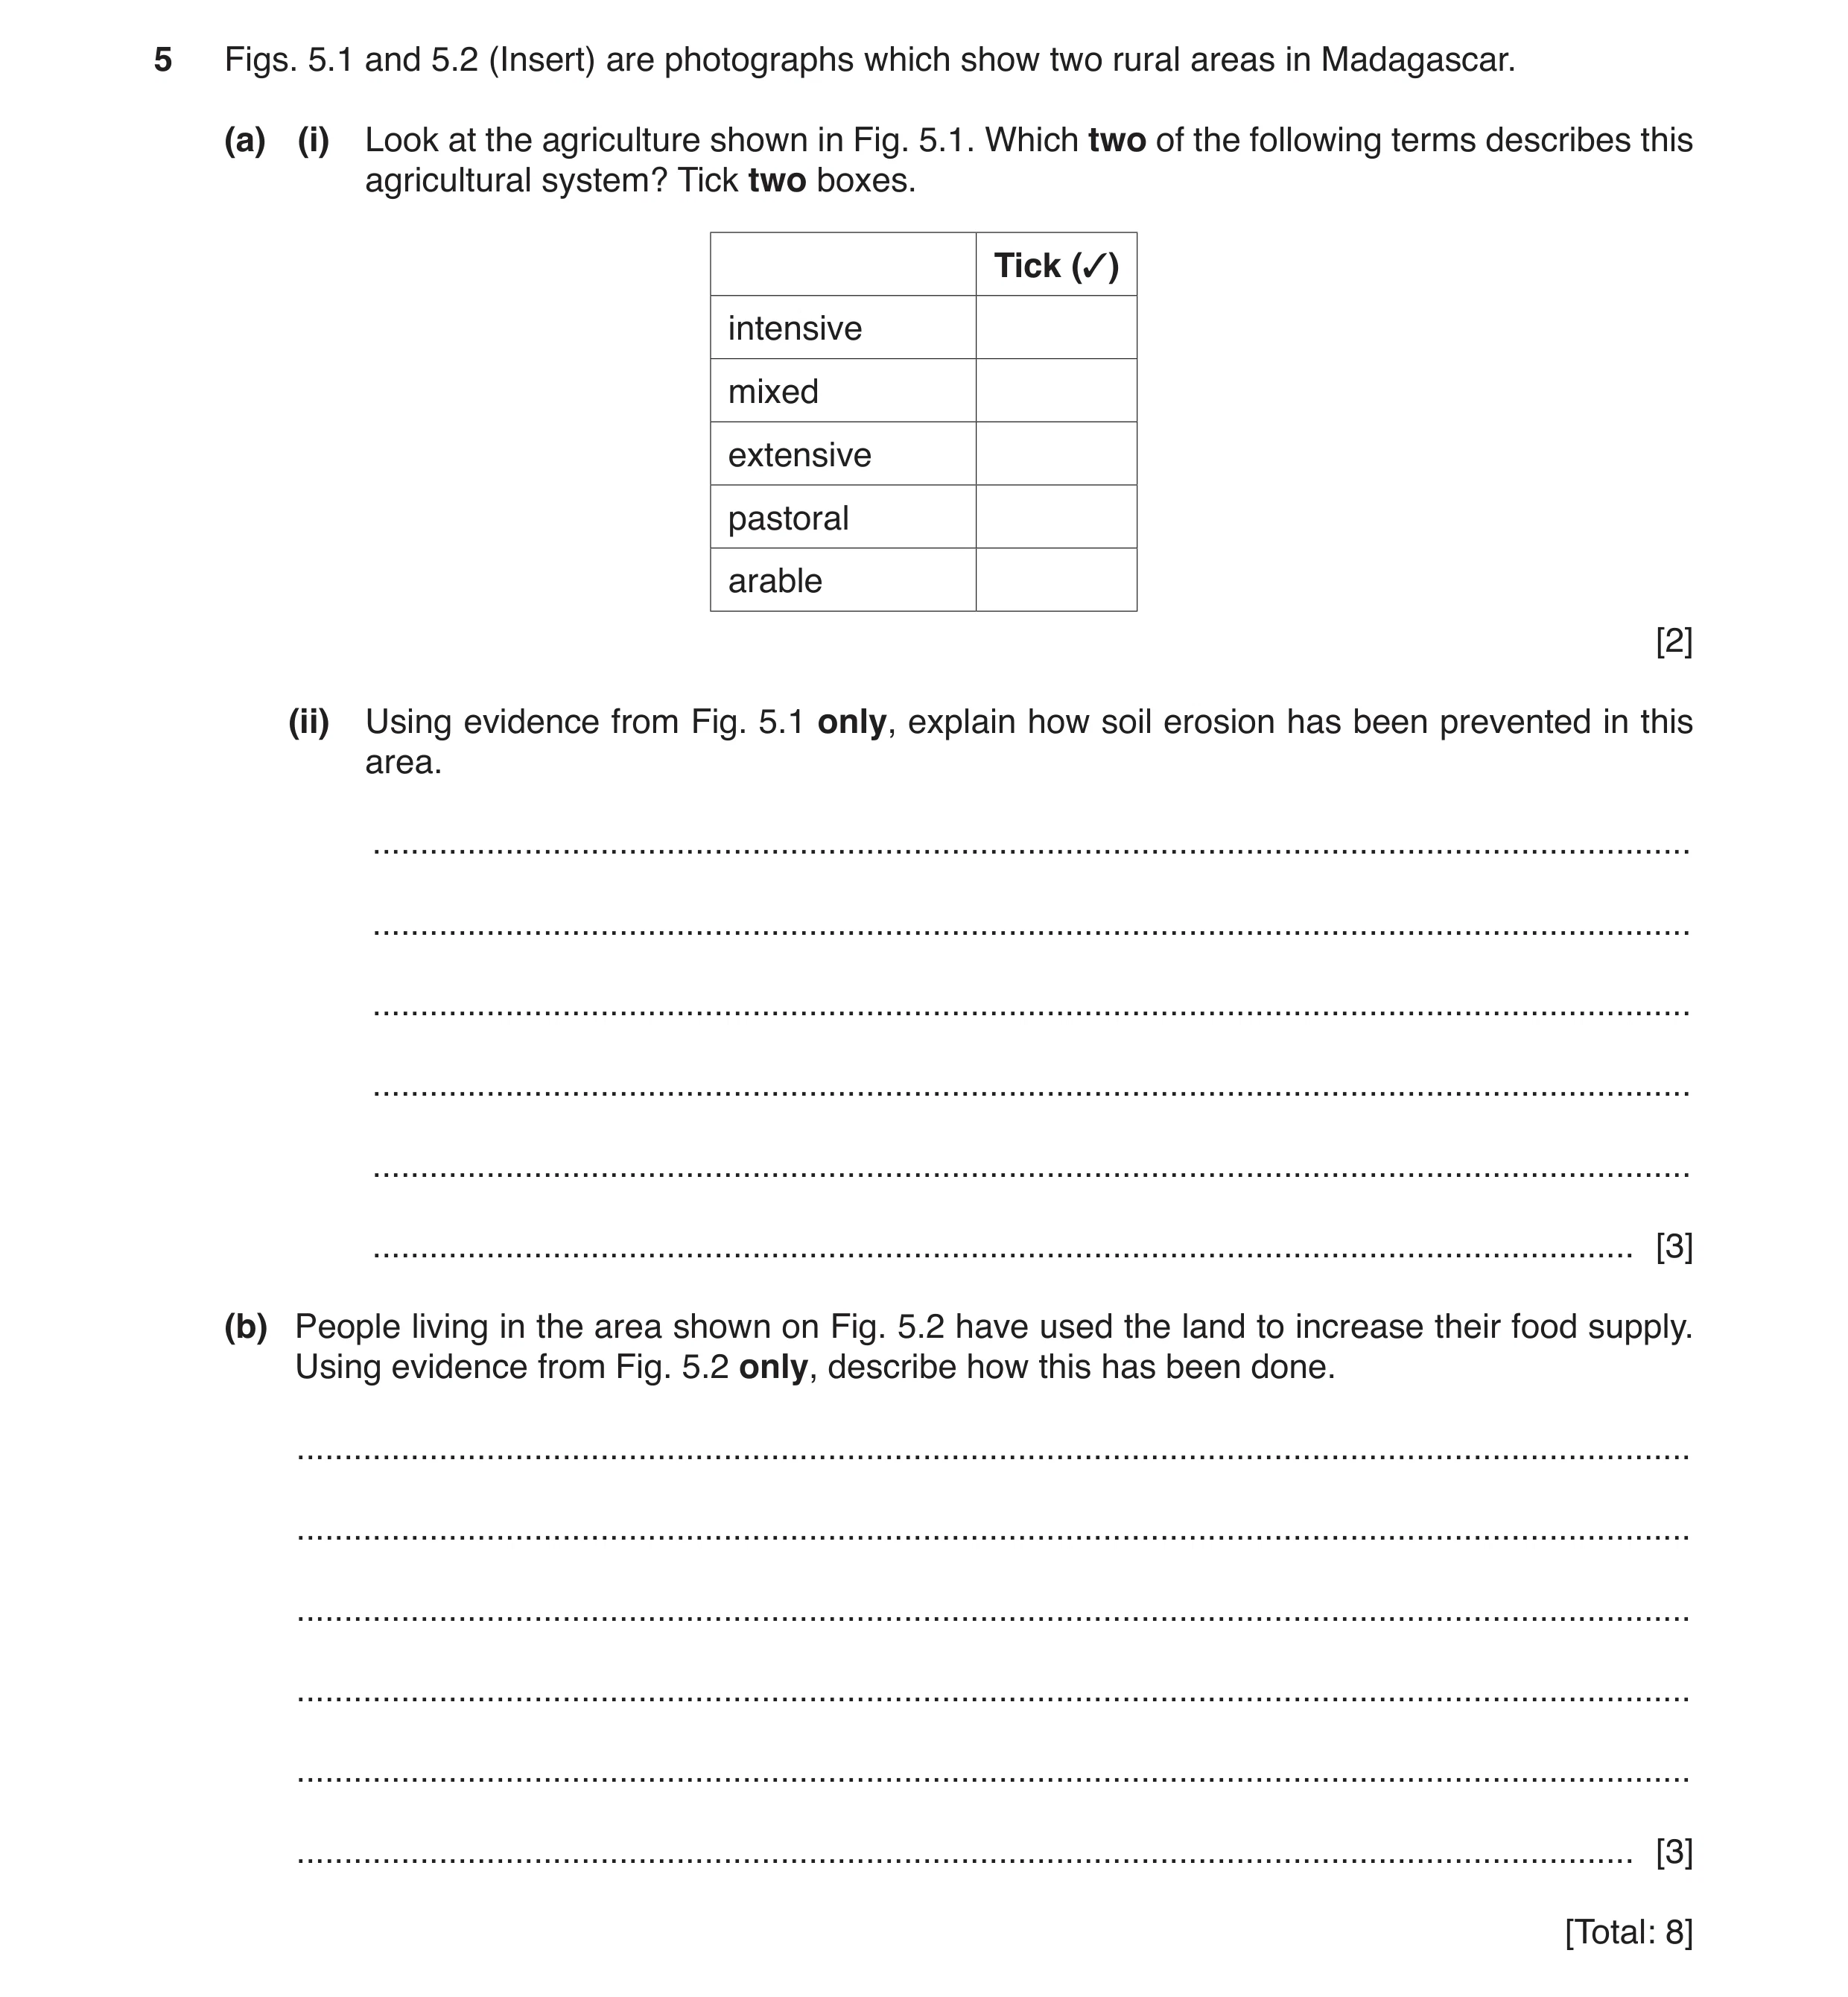
5 Figs. 5.1 and 5.2 (Insert) are photographs which show two rural areas in Madagascar. (a) (i) Look at the agriculture shown in Fig. 5.1. Which two of the following terms describes this agricultural system? Tick two boxes. Tick (✓) intensive mixed extensive pastoral arable [2] (ii) Using evidence from Fig. 5.1 only, explain how soil erosion has been prevented in this area. … … … … … … [3] (b) People living in the area shown on Fig. 5.2 have used the land to increase their food supply. Using evidence from Fig. 5.2 only, describe how this has been done. … … … … … … [3] [Total: 8]
8 marks
Mark scheme: 5(a)(i) intensive, 2 arable 5(a)(ii) terraces/or description, (contour ploughing, ridges = 0) 3 slow runoff/slow surface flow/increase infiltration, grass strips/strip farming/or description, catch/trap moving soil, trees stop wind/bind soil/hold soil/intercept rain/absorb water 5(b)(iii) Emphasis on activities as follows: 3 deforestation/remove vegetation, banks/ridges/bunds made/divide into plots/fields, irrigate/provide water for crops/water supplied/fields flooded, planting/sowing/crops grown/crops cultivated
This question in 0460/22 Oct/Nov 2019
Question 12 0460/22 May/June 2020
6 Fig. 6.1 (Insert) shows an agricultural system in Madagascar. (a) Which of the following terms describes the agricultural system in Fig. 6.1? Tick one box below. Tick (✓) pastoral extensive mechanised intensive [1] (b) Describe the features of the agriculture shown in Fig. 6.1. … … … … … … … … … … [4] (c) Describe the natural problems which cause food shortages. … … … … … … … … … [3] [Total: 8] Additional Pages If you use the following lined pages to complete the answer(s) to any question(s), the question number(s) must be clearly shown. … … … … … … … … … … … … … … … … … … … … … … … … … … … … … … … … … … … … … … … … … … … … … … … … … …
8 marks
Mark scheme: 6(a) intensive, 1 6(b) hand labour/no machinery, 4 simple tool/hoe, ploughing, using animals, small plots, on flat valley floor on valley sides, bare land, 6(c) drought causes crop failure, 3 floods destroy crops, tropical storms destroy crops/cause flooding, pests eat crops,
This question in 0460/22 May/June 2020
Q13 · Information about the states most affected by soil erosion in one year in the USA 0460/21 Oct/Nov 2020
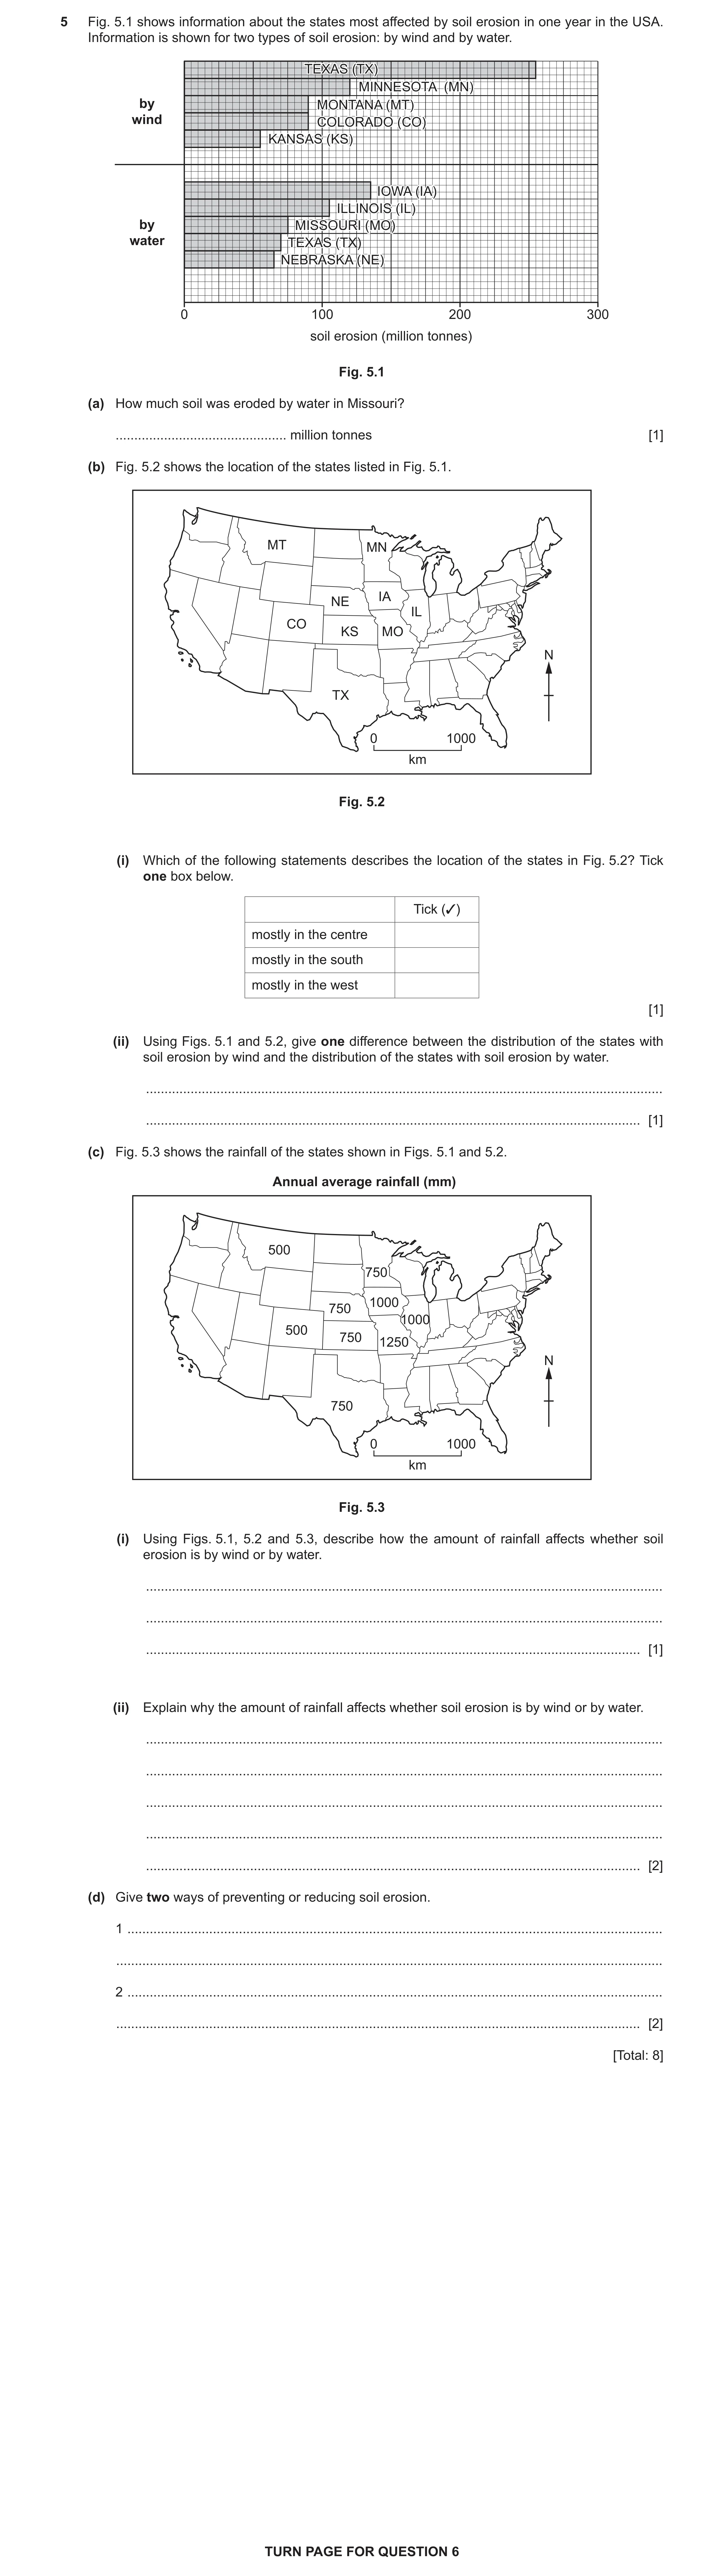
5 Fig. 5.1 shows information about the states most affected by soil erosion in one year in the USA. Information is shown for two types of soil erosion: by wind and by water. TEXASTEXAS (TX)(TX) MINNESOTAMINNESOTA (MN)(MN) by MONTANAMONTANA (MT)(MT) wind COLORADOCOLORADO (CO)(CO) KANSASKANSAS (KS)(KS) IOWAIOWA (IA)(IA) ILLINOISILLINOIS (IL)(IL) by MISSOURIMISSOURI (MO)(MO) water TEXASTEXAS ()(TX) NEBRASKANEBRASKA (NE)(NE) 0 100 200 300 soil erosion (million tonnes) Fig. 5.1 (a) How much soil was eroded by water in Missouri? … million tonnes [1] (b) Fig. 5.2 shows the location of the states listed in Fig. 5.1. MT MN IA NE IL CO KS MO N TX 0 1000 km Fig. 5.2 (i) Which of the following statements describes the location of the states in Fig. 5.2? Tick one box below. Tick (3) mostly in the centre mostly in the south mostly in the west [1] (ii) Using Figs. 5.1 and 5.2, give one difference between the distribution of the states with soil erosion by wind and the distribution of the states with soil erosion by water. … … [1] (c) Fig. 5.3 shows the rainfall of the states shown in Figs. 5.1 and 5.2. Annual average rainfall (mm) 500 750 1000 750 1000 50025 750 1250 N 500750– 750 0 1000 km Fig. 5.3 (i) Using Figs. 5.1, 5.2 and 5.3, describe how the amount of rainfall affects whether soil erosion is by wind or by water. … … … [1] (ii) Explain why the amount of rainfall affects whether soil erosion is by wind or by water. … … … … … [2] (d) Give two ways of preventing or reducing soil erosion. 1 … … 2 … … [2] [Total: 8] TURN PAGE FOR QUESTION 6
8 marks
Mark scheme: 5(a) 75 (million tonnes), 1 5(b)(i) in the centre, 1 5(b)(ii) wind further west/water further east, 1 5(c)(i) wind in drier areas/water in wetter areas, 1 5(c)(ii) in dry areas soil is loose/in wet areas soil is sticky/heavy, 2 in dry areas soil is bare/exposed/in wet areas there is vegetation cover, in wet areas more surface runoff/in dry areas there is less surface runoff, 5(d) terracing, 2 contour ploughing, crop rotation, fallow, strip/inter-cropping, cover cropping, reduction of stock, check dams, filling gullies, afforestation, shelter belts, dry farming, irrigation,
This question in 0460/21 Oct/Nov 2020
Question 14 0460/23 Oct/Nov 2020
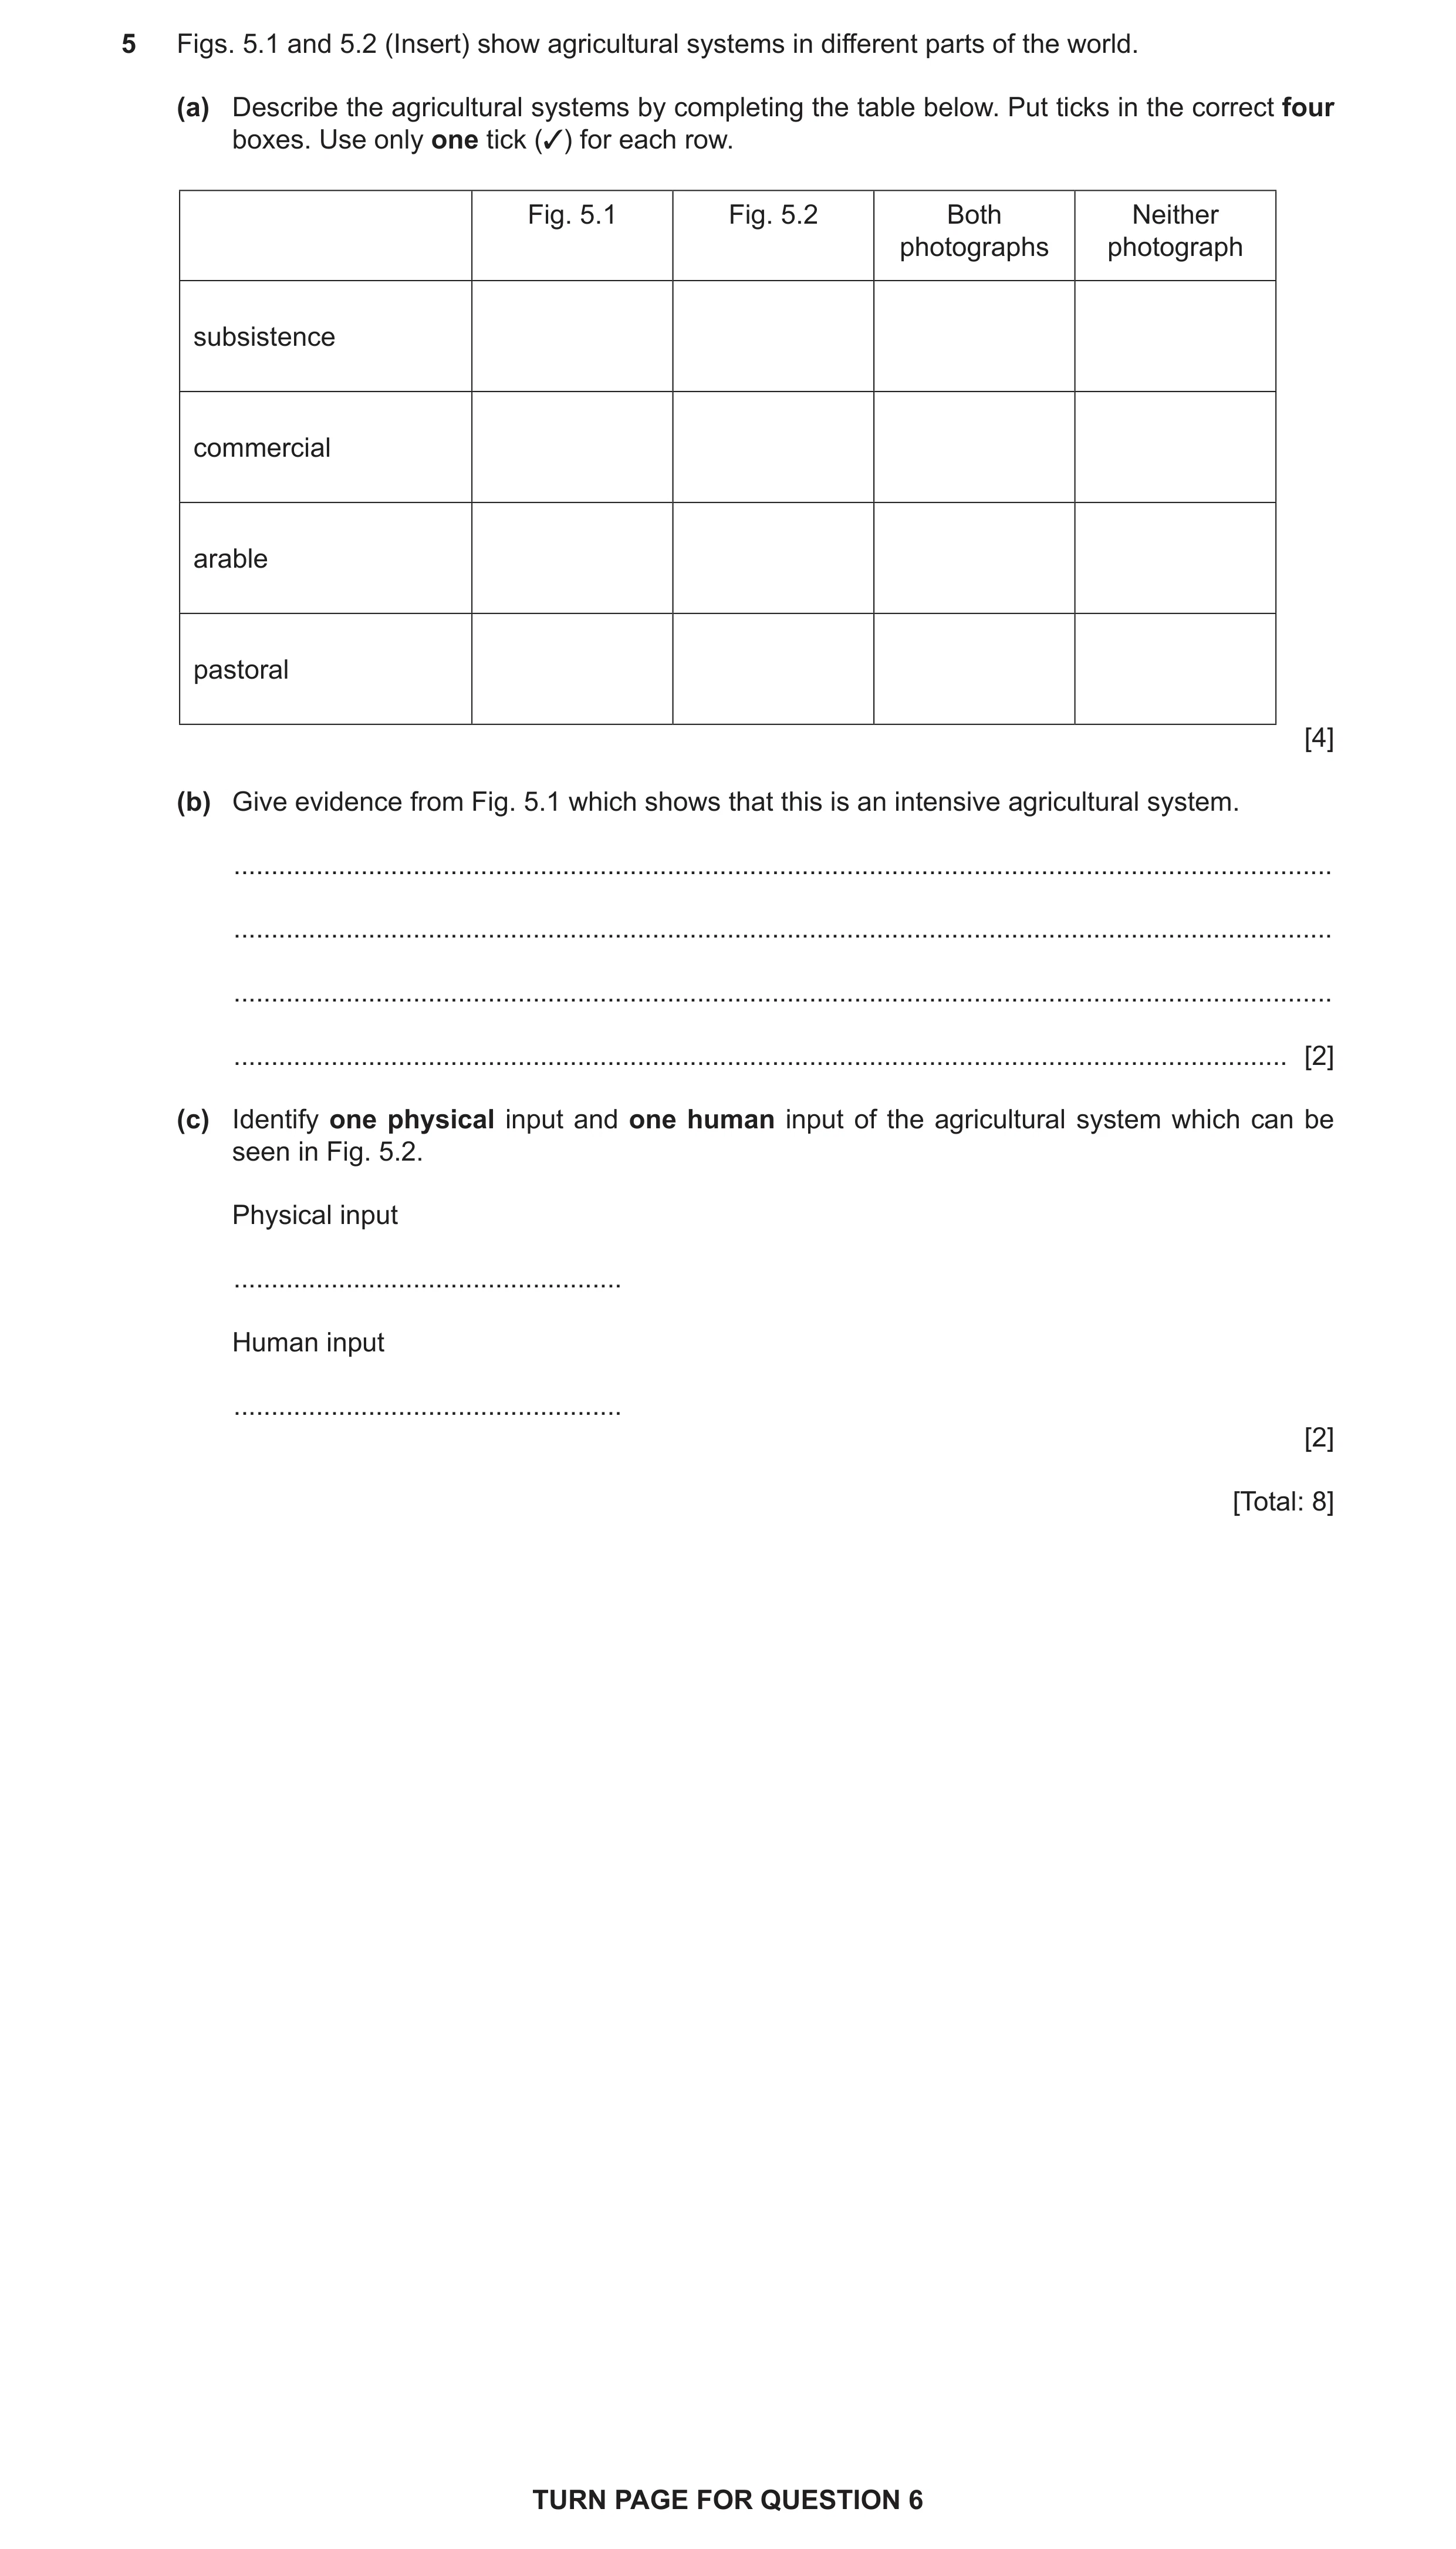
5 Figs. 5.1 and 5.2 (Insert) show agricultural systems in different parts of the world. (a) Describe the agricultural systems by completing the table below. Put ticks in the correct four boxes. Use only one tick (✓) for each row. Fig. 5.1 Fig. 5.2 Both Neither photographs photograph subsistence commercial arable pastoral [4] (b) Give evidence from Fig. 5.1 which shows that this is an intensive agricultural system. … … … … [2] (c) Identify one physical input and one human input of the agricultural system which can be seen in Fig. 5.2. Physical input … Human input … [2] [Total: 8] TURN PAGE FOR QUESTION 6
8 marks
Mark scheme: 5(a) 4 Both Neither Fig. 5.1 Fig. 5.2 photographs photograph subsistence commercial arable pastoral 5(b) small scale/small plots, 2 hand labour/no machines, much labour input, 5(c) relief, 2 soil, land, light/climate, machinery/tractor/named machine,
This question in 0460/23 Oct/Nov 2020
Question 15 0460/21 May/June 2021
6 Study Fig. 6.1 (Insert), which is a photograph of coffee bushes in Ecuador. (a) Describe the coffee bushes shown in Fig. 6.1. … … … … … … [3] (b) Many coffee plantations are using fertilisers and pesticides. Suggest two advantages of doing this. Fertilisers … … Pesticides … … [2] (c) Suggest three ways in which this small-scale commercial farming benefits local people. … … … … … … … … [3] [Total: 8] Additional Pages If you use the following lined pages to complete the answer(s) to any question(s), the question number(s) must be clearly shown. … … … … … … … … … … … … … … … … … … … … … … … … … … … … … … … … … … … … … … … … … … … … … … … … … … … … …
8 marks
Mark scheme: 6(a) large leaves, 3 green, low/about 1 metre high, in rows, below/in shade of trees, pointed leaves/drip tips, 6(b) Fertilisers – increase crop growth/yield/faster growth/provide necessary 2 minerals, Pesticides – kill insects and decrease crop losses/less damage/more growth/higher yield, 6(c) jobs/income, 3 use income to purchase goods, develop the area/economy, involved in decision-making, learn new skills, reduce out migration, protects way of life, doesn’t involve TNCs,
This question in 0460/21 May/June 2021
Question 16 0460/23 Oct/Nov 2021
5 Study Figs. 5.1 and 5.2 (Insert), which show two different types of farming in England. Describe the types of farming shown, including the human and natural inputs of each farming type. Farming in Fig. 5.1 … … … … … … … … … … … … Farming in Fig. 5.2 … … … … … … … … … … … … [8] [Total: 8] TURN PAGE FOR QUESTION 6
8 marks
Mark scheme: 5 Fig. 5.1 8 pastoral/birds/chickens/poultry/animals, covered/shelter, large building/large number of birds/large scale, intensive/high density, commercial/for sale/for profit, material on ground/food, light, ventilation, Fig. 5.2 arable/crops/plants, large area/extensive/large scale, different crops/green and yellow, commercial/for sale/for profit, machinery, seeds, gently sloping/flat land, Reserve three for each photograph.
This question in 0460/23 Oct/Nov 2021
Q17 · How the employment structure of Bangladesh (an LEDC) has changed over time 0460/22 May/June 2022
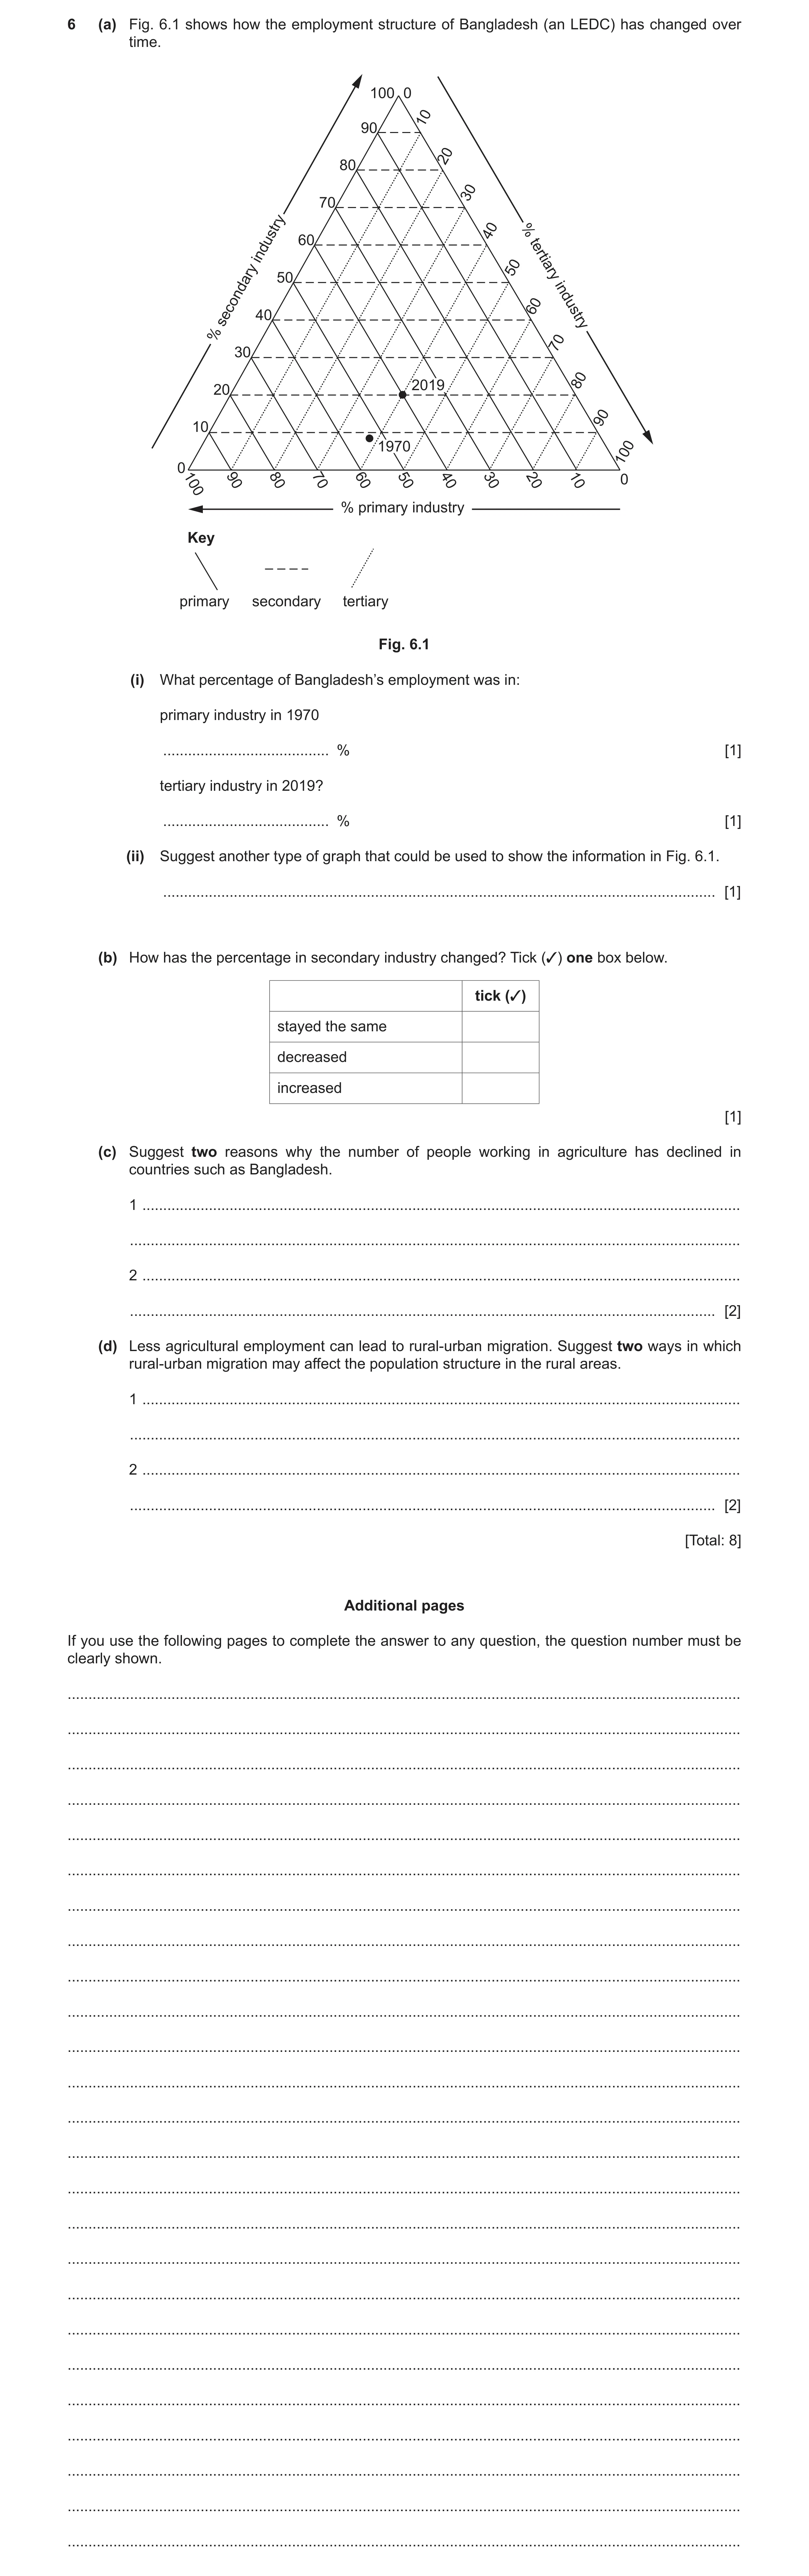
6 (a) Fig. 6.1 shows how the employment structure of Bangladesh (an LEDC) has changed over time. 100 0 10 90 20 80 30 70 40 % 60 industry 50 50 tertiary 60 40 secondary industry % 70 30 2019 80 20 90 10 1970 100 0 100 90 80 70 60 50 40 30 20 10 0 % primary industry Key primary secondary tertiary Fig. 6.1 (i) What percentage of Bangladesh’s employment was in: primary industry in 1970 … % [1] tertiary industry in 2019? … % [1] (ii) Suggest another type of graph that could be used to show the information in Fig. 6.1. … [1] (b) How has the percentage in secondary industry changed? Tick (✓) one box below. tick (✓) stayed the same decreased increased [1] (c) Suggest two reasons why the number of people working in agriculture has declined in countries such as Bangladesh. 1 … … 2 … … [2] (d) Less agricultural employment can lead to rural-urban migration. Suggest two ways in which rural-urban migration may affect the population structure in the rural areas. 1 … … 2 … … [2] [Total: 8] Additional pages If you use the following pages to complete the answer to any question, the question number must be clearly shown. … … … … … … … … … … … … … … … … … … … … … … … … …
8 marks
Mark scheme: 6(a)(i) 52–54 (%) 1 40 (%) 1 6(a)(ii) bar/divided/compound bar graph/pie graph 1 6(b) increased 1 6(c) import of food; 2 mechanisation; labour force more educated/skilled/prefer/more manufacturing jobs/tertiary jobs/less primary sector jobs/better paid jobs/poorly paid in countryside/ moved to towns for work/less physical jobs; land degradation/soil erosion/exhaustion/overcultivation; flooding/cyclones/drought; land taken for expansion of cities/build houses/urban sprawl; 6(d) loss of working age/less economically active/less 16–65 (or ages in 2 between)/ageing workforce; ageing population/older dependents remain/more older dependent population; less children born/lower BR/less young(er) people; less males/more females/gender imbalance;
This question in 0460/22 May/June 2022
Question 18 0460/21 Oct/Nov 2022
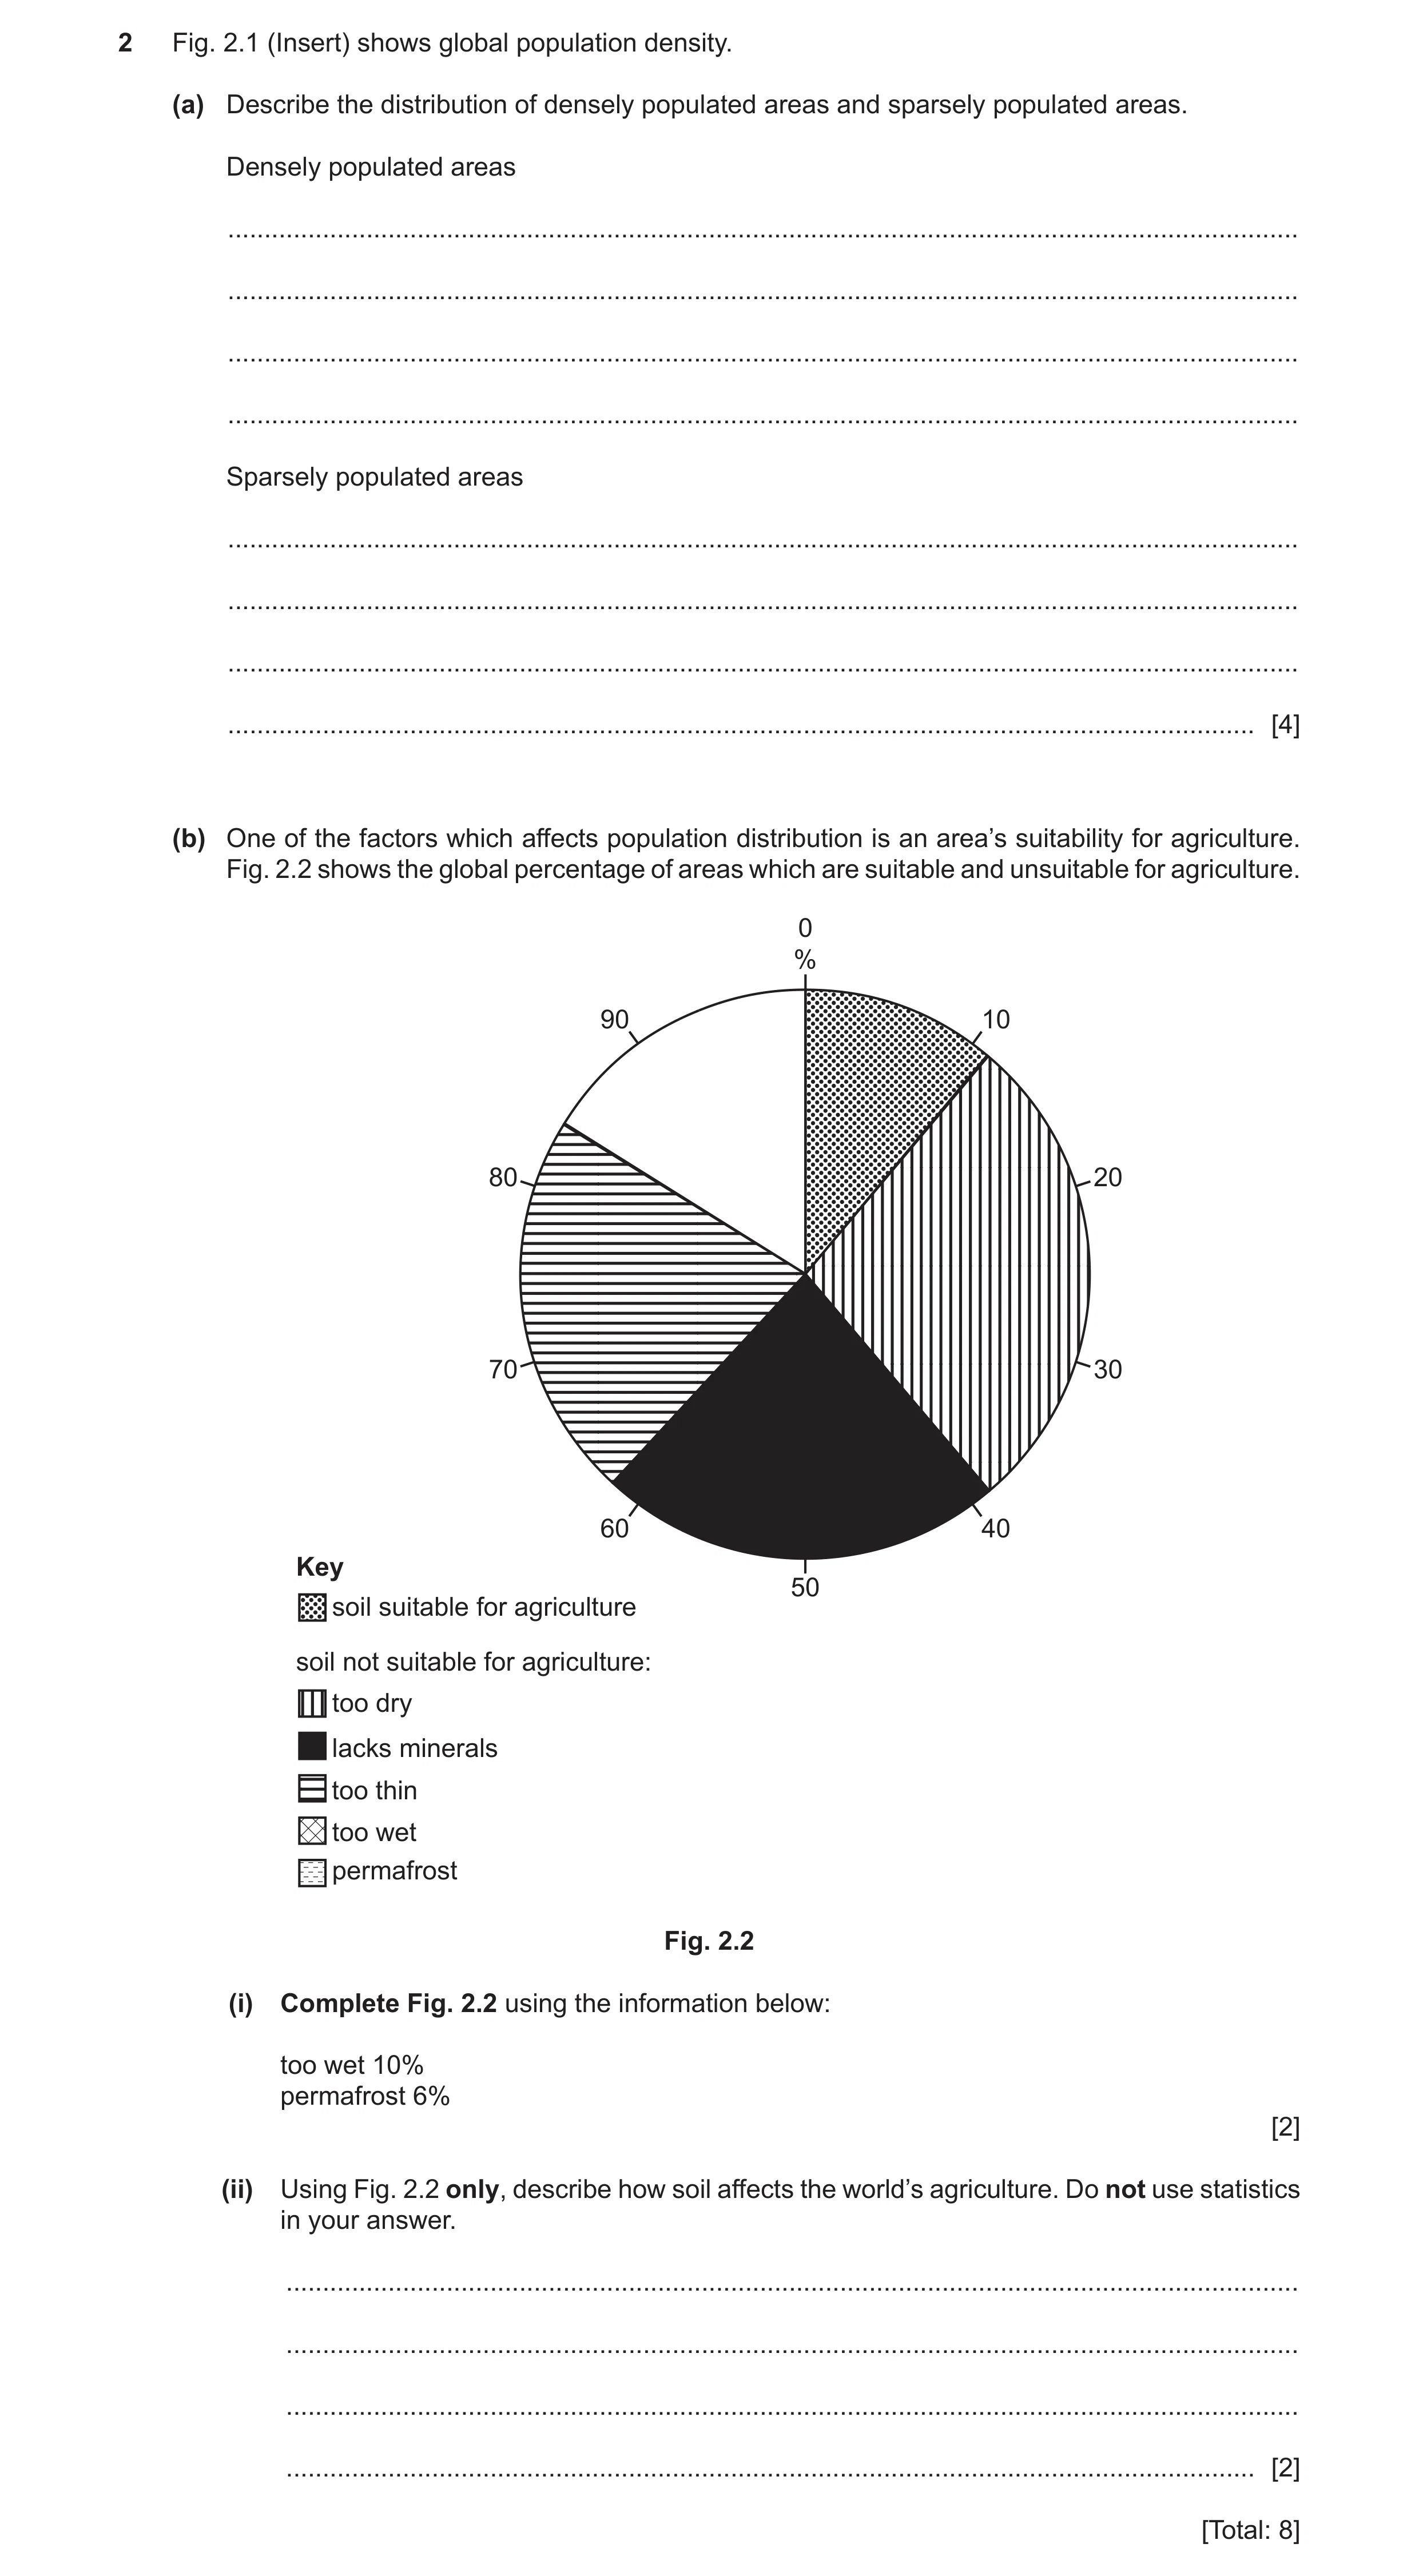
2 Fig. 2.1 (Insert) shows global population density. (a) Describe the distribution of densely populated areas and sparsely populated areas. Densely populated areas … … … … Sparsely populated areas … … … … [4] (b) One of the factors which affects population distribution is an area’s suitability for agriculture. Fig. 2.2 shows the global percentage of areas which are suitable and unsuitable for agriculture. 0 % 90 10 80 20 70 30 60 40 Key 50 soil suitable for agriculture soil not suitable for agriculture: too dry lacks minerals too thin too wet permafrost Fig. 2.2 (i) Complete Fig. 2.2 using the information below: too wet 10% permafrost 6% [2] (ii) Using Fig. 2.2 only, describe how soil affects the world’s agriculture. Do not use statistics in your answer. … … … … [2] [Total: 8]
8 marks
Mark scheme: 2(a) Densely: 4 No pattern; In northern hemisphere/in north; Few/sparse; 3 countries/areas; In Asia; In Europe; Coastal. Sparsely: Far north/far south; In every continent/throughout world/widely distributed; All of Australasia. 2(b)(i) Correctly drawn line at 90% (no tolerance) or 94% (1° tolerance) too wet = 2 36°; Correctly shaded: biggest segment (crossed diagonals) too wet, smallest segment (horizontal dashes) permafrost; Accept any order. Use the protractor tool. 2(b)(ii) Very important/depends on soil; 2 Only small proportion can be cultivated; Large area of world has soil problems which limits agriculture/most not suitable; Smallest impact is permafrost; Main problems are too dry/lacks minerals/too thin.
This question in 0460/21 Oct/Nov 2022
Question 19 0460/21 Oct/Nov 2022
6 Fig. 6.1 (Insert) shows a farm in Indonesia. (a) Which one of the following terms describes the farm in Fig. 6.1? Tick (✓) one box below. tick (✓) extensive pastoral mechanised intensive [1] (b) Describe the features of the agriculture shown in Fig. 6.1 (Insert). … … … … … … … … [4] (c) Describe the economic and political problems which cause food shortages. … … … … … … … … [3] [Total: 8] Additional pages If you use the following pages to complete the answer to any question, the question number must be clearly shown. … … … … … … … … … … … … … … … … … … … … … … … … … … … … … … … … … … … … … … … … … … … … … … … … The boundaries and names shown, the designations used and the presentation of material on any maps contained in this question paper/insert do not imply official endorsement or acceptance by Cambridge Assessment International Education concerning the legal status of any country, territory, or area or any of its authorities, or of the delimitation of its frontiers or boundaries.
8 marks
Mark scheme: 6(a) Intensive 1 6(b) Arable/crop farming; 4 Crops/trees in rows; One type of crop/monoculture; Shaded by trees; Coconut/palm trees; Small scale; Manual work/by hand/single worker; Terracing/stone walls. 6(c) Poverty (consumers cannot buy/farmers lack seeds, machinery); 3 Inflation (consumers cannot buy/farmers lack seeds, machinery); Tax increase so cannot afford food; Cannot afford to import food; Food aid not supplied by government/other countries; Less food produced leads to higher prices; Cash crops for export reduces available land; Country can’t afford/lack of loans/grants/subsidies/funding for farmers; Transport system not developed so distribution is difficult; Government corruption diverts food/money/aid; Wars/conflicts/divisions destroys food crops/reduces number of farmers/prevents movement of food to areas in need; Lack of land/small plots of land which are uneconomic; Change of land use to industry/housing reduces land for agriculture; Lack of agricultural labour as people move to cities to work. Two ways listed above only – 1 max. if no other marks awarded.
This question in 0460/21 Oct/Nov 2022
Q20 · Information about fertiliser use and cereal crop production in part of China 0460/22 Oct/Nov 2022
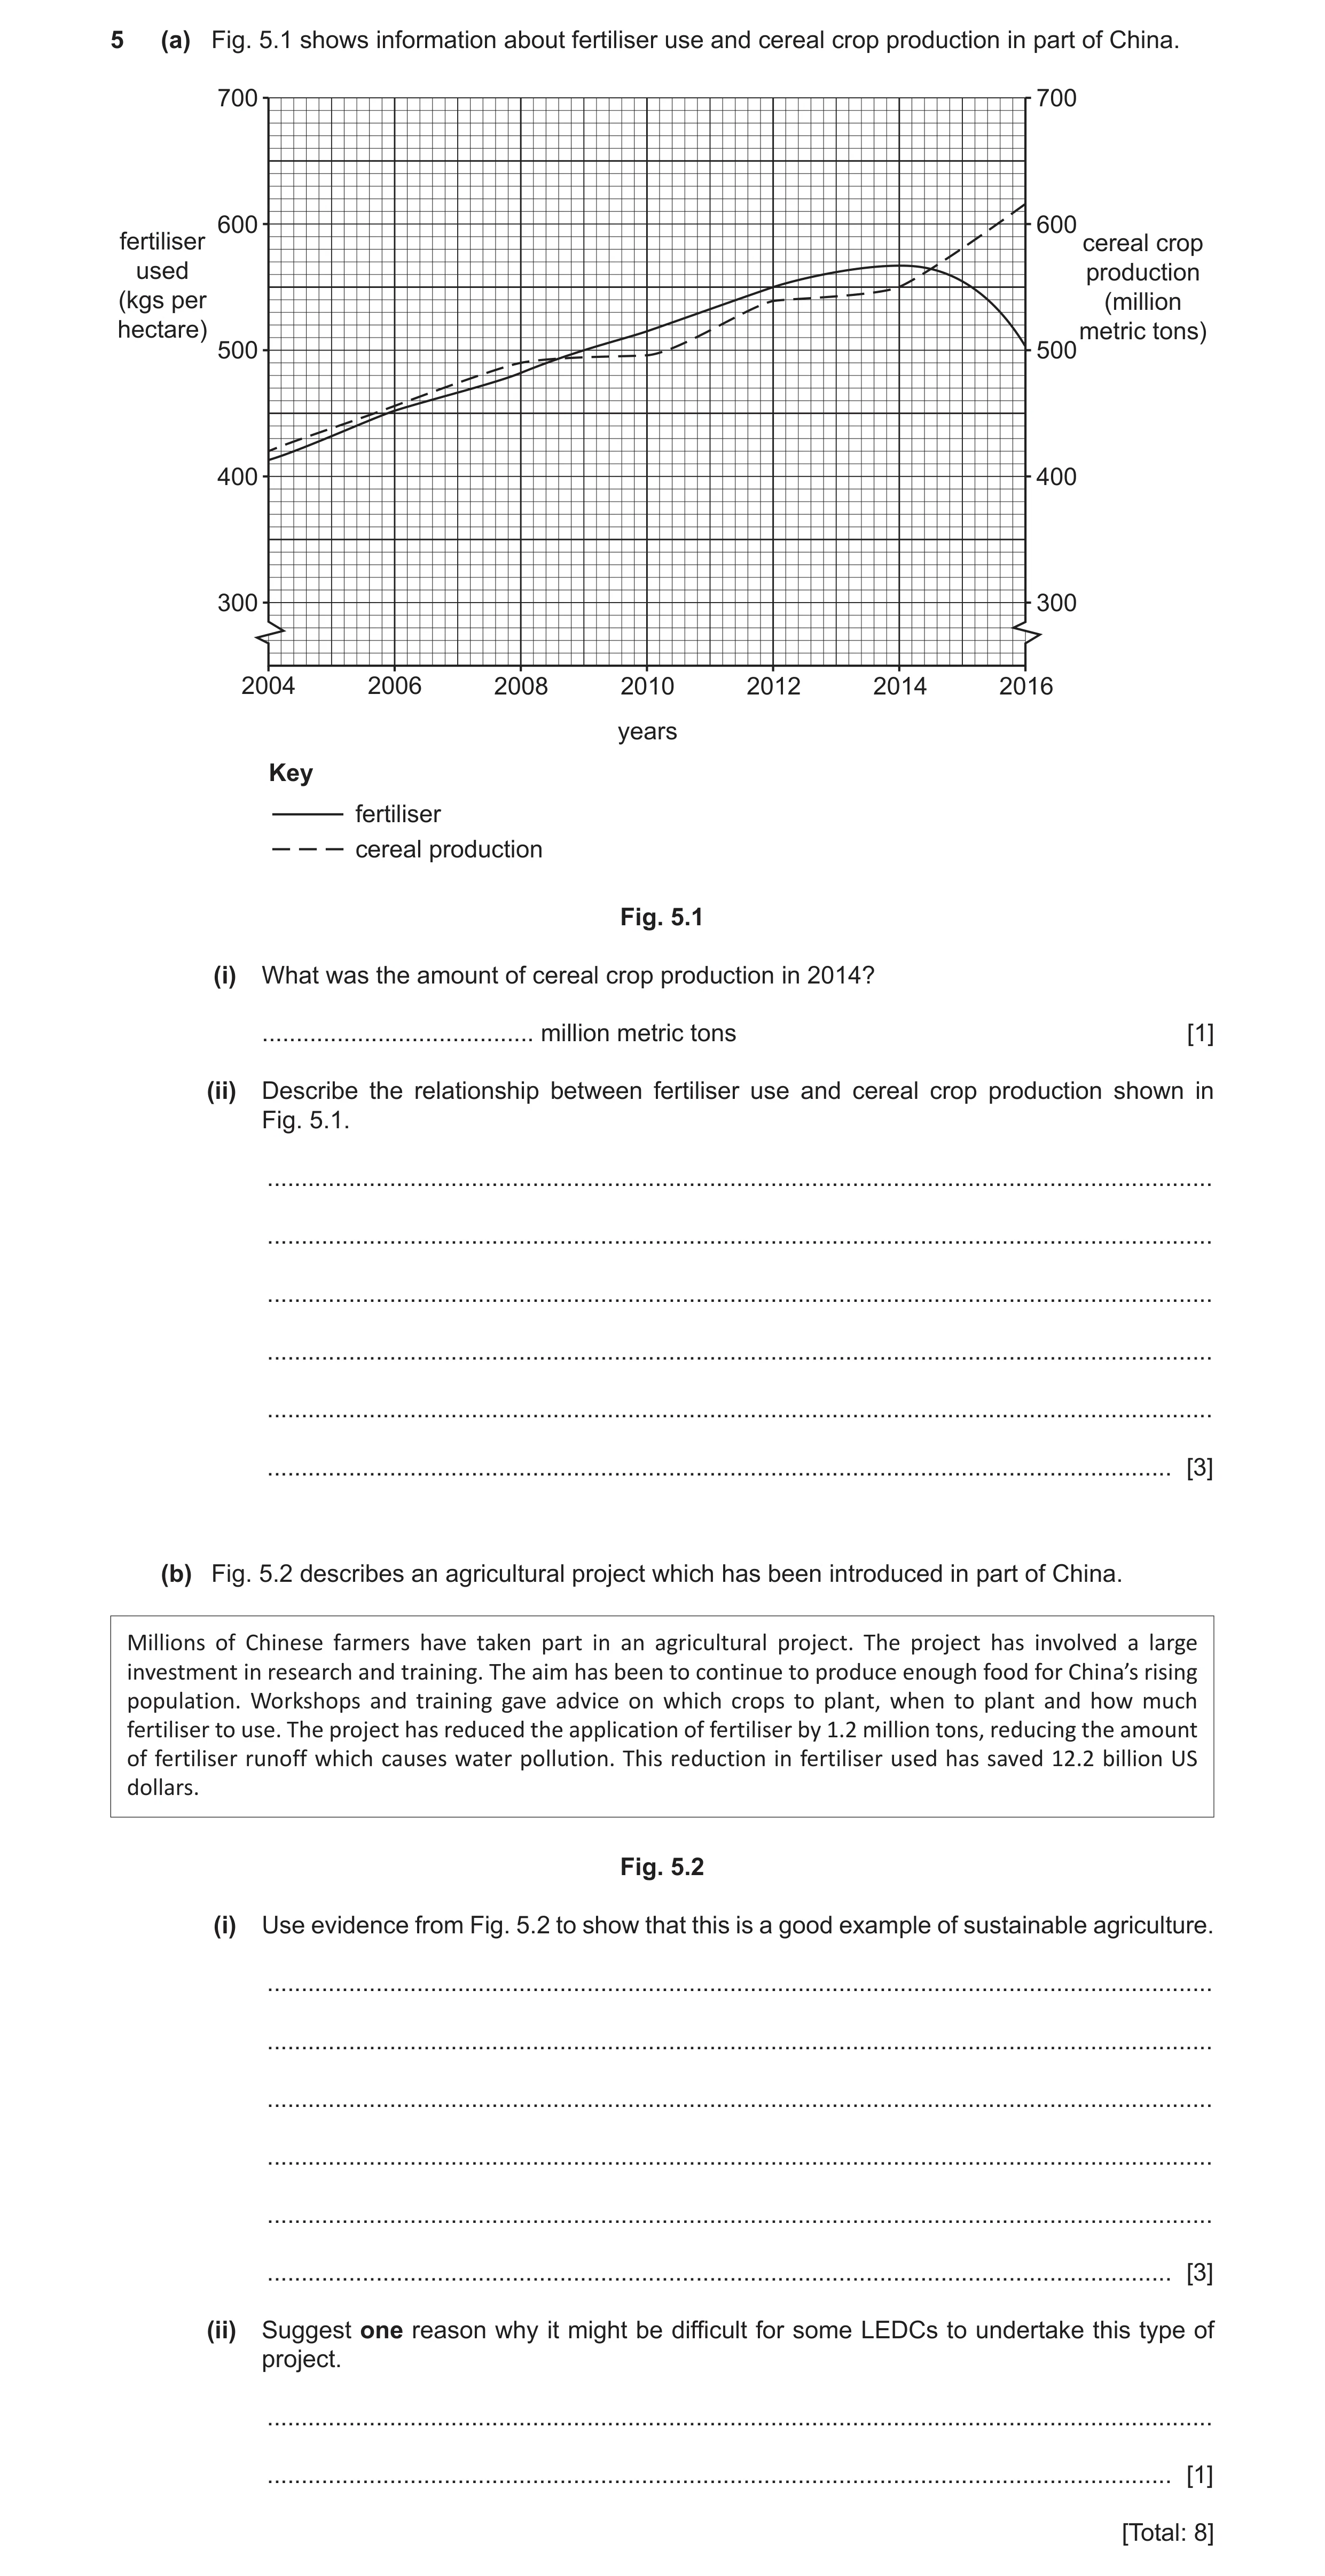
5 (a) Fig. 5.1 shows information about fertiliser use and cereal crop production in part of China. 700 700 600 600 fertiliser cereal crop used production (kgs per (million hectare) metric tons) 500 500 400 400 300 300 2004 2006 2008 2010 2012 2014 2016 years Key fertiliser cereal production Fig. 5.1 (i) What was the amount of cereal crop production in 2014? … million metric tons [1] (ii) Describe the relationship between fertiliser use and cereal crop production shown in Fig. 5.1. … … … … … … [3] (b) Fig. 5.2 describes an agricultural project which has been introduced in part of China. Millions of Chinese farmers have taken part in an agricultural project. The project has involved a large investment in research and training. The aim has been to continue to produce enough food for China’s rising population. Workshops and training gave advice on which crops to plant, when to plant and how much fertiliser to use. The project has reduced the application of fertiliser by 1.2 million tons, reducing the amount of fertiliser runoff which causes water pollution. This reduction in fertiliser used has saved 12.2 billion US dollars. Fig. 5.2 (i) Use evidence from Fig. 5.2 to show that this is a good example of sustainable agriculture. … … … … … … [3] (ii) Suggest one reason why it might be difficult for some LEDCs to undertake this type of project. … … [1] [Total: 8]
8 marks
Mark scheme: 5(a)(i) 550 (million metric tons) 1 5(a)(ii) (Overall/2004 – 2016) both increased/the more fertiliser used, the greater 3 the cereal production/positive correlation; Credit the three sections of the graph without years if the sequence is clear, as follows: Initial increase in both/2004 – 2008 both increased (at the same rate)/directly proportional; Fertiliser rate continues to increase/increases 2008/2009 – 2014 whilst cereal production fluctuates/increases at a slower rate; 2014 – 2016 fertiliser decreases whilst cereal production increases/steep decrease vs. steep rise/negative relationship/inversely proportional; Positive relationship/both increased until 2014; 2008/2009 fertiliser overtook cereal production/2014/2015 crop production overtook fertiliser; Max 1 data mark for the following: 2004 – 2008 fertiliser 410–420 to 480 kg and cereal production 420 to 490m metric tonnes; OR 2008 – 2014 fertiliser 480 to 560–570 kg and cereal production 490 to 550m metric tonnes; OR 2014 – 2016 fertiliser 560–570 to 500–510 kg and cereal production 550 to 610–620m metric tonnes. Units used once for each of fertiliser usage and cereal production verifies rest of data mark. 4 correct figures must be used. Figures within given range acceptable. Allow reference to cereal/crop/cereal crop. fertiliser(kg) cereal production (m metric tonnes) 2004 – 2008 410–420 480 420 490 2008 – 2014 480 560–570 490 550 2014 – 2016 560–570 500–510 550 610–620 5(b)(i) Provides enough food (for China’s increasing population)/increased yields; 3 Reduces the amount of fertiliser used/teaches farmers not to overuse fertilisers/can pass on knowledge about fertiliser use; Reduces environmental impact of fertiliser application/runoff/water pollution; Reduces the cost of food production/saves on cost of fertilisers/saved 12.2 billion US dollars/saved money. 5(b)(ii) High cost (of research and training)/poorer countries/farmers don’t have 1 sufficient funds/cost of fertilisers/don’t have resources/money; Some rural communities far from training centres/not enough workshops/equipment/access to fertilisers/lack access to training; Low literacy levels make it difficult for ideas to be understood.
This question in 0460/22 Oct/Nov 2022
Question 21 0460/22 Feb/March 2023
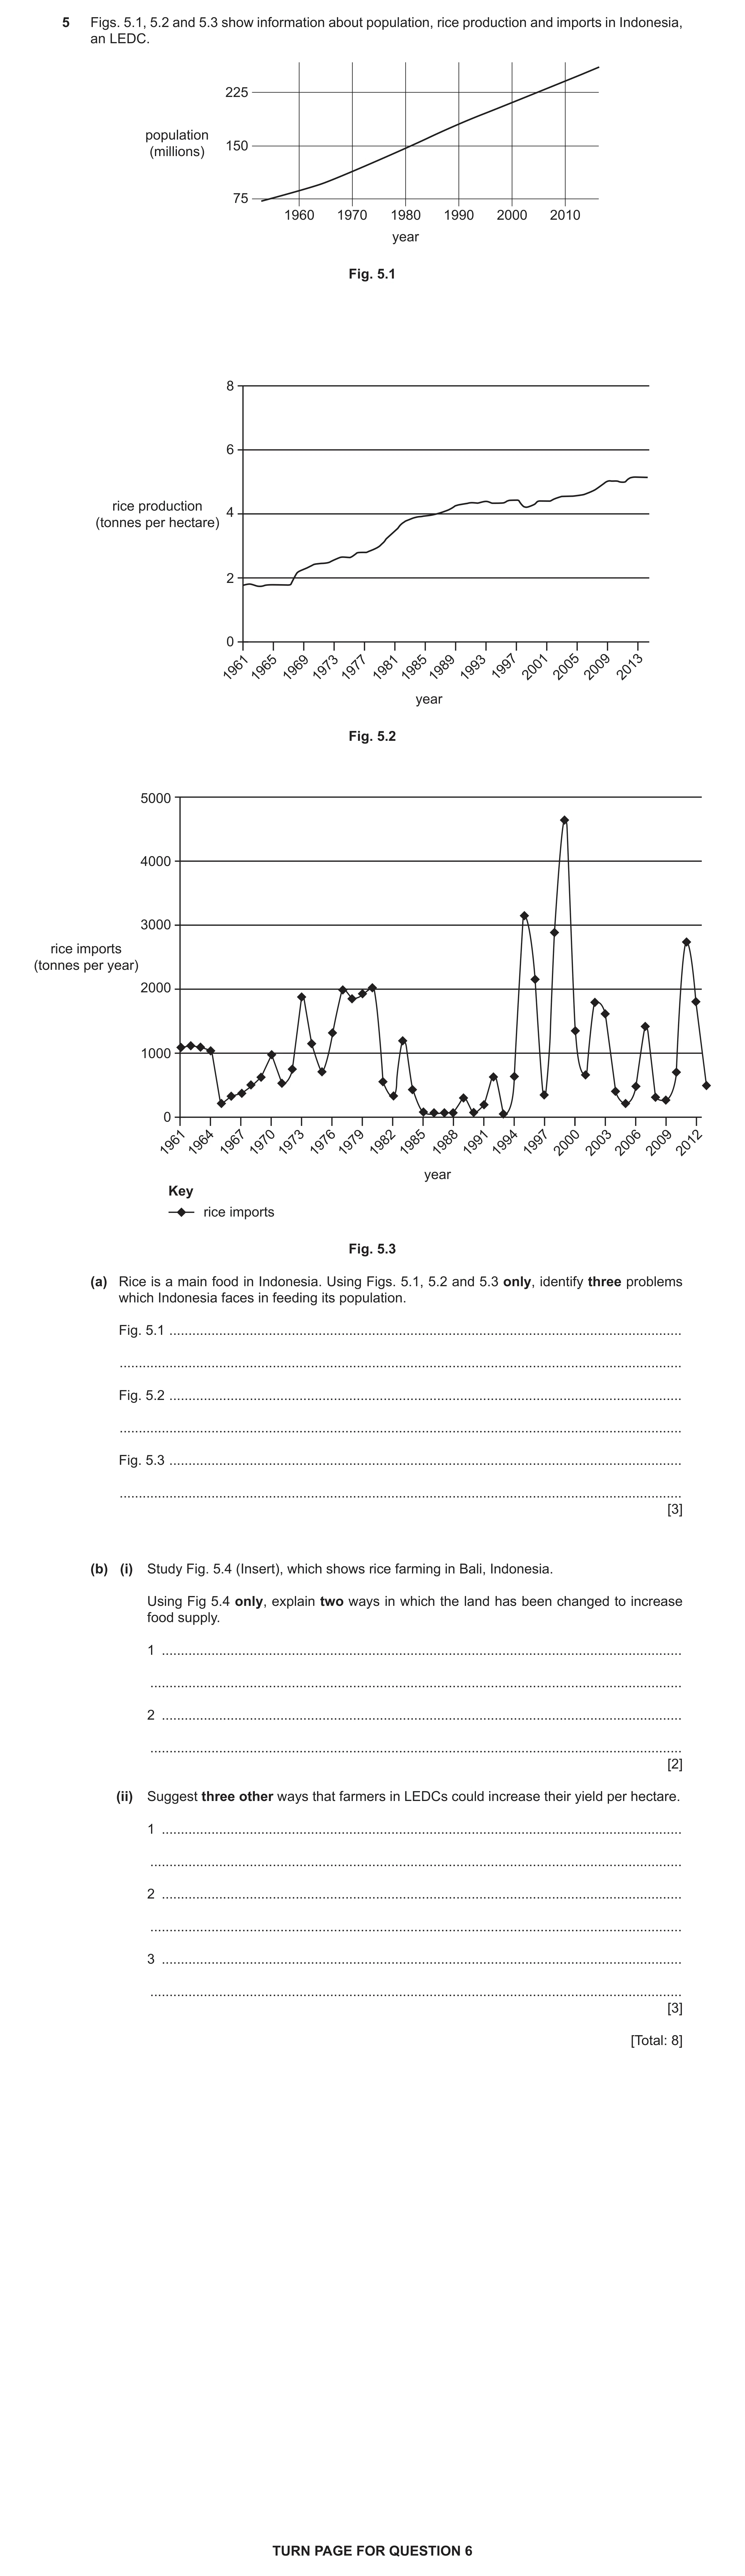
5 Figs. 5.1, 5.2 and 5.3 show information about population, rice production and imports in Indonesia, an LEDC. 225 population 150 (millions) 75 1960 1970 1980 1990 2000 2010 year Fig. 5.1 8 6 rice production 4 (tonnes per hectare) 2 0 19611965196919731977198119851989199319972001200520092013 year Fig. 5.2 5000 4000 3000 rice imports (tonnes per year) 2000 1000 0 196119641967197019731976197919821985198819911994199720002003200620092012 year Key rice imports Fig. 5.3 (a) Rice is a main food in Indonesia. Using Figs. 5.1, 5.2 and 5.3 only, identify three problems which Indonesia faces in feeding its population. Fig. 5.1 … … Fig. 5.2 … … Fig. 5.3 … … [3] (b) (i) Study Fig. 5.4 (Insert), which shows rice farming in Bali, Indonesia. Using Fig 5.4 only, explain two ways in which the land has been changed to increase food supply. 1 … … 2 … … [2] (ii) Suggest three other ways that farmers in LEDCs could increase their yield per hectare. 1 … … 2 … … 3 … … [3] [Total: 8] TURN PAGE FOR QUESTION 6
8 marks
Mark scheme: 5(a) Population/demand is increasing/high population growth/high population; 3 Yield is increasing gradually/slowly/levelling out/ not keeping up with rising/large population; Reliance on imports/imports vary in amount/fluctuate each year/ inconsistent/unpredictable imports/ many years rice imports lower than 2000 tonnes/ need for imports indicates it is not growing enough food. Each mark awarded must relate to a different graph. Too vague: Low/varying rice production; Imports are low; Overall decrease in imports; Increase in imports; High cost of imports; Needs to spend a lot of money on imports; Reduction in imports after 2010. 5(b)(i) Terracing/step farming to ensure flat land/increase land area (available for 2 cultivation)/steps created to hold water; Bunds/walls to retain water; (Irrigation) canals/channels to supply water. Recognition of two methods without explanation = Max.1 (in absence of any appropriate explanation). 5(b)(ii) Machinery/tractors; 3 HYVs/GM crops/use drought tolerant varieties/higher quality seeds; Pesticides/herbicides/fungicides/introduced natural predators; Fertilisers/dung; Double-cropping/multiple cropping/intercropping/mixed cropping/farm a variety of crops; Land consolidation; Crop rotation; Contour ploughing; Education to learn about most efficient techniques/methods/etc.; Drip/trickle irrigation/water spraying/sprinklers. Too vague: Regular ploughing; More workers; Monoculture; Growing crops more densely; Loans/subsidies; Less overgrazing.
This question in 0460/22 Feb/March 2023
Question 22 0460/22 May/June 2023
6 Fig. 6.1 (Insert) is a photograph which shows a rural area in Bali, Indonesia. (a) Describe how the land has been used in Fig. 6.1. … … … … … … … … … … [5] (b) Suggest ways in which the government can help to increase the agricultural output. … … … … … … [3] [Total: 8] Additional pages If you use the following pages to complete the answer to any question, the question number must be clearly shown. … … … … … … … … … … … … … … … … … … … … … … … … … … … … … … … … … … … … … … … … … … … … … … … … … … … … …
8 marks
Mark scheme: 6(a) Arable/crop farming/cultivation/growing/producing/used for crops/crops; 5 Rice/paddy (fields); Irrigation/flooded land; Ponds/pools of water/water body/lake; Bunds/walls/mud borders/grass borders/(raised) banks/raised barriers; Rectangular/square/sub-divided; Terracing/steps/stairs/tiered; Bushes/palms; Trees/woodland/forest (in distance); Grassland; Hedges; Storage/farm/residential buildings/barns/houses. 6(b) Affordable credit; 3 Loans/grants/money/investment/funds/subsidies/discount for/to (help) buy machinery/equipment/HYVs/GM crops/seeds/fertilisers/tube wells/silos/ drainage/ treating salinity; Tax breaks; (Government) builds named infrastructure such as dams/irrigation canals/drainage system/ roads for transport of crops/raw materials/access to electricity; Education/training about different crops/farming techniques; Guaranteed prices for crops; Develop/research into HYVs/GM crops; Limit imports of similar crops/import tariffs; Land reform/consolidation/restrictions to stop farming land being built on.
This question in 0460/22 May/June 2023
Question 23 0460/23 May/June 2023
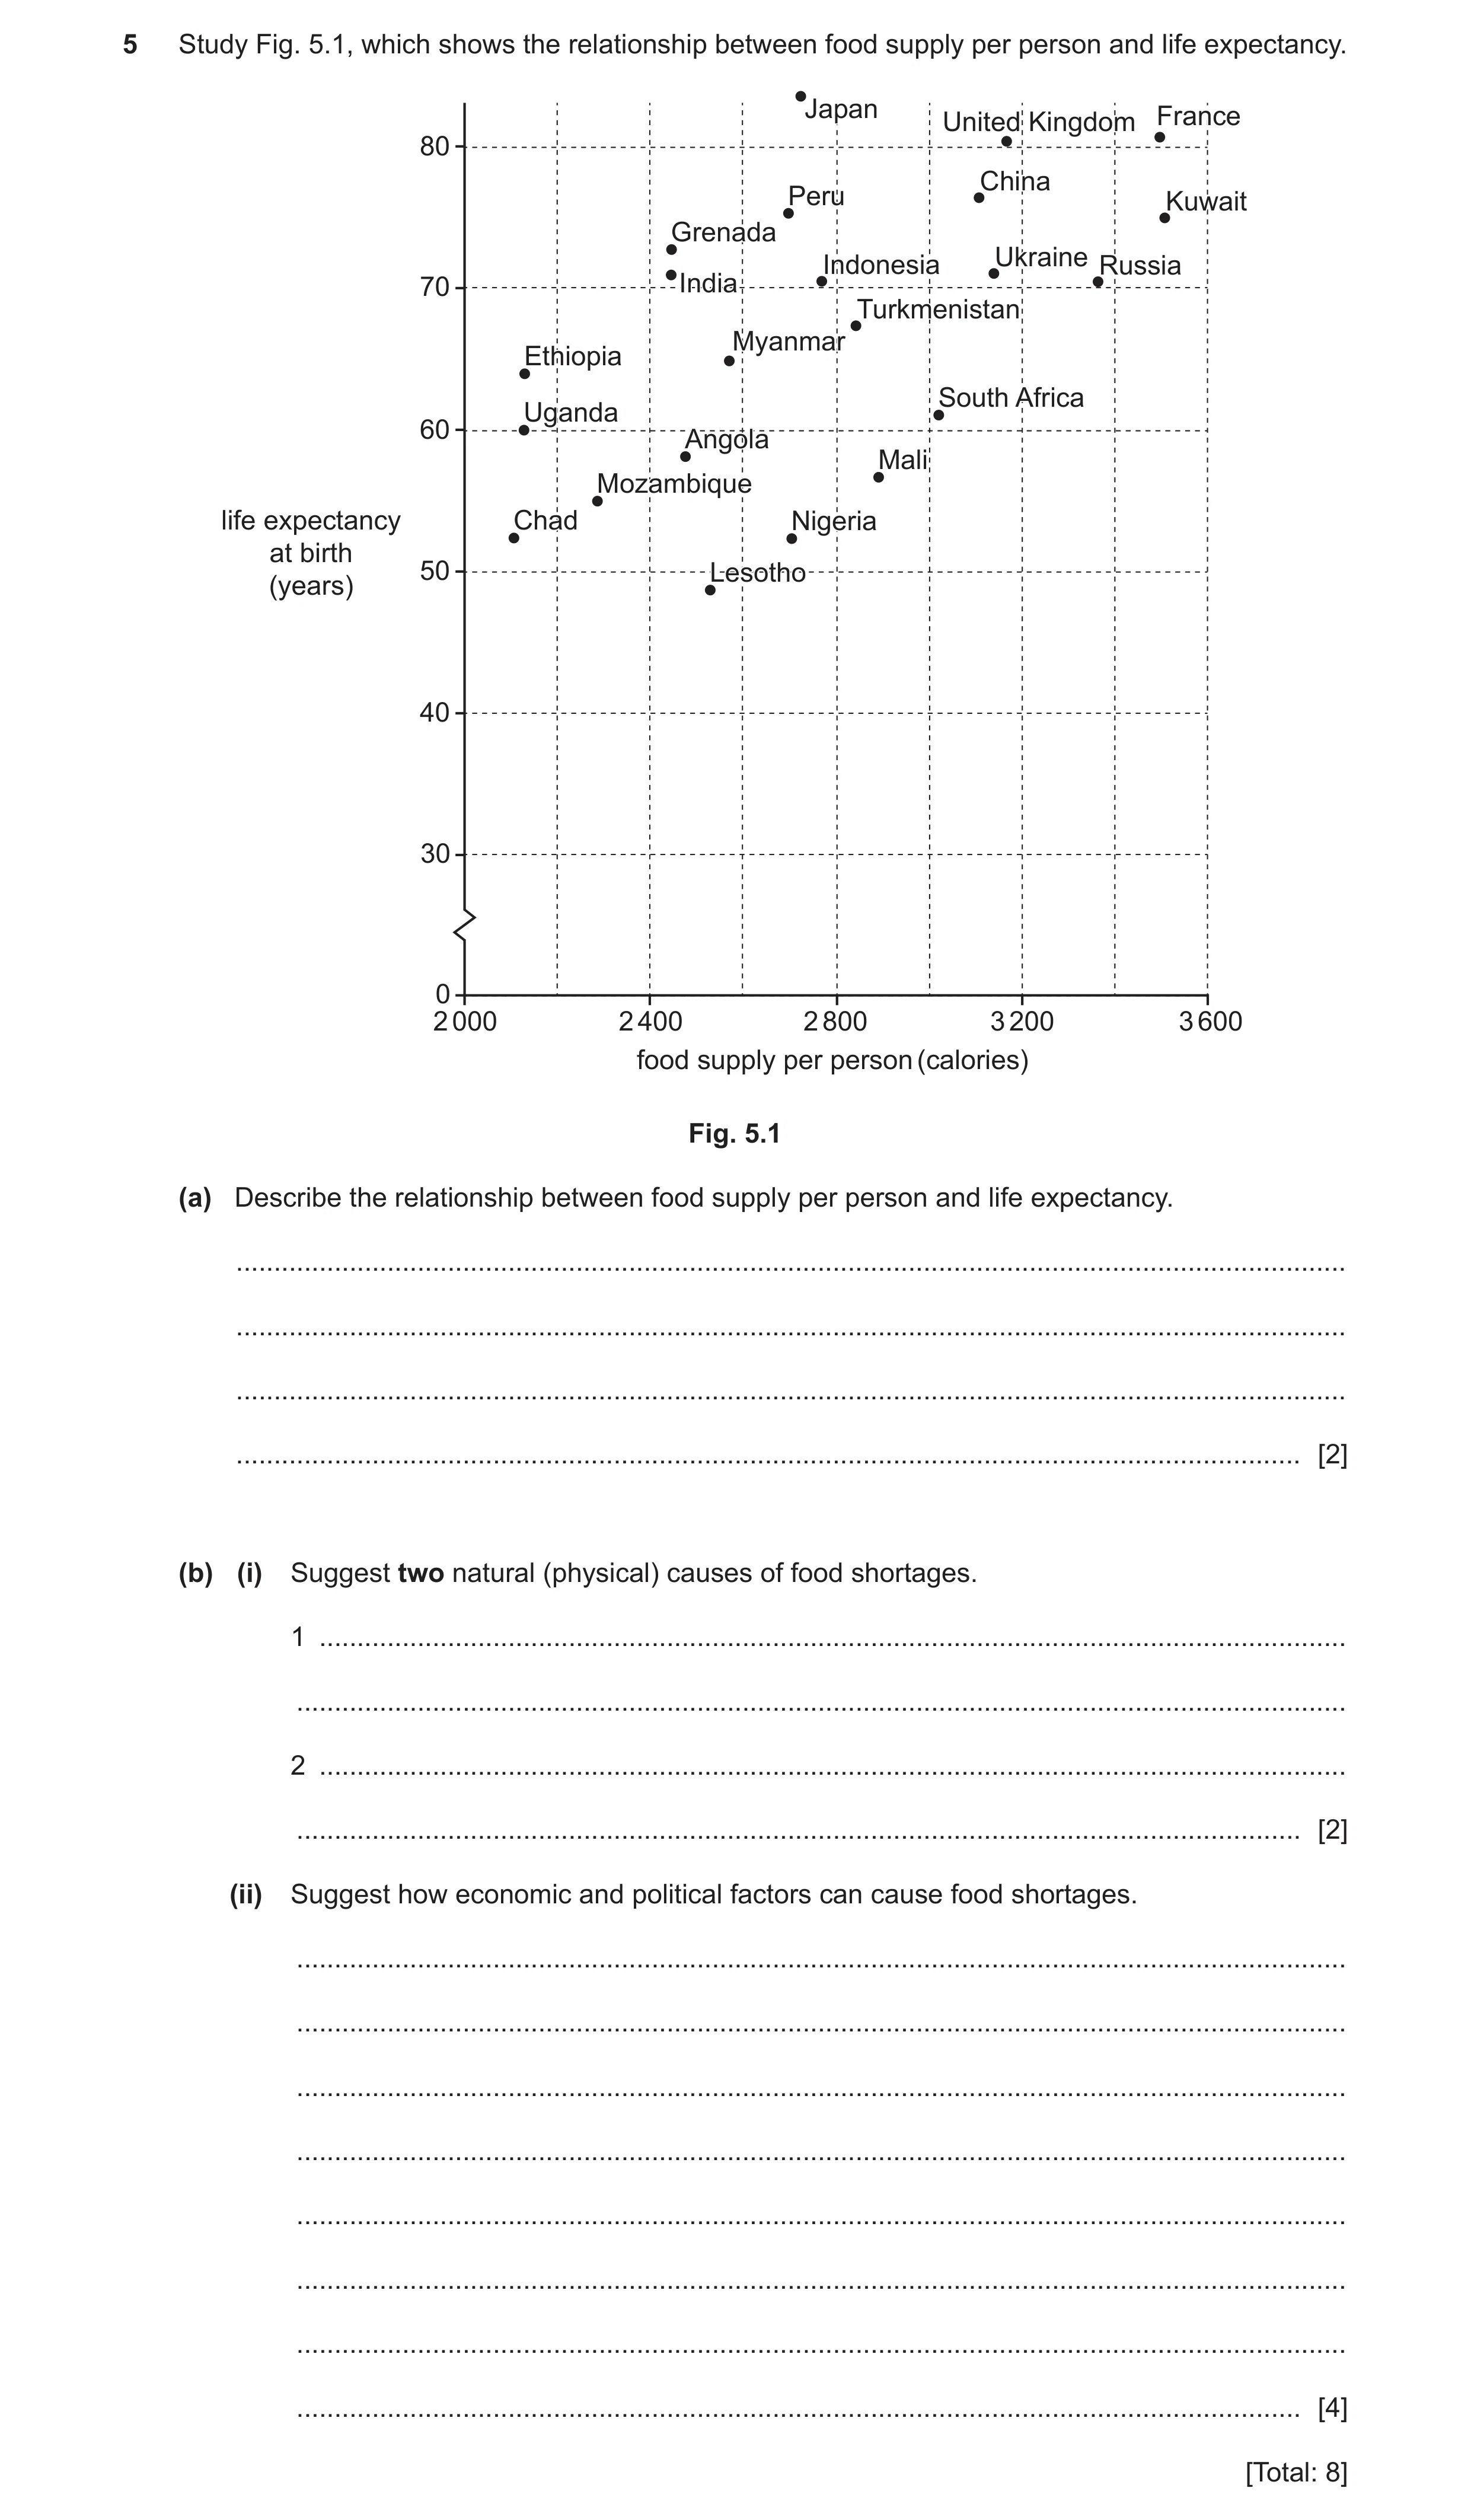
5 Study Fig. 5.1, which shows the relationship between food supply per person and life expectancy. JapanJapan UnitedUnited KingdomKingdom FranceFrance 80 ChinaChina PeruPeru KuwaitKuwait GrenadaGrenada UkraineUkraine IndonesiaIndonesia RussiaRussia 70 IndiaIndia TurkmenistanTurkmenistan MyanmarMyanmar EthiopiaEthiopia SouthSouth AfricaAfrica UgandaUganda 60 AngolaAngola MaliMali MozambiqueMozambique life expectancy ChadChad NigeriaNigeria at birth 50 LesothoLesotho (years) 40 30 0 2 000 2 400 2 800 3 200 3 600 food supply per person (calories) Fig. 5.1 (a) Describe the relationship between food supply per person and life expectancy. … … … … [2] (b) (i) Suggest two natural (physical) causes of food shortages. 1 … … 2 … … [2] (ii) Suggest how economic and political factors can cause food shortages. … … … … … … … … [4] [Total: 8]
8 marks
Mark scheme: 5(a)(i) Positive correlation/directly proportional; 2 Fairly/relatively strong relationship; As food supply increases then life expectancy increases; OR Better the food supply, the longer the life expectancy; OR Low food supply has low life expectancy and high food supply has high life expectancy; Some anomalies/exceptions (e.g., Japan, Lesotho). 5(b)(i) Drought; 2 Floods; Tropical storms/cyclones/hurricanes/typhoons; Pests/diseases or named example e.g., locusts/leaf curl virus; Volcanic eruption. 5(b)(ii) Wars destroy farms/crops/kills or injures farmers/prevents food 4 distribution/blocks access to food supply; Politically opposed countries may stop food exports/food aid which means people are left to starve; Influx of refugees can outstrip food supply; Labour shortage/rural urban migration means less food produced; Political corruption diverts money away from investment in agriculture/unfair distribution of food; Lack of/can’t afford investment in agriculture/machinery/fertiliser/HYV seeds; Poverty lowers the amount of income families have to spend on food; Inflation/rising costs of production (e.g., feed and energy) increases food prices, so can afford less; Poor countries lack finance to import food thus reducing food supply; Lack of transport network means food crops unable to reach market/deteriorates before reaching market; Lack of policies to control population growth means consumption outgrows supply; Focus on cash crops rather than food for local population; Urbanisation/industrialisation reduces farmland.
This question in 0460/23 May/June 2023
Q24 · The number of tractors per 100 000 km2 of agricultural land between 1988 and 2000 in… 0460/23 Oct/Nov 2023
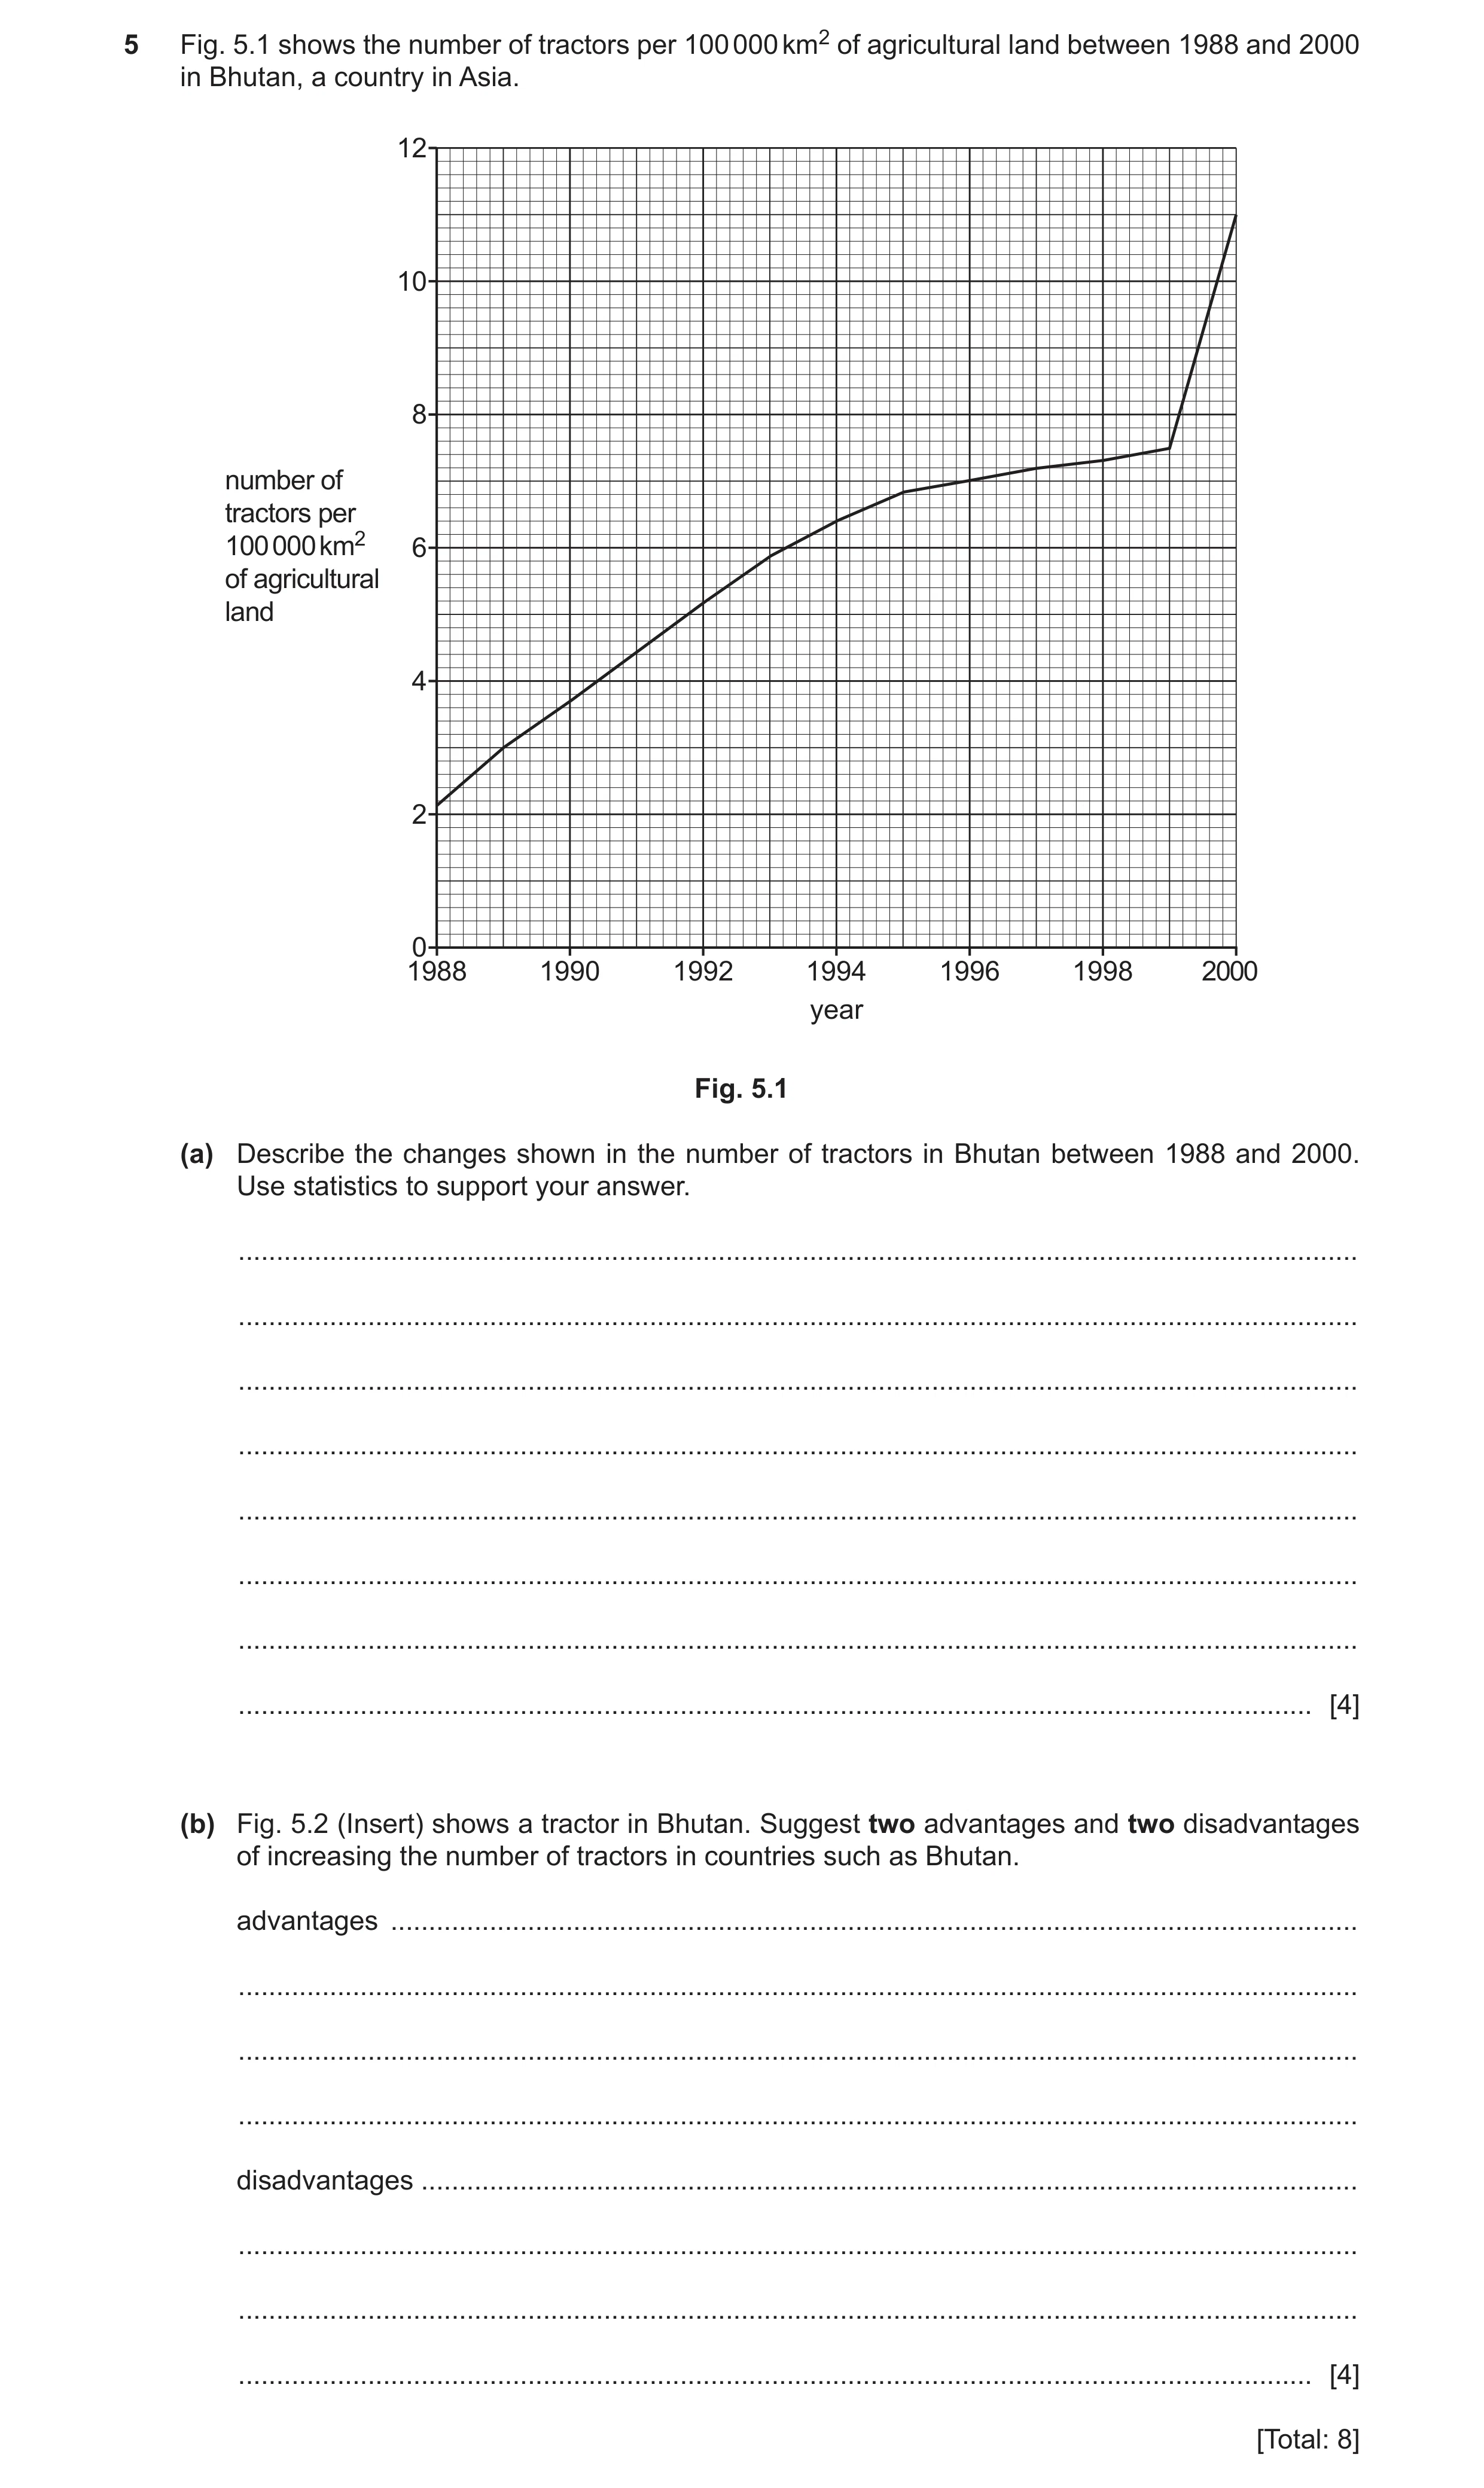
5 Fig. 5.1 shows the number of tractors per 100 000 km2 of agricultural land between 1988 and 2000 in Bhutan, a country in Asia. 12 10 8 number of tractors per 100 000 km2 6 of agricultural land 4 2 0 1988 1990 1992 1994 1996 1998 2000 year Fig. 5.1 (a) Describe the changes shown in the number of tractors in Bhutan between 1988 and 2000. Use statistics to support your answer. … … … … … … … … [4] (b) Fig. 5.2 (Insert) shows a tractor in Bhutan. Suggest two advantages and two disadvantages of increasing the number of tractors in countries such as Bhutan. advantages … … … … disadvantages … … … … [4] [Total: 8]
8 marks
Mark scheme: 5(a) Overall increase/increase 1988 – 2000; 4 2.1/2.2 to 11 tractors/by 8.8/8.9 per 100 000 km²; Steady/gradual increase from 1988 to 1995; 2.1/2.2 to 6.8 tractors/by 4.6/4.7 per 100 000 km²; Levelled off/slowest increase/slowed down 1995 until 1999; 6.8 to 7.5 tractors /by 0.7 per 100 000 km²; Increased rapidly/sharp increase in 1999/1999–2000; 7.5 to 11 tractors/by 3.5 per 100 000 km²; Note: 1 mark reserve for stats (Max. 2 marks for stats). 5(b) Possible advantages: 4 Help to increase agricultural output/food supply/increased productivity/yield; Can plough land more quickly/more efficiently; Allows farming at a larger scale/greater area can be covered. Need fewer workers/reduce cost of labour/less physical effort; Don’t have to pay for animal feed/vets to look after animals that may have previously been used; Children not needed to work on the farm (so can go to school). Possible disadvantages: (Fewer workers needed) causes under/unemployment; Could lead to rural poverty; Causes rural-urban migration; Increase air pollution/noise pollution; Increased compaction of land: Cost to buy/import tractors is high; Cost to maintain/run tractors is high/hard to get parts/fuel; May not have the skills needed to operate tractors; Tractors can break down. Note: Responses must be in correct section. Reserve 2 marks for advantages and 2 marks for disadvantages.
This question in 0460/23 Oct/Nov 2023
Question 25 0460/21 May/June 2024
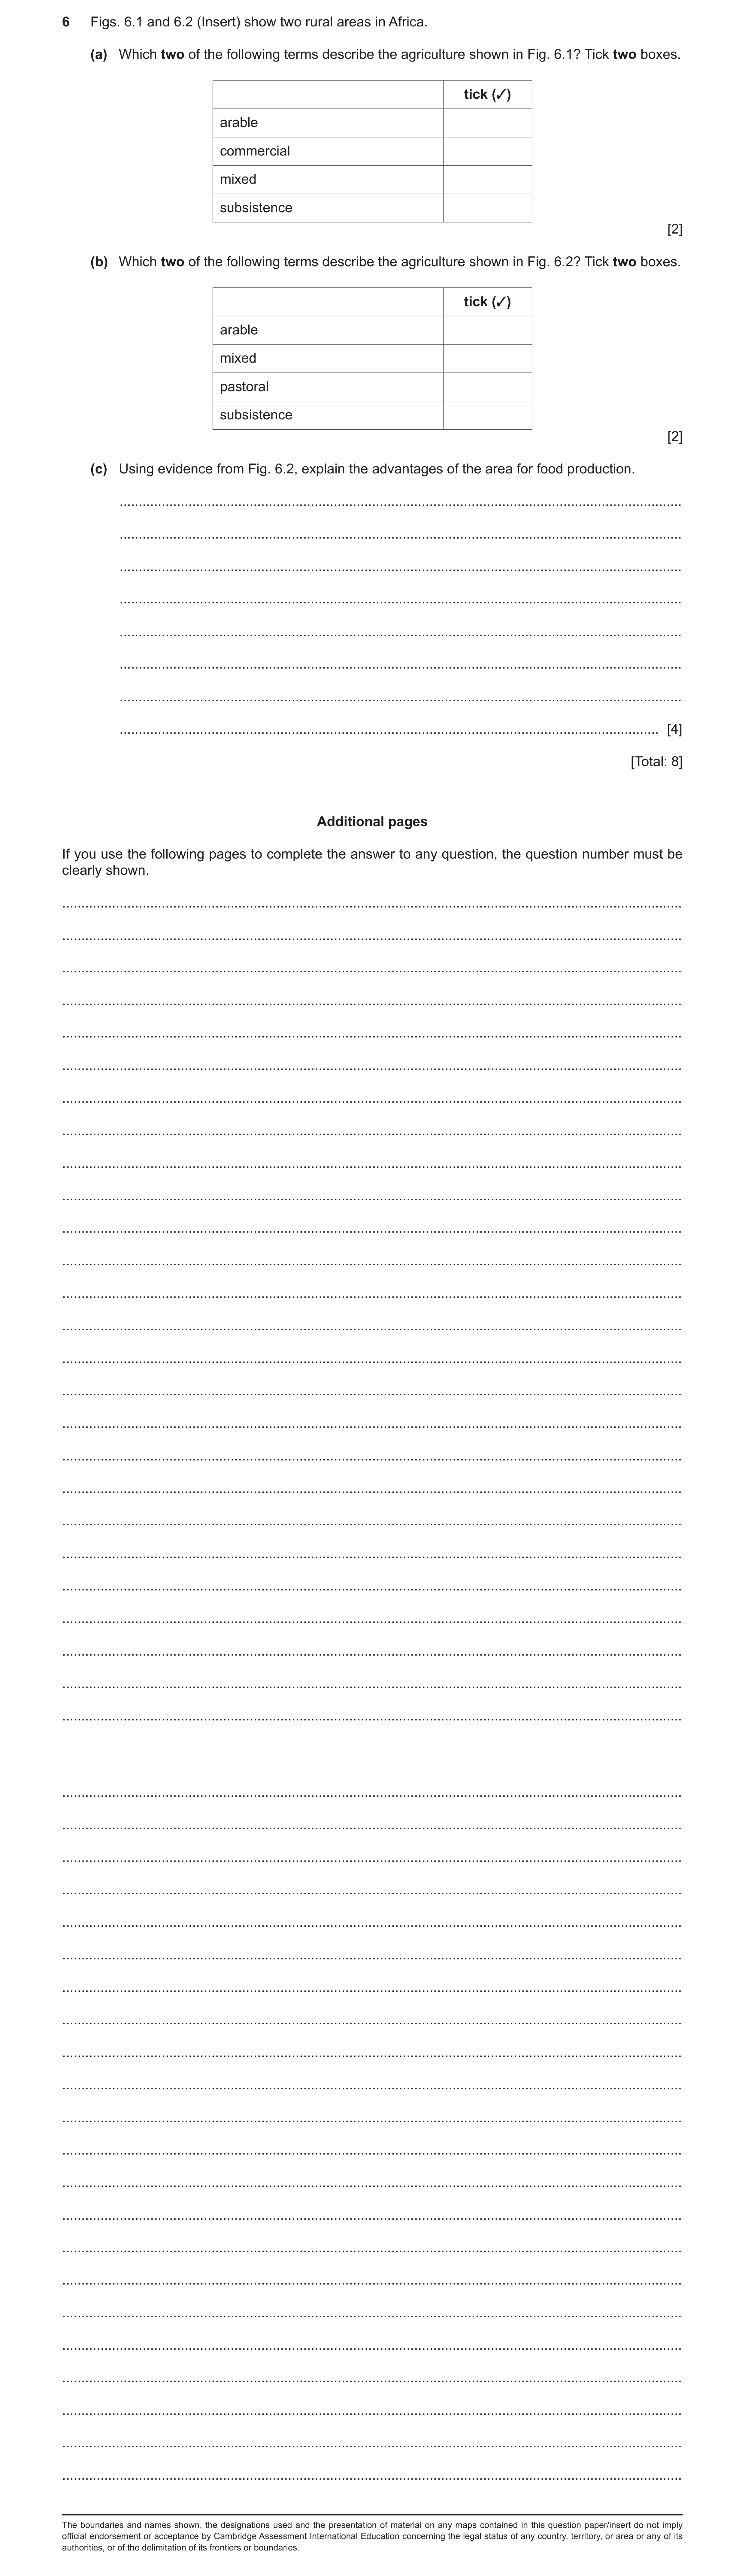
6 Figs. 6.1 and 6.2 (Insert) show two rural areas in Africa. (a) Which two of the following terms describe the agriculture shown in Fig. 6.1? Tick two boxes. tick (3) arable commercial mixed subsistence [2] (b) Which two of the following terms describe the agriculture shown in Fig. 6.2? Tick two boxes. tick (3) arable mixed pastoral subsistence [2] (c) Using evidence from Fig. 6.2, explain the advantages of the area for food production. … … … … … … … … [4] [Total: 8] Additional pages If you use the following pages to complete the answer to any question, the question number must be clearly shown. … … … … … … … … … … … … … … … … … … … … … … … … … … … … … … … … … … … … … … … … … … … … … … … … The boundaries and names shown, the designations used and the presentation of material on any maps contained in this question paper/insert do not imply official endorsement or acceptance by Cambridge Assessment International Education concerning the legal status of any country, territory, or area or any of its authorities, or of the delimitation of its frontiers or boundaries.
8 marks
Mark scheme: 6(a) Mixed 2 Subsistence 6(b) Arable 2 Subsistence 6(c) River can be used for irrigation/water for crops; 4 River for alluvium/fertile soil; River for transporting crops; Rich green colour suggests fertile land; Can be flooded to allow rice production; Land above flood level; Some flat land available for use of machinery/planting crops/harvesting; Sloping land can be terraced; Hill for shelter; Different crop areas/different types of crops can be planted in different areas; e.g. tree crops/banana on slopes/rice; No dense vegetation to clear. Note: A list of 2 or more factors without explanation = Max. 1.
This question in 0460/21 May/June 2024
Question 26 0460/22 May/June 2024
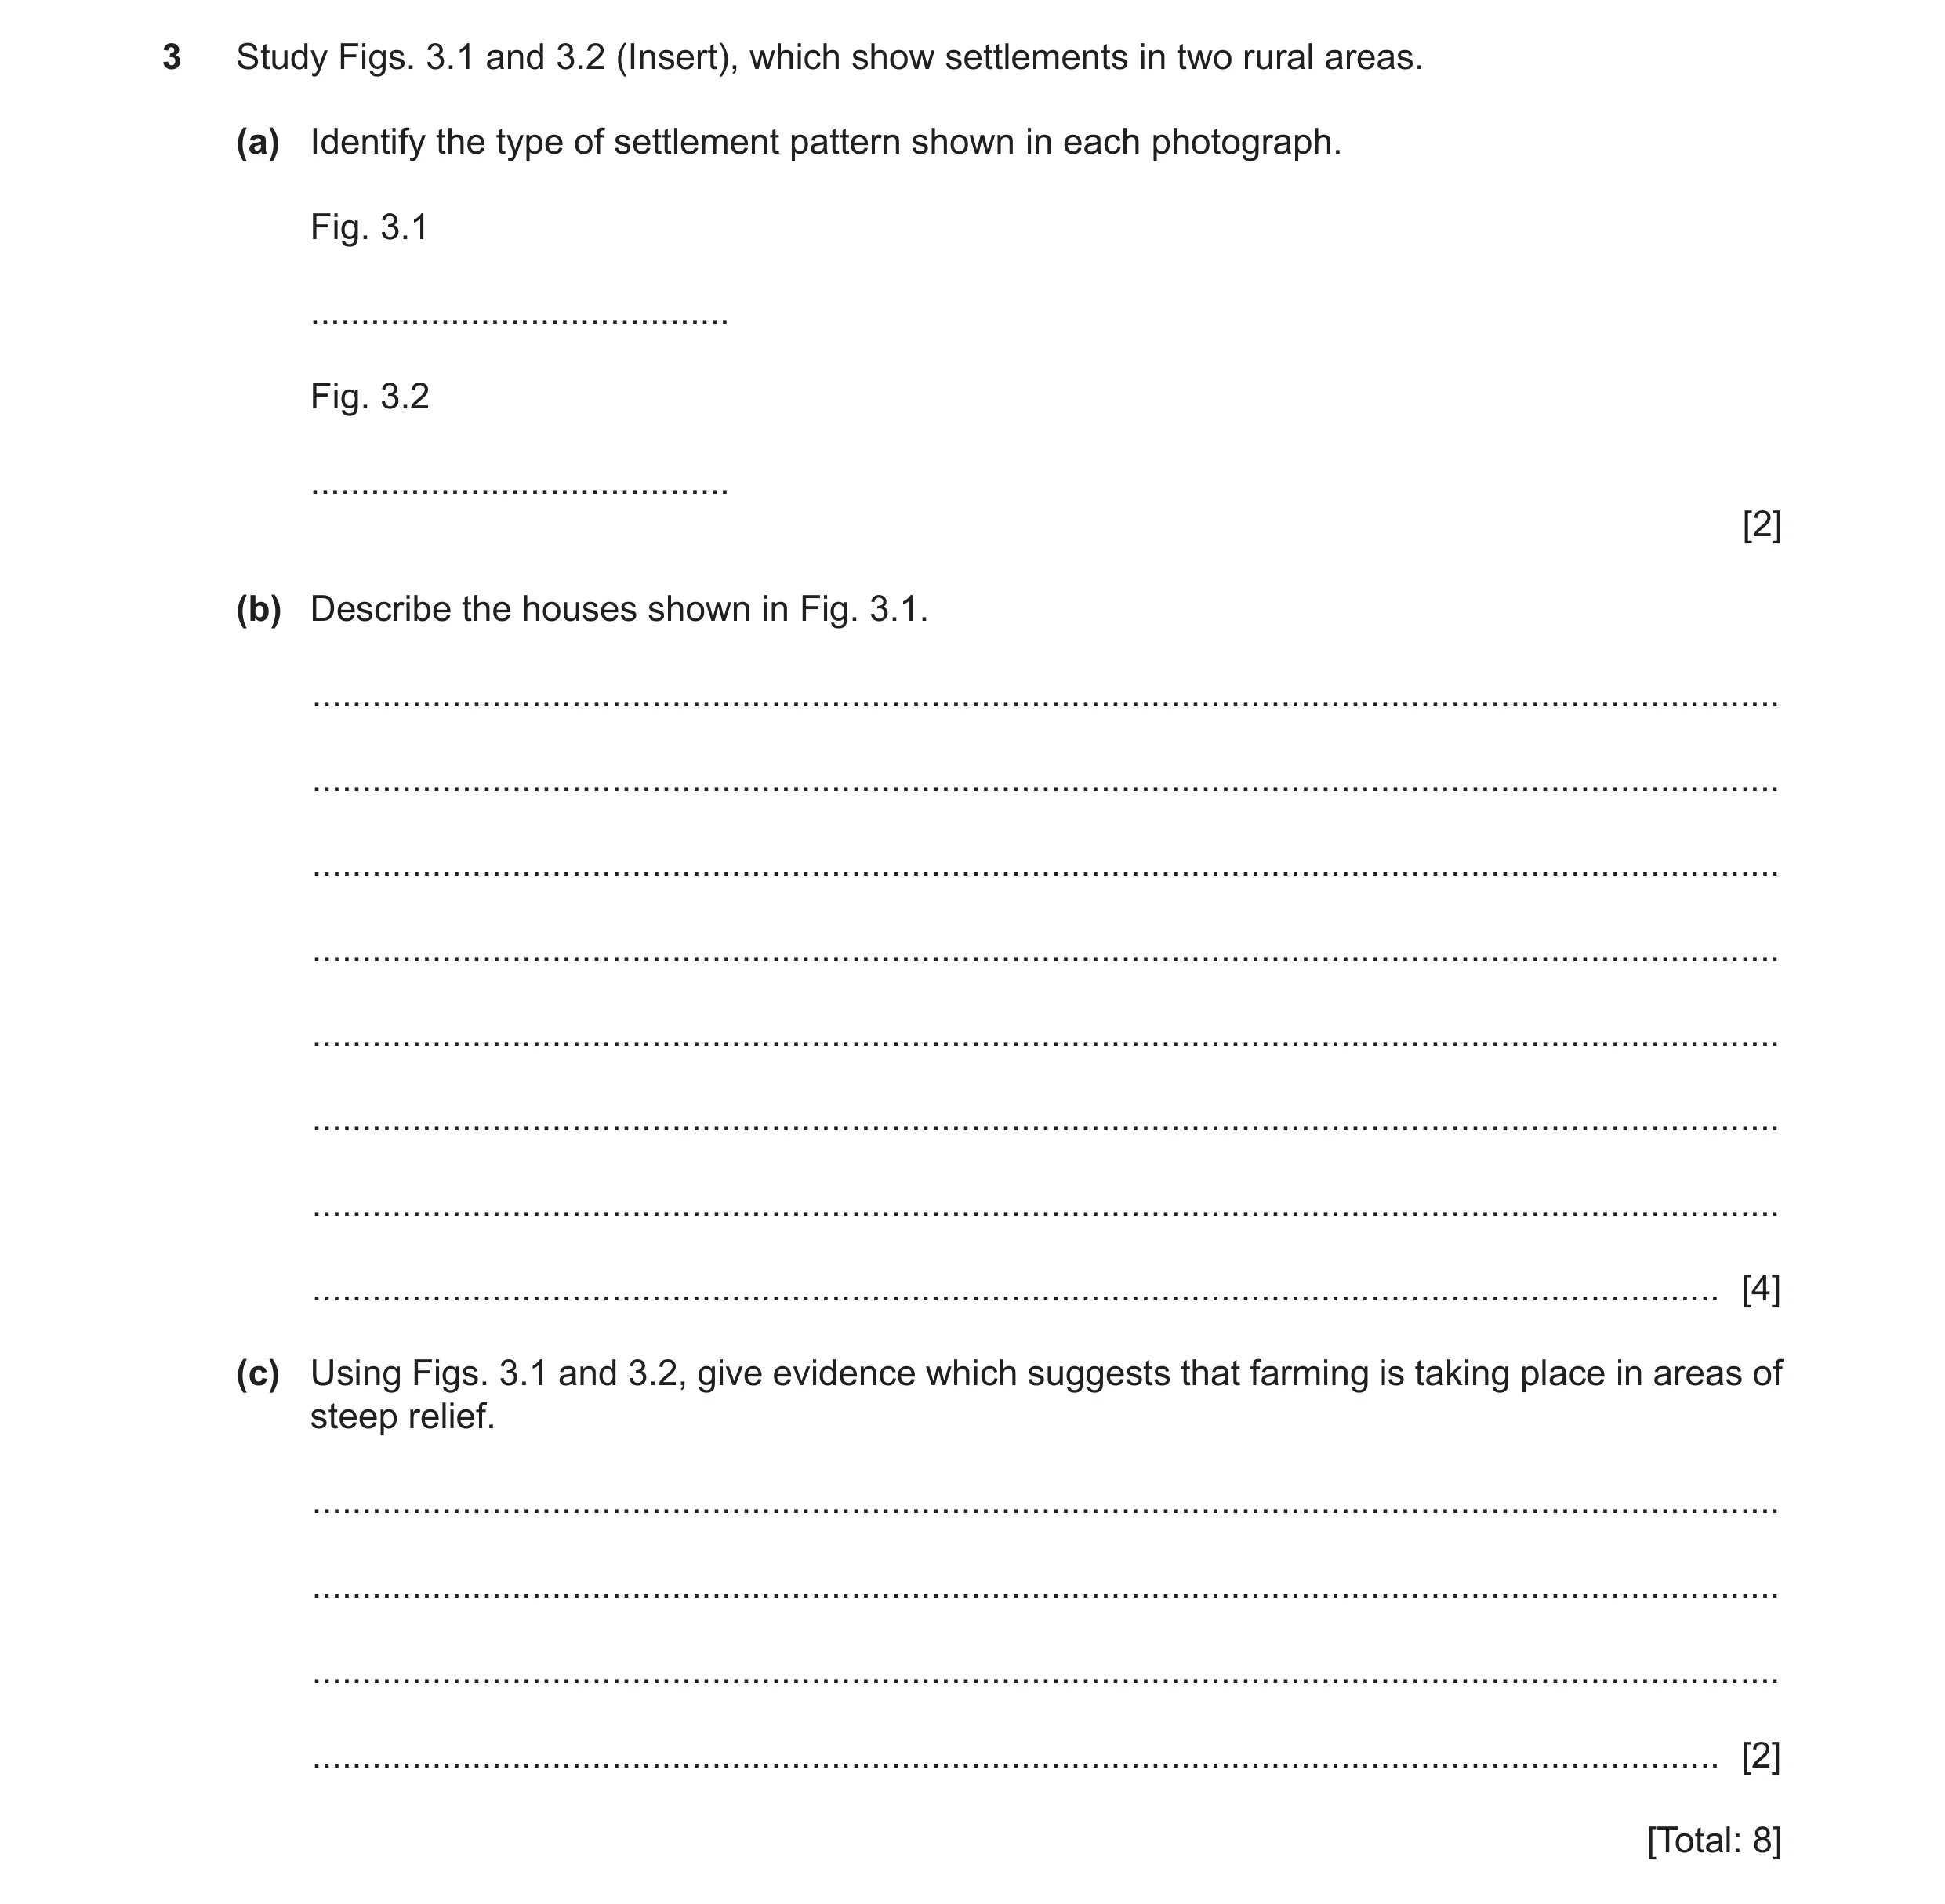
3 Study Figs. 3.1 and 3.2 (Insert), which show settlements in two rural areas. (a) Identify the type of settlement pattern shown in each photograph. Fig. 3.1 … Fig. 3.2 … [2] (b) Describe the houses shown in Fig. 3.1. … … … … … … … … [4] (c) Using Figs. 3.1 and 3.2, give evidence which suggests that farming is taking place in areas of steep relief. … … … … [2] [Total: 8]
8 marks
Mark scheme: 3(a) Fig. 3.1 linear. 2 Fig. 3.2 dispersed/isolated/scattered. 3(b) 2/3/4/5 storeys/multiple stories/floors/more than one storey/tall/high; 4 Apartments/flats; Similar (design or size); Concrete/cement; Different colours/bright/colourful/red/blue/white/yellow/ green/brown; Rectangular/cubic/square; Flat /pitched/slanting/terracotta/tiled/mixed types of roofs; Terraced houses/some detached; Balconies/terraces; Gardens; Many windows. 3(c) Contour ploughing; 2 Terracing/(farming) in layers/different levels/steps; Grass strips/rows; Banks/walls to support plots/retain water/use of bunds.
This question in 0460/22 May/June 2024
Q27 · Study Table 6.1, which shows the percentage of the total population of each continent who… 0460/21 Oct/Nov 2024
6 (a) Study Table 6.1, which shows the percentage of the total population of each continent who suffered from severe food shortages in 2014 and 2018. Table 6.1 2014 2018 % % Africa 18.1 21.5 Asia 7.0 7.8 Australasia 2.4 3.6 Europe 1.7 1.0 North America 1.0 0.8 South America 5.6 8.3 Using Table 6.1, calculate the difference in the percentage of people suffering from severe food shortages in South America between 2014 and 2018. … % [1] (b) (i) Complete the table to classify the reasons for food shortages listed. drought low capital investment floods transport difficulties tropical storms pests rising prices natural causes economic causes [2] (ii) Suggest two reasons why wars may cause food shortages. 1 … … 2 … … [2] (c) Describe three different methods that can be used to increase food supplies. 1 … … 2 … … 3 … … [3] [Total: 8] Additional pages If you use the following pages to complete the answer to any question, the question number must be clearly shown. … … … … … … … … … … … … … … … … … … … … … … … … …
8 marks
Mark scheme: 6(a) 2.7% 1 6(b)(i) Natural – drought, floods, tropical storms, pests 2 Economic/political – low capital investment, transport difficulties, rising prices 5–7 correct = 2 marks 1–4 correct = 1 mark 6(b)(ii) Farmers leave their land to fight; 2 Crops/livestock/farms/markets destroyed; Water supplies/irrigation destroyed; Food used to feed soldiers/stolen by invading forces/used as a bargaining tool; Transport systems/manufacturing systems destroyed; Inflation/increased cost of food/farming; Less investment in food/farming (money used for war effort); Panic buying. 6(c) Irrigation; 3 Aeroponics/hydroponics; Fertilisers/manure; High-yield crop varieties; Genetic modification/selective breeding; Disease resistant crops; Technology/machinery/computerisation; Pesticides/insecticides/herbicides; Land reform; Terracing; Greenhouses; Food imports/trading; Government subsidies/lowering cost of food.
This question in 0460/21 Oct/Nov 2024
Question 28 0460/23 Oct/Nov 2024
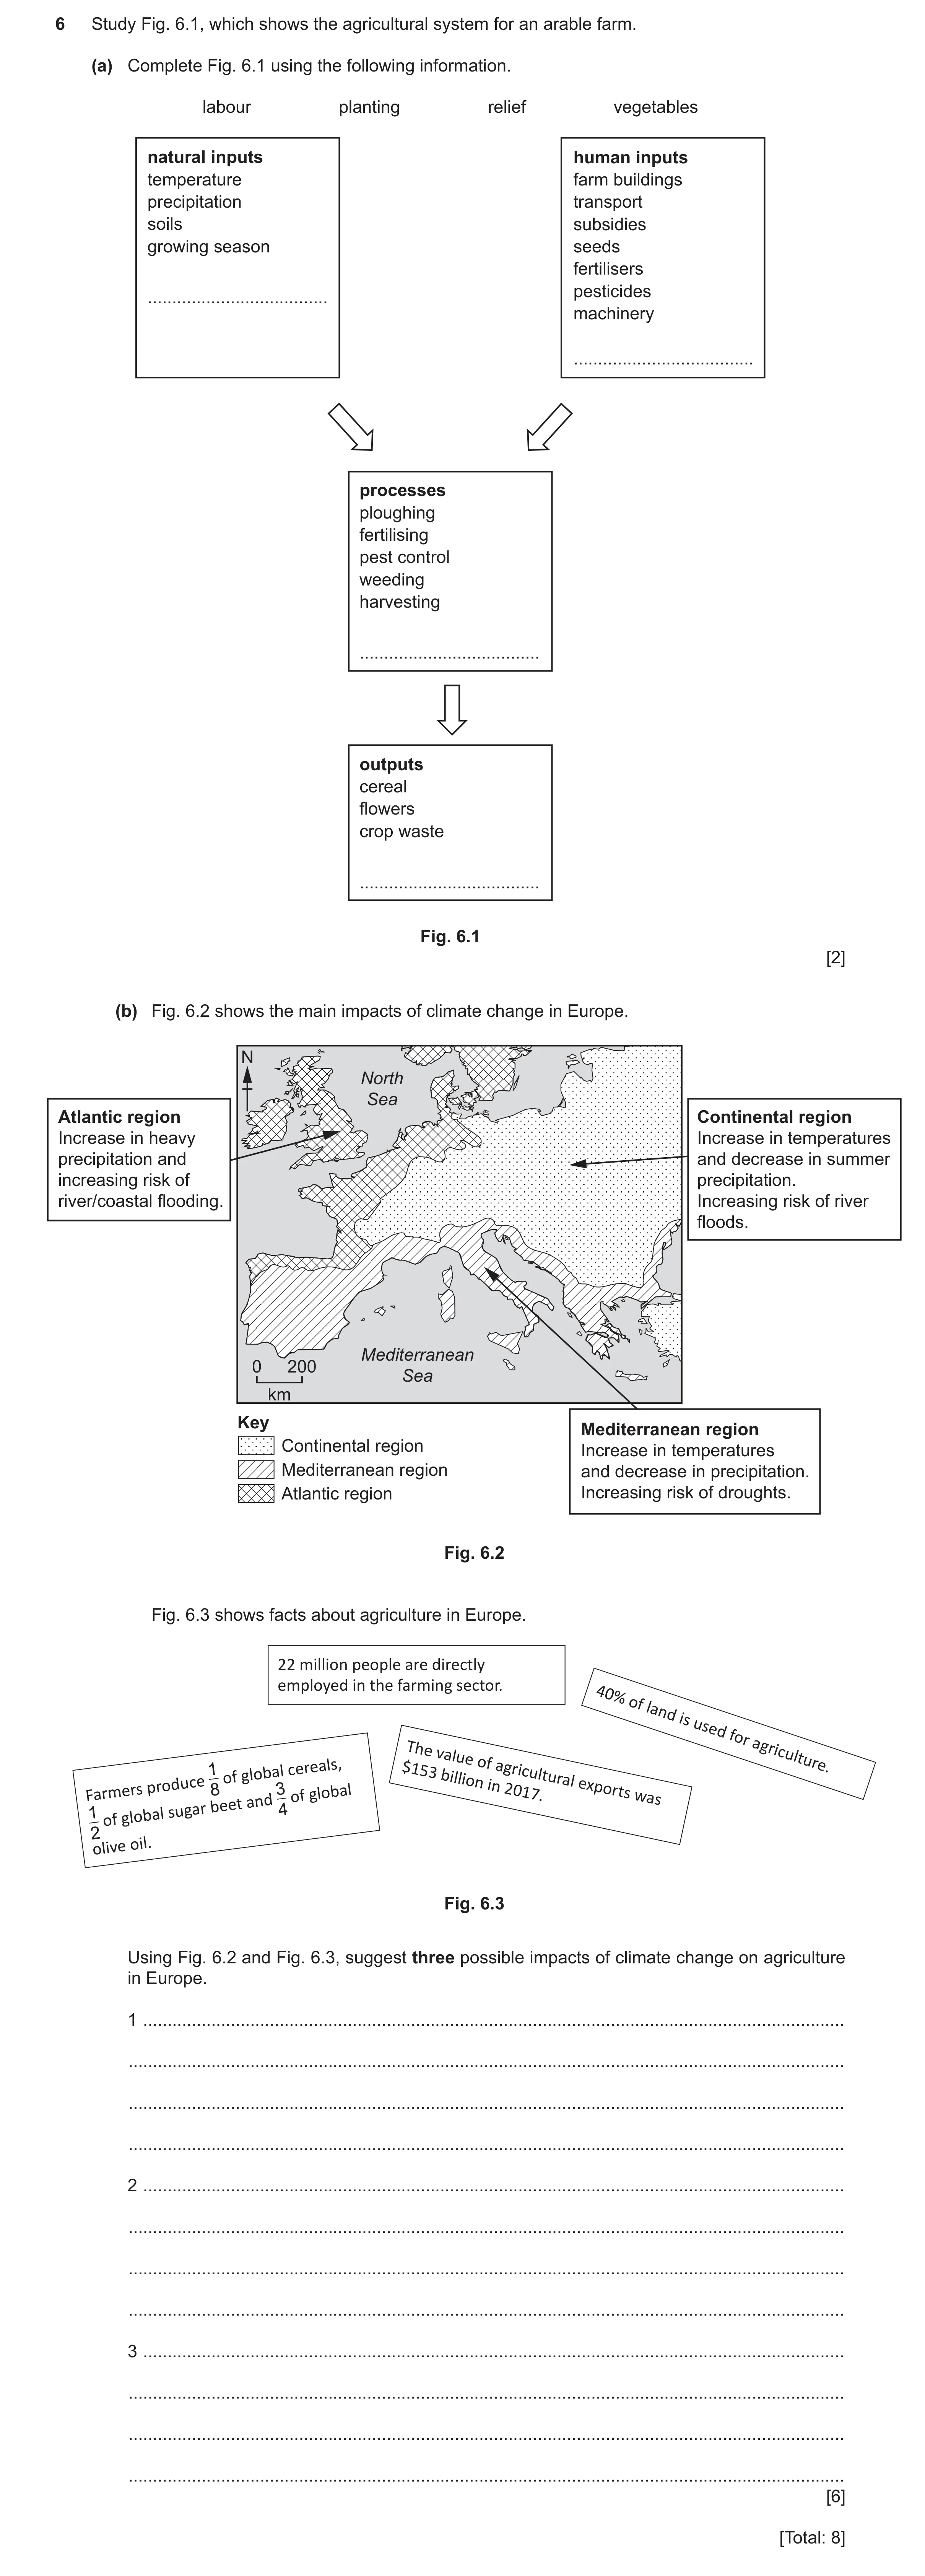
6 Study Fig. 6.1, which shows the agricultural system for an arable farm. (a) Complete Fig. 6.1 using the following information. labour planting relief vegetables natural inputs human inputs temperature farm buildings precipitation transport soils subsidies growing season seeds fertilisers pesticides … machinery … processes ploughing fertilising pest control weeding harvesting … outputs cereal flowers crop waste … Fig. 6.1 [2] (b) Fig. 6.2 shows the main impacts of climate change in Europe. N North Sea Atlantic region Continental region Increase in heavy Increase in temperatures precipitation and and decrease in summer increasing risk of precipitation. river/coastal flooding. Increasing risk of river floods. Mediterranean 0 200 Sea km Key Mediterranean region Continental region Increase in temperatures Mediterranean region and decrease in precipitation. Atlantic region Increasing risk of droughts. Fig. 6.2 Fig. 6.3 shows facts about agriculture in Europe. 22 million people are directly employed in the farming sector. 40% of landis used for The value of agriculture. 1 cereals, $153 of global agricultural billion in produce 3 8 Farmers of global 2017. exports was and beet 4 sugar 1 of global 2 olive oil. Fig. 6.3 Using Fig. 6.2 and Fig. 6.3, suggest three possible impacts of climate change on agriculture in Europe. 1 … … … … 2 … … … … 3 … … … … [6] [Total: 8]
8 marks
Mark scheme: 6(a) Natural inputs – relief 2 Human inputs – labour Processes – planting Outputs – vegetables 1–2 correct = 1 mark 3–4 correct = 2 marks 6(b) NOTE All bullet points can score, but don’t double credit. 6 Increase in temperatures will: • increase yields; • increase length of growing season; • reduce frosts. Increase in heavy precipitation will: • reduce yields; • destroy crops; • increase soil erosion; • flood fields. Increase in flooding will: • reduce amount of land used for agriculture; • destroy crops; • kill animals; • produce nutrient-rich soil; • cause salination of soil; • bring water-borne disease/contaminants affecting animals/farmers. Decrease in precipitation/droughts/increase in evapotranspiration will: • increase water demand; • increase costs for farmers; • mean lack of water for animals; • cause salination/degraded soil/damaged land. Reduced yields will mean: • less income for farmer; • increase prices; • decrease exports; • shortage of food; • lead to less farmers/less employed in agriculture. Increased yields will mean: • more income for farmer; • reduce prices; • Increase exports. Changes in conditions will: • change areas in which crops are grown; • cause diversification.
This question in 0460/23 Oct/Nov 2024
Question 29 0460/22 May/June 2025
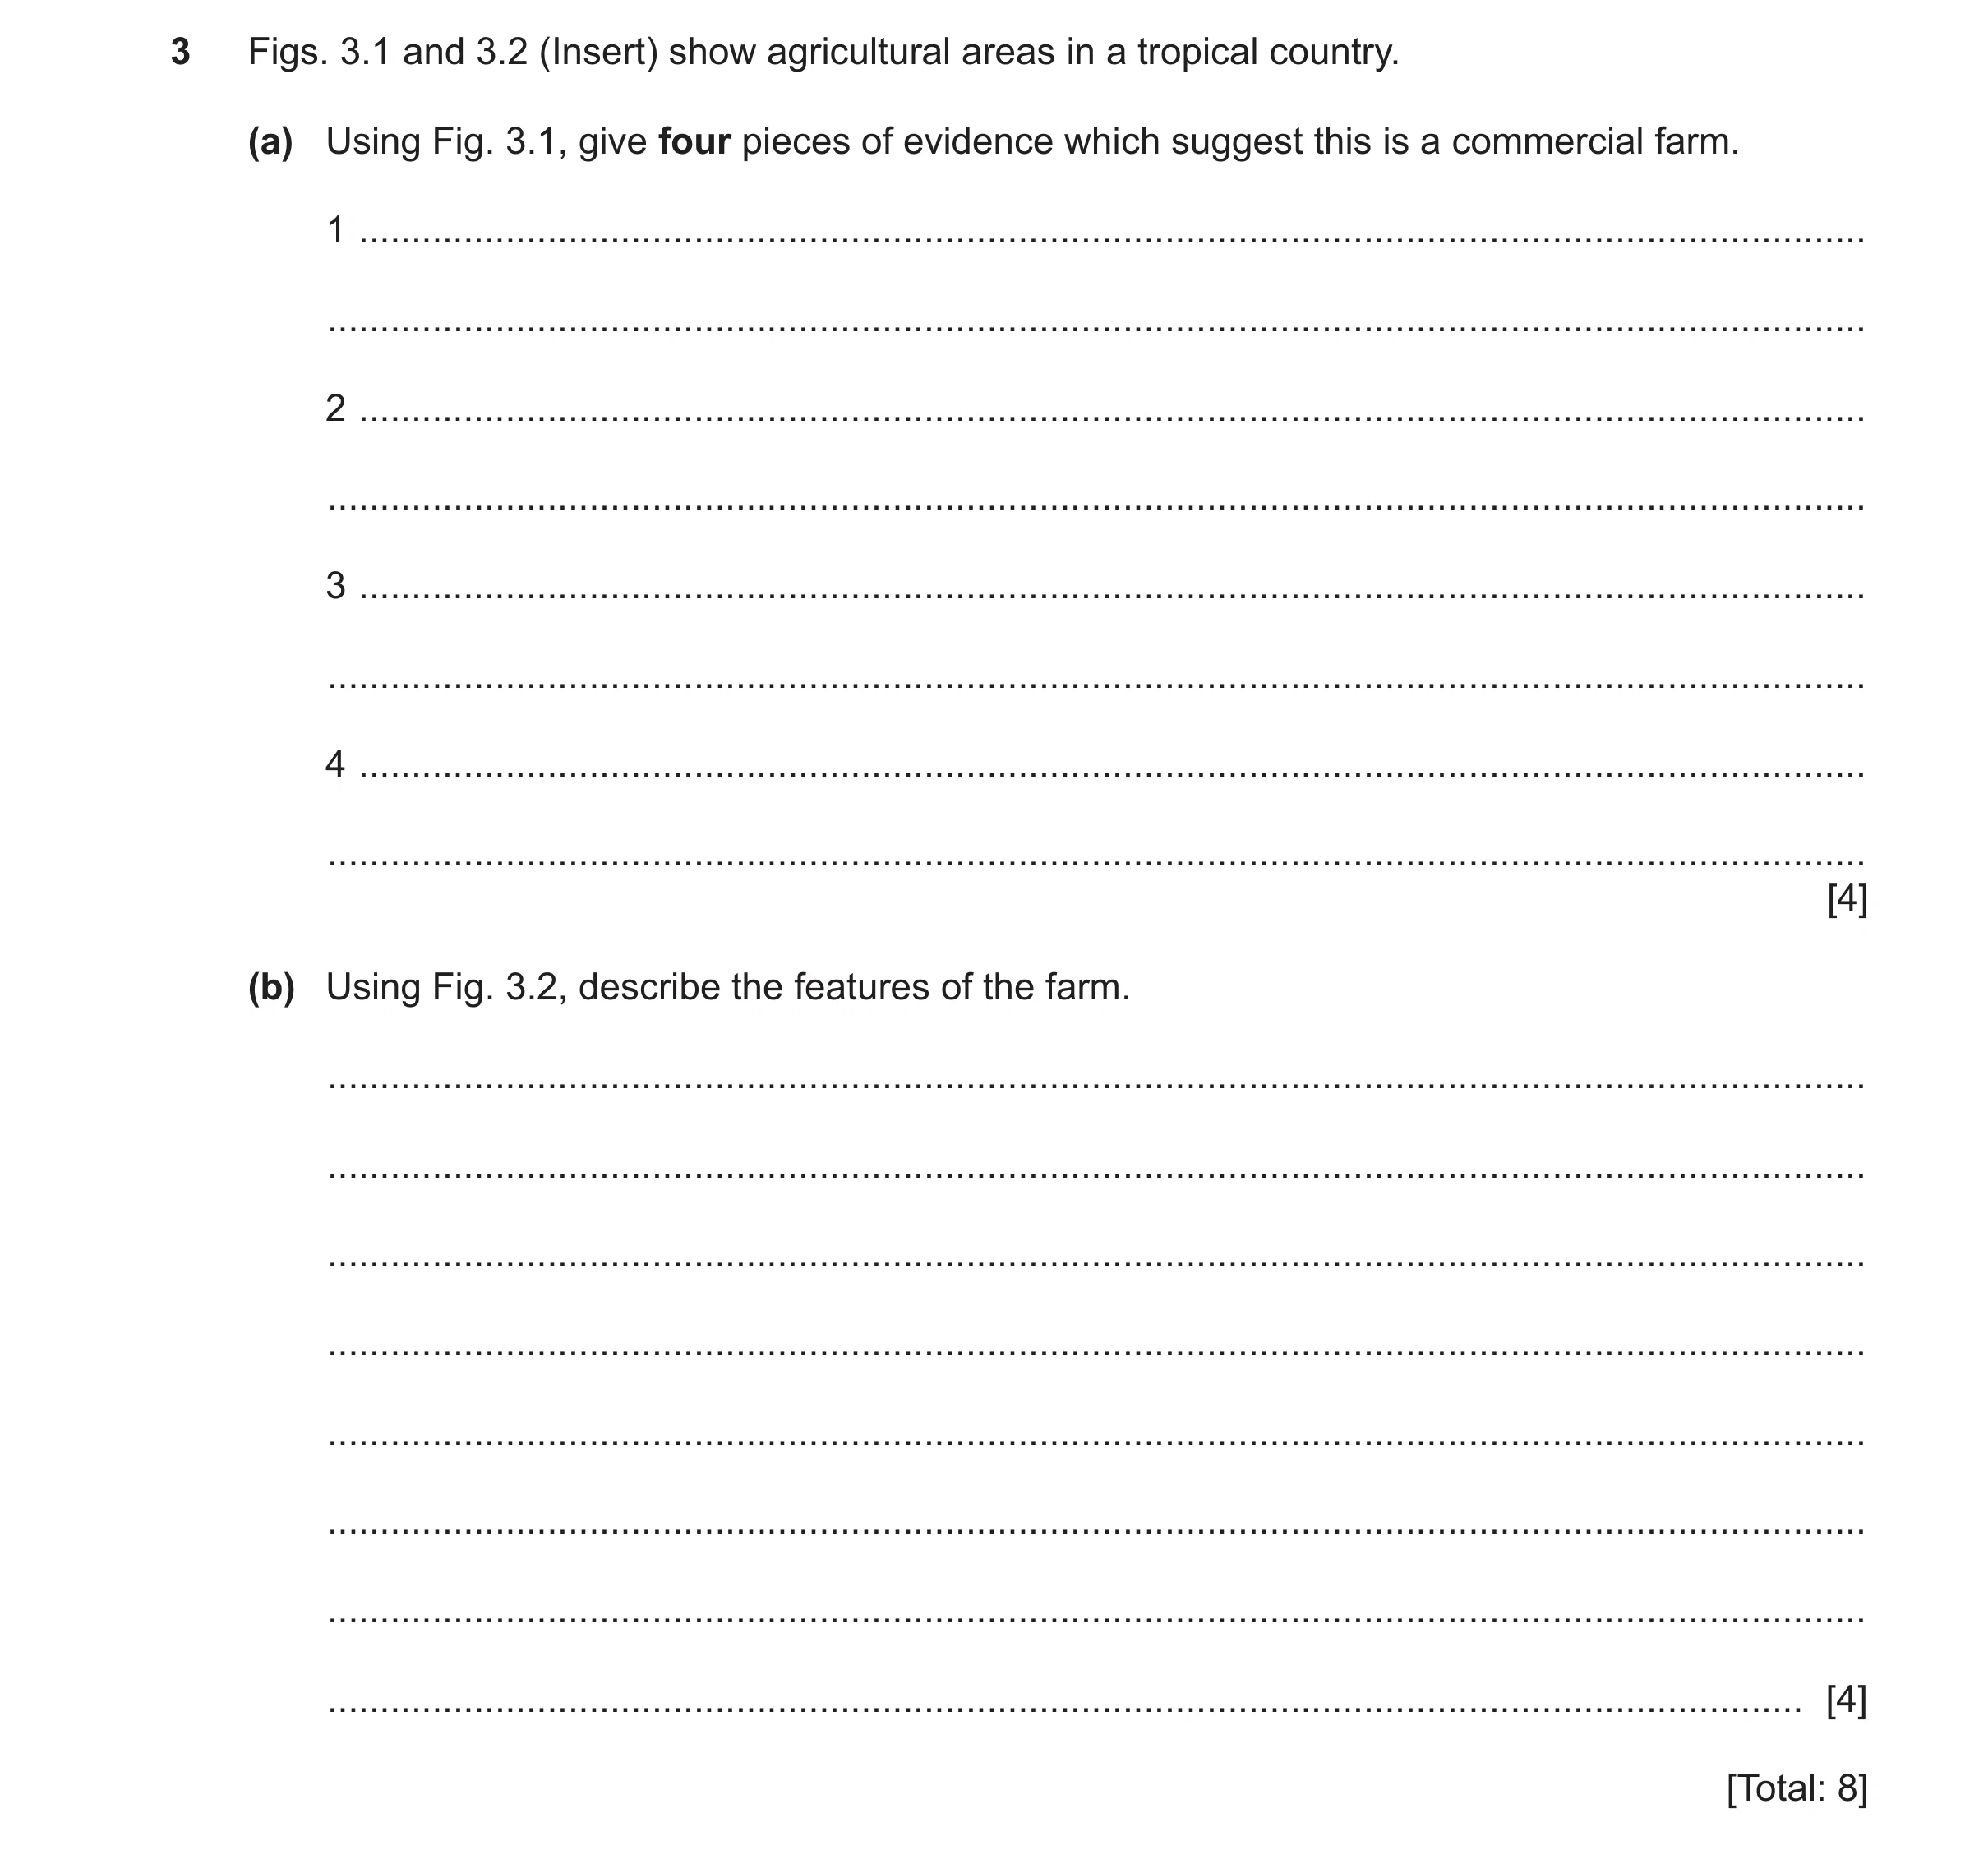
3 Figs. 3.1 and 3.2 (Insert) show agricultural areas in a tropical country. (a) Using Fig. 3.1, give four pieces of evidence which suggest this is a commercial farm. 1 … … 2 … … 3 … … 4 … … [4] (b) Using Fig. 3.2, describe the features of the farm. … … … … … … … … [4] [Total: 8]
8 marks
Mark scheme: 3(a) • plantation; 4 • monoculture/only one or two crops grown; • tea; • mass production (of crops)/large amount of crops/large scale/all land/large area of land is used/large fields; • intensive/densely packed/used to its full potential/organised; • mechanised/machinery; • tractor/vehicles for transport/delivery of products; • planted in rows/strips/linear fields; • crop planted amongst trees (to maximise space); • flat (land); • terracing/terraces (cut into slope/on hillside/to maximise use of land). Note: More than one mark can be scored in any sentence. 3(b) • subsistence farming/farming just for the family; 4 • no/lack of machinery/mechanisation; • small (scale)/small fields; • mixed farm(ing)/animals and crops/pastoral/livestock farm(ing)/animal farm(ing)/dairy/beef farming/rearing; • cows/cattle; • jungle/lush/rich/verdant trees/vegetation; • palm trees; • grass/grazing land; • some land is fallow/overgrown; • barns/storage buildings/shelter for animals; • with metal/thatch/straw(hay)/tin roofs/buildings; • dirt/earth tracks/paths; • vessel/container/bowl/tub/basin/trough/for cows to drink/eat from.
This question in 0460/22 May/June 2025
Question 30 0460/23 Oct/Nov 2025
6 (a) Fig. 6.1 (Insert) shows a farm in the UK. Using Fig 6.1 only, describe the features of the farm. … … … … … … … … [4] (b) Fig. 6.2 shows the area used to grow three types of crop in the UK in 2000 and 2018. 2500 2000 1500 hectares (thousand) 1000 500 0 wheat oats oilseed rape Key crop 2000 2018 Fig. 6.2 (i) Compare the amount of land used for wheat and oats in the year 2000. Use statistics in your answer. … … … … [2] (ii) Describe the change in the number of hectares used for growing oilseed rape between 2000 and 2018. Do not use statistics in your answer. … … … [1] (c) Many UK farms are intensive farms. What does the term ‘intensive’ mean? … … [1] [Total: 8] Additional page If you use the following page to complete the answer to any question, the question number must be clearly shown. … … … … … … … … … … … … … … … … … … … … The boundaries and names shown, the designations used and the presentation of material on any maps contained in this question paper/insert do not imply official endorsement or acceptance by Cambridge Assessment International Education concerning the legal status of any country, territory, or area or any of its authorities, or of the delimitation of its frontiers or boundaries.
8 marks
Mark scheme: 6(a) arable/mixed/animals and crops 4 extensive/farm is large mechanised/machinery/combine harvester/tractor harvesting more than one crop hedgerows/bushes/woodland/line of trees/cluster of trees flat/gently sloping land commercial farming/crops to sell (divided into) fields sheep fences 6(b)(i) more used for wheat/less for oats 2 2060–2090 thousand ha/ almost 2100 thousand ha wheat and 100–120 thousand ha oats difference 1940–1990 thousand ha (reserve1 mark for statement and reserve 1 mark for data) 6(b)(ii) increased 1 6(c) large amount of output compared to size of land 1 high labour input for size of land high capital input for size of land uses high levels of technology on relatively small area of land
This question in 0460/23 Oct/Nov 2025


 18 / 59
 19 / 59
 20 / 59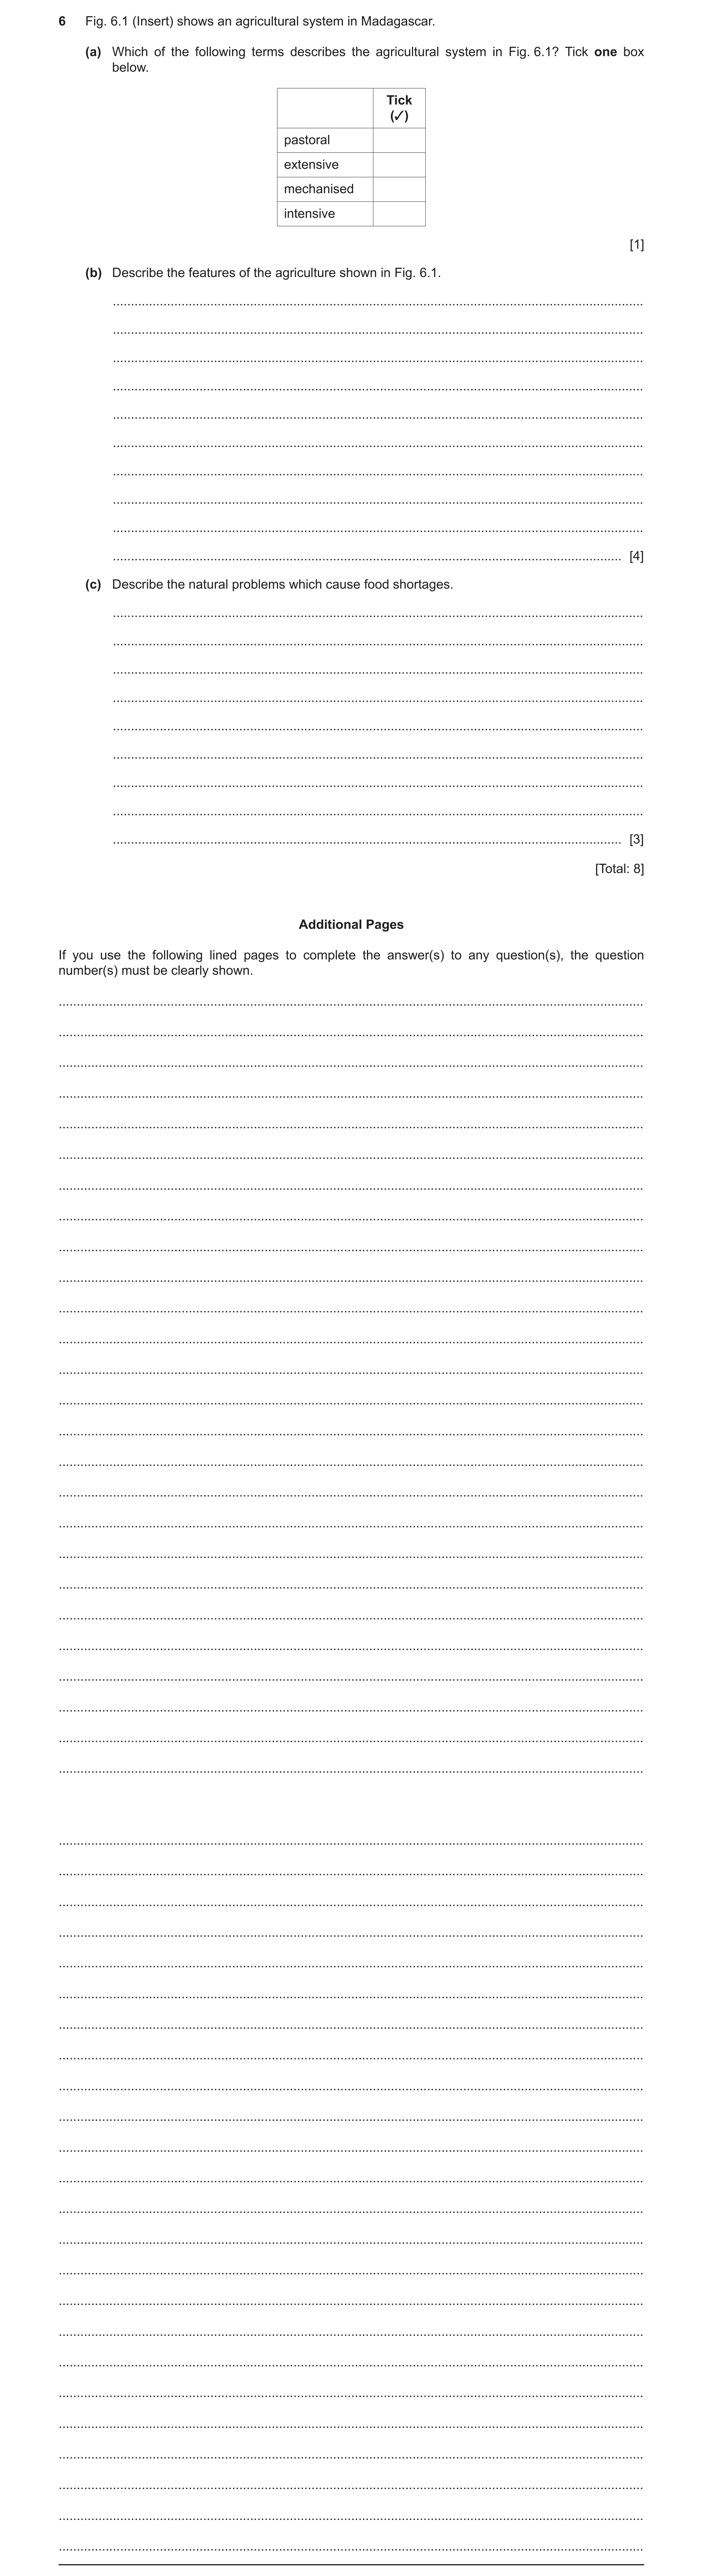


 52 / 59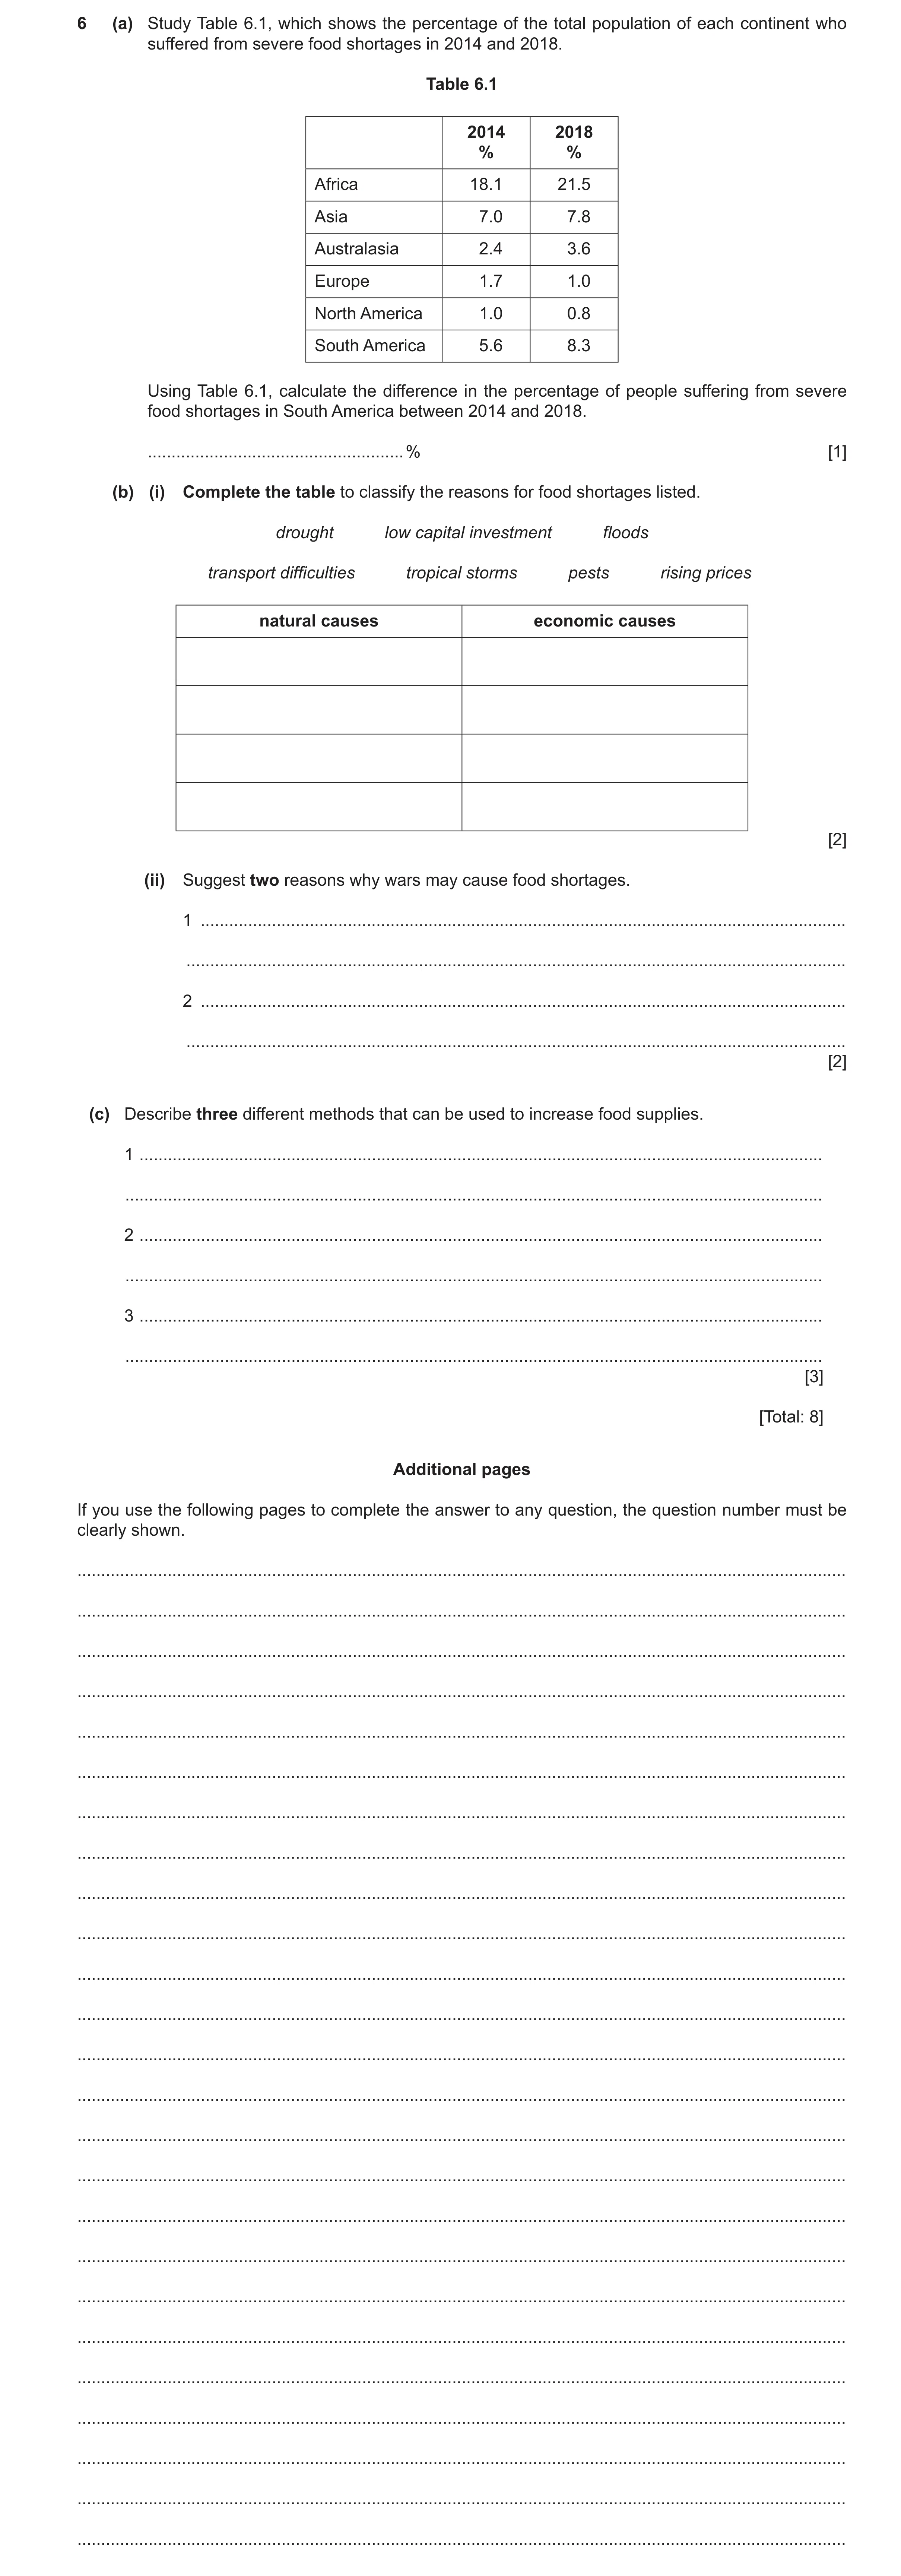
 57 / 59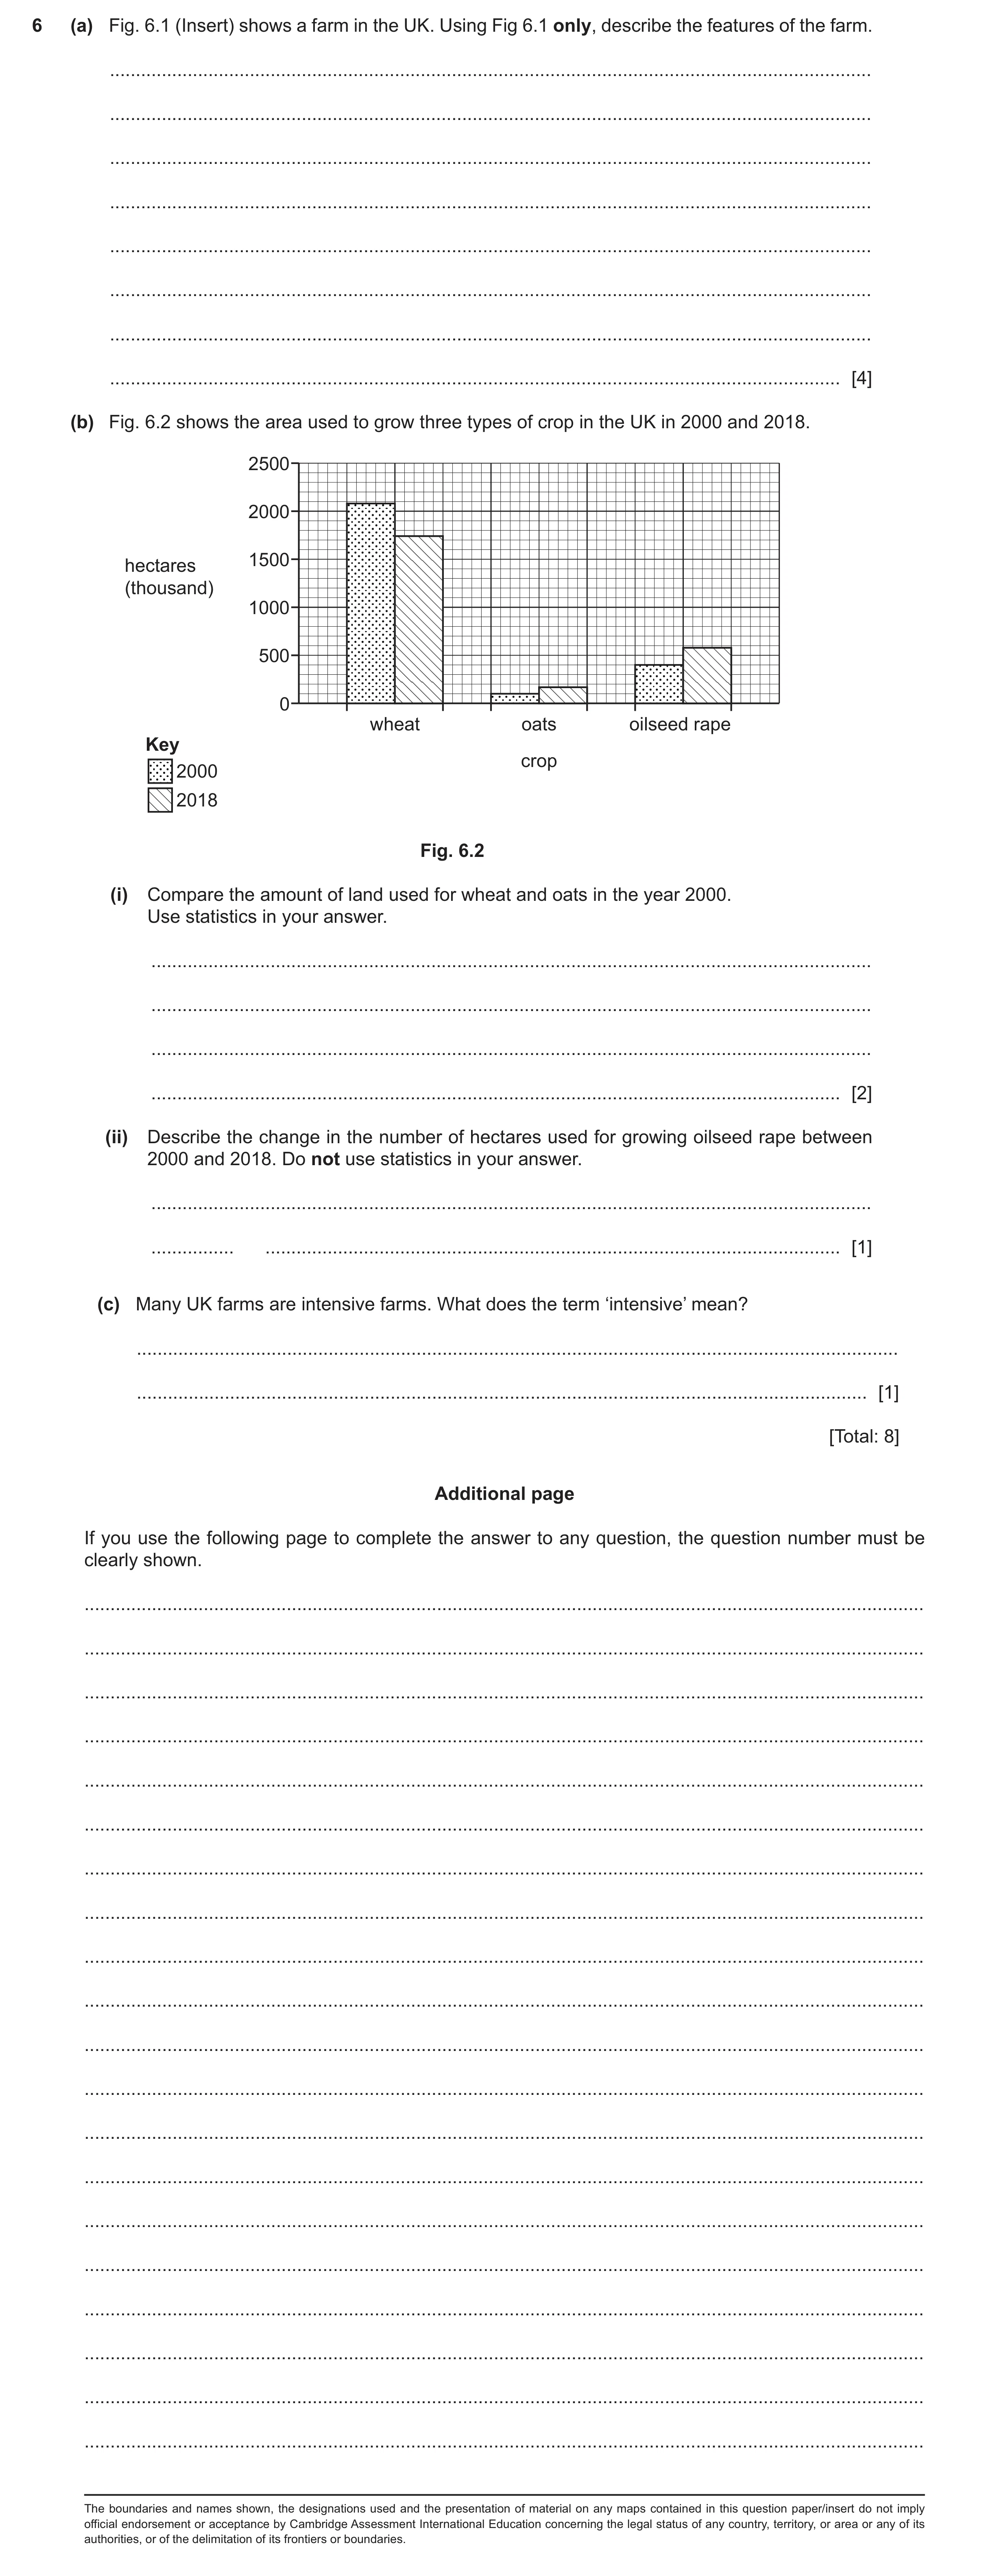
 8
8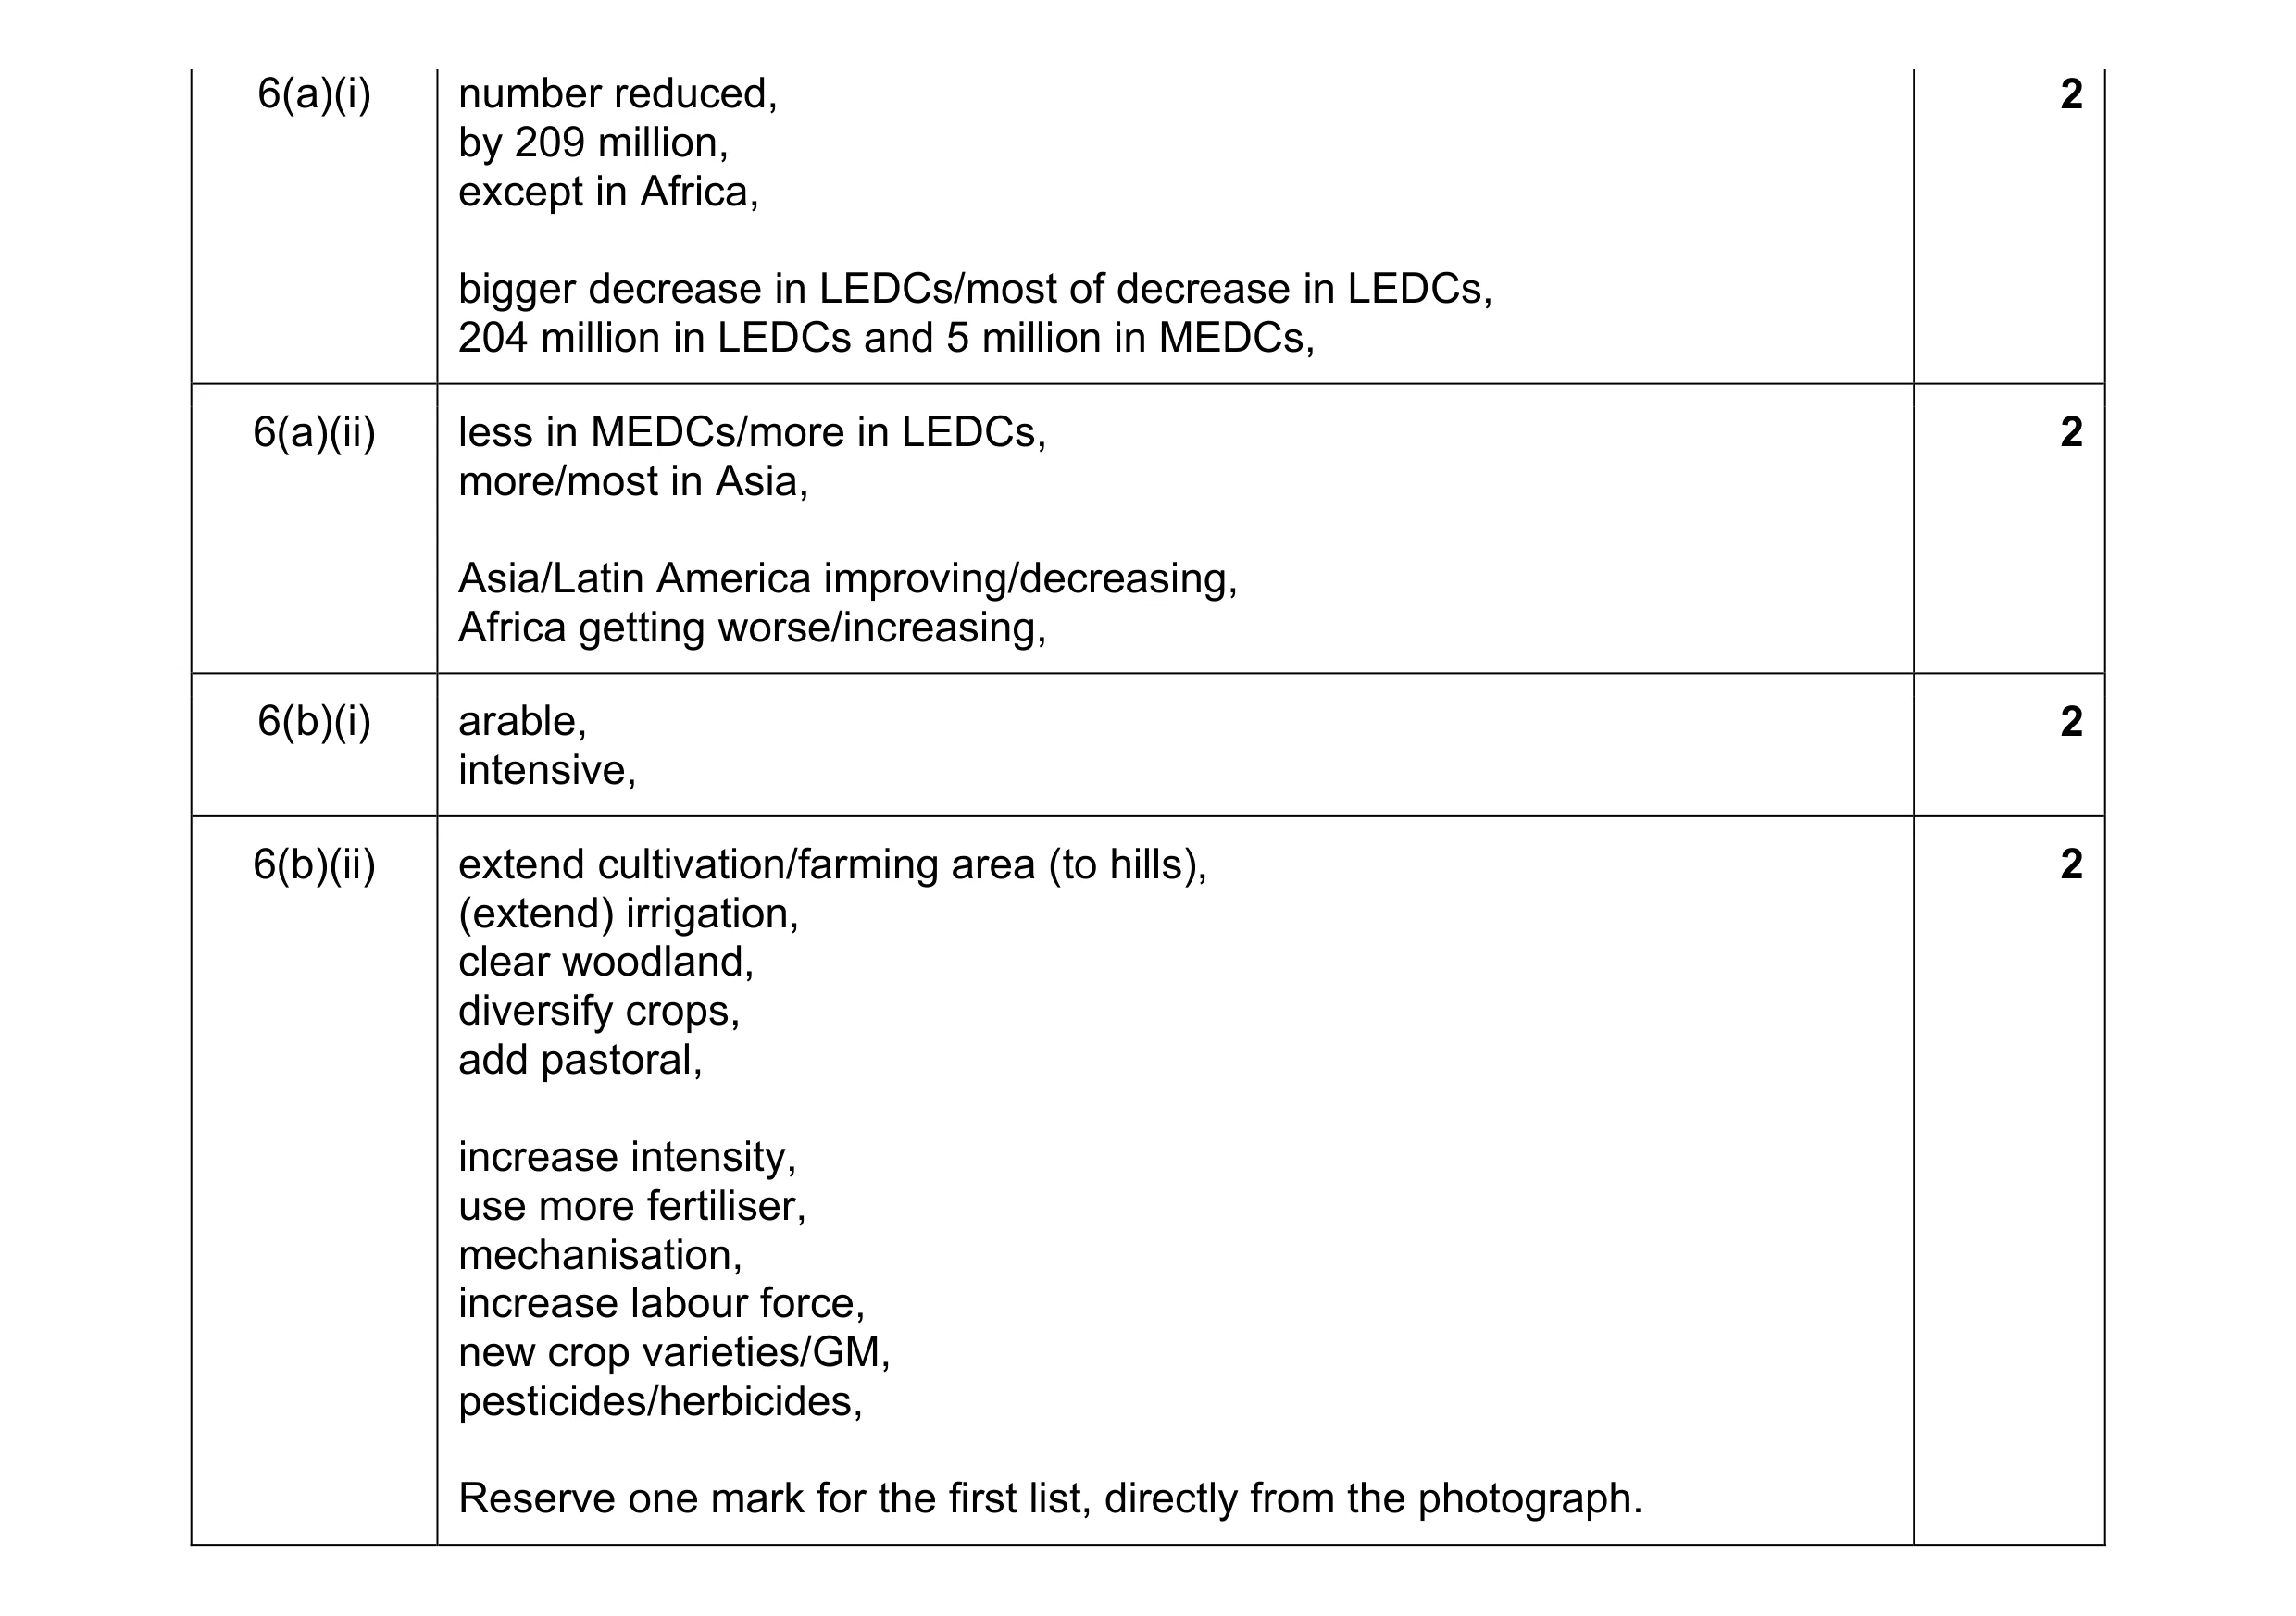 8
8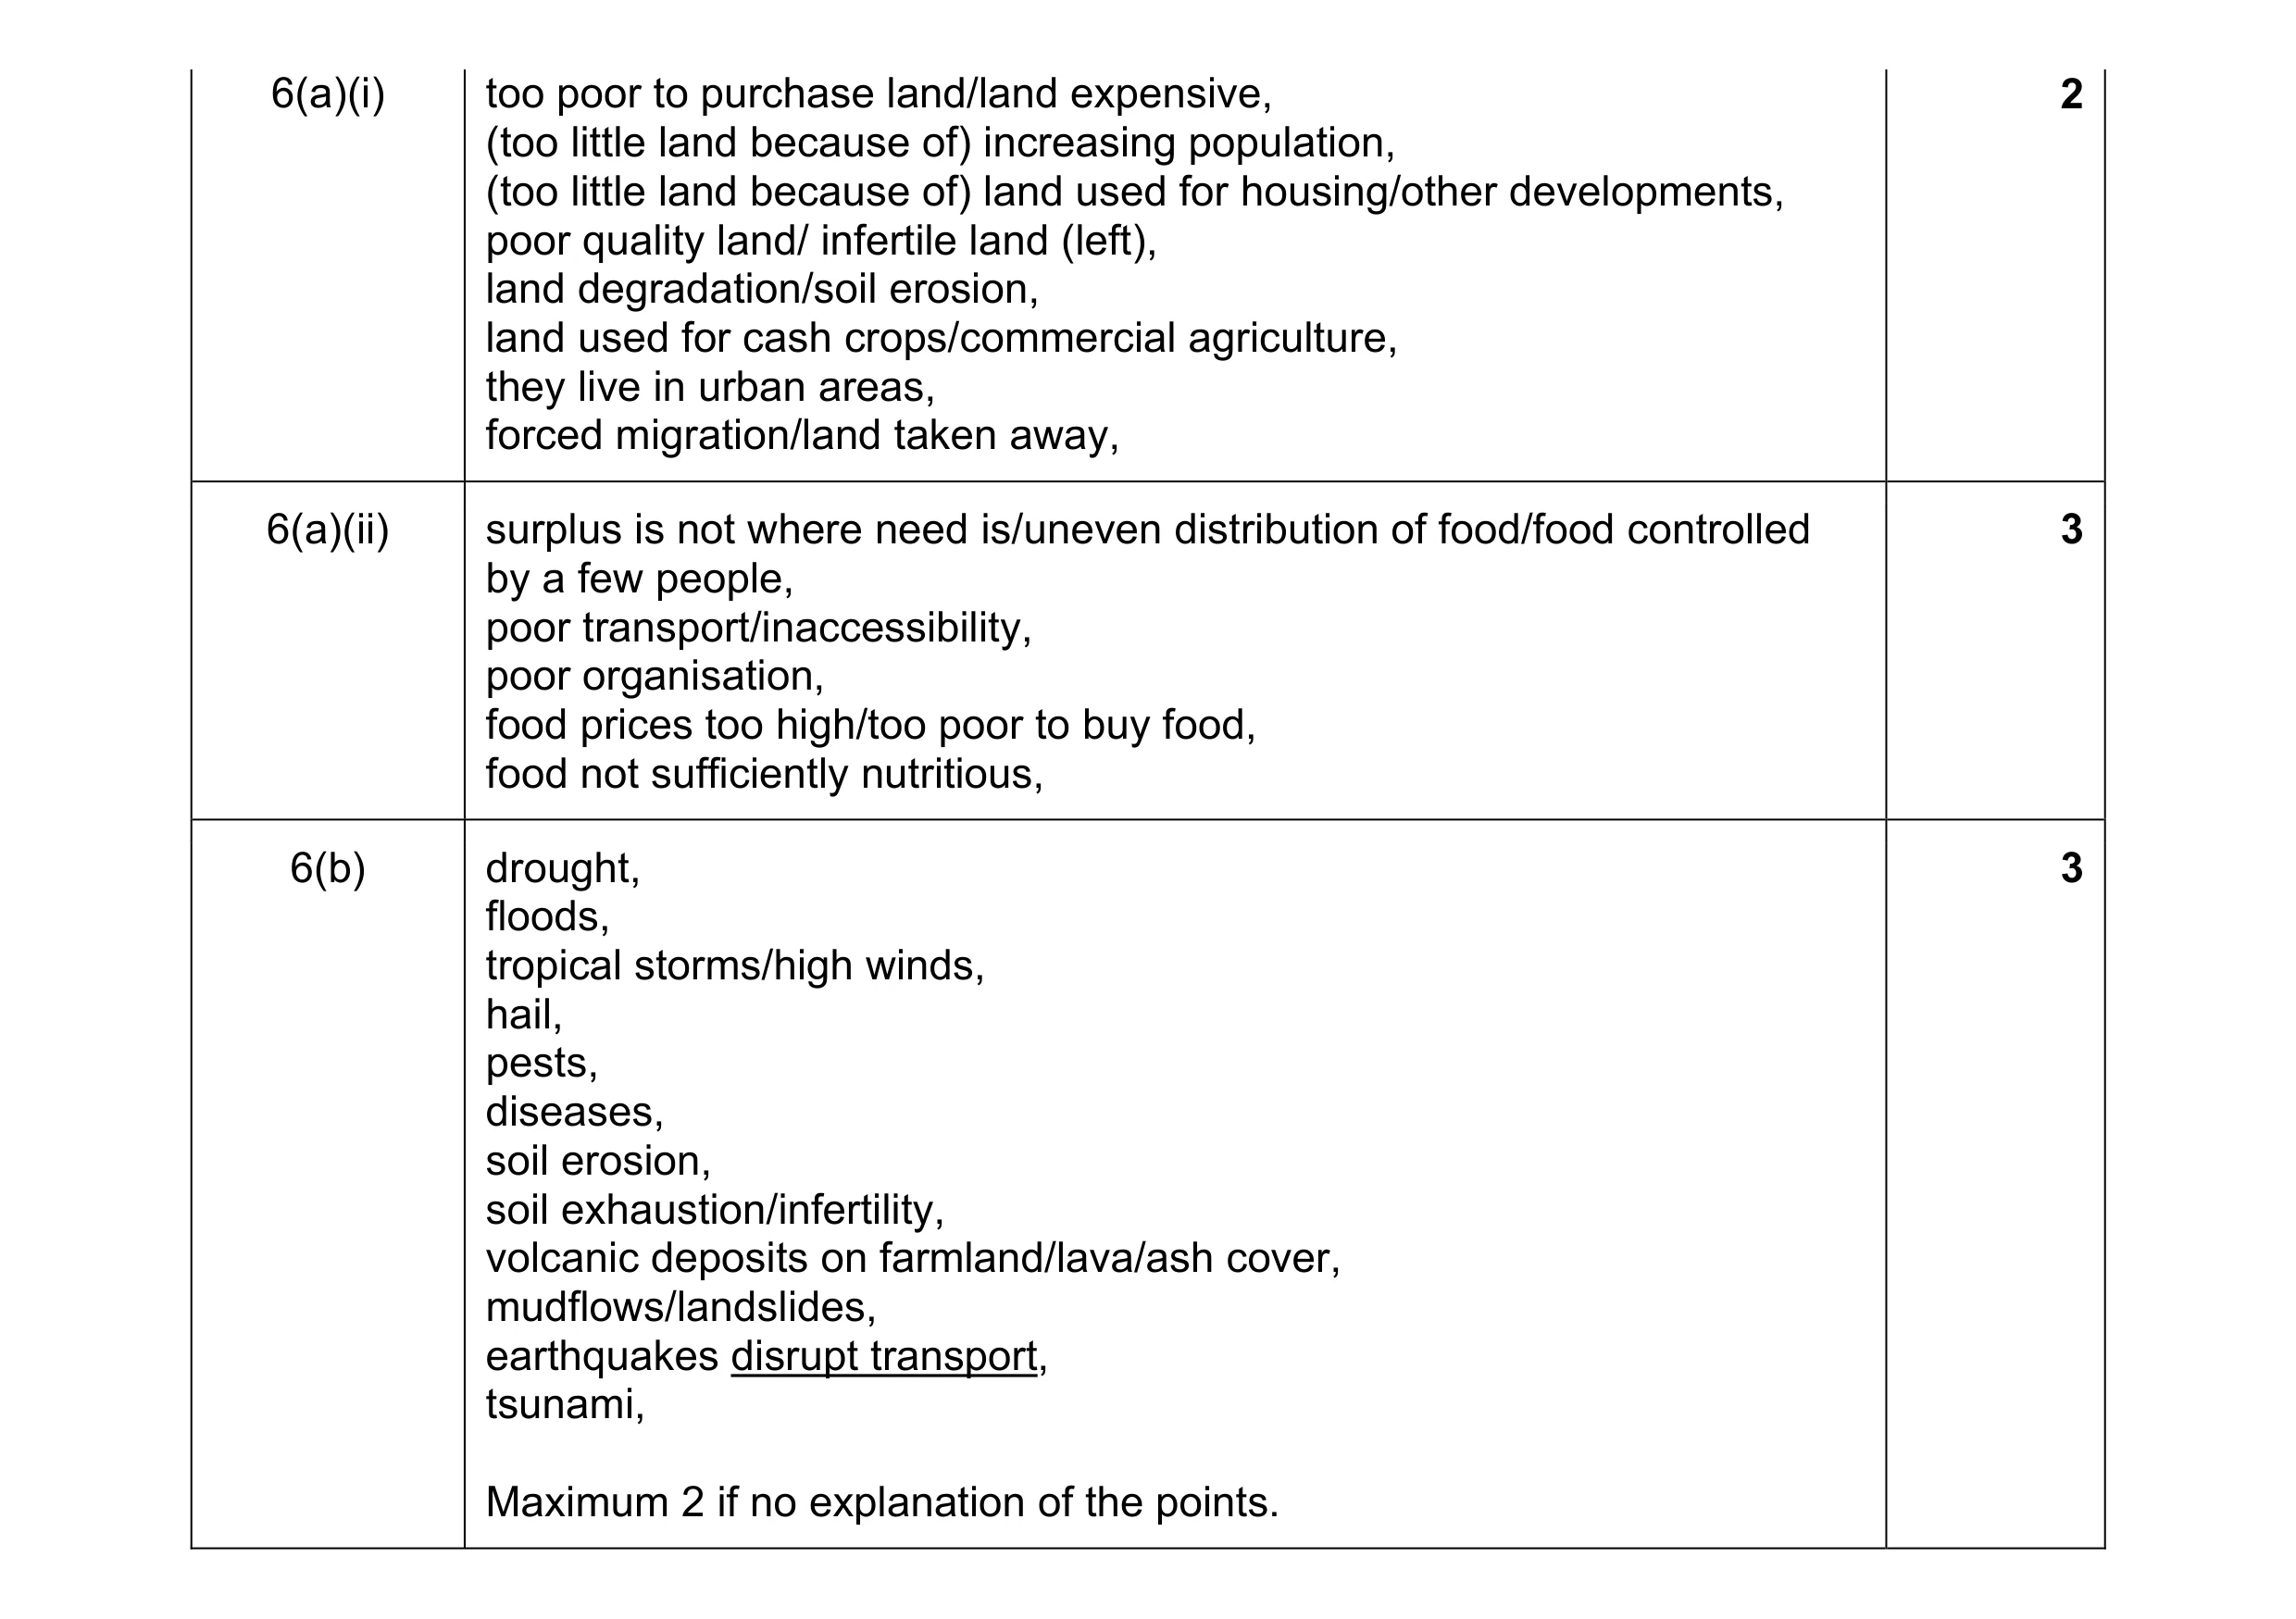 8
8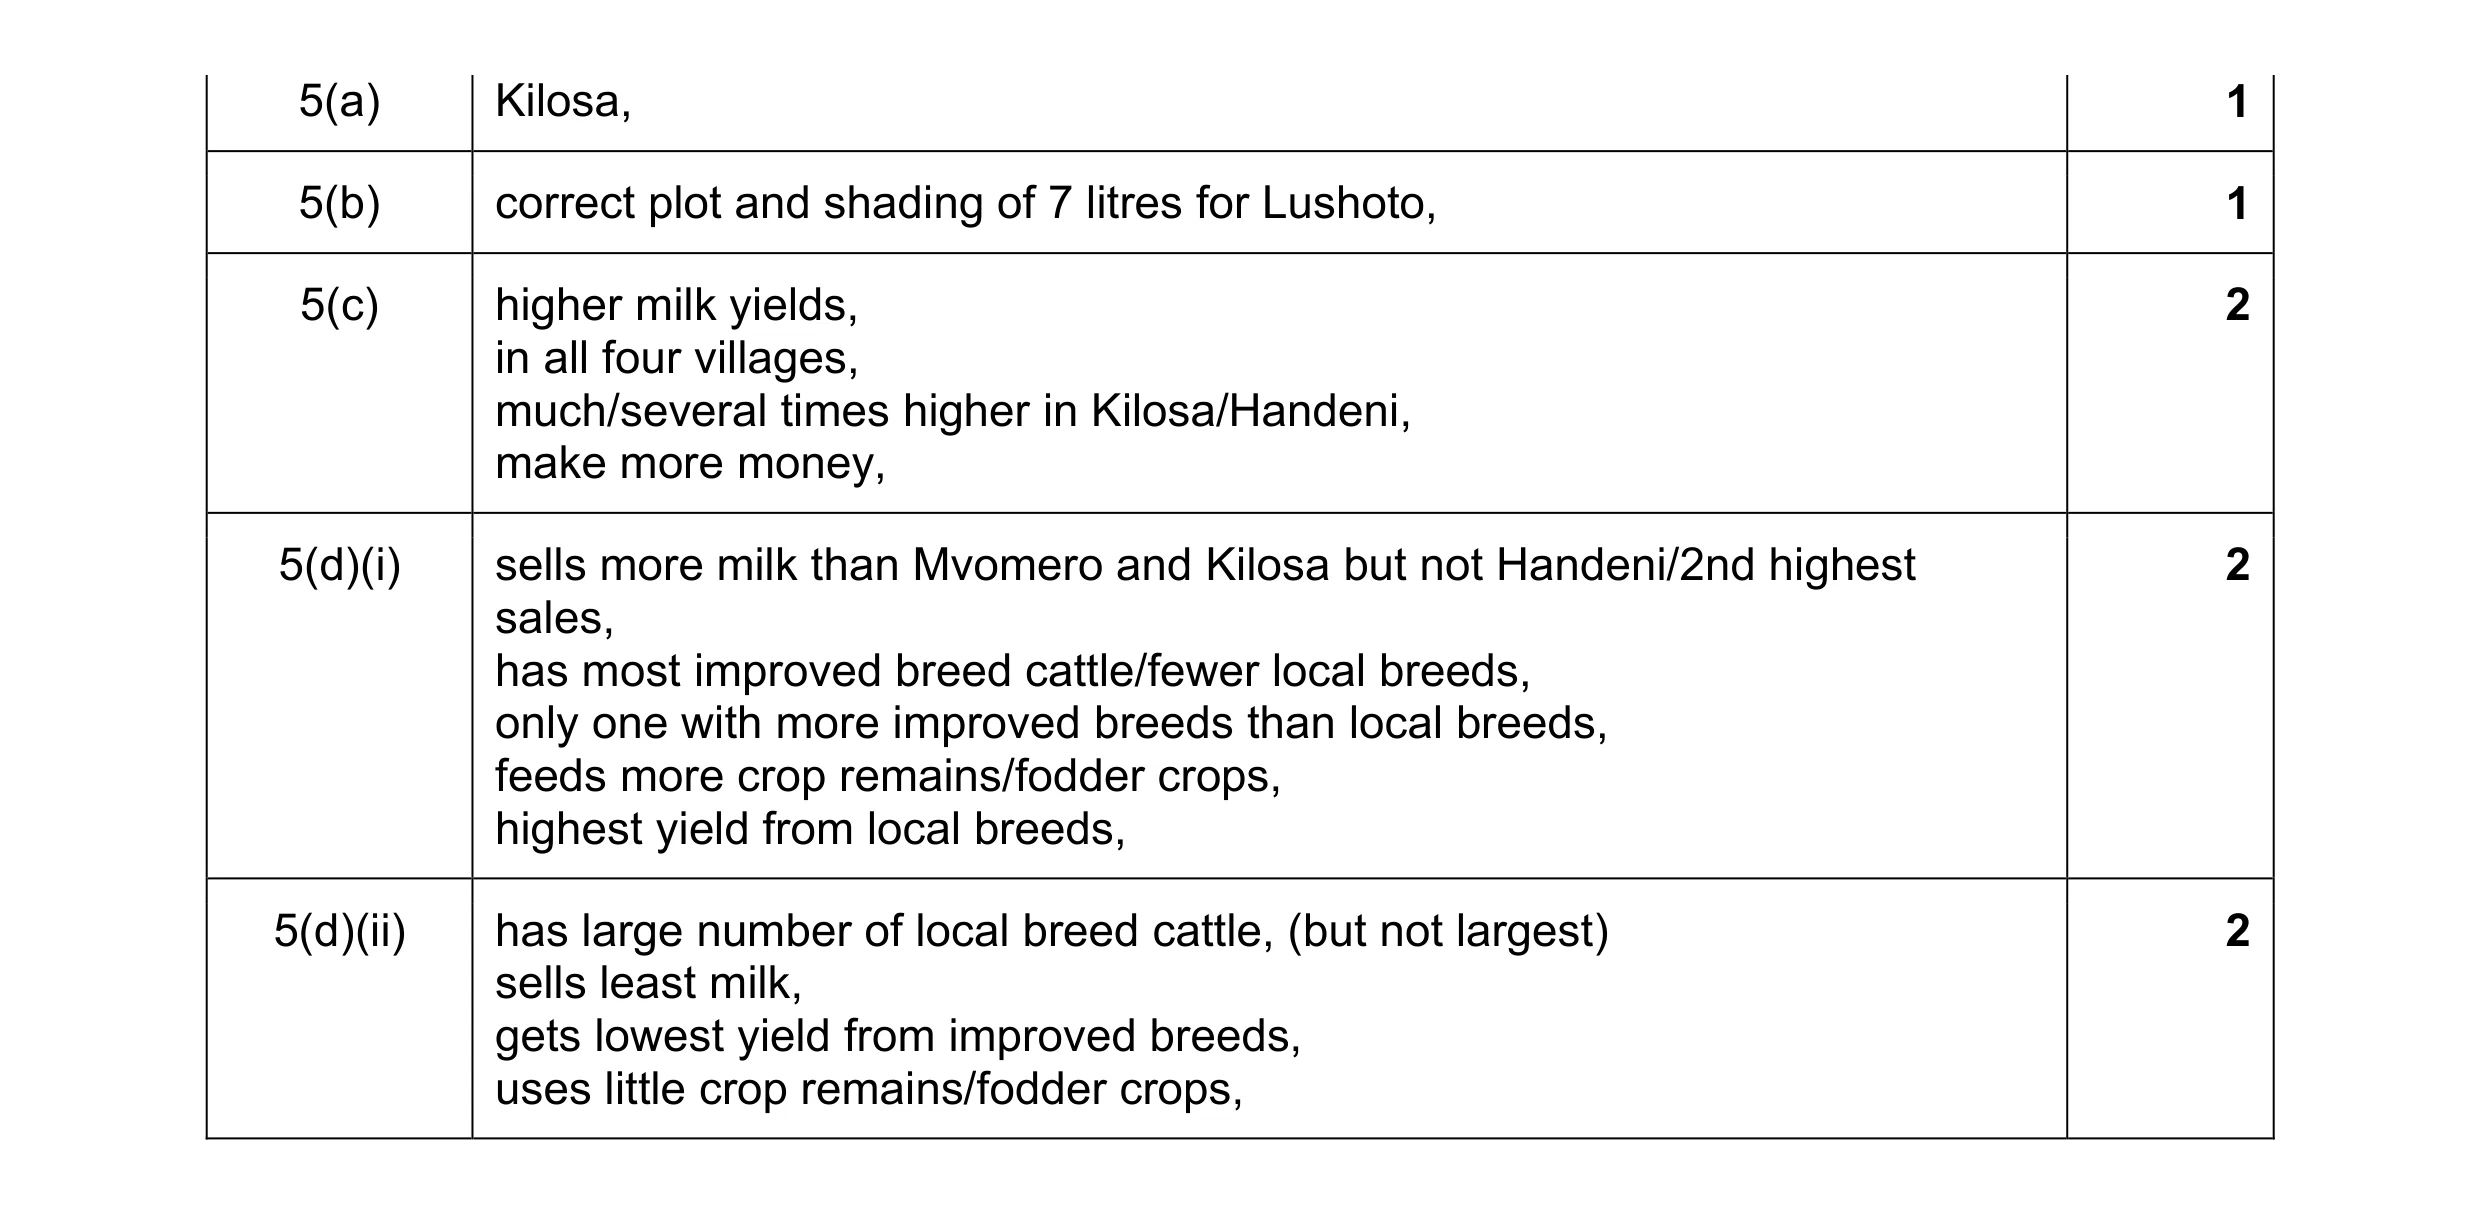 8
8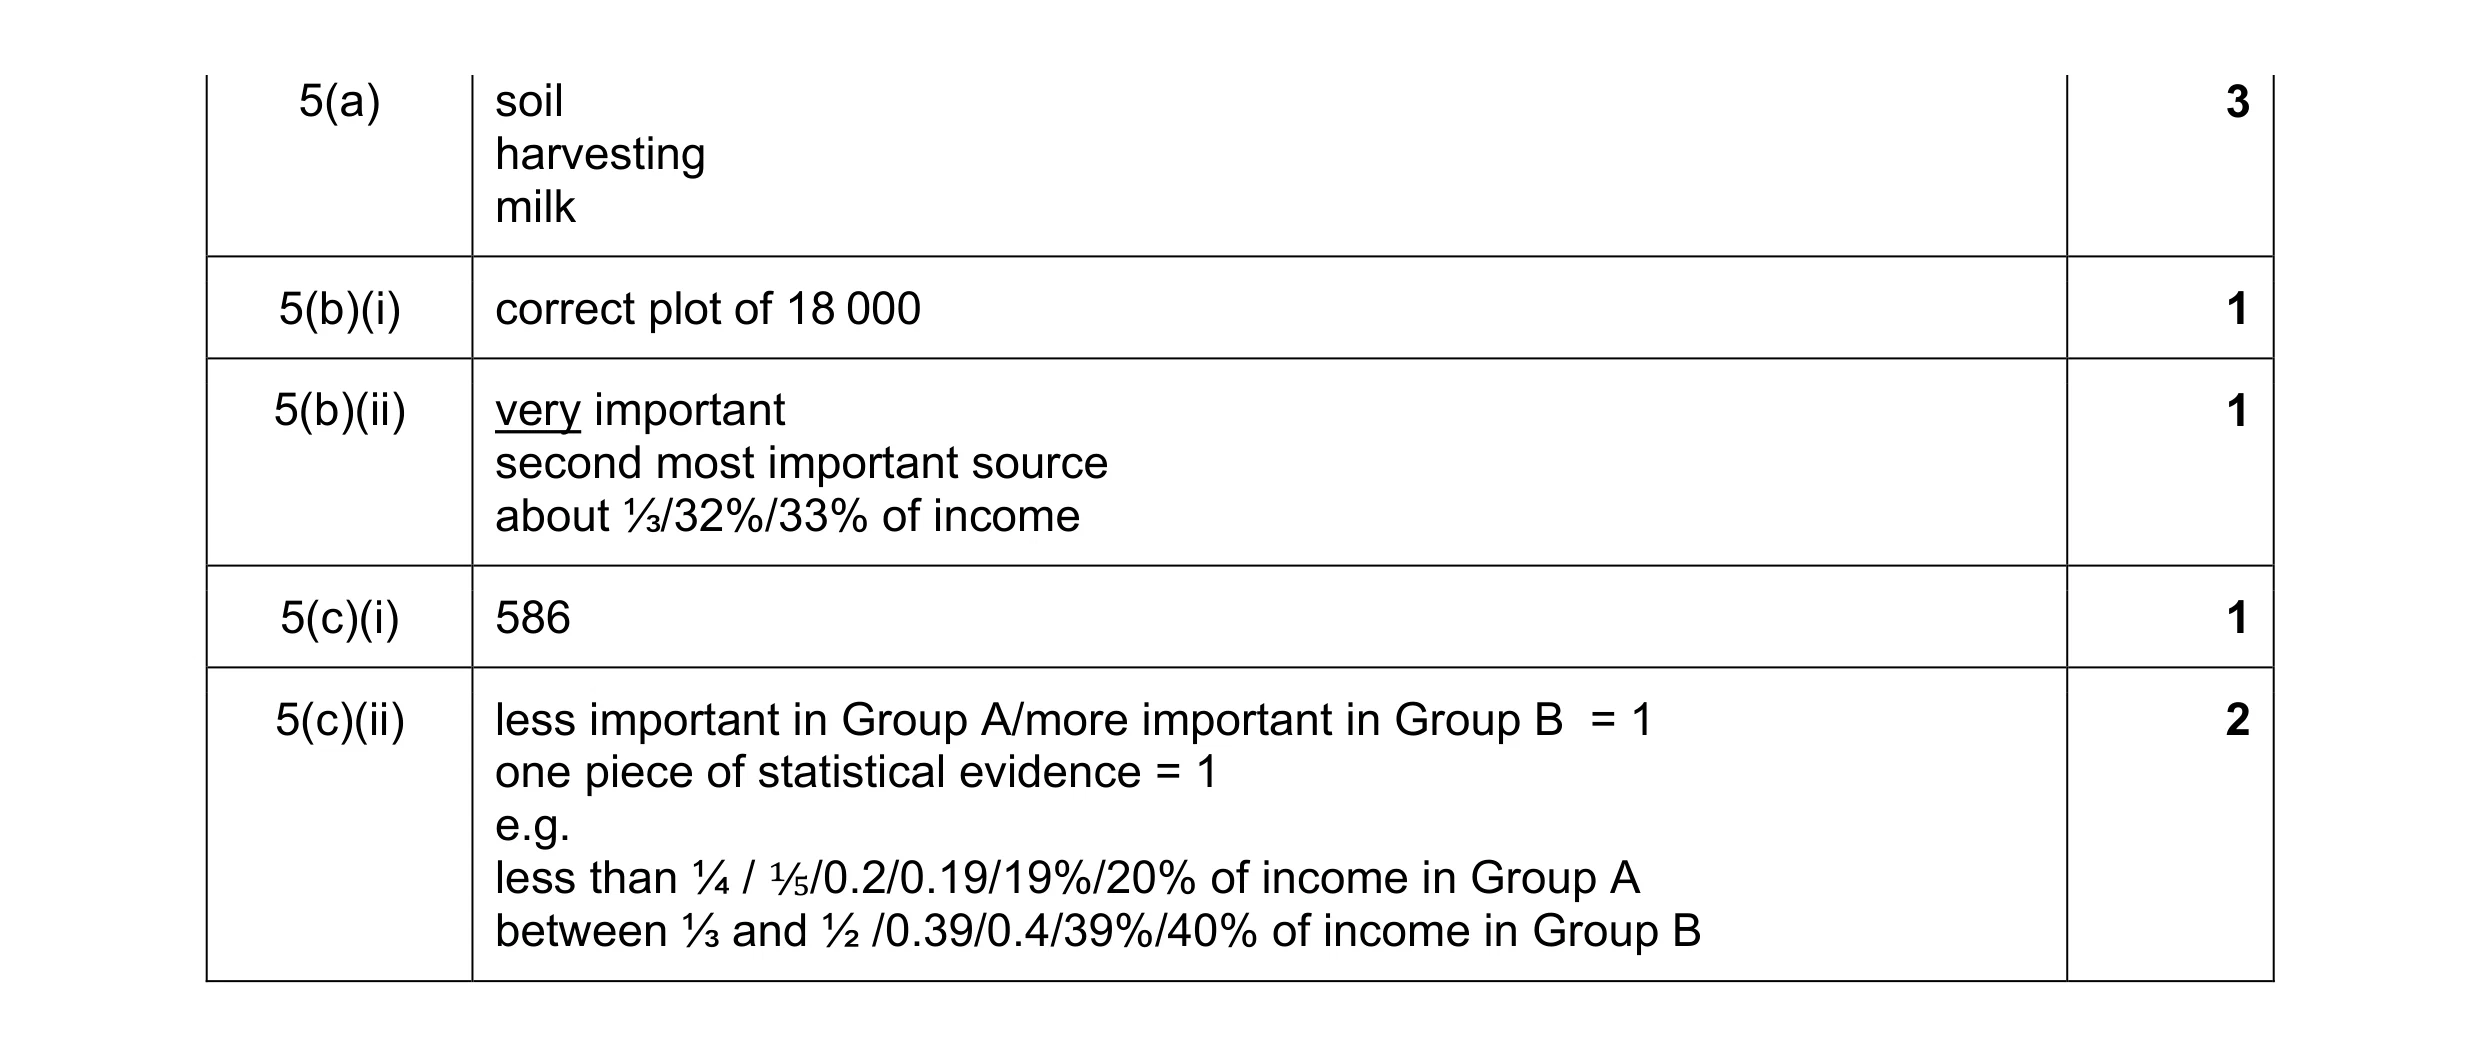 8
8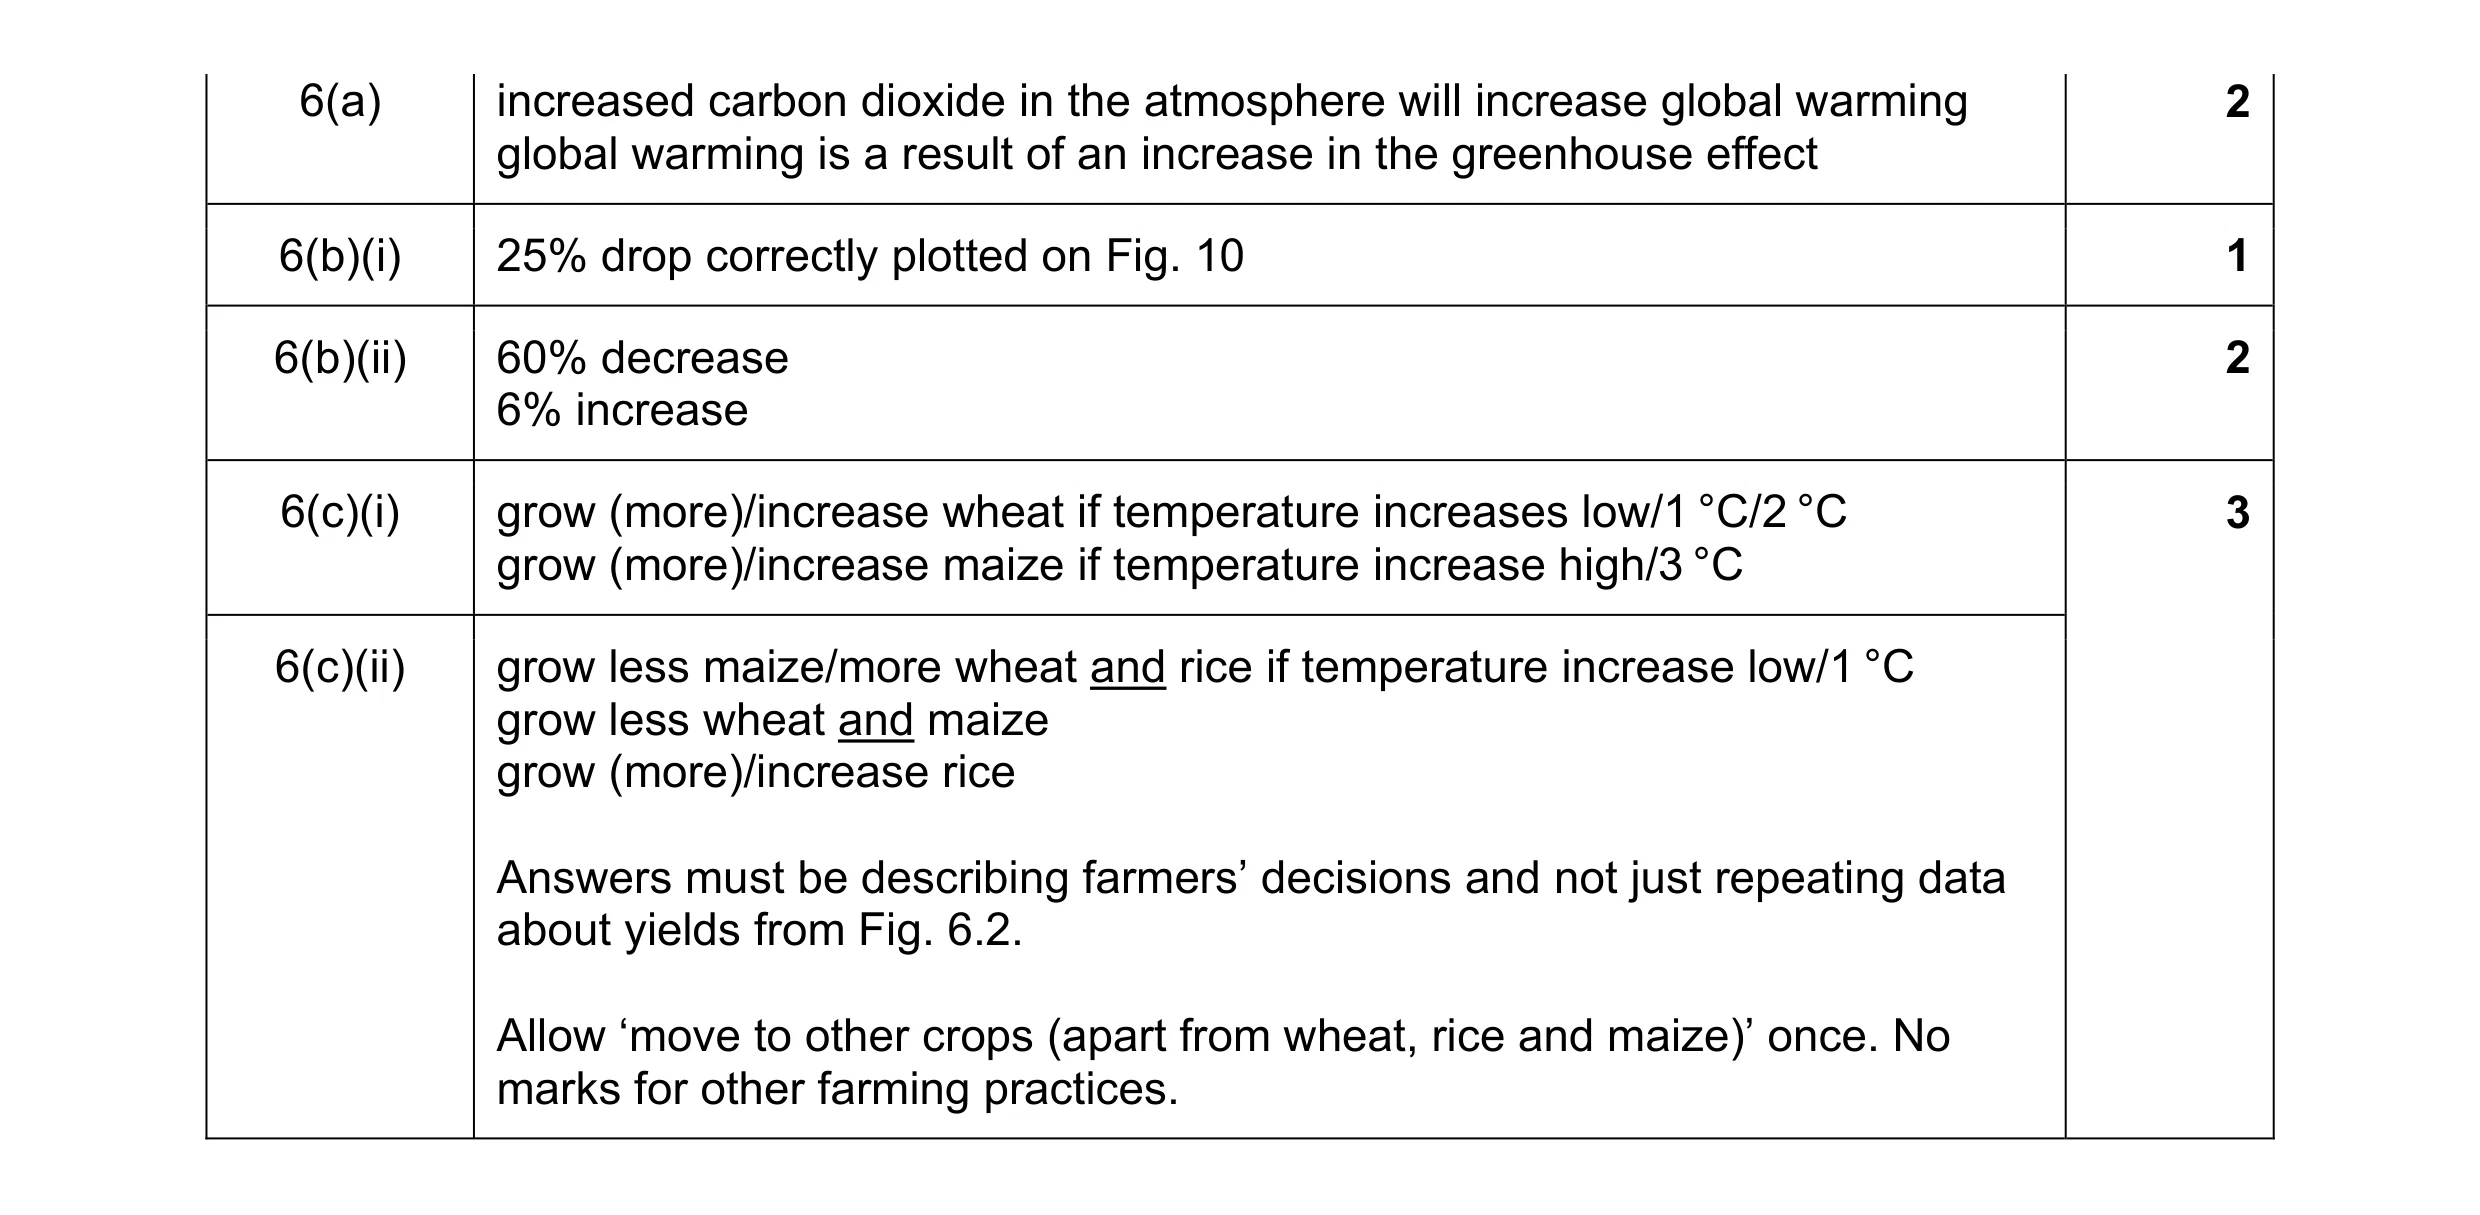 8
8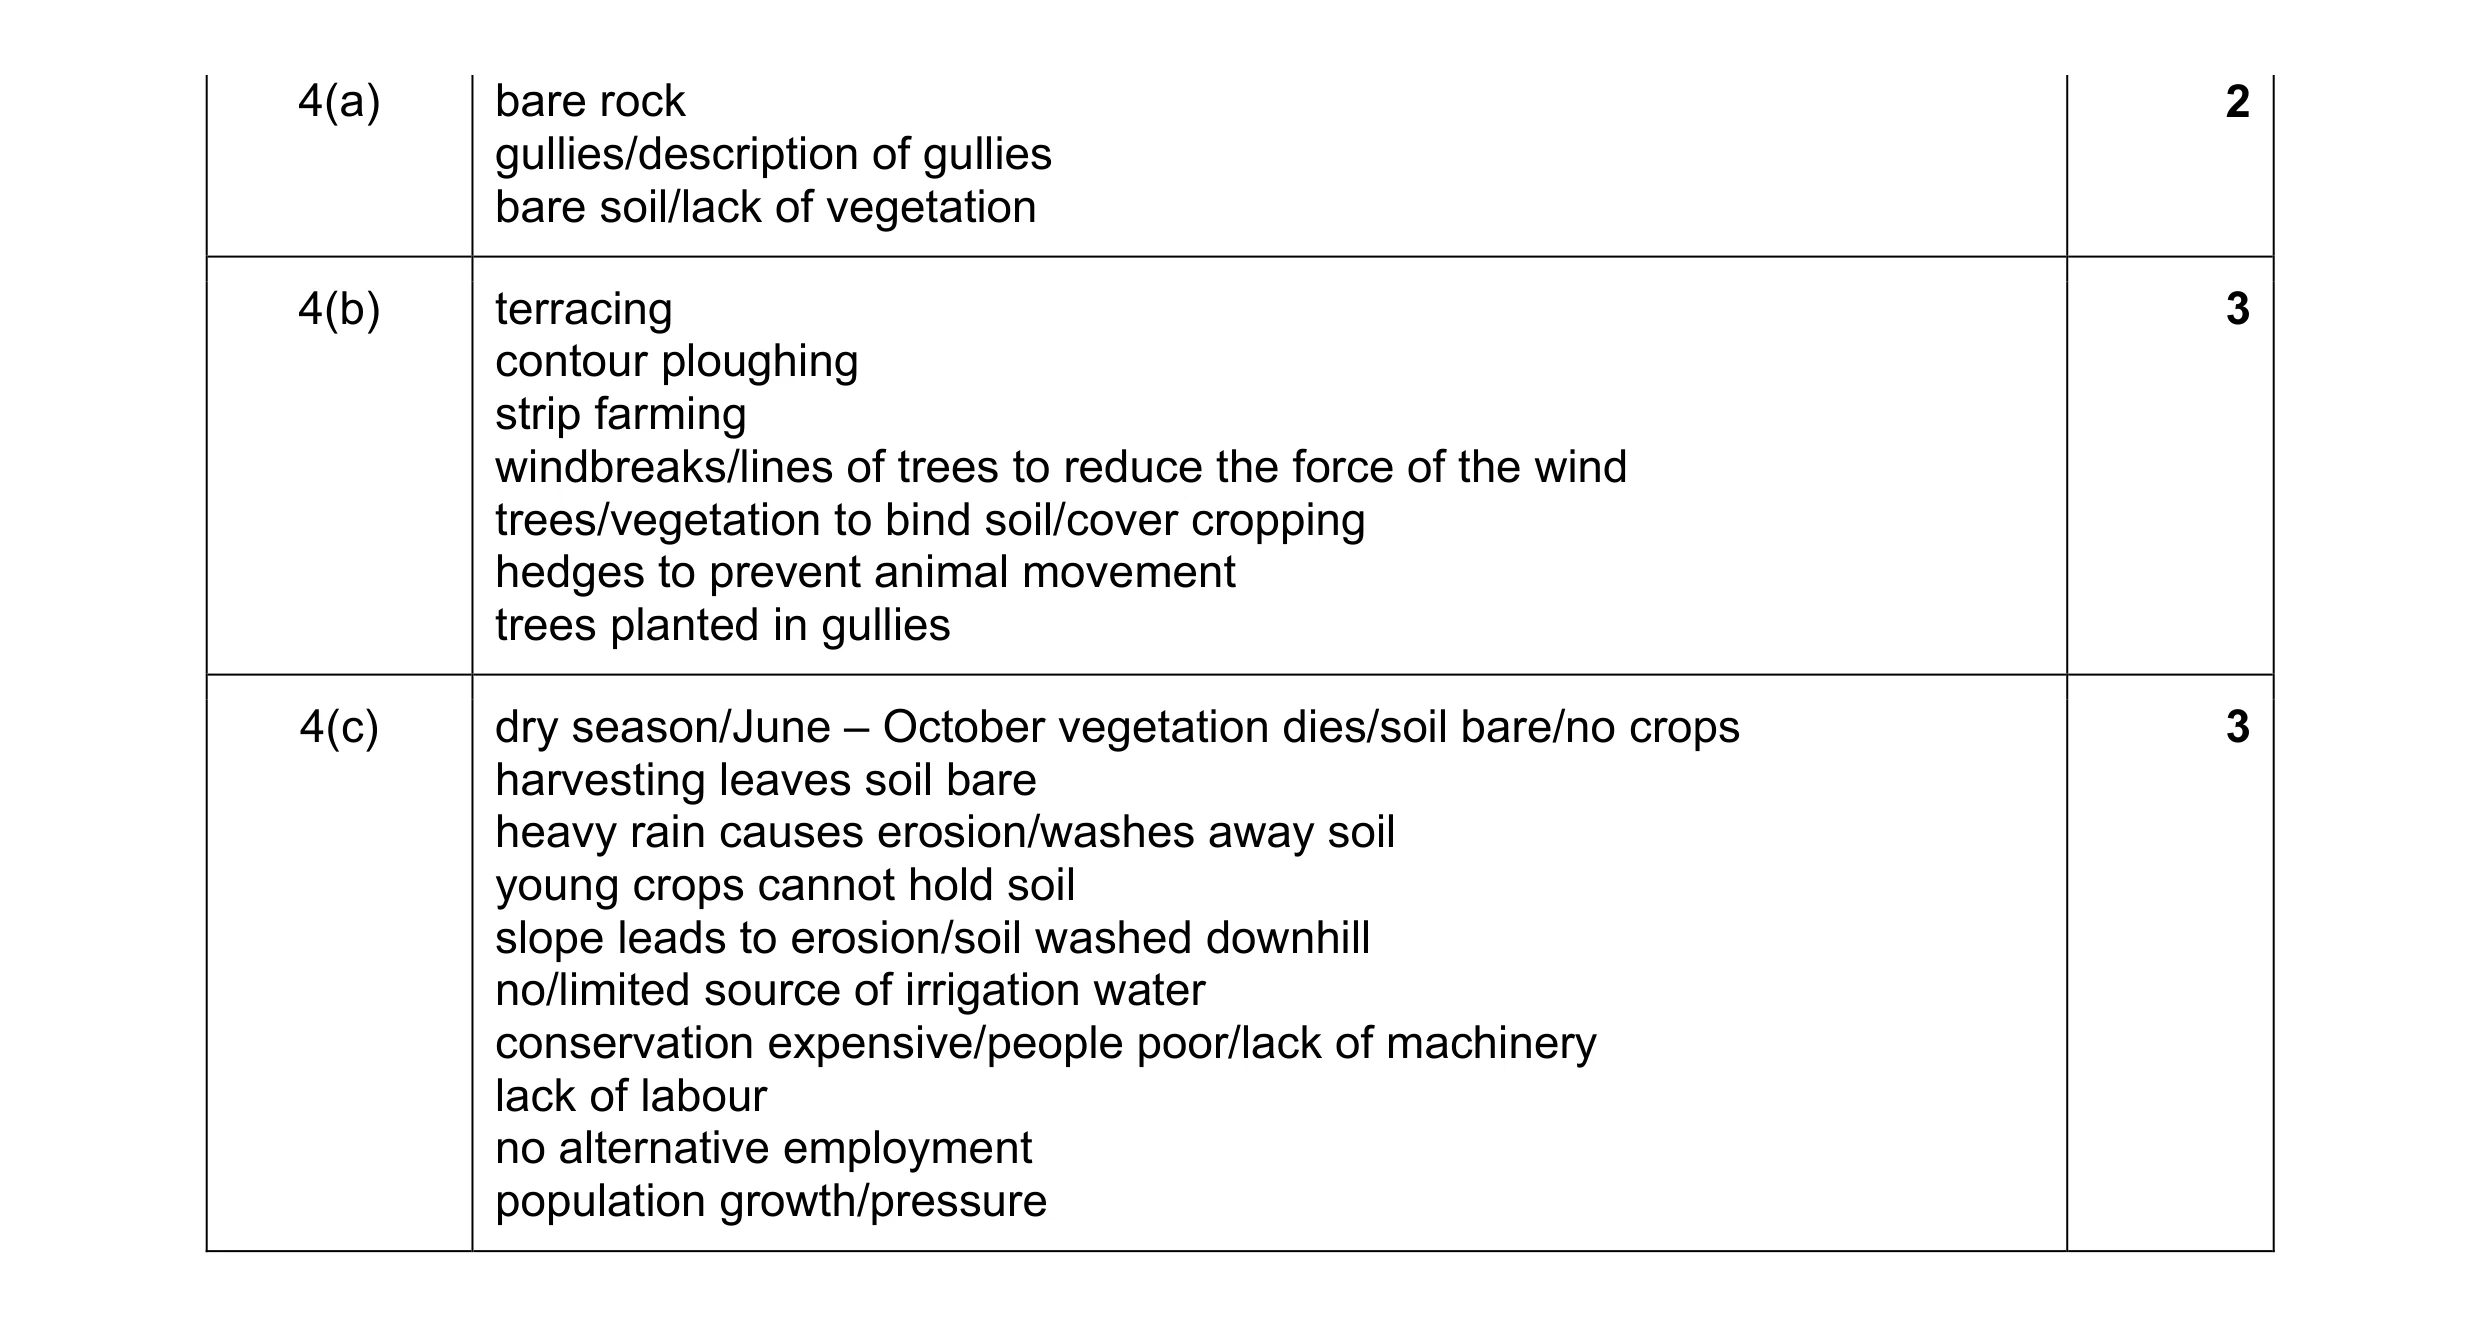 8
8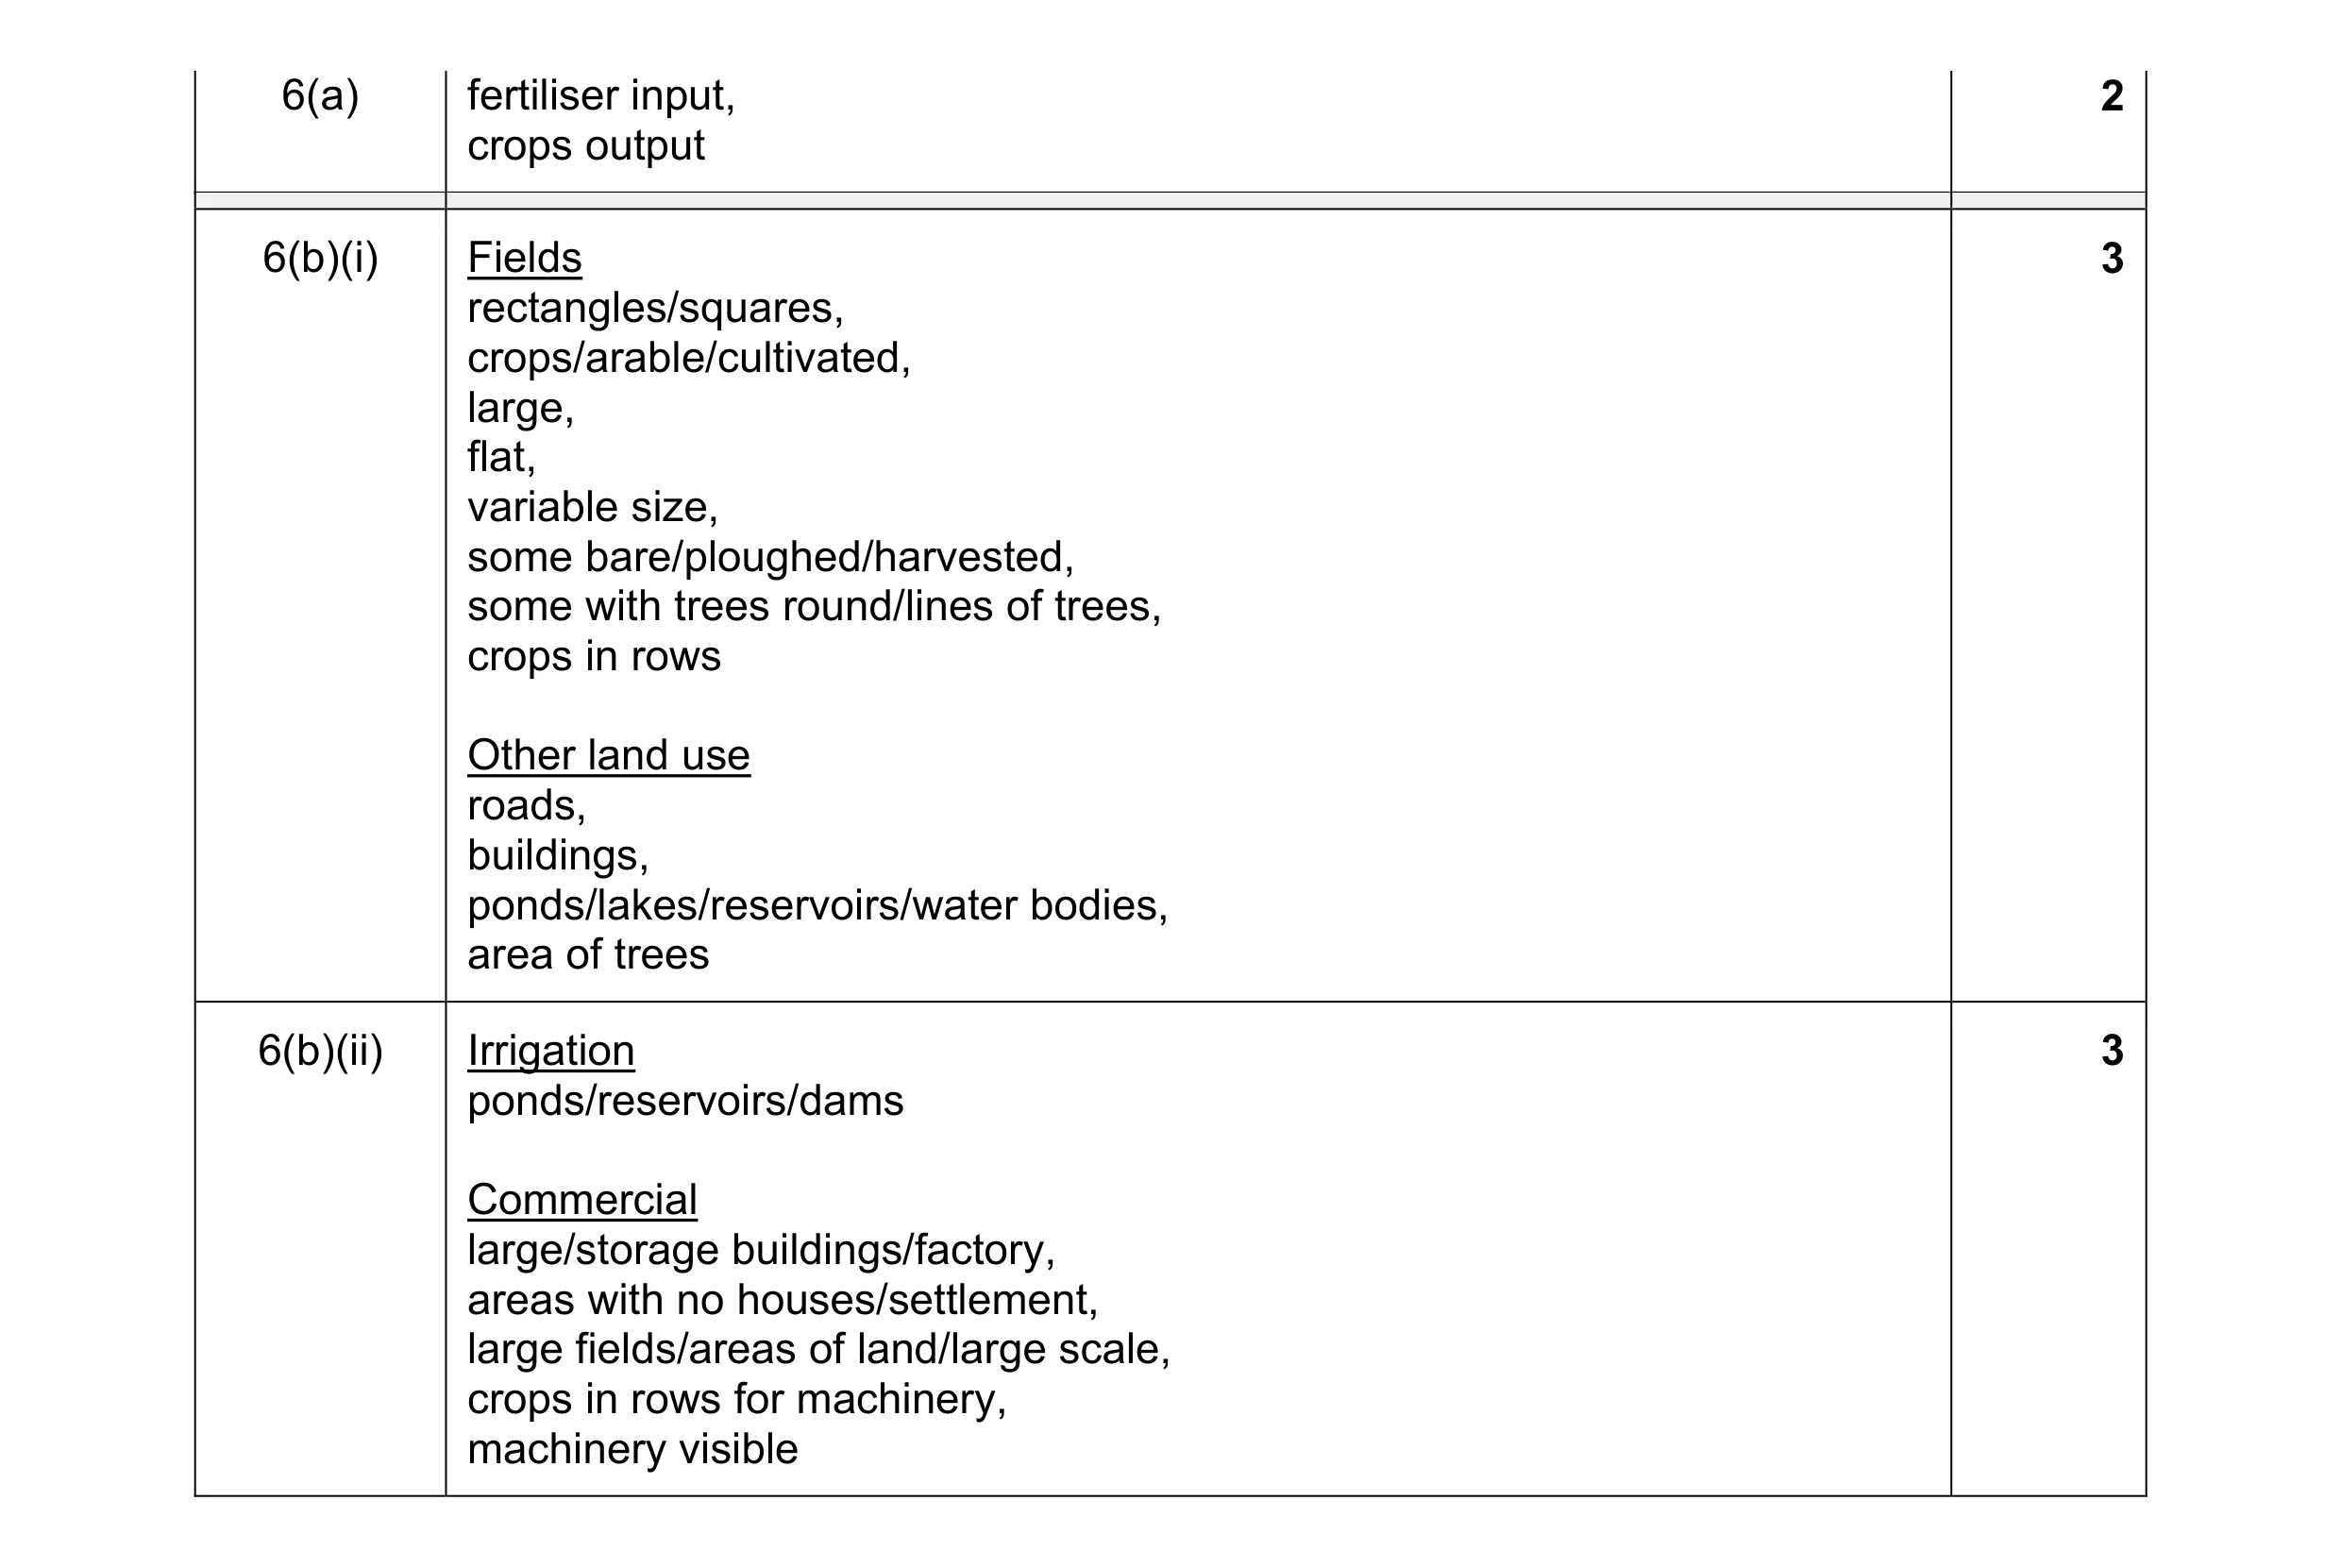 8
8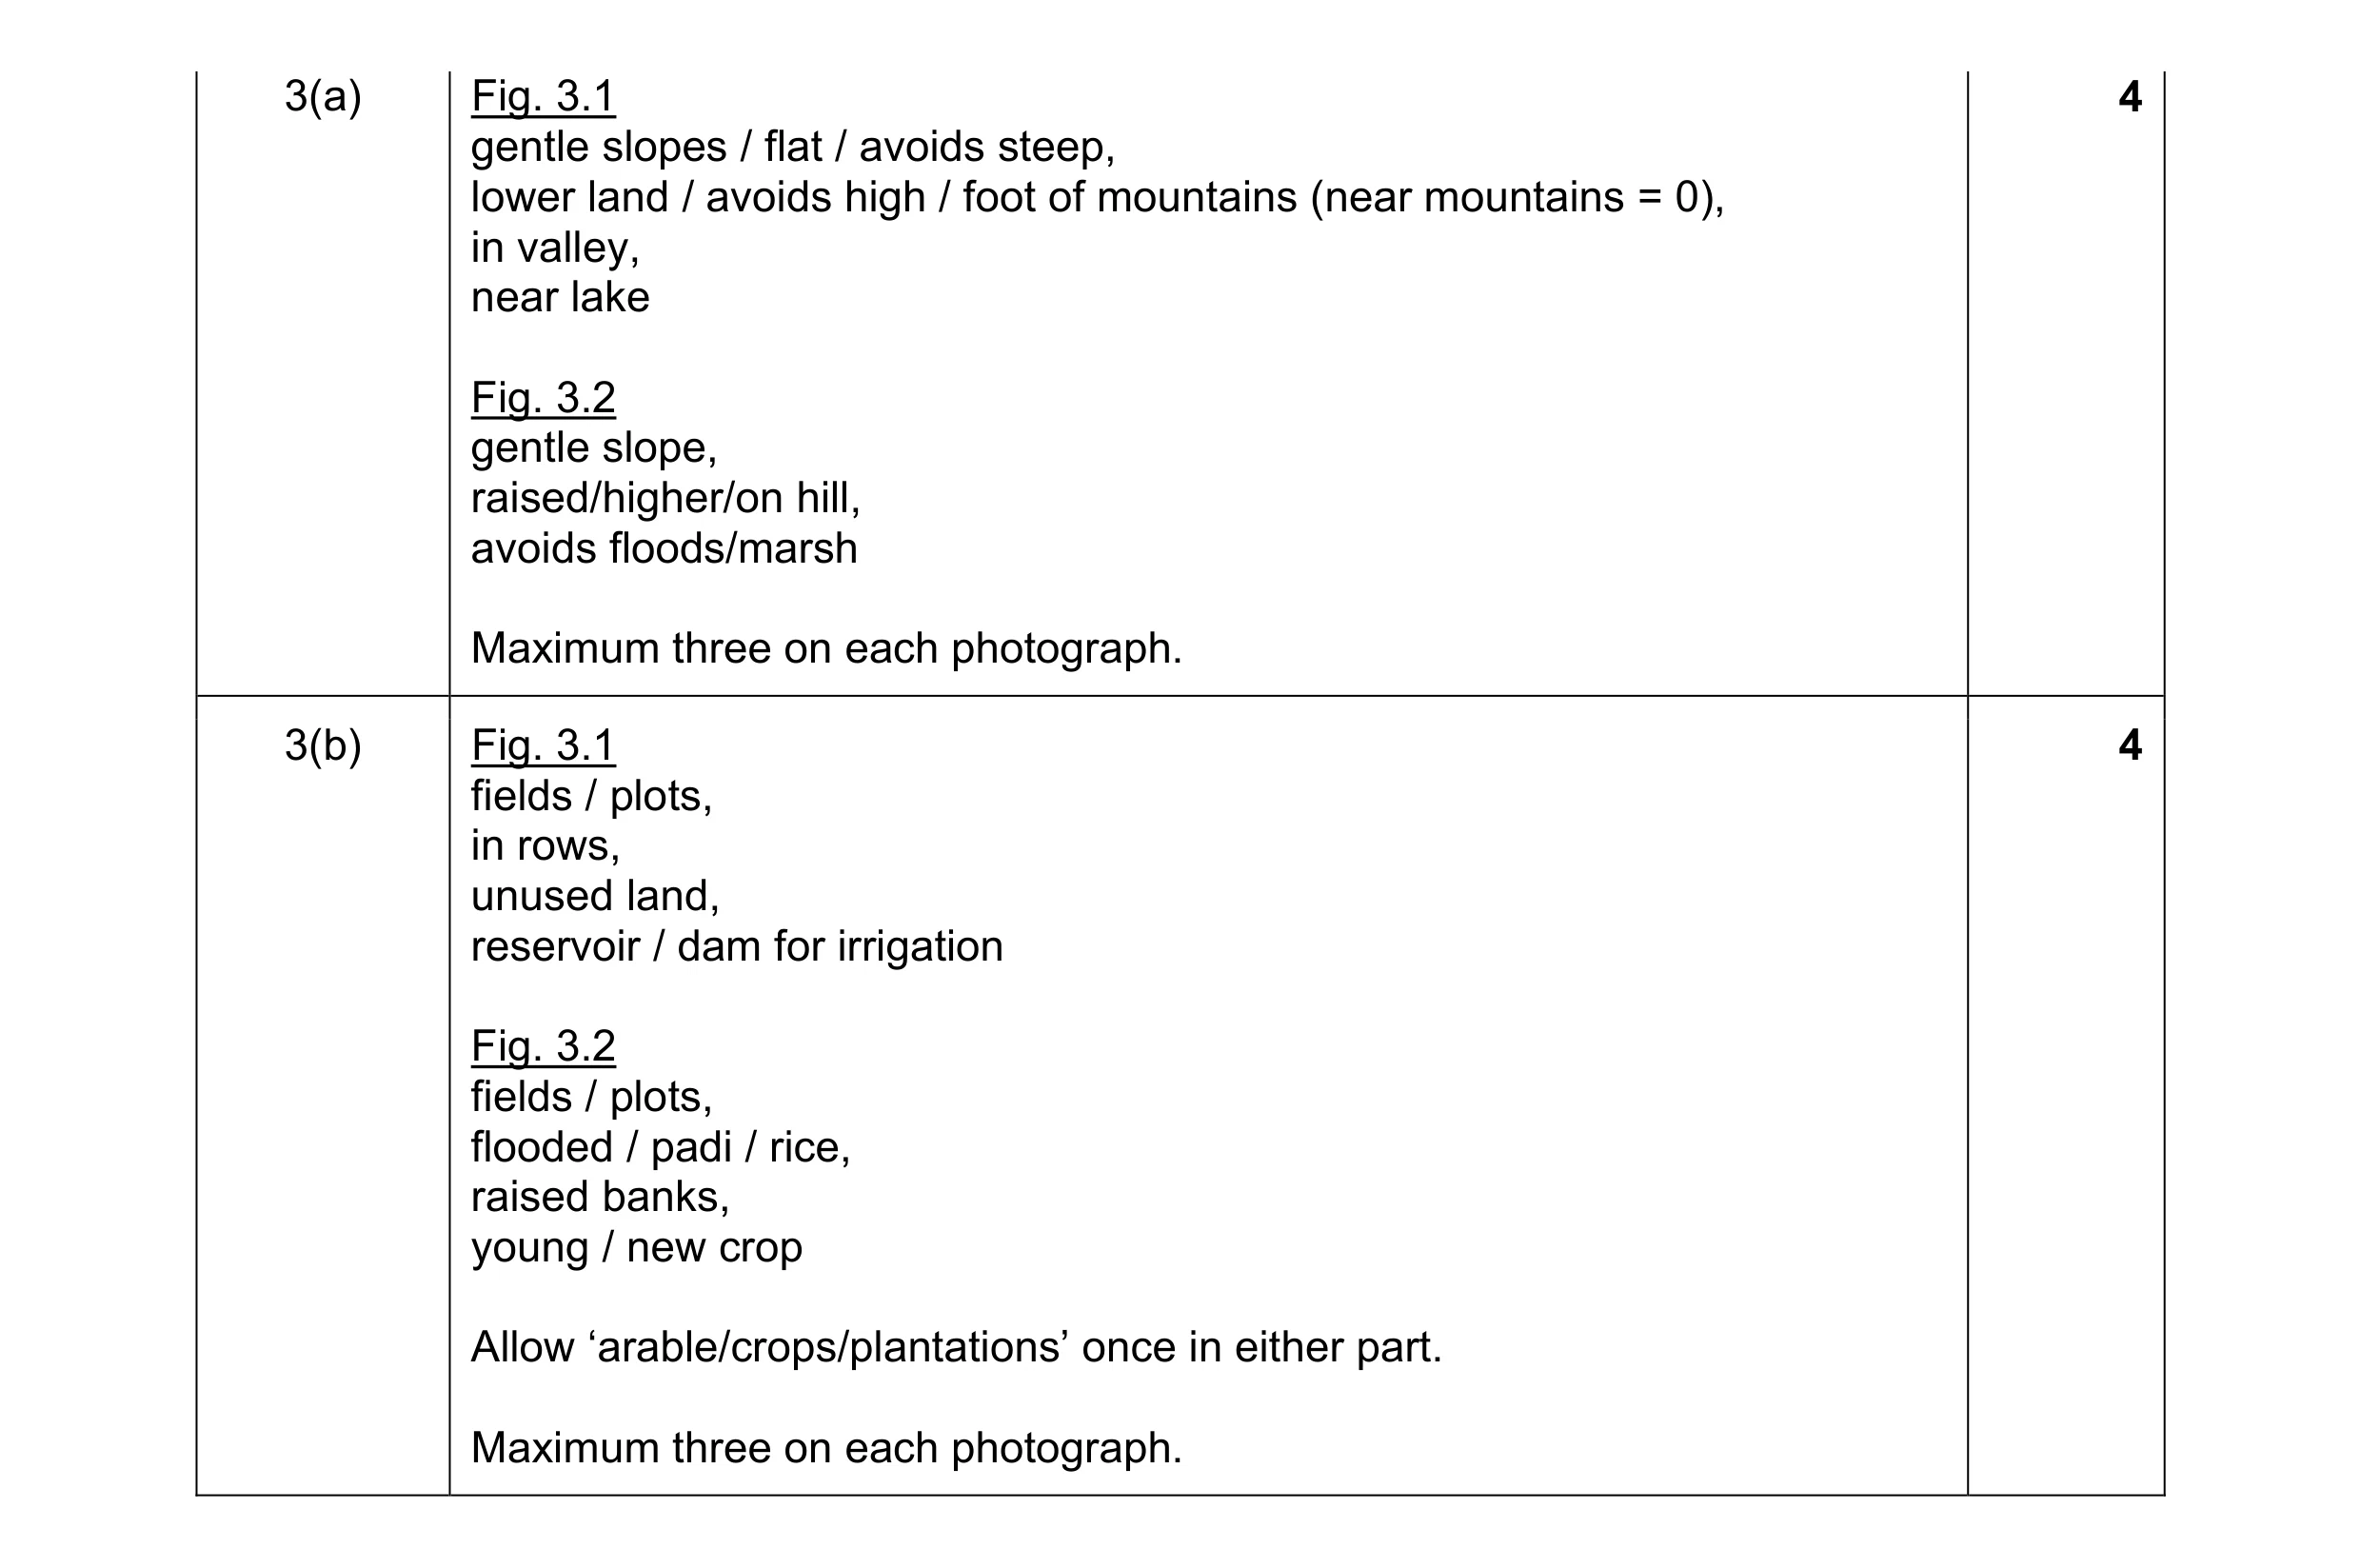 8
8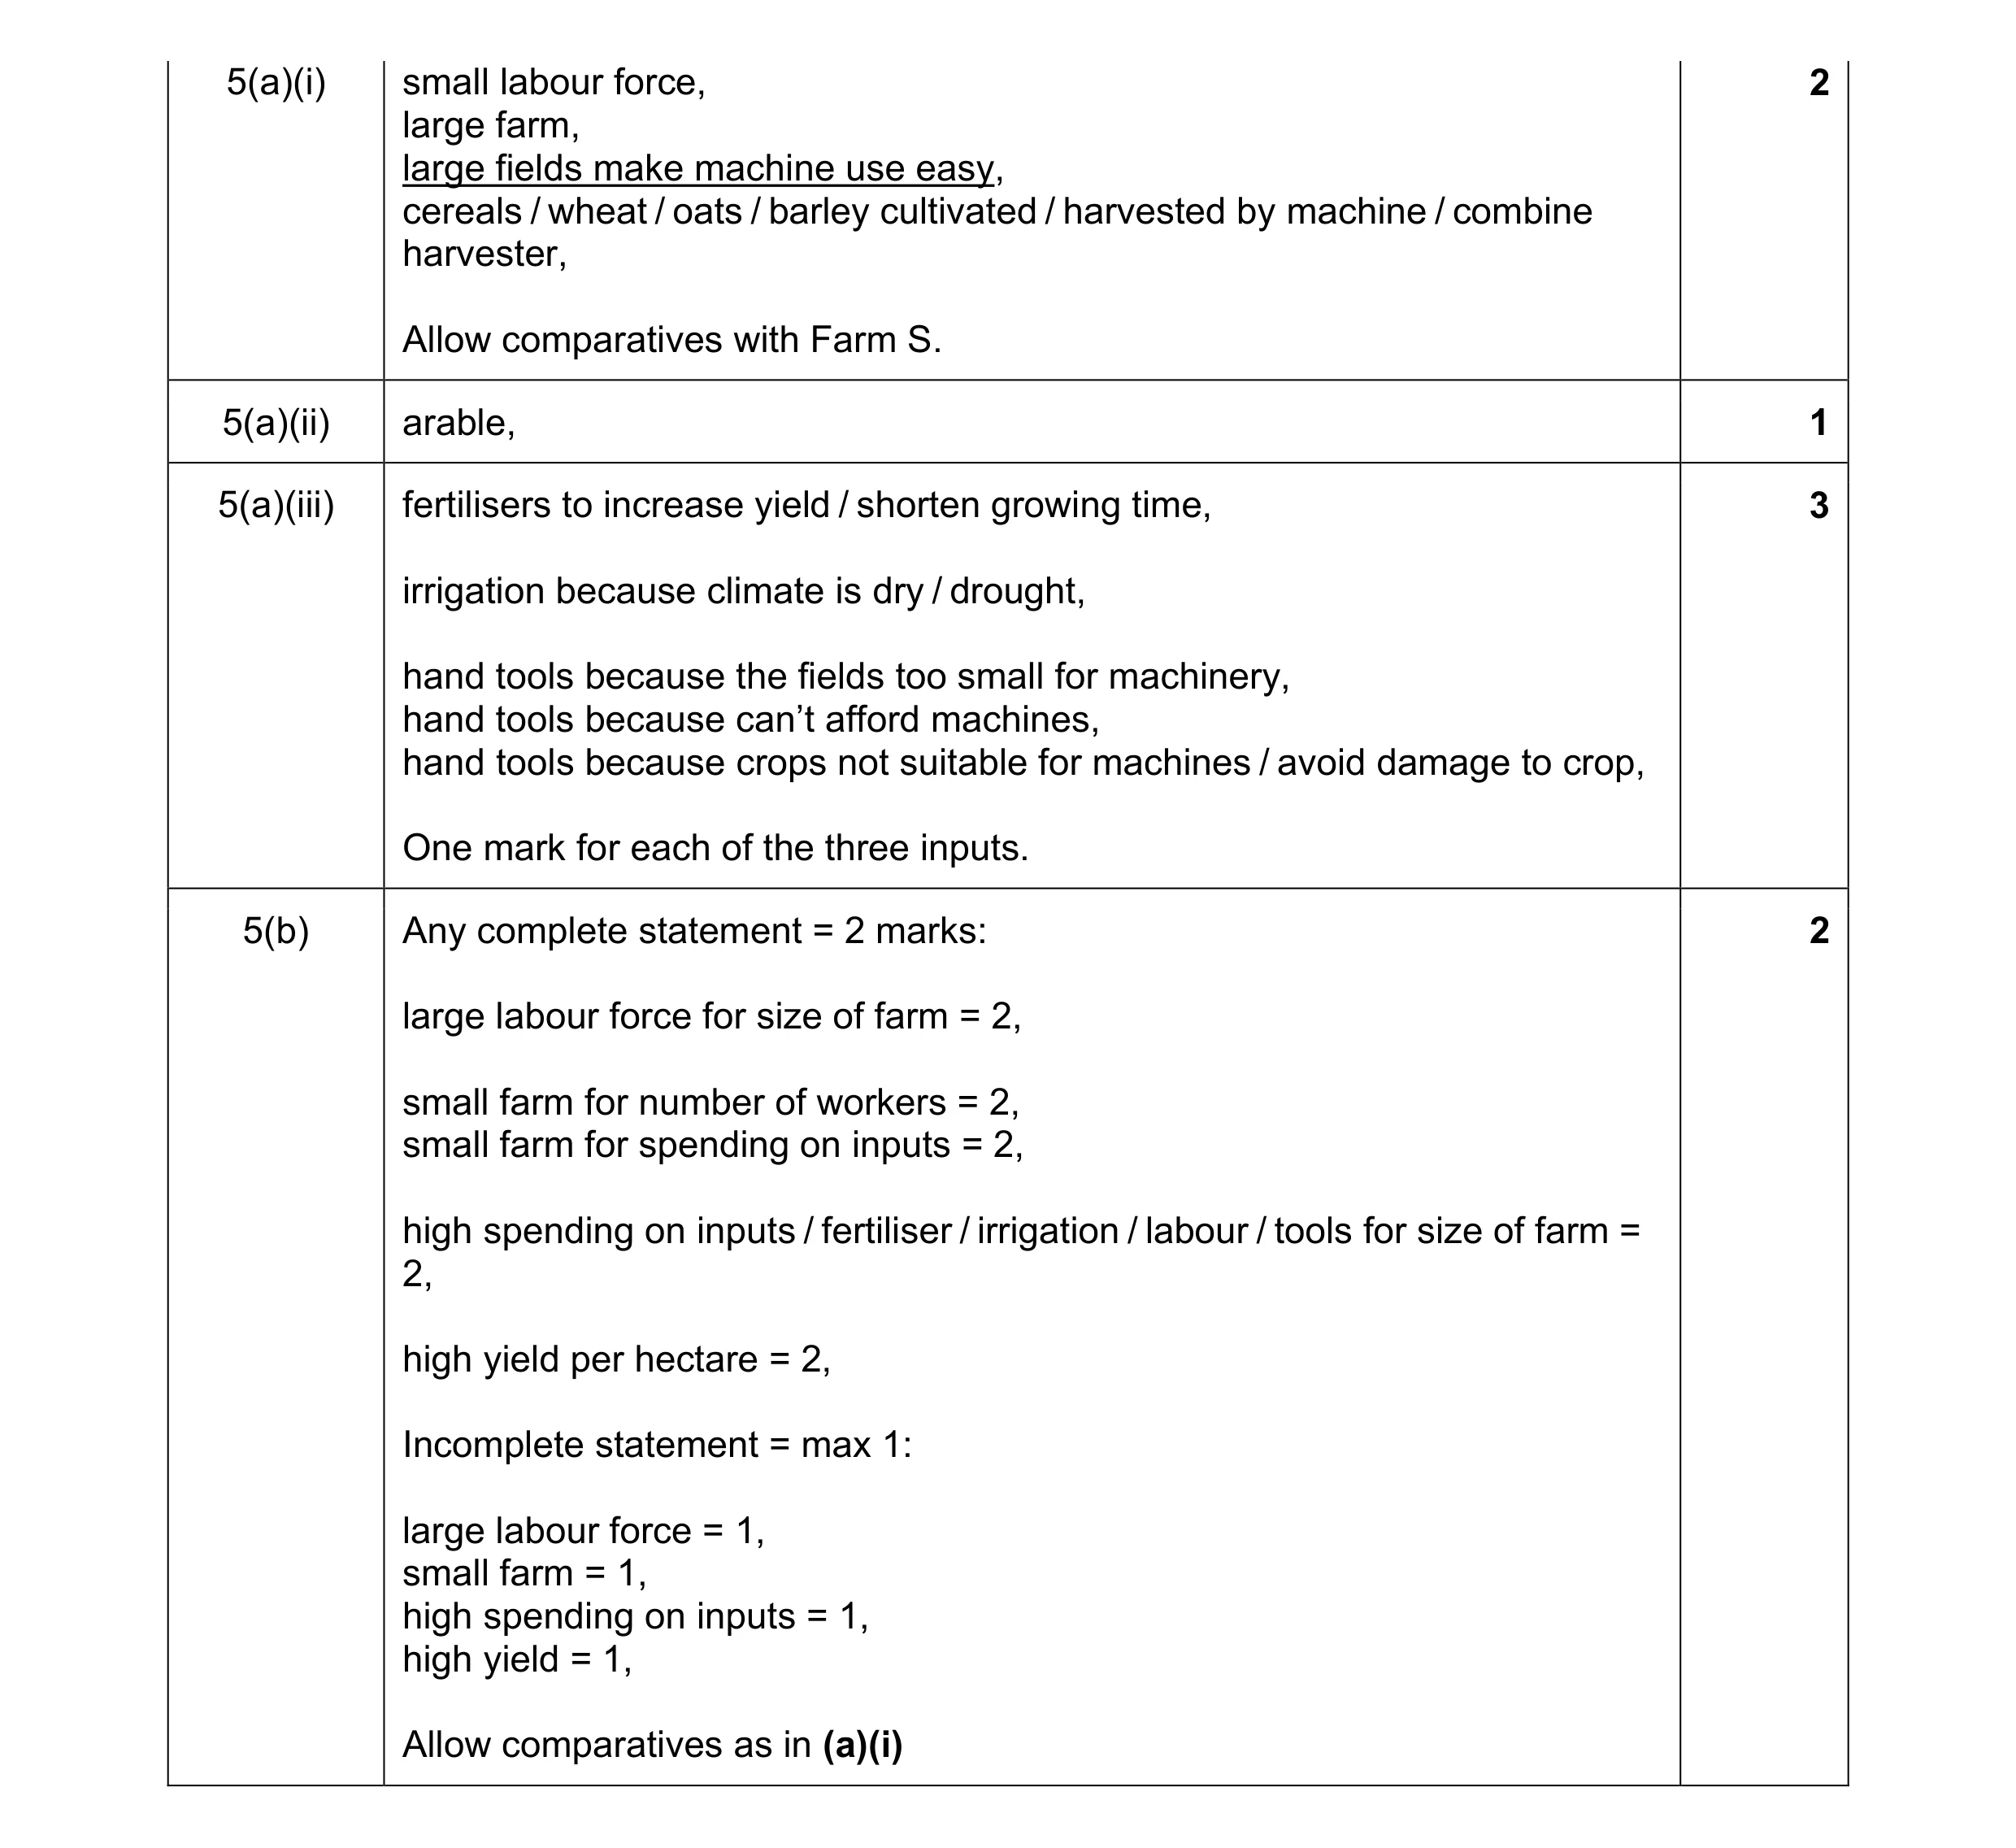 8
8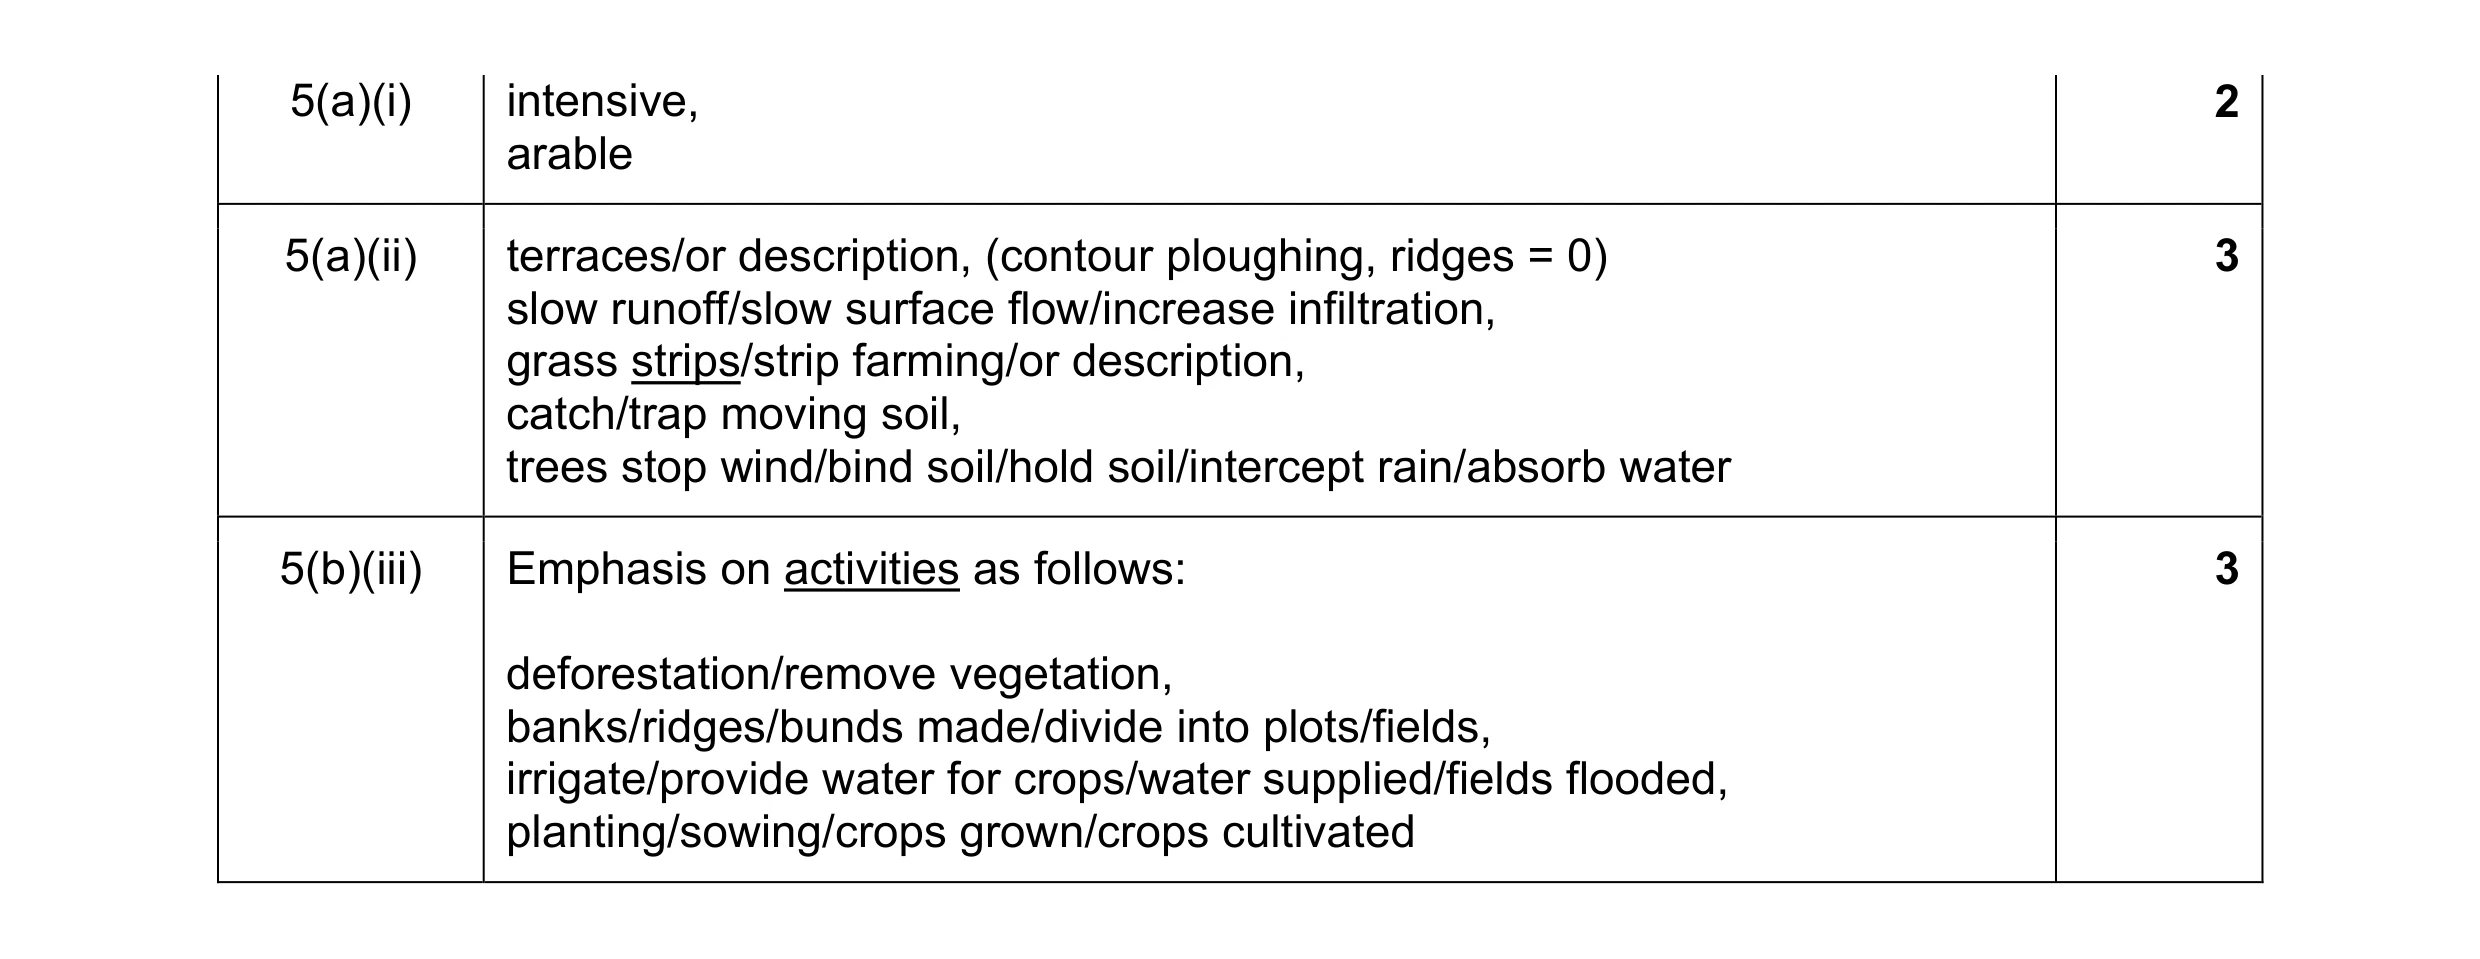 8
8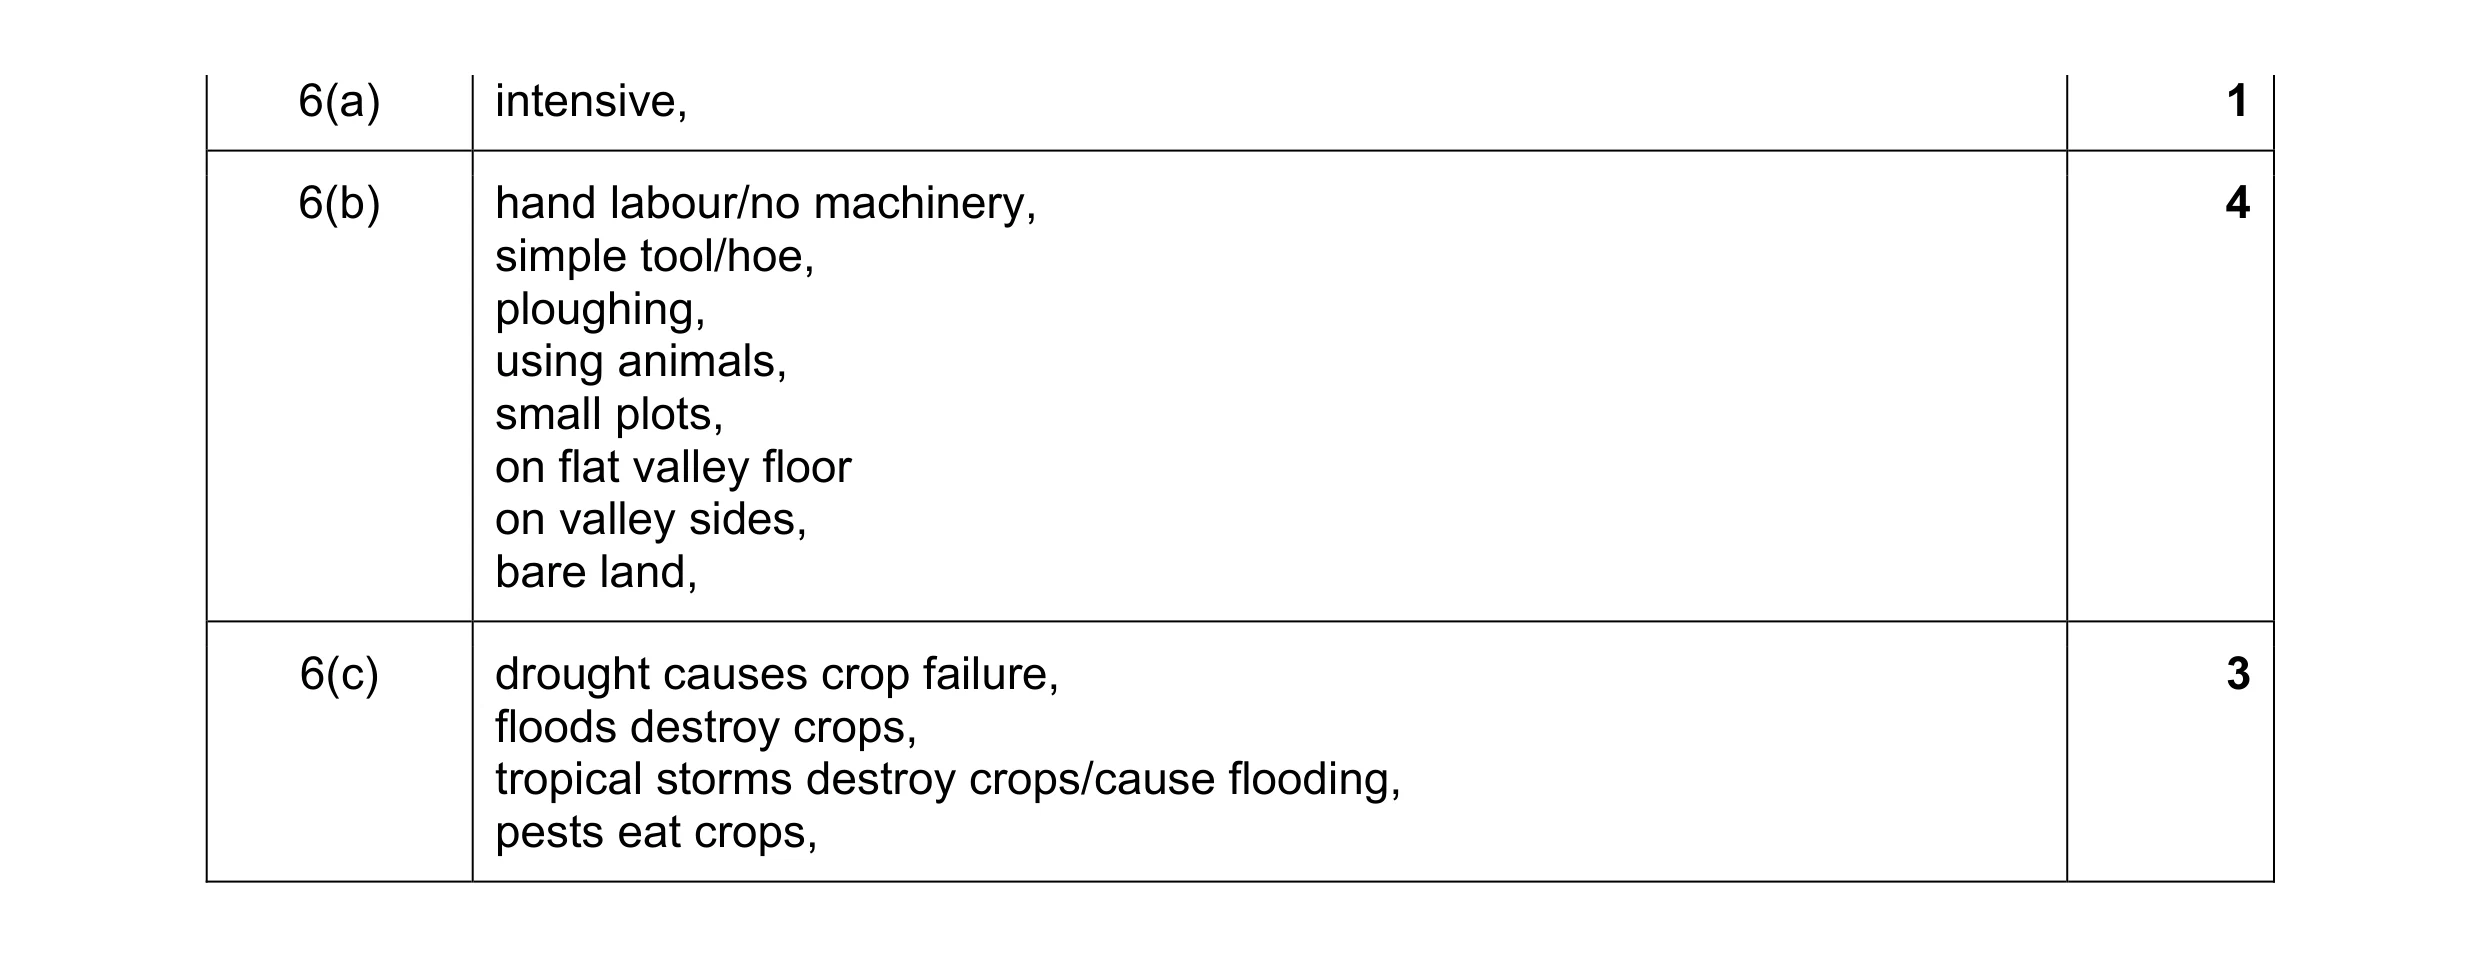 8
8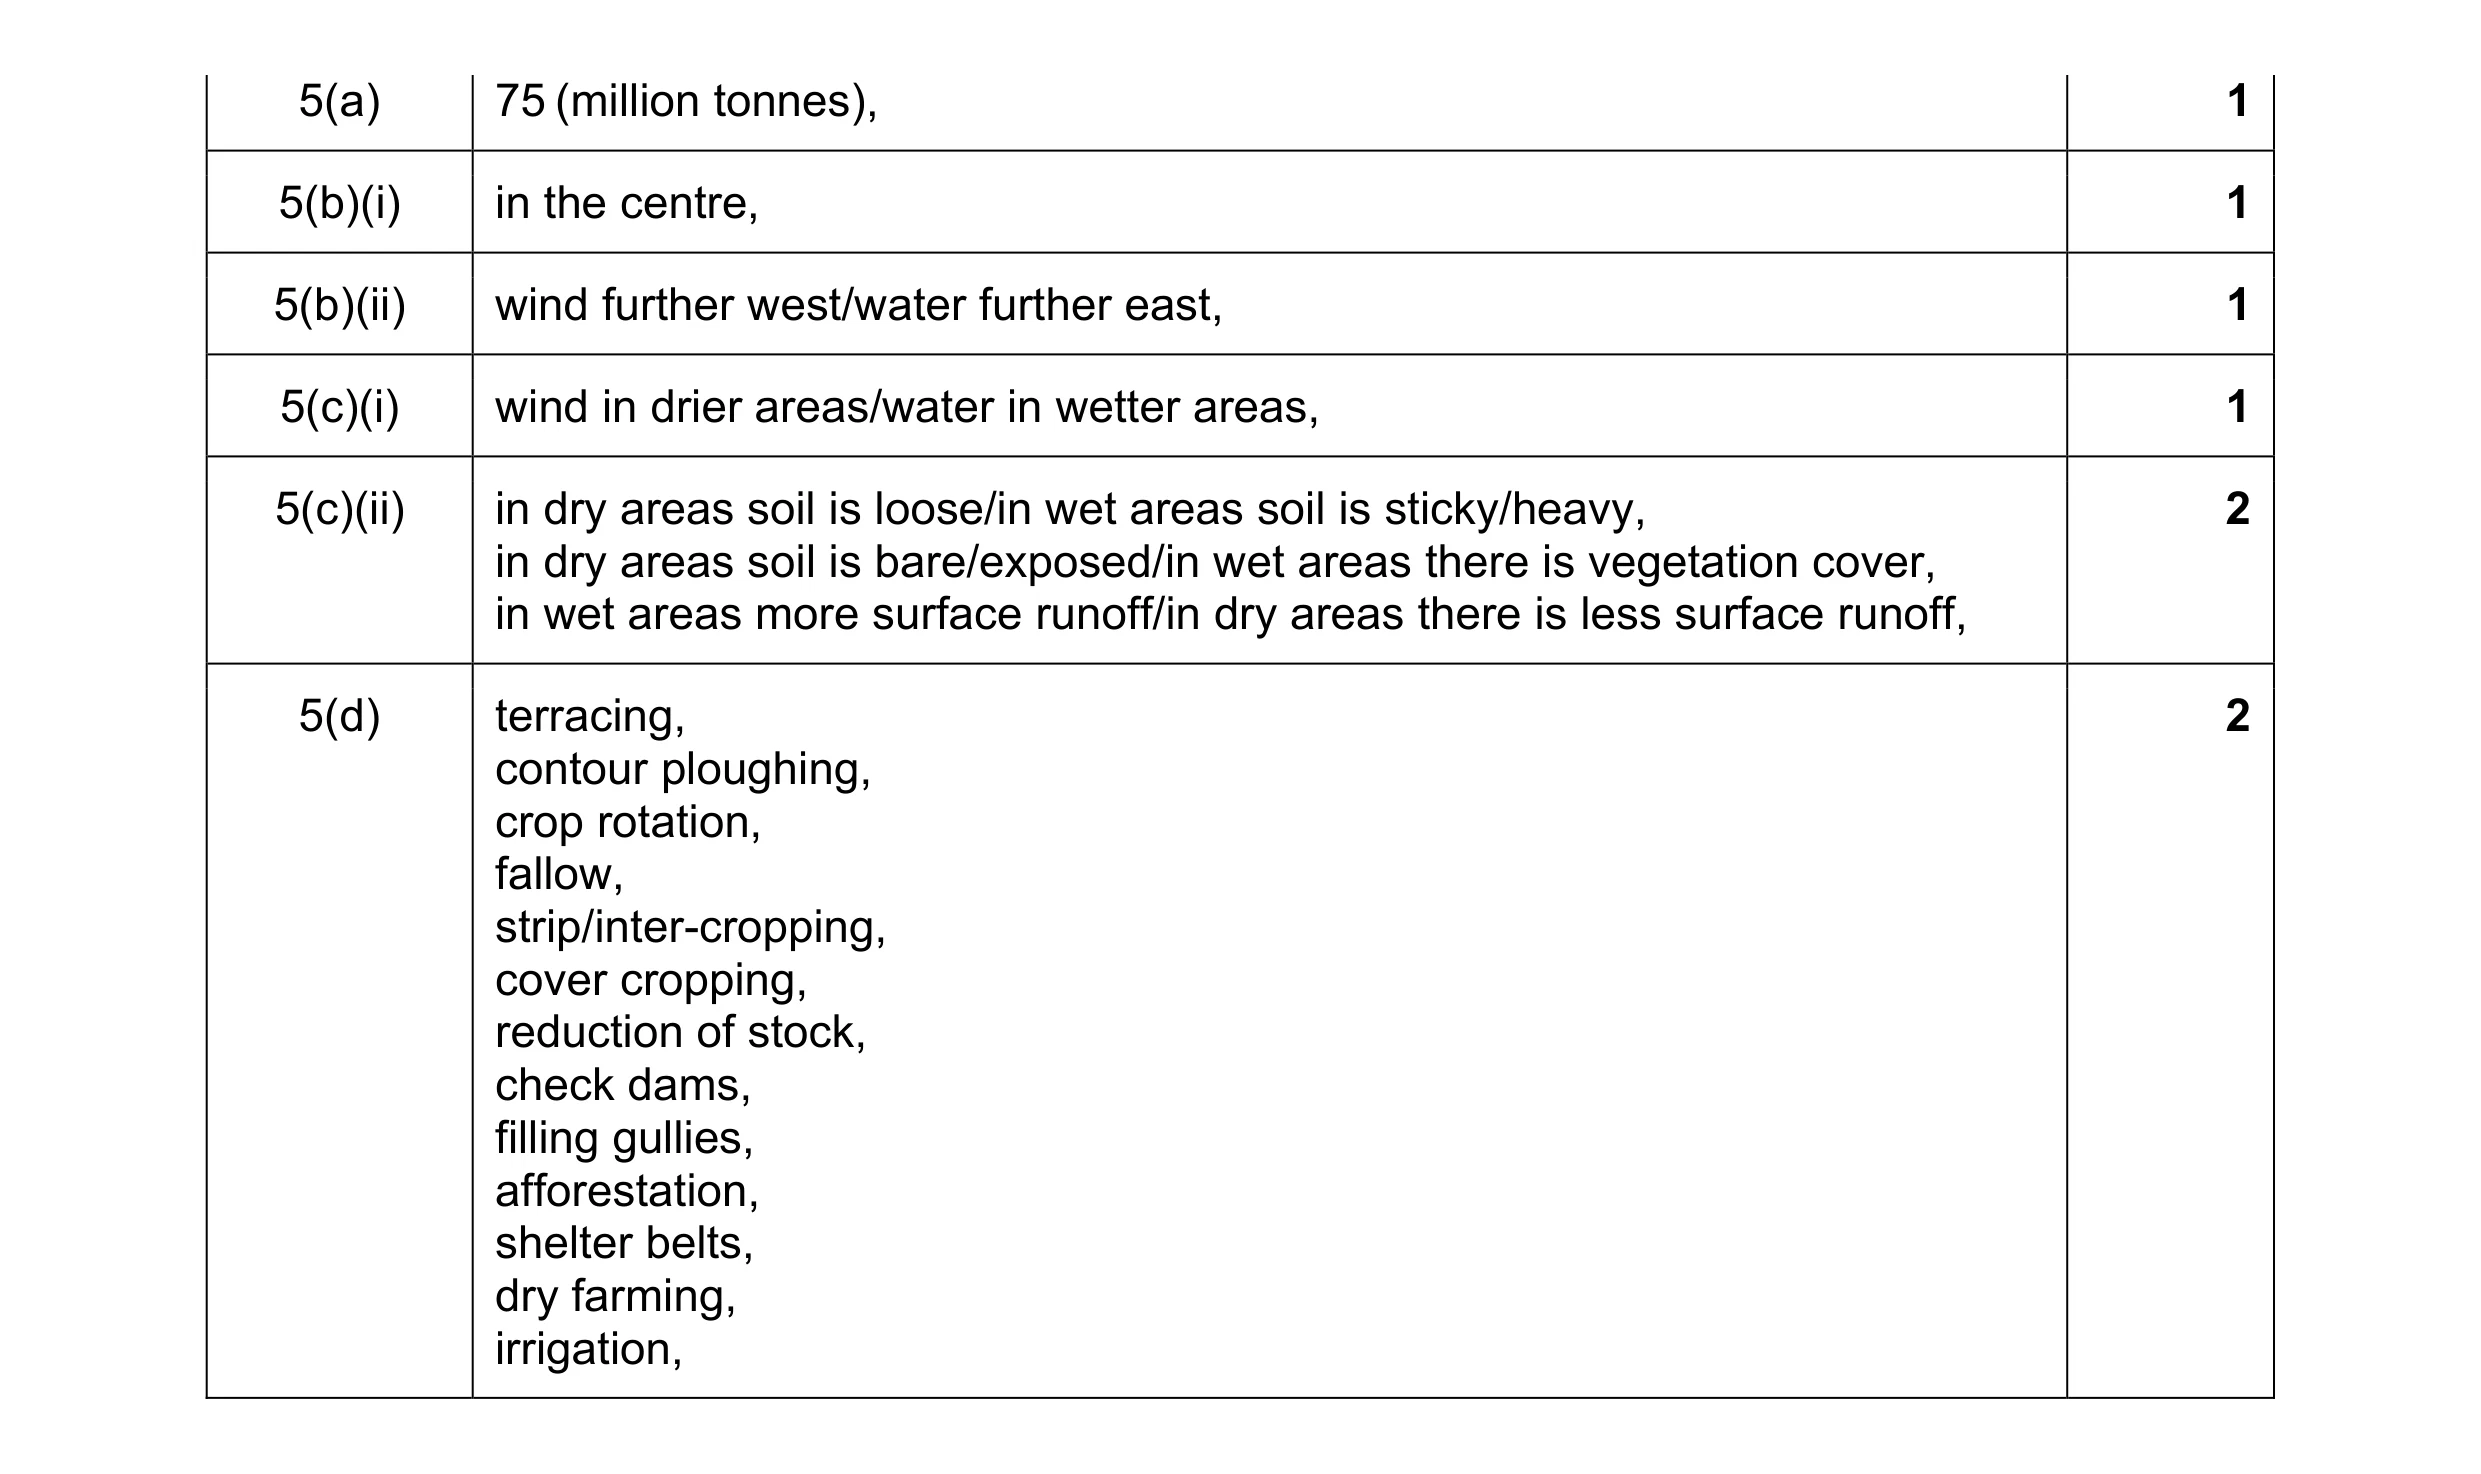 8
8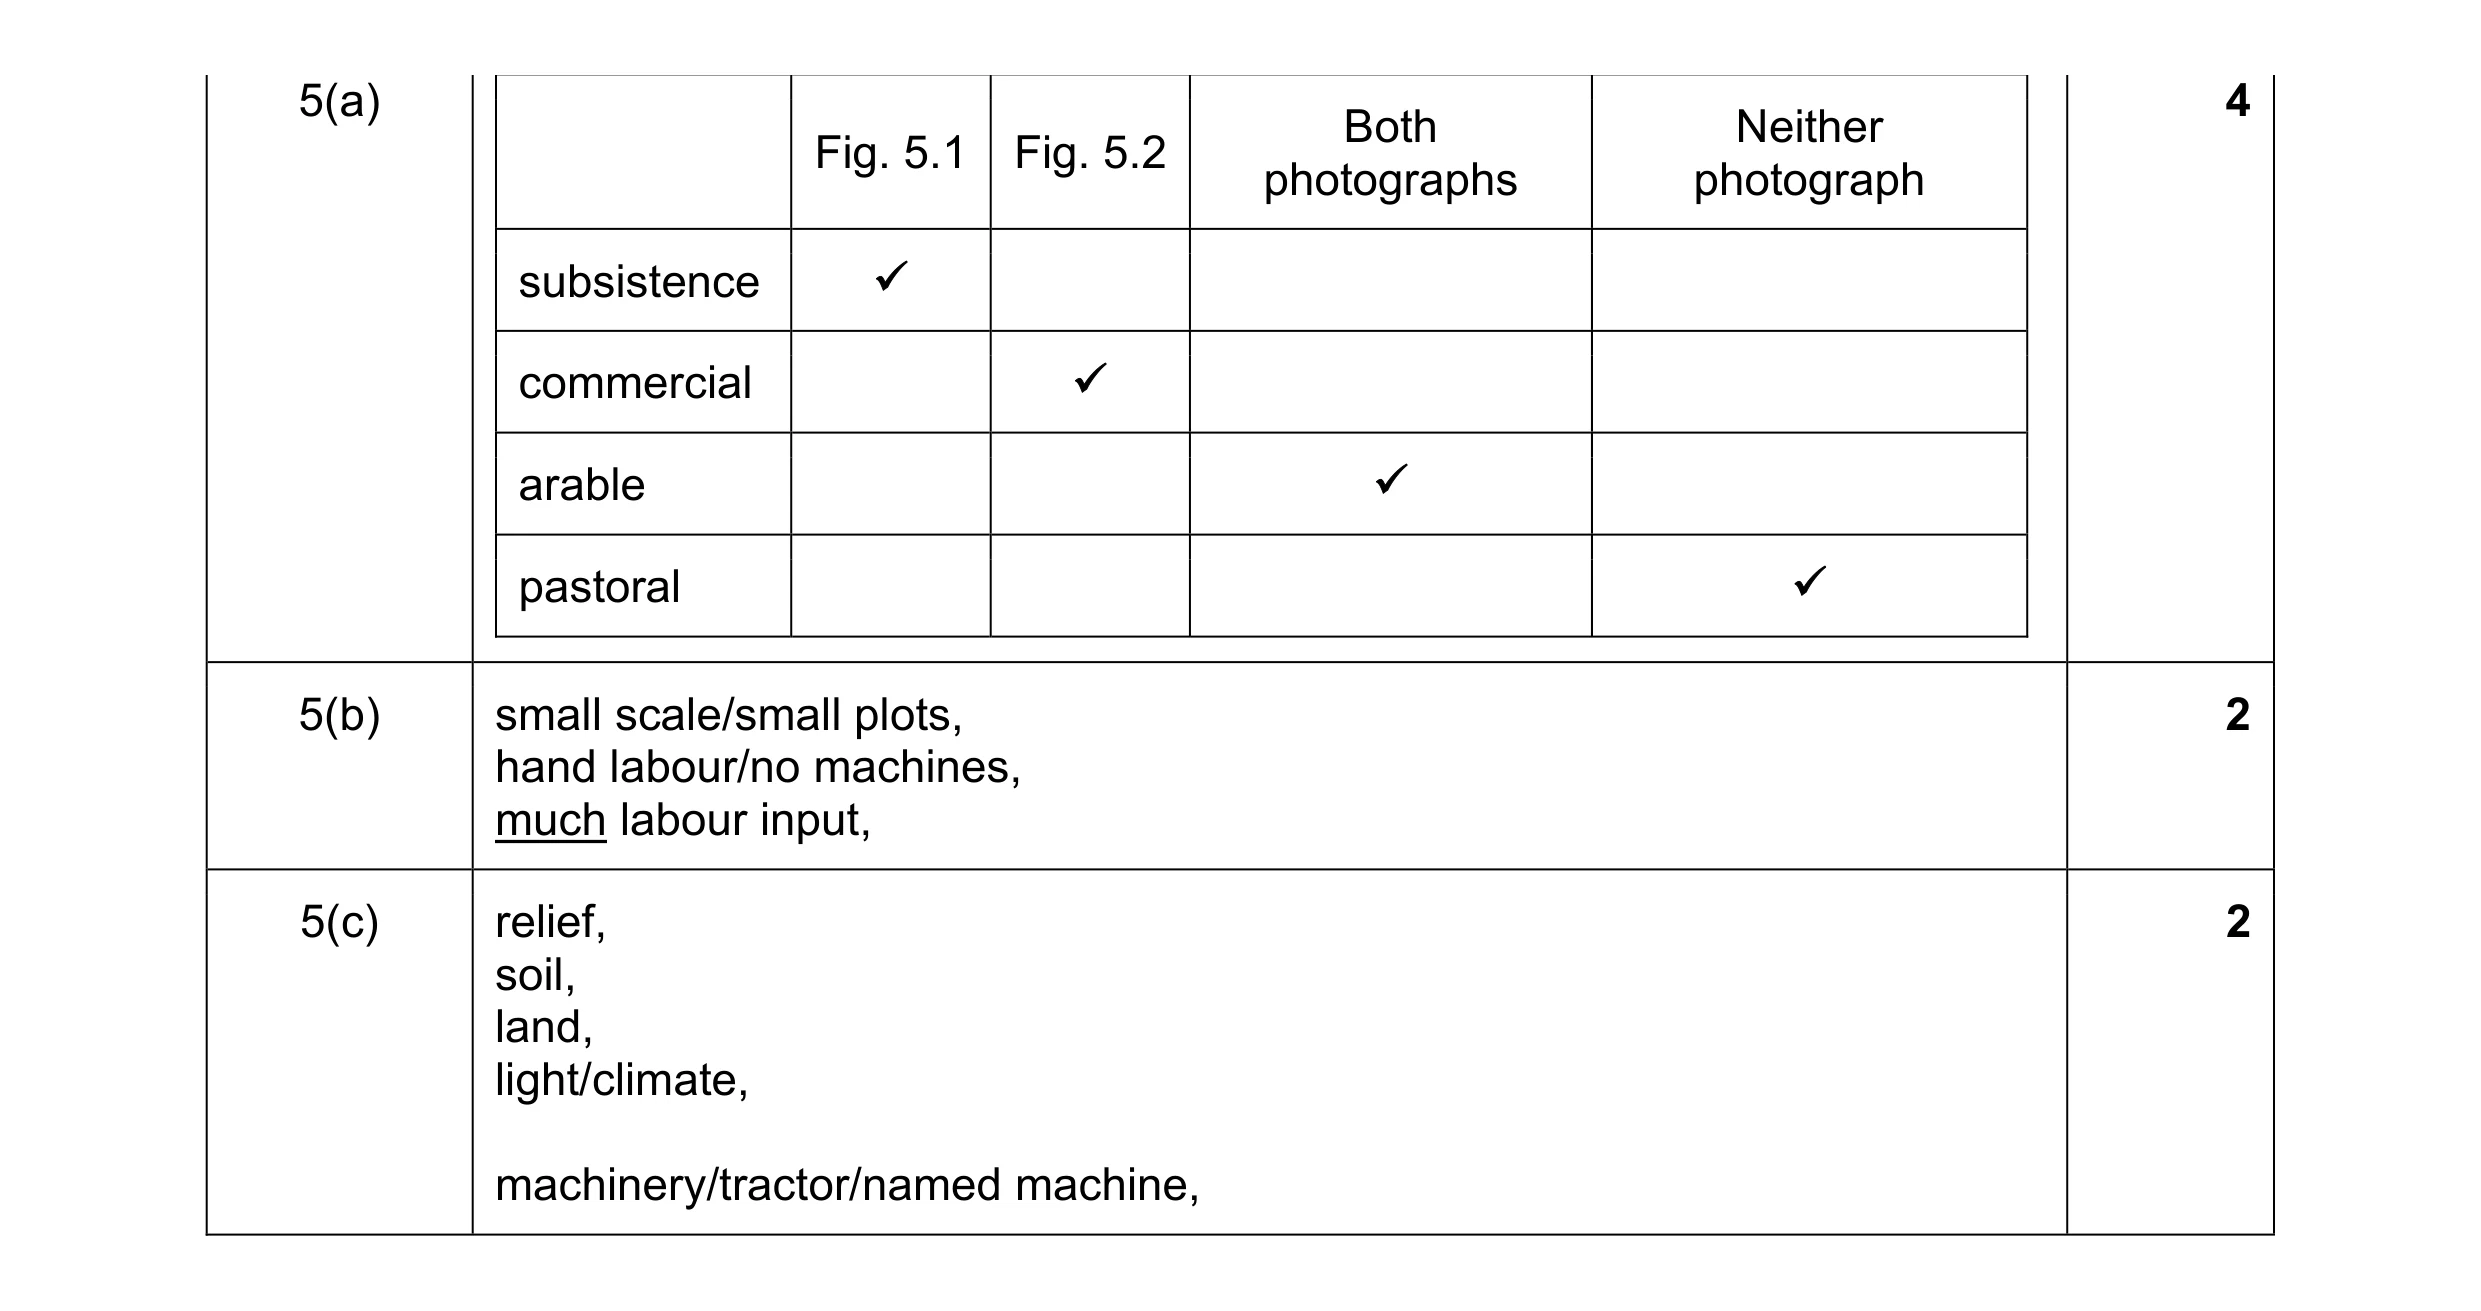 8
8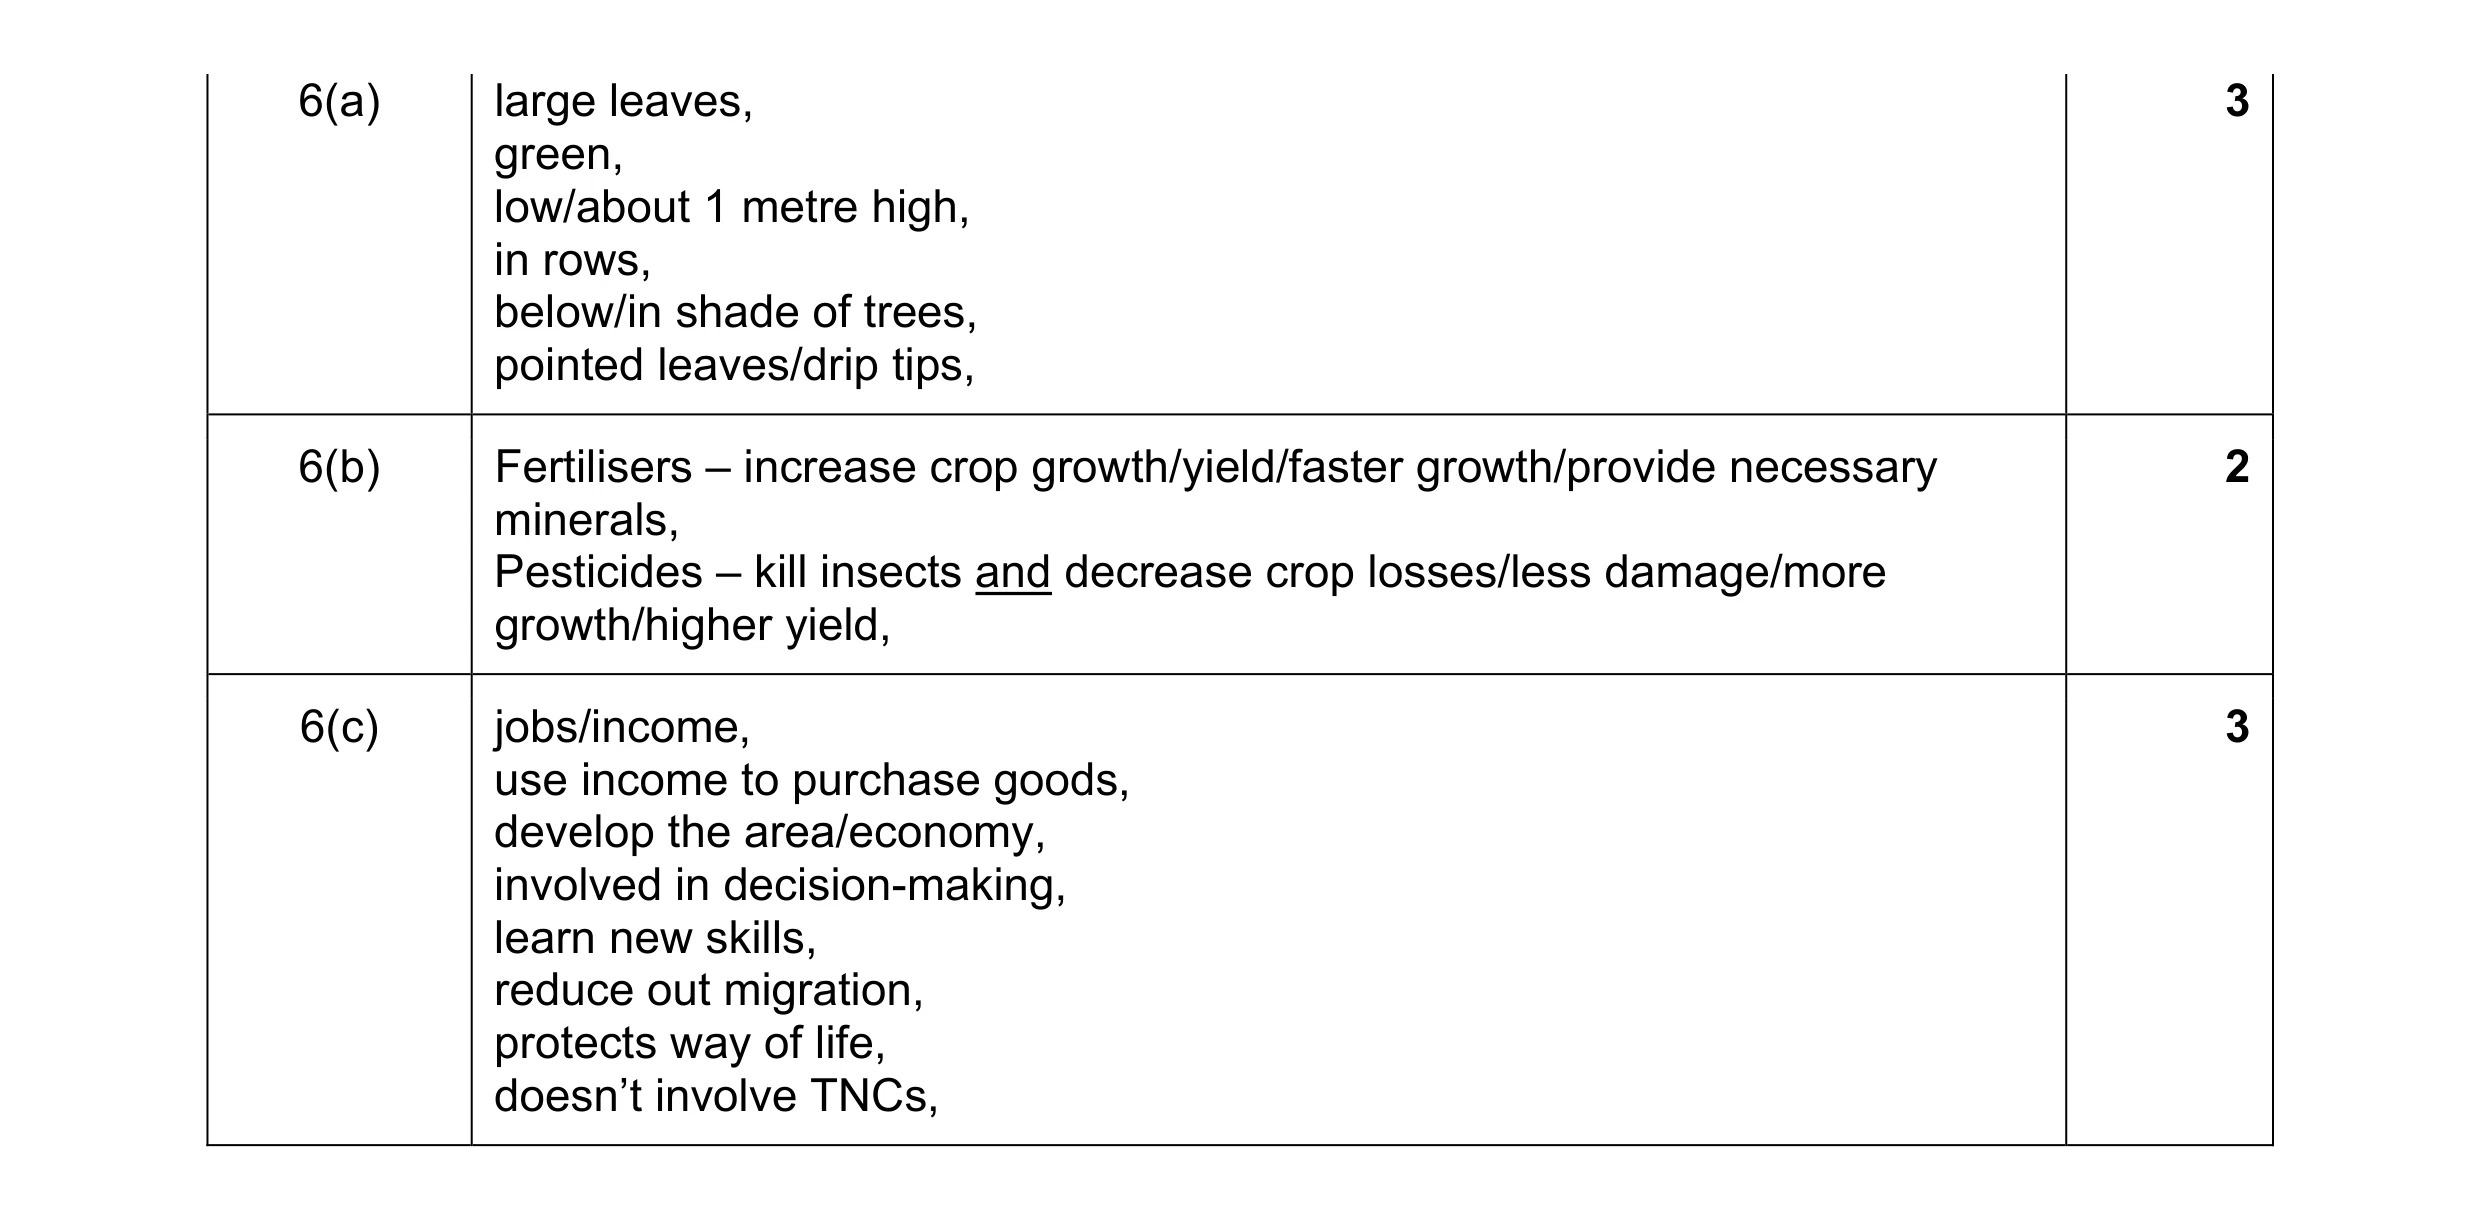 8
8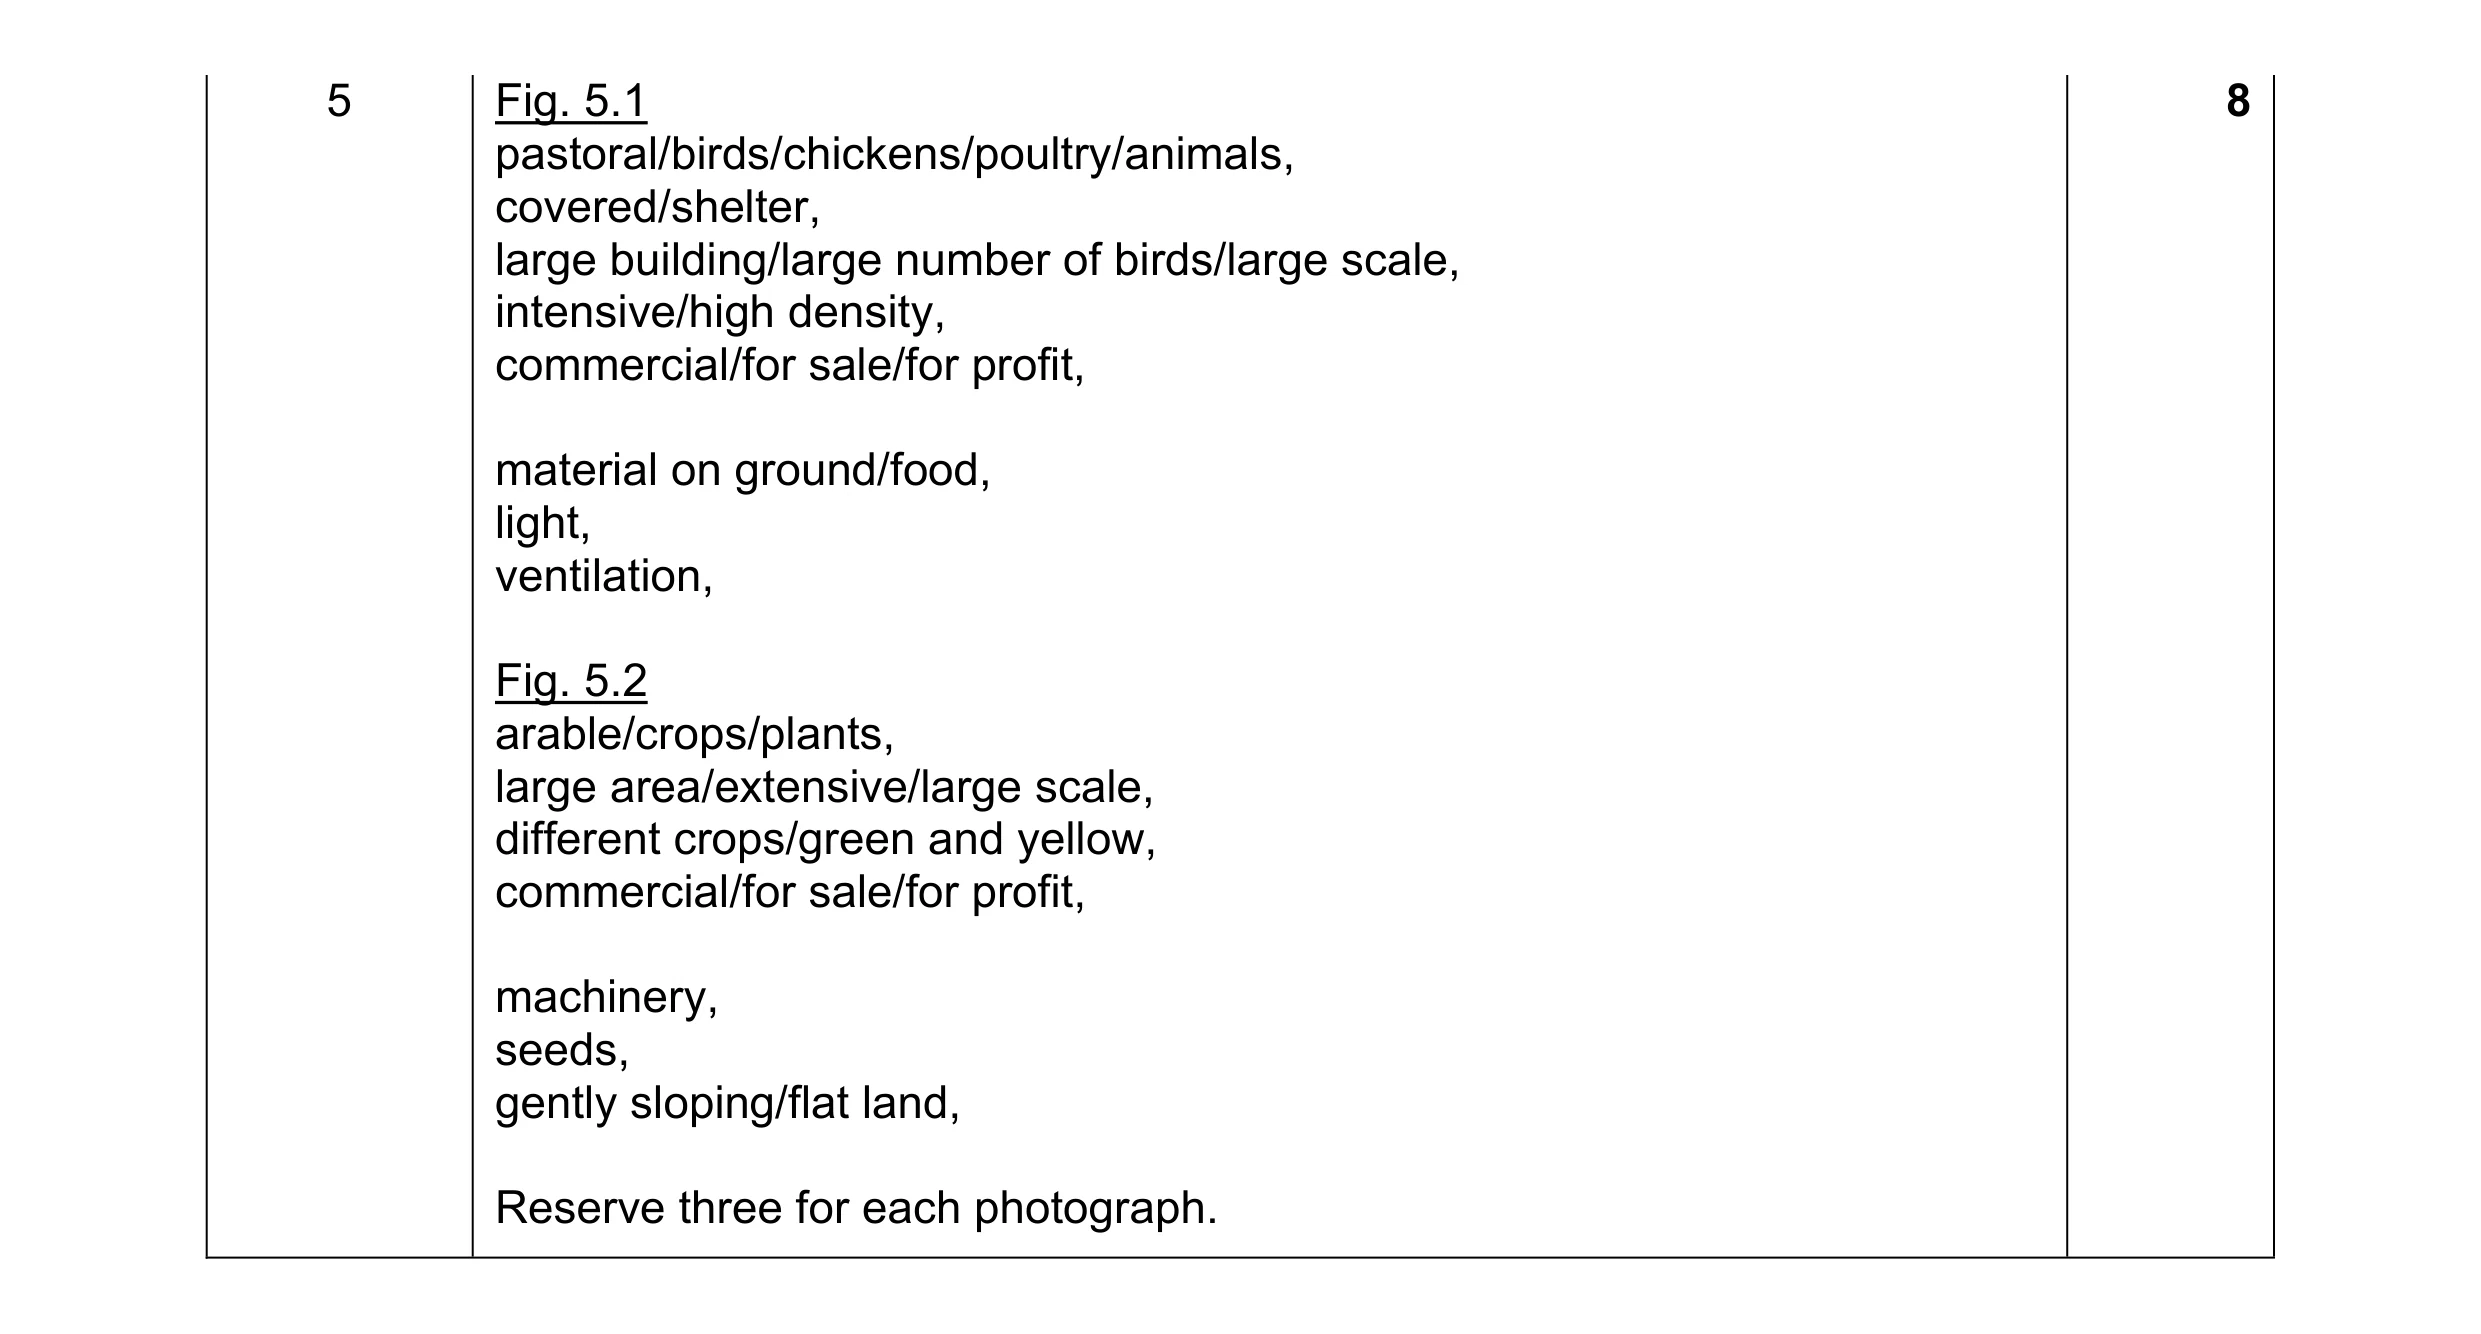 8
8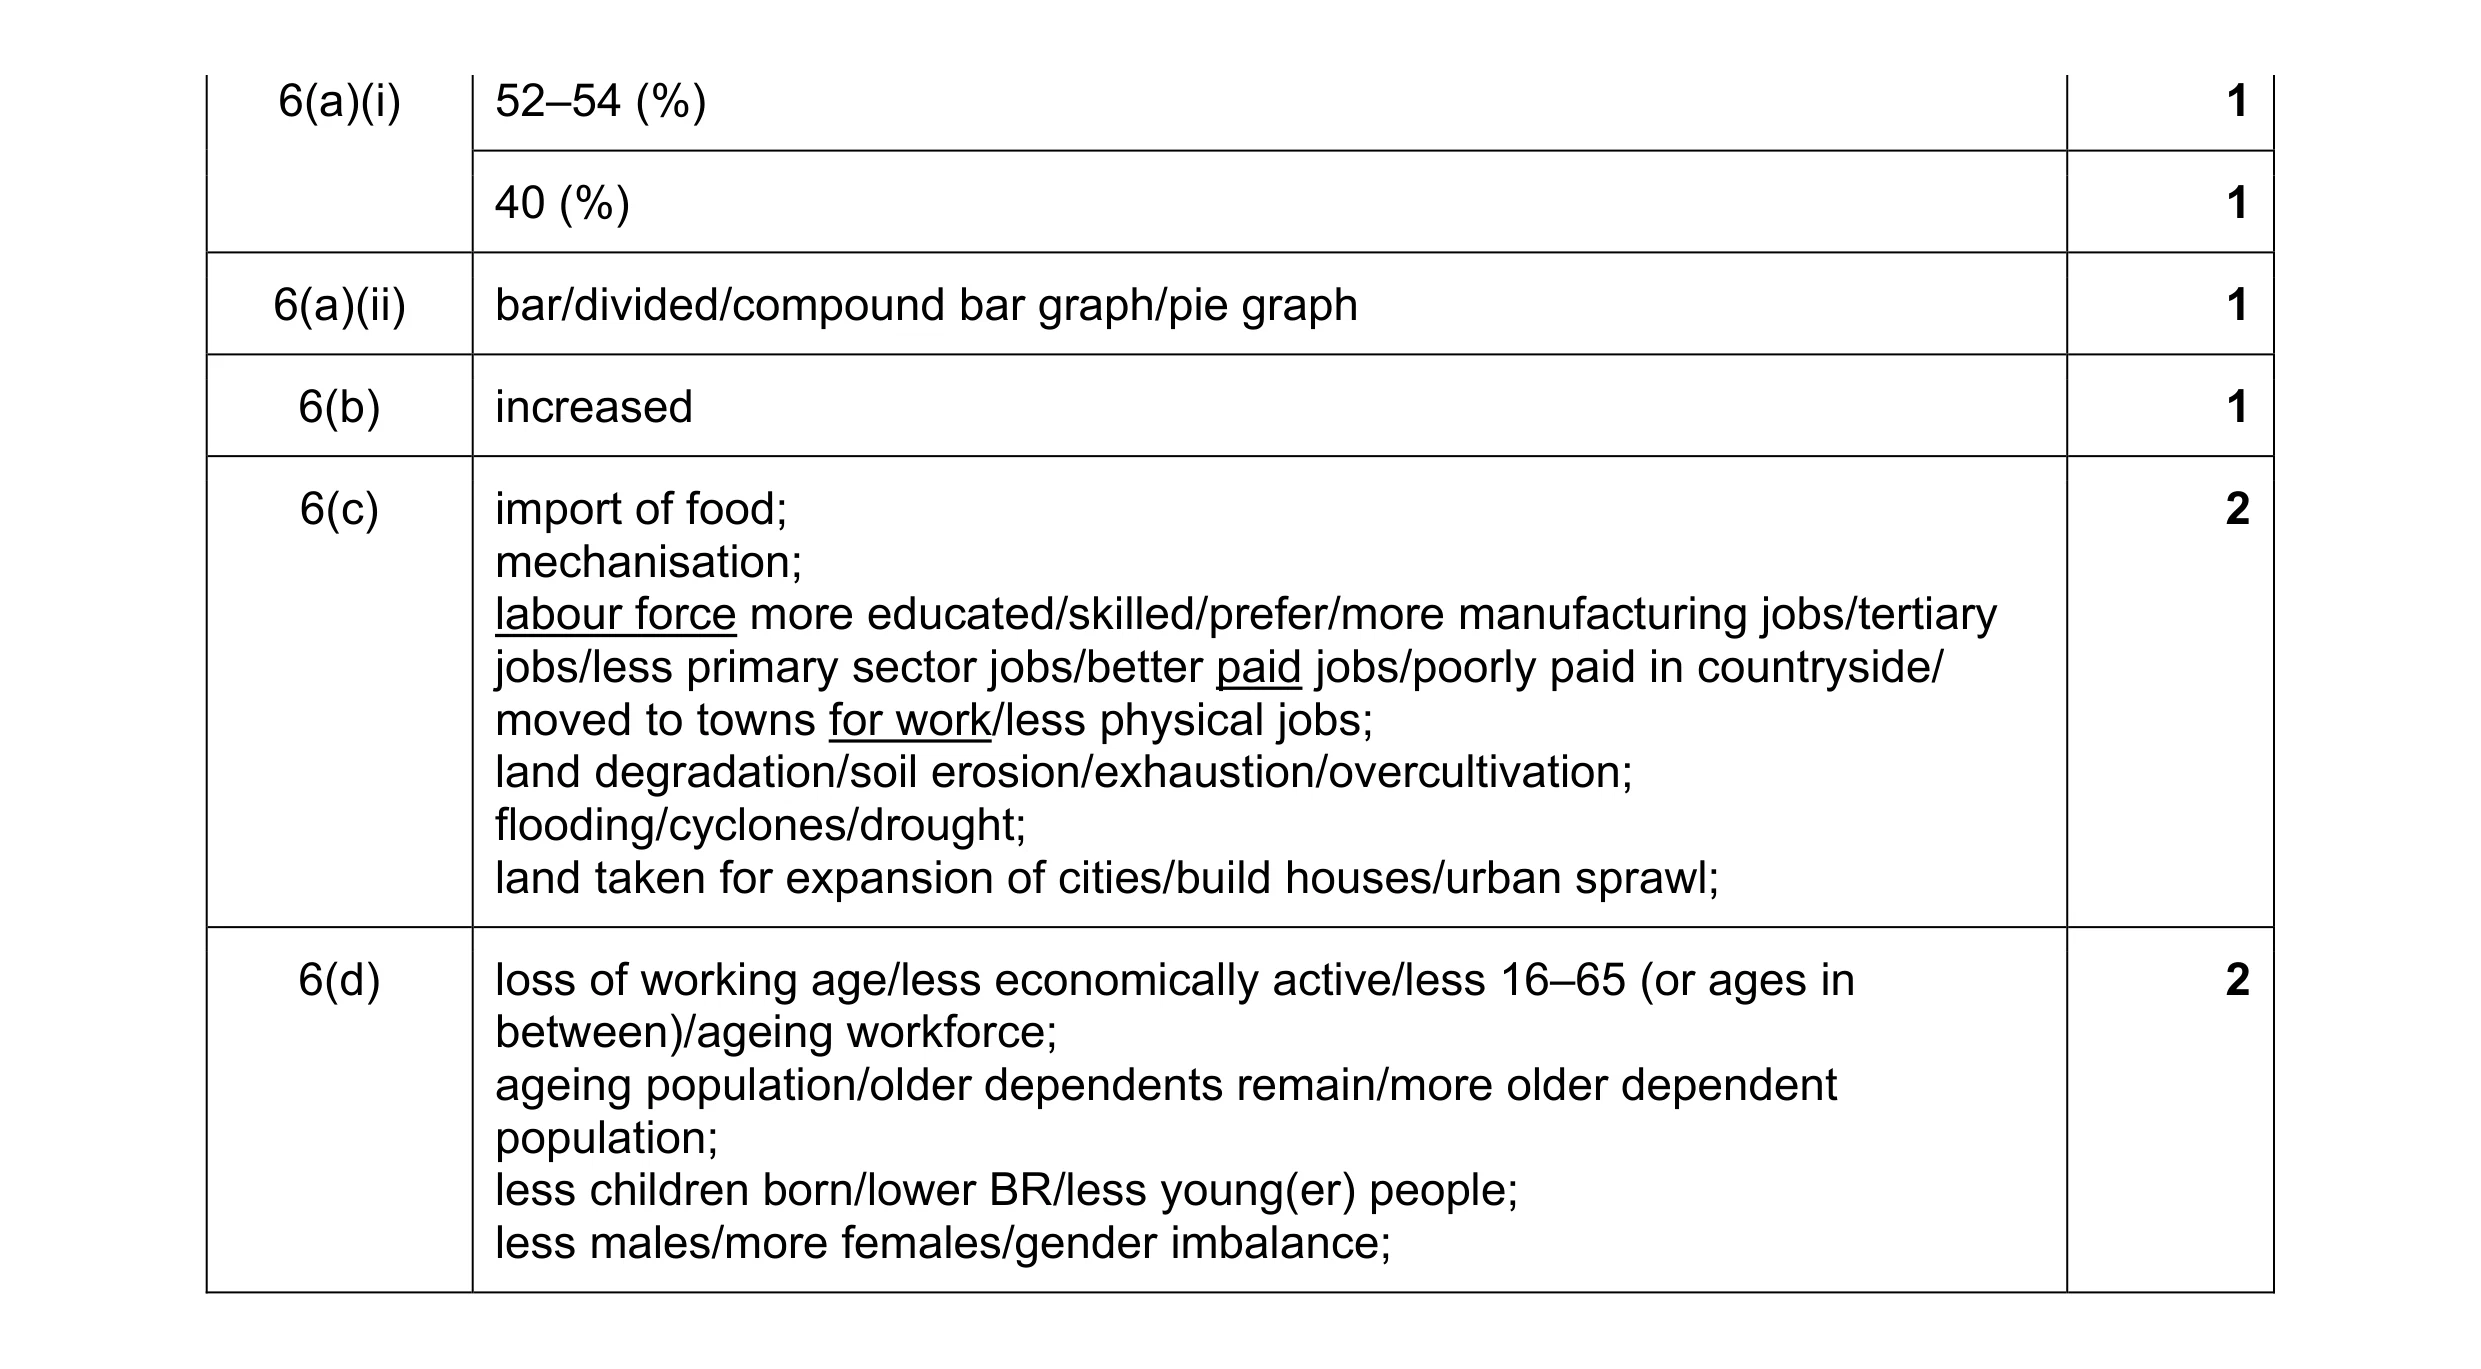 8
8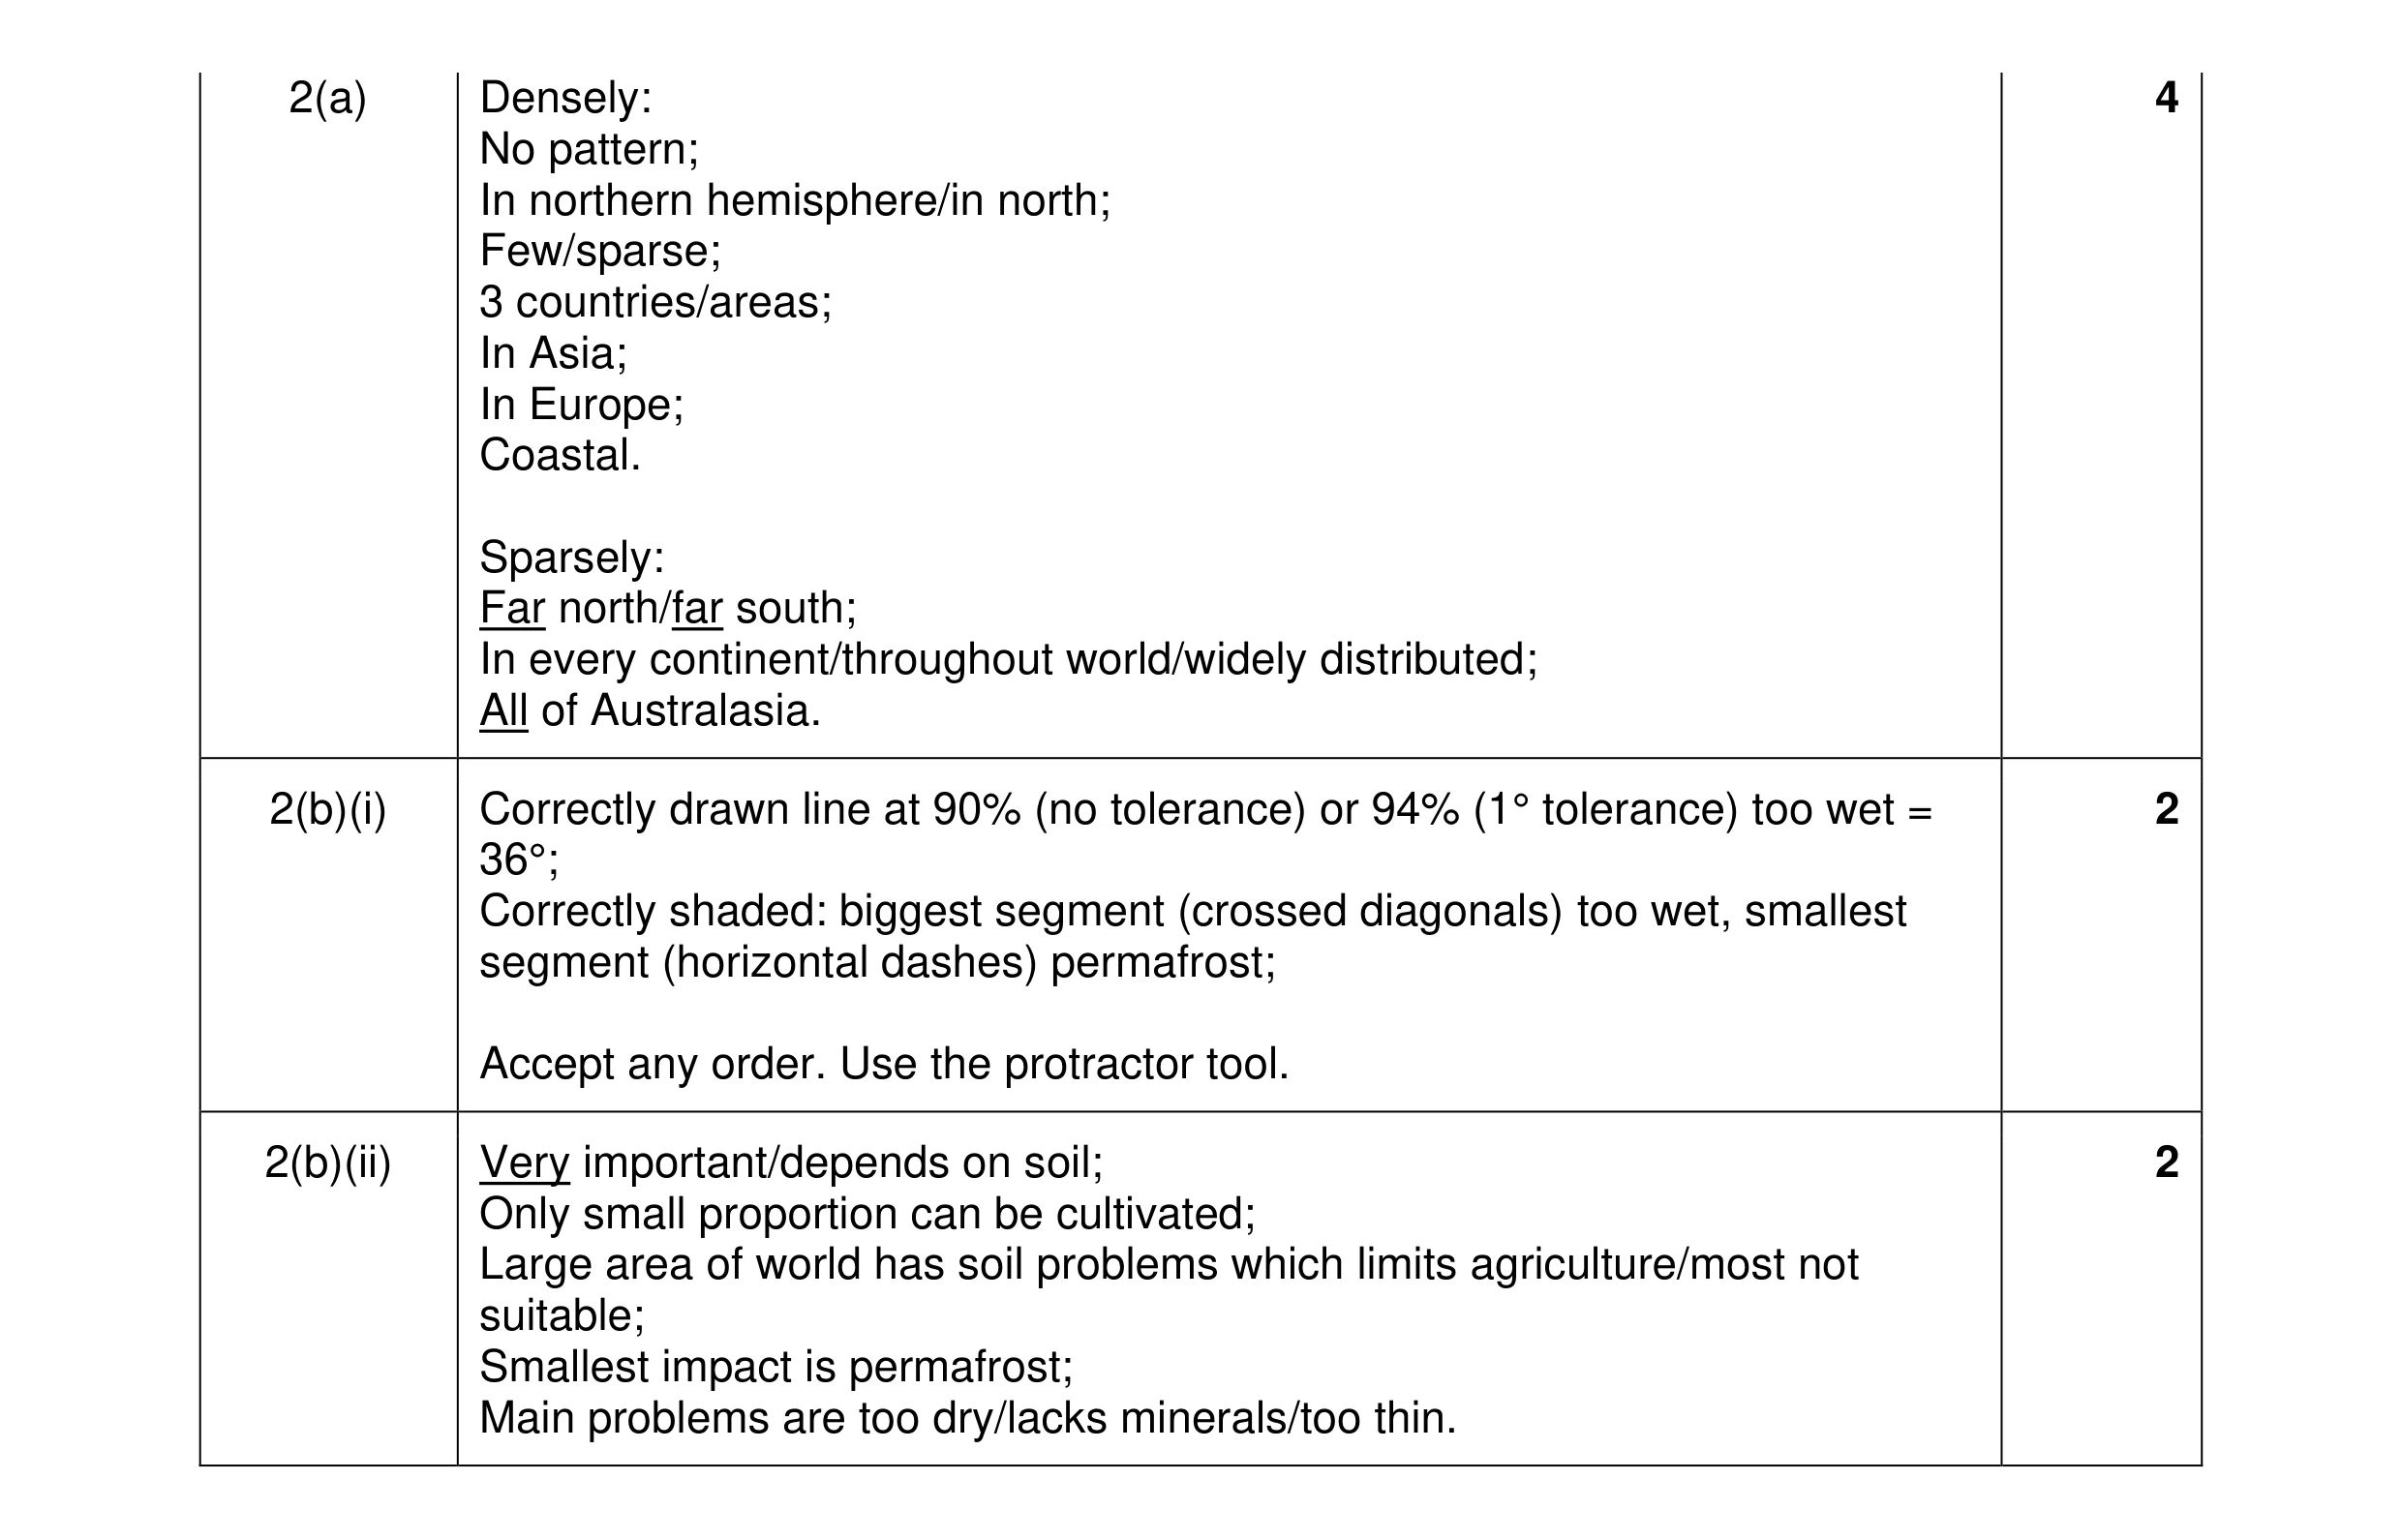 8
8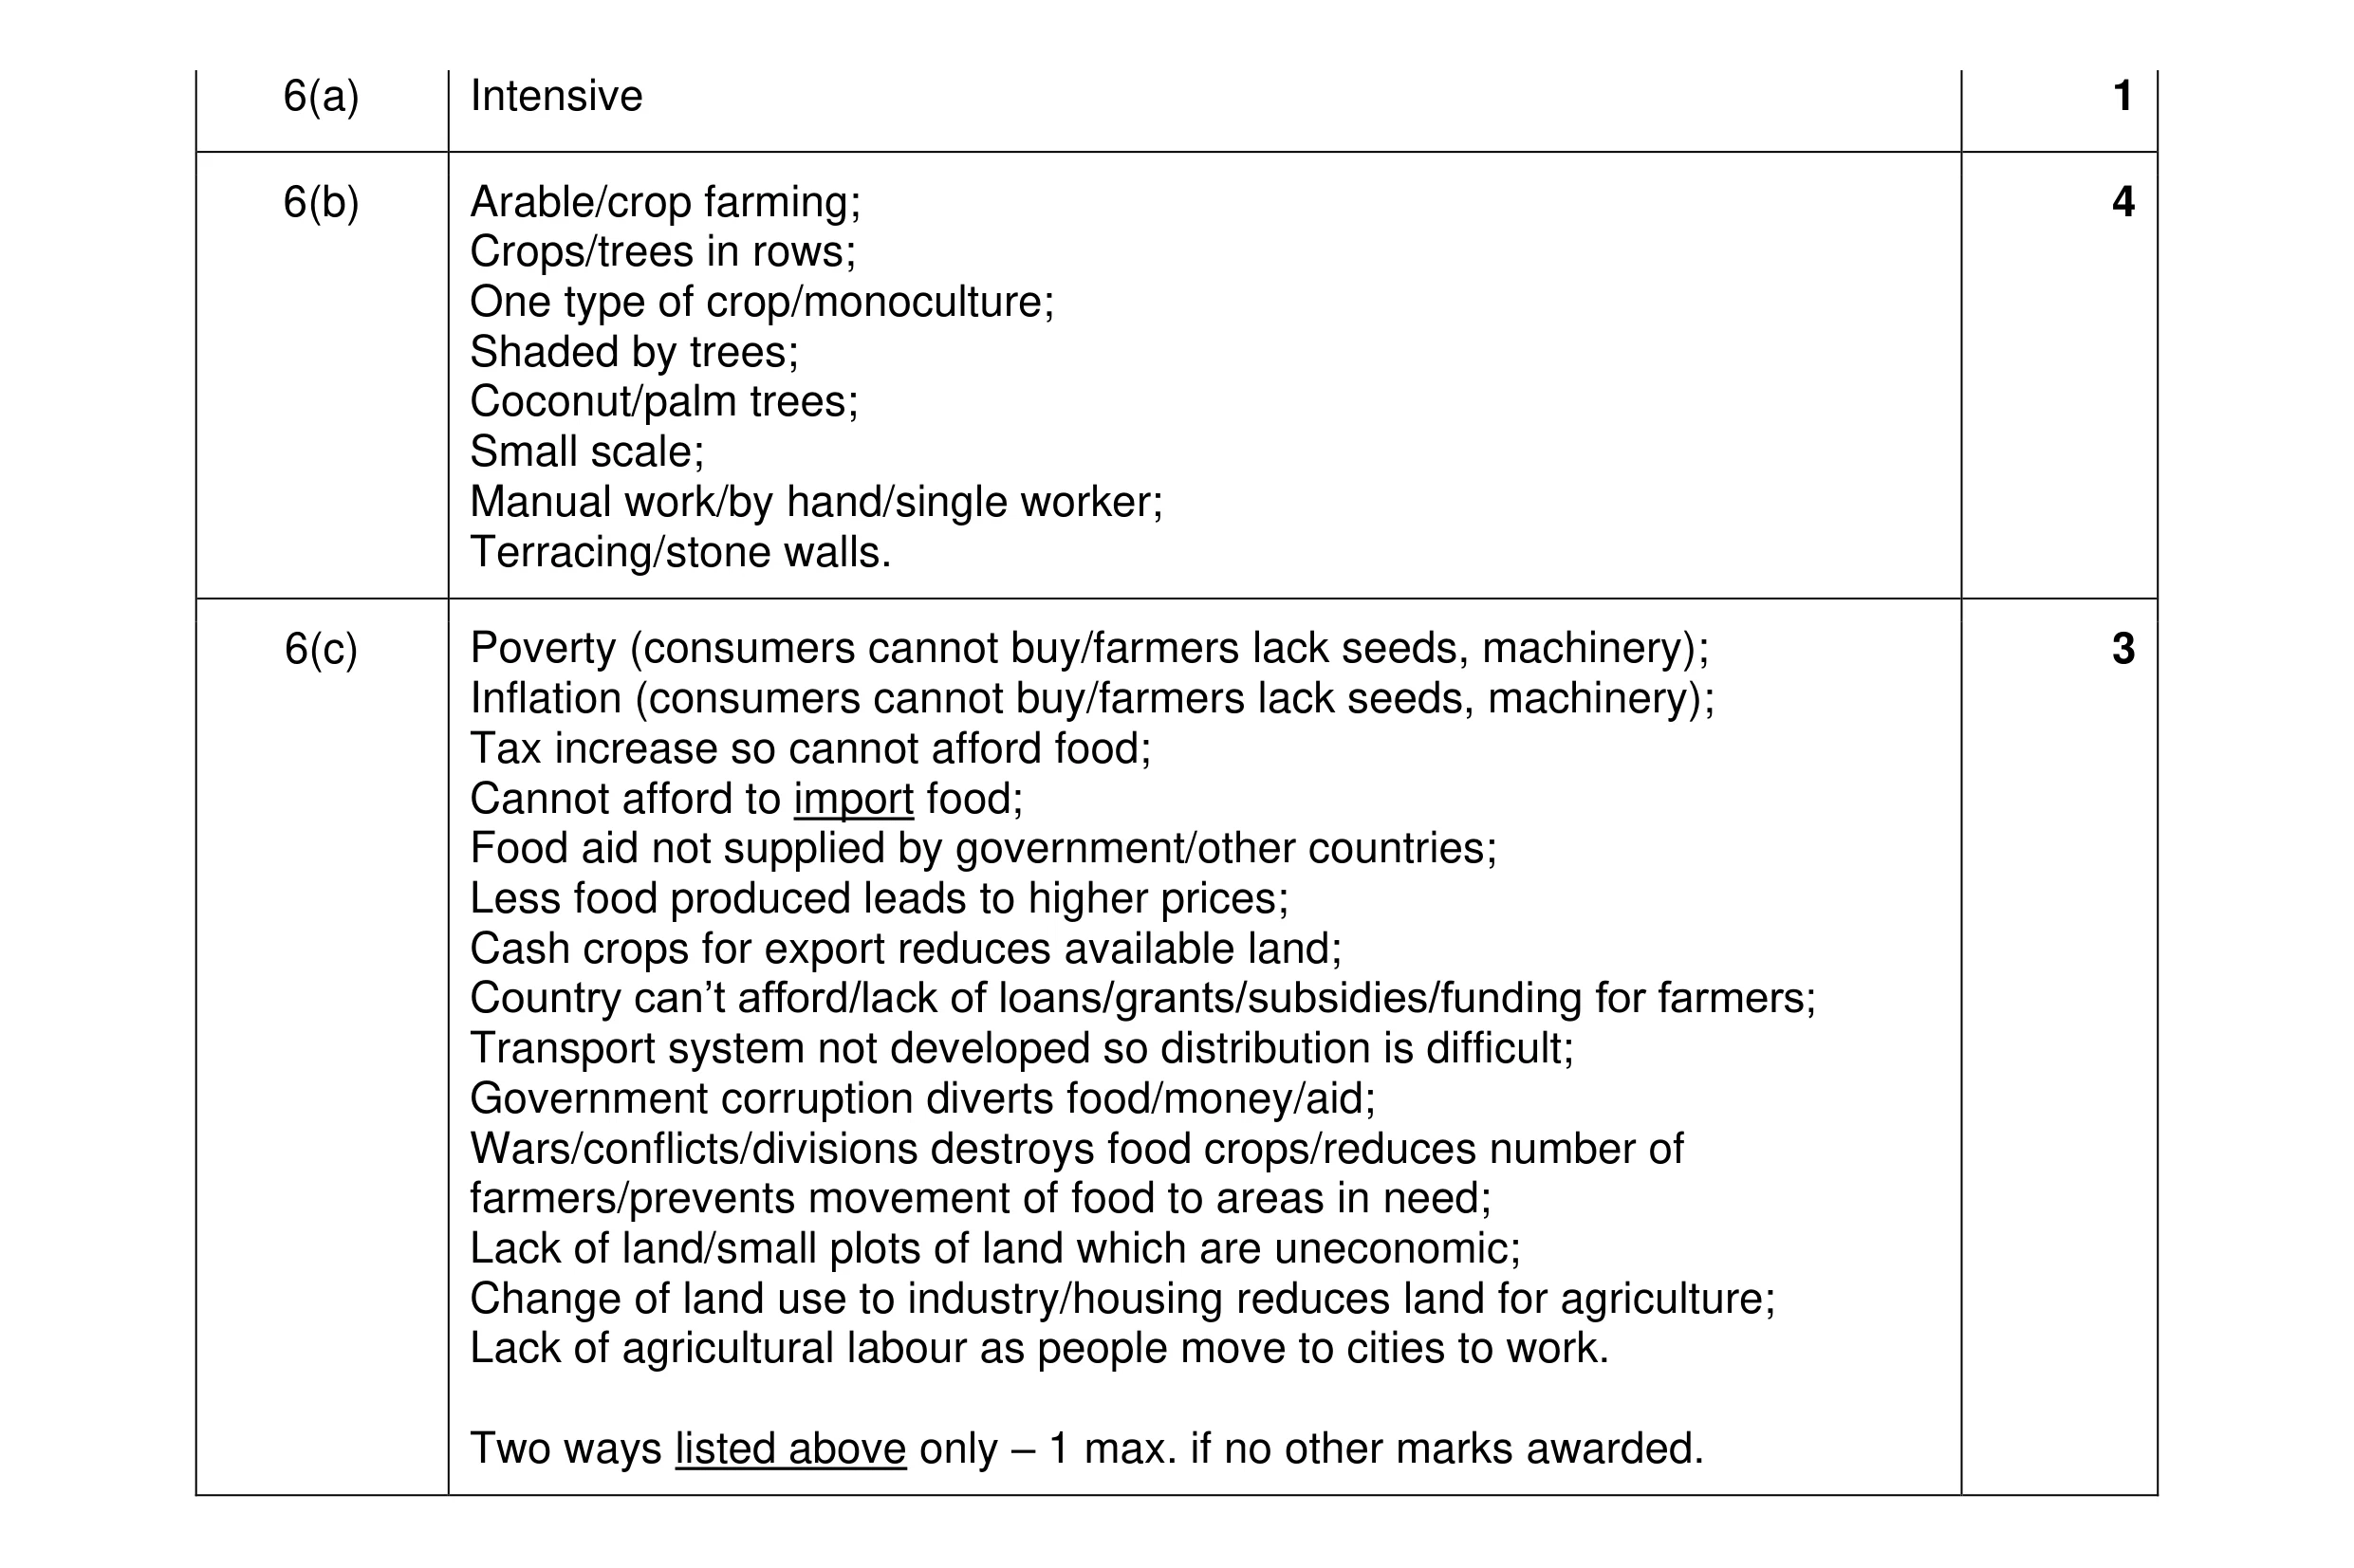 8
8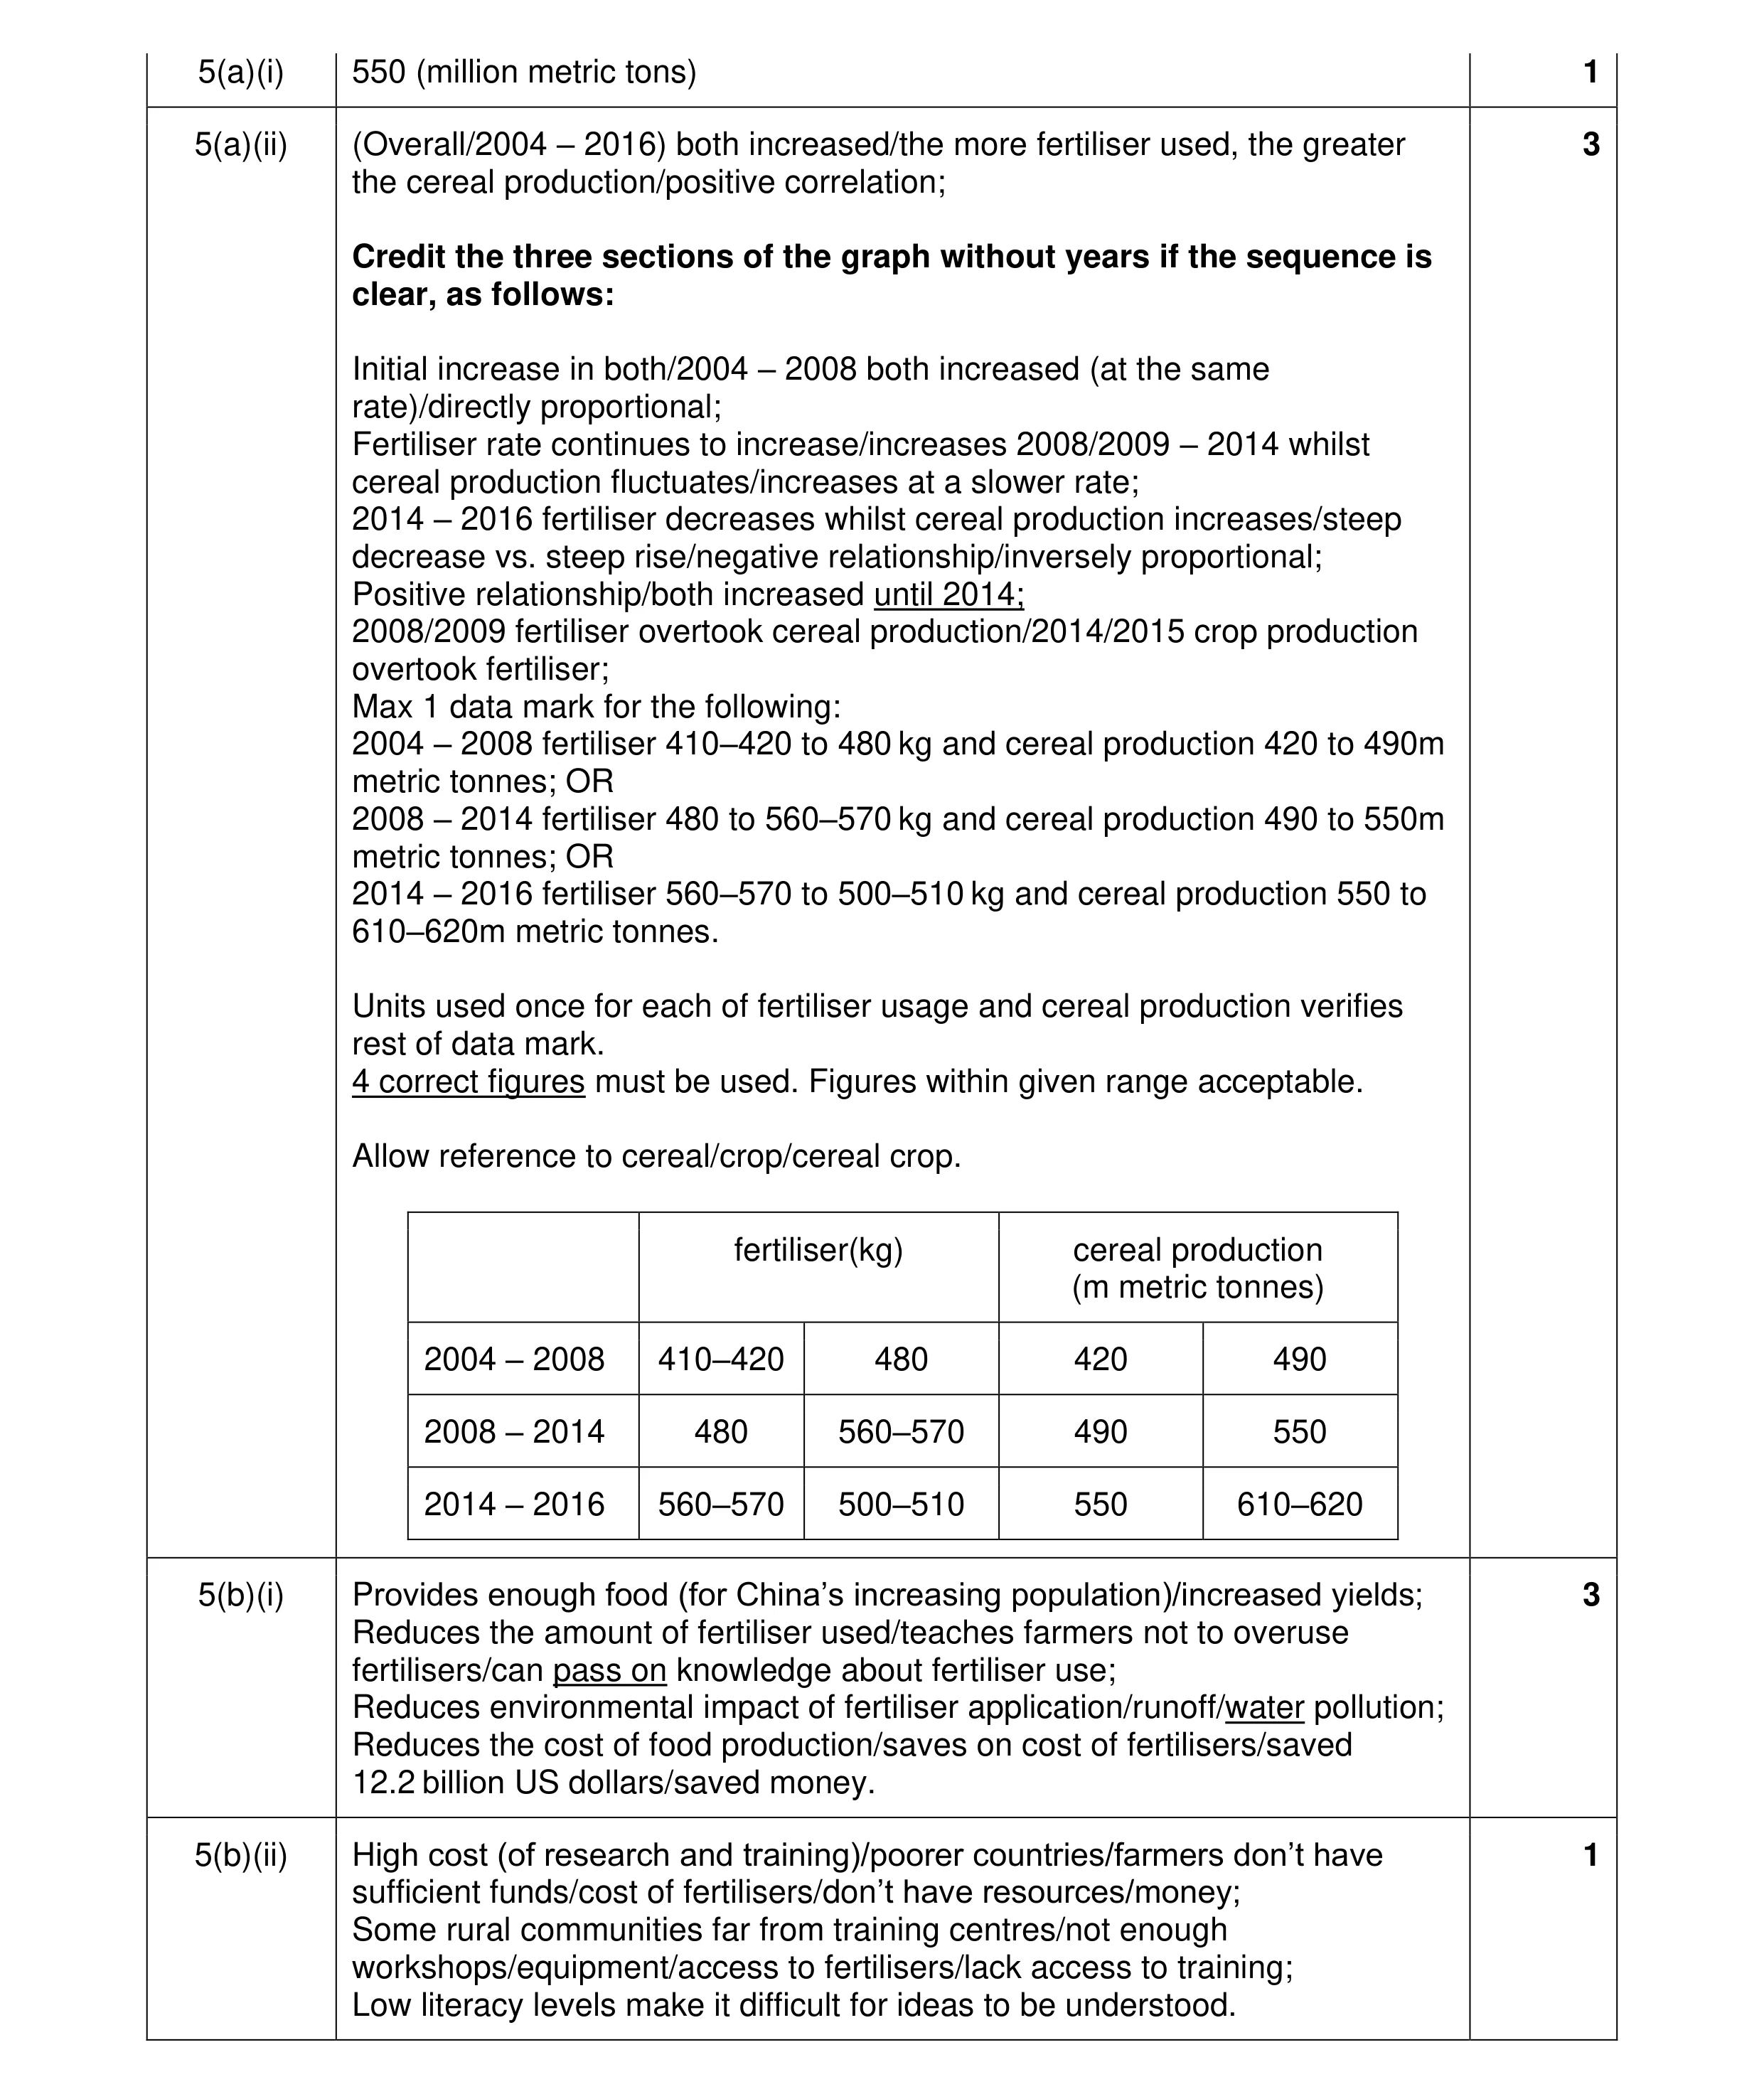 8
8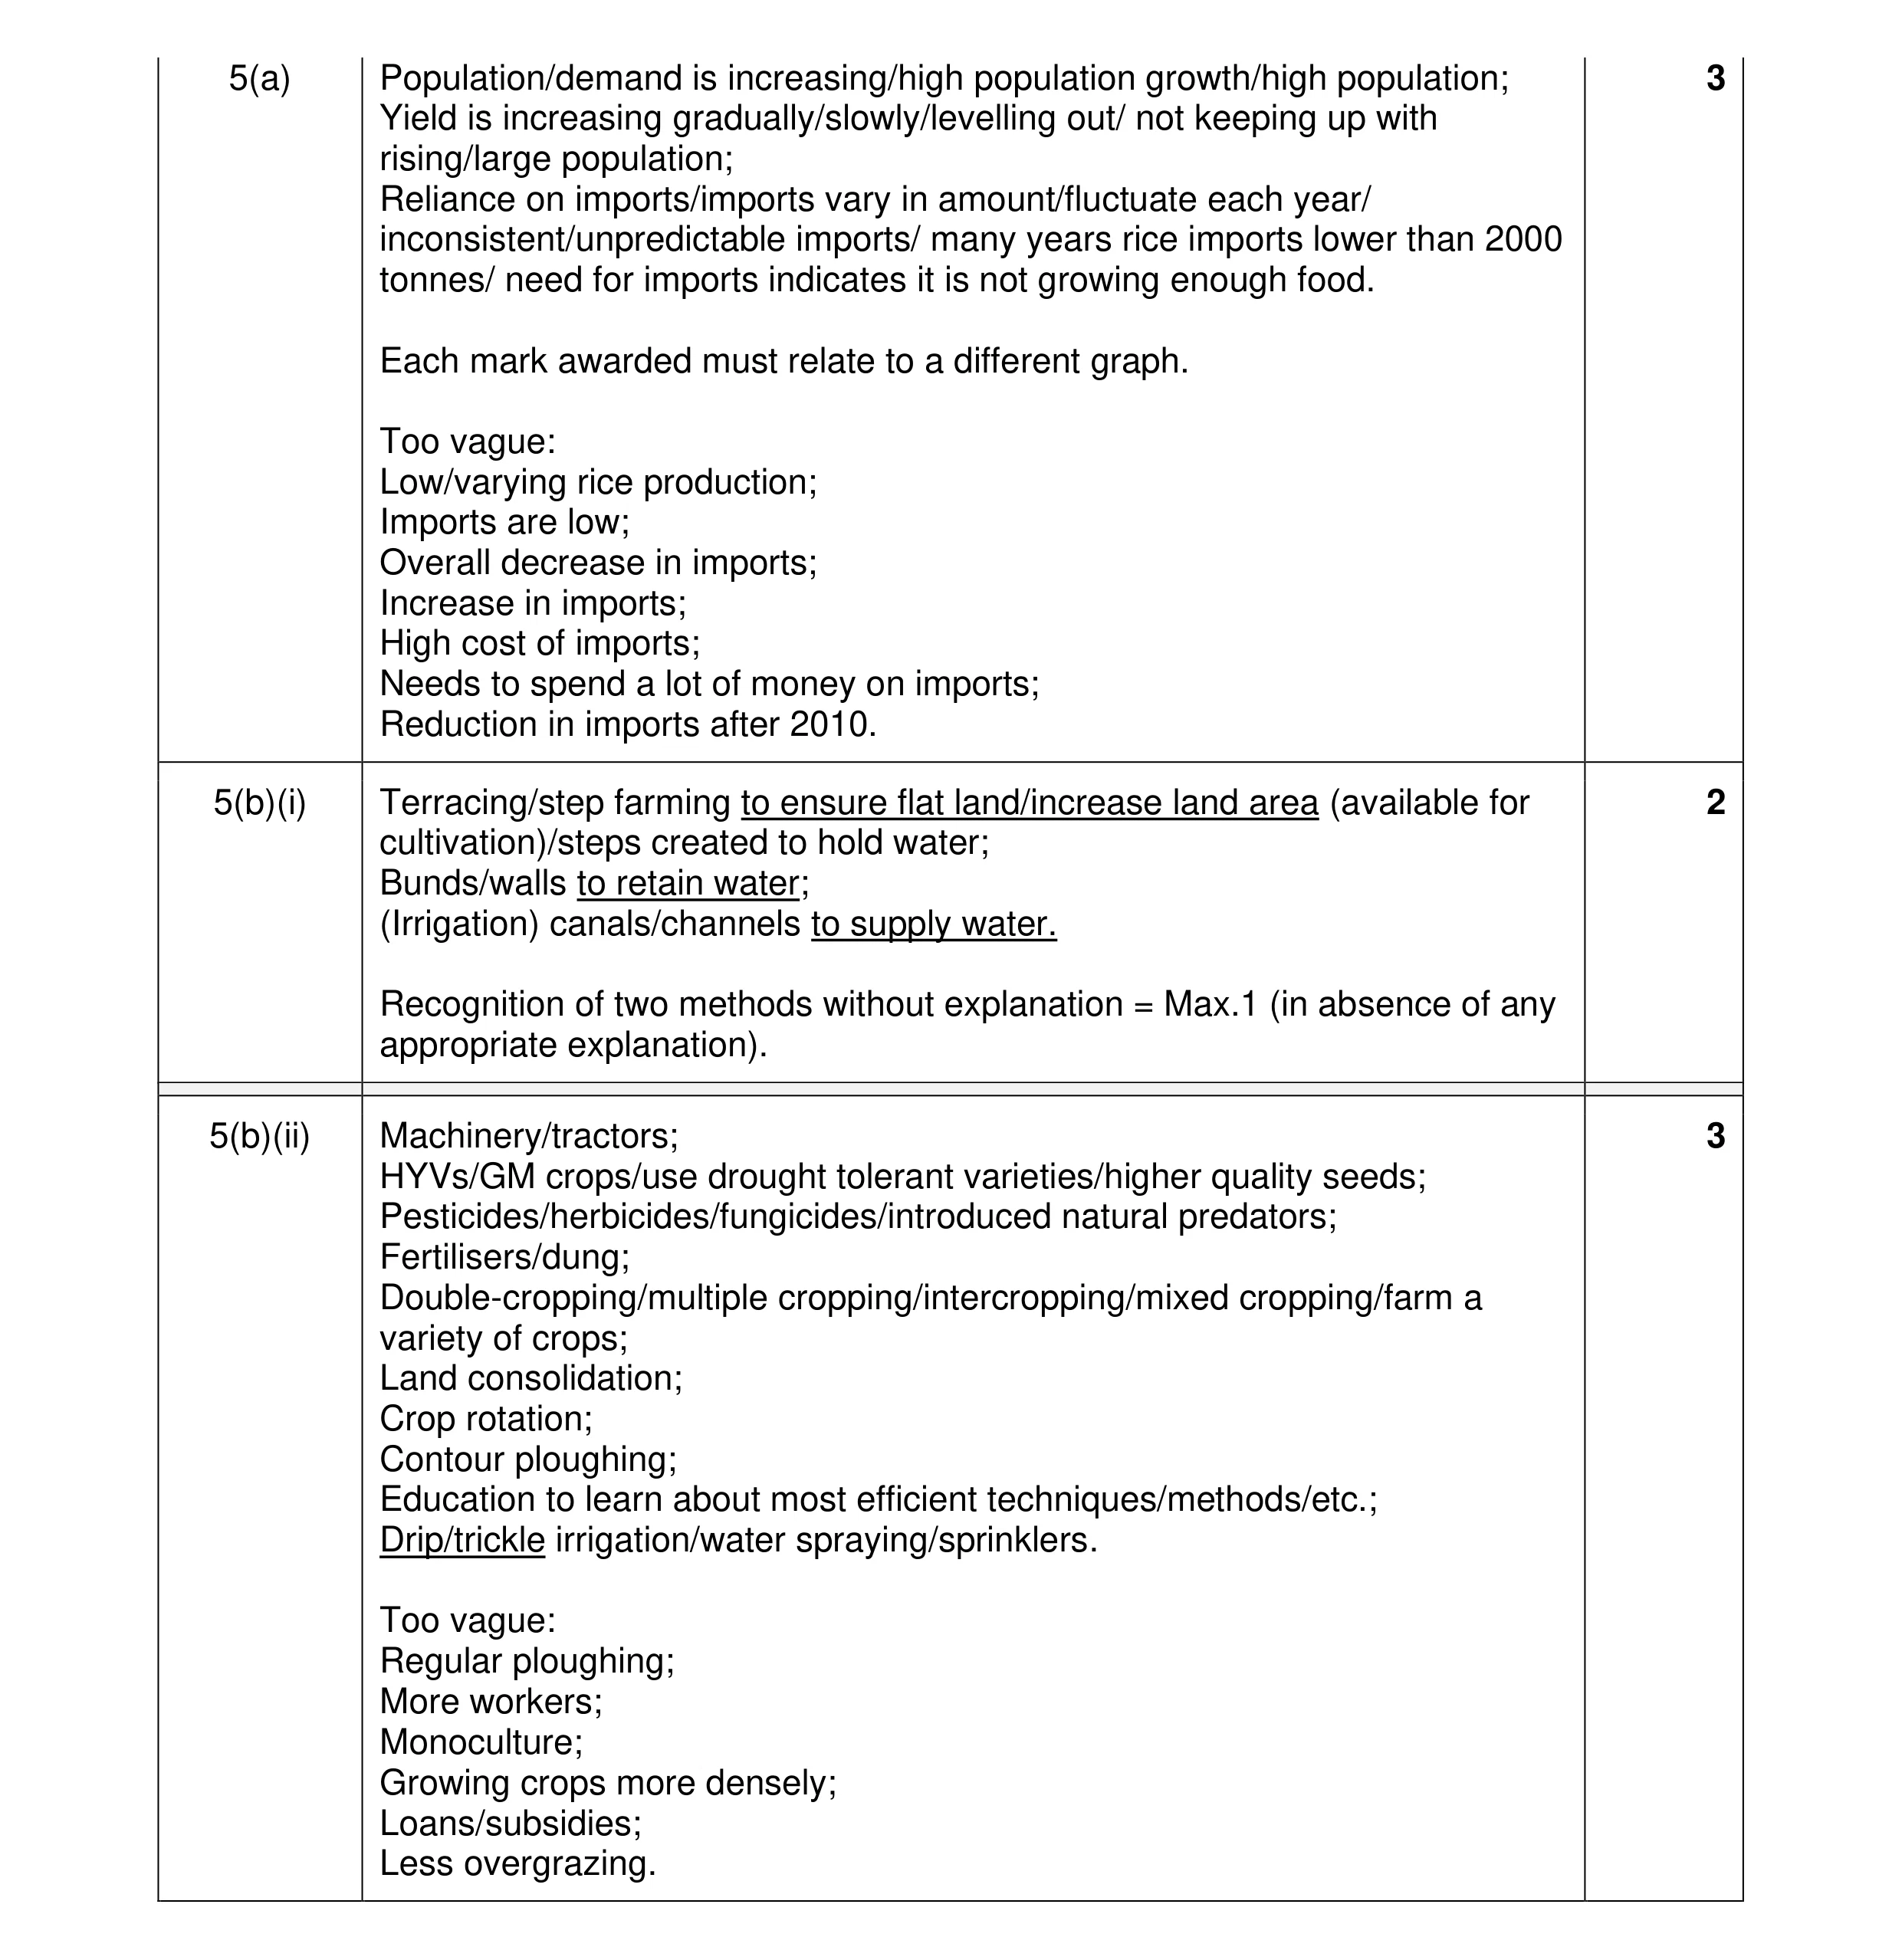 8
8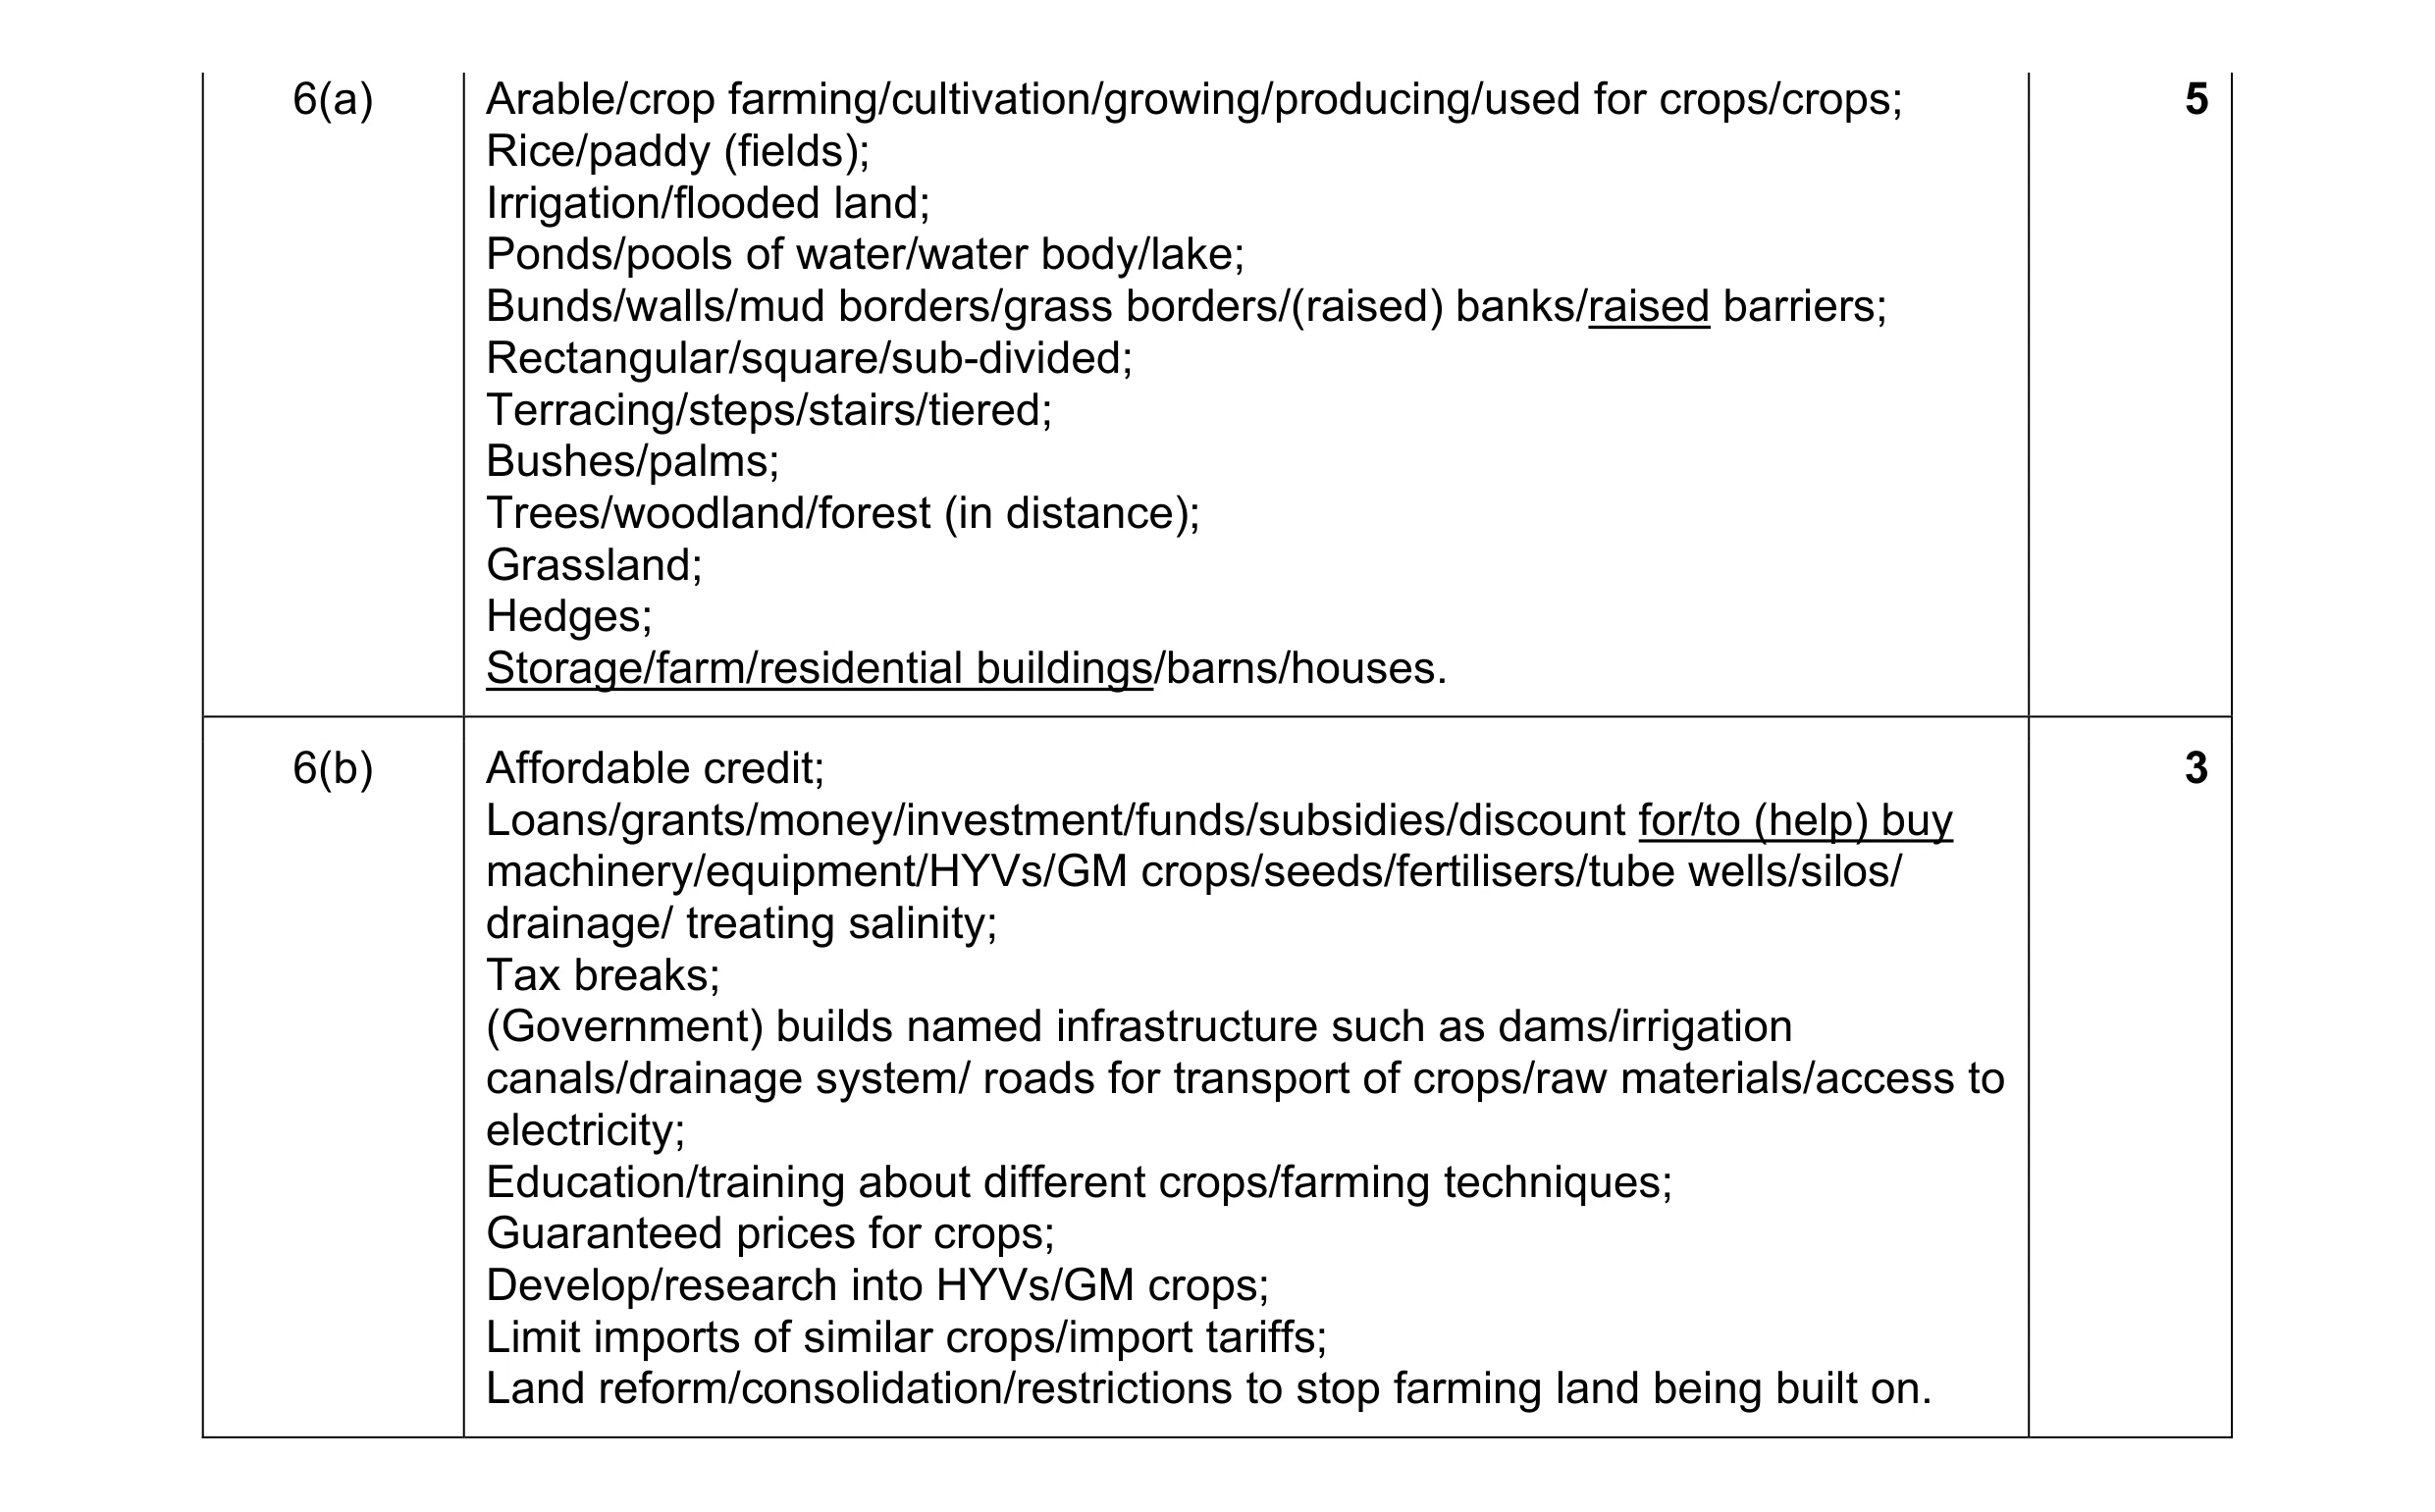 8
8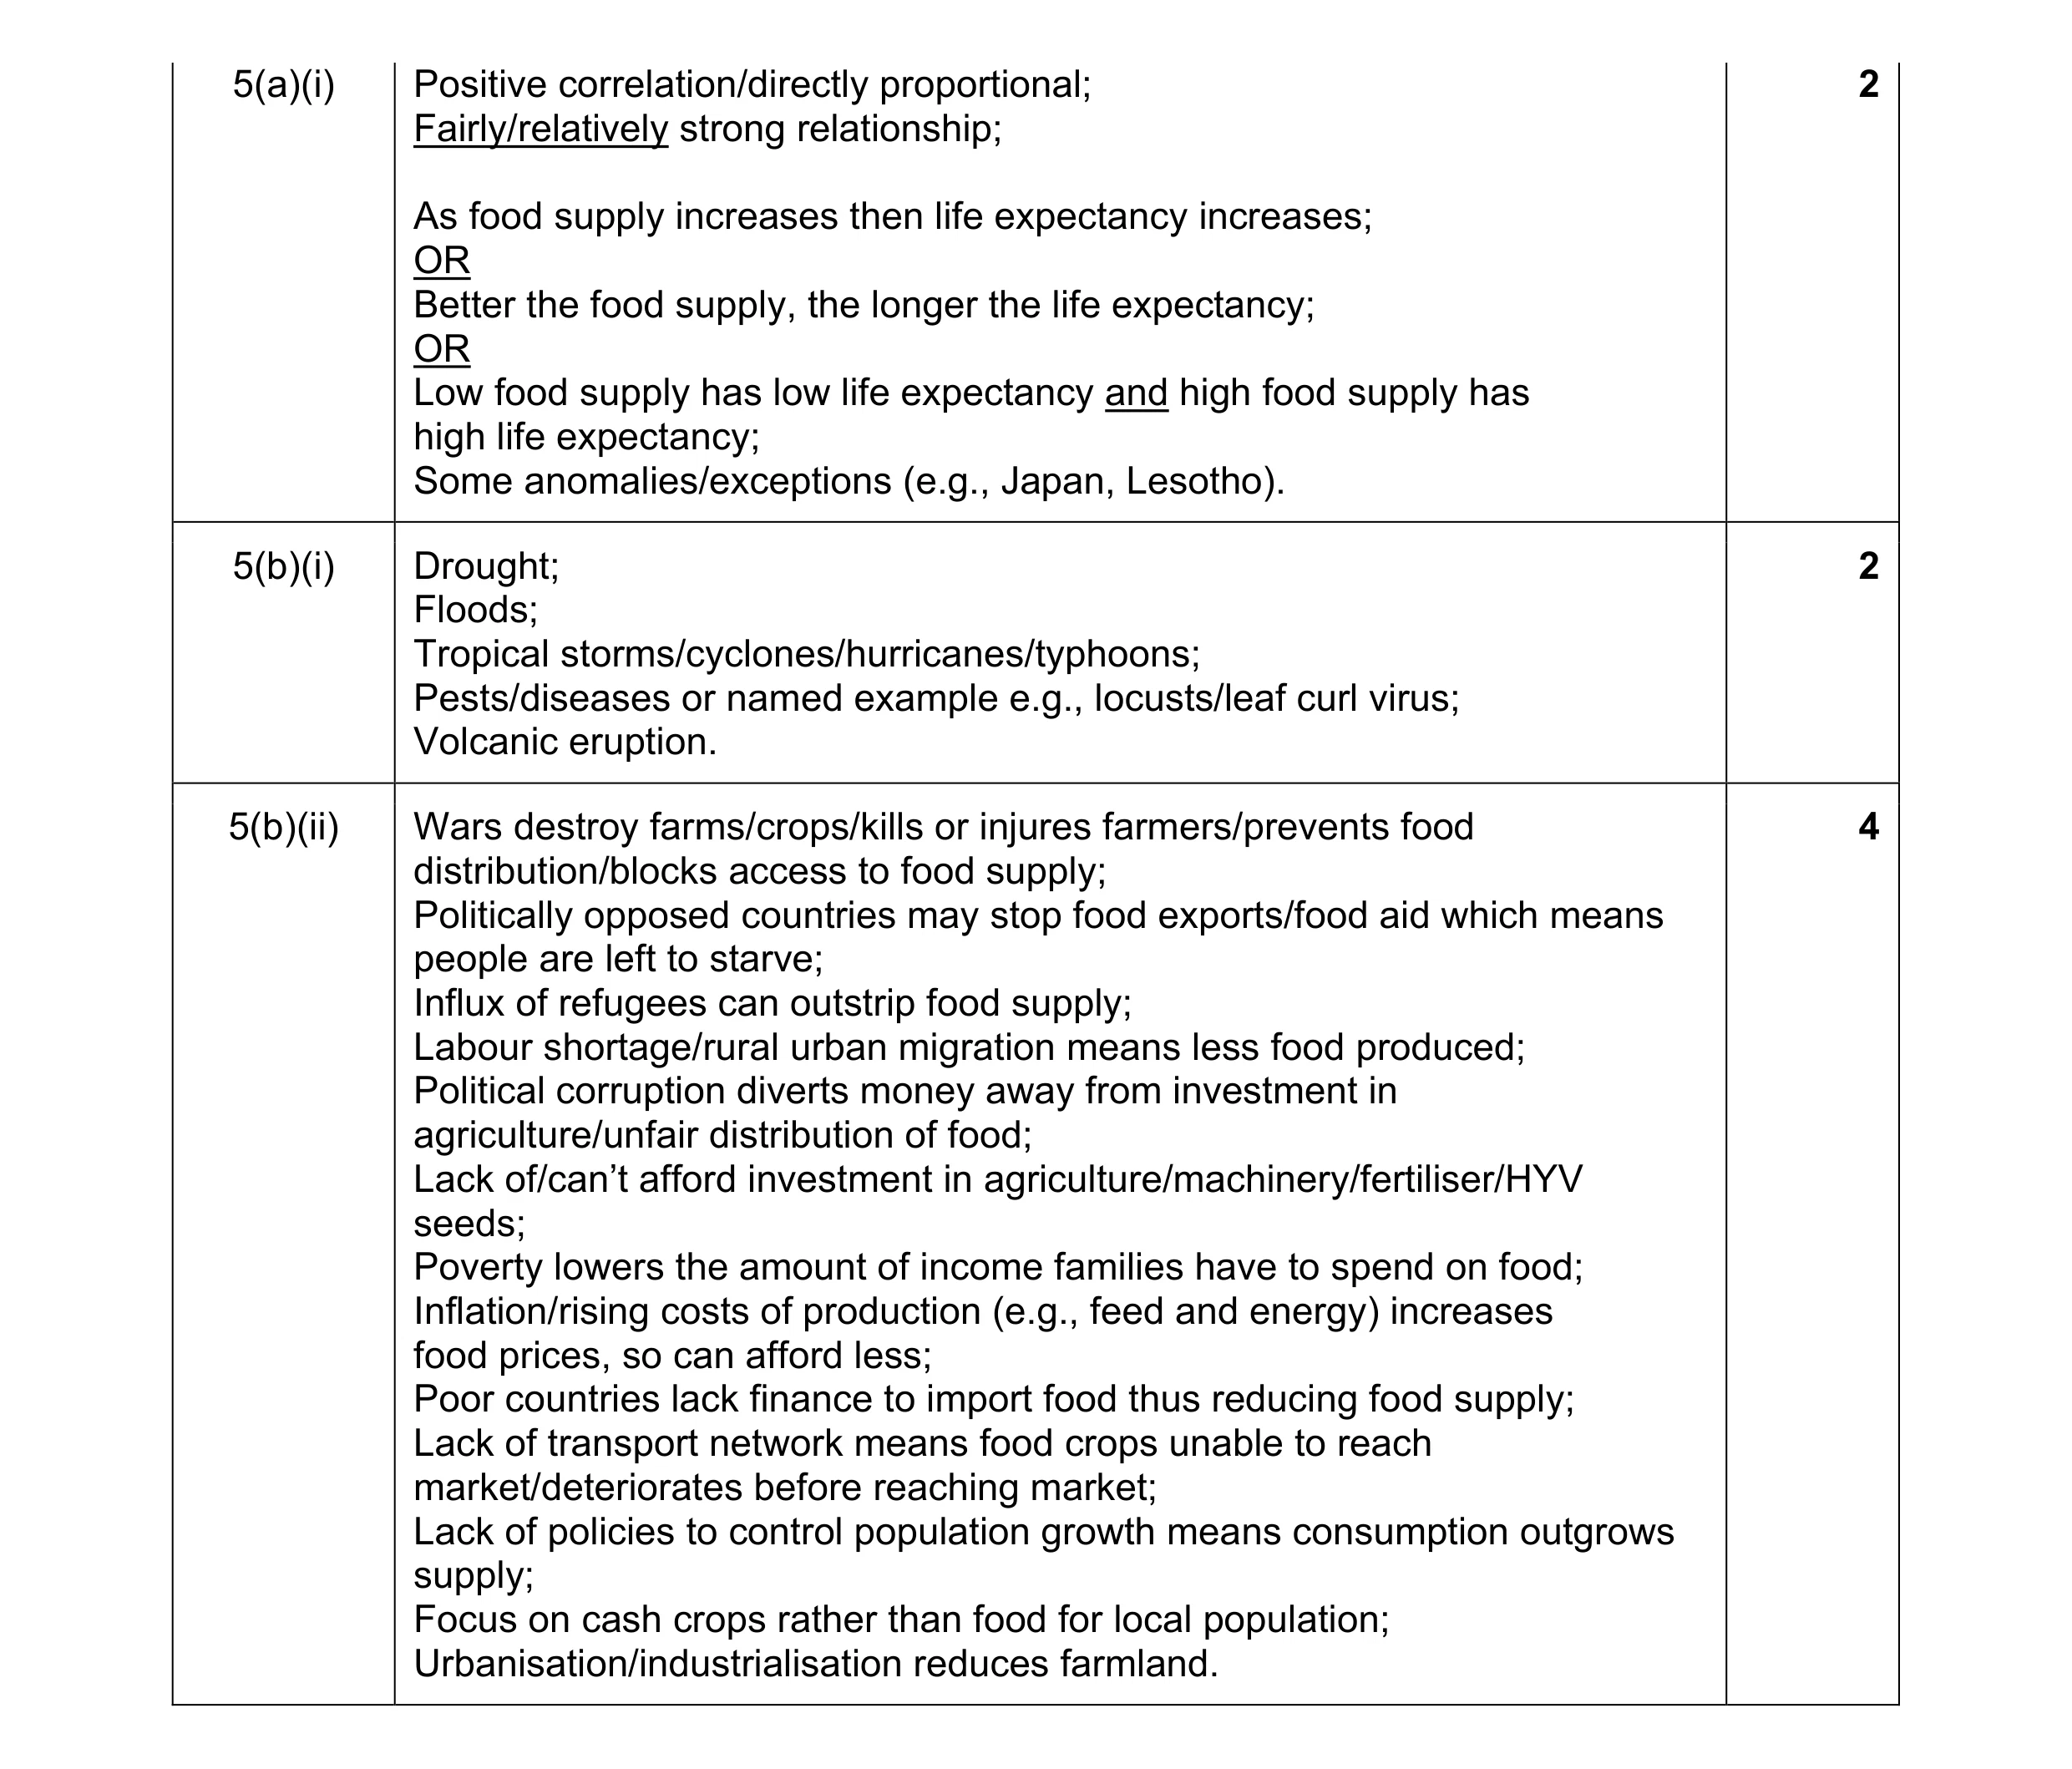 8
8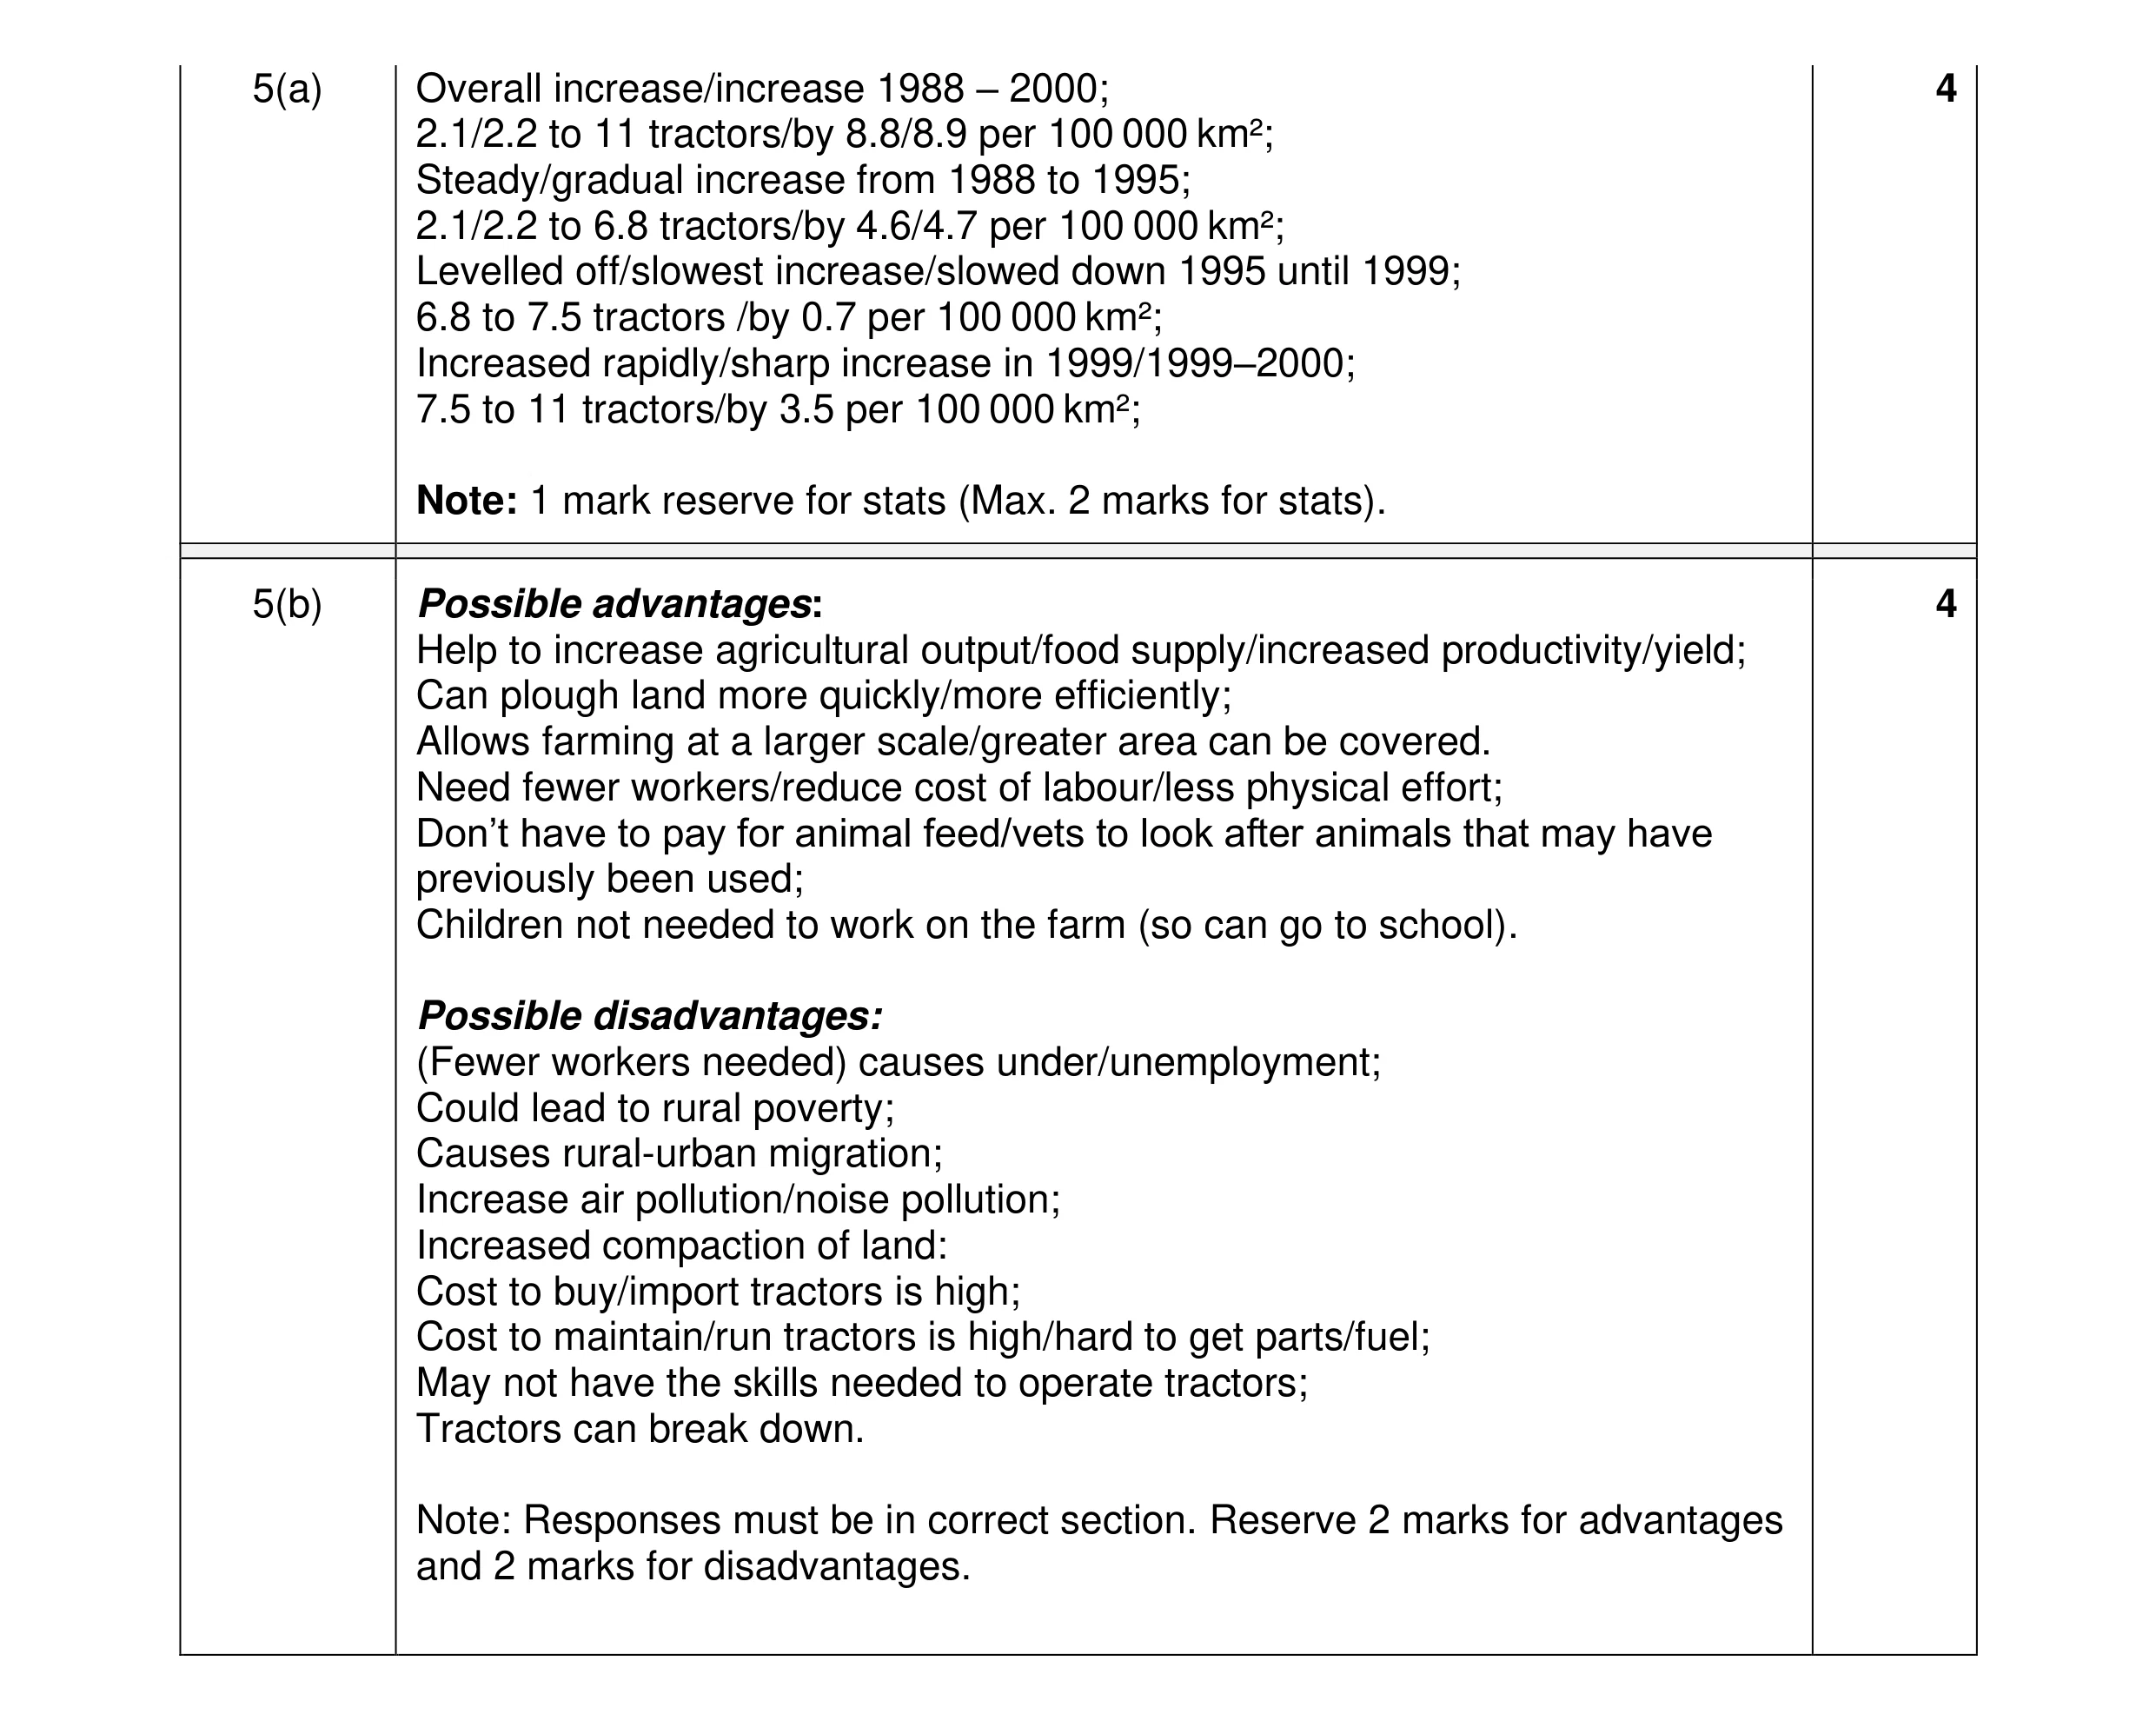 8
8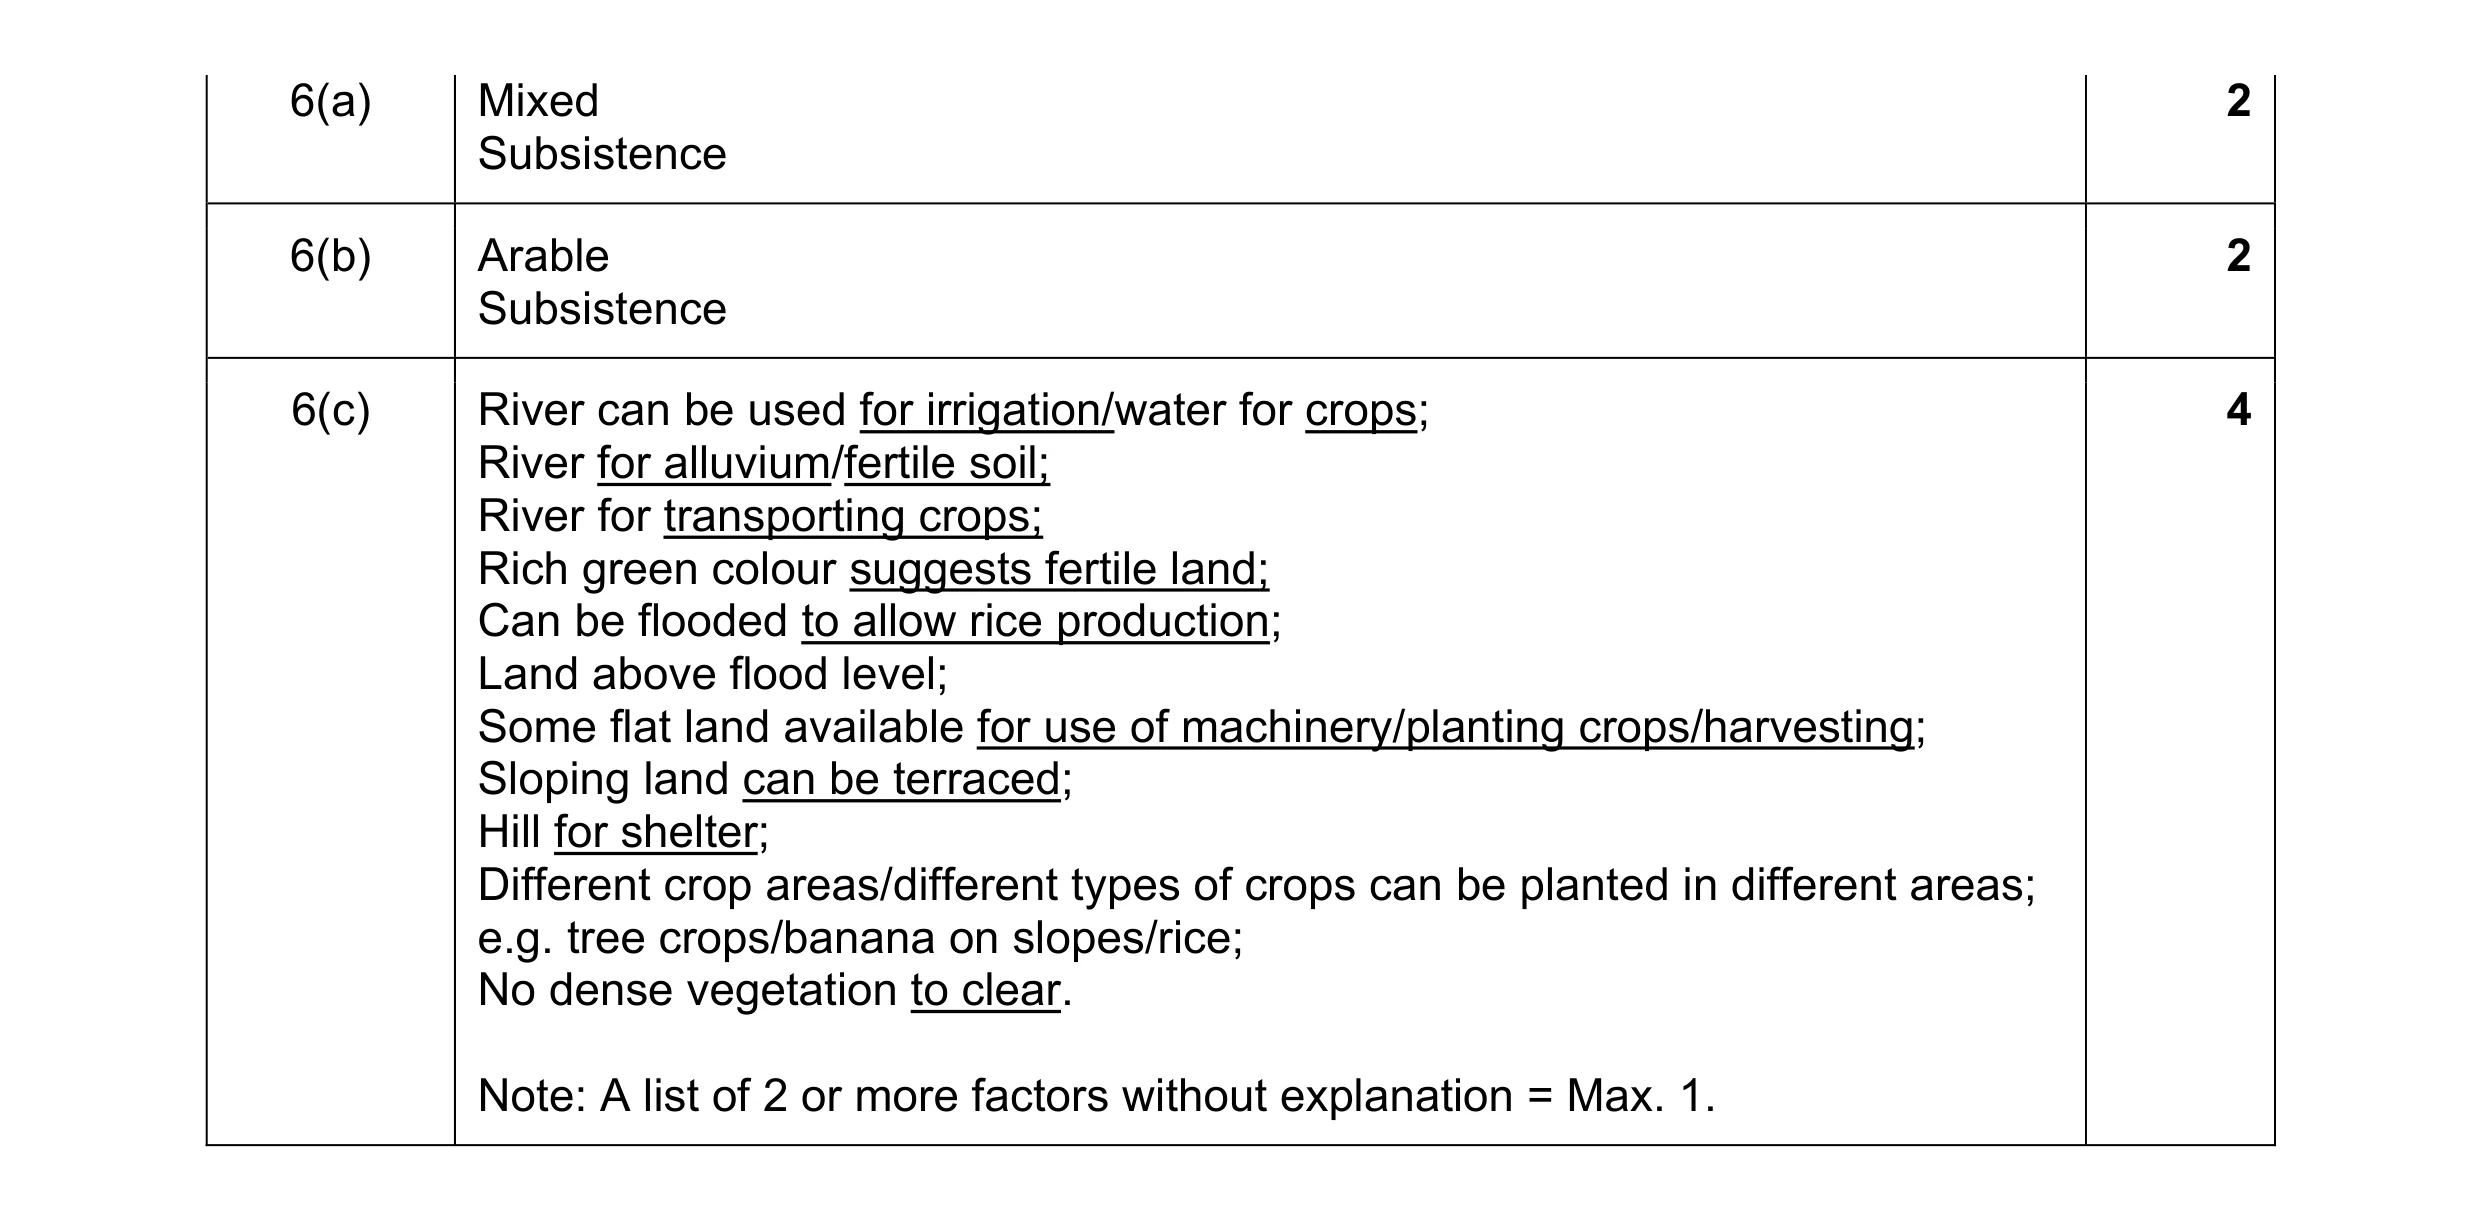 8
8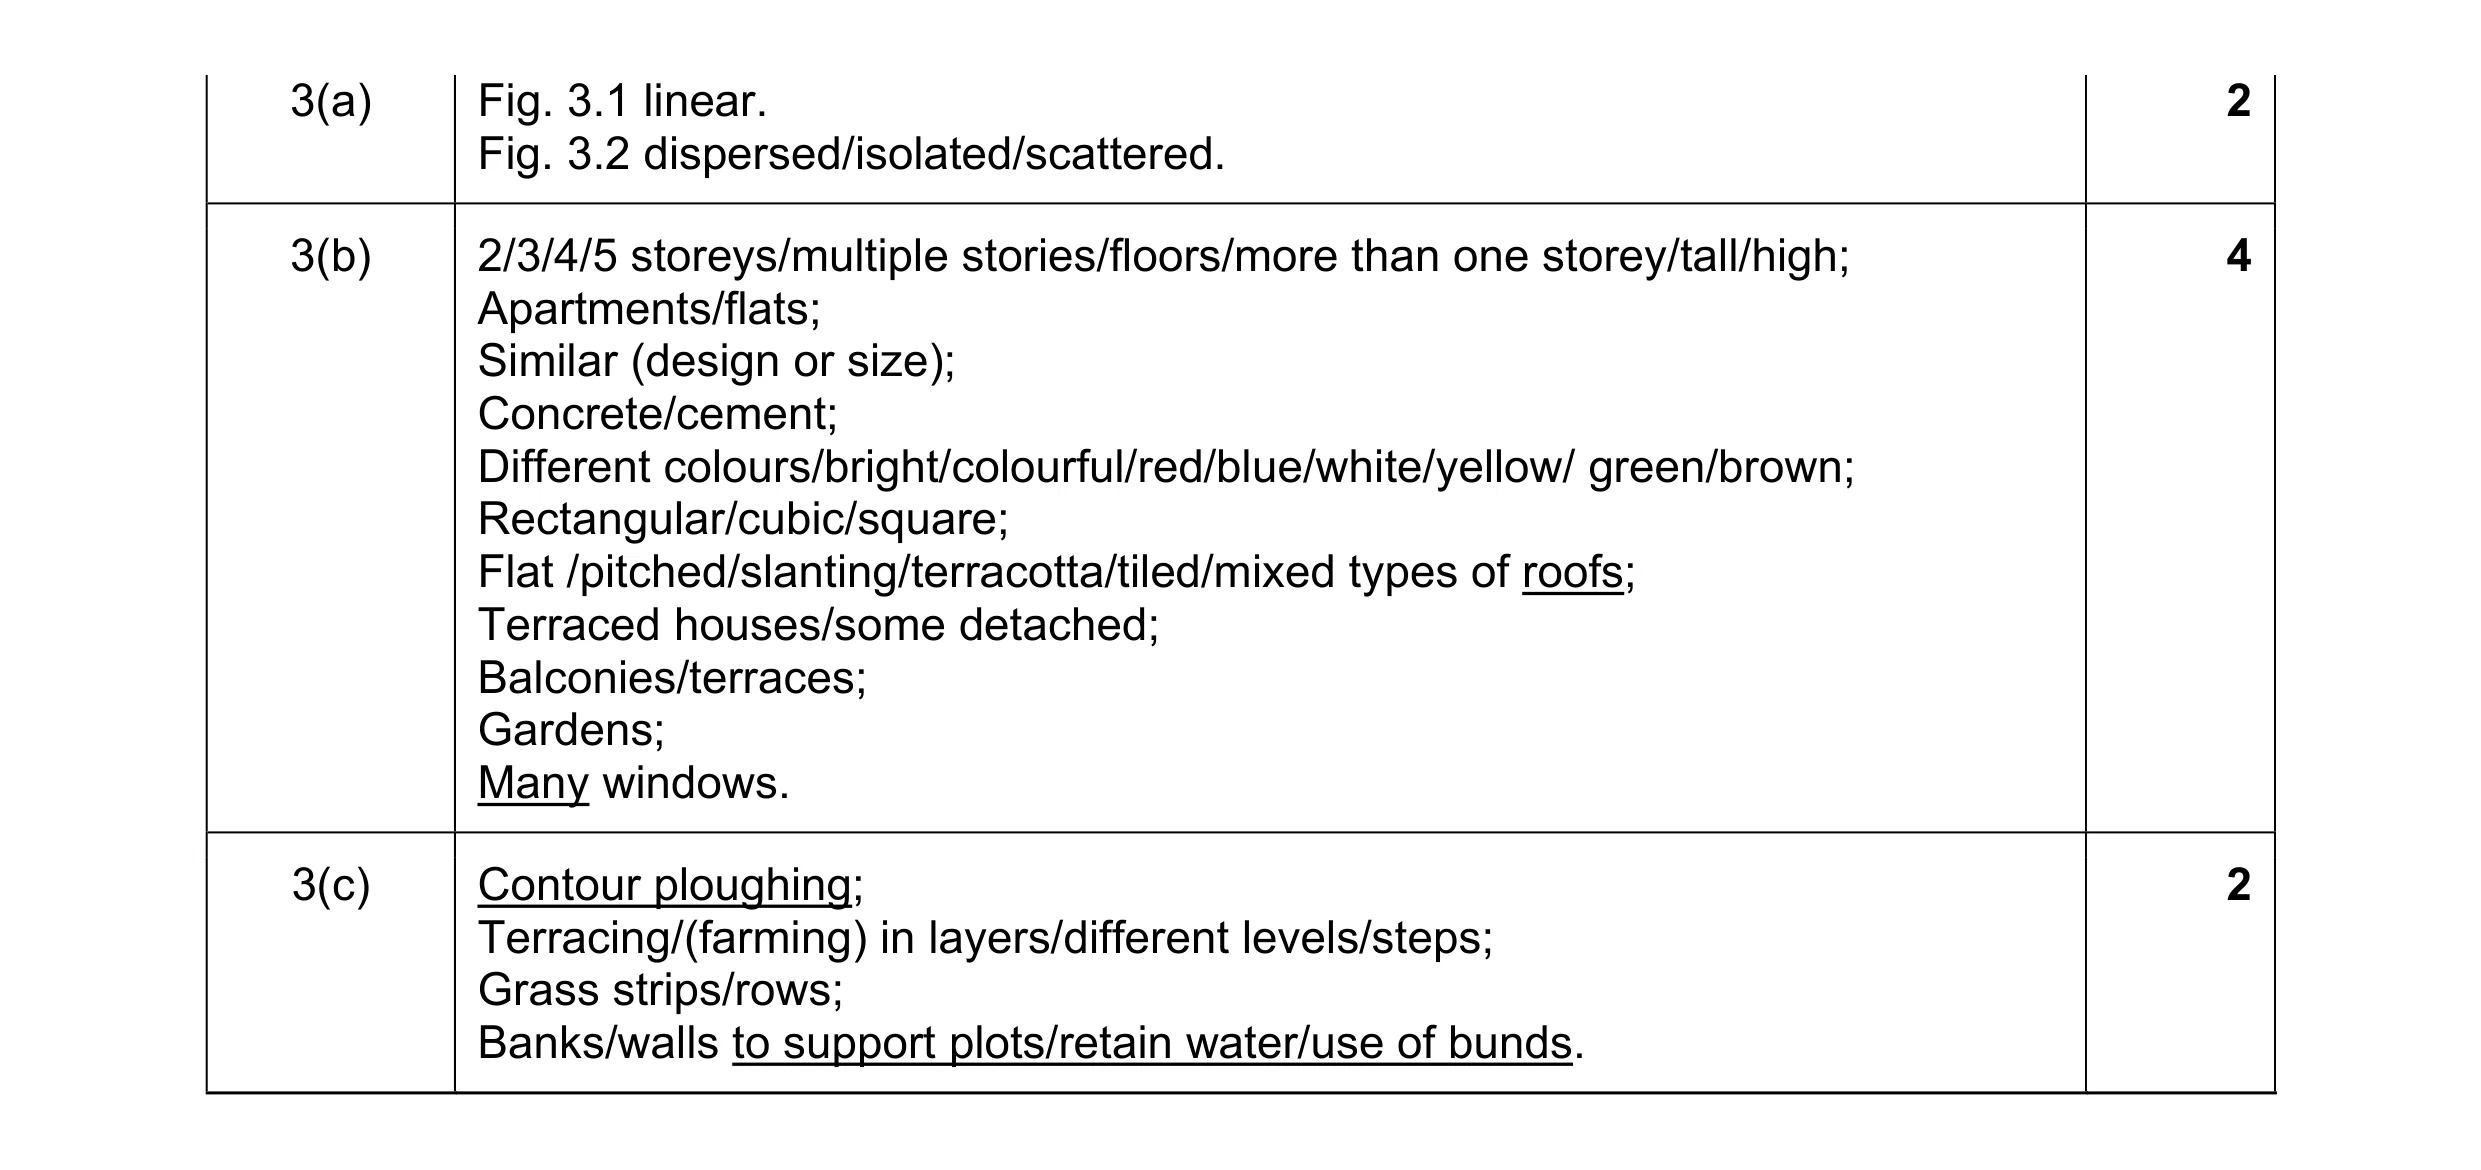 8
8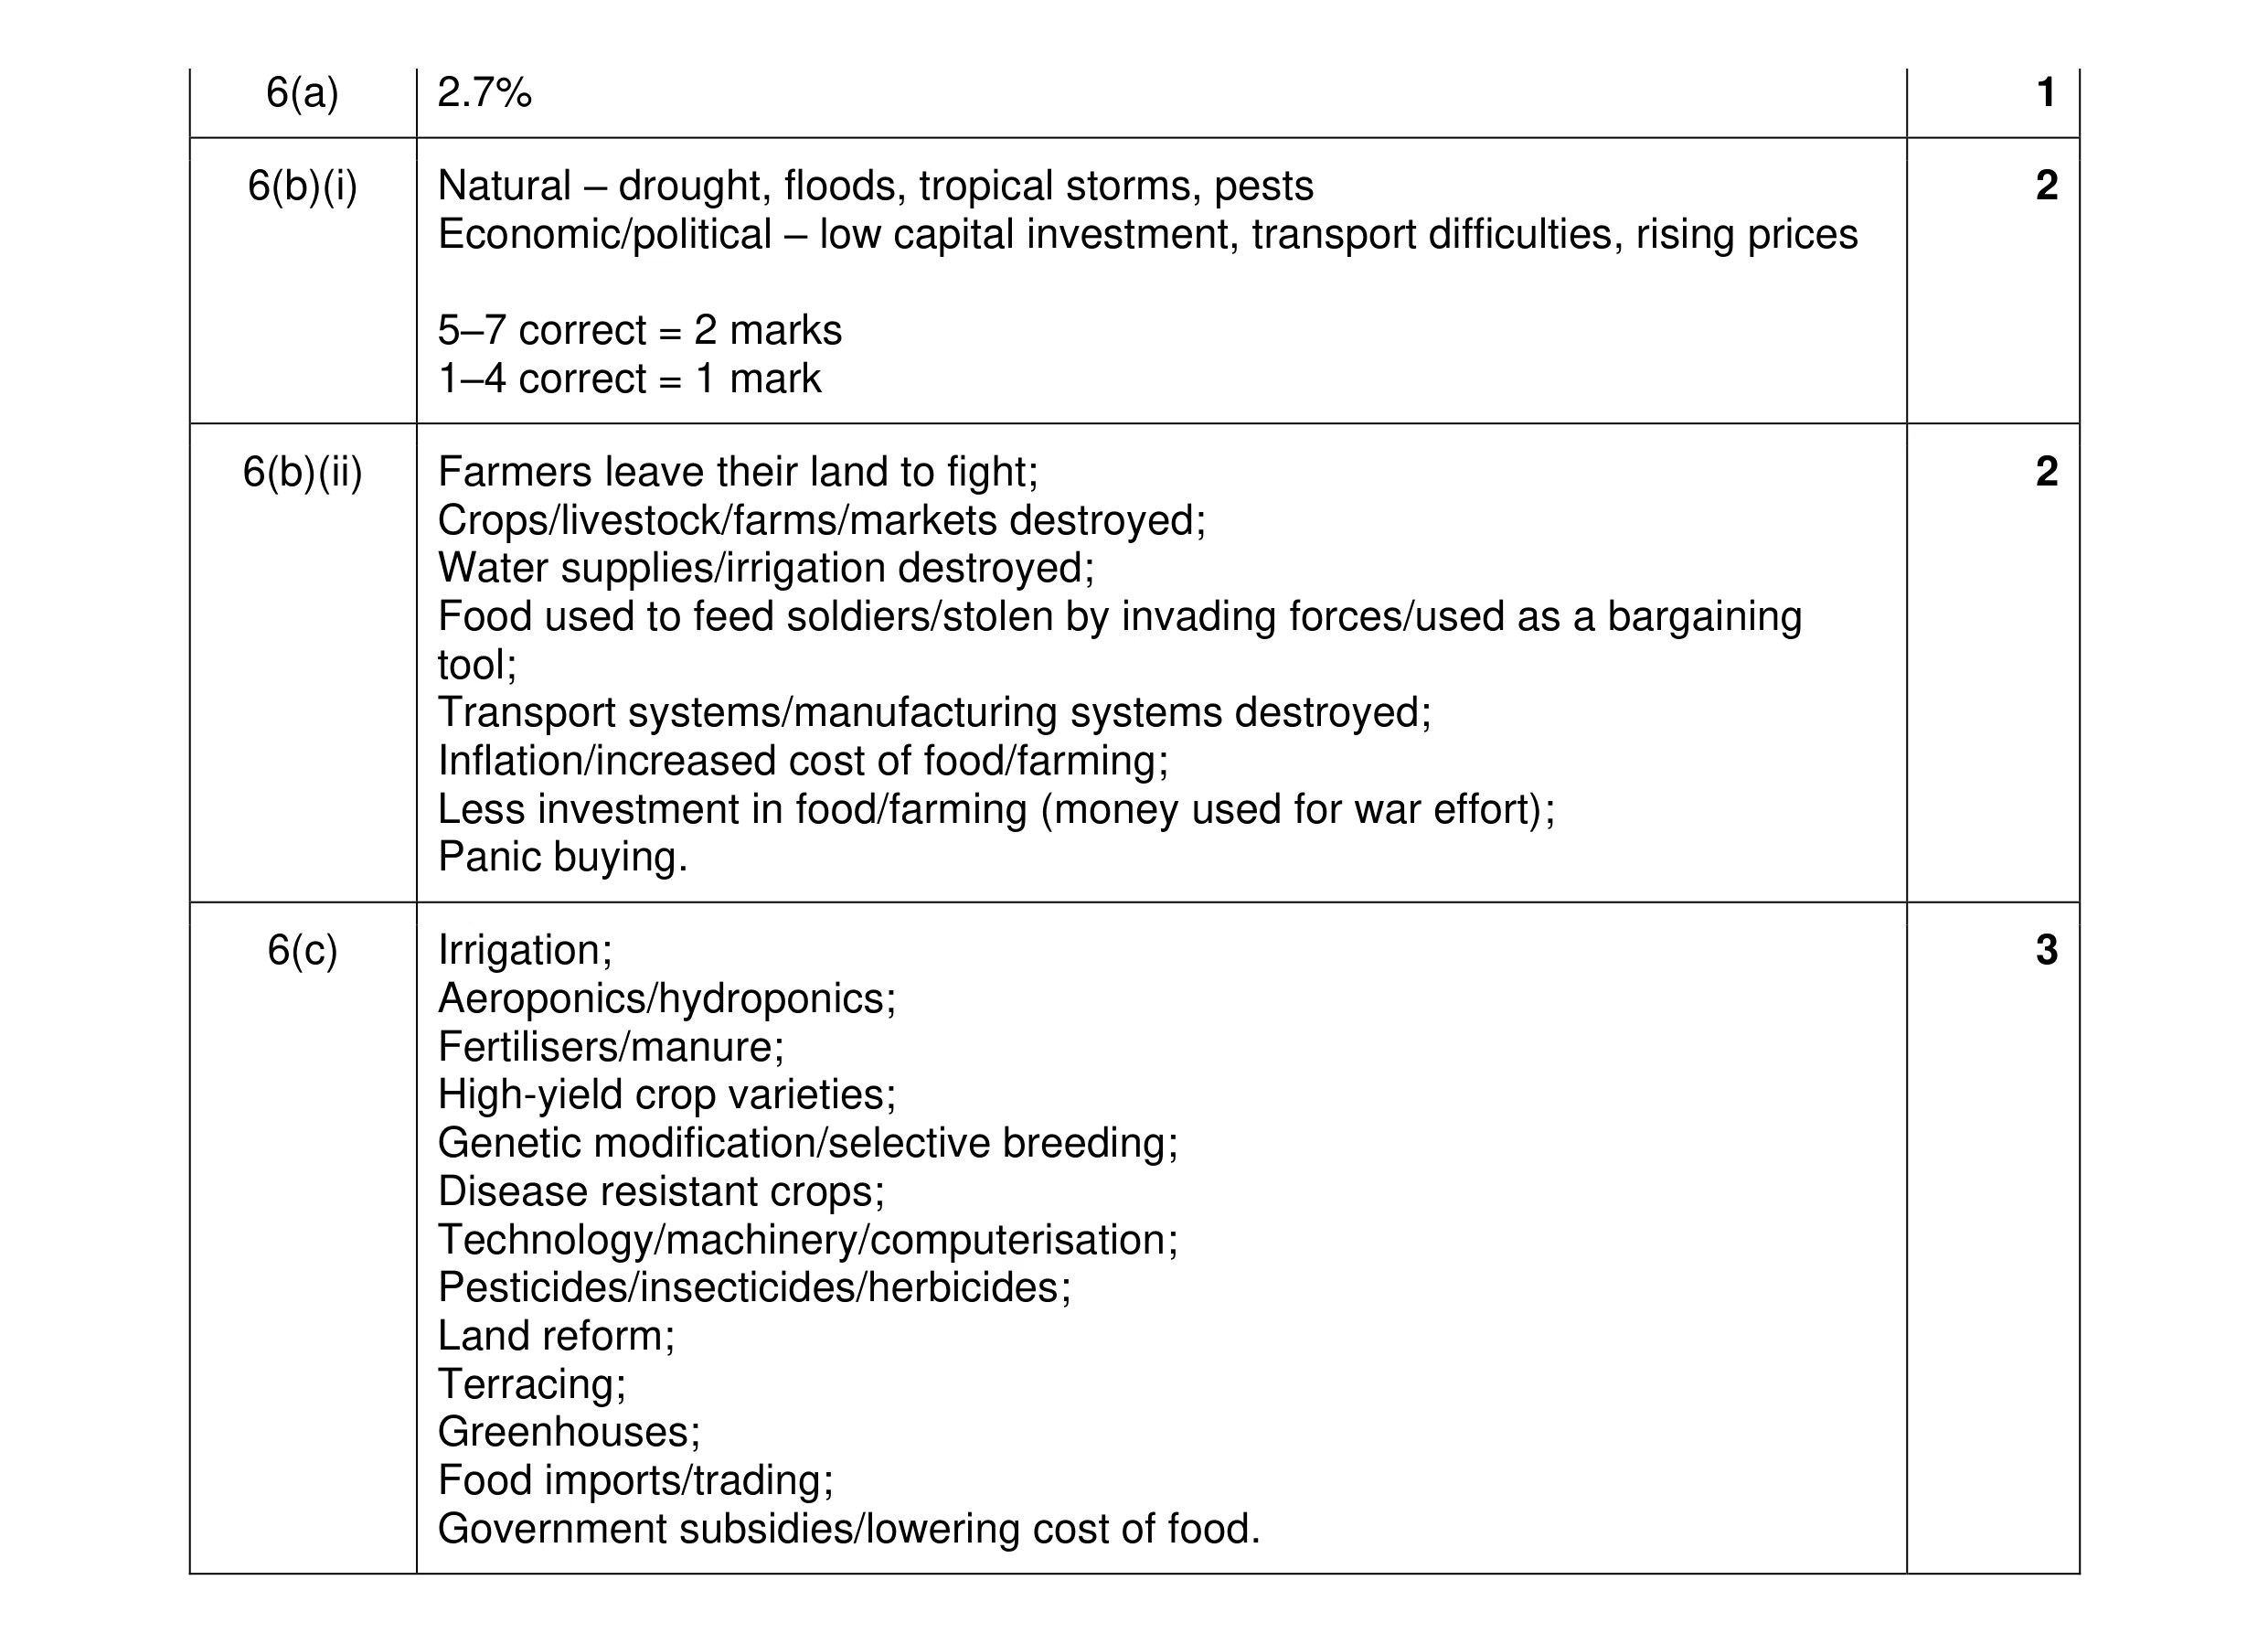 8
8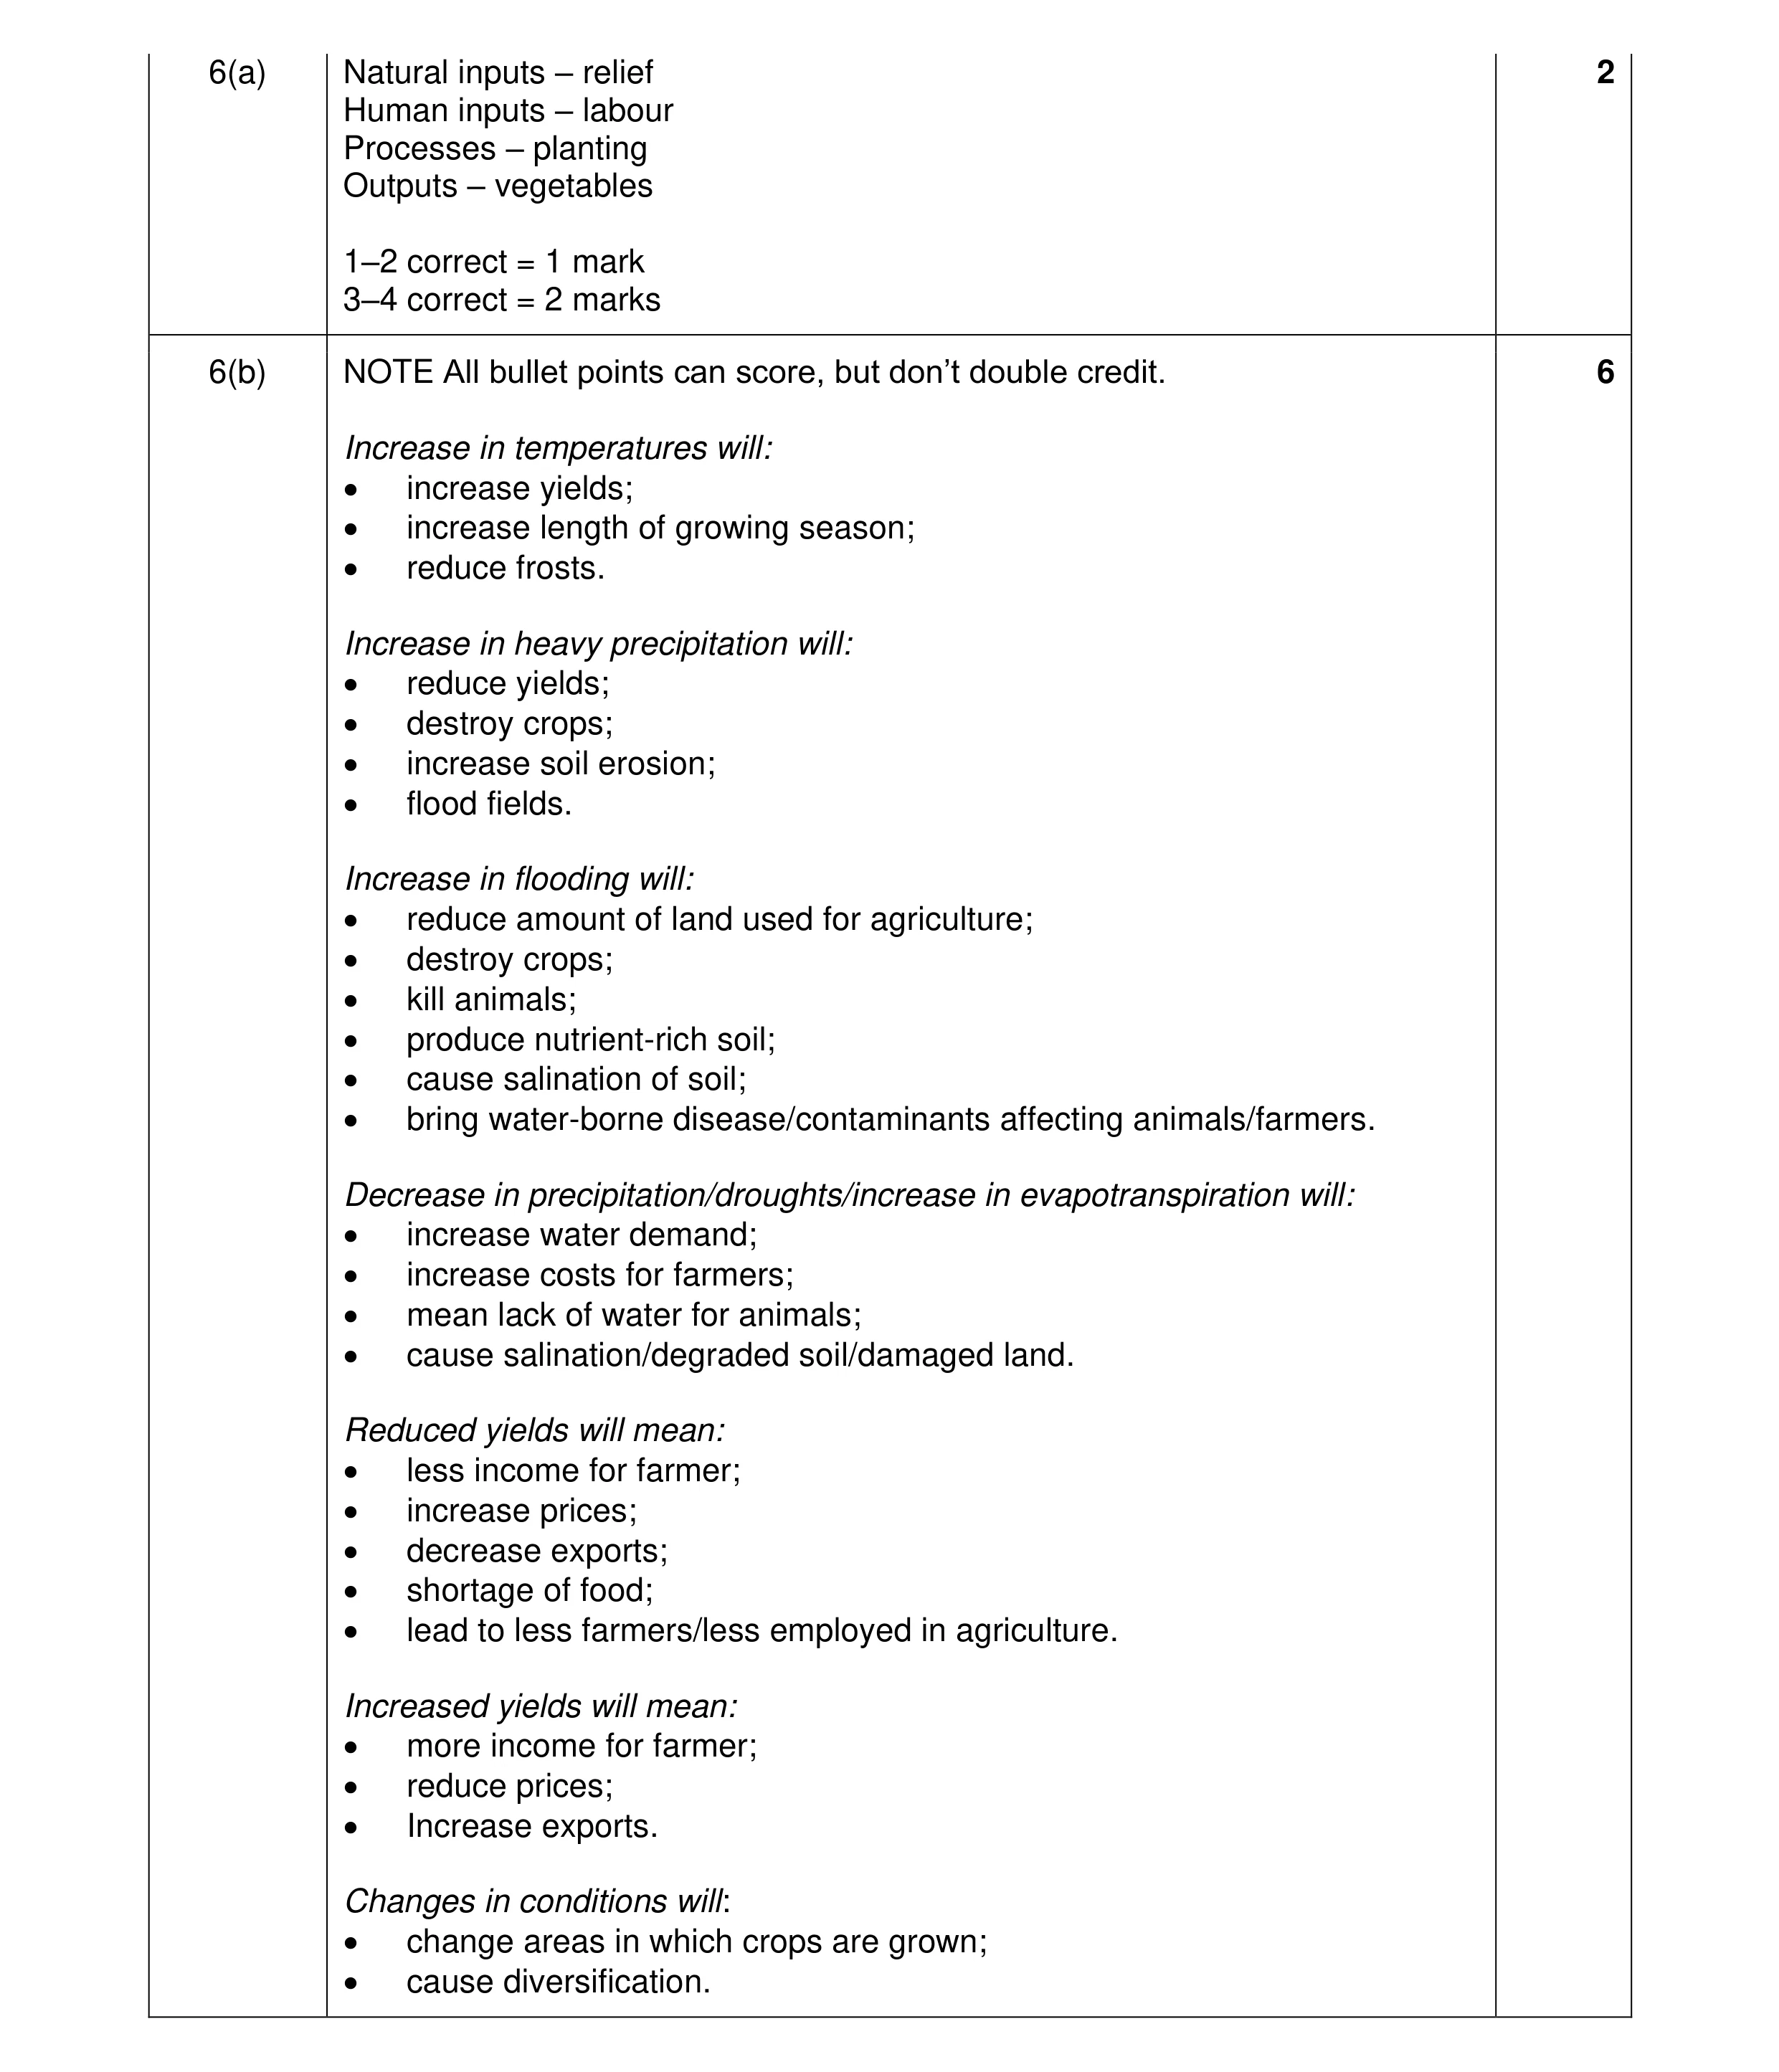 8
8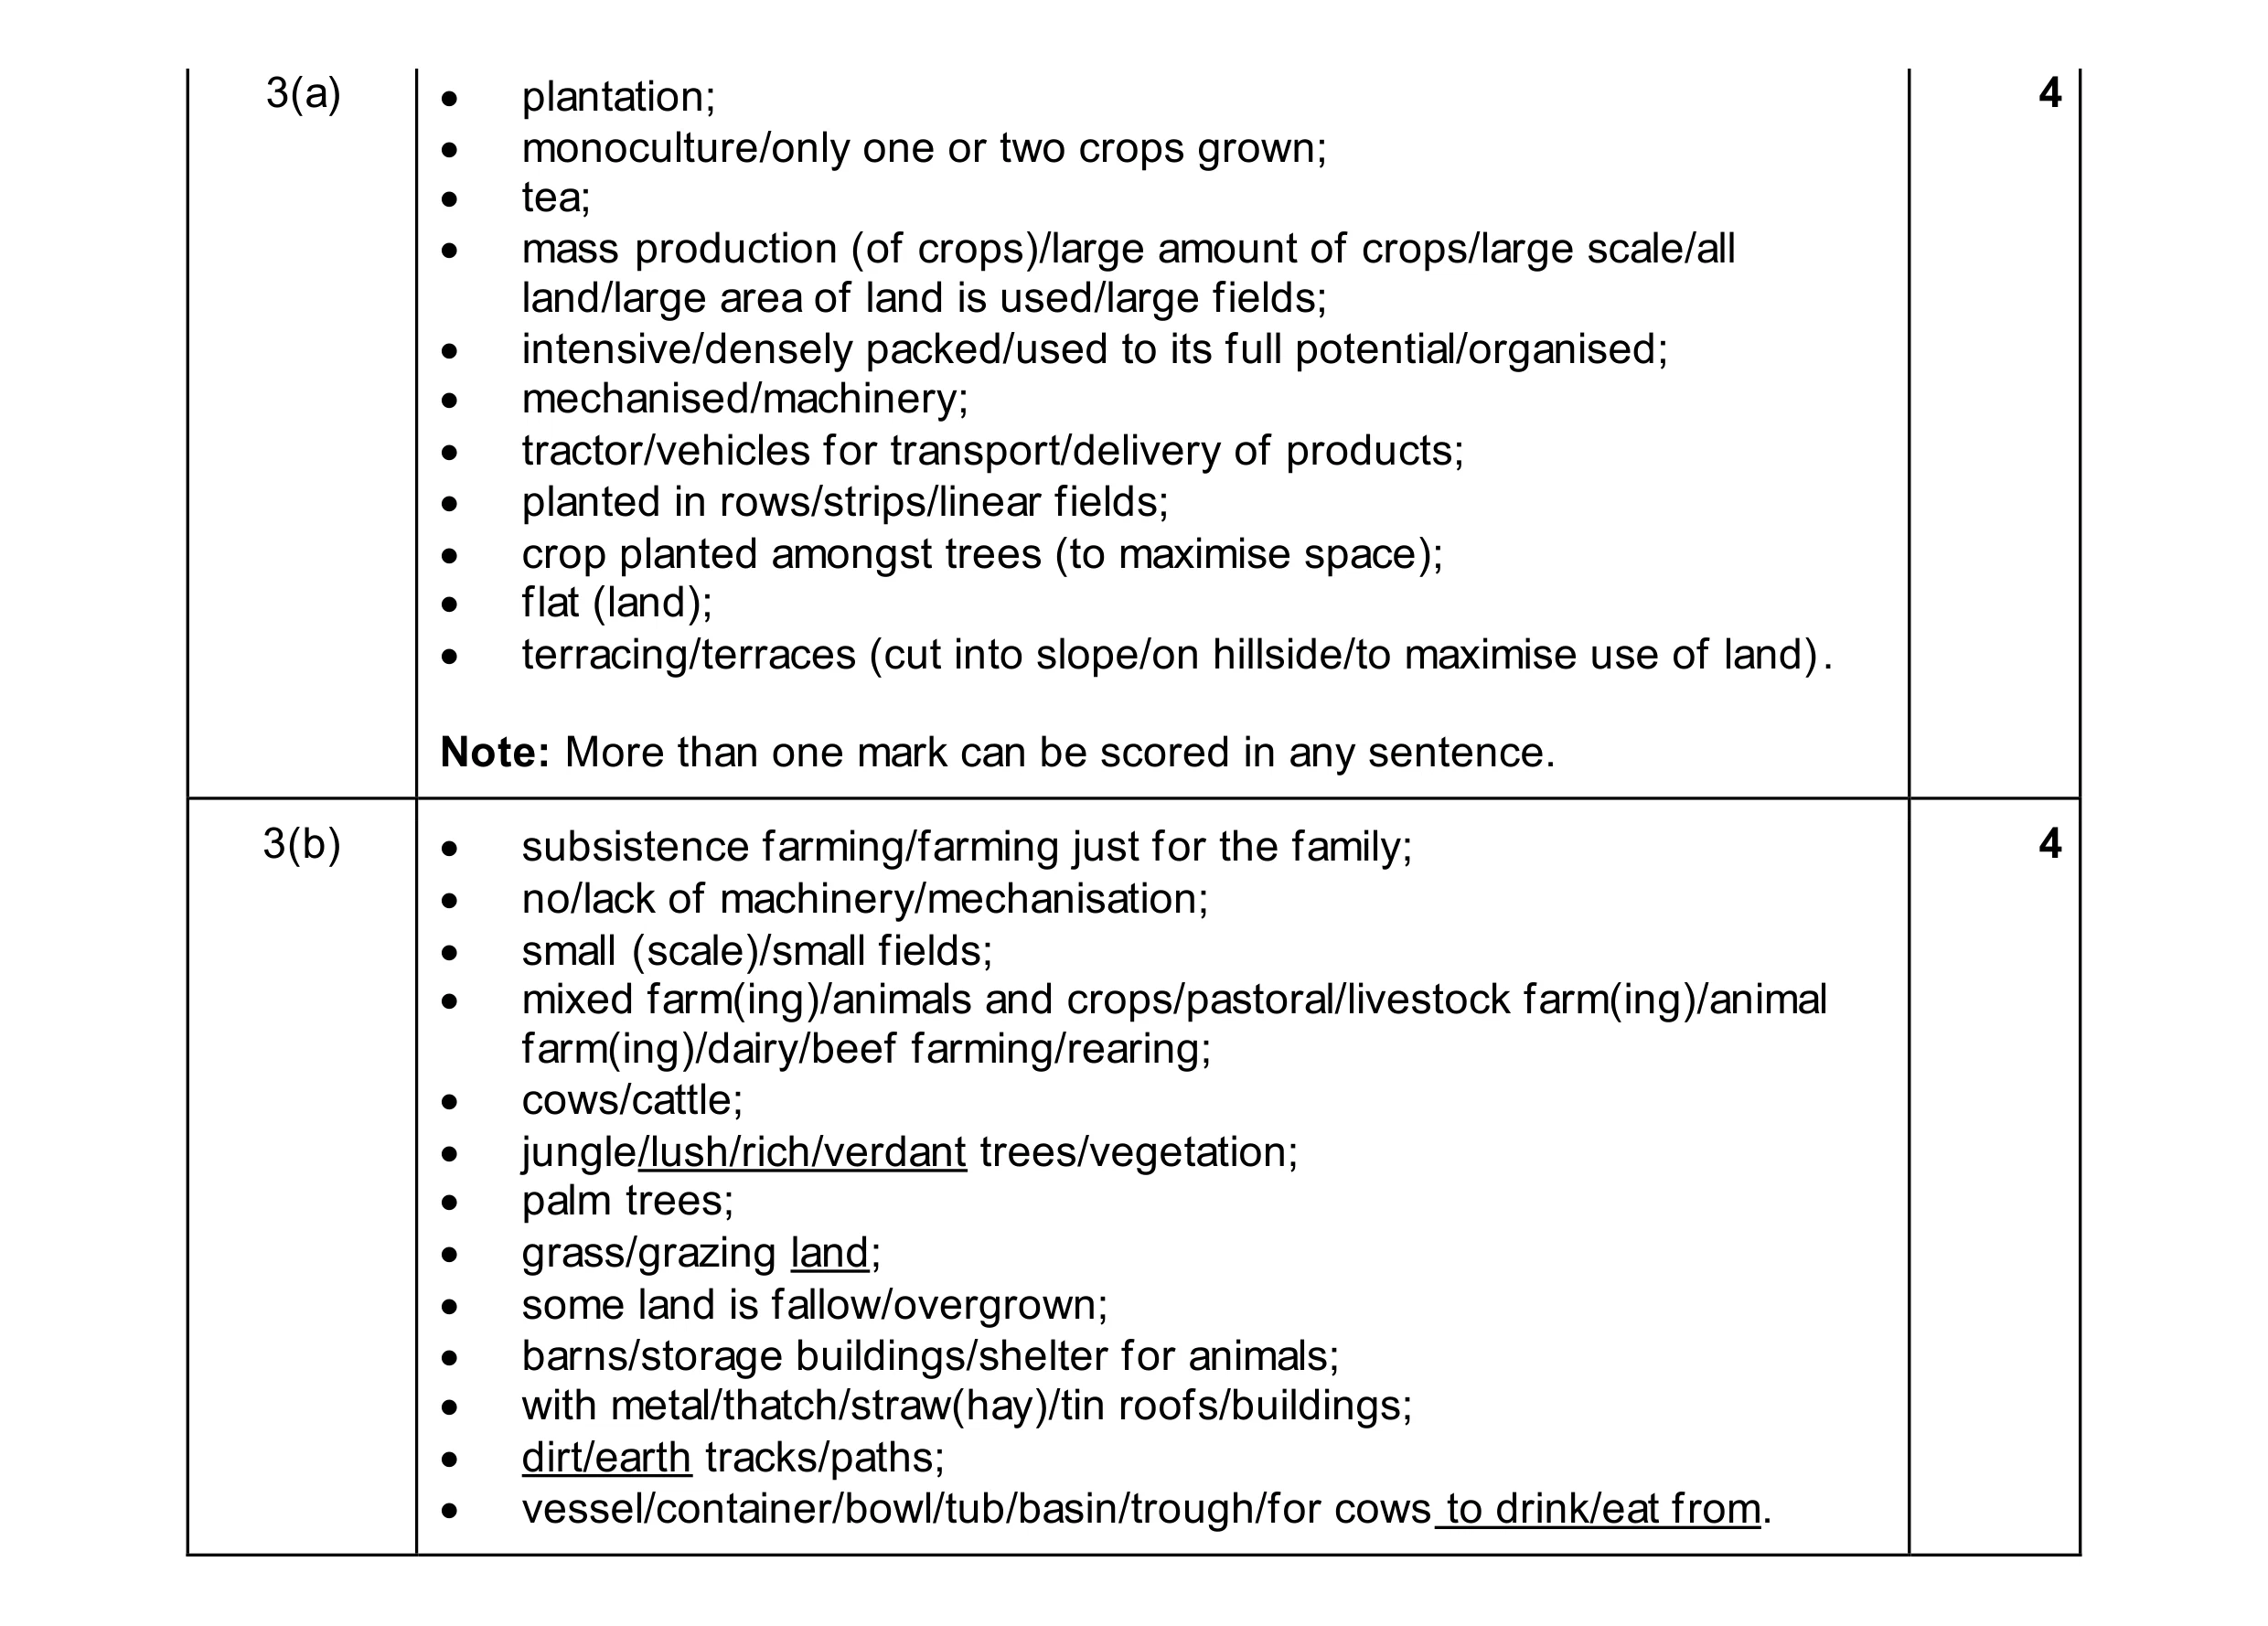 8
8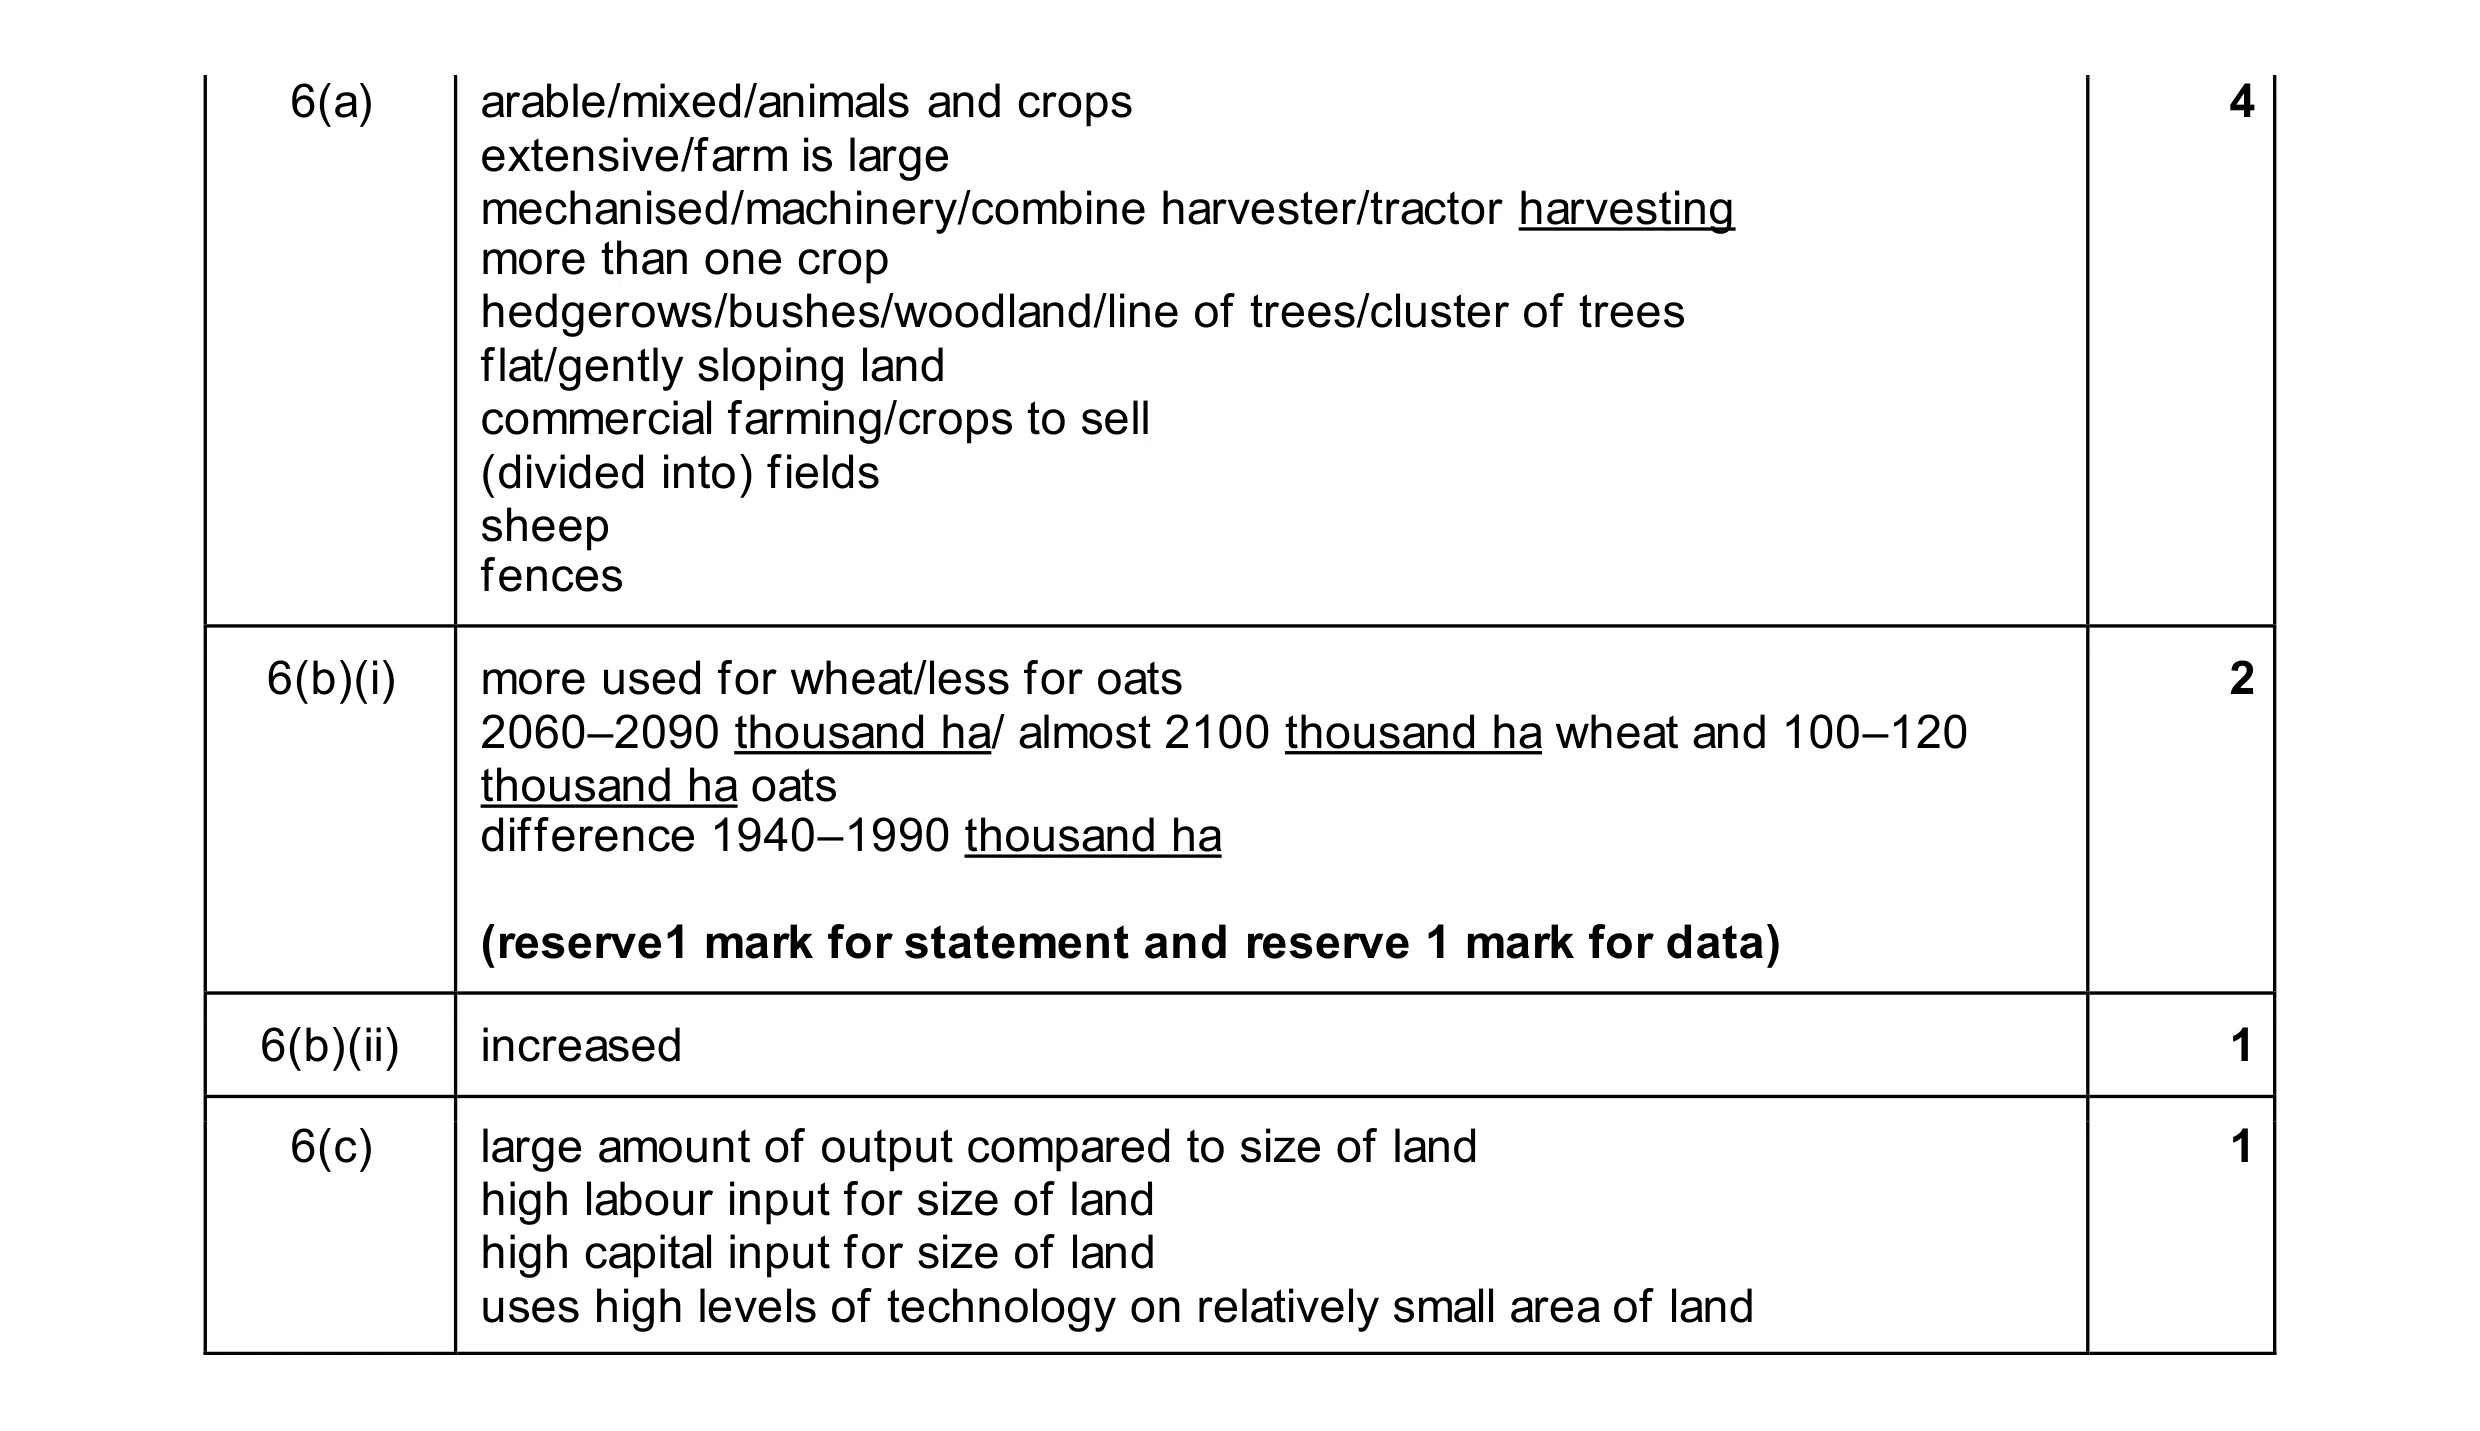 8
8