Cambridge IGCSE Geography 0460 — 2019 Feb/March Paper 2 · Variant 2
0460/22/F/M/19 · 6 questions · 60 marks · ≈68 min
The question paper and its mark scheme, free to read here and free to download. This is Cambridge’s own paper, exactly as it was sat.
Question paper20 pages



Mark scheme6 pages
Answers below. Sit the paper first if you are practising.
Questions as text
Q1 · Study the map extract for Åhus, Sweden
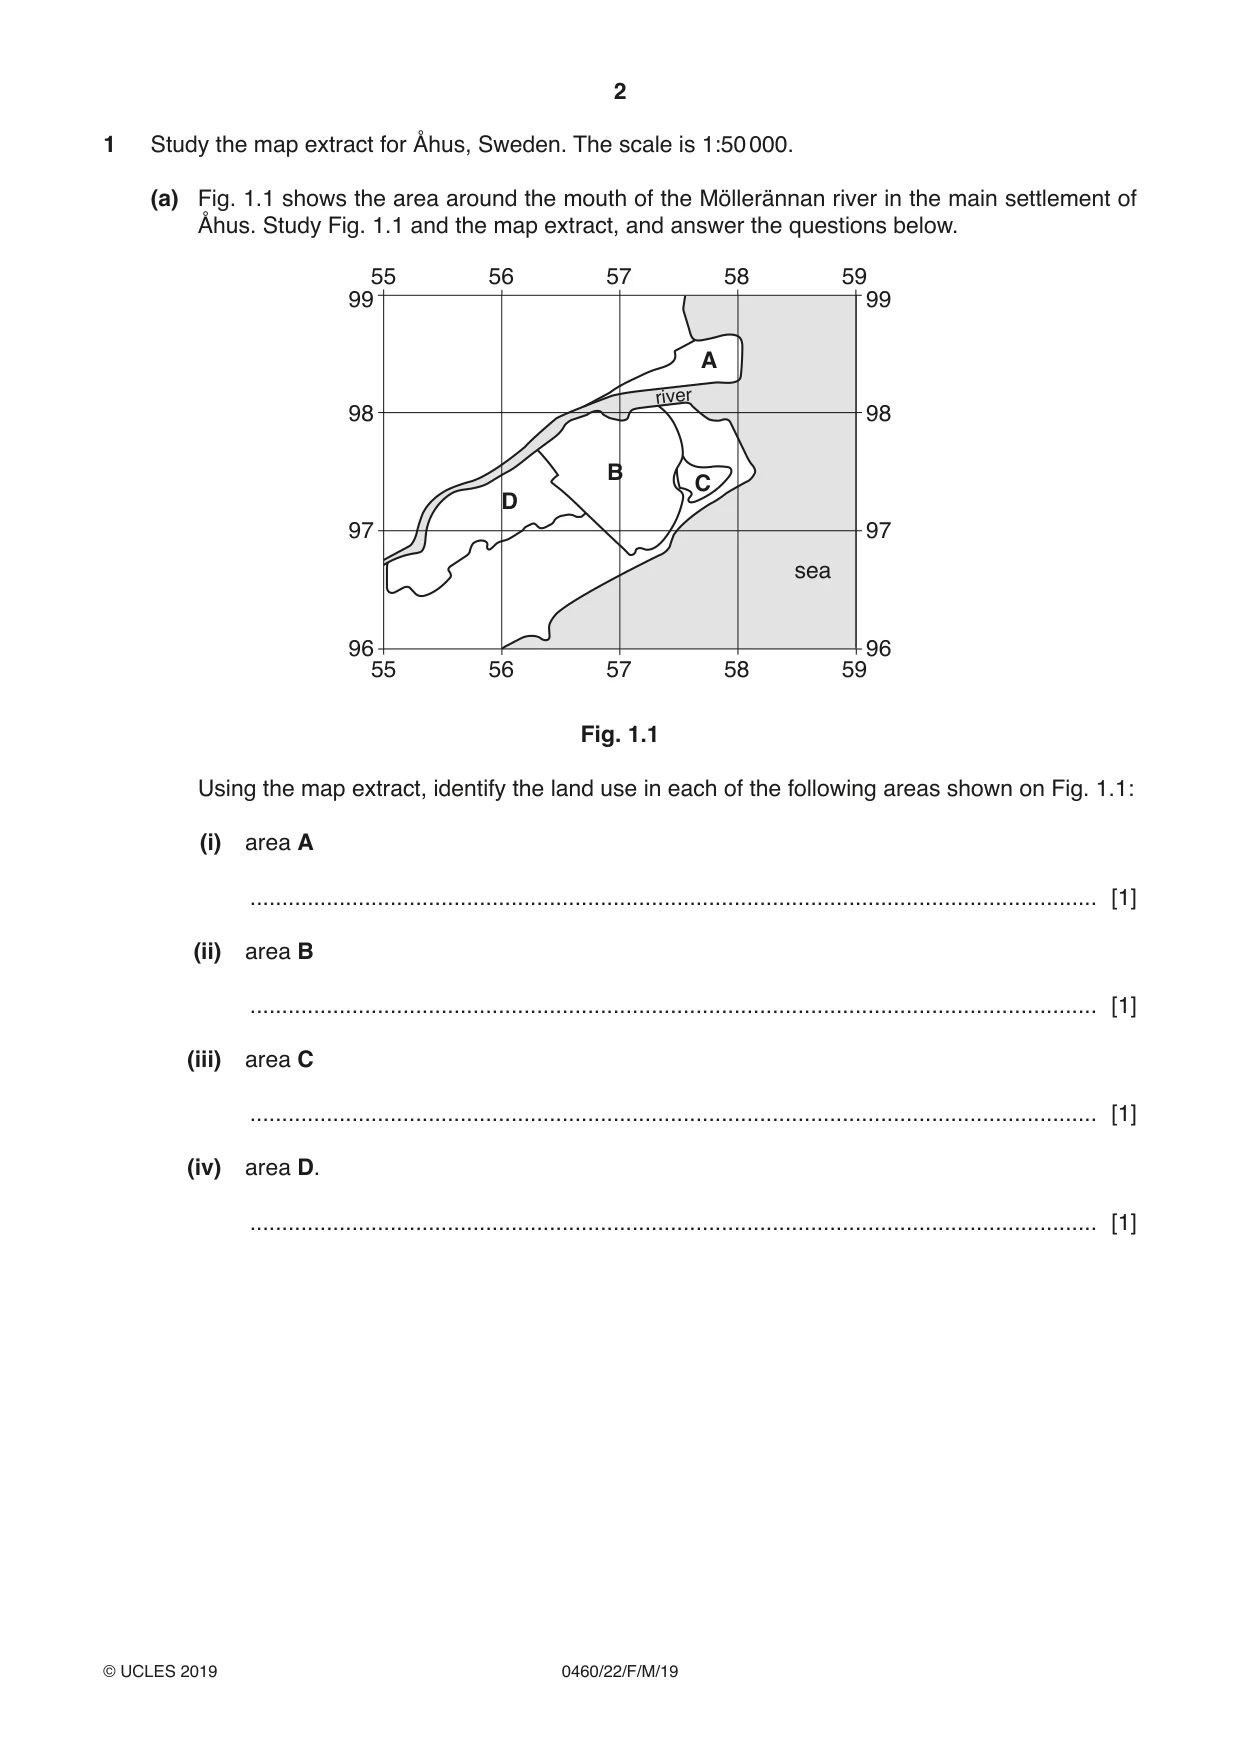
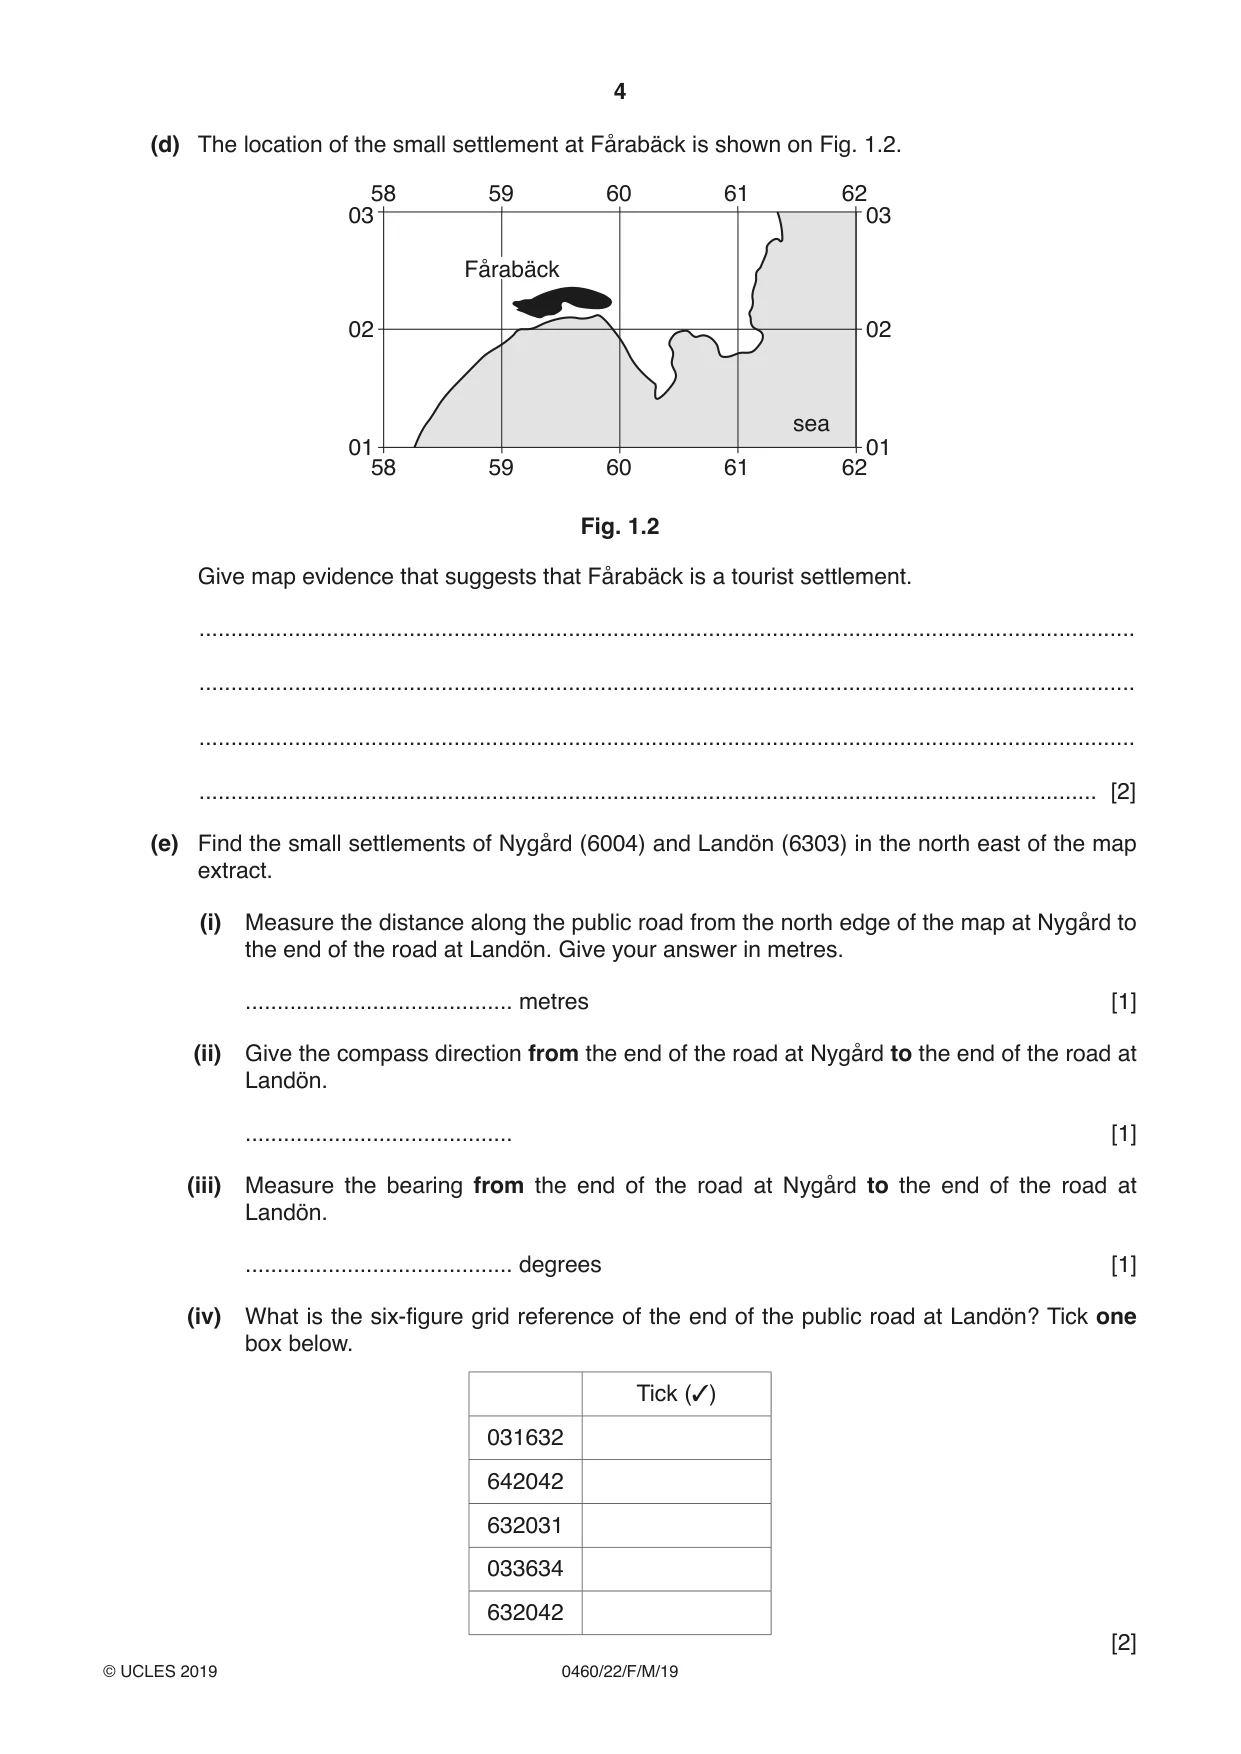
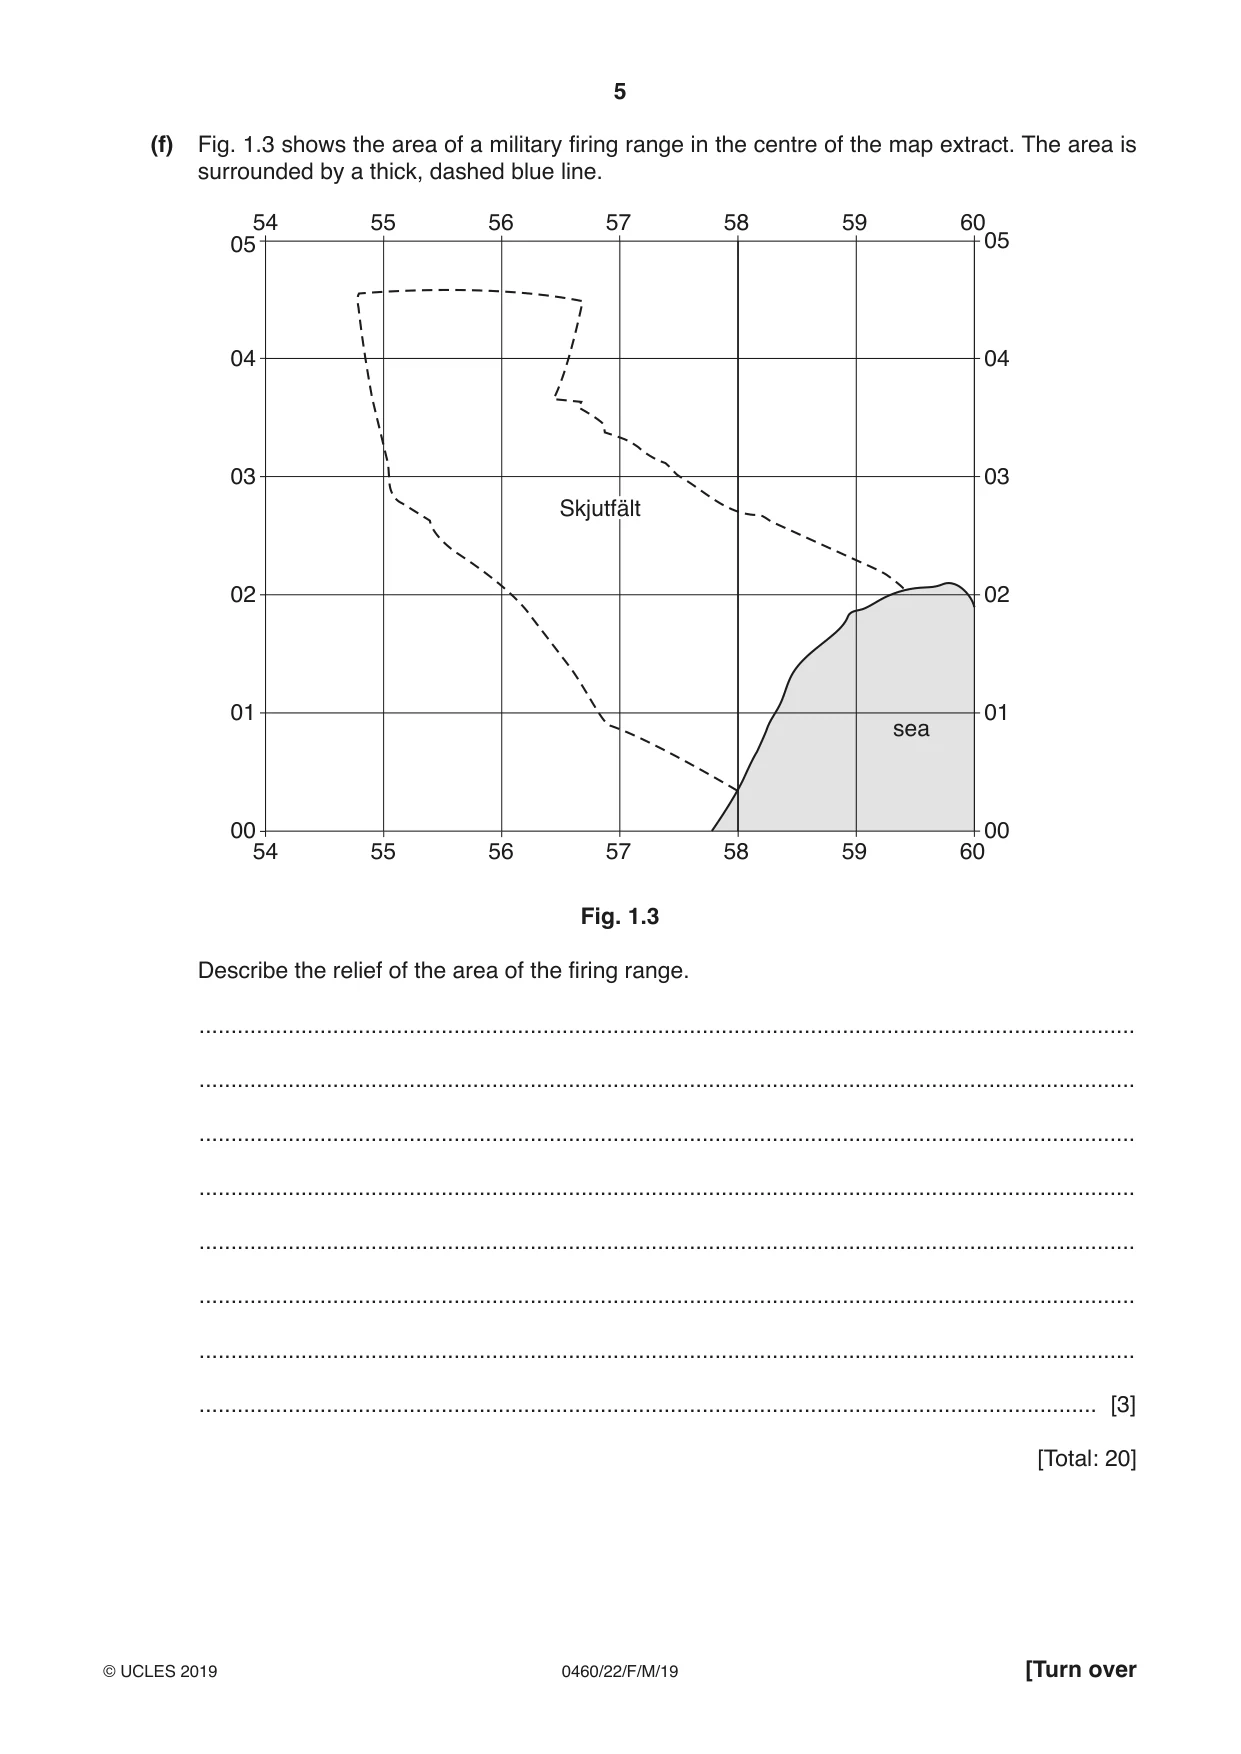
1 Study the map extract for Åhus, Sweden. The scale is 1:50 000. (a) Fig. 1.1 shows the area around the mouth of the Möllerännan river in the main settlement of Åhus. Study Fig. 1.1 and the map extract, and answer the questions below. 55 56 57 58 59 99 99 A river 98 98 B C D 97 97 sea 96 96 55 56 57 58 59 Fig. 1.1 Using the map extract, identify the land use in each of the following areas shown on Fig. 1.1: (i) area A ..................................................................................................................................... [1] (ii) area B ..................................................................................................................................... [1] (iii) area C ..................................................................................................................................... [1] (iv) area D. ..................................................................................................................................... [1] (b) Look at the Möllerännan river in the south west of the map extract. Describe the human and physical features of the river. ................................................................................................................................................... ................................................................................................................................................... ................................................................................................................................................... ................................................................................................................................................... ................................................................................................................................................... ................................................................................................................................................... ................................................................................................................................................... ................................................................................................................................................... ............................................................................................................................................. [4] (c) Describe the shape of the coastline between the main settlement at Åhus and the north edge of the map. ................................................................................................................................................... ................................................................................................................................................... ................................................................................................................................................... ................................................................................................................................................... ................................................................................................................................................... ............................................................................................................................................. [2] (d) The location of the small settlement at Fårabäck is shown on Fig. 1.2. 58 59 60 61 62 03 03 Fårabäck 02 02 sea 01 01 58 59 60 61 62 Fig. 1.2 Give map evidence that suggests that Fårabäck is a tourist settlement. ................................................................................................................................................... ................................................................................................................................................... ................................................................................................................................................... ............................................................................................................................................. [2] (e) Find the small settlements of Nygård (6004) and Landön (6303) in the north east of the map extract. (i) Measure the distance along the public road from the north edge of the map at Nygård to the end of the road at Landön. Give your answer in metres. .......................................... metres [1] (ii) Give the compass direction from the end of the road at Nygård to the end of the road at Landön. .......................................... [1] (iii) Measure the bearing from the end of the road at Nygård to the end of the road at Landön. .......................................... degrees [1] (iv) What is the six-figure grid reference of the end of the public road at Landön? Tick one box below. Tick (✓) 031632 642042 632031 033634 632042 [2] (f) Fig. 1.3 shows the area of a military firing range in the centre of the map extract. The area is surrounded by a thick, dashed blue line. 54 55 56 57 58 59 6005 05 04 04 03 03 Skjutfält 02 02 01 01 sea 00 00 54 55 56 57 58 59 60 Fig. 1.3 Describe the relief of the area of the firing range. ................................................................................................................................................... ................................................................................................................................................... ................................................................................................................................................... ................................................................................................................................................... ................................................................................................................................................... ................................................................................................................................................... ................................................................................................................................................... ............................................................................................................................................. [3] [Total: 20]
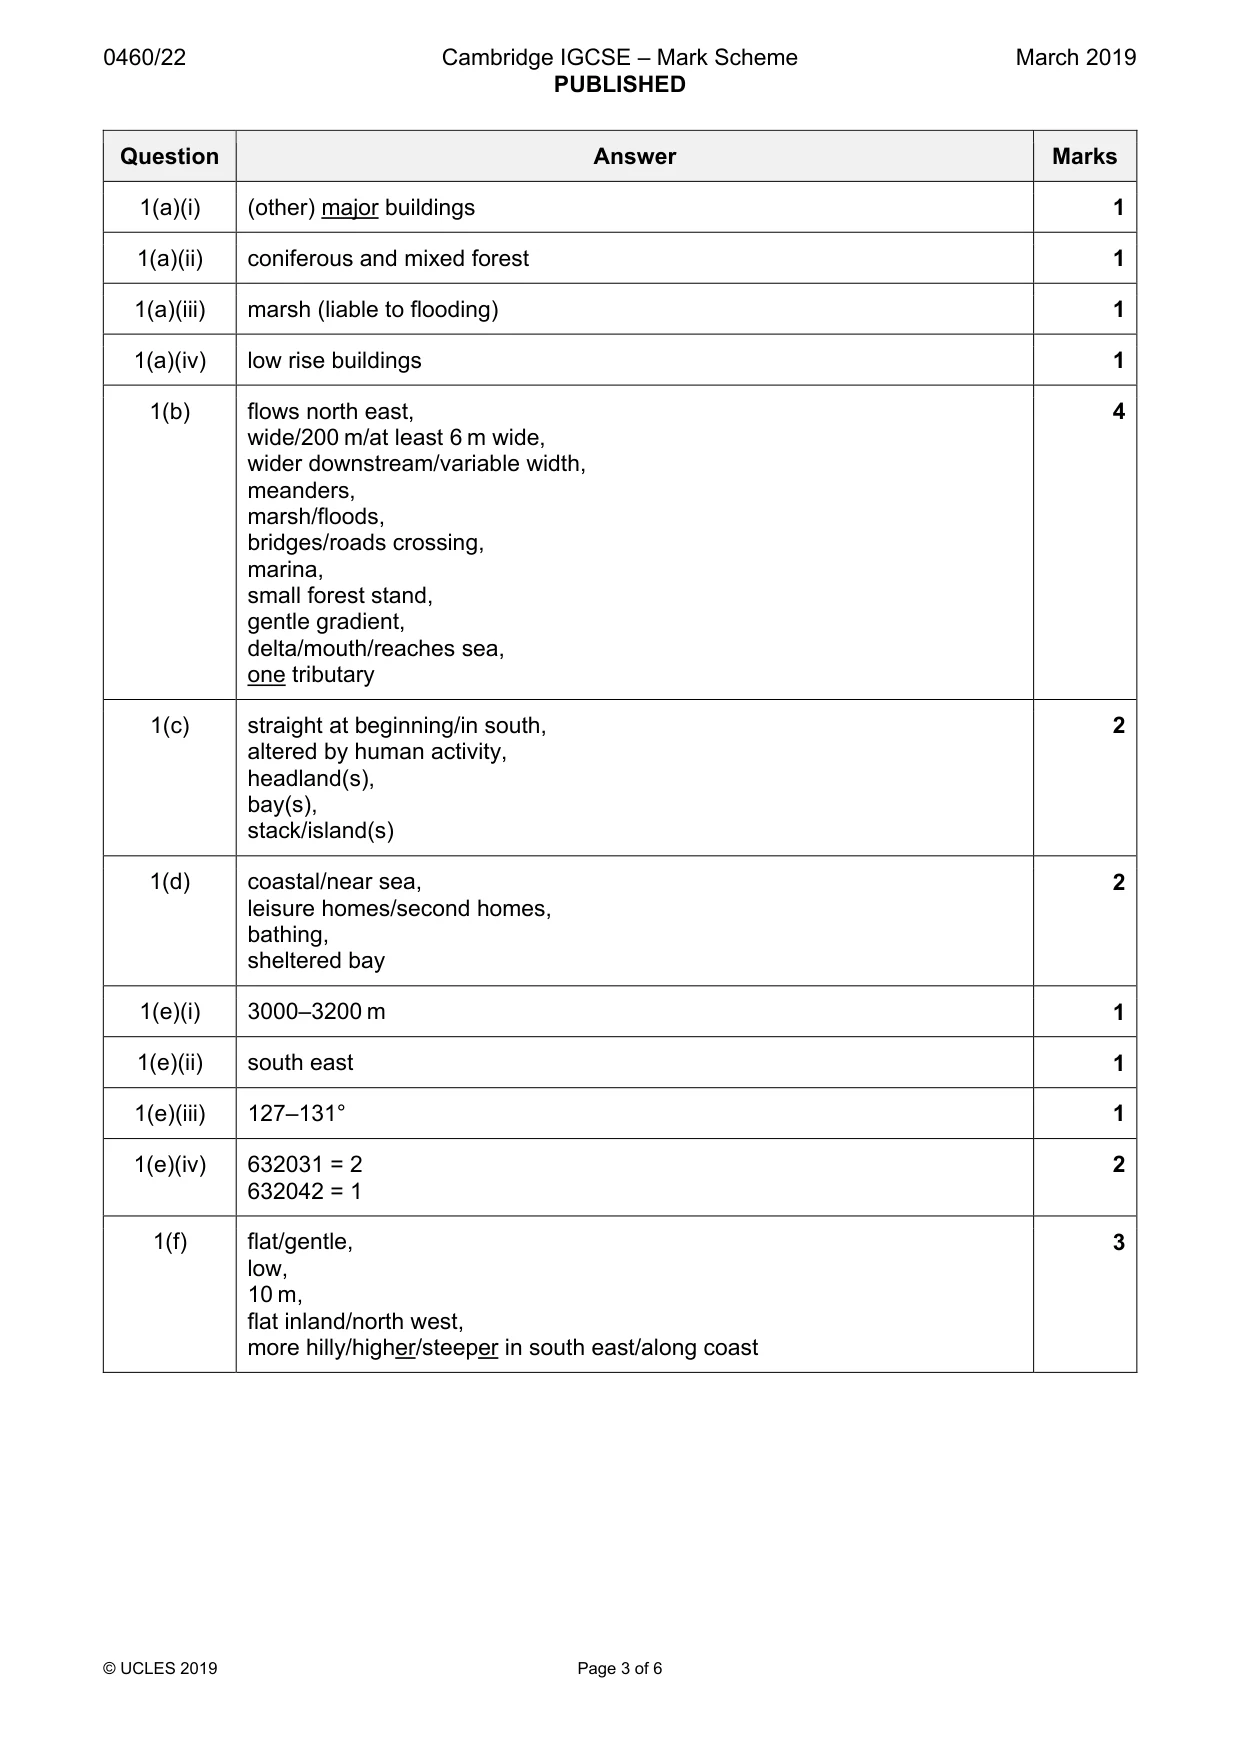
Mark scheme: Question Answer Marks 1(a)(i) (other) major buildings 1 1(a)(ii) coniferous and mixed forest 1 1(a)(iii) marsh (liable to flooding) 1 1(a)(iv) low rise buildings 1 1(b) flows north east, 4 wide/200 m/at least 6 m wide, wider downstream/variable width, meanders, marsh/floods, bridges/roads crossing, marina, small forest stand, gentle gradient, delta/mouth/reaches sea, one tributary 1(c) straight at beginning/in south, 2 altered by human activity, headland(s), bay(s), stack/island(s) 1(d) coastal/near sea, 2 leisure homes/second homes, bathing, sheltered bay 1(e)(i) 3000–3200 m 1 1(e)(ii) south east 1 1(e)(iii) 127–131° 1 1(e)(iv) 632031 = 2 2 632042 = 1 1(f) flat/gentle, 3 low, 10 m, flat inland/north west, more hilly/higher/steeper in south east/along coast
More questions on Settlements (rural and urban) and service provision
Q2 · Population migration to and from California, USA, between 2001 and 2013
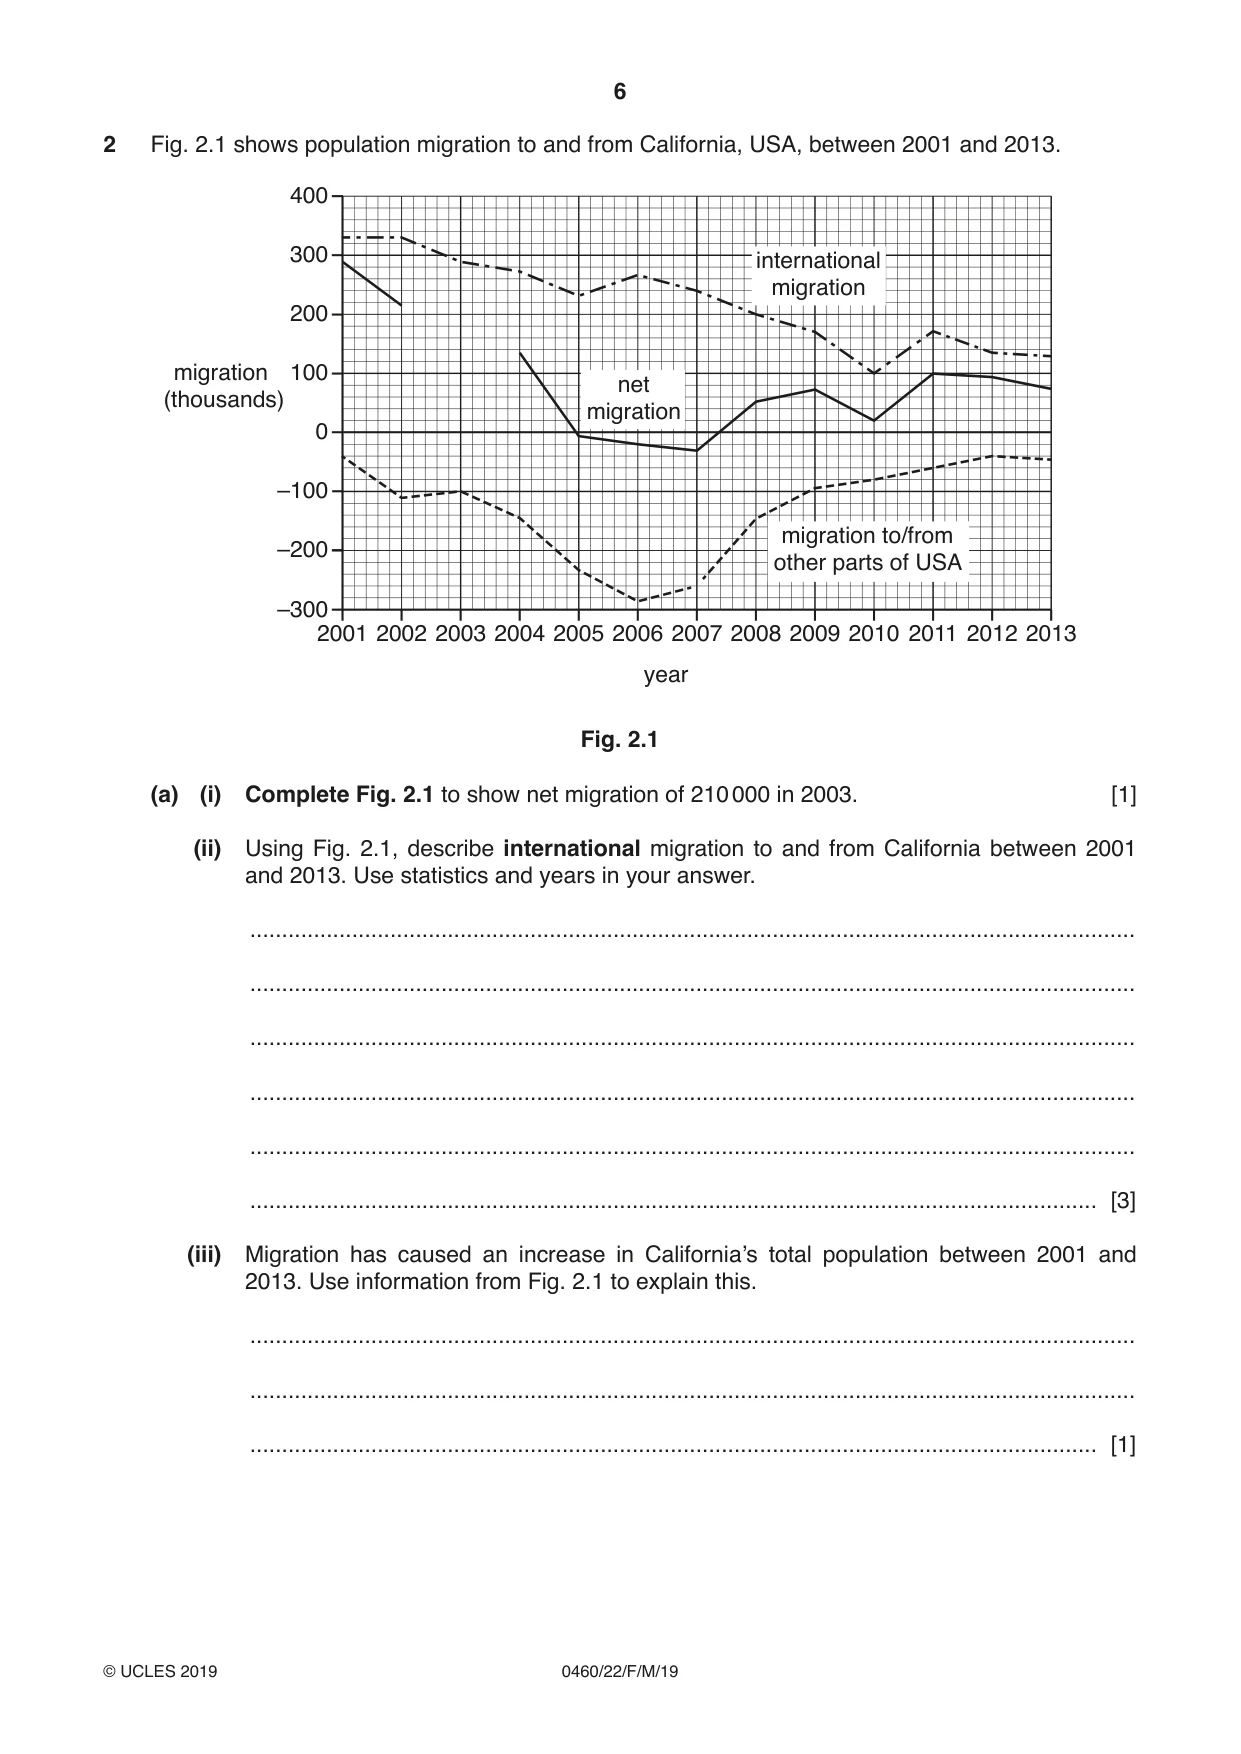
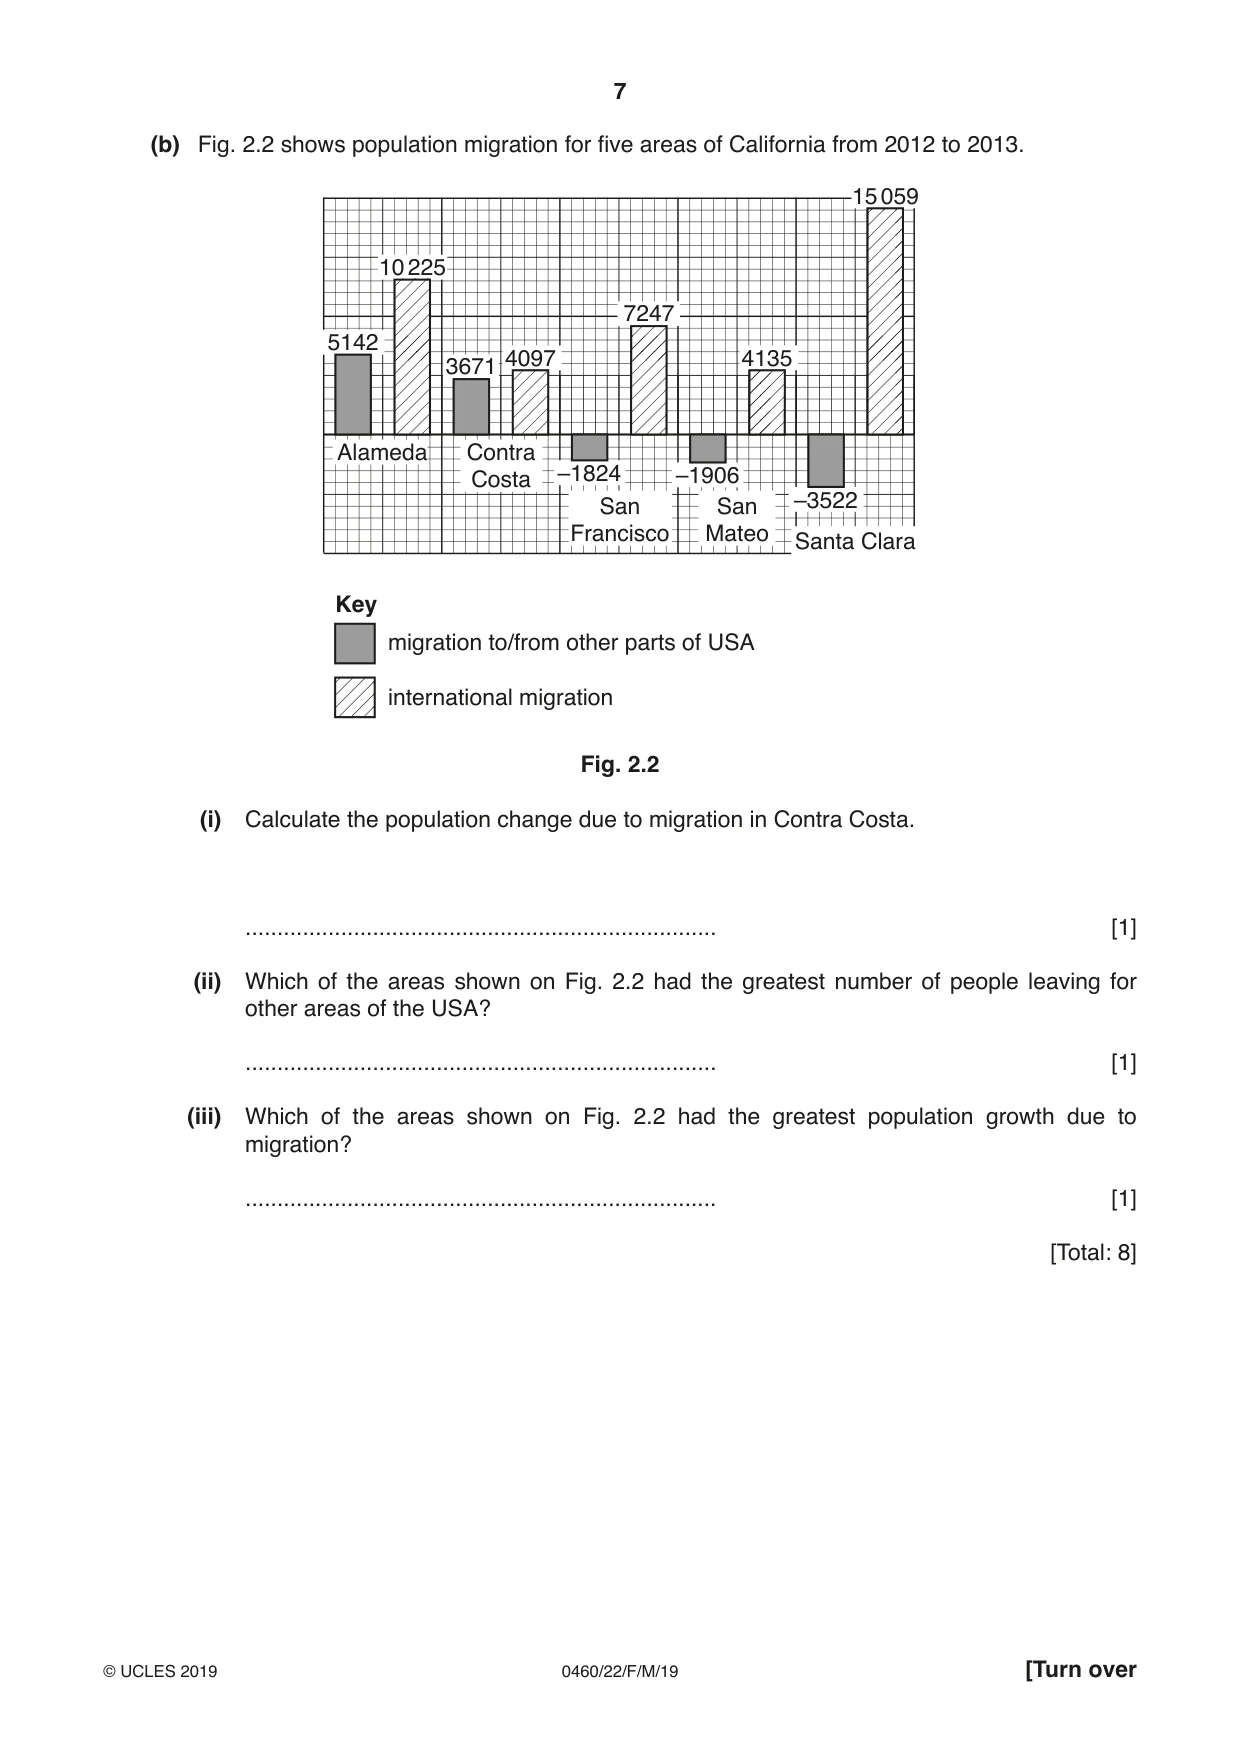
2 Fig. 2.1 shows population migration to and from California, USA, between 2001 and 2013. 400 300 international migration 200 migration 100 net (thousands) migration 0 –100 migration to/from –200 other parts of USA –300 2001 2002 2003 2004 2005 2006 2007 2008 2009 2010 2011 2012 2013 year Fig. 2.1 (a) (i) Complete Fig. 2.1 to show net migration of 210 000 in 2003. [1] (ii) Using Fig. 2.1, describe international migration to and from California between 2001 and 2013. Use statistics and years in your answer. ........................................................................................................................................... ........................................................................................................................................... ........................................................................................................................................... ........................................................................................................................................... ........................................................................................................................................... ..................................................................................................................................... [3] (iii) Migration has caused an increase in California’s total population between 2001 and 2013. Use information from Fig. 2.1 to explain this. ........................................................................................................................................... ........................................................................................................................................... ..................................................................................................................................... [1] (b) Fig. 2.2 shows population migration for five areas of California from 2012 to 2013. 15 059 10 225 7247 5142 4097 4135 3671 Alameda Contra –1824 –1906 Costa San San –3522 Francisco Mateo Santa Clara Key migration to/from other parts of USA international migration Fig. 2.2 (i) Calculate the population change due to migration in Contra Costa. .......................................................................... [1] (ii) Which of the areas shown on Fig. 2.2 had the greatest number of people leaving for other areas of the USA? .......................................................................... [1] (iii) Which of the areas shown on Fig. 2.2 had the greatest population growth due to migration? .......................................................................... [1] [Total: 8]
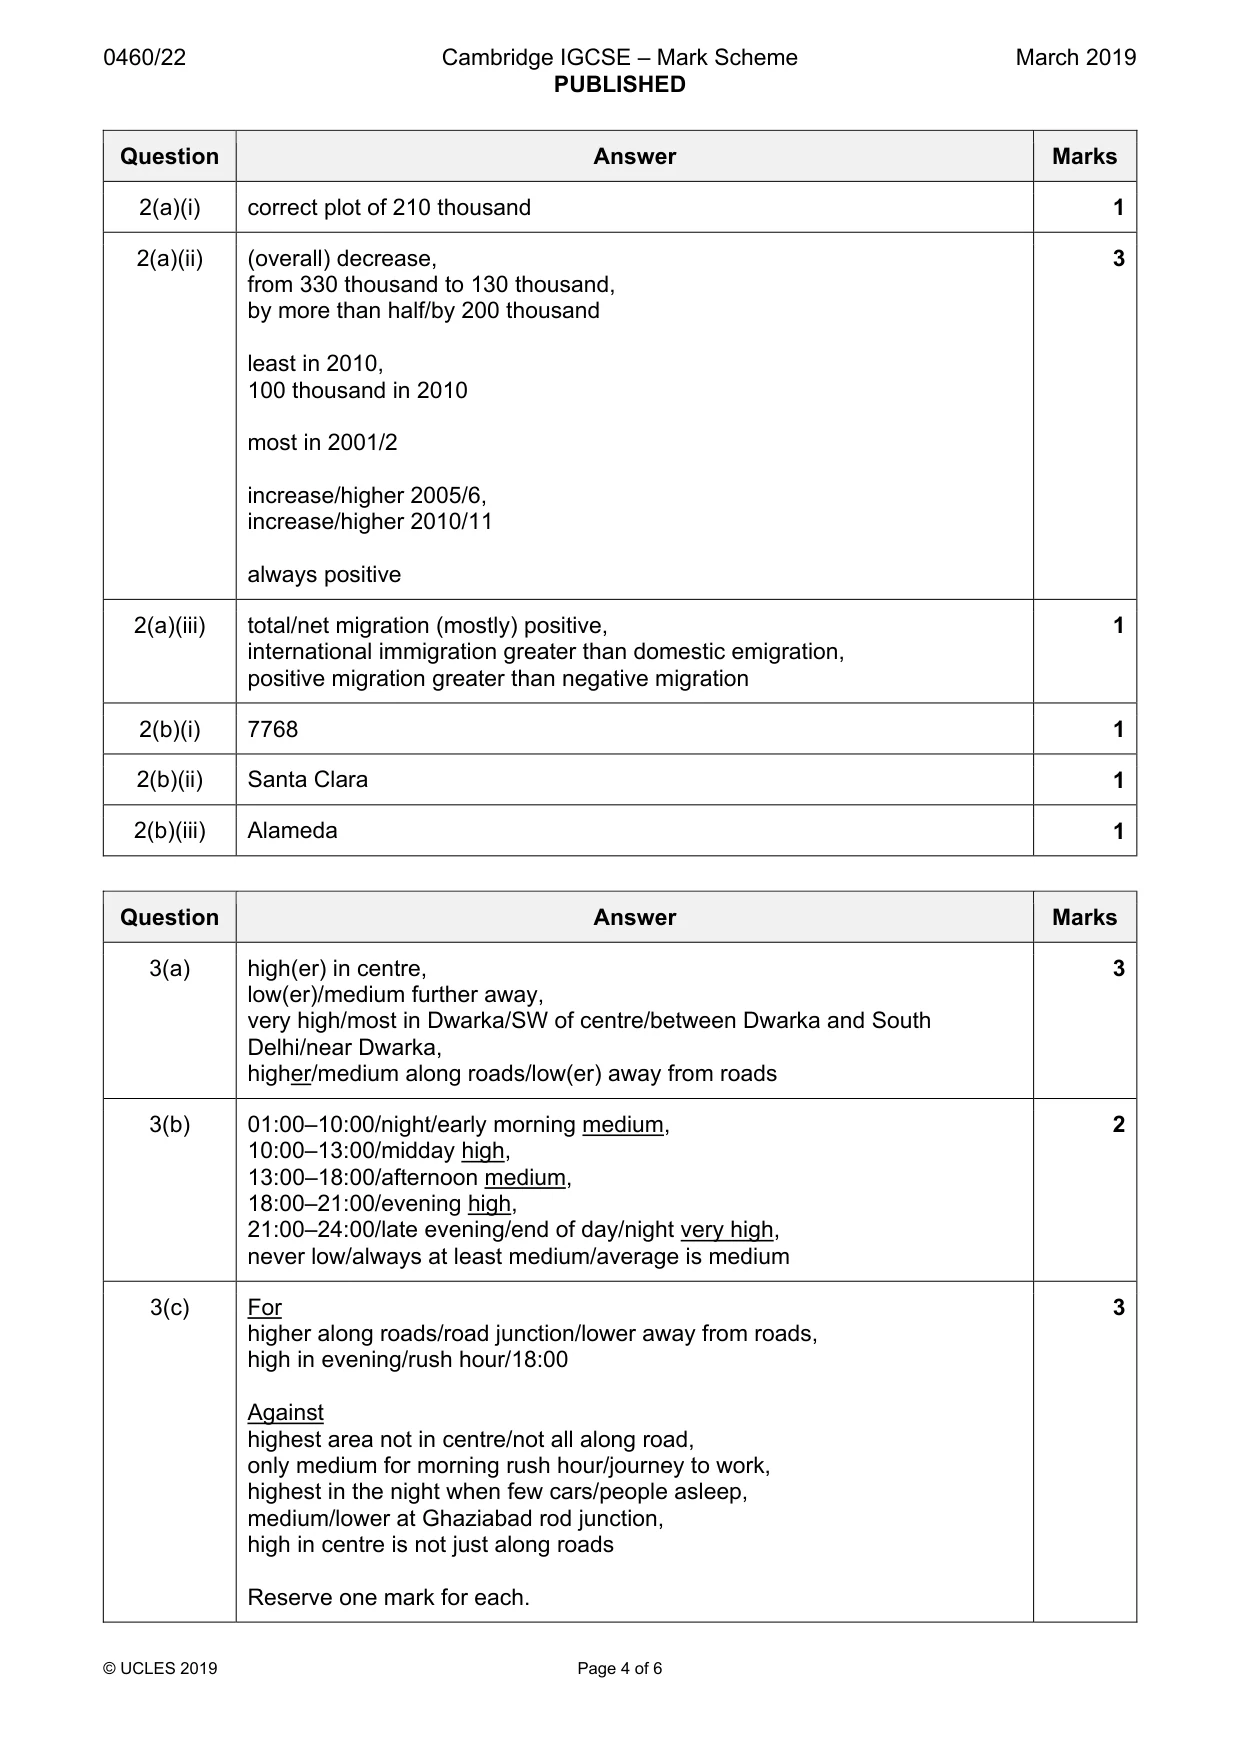
Mark scheme: 2(a)(i) correct plot of 210 thousand 1 2(a)(ii) (overall) decrease, 3 from 330 thousand to 130 thousand, by more than half/by 200 thousand least in 2010, 100 thousand in 2010 most in 2001/2 increase/higher 2005/6, increase/higher 2010/11 always positive 2(a)(iii) total/net migration (mostly) positive, 1 international immigration greater than domestic emigration, positive migration greater than negative migration 2(b)(i) 7768 1 2(b)(ii) Santa Clara 1 2(b)(iii) Alameda 1
Q3 · Air pollution by fine particles in the area around Delhi for one day
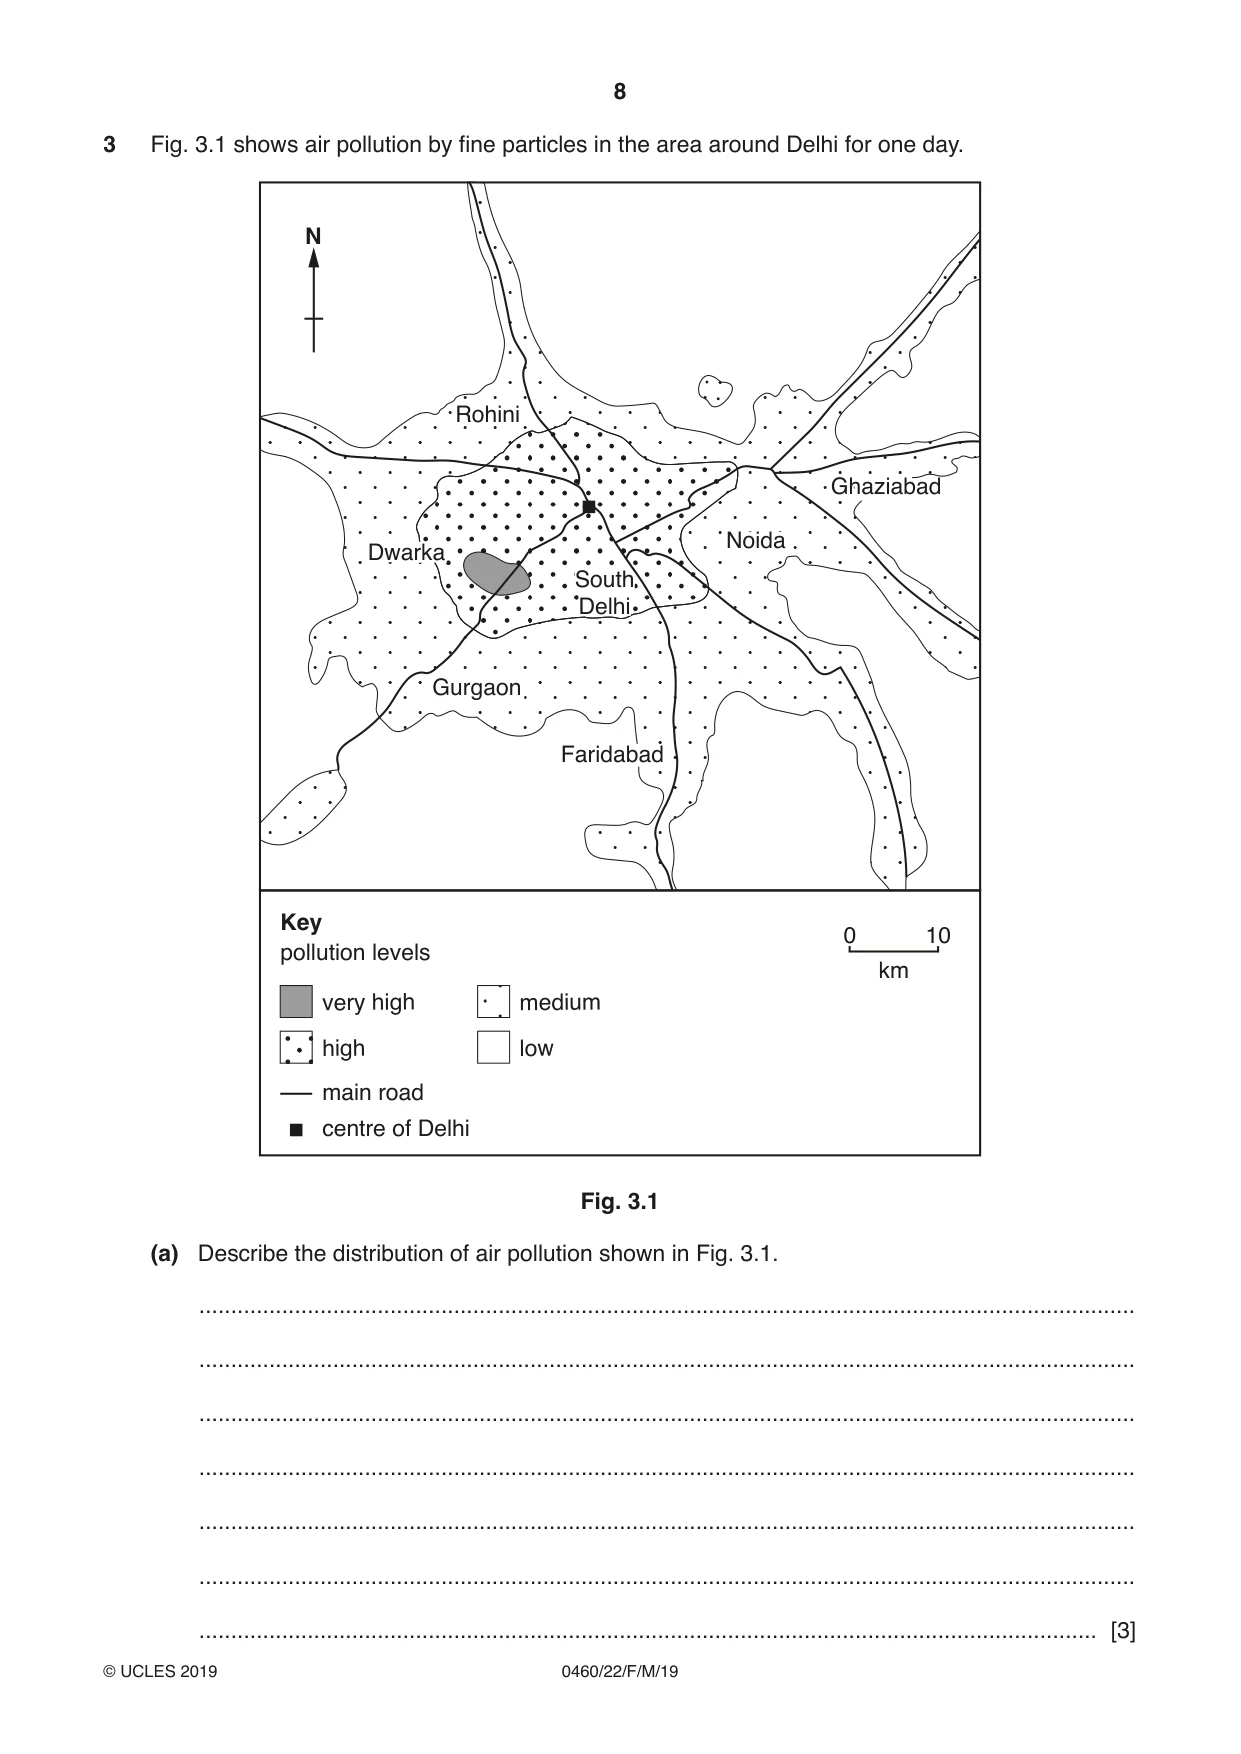
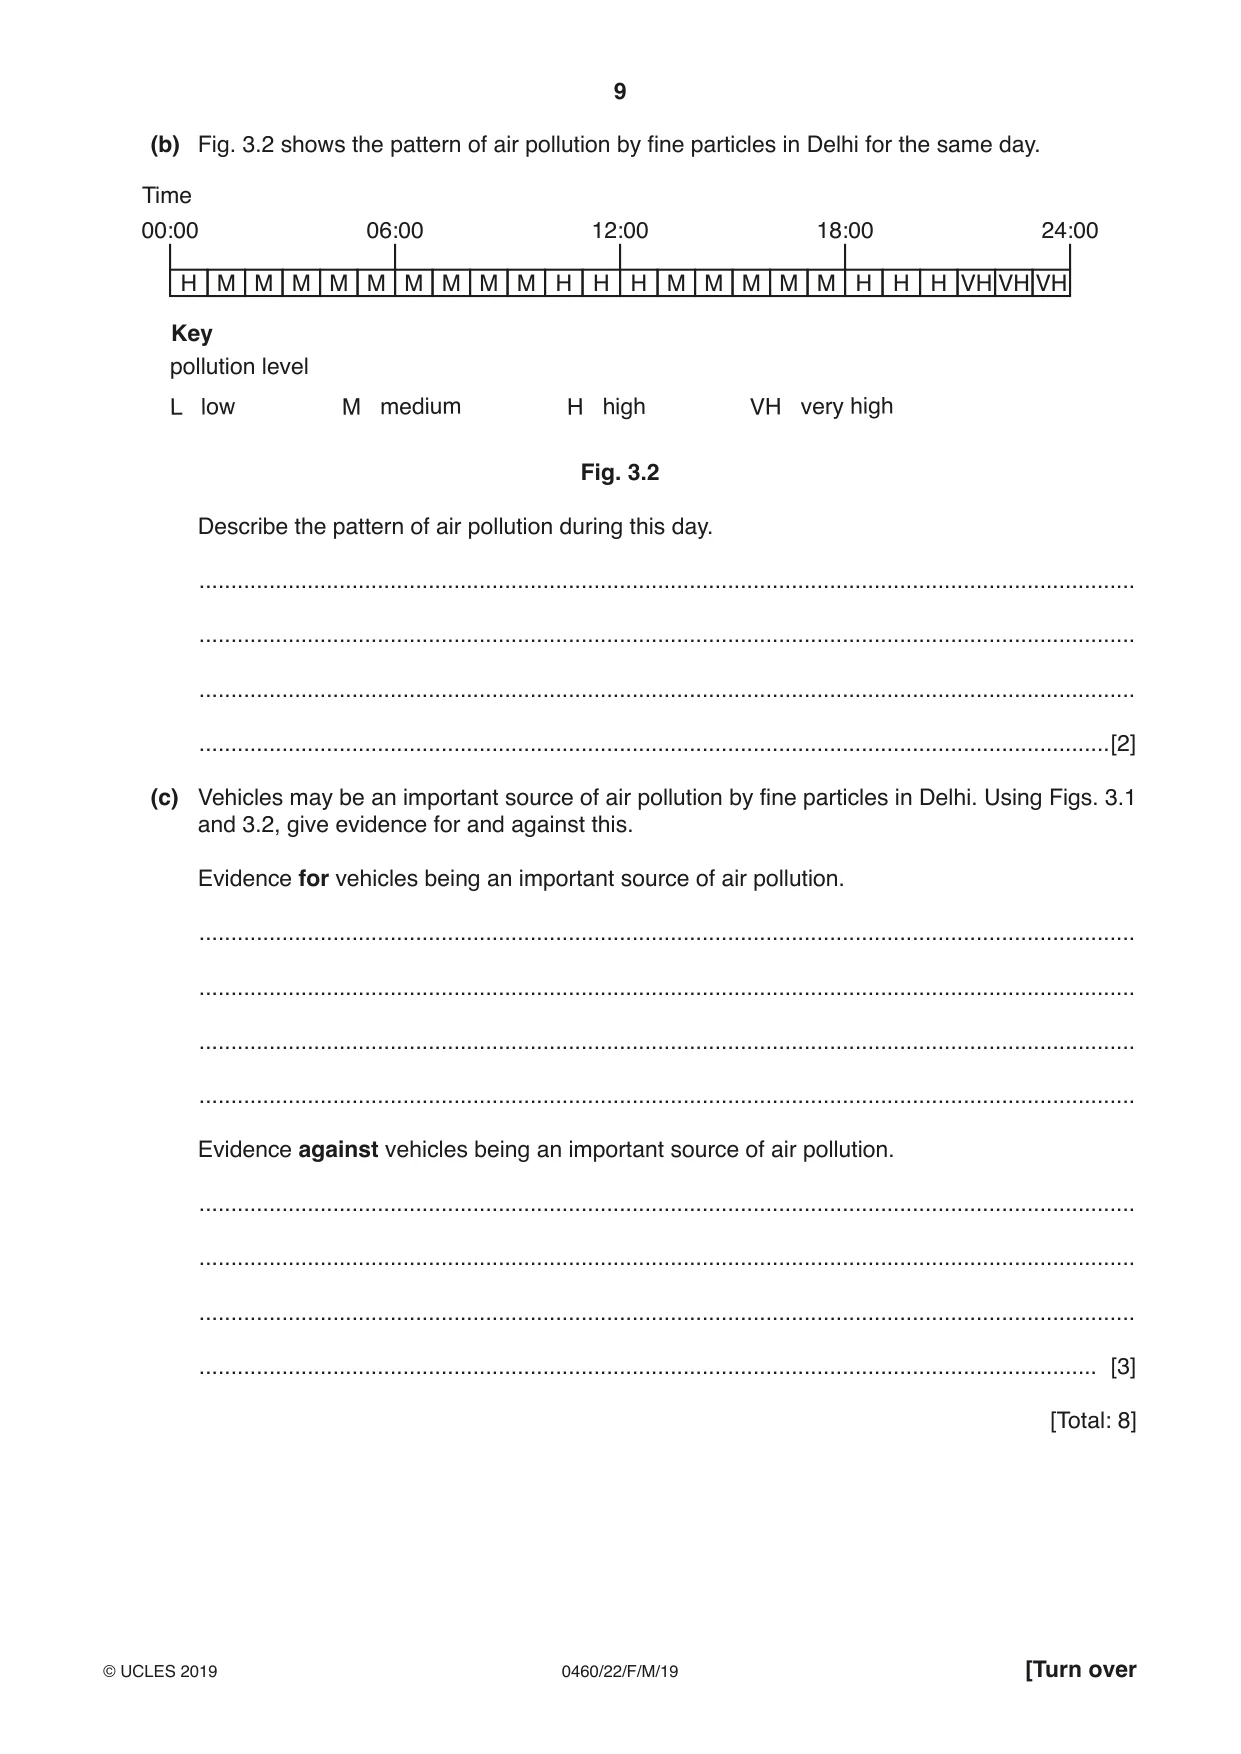
3 Fig. 3.1 shows air pollution by fine particles in the area around Delhi for one day. N Rohini Ghaziabad Noida Dwarka South Delhi Gurgaon Faridabad Key 0 10 pollution levels km very high medium high low main road centre of Delhi Fig. 3.1 (a) Describe the distribution of air pollution shown in Fig. 3.1. ................................................................................................................................................... ................................................................................................................................................... ................................................................................................................................................... ................................................................................................................................................... ................................................................................................................................................... ................................................................................................................................................... ............................................................................................................................................. [3] (b) Fig. 3.2 shows the pattern of air pollution by fine particles in Delhi for the same day. Time 00:00 06:00 12:00 18:00 24:00 H M M M M M M M M M H H H M M M M M H H H VH VH VH Key pollution level L low M medium H high VH very high Fig. 3.2 Describe the pattern of air pollution during this day. ................................................................................................................................................... ................................................................................................................................................... ................................................................................................................................................... ...............................................................................................................................................[2] (c) Vehicles may be an important source of air pollution by fine particles in Delhi. Using Figs. 3.1 and 3.2, give evidence for and against this. Evidence for vehicles being an important source of air pollution. ................................................................................................................................................... ................................................................................................................................................... ................................................................................................................................................... ................................................................................................................................................... Evidence against vehicles being an important source of air pollution. ................................................................................................................................................... ................................................................................................................................................... ................................................................................................................................................... ............................................................................................................................................. [3] [Total: 8]
Mark scheme: 3(a) high(er) in centre, 3 low(er)/medium further away, very high/most in Dwarka/SW of centre/between Dwarka and South Delhi/near Dwarka, higher/medium along roads/low(er) away from roads 3(b) 01:00–10:00/night/early morning medium, 2 10:00–13:00/midday high, 13:00–18:00/afternoon medium, 18:00–21:00/evening high, 21:00–24:00/late evening/end of day/night very high, never low/always at least medium/average is medium 3(c) For 3 higher along roads/road junction/lower away from roads, high in evening/rush hour/18:00 Against highest area not in centre/not all along road, only medium for morning rush hour/journey to work, highest in the night when few cars/people asleep, medium/lower at Ghaziabad rod junction, high in centre is not just along roads Reserve one mark for each.
More questions on Environmental risks of economic development
Q4 · Name the following processes which operate in a drainage basin
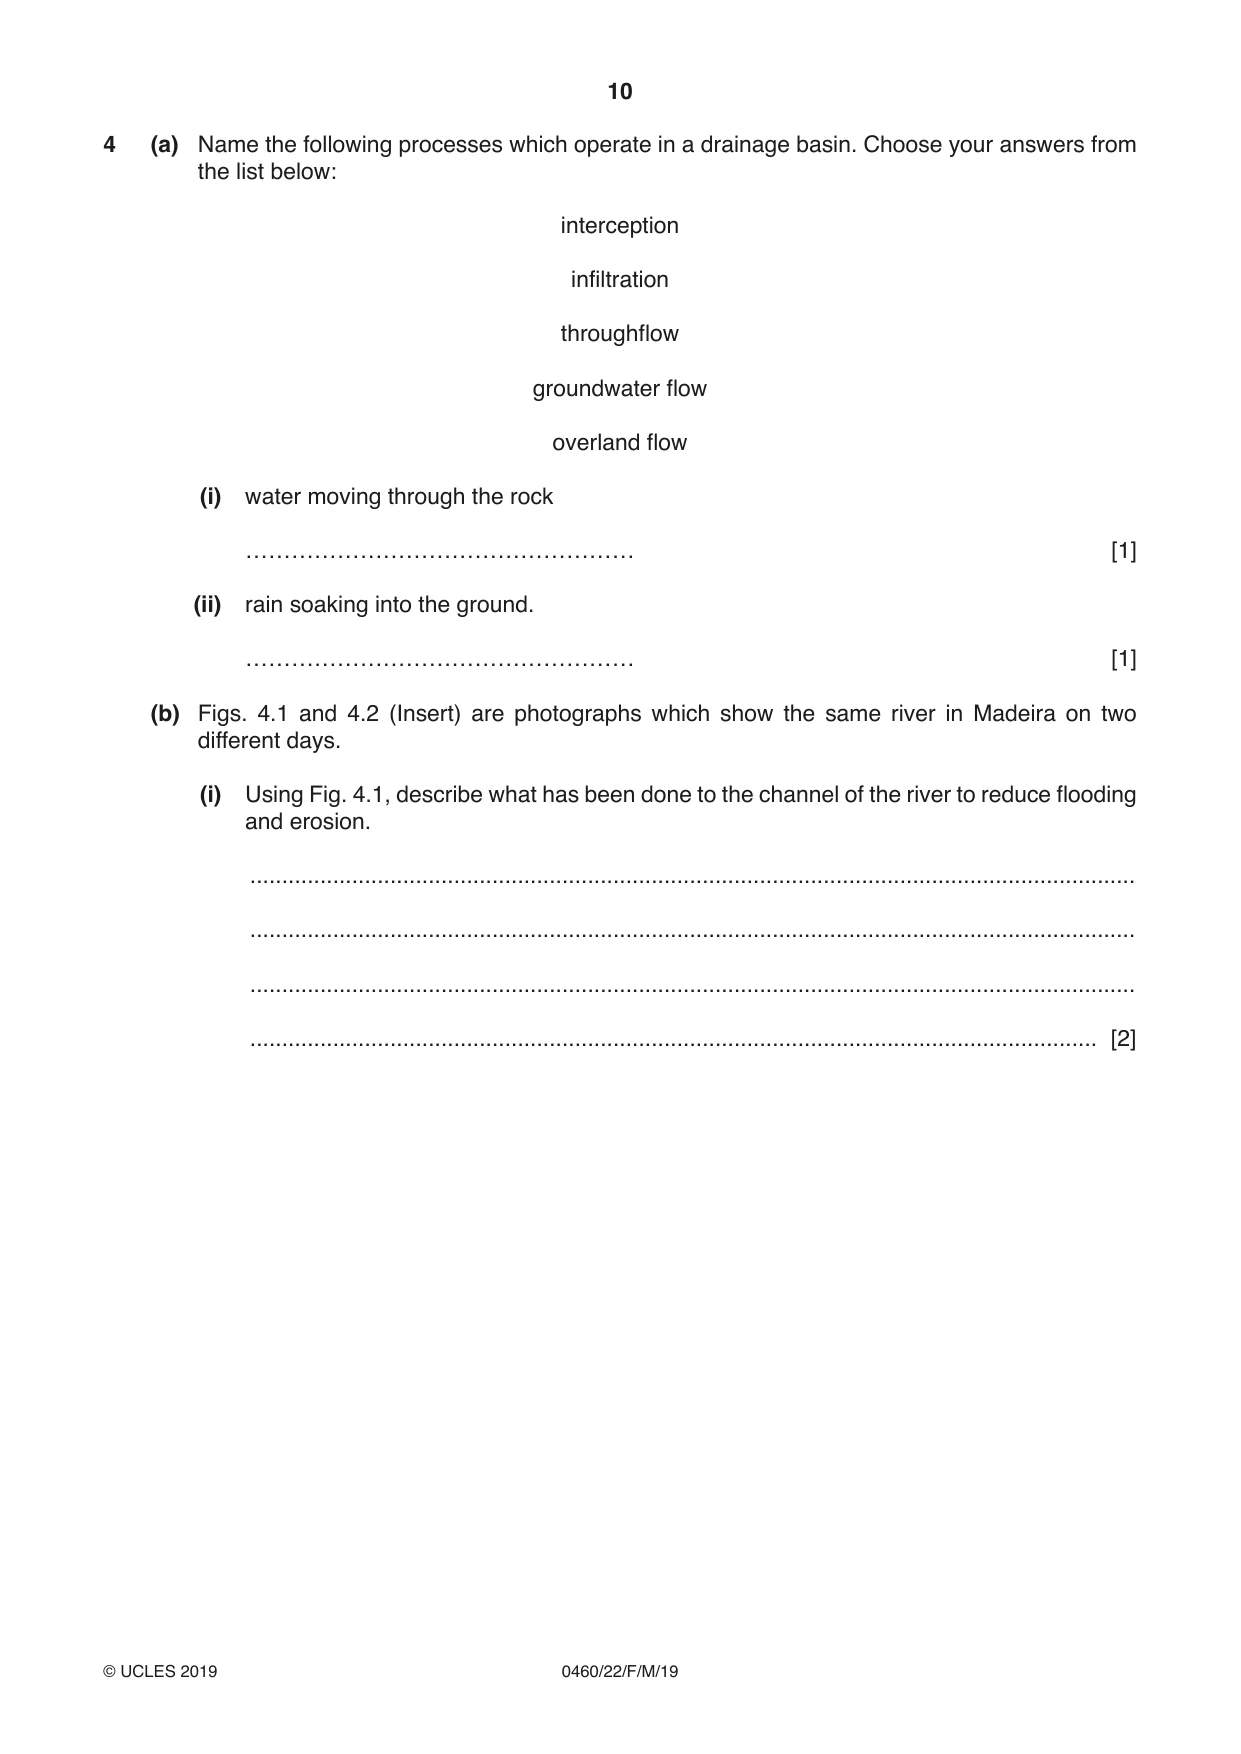
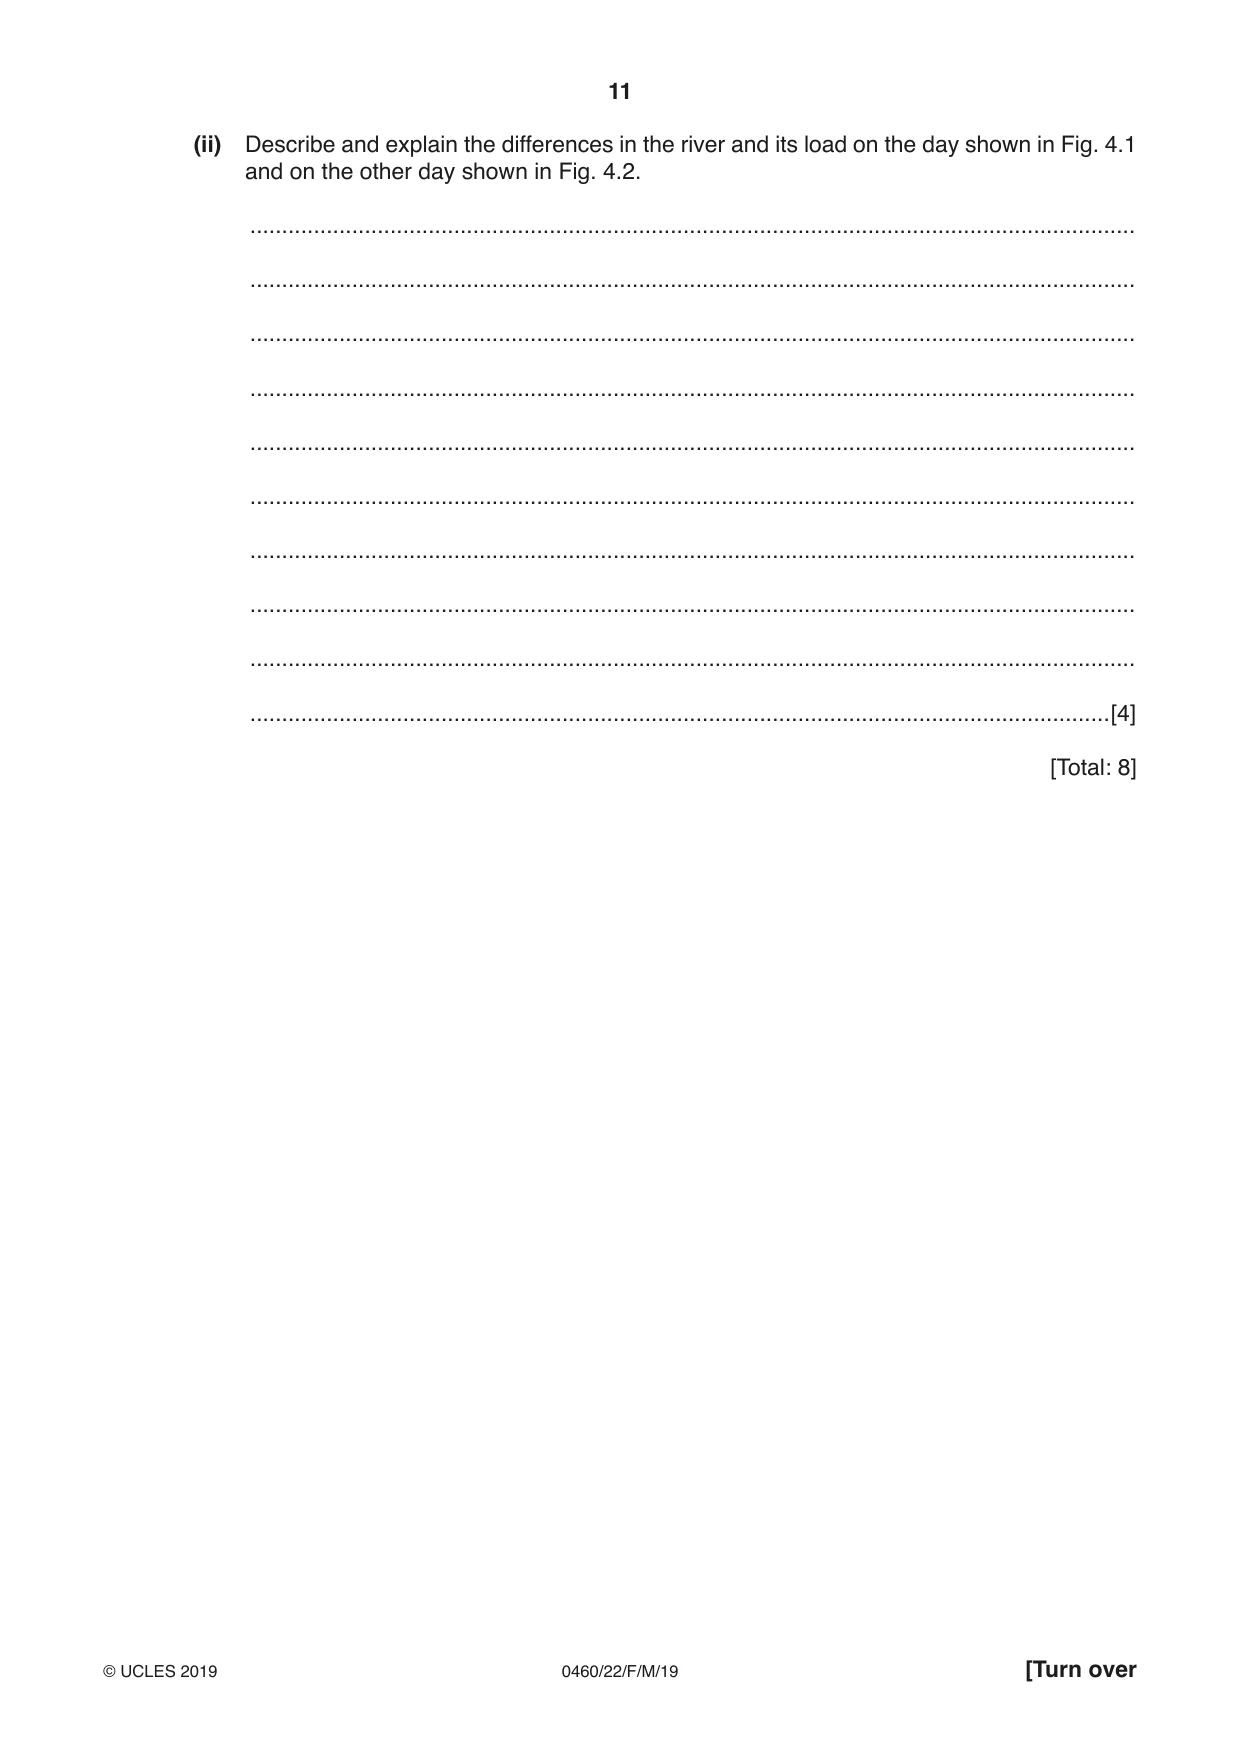
4 (a) Name the following processes which operate in a drainage basin. Choose your answers from the list below: interception infiltration throughflow groundwater flow overland flow (i) water moving through the rock [1] (ii) rain soaking into the ground. [1] (b) Figs. 4.1 and 4.2 (Insert) are photographs which show the same river in Madeira on two different days. (i) Using Fig. 4.1, describe what has been done to the channel of the river to reduce flooding and erosion. ........................................................................................................................................... ........................................................................................................................................... ........................................................................................................................................... ..................................................................................................................................... [2] (ii) Describe and explain the differences in the river and its load on the day shown in Fig. 4.1 and on the other day shown in Fig. 4.2. ........................................................................................................................................... ........................................................................................................................................... ........................................................................................................................................... ........................................................................................................................................... ........................................................................................................................................... ........................................................................................................................................... ........................................................................................................................................... ........................................................................................................................................... ........................................................................................................................................... .......................................................................................................................................[4] [Total: 8]
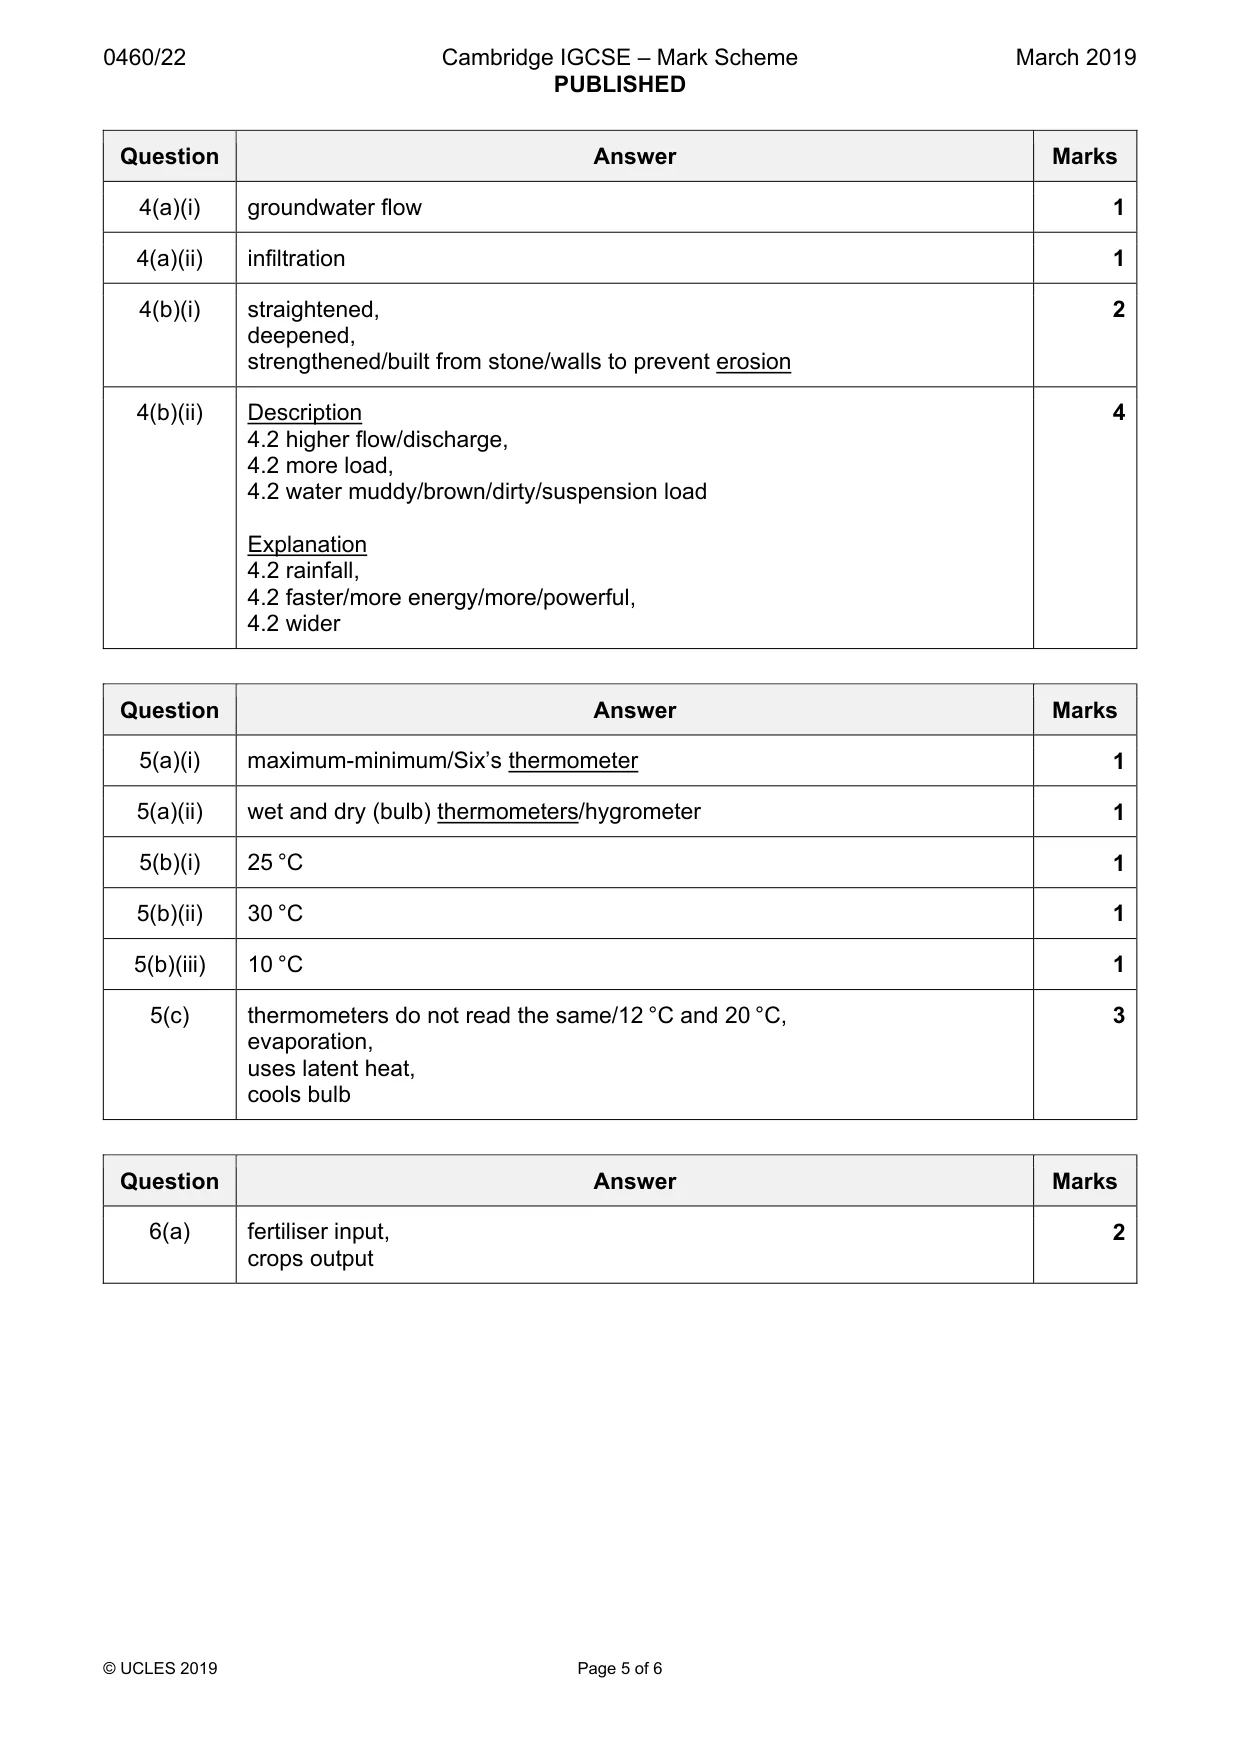
Mark scheme: 4(a)(i) groundwater flow 1 4(a)(ii) infiltration 1 4(b)(i) straightened, 2 deepened, strengthened/built from stone/walls to prevent erosion 4(b)(ii) Description 4 4.2 higher flow/discharge, 4.2 more load, 4.2 water muddy/brown/dirty/suspension load Explanation 4.2 rainfall, 4.2 faster/more energy/more/powerful, 4.2 wider
Question 5
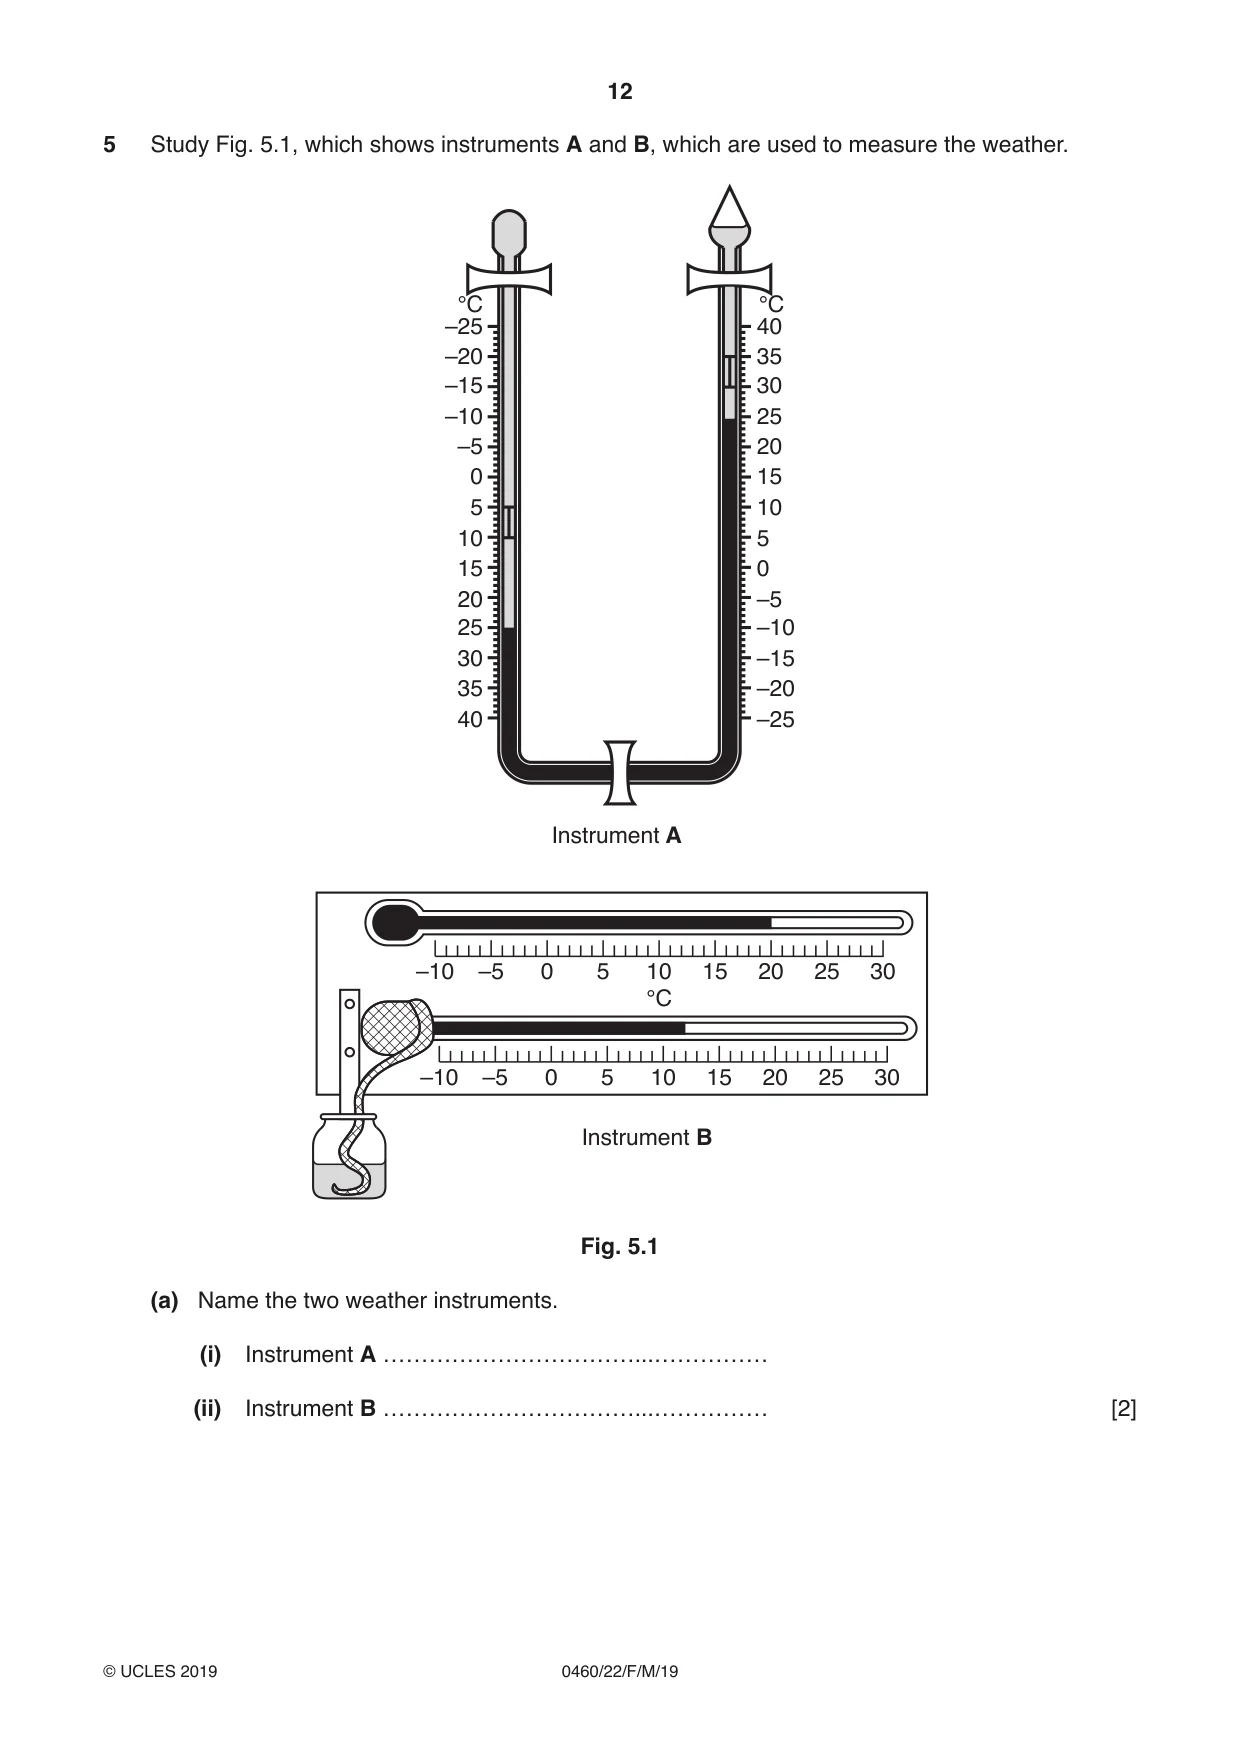
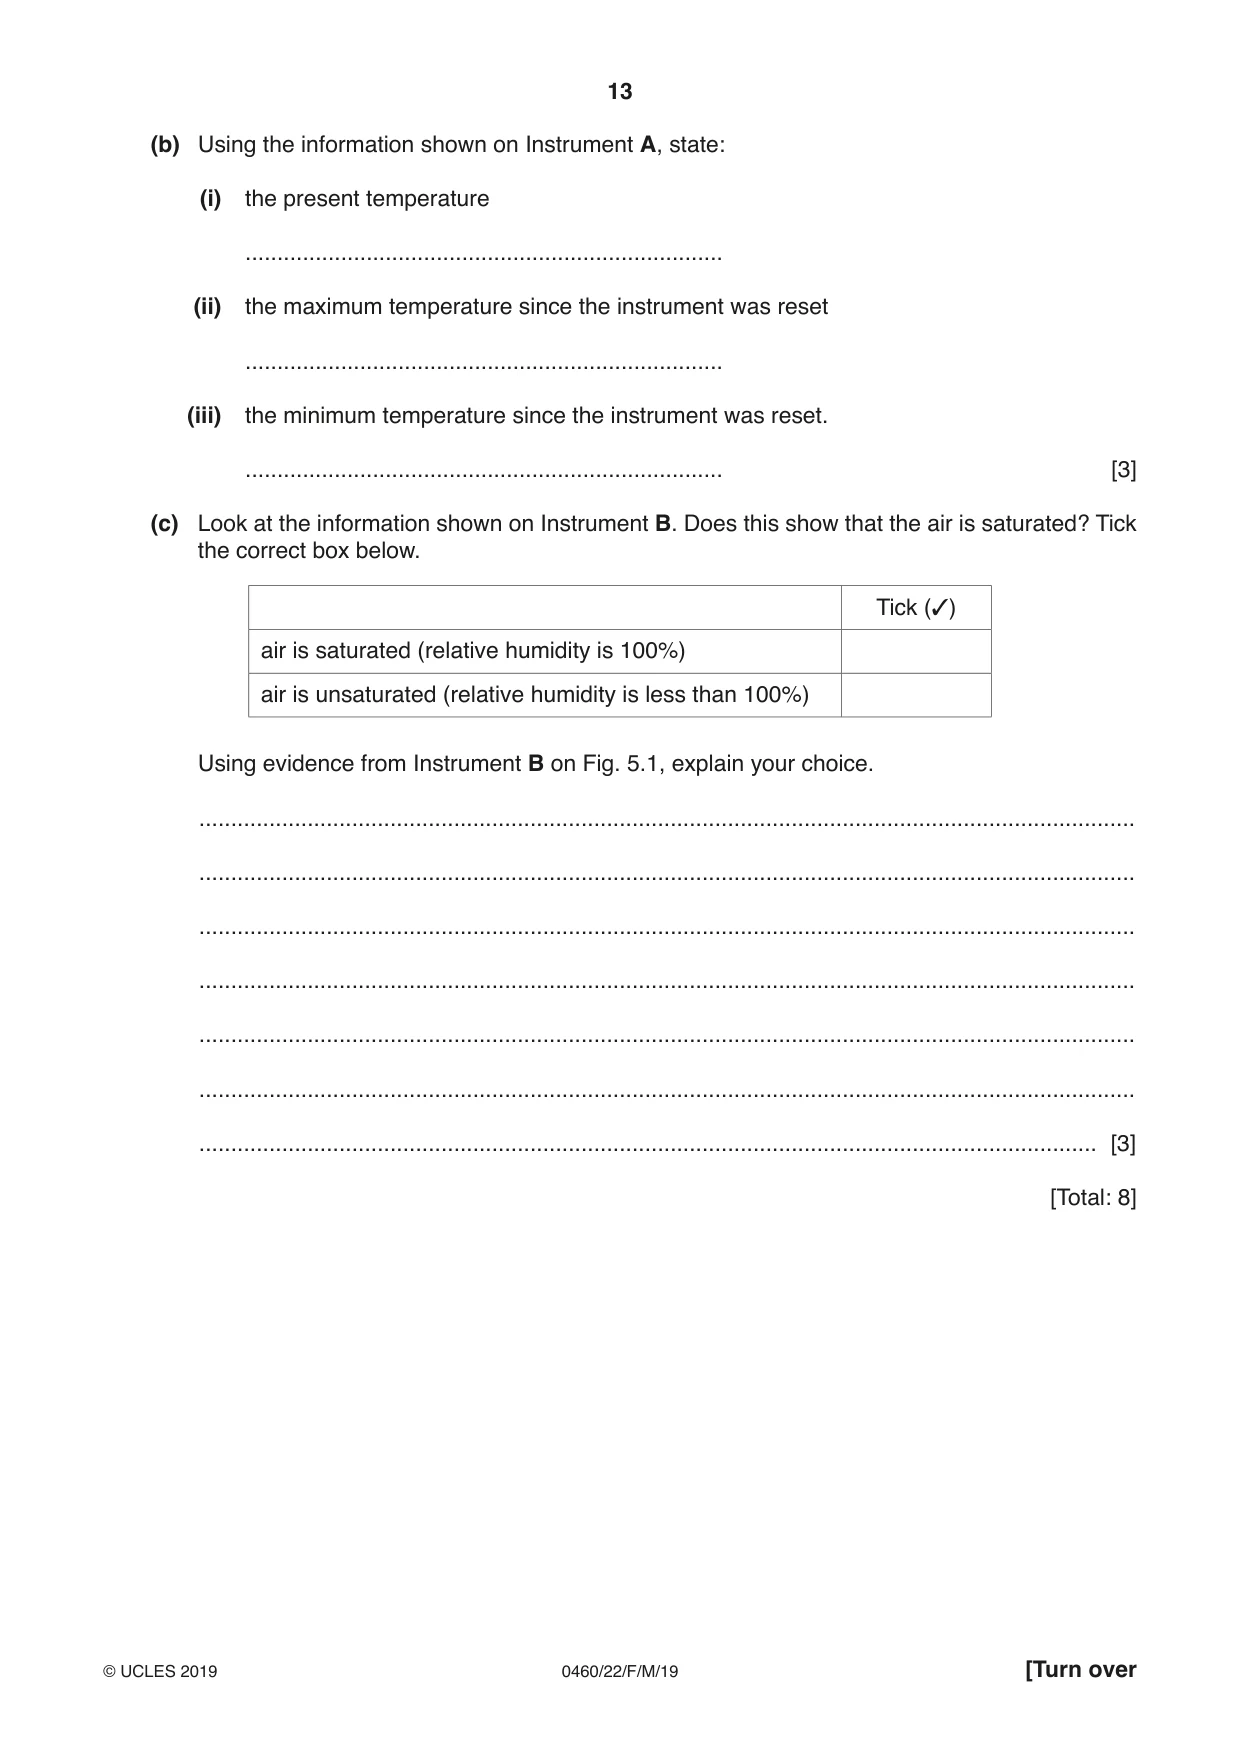
5 Study Fig. 5.1, which shows instruments A and B, which are used to measure the weather. °C °C –25 40 –20 35 –15 30 –10 25 –5 20 0 15 5 10 10 5 15 0 20 –5 25 –10 30 –15 35 –20 40 –25 Instrument A –10 –5 0 5 10 15 20 25 30 °C –10 –5 0 5 10 15 20 25 30 Instrument B Fig. 5.1 (a) Name the two weather instruments. (i) Instrument A ……………………………...…………… (ii) Instrument B ……………………………...…………… [2] (b) Using the information shown on Instrument A, state: (i) the present temperature ........................................................................... (ii) the maximum temperature since the instrument was reset ........................................................................... (iii) the minimum temperature since the instrument was reset. ........................................................................... [3] (c) Look at the information shown on Instrument B. Does this show that the air is saturated? Tick the correct box below. Tick (✓) air is saturated (relative humidity is 100%) air is unsaturated (relative humidity is less than 100%) Using evidence from Instrument B on Fig. 5.1, explain your choice. ................................................................................................................................................... ................................................................................................................................................... ................................................................................................................................................... ................................................................................................................................................... ................................................................................................................................................... ................................................................................................................................................... ............................................................................................................................................. [3] [Total: 8]
Mark scheme: 5(a)(i) maximum-minimum/Six’s thermometer 1 5(a)(ii) wet and dry (bulb) thermometers/hygrometer 1 5(b)(i) 25 °C 1 5(b)(ii) 30 °C 1 5(b)(iii) 10 °C 1 5(c) thermometers do not read the same/12 °C and 20 °C, 3 evaporation, uses latent heat, cools bulb
Question 6
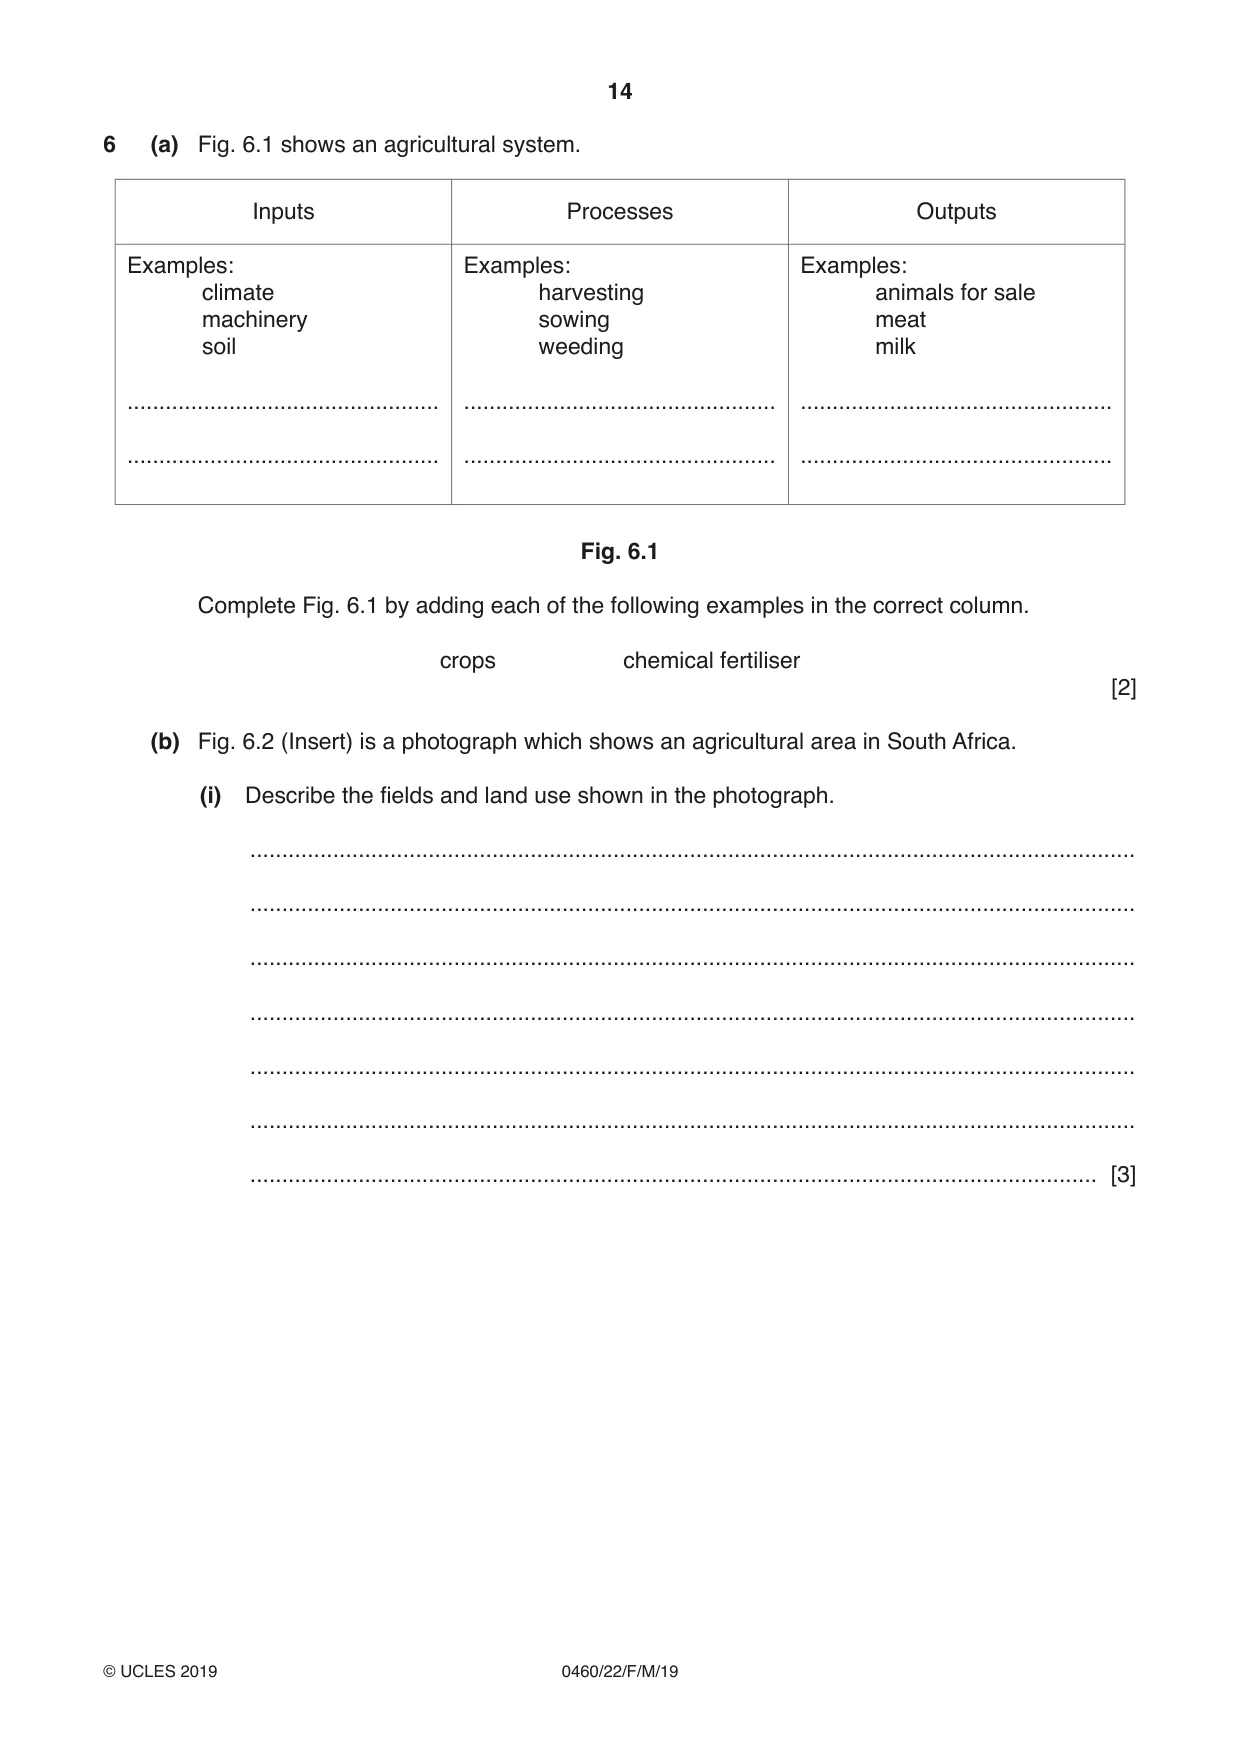
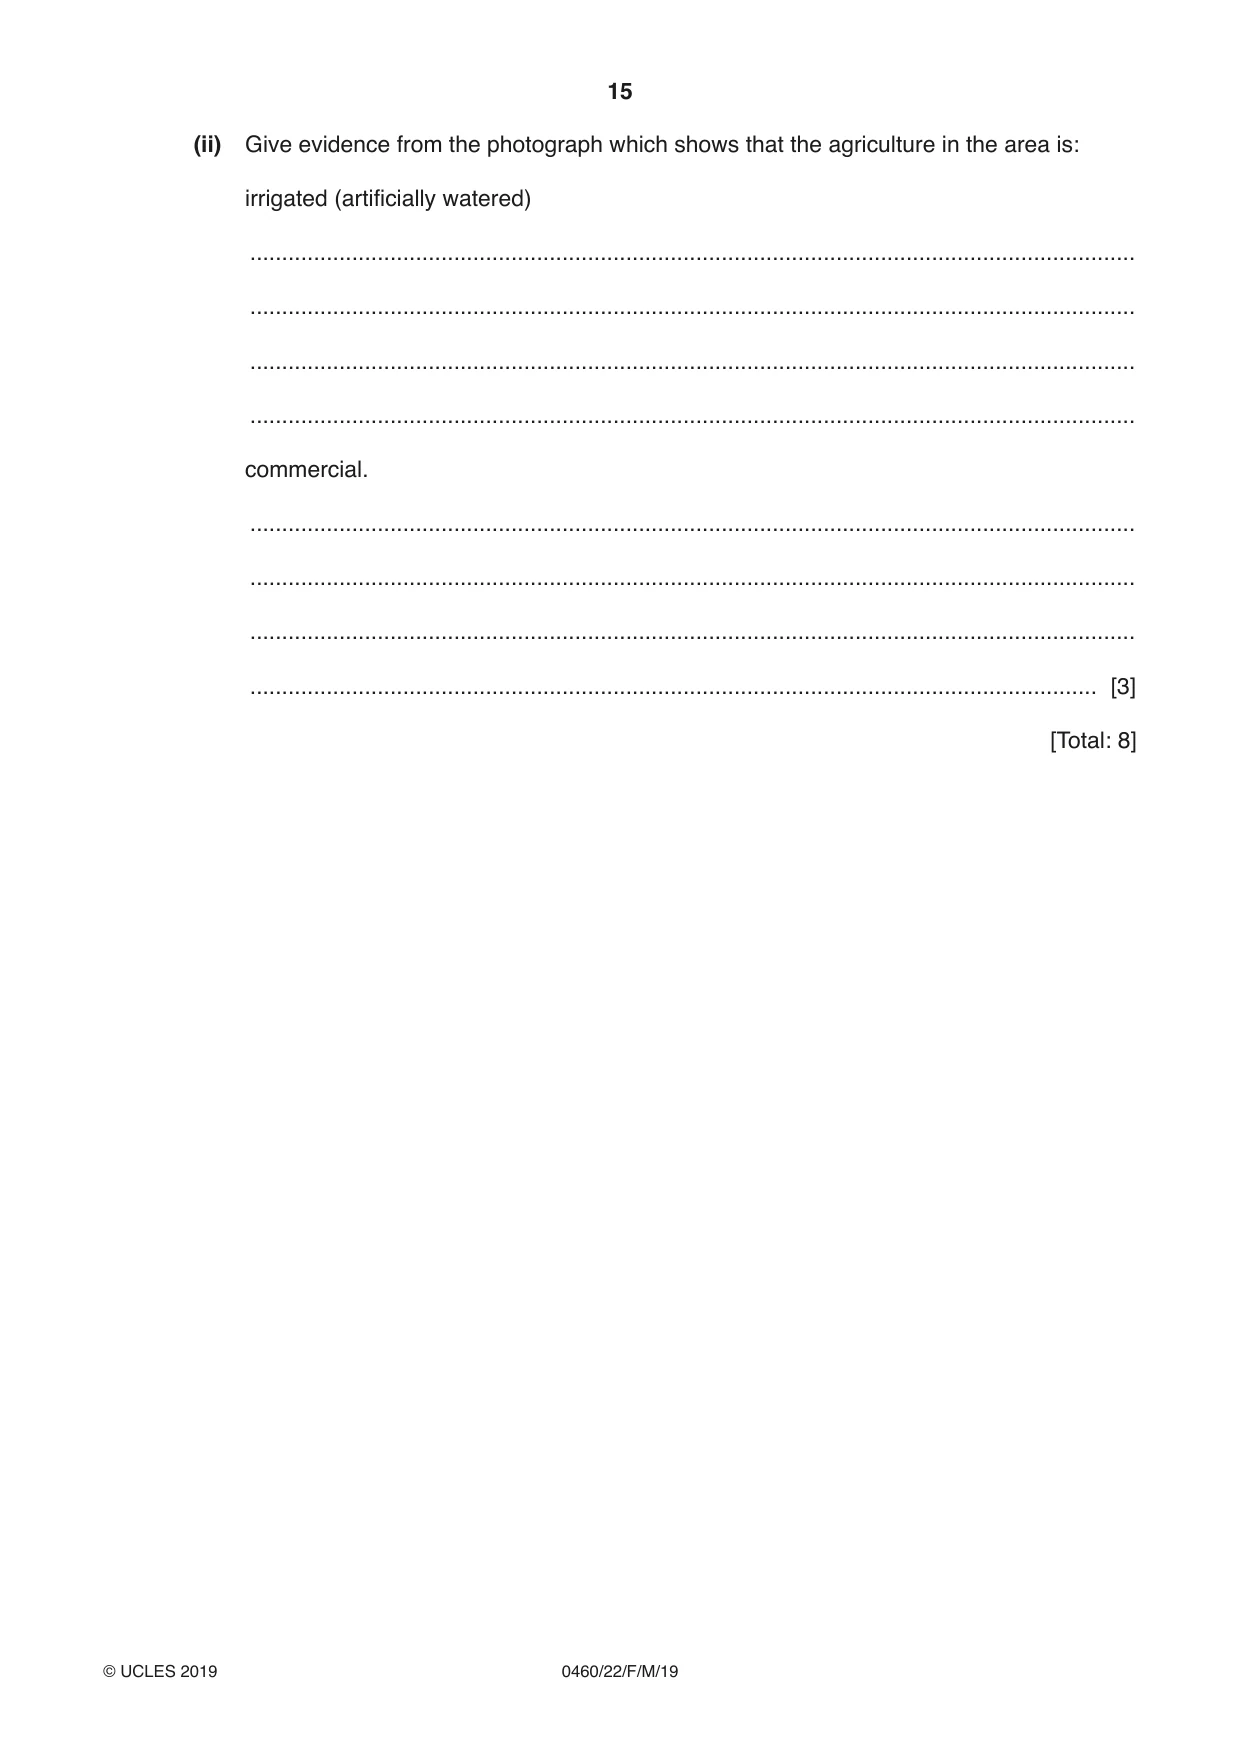
6 (a) Fig. 6.1 shows an agricultural system. Inputs Processes Outputs Examples: Examples: Examples: climate harvesting animals for sale machinery sowing meat soil weeding milk ................................................. ................................................. ................................................. ................................................. ................................................. ................................................. Fig. 6.1 Complete Fig. 6.1 by adding each of the following examples in the correct column. crops chemical fertiliser [2] (b) Fig. 6.2 (Insert) is a photograph which shows an agricultural area in South Africa. (i) Describe the fields and land use shown in the photograph. ........................................................................................................................................... ........................................................................................................................................... ........................................................................................................................................... ........................................................................................................................................... ........................................................................................................................................... ........................................................................................................................................... ..................................................................................................................................... [3] (ii) Give evidence from the photograph which shows that the agriculture in the area is: irrigated (artificially watered) ........................................................................................................................................... ........................................................................................................................................... ........................................................................................................................................... ........................................................................................................................................... commercial. ........................................................................................................................................... ........................................................................................................................................... ........................................................................................................................................... ..................................................................................................................................... [3] [Total: 8] Additional Pages If you use the following lined pages to complete the answer(s) to any question(s), the question number(s) must be clearly shown. .................................................................................................................................................................. .................................................................................................................................................................. .................................................................................................................................................................. .................................................................................................................................................................. .................................................................................................................................................................. .................................................................................................................................................................. .................................................................................................................................................................. .................................................................................................................................................................. .................................................................................................................................................................. .................................................................................................................................................................. .................................................................................................................................................................. .................................................................................................................................................................. .................................................................................................................................................................. .................................................................................................................................................................. .................................................................................................................................................................. .................................................................................................................................................................. .................................................................................................................................................................. .................................................................................................................................................................. .................................................................................................................................................................. .................................................................................................................................................................. .................................................................................................................................................................. .................................................................................................................................................................. .................................................................................................................................................................. .................................................................................................................................................................. ..................................................................................................................................................................
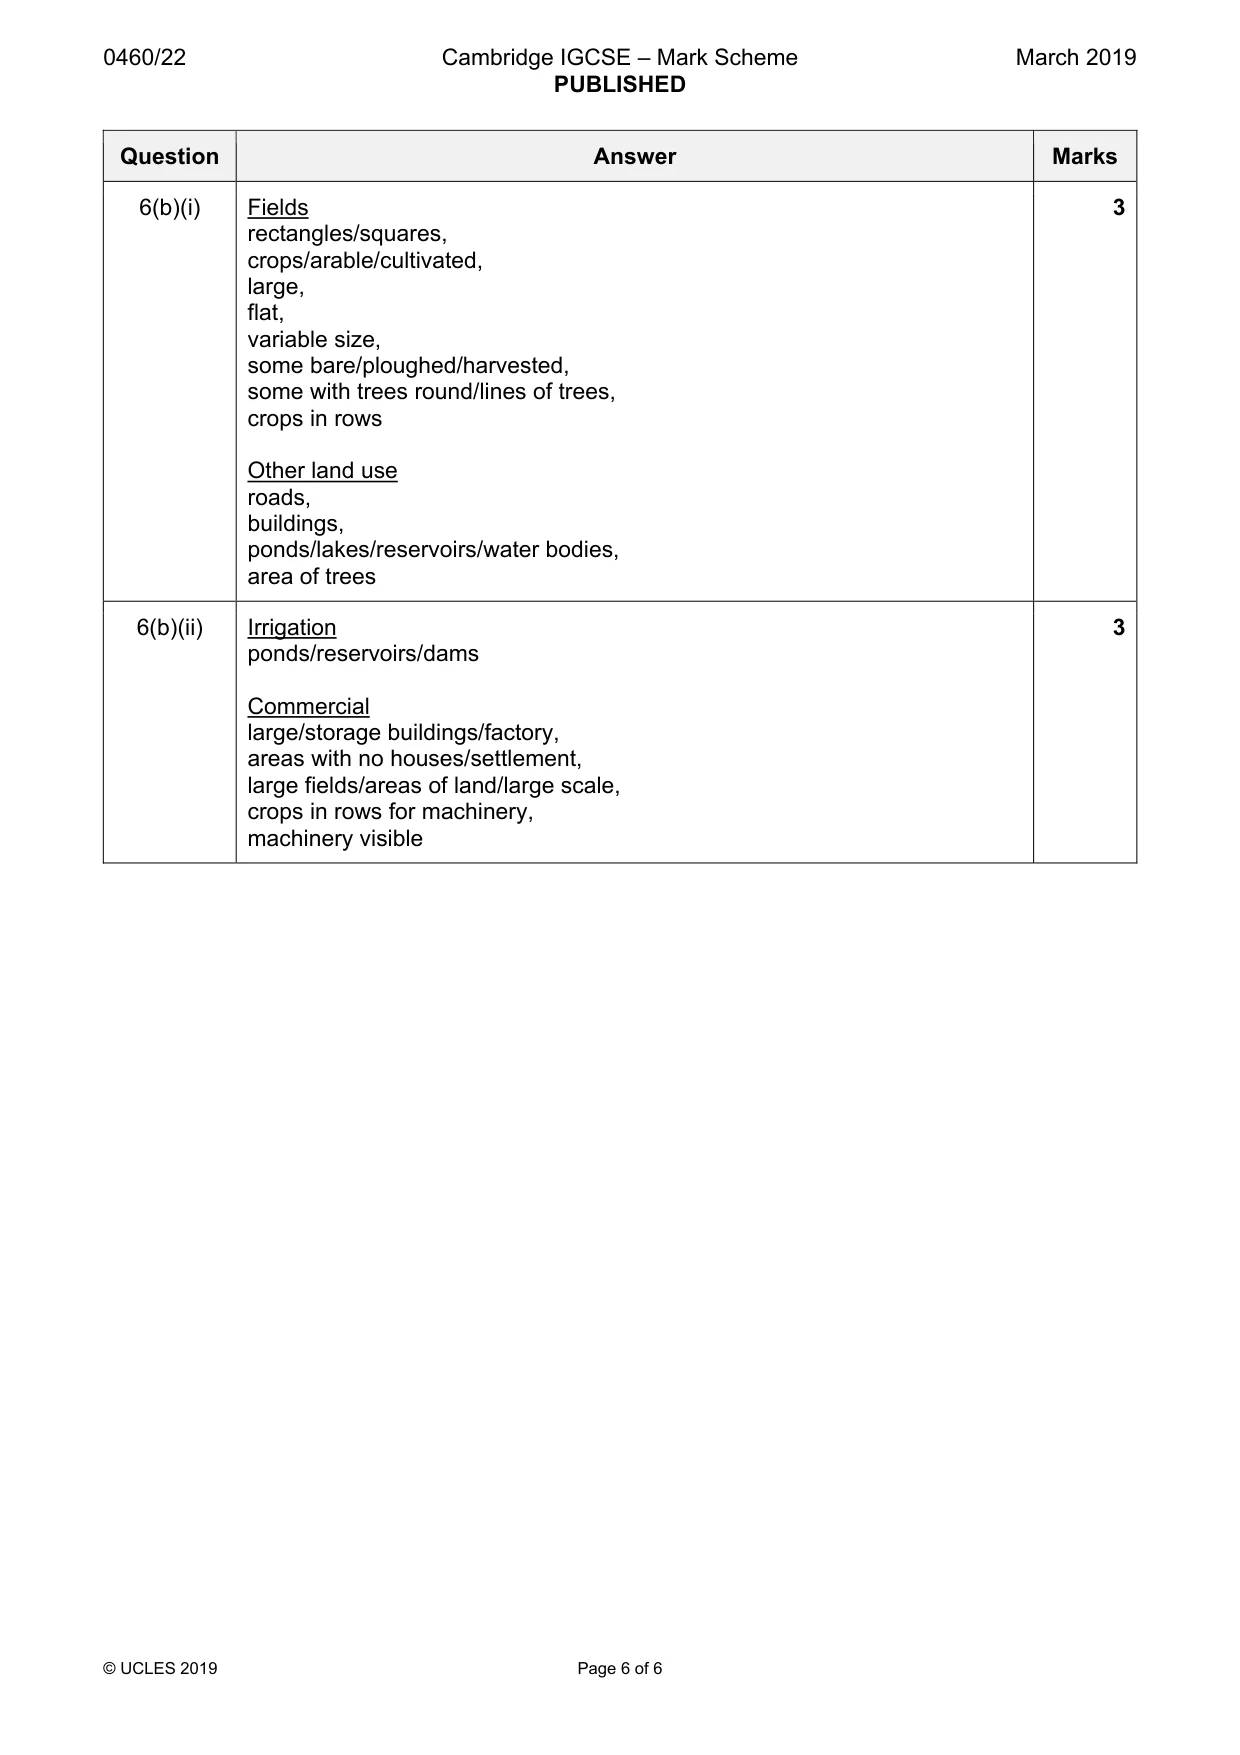
Mark scheme: 6(a) fertiliser input, 2 crops output 6(b)(i) Fields 3 rectangles/squares, crops/arable/cultivated, large, flat, variable size, some bare/ploughed/harvested, some with trees round/lines of trees, crops in rows Other land use roads, buildings, ponds/lakes/reservoirs/water bodies, area of trees 6(b)(ii) Irrigation 3 ponds/reservoirs/dams Commercial large/storage buildings/factory, areas with no houses/settlement, large fields/areas of land/large scale, crops in rows for machinery, machinery visible
What was in this paper
The subtopics covered by these 6 questions, and how many questions each got. Open one in a new tab to see every Cambridge question on it.
What you needed in this session
Cambridge’s own grade thresholds for 2019 Feb/March, Paper 2 · Variant 2. A higher threshold means an easier paper — the bar moves with how the cohort did.