Cambridge IGCSE Geography 0460 — 2023 May/June Paper 2 · Variant 3
0460/23/M/J/23 · 6 questions · 60 marks · ≈68 min
The question paper and its mark scheme, free to read here and free to download. This is Cambridge’s own paper, exactly as it was sat.
Question paper16 pages
Mark scheme6 pages
Answers below. Sit the paper first if you are practising.
Questions as text
Q1 · Study the map extract for Cunninghame, Scotland
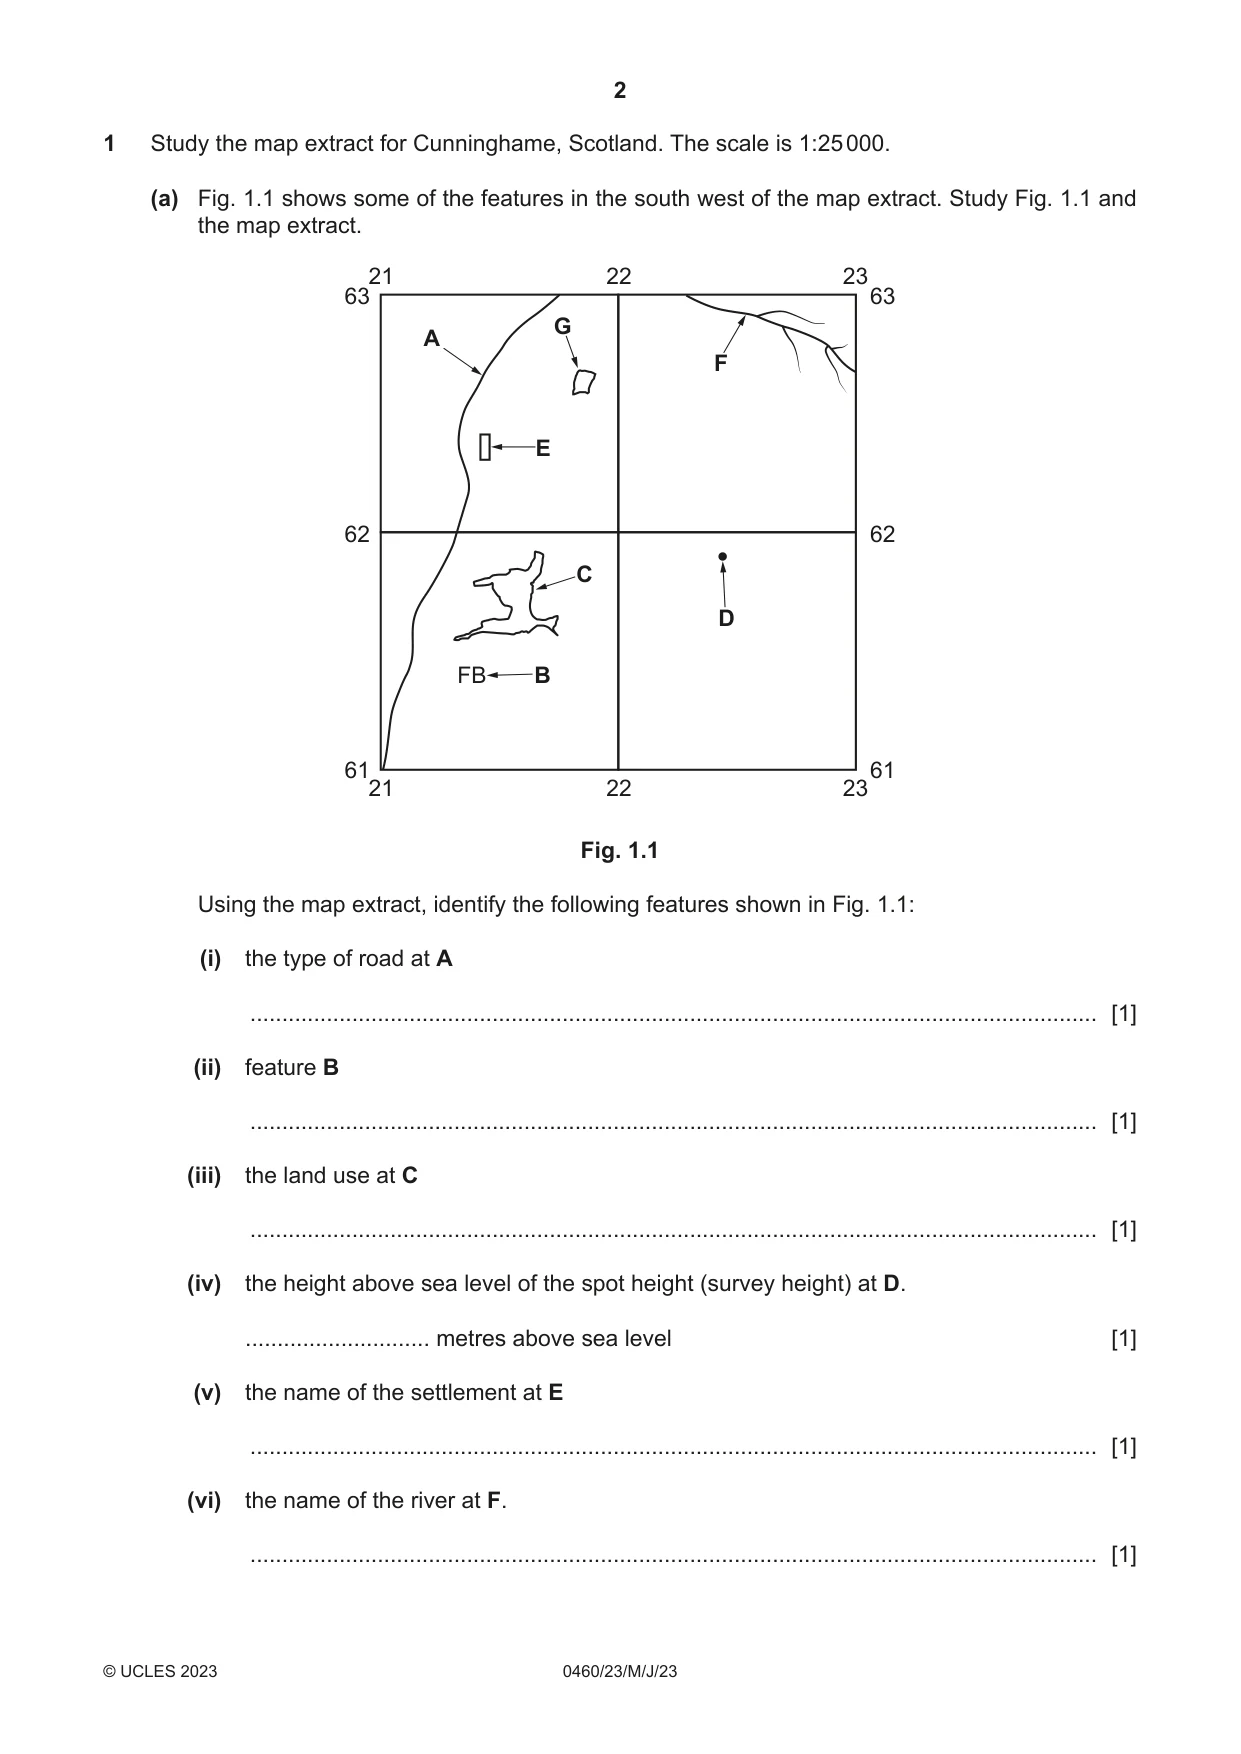
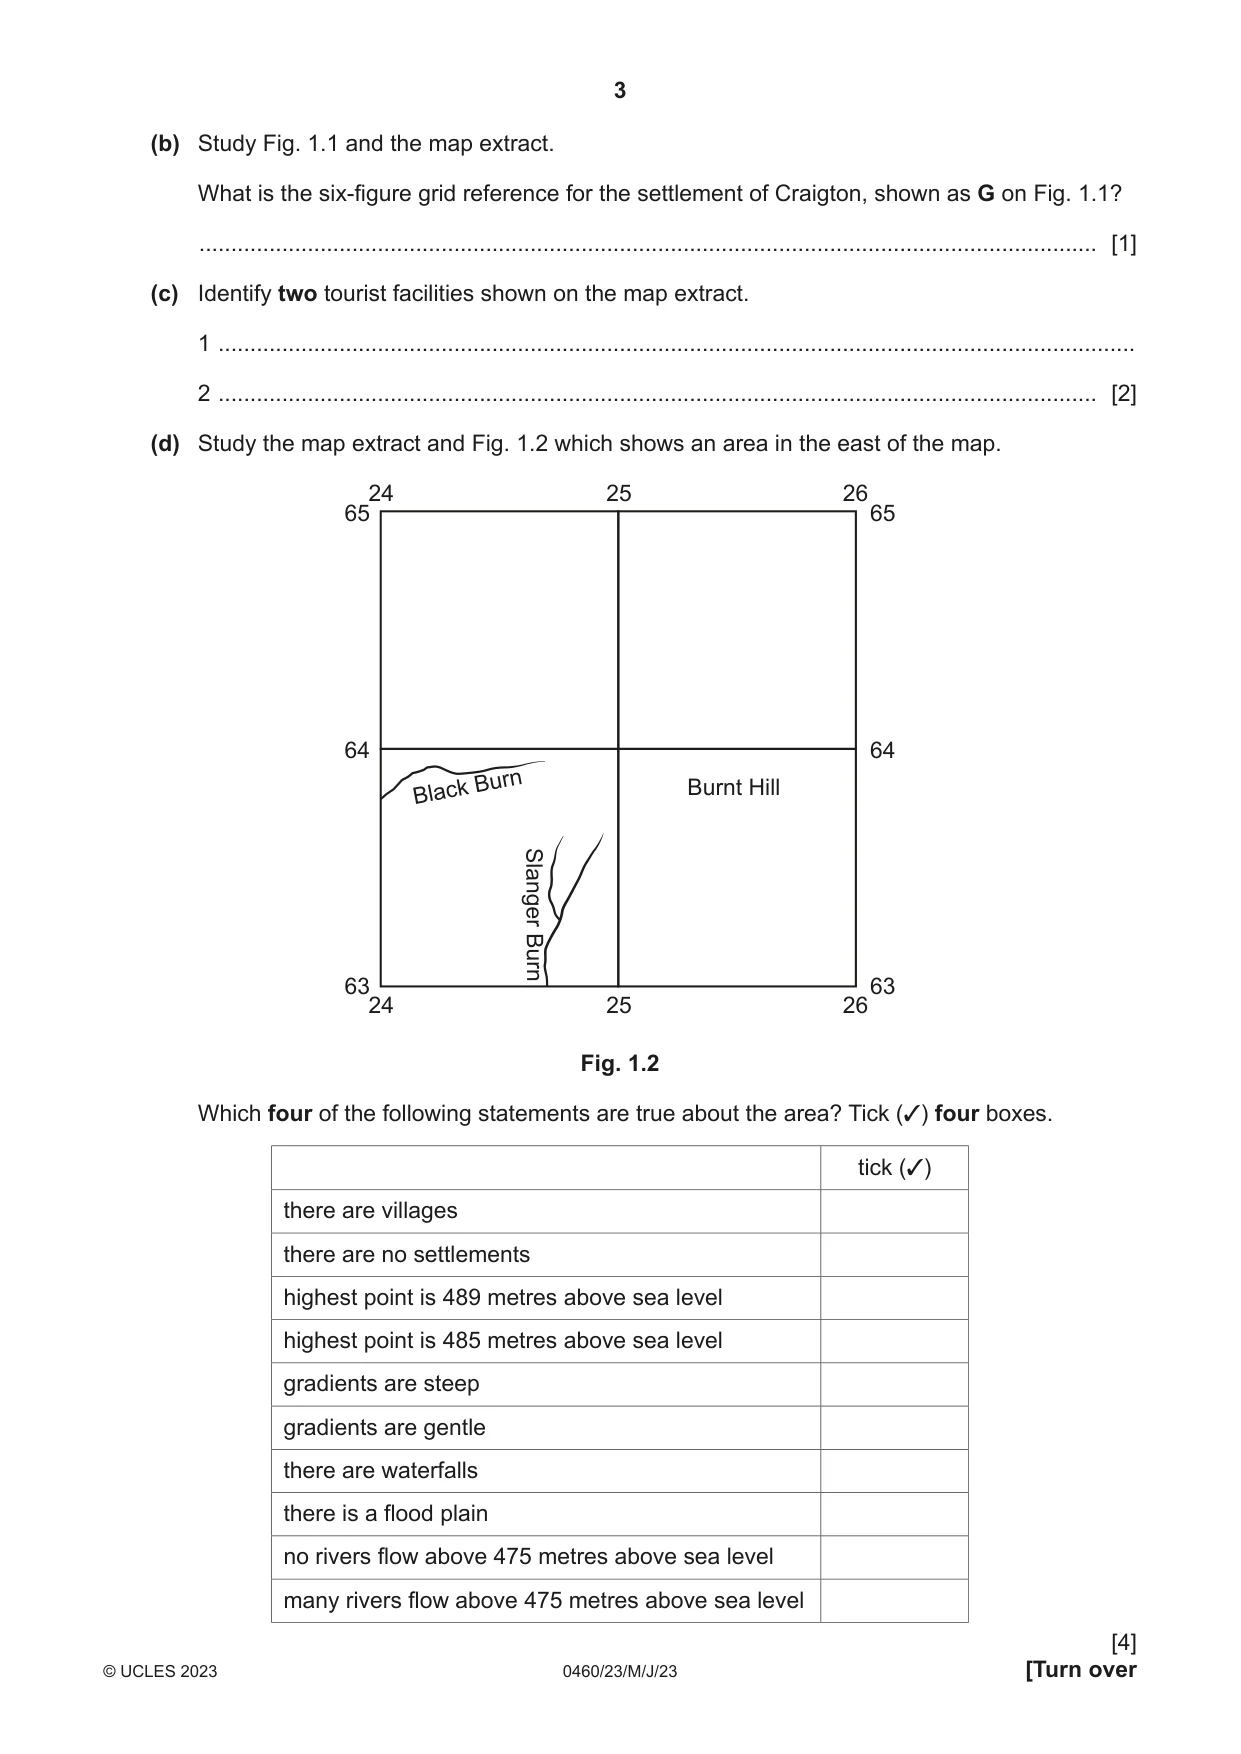
1 Study the map extract for Cunninghame, Scotland. The scale is 1:25 000. (a) Fig. 1.1 shows some of the features in the south west of the map extract. Study Fig. 1.1 and the map extract. 21 22 23 63 63 G A F E 62 62 C D FB B 61 61 21 22 23 Fig. 1.1 Using the map extract, identify the following features shown in Fig. 1.1: (i) the type of road at A ..................................................................................................................................... [1] (ii) feature B ..................................................................................................................................... [1] (iii) the land use at C ..................................................................................................................................... [1] (iv) the height above sea level of the spot height (survey height) at D. ............................. metres above sea level [1] (v) the name of the settlement at E ..................................................................................................................................... [1] (vi) the name of the river at F. ..................................................................................................................................... [1] (b) Study Fig. 1.1 and the map extract. What is the six‑figure grid reference for the settlement of Craigton, shown as G on Fig. 1.1? ............................................................................................................................................. [1] (c) Identify two tourist facilities shown on the map extract. 1 ................................................................................................................................................ 2 .......................................................................................................................................... [2] (d) Study the map extract and Fig. 1.2 which shows an area in the east of the map. 24 25 26 65 65 64 64 Burn Burnt Hill Black Slanger Burn 63 63 24 25 26 Fig. 1.2 Which four of the following statements are true about the area? Tick (✓) four boxes. tick (✓) there are villages there are no settlements highest point is 489 metres above sea level highest point is 485 metres above sea level gradients are steep gradients are gentle there are waterfalls there is a flood plain no rivers flow above 475 metres above sea level many rivers flow above 475 metres above sea level (e) Look at the main river (Noddsdale Water) which flows in the west of the map extract. Describe the physical (natural) features of the river and its valley. ................................................................................................................................................... ................................................................................................................................................... ................................................................................................................................................... ................................................................................................................................................... ................................................................................................................................................... ................................................................................................................................................... ................................................................................................................................................... ................................................................................................................................................... ................................................................................................................................................... ................................................................................................................................................... ................................................................................................................................................... ................................................................................................................................................... ................................................................................................................................................... ............................................................................................................................................. [7] [Total: 20]
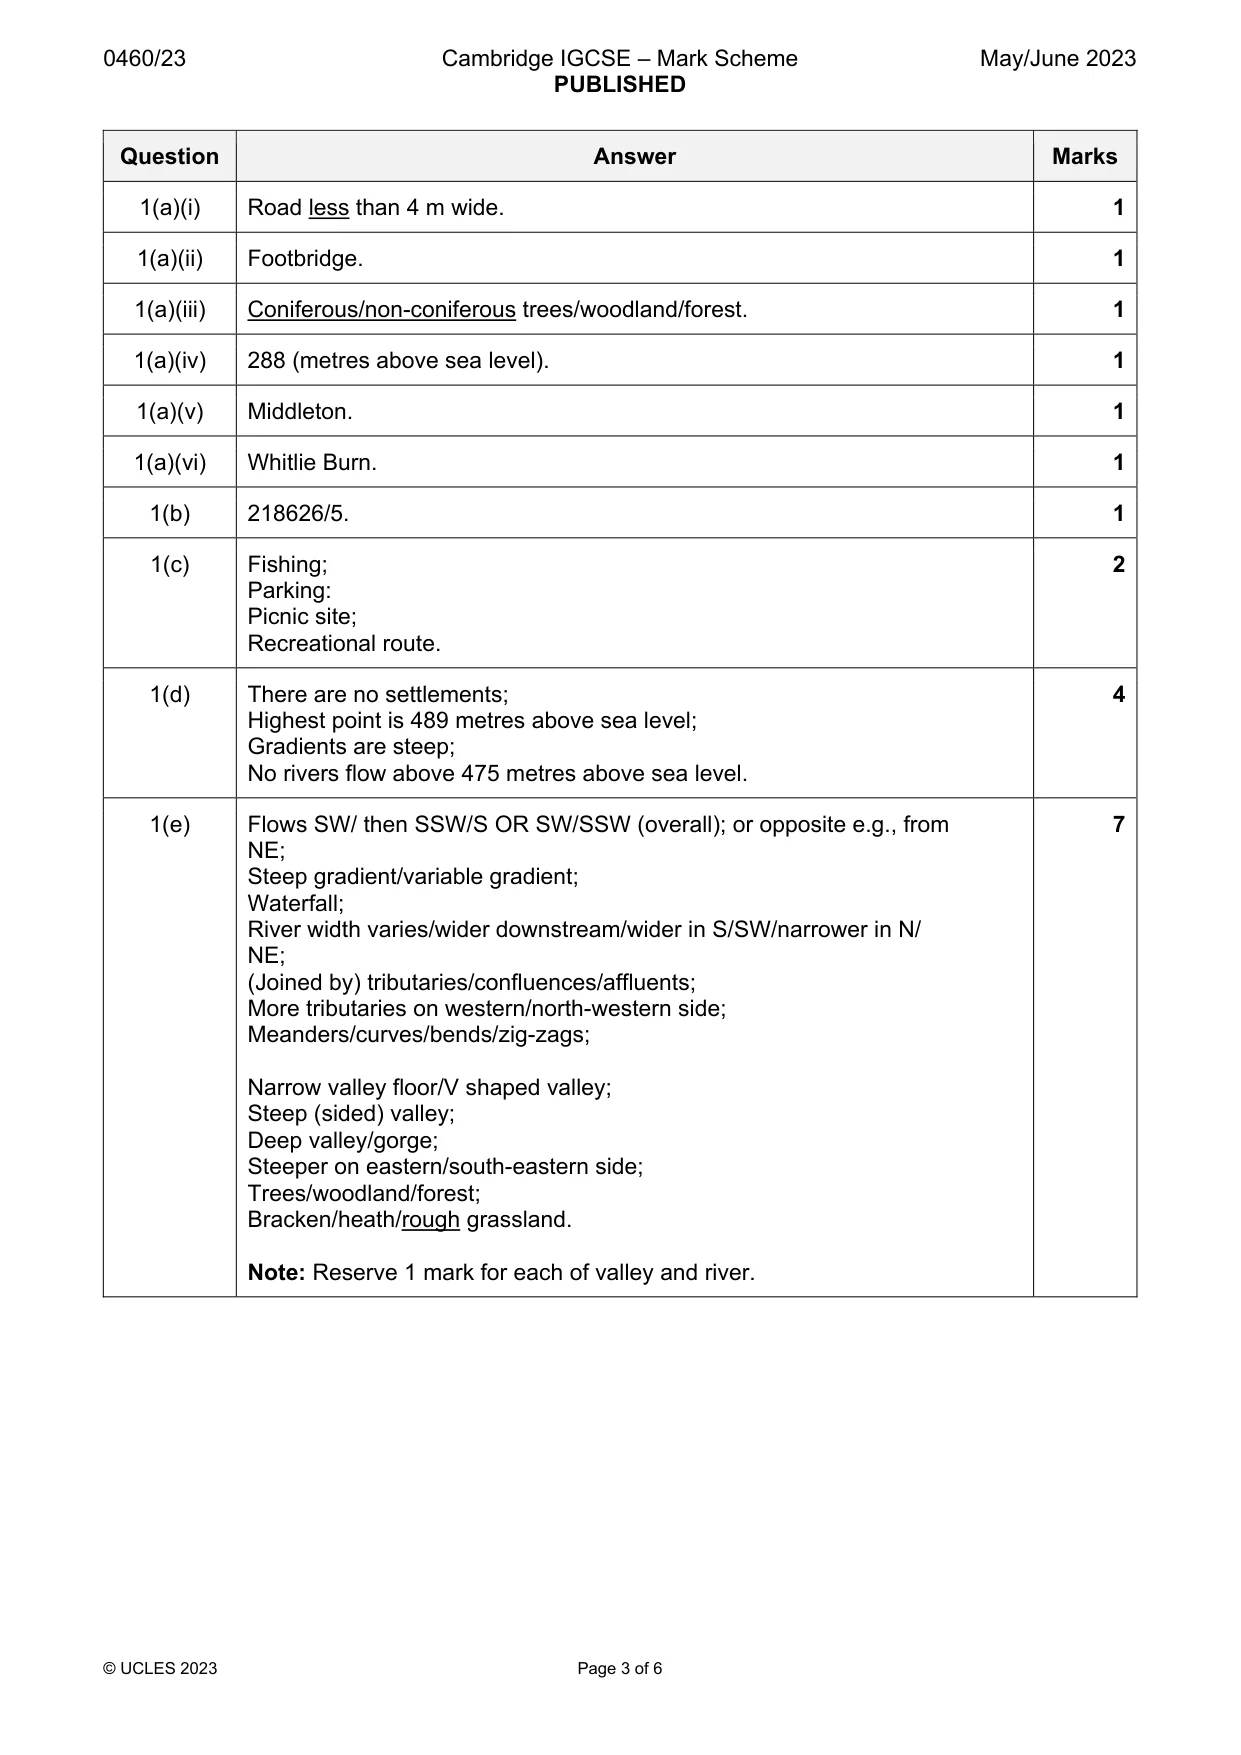
Mark scheme: Question Answer Marks 1(a)(i) Road less than 4 m wide. 1 1(a)(ii) Footbridge. 1 1(a)(iii) Coniferous/non-coniferous trees/woodland/forest. 1 1(a)(iv) 288 (metres above sea level). 1 1(a)(v) Middleton. 1 1(a)(vi) Whitlie Burn. 1 1(b) 218626/5. 1 1(c) Fishing; 2 Parking: Picnic site; Recreational route. 1(d) There are no settlements; 4 Highest point is 489 metres above sea level; Gradients are steep; No rivers flow above 475 metres above sea level. 1(e) Flows SW/ then SSW/S OR SW/SSW (overall); or opposite e.g., from 7 NE; Steep gradient/variable gradient; Waterfall; River width varies/wider downstream/wider in S/SW/narrower in N/ NE; (Joined by) tributaries/confluences/affluents; More tributaries on western/north-western side; Meanders/curves/bends/zig-zags; Narrow valley floor/V shaped valley; Steep (sided) valley; Deep valley/gorge; Steeper on eastern/south-eastern side; Trees/woodland/forest; Bracken/heath/rough grassland. Note: Reserve 1 mark for each of valley and river.
Question 2
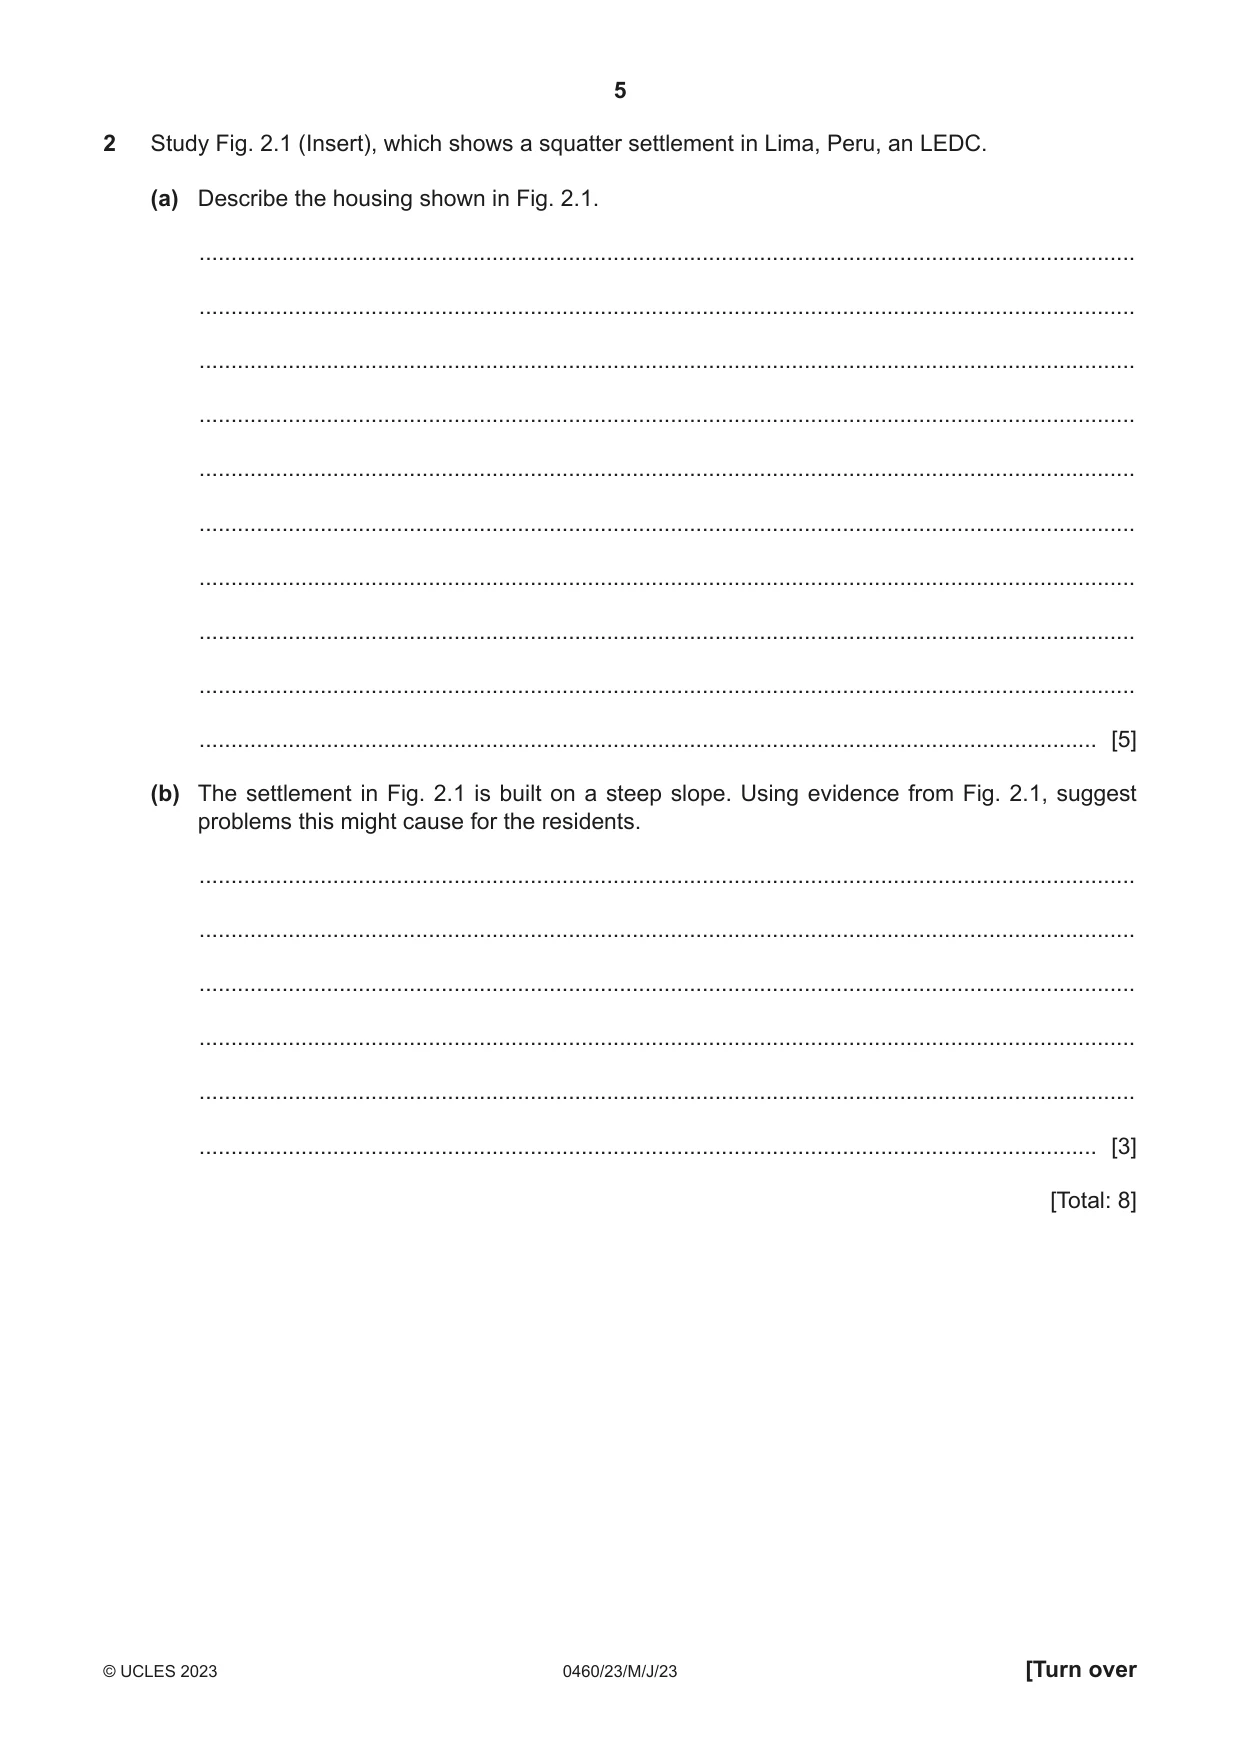
2 Study Fig. 2.1 (Insert), which shows a squatter settlement in Lima, Peru, an LEDC. (a) Describe the housing shown in Fig. 2.1. ................................................................................................................................................... ................................................................................................................................................... ................................................................................................................................................... ................................................................................................................................................... ................................................................................................................................................... ................................................................................................................................................... ................................................................................................................................................... ................................................................................................................................................... ................................................................................................................................................... ............................................................................................................................................. [5] (b) The settlement in Fig. 2.1 is built on a steep slope. Using evidence from Fig. 2.1, suggest problems this might cause for the residents. ................................................................................................................................................... ................................................................................................................................................... ................................................................................................................................................... ................................................................................................................................................... ................................................................................................................................................... ............................................................................................................................................. [3] [Total: 8]
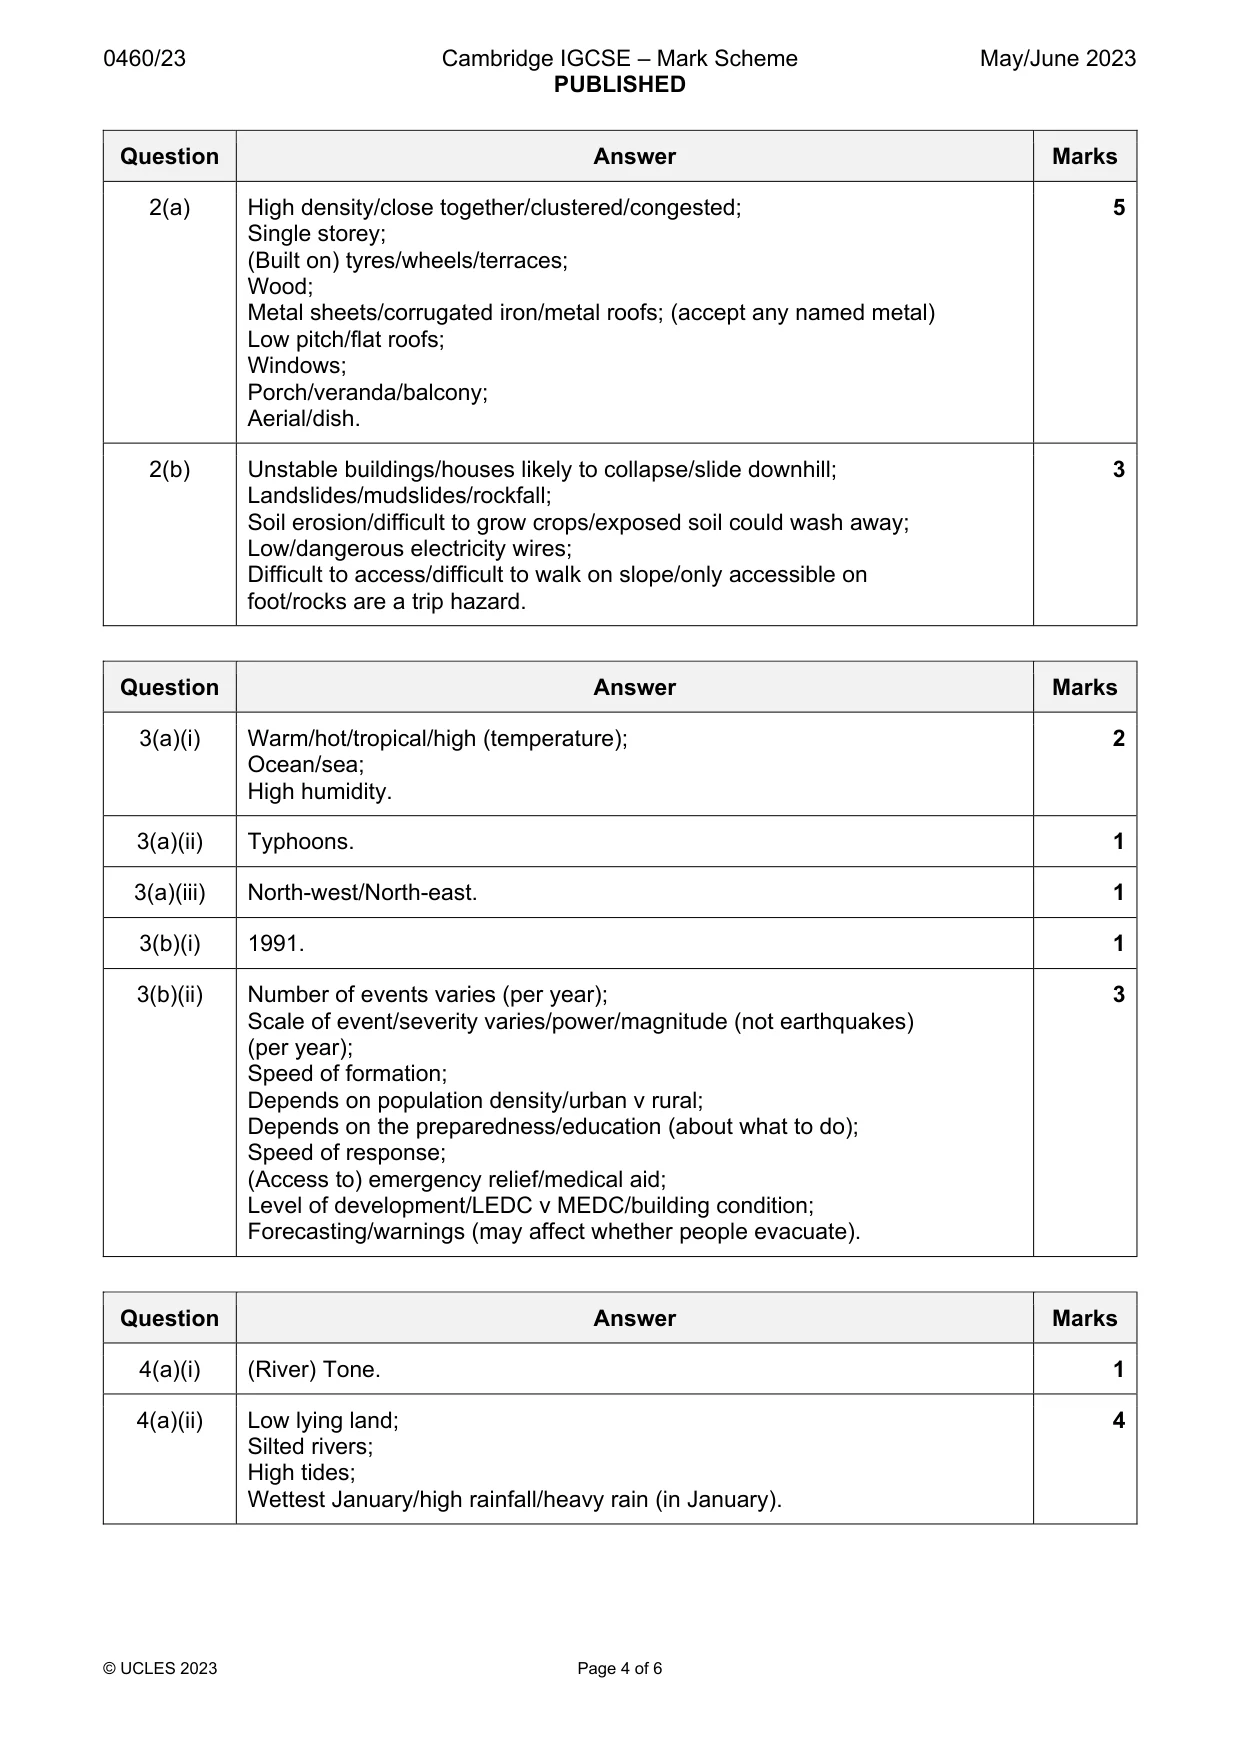
Mark scheme: 2(a) High density/close together/clustered/congested; 5 Single storey; (Built on) tyres/wheels/terraces; Wood; Metal sheets/corrugated iron/metal roofs; (accept any named metal) Low pitch/flat roofs; Windows; Porch/veranda/balcony; Aerial/dish. 2(b) Unstable buildings/houses likely to collapse/slide downhill; 3 Landslides/mudslides/rockfall; Soil erosion/difficult to grow crops/exposed soil could wash away; Low/dangerous electricity wires; Difficult to access/difficult to walk on slope/only accessible on foot/rocks are a trip hazard.
Q3 · Where tropical storms form
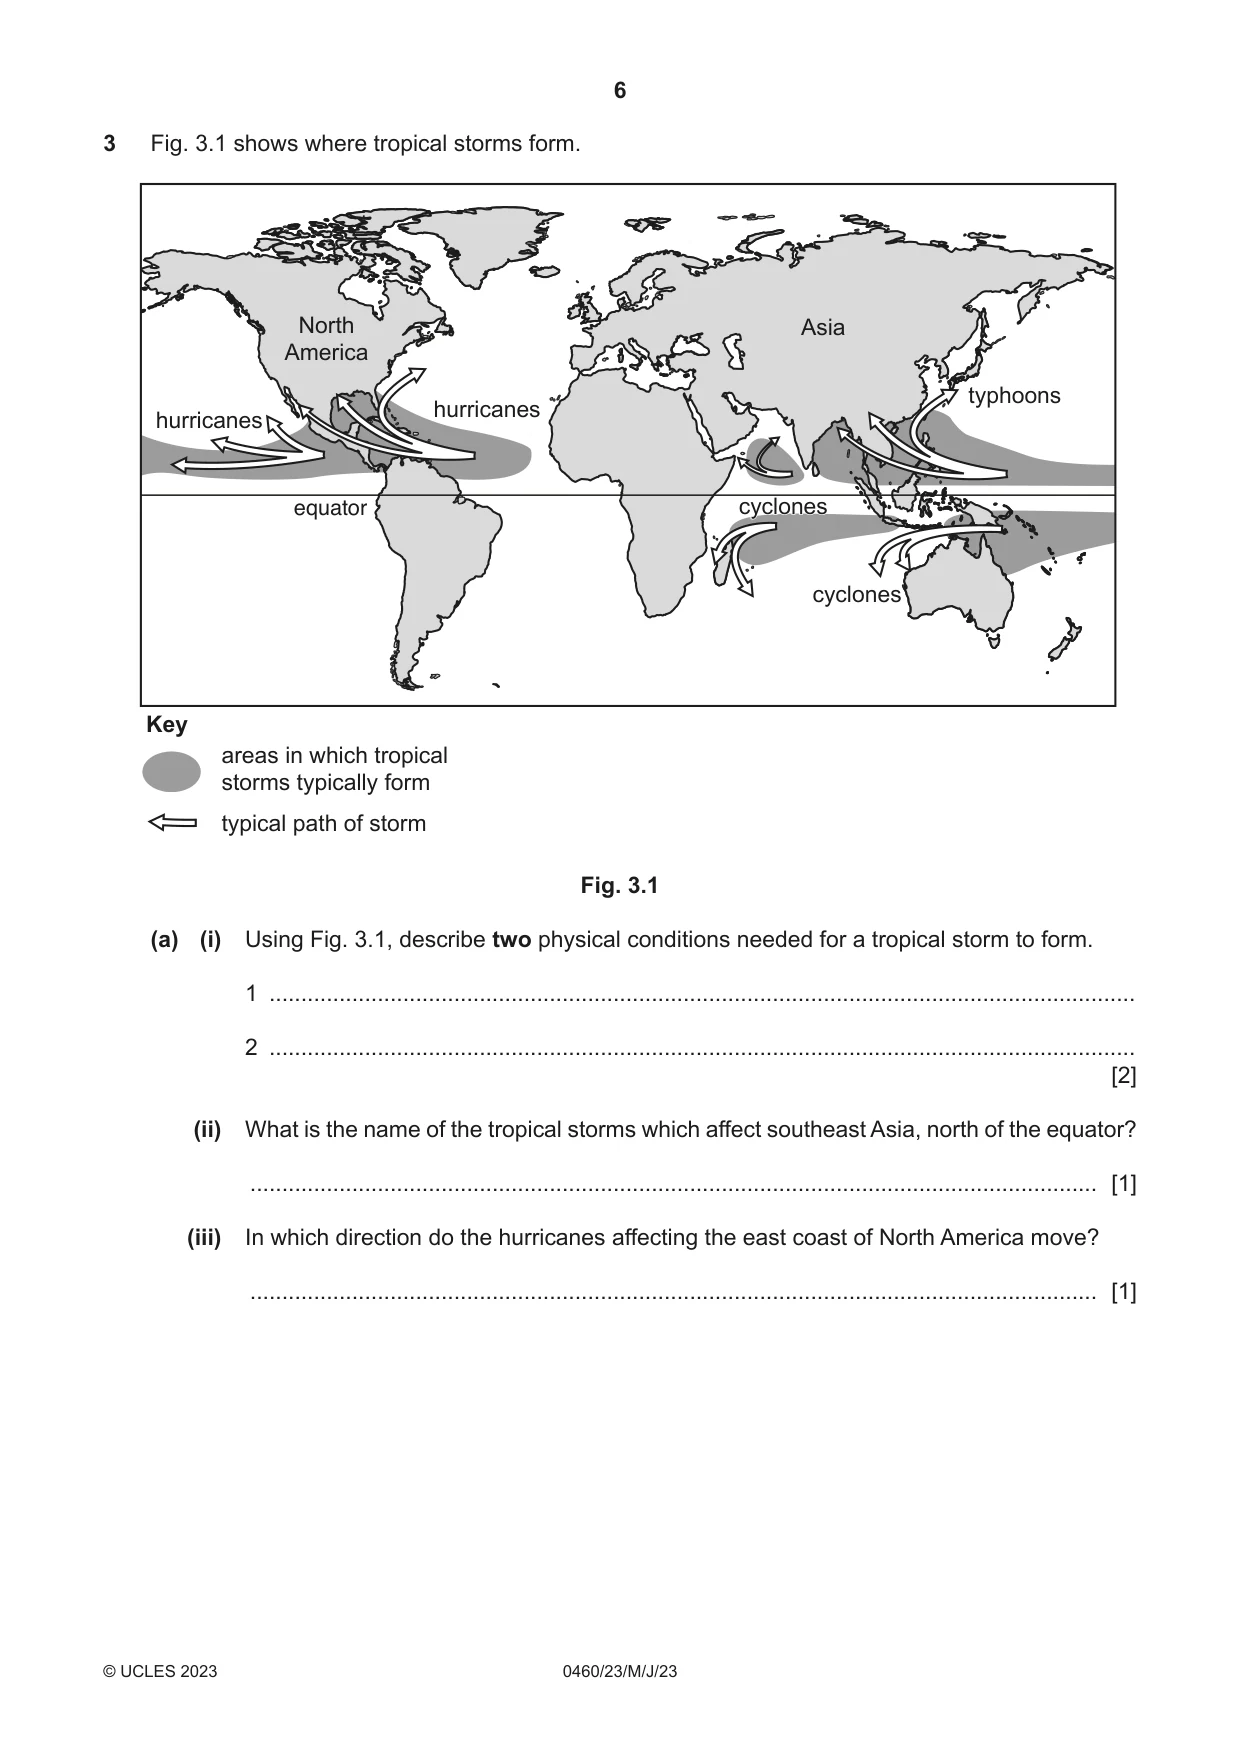
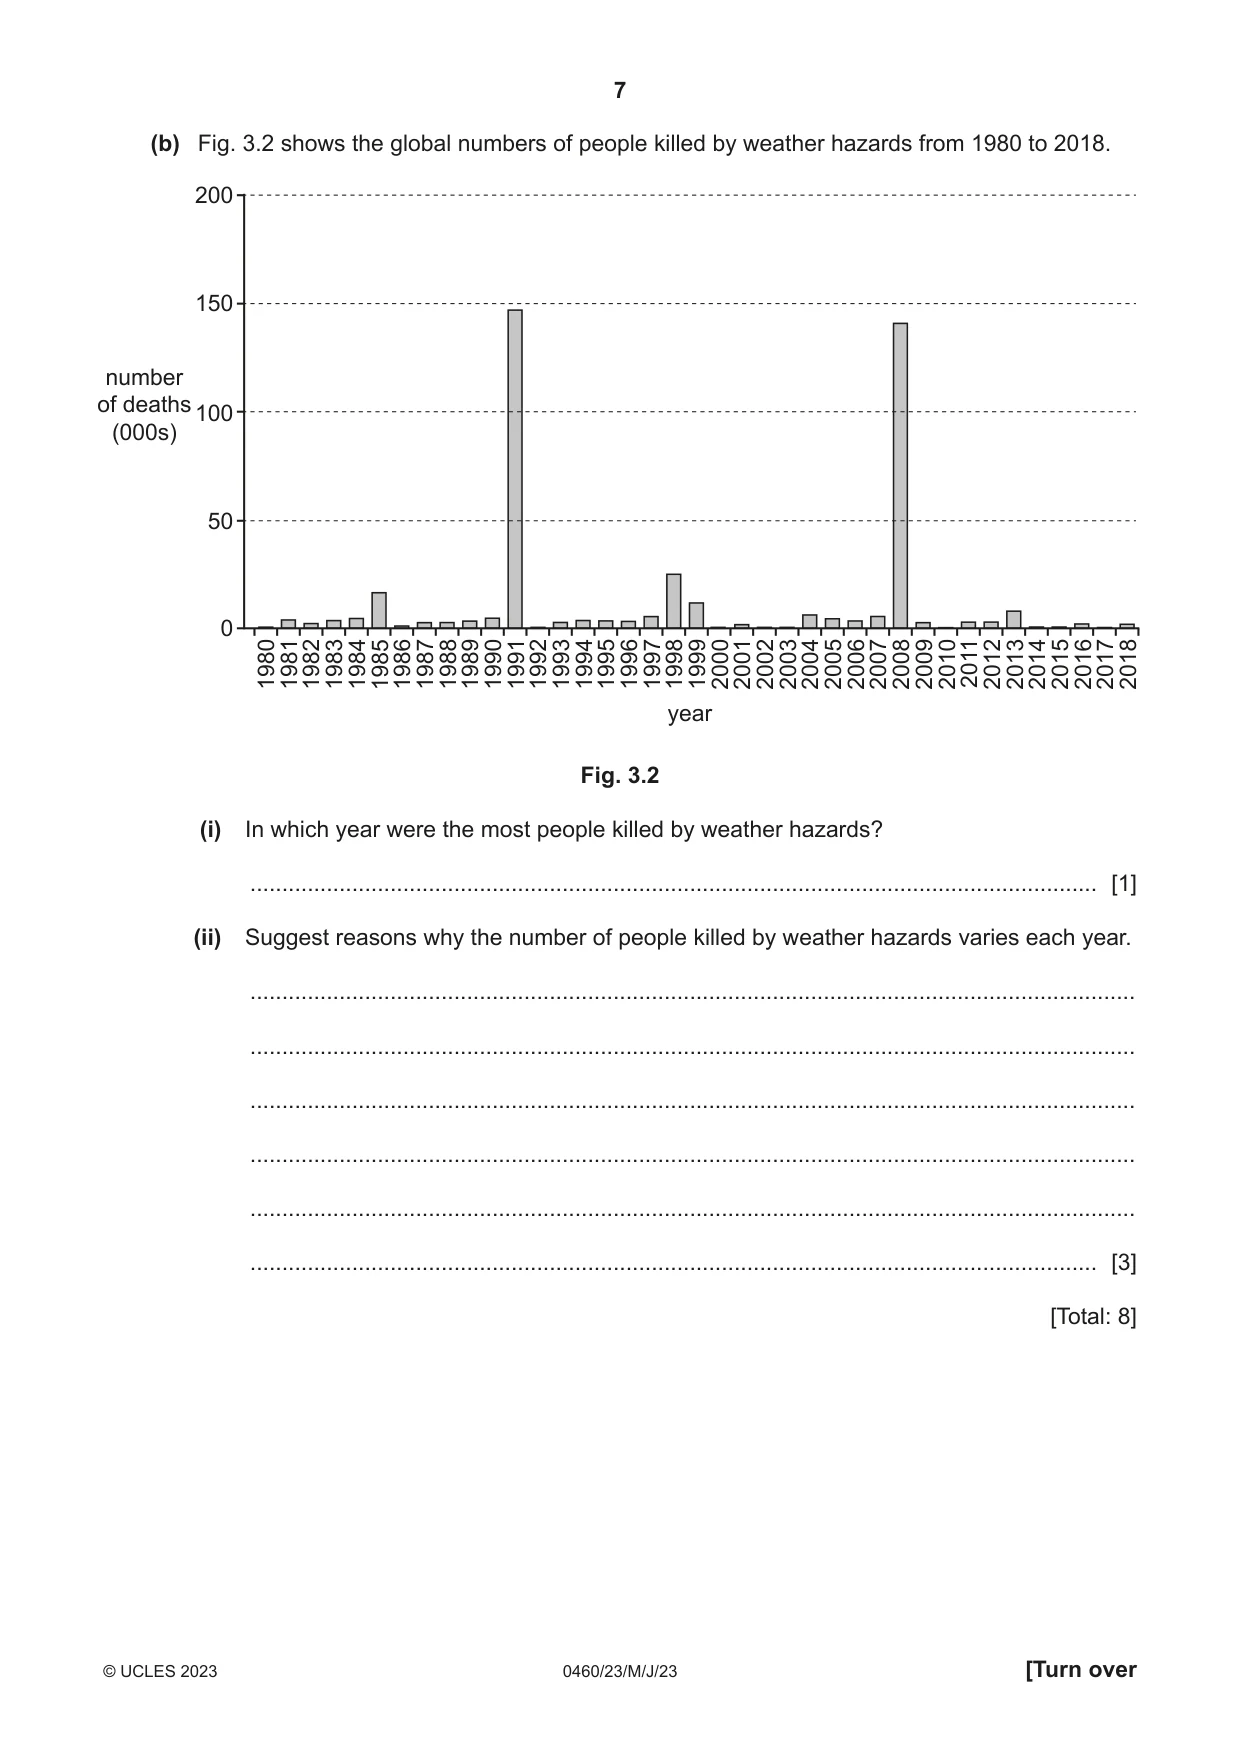
3 Fig. 3.1 shows where tropical storms form. North Asia America typhoons hurricanes hurricanes equator cyclonescyclones cyclonescyclones Key areas in which tropical storms typically form typical path of storm Fig. 3.1 (a) (i) Using Fig. 3.1, describe two physical conditions needed for a tropical storm to form. 1 ........................................................................................................................................ 2 ........................................................................................................................................ [2] (ii) What is the name of the tropical storms which affect southeast Asia, north of the equator? ..................................................................................................................................... [1] (iii) In which direction do the hurricanes affecting the east coast of North America move? ..................................................................................................................................... [1] (b) Fig. 3.2 shows the global numbers of people killed by weather hazards from 1980 to 2018. 200 150 number of deaths 100 (000s) 50 0 198019811982198319841985198619871988198919901991199219931994199519961997199819992000200120022003200420052006200720082009201020112012201320142015201620172018 year Fig. 3.2 (i) In which year were the most people killed by weather hazards? ..................................................................................................................................... [1] (ii) Suggest reasons why the number of people killed by weather hazards varies each year. ........................................................................................................................................... ........................................................................................................................................... ........................................................................................................................................... ........................................................................................................................................... ........................................................................................................................................... ..................................................................................................................................... [3] [Total: 8]
Mark scheme: 3(a)(i) Warm/hot/tropical/high (temperature); 2 Ocean/sea; High humidity. 3(a)(ii) Typhoons. 1 3(a)(iii) North-west/North-east. 1 3(b)(i) 1991. 1 3(b)(ii) Number of events varies (per year); 3 Scale of event/severity varies/power/magnitude (not earthquakes) (per year); Speed of formation; Depends on population density/urban v rural; Depends on the preparedness/education (about what to do); Speed of response; (Access to) emergency relief/medical aid; Level of development/LEDC v MEDC/building condition; Forecasting/warnings (may affect whether people evacuate).
Question 4
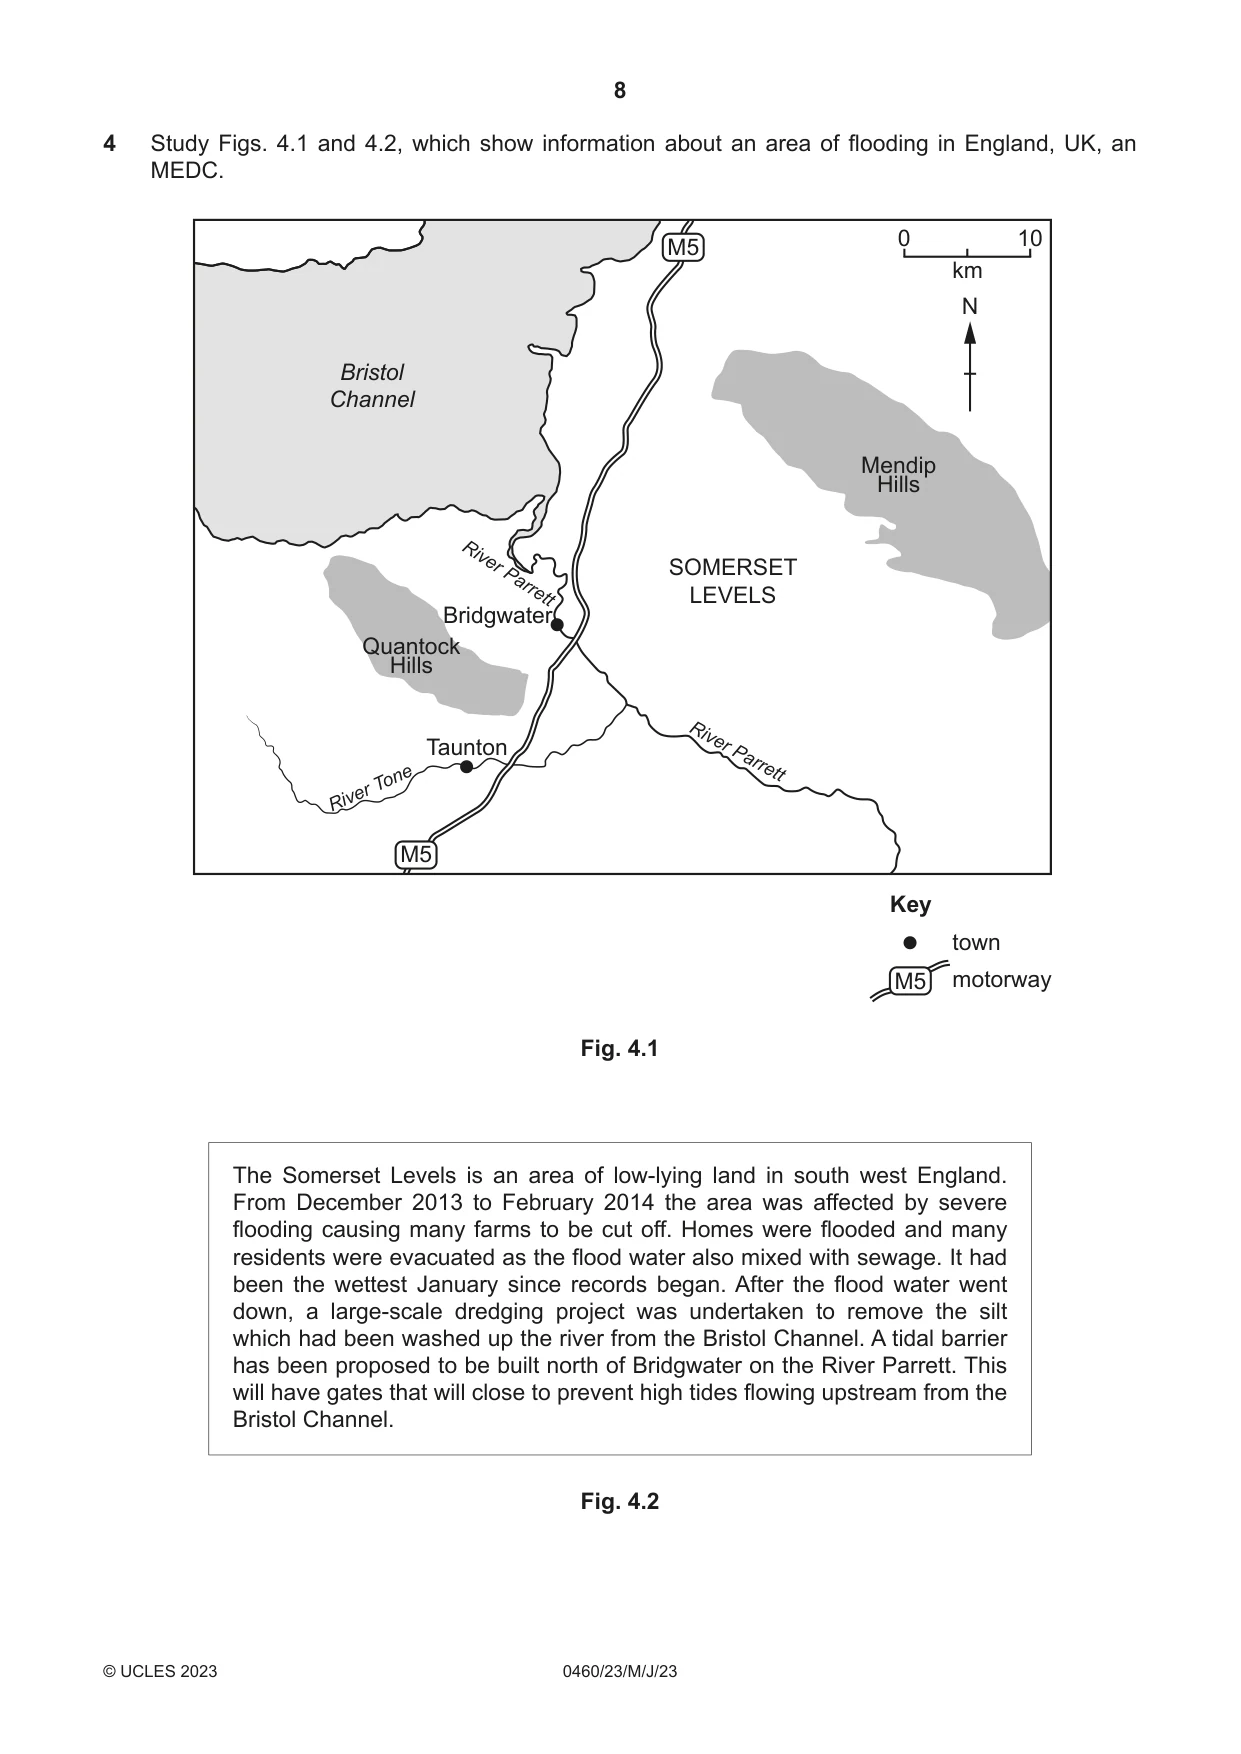
4 Study Figs. 4.1 and 4.2, which show information about an area of flooding in England, UK, an MEDC. 0 10 M5 km N Bristol Channel Mendip Hills River SOMERSET Parrett LEVELS Bridgwater Quantock Hills Taunton River Parrett Tone River M5 Key town M5 motorway Fig. 4.1 The Somerset Levels is an area of low‑lying land in south west England. From December 2013 to February 2014 the area was affected by severe flooding causing many farms to be cut off. Homes were flooded and many residents were evacuated as the flood water also mixed with sewage. It had been the wettest January since records began. After the flood water went down, a large‑scale dredging project was undertaken to remove the silt which had been washed up the river from the Bristol Channel. A tidal barrier has been proposed to be built north of Bridgwater on the River Parrett. This will have gates that will close to prevent high tides flowing upstream from the Bristol Channel. Fig. 4.2 (a) (i) Identify the tributary of the River Parrett shown in Fig. 4.1. ..................................................................................................................................... [1] (ii) Using Fig. 4.2, identify four physical factors which led to the flooding of the Somerset Levels. 1 ........................................................................................................................................ 2 ........................................................................................................................................ 3 ........................................................................................................................................ 4 .................................................................................................................................. [4] (b) Suggest three reasons why local residents might be against the building of the tidal barrier. 1 ................................................................................................................................................ ................................................................................................................................................... 2 ................................................................................................................................................ ................................................................................................................................................... 3 ................................................................................................................................................ ............................................................................................................................................. [3] [Total: 8]
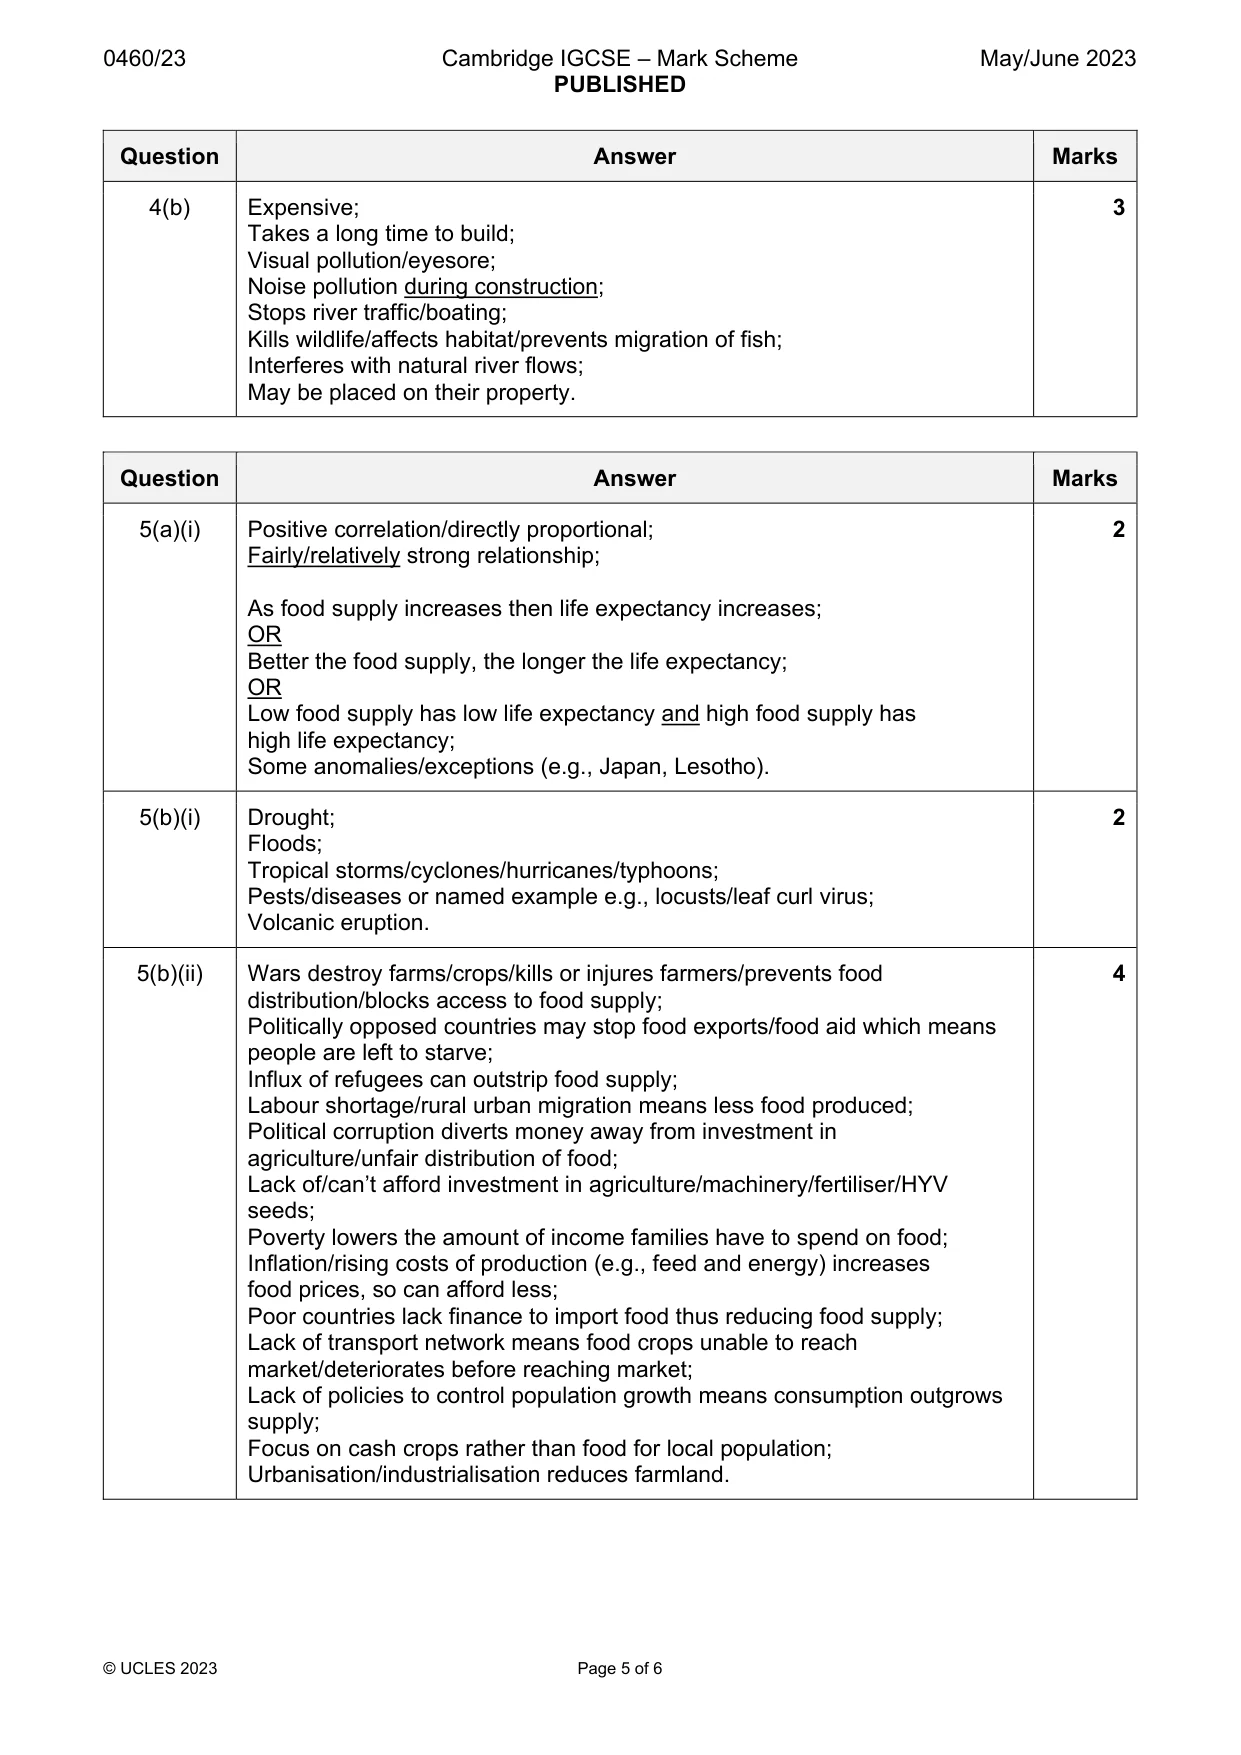
Mark scheme: 4(a)(i) (River) Tone. 1 4(a)(ii) Low lying land; 4 Silted rivers; High tides; Wettest January/high rainfall/heavy rain (in January). 4(b) Expensive; 3 Takes a long time to build; Visual pollution/eyesore; Noise pollution during construction; Stops river traffic/boating; Kills wildlife/affects habitat/prevents migration of fish; Interferes with natural river flows; May be placed on their property.
Question 5
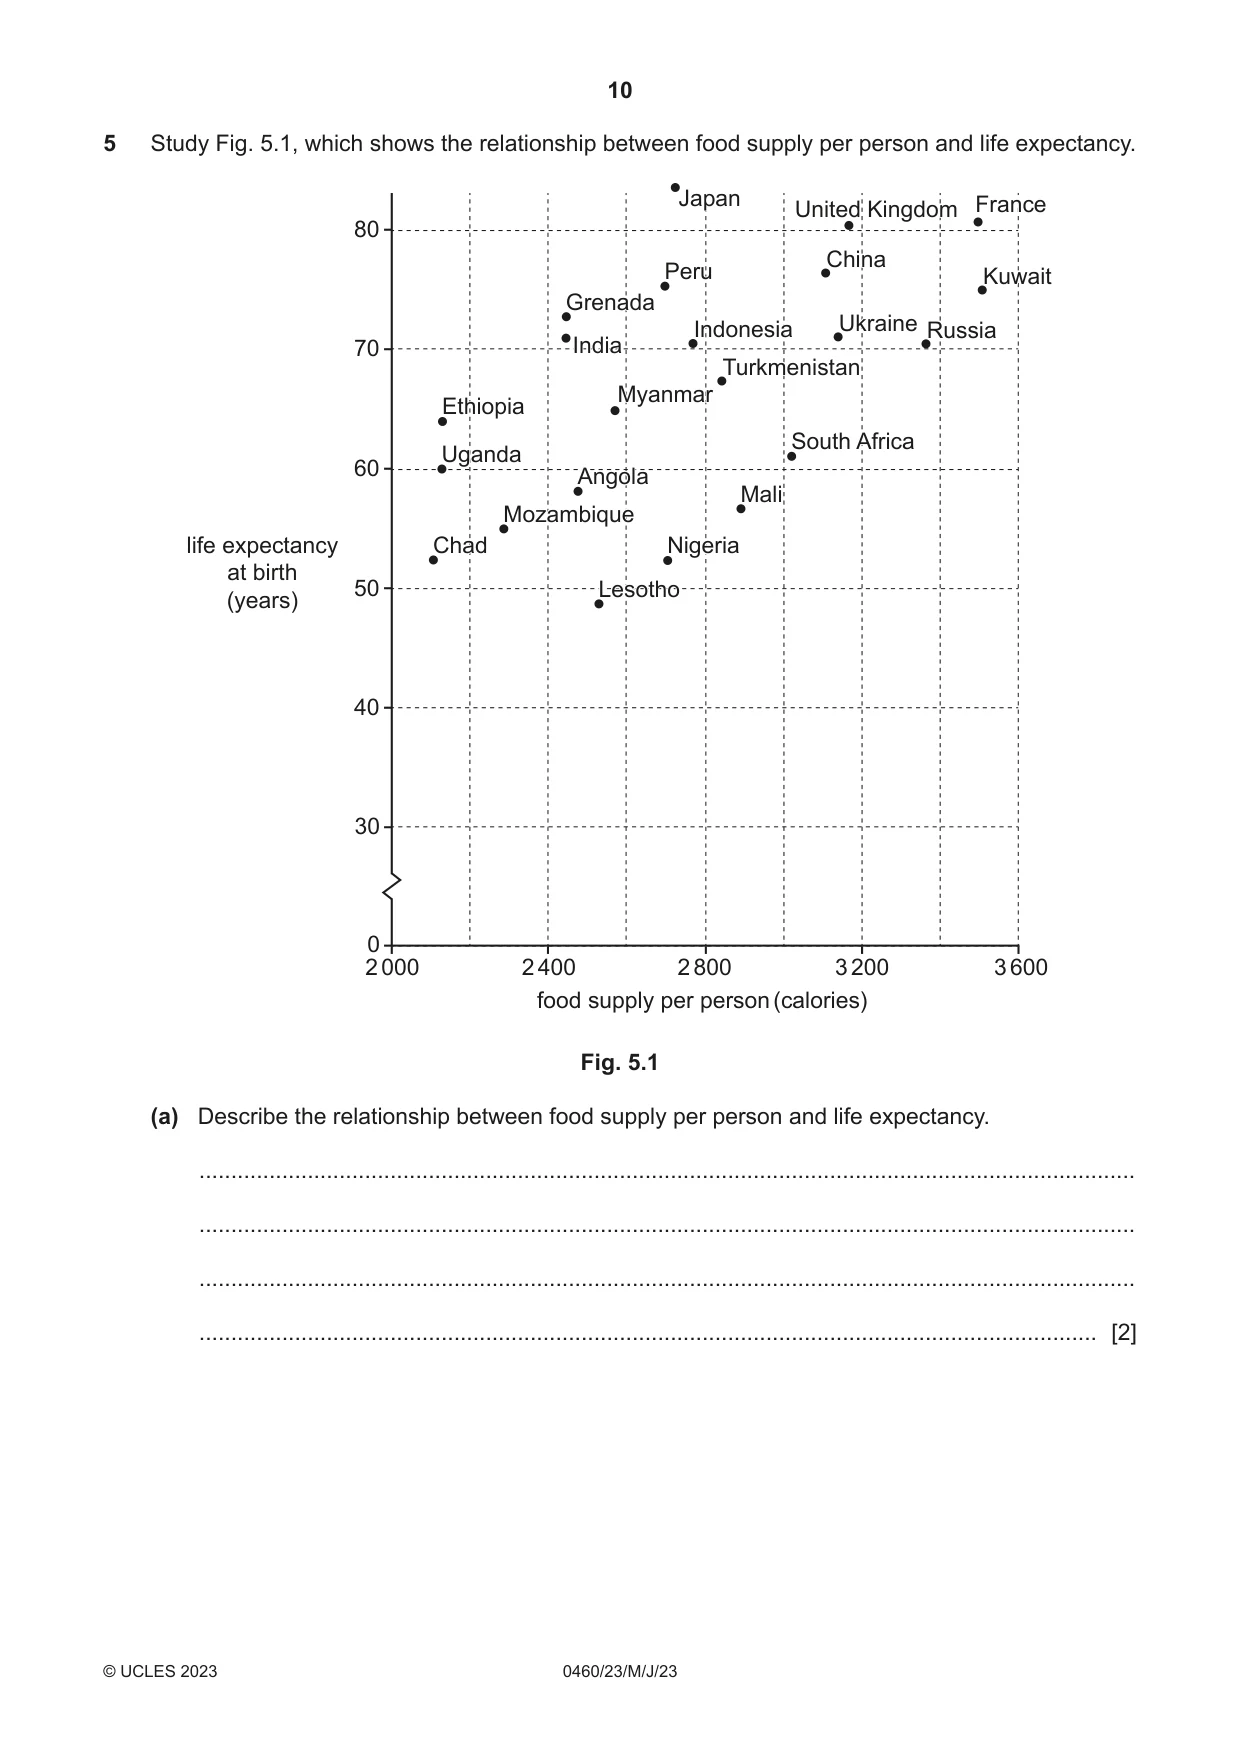
5 Study Fig. 5.1, which shows the relationship between food supply per person and life expectancy. JapanJapan UnitedUnited KingdomKingdom FranceFrance 80 ChinaChina PeruPeru KuwaitKuwait GrenadaGrenada UkraineUkraine IndonesiaIndonesia RussiaRussia 70 IndiaIndia TurkmenistanTurkmenistan MyanmarMyanmar EthiopiaEthiopia SouthSouth AfricaAfrica UgandaUganda 60 AngolaAngola MaliMali MozambiqueMozambique life expectancy ChadChad NigeriaNigeria at birth 50 LesothoLesotho (years) 40 30 0 2 000 2 400 2 800 3 200 3 600 food supply per person (calories) Fig. 5.1 (a) Describe the relationship between food supply per person and life expectancy. ................................................................................................................................................... ................................................................................................................................................... ................................................................................................................................................... ............................................................................................................................................. [2] (b) (i) Suggest two natural (physical) causes of food shortages. 1 ........................................................................................................................................ ........................................................................................................................................... 2 ........................................................................................................................................ ..................................................................................................................................... [2] (ii) Suggest how economic and political factors can cause food shortages. ........................................................................................................................................... ........................................................................................................................................... ........................................................................................................................................... ........................................................................................................................................... ........................................................................................................................................... ........................................................................................................................................... ........................................................................................................................................... ..................................................................................................................................... [4] [Total: 8]
Mark scheme: 5(a)(i) Positive correlation/directly proportional; 2 Fairly/relatively strong relationship; As food supply increases then life expectancy increases; OR Better the food supply, the longer the life expectancy; OR Low food supply has low life expectancy and high food supply has high life expectancy; Some anomalies/exceptions (e.g., Japan, Lesotho). 5(b)(i) Drought; 2 Floods; Tropical storms/cyclones/hurricanes/typhoons; Pests/diseases or named example e.g., locusts/leaf curl virus; Volcanic eruption. 5(b)(ii) Wars destroy farms/crops/kills or injures farmers/prevents food 4 distribution/blocks access to food supply; Politically opposed countries may stop food exports/food aid which means people are left to starve; Influx of refugees can outstrip food supply; Labour shortage/rural urban migration means less food produced; Political corruption diverts money away from investment in agriculture/unfair distribution of food; Lack of/can’t afford investment in agriculture/machinery/fertiliser/HYV seeds; Poverty lowers the amount of income families have to spend on food; Inflation/rising costs of production (e.g., feed and energy) increases food prices, so can afford less; Poor countries lack finance to import food thus reducing food supply; Lack of transport network means food crops unable to reach market/deteriorates before reaching market; Lack of policies to control population growth means consumption outgrows supply; Focus on cash crops rather than food for local population; Urbanisation/industrialisation reduces farmland.
Question 6
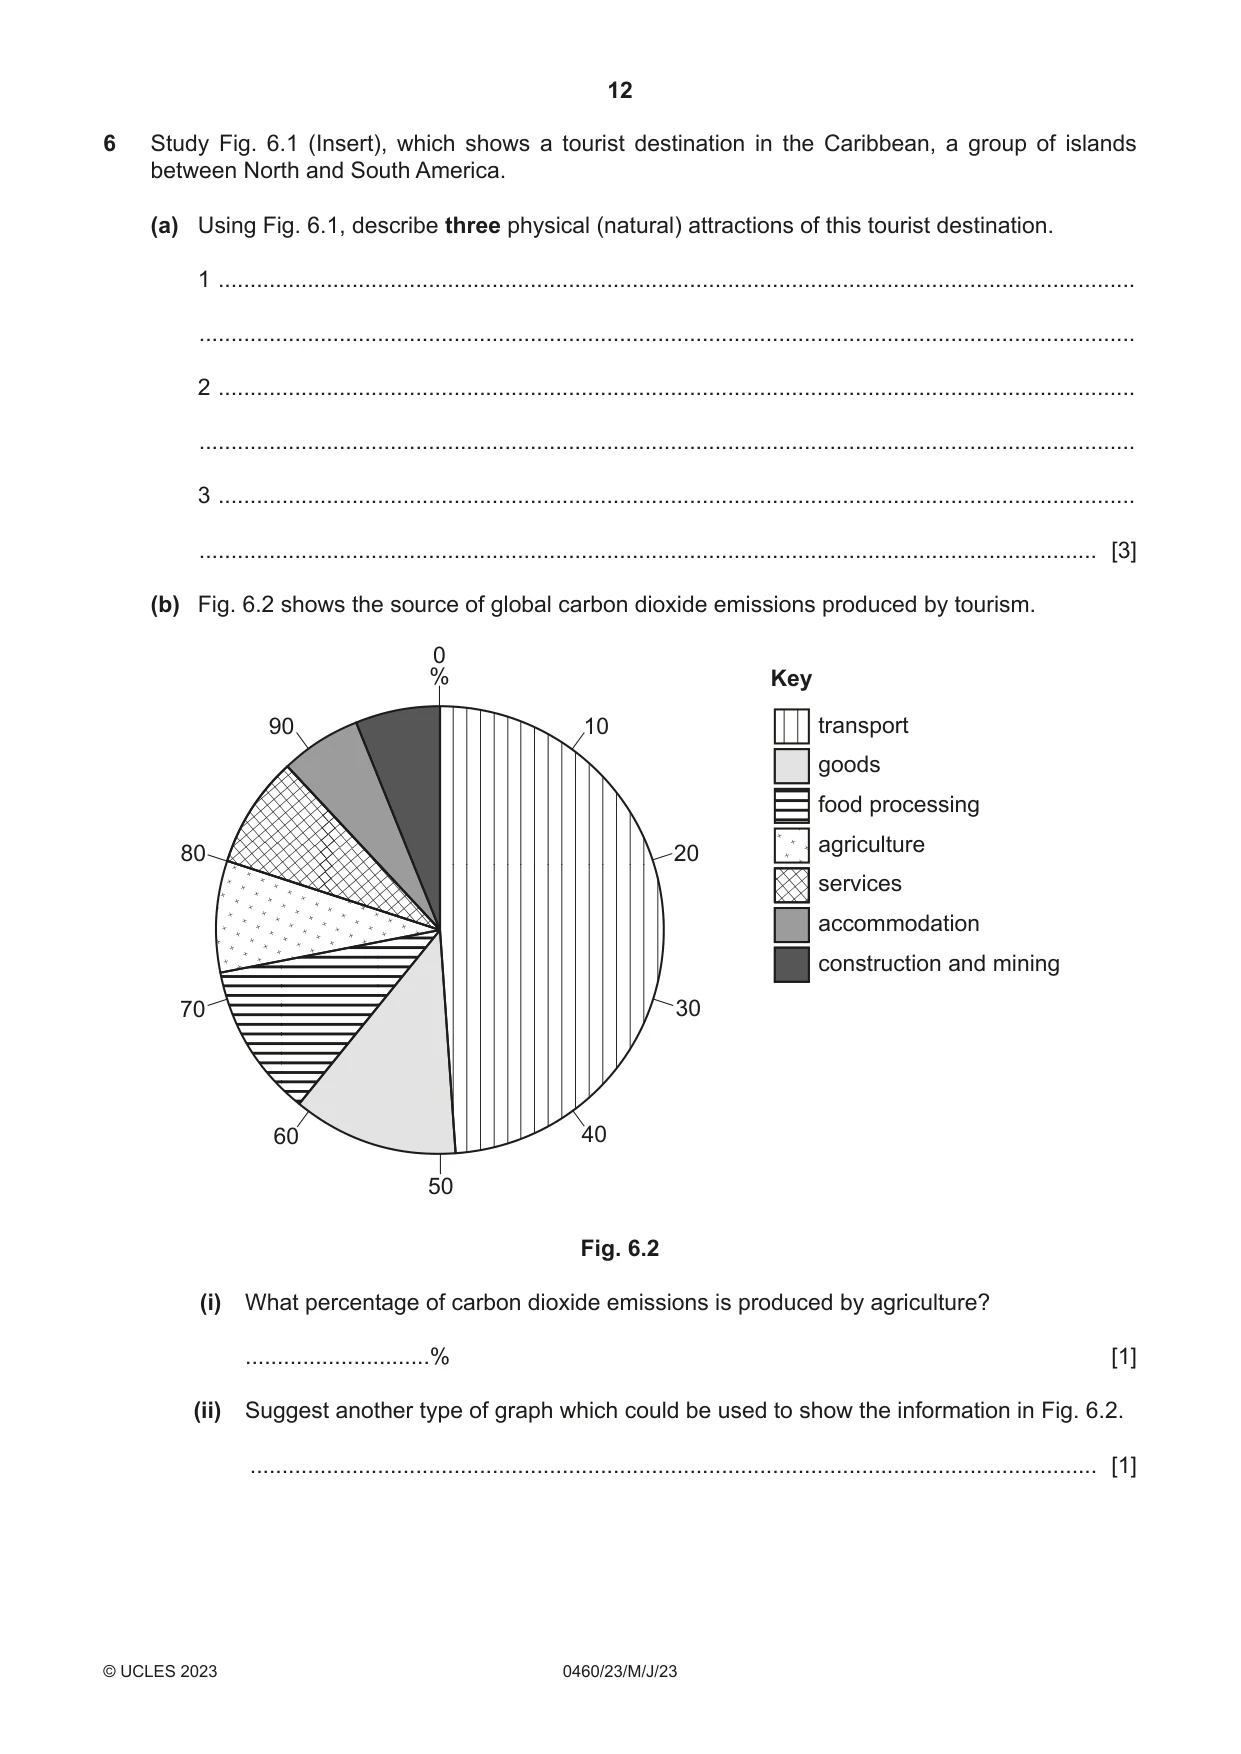
6 Study Fig. 6.1 (Insert), which shows a tourist destination in the Caribbean, a group of islands between North and South America. (a) Using Fig. 6.1, describe three physical (natural) attractions of this tourist destination. 1 ................................................................................................................................................ ................................................................................................................................................... 2 ................................................................................................................................................ ................................................................................................................................................... 3 ................................................................................................................................................ ............................................................................................................................................. [3] (b) Fig. 6.2 shows the source of global carbon dioxide emissions produced by tourism. 0 % Key 90 10 transport goods food processing agriculture 80 20 services accommodation construction and mining 70 30 60 40 50 Fig. 6.2 (i) What percentage of carbon dioxide emissions is produced by agriculture? .............................% [1] (ii) Suggest another type of graph which could be used to show the information in Fig. 6.2. ..................................................................................................................................... [1] (c) Governments in the Caribbean wish to reduce the pollution produced by tourism. Suggest ways in which they could reduce the amount of carbon emissions produced by transport and agriculture. Transport .................................................................................................................................. ................................................................................................................................................... ................................................................................................................................................... ................................................................................................................................................... ................................................................................................................................................... ................................................................................................................................................... Agriculture ................................................................................................................................ ................................................................................................................................................... ................................................................................................................................................... ................................................................................................................................................... ................................................................................................................................................... ............................................................................................................................................. [3] [Total: 8] Additional pages If you use the following pages to complete the answer to any question, the question number must be clearly shown. .................................................................................................................................................................. .................................................................................................................................................................. .................................................................................................................................................................. .................................................................................................................................................................. .................................................................................................................................................................. .................................................................................................................................................................. .................................................................................................................................................................. .................................................................................................................................................................. .................................................................................................................................................................. .................................................................................................................................................................. .................................................................................................................................................................. .................................................................................................................................................................. .................................................................................................................................................................. .................................................................................................................................................................. .................................................................................................................................................................. .................................................................................................................................................................. .................................................................................................................................................................. .................................................................................................................................................................. .................................................................................................................................................................. .................................................................................................................................................................. .................................................................................................................................................................. .................................................................................................................................................................. .................................................................................................................................................................. .................................................................................................................................................................. ..................................................................................................................................................................
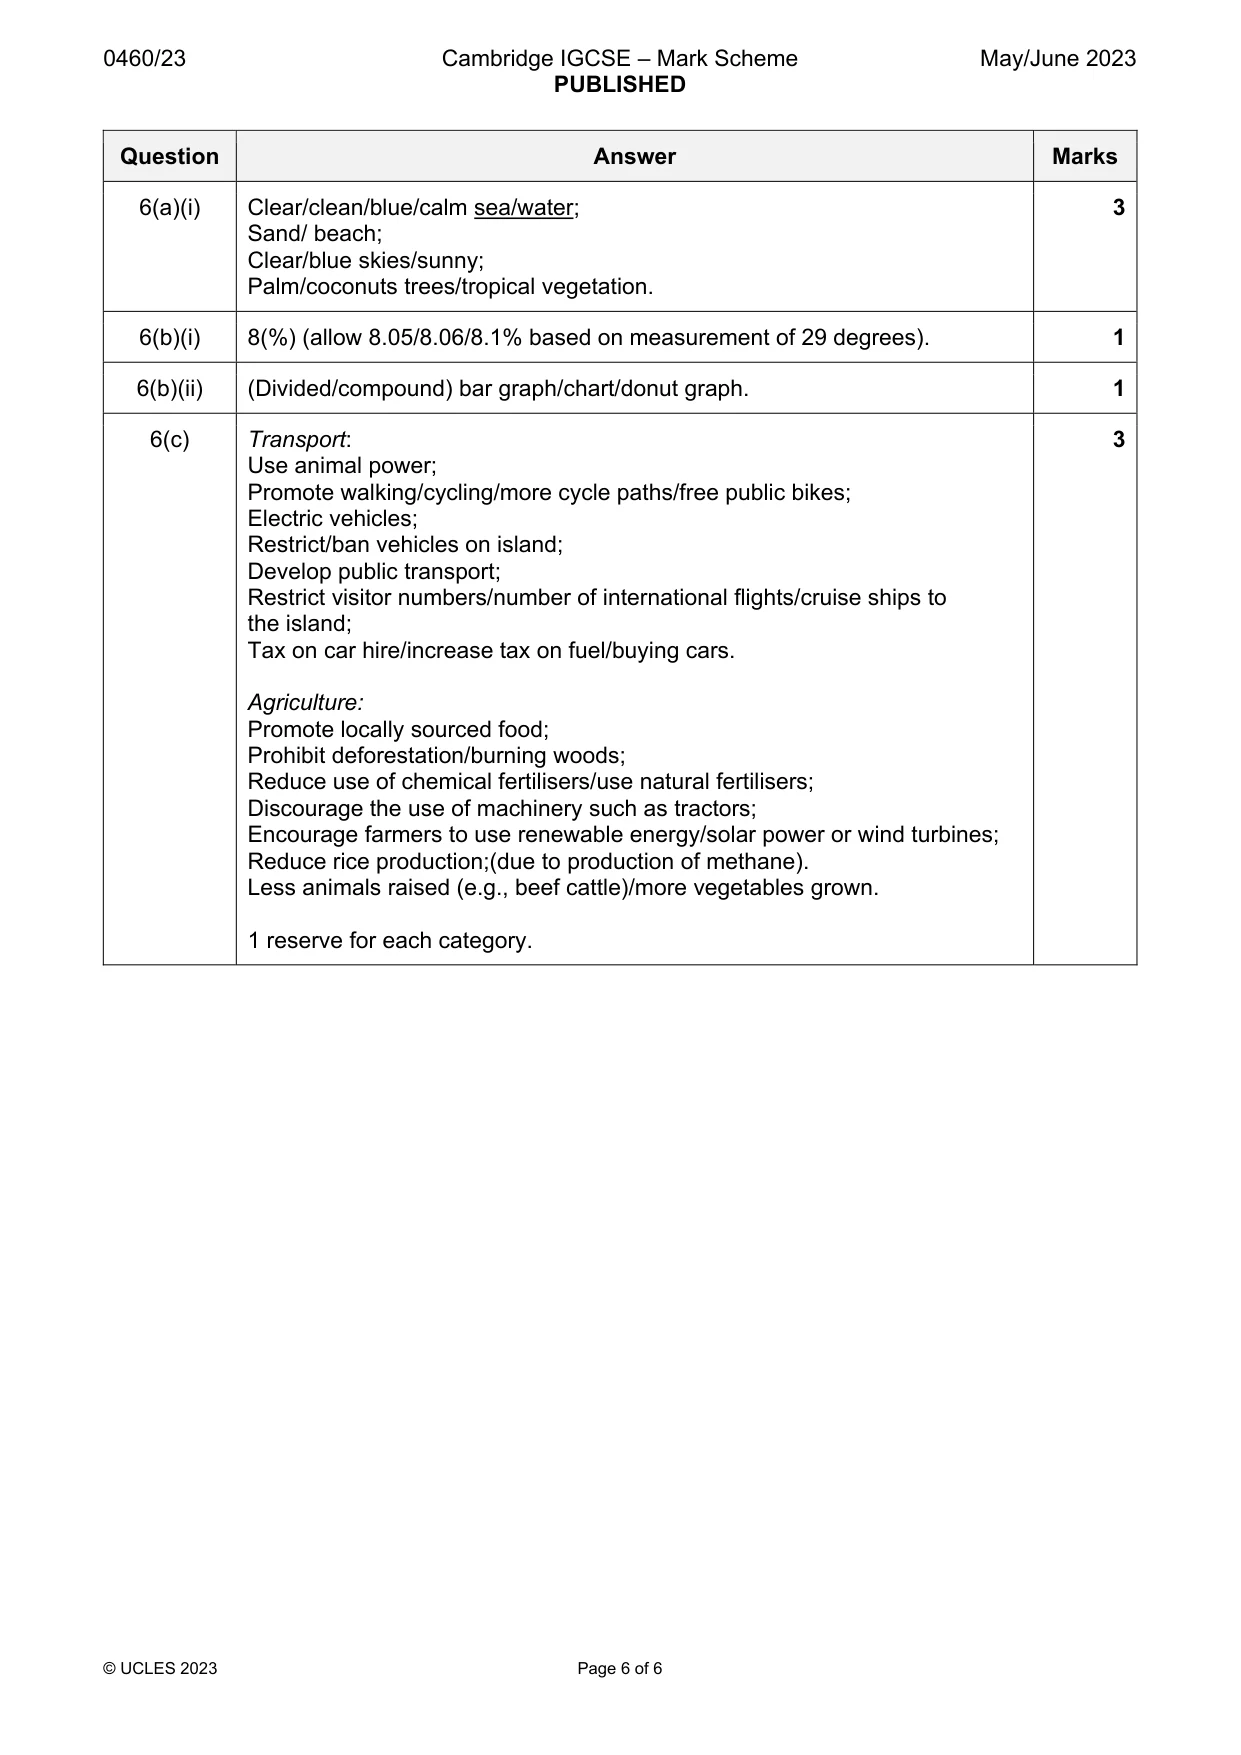
Mark scheme: 6(a)(i) Clear/clean/blue/calm sea/water; 3 Sand/ beach; Clear/blue skies/sunny; Palm/coconuts trees/tropical vegetation. 6(b)(i) 8(%) (allow 8.05/8.06/8.1% based on measurement of 29 degrees). 1 6(b)(ii) (Divided/compound) bar graph/chart/donut graph. 1 6(c) Transport: 3 Use animal power; Promote walking/cycling/more cycle paths/free public bikes; Electric vehicles; Restrict/ban vehicles on island; Develop public transport; Restrict visitor numbers/number of international flights/cruise ships to the island; Tax on car hire/increase tax on fuel/buying cars. Agriculture: Promote locally sourced food; Prohibit deforestation/burning woods; Reduce use of chemical fertilisers/use natural fertilisers; Discourage the use of machinery such as tractors; Encourage farmers to use renewable energy/solar power or wind turbines; Reduce rice production;(due to production of methane). Less animals raised (e.g., beef cattle)/more vegetables grown. 1 reserve for each category.
What was in this paper
The subtopics covered by these 6 questions, and how many questions each got. Open one in a new tab to see every Cambridge question on it.
What you needed in this session
Cambridge’s own grade thresholds for 2023 May/June, Paper 2 · Variant 3. A higher threshold means an easier paper — the bar moves with how the cohort did.