Cambridge IGCSE Geography 0460 — 2018 Oct/Nov Paper 2 · Variant 1
0460/21/O/N/18 · 6 questions · 60 marks · ≈68 min
The question paper and its mark scheme, free to read here and free to download. This is Cambridge’s own paper, exactly as it was sat.
Question paper20 pages

Mark scheme6 pages
Answers below. Sit the paper first if you are practising.
Questions as text
Q1 · Study the map extract for Frya, Norway
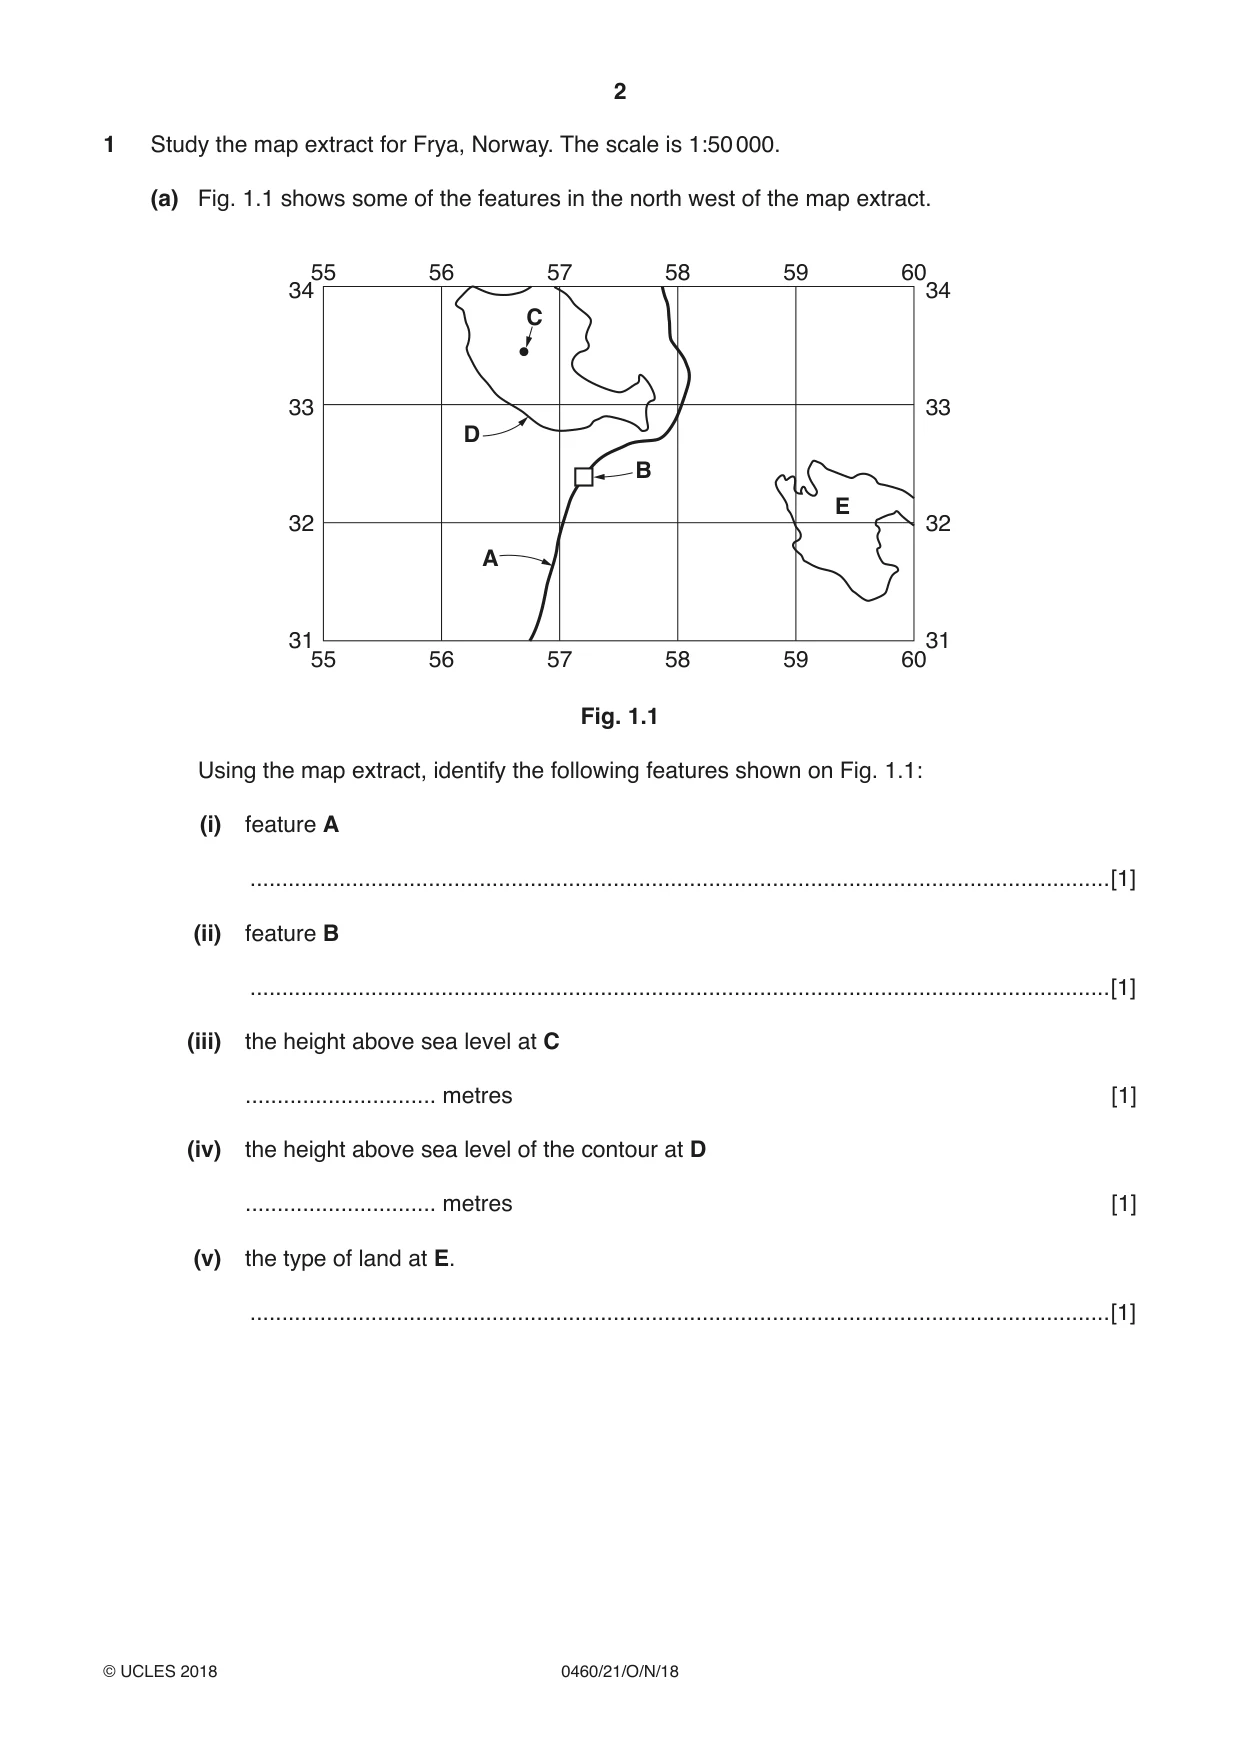
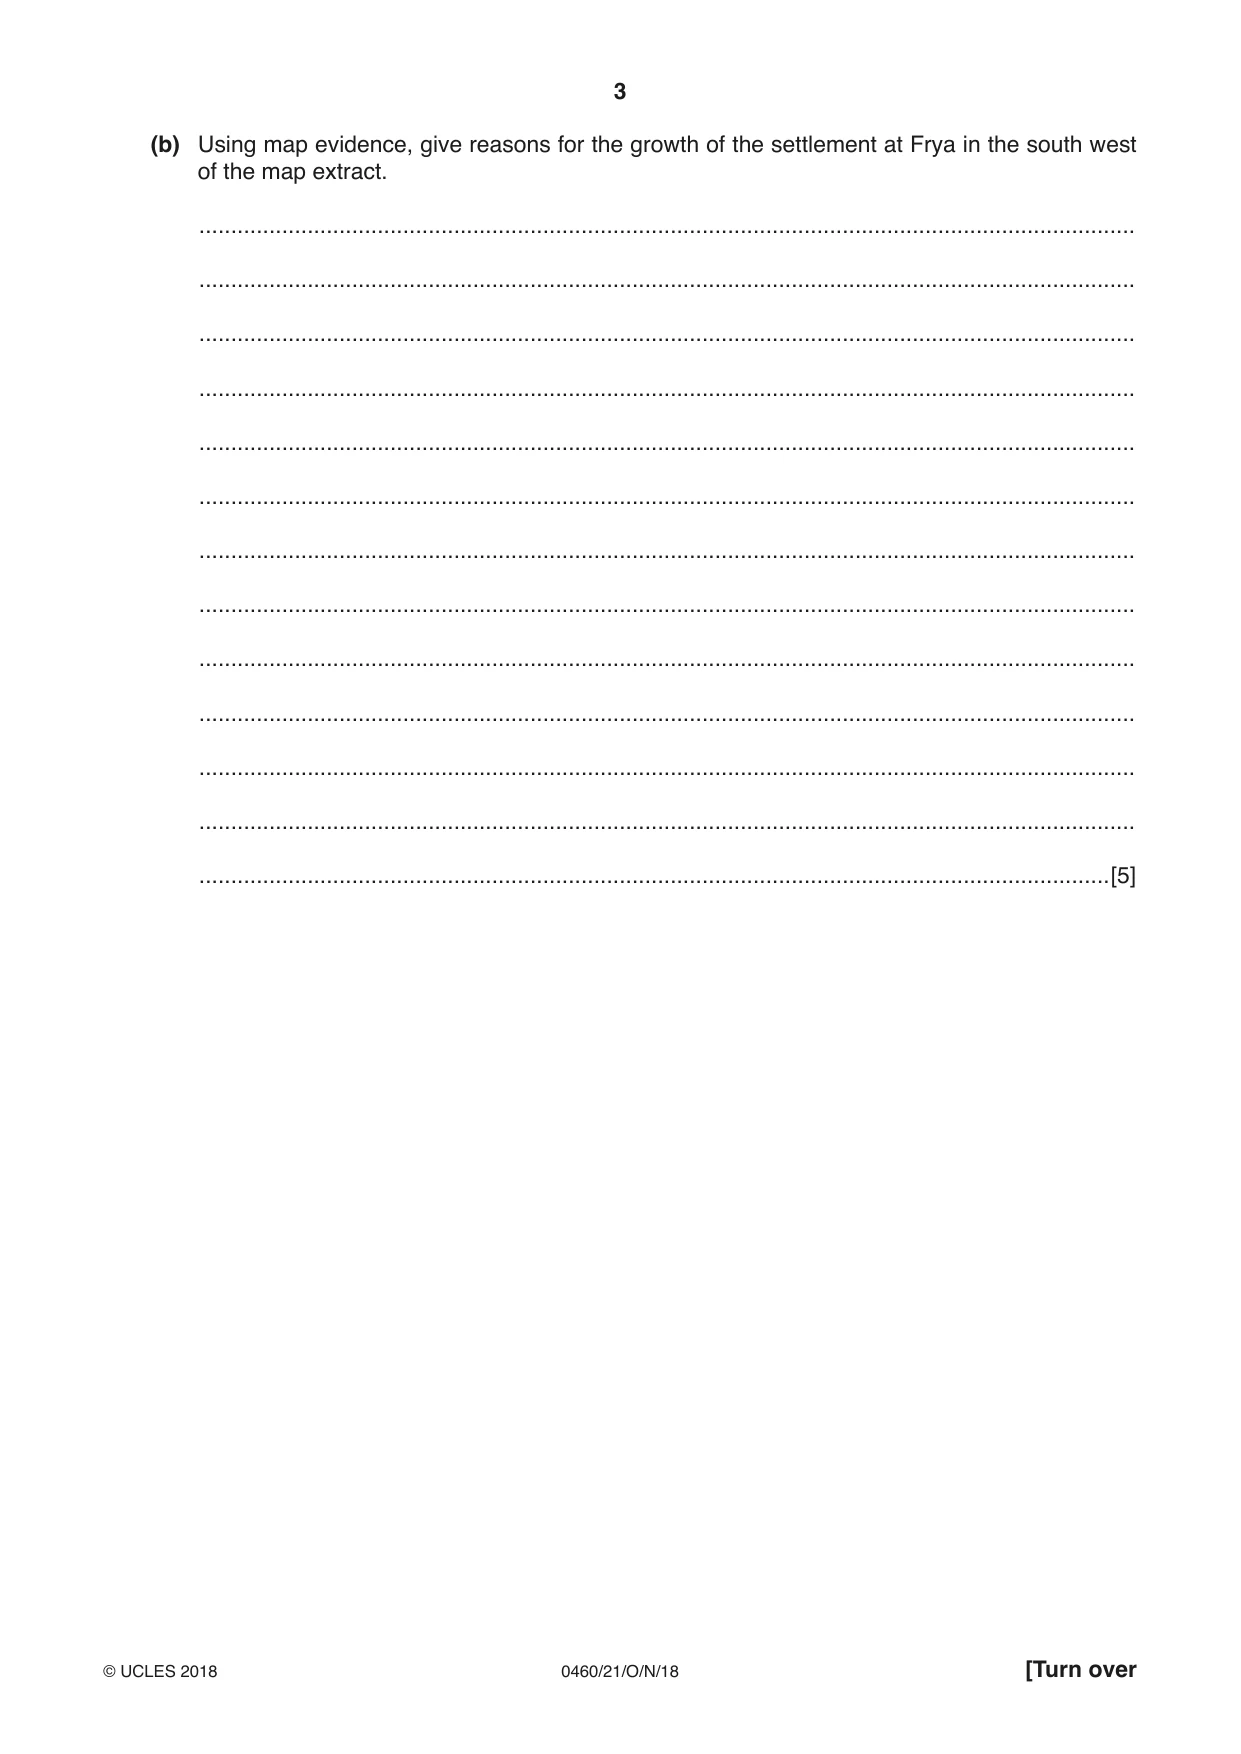
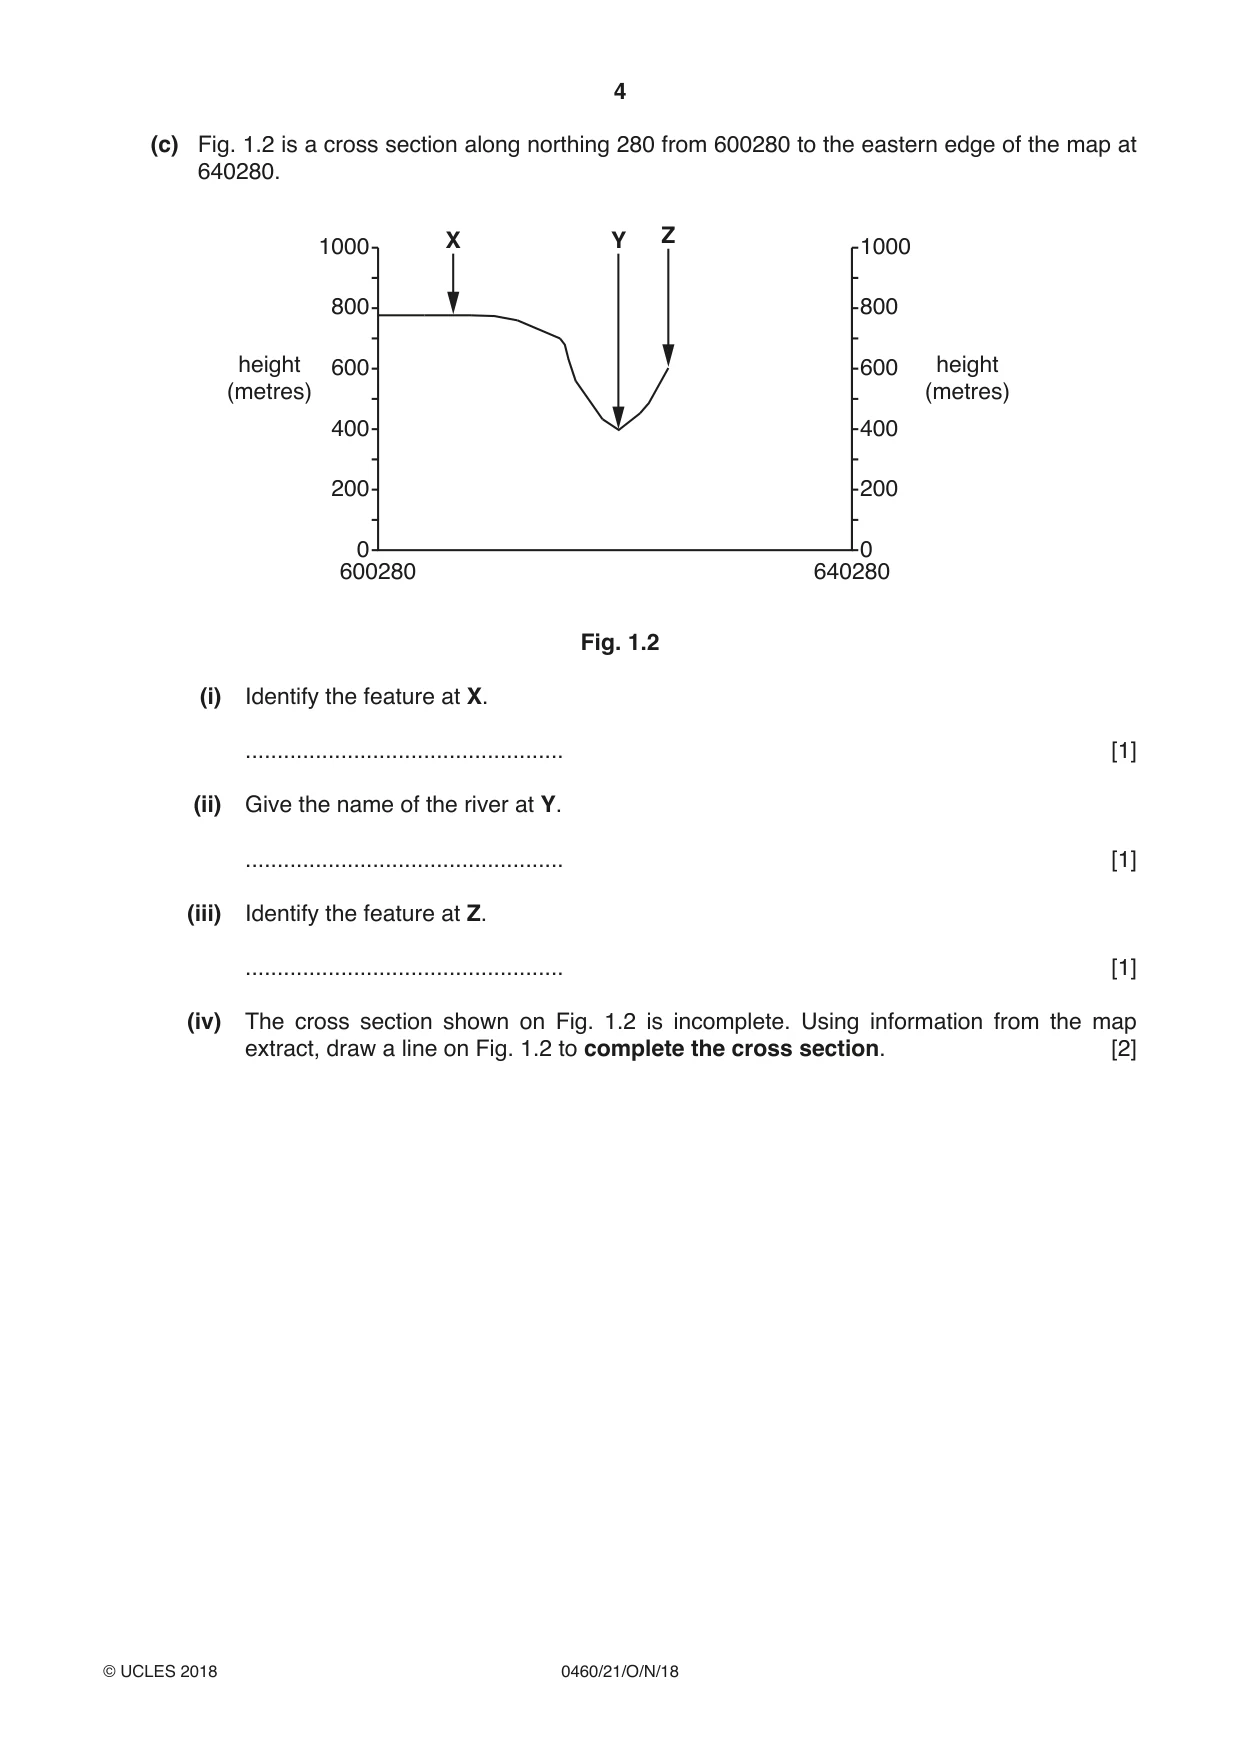
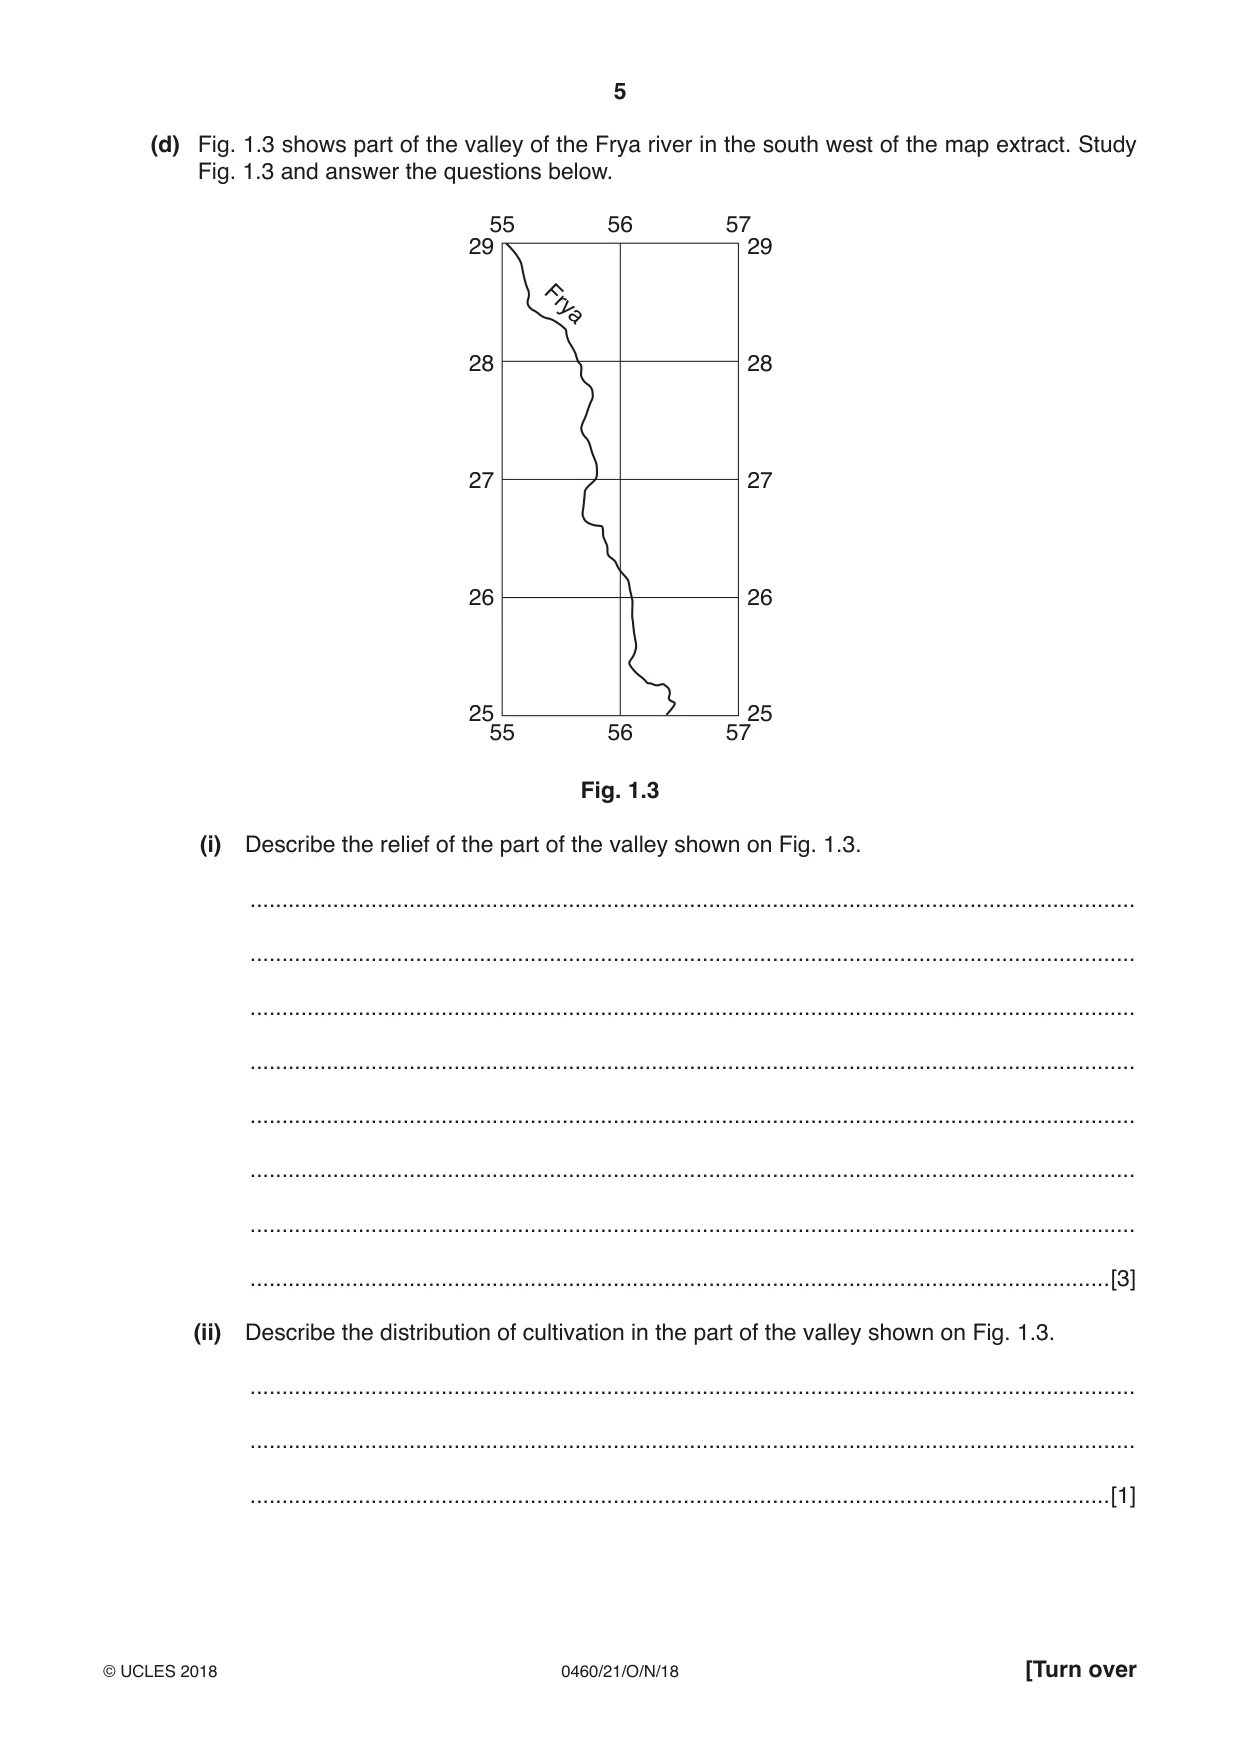
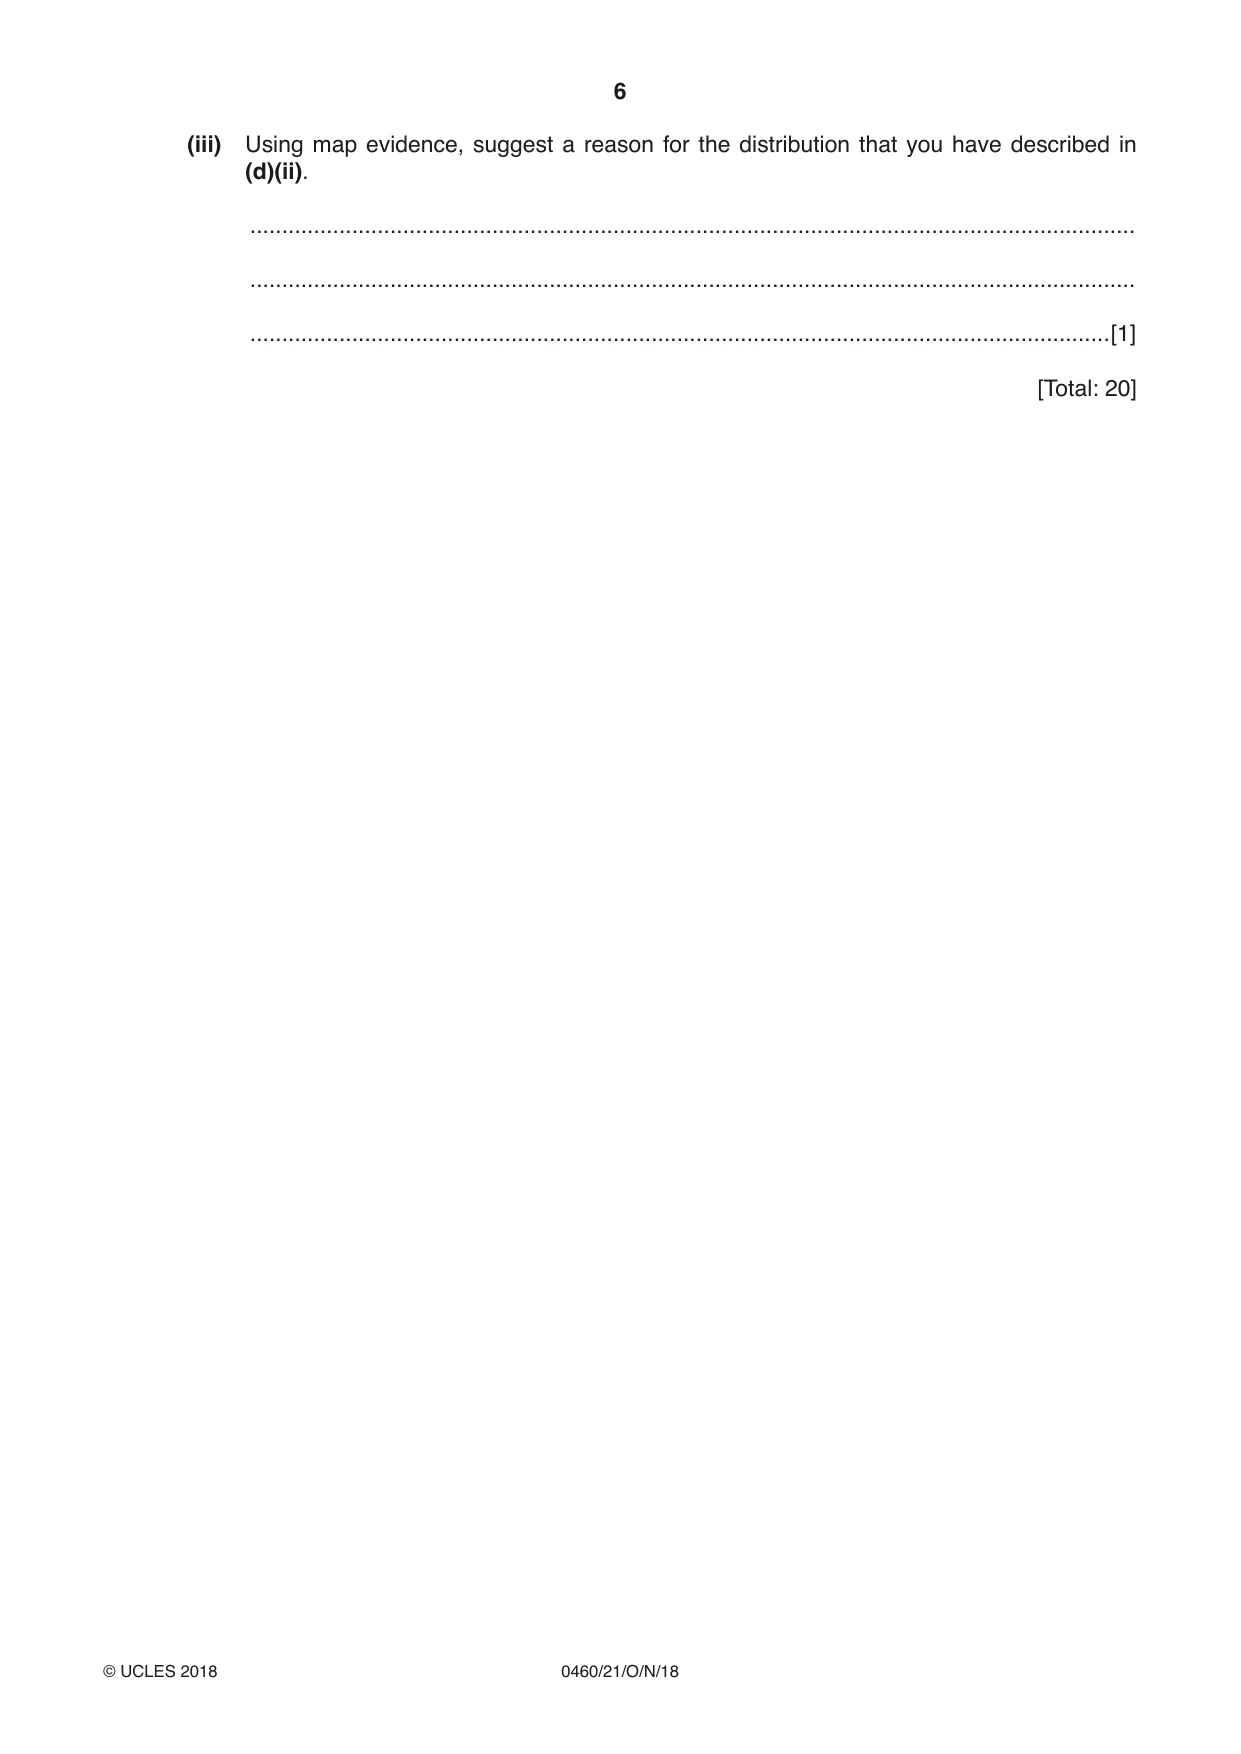
1 Study the map extract for Frya, Norway. The scale is 1:50 000. (a) Fig. 1.1 shows some of the features in the north west of the map extract. 55 56 57 58 59 60 34 34 C 33 33 D B E 32 32 A 31 31 55 56 57 58 59 60 Fig. 1.1 Using the map extract, identify the following features shown on Fig. 1.1: (i) feature A .......................................................................................................................................[1] (ii) feature B .......................................................................................................................................[1] (iii) the height above sea level at C .............................. metres [1] (iv) the height above sea level of the contour at D .............................. metres [1] (v) the type of land at E. .......................................................................................................................................[1] (b) Using map evidence, give reasons for the growth of the settlement at Frya in the south west of the map extract. ................................................................................................................................................... ................................................................................................................................................... ................................................................................................................................................... ................................................................................................................................................... ................................................................................................................................................... ................................................................................................................................................... ................................................................................................................................................... ................................................................................................................................................... ................................................................................................................................................... ................................................................................................................................................... ................................................................................................................................................... ................................................................................................................................................... ...............................................................................................................................................[5] (c) Fig. 1.2 is a cross section along northing 280 from 600280 to the eastern edge of the map at 640280. 1000 X Y Z 1000 800 800 height 600 600 height (metres) (metres) 400 400 200 200 0 0 600280 640280 Fig. 1.2 (i) Identify the feature at X. .................................................. [1] (ii) Give the name of the river at Y. .................................................. [1] (iii) Identify the feature at Z. .................................................. [1] (iv) The cross section shown on Fig. 1.2 is incomplete. Using information from the map extract, draw a line on Fig. 1.2 to complete the cross section. [2] (d) Fig. 1.3 shows part of the valley of the Frya river in the south west of the map extract. Study Fig. 1.3 and answer the questions below. 55 56 57 29 29 Frya 28 28 27 27 26 26 25 25 55 56 57 Fig. 1.3 (i) Describe the relief of the part of the valley shown on Fig. 1.3. ........................................................................................................................................... ........................................................................................................................................... ........................................................................................................................................... ........................................................................................................................................... ........................................................................................................................................... ........................................................................................................................................... ........................................................................................................................................... .......................................................................................................................................[3] (ii) Describe the distribution of cultivation in the part of the valley shown on Fig. 1.3. ........................................................................................................................................... ........................................................................................................................................... .......................................................................................................................................[1] (iii) Using map evidence, suggest a reason for the distribution that you have described in (d)(ii). ........................................................................................................................................... ........................................................................................................................................... .......................................................................................................................................[1] [Total: 20]
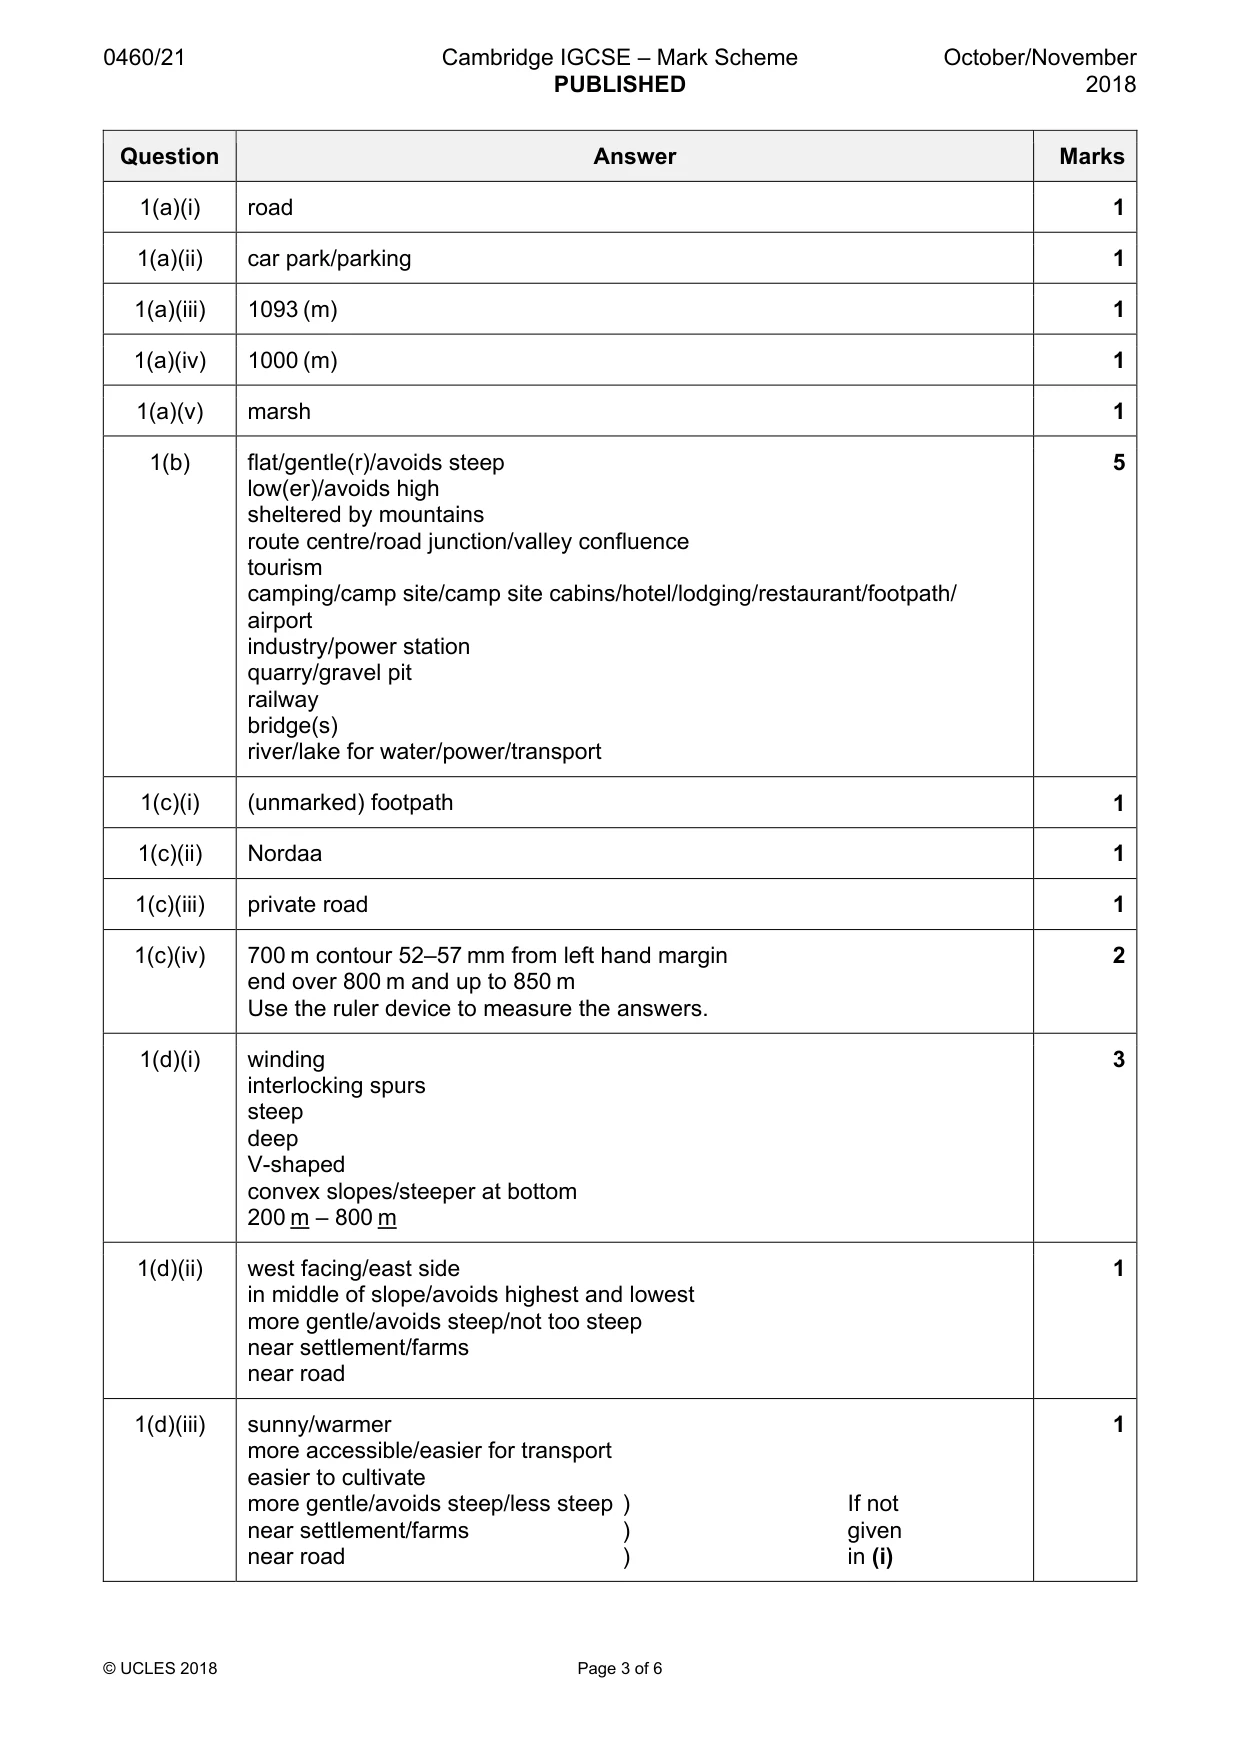
Mark scheme: Question Answer Marks 1(a)(i) road 1 1(a)(ii) car park/parking 1 1(a)(iii) 1093 (m) 1 1(a)(iv) 1000 (m) 1 1(a)(v) marsh 1 1(b) flat/gentle(r)/avoids steep 5 low(er)/avoids high sheltered by mountains route centre/road junction/valley confluence tourism camping/camp site/camp site cabins/hotel/lodging/restaurant/footpath/ airport industry/power station quarry/gravel pit railway bridge(s) river/lake for water/power/transport 1(c)(i) (unmarked) footpath 1 1(c)(ii) Nordaa 1 1(c)(iii) private road 1 1(c)(iv) 700 m contour 52–57 mm from left hand margin 2 end over 800 m and up to 850 m Use the ruler device to measure the answers. 1(d)(i) winding 3 interlocking spurs steep deep V-shaped convex slopes/steeper at bottom 200 m – 800 m 1(d)(ii) west facing/east side 1 in middle of slope/avoids highest and lowest more gentle/avoids steep/not too steep near settlement/farms near road 1(d)(iii) sunny/warmer 1 more accessible/easier for transport easier to cultivate more gentle/avoids steep/less steep ) If not near settlement/farms ) given near road ) in (i)
More questions on Settlements (rural and urban) and service provision
Q2 · A prediction of how the population of some countries in Europe might change by the year…
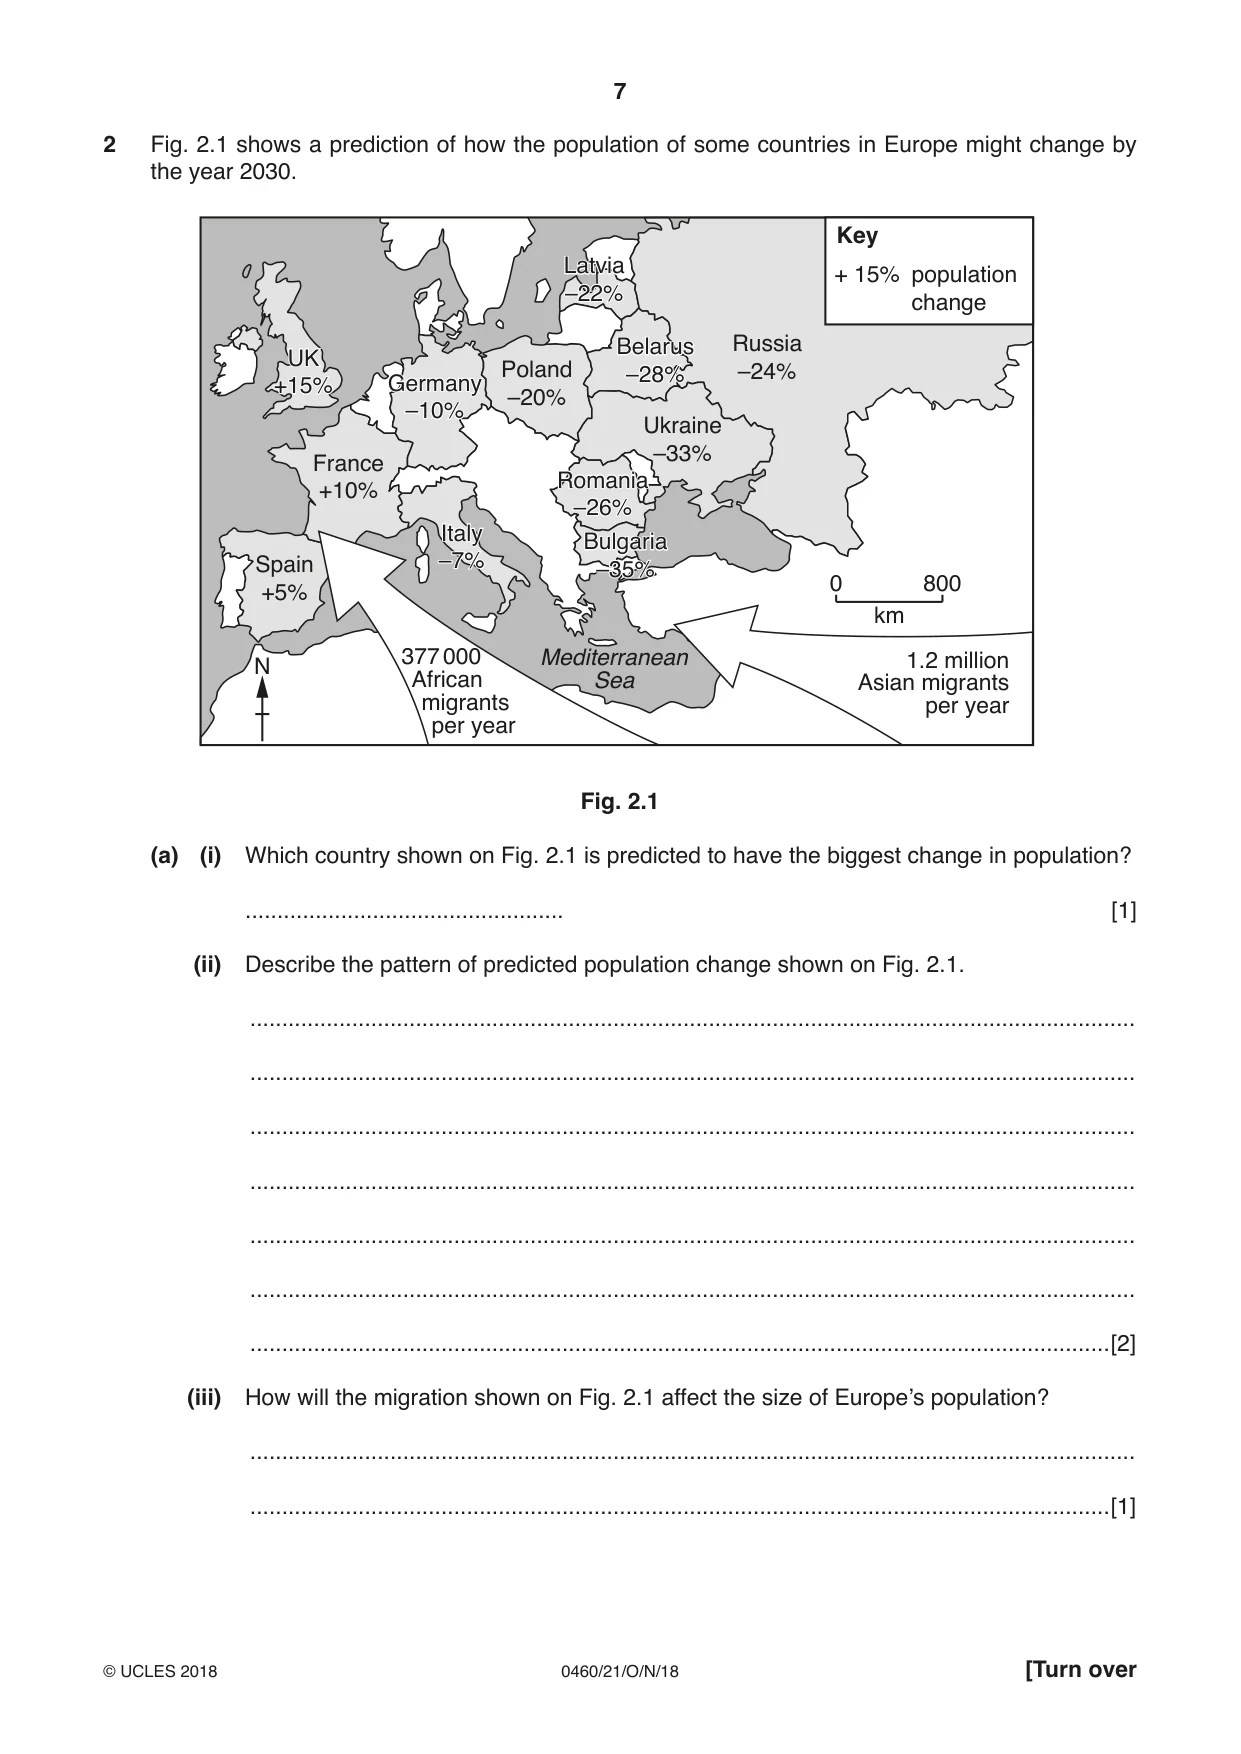
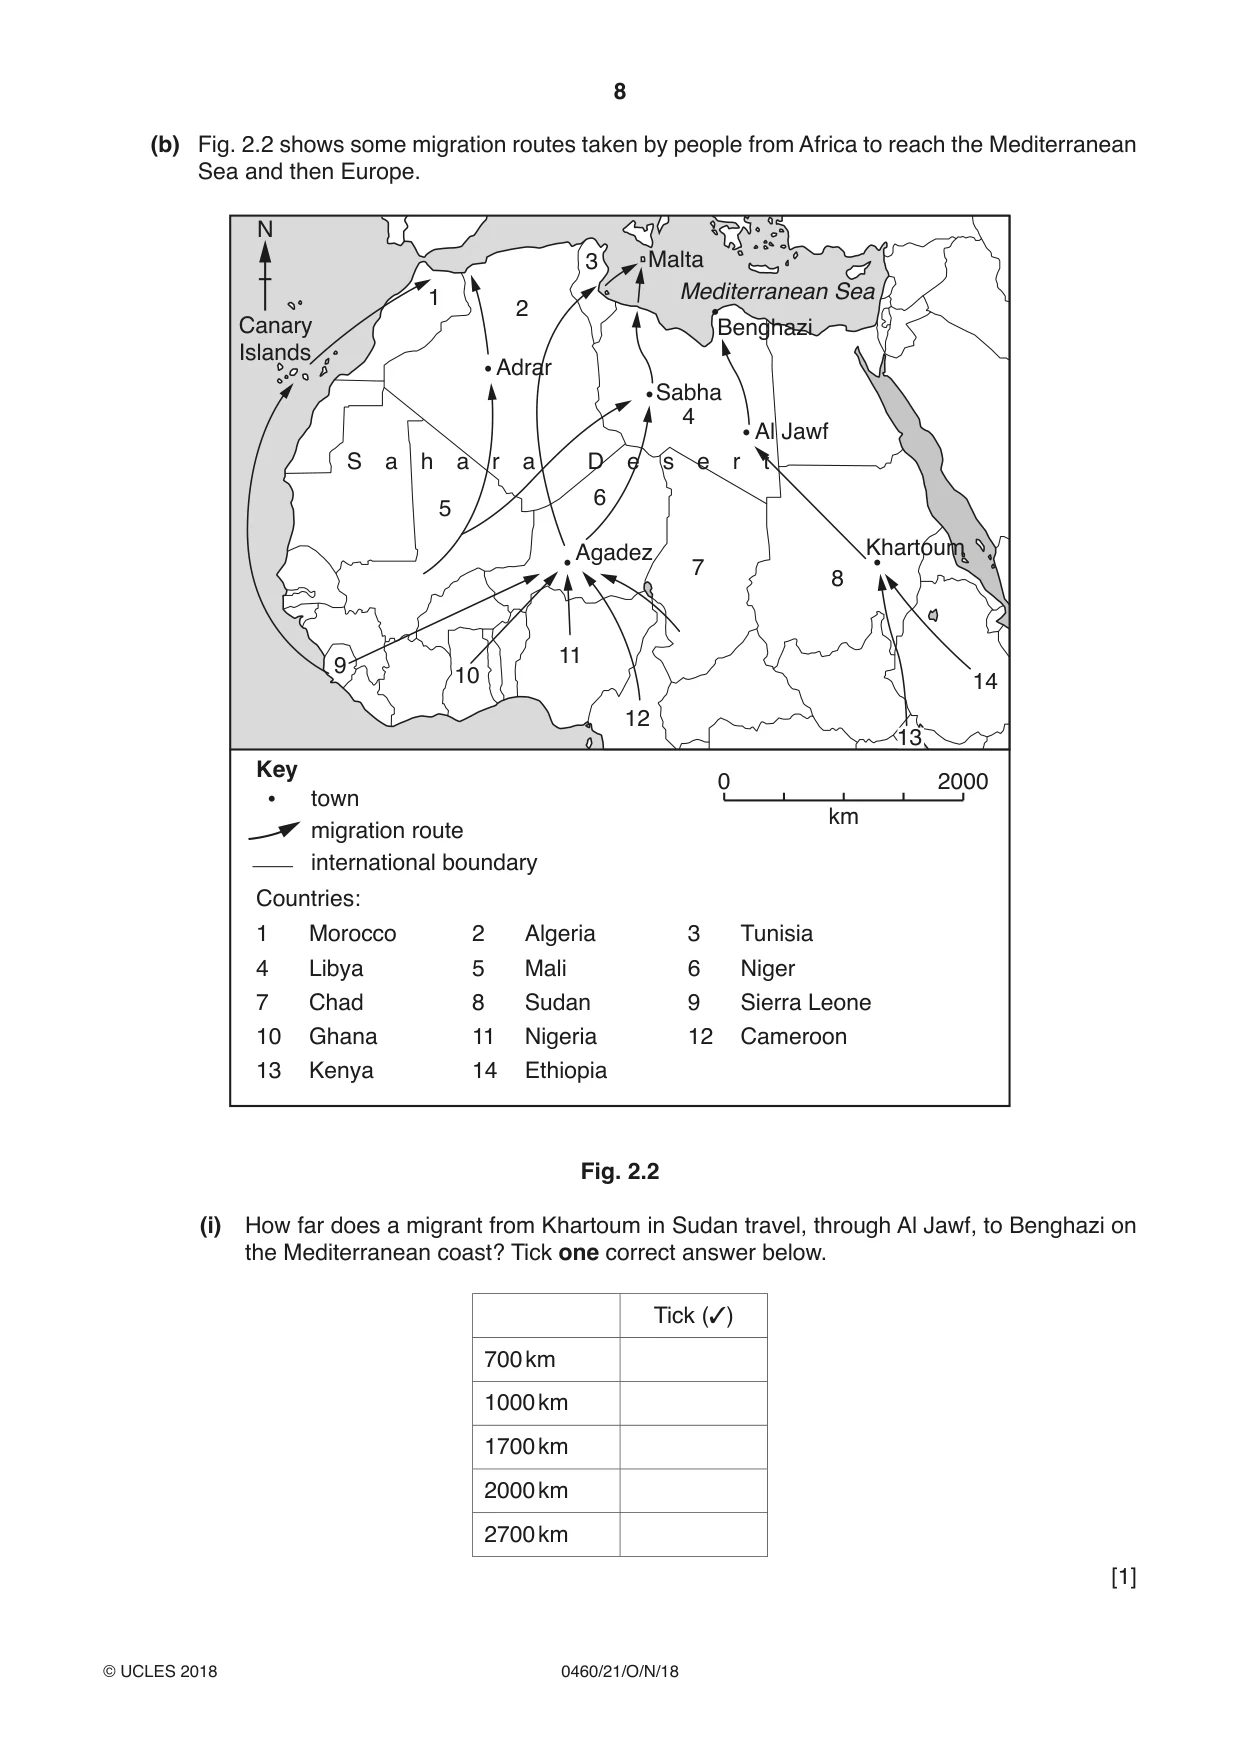
2 Fig. 2.1 shows a prediction of how the population of some countries in Europe might change by the year 2030. Key LatviaLatvia + 15% population –22%–22% change BelarusBelarus Russia UKUK Poland –28%–28% –24% +15%+15% GermanyGermany –20% –10%–10% Ukraine –33% France RomaniaRomania +10% –26%–26% ItalyItaly BulgariaBulgaria Spain –7%–7% –35%–35% 0 800 +5% km 377 000 Mediterranean 1.2 million N African Sea Asian migrants migrants per year per year Fig. 2.1 (a) (i) Which country shown on Fig. 2.1 is predicted to have the biggest change in population? .................................................. [1] (ii) Describe the pattern of predicted population change shown on Fig. 2.1. ........................................................................................................................................... ........................................................................................................................................... ........................................................................................................................................... ........................................................................................................................................... ........................................................................................................................................... ........................................................................................................................................... .......................................................................................................................................[2] (iii) How will the migration shown on Fig. 2.1 affect the size of Europe’s population? ........................................................................................................................................... .......................................................................................................................................[1] (b) Fig. 2.2 shows some migration routes taken by people from Africa to reach the Mediterranean Sea and then Europe. N 3 Malta Mediterranean Sea 1 2 Canary Benghazi Islands Adrar Sabha 4 Al Jawf S a h a r a D e s e r t 6 5 Agadez Khartoum 7 8 11 9 10 14 12 13 Key 0 2000 town km migration route international boundary Countries: 1 Morocco 2 Algeria 3 Tunisia 4 Libya 5 Mali 6 Niger 7 Chad 8 Sudan 9 Sierra Leone 10 Ghana 11 Nigeria 12 Cameroon 13 Kenya 14 Ethiopia Fig. 2.2 (i) How far does a migrant from Khartoum in Sudan travel, through Al Jawf, to Benghazi on the Mediterranean coast? Tick one correct answer below. Tick (3) 700 km 1000 km 1700 km 2000 km 2700 km [1] (ii) Describe the routes that migrants from Sierra Leone travel to reach the Mediterranean Sea. ........................................................................................................................................... ........................................................................................................................................... ........................................................................................................................................... ........................................................................................................................................... ........................................................................................................................................... ........................................................................................................................................... ........................................................................................................................................... .......................................................................................................................................[3] [Total: 8]
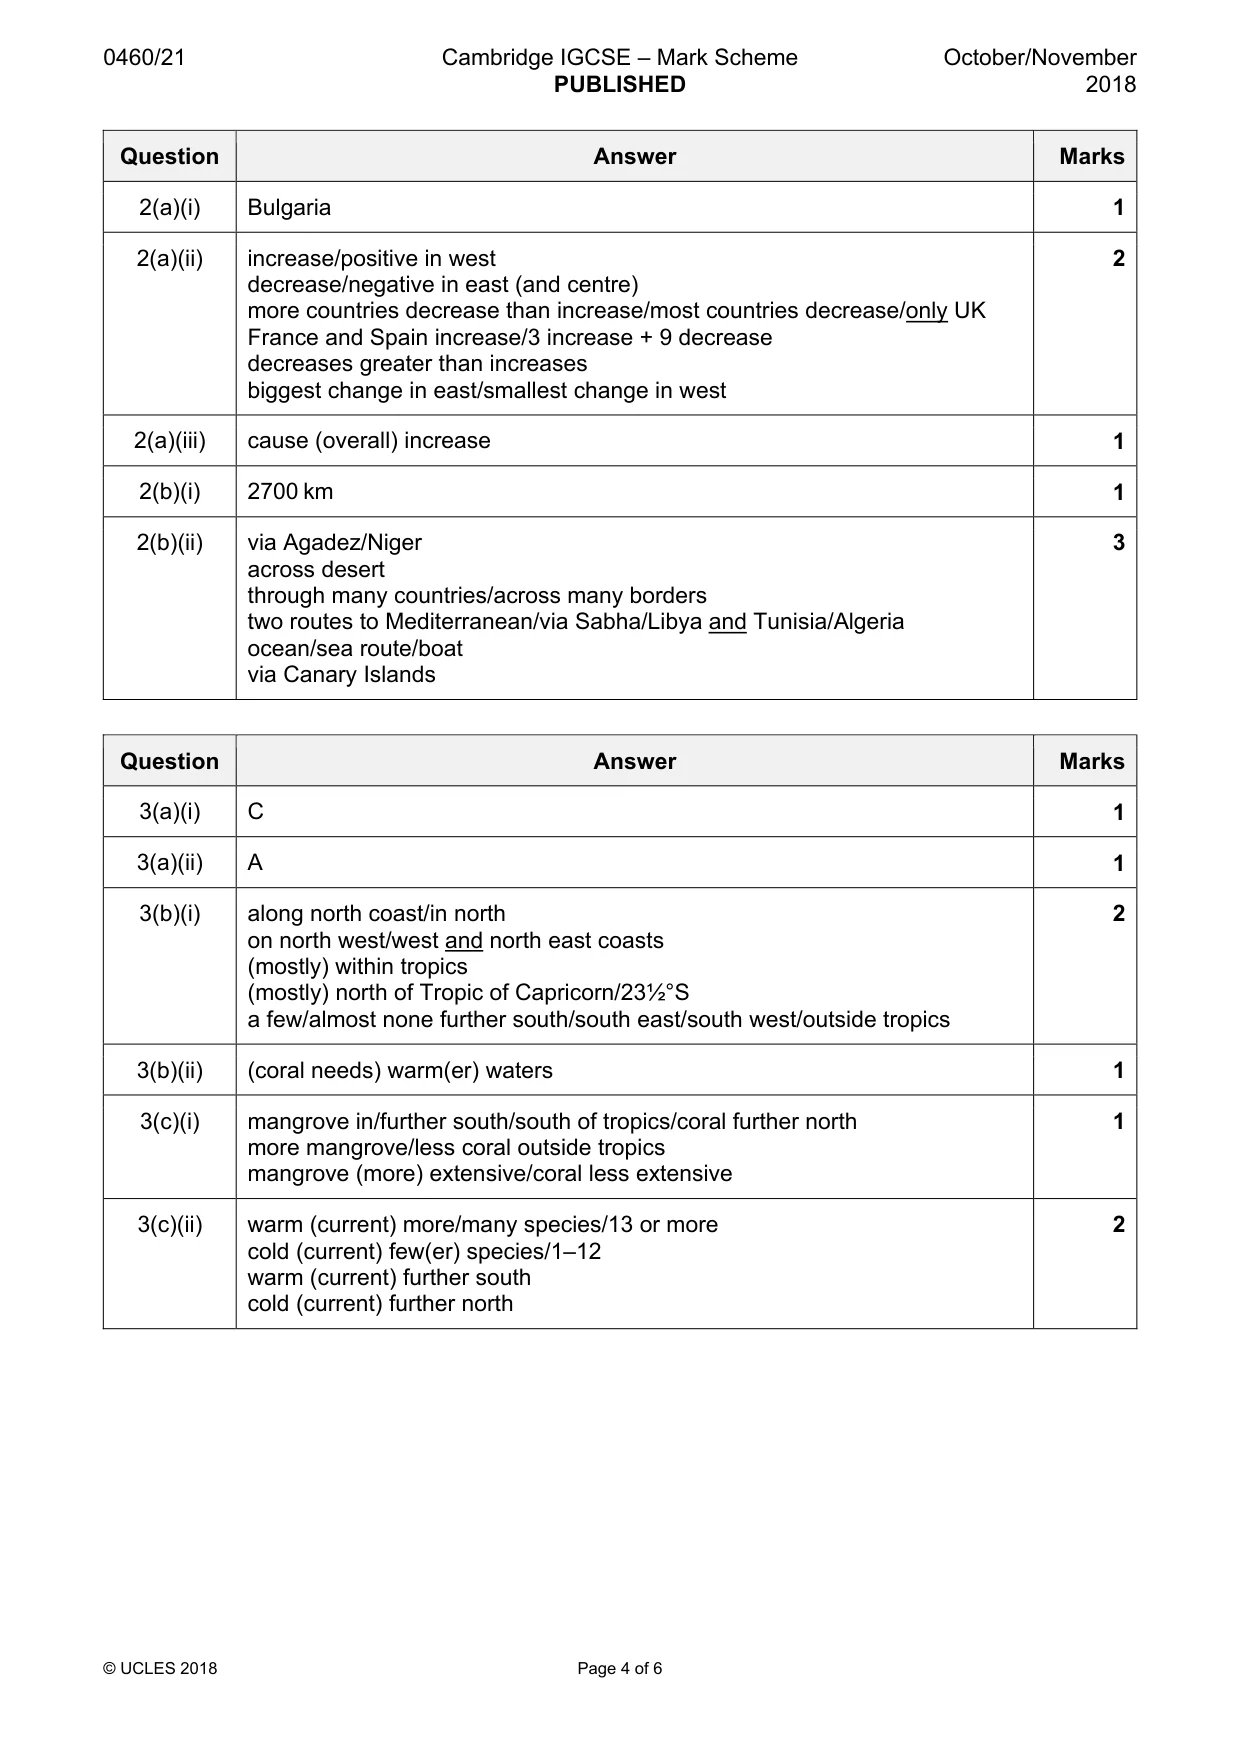
Mark scheme: 2(a)(i) Bulgaria 1 2(a)(ii) increase/positive in west 2 decrease/negative in east (and centre) more countries decrease than increase/most countries decrease/only UK France and Spain increase/3 increase + 9 decrease decreases greater than increases biggest change in east/smallest change in west 2(a)(iii) cause (overall) increase 1 2(b)(i) 2700 km 1 2(b)(ii) via Agadez/Niger 3 across desert through many countries/across many borders two routes to Mediterranean/via Sabha/Libya and Tunisia/Algeria ocean/sea route/boat via Canary Islands
Q3 · Five definitions, A, B, C, D and E are shown in Table 3.1
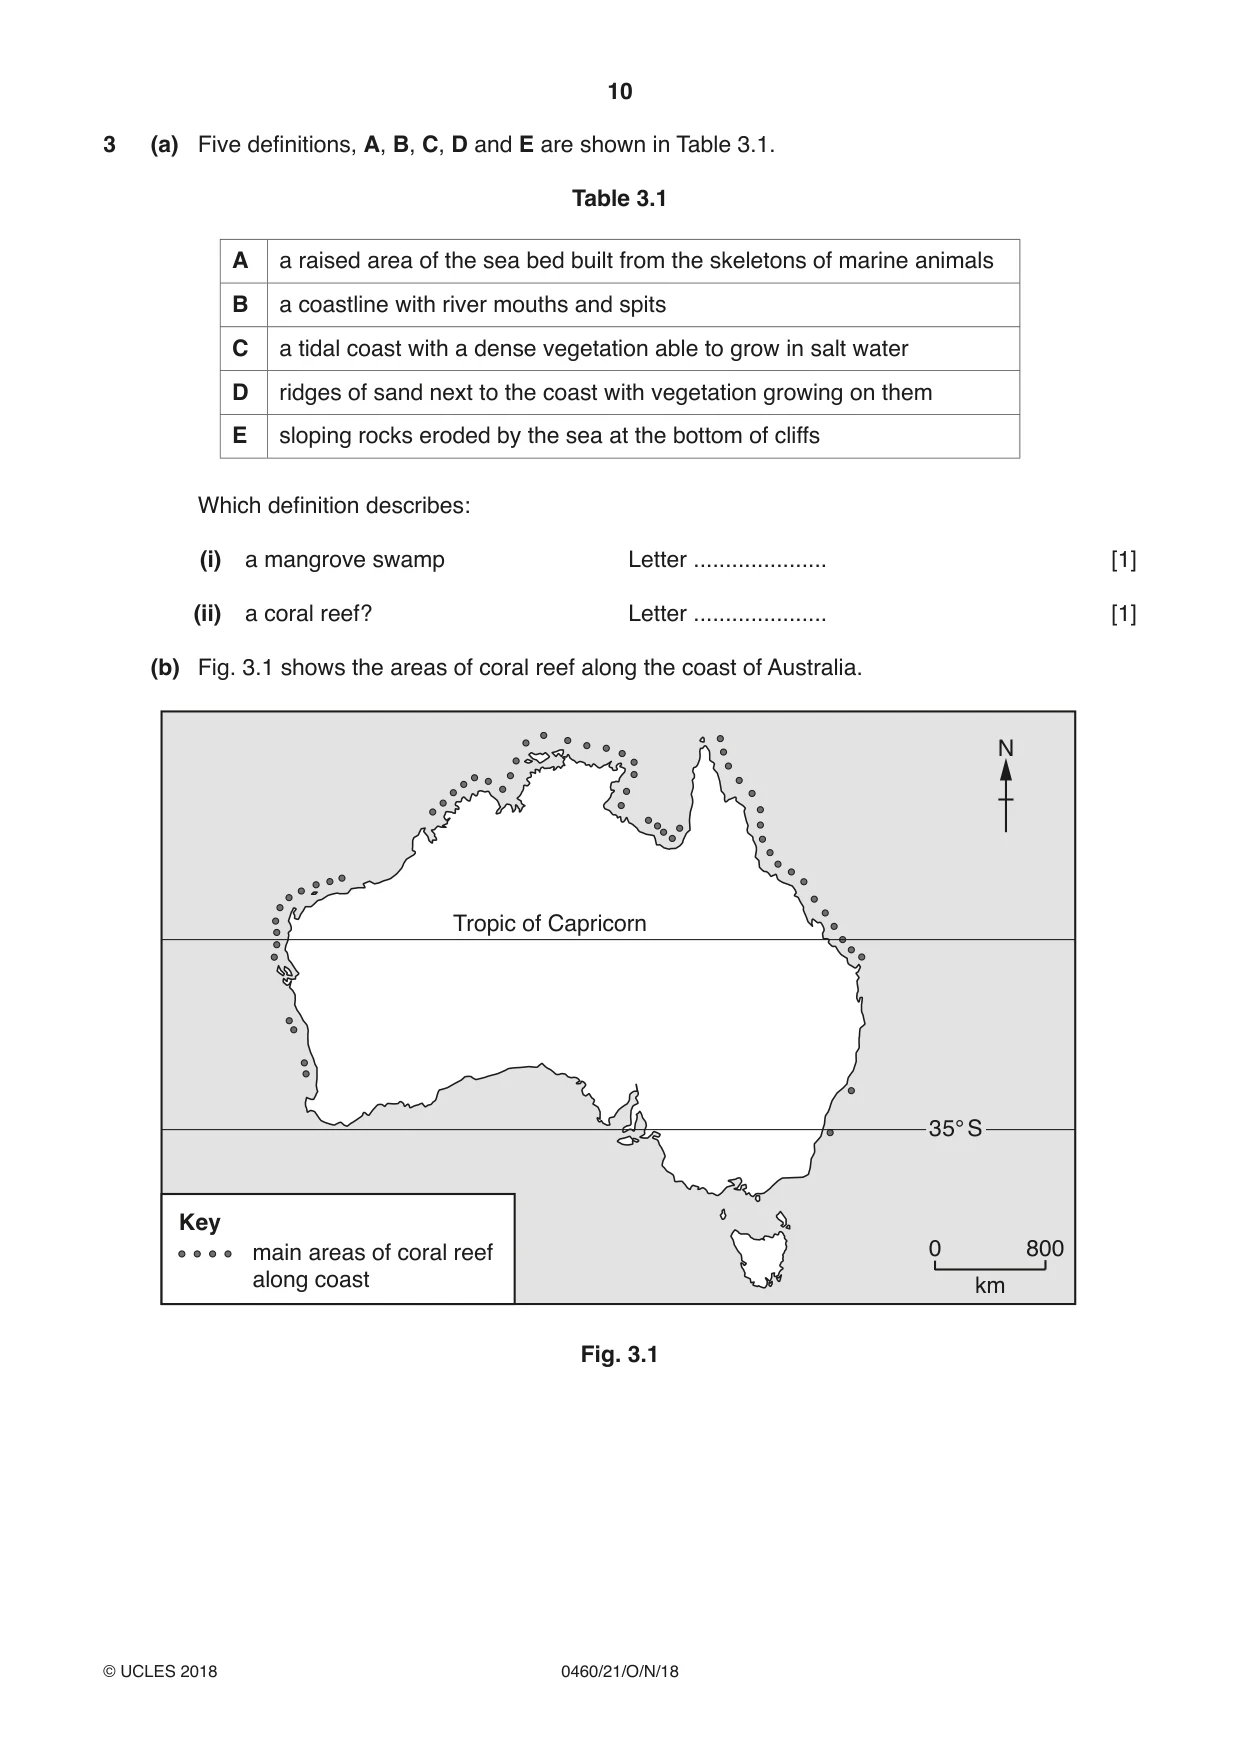
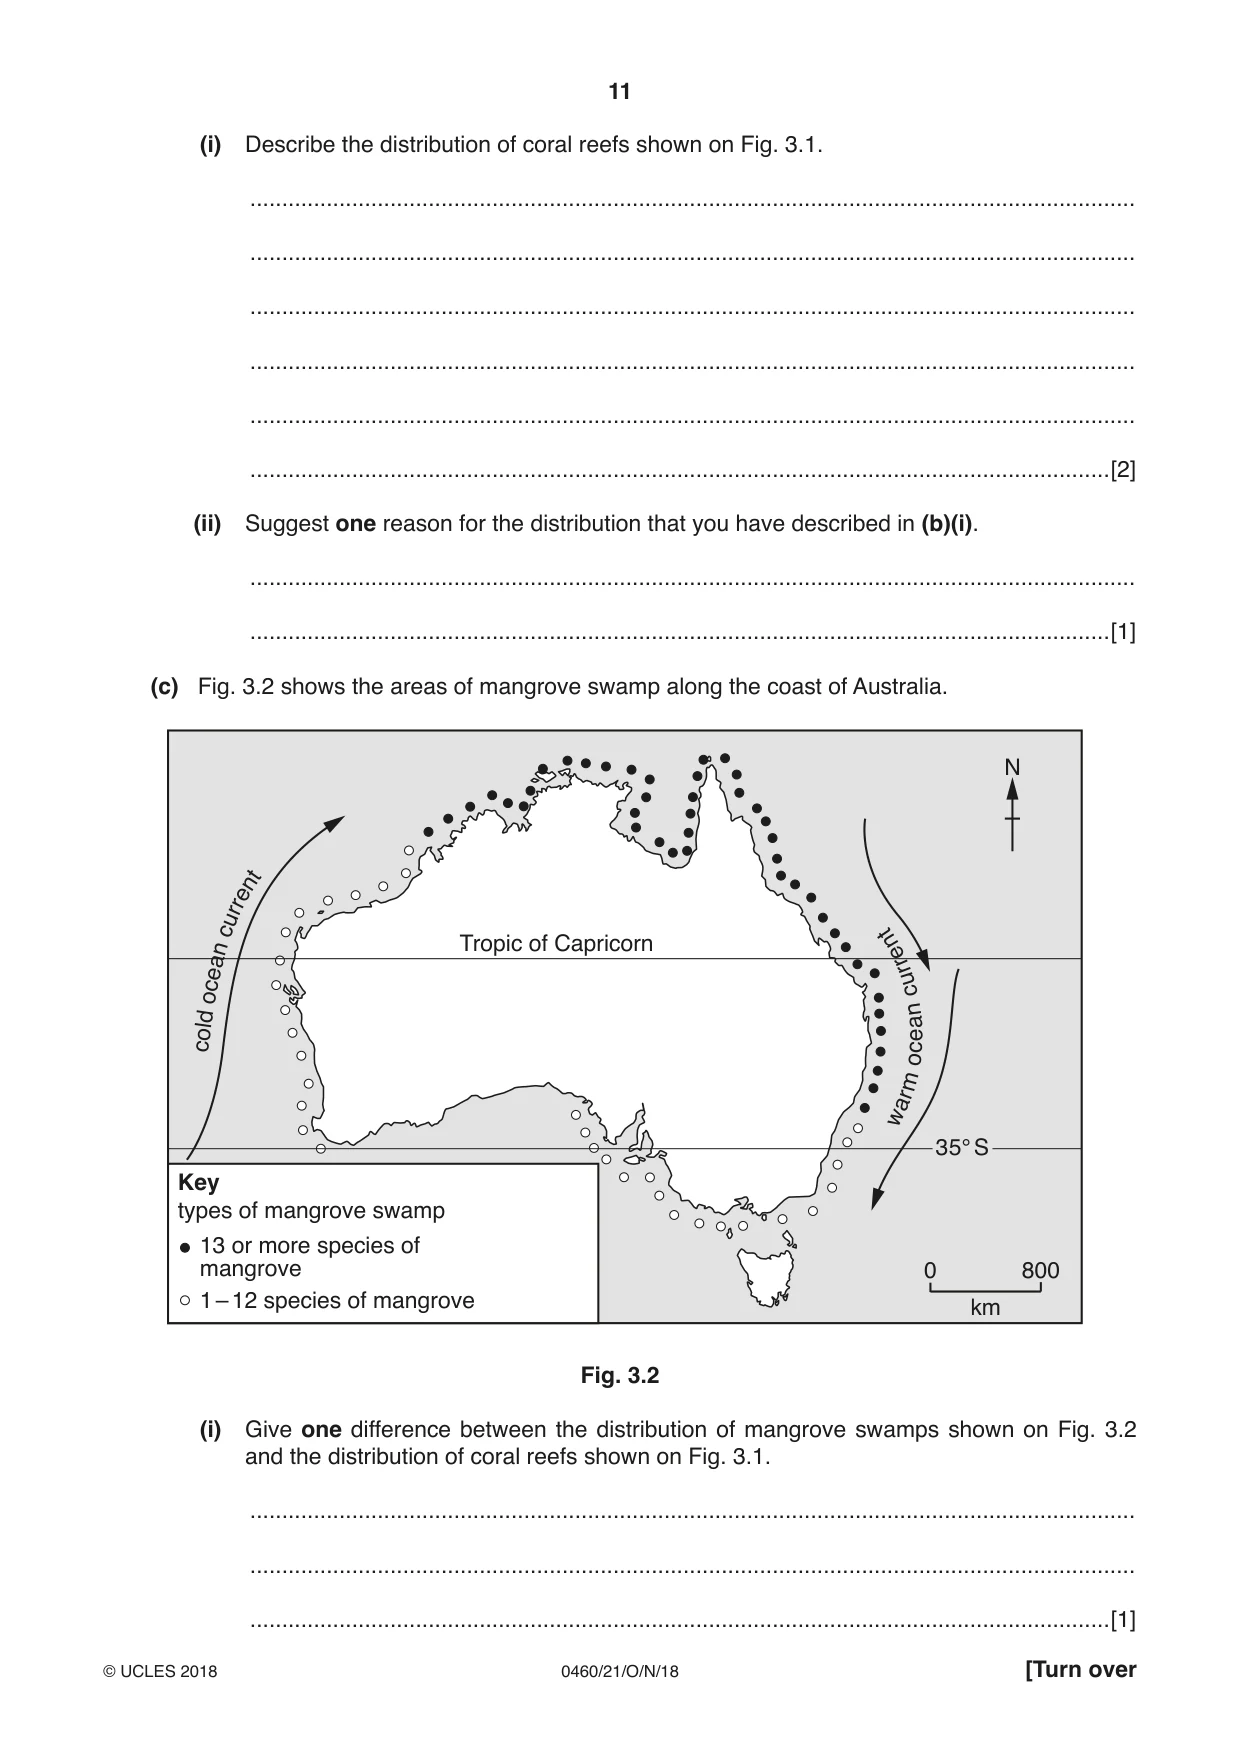
3 (a) Five definitions, A, B, C, D and E are shown in Table 3.1. Table 3.1 A a raised area of the sea bed built from the skeletons of marine animals B a coastline with river mouths and spits C a tidal coast with a dense vegetation able to grow in salt water D ridges of sand next to the coast with vegetation growing on them E sloping rocks eroded by the sea at the bottom of cliffs Which definition describes: (i) a mangrove swamp Letter ..................... [1] (ii) a coral reef? Letter ..................... [1] (b) Fig. 3.1 shows the areas of coral reef along the coast of Australia. N Tropic of Capricorn 35° S Key main areas of coral reef 0 800 along coast km Fig. 3.1 (i) Describe the distribution of coral reefs shown on Fig. 3.1. ........................................................................................................................................... ........................................................................................................................................... ........................................................................................................................................... ........................................................................................................................................... ........................................................................................................................................... .......................................................................................................................................[2] (ii) Suggest one reason for the distribution that you have described in (b)(i). ........................................................................................................................................... .......................................................................................................................................[1] (c) Fig. 3.2 shows the areas of mangrove swamp along the coast of Australia. N nt re ur c t n Tropic of Capricorn ne ea rr u oc c n a e cold c o m r a w 35° S Key types of mangrove swamp 13 or more species of mangrove 0 800 1 – 12 species of mangrove km Fig. 3.2 (i) Give one difference between the distribution of mangrove swamps shown on Fig. 3.2 and the distribution of coral reefs shown on Fig. 3.1. ........................................................................................................................................... ........................................................................................................................................... .......................................................................................................................................[1] (ii) Suggest how the distribution of mangrove swamps shown on Fig. 3.2 is influenced by ocean currents. ........................................................................................................................................... ........................................................................................................................................... ........................................................................................................................................... ........................................................................................................................................... ........................................................................................................................................... .......................................................................................................................................[2] [Total: 8]
Mark scheme: 3(a)(i) C 1 3(a)(ii) A 1 3(b)(i) along north coast/in north 2 on north west/west and north east coasts (mostly) within tropics (mostly) north of Tropic of Capricorn/23½°S a few/almost none further south/south east/south west/outside tropics 3(b)(ii) (coral needs) warm(er) waters 1 3(c)(i) mangrove in/further south/south of tropics/coral further north 1 more mangrove/less coral outside tropics mangrove (more) extensive/coral less extensive 3(c)(ii) warm (current) more/many species/13 or more 2 cold (current) few(er) species/1–12 warm (current) further south cold (current) further north
Question 4
4 Figs. 4.1 and 4.2 (Insert) show the natural vegetation in two areas with very different climates. (a) Describe the natural vegetation shown in Fig. 4.1. ................................................................................................................................................... ................................................................................................................................................... ................................................................................................................................................... ................................................................................................................................................... ................................................................................................................................................... ................................................................................................................................................... ................................................................................................................................................... ................................................................................................................................................... ................................................................................................................................................... ................................................................................................................................................... ...............................................................................................................................................[4] (b) Describe the natural vegetation shown in Fig. 4.2. ................................................................................................................................................... ................................................................................................................................................... ................................................................................................................................................... ................................................................................................................................................... ................................................................................................................................................... ................................................................................................................................................... ................................................................................................................................................... ................................................................................................................................................... ................................................................................................................................................... ................................................................................................................................................... ...............................................................................................................................................[4] [Total: 8]
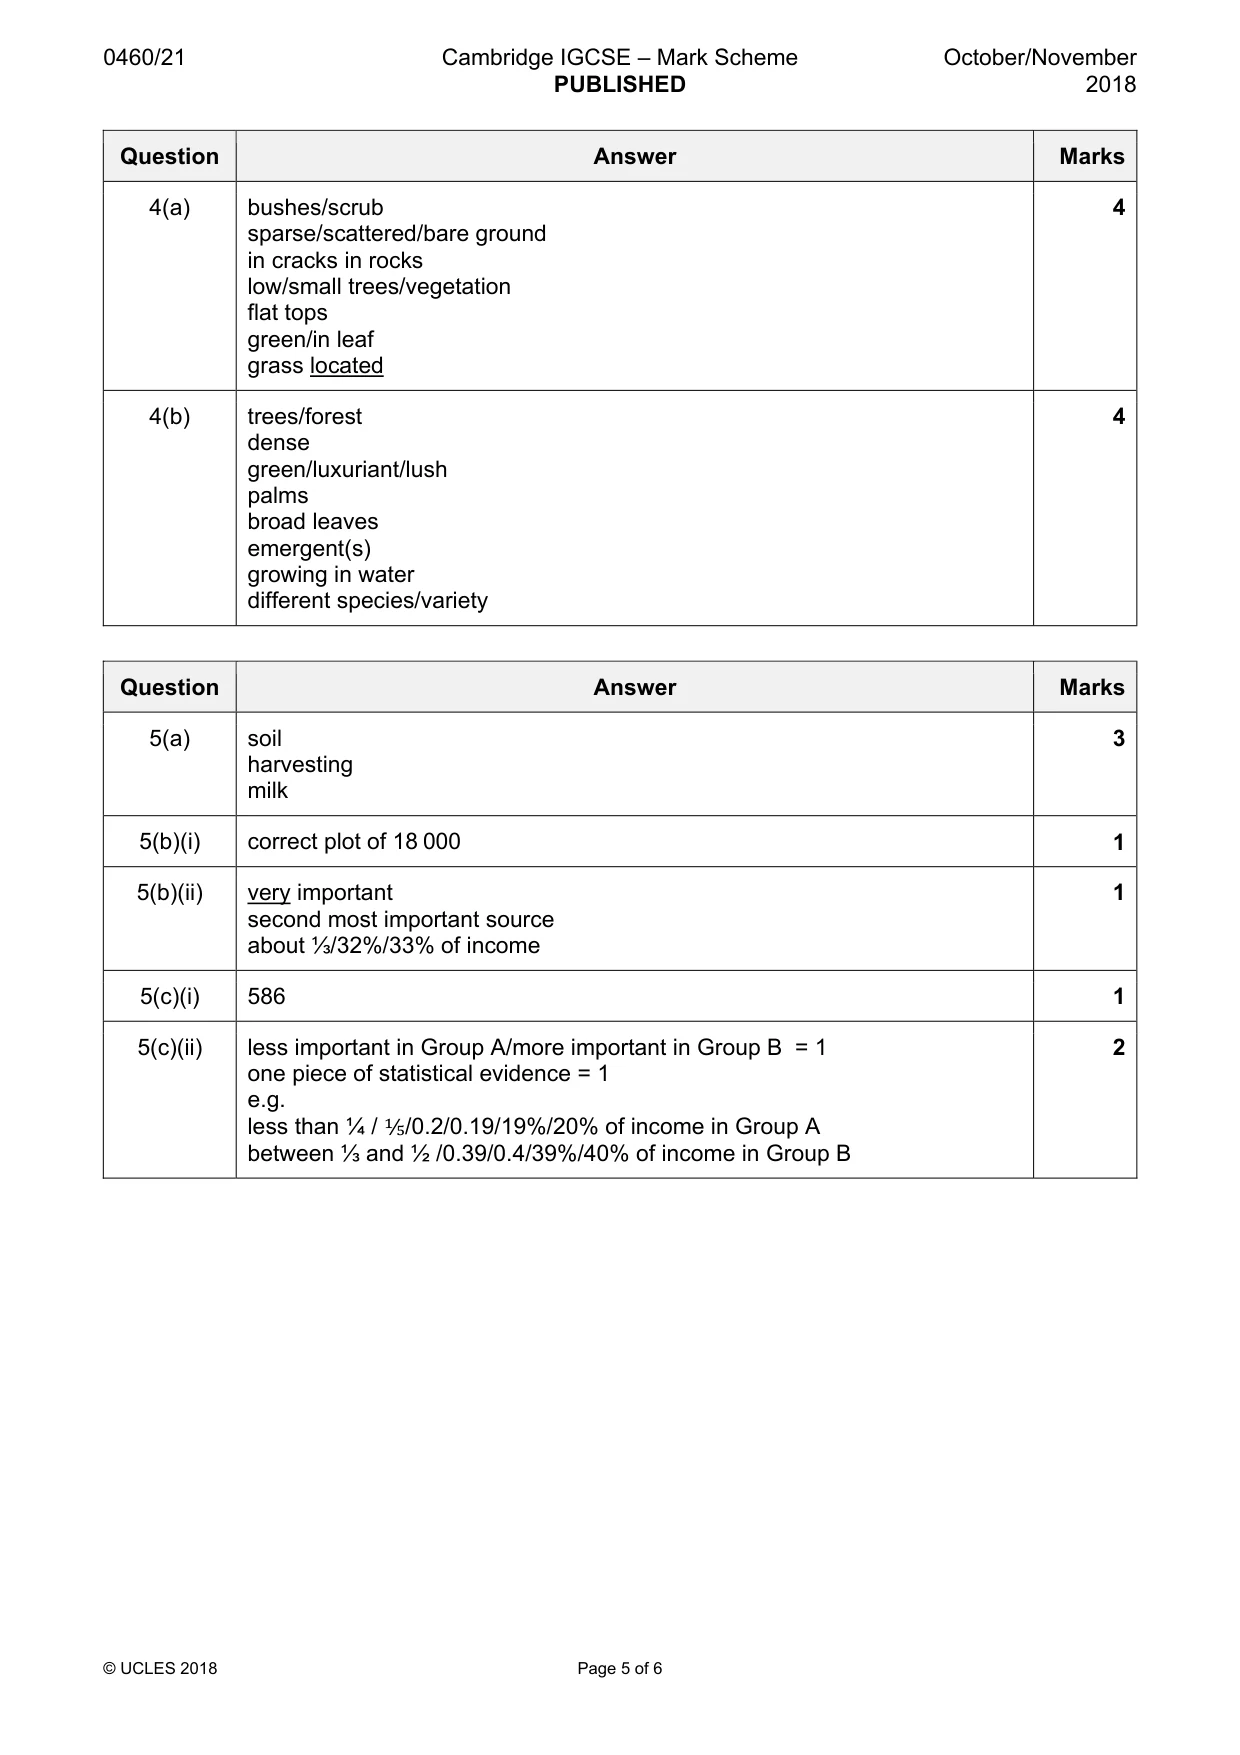
Mark scheme: 4(a) bushes/scrub 4 sparse/scattered/bare ground in cracks in rocks low/small trees/vegetation flat tops green/in leaf grass located 4(b) trees/forest 4 dense green/luxuriant/lush palms broad leaves emergent(s) growing in water different species/variety
Question 5
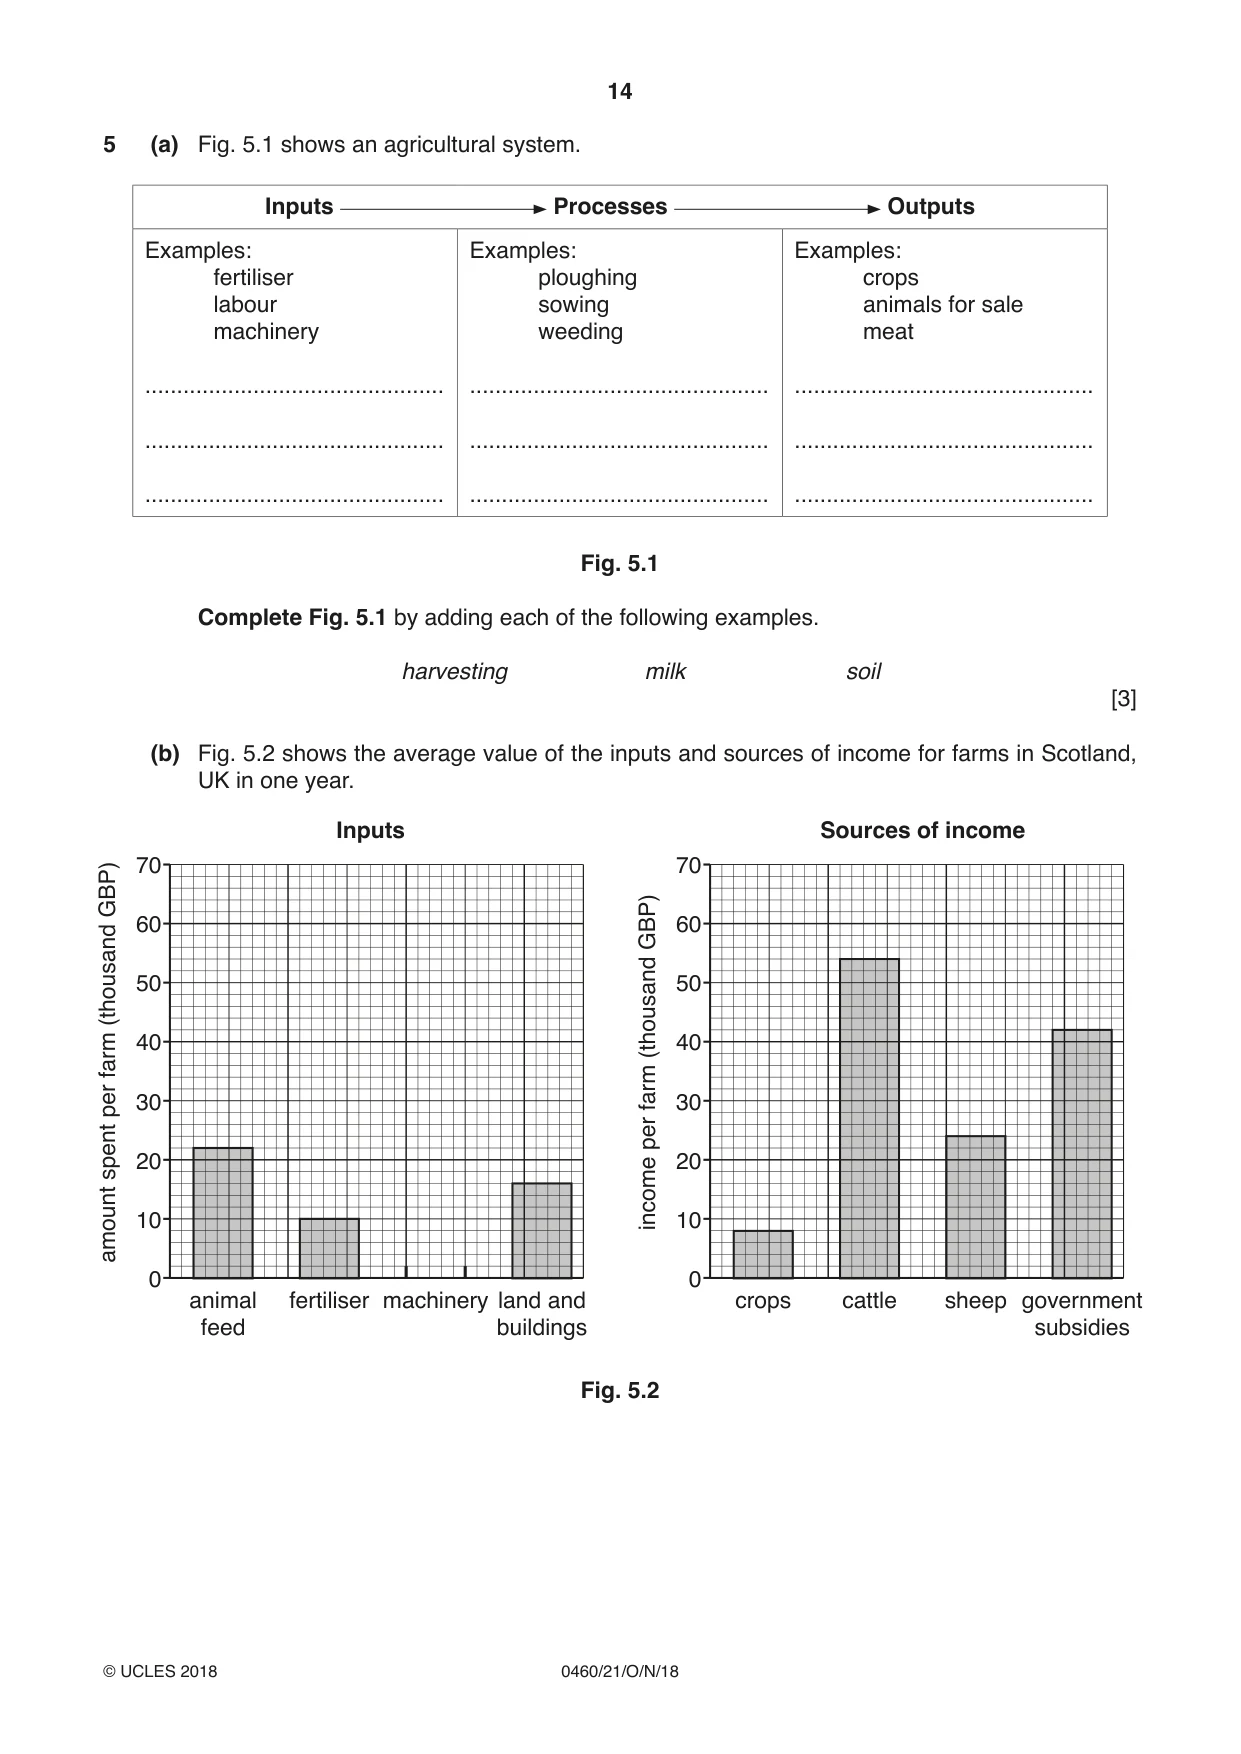
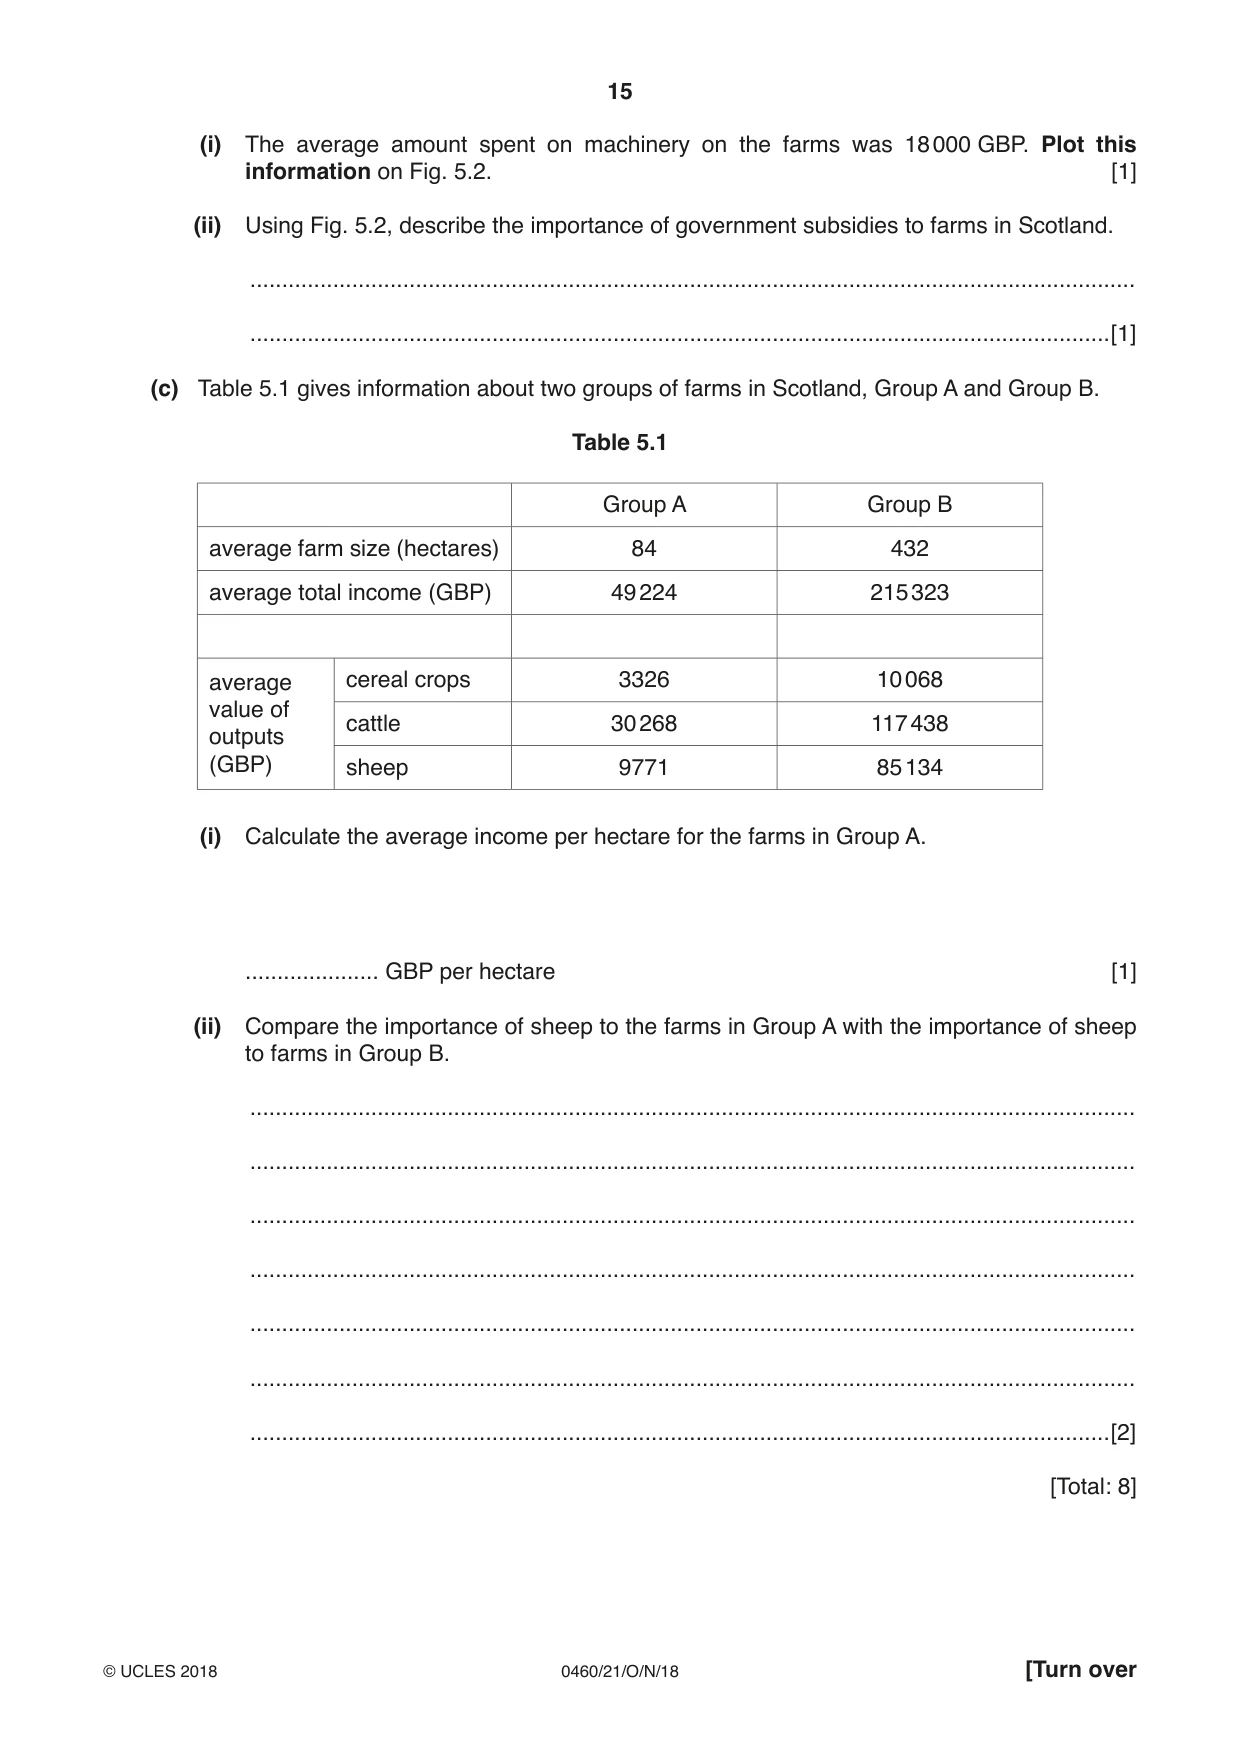
5 (a) Fig. 5.1 shows an agricultural system. Inputs Processes Outputs Examples: Examples: Examples: fertiliser ploughing crops labour sowing animals for sale machinery weeding meat ............................................... ............................................... ............................................... ............................................... ............................................... ............................................... ............................................... ............................................... ............................................... Fig. 5.1 Complete Fig. 5.1 by adding each of the following examples. harvesting milk soil [3] (b) Fig. 5.2 shows the average value of the inputs and sources of income for farms in Scotland, UK in one year. Inputs Sources of income 70 70 GBP) 60 60 GBP) 50 50(thousand 40 (thousand 40farm farmper 30 30 per spent 20 20 income 10 10amount 0 0 animal fertiliser machinery land and crops cattle sheep government feed buildings subsidies Fig. 5.2 (i) The average amount spent on machinery on the farms was 18 000 GBP. Plot this information on Fig. 5.2. [1] (ii) Using Fig. 5.2, describe the importance of government subsidies to farms in Scotland. ........................................................................................................................................... .......................................................................................................................................[1] (c) Table 5.1 gives information about two groups of farms in Scotland, Group A and Group B. Table 5.1 Group A Group B average farm size (hectares) 84 432 average total income (GBP) 49 224 215 323 average cereal crops 3326 10 068 value of cattle 30 268 117 438 outputs (GBP) sheep 9771 85 134 (i) Calculate the average income per hectare for the farms in Group A. ..................... GBP per hectare [1] (ii) Compare the importance of sheep to the farms in Group A with the importance of sheep to farms in Group B. ........................................................................................................................................... ........................................................................................................................................... ........................................................................................................................................... ........................................................................................................................................... ........................................................................................................................................... ........................................................................................................................................... .......................................................................................................................................[2] [Total: 8]
Mark scheme: 5(a) soil 3 harvesting milk 5(b)(i) correct plot of 18 000 1 5(b)(ii) very important 1 second most important source about ⅓/32%/33% of income 5(c)(i) 586 1 5(c)(ii) less important in Group A/more important in Group B = 1 2 one piece of statistical evidence = 1 e.g. less than ¼ / ⅕/0.2/0.19/19%/20% of income in Group A between ⅓ and ½ /0.39/0.4/39%/40% of income in Group B
Q6 · Information about a coal-fired power station at Kalundborg in Denmark and its links with…
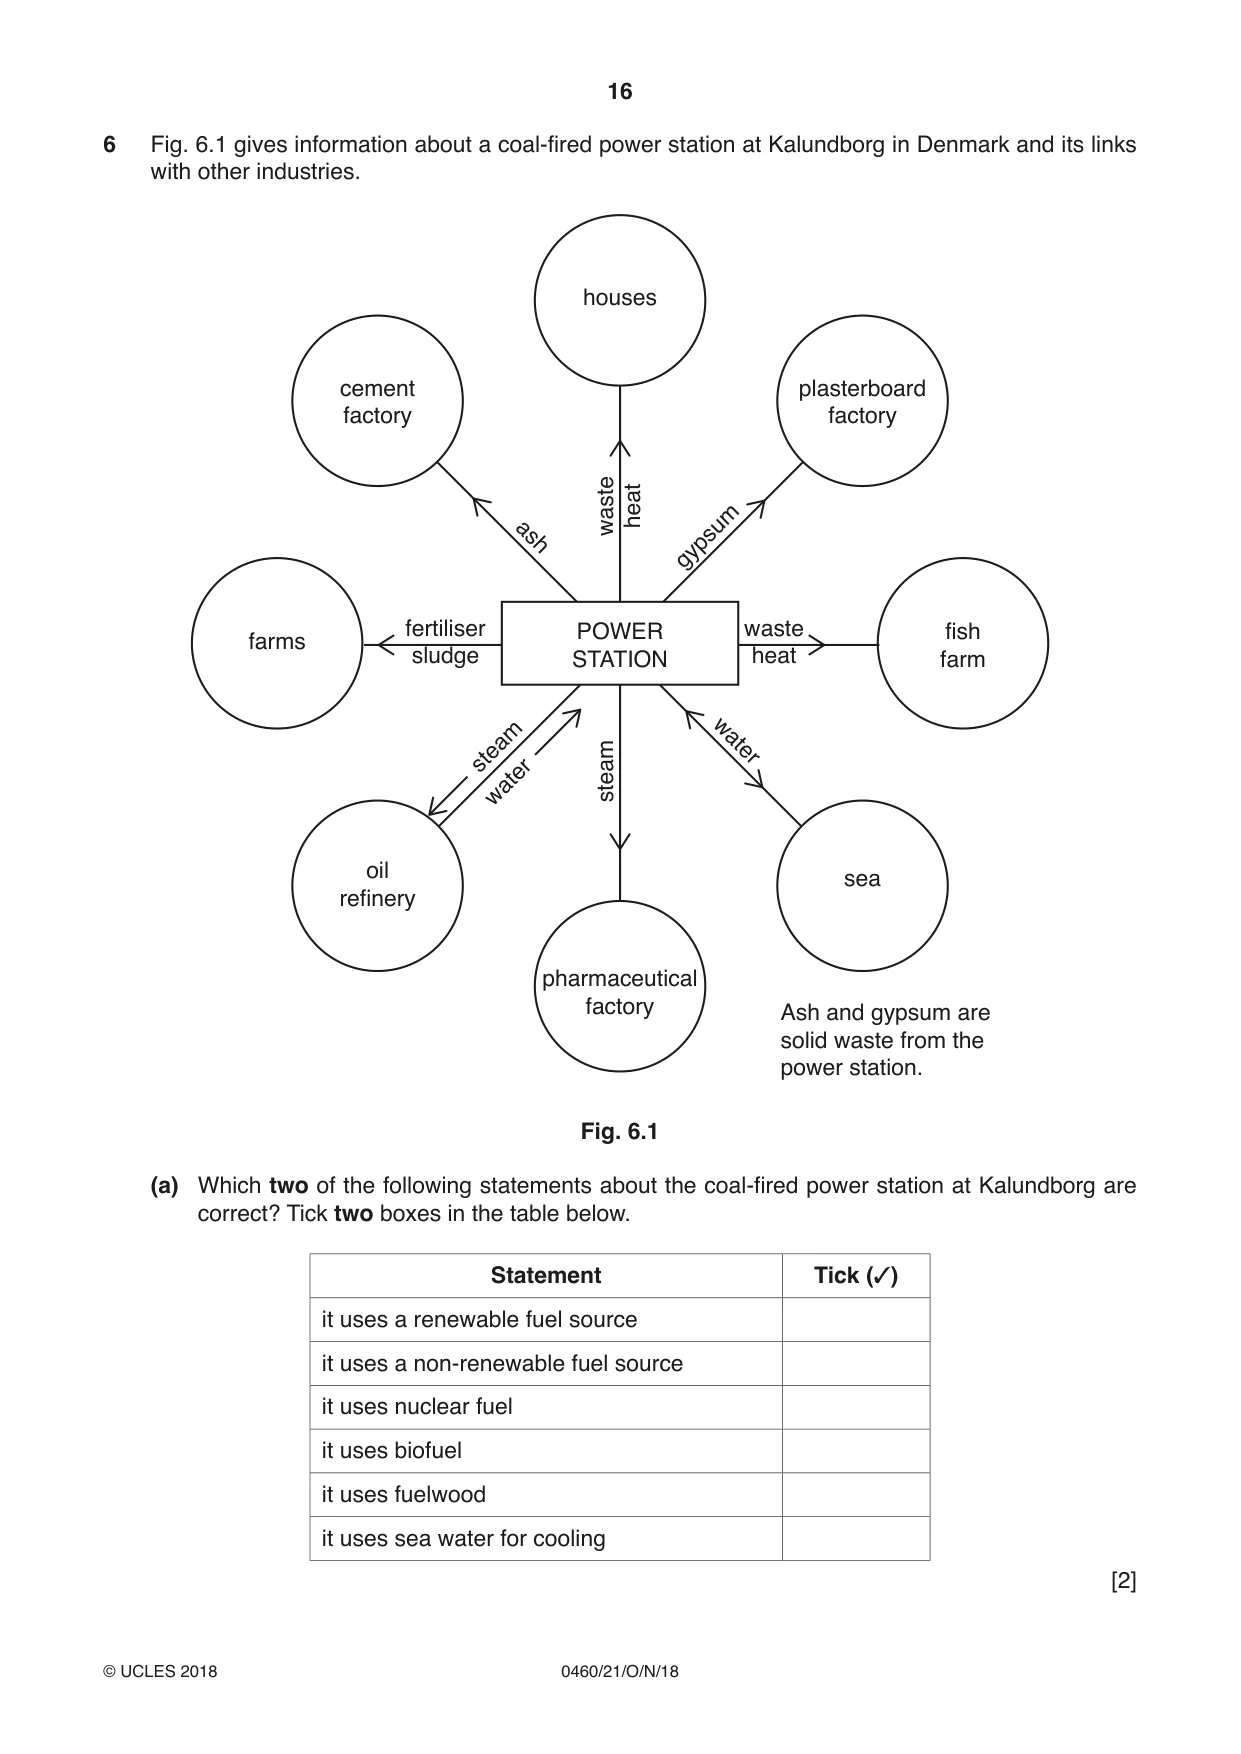
6 Fig. 6.1 gives information about a coal-fired power station at Kalundborg in Denmark and its links with other industries. houses cement plasterboard factory factory heat waste ash gypsum fertiliser POWER waste fish farms sludge STATION heat farm steam water steam water oil sea refinery pharmaceutical factory Ash and gypsum are solid waste from the power station. Fig. 6.1 (a) Which two of the following statements about the coal-fired power station at Kalundborg are correct? Tick two boxes in the table below. Statement Tick (3) it uses a renewable fuel source it uses a non-renewable fuel source it uses nuclear fuel it uses biofuel it uses fuelwood it uses sea water for cooling [2] (b) How do the Kalundborg power station’s links with other industries help to conserve energy? ................................................................................................................................................... ................................................................................................................................................... ................................................................................................................................................... ................................................................................................................................................... ................................................................................................................................................... ................................................................................................................................................... ................................................................................................................................................... ................................................................................................................................................... ...............................................................................................................................................[3] (c) How do the Kalundborg power station’s links with other industries help to conserve water? ................................................................................................................................................... ................................................................................................................................................... ................................................................................................................................................... ................................................................................................................................................... ................................................................................................................................................... ................................................................................................................................................... ................................................................................................................................................... ................................................................................................................................................... ...............................................................................................................................................[3] [Total: 8] Additional Pages If you use the following pages to complete the answer(s) to any question(s), the question number(s) must be clearly shown. .................................................................................................................................................................. .................................................................................................................................................................. .................................................................................................................................................................. .................................................................................................................................................................. .................................................................................................................................................................. .................................................................................................................................................................. .................................................................................................................................................................. .................................................................................................................................................................. .................................................................................................................................................................. .................................................................................................................................................................. .................................................................................................................................................................. .................................................................................................................................................................. .................................................................................................................................................................. .................................................................................................................................................................. .................................................................................................................................................................. .................................................................................................................................................................. .................................................................................................................................................................. .................................................................................................................................................................. .................................................................................................................................................................. .................................................................................................................................................................. .................................................................................................................................................................. .................................................................................................................................................................. .................................................................................................................................................................. .................................................................................................................................................................. ..................................................................................................................................................................
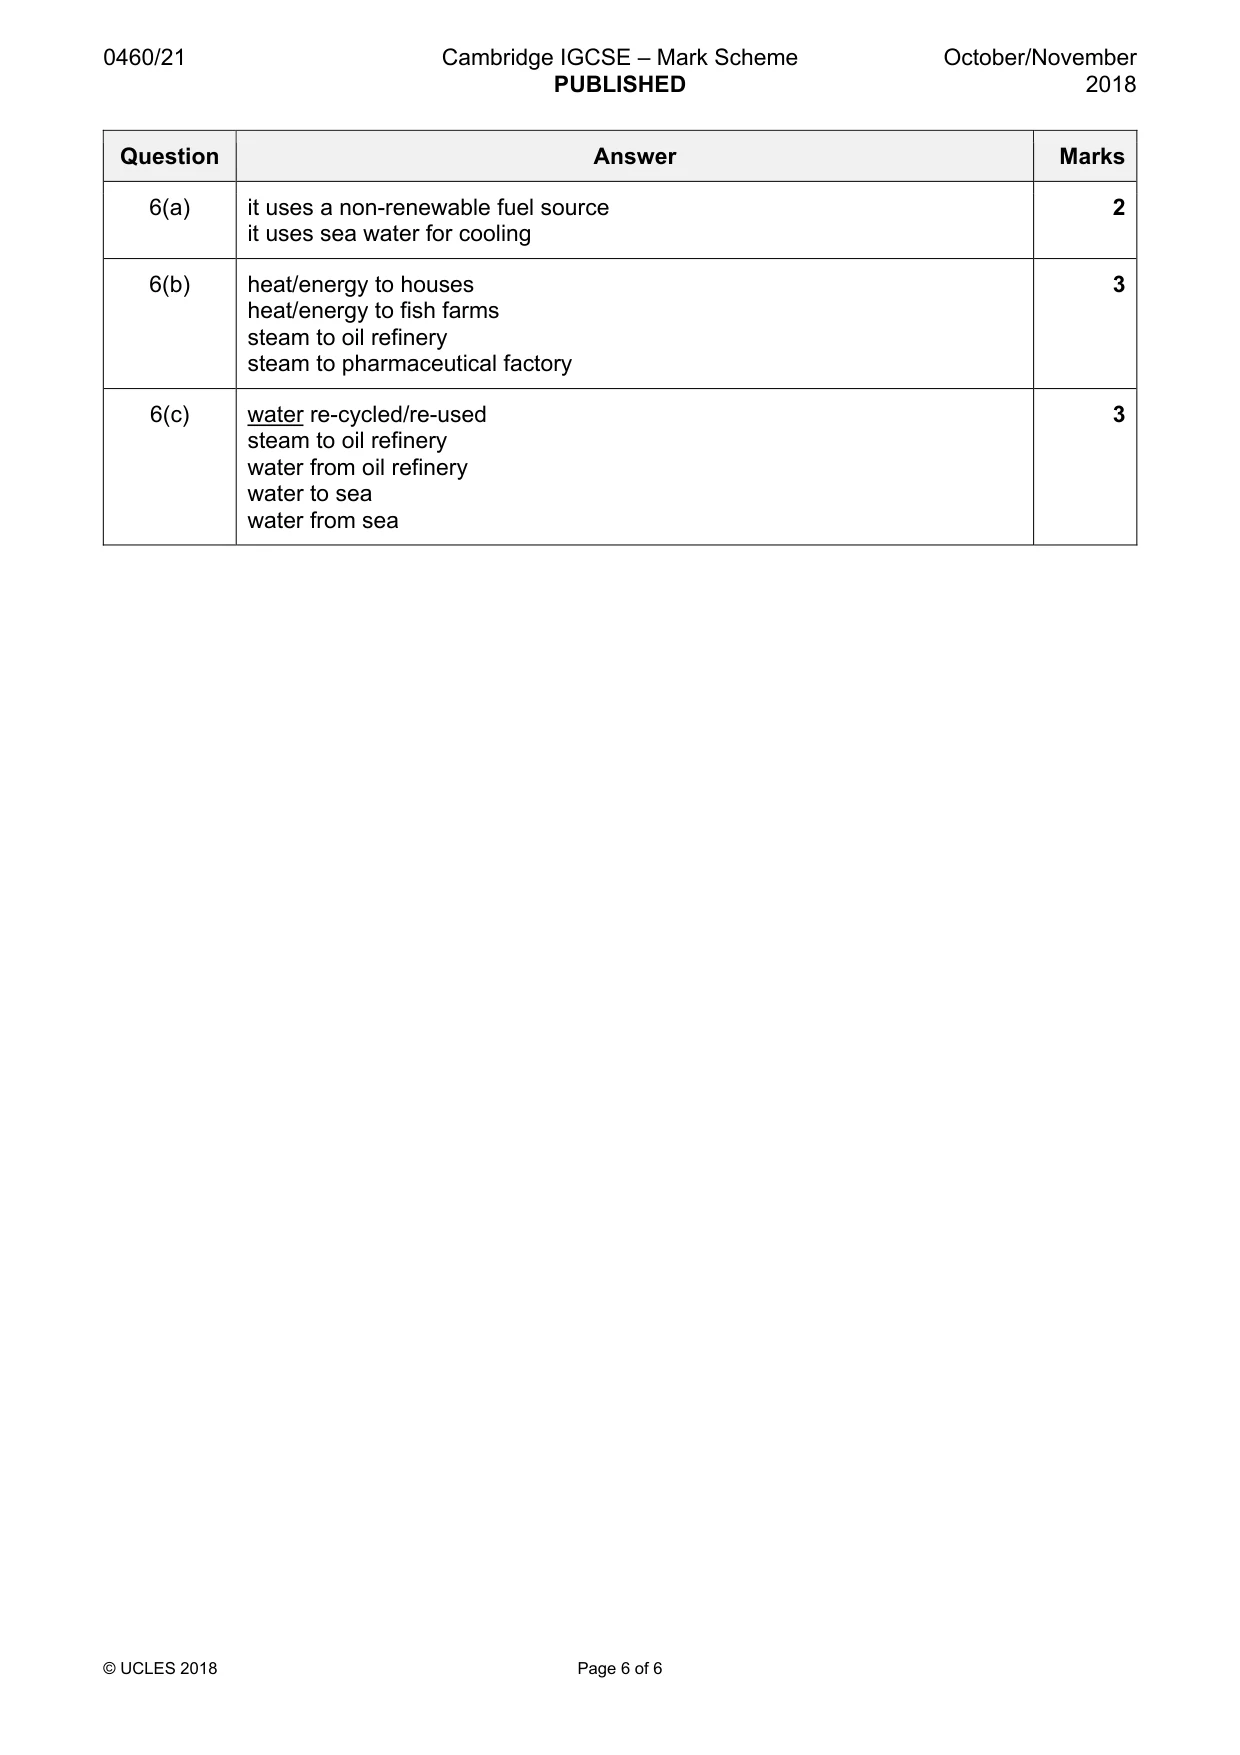
Mark scheme: 6(a) it uses a non-renewable fuel source 2 it uses sea water for cooling 6(b) heat/energy to houses 3 heat/energy to fish farms steam to oil refinery steam to pharmaceutical factory 6(c) water re-cycled/re-used 3 steam to oil refinery water from oil refinery water to sea water from sea
What was in this paper
The subtopics covered by these 6 questions, and how many questions each got. Open one in a new tab to see every Cambridge question on it.
What you needed in this session
Cambridge’s own grade thresholds for 2018 Oct/Nov, Paper 2 · Variant 1. A higher threshold means an easier paper — the bar moves with how the cohort did.