Cambridge IGCSE Geography 0460 — 2019 May/June Paper 2 · Variant 3
0460/23/M/J/19 · 6 questions · 60 marks · ≈68 min
The question paper and its mark scheme, free to read here and free to download. This is Cambridge’s own paper, exactly as it was sat.
Question paper20 pages





Mark scheme8 pages
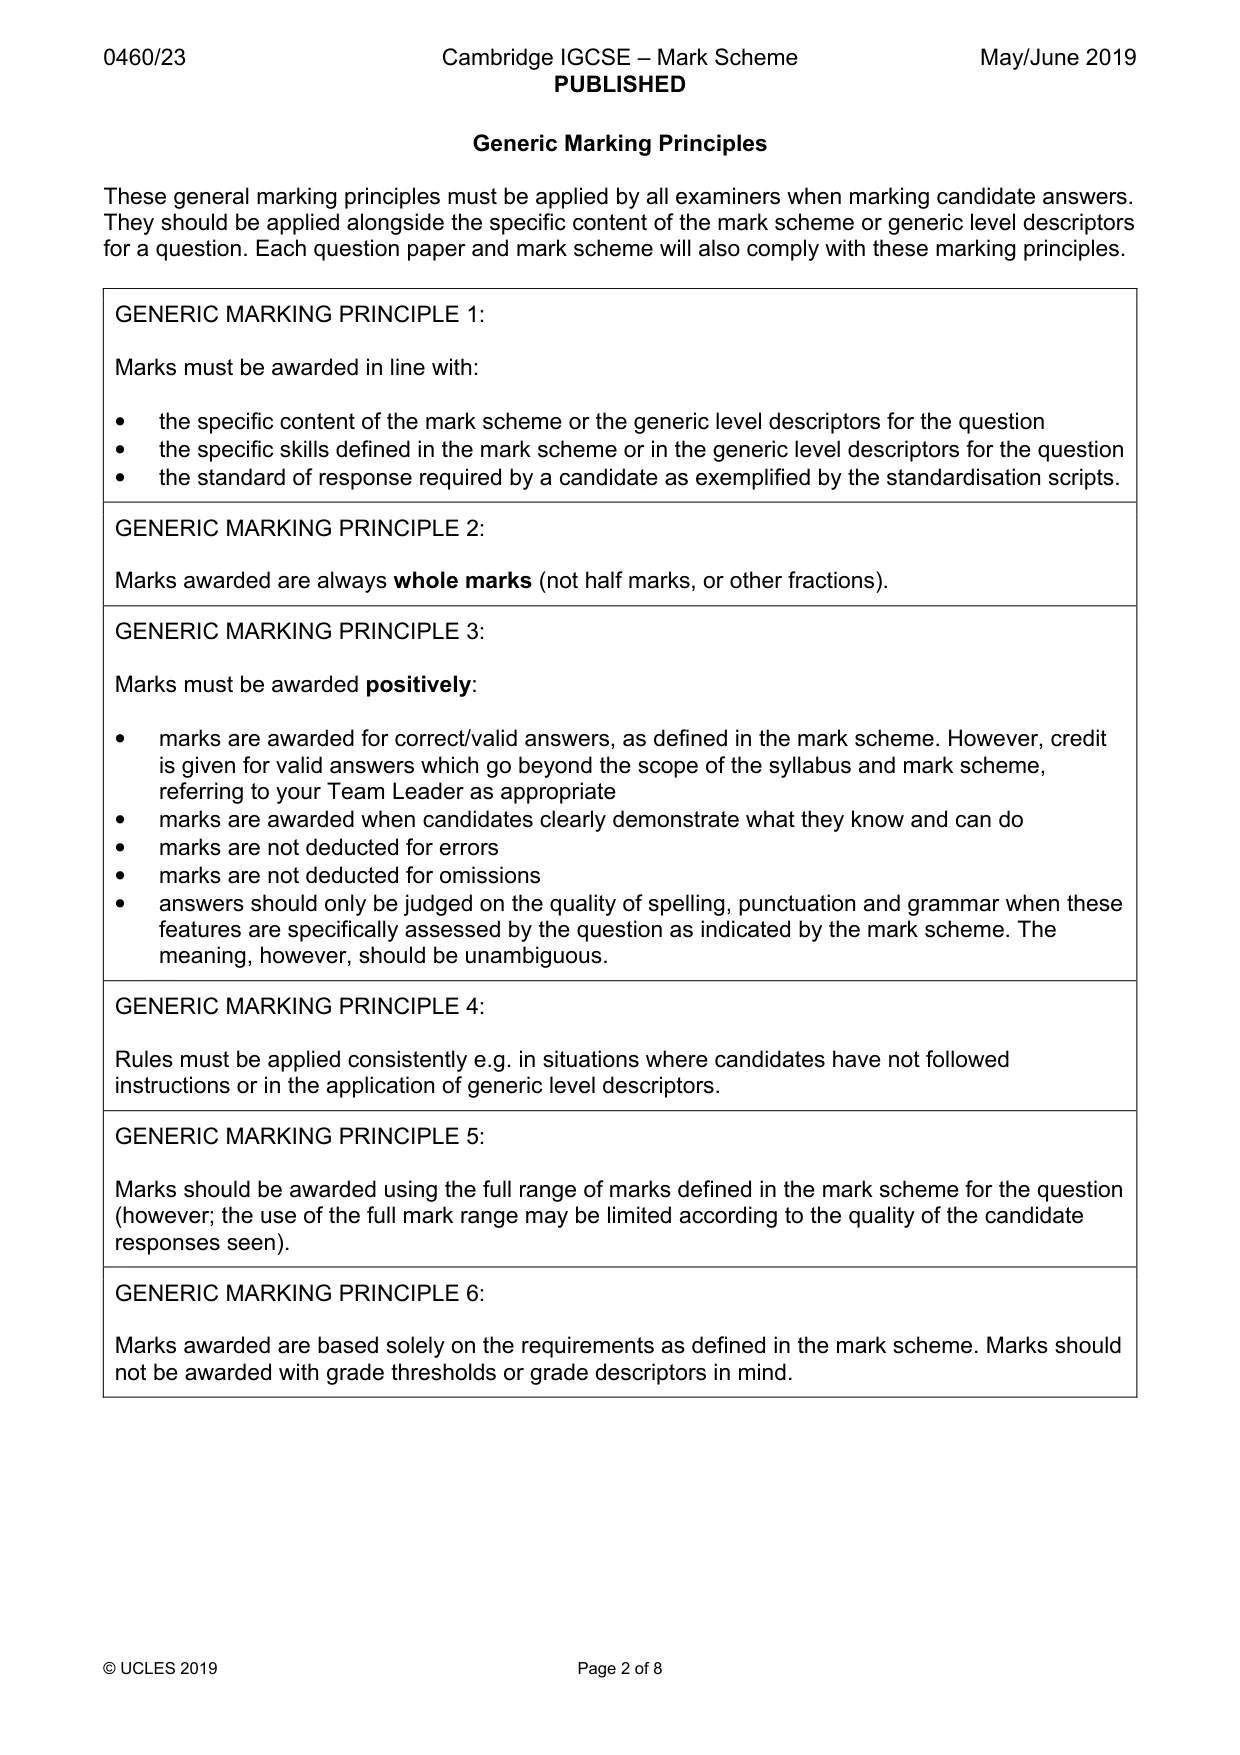
Answers below. Sit the paper first if you are practising.
Questions as text
Q1 · Study the map extract for Kristianstad, Sweden
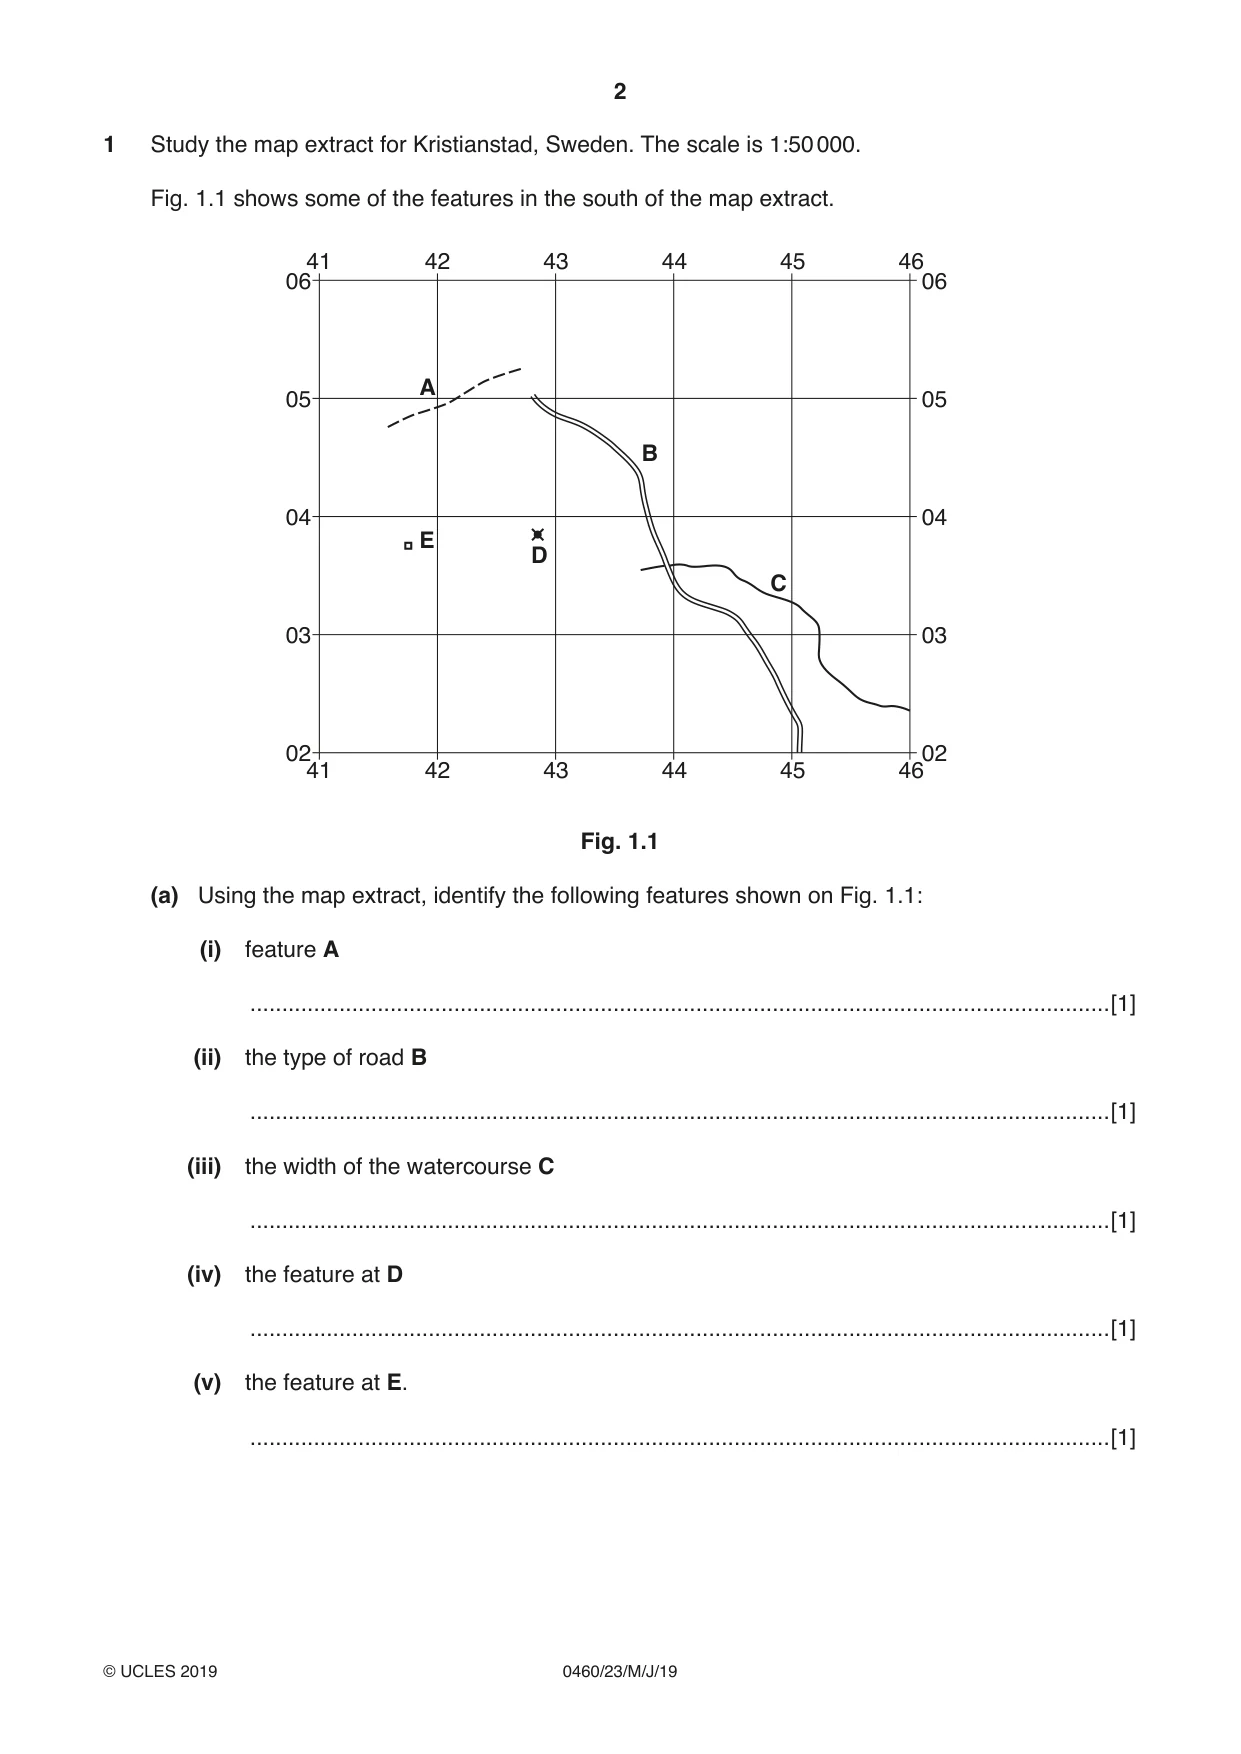
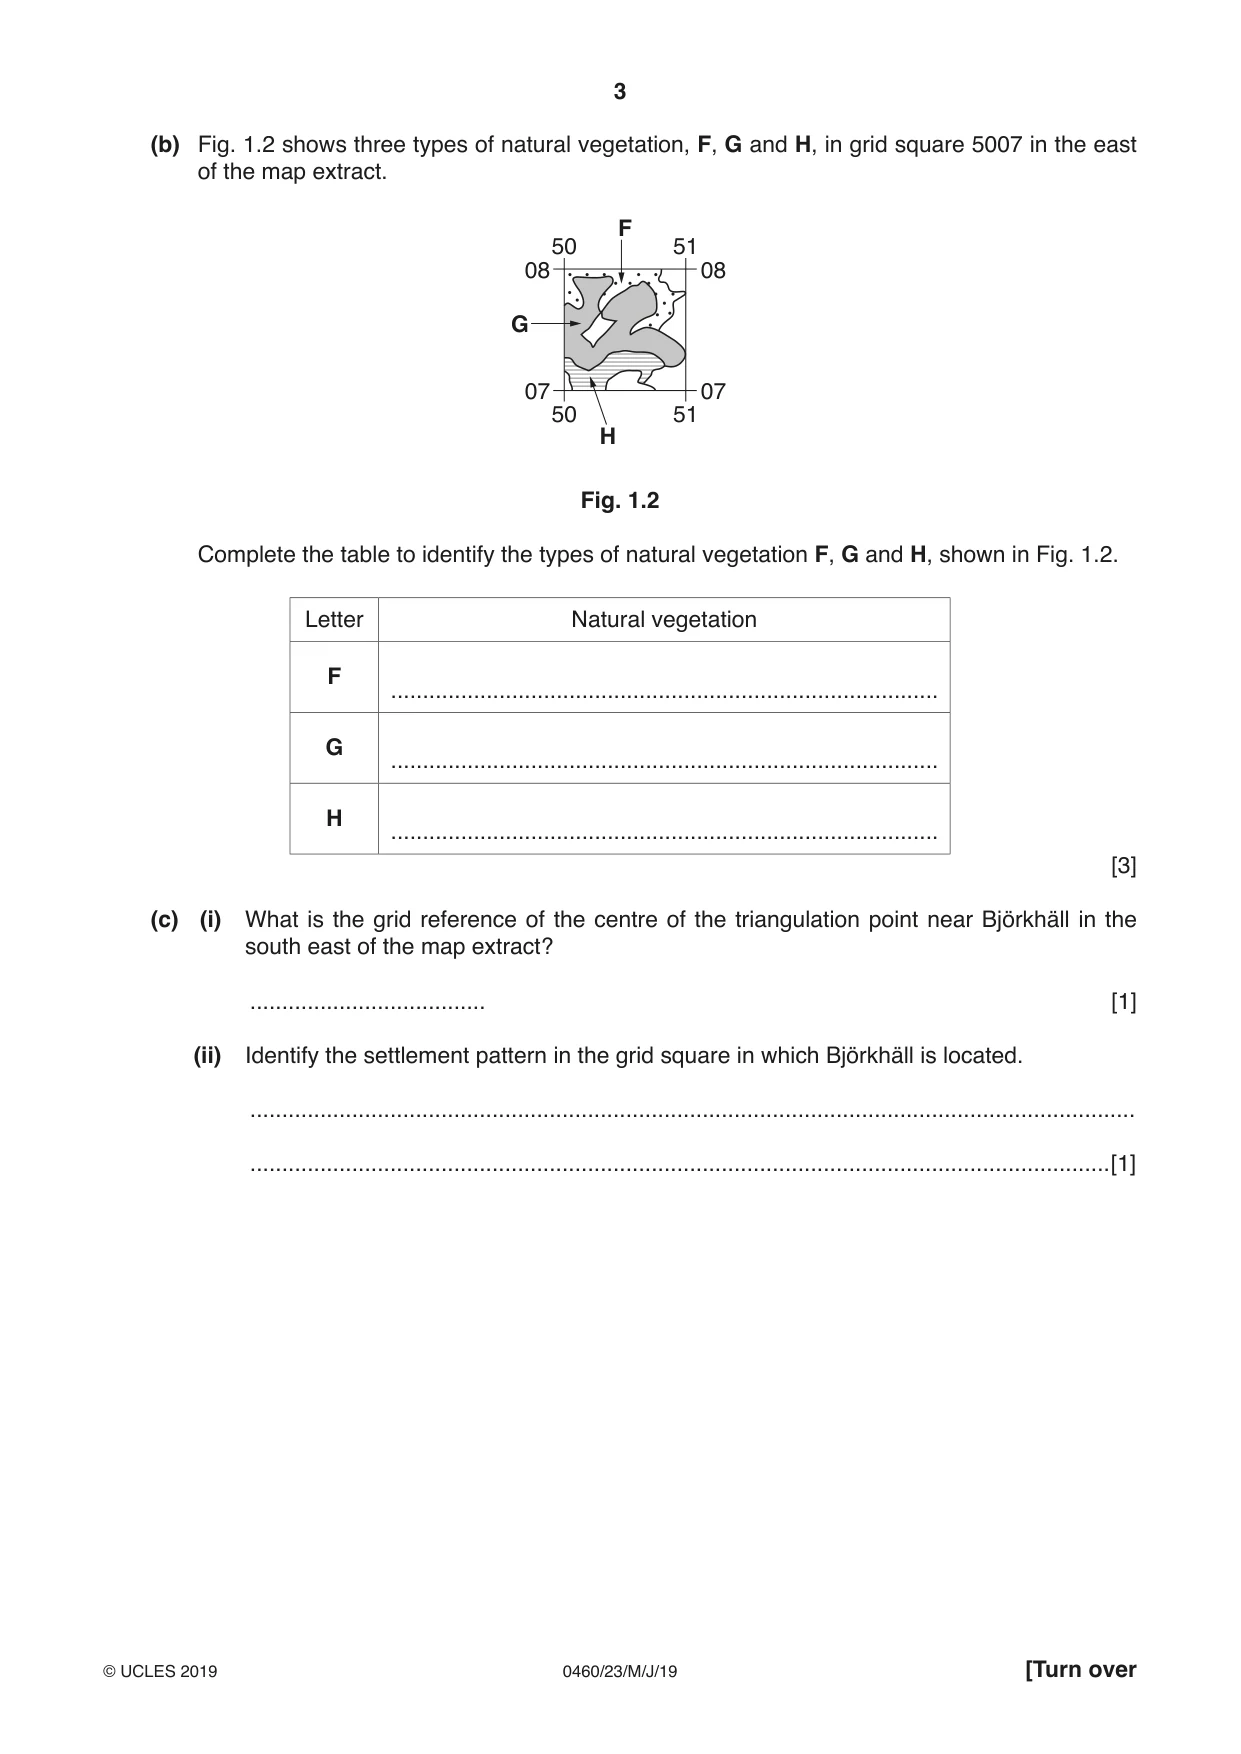
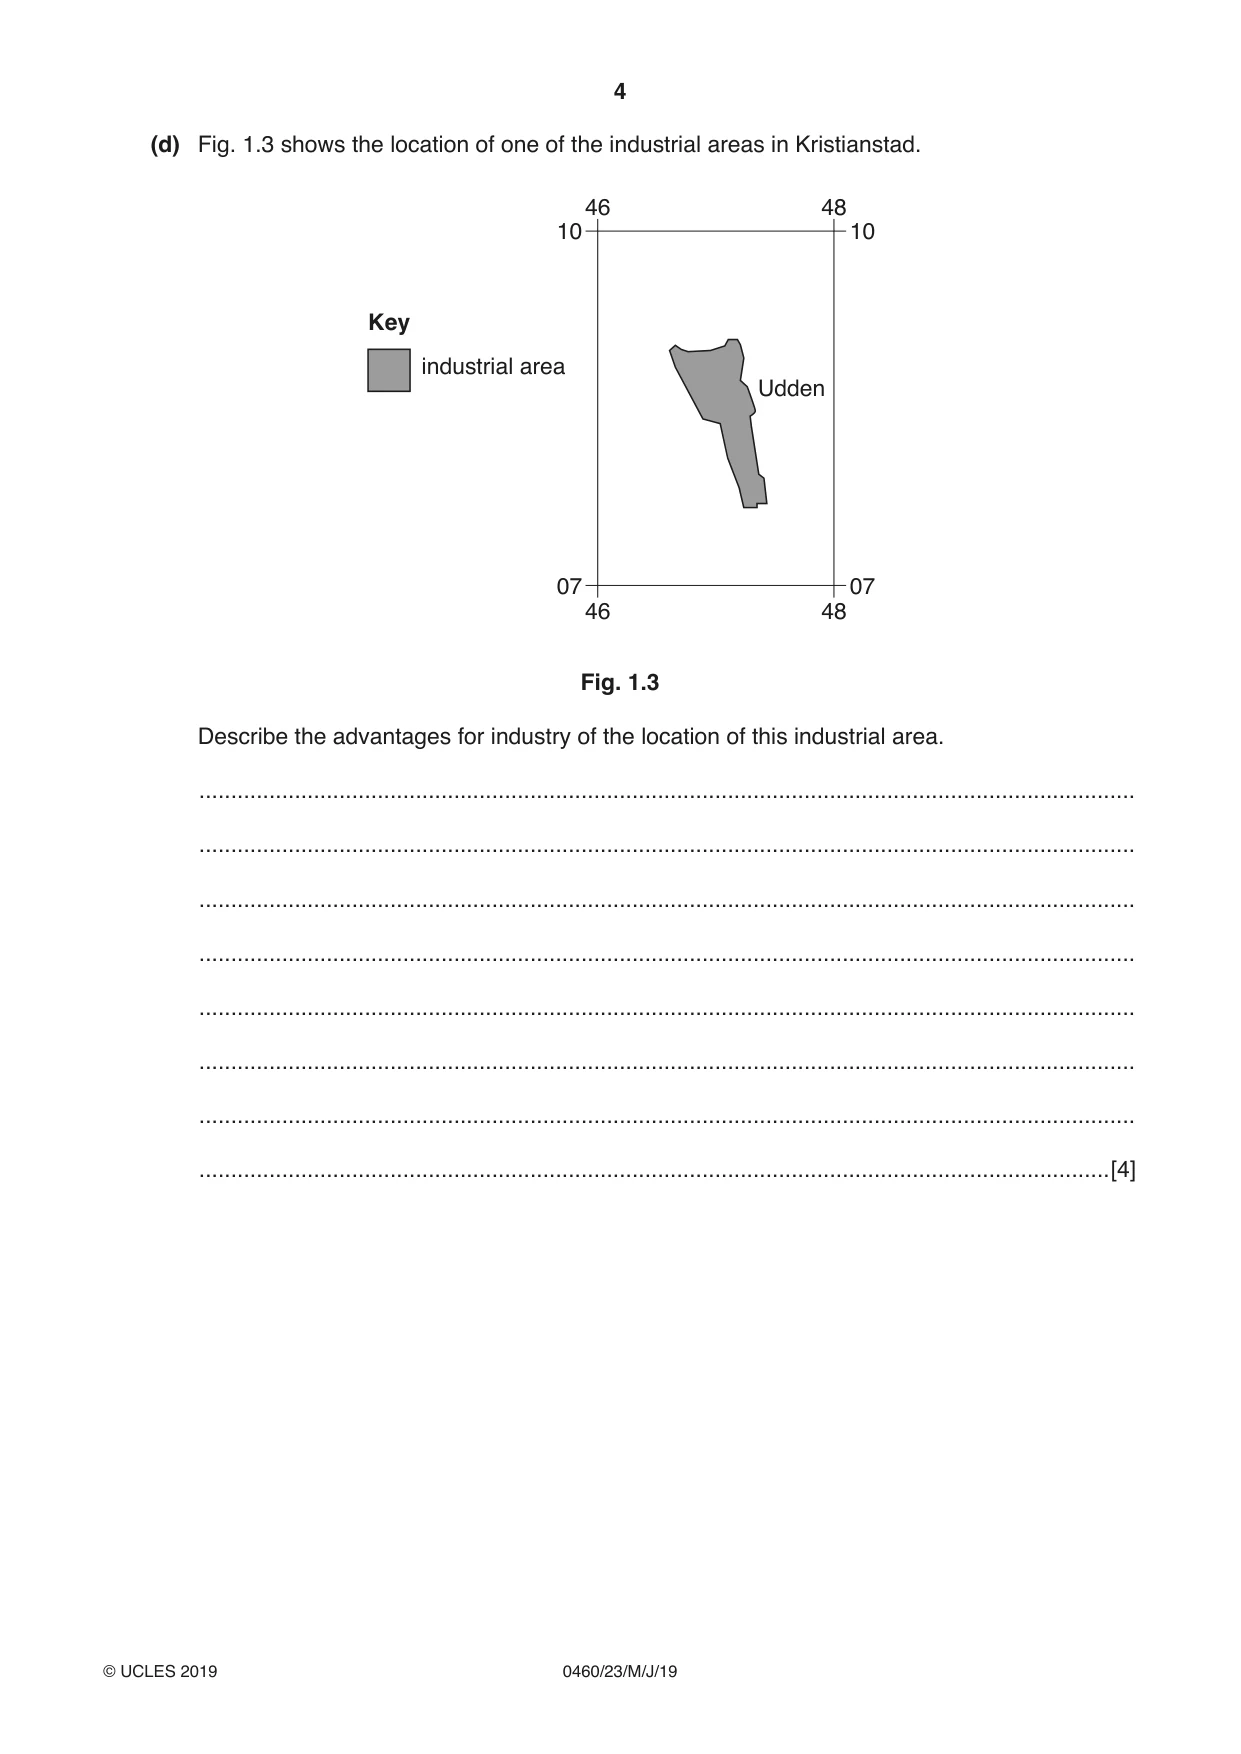
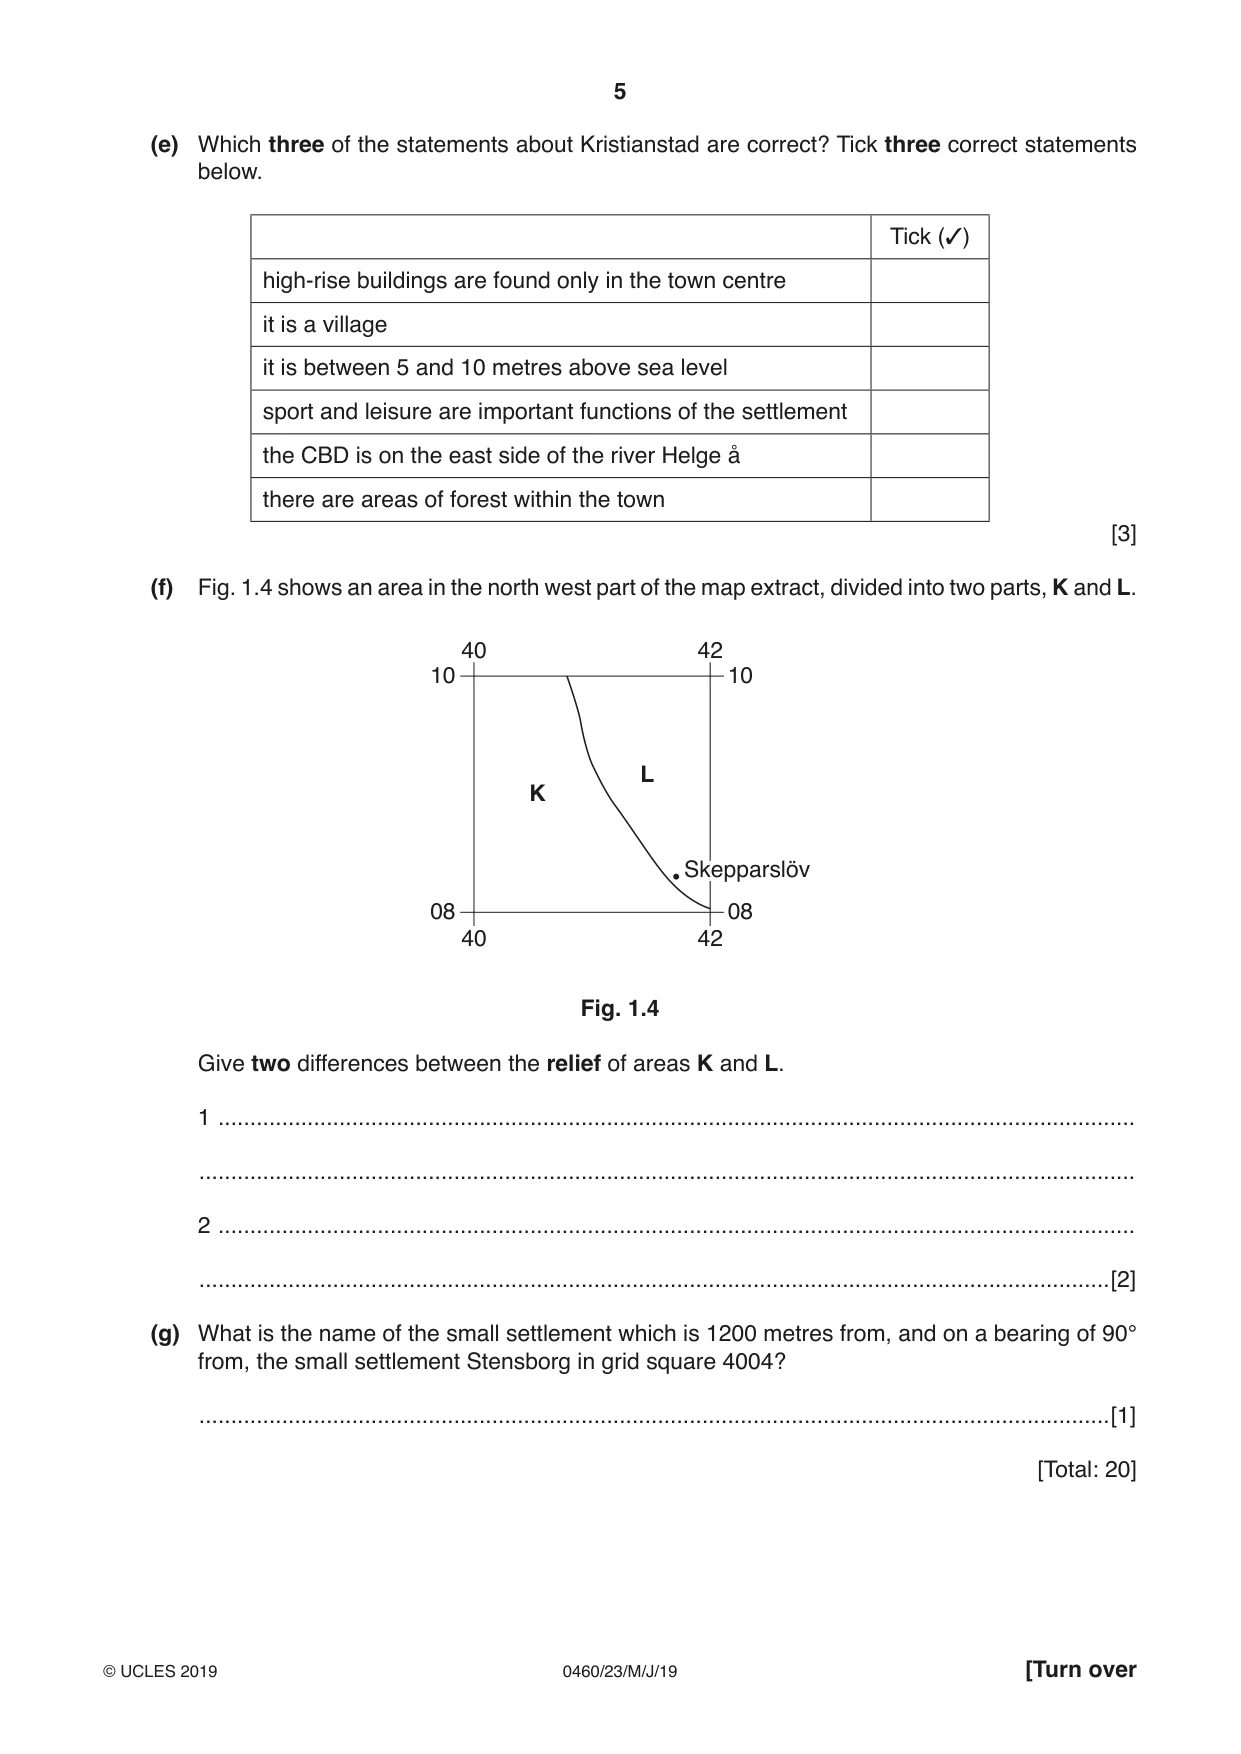
1 Study the map extract for Kristianstad, Sweden. The scale is 1:50 000. Fig. 1.1 shows some of the features in the south of the map extract. 41 42 43 44 45 46 06 06 A 05 05 B 04 04 E D C 03 03 02 02 41 42 43 44 45 46 Fig. 1.1 (a) Using the map extract, identify the following features shown on Fig. 1.1: (i) feature A .......................................................................................................................................[1] (ii) the type of road B .......................................................................................................................................[1] (iii) the width of the watercourse C .......................................................................................................................................[1] (iv) the feature at D .......................................................................................................................................[1] (v) the feature at E. .......................................................................................................................................[1] (b) Fig. 1.2 shows three types of natural vegetation, F, G and H, in grid square 5007 in the east of the map extract. F 50 51 08 08 G 07 07 50 51 H Fig. 1.2 Complete the table to identify the types of natural vegetation F, G and H, shown in Fig. 1.2. Letter Natural vegetation F ...................................................................................... G ...................................................................................... H ...................................................................................... [3] (c) (i) What is the grid reference of the centre of the triangulation point near Björkhäll in the south east of the map extract? ..................................... [1] (ii) Identify the settlement pattern in the grid square in which Björkhäll is located. ........................................................................................................................................... .......................................................................................................................................[1] (d) Fig. 1.3 shows the location of one of the industrial areas in Kristianstad. 46 48 10 10 Key industrial area Udden 07 07 46 48 Fig. 1.3 Describe the advantages for industry of the location of this industrial area. ................................................................................................................................................... ................................................................................................................................................... ................................................................................................................................................... ................................................................................................................................................... ................................................................................................................................................... ................................................................................................................................................... ................................................................................................................................................... ...............................................................................................................................................[4] (e) Which three of the statements about Kristianstad are correct? Tick three correct statements below. Tick (3) high-rise buildings are found only in the town centre it is a village it is between 5 and 10 metres above sea level sport and leisure are important functions of the settlement the CBD is on the east side of the river Helge å there are areas of forest within the town [3] (f) Fig. 1.4 shows an area in the north west part of the map extract, divided into two parts, K and L. 40 42 10 10 L K Skepparslöv 08 08 40 42 Fig. 1.4 Give two differences between the relief of areas K and L. 1 ................................................................................................................................................ ................................................................................................................................................... 2 ................................................................................................................................................ ...............................................................................................................................................[2] (g) What is the name of the small settlement which is 1200 metres from, and on a bearing of 90° from, the small settlement Stensborg in grid square 4004? ...............................................................................................................................................[1] [Total: 20]
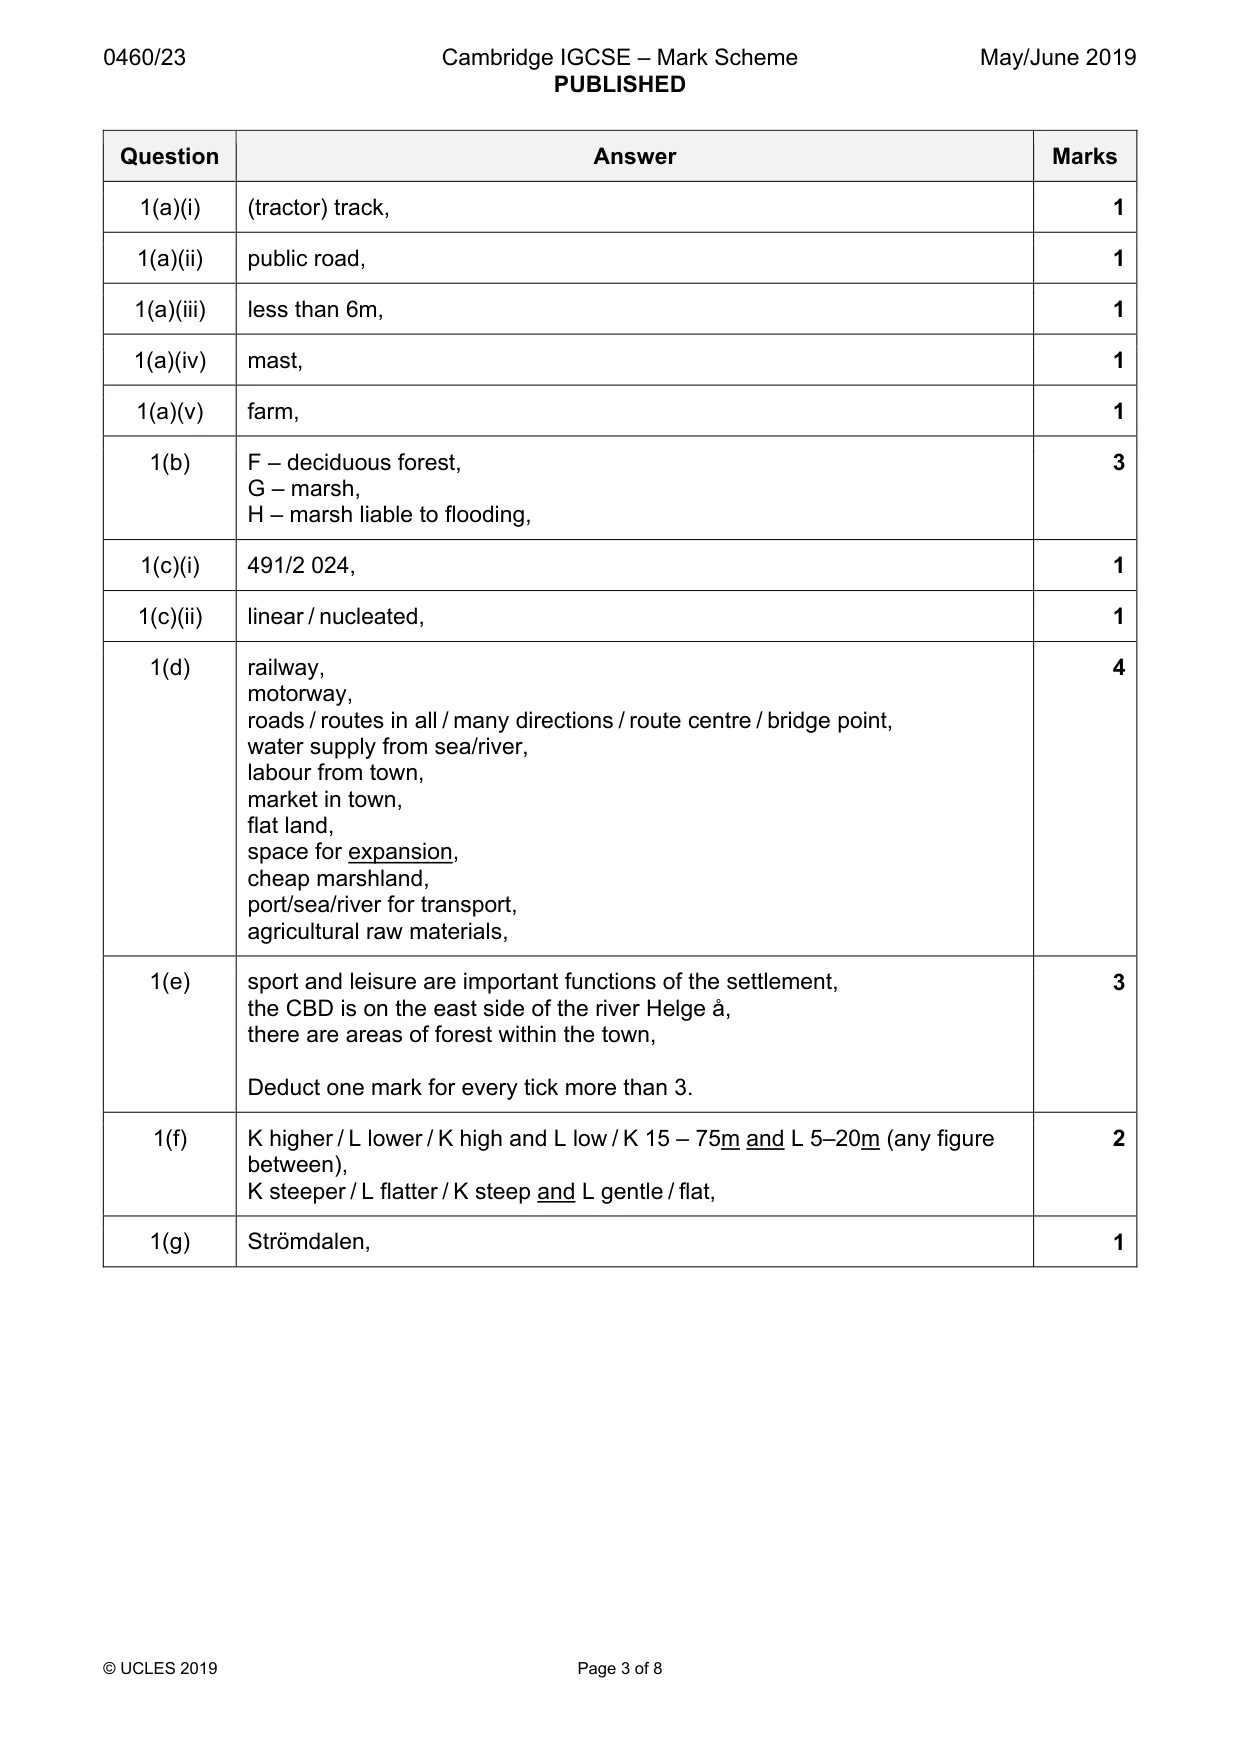
Mark scheme: Question Answer Marks 1(a)(i) (tractor) track, 1 1(a)(ii) public road, 1 1(a)(iii) less than 6m, 1 1(a)(iv) mast, 1 1(a)(v) farm, 1 1(b) F – deciduous forest, 3 G – marsh, H – marsh liable to flooding, 1(c)(i) 491/2 024, 1 1(c)(ii) linear / nucleated, 1 1(d) railway, 4 motorway, roads / routes in all / many directions / route centre / bridge point, water supply from sea/river, labour from town, market in town, flat land, space for expansion, cheap marshland, port/sea/river for transport, agricultural raw materials, 1(e) sport and leisure are important functions of the settlement, 3 the CBD is on the east side of the river Helge å, there are areas of forest within the town, Deduct one mark for every tick more than 3. 1(f) K higher / L lower / K high and L low / K 15 – 75m and L 5–20m (any figure 2 between), K steeper / L flatter / K steep and L gentle / flat, 1(g) Strömdalen, 1
More questions on Settlements (rural and urban) and service provision
Question 2
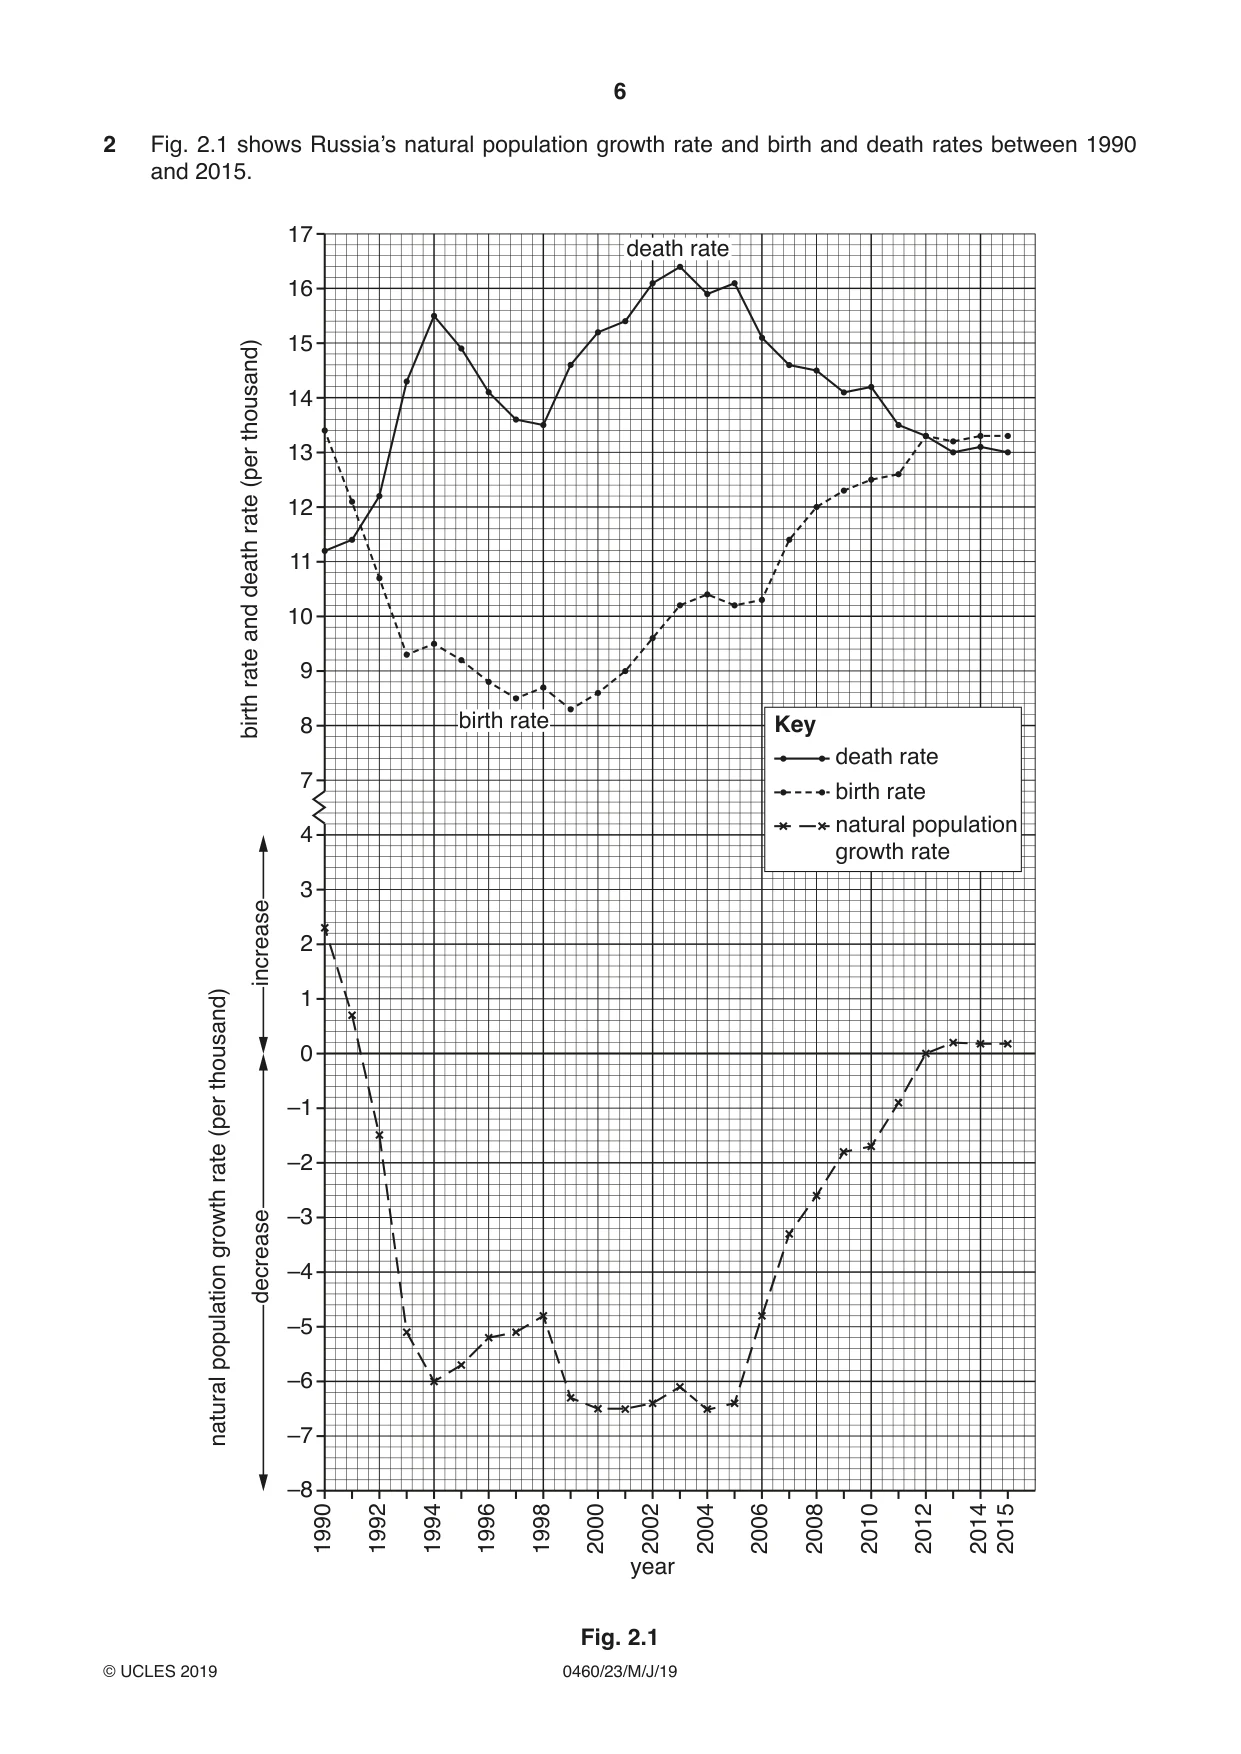
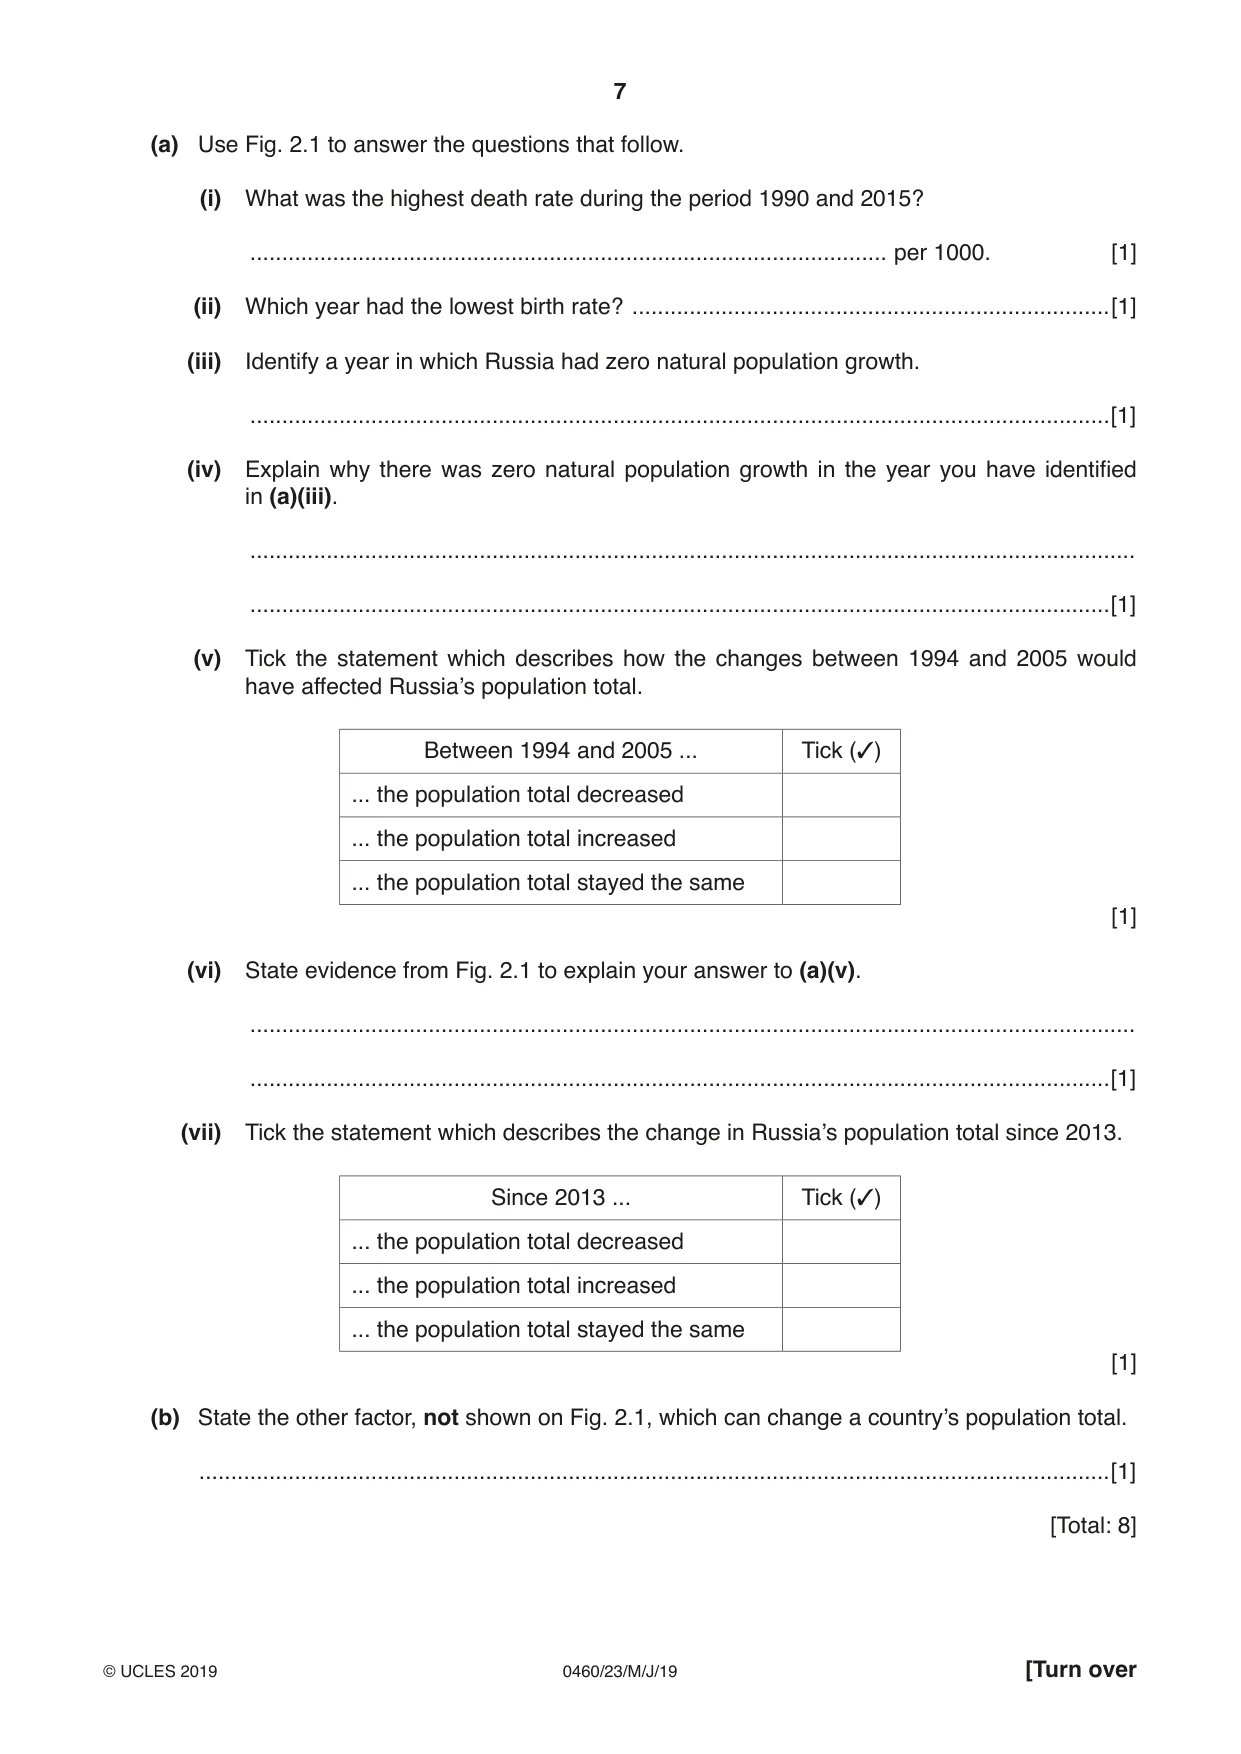
(a) Use Fig. 2.1 to answer the questions that follow. (i) What was the highest death rate during the period 1990 and 2015? .................................................................................................... per 1000. [1] (ii) Which year had the lowest birth rate? ...........................................................................[1] (iii) Identify a year in which Russia had zero natural population growth. .......................................................................................................................................[1] (iv) Explain why there was zero natural population growth in the year you have identified in (a)(iii). ........................................................................................................................................... .......................................................................................................................................[1] (v) Tick the statement which describes how the changes between 1994 and 2005 would have affected Russia’s population total. Between 1994 and 2005 ... Tick (3) ... the population total decreased ... the population total increased ... the population total stayed the same [1] (vi) State evidence from Fig. 2.1 to explain your answer to (a)(v). ........................................................................................................................................... .......................................................................................................................................[1] (vii) Tick the statement which describes the change in Russia’s population total since 2013. Since 2013 ... Tick (3) ... the population total decreased ... the population total increased ... the population total stayed the same [1] (b) State the other factor, not shown on Fig. 2.1, which can change a country’s population total. ...............................................................................................................................................[1] [Total: 8]
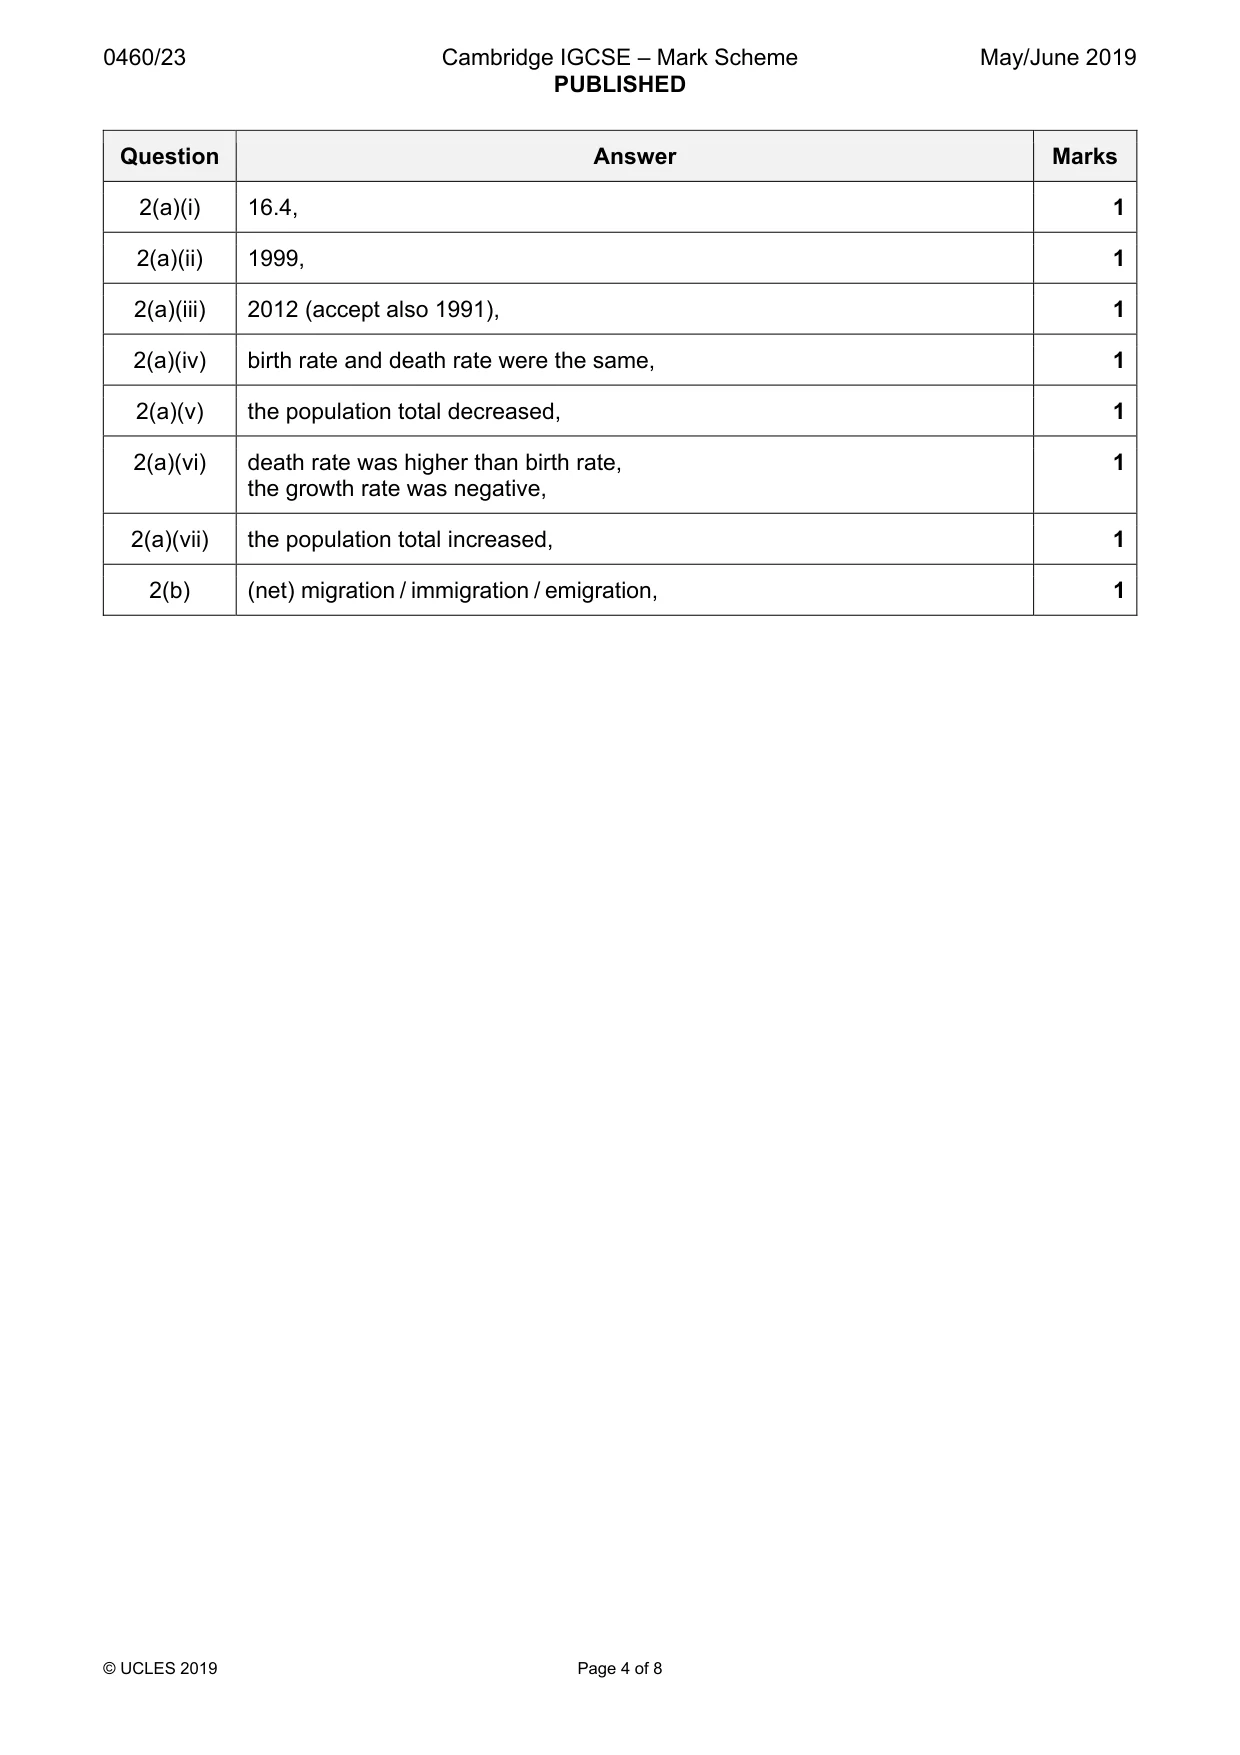
Mark scheme: 2(a)(i) 16.4, 1 2(a)(ii) 1999, 1 2(a)(iii) 2012 (accept also 1991), 1 2(a)(iv) birth rate and death rate were the same, 1 2(a)(v) the population total decreased, 1 2(a)(vi) death rate was higher than birth rate, 1 the growth rate was negative, 2(a)(vii) the population total increased, 1 2(b) (net) migration / immigration / emigration, 1
Question 3
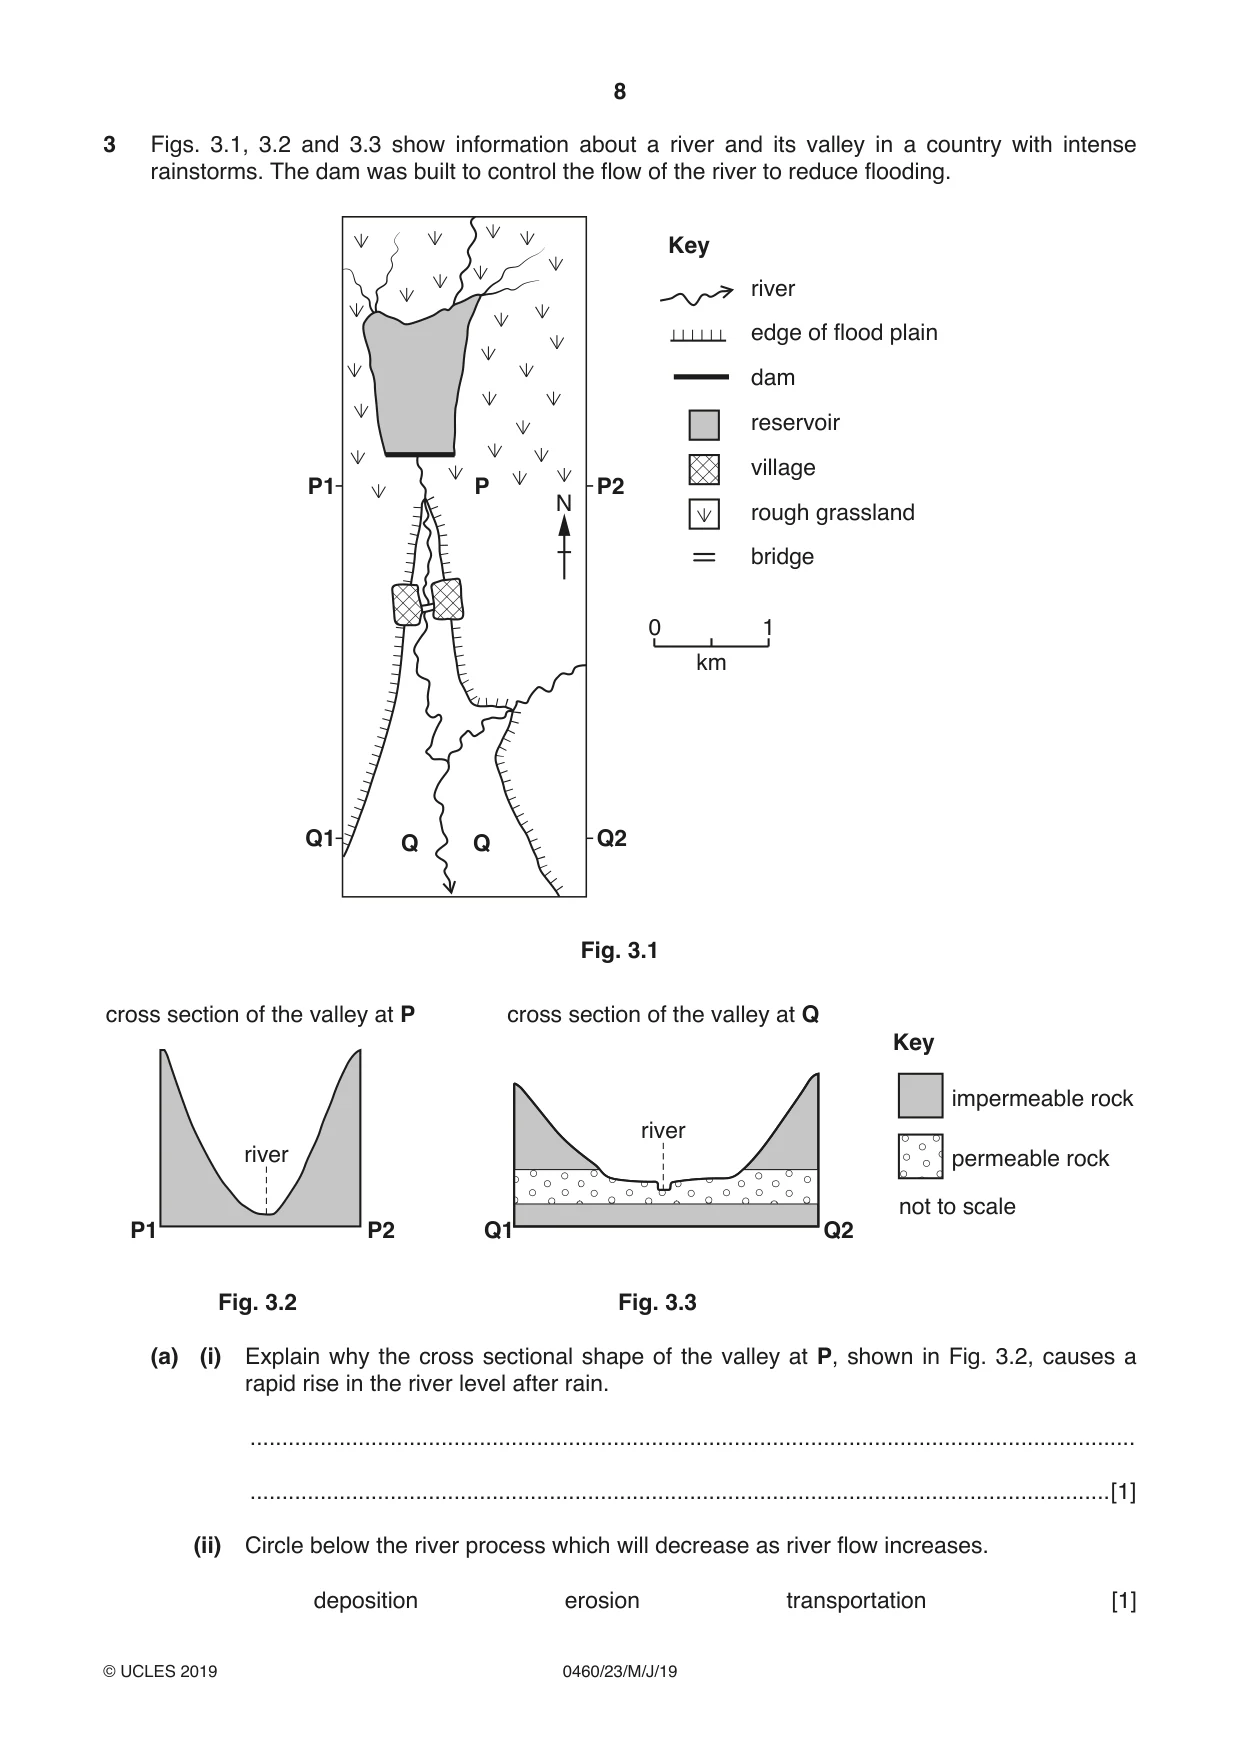
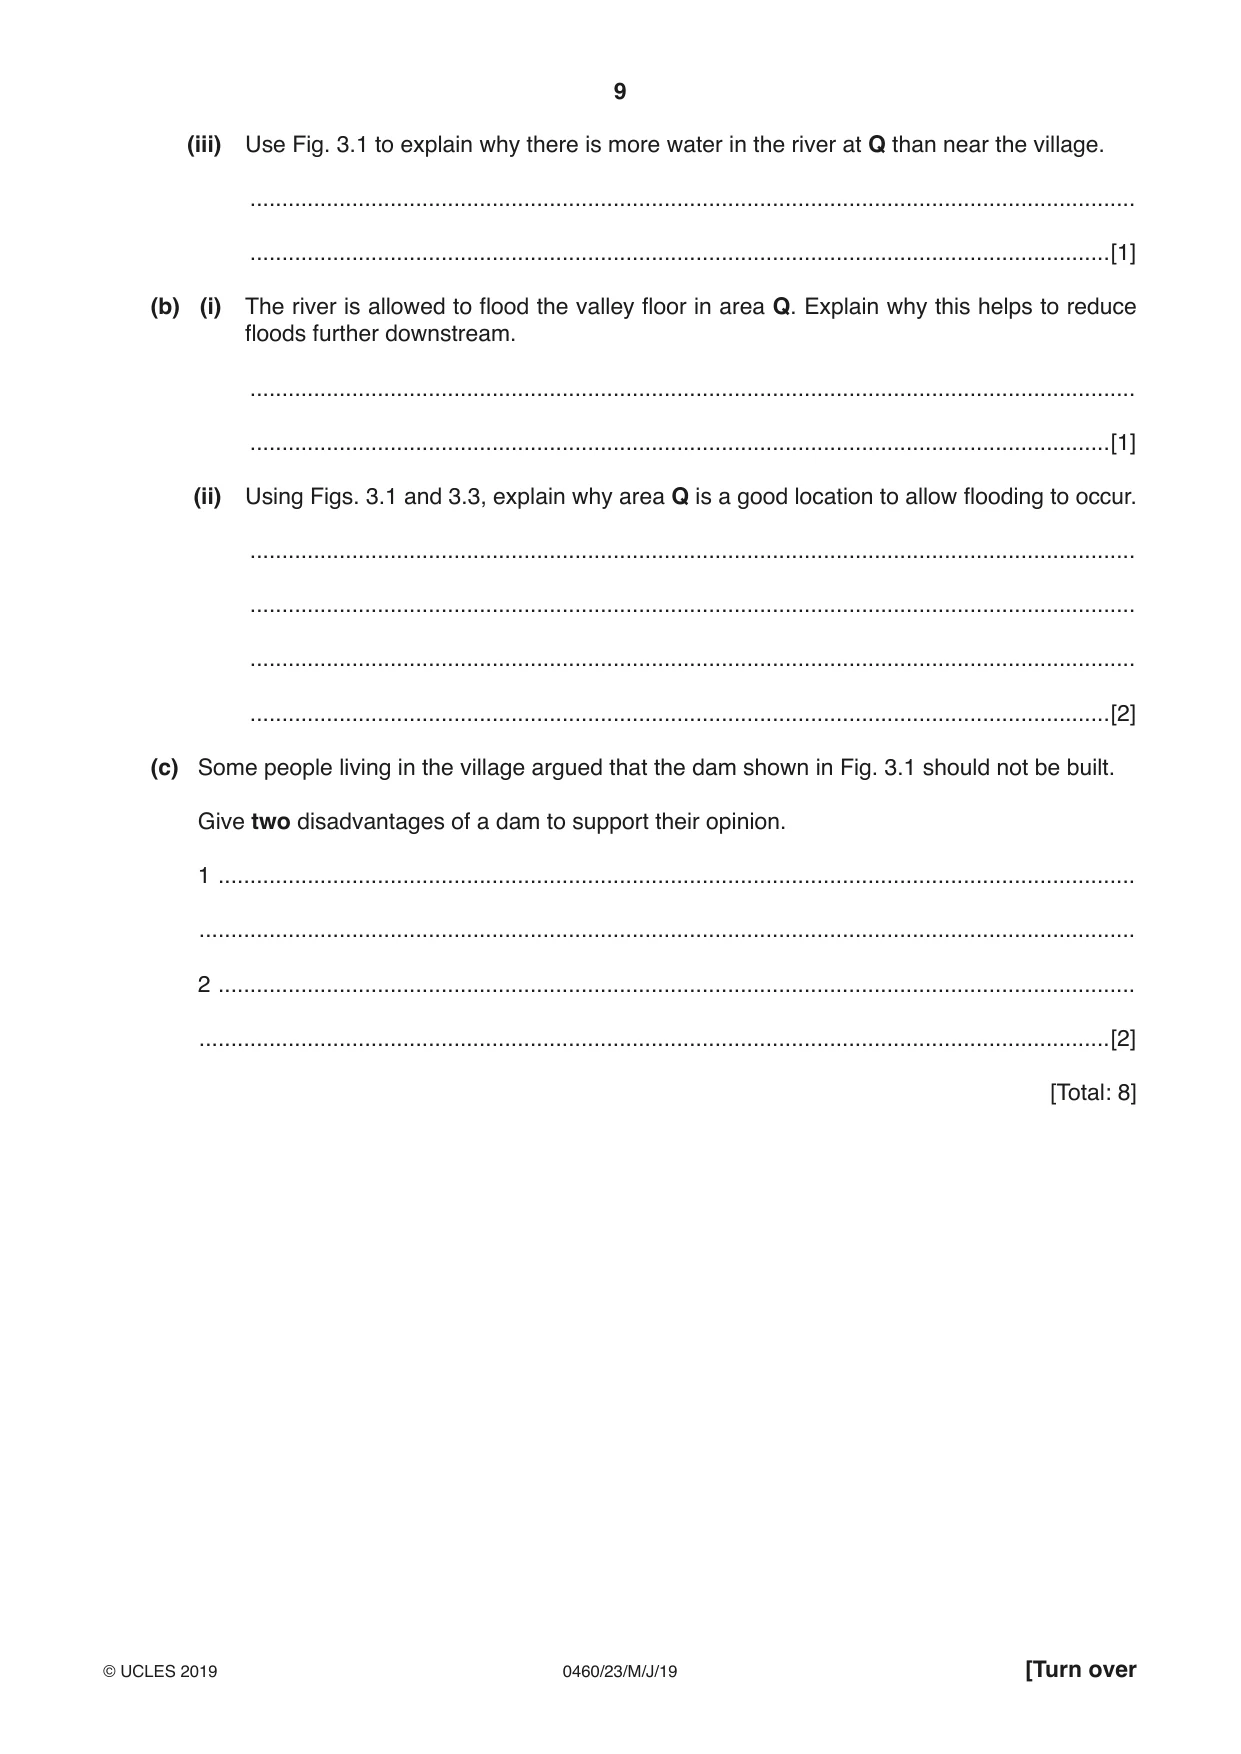
3 Figs. 3.1, 3.2 and 3.3 show information about a river and its valley in a country with intense rainstorms. The dam was built to control the flow of the river to reduce flooding. Key river edge of flood plain dam reservoir village P1 P P2 N rough grassland bridge 0 1 km Q1 Q Q Q2 Fig. 3.1 cross section of the valley at P cross section of the valley at Q Key impermeable rock river river permeable rock not to scale P1 P2 Q1 Q2 Fig. 3.2 Fig. 3.3 (a) (i) Explain why the cross sectional shape of the valley at P, shown in Fig. 3.2, causes a rapid rise in the river level after rain. ........................................................................................................................................... .......................................................................................................................................[1] (ii) Circle below the river process which will decrease as river flow increases. deposition erosion transportation [1] (iii) Use Fig. 3.1 to explain why there is more water in the river at Q than near the village. ........................................................................................................................................... .......................................................................................................................................[1] (b) (i) The river is allowed to flood the valley floor in area Q. Explain why this helps to reduce floods further downstream. ........................................................................................................................................... .......................................................................................................................................[1] (ii) Using Figs. 3.1 and 3.3, explain why area Q is a good location to allow flooding to occur. ........................................................................................................................................... ........................................................................................................................................... ........................................................................................................................................... .......................................................................................................................................[2] (c) Some people living in the village argued that the dam shown in Fig. 3.1 should not be built. Give two disadvantages of a dam to support their opinion. 1 ................................................................................................................................................ ................................................................................................................................................... 2 ................................................................................................................................................ ...............................................................................................................................................[2] [Total: 8]
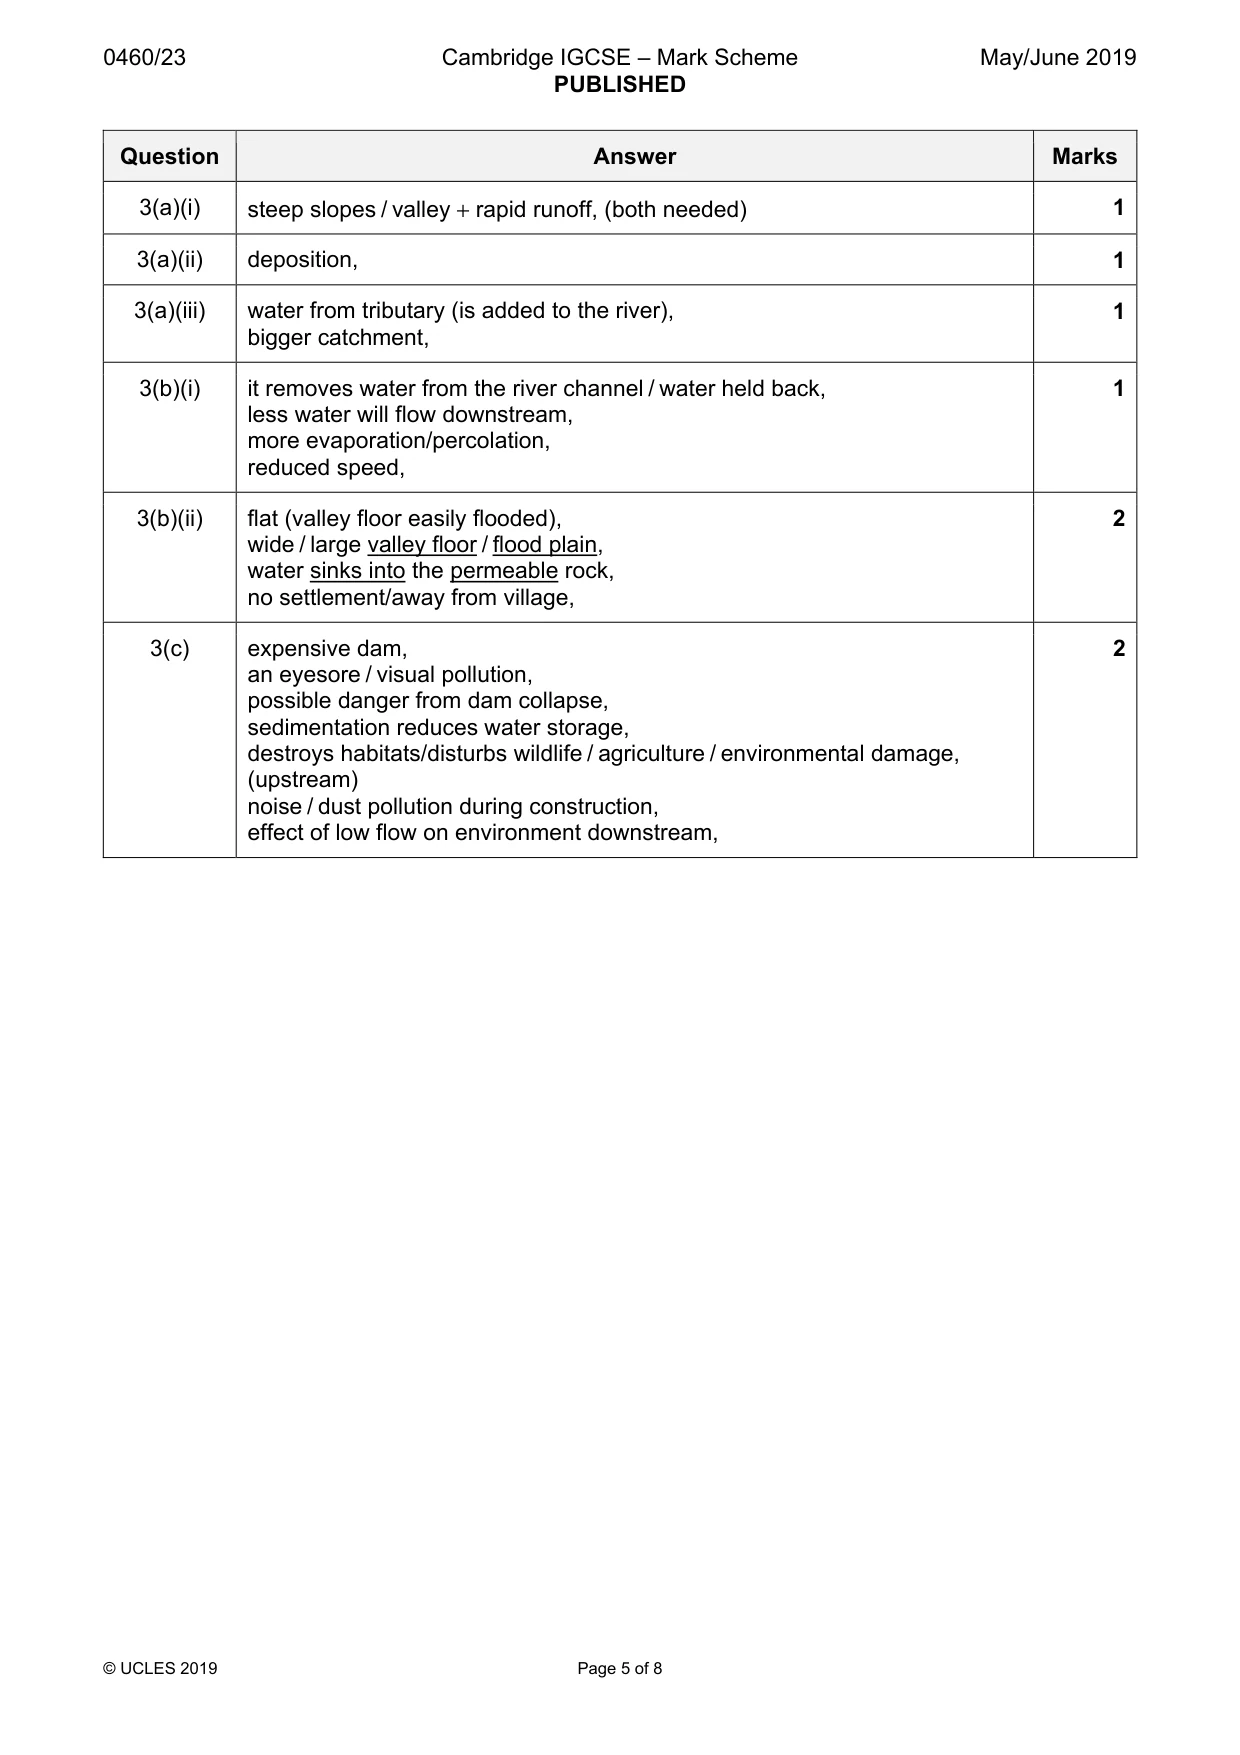
Mark scheme: 3(a)(i) steep slopes / valley + rapid runoff, (both needed) 1 3(a)(ii) deposition, 1 3(a)(iii) water from tributary (is added to the river), 1 bigger catchment, 3(b)(i) it removes water from the river channel / water held back, 1 less water will flow downstream, more evaporation/percolation, reduced speed, 3(b)(ii) flat (valley floor easily flooded), 2 wide / large valley floor / flood plain, water sinks into the permeable rock, no settlement/away from village, 3(c) expensive dam, 2 an eyesore / visual pollution, possible danger from dam collapse, sedimentation reduces water storage, destroys habitats/disturbs wildlife / agriculture / environmental damage, (upstream) noise / dust pollution during construction, effect of low flow on environment downstream,
Question 4
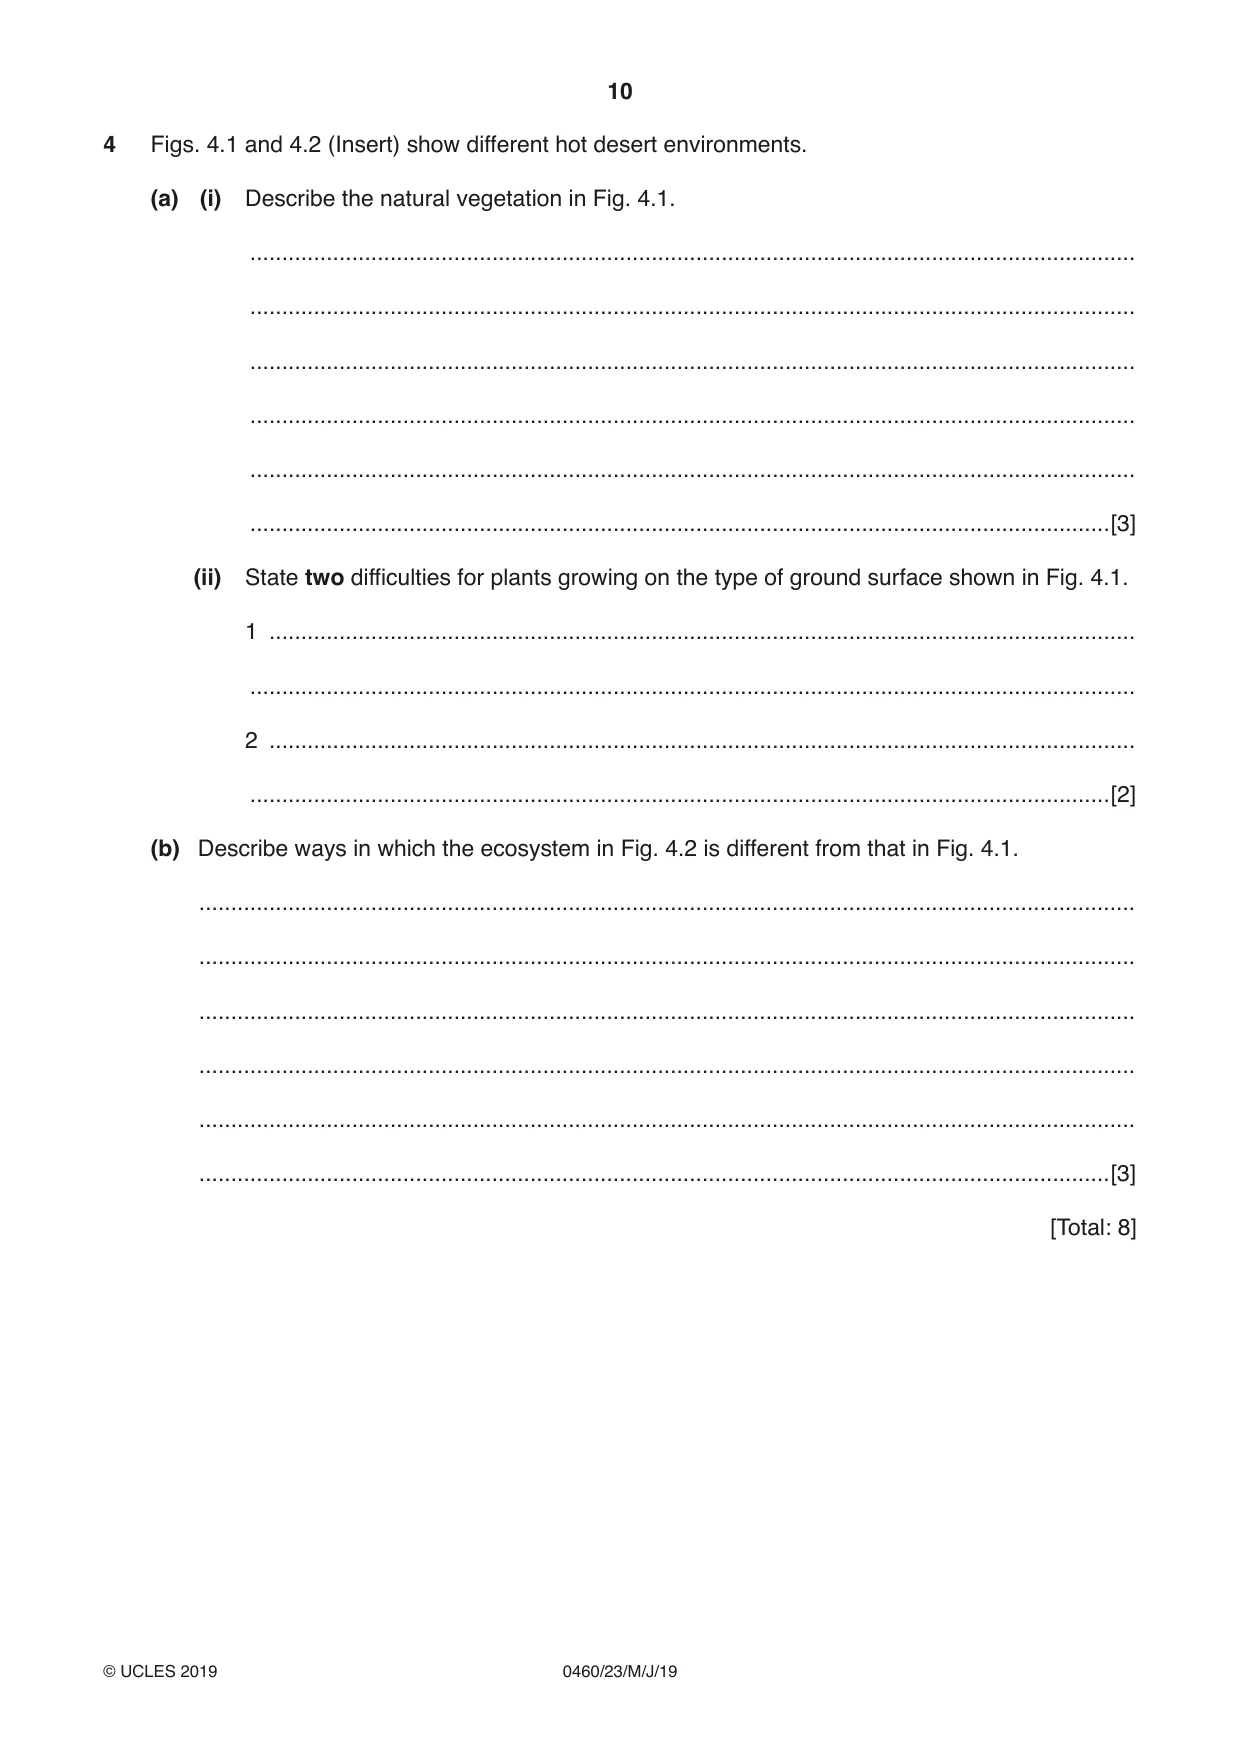
4 Figs. 4.1 and 4.2 (Insert) show different hot desert environments. (a) (i) Describe the natural vegetation in Fig. 4.1. ........................................................................................................................................... ........................................................................................................................................... ........................................................................................................................................... ........................................................................................................................................... ........................................................................................................................................... .......................................................................................................................................[3] (ii) State two difficulties for plants growing on the type of ground surface shown in Fig. 4.1. 1 ........................................................................................................................................ ........................................................................................................................................... 2 ........................................................................................................................................ .......................................................................................................................................[2] (b) Describe ways in which the ecosystem in Fig. 4.2 is different from that in Fig. 4.1. ................................................................................................................................................... ................................................................................................................................................... ................................................................................................................................................... ................................................................................................................................................... ................................................................................................................................................... ...............................................................................................................................................[3] [Total: 8] TURN PAGE FOR QUESTION 5
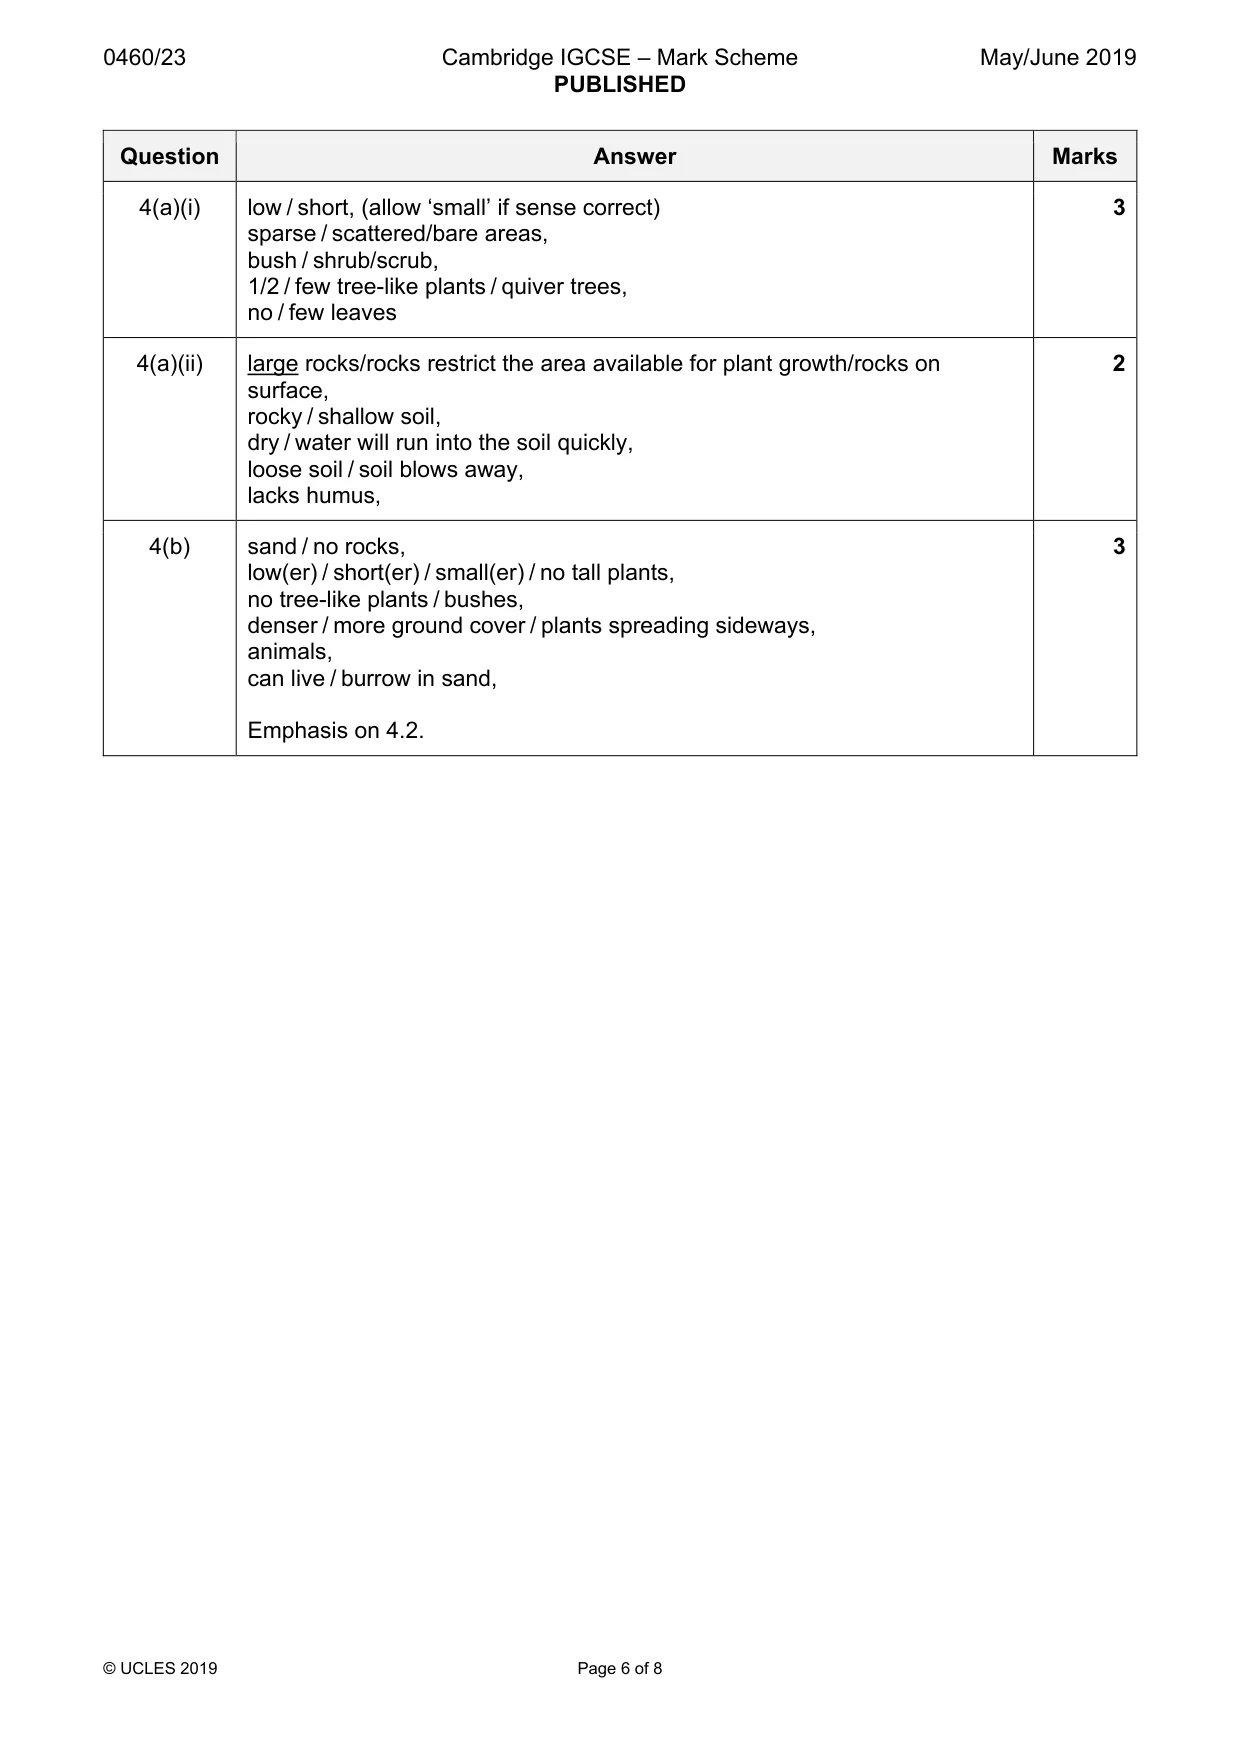
Mark scheme: 4(a)(i) low / short, (allow ‘small’ if sense correct) 3 sparse / scattered/bare areas, bush / shrub/scrub, 1/2 / few tree-like plants / quiver trees, no / few leaves 4(a)(ii) large rocks/rocks restrict the area available for plant growth/rocks on 2 surface, rocky / shallow soil, dry / water will run into the soil quickly, loose soil / soil blows away, lacks humus, 4(b) sand / no rocks, 3 low(er) / short(er) / small(er) / no tall plants, no tree-like plants / bushes, denser / more ground cover / plants spreading sideways, animals, can live / burrow in sand, Emphasis on 4.2.
Q5 · Information about Farm R, a farm in Canada and Farm S, a farm in South Africa
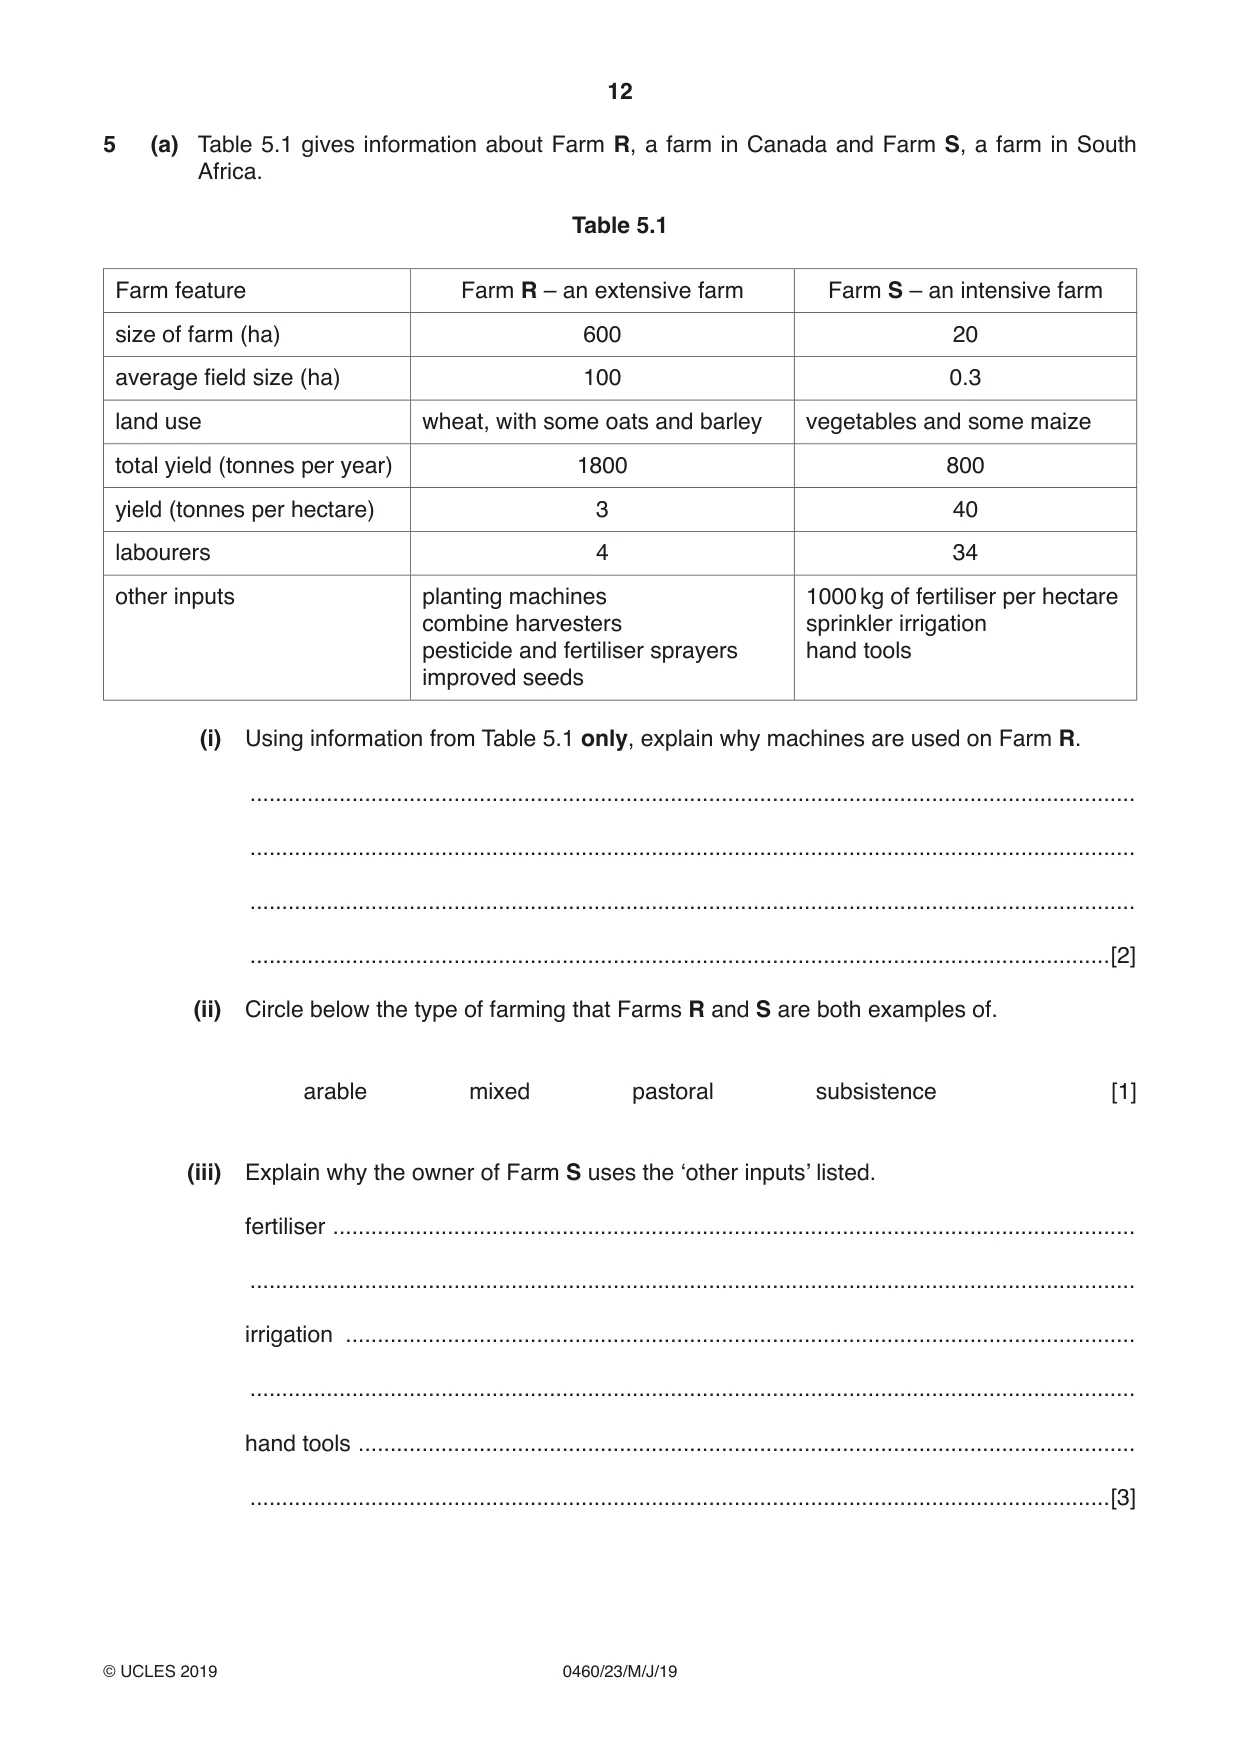
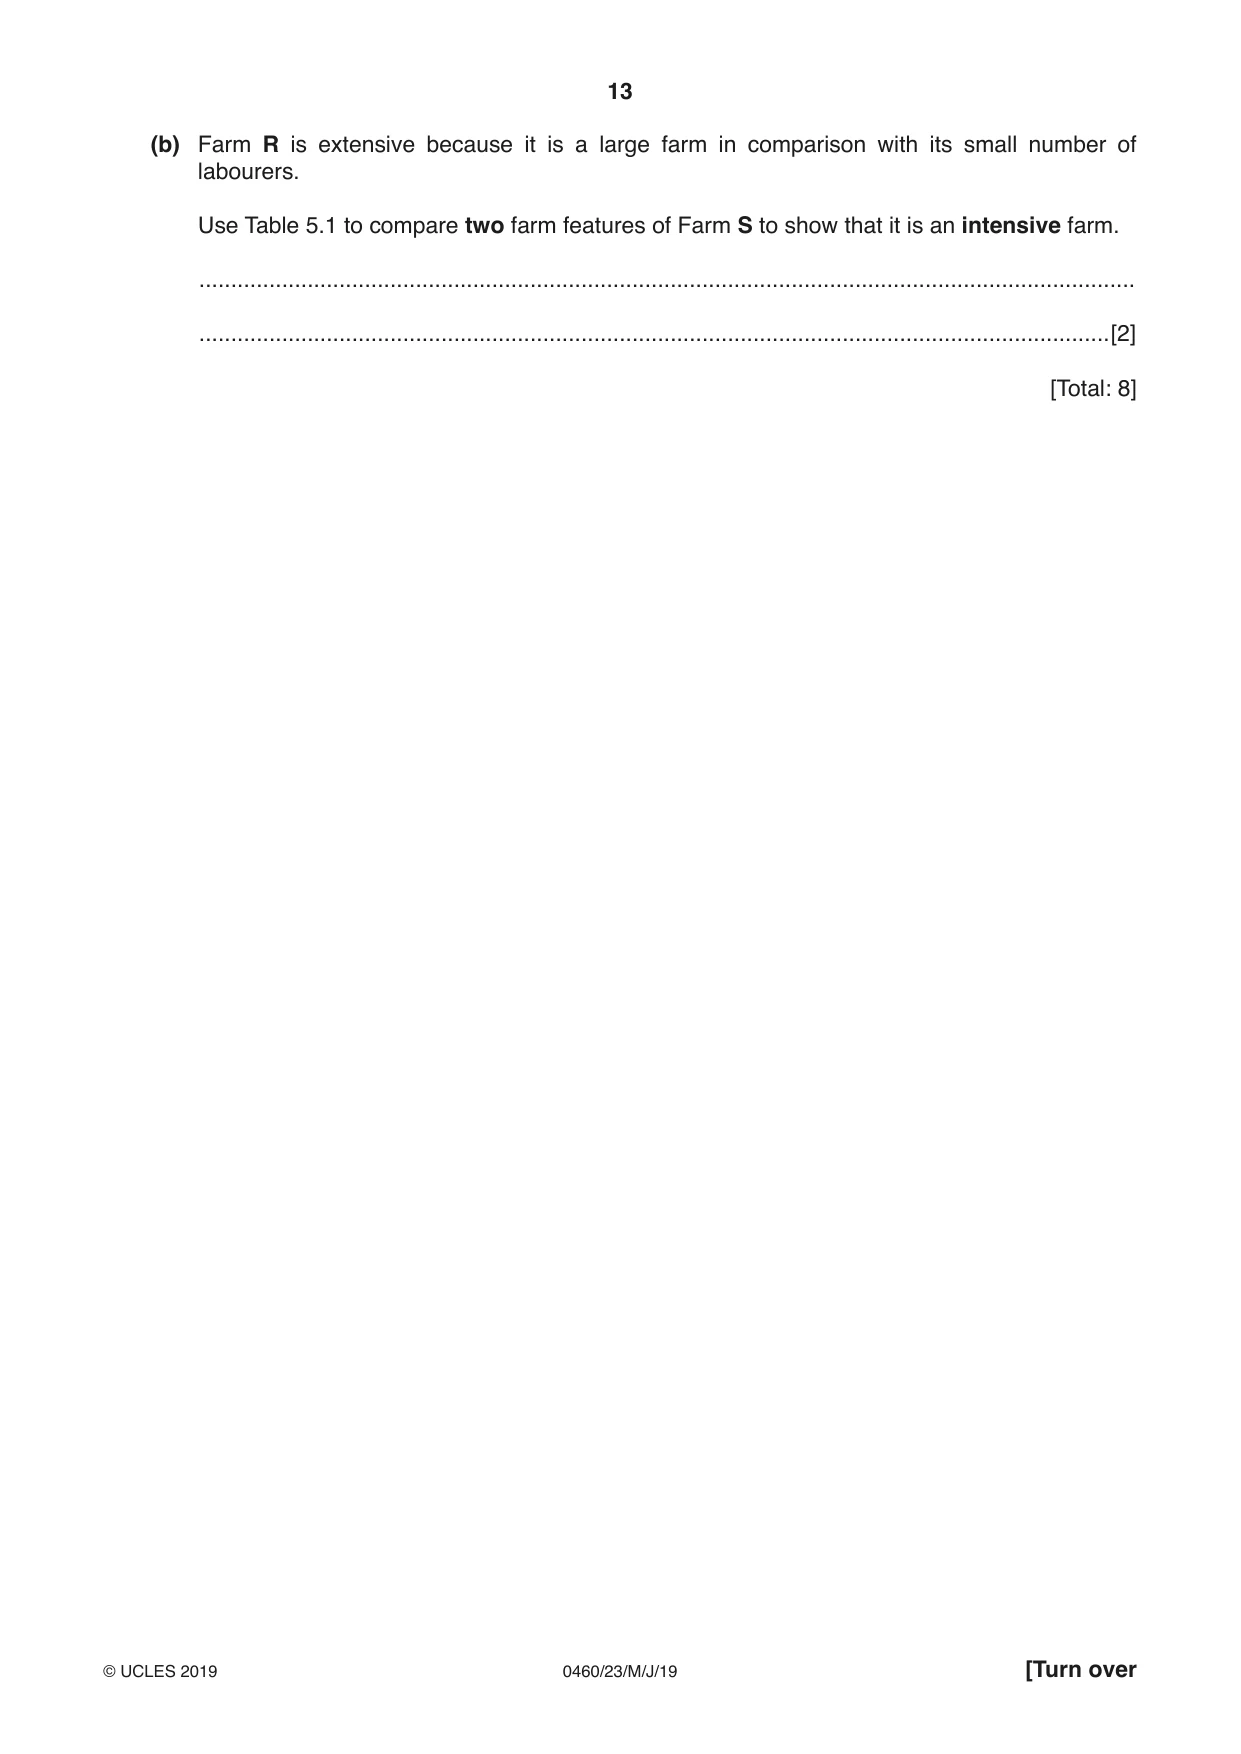
5 (a) Table 5.1 gives information about Farm R, a farm in Canada and Farm S, a farm in South Africa. Table 5.1 Farm feature Farm R – an extensive farm Farm S – an intensive farm size of farm (ha) 600 20 average field size (ha) 100 0.3 land use wheat, with some oats and barley vegetables and some maize total yield (tonnes per year) 1800 800 yield (tonnes per hectare) 3 40 labourers 4 34 other inputs planting machines 1000 kg of fertiliser per hectare combine harvesters sprinkler irrigation pesticide and fertiliser sprayers hand tools improved seeds (i) Using information from Table 5.1 only, explain why machines are used on Farm R. ........................................................................................................................................... ........................................................................................................................................... ........................................................................................................................................... .......................................................................................................................................[2] (ii) Circle below the type of farming that Farms R and S are both examples of. arable mixed pastoral subsistence [1] (iii) Explain why the owner of Farm S uses the ‘other inputs’ listed. fertiliser .............................................................................................................................. ........................................................................................................................................... irrigation ............................................................................................................................ ........................................................................................................................................... hand tools .......................................................................................................................... .......................................................................................................................................[3] (b) Farm R is extensive because it is a large farm in comparison with its small number of labourers. Use Table 5.1 to compare two farm features of Farm S to show that it is an intensive farm. ................................................................................................................................................... ...............................................................................................................................................[2] [Total: 8]
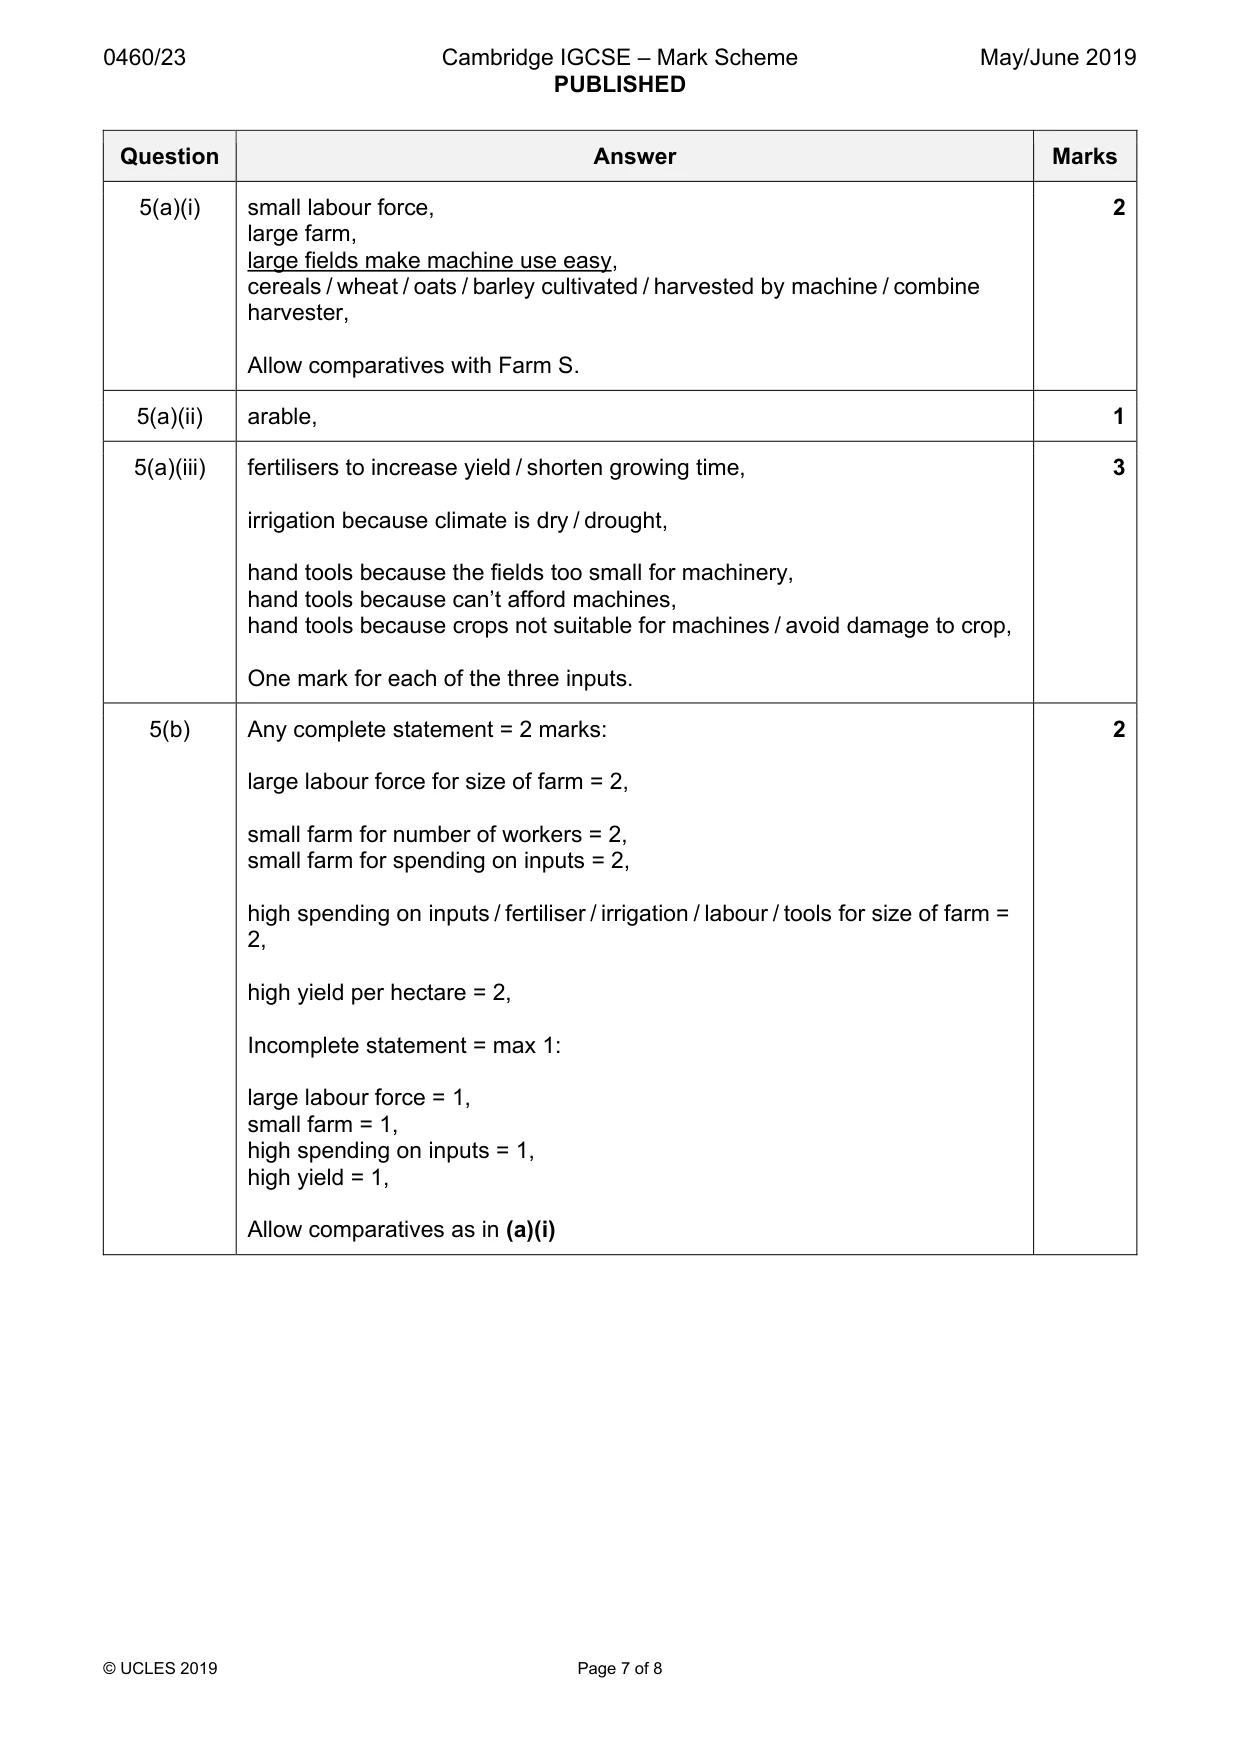
Mark scheme: 5(a)(i) small labour force, 2 large farm, large fields make machine use easy, cereals / wheat / oats / barley cultivated / harvested by machine / combine harvester, Allow comparatives with Farm S. 5(a)(ii) arable, 1 5(a)(iii) fertilisers to increase yield / shorten growing time, 3 irrigation because climate is dry / drought, hand tools because the fields too small for machinery, hand tools because can’t afford machines, hand tools because crops not suitable for machines / avoid damage to crop, One mark for each of the three inputs. 5(b) Any complete statement = 2 marks: 2 large labour force for size of farm = 2, small farm for number of workers = 2, small farm for spending on inputs = 2, high spending on inputs / fertiliser / irrigation / labour / tools for size of farm = 2, high yield per hectare = 2, Incomplete statement = max 1: large labour force = 1, small farm = 1, high spending on inputs = 1, high yield = 1, Allow comparatives as in (a)(i)
Question 6
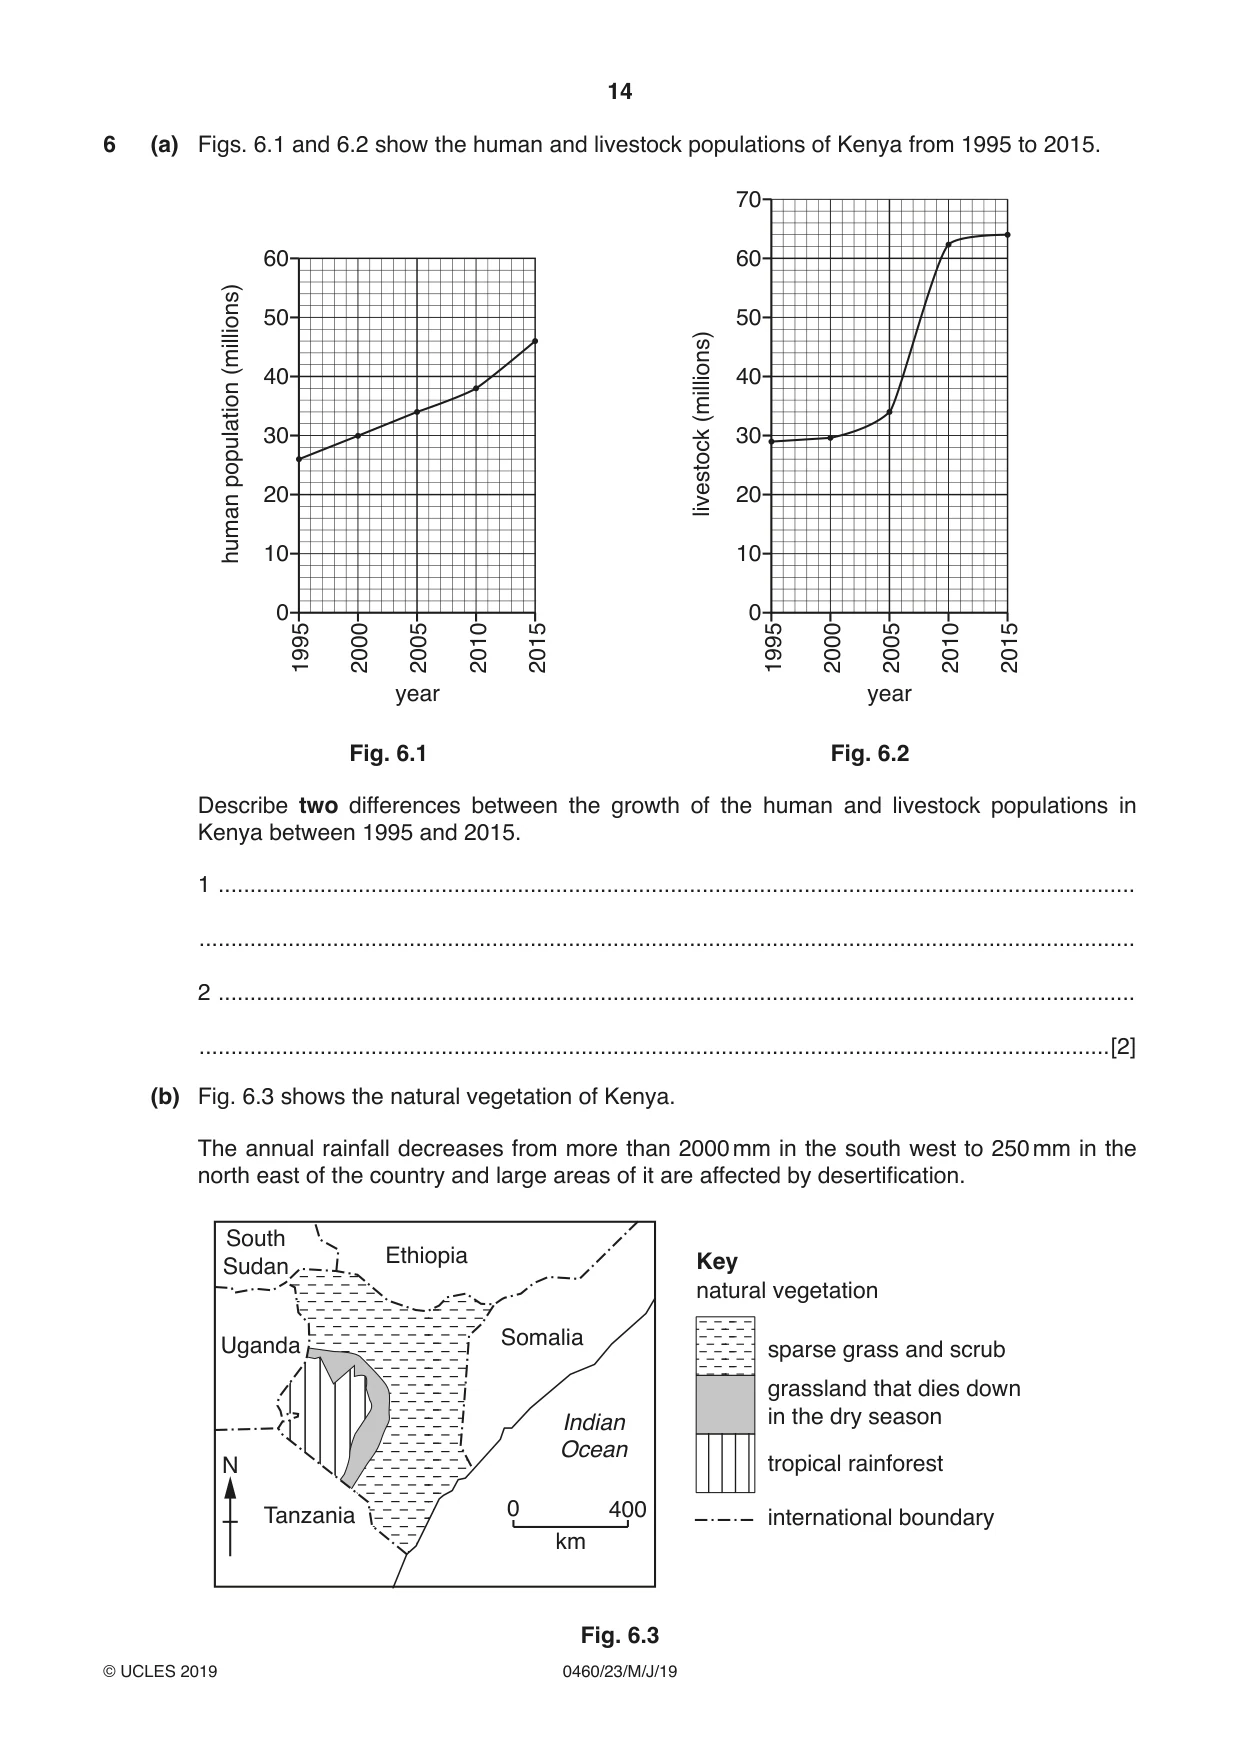
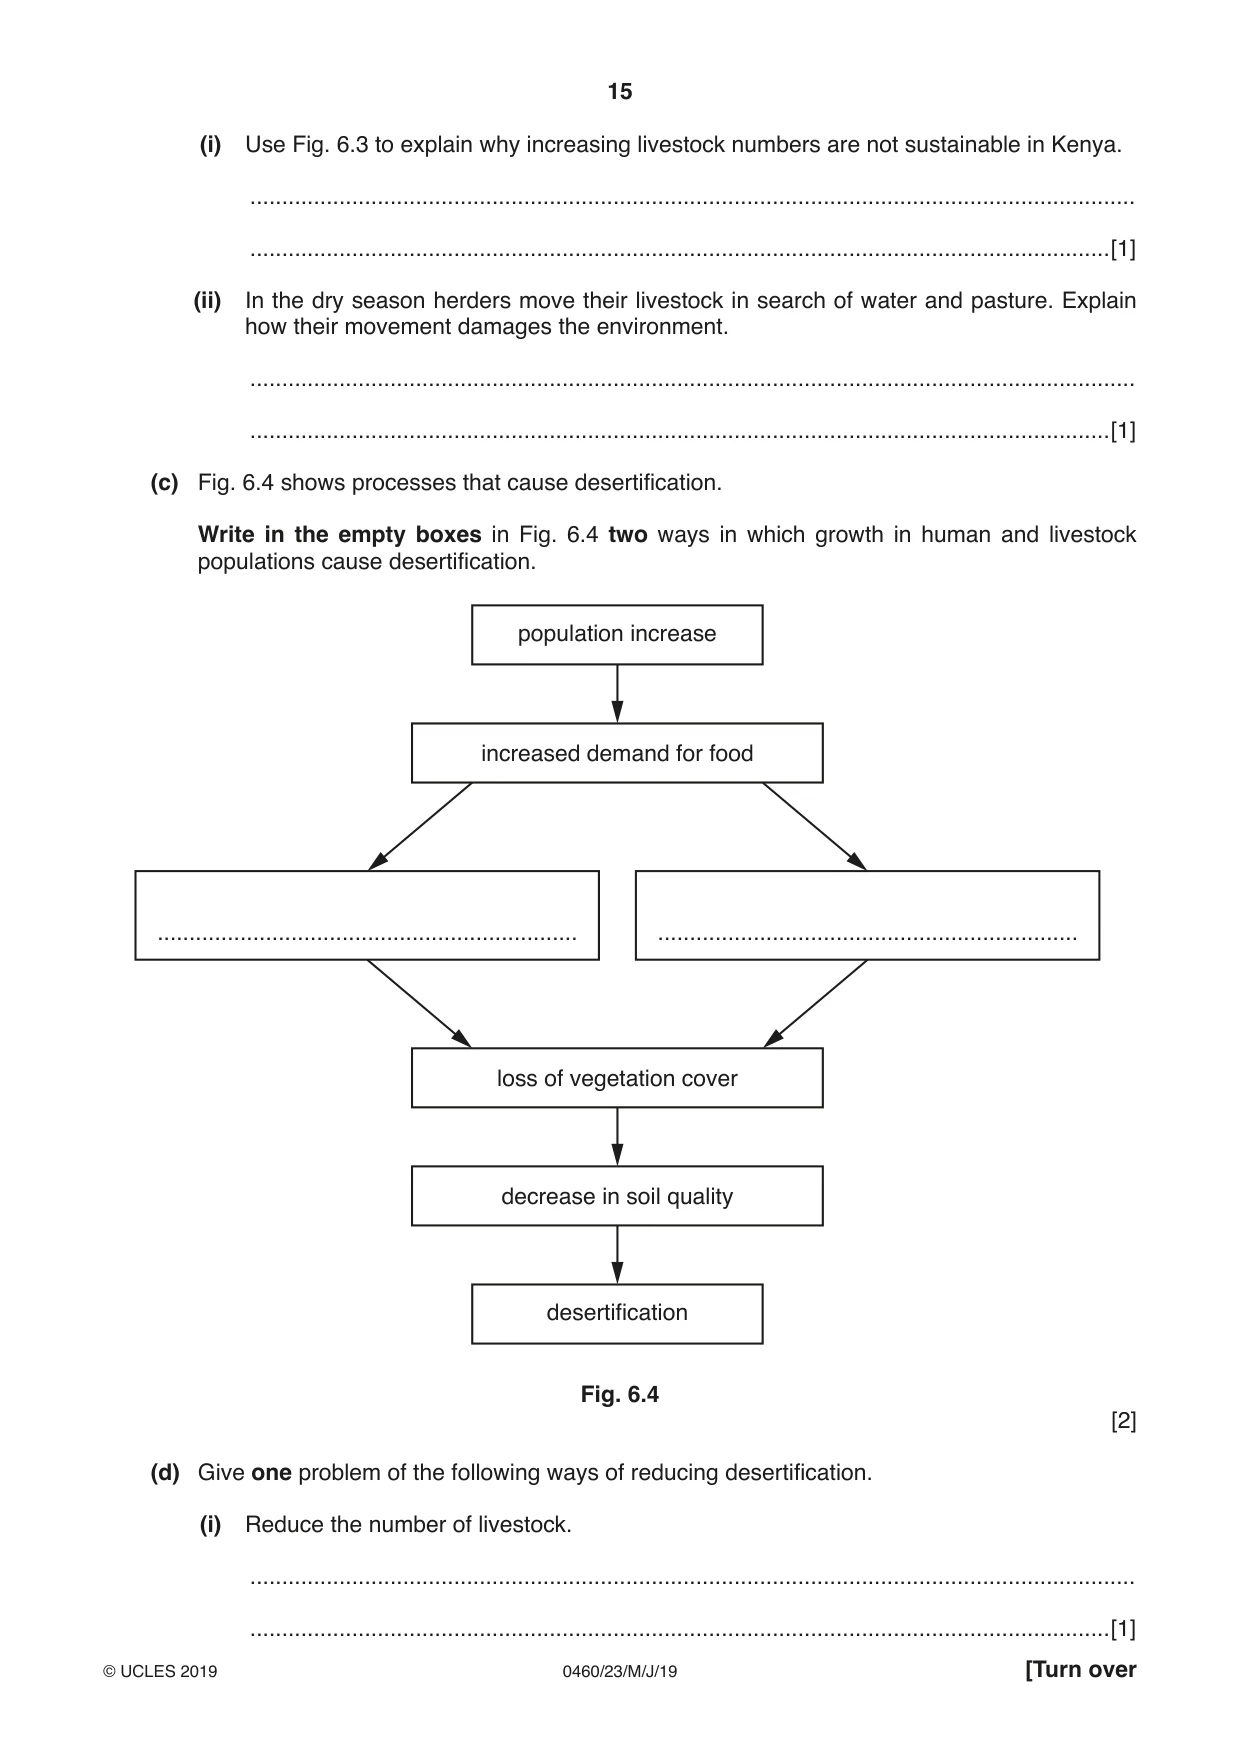
6 (a) Figs. 6.1 and 6.2 show the human and livestock populations of Kenya from 1995 to 2015. 70 60 60 50 50 (millions) 40 40 (millions) 30 30 population 20 livestock 20 human 10 10 0 0 1995 2000 2005 2010 2015 1995 2000 2005 2010 2015 year year Fig. 6.1 Fig. 6.2 Describe two differences between the growth of the human and livestock populations in Kenya between 1995 and 2015. 1 ................................................................................................................................................ ................................................................................................................................................... 2 ................................................................................................................................................ ...............................................................................................................................................[2] (b) Fig. 6.3 shows the natural vegetation of Kenya. The annual rainfall decreases from more than 2000 mm in the south west to 250 mm in the north east of the country and large areas of it are affected by desertification. South Ethiopia Key Sudan natural vegetation Somalia Uganda sparse grass and scrub grassland that dies down Indian in the dry season Ocean N tropical rainforest 0 400 Tanzania international boundary km Fig. 6.3 (i) Use Fig. 6.3 to explain why increasing livestock numbers are not sustainable in Kenya. ........................................................................................................................................... .......................................................................................................................................[1] (ii) In the dry season herders move their livestock in search of water and pasture. Explain how their movement damages the environment. ........................................................................................................................................... .......................................................................................................................................[1] (c) Fig. 6.4 shows processes that cause desertification. Write in the empty boxes in Fig. 6.4 two ways in which growth in human and livestock populations cause desertification. population increase increased demand for food .................................................................. .................................................................. loss of vegetation cover decrease in soil quality desertification Fig. 6.4 [2] (d) Give one problem of the following ways of reducing desertification. (i) Reduce the number of livestock. ........................................................................................................................................... .......................................................................................................................................[1] (ii) Use oil or gas in stoves instead of wood or charcoal. ........................................................................................................................................... .......................................................................................................................................[1] [Total: 8]
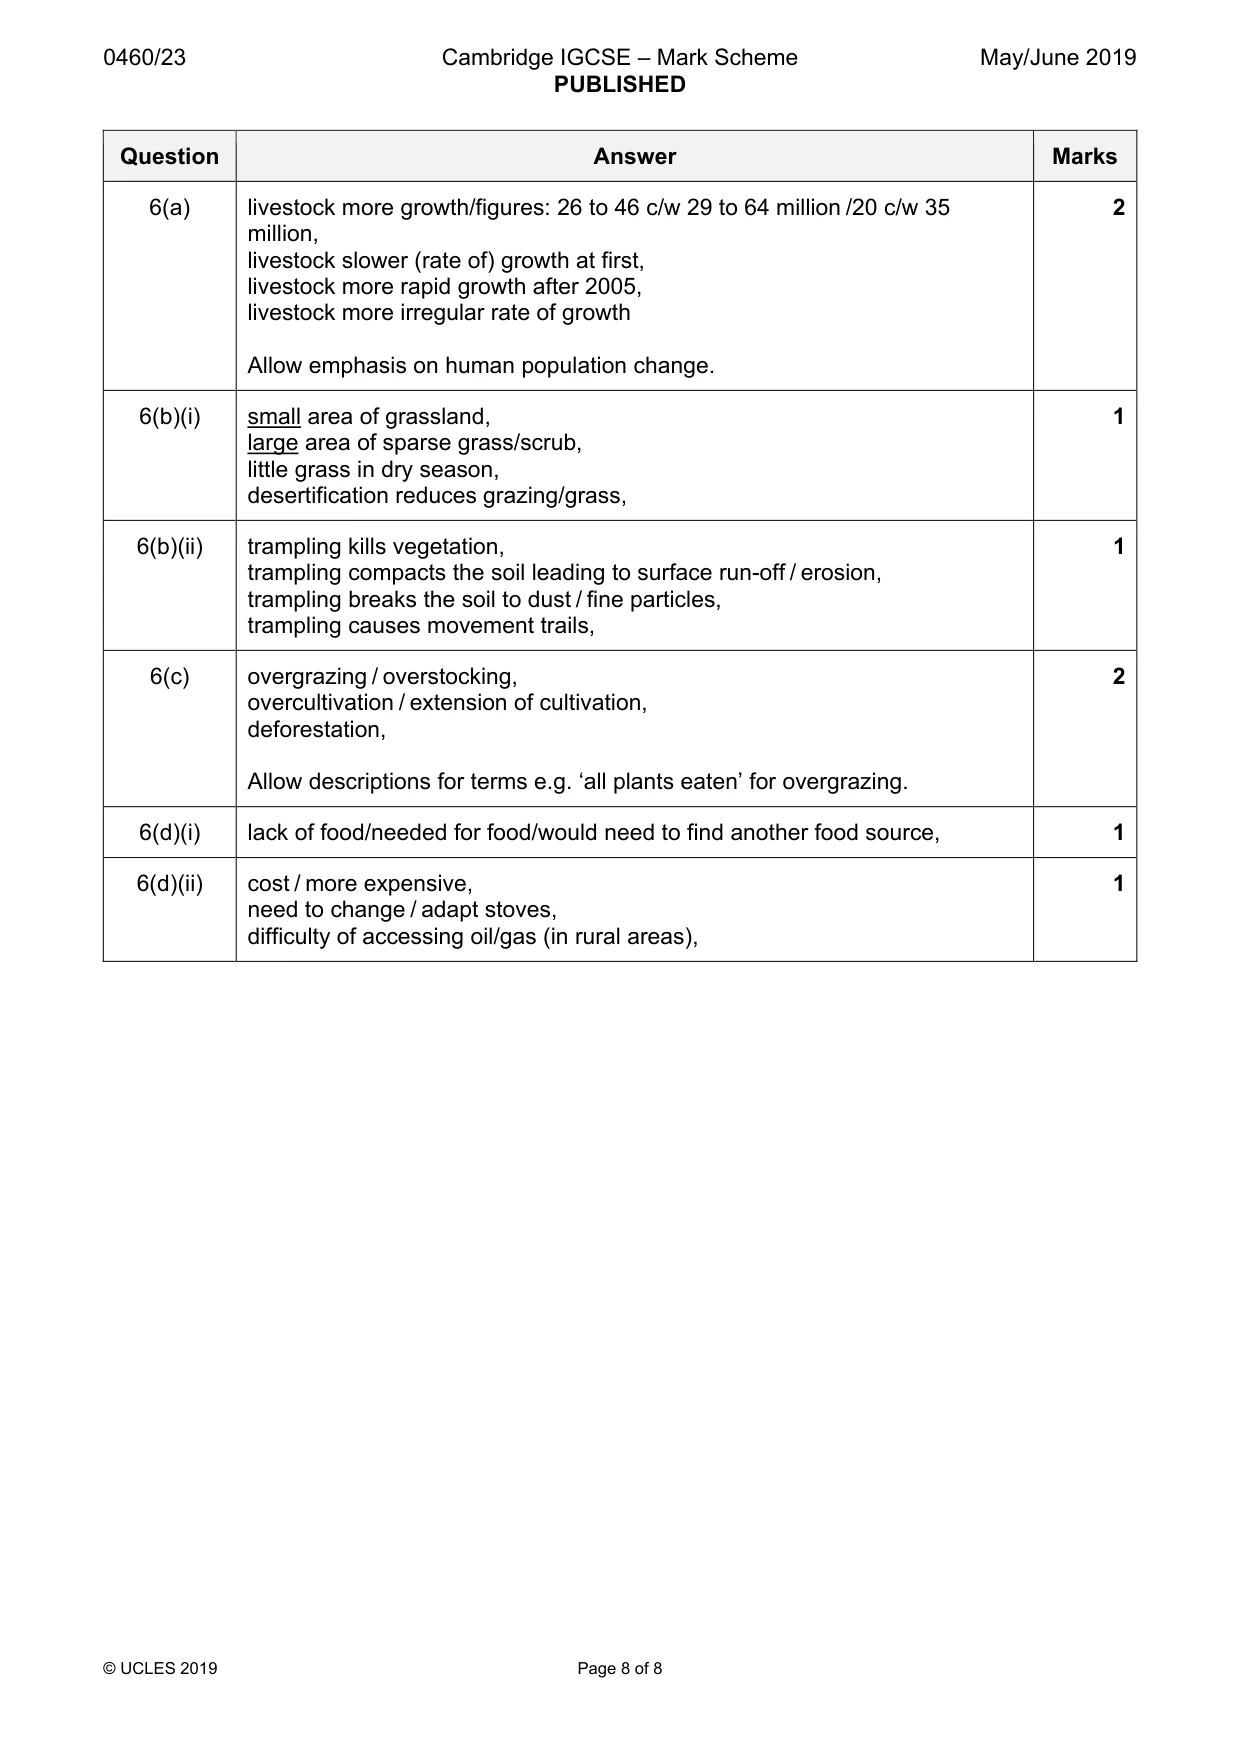
Mark scheme: 6(a) livestock more growth/figures: 26 to 46 c/w 29 to 64 million /20 c/w 35 2 million, livestock slower (rate of) growth at first, livestock more rapid growth after 2005, livestock more irregular rate of growth Allow emphasis on human population change. 6(b)(i) small area of grassland, 1 large area of sparse grass/scrub, little grass in dry season, desertification reduces grazing/grass, 6(b)(ii) trampling kills vegetation, 1 trampling compacts the soil leading to surface run-off / erosion, trampling breaks the soil to dust / fine particles, trampling causes movement trails, 6(c) overgrazing / overstocking, 2 overcultivation / extension of cultivation, deforestation, Allow descriptions for terms e.g. ‘all plants eaten’ for overgrazing. 6(d)(i) lack of food/needed for food/would need to find another food source, 1 6(d)(ii) cost / more expensive, 1 need to change / adapt stoves, difficulty of accessing oil/gas (in rural areas),
More questions on Environmental risks of economic development
What was in this paper
The subtopics covered by these 6 questions, and how many questions each got. Open one in a new tab to see every Cambridge question on it.
What you needed in this session
Cambridge’s own grade thresholds for 2019 May/June, Paper 2 · Variant 3. A higher threshold means an easier paper — the bar moves with how the cohort did.