Cambridge IGCSE Geography 0460 — 2022 Oct/Nov Paper 2 · Variant 2
0460/22/O/N/22 · 6 questions · 60 marks · ≈68 min
The question paper and its mark scheme, free to read here and free to download. This is Cambridge’s own paper, exactly as it was sat.
Question paper16 pages



Mark scheme8 pages
Answers below. Sit the paper first if you are practising.
Questions as text
Q1 · Study the map extract for Largs, Scotland
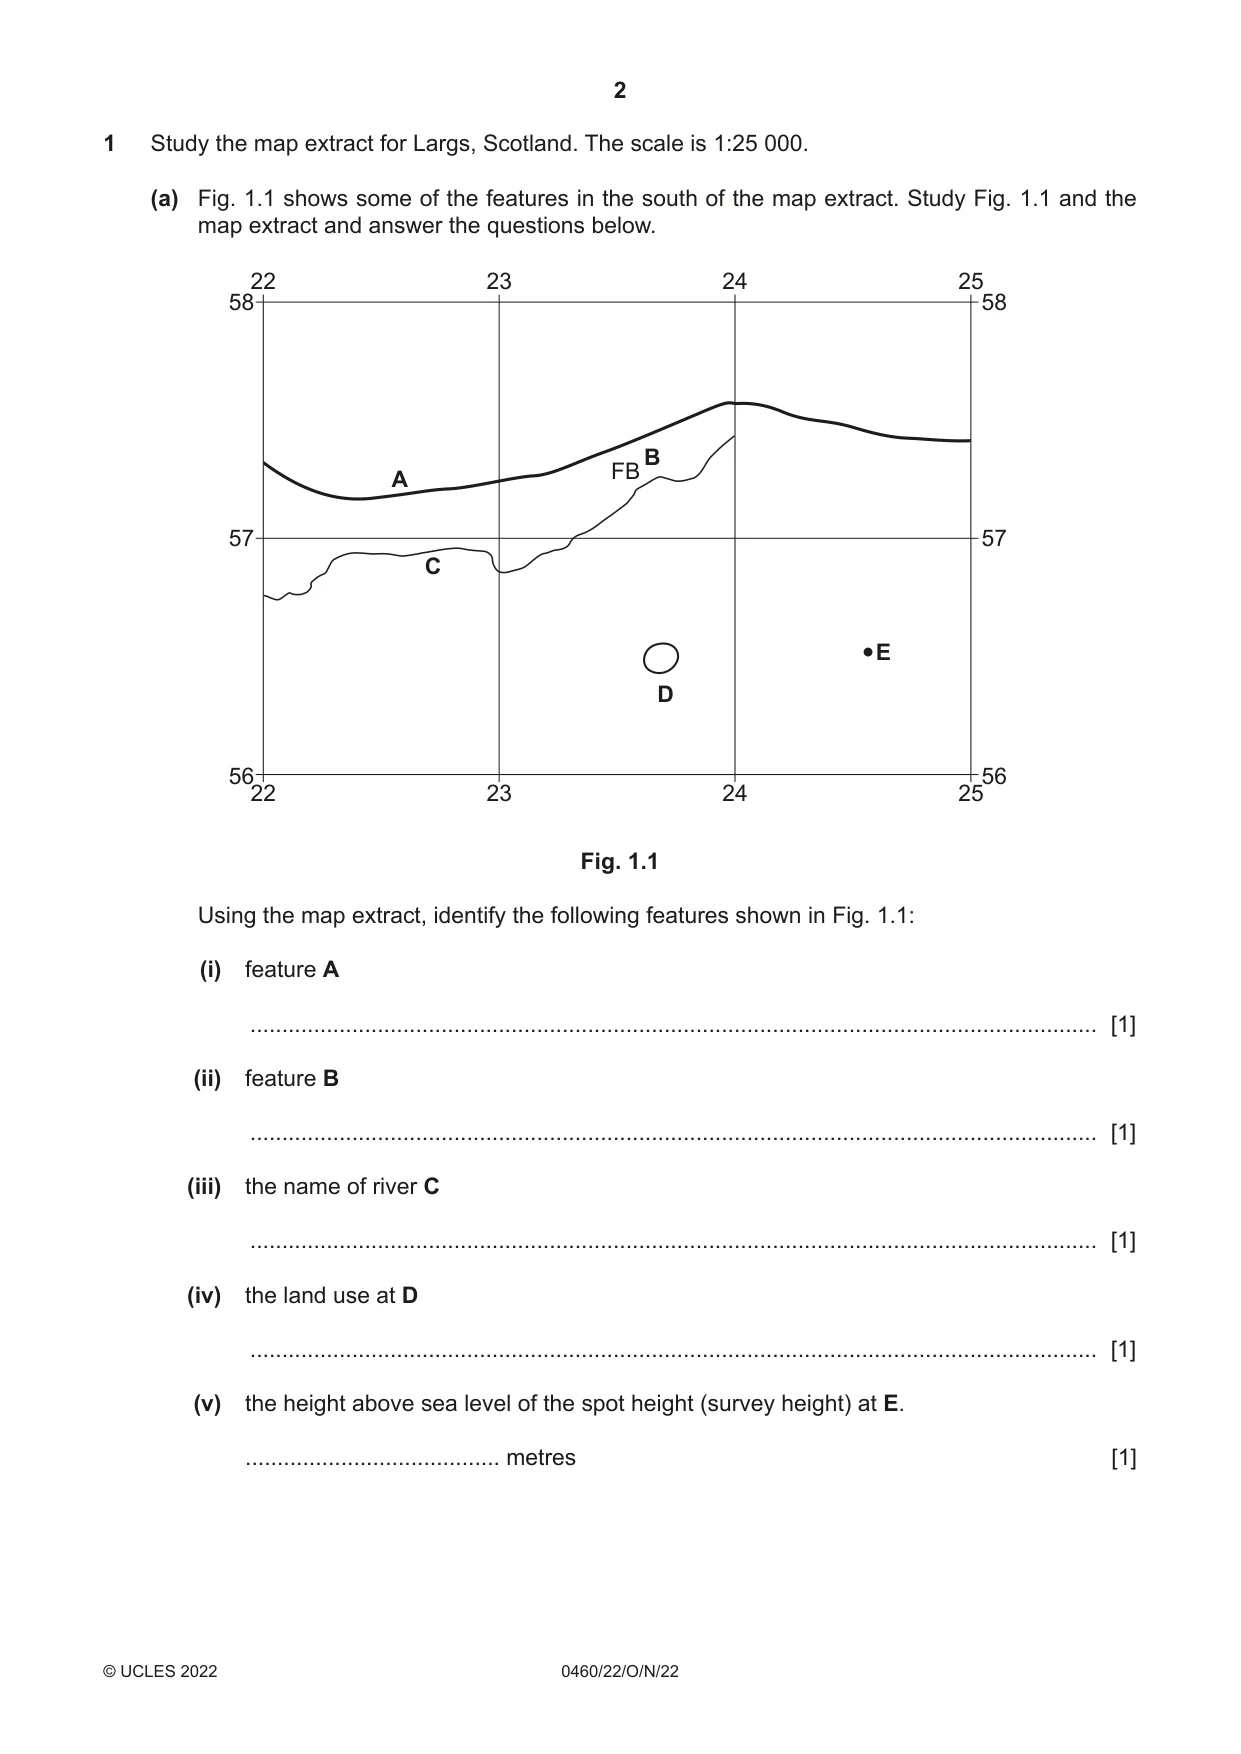
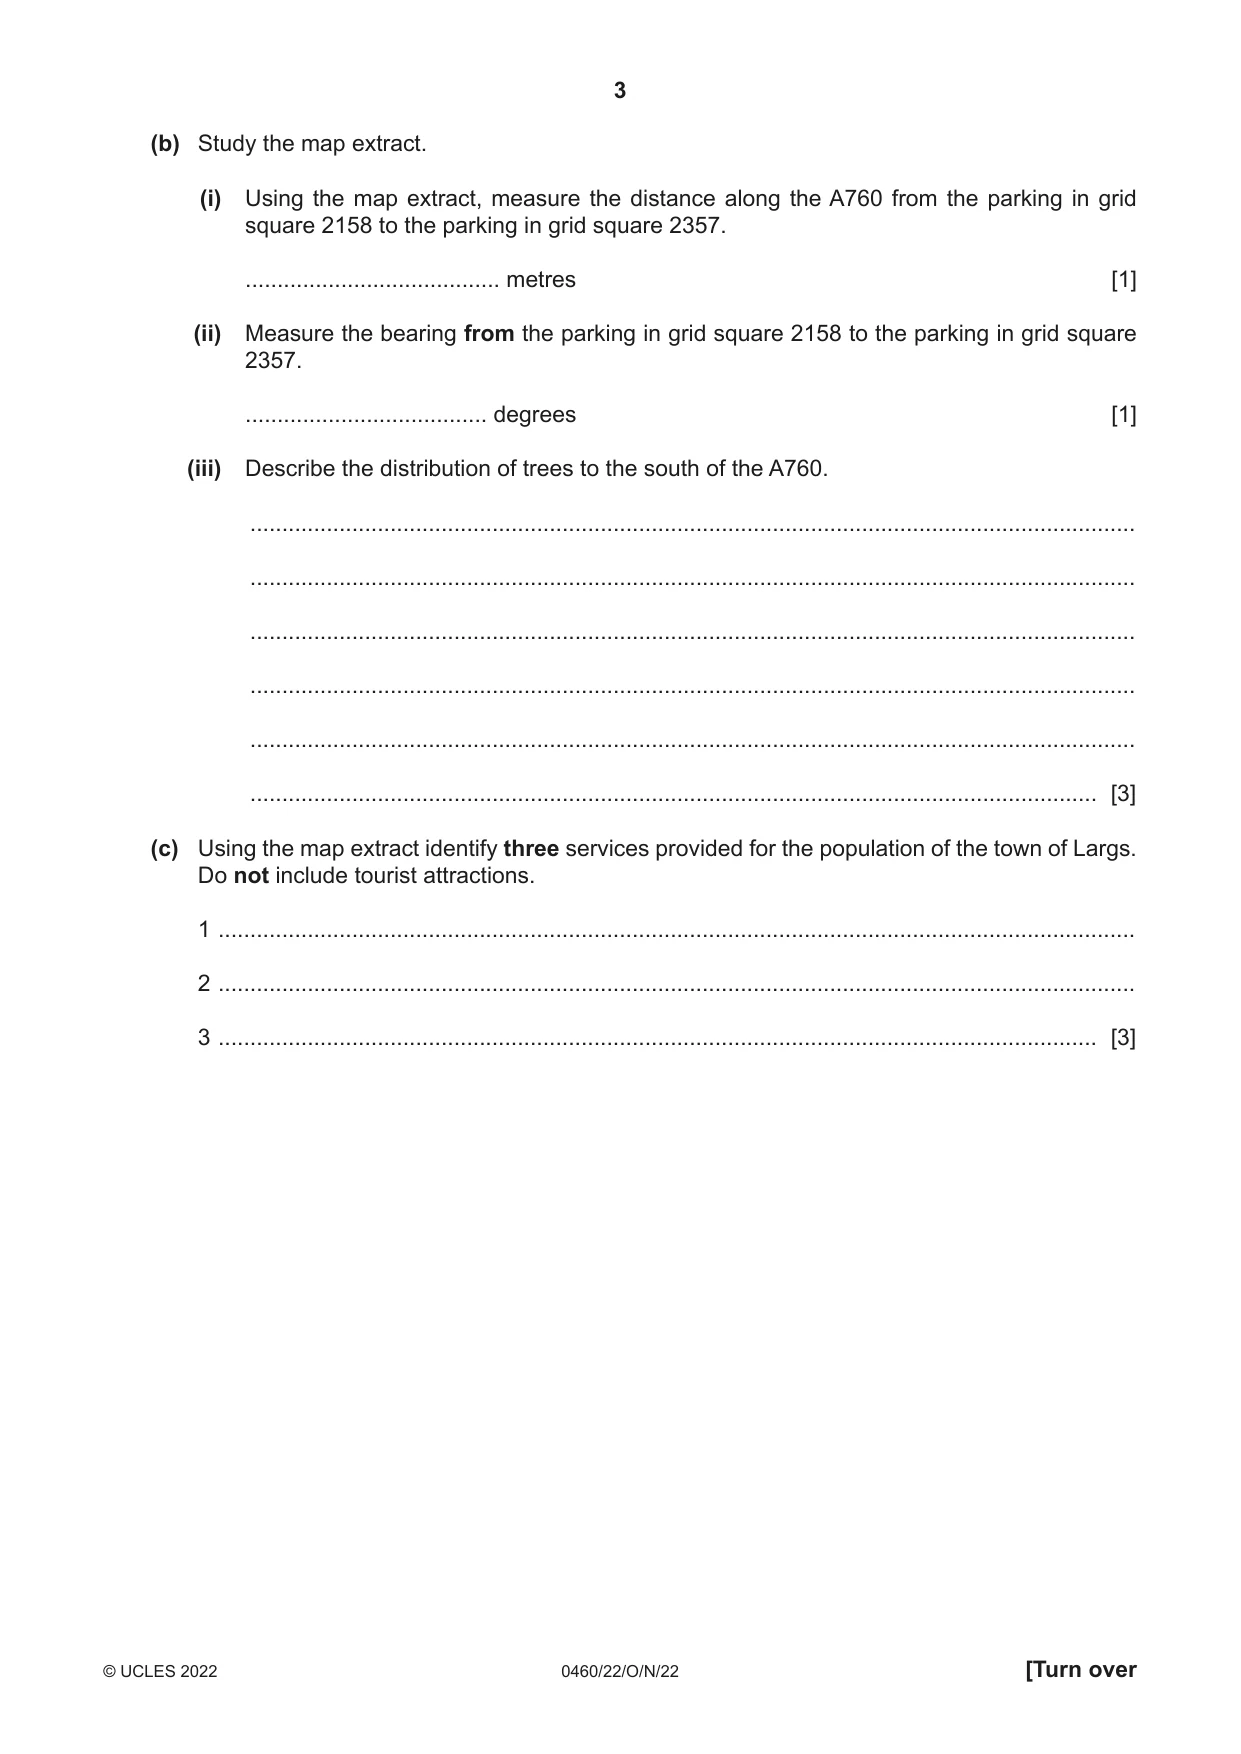
1 Study the map extract for Largs, Scotland. The scale is 1:25 000. (a) Fig. 1.1 shows some of the features in the south of the map extract. Study Fig. 1.1 and the map extract and answer the questions below. 22 23 24 25 58 58 B FB A 57 57 C E D 56 56 22 23 24 25 Fig. 1.1 Using the map extract, identify the following features shown in Fig. 1.1: (i) feature A ..................................................................................................................................... [1] (ii) feature B ..................................................................................................................................... [1] (iii) the name of river C ..................................................................................................................................... [1] (iv) the land use at D ..................................................................................................................................... [1] (v) the height above sea level of the spot height (survey height) at E. ........................................ metres [1] (b) Study the map extract. (i) Using the map extract, measure the distance along the A760 from the parking in grid square 2158 to the parking in grid square 2357. ........................................ metres [1] (ii) Measure the bearing from the parking in grid square 2158 to the parking in grid square 2357. ...................................... degrees [1] (iii) Describe the distribution of trees to the south of the A760. ........................................................................................................................................... ........................................................................................................................................... ........................................................................................................................................... ........................................................................................................................................... ........................................................................................................................................... ..................................................................................................................................... [3] (c) Using the map extract identify three services provided for the population of the town of Largs. Do not include tourist attractions. 1 ................................................................................................................................................ 2 ................................................................................................................................................ 3 .......................................................................................................................................... [3] (d) Find the main river, the Gogo Water, in the north of the map. Describe the physical features of the river and its valley. River ................................................................................................................................................... ................................................................................................................................................... ................................................................................................................................................... ................................................................................................................................................... ................................................................................................................................................... ................................................................................................................................................... ................................................................................................................................................... ................................................................................................................................................... Valley ................................................................................................................................................... ................................................................................................................................................... ................................................................................................................................................... ................................................................................................................................................... ................................................................................................................................................... ................................................................................................................................................... ................................................................................................................................................... ............................................................................................................................................. [7] [Total: 20] TURN PAGE FOR QUESTION 2
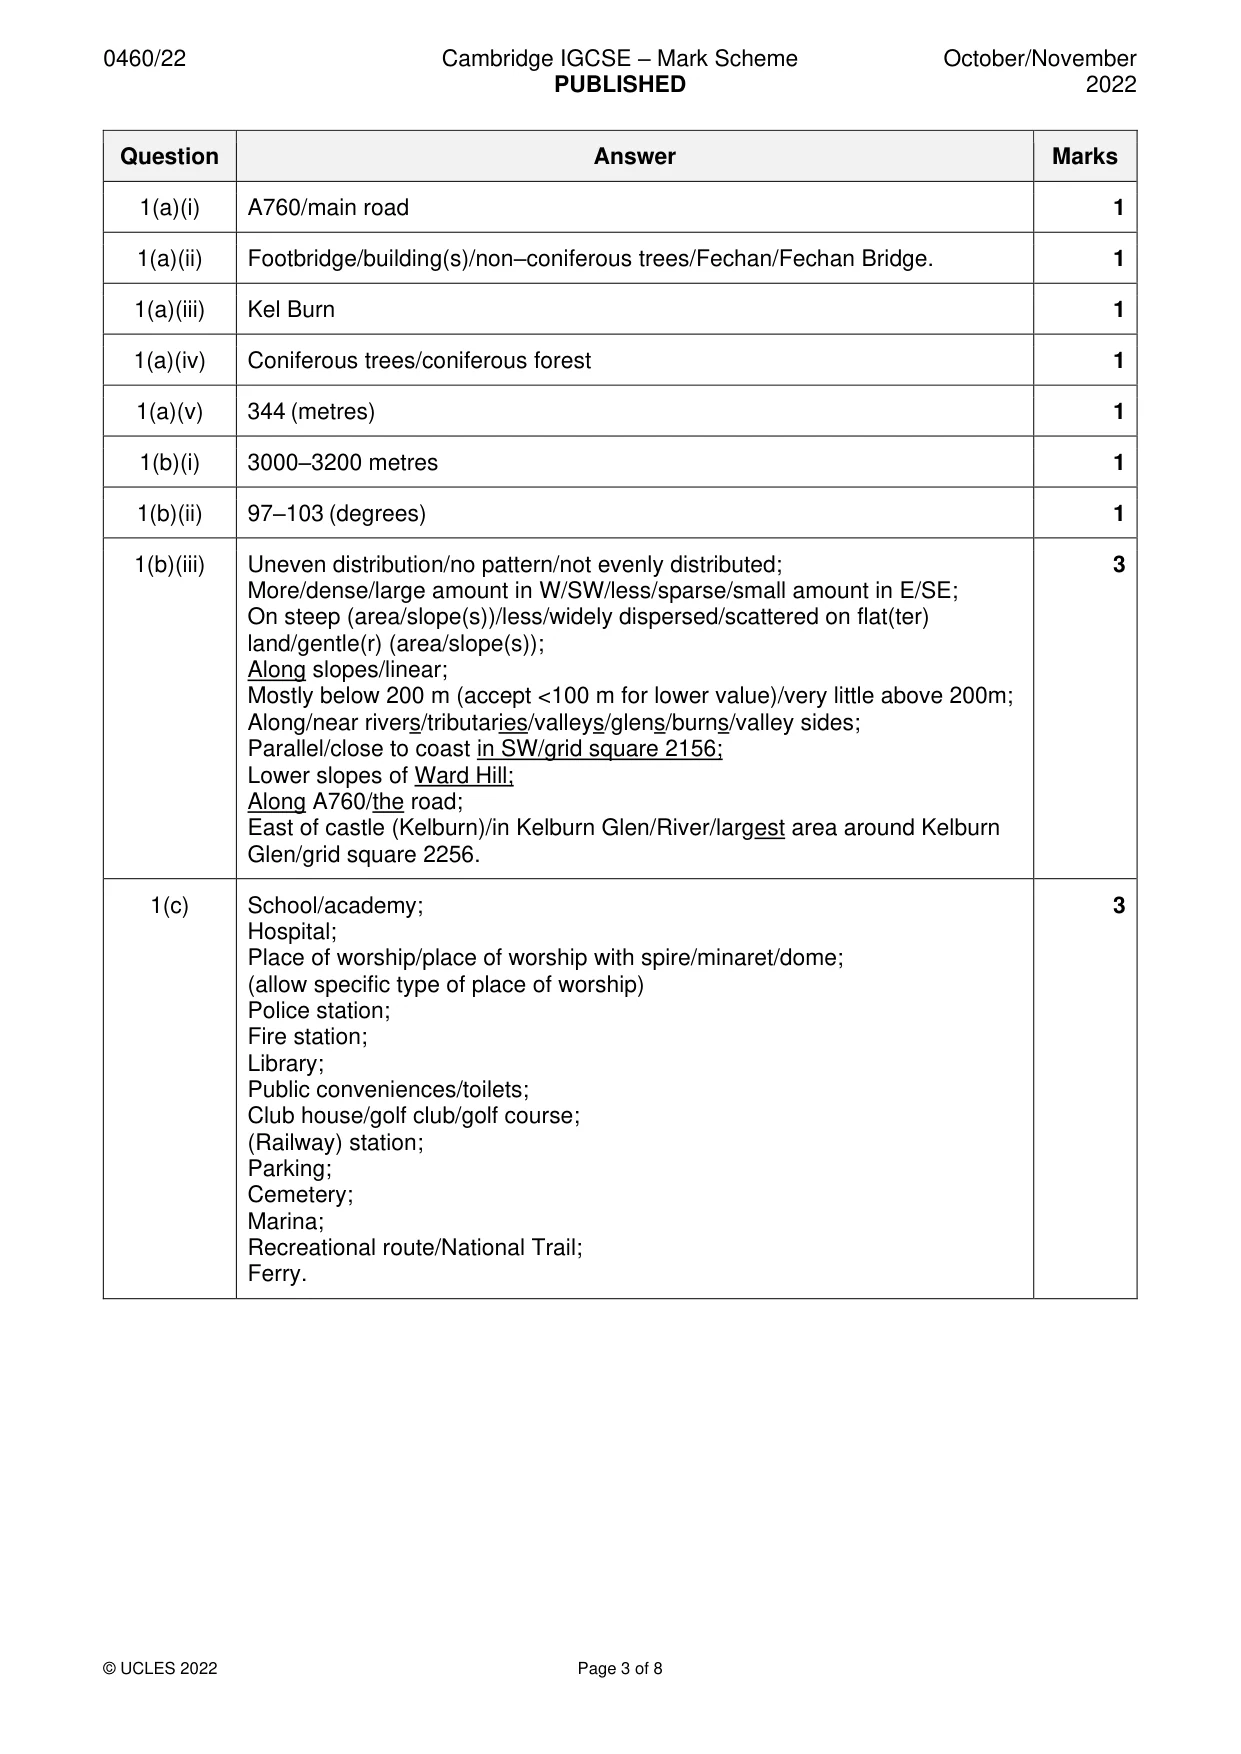
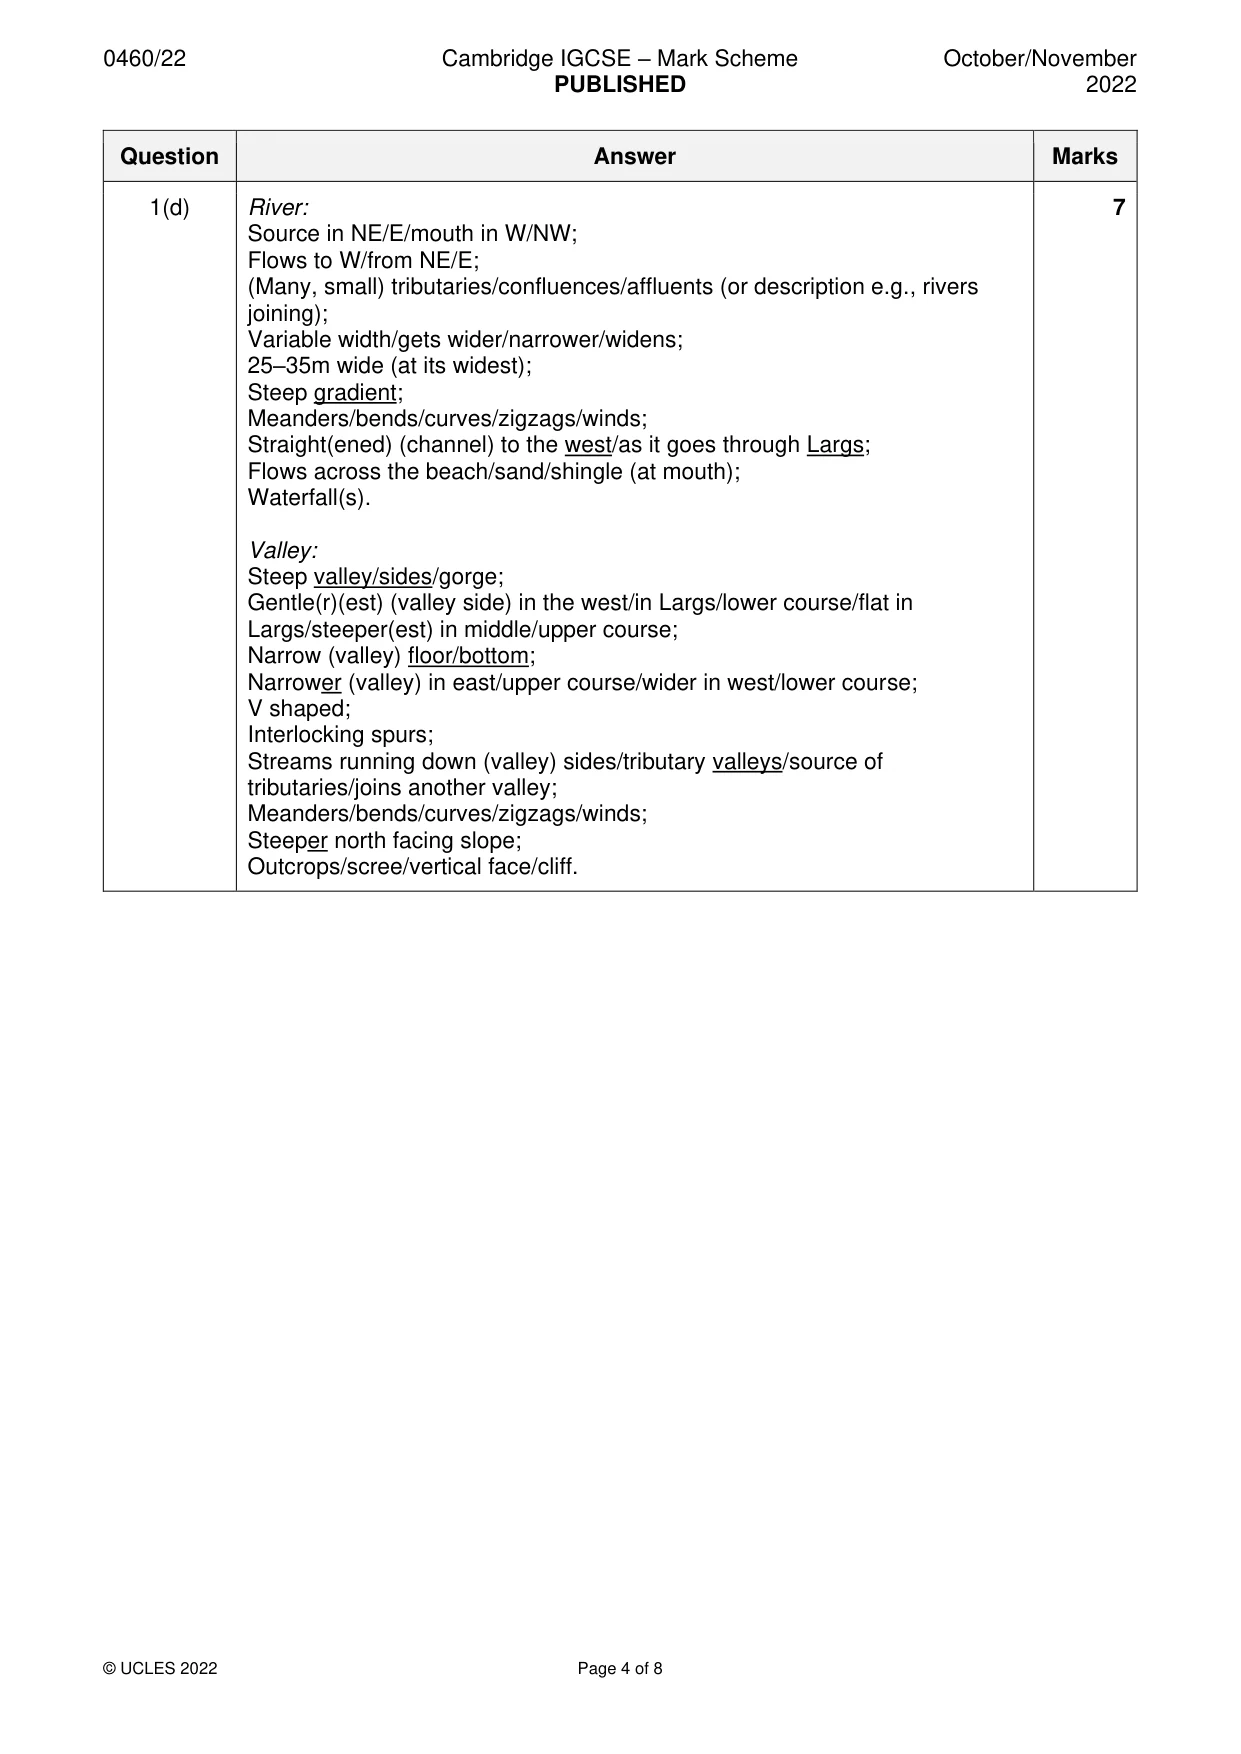
Mark scheme: Question Answer Marks 1(a)(i) A760/main road 1 1(a)(ii) Footbridge/building(s)/non–coniferous trees/Fechan/Fechan Bridge. 1 1(a)(iii) Kel Burn 1 1(a)(iv) Coniferous trees/coniferous forest 1 1(a)(v) 344 (metres) 1 1(b)(i) 3000–3200 metres 1 1(b)(ii) 97–103 (degrees) 1 1(b)(iii) Uneven distribution/no pattern/not evenly distributed; 3 More/dense/large amount in W/SW/less/sparse/small amount in E/SE; On steep (area/slope(s))/less/widely dispersed/scattered on flat(ter) land/gentle(r) (area/slope(s)); Along slopes/linear; Mostly below 200 m (accept <100 m for lower value)/very little above 200m; Along/near rivers/tributaries/valleys/glens/burns/valley sides; Parallel/close to coast in SW/grid square 2156; Lower slopes of Ward Hill; Along A760/the road; East of castle (Kelburn)/in Kelburn Glen/River/largest area around Kelburn Glen/grid square 2256. 1(c) School/academy; 3 Hospital; Place of worship/place of worship with spire/minaret/dome; (allow specific type of place of worship) Police station; Fire station; Library; Public conveniences/toilets; Club house/golf club/golf course; (Railway) station; Parking; Cemetery; Marina; Recreational route/National Trail; Ferry. 1(d) River: 7 Source in NE/E/mouth in W/NW; Flows to W/from NE/E; (Many, small) tributaries/confluences/affluents (or description e.g., rivers joining); Variable width/gets wider/narrower/widens; 25–35m wide (at its widest); Steep gradient; Meanders/bends/curves/zigzags/winds; Straight(ened) (channel) to the west/as it goes through Largs; Flows across the beach/sand/shingle (at mouth); Waterfall(s). Valley: Steep valley/sides/gorge; Gentle(r)(est) (valley side) in the west/in Largs/lower course/flat in Largs/steeper(est) in middle/upper course; Narrow (valley) floor/bottom; Narrower (valley) in east/upper course/wider in west/lower course; V shaped; Interlocking spurs; Streams running down (valley) sides/tributary valleys/source of tributaries/joins another valley; Meanders/bends/curves/zigzags/winds; Steeper north facing slope; Outcrops/scree/vertical face/cliff.
Q2 · Information about global population change in 2015
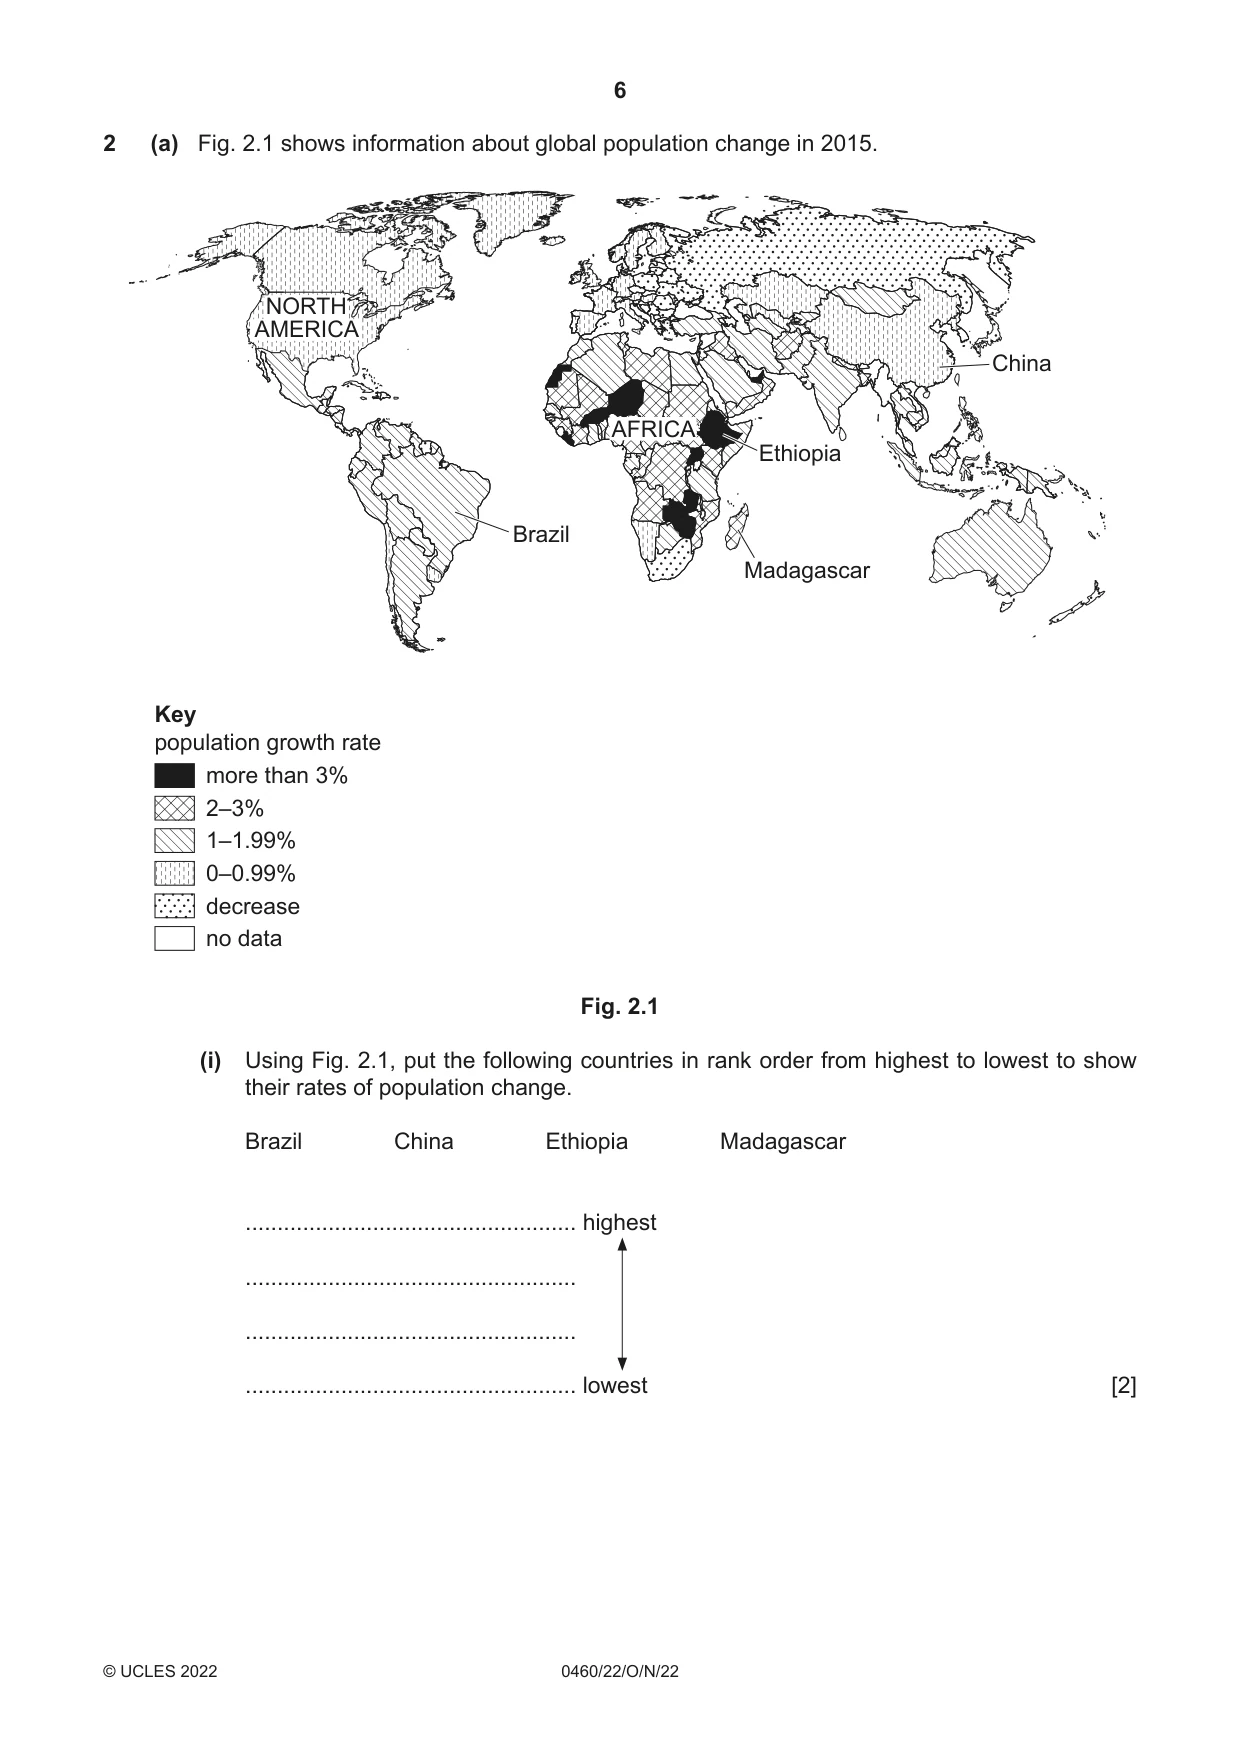
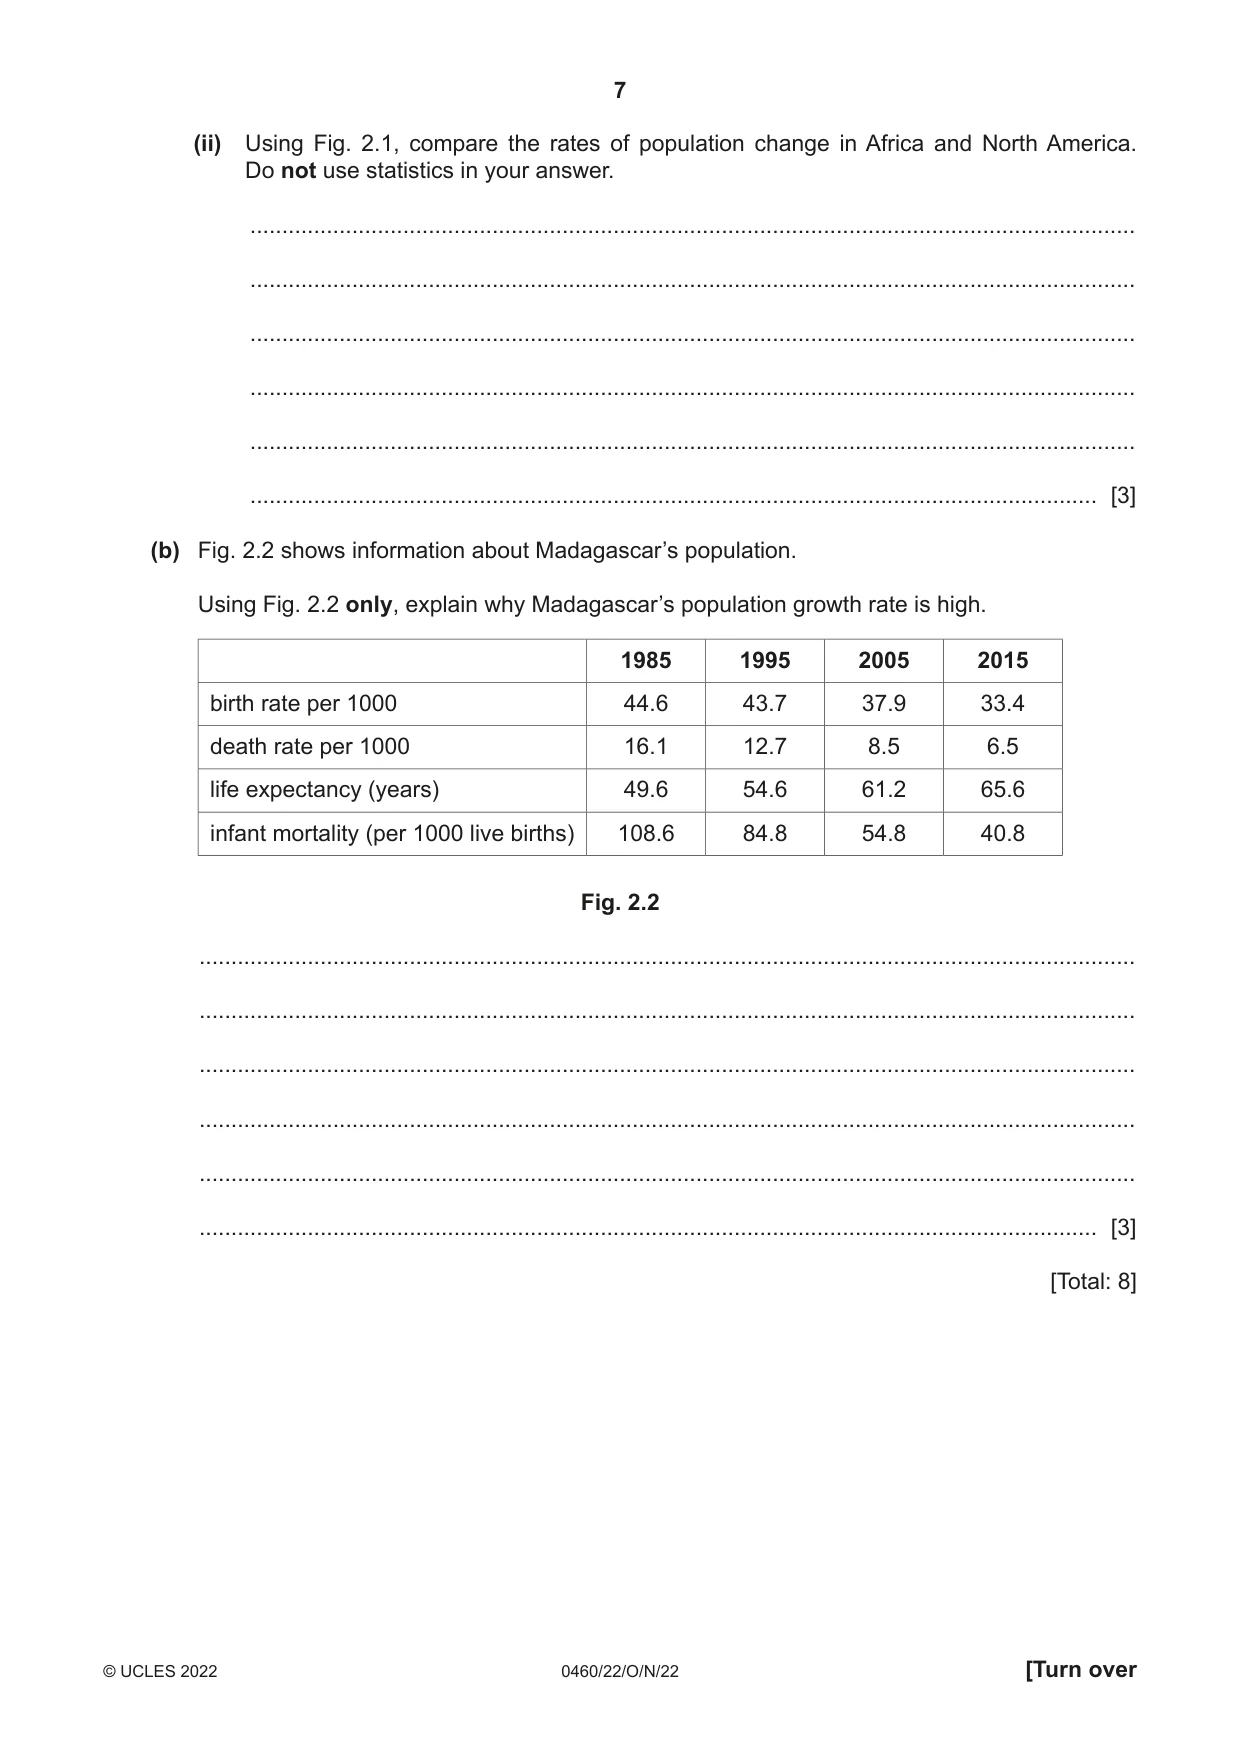
2 (a) Fig. 2.1 shows information about global population change in 2015. NORTH AMERICA China AFRICA Ethiopia Brazil Madagascar Key population growth rate more than 3% 2–3% 1–1.99% 0–0.99% decrease no data Fig. 2.1 (i) Using Fig. 2.1, put the following countries in rank order from highest to lowest to show their rates of population change. Brazil China Ethiopia Madagascar .................................................... highest .................................................... .................................................... .................................................... lowest [2] (ii) Using Fig. 2.1, compare the rates of population change in Africa and North America. Do not use statistics in your answer. ........................................................................................................................................... ........................................................................................................................................... ........................................................................................................................................... ........................................................................................................................................... ........................................................................................................................................... ..................................................................................................................................... [3] (b) Fig. 2.2 shows information about Madagascar’s population. Using Fig. 2.2 only, explain why Madagascar’s population growth rate is high. 1985 1995 2005 2015 birth rate per 1000 44.6 43.7 37.9 33.4 death rate per 1000 16.1 12.7 8.5 6.5 life expectancy (years) 49.6 54.6 61.2 65.6 infant mortality (per 1000 live births) 108.6 84.8 54.8 40.8 Fig. 2.2 ................................................................................................................................................... ................................................................................................................................................... ................................................................................................................................................... ................................................................................................................................................... ................................................................................................................................................... ............................................................................................................................................. [3] [Total: 8]
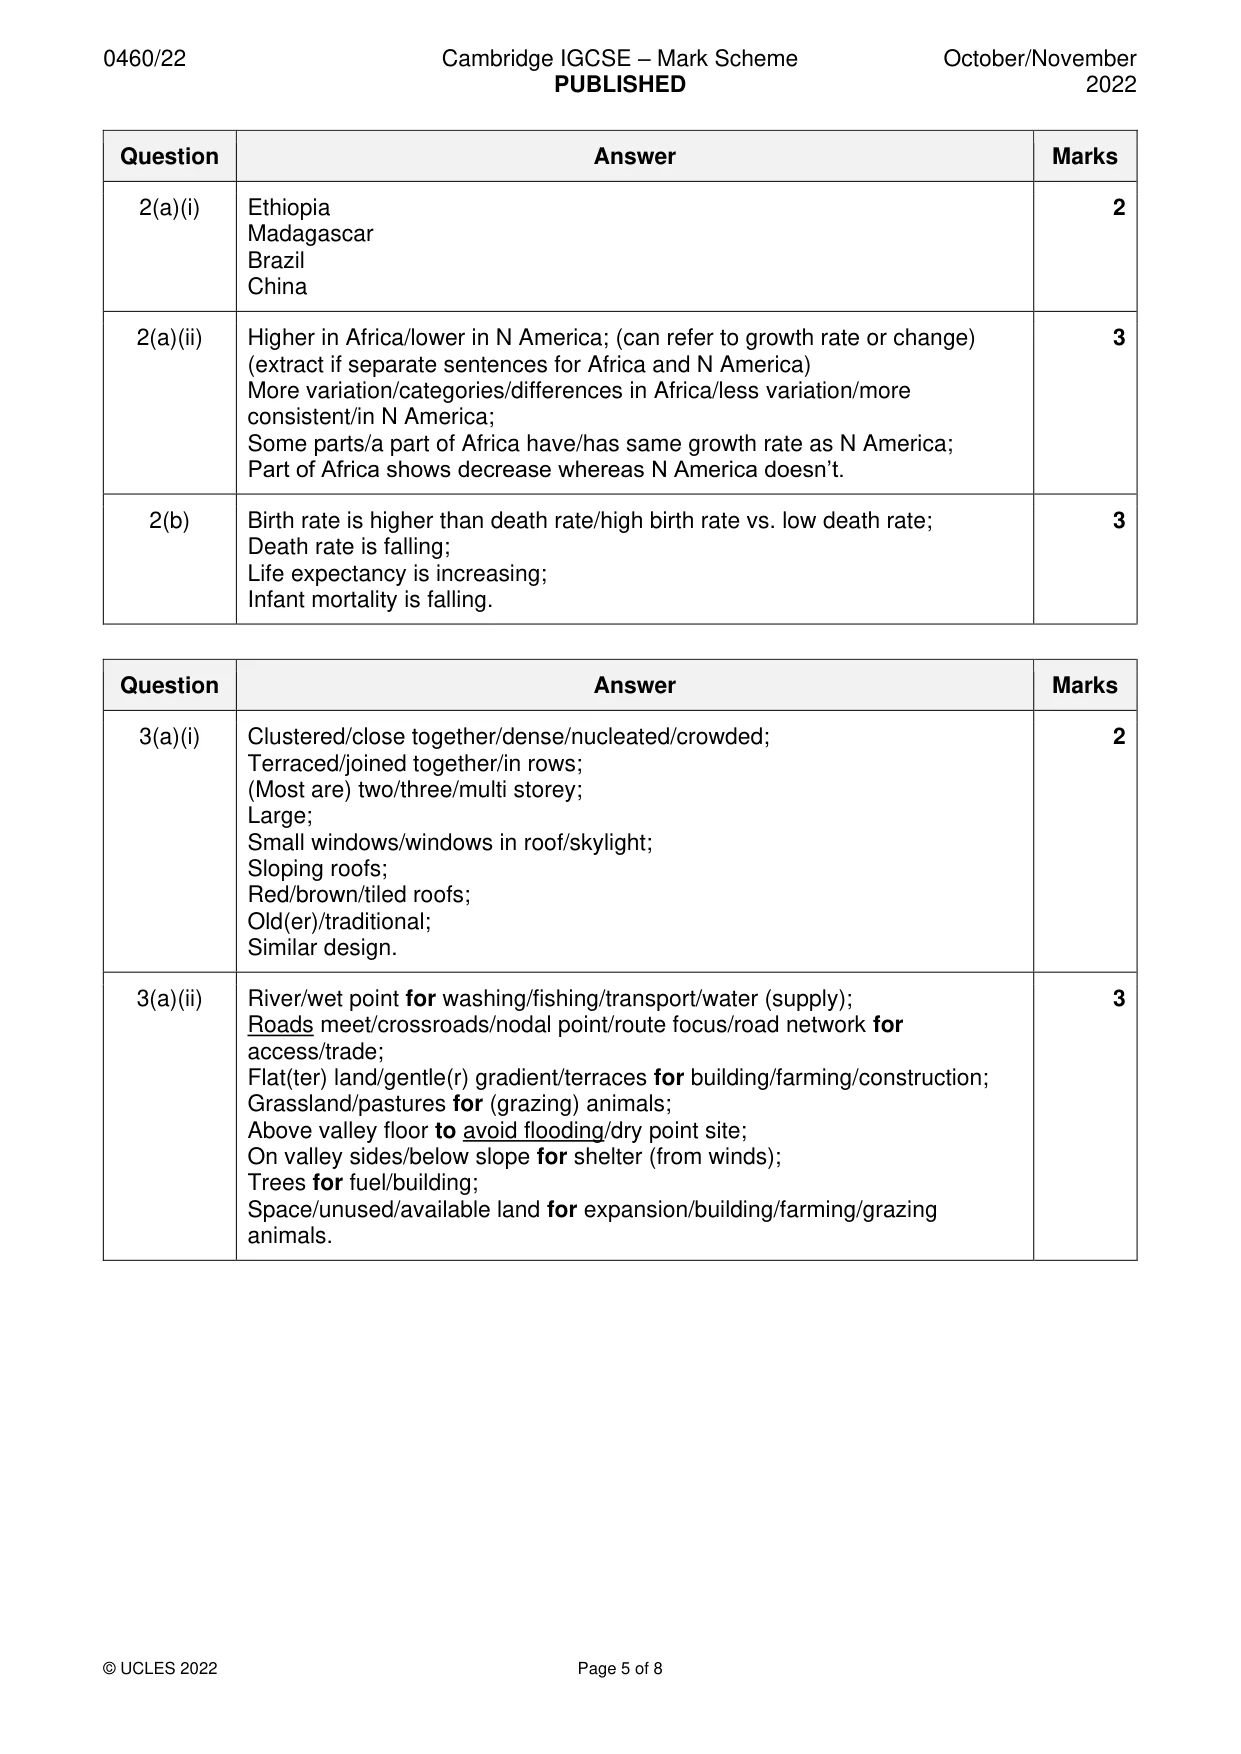
Mark scheme: 2(a)(i) Ethiopia 2 Madagascar Brazil China 2(a)(ii) Higher in Africa/lower in N America; (can refer to growth rate or change) 3 (extract if separate sentences for Africa and N America) More variation/categories/differences in Africa/less variation/more consistent/in N America; Some parts/a part of Africa have/has same growth rate as N America; Part of Africa shows decrease whereas N America doesn’t. 2(b) Birth rate is higher than death rate/high birth rate vs. low death rate; 3 Death rate is falling; Life expectancy is increasing; Infant mortality is falling.
Question 3
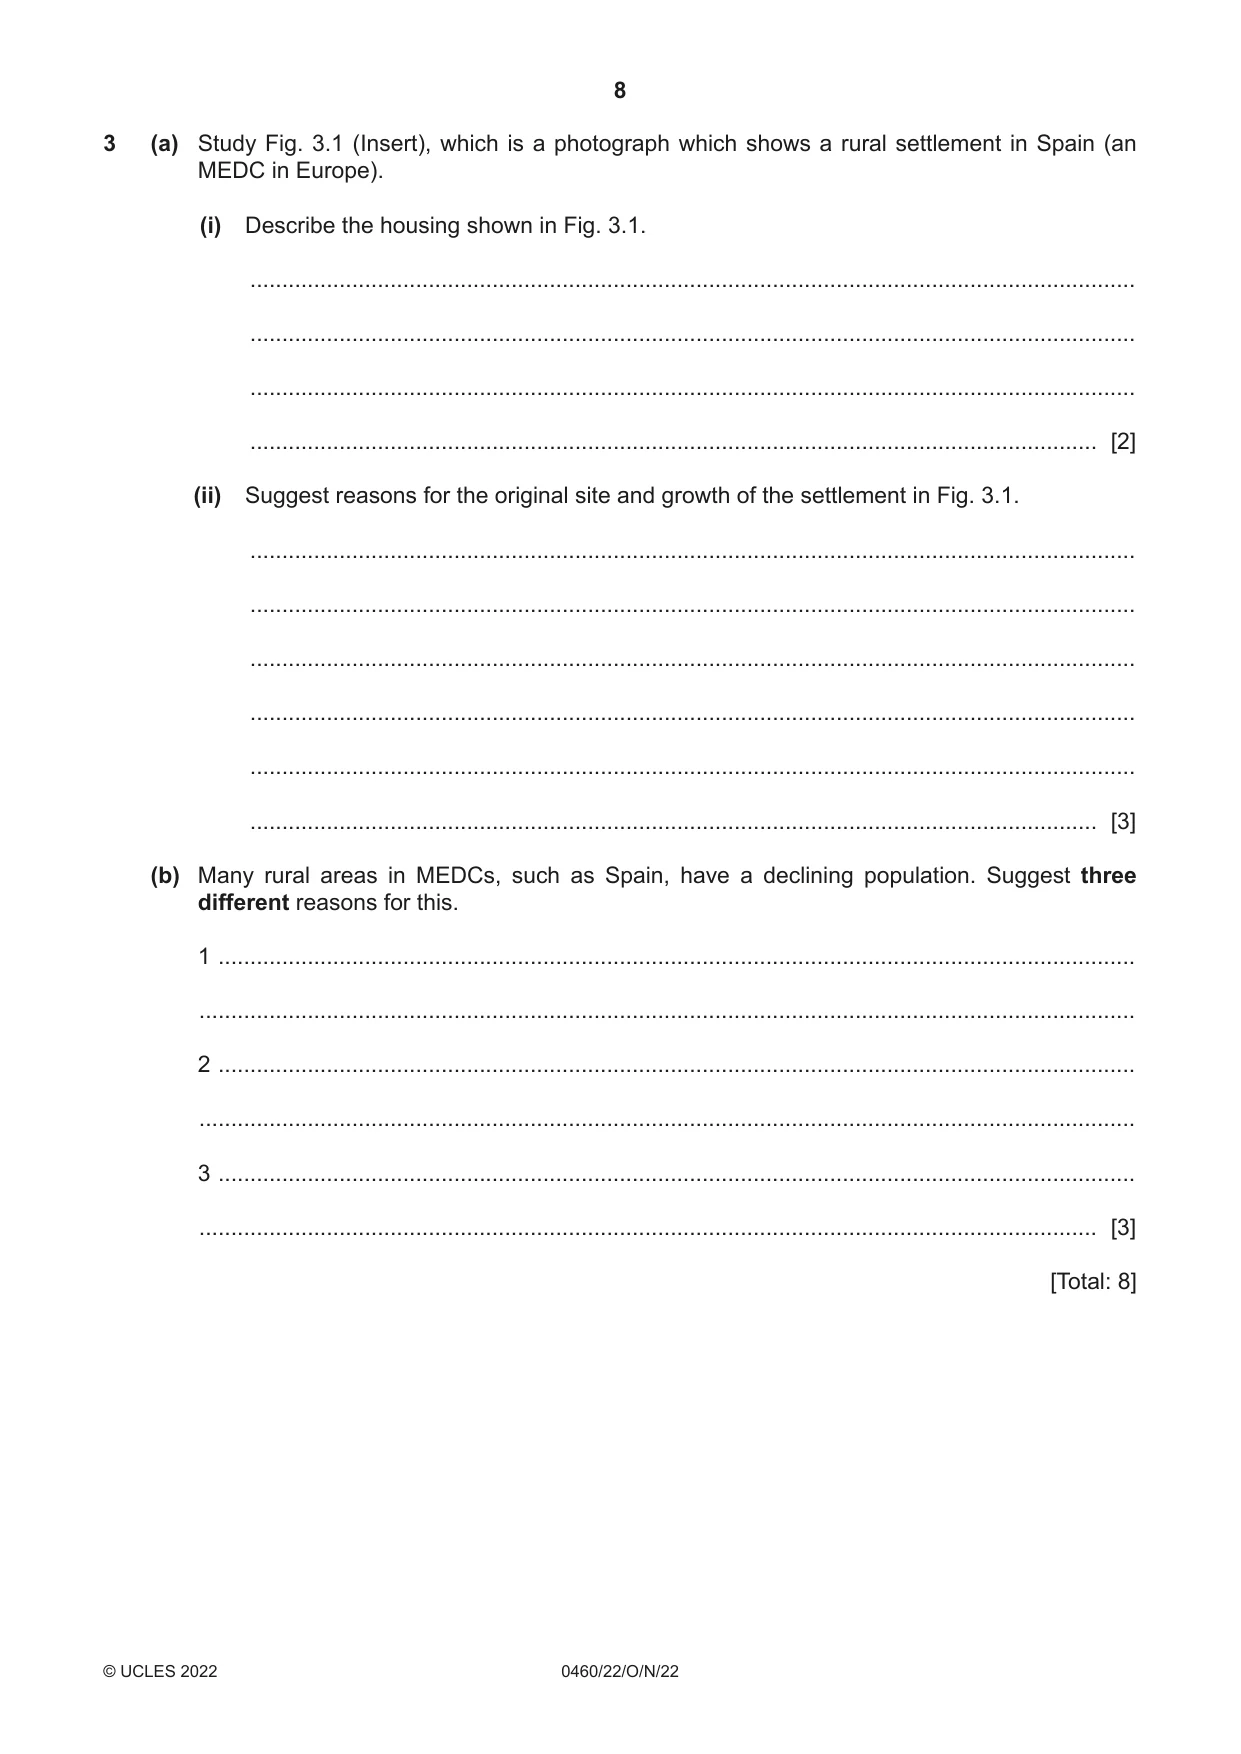
3 (a) Study Fig. 3.1 (Insert), which is a photograph which shows a rural settlement in Spain (an MEDC in Europe). (i) Describe the housing shown in Fig. 3.1. ........................................................................................................................................... ........................................................................................................................................... ........................................................................................................................................... ..................................................................................................................................... [2] (ii) Suggest reasons for the original site and growth of the settlement in Fig. 3.1. ........................................................................................................................................... ........................................................................................................................................... ........................................................................................................................................... ........................................................................................................................................... ........................................................................................................................................... ..................................................................................................................................... [3] (b) Many rural areas in MEDCs, such as Spain, have a declining population. Suggest three different reasons for this. 1 ................................................................................................................................................ ................................................................................................................................................... 2 ................................................................................................................................................ ................................................................................................................................................... 3 ................................................................................................................................................ ............................................................................................................................................. [3] [Total: 8]
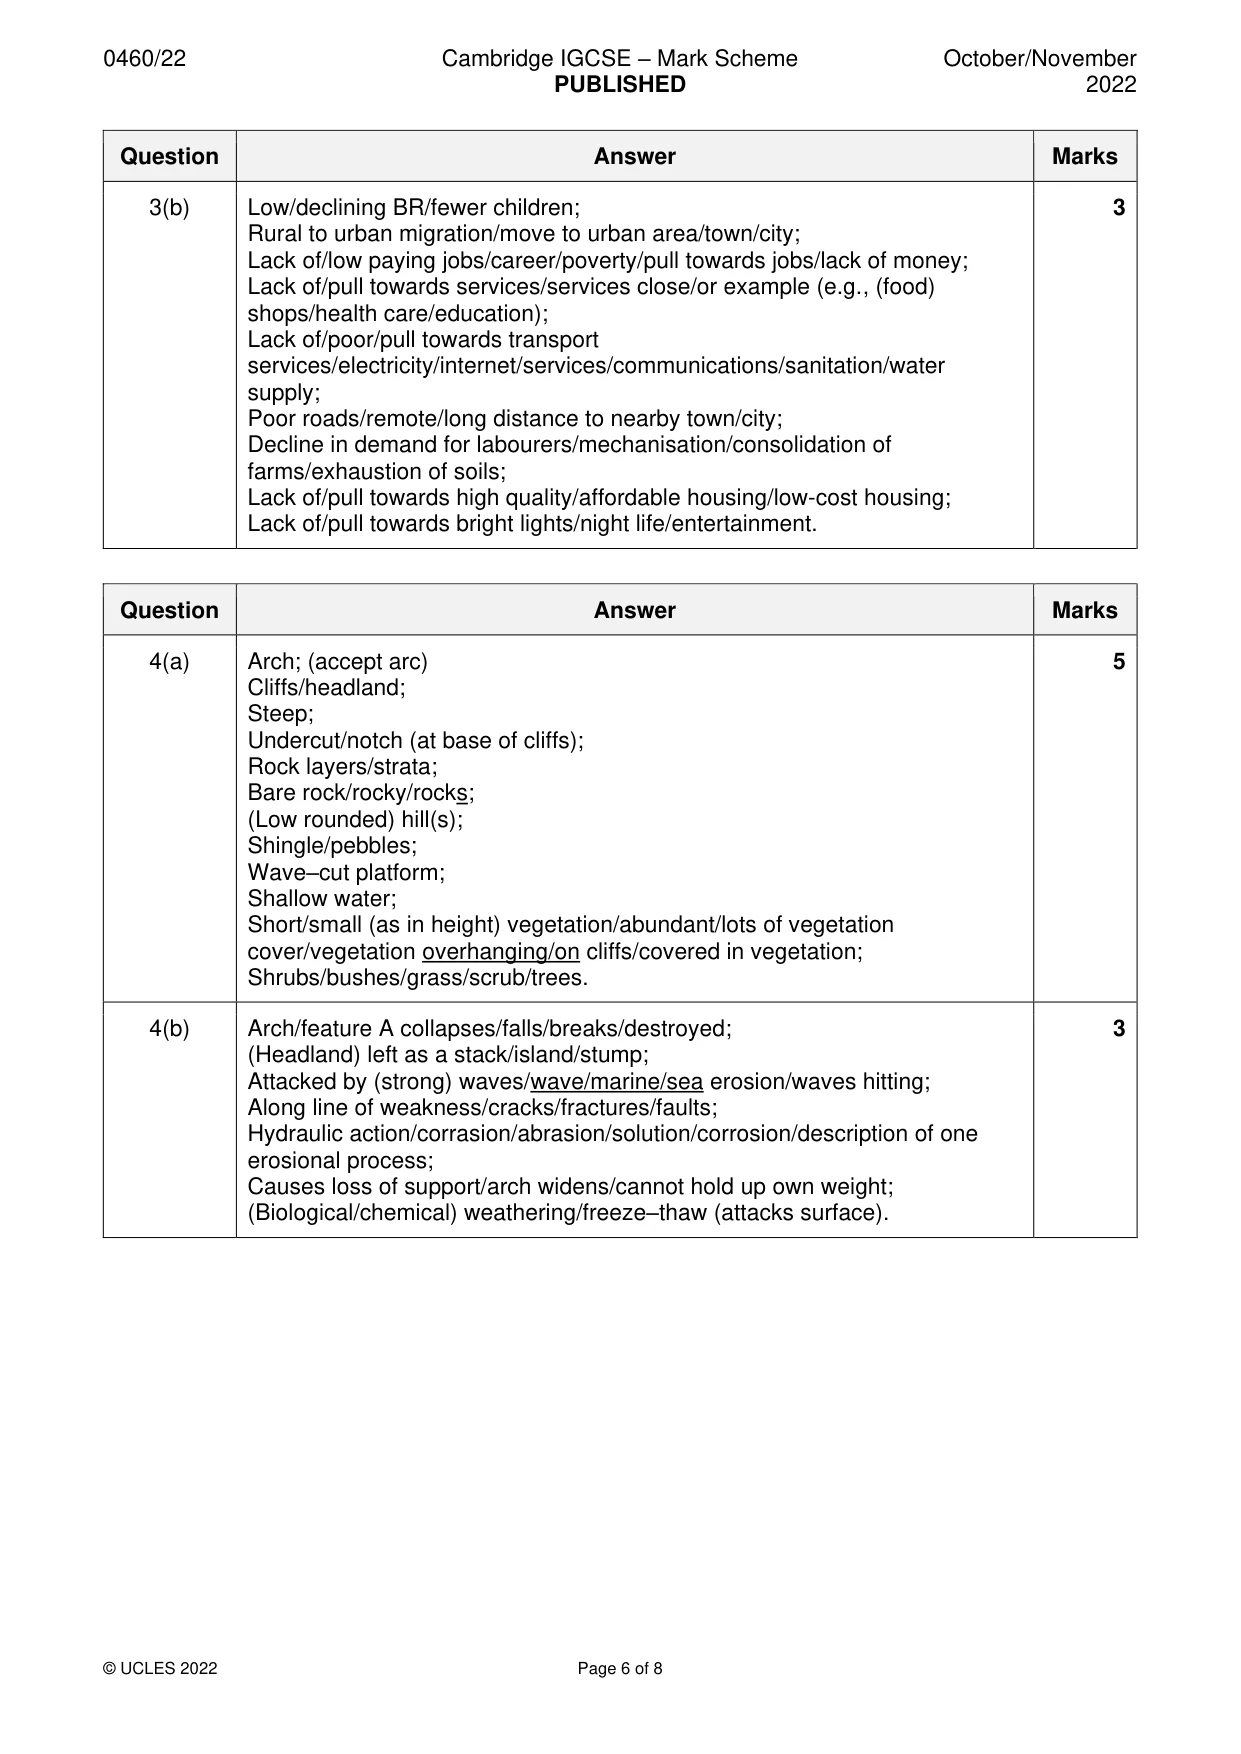
Mark scheme: 3(a)(i) Clustered/close together/dense/nucleated/crowded; 2 Terraced/joined together/in rows; (Most are) two/three/multi storey; Large; Small windows/windows in roof/skylight; Sloping roofs; Red/brown/tiled roofs; Old(er)/traditional; Similar design. 3(a)(ii) River/wet point for washing/fishing/transport/water (supply); 3 Roads meet/crossroads/nodal point/route focus/road network for access/trade; Flat(ter) land/gentle(r) gradient/terraces for building/farming/construction; Grassland/pastures for (grazing) animals; Above valley floor to avoid flooding/dry point site; On valley sides/below slope for shelter (from winds); Trees for fuel/building; Space/unused/available land for expansion/building/farming/grazing animals. 3(b) Low/declining BR/fewer children; 3 Rural to urban migration/move to urban area/town/city; Lack of/low paying jobs/career/poverty/pull towards jobs/lack of money; Lack of/pull towards services/services close/or example (e.g., (food) shops/health care/education); Lack of/poor/pull towards transport services/electricity/internet/services/communications/sanitation/water supply; Poor roads/remote/long distance to nearby town/city; Decline in demand for labourers/mechanisation/consolidation of farms/exhaustion of soils; Lack of/pull towards high quality/affordable housing/low-cost housing; Lack of/pull towards bright lights/night life/entertainment.
More questions on Settlements (rural and urban) and service provision
Question 4
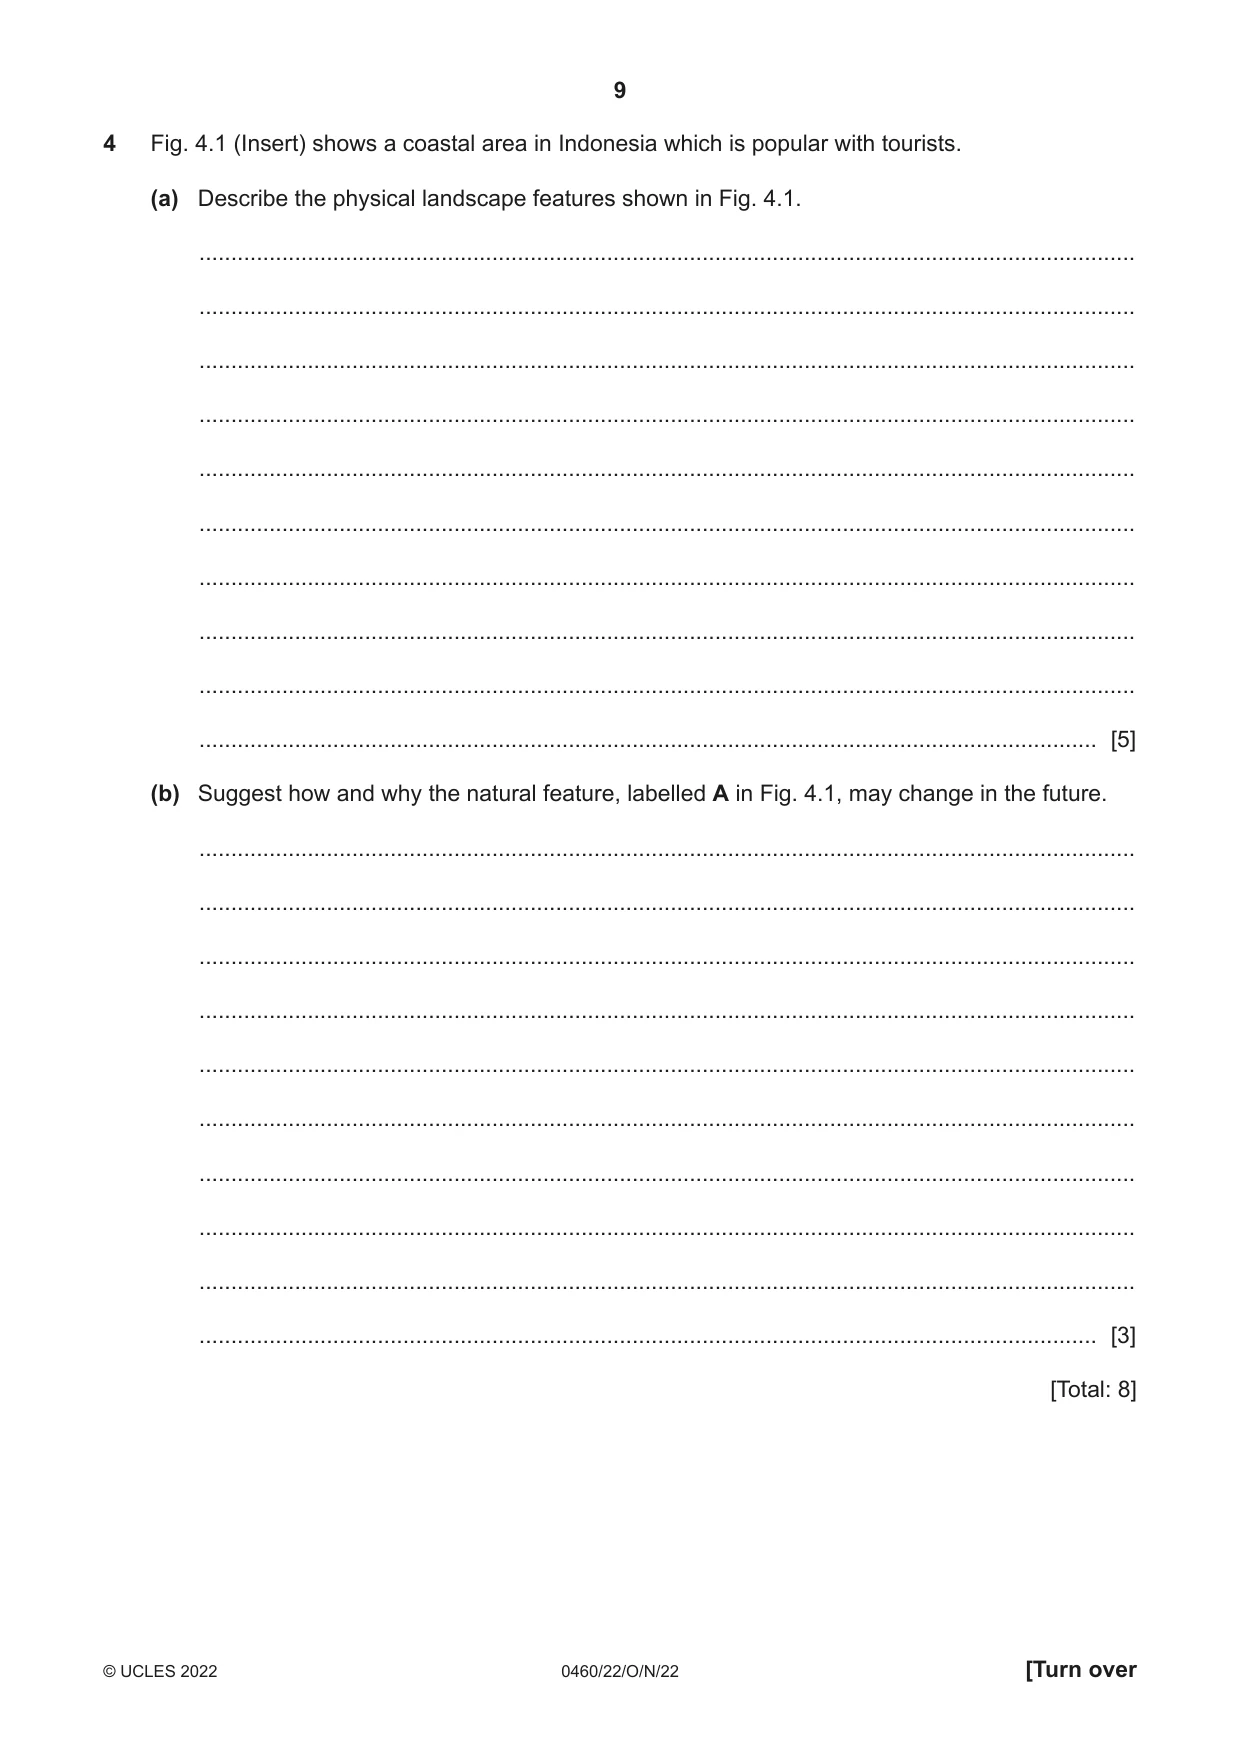
4 Fig. 4.1 (Insert) shows a coastal area in Indonesia which is popular with tourists. (a) Describe the physical landscape features shown in Fig. 4.1. ................................................................................................................................................... ................................................................................................................................................... ................................................................................................................................................... ................................................................................................................................................... ................................................................................................................................................... ................................................................................................................................................... ................................................................................................................................................... ................................................................................................................................................... ................................................................................................................................................... ............................................................................................................................................. [5] (b) Suggest how and why the natural feature, labelled A in Fig. 4.1, may change in the future. ................................................................................................................................................... ................................................................................................................................................... ................................................................................................................................................... ................................................................................................................................................... ................................................................................................................................................... ................................................................................................................................................... ................................................................................................................................................... ................................................................................................................................................... ................................................................................................................................................... ............................................................................................................................................. [3] [Total: 8]
Mark scheme: 4(a) Arch; (accept arc) 5 Cliffs/headland; Steep; Undercut/notch (at base of cliffs); Rock layers/strata; Bare rock/rocky/rocks; (Low rounded) hill(s); Shingle/pebbles; Wave–cut platform; Shallow water; Short/small (as in height) vegetation/abundant/lots of vegetation cover/vegetation overhanging/on cliffs/covered in vegetation; Shrubs/bushes/grass/scrub/trees. 4(b) Arch/feature A collapses/falls/breaks/destroyed; 3 (Headland) left as a stack/island/stump; Attacked by (strong) waves/wave/marine/sea erosion/waves hitting; Along line of weakness/cracks/fractures/faults; Hydraulic action/corrasion/abrasion/solution/corrosion/description of one erosional process; Causes loss of support/arch widens/cannot hold up own weight; (Biological/chemical) weathering/freeze–thaw (attacks surface).
Q5 · Information about fertiliser use and cereal crop production in part of China
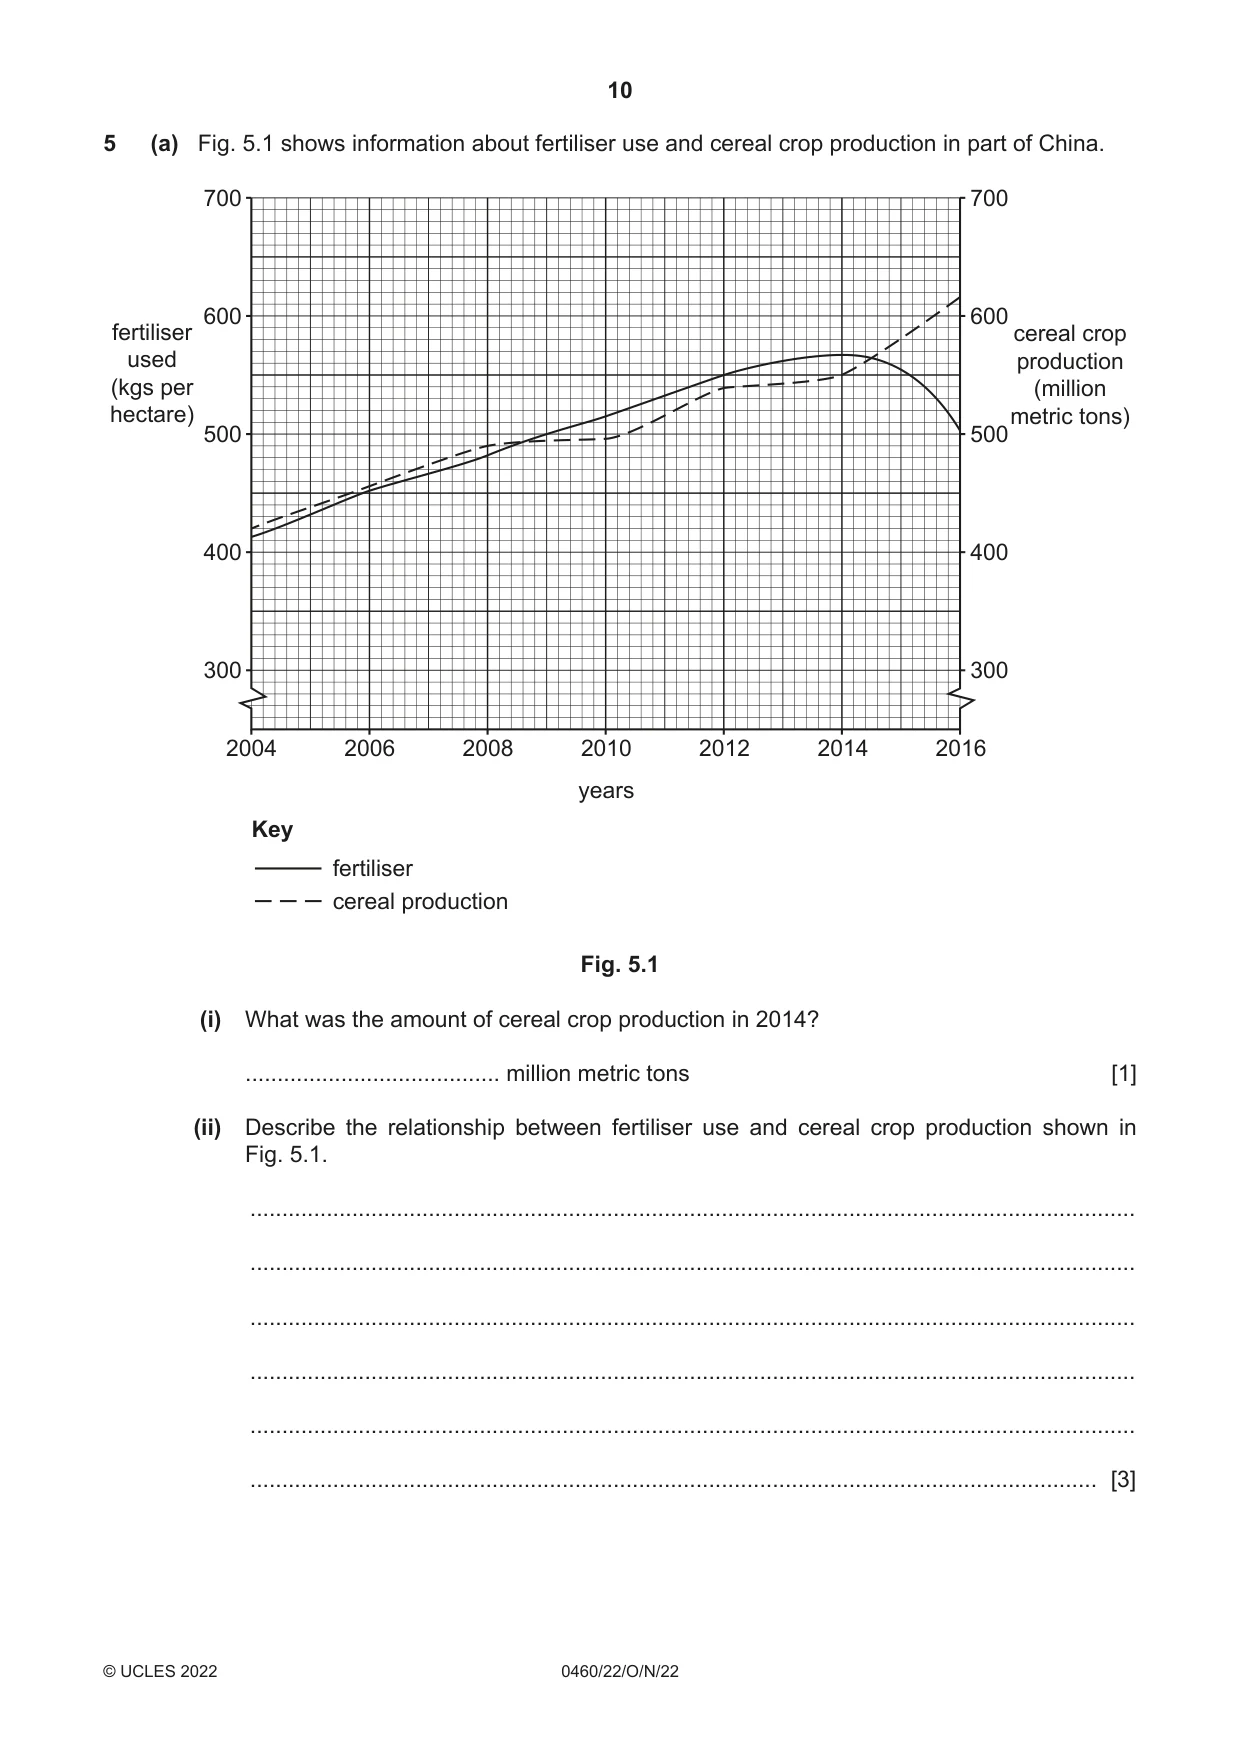
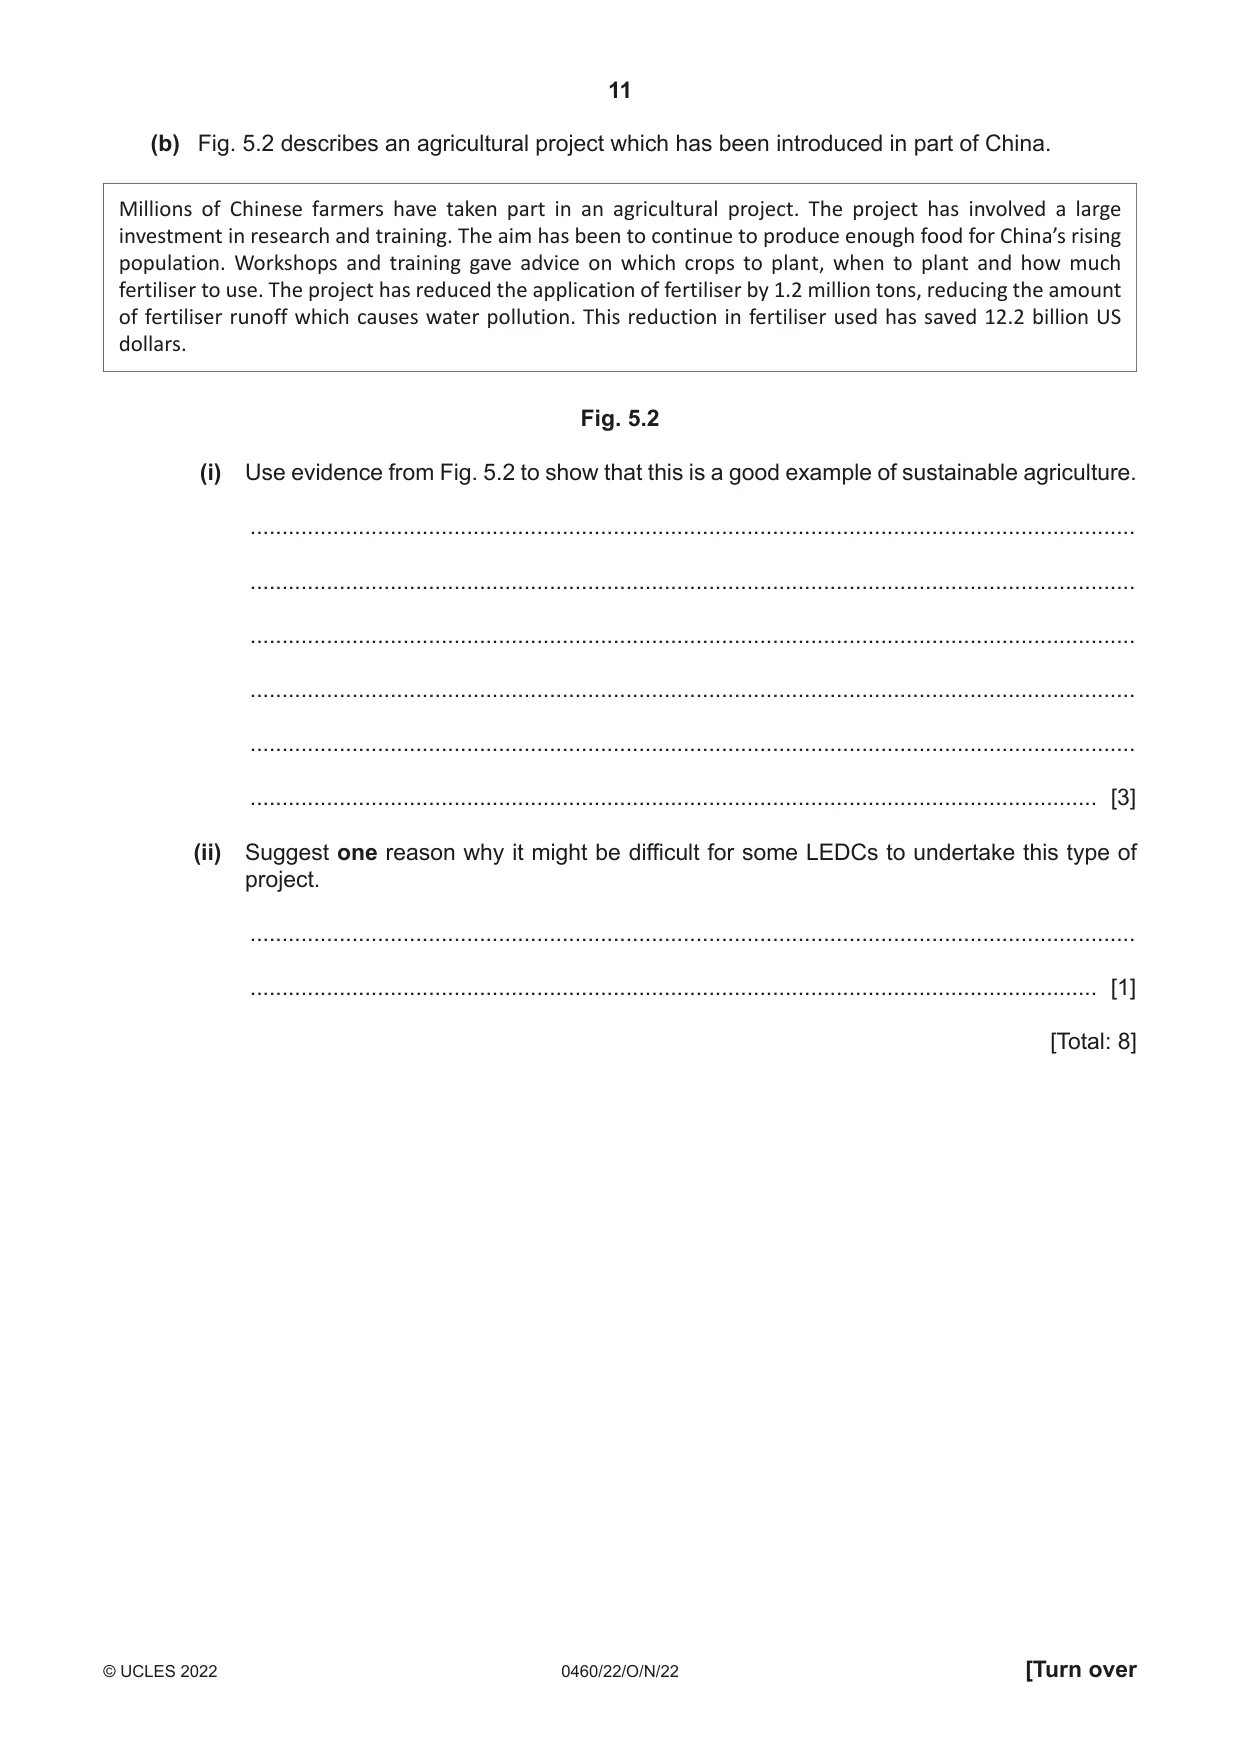
5 (a) Fig. 5.1 shows information about fertiliser use and cereal crop production in part of China. 700 700 600 600 fertiliser cereal crop used production (kgs per (million hectare) metric tons) 500 500 400 400 300 300 2004 2006 2008 2010 2012 2014 2016 years Key fertiliser cereal production Fig. 5.1 (i) What was the amount of cereal crop production in 2014? ........................................ million metric tons [1] (ii) Describe the relationship between fertiliser use and cereal crop production shown in Fig. 5.1. ........................................................................................................................................... ........................................................................................................................................... ........................................................................................................................................... ........................................................................................................................................... ........................................................................................................................................... ..................................................................................................................................... [3] (b) Fig. 5.2 describes an agricultural project which has been introduced in part of China. Millions of Chinese farmers have taken part in an agricultural project. The project has involved a large investment in research and training. The aim has been to continue to produce enough food for China’s rising population. Workshops and training gave advice on which crops to plant, when to plant and how much fertiliser to use. The project has reduced the application of fertiliser by 1.2 million tons, reducing the amount of fertiliser runoff which causes water pollution. This reduction in fertiliser used has saved 12.2 billion US dollars. Fig. 5.2 (i) Use evidence from Fig. 5.2 to show that this is a good example of sustainable agriculture. ........................................................................................................................................... ........................................................................................................................................... ........................................................................................................................................... ........................................................................................................................................... ........................................................................................................................................... ..................................................................................................................................... [3] (ii) Suggest one reason why it might be difficult for some LEDCs to undertake this type of project. ........................................................................................................................................... ..................................................................................................................................... [1] [Total: 8]
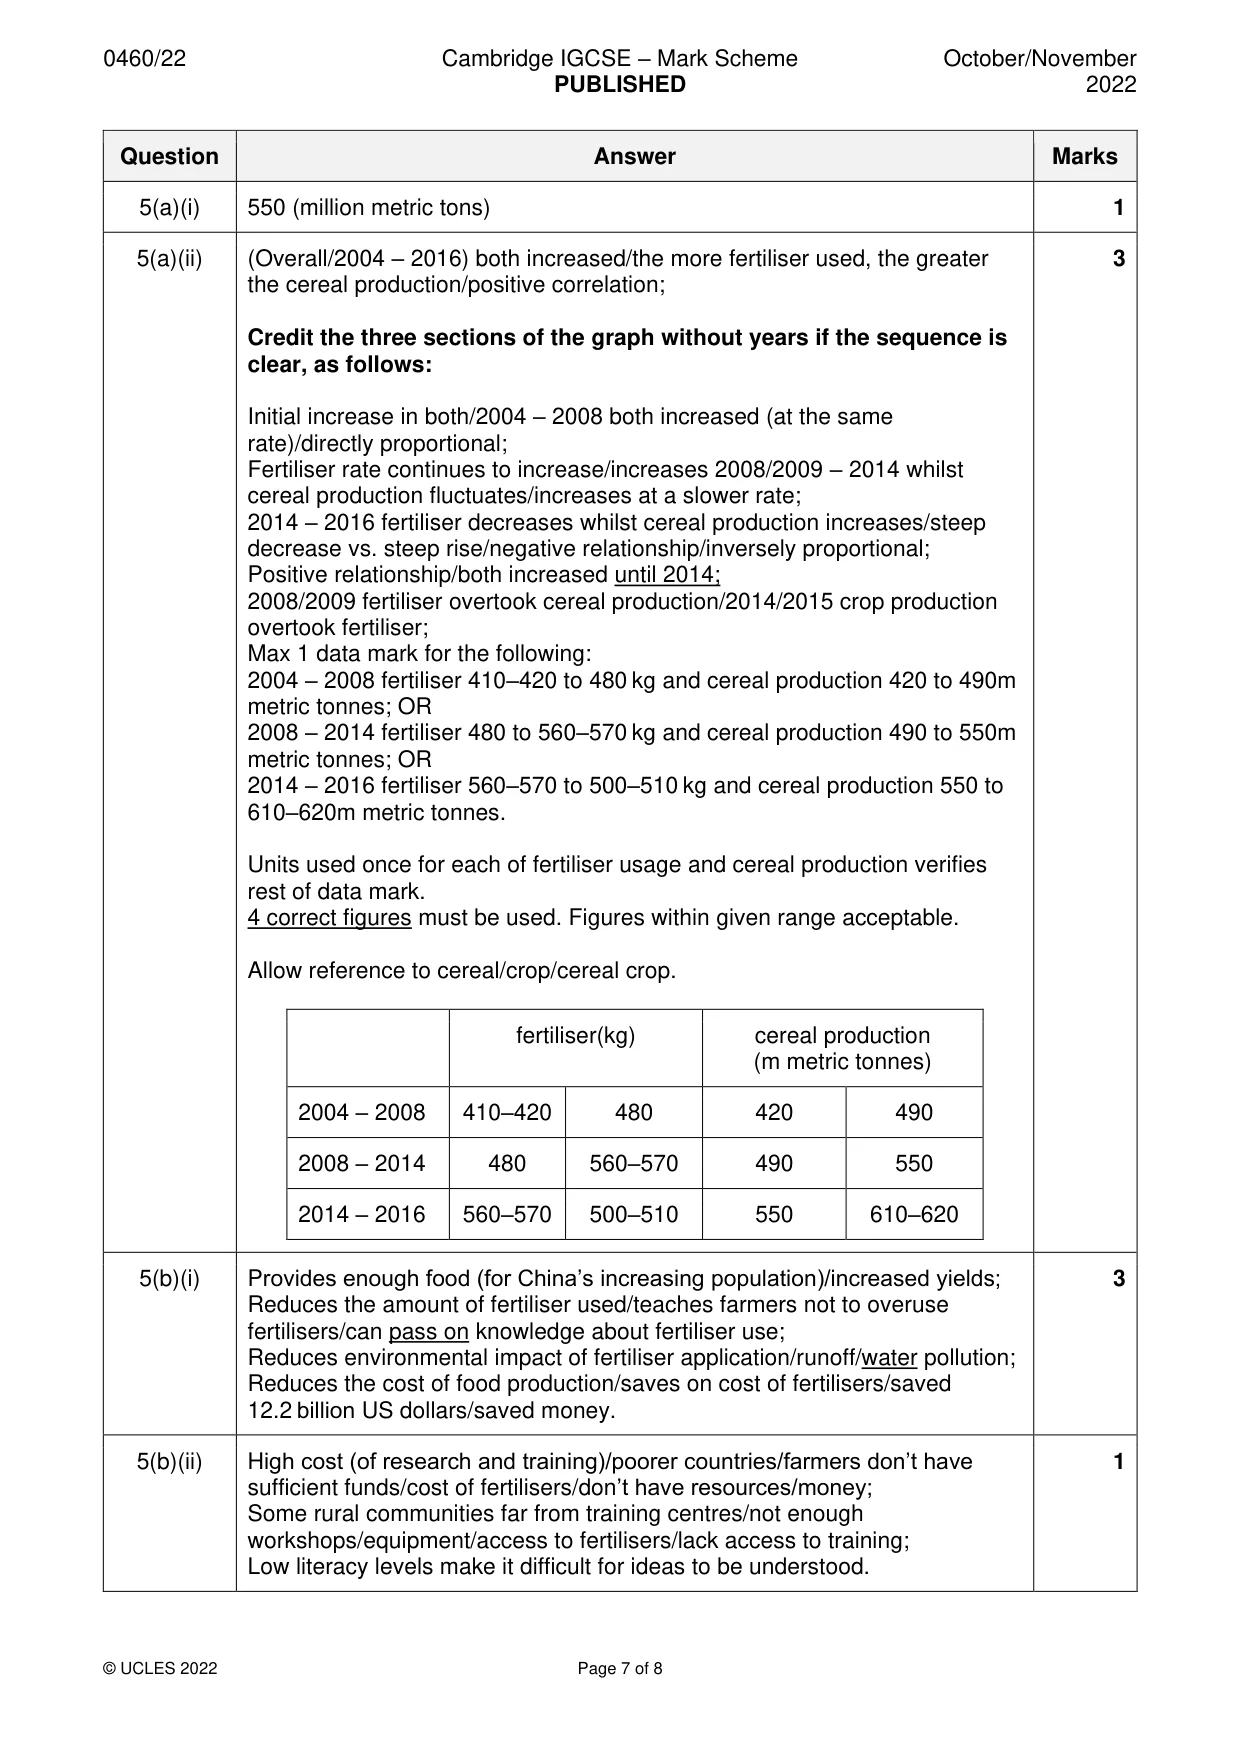
Mark scheme: 5(a)(i) 550 (million metric tons) 1 5(a)(ii) (Overall/2004 – 2016) both increased/the more fertiliser used, the greater 3 the cereal production/positive correlation; Credit the three sections of the graph without years if the sequence is clear, as follows: Initial increase in both/2004 – 2008 both increased (at the same rate)/directly proportional; Fertiliser rate continues to increase/increases 2008/2009 – 2014 whilst cereal production fluctuates/increases at a slower rate; 2014 – 2016 fertiliser decreases whilst cereal production increases/steep decrease vs. steep rise/negative relationship/inversely proportional; Positive relationship/both increased until 2014; 2008/2009 fertiliser overtook cereal production/2014/2015 crop production overtook fertiliser; Max 1 data mark for the following: 2004 – 2008 fertiliser 410–420 to 480 kg and cereal production 420 to 490m metric tonnes; OR 2008 – 2014 fertiliser 480 to 560–570 kg and cereal production 490 to 550m metric tonnes; OR 2014 – 2016 fertiliser 560–570 to 500–510 kg and cereal production 550 to 610–620m metric tonnes. Units used once for each of fertiliser usage and cereal production verifies rest of data mark. 4 correct figures must be used. Figures within given range acceptable. Allow reference to cereal/crop/cereal crop. fertiliser(kg) cereal production (m metric tonnes) 2004 – 2008 410–420 480 420 490 2008 – 2014 480 560–570 490 550 2014 – 2016 560–570 500–510 550 610–620 5(b)(i) Provides enough food (for China’s increasing population)/increased yields; 3 Reduces the amount of fertiliser used/teaches farmers not to overuse fertilisers/can pass on knowledge about fertiliser use; Reduces environmental impact of fertiliser application/runoff/water pollution; Reduces the cost of food production/saves on cost of fertilisers/saved 12.2 billion US dollars/saved money. 5(b)(ii) High cost (of research and training)/poorer countries/farmers don’t have 1 sufficient funds/cost of fertilisers/don’t have resources/money; Some rural communities far from training centres/not enough workshops/equipment/access to fertilisers/lack access to training; Low literacy levels make it difficult for ideas to be understood.
Q6 · The employment structure for countries with different incomes in 2019
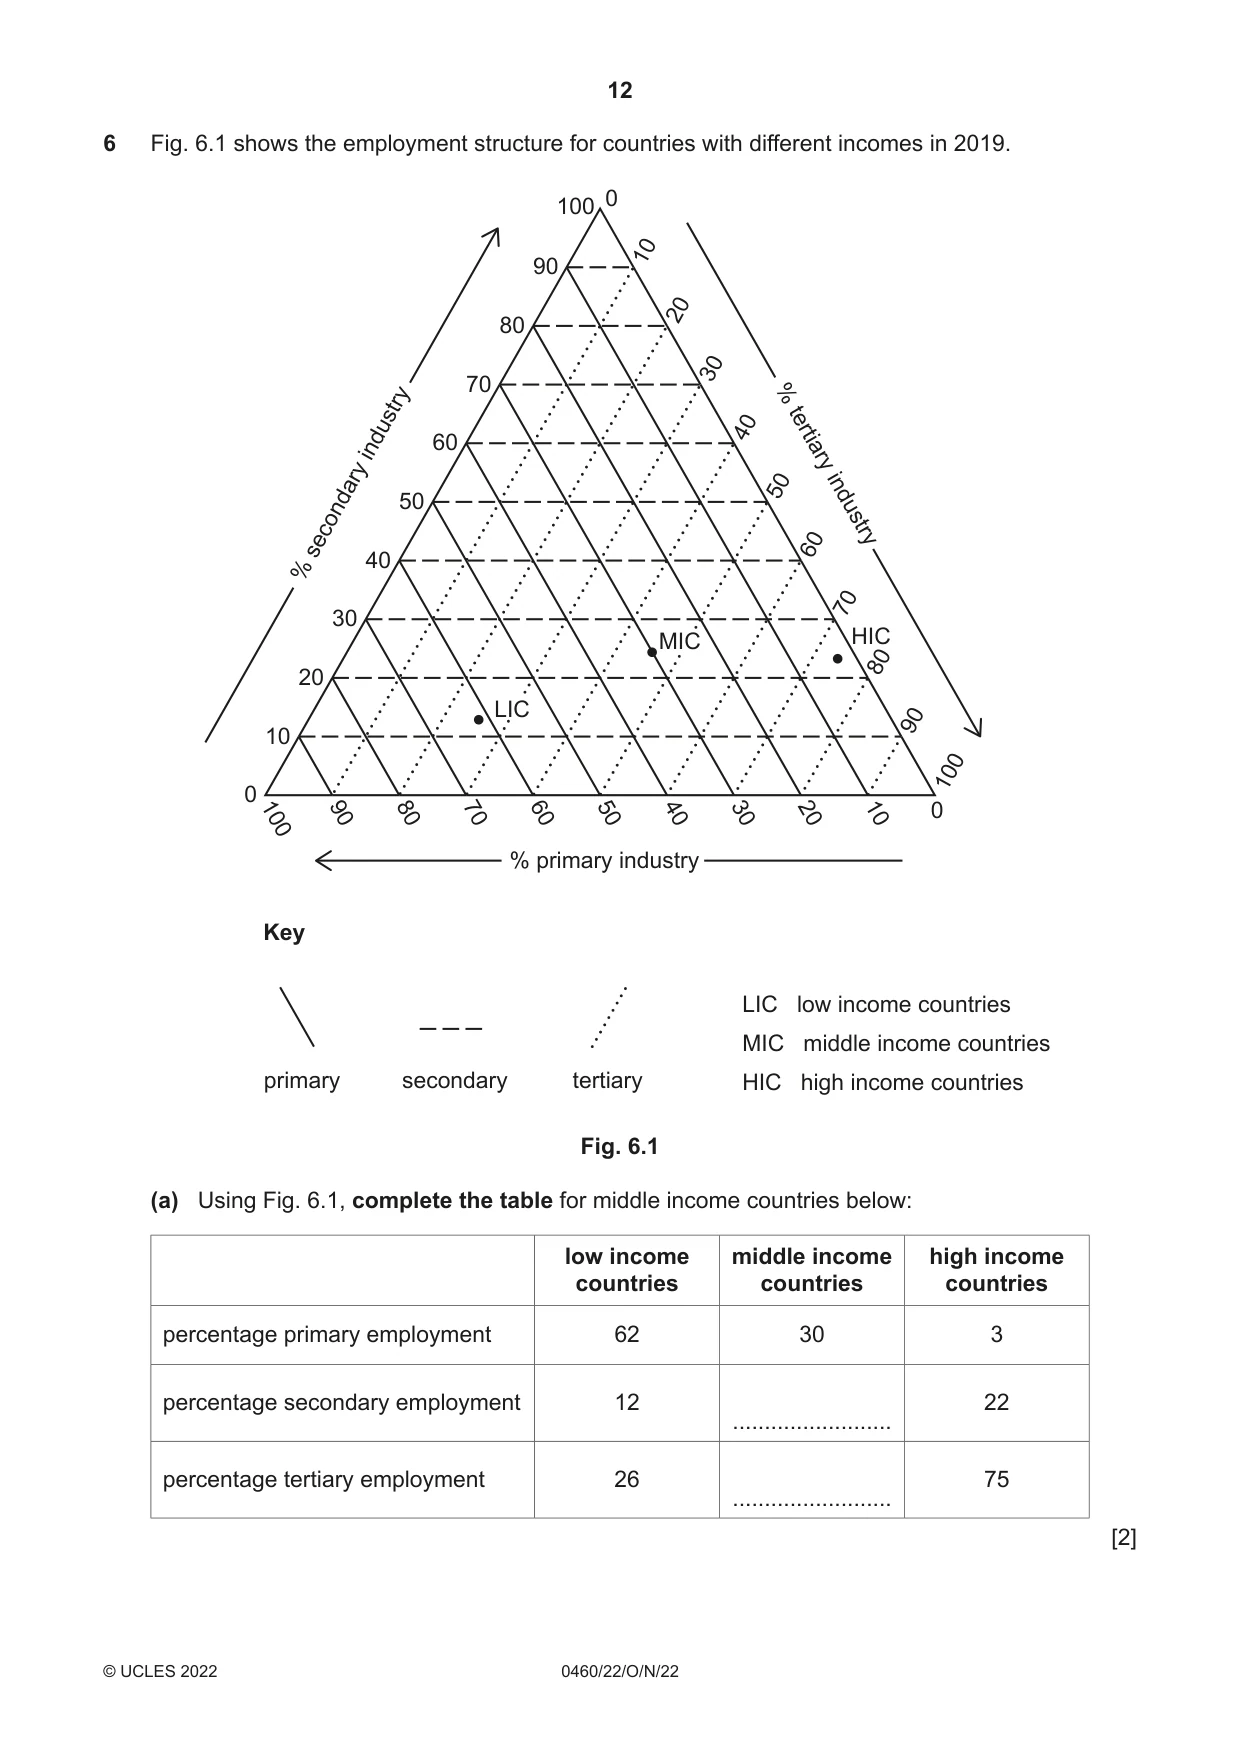
6 Fig. 6.1 shows the employment structure for countries with different incomes in 2019. 0 100 10 90 20 80 30 70 % 40 60 industry tertiary 50 50 industry secondary 60 40 % 70 30 MIC HIC 80 20 LIC 90 10 100 0 100 90 80 70 60 50 40 30 20 10 0 % primary industry Key LIC low income countries MIC middle income countries primary secondary tertiary HIC high income countries Fig. 6.1 (a) Using Fig. 6.1, complete the table for middle income countries below: low income middle income high income countries countries countries percentage primary employment 62 30 3 percentage secondary employment 12 22 ......................... percentage tertiary employment 26 75 ......................... [2] (b) Explain why the employment structure of a country changes as it develops. ................................................................................................................................................... ................................................................................................................................................... ................................................................................................................................................... ................................................................................................................................................... ................................................................................................................................................... ................................................................................................................................................... ................................................................................................................................................... ............................................................................................................................................. [4] (c) State two economic benefits of increasing globalisation. 1 ................................................................................................................................................ ................................................................................................................................................... 2 ................................................................................................................................................ ............................................................................................................................................. [2] [Total: 8] Additional pages If you use the following pages to complete the answer to any question, the question number must be clearly shown. .................................................................................................................................................................. .................................................................................................................................................................. .................................................................................................................................................................. .................................................................................................................................................................. .................................................................................................................................................................. .................................................................................................................................................................. .................................................................................................................................................................. .................................................................................................................................................................. .................................................................................................................................................................. .................................................................................................................................................................. .................................................................................................................................................................. .................................................................................................................................................................. .................................................................................................................................................................. .................................................................................................................................................................. .................................................................................................................................................................. .................................................................................................................................................................. .................................................................................................................................................................. .................................................................................................................................................................. .................................................................................................................................................................. .................................................................................................................................................................. .................................................................................................................................................................. .................................................................................................................................................................. .................................................................................................................................................................. .................................................................................................................................................................. ..................................................................................................................................................................
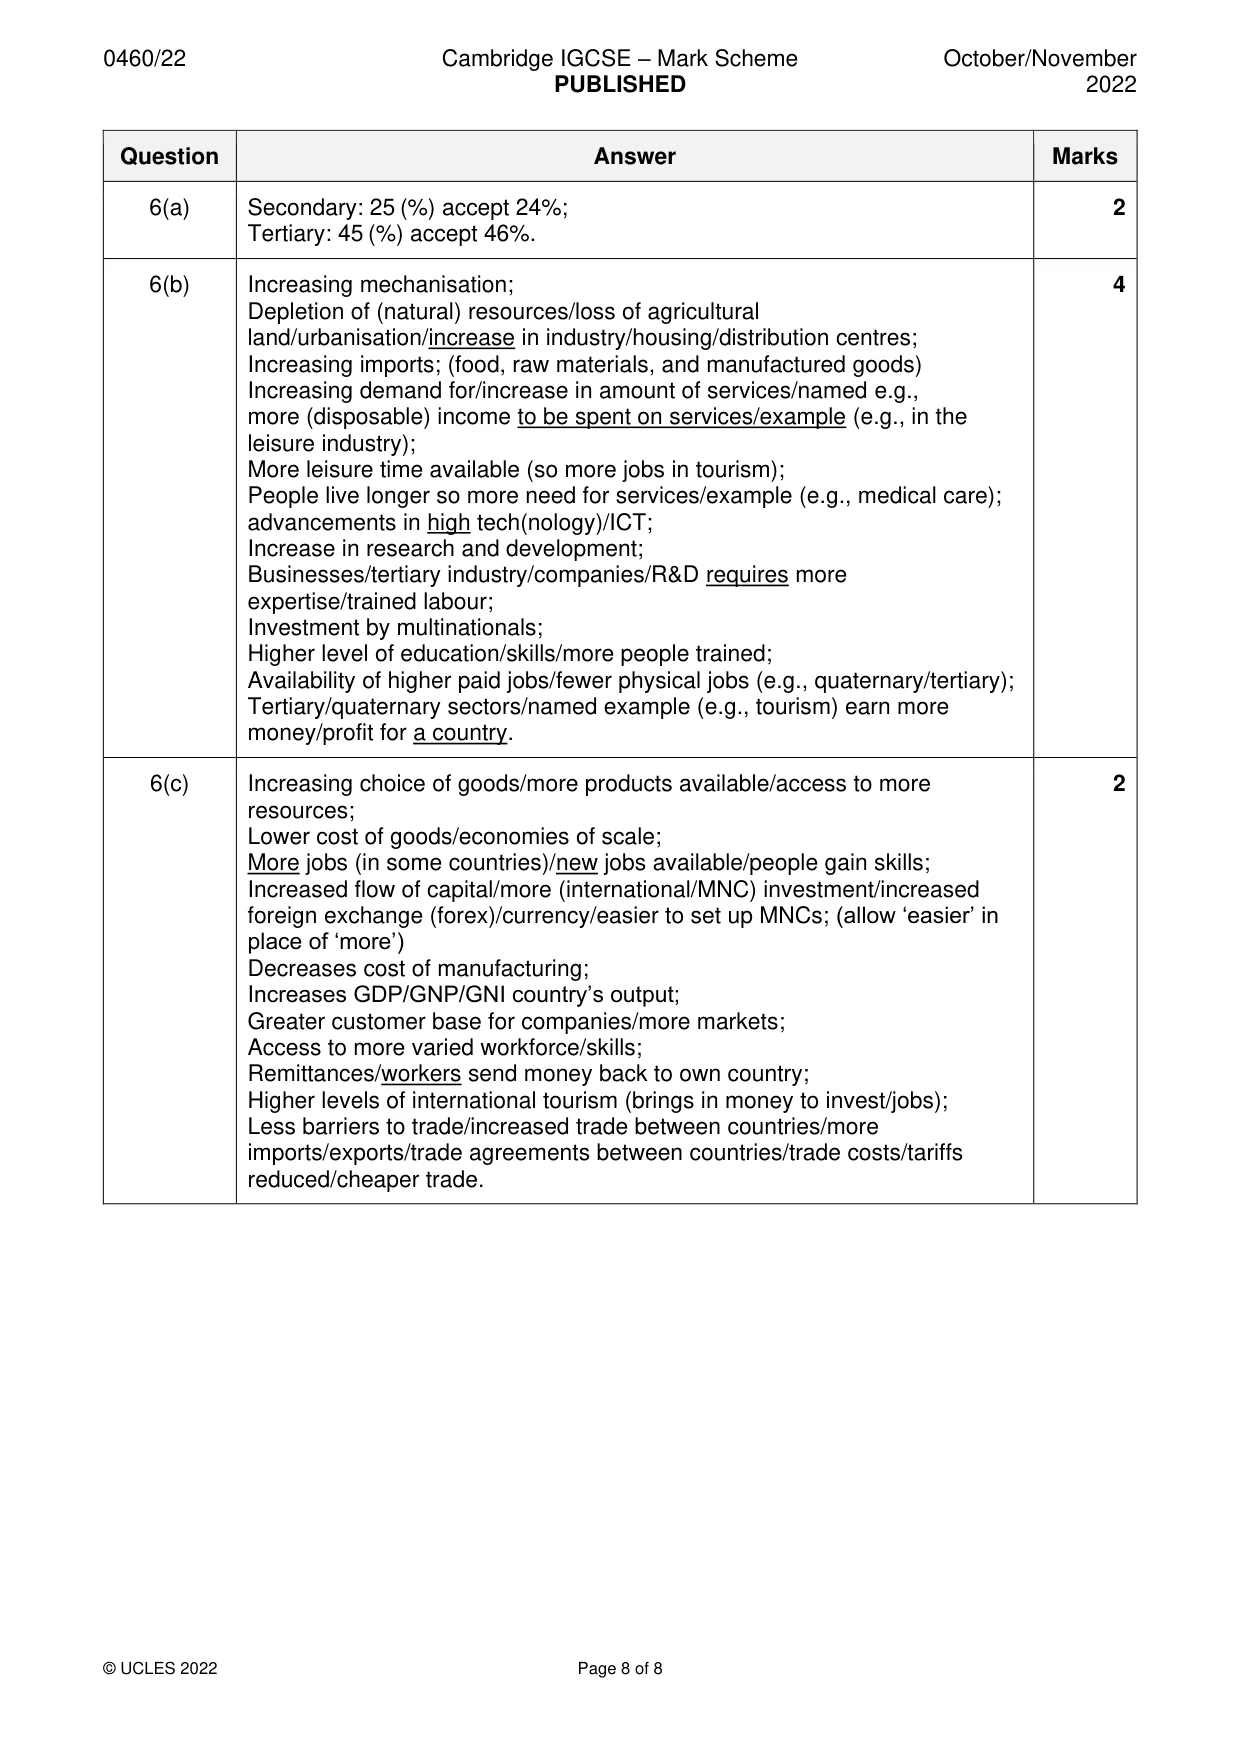
Mark scheme: 6(a) Secondary: 25 (%) accept 24%; 2 Tertiary: 45 (%) accept 46%. 6(b) Increasing mechanisation; 4 Depletion of (natural) resources/loss of agricultural land/urbanisation/increase in industry/housing/distribution centres; Increasing imports; (food, raw materials, and manufactured goods) Increasing demand for/increase in amount of services/named e.g., more (disposable) income to be spent on services/example (e.g., in the leisure industry); More leisure time available (so more jobs in tourism); People live longer so more need for services/example (e.g., medical care); advancements in high tech(nology)/ICT; Increase in research and development; Businesses/tertiary industry/companies/R&D requires more expertise/trained labour; Investment by multinationals; Higher level of education/skills/more people trained; Availability of higher paid jobs/fewer physical jobs (e.g., quaternary/tertiary); Tertiary/quaternary sectors/named example (e.g., tourism) earn more money/profit for a country. 6(c) Increasing choice of goods/more products available/access to more 2 resources; Lower cost of goods/economies of scale; More jobs (in some countries)/new jobs available/people gain skills; Increased flow of capital/more (international/MNC) investment/increased foreign exchange (forex)/currency/easier to set up MNCs; (allow ‘easier’ in place of ‘more’) Decreases cost of manufacturing; Increases GDP/GNP/GNI country’s output; Greater customer base for companies/more markets; Access to more varied workforce/skills; Remittances/workers send money back to own country; Higher levels of international tourism (brings in money to invest/jobs); Less barriers to trade/increased trade between countries/more imports/exports/trade agreements between countries/trade costs/tariffs reduced/cheaper trade.
What was in this paper
The subtopics covered by these 6 questions, and how many questions each got. Open one in a new tab to see every Cambridge question on it.
What you needed in this session
Cambridge’s own grade thresholds for 2022 Oct/Nov, Paper 2 · Variant 2. A higher threshold means an easier paper — the bar moves with how the cohort did.