Cambridge IGCSE Geography 0460 — 2023 Oct/Nov Paper 2 · Variant 3
0460/23/O/N/23 · 6 questions · 60 marks · ≈68 min
The question paper and its mark scheme, free to read here and free to download. This is Cambridge’s own paper, exactly as it was sat.
Question paper16 pages





Mark scheme8 pages
Answers below. Sit the paper first if you are practising.


Questions as text
Q1 · Study the map extract for Kilwinning, Scotland
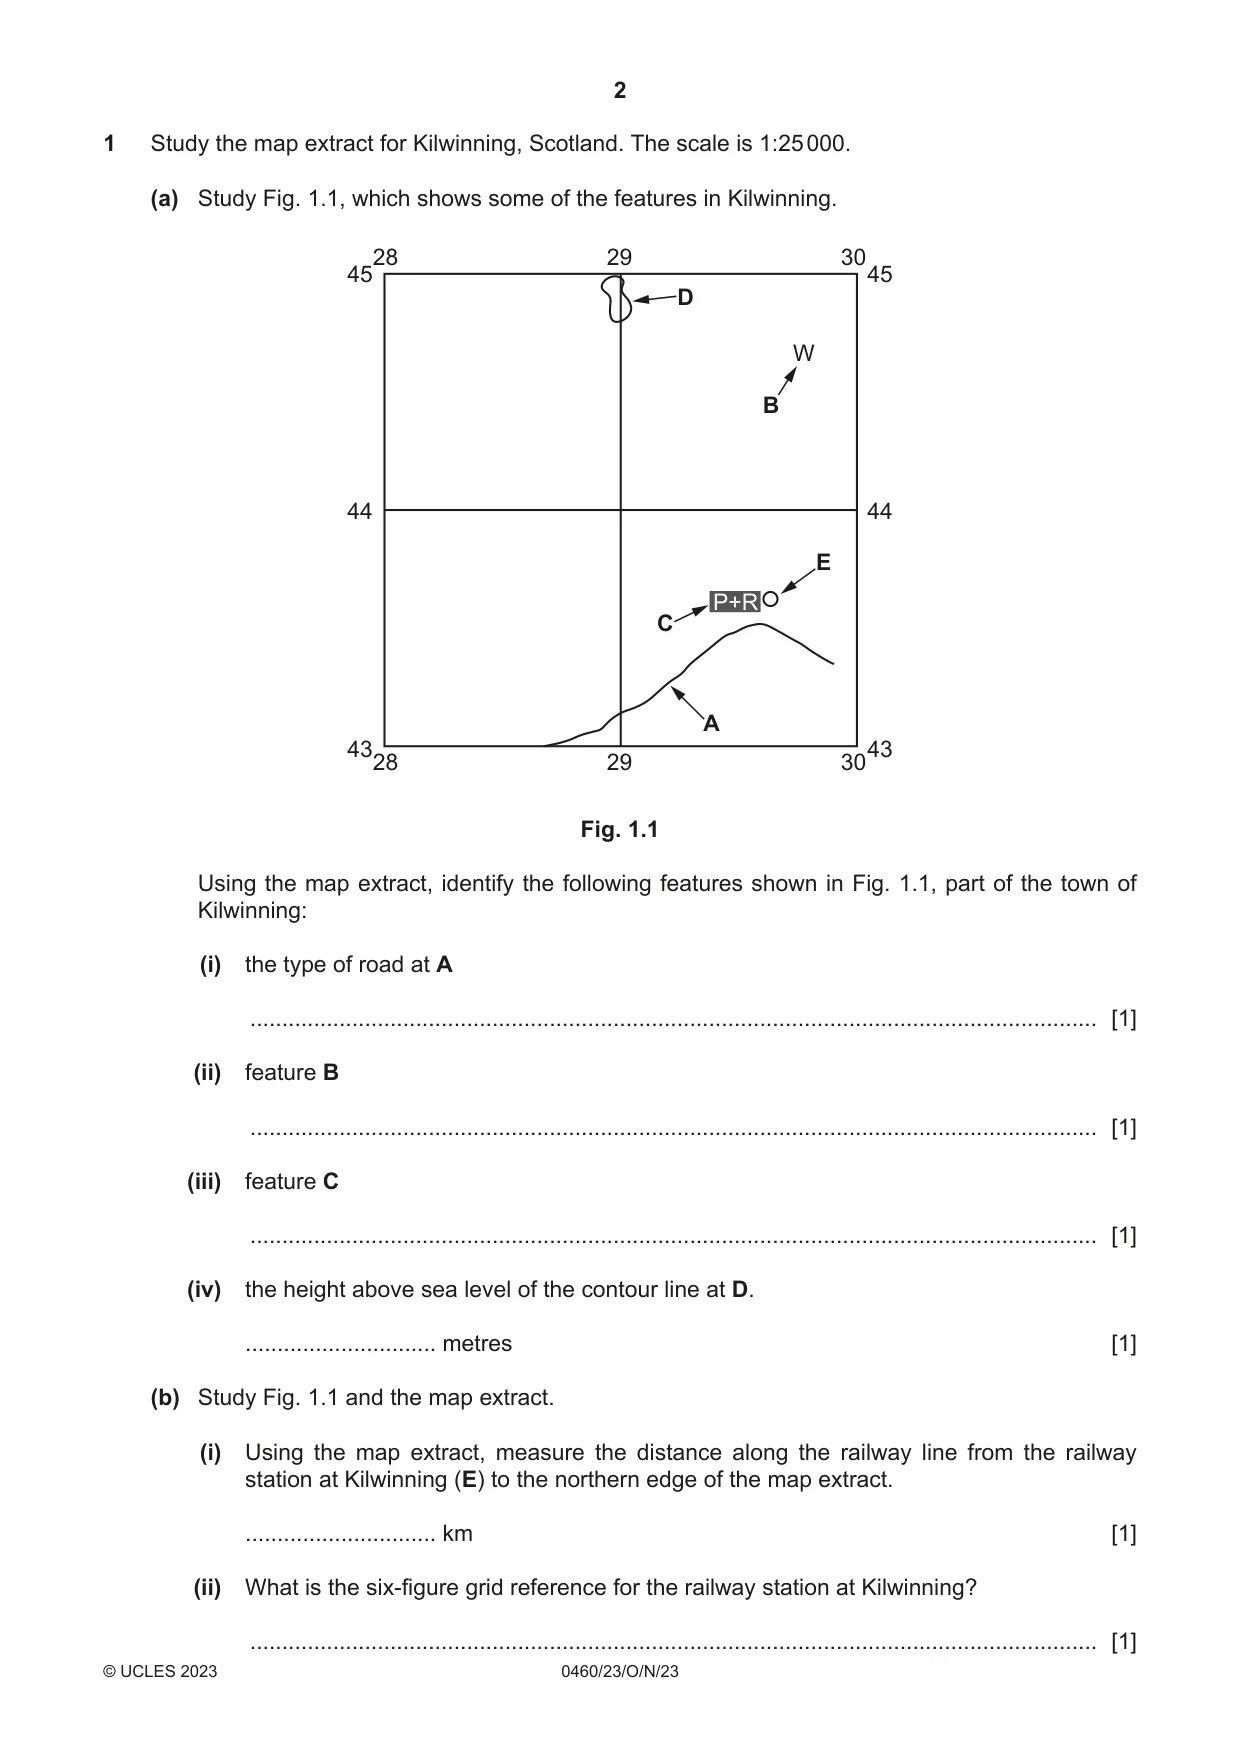
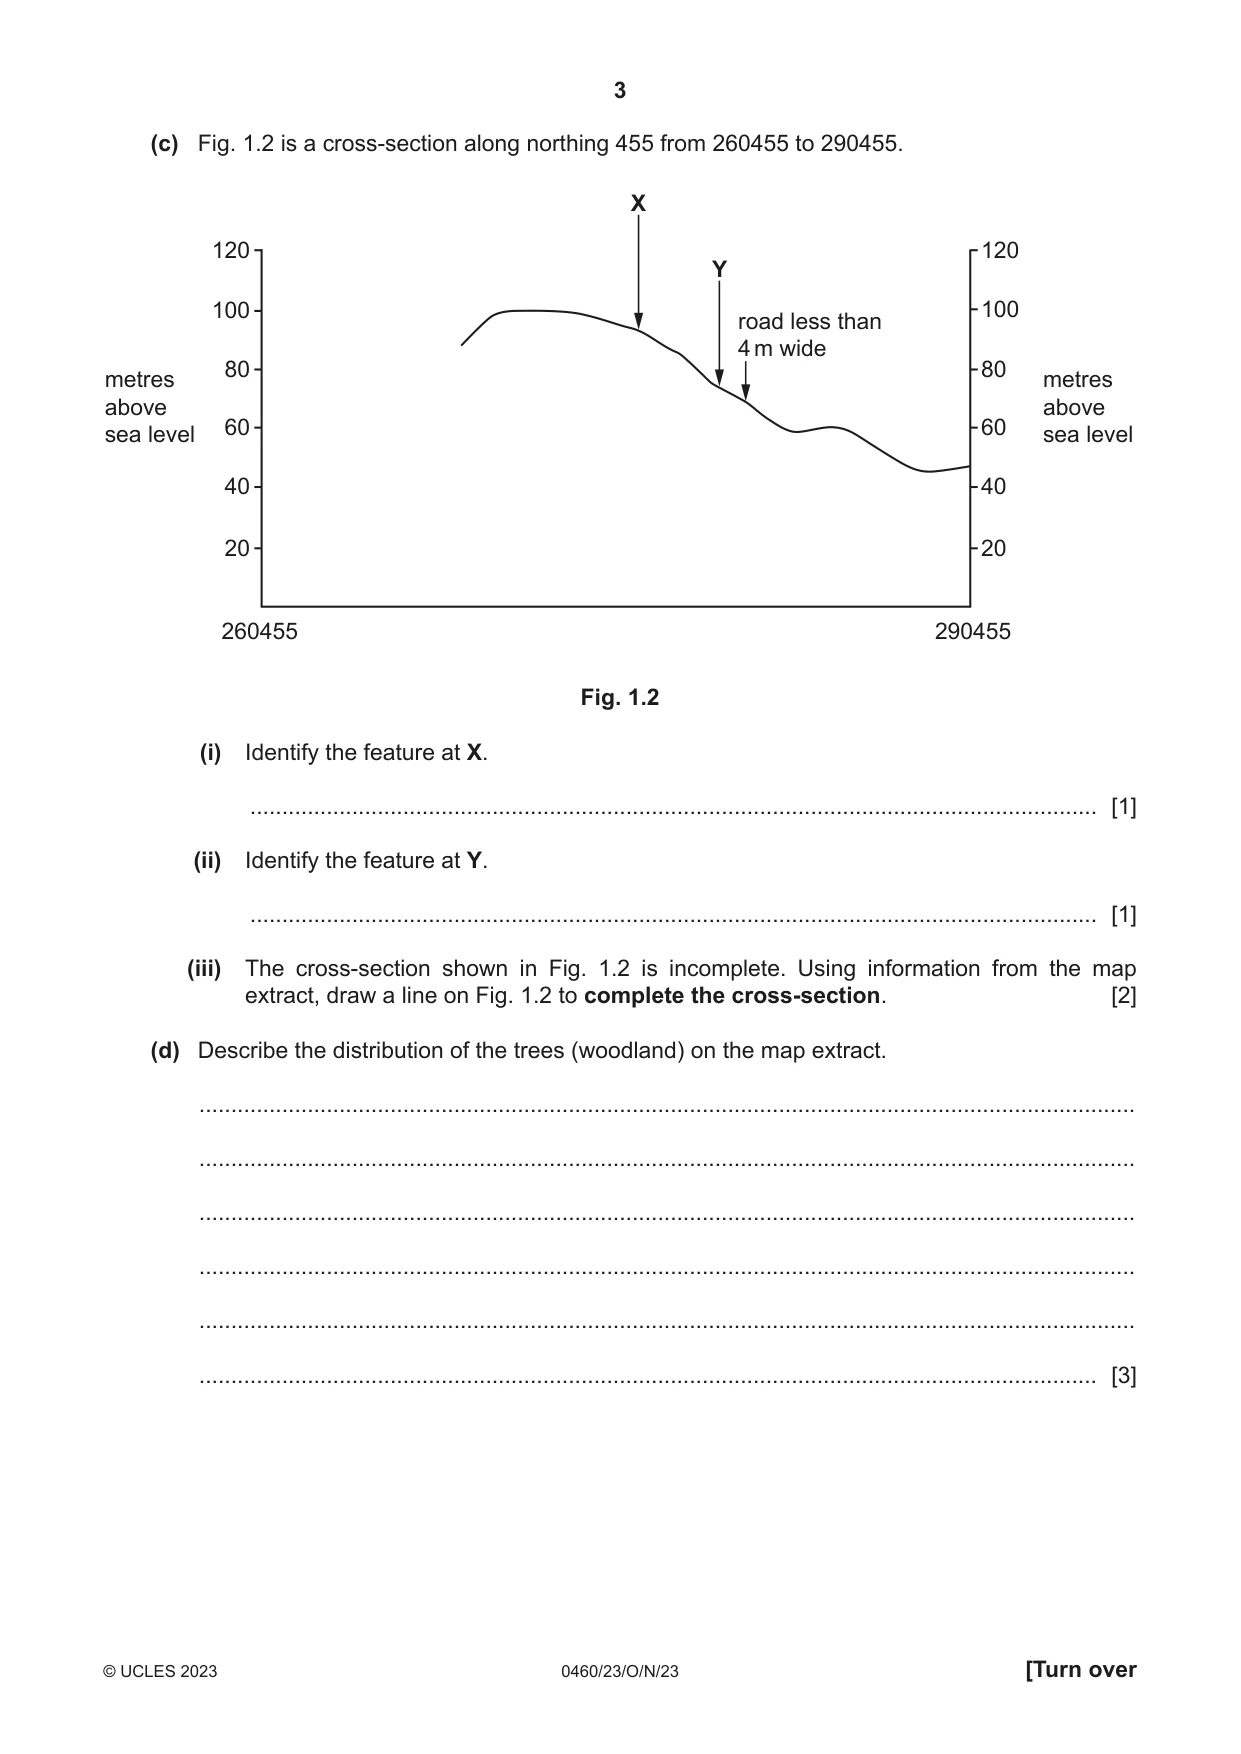
1 Study the map extract for Kilwinning, Scotland. The scale is 1:25 000. (a) Study Fig. 1.1, which shows some of the features in Kilwinning. 28 29 30 45 45 D W B 44 44 E P+R C A 43 43 28 29 30 Fig. 1.1 Using the map extract, identify the following features shown in Fig. 1.1, part of the town of Kilwinning: (i) the type of road at A ..................................................................................................................................... [1] (ii) feature B ..................................................................................................................................... [1] (iii) feature C ..................................................................................................................................... [1] (iv) the height above sea level of the contour line at D. .............................. metres [1] (b) Study Fig. 1.1 and the map extract. (i) Using the map extract, measure the distance along the railway line from the railway station at Kilwinning (E) to the northern edge of the map extract. .............................. km [1] (ii) What is the six-figure grid reference for the railway station at Kilwinning? ..................................................................................................................................... [1] (c) Fig. 1.2 is a cross-section along northing 455 from 260455 to 290455. X 120 120 Y 100 100 road less than 4 m wide 80 80metres metres above above 60 60sea level sea level 40 40 20 20 260455 290455 Fig. 1.2 (i) Identify the feature at X. ..................................................................................................................................... [1] (ii) Identify the feature at Y. ..................................................................................................................................... [1] (iii) The cross-section shown in Fig. 1.2 is incomplete. Using information from the map extract, draw a line on Fig. 1.2 to complete the cross-section. [2] (d) Describe the distribution of the trees (woodland) on the map extract. ................................................................................................................................................... ................................................................................................................................................... ................................................................................................................................................... ................................................................................................................................................... ................................................................................................................................................... ............................................................................................................................................. [3] (e) Using map evidence, describe the site and functions of the settlement of Kilwinning. site ............................................................................................................................................ ................................................................................................................................................... ................................................................................................................................................... ................................................................................................................................................... ................................................................................................................................................... ................................................................................................................................................... ................................................................................................................................................... functions ................................................................................................................................... ................................................................................................................................................... ................................................................................................................................................... ................................................................................................................................................... ................................................................................................................................................... ................................................................................................................................................... ............................................................................................................................................. [7] [Total: 20]
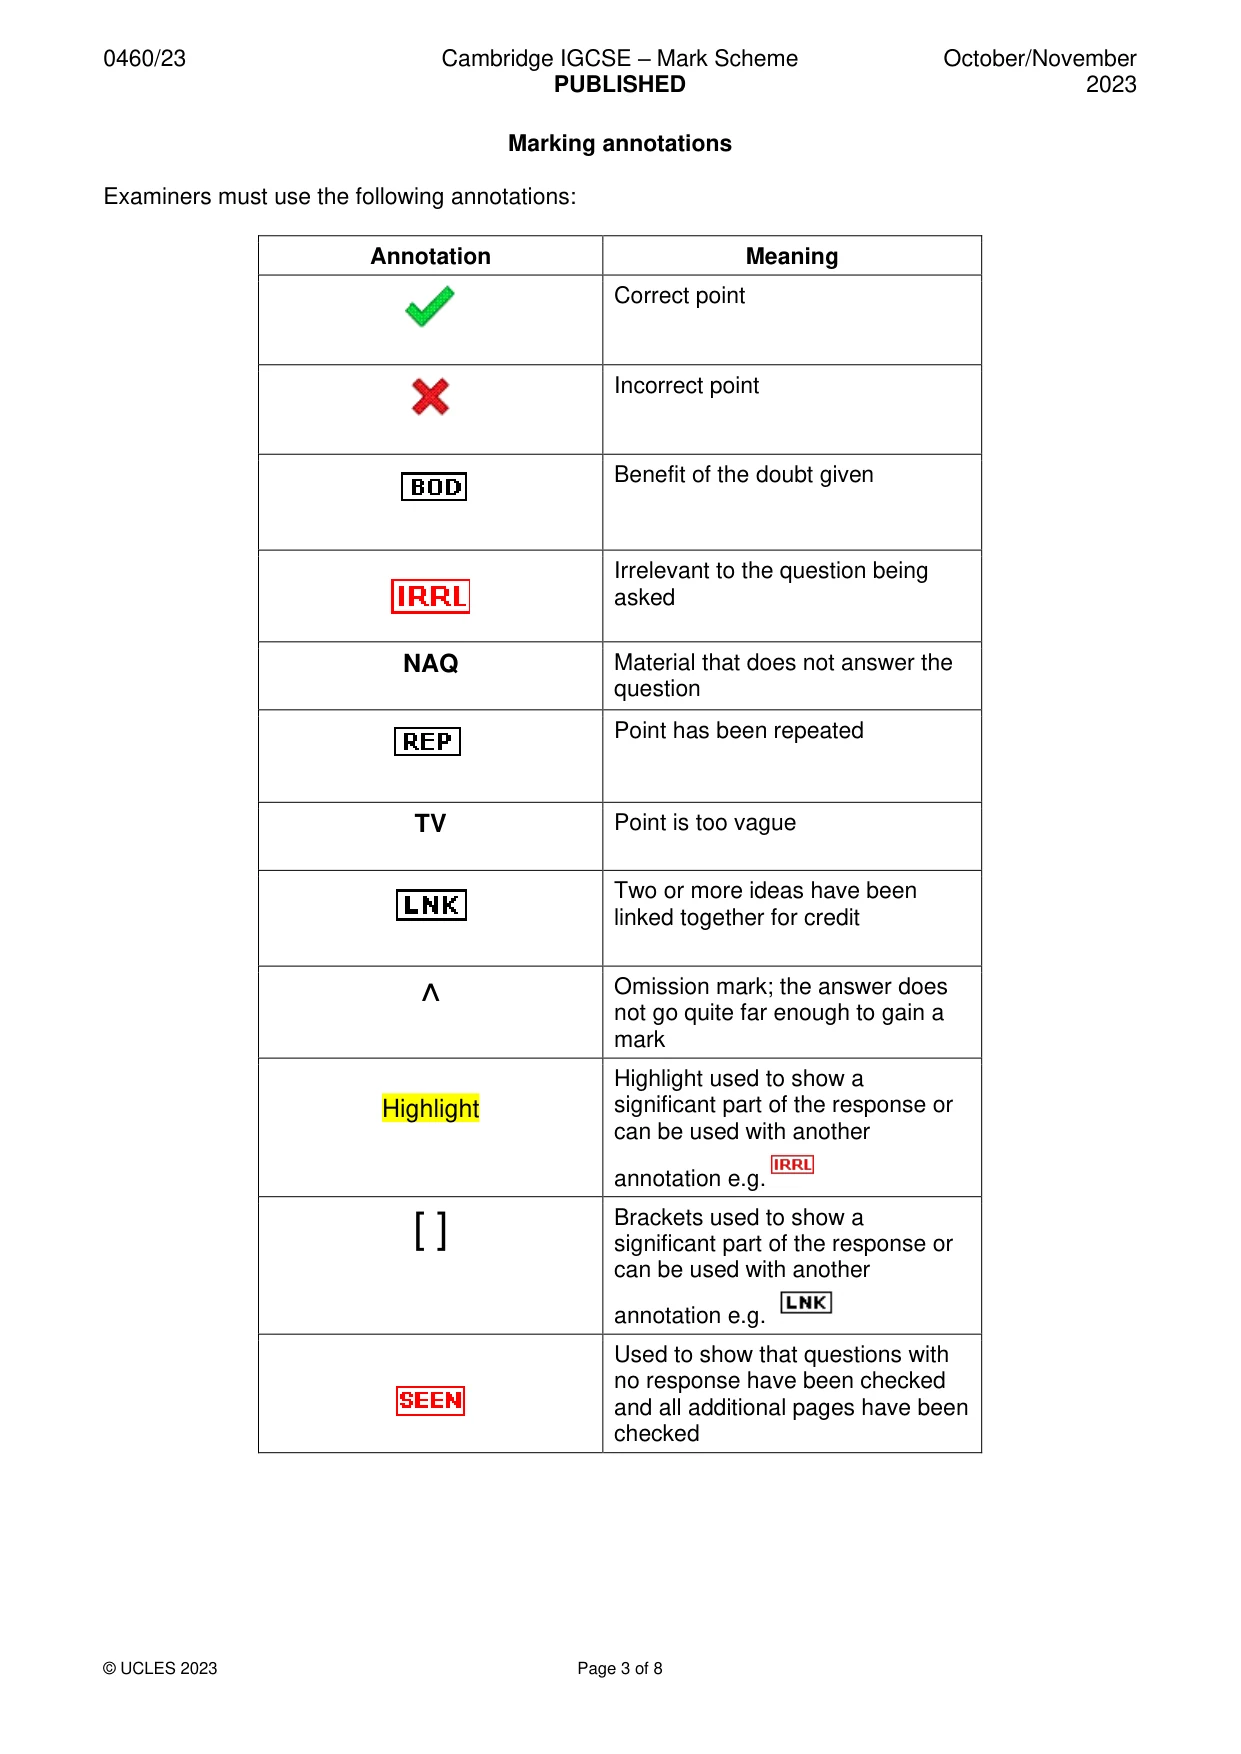
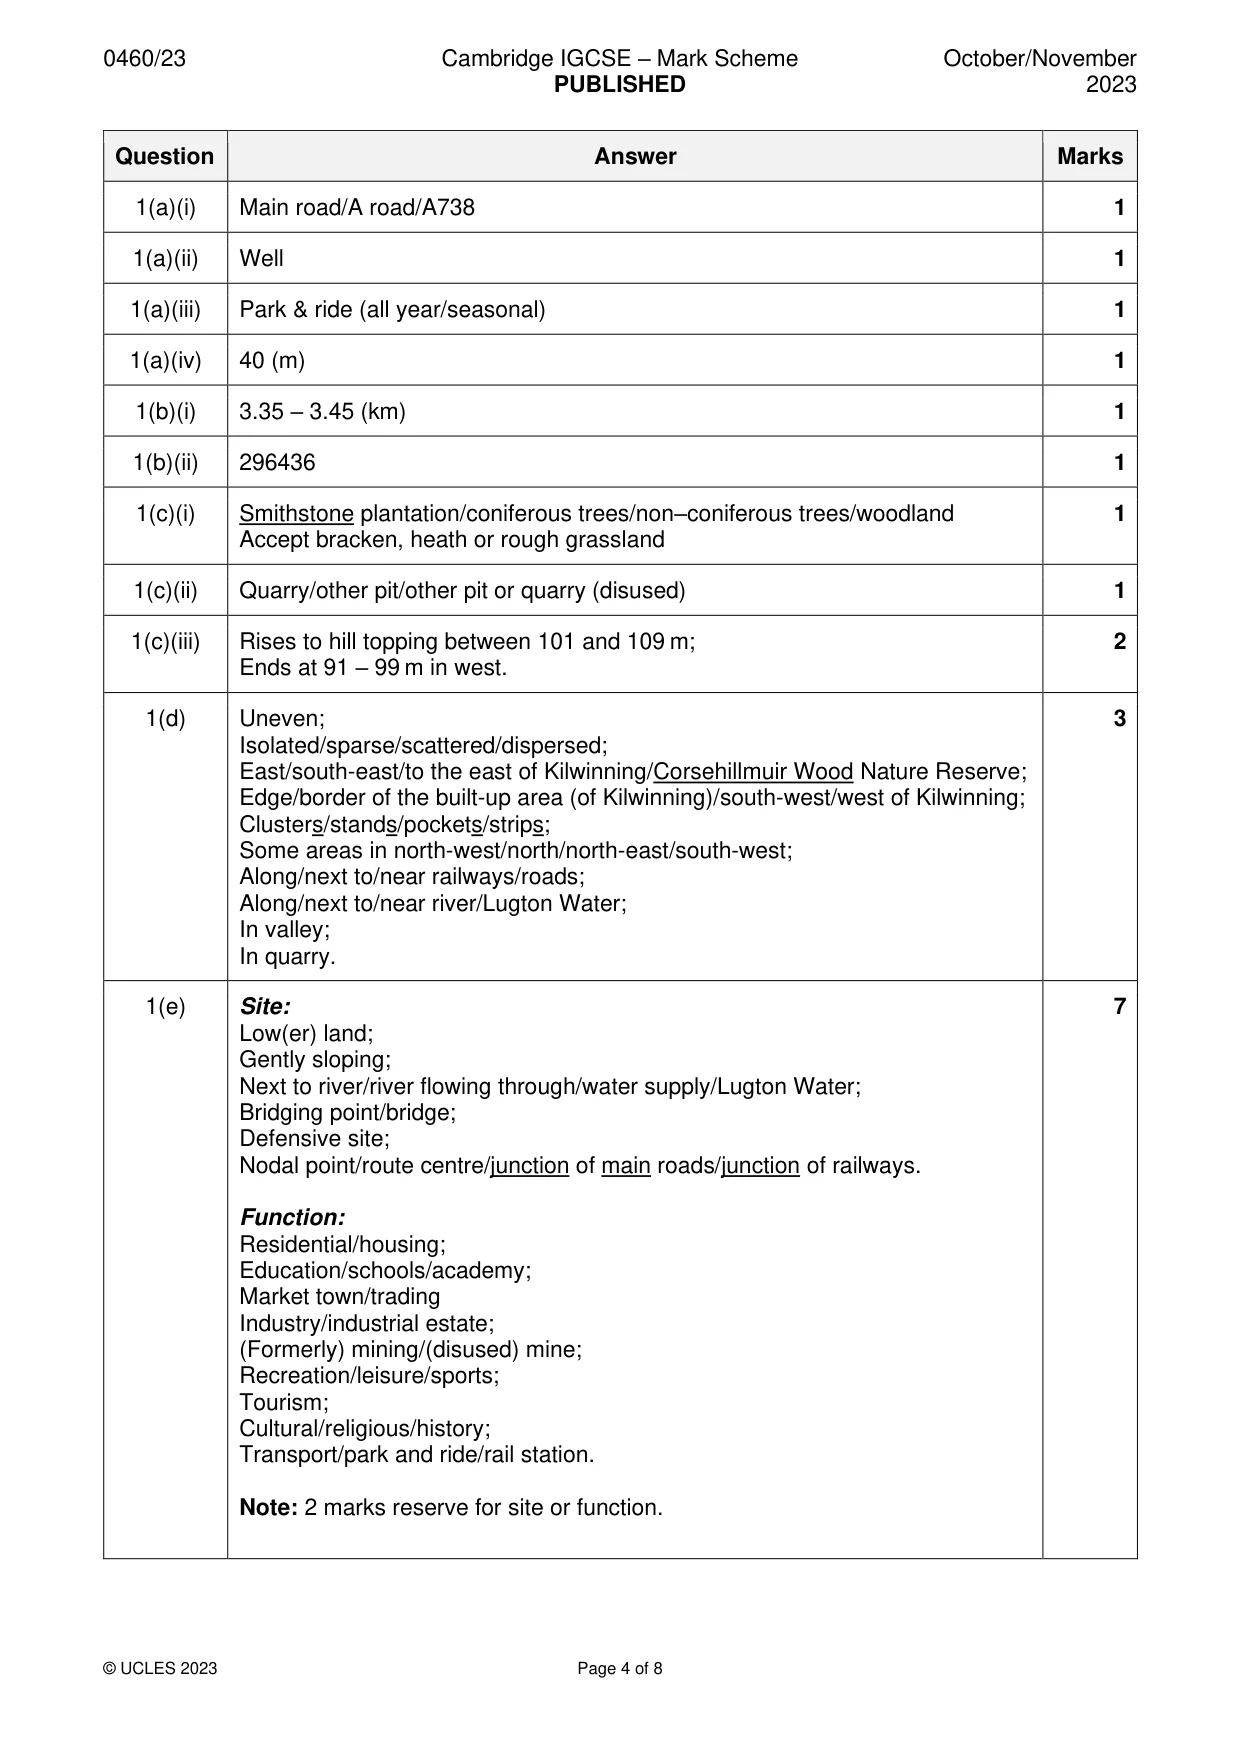
Mark scheme: Question Answer Marks 1(a)(i) Main road/A road/A738 1 1(a)(ii) Well 1 1(a)(iii) Park & ride (all year/seasonal) 1 1(a)(iv) 40 (m) 1 1(b)(i) 3.35 – 3.45 (km) 1 1(b)(ii) 296436 1 1(c)(i) Smithstone plantation/coniferous trees/non–coniferous trees/woodland 1 Accept bracken, heath or rough grassland 1(c)(ii) Quarry/other pit/other pit or quarry (disused) 1 1(c)(iii) Rises to hill topping between 101 and 109 m; 2 Ends at 91 – 99 m in west. 1(d) Uneven; 3 Isolated/sparse/scattered/dispersed; East/south-east/to the east of Kilwinning/Corsehillmuir Wood Nature Reserve; Edge/border of the built-up area (of Kilwinning)/south-west/west of Kilwinning; Clusters/stands/pockets/strips; Some areas in north-west/north/north-east/south-west; Along/next to/near railways/roads; Along/next to/near river/Lugton Water; In valley; In quarry. 1(e) Site: 7 Low(er) land; Gently sloping; Next to river/river flowing through/water supply/Lugton Water; Bridging point/bridge; Defensive site; Nodal point/route centre/junction of main roads/junction of railways. Function: Residential/housing; Education/schools/academy; Market town/trading Industry/industrial estate; (Formerly) mining/(disused) mine; Recreation/leisure/sports; Tourism; Cultural/religious/history; Transport/park and ride/rail station. Note: 2 marks reserve for site or function.
More questions on Settlements (rural and urban) and service provision
Question 2
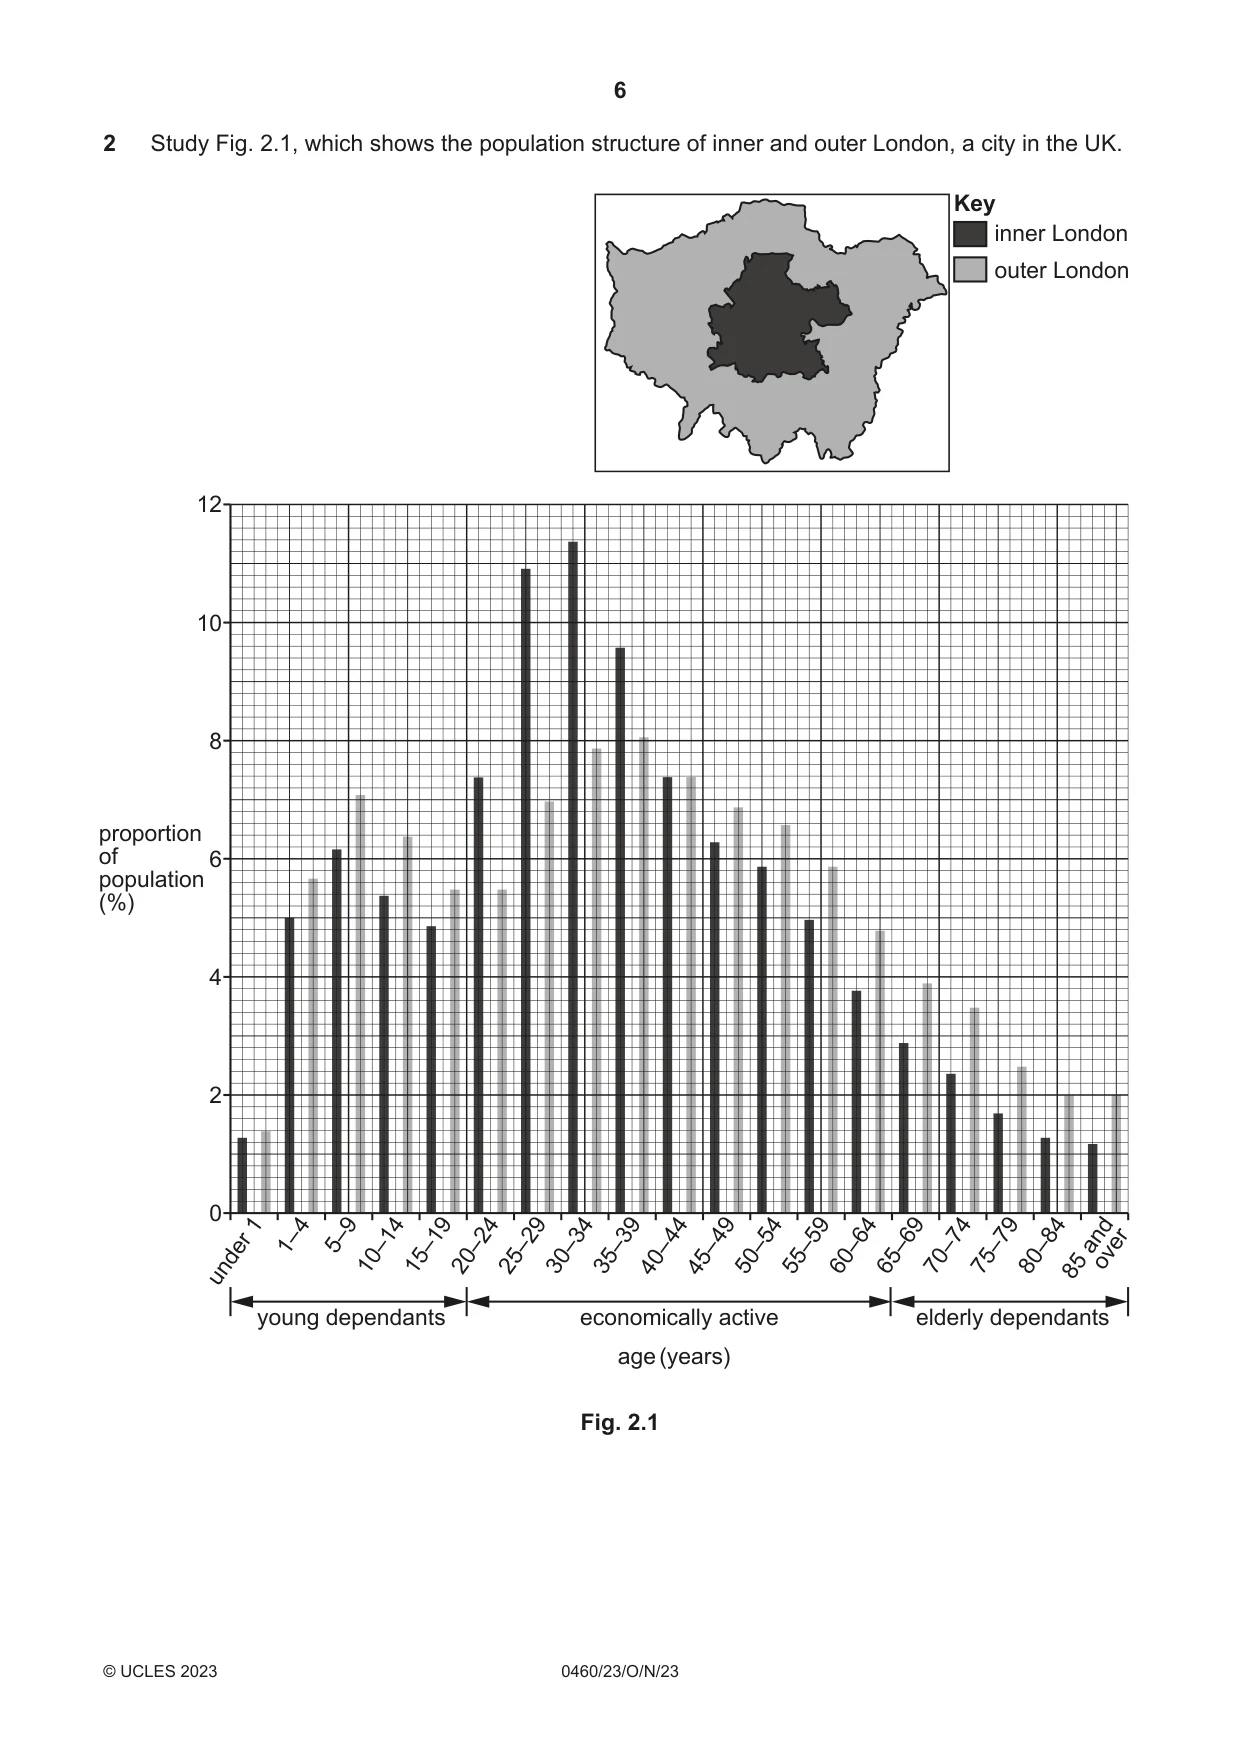
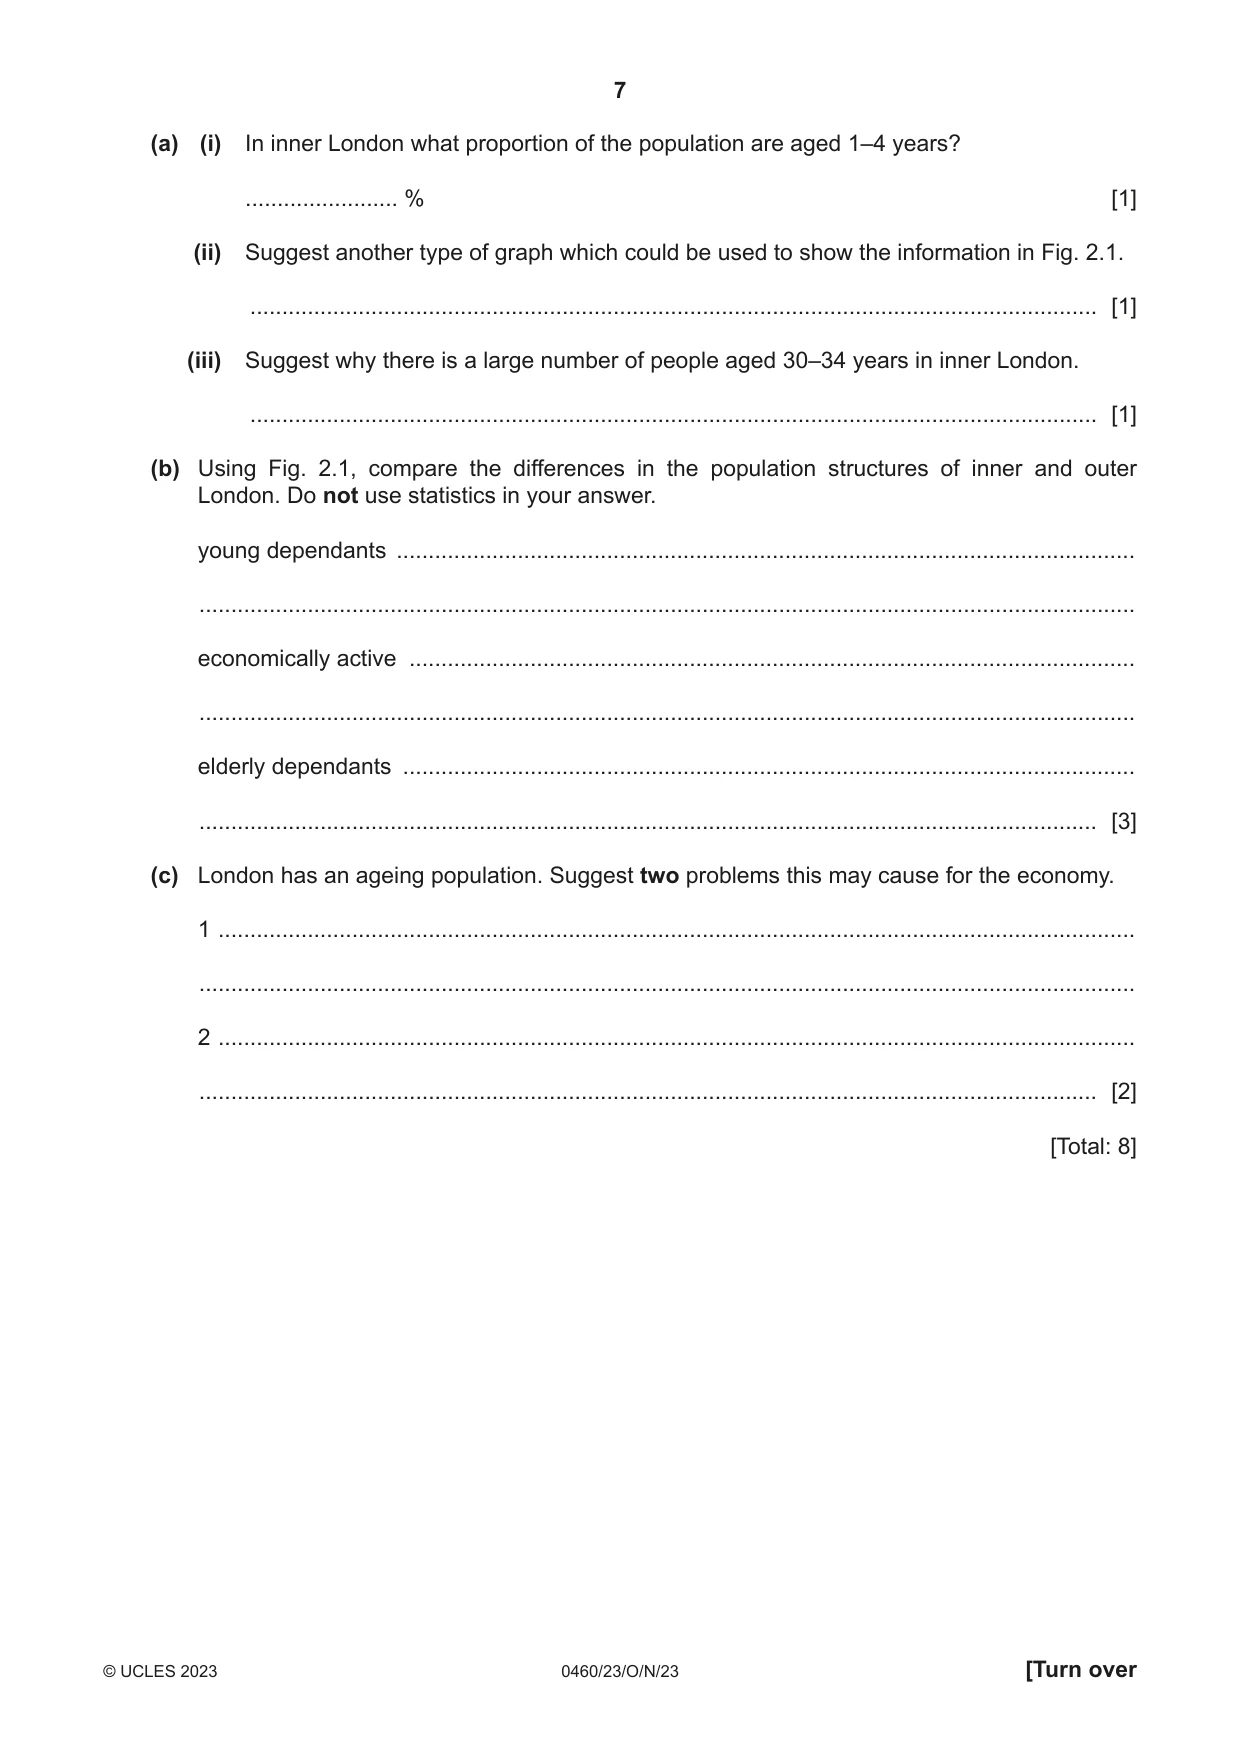
2 Study Fig. 2.1, which shows the population structure of inner and outer London, a city in the UK. Key inner London outer London 12 10 8 proportion of 6 population (%) 4 2 0 1 4 5–9 44 49 and 1– over 10–1415–1920–2425–2930–3435–3940– 45– 50–5455–5960–6465–6970–7475–7980–8485 under young dependants economically active elderly dependants age (years) Fig. 2.1 (a) (i) In inner London what proportion of the population are aged 1–4 years? ........................ % [1] (ii) Suggest another type of graph which could be used to show the information in Fig. 2.1. ..................................................................................................................................... [1] (iii) Suggest why there is a large number of people aged 30–34 years in inner London. ..................................................................................................................................... [1] (b) Using Fig. 2.1, compare the differences in the population structures of inner and outer London. Do not use statistics in your answer. young dependants .................................................................................................................... ................................................................................................................................................... economically active .................................................................................................................. ................................................................................................................................................... elderly dependants ................................................................................................................... ............................................................................................................................................. [3] (c) London has an ageing population. Suggest two problems this may cause for the economy. 1 ................................................................................................................................................ ................................................................................................................................................... 2 ................................................................................................................................................ ............................................................................................................................................. [2] [Total: 8]
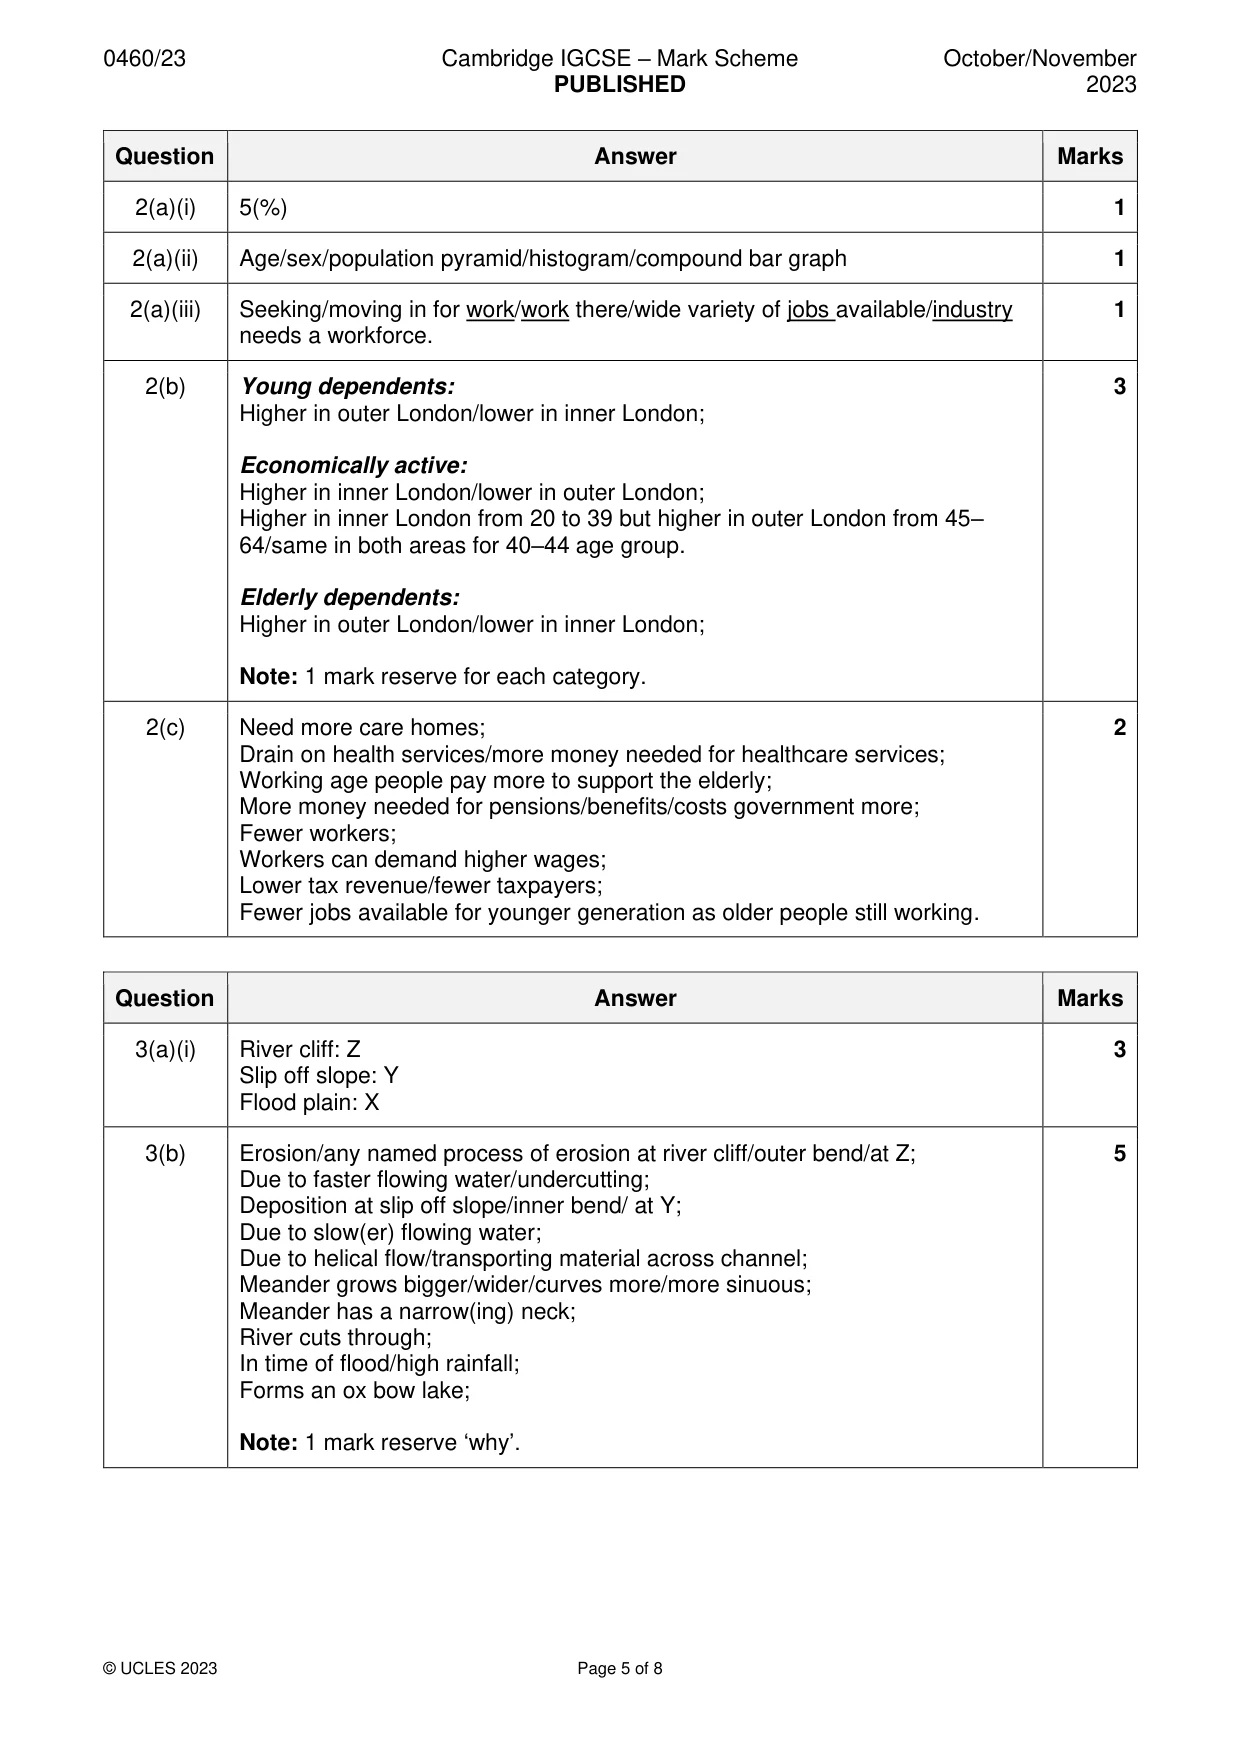
Mark scheme: 2(a)(i) 5(%) 1 2(a)(ii) Age/sex/population pyramid/histogram/compound bar graph 1 2(a)(iii) Seeking/moving in for work/work there/wide variety of jobs available/industry 1 needs a workforce. 2(b) Young dependents: 3 Higher in outer London/lower in inner London; Economically active: Higher in inner London/lower in outer London; Higher in inner London from 20 to 39 but higher in outer London from 45– 64/same in both areas for 40–44 age group. Elderly dependents: Higher in outer London/lower in inner London; Note: 1 mark reserve for each category. 2(c) Need more care homes; 2 Drain on health services/more money needed for healthcare services; Working age people pay more to support the elderly; More money needed for pensions/benefits/costs government more; Fewer workers; Workers can demand higher wages; Lower tax revenue/fewer taxpayers; Fewer jobs available for younger generation as older people still working.
Question 3
3 Study Fig. 3.1 (Insert), a photograph of a river meander and its valley. (a) Using Fig. 3.1, tick the correct answers to identify the features shown. Place one tick (3) in each row. X Y Z river cliff slip-off slope flood plain [3] (b) Suggest how and why the meander will change over time. ................................................................................................................................................... ................................................................................................................................................... ................................................................................................................................................... ................................................................................................................................................... ................................................................................................................................................... ................................................................................................................................................... ................................................................................................................................................... ................................................................................................................................................... ................................................................................................................................................... ............................................................................................................................................. [5] [Total: 8]
Mark scheme: 3(a)(i) River cliff: Z 3 Slip off slope: Y Flood plain: X 3(b) Erosion/any named process of erosion at river cliff/outer bend/at Z; 5 Due to faster flowing water/undercutting; Deposition at slip off slope/inner bend/ at Y; Due to slow(er) flowing water; Due to helical flow/transporting material across channel; Meander grows bigger/wider/curves more/more sinuous; Meander has a narrow(ing) neck; River cuts through; In time of flood/high rainfall; Forms an ox bow lake; Note: 1 mark reserve ‘why’.
Question 4
4 Study Fig. 4.1, which shows the main causes of global deforestation between 2001 and 2015. Content removed due to copyright restrictions. Fig. 4.1 (a) (i) Which region has the largest area of deforestation? ..................................................................................................................................... [1] (ii) Identify the main cause of deforestation in Russia, China and South Asia. ..................................................................................................................................... [1] (iii) Which cause of deforestation affects all regions? ..................................................................................................................................... [1] (b) Study Fig. 4.2 (Insert), which shows an area of Brazil that has been partially deforested. (i) Identify the type of farming shown in Fig. 4.2. ..................................................................................................................................... [1] (ii) Describe the vegetation shown in Fig. 4.2. ........................................................................................................................................... ........................................................................................................................................... ........................................................................................................................................... ........................................................................................................................................... ........................................................................................................................................... ........................................................................................................................................... ........................................................................................................................................... ..................................................................................................................................... [4] [Total: 8]
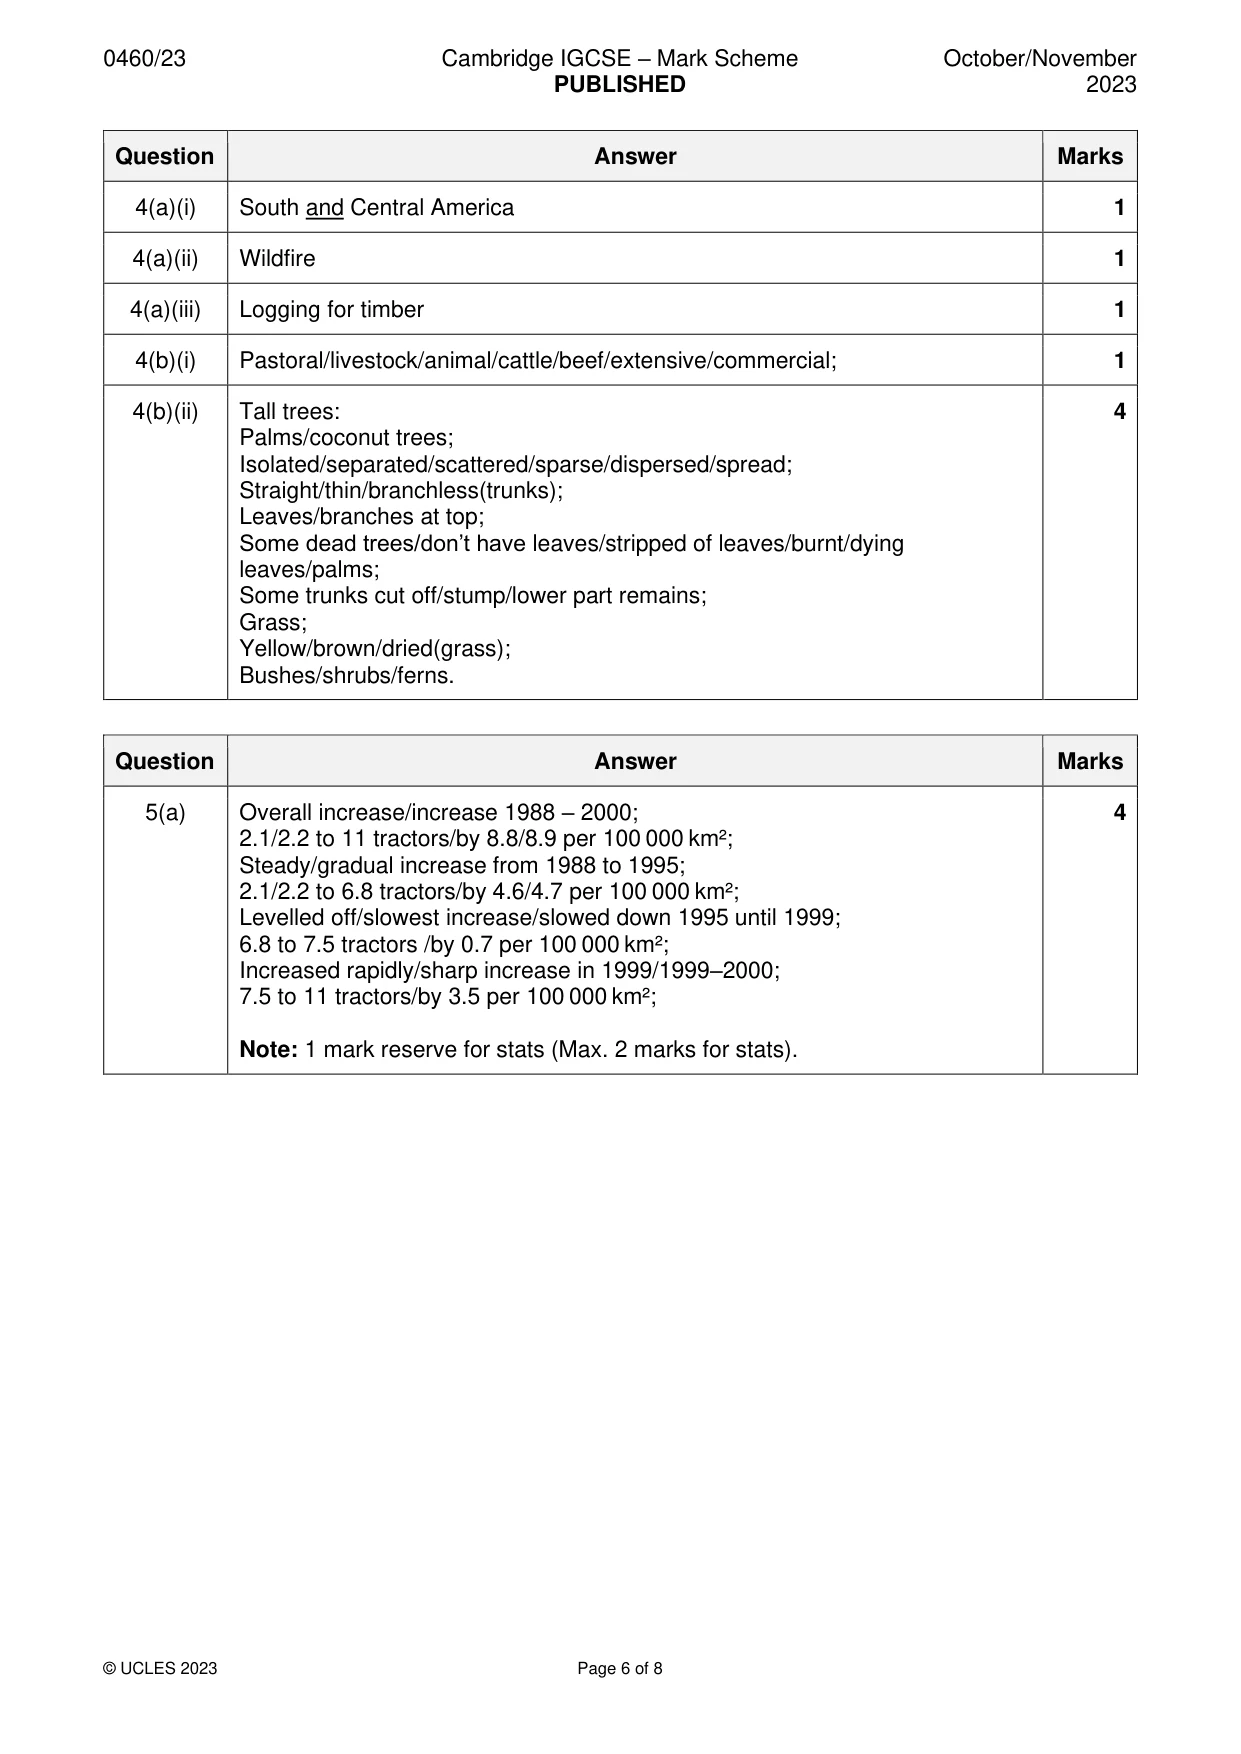
Mark scheme: 4(a)(i) South and Central America 1 4(a)(ii) Wildfire 1 4(a)(iii) Logging for timber 1 4(b)(i) Pastoral/livestock/animal/cattle/beef/extensive/commercial; 1 4(b)(ii) Tall trees: 4 Palms/coconut trees; Isolated/separated/scattered/sparse/dispersed/spread; Straight/thin/branchless(trunks); Leaves/branches at top; Some dead trees/don’t have leaves/stripped of leaves/burnt/dying leaves/palms; Some trunks cut off/stump/lower part remains; Grass; Yellow/brown/dried(grass); Bushes/shrubs/ferns.
More questions on Environmental risks of economic development
Q5 · The number of tractors per 100 000 km2 of agricultural land between 1988 and 2000 in…
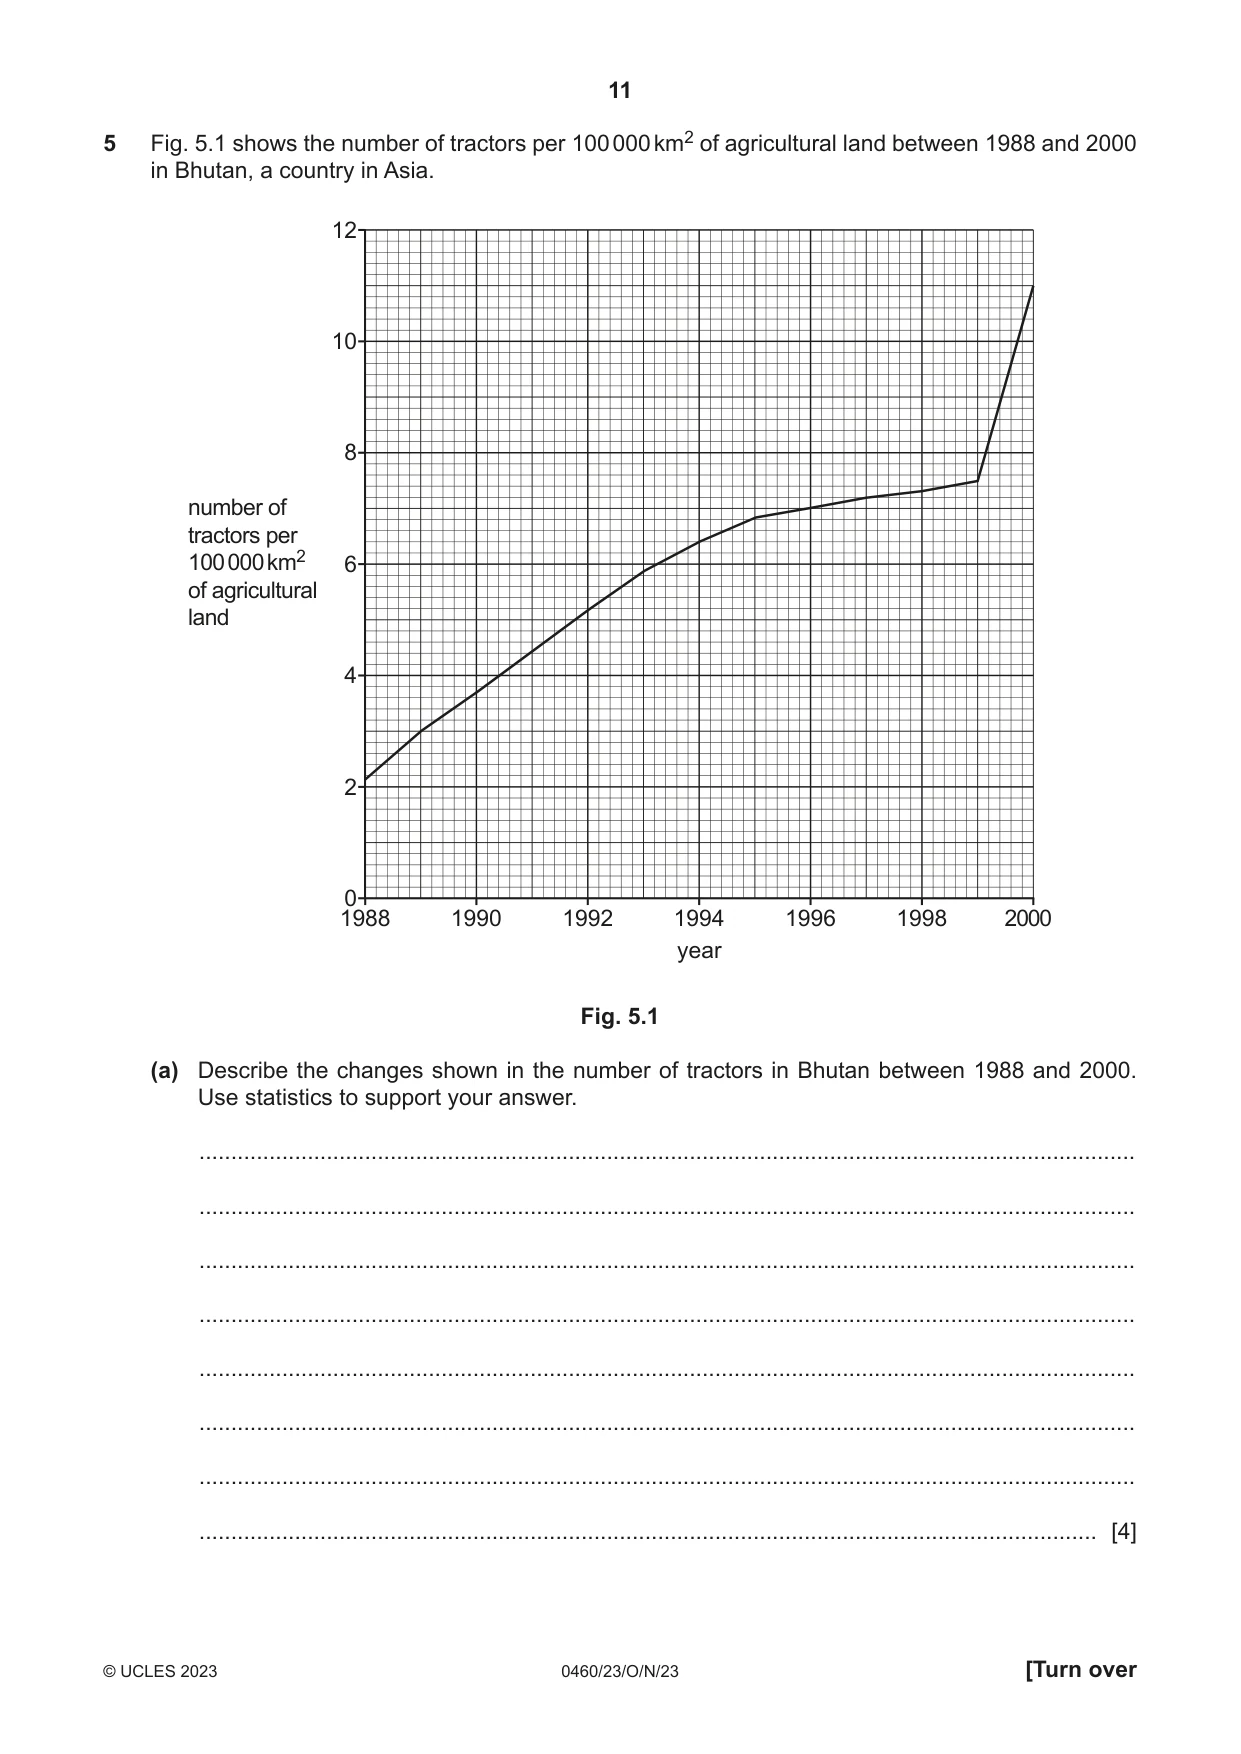
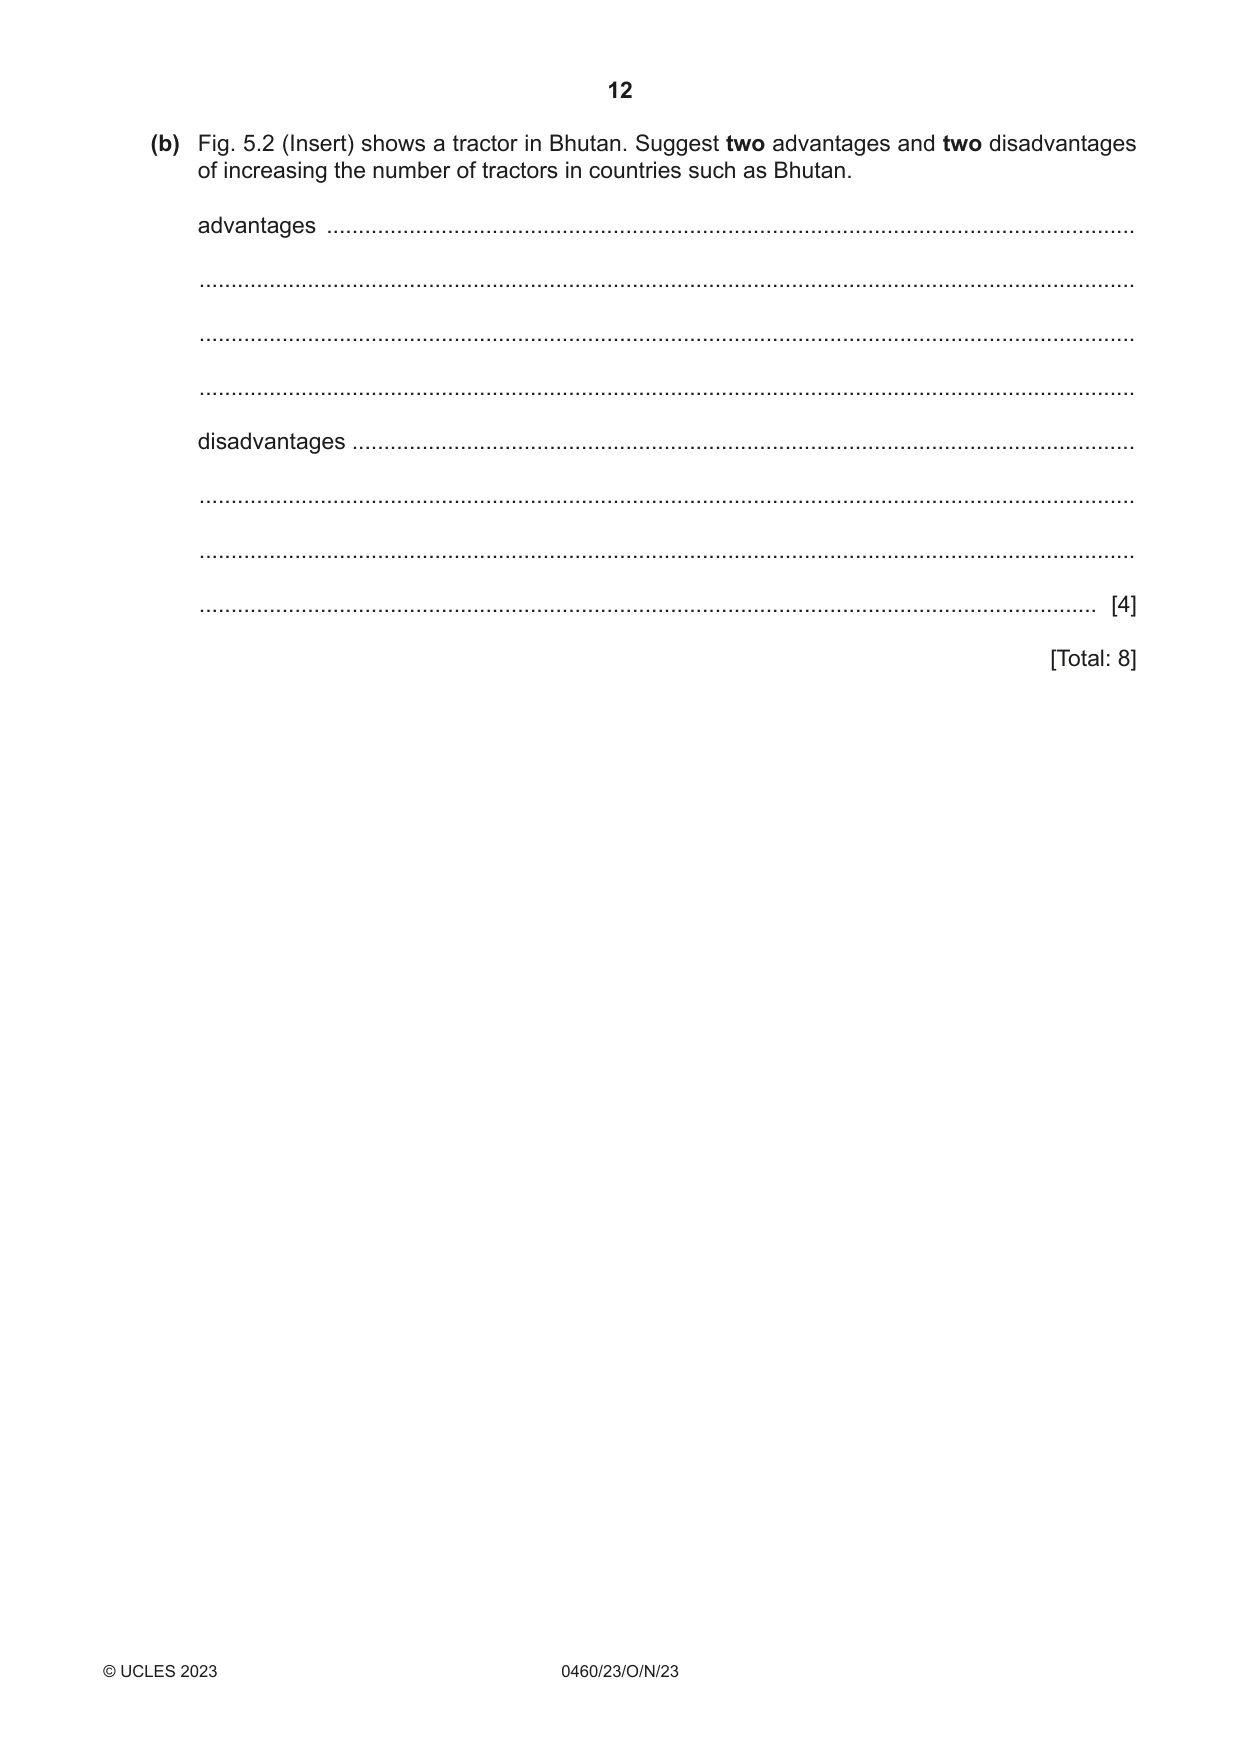
5 Fig. 5.1 shows the number of tractors per 100 000 km2 of agricultural land between 1988 and 2000 in Bhutan, a country in Asia. 12 10 8 number of tractors per 100 000 km2 6 of agricultural land 4 2 0 1988 1990 1992 1994 1996 1998 2000 year Fig. 5.1 (a) Describe the changes shown in the number of tractors in Bhutan between 1988 and 2000. Use statistics to support your answer. ................................................................................................................................................... ................................................................................................................................................... ................................................................................................................................................... ................................................................................................................................................... ................................................................................................................................................... ................................................................................................................................................... ................................................................................................................................................... ............................................................................................................................................. [4] (b) Fig. 5.2 (Insert) shows a tractor in Bhutan. Suggest two advantages and two disadvantages of increasing the number of tractors in countries such as Bhutan. advantages ............................................................................................................................... ................................................................................................................................................... ................................................................................................................................................... ................................................................................................................................................... disadvantages ........................................................................................................................... ................................................................................................................................................... ................................................................................................................................................... ............................................................................................................................................. [4] [Total: 8]
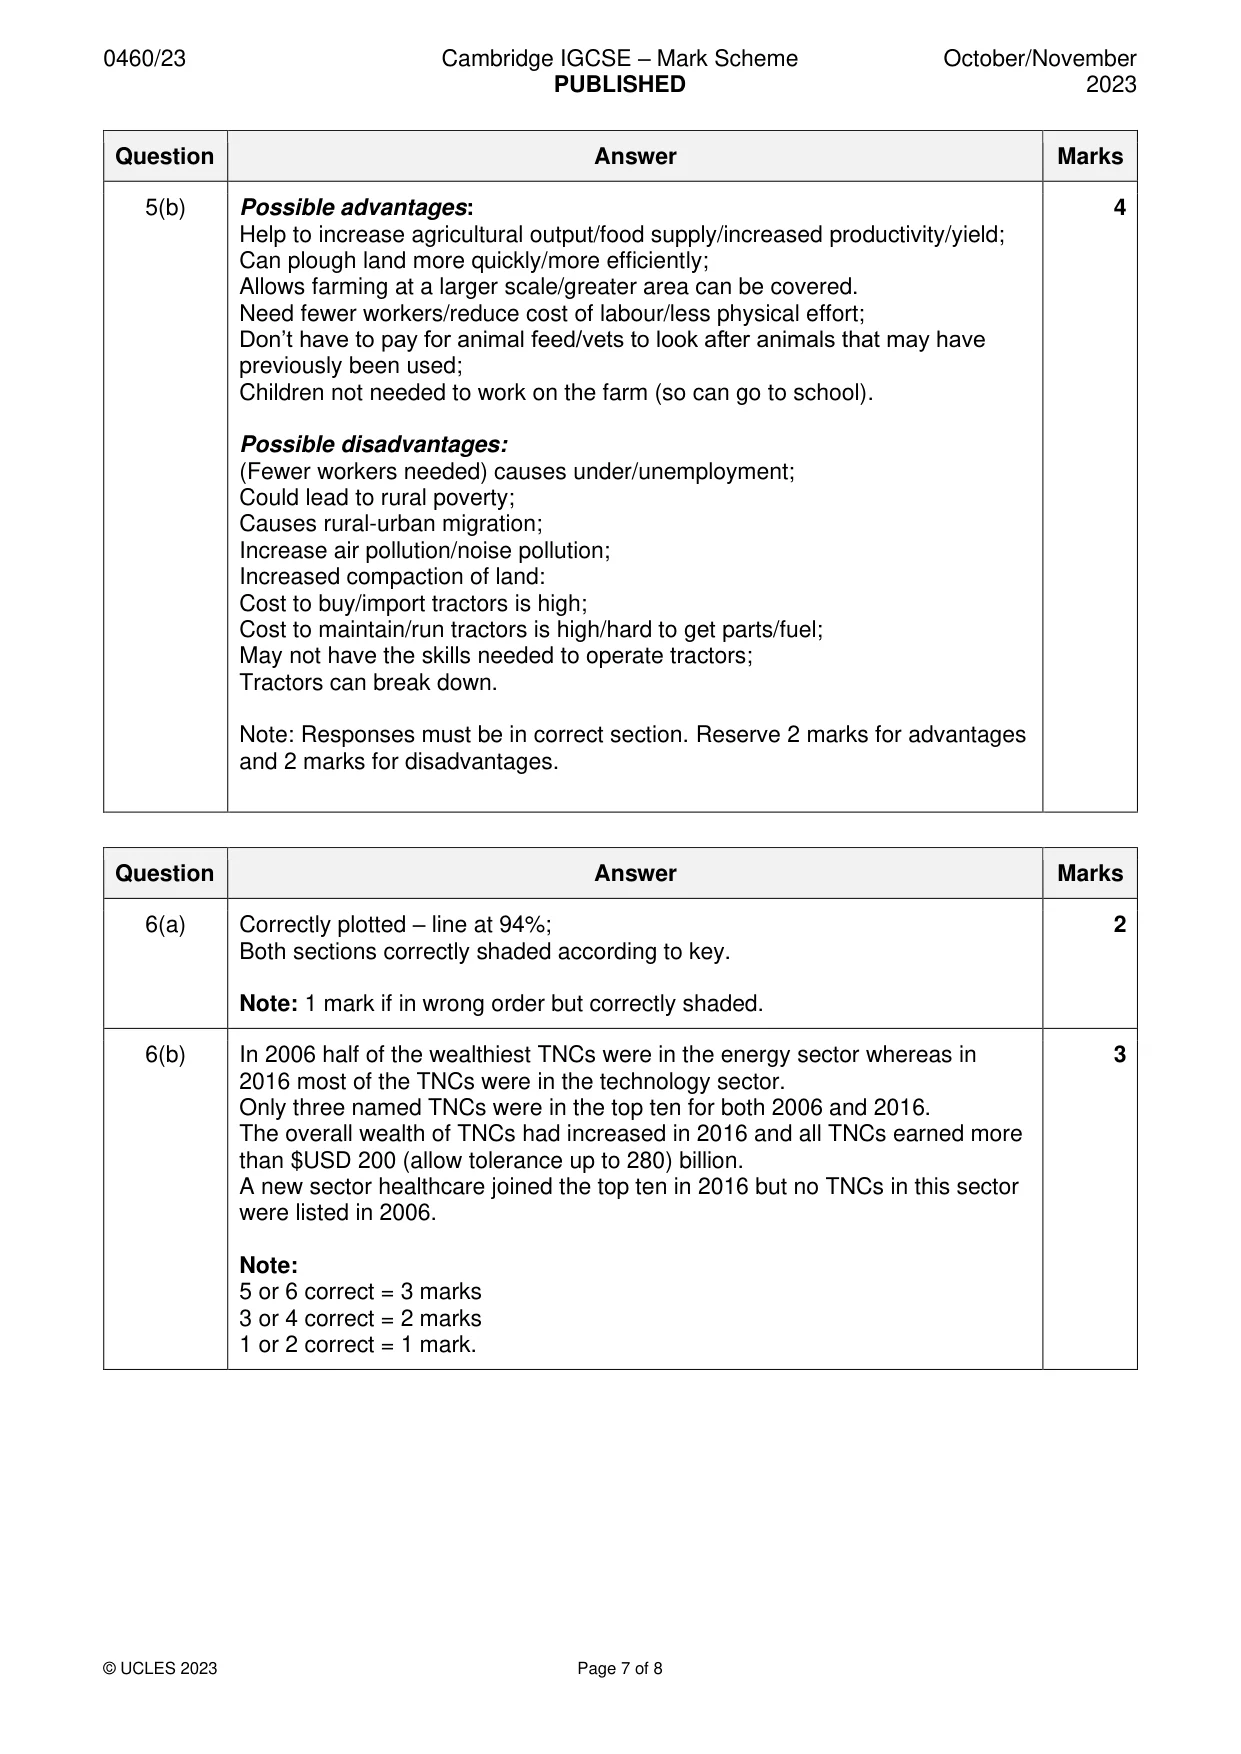
Mark scheme: 5(a) Overall increase/increase 1988 – 2000; 4 2.1/2.2 to 11 tractors/by 8.8/8.9 per 100 000 km²; Steady/gradual increase from 1988 to 1995; 2.1/2.2 to 6.8 tractors/by 4.6/4.7 per 100 000 km²; Levelled off/slowest increase/slowed down 1995 until 1999; 6.8 to 7.5 tractors /by 0.7 per 100 000 km²; Increased rapidly/sharp increase in 1999/1999–2000; 7.5 to 11 tractors/by 3.5 per 100 000 km²; Note: 1 mark reserve for stats (Max. 2 marks for stats). 5(b) Possible advantages: 4 Help to increase agricultural output/food supply/increased productivity/yield; Can plough land more quickly/more efficiently; Allows farming at a larger scale/greater area can be covered. Need fewer workers/reduce cost of labour/less physical effort; Don’t have to pay for animal feed/vets to look after animals that may have previously been used; Children not needed to work on the farm (so can go to school). Possible disadvantages: (Fewer workers needed) causes under/unemployment; Could lead to rural poverty; Causes rural-urban migration; Increase air pollution/noise pollution; Increased compaction of land: Cost to buy/import tractors is high; Cost to maintain/run tractors is high/hard to get parts/fuel; May not have the skills needed to operate tractors; Tractors can break down. Note: Responses must be in correct section. Reserve 2 marks for advantages and 2 marks for disadvantages.
Question 6
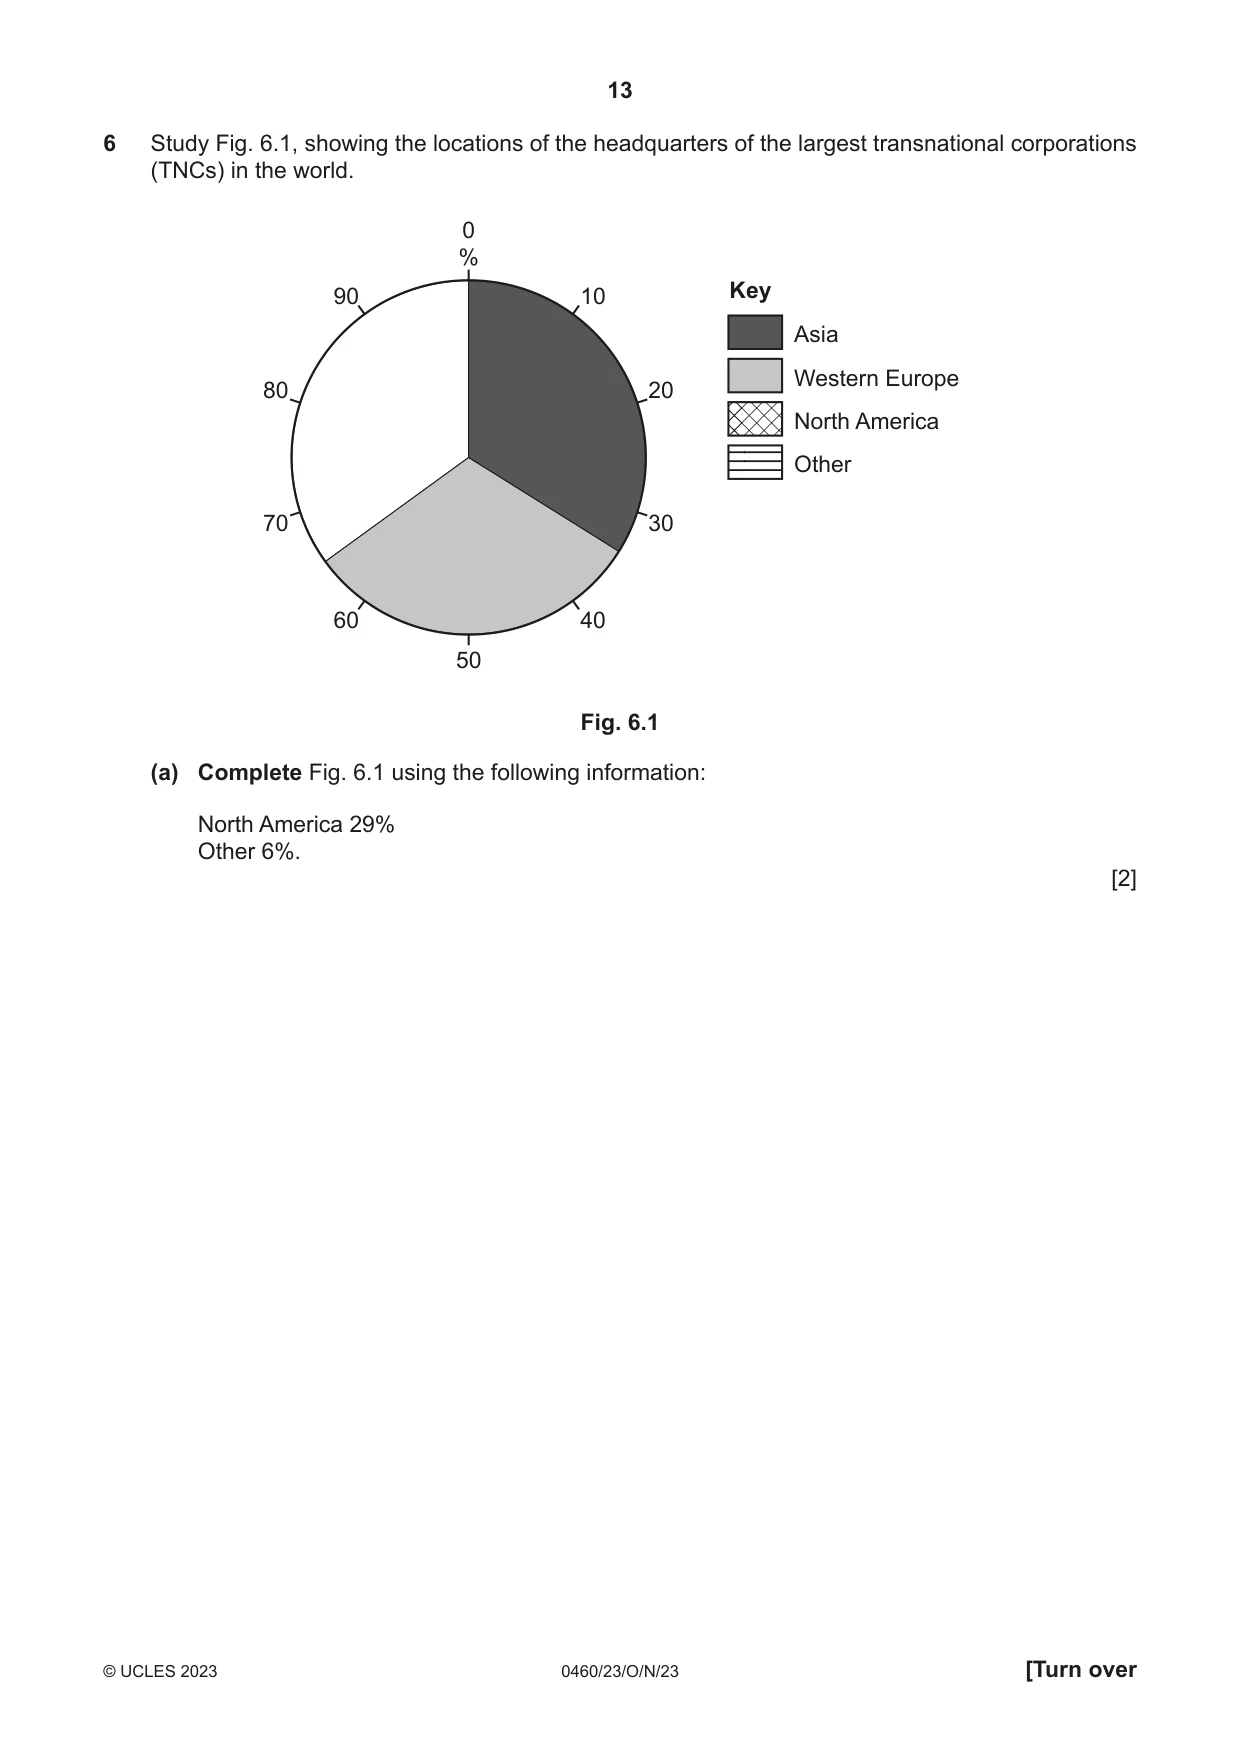
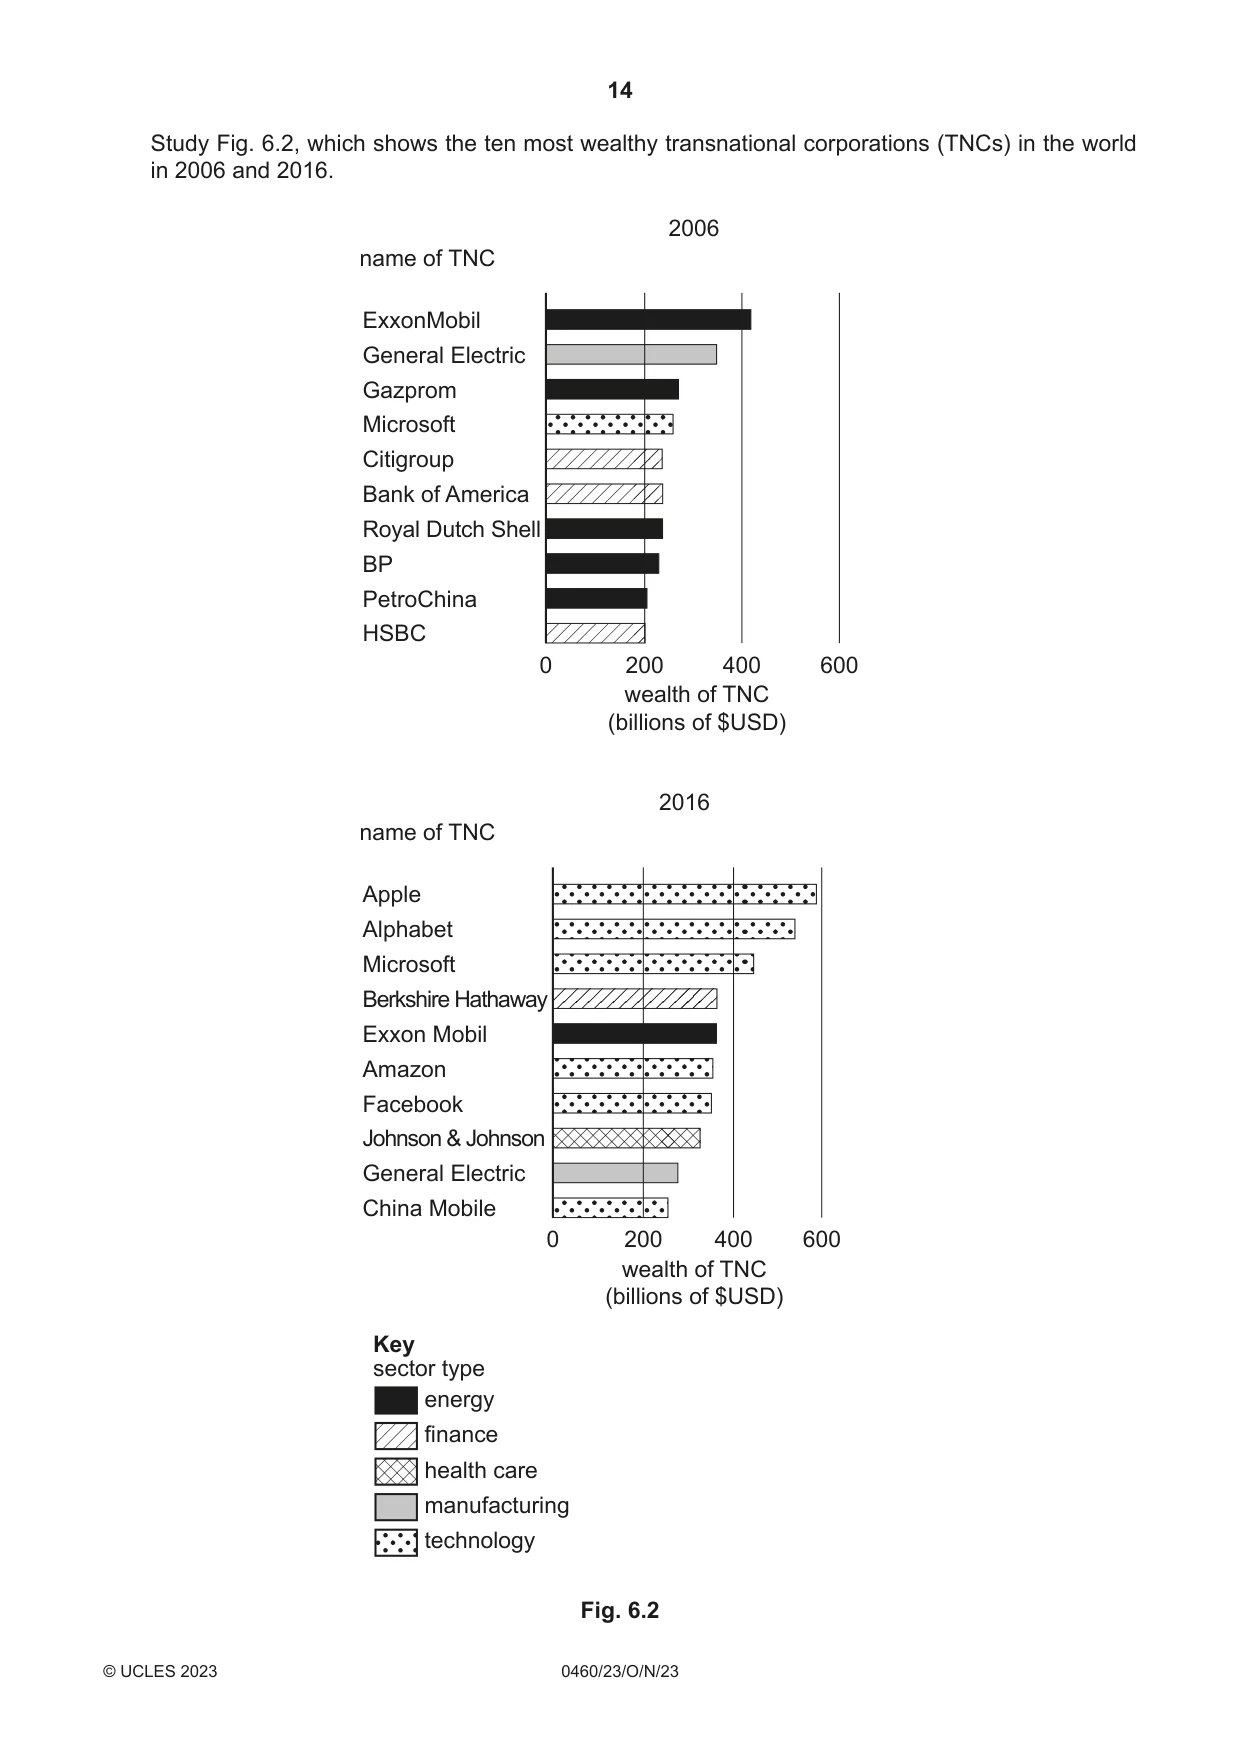
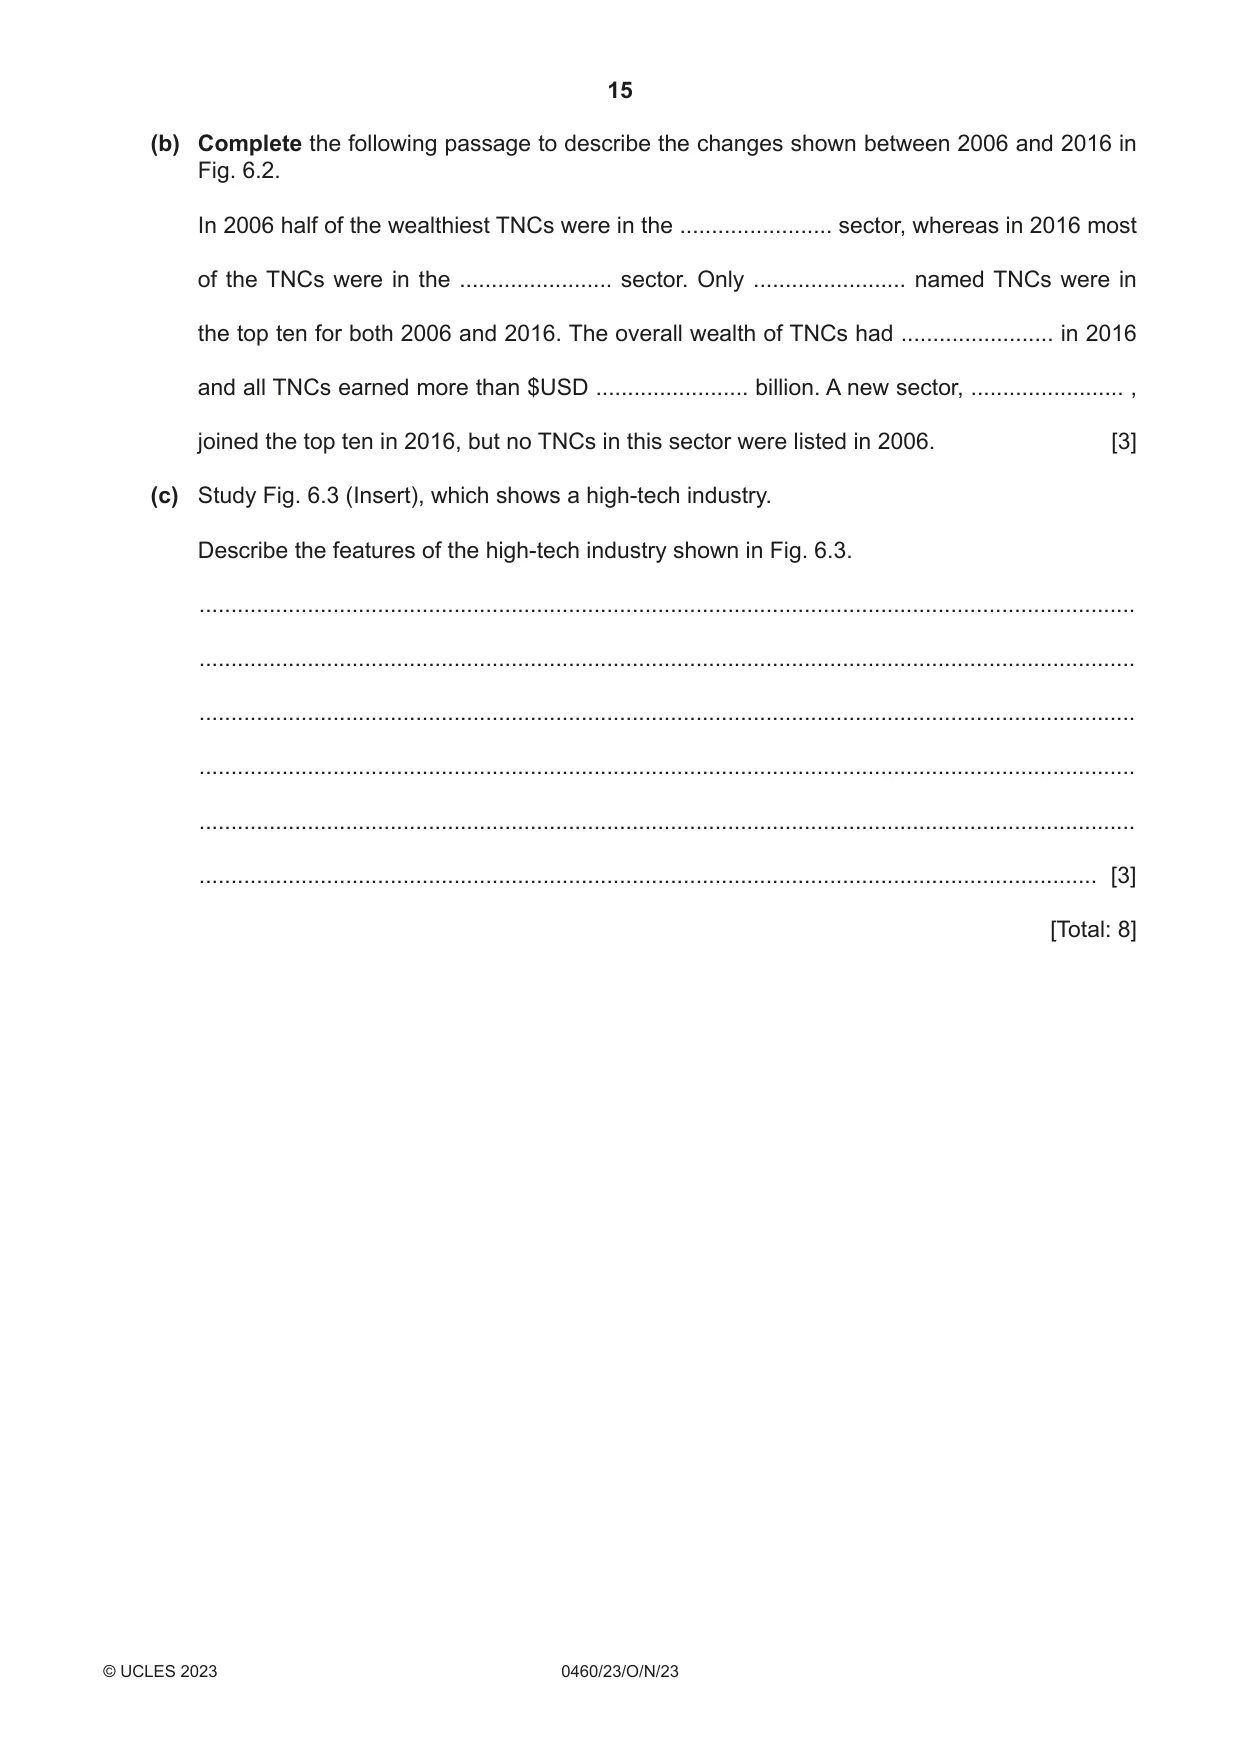
6 Study Fig. 6.1, showing the locations of the headquarters of the largest transnational corporations (TNCs) in the world. 0 % 90 10 Key Asia Western Europe 80 20 North America Other 70 30 60 40 50 Fig. 6.1 (a) Complete Fig. 6.1 using the following information: North America 29% Other 6%. [2] Study Fig. 6.2, which shows the ten most wealthy transnational corporations (TNCs) in the world in 2006 and 2016. 2006 name of TNC ExxonMobil General Electric Gazprom Microsoft Citigroup Bank of America Royal Dutch Shell BP PetroChina HSBC 0 200 400 600 wealth of TNC (billions of $USD) 2016 name of TNC Apple Alphabet Microsoft Berkshire Hathaway Exxon Mobil Amazon Facebook Johnson & Johnson General Electric China Mobile 0 200 400 600 wealth of TNC (billions of $USD) Key sector type energy finance health care manufacturing technology Fig. 6.2 (b) Complete the following passage to describe the changes shown between 2006 and 2016 in Fig. 6.2. In 2006 half of the wealthiest TNCs were in the ........................ sector, whereas in 2016 most of the TNCs were in the ........................ sector. Only ........................ named TNCs were in the top ten for both 2006 and 2016. The overall wealth of TNCs had ........................ in 2016 and all TNCs earned more than $USD ........................ billion. A new sector, ........................ , joined the top ten in 2016, but no TNCs in this sector were listed in 2006. [3] (c) Study Fig. 6.3 (Insert), which shows a high-tech industry. Describe the features of the high-tech industry shown in Fig. 6.3. ................................................................................................................................................... ................................................................................................................................................... ................................................................................................................................................... ................................................................................................................................................... ................................................................................................................................................... ............................................................................................................................................. [3] [Total: 8]
Mark scheme: 6(a) Correctly plotted – line at 94%; 2 Both sections correctly shaded according to key. Note: 1 mark if in wrong order but correctly shaded. 6(b) In 2006 half of the wealthiest TNCs were in the energy sector whereas in 3 2016 most of the TNCs were in the technology sector. Only three named TNCs were in the top ten for both 2006 and 2016. The overall wealth of TNCs had increased in 2016 and all TNCs earned more than $USD 200 (allow tolerance up to 280) billion. A new sector healthcare joined the top ten in 2016 but no TNCs in this sector were listed in 2006. Note: 5 or 6 correct = 3 marks 3 or 4 correct = 2 marks 1 or 2 correct = 1 mark. 6(c) Computerised/computer controlled; 3 Automated/mechanised/machines; Robotic arms/robots/Artificial Intelligence(AI); Assembly; Modern/new/advanced; Car/vehicle manufacturing; Few people/workers; Clean/sterile/white room/brightly lit; Information on screen/monitors/LED displays/televisions; Camera/projector (on roof).
What was in this paper
The subtopics covered by these 6 questions, and how many questions each got. Open one in a new tab to see every Cambridge question on it.
What you needed in this session
Cambridge’s own grade thresholds for 2023 Oct/Nov, Paper 2 · Variant 3. A higher threshold means an easier paper — the bar moves with how the cohort did.