Cambridge IGCSE Geography 0460 — 2018 May/June Paper 2 · Variant 1
0460/21/M/J/18 · 6 questions · 60 marks · ≈68 min
The question paper and its mark scheme, free to read here and free to download. This is Cambridge’s own paper, exactly as it was sat.
Question paper24 pages

Mark scheme6 pages
Answers below. Sit the paper first if you are practising.
Questions as text
Q1 · Study the map extract for Geitsida, Norway
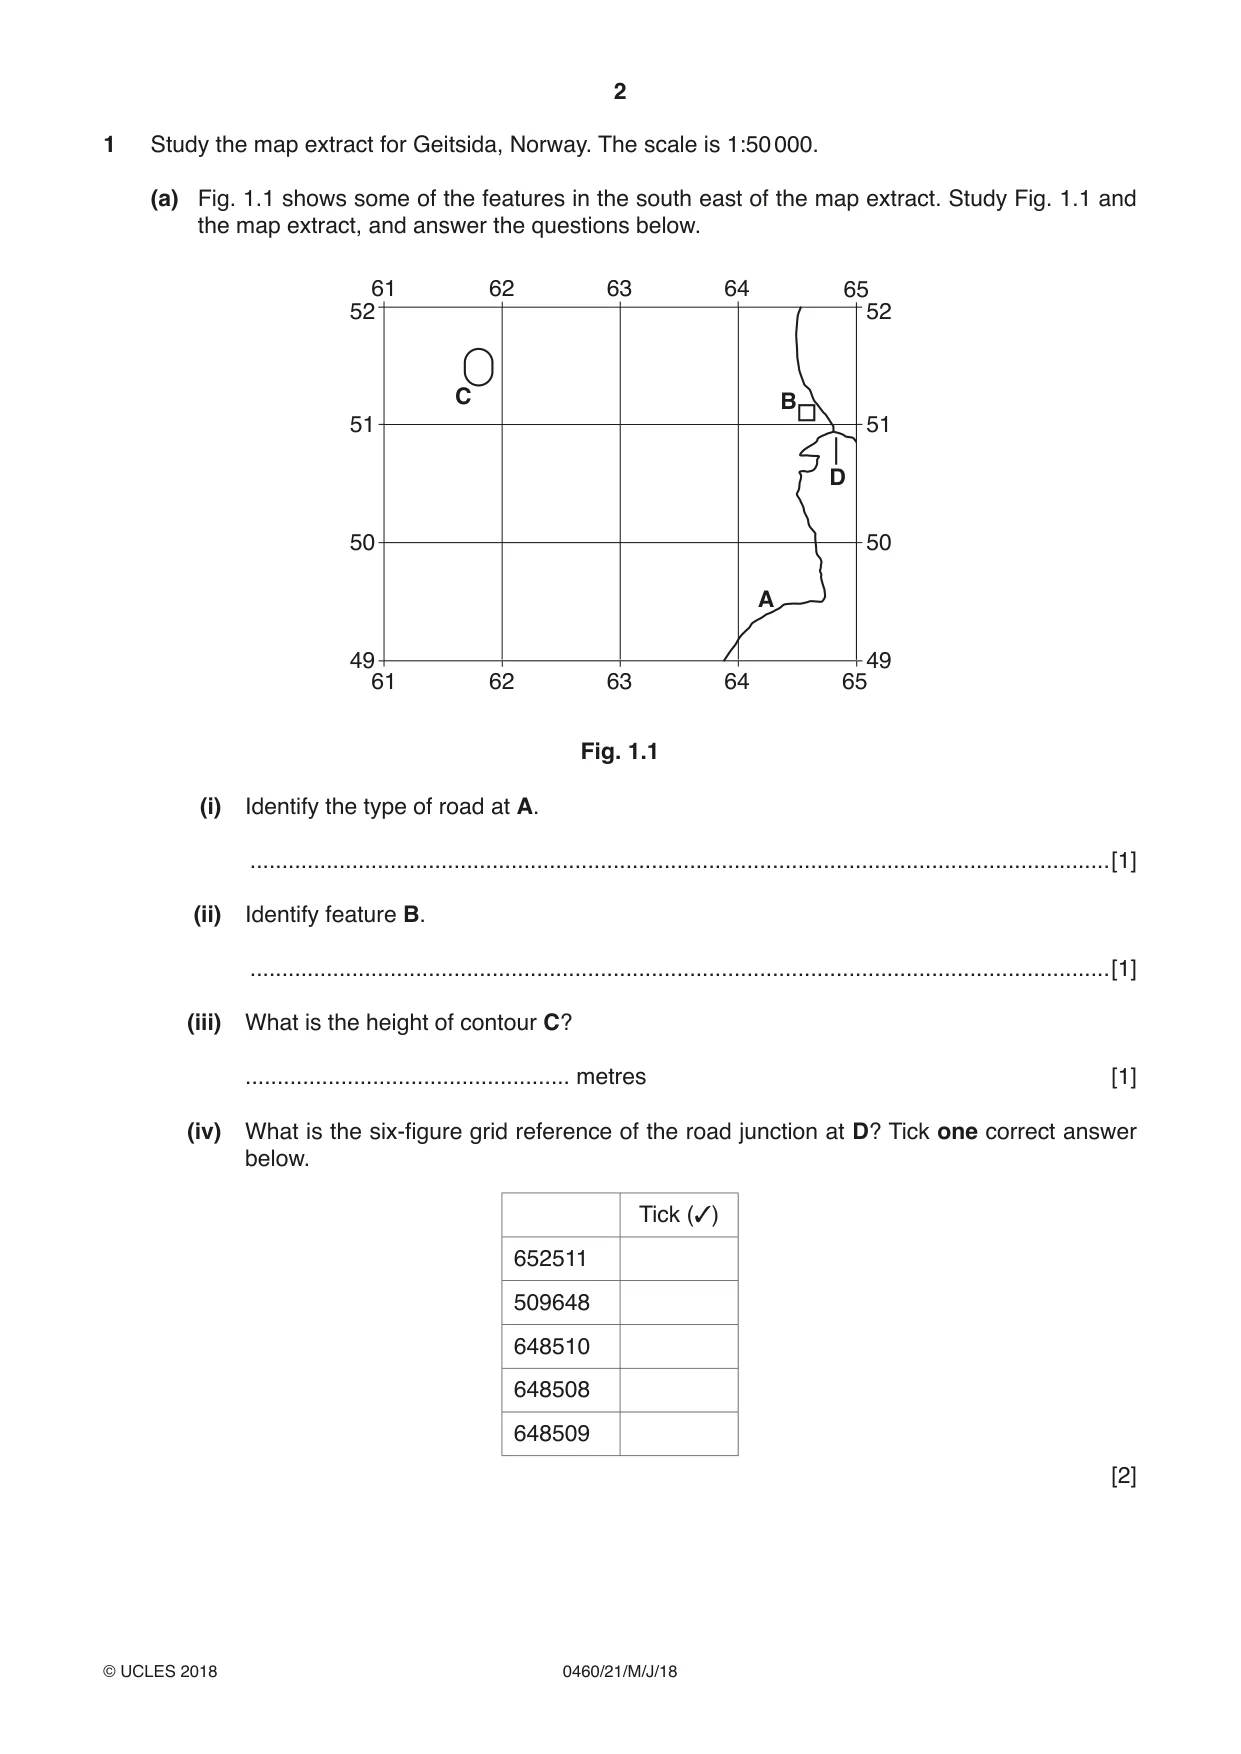
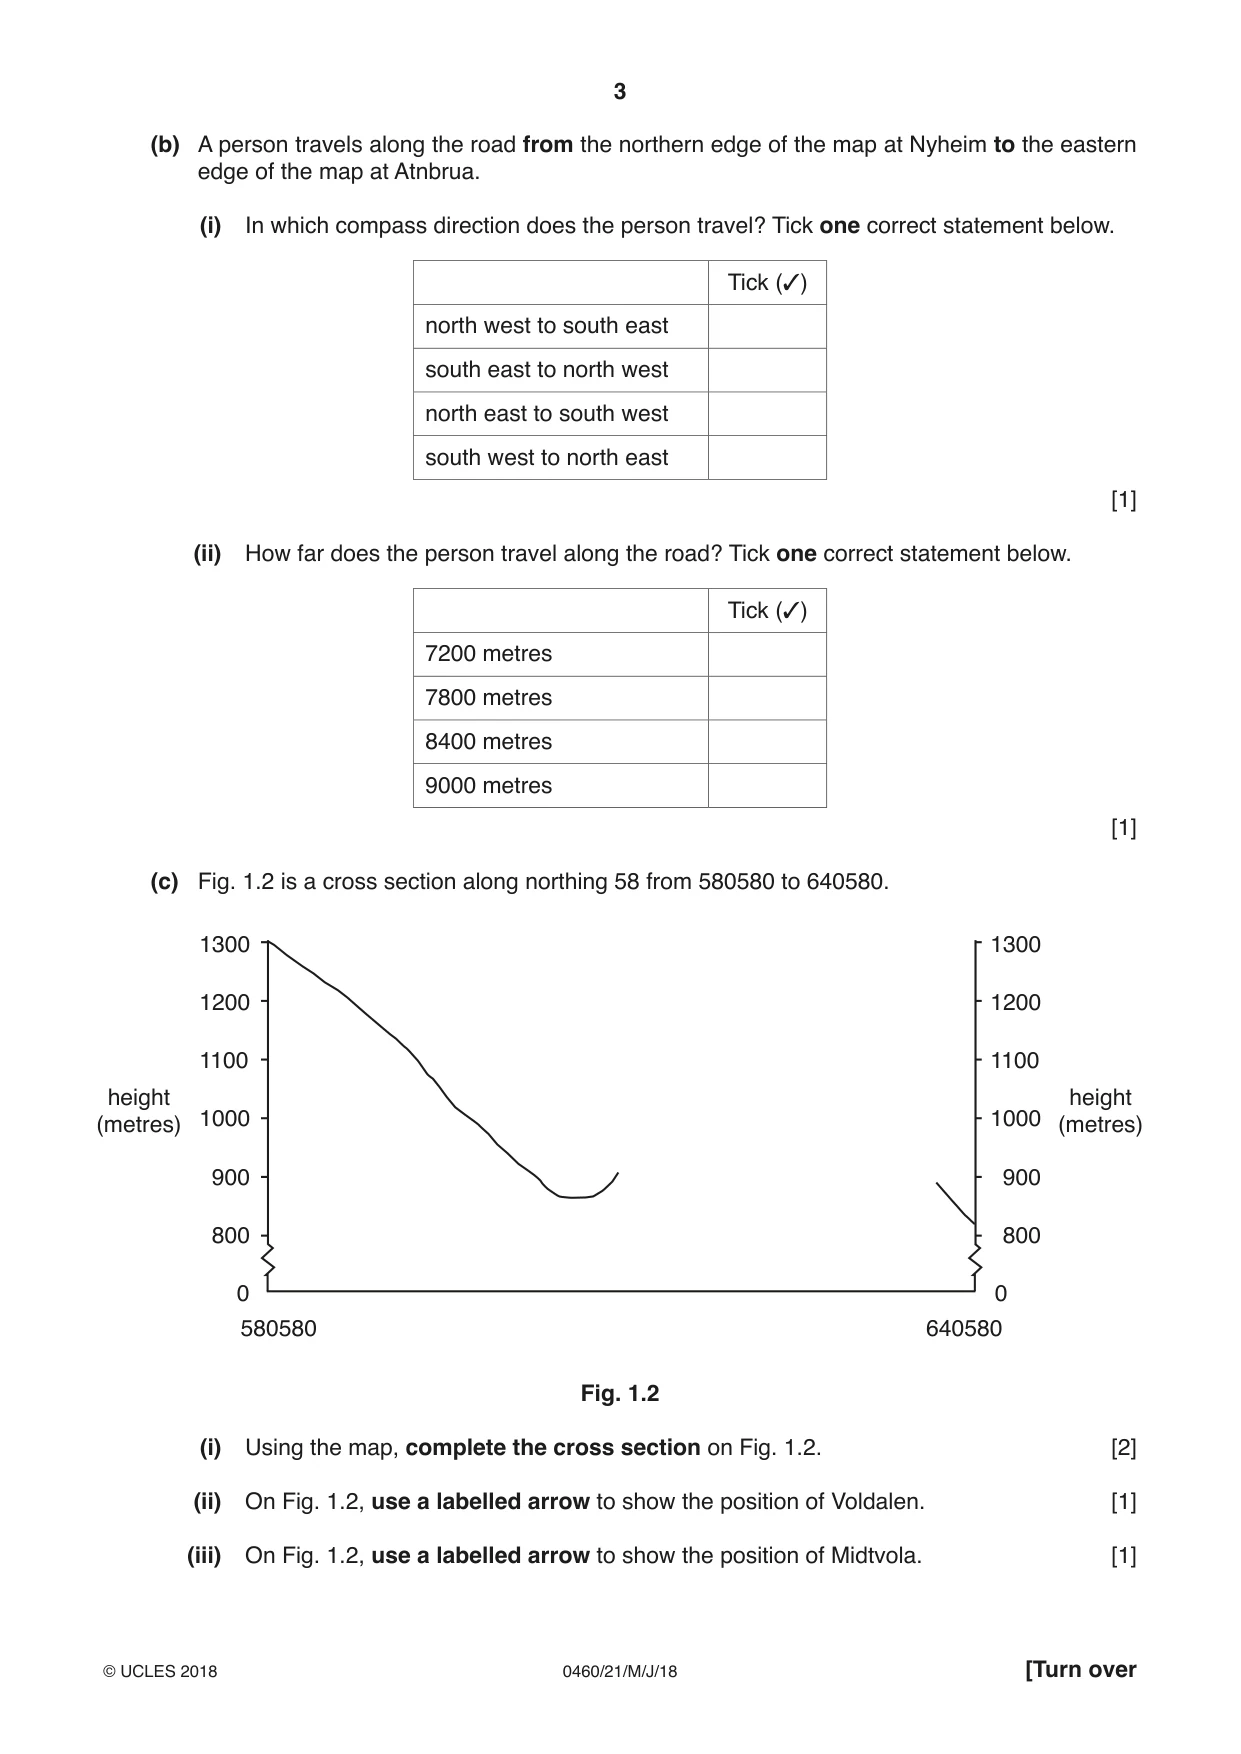
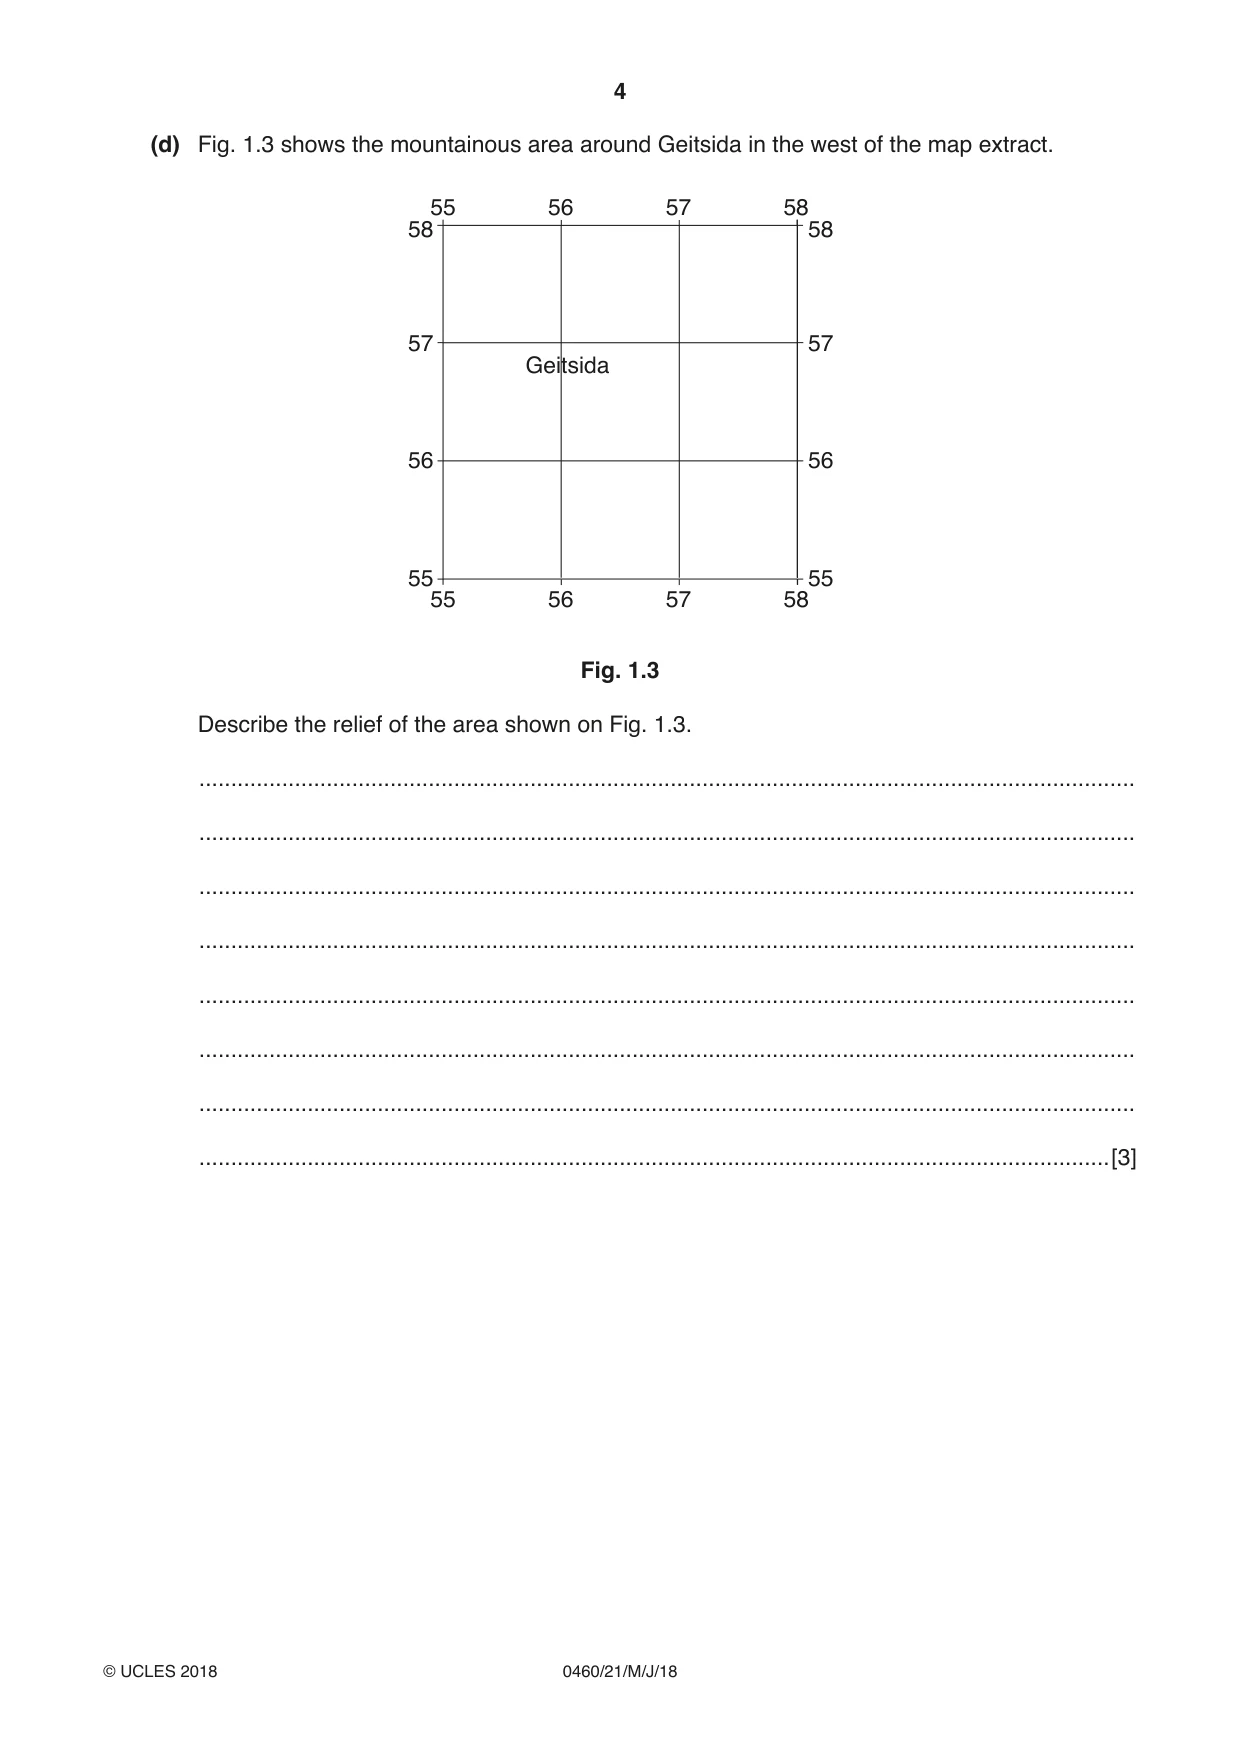
1 Study the map extract for Geitsida, Norway. The scale is 1:50 000. (a) Fig. 1.1 shows some of the features in the south east of the map extract. Study Fig. 1.1 and the map extract, and answer the questions below. 61 62 63 64 65 52 52 C B 51 51 D 50 50 A 49 49 61 62 63 64 65 Fig. 1.1 (i) Identify the type of road at A. .......................................................................................................................................[1] (ii) Identify feature B. .......................................................................................................................................[1] (iii) What is the height of contour C? ................................................... metres [1] (iv) What is the six-figure grid reference of the road junction at D? Tick one correct answer below. Tick (3) 652511 509648 648510 648508 648509 [2] (b) A person travels along the road from the northern edge of the map at Nyheim to the eastern edge of the map at Atnbrua. (i) In which compass direction does the person travel? Tick one correct statement below. Tick (3) north west to south east south east to north west north east to south west south west to north east [1] (ii) How far does the person travel along the road? Tick one correct statement below. Tick (3) 7200 metres 7800 metres 8400 metres 9000 metres [1] (c) Fig. 1.2 is a cross section along northing 58 from 580580 to 640580. 1300 1300 1200 1200 1100 1100 height height 1000 1000(metres) (metres) 900 900 800 800 0 0 580580 640580 Fig. 1.2 (i) Using the map, complete the cross section on Fig. 1.2. [2] (ii) On Fig. 1.2, use a labelled arrow to show the position of Voldalen. [1] (iii) On Fig. 1.2, use a labelled arrow to show the position of Midtvola. [1] (d) Fig. 1.3 shows the mountainous area around Geitsida in the west of the map extract. 55 56 57 58 58 58 57 57 Geitsida 56 56 55 55 55 56 57 58 Fig. 1.3 Describe the relief of the area shown on Fig. 1.3. ................................................................................................................................................... ................................................................................................................................................... ................................................................................................................................................... ................................................................................................................................................... ................................................................................................................................................... ................................................................................................................................................... ................................................................................................................................................... ...............................................................................................................................................[3] (e) Look at the whole of the map extract. (i) Describe the distribution of cultivation and forest. ........................................................................................................................................... ........................................................................................................................................... ........................................................................................................................................... ........................................................................................................................................... ........................................................................................................................................... ........................................................................................................................................... ........................................................................................................................................... .......................................................................................................................................[3] (ii) Describe the relationship between roads and relief. ........................................................................................................................................... ........................................................................................................................................... ........................................................................................................................................... ........................................................................................................................................... ........................................................................................................................................... ........................................................................................................................................... ........................................................................................................................................... .......................................................................................................................................[3] [Total: 20]
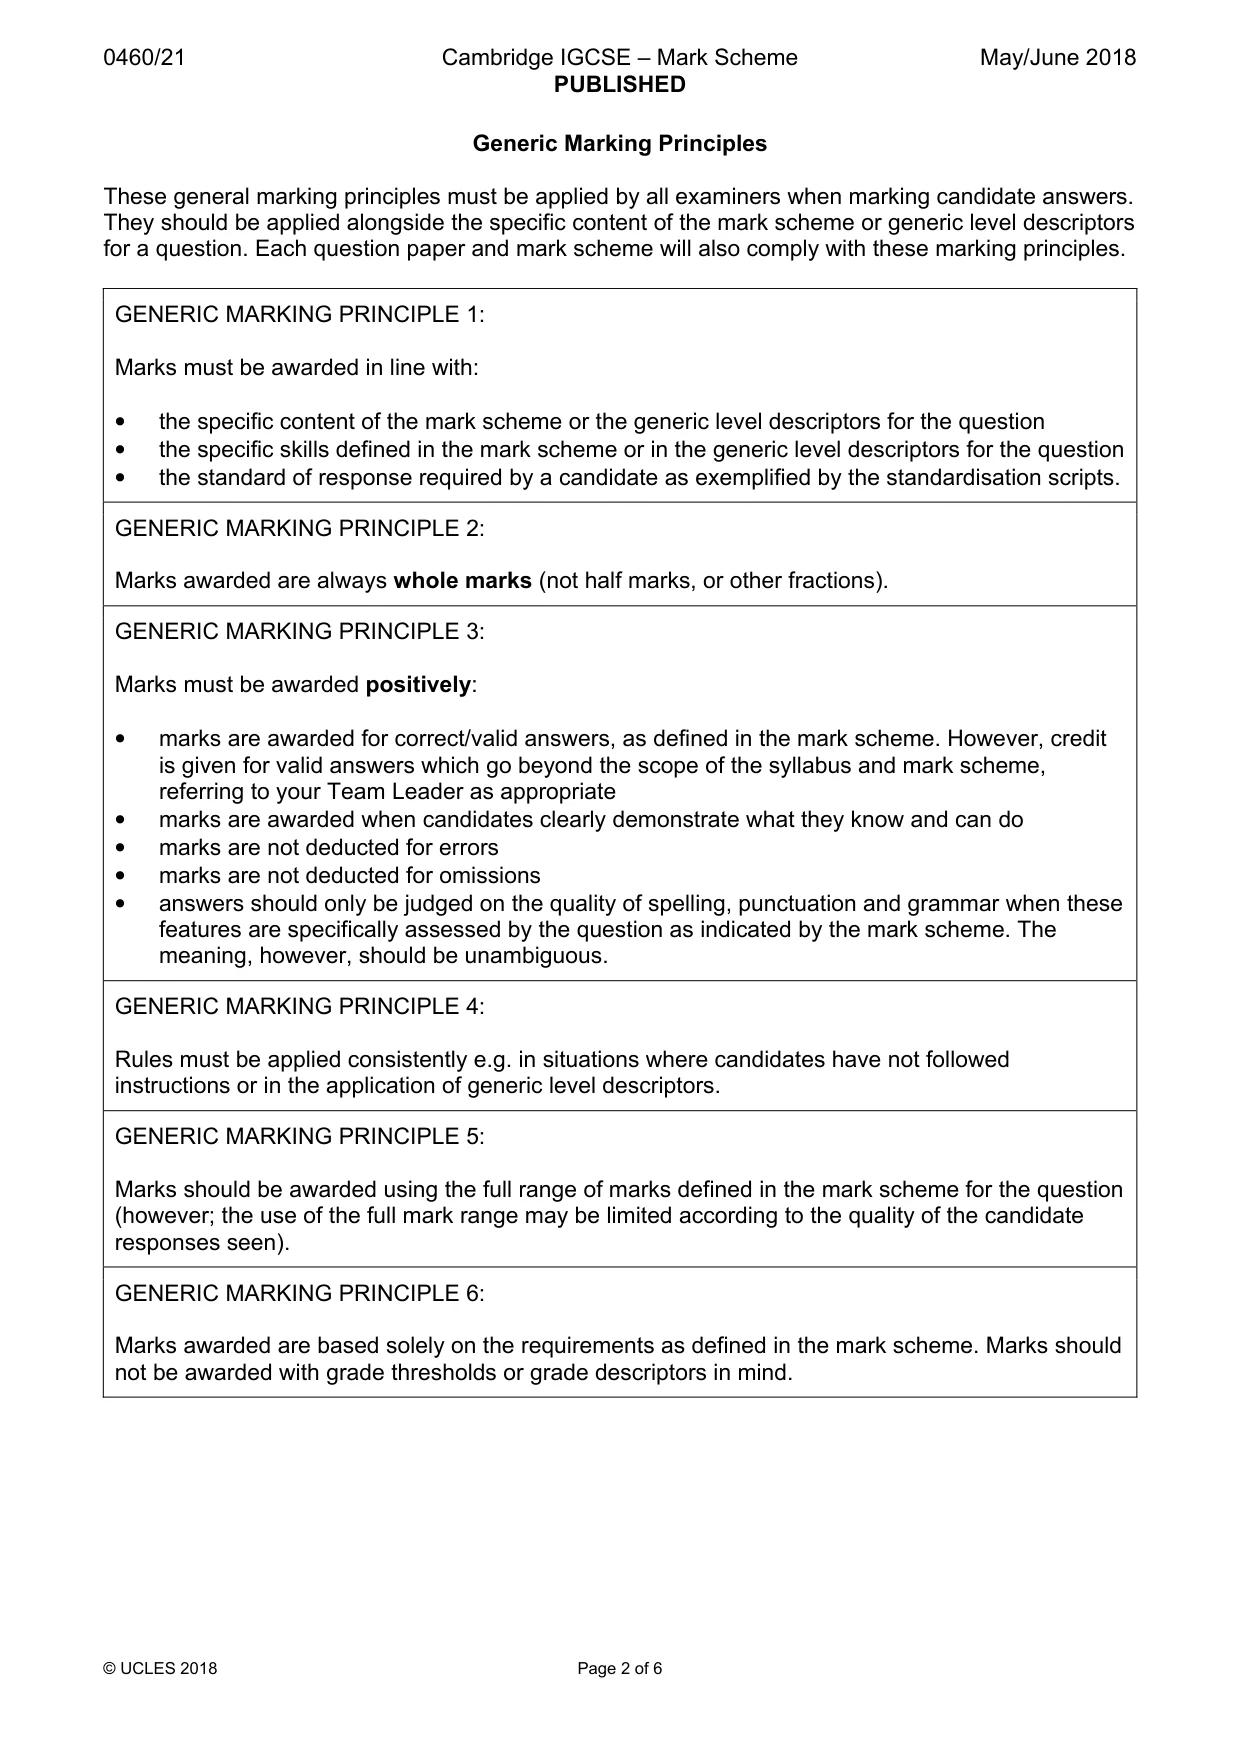
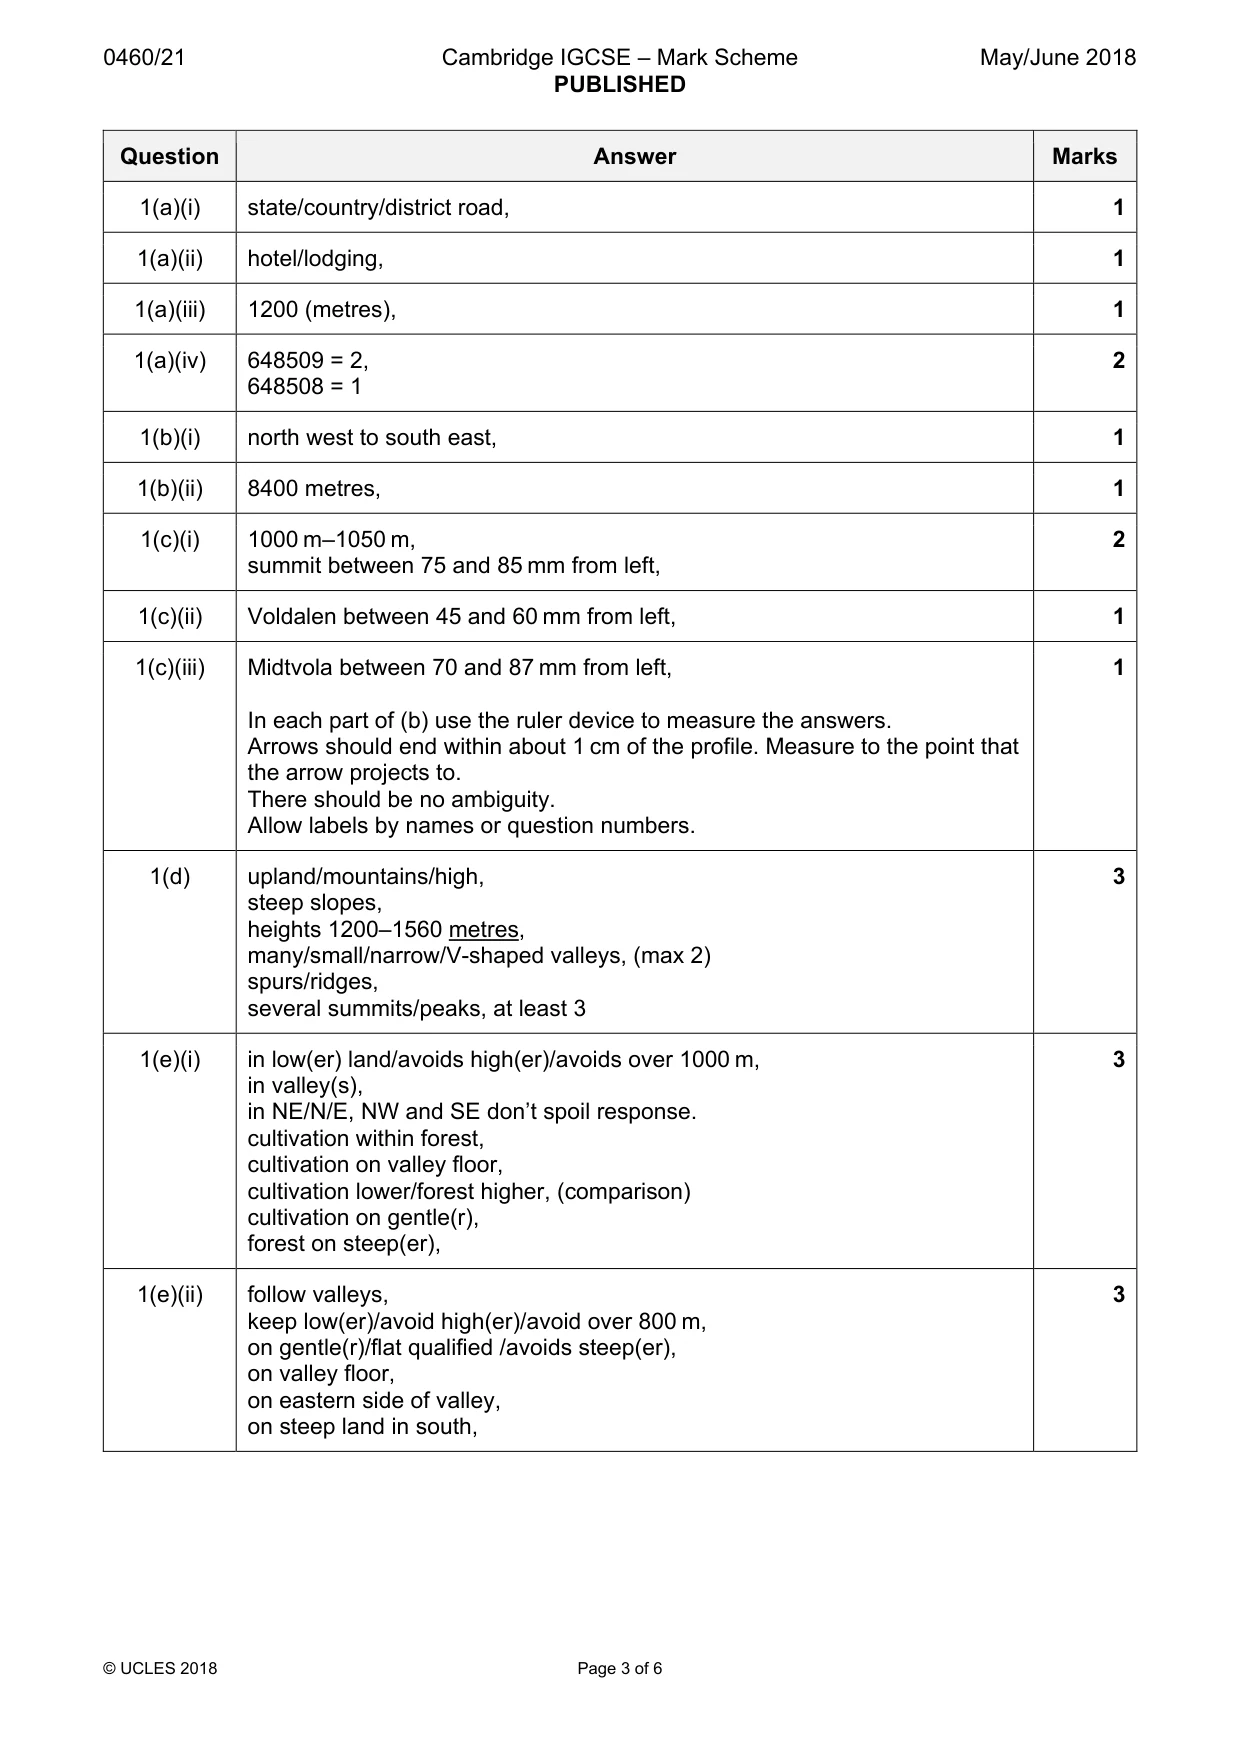
Mark scheme: Question Answer Marks 1(a)(i) state/country/district road, 1 1(a)(ii) hotel/lodging, 1 1(a)(iii) 1200 (metres), 1 1(a)(iv) 648509 = 2, 2 648508 = 1 1(b)(i) north west to south east, 1 1(b)(ii) 8400 metres, 1 1(c)(i) 1000 m–1050 m, 2 summit between 75 and 85 mm from left, 1(c)(ii) Voldalen between 45 and 60 mm from left, 1 1(c)(iii) Midtvola between 70 and 87 mm from left, 1 In each part of (b) use the ruler device to measure the answers. Arrows should end within about 1 cm of the profile. Measure to the point that the arrow projects to. There should be no ambiguity. Allow labels by names or question numbers. 1(d) upland/mountains/high, 3 steep slopes, heights 1200–1560 metres, many/small/narrow/V-shaped valleys, (max 2) spurs/ridges, several summits/peaks, at least 3 1(e)(i) in low(er) land/avoids high(er)/avoids over 1000 m, 3 in valley(s), in NE/N/E, NW and SE don’t spoil response. cultivation within forest, cultivation on valley floor, cultivation lower/forest higher, (comparison) cultivation on gentle(r), forest on steep(er), 1(e)(ii) follow valleys, 3 keep low(er)/avoid high(er)/avoid over 800 m, on gentle(r)/flat qualified /avoids steep(er), on valley floor, on eastern side of valley, on steep land in south,
More questions on Settlements (rural and urban) and service provision
Question 2
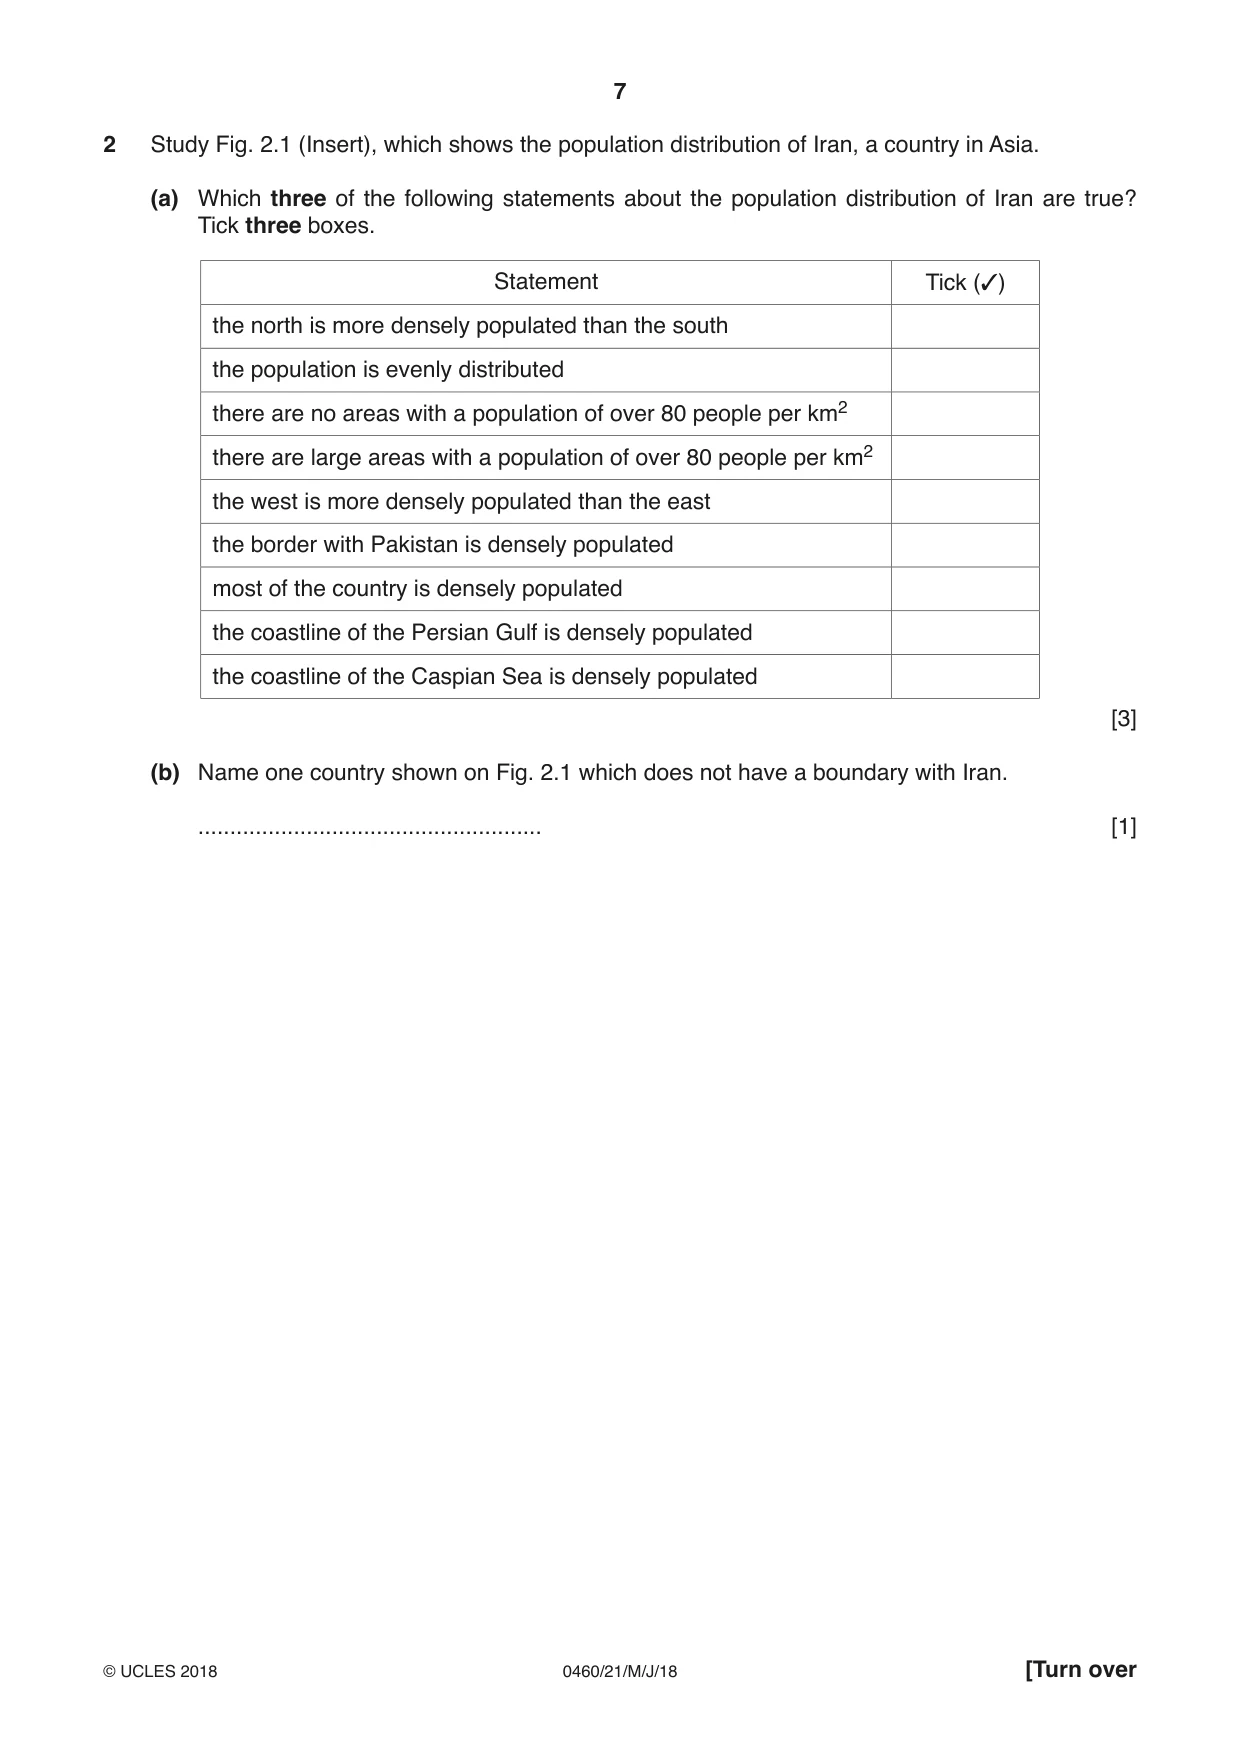
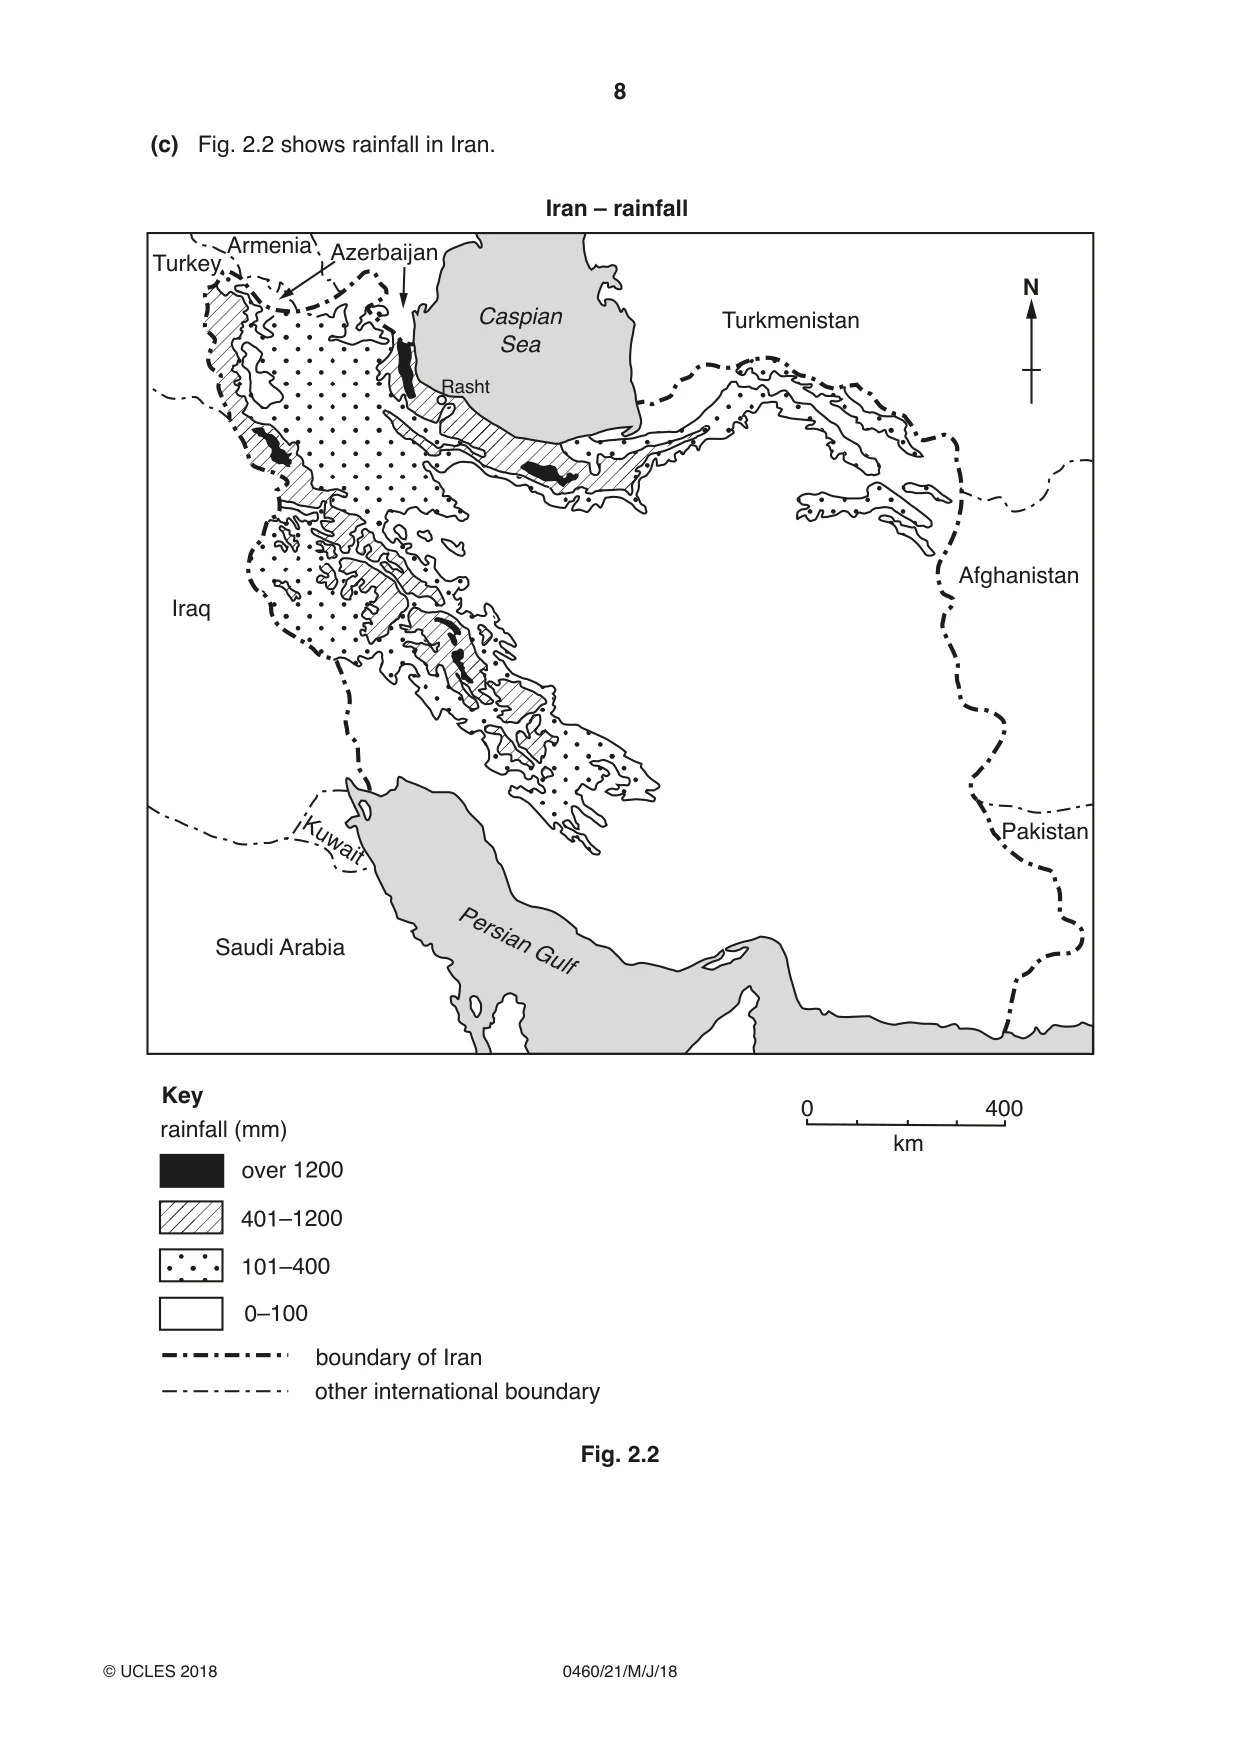
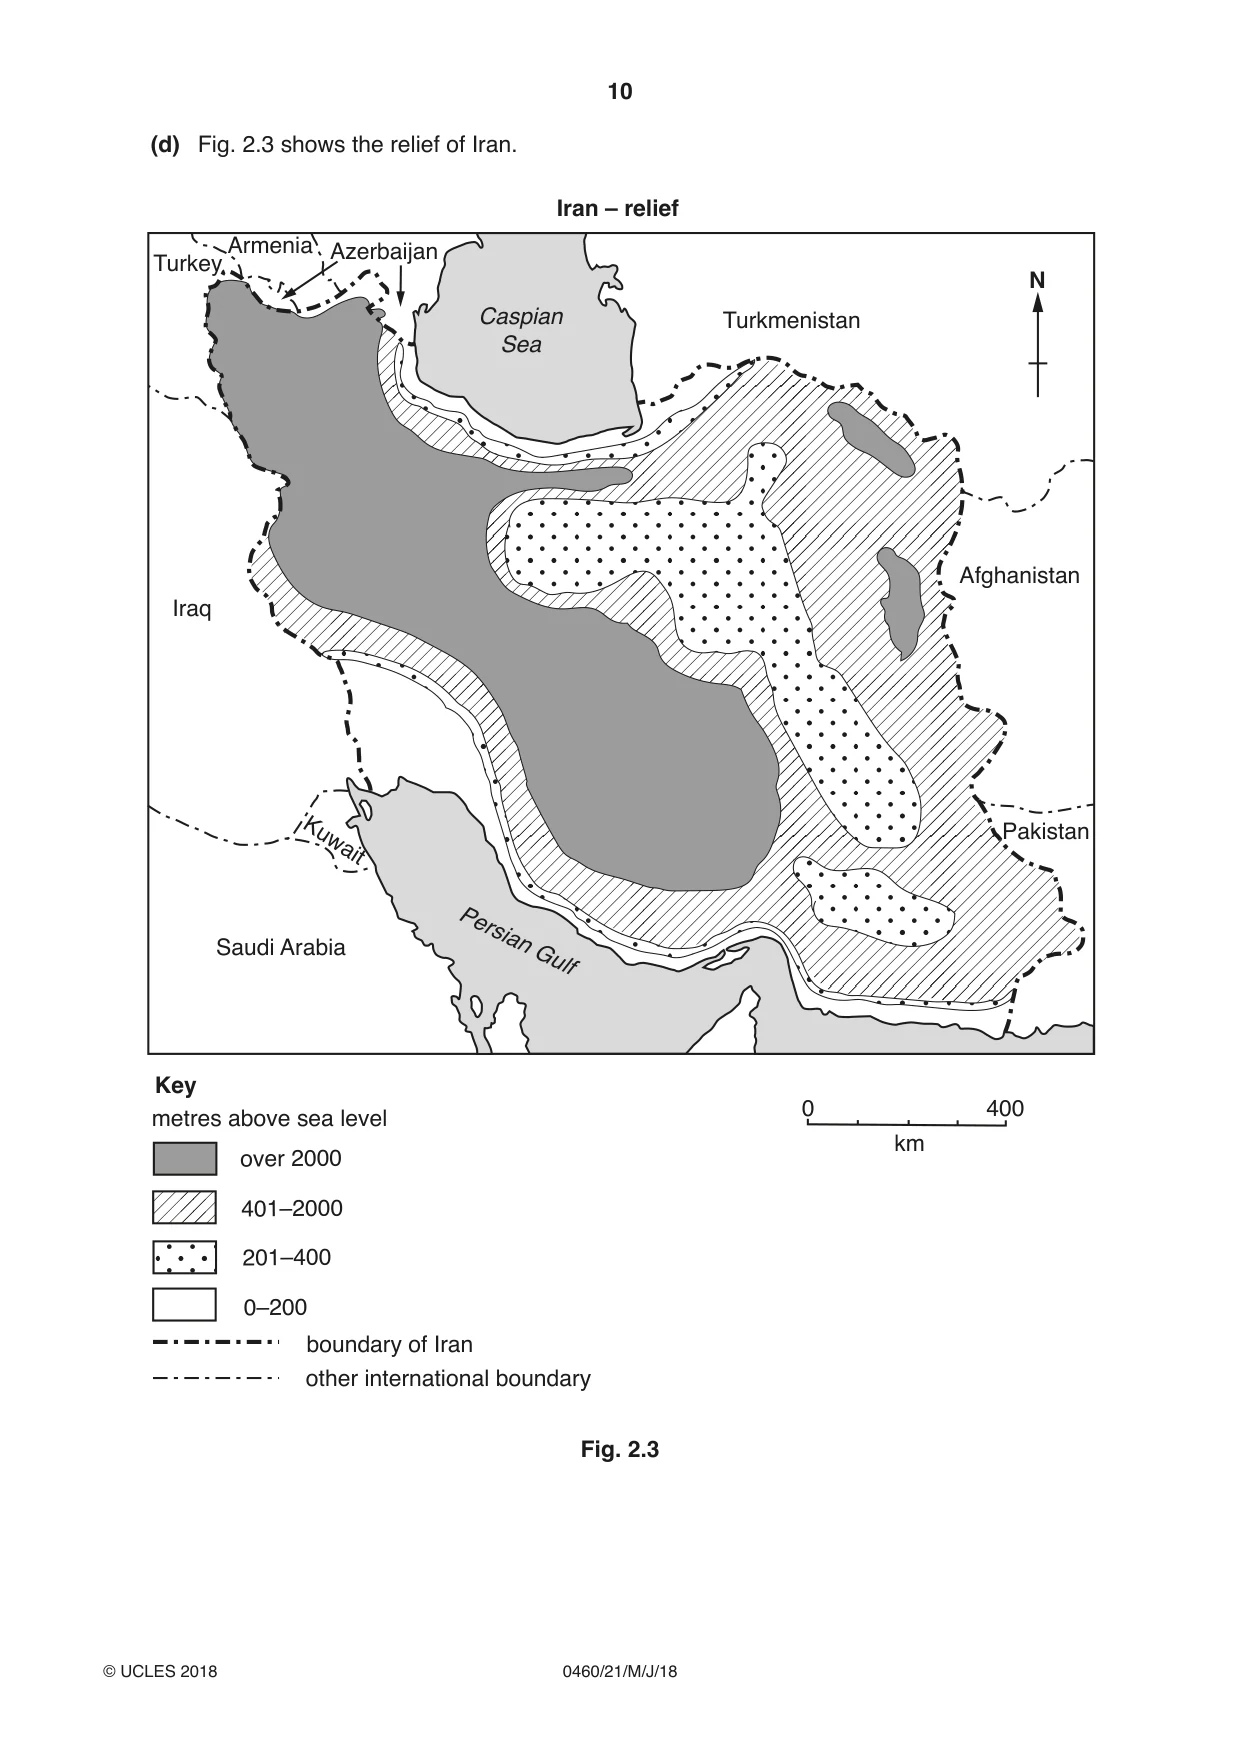
2 Study Fig. 2.1 (Insert), which shows the population distribution of Iran, a country in Asia. (a) Which three of the following statements about the population distribution of Iran are true? Tick three boxes. Statement Tick (3) the north is more densely populated than the south the population is evenly distributed there are no areas with a population of over 80 people per km2 there are large areas with a population of over 80 people per km2 the west is more densely populated than the east the border with Pakistan is densely populated most of the country is densely populated the coastline of the Persian Gulf is densely populated the coastline of the Caspian Sea is densely populated [3] (b) Name one country shown on Fig. 2.1 which does not have a boundary with Iran. ...................................................... [1] (c) Fig. 2.2 shows rainfall in Iran. Iran – rainfall Armenia AzerbaijanTurkey N Caspian Turkmenistan Sea Rasht Afghanistan Iraq Pakistan Kuwait Saudi Arabia Persian Gulf Key 0 400 rainfall (mm) km over 1200 401–1200 101–400 0–100 boundary of Iran other international boundary Fig. 2.2 Describe the relationship between population density shown on Fig. 2.1 (Insert) and rainfall shown on Fig. 2.2. ................................................................................................................................................... ................................................................................................................................................... ................................................................................................................................................... ................................................................................................................................................... ................................................................................................................................................... ...............................................................................................................................................[2] (d) Fig. 2.3 shows the relief of Iran. Iran – relief Armenia AzerbaijanTurkey N Caspian Turkmenistan Sea Afghanistan Iraq Pakistan Kuwait Saudi Arabia Persian Gulf Key 0 400metres above sea level km over 2000 401–2000 201–400 0–200 boundary of Iran other international boundary Fig. 2.3 Describe the relationship between population density shown on Fig. 2.1 (Insert) and relief shown on Fig. 2.3. ................................................................................................................................................... ................................................................................................................................................... ................................................................................................................................................... ................................................................................................................................................... ................................................................................................................................................... ...............................................................................................................................................[2] [Total: 8]
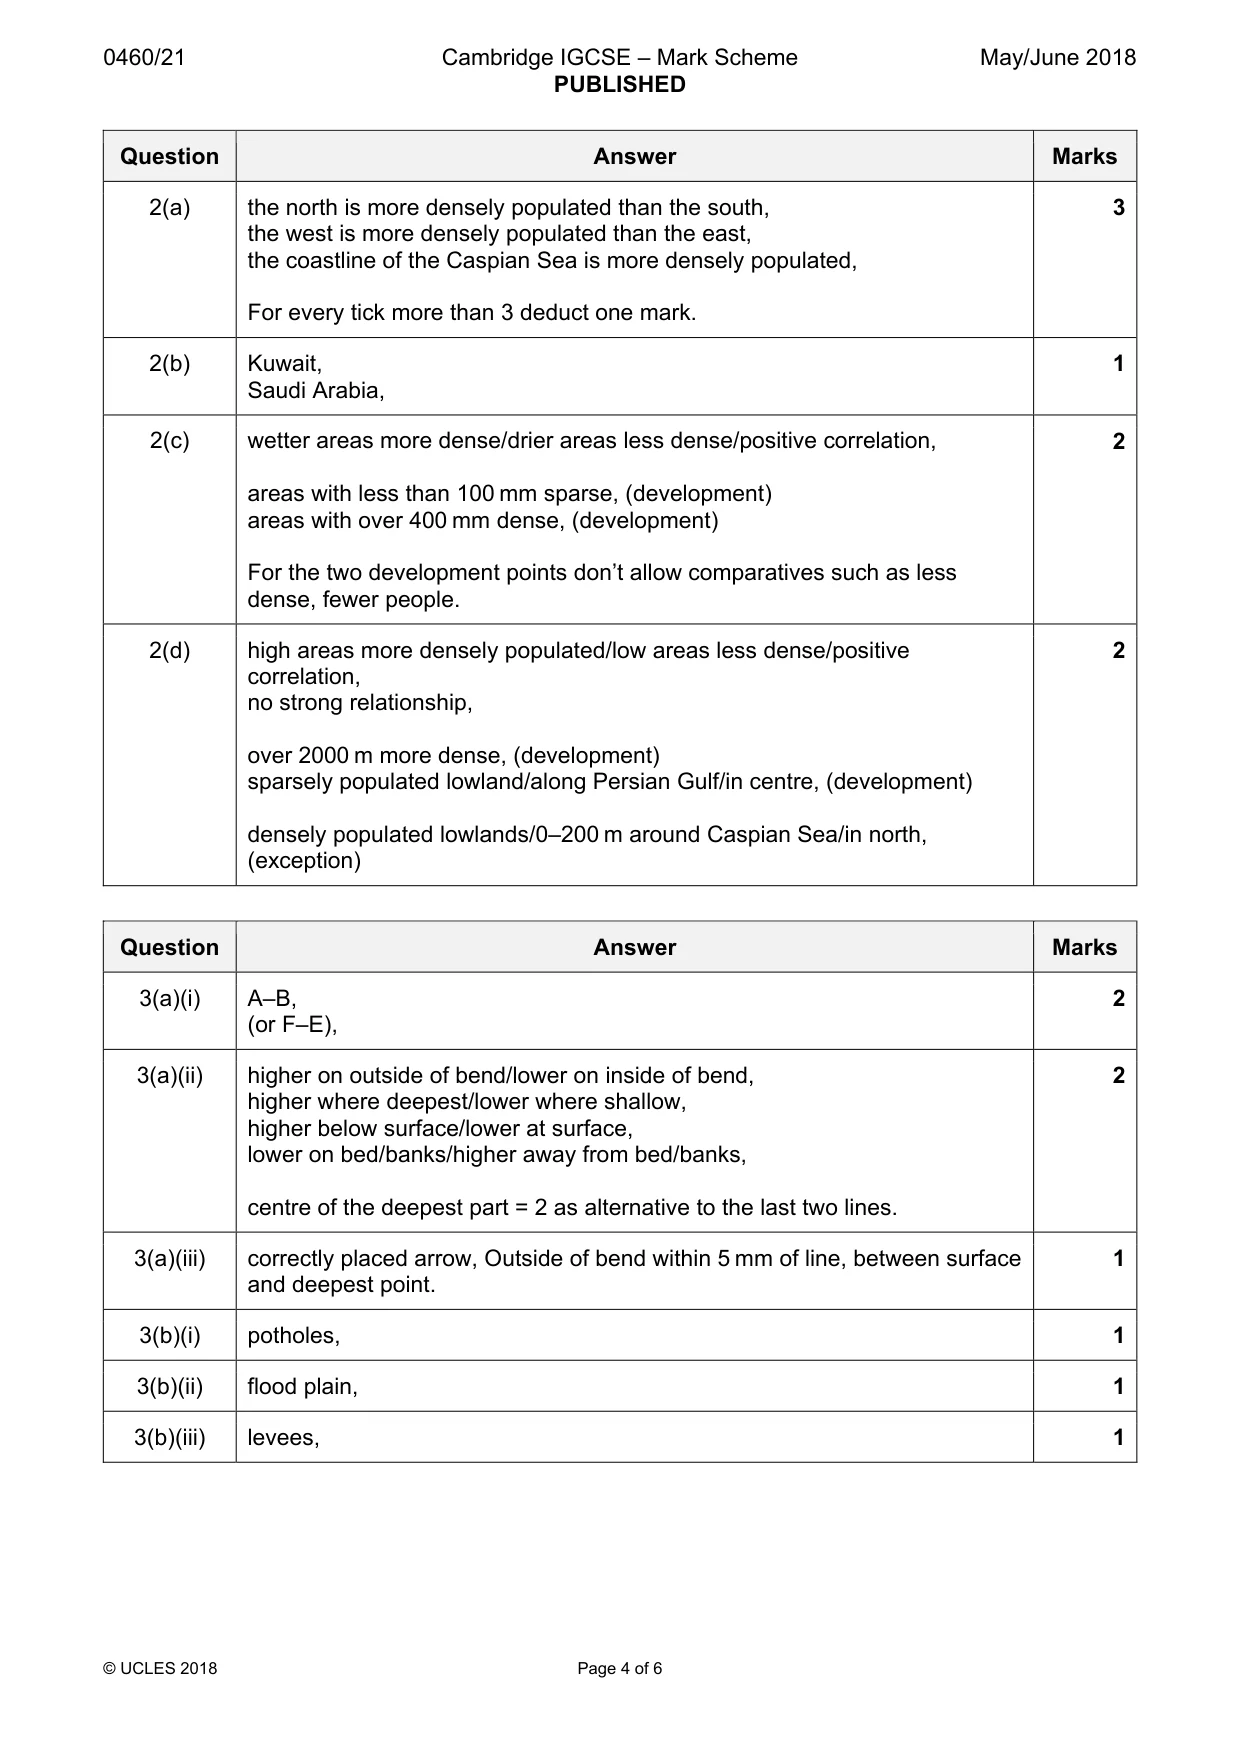
Mark scheme: 2(a) the north is more densely populated than the south, 3 the west is more densely populated than the east, the coastline of the Caspian Sea is more densely populated, For every tick more than 3 deduct one mark. 2(b) Kuwait, 1 Saudi Arabia, 2(c) wetter areas more dense/drier areas less dense/positive correlation, 2 areas with less than 100 mm sparse, (development) areas with over 400 mm dense, (development) For the two development points don’t allow comparatives such as less dense, fewer people. 2(d) high areas more densely populated/low areas less dense/positive 2 correlation, no strong relationship, over 2000 m more dense, (development) sparsely populated lowland/along Persian Gulf/in centre, (development) densely populated lowlands/0–200 m around Caspian Sea/in north, (exception)
Q3 · A map of a river
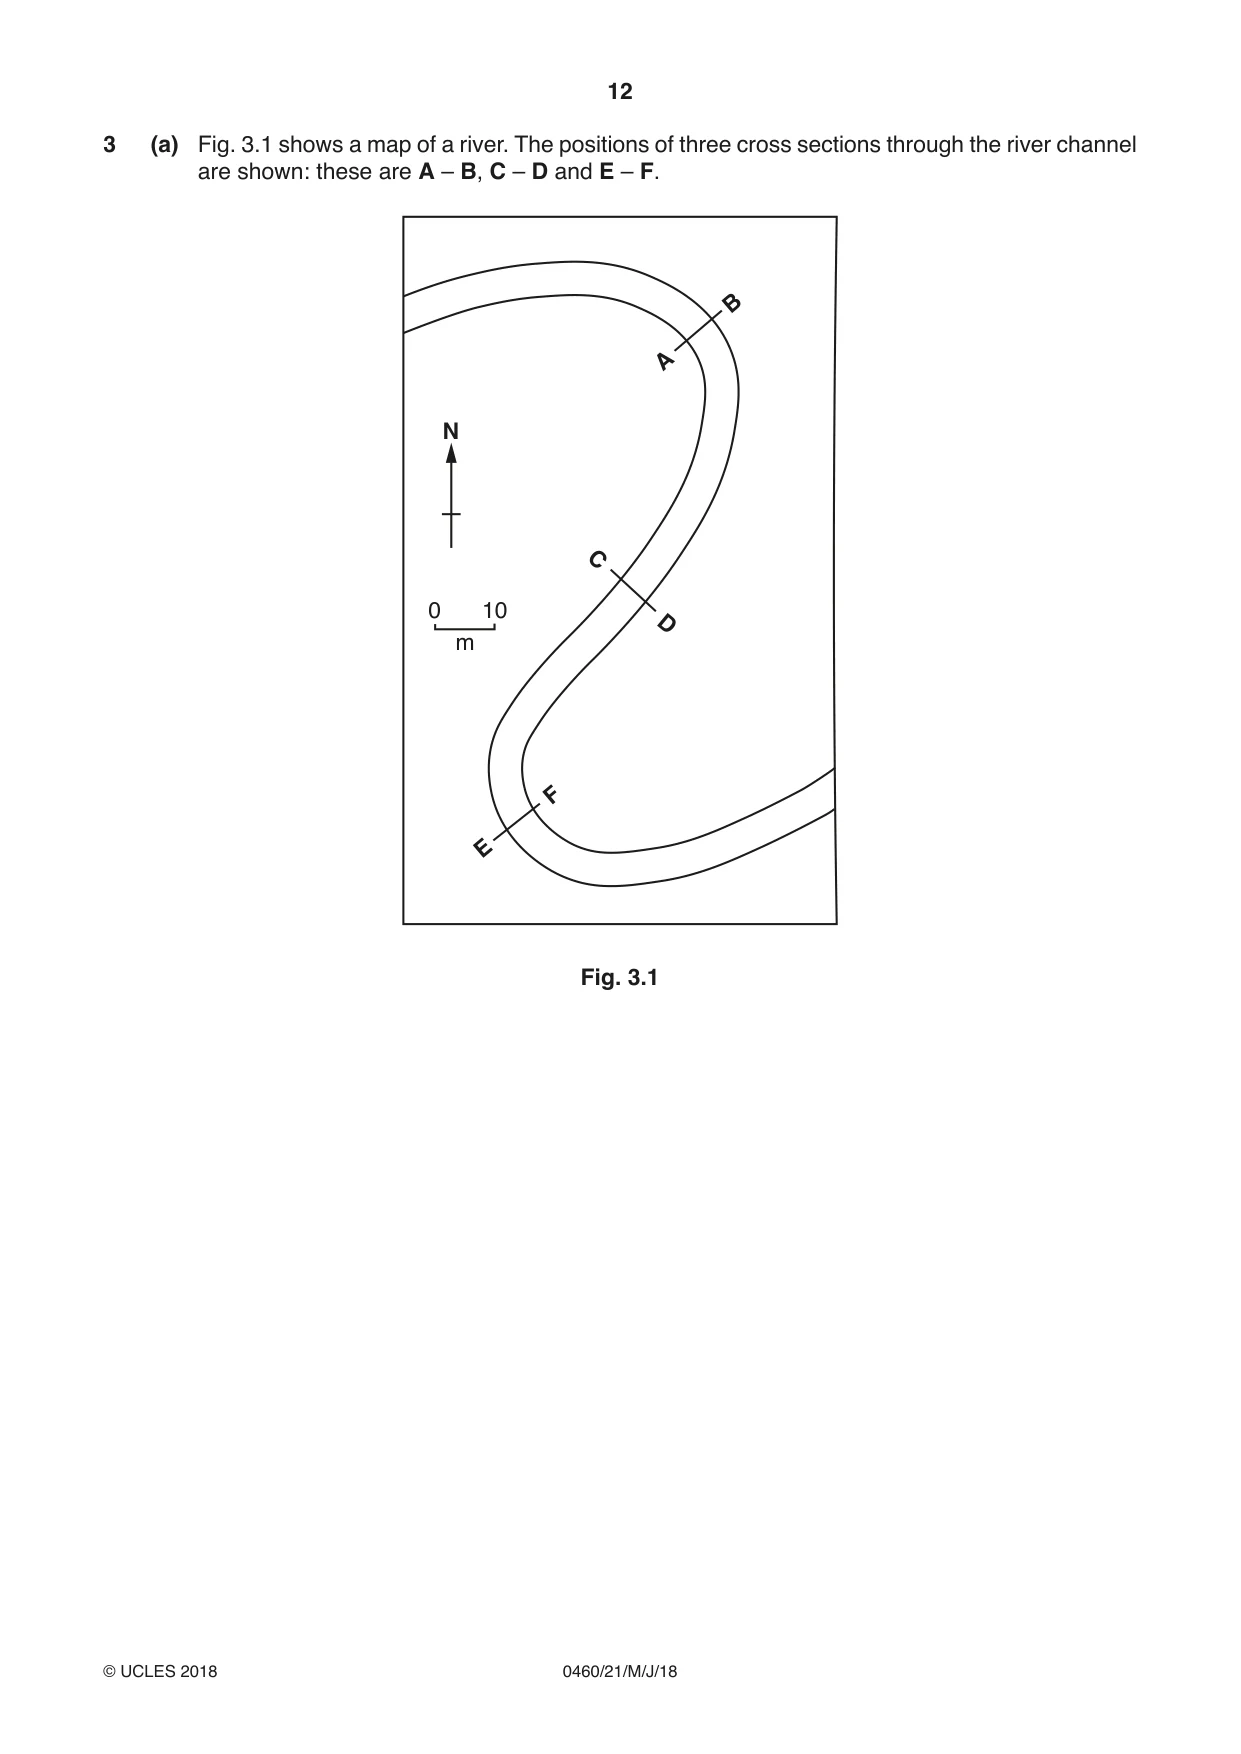
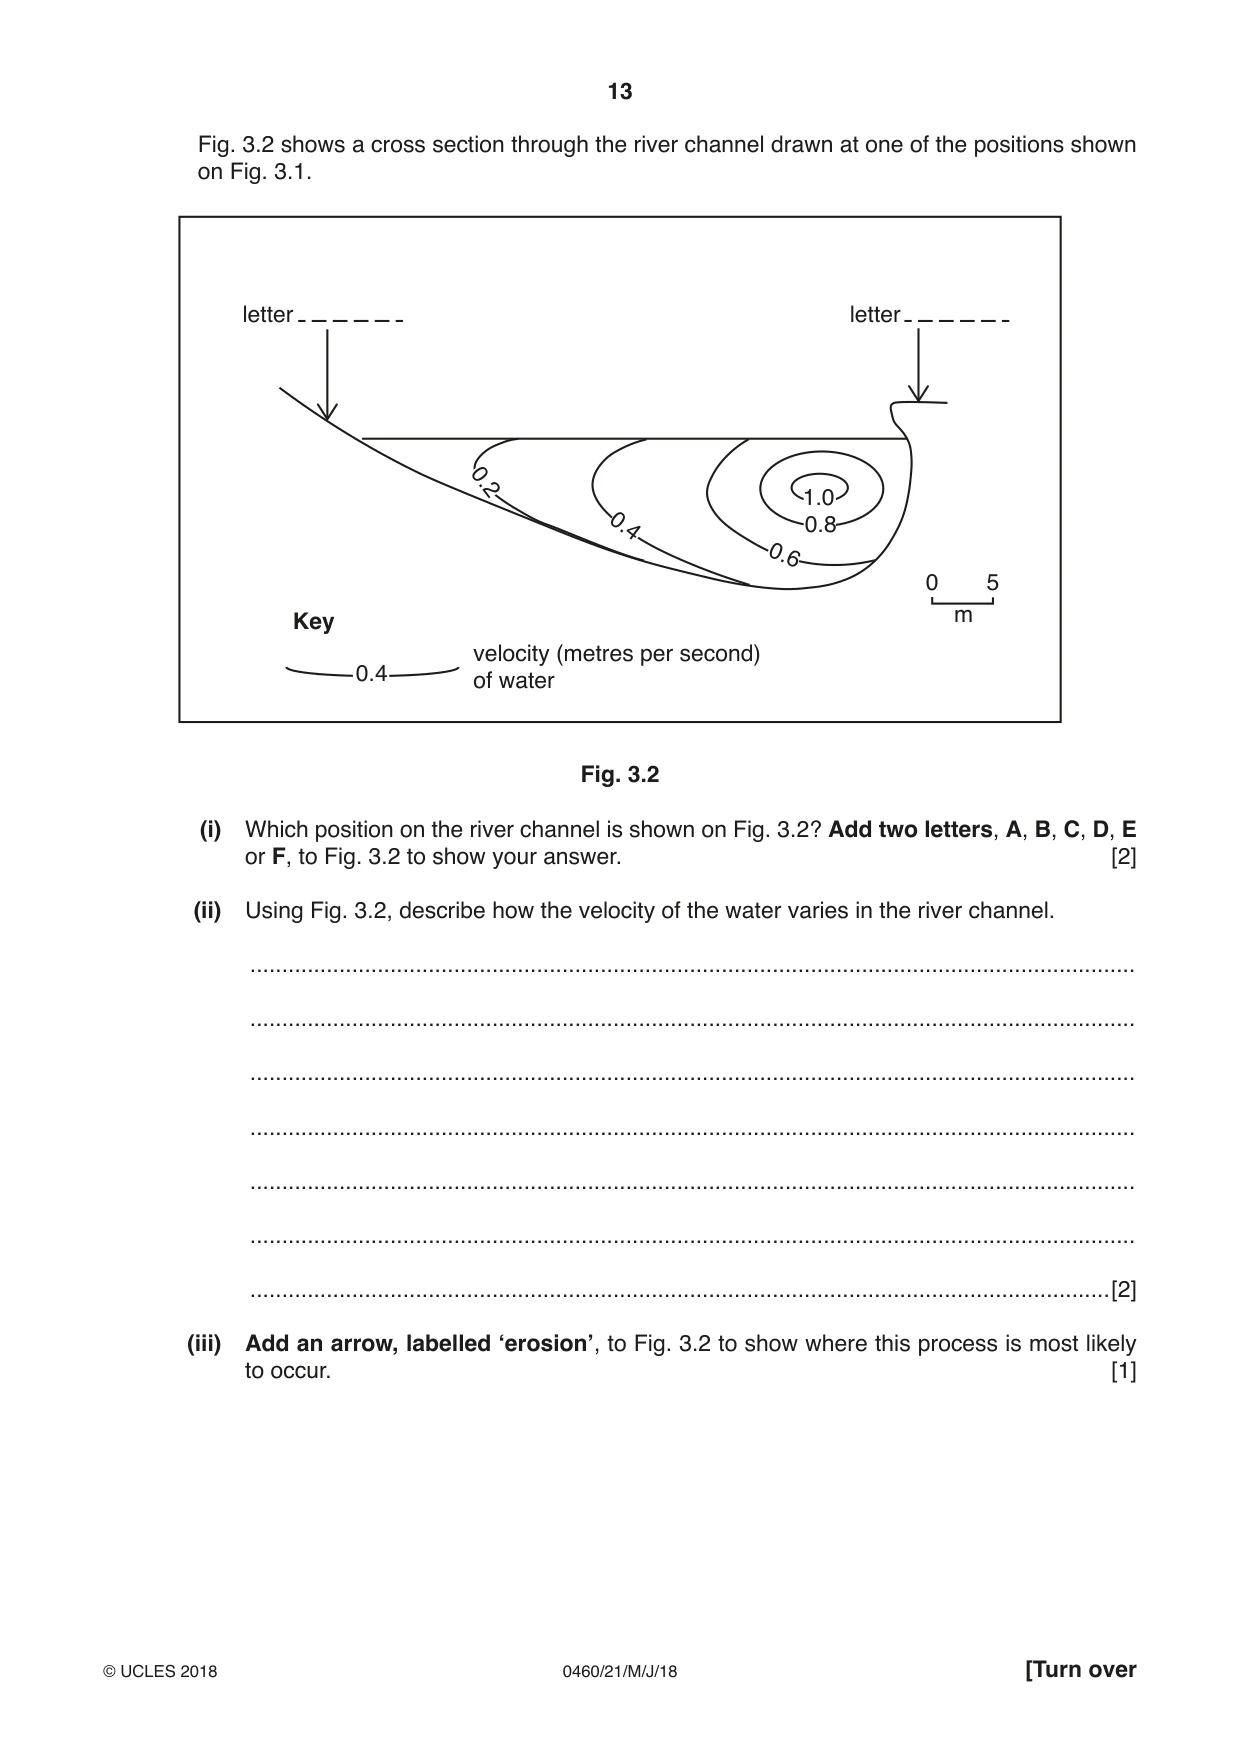
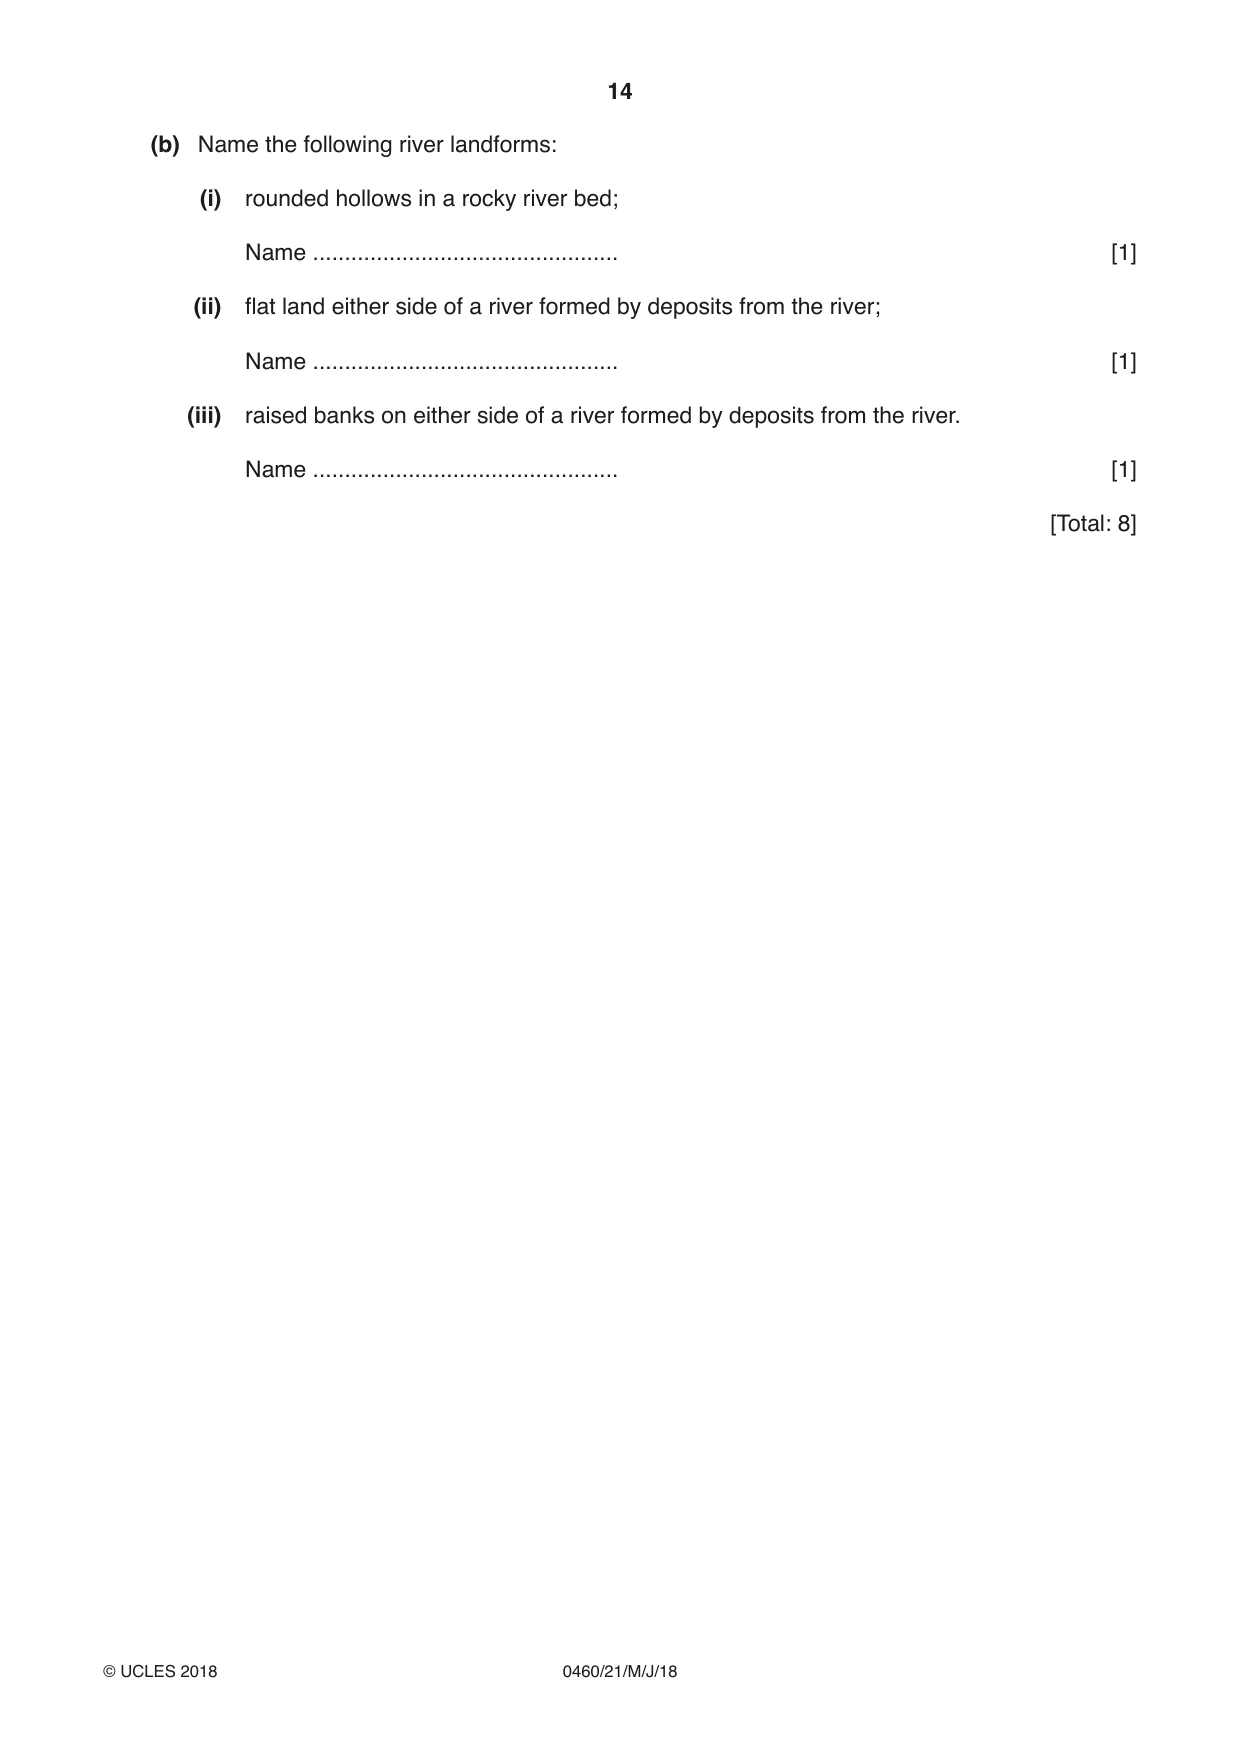
3 (a) Fig. 3.1 shows a map of a river. The positions of three cross sections through the river channel are shown: these are A – B, C – D and E – F. B A N C 0 10 D m F E Fig. 3.1 Fig. 3.2 shows a cross section through the river channel drawn at one of the positions shown on Fig. 3.1. letter letter 0.2 1.0 0.4 0.8 0.6 0 5 m Key velocity (metres per second) 0.4 of water Fig. 3.2 (i) Which position on the river channel is shown on Fig. 3.2? Add two letters, A, B, C, D, E or F, to Fig. 3.2 to show your answer. [2] (ii) Using Fig. 3.2, describe how the velocity of the water varies in the river channel. ........................................................................................................................................... ........................................................................................................................................... ........................................................................................................................................... ........................................................................................................................................... ........................................................................................................................................... ........................................................................................................................................... .......................................................................................................................................[2] (iii) Add an arrow, labelled ‘erosion’, to Fig. 3.2 to show where this process is most likely to occur. [1] (b) Name the following river landforms: (i) rounded hollows in a rocky river bed; Name ................................................ [1] (ii) flat land either side of a river formed by deposits from the river; Name ................................................ [1] (iii) raised banks on either side of a river formed by deposits from the river. Name ................................................ [1] [Total: 8]
Mark scheme: 3(a)(i) A–B, 2 (or F–E), 3(a)(ii) higher on outside of bend/lower on inside of bend, 2 higher where deepest/lower where shallow, higher below surface/lower at surface, lower on bed/banks/higher away from bed/banks, centre of the deepest part = 2 as alternative to the last two lines. 3(a)(iii) correctly placed arrow, Outside of bend within 5 mm of line, between surface 1 and deepest point. 3(b)(i) potholes, 1 3(b)(ii) flood plain, 1 3(b)(iii) levees, 1
Question 4
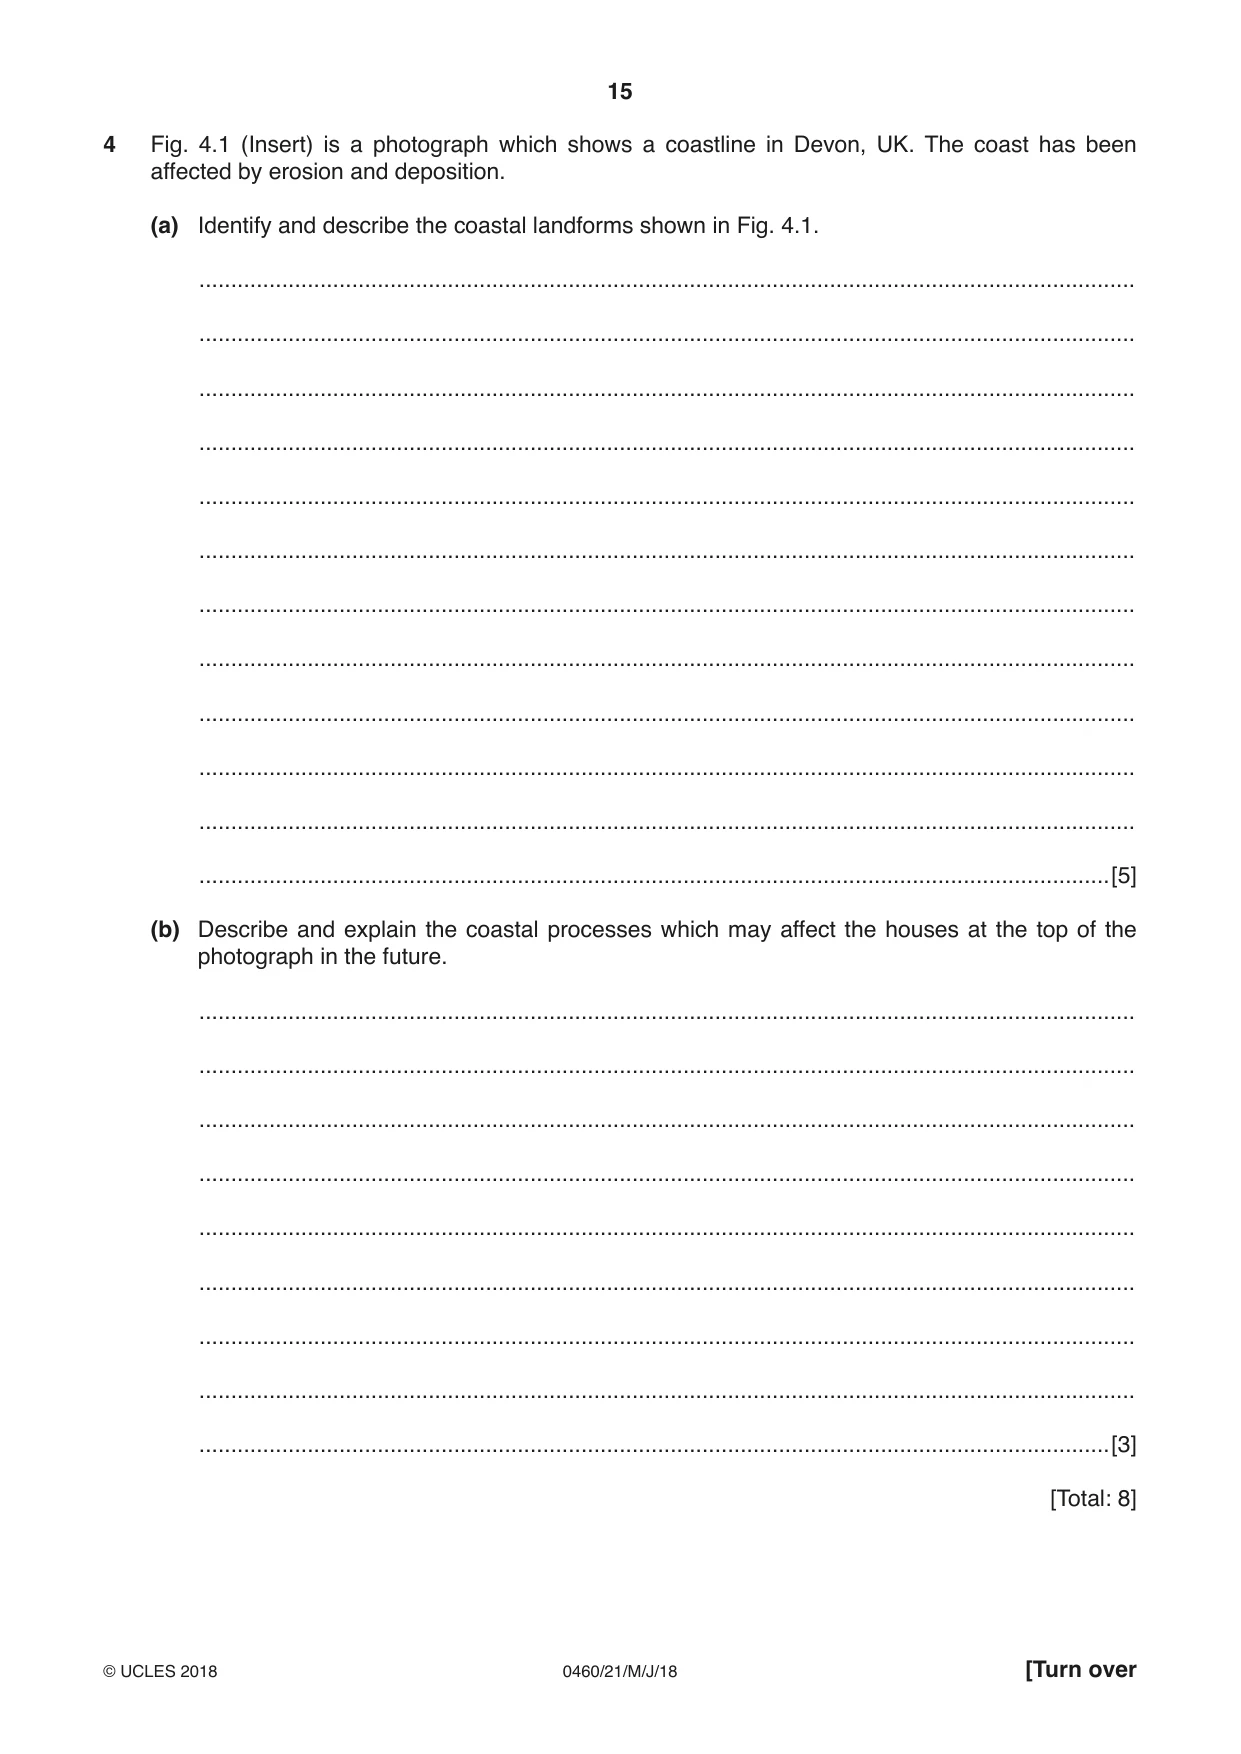
4 Fig. 4.1 (Insert) is a photograph which shows a coastline in Devon, UK. The coast has been affected by erosion and deposition. (a) Identify and describe the coastal landforms shown in Fig. 4.1. ................................................................................................................................................... ................................................................................................................................................... ................................................................................................................................................... ................................................................................................................................................... ................................................................................................................................................... ................................................................................................................................................... ................................................................................................................................................... ................................................................................................................................................... ................................................................................................................................................... ................................................................................................................................................... ................................................................................................................................................... ...............................................................................................................................................[5] (b) Describe and explain the coastal processes which may affect the houses at the top of the photograph in the future. ................................................................................................................................................... ................................................................................................................................................... ................................................................................................................................................... ................................................................................................................................................... ................................................................................................................................................... ................................................................................................................................................... ................................................................................................................................................... ................................................................................................................................................... ...............................................................................................................................................[3] [Total: 8]
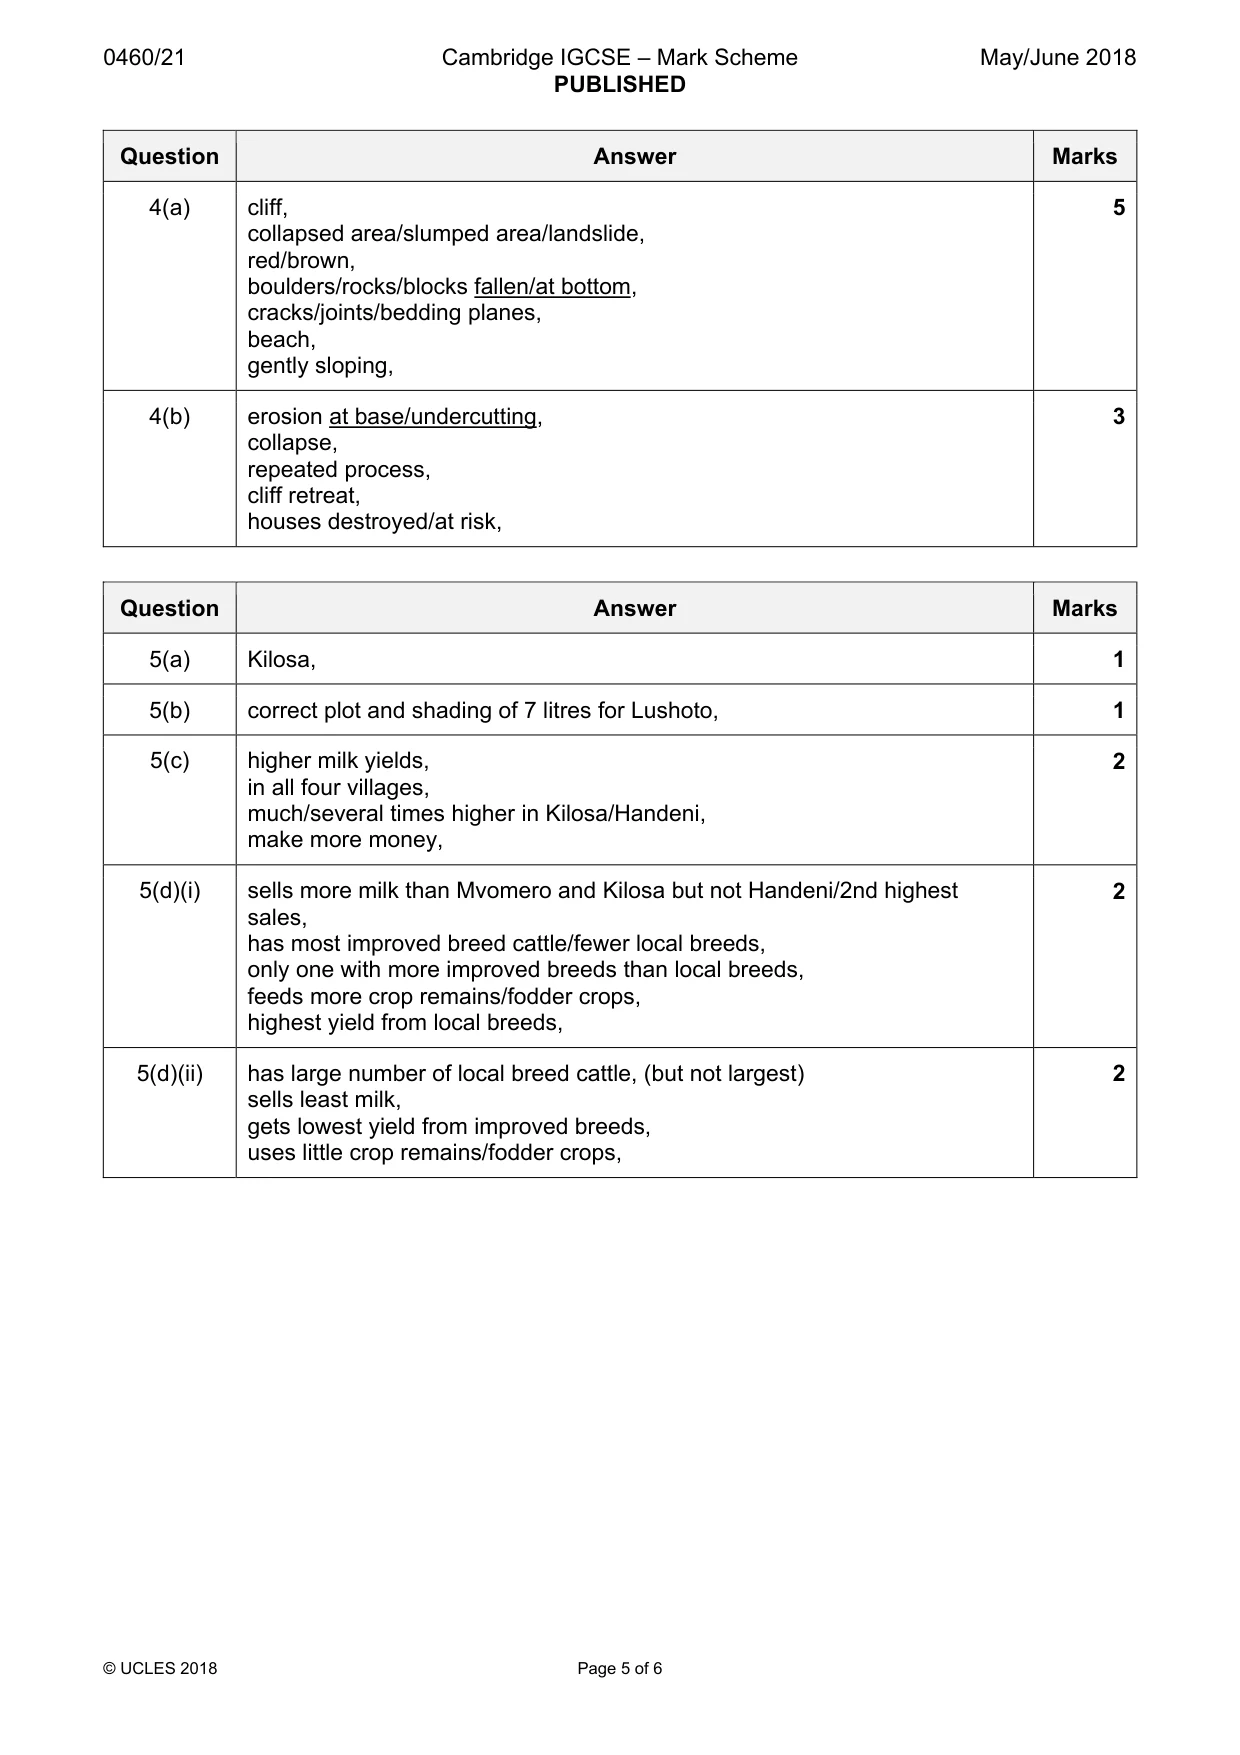
Mark scheme: 4(a) cliff, 5 collapsed area/slumped area/landslide, red/brown, boulders/rocks/blocks fallen/at bottom, cracks/joints/bedding planes, beach, gently sloping, 4(b) erosion at base/undercutting, 3 collapse, repeated process, cliff retreat, houses destroyed/at risk,
Q5 · Information about milk production from cattle in four villages in Tanzania, East Africa
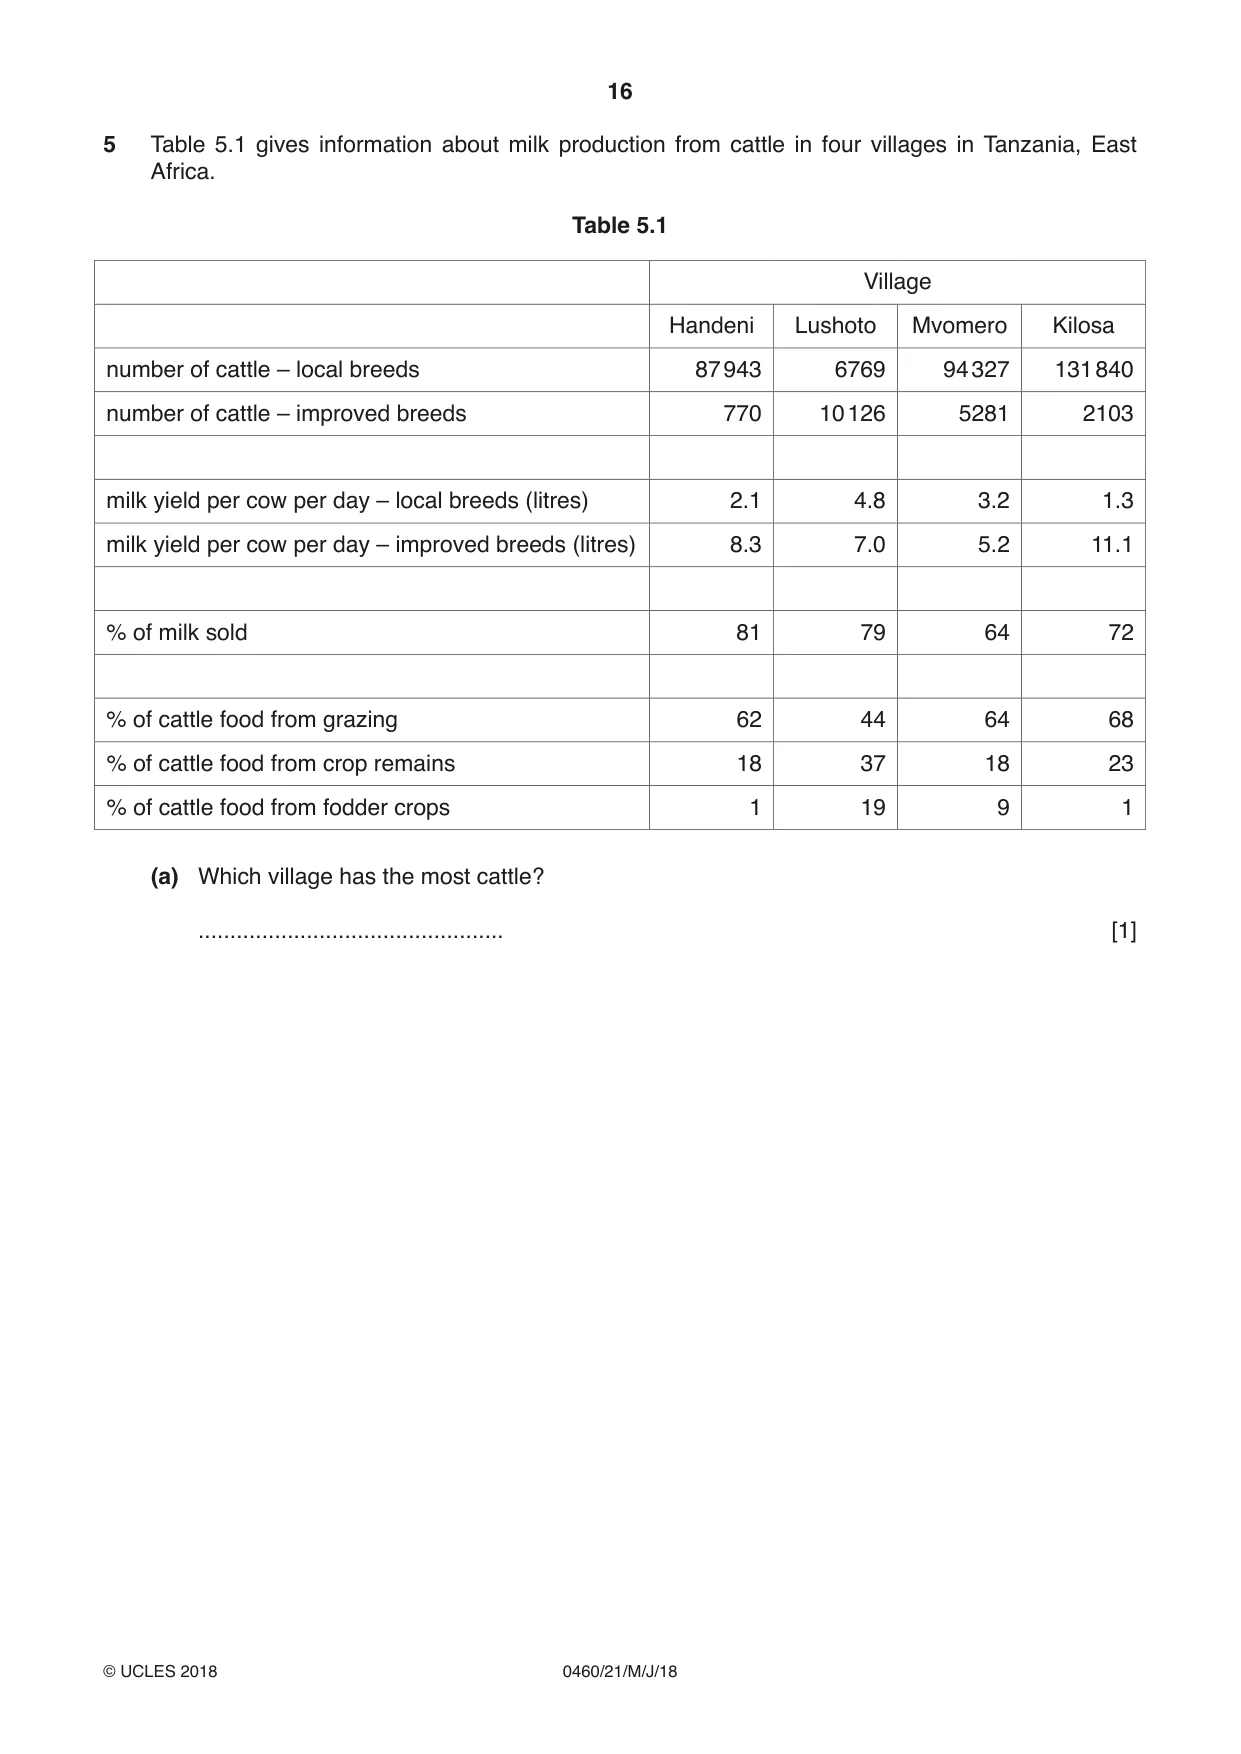
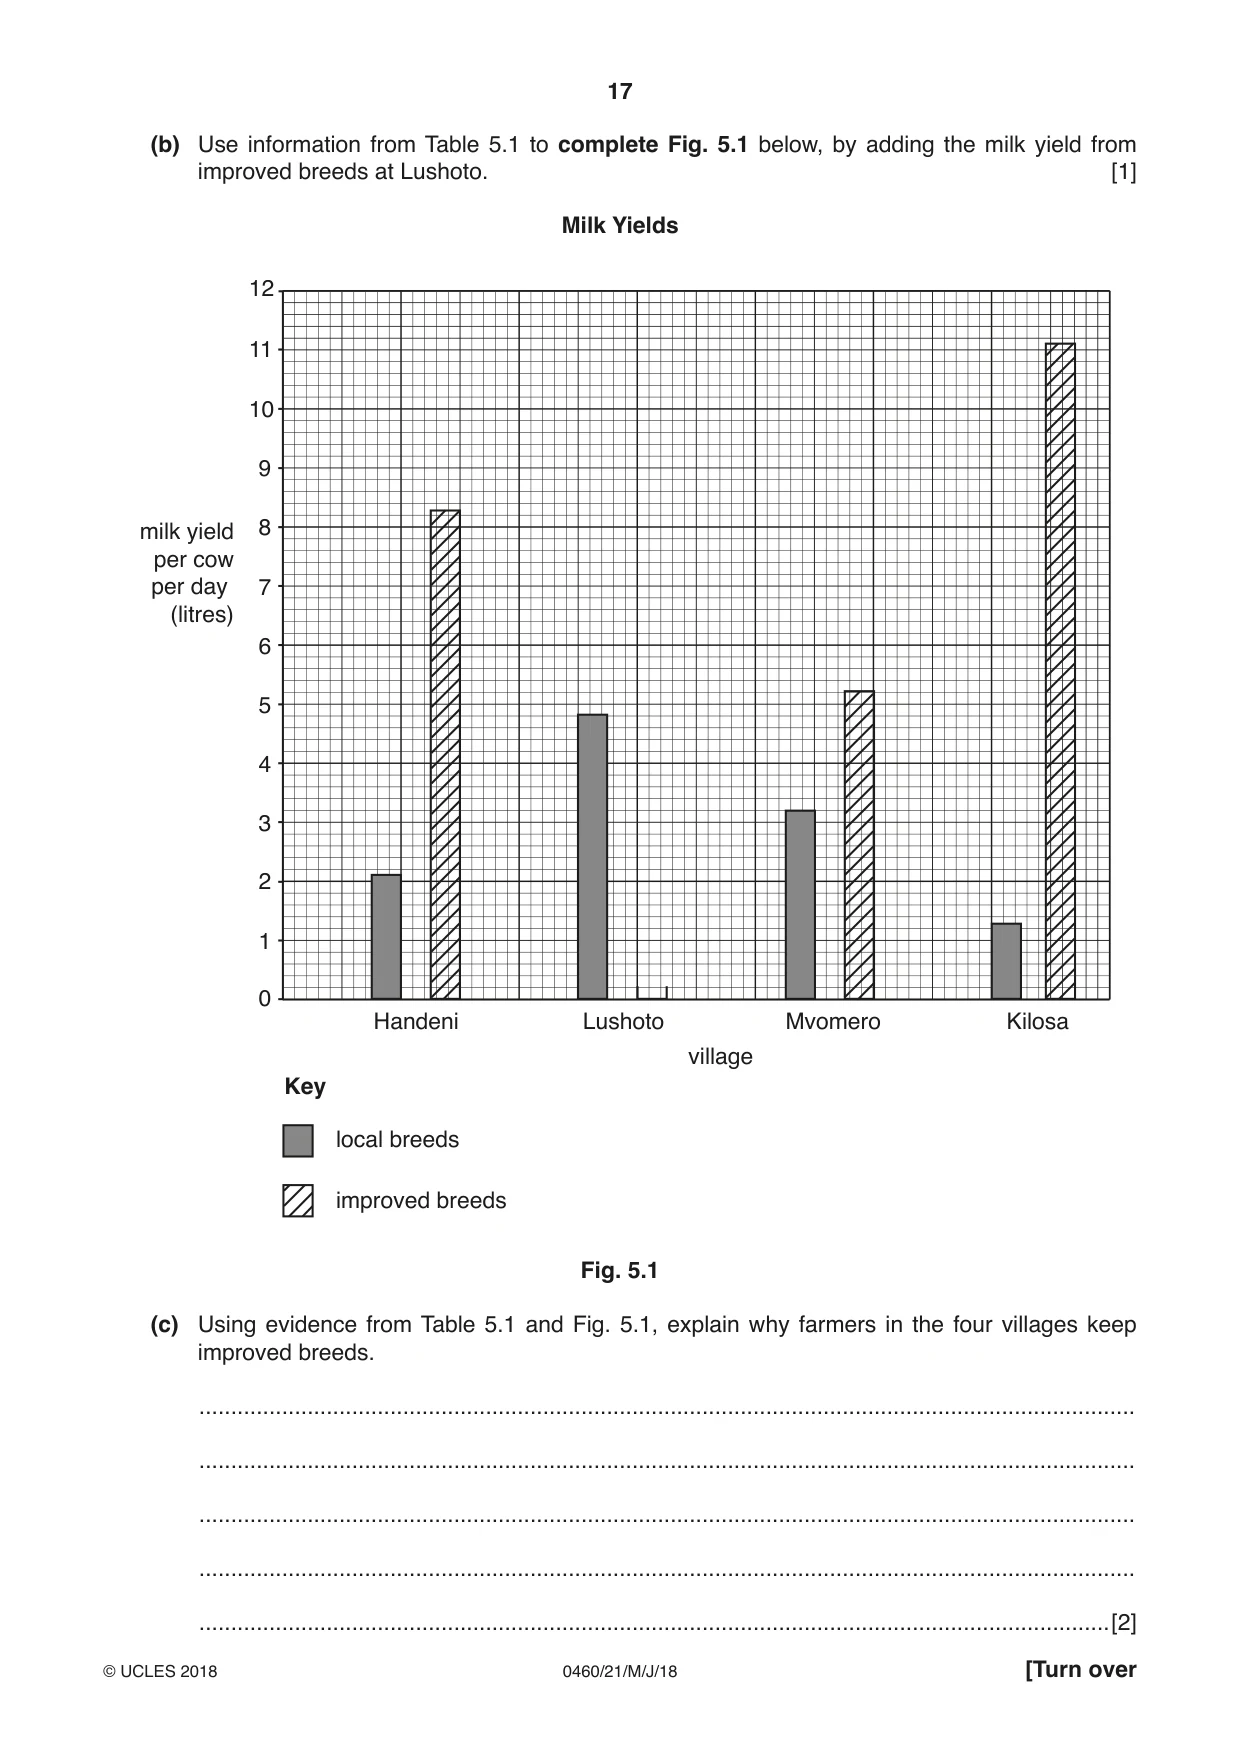
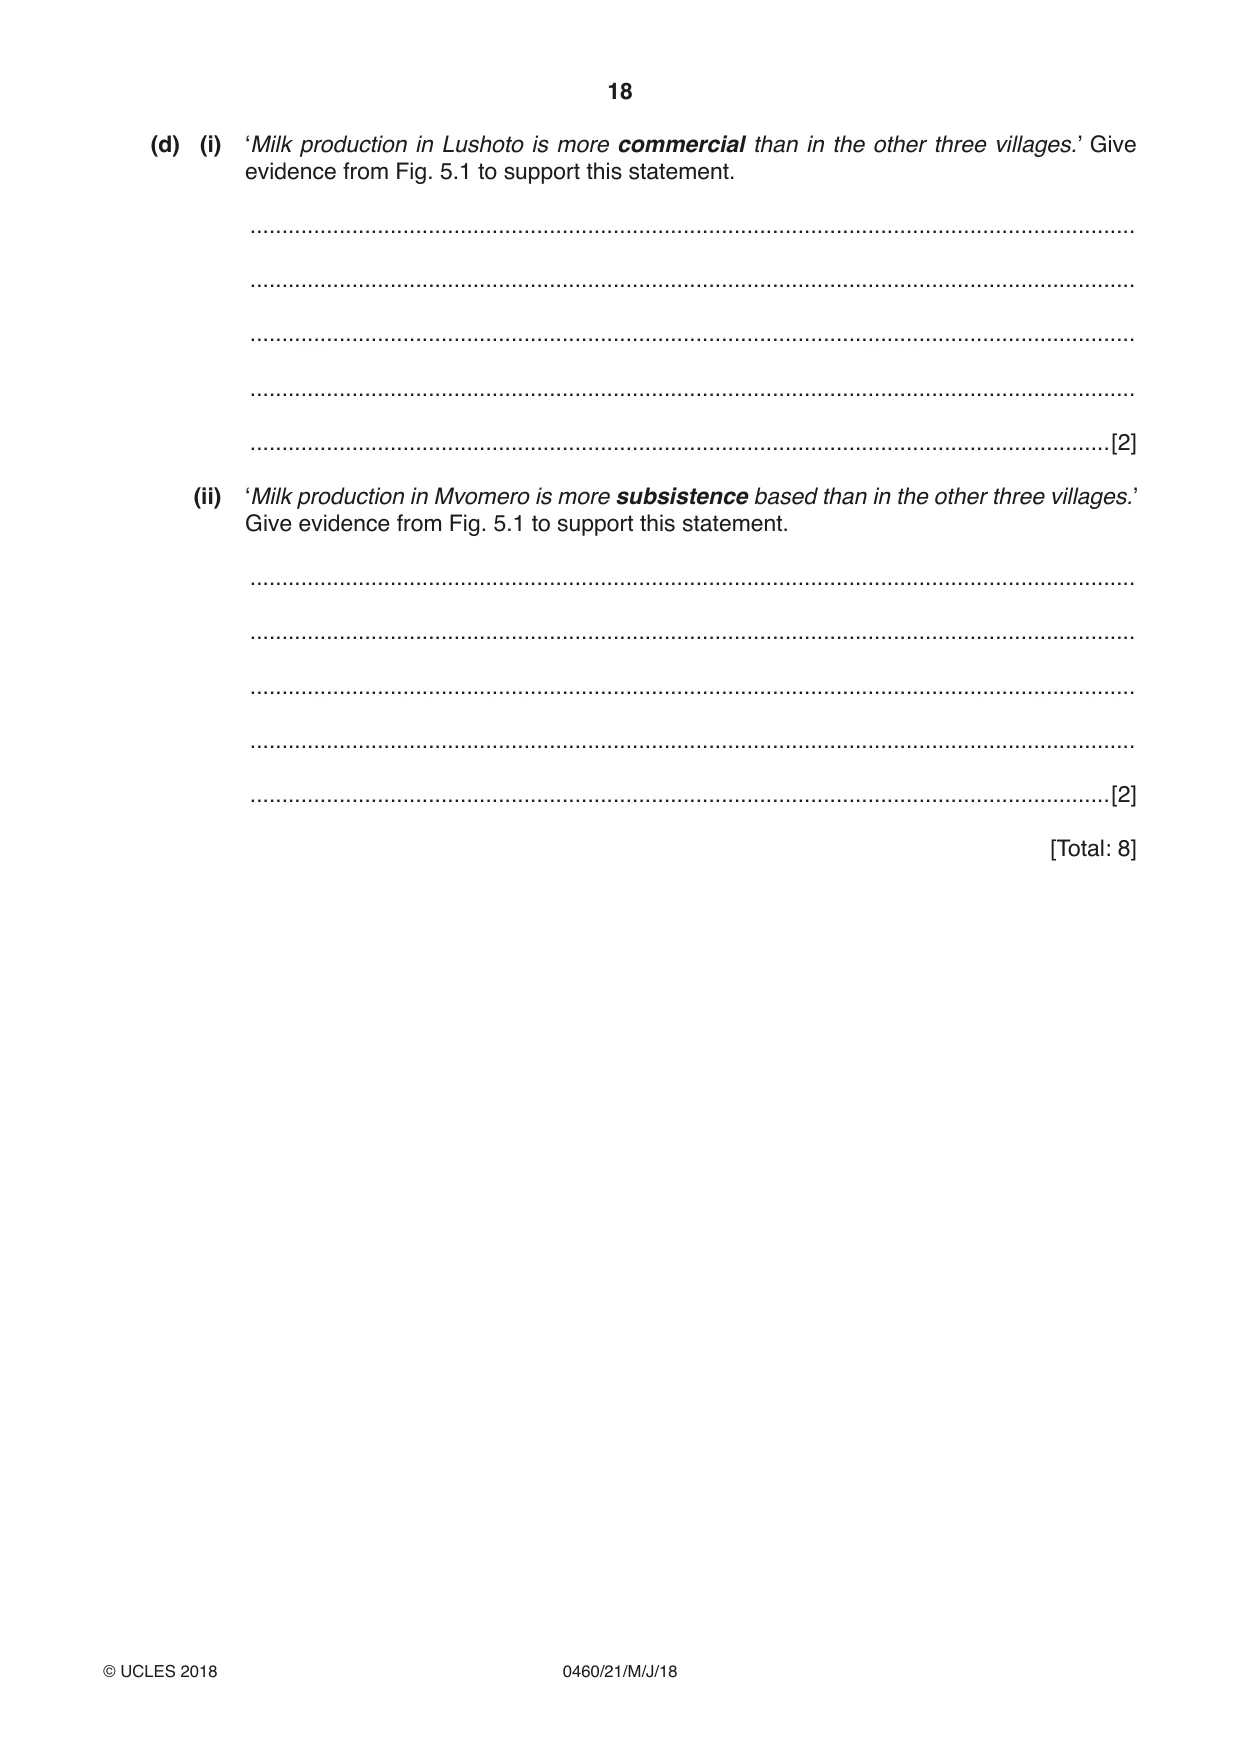
5 Table 5.1 gives information about milk production from cattle in four villages in Tanzania, East Africa. Table 5.1 Village Handeni Lushoto Mvomero Kilosa number of cattle – local breeds 87 943 6769 94 327 131 840 number of cattle – improved breeds 770 10 126 5281 2103 milk yield per cow per day – local breeds (litres) 2.1 4.8 3.2 1.3 milk yield per cow per day – improved breeds (litres) 8.3 7.0 5.2 11.1 % of milk sold 81 79 64 72 % of cattle food from grazing 62 44 64 68 % of cattle food from crop remains 18 37 18 23 % of cattle food from fodder crops 1 19 9 1 (a) Which village has the most cattle? ................................................ [1] (b) Use information from Table 5.1 to complete Fig. 5.1 below, by adding the milk yield from improved breeds at Lushoto. [1] Milk Yields 12 11 10 9 milk yield 8 per cow per day 7 (litres) 6 5 4 3 2 1 0 Handeni Lushoto Mvomero Kilosa village Key local breeds improved breeds Fig. 5.1 (c) Using evidence from Table 5.1 and Fig. 5.1, explain why farmers in the four villages keep improved breeds. ................................................................................................................................................... ................................................................................................................................................... ................................................................................................................................................... ................................................................................................................................................... ...............................................................................................................................................[2] (d) (i) ‘Milk production in Lushoto is more commercial than in the other three villages.’ Give evidence from Fig. 5.1 to support this statement. ........................................................................................................................................... ........................................................................................................................................... ........................................................................................................................................... ........................................................................................................................................... .......................................................................................................................................[2] (ii) ‘Milk production in Mvomero is more subsistence based than in the other three villages.’ Give evidence from Fig. 5.1 to support this statement. ........................................................................................................................................... ........................................................................................................................................... ........................................................................................................................................... ........................................................................................................................................... .......................................................................................................................................[2] [Total: 8]
Mark scheme: 5(a) Kilosa, 1 5(b) correct plot and shading of 7 litres for Lushoto, 1 5(c) higher milk yields, 2 in all four villages, much/several times higher in Kilosa/Handeni, make more money, 5(d)(i) sells more milk than Mvomero and Kilosa but not Handeni/2nd highest 2 sales, has most improved breed cattle/fewer local breeds, only one with more improved breeds than local breeds, feeds more crop remains/fodder crops, highest yield from local breeds, 5(d)(ii) has large number of local breed cattle, (but not largest) 2 sells least milk, gets lowest yield from improved breeds, uses little crop remains/fodder crops,
Question 6
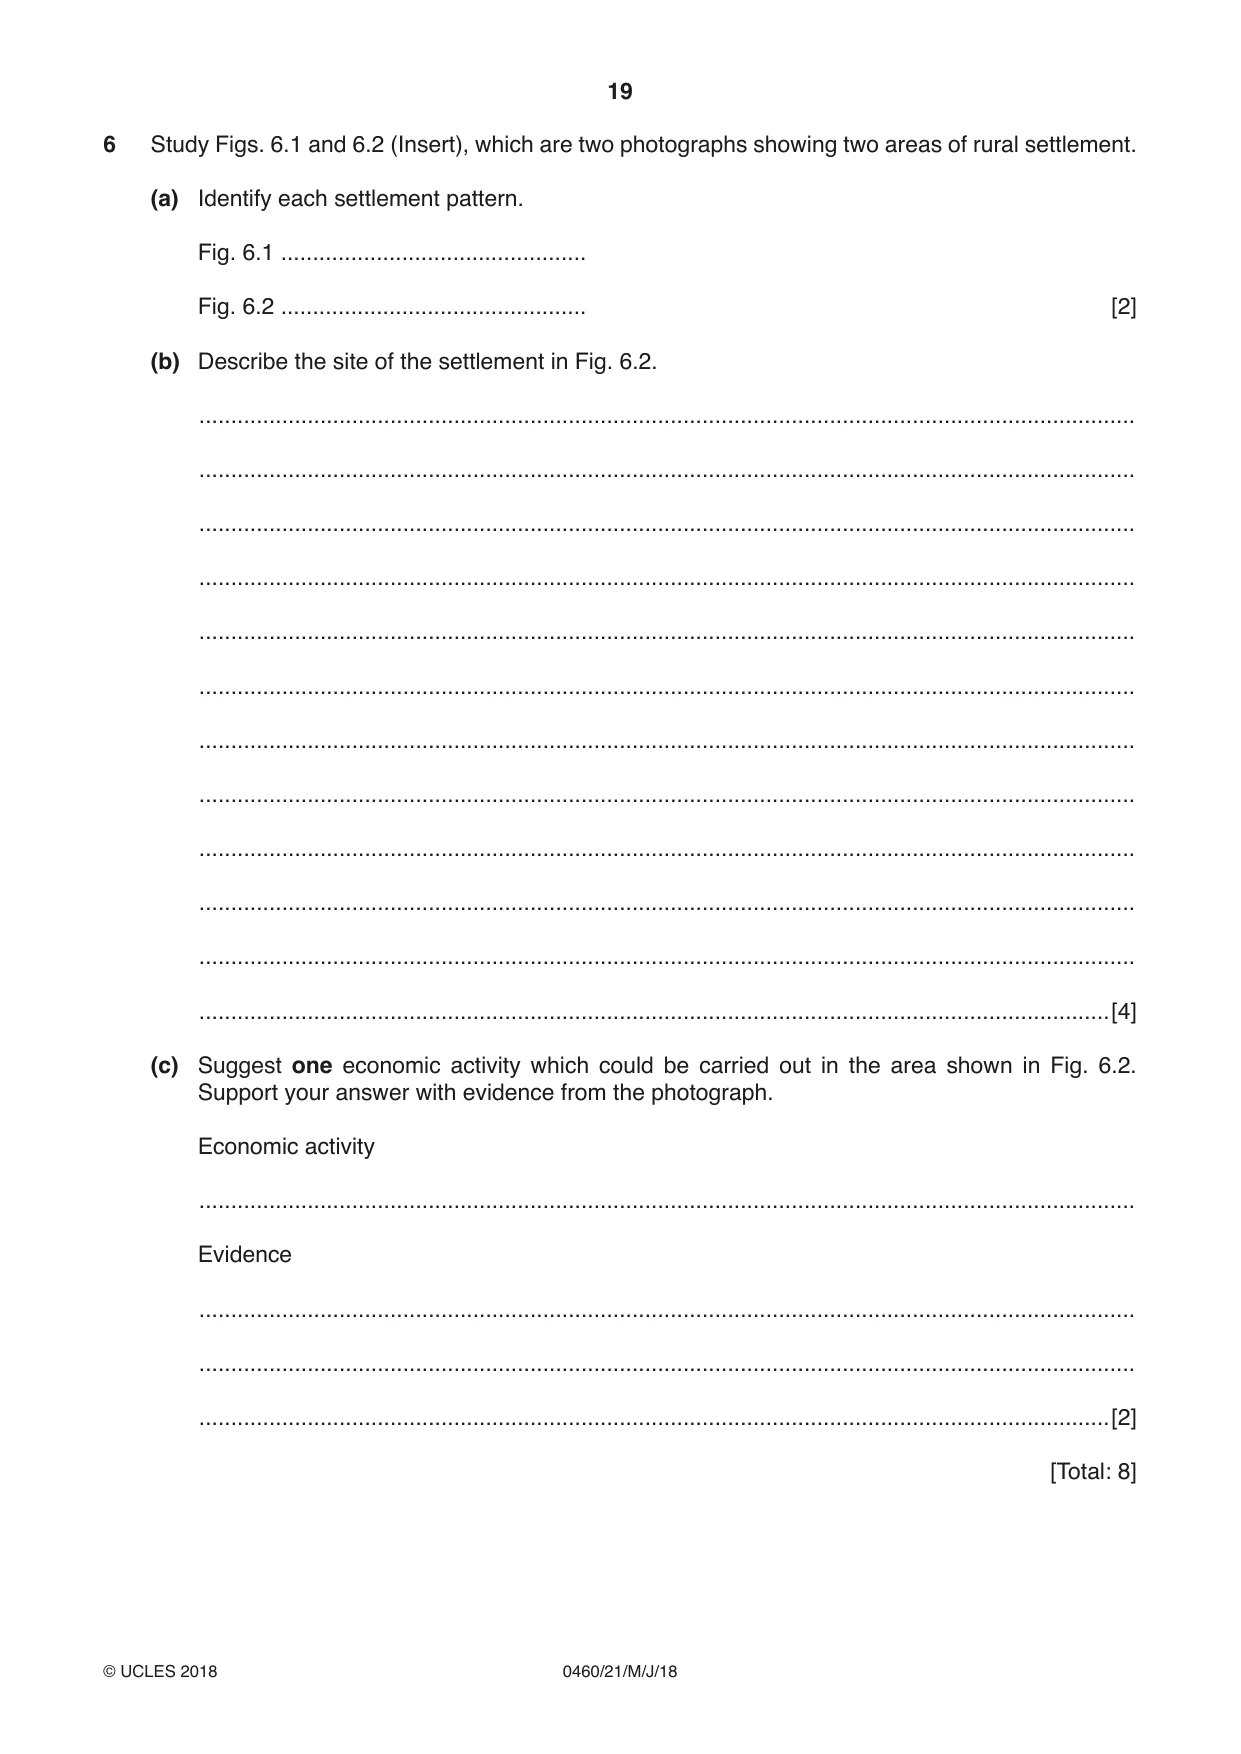
6 Study Figs. 6.1 and 6.2 (Insert), which are two photographs showing two areas of rural settlement. (a) Identify each settlement pattern. Fig. 6.1 ................................................ Fig. 6.2 ................................................ [2] (b) Describe the site of the settlement in Fig. 6.2. ................................................................................................................................................... ................................................................................................................................................... ................................................................................................................................................... ................................................................................................................................................... ................................................................................................................................................... ................................................................................................................................................... ................................................................................................................................................... ................................................................................................................................................... ................................................................................................................................................... ................................................................................................................................................... ................................................................................................................................................... ...............................................................................................................................................[4] (c) Suggest one economic activity which could be carried out in the area shown in Fig. 6.2. Support your answer with evidence from the photograph. Economic activity ................................................................................................................................................... Evidence ................................................................................................................................................... ................................................................................................................................................... ...............................................................................................................................................[2] [Total: 8] Additional Pages If you use the following lined pages to complete the answer(s) to any question(s), the question number(s) must be clearly shown. .................................................................................................................................................................. .................................................................................................................................................................. .................................................................................................................................................................. .................................................................................................................................................................. .................................................................................................................................................................. .................................................................................................................................................................. .................................................................................................................................................................. .................................................................................................................................................................. .................................................................................................................................................................. .................................................................................................................................................................. .................................................................................................................................................................. .................................................................................................................................................................. .................................................................................................................................................................. .................................................................................................................................................................. .................................................................................................................................................................. .................................................................................................................................................................. .................................................................................................................................................................. .................................................................................................................................................................. .................................................................................................................................................................. .................................................................................................................................................................. .................................................................................................................................................................. .................................................................................................................................................................. .................................................................................................................................................................. .................................................................................................................................................................. .................................................................................................................................................................. .................................................................................................................................................................. .................................................................................................................................................................. .................................................................................................................................................................. .................................................................................................................................................................. .................................................................................................................................................................. .................................................................................................................................................................. .................................................................................................................................................................. .................................................................................................................................................................. .................................................................................................................................................................. .................................................................................................................................................................. .................................................................................................................................................................. .................................................................................................................................................................. .................................................................................................................................................................. .................................................................................................................................................................. .................................................................................................................................................................. .................................................................................................................................................................. .................................................................................................................................................................. .................................................................................................................................................................. .................................................................................................................................................................. .................................................................................................................................................................. .................................................................................................................................................................. .................................................................................................................................................................. .................................................................................................................................................................. .................................................................................................................................................................. .................................................................................................................................................................. .................................................................................................................................................................. .................................................................................................................................................................. ..................................................................................................................................................................
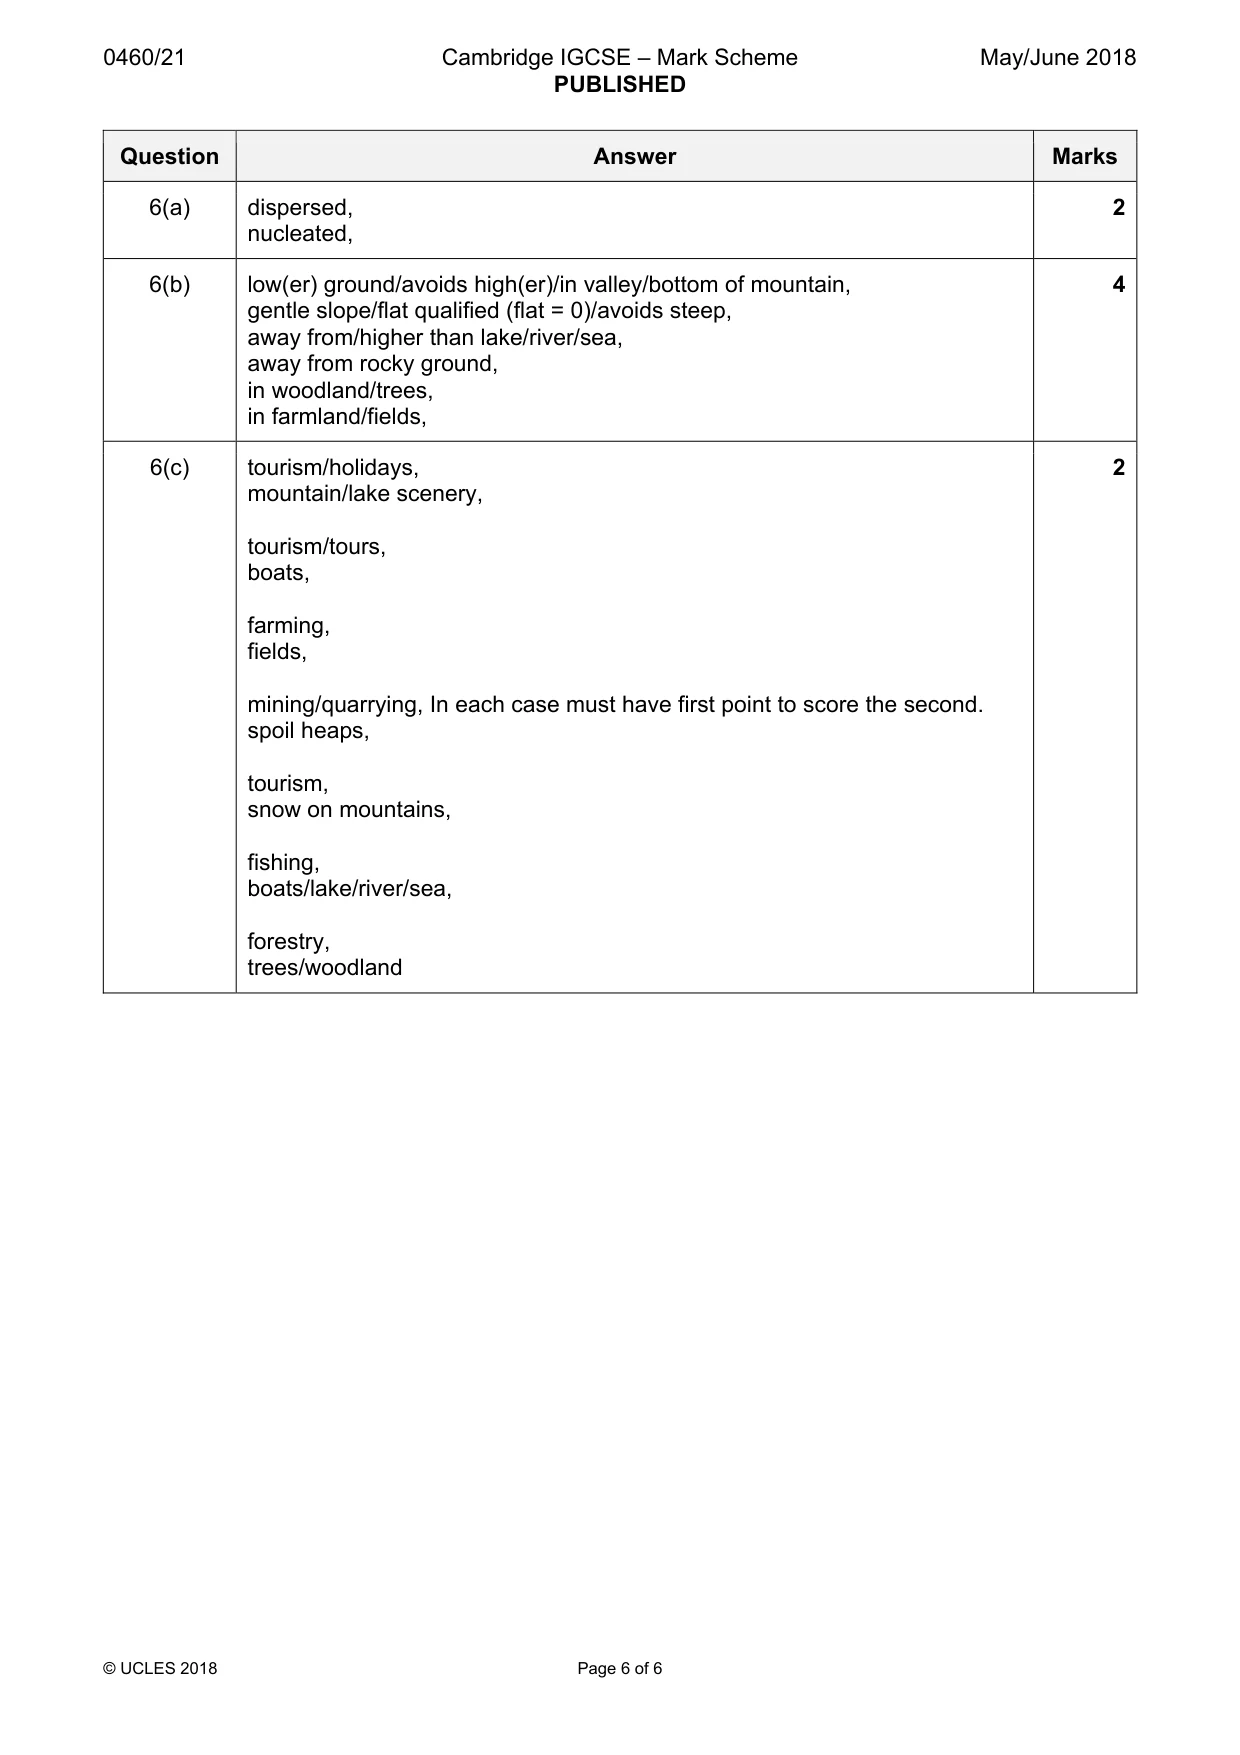
Mark scheme: 6(a) dispersed, 2 nucleated, 6(b) low(er) ground/avoids high(er)/in valley/bottom of mountain, 4 gentle slope/flat qualified (flat = 0)/avoids steep, away from/higher than lake/river/sea, away from rocky ground, in woodland/trees, in farmland/fields, 6(c) tourism/holidays, 2 mountain/lake scenery, tourism/tours, boats, farming, fields, mining/quarrying, In each case must have first point to score the second. spoil heaps, tourism, snow on mountains, fishing, boats/lake/river/sea, forestry, trees/woodland
More questions on Settlements (rural and urban) and service provision
What was in this paper
The subtopics covered by these 6 questions, and how many questions each got. Open one in a new tab to see every Cambridge question on it.
What you needed in this session
Cambridge’s own grade thresholds for 2018 May/June, Paper 2 · Variant 1. A higher threshold means an easier paper — the bar moves with how the cohort did.