Cambridge IGCSE Geography 0460 — 2021 Oct/Nov Paper 2 · Variant 3
0460/23/O/N/21 · 6 questions · 60 marks · ≈68 min
The question paper and its mark scheme, free to read here and free to download. This is Cambridge’s own paper, exactly as it was sat.
Question paper20 pages



Mark scheme6 pages
Answers below. Sit the paper first if you are practising.
Questions as text
Q1 · Study the map extract for St-Paul-de-Salers, France
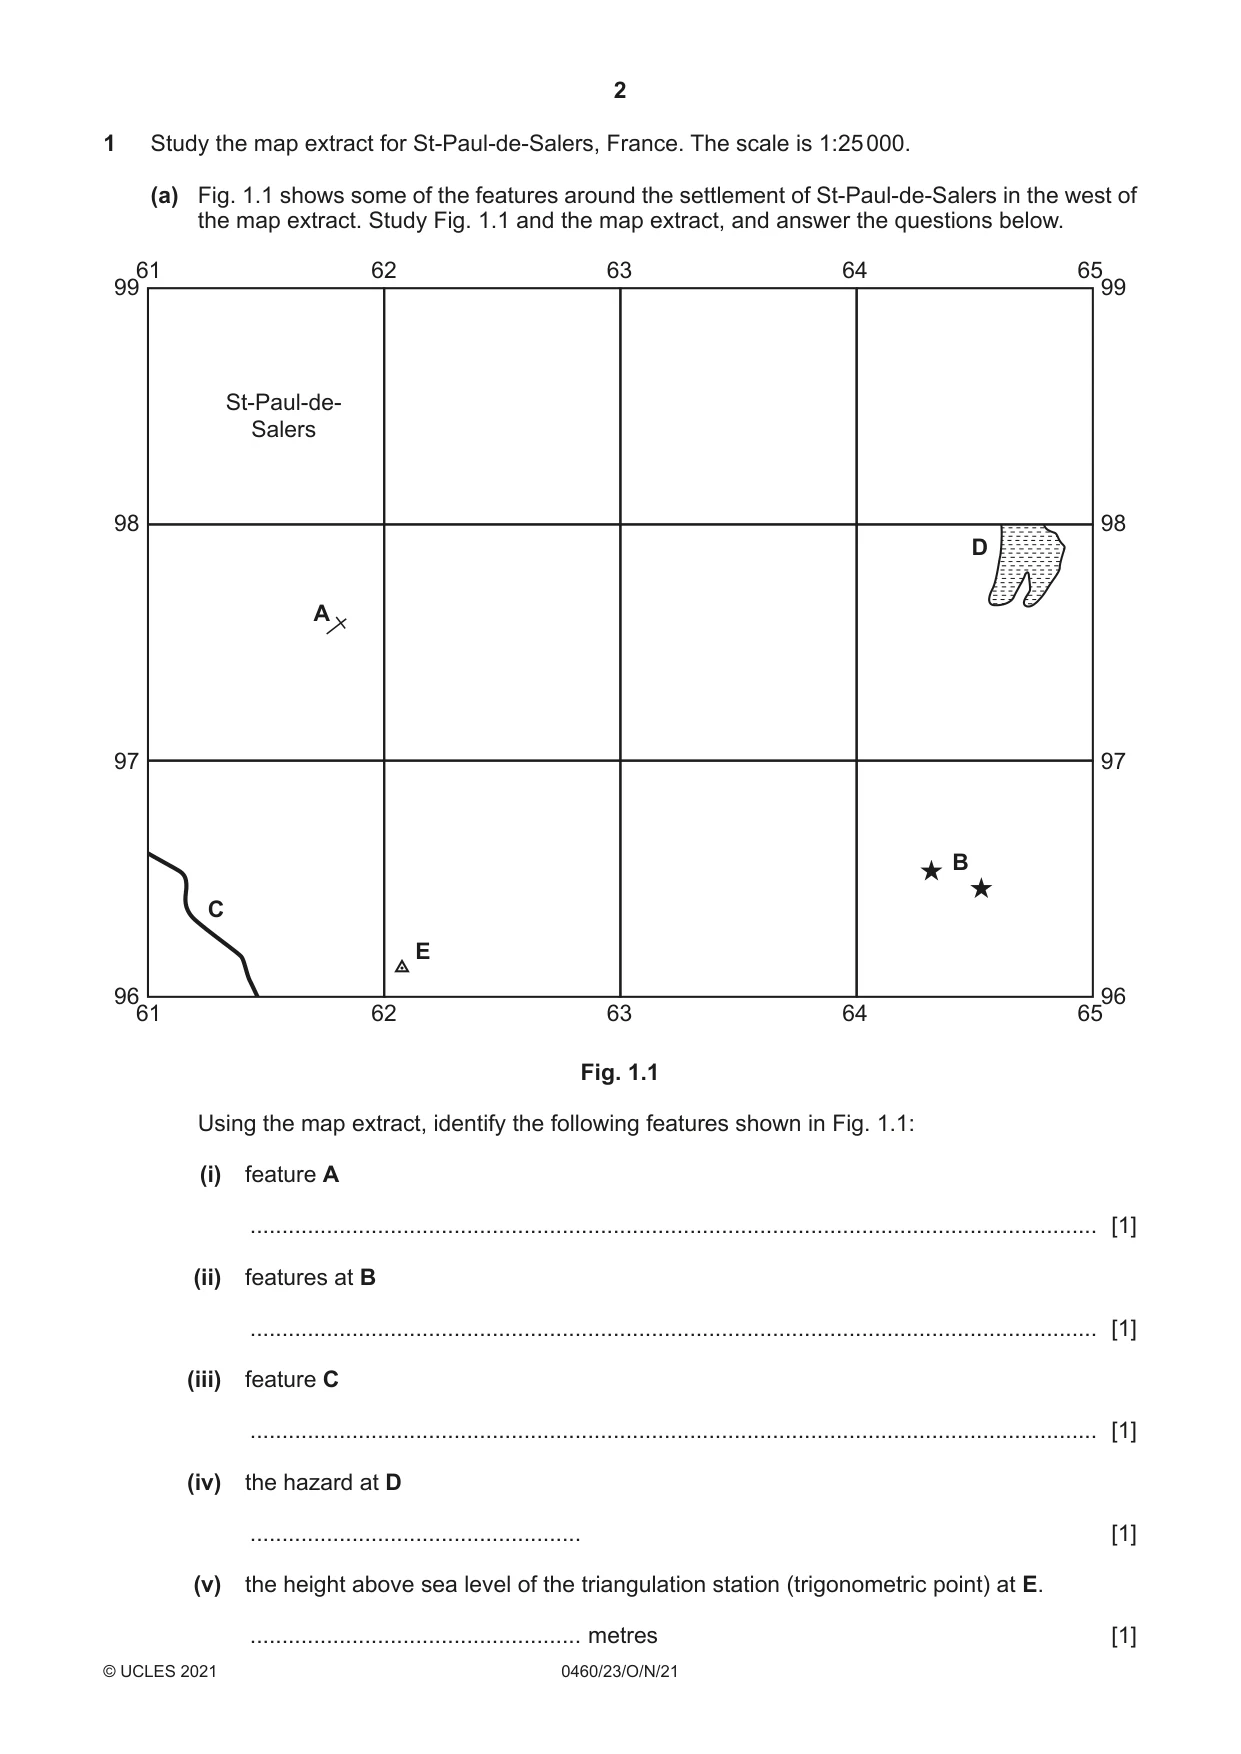
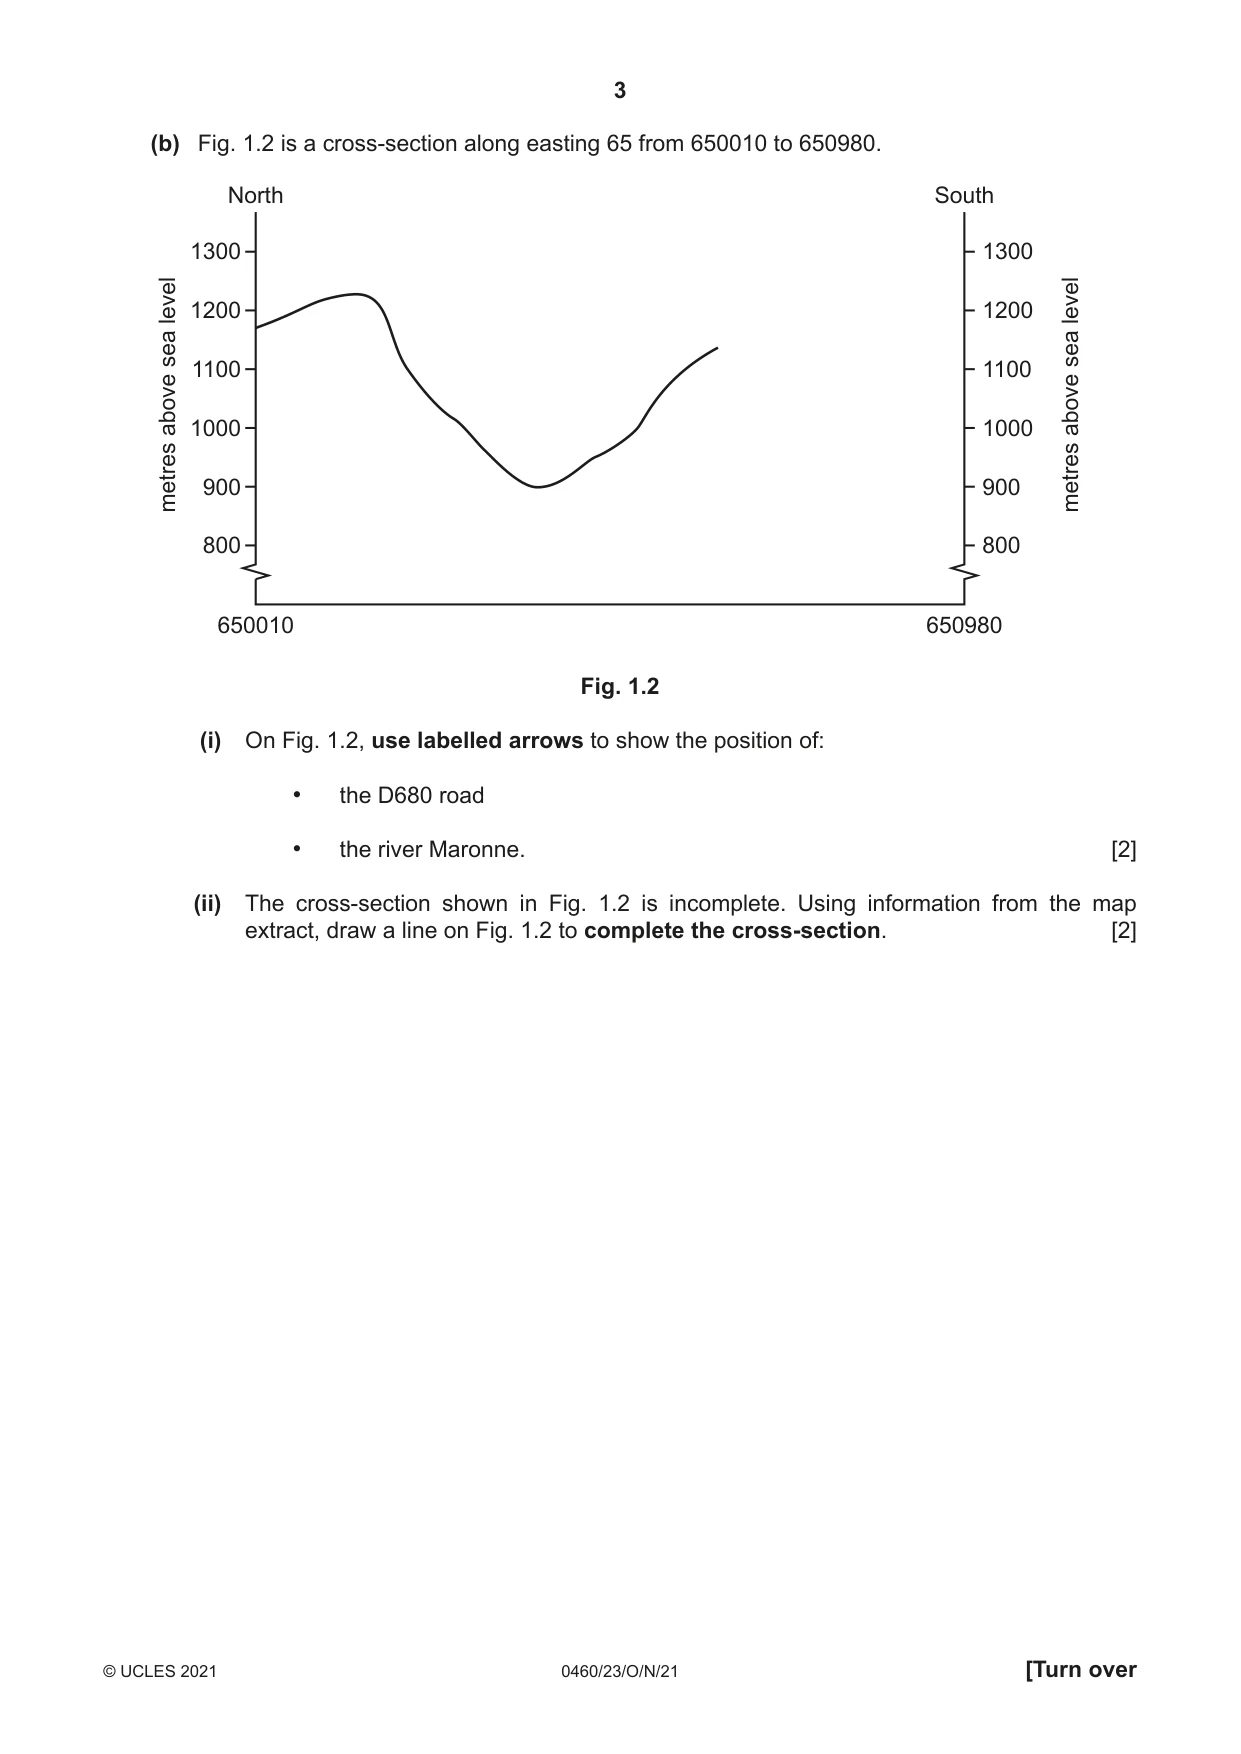
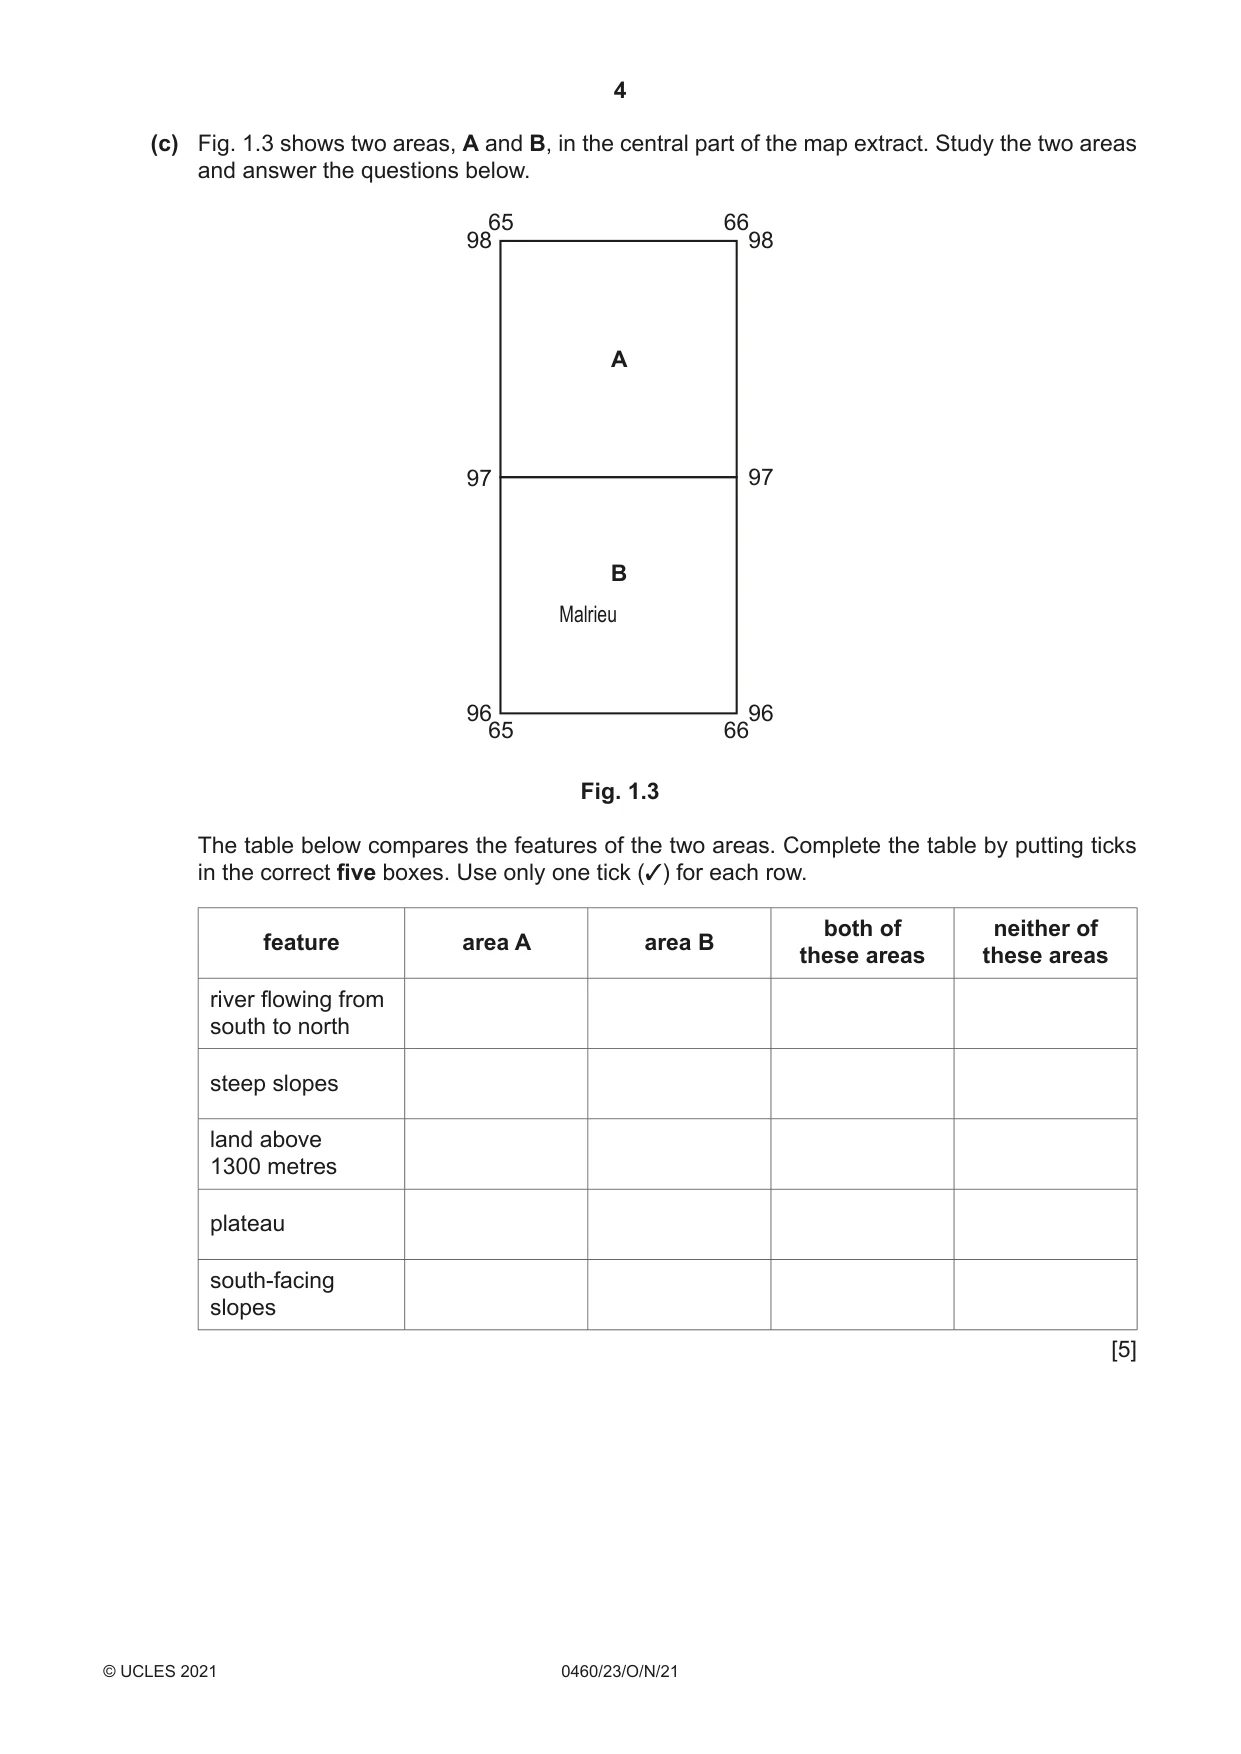
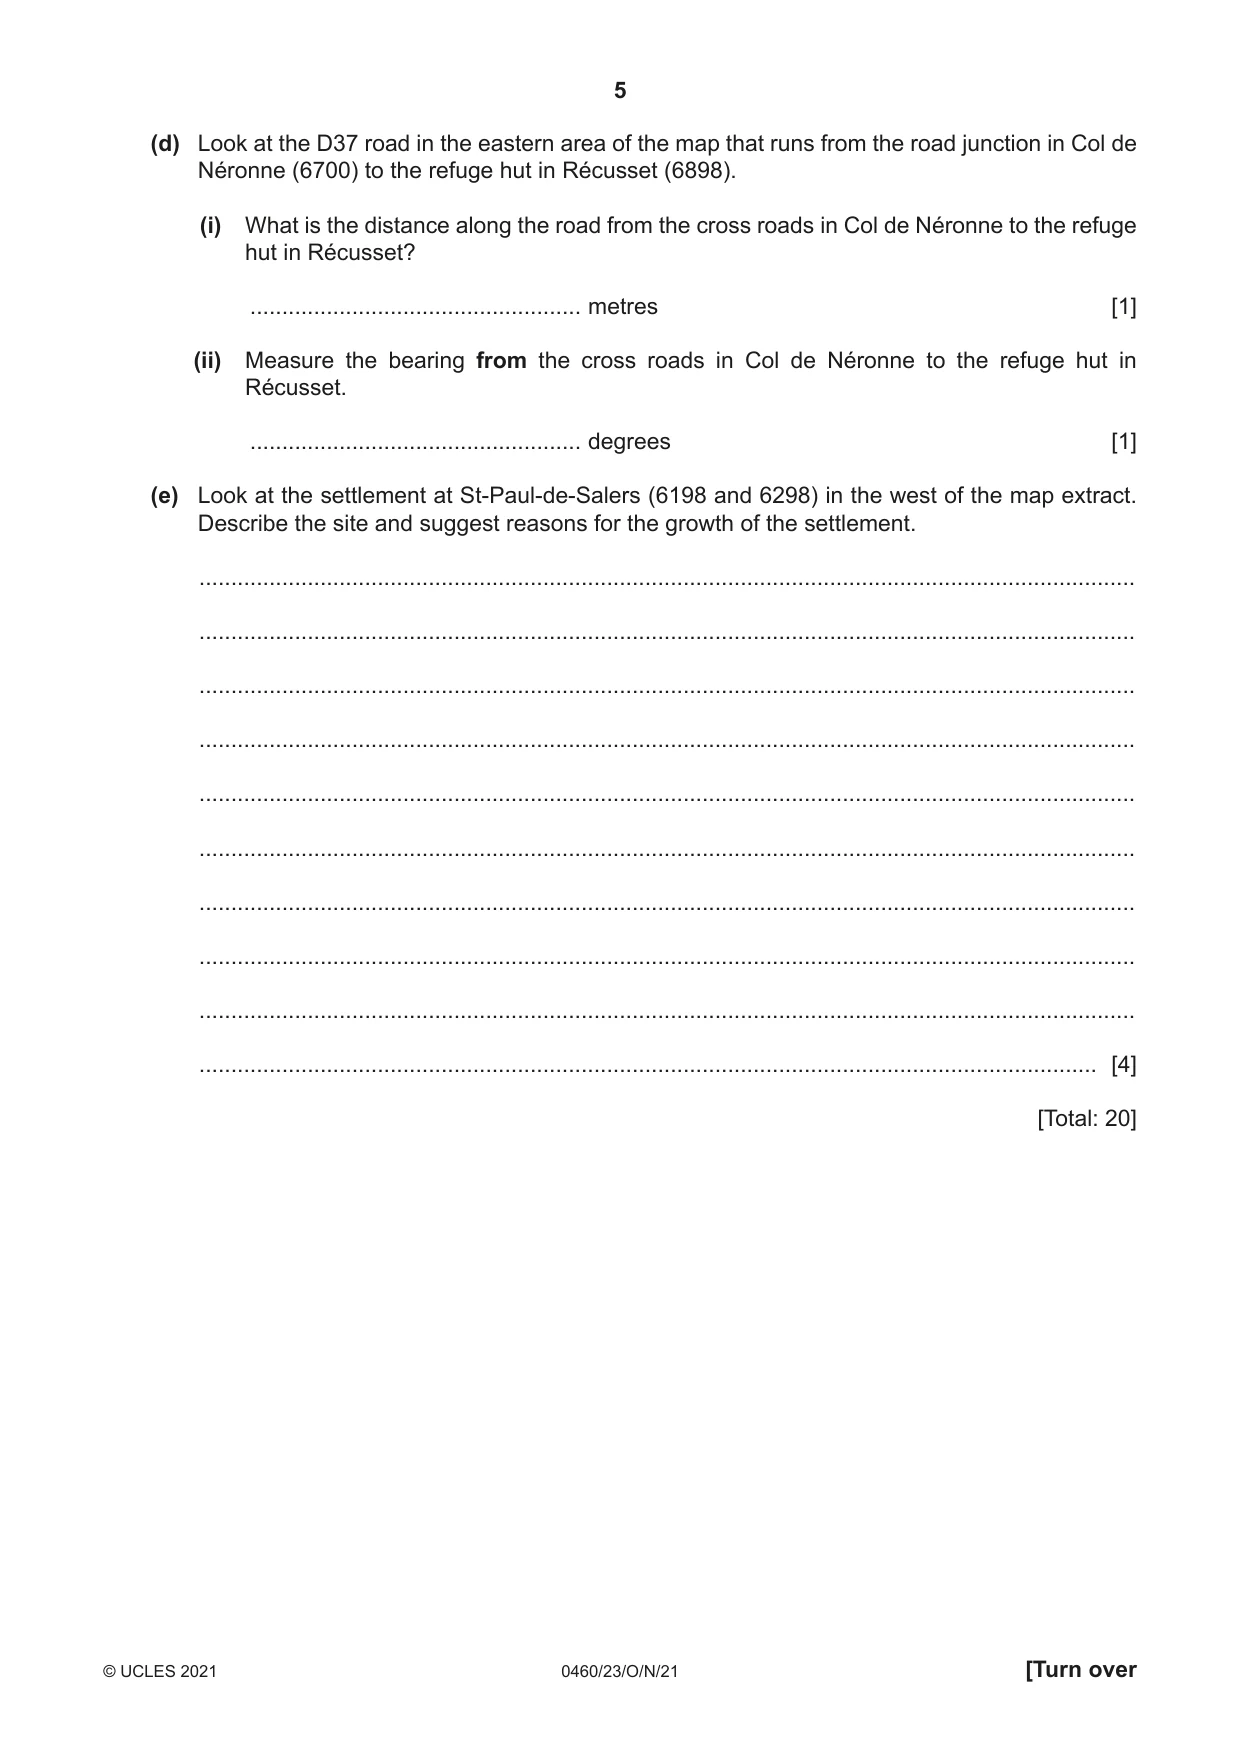
1 Study the map extract for St-Paul-de-Salers, France. The scale is 1:25 000. (a) Fig. 1.1 shows some of the features around the settlement of St-Paul-de-Salers in the west of the map extract. Study Fig. 1.1 and the map extract, and answer the questions below. 61 62 63 64 65 99 99 St-Paul-de- Salers 98 98 D A 97 97 B C E 96 96 61 62 63 64 65 Fig. 1.1 Using the map extract, identify the following features shown in Fig. 1.1: (i) feature A ..................................................................................................................................... [1] (ii) features at B ..................................................................................................................................... [1] (iii) feature C ..................................................................................................................................... [1] (iv) the hazard at D .................................................... [1] (v) the height above sea level of the triangulation station (trigonometric point) at E. .................................................... metres [1] (b) Fig. 1.2 is a cross-section along easting 65 from 650010 to 650980. North South 1300 1300 level 1200 1200 level sea sea 1100 1100 above above 1000 1000 900 900metres metres 800 800 650010 650980 Fig. 1.2 (i) On Fig. 1.2, use labelled arrows to show the position of: • the D680 road • the river Maronne. [2] (ii) The cross-section shown in Fig. 1.2 is incomplete. Using information from the map extract, draw a line on Fig. 1.2 to complete the cross-section. [2] (c) Fig. 1.3 shows two areas, A and B, in the central part of the map extract. Study the two areas and answer the questions below. 65 66 98 98 A 97 97 B Malrieu 96 96 65 66 Fig. 1.3 The table below compares the features of the two areas. Complete the table by putting ticks in the correct five boxes. Use only one tick (3) for each row. both of neither of feature area A area B these areas these areas river flowing from south to north steep slopes land above 1300 metres plateau south-facing slopes [5] (d) Look at the D37 road in the eastern area of the map that runs from the road junction in Col de Néronne (6700) to the refuge hut in Récusset (6898). (i) What is the distance along the road from the cross roads in Col de Néronne to the refuge hut in Récusset? .................................................... metres [1] (ii) Measure the bearing from the cross roads in Col de Néronne to the refuge hut in Récusset. .................................................... degrees [1] (e) Look at the settlement at St-Paul-de-Salers (6198 and 6298) in the west of the map extract. Describe the site and suggest reasons for the growth of the settlement. ................................................................................................................................................... ................................................................................................................................................... ................................................................................................................................................... ................................................................................................................................................... ................................................................................................................................................... ................................................................................................................................................... ................................................................................................................................................... ................................................................................................................................................... ................................................................................................................................................... ............................................................................................................................................. [4] [Total: 20]
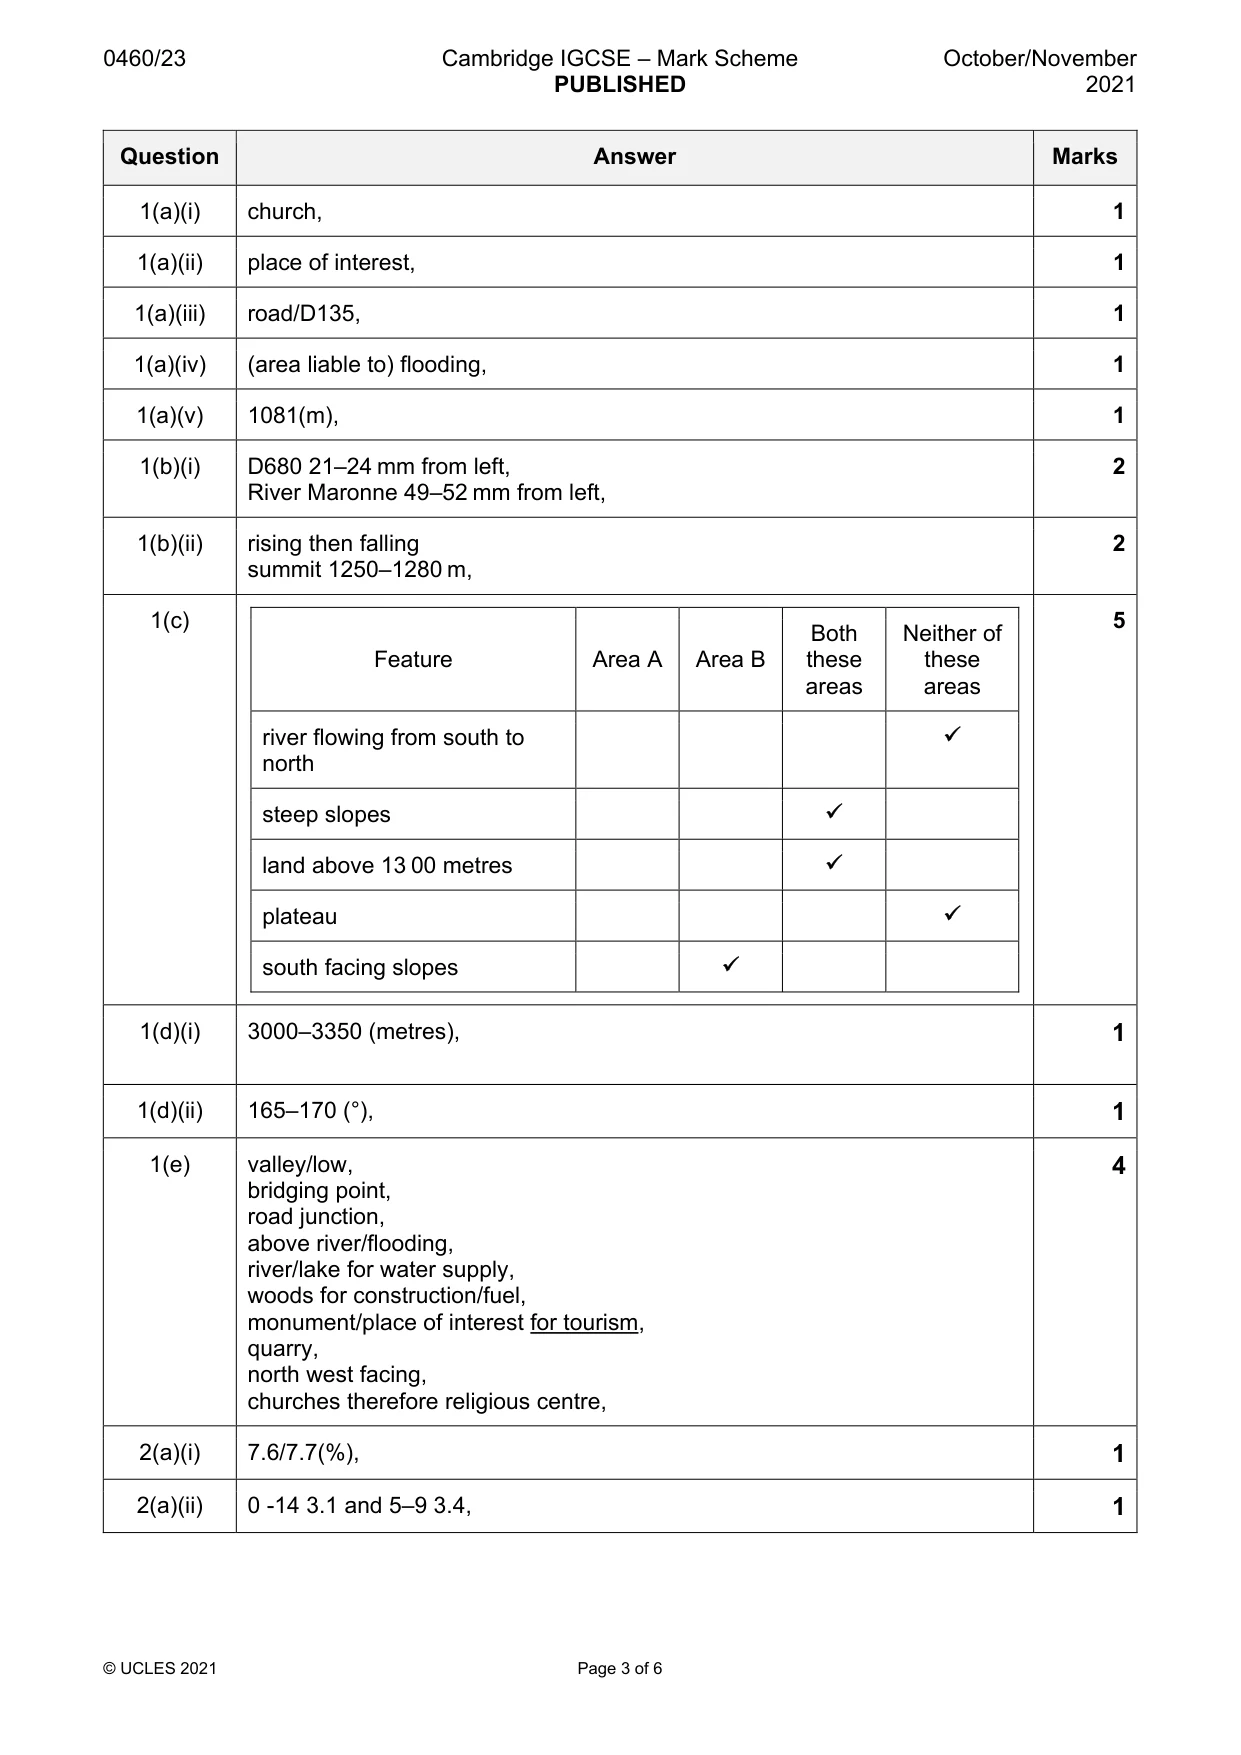
Mark scheme: Question Answer Marks 1(a)(i) church, 1 1(a)(ii) place of interest, 1 1(a)(iii) road/D135, 1 1(a)(iv) (area liable to) flooding, 1 1(a)(v) 1081(m), 1 1(b)(i) D680 21–24 mm from left, 2 River Maronne 49–52 mm from left, 1(b)(ii) rising then falling 2 summit 1250–1280 m, 1(c) 5 Both Neither of Feature Area A Area B these these areas areas river flowing from south to north steep slopes land above 13 00 metres plateau south facing slopes 1(d)(i) 3000–3350 (metres), 1 1(d)(ii) 165–170 (°), 1 1(e) valley/low, 4 bridging point, road junction, above river/flooding, river/lake for water supply, woods for construction/fuel, monument/place of interest for tourism, quarry, north west facing, churches therefore religious centre,
Q2 · A population pyramid for Pakistan for 1998 and a projected pyramid for 2025
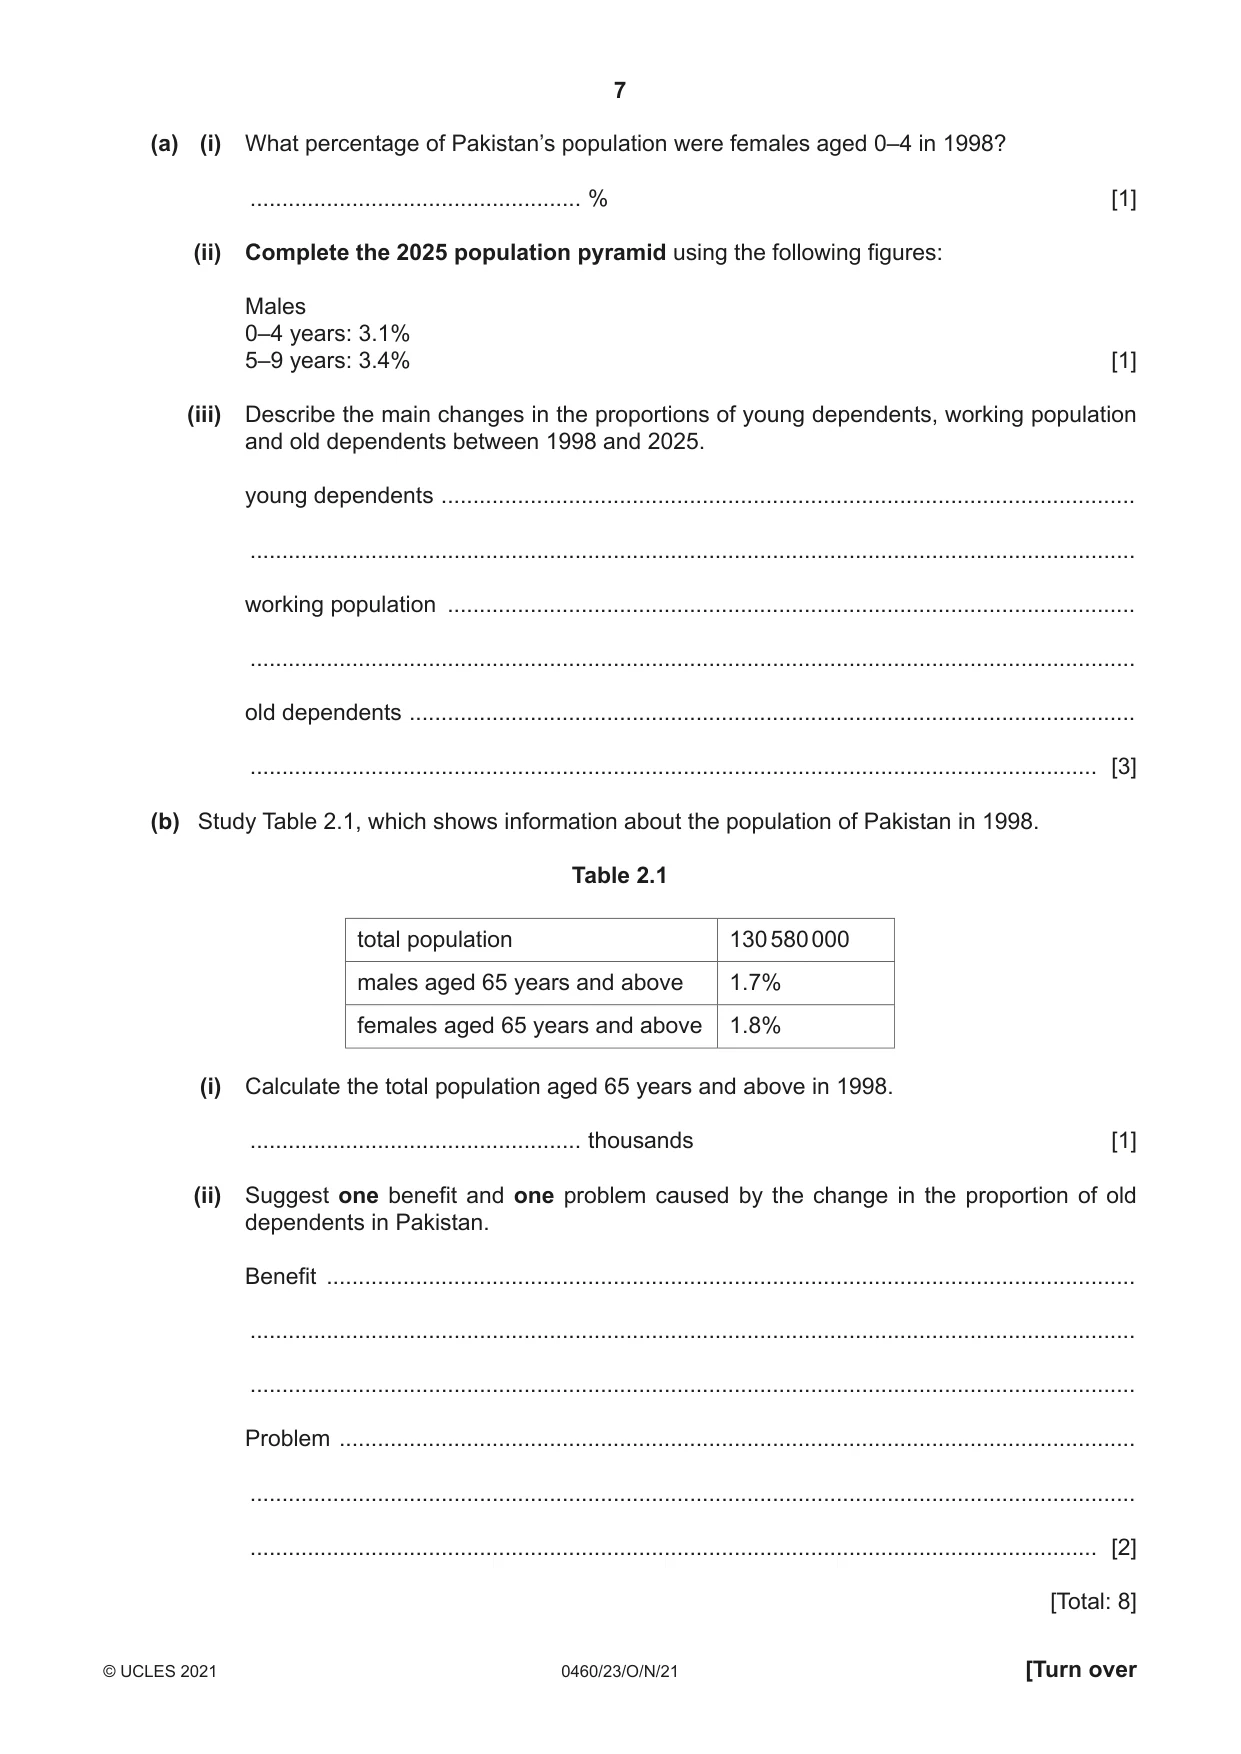
2 Fig. 2.1 shows a population pyramid for Pakistan for 1998 and a projected pyramid for 2025. Content removed due to copyright restrictions. Fig. 2.1 (a) (i) What percentage of Pakistan’s population were females aged 0–4 in 1998? .................................................... % [1] (ii) Complete the 2025 population pyramid using the following figures: Males 0–4 years: 3.1% 5–9 years: 3.4% [1] (iii) Describe the main changes in the proportions of young dependents, working population and old dependents between 1998 and 2025. young dependents ............................................................................................................. ........................................................................................................................................... working population ............................................................................................................ ........................................................................................................................................... old dependents .................................................................................................................. ..................................................................................................................................... [3] (b) Study Table 2.1, which shows information about the population of Pakistan in 1998. Table 2.1 total population 130 580 000 males aged 65 years and above 1.7% females aged 65 years and above 1.8% (i) Calculate the total population aged 65 years and above in 1998. .................................................... thousands [1] (ii) Suggest one benefit and one problem caused by the change in the proportion of old dependents in Pakistan. Benefit ............................................................................................................................... ........................................................................................................................................... ........................................................................................................................................... Problem ............................................................................................................................. ........................................................................................................................................... ..................................................................................................................................... [2] [Total: 8]
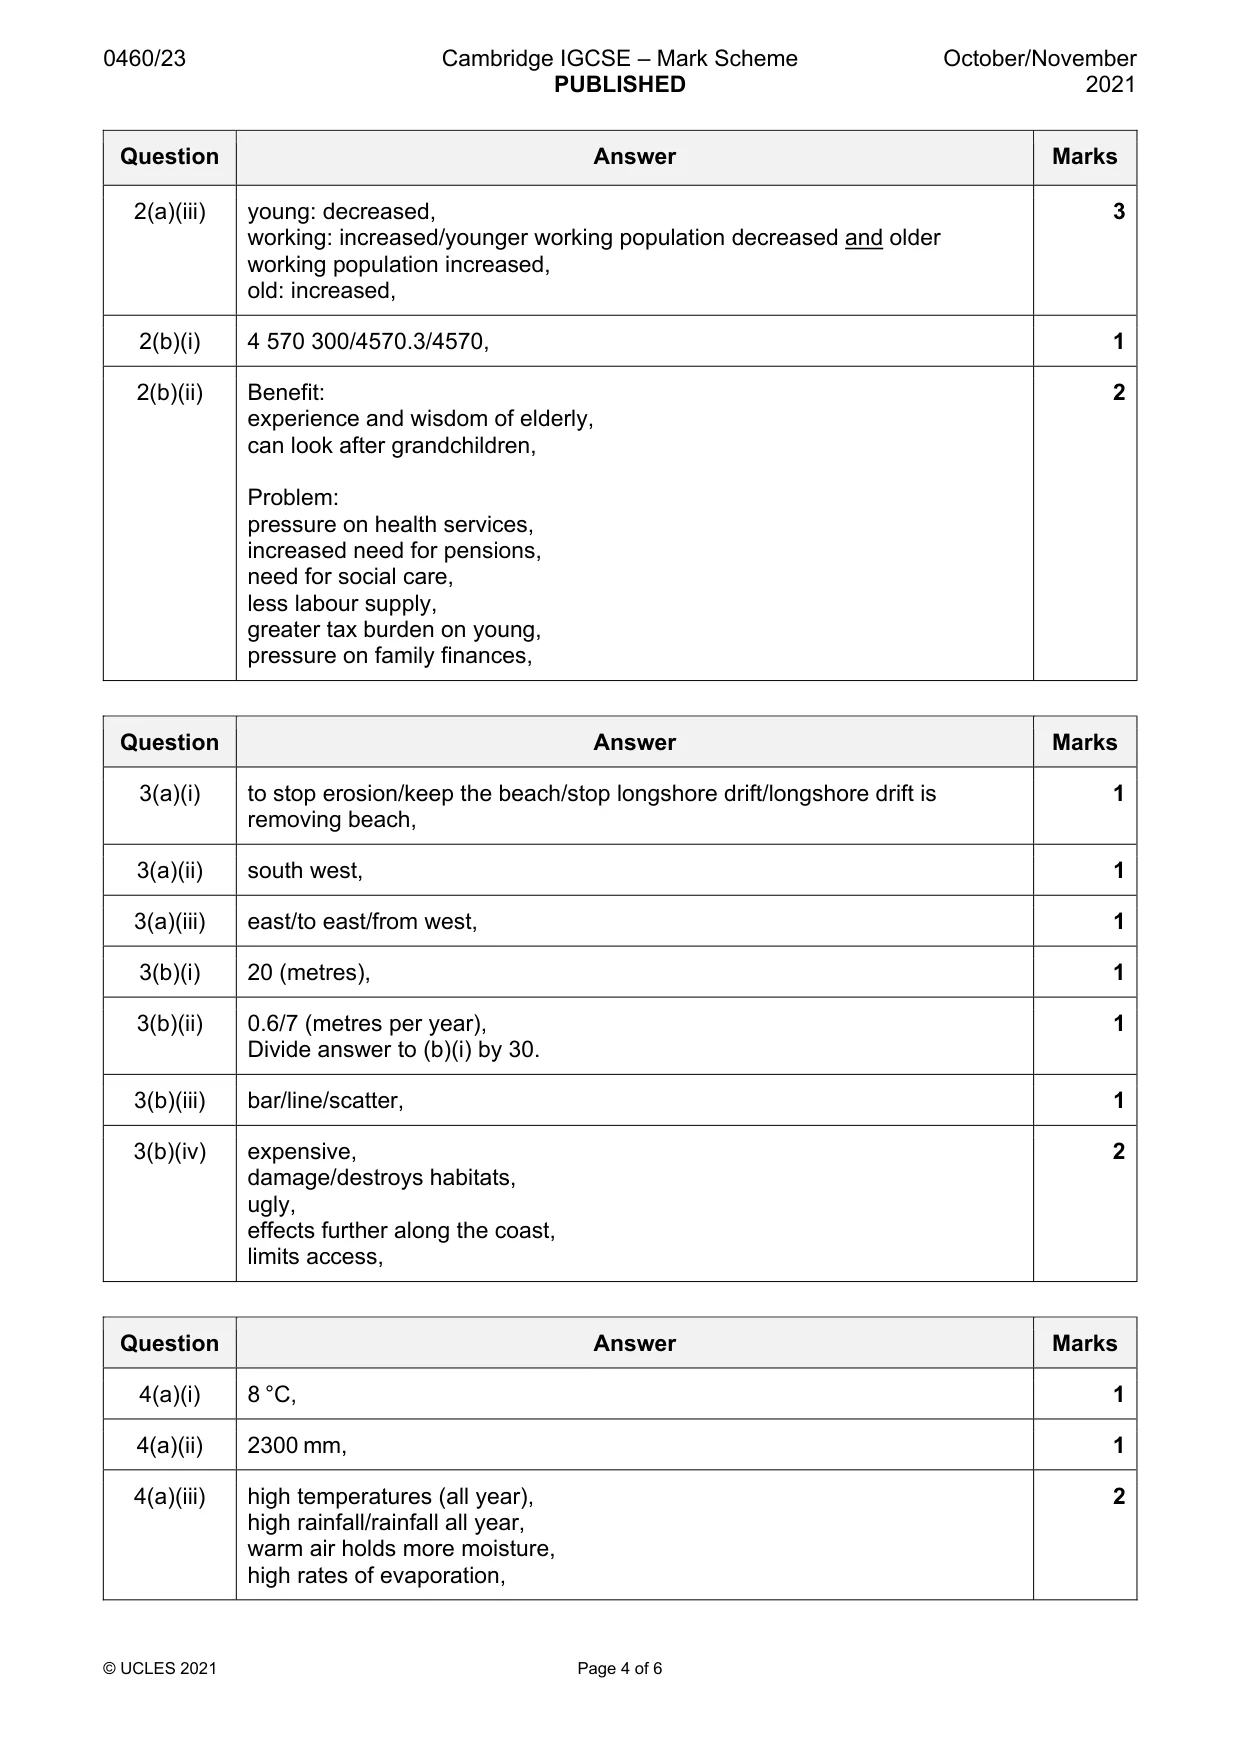
Mark scheme: 2(a)(i) 7.6/7.7(%), 1 2(a)(ii) 0 -14 3.1 and 5–9 3.4, 1 2(a)(iii) young: decreased, 3 working: increased/younger working population decreased and older working population increased, old: increased, 2(b)(i) 4 570 300/4570.3/4570, 1 2(b)(ii) Benefit: 2 experience and wisdom of elderly, can look after grandchildren, Problem: pressure on health services, increased need for pensions, need for social care, less labour supply, greater tax burden on young, pressure on family finances,
Question 3
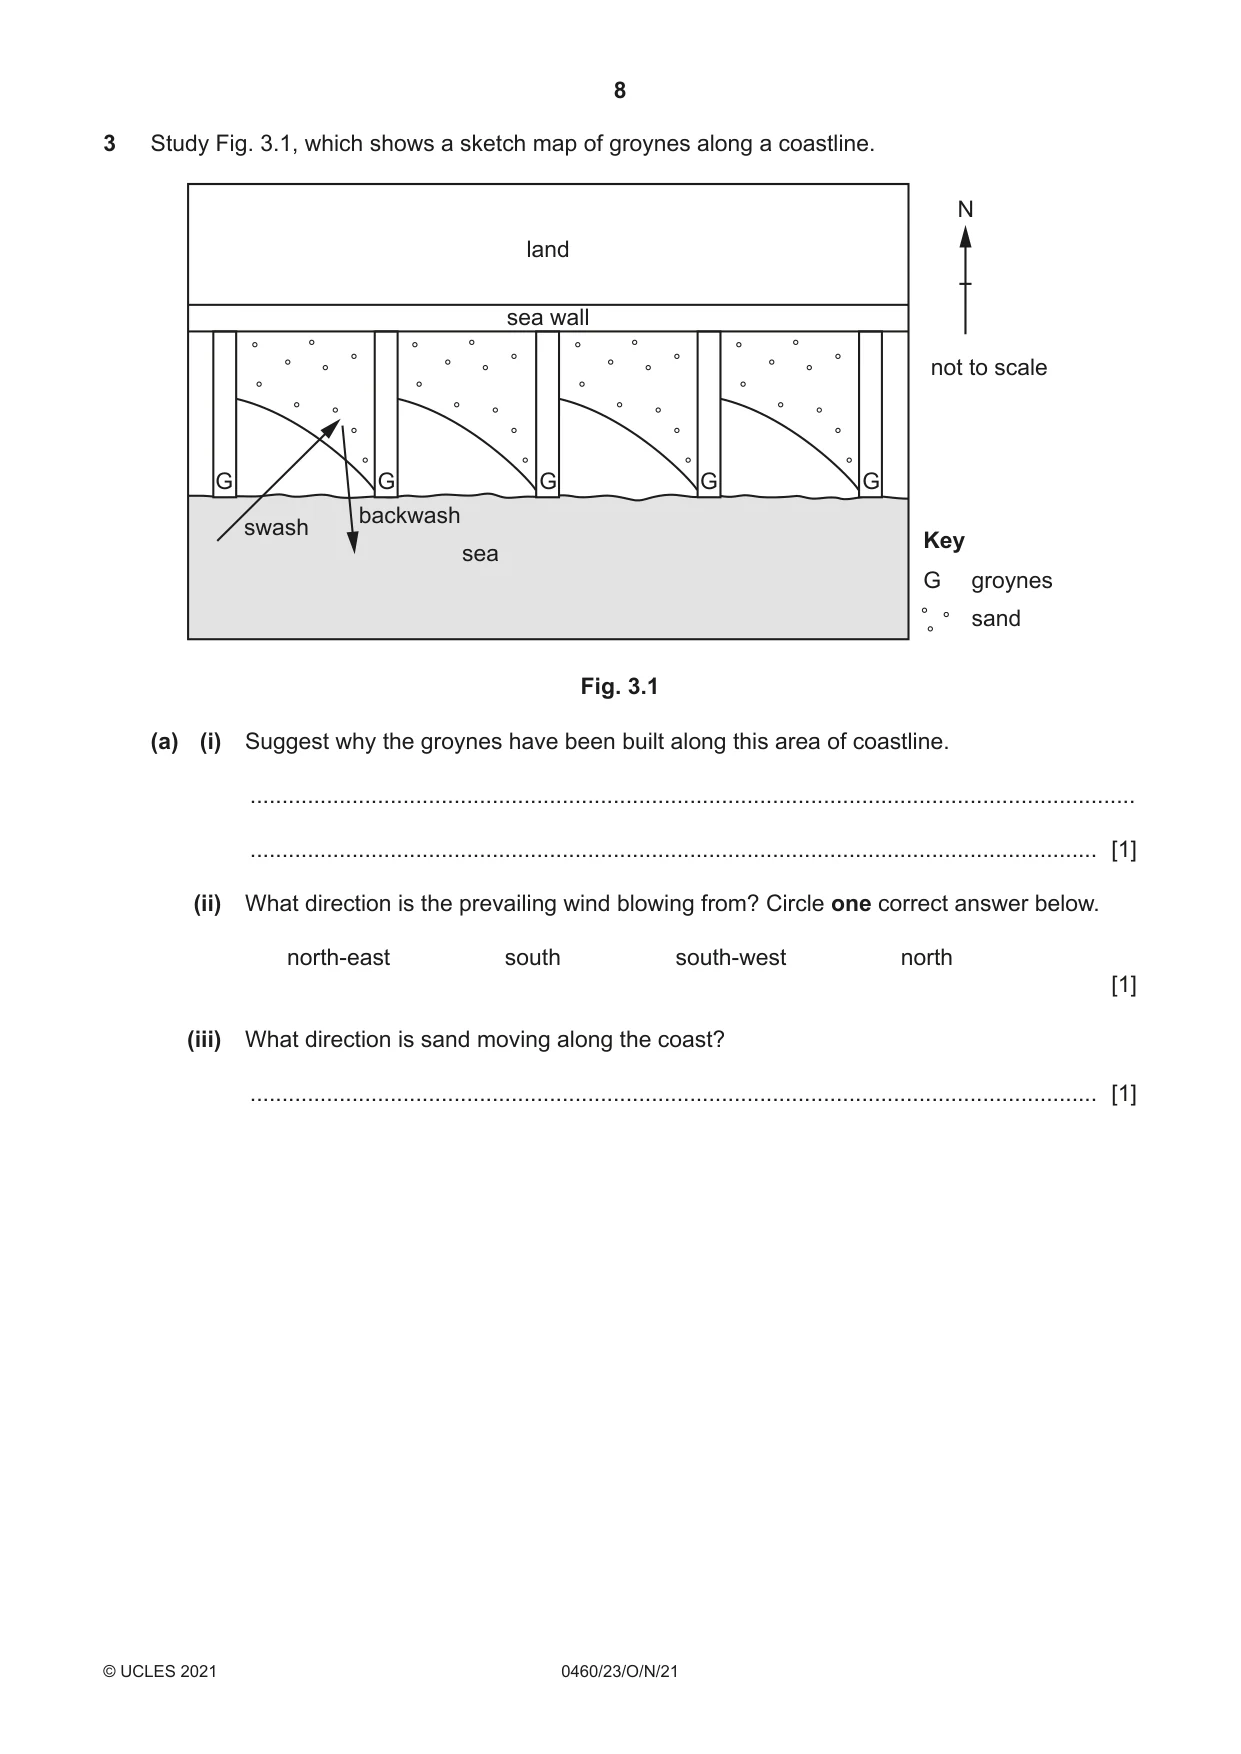
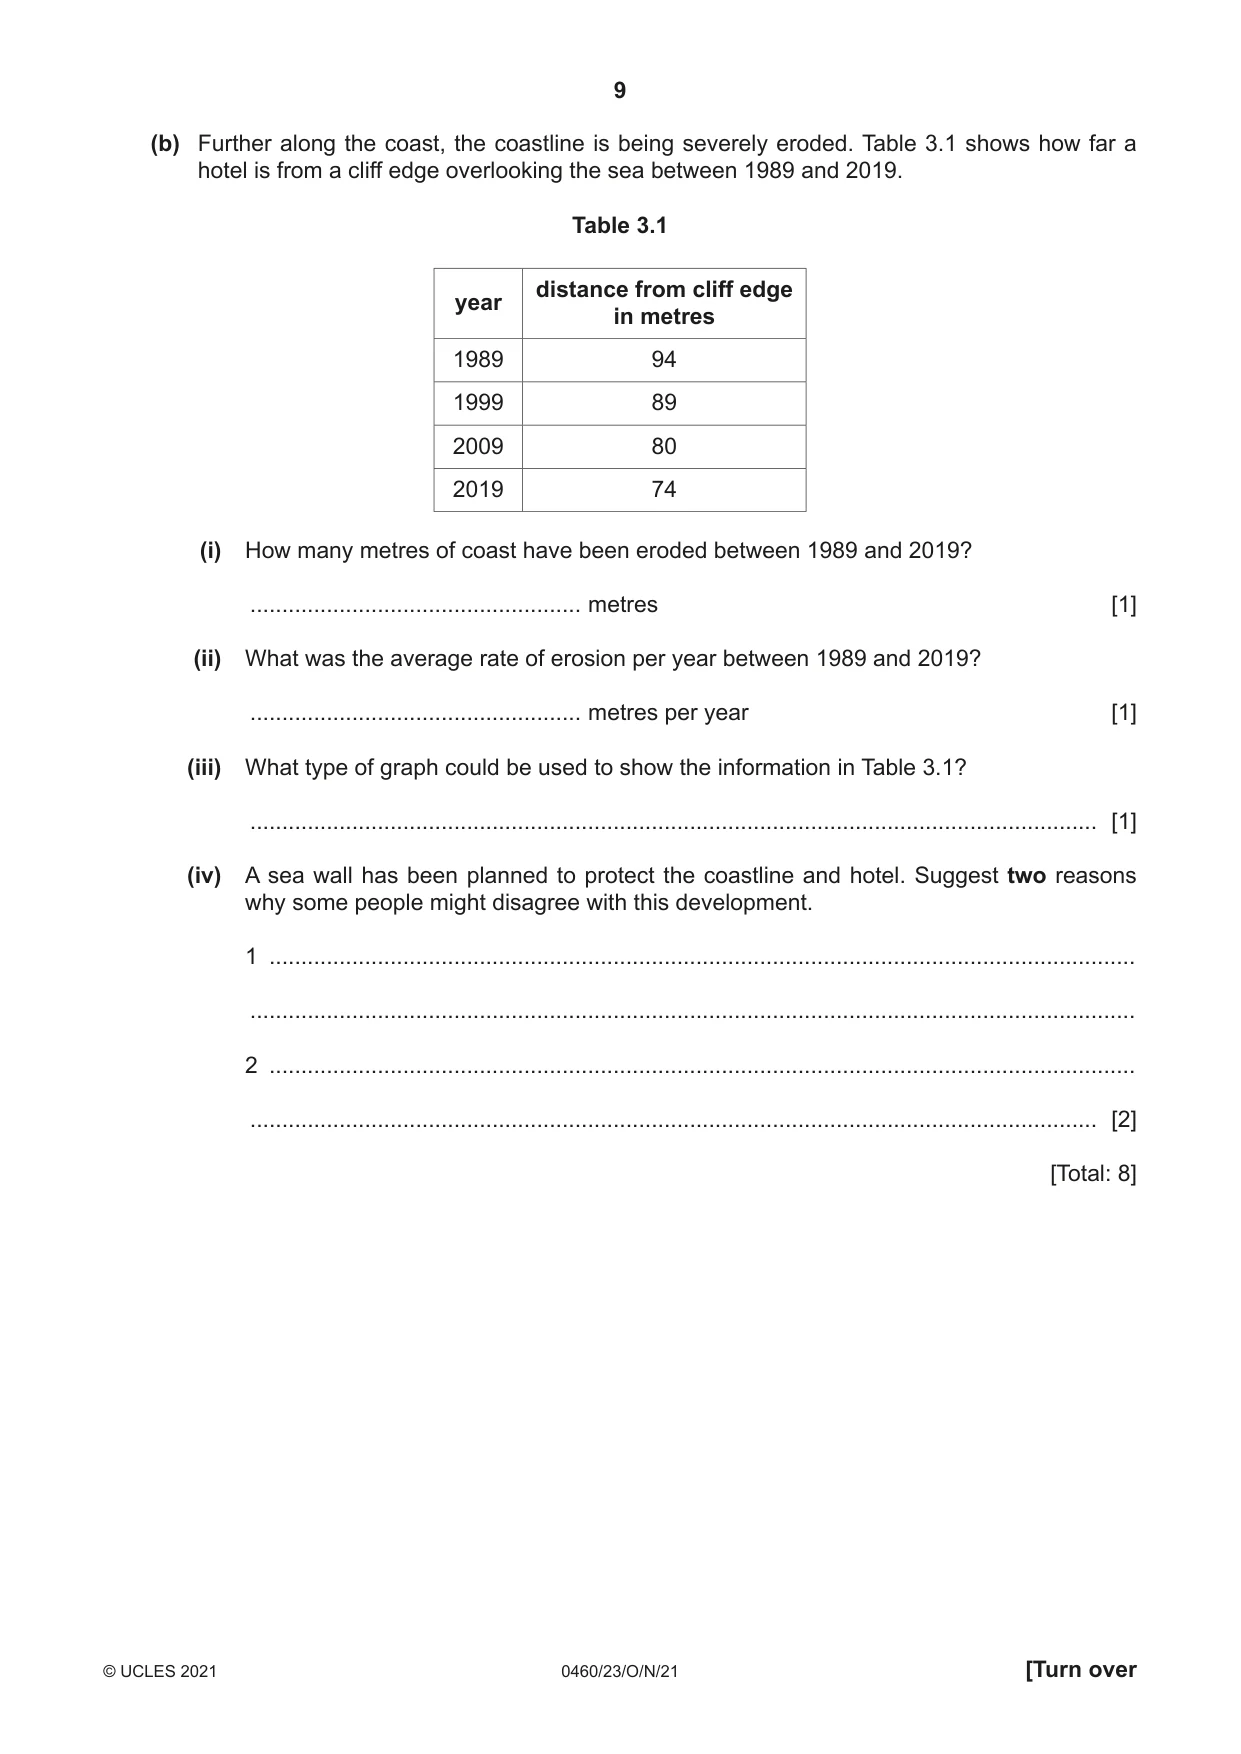
3 Study Fig. 3.1, which shows a sketch map of groynes along a coastline. N land sea wall not to scale G G G G G backwash swash Key sea G groynes sand Fig. 3.1 (a) (i) Suggest why the groynes have been built along this area of coastline. ........................................................................................................................................... ..................................................................................................................................... [1] (ii) What direction is the prevailing wind blowing from? Circle one correct answer below. north-east south south-west north [1] (iii) What direction is sand moving along the coast? ..................................................................................................................................... [1] (b) Further along the coast, the coastline is being severely eroded. Table 3.1 shows how far a hotel is from a cliff edge overlooking the sea between 1989 and 2019. Table 3.1 distance from cliff edge year in metres 1989 94 1999 89 2009 80 2019 74 (i) How many metres of coast have been eroded between 1989 and 2019? .................................................... metres [1] (ii) What was the average rate of erosion per year between 1989 and 2019? .................................................... metres per year [1] (iii) What type of graph could be used to show the information in Table 3.1? ..................................................................................................................................... [1] (iv) A sea wall has been planned to protect the coastline and hotel. Suggest two reasons why some people might disagree with this development. 1 ........................................................................................................................................ ........................................................................................................................................... 2 ........................................................................................................................................ ..................................................................................................................................... [2] [Total: 8]
Mark scheme: 3(a)(i) to stop erosion/keep the beach/stop longshore drift/longshore drift is 1 removing beach, 3(a)(ii) south west, 1 3(a)(iii) east/to east/from west, 1 3(b)(i) 20 (metres), 1 3(b)(ii) 0.6/7 (metres per year), 1 Divide answer to (b)(i) by 30. 3(b)(iii) bar/line/scatter, 1 3(b)(iv) expensive, 2 damage/destroys habitats, ugly, effects further along the coast, limits access,
Question 4
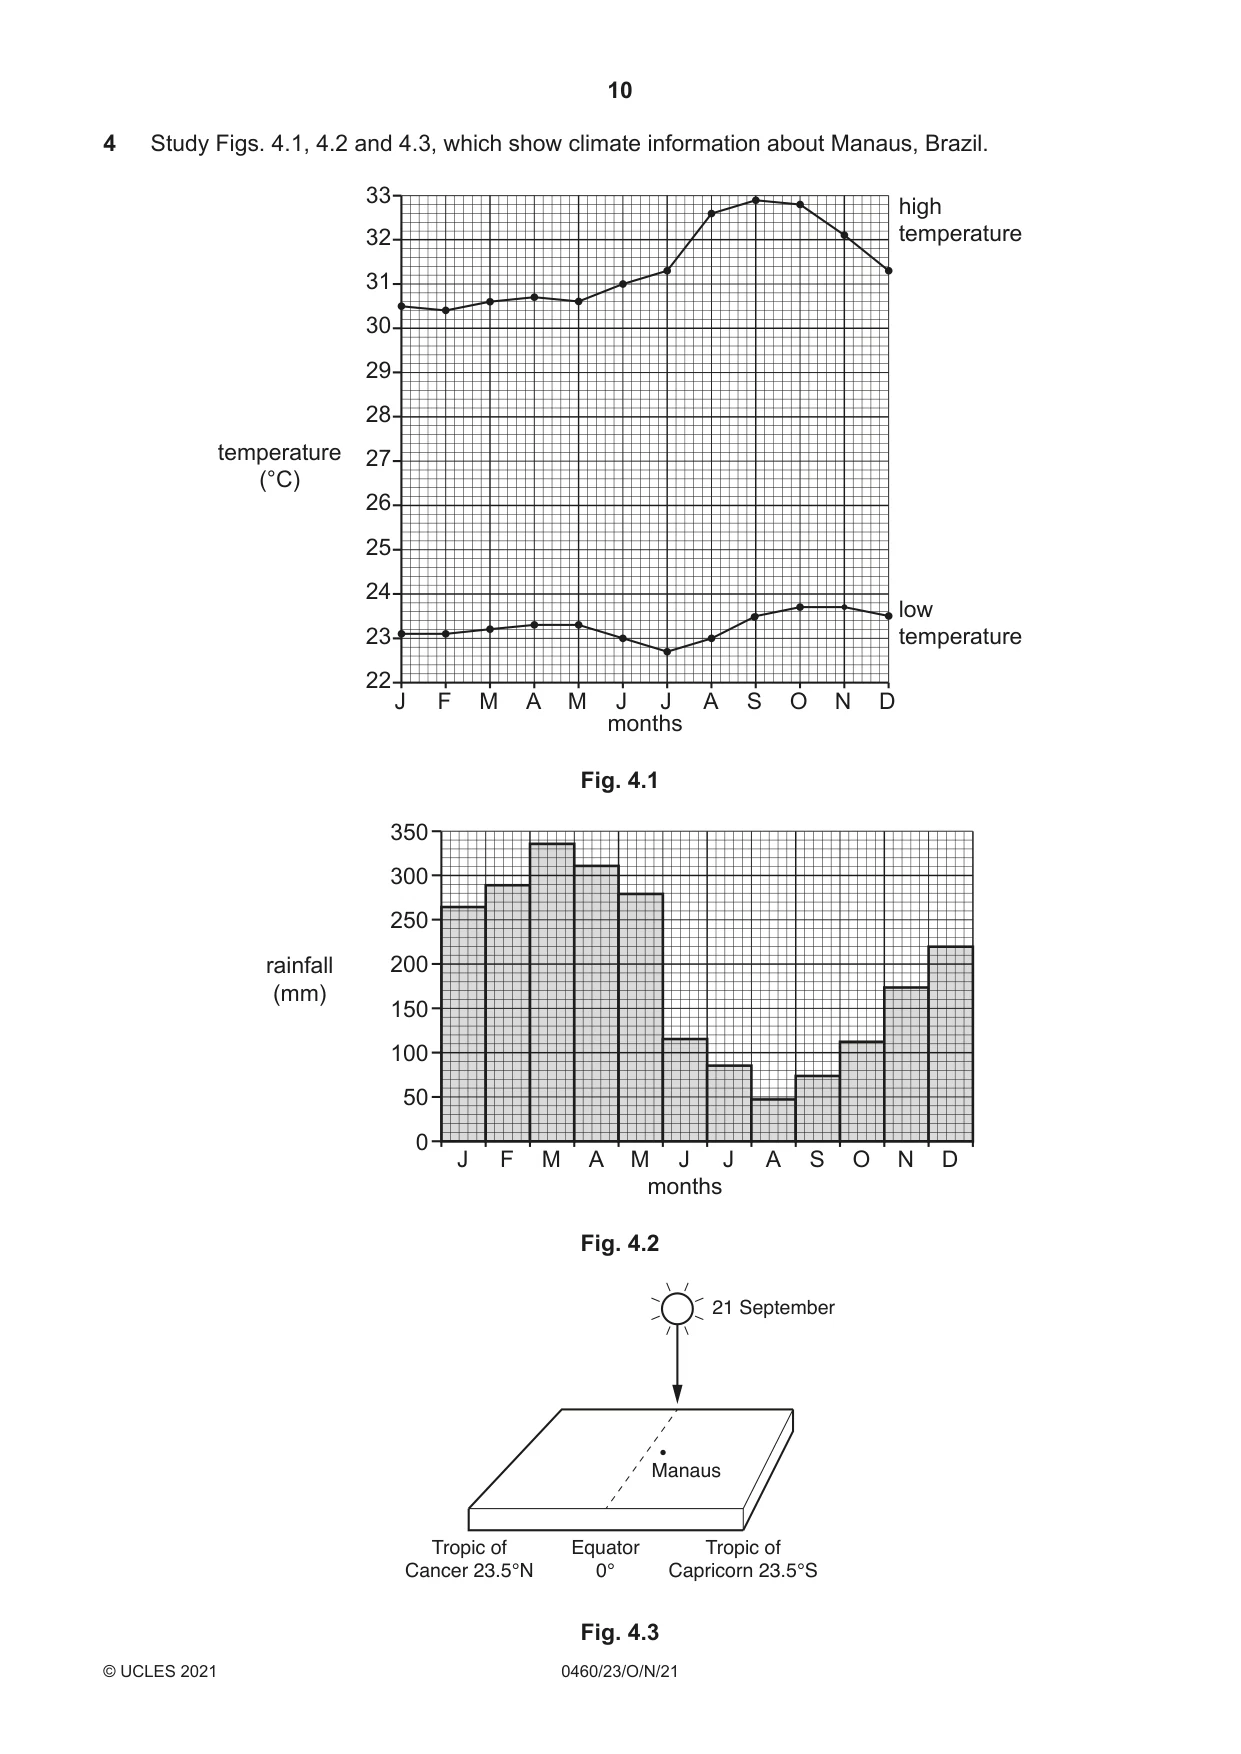
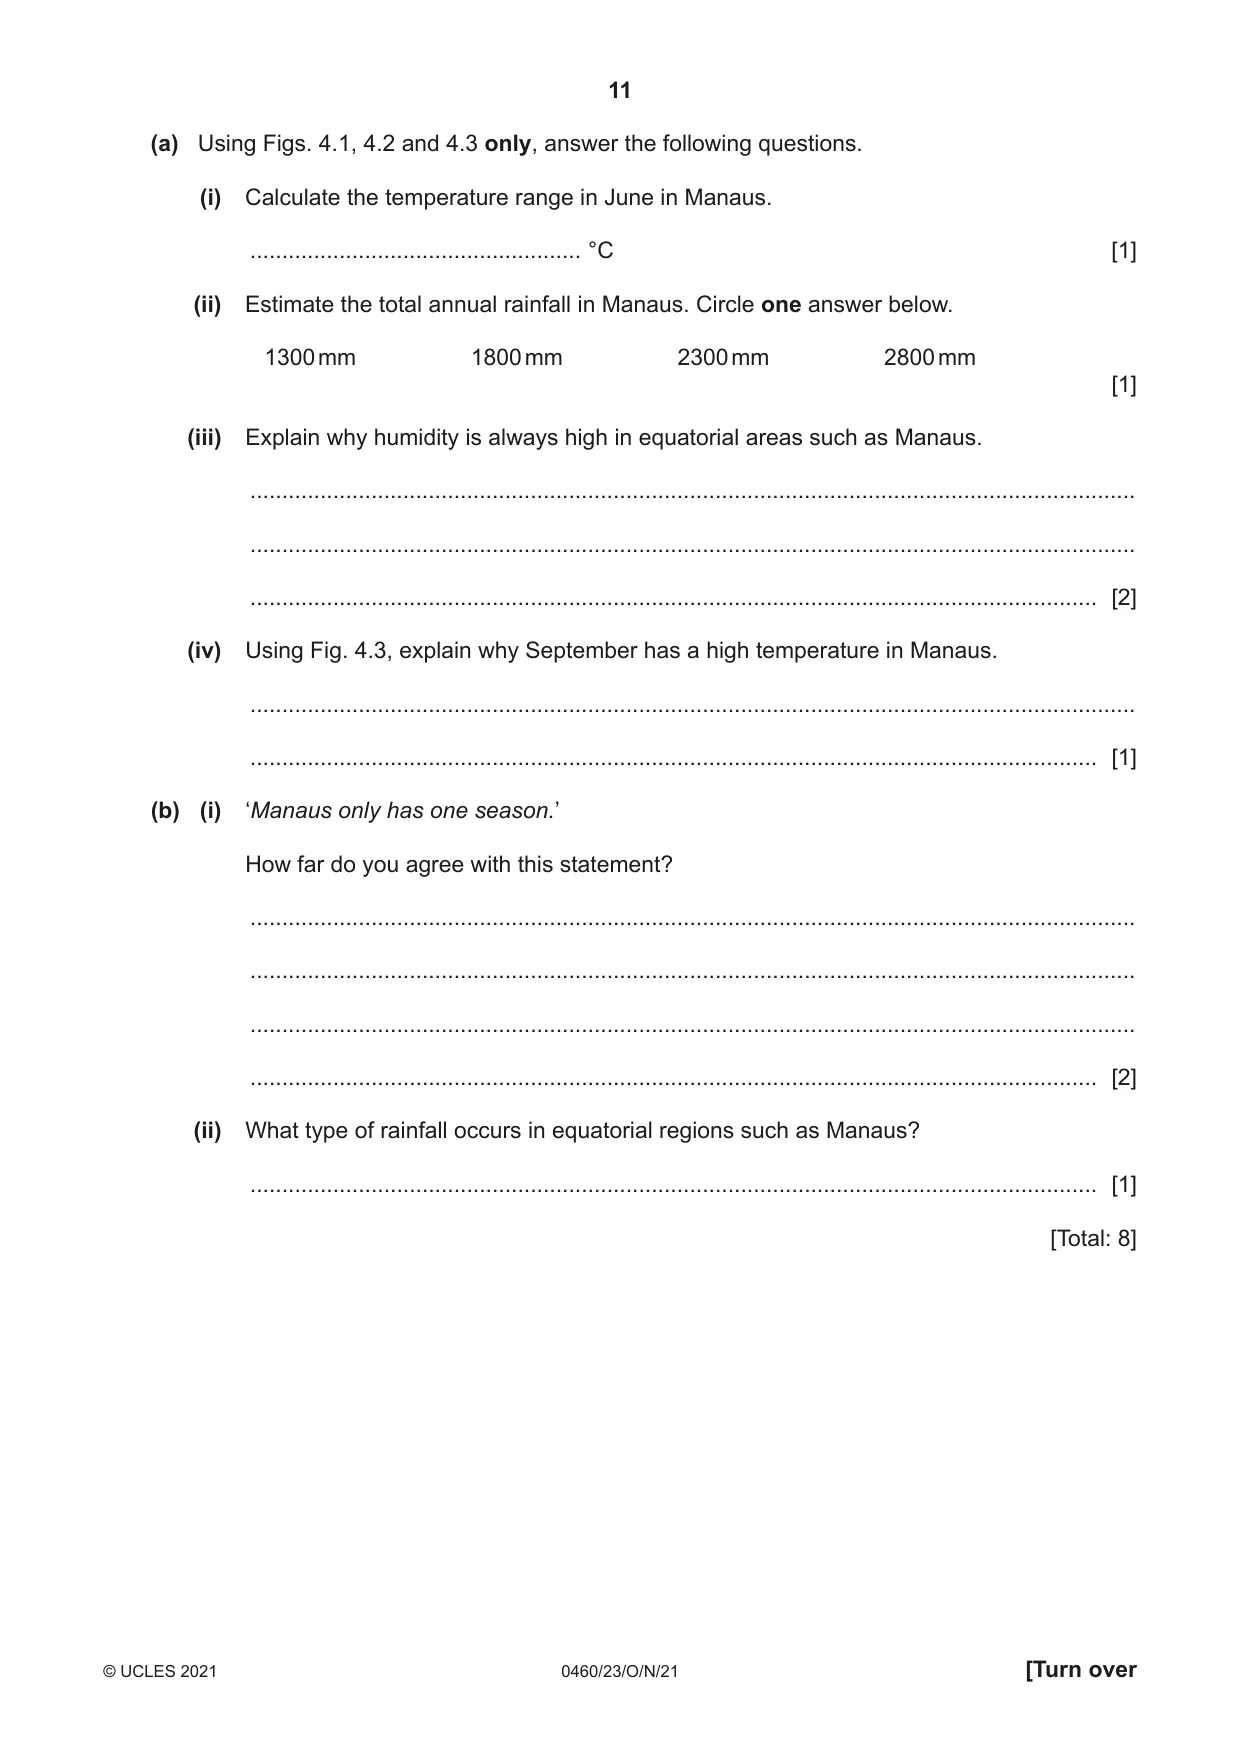
4 Study Figs. 4.1, 4.2 and 4.3, which show climate information about Manaus, Brazil. 33 high 32 temperature 31 30 29 28 temperature 27 (°C) 26 25 24 low 23 temperature 22 J F M A M J J A S O N D months Fig. 4.1 350 300 250 rainfall 200 (mm) 150 100 50 0 J F M A M J J A S O N D months Fig. 4.2 21 September Manaus Tropic of Equator Tropic of Cancer 23.5°N 0° Capricorn 23.5°S Fig. 4.3 (a) Using Figs. 4.1, 4.2 and 4.3 only, answer the following questions. (i) Calculate the temperature range in June in Manaus. .................................................... °C [1] (ii) Estimate the total annual rainfall in Manaus. Circle one answer below. 1300 mm 1800 mm 2300 mm 2800 mm [1] (iii) Explain why humidity is always high in equatorial areas such as Manaus. ........................................................................................................................................... ........................................................................................................................................... ..................................................................................................................................... [2] (iv) Using Fig. 4.3, explain why September has a high temperature in Manaus. ........................................................................................................................................... ..................................................................................................................................... [1] (b) (i) ‘Manaus only has one season.’ How far do you agree with this statement? ........................................................................................................................................... ........................................................................................................................................... ........................................................................................................................................... ..................................................................................................................................... [2] (ii) What type of rainfall occurs in equatorial regions such as Manaus? ..................................................................................................................................... [1] [Total: 8]
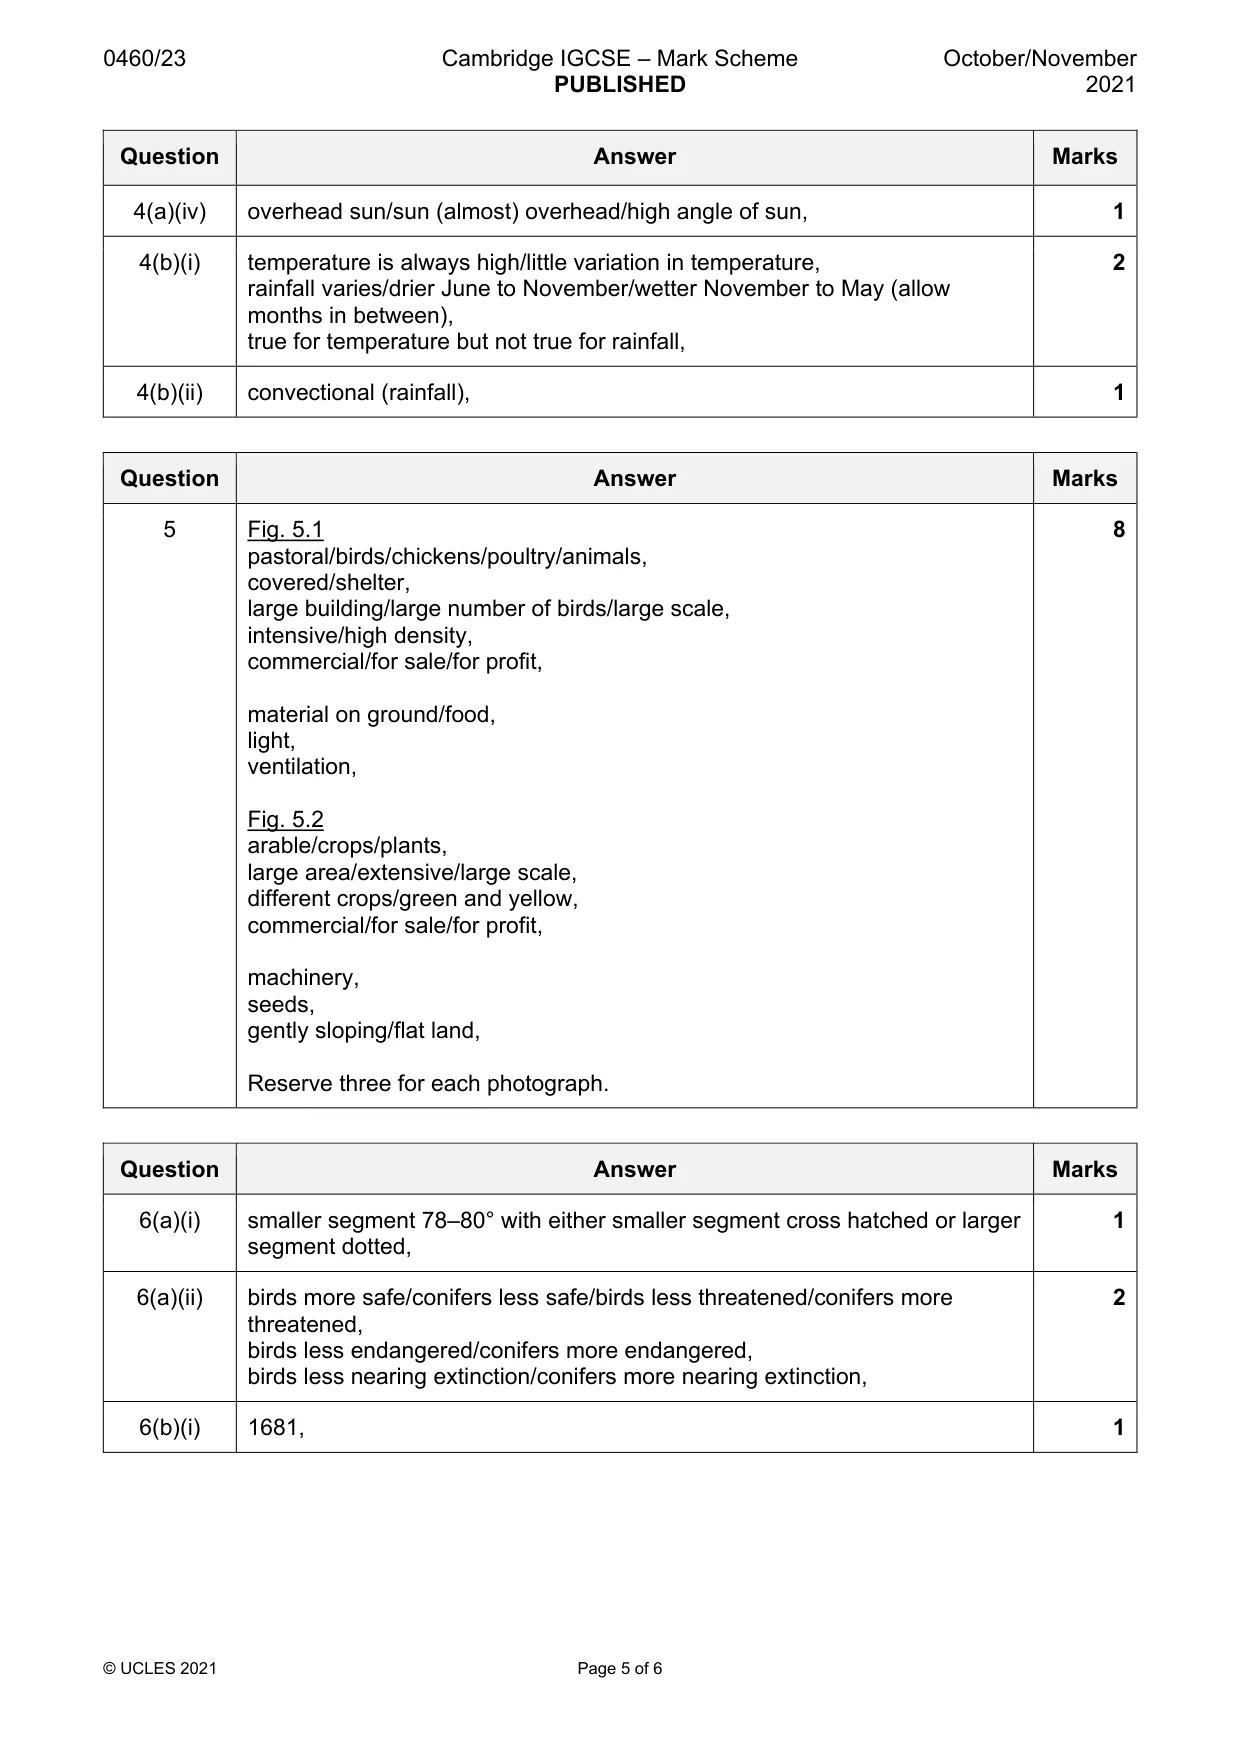
Mark scheme: 4(a)(i) 8 °C, 1 4(a)(ii) 2300 mm, 1 4(a)(iii) high temperatures (all year), 2 high rainfall/rainfall all year, warm air holds more moisture, high rates of evaporation, 4(a)(iv) overhead sun/sun (almost) overhead/high angle of sun, 1 4(b)(i) temperature is always high/little variation in temperature, 2 rainfall varies/drier June to November/wetter November to May (allow months in between), true for temperature but not true for rainfall, 4(b)(ii) convectional (rainfall), 1
Question 5
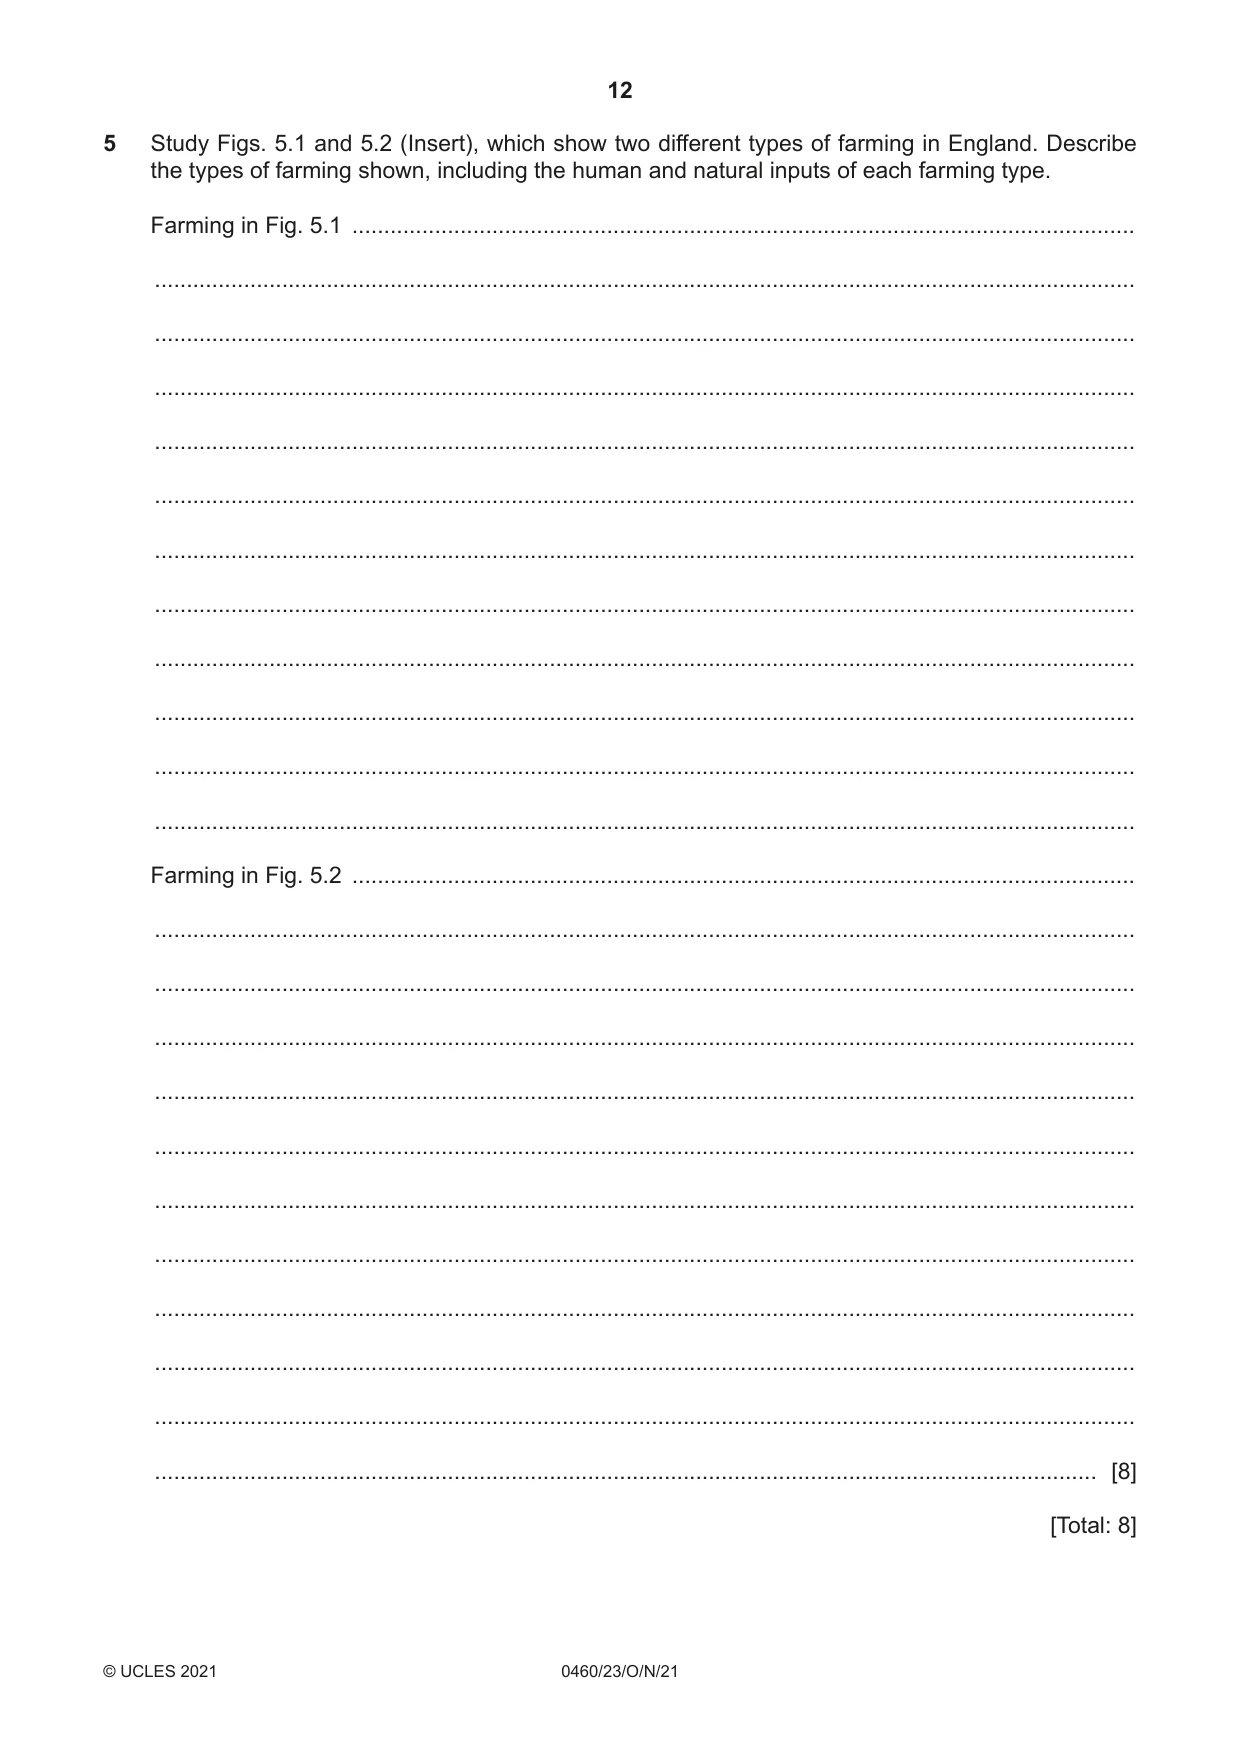
5 Study Figs. 5.1 and 5.2 (Insert), which show two different types of farming in England. Describe the types of farming shown, including the human and natural inputs of each farming type. Farming in Fig. 5.1 ........................................................................................................................... .......................................................................................................................................................... .......................................................................................................................................................... .......................................................................................................................................................... .......................................................................................................................................................... .......................................................................................................................................................... .......................................................................................................................................................... .......................................................................................................................................................... .......................................................................................................................................................... .......................................................................................................................................................... .......................................................................................................................................................... .......................................................................................................................................................... Farming in Fig. 5.2 ........................................................................................................................... .......................................................................................................................................................... .......................................................................................................................................................... .......................................................................................................................................................... .......................................................................................................................................................... .......................................................................................................................................................... .......................................................................................................................................................... .......................................................................................................................................................... .......................................................................................................................................................... .......................................................................................................................................................... .......................................................................................................................................................... .................................................................................................................................................... [8] [Total: 8] TURN PAGE FOR QUESTION 6
Mark scheme: 5 Fig. 5.1 8 pastoral/birds/chickens/poultry/animals, covered/shelter, large building/large number of birds/large scale, intensive/high density, commercial/for sale/for profit, material on ground/food, light, ventilation, Fig. 5.2 arable/crops/plants, large area/extensive/large scale, different crops/green and yellow, commercial/for sale/for profit, machinery, seeds, gently sloping/flat land, Reserve three for each photograph.
Q6 · The United Nations Global Assessment Report (2019) showed that many species of plants and…
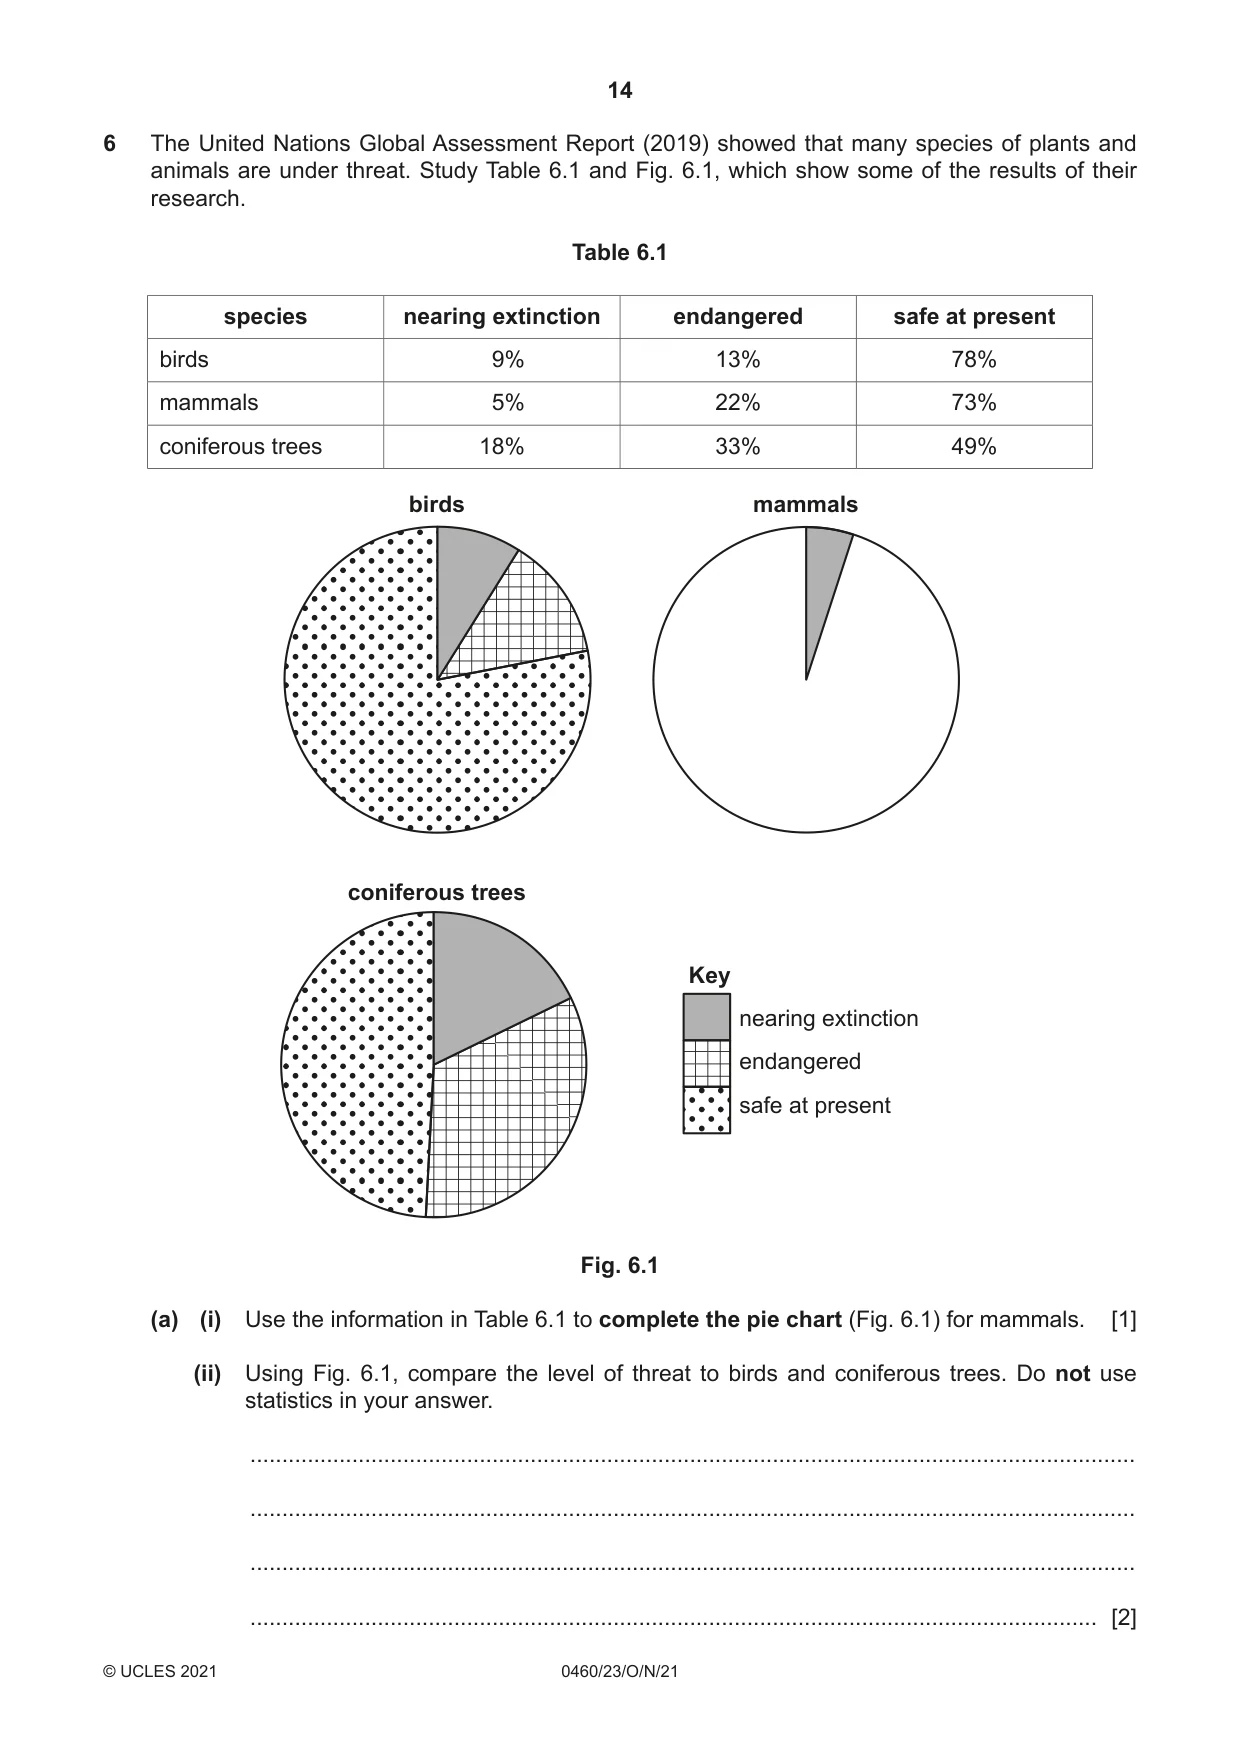
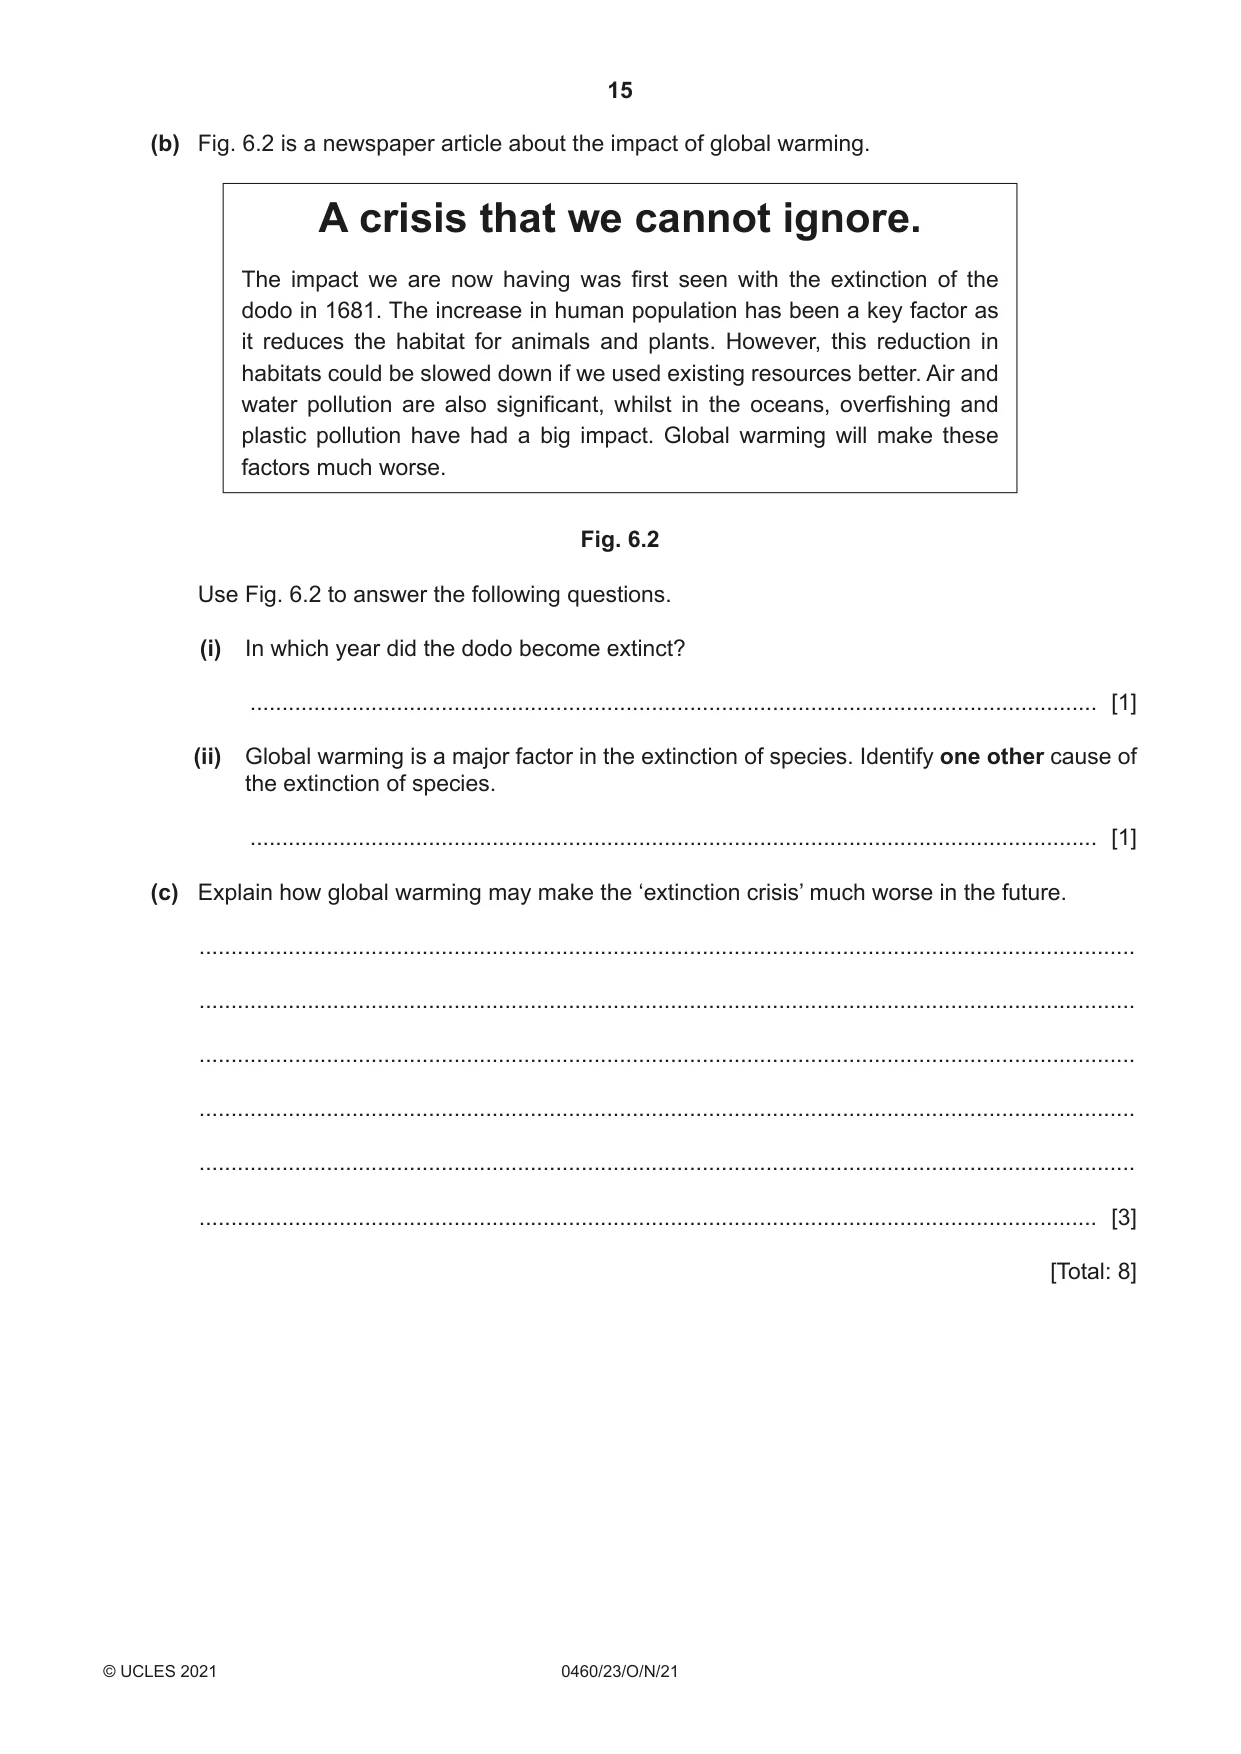
6 The United Nations Global Assessment Report (2019) showed that many species of plants and animals are under threat. Study Table 6.1 and Fig. 6.1, which show some of the results of their research. Table 6.1 species nearing extinction endangered safe at present birds 9% 13% 78% mammals 5% 22% 73% coniferous trees 18% 33% 49% birds mammals coniferous trees Key nearing extinction endangered safe at present Fig. 6.1 (a) (i) Use the information in Table 6.1 to complete the pie chart (Fig. 6.1) for mammals. [1] (ii) Using Fig. 6.1, compare the level of threat to birds and coniferous trees. Do not use statistics in your answer. ........................................................................................................................................... ........................................................................................................................................... ........................................................................................................................................... ..................................................................................................................................... [2] (b) Fig. 6.2 is a newspaper article about the impact of global warming. A crisis that we cannot ignore. The impact we are now having was first seen with the extinction of the dodo in 1681. The increase in human population has been a key factor as it reduces the habitat for animals and plants. However, this reduction in habitats could be slowed down if we used existing resources better. Air and water pollution are also significant, whilst in the oceans, overfishing and plastic pollution have had a big impact. Global warming will make these factors much worse. Fig. 6.2 Use Fig. 6.2 to answer the following questions. (i) In which year did the dodo become extinct? ..................................................................................................................................... [1] (ii) Global warming is a major factor in the extinction of species. Identify one other cause of the extinction of species. ..................................................................................................................................... [1] (c) Explain how global warming may make the ‘extinction crisis’ much worse in the future. ................................................................................................................................................... ................................................................................................................................................... ................................................................................................................................................... ................................................................................................................................................... ................................................................................................................................................... ............................................................................................................................................. [3] [Total: 8] Additional Pages If you use the following lined pages to complete the answer(s) to any question(s), the question number(s) must be clearly shown. .................................................................................................................................................................. .................................................................................................................................................................. .................................................................................................................................................................. .................................................................................................................................................................. .................................................................................................................................................................. .................................................................................................................................................................. .................................................................................................................................................................. .................................................................................................................................................................. .................................................................................................................................................................. .................................................................................................................................................................. .................................................................................................................................................................. .................................................................................................................................................................. .................................................................................................................................................................. .................................................................................................................................................................. .................................................................................................................................................................. .................................................................................................................................................................. .................................................................................................................................................................. .................................................................................................................................................................. .................................................................................................................................................................. .................................................................................................................................................................. .................................................................................................................................................................. .................................................................................................................................................................. .................................................................................................................................................................. .................................................................................................................................................................. ..................................................................................................................................................................
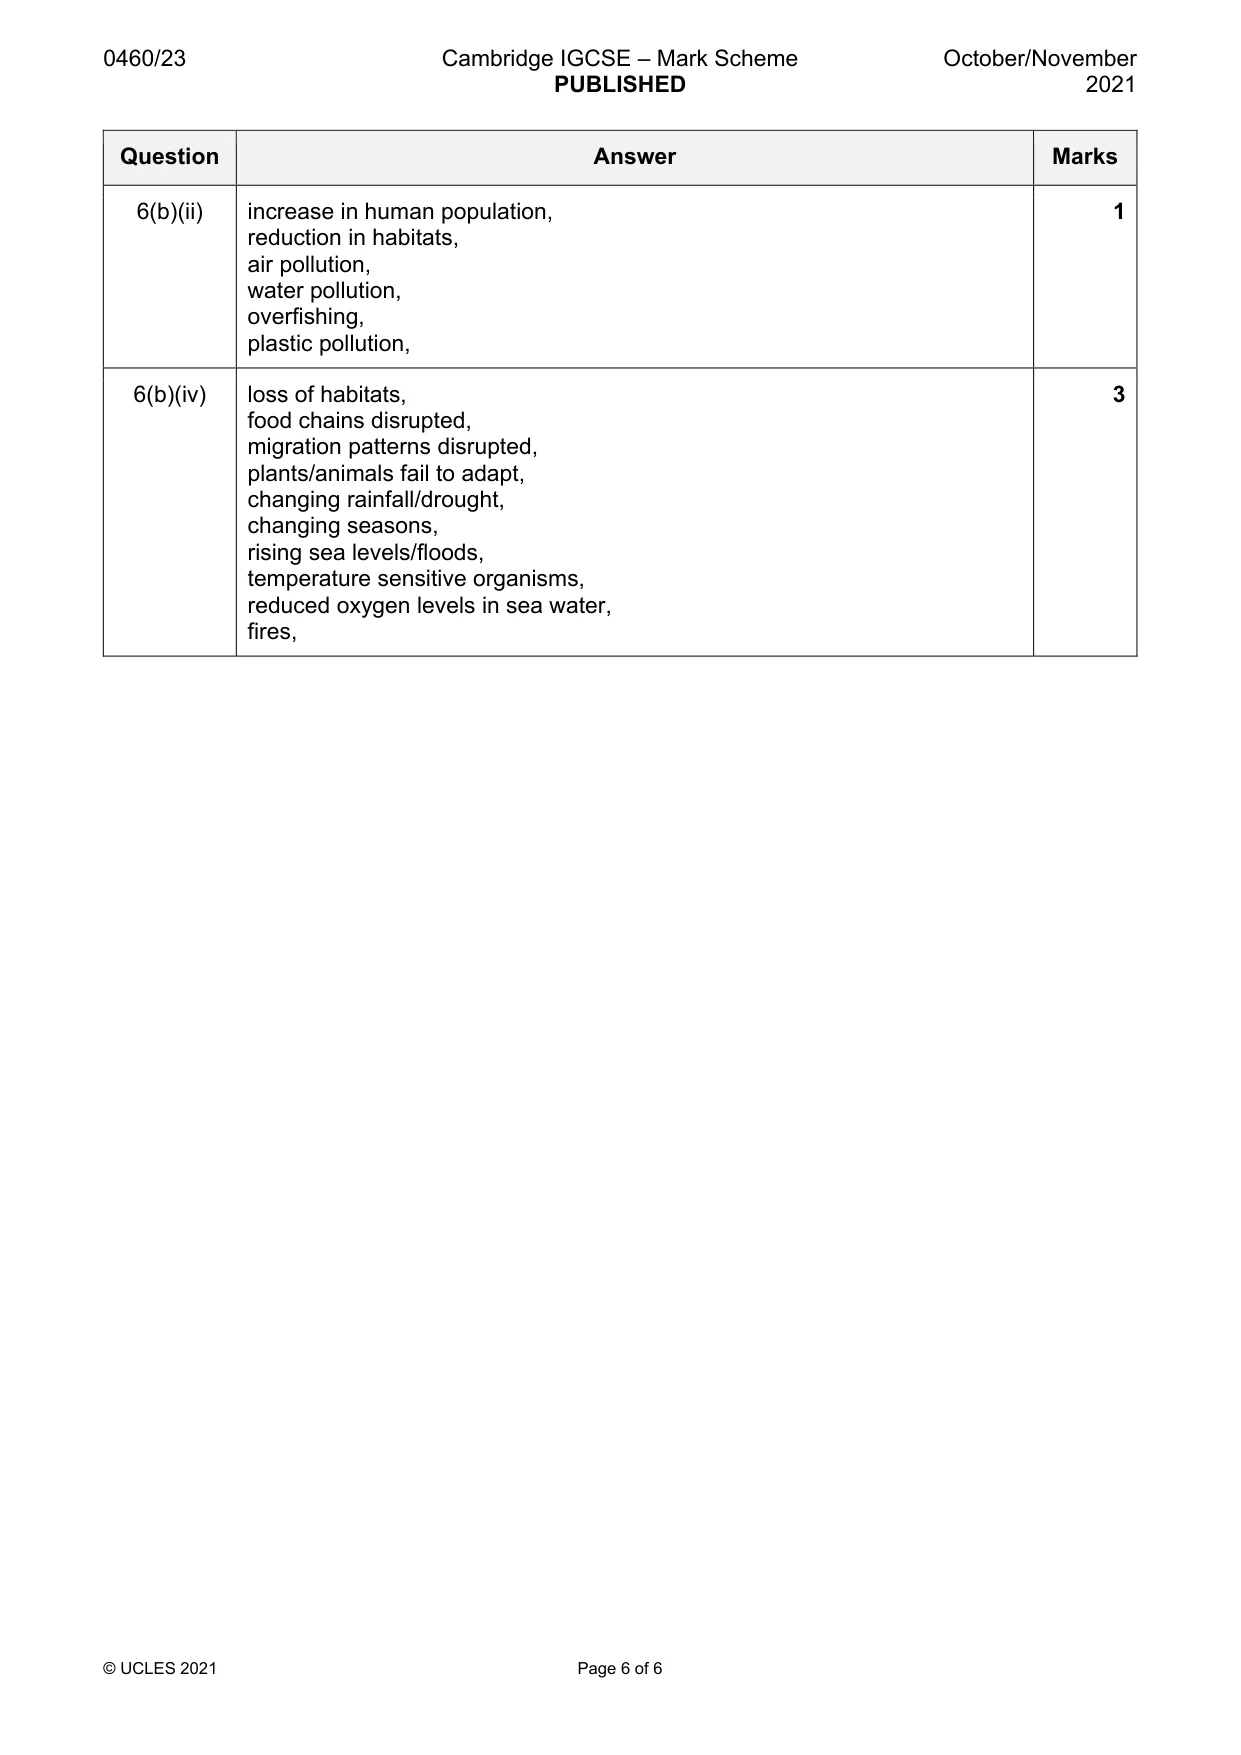
Mark scheme: 6(a)(i) smaller segment 78–80° with either smaller segment cross hatched or larger 1 segment dotted, 6(a)(ii) birds more safe/conifers less safe/birds less threatened/conifers more 2 threatened, birds less endangered/conifers more endangered, birds less nearing extinction/conifers more nearing extinction, 6(b)(i) 1681, 1 6(b)(ii) increase in human population, 1 reduction in habitats, air pollution, water pollution, overfishing, plastic pollution, 6(b)(iv) loss of habitats, 3 food chains disrupted, migration patterns disrupted, plants/animals fail to adapt, changing rainfall/drought, changing seasons, rising sea levels/floods, temperature sensitive organisms, reduced oxygen levels in sea water, fires,
More questions on Environmental risks of economic development
What was in this paper
The subtopics covered by these 6 questions, and how many questions each got. Open one in a new tab to see every Cambridge question on it.
What you needed in this session
Cambridge’s own grade thresholds for 2021 Oct/Nov, Paper 2 · Variant 3. A higher threshold means an easier paper — the bar moves with how the cohort did.