Questions as text
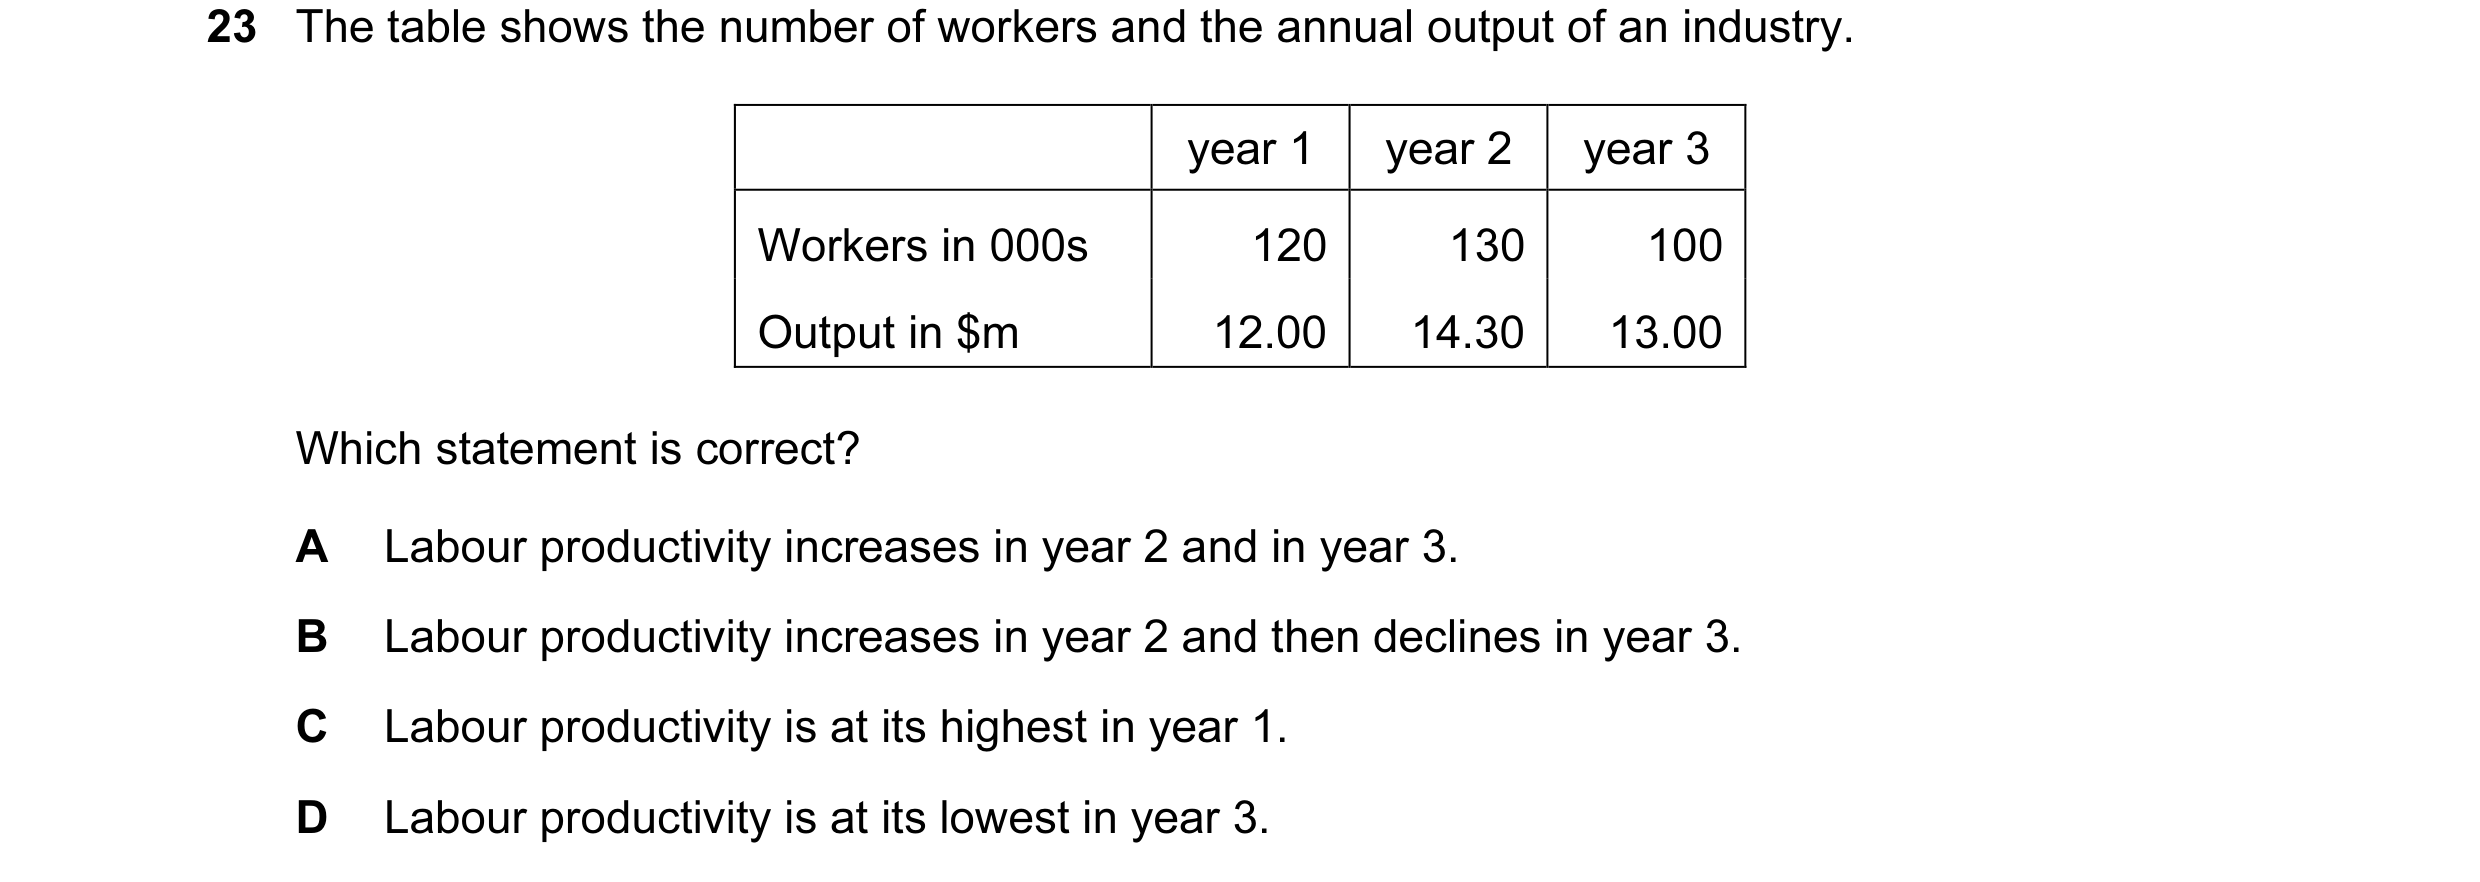
Q1 · The table shows the number of workers and the annual output of an industry 9708/11 Oct/Nov 2005
23 The table shows the number of workers and the annual output of an industry. year 1 year 2 year 3 Workers in 000s 120 130 100 Output in $m 12.00 14.30 13.00 Which statement is correct? A Labour productivity increases in year 2 and in year 3. B Labour productivity increases in year 2 and then declines in year 3. C Labour productivity is at its highest in year 1. D Labour productivity is at its lowest in year 3.
1 marks
Answer: A
This question in 9708/11 Oct/Nov 2005
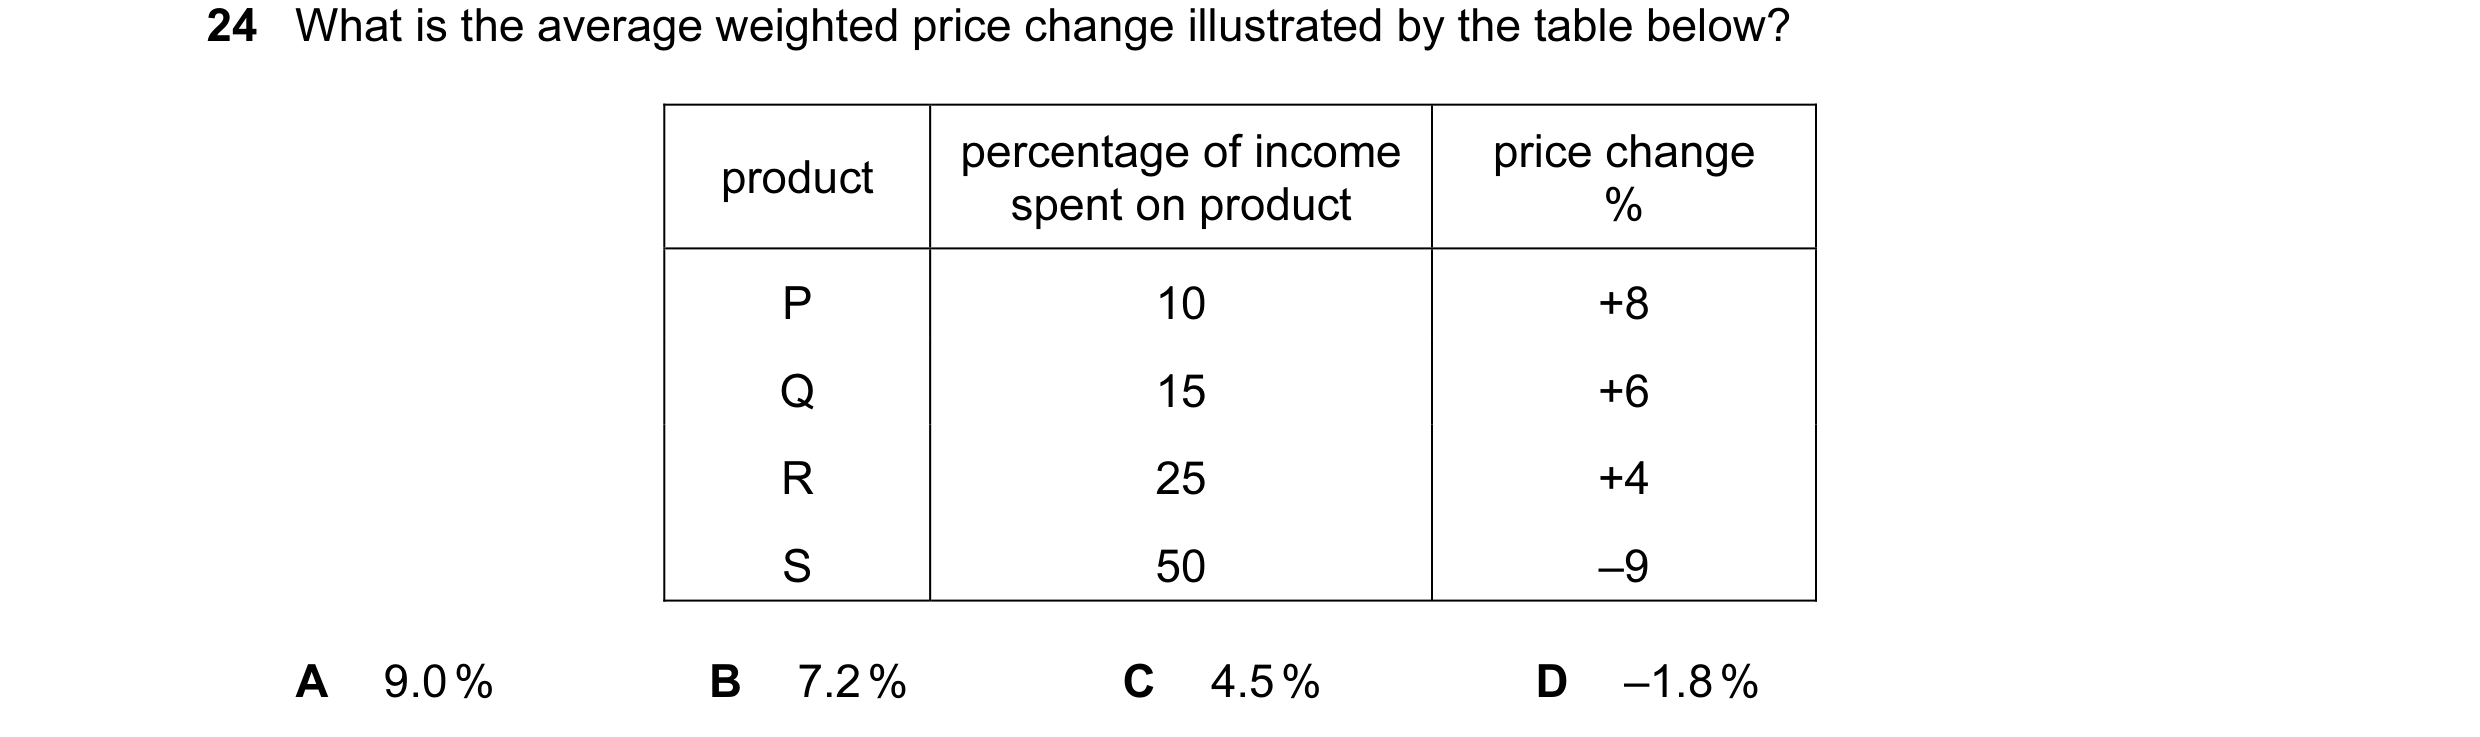
Q2 · What is the average weighted price change illustrated by the table below? 9708/11 May/June 2009
24 What is the average weighted price change illustrated by the table below? percentage of income price change product spent on product % P 10 +8 Q 15 +6 R 25 +4 S 50 –9 A 9.0 % B 7.2 % C 4.5 % D –1.8 %
1 marks
Answer: D
This question in 9708/11 May/June 2009
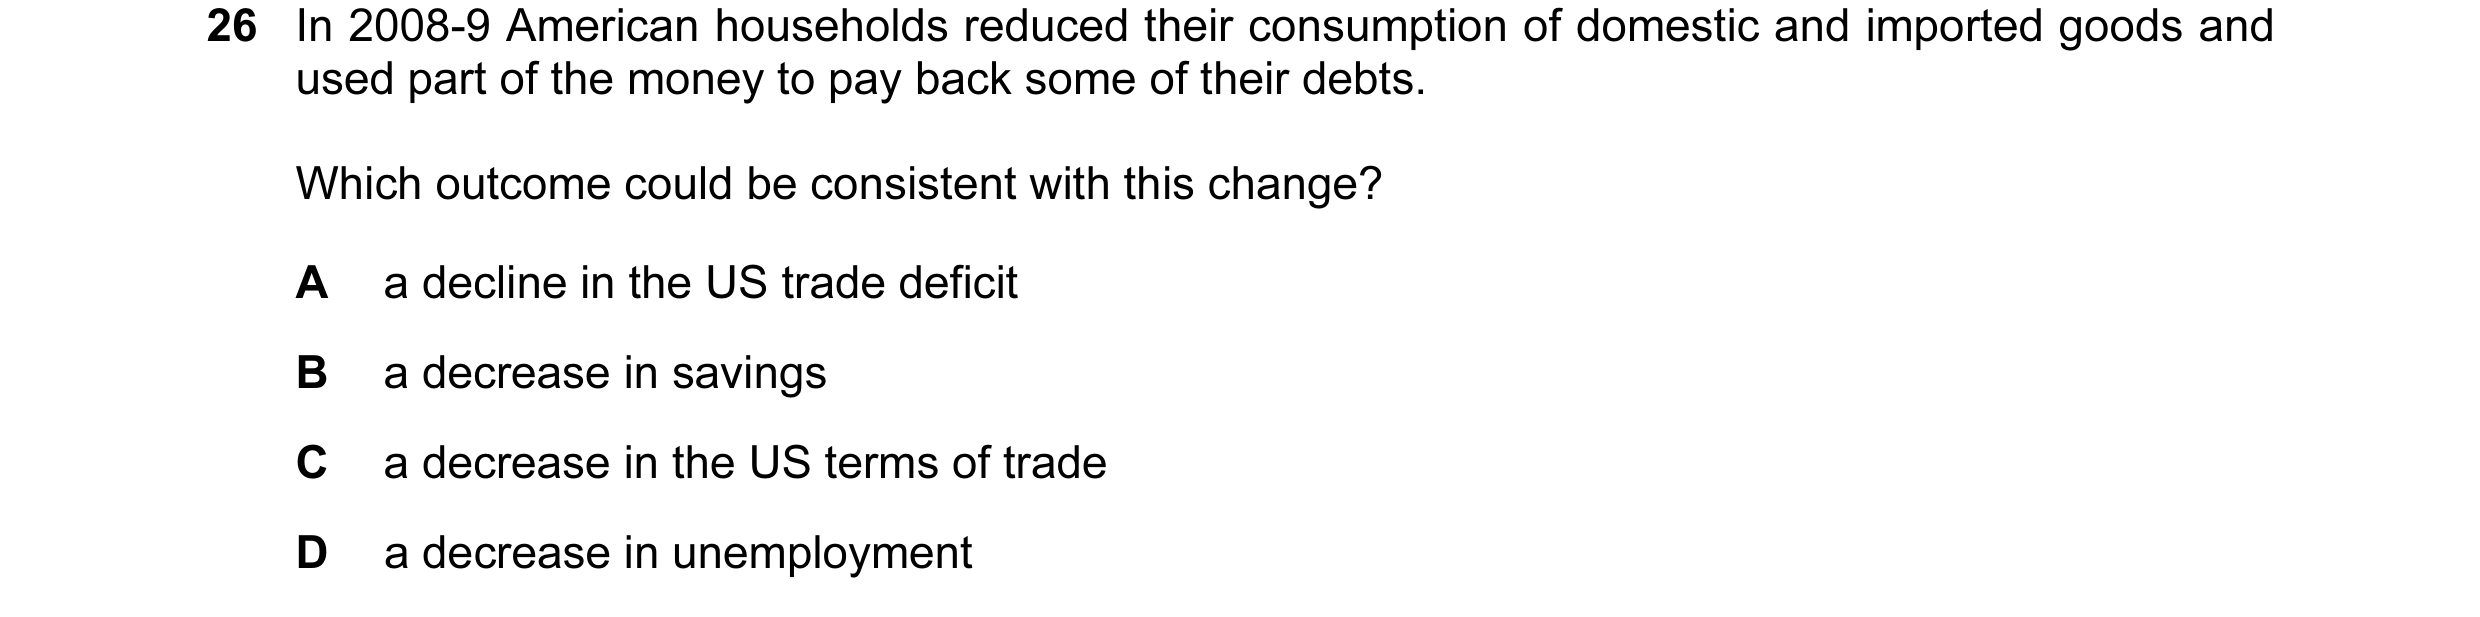
Q3 · In 2008-9 American households reduced their consumption of domestic and imported goods… 9708/11 Oct/Nov 2011
26 In 2008-9 American households reduced their consumption of domestic and imported goods and used part of the money to pay back some of their debts. Which outcome could be consistent with this change? A a decline in the US trade deficit B a decrease in savings C a decrease in the US terms of trade D a decrease in unemployment
1 marks
Answer: A
This question in 9708/11 Oct/Nov 2011
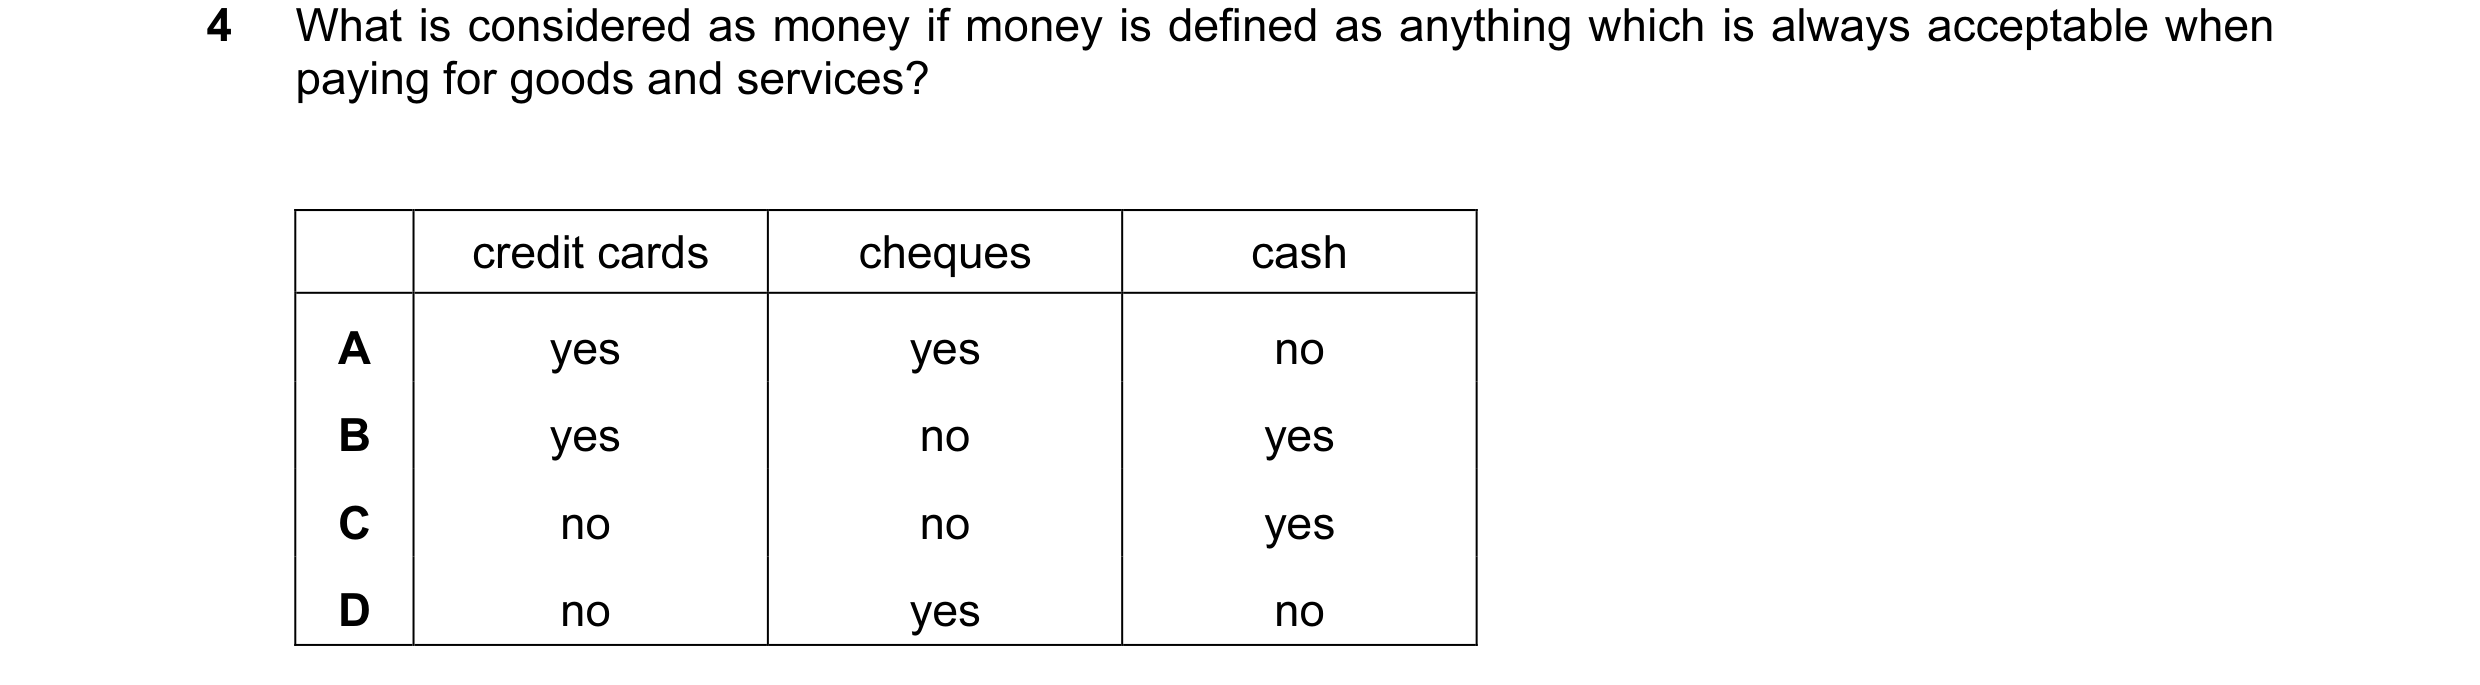
Q4 · What is considered as money if money is defined as anything which is always acceptable… 9708/12 May/June 2012
4 What is considered as money if money is defined as anything which is always acceptable when paying for goods and services? credit cards cheques cash A yes yes no B yes no yes C no no yes D no yes no
1 marks
Answer: C
This question in 9708/12 May/June 2012
Q5 · The table shows the number of workers and the annual output of an industry 9708/11 Oct/Nov 2012
23 The table shows the number of workers and the annual output of an industry. year 1 year 2 year 3 workers in 000s 120 130 100 output in $m 12.00 14.30 13.00 Which statement is correct? A Labour productivity increases in year 2 and in year 3. B Labour productivity increases in year 2 and then declines in year 3. C Labour productivity is at its highest in year 1. D Labour productivity is at its lowest in year 3.
1 marks
Answer: A
This question in 9708/11 Oct/Nov 2012
Q6 · The table shows some of the elements of aggregate demand in selected countries in US$ in… 9708/13 Oct/Nov 2012
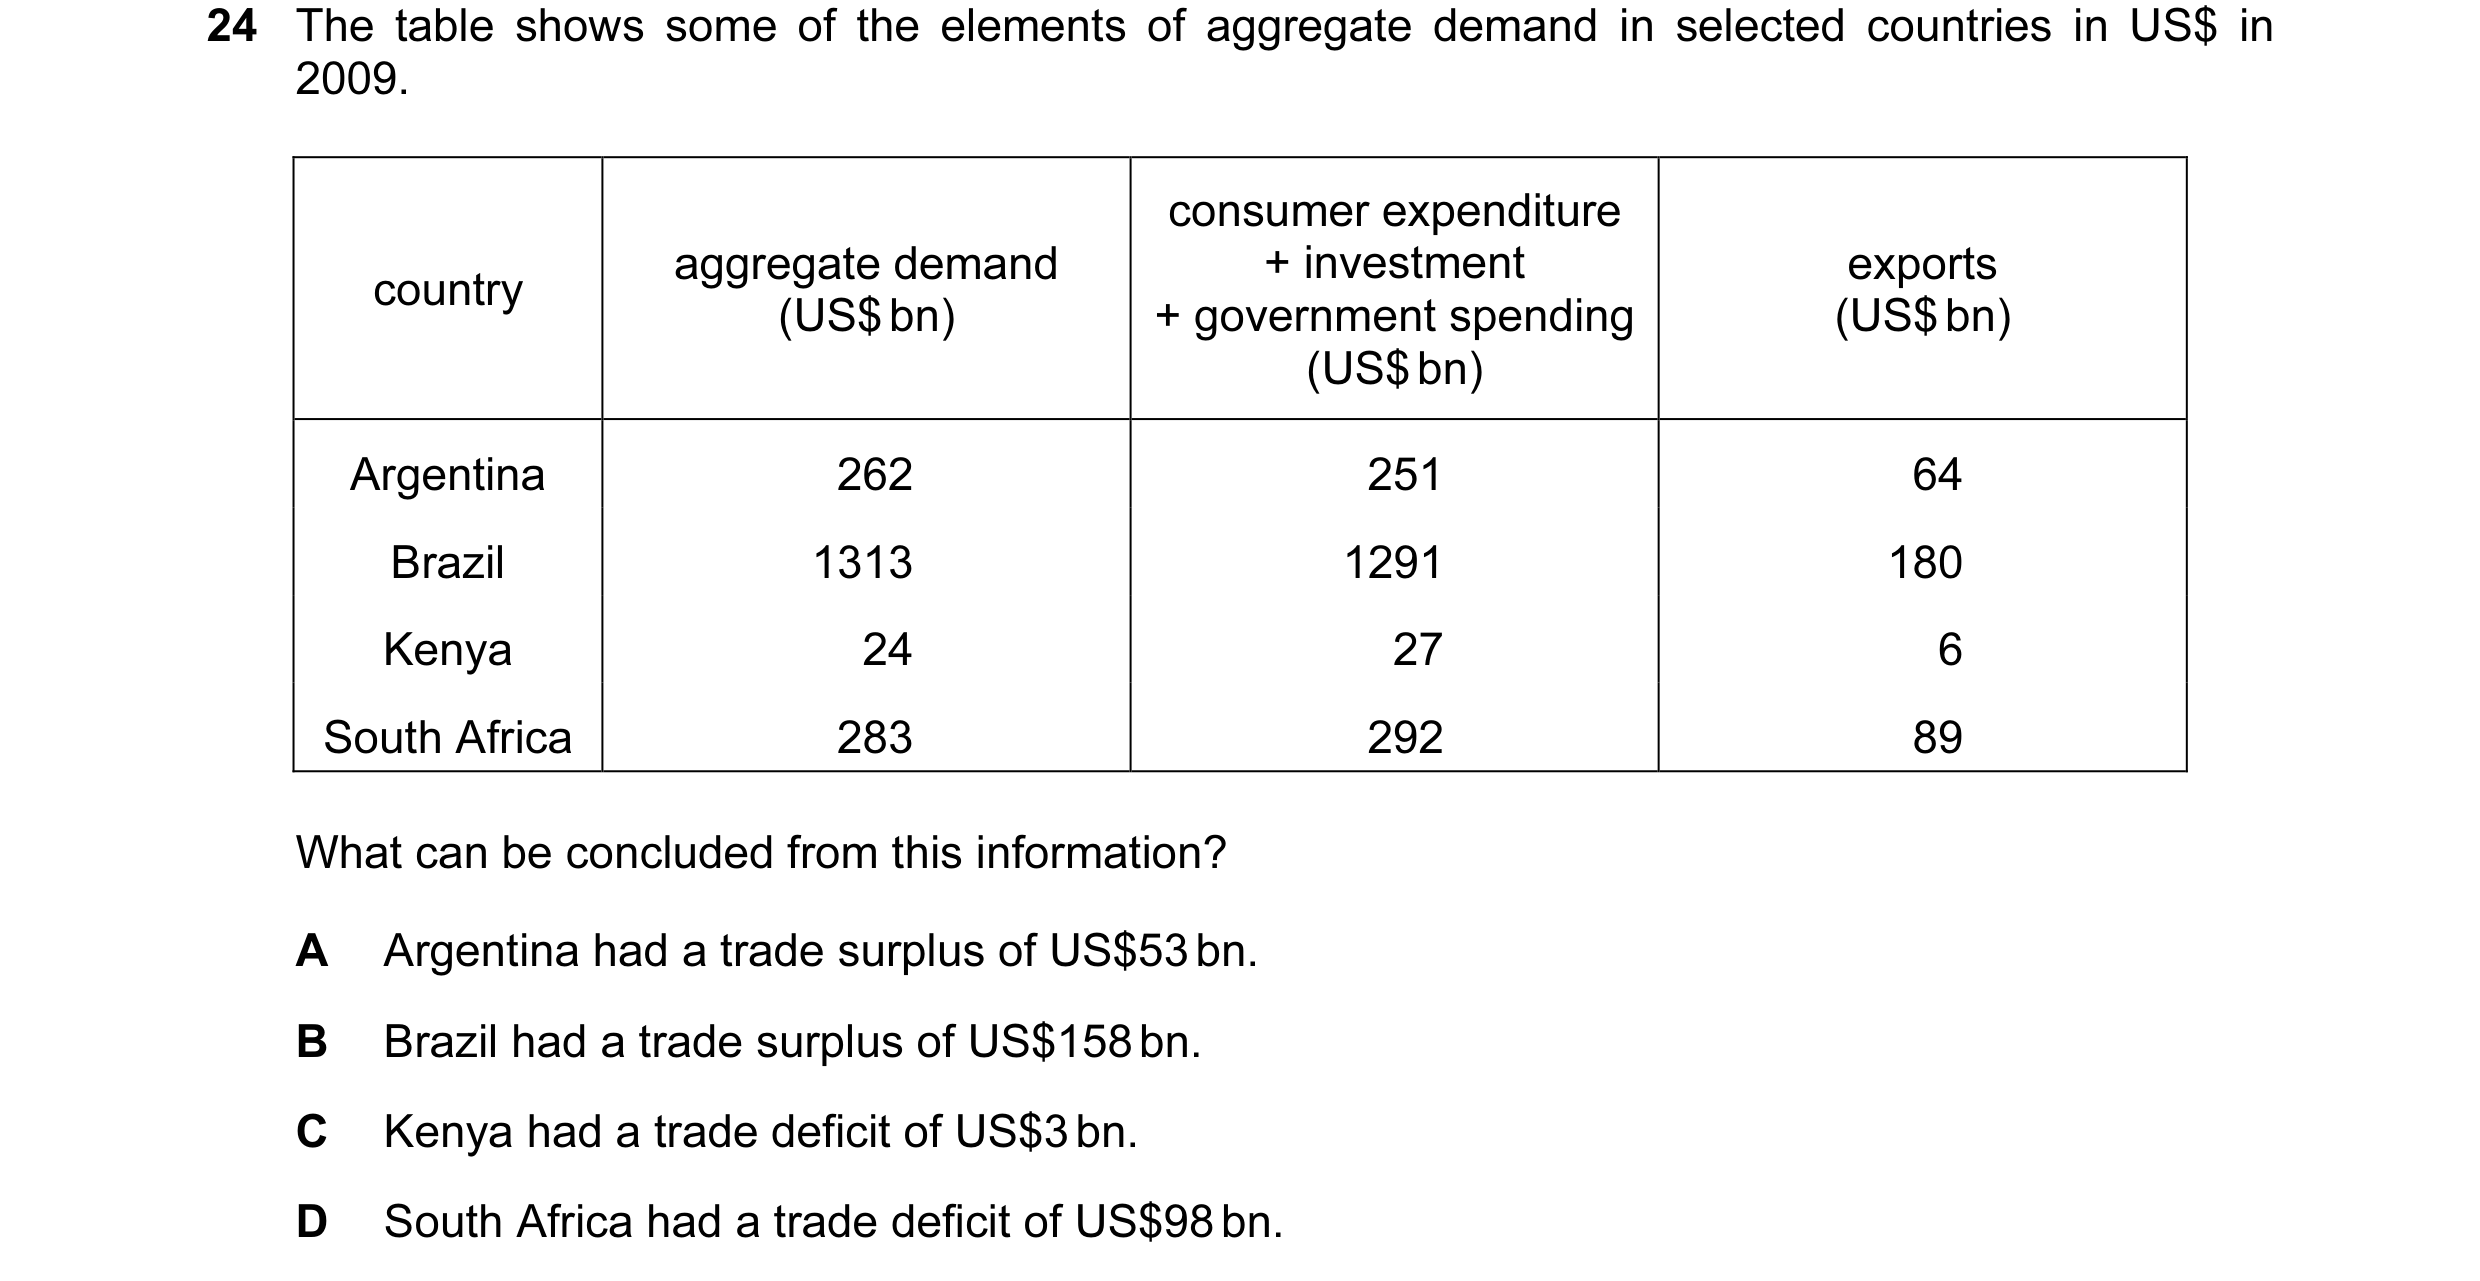
24 The table shows some of the elements of aggregate demand in selected countries in US$ in 2009. consumer expenditure aggregate demand + investment exports country (US$ bn) + government spending (US$ bn) (US$ bn) Argentina 262 251 64 Brazil 1313 1291 180 Kenya 24 27 6 South Africa 283 292 89 What can be concluded from this information? A Argentina had a trade surplus of US$53 bn. B Brazil had a trade surplus of US$158 bn. C Kenya had a trade deficit of US$3 bn. D South Africa had a trade deficit of US$98 bn.
1 marks
Answer: C
This question in 9708/13 Oct/Nov 2012
Q7 · The graph shows the annual % changes in the prices of new houses and existing houses in… 9708/13 May/June 2014
12 The graph shows the annual % changes in the prices of new houses and existing houses in the United Kingdom between 2010 and 2012. 15 10 new houses 5 price 0 existing houses (% change) –5 –10 –15 2010 Mar Apr May Jun Jul Aug Sep Oct Nov Dec 2011 Jan Feb Mar Apr May Jun Jul Aug Sep Oct Nov Dec 2012 Jan Feb Mar What can be concluded about the graph? A In the period after October 2010, new houses were more expensive than existing houses. B In the period up until January 2011, there was a steady fall in the prices of existing houses. C The average price of existing houses was lower in March 2012 than two years earlier. D The prices of new houses continued to rise throughout the period.
1 marks
Answer: D
This question in 9708/13 May/June 2014
Q8 · The table gives figures for household spending in the UK economy between 2008 and 2010 9708/11 Oct/Nov 2014
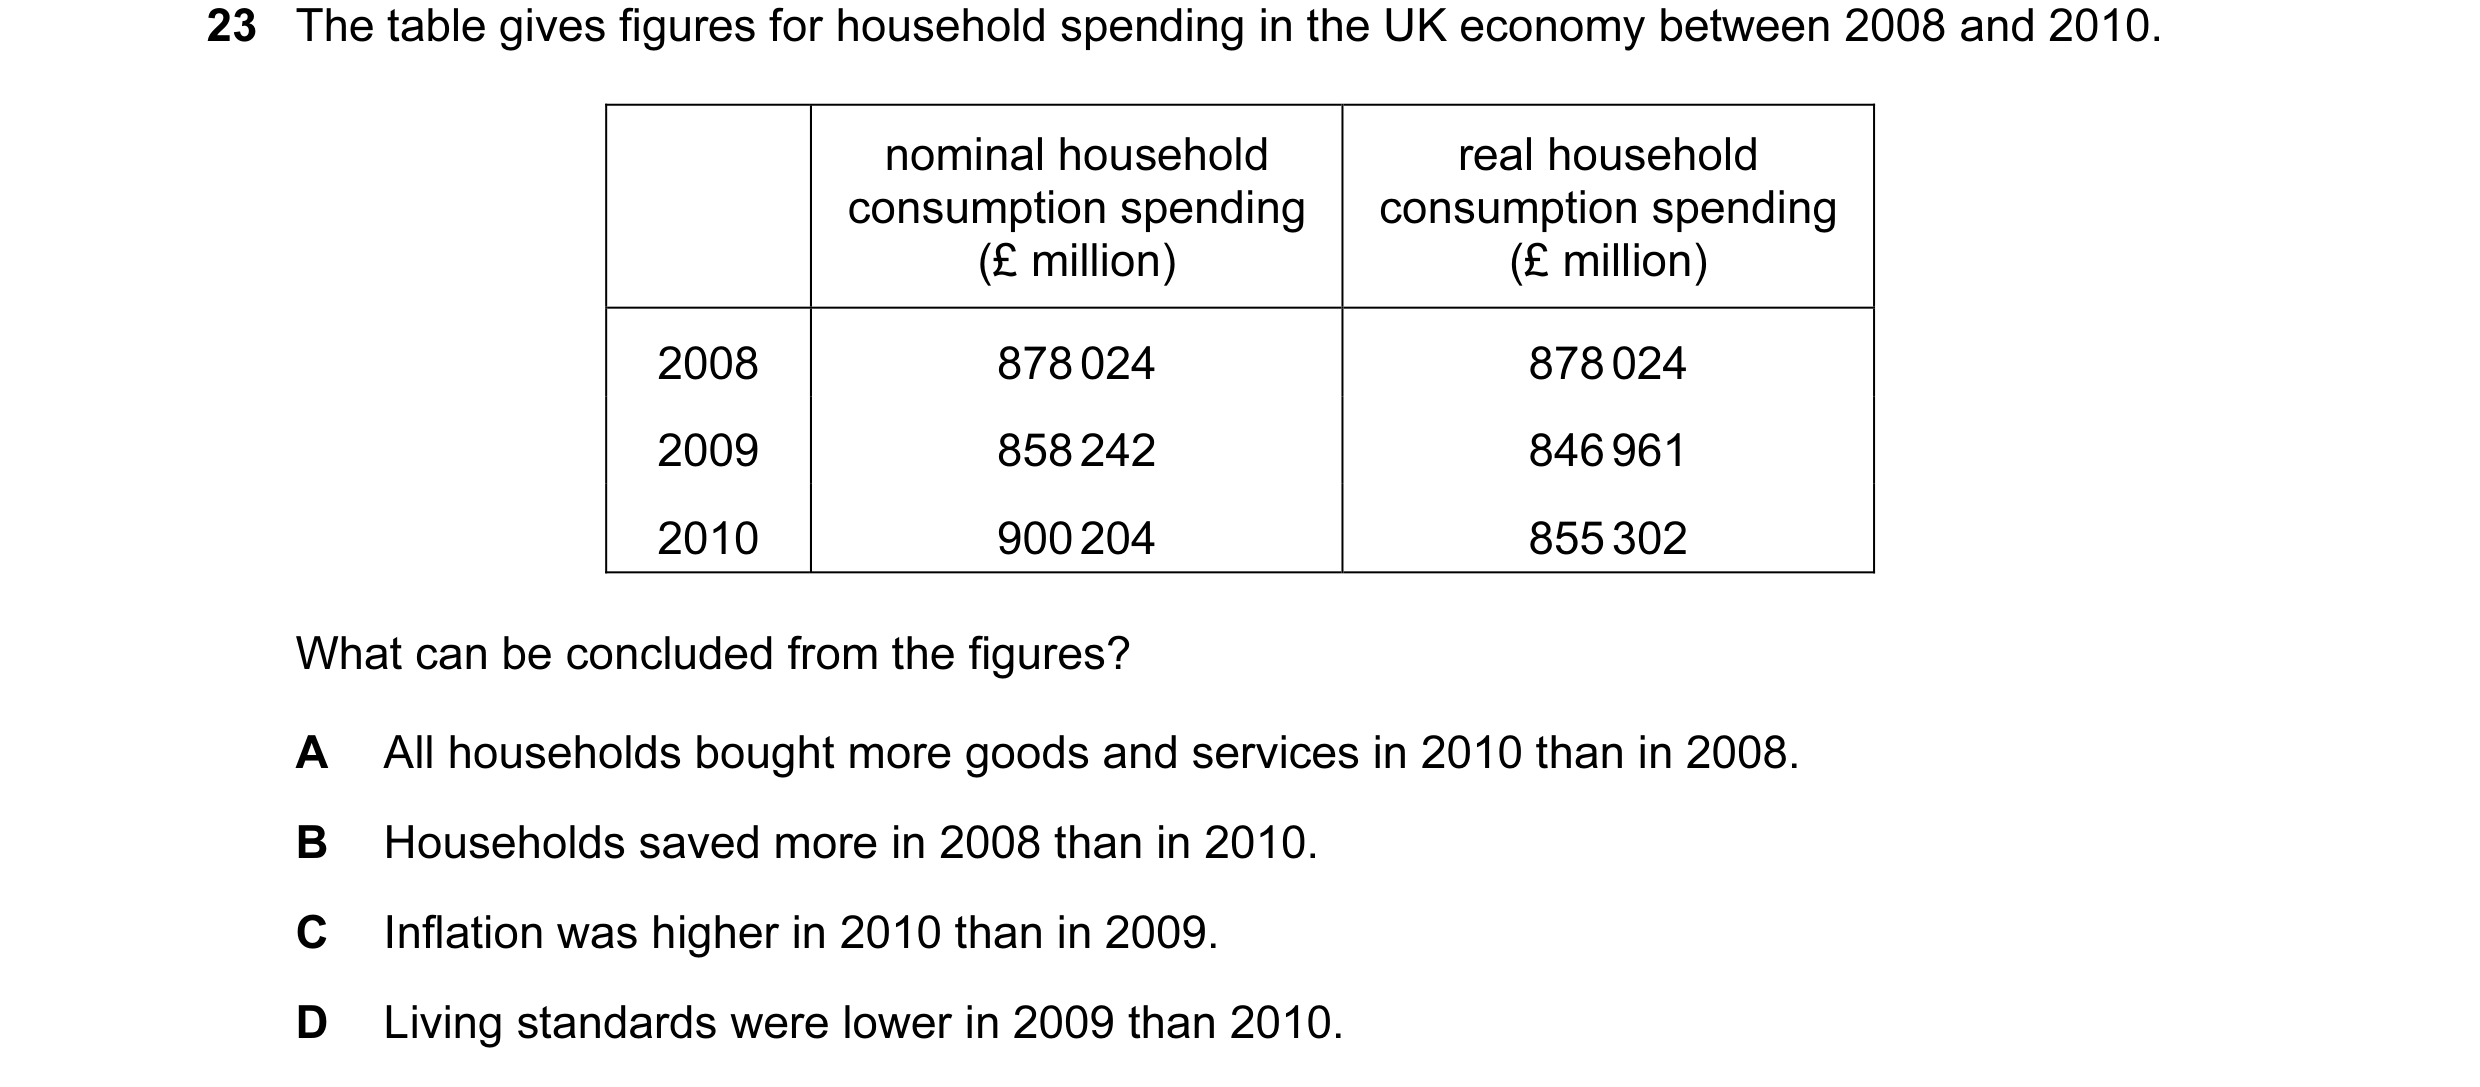
23 The table gives figures for household spending in the UK economy between 2008 and 2010. nominal household real household consumption spending consumption spending (£ million) (£ million) 2008 878 024 878 024 2009 858 242 846 961 2010 900 204 855 302 What can be concluded from the figures? A All households bought more goods and services in 2010 than in 2008. B Households saved more in 2008 than in 2010. C Inflation was higher in 2010 than in 2009. D Living standards were lower in 2009 than 2010.
1 marks
This question in 9708/11 Oct/Nov 2014
Q9 · In 2012, a survey of household expenditure identified X and Y as the contents of a basket… 9708/12 May/June 2015
24 In 2012, a survey of household expenditure identified X and Y as the contents of a basket of goods for a price index. The value of the index in 2012 was 100. In 2013, the index was valued at 116. During 2013, the prices of X and Y increased by 10% and 20%, respectively. In percentage terms, which weights were attached to X and Y in calculating the index? good X good Y (%) (%) A 25 75 B 40 60 C 50 50 D 70 30
1 marks
Answer: B
This question in 9708/12 May/June 2015
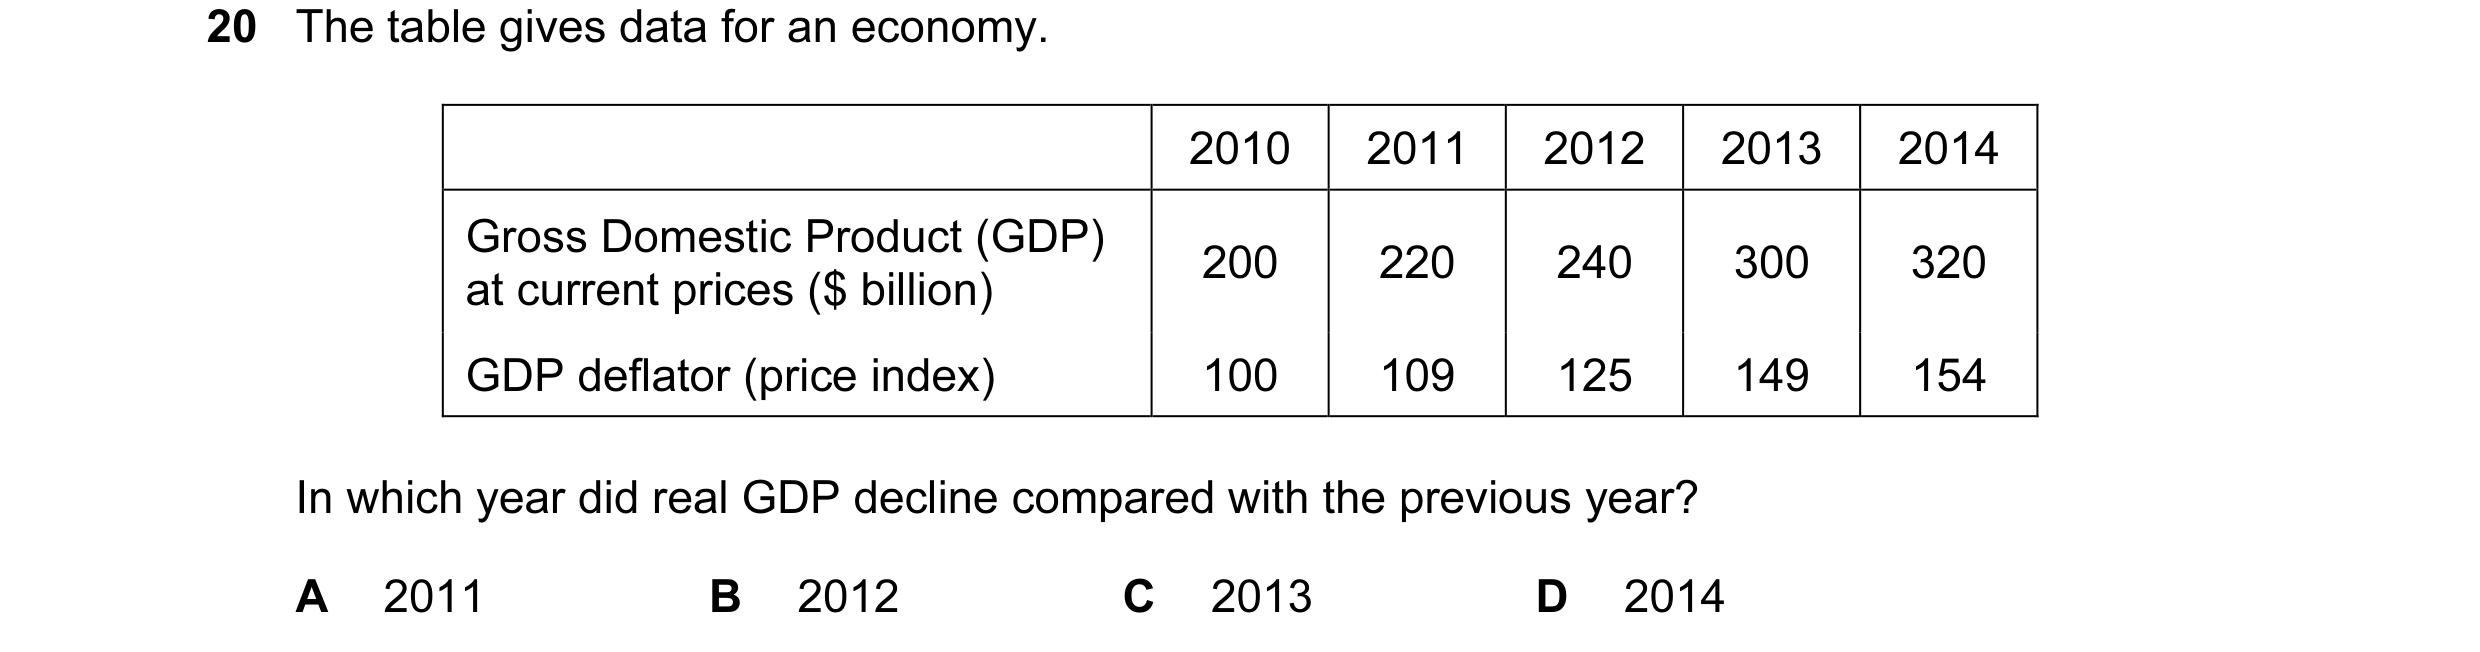
Q10 · The table gives data for an economy 9708/12 Feb/March 2016
20 The table gives data for an economy. 2010 2011 2012 2013 2014 Gross Domestic Product (GDP) 200 220 240 300 320 at current prices ($ billion) GDP deflator (price index) 100 109 125 149 154 In which year did real GDP decline compared with the previous year? A 2011 B 2012 C 2013 D 2014
1 marks
Answer: B
This question in 9708/12 Feb/March 2016
Q11 · Which is a transfer payment? 9708/13 May/June 2016
16 Which is a transfer payment? A dividend payments to shareholders B payments of rent C unemployment benefit D wages of government employees
1 marks
Answer: C
This question in 9708/13 May/June 2016
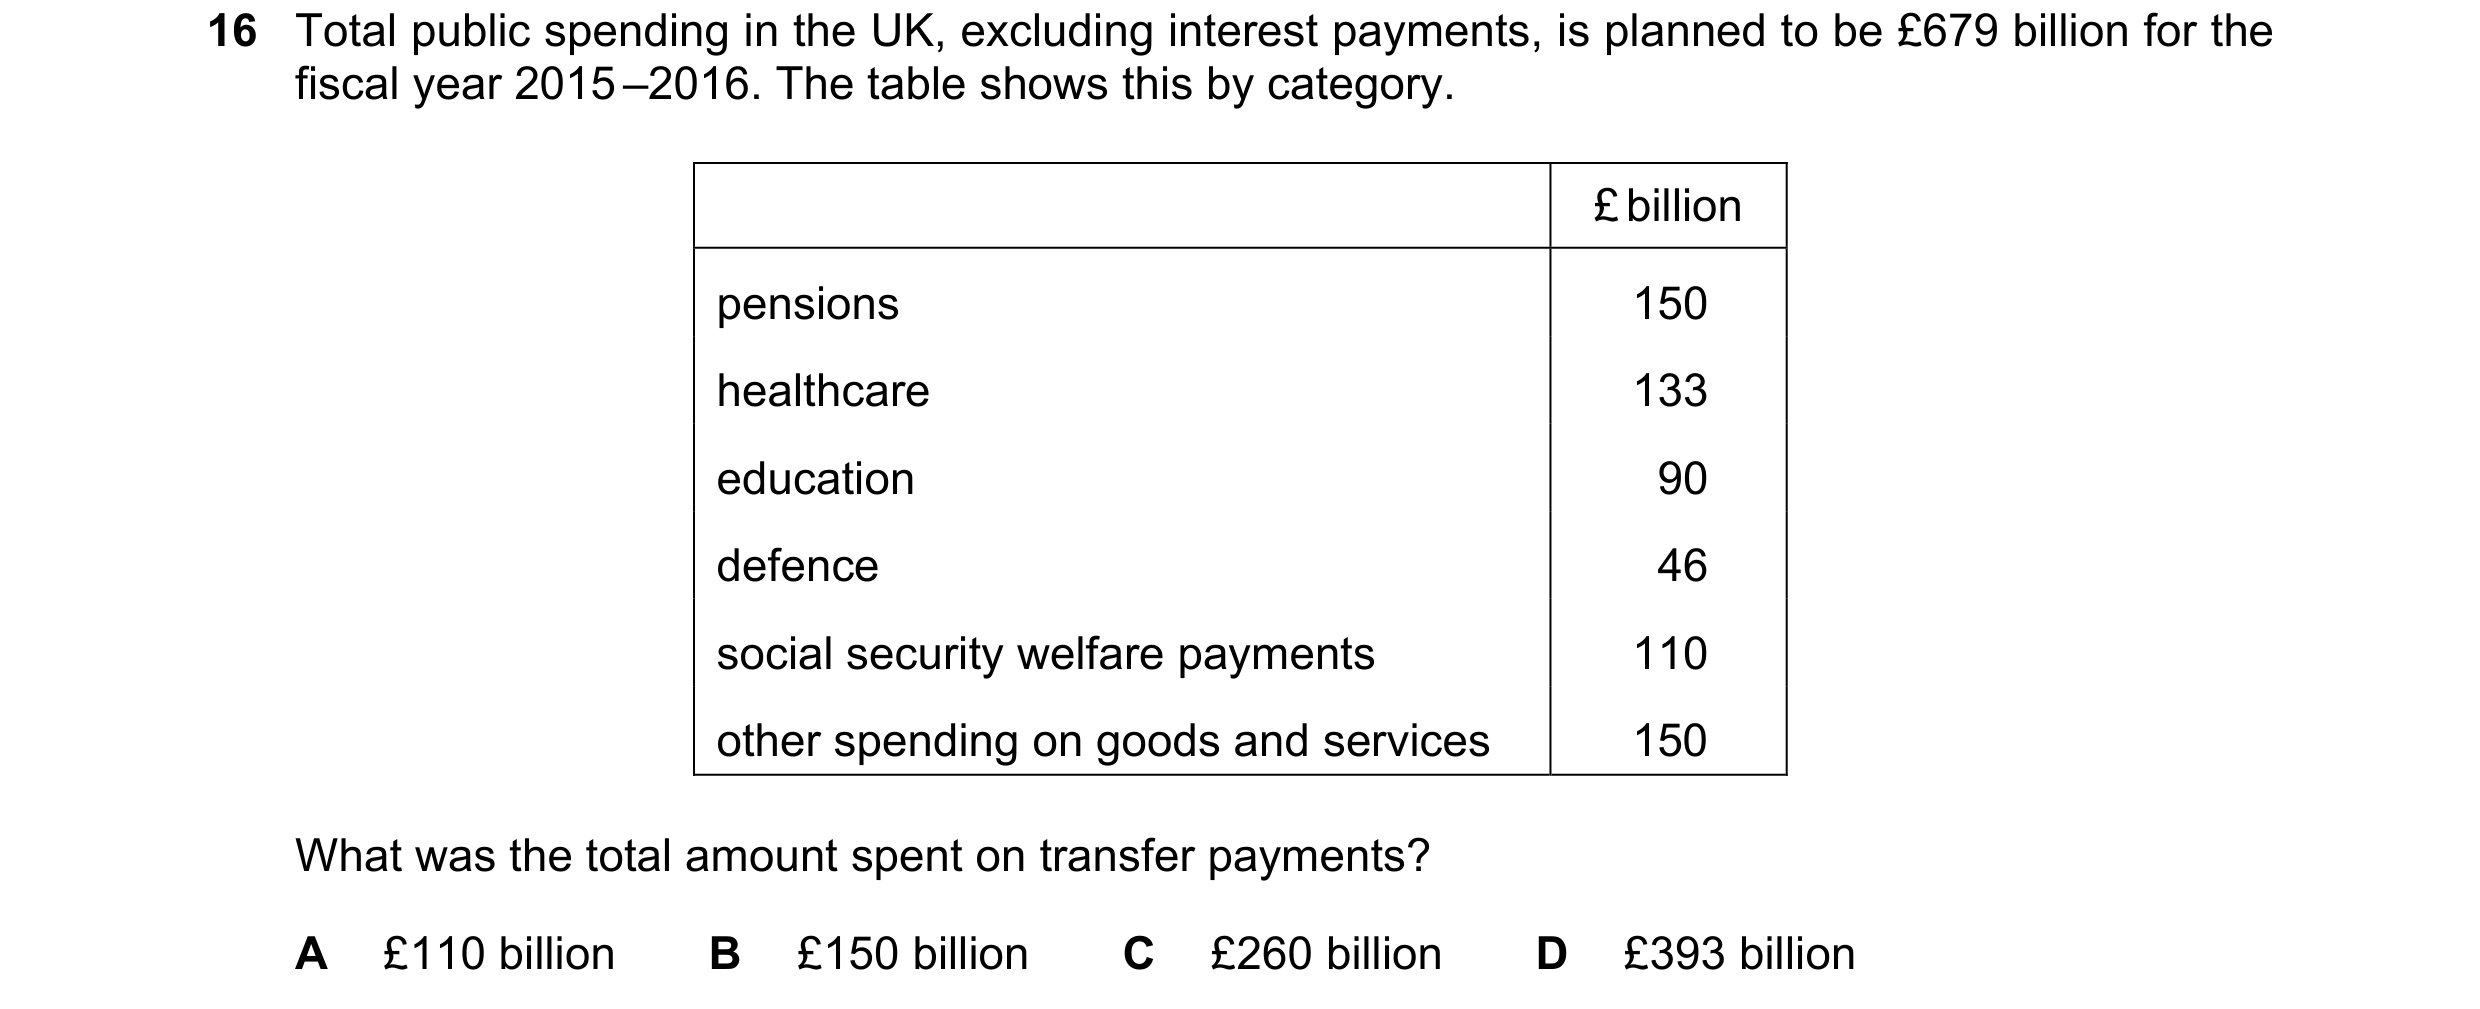
Q12 · Total public spending in the UK, excluding interest payments, is planned to be £679… 9708/12 Oct/Nov 2016
16 Total public spending in the UK, excluding interest payments, is planned to be £679 billion for the fiscal year 2015 –2016. The table shows this by category. £ billion pensions 150 healthcare 133 education 90 defence 46 social security welfare payments 110 other spending on goods and services 150 What was the total amount spent on transfer payments? A £110 billion B £150 billion C £260 billion D £393 billion
1 marks
Answer: C
This question in 9708/12 Oct/Nov 2016
Q13 · Planned government expenditure for the UK in the fiscal year 2016 is estimated at £760… 9708/11 May/June 2017
17 Planned government expenditure for the UK in the fiscal year 2016 is estimated at £760 billion. The top five areas of expenditure are given in the table. £ billion pensions 153 healthcare 138 welfare 111 education 89 defence 45 total top five 536 What is the total amount spent on transfer payments shown in the table? A £89 billion B £111 billion C £264 billion D £536 billion
1 marks
Answer: C
This question in 9708/11 May/June 2017
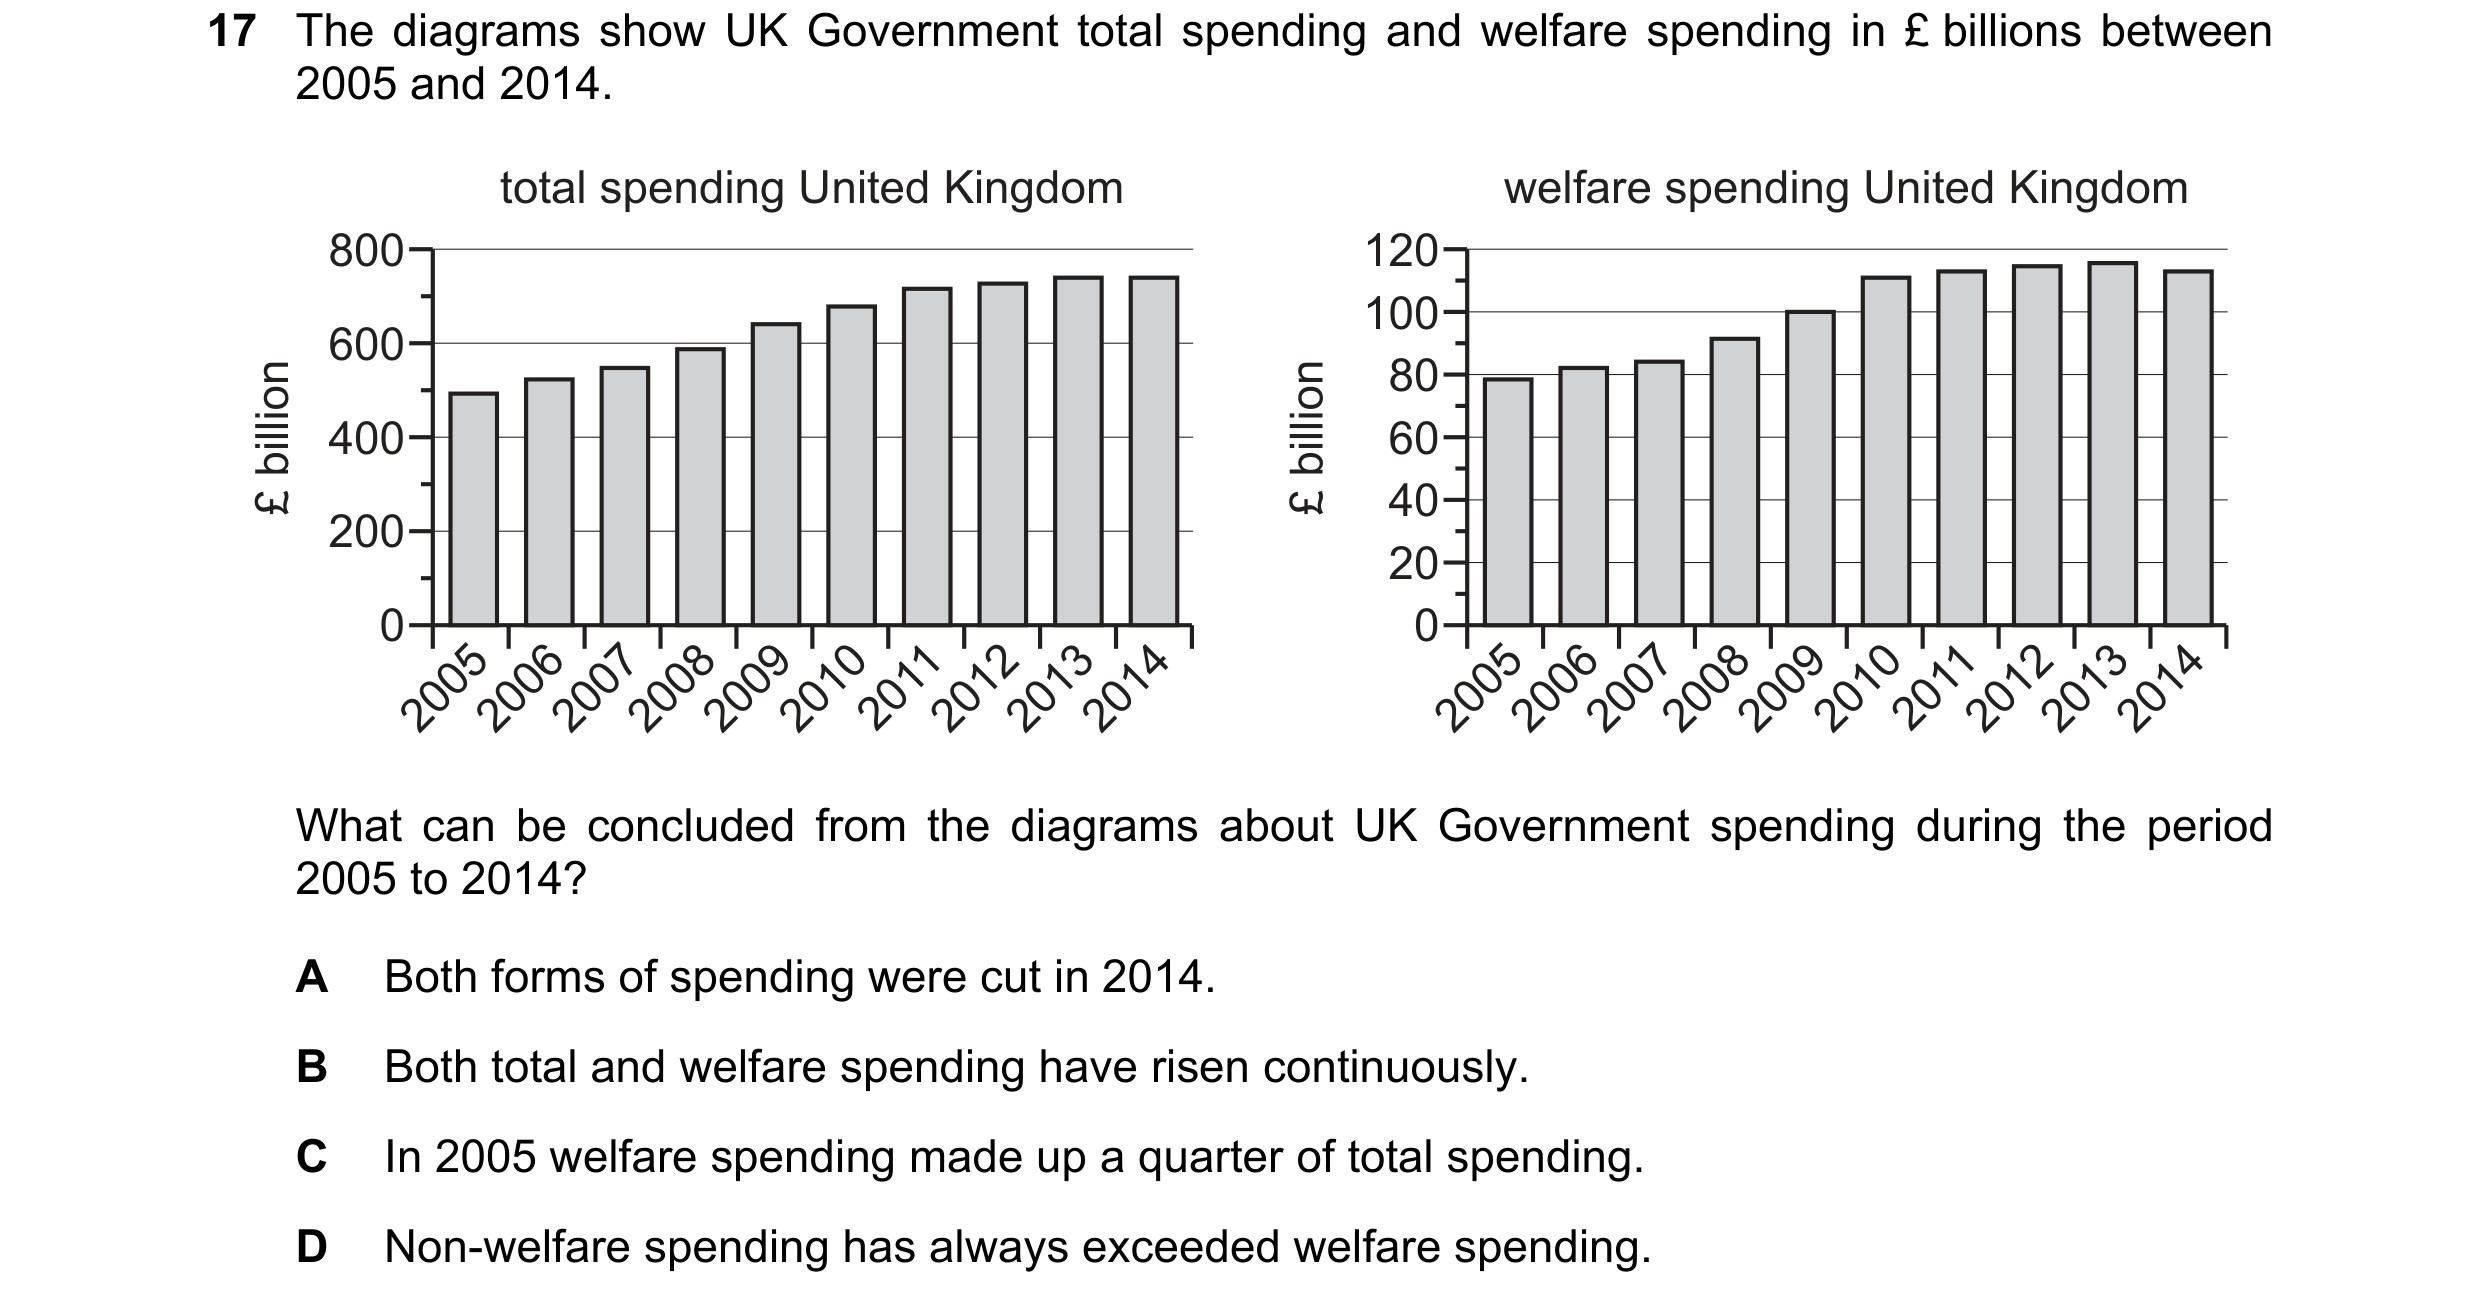
Q14 · The diagrams show UK Government total spending and welfare spending in £ billions between… 9708/12 Oct/Nov 2017
17 The diagrams show UK Government total spending and welfare spending in £ billions between 2005 and 2014. total spending United Kingdom welfare spending United Kingdom 800 120 100 600 £ billion £ billion 80 400 60 40 200 20 0 0 2005 2006 2007 2008 2009 2010 2011 2012 2013 2014 2005 2006 2007 2008 2009 2010 2011 2012 2013 2014 What can be concluded from the diagrams about UK Government spending during the period 2005 to 2014? A Both forms of spending were cut in 2014. B Both total and welfare spending have risen continuously. C In 2005 welfare spending made up a quarter of total spending. D Non-welfare spending has always exceeded welfare spending.
1 marks
Answer: D
This question in 9708/12 Oct/Nov 2017
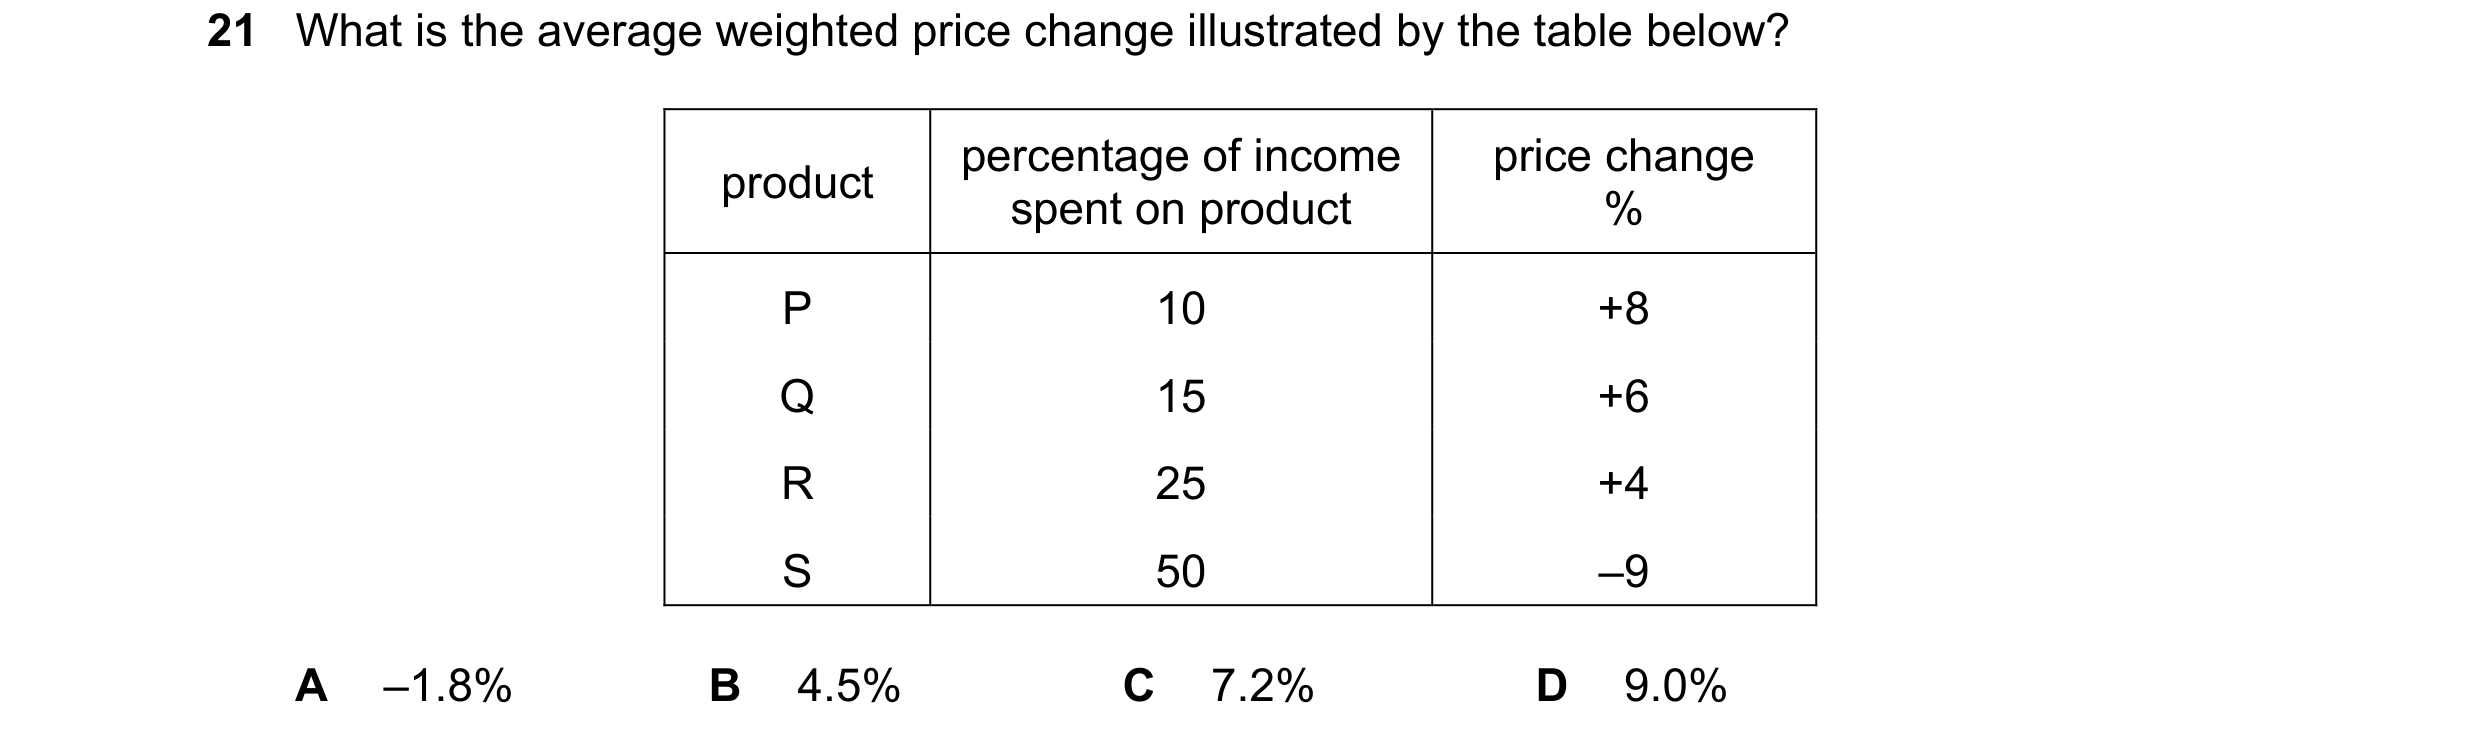
Q15 · What is the average weighted price change illustrated by the table below? 9708/13 Oct/Nov 2017
21 What is the average weighted price change illustrated by the table below? percentage of income price change product spent on product % P 10 +8 Q 15 +6 R 25 +4 S 50 –9 A –1.8% B 4.5% C 7.2% D 9.0%
1 marks
Answer: A
This question in 9708/13 Oct/Nov 2017
Q16 · During one year the national output of a country valued in terms of money prices… 9708/12 Feb/March 2018
21 During one year the national output of a country valued in terms of money prices increased by 8% while the index of the prices of all goods and services produced in the country increased by 3%. By how much did the real national output increase? A 3% B 5% C 8% D 11%
1 marks
Answer: B
This question in 9708/12 Feb/March 2018
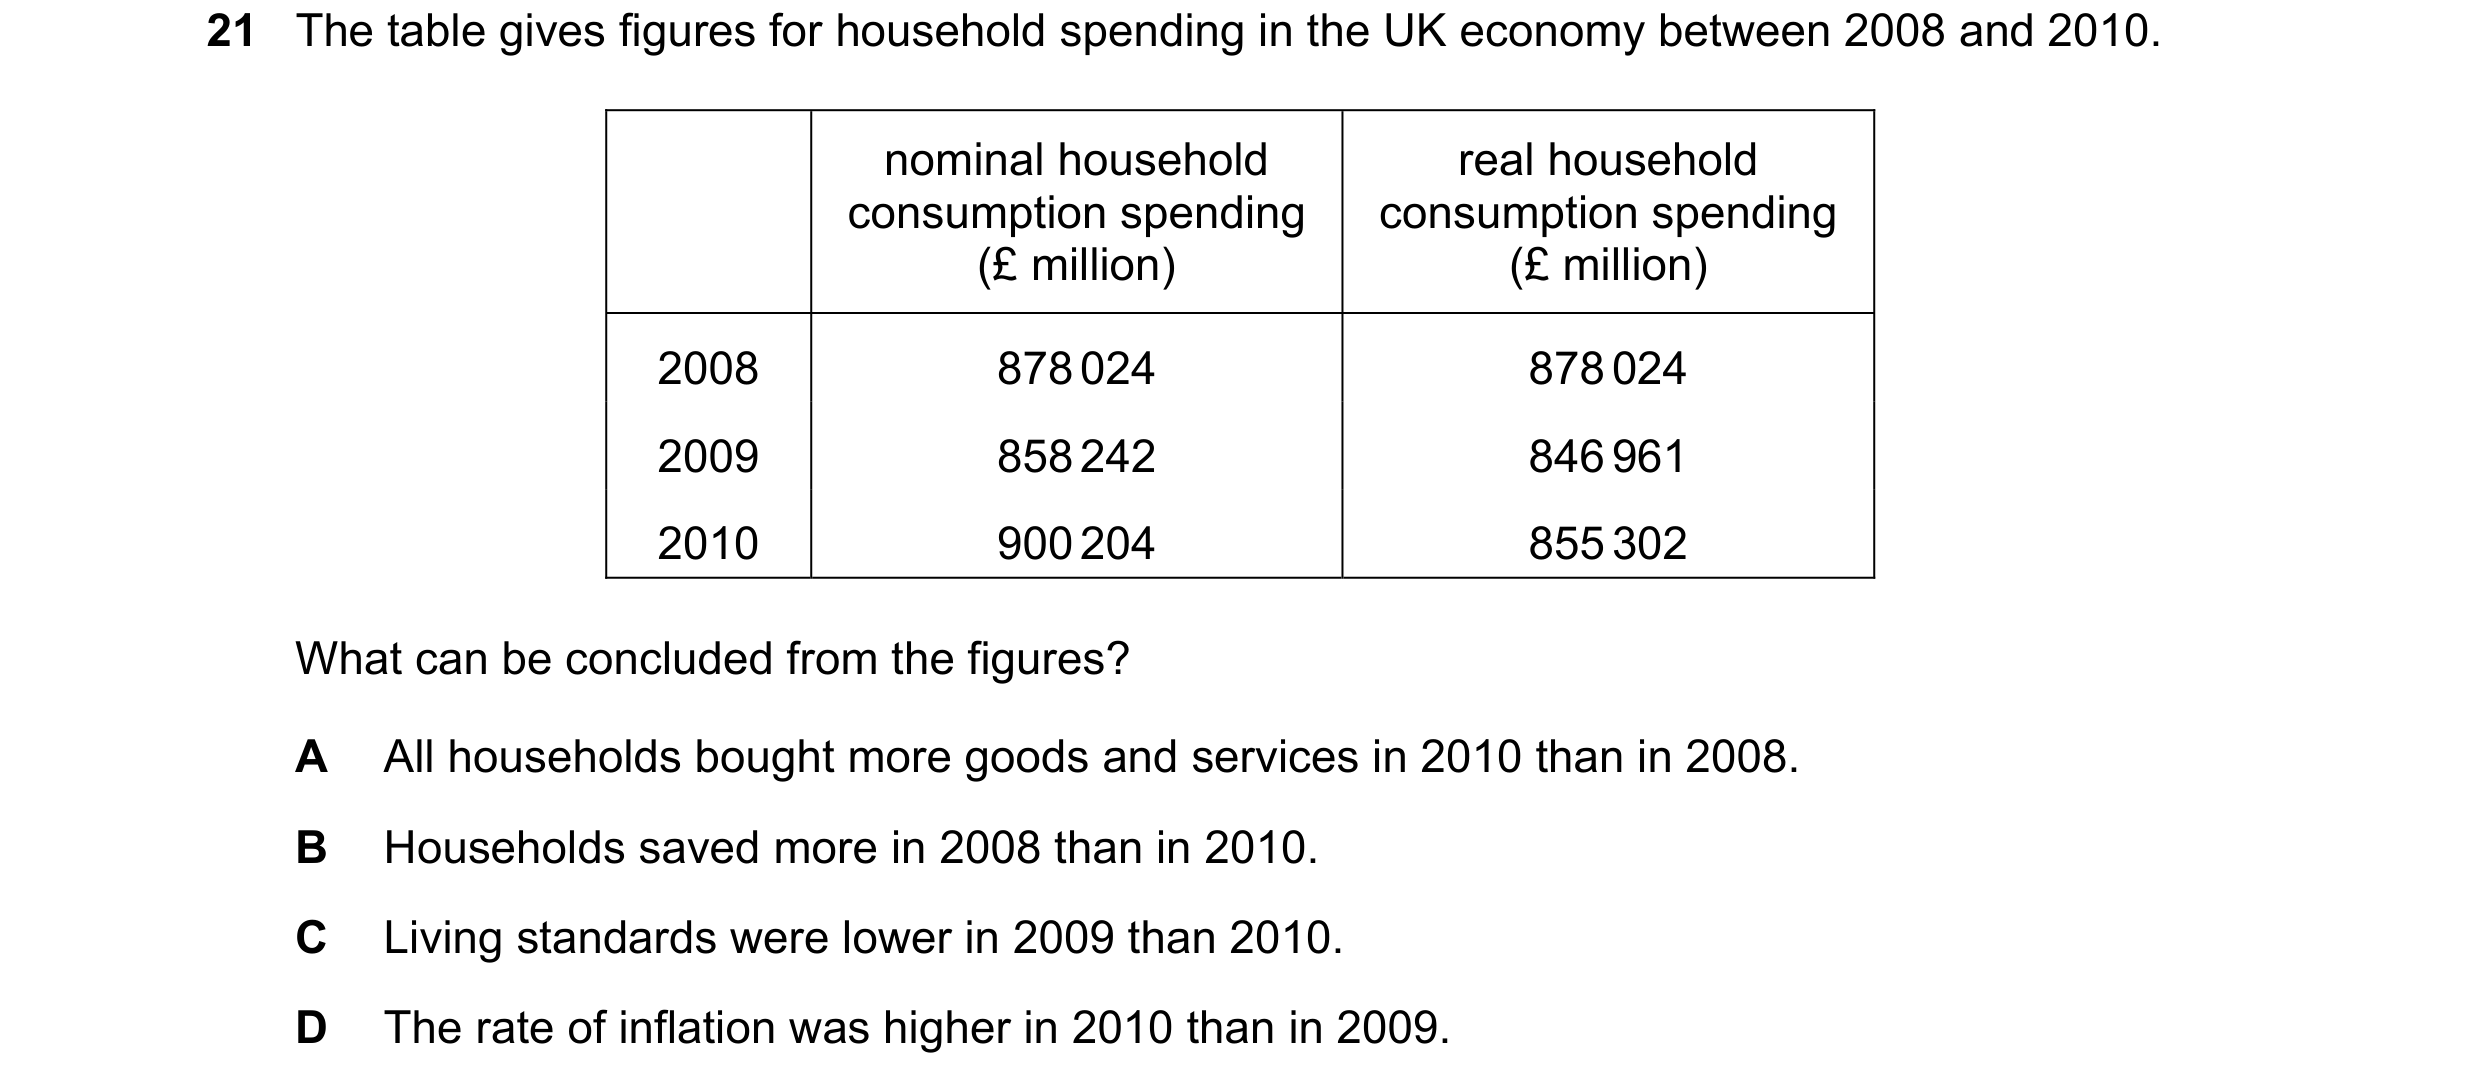
Q17 · The table gives figures for household spending in the UK economy between 2008 and 2010 9708/11 May/June 2018
21 The table gives figures for household spending in the UK economy between 2008 and 2010. nominal household real household consumption spending consumption spending (£ million) (£ million) 2008 878 024 878 024 2009 858 242 846 961 2010 900 204 855 302 What can be concluded from the figures? A All households bought more goods and services in 2010 than in 2008. B Households saved more in 2008 than in 2010. C Living standards were lower in 2009 than 2010. D The rate of inflation was higher in 2010 than in 2009.
1 marks
Answer: D
This question in 9708/11 May/June 2018
Q18 · A government statistical office measured changes in income from employment, pensions and… 9708/12 May/June 2018
21 A government statistical office measured changes in income from employment, pensions and benefits, then subtracted income tax and welfare contributions and adjusted for inflation. What did the final figure represent? A changes in nominal income B changes in nominal net earnings C changes in real disposable income D changes in real gross earnings
1 marks
Answer: C
This question in 9708/12 May/June 2018
Q19 · When is a transfer payment most likely to be an individual’s main source of income? 9708/11 Oct/Nov 2018
17 When is a transfer payment most likely to be an individual’s main source of income? A when employed B when investing C when saving D when unemployed
1 marks
Answer: D
This question in 9708/11 Oct/Nov 2018
Q20 · The table shows the consumer price index (CPI) and national output at current prices in… 9708/12 Oct/Nov 2018
20 The table shows the consumer price index (CPI) and national output at current prices in 2014 and 2015 for an economy. national output year CPI at current prices 2014 100 100 2015 120 110 What can be concluded when 2015 is compared with 2014? A Money national output decreased by 10%. B Money national output increased by 20%. C Real national output fell. D Real national output increased.
1 marks
Answer: C
This question in 9708/12 Oct/Nov 2018
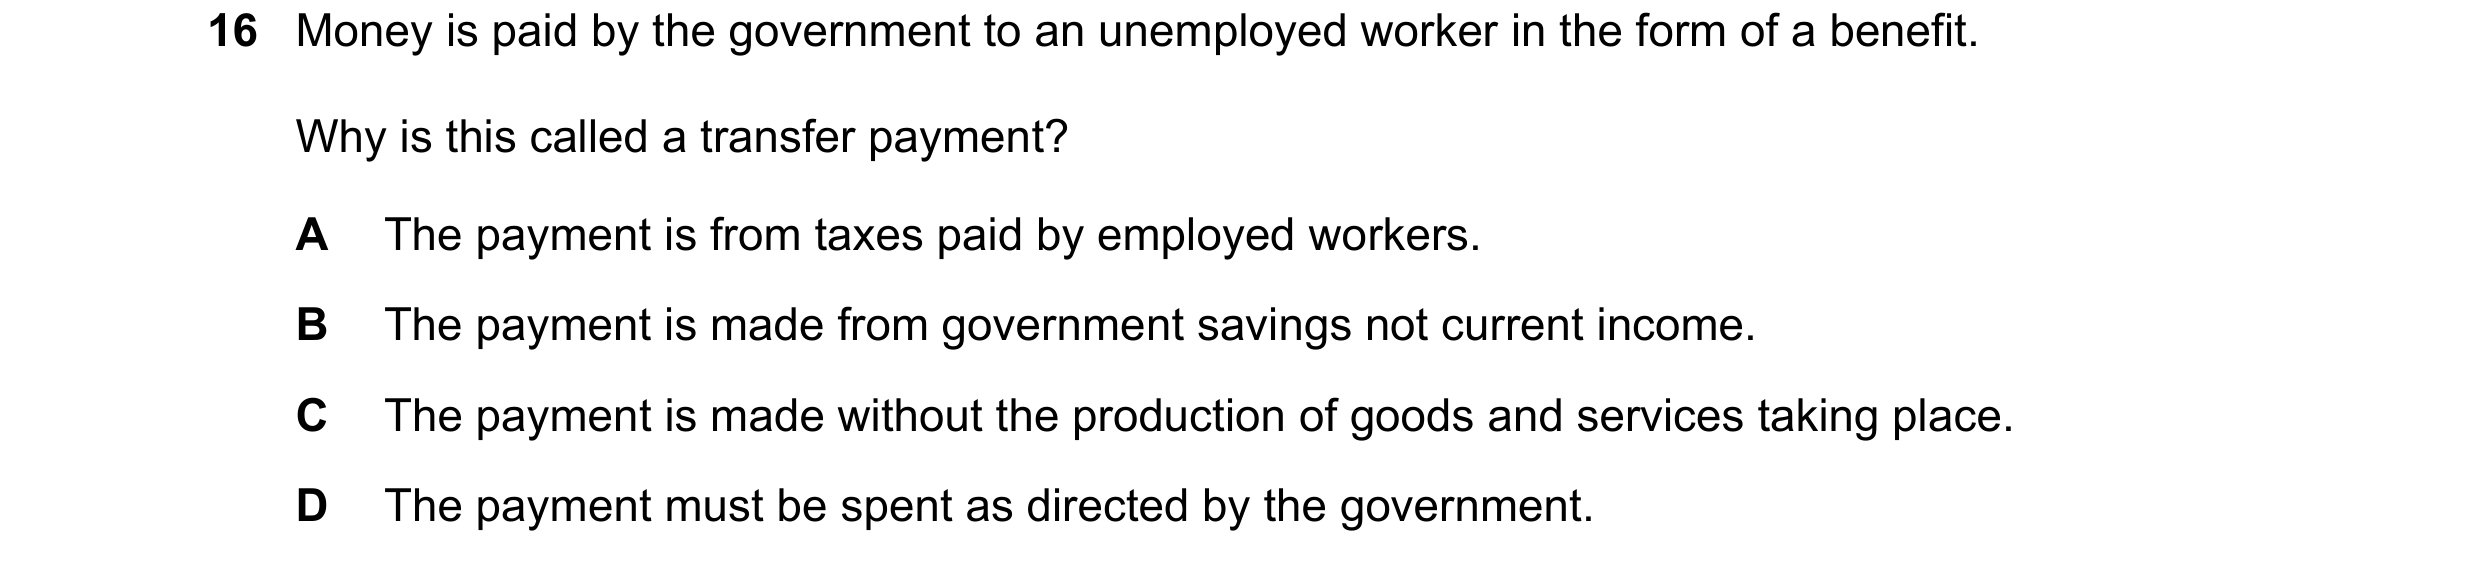
Q21 · Money is paid by the government to an unemployed worker in the form of a benefit 9708/12 Feb/March 2019
16 Money is paid by the government to an unemployed worker in the form of a benefit. Why is this called a transfer payment? A The payment is from taxes paid by employed workers. B The payment is made from government savings not current income. C The payment is made without the production of goods and services taking place. D The payment must be spent as directed by the government.
1 marks
Answer: C
This question in 9708/12 Feb/March 2019
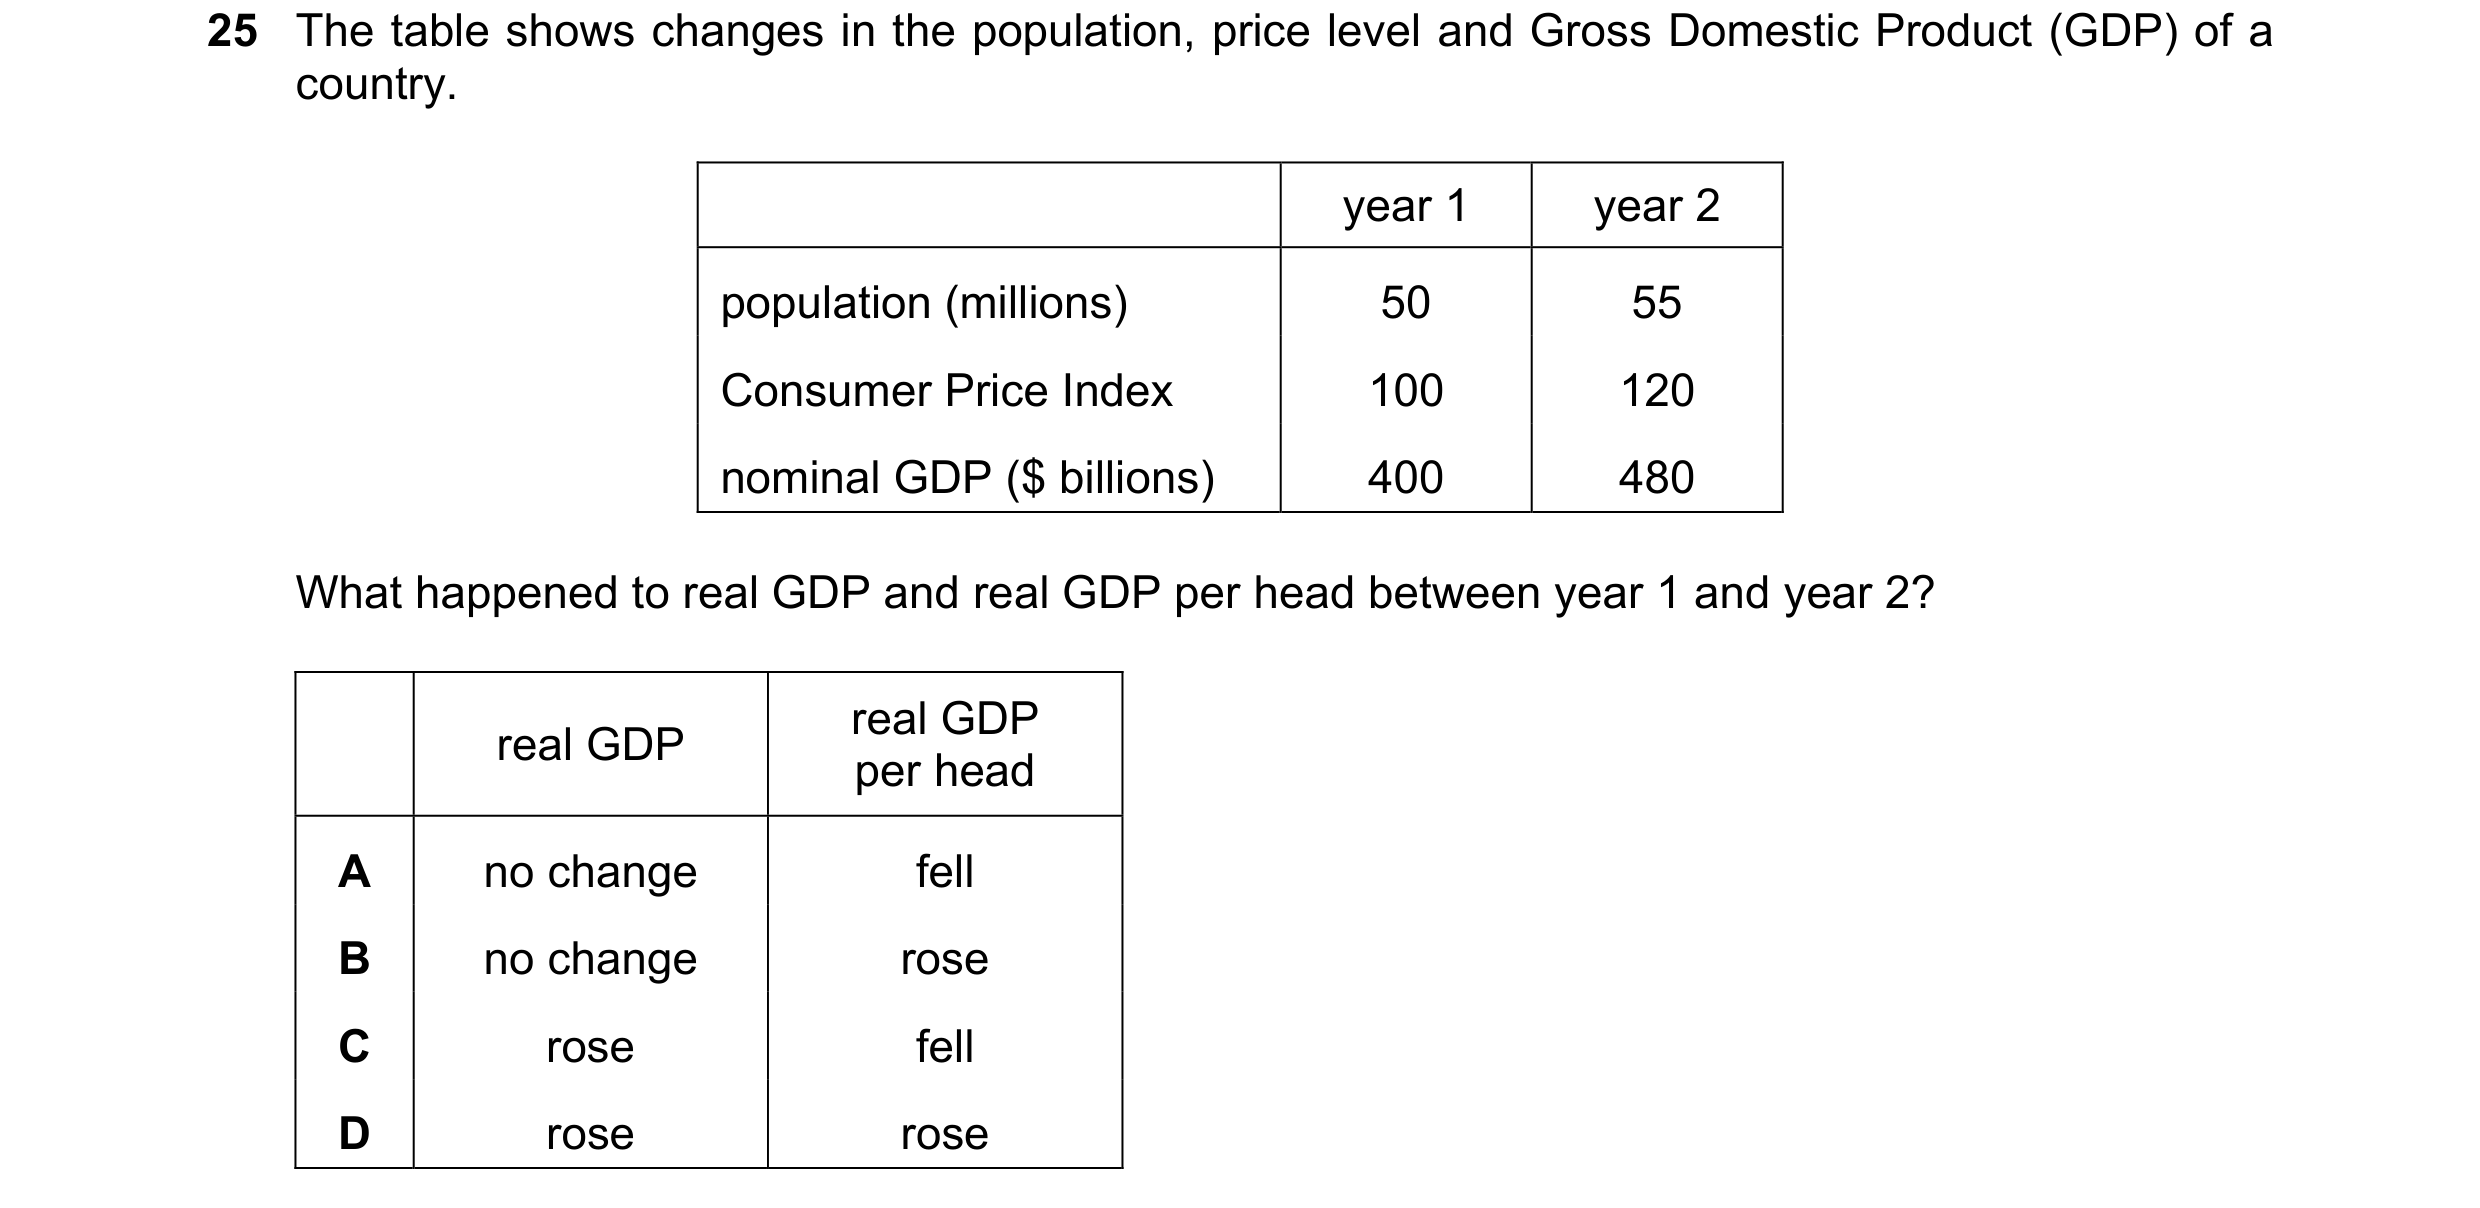
Q22 · The table shows changes in the population, price level and Gross Domestic Product (GDP)… 9708/11 May/June 2019
25 The table shows changes in the population, price level and Gross Domestic Product (GDP) of a country. year 1 year 2 population (millions) 50 55 Consumer Price Index 100 120 nominal GDP ($ billions) 400 480 What happened to real GDP and real GDP per head between year 1 and year 2? real GDP real GDP per head A no change fell B no change rose C rose fell D rose rose
1 marks
Answer: A
This question in 9708/11 May/June 2019
Q23 · A teenager received a cheque for $50 as a birthday gift from her parents 9708/11 May/June 2020
17 A teenager received a cheque for $50 as a birthday gift from her parents. The teenager paid the cheque into her savings account at the bank. Why is this gift a transfer payment? A It did not involve a cash payment. B It transfers money between bank accounts. C The parents did not spend their money. D The teenager did not produce any output.
1 marks
Answer: D
This question in 9708/11 May/June 2020
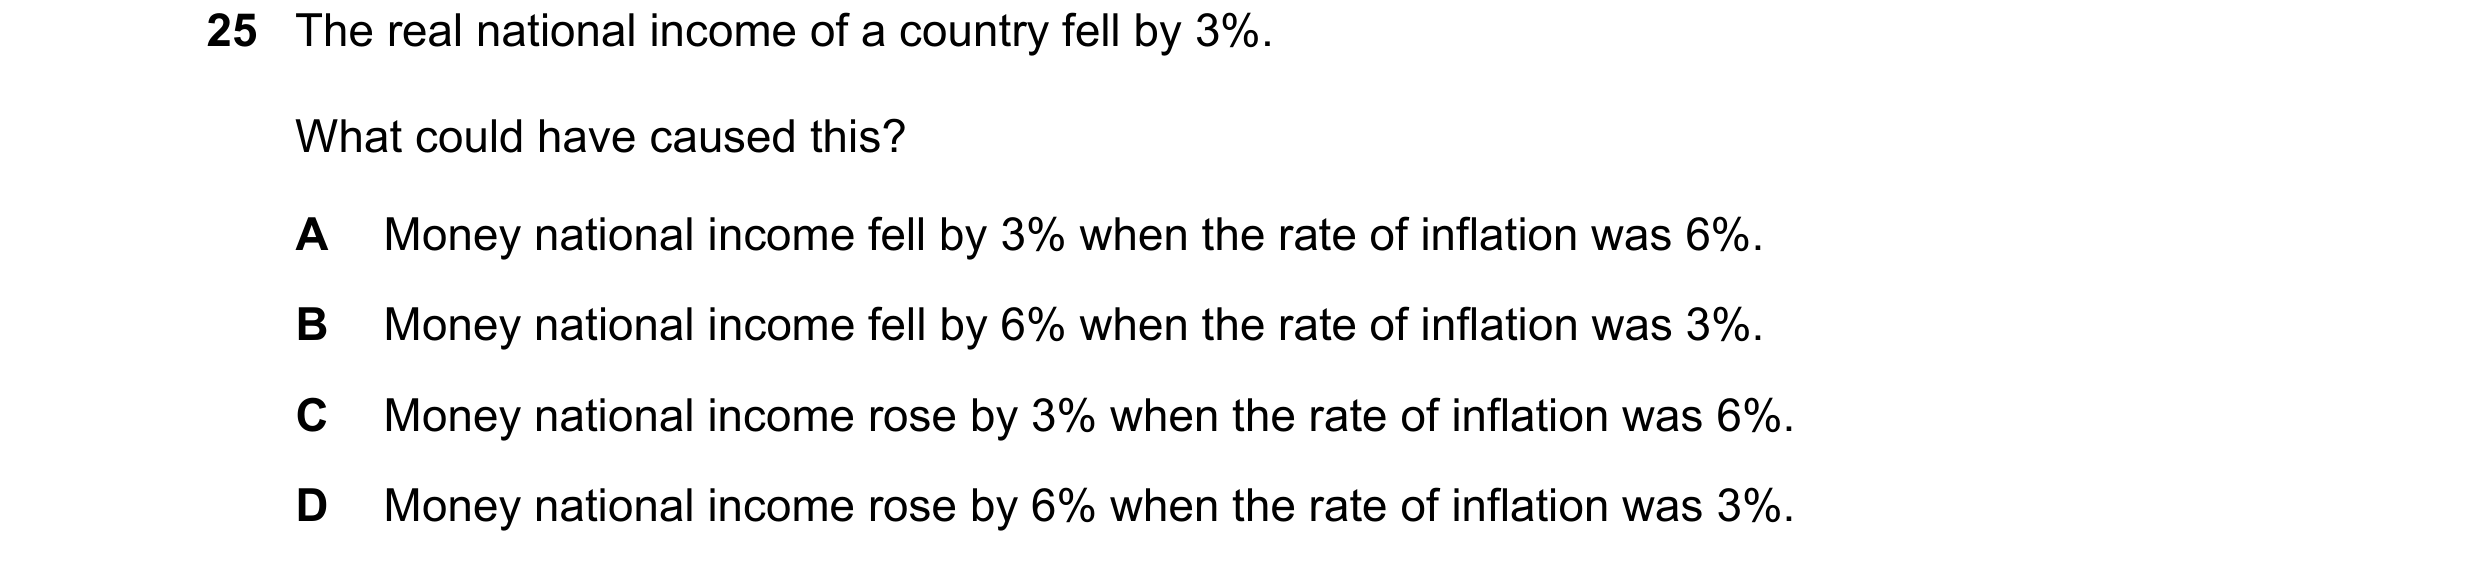
Q24 · The real national income of a country fell by 3% 9708/13 May/June 2020
25 The real national income of a country fell by 3%. What could have caused this? A Money national income fell by 3% when the rate of inflation was 6%. B Money national income fell by 6% when the rate of inflation was 3%. C Money national income rose by 3% when the rate of inflation was 6%. D Money national income rose by 6% when the rate of inflation was 3%.
1 marks
Answer: C
This question in 9708/13 May/June 2020
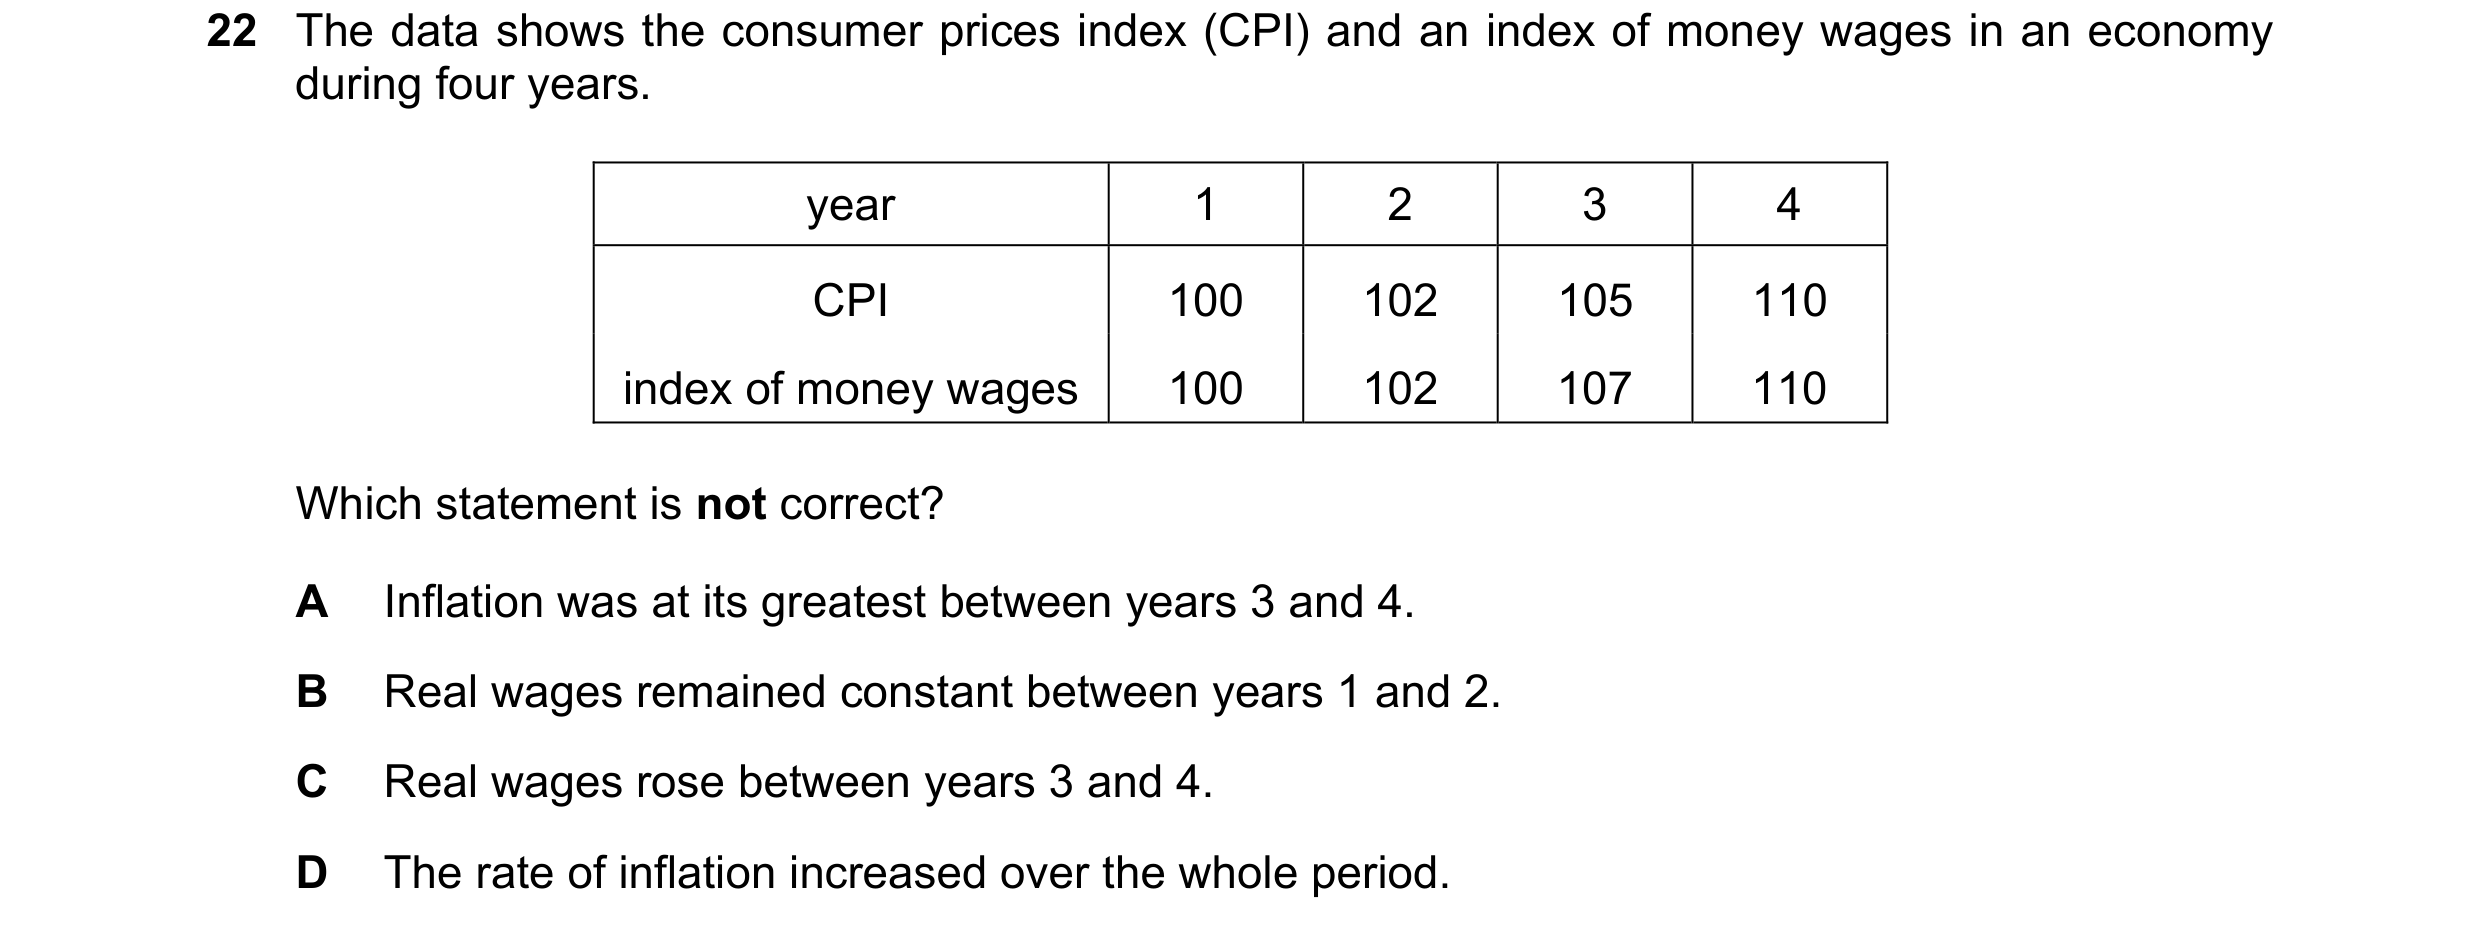
Q25 · The data shows the consumer prices index (CPI) and an index of money wages in an economy… 9708/11 Oct/Nov 2020
22 The data shows the consumer prices index (CPI) and an index of money wages in an economy during four years. year 1 2 3 4 CPI 100 102 105 110 index of money wages 100 102 107 110 Which statement is not correct? A Inflation was at its greatest between years 3 and 4. B Real wages remained constant between years 1 and 2. C Real wages rose between years 3 and 4. D The rate of inflation increased over the whole period.
1 marks
Answer: C
This question in 9708/11 Oct/Nov 2020
Q26 · What is classified as a transfer payment? 9708/13 Oct/Nov 2020
18 What is classified as a transfer payment? A money paid as a gift to a charity B money paid as a tip to a waiter C money paid as commission to a salesperson D money paid for an imported good
1 marks
Answer: A
This question in 9708/13 Oct/Nov 2020
Q27 · Government spending for a year includes these items 9708/13 May/June 2021
18 Government spending for a year includes these items. $m pensions for elderly people 200 welfare payments to sick people 200 spending on hospitals 150 payment to unemployed workers 100 defence spending 100 teachers’ salaries 50 What is the total of transfer payments by this government in $m? A 50 B 500 C 750 D 800
1 marks
Answer: B
This question in 9708/13 May/June 2021
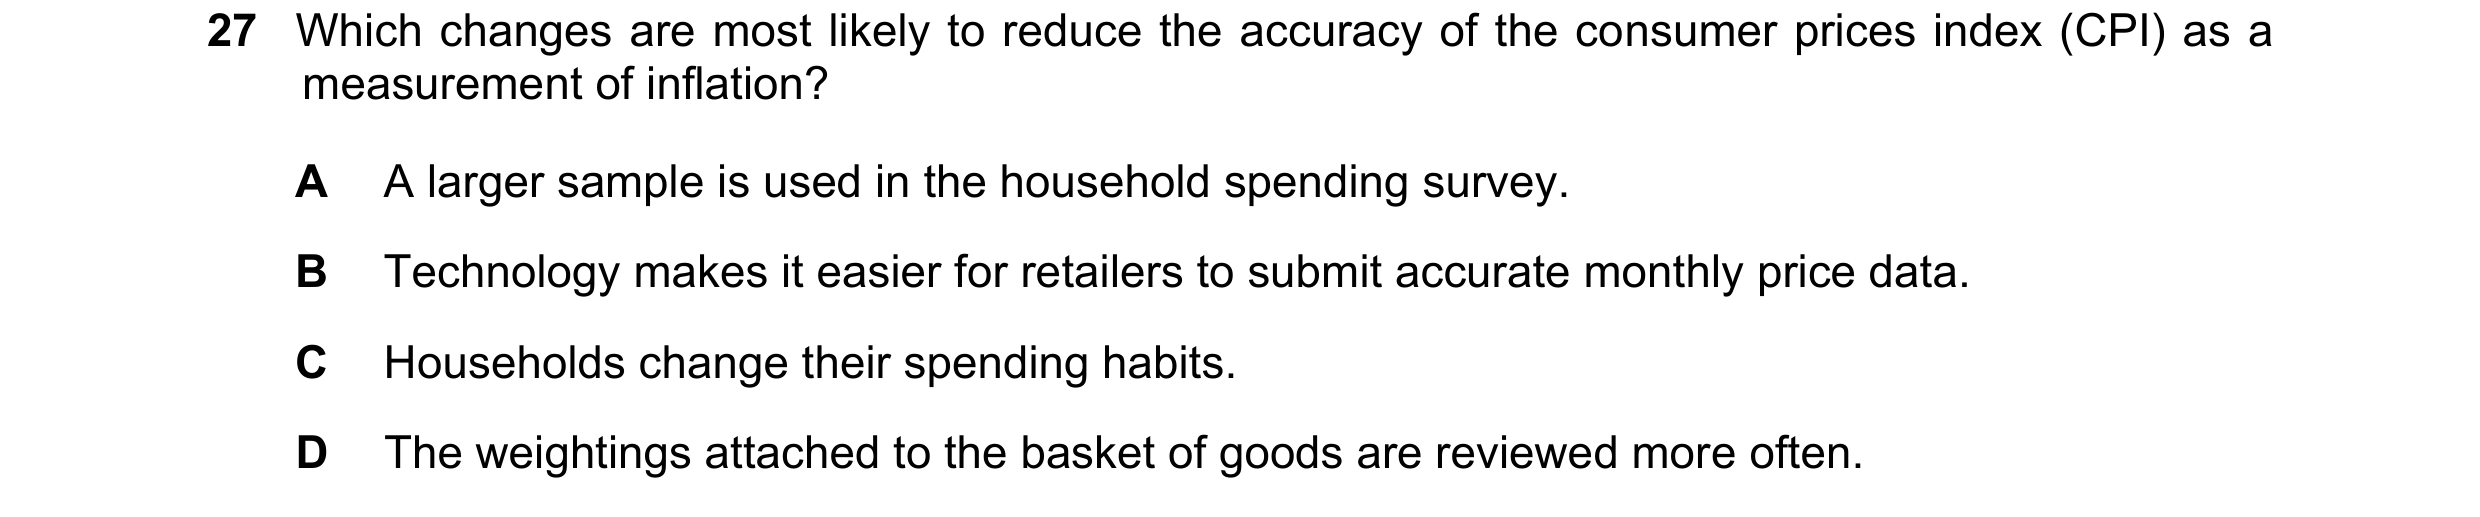
Q28 · Which changes are most likely to reduce the accuracy of the consumer prices index (CPI)… 9708/11 Oct/Nov 2021
27 Which changes are most likely to reduce the accuracy of the consumer prices index (CPI) as a measurement of inflation? A A larger sample is used in the household spending survey. B Technology makes it easier for retailers to submit accurate monthly price data. C Households change their spending habits. D The weightings attached to the basket of goods are reviewed more often.
1 marks
Answer: C
This question in 9708/11 Oct/Nov 2021
Q29 · Which payment is a transfer payment? 9708/13 Oct/Nov 2021
16 Which payment is a transfer payment? A households’ payments of indirect taxes B government pension payments C payments between firms for the supply of raw materials D payment of salaries
1 marks
Answer: B
This question in 9708/13 Oct/Nov 2021
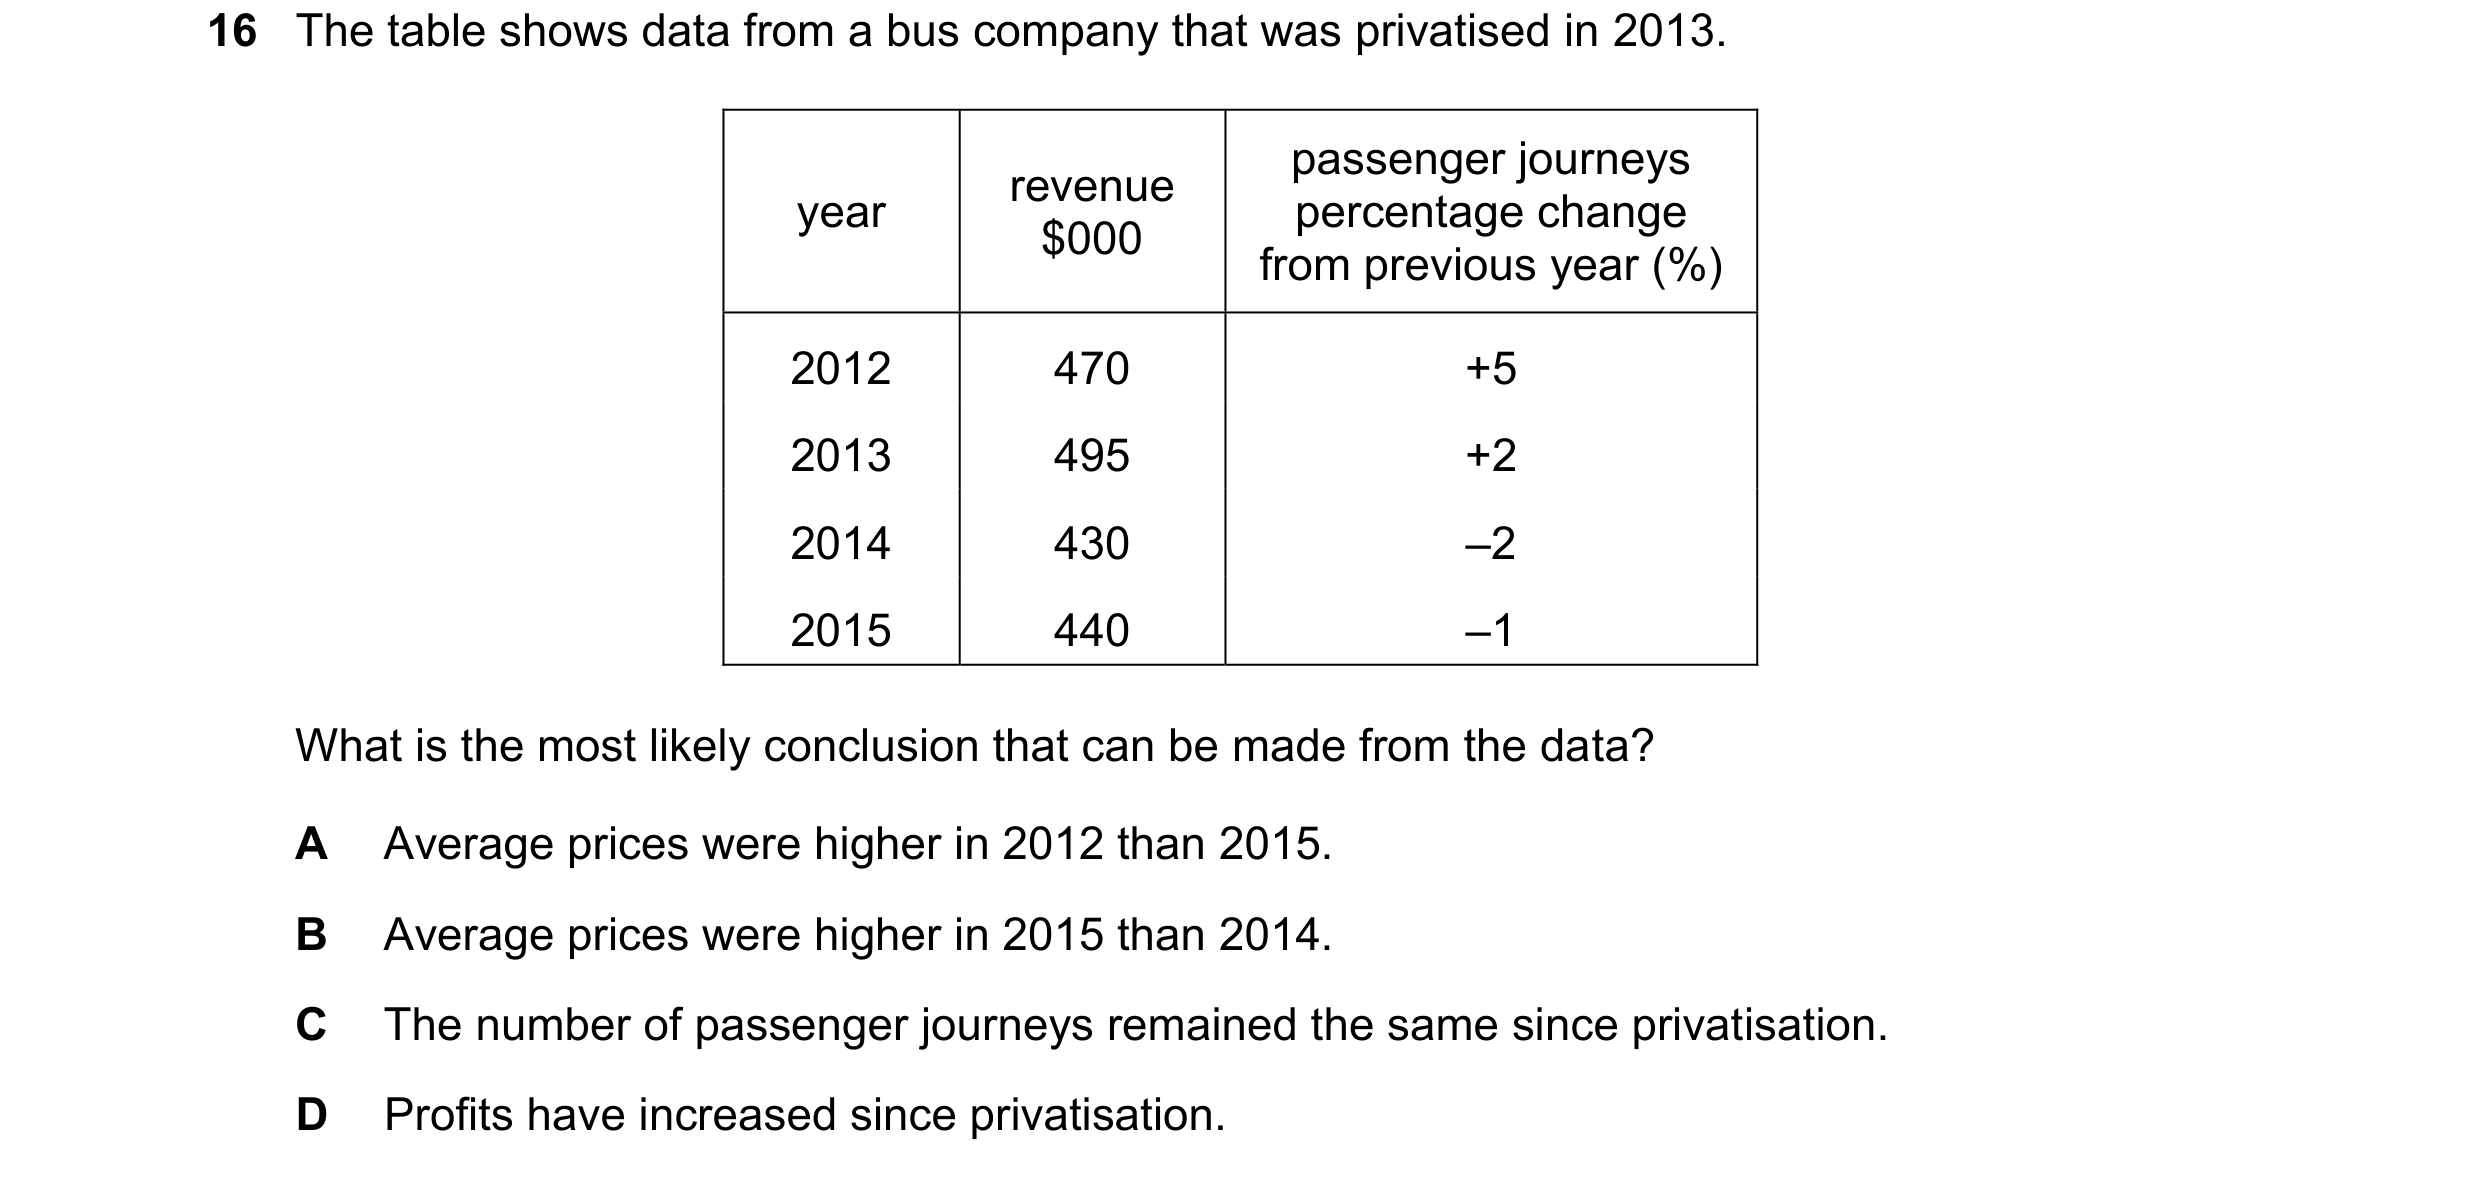
Q30 · The table shows data from a bus company that was privatised in 2013 9708/11 May/June 2022
16 The table shows data from a bus company that was privatised in 2013. passenger journeys revenue year percentage change $000 from previous year (%) 2012 470 +5 2013 495 +2 2014 430 –2 2015 440 –1 What is the most likely conclusion that can be made from the data? A Average prices were higher in 2012 than 2015. B Average prices were higher in 2015 than 2014. C The number of passenger journeys remained the same since privatisation. D Profits have increased since privatisation.
1 marks
Answer: B
This question in 9708/11 May/June 2022
Q31 · The table shows a country’s total output and its average price in each of three years 9708/11 May/June 2022
20 The table shows a country’s total output and its average price in each of three years. output price year (millions) ($) 1 10 20 2 12 24 3 13 26 What can be concluded about output? A Nominal output and real output increased at the same rate. B Nominal output rose at a faster rate than real output. C Nominal output rose at an increasing rate. D Real output rose at a constant rate.
1 marks
Answer: B
This question in 9708/11 May/June 2022
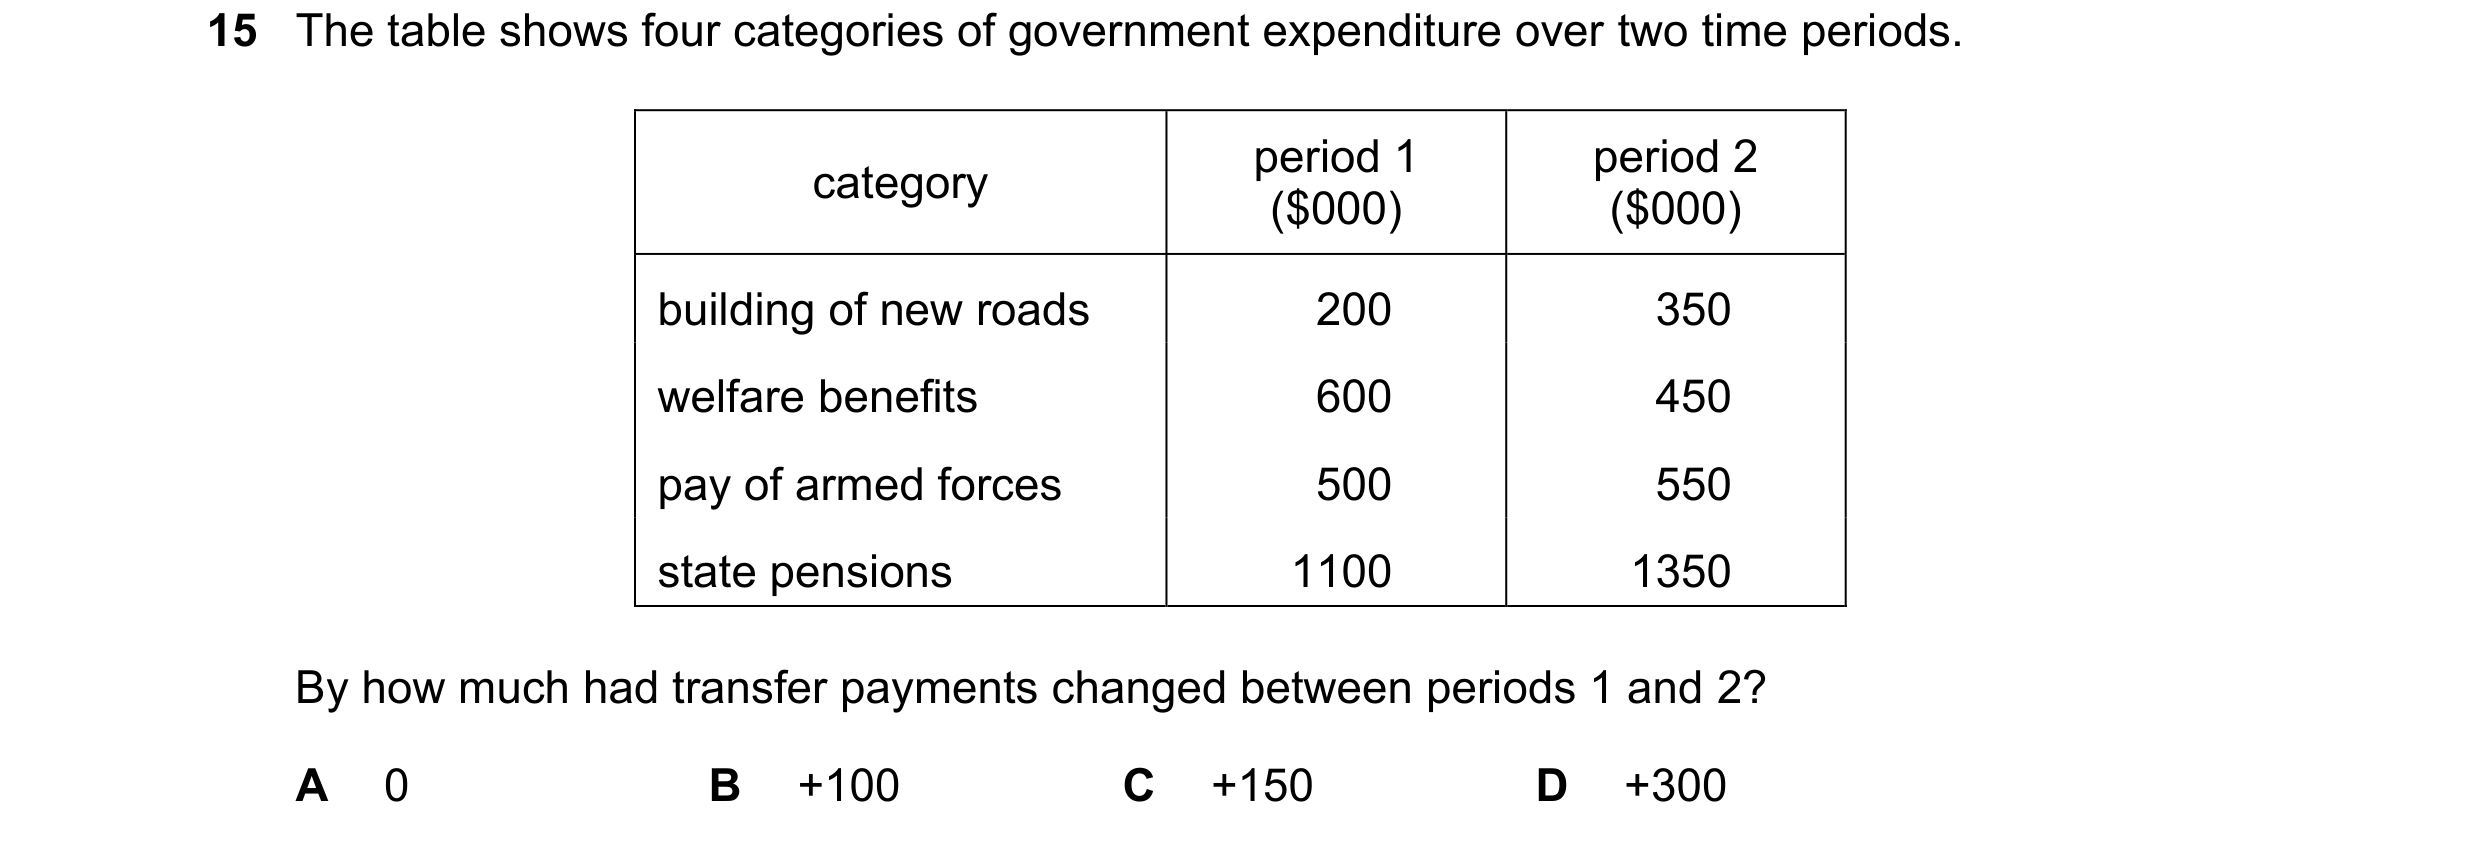
Q32 · The table shows four categories of government expenditure over two time periods 9708/13 May/June 2022
15 The table shows four categories of government expenditure over two time periods. period 1 period 2 category ($000) ($000) building of new roads 200 350 welfare benefits 600 450 pay of armed forces 500 550 state pensions 1100 1350 By how much had transfer payments changed between periods 1 and 2? A 0 B +100 C +150 D +300
1 marks
Answer: B
This question in 9708/13 May/June 2022
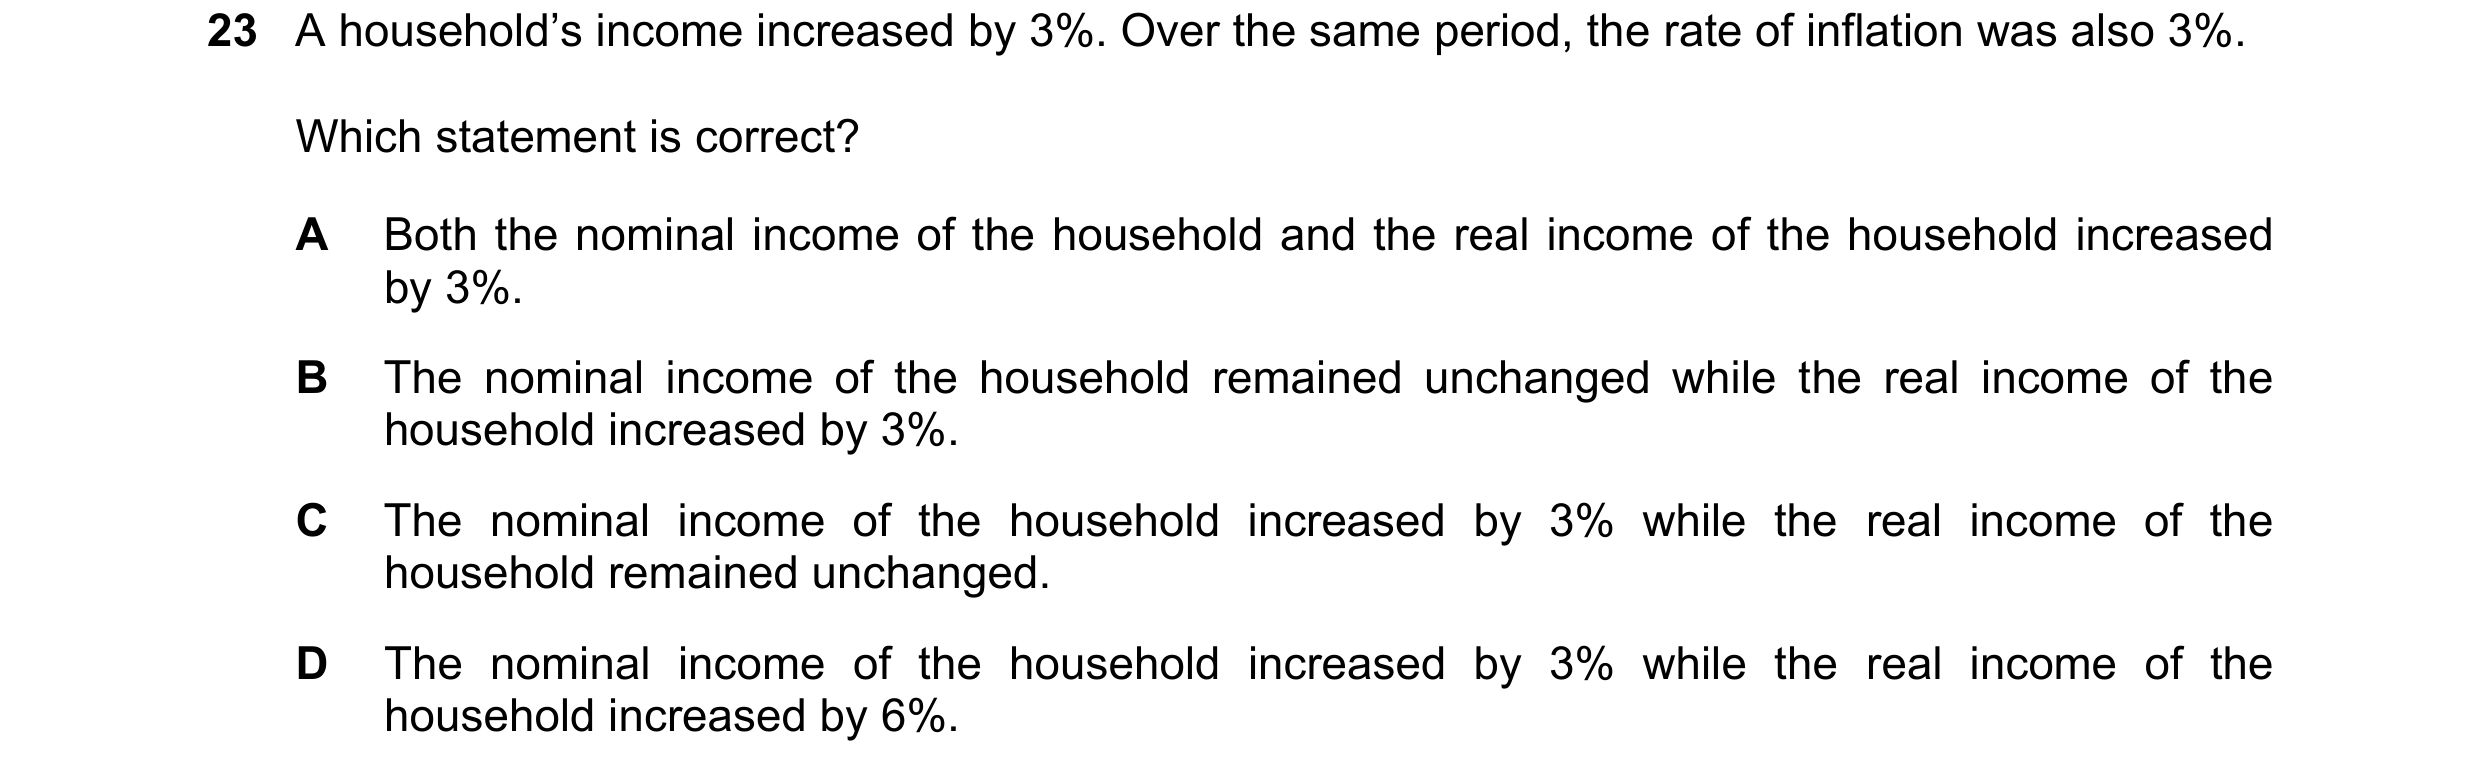
Q33 · A household’s income increased by 3% 9708/13 May/June 2022
23 A household’s income increased by 3%. Over the same period, the rate of inflation was also 3%. Which statement is correct? A Both the nominal income of the household and the real income of the household increased by 3%. B The nominal income of the household remained unchanged while the real income of the household increased by 3%. C The nominal income of the household increased by 3% while the real income of the household remained unchanged. D The nominal income of the household increased by 3% while the real income of the household increased by 6%.
1 marks
Answer: C
This question in 9708/13 May/June 2022
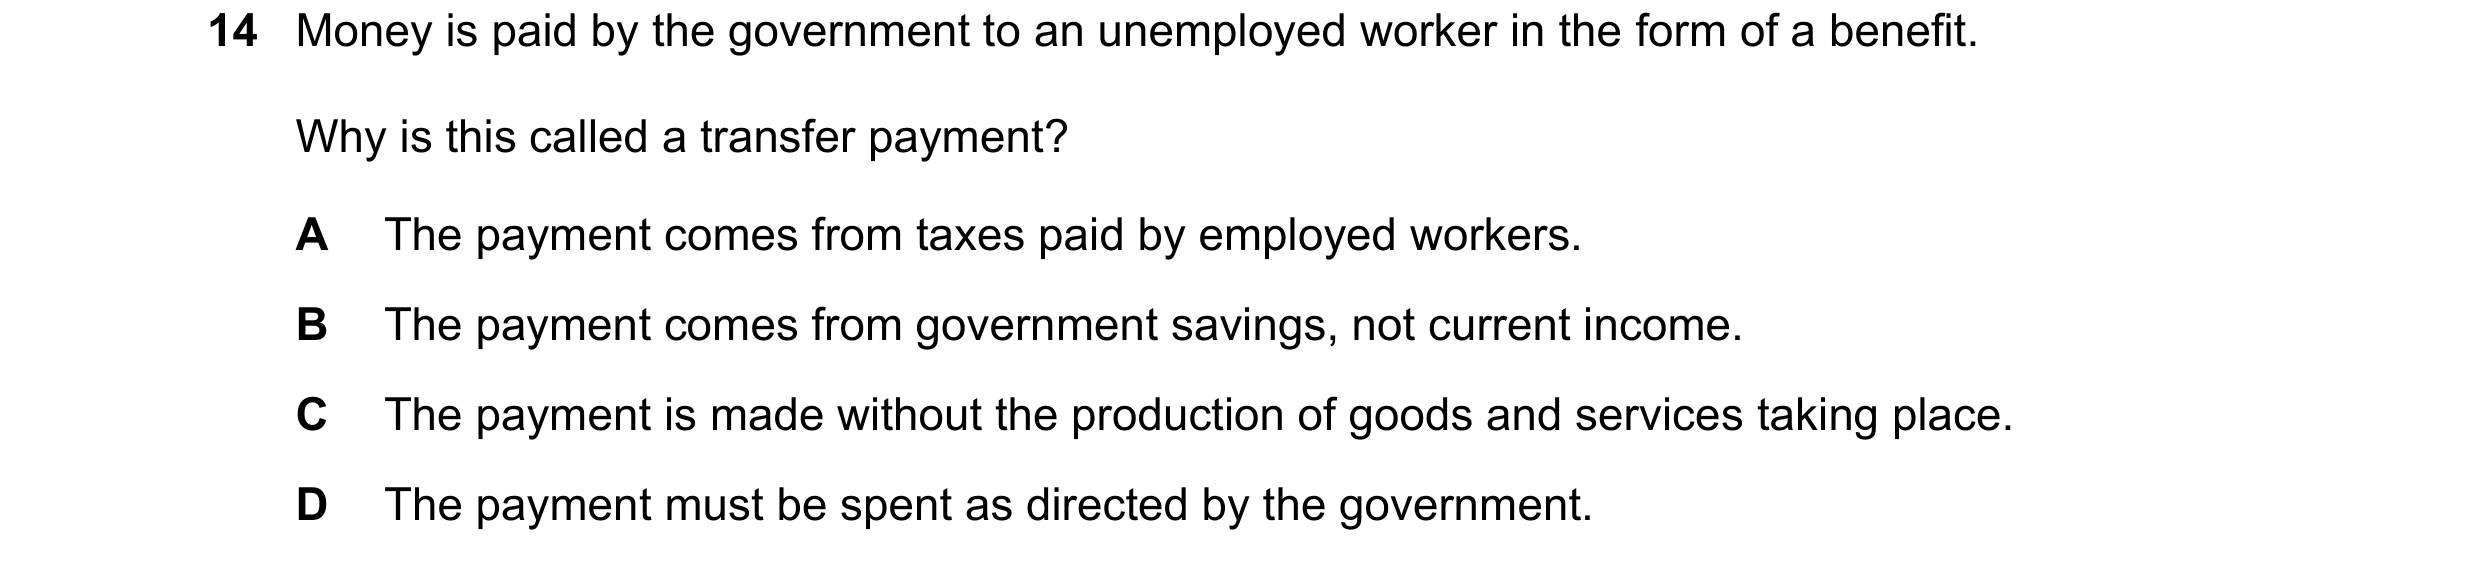
Q34 · Money is paid by the government to an unemployed worker in the form of a benefit 9708/14 May/June 2022
14 Money is paid by the government to an unemployed worker in the form of a benefit. Why is this called a transfer payment? A The payment comes from taxes paid by employed workers. B The payment comes from government savings, not current income. C The payment is made without the production of goods and services taking place. D The payment must be spent as directed by the government.
1 marks
Answer: C
This question in 9708/14 May/June 2022
Q35 · What is a transfer payment? 9708/12 Oct/Nov 2022
17 What is a transfer payment? A the advertising expenditure of a firm B the allowance given by a parent to their child while at school C the rent paid to a land owner by a tenant farmer D the wage paid to a worker in the government service
1 marks
Answer: B
This question in 9708/12 Oct/Nov 2022
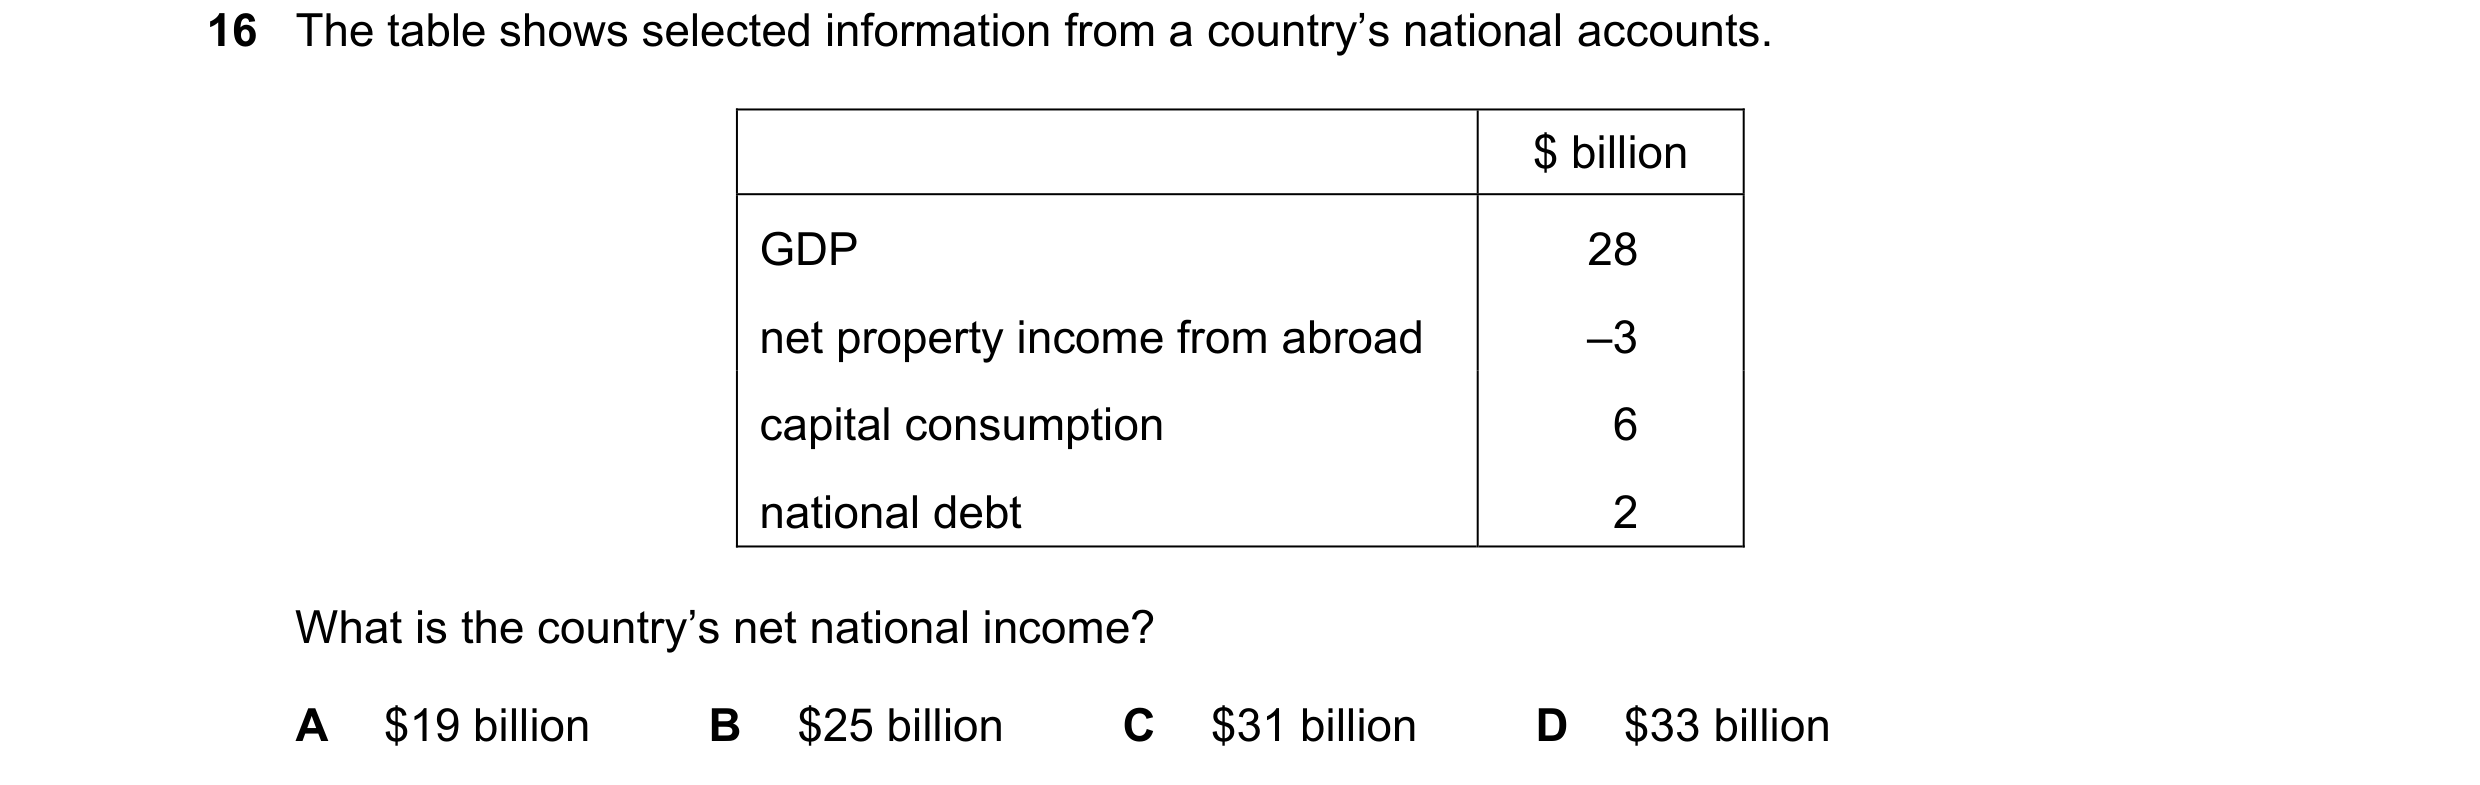
Q36 · The table shows selected information from a country’s national accounts 9708/12 Feb/March 2023
16 The table shows selected information from a country’s national accounts. $ billion GDP 28 net property income from abroad –3 capital consumption 6 national debt 2 What is the country’s net national income? A $19 billion B $25 billion C $31 billion D $33 billion
1 marks
Answer: A
This question in 9708/12 Feb/March 2023
Q37 · What is used to convert nominal GDP to real GDP? 9708/12 May/June 2023
20 What is used to convert nominal GDP to real GDP? A exchange rates B changes in the price level C interest rates D taxation
1 marks
Answer: B
This question in 9708/12 May/June 2023
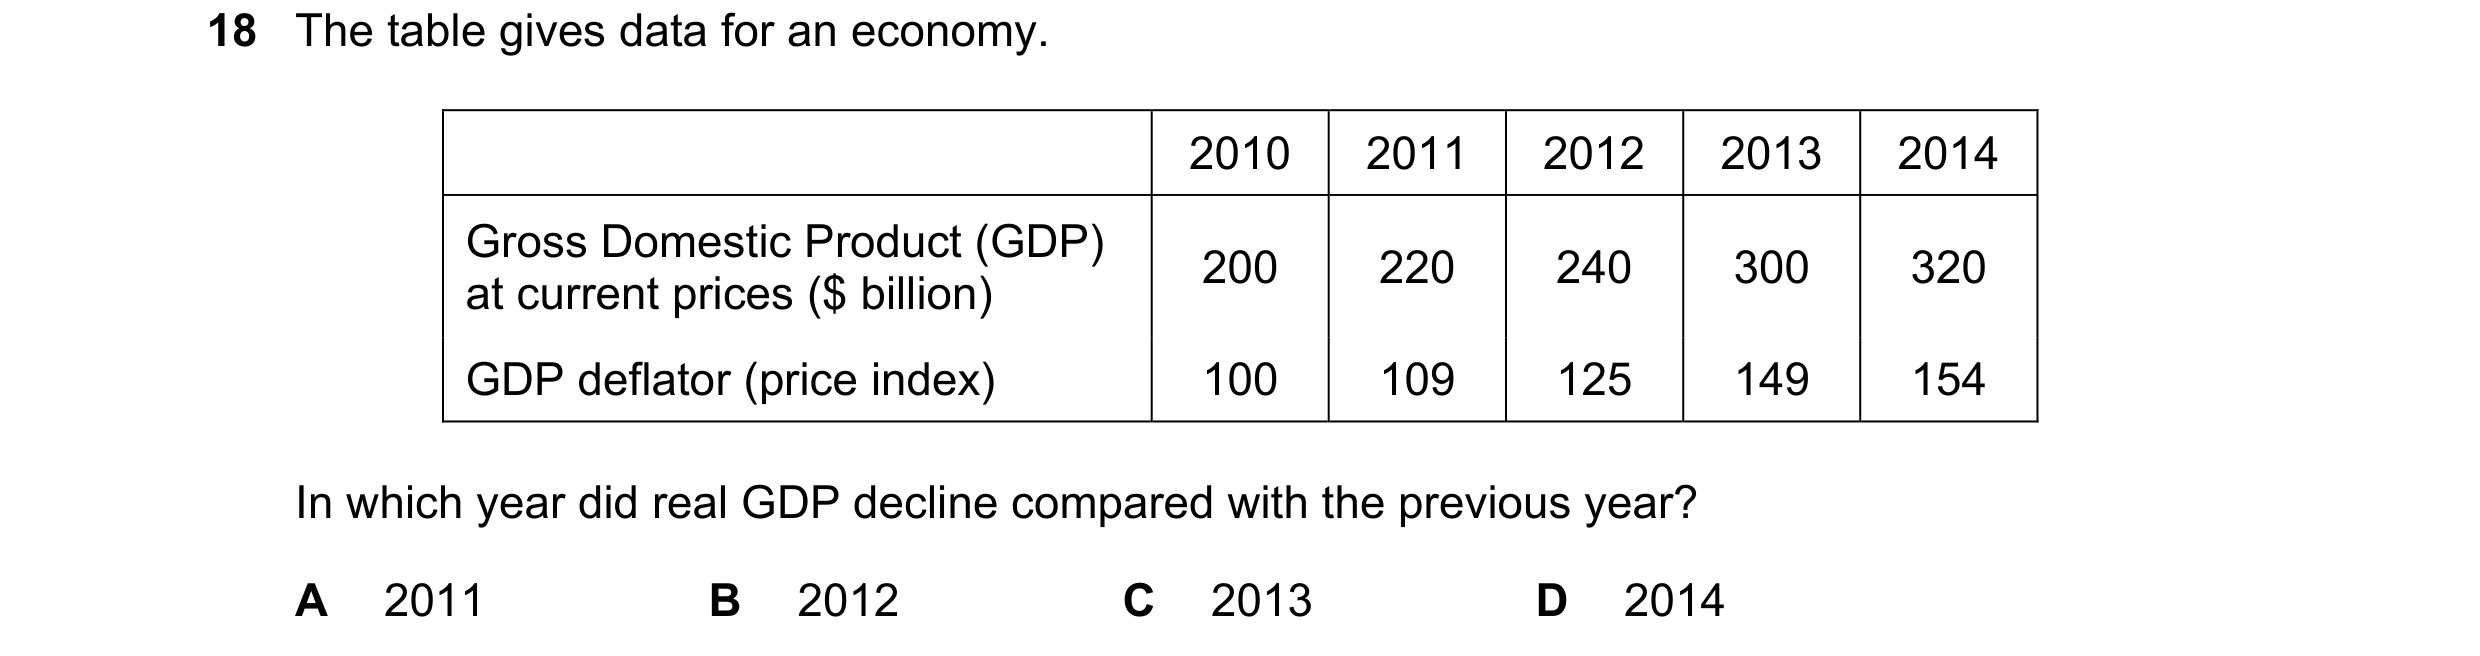
Q38 · The table gives data for an economy 9708/13 May/June 2023
18 The table gives data for an economy. 2010 2011 2012 2013 2014 Gross Domestic Product (GDP) 200 220 240 300 320 at current prices ($ billion) GDP deflator (price index) 100 109 125 149 154 In which year did real GDP decline compared with the previous year? A 2011 B 2012 C 2013 D 2014
1 marks
Answer: B
This question in 9708/13 May/June 2023
Q39 · In year 1, a country’s real GDP was $500 billion 9708/13 May/June 2023
20 In year 1, a country’s real GDP was $500 billion. In year 2, nominal GDP rose to $577.5 billion and the prices increased by 5%. What is the real GDP in year 2? A $4.76 billion B $5 billion C $476 billion D $550 billion
1 marks
Answer: D
This question in 9708/13 May/June 2023
Q40 · The table gives details of national income statistics for an economy 9708/13 May/June 2023
21 The table gives details of national income statistics for an economy. US$bn consumption 2000 investment 500 government expenditure 600 net exports –100 net foreign factor income –200 depreciation 100 What is the net national income for this economy? A US$2700bn B US$2800bn C US$2900bn D US$3000bn
1 marks
Answer: A
This question in 9708/13 May/June 2023
Q41 · What is not included in the measurement of national income? 9708/11 Oct/Nov 2023
17 What is not included in the measurement of national income? A benefits paid to the unemployed B dividends paid to shareholders C profits retained by companies D rent paid to landlords
1 marks
Answer: A
This question in 9708/11 Oct/Nov 2023
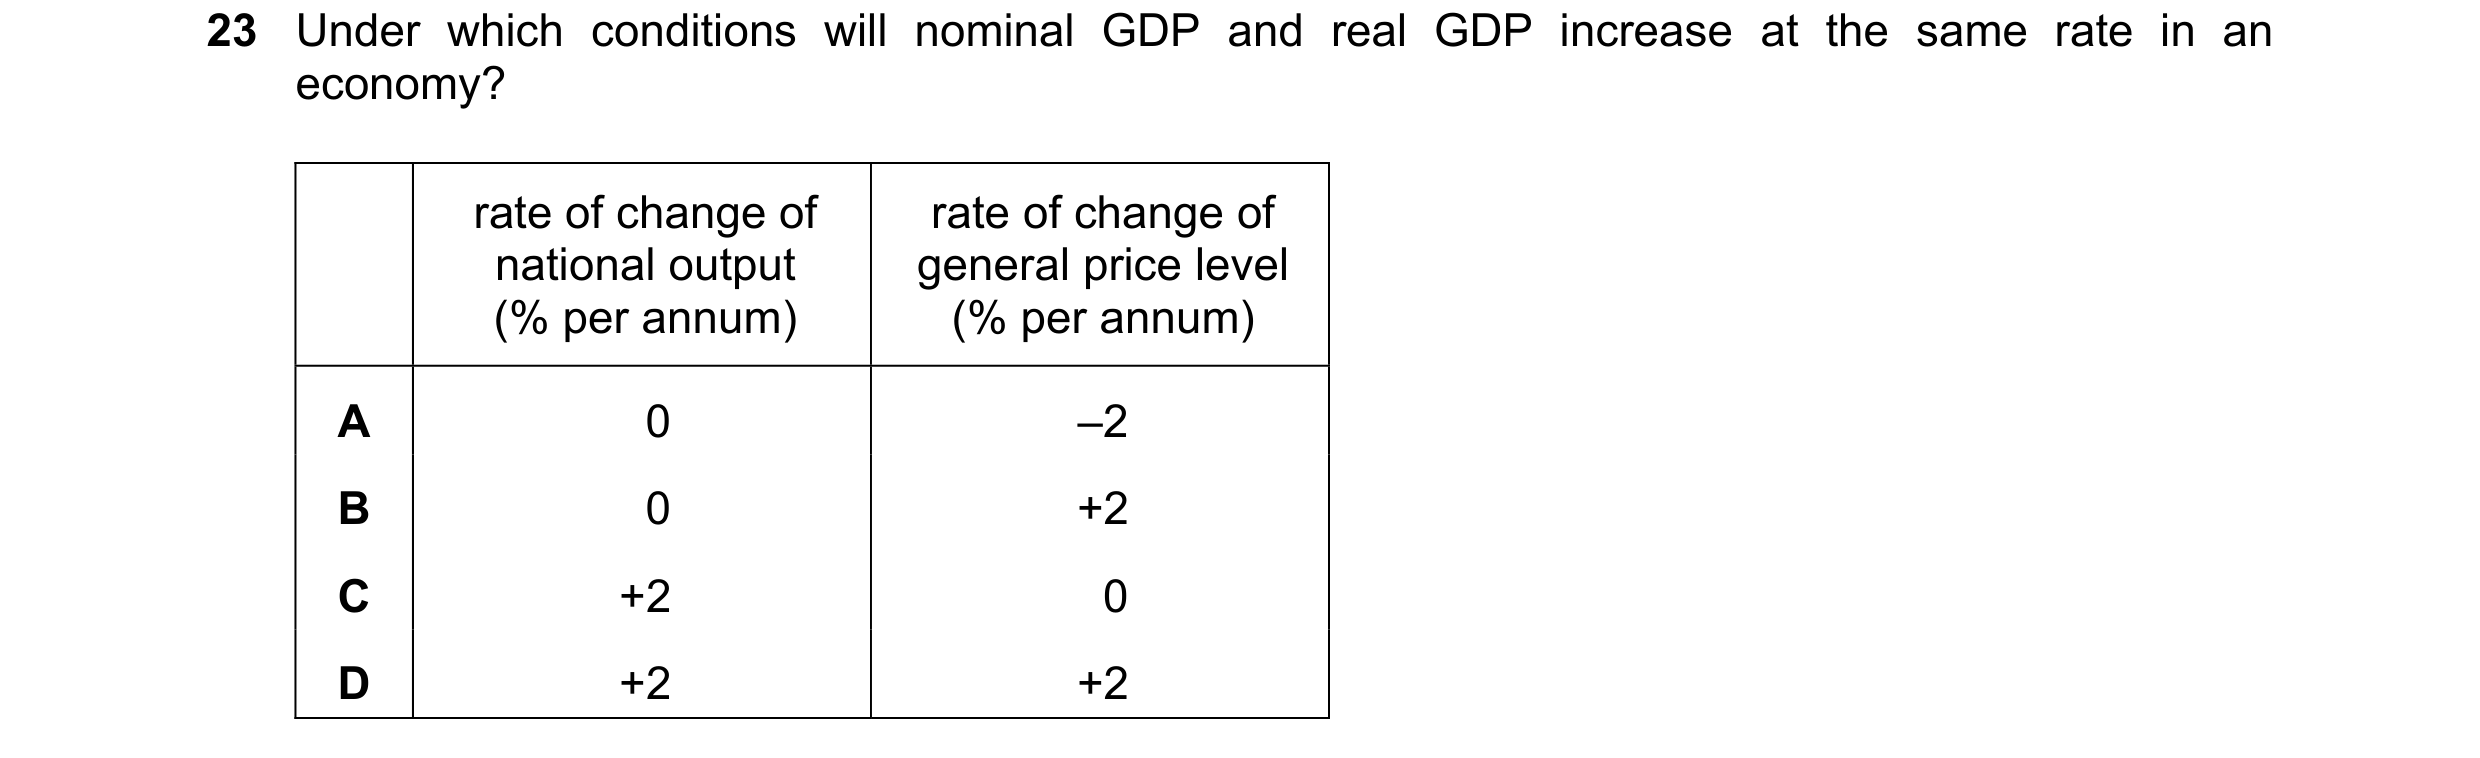
Q42 · Under which conditions will nominal GDP and real GDP increase at the same rate in an… 9708/11 Oct/Nov 2023
23 Under which conditions will nominal GDP and real GDP increase at the same rate in an economy? rate of change of rate of change of national output general price level (% per annum) (% per annum) A 0 –2 B 0 +2 C +2 0 D +2 +2
1 marks
Answer: C
This question in 9708/11 Oct/Nov 2023
Q43 · What is necessary for an action to be classed as a transfer payment? 9708/12 Oct/Nov 2023
15 What is necessary for an action to be classed as a transfer payment? A It must include a cash payment. B It must involve a banking transaction. C It must originate from government activity. D It must relate to a non-productive activity.
1 marks
Answer: D
This question in 9708/12 Oct/Nov 2023
Q44 · For a given year, economy X publishes the following 9708/12 Oct/Nov 2023
20 For a given year, economy X publishes the following. $bn Gross Domestic Product (GDP) 100 factor income earned by residents of 10 economy X working in foreign countries factor income earned in 25 economy X by non-residents What is the size of the Gross National Income (GNI) for country X? A $75bn B $85bn C $110bn D $115bn
1 marks
Answer: B
This question in 9708/12 Oct/Nov 2023
Q45 · What is not included in the measurement of national income? 9708/13 Oct/Nov 2023
22 What is not included in the measurement of national income? A dividends paid to shareholders B overtime payments C rents from government-owned houses D welfare benefit payments
1 marks
Answer: D
This question in 9708/13 Oct/Nov 2023
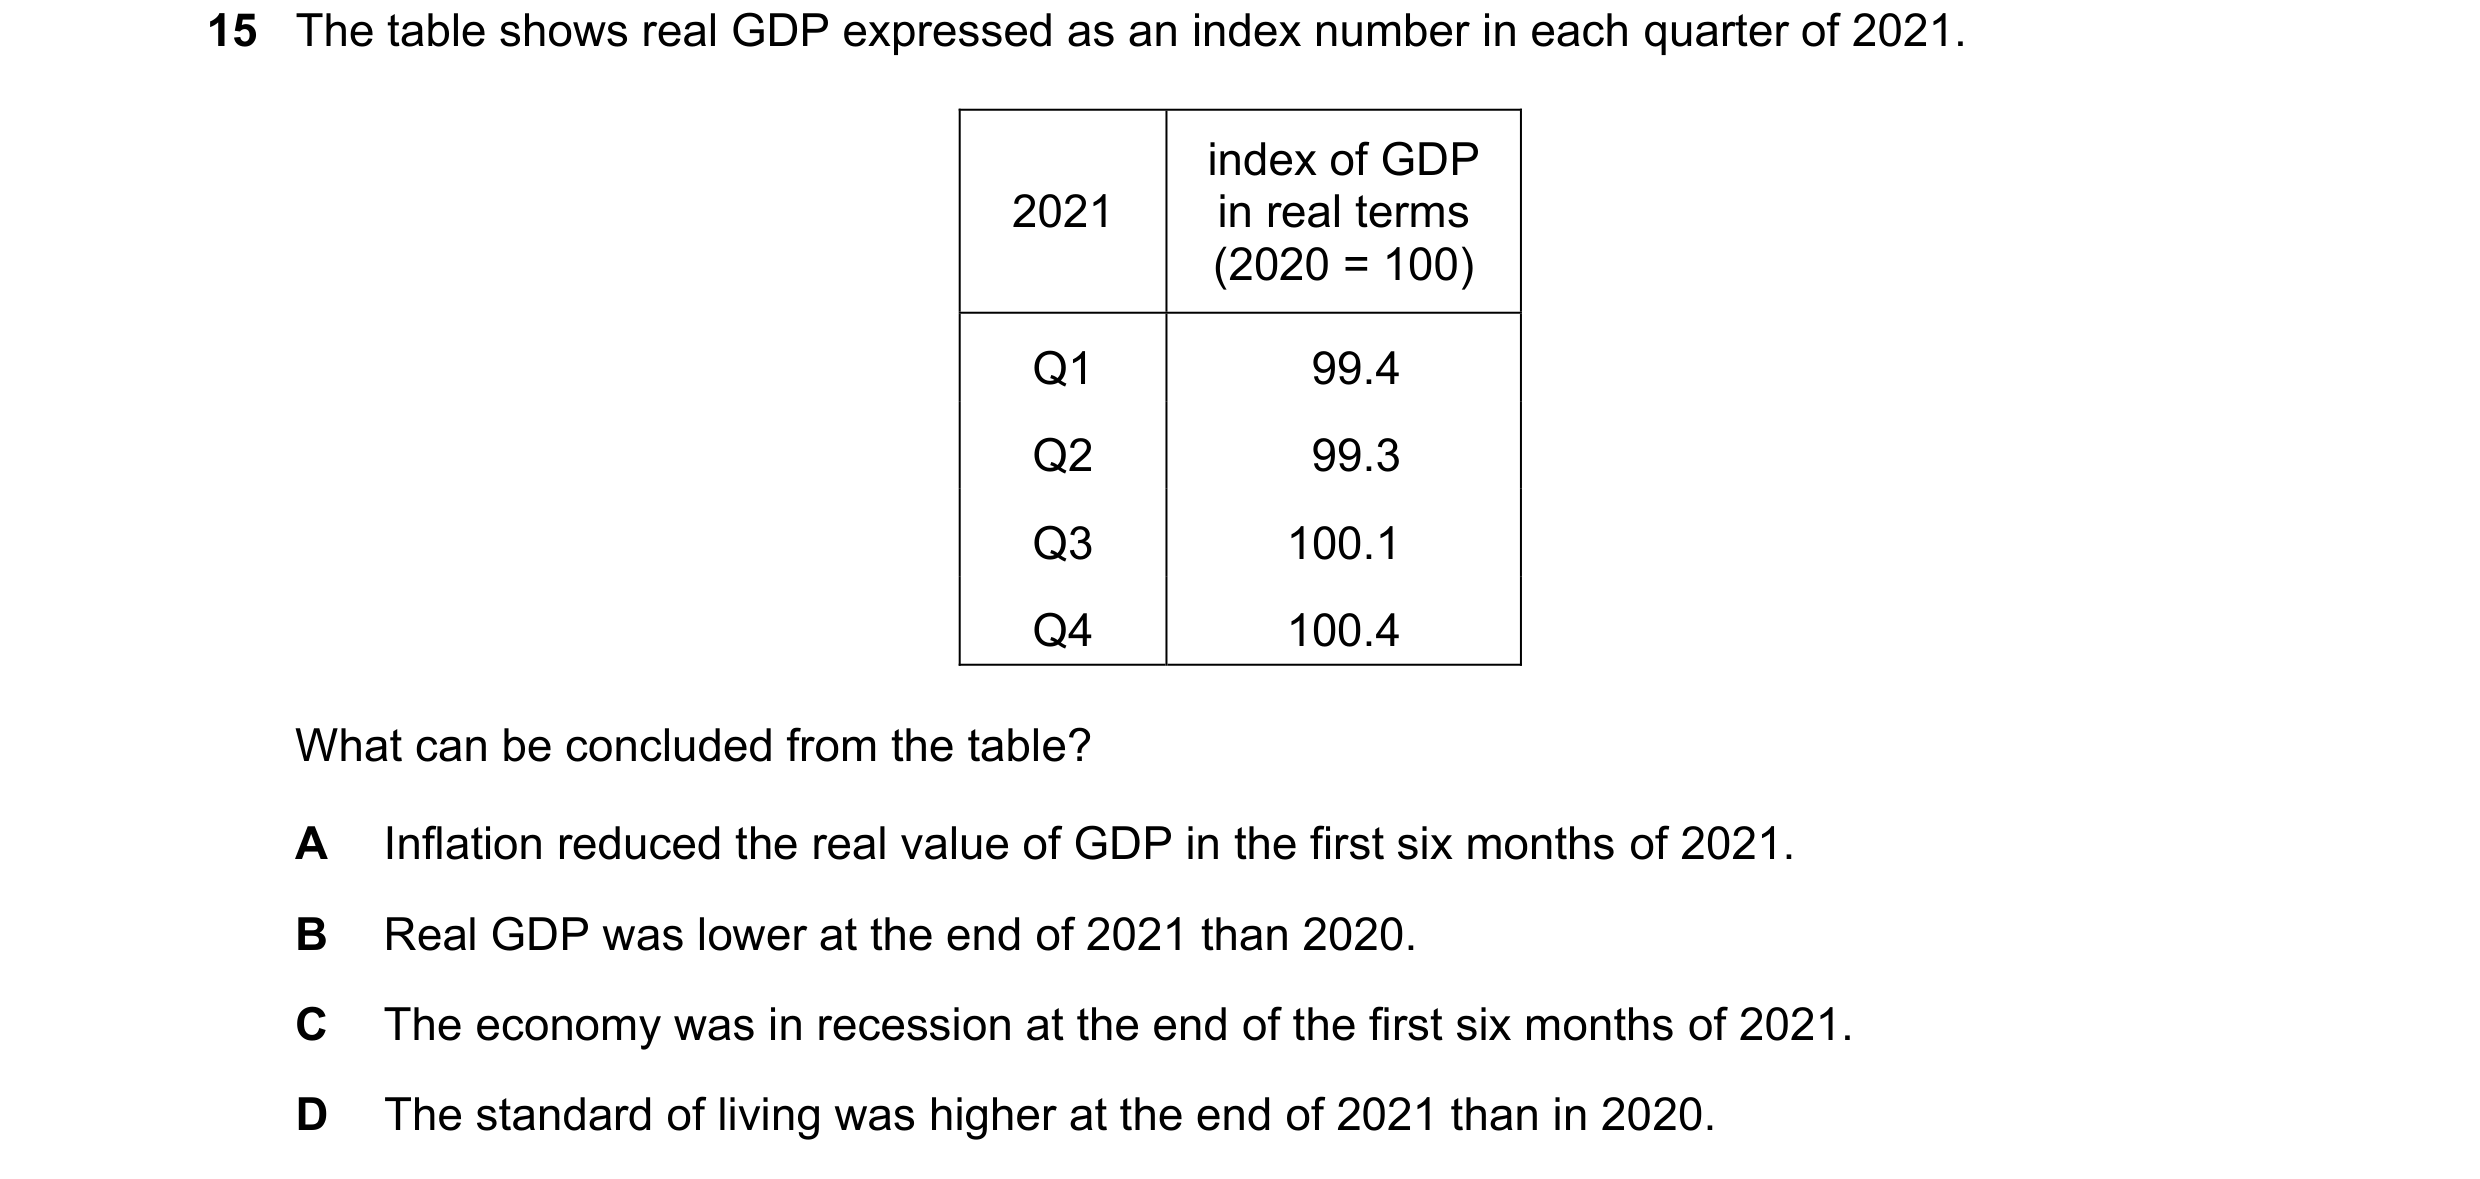
Q46 · The table shows real GDP expressed as an index number in each quarter of 2021 9708/12 Feb/March 2024
15 The table shows real GDP expressed as an index number in each quarter of 2021. index of GDP 2021 in real terms (2020 = 100) Q1 99.4 Q2 99.3 Q3 100.1 Q4 100.4 What can be concluded from the table? A Inflation reduced the real value of GDP in the first six months of 2021. B Real GDP was lower at the end of 2021 than 2020. C The economy was in recession at the end of the first six months of 2021. D The standard of living was higher at the end of 2021 than in 2020.
1 marks
Answer: C
This question in 9708/12 Feb/March 2024
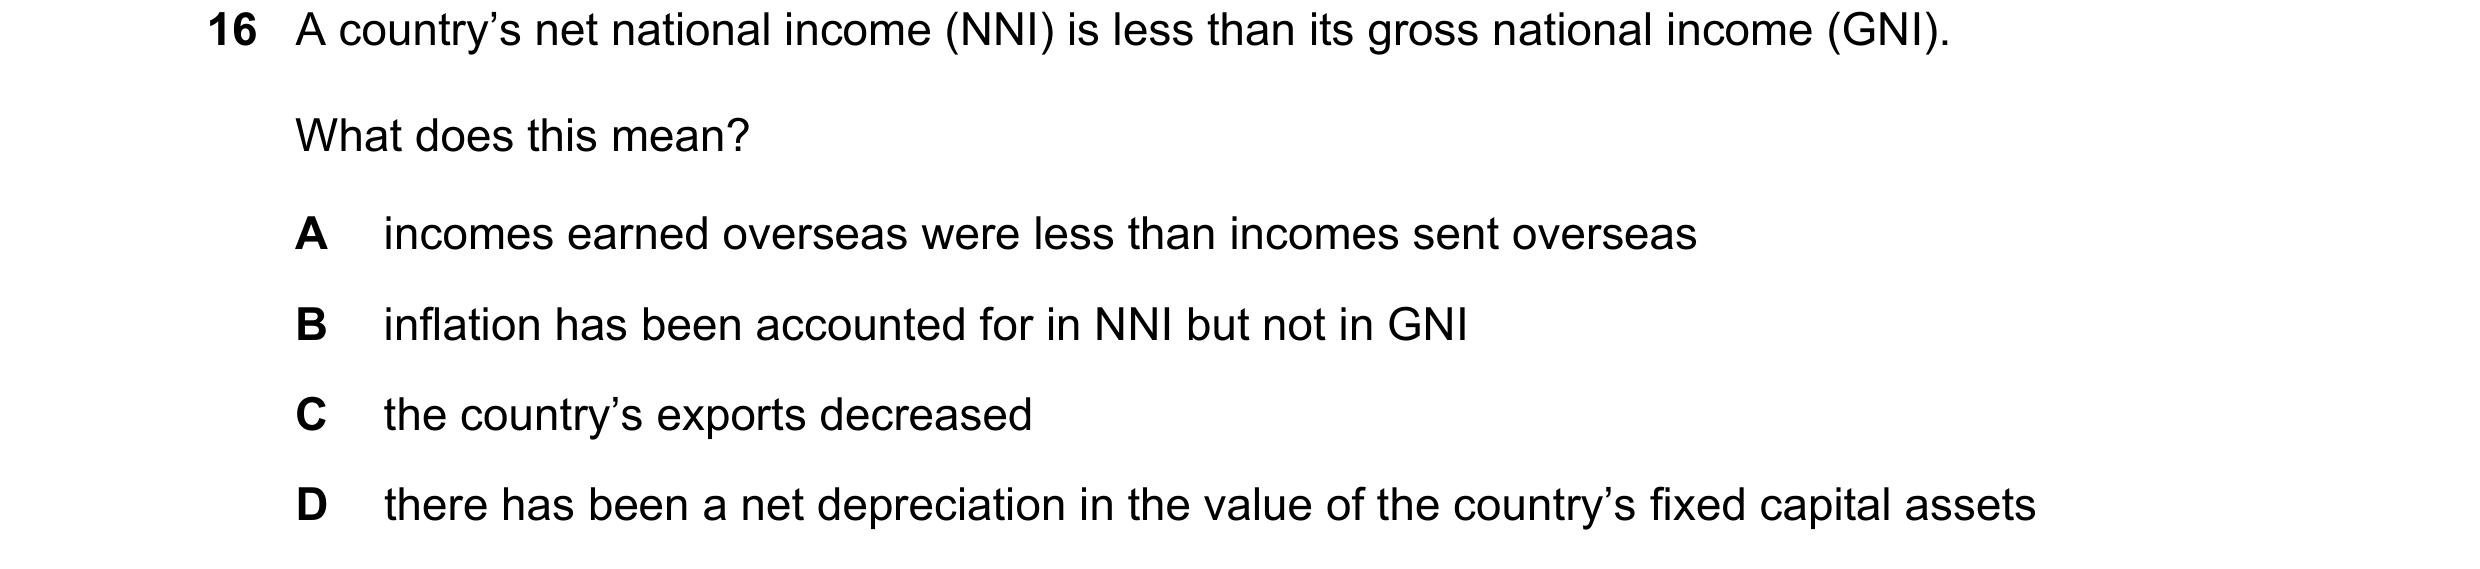
Q47 · A country’s net national income (NNI) is less than its gross national income (GNI) 9708/11 May/June 2024
16 A country’s net national income (NNI) is less than its gross national income (GNI). What does this mean? A incomes earned overseas were less than incomes sent overseas B inflation has been accounted for in NNI but not in GNI C the country’s exports decreased D there has been a net depreciation in the value of the country’s fixed capital assets
1 marks
Answer: D
This question in 9708/11 May/June 2024
Q48 · The table gives the value of the price index of an economy in two years 9708/12 May/June 2024
16 The table gives the value of the price index of an economy in two years. year price index 1 60 2 120 What can be concluded about the period? A Nominal income doubled. B Real income doubled. C The cost of living doubled. D The standard of living doubled.
1 marks
Answer: C
This question in 9708/12 May/June 2024
Q49 · Which factor explains the difference between GDP and GNI? 9708/12 May/June 2024
19 Which factor explains the difference between GDP and GNI? A foreign investment in the domestic automobile industry B revenues received from exporting capital goods C revenues received from exporting consumer goods D salaries remitted by those working abroad to their home accounts
1 marks
Answer: D
This question in 9708/12 May/June 2024
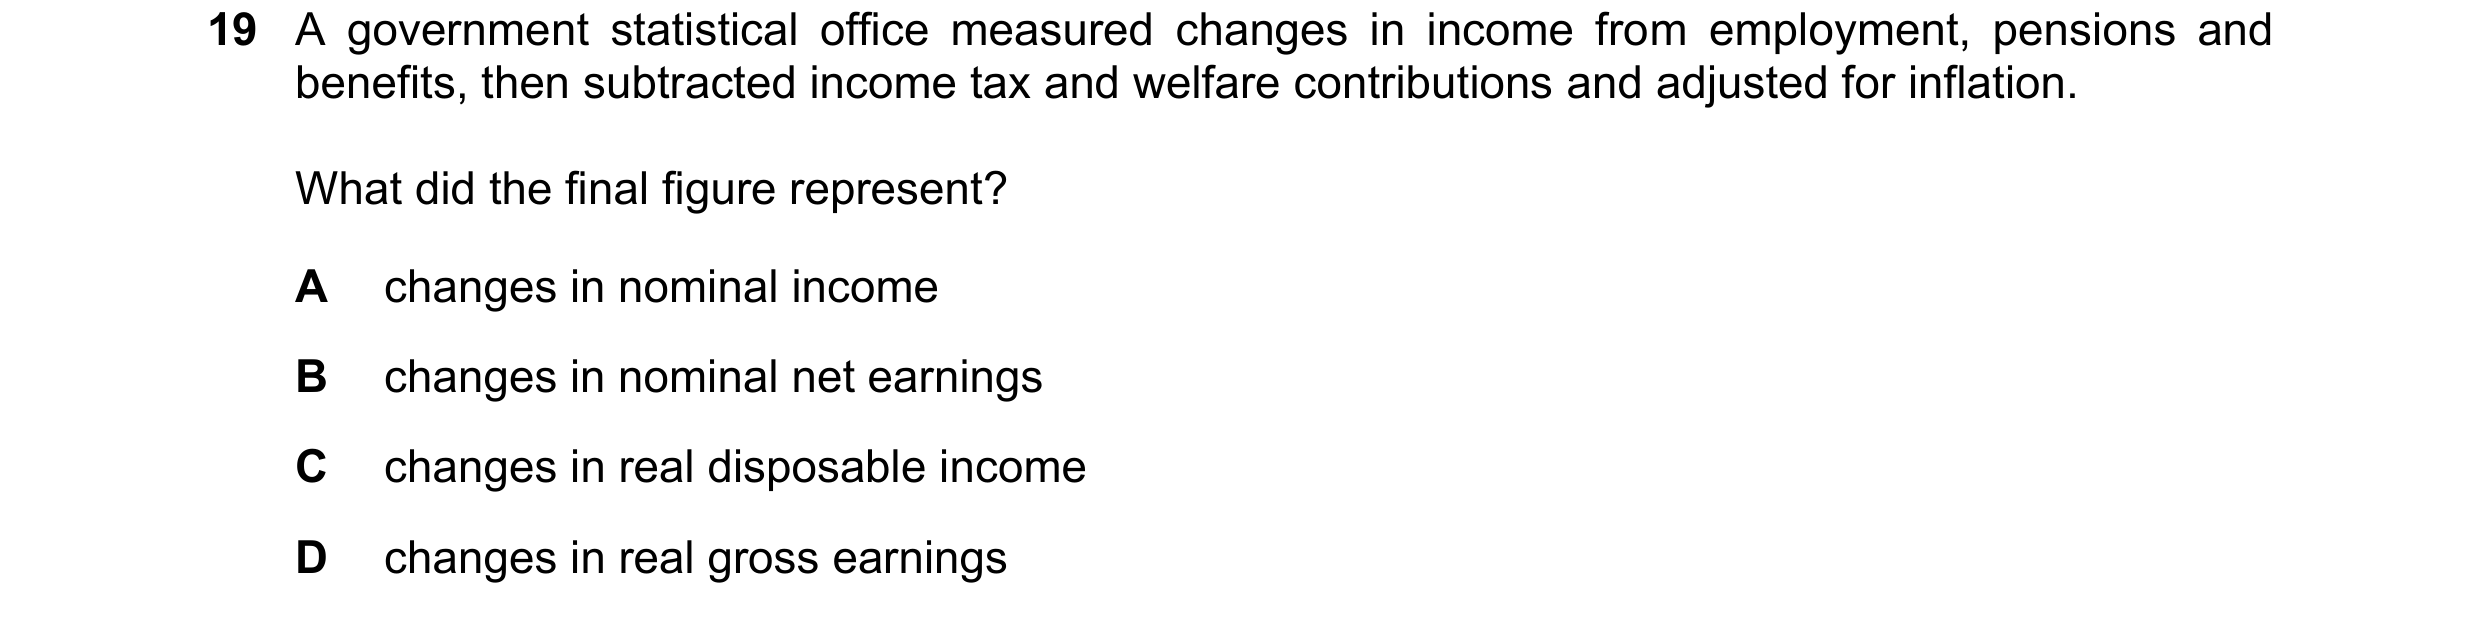
Q50 · A government statistical office measured changes in income from employment, pensions and… 9708/13 May/June 2024
19 A government statistical office measured changes in income from employment, pensions and benefits, then subtracted income tax and welfare contributions and adjusted for inflation. What did the final figure represent? A changes in nominal income B changes in nominal net earnings C changes in real disposable income D changes in real gross earnings
1 marks
Answer: C
This question in 9708/13 May/June 2024
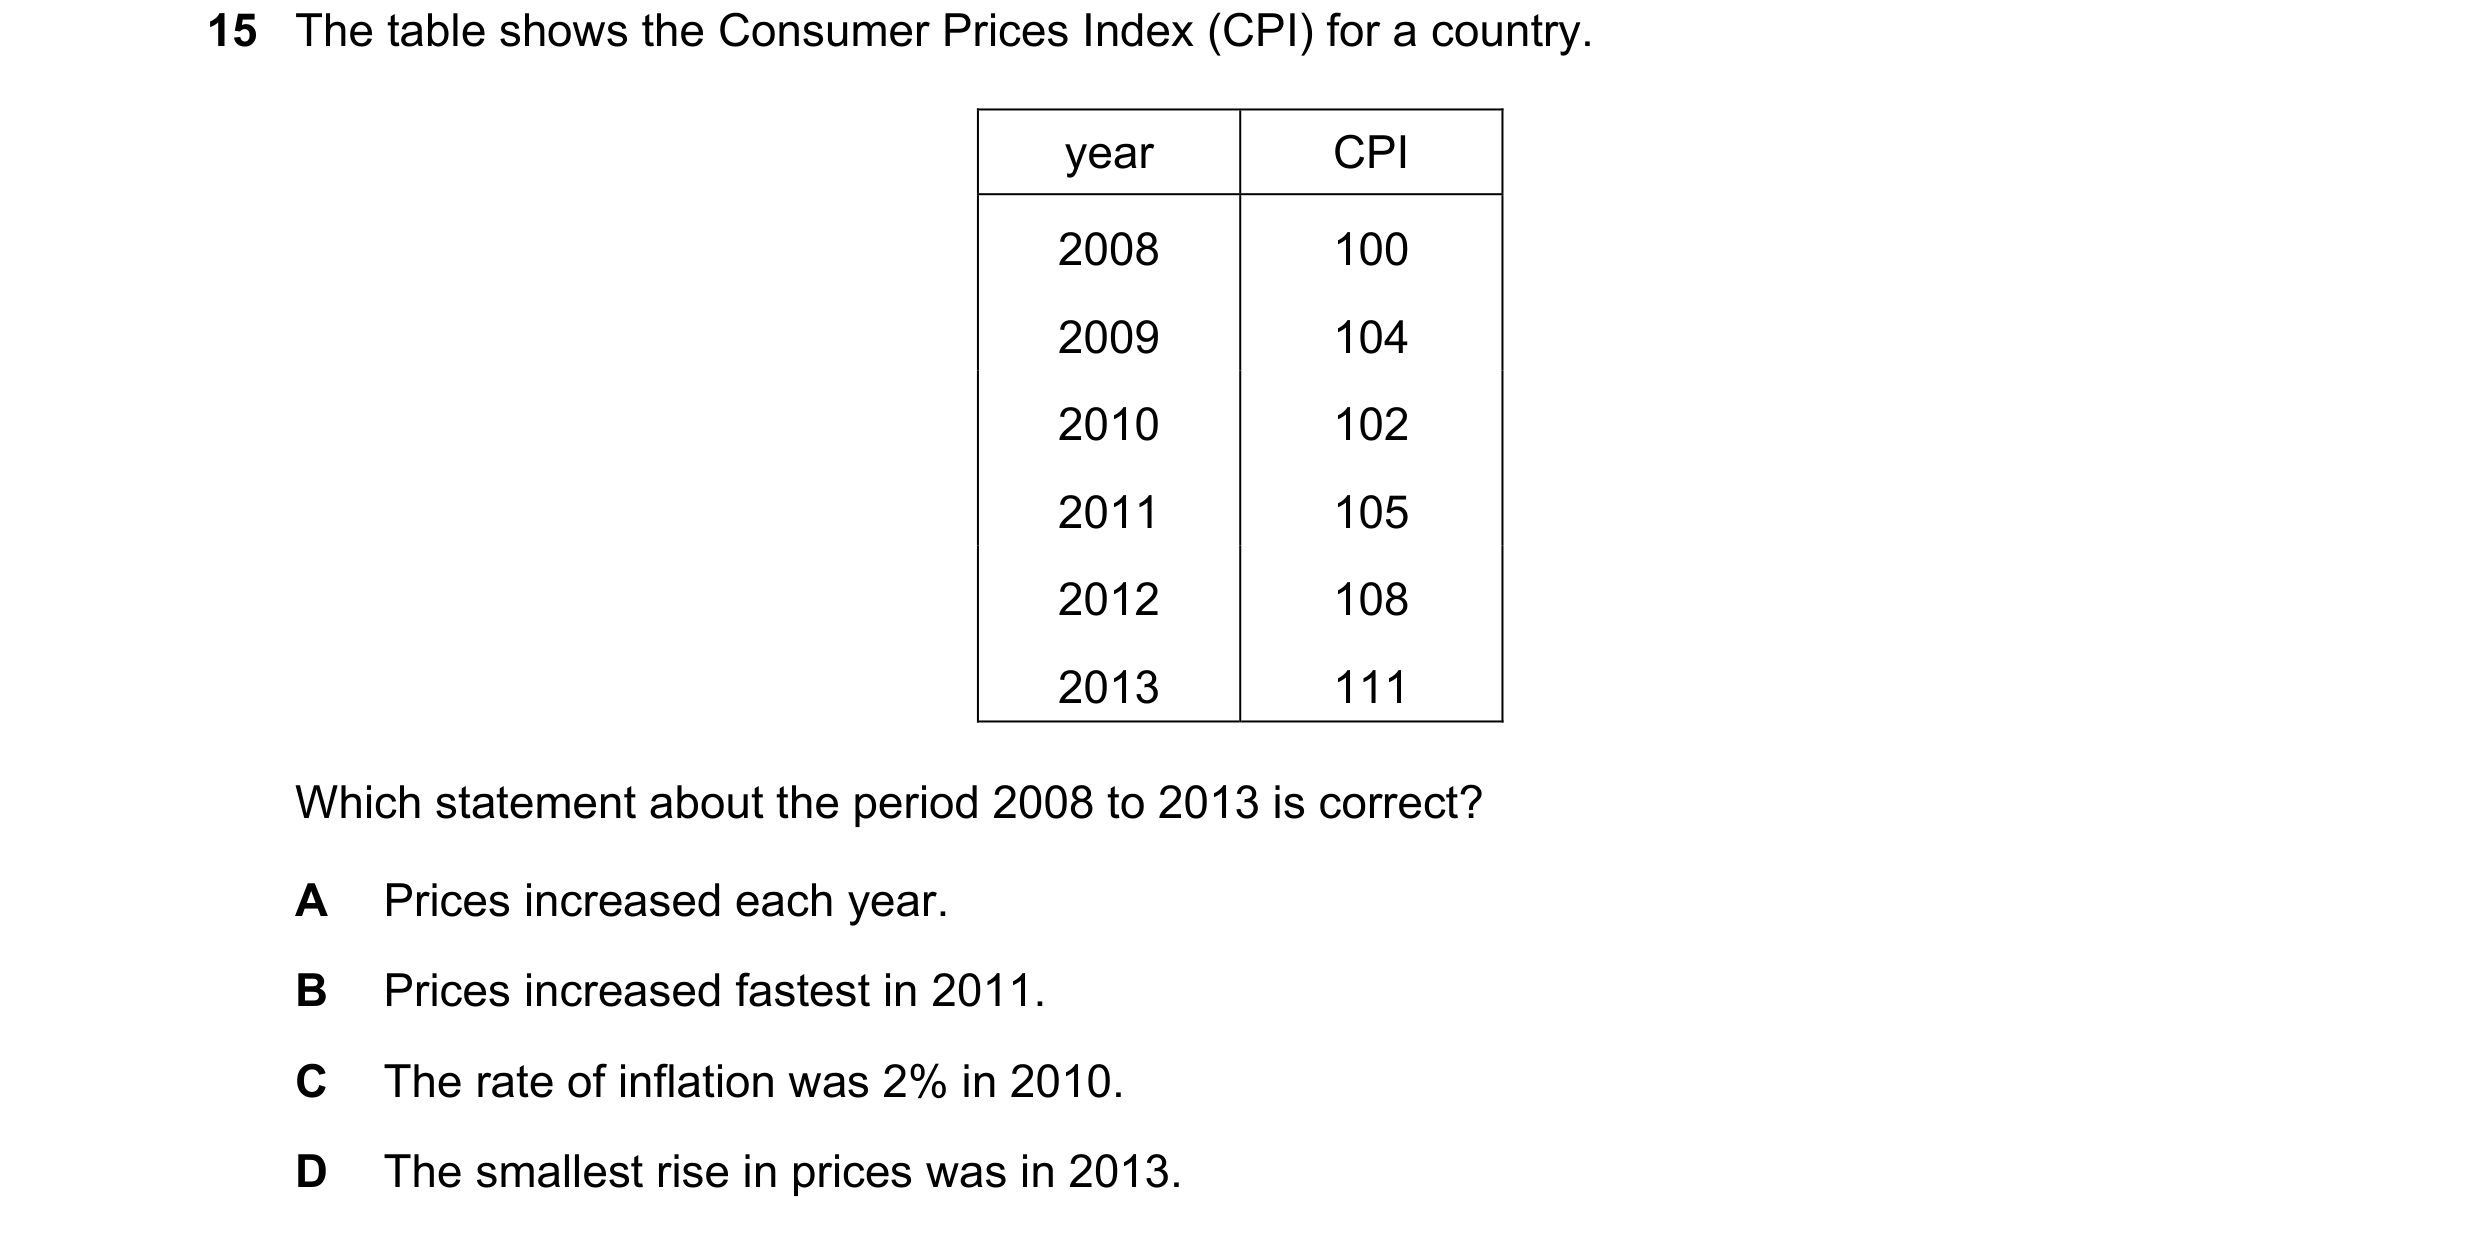
Q51 · The table shows the Consumer Prices Index (CPI) for a country 9708/11 Oct/Nov 2024
15 The table shows the Consumer Prices Index (CPI) for a country. year CPI 2008 100 2009 104 2010 102 2011 105 2012 108 2013 111 Which statement about the period 2008 to 2013 is correct? A Prices increased each year. B Prices increased fastest in 2011. C The rate of inflation was 2% in 2010. D The smallest rise in prices was in 2013.
1 marks
Answer: D
This question in 9708/11 Oct/Nov 2024
Q52 · The table shows the values of Consumer Prices Index (CPI) and a worker’s salary in 2022… 9708/12 Oct/Nov 2024
15 The table shows the values of Consumer Prices Index (CPI) and a worker’s salary in 2022 and 2023. CPI 2022 100 CPI 2023 110 worker’s salary 2022 $20 000 worker’s salary 2023 $25 000 What is the real value of the worker’s salary in 2023 compared with 2022? A $18 182 B $22 727 C $25 000 D $27 500
1 marks
Answer: B
This question in 9708/12 Oct/Nov 2024
Q53 · Which items have to be added to and subtracted from Gross Domestic Product at market… 9708/12 Oct/Nov 2024
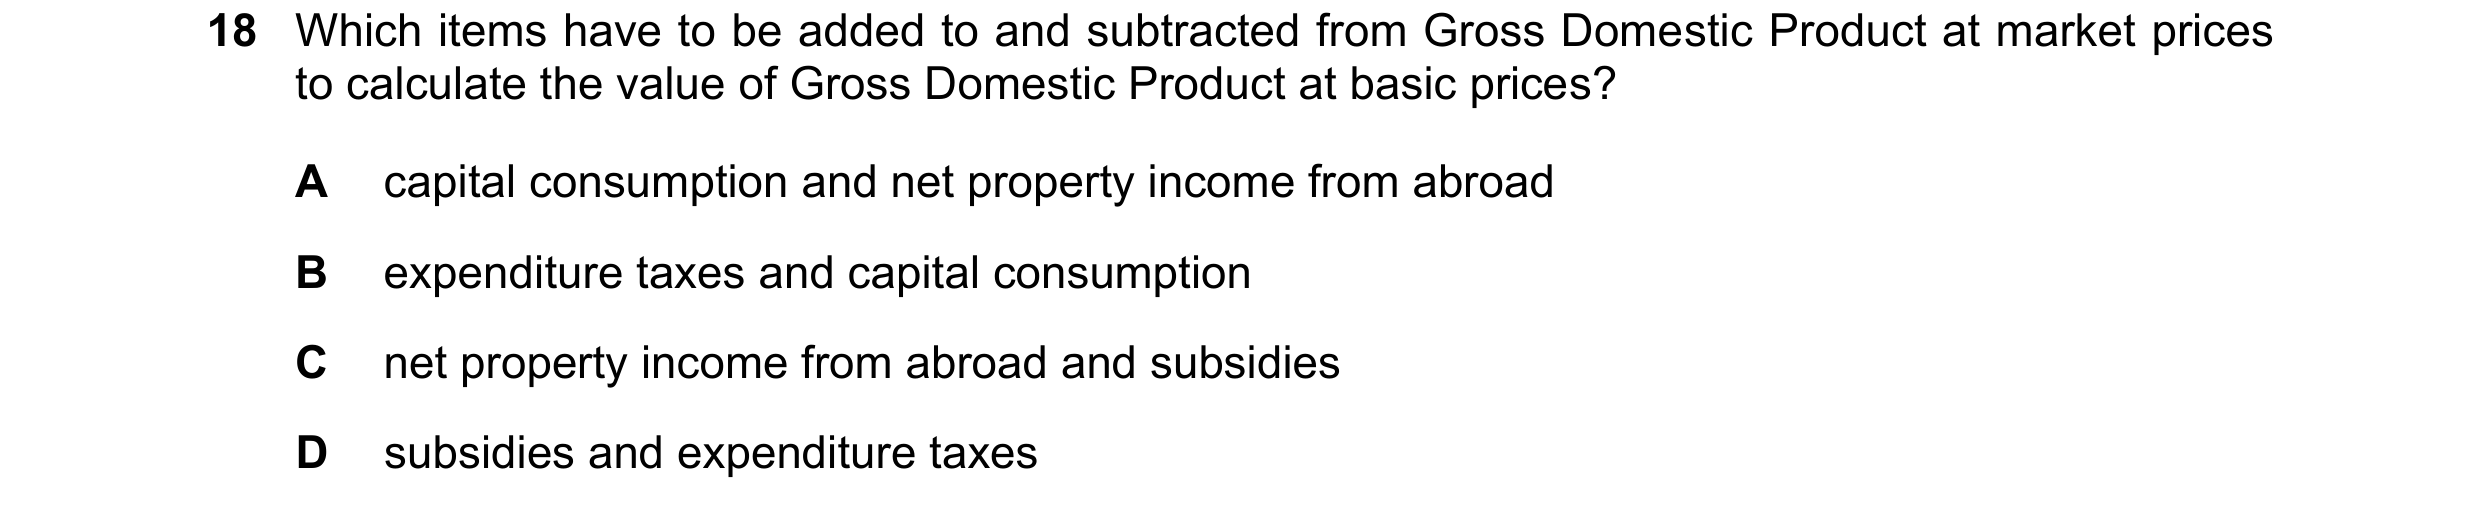
18 Which items have to be added to and subtracted from Gross Domestic Product at market prices to calculate the value of Gross Domestic Product at basic prices? A capital consumption and net property income from abroad B expenditure taxes and capital consumption C net property income from abroad and subsidies D subsidies and expenditure taxes
1 marks
Answer: D
This question in 9708/12 Oct/Nov 2024
Q54 · The information shows data from a country’s national income accounts 9708/13 Oct/Nov 2024
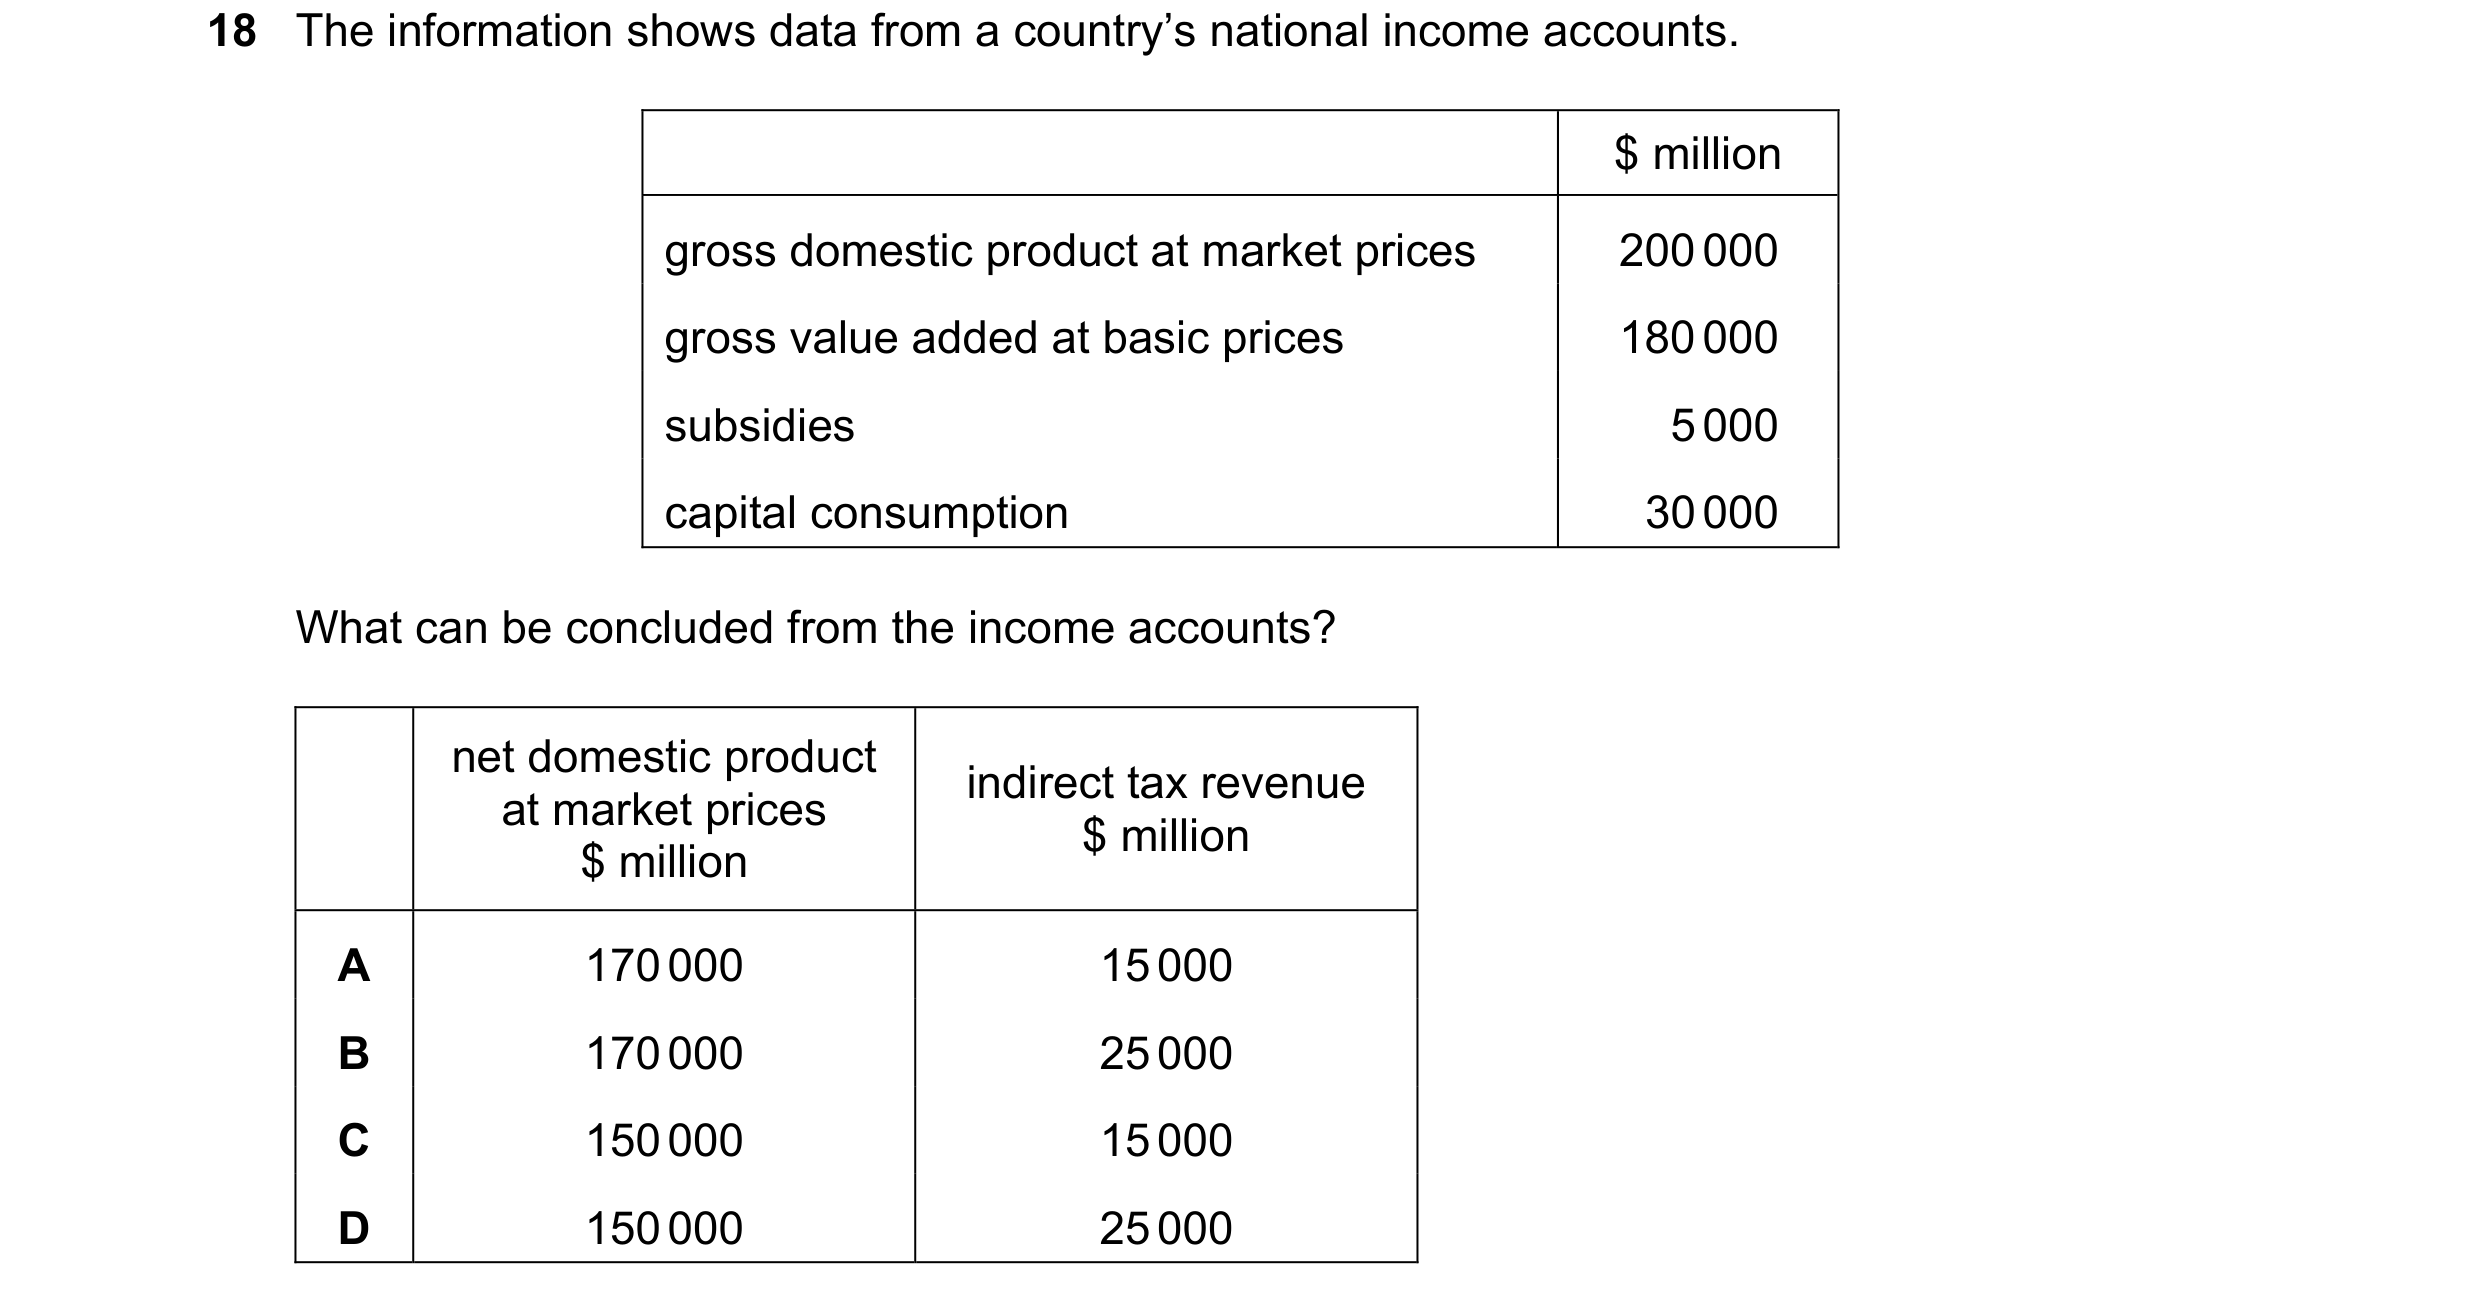
18 The information shows data from a country’s national income accounts. $ million gross domestic product at market prices 200 000 gross value added at basic prices 180 000 subsidies 5 000 capital consumption 30 000 What can be concluded from the income accounts? net domestic product indirect tax revenue at market prices $ million $ million A 170 000 15 000 B 170 000 25 000 C 150 000 15 000 D 150 000 25 000
1 marks
Answer: B
This question in 9708/13 Oct/Nov 2024
Q55 · The money income of a country rises by 10% whereas its population falls by 10% during a… 9708/12 Feb/March 2025
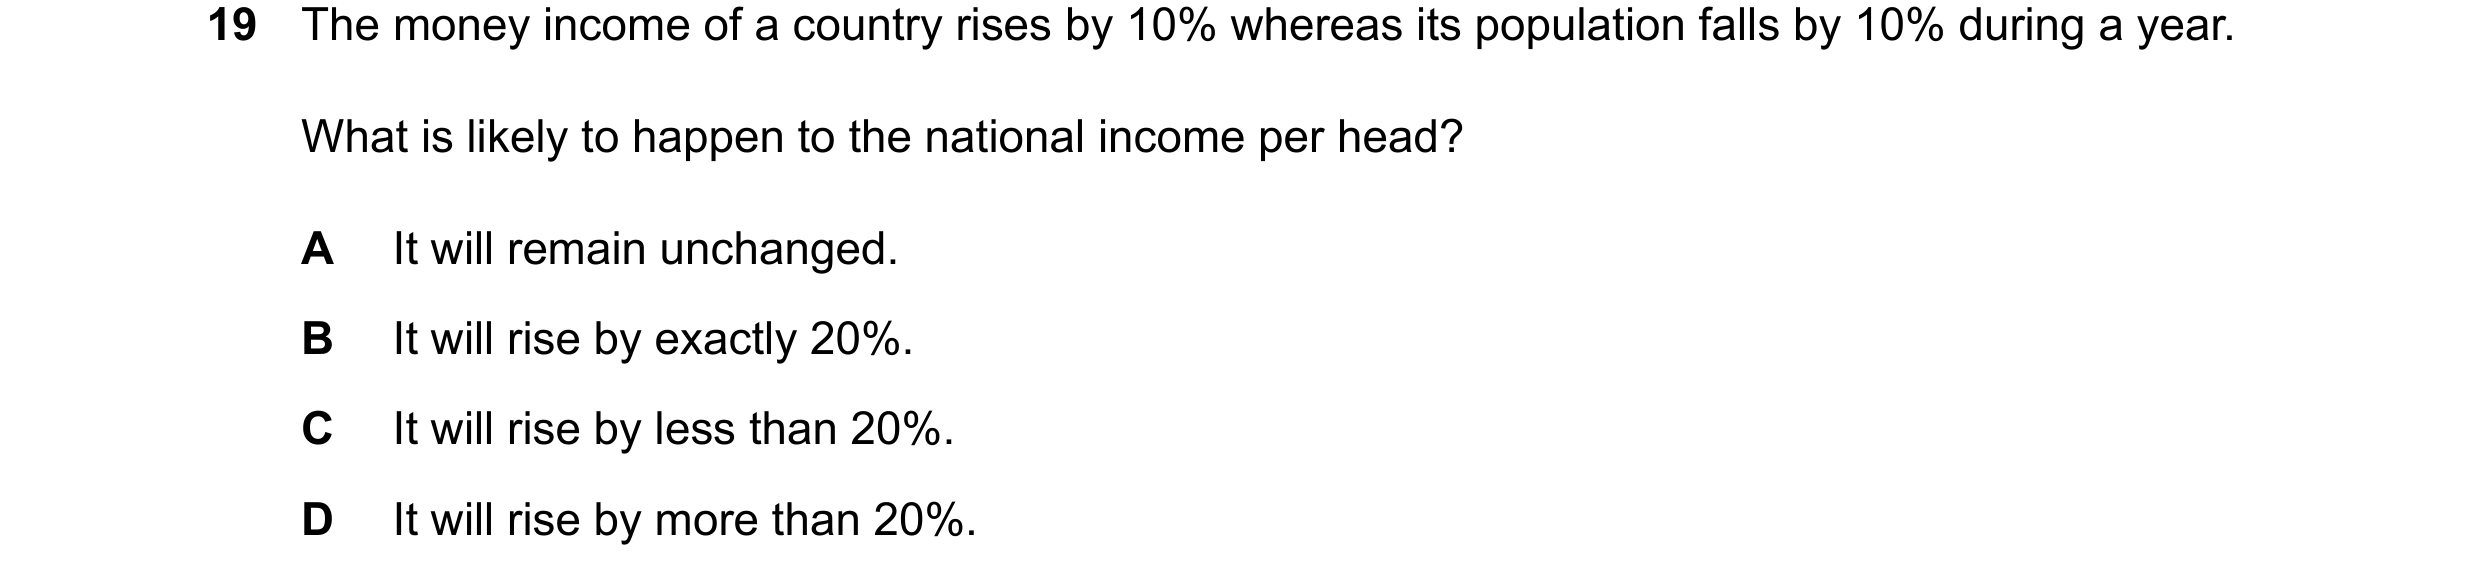
19 The money income of a country rises by 10% whereas its population falls by 10% during a year. What is likely to happen to the national income per head? A It will remain unchanged. B It will rise by exactly 20%. C It will rise by less than 20%. D It will rise by more than 20%.
1 marks
Answer: D
This question in 9708/12 Feb/March 2025
Q56 · Which statement correctly describes an increase in real GDP? 9708/11 May/June 2025
16 Which statement correctly describes an increase in real GDP? A Nominal GDP rising faster than nominal income. B Nominal GDP rising faster than the rate of inflation. C The rate of inflation rising faster than aggregate demand. D The rate of inflation rising faster than nominal income.
1 marks
Answer: B
This question in 9708/11 May/June 2025
Q57 · The price of a pack of six eggs rises from $1.00 to $1.32 over a year 9708/11 May/June 2025
20 The price of a pack of six eggs rises from $1.00 to $1.32 over a year. Consumer prices, as measured by the consumer price index, rise by 10% over the same period. What is the real price of a pack of six eggs at the end of the year? A $1.00 B $1.10 C $1.20 D $1.32
1 marks
Answer: C
This question in 9708/11 May/June 2025
Q58 · The table shows figures estimated at the end of a train drivers’ strike 9708/12 May/June 2025
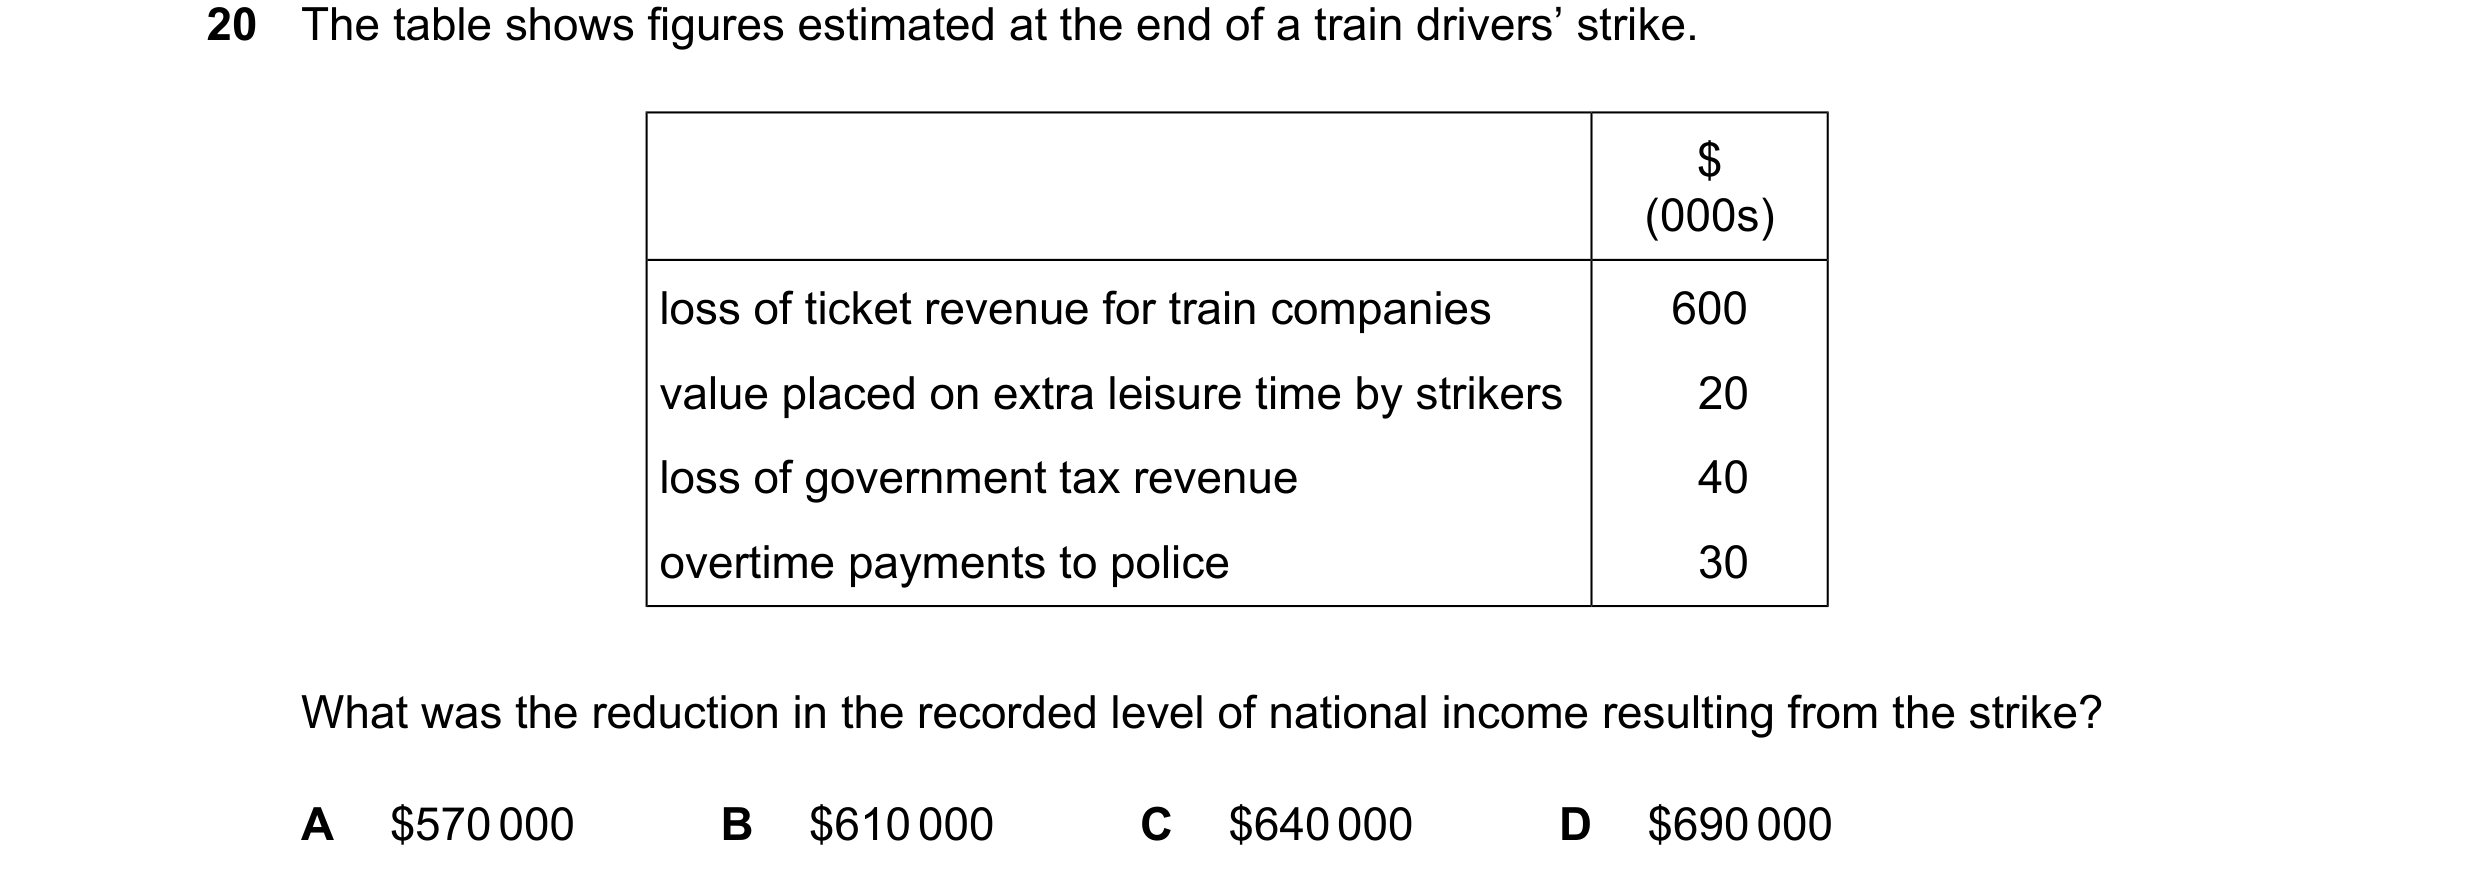
20 The table shows figures estimated at the end of a train drivers’ strike. $ (000s) loss of ticket revenue for train companies 600 value placed on extra leisure time by strikers 20 loss of government tax revenue 40 overtime payments to police 30 What was the reduction in the recorded level of national income resulting from the strike? A $570000 B $610000 C $640000 D $690000
1 marks
Answer: A
This question in 9708/12 May/June 2025
Q59 · Which source of income is not included in measuring real GDP? 9708/13 May/June 2025
16 Which source of income is not included in measuring real GDP? A pension paid to retired people B profits made by firms C rent paid to landlords D wages paid to nurses
1 marks
Answer: A
This question in 9708/13 May/June 2025
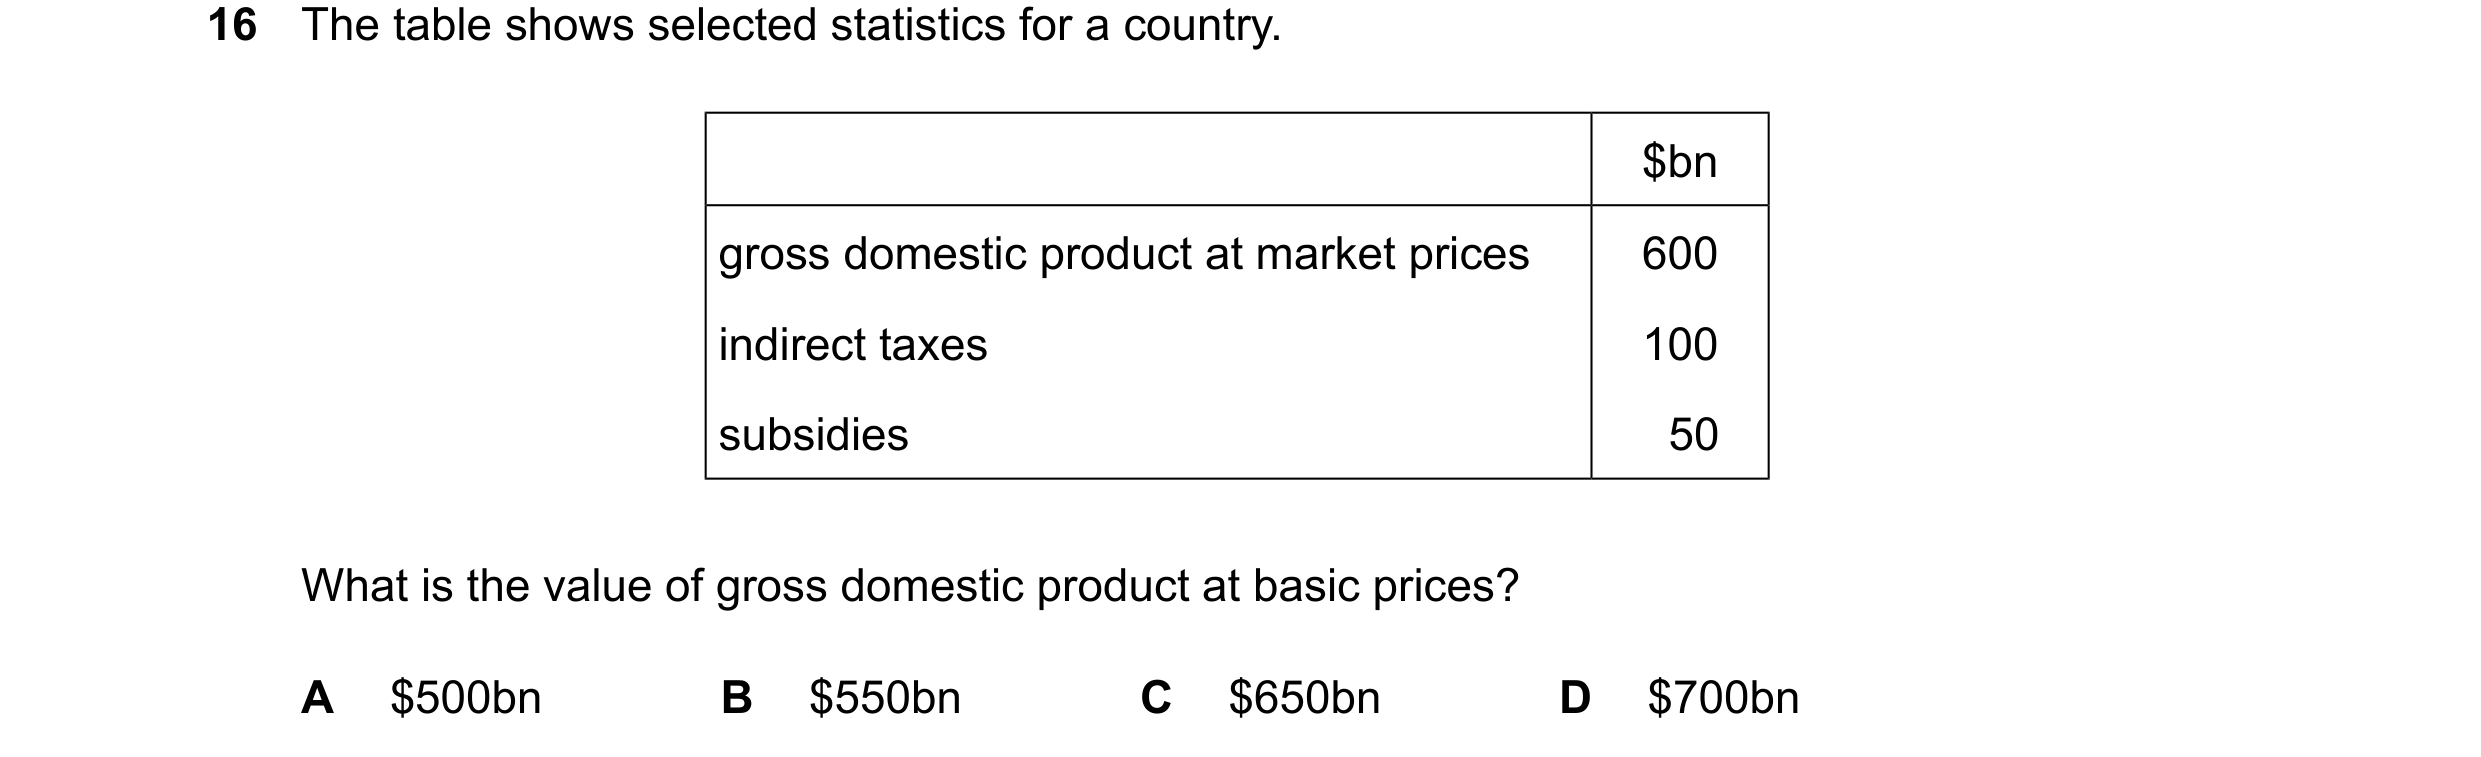
Q60 · The table shows selected statistics for a country 9708/11 Oct/Nov 2025
16 The table shows selected statistics for a country. $bn gross domestic product at market prices 600 indirect taxes 100 subsidies 50 What is the value of gross domestic product at basic prices? A $500bn B $550bn C $650bn D $700bn
1 marks
Answer: B
This question in 9708/11 Oct/Nov 2025
Q61 · GDP of a country measured at current market prices was $1000bn in year 1 9708/11 Oct/Nov 2025
17 GDP of a country measured at current market prices was $1000bn in year 1. This had risen to $1100bn in year 2. Over the same period the general price level had risen by 5%. What has happened to real GDP? A Real GDP fell by approximately 5%. B Real GDP fell by approximately 10%. C Real GDP rose by approximately 5%. D Real GDP rose by approximately 10%.
1 marks
Answer: C
This question in 9708/11 Oct/Nov 2025
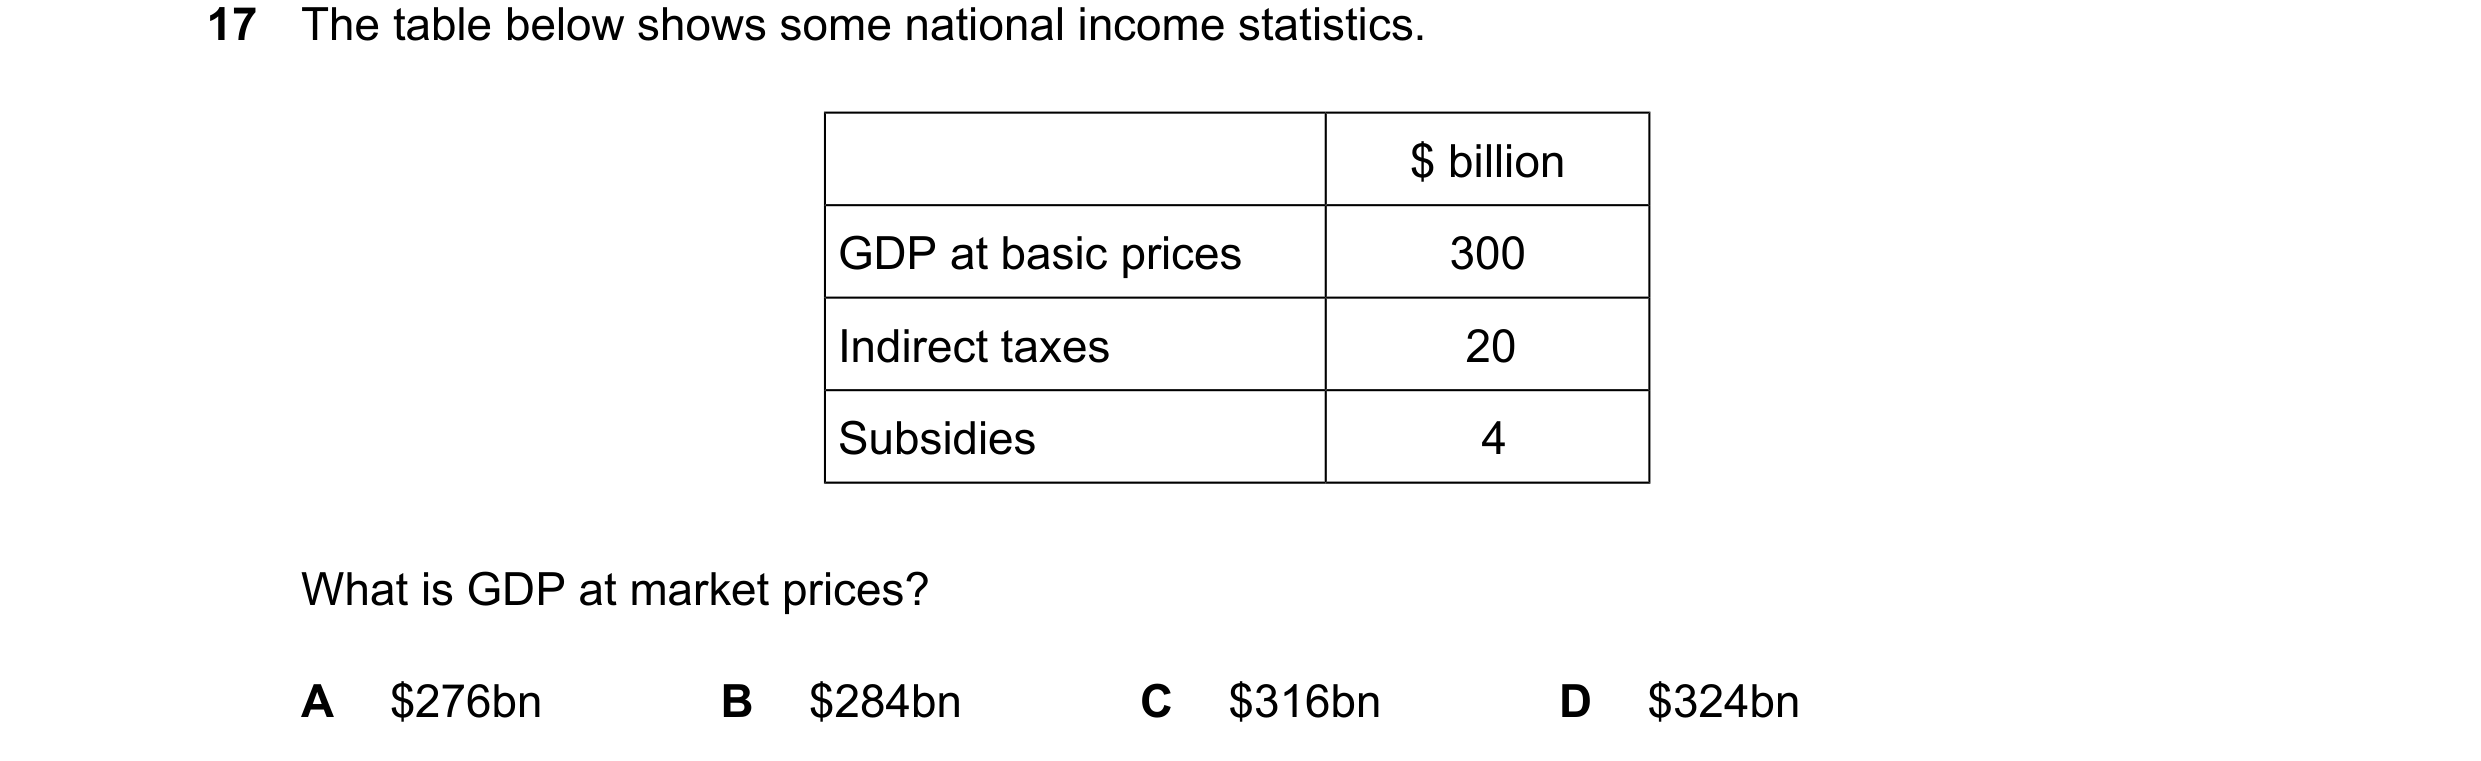
Q62 · The table below shows some national income statistics 9708/13 Oct/Nov 2025
17 The table below shows some national income statistics. $ billion GDP at basic prices 300 Indirect taxes 20 Subsidies 4 What is GDP at market prices? A $276bn B $284bn C $316bn D $324bn
1 marks
Answer: B
This question in 9708/13 Oct/Nov 2025
 1 / 17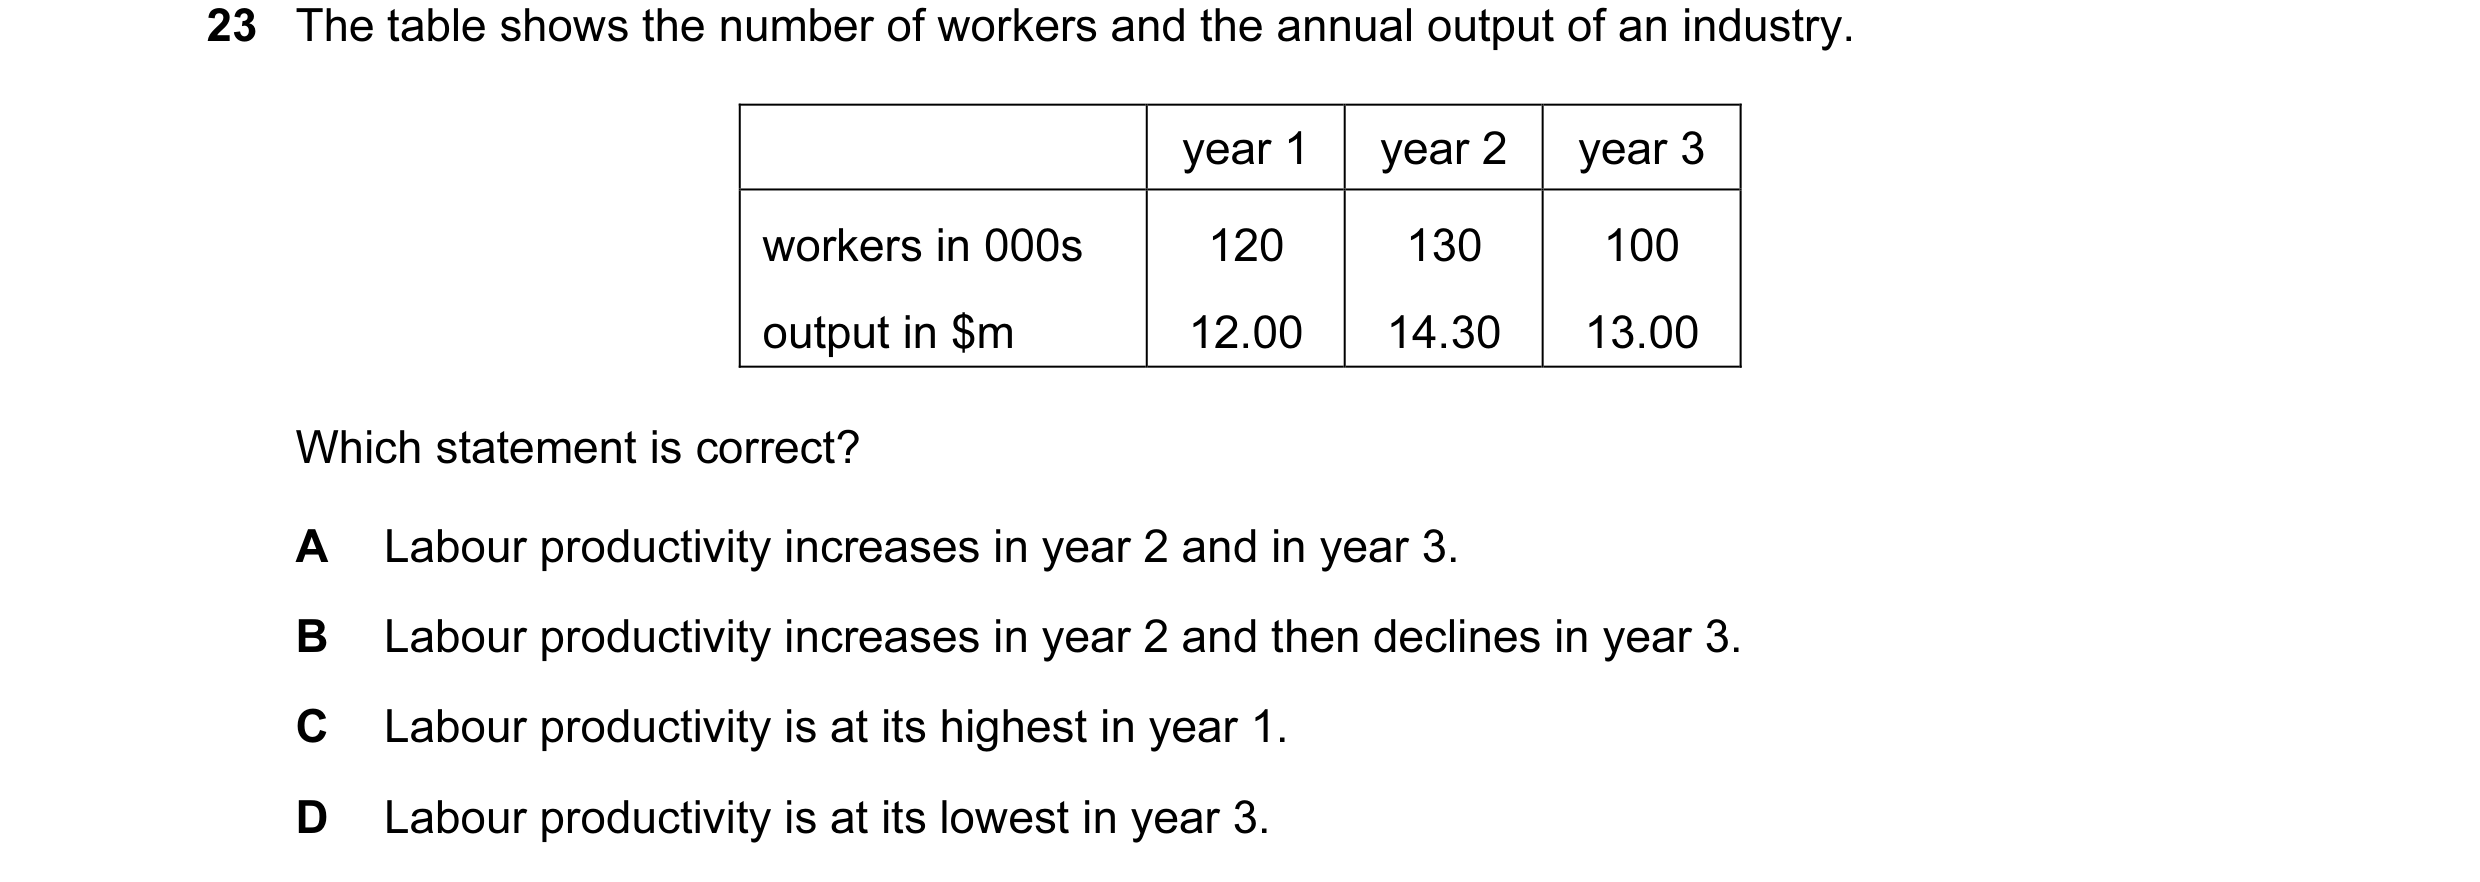
 2 / 17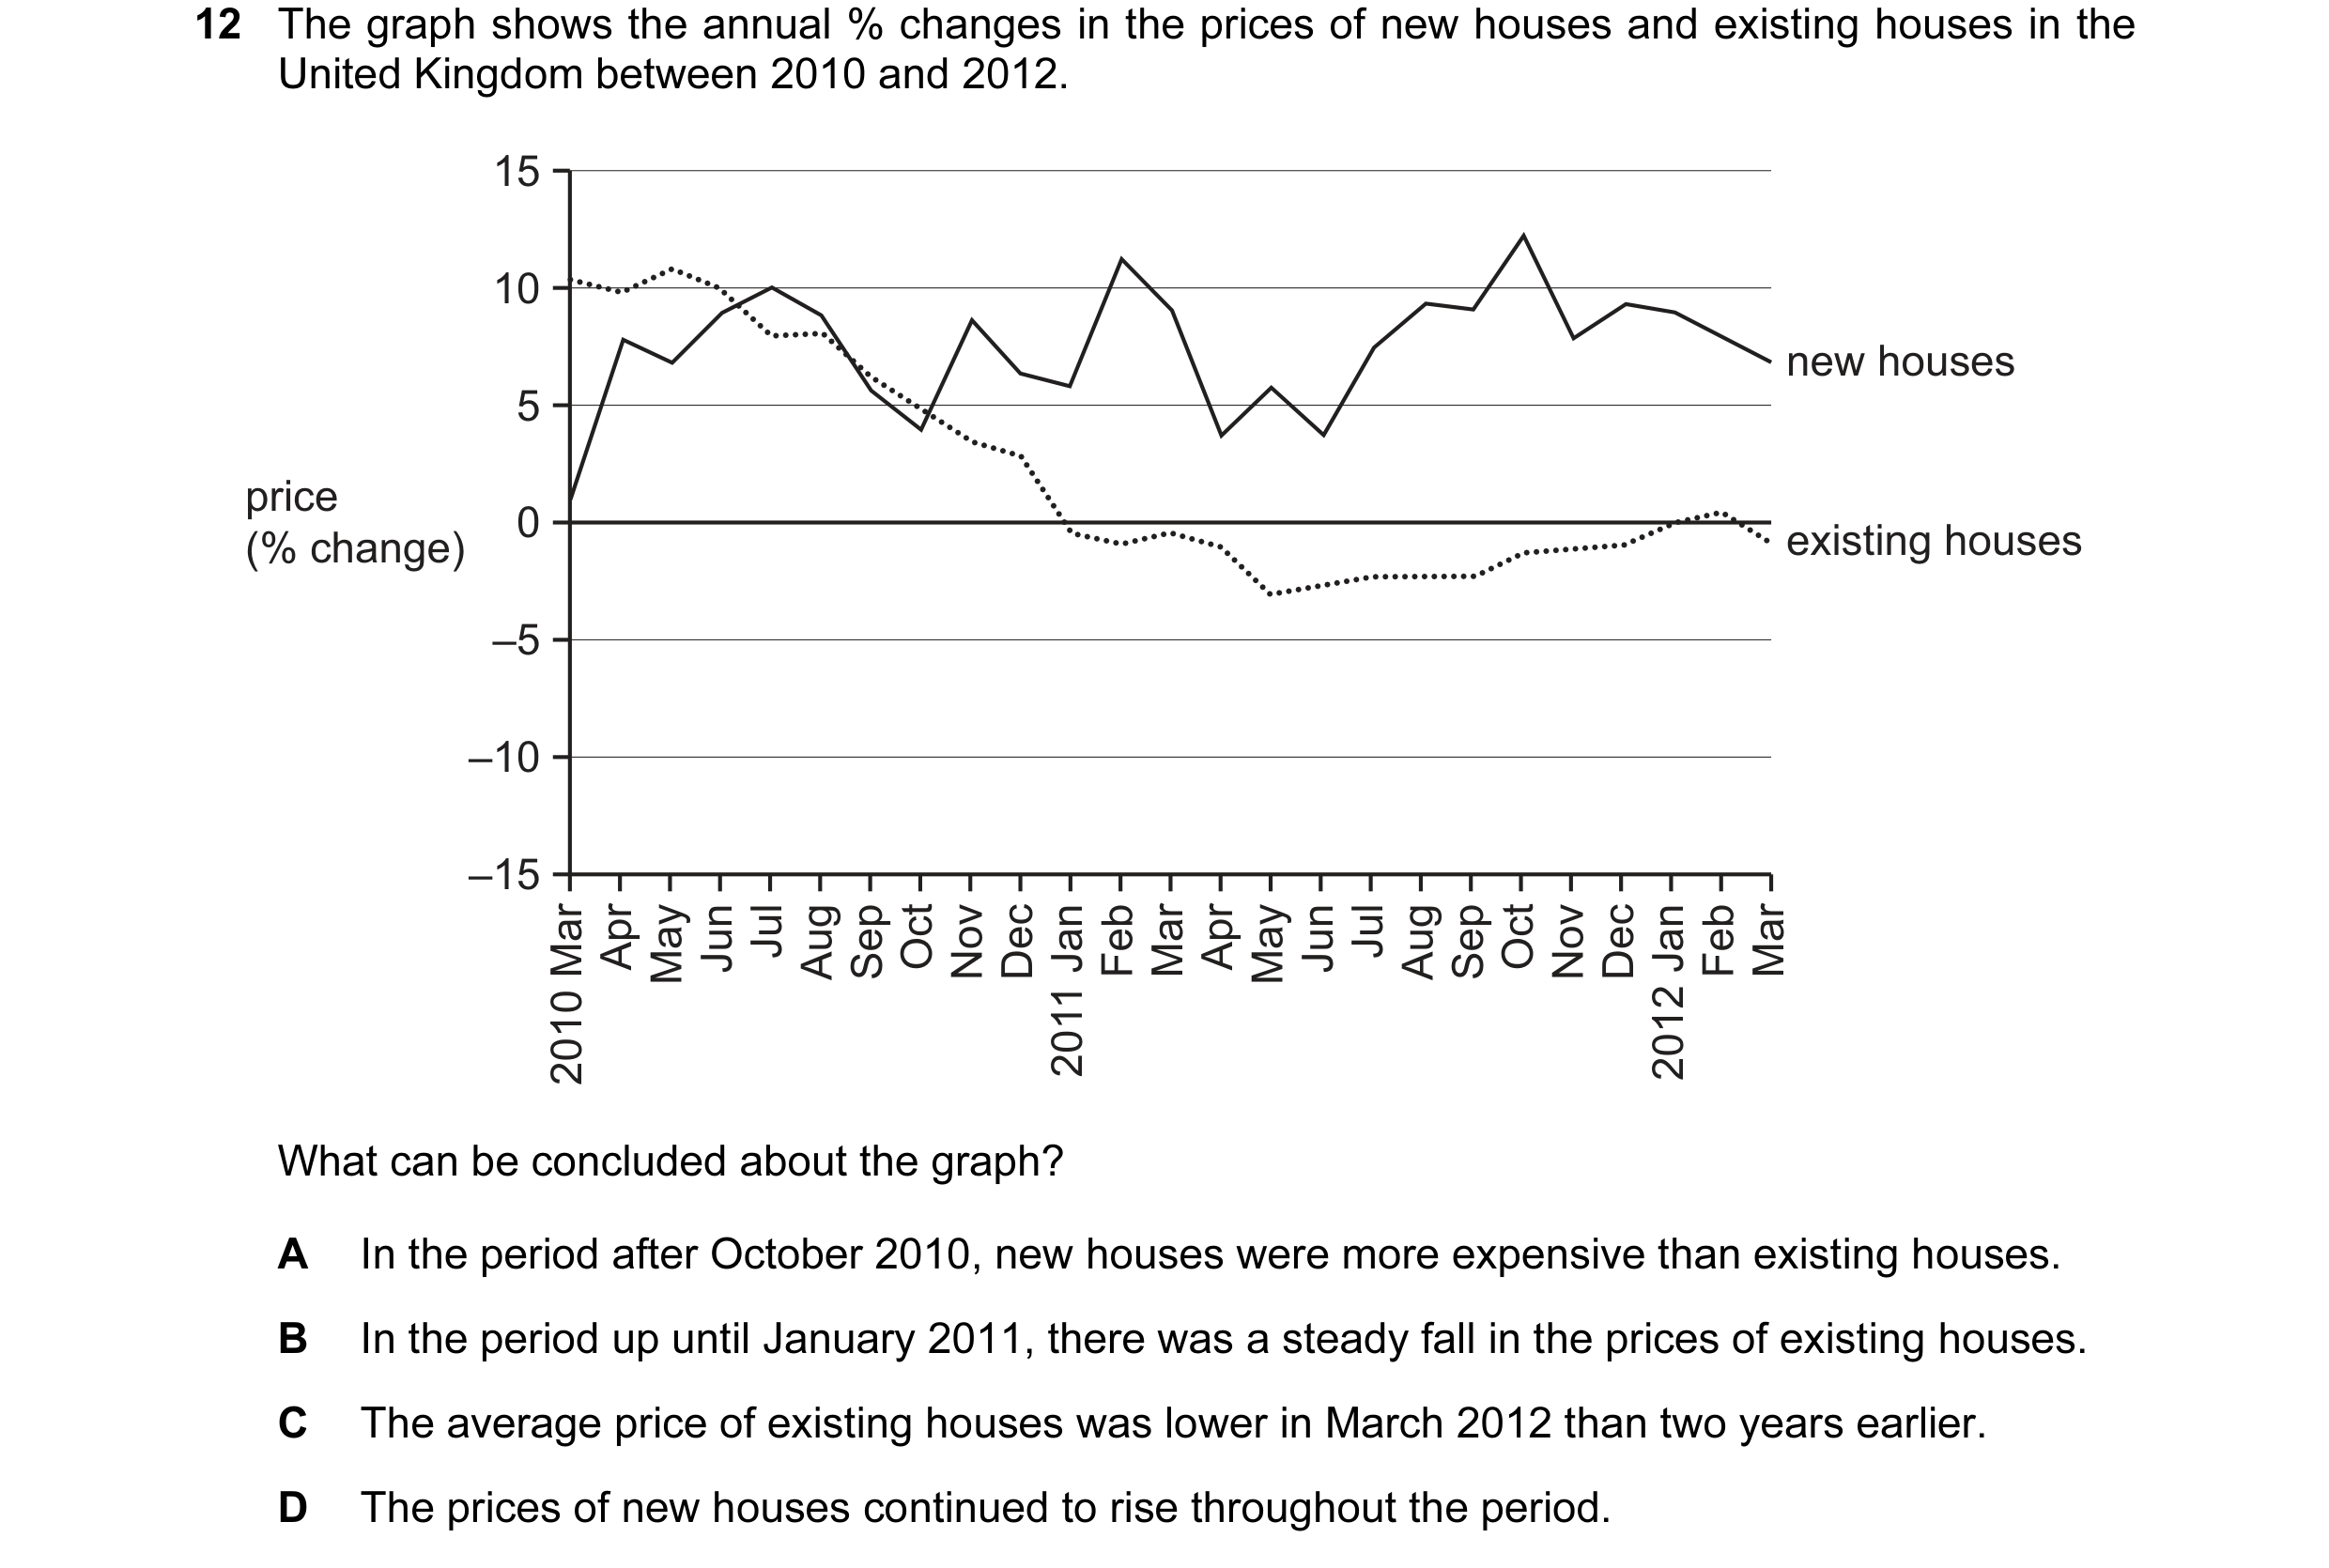
 3 / 17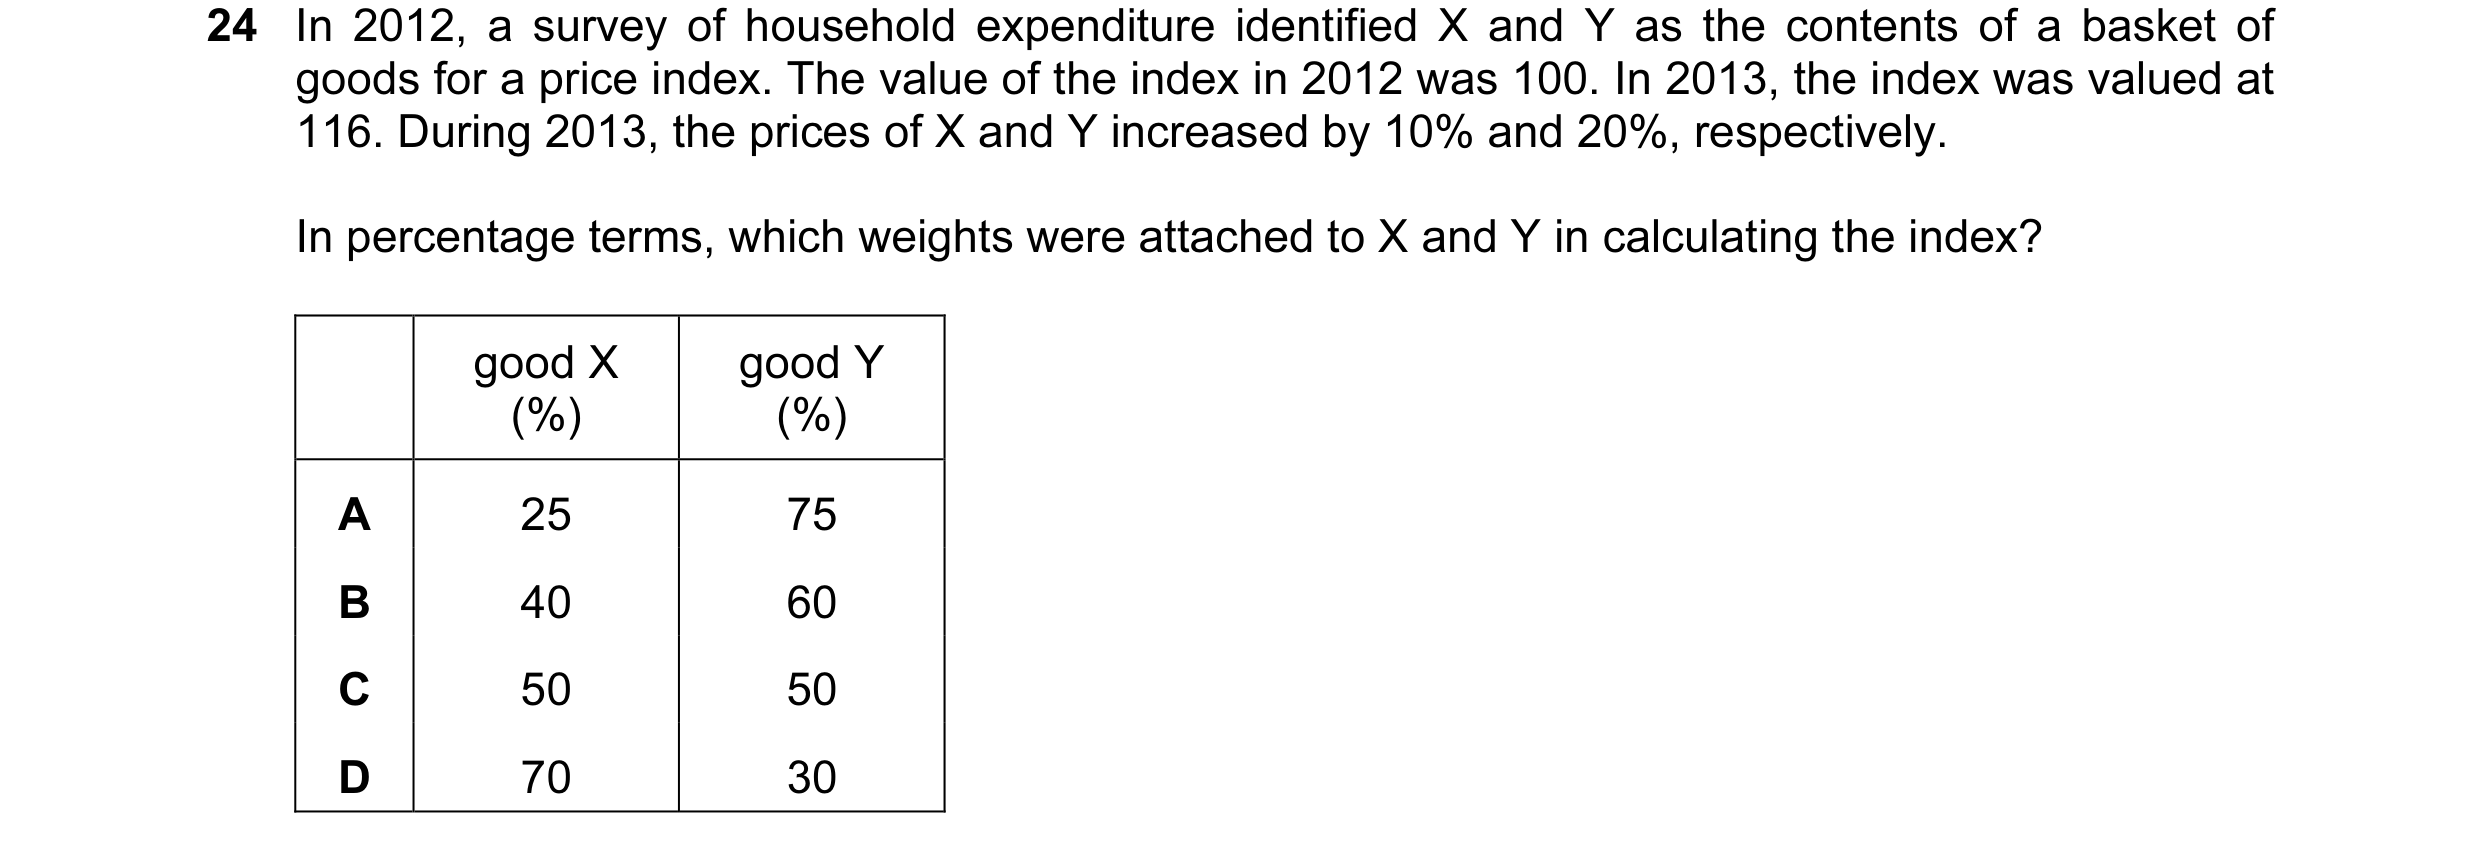

 4 / 17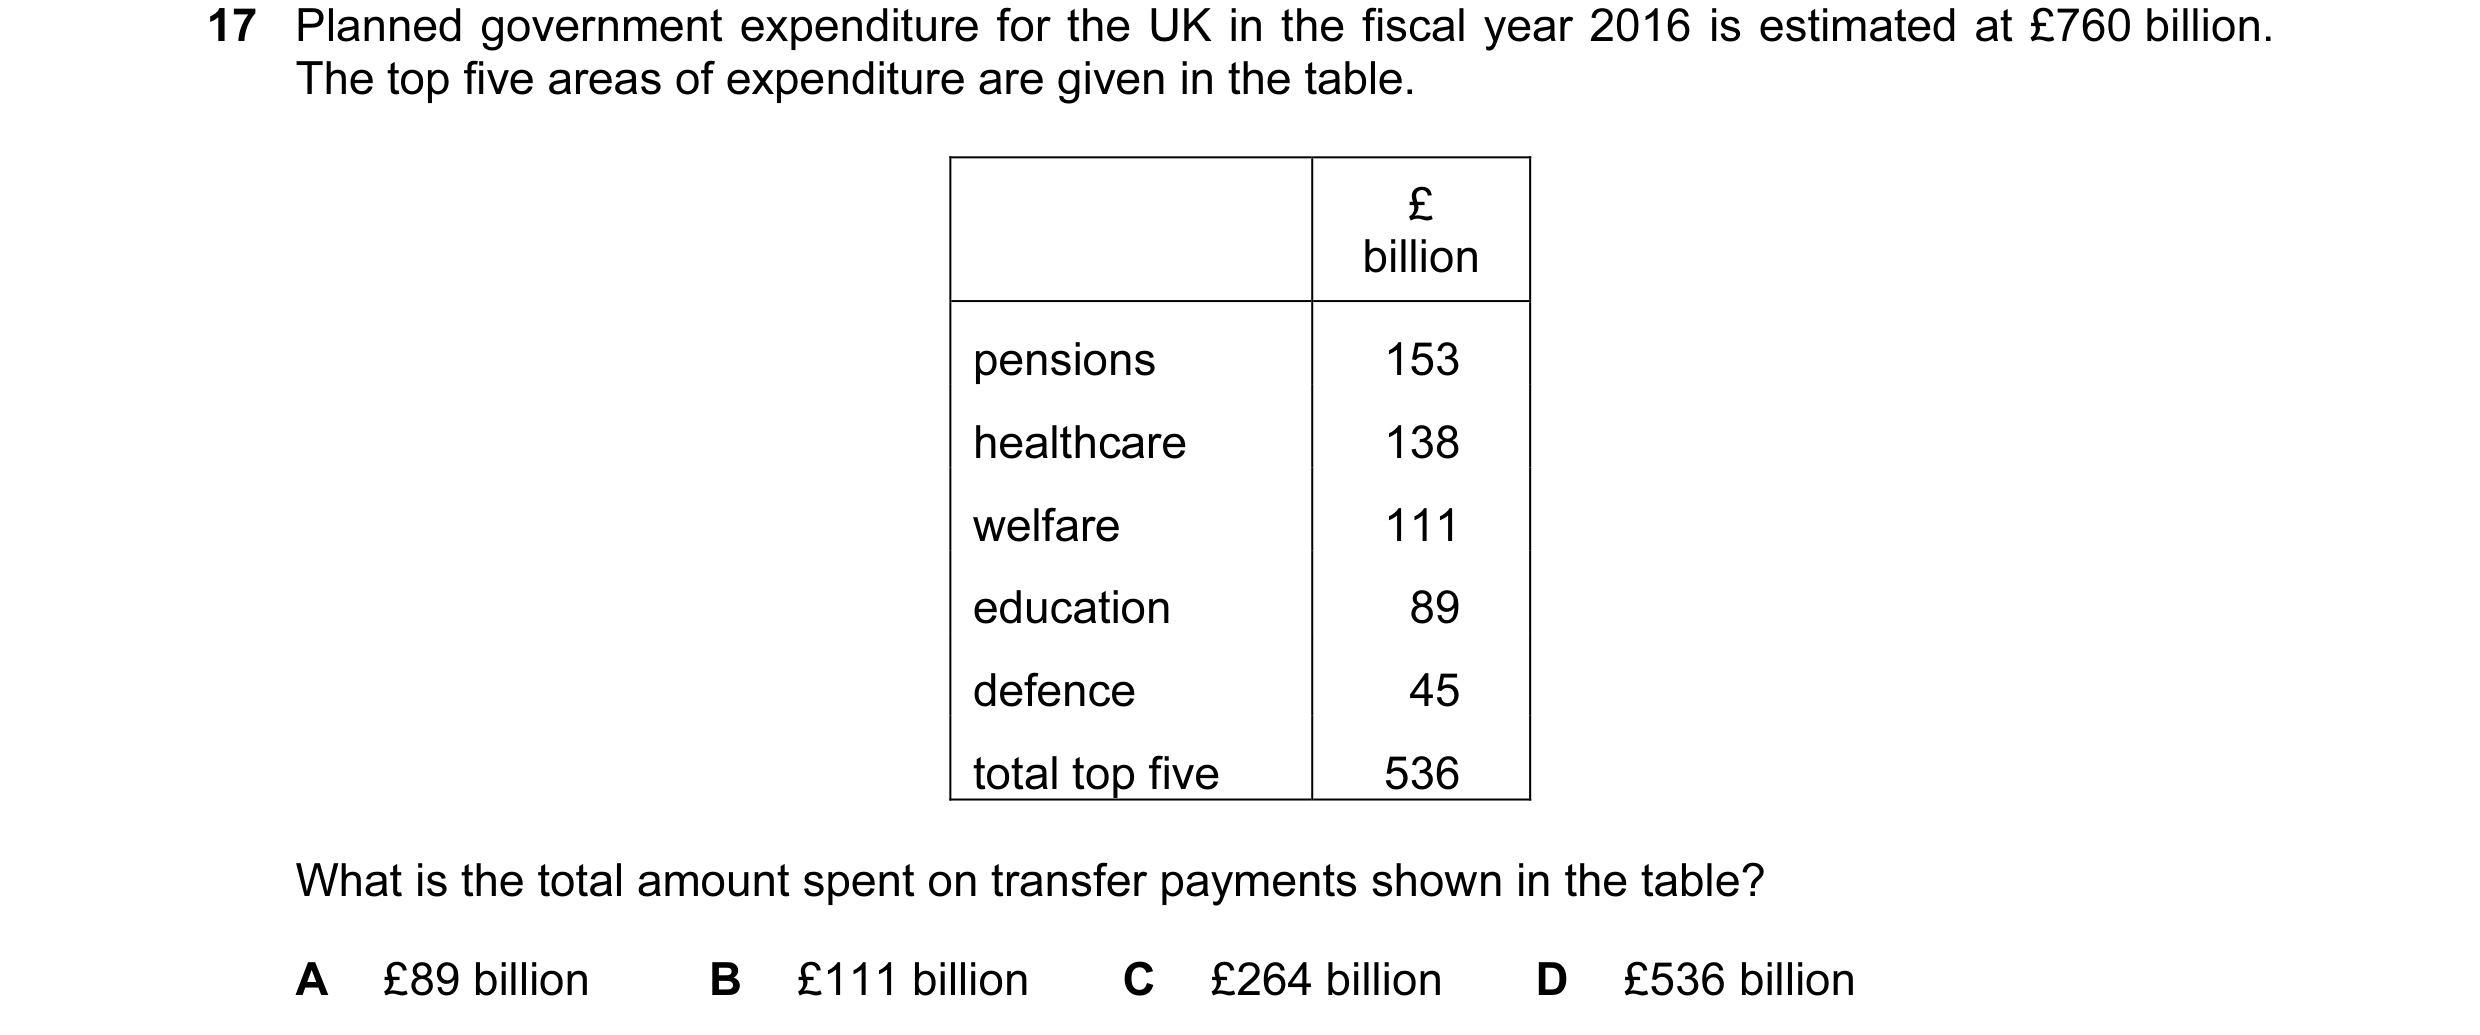
 5 / 17
 6 / 17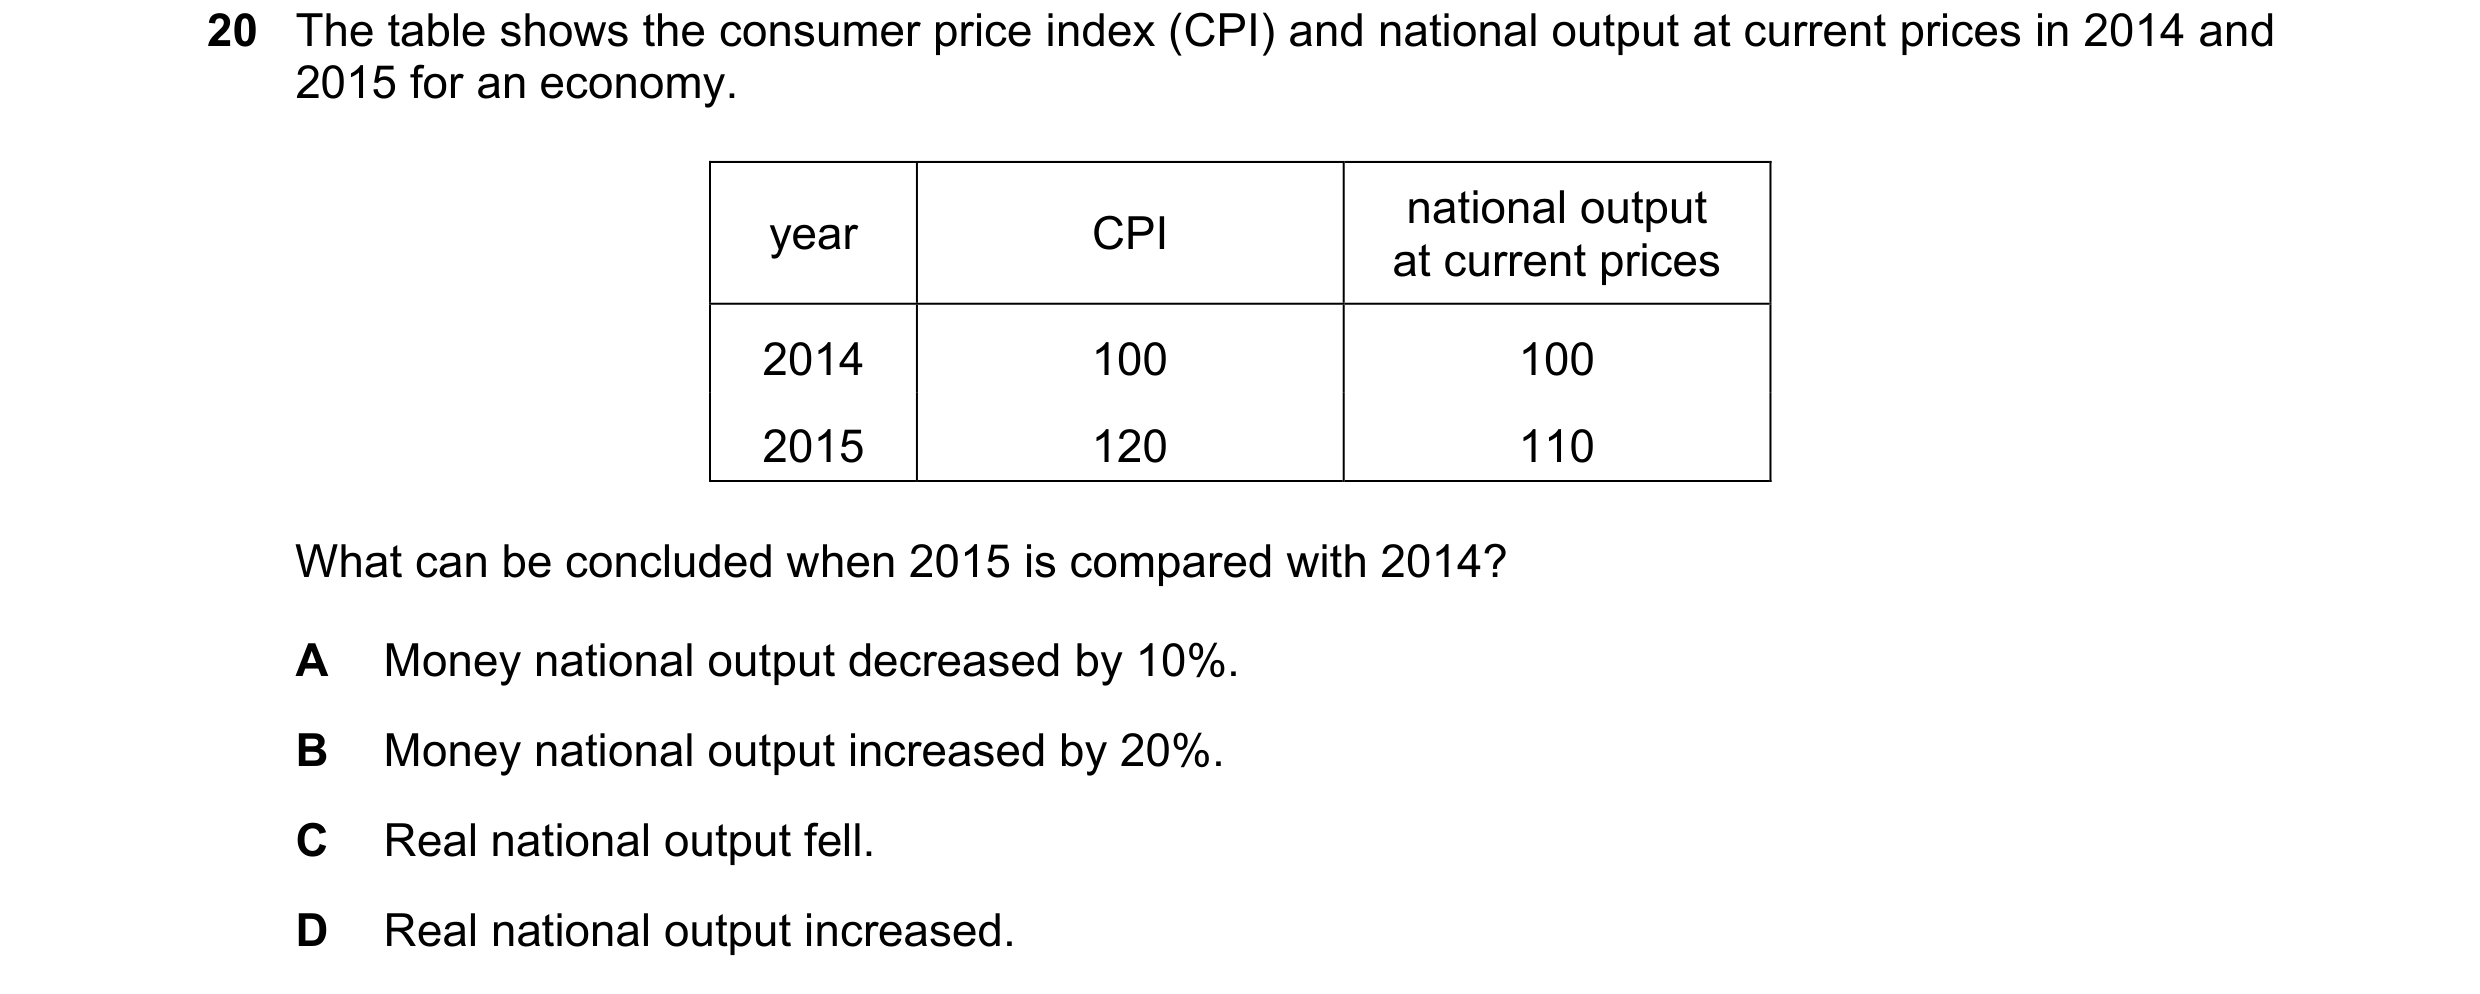
 7 / 17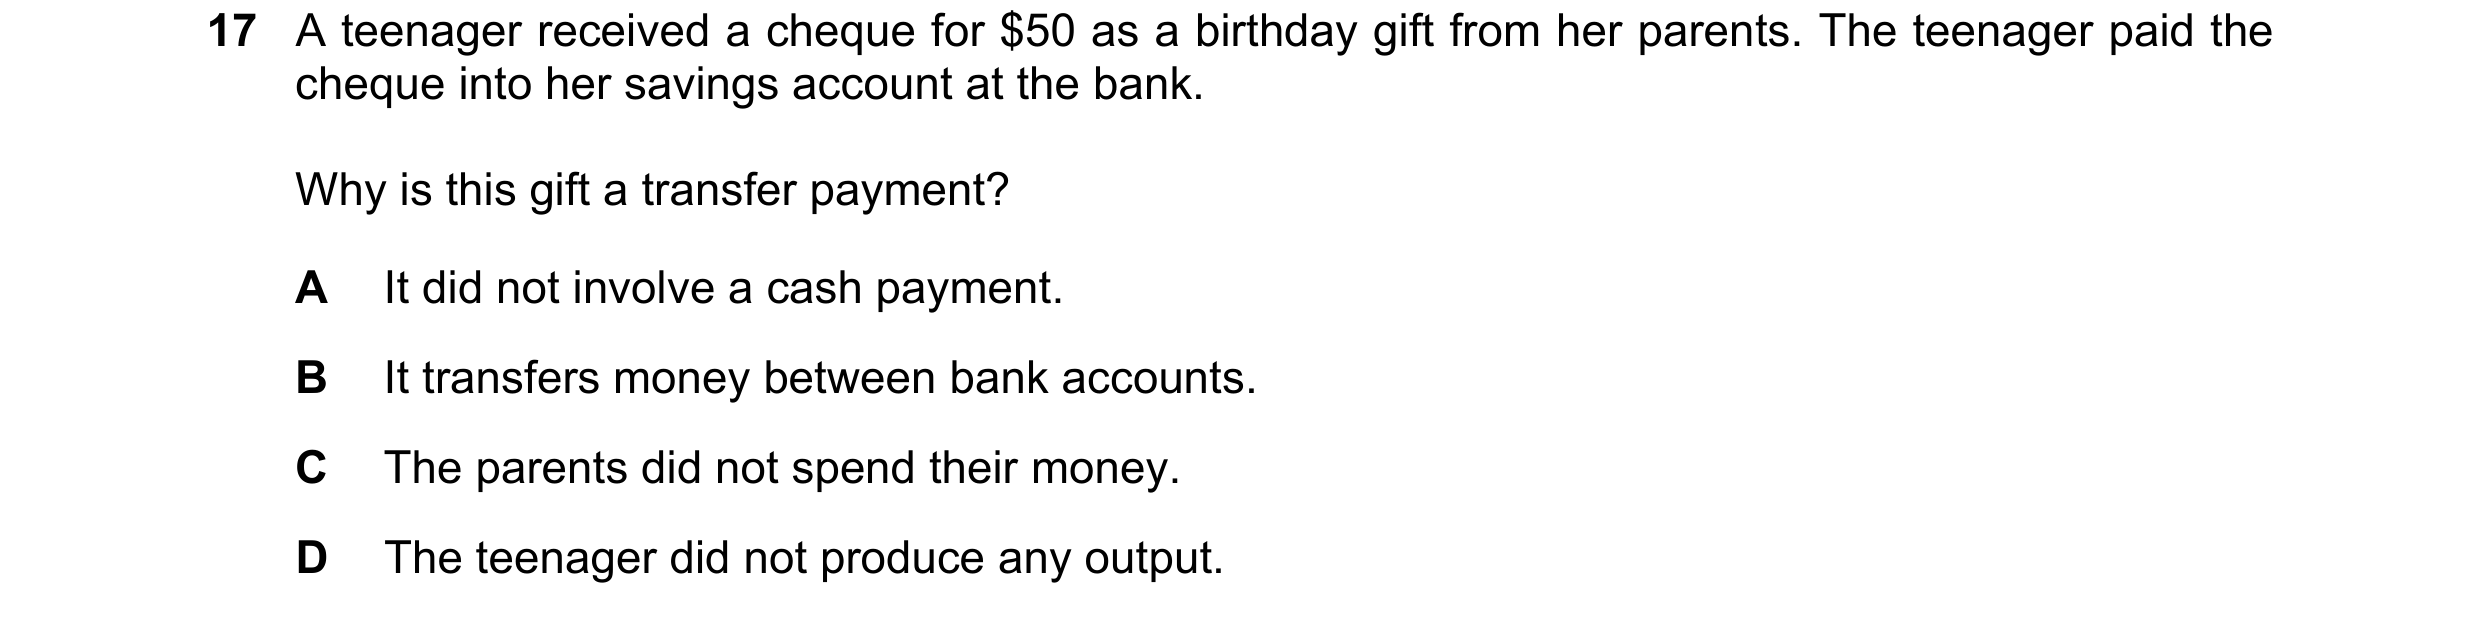
 8 / 17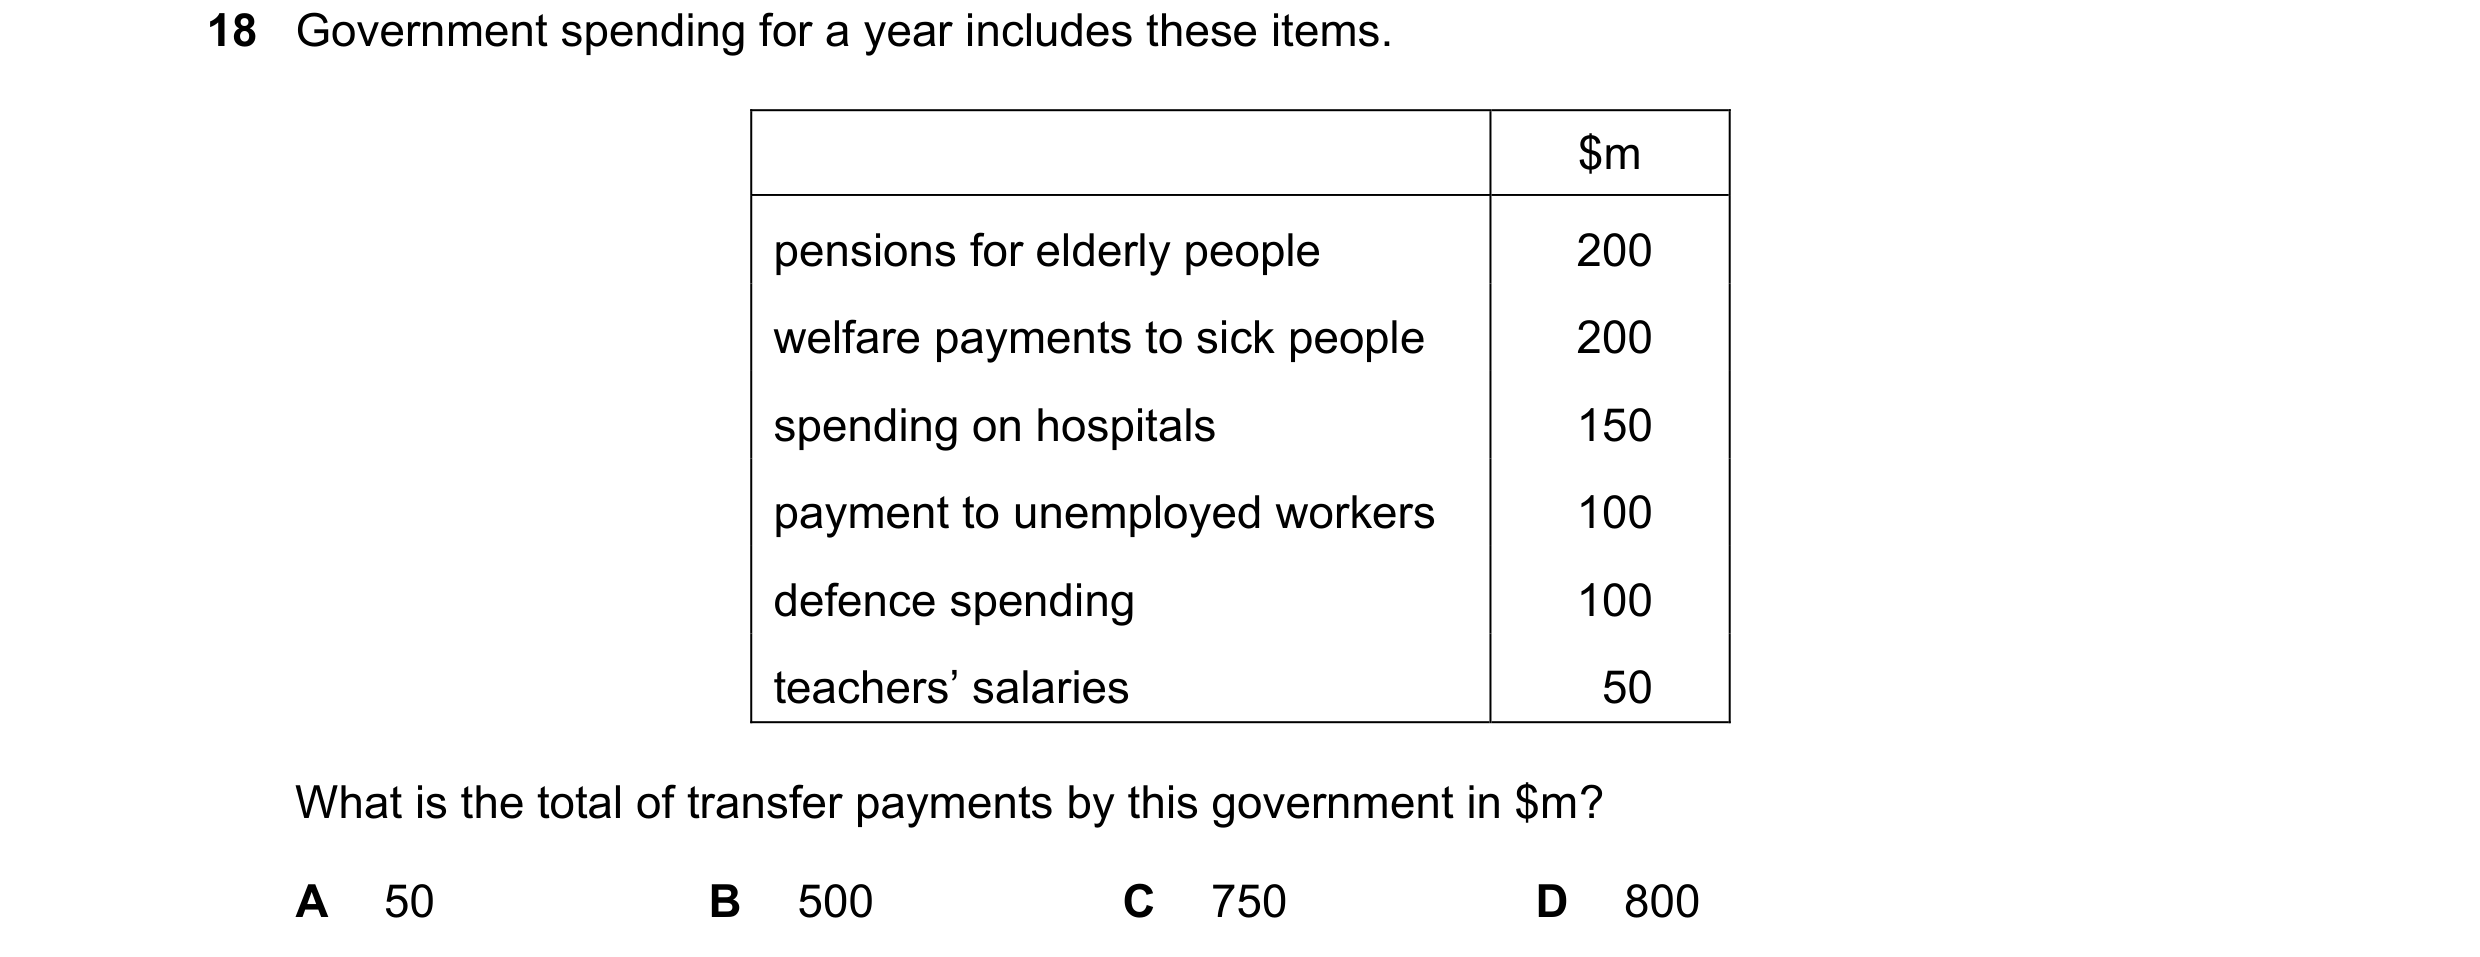

 9 / 17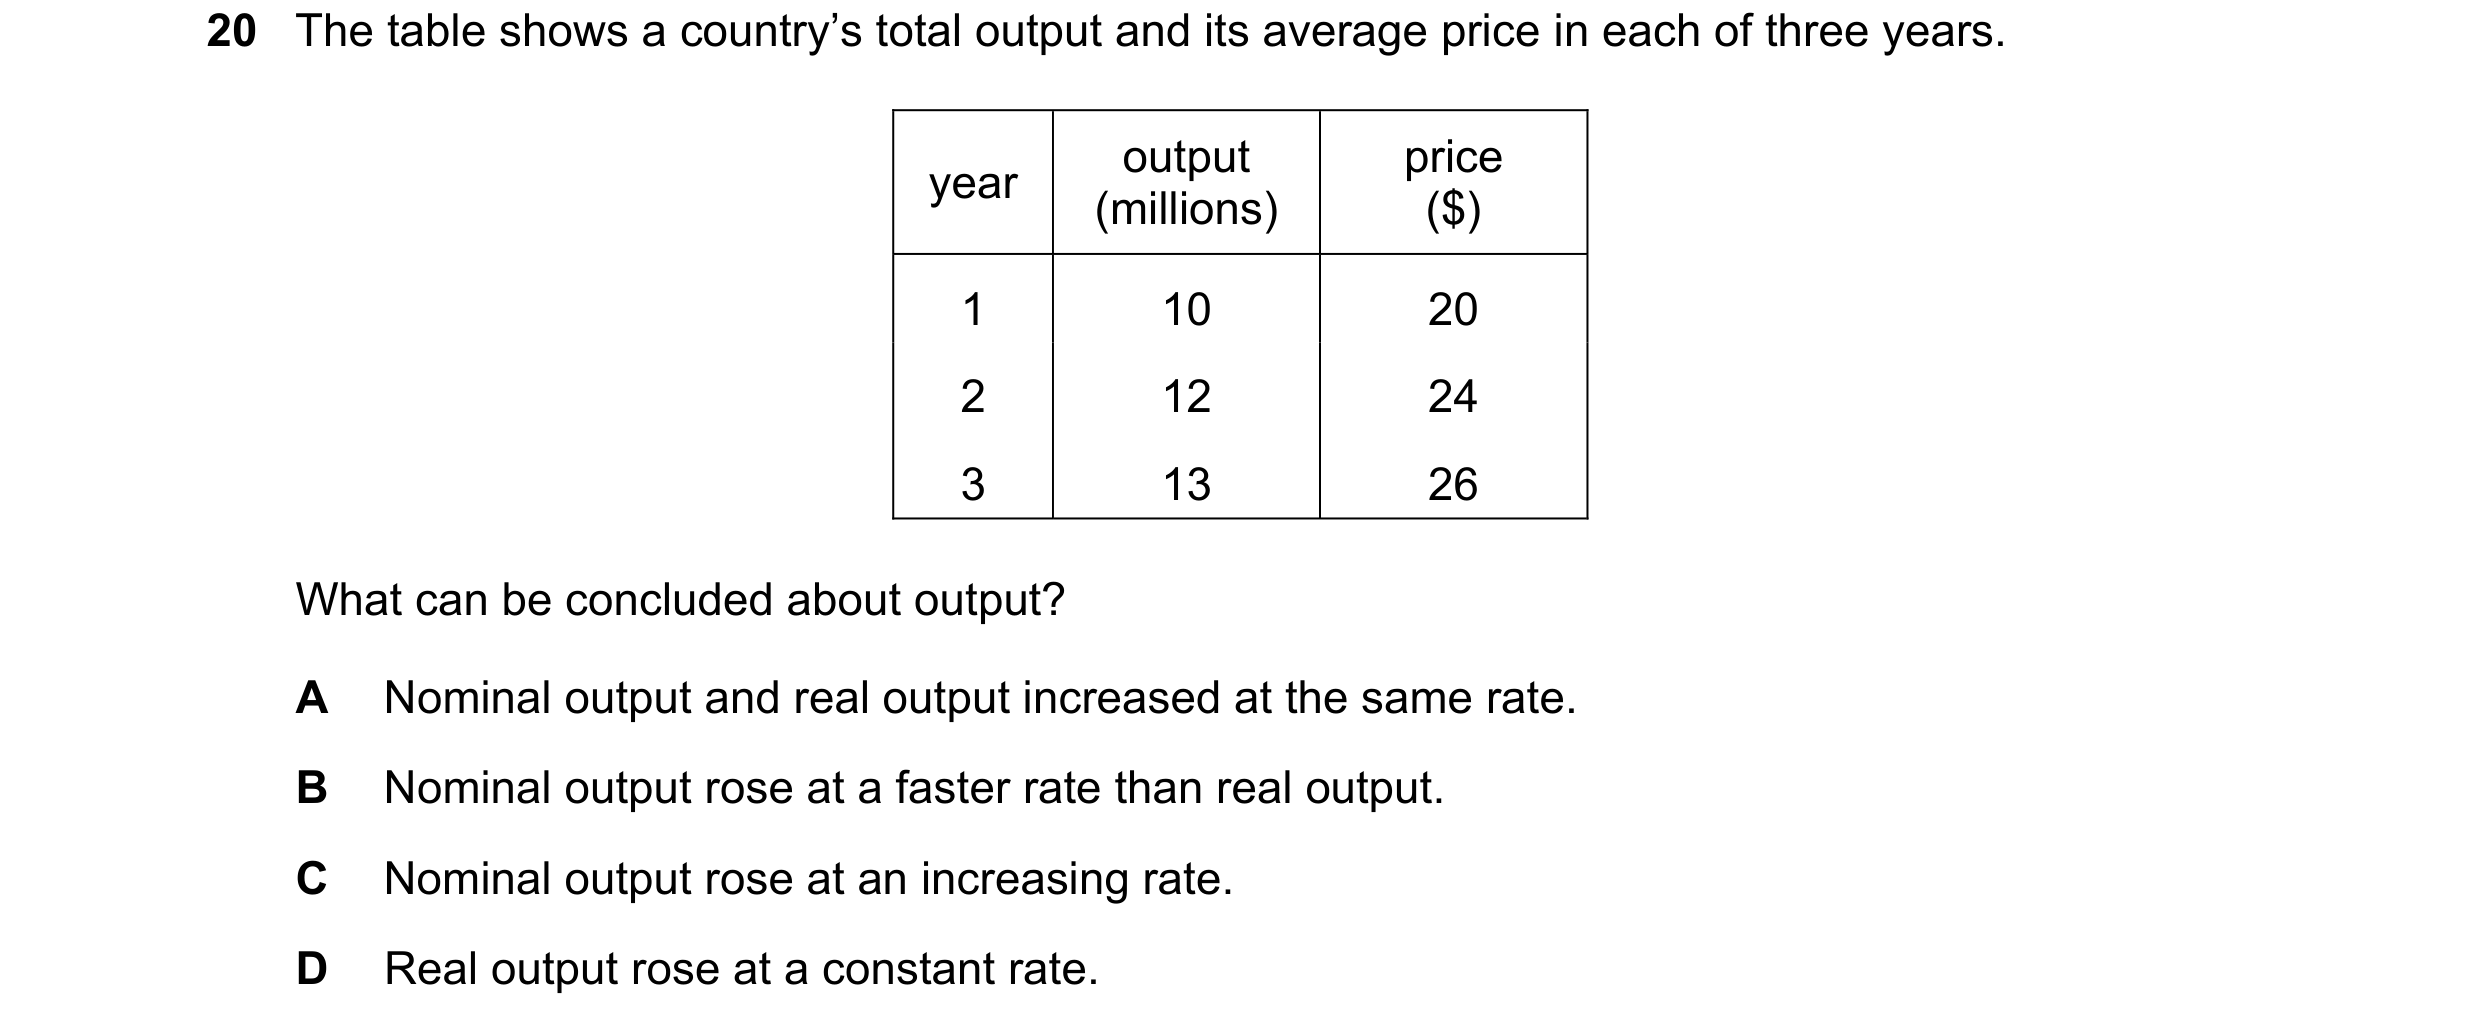
 10 / 17

 11 / 17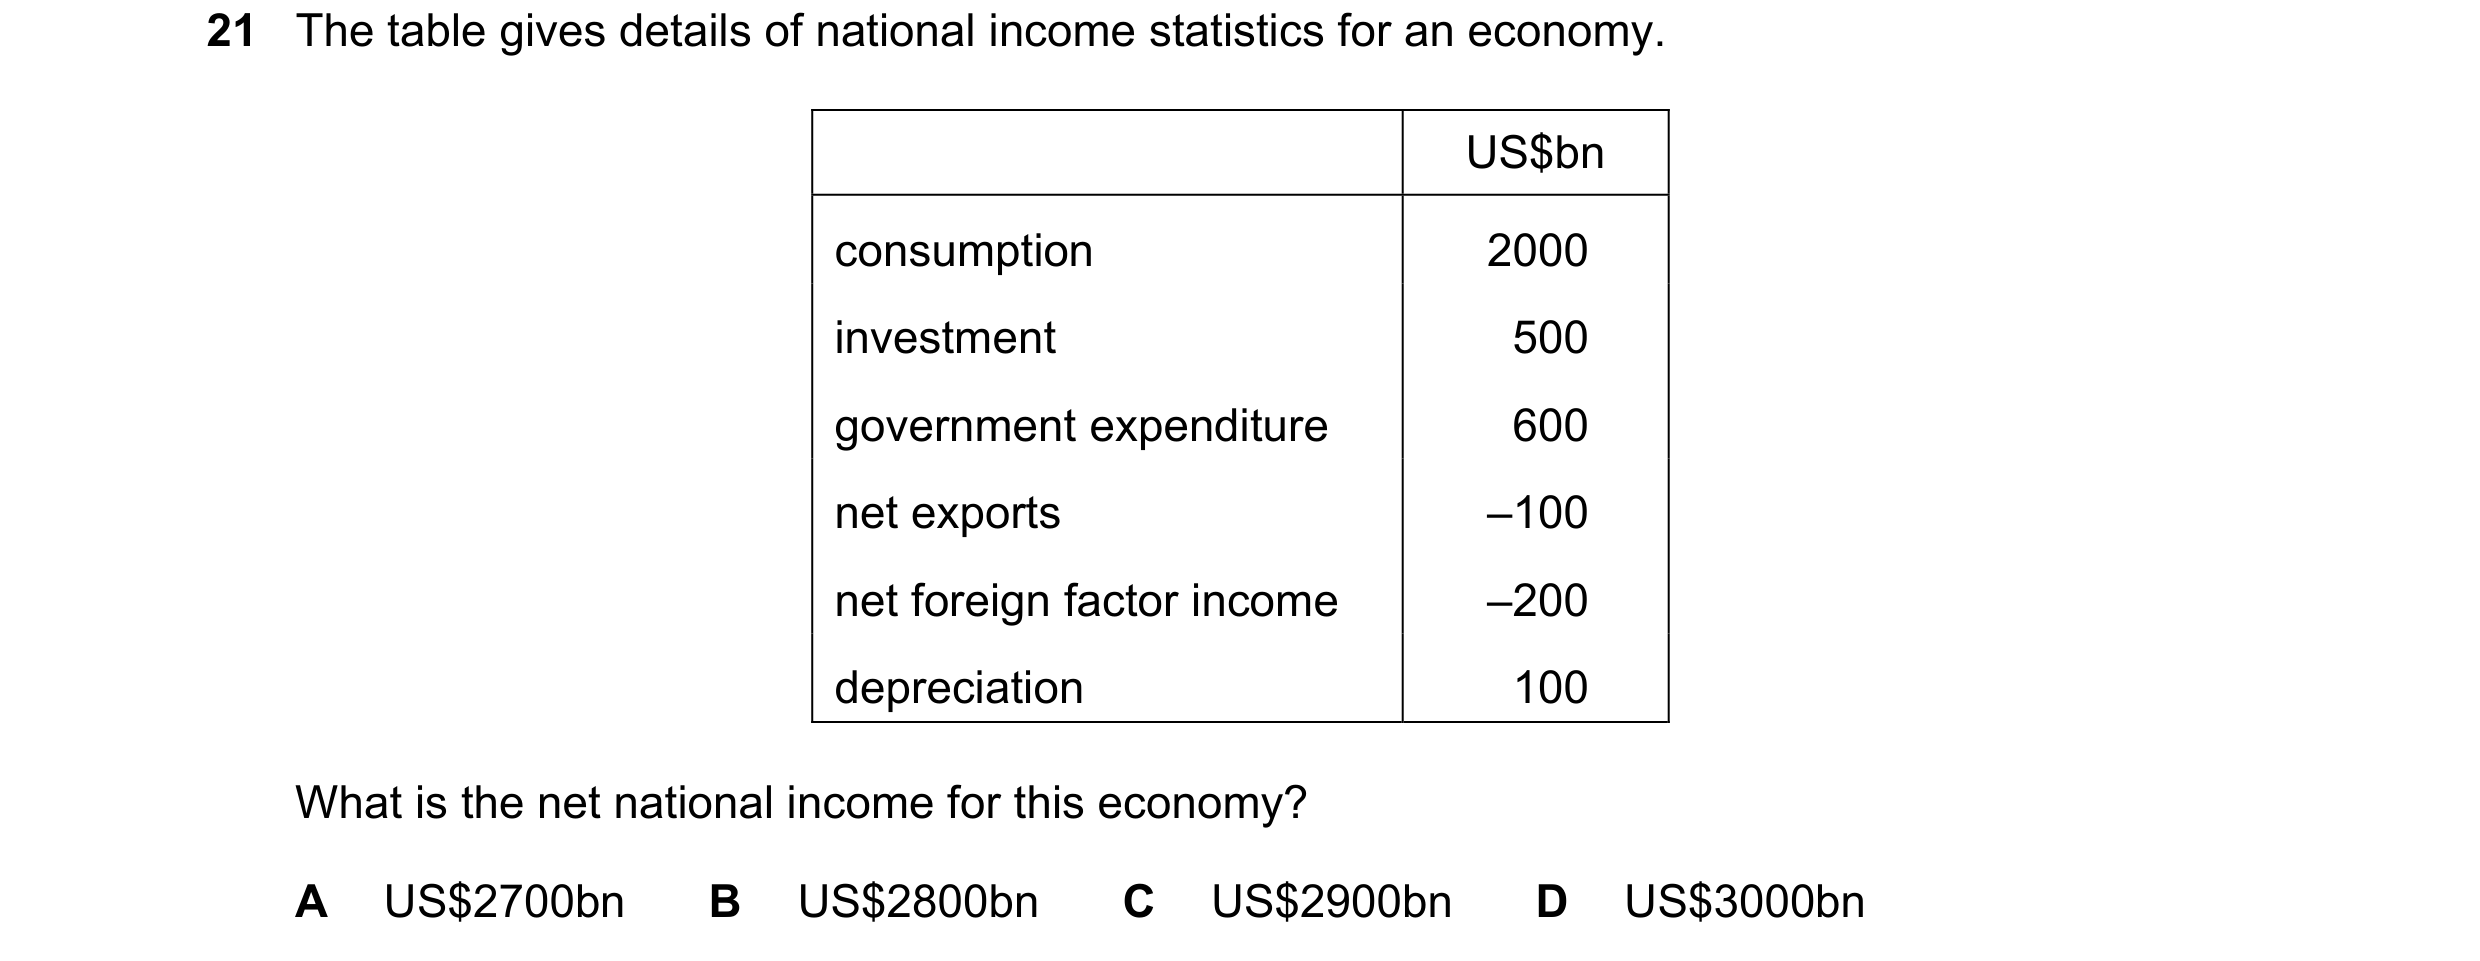

 12 / 17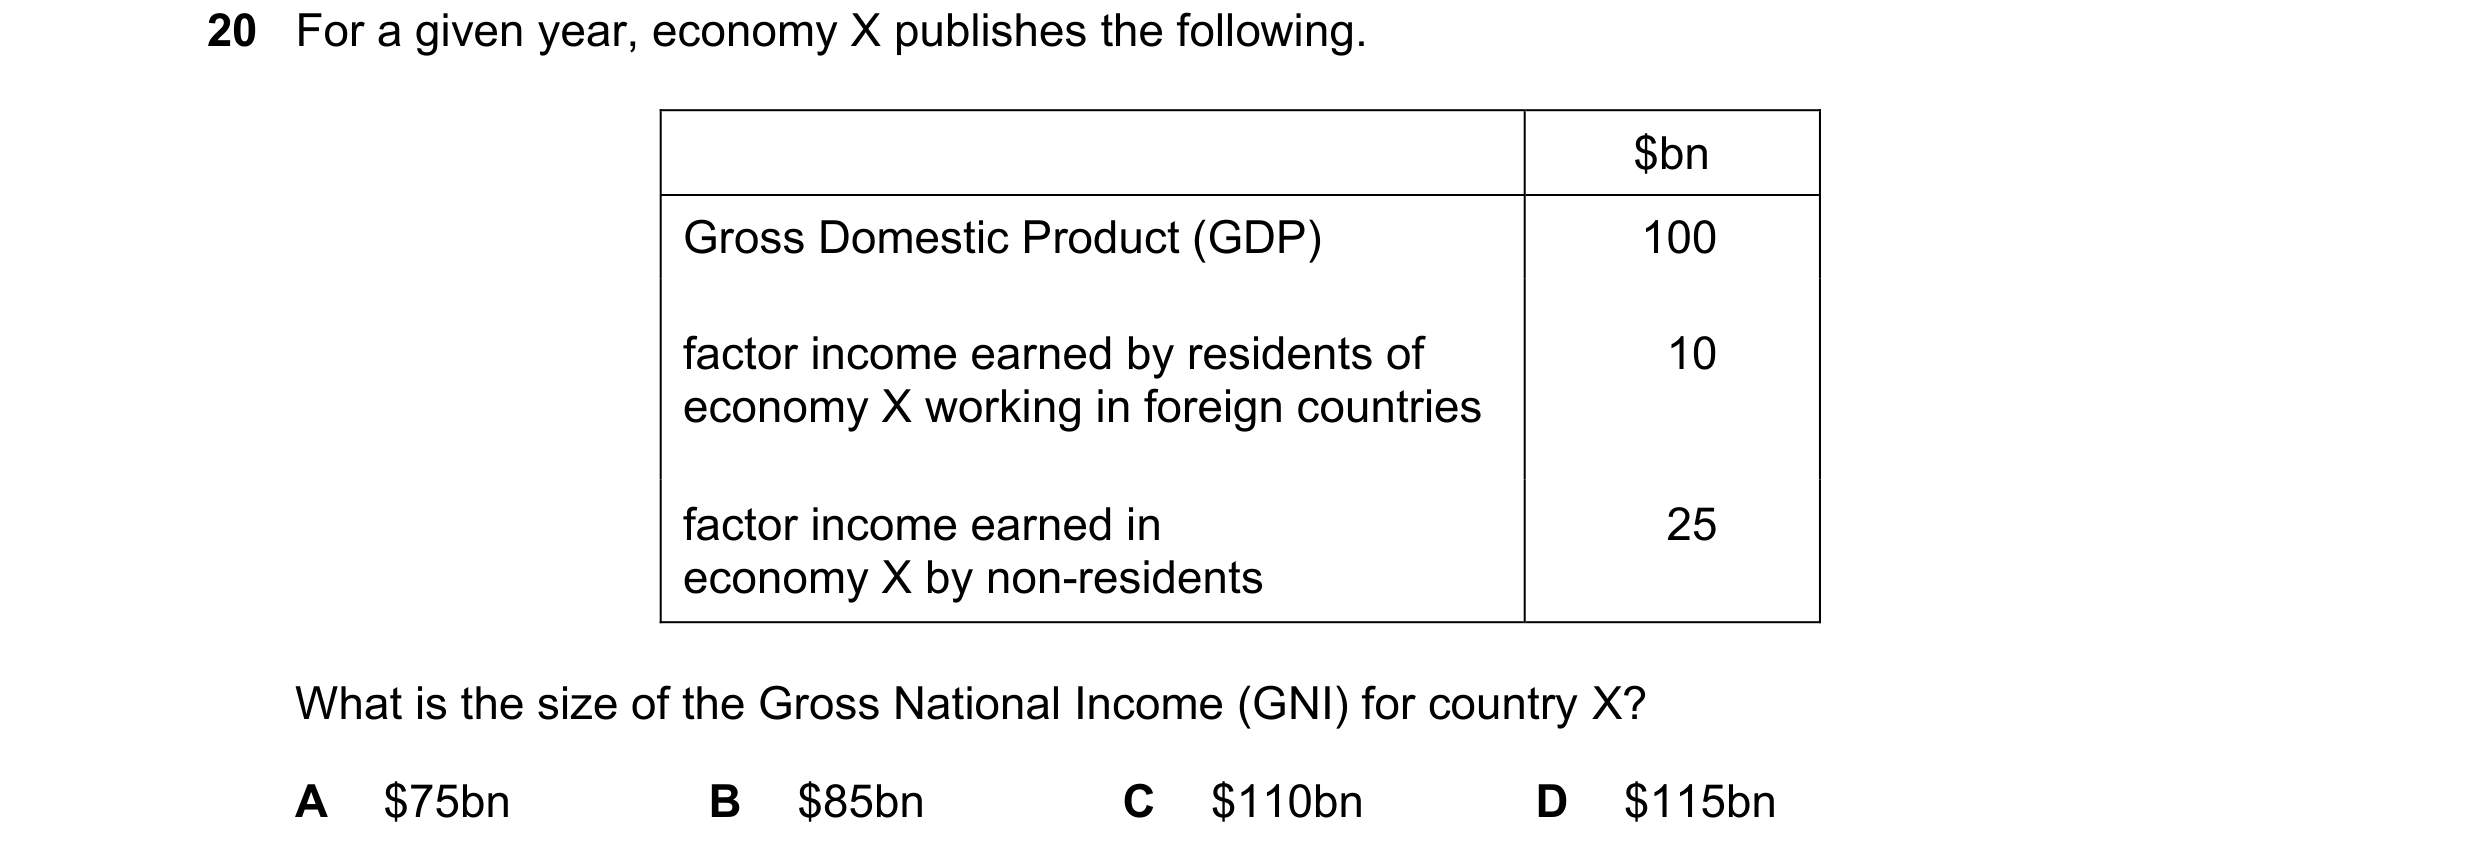

 13 / 17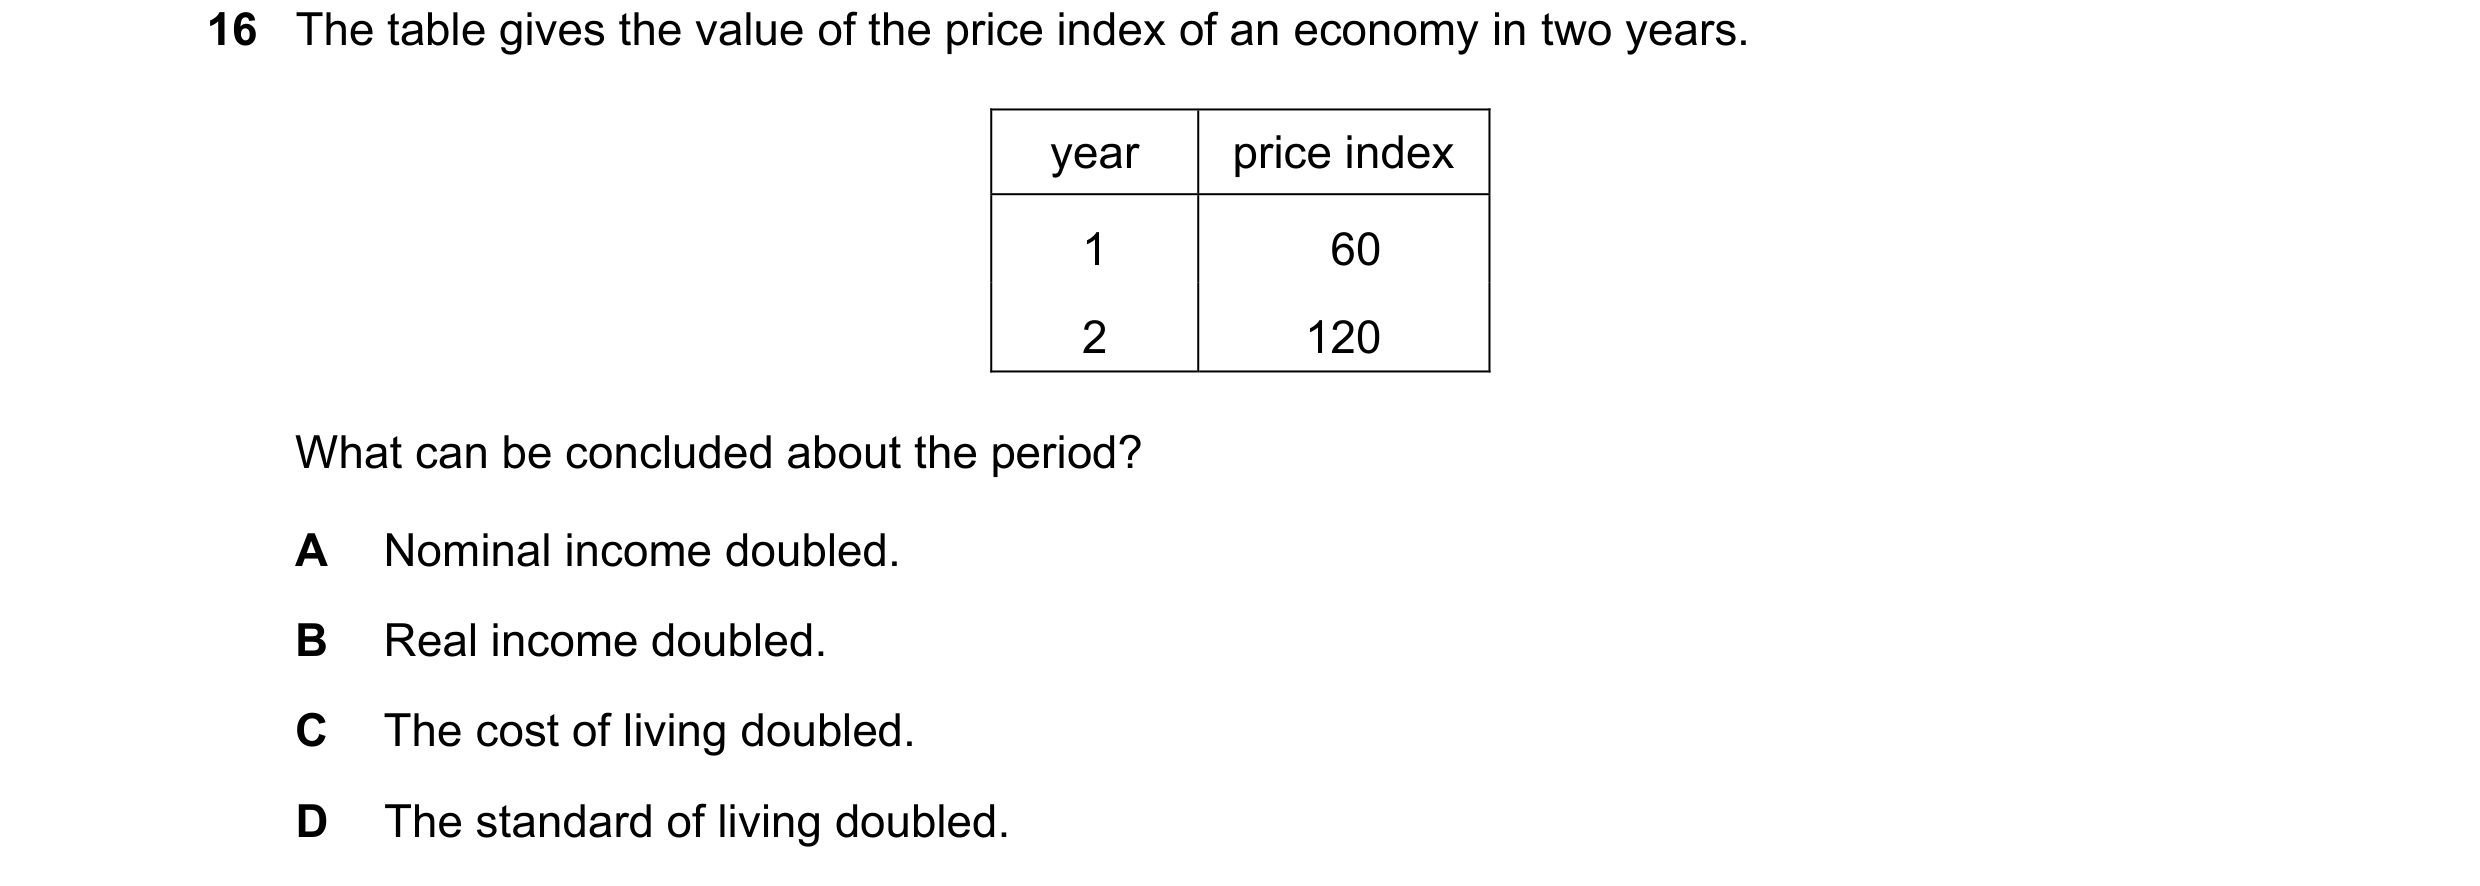

 14 / 17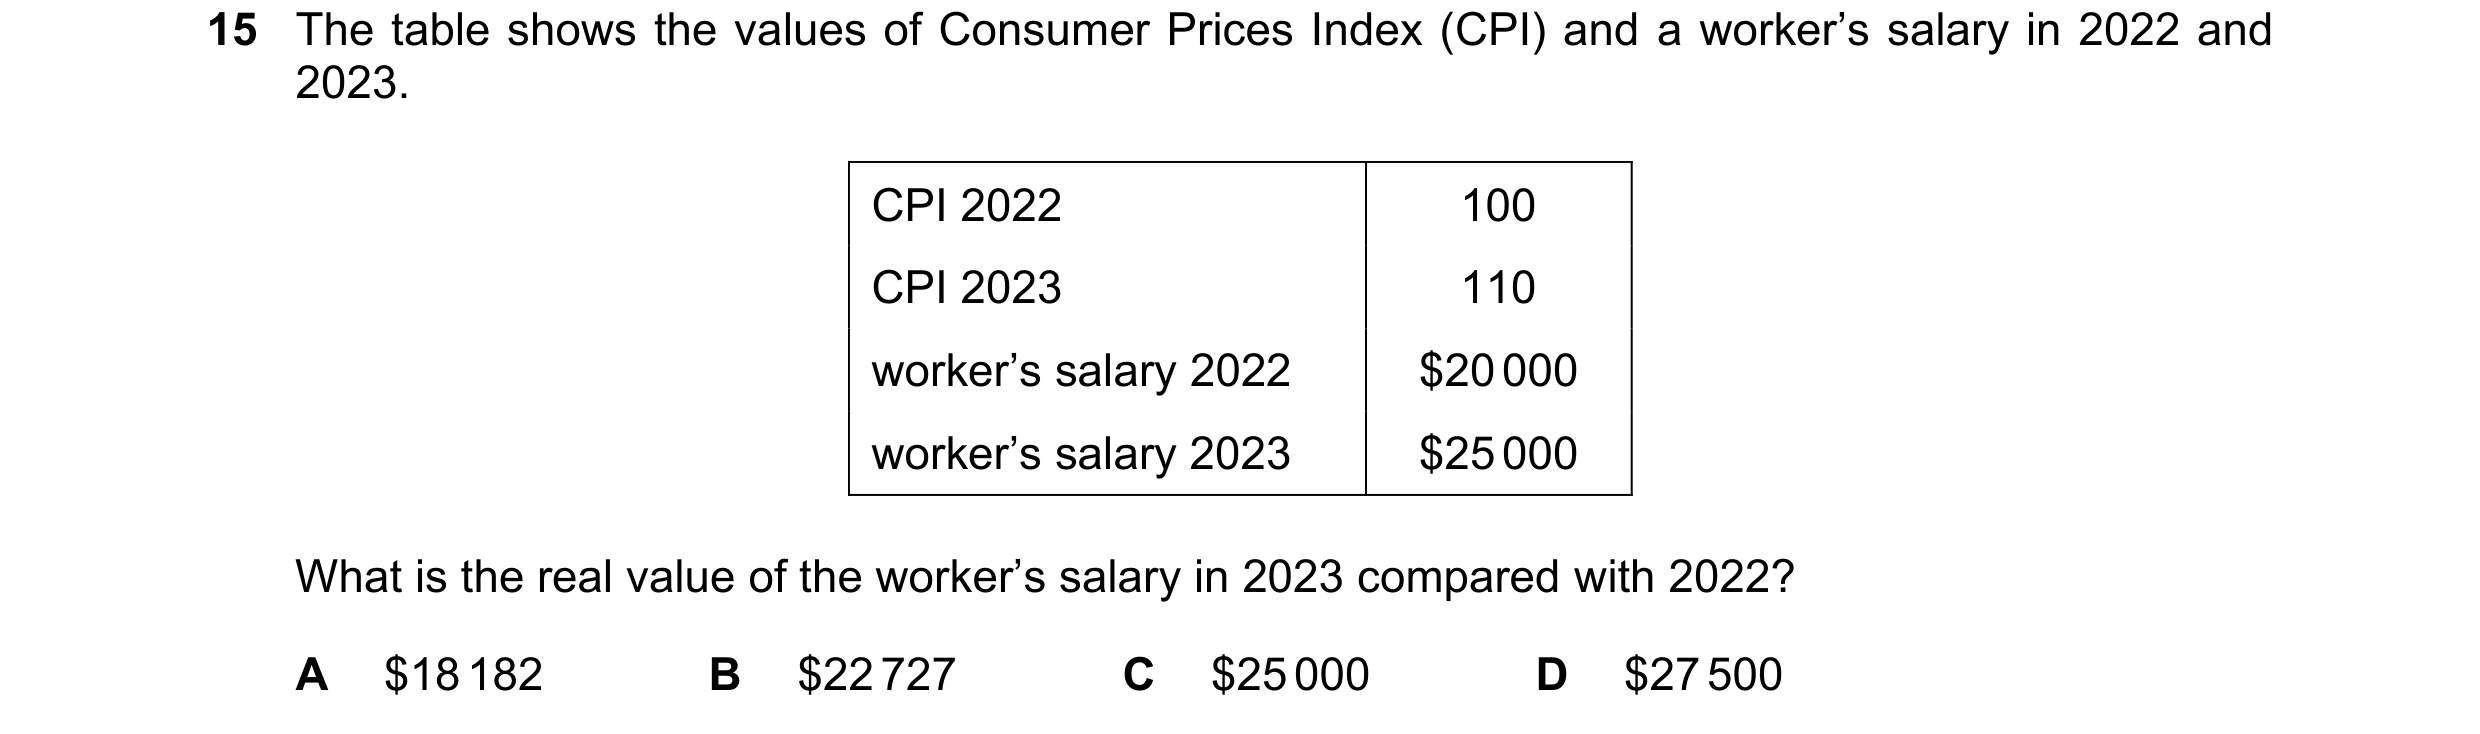
 15 / 17


 16 / 17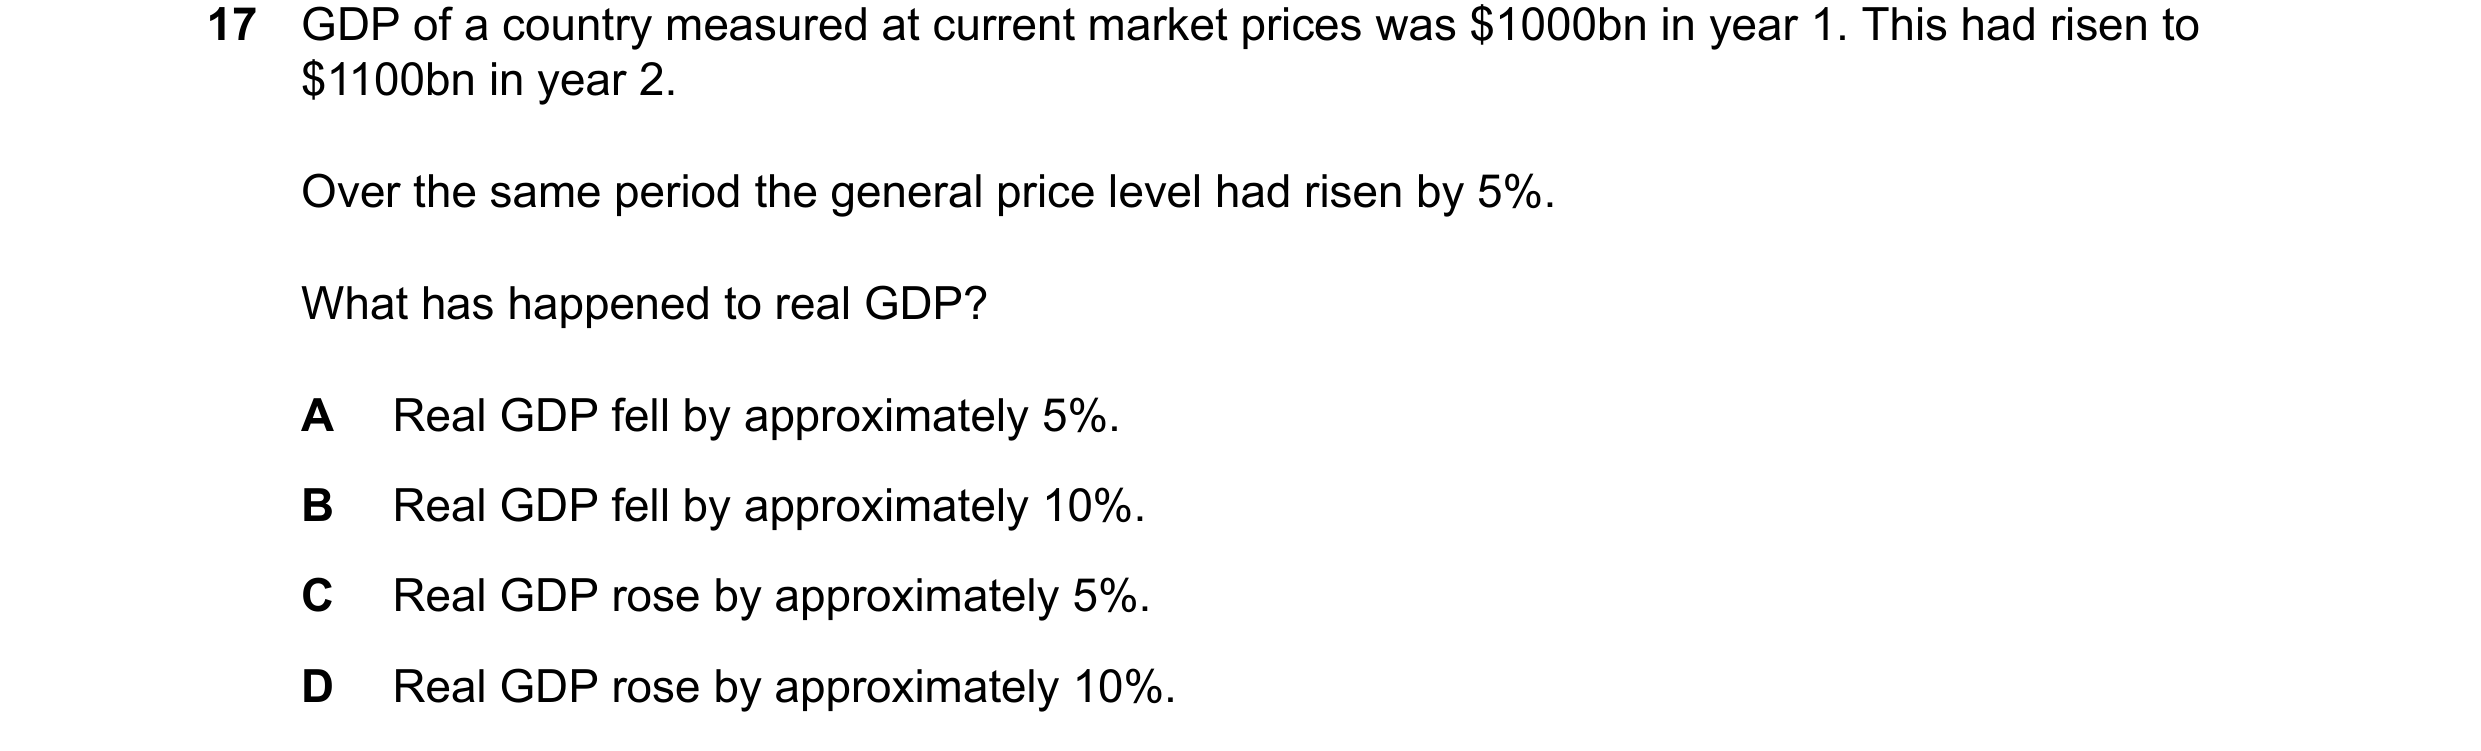
 17 / 17