Questions as text
Q1 · The information in the table is taken from a country’s national income accounts 9708/31 Oct/Nov 2009
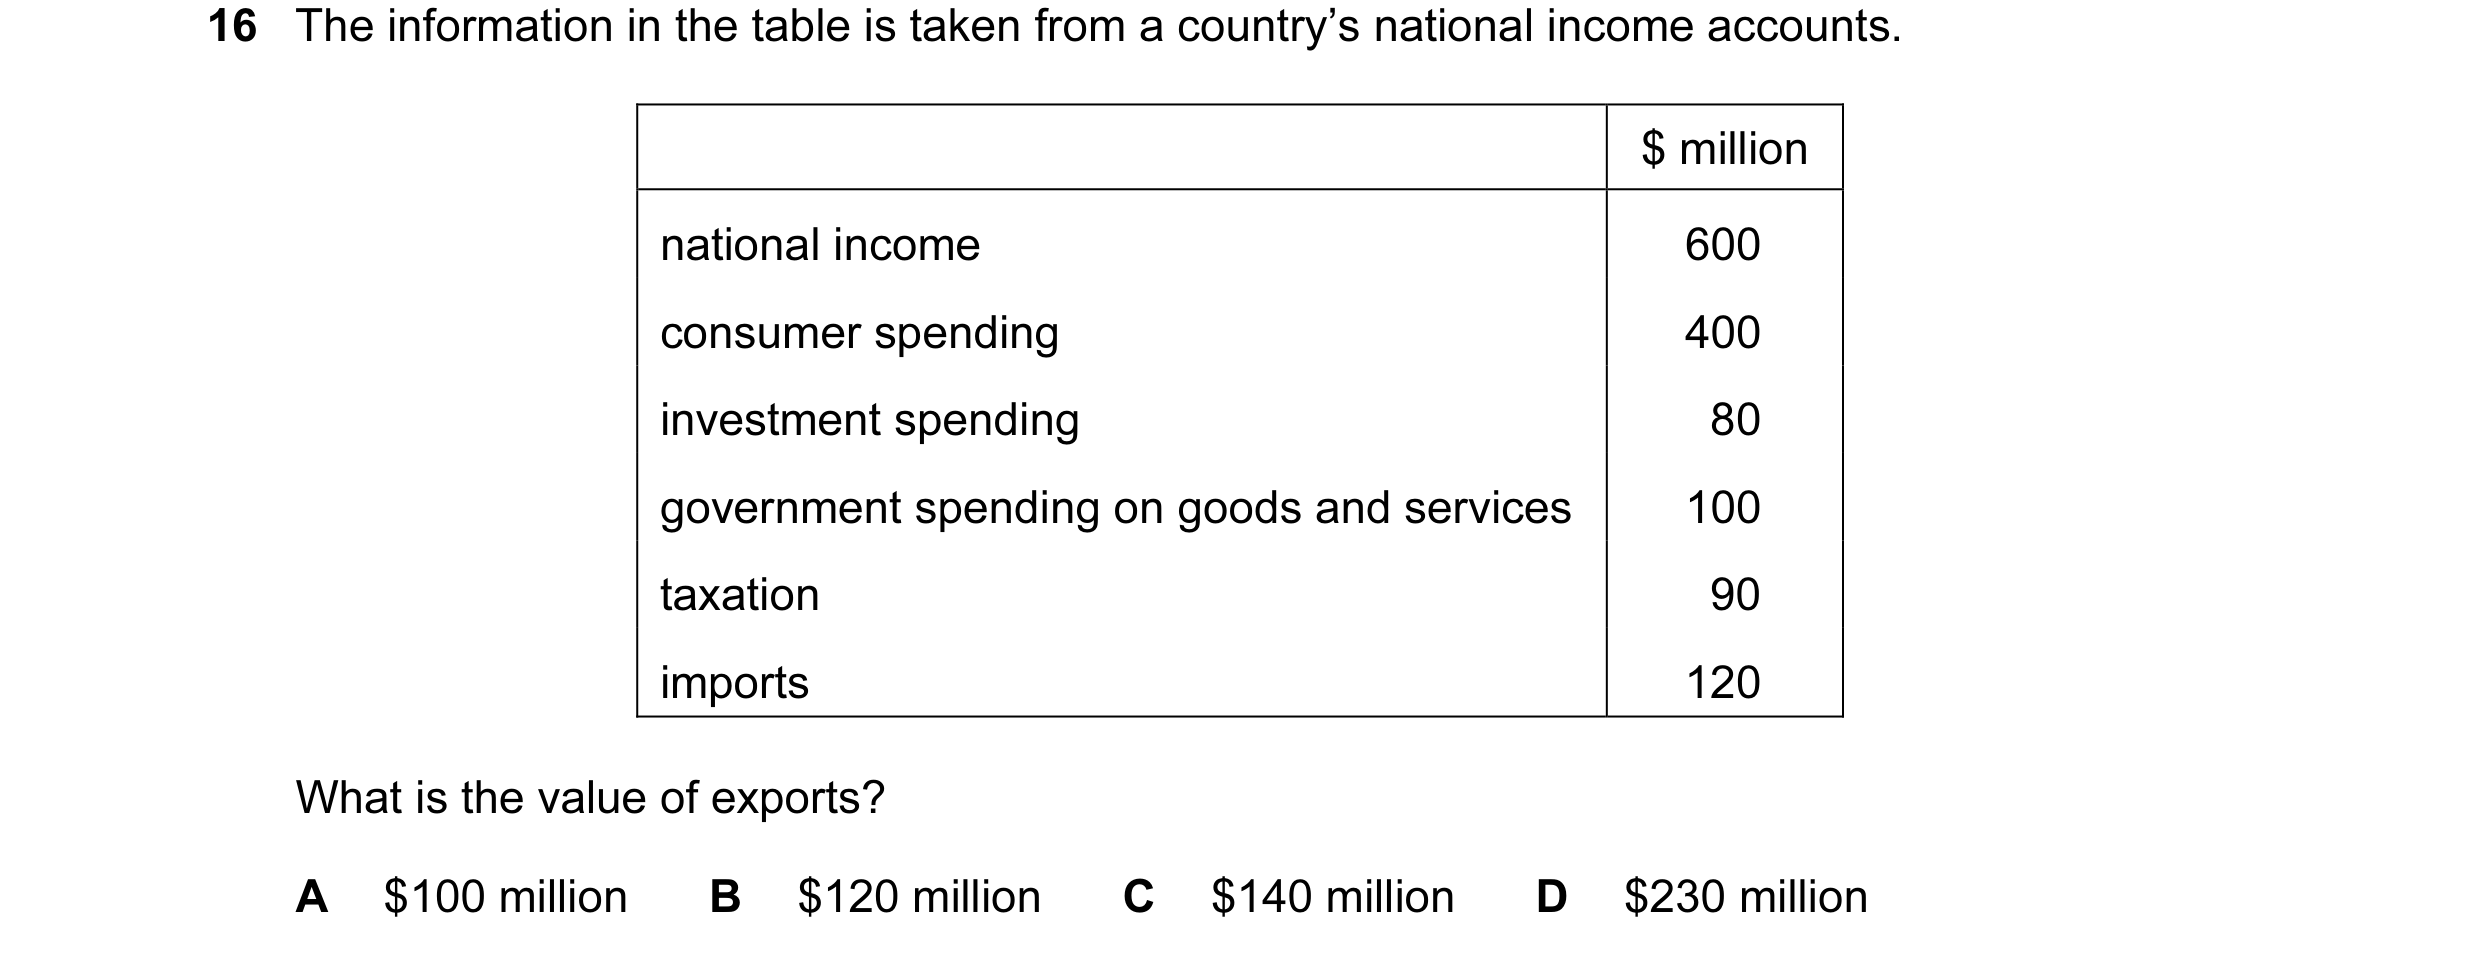
16 The information in the table is taken from a country’s national income accounts. $ million national income 600 consumer spending 400 investment spending 80 government spending on goods and services 100 taxation 90 imports 120 What is the value of exports? A $100 million B $120 million C $140 million D $230 million
1 marks
Answer: C
This question in 9708/31 Oct/Nov 2009
Q2 · The information in the table is taken from a country’s national income accounts 9708/32 Oct/Nov 2009
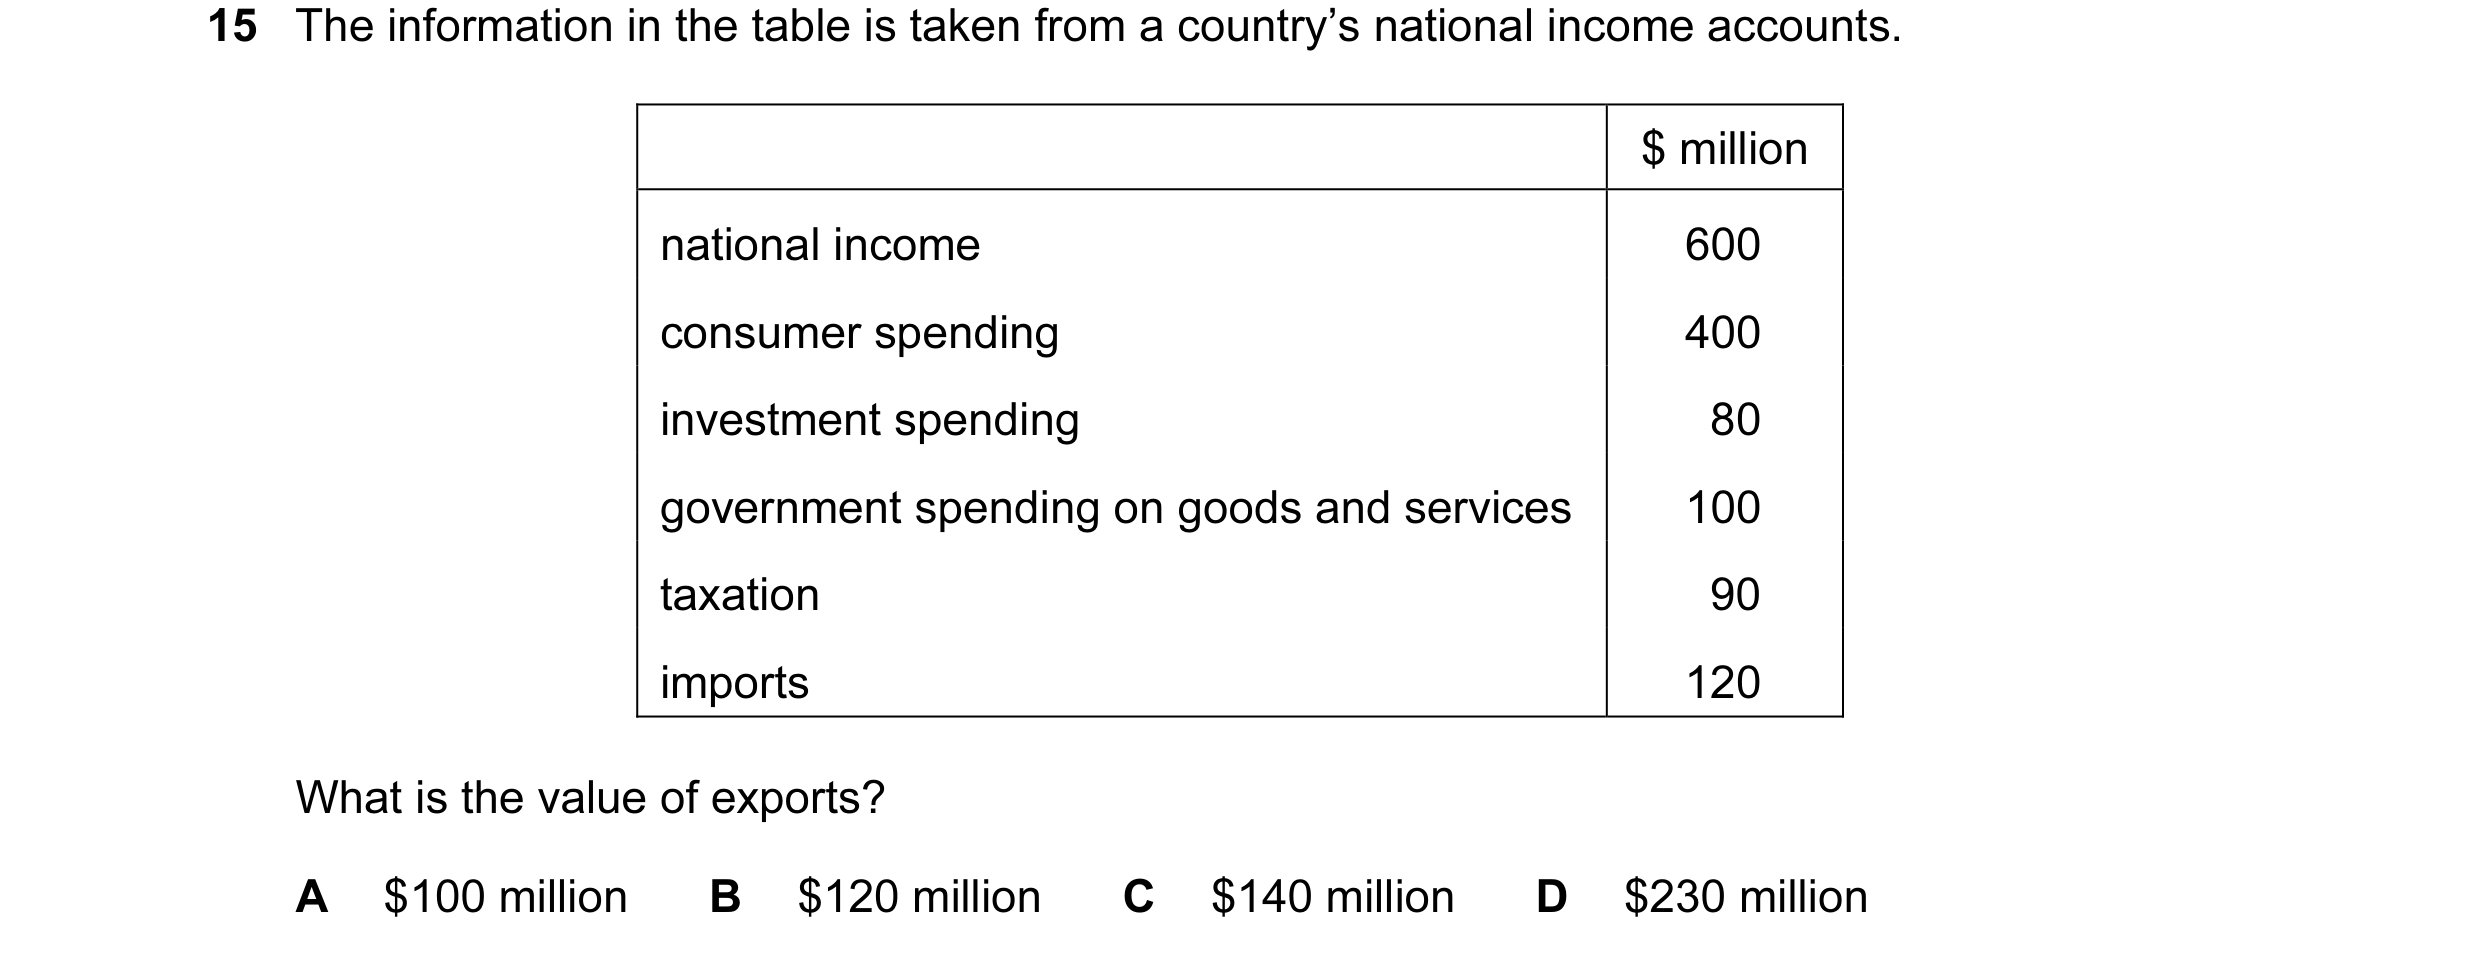
15 The information in the table is taken from a country’s national income accounts. $ million national income 600 consumer spending 400 investment spending 80 government spending on goods and services 100 taxation 90 imports 120 What is the value of exports? A $100 million B $120 million C $140 million D $230 million
1 marks
Answer: C
This question in 9708/32 Oct/Nov 2009
Q3 · A government requires all its young citizens to undertake community service for a period… 9708/31 May/June 2010
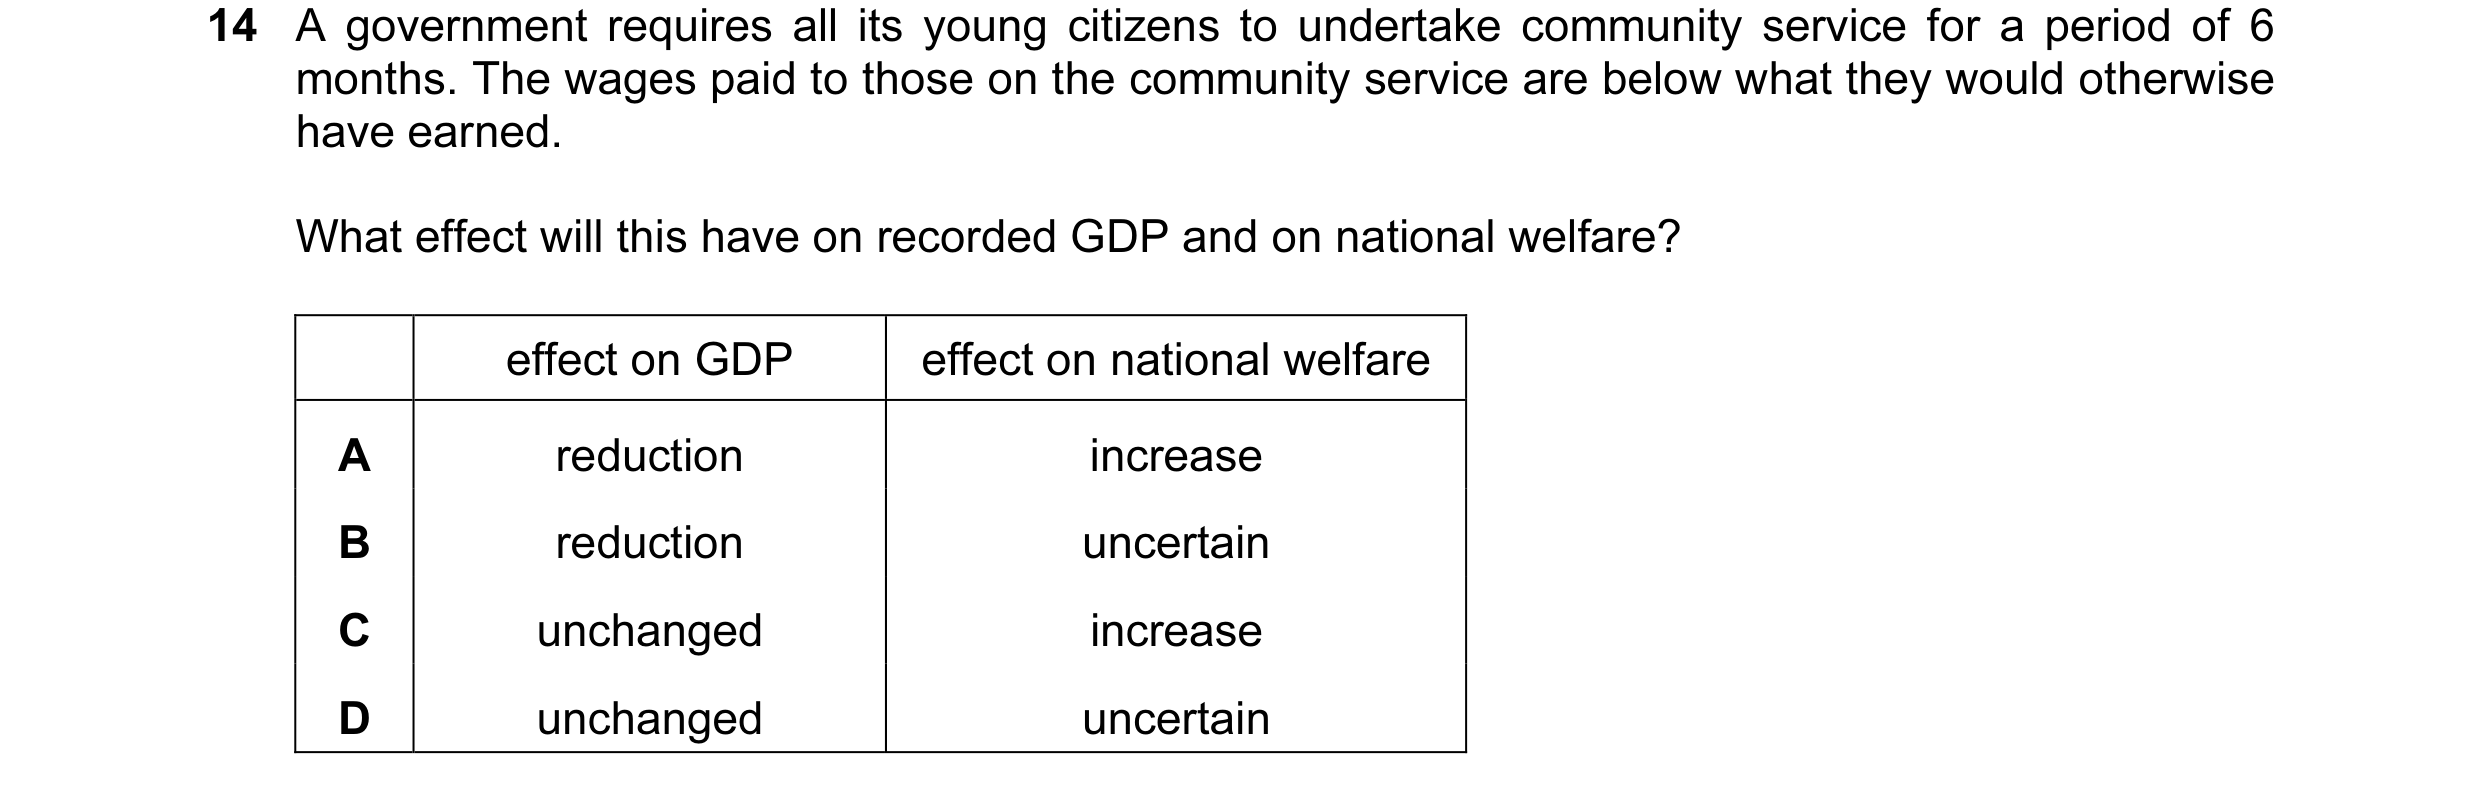
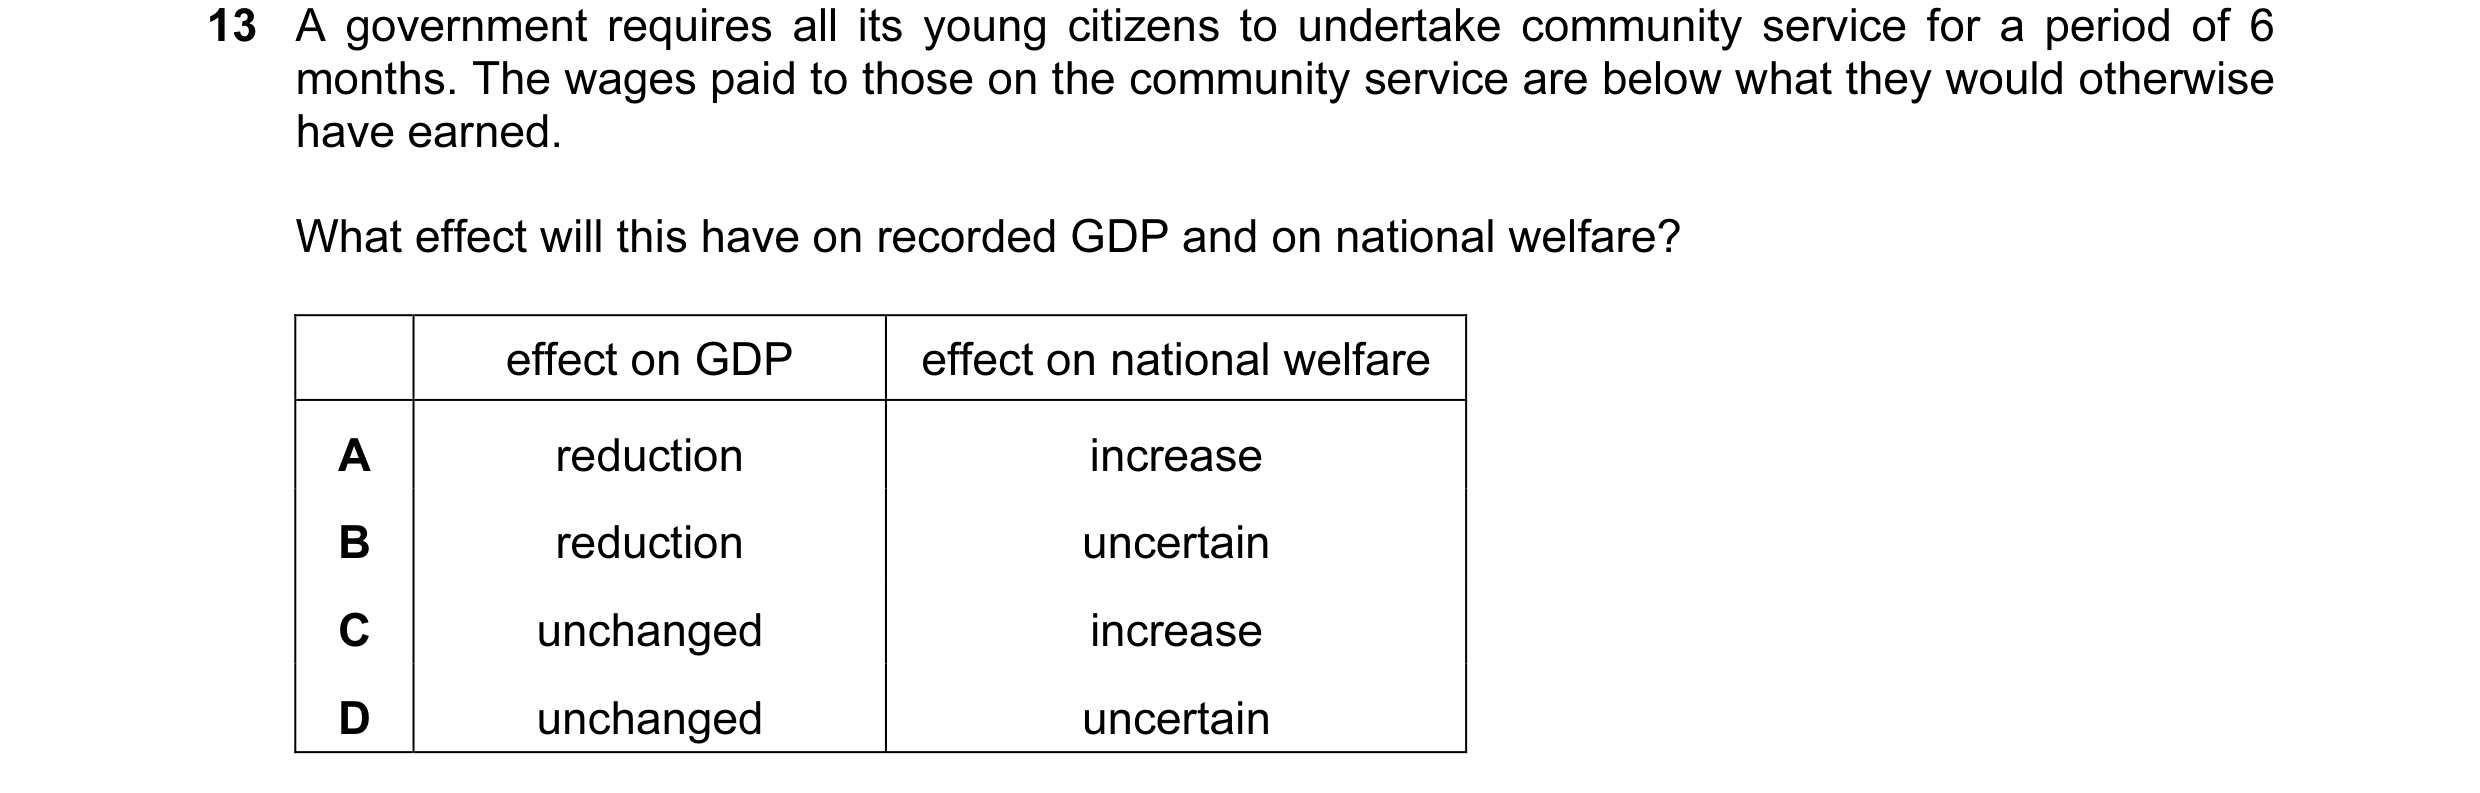
14 A government requires all its young citizens to undertake community service for a period of 6 months. The wages paid to those on the community service are below what they would otherwise have earned. What effect will this have on recorded GDP and on national welfare? effect on GDP effect on national welfare A reduction increase B reduction uncertain C unchanged increase D unchanged uncertain
1 marks
Answer: B
This question in 9708/31 May/June 2010
Q4 · Between 2008 and 2009 a country’s national income at current prices increased by 15 % 9708/31 May/June 2010
15 Between 2008 and 2009 a country’s national income at current prices increased by 15 %. At the same time the country experienced 5 % inflation. Which index number most closely represents the country’s national income in 2009 at 2008 prices (2008 = 100)? A 103 B 110 C 115 D 120
1 marks
Answer: B
This question in 9708/31 May/June 2010
Q5 · A government requires all its young citizens to undertake community service for a period… 9708/32 May/June 2010
13 A government requires all its young citizens to undertake community service for a period of 6 months. The wages paid to those on the community service are below what they would otherwise have earned. What effect will this have on recorded GDP and on national welfare? effect on GDP effect on national welfare A reduction increase B reduction uncertain C unchanged increase D unchanged uncertain
1 marks
Answer: B
This question in 9708/32 May/June 2010
Q6 · Between 2008 and 2009 a country’s national income at current prices increased by 15 % 9708/32 May/June 2010
14 Between 2008 and 2009 a country’s national income at current prices increased by 15 %. At the same time the country experienced 5 % inflation. Which index number most closely represents the country’s national income in 2009 at 2008 prices (2008 = 100)? A 103 B 110 C 115 D 120
1 marks
Answer: B
This question in 9708/32 May/June 2010
Q7 · A government requires all its young citizens to undertake community service for a period… 9708/33 May/June 2010
13 A government requires all its young citizens to undertake community service for a period of 6 months. The wages paid to those on the community service are below what they would otherwise have earned. What effect will this have on recorded GDP and on national welfare? effect on GDP effect on national welfare A reduction increase B reduction uncertain C unchanged increase D unchanged uncertain
1 marks
Answer: B
This question in 9708/33 May/June 2010
Q8 · Between 2008 and 2009 a country’s national income at current prices increased by 15 % 9708/33 May/June 2010
14 Between 2008 and 2009 a country’s national income at current prices increased by 15 %. At the same time the country experienced 5 % inflation. Which index number most closely represents the country’s national income in 2009 at 2008 prices (2008 = 100)? A 103 B 110 C 115 D 120
1 marks
Answer: B
This question in 9708/33 May/June 2010
Q9 · The table shows data on a country’s gross national product at market prices and on… 9708/31 May/June 2011
14 The table shows data on a country’s gross national product at market prices and on domestic
spending.
year 1 year2 | year 3
($m) ($m) ($m)
GNP at market prices 420 440 560
private consumption 200 260 300
government consumption 120 120 140
gross investment 90 80 130
In which of these years will the country be faced with a deficit on the current account of the
balance of payments?
year 1 year 2 year 3
A x v v
B x v x
Cc v x v
D v x x
1 marks
Answer: A
This question in 9708/31 May/June 2011
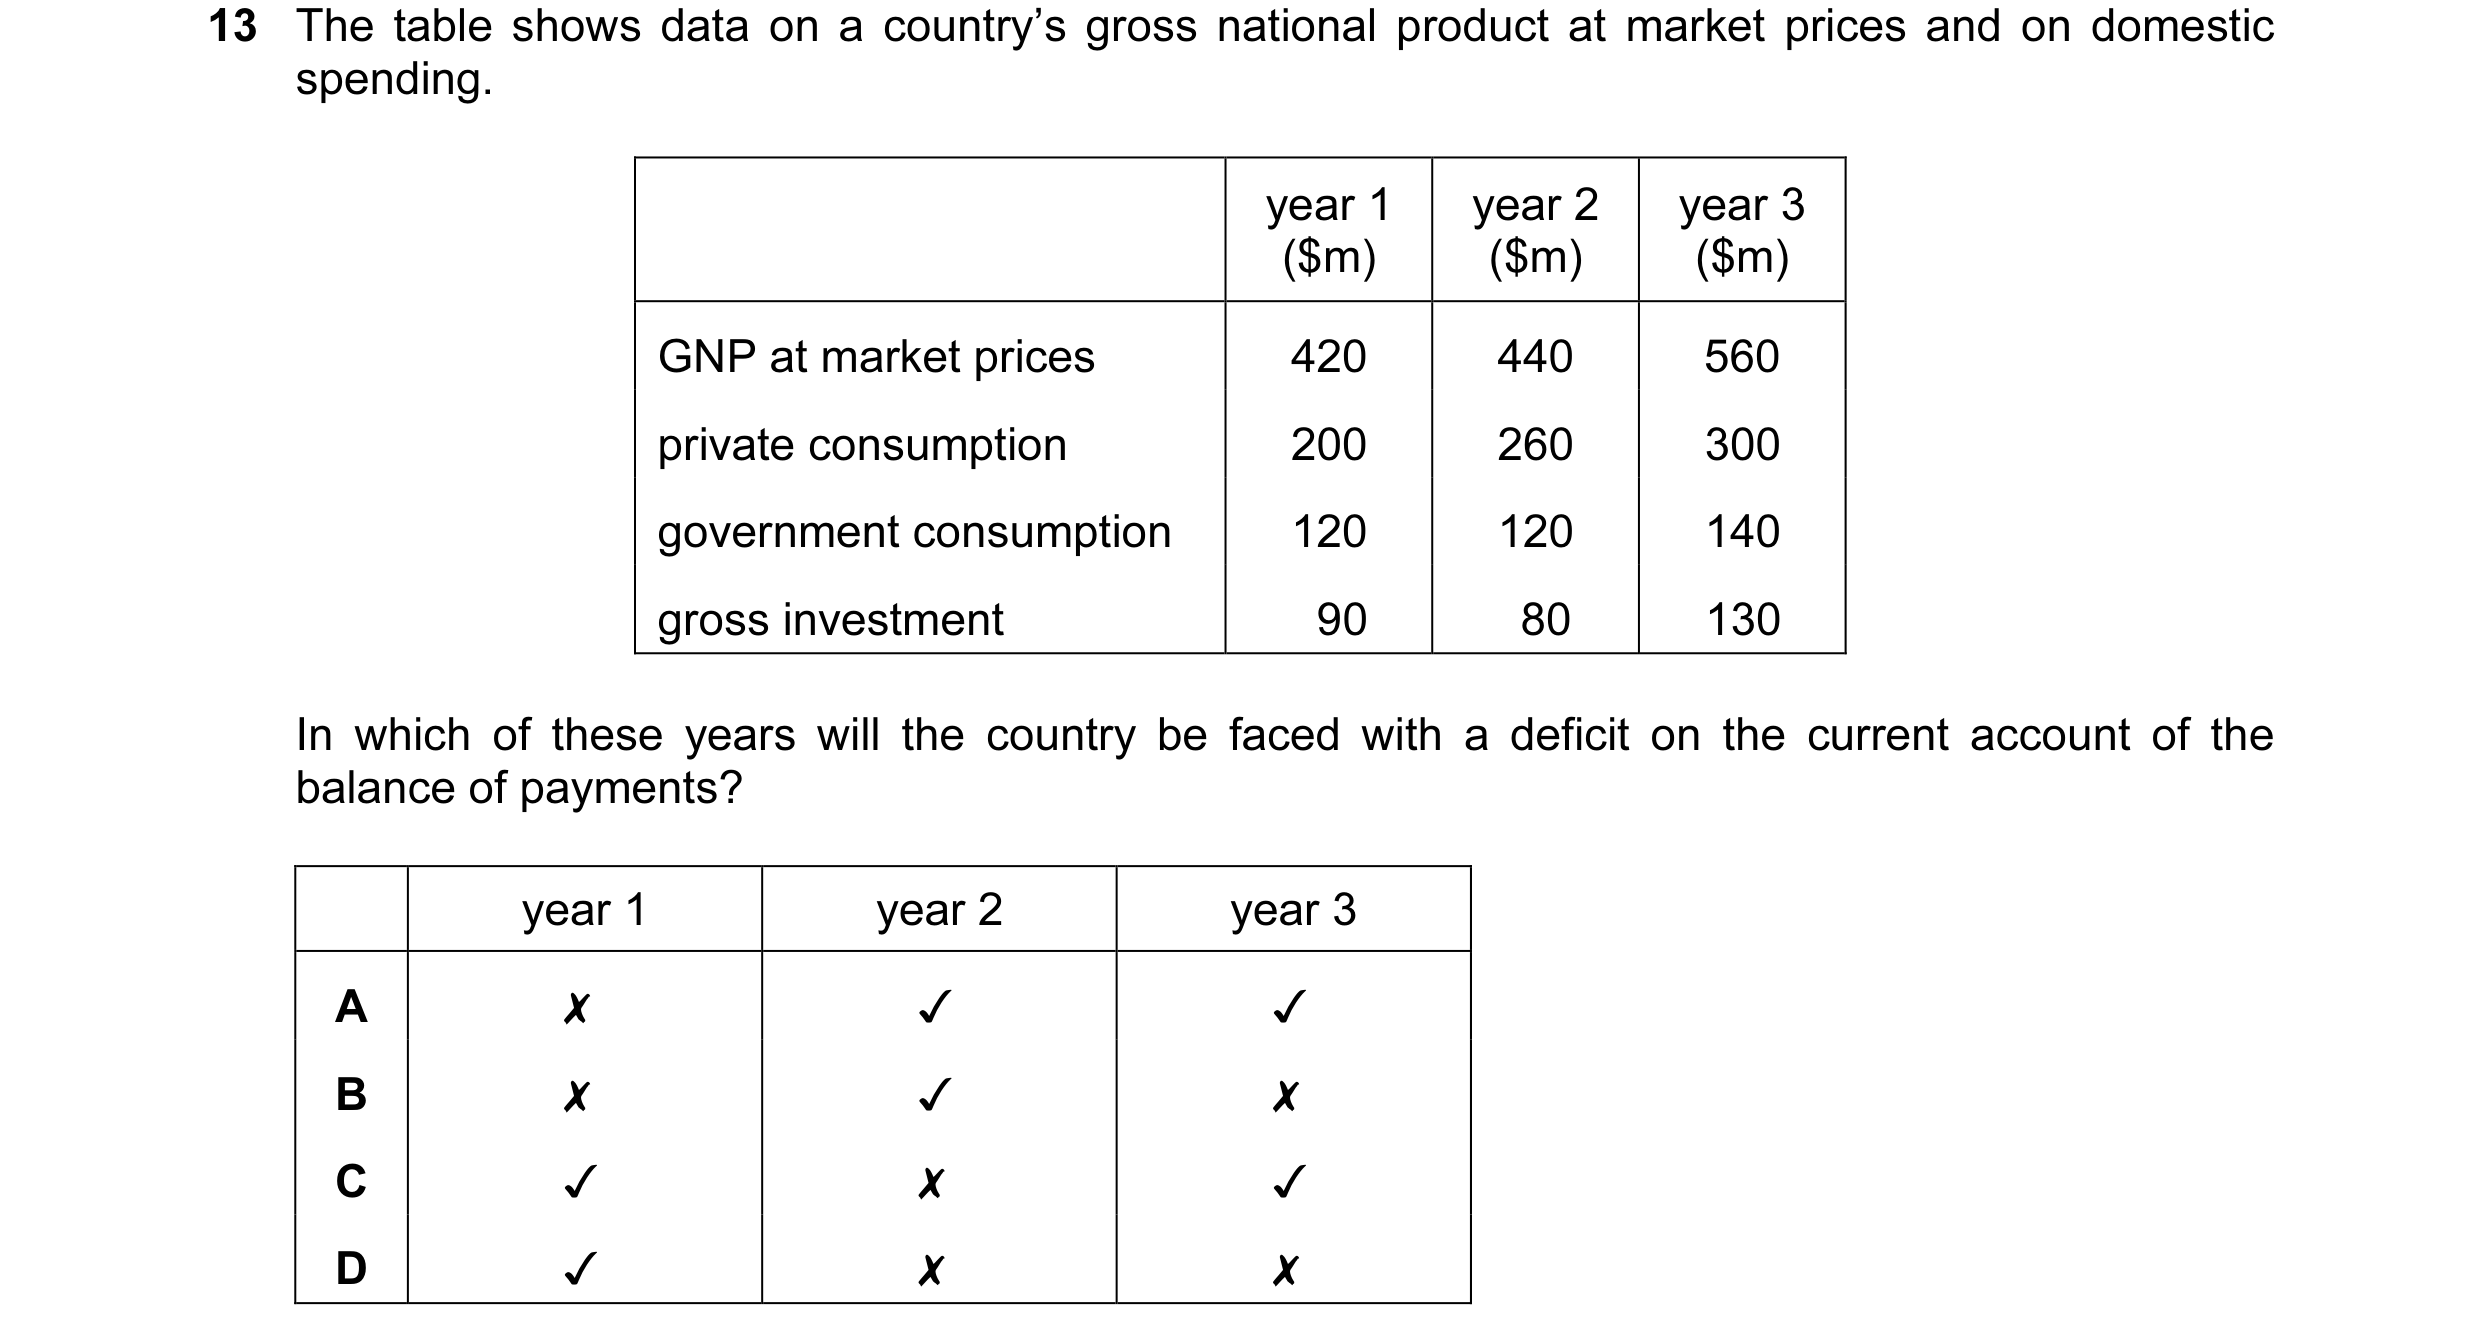
Q10 · The table shows data on a country’s gross national product at market prices and on… 9708/33 May/June 2011
13 The table shows data on a country’s gross national product at market prices and on domestic
spending.
year 1 year2 | year 3
($m) ($m) ($m)
GNP at market prices 420 440 560
private consumption 200 260 300
government consumption 120 120 140
gross investment 90 80 130
In which of these years will the country be faced with a deficit on the current account of the
balance of payments?
year 1 year 2 year 3
A x v v
B x v x
Cc v x v
D v x x
1 marks
Answer: A
This question in 9708/33 May/June 2011
Q11 · The table gives information about two countries in 1994 and 2004 9708/31 Oct/Nov 2011
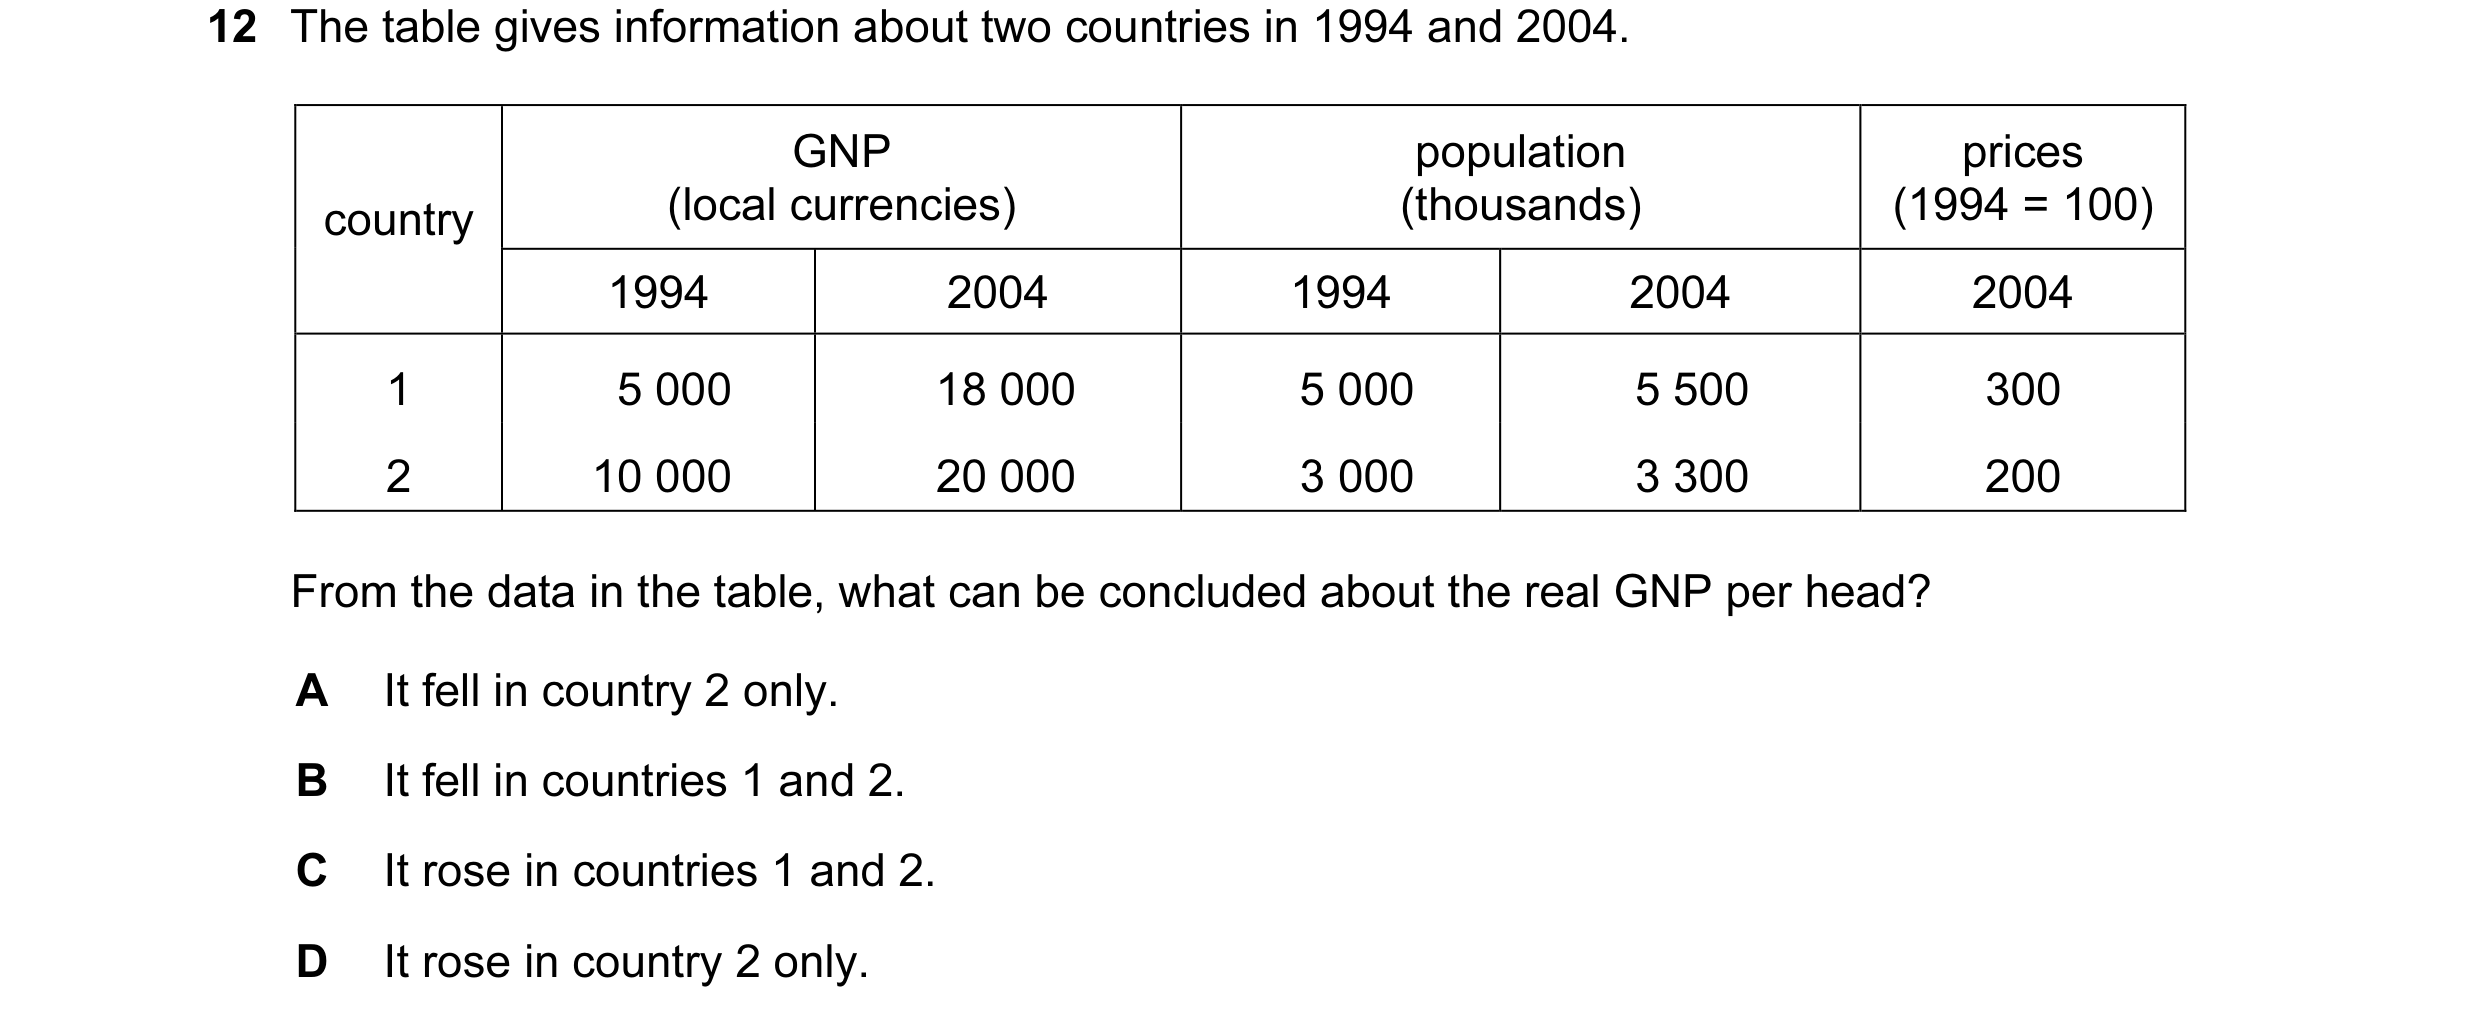
13 The table gives information about two countries in 1994 and 2004. GNP population prices country (local currencies) (thousands) (1994 = 100) 1994 2004 1994 2004 2004 1 5 000 18 000 5 000 5 500 300 2 10 000 20 000 3 000 3 300 200 From the data in the table, what can be concluded about the real GNP per head? A It fell in country 2 only. B It fell in countries 1 and 2. C It rose in countries 1 and 2. D It rose in country 2 only.
1 marks
Answer: A
This question in 9708/31 Oct/Nov 2011
Q12 · The table gives information about two countries in 1994 and 2004 9708/33 Oct/Nov 2011
12 The table gives information about two countries in 1994 and 2004. GNP population prices country (local currencies) (thousands) (1994 = 100) 1994 2004 1994 2004 2004 1 5 000 18 000 5 000 5 500 300 2 10 000 20 000 3 000 3 300 200 From the data in the table, what can be concluded about the real GNP per head? A It fell in country 2 only. B It fell in countries 1 and 2. C It rose in countries 1 and 2. D It rose in country 2 only.
1 marks
Answer: A
This question in 9708/33 Oct/Nov 2011
Q13 · The graphs indicate economic performance in a country between 2007 and 2010 9708/31 May/June 2012
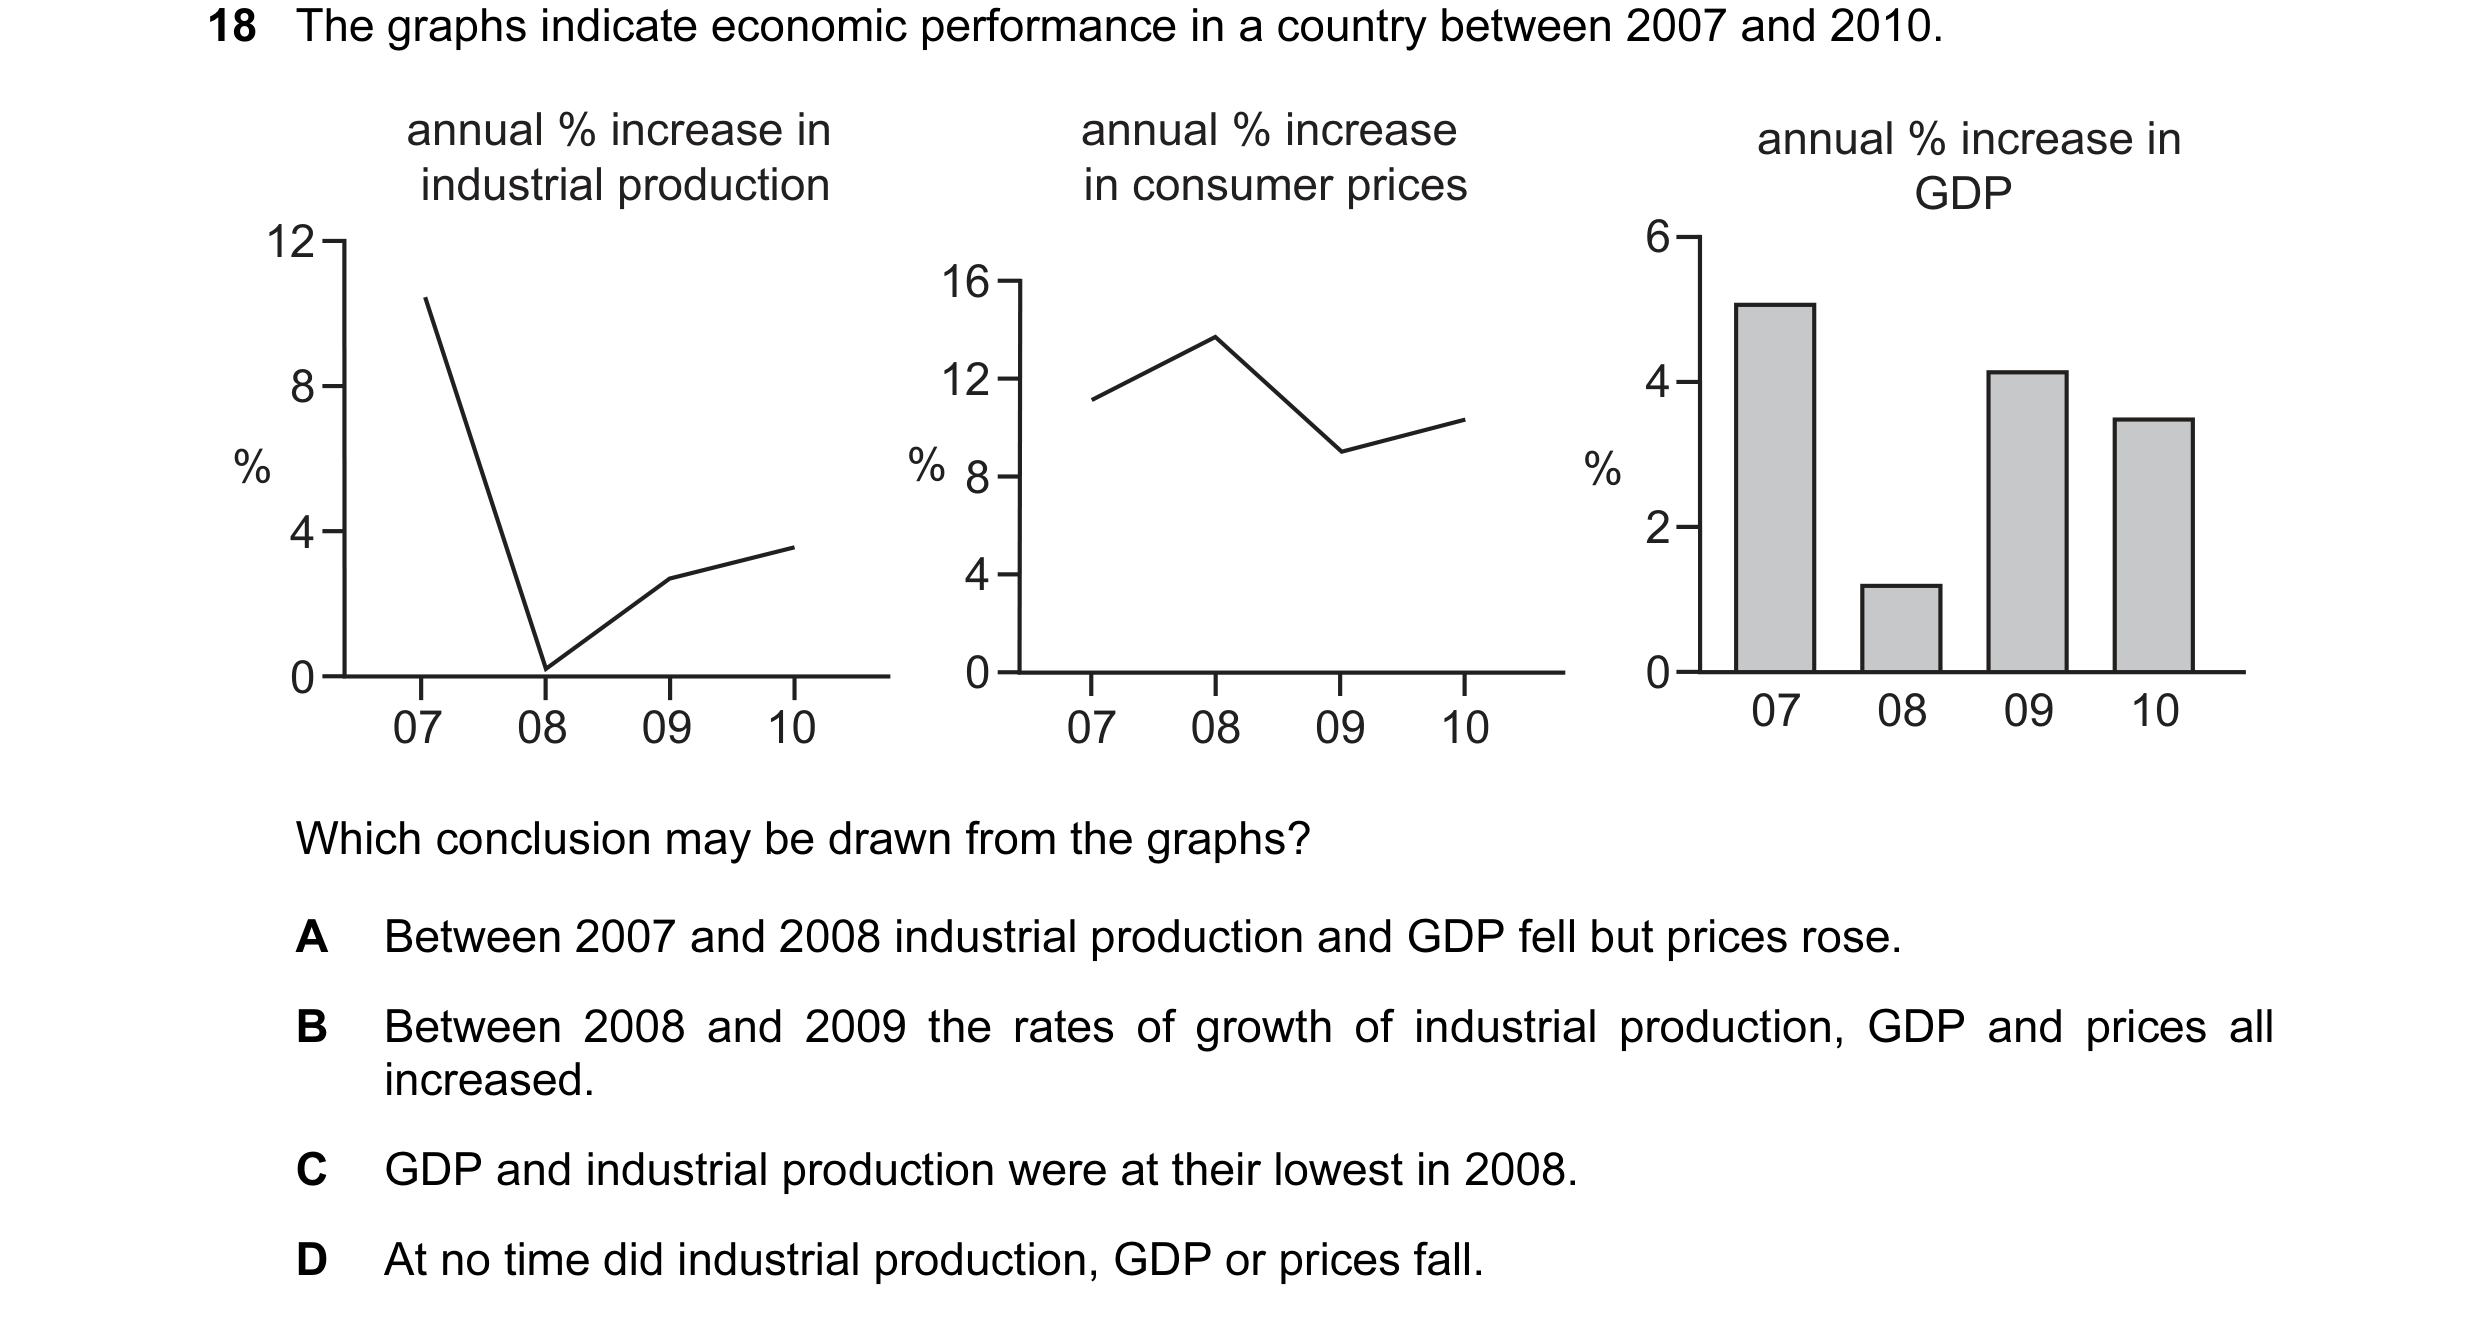
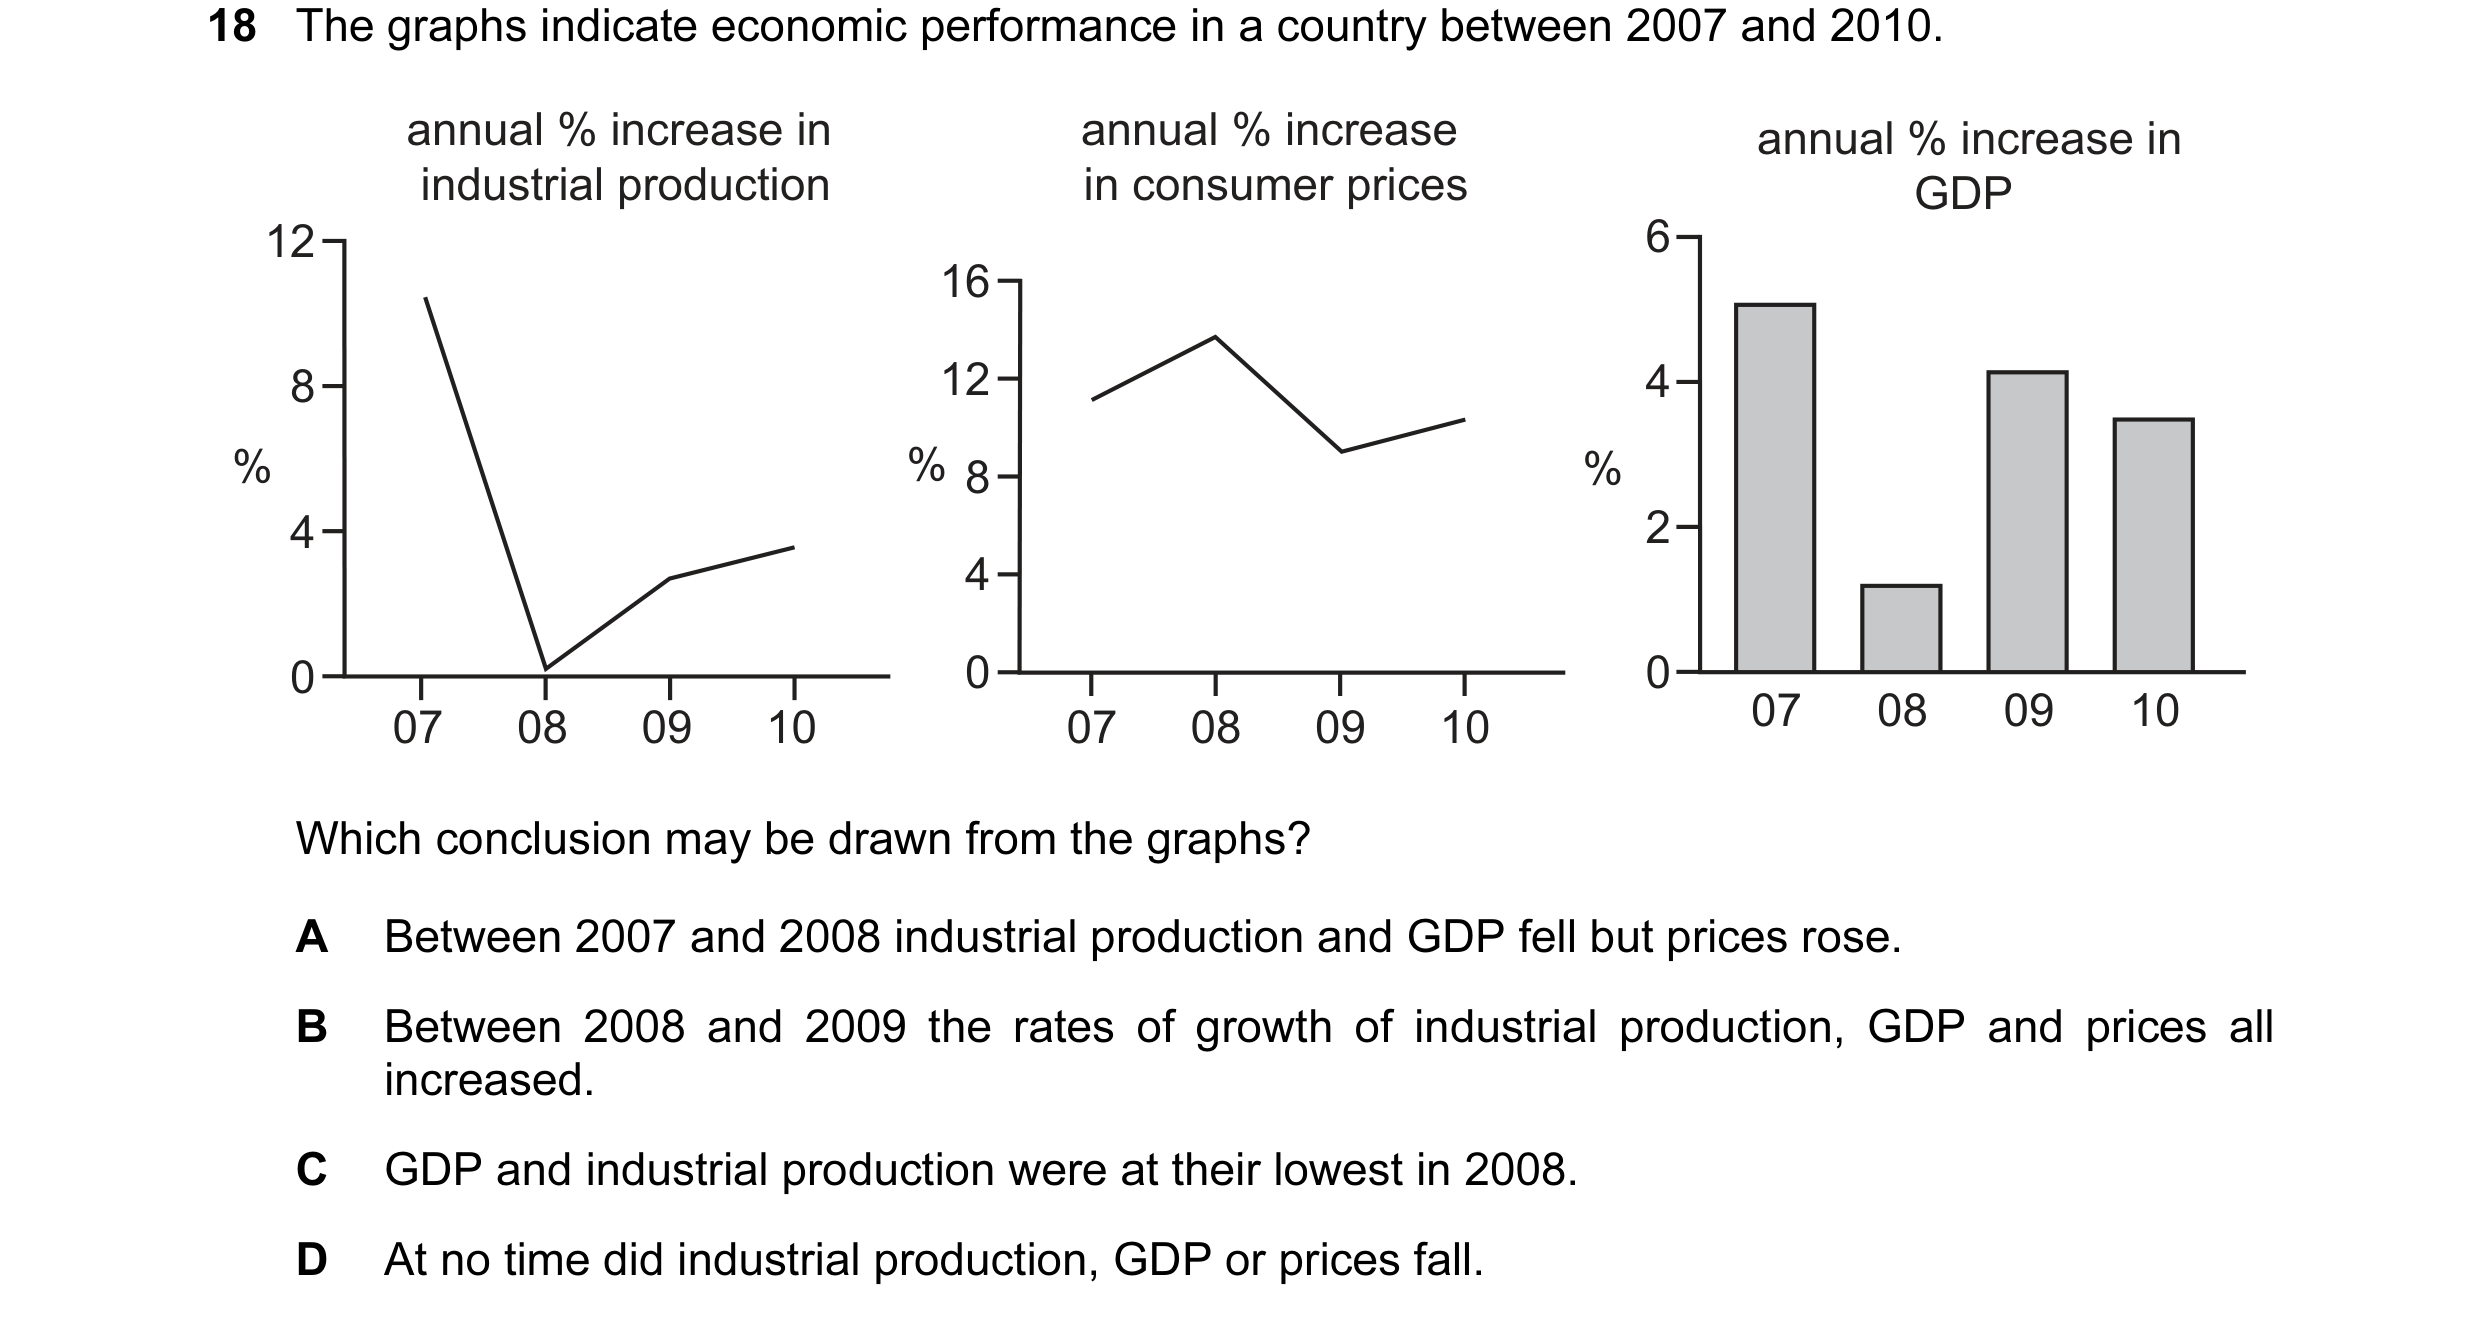
18 The graphs indicate economic performance in a country between 2007 and 2010. annual % increase in annual % increase annual % increase in industrial production in consumer prices GDP 12 6 16 8 12 4 % % 8 % 4 2 4 0 0 0 07 08 09 10 07 08 09 10 07 08 09 10 Which conclusion may be drawn from the graphs? A Between 2007 and 2008 industrial production and GDP fell but prices rose. B Between 2008 and 2009 the rates of growth of industrial production, GDP and prices all increased. C GDP and industrial production were at their lowest in 2008. D At no time did industrial production, GDP or prices fall.
1 marks
Answer: D
This question in 9708/31 May/June 2012
Q14 · A government uses real personal disposable income per head as a measure of the standard… 9708/32 May/June 2012
17 A government uses real personal disposable income per head as a measure of the standard of living. What does this measure not take into account? A the distribution of income B the level of national income C the size of the population D the average price level
1 marks
Answer: A
This question in 9708/32 May/June 2012
Q15 · The graphs indicate economic performance in a country between 2007 and 2010 9708/32 May/June 2012
18 The graphs indicate economic performance in a country between 2007 and 2010. annual % increase in annual % increase annual % increase in industrial production in consumer prices GDP 12 6 16 8 12 4 % % 8 % 4 2 4 0 0 0 07 08 09 10 07 08 09 10 07 08 09 10 Which conclusion may be drawn from the graphs? A Between 2007 and 2008 industrial production and GDP fell but prices rose. B Between 2008 and 2009 the rates of growth of industrial production, GDP and prices all increased. C GDP and industrial production were at their lowest in 2008. D At no time did industrial production, GDP or prices fall.
1 marks
Answer: D
This question in 9708/32 May/June 2012
Q16 · What might make Gross National Product (GNP) per capita a misleading indicator when… 9708/33 May/June 2012
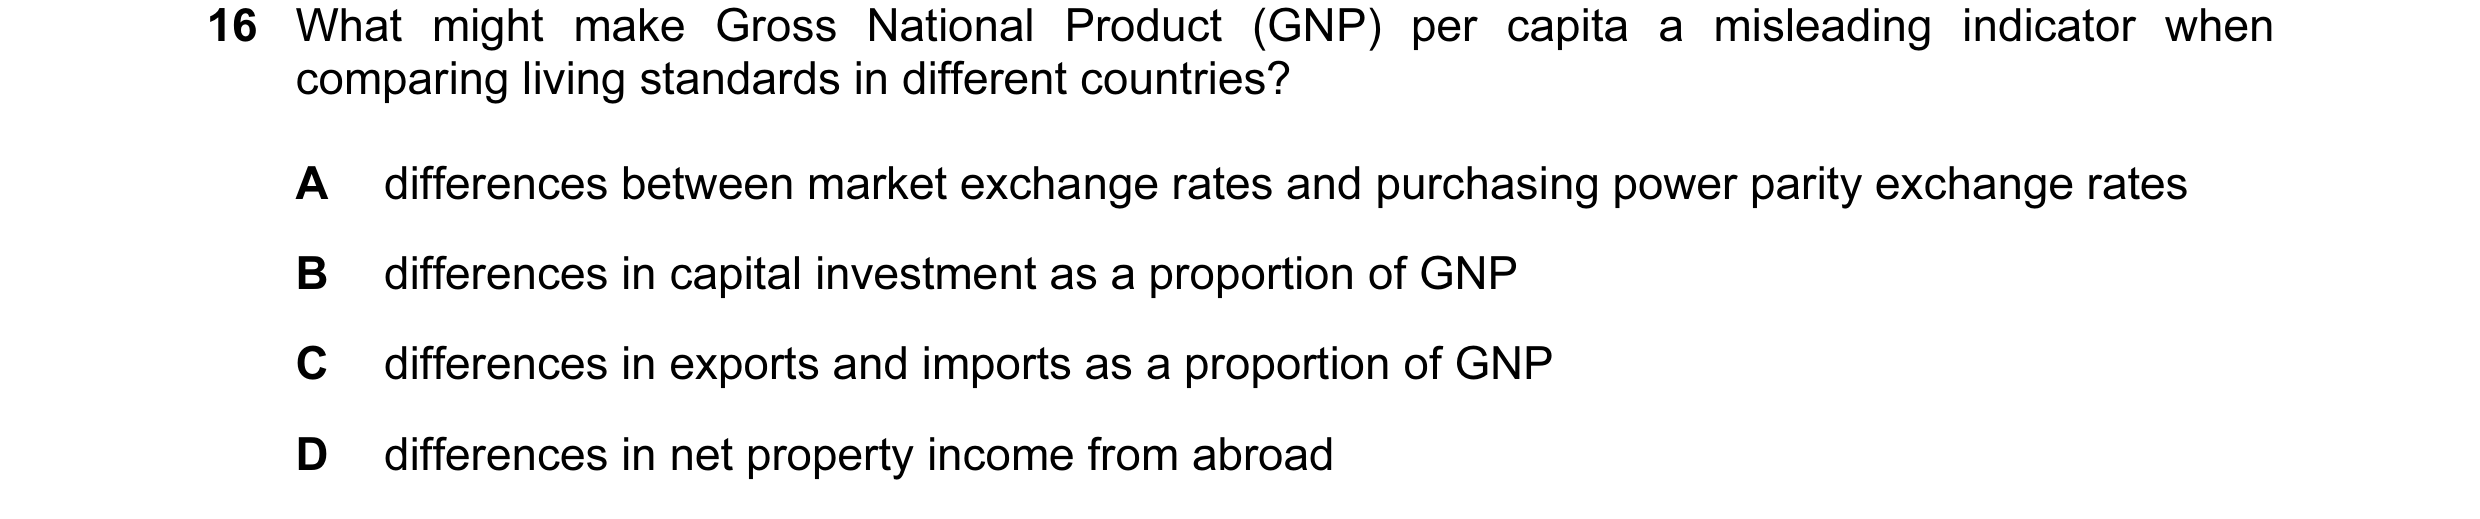
16 What might make Gross National Product (GNP) per capita a misleading indicator when comparing living standards in different countries? A differences between market exchange rates and purchasing power parity exchange rates B differences in capital investment as a proportion of GNP C differences in exports and imports as a proportion of GNP D differences in net property income from abroad
1 marks
Answer: A
This question in 9708/33 May/June 2012
Q17 · Over a given period, the nominal value of a country’s national income increased by 20 %… 9708/32 Oct/Nov 2012
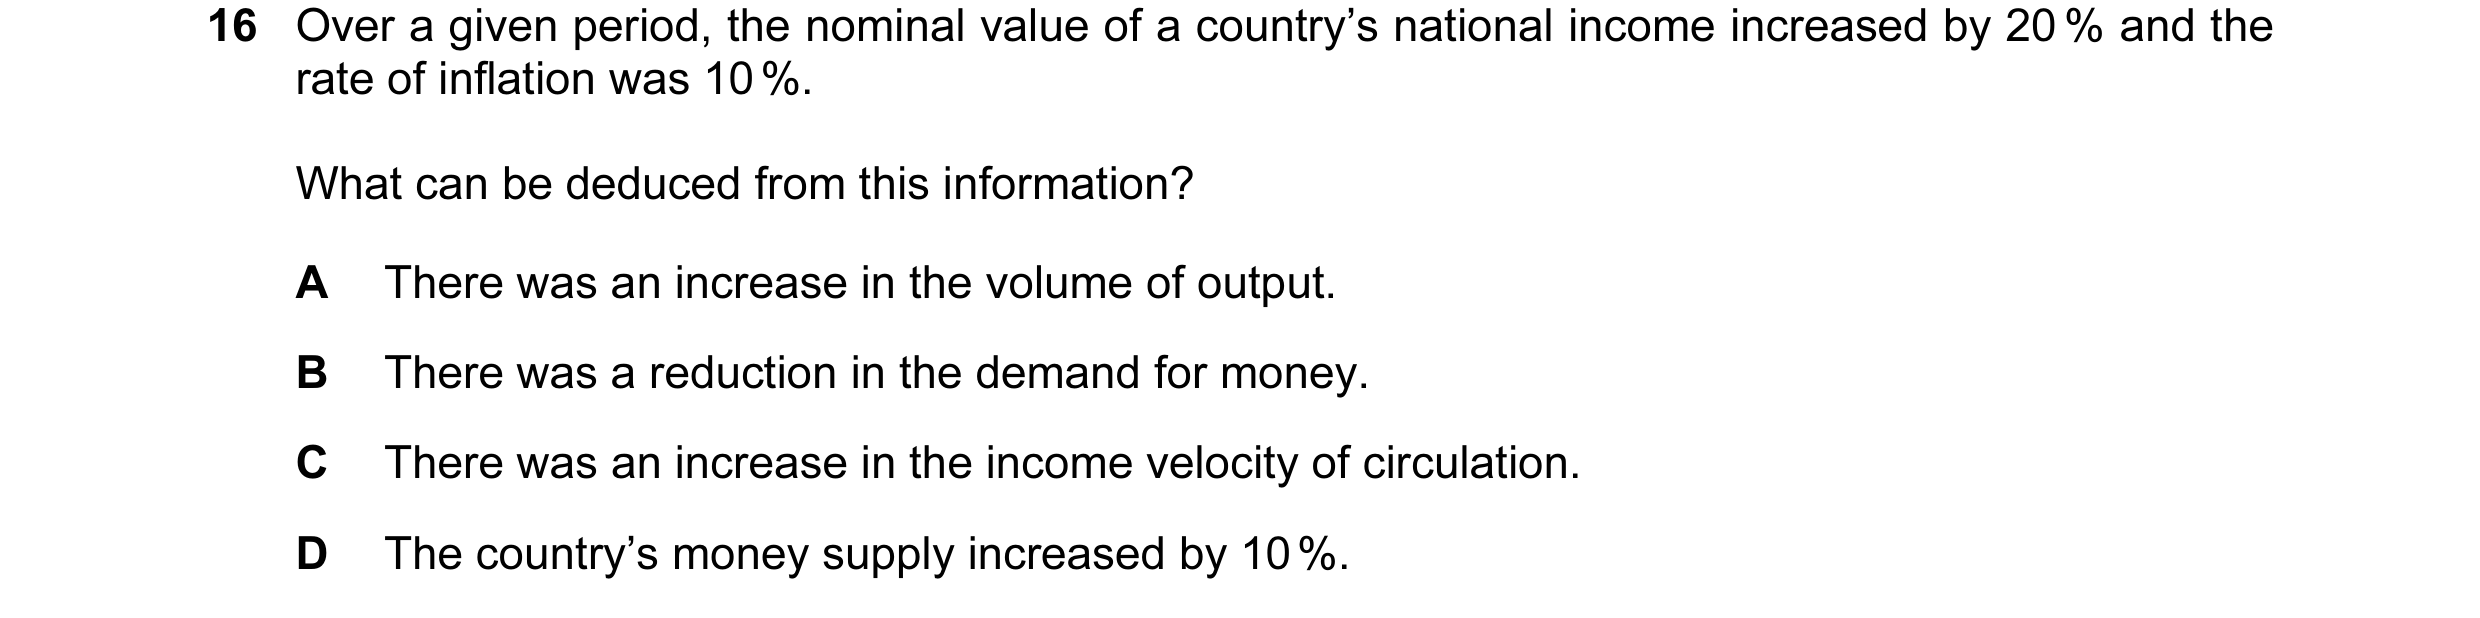
16 Over a given period, the nominal value of a country’s national income increased by 20 % and the rate of inflation was 10 %. What can be deduced from this information? A There was an increase in the volume of output. B There was a reduction in the demand for money. C There was an increase in the income velocity of circulation. D The country’s money supply increased by 10 %.
1 marks
Answer: A
This question in 9708/32 Oct/Nov 2012
Q18 · The graphs below show percentage changes in money GDP and consumer prices in a country… 9708/33 Oct/Nov 2012
16 The graphs below show percentage changes in money GDP and consumer prices in a country between 2008 and 2010. 10 6 4 % % 5 2 2008 2009 2010 2008 2009 2010 % change in % change in money GDP consumer prices Which conclusion may be drawn from the graphs? A Between 2009 and 2010 money GDP fell but consumer prices continued to rise. B Consumer prices and money GDP both continued to rise throughout the period. C In real terms GDP grew throughout the period. D When consumer prices rose, money GDP fell.
1 marks
This question in 9708/33 Oct/Nov 2012
Q19 · The table shows data on a country’s gross domestic product (GDP) at market prices and on… 9708/33 Oct/Nov 2012
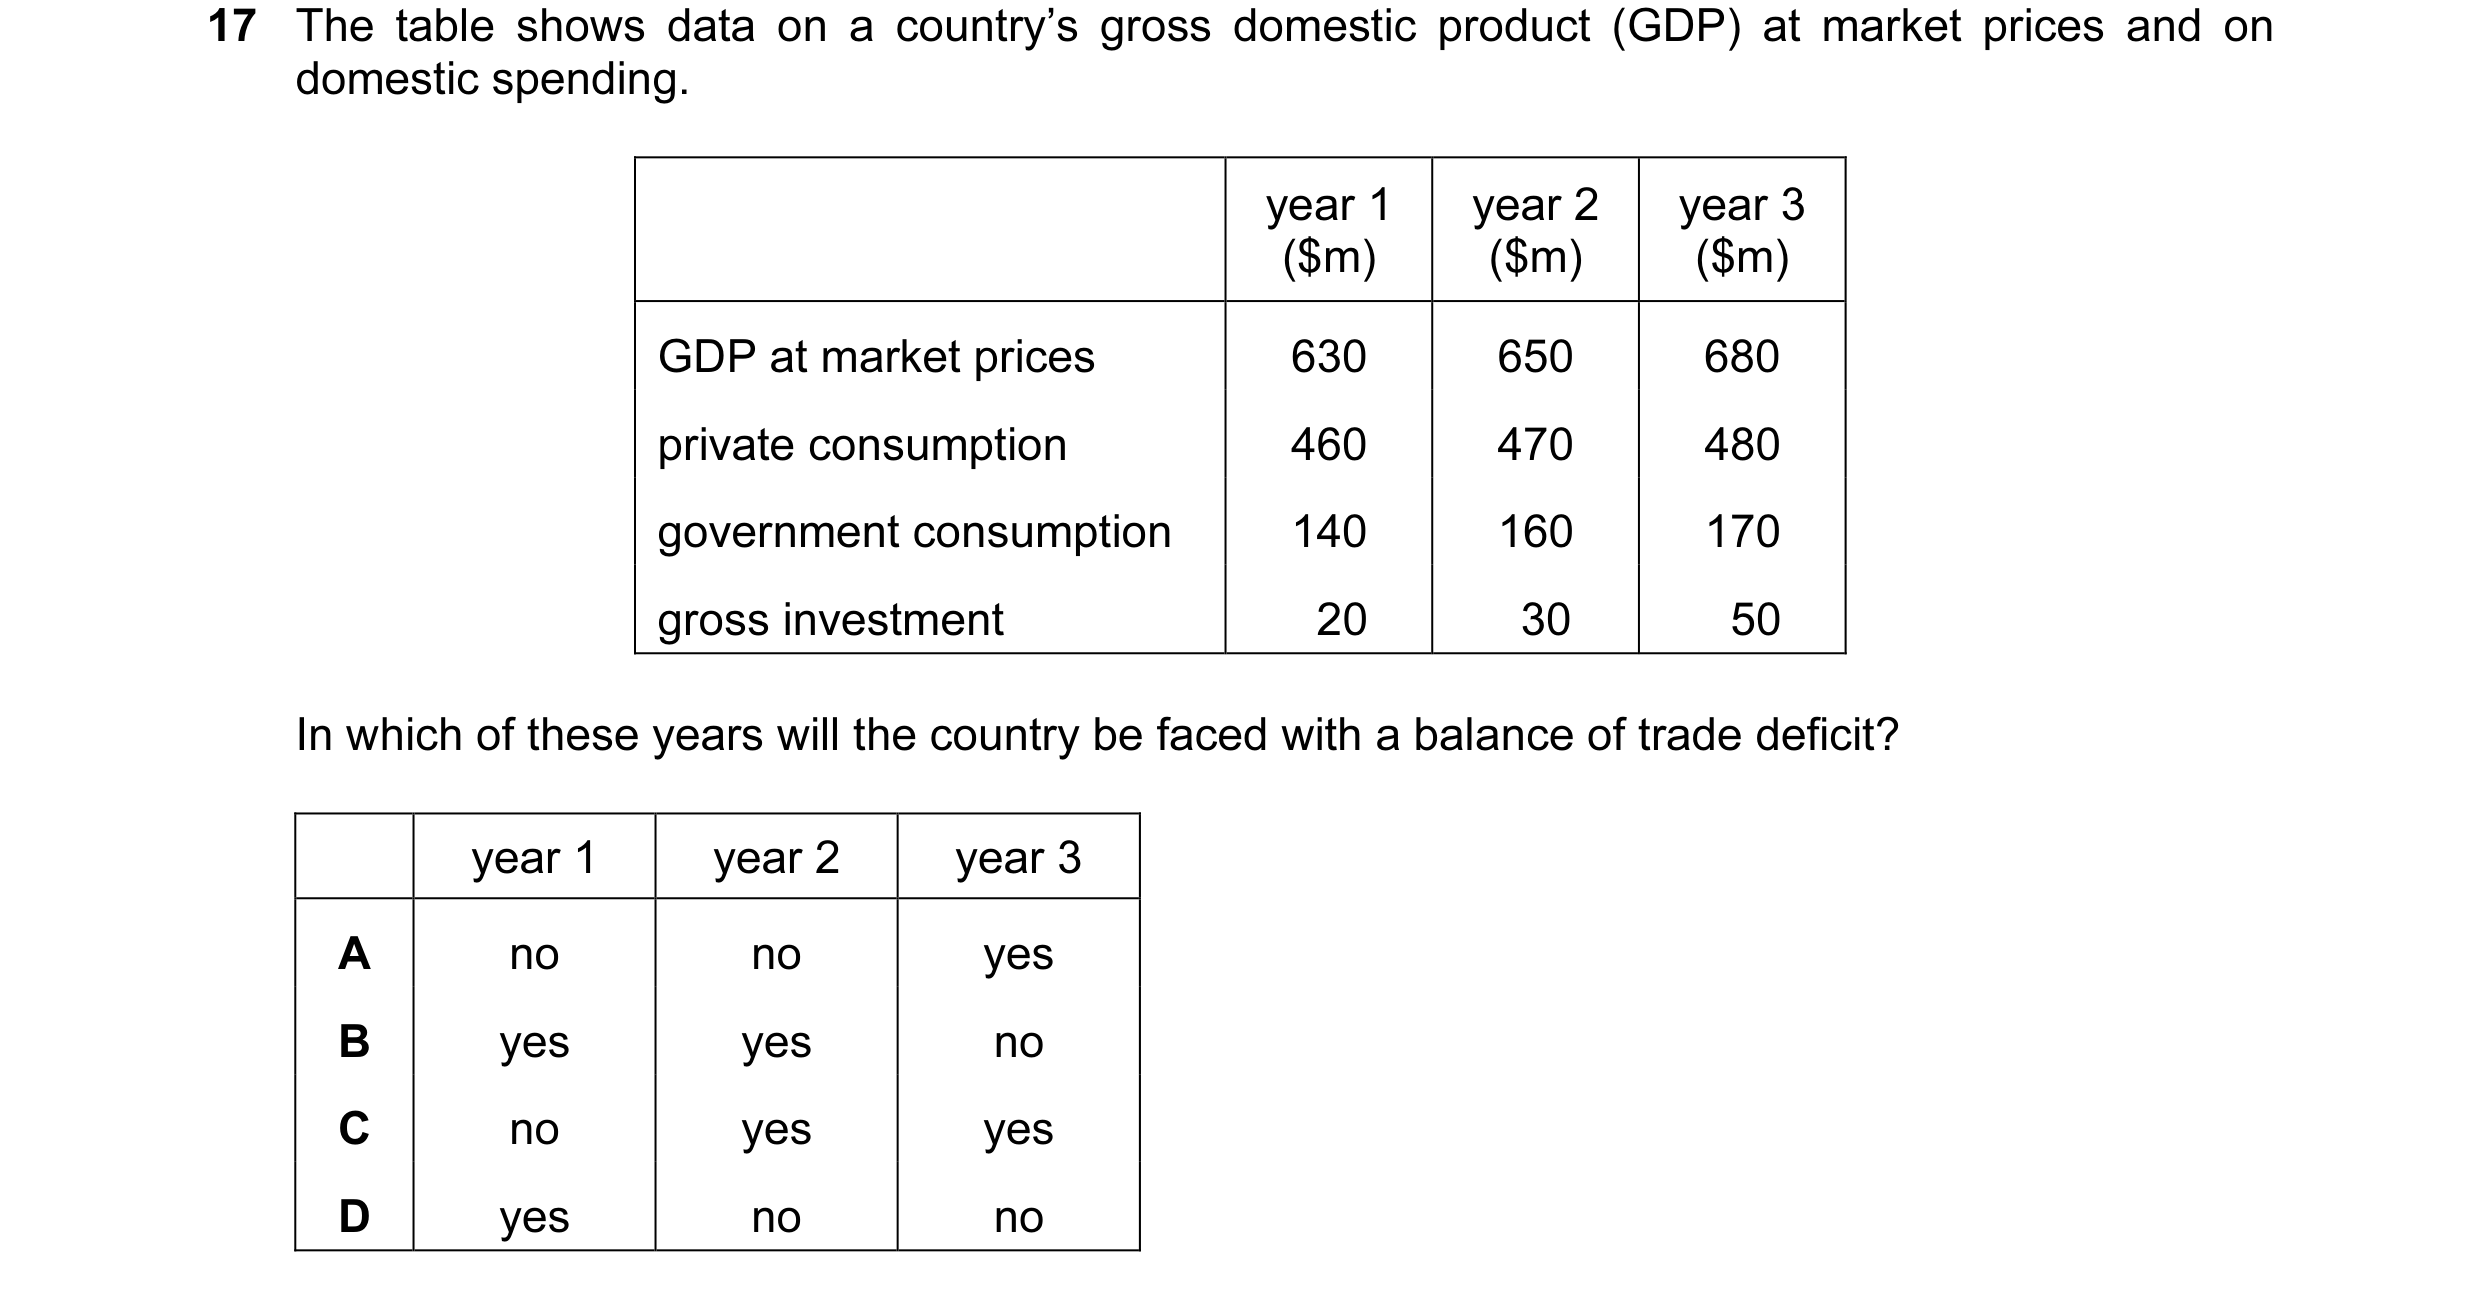
17 The table shows data on a country’s gross domestic product (GDP) at market prices and on domestic spending. year 1 year 2 year 3 ($m) ($m) ($m) GDP at market prices 630 650 680 private consumption 460 470 480 government consumption 140 160 170 gross investment 20 30 50 In which of these years will the country be faced with a balance of trade deficit? year 1 year 2 year 3 A no no yes B yes yes no C no yes yes D yes no no
1 marks
This question in 9708/33 Oct/Nov 2012
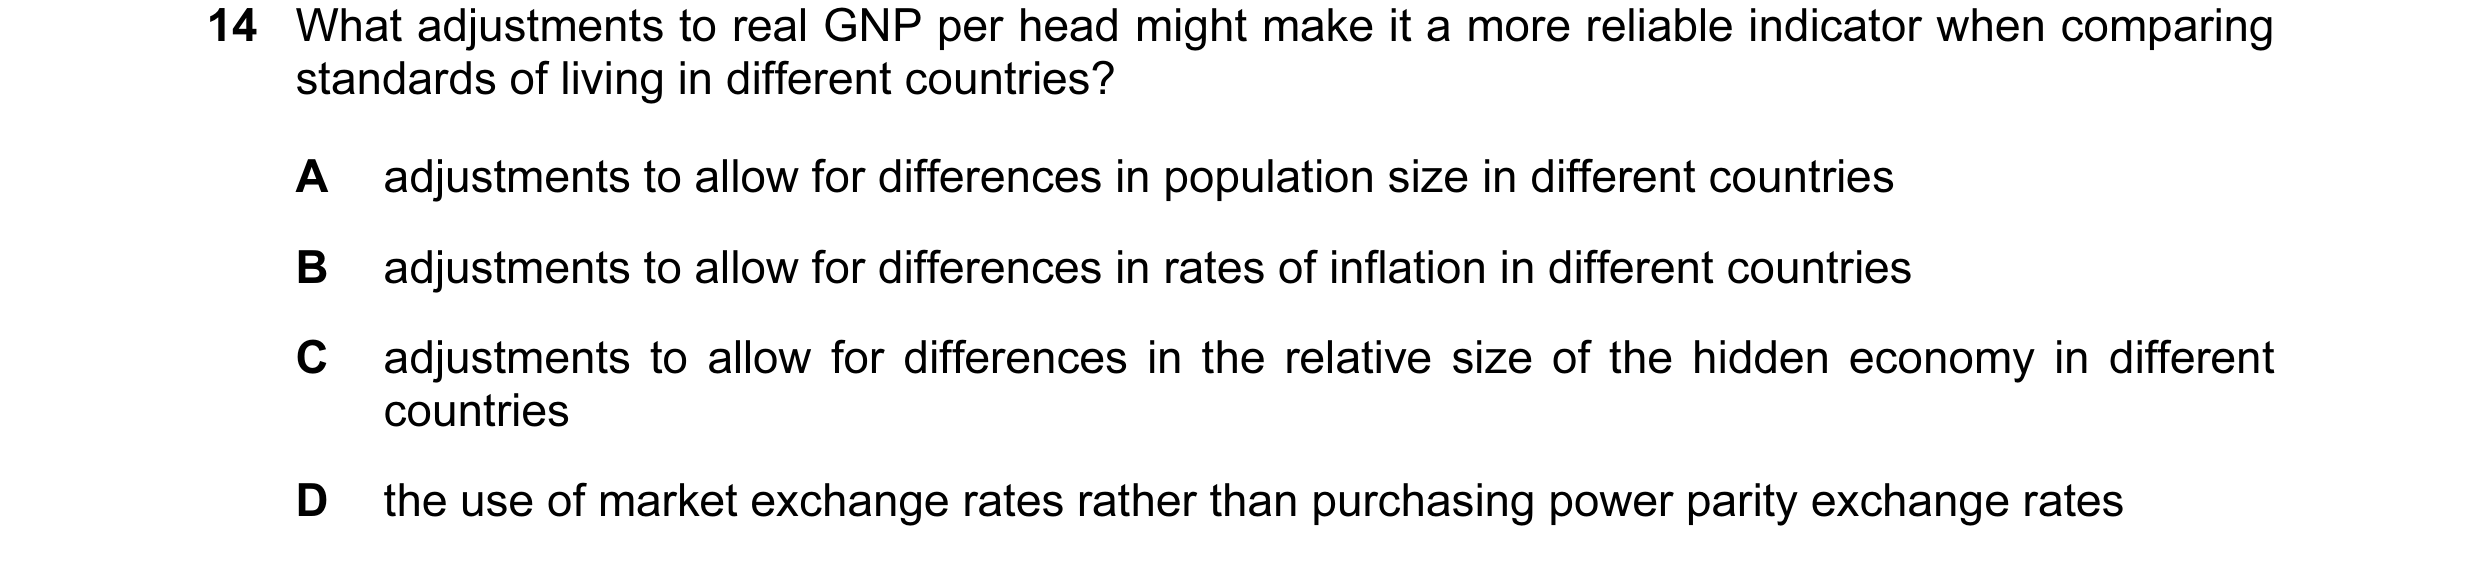
Q20 · What adjustments to real GNP per head might make it a more reliable indicator when… 9708/31 May/June 2013
14 What adjustments to real GNP per head might make it a more reliable indicator when comparing standards of living in different countries? A adjustments to allow for differences in population size in different countries B adjustments to allow for differences in rates of inflation in different countries C adjustments to allow for differences in the relative size of the hidden economy in different countries D the use of market exchange rates rather than purchasing power parity exchange rates
1 marks
Answer: C
This question in 9708/31 May/June 2013
Q21 · National income statistics show that real GDP per head is 25% higher in country X than in… 9708/32 May/June 2013
17 National income statistics show that real GDP per head is 25% higher in country X than in country Y. Why might this difference exaggerate the gap in average living standards between the two countries? A Country X has a larger population than country Y. B Country X has a higher rate of inflation than country Y. C The proportion of services people provide for themselves is higher in country Y. D The proportion of the country’s industry which is owned by foreign firms is higher in country Y.
1 marks
Answer: C
This question in 9708/32 May/June 2013
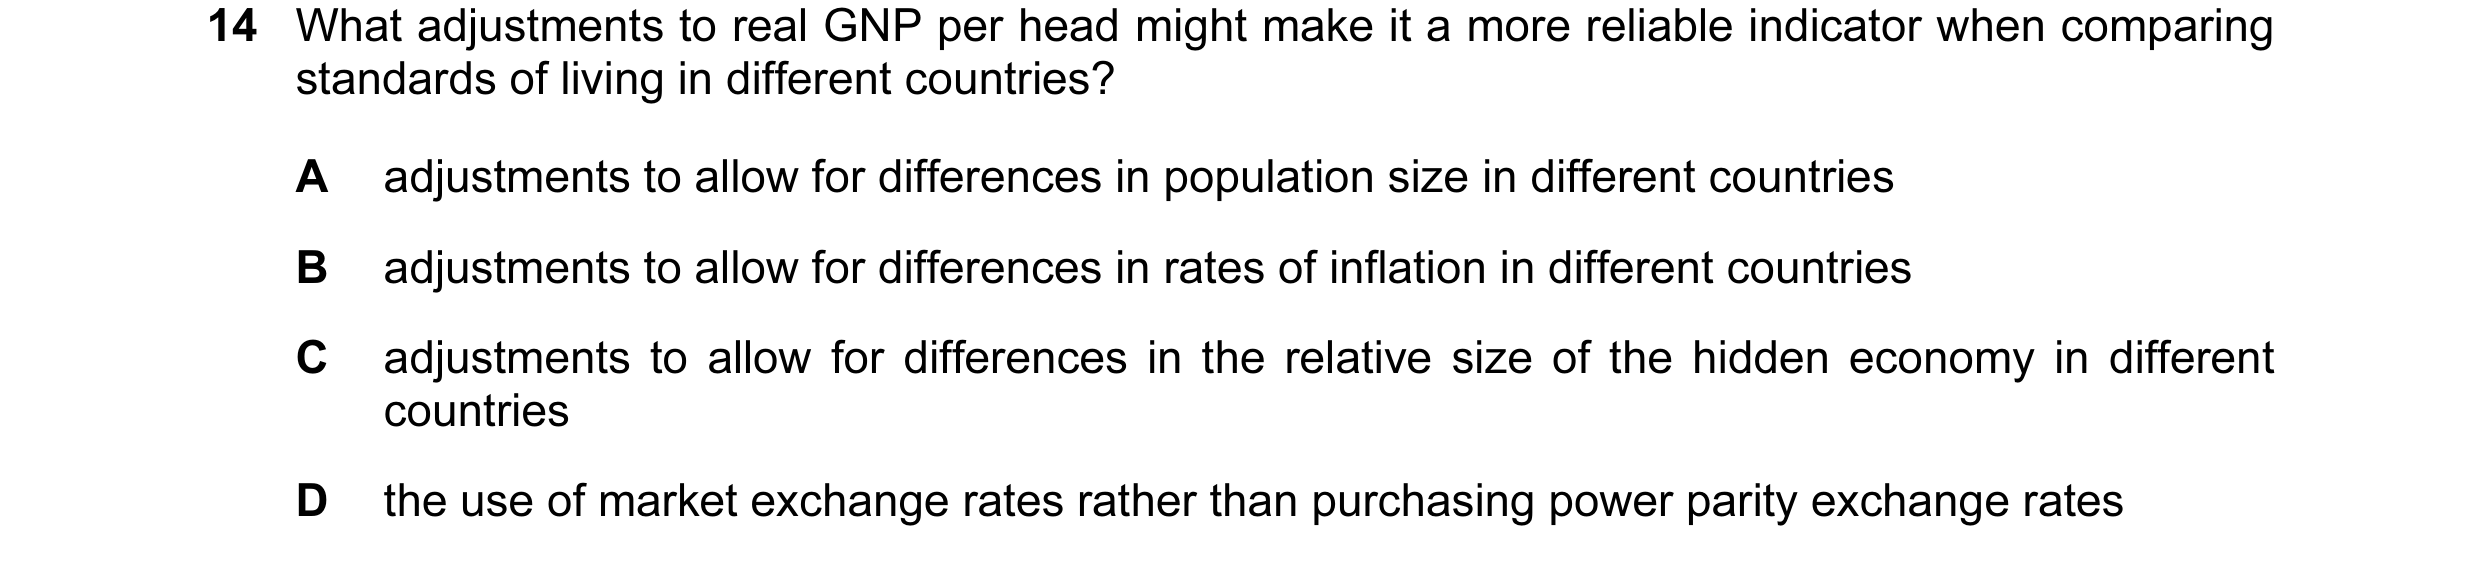
Q22 · What adjustments to real GNP per head might make it a more reliable indicator when… 9708/33 May/June 2013
14 What adjustments to real GNP per head might make it a more reliable indicator when comparing standards of living in different countries? A adjustments to allow for differences in population size in different countries B adjustments to allow for differences in rates of inflation in different countries C adjustments to allow for differences in the relative size of the hidden economy in different countries D the use of market exchange rates rather than purchasing power parity exchange rates
1 marks
Answer: C
This question in 9708/33 May/June 2013
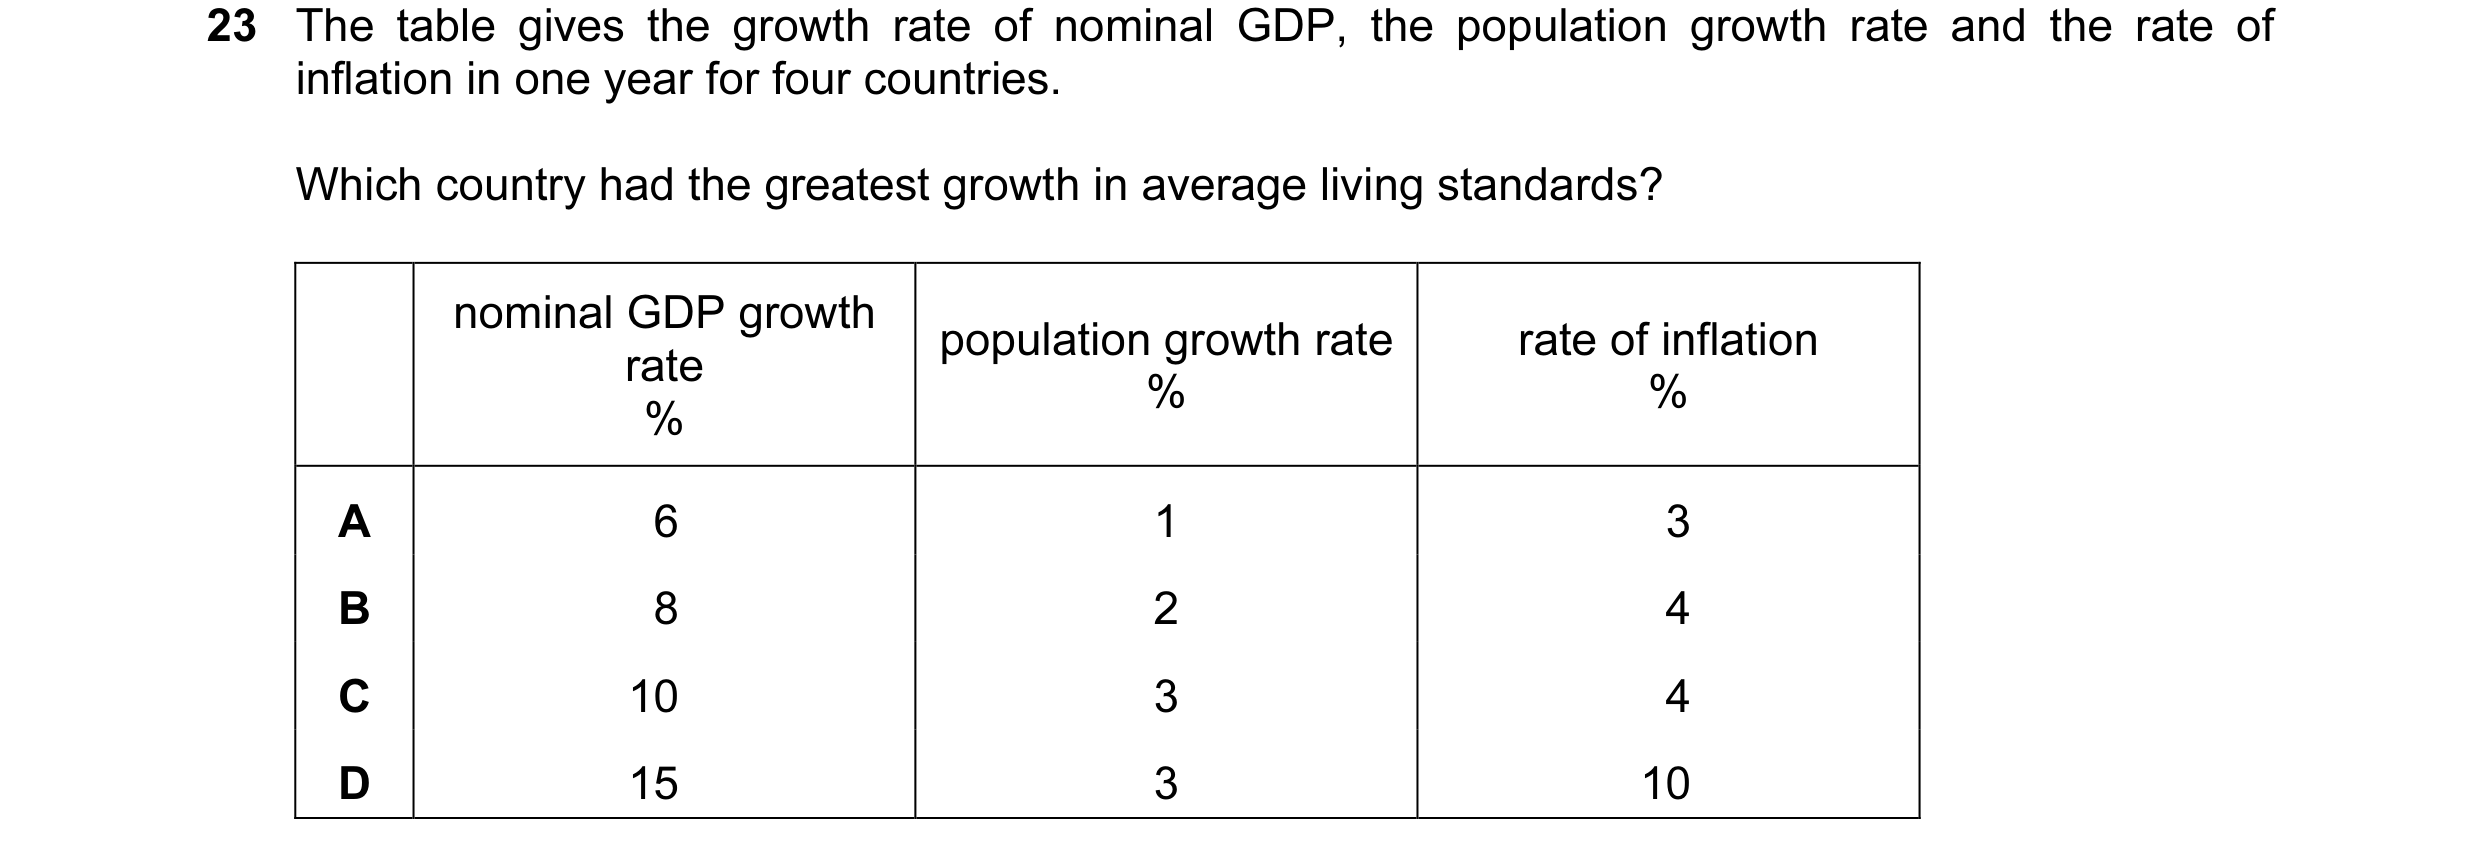
Q23 · The table gives the growth rate of nominal GDP, the population growth rate and the rate… 9708/31 Oct/Nov 2013
23 The table gives the growth rate of nominal GDP, the population growth rate and the rate of inflation in one year for four countries. Which country had the greatest growth in average living standards? nominal GDP growth population growth rate rate of inflation rate % % % A 6 1 3 B 8 2 4 C 10 3 4 D 15 3 10
1 marks
Answer: C
This question in 9708/31 Oct/Nov 2013
Q24 · A woman joins the labour force earning a salary of $25 000 per annum 9708/31 Oct/Nov 2014
17 A woman joins the labour force earning a salary of $25 000 per annum. Her partner, who is already employed, earns $18 000 per annum. The couple pay a childminder $8000 per annum to look after their baby. What will be the increase in GDP? A $17 000 B $25 000 C $33 000 D $51 000
1 marks
Answer: C
This question in 9708/31 Oct/Nov 2014
Q25 · The table shows some data for an economy 9708/31 Oct/Nov 2014
21 The table shows some data for an economy. government national investment exports savings imports taxation expenditure income $m $m $m $m $m $m $m 200 100 100 100 120 100 700 200 100 100 120 140 100 800 200 100 100 130 170 100 900 200 100 100 140 200 280 1000 What is the equilibrium level of national income? A $700 m B $800 m C $900 m D $1000 m
1 marks
Answer: C
This question in 9708/31 Oct/Nov 2014
Q26 · Between 2008 and 2009 a country’s national income at current prices increased by 15% 9708/33 Oct/Nov 2014
17 Between 2008 and 2009 a country’s national income at current prices increased by 15%. At the same time the country experienced 5% inflation. Which index number most closely represents the country’s national income in 2009 at 2008 prices (2008 = 100)? A 103 B 110 C 115 D 120
1 marks
Answer: B
This question in 9708/33 Oct/Nov 2014
Q27 · During a year, a country’s national income in money terms increased by 5%, prices… 9708/31 May/June 2015
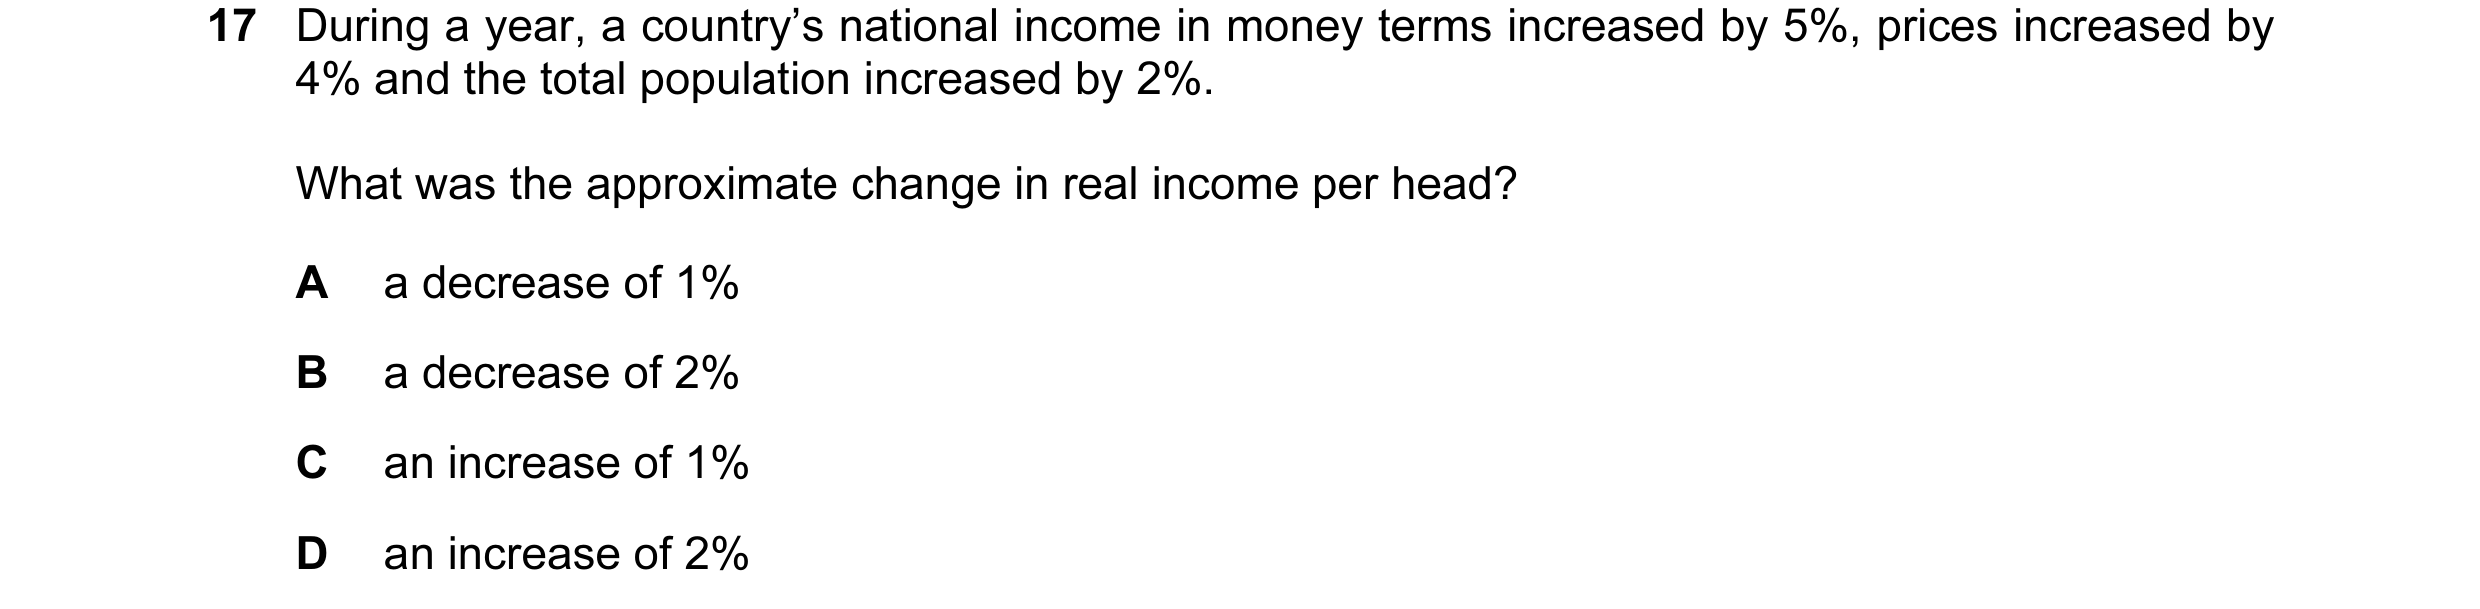
17 During a year, a country’s national income in money terms increased by 5%, prices increased by 4% and the total population increased by 2%. What was the approximate change in real income per head? A a decrease of 1% B a decrease of 2% C an increase of 1% D an increase of 2%
1 marks
Answer: A
This question in 9708/31 May/June 2015
Q28 · A government requires all its young citizens to undertake community service for a period… 9708/31 Oct/Nov 2015
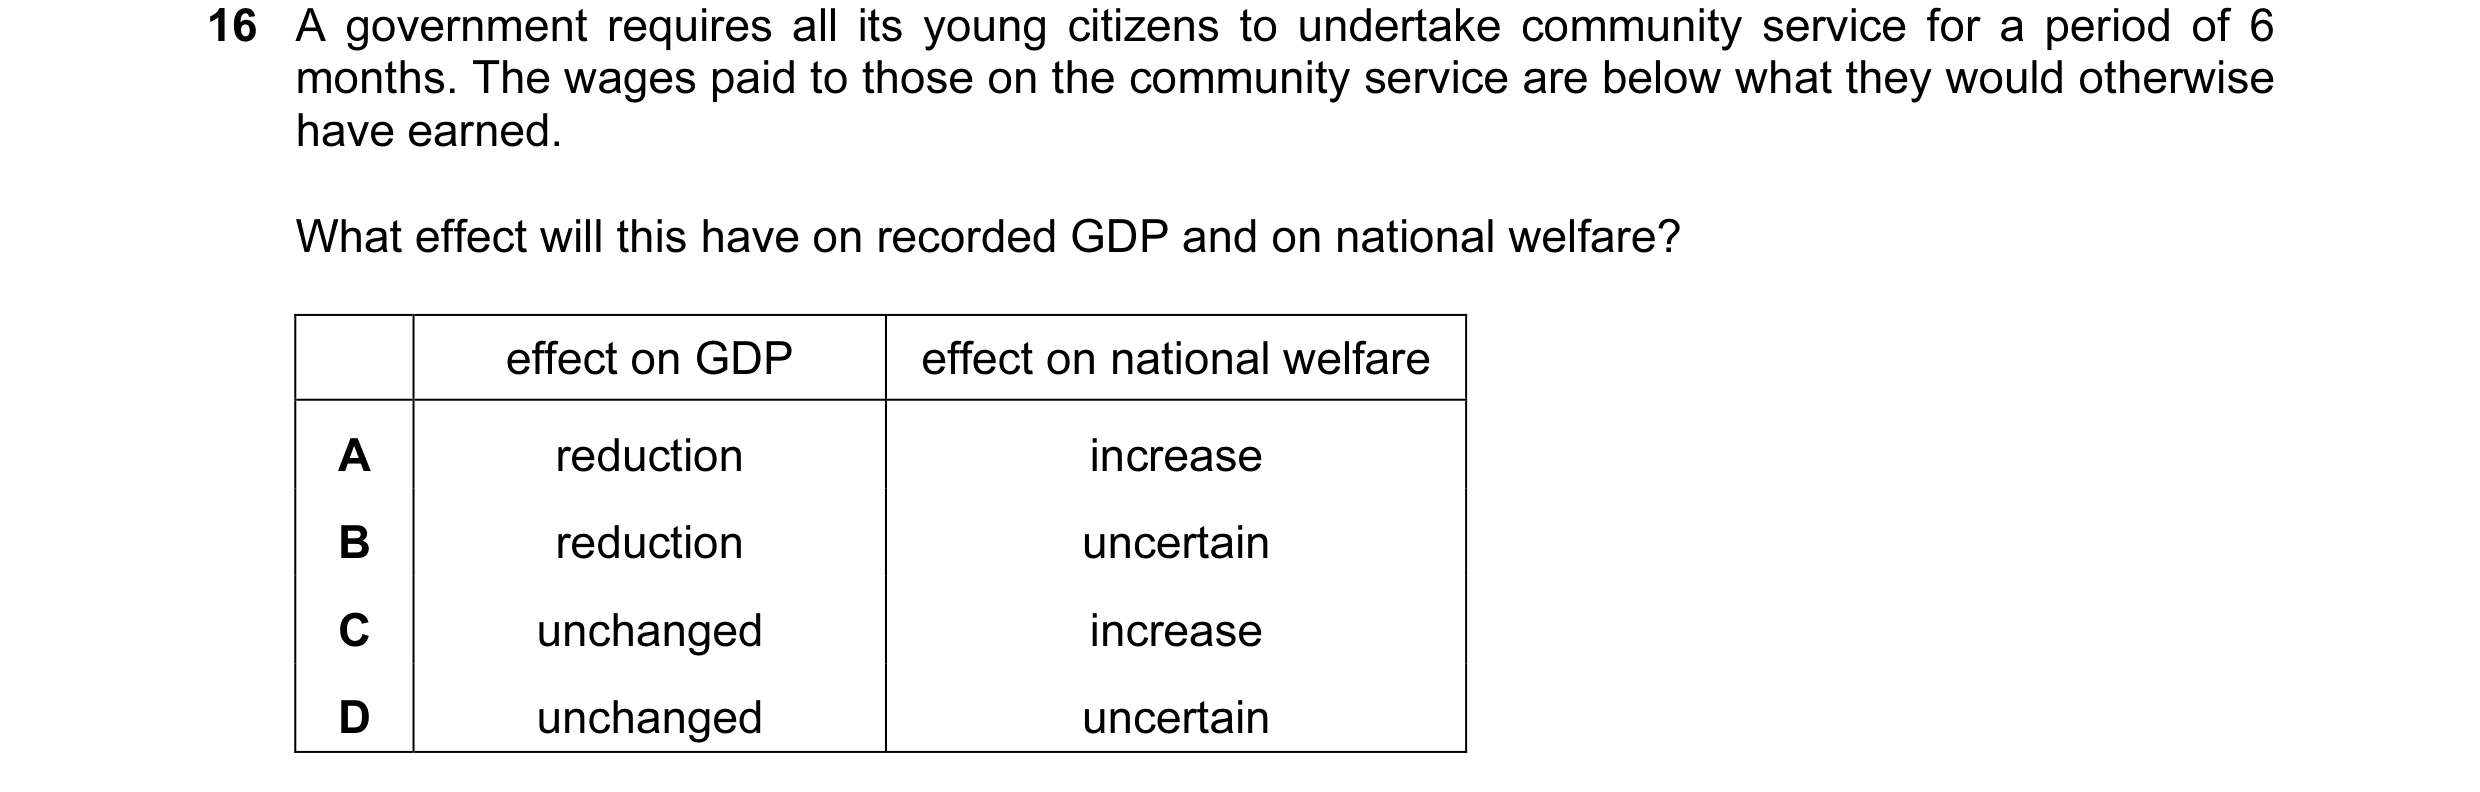
16 A government requires all its young citizens to undertake community service for a period of 6 months. The wages paid to those on the community service are below what they would otherwise have earned. What effect will this have on recorded GDP and on national welfare? effect on GDP effect on national welfare A reduction increase B reduction uncertain C unchanged increase D unchanged uncertain
1 marks
This question in 9708/31 Oct/Nov 2015
Q29 · The information in the table is taken from a country’s national income accounts 9708/32 Oct/Nov 2015
18 The information in the table is taken from a country’s national income accounts. $ million national income 600 consumer spending 400 investment spending 80 government spending on goods and services 100 exports 140 What is the value of imports? A $100 million B $120 million C $140 million D $240 million
1 marks
Answer: B
This question in 9708/32 Oct/Nov 2015
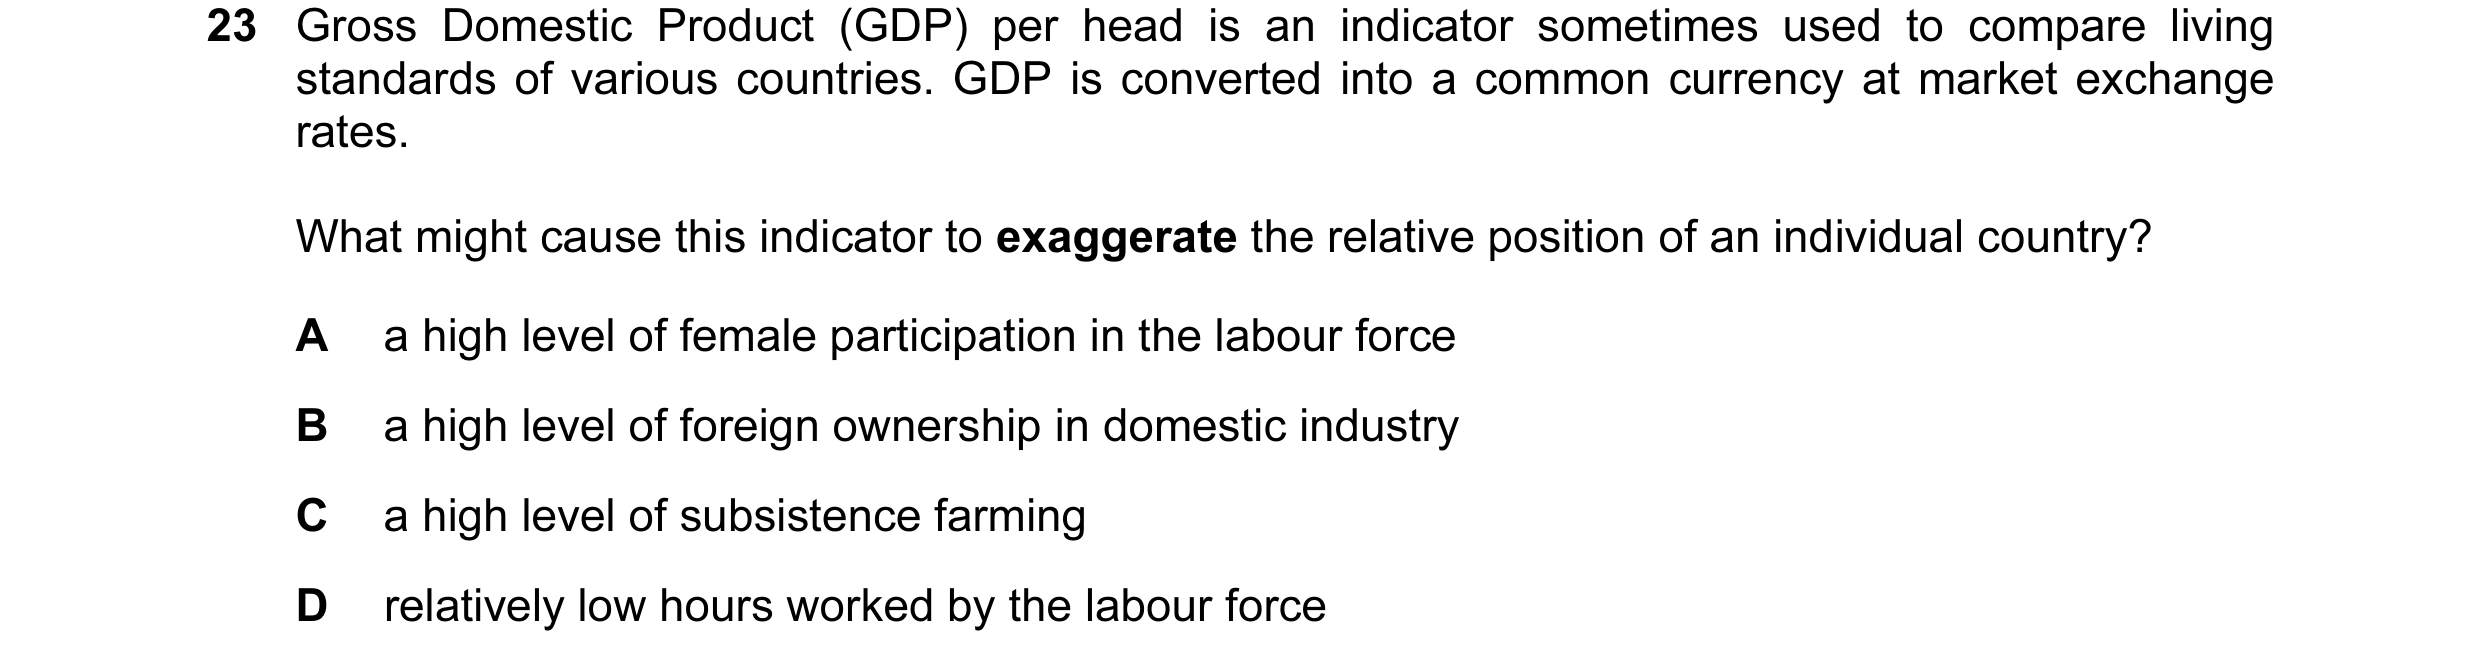
Q30 · Gross Domestic Product (GDP) per head is an indicator sometimes used to compare living… 9708/32 Oct/Nov 2015
23 Gross Domestic Product (GDP) per head is an indicator sometimes used to compare living standards of various countries. GDP is converted into a common currency at market exchange rates. What might cause this indicator to exaggerate the relative position of an individual country? A a high level of female participation in the labour force B a high level of foreign ownership in domestic industry C a high level of subsistence farming D relatively low hours worked by the labour force
1 marks
Answer: B
This question in 9708/32 Oct/Nov 2015
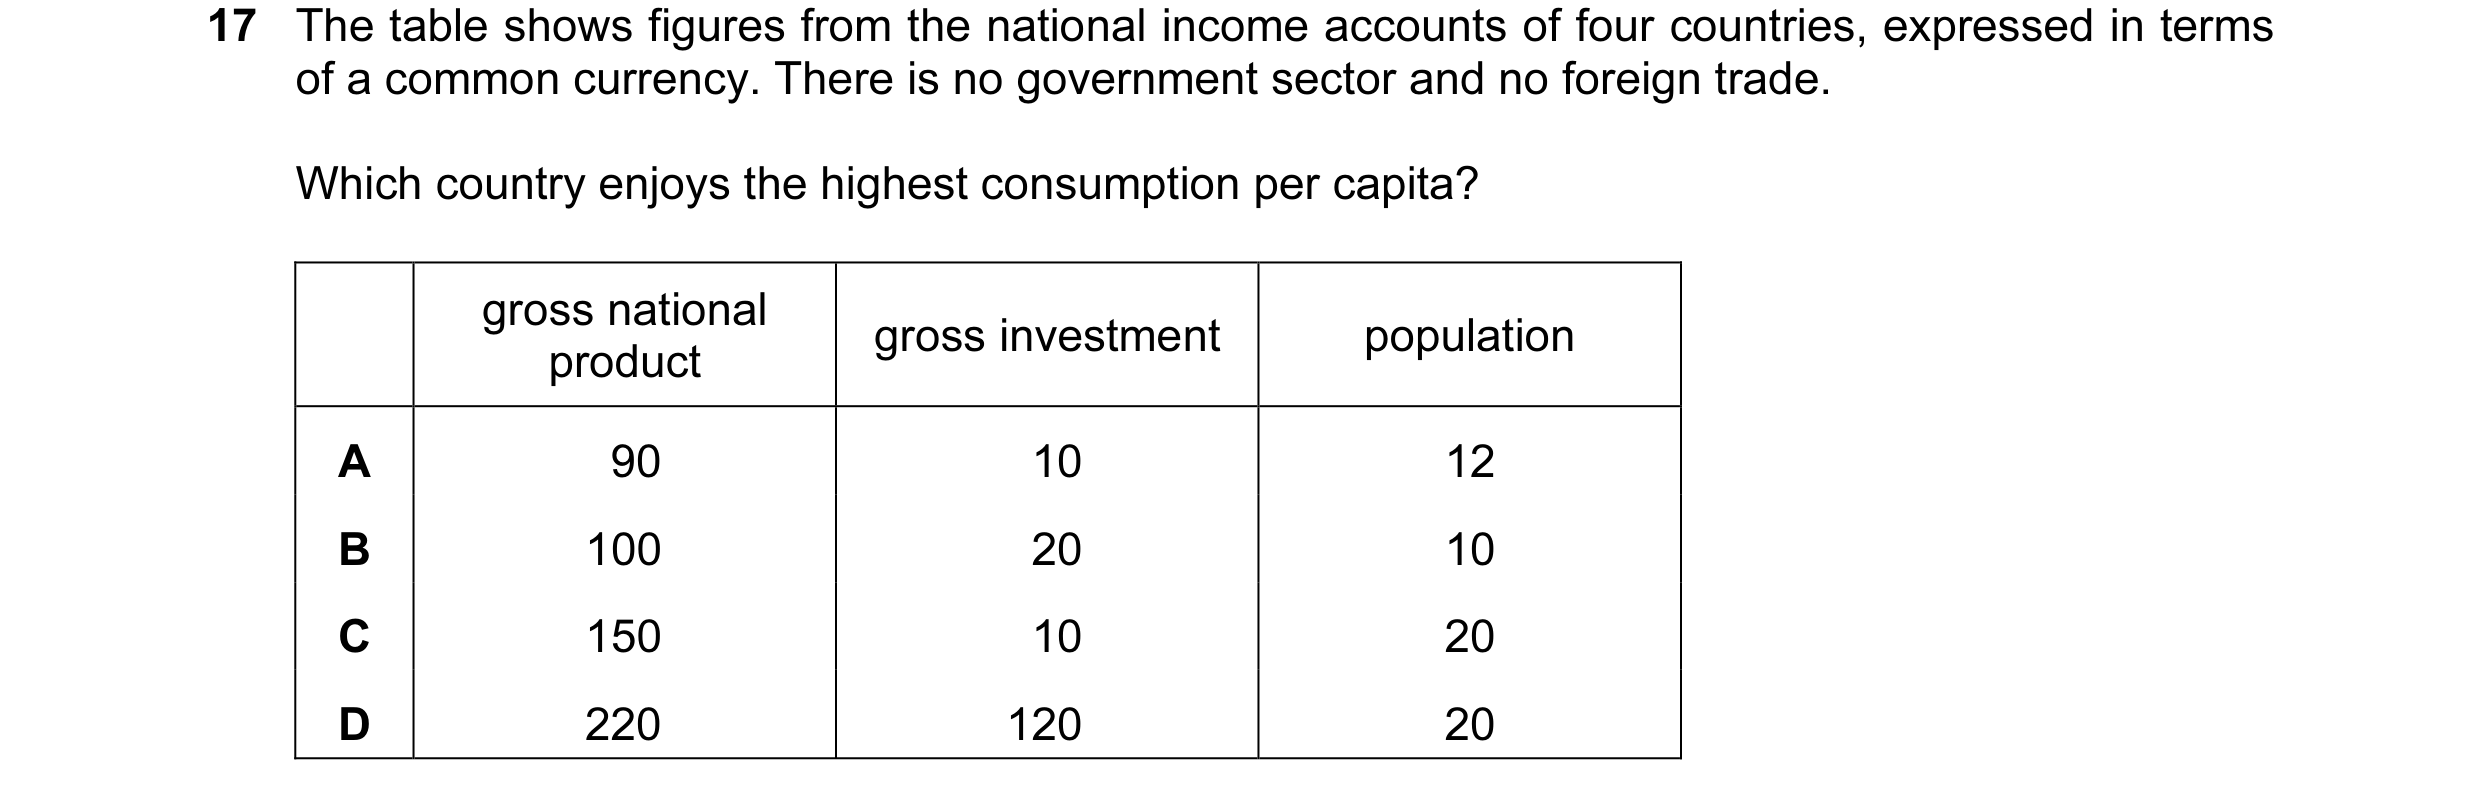
Q31 · The table shows figures from the national income accounts of four countries, expressed in… 9708/33 Oct/Nov 2015
17 The table shows figures from the national income accounts of four countries, expressed in terms of a common currency. There is no government sector and no foreign trade. Which country enjoys the highest consumption per capita? gross national gross investment population product A 90 10 12 B 100 20 10 C 150 10 20 D 220 120 20
1 marks
Answer: B
This question in 9708/33 Oct/Nov 2015
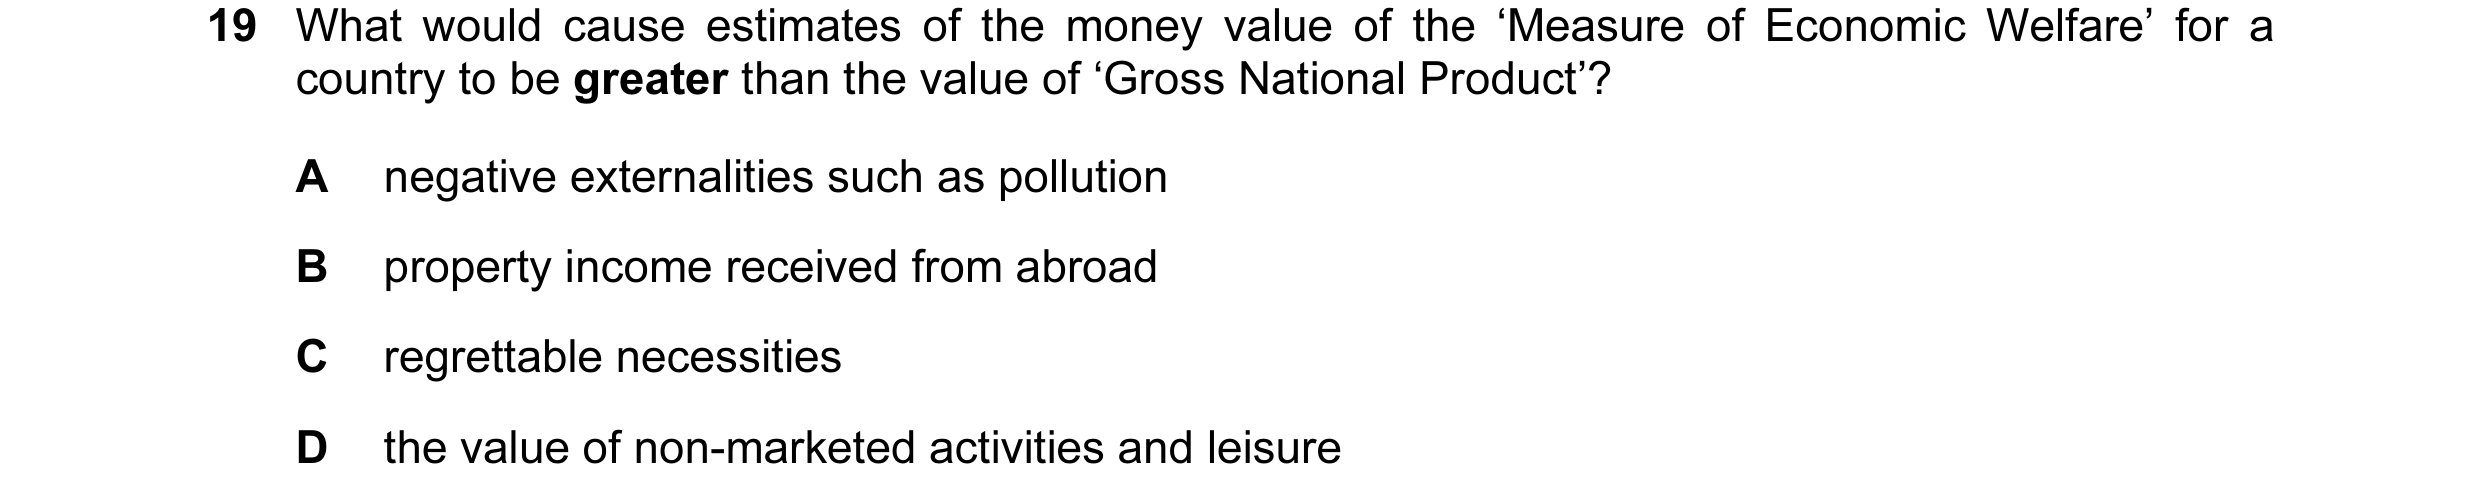
Q32 · What would cause estimates of the money value of the ‘Measure of Economic Welfare’ for a… 9708/32 May/June 2016
19 What would cause estimates of the money value of the ‘Measure of Economic Welfare’ for a country to be greater than the value of ‘Gross National Product’? A negative externalities such as pollution B property income received from abroad C regrettable necessities D the value of non-marketed activities and leisure
1 marks
Answer: D
This question in 9708/32 May/June 2016
Q33 · What adjustments to real GNP per head might make it a more reliable indicator when… 9708/33 May/June 2016
19 What adjustments to real GNP per head might make it a more reliable indicator when comparing standards of living in different countries? A adjustments to allow for differences in the level of government spending in different countries B adjustments to allow for differences in the rates of inflation in different countries C adjustments to allow for differences in the size of the hidden economy in different countries D adjustments to allow for differences in the value of exports from different countries
1 marks
Answer: C
This question in 9708/33 May/June 2016
Q34 · The table shows real GDP per head measured in $US for countries X and Y over a three year… 9708/33 May/June 2016
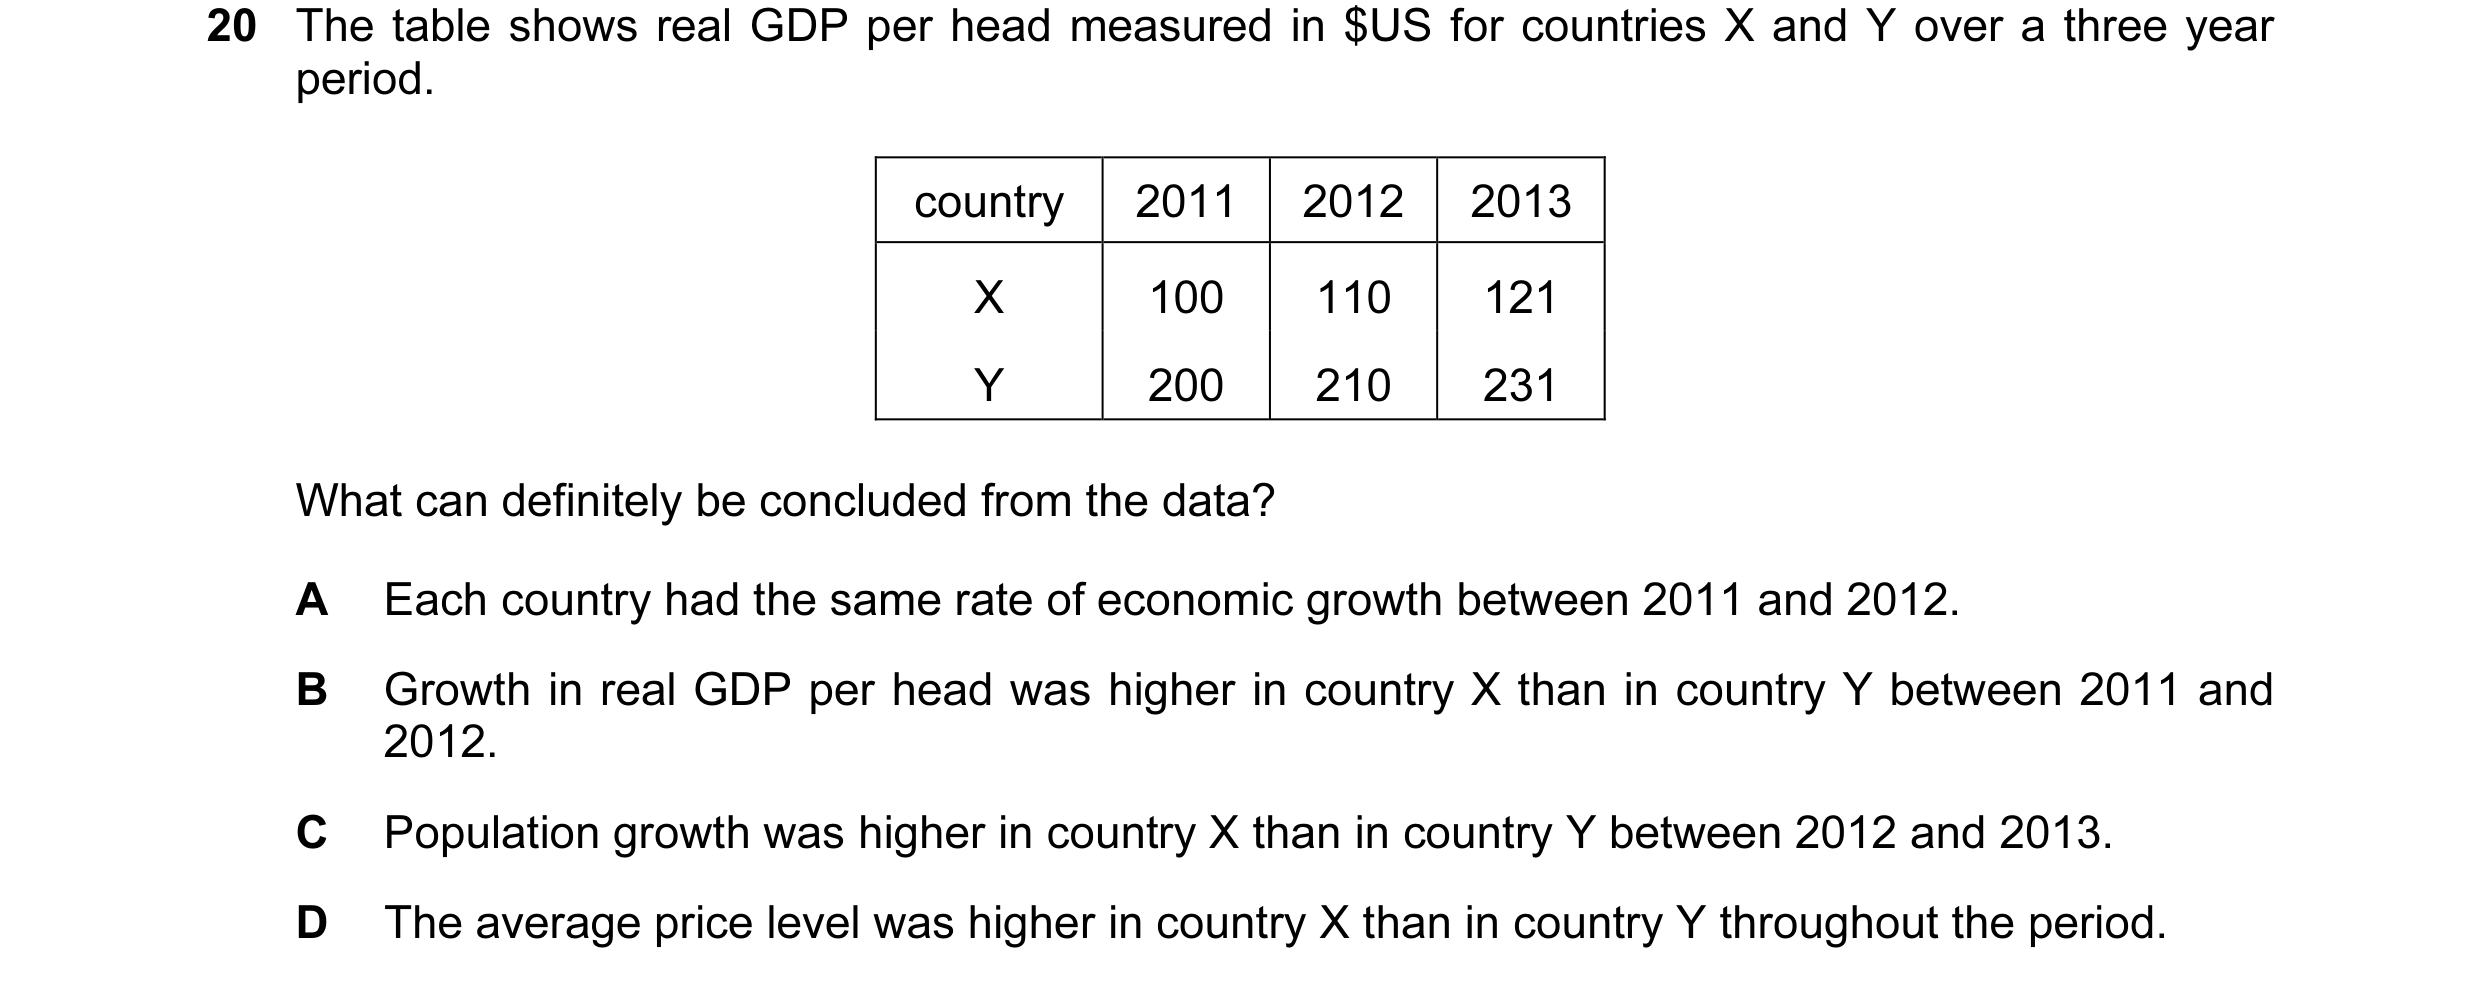
20 The table shows real GDP per head measured in $US for countries X and Y over a three year period. country 2011 2012 2013 X 100 110 121 Y 200 210 231 What can definitely be concluded from the data? A Each country had the same rate of economic growth between 2011 and 2012. B Growth in real GDP per head was higher in country X than in country Y between 2011 and 2012. C Population growth was higher in country X than in country Y between 2012 and 2013. D The average price level was higher in country X than in country Y throughout the period.
1 marks
Answer: B
This question in 9708/33 May/June 2016
Q35 · During a certain period, a country with a constant population expands its output per head 9708/32 May/June 2017
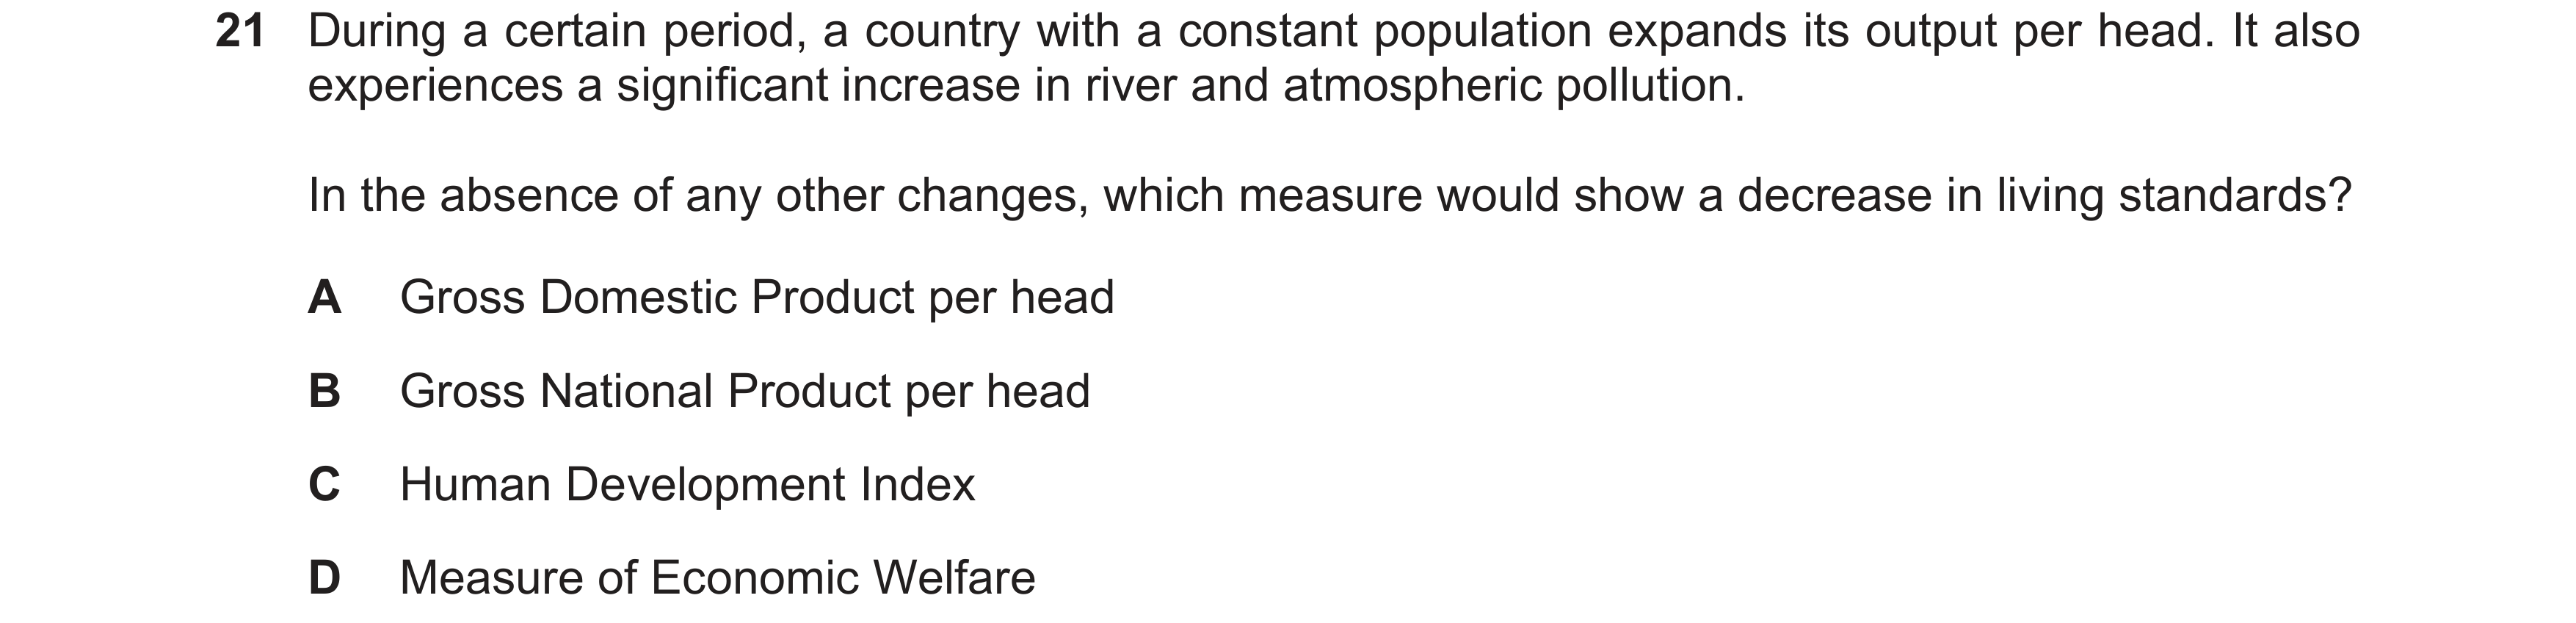
21 During a certain period, a country with a constant population expands its output per head. It also experiences a significant increase in river and atmospheric pollution. In the absence of any other changes, which measure would show a decrease in living standards? A Gross Domestic Product per head B Gross National Product per head C Human Development Index D Measure of Economic Welfare
1 marks
Answer: D
This question in 9708/32 May/June 2017
Q36 · Which could cause the official statistics for the national income per head of a… 9708/32 May/June 2017
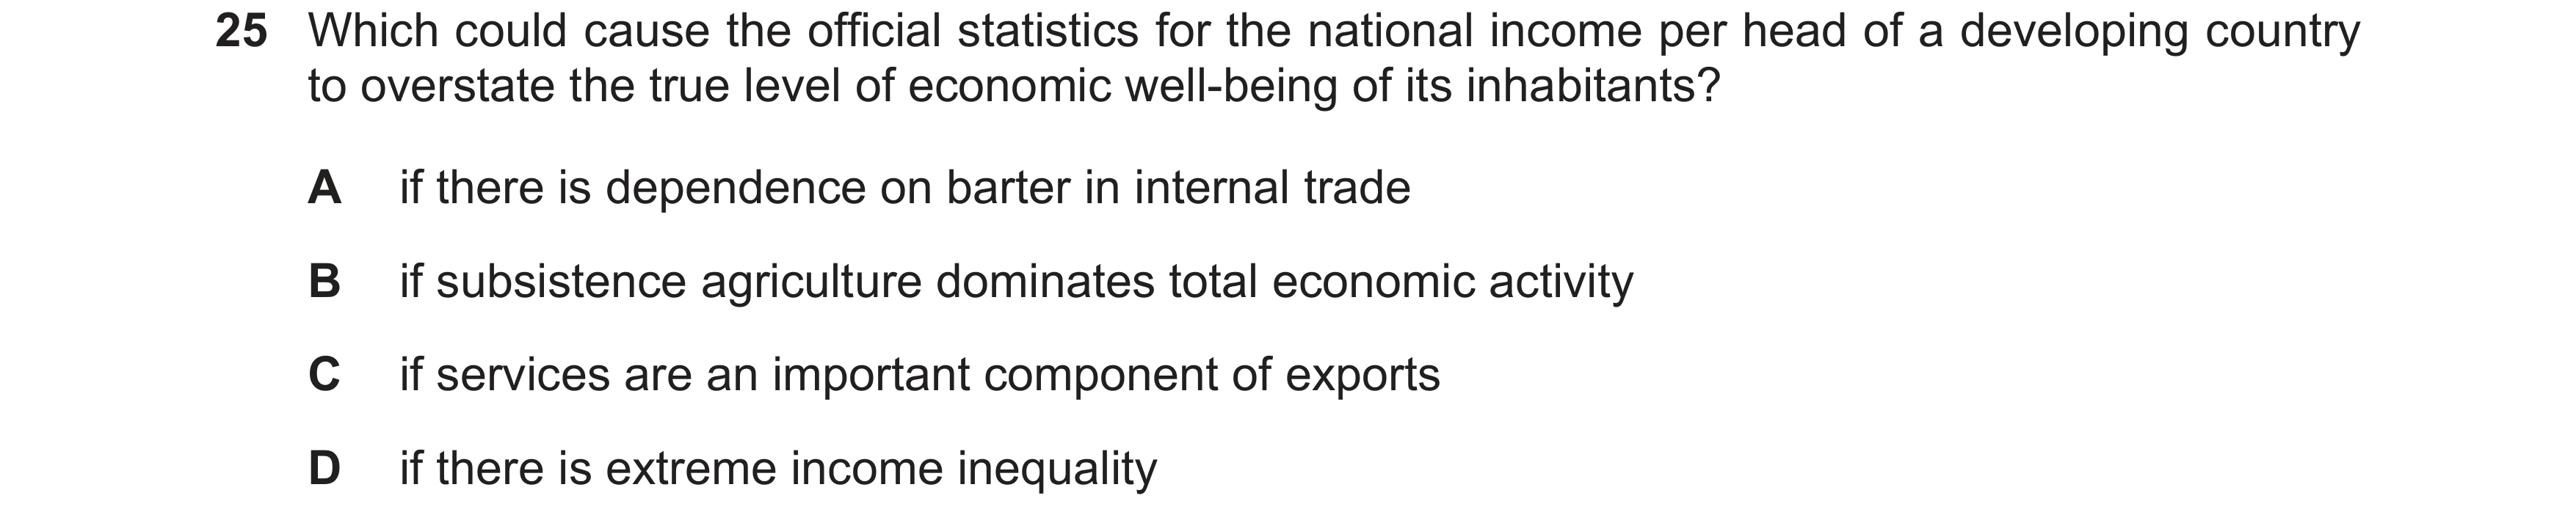
25 Which could cause the official statistics for the national income per head of a developing country to overstate the true level of economic well-being of its inhabitants? A if there is dependence on barter in internal trade B if subsistence agriculture dominates total economic activity C if services are an important component of exports D if there is extreme income inequality
1 marks
Answer: D
This question in 9708/32 May/June 2017
Q37 · The information in the table is taken from a country’s national income accounts 9708/32 Feb/March 2019
19 The information in the table is taken from a country’s national income accounts. $ million consumer expenditure 250 investment expenditure 100 government expenditure 150 exports 100 imports 150 taxes 80 subsidies 40 What is the value of national income at factor cost in $ million? A 410 B 450 C 500 D 550
1 marks
Answer: A
This question in 9708/32 Feb/March 2019
Q38 · Which source of income is not included in measuring real GDP? 9708/32 Feb/March 2019
20 Which source of income is not included in measuring real GDP? A pension paid to retired people B profits made by firms C rent paid to landlords D wages paid to nurses
1 marks
Answer: A
This question in 9708/32 Feb/March 2019
Q39 · Which adjustments to real GNP per head might make it a more reliable indicator when… 9708/32 Feb/March 2019
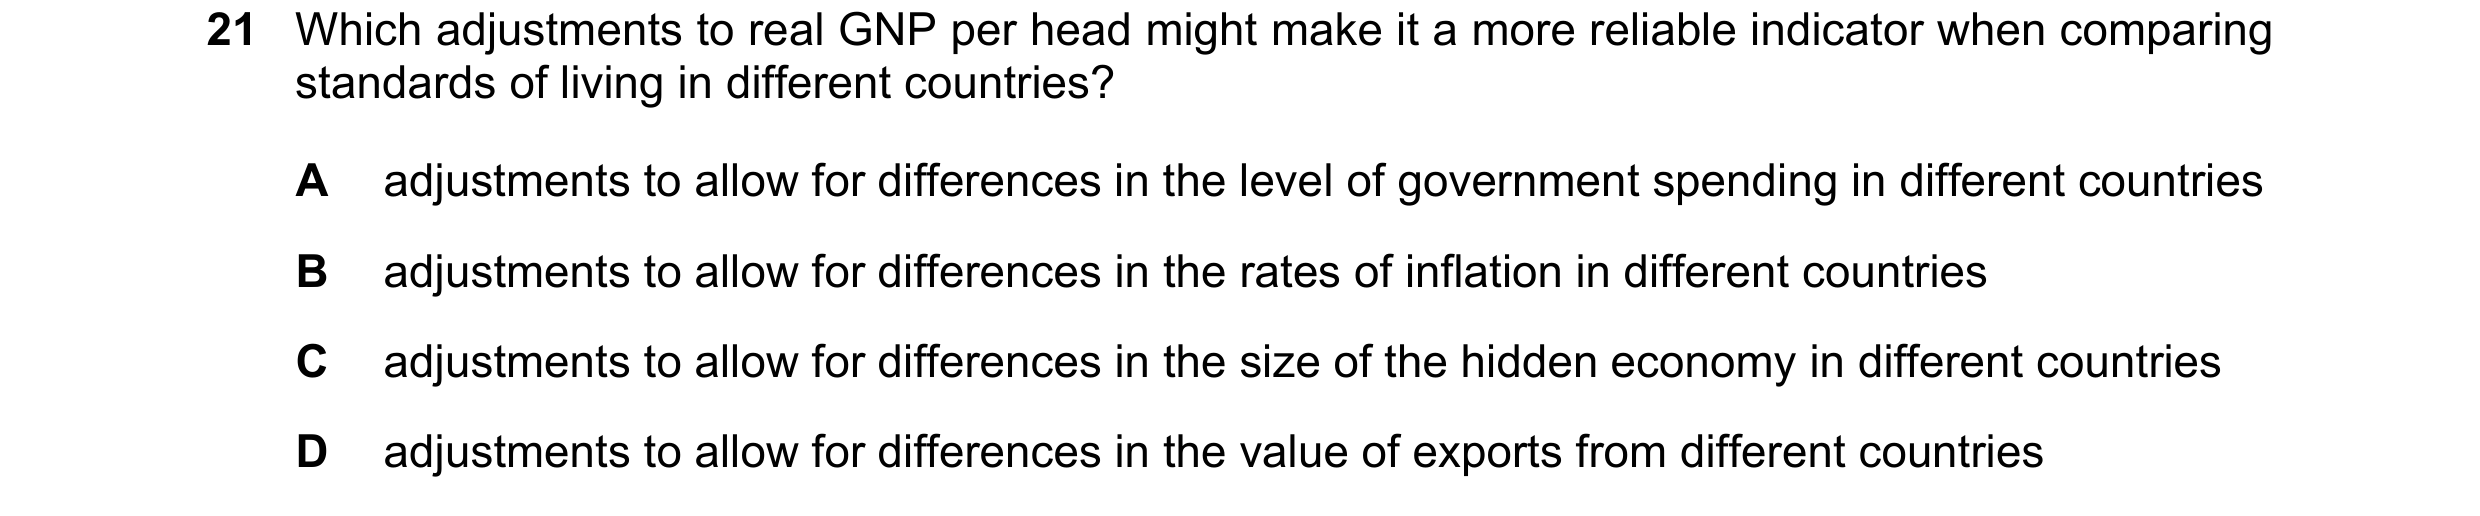
21 Which adjustments to real GNP per head might make it a more reliable indicator when comparing standards of living in different countries? A adjustments to allow for differences in the level of government spending in different countries B adjustments to allow for differences in the rates of inflation in different countries C adjustments to allow for differences in the size of the hidden economy in different countries D adjustments to allow for differences in the value of exports from different countries
1 marks
Answer: C
This question in 9708/32 Feb/March 2019
Q40 · The information in the table is taken from a country’s national income accounts 9708/32 Feb/March 2019
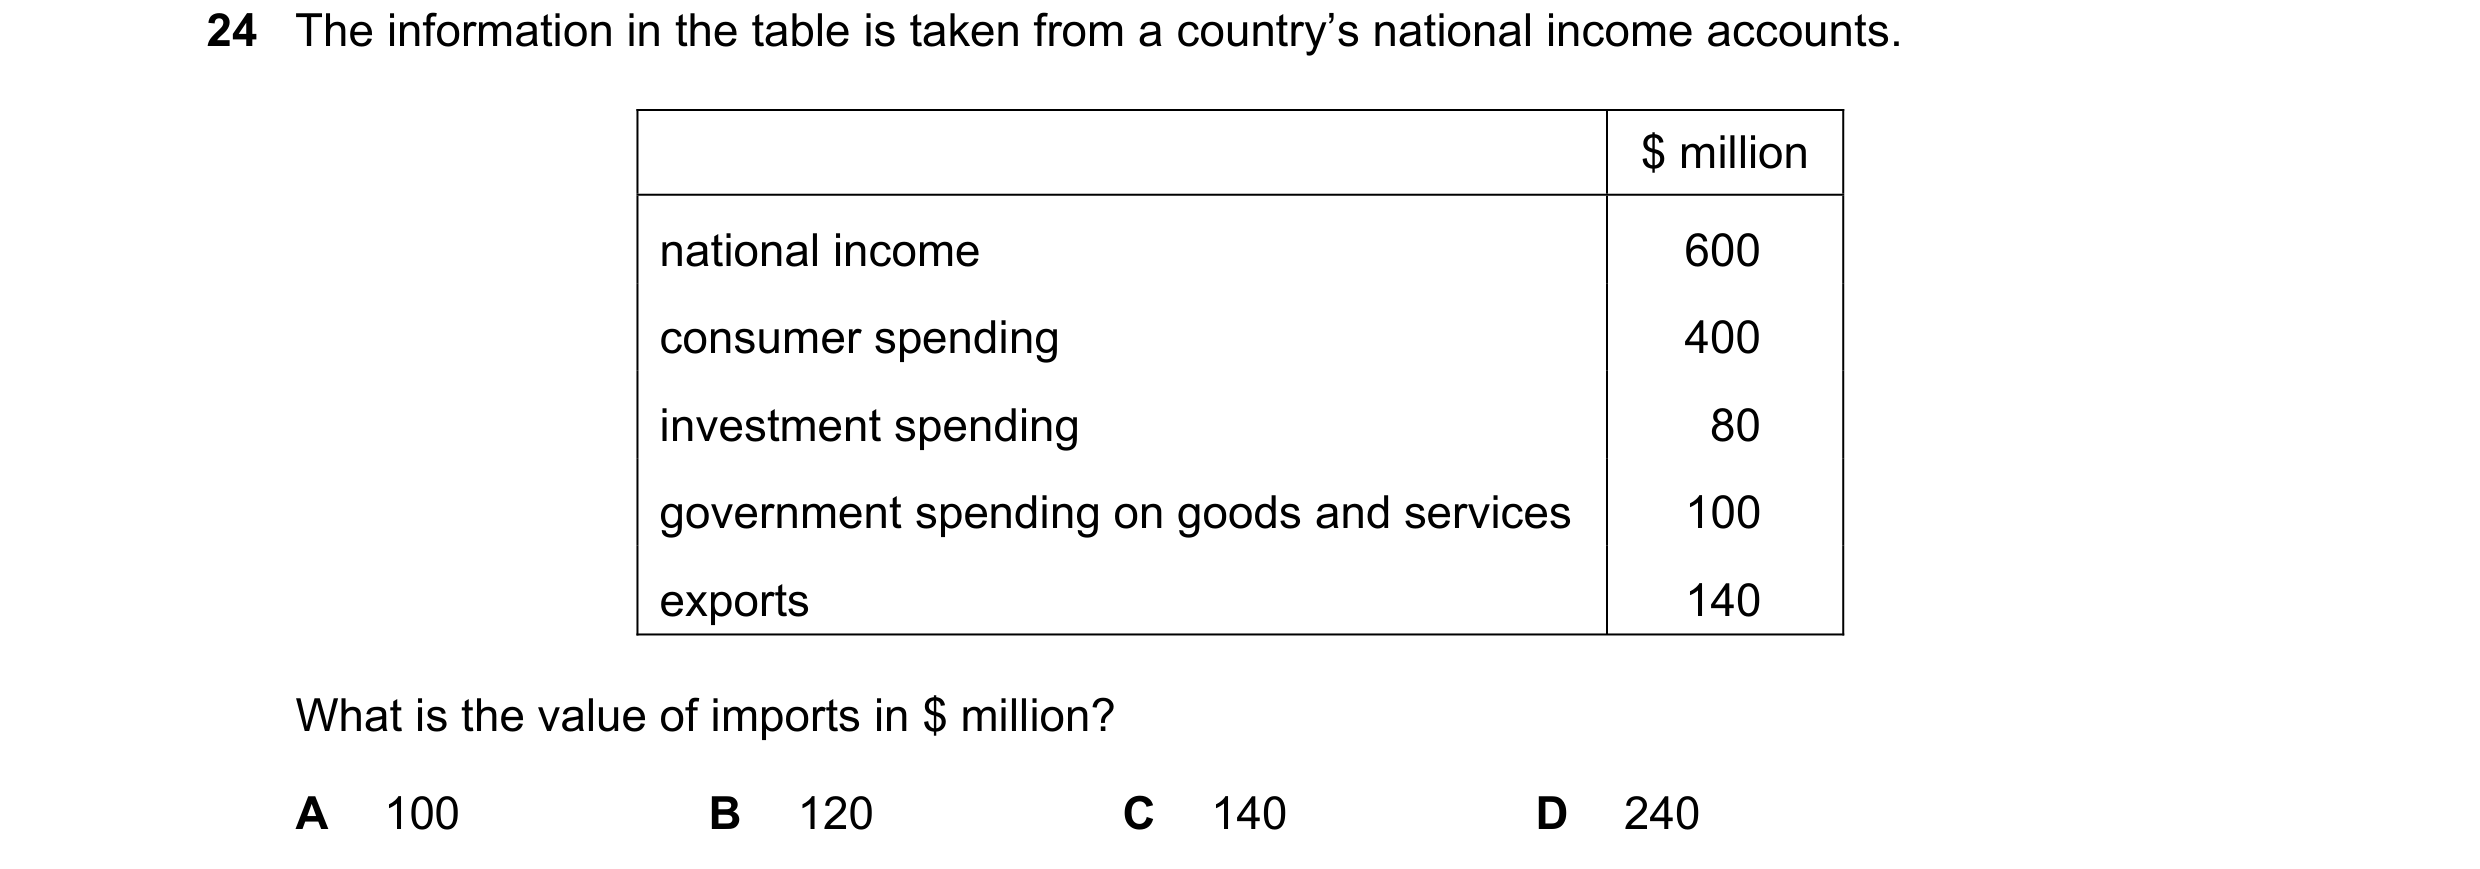
24 The information in the table is taken from a country’s national income accounts. $ million national income 600 consumer spending 400 investment spending 80 government spending on goods and services 100 exports 140 What is the value of imports in $ million? A 100 B 120 C 140 D 240
1 marks
Answer: B
This question in 9708/32 Feb/March 2019
Q41 · What is not included in the measurement of national income? 9708/32 May/June 2019
19 What is not included in the measurement of national income? A age-related pensions B dividends obtained from foreign investments C housing authorities’ income from rent D profits distributed to shareholders
1 marks
Answer: A
This question in 9708/32 May/June 2019
Q42 · When calculating national income by the income method, what would not be included? 9708/32 Feb/March 2020
19 When calculating national income by the income method, what would not be included? A income from abroad B profits of private sector businesses C rent from the ownership of land D transfer payments
1 marks
Answer: D
This question in 9708/32 Feb/March 2020
Q43 · Which changes to basic income at points W and X might be included in the calculation to… 9708/32 Feb/March 2020
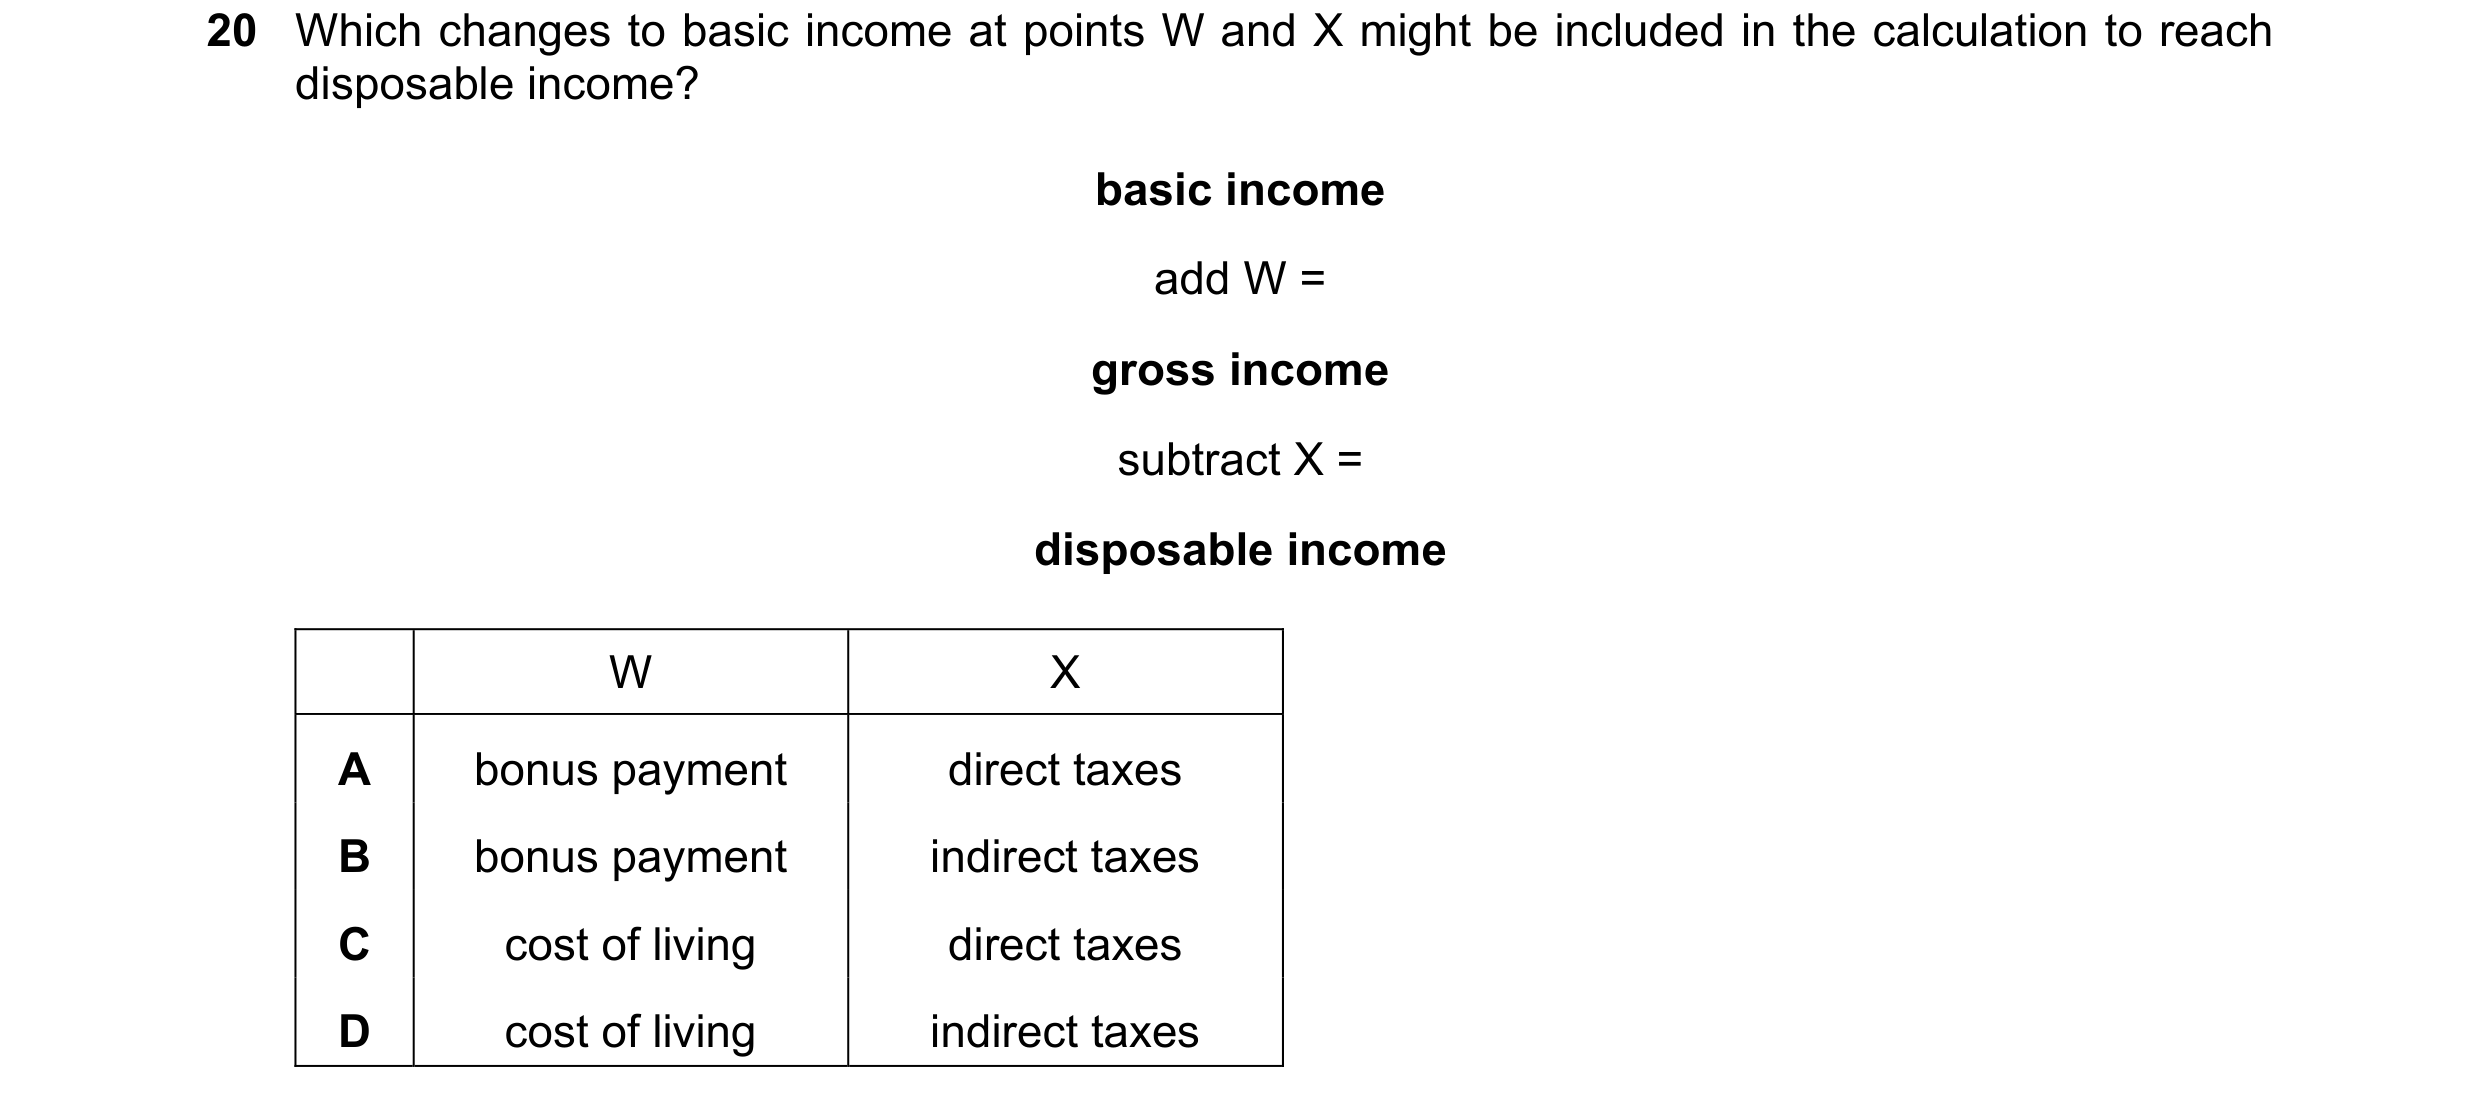
20 Which changes to basic income at points W and X might be included in the calculation to reach disposable income? basic income add W = gross income subtract X = disposable income W X A bonus payment direct taxes B bonus payment indirect taxes C cost of living direct taxes D cost of living indirect taxes
1 marks
Answer: A
This question in 9708/32 Feb/March 2020
Q44 · A director becomes redundant as the result of a company merger 9708/33 Oct/Nov 2020
22 A director becomes redundant as the result of a company merger. His salary was $80 000. In his first year after redundancy he earns $60 000 in consultancy fees, $10 000 in dividends on shares, and saves $8000 by dismissing his gardener. What is the resulting change in measured national income in the first year? A + $70 000 B + $60 000 C – $80 000 D –$18 000
1 marks
Answer: D
This question in 9708/33 Oct/Nov 2020
Q45 · What can be deduced directly from the calculation of the national income? 9708/33 Oct/Nov 2020
26 What can be deduced directly from the calculation of the national income? A the balance of payments position B the pattern of production in the economy C the distribution of income among the population D the standard of living in the country
1 marks
Answer: B
This question in 9708/33 Oct/Nov 2020
Q46 · Governments are interested in providing statistics on the standard of living 9708/32 Feb/March 2021
19 Governments are interested in providing statistics on the standard of living. They measure the value of material goods and services. Non-material characteristics that affect the standard of living cannot easily be measured. What is an example of a non-material characteristic? A the failure to include unpaid work in the home B the freedom to make informed economic choices C the proportion of GNP used for weapons of war D the removal of taxes from all forms of consumer expenditure
1 marks
Answer: B
This question in 9708/32 Feb/March 2021
Q47 · The Measure of Economic Welfare (MEW) is often regarded as a better measure of economic… 9708/31 May/June 2021
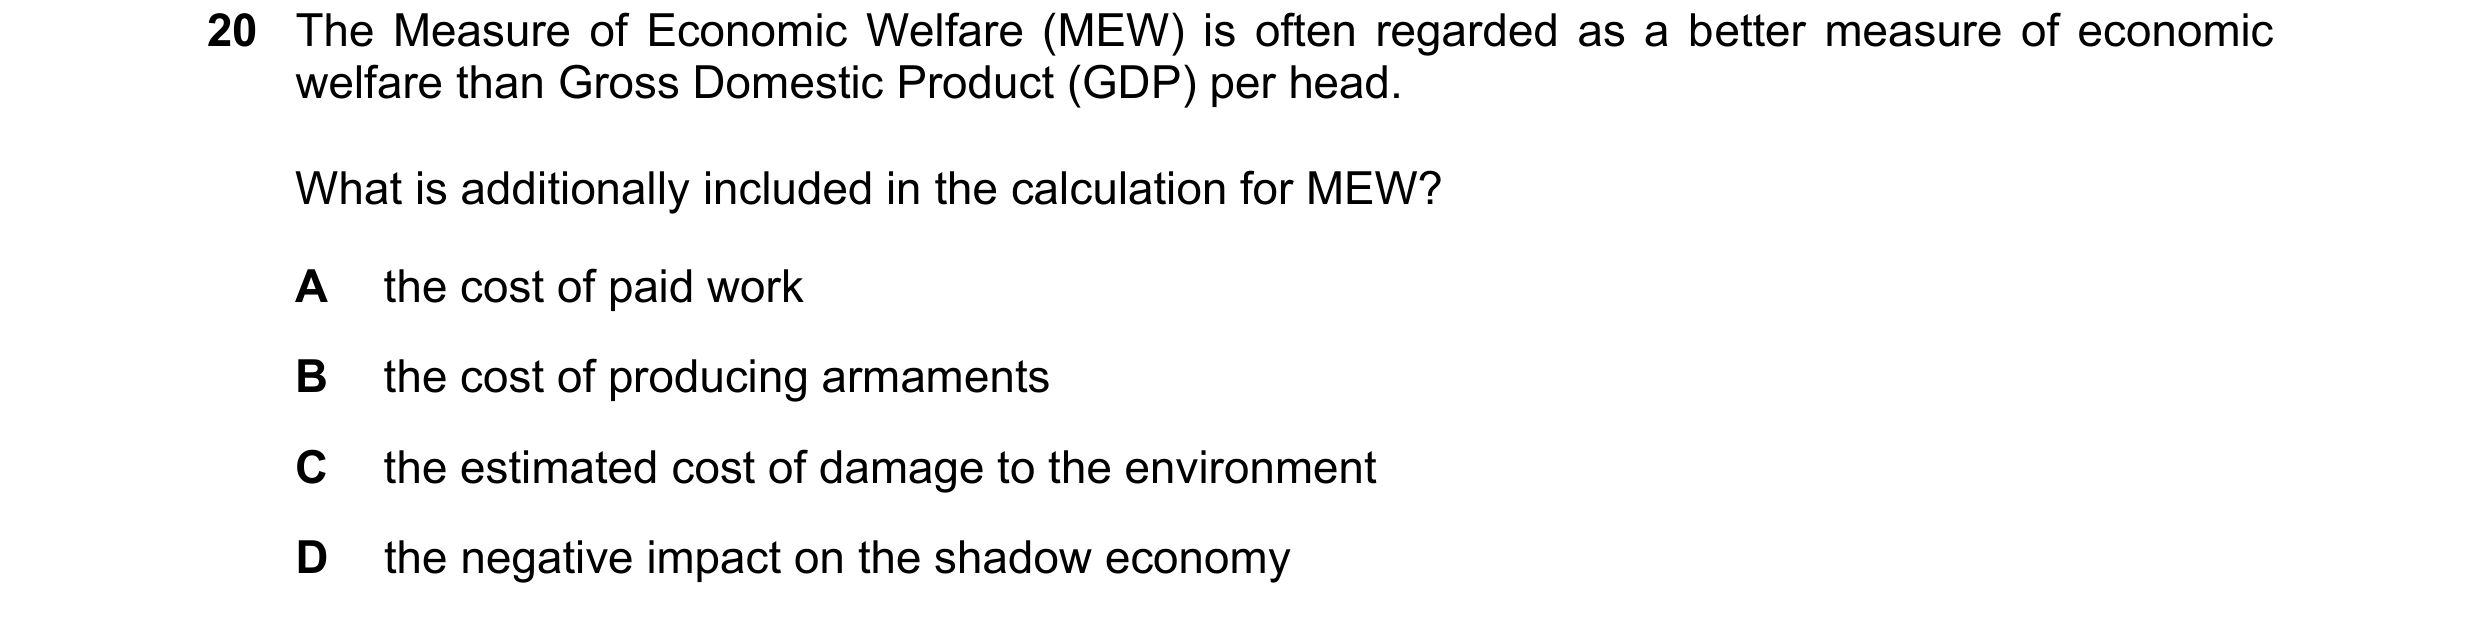
20 The Measure of Economic Welfare (MEW) is often regarded as a better measure of economic welfare than Gross Domestic Product (GDP) per head. What is additionally included in the calculation for MEW? A the cost of paid work B the cost of producing armaments C the estimated cost of damage to the environment D the negative impact on the shadow economy
1 marks
Answer: C
This question in 9708/31 May/June 2021
Q48 · Which statement about national income accounting is correct? 9708/31 May/June 2021
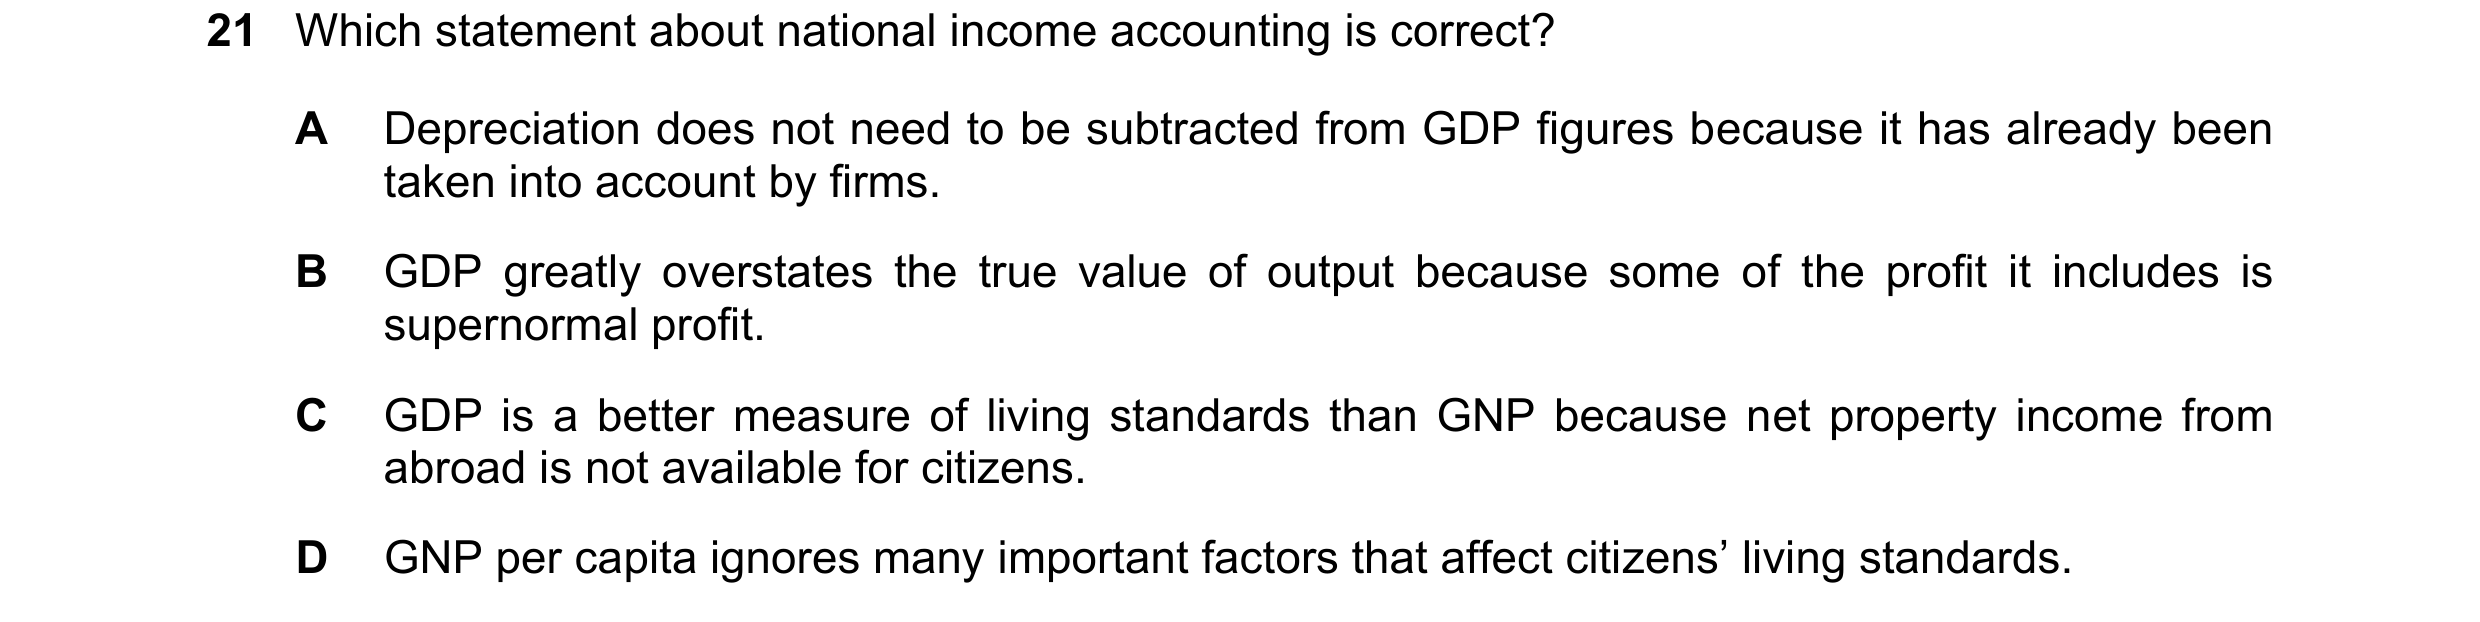
21 Which statement about national income accounting is correct? A Depreciation does not need to be subtracted from GDP figures because it has already been taken into account by firms. B GDP greatly overstates the true value of output because some of the profit it includes is supernormal profit. C GDP is a better measure of living standards than GNP because net property income from abroad is not available for citizens. D GNP per capita ignores many important factors that affect citizens’ living standards.
1 marks
Answer: D
This question in 9708/31 May/June 2021
Q49 · What is the difference between a country’s gross domestic product and its gross national… 9708/32 May/June 2021
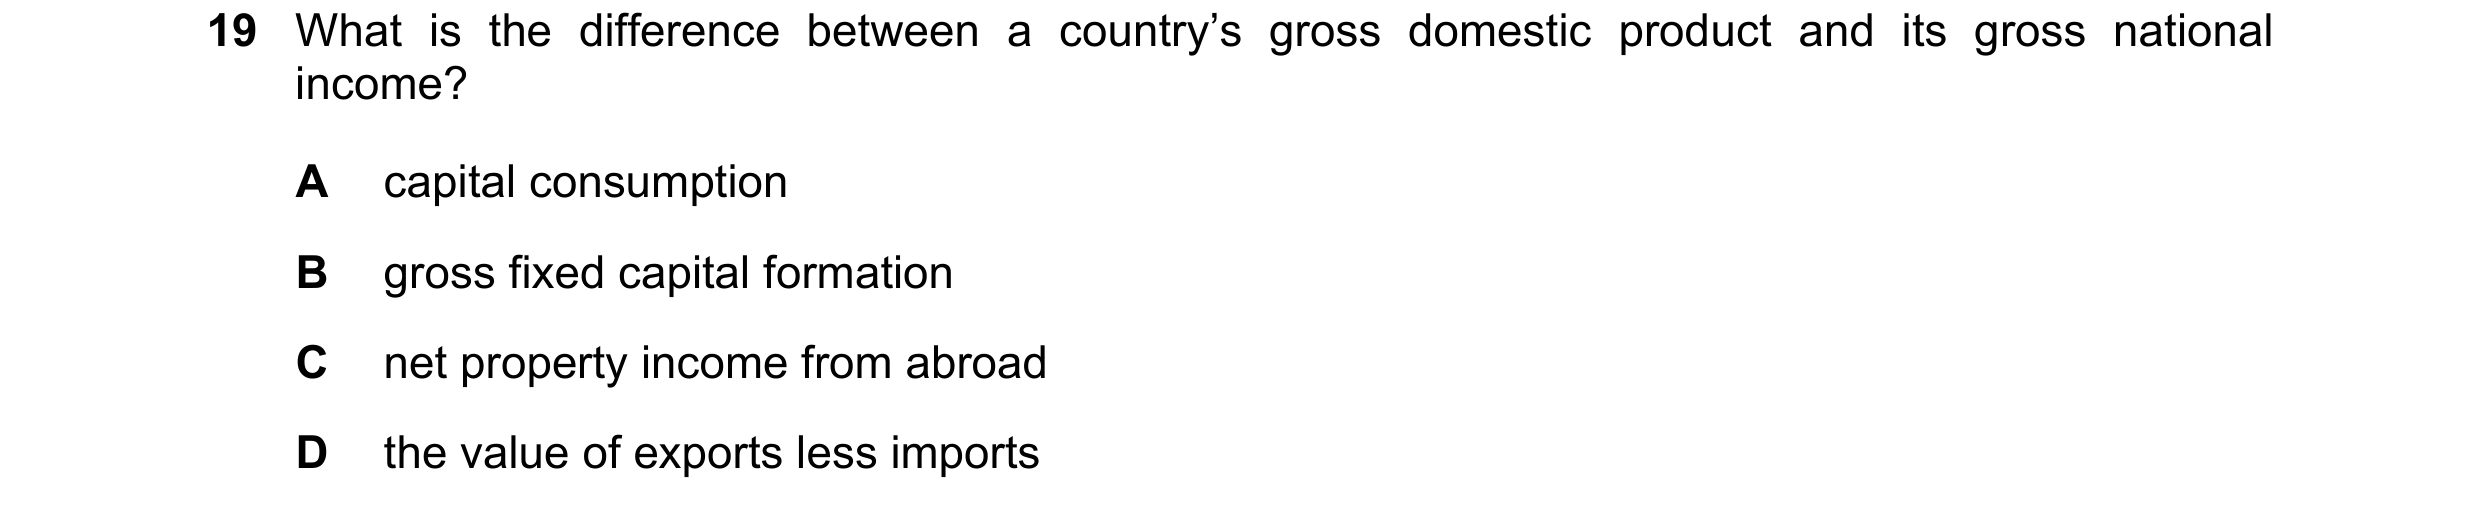
19 What is the difference between a country’s gross domestic product and its gross national income? A capital consumption B gross fixed capital formation C net property income from abroad D the value of exports less imports
1 marks
Answer: C
This question in 9708/32 May/June 2021
Q50 · The Measure of Economic Welfare (MEW) is often regarded as a better measure of economic… 9708/33 May/June 2021
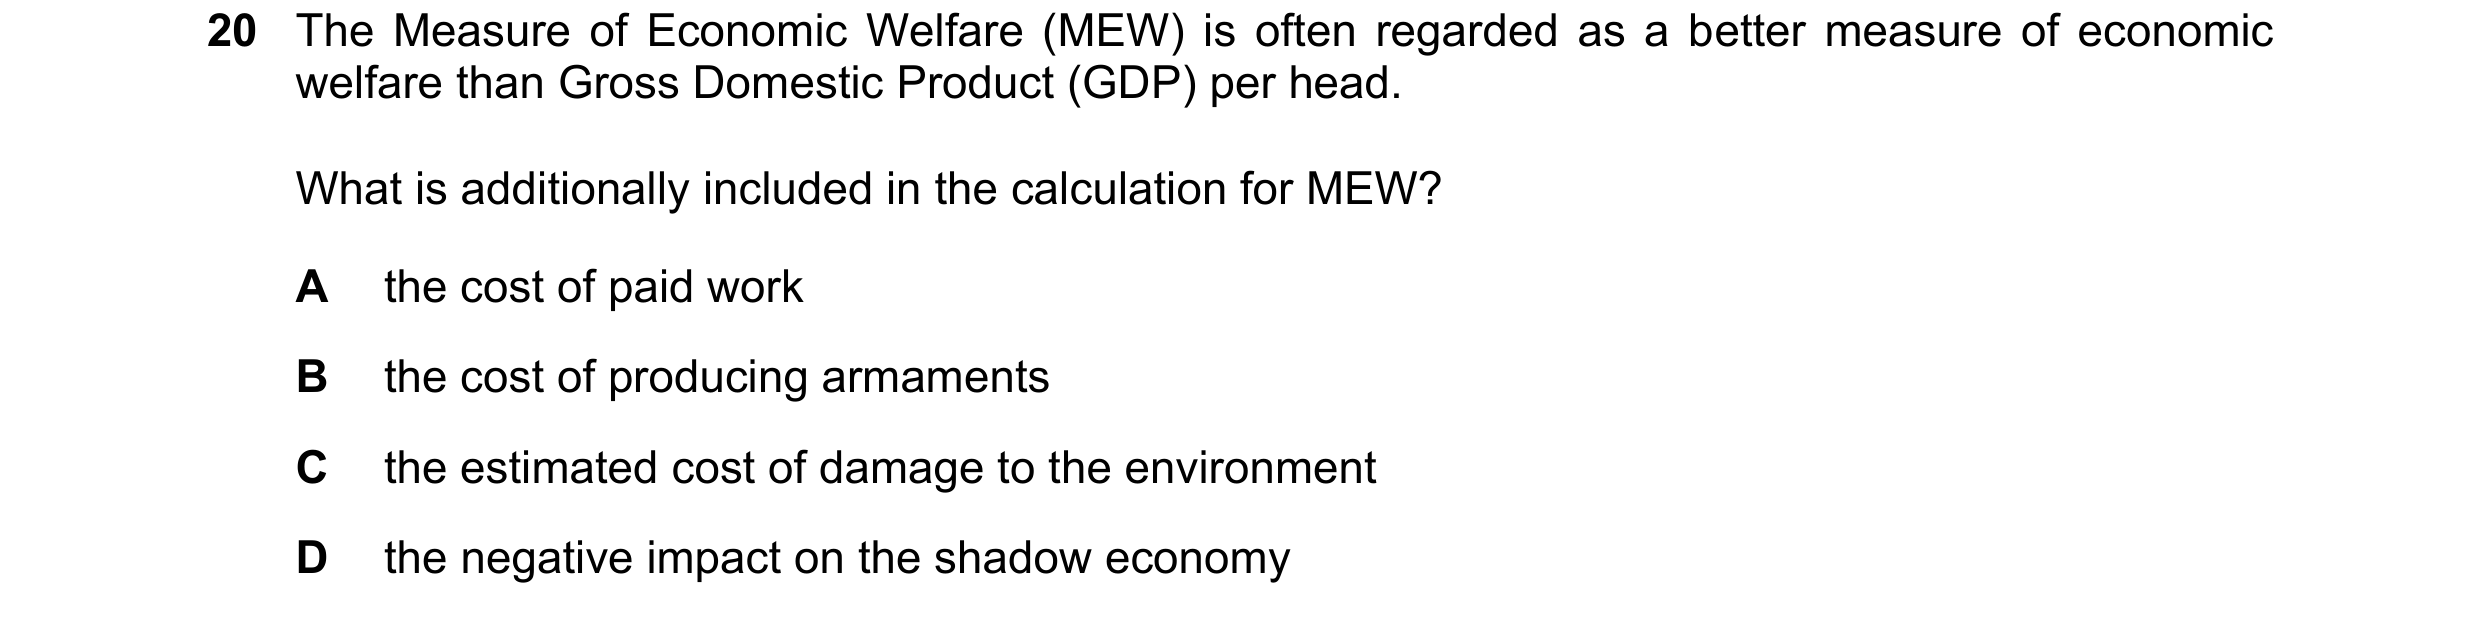
20 The Measure of Economic Welfare (MEW) is often regarded as a better measure of economic welfare than Gross Domestic Product (GDP) per head. What is additionally included in the calculation for MEW? A the cost of paid work B the cost of producing armaments C the estimated cost of damage to the environment D the negative impact on the shadow economy
1 marks
Answer: C
This question in 9708/33 May/June 2021
Q51 · Which statement about national income accounting is correct? 9708/33 May/June 2021
21 Which statement about national income accounting is correct? A Depreciation does not need to be subtracted from GDP figures because it has already been taken into account by firms. B GDP greatly overstates the true value of output because some of the profit it includes is supernormal profit. C GDP is a better measure of living standards than GNP because net property income from abroad is not available for citizens. D GNP per capita ignores many important factors that affect citizens’ living standards.
1 marks
Answer: D
This question in 9708/33 May/June 2021
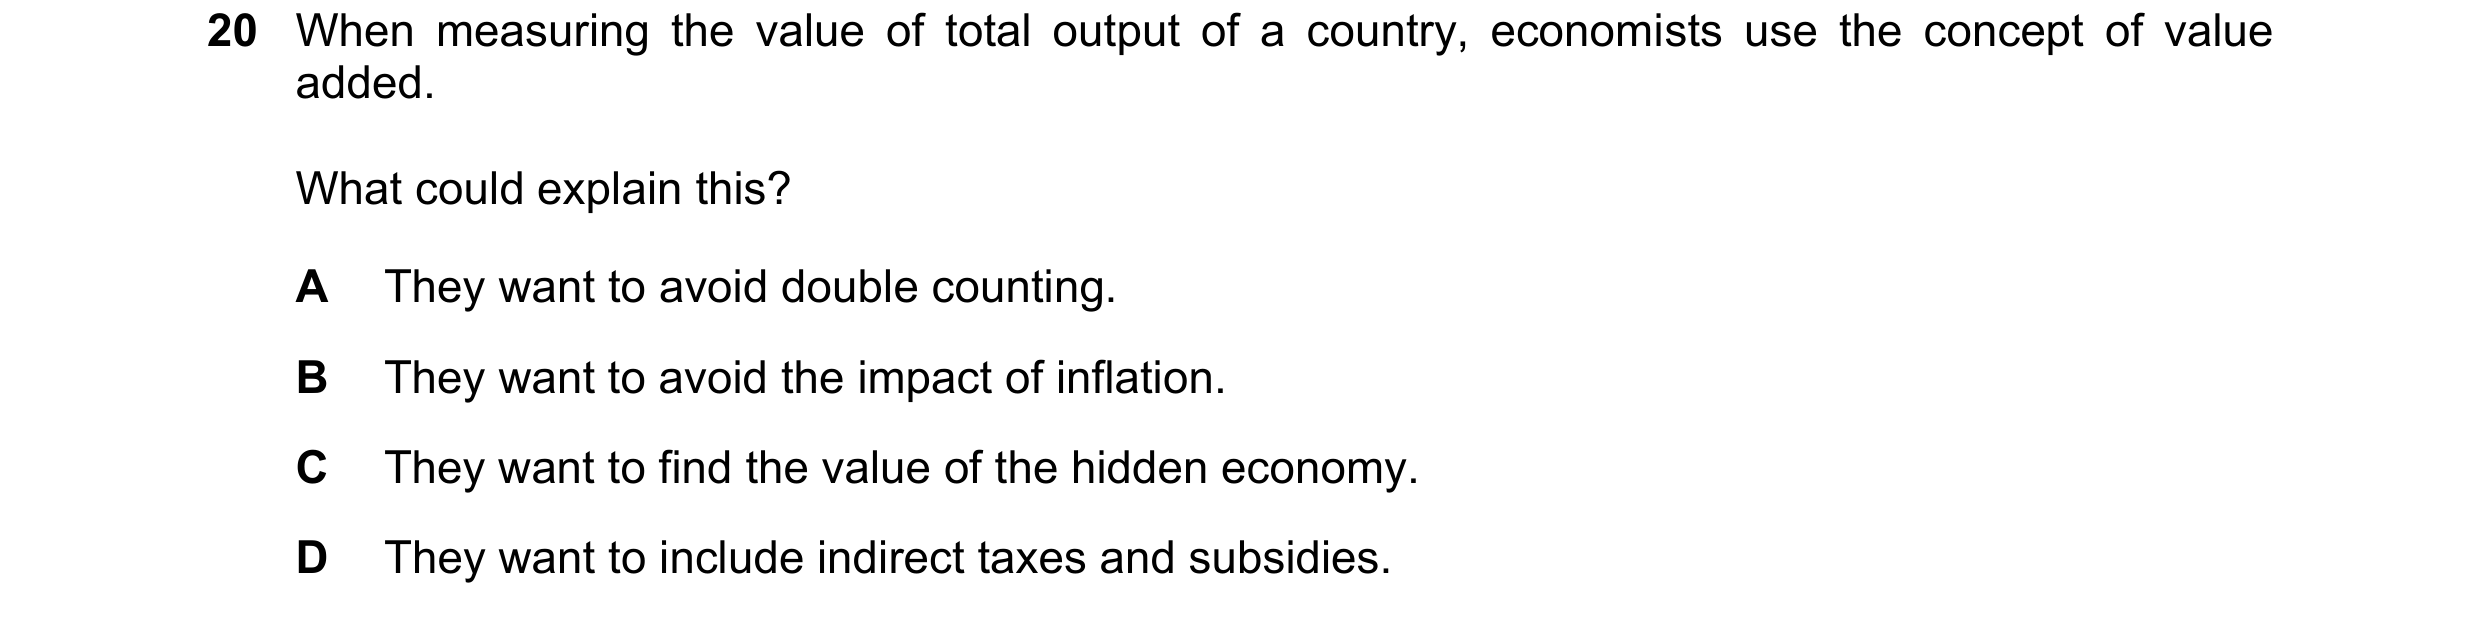
Q52 · When measuring the value of total output of a country, economists use the concept of… 9708/31 Oct/Nov 2021
20 When measuring the value of total output of a country, economists use the concept of value added. What could explain this? A They want to avoid double counting. B They want to avoid the impact of inflation. C They want to find the value of the hidden economy. D They want to include indirect taxes and subsidies.
1 marks
Answer: A
This question in 9708/31 Oct/Nov 2021
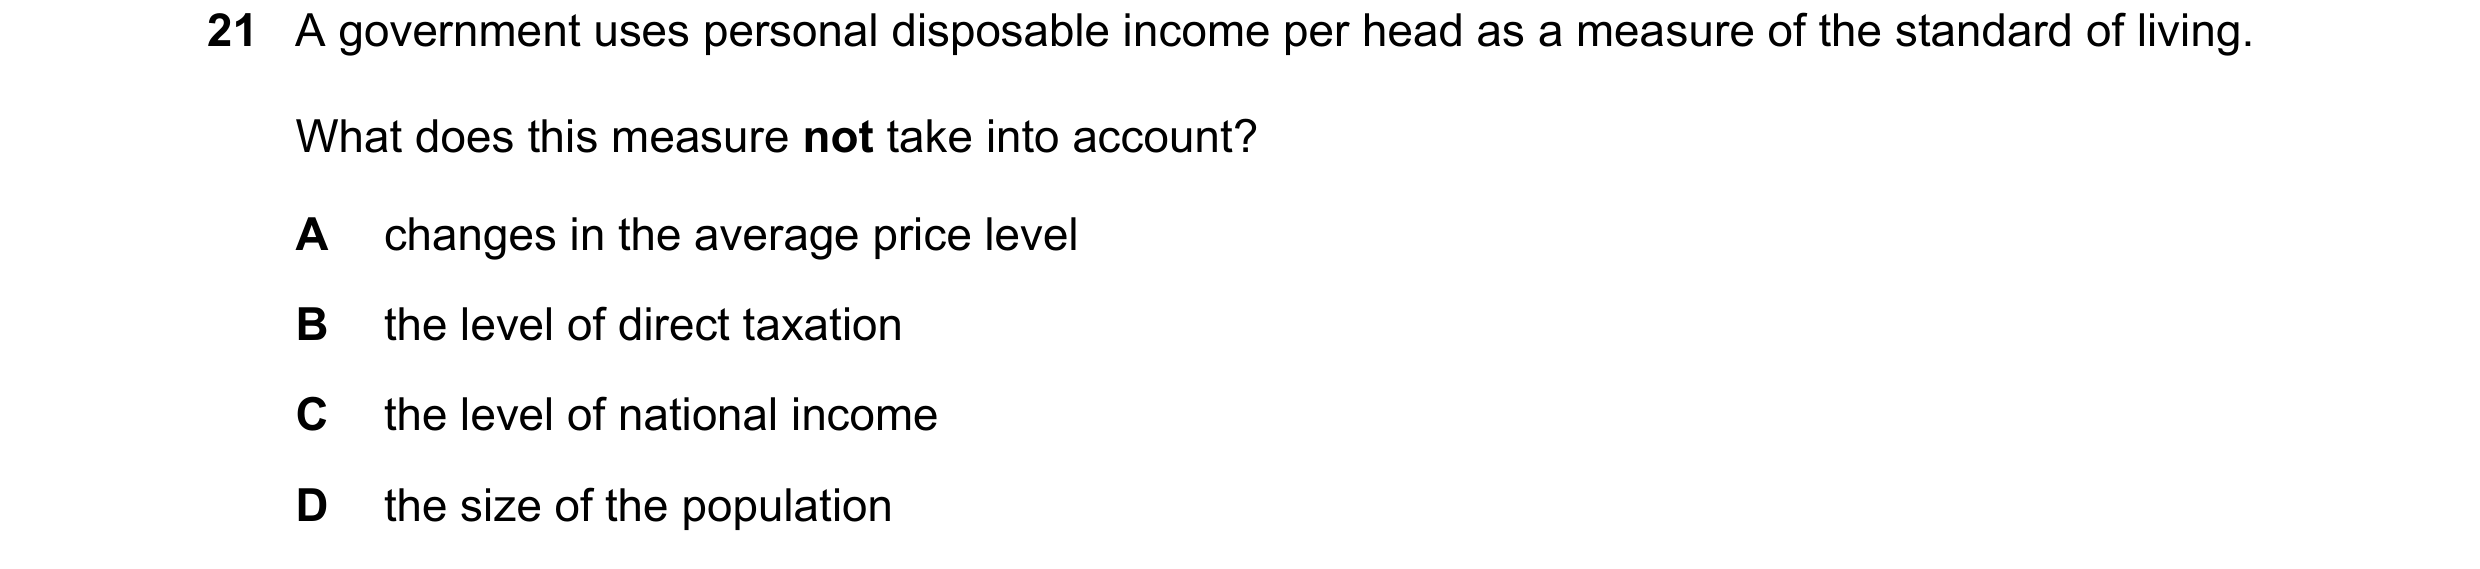
Q53 · A government uses personal disposable income per head as a measure of the standard of… 9708/31 Oct/Nov 2021
21 A government uses personal disposable income per head as a measure of the standard of living. What does this measure not take into account? A changes in the average price level B the level of direct taxation C the level of national income D the size of the population
1 marks
Answer: A
This question in 9708/31 Oct/Nov 2021
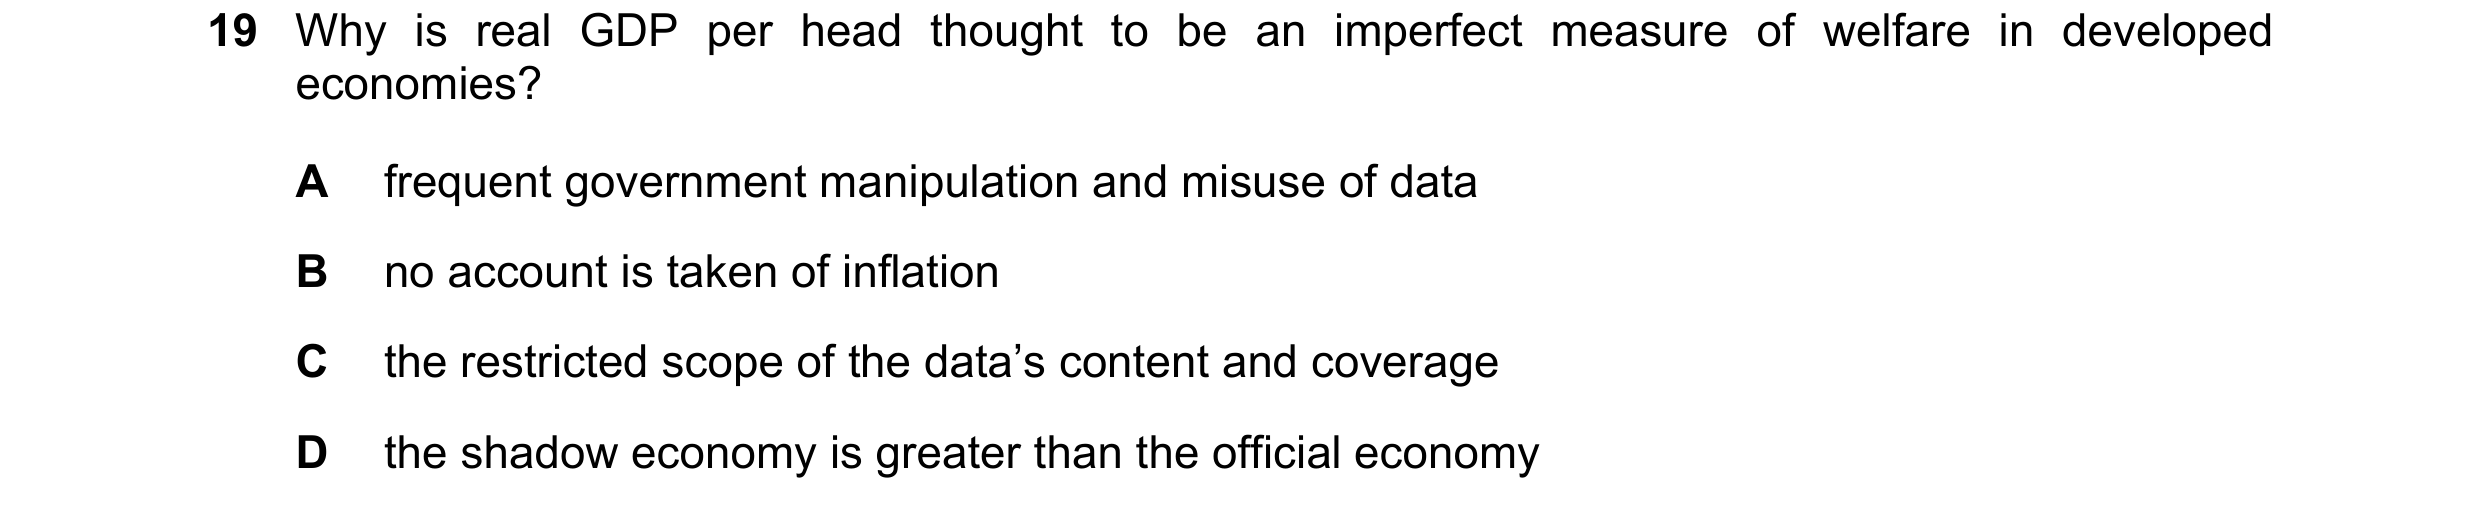
Q54 · Why is real GDP per head thought to be an imperfect measure of welfare in developed… 9708/32 Oct/Nov 2021
19 Why is real GDP per head thought to be an imperfect measure of welfare in developed economies? A frequent government manipulation and misuse of data B no account is taken of inflation C the restricted scope of the data’s content and coverage D the shadow economy is greater than the official economy
1 marks
Answer: C
This question in 9708/32 Oct/Nov 2021
Q55 · The information in the table is taken from a country’s national income accounts 9708/32 Oct/Nov 2021
24 The information in the table is taken from a country’s national income accounts. $ income (millions) wages 8000 salaries 7000 unemployment benefit 1000 government pensions 1000 rent 3000 interest 2000 What is the value of national income in millions of dollars? A 17 000 B 19 000 C 20 000 D 21 000
1 marks
Answer: C
This question in 9708/32 Oct/Nov 2021
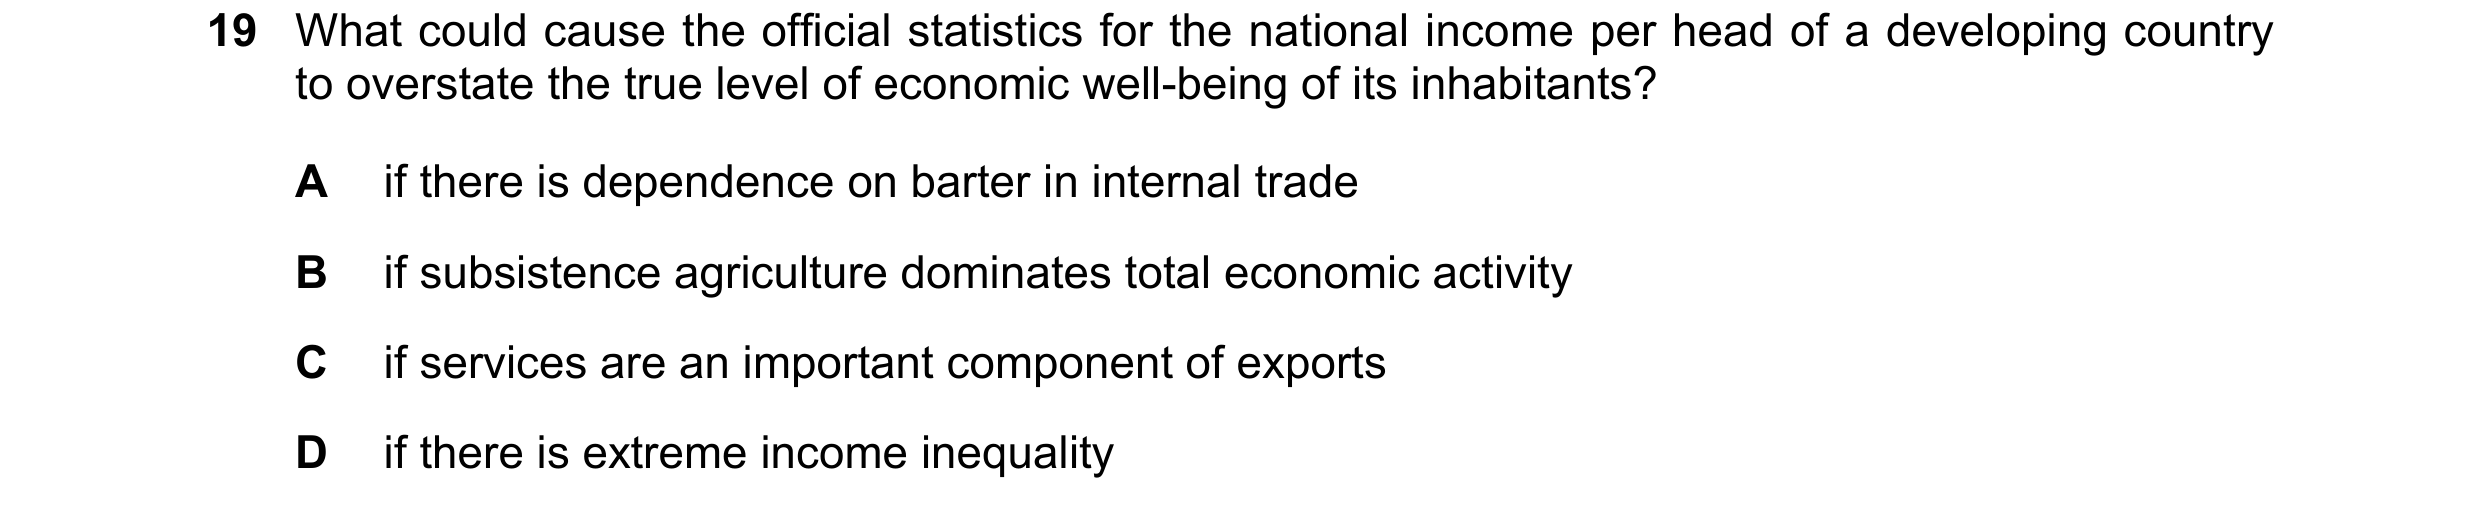
Q56 · What could cause the official statistics for the national income per head of a developing… 9708/31 May/June 2022
19 What could cause the official statistics for the national income per head of a developing country to overstate the true level of economic well-being of its inhabitants? A if there is dependence on barter in internal trade B if subsistence agriculture dominates total economic activity C if services are an important component of exports D if there is extreme income inequality
1 marks
Answer: D
This question in 9708/31 May/June 2022
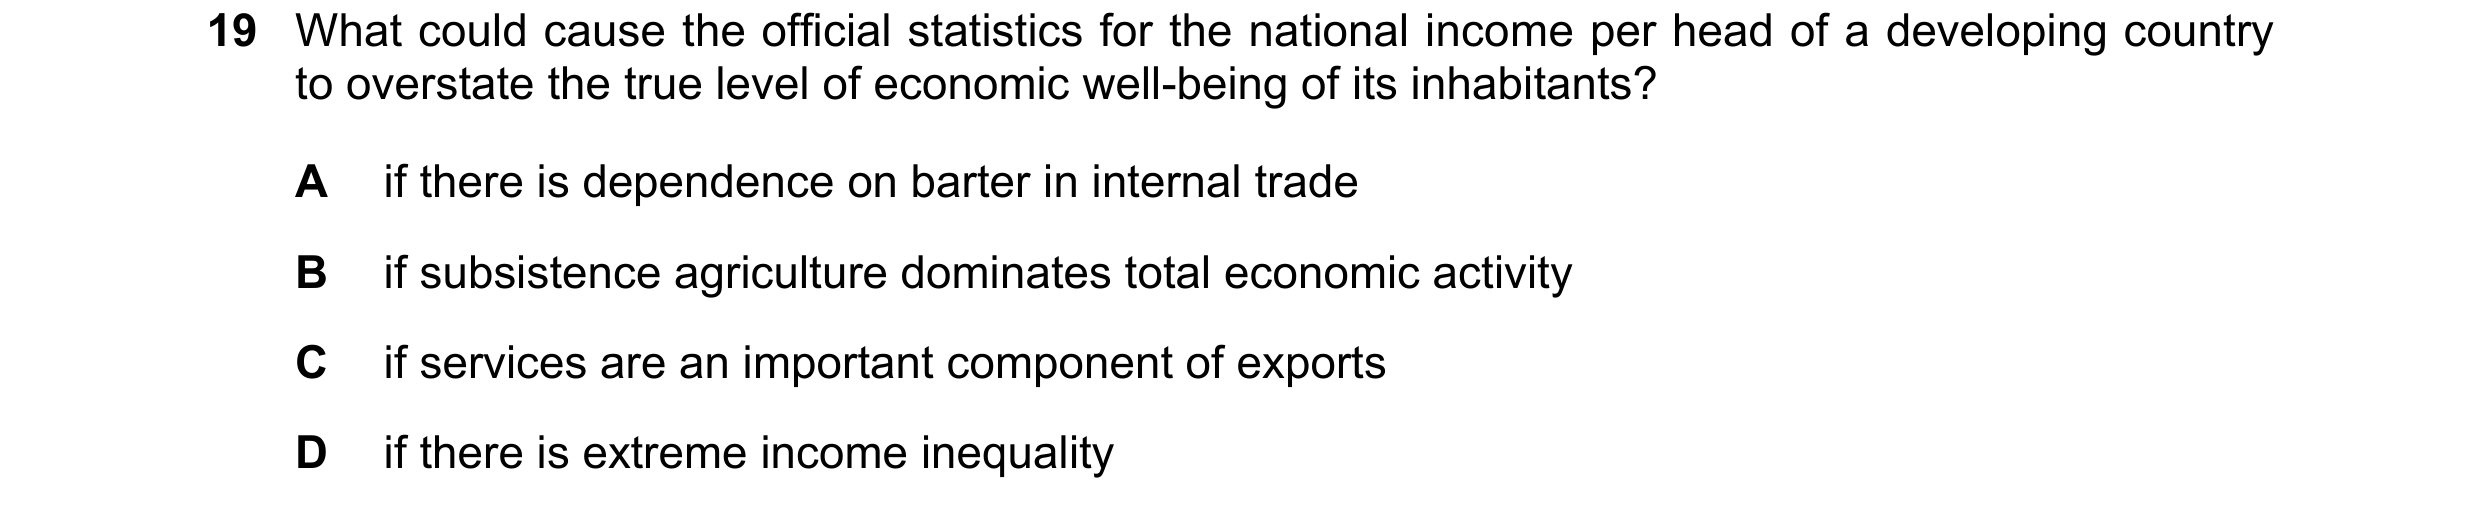
Q57 · What could cause the official statistics for the national income per head of a developing… 9708/33 May/June 2022
19 What could cause the official statistics for the national income per head of a developing country to overstate the true level of economic well-being of its inhabitants? A if there is dependence on barter in internal trade B if subsistence agriculture dominates total economic activity C if services are an important component of exports D if there is extreme income inequality
1 marks
Answer: D
This question in 9708/33 May/June 2022
Q58 · How can GDP at market prices be calculated if GDP at factor cost is known? 9708/31 Oct/Nov 2022
19 How can GDP at market prices be calculated if GDP at factor cost is known? A add taxes, add subsidies B add taxes, subtract subsidies C subtract taxes, add subsidies D subtract taxes, subtract subsidies
1 marks
Answer: B
This question in 9708/31 Oct/Nov 2022
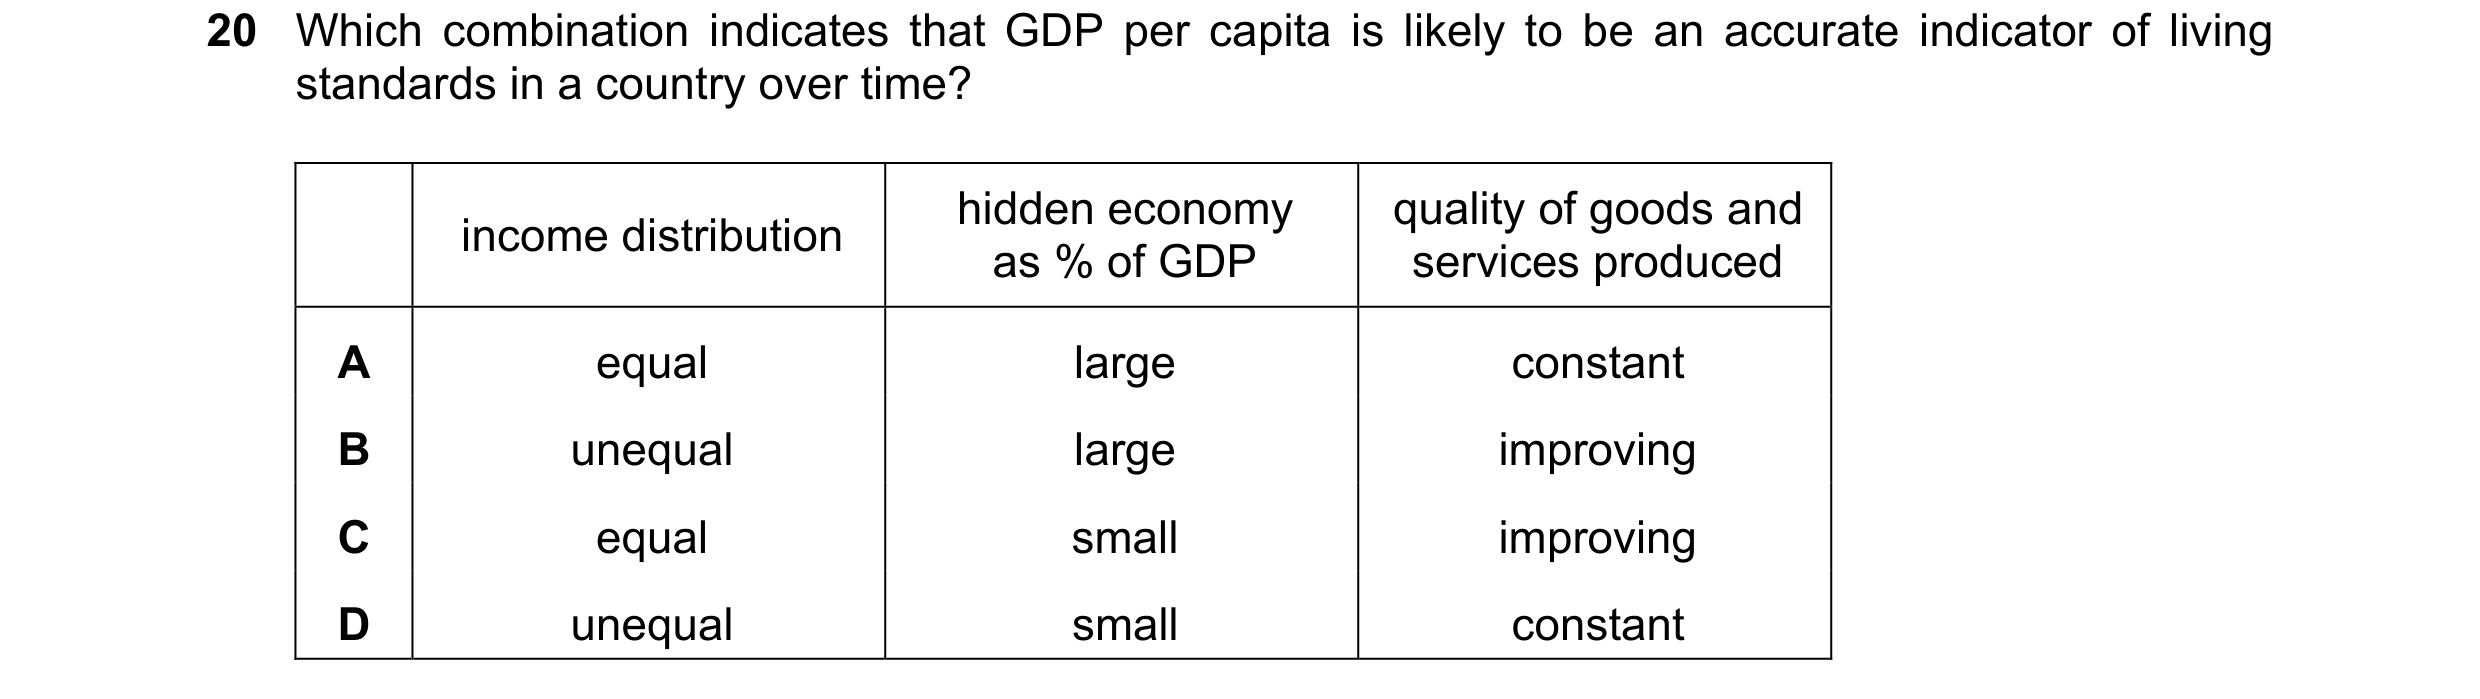
Q59 · Which combination indicates that GDP per capita is likely to be an accurate indicator of… 9708/31 Oct/Nov 2022
20 Which combination indicates that GDP per capita is likely to be an accurate indicator of living standards in a country over time? hidden economy quality of goods and income distribution as % of GDP services produced A equal large constant B unequal large improving C equal small improving D unequal small constant
1 marks
Answer: C
This question in 9708/31 Oct/Nov 2022
Q60 · Growth rates can be calculated using changes in the value of GDP from year to year 9708/32 Oct/Nov 2022
19 Growth rates can be calculated using changes in the value of GDP from year to year. Why is real GDP considered to be a better indicator than nominal GDP for this calculation? A Real GDP adjusts for price changes by using a base year. B Real GDP ignores the effects of fluctuations in exchange rates on purchasing power. C Real GDP includes changes in the size of the population. D Real GDP measures GDP at factor cost rather than market prices.
1 marks
Answer: A
This question in 9708/32 Oct/Nov 2022
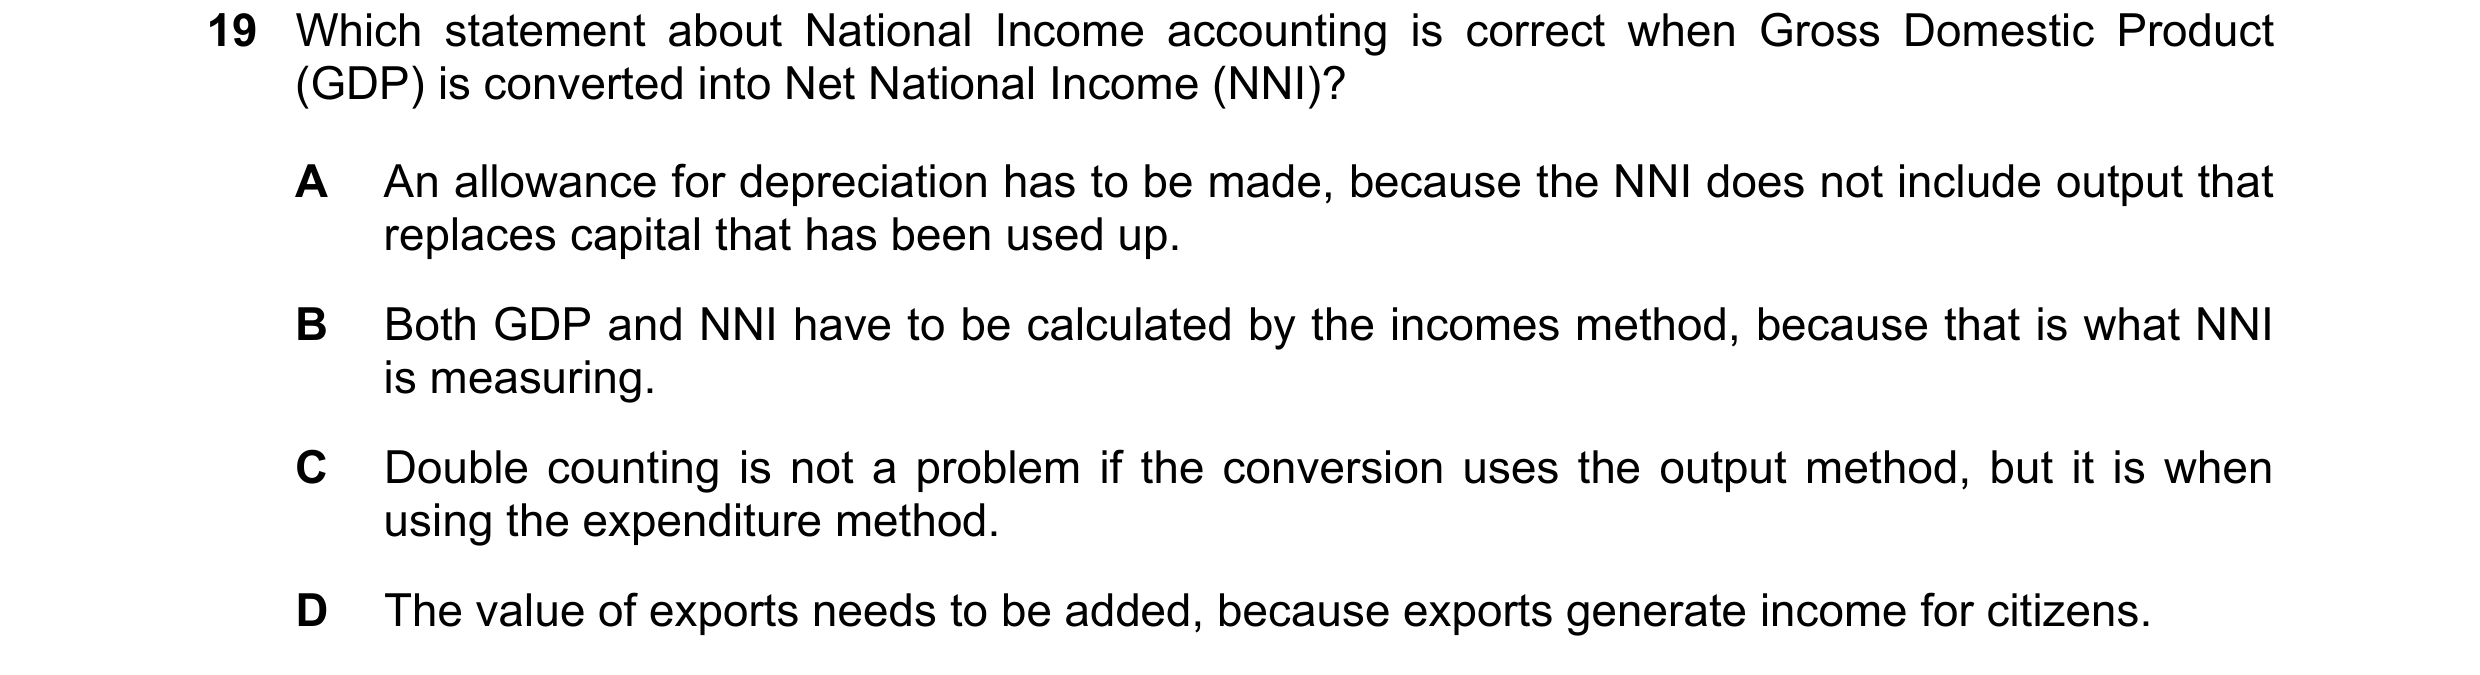
Q61 · Which statement about National Income accounting is correct when Gross Domestic Product… 9708/33 Oct/Nov 2022
19 Which statement about National Income accounting is correct when Gross Domestic Product (GDP) is converted into Net National Income (NNI)? A An allowance for depreciation has to be made, because the NNI does not include output that replaces capital that has been used up. B Both GDP and NNI have to be calculated by the incomes method, because that is what NNI is measuring. C Double counting is not a problem if the conversion uses the output method, but it is when using the expenditure method. D The value of exports needs to be added, because exports generate income for citizens.
1 marks
Answer: A
This question in 9708/33 Oct/Nov 2022
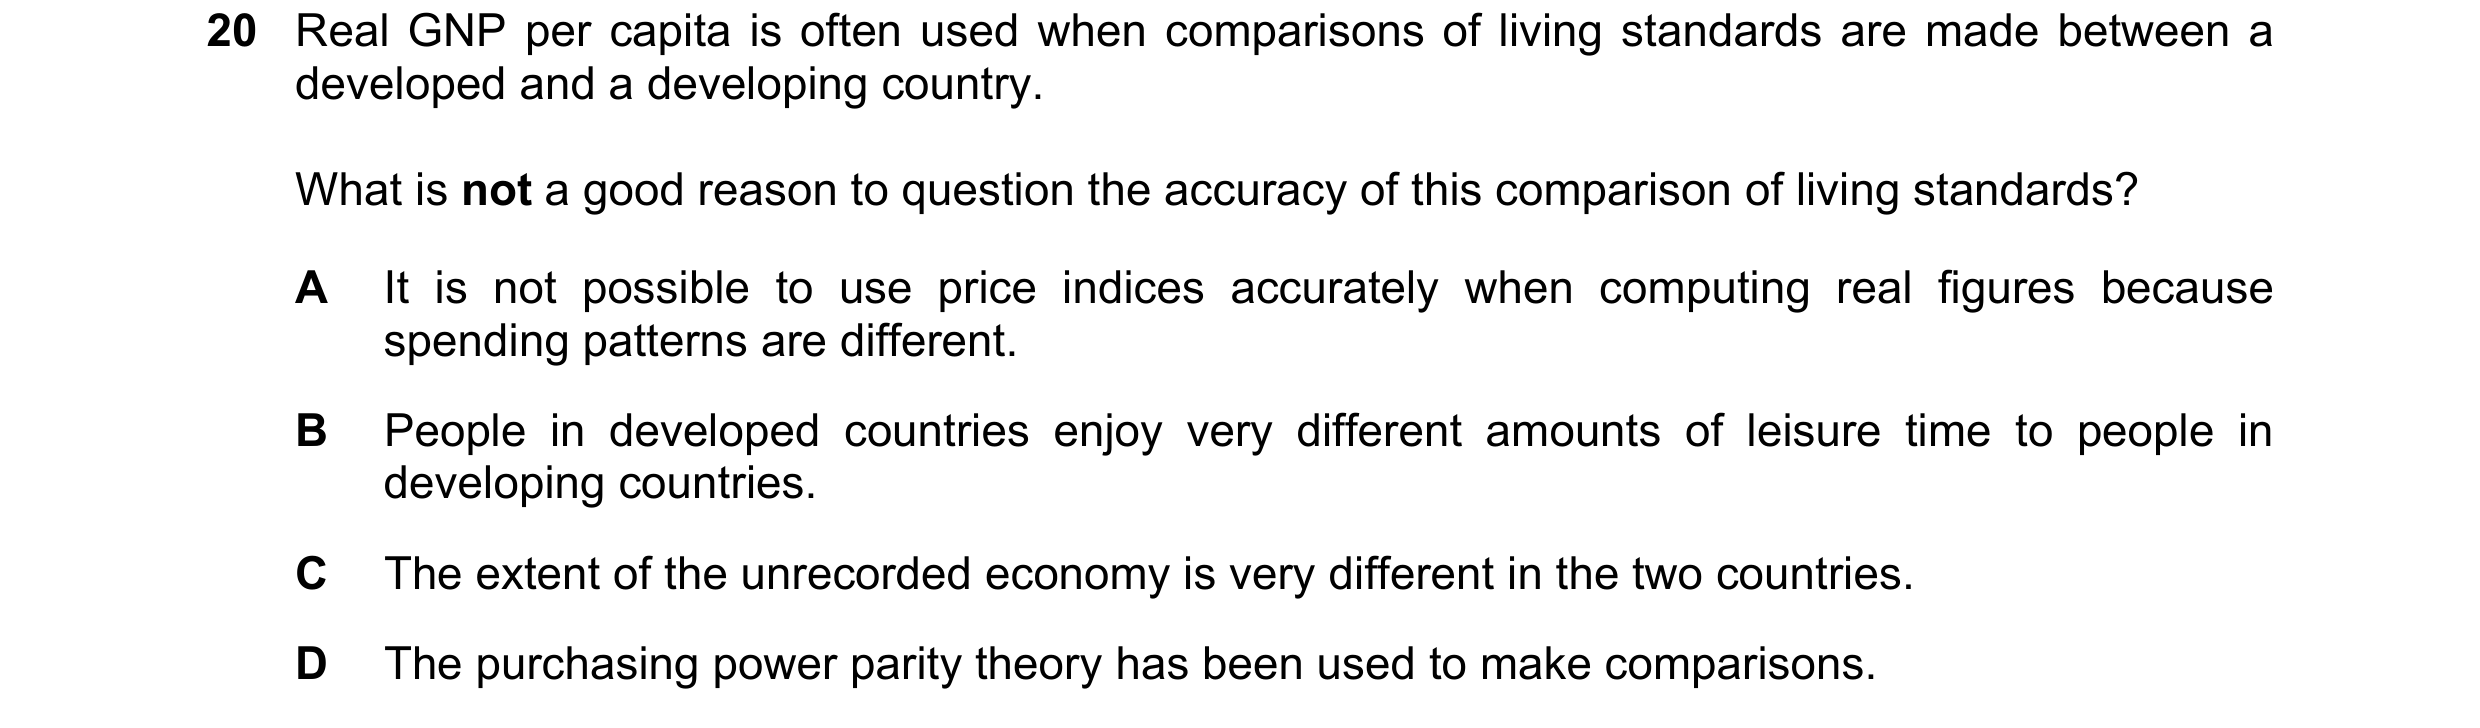
Q62 · Real GNP per capita is often used when comparisons of living standards are made between a… 9708/33 Oct/Nov 2022
20 Real GNP per capita is often used when comparisons of living standards are made between a developed and a developing country. What is not a good reason to question the accuracy of this comparison of living standards? A It is not possible to use price indices accurately when computing real figures because spending patterns are different. B People in developed countries enjoy very different amounts of leisure time to people in developing countries. C The extent of the unrecorded economy is very different in the two countries. D The purchasing power parity theory has been used to make comparisons.
1 marks
Answer: D
This question in 9708/33 Oct/Nov 2022
 1 / 16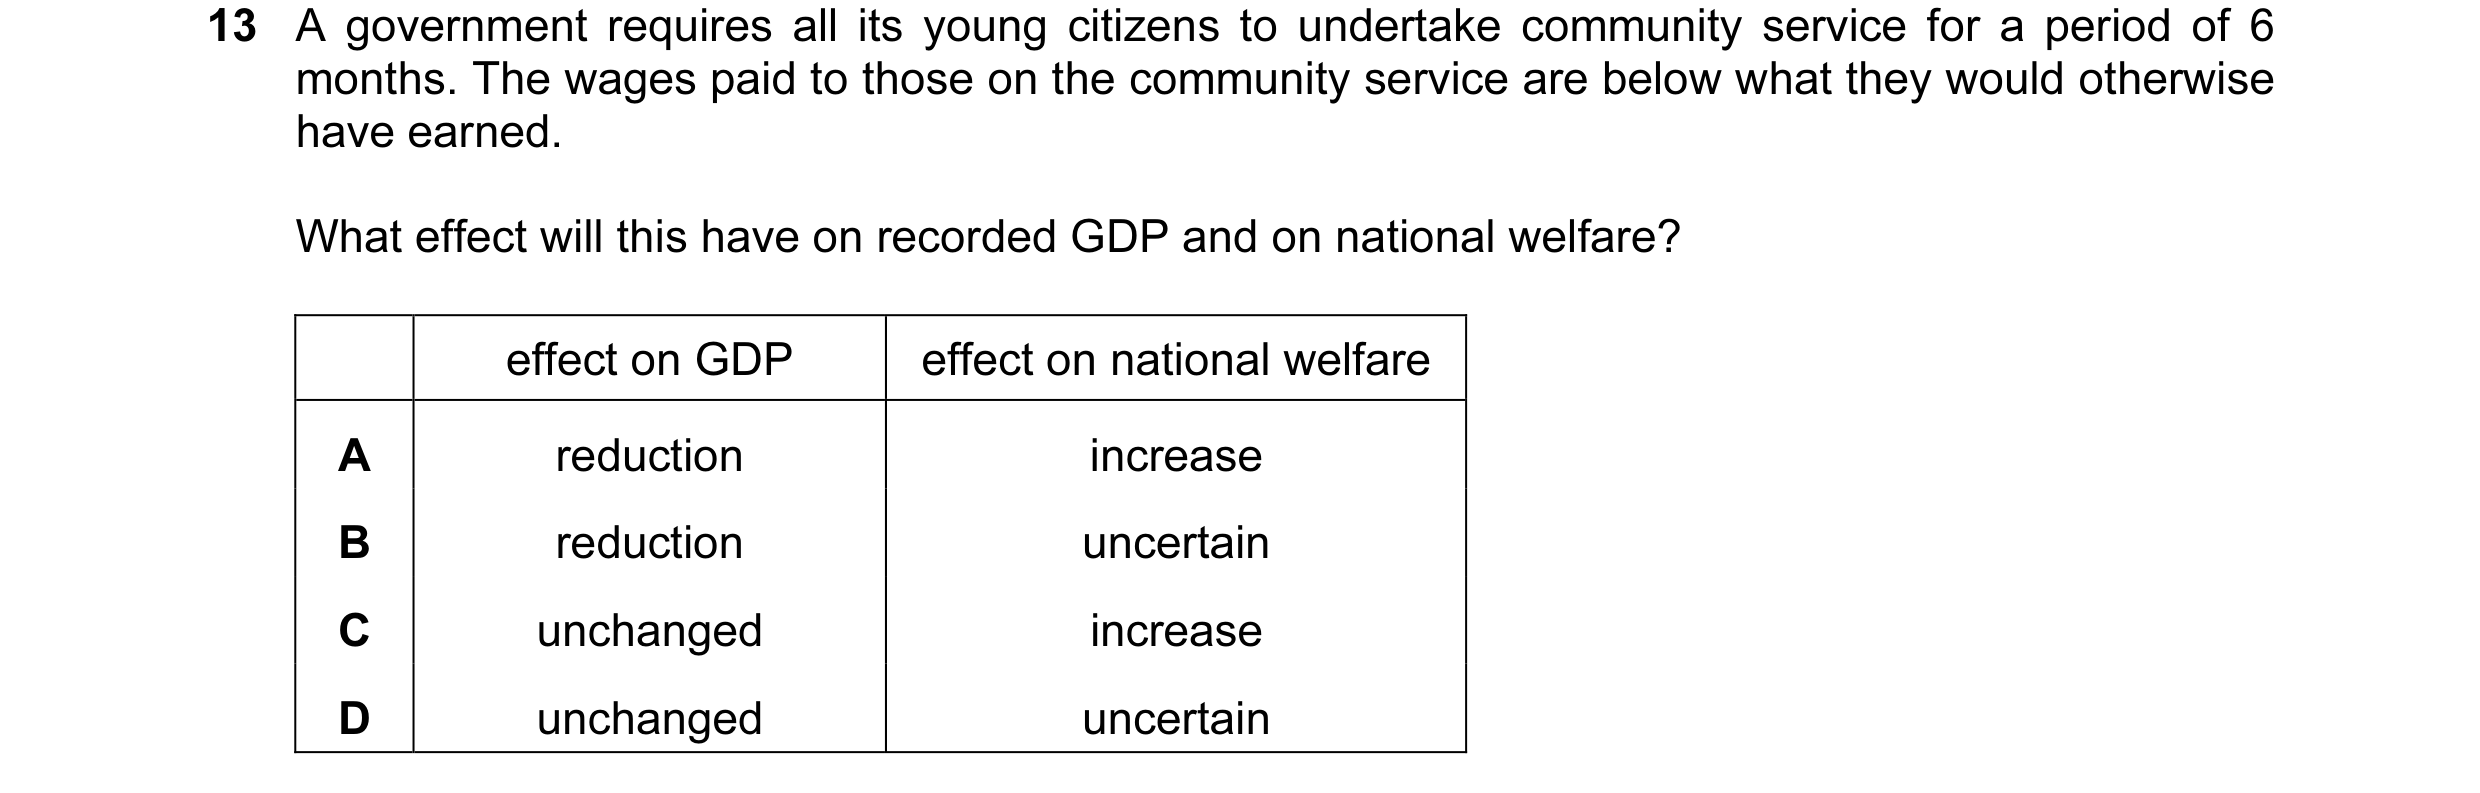

 2 / 16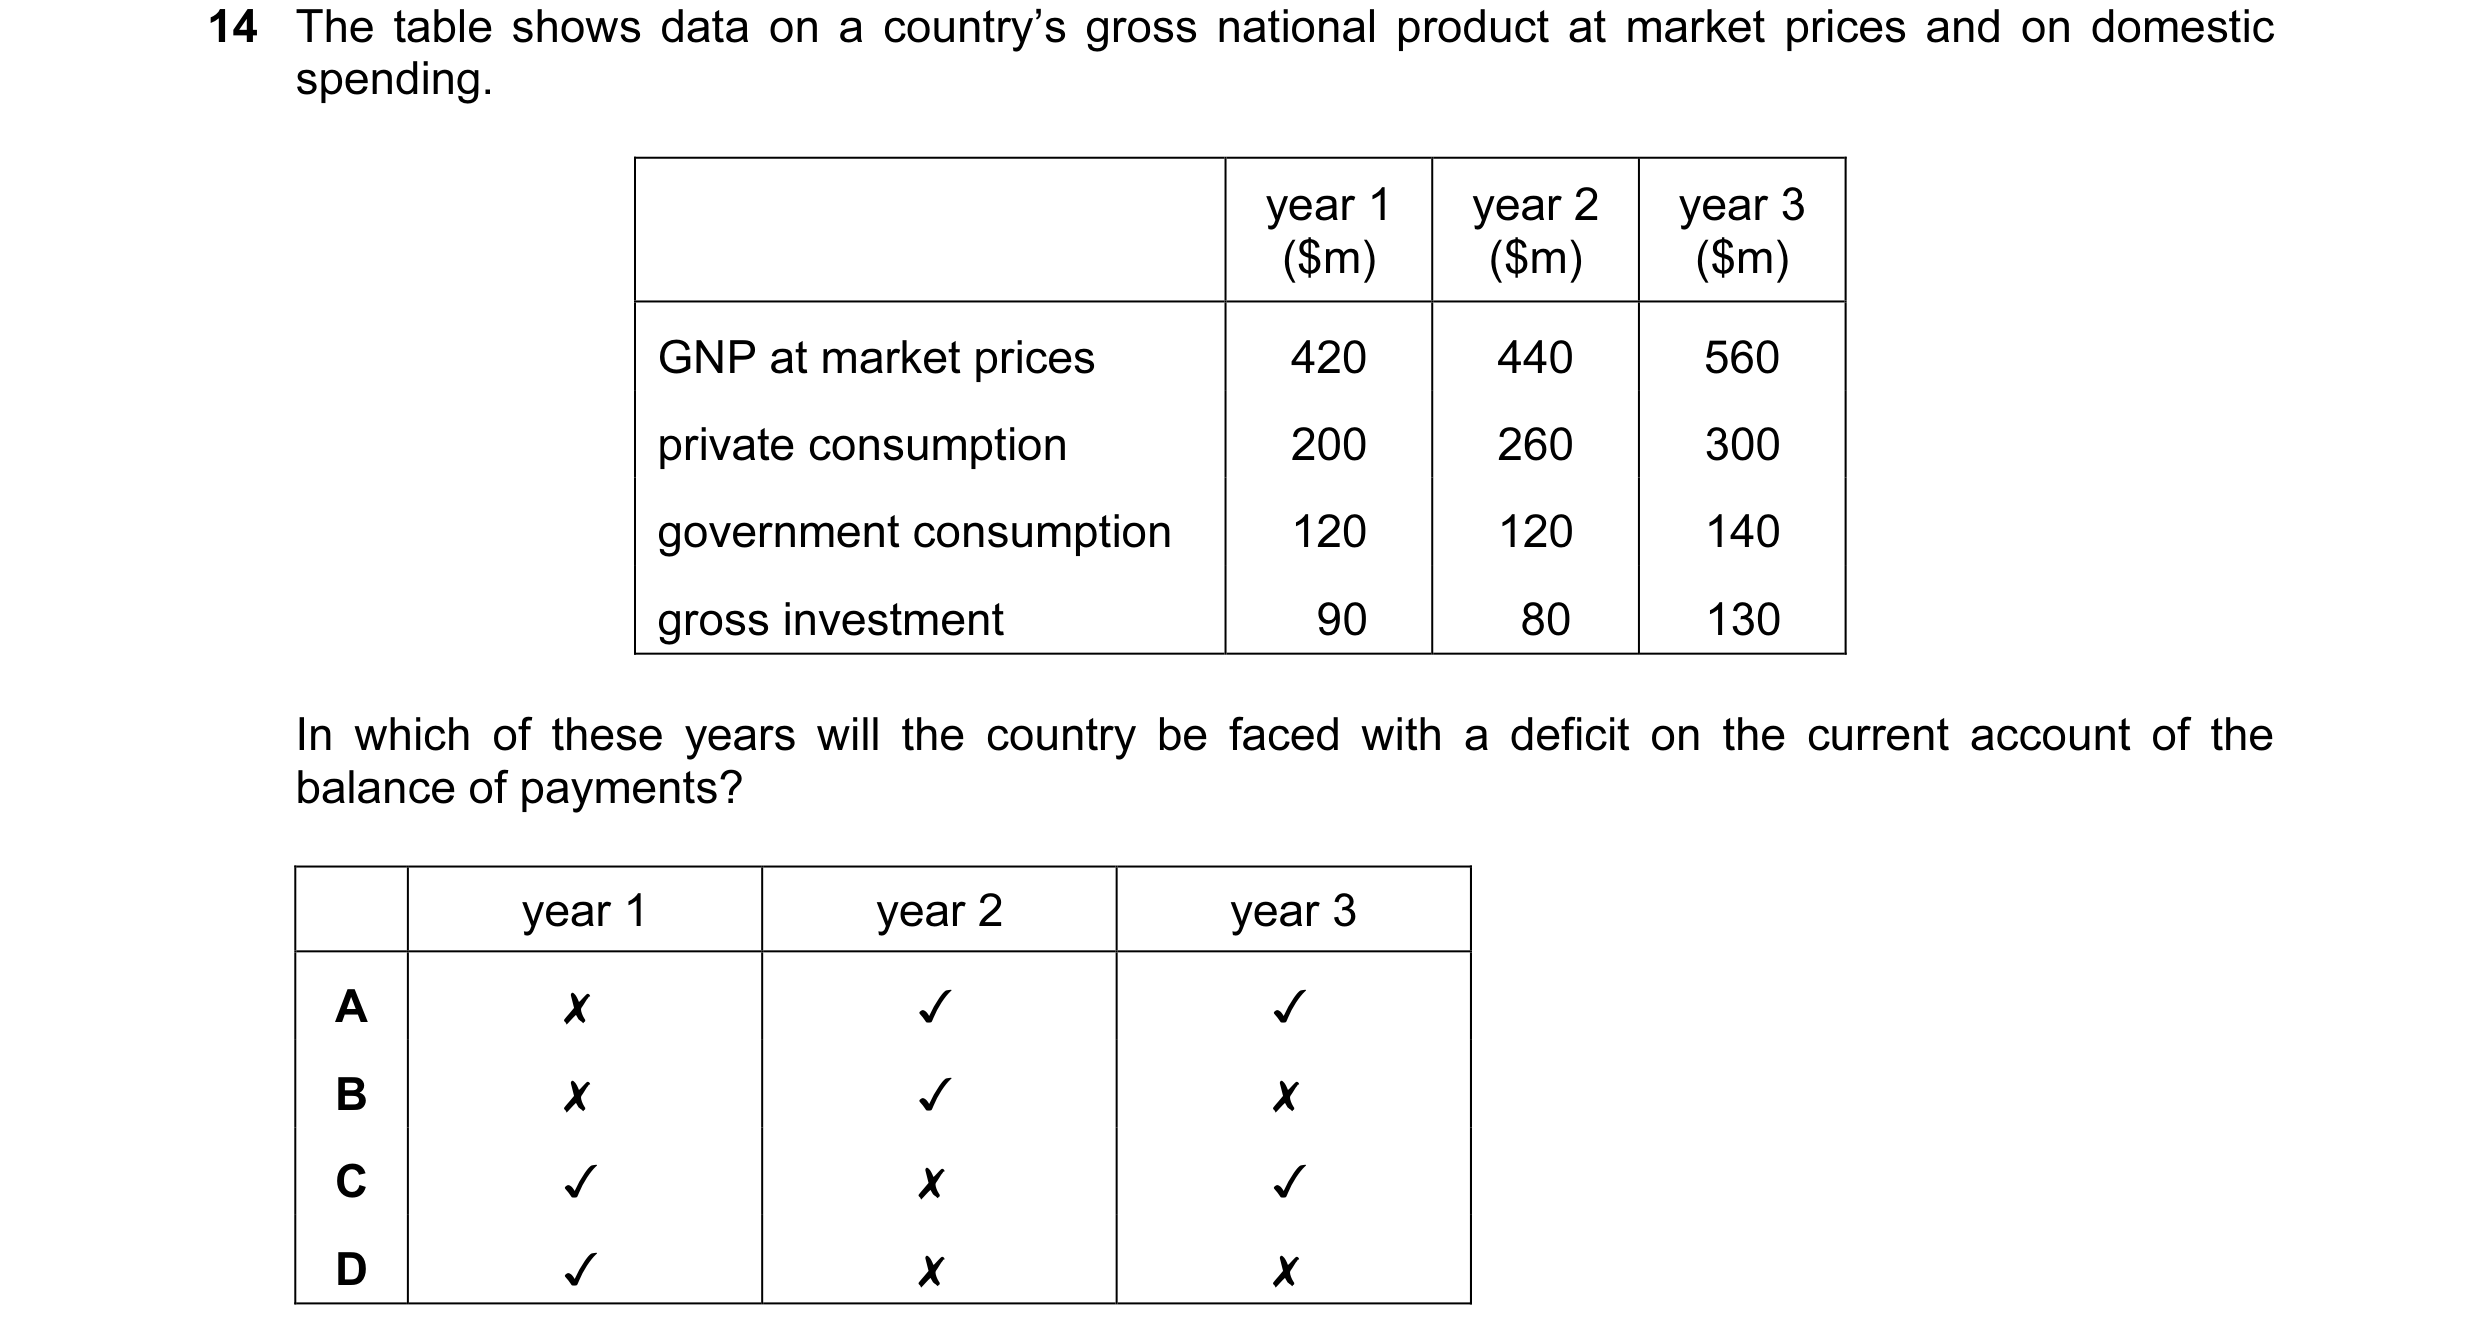
 3 / 16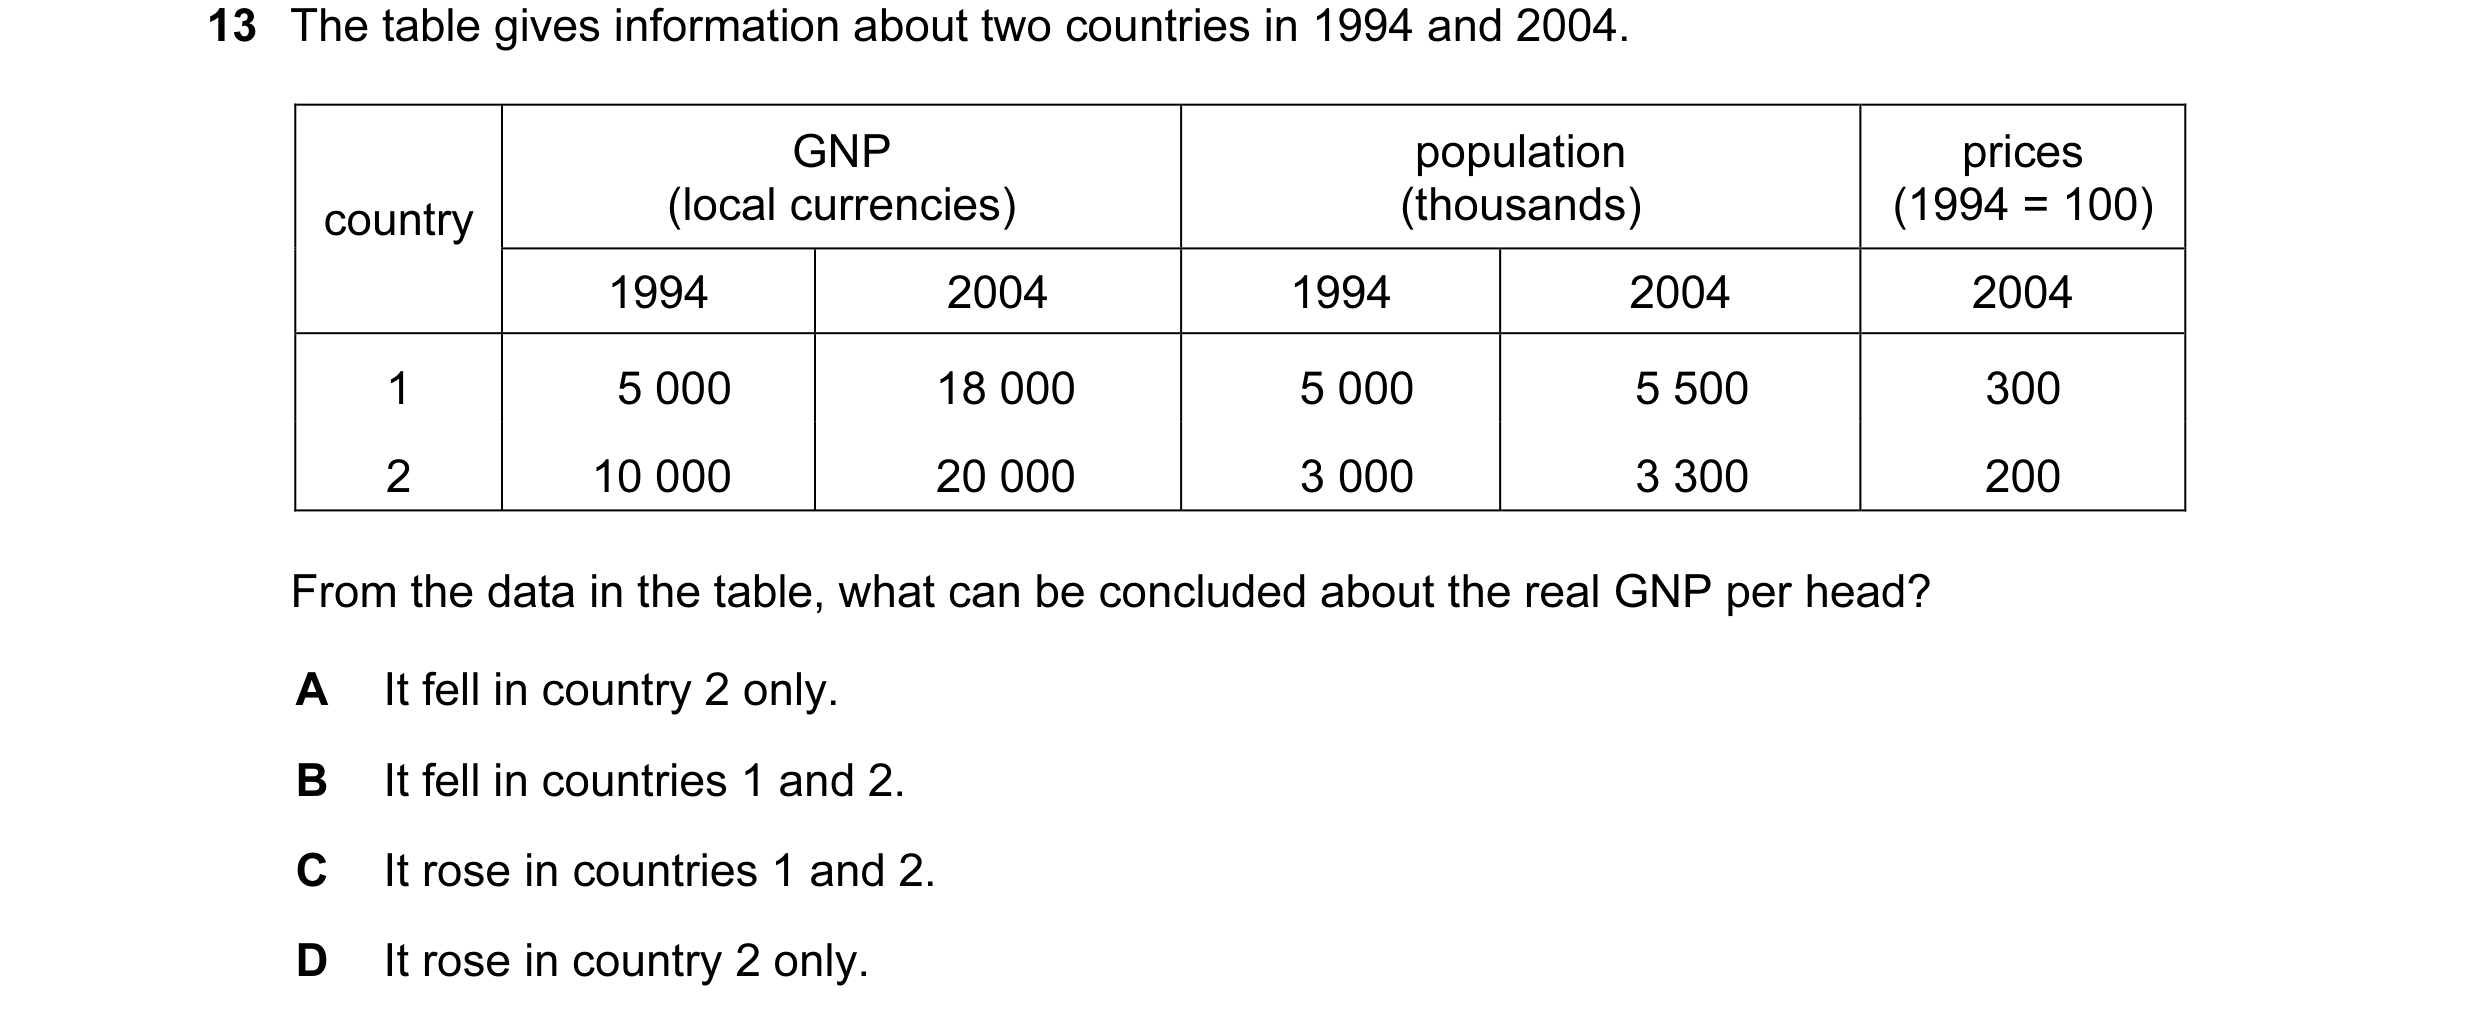
 4 / 16
 5 / 16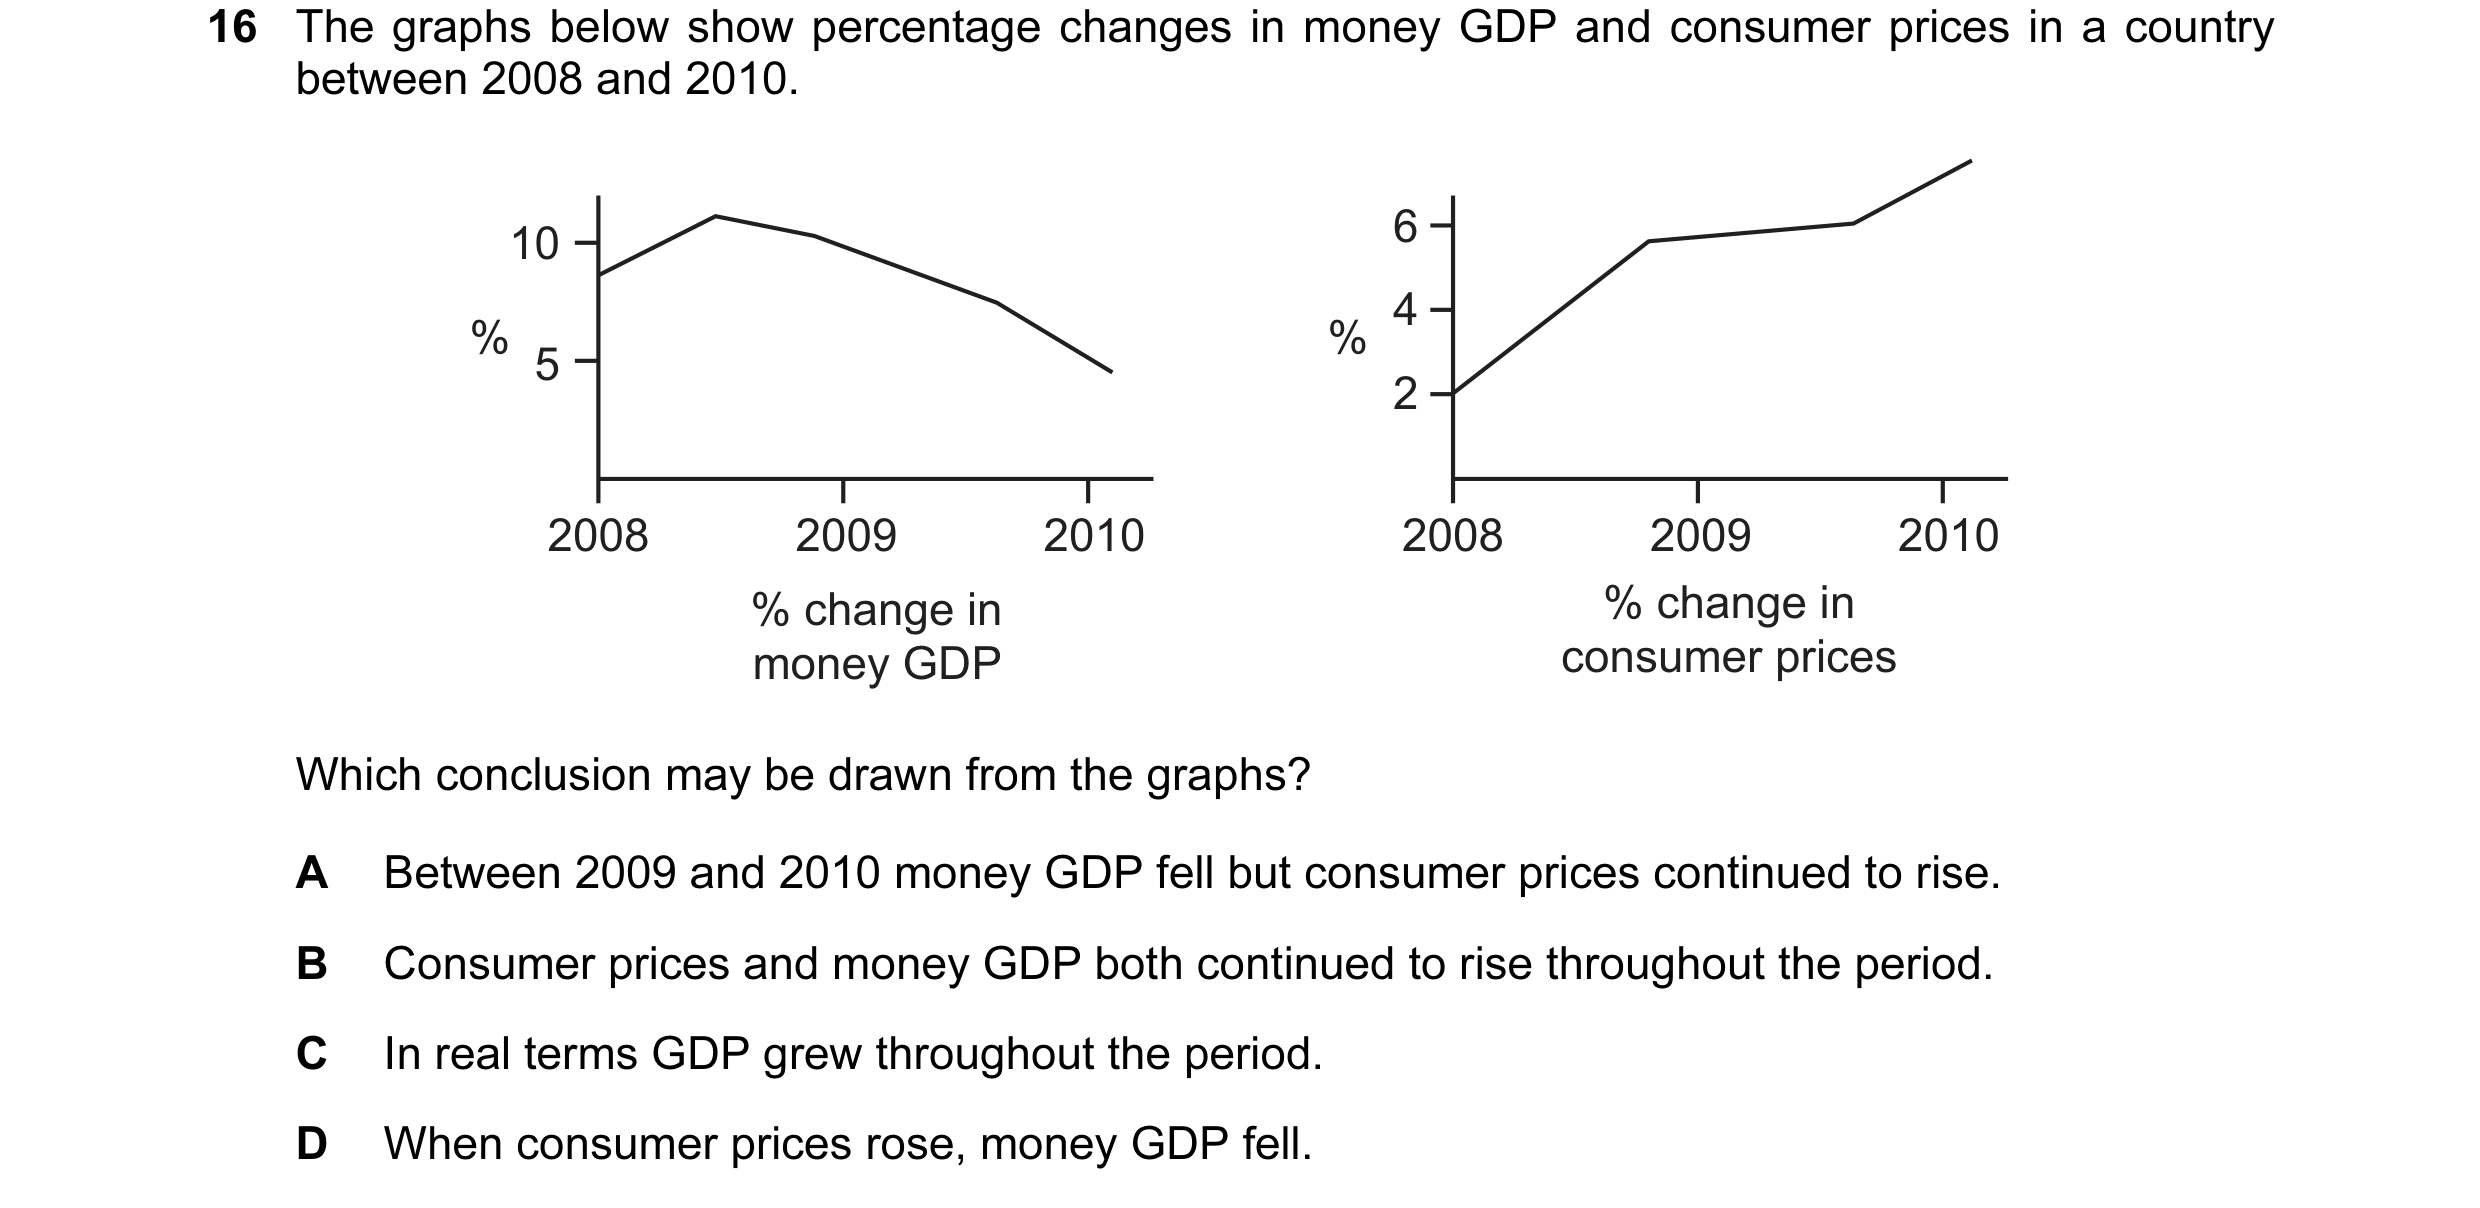
 6 / 16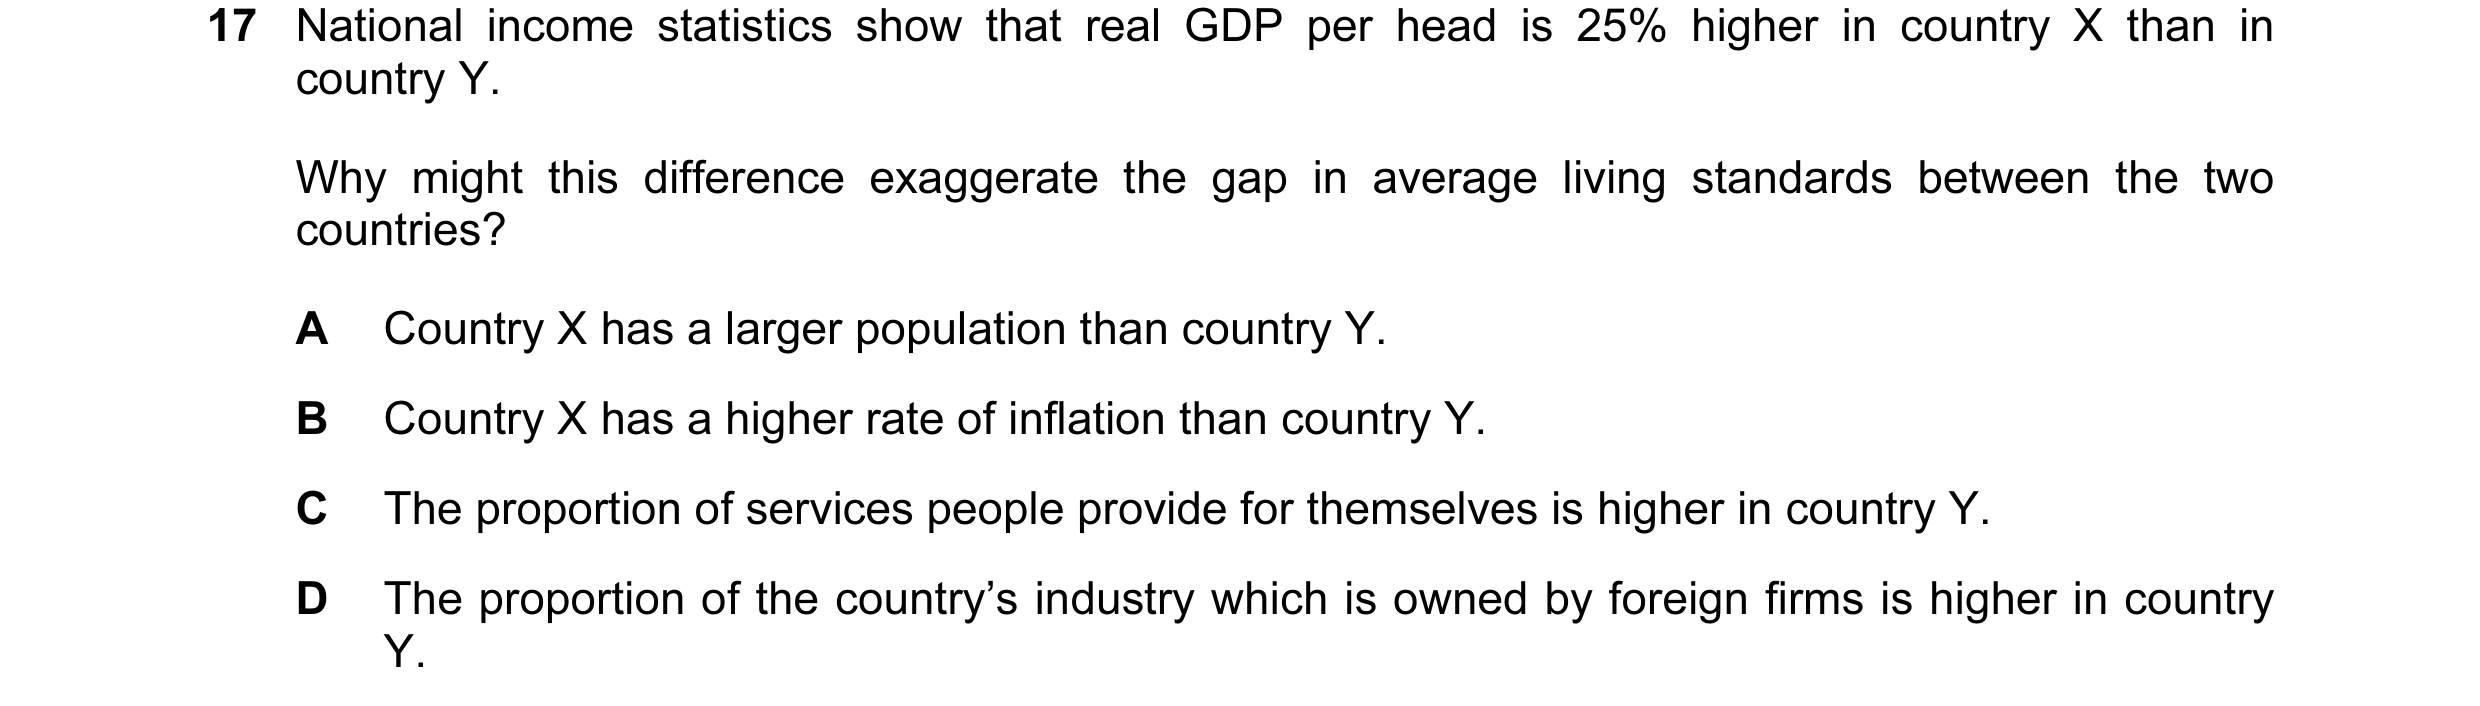
 7 / 16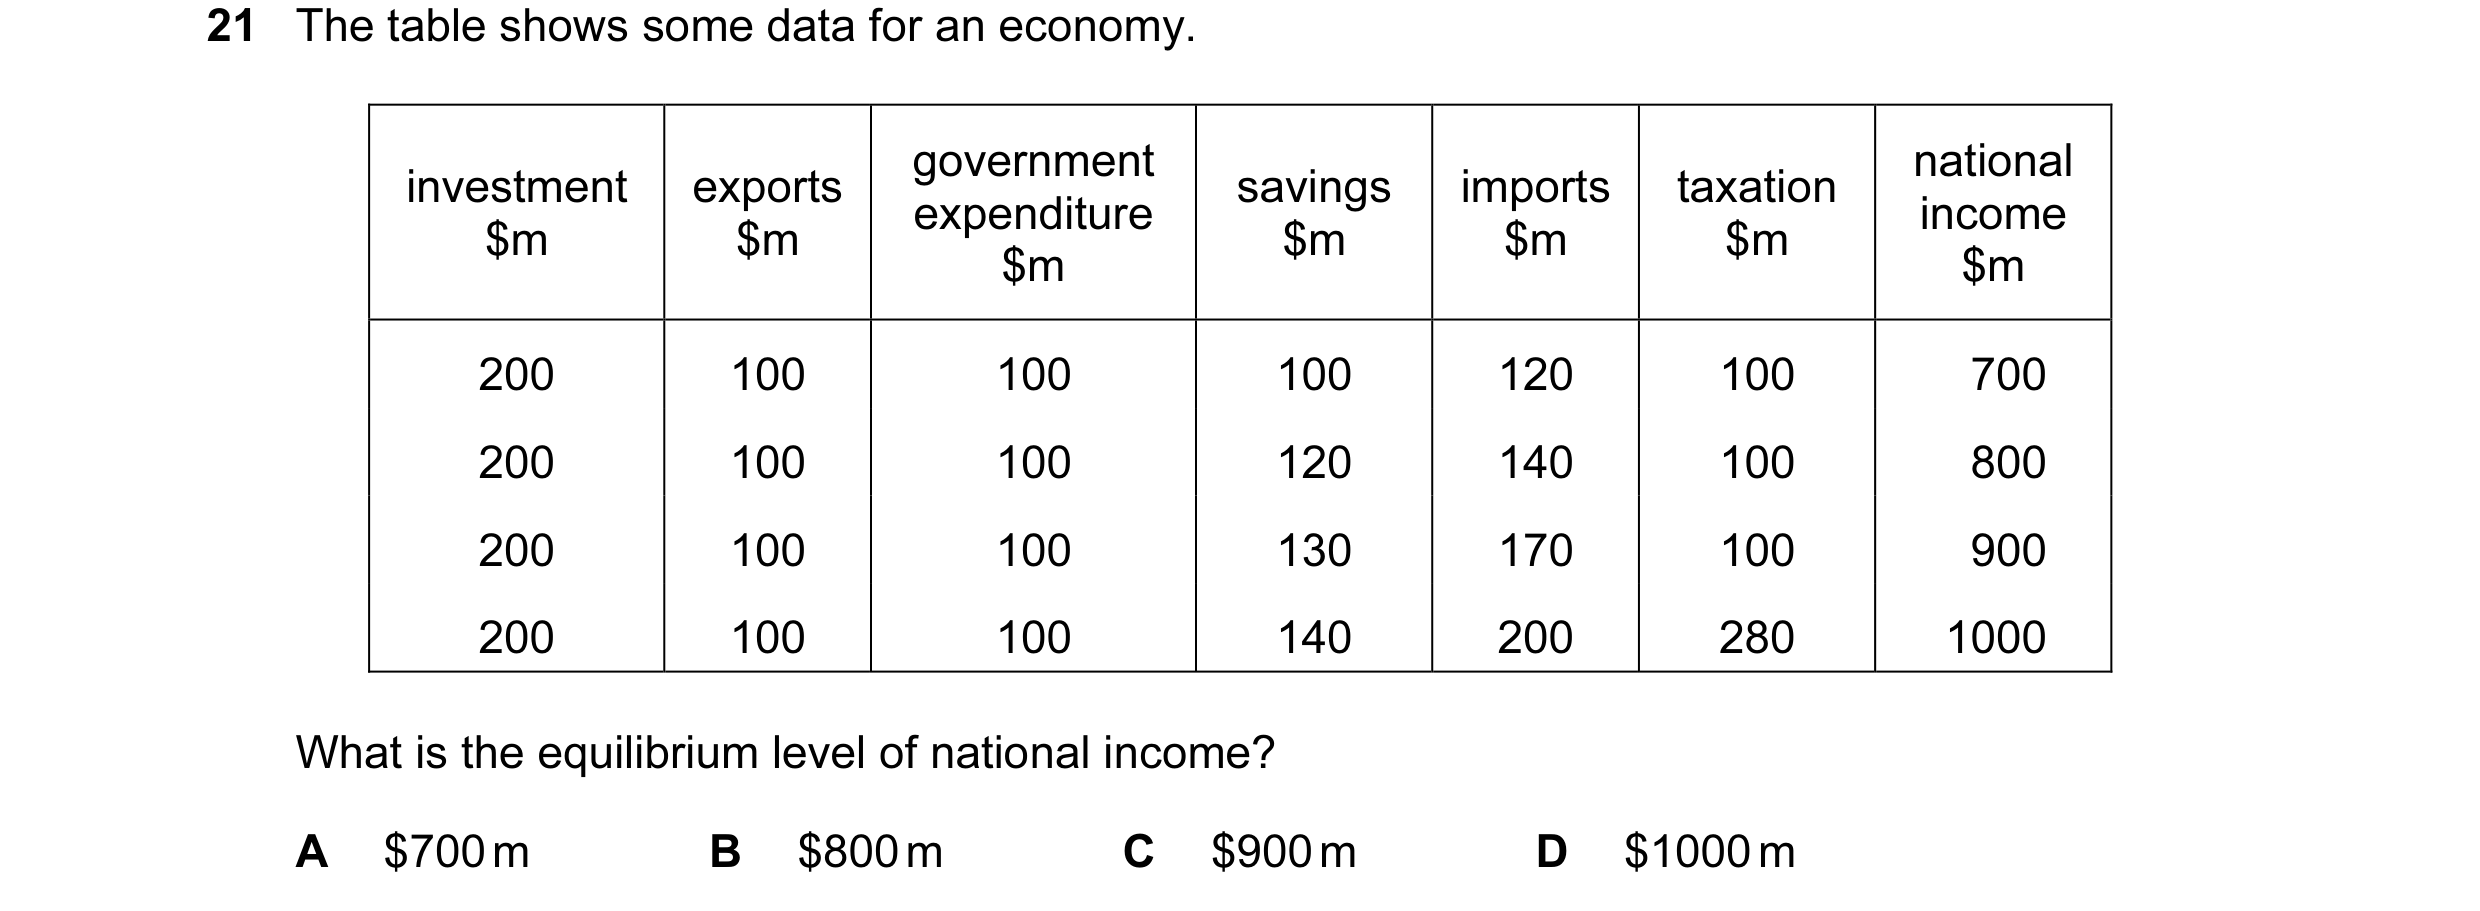

 8 / 16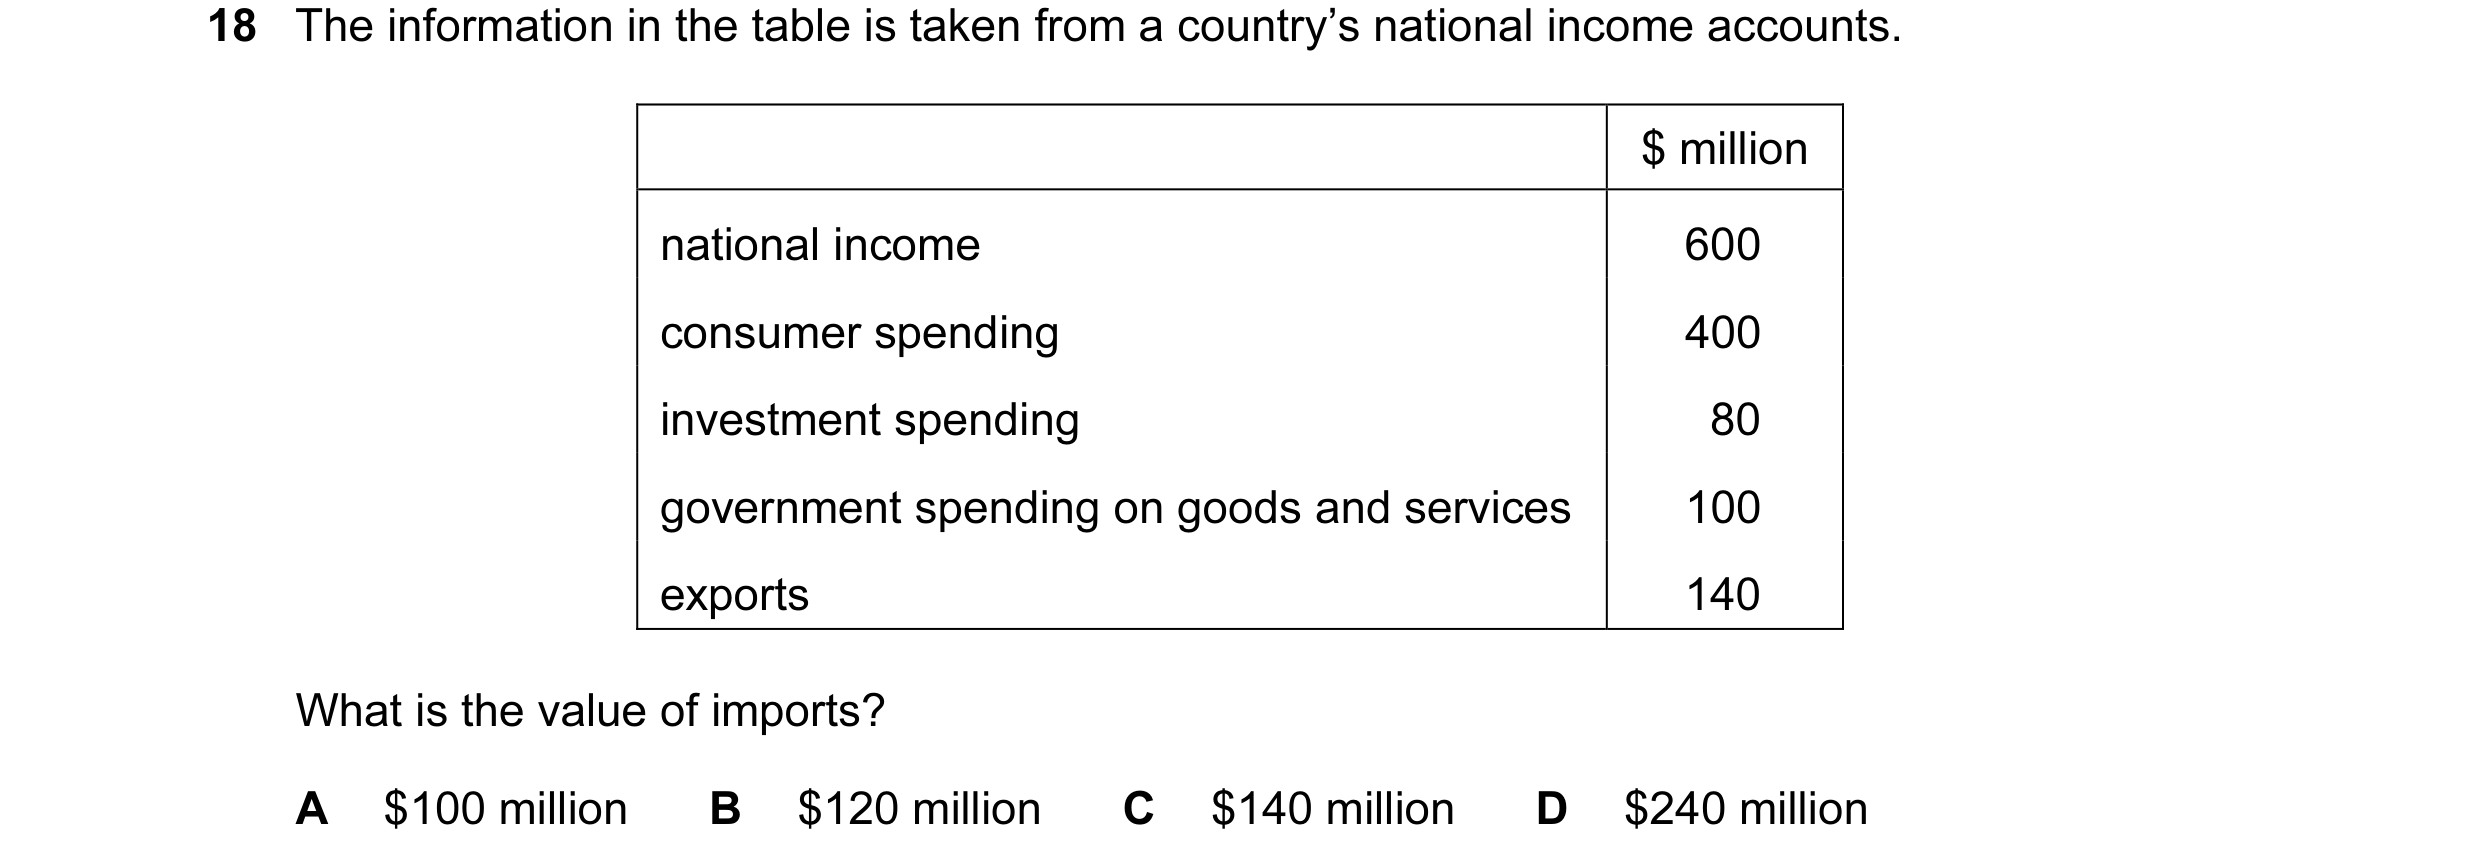
 9 / 16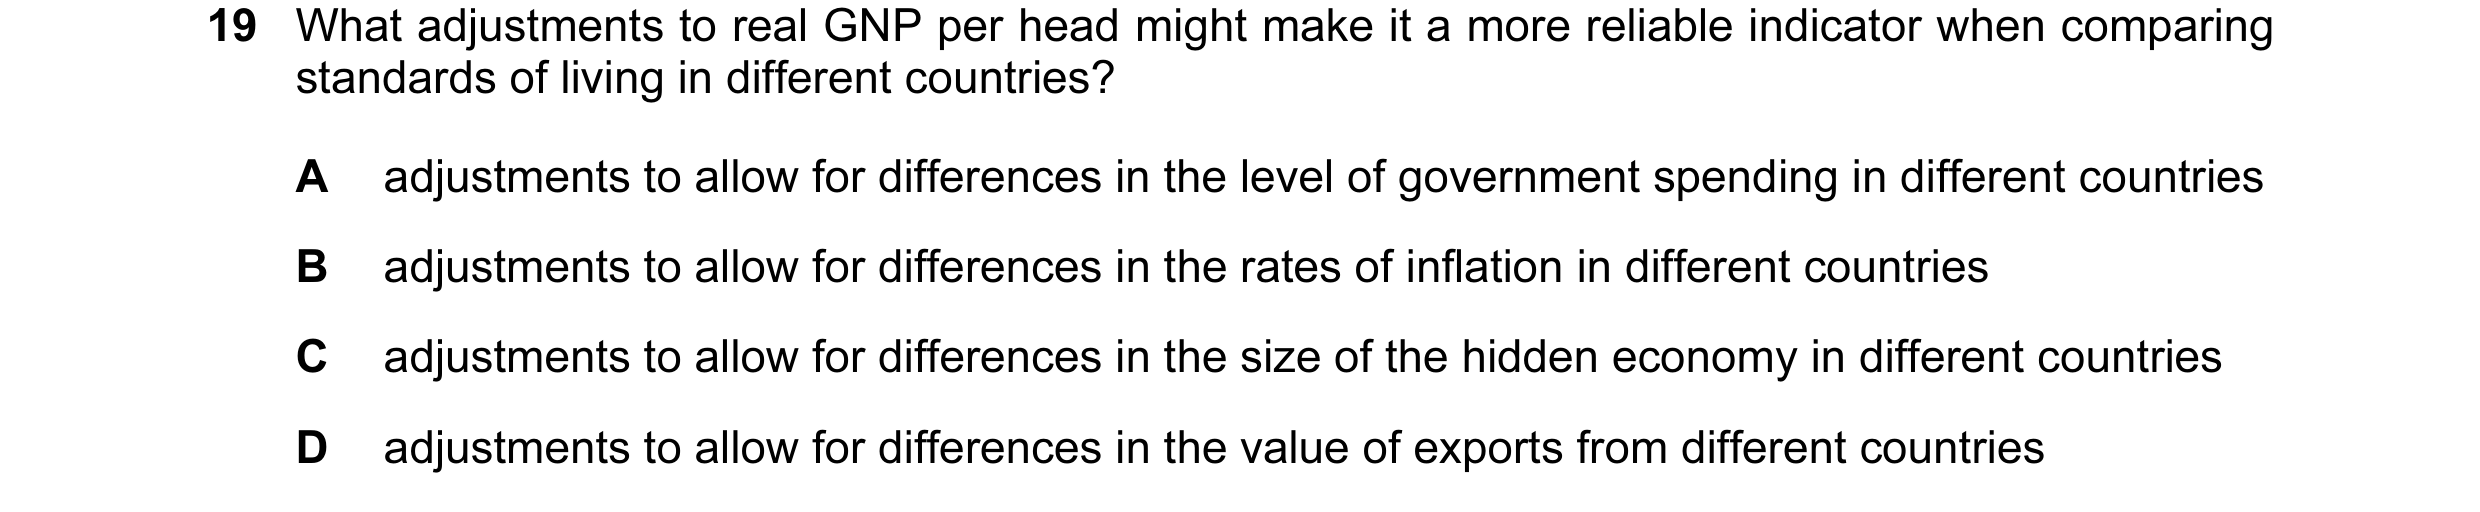
 10 / 16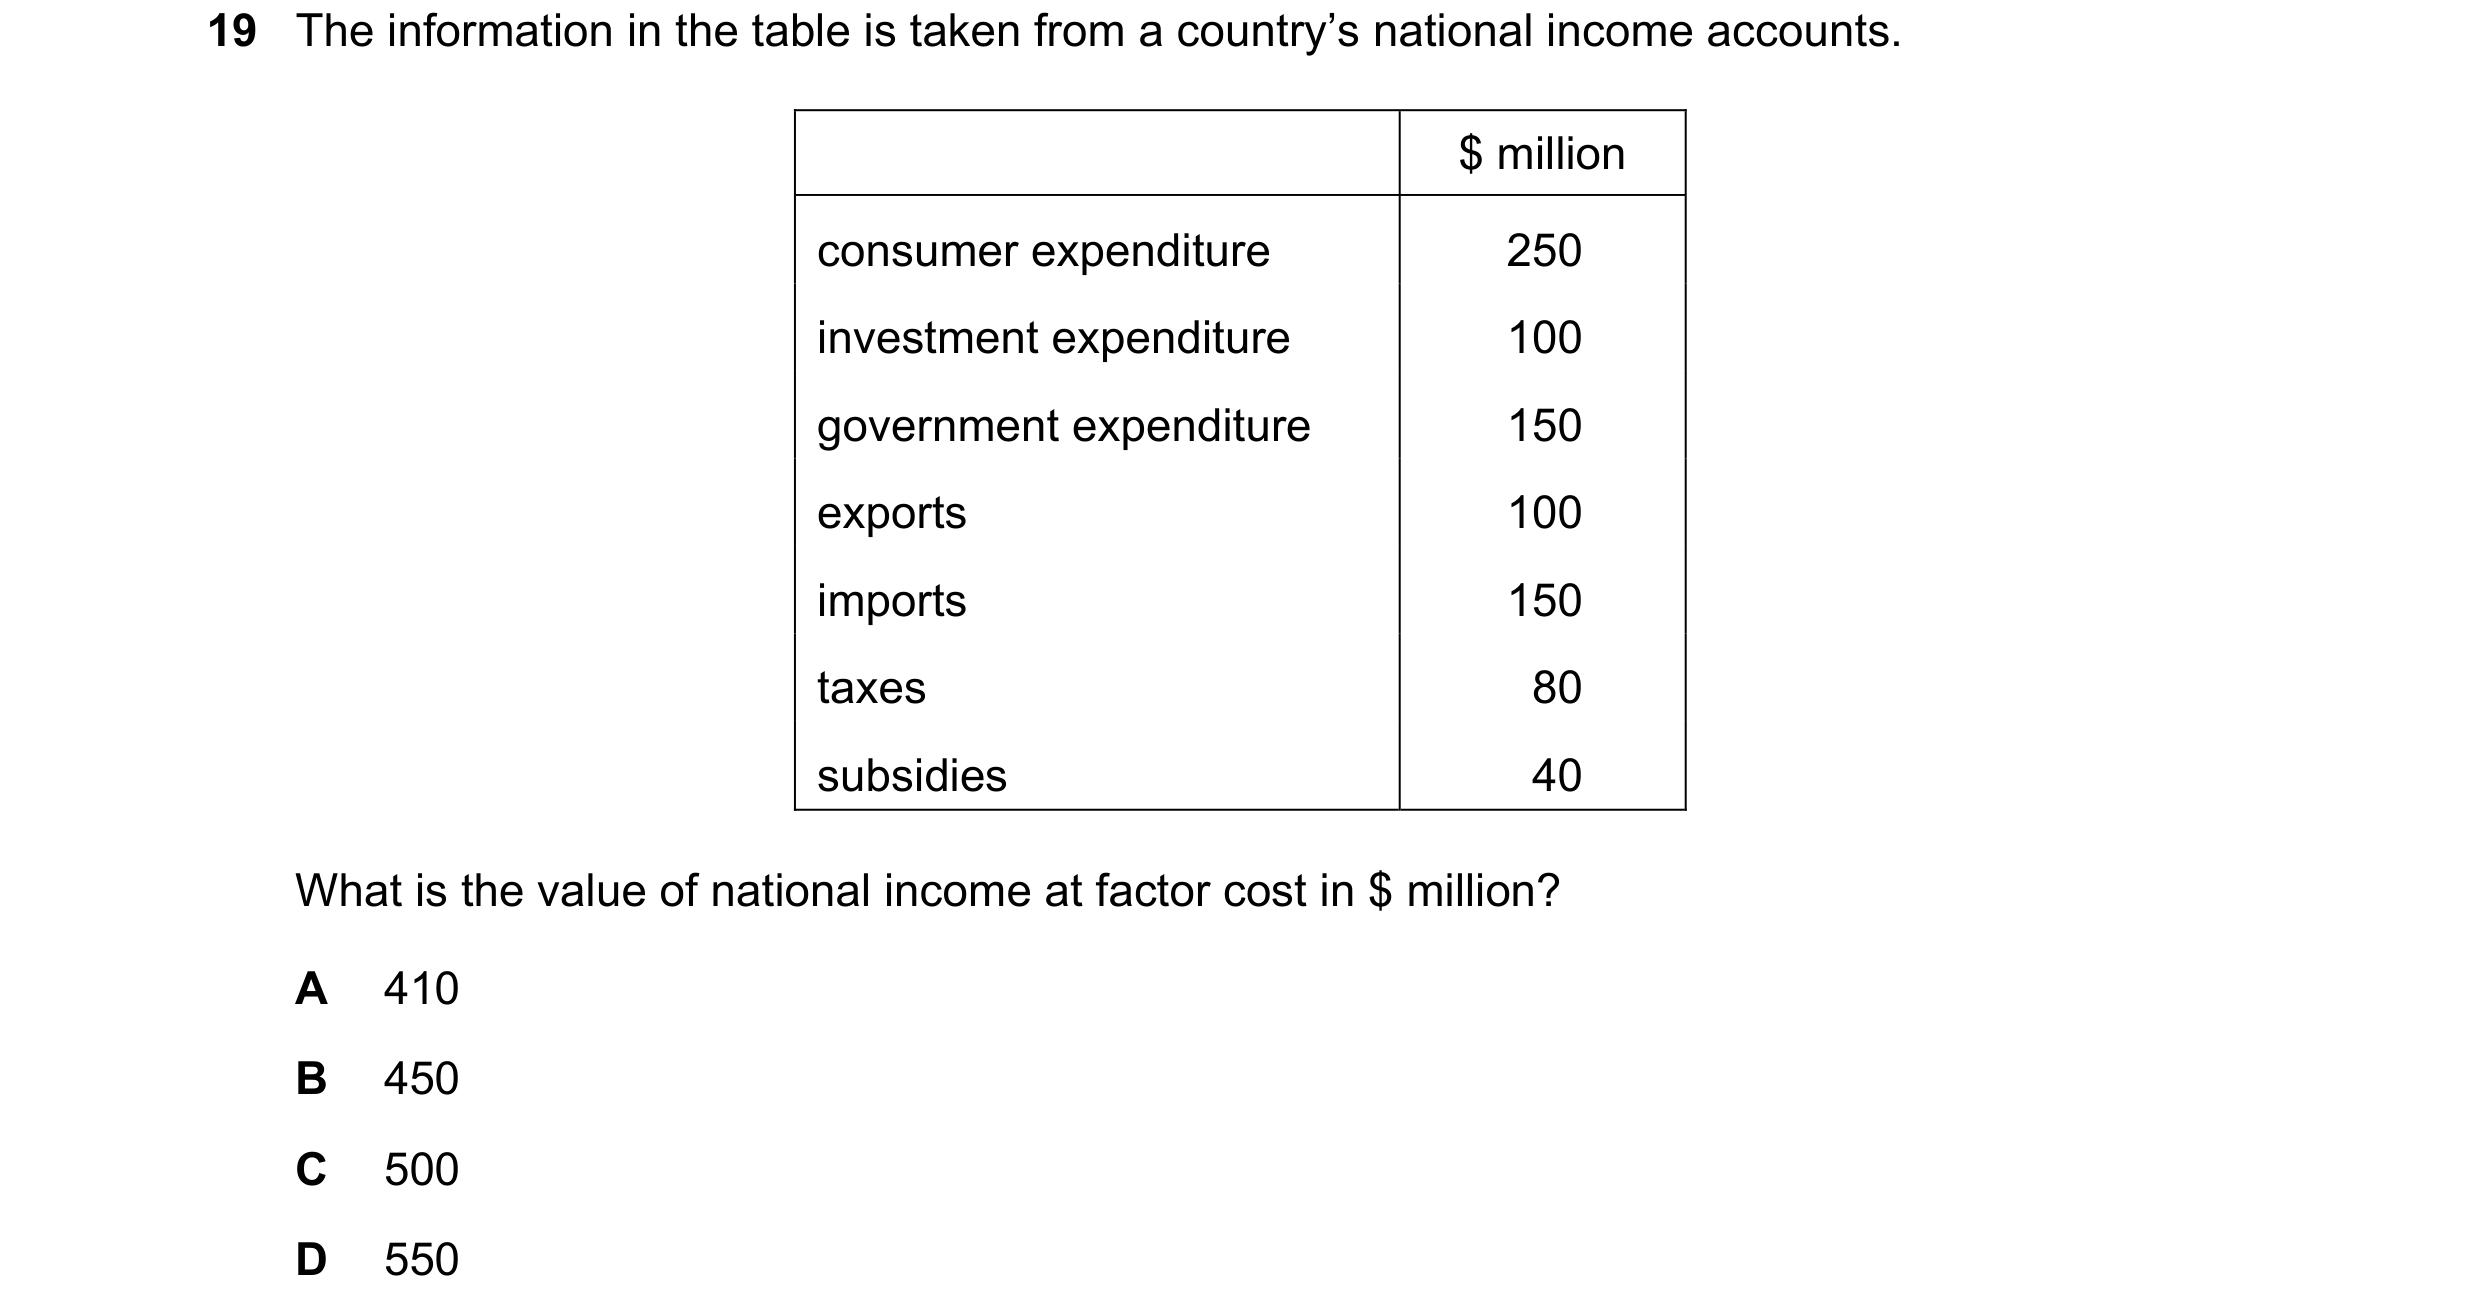

 11 / 16


 12 / 16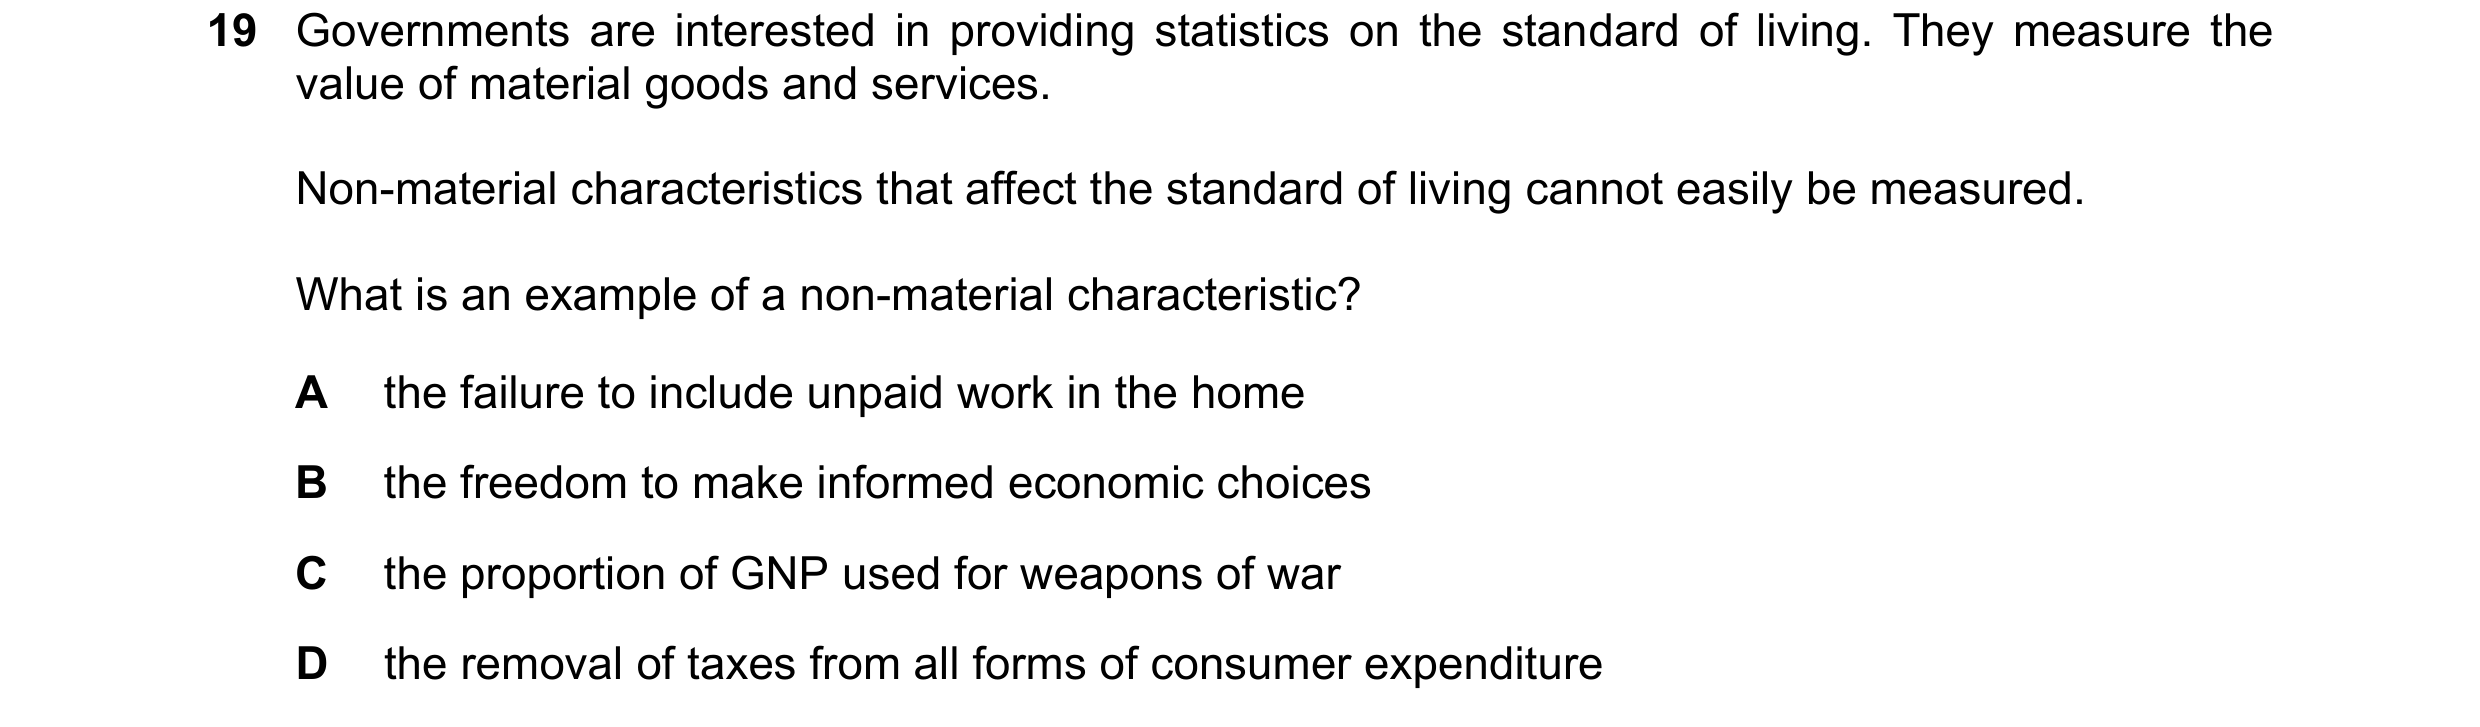
 13 / 16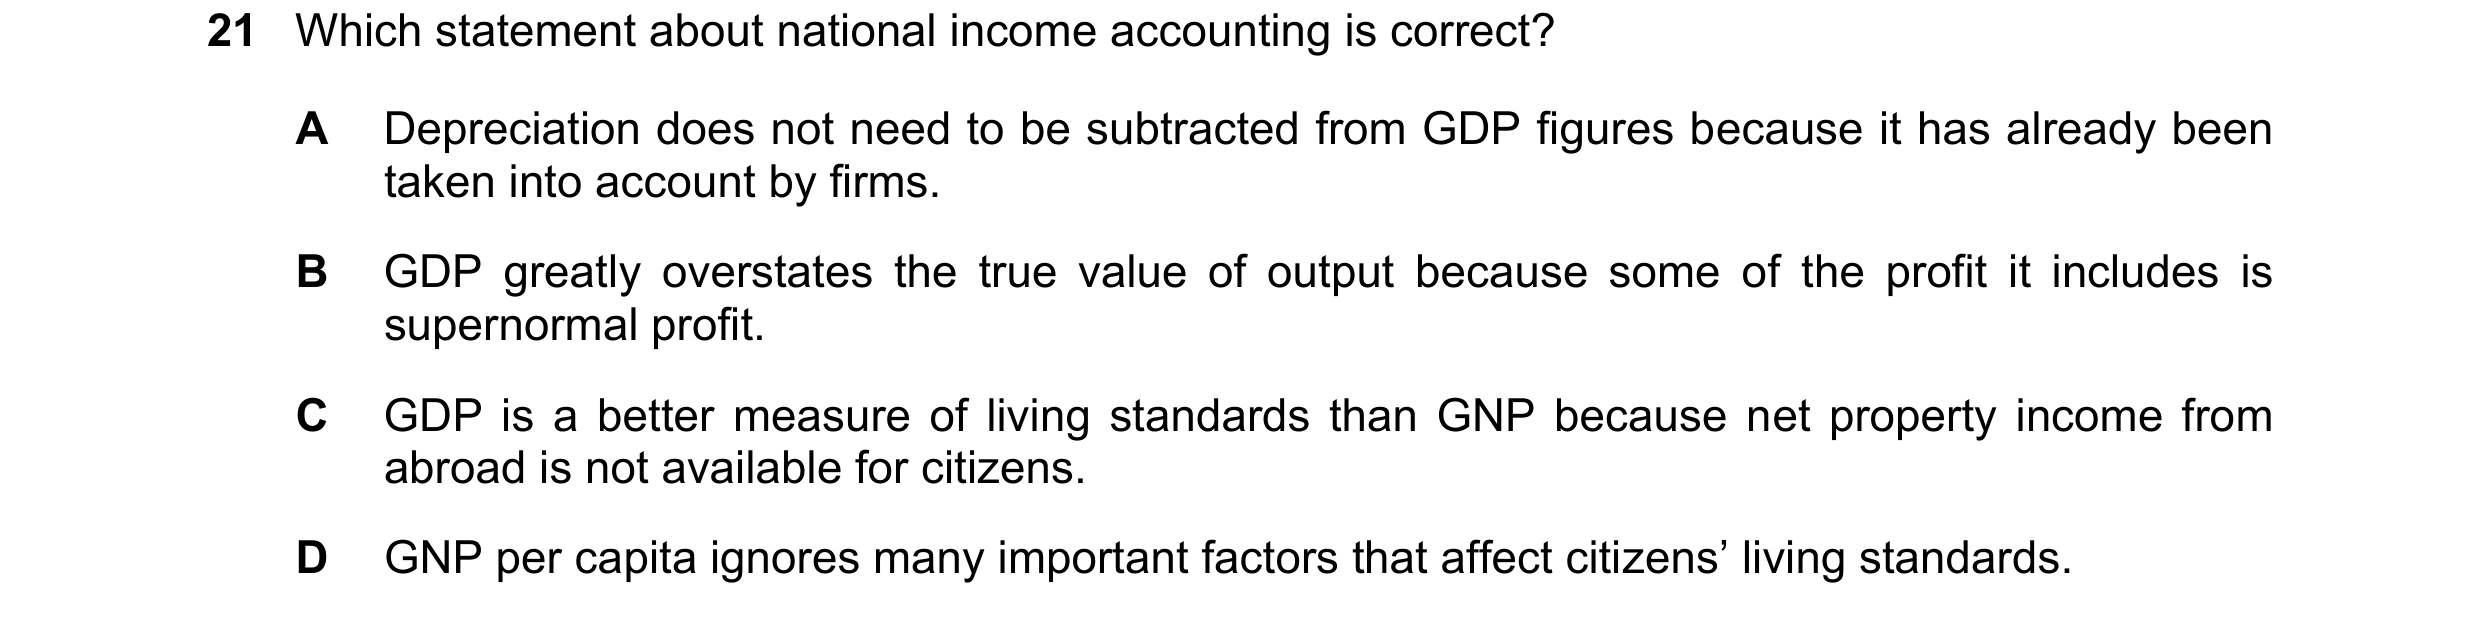
 14 / 16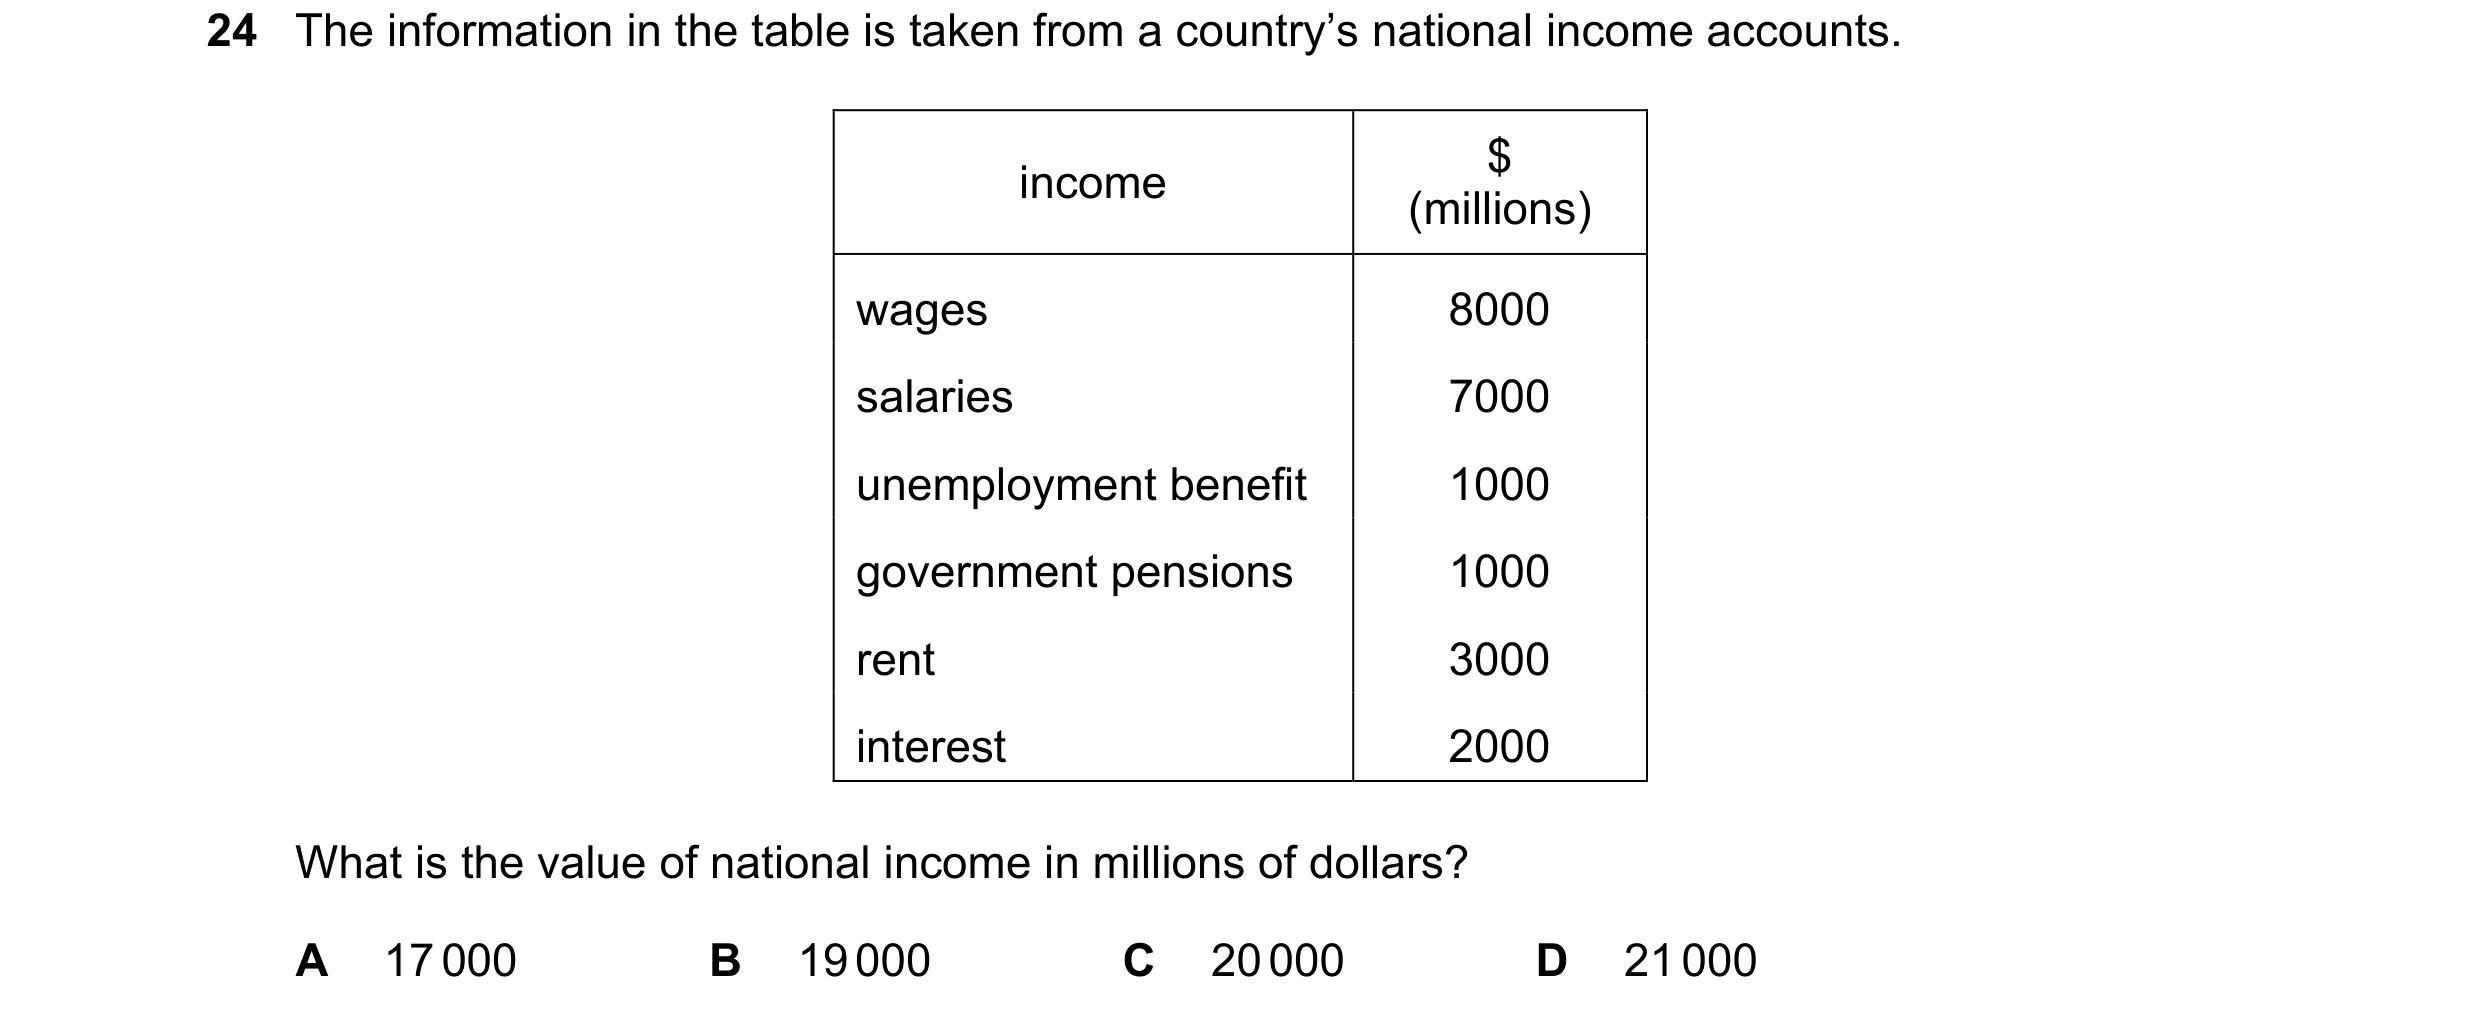

 15 / 16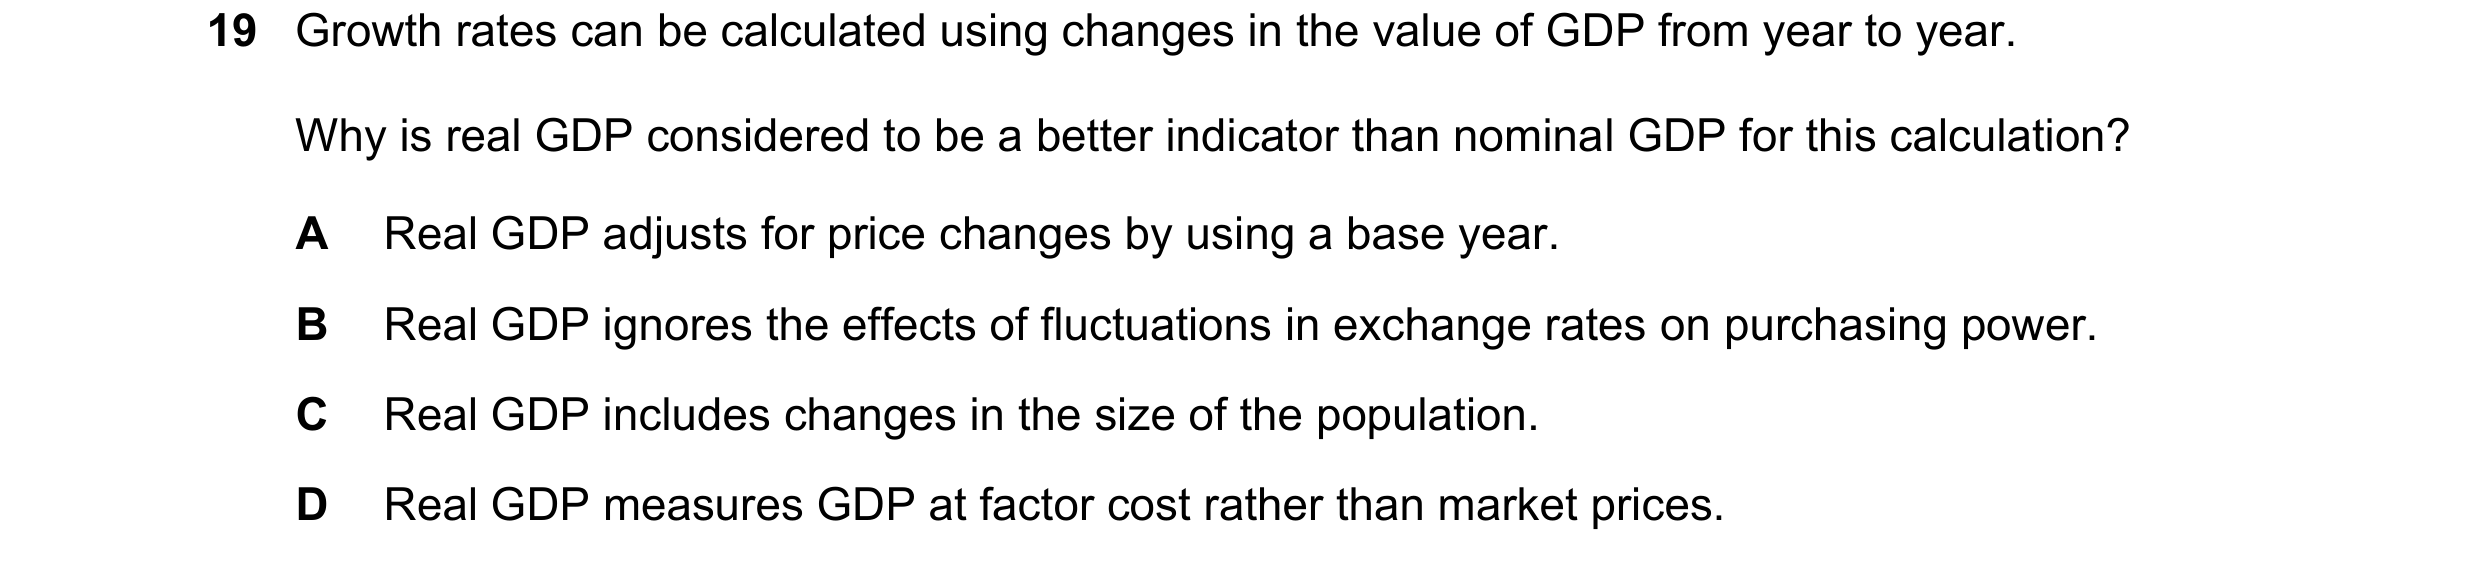
 16 / 16