Questions as text
Q1 · Firms use different quantities of land, labour, capital and enterprise in producing their… 0455/22 Feb/March 2017
3 Firms use different quantities of land, labour, capital and enterprise in producing their products. The ways in which a country’s resources can be used, and the extent to which they are employed, can be shown on a production possibility diagram. (a) What is the difference between capital and land? [2] (b) Explain two reasons why a firm may decide to use more labour and less capital in producing its products. [4] (c) Analyse, using a production possibility diagram, the effect on an economy’s output when there is a change from full employment to unemployment. [6] (d) Discuss whether it is always possible for a country to have low unemployment and low inflation at the same time. [8]
20 marks
Mark scheme: 3(a) What is the difference between capital and land? Capital is human-made goods used to produce other products (1) whereas land is a natural resource (1). Capital receives interest as a payment (1) while land receives rent (1). 2 3(b) Explain two reasons why a firm may decide to use more labour and less capital in producing its products. 1 mark each for each of two reasons identified: • may be cheaper • may be more available • may want to make hand-made products • may be subsidised to do so by the government • may be more mobile/less specific • may be less initial cost 1 mark each for each of two explanations given: • costs of production may be lower using labour/labour may be more productive • there may be a shortage of capital goods/it may take time for capital goods to be produced • each product produced may be tailored to customer’s requirements/not standardised • the government may subsidise firms to take on workers in order to reduce unemployment. • capital may not be able to switch to producing other products • example of labour-intensive industry • high cost of purchasing the capital equipment. 4 Question Answer Marks Guidance 3(c) Using a production possibility curve diagram, analyse the effect on an economy’s output when there is a change from full employment to unemployment. Up to 4 marks for diagram: Axes correctly labelled (1) Curve/straight downward sloping line drawn to the axes (1) A production point on the one curve (1) A production point inside the one curve (1). Up to 2 marks for written explanation: Full employment would mean an economy making maximum use of resources (1) making as much output as possible/efficient use of resources (1) unemployment means output is below potential (1) inefficient use of resources/resources lying idle (1) output will fall (1). 6 O e.g. consumer goods e.g. capital goods Question Answer Marks Guidance 3(d) Discuss whether it is always possible for a country to have low unemployment and low inflation at the same time. Up to 5 marks for why it might: If total supply is increasing (1) as total demand increases (1) output will be high (1) causing low unemployment without inflation (1). Advances in technology/improvements in education (1) raises productivity (1) can lower costs of production (1) reducing cost-push inflation (1) and increasing demand for labour (1). Low inflation may stimulate firms to raise output (1) take on more workers (1). Up to 5 marks for why it might not: Low unemployment may mean incomes are high (1) total demand may be high (1) causing demand-pull inflation (1). Low unemployment may result in increased competition for labour (1) this may raise wages (1) increasing firms’ costs of production (1) causing cost-push inflation (1). Inflation may create a price/wage spiral (1) demand-pull inflation leading to cost-push inflation (1). 8
This question in 0455/22 Feb/March 2017
Q2 · Japan’s birth rate is falling 0455/21 May/June 2017
6 Japan’s birth rate is falling. Its population is ageing, and declining at a faster rate than any other country’s population. This has an impact on the amount that the Japanese Government spends on pensions. Its government is considering measures to increase the country’s birth rate and to encourage immigration. (a) Identify two causes of a fall in a country’s birth rate. [2] (b) Explain two reasons why more educated people tend to live longer than less educated people. [4] (c) Analyse, using a production possibility curve diagram, what effect net immigration is likely to have on an economy. [6] (d) Discuss whether the government of a country should reduce the pensions it pays to retired people. [8]
20 marks
Mark scheme: 6(a) Identify two causes of a fall in a country’s birth rate. 1 mark each for each of two causes identified: • higher levels of education • better family planning/use of contraceptives • higher proportion of women in the labour force • lower infant mortality rate • increased state provision of state pensions • state support for farmers • war • government policy • drop in standard of living/higher costs • older population • decrease in fertility rates 2 6(b) Explain two reasons why more educated people tend to live longer than less educated people. 1 mark each for each reason identified: • educated people tend to have higher incomes • educated people tend to be better informed • educated people tend to do less physically demanding/dangerous jobs 1 mark each for each of two reasons explained: • can afford a higher standard of living/afford medical care • more likely to lead a healthier lifestyle/smoke less/drink less alcohol • less likely to be worn out/injured at work 4 Opposite wording of the argument is acceptable, i.e. explanations as to why less well educated people might live shorter lives. Question Answer Marks Guidance 6(c) Analyse, using a production possibility curve diagram, what effect net immigration is likely to have on an economy. Up to 4 marks for the diagram: • axes correctly labelled (1) • curve drawn, either bowed out or as a straight downward sloping line, meeting the axes (1) • new curve drawn (1) • position of the new curve to the right of the original indicated either by labelling or an arrow (1) Up to 2 marks for written analysis: • net immigration will increase resources/labour (1) • more resources will increase productive potential/enable countries to produce more (1) 6 6(d) Discuss whether the government of a country should reduce the pensions it pays to retired people. Up to 5 marks for why it should: Ageing population increases the burden of pensions (1) result in higher taxes (1) or lower government spending on another area (1) opportunity cost (1) benefits of spending on alternatives (1). Reducing pensions may encourage some older people to continue to work (1) increase income tax revenue (1) increase output (1) may keep some older people healthier (1). Up to 5 marks for why it should not: May increase poverty/lower standard of living for some (1) with a lower pension some people may not be able to afford basic necessities (1) no other source of income (1). May mean that some older people may have to continue to undertake physically demanding jobs (1) these may harm their health (1). Lower government spending on pensions may reduce total demand (1) may reduce output (1) may increase unemployment (1) lower tax revenue (1). 8 A response may develop a mixture of relevant points to achieve up to 5 marks on either side. Maximum of 2 marks on each side of the discussion for a list-like approach.
This question in 0455/21 May/June 2017
Q3 · Indonesia’s output is influenced by its factors of production 0455/22 May/June 2017
2 Indonesia’s output is influenced by its factors of production. A production possibility curve diagram can be used to show this relationship between resources and output. Indonesia does have extensive fishing waters but does not actually catch many fish. Most of its fishing firms are small and they compete against much larger foreign firms. These larger foreign firms have been attracted into Indonesia’s waters because of increasing demand for fish. The price elasticity of demand for different types of fish has changed in the last few years. (a) Identify the two human factors of production. [2] (b) Explain two economic concepts shown by a production possibility curve diagram. [4] (c) Analyse why demand for a product may become more elastic over time. [6] (d) Discuss whether small firms can compete successfully against large firms. [8]
20 marks
Mark scheme: 2(a) Identify the two human factors of production. • Labour (1) entrepreneur/enterprise (1). 2 2(b) Explain two economic concepts shown by a production possibility curve diagram. 1 mark each for each of two concepts identified: • opportunity cost • scarcity/economic problem/unlimited wants and limited resources • choice • efficiency/full employment • specialisation • economic growth/the difference between actual and potential economic growth 1 mark each for each of two explanations given: • The curve shows that if more of one type of product is produced, less of another product can be made • The curve shows that there is a limit to the amount that can be produced with existing resources/maximum output of two products • The curve shows that more than one production point cannot be selected • Any point on the curve is efficient/any point inside the curve is inefficient • The curve shows the maximum amount of a product that can be produced if all resources are devoted to one good • Economic growth is shown by a shift to the right of the curve/actual growth is shown by a movement towards the curve and potential growth by a shift to the right 4 Maximum of 2 marks for a list- like approach. Only reward the use of a diagram if the concepts are clearly shown and linked to an explanation. Accept limited resources as an alternative to scarcity. Question Answer Marks Guidance 2(c) Analyse why demand for a product may become more elastic over time. • More substitutes may be available for the product (1) due to more firms/more competition/more innovation/improved versions (1) which means people are more willing to switch to and from the product (1) • The product may be seen to be more of a luxury (1) and less of a necessity (1) • Demand becomes more price sensitive the higher the price (1) as the product becomes less affordable (1) • The product may become less habit forming (1) addictive products have price inelastic demand (1) • It may become easier to postpone purchasing the product (1) so a rise in price may result in more consumers delaying its purchase (1) • The product may take up a higher proportion of income (1) change in price would become more significant (1) • Demand will become more price sensitive as the price of complements rises (1) as the two products combined become less affordable (1) 6 Maximum of 3 marks for a static approach e.g. demand is elastic when there are substitutes. Question Answer Marks Guidance 2(d) Discuss whether small firms can compete successfully against large firms. Up to 5 marks for why they might: • May provide a personal service (1) operate in a niche market (1) may be more in touch with consumers (1) may be more adaptable/flexible in response to changes in consumer demand (1) • May be subsidised by the government (1) which would reduce costs of production (1) allowing small firms to charge lower prices (1) • May be operating in an industry where economies of scale are not significant (1) or there are diseconomies of scale (1) raising average cost (1) example (max 2) • May be able to take advantage of external economies of scale (1) reducing average cost (1) example (max 2) Up to 5 marks for why they might not: • Large firms may benefit from economies of scale (1) enjoy lower average costs (1) example (max 2) • Large firms may take over small firms (1) may drive small firms out of business by charging lower prices (1) • Large firms may have more market power (1) use barriers to entry (1) drive firms out of the industry by e.g. using predatory pricing (1) • Large firms may be better known (1) have brand loyalty (1) • Large firms may have more finance (1) which may enable them to purchase more efficient capital/machinery/technology (1) spend more on advertising (1) 8 A response may develop a mixture of relevant points to achieve up to 5 marks on either side. Do not credit references to just ‘costs’ in relation to EoS/DoS. 1 mark may be awarded for small firms and large firms are able to charge lower prices, if explained separately. Maximum of 2 marks on each side of the discussion for a list- like approach.
This question in 0455/22 May/June 2017
Q4 · Cigarette smoking in China China has recently experienced rapid economic growth and an… 0455/21 Oct/Nov 2017
1 Cigarette smoking in China China has recently experienced rapid economic growth and an improving Human Development Index (HDI) ranking. It is, however, facing a number of health challenges. It is currently the world’s largest cigarette market, with more than 350 million smokers. A higher proportion of men smoke in China than in most other countries, including Russia and the USA. While 50% of Chinese men smoke, only 2% of Chinese women smoke. It has been estimated that nearly 2 million Chinese citizens a year die from smoking-related illnesses. These include smokers and those who have suffered from passive smoking. As well as being the largest consumer of cigarettes, China is also the world’s largest producer of cigarettes. Tobacco is grown in a number of the provinces of China, including the province of Yunnan. Over 3 million workers are employed in the industry, which is increasingly using advanced technological capital equipment. However, between 2009 and 2014 the number of cigarette- producing firms declined from 200 to 40 as firms merged and grew in size. Although revenue from taxes on cigarettes earned the Chinese Government 800 billion yuan in 2014 (5% of the government’s total tax revenue), it recently introduced a number of measures to discourage smoking. It has imposed a ban on smoking in public places, hospitals, schools and public transport. Health campaigns are also being used. Such campaigns are used throughout the world both to discourage the consumption of some products that are thought to be harmful to health and to encourage the consumption of products that are considered to be beneficial to health. For example, an information campaign on the benefits of consuming fruit has met with some success in the UK. Fig. 1 shows the impact it had on the market for fruit in the UK in 2015. price S of fruit P2 P1 D2 D1 O Q1 Q2 quantity of fruit Fig. 1 The market for fruit in the UK in 2015 (a) Identify, from the extract, two factors of production used in producing cigarettes. [2] (b) Explain two reasons why firms merge. [4] (c) Calculate, using information from the extract: (i) the percentage decrease in the number of cigarette firms in China from 2009 to 2014 [2] (ii) the total tax revenue that the Chinese Government received in 2014. [2] (d) Analyse, using a production possibility curve diagram, the effect of moving factors of production from producing cigarettes to producing other products. [5] (e) Discuss whether people in countries with a high HDI always enjoy a high standard of living. [5] (f) Explain, using information from the extract and Fig. 1, what happened to the market for fruit in the UK in 2015. [4] (g) Discuss the arguments for and against the Chinese Government increasing the tax on cigarettes. [6]
30 marks
Mark scheme: Question Answer Mark 1(a) Identify, from the extract, two factors of production employed in 2 producing cigarettes. Workers/labour (1) capital (1). 1(b) Explain two reasons why firms merge. 4 1 mark each for each of two reasons identified: • to take advantage of economies of scale / reduce costs of production • to gain greater market share / market power / reduce competition • to gain access to market outlets • to gain access to raw materials / resources / better methods of production • to diversify • to prevent one firm going out of business • to increase profit • to grow / expand / become larger 1 mark each for each of two explanations: • a merged firm will be larger and due to economies of scale, average costs may be lower, example • a merged firm eliminates a competitor • a vertical merger forwards gives the firm control of the sale of its product • a vertical merger backwards may ensure an adequate supply of a raw material • a conglomerate merger will increase the range of products produced • a combined, larger firm will be able to survive • the combined profit of two merged firms might be greater than the profit of two individual firms • one of the key business goals is growth 1(c)(i) Calculate, using information from the extract, the percentage decrease 2 in the number of cigarette firms in China from 2009 to 2014 80% (2). Correct working e.g. 160/200 × 100 (1). 1(c)(ii) Calculate, using information from the extract, the total tax revenue that 2 the Chinese government received in 2014. 16 000 billion yuan (2). 16 000 billion OR yuan (1). Correct working i.e. 800 billion × 100/5 (1). Note: 16 000 billion = 16 000 000 000 000 or 1.6 × 10¹³ 1(d) Analyse, using a production possibility curve diagram, the effect of 5 moving factors of production from producing cigarettes to producing other products. Up to 3 marks for the diagram: Axes correctly labelled (1). Curve / downward-sloping straight line drawn to the axes (1). Movement along curve from cigarettes to other products (1) shown by an arrow on the curve or by change in combinations. cigarettes A1 A2 O B1 B2 other products Up to 2 marks for explanation: Opportunity cost of producing more other products / devoting more resources to other products (1) means producing fewer cigarettes (1). 1(e) Discuss whether people in countries with a high HDI always enjoy a 5 high standard of living. Up to 3 marks for why they might: Indicates high income per head / high purchasing power / high ability to buy goods (1) high life expectancy / low death rate / good healthcare (1) good education / high literacy (1). 1 mark for a general idea of what the HDI includes. Up to 3 marks for why they might not: May be uneven distribution of income / GDP figure is an average (1) so that not everyone enjoys a high standard of living / there may still be many poor people (1) unemployment may still be high (1) healthcare may still be poor for some (1) literacy levels may be high but there may be no suitable jobs (1). There are other influences on living standards (1) working hours may be long (1) working conditions may be poor (1) there may be high levels of pollution (1). 1(f) Explain, using information from the extract and Fig. 1, what happened 4 to the market for fruit in the UK in 2015. The diagram shows demand increasing (1) price rising (1) revenue increasing (1) supply extending / quantity of fruit consumed increasing (1). This is due to the information campaign / people being better informed about the benefits of fruit (1). Inelastic demand (1) inelastic supply (1). 1(g) Discuss the arguments for and against the Chinese Government 6 increasing the tax on cigarettes. Up to 4 marks for why it should: Demand for cigarettes is price-inelastic (1) so may increase tax revenues (1) which government could spend on public services, e.g. health and education (1). Smoking is harmful (demerit good) (1) tax will raise the price (1) may discourage cigarette smoking / reduce consumption (1) improve smokers’ health (1) prevent early deaths from smoking related diseases (1) reduce external costs (1) e.g. air pollution, passive smoking (1) reduces health costs (1) increases productivity of workers (1). Up to 4 marks for why it should not: May not be very effective in reducing consumption (1) smoking is addictive / demand is price-inelastic (1) and tax will therefore not reduce smoking significantly (1). May reduce output of cigarettes in the country / tobacco firms may close (1) may increase unemployment (1). May lead to an illegal market in cigarettes / cheap alternatives (1) people not paying the tax (1).
This question in 0455/21 Oct/Nov 2017
Q5 · Rich people in some countries are now working for more hours on average than poor people 0455/22 Oct/Nov 2017
3 Rich people in some countries are now working for more hours on average than poor people. One reason for this is thought to be that well-paid jobs provide more job satisfaction. Gaining enjoyment from work can lead to high labour productivity. (a) What is a possible opportunity cost of working? [2] (b) Explain two reasons why older workers tend to earn more than younger workers. [4] (c) Analyse, using a production possibility curve diagram, how an increase in labour productivity will affect an economy. [6] (d) Discuss whether the rich in one country will save more than the rich in another country. [8]
20 marks
Mark scheme: 3(a) What is a possible opportunity cost of working? Opportunity cost is the (next) best alternative forgone (1). Opportunity cost is leisure / education / retirement / raising a family (1). 2 3(b) Explain two reasons why older workers tend to earn more than young workers. 1 mark each for each of two reasons identified: An older worker (or vice versa): • may have gained more qualifications • may have received more training • may have gained experience • may have been promoted • length of service. 1 mark each for each of two explanations given: • a more qualified worker can apply for a better paid job • a better trained worker will have more choice of occupation • more experience is likely to increase productivity/skills • over time a worker may become better at doing the job • in some jobs there are regular increases in pay. 4 Some candidates may answer from the perspective of younger workers earning less than older workers. Question Answer Marks Guidance 3(c) Analyse, using a production possibility curve diagram, how an increase in labour productivity will affect an economy. Up to 4 marks for the diagram: Axes correctly labelled (1). Original production possibility curve / straight downward sloping line drawn to the axes (1). New PPC (1). Indication of shift to the right – arrow or labelling (1). Up to 2 marks for written explanation: An increase in labour productivity increases the quality of labour (1) increases output per worker hour / efficiency (1) increases productive potential / cause economic growth (1). 6 O e.g. capital goods e.g. consumer goods B B A A Question Answer Marks Guidance 3(d) Discuss whether the rich in one country will save more than the rich in another country. Up to 5 marks for why they might: The rich in one country may save more if they have more income than the rich in another country (1) people tend to save more as income rises (1) greater ability to save (1). The interest rate may be higher in the country (1) greater financial return from saving / save more / spend less (1). There may be more tax incentives in the country to encourage saving (1) i.e. interest rates earned not taxed or taxed at a lower rate (1). There may be a greater fear of a recession (1) rich expecting their income to be lower in the future / risk of losing their jobs (1). Up to 5 marks for why they might not: The rich in the country may be more optimistic about the future / may have greater job security (1) which will encourage them to spend a higher proportion of their income (1). There may be more of a culture of saving in another country (1). There may be more / greater range of financial institutions in another country (1) encouraging more saving there (1). The total number of the rich may be higher in another country (1) so even if, on average, the rich save more in the country, total saving may be higher in another country (1). There may be higher inflation / greater expectation of higher inflation in the future (1) encouraging higher spending now (1). 8
This question in 0455/22 Oct/Nov 2017
Q6 · Changes in the global balance of economic power In 2014, global Gross Domestic Product… 0455/23 Oct/Nov 2017
1 Changes in the global balance of economic power In 2014, global Gross Domestic Product (GDP) stood at US$78 000 billion. A year later it had increased to US$80 730 billion. In the past, countries such as the USA and Germany might have been expected to have made the largest contribution to the increase in GDP. China accounted for 20% of the increase in world output in 2015. China is set to become the largest economy. It is becoming a stronger competitor in a number of markets. This increased price competitiveness is the result of a number of factors including maintaining a low exchange rate, providing subsidies to a number of industries and increased labour productivity. However, in 2015 the Chinese Government was considering whether to reduce the size of the country’s steel industry, possibly by cutting the subsidy it received. Fig. 1 shows how the market for steel might be affected by such a change. price of steel S2 S1 P2 P1 D1 O Q2 Q1 quantity of steel Fig. 1 The market for steel in China in 2015 Some developed countries have been struggling recently. For example, Australia has seen its economic growth rate declining. To try to increase domestic economic activity the Reserve Bank of Australia has cut interest rates. Developing and emerging economies’ economic growth rates are increasing. In Africa, this is in part because of the discovery and exploitation of oil and mineral resources. These countries have different exchange rate systems and have different records of success in attracting multinational companies. Many African countries use protectionist measures but some are moving towards free trade. In most developing and emerging economies the birth rate is falling. The impact of this change is influenced by the relative size of the fall. For instance, Nauru is one of the smallest countries in the world having a population of only 10 000. Its birth rate fell from 26 to 25 in 2015. (a) Identify, from the extract, two monetary policy measures. [2] (b) Explain two causes of a fall in the birth rate. [4] (c) Calculate, using information from the extract: (i) the value in US$ of China’s contribution to global GDP growth in 2015 [2] (ii) the number of children born in Nauru in 2015. [2] (d) Analyse, using a production possibility curve diagram, how the discovery of new oil reserves would affect an economy. [5] (e) Discuss whether a firm would benefit from a fall in its country’s exchange rate. [5] (f) Explain, using information from the extract and Fig. 1, what might have happened to the market for steel in China in 2015. [4] (g) Discuss whether engaging in free trade increases living standards in a country. [6]
30 marks
Mark scheme: 1(a) Identify from the extract, two monetary policy measures. interest rates (1) exchange rates (1) 2 expansionary monetary policy 1(b) Explain two causes of a fall in the birth rate. 1 mark each for each of two causes identified: • rise in incomes / standard of living • Increase in education • more women working • improved family planning • women marrying later • improved social provision / more affordable healthcare • higher cost of raising children / cut in government child benefits • fall in infant mortality rates • government discourages births. 1 mark each for each of two explanations: • richer people tend to have fewer children – tend to spend more on their education, do not rely on children to support them • increased education raises people’s expectations of living standards for themselves and for their children • more educated women tend to marry later • more knowledge and availability of ways to limit families will reduce the number of unwanted births • more children surviving to adulthood so fewer births • working women tend to limit their families to avoid too many career breaks • provision of state pensions and healthcare reduces parents, need to have children to look after them • reduces incentives to have children. 4 Question Answer Marks Guidance 1(c)(i) Calculate, using information from the extract: the value in US$ of China’s contribution to global GDP growth in 2015 $546 billion (2) Correct method, i.e. 20% of US$2.730 billion or $546/546 billion (1) 2 1(c)(ii) Calculate, using information from the extract: the number of children born in Nauru in 2015. 250 (2) Correct method, i.e. 25 × 10 (1) 2500 (1) 2 1(d) Analyse, using a production possibility curve diagram, how the discovery of new oil reserves would affect an economy. Up to 4 marks for the diagram: • 1 mark for axes correctly labelled • 1 mark for original curve/straight downward sloping line drawn to the axes. • 1 mark for new production possibility curve • 1 mark for indicating curve will shift to the right – either by arrows or labels. Up to 1 mark for explanation: A discovery of new oil reserves will increase productive potential / capacity / be able to produce more / results in economic growth (1) 5 Accept any reasonable label of axis. If labelled with oil / petrol accept parallel PPCs. Do not reward output / production increases O e.g. capital goods e.g. consumer goods B B A A O other products oil / petrol B1 A B Question Answer Marks Guidance 1(e) Discuss whether a firm would benefit from a fall in its country’s exchange rate. Up to 3 marks for why it might: Lower prices of exports (1) increase demand for its products (1) raise sales / revenue (1) increase profits (1). Increase size of market (1) enabling it to take greater advantage of economies of scale (1) lower average costs of production (1). Domestic producers can produce goods cheaper than overseas goods (1) resulting in higher home sales (1). Up to 3 marks for why it might not: Increase price of imports (1) raise a firm’s costs of production (1) lower profits (1). If demand for exports is price-inelastic (1) a fall in price of exports will cause a fall in revenue (1). A fall in the exchange rate (1) may create uncertainty making it difficult for a firm to plan (1) Maybe recession in other countries (1) will not result in increased sales (1). Quality of goods may be poor compared with other competitors (1) sales do not rise (1). 5 To achieve full marks, benefits to a firm must be discussed. 1(f) Explain, using information from the extract and Fig. 1, what might have happened to the market for steel in China in 2015. The diagram shows: supply decreasing (1). price rising (1). demand contracting / less steel / fall in quantity (1). if the subsidy to steel industry was cut (1). demand and supply are inelastic (1). 4 Question Answer Marks Guidance 1(g) Discuss whether engaging in free trade increases living standards in a country. Up to 4 marks for why it might: Free trade may increase competition / removal of tariffs and quotas (1) encourages multinational corporations (MNCs) to set up in country (1) specialise (1) drives down prices (1) promotes efficiency (1) encourages innovation (1) increases quality (1) increase the range of products available (1) reduce unemployment (1) raise income/GDP (1). May increase the size of firms’ markets (1) allowing them to take advantage of economies of scale (1). Up to 4 marks for why it might not: Free trade may cause some industries to go out of business (1) increasing unemployment (1) reducing incomes / GDP falls (1) may cause higher pollution (1). Unsafe products/low quality products may be imported (1). Dumping may occur (1) driving out domestic producers (1) which can raise prices (1) lower quality in the long run (1). 6
This question in 0455/23 Oct/Nov 2017
Q7 · The production process in the oil industry is capital-intensive 0455/23 May/June 2018
6 The production process in the oil industry is capital-intensive. The pollution it generates means it is one cause of environmental market failure. A Nigerian oil monopoly is starting to produce more environmentally friendly liquefied petroleum gas (LPG), rather than kerosene, in an attempt to reduce pollution. The Nigerian government intends to split the monopoly firm into separate companies to improve efficiency. (a) Identify two features of a capital-intensive production process. [2] (b) Explain how market failure might occur in the oil industry. [4] (c) Analyse, using a production possibility curve (PPC) diagram, the effect of reallocating resources from kerosene to LPG. [6] (d) Discuss whether or not removing a firm’s monopoly power will benefit consumers. [8]
20 marks
Mark scheme: 6(a) Identify two features of a capital-intensive production process. Process which relies heavily on capital goods e.g. machines (1) does not use much labour (1) relies less on other factors of production e.g. land (1). 2 6(b) Explain how market failure might occur in the oil industry. Market failure is when there is an inefficient allocation of resources (1). There is over-consumption / over-production of oil (1) because the external costs (1) are ignored by the market mechanism (1), such as pollution / global warming / harm to the environment (1). There are cases of monopoly power (1) restricting output (1) pushing up price (1). 4 Question Answer Mark Guidance 6(c) Analyse, using a production possibility curve (PPC) diagram, the effect of reallocating resources from kerosene to LPG. Award up to 4 marks for a correct diagram: • Axes labels LPG and kerosene (1) • Curve / downward sloping line drawn to axes (1) • Two production points illustrating increased production of LPG (1) • New production point indicated (1) Award up to 2 marks for associated explanation: Reallocating resources will involve a movement along the PPC (1) this will involve an opportunity cost (1). 6 Accept points on the curve with arrow from A to B. kerosene LPG K1 L1 L2 K2 A B Question Answer Mark Guidance 6(d) Discuss whether or not removing a firm’s monopoly power will benefit consumers. Up to 5 marks for why it might: More choice for consumers (1) improved competition (1) will causes prices to fall (1) which will increase consumers’ real disposable income (1). The monopoly may be experiencing diseconomies of scale (1) with high (average) costs of production (1) Quality is likely to improve (1) as firms will innovate in order to win customers (1). Competition will force firms to be more efficient in order to survive (1). They will look to reduce costs in order to remain competitive (1) and will invest in research and development to maintain market share (1). Up to 5 marks for why it might not: A monopoly firm can take advantage of economies of scale (1) reducing (average) costs of production (1) example (1) the removal of monopoly power may increase prices for consumers, reducing their welfare (1) Consumers may rely upon the reputation of a monopoly (1) for quality / customer service (1) too much choice can lead to confusion / inconvenience for consumers (1). The firm may be state owned (1) may take into account the full social costs and benefits (1) may have charged low prices (1) to make products affordable (1). 8
This question in 0455/23 May/June 2018
Q8 · In 2016, the Indonesian government increased its spending on healthcare and education and… 0455/22 Oct/Nov 2018
3 In 2016, the Indonesian government increased its spending on healthcare and education and considered raising the school leaving age. The government also planned to increase taxation. Such a move might conflict with its aim of reducing unemployment at a time when a number of countries were at risk of entering a recession. (a) Identify two types of tax. [2] (b) Explain two benefits to a government from a fall in unemployment. [4] (c) Analyse, using a production possibility curve (PPC) diagram, the effects of high unemployment in a country. [6] (d) Discuss whether or not a government should raise the school leaving age. [8]
20 marks
Mark scheme: 3(a) Identify two types of tax. Any 2 from: Direct (1) indirect (1) progressive (1) regressive (1) proportional (1) VAT/GST (1) excise duty (1) income tax (1) corporation tax (1) inheritance tax (1) lump sum tax (1) specific tax (1) ad valorem tax (1). 2 3(b) Explain two benefits to a government from a fall in unemployment. Rise in tax revenue (direct/indirect) (1) people earning more / people spending more / output higher (1). Fall in expenditure on unemployment benefit (1) enabling government to spend on other areas e.g. healthcare/education (1) May help the government achieve its macroeconomic objectives (1) e.g. raise GDP / achieve full employment (1) 4 3(c) Analyse, using a production possibility curve (PPC) diagram, the effects of high unemployment in a country. Diagram up to 3 marks: • axes labelled Capital Goods & Consumer Goods (also accept any other combination as long as it is clear that it is two separate products, and not Price and Quantity) • a curve bowed outwards or a downward sloping straight line drawn to the axes • point inside the curve identified as point of unemployment e.g. X Written analysis up to 3 marks: • high unemployment means that the available resources are not fully (1) and efficiently used (1) • the economy will not be able to produce at its maximum level (1) i.e. on the PPC (1) output of the economy is smaller than the maximum (1) lower than potential living standards (1) • May be negative or lower economic growth / recession (1) 6 Question Answer Marks Guidance 3(d) Discuss whether or not a government should raise the school leaving age. Up to 5 marks for why it should: More time in education may increase workers’ skills (1) raise qualifications (1) reduce unemployment (1) raise productivity (1) increase output / increase economic growth (1) raise wages / increase living standards / increase HDI / reduce poverty (1) lower costs of production / improved quality of products (1) increase net exports / raise exports / lower imports (1) improve the current account position (1). May improve life expectancy / health (1) by making people better informed (1). May attract more MNCs to set up in the country (1) reduce their training costs / raise the quality of their output (1). Up to 5 marks for why it should not: May increase government spending (1) it will involve the use of extra resources (1) there will be an opportunity cost involved (1) example (1). In the short run the labour force will be reduced (1) lower potential output (1). A greater quantity of education does not necessarily mean a rise in quality of education (1). Some of those who receive the extra years, of schooling may not take full advantage of these (1) which may disrupt the learning of others (1). The dependency ratio may rise (1) tax rates may have to be increased (1). Families may not be able to afford the extra years schooling (1). 8 Each point may be credited only once, on either side of an argument, but separate development as to how/why the outcome may differ is expected.
This question in 0455/22 Oct/Nov 2018
Q9 · Premium Friday At the start of February 2017, the Japanese government introduced its… 0455/22 May/June 2019
1 Premium Friday At the start of February 2017, the Japanese government introduced its ‘Premium Friday’ scheme. This encourages employers to allow their workers to leave work at 15:00 on the last Friday of each month, without experiencing any reduction in their wages. The Japanese government wants to reduce the number of hours people work. One reason is to improve the health, and so possibly the productivity, of workers. Fig. 1.1 shows the average number of hours worked and productivity (GDP per hour worked in US $) in six selected countries. 80 70 60 50 40 30 20 10 0 France Germany Japan Mexico Russia South Korea Average hours worked per week Productivity (GDP per hour worked (US $)) Fig. 1.1 Average hours worked and productivity of selected countries in 2017 Nearly one quarter of Japanese workers work more than 50 hours a week and some work more than 25 hours overtime a week. The average Japanese worker only takes half of their paid holidays. Nearly 20 years of low economic growth and deflation have created a sense of job insecurity. Trade unions in Japan have been concentrating on trying to achieve shorter working hours. The government thinks that working fewer hours would give people more time to bring up a child and look after elderly relatives. Japan’s birth rate has fallen every year for the last 36 years, and at a faster rate than the fall in the death rate leading to a fall in the size of the population. The government hopes more leisure time will encourage an increase in consumer spending. Higher consumer spending would benefit Japanese firms and would reduce the chances of deflation returning. The initial response to Premium Friday was not promising. At the end of February 2017, only 4% of Japanese workers left early. In the longer run, however, the scheme may be more successful. This is because unemployment in the country had fallen with only 2 million out of a labour force of 66 million being unemployed at the end of February 2017. Low unemployment increases job security and usually increases wages. In Japan’s case, however, the higher demand for labour has been matched by a higher supply. Some of this higher supply has come from migrant workers, but a greater proportion has come from more Japanese people working past retirement age and more women working. (a) Identify, using information from the extract, two factors that influence an individual’s choice of occupation. [2] (b) Explain, using information from the extract, an opportunity cost of working. [2] (c) Calculate, using information from the extract, the number of Japanese workers who left work early on Premium Friday in February 2017. [2] (d) Explain, using information from the extract, why the size of Japan’s population has fallen in recent years. [4] (e) Analyse, using Fig. 1.1, the relationship between the average hours worked and productivity. [5] (f) Discuss whether or not a cut in income tax would stop deflation. [5] (g) Explain, using information from the extract, why wage rises have been low in Japan. [4] (h) Discuss whether or not Japan will benefit from employing more migrant workers. [6]
30 marks
Mark scheme: 1(a) Identify, using information from the extract, two factors that influence an individual’s choice of occupation. • working hours / leisure time • holidays • job security / job insecurity • wages 2 1(b) Explain, using information from the extract, an opportunity cost of working. Leisure time / holidays / time devoted to raising children / looking after the elderly (1) opportunity cost is the (next) best alternative forgone (1). 2 1(c) Calculate, using information from the extract, the number of Japanese workers who left work early on Premium Friday in February 2017. 2.56m / 2 560 000 (2). Correct working: 4% of 64m (66m – 2m) or 2,560 or version of 2.56 (1). 2 1(d) Explain, using information from the extract, why the size of Japan’s population has fallen in recent years. The birth rate has fallen (1) more than the fall in the death rate (1). A fall in the birth rate means fewer children are being born (1) a reason e.g. more women working / people working longer hours / job insecurity / looking after elderly relatives (1). A fall in the death rate means people are living longer (1). If the birth rate falls by more than the death rate there may be a natural decrease in population (1) actual decrease if natural decrease is more than net immigration (1) extra number of older people is more than offset by fewer babies (1). 4 Question Answer Marks Guidance 1(e) Analyse, using Fig.1, the relationship between the average hours worked and productivity. Generally, the shorter the hours worked the higher the productivity (1) inverse relationship / negative relationship (1). The expected relationship (1) workers will not be tired and so will be able to produce more per hour / more leisure time may increase efficiency / may be more motivated (1). Two countries, France and Germany, have the shortest working hours and the highest productivity (1). Country with the longest working hours, Mexico, has the lowest productivity (1). South Korea is an exception (1), long working hours but higher productivity than Mexico / Russia which have shorter working hours (1), 5 Expected relationship may be explained in reverse e.g. long hours may make workers tired. Question Answer Marks Guidance 1(f) Discuss whether or not a cut in income tax would stop deflation. Up to 3 marks for why it might: A cut in income tax will increase disposable income / purchasing power (1) this may increase spending (1) higher spending may encourage more investment (1) higher total (aggregate) demand (1) may encourage firms to raise prices/demand-pull inflation (1). Higher demand may encourage firms to expand (1) they may take on extra workers (1) reduce unemployment (1) they may pay higher wages (1) increasing costs of production (1) causing cost-push inflation (1). Up to 3 marks for why it might not: Consumers may lack confidence (1) and so not spend any more / may save (1) may still delay purchases (1) they may spend on imports rather than domestic products (1). Firms may lack confidence (1) and so not invest (1). Any extra investment which takes place may reduce costs of production (1) and so prices may fall further (1). Firms may have spare capacity (1) and so may be able to increase output without increasing average costs of production (1) and so prices may not rise (1). Government tax revenue may fall (1) reducing government spending which may mean that total demand does not rise (1). Apply this example to all questions with the command word DISCUSS (1(f), 1(h), 2(d), 3(d), 4(d), 5(d), 6(d) and 7(d)) Each point may be credited only once, on either side of an argument, but separate development as to how/why the outcome may differ is to be rewarded. Generic example mark Tax revenue may decrease« 1 ...because of reason e.g. incomes may be lower. 1 Tax revenue may increase because incomes may be higher i.e. reverse of 1st argument 0 Tax revenue may increase« because of a different reason that is not the reverse of a previous argument e.g. «government spending on subsidies may stimulate the economy more than spending on education. 1 Demand-pull inflation and/or cost-push inflation may be shown on a diagram. Question Answer Marks Guidance 1(g) Explain, using information from the extract, why wage rises have been low in Japan. Trade unions have been concentrating on trying to achieve shorter working hours (1) this may suggest they have not been pressing for wage rises (1). Higher demand for labour has been matched by higher supply (1) the higher supply has come from immigration (1) and a higher proportion of women in the labour force / people working past retirement age (1) making it easier for firms to recruit workers without raising wages (1). Long experience of deflation / low economic growth (1) may have resulted in lower consumer spending / low profits / real wages may have increased (1). Job insecurity (1) less willing to press for wage rises (1). 4 Question Answer Marks Guidance 1(h) Discuss whether or not Japan will benefit from employing more migrant workers. Up to 4 marks for why it might: They may increase the size of the labour force (1) increase productive capacity / potential output / economic growth (1). They may increase total (aggregate) demand (1) and so generate more jobs (1). Japan’s population is falling (1) without a rise in the supply of labour, there may be a shortage of workers (1) this may cause cost-push inflation (1). Migrant workers may have higher skills (1) new ideas / up to date with technology (1) this could raise productivity (1) may work for lower wages (1) lower costs of production (1) make the country’s products more internationally competitive / lower prices (1). Tax revenue may increase (1) enabling the government to spend more on e.g. education (1). Up to 4 marks for why it might not: Migrant workers may keep wage rises low (1) and so restrict increases in living standards (1). In some cases, migrant workers may replace domestic workers causing some to be unemployed (1). Migrant workers may need training (1) increase firms costs (1). Migrant workers may bring their families with them (1) this may increase pressure on e.g. housing, school and healthcare (1) may lead to overpopulation (1). Migrant workers may send money home (1) harming the current account position (1). 6
This question in 0455/22 May/June 2019
Q10 · In March 2017, Peru was hit by floods and the strongest winds in decades 0455/22 May/June 2019
4 In March 2017, Peru was hit by floods and the strongest winds in decades. Roads, bridges, houses and capital goods were destroyed. It is expected that the damage caused will affect Peru’s Human Development Index (HDI) and economic growth rate. In 2016, Peru experienced a 4% economic growth rate which was higher than the growth rate of the USA. (a) Define a capital good. [2] (b) Explain two causes of an increase in a country’s HDI. [4] (c) Analyse, using a production possibility curve (PPC) diagram, the effect of damaging weather on an economy. [6] (d) Discuss whether countries with a high Gross Domestic Product (GDP) per head will have a faster rate of economic growth than countries with a low GDP per head. [8]
20 marks
Mark scheme: 4(a) Define a capital good. A human-made good (1) used to produce other goods and services (1). 2 4(b) Explain two causes of an increase in a country’s HDI. • an increase in GDP / GNI / income per head (1) raises the goods and services people can consume / due to e.g. higher employment (1) • an increase in life expectancy (1) indicates better healthcare / due to better healthcare / more investment in healthcare (1) • an increase in education / mean and expected years of schooling (1) increases job opportunities / quality of life / due to government investing more in education (1) 4 4(c) Analyse, using a production possibility curve (PPC) diagram, the effect of damaging weather on an economy. Up to 4 marks for the diagram: • axes correctly labelled in terms of two different products or types of products (1) • initial curve or downward sloping line is drawn to the axes (1) • second curve or downward sloping line is drawn to the axes (1) • An indication either by labelling or an arrow that the curve has shifted inwards / left (1) Up to 2 marks for written analysis: Bad weather will reduce the quantity of resources (1). The amount that can be produced with fewer resources will fall (1). 6 O capital goods consumer goods Question Answer Marks Guidance 4(d) Discuss whether countries with a high Gross Domestic Product (GDP) per head will have a faster rate of economic growth than countries with a low GDP per head. Up to 5 marks for why they might: They are likely to have good education (1) good healthcare (1) this will mean skills will be high (1) productivity will be high (1) there may be advances in technology (1) reducing costs of production (1) exports may increase (1). Unemployment may be low (1) with most resources being used (1). MNCs may be attracted to set up in the country (1) contributing to the country’s output (1). Foreign banks may be more willing to lend to the countries’ firms (1) allowing them to expand (1). High incomes are likely to mean high demand / high consumer spending (1) encouraging firms to produce more (1). Up to 5 marks for why they might not: Countries with a low GDP per head may discover raw materials (1) which may be in high world demand (1). People in poorer countries may have more drive to improve their living standards (1) they may work harder (1). Richer countries may have a lower rate of population growth or declining populations (1) this may mean their labour forces are growing more slowly (1) restricting their ability to produce more goods and services (1). Other factors may influence economic growth (1) e.g. type of government policies pursued / deficit on the current account of the balance of payments (1). 8
This question in 0455/22 May/June 2019
Q11 · Estonia has one of the fastest internet speeds in the world 0455/21 Oct/Nov 2019
3 Estonia has one of the fastest internet speeds in the world. The government allows both direct and indirect taxes to be paid online. According to the World Bank, it is very easy for a firm to deal with construction permits and to register property in Estonia. A low level of government regulation affects how easy it is to start and to run a firm. Many new firms are labour-intensive but some become more capital-intensive as they grow. (a) Identify one example of a direct tax and one example of an indirect tax. [2] (b) Explain two reasons why a firm may become more capital-intensive as it grows. [4] (c) Analyse, using a production possibility curve (PPC) diagram, the possible effects of faster internet speeds for economic growth. [6] (d) Discuss whether or not an economy would benefit from less government regulation. [8]
20 marks
Mark scheme: 3(a) Identify one example of a direct tax and one example of an indirect tax. Income Tax / Corporation Tax / National Insurance / Profit Tax (1). Value Added Tax (VAT) / Goods and Services Tax (GST) / Sales Tax / tax on product e.g. bar of chocolate (1). 2 3(b) Explain two reasons why a firm may become more capital intensive as it grows. • to increase output (1) capital more efficient/productive (1) • to reduce costs (1) labour costs becoming relatively higher than machines (1) increasing profits (1) • may be able to take advantage of technical economies of scale (1) specialist capital may become viable for a large firm (1) 4 Accept making more profit may allow a firm to afford more investment in capital. 3(c) Analyse, using a production possibility curve (PPC) diagram, the possible effects of faster internet speeds for economic growth. Up to 4 marks for the diagram: • axes correctly labelled in terms of two different products or types of products (1) • the curve or downward sloping line is drawn to the axes (1) • second curve or downward sloping line is drawn to the axes (1) • an indication either by labelling or an arrow that the curve has shifted outwards / right (1) Up to 2 marks for written analysis: Faster internet speed increases productive capacity / the maximum quantity of products that can be produced within a certain time period (1) better communication infrastructure (1) e.g. labour can work faster, capital is better (1) lower costs of production (1) encourage more investments therefore increase financial capital (1) increased productive capacity results in (potential) economic growth / cause economic growth (1). 6 Do not reward analysis marks for description of diagram e.g. PPC shifts to the right. Question Answer Marks Guidance 3(d) Discuss whether or not an economy would benefit from less government regulation. Up to 5 marks why it might: More freedom (1) less red tape / bureaucracy (1) easier to set up new firms (1) more competition (1) decrease cost of production (1) decrease price (1) including exports (1) increase quantity demanded (1) increase total revenue (1) increase profits (1) more investments (1) increase demand for labour (1) less unemployment (1) decrease current account deficit (1) increase aggregate demand (1) increase economic growth (1). More control over prices (1) resulting from removal of e.g. a maximum price (1). Up to 5 marks why it might not: Less labour regulations would reduce job security (1) more exploitation of workers (1) e.g lower wages / longer working hours (1) more inequality (1). Less environmental regulations would increase pollution (1) e.g. air pollution / water pollution (1) health standards of society reduces (1) Less antitrust/anticompetitive regulations will create monopolies (1) small firms can’t compete (1) higher prices (1). Less protection of domestic firms from e.g. embargo (1) domestic firms may go out of business (1). Discourage consumption of harmful products (1) e.g. smoking ban (1). External costs may be ignored (1) e.g. air pollution, noise (1). It may mean that there is less consumption of beneficial (merit) goods (1) e.g compulsory state education (1) 8
This question in 0455/21 Oct/Nov 2019
Q12 · The main industries in the Seychelles, an island country in the Indian ocean, are tourism… 0455/22 Feb/March 2020
2 The main industries in the Seychelles, an island country in the Indian ocean, are tourism and fishing. The price elasticity of supply of fish is affected by the relatively short time that fish can be stored. Economic goods and free goods play a role in both fishing and tourism. With rises in the skills of workers and an increase in enterprise, GDP per head has increased by more than seven times over the last fifty years. (a) State the formula for calculating the price elasticity of supply (PES). [2] (b) Explain how opportunity cost is different for economic goods and free goods. [4] (c) Analyse, using a production possibility curve (PPC) diagram, the effect of an increase in enterprise on an economy. [6] (d) Discuss whether or not skilled workers are always paid more than unskilled workers. [8]
20 marks
Mark scheme: 2(a) State the formula for calculating the price elasticity of supply (PES). % change in quantity supplied % change in price (2). OR Percentage change in quantity supplied divided by percentage change in price (2). 2(b) Explain how opportunity cost is different for economic goods and free goods. Logical explanation which might include: Economic goods have an opportunity cost (1) resources are used to produce them / resources have alternative uses / if resources are used to produce one economic good, they cannot be used to produce another good / in limited supply (1). Free goods do not have an opportunity cost (1) resources are not used to produce them / there is no restriction on their supply (1). 4 One mark for each of two differences identified and one mark for each explanation. Question Answer Marks Guidance 2(c) Analyse, using a production possibility curve (PPC) diagram, the effect of an increase in enterprise on an economy. Up to 4 marks for the diagram: Axes correctly labelled (1). Initial curve drawn as a curve / downward sloping line to the axes (1). New curve drawn as a curve / downward sloping line to the axes (1). Shift to the right indicated by arrow or lettering (1). Up to 2 marks for coherent analysis which might include: Enterprise is a factor of production / resource (1) there will be more risk takers / decision makers / firms (1) more enterprise increases productive capacity / potential / maximum output that can be produced / causes economic growth (1). 6 Question Answer Marks Guidance 2(d) Discuss whether or not skilled workers are always paid more than unskilled workers. In assessing each answer, use the table opposite. Why they might be: • skilled workers may be in shorter supply as they may require training and qualifications • skilled workers may be in inelastic supply and demand for them may be inelastic • skilled workers may be in higher demand as they will be more productive • skilled workers may have stronger bargaining power • skilled workers may be more likely to work in the tertiary sector • Skilled workers may be more mobile. Why they might not be: • skilled workers may have less experience and may be in less promoted positions • skilled workers may be in declining industries • skilled workers may place more importance on non-wage factors when deciding what jobs to do • skilled workers in poorer countries may have lower wages than some unskilled workers in richer countries. Example of a Level 3 answer: Skilled workers may be paid more than unskilled workers as they have more qualifications and/or experience, so demand may be high compared to supply. Supply could be low due to long training required to learn skills, so the labour market would be more competitive and skilled workers higher paid. Demand for the products skilled workers provide may be higher, so their pay could be higher due to higher derived demand. Also, they may belong to stronger trade unions which have more bargaining power to negotiate for higher pay. 8 Accept responses from the viewpoint of why unskilled workers may be paid more. Level Description Marks 3 A reasoned discussion which accurately examines both sides of the economic argument, making use of economic information and clear and logical analysis to evaluate economic issues and situations. One side of the argument may have more depth than the other, but overall both sides of the argument are considered and developed. There is thoughtful evaluation of economic concepts, terminology, information and/or data appropriate to the question. The discussion may also point out the possible uncertainties of alternative decisions and outcomes. 6–8 Question Answer Marks Guidance 2(d) It is also possible that unskilled workers could be higher paid. This is because their work may be dangerous, e.g. miners, so the supply of workers willing to do the job may be lower and firms have to pay more to attract workers. Long working hours (less leisure time) and poor working conditions mean unskilled workers may be higher paid, and if the work is boring and very few people are willing to do the job. For example, cleaners in the US are paid much higher wages than cleaners in India as the number of people willing to accept a job as a cleaner in the US is very low. There is even a possibility that unskilled workers could be paid higher than skilled workers. Principal Examiner comment: This is a strong L3 response. It is a two-sided answer with depth and logical links. For example, the candidate links qualifications and experience to demand for and supply of workers, as well as linking demand for workers with demand for the products they produce. The candidate discusses some of the key influences on wage determination. Level Description Marks 2 A reasoned discussion which makes use of economic information and clear analysis to evaluate economic issues and situations. The answer may lack some depth and development may be one- sided. There is relevant use of economic concepts, terminology, information and data appropriate to the question. 3–5 1 There is a simple attempt at using economic definitions and terminology. Some reference may be made to economic theory, with occasional understanding. 1–2 0 A mark of zero should be awarded for no creditable content. 0
This question in 0455/22 Feb/March 2020
Q13 · Australian firms have been praised for introducing new technology 0455/21 May/June 2020
5 Australian firms have been praised for introducing new technology. The actions of some of these firms, however, cause market failure. The Australian government uses subsidies, among other policies, to reduce market failure. Government spending is used both to improve the performance of individual markets and the macroeconomy. The Australian government increased its spending in 2017, in part to reduce unemployment. (a) State two objectives of firms. [2] (b) Explain how a subsidy can correct market failure. [4] (c) Analyse, using a production possibility curve (PPC) diagram, the effect of advances in technology on an economy. [6] (d) Discuss whether or not an increase in government spending will reduce unemployment. [8]
20 marks
Mark scheme: 5(a) State two objectives of firms. 2 One mark each for two from: survival, social welfare, profit maximisation and growth. 5(b) Explain how a subsidy can correct market failure. 4 Logical explanation which might include: A payment to increase production (1) and lower price (1) can increase consumption of merit goods (1) products with positive externalities (1) which are under-consumed if left to market forces (1) can be paid to private sector firms to produce public goods (1) would not be produced if left to market forces (1). 5(c) Analyse, using a production possibility curve (PPC) diagram, the effect 6 of advances in technology on an economy. Up to 4 marks for the diagram: Axes correctly drawn (1). Initial curve drawn as a curve or a downward sloping line to the axes (1). New curve drawn as a curve or a downward sloping line to the axes (1). Shift to the right indicated by arrow or lettering (1). Up to 2 marks for logical analysis: Advances in technology raise the quality of capital (1) increase productive capacity (1). 5(d) Discuss whether or not an increase in government spending will 8 reduce unemployment. In assessing each answer, use the table below. Level Description Marks 3 A reasoned discussion which accurately examines both 6–8 sides of the economic argument, making use of economic information and clear and logical analysis to evaluate economic issues and situations. One side of the argument may have more depth than the other but, overall, both sides of the argument are considered and developed. There is thoughtful evaluation of economic concepts, terminology, information and/or data appropriate to the question. The discussion may also point out the possible uncertainties of alternative decisions and outcomes. 2 A reasoned discussion which makes use of economic 3–5 information and clear analysis to evaluate economic issues and situations. The answer may lack some depth and development may be one-sided. There is relevant use of economic concepts, terminology, information and data appropriate to the question. 1 There is a simple attempt at using economic definitions 1–2 and terminology. Some reference may be made to economic theory, with occasional understanding. 0 A mark of zero should be awarded for no creditable 0 content. Why it might: • may raise total (aggregate) demand, encouraging firms to hire more workers • may be spent on education which may increase people’s skills • may be spent on healthcare which may make people fitter and more employable • may be spent on subsidies to firms which will encourage them to increase output and take on more workers. Why it might not: • if spent on unemployment benefits, it may encourage some people to leave their jobs • if there is full employment, it will just cause inflation • spending on education may be ineffective e.g. develop the wrong skills • higher total (aggregate) demand may encourage firms to use more capital goods rather than labour.
This question in 0455/21 May/June 2020
Q14 · In 2017, the Japanese government announced improvements to its tax system 0455/22 May/June 2020
4 In 2017, the Japanese government announced improvements to its tax system. The amount of tax raised is influenced by the size and age distribution of a country’s population. Japan’s birth and death rates are falling, its population is ageing, and it has low immigration. Overall, Japan’s population is decreasing. (a) State two qualities of a good tax. [2] (b) Explain two causes of a decrease in the death rate. [4] (c) Analyse, using a production possibility curve (PPC) diagram, the effect of a decrease in population size on an economy. [6] (d) Discuss whether or not an ageing population is a benefit to an economy. [8]
20 marks
Mark scheme: 4(a) State two qualities of a good tax. 2 One mark each for two from: convenient, equitable, certain, efficient, flexible. 4(b) Explain two causes of a decrease in the death rate. 4 Logical explanation which might include: Rises in income (1) leading to better living standards (1). Better education (1) resulting in e.g. better nutrition (1). Better healthcare (1) due to e.g. advances in medical technology (1). Reduction in crime/end of a war (1) fewer people dying violently (1). 4(c) Analyse, using a production possibility curve (PPC) diagram, the effect 6 of a decrease in population size on an economy. capital goods O consumer goods Up to 4 marks for the diagram: Axes correctly drawn (1). Initial curve drawn as a curve / line sloping downward to the axes (1). New curve drawn as a curve / line sloping downward to the axes (1). Shift to the left indicated by arrow or letter (1). Up to 2 marks for coherent analysis which might include: A decrease in population size may decrease the size of the labour force (1) decrease productive capacity (1). 4(d) Discuss whether or not an ageing population is a benefit to an 8 economy. In assessing each answer, use the table below. Level Description Marks 3 A reasoned discussion which accurately examines both 6–8 sides of the economic argument, making use of economic information and clear and logical analysis to evaluate economic issues and situations. One side of the argument may have more depth than the other but, overall, both sides of the argument are considered and developed. There is thoughtful evaluation of economic concepts, terminology, information and/or data appropriate to the question. The discussion may also point out the possible uncertainties of alternative decisions and outcomes. 2 A reasoned discussion which makes use of economic 3–5 information and clear analysis to evaluate economic issues and situations. The answer may lack some depth and development may be one-sided. There is relevant use of economic concepts, terminology, information and data appropriate to the question. 1 There is a simple attempt at using economic definitions 1–2 and terminology. Some reference may be made to economic theory, with occasional understanding. 0 A mark of zero should be awarded for no creditable 0 content. Why it might: • older people may be an economic asset through their knowledge and experience • the retirement age may be raised so that the labour force may increase • in some countries, an increase in the average age of the population may mean more people are in the labour force and may reduce the dependency ratio • may indicate a good standard of living increasing life expectancy. Why it might not: • may be an increase in the dependency ratio with a smaller proportion of workers to support a higher proportion of retired • any increased spending on healthcare and pensions will involve an opportunity cost • taxes may have to be increased to finance increased costs of healthcare and pensions • any shortage of workers may drive up wages and cause cost-push inflation • older workers may not be up to date with new technology and new ideas
This question in 0455/22 May/June 2020
Q15 · Ireland has one of the lowest rates of corporation tax in Europe 0455/23 May/June 2020
3 Ireland has one of the lowest rates of corporation tax in Europe. This has encouraged many multinational companies (MNCs) to produce in Ireland. Other reasons why firms want to produce in Ireland include access to freer trade with other European countries, higher labour productivity and government grants. (a) State two benefits of free trade. [2] (b) Explain two reasons why governments levy taxes. [4] (c) Analyse, using a production possibility curve (PPC) diagram, the impact of higher labour productivity on an economy. [6] (d) Discuss whether or not MNCs always benefit their host countries. [8]
20 marks
Mark scheme: 3(a) State two benefits of free trade. 2 Any two from: Increase choices, more competition, lower prices, more specialisation 3(b) Explain two reasons why governments levy taxes. 4 Logical explanation which might include: To be able to fund government spending (1) types of government spending (1) to improve standards of living (1). To be able to control inflation (1) fiscal policy (1) reducing total demand (1). To reduce inequality (1) tax the rich and help the poor (1). To discourage the consumption of demerit good (1), to improve allocation of resources / reduce external cost (1) to change external costs to private costs (1) e.g. reduce pollution (1). To reduce imports (1) to protect home producers (1). 3(c) Analyse, using a production possibility curve (PPC) diagram, the 6 impact of higher labour productivity on an economy. Up to 4 marks for the diagram: Axes correctly drawn (1) Initial curve or line sloping downward drawn to the axes (1) New curve or line sloping downward drawn to the axes (1) Shift to the right indicated by arrow or lettering (1). Up to 2 marks for coherent analysis which might include: Higher labour productivity will increase output per worker (1) increase productive capacity (1). 3(d) Discuss whether or not MNCs always benefit their host countries. 8 In assessing each answer, use the table below. Level Description Marks 3 A reasoned discussion which accurately examines both 6–8 sides of the economic argument, making use of economic information and clear and logical analysis to evaluate economic issues and situations. One side of the argument may have more depth than the other but, overall, both sides of the argument are considered and developed. There is thoughtful evaluation of economic concepts, terminology, information and/or data appropriate to the question. The discussion may also point out the possible uncertainties of alternative decisions and outcomes. 2 A reasoned discussion which makes use of economic 3–5 information and clear analysis to evaluate economic issues and situations. The answer may lack some depth and development may be one-sided. There is relevant use of economic concepts, terminology, information and data appropriate to the question. 1 There is a simple attempt at using economic definitions 1–2 and terminology. Some reference may be made to economic theory, with occasional understanding. 0 A mark of zero should be awarded for no creditable 0 content. Why they might: • bring in more investment • increase total demand and economic growth • provide more employment opportunities • bring in more foreign capital and more advanced machinery. Why they might not: • MNCs might exploit local workers, pay low wages / provide low quality working environments • most profits of MNCs not reinvested back into the domestic economy but brought back to home country • big MNCs may meddle with domestic policy making.
This question in 0455/23 May/June 2020
Q16 · South east Asian countries have reduced tariffs between themselves through the ASEAN Free… 0455/21 Oct/Nov 2020
4 South east Asian countries have reduced tariffs between themselves through the ASEAN Free Trade Agreement. ASEAN member countries are also removing non-tariff methods of protection. The intention is to raise economic growth through more international trade. This should enable small and medium-sized firms in ASEAN countries to grow and increase their exports. (a) Define tariffs. [2] (b) Explain two non-tariff methods of protection. [4] (c) Analyse, using a production possibility curve (PPC) diagram, the beneficial effects for a country of the growth of its small and medium-sized firms. [6] (d) Discuss whether or not increased international trade can promote economic growth. [8]
20 marks
Mark scheme: 4(a) Define tariffs. Tariffs are a tax (1) on imports/exports (1) which increase the price of imported/exported goods (1). 2 4(b) Explain two non-tariff methods of protection. Logical explanation which might include: Quotas (1) quantitative restriction on the amount of imports that can enter a country (1). Subsidies (1) grants given to domestic firms to reduce domestic cost of production and reduce demand for imported goods (1). Embargoes (1) total restriction on a certain product from a certain country (1). 4 Also accept other non-tariff barriers such as rules and regulations, exchange controls, etc. One mark for each of two reasons identified and one mark for each of two explanations. 4(c) Analyse, using a production possibility curve (PPC) diagram, the beneficial effects for a country of the growth of its small and medium-sized firms. Up to 4 marks for the diagram: Axes correctly labelled (1). Initial curve drawn as a curve or downward sloping line to the axes (1). New curve drawn as a curve or downward sloping line to the axes (1). Shift to the right indicated by arrow or lettering (1). Up to 2 marks for coherent analysis which might include: The growth of its small and medium-sized firms will lead to an increase in the number of firms in the economy (1) this will increase productive potential / increase productive capacity / cause economic growth (1). 6 Also accept a tilt outward of the new PPC curve. Question Answer Marks Guidance 4(d) Discuss whether or not increased international trade can promote economic growth. In assessing each answer, use the table opposite. Why it may: • increase size of the market for domestically produced goods, increase exports, increase total demand • firms can specialise and achieve economies of scale, decrease cost of production, increase demand for goods and services produced domestically • increase competitive pressure (1) making firms more efficient (1) • increase access to products not available domestically, e.g. raw materials to produce other goods, increase output of an economy (1). Why it may not: • Increase amount of imports, decrease total demand of the economy • domestic firms may not be able to compete causing less revenue, less profits, more unemployment, • may result in shortages of e.g. rice in the domestic market • make the economy more subject to sudden changes in demand and supply. 8 Level Descriptors Mark 3 A reasoned discussion which accurately examines both sides of the economic argument, making use of economic information and clear and logical analysis to evaluate economic issues and situations. One side of the argument may have more depth than the other, but overall both sides of the argument are considered and developed. There is thoughtful evaluation of economic concepts, terminology, information and/or data appropriate to the question. The discussion may also point out the possible uncertainties of alternative decisions and outcomes. 6–8 2 A reasoned discussion which makes use of economic information and clear analysis to evaluate economic issues and situations. The answer may lack some depth and development or may be one-sided. There is relevant use of economic concepts, terminology, information and data appropriate to the question. 3–5 1 There is a simple attempt at using economic definitions and terminology. Some reference may be made to economic theory, with occasional understanding. 1–2 0 A mark of zero should be awarded for no creditable content. 0 Question Answer Marks Guidance 4(d) Example of L2 answer: Increased international trade may not benefit a country because the country may be in a trade deficit as the cost of a country’s imports exceed the total value of its exports. Consumers may purchase more goods and services from abroad than from domestic firms which may reduce economic growth as they make less profit. The value of the currency may fall eventually because more goods and services are being imported instead of exported. Principal Examiner comment: Limited on one side.
This question in 0455/21 Oct/Nov 2020
Q17 · Mexico has a history of trade deficits 0455/22 Oct/Nov 2020
2 Mexico has a history of trade deficits. The government is moving the economy closer to free trade, to try to improve its macroeconomic performance. It was predicted in 2017 that Mexico’s economy would experience a small rise in its unemployment rate. In 2017 the economy’s inflation rate was 6.6%, the highest rate since 2001. A number of policy measures may be used to reduce inflation, including increasing the rate of income tax. (a) Define trade in goods balance. [2] (b) Explain two benefits producers may gain from free trade. [4] (c) Analyse, using a production possibility curve (PPC) diagram, the effect of an increase in unemployment on an economy. [6] (d) Discuss whether or not an increase in the rate of income tax will reduce inflation. [8]
20 marks
Mark scheme: 2(a) Define trade in goods balance. Value of exports of goods / revenue earned from exports minus value of imports of goods / expenditure on imports of goods (2). Exports minus imports (1) of goods / visible items (1). 2 Accept exports (of goods) = imports of (goods) for 1 mark 2(b) Explain two benefits producers may gain from free trade. Logical explanation which might include: Availability of larger/global market (1) may increase revenue/profit (1). Ability to produce on a larger scale / higher output (1) take advantage of economies of scale (1) specialise (1). Access to cheaper / better quality raw materials / raw materials without tariffs imposed on them (1) lowering costs of production/raising quality of products produced/lowering price (1). Access to advanced technology/ideas from abroad (1) resulting in improved methods of production/new products (1). Increased competitive pressure (1) which may raise efficiency (1). 4 One mark for each of two benefits identified and one mark for each of two explanations. Question Answer Marks Guidance 2(c) Analyse, using a production possibility curve (PPC) diagram, the effect of an increase in unemployment on an economy. Up to 4 marks for the diagram: Axes correctly labelled (1). Curve drawn as a curve or downward sloping line to the axes (1). Two production points shown – one on or to left of PPC and the other further to the left of the PPC (1). Movement of the production point inwards indicated by arrow or lettering (1). Up to 2 marks for coherent analysis which might include: Unemployment means resources are not used (1) there is inefficiency (1) reduces output/GDP / causes a recession (1). 6 For analysis, only accept a PPC shifted inwards if logical justification is given i.e. an increase in unemployment may cause some workers to leave the labour force – ‘unemployment causing unemployment’. capital goods O consumer goods A B Question Answer Marks Guidance 2(d) Discuss whether or not an increase in the rate of income tax will reduce inflation. In assessing each answer, use the table opposite. Why it might: • reduce disposable income/purchasing power • consumer expenditure likely to fall • investment may fall • total (aggregate) demand may fall • demand-pull inflation may decrease • higher government revenue may increase government spending on supply-side policy measures. Why it might not: • workers may seek higher wages • higher wages may increase costs of production • cost-push inflation/wage-price spiral may occur • higher tax revenue may increase government spending • higher government spending may offset lower consumer expenditure leaving total (aggregate) demand unchanged • people may be very confident about the future so they cut back on savings rather than spending. 8 Level Descriptors Mark 3 A reasoned discussion which accurately examines both sides of the economic argument, making use of economic information and clear and logical analysis to evaluate economic issues and situations. One side of the argument may have more depth than the other, but overall both sides of the argument are considered and developed. There is thoughtful evaluation of economic concepts, terminology, information and/or data appropriate to the question. The discussion may also point out the possible uncertainties of alternative decisions and outcomes. 6–8 2 A reasoned discussion which makes use of economic information and clear analysis to evaluate economic issues and situations. The answer may lack some depth and development or may be one-sided. There is relevant use of economic concepts, terminology, information and data appropriate to the question. 3–5 1 There is a simple attempt at using economic definitions and terminology. Some reference may be made to economic theory, with occasional understanding. 1–2 0 A mark of zero should be awarded for no creditable content. 0 Question Answer Marks Guidance 2(d) Example of L3 answer: Due to an increase in the rate of income tax, inflation may fall as disposable income will fall. People will have less money to spend so they may spend less and total demand will fall. A fall in demand will cause prices to fall as producers will not be able to sell as many goods and services. They will want to keep their market share. Demand-pull inflation will decrease. However, an increase in income tax may not cause inflation to fall. Workers may force up the wage rate. Firms’ labour cost and costs of production will increase so firms may push up prices to maintain profits. This can cause cost-push inflation and a wage price spiral. Plus, government revenue from high taxes will rise and government spending may rise. This may offset the fall in consumer expenditure and inflation may not fall. Principal Examiner comment: Strong on both sides. Example of L1 answer: Inflation refers to the fall in the purchasing power of money. Income tax is a payment to the government. The increase in direct tax will definitely help the government. This may help the government solve the problem of inflation and will increase the purchasing power of money. Principal Examiner comment: Definitions given but the answer does not explain why inflation may, or may not, be reduced.
This question in 0455/22 Oct/Nov 2020
Q18 · Russia’s birth rate fell by 11% in 2017 to its lowest level for a decade 0455/23 Oct/Nov 2020
3 Russia’s birth rate fell by 11% in 2017 to its lowest level for a decade. Over the next 30 years, Russia’s population is forecast to fall from 144 million to 107 million. The government announced measures to reverse this decline in population. In 2017, it also announced privatisation plans and measures to reverse a decrease in investment which could lead to a fall in the quantity of capital goods. Privatisation can reduce monopoly power in a market. (a) Define privatisation. [2] (b) Explain two causes of a fall in the birth rate. [4] (c) Analyse, using a production possibility curve (PPC) diagram, the effects of a decrease in the quantity of capital goods in an economy. [6] (d) Discuss whether or not a government should allow monopolies. [8]
20 marks
Mark scheme: 3(a) Define privatisation. The sale of state-owned assets / state-owned enterprises / nationalised industries (1) to the private sector / individuals (1). 2 Allow denationalisation (2) only private firms (1). 3(b) Explain two causes of a fall in the birth rate. Logical explanation which might include: Rise in the cost of having children (1) e.g. children staying in education for longer (1). Rise in the education of women (1) may be more likely to enter employment/delay having children (1). Rise in government provision of state pensions (1) less need for couples to have children to support them in old age (1). Rise in access to contraceptives (1) making family planning more effective (1). Improvement in healthcare (1) reducing infant mortality (1). Increase in state provision of welfare payments (1) reducing the need to have children support parents in old age (1). Reduction in infant mortality (1) people having fewer children in the expectation more will survive (1). Ageing population (1) fewer people of child-bearing age (1). Education (1) e.g. higher cost of having children (1) women may get married later (1). More women working (1) may delay childbirth (1). Government policy (1) e.g. placing a limit on number of children (1). 4 One mark for each of two causes identified and one mark for each of two explanations. No mark for simply linking fall in birth rate with low income. Question Answer Marks Guidance 3(c) Analyse, using a production possibility curve (PPC) diagram, the effects of a decrease in the quantity of capital goods in an economy. Up to 4 marks for the diagram: Axes correctly labelled (1). Initial curve drawn as a curve or downward sloping line to the axes (1). New curve drawn as a curve or downward sloping line to the axes (1). Shift to the left / pivot indicated by arrow or lettering (1). Up to 2 marks for coherent analysis which might include: Capital goods are a resource / investment used to produce other goods (1). Fewer capital goods / factors of production reduce potential output / productive capacity (1). 6 Accept a PPC diagram that shows fewer capital goods and the same quantity of consumer goods. Accept Good A / Good B labelling on axis. Note: movement along the existing PPC is incorrect. So potentially only 2 marks for correctly labelled axes and correct curve. A B capital goods O B A consumer goods Question Answer Marks Guidance 3(d) Discuss whether or not a government should allow monopolies. In assessing each answer, use the table opposite. Why it should: • monopolies may be able to take advantage of economies of scale • may be able to experience lower average costs and charge lower prices • may earn high profits and so be able to spend on investment and research and development • may be able to produce high quality products • may be internationally competitive • maybe nationalised monopolies with welfare objectives Why it should not: • maybe market failure/abuse market power • may charge high prices • may restrict output • may become complacent • may not improve quality Example of Level 3 answer: Yes, the government should allow monopolies. It will prevent duplication of goods due to unique products with no close substitutes produced. This can reduce the wastage of resources. Monopolies can also benefit from economies of scale as they produce in large quantities so they can benefit from cost saving by negotiating favourable prices as a result of bulk buying. This can translate into lower prices for consumers, increasing their ability to consume more goods and services, boosting economic growth and their standard of living. 8 Level Descriptors Mark 3 A reasoned discussion which accurately examines both sides of the economic argument, making use of economic information and clear and logical analysis to evaluate economic issues and situations. One side of the argument may have more depth than the other, but overall, both sides of the argument are considered and developed. There is thoughtful evaluation of economic concepts, terminology, information and/or data appropriate to the question. The discussion may also point out the possible uncertainties of alternative decisions and outcomes. 6–8 2 A reasoned discussion which makes use of economic information and clear analysis to evaluate economic issues and situations. The answer may lack some depth and development or may be one-sided. There is relevant use of economic concepts, terminology, information, and data appropriate to the question. 3–5 1 There is a simple attempt at using economic definitions and terminology. Some reference may be made to economic theory, with occasional understanding. 1–2 0 A mark of zero should be awarded for no creditable content. 0 Question Answer Marks Guidance 3(d) Since it is possible for monopolies to earn supernormal profits, they are more able to spend more on research and development of their products, improving quality for consumers. No, they should not allow monopolies. Due to them being a single seller, this allows them to exploit consumers by charging higher prices as there is imperfect information and they are the only firm in the market, consumers have no choice but to buy the unreasonably priced products which means consumers spend too much in the long run and may even cause inflation to rise too. Monopolies may also increase income inequality as the producer gains at the expense of their consumers, especially those on lower incomes, causing poverty for those on low incomes especially if these products are essential goods and services such as food and utilities. Principal Examiner comment: This is a well thought out response with strong arguments on both sides and several aspects analysed.
This question in 0455/23 Oct/Nov 2020
Q19 · Sweden has a mixed economic system 0455/22 Feb/March 2021
5 Sweden has a mixed economic system. In 2018, it was operating at a point inside its production possibility curve (PPC). In 2018, the country’s schools employed nearly 2500 extra teachers. A few of these had previously been actors. A higher number had previously been government officials involved with regulation of Swedish monopolies. (a) Define a mixed economic system. [2] (b) Explain the difference between a point inside a PPC and a point outside a PPC. [4] (c) Analyse why an actor may decide to become a teacher. [6] (d) Discuss whether all monopolies have low costs of production. [8]
20 marks
Mark scheme: 5(a) Define a mixed economic system. One with a public / government sector (1) and a private sector / use of market forces (1) One which makes use of the price mechanism (1) and government directives (1). 2 5(b) Explain the difference between a point inside a PPC and a point outside a PPC Logical explanation which might include: A point inside indicates unemployed resources (1) inefficient use of resources / wasted resources (1) output is below potential output (1) an attainable point (1). A point outside is unattainable (1) not enough resources / beyond productive potential / only achievable with more resources / only achievable with better quality resources / not achievable with current resources / will be possible with future economic growth (1). 4 Maximum of 2 marks for point inside and a maximum of 2 marks for point outside. Question Answer Marks Guidance 5(c) Analyse why an actor may decide to become a teacher. Coherent analysis which might include: Wage rate may be higher (1) enable more goods and services to be purchased (1) higher living standards (1) demand for teachers may increase (1). Greater job security (1) actors often experience frictional/casual unemployment (1). More sociable/convenient working hours (1) may fit in more with having children (1) teachers may also enjoy longer holidays (1). Working conditions may be better (1) may be a safer environment (1) may have better pensions (1). May find they are better qualified / suited to be a teacher (1) more likely to be successful in the career (1). May gain more job satisfaction (1) enjoy helping children learn (1). 6 Maximum of 3 marks for a list-like approach. Question Answer Marks Guidance 5(d) Discuss whether all monopolies have low costs of production. In assessing each answer, use the table opposite. Why some have: • may earn high profits and so may have incentive to reinvest • may be small e.g. a local monopoly / low total costs • may be large and so may experience economies of scale • state-owned monopolies may be subsidised Why some do not: • lack of competition may reduce pressure to keep costs low • may be small so do not benefit from economies of scale • may be large so experience diseconomies of scale / high average costs • may be producing in a country with a high inflation rate Example of an L3 answer Monopolies are firms that dominate the market for a particular product. They supply 100% of the market and usually there are no substitutes to the product it supplies. There is no competition for a monopoly. A monopoly may not have a low cost of production as it may allocate resources inefficiently. Monopolies do have any competition as they may simply produce low quality products and earn large profits without working hard to lower costs of production. 8 Level Description Marks 3 A reasoned discussion which accurately examines both sides of the economic argument, making use of economic information and clear and logical analysis to evaluate economic issues and situations. One side of the argument may have more depth than the other, but overall both sides of the argument are considered and developed. There is thoughtful evaluation of economic concepts, terminology, information and/or data appropriate to the question. The discussion may also point out the possible uncertainties of alternative decisions and outcomes. 6–8 2 A reasoned discussion which makes use of economic information and clear analysis to evaluate economic issues and situations. The answer may lack some depth and development may be one-sided. There is relevant use of economic concepts, terminology, information and data appropriate to the question. 3–5 Question Answer Marks Guidance 5(d) A monopoly will usually require a large scale of production to operate and may soon grow too large and face diseconomies of scale. It may have supply constraints pushing up the cost of production. It may be subject to labour diseconomies as the workers feel alienated in such a large enterprise leading to extra cost of labour disputes. All this could promote increased costs of production. Furthermore, governments may implement regulations that the monopoly must rigidly follow increasing the cost of production at each step. However, monopolies may be able to maintain a low cost of production as it grows. It can benefit from economies of scale. The advertising cost will be spread over a large base, lowering costs. Banks will provide loans easily due to available collateral and suppliers will also reduce costs as they can deliver bulk orders lowering their transport costs. These internal economies of scale help monopolies keep low costs of production. Monopolies may invent new production methods, technologies and invest in R & D to keep their costs low to compete with international firms. They may also try to be efficient if there are high fines or high taxes in the economy. Example of L2 answer Monopolies might have low cost of production since the benefit from greater economies of scale such as purchasing economies which means buying in bulk and receiving discounts from the supplier. Another economies of scale could be technical economies which is investing with more capital goods, increasing the productive capacity and reducing average cost. Level Description Marks 1 There is a simple attempt at using economic definitions and terminology. Some reference may be made to economic theory, with occasional understanding. 1–2 0 A mark of zero should be awarded for no creditable content. 0 Question Answer Marks Guidance 5(d) Although having higher economies of scale, there may be diseconomies of scale like managerial diseconomies, which means firms having problems in management of the company, which means firms having problems in management of the company, this will reduce productivity and hence increasing cost of production. Another diseconomy could be communication problems which might occur between the entrepreneur, the workers and the managers. Example of an L1 answer Monopolies are single firms where they don’t have any other competitors. They might lose money often because it is very tough job to run a monopoly company. They could have low cost of production because if they produce more the price might be the same but if the consumers doesn’t want the products would go to waste.
This question in 0455/22 Feb/March 2021
Q20 · Global spending on the health sector, by both the private and public sectors, is the… 0455/23 May/June 2021
4 Global spending on the health sector, by both the private and public sectors, is the highest compared with all other sectors including education and defence. Investment in education and the health sector has resulted in new life-saving technology being introduced. However, demand for certain vaccinations has decreased over the years, shifting the demand curve of vaccinations to the left. (a) Define investment. [2] (b) Explain two causes of a shift of a product’s demand curve to the left. [4] (c) Analyse, using a production possibility curve diagram (PPC), the effect of increased investment in both education and the health sector. [6] (d) Discuss whether consumers would benefit more from healthcare being provided by the private sector or the public sector. [8]
20 marks
Mark scheme: 4(a) Define investment. Investment is spending (1) on capital goods (1) to increase output (1). 2 4(b) Explain two causes of a shift of a product’s demand curve to the left. Logical explanation which might include: Decrease in price / rise in quality of substitutes (1) increased demand for substitutes (1). Increase in price of complements (1) decrease demand for complements (1). Decrease in income (1) decrease in purchasing power (1). Changing trends / tastes (1) decrease popularity (1). Changing seasons (1) changing demand (1). Decrease in population size (1) fewer people to buy the product (1). Rise in the rate of interest (1) less able to borrow to buy the product (1). 4 One mark for each cause identified and one mark for each explanation. No mark for stating demand falls because of a rise in price. No diagram is required. No marks for a diagram. Question Answer Mark Guidance 4(c) Analyse, using a production possibility curve diagram (PPC), the effect of increased investment in both education and the health sector. Up to 4 marks for the diagram: Axes correctly labelled with different goods or services (1). Initial curve drawn as a curve / line sloping downward to the axes (1). New curve drawn to the right as a curve / line sloping downward to the axes (1). Shift indicated by arrow or letters (1). Up to 2 marks for written comments: Increased investments in education and healthcare leads to better health/qualification / higher quality resources (1) better technology (1) increased productivity (1) better quality workforce/skills/qualification (1) may be more resources (1) increase productive capacity / the maximum quantity of products that can be produced within a certain time period / create economic growth (1). 6 Accept education on one axis and health on the other. Accept any other two relevant categories e.g. manufactured and agricultural goods. Accept a pivot out if education and health is on one axis and other goods on the other. Question Answer Mark Guidance 4(d) Discuss whether consumers would benefit more from healthcare being provided by the private sector or the public sector. In assessing each answer, use the table opposite. Why private sector is better: • profit maximising objective will lead to higher efficiency. • lower costs. • more choice • private firms will try to compete • could lead to higher quality • private sector more likely to be able to raise funds • private sector investment will lead to less opportunity cost for public sector – leading to more spending on other industries e.g. education / government do not have to raise taxes to fund healthcare services Why public sector is better: • private sector investment leads to market failure such as merit goods • public sector cares more about the wellbeing of the people • could lead to higher quality provisions • public sector may produce on a larger scale and take advantage of economies of scale • public sector may not charge for services whereas private sector will or public sector may charge a lower price. 8 Level Description Marks 3 A reasoned discussion which accurately examines both sides of the economic argument, making use of economic information and clear and logical analysis to evaluate economic issues and situations. One side of the argument may have more depth than the other, but overall both sides of the argument are considered and developed. There is thoughtful evaluation of economic concepts, terminology, information and/or data appropriate to the question. The discussion may also point out the possible uncertainties of alternative decisions and outcomes. 6–8 2 A reasoned discussion which makes use of economic information and clear analysis to evaluate economic issues and situations. The answer may lack some depth and development may be one- sided. There is relevant use of economic concepts, terminology, information and data appropriate to the question. 3–5 Question Answer Mark Guidance 4(d) Level Description Marks 1 There is a simple attempt at using economic definitions and terminology. Some reference may be made to economic theory, with occasional understanding. 1–2 0 A mark of zero should be awarded for no creditable content. 0
This question in 0455/23 May/June 2021
Q21 · A number of countries, including Morocco, capture water from fog 0455/22 Oct/Nov 2021
2 A number of countries, including Morocco, capture water from fog. Water is used in the primary, secondary and tertiary sectors. In recent years, Morocco has increased the quantity and quality of its resources and has moved more of them into the tertiary sector. The quantity, quality and composition of a country’s resources are influenced by a number of factors, including its birth rate. Morocco’s birth rate fell from 19.9 in 2016 to 18.7 in 2018. (a) Define a free good. [2] (b) Explain, with examples, the difference between the secondary sector and the tertiary sector. [4] (c) Analyse, using a production possibility curve (PPC), the effect of an increase in the quality of its resources on an economy. [6] (d) Discuss whether or not a fall in a country’s birth rate will benefit an economy. [8]
20 marks
Mark scheme: 2(a) Define a free good. No opportunity cost (1) a good that takes no resources/factors of production to produce / naturally abundant in supply / does not use scarce resources (1). 2(b) Explain, with examples, the difference between the secondary sector and the tertiary sector. Logical explanation which might include: Secondary sector covers manufacturing (and construction) / converts primary products into finished goods (1) e.g. car industry (1). Tertiary sector covers services / final stage of production (1) e.g. insurance (1). 4 For tertiary sector, it is not sufficient to just have the sector which sells products as this is only part of the sector. But for the tertiary sector example accept the sale of a product e.g. the sale of jewellery. Question Answer Marks Guidance 2(c) Analyse, using a production possibility curve (PPC), the effect of an increase in the quality of its resources on an economy. Up to 4 marks for the diagram: Axes correctly labelled with different outputs (1). Initial curve drawn as a curve / line sloping downward to the axes (1). New curve drawn as a curve / line sloping downward to the axes (1). Shift indicated by arrow or letter (1). Up to 2 marks for coherent analysis which might include: Better quality resources will increase productivity (1) enable more of both types of goods to be produced (1) with a given quantity of resources (1) increase productive potential / productive capacity / total supply (1) cause economic growth (1). 6 Nothing for higher output, higher GDP as this is uncertain. Question Answer Marks Guidance 2(d) Discuss whether or not a fall in a country’s birth rate will benefit an economy. In assessing each answer, use the table opposite. Why it might: • reduce the number of dependents • fewer workers away from work to bring up children • enable resources to be used to increase economic growth / raise living standards • reduce pressure on the environment • move towards the optimum population Why it might not: • reduce the size of the labour force in the longer term • reduce labour mobility • create an ageing population • reduce size of markets 8 Level Description Marks 3 A reasoned discussion which accurately examines both sides of the economic argument, making use of economic information and clear and logical analysis to evaluate economic issues and situations. One side of the argument may have more depth than the other, but overall, both sides of the argument are considered and developed. There is thoughtful evaluation of economic concepts, terminology, information and/or data appropriate to the question. The discussion may also point out the possible uncertainties of alternative decisions and outcomes. 6–8 2 A reasoned discussion which makes use of economic information and clear analysis to evaluate economic issues and situations. The answer may lack some depth and development may be one-sided. There is relevant use of economic concepts, terminology, information and data appropriate to the question. 3–5 1 There is a simple attempt at u sing economic definitions and terminology. Some reference may be made to economic theory, with occasional understanding. 1–2 Question Answer Marks Guidance 2(d) Level Description Marks 0 A mark of zero should be awarded for no creditable content. 0
This question in 0455/22 Oct/Nov 2021
Q22 · South Africa has a high number of unemployed workers 0455/23 Oct/Nov 2021
3 South Africa has a high number of unemployed workers. South Africa’s inflation rate has been stable in recent years, partly due to relatively stable wages. An increase in wages can cause inflation and can increase the number of consumer goods bought and produced. To increase employment and reduce the deficit on the current account of South Africa’s balance of payments, some economists suggest more foreign multinational companies (MNCs) should be encouraged to produce in South Africa. (a) Identify two ways unemployment is measured. [2] (b) Explain two ways an increase in wages can cause inflation. [4] (c) Analyse, using a production possibility curve (PPC), the opportunity cost to an economy of producing more consumer goods. [6] (d) Discuss whether or not an increase in foreign MNCs will reduce a deficit on the current account of the balance of payments of a host country. [8]
20 marks
Mark scheme: 3(a) Identify two ways unemployment is measured. • claimant count/claiming benefits • labour force survey/ILO measure/without a job and seeking work • formula for the unemployment rate/number of unemployed divided by labour force × 100/through the unemployment rate • total labour force minus those currently employed 2 3(b) Explain two ways an increase in wages can cause inflation. Logical explanation which might include: Increase in wages may increase total (aggregate) demand/consumption (1) causing demand-pull inflation (1). Increase in wages may increase costs of production (1) causing cost-push inflation (1). 4 One mark each for each of two ways identified and one mark each for each of two explanations. Allow 1 mark if refer to prices rise but no mention of demand-pull or cost-push inflation Question Answer Marks Guidance 3(c) Analyse, using a production possibility curve (PPC), the opportunity cost to an economy of producing more consumer goods. Up to 4 marks for the diagram: Axes correctly labelled with capital/consumer goods (1). Curve drawn as a curve/line sloping downward to the axes (1). Movement along the curve/along the axes (1). Reduction in capital goods/increase in consumer goods shown by numbers or letters or arrows (1). Up to 2 marks for coherent analysis which might include: Opportunity cost is the (next) best alternative forgone (1) resources used to produce consumer goods cannot be used to produce capital goods (1). Producing more consumer goods now may mean fewer consumer goods in the future (1) as there may be fewer capital goods to make them (1). 6 Question Answer Marks Guidance 3(d) Discuss whether or not an increase in foreign MNCs will reduce a deficit on the current account of the balance of payments of a host country. In assessing each answer, use the table opposite. Why it might: • MNCs tend to export a relatively high proportion of their output • may produce at a low cost of production/be efficient • may be internationally competitive • may produce products that were previously imported • may bring in new technology Why it might not: • may buy raw materials and capital goods from their home countries • MNC may send profits back to home country • workers/managers may send remittances back to home country • may eliminate firms in the host country that had a good export record • may deplete non-renewable resources reducing the ability to export in the long run 8 For level 3, an answer must look at both sides of whether a deficit on the current account would be reduced. Level Description Marks 3 A reasoned discussion which accurately examines both sides of the economic argument, making use of economic information and clear and logical analysis to evaluate economic issues and situations. One side of the argument may have more depth than the other, but overall, both sides of the argument are considered and developed. There is thoughtful evaluation of economic concepts, terminology, information and/or data appropriate to the question. The discussion may also point out the possible uncertainties of alternative decisions and outcomes. 6–8 2 A reasoned discussion which makes use of economic information and clear analysis to evaluate economic issues and situations. The answer may lack some depth and development may be one- sided. There is relevant use of economic concepts, terminology, information and data appropriate to the question. 3–5 Question Answer Marks Guidance 3(d) Level Description Marks 1 There is a simple attempt at using economic definitions and terminology. Some reference may be made to economic theory, with occasional understanding. 1–2 0 A mark of zero should be awarded for no creditable content. 0
This question in 0455/23 Oct/Nov 2021
Q23 · Calculate the number of births in Cyprus in 2019 0455/21 May/June 2022
1 (a) Calculate the number of births in Cyprus in 2019. [1] (b) Identify two indicators of living standards. [2] (c) State why the global market for grapes was in disequilibrium in 2019. [2] (d) Explain two reasons why more well-educated workers tend to work past retirement age than less-educated workers. [4] (e) Analyse how a rise in a country’s retirement age is likely to affect its government’s budget. [4] (f) Analyse the relationship between inflation rates and current account balances. [5] (g) Discuss whether or not, after 2019, Cyprus’s production possibility curve (PPC) is likely to shift to the right. [6] (h) Discuss whether or not adopting capital-intensive production will benefit consumers. [6]
30 marks
Mark scheme: 1(a) Calculate the number of births in Cyprus in 2019. 12 240 (1) 1 1(b) Identify two indicators of living standards. GDP per head / per capita (1). HDI (1). Life expectancy / healthy people (1). Proportion of people in primary sector (1). Level of education / qualifications (1). 2 Do not reward GDP 1(c) State why the global market for grapes was in disequilibrium in 2019. Bad weather / failure of the grape harvest (1) there was a shortage (1) which means demand exceeded supply (1). 2 1(d) Explain two reasons why more well-educated workers tend to work past retirement age than less-educated workers. Logical explanation which might include: Well-paid / good work benefits (1) which provides an incentive to work for longer / high job satisfaction / enter workforce late (1). Healthy (1) and so more able to work for longer / remain productive (1). Work in jobs which do not require physical strength / less tiring (1) older workers tend to be less strong / allows them to continue working as long as remain fit (1). 4 One mark for each of two reasons identified and one mark for each explanation. Question Answer Marks Guidance 1(e) Analyse how a rise in a country’s retirement age is likely to affect its government’s budget. Coherent analysis which might include: A rise in the retirement age / less people retired will reduce the cost of pensions (1) may reduce government spending / government may spend on alternatives e.g., infrastructure, education or health (1). More people in work will increase incomes / businesses expand production (1) raise direct tax revenue (1) spending will increase (1) raise indirect tax revenue (1). 4 Question Answer Marks Guidance 1(f) Analyse the relationship between inflation rates and current account balances. Coherent analysis which might include: Overview: Generally, an inverse relationship / the lower the inflation rate, the higher the current account surplus or the higher the inflation rate, the higher the current account deficit (1). Supporting evidencemax of 2 marks Mongolia has the highest inflation rate (1) and the largest current account deficit (1) Mongolia / Kenya / Nepal have the highest inflation rates (1) all have a current account deficit (1). Iceland / Slovenia have a low rate of inflation (1) but have a current balance of payments surplus (1) Exception: Cyprus lowest inflation rate (1) but a current account deficit / 3rd highest current account deficit (1). Comments: Most of the table shows the expected relationship. (1) Low inflation rates may make products more price competitive / high inflation rates may make prices less price competitive (1) 5 Do not accept current account balance is high or low. Answers need to refer to size of surplus or deficit. Simply using data without explanation is description rather than analysis. Question Answer Marks Guidance 1(g) Discuss whether or not, after 2019, Cyprus’s production possibility curve (PPC) is to shift to the right. Award up to 4 marks for logical reasons why it might, which may include: Quantity / quality of resources may have increased (1) retirement age may have increased (1) people living longer (1) so labour force is likely to have increased (1). Investment may have increased (1) due to low interest rates (1) more capital goods would increase productive capacity (1). Award up to 4 marks for logical reasons why it might not, which may include: Quantity and quality of resources may have decreased (1) land quality is decreasing (1) which will reduce the productivity of land (1). Entrepreneurs may emigrate (1) reducing the supply of enterprise / skilled workers (1). Birth rate is falling (1) size of workforce may fall in future (1) Covid19 may have reduced productivity (1). For recognising that any of these reasons could result in PPC shifting to the left / stay unchanged (1). 6 Apply this example to all questions with the command word DISCUSS (1g, 1h, 2d, 3d, 4d and 5d) Each point may be credited only once, on either side of an argument, but separate development as to how/why the outcome may differ is rewarded. Generic example Marks Tax revenue may decrease 1 because of reason e.g., incomes may be lower. 1 Tax revenue may increase because incomes may be higher i.e., reverse of a previous argument. 0 Tax revenue may increase because of a different reason i.e., not the reverse of a previous argument e.g., government spending on subsidies may stimulate the economy more than spending on education. 1 Question Answer Marks Guidance 1(h) Discuss whether or not adopting capital-intensive production will benefit consumers. Award up to 4 marks for logical reasons why it might, which may include: It may reduce costs of production / more efficient / may result in economies of scale (1) lower costs may reduce prices (1). It may avoid disruption to supply (1) as no industrial action / strikes (1). It may be quicker / faster (1) to respond to changes in consumer demand (1) It may raise quality (1) as absence of human error (1). Award up to 4 marks for logical reasons why it might not, which may include: Products may be standardised / lack variety (1) individual wants may not be met (1). Capital equipment may break down / costly to maintain (1) causing delays in production (1). Initial high cost of capital equipment (1) may push up prices (1). 6
This question in 0455/21 May/June 2022
Q24 · In 2019, France produced inside its production possibility curve (PPC) 0455/22 May/June 2022
3 In 2019, France produced inside its production possibility curve (PPC). France exports a wide range of its products. It is the world’s top exporter of luxury perfume and the 7th largest exporter of soap. Changes in technology affect the products people produce and buy. The French government plans to upgrade its infrastructure for all households to have internet access. (a) Define a production possibility curve. [2] (b) Explain why demand for soap is more price-inelastic than demand for a luxury brand of perfume. [4] (c) Analyse, using a demand and supply diagram, how an increase in income will affect the market for a luxury brand of perfume. [6] (d) Discuss whether or not the public sector should be responsible for the supply of all internet services. [8]
20 marks
Mark scheme: 3(a) Define a production possibility curve. A diagram showing maximum output / possible combinations (1) of two types of products / of capital and consumer goods (1) with given resources / given technology / in a given time period (1) shows opportunity cost (1). 2 Nothing for a diagram, 3(b) Explain why demand for soap is more price-inelastic than demand for a luxury brand of perfume. Logical explanation which might include: Soap is more essential / necessary than a luxury brand of perfume (2) OR soap is a necessity (1) luxury brand of perfume does not have to be purchased / not essential / a want (1). Soap has fewer substitutes than a luxury brand of perfume (2) OR soap does not have close substitutes (1) whereas a luxury brand of perfume may have close substitutes (1). Soap is likely to take up a smaller proportion of income than a luxury brand of soap (2) OR soap is likely to take only a small proportion of income (1) whereas a luxury brand of perfume is likely to take up a large proportion (1). It is harder to delay the purchase of soap than the purchase of a luxury brand of perfume OR the purchase of soap cannot be delayed (1) while the purchase of a luxury brand of perfume can be (1). 4 Question Answer Marks Guidance 3(c) Analyse, using a demand and supply diagram, how an increase in income will affect the market for a luxury brand of perfume. Coherent analysis which might include: Up to 4 marks for the diagram: D and S diagram: Axes correctly labelled – price and quantity or p and q (1). Original demand and supply curves correctly labelled (1). New demand curve shifted to the right (1). Equilibriums – shown by lines or equilibrium points (1). Up to 2 marks for written analysis which might include: Luxury perfume will be more affordable / greater purchasing power / luxury perfume will take a smaller proportion of income / more will be demanded at the same price (1) price will rise / quantity traded will increase (1). 6 Written analysis An increase in income will cause an increase in demand for luxury perfume is not sufficient for a mark. Reward but do not expect reference to a luxury brand of perfume being a normal good. Question Answer Marks Guidance 3(d) Discuss whether or not the public sector should be responsible for the supply of all internet services. In assessing each answer, use the table opposite. Why it might: government may charge a low price enable poor to gain access to the internet, help children with education government may base decisions on social costs and benefits government can control what is on the internet may be more able to take advantage of economies of scale avoidance of wasteful duplication government may take a longer-term view on investing. Why it might not: opportunity cost – could have spent the money on e.g. healthcare private sector may invest more private sector may be more efficient / have lower costs of production profit incentive may encourage private sector to raise quality private sector may make decisions quicker. 8 Level Description Marks 3 A reasoned discussion which accurately examines both sides of the economic argument, making use of economic information and clear and logical analysis to evaluate economic issues and situations. One side of the argument may have more depth than the other, but overall, both sides of the argument are considered and developed. There is thoughtful evaluation of economic concepts, terminology, information and/or data appropriate to the question. The discussion may also point out the possible uncertainties of alternative decisions and outcomes. 68 Question Answer Marks Guidance 3(d) 2 A reasoned discussion which makes use of economic information and clear analysis to evaluate economic issues and situations. The answer may lack some depth and development may be one-sided. There is relevant use of economic concepts, terminology, information and data appropriate to the question. 35 1 There is a simple attempt at using economic definitions and terminology. Some reference may be made to economic theory, with occasional understanding. 12 0 A mark of zero should be awarded for no creditable content. 0
This question in 0455/22 May/June 2022
Q25 · In Greece, rich households spend more than the average household 0455/21 May/June 2023
5 In Greece, rich households spend more than the average household. The amount of spending in an economy influences whether its production point is on or inside its production possibility curve (PPC). In 2020, household spending in Greece fell. This affected some firms’ plans to merge. It also increased unemployment. More than half of those unemployed in Greece had been unemployed for more than a year. (a) Identify two reasons why rich households spend more than the average household. [2] (b) Explain the significance of a production point inside a PPC and a production point on its PPC. [4] (c) Analyse why someone who has been unemployed for more than a year may not get another job. [6] (d) Discuss whether or not a government should encourage firms to merge. [8]
20 marks
Mark scheme: 5(a) Identify two reasons why rich households spend more than the average household. Two from: higher incomes find it easier to borrow more confidence more savings / more wealth high cost of luxury goods and services maintaining / showing status rich households may choose to have large families 2 If more than two reasons are given, consider the first three. 5(b) Explain the significance of a production point inside a PPC and a production point on its PPC. Logical explanation which might include: A point inside a PPC means output is lower than potentially achievable (1) there are unemployed resources / there is inefficient use of resources (1). A point on a PPC means output is at its maximum (1) all resources are employed / full employment / there is efficient use of resources (1). A production point shows a combination of goods produced (1) example e.g. X capital goods and Y consumer goods (1). 4 One mark each for each of two significances identified and one mark each for each of two explanations. Question Answer Marks Guidance 5(c) Analyse why someone who has been unemployed for more than a year may not get another job. Coherent analysis which might include: May lose skills (1) qualifications may become out of date (1) may experience ill-health (1) lack of recent job experience (1) high cost of retraining (1) may become less attractive to employers (1). Skills may be outdated (1) industry in decline (1) will need retraining (1). Economy could be in recession (1) with high number of people unemployed and few vacancies (1). May lose confidence / become discouraged / depressed (1) put less effort into finding another job (1). Unemployed workers may be occupationally immobile (1) geographically immobile (1). Unemployment/welfare benefits may be high (1) may be above low wages / maybe sufficient to live on (1). May face discrimination (1) on grounds of e.g. age (1). May retire (1) and leave the labour force (1). 6 Question Answer Marks Guidance 5(d) Discuss whether or not a government should encourage firms to merge. In assessing each answer, use the table opposite. Why it should: may result in economies of scale lower average costs of production lower prices for consumers raise quality of products increase international competitiveness and improve current account improved performance may increase profits and corporation tax Why it should not: may result in diseconomies of scale may increase monopoly power / reduce competition raise prices may reduce innovation rationalisation may result in some workers losing their jobs should be left to market forces to decide. 8 Level Description Marks 3 A reasoned discussion which accurately examines both sides of the economic argument, making use of economic information and clear and logical analysis to evaluate economic issues and situations. One side of the argument may have more depth than the other, but overall, both sided of the argument are considered and developed. There is thoughtful evaluation of economic concepts, terminology, information and/or data appropriate to the question. The discussion may also point out the possible uncertainties of alternative decisions and outcomes. 6–8 2 A reasoned discussion which makes use of economic information and clear analysis to evaluate economic issues and situations. The answer may lack some depth and development may be one-sided. There is relevant use of economic concepts, terminology, information and data appropriate to the question. 3–5 1 There is a simple attempt at using economic definitions and terminology. Some reference may be made to economic theory, with occasional understanding. 1–2 0 A mark of zero should be awarded for no creditable content. 0
This question in 0455/21 May/June 2023
Q26 · In 2020, Singapore experienced a decrease in both its population size and its labour force 0455/22 Oct/Nov 2023
5 In 2020, Singapore experienced a decrease in both its population size and its labour force. 2020 was a year of great change in a number of Singaporean markets. Some moved from disequilibrium to equilibrium. Despite all these changes, Singapore managed to increase its exports of goods and services. (a) Identify two benefits of a decrease in a country’s population size. [2] (b) Explain how a market moves from disequilibrium to equilibrium. [4] (c) Analyse, using a production possibility curve (PPC) diagram, the effect of a decrease in the size of a country’s labour force on its economy. [6] (d) Discuss whether or not an increase in exports will benefit an economy. [8]
20 marks
Mark scheme: 5(a) Identify two benefits of a decrease in a country’s 2 population size. Two from: • may be fewer dependents • less pressure on resources • less food needed • move population towards the optimum level / reduce overpopulation • reduce overcrowding / more land space • reduce pollution / less negative externalities • lower imports • lower government expenditure (on healthcare/education) • less unemployment / less unemployment benefit • may increase GDP per head. 5(b) Explain how a market moves from disequilibrium to 4 One mark for reference to a change in price. equilibrium. Maximum of 2 marks for diagrams which show initial Logical explanation which might include: disequilibrium and change in price which restores If demand is greater than supply / there is a shortage / equilibrium. excess demand (1) price will rise (1). If supply is greater than demand / there is a surplus / excess supply (1) price will fall (1). Demand will again equal supply / demand would not initially have been equal to supply (1). 5(c) Analyse, using a production possibility curve (PPC) 6 diagram, the effect of a decrease in the size of a country’s labour force on its economy. Up to 4 marks for the diagram: Axes correctly labelled with different outputs (1). Initial curve drawn as a curve/line sloping downward to the axes (1). New curve drawn as a curve/line sloping downward to the axes (1). Shift to the left indicated by arrow or letters (1). Up to 2 marks for coherent analysis which might include: A decrease in the size of the labour force reduces resources / factors of production available (1) this lowers productive capacity / the maximum output that can be produced (1). Note to gain the marks for the curves, these must be drawn to the axes. 5(d) Discuss whether or not an increase in exports will 8 Level Description Marks benefit an economy. 3 A reasoned discussion which accurately 6–8 In assessing each answer, use the table opposite. examines both sides of the economic argument, making use of economic Why it might: information and clear and logical analysis • may increase export revenue, improve the current to evaluate economic issues and account balance situations. One side of the argument may • may increase total demand have more depth than the other, but • may increase investment overall, both sided of the argument are • may increase output / economic growth considered and developed. There is • may reduce unemployment thoughtful evaluation of economic • may increase incomes. concepts, terminology, information and/or data appropriate to the question. The Why it might not: discussion may also point out the • may cause demand-pull inflation possible uncertainties of alternative • opportunity cost of selling more products on the home decisions and outcomes. market 2 A reasoned discussion which makes use 3–5 • may lead to shortages on the home market of economic information and clear • may deplete resources analysis to evaluate economic issues • may push up the exchange rate, reversing the increase and situations. The answer may lack in exports in the long run some depth and development may be • may make the economy more subject to external one-sided. There is relevant use of shocks. economic concepts, terminology, information and data appropriate to the question. 1 There is a simple attempt at using 1–2 economic definitions and terminology. Some reference may be made to economic theory, with occasional understanding. 0 A mark of zero should be awarded for no 0 creditable content.
This question in 0455/22 Oct/Nov 2023
Q27 · In 2019, Mozambique was hit by a serious storm which destroyed bridges, factories, roads… 0455/23 Oct/Nov 2023
2 In 2019, Mozambique was hit by a serious storm which destroyed bridges, factories, roads and electricity lines. Almost 60% of Mozambique’s population live in absolute poverty. The country’s people are keen to increase Mozambique’s economic development. There is a high level of government intervention in Mozambique’s economy. Although Mozambique does not impose import quotas, it does impose a range of import tariffs. (a) Identify two reasons why a person may experience absolute poverty. [2] (b) Explain two causes of an increase in a country’s economic development. [4] (c) Analyse, using a production possibility curve (PPC) diagram, the effect of a serious storm on an economy. [6] (d) Discuss whether or not imposing tariffs on imports will increase a country’s output. [8]
20 marks
Mark scheme: 2(a) Identify two reasons why a person may experience 2 If more than two reasons are given, consider the first three. absolute poverty. Two from: • unemployment • sickness / mental health / poor health • old age • refugees • war / famine / natural disasters • lack of government benefits • low level of education / social skills • income too low to afford basic necessities. 2(b) Explain two causes of an increase in a country’s 4 One mark each for each of two causes identified and one economic development. mark each for each of two explanations. Logical explanation which might include: If more than two causes are given, consider the first three. Improvements in education (1 improve production capacity Note: the development mark might apply to several causes can raise wages / reduce unemployment (1). and are therefore interchangeable. Improvements in healthcare (1) can increase life expectancy (1). Improvements in technology (1) better quality goods and services (1) Increase in savings (1) provide finance for investment (1). Increase in investment (1) raise quality of output / economic growth (1). Increase in FDI (1) can increase job opportunities (1). Increase in proportion of workers in the tertiary sector (1) working conditions / pay may be better (1). Increase in incomes (1) able to buy more goods and services (1). Increase in government expenditure on infrastructure (1) improves labour mobility / access to resources (1). Increase in international trade / exports (1) creates more jobs / income (1). Discovery of new resources (1) e.g. oil improves production (1). 2(c) Analyse, using a production possibility curve (PPC) 6 diagram, the effect of a serious storm on an economy. Up to 4 marks for the diagram: Axes correctly labelled with different outputs (1). Initial curve drawn as a curve/line sloping downward to the axes (1). New curve drawn as a curve/line sloping downward to the axes (1). Shift indicated by arrow or letter (1). Up to 2 marks for coherent analysis which might include: A serious storm will reduce resources / reduce availability of factors of production / destroy infrastructure (1) reduce the ability to produce goods and services / reduce maximum capacity / reduce productive capacity (1). Note: both curves must touch both axes to get the marks. Note: Axes need labelling such as good X / good Y or capital goods and consumer goods. Labelling A and B is not sufficient. 2(d) Discuss whether or not imposing tariffs on imports will 8 Level Description Marks increase a country’s output. 3 A reasoned discussion which accurately 6–8 In assessing each answer, use the table opposite. examines both sides of the economic argument, making use of economic Why it might: information and clear and logical analysis to evaluate economic issues and situations. • increase price of imports which may reduce demand for One side of the argument may have more imports depth than the other, but overall, both sides • people may switch to buying domestically produced of the argument are considered and products developed. There is thoughtful evaluation of • net exports may increase, raising total demand economic concepts, terminology, • the higher demand may encourage the country’s firms information and/or data appropriate to the to produce more goods and services question. The discussion may also point out • government could use tax revenue to subsidise the possible uncertainties of alternative domestic goods. decisions and outcomes. Why it might not: 2 A reasoned discussion which makes use of 3–5 economic information and clear analysis to • even with tariffs, imports may still be cheaper than evaluate economic issues and situations. domestically produced products The answer may lack some depth and • there may not be domestically produced substitutes development may be one-sided. There is • if tariffs are put on raw materials and capital goods, relevant use of economic concepts, costs of production could rise and demand may fall terminology, information and data • other countries may retaliate, raising price of exports appropriate to the question. and reducing demand for the country’s exports. 1 There is a simple attempt at using economic 1–2 definitions and terminology. Some reference Note: level 1 would be knowledge and understanding of imports and tariffs or just identification of points. may be made to economic theory, with occasional understanding. 0 A mark of zero should be awarded for no 0 creditable content.
This question in 0455/23 Oct/Nov 2023
Q28 · Calculate the percentage contribution of Jakarta to Indonesia’s GDP in 2021 0455/23 May/June 2024
1 (a) Calculate the percentage contribution of Jakarta to Indonesia’s GDP in 2021. [1] (b) Identify two examples of external costs ignored by the free market. [2] (c) Explain how real GDP per head can be an indicator of living standards. [2] (d) Explain two ways climate change can lead to a fall in the Human Development Index (HDI) of Indonesia. [4] (e) Draw a production possibility curve (PPC) diagram to show the impact of climate change on an economy such as Indonesia. [4] (f) Analyse the relationship between GDP and government spending on the environment. [5] (g) Discuss whether or not internal migration benefits an economy such as Indonesia. [6] (h) Discuss whether or not relocating the capital city from Jakarta will benefit the Indonesian economy. [6]
30 marks
Mark scheme: 1(a) Calculate the percentage contribution of Jakarta to Indonesia’s GDP in 2021. 27.3%, 27.27%, 27.2%, 27% 1 Accept without the percentage sign. 1(b) Identify two examples of external costs ignored by the free market. air pollution (1) rising sea levels/floods (1) disease / mosquitoes (1) climate change (1) 2 1(c) Explain how real GDP per head can be an indicator of living standards. Real GDP per head has been adjusted for population / inflation / takes account of the cost of living (1). Low real GDP per head leads to a fall in living standards (1) because lower GDP per head would mean lower income / real GDP per head is average income (1) reducing consumption / material wellbeing / influencing how much people can spend / whether they can buy basic necessities (1). 2 Accept answers based on either higher or lower GDP per head. Question Answer Mark Guidance 1(d) Explain two ways climate change can lead to a fall in the Human Development Index (HDI) of Indonesia. Logical explanation which might include: Schools have been flooded (1) reducing education levels / mean years of schooling / expected years of schooling (1). Floods have led to an increase in diseases (transmitted through water and mosquitoes which breed in water) (1) reducing health level / life expectancy / increasing death rate (1). Farmland has been submerged, (cutting off a vital source of income of many farmers) / roads have been destroyed (1) reducing income levels / GNI per capita / GDP per capita / living standards (1). 4 One mark each for each of two ways identified and one mark for each of two explanations. Accept an explanation combining two different ways, e.g. increase in diseases reducing education levels. 1(e) Draw a production possibility curve (PPC) diagram to show the impact of climate change on an economy such as Indonesia. PPC diagram: Axes correctly with different outputs (1). Initial curve drawn as a curve/line sloping downward to the axes (1). New curve drawn as a curve/line sloping downward to the axes (1). Shift to the left indicated by arrow(s) or letters or numbers e.g. PPC1 to PPC2 (1). 4 Question Answer Mark Guidance 1(f) Analyse the relationship between GDP and government spending on the environment. Coherent analysis which might include: Expected relationship: direct relationship / move in the same direction (1) higher GDP may lead to higher government spending on the environment / higher government spending on the environment may increase GDP (1). Supporting evidence: Japan has highest GDP and highest spending on environment (1) France has second highest GDP and second highest spending on environment (1) Thailand has lowest GDP and lowest spending on environment (1). Analysis: Higher GDP may create more pollution, therefore countries have more to spend on environment / high government spending on the environment can reduce pollution/climate change (1). Higher tax revenue / more education and so more concern for the environment / a cleaner environment can raise productivity (1). Higher GDP therefore more developed and can spend more on other objectives such as protection of the environment (1). Exception: Switzerland/Indonesia (1) Switzerland has lower GDP than Indonesia but higher expenditure on environment/ Indonesia has higher GDP and lower expenditure on environment than Switzerland (1). Analysis of the exception: These countries may be facing different pressures on government spending e.g. higher level of poverty (1). 5 Responses do not have to be in the format suggested but they should address the expected/normal relationship, offer supporting evidence of that, highlight any exceptions to that, and analyse the overall data. Question Answer Mark Guidance 1(g) Discuss whether or not internal migration benefits an economy such as Indonesia. Award up to 4 marks for logical reasons why it might, which may include: higher production of different crops (1) more income / higher living standards (for farmers) (1) less pressure on government resources / natural resources (1) e.g., less overcrowding (1) less spending on healthcare if people move away from areas of flooding/ mosquitoes (1) labour force may increase in some areas (1) moving from low productivity areas to high productivity areas(1) increasing output (1) housing may be cheaper / more available in some areas (1) reducing cost of living for workers (1) migration may be to high wage areas (1) boosting total demand (1) fewer resources may be wasted (1) if migration is to an area where they are under-used e.g. schools, hospitals (1). Award up to 4 marks for logical reasons why it might not, which may include: as workers migrate, it could also lead to the collapse of entire communities (1) without workers (1) less demand for goods and services in the area (1) increased inequality between more mobile labour and less mobile labour (1) as some workers who cannot move will not be able to find jobs (1) and gain higher income (1) more pressure on government resources in areas they move to (1) more overcrowding in those areas / housing shortages (1) external costs (1) more pollution / congestion (1). 6 Apply this example to all questions with the command word DISCUSS (1g, 1h, 2d, 3d, 4d and 5d) Accept the reverse argument, (e.g. for Q1g internal migration may be to a less polluted area) but recognise that each point may be credited only once, on either side of an argument, but separate development as to how/why the outcome may differ is rewarded. Generic example mark Tax revenue may decrease… 1 ...because of reason e.g. incomes may be lower. 1 Tax revenue may increase because incomes may be higher i.e. reverse of a previous argument. 0 Tax revenue may increase because of a different reason i.e. not the reverse of a previous argument e.g. government spending on subsidies may stimulate the economy more than spending on education. 1 Question Answer Mark Guidance 1(h) Discuss whether or not relocating the capital city from Jakarta will benefit the Indonesian economy. Award up to 4 marks for logical reasons why it might, which may include: the new city will provide new job opportunities (1) decreasing unemployment in Indonesia (1) increasing incomes / economic growth (1) reduce inequality between the different regions of Indonesia (1) reducing social dissatisfaction / increase standards of living of everyone in Indonesia (1) better environment as new city is carbon-neutral / less pollution (1) reduced external costs (1) better health for population of Indonesia (1) higher productivity (1) fewer floods that require expenditure to repair the damage (1) foreign investors may be more willing to relocate to Indonesia (1). Award up to 4 marks for logical reasons why it might not, which may include: cost of the move may be too high (1) opportunity cost in terms of other areas of government spending (1) e.g. education / healthcare in other regions (1) could result in higher taxes / government budget deficit (1) the relocation is expected to benefit only a small number of people who already have the financial capital / connection to the government (1) inequality could rise (1) people may be reluctant to leave Jakarta (1) causing the resources invested in the new city to be wasted (1). 6
This question in 0455/23 May/June 2024
Q29 · Calculate the percentage of the population who were foreign nationals living in the UAE 0455/21 Oct/Nov 2024
1 (a) Calculate the percentage of the population who were foreign nationals living in the UAE. [1] (b) Identify two features of globalisation. [2] (c) Explain one factor that can influence labour mobility between countries. [2] (d) Explain one advantage and one disadvantage of producing a product which is price-inelastic in demand such as oil. [4] (e) Explain the relationship between the oil price and the UAE’s current account balance. [4] (f) Analyse, using a production possibility curve (PPC) diagram, the effect of technological progress on an economy such as the UAE. [5] (g) Discuss whether or not luxury tourism and financial services have helped Dubai achieve economic development. [6] (h) Discuss whether or not having a fixed exchange rate is beneficial for a country such as the UAE. [6]
30 marks
Mark scheme: Question Answer Mark Guidance 1(a) Calculate the percentage of the population who were 1 Accept answer without % foreign nationals living in the UAE. 89% 1(b) Identify two features of globalisation. 2 The increased connection of people from all over the world through migration (1) the trade of goods and services (1) the sharing of ideas (1) technological development (1). 1(c) Explain one factor that can influence labour mobility 2 One mark for a factor identified and one mark for an between countries. explanation. • Good transport helping workers to move (1) availability of flights / development of air travel (1) • Technological progress / development (1) increasing quality / quantity of factors production (1) 1(d) Explain one advantage and one disadvantage of 4 One mark for each effect identified and one mark for each producing a product which is price-inelastic in demand explanation. such as oil. Accept responses that consider perfect price inelasticity Logical explanation which might include: (PED = 0) Advantage: when price increases, there is a less than proportionate fall in quantity demanded (1) revenue generated from the product increases (1) because it’s a necessity / has no substitutes (1) Disadvantage: when price decreases, there is a less than proportionate rise in quantity demanded (1) revenue generated from this product decreases (1) 1(e) Explain the relationship between the oil price and the 4 Responses do not have to be in the format suggested but UAE’s current account balance. they should address the expected / normal relationship, offer supporting evidence of that, and analyse the overall data. Coherent analysis which might include: Expected relationship: Positive / direct relationship (1) the oil price and the current account balance would be expected to move in the same direction (1). Supporting Evidence: As the % change in the price of oil increases, the % change in the current account balance increases (1) (and vice versa). When oil price goes up, the current account balance goes up, e.g. 2016 – 2018, 2020 – 2022 (1) When oil price goes down, the current account balance goes down, e.g. 2019 – 2020 (1). When the % change in the price of oil is highest, the % change in the current account balance is also the highest e.g. 2021 (1). When the % change in the price of oil is lowest, the % change in the current account is also the lowest e.g. 2020 (1) Analysis: Higher oil prices increase export revenue as demand for oil is inelastic (1) increases inflows into current account (1). Exception: There is no exception evident in the figure (1) 1(f) Analyse, using a production possibility curve (PPC) 5 diagram, the effect of technological progress on an economy such as the UAE. PPC diagram: Axes correctly labelled with different outputs (1). Initial curve drawn as a curve / line sloping downward to the axes (1). New curve drawn to the right of the initial curve as a curve / line sloping downward to the axes (1). Shift to the right indicated by arrow or PPC1 to PPC2 (1). Written analysis: Technological progress can increase productive capacity / the economy is able to produce more (1). 1(g) Discuss whether or not luxury tourism and financial 6 Apply this example to all questions with the command services have helped Dubai achieve economic word DISCUSS development. (1g, 1h, 2d, 3d, 4d and 5d) Award up to 4 marks for logical reasons why it might, which Each point may be credited only once, on either side of an may include: argument, but separate development as to how / why the • they attract foreign tourists (1) who spend on goods and outcome may differ is rewarded. services in Dubai (1) increasing total demand / economic growth (1) Generic example mark • employment is generated (1) increasing incomes (1) and improving living standards (1) Tax revenue may decrease… 1 • increased government’s tax revenues (1) may be spent on public services / infrastructure / education / healthcare because of reason e.g. incomes may be 1 (1) lower. • increased export revenues (1) improve the current account of the balance of payments (1) increase profits Tax revenue may increase because 0 of firms in tourism and financial services (1). incomes may be higher i.e. reverse of a previous argument. Award up to 4 marks for logical reasons why it might not, which may include: Tax revenue may increase because of a 1 • increased pollution (1) environmental damage / external different reason i.e. not the reverse of a costs e.g. health problems (1) high use of water previous argument e.g. government resources (1) spending on subsidies may stimulate the • inequality in the distribution of income (1) some workers economy more than spending on education. may be paid much lower than others (1) • spending on luxury tourism and financial services may change with income (1) depending on them could be risky (1) • workers may lack the skills for these occupations (1) be unable to gain employment to improve living standards (1) 1(h) Discuss whether or not having a fixed exchange rate is 6 Maximum 3 marks for only identifying benefits / disbenefits. beneficial for a country such as the UAE. Award up to 4 marks for logical reasons why it might, that may include: • currency has more stability (1) it will not increase / decrease in value (1) avoiding reduced / increased competitiveness (1) • maintains investor confidence in the economy (1) increasing investments (1) increasing total demand / employment (1) • may maintain consumer confidence (1) by controlling inflation (1) • it can be set at a low rate to gain a competitive advantage (1). Award up to 4 marks for logical reasons why might it not, that may include: • limits the government’s flexibility (1) with monetary policy (1) as interest rate changes (1) may be used to maintain the fixed exchange rate (1) • other macroeconomic objectives cannot be met (1) e.g. if a low exchange rate is fixed, inflation might occur (1) • reserves of foreign currency have to be kept (1) to maintain the exchange rate (1) • the fixed exchange rate might not reflect market conditions (supply and demand) for the currency (1)
This question in 0455/21 Oct/Nov 2024
Q30 · In 2021, the production point on the UK’s production possibility curve (PPC) changed 0455/22 Oct/Nov 2024
2 In 2021, the production point on the UK’s production possibility curve (PPC) changed. Average wages increased. The average annual wage of a waiter was $23,580 while that of a chief executive of a large commercial bank was $1,617,000. A rise in wages enables people to eat in restaurants more often. Some of the food sold in UK restaurants is imported. In 2021, the UK government signed free trade agreements, removing import restrictions, with a number of countries. (a) Identify two places where a production point could be located on a PPC diagram. [2] (b) Explain two reasons why someone may switch from eating in one restaurant to eating in another restaurant. [4] (c) Analyse why the wage of a chief executive of a large commercial bank is higher than that of a waiter. [6] (d) Discuss whether or not free trade will increase economic growth. [8]
20 marks
Mark scheme: 2(a) Identify two places where a production point could be 2 The points may be identified on a diagram. located on a PPC diagram. Accept below the curve and above the curve. Two from: • point inside the curve / left of the curve • point on the curve / along the curve • point outside the curve / right of the curve 2(b) Explain two reasons why someone may switch from 4 One mark each for each of two reasons identified and one eating in one restaurant to eating in another restaurant. mark for each of two explanations. Logical explanation which might include: (Change in) prices (1) lower price making it more affordable / substitutes / save money (1). (Change in) quality (1) better ingredients / better cleanliness / quicker service / new menu / more satisfaction / better taste / change in staff (1). (Change in) convenience (1) e.g. longer opening hours / / better location (1) (Change in) facilities (1) e.g. better restrooms (1). (Change in) income (1) enabling some to eat in more expensive restaurants (1). (Change in) consumer tastes (1) switch to e.g. vegan restaurant (1) Advertising (1) may attract/persuade customers / increase attractiveness (1). (Change in) quantity provided (1) lower quantity may represent lower value for money (1). 2(c) Analyse why the wage of a chief executive of a large 6 Note: may also be answered from the point of view why the commercial bank is higher than that of a waiter. wage of a waiter may be lower than that of a chief executive. Coherent analysis which might include: No marks here for banks may be more profitable than restaurants as e.g. a cleaner in a bank may have a lower Chief executive may be more qualified / more educated (1) wage than a waiter. received more training (1) more skilled / talented (1) more productive (1) more experienced (1) higher level of responsibility / higher level of stress / more demanding job (1) in shorter supply / harder to replace (1) more inelastic supply (1). Chief executive may be in higher demand (1) more inelastic demand (1). Chief executive may have stronger bargaining power (1) may be more likely to be in a trade union / professional body (1). May be less likely to be in a group that is discriminated against (1) e.g. migrant workers (1). Chief executive may work longer hours (1). 2(d) Discuss whether or not free trade will increase 8 Level Description Marks economic growth. 3 A reasoned discussion which 6–8 In assessing each answer, use the table opposite. accurately examines both sides of the economic argument, making use of Why it might: economic information and clear and • may enable countries to specialise on what they are logical analysis to evaluate economic best at producing issues and situations. One side of the • higher competition may increase productivity and lower argument may have more depth than the other, but overall both sides of the costs of production, increasing demand for their argument are considered and products developed. There is thoughtful • may enable firms to buy raw materials and capital evaluation of economic concepts, goods at a lower price terminology, information and/or data • may give firms access to larger markets, enabling them appropriate to the question. The to expand output. discussion may also point out the possible uncertainties of alternative decisions and outcomes. Why it might not: • may prevent infant industry from growing 2 A reasoned discussion which makes 3–5 • may speed up the closure of declining industries use of economic information and clear • may replace domestic output with imports analysis to evaluate economic issues • may reduce tax revenue and situations. The answer may lack • firms may gain monopoly power and may restrict output some depth and development may be • firms may engage in unfair competition e.g. dumping. one-sided. There is relevant use of economic concepts, terminology, information and data appropriate to the question. 1 There is a simple attempt at using 1–2 economic definitions and terminology. Some reference may be made to economic theory, with occasional understanding. 0 A mark of zero should be awarded for 0 no creditable content.
This question in 0455/22 Oct/Nov 2024
Q31 · Calculate the average cost of producing a car in Belarus in 2021 0455/23 Oct/Nov 2024
1 (a) Calculate the average cost of producing a car in Belarus in 2021. [1] (b) Identify two reasons why Belarus is described as a mixed economy. [2] (c) Explain the type of inflation experienced by Belarus. [2] (d) Explain two reasons why the production possibility curve (PPC) of Belarus may have shifted to the left between 2011 and 2021. [4] (e) Analyse the relationship between life expectancy and HDI value. [4] (f) Analyse, using a demand and supply diagram, how subsidising the production of milk would affect the market for milk. [5] (g) Discuss whether or not the construction of electric vehicle charging stations would benefit an economy. [6] (h) Discuss whether or not people should be fined for being unemployed. [6]
30 marks
Mark scheme: Question Answer Marks Guidance 1(a) Calculate the average cost of producing a car in Belarus 1 Accept 10 650 or 0.010650million or 0.1065m. in 2021. Needs to be to at least 2 dp e.g. 0.011m $10 650 (1). 1(b) Identify two reasons why Belarus is described as a 2 mixed economy. • There is a public sector / some people work in the public sector / there are state-owned firms / there is government intervention e.g. fining the unemployed (1). • There is a private sector (1). 1(c) Explain the type of inflation experienced by Belarus. 2 Cost-push (1) due to a rise in the price of energy / increase in costs of production of firms (1). 1(d) Explain two reasons why the production possibility 4 One mark each for each of two reasons identified and one curve (PPC) of Belarus may have shifted to the left mark for each of two explanations. between 2011 and 2021. No marks for drawing a PPC diagram. Logical explanation which might include: • a decline in the size of the country’s labour force (1) reduction in the quantity of resources / fewer workers will be likely to reduce country’s ability to produce products (1) • a decrease in the number of students going to university (1) reduce quality of resources / labour skills / productivity / (1). 1(e) Analyse the relationship between life expectancy and 4 Responses do not have to be in the format suggested but HDI value. they should address the expected/normal relationship, offer supporting evidence of that, highlight any exceptions to that, Coherent analysis which might include: and analyse the overall data. Expected relationship: Note: simply repeating the data is not enough for a mark as • a high life expectancy would be expected to be it is only description whereas the skill being tested is associated with a high HDI value (1) analysis. • positive relationship / direct relationship / move in the same direction (1). Supporting evidence: • two countries with the longest life expectancy have the highest HDI value OR two countries with the lowest life expectancy also have the lowest HDI value (1) • specific reference to a country e.g. Norway had the longest life expectancy and the highest HDI value (1). Analysis of expected relationship: • life expectancy is one of the components of HDI (1) accounts for a third of its value / explanation of how better health / life expectancy raises standard of living (1). Exception: • Belarus / Thailand (1) Belarus has a shorter life expectancy but a higher HDI value (1). Analysis of exception: • there are other components of the HDI: education / GDP (GNI) per head (1). 1(f) Analyse, using a demand and supply diagram, how 5 subsidising the production of milk would affect the market for milk. Coherent analysis which might include: D&S diagram: • axes correctly labelled – price and quantity or P and Q (1) • original demand and supply curves correctly labelled (1) • new supply curve shifted to the right (1) • equilibriums – shown by lines P1 and Q1 and P2 and Q2 or equilibrium points marked as E1 and E2 (1). Written analysis: • reduction in cost of production / increase in supply / increase in quantity traded / reduction in price (1). 1(g) Discuss whether or not the construction of electric 6 Apply this example to all questions with the command vehicle charging stations would benefit an economy. word DISCUSS (1(g), 1(h), 2(d), 3(d), 4(d) and 5(d) Award up to 4 marks for logical reasons why it might benefit, which may include: Each point may be credited only once, on either side of an • likely to encourage use of electric vehicles (1) stations argument, but separate development as to how/why the and vehicles are complements (1) outcome may differ is rewarded. • improve the environment (1) reduce external costs (1) including air / noise pollution (1) reduce healthcare Generic example Mark costs / improve health of workers (1) • building the stations / building more electric cars may Tax revenue may decrease… 1 create employment (1) • government / private sector investment / purchase of ...because of reason e.g. incomes 1 electric vehicles may raise total (aggregate) demand (1) may be lower. causing higher output / economic growth (1). Tax revenue may increase 0 Award up to 4 marks for logical reasons why it might not because incomes may be higher benefit, which may include: i.e. reverse of a previous • other forms of transport may have more beneficial argument. effects on the environment (1) e.g. cycling / buses (1) • some people may be reluctant to switch (1) price of Tax revenue may increase 1 electric cars may be too high (1) resources are wasted because of a different reason i.e. (1) not the reverse of a previous • if people do switch, it may cause unemployment (1) in argument e.g. government e.g. oil firms / production of diesel and petrol cars / less spending on subsidies may public transport (1) stimulate the economy more than • Increase in electric vehicles on road (1) causes road spending on education. congestion (1) • Opportunity cost of government investment (1) monies could have been spent e.g. education /health / infrastructure (1) • If economy at full employment (1) investment may lead to demand-pull inflation (1). 1(h) Discuss whether or not people should be fined for being 6 unemployed. Award up to 4 marks for logical reasons why they should be fined, which may include: • if frictional unemployment (1) a fine would encourage workers to put more effort into finding a job (1) spend less time between jobs (1) help move economy towards full employment (1) higher output (1) and economic growth (1) • fines may increase government revenue (1) which could be spent on e.g. healthcare / support to find a job (1) • may not be seeking a job as receive benefits (1) fines may encourage them to find work and reduce government spending on unemployment benefits (1). Award up to 4 marks for logical reasons why they should not be fined, which may include: • may be a lack of suitable jobs available (1) the unemployed may have lacked the skills required (1) may not have been able to move to other areas of the country (1) may have disabilities / ill-health (1) providing support may reduce unemployment more quickly (1) • unemployment may be structural / cyclical (1) it would have been more effective to increase training (1) increase total demand (1) • unemployed may have little income to pay the fine (1) may increase their debt (1) lead to greater poverty / unable to pay for basic necessities (1) affect their mental health / wellbeing / causes depression (1) • may encourage the growth of the shadow/unofficial/informal economy (1) as not registered as unemployed (1) • may reduce wages (1) workers may be forced to accept low-paid jobs (1).
This question in 0455/23 Oct/Nov 2024
Q32 · In 2022, Paraguay’s production possibility curve (PPC) shifted to the right 0455/22 May/June 2025
3 In 2022, Paraguay’s production possibility curve (PPC) shifted to the right. Paraguay has a mixed economic system. Its government provides merit goods and public goods. The country’s private sector is a major producer of shampoo. The firms in the shampoo industry make use of division of labour. There are several firms in the industry, but the number is declining. There is a possibility that soon there may be just one firm in the industry. (a) Identify what is measured on the axes of a production possibility curve. [2] (b) Explain, with an example of each, the difference between a merit good and a public good. [4] (c) Analyse how division of labour can benefit firms. [6] (d) Discuss whether or not consumers would benefit from only one firm producing shampoo. [8]
20 marks
Mark scheme: 3(a) Identify what is measured on the axes of a production 2 Two types of products may be shown on the axes on a PPC possibility curve. diagram for two marks. (Output of) two types of product (2). If more than two items are given, consider the first three. Output (1) one type of product (1) another type of product (1). 3(b) Explain, with an example of each, the difference 4 One mark for an explanation of a merit good and one mark between a merit good and a public good. for an example of a merit good. One mark for an explanation of a public good and one mark Logical explanation which might include: for an example of a public good. A merit good is under-consumed / underproduced / Accept but do not expect reference to non-rejectable / zero consumers do not appreciate its full value / has external cost of producing an extra unit for a public good. benefits / can be produced by the private sector / can be produced by the private sector and the public sector / is a Allow public park. private good / is rival and excludable (1) e.g. education / healthcare / fruit (1). No mark for roads unless qualified by e.g. uncrowded roads A public good would not be produced by the private sector / with many entry and exit points. is (usually) supplied / produced by the government / funded by the government (1) non-excludable / non-rival (1) e.g. street lighting / defence / flood control (1). 3(c) Analyse how division of labour can benefit firms. 6 Coherent analysis which might include: • Workers can specialise (1) in what they are best at producing (1) save time / speed up production (1) reduce waste (1) reduce mistakes (1) increase productivity /skill / efficiency (1) increase output / supply (1) lower (average) cost (1). • Increase quality (1) lower prices (1) raise demand / increase sales (1) increase revenue (1) increase profits (1). • Make it easier to mechanise production (1) reduce labour required (1). • Reduce training / training costs (1) as reduce tasks undertaken / division of labour involves breaking production down into different tasks (1). 3(d) Discuss whether or not consumers would benefit from 8 Level Description Marks only one firm producing shampoo. 3 A reasoned discussion which accurately 6–8 In assessing each answer, use the table opposite. examines both sides of the economic argument, making use of economic Why they might: information and clear and logical • one firm may be able to benefit from economies of scale analysis to evaluate economic issues • lower average cost may lead to lower prices and situations. One side of the argument • firm may spend a large amount on research and may have more depth than the other, but development due to high profits and security overall both sides of the argument are • quality of product may be high considered and developed. There is • less time / less effort choosing shampoo. thoughtful evaluation of economic concepts, terminology, information Why they might not: and/or data appropriate to the question. • lack of competition may drive up prices The discussion may also point out the • lack of choice possible uncertainties of alternative • if quality is poor, cannot switch to substitutes decisions and outcomes. • firm may experience diseconomies of scale. 2 A reasoned discussion which makes use 3–5 of economic information and clear analysis to evaluate economic issues and situations. The answer may lack some depth and development may be one-sided. There is relevant use of economic concepts, terminology, information and data appropriate to the question. 3(d) Level Description Marks 1 There is a simple attempt at using 1–2 economic definitions and terminology. Some reference may be made to economic theory, with occasional understanding. 0 A mark of zero should be awarded for no 0 creditable content.
This question in 0455/22 May/June 2025
Q33 · Some markets in Belgium are in equilibrium 0455/22 Oct/Nov 2025
2 Some markets in Belgium are in equilibrium. The country produces a wide range of goods and services with different degrees of price elasticity of demand. The Belgian Government wants the economy to move to a production possibility point beyond its current production possibility curve (PPC). Belgium’s scientific industry is one industry which is doing well. Workers in this industry are highly specialised. (a) Define market equilibrium. [2] (b) Explain two ways an economy could reach a point outside its current PPC. [4] (c) Analyse how price elasticity of demand can influence a firm’s pricing decisions. [6] (d) Discuss whether or not firms benefit from their workers undertaking training. [8]
20 marks
Mark scheme: 2(a) Define market equilibrium. 2 Demand equalling supply (2). No shortage (1) no surplus (1). Balance of demand and supply (2). 2(b) Explain two ways an economy could reach a point 4 One mark each for two ways identified and one mark each outside its current PPC. for two explanations. Logical explanation which might include the following. If more than two reasons are given, consider the first three. • Increase investment (1) devoting more resources to capital goods (1). • Encourage immigration (1) increase size of the labour force (1). • Land reclamation (1) creating more land on which to e.g. grow crops (1). • Increase in education and training (1) raise quality / efficiency / productivity of labour (1). • Increase spending on research and development / new technology (1) increase quality / efficiency / productivity of capital (1). • Discovery of sources of resources (1) example/enables extra output to be produced (1). 2(c) Analyse how price elasticity of demand can influence a 6 Reward, but do not expect: firm’s pricing decisions. Facilitate price discrimination (1) charging higher prices in Coherent analysis which might include the following. markets with inelastic demand (1) valid example, e.g. higher rail fares at peak times (1). Price elasticity of demand is a measure of the responsiveness of demand to a change in price (1). If demand is elastic, a rise in price will cause a greater percentage change in demand (1) may indicate the firm’s product has close substitutes / is not a necessity / takes a significant proportion of consumers’ incomes (1) may encourage firms to lower price (1) raise revenue (1). If demand is inelastic, a rise in price will cause a smaller percentage change in demand (1) may indicate the firm’s product has few substitutes / is a necessity / takes a small proportion of consumers’ incomes (1) may encourage firms to raise prices (1) revenue would increase (1). 2(d) Discuss whether or not firms benefit from their workers 8 Level Description Marks undertaking training. 3 A reasoned discussion which accurately 6–8 In assessing each answer, use the table opposite. examines both sides of the economic argument, making use of economic Why they might: information and clear and logical • may increase productivity analysis to evaluate economic issues • may enable workers to work with more advanced and situations. One side of the technology argument may have more depth than • may lower costs of production the other, but overall, both sides of the • may be able to fill promoted posts argument are considered and • reduce waste developed. There is thoughtful • raise quality of output evaluation of economic concepts, • training may be provided by the government at no direct terminology, information and/or data cost for firms. appropriate to the question. The • increase workers motivation, reducing labour turnover discussion may also point out the • increase flexibility to cover absences. possible uncertainties of alternative decisions and outcomes. Why they might not: • if the firms provide the training, increase costs / 2 A reasoned discussion which makes 3–5 use of economic information and clear opportunity cost • output may fall while workers are being trained analysis to evaluate economic issues and situations. The answer may lack • training may not be successful some depth and development may be • trained workers may demand higher wages one-sided. There is relevant use of • trained workers may leave to work for other firms – economic concepts, terminology, other firms will gain the benefits of the training. information and data appropriate to the question. 2(d) Level Description Marks 1 There is a simple attempt at using 1–2 economic definitions and terminology. Some reference may be made to economic theory, with occasional understanding. 0 A mark of zero should be awarded for 0 no creditable content.
This question in 0455/22 Oct/Nov 2025
Q34 · Calculate the number of Malawians who had access to electricity in 2022 0455/23 Oct/Nov 2025
1 (a) Calculate the number of Malawians who had access to electricity in 2022. [1] (b) Identify two capital goods used in Malawi. [2] (c) Explain what is likely to have happened to Malawi’s production possibility curve (PPC) in January 2022. [2] (d) Explain two reasons why the supply of Malawian tea may increase. [4] (e) Draw a demand and supply diagram to show the effect of a report stating the health risks of consuming sugar on the market for sugar. [4] (f) Analyse the relationship between GDP per head and the percentage of children who complete primary education. [5] (g) Discuss whether or not Malawi should develop a solar energy industry. [6] (h) Discuss whether or not a government should try to stop its country’s foreign exchange rate falling in value. [6]
30 marks
Mark scheme: Question Answer Marks Guidance 1(a) Calculate the number of Malawians who had access to 1 Accept 3.3 106. electricity in 2022. 3.3 m or 3 300 000. 1(b) Identify two capital goods used in Malawi. 2 If more than two capital goods are given, consider the first three. Two from: Factories (1) power stations (1) solar panels (1) electricity (1) fertilisers (1). 1(c) Explain what is likely to have happened to Malawi’s 2 Accept an accurate and fully labelled PPC diagram showing production possibility curve (PPC) in January 2022. the PPC shifting to the left for the first mark. • It is likely to have shifted to the left / inside / inwards / Second mark for any relevant reason from the source contract (1). material. • due to natural disasters / Storm (Ana) / resources destroyed / productive capacity (or land) reduced / less labour (1). 1(d) Explain two reasons why the supply of Malawian tea 4 One mark each for two reasons identified and one mark may increase. each for two explanations. Logical explanation which might include: If more than two reasons are given, consider the first three. • good weather conditions (1) would increase crop yields / Do not accept an answer that links tea with sugar. prevent crops being destroyed (1). • government subsidies (1) provide a financial incentive / additional payment to that received from consumers / reduce costs of production (1). • fall in price of fertiliser (1) which reduces cost of production / increase crop yields / allows farmers to purchase more fertiliser (1). • fall in exchange rate (1) higher demand for Malawian tea (1). 1(e) Draw a demand and supply diagram to show the effect 4 of a report stating the health risks of consuming sugar on the market for sugar. Coherent analysis which might include the following. D&S diagram: • Axes correctly labelled – price and quantity or p and q (1). • Original demand and supply curves correctly labelled (1). • New labelled demand curve shifted to the left (1). • Equilibriums – shown by lines P1 and Q1 and P2 and Q2 or equilibrium points marked as E1 and E2 (1). 1(f) Analyse the relationship between GDP per head and the 5 Responses do not have to be in the format suggested but percentage of children who complete primary they should address the expected / normal relationship, offer education. supporting evidence of that, highlight any exceptions to that, and analyse the overall data. Coherent analysis which might include the following. Supporting evidence should involve interpretation, not just Expected relationship: description e.g. simply quoting data without reference to Generally, a direct / positive relationship (1) the higher the high or low. GDP per head, the higher the percentage of children who complete primary education (1). 1(f) Supporting evidence: Four countries with the highest GDP per head had the highest percentage of children who complete primary education / Malawi / Uganda have the lowest of both (1). South Africa had the highest GDP per head and the highest percentage of children who complete primary education (1). Comparison of two countries (e.g. Namibia and Senegal where GDP falls as does percentage of children completing primary education). Analysis of the expected relationship: Parents in countries with high incomes are more likely to be able to afford to keep their children in primary education (1). Government tax revenue is likely to be higher in countries with high incomes and so will be able to spend more on primary education (1). Completing primary education may increase the chance of skilled / occupationally mobile high income earning workers (1). Exception: Malawi / Uganda (1) Malawi has a lower GDP per head but a higher percentage of children who complete primary education than Uganda (1). Analysis of exception: A higher percentage of children may complete primary education but the quality of the education may be low leading to a low GDP per head / GDP per head may be high but there may be a high degree of inequality with a relatively high proportion of the population unable to keep their children in primary education (1). 1(g) Discuss whether or not Malawi should develop a solar 6 Apply this example to all questions with the command energy industry. word DISCUSS (1g, 1h, 2d, 3d, 4d and 5d) Award up to 4 marks for logical reasons why it might, which may include: Each point may be credited only once, on either side of an • a sustainable source of energy (1) enables future argument, but separate development as to how / why the generations to access energy (1) outcome may differ is rewarded. • would create less pollution / external costs than burning wood and charcoal / improve air quality (1) reduce Generic example mark deforestation (1) improve health (1) • may enable more Malawian households to gain access Tax revenue may decrease… 1 to electricity (1) increase living standards / reduce inequality (1) ...because of reason e.g. incomes may be lower. 1 • setting up solar panels creates jobs (1) leads to increased output / economic growth / access to Tax revenue may increase because incomes 0 electricity for Malawian firms (1) may be higher i.e. reverse of a previous • long hours / 3000 hours of sunshine (1) a good / viable argument. source of energy (1) • less need to import energy (1) reduce current account Tax revenue may increase because of a different 1 deficit (1) reason i.e. not the reverse of a previous • develops employment opportunities (1) raising incomes argument e.g. government spending on subsidies (1). may stimulate the economy more than spending on education. 1(g) Award up to 4 marks for logical reasons why it might not, which may include: • opportunity cost of installing (1) example (1) • opportunity cost of land use (1) reduced agricultural output (1) • dependent on weather / sunshine and days lost (1) unstable supply (1) may experience storm damage / natural disasters (1) • visual pollution (1) might reduce tourism / reduce house prices (1) • cost of developing an electricity distribution network may be prohibitive • cost of switching from fossil-fuel burning domestic appliances to electrical ones may not be affordable to households (1) limiting the impact of the switch (1) • expensive to install (1) worsen government budget position (1) • visual pollution (1) might reduce tourism / reduce house prices (1) • solar panels could be damaged by storms (1) making them inefficient (1). 1(h) Discuss whether or not a government should try to stop 6 Note: many candidates provide incorrect analysis e.g. its country’s foreign exchange rate falling in value. wrong way around. Award up to 4 marks for logical reasons why it should try to Maximum of 3 marks if there is no development / evaluation stop it falling in value e.g. the disadvantages of the fall, of reasons given. including: • will increase import prices (1) reducing imports (1) may increase cost of imported raw materials and capital goods cost (1) cause cost-push inflation (1) cause slow economic growth (1) • may reduce pressure on domestic firms to keep prices low (1) quality high (1) • may reduce confidence in the economy (1) reduce investment (1) increase debt (1). Award up to 4 marks for logical reasons why it should allow a fall in value e.g. the advantages of the fall, including: • will reduce export prices (1) increase exports (1) reduce imports (1) • make domestic goods more competitive (1) reduce a current account deficit / improve the balance of payments (1) • may increase economic growth (1) reduce unemployment (1) attract MNCs / attract investment (1) increase tourism (1) • opportunity cost / costly for government to intervene (1) e.g. less funding for education / healthcare / housing (1) • may increase government tax revenue (1).
This question in 0455/23 Oct/Nov 2025
 1 / 14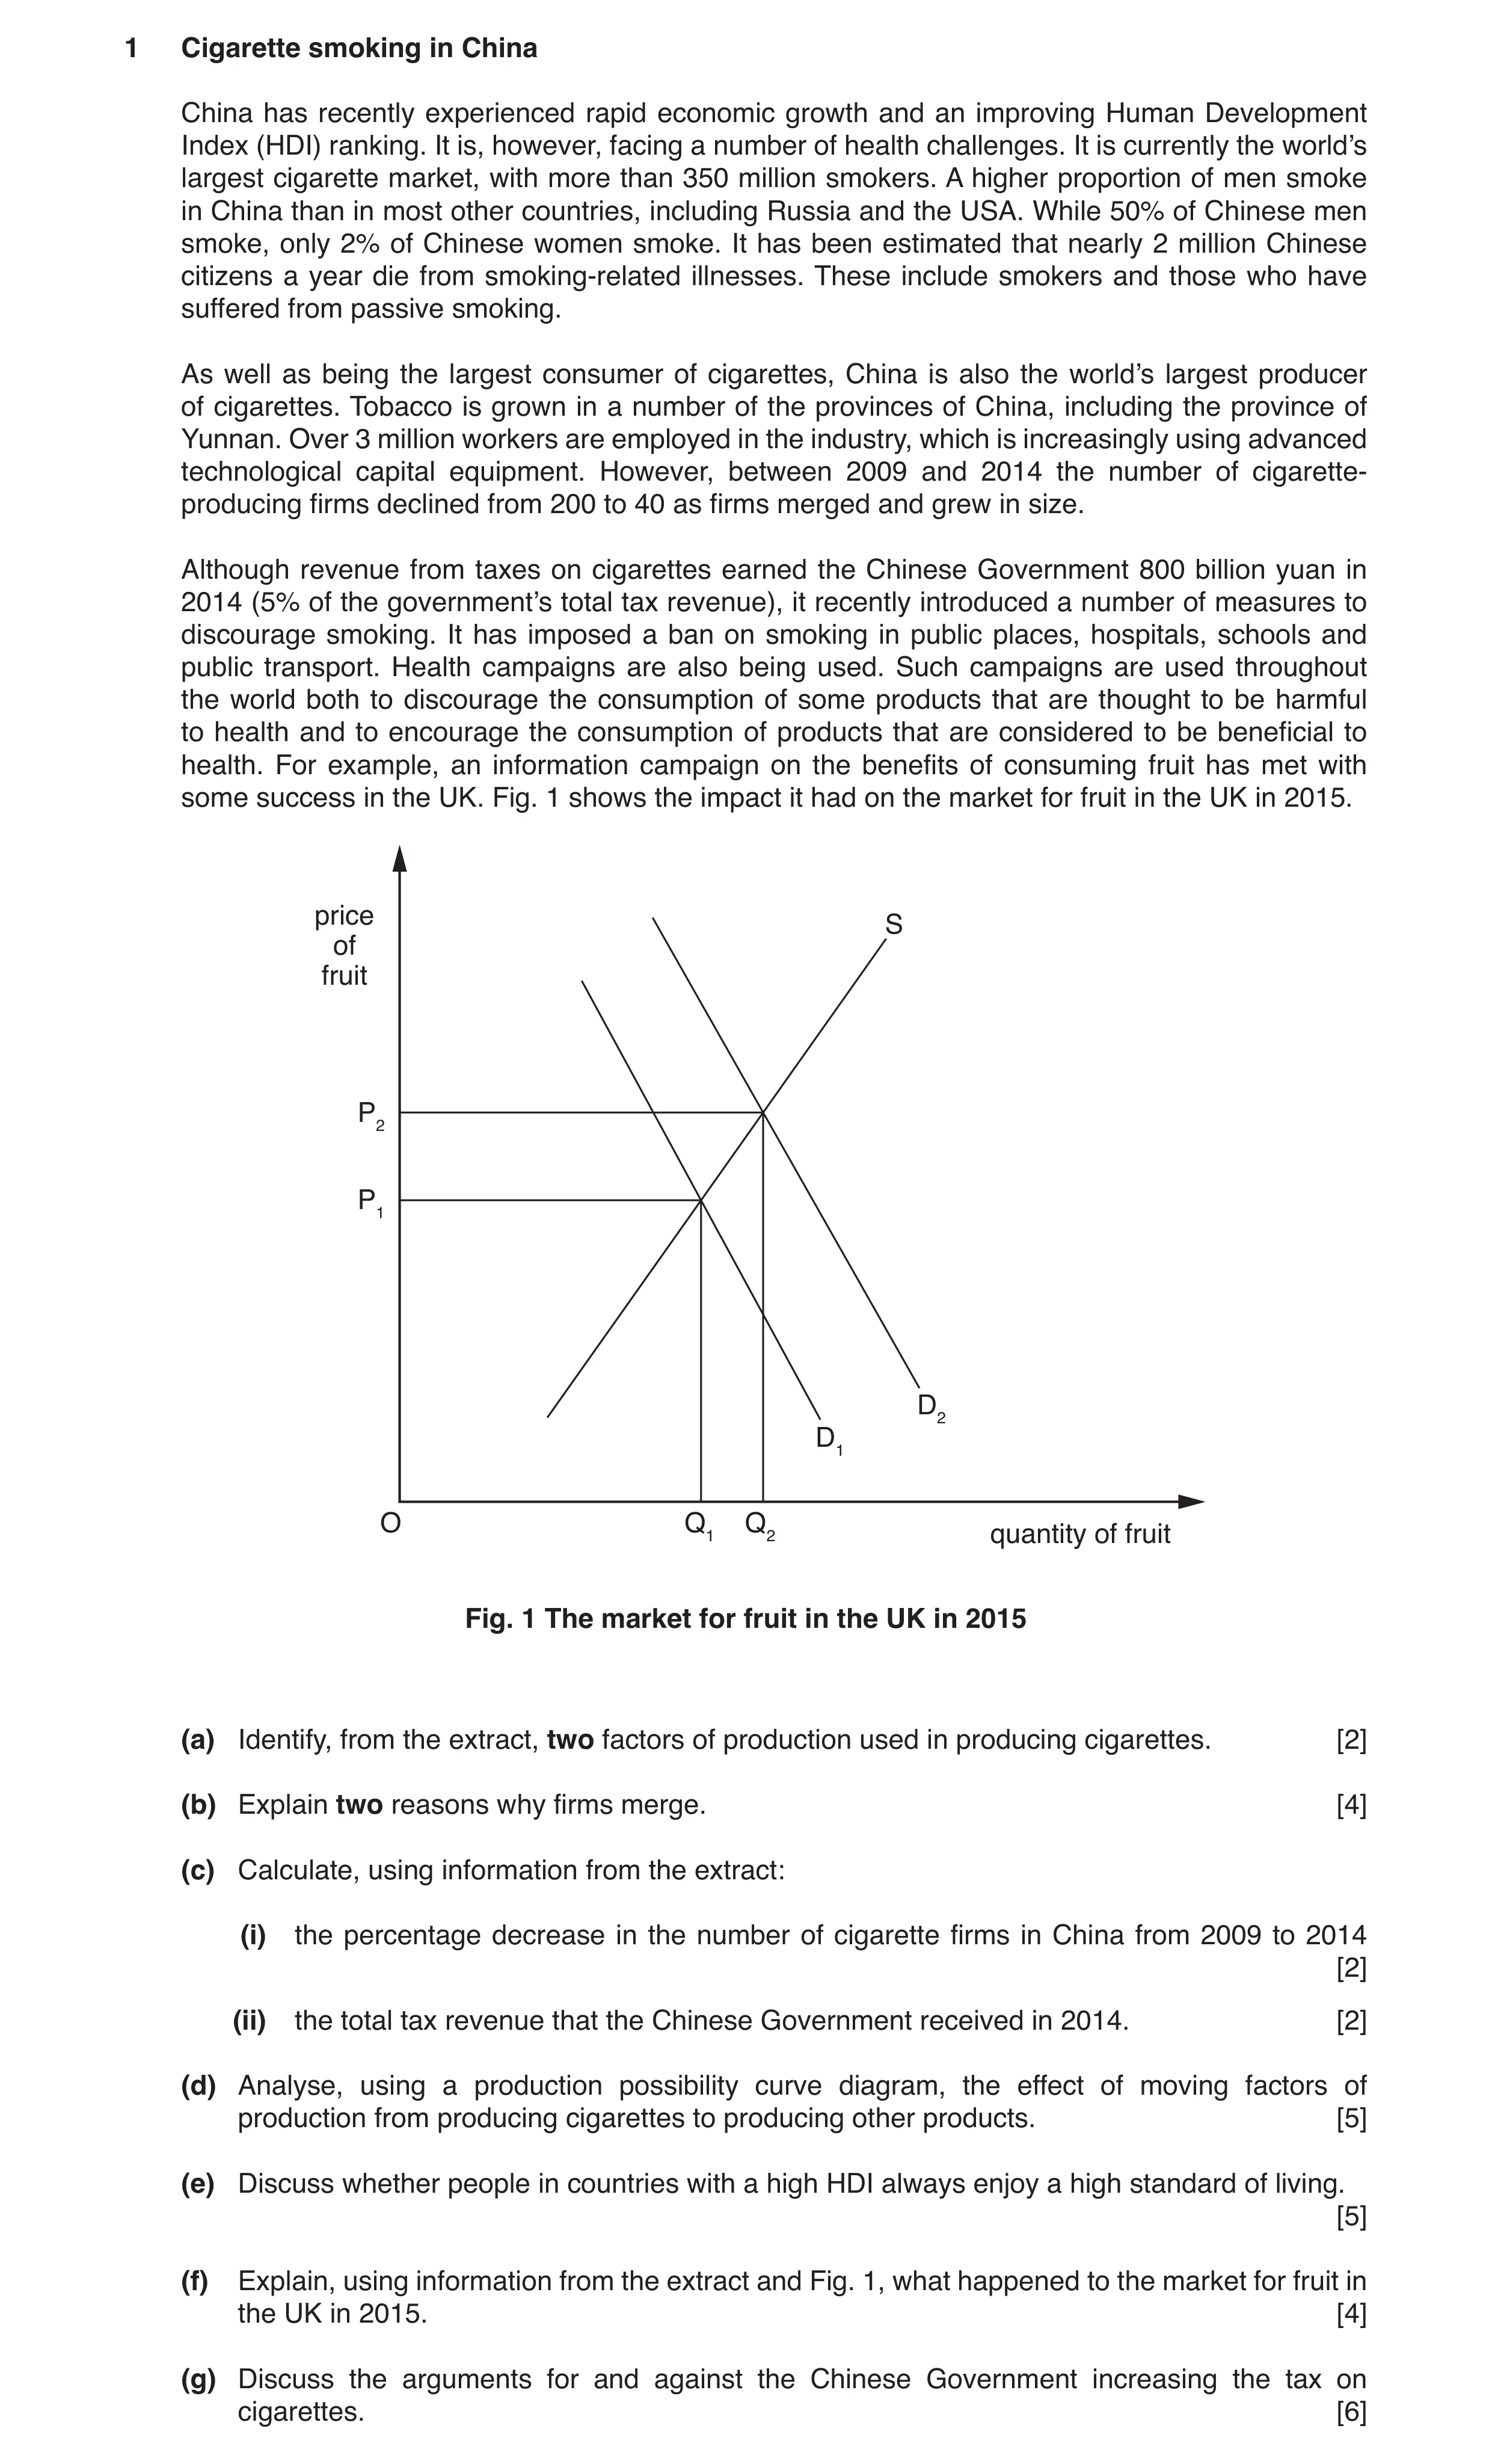
 3 / 14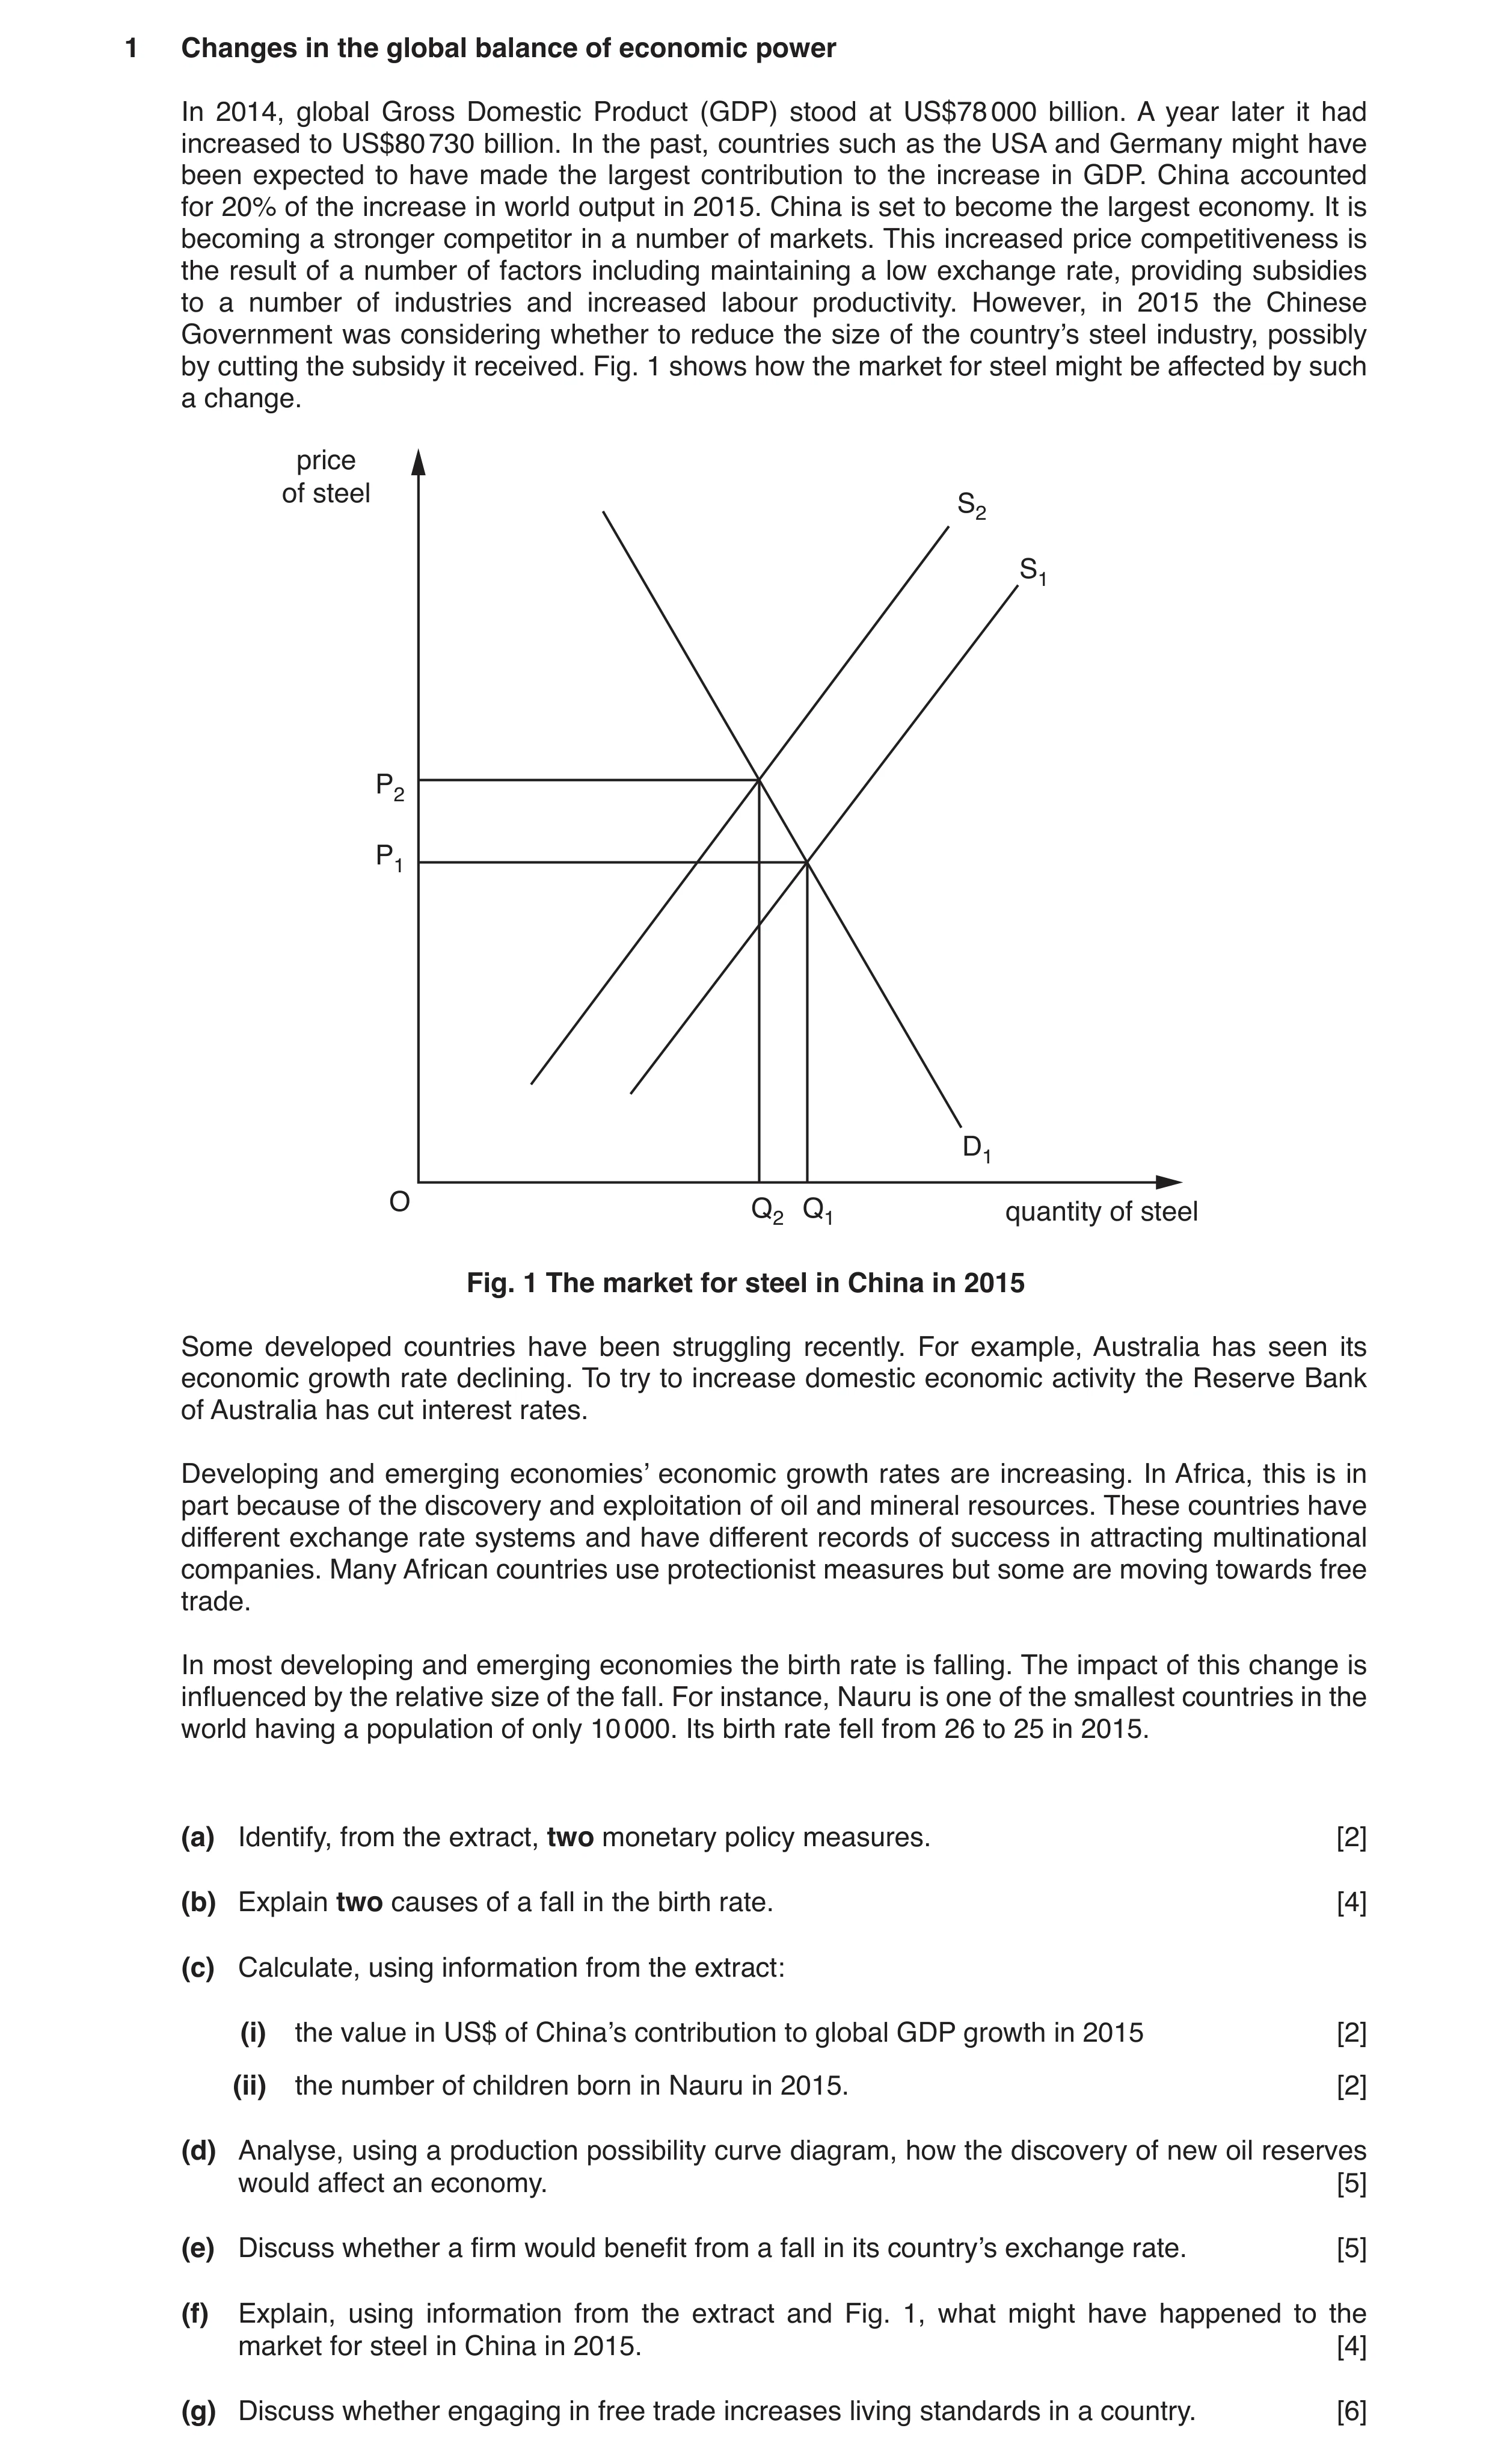
 5 / 14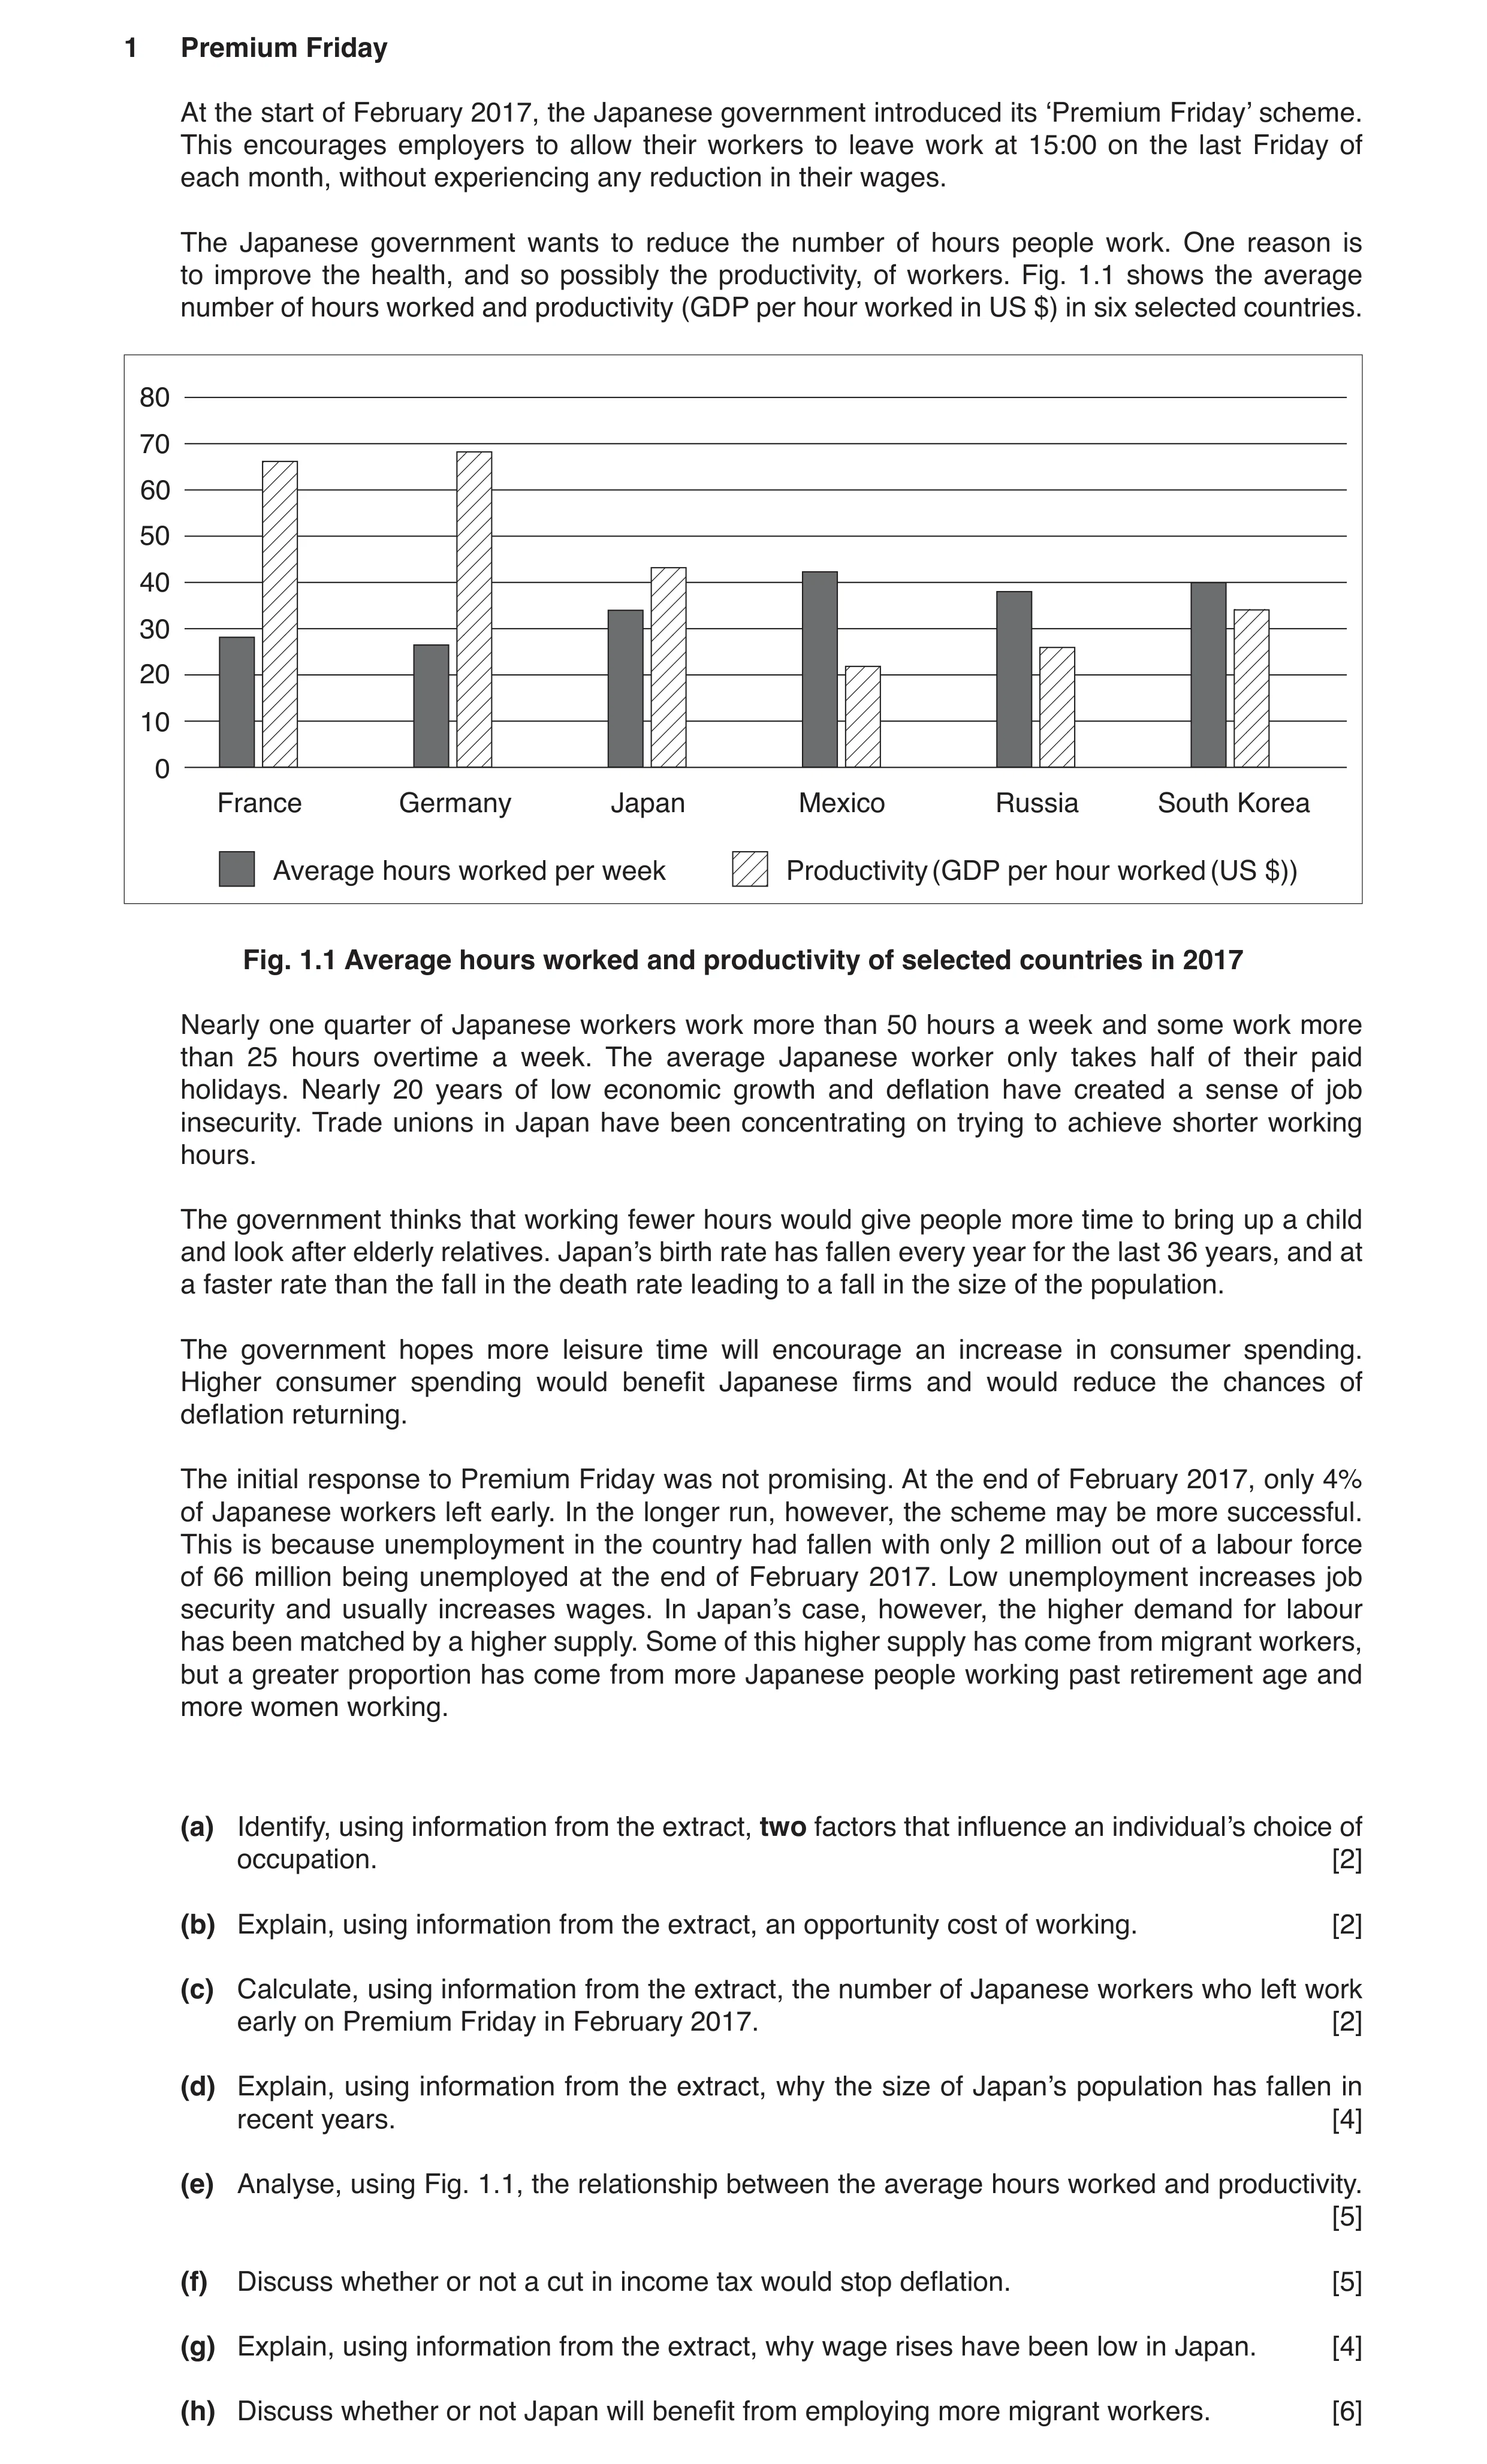
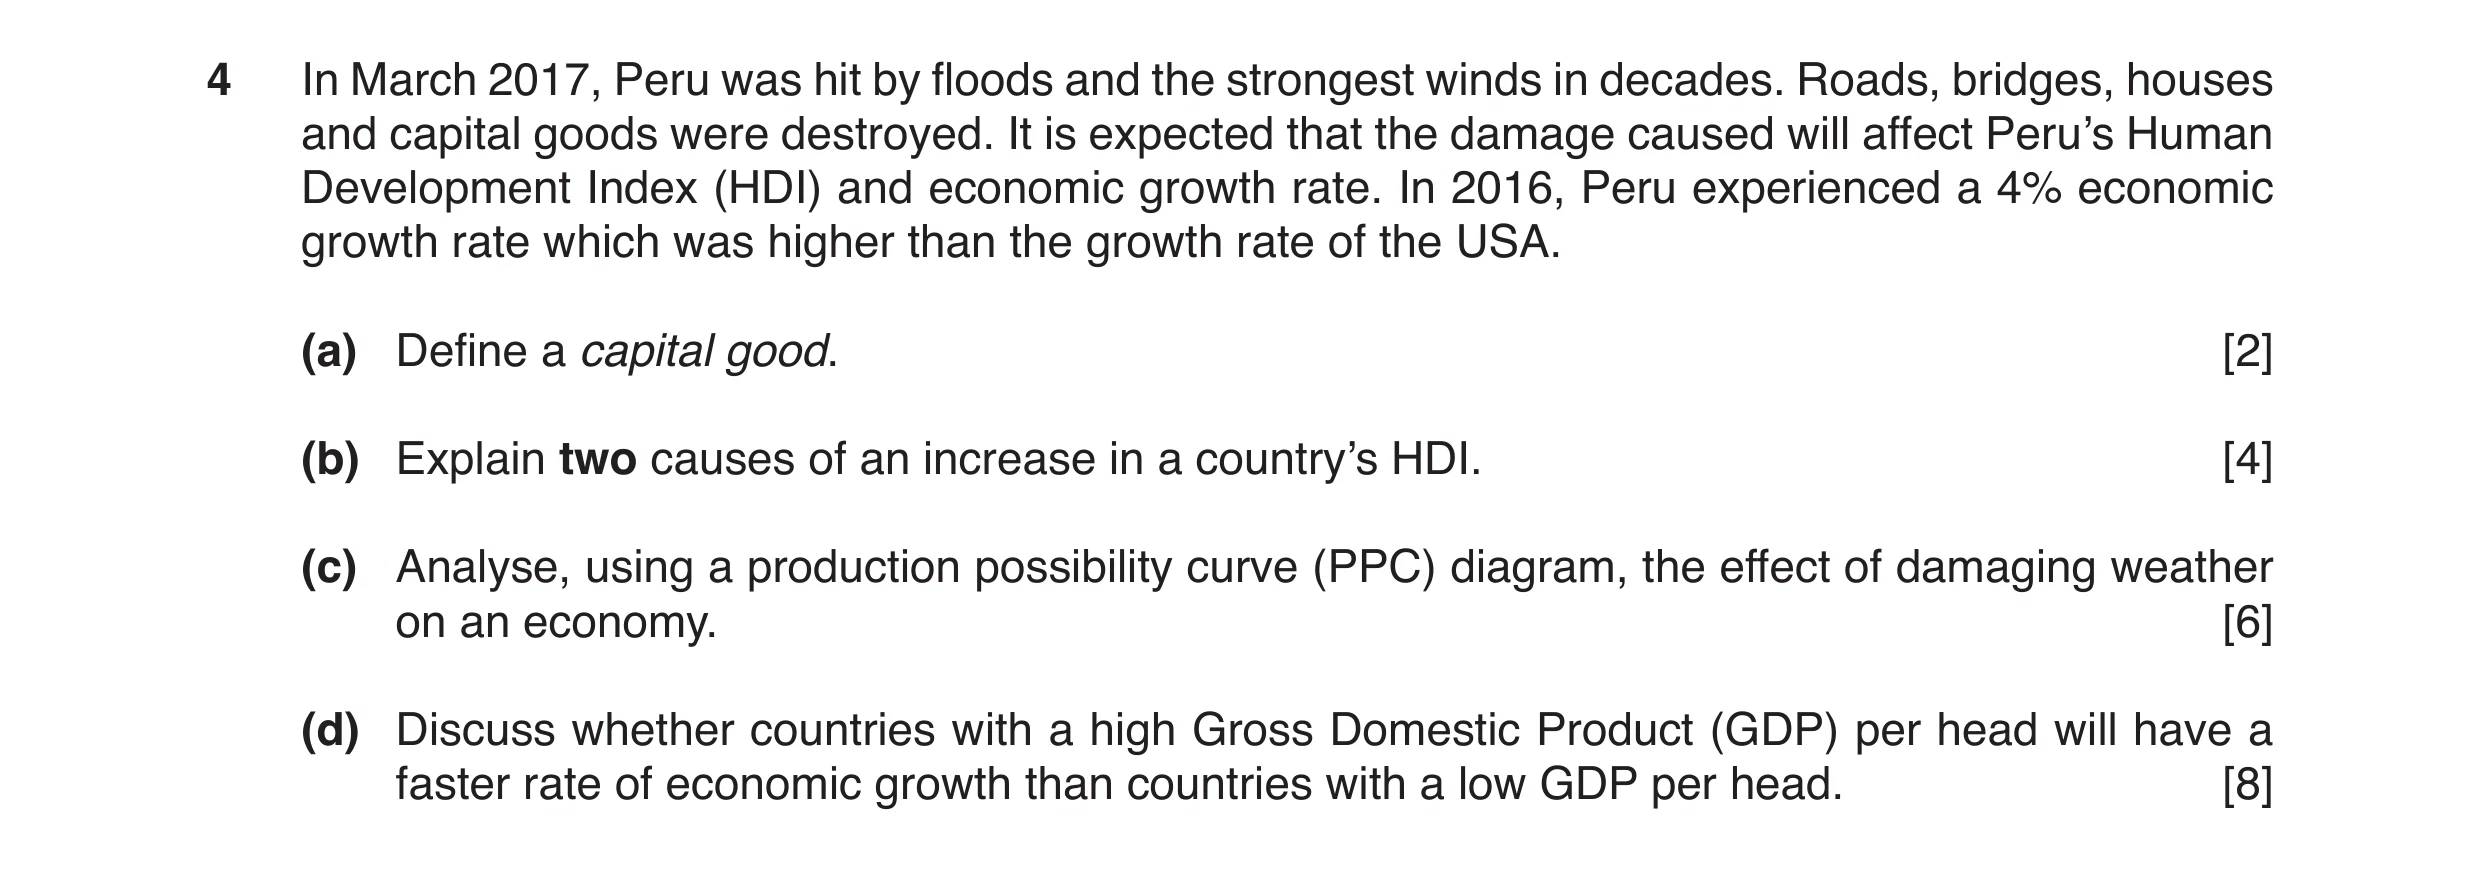 6 / 14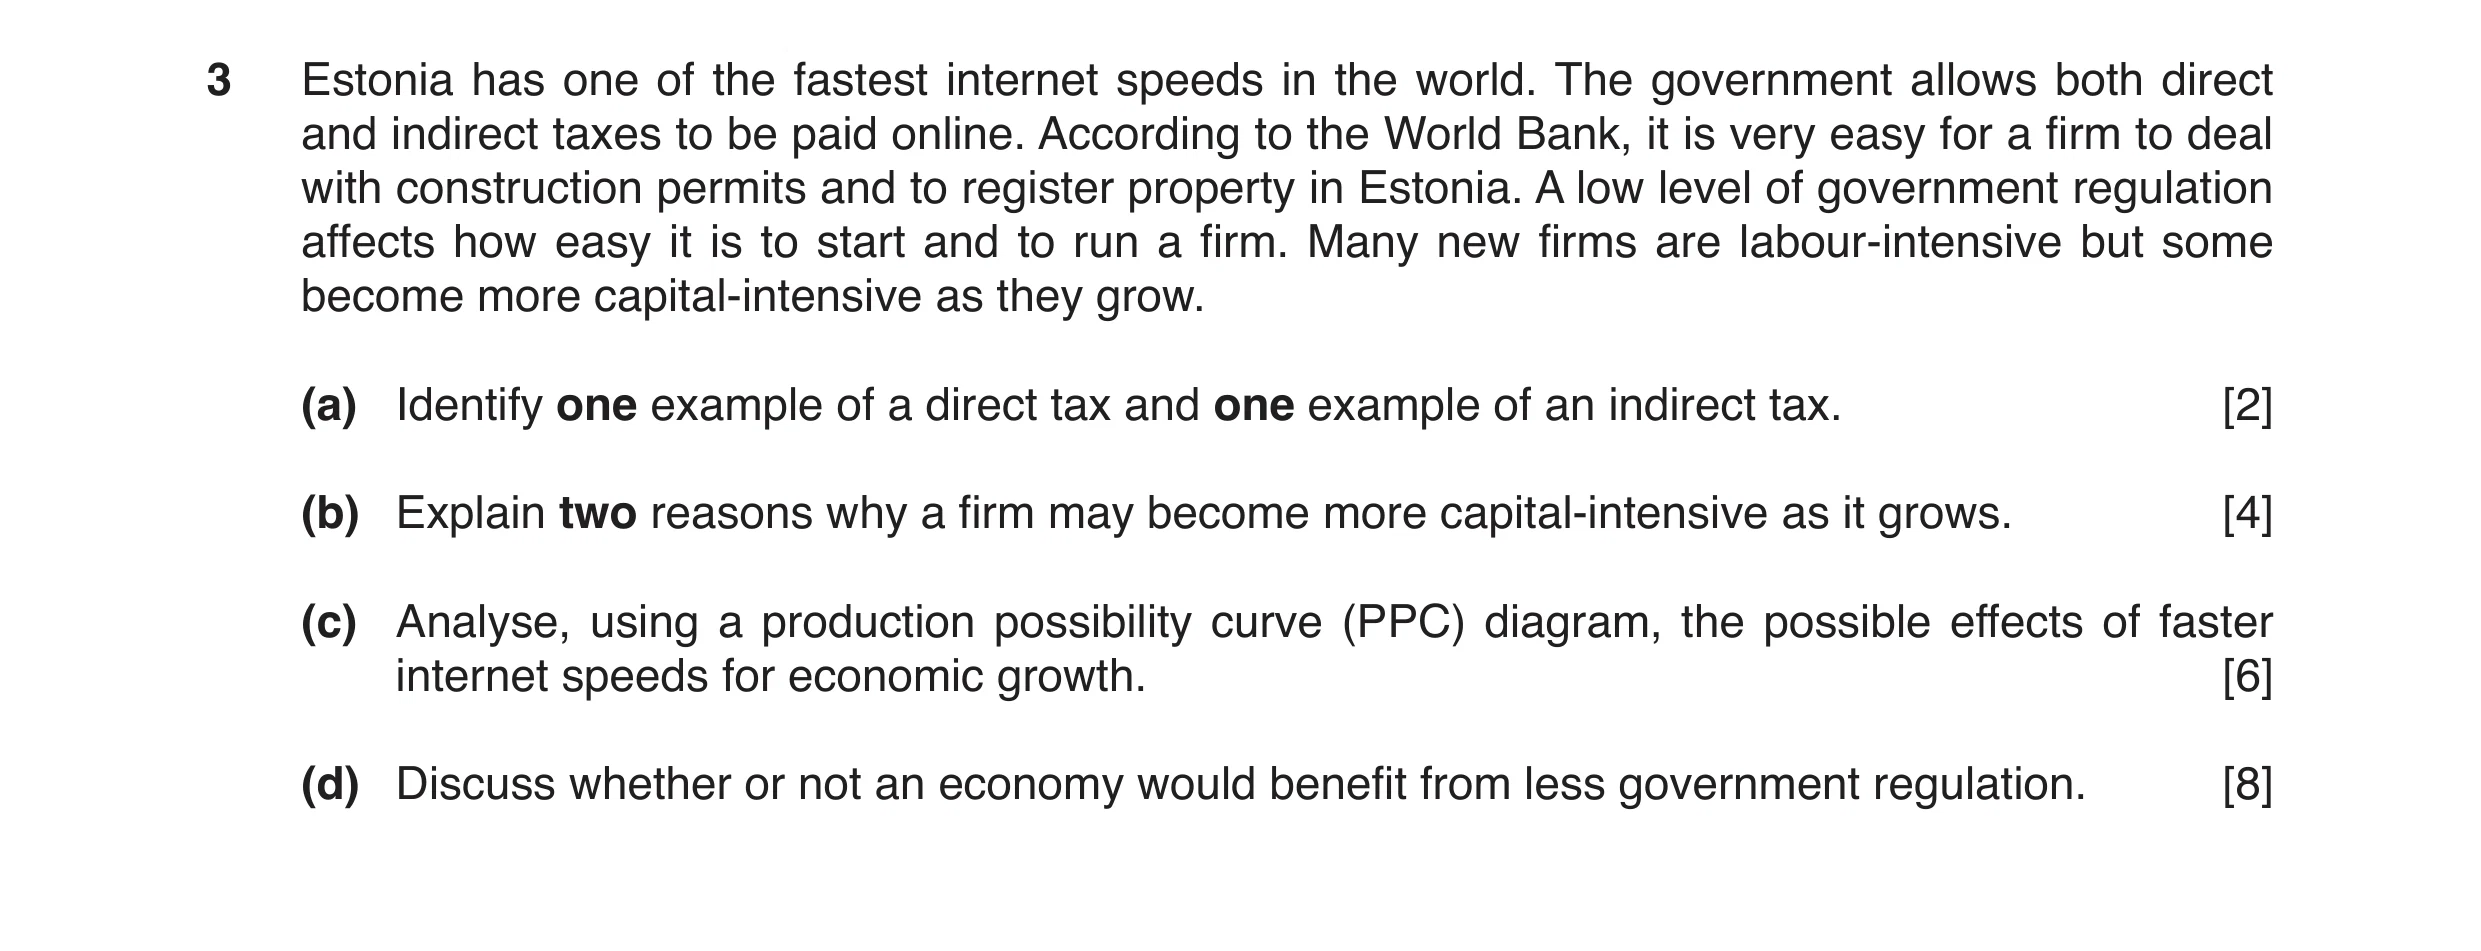
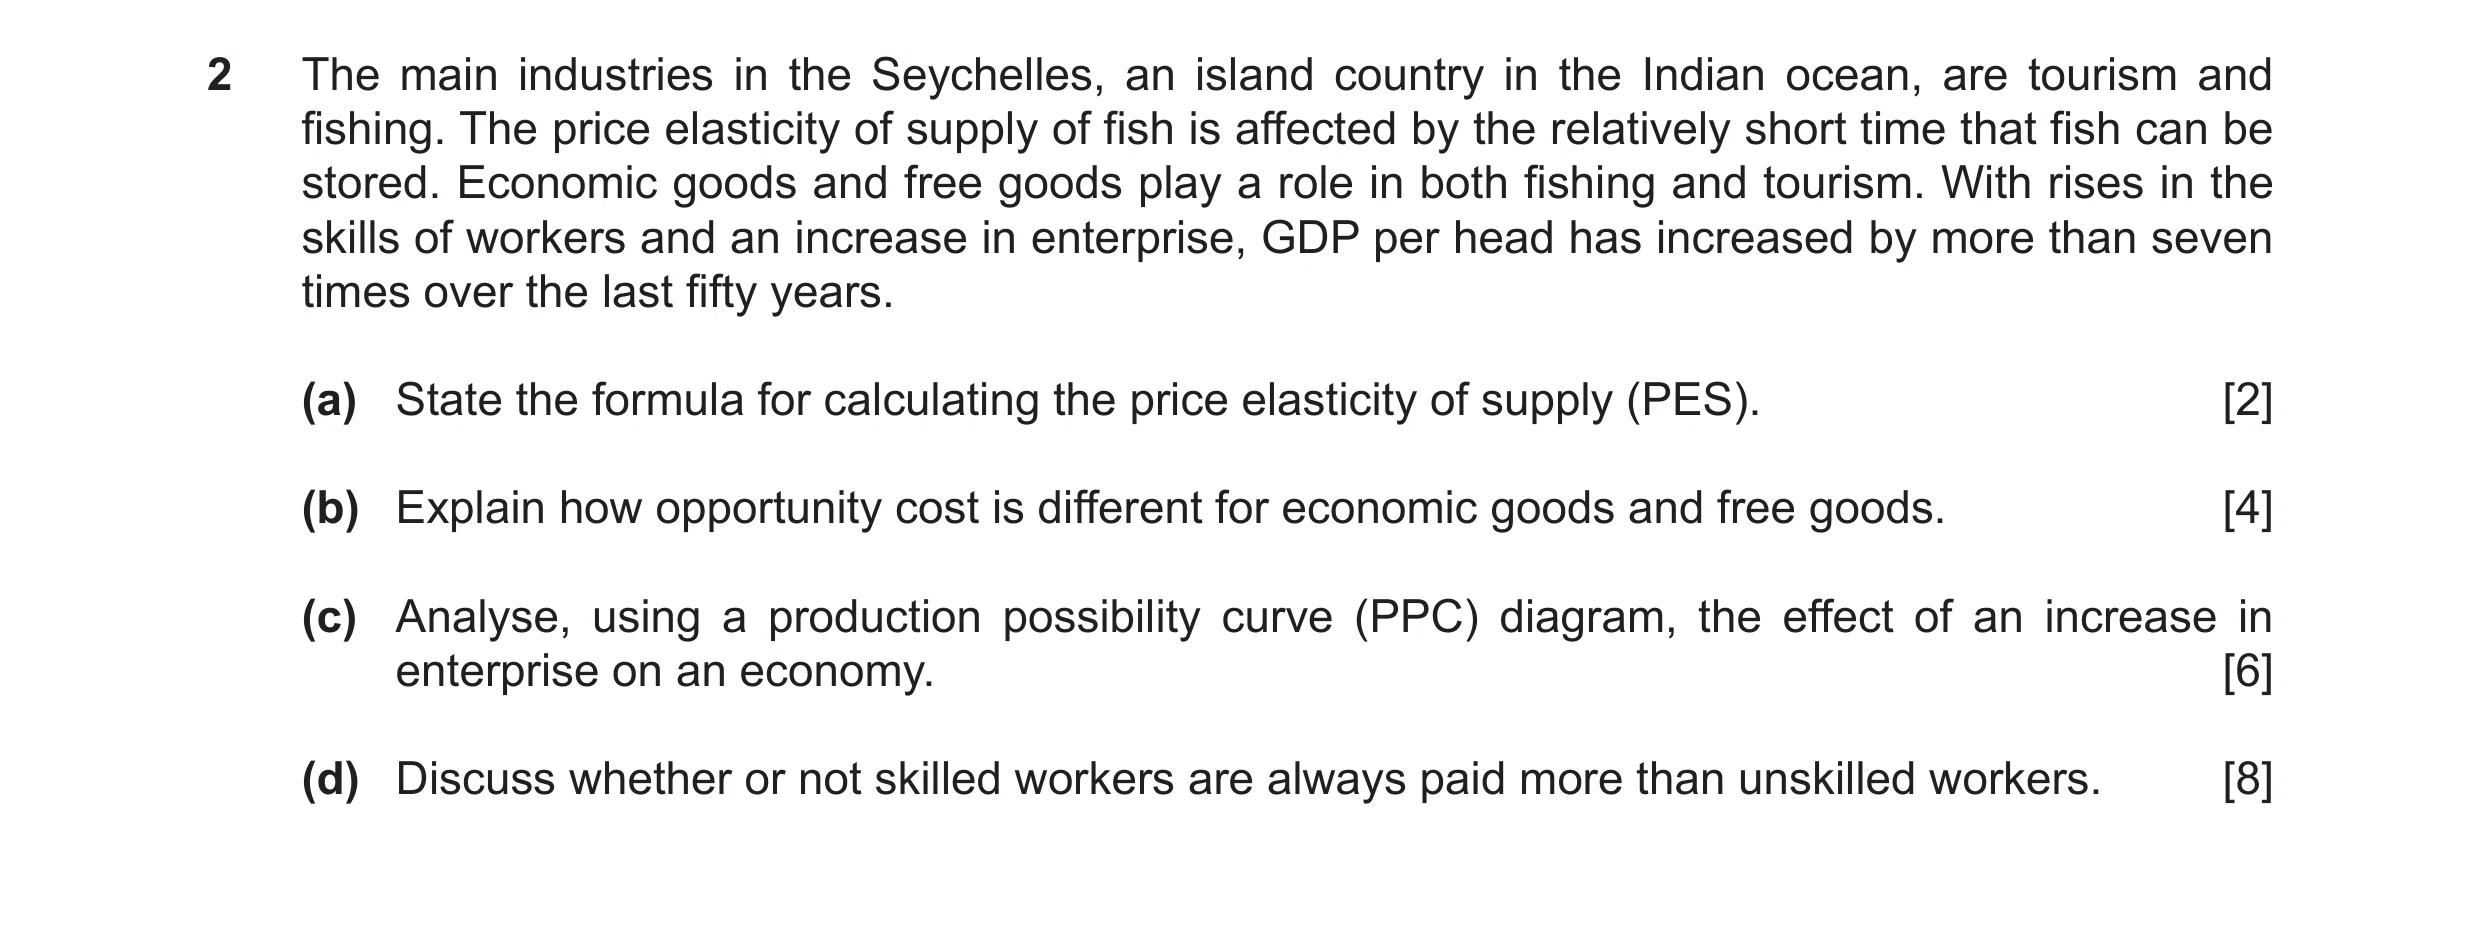
 7 / 14
 8 / 14
 9 / 14
 10 / 14
![Question 23: (a) Calculate the number of births in Cyprus in 2019. [1] (b) Identify two indicators of living standards. [2] (c) State why the global mar…](https://img.pastlit.com/crops/24be1e6c-3827-42eb-a1e9-48859ec14012/q1.webp)
 11 / 14
![Question 28: (a) Calculate the percentage contribution of Jakarta to Indonesia’s GDP in 2021. [1] (b) Identify two examples of external costs ignored by…](https://img.pastlit.com/crops/409e44c7-deac-4652-a187-f046d8960843/q1.webp) 12 / 14
12 / 14![Question 29: (a) Calculate the percentage of the population who were foreign nationals living in the UAE. [1] (b) Identify two features of globalisation…](https://img.pastlit.com/crops/7eea9f29-1b7b-4af3-bef9-c39a027dec63/q1.webp)
![Question 31: (a) Calculate the average cost of producing a car in Belarus in 2021. [1] (b) Identify two reasons why Belarus is described as a mixed econ…](https://img.pastlit.com/crops/694c5e96-092a-4fd5-aadb-0306b621e45b/q1.webp) 13 / 14
13 / 14
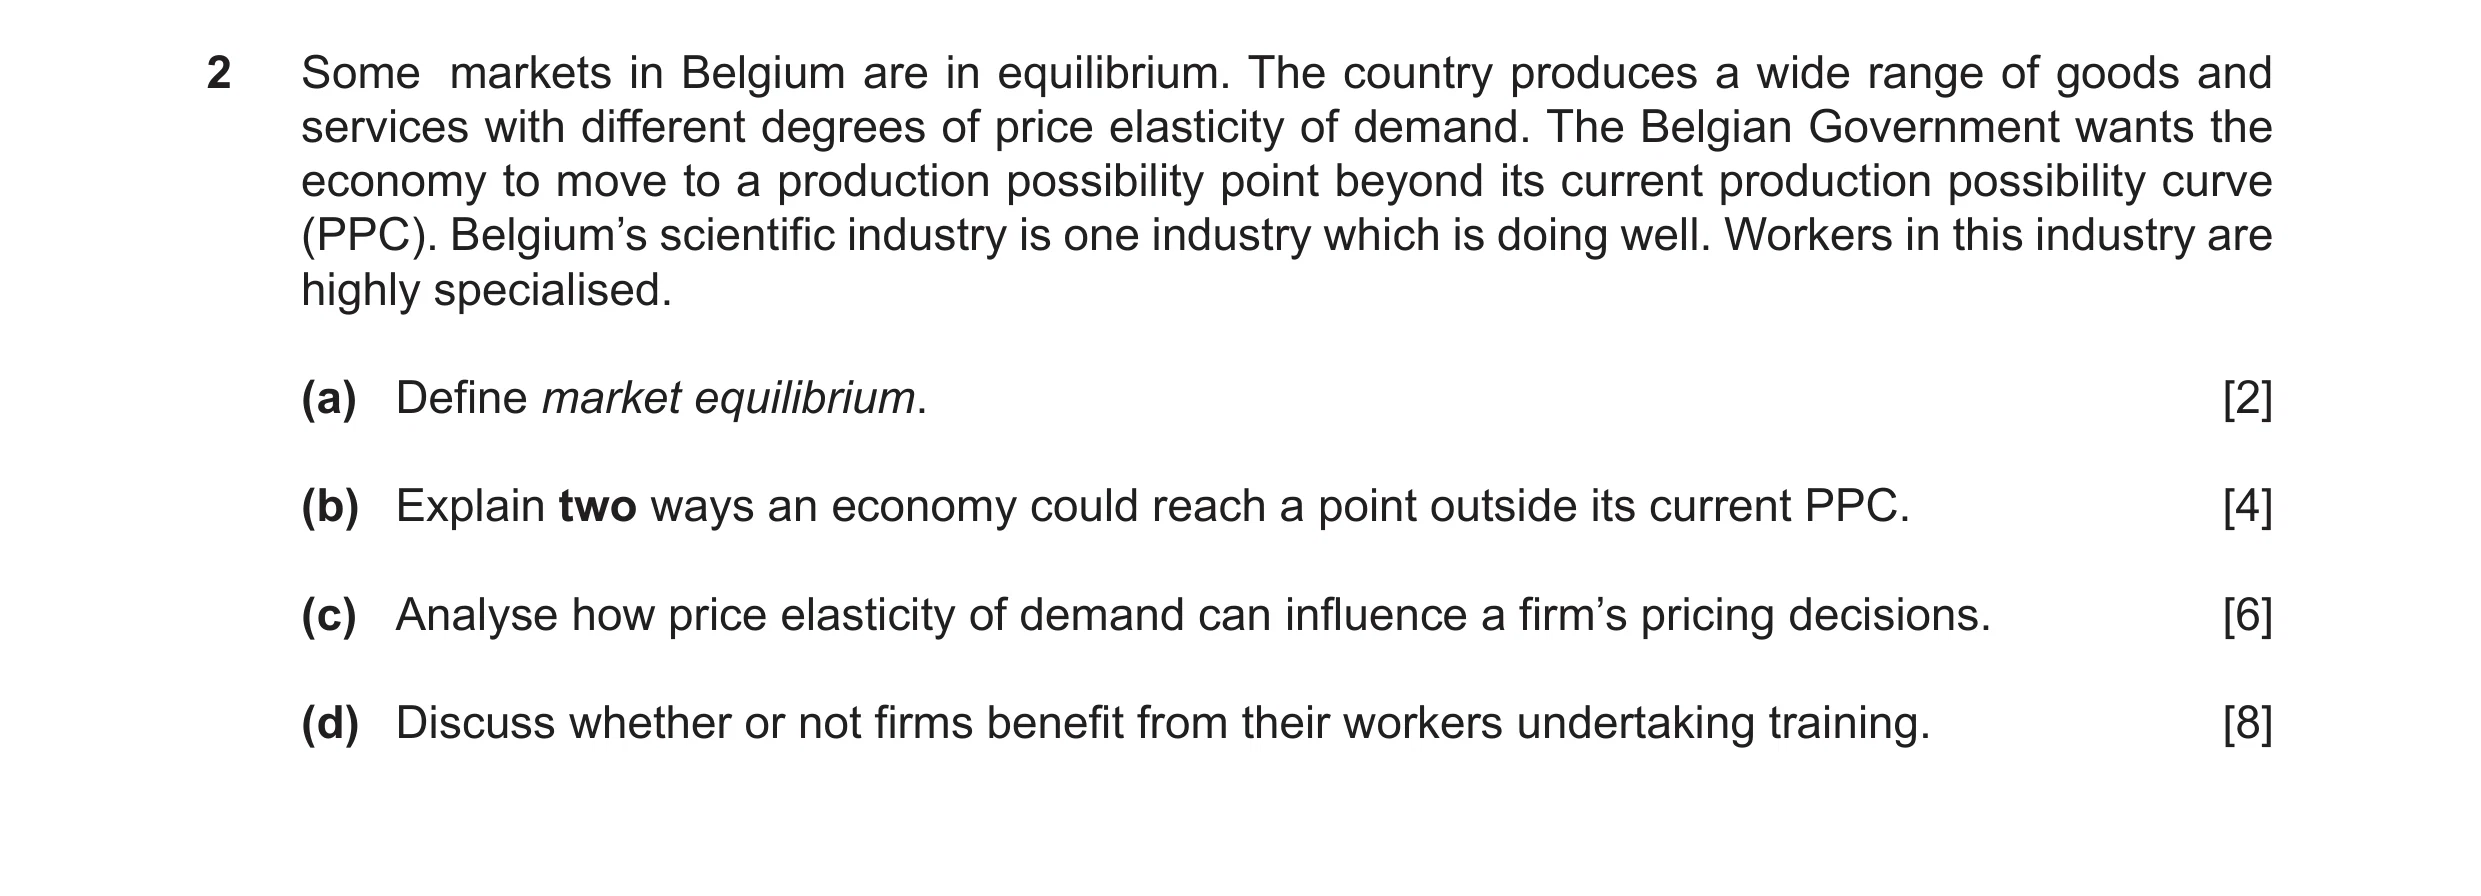
![Question 34: (a) Calculate the number of Malawians who had access to electricity in 2022. [1] (b) Identify two capital goods used in Malawi. [2] (c) Exp…](https://img.pastlit.com/crops/b205f8e6-b286-4d23-b321-d74a5c411a28/q1.webp) 14 / 14
14 / 14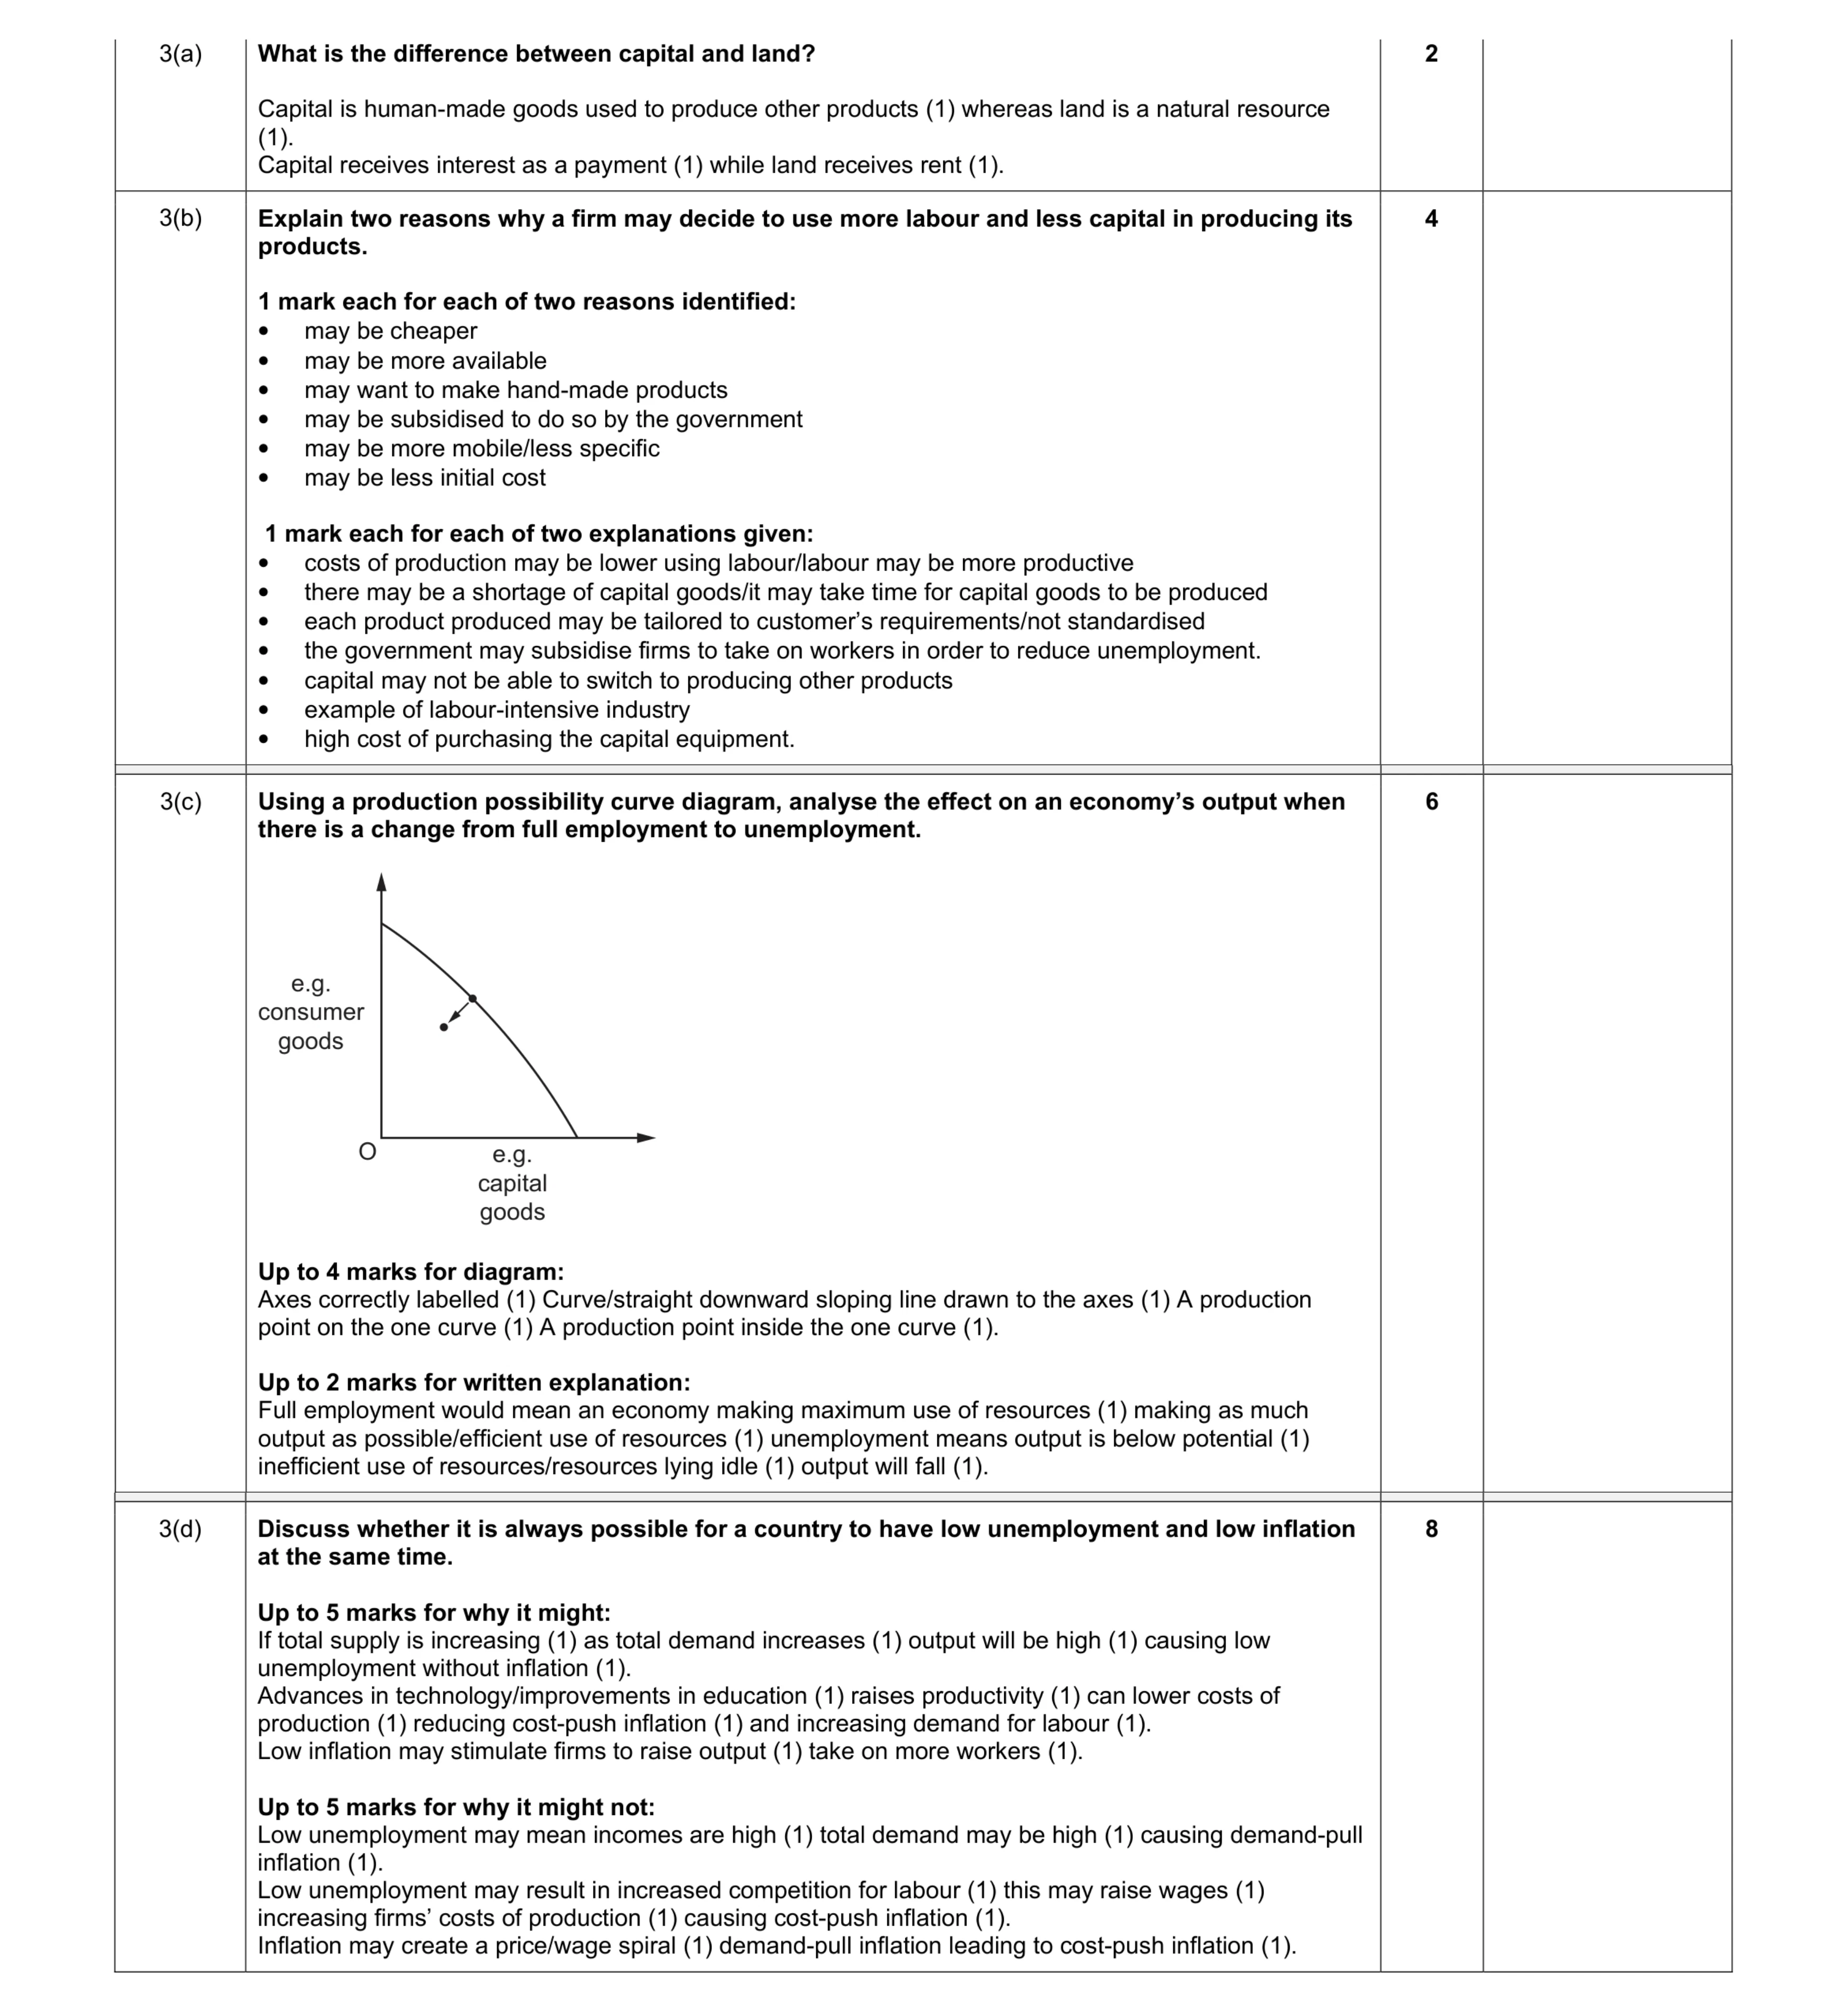 20
20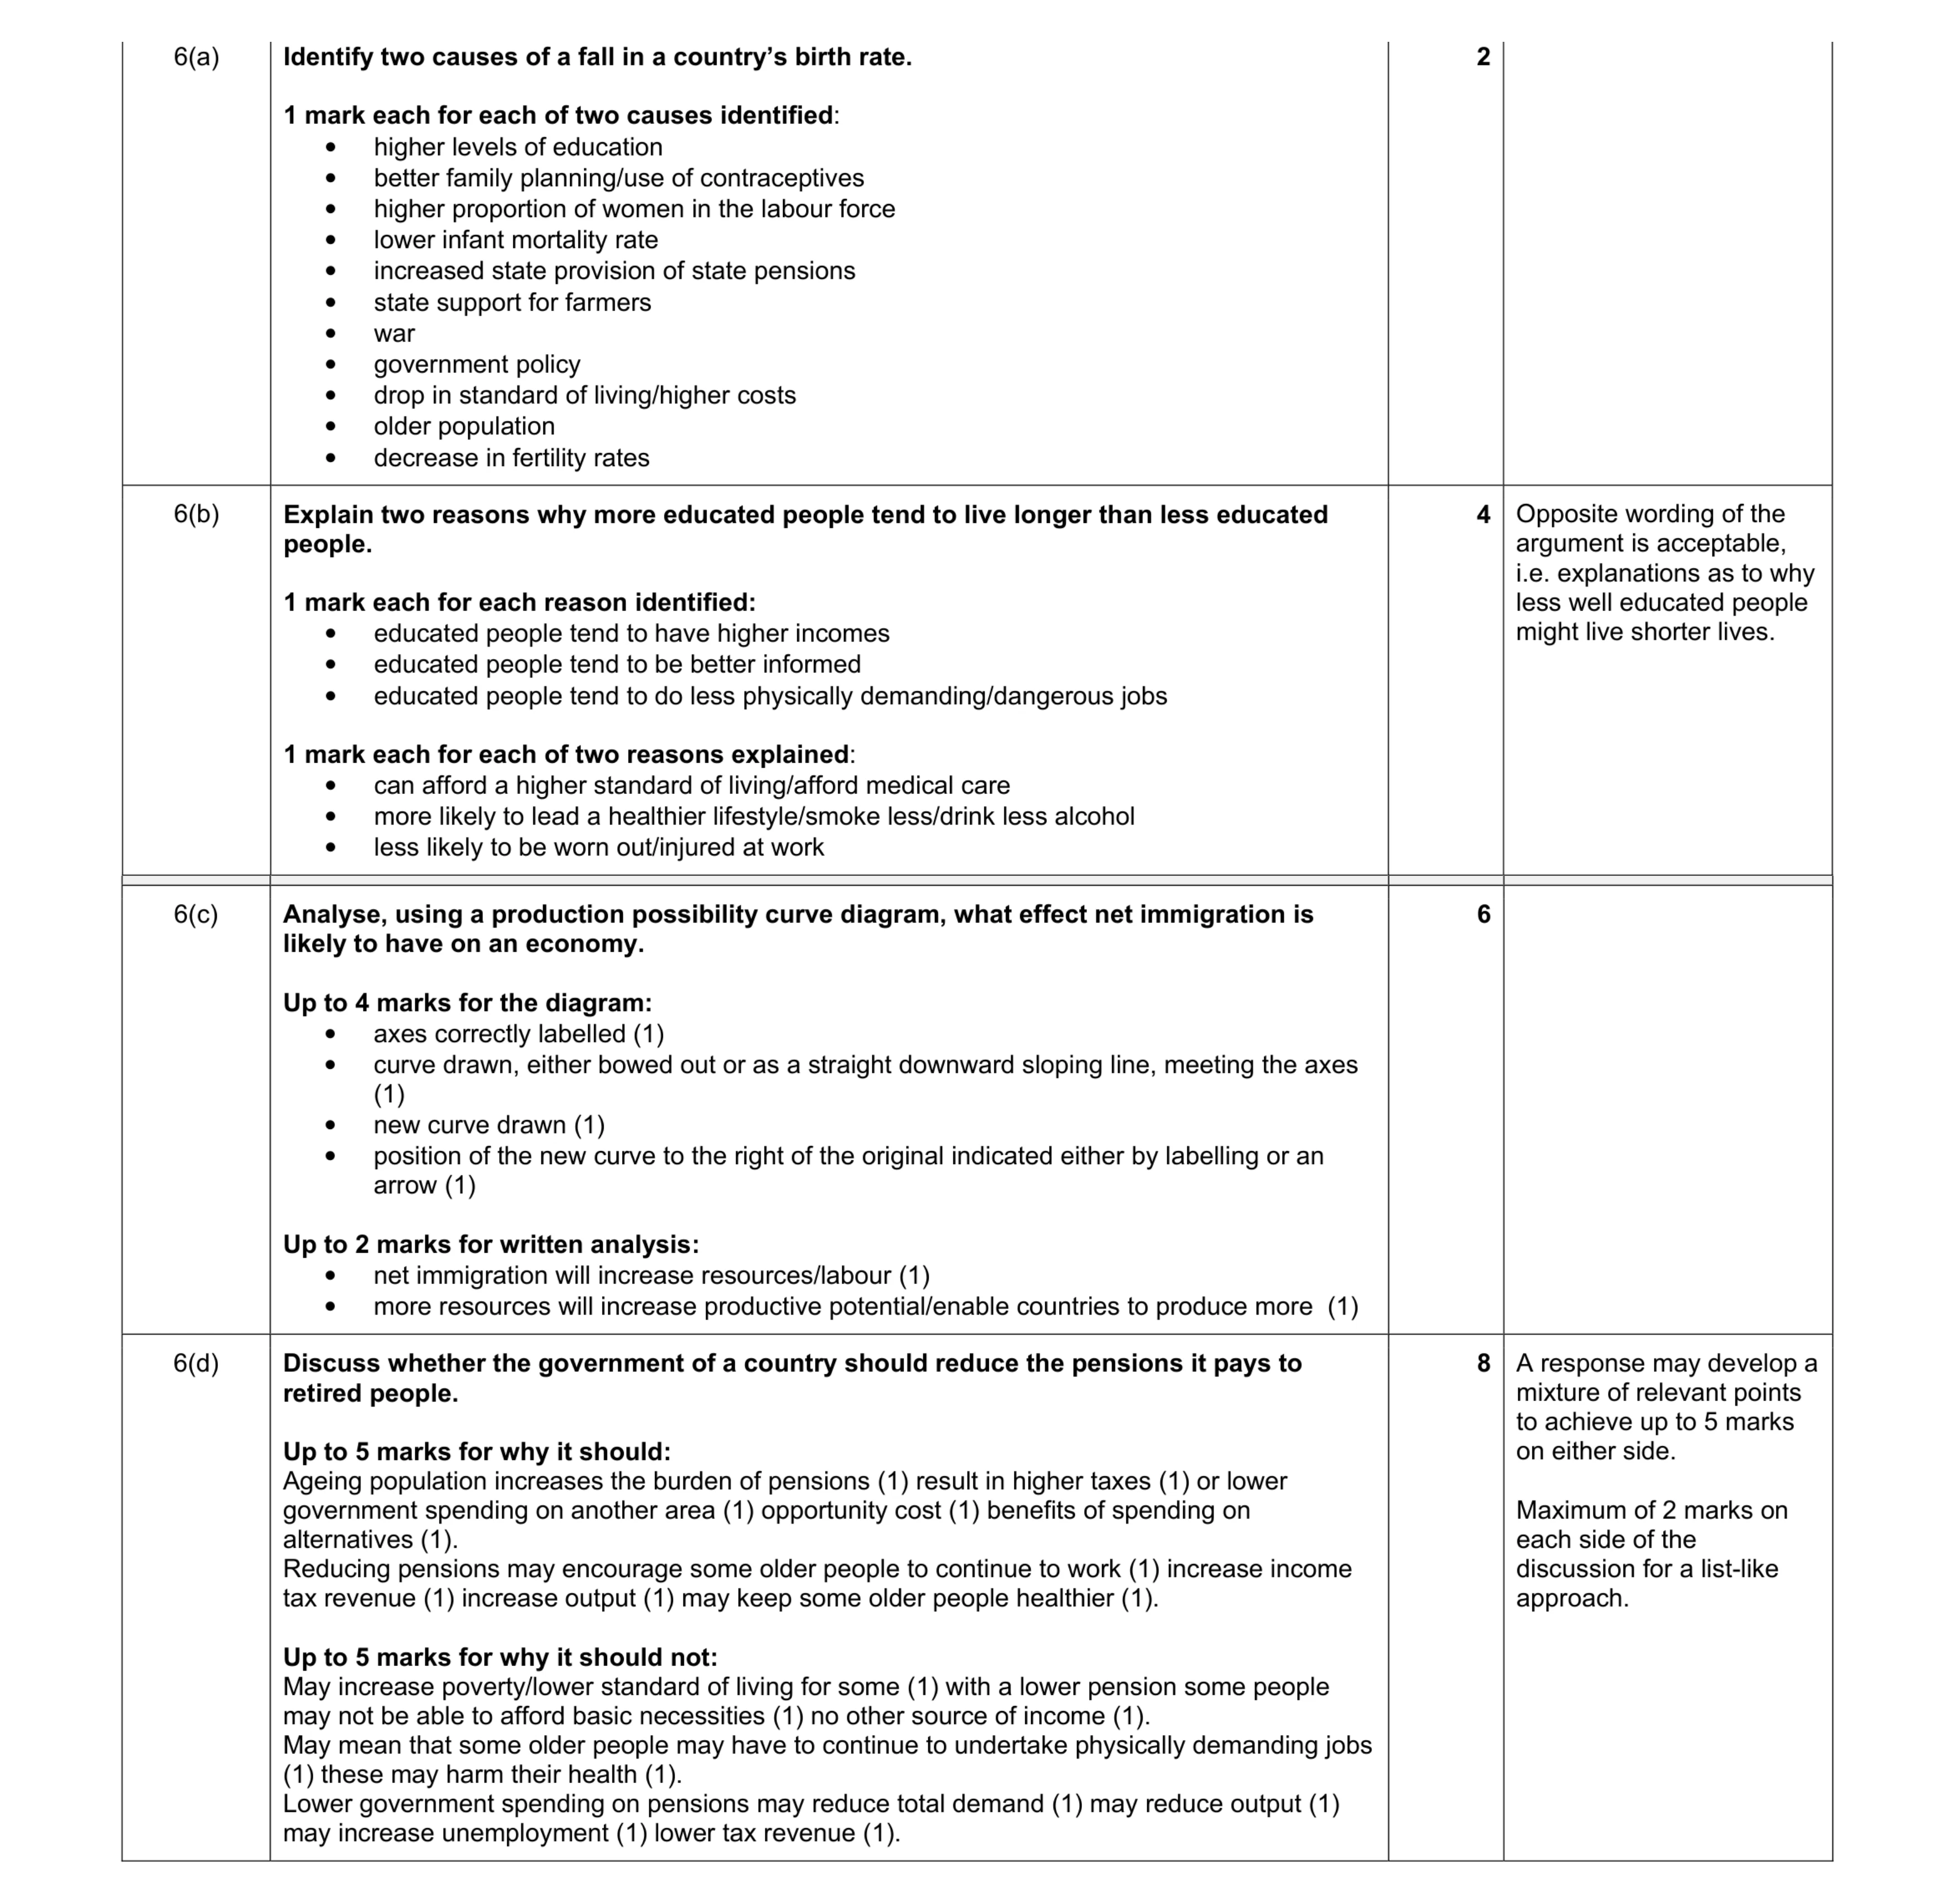 20
20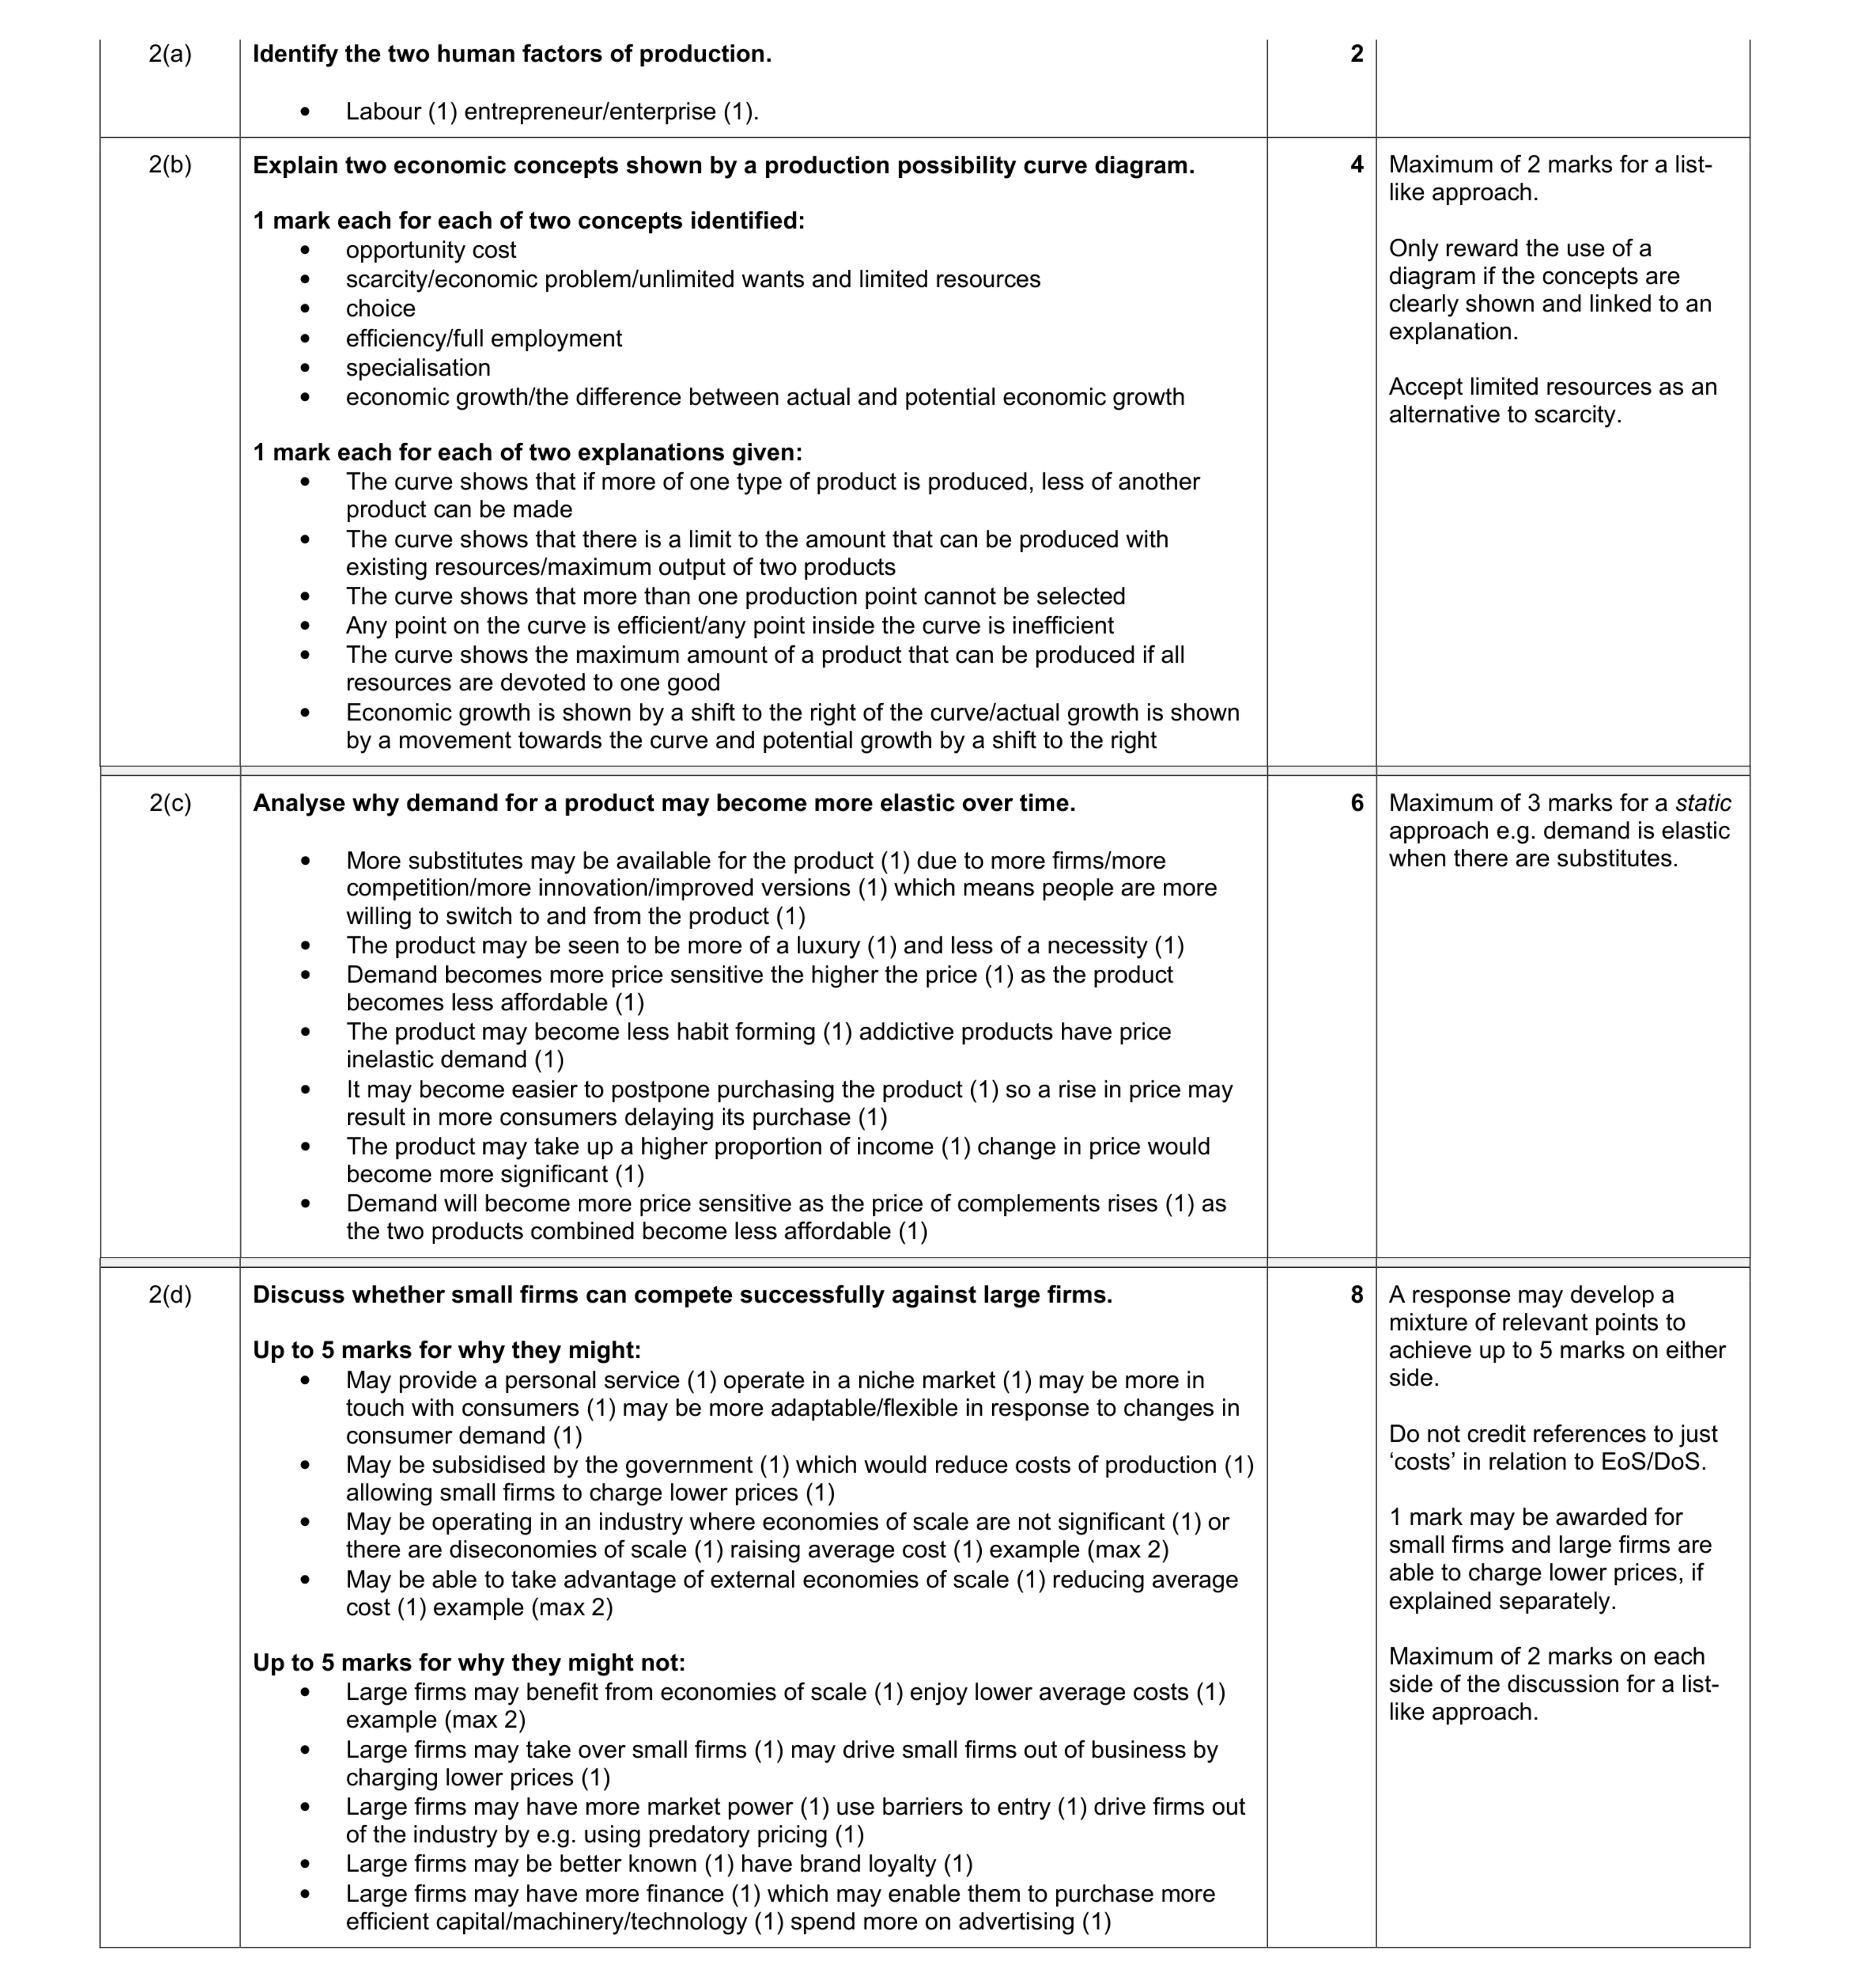 20
20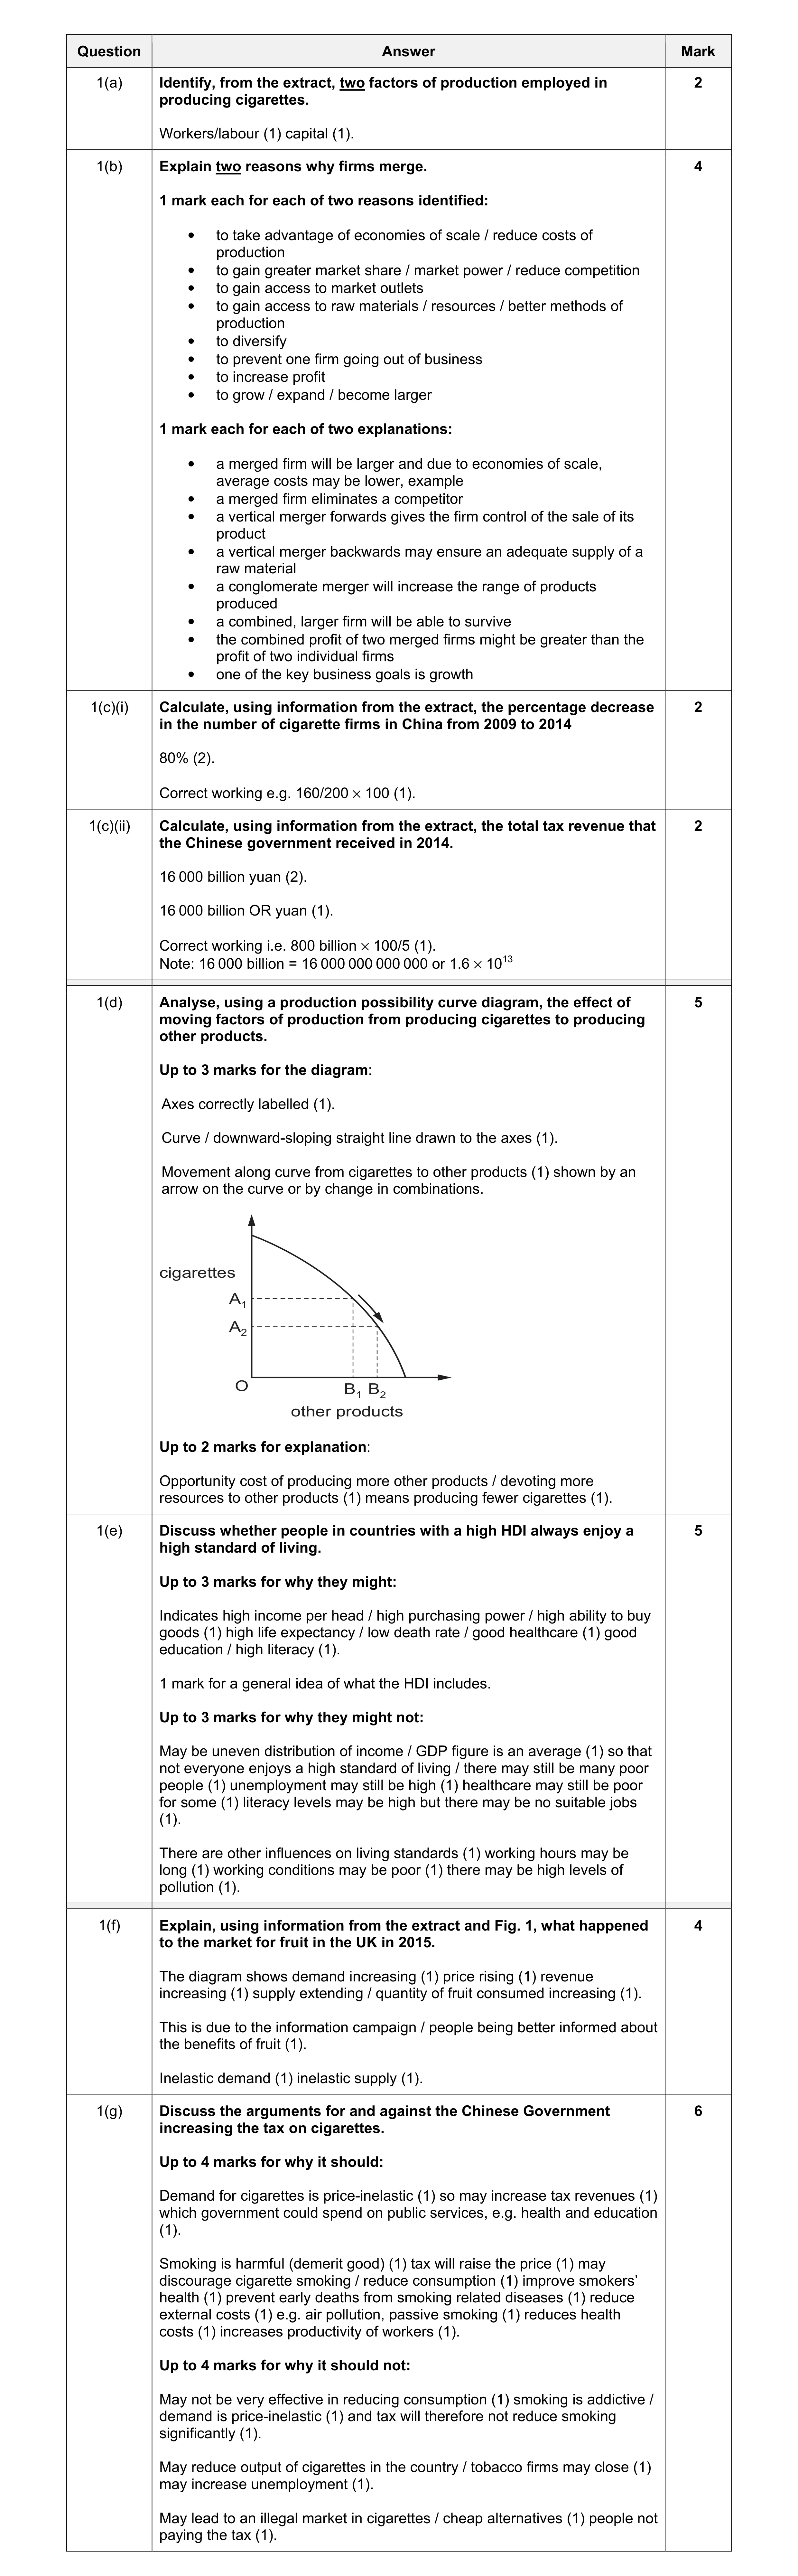 30
30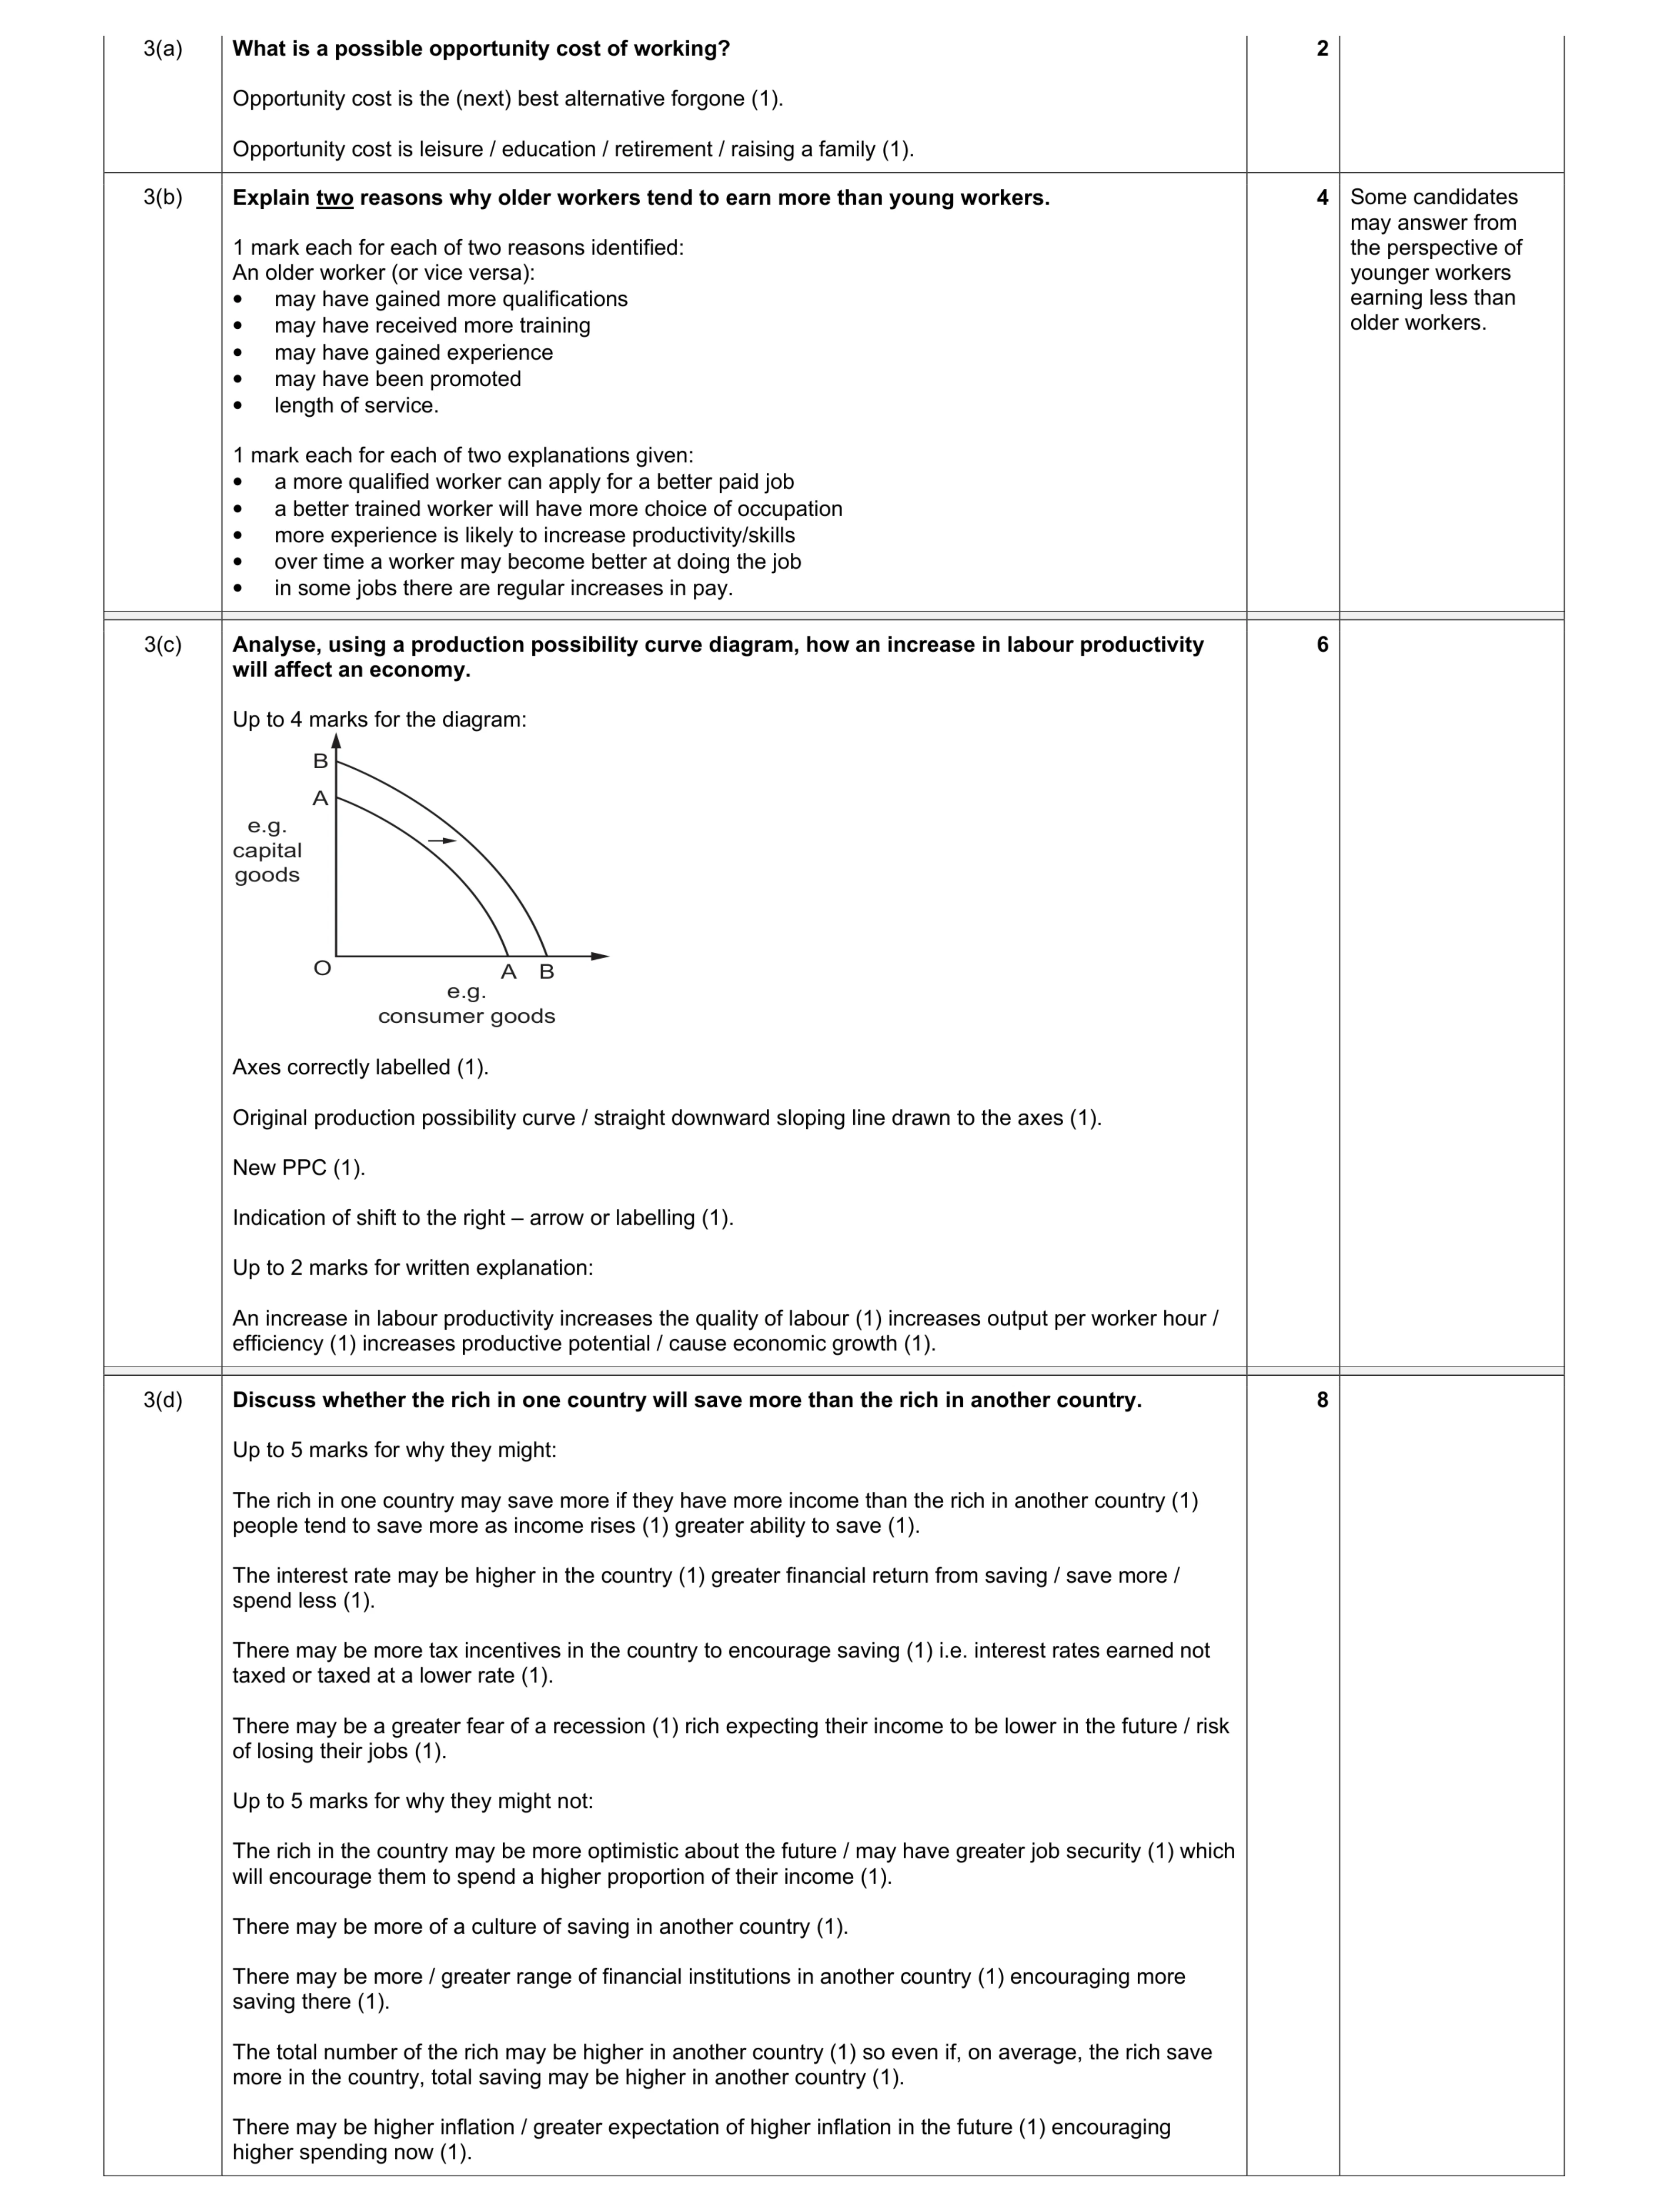 20
20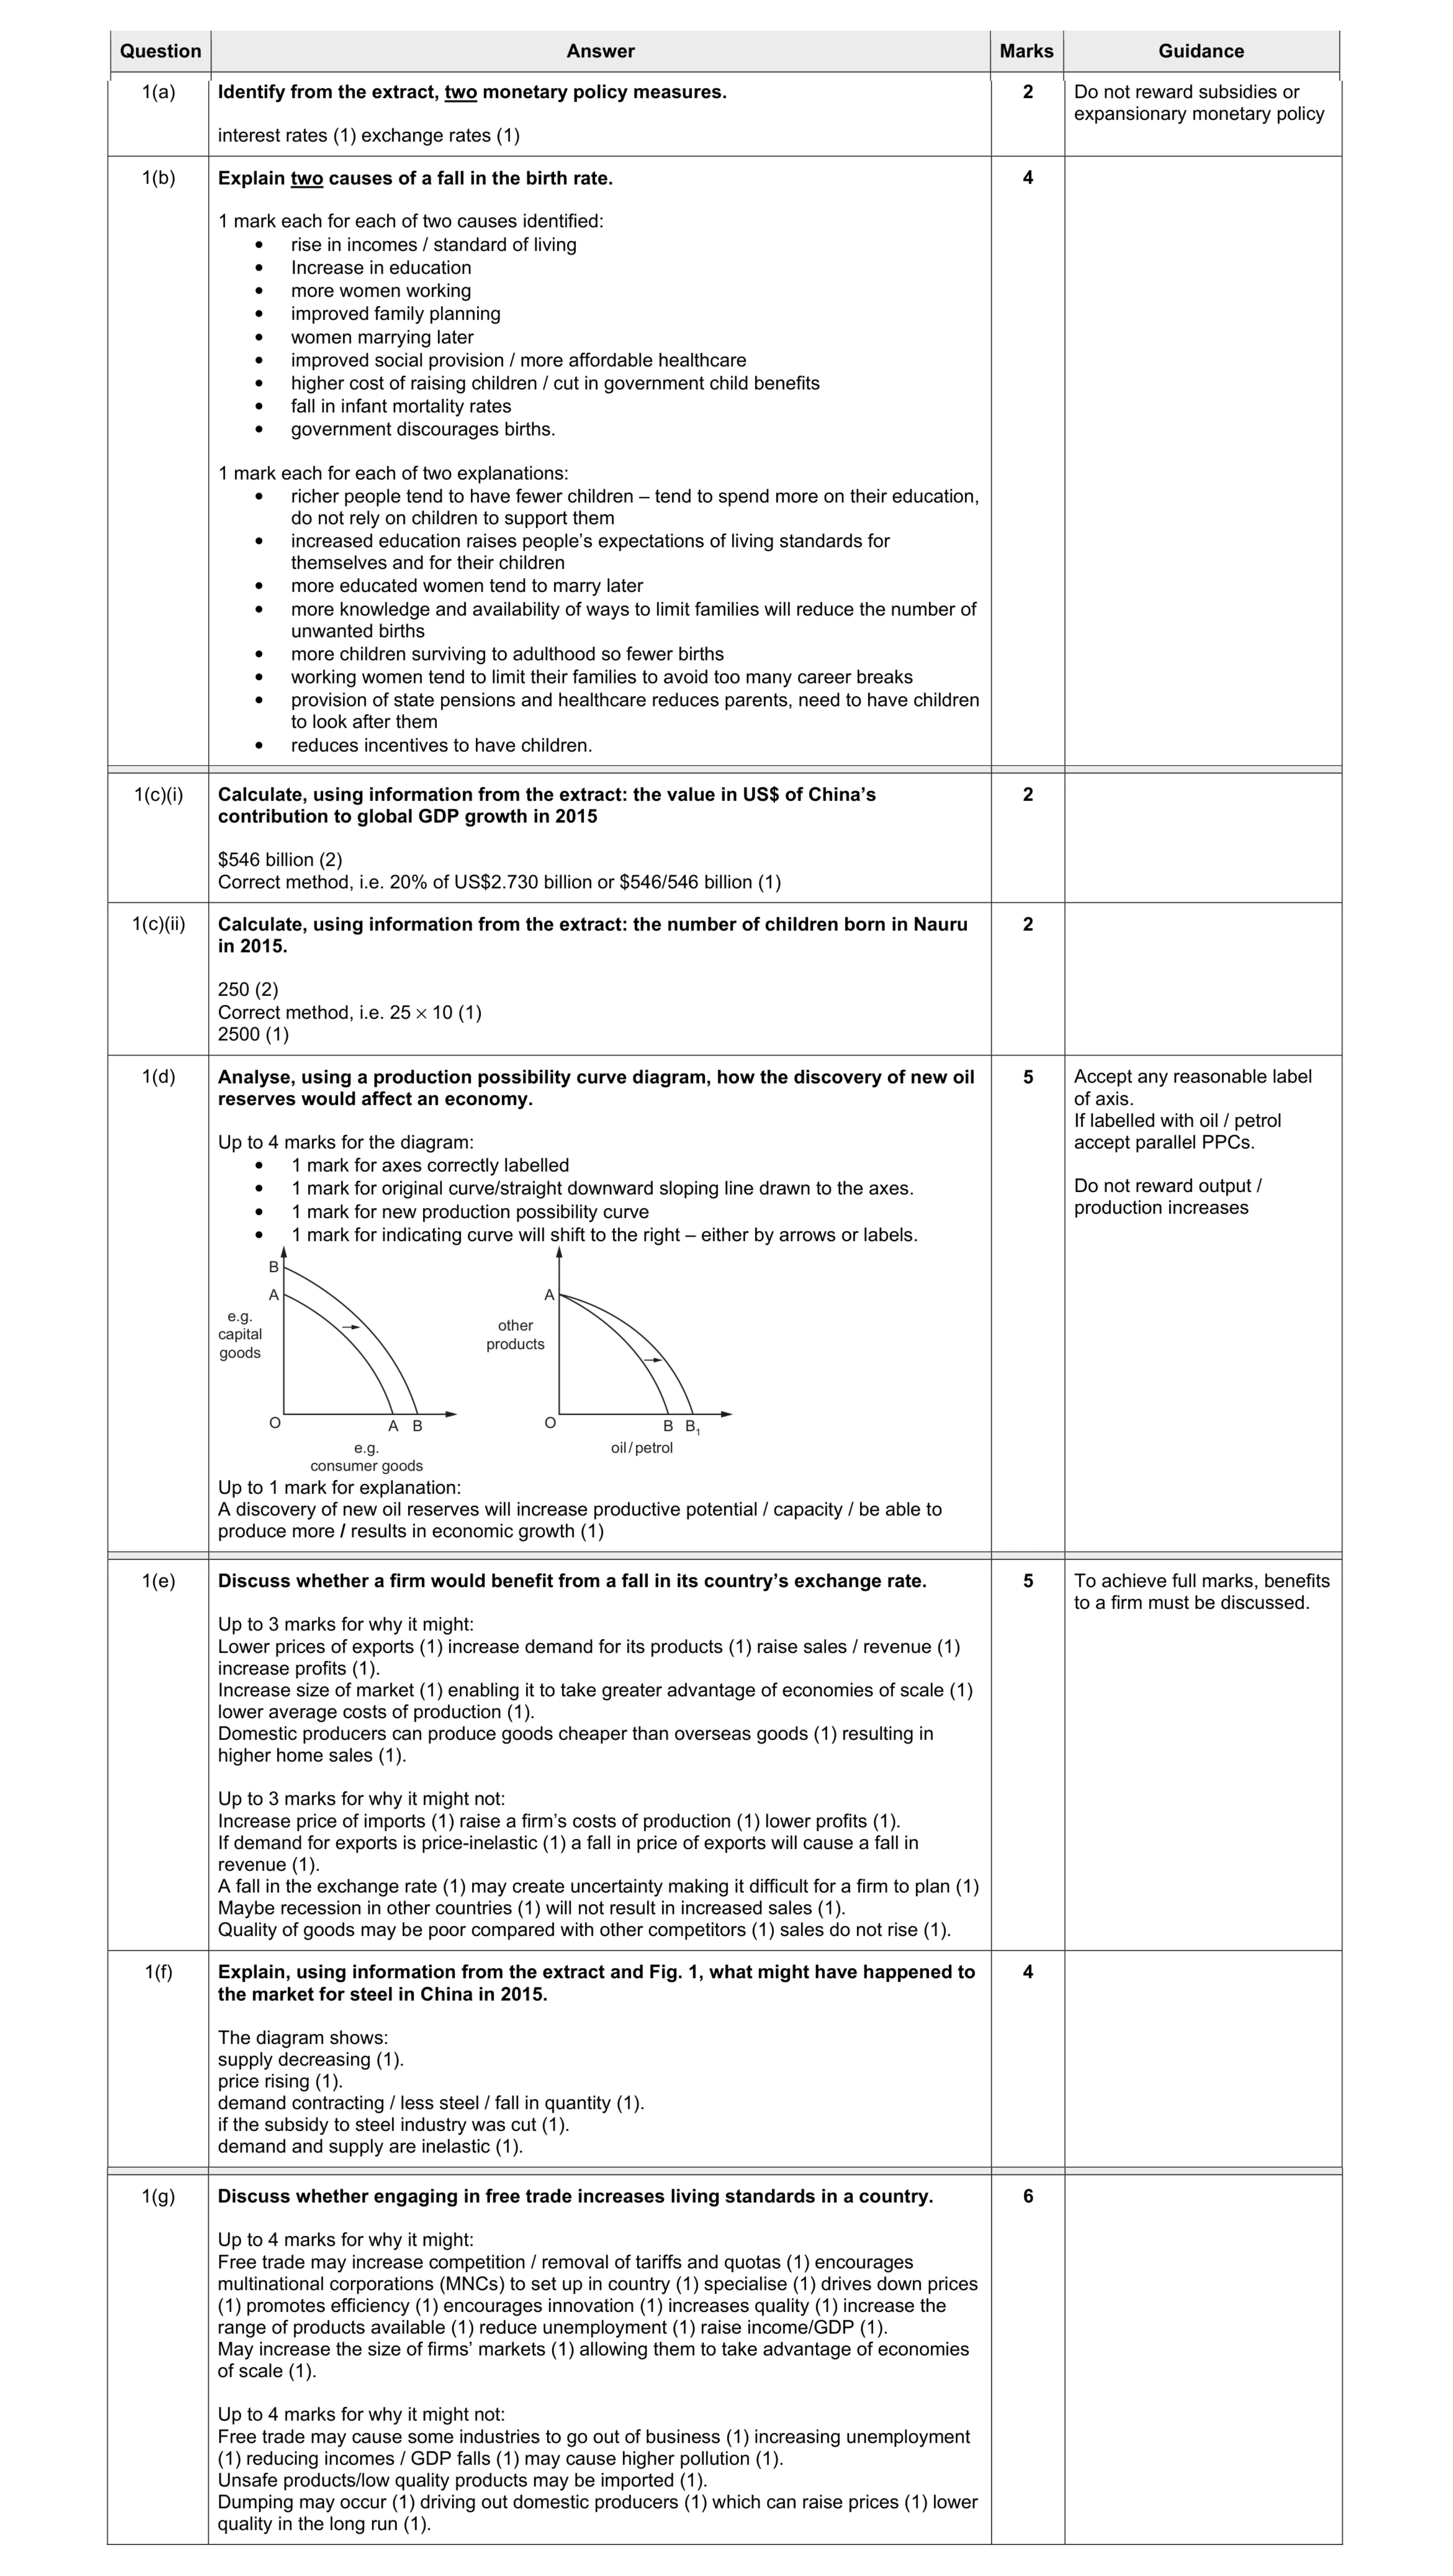 30
30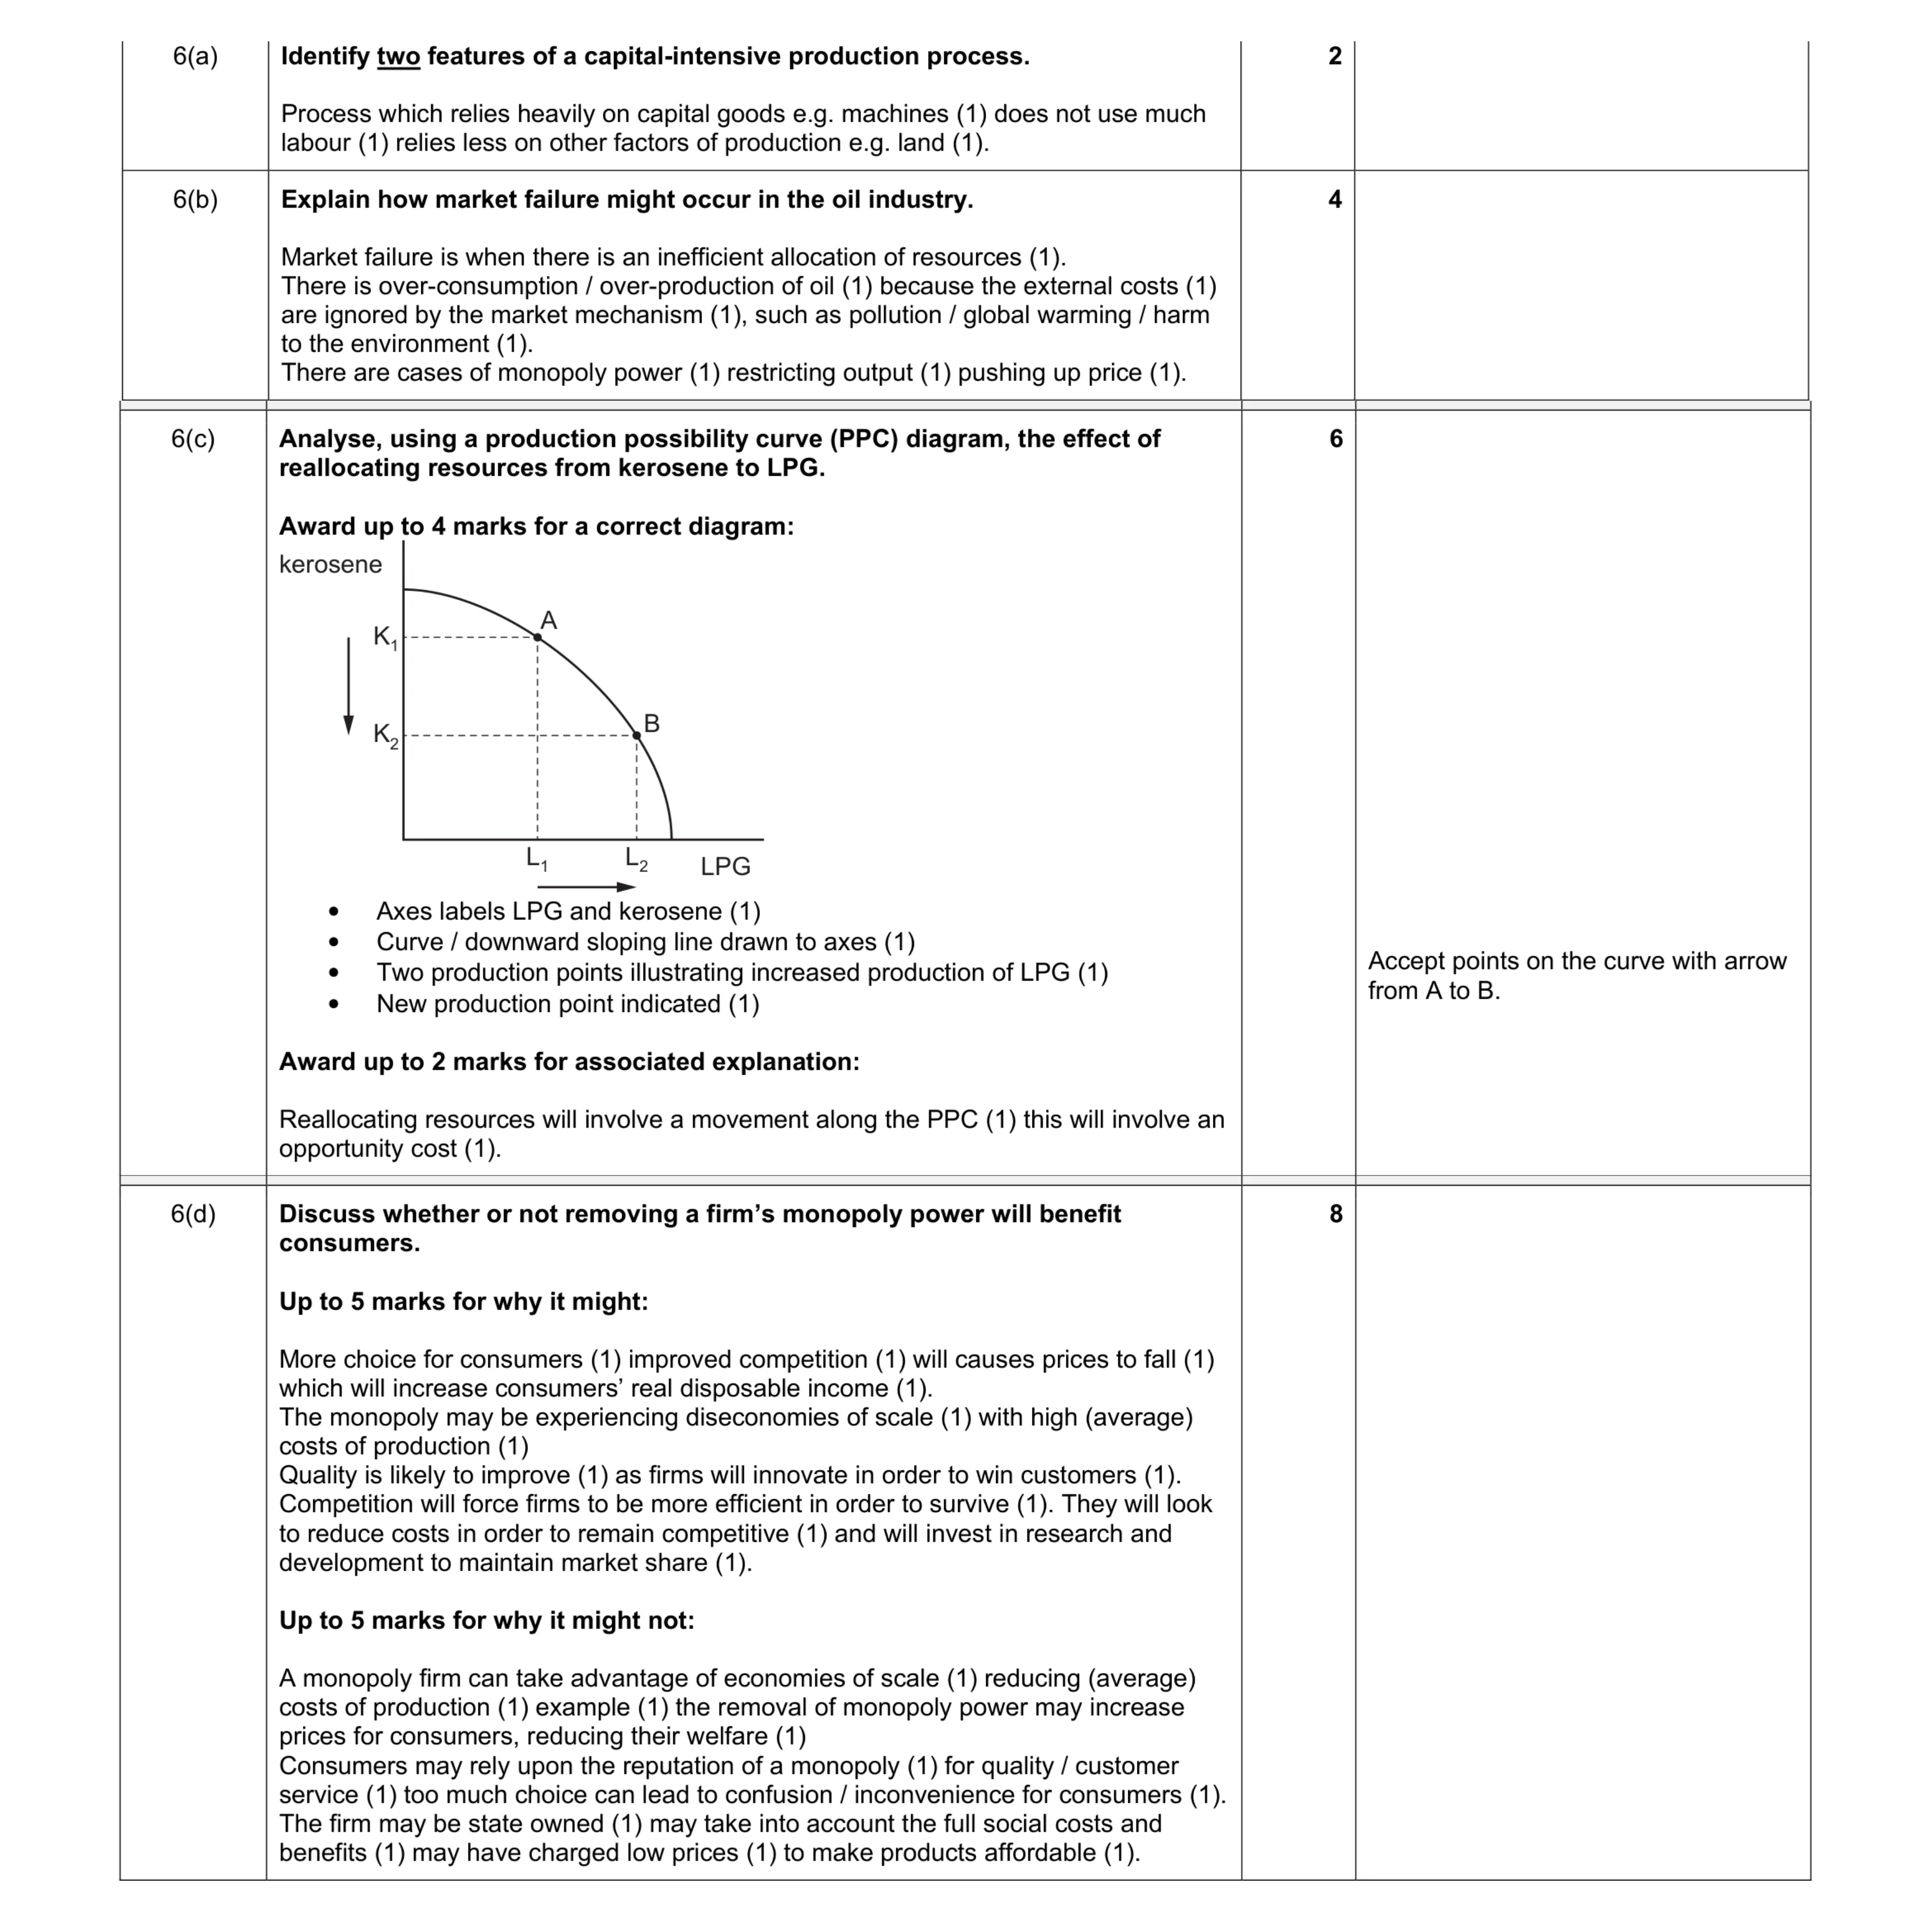 20
20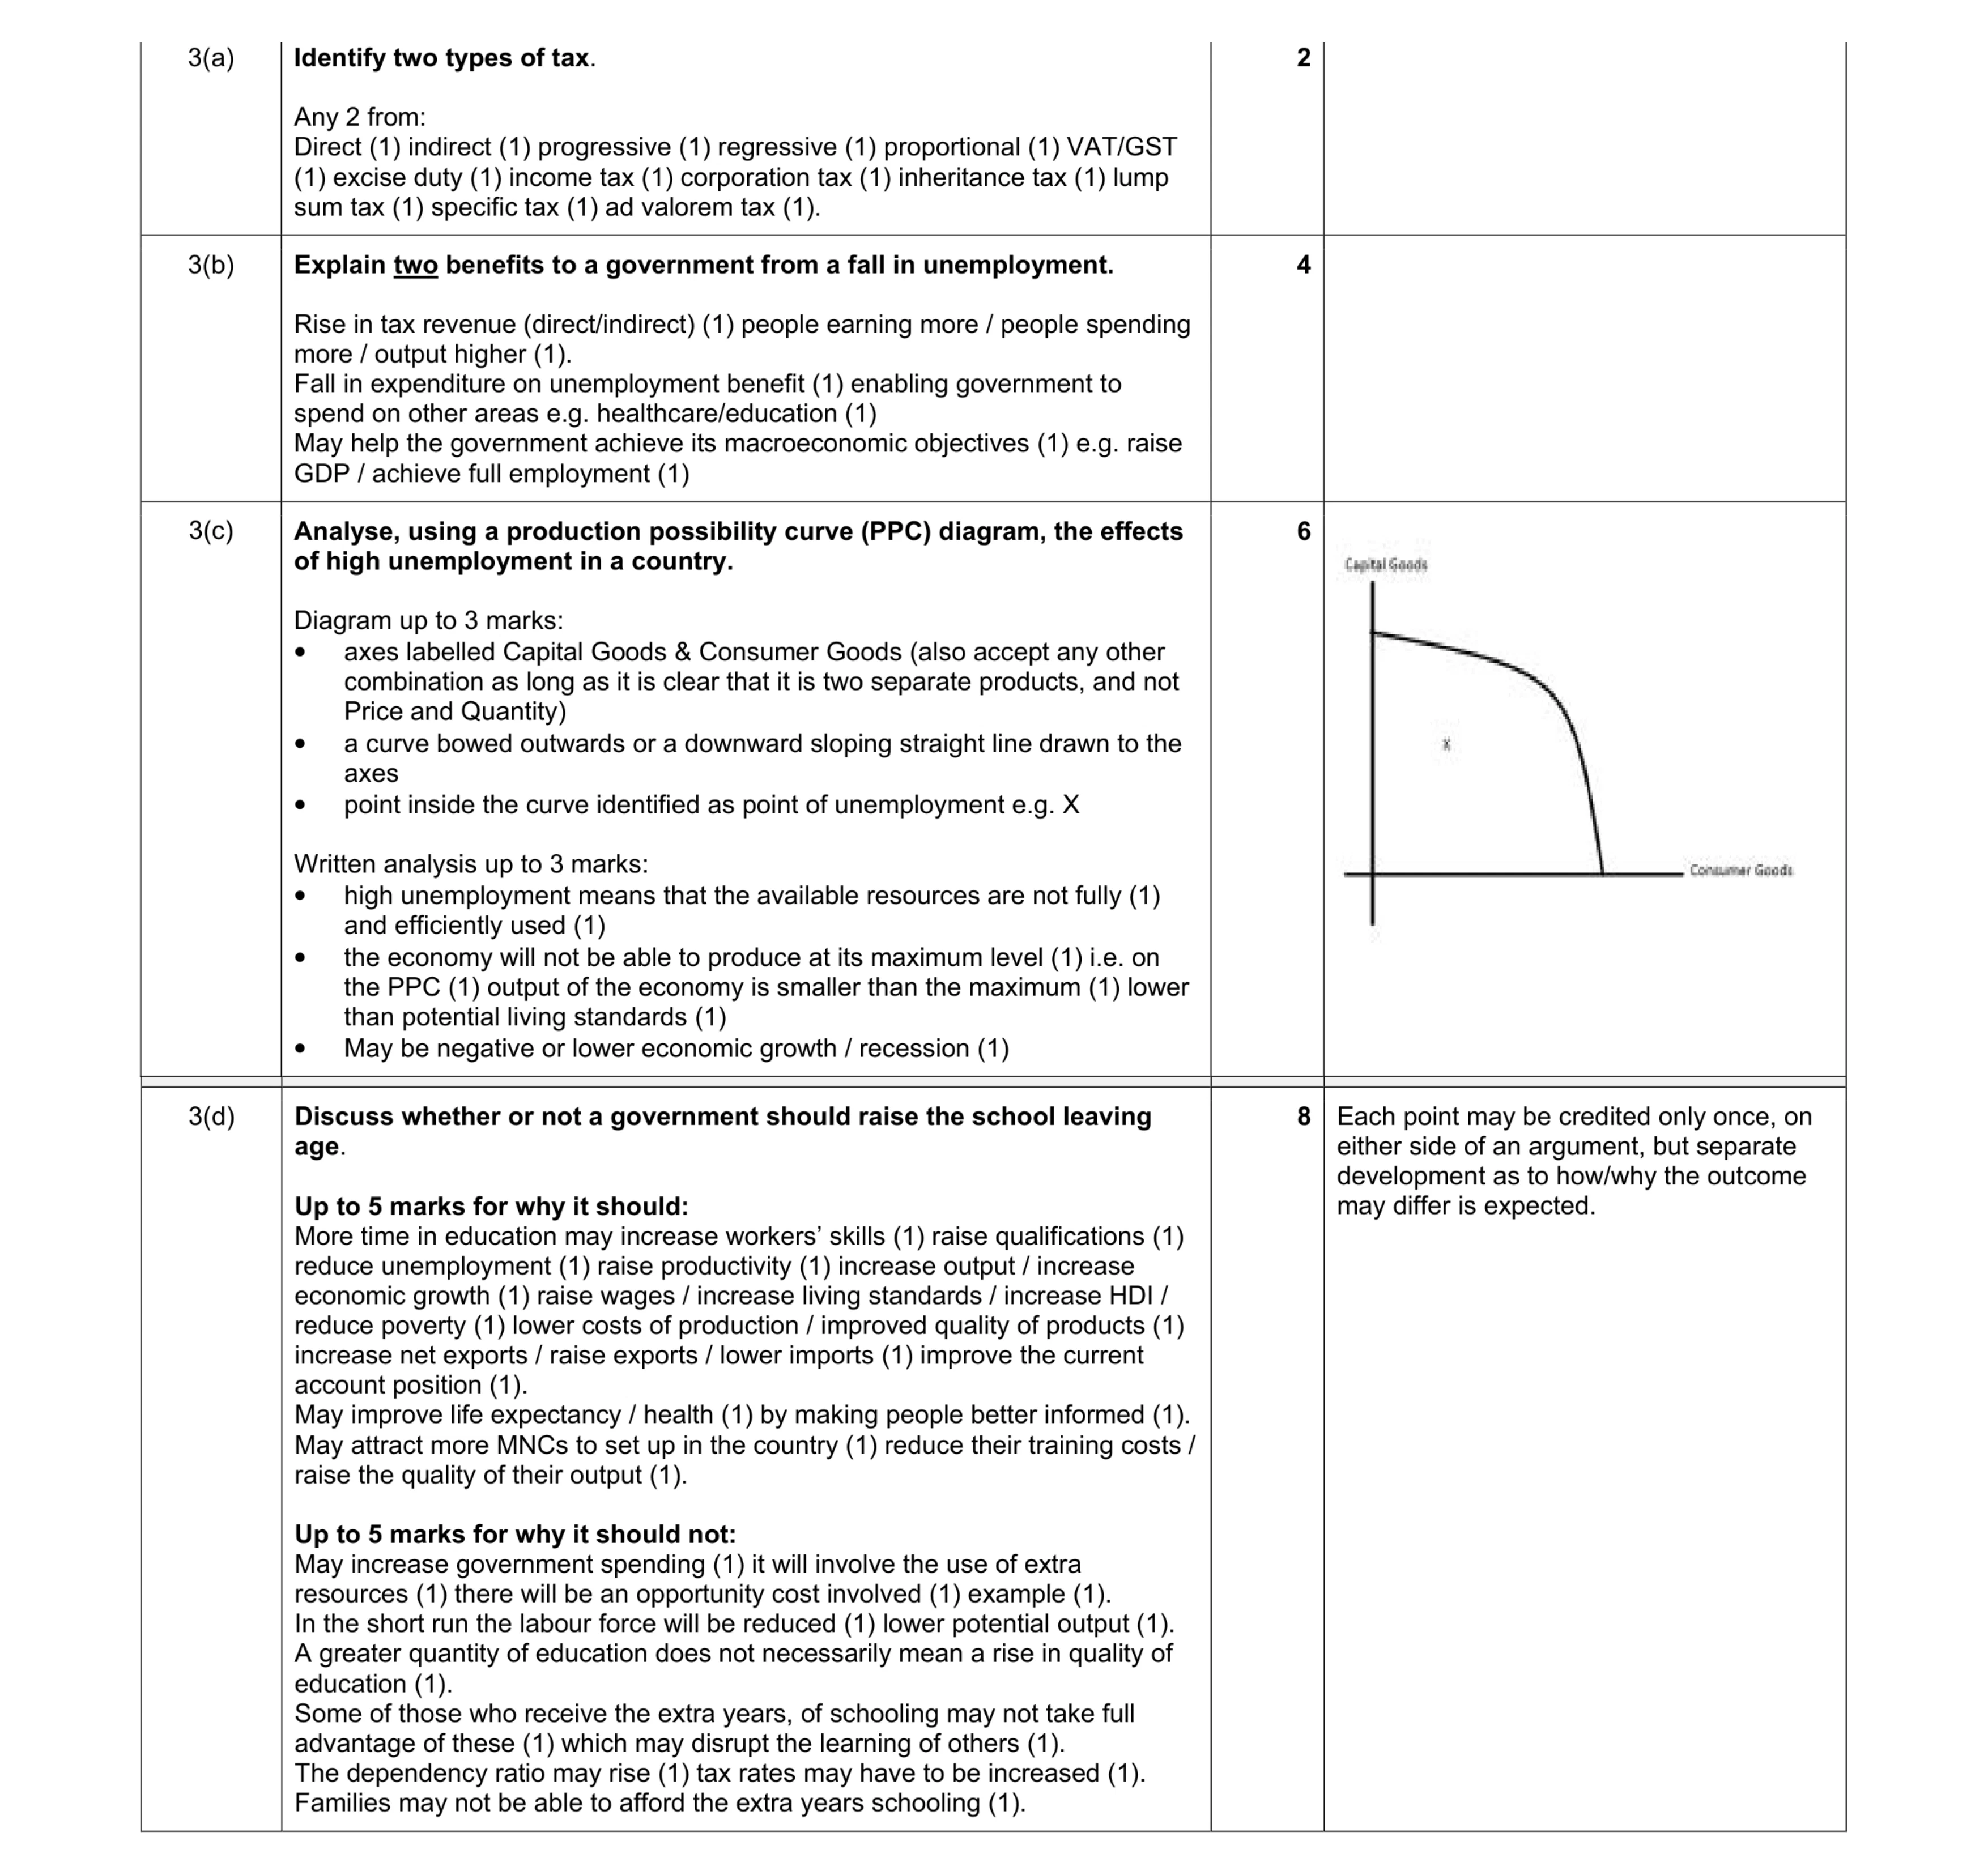 20
20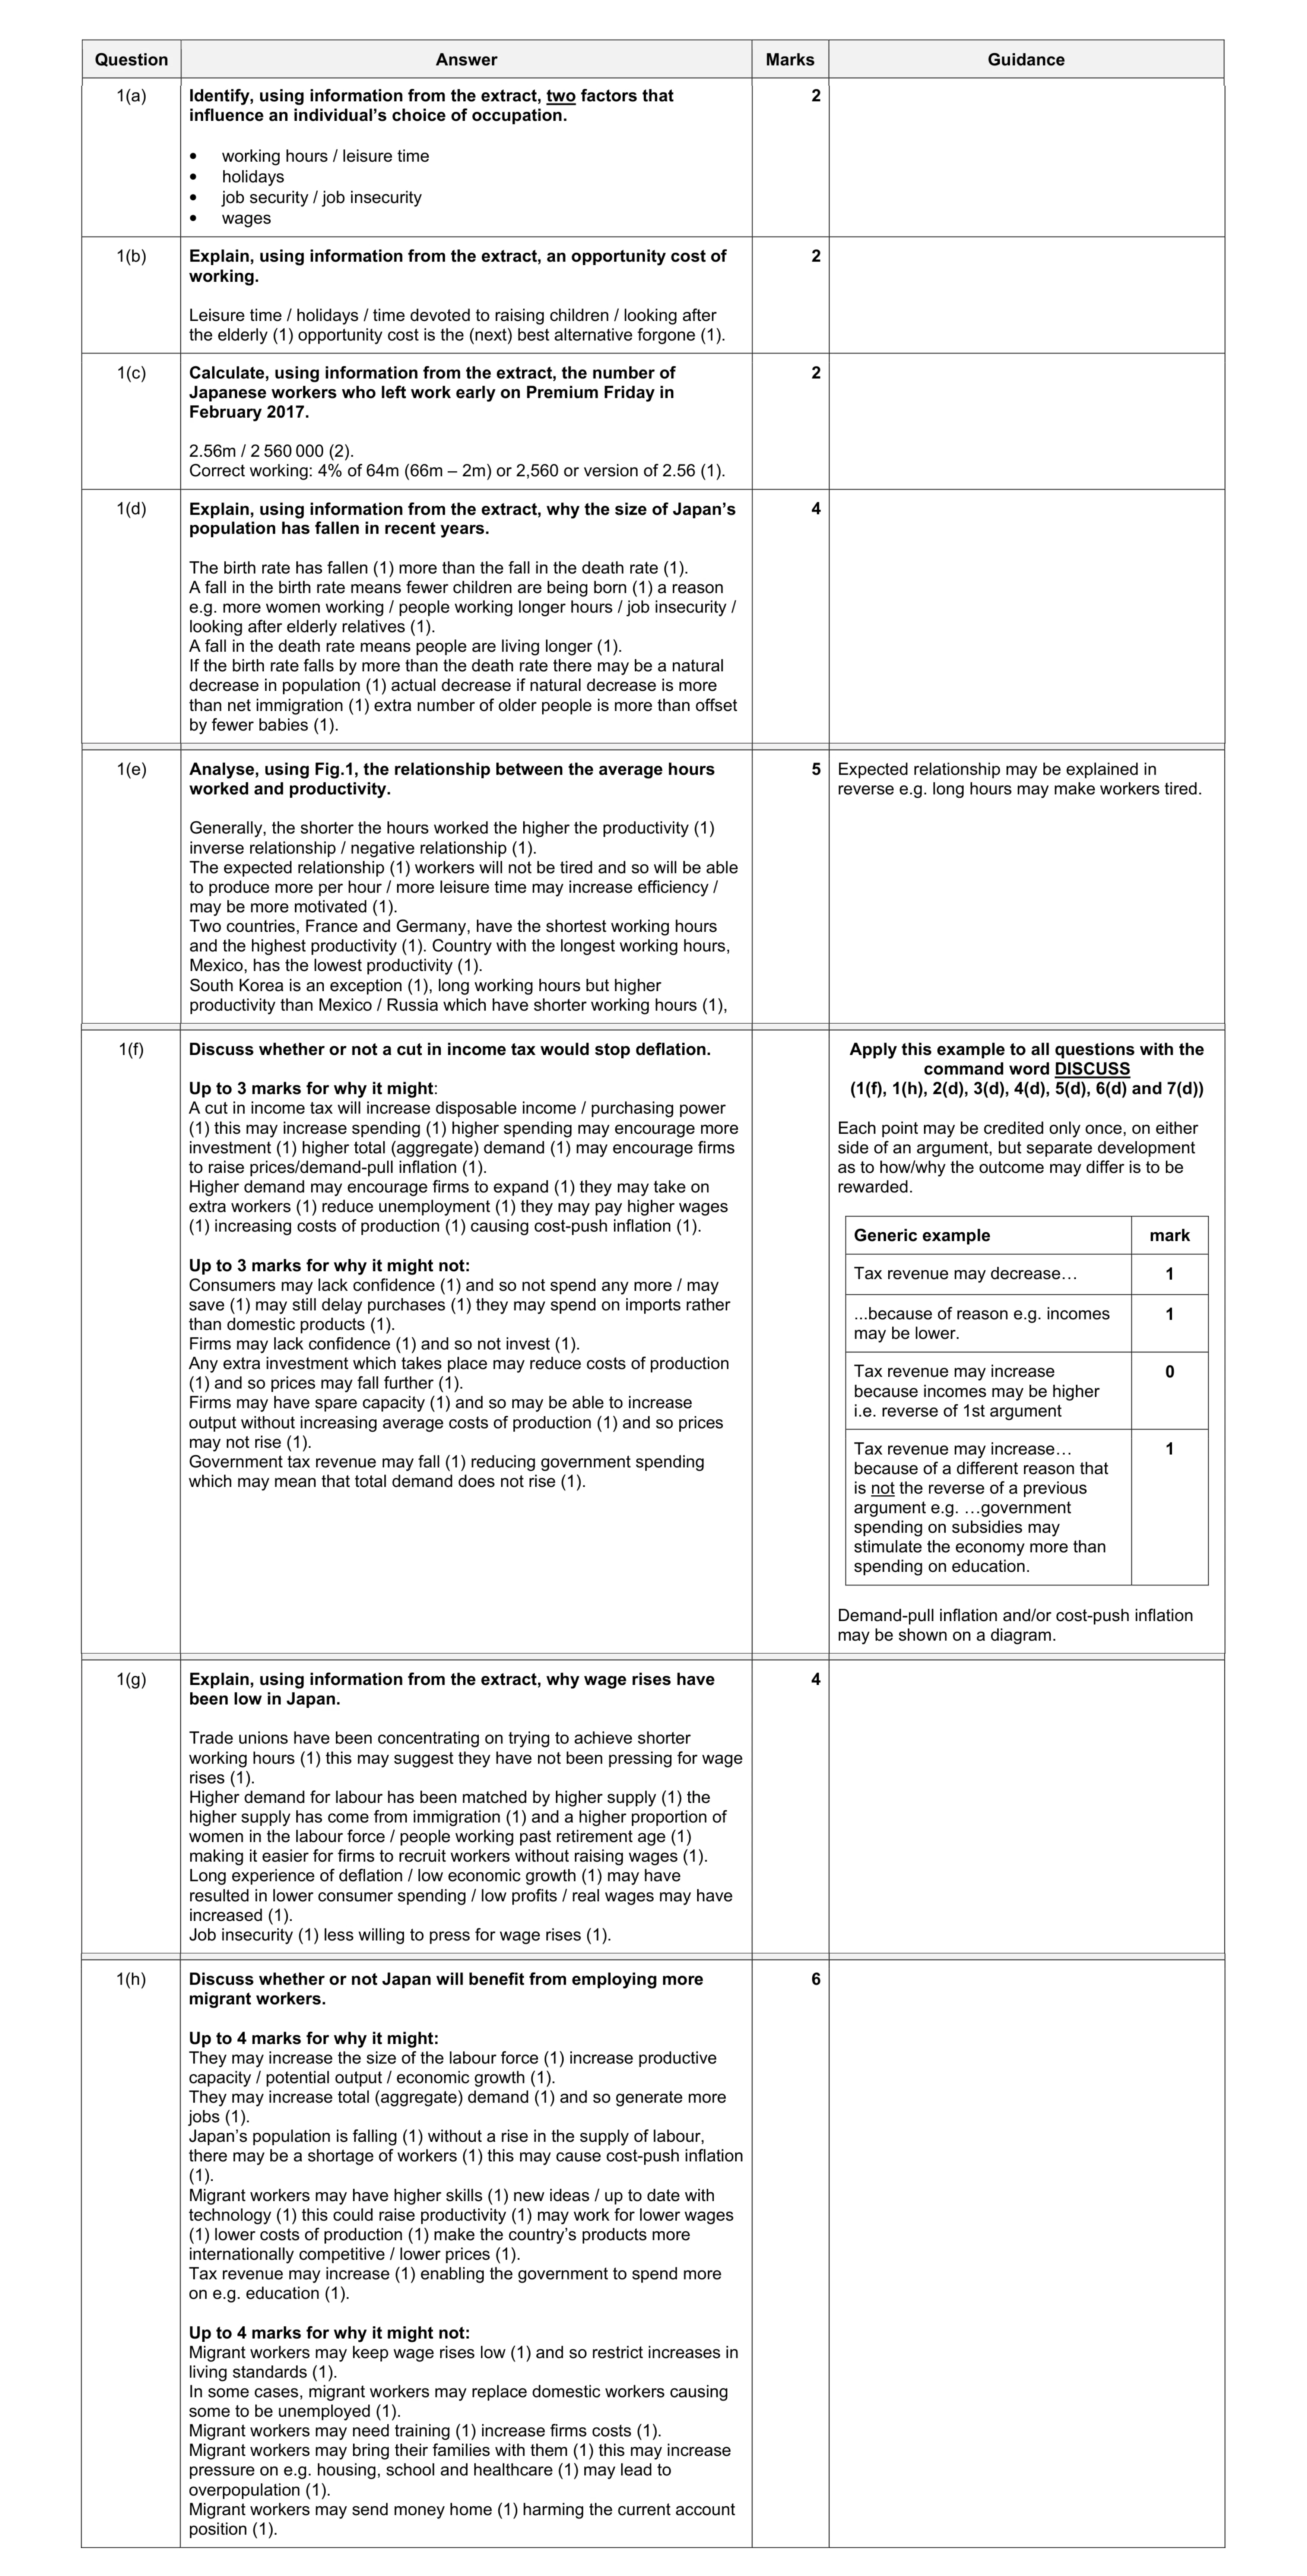 30
30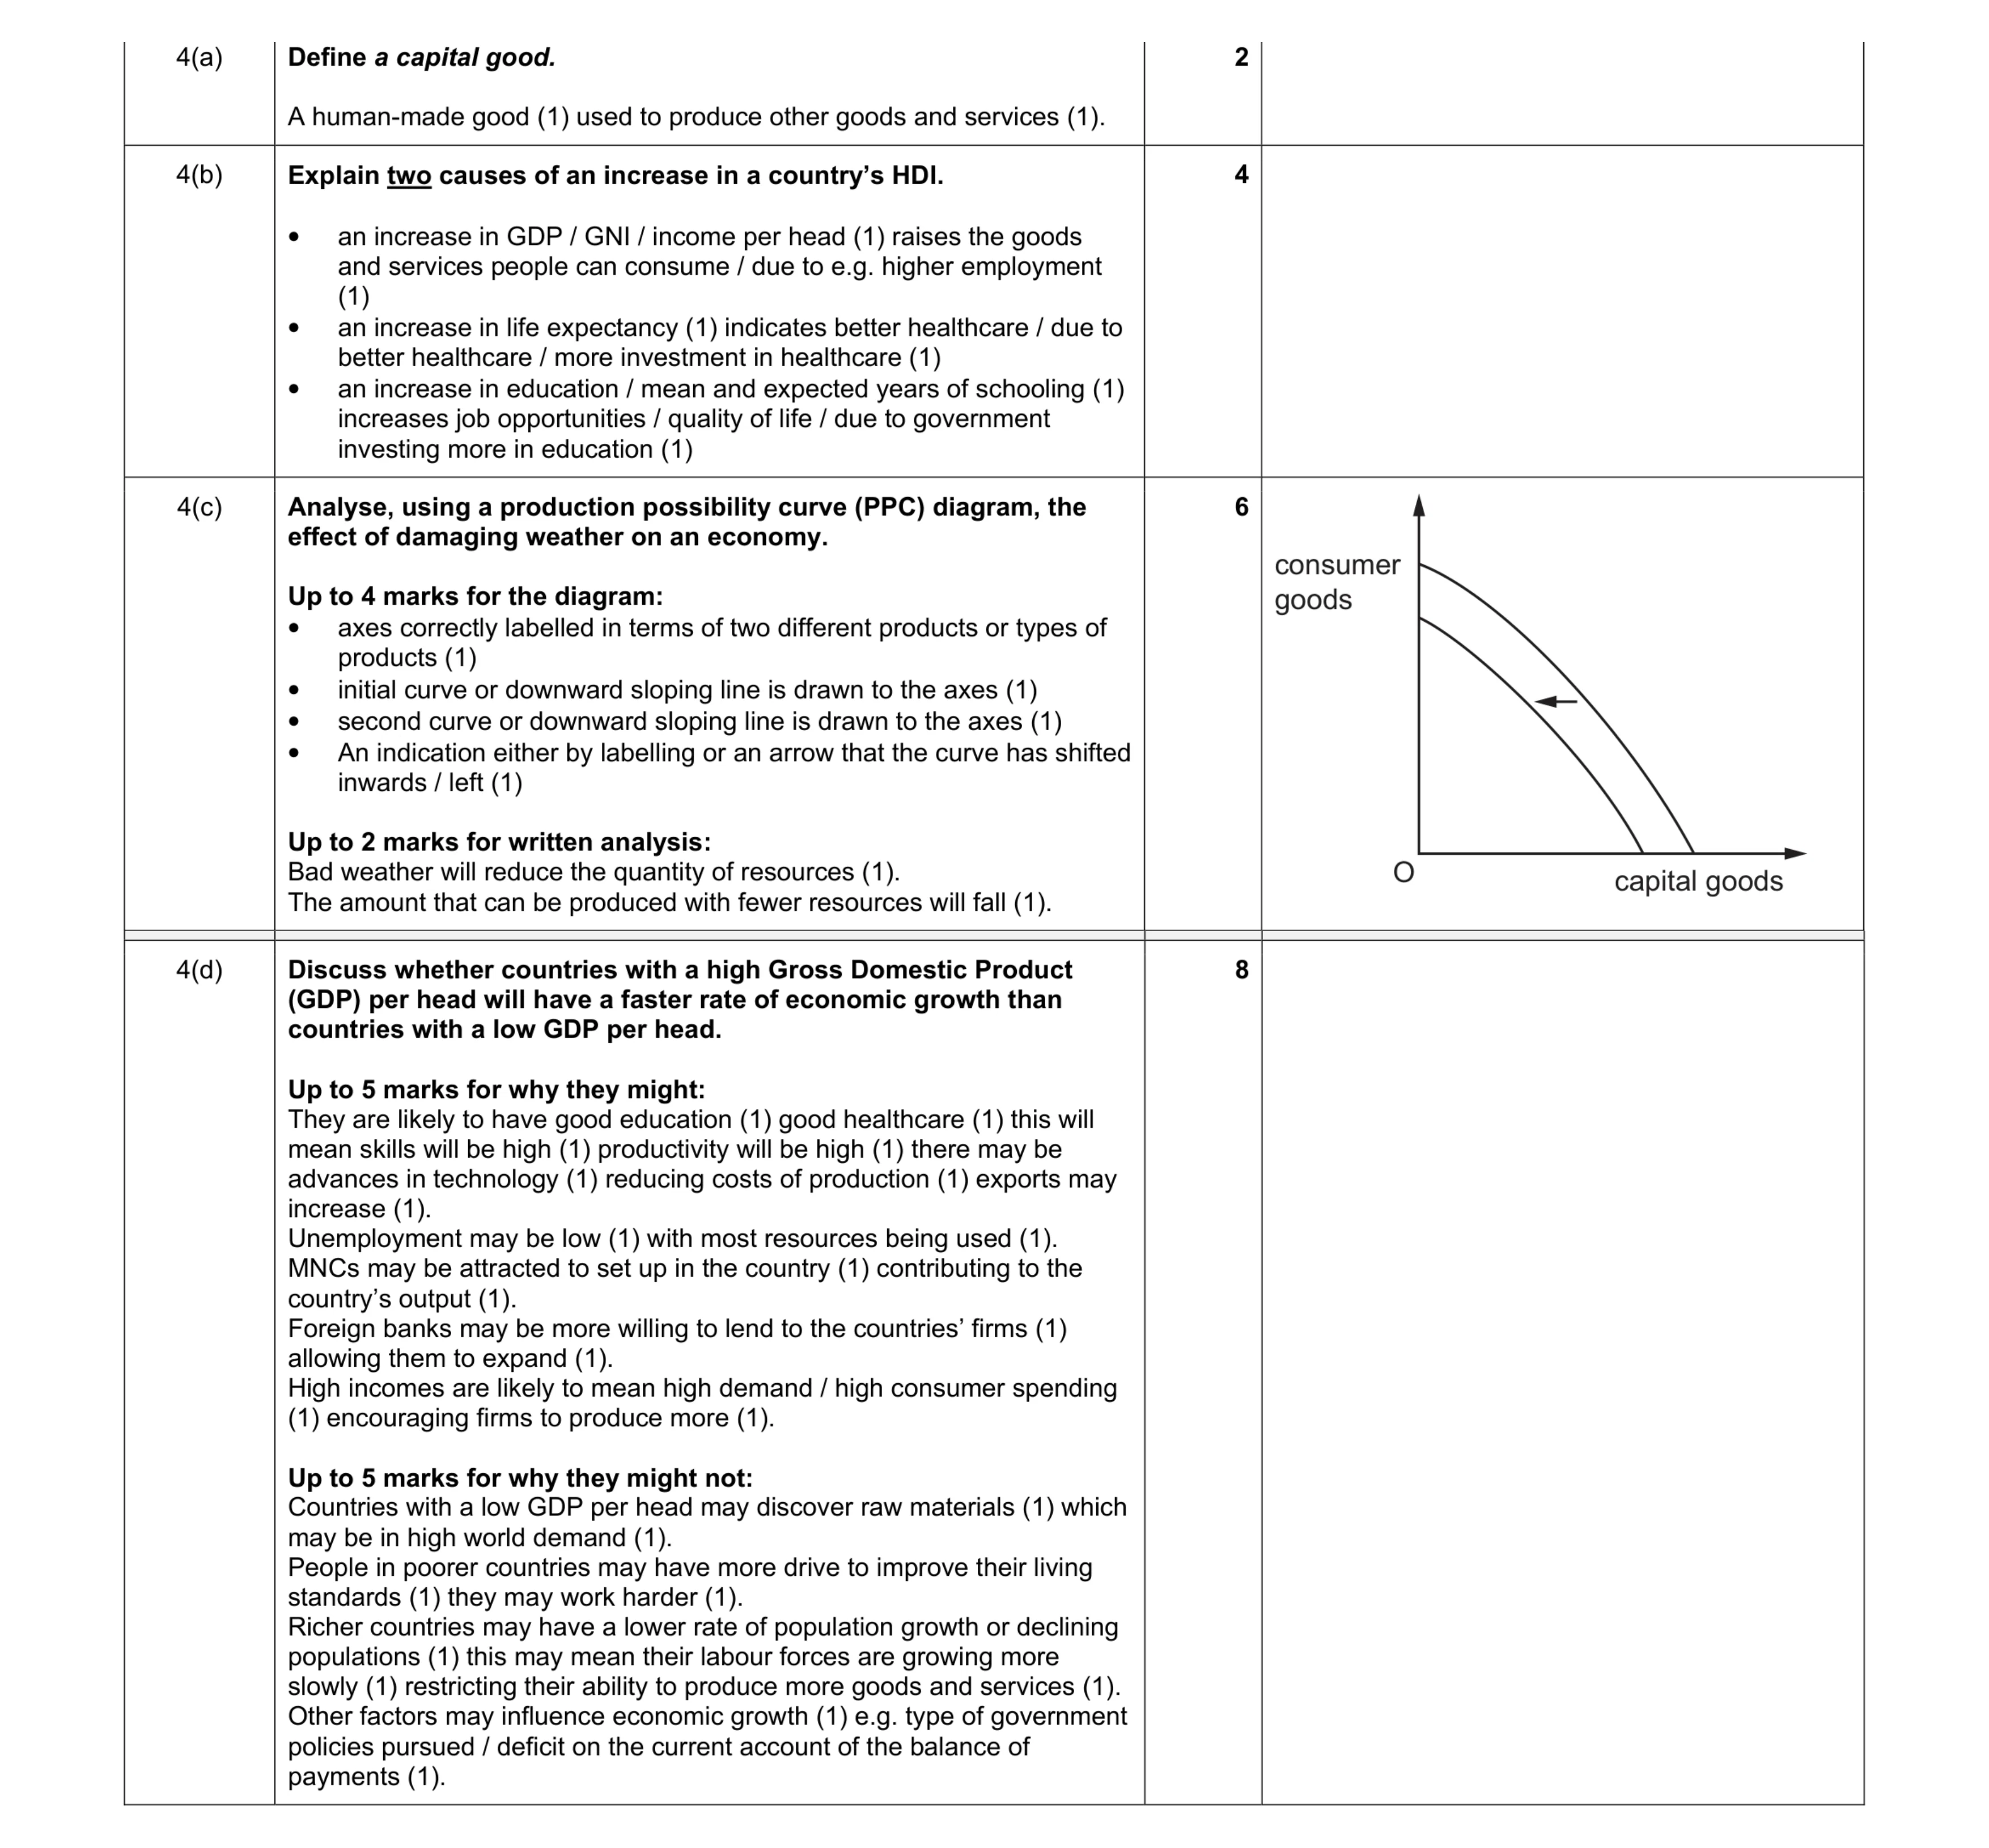 20
20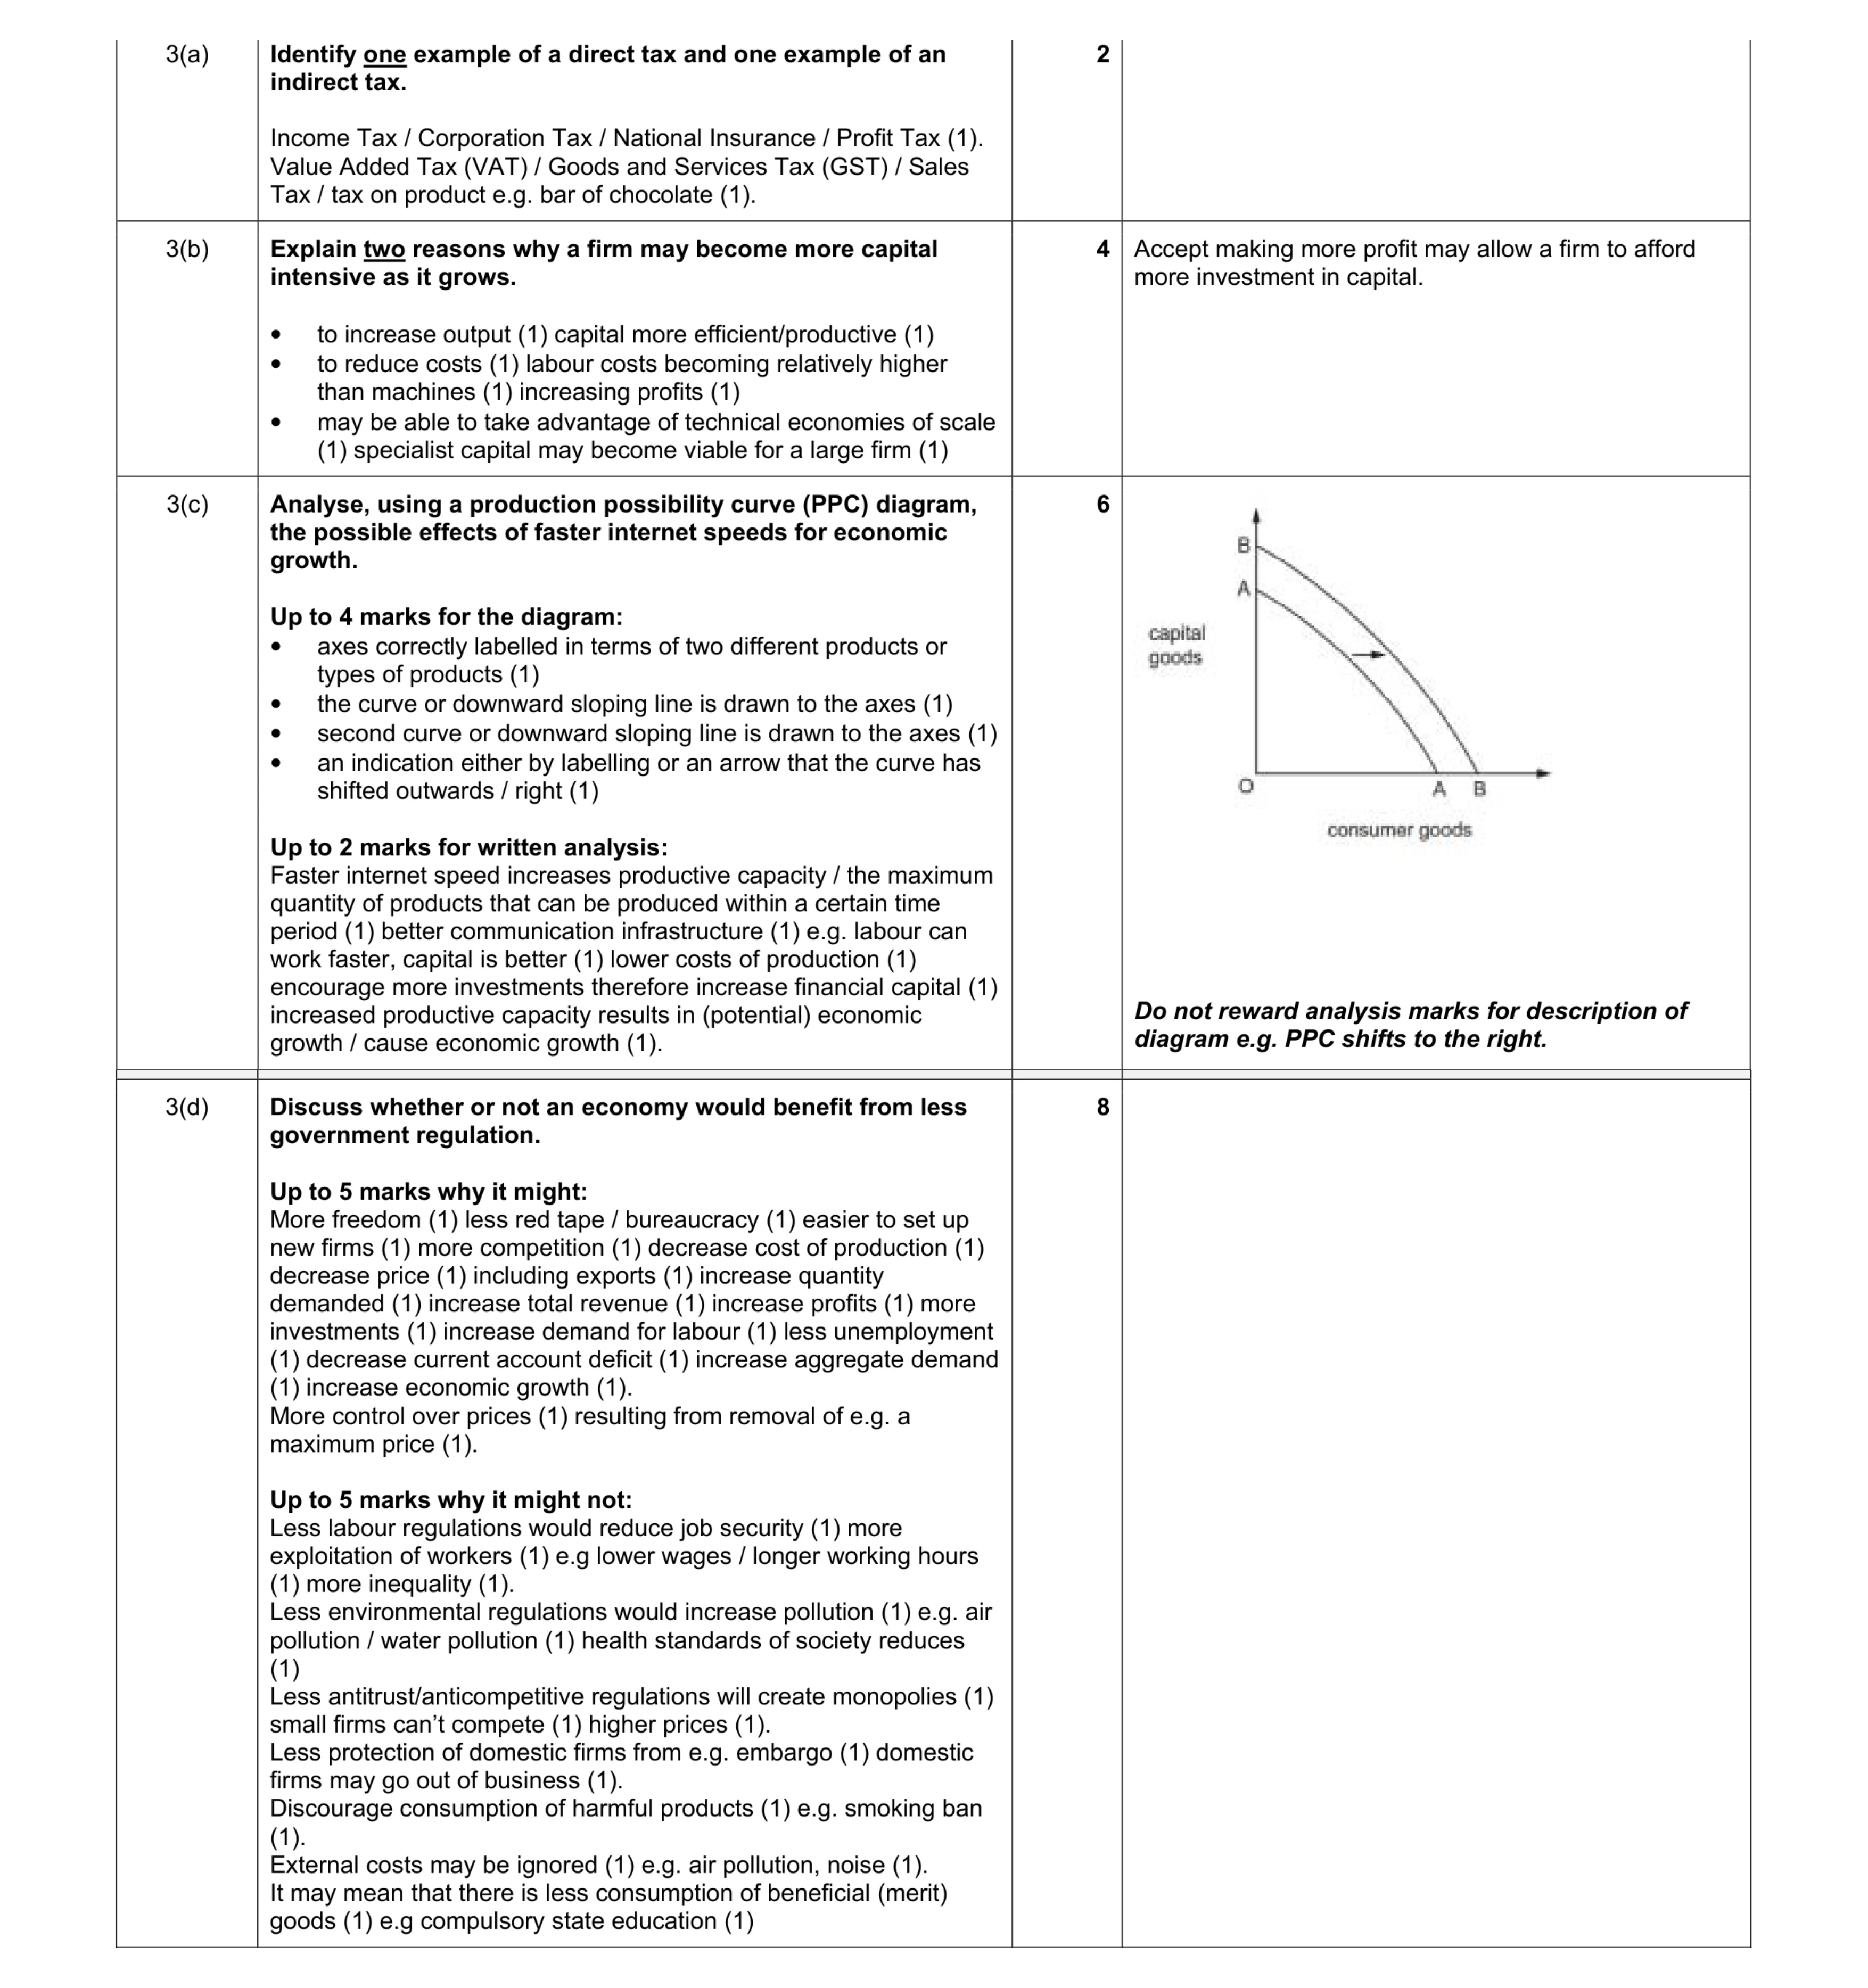 20
20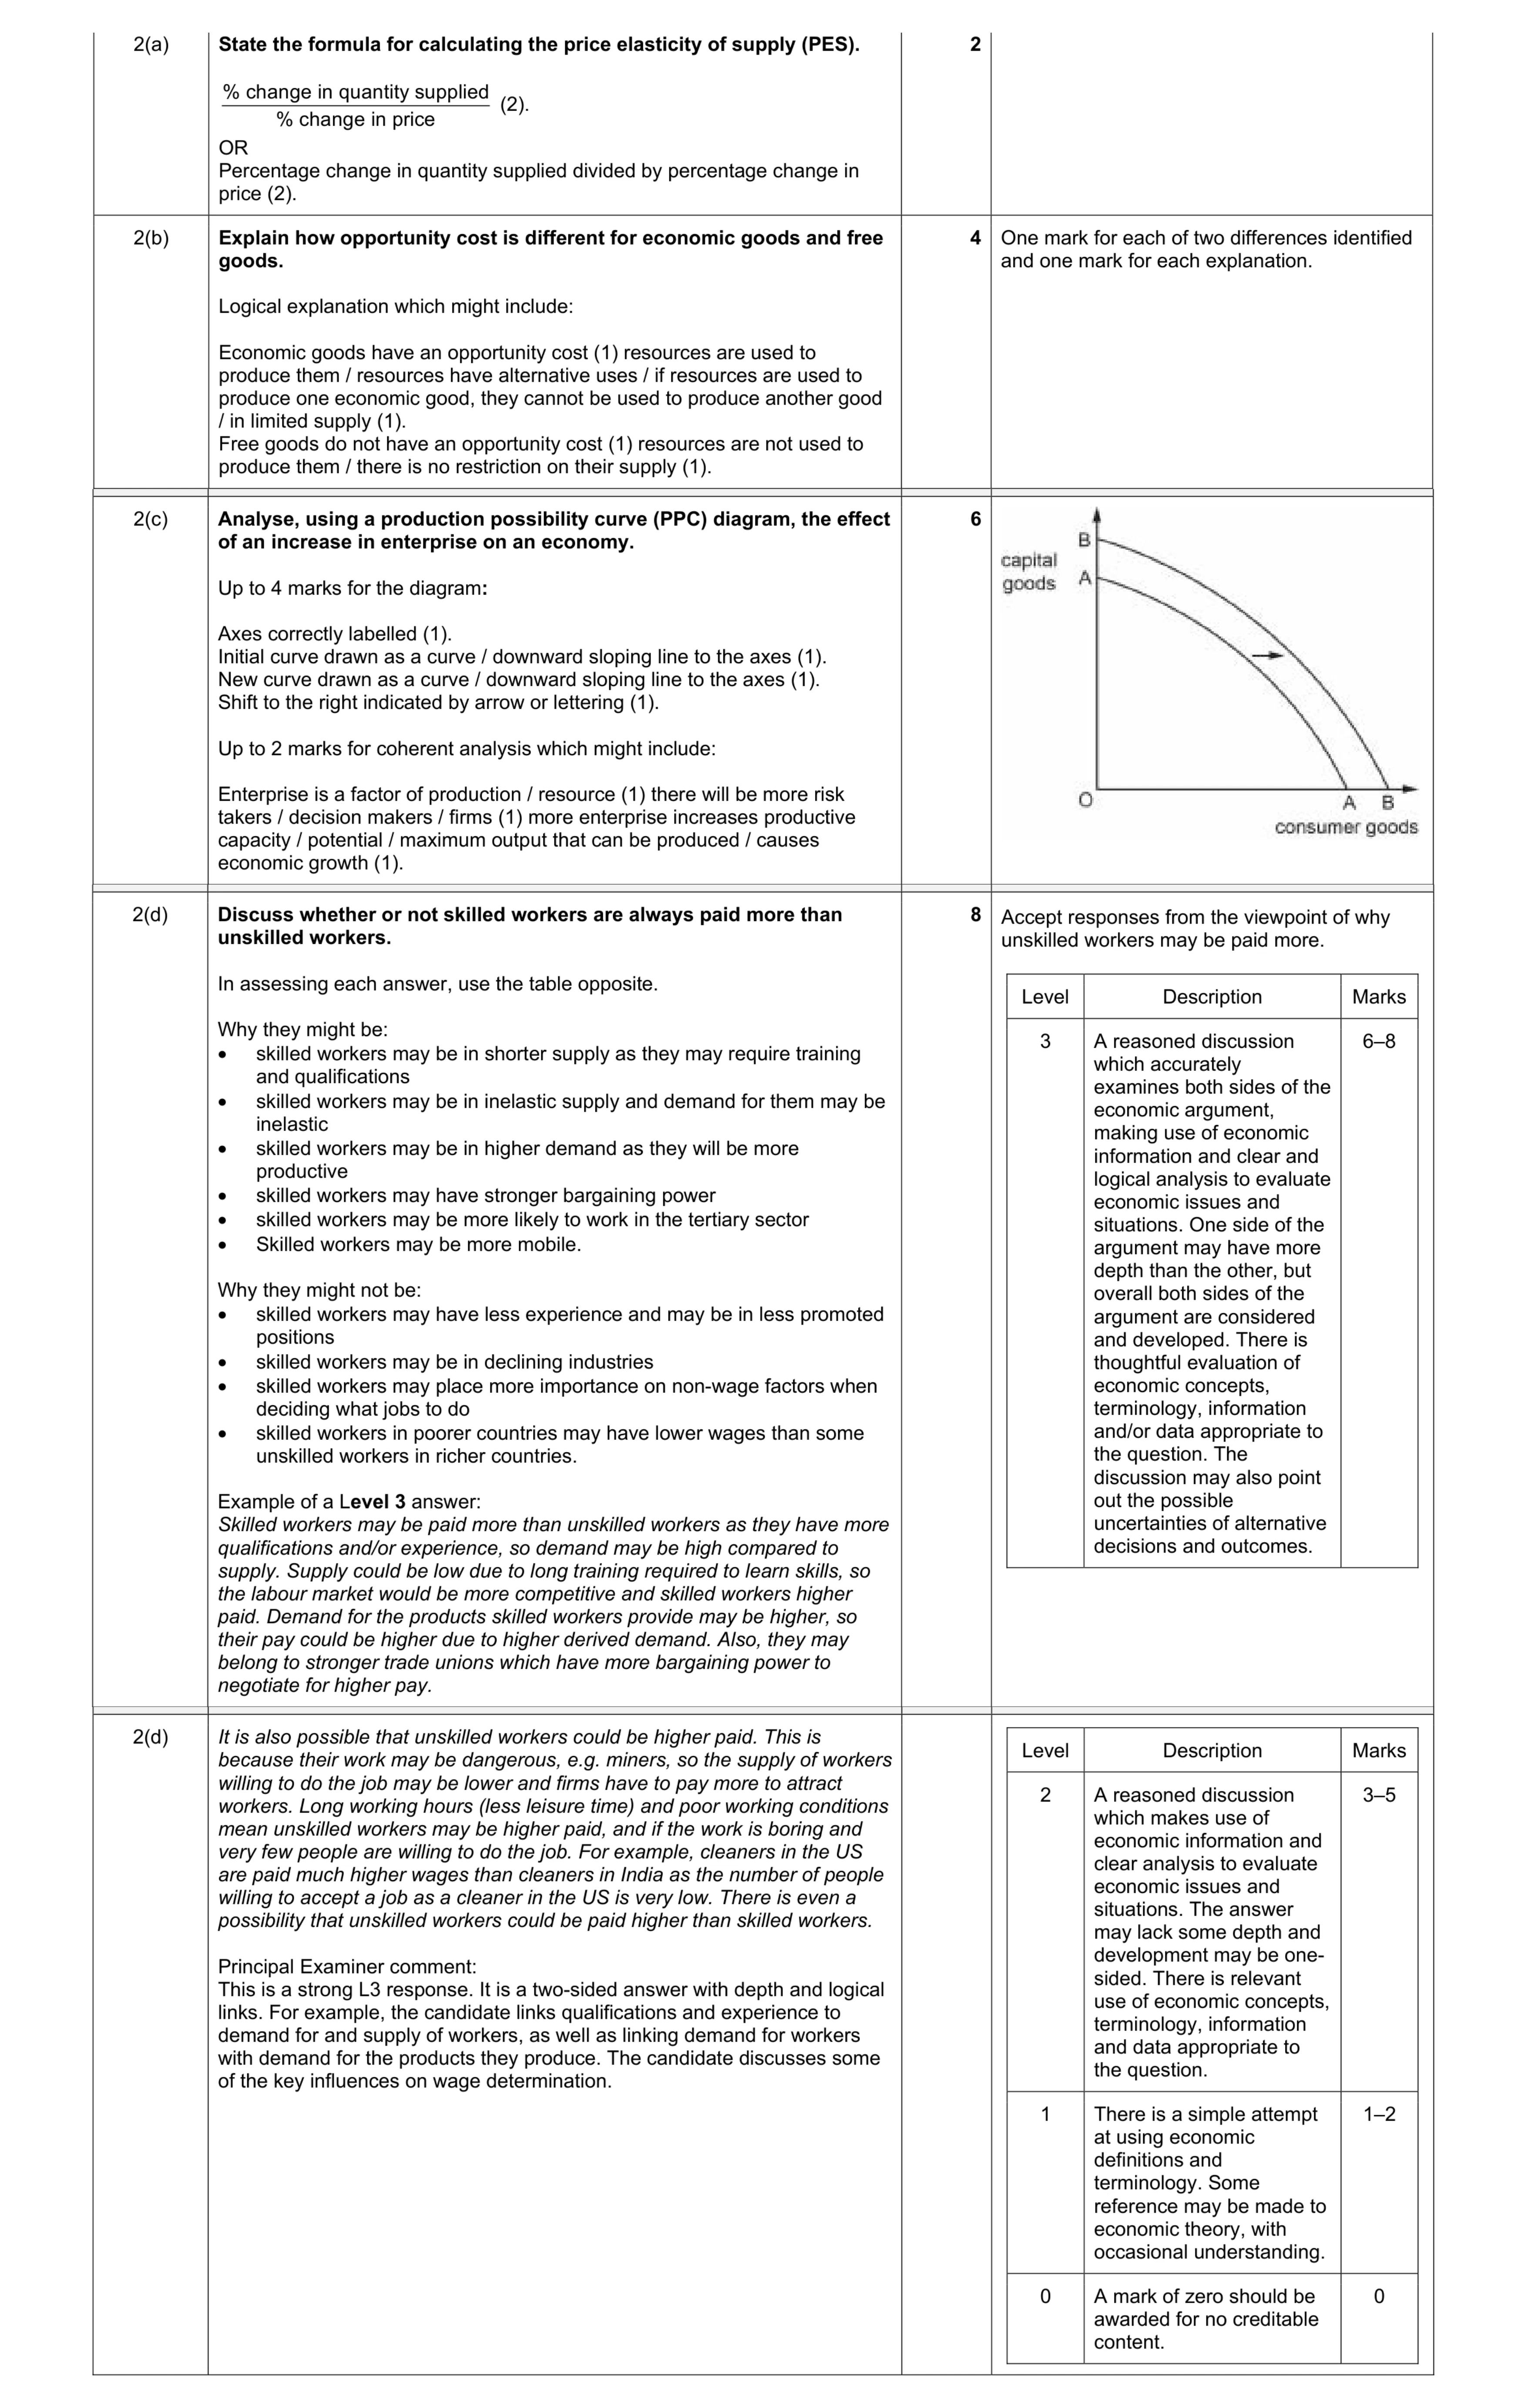 20
20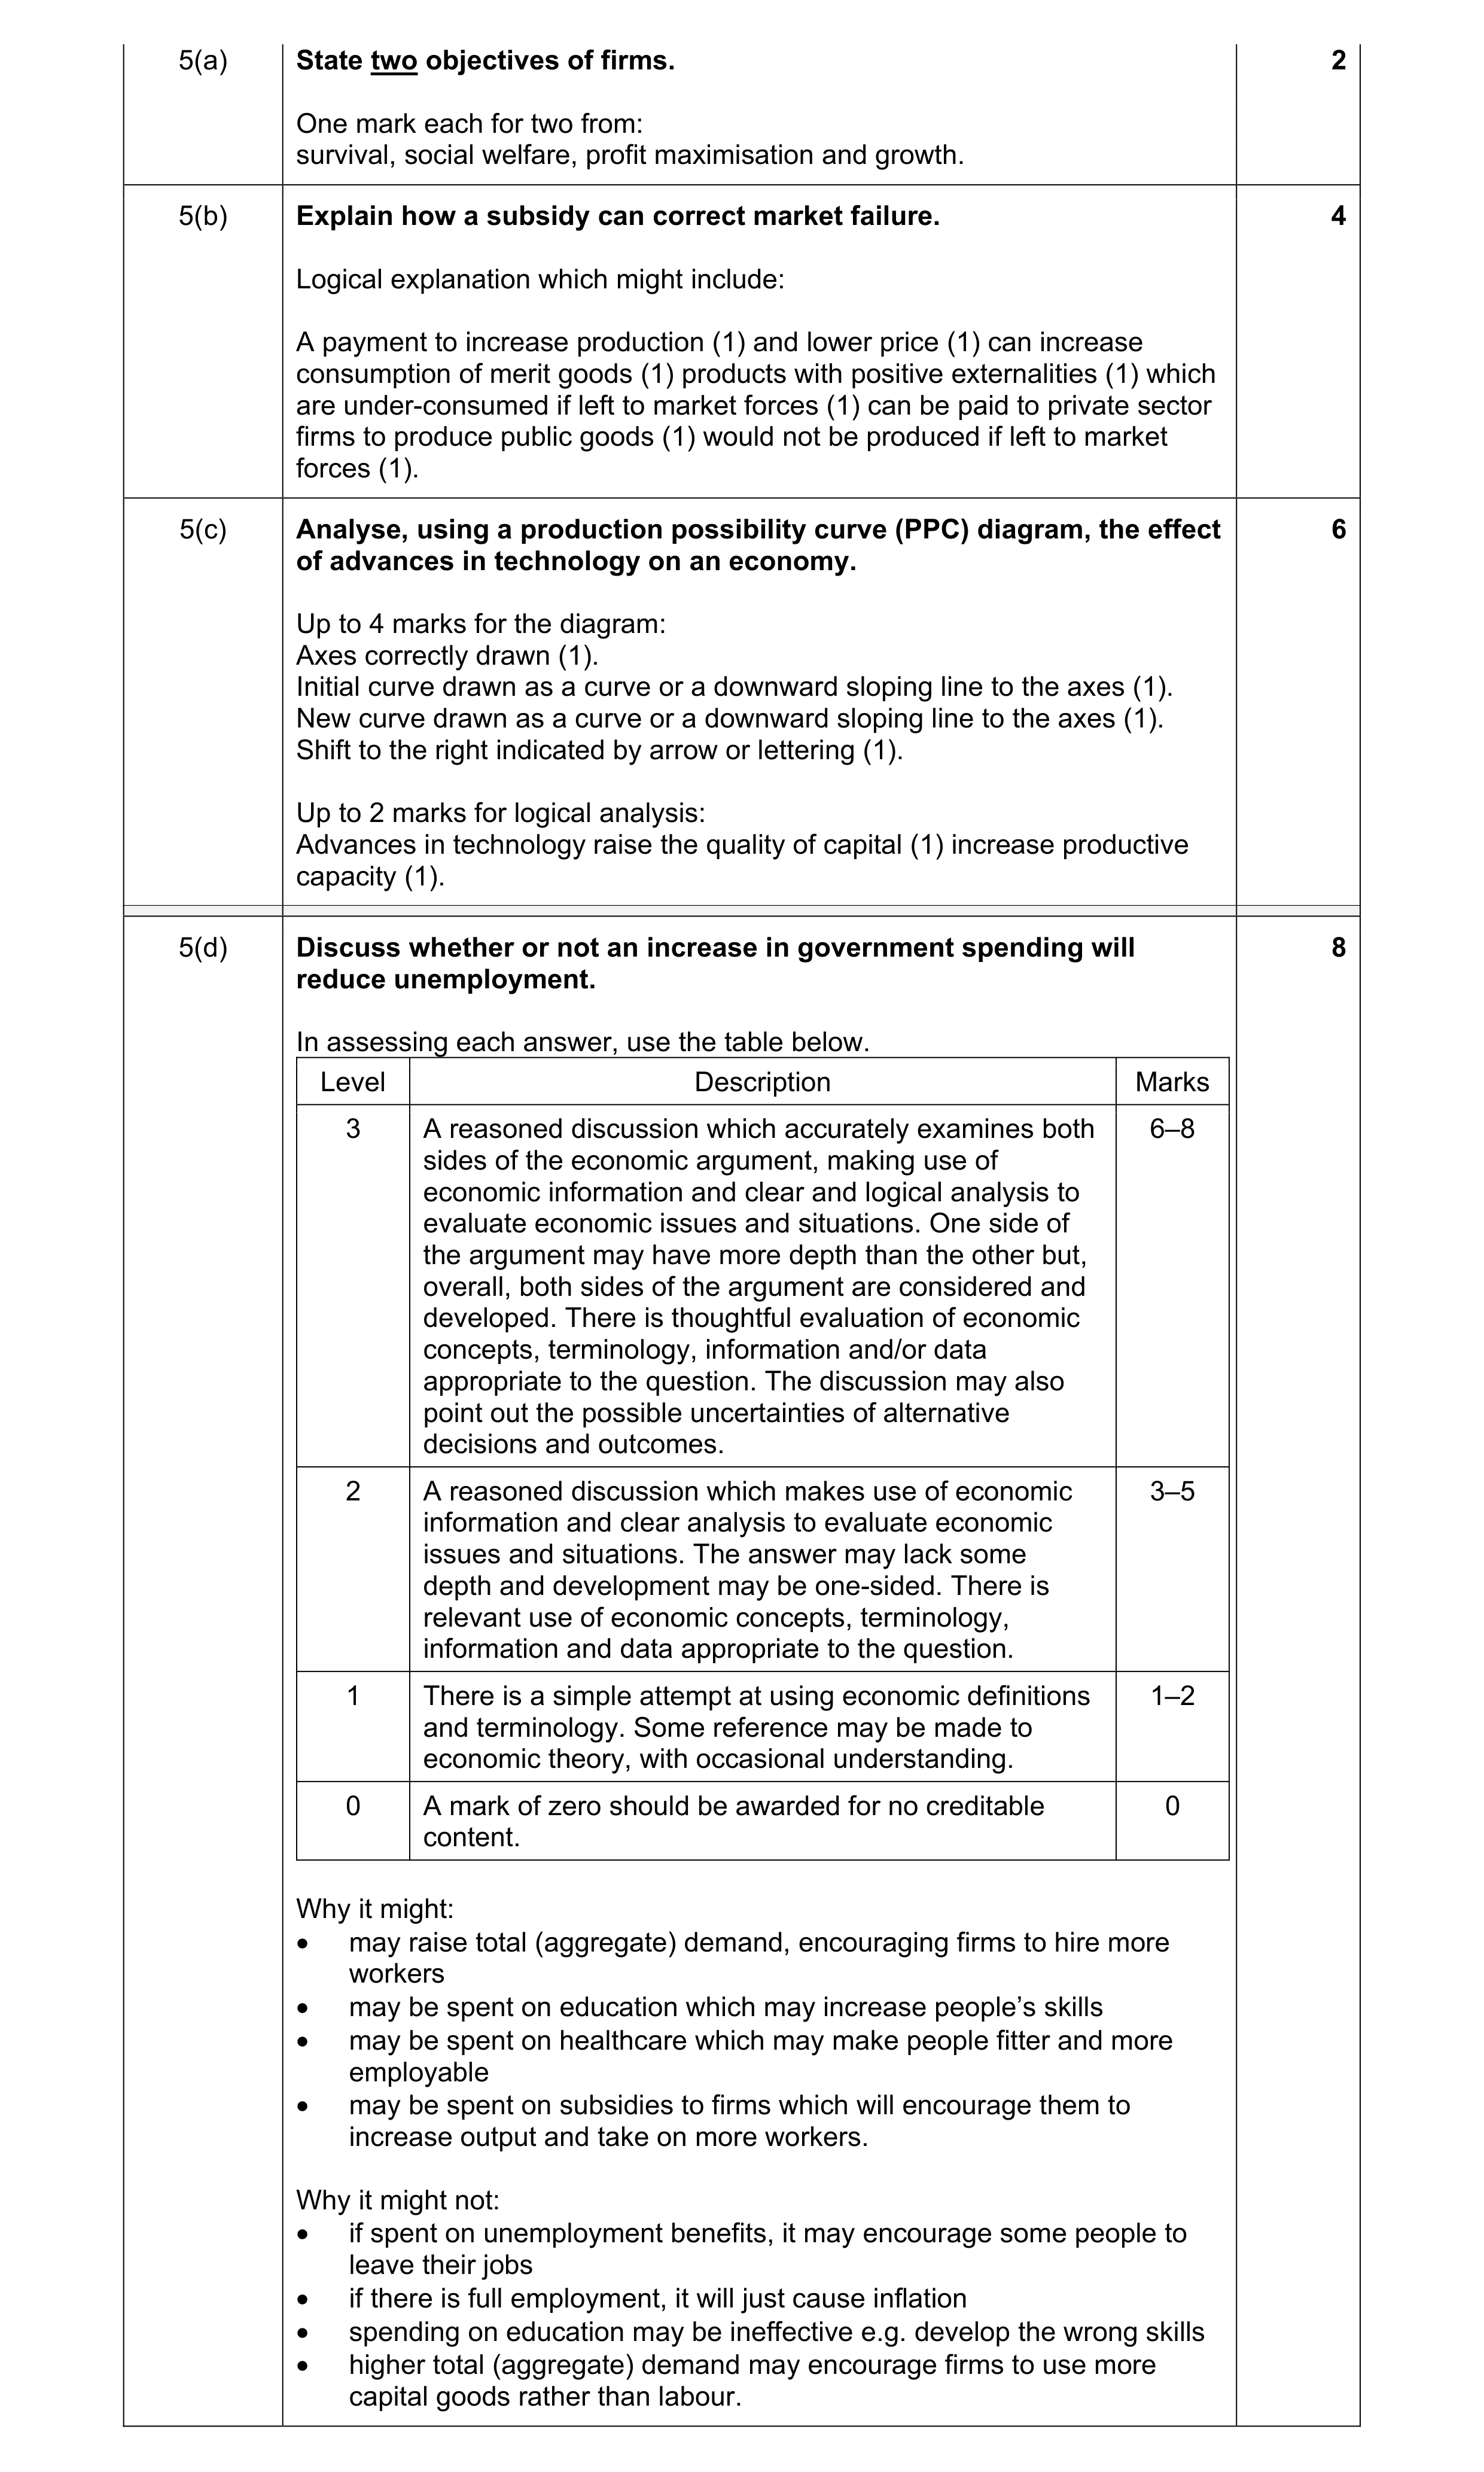 20
20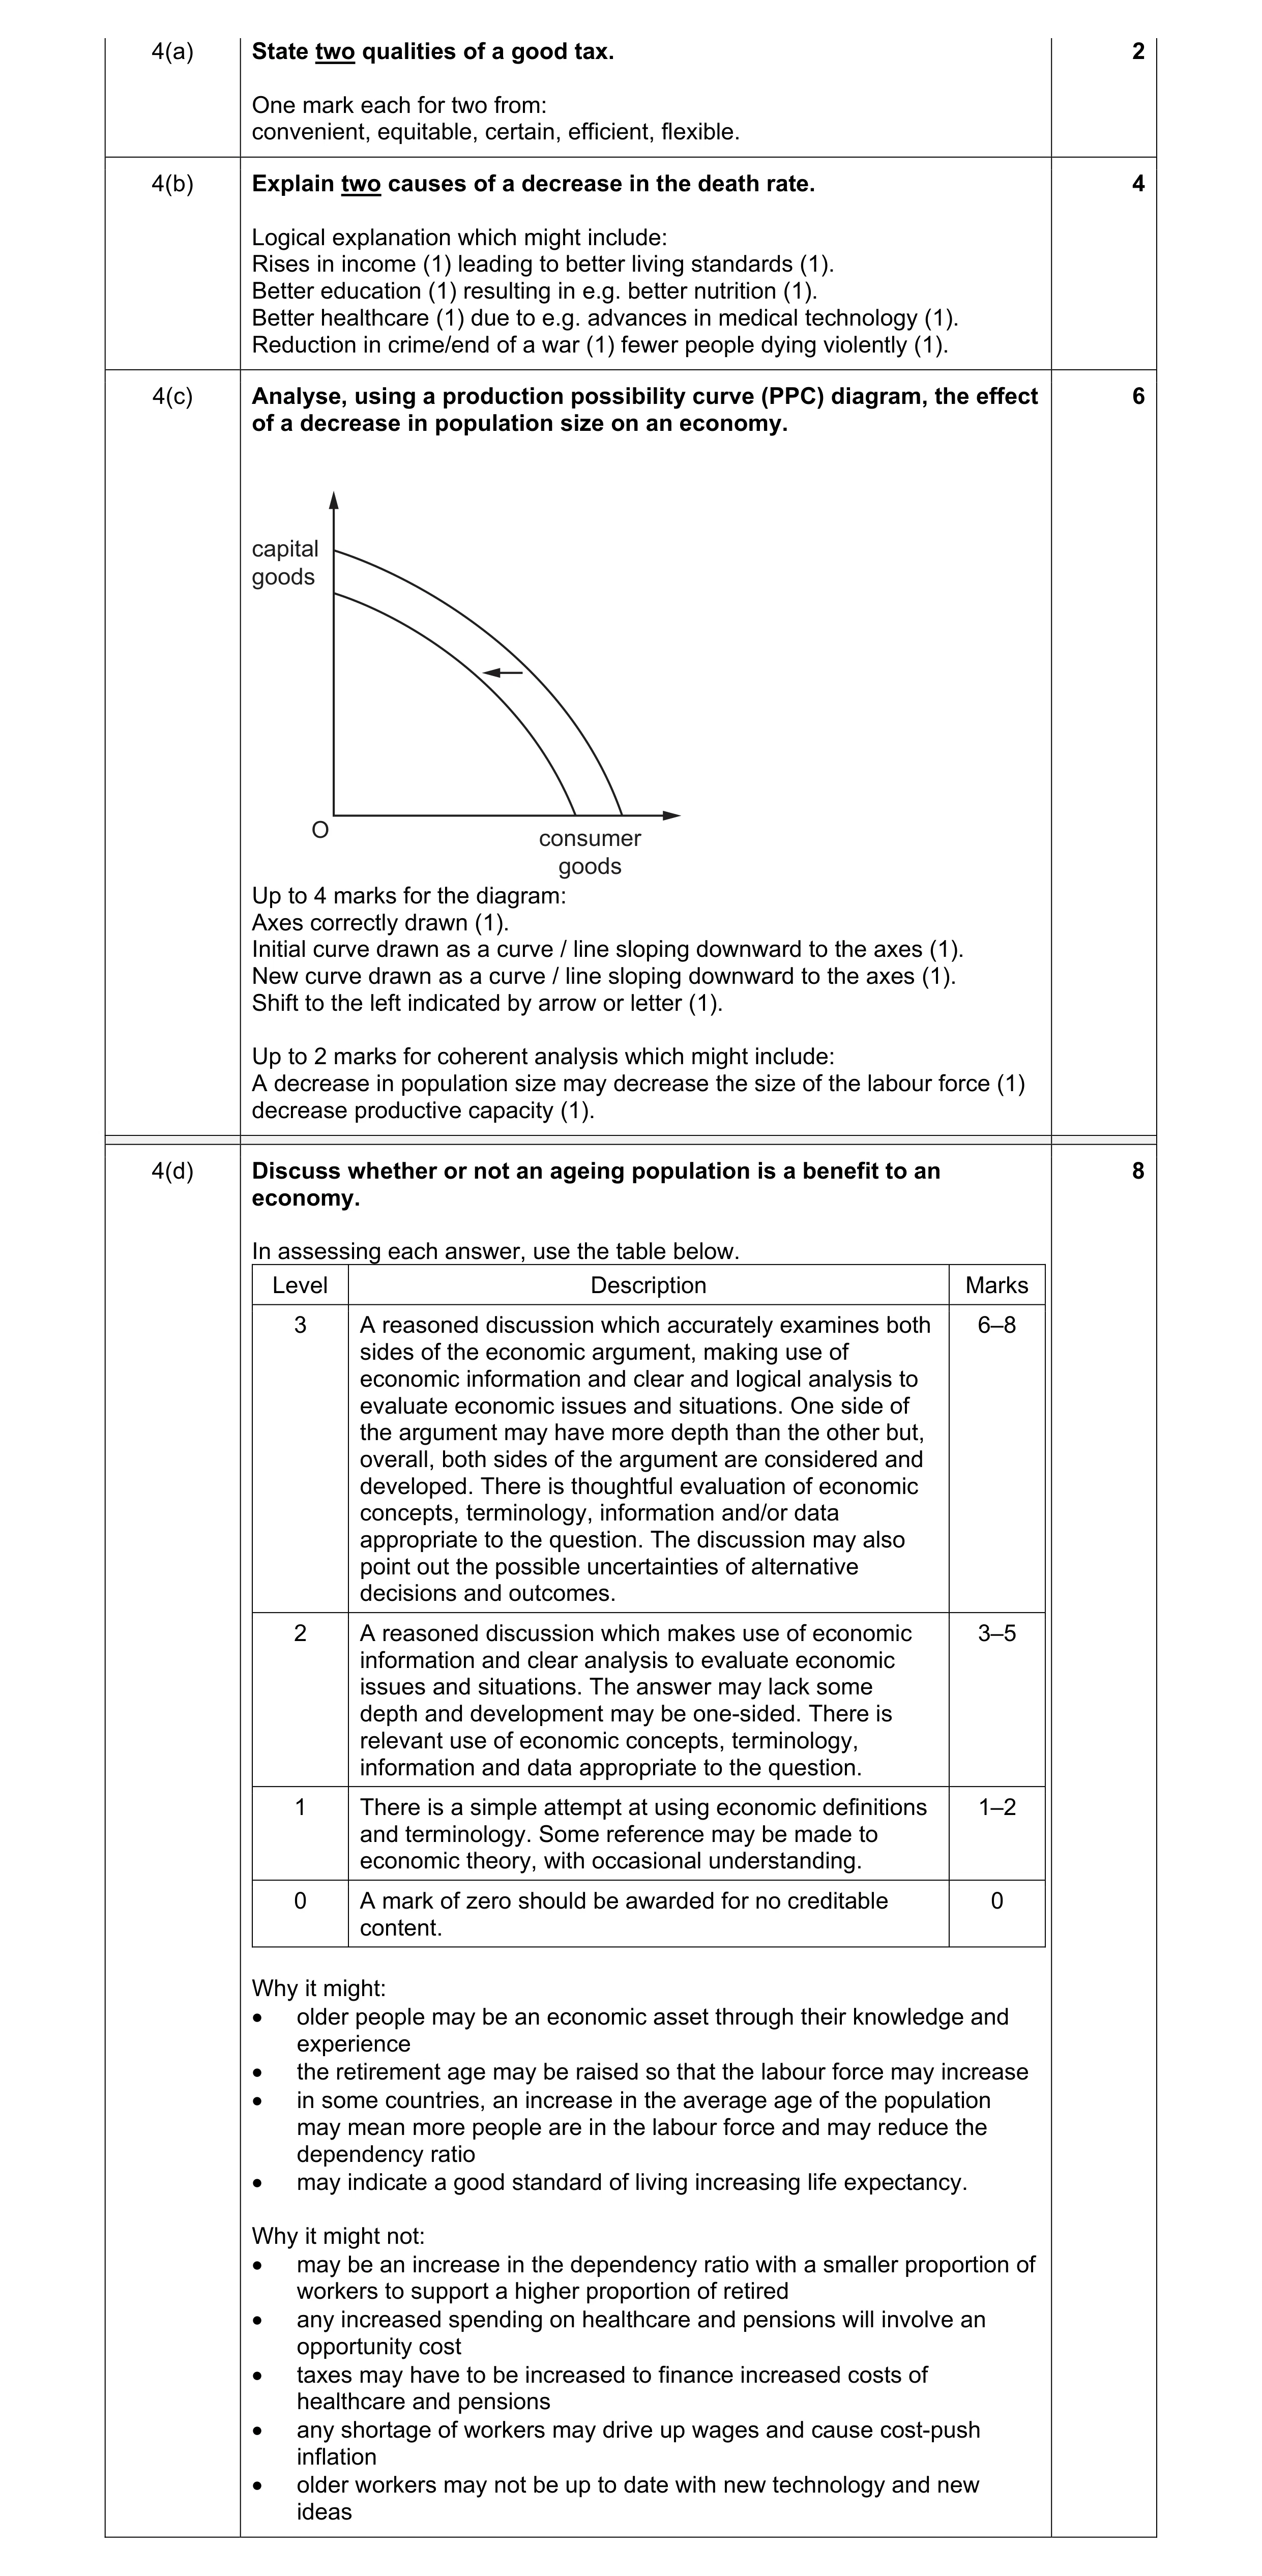 20
20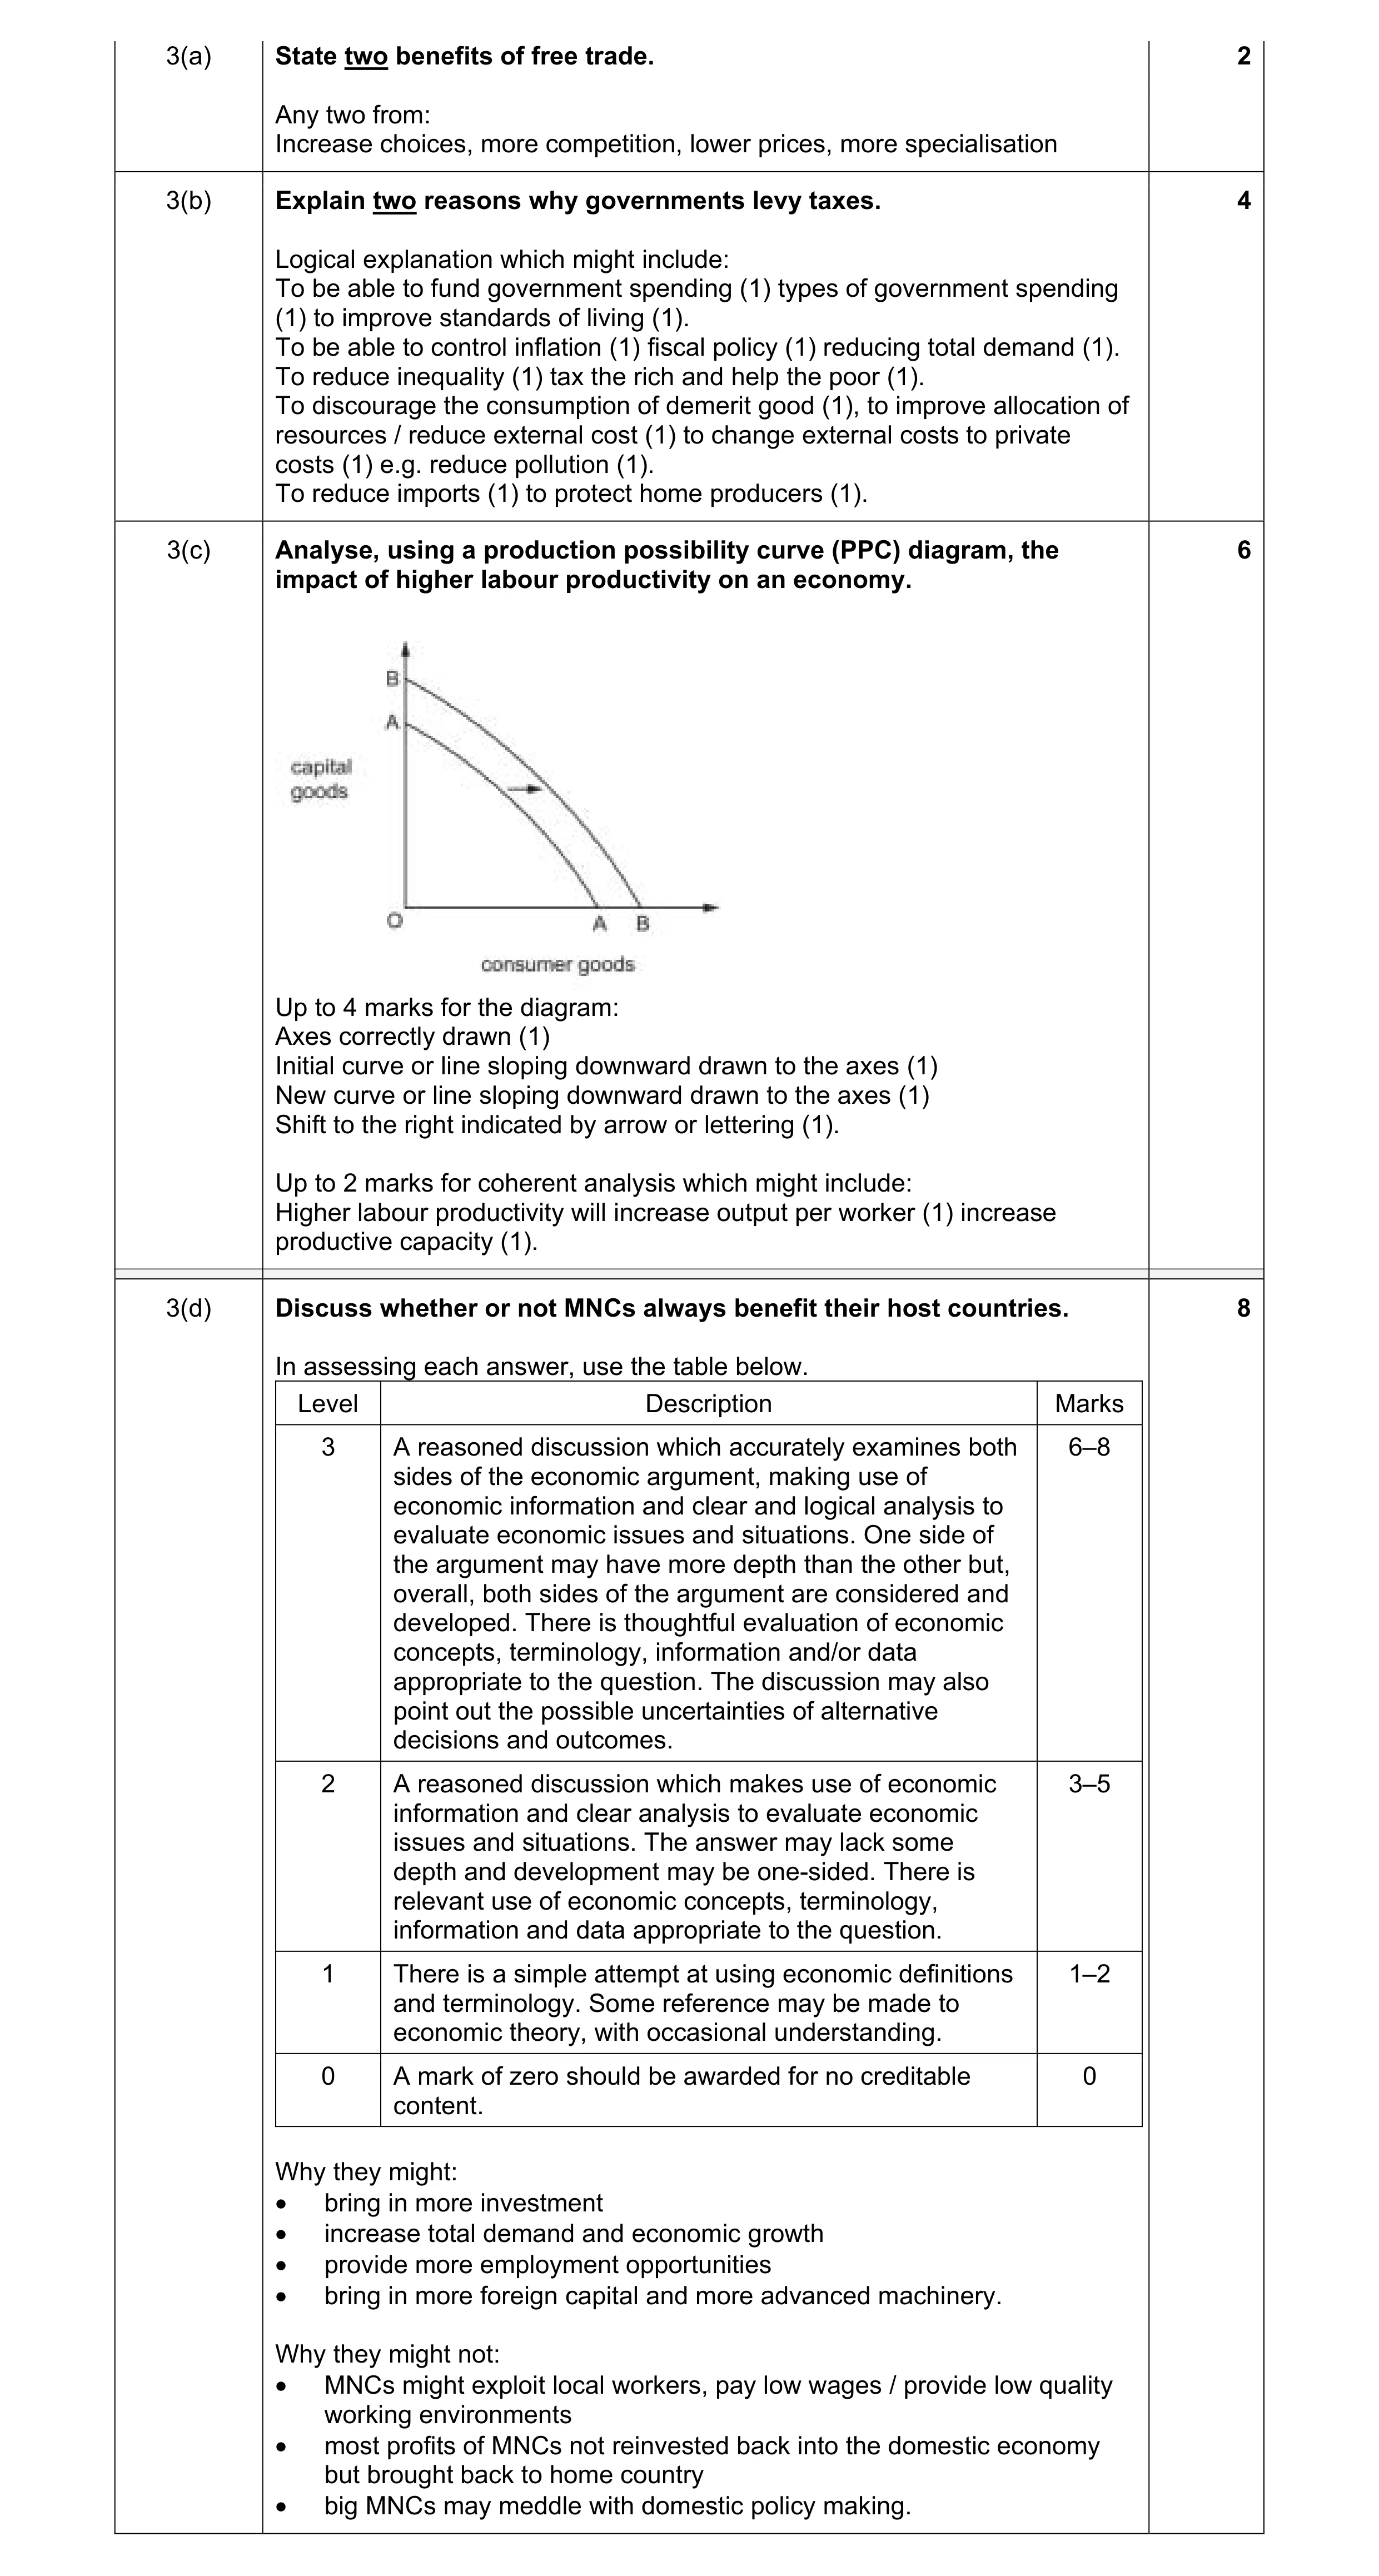 20
20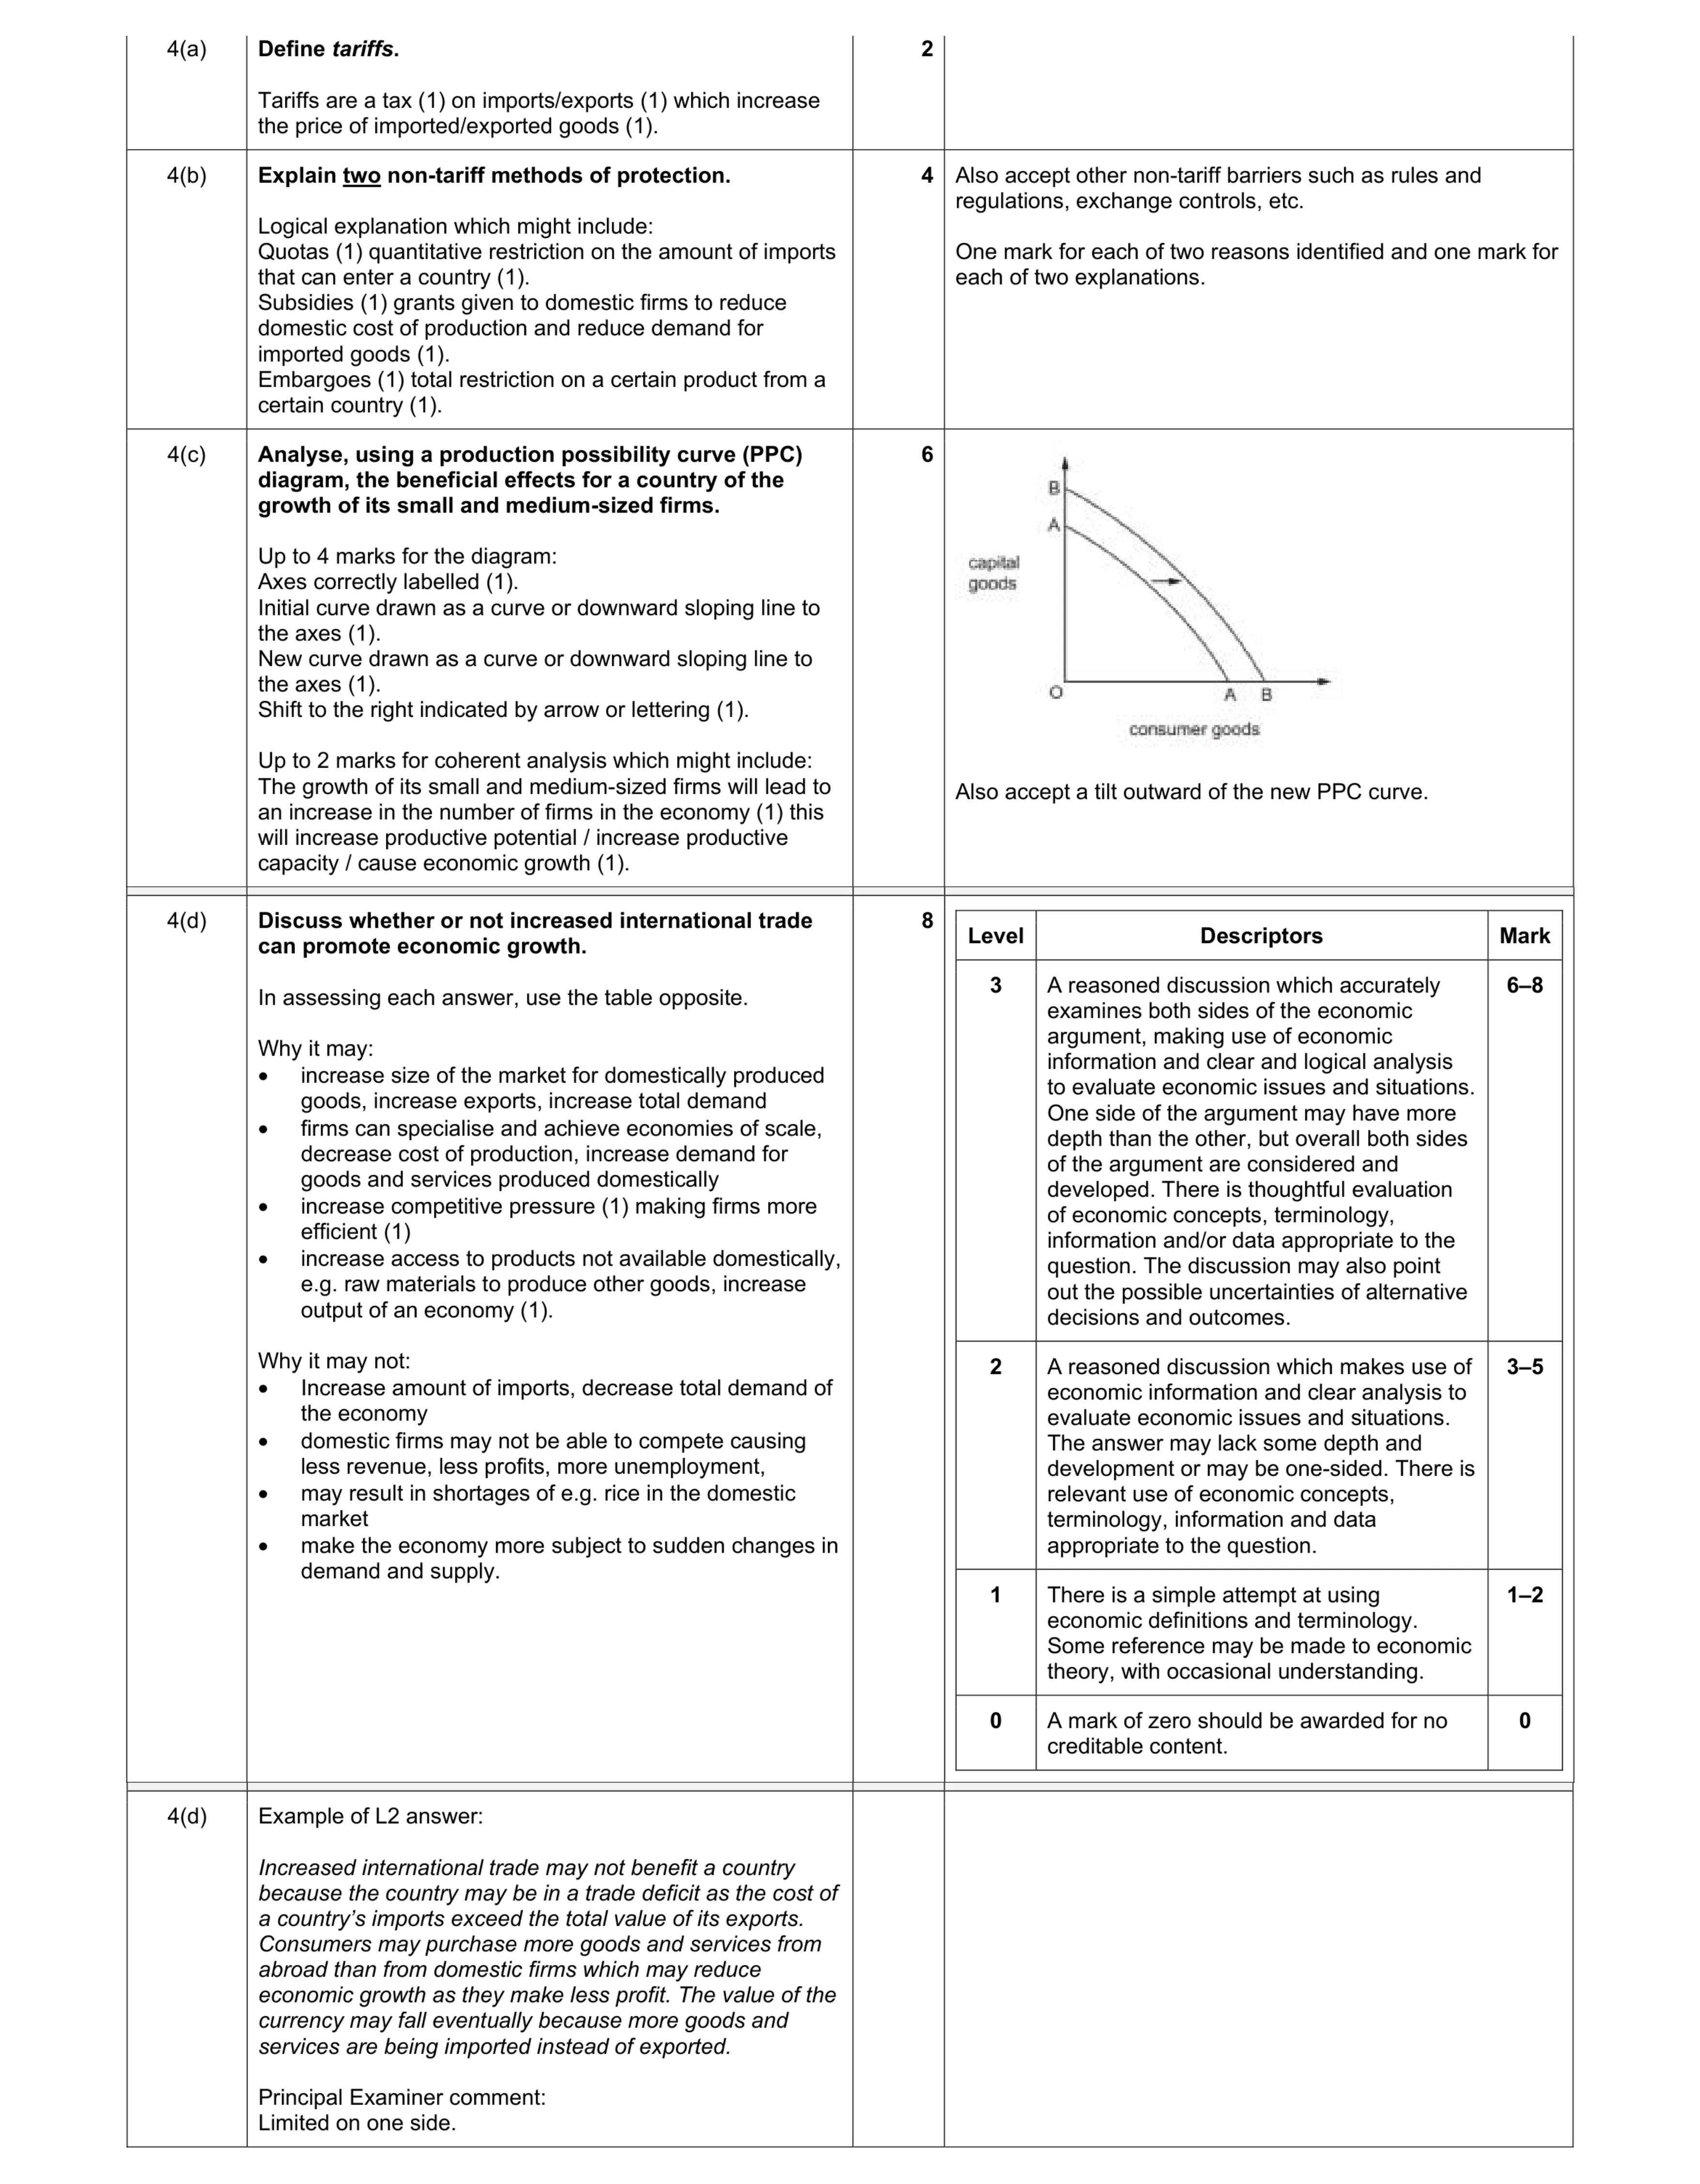 20
20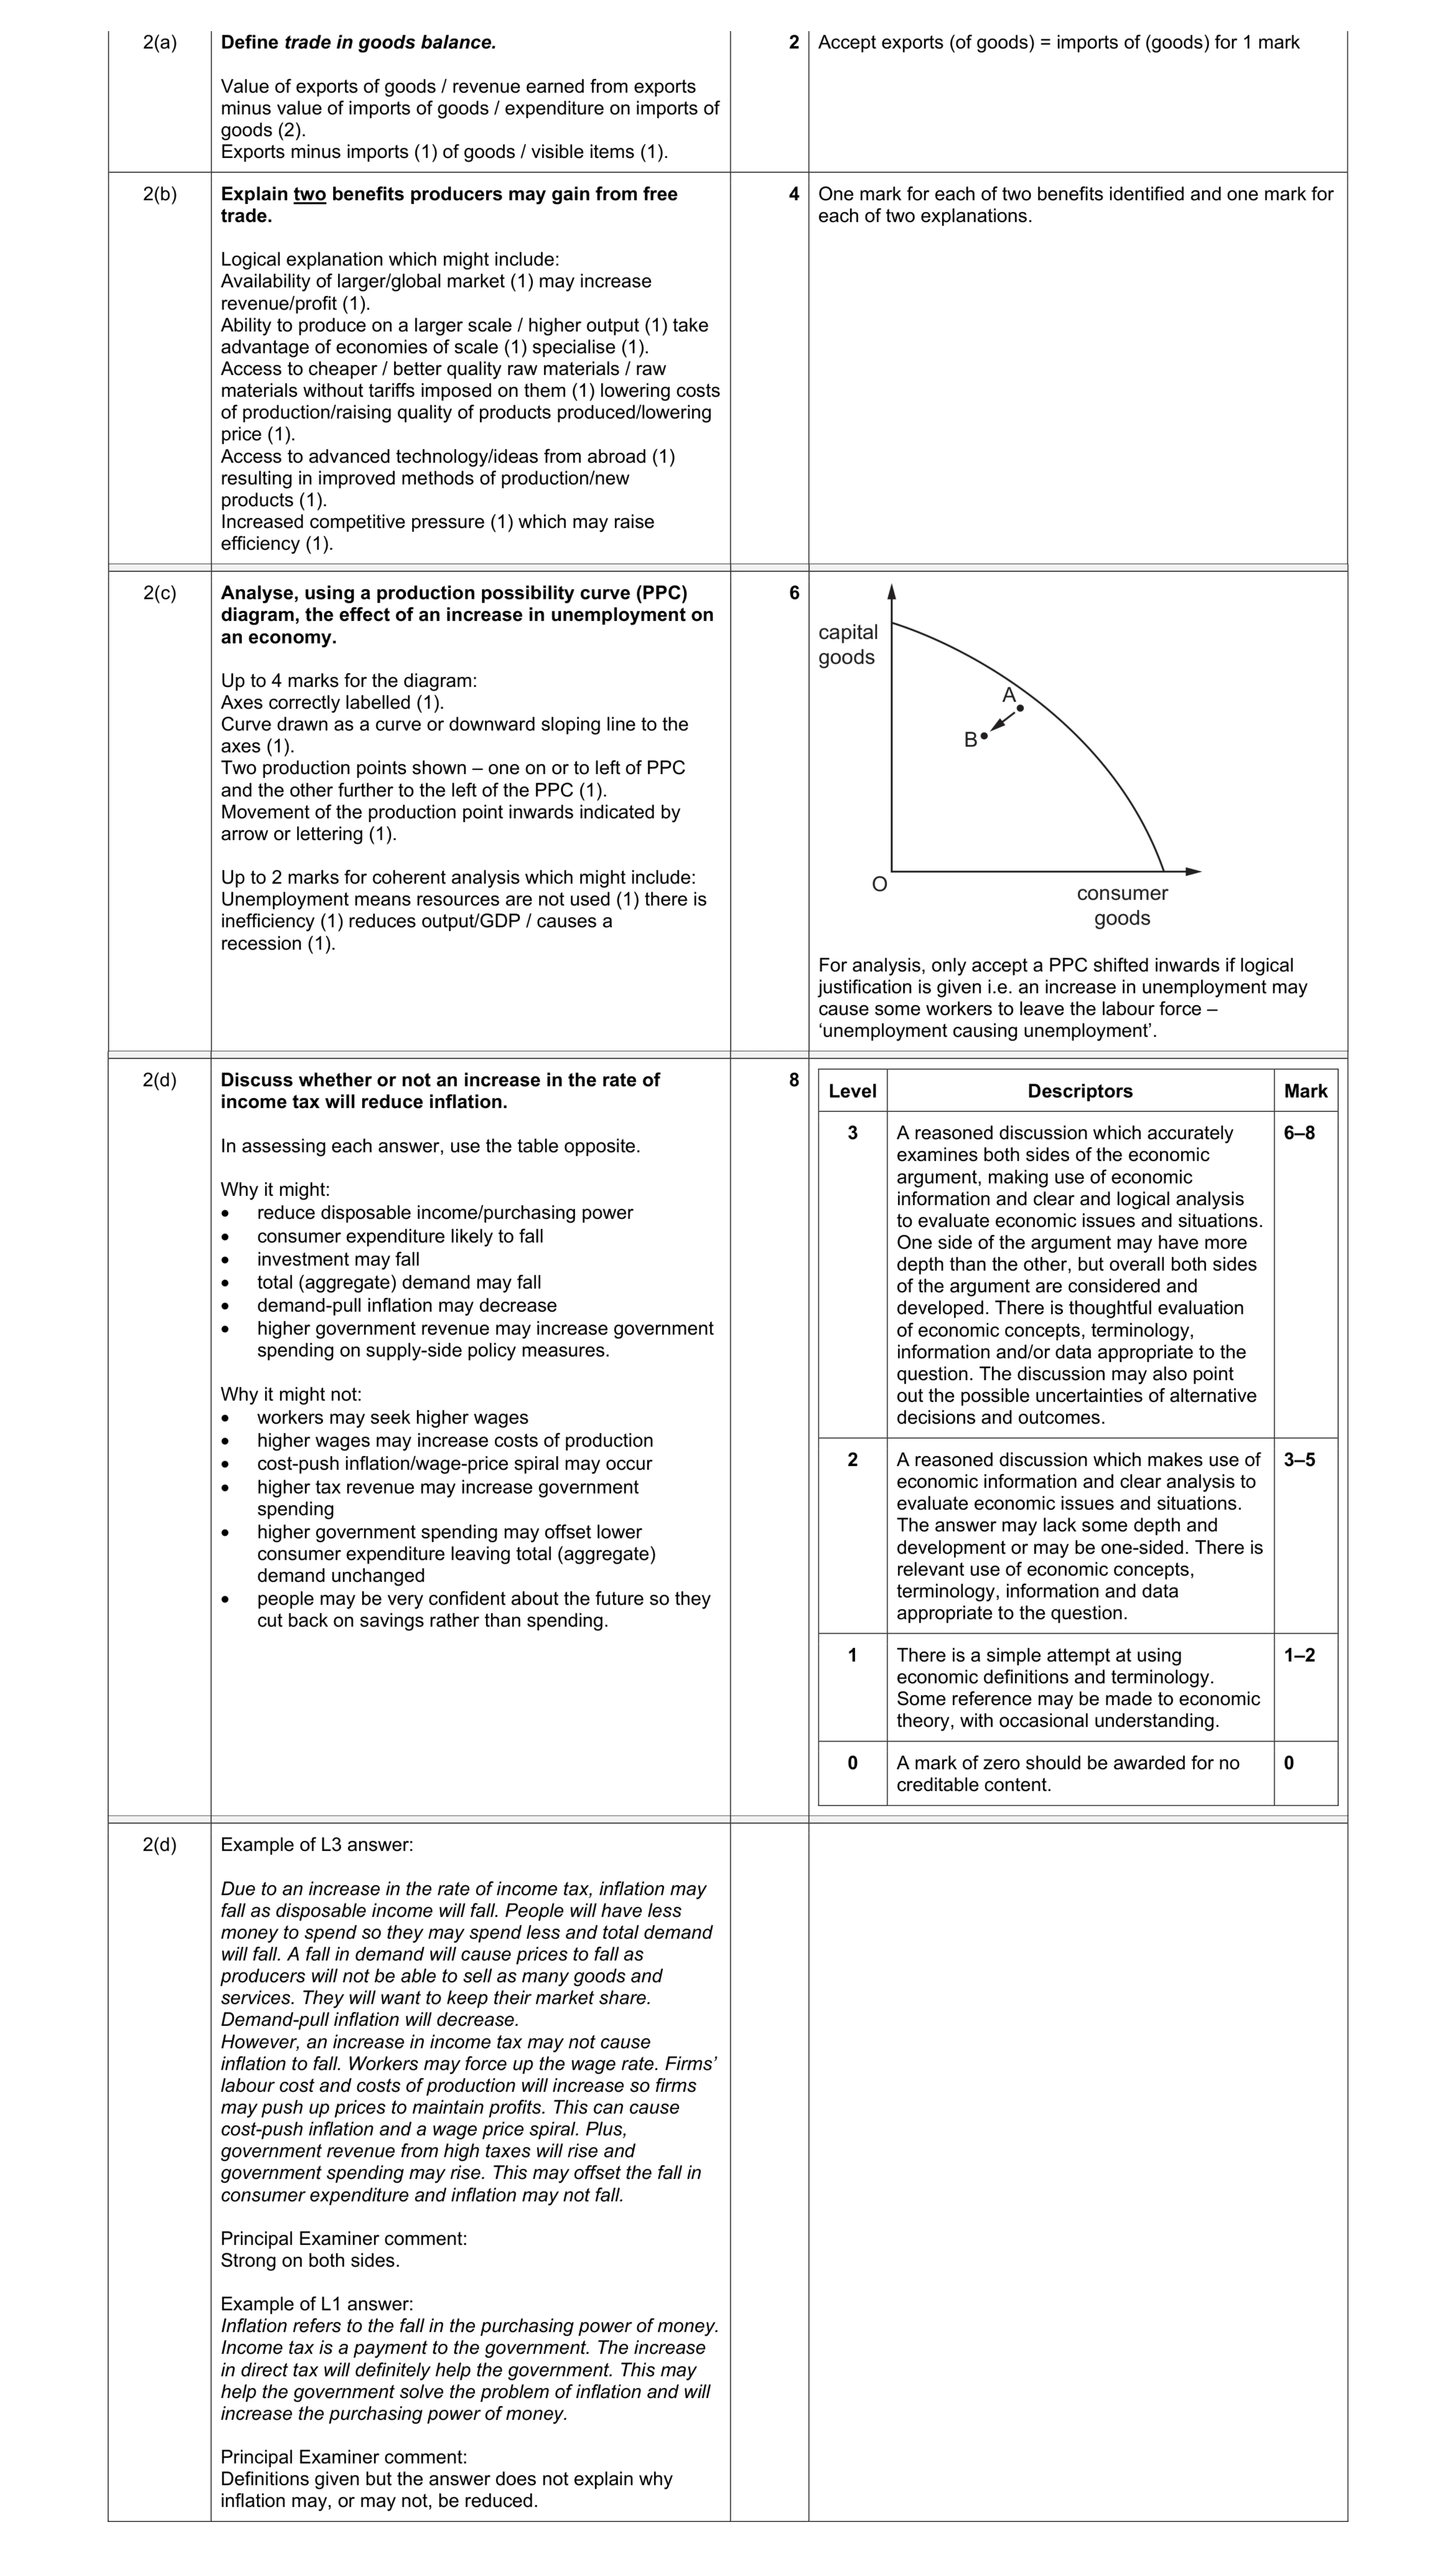 20
20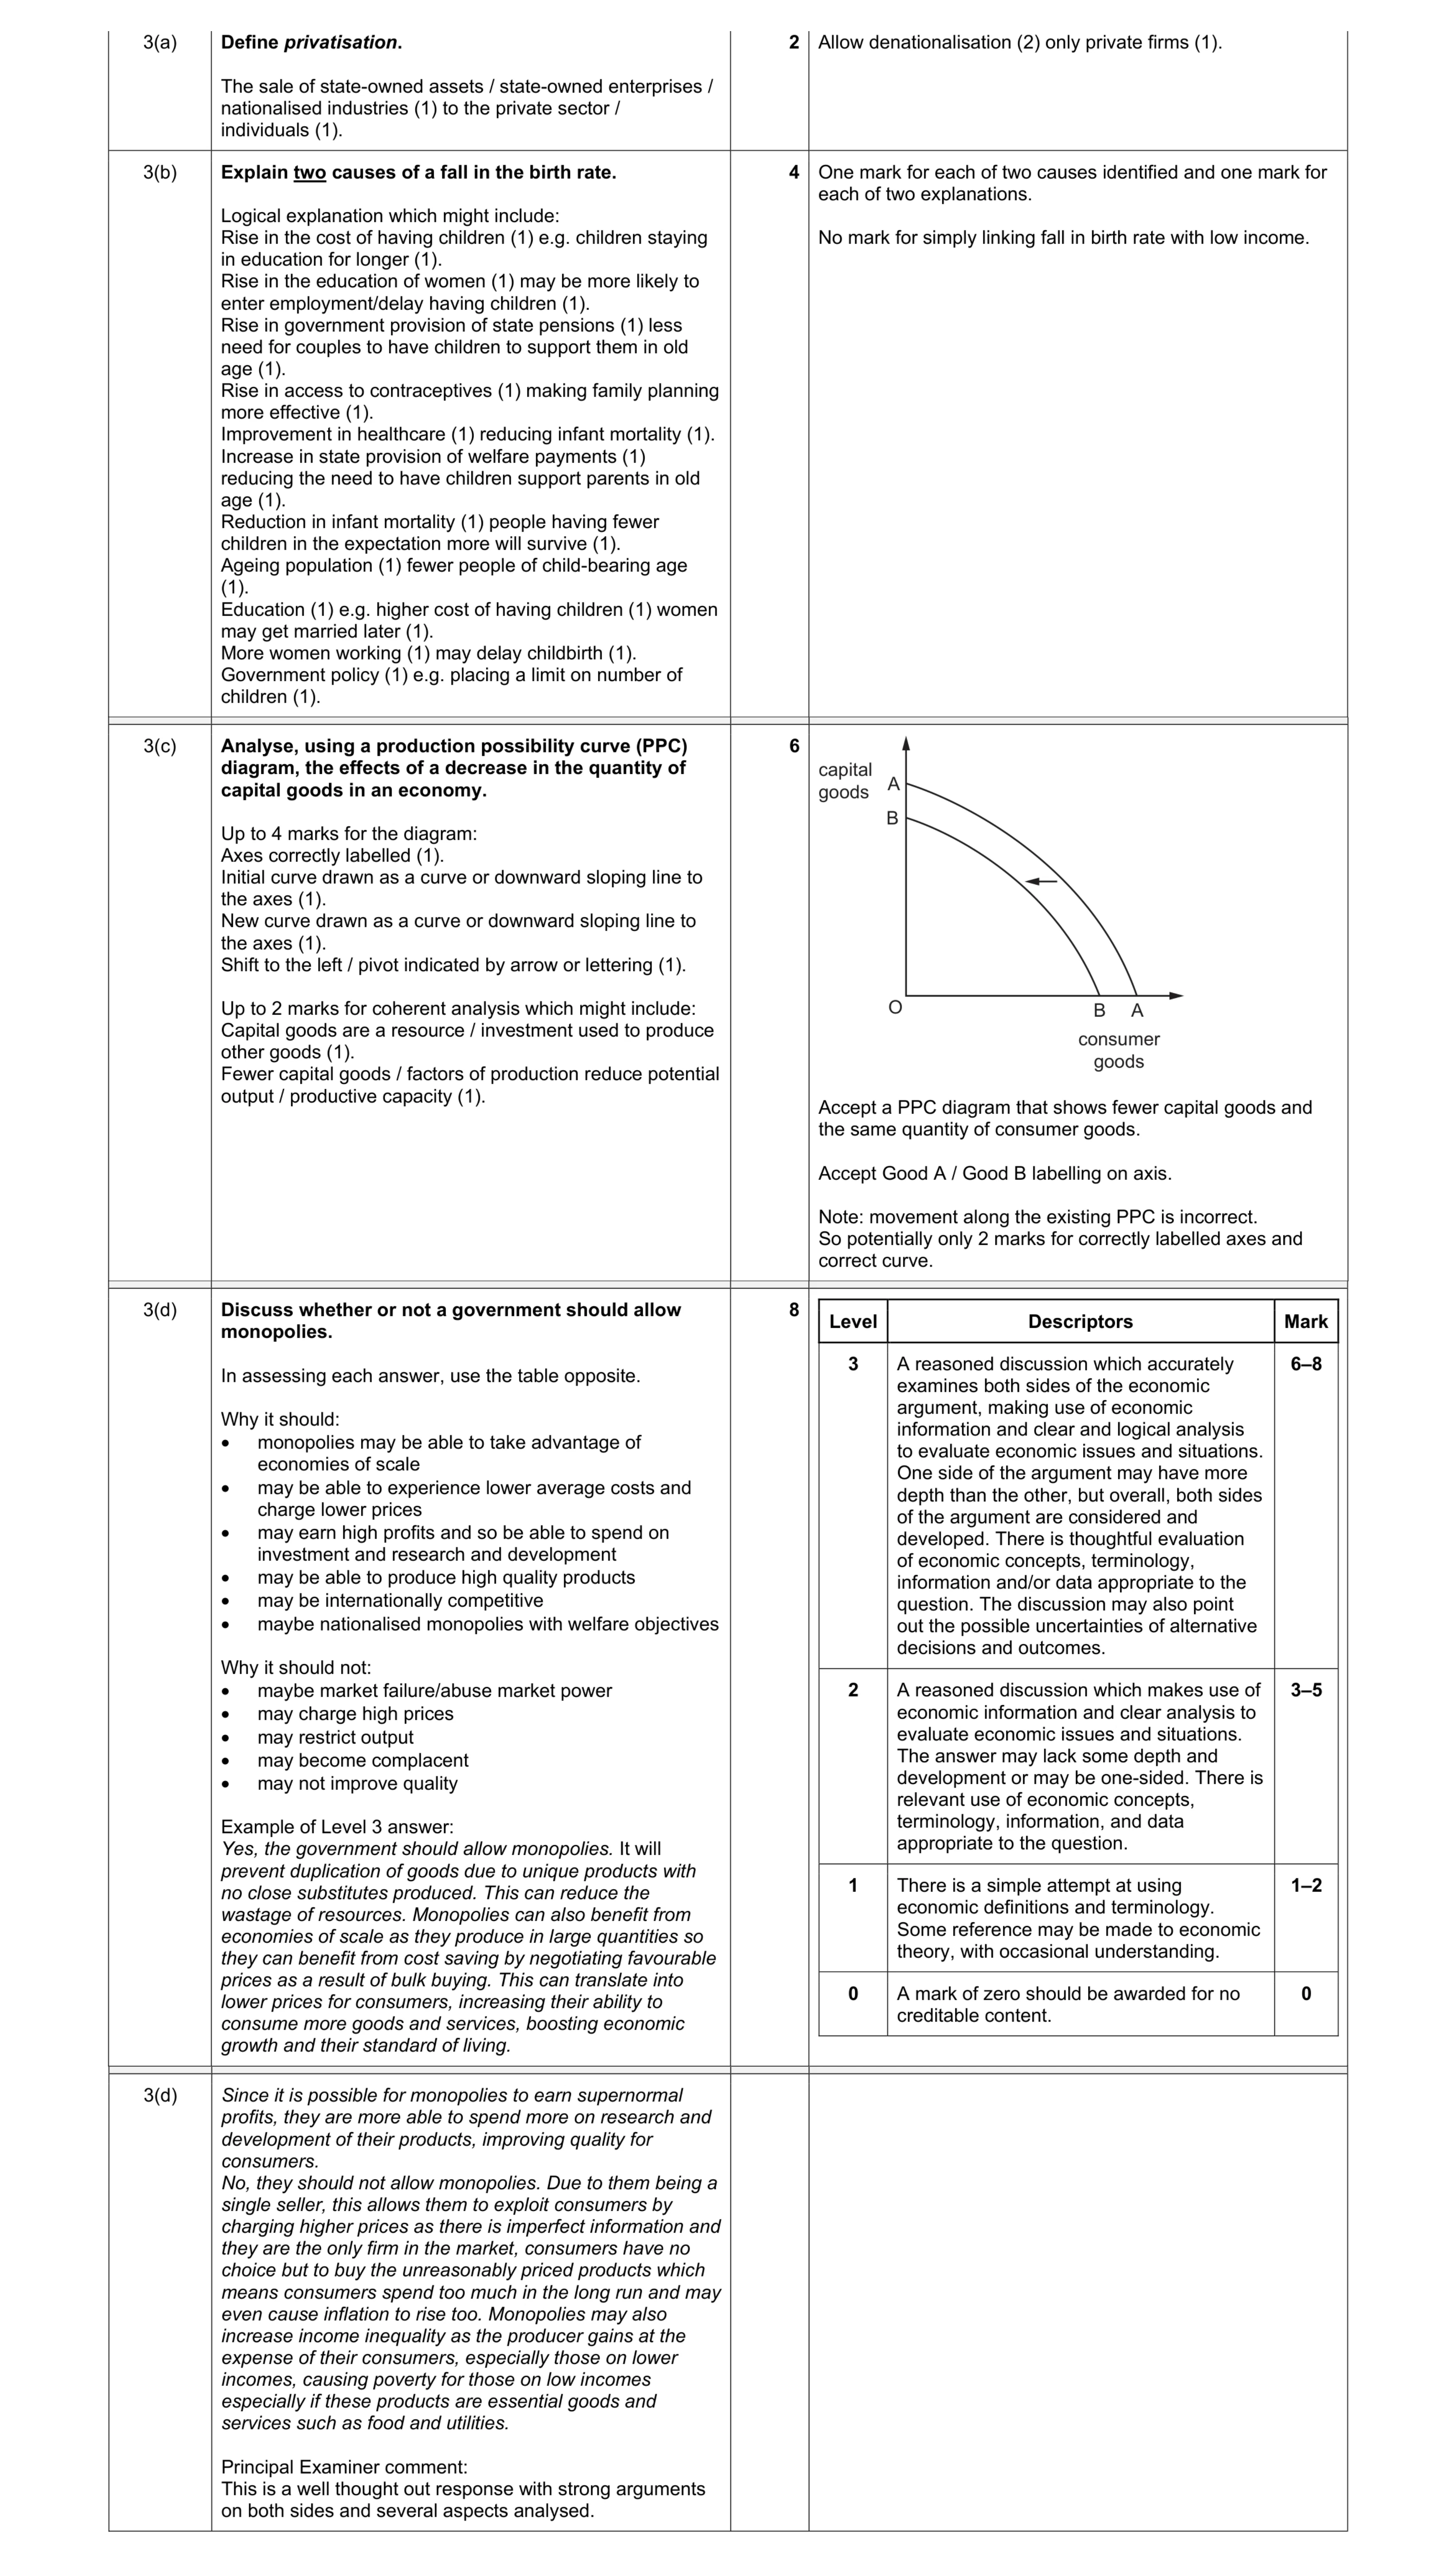 20
20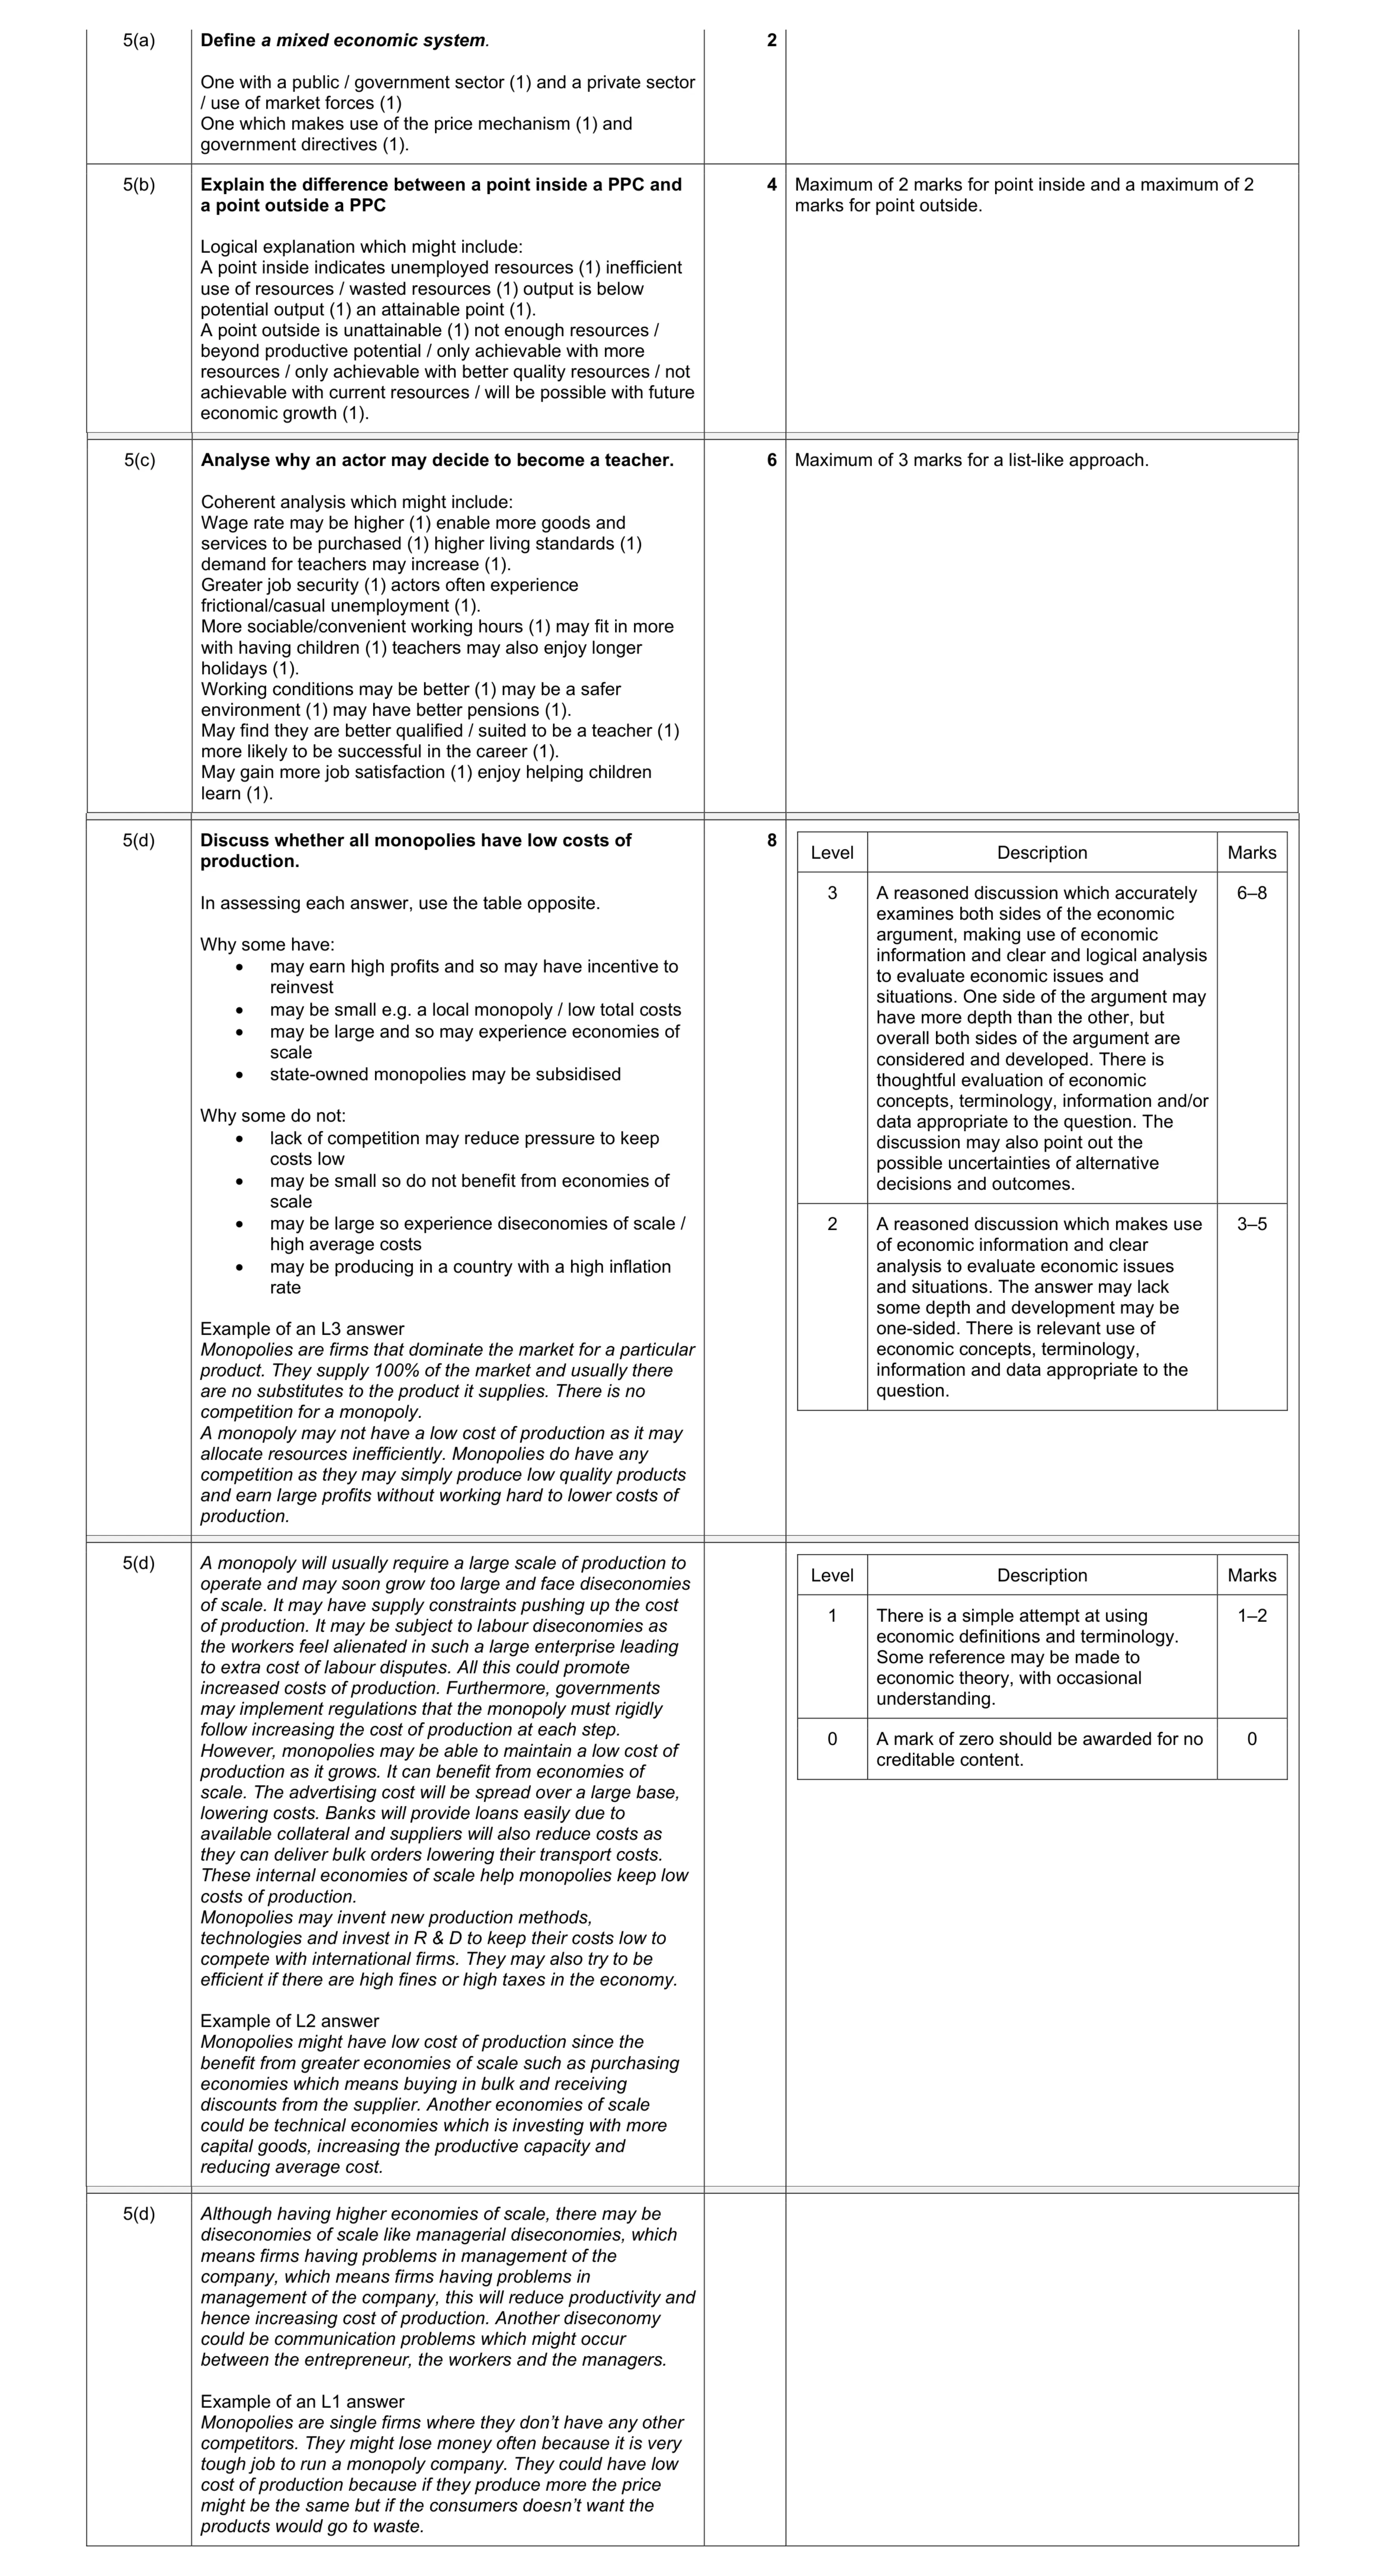 20
20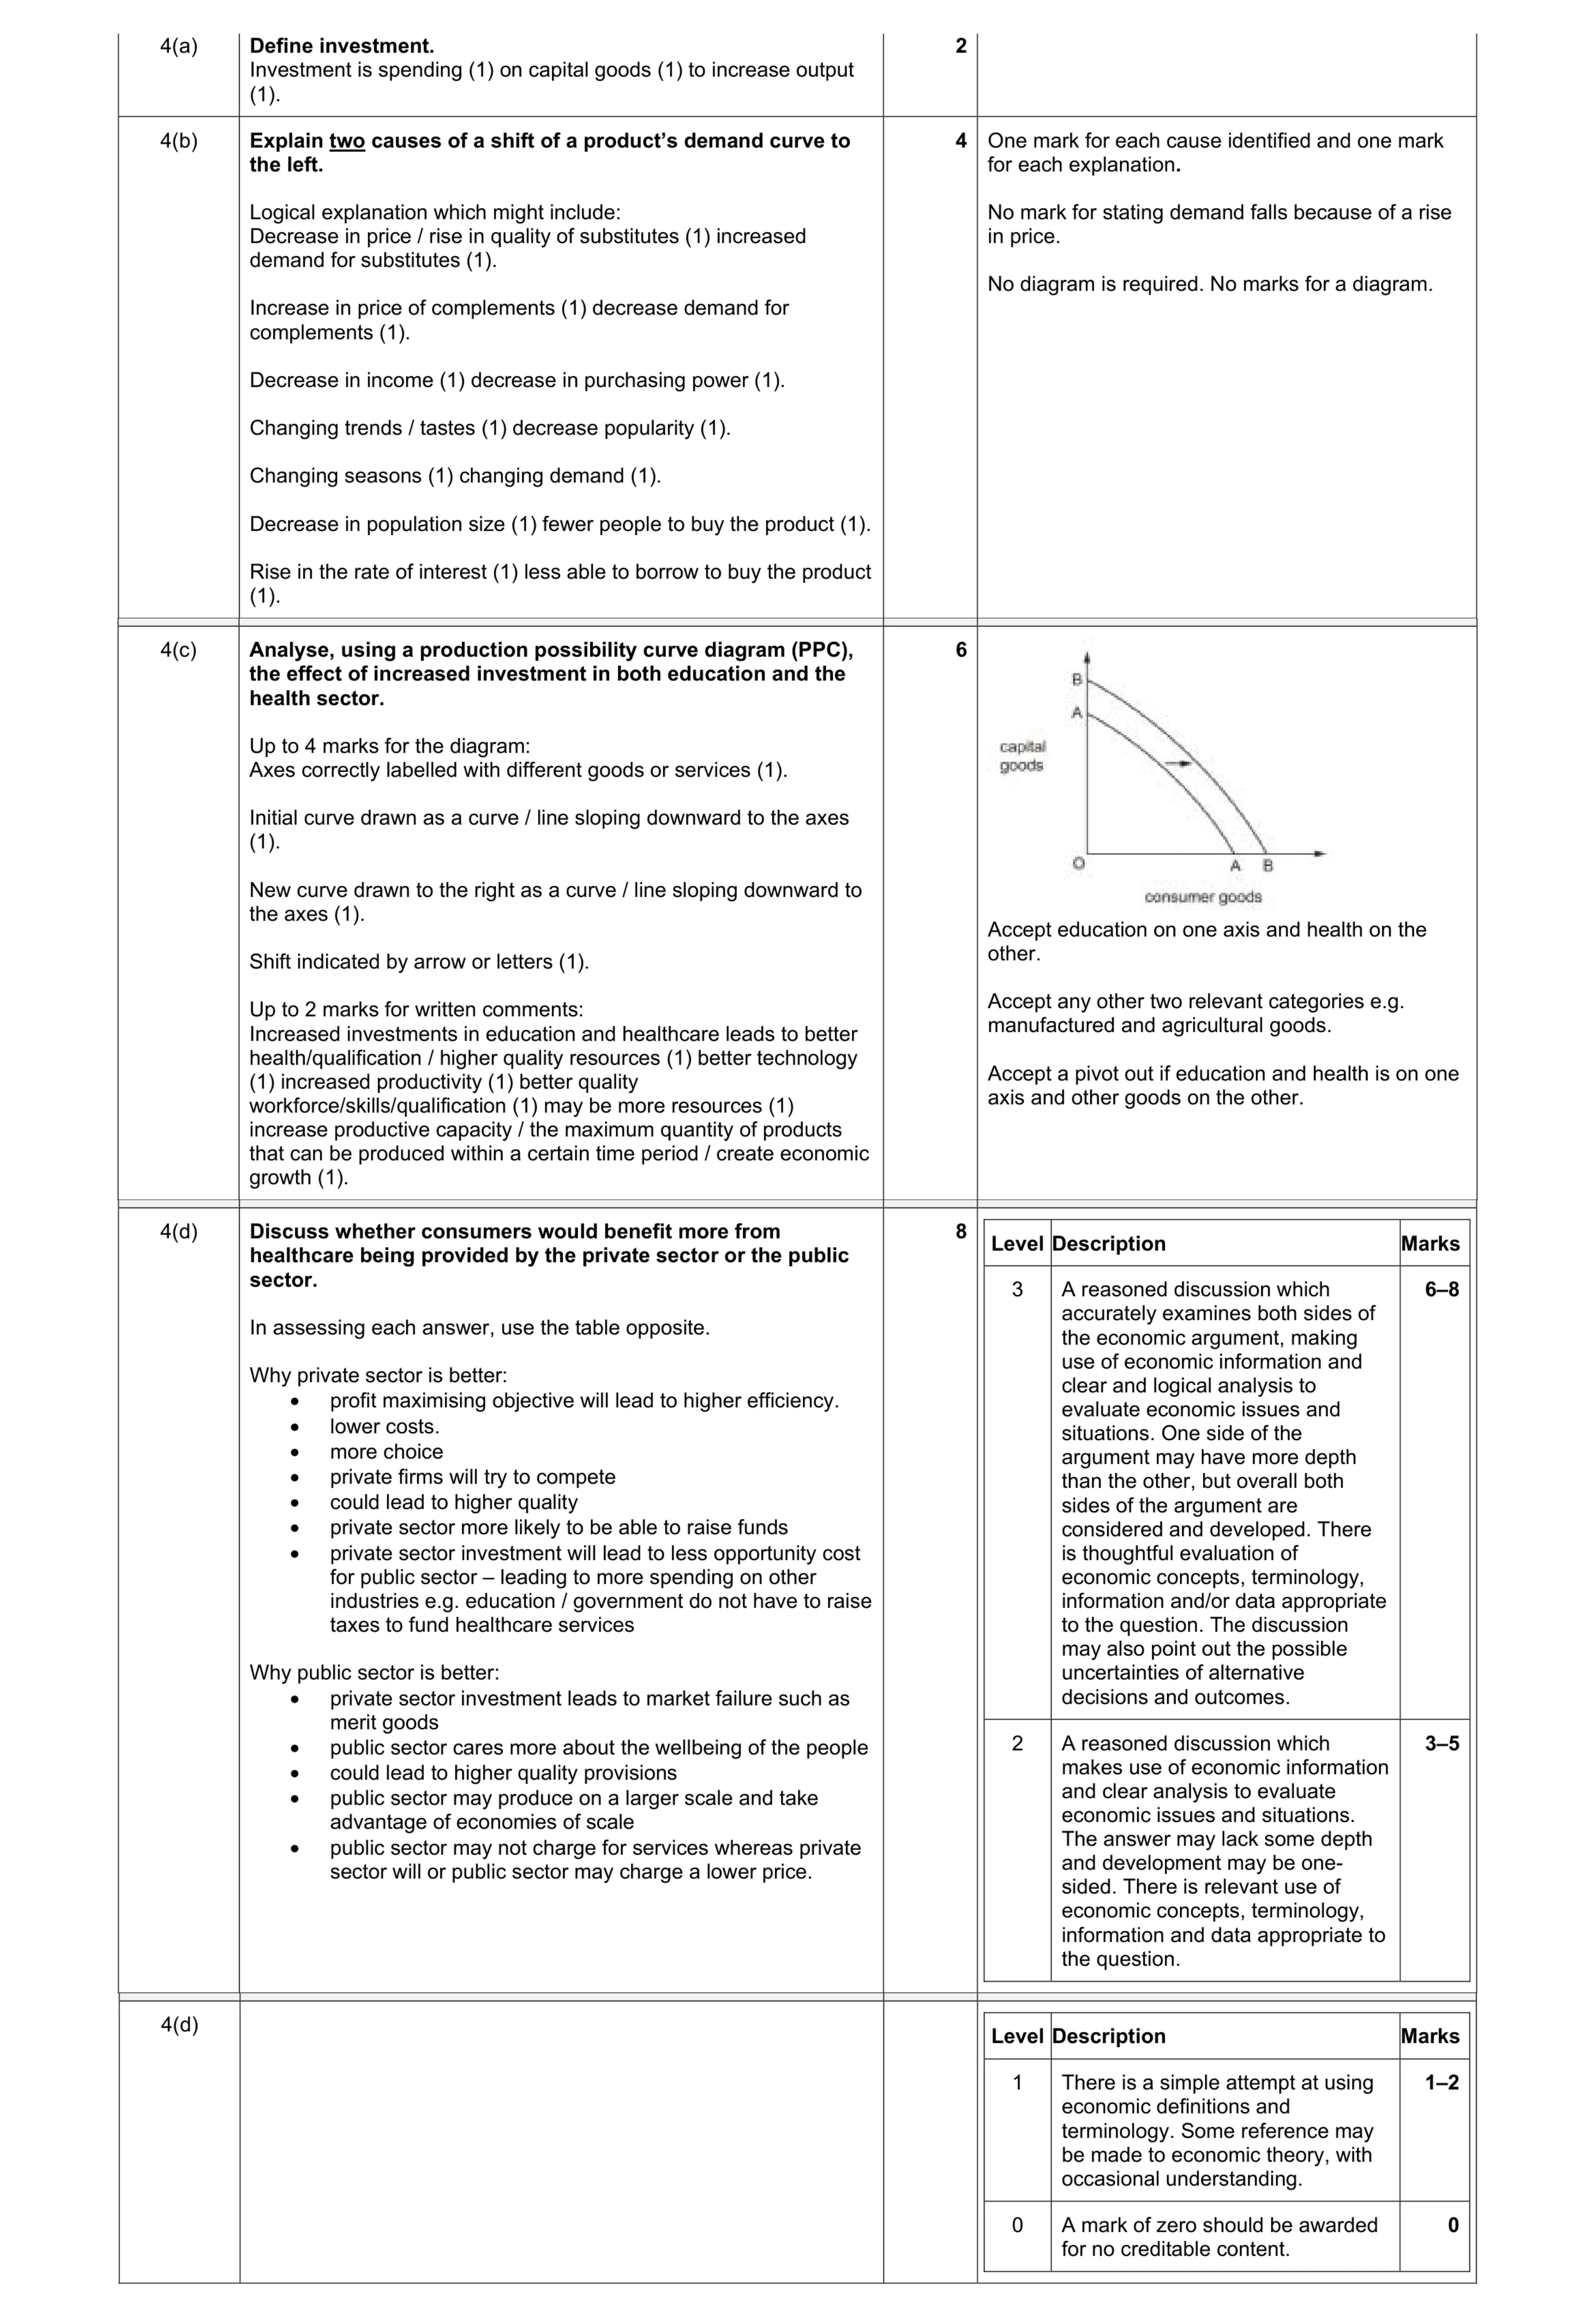 20
20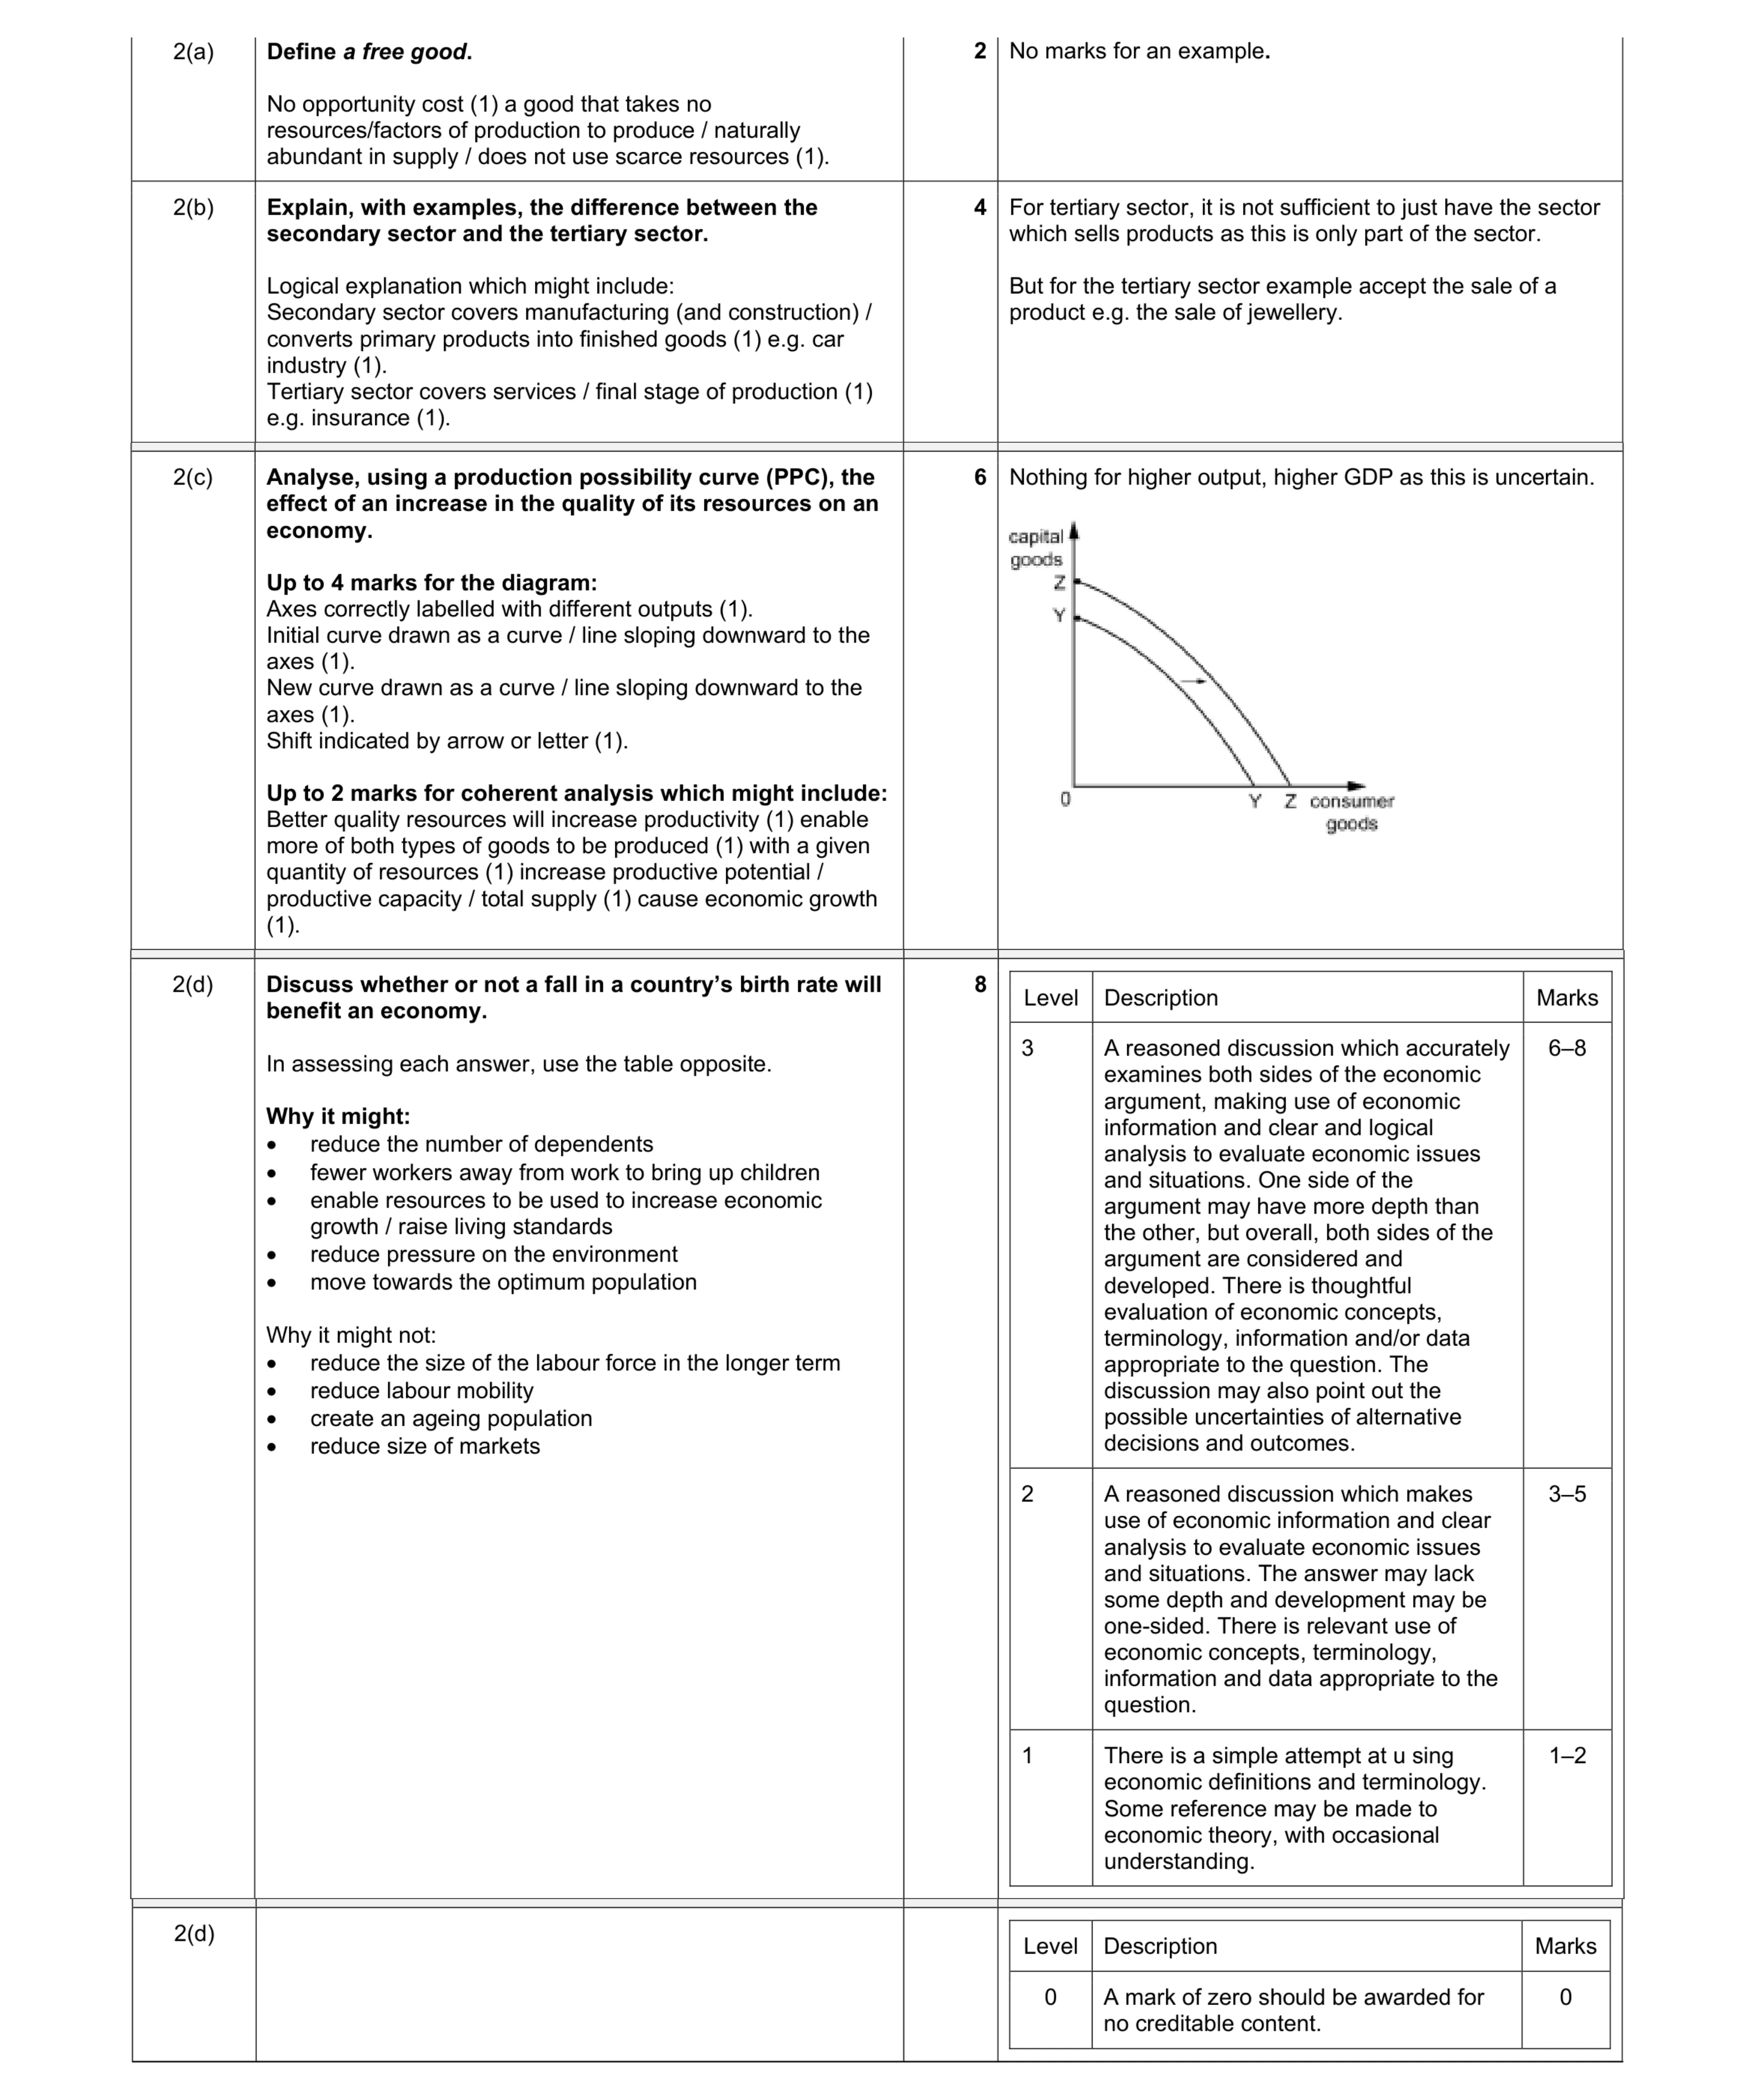 20
20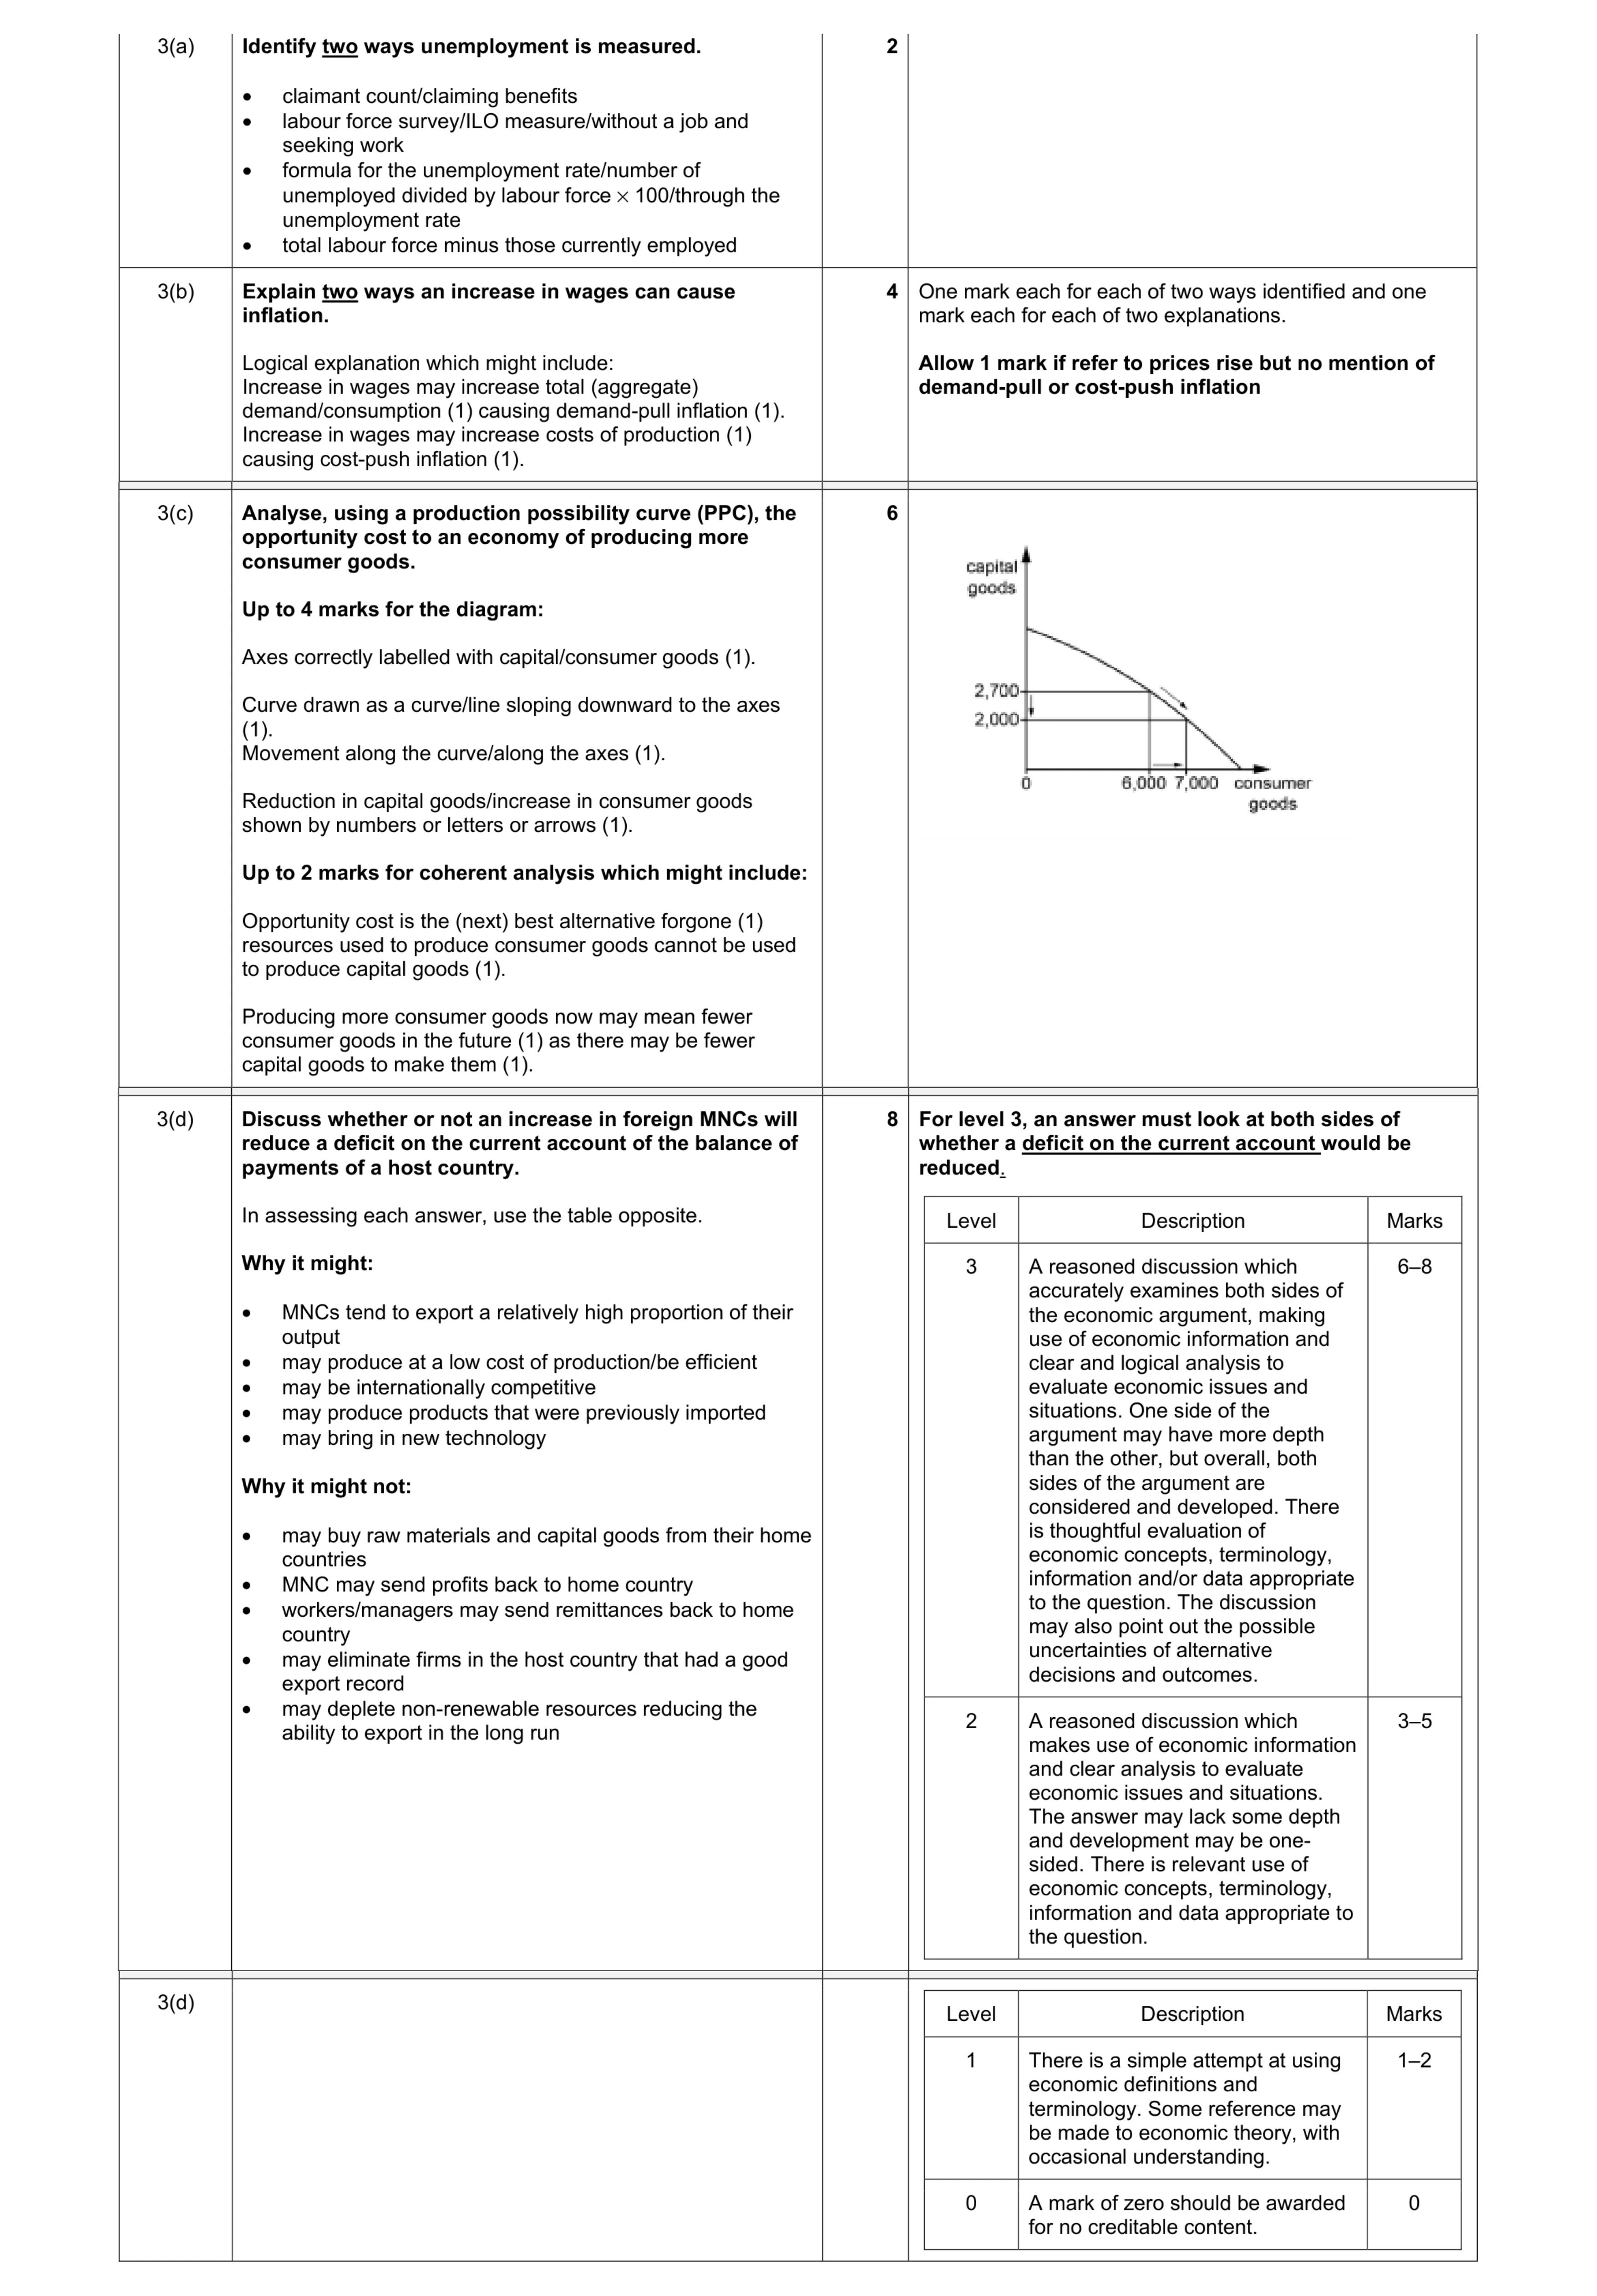 20
20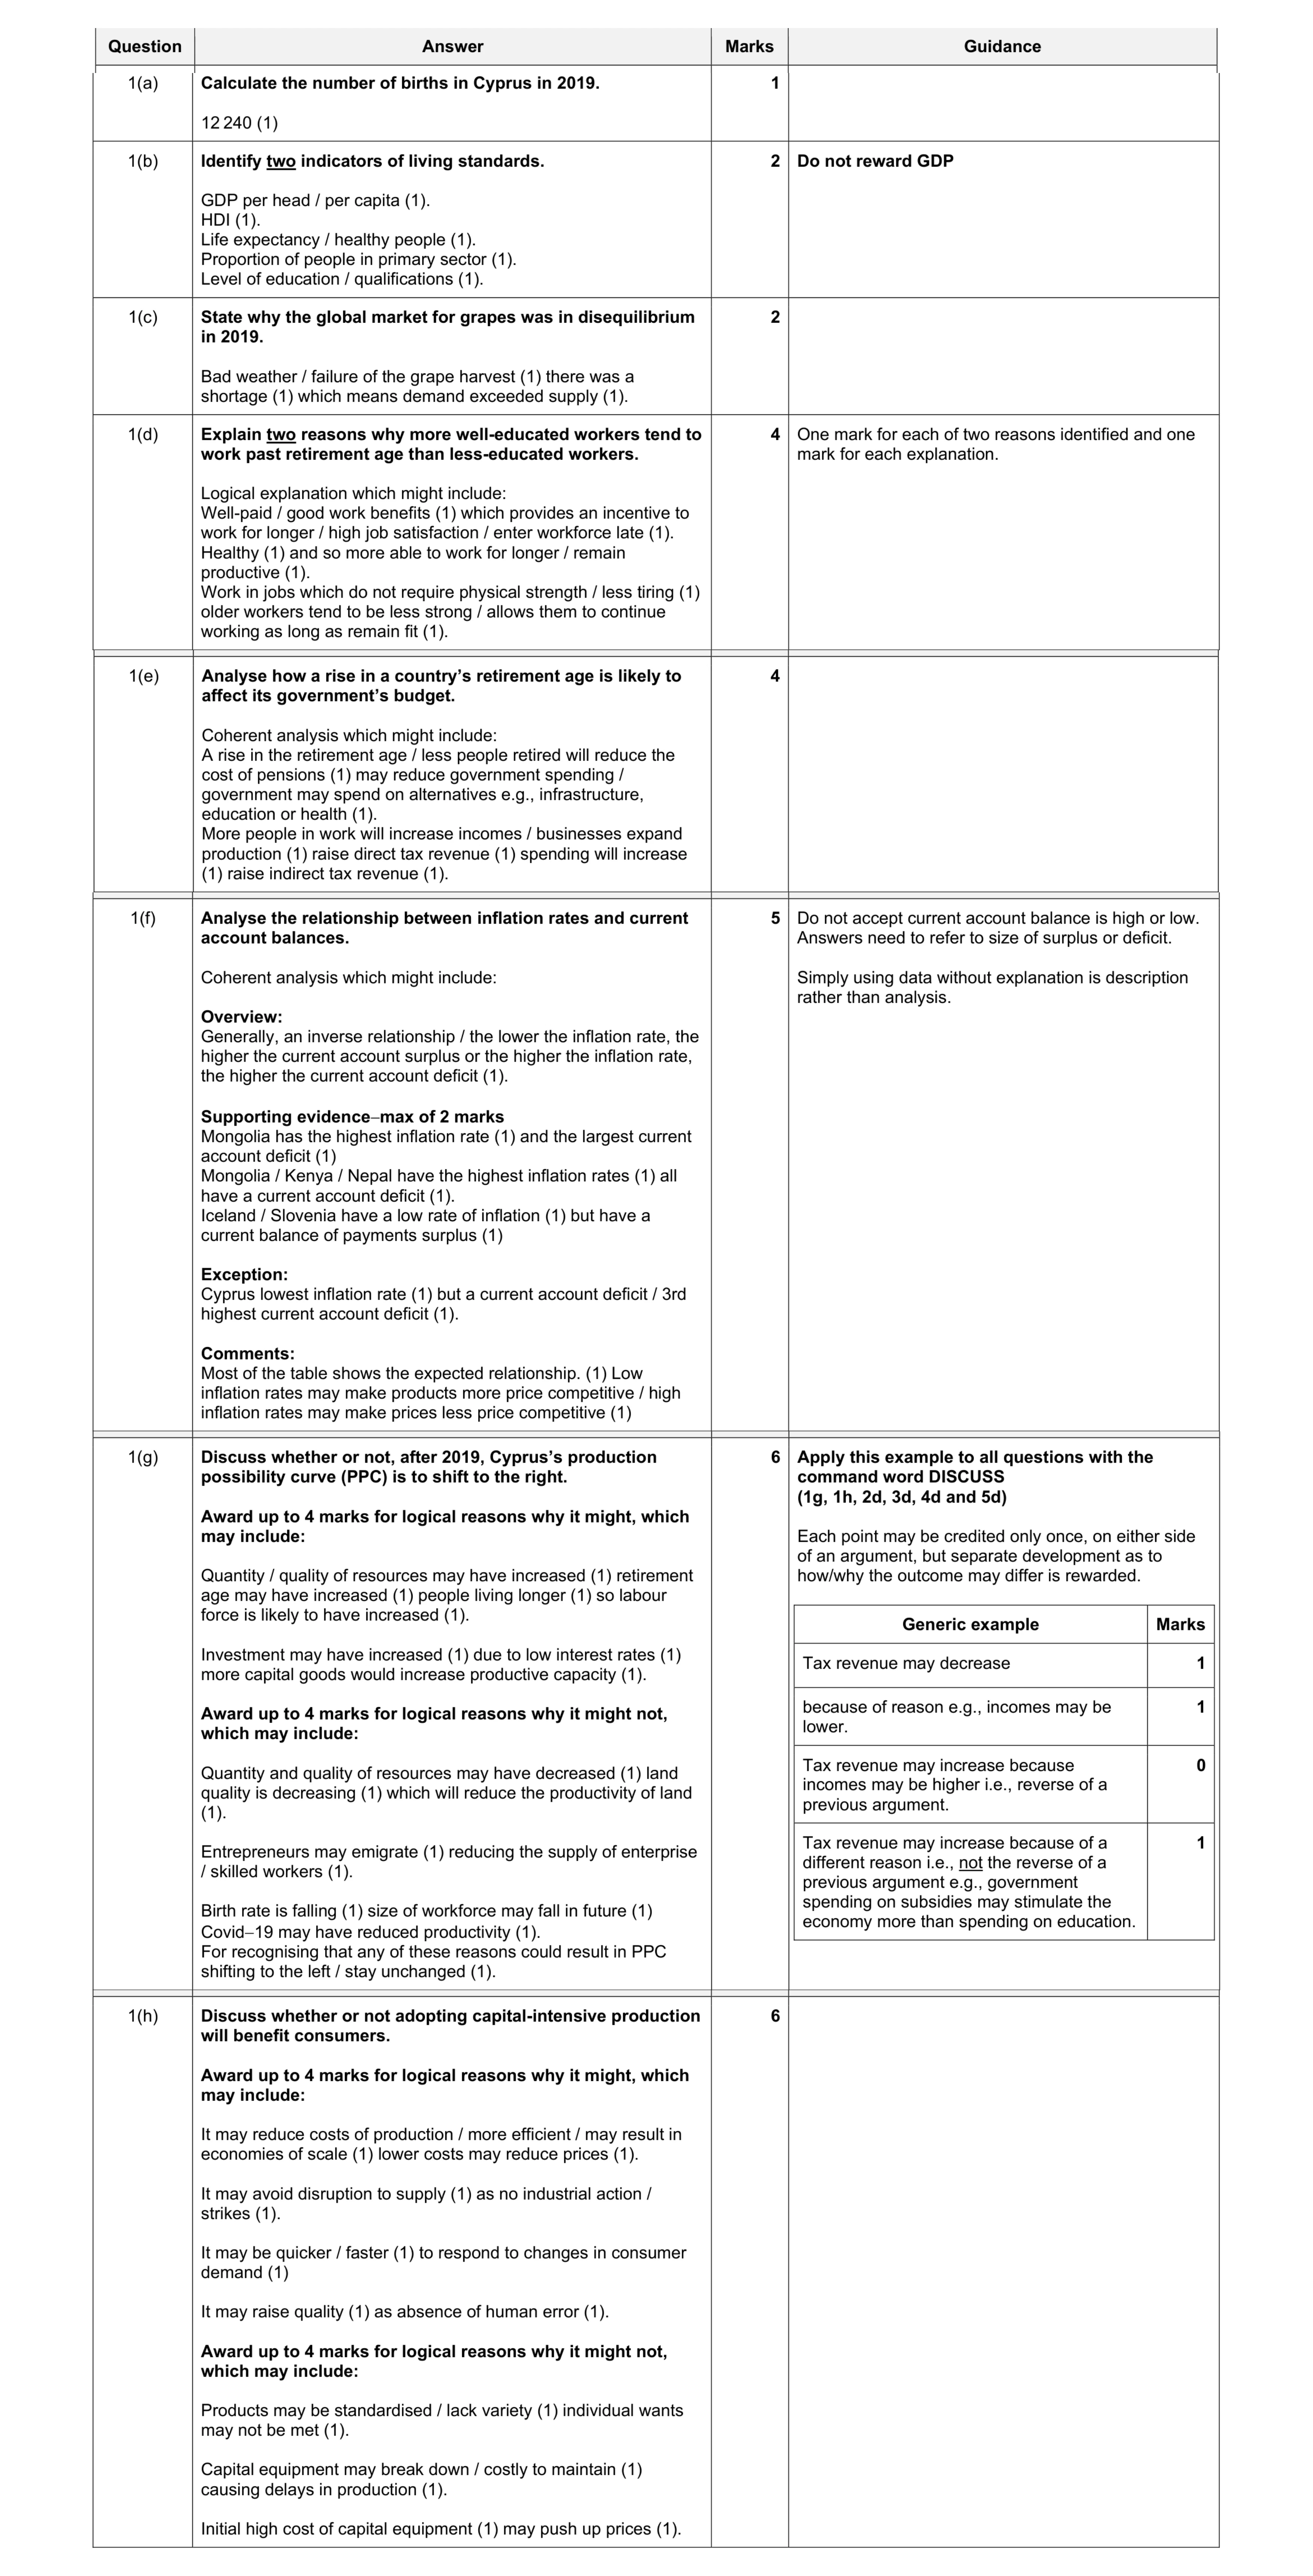 30
30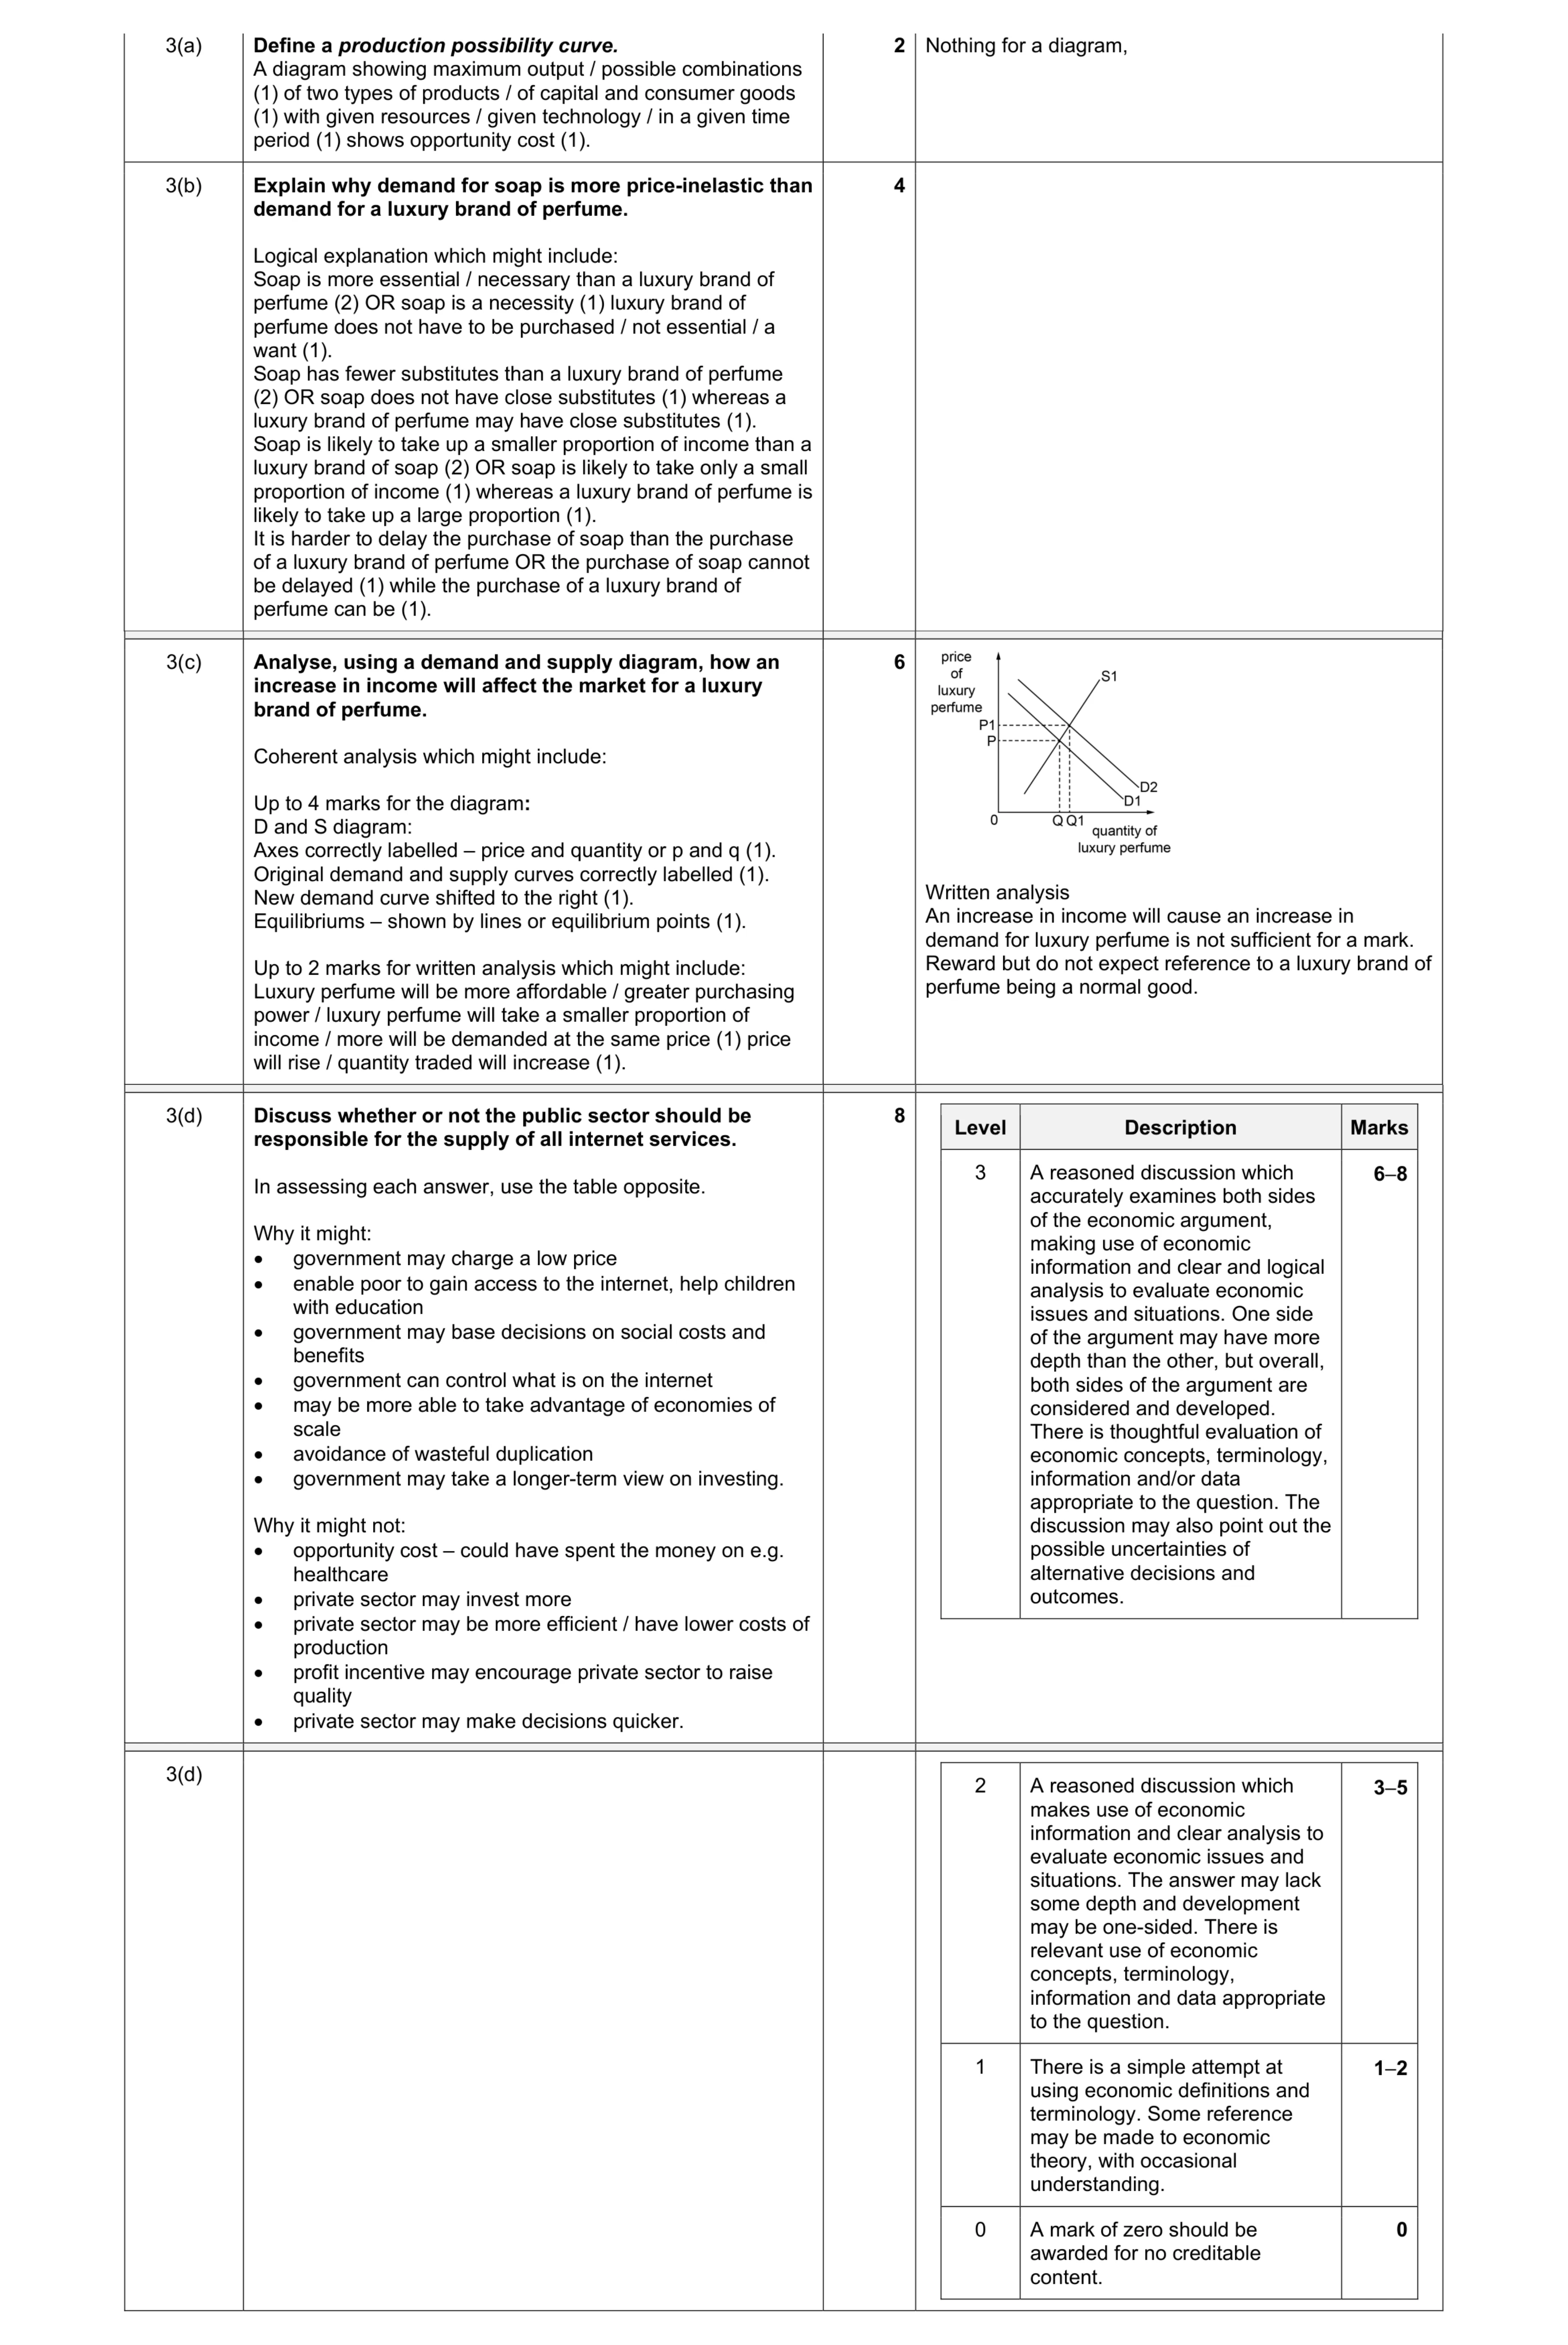 20
20 20
20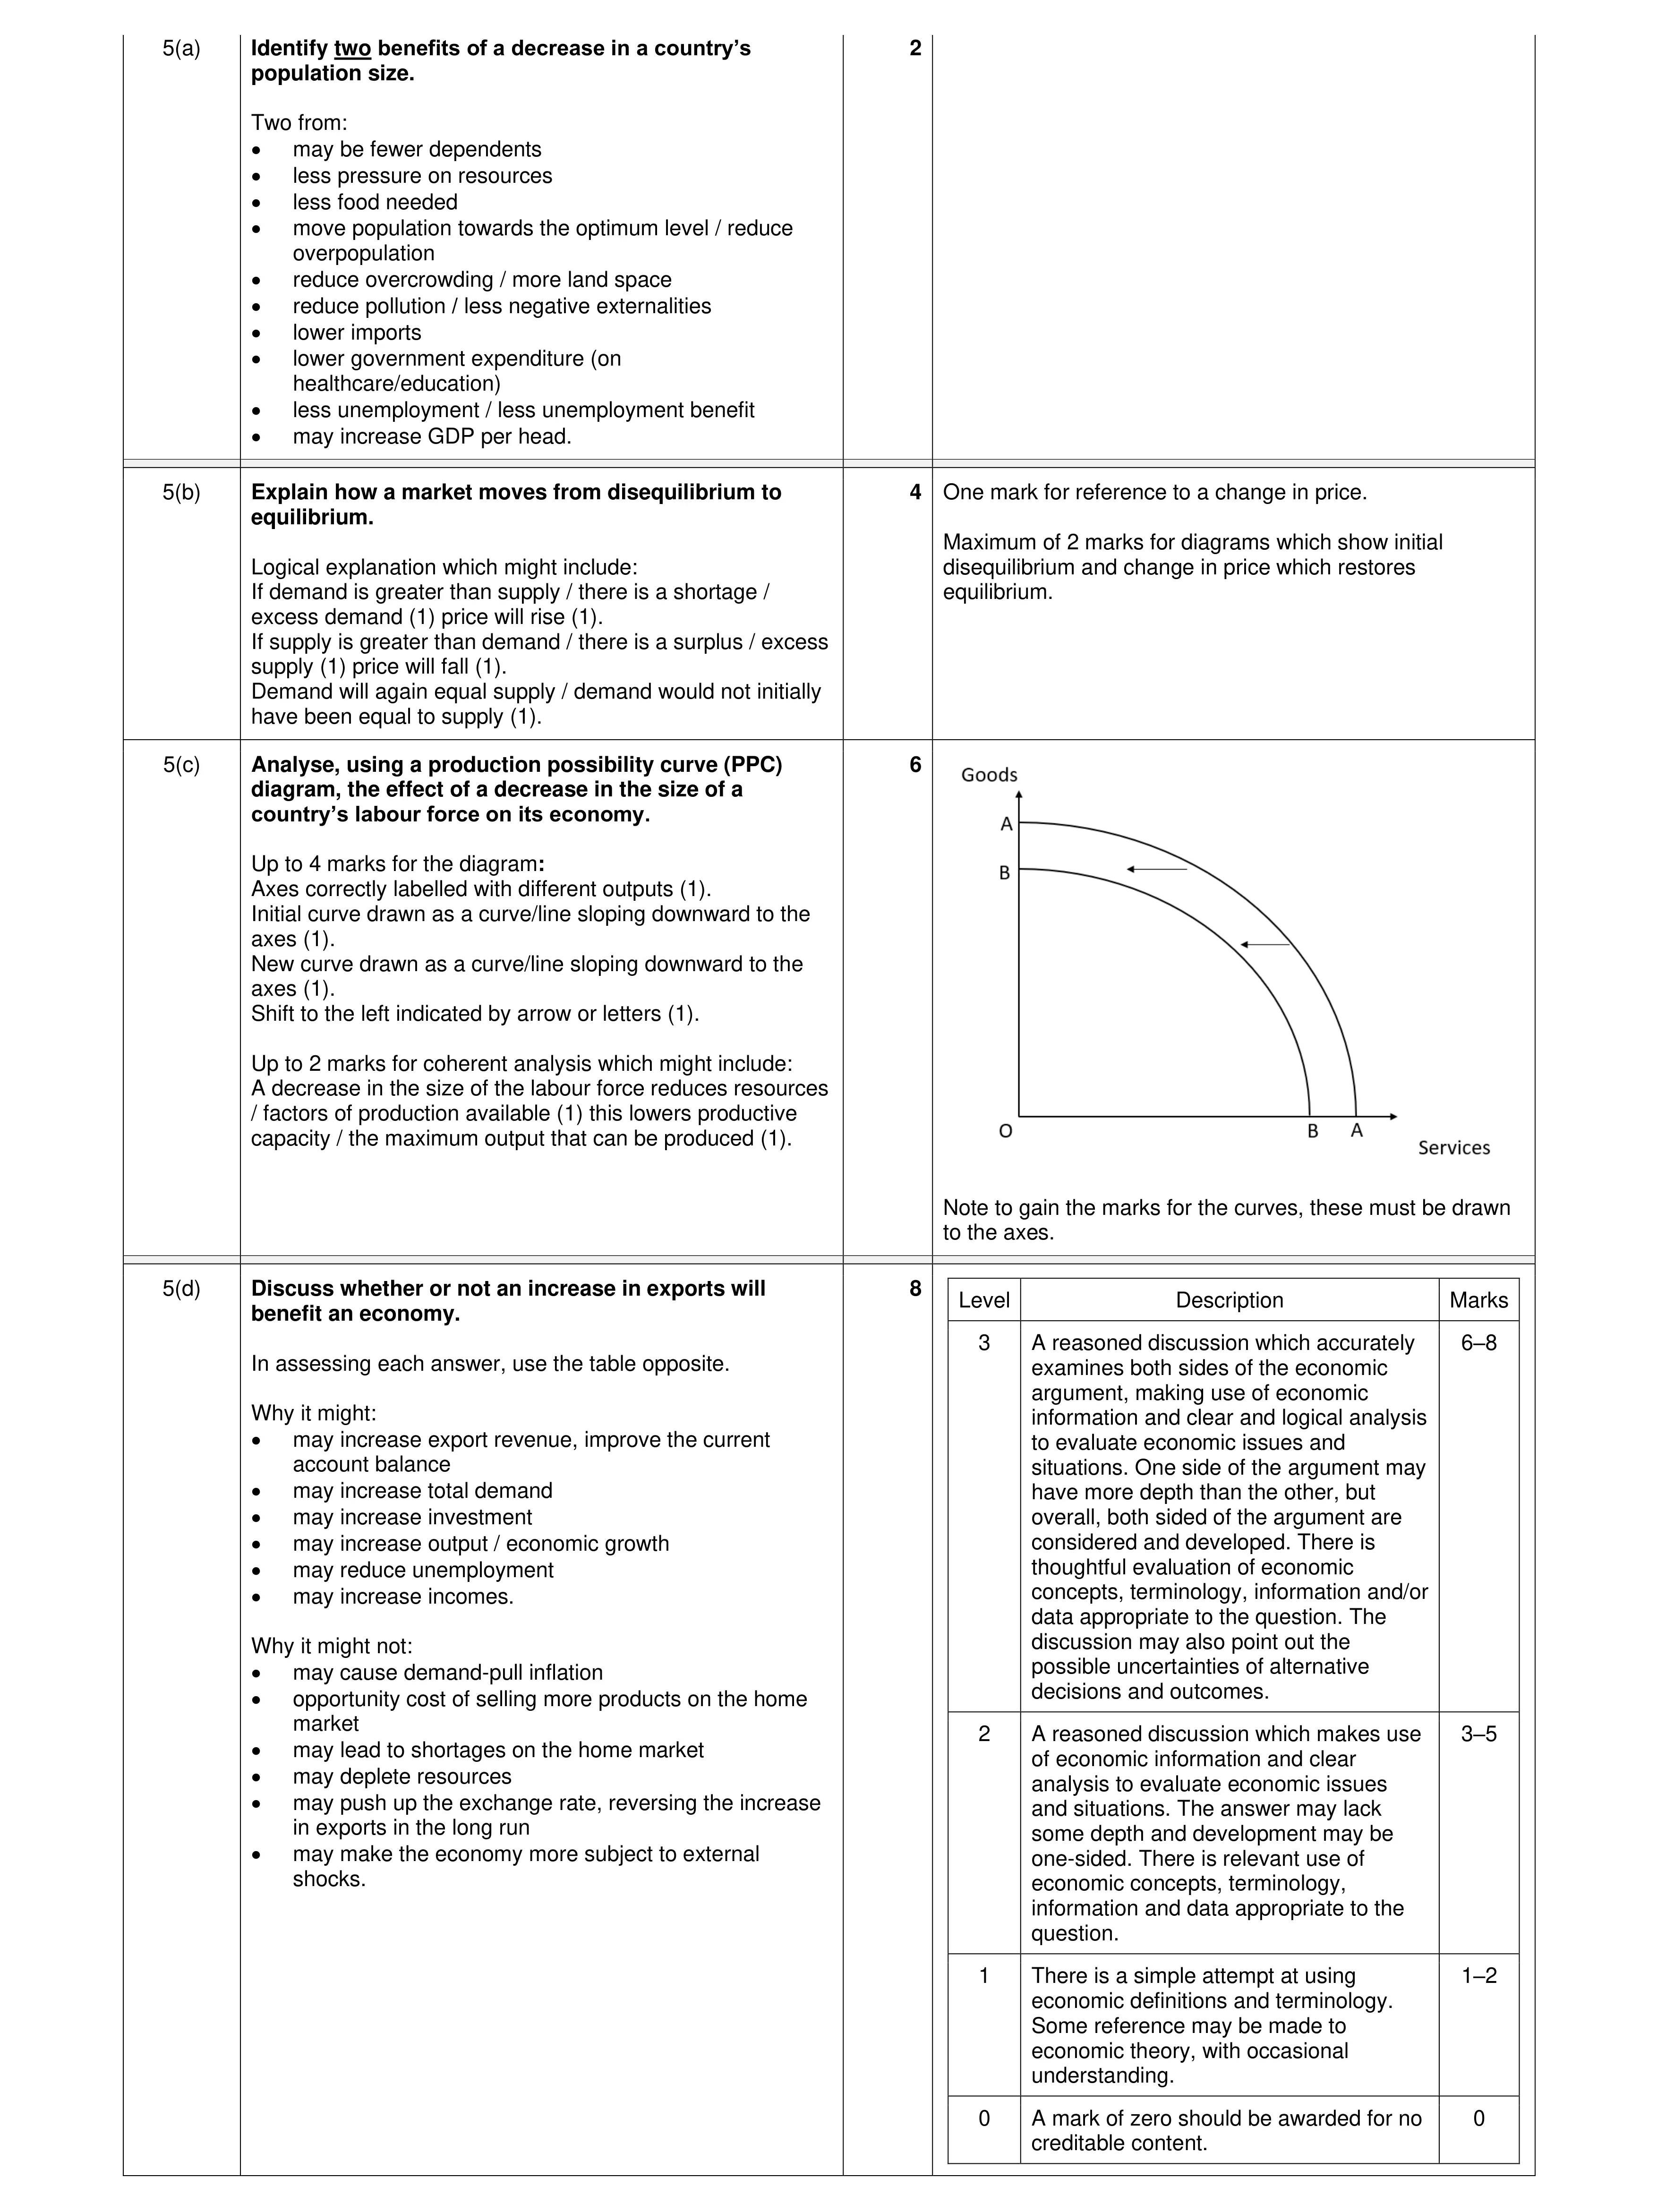 20
20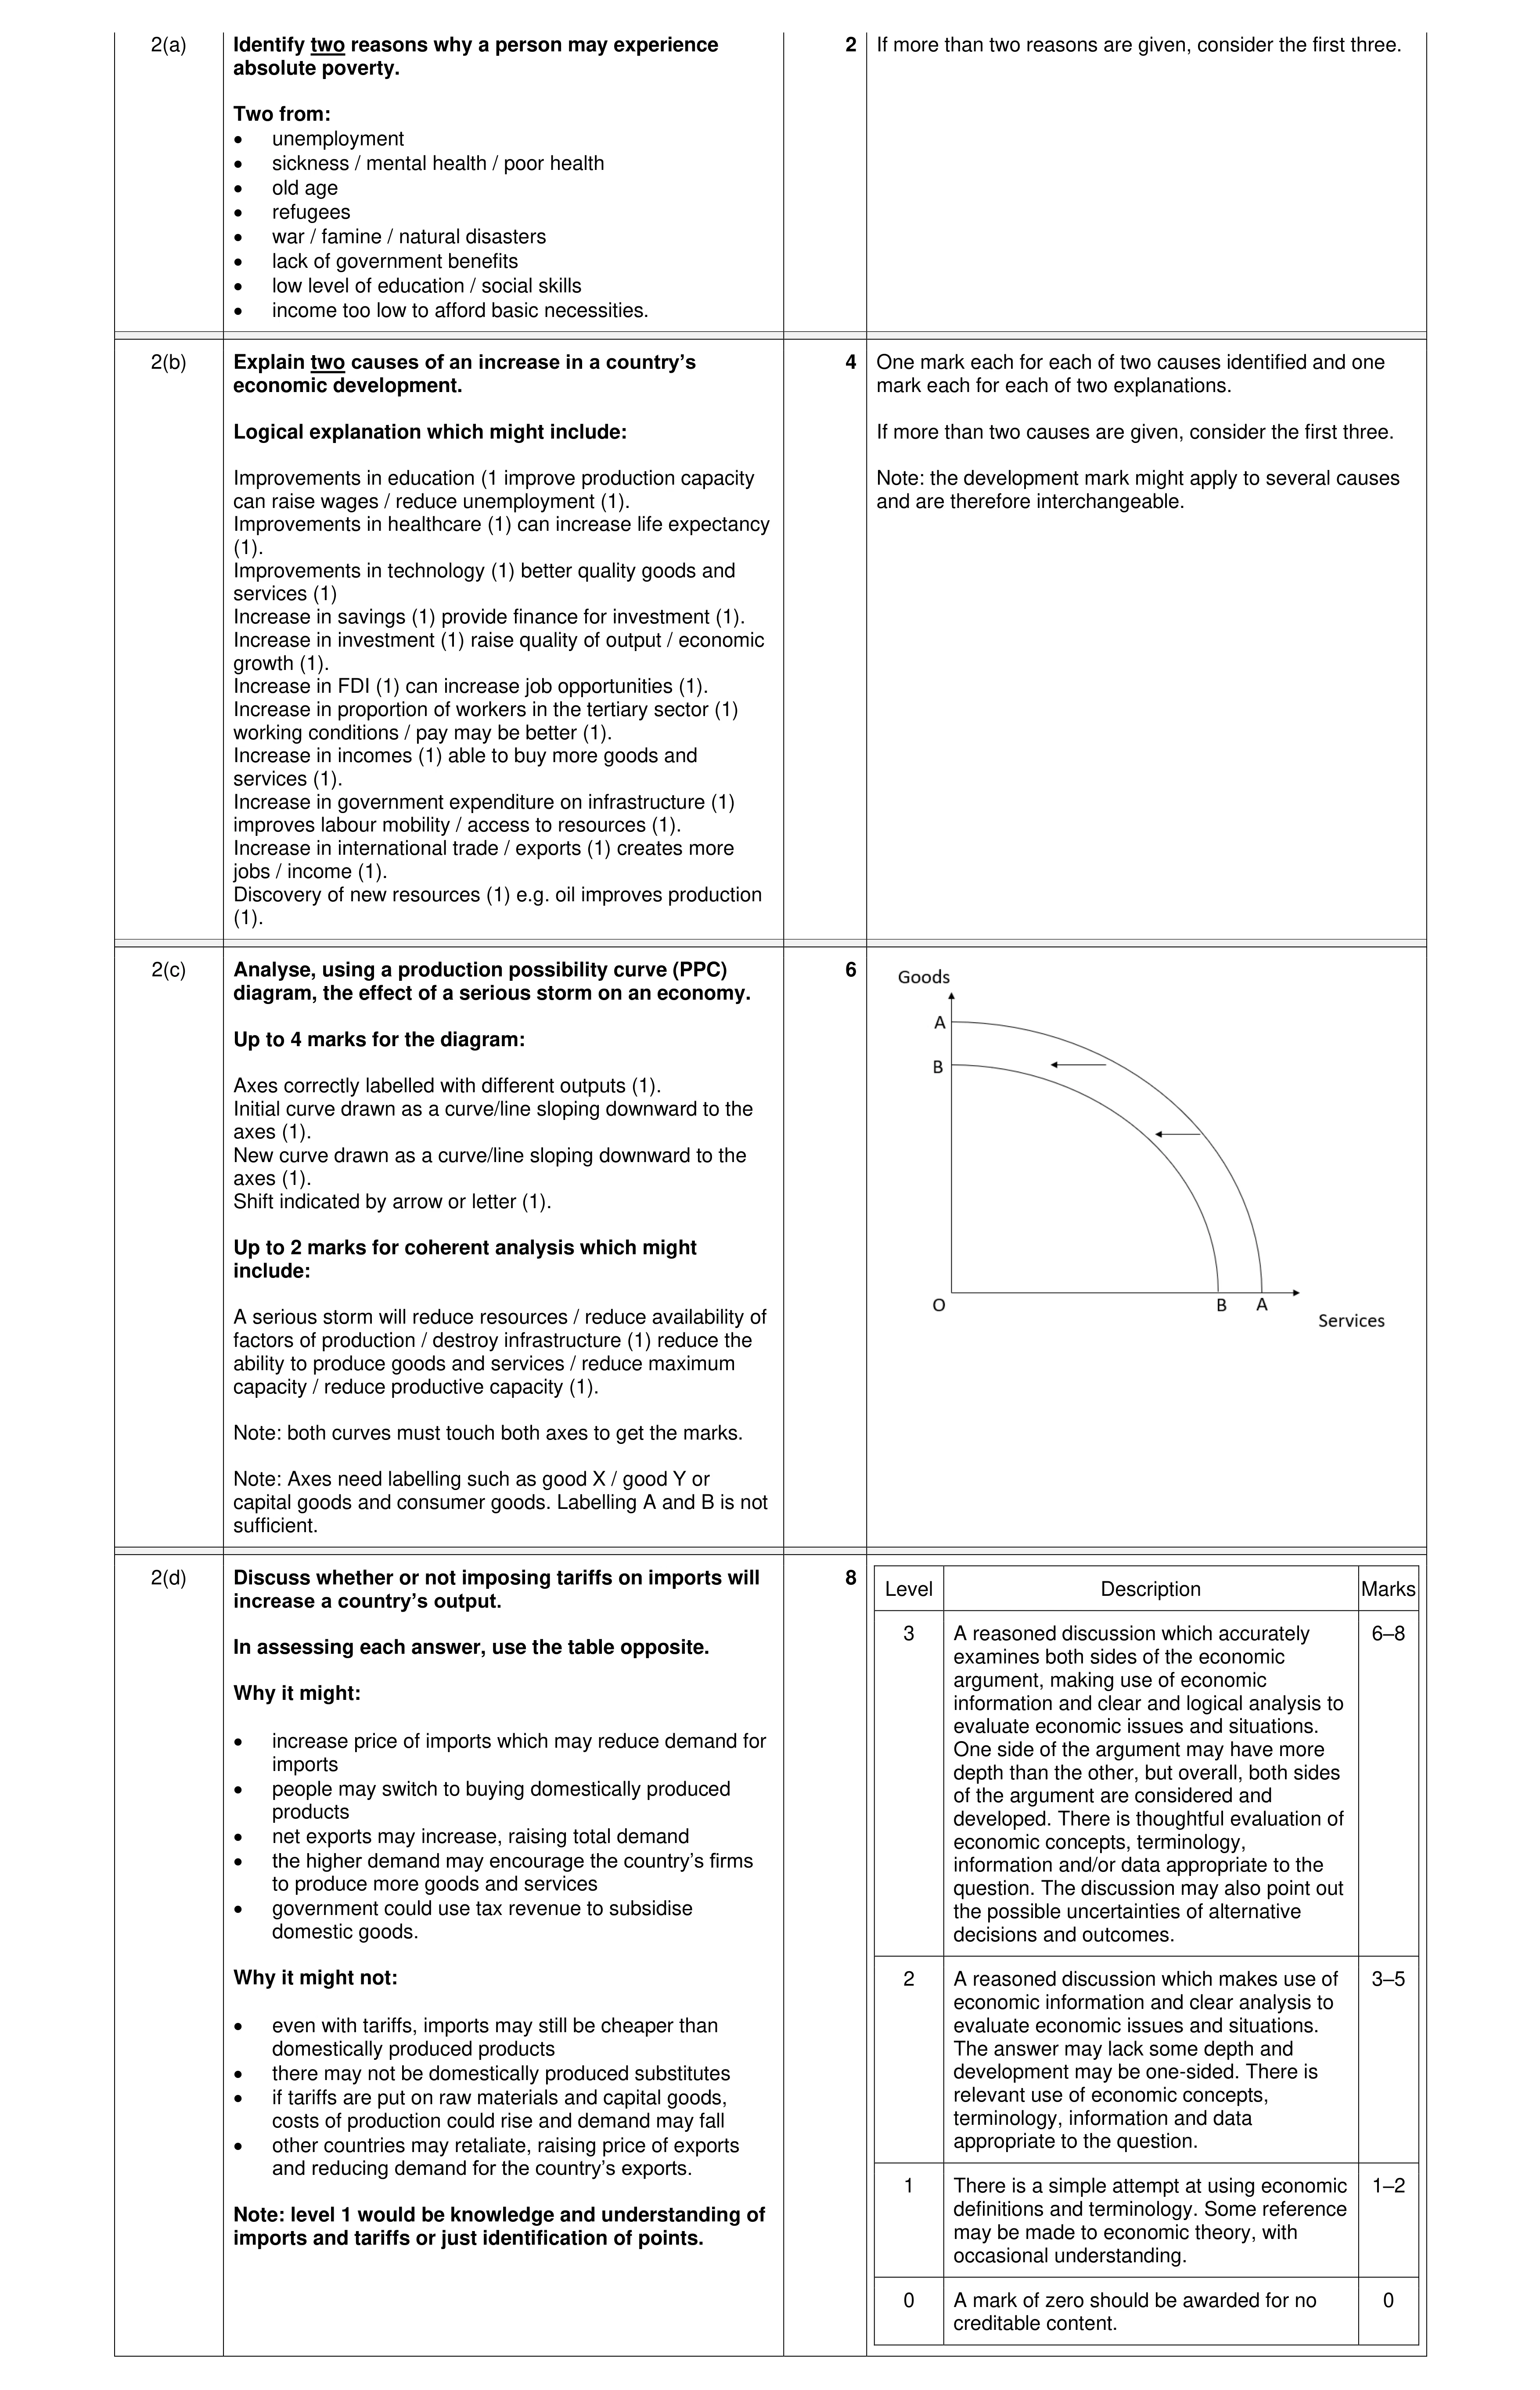 20
20 30
30 30
30 20
20 30
30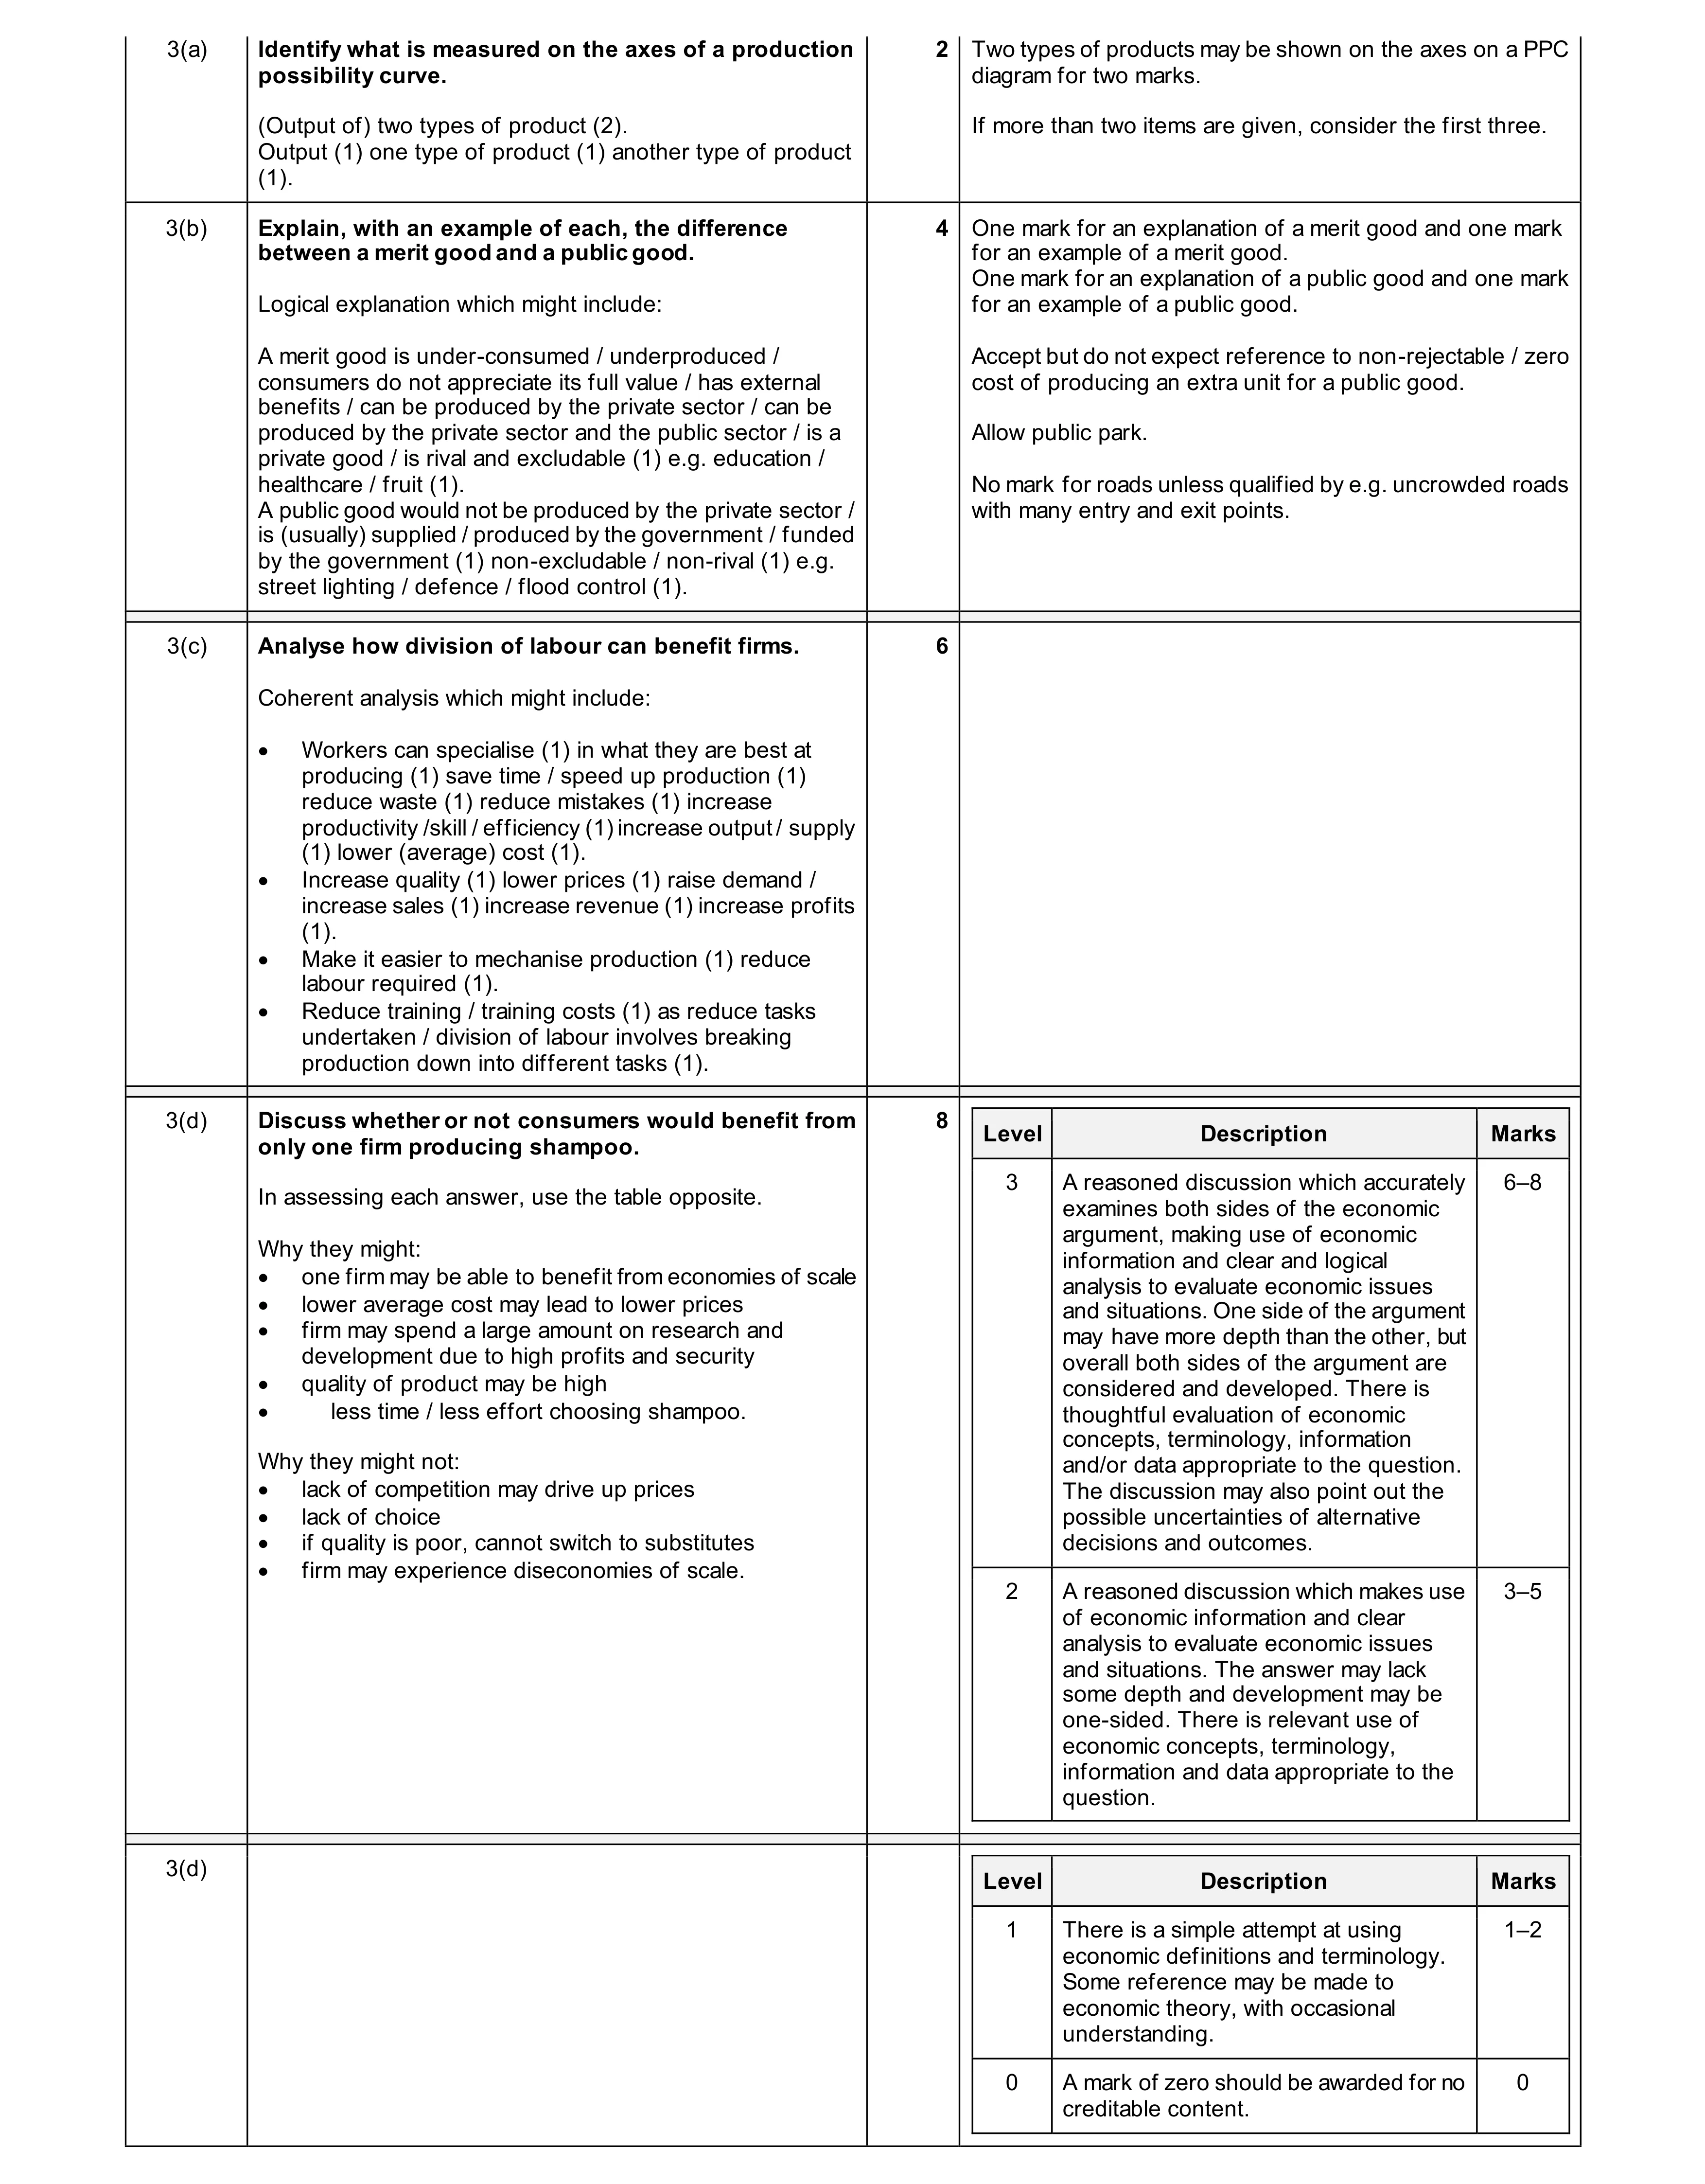 20
20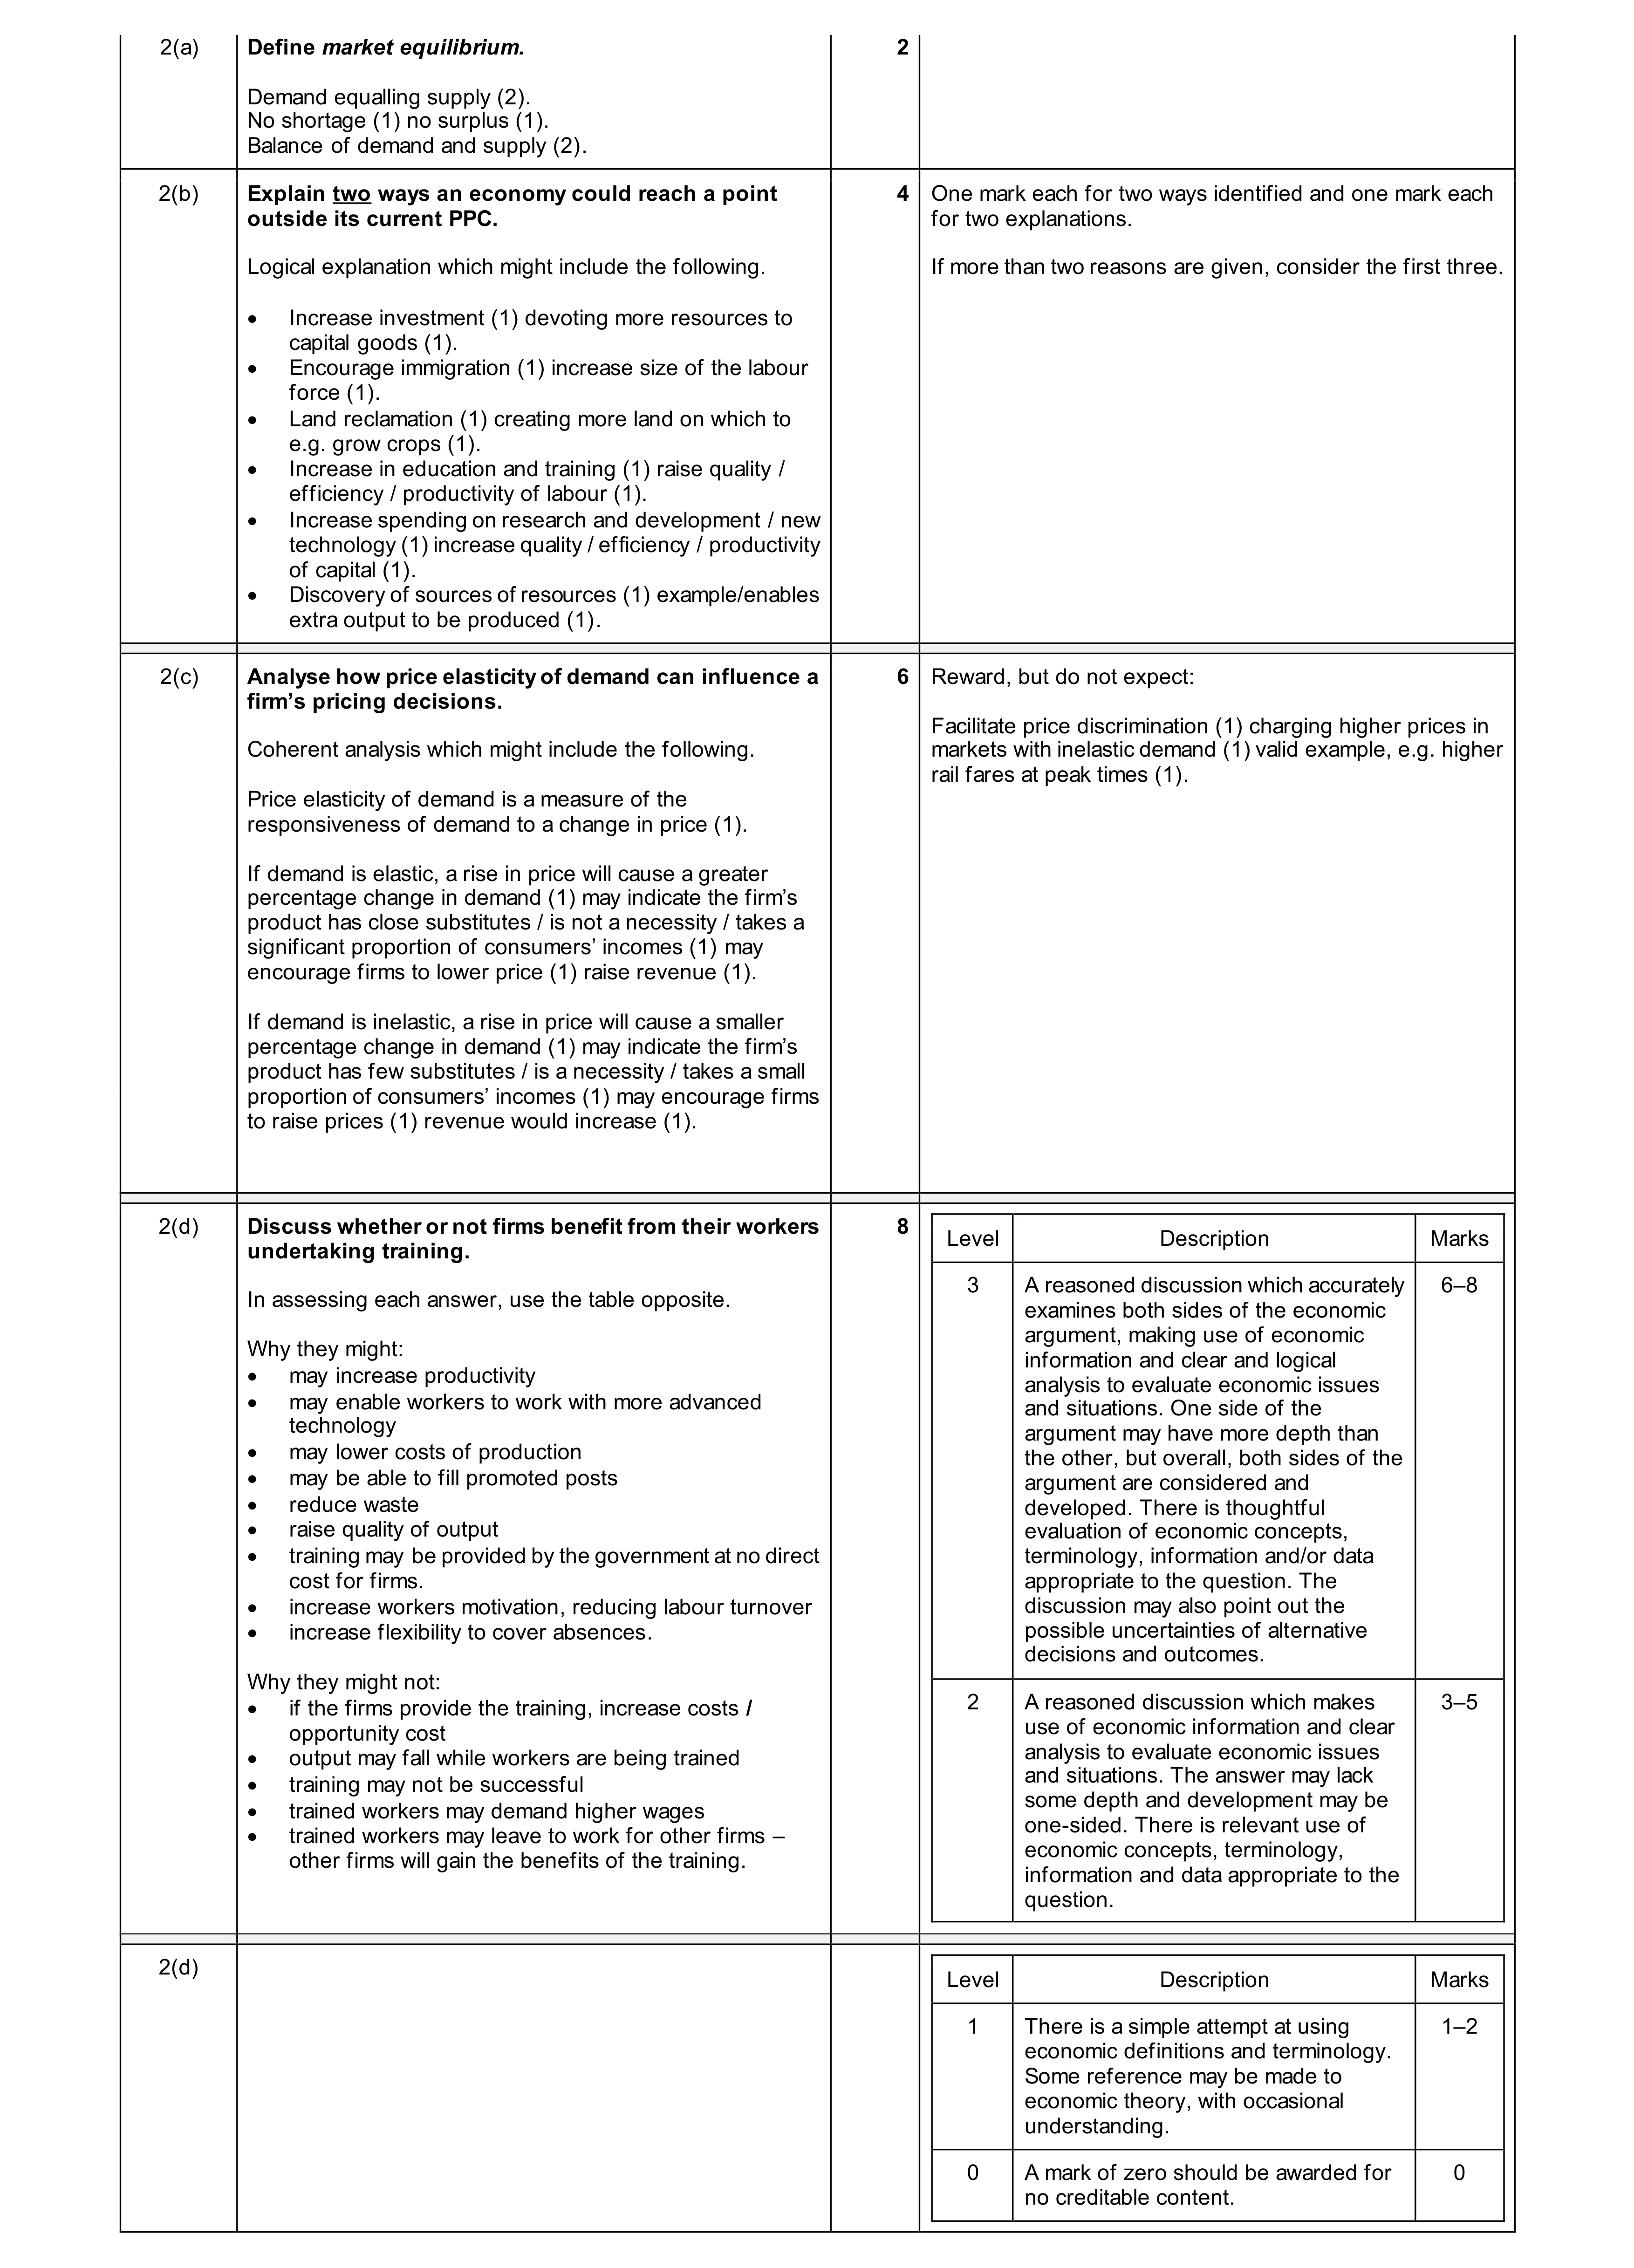 20
20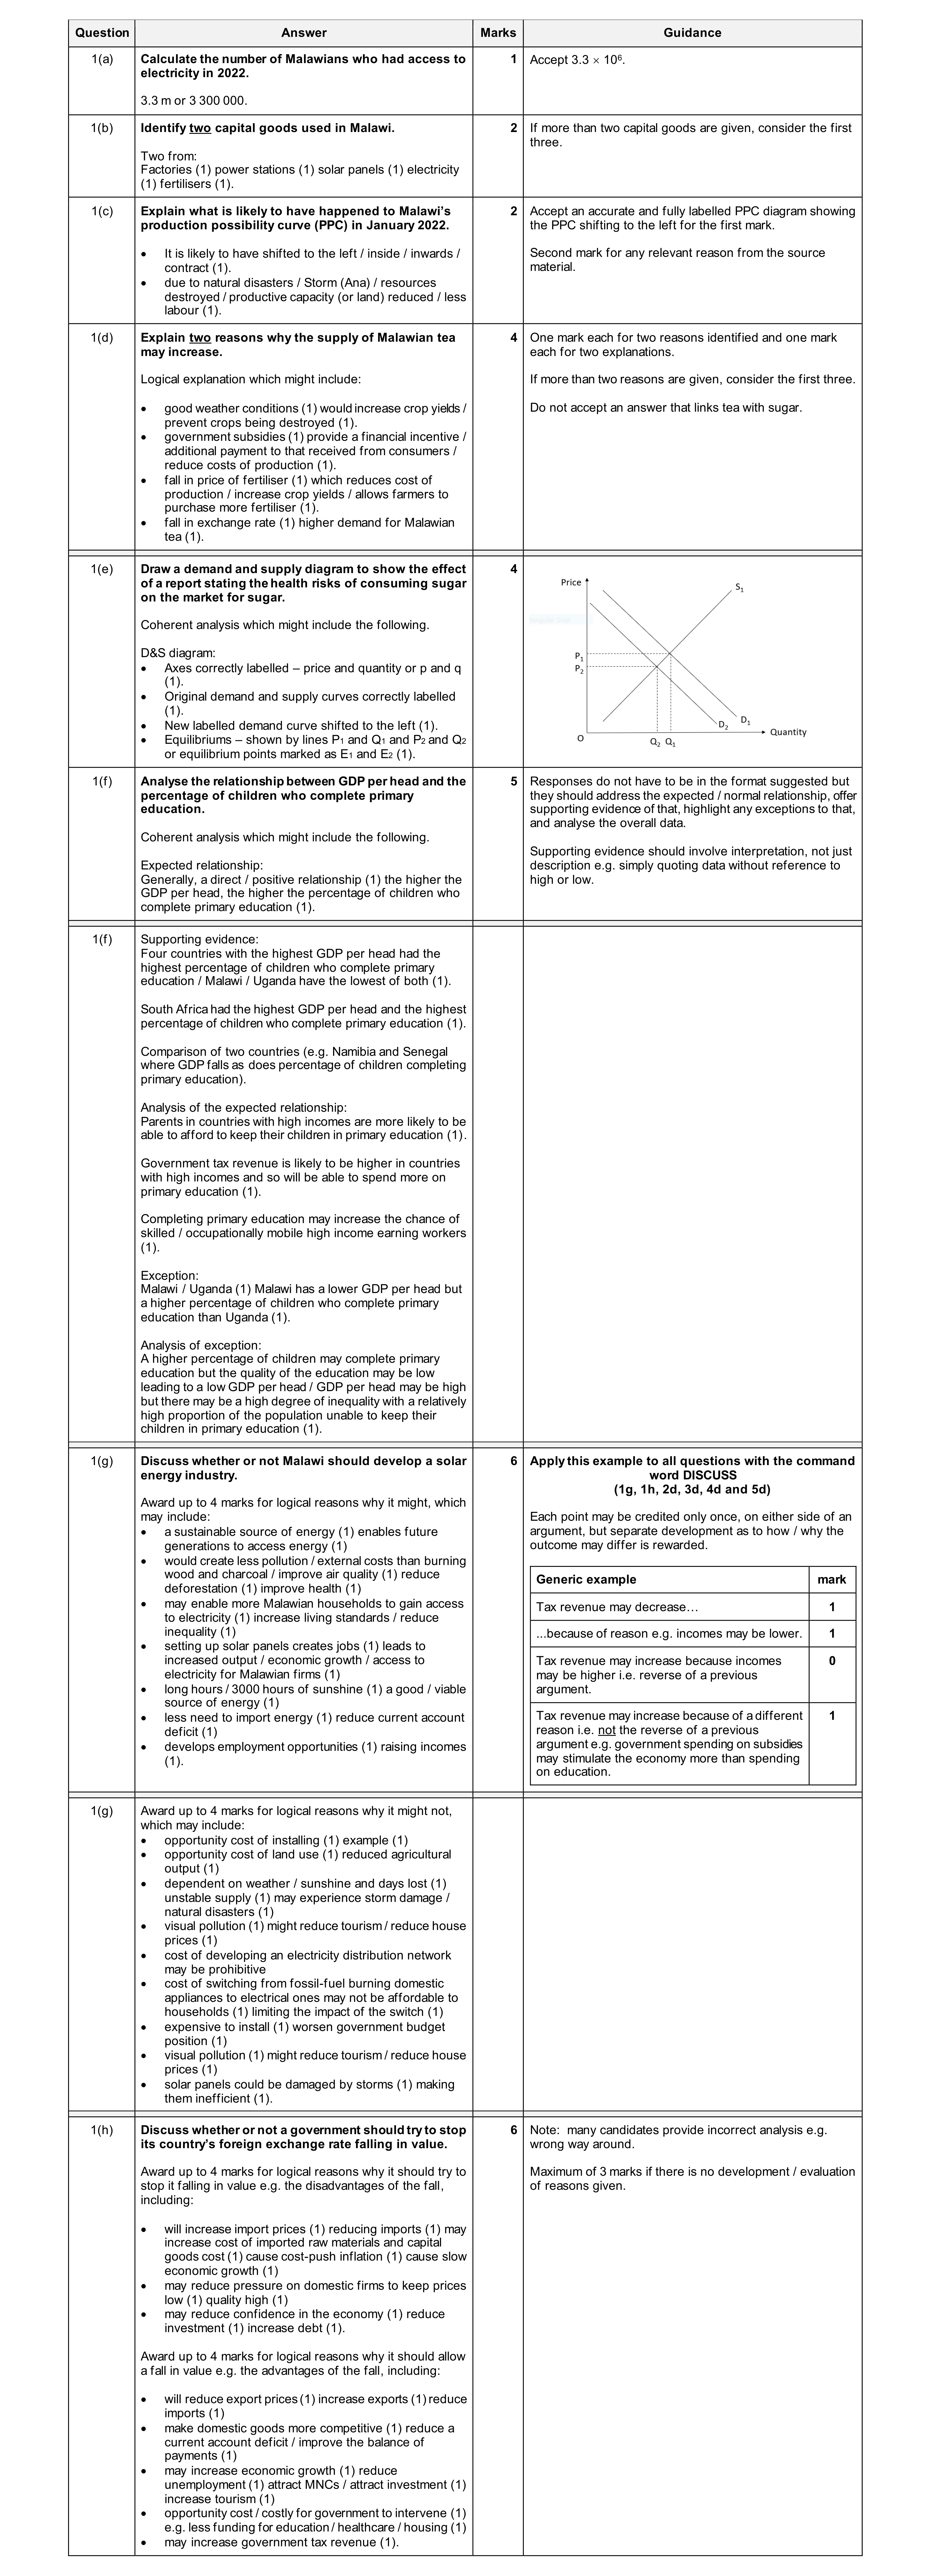 30
30