Questions as text
Question 1 0460/22 Feb/March 2017
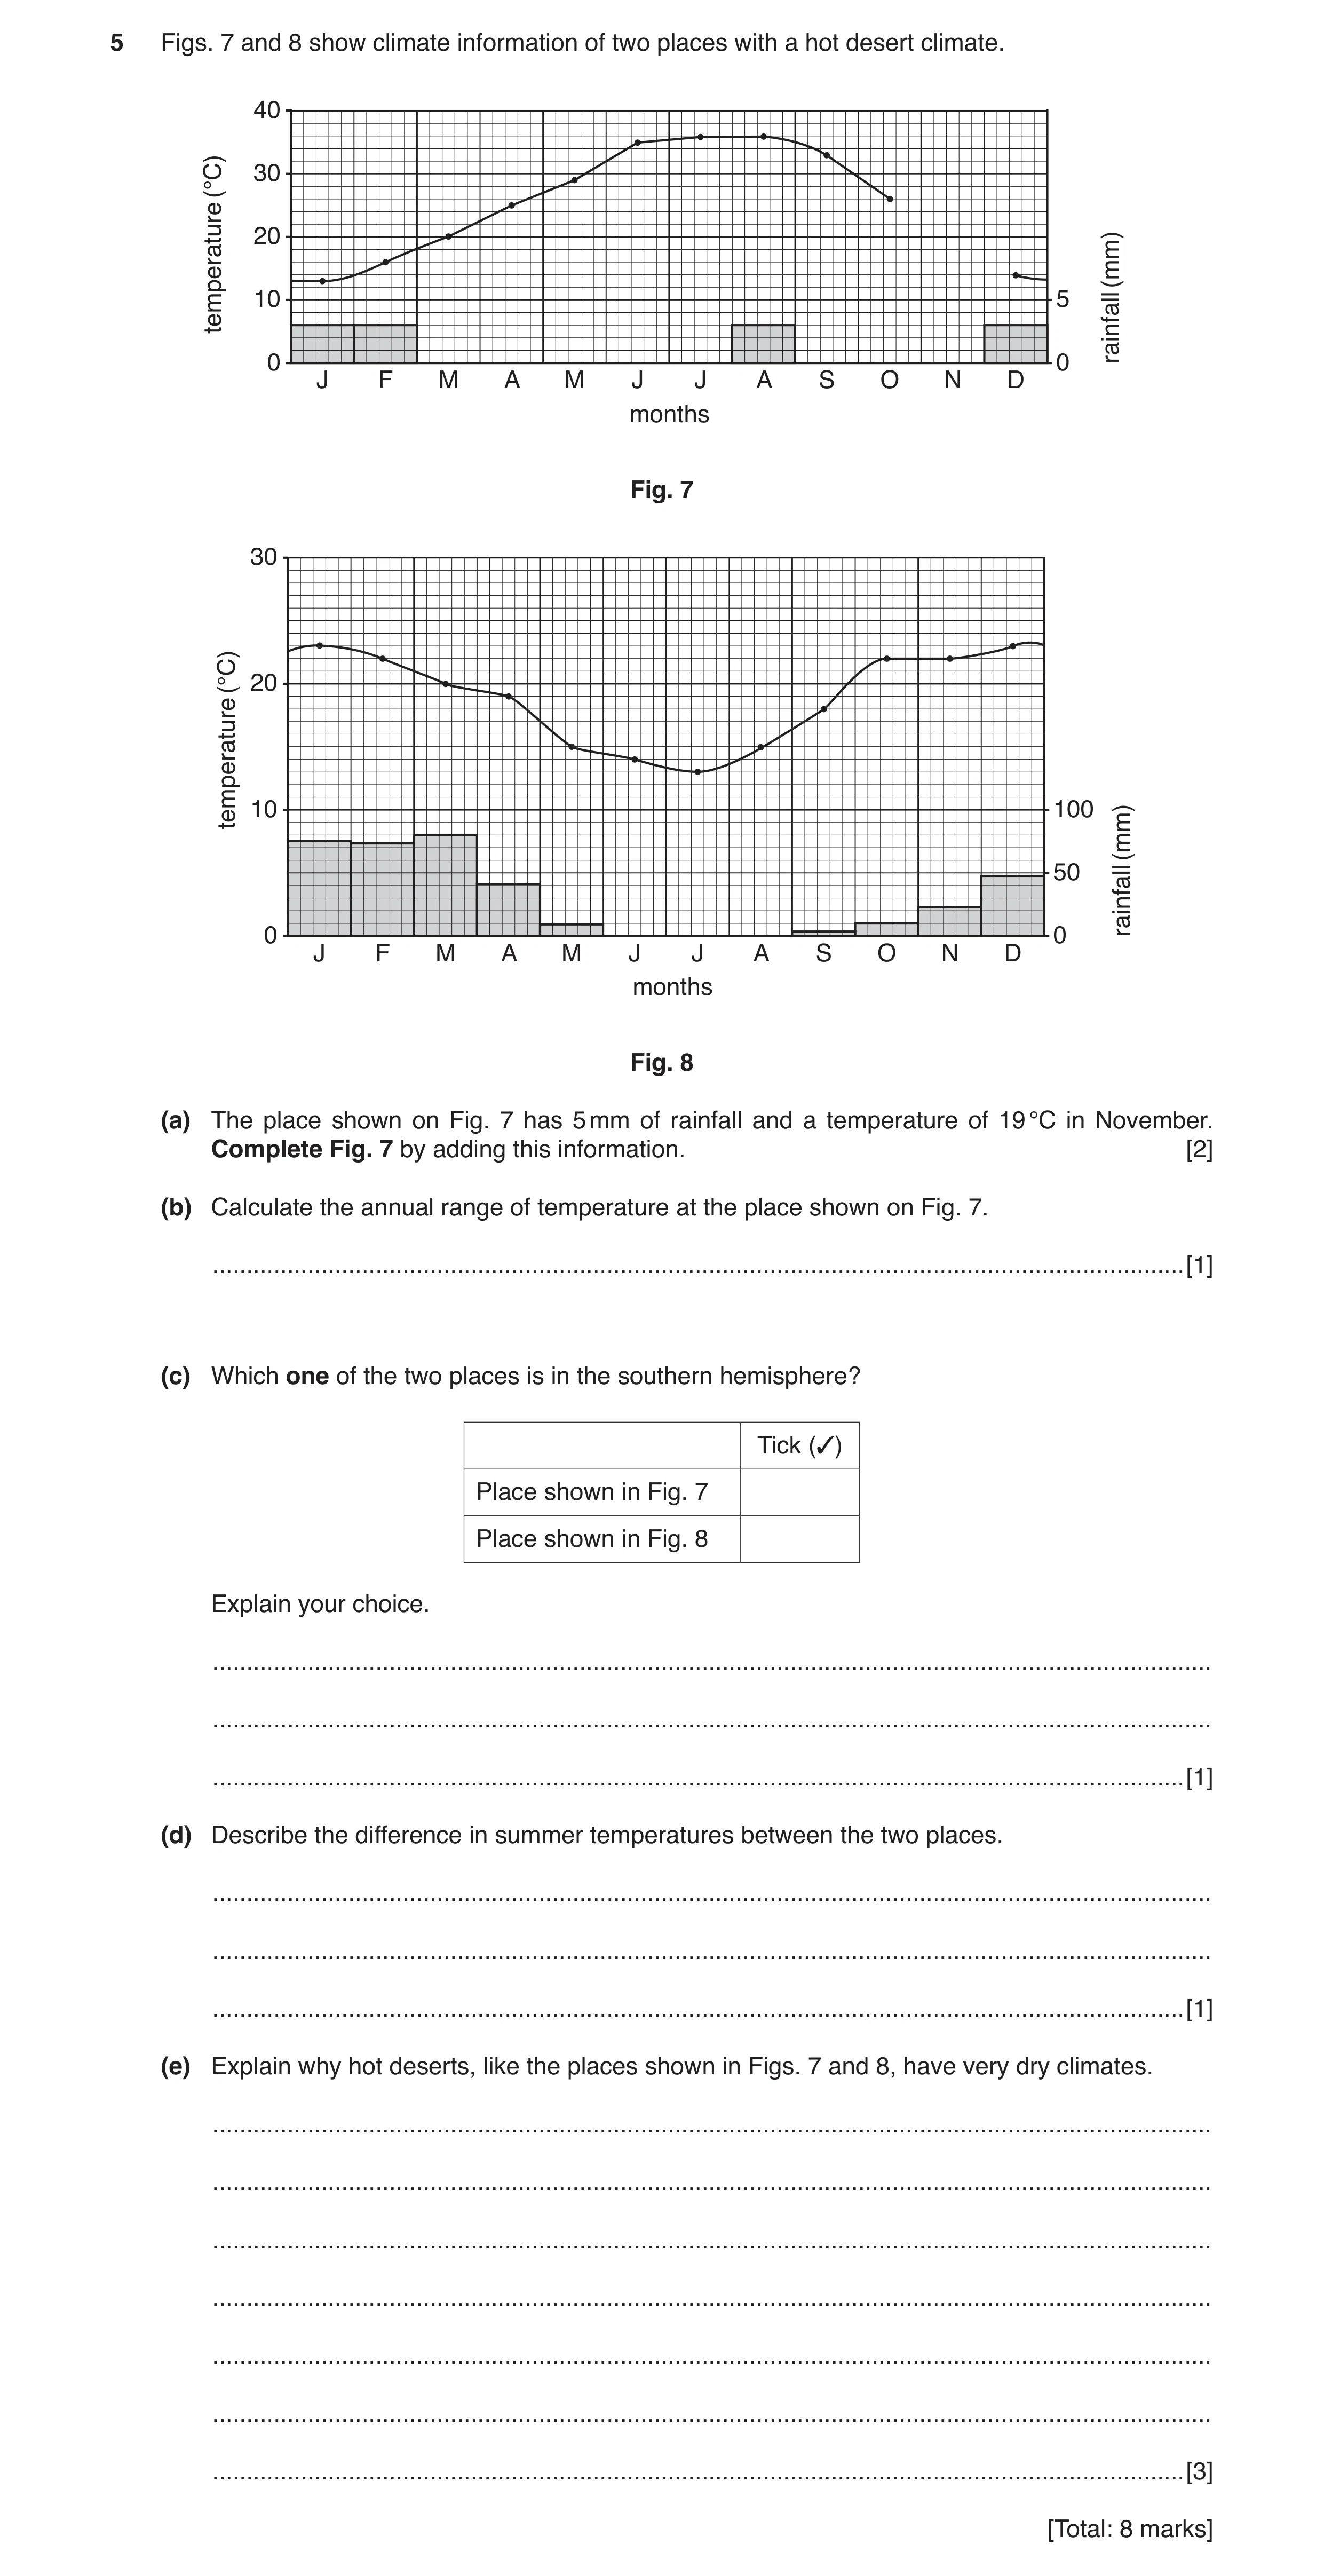
5 Figs. 7 and 8 show climate information of two places with a hot desert climate. 40 (°C) 30 20 (mm) 10 5 temperature rainfall 0 0 J F M A M J J A S O N D months Fig. 7 30 (°C) 20 temperature 10 100 (mm) 50 rainfall 0 0 J F M A M J J A S O N D months Fig. 8 (a) The place shown on Fig. 7 has 5 mm of rainfall and a temperature of 19 °C in November. Complete Fig. 7 by adding this information. [2] (b) Calculate the annual range of temperature at the place shown on Fig. 7. … [1] (c) Which one of the two places is in the southern hemisphere? Tick (3) Place shown in Fig. 7 Place shown in Fig. 8 Explain your choice. … … … [1] (d) Describe the difference in summer temperatures between the two places. … … … [1] (e) Explain why hot deserts, like the places shown in Figs. 7 and 8, have very dry climates. … … … … … … … [3] [Total: 8 marks]
8 marks
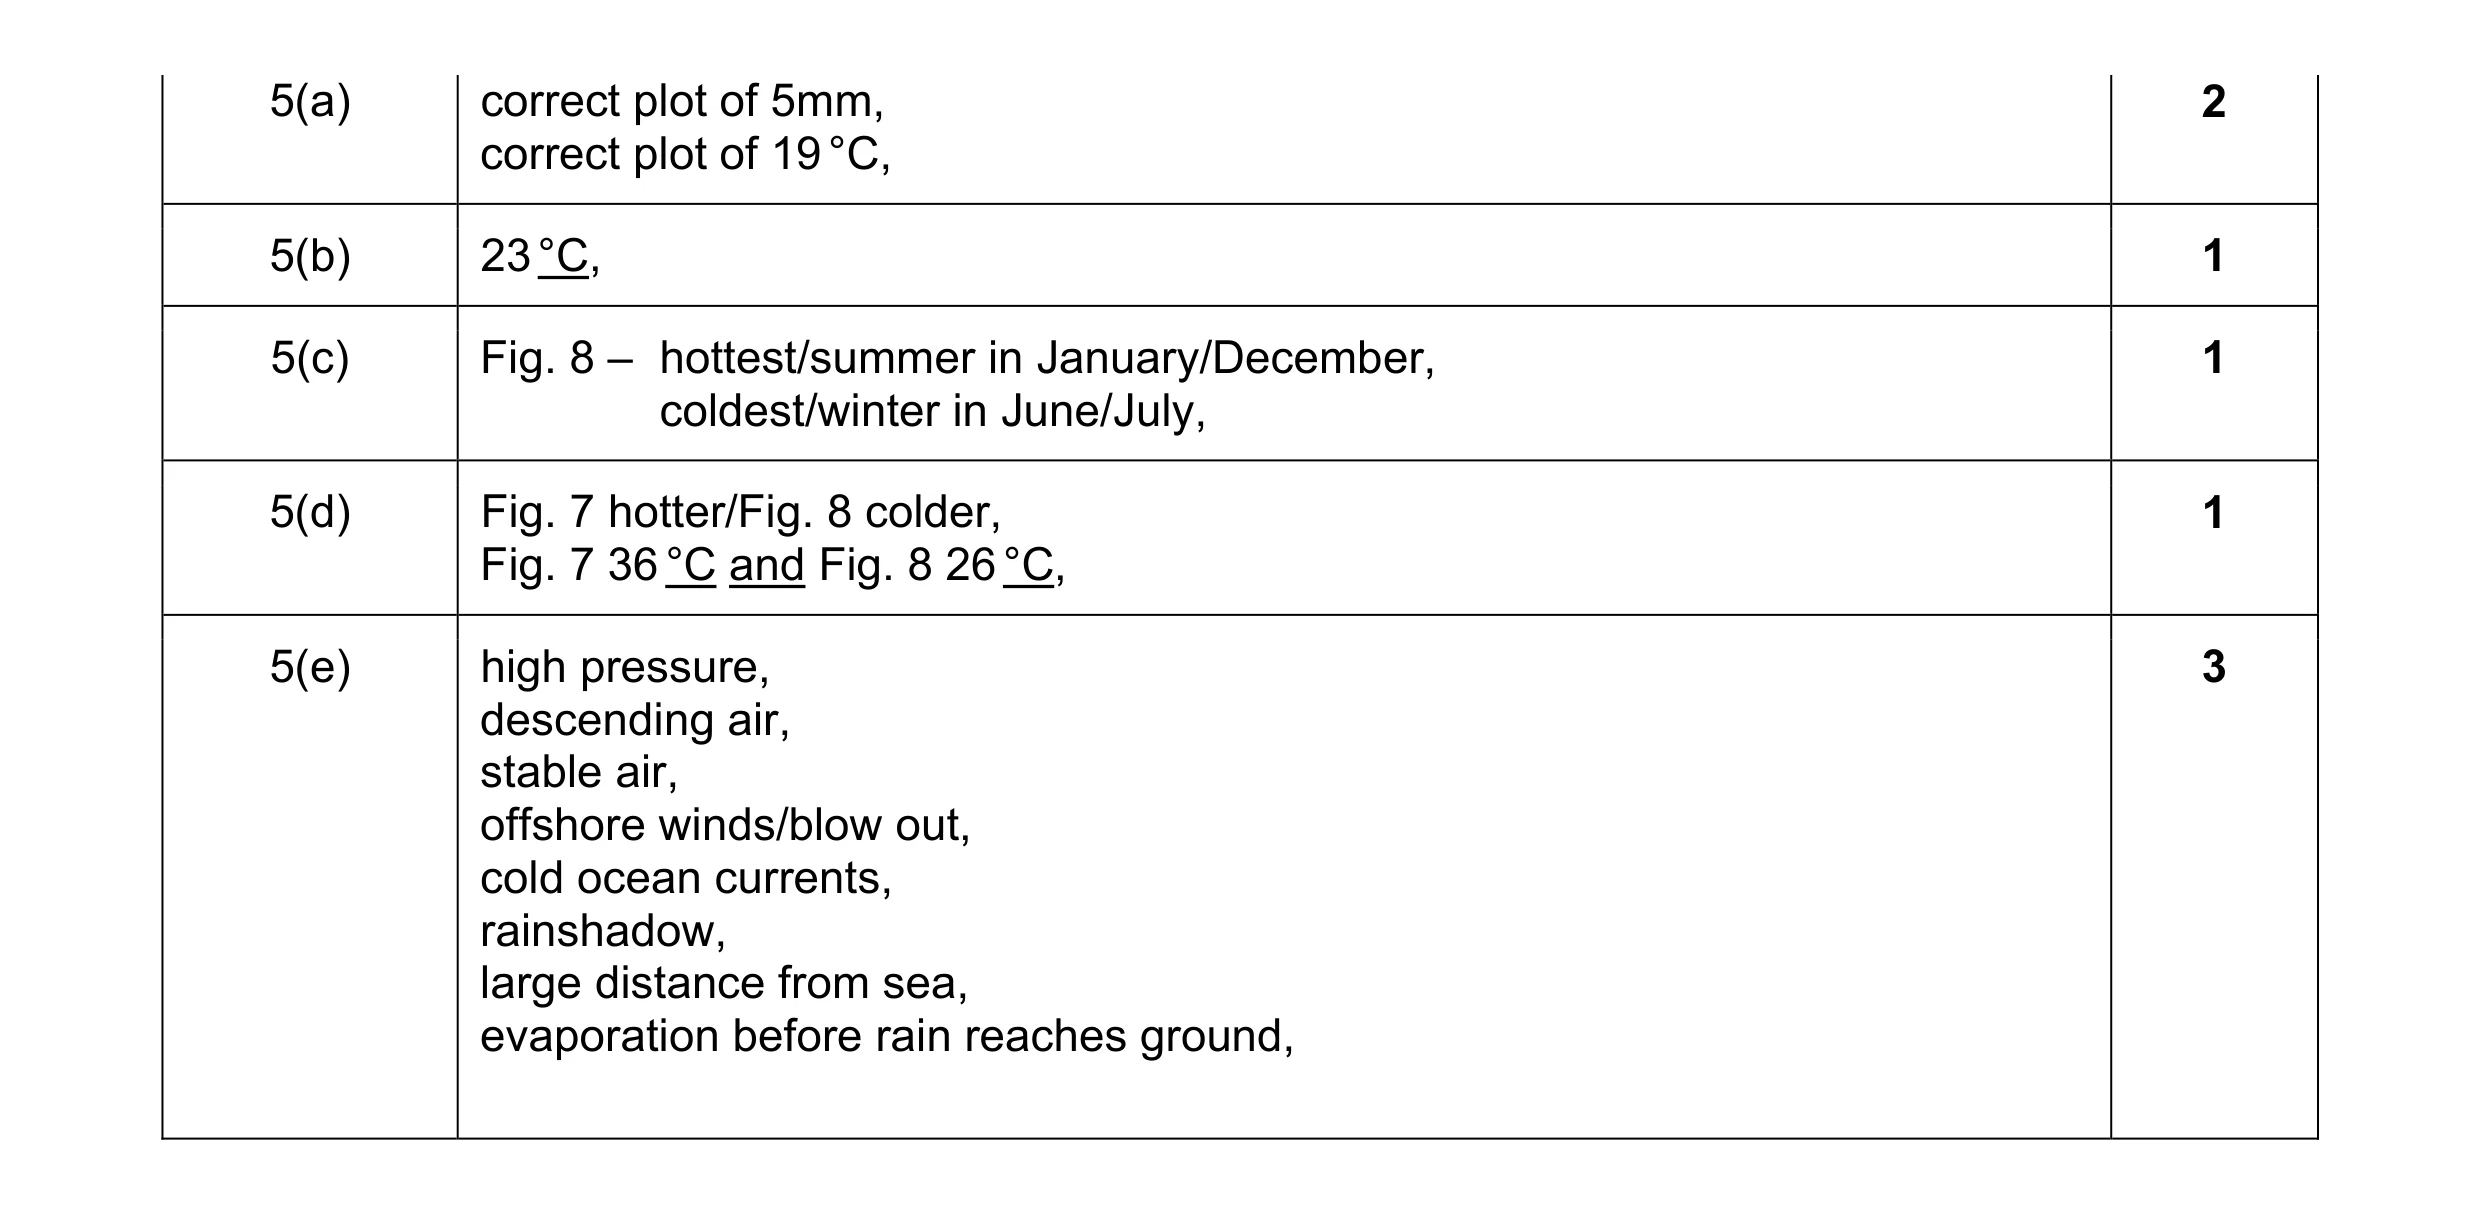
Mark scheme: 5(a) correct plot of 5mm, 2 correct plot of 19 °C, 5(b) 23 °C, 1 5(c) Fig. 8 – hottest/summer in January/December, 1 coldest/winter in June/July, 5(d) Fig. 7 hotter/Fig. 8 colder, 1 Fig. 7 36 °C and Fig. 8 26 °C, 5(e) high pressure, 3 descending air, stable air, offshore winds/blow out, cold ocean currents, rainshadow, large distance from sea, evaporation before rain reaches ground,
This question in 0460/22 Feb/March 2017
Q2 · Photographs B and C (Insert) show three types of cloud 0460/22 May/June 2017
5 (a) Photographs B and C (Insert) show three types of cloud. Name and describe the clouds at X in Photograph B and at Y and Z in Photograph C. Cloud at X (Photograph B) Name … Description … … … … Cloud at Y (Photograph C) Name … Description … … … … Cloud at Z (Photograph C) Name … Description … … … … [5] (b) Explain how clouds are formed. … … … … … … … [3] [Total: 8 marks] TURN PAGE FOR QUESTION 6
8 marks
Mark scheme: 5(a) Cloud at X 5 Cumulus / cumulo-nimbus, Heaped / fluffy / cotton wool, domed tops / globular, dense / thick, Cloud at Y cirrus, high, thin wispy / feather-like / mares’ tails / filaments, Cloud at Z Stratus / alto-stratus, Layer / sheet, uniform, Reserve 1 for each of X, Y and Z. 5(b) moist air, 3 rises, front / convection / relief, cooling, expansion, dew point temperature reached, relative humidity 100% / saturation, *condensation / water (vapour) condenses / gas to liquid, (air condenses = 0), condensation nuclei, *Compulsory point.
This question in 0460/22 May/June 2017
Question 3 0460/23 May/June 2017
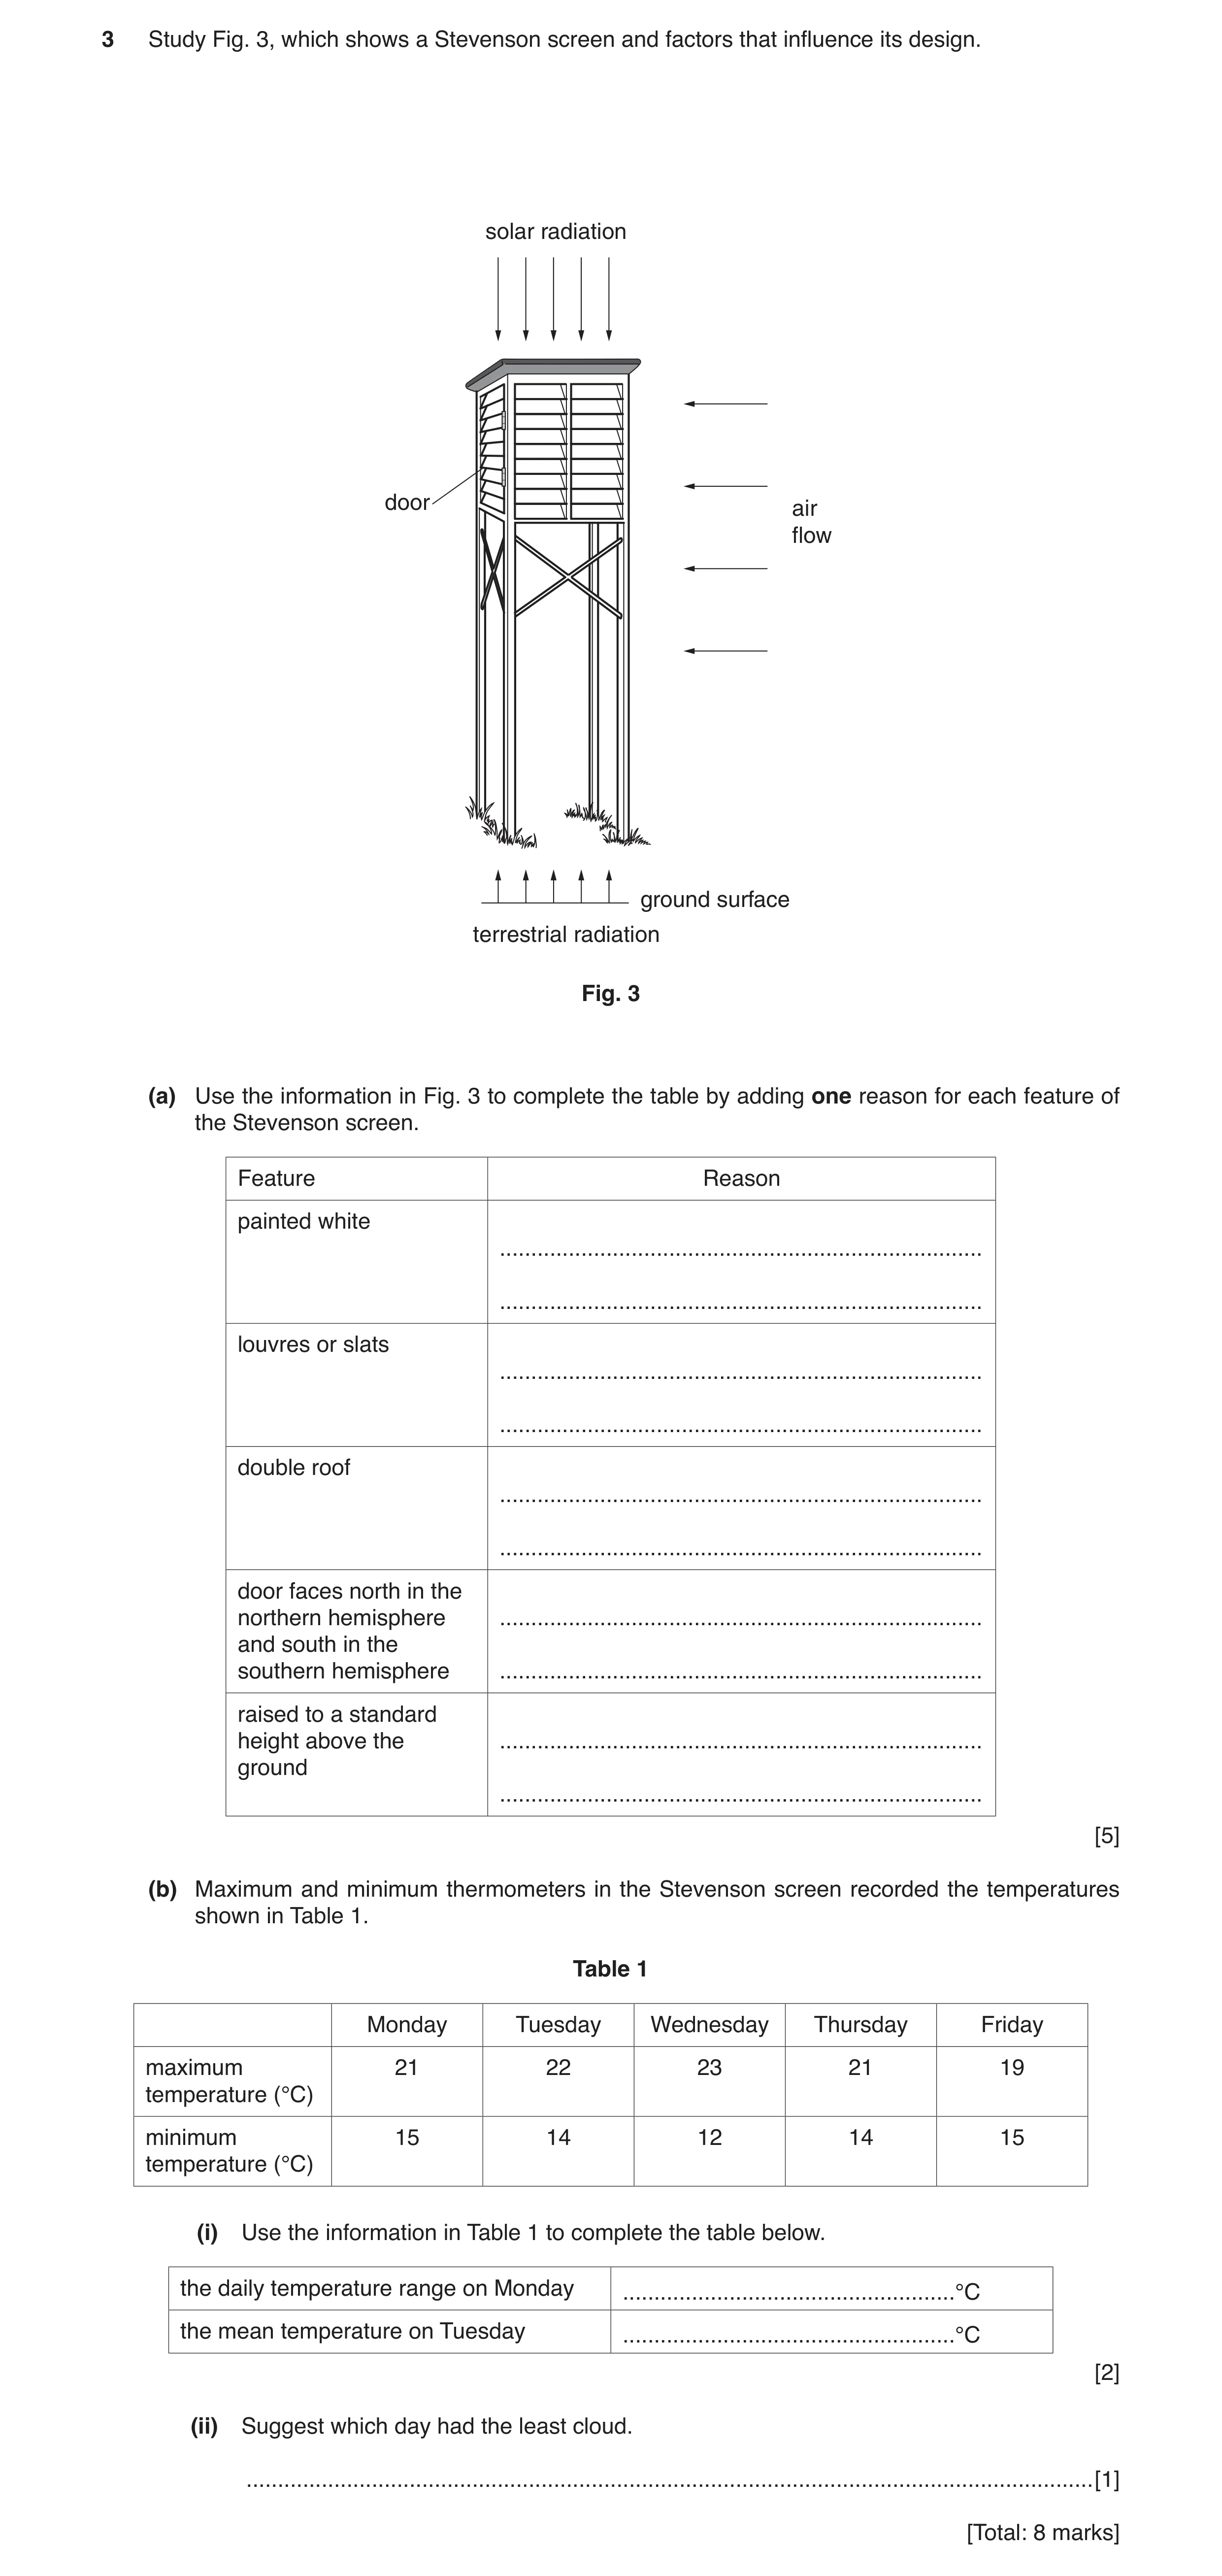
3 Study Fig. 3, which shows a Stevenson screen and factors that influence its design. solar radiation door air flow ground surface terrestrial radiation Fig. 3 (a) Use the information in Fig. 3 to complete the table by adding one reason for each feature of the Stevenson screen. Feature Reason painted white … … louvres or slats … … double roof … … door faces north in the northern hemisphere … and south in the southern hemisphere … raised to a standard height above the … ground … [5] (b) Maximum and minimum thermometers in the Stevenson screen recorded the temperatures shown in Table 1. Table 1 Monday Tuesday Wednesday Thursday Friday maximum 21 22 23 21 19 temperature (°C) minimum 15 14 12 14 15 temperature (°C) (i) Use the information in Table 1 to complete the table below. the daily temperature range on Monday … °C the mean temperature on Tuesday … °C [2] (ii) Suggest which day had the least cloud. … [1] [Total: 8 marks]
8 marks
Mark scheme: 3(a) painted white – to reflect solar radiation/reflect the sun/prevent heat absorption, 5 louvres or slats – to allow air into the screen/ventilation, double roof – to protect against solar radiation/solar heat/prevent conduction/ for insulation, door faces north/south – to prevent sun’s rays/heat falling on the instruments/prevent sun entering, raised on legs to a standard height above ground – standardisation/comparability, – to avoid terrestrial radiation/ground heat, 3(b)(i) 6 (°C), 2 18 (°C), 3(b)(ii) Wednesday 1
This question in 0460/23 May/June 2017
Question 4 0460/23 May/June 2017
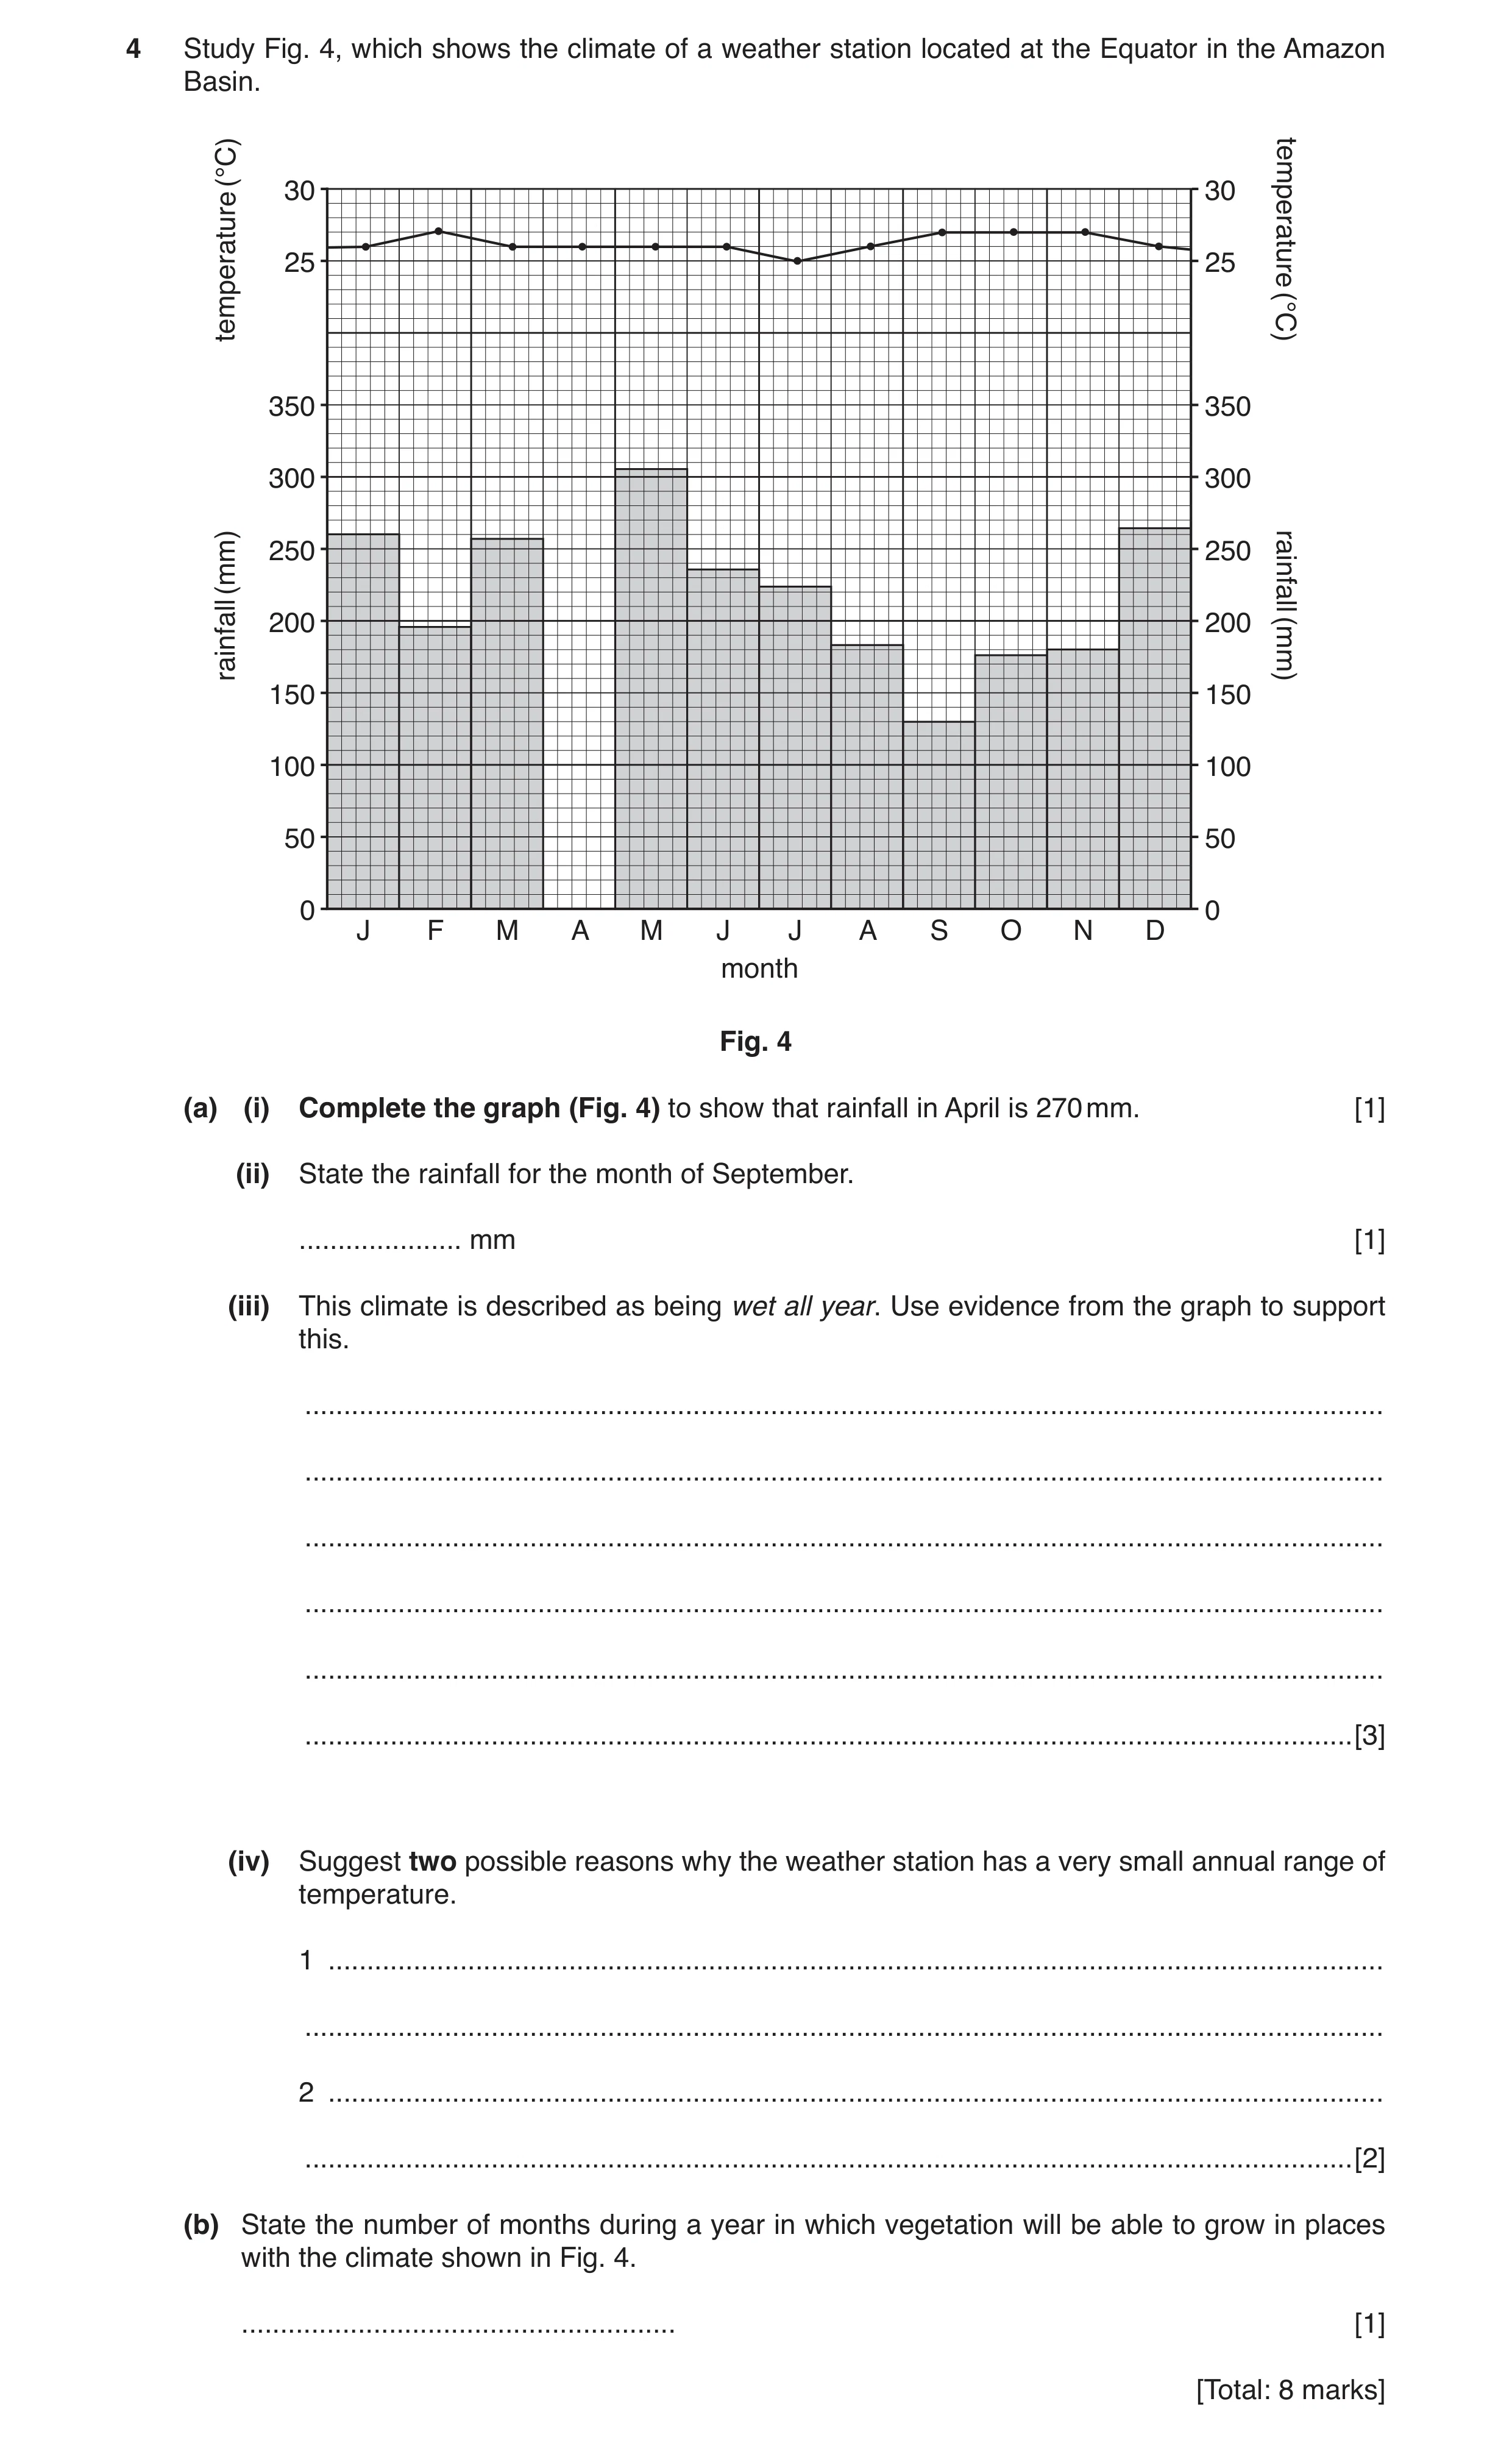
4 Study Fig. 4, which shows the climate of a weather station located at the Equator in the Amazon Basin. (°C) 30 30 25 25 temperature temperature (°C) 350 350 300 300 (mm) 250 250 rainfall rainfall 200 200 (mm) 150 150 100 100 50 50 0 0 J F M A M J J A S O N D month Fig. 4 (a) (i) Complete the graph (Fig. 4) to show that rainfall in April is 270 mm. [1] (ii) State the rainfall for the month of September. … mm [1] (iii) This climate is described as being wet all year. Use evidence from the graph to support this. … … … … … … [3] (iv) Suggest two possible reasons why the weather station has a very small annual range of temperature. 1 … … 2 … … [2] (b) State the number of months during a year in which vegetation will be able to grow in places with the climate shown in Fig. 4. … [1] [Total: 8 marks]
8 marks
Mark scheme: 4(a)(i) bar at 270 mm 1 4(a)(ii) 130 1 4(a)(iii) rain in every month, 3 lowest month is 130 mm/at least 130 mm every month/more than 100 mm every month/>150 mm every month except September, average 200–250 mm per month, lowest monthly total is high, high annual total/high overall rainfall, annual total 2630–2730 mm/more than 2600 mm, 4(a)(iv) sun always at a high angle/overhead, 2 day and night of same length all year, cloudy climate, 4(b) 12 1
This question in 0460/23 May/June 2017
Q5 · Photograph A (Insert) shows a weather station at a school in Zimbabwe 0460/21 Oct/Nov 2017
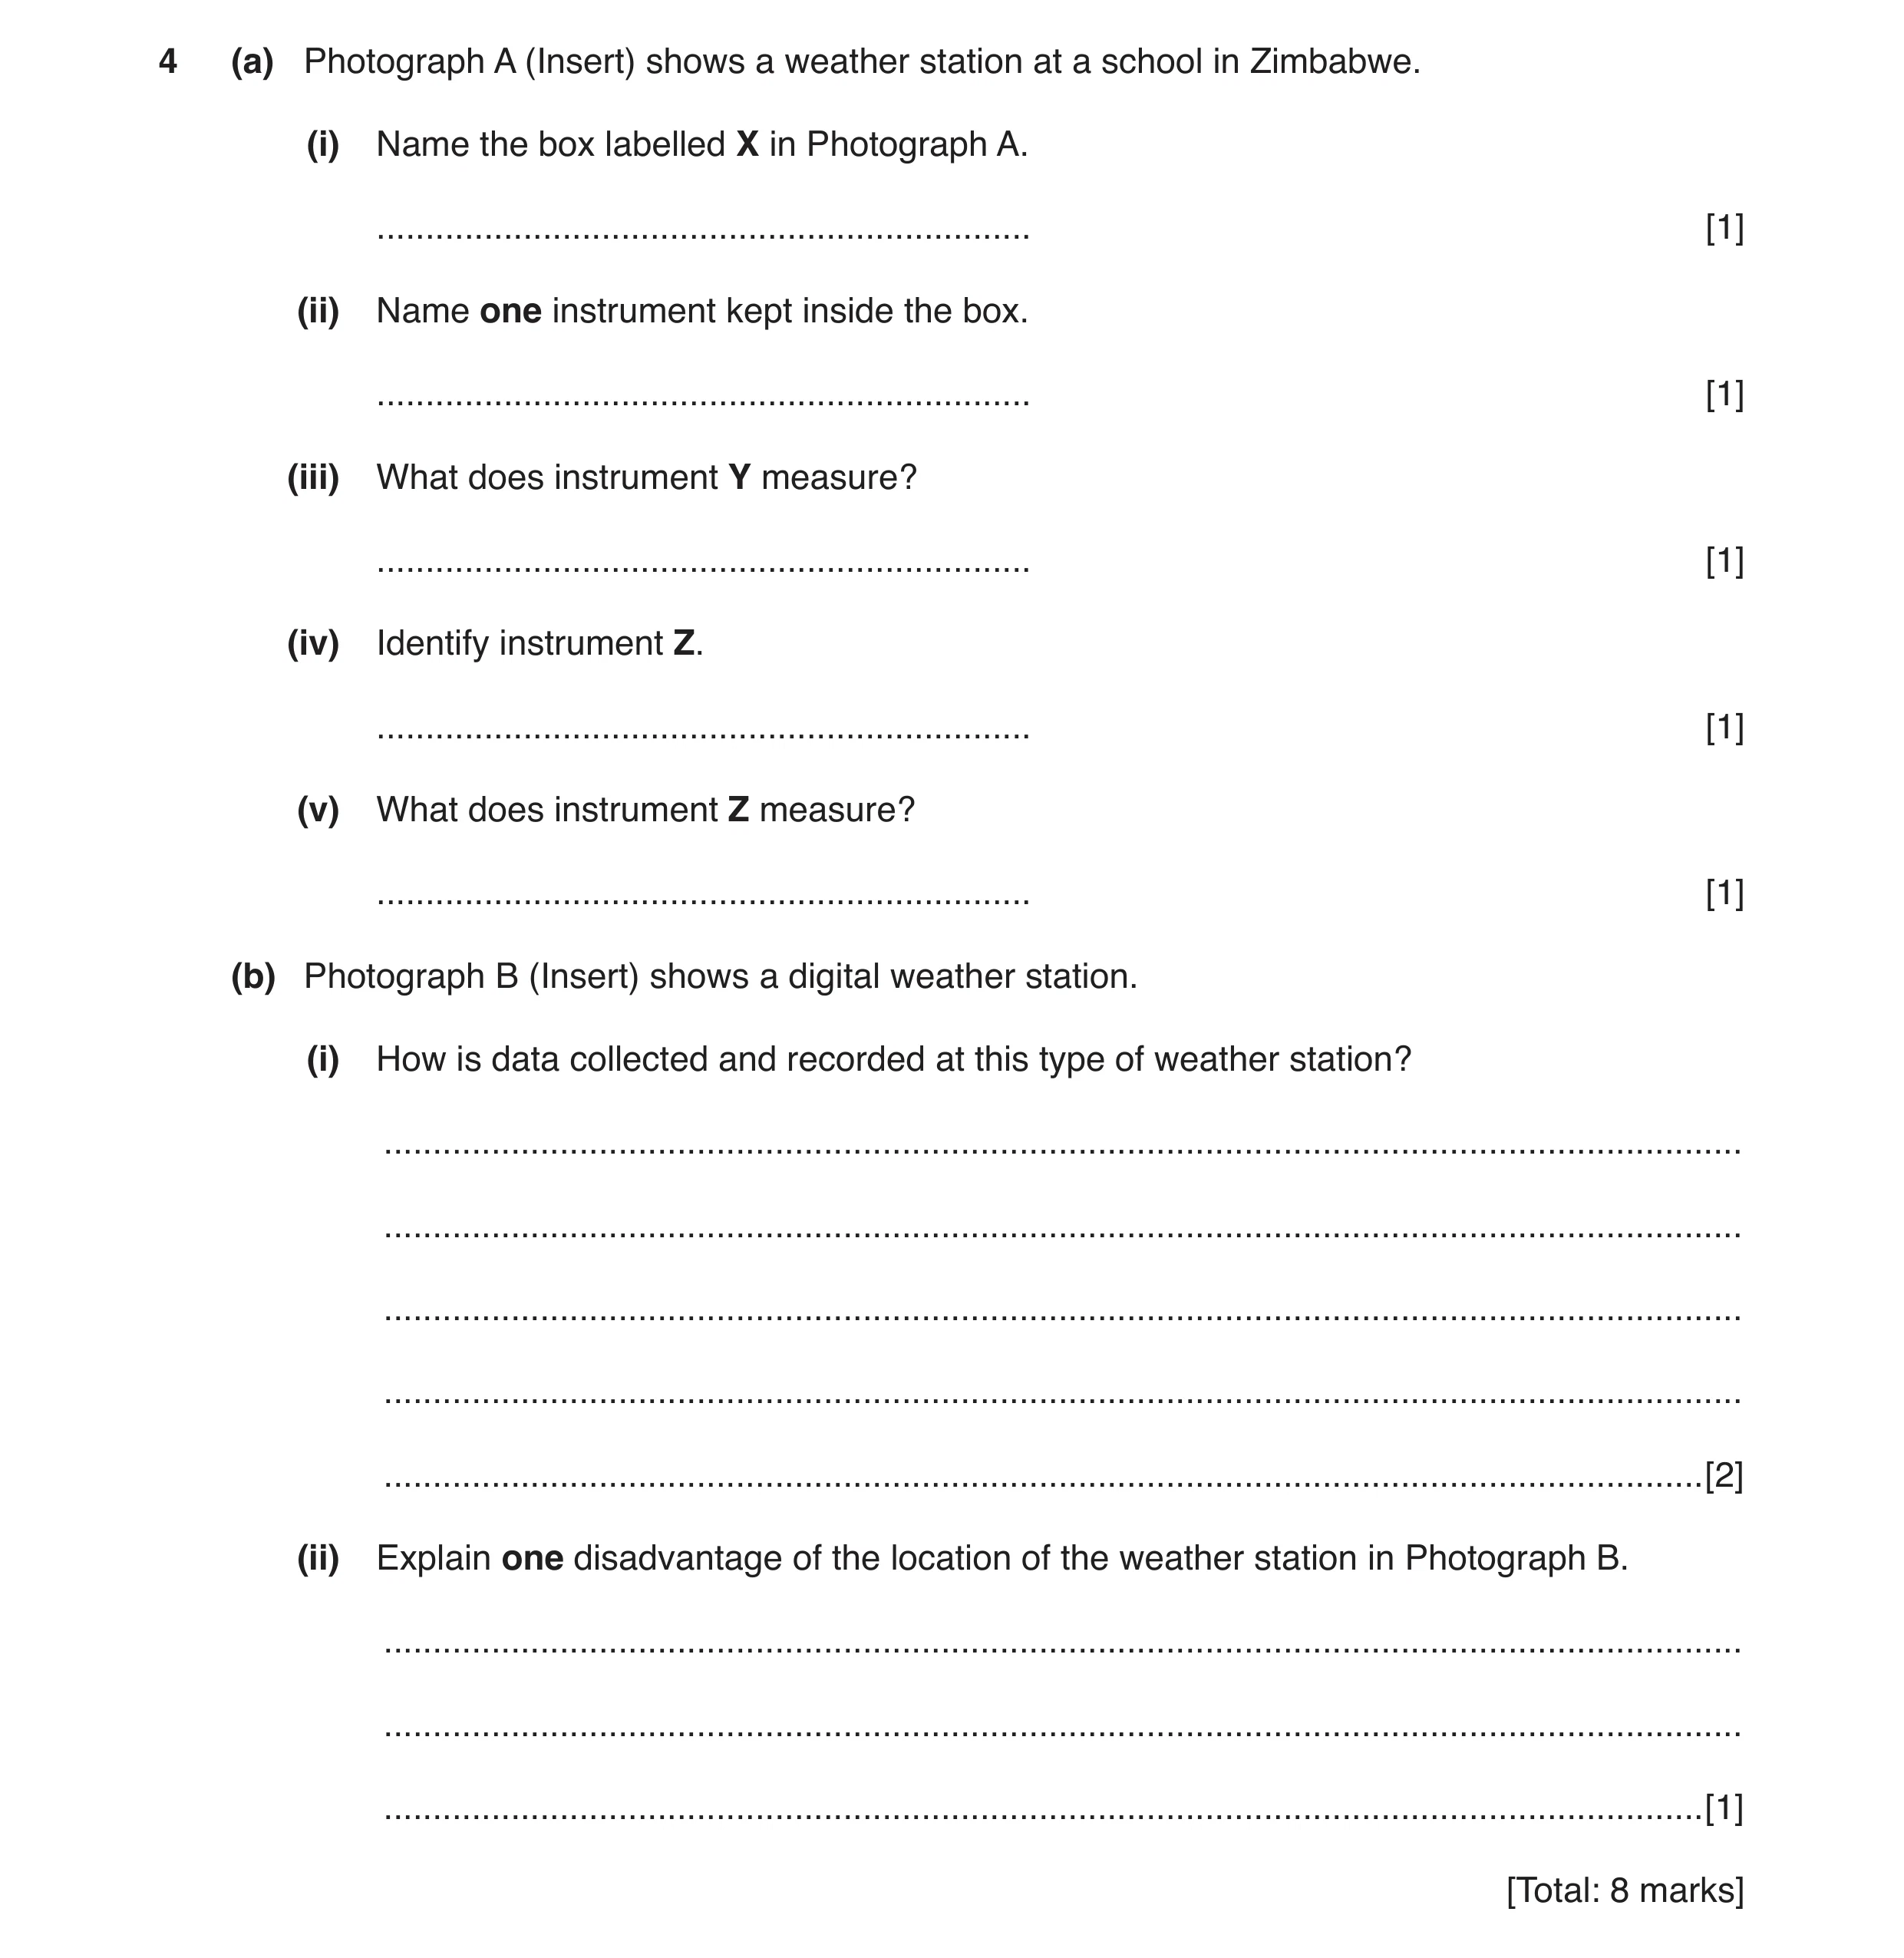
4 (a) Photograph A (Insert) shows a weather station at a school in Zimbabwe. (i) Name the box labelled X in Photograph A. … [1] (ii) Name one instrument kept inside the box. … [1] (iii) What does instrument Y measure? … [1] (iv) Identify instrument Z. … [1] (v) What does instrument Z measure? … [1] (b) Photograph B (Insert) shows a digital weather station. (i) How is data collected and recorded at this type of weather station? … … … … … [2] (ii) Explain one disadvantage of the location of the weather station in Photograph B. … … … [1] [Total: 8 marks]
8 marks
Mark scheme: 4(a)(i) Stevenson screen, 1 4(a)(ii) thermometer, 1 hygrometer, barometer, 4(a)(iii) rainfall/precipitation, 1 4(a)(iv) anemometer, 1 4(a)(v) wind speed/force/strength, 1 4(b)(i) remotely/no need for visit to station/automatically, 2 signal sent (wireless or wire), receiver/recorder (in building/house/elsewhere), use of computer, 4(b)(ii) tree/house may cause shade/shelter/damage, 1
This question in 0460/21 Oct/Nov 2017
Question 6 0460/23 Oct/Nov 2017
5 (a) Study Fig. 7, showing weather in the northern part of South America at midday on a day in July. N Caribbean Sea 1012 Georgetown 25 Atlantic 1008 Ocean 9 Equator 26 Quito Manaus Pacific Ocean 1012 1016 0 1000 1012 km Key circles cloud cover circles wind speed clear sky calm temperature (°C) 12 one okta 1–2 knots wind direction (SW) cloud cover two oktas 3–7 knots (six oktas) three oktas 8–12 knots wind speed four oktas 13–17 knots (23–27 knots) five oktas 18–22 etc until atmospheric 1012 pressure (mb) six oktas 48–52 knots seven oktas eight oktas sky obscured Fig. 7 (i) Shade the area on Fig. 7 which has the highest atmospheric pressure and label it ‘high’. [1] (ii) Use Fig. 7 to complete the table below. weather answer cloud amount at Quito … oktas wind direction at Manaus … wind speed at Manaus … knots [3] (iii) Describe the weather conditions at Georgetown shown in Fig. 7. … … … … … … [3] (b) Give one reason why there is a low annual temperature range in equatorial areas. … … [1] [Total: 8 marks]
8 marks
Mark scheme: 5(a)(i) area above 1016 mb shaded/labelled “high”, 1 5(a)(ii) 4 (oktas), 3 NE/ENE, 8 to 12 (knots), 5(a)(iii) hot/high temperature/25°C, 3 no cloud/clear, calm/no wind, 5(b) sun at a high angle all year, 1 (almost) constant length of day and night,
This question in 0460/23 Oct/Nov 2017
Question 7 0460/22 May/June 2018
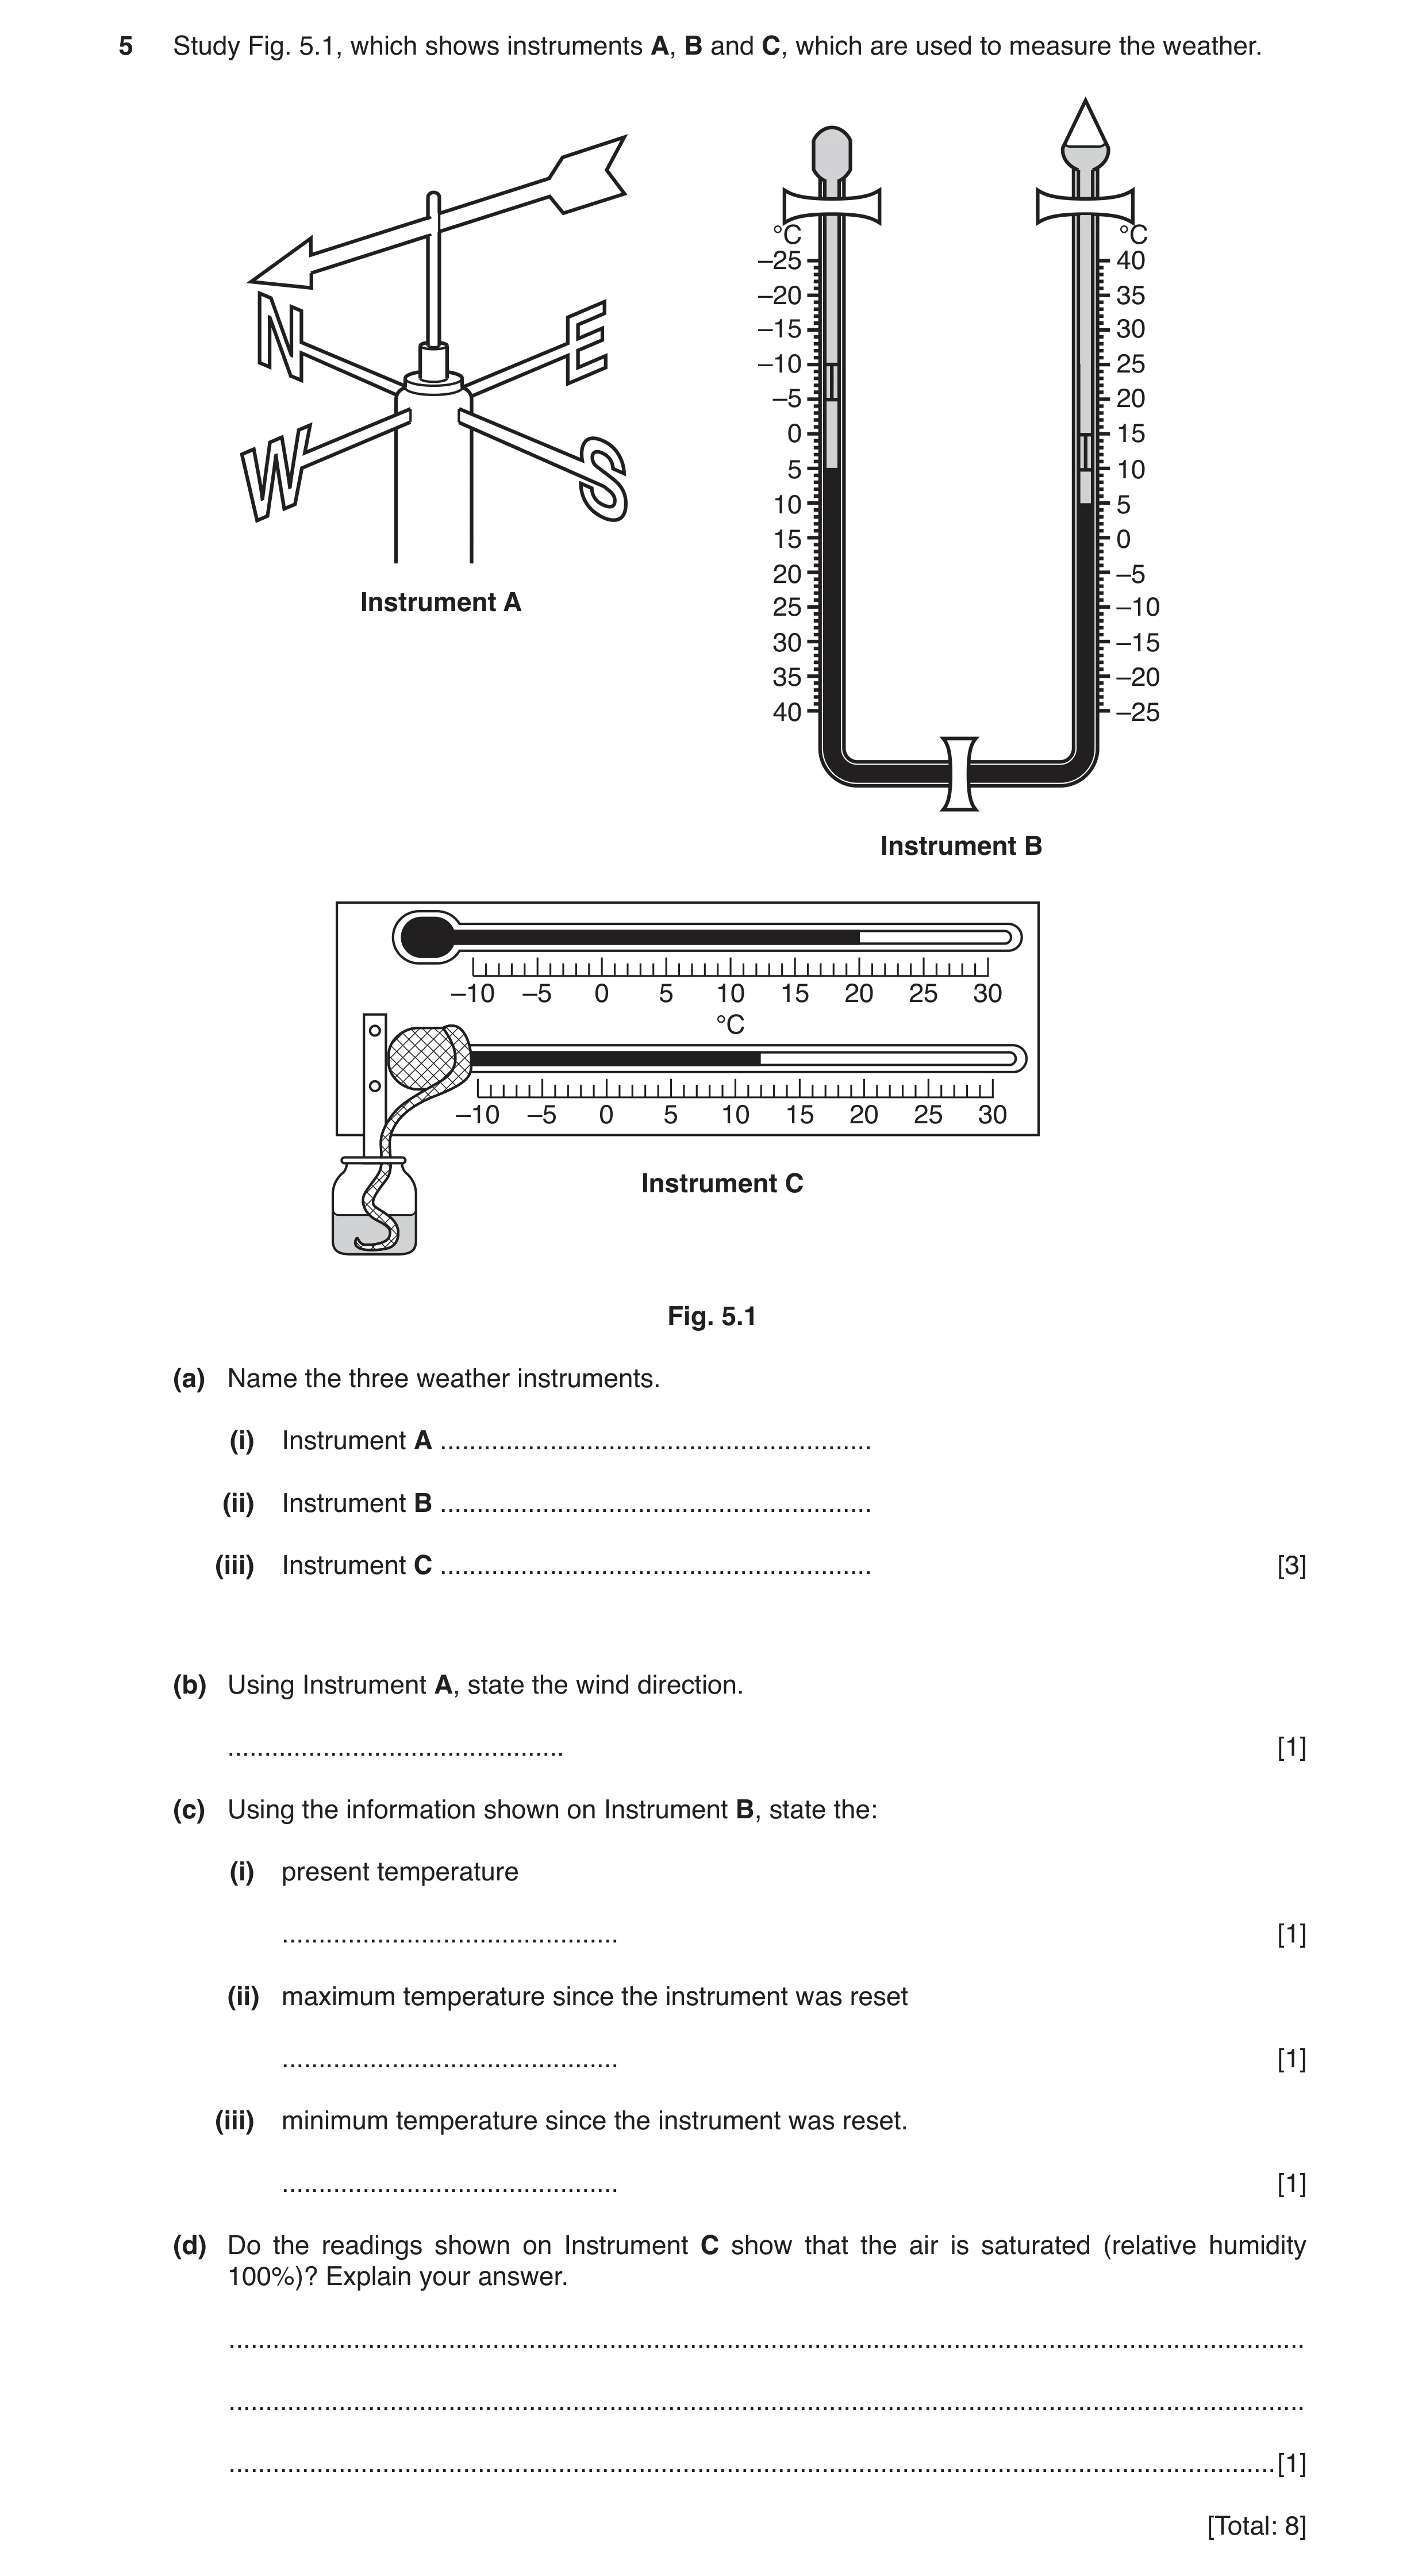
5 Study Fig. 5.1, which shows instruments A, B and C, which are used to measure the weather. °C °C –25 40 –20 35 –15 30 –10 25 –5 20 0 15 5 10 10 5 15 0 20 –5 Instrument A 25 –10 30 –15 35 –20 40 –25 Instrument B –10 –5 0 5 10 15 20 25 30 °C –10 –5 0 5 10 15 20 25 30 Instrument C Fig. 5.1 (a) Name the three weather instruments. (i) Instrument A … (ii) Instrument B … (iii) Instrument C … [3] (b) Using Instrument A, state the wind direction. … [1] (c) Using the information shown on Instrument B, state the: (i) present temperature … [1] (ii) maximum temperature since the instrument was reset … [1] (iii) minimum temperature since the instrument was reset. … [1] (d) Do the readings shown on Instrument C show that the air is saturated (relative humidity 100%)? Explain your answer. … … … [1] [Total: 8]
8 marks
Mark scheme: 5(a)(i) wind vane/weather vane. 1 5(a)(ii) Six’s/maximum-minimum thermometer(s). 1 5(a)(iii) hygrometer/wet and dry (bulb) thermometer(s)/psychrometer. 1 5(b) west, (allow north west.) 1 5(c)(i) 5 ºC. 1 5(c)(ii) 10 ºC. 1 5(c)(iii) –5 ºC, 1 In (c), if no units used deduct 1 mark in part (i). Use of units once validates the rest. Allow a tolerance of ± 0.5 ºC in each part of (c). 5(d) no – the temperatures are not the same, 1 no – temperatures would be the same if the air was saturated.
This question in 0460/22 May/June 2018
Q8 · Weather information for Mbabane, Swaziland for five days in 2016 0460/22 Oct/Nov 2018
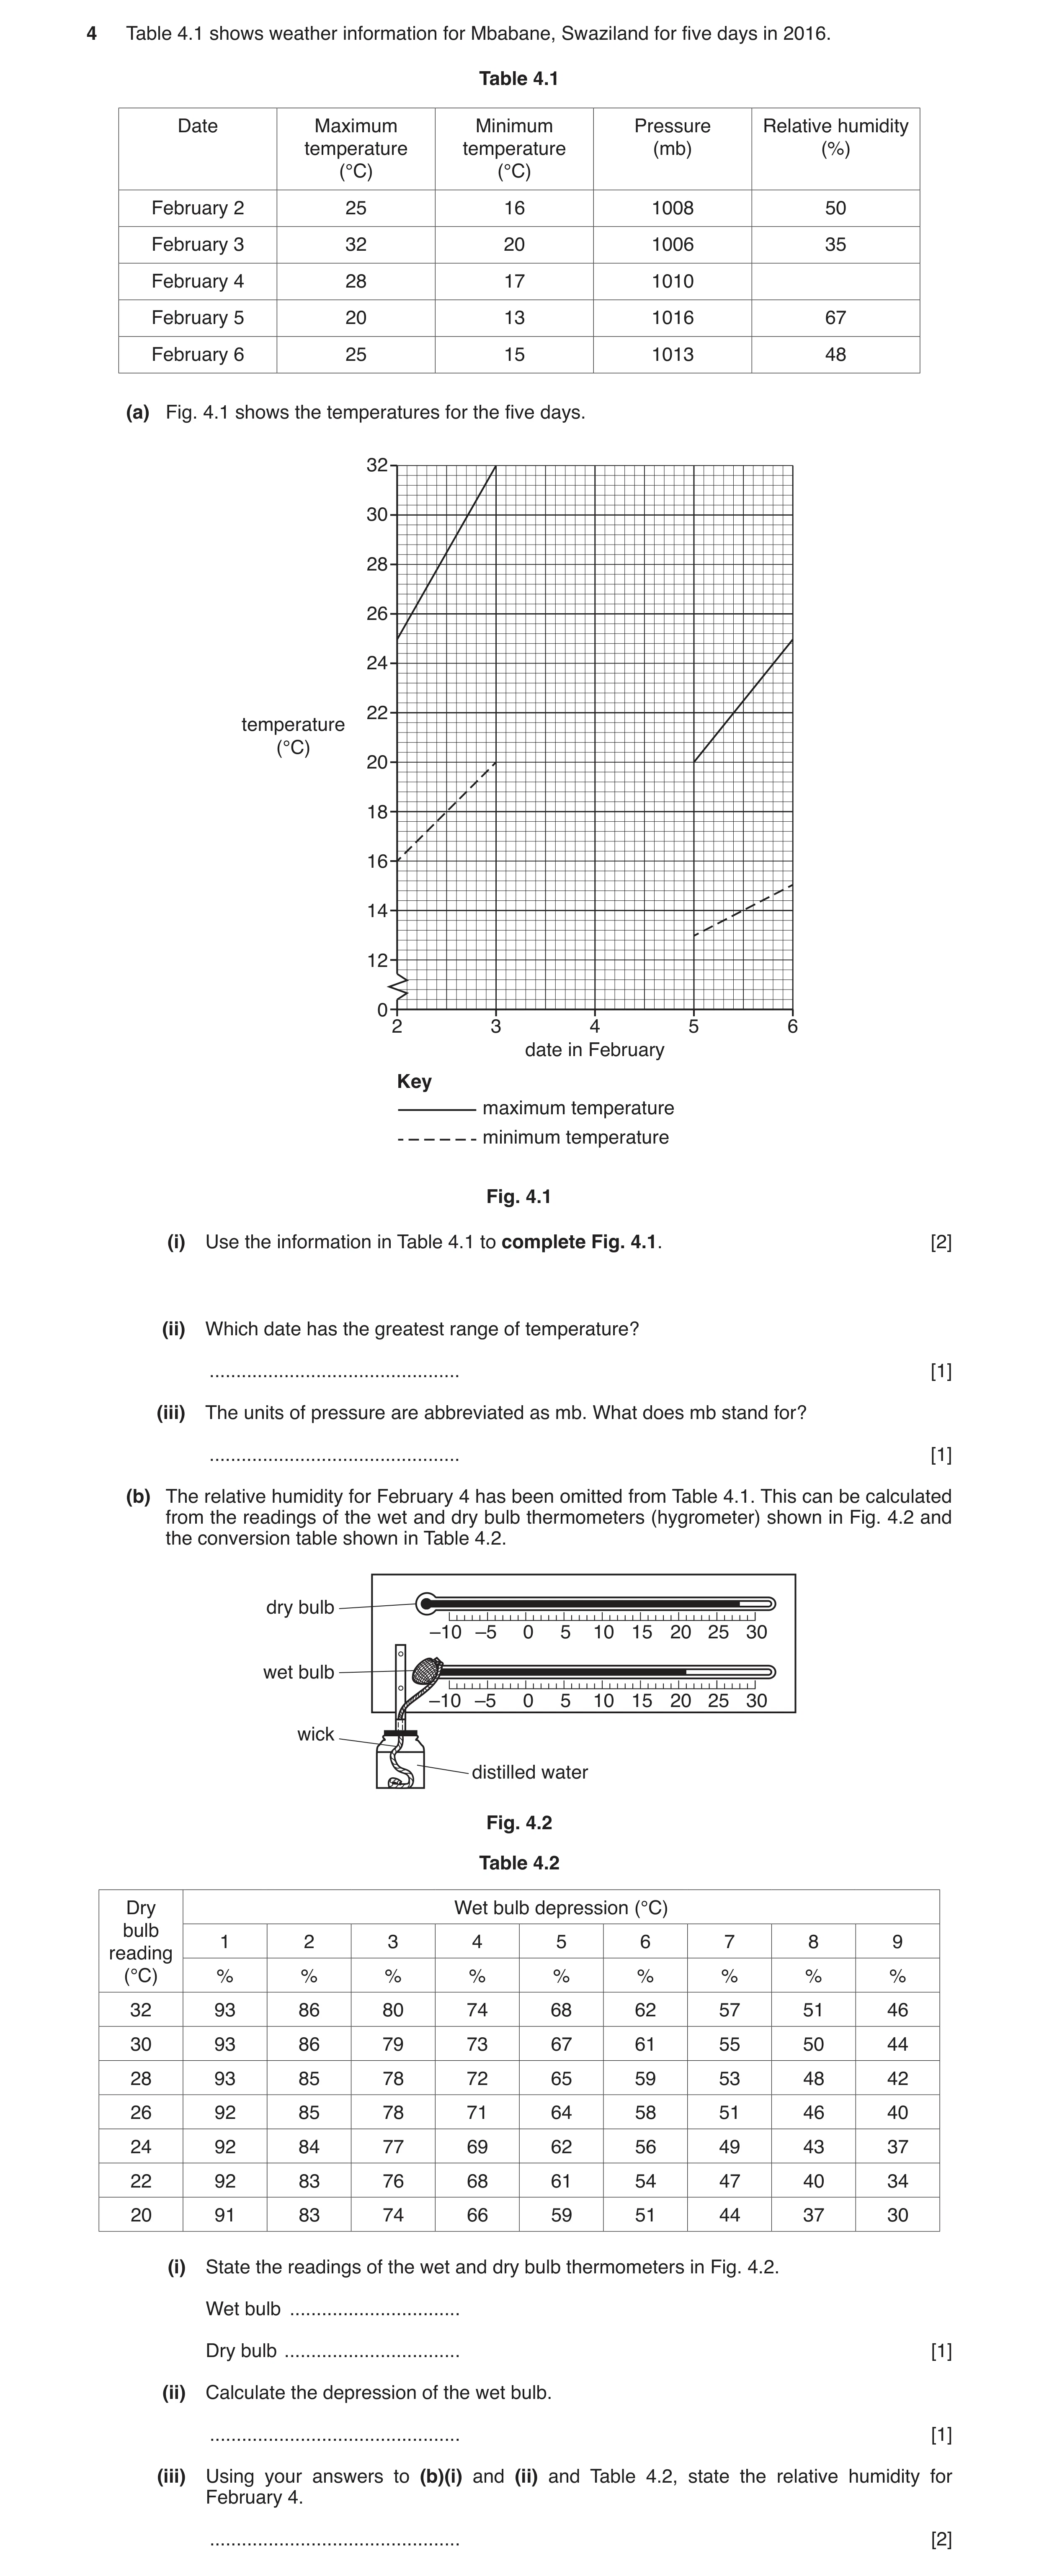
4 Table 4.1 shows weather information for Mbabane, Swaziland for five days in 2016. Table 4.1 Date Maximum Minimum Pressure Relative humidity temperature temperature (mb) (%) (°C) (°C) February 2 25 16 1008 50 February 3 32 20 1006 35 February 4 28 17 1010 February 5 20 13 1016 67 February 6 25 15 1013 48 (a) Fig. 4.1 shows the temperatures for the five days. 32 30 28 26 24 22 temperature (°C) 20 18 16 14 12 0 2 3 4 5 6 date in February Key maximum temperature minimum temperature Fig. 4.1 (i) Use the information in Table 4.1 to complete Fig. 4.1. [2] (ii) Which date has the greatest range of temperature? … [1] (iii) The units of pressure are abbreviated as mb. What does mb stand for? … [1] (b) The relative humidity for February 4 has been omitted from Table 4.1. This can be calculated from the readings of the wet and dry bulb thermometers (hygrometer) shown in Fig. 4.2 and the conversion table shown in Table 4.2. dry bulb –10 –5 0 5 10 15 20 25 30 wet bulb –10 –5 0 5 10 15 20 25 30 wick distilled water Fig. 4.2 Table 4.2 Dry Wet bulb depression (°C) bulb 1 2 3 4 5 6 7 8 9reading (°C) % % % % % % % % % 32 93 86 80 74 68 62 57 51 46 30 93 86 79 73 67 61 55 50 44 28 93 85 78 72 65 59 53 48 42 26 92 85 78 71 64 58 51 46 40 24 92 84 77 69 62 56 49 43 37 22 92 83 76 68 61 54 47 40 34 20 91 83 74 66 59 51 44 37 30 (i) State the readings of the wet and dry bulb thermometers in Fig. 4.2. Wet bulb … Dry bulb … [1] (ii) Calculate the depression of the wet bulb. … [1] (iii) Using your answers to (b)(i) and (ii) and Table 4.2, state the relative humidity for February 4. … [2]
8 marks
Mark scheme: 4(a)(i) correct plot of 28 °C and solid lines drawn 2 correct plot of 17 °C and dashed lines drawn 2 correct plots and no lines = 1. 4(a)(ii) (February) 3 1 4(a)(iii) millibars 1 4(b)(i) 21 °C 1 28 °C 4(b)(ii) 7 °C 1 Error carried forward from (i) Units should be used in both (i) and (ii). 4(b)(iii) 53 2 % If there is no response check Table 4.1. ECF from (i)( – dry bulb reading) and (ii)( – depression).
This question in 0460/22 Oct/Nov 2018
Question 9 0460/23 Oct/Nov 2018
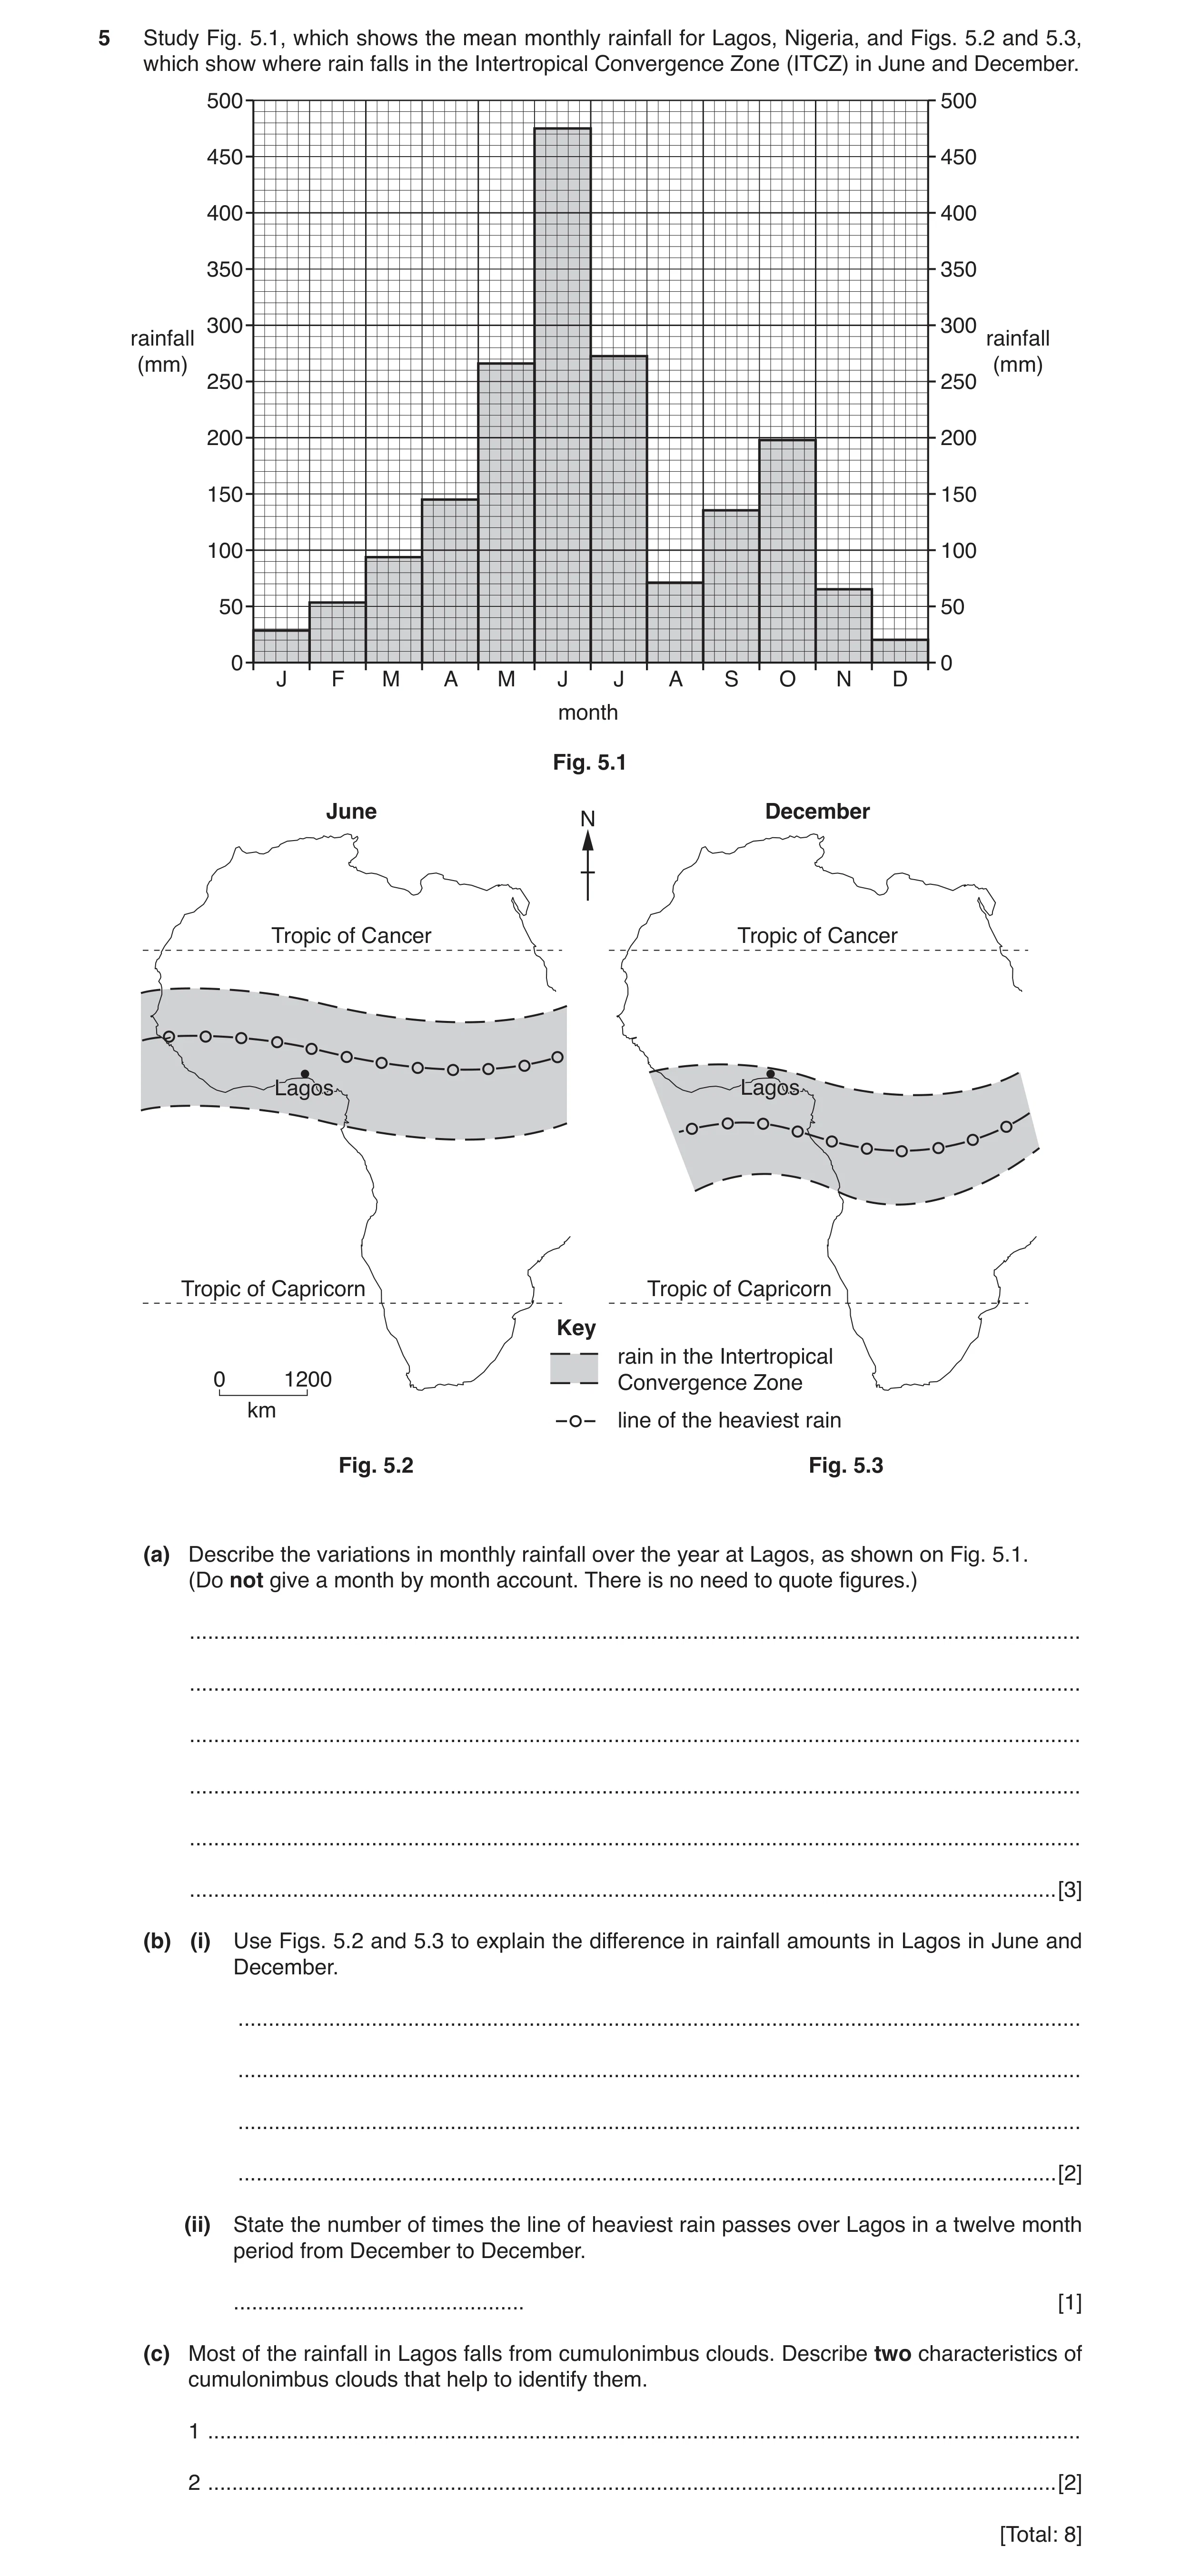
5 Study Fig. 5.1, which shows the mean monthly rainfall for Lagos, Nigeria, and Figs. 5.2 and 5.3, which show where rain falls in the Intertropical Convergence Zone (ITCZ) in June and December. 500 500 450 450 400 400 350 350 300 300 rainfall rainfall (mm) (mm) 250 250 200 200 150 150 100 100 50 50 0 0 J F M A M J J A S O N D month Fig. 5.1 June December N Tropic of Cancer Tropic of Cancer Lagos Lagos Tropic of Capricorn Tropic of Capricorn Key rain in the Intertropical 0 1200 Convergence Zone km line of the heaviest rain Fig. 5.2 Fig. 5.3 (a) Describe the variations in monthly rainfall over the year at Lagos, as shown on Fig. 5.1. (Do not give a month by month account. There is no need to quote figures.) … … … … … … [3] (b) (i) Use Figs. 5.2 and 5.3 to explain the difference in rainfall amounts in Lagos in June and December. … … … … [2] (ii) State the number of times the line of heaviest rain passes over Lagos in a twelve month period from December to December. … [1] (c) Most of the rainfall in Lagos falls from cumulonimbus clouds. Describe two characteristics of cumulonimbus clouds that help to identify them. 1 … 2 … [2] [Total: 8]
8 marks
Mark scheme: 5(a) high(est) in middle of year/June/May–July 3 low(est) at (start and) end of the year/December (and January) rise to June/middle of year rise to October double maximum/two peaks 5(b)(i) June – Lagos near the (line of) heaviest rain/middle of ITC zone 2 December – Lagos near the edge of the rain/away from the heaviest rain 5(b)(ii) 2 1 5(c) tall/great vertical extent 2 flat top/cauliflower top anvil/wide top dark/black/grey flat base low base thunder/lightning/hail
This question in 0460/23 Oct/Nov 2018
Question 10 0460/22 Feb/March 2019
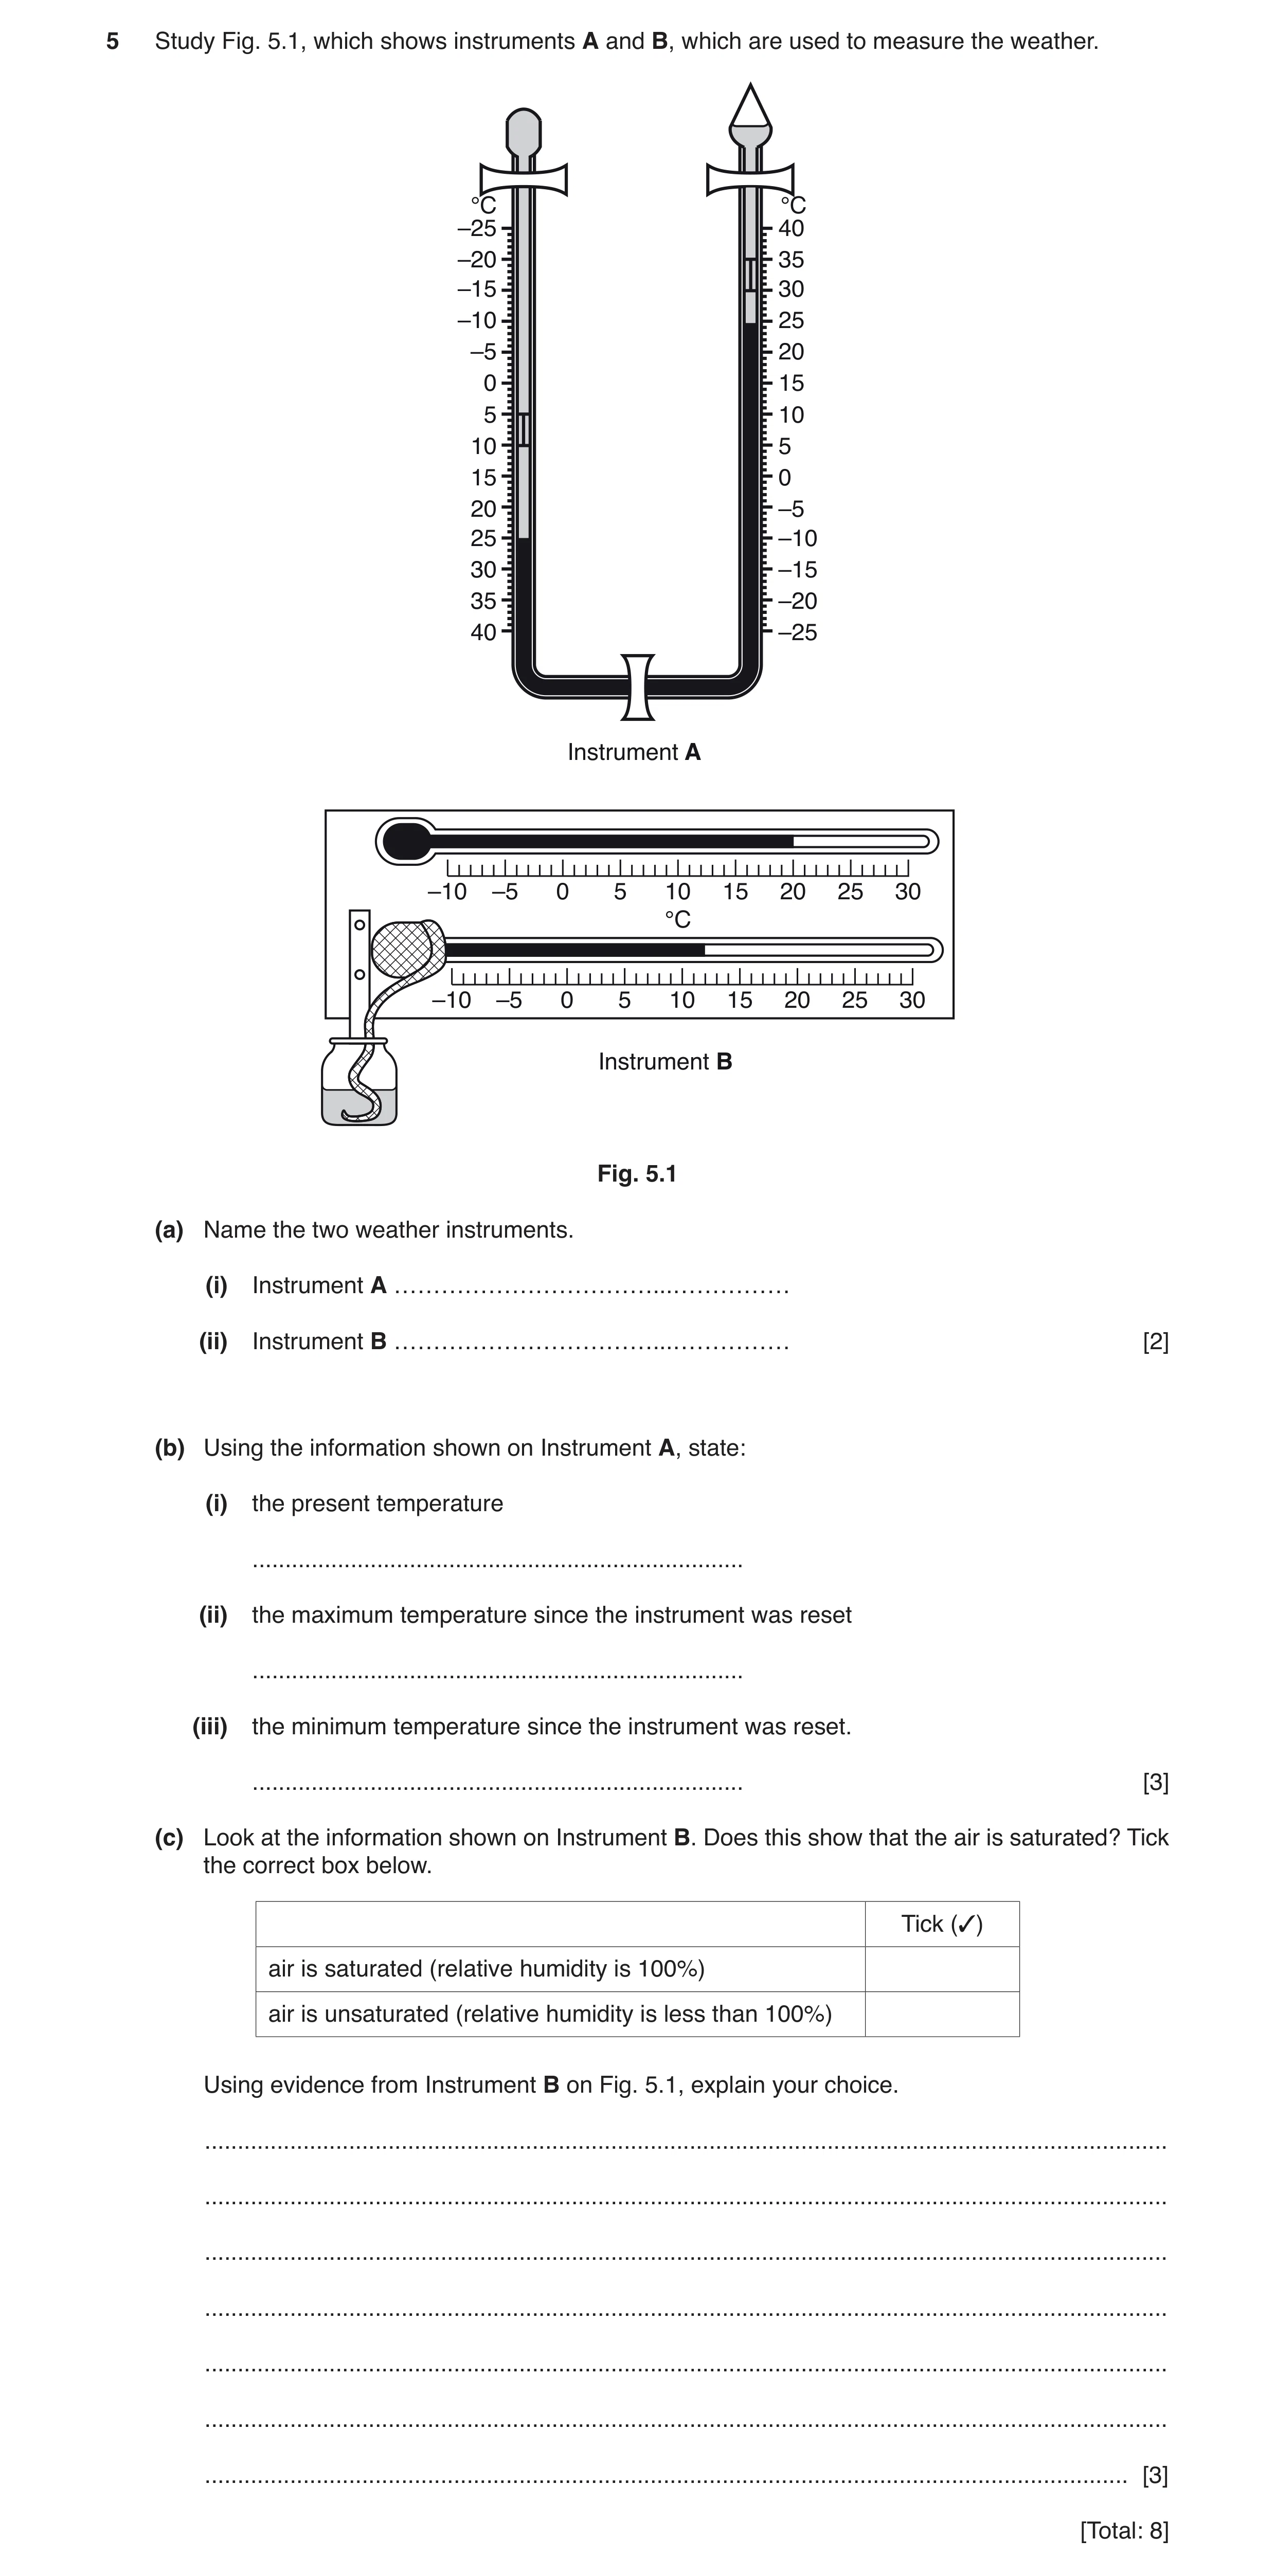
5 Study Fig. 5.1, which shows instruments A and B, which are used to measure the weather. °C °C –25 40 –20 35 –15 30 –10 25 –5 20 0 15 5 10 10 5 15 0 20 –5 25 –10 30 –15 35 –20 40 –25 Instrument A –10 –5 0 5 10 15 20 25 30 °C –10 –5 0 5 10 15 20 25 30 Instrument B Fig. 5.1 (a) Name the two weather instruments. (i) Instrument A ……………………………...…………… (ii) Instrument B ……………………………...…………… [2] (b) Using the information shown on Instrument A, state: (i) the present temperature … (ii) the maximum temperature since the instrument was reset … (iii) the minimum temperature since the instrument was reset. … [3] (c) Look at the information shown on Instrument B. Does this show that the air is saturated? Tick the correct box below. Tick (✓) air is saturated (relative humidity is 100%) air is unsaturated (relative humidity is less than 100%) Using evidence from Instrument B on Fig. 5.1, explain your choice. … … … … … … … [3] [Total: 8]
8 marks
Mark scheme: 5(a)(i) maximum-minimum/Six’s thermometer 1 5(a)(ii) wet and dry (bulb) thermometers/hygrometer 1 5(b)(i) 25 °C 1 5(b)(ii) 30 °C 1 5(b)(iii) 10 °C 1 5(c) thermometers do not read the same/12 °C and 20 °C, 3 evaporation, uses latent heat, cools bulb
This question in 0460/22 Feb/March 2019
Q11 · Study the following information about the weather for one week in January in Cumbria, UK 0460/21 May/June 2019
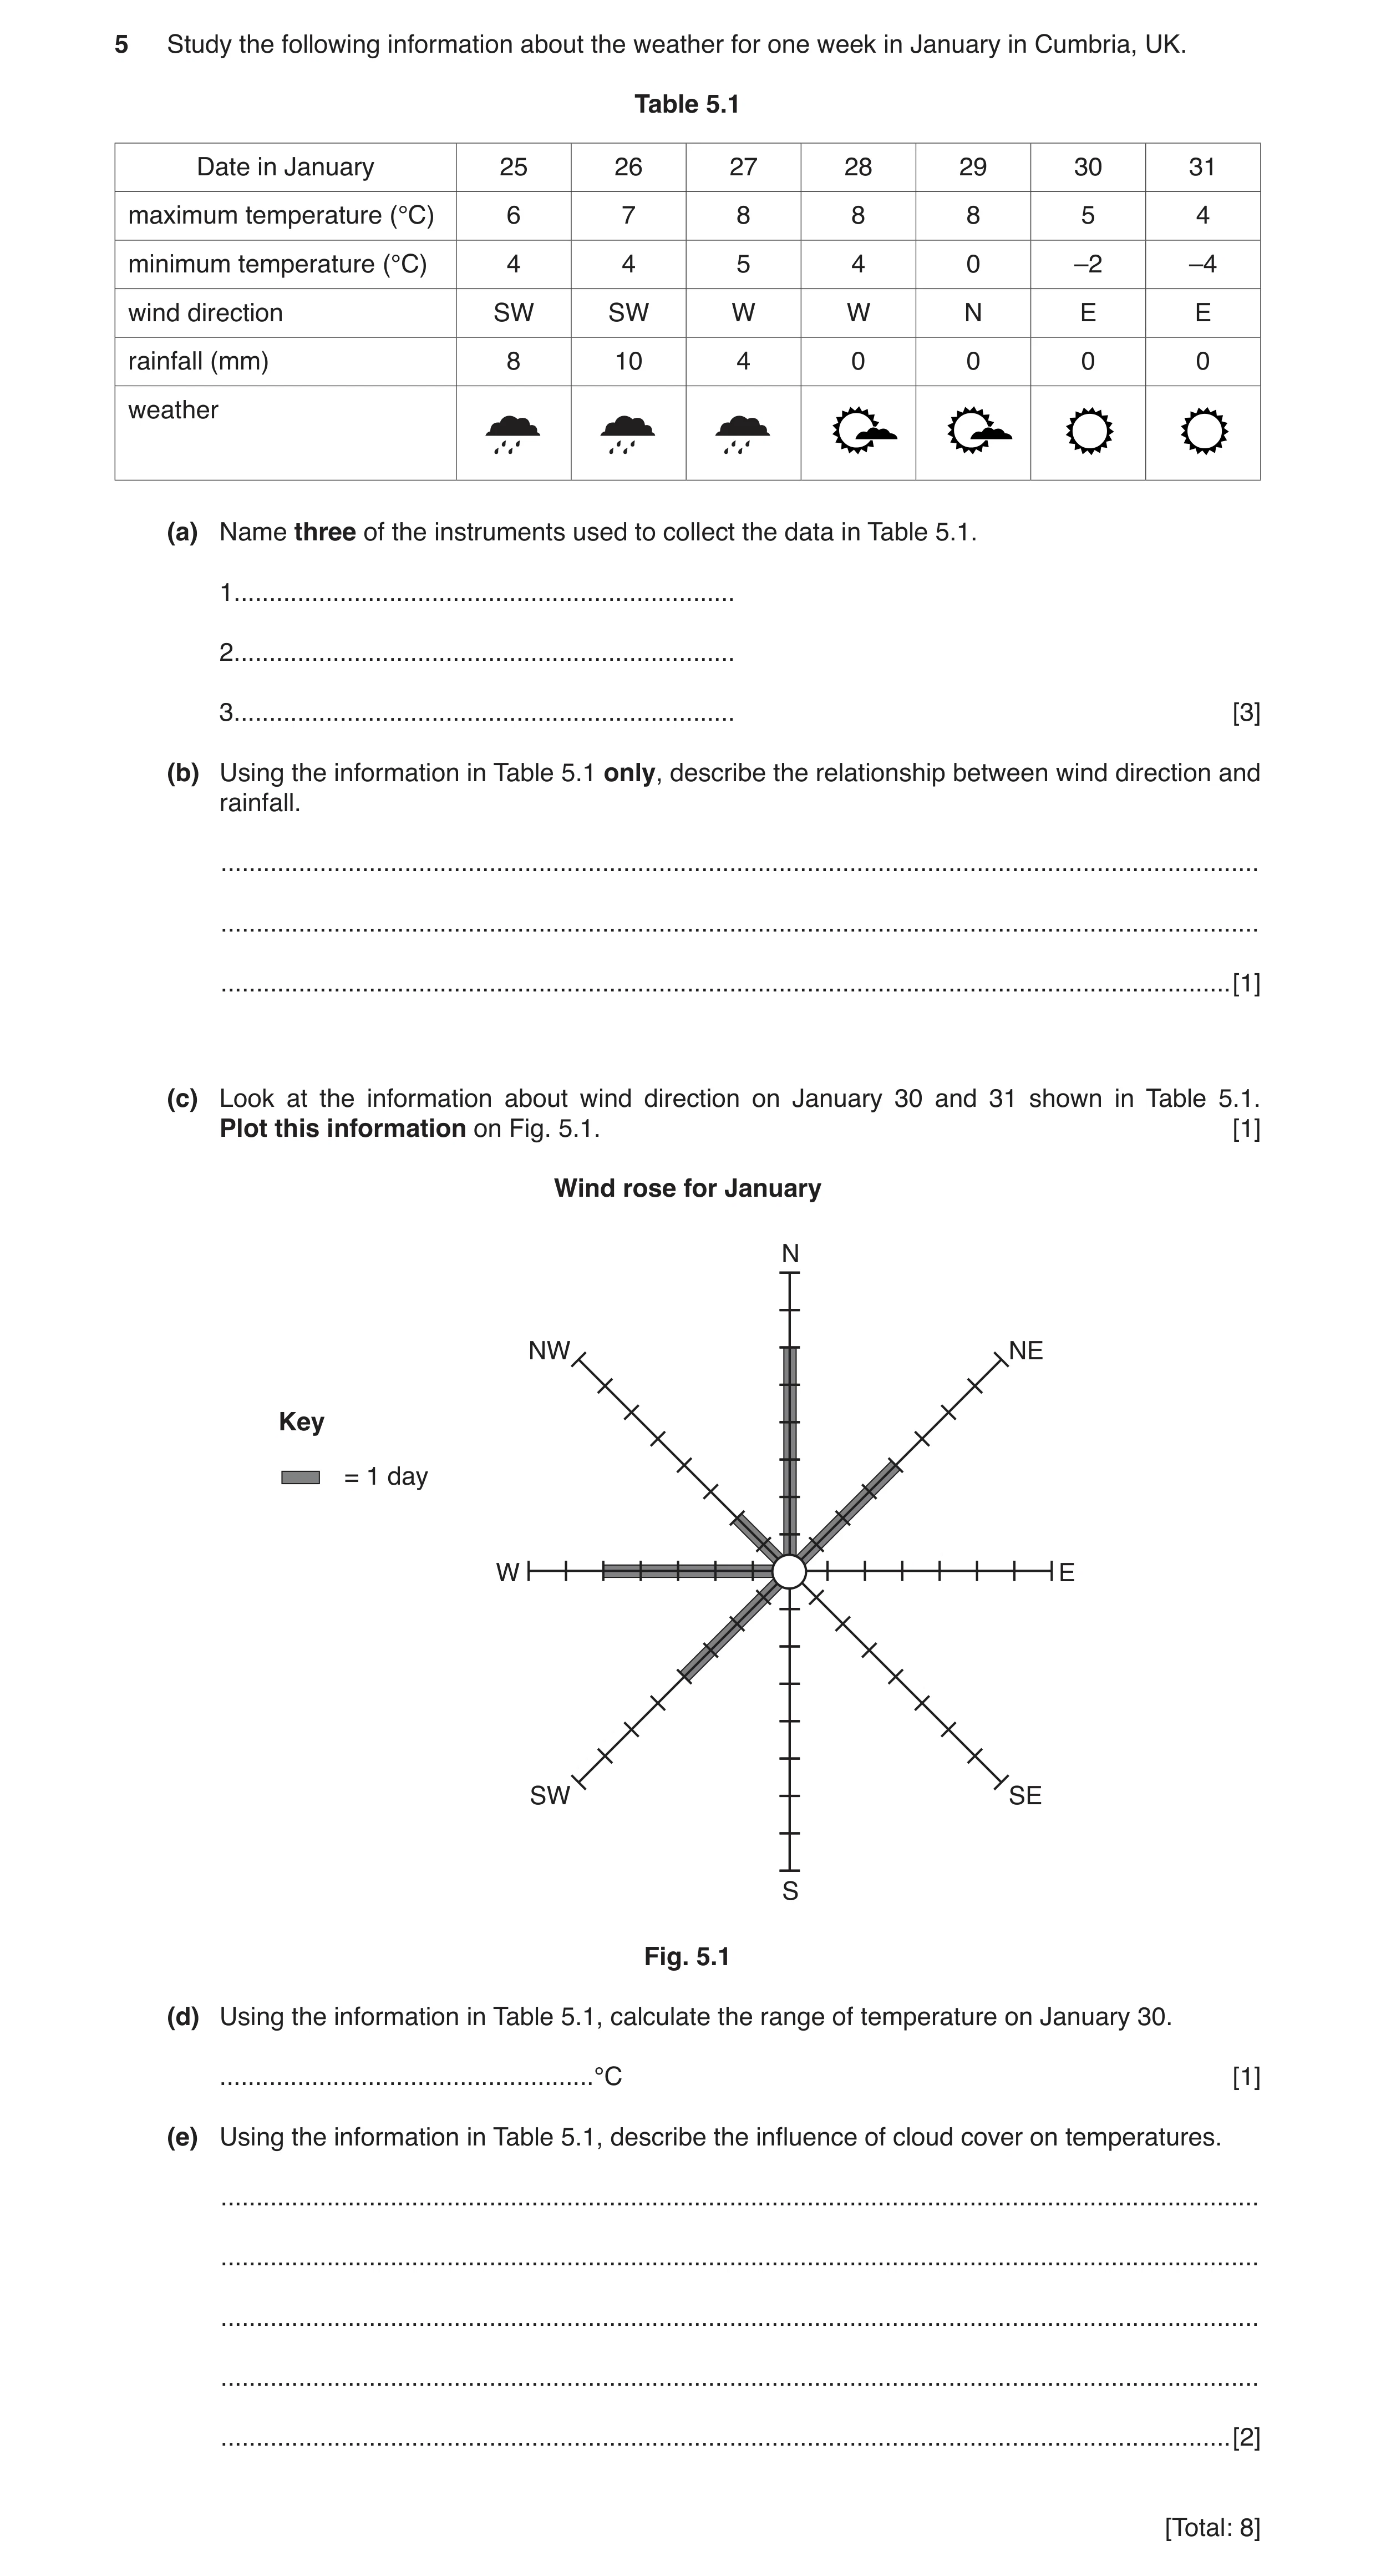
5 Study the following information about the weather for one week in January in Cumbria, UK. Table 5.1 Date in January 25 26 27 28 29 30 31 maximum temperature (°C) 6 7 8 8 8 5 4 minimum temperature (°C) 4 4 5 4 0 –2 –4 wind direction SW SW W W N E E rainfall (mm) 8 10 4 0 0 0 0 weather (a) Name three of the instruments used to collect the data in Table 5.1. 1 … 2 … 3 … [3] (b) Using the information in Table 5.1 only, describe the relationship between wind direction and rainfall. … … … [1] (c) Look at the information about wind direction on January 30 and 31 shown in Table 5.1. Plot this information on Fig. 5.1. [1] Wind rose for January N NW NE Key = 1 day W E SW SE S Fig. 5.1 (d) Using the information in Table 5.1, calculate the range of temperature on January 30. … °C [1] (e) Using the information in Table 5.1, describe the influence of cloud cover on temperatures. … … … … … [2] [Total: 8]
8 marks
Mark scheme: 5(a) maximum – minimum thermometers / Six’s thermometer, 3 wind / weather vane, rain gauge, sunshine recorder 5(b) SW wind rain E / N wind no rain (allow sunny / no cloud) 1 5(c) correct plot of 2 days east 1 5(d) 7 °C 1 5(e) more cloud higher maximum, (If neither given allow 2 more cloud higher minimum, more cloud higher temperatures = 1) more cloud smaller range Or converse of each point.
This question in 0460/21 May/June 2019
Question 12 0460/23 Oct/Nov 2019
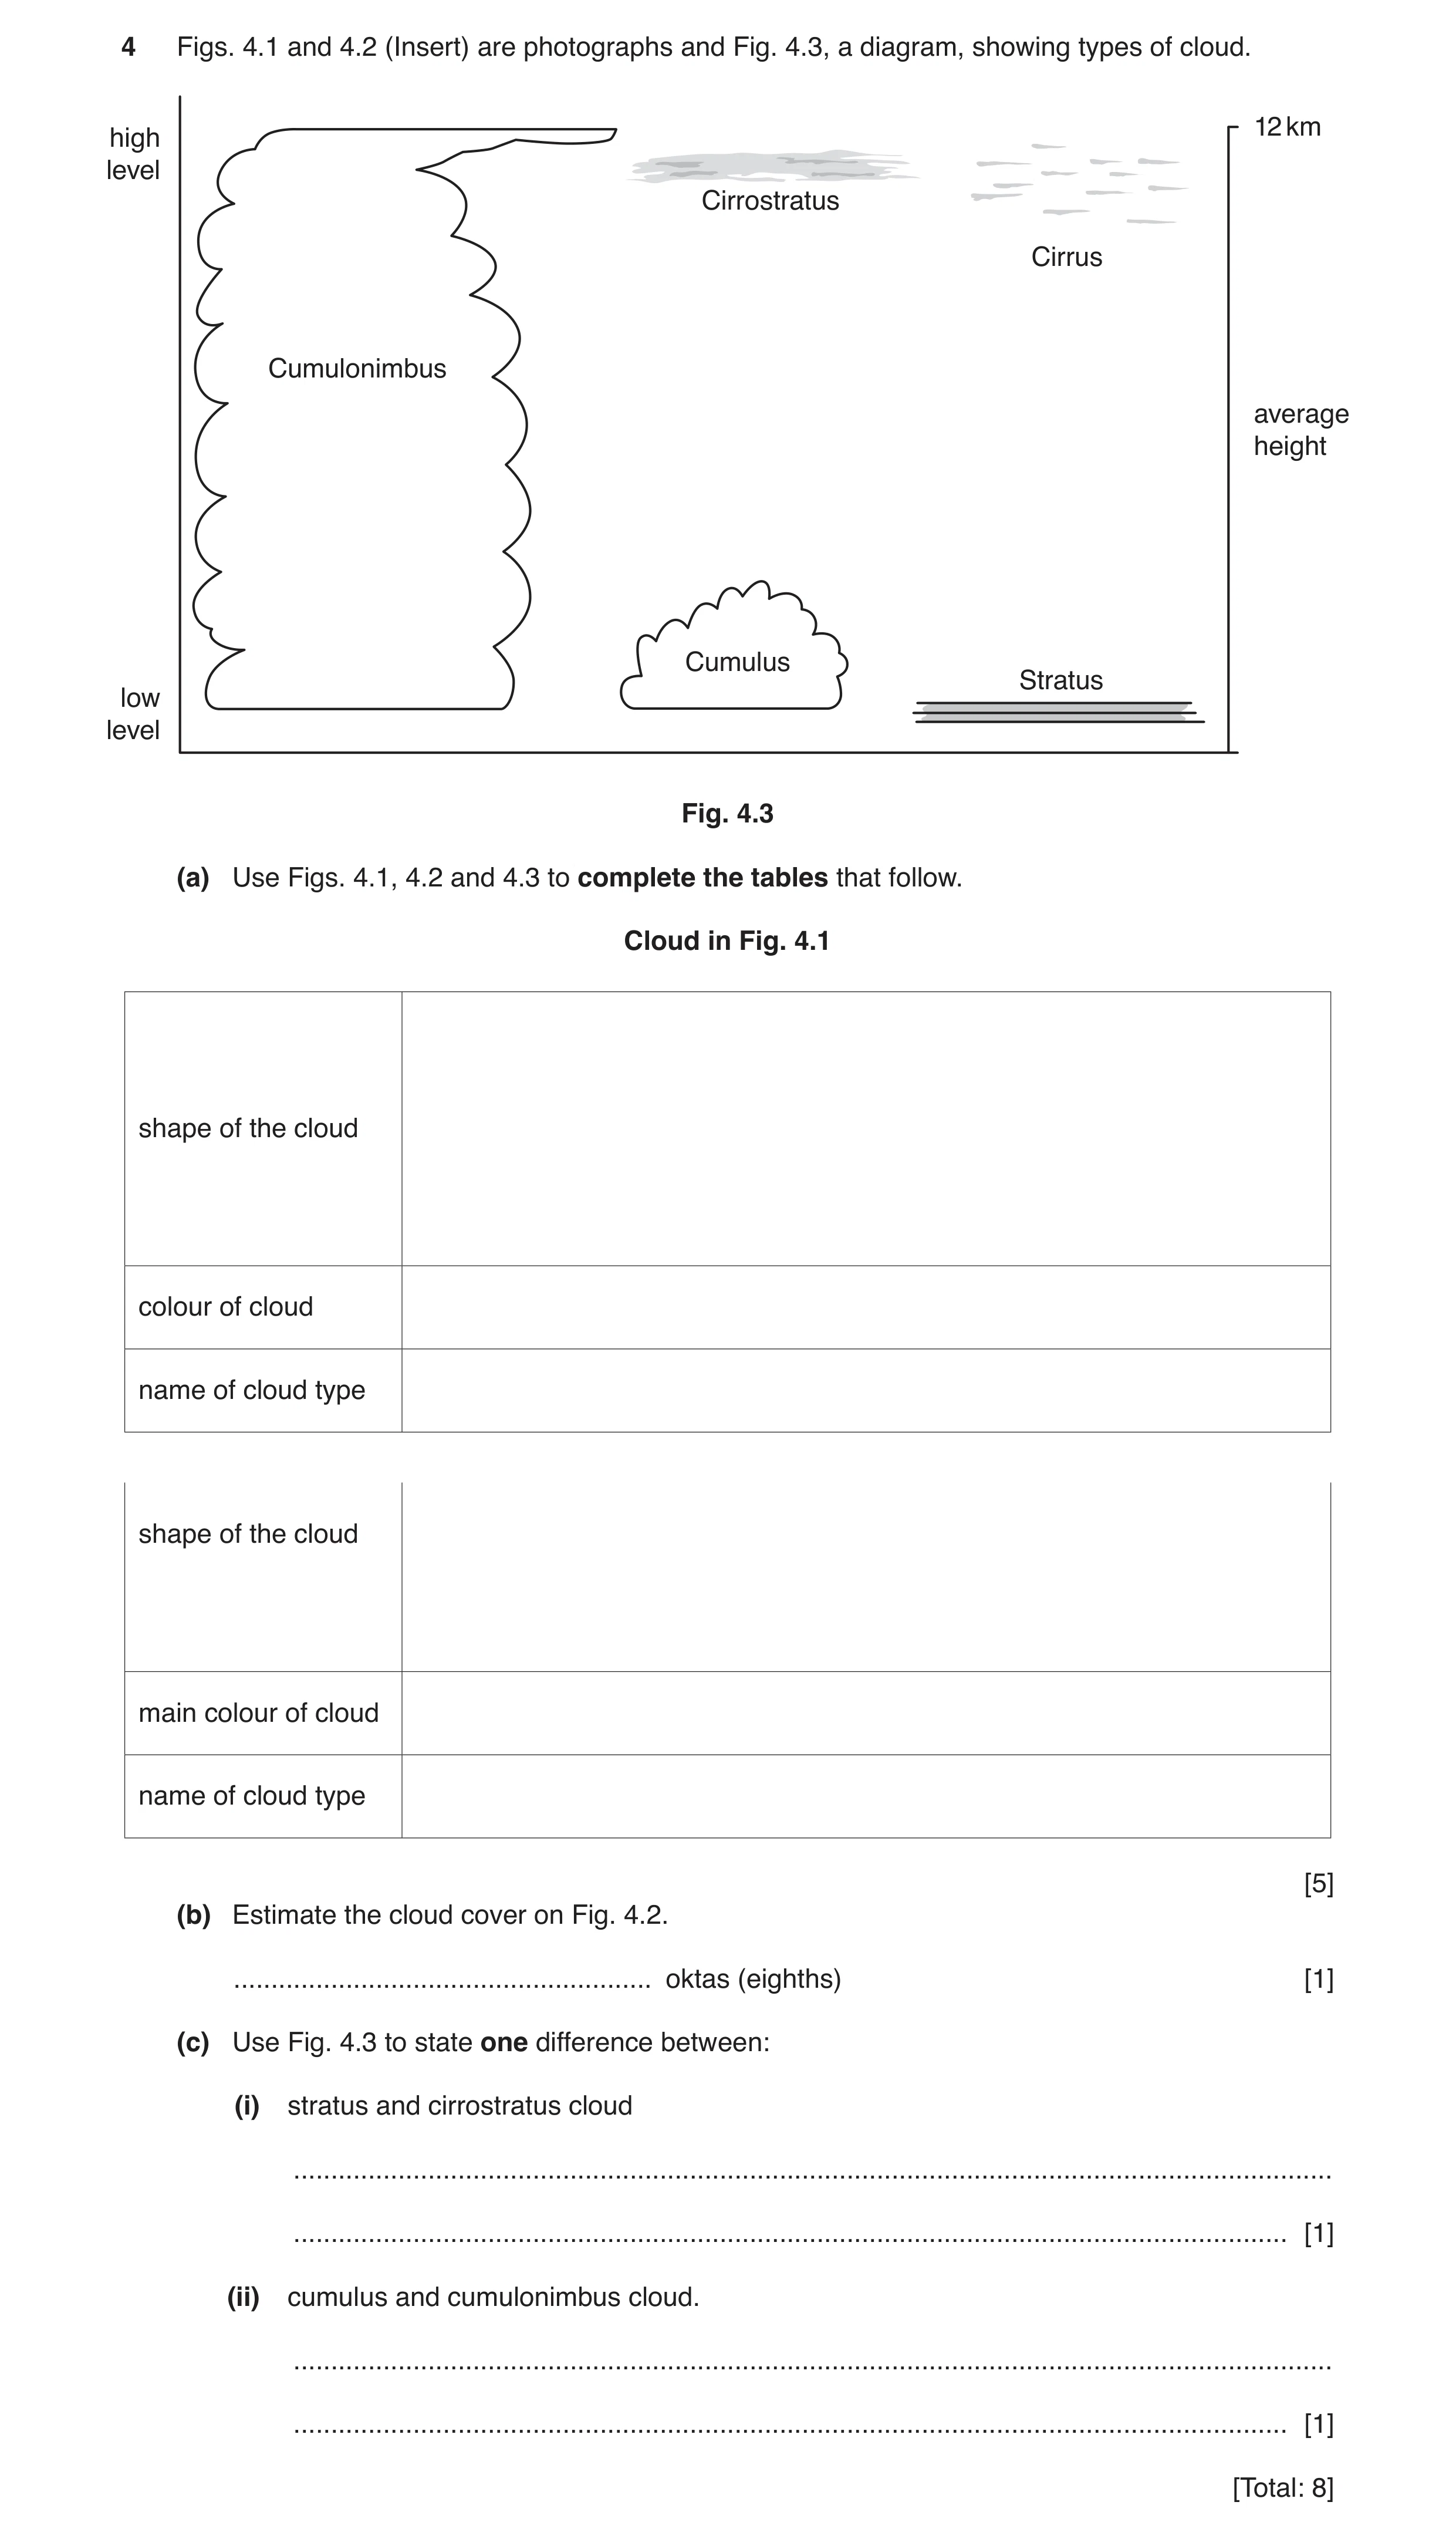
4 Figs. 4.1 and 4.2 (Insert) are photographs and Fig. 4.3, a diagram, showing types of cloud. 12 kmhigh level Cirrostratus Cirrus Cumulonimbus average height Cumulus Stratus low level Fig. 4.3 (a) Use Figs. 4.1, 4.2 and 4.3 to complete the tables that follow. Cloud in Fig. 4.1 shape of the cloud colour of cloud name of cloud type shape of the cloud main colour of cloud name of cloud type [5] (b) Estimate the cloud cover on Fig. 4.2. … oktas (eighths) [1] (c) Use Fig. 4.3 to state one difference between: (i) stratus and cirrostratus cloud … … [1] (ii) cumulus and cumulonimbus cloud. … … [1] [Total: 8]
8 marks
Mark scheme: 4(a) Fig. 4.1 5 globular/cauliflower shaped/dome shaped/curved/irregular top/cotton wool, (allow fluffy or puffy) flat base, white/light/pale/grey, cumulus, Fig. 4.2 layer/sheet, (allow blanket) horizontal, (allow flat) uniform, grey/bluey-grey/light blue, stratus, Reserve one mark for each photograph 4(b) 7/8 oktas, 1 4(c)(i) stratus is lower/cirrostratus is higher, 1 4(c)(ii) cumulonimbus is deeper/taller/bigger/greater vertical extent, 1 cumulonimbus can have a flat top, Or emphasis on cumulus
This question in 0460/23 Oct/Nov 2019
Question 13 0460/23 May/June 2020
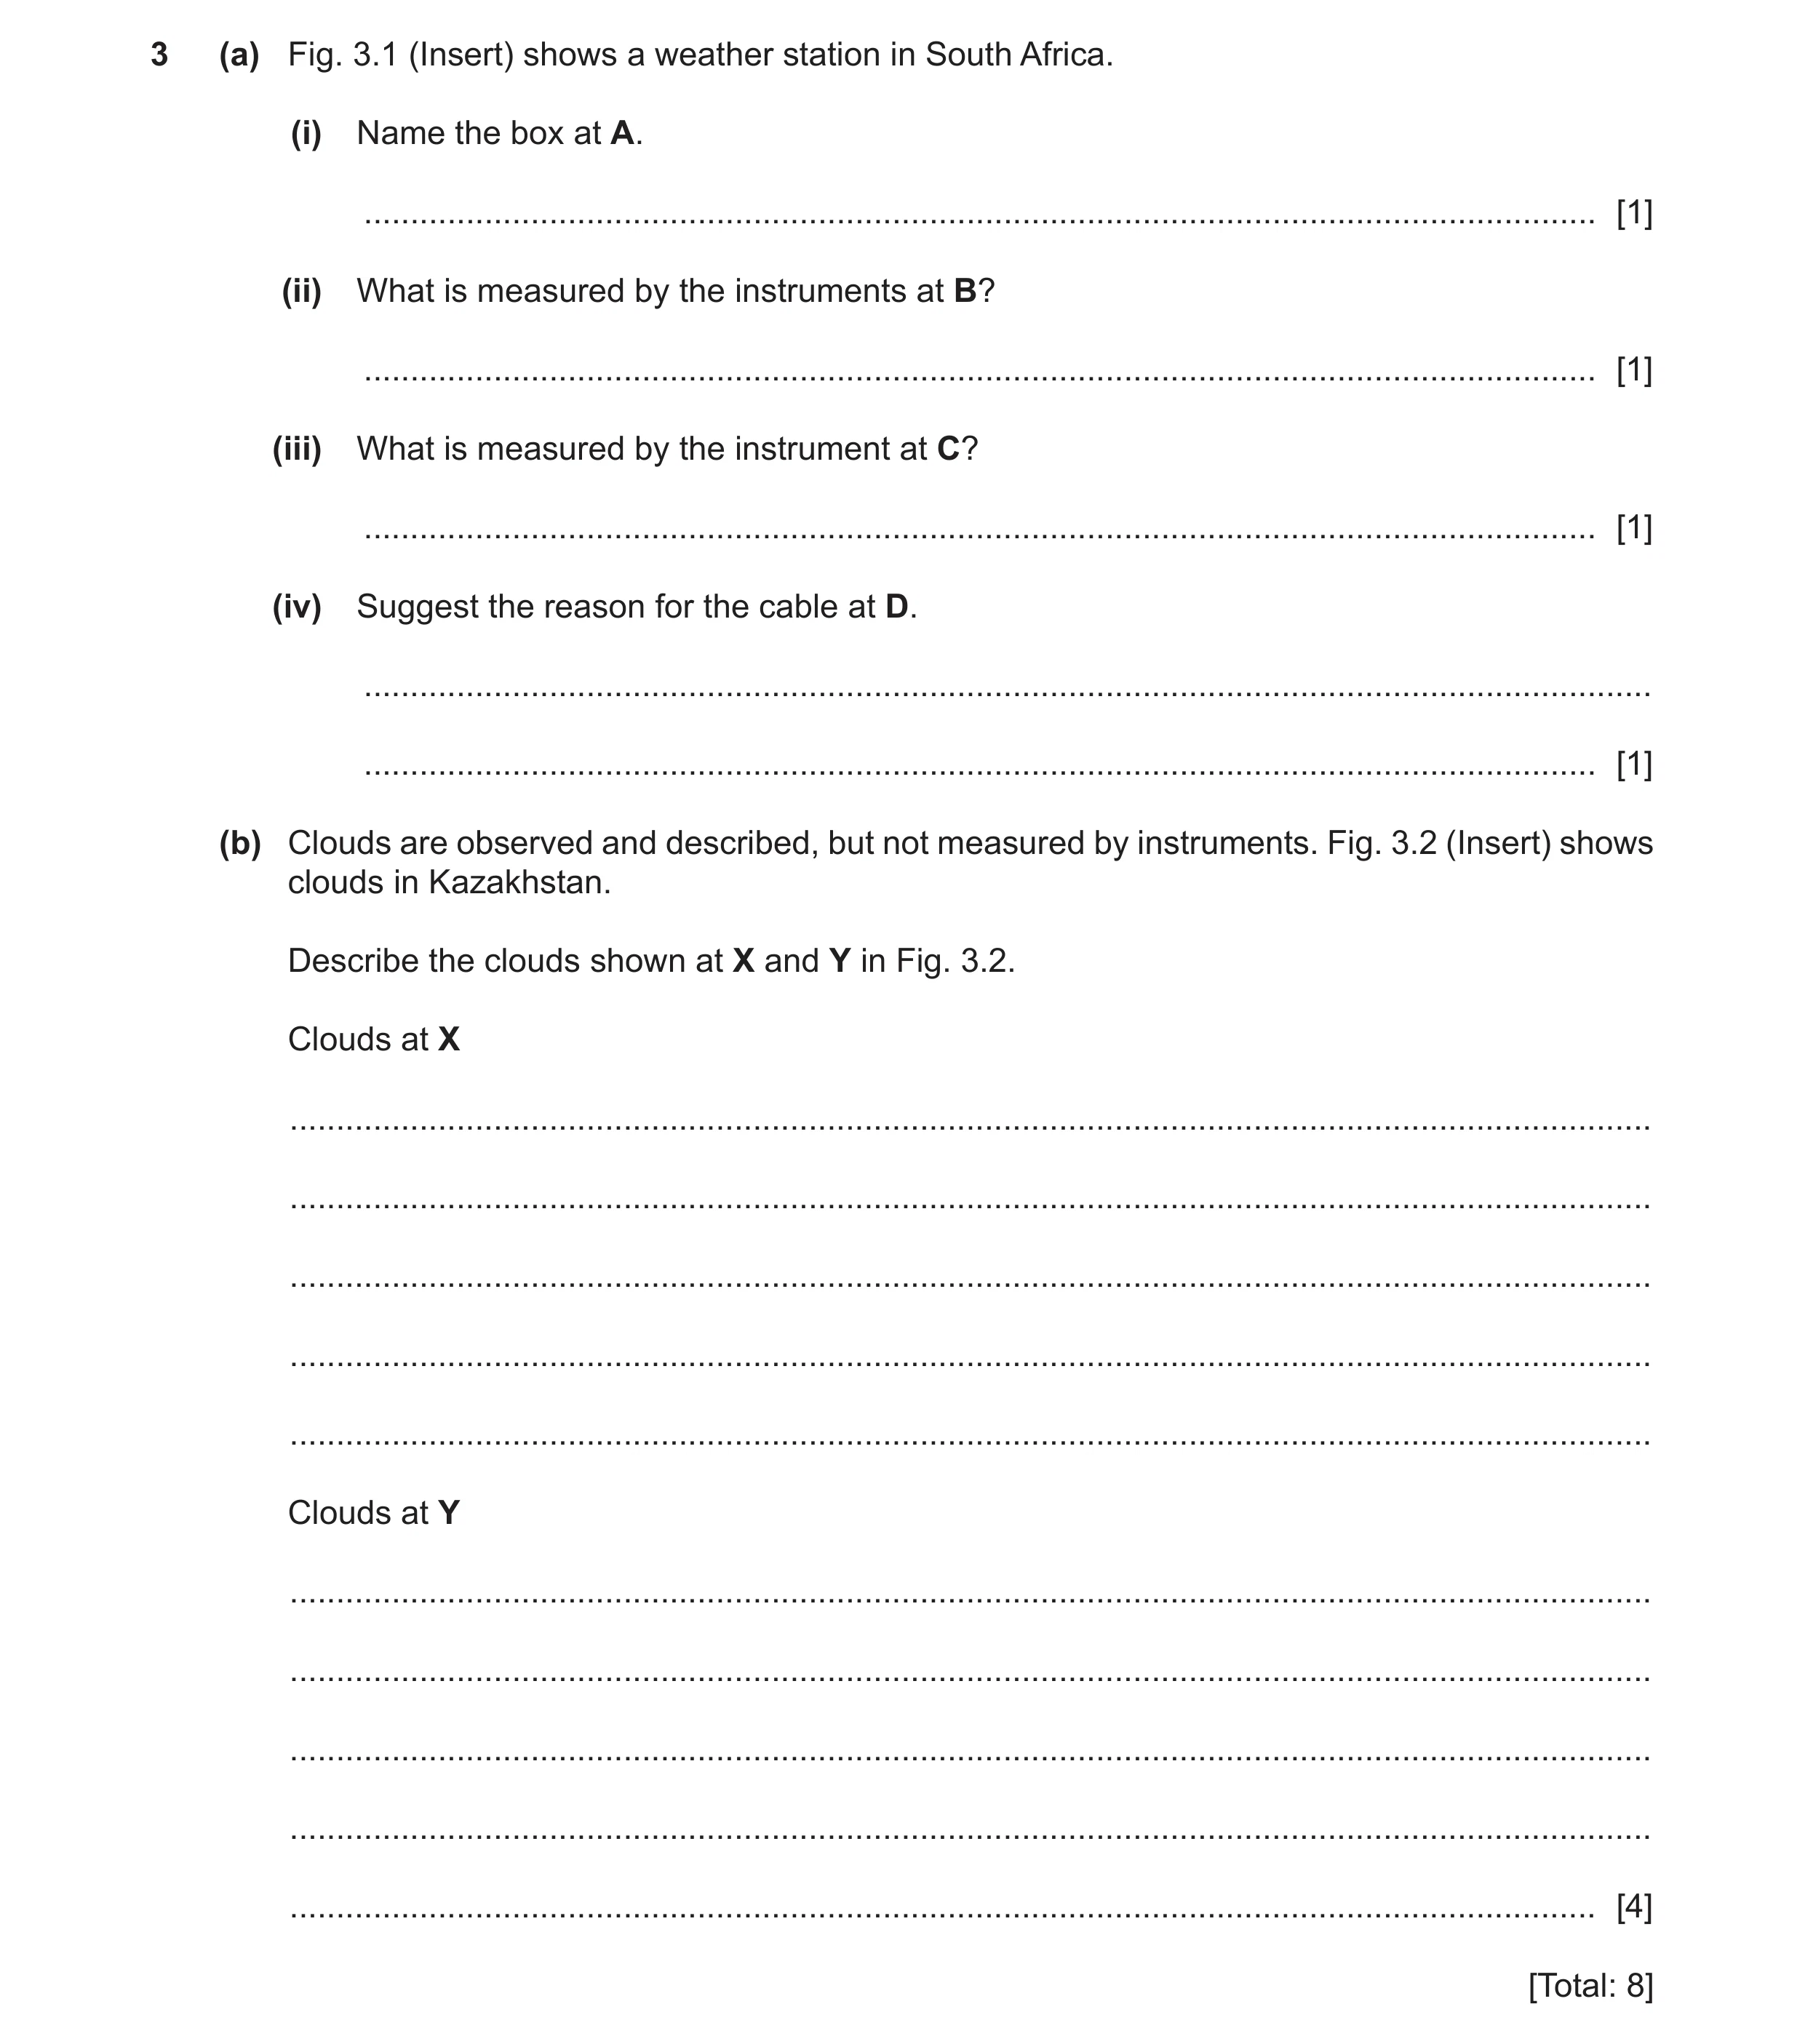
3 (a) Fig. 3.1 (Insert) shows a weather station in South Africa. (i) Name the box at A. … [1] (ii) What is measured by the instruments at B? … [1] (iii) What is measured by the instrument at C? … [1] (iv) Suggest the reason for the cable at D. … … [1] (b) Clouds are observed and described, but not measured by instruments. Fig. 3.2 (Insert) shows clouds in Kazakhstan. Describe the clouds shown at X and Y in Fig. 3.2. Clouds at X … … … … … Clouds at Y … … … … … [4] [Total: 8]
8 marks
Mark scheme: 3(a)(i) Stevenson screen, 1 3(a)(ii) wind (speed or direction), 1 3(a)(iii) rainfall/precipitation, 1 3(a)(iv) transmit data, 1 3(b) Clouds at X 4 low, fluffy/cotton wool/cauliflower, cumulus, Clouds at Y high, wispy, cirrus, anvil, Reserve one mark for each.
This question in 0460/23 May/June 2020
Q14 · The sunshine hours per month for an area in southern England 0460/22 Feb/March 2021
4 Fig. 4.1 shows the sunshine hours per month for an area in southern England. 220 200 180 160 sunshine hours 140 per month 120 100 80 60 40 20 J F M A M J J A S O N D month Fig. 4.1 (a) (i) Using Fig. 4.1, state the total sunshine hours in April. … hours [1] (ii) Complete Fig. 4.1 to show the following information: total sunshine hours for July: 160 hours. [1] (iii) Describe the best location for a sunshine recorder. … … … … [2] (b) Fig. 4.2 (Insert) shows some clouds. Describe the clouds shown in Fig. 4.2. … … … … [2] (c) Describe how cloud cover is measured. … … … … [2] [Total: 8]
8 marks
Mark scheme: 4(a)(i) 224/225, 1 4(a)(ii) correct plot of 160 hours, 1 4(a)(iii) open/unobstructed area/no shade, 2 away from buildings/trees, on roof, flat area, 4(b) uniform, 2 layer/sheet/blanket, grey, low, thick/dense, 4(c) observation/visually, 2 estimation, eighths/oktas,
This question in 0460/22 Feb/March 2021
Q15 · Isobars join points of equal air pressure on a weather map 0460/23 May/June 2021
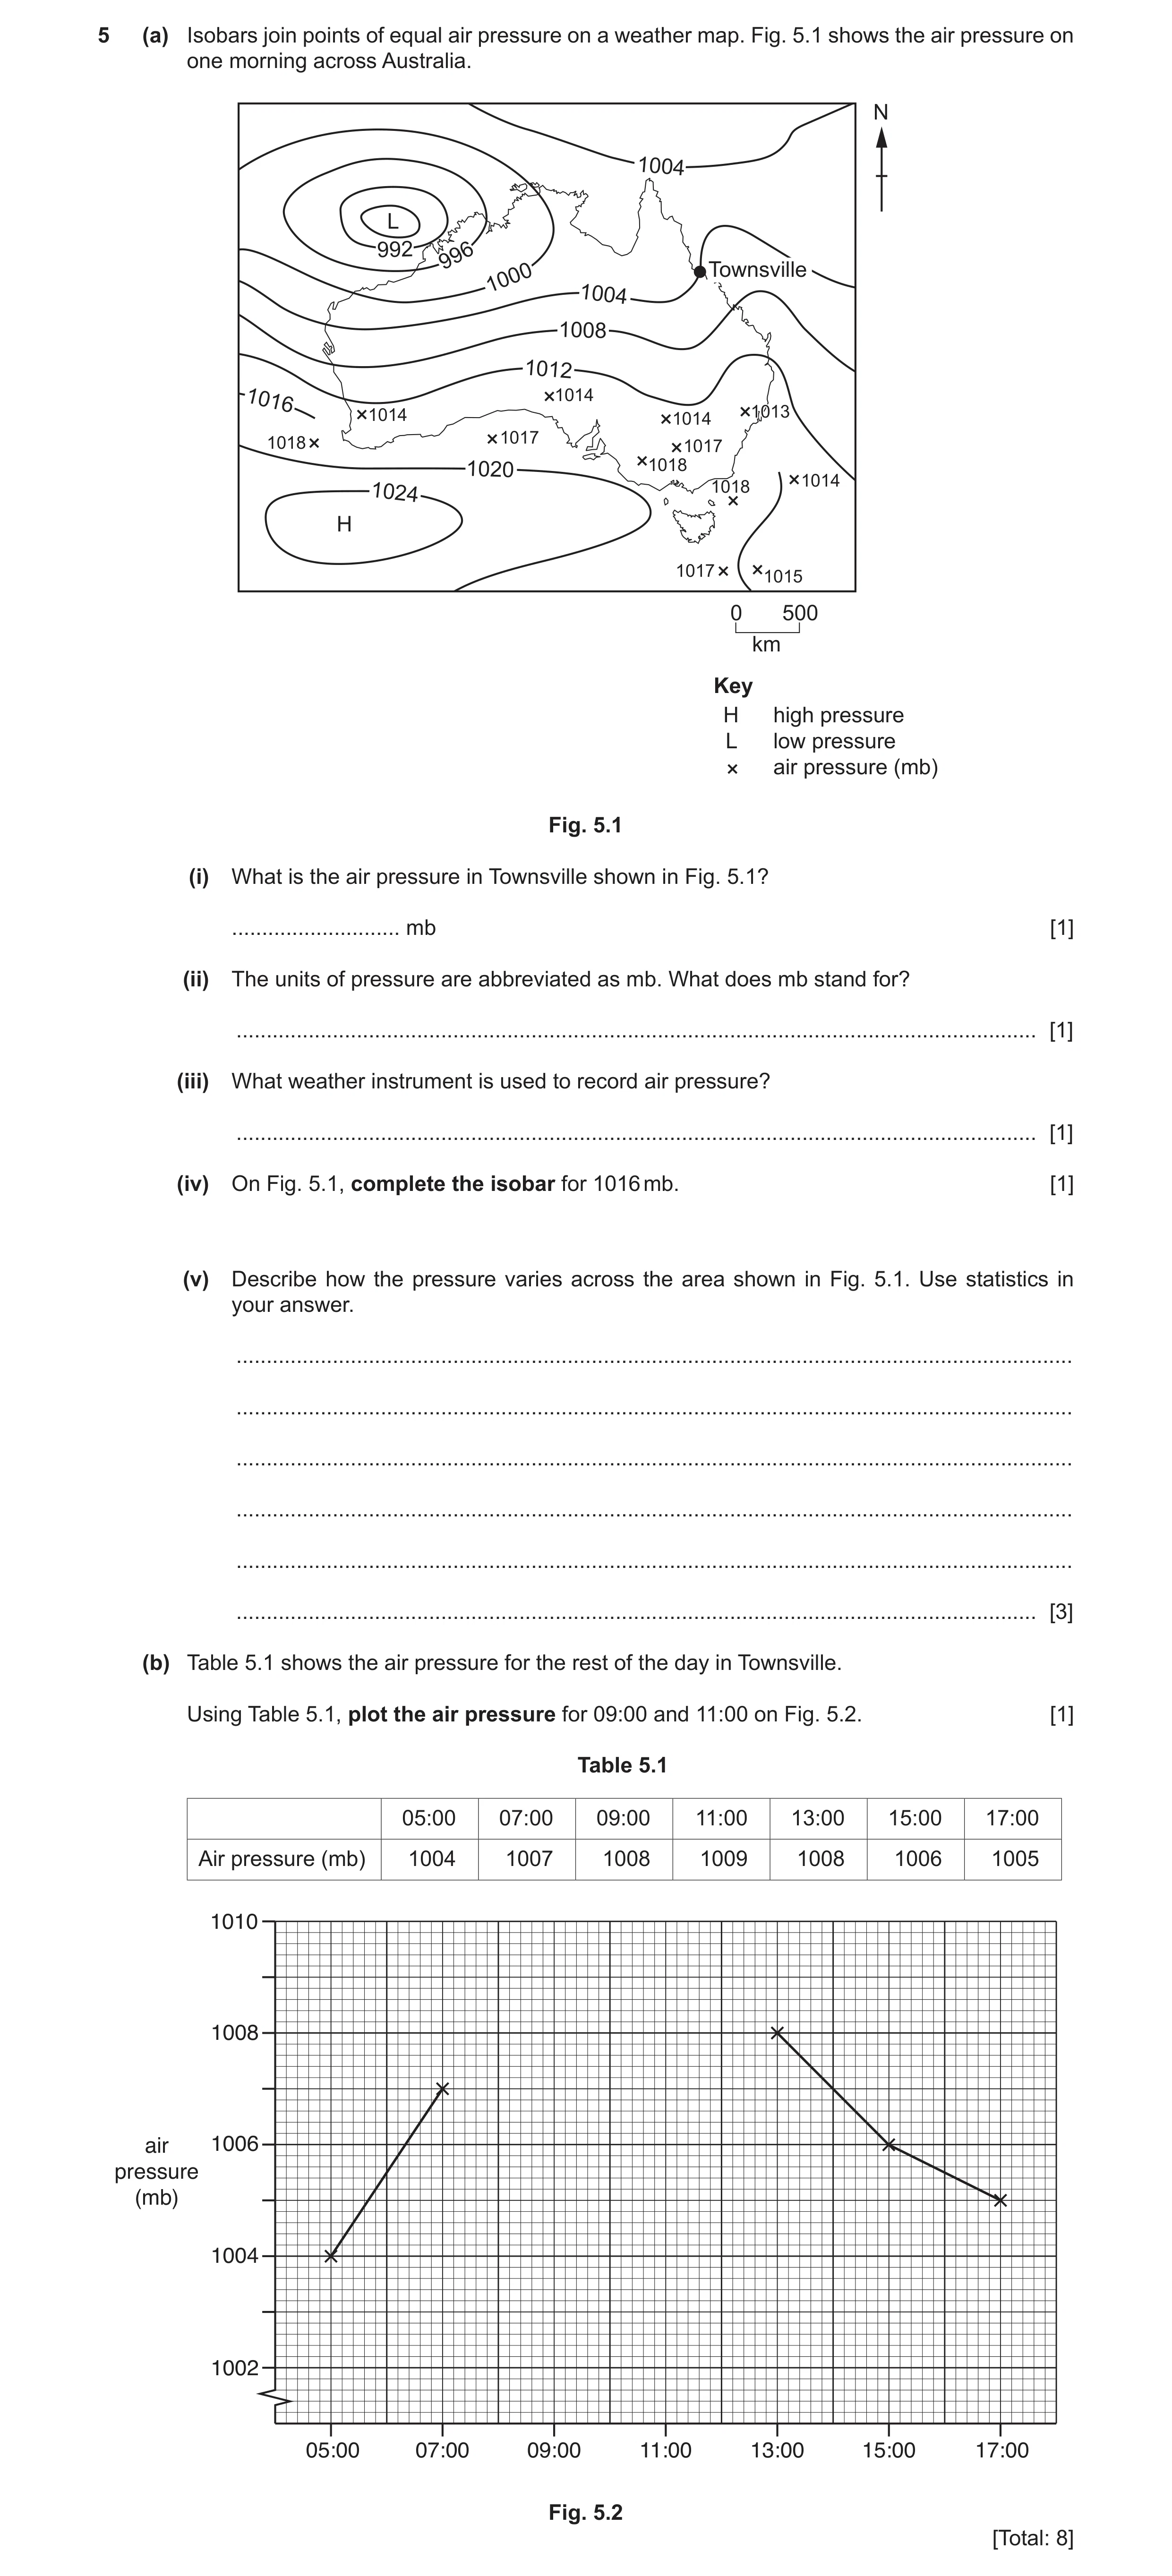
5 (a) Isobars join points of equal air pressure on a weather map. Fig. 5.1 shows the air pressure on one morning across Australia. N 1004 L 992 996 1000 Townsville 1004 1008 1012 1014 1016 1013 1014 1014 1018 1017 1017 1020 1018 1014 1024 1018 H 1017 1015 0 500 km Key H high pressure L low pressure air pressure (mb) Fig. 5.1 (i) What is the air pressure in Townsville shown in Fig. 5.1? … mb [1] (ii) The units of pressure are abbreviated as mb. What does mb stand for? … [1] (iii) What weather instrument is used to record air pressure? … [1] (iv) On Fig. 5.1, complete the isobar for 1016 mb. [1] (v) Describe how the pressure varies across the area shown in Fig. 5.1. Use statistics in your answer. … … … … … … [3] (b) Table 5.1 shows the air pressure for the rest of the day in Townsville. Using Table 5.1, plot the air pressure for 09:00 and 11:00 on Fig. 5.2. [1] Table 5.1 05:00 07:00 09:00 11:00 13:00 15:00 17:00 Air pressure (mb) 1004 1007 1008 1009 1008 1006 1005 1010 1008 air 1006 pressure (mb) 1004 1002 05:00 07:00 09:00 11:00 13:00 15:00 17:00 Fig. 5.2 [Total: 8]
8 marks
Mark scheme: 5(a)(i) 1004 (mb), 1 5(a)(ii) millibars, 1 5(a)(iii) barometer/barograph, 1 5(a)(iv) isobar drawn correctly between 1014 and 1017 mb, 1 5(a)(v) high(est) in S/SW,) If neither of these points is given allow ‘higher in 3 low(est) in N/NW,) south/lower in north’ for one mark. ridge in E, highest 1024 mb,) If no units given deduct one mark. Use of units lowest 988 mb,) once validates both figures. biggest range/change in W/lowest range/change in E, 5(b) plots of 1008 and 1009 mb, 1
This question in 0460/23 May/June 2021
Question 16 0460/21 Oct/Nov 2021
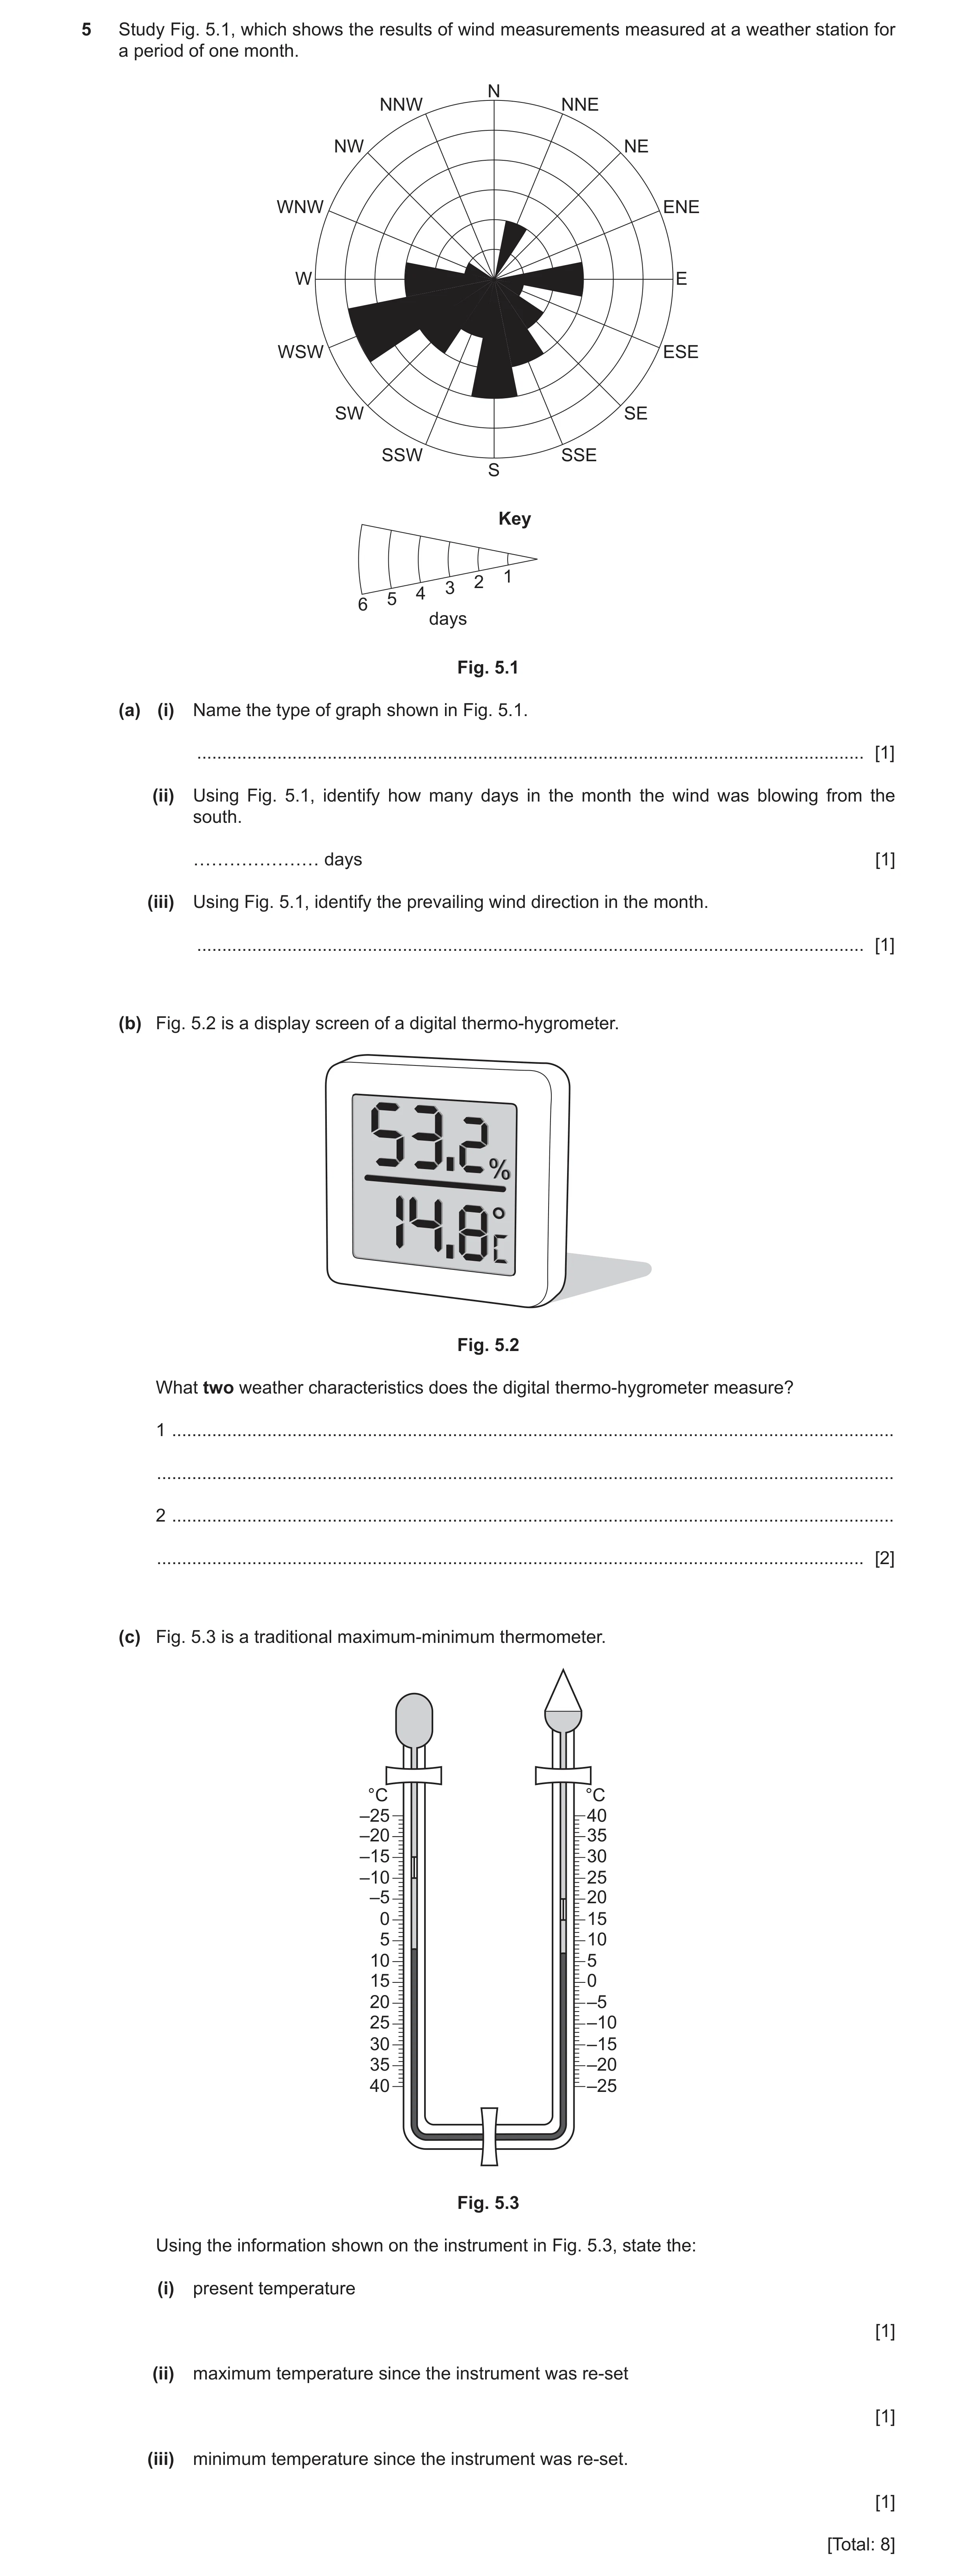
5 Study Fig. 5.1, which shows the results of wind measurements measured at a weather station for a period of one month. N NNW NNE NW NE WNW ENE W E WSW ESE SW SE SSW SSE S Key 1 2 3 4 5 6 days Fig. 5.1 (a) (i) Name the type of graph shown in Fig. 5.1. … [1] (ii) Using Fig. 5.1, identify how many days in the month the wind was blowing from the south. ………………… days [1] (iii) Using Fig. 5.1, identify the prevailing wind direction in the month. … [1] (b) Fig. 5.2 is a display screen of a digital thermo-hygrometer. Fig. 5.2 What two weather characteristics does the digital thermo-hygrometer measure? 1 … … 2 … … [2] (c) Fig. 5.3 is a traditional maximum-minimum thermometer. °C °C –25 40 –20 35 –15 30 –10 25 –5 20 0 15 5 10 10 5 15 0 20 –5 25 –10 30 –15 35 –20 40 –25 Fig. 5.3 Using the information shown on the instrument in Fig. 5.3, state the: (i) present temperature [1] (ii) maximum temperature since the instrument was re-set [1] (iii) minimum temperature since the instrument was re-set. [1] [Total: 8]
8 marks
Mark scheme: 5(a)(i) wind rose/radial diagram, 1 5(a)(ii) 4, 1 5(a)(iii) WSW, 1 5(b) temperature, 2 (relative) humidity, 5(c)(i) 7 °C, 1 5(c)(ii) 15 °C, 1 5(c)(iii) –10 °C, 1
This question in 0460/21 Oct/Nov 2021
Q17 · Part of a weather station 0460/22 Oct/Nov 2021
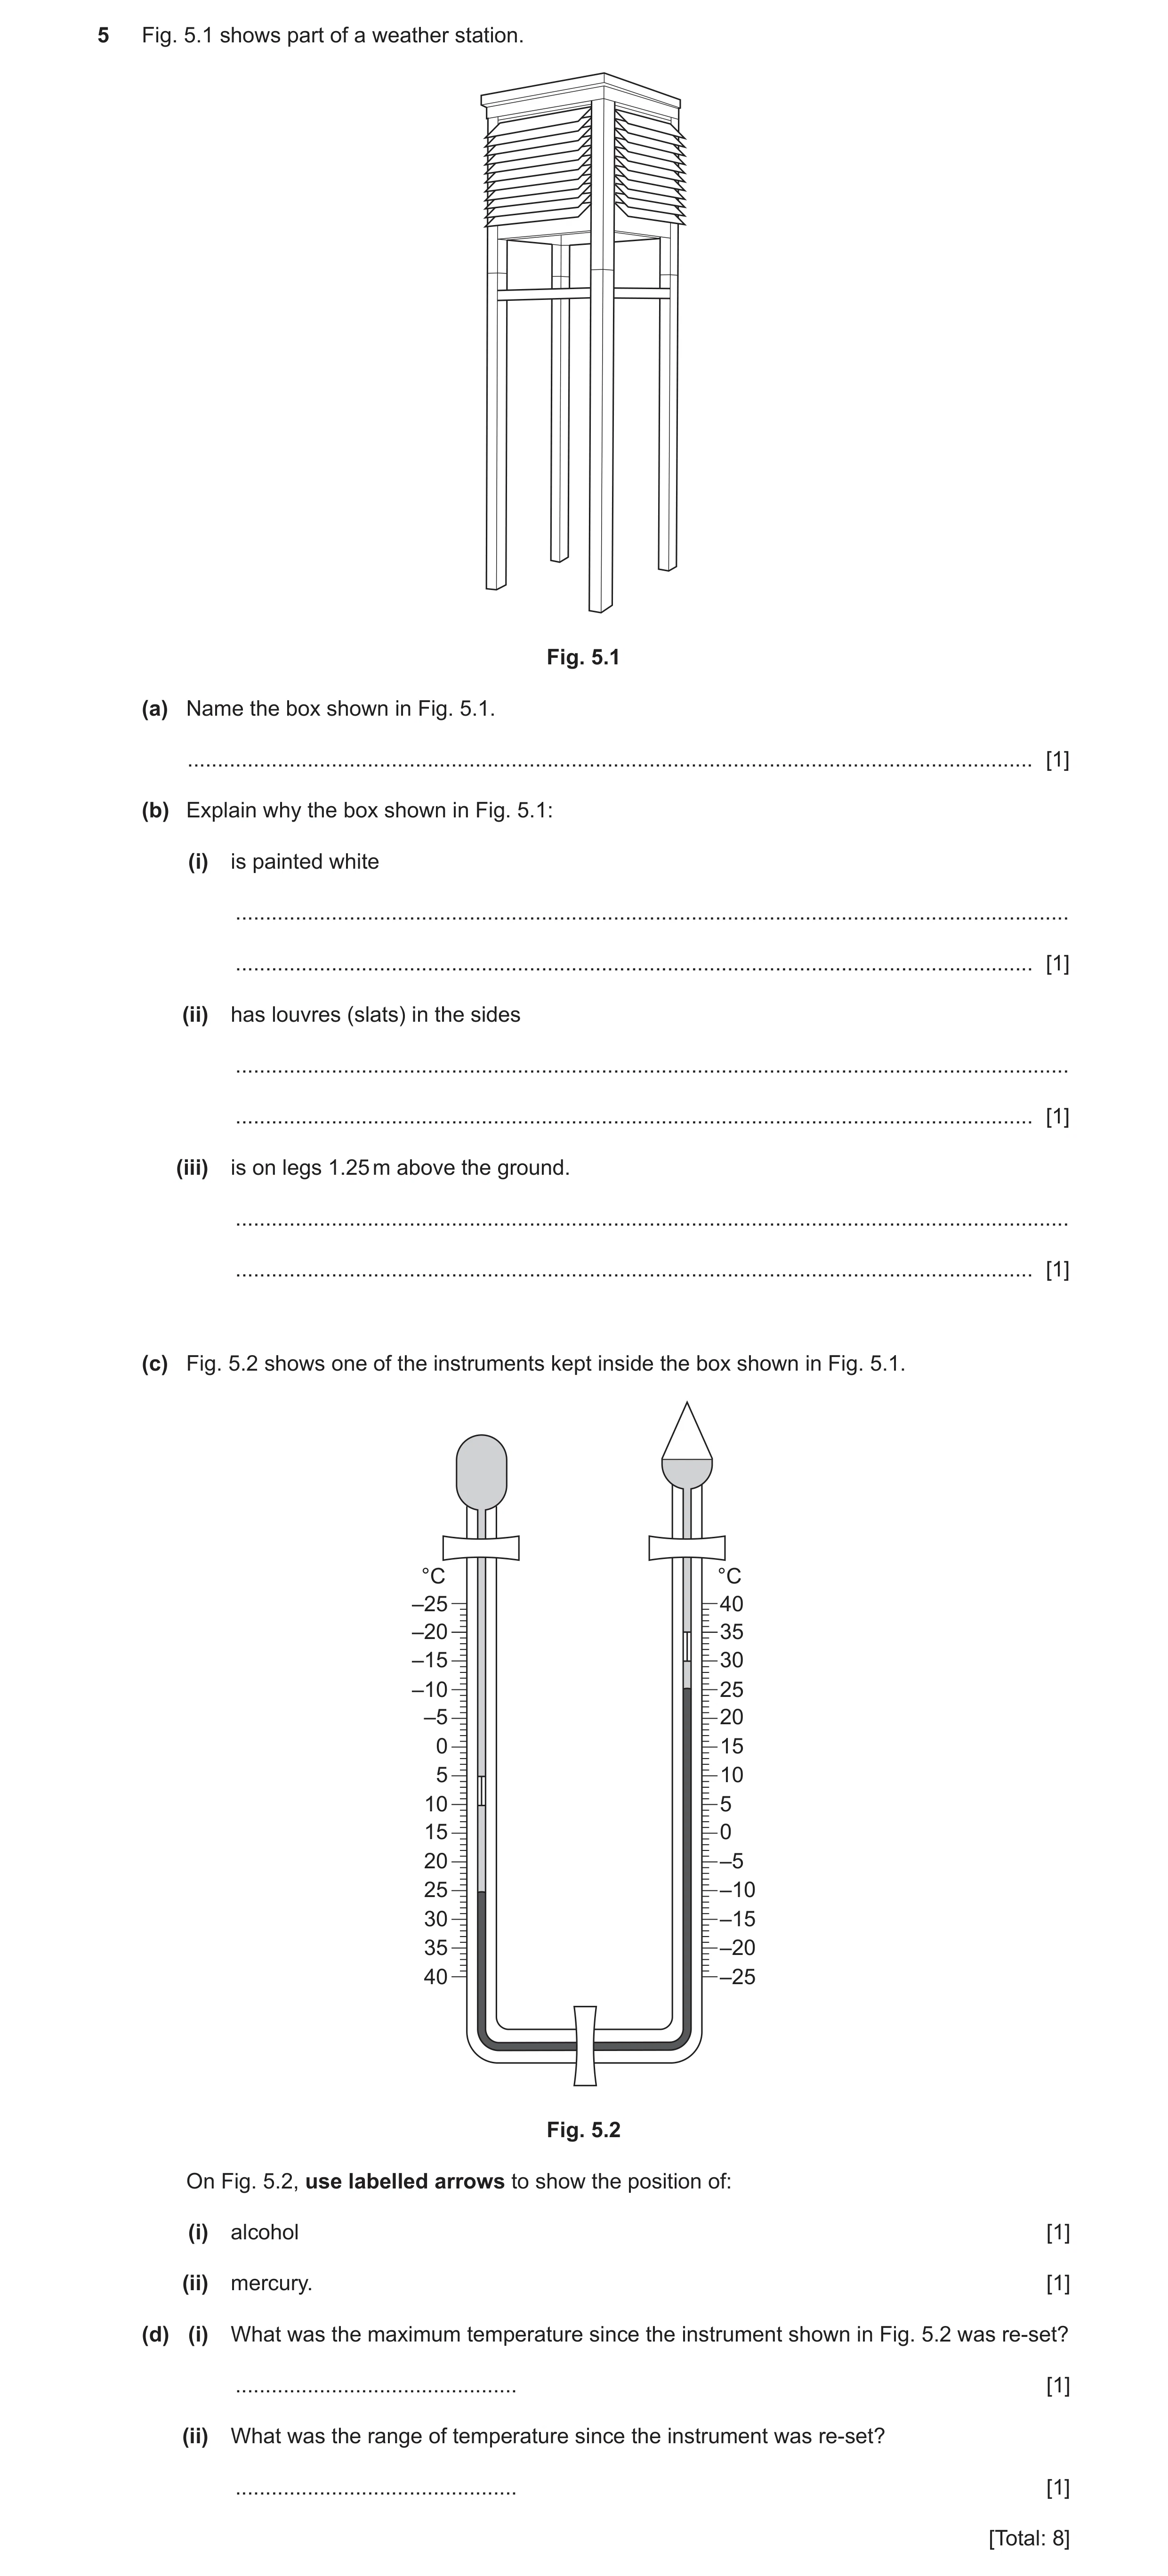
5 Fig. 5.1 shows part of a weather station. Fig. 5.1 (a) Name the box shown in Fig. 5.1. … [1] (b) Explain why the box shown in Fig. 5.1: (i) is painted white … … [1] (ii) has louvres (slats) in the sides … … [1] (iii) is on legs 1.25 m above the ground. … … [1] (c) Fig. 5.2 shows one of the instruments kept inside the box shown in Fig. 5.1. °C °C –25 40 –20 35 –15 30 –10 25 –5 20 0 15 5 10 10 5 15 0 20 –5 25 –10 30 –15 35 –20 40 –25 Fig. 5.2 On Fig. 5.2, use labelled arrows to show the position of: (i) alcohol [1] (ii) mercury. [1] (d) (i) What was the maximum temperature since the instrument shown in Fig. 5.2 was re-set? … [1] (ii) What was the range of temperature since the instrument was re-set? … [1] [Total: 8]
8 marks
Mark scheme: 5(a) Stevenson Screen, 1 5(b)(i) to reflect the sun/heat/light/radiation/absorb less heat, 1 5(b)(ii) to allow air to enter/circulate/reach instruments/ventilation, 1 5(b)(iii) to avoid ground heat/ground conditions, standardised height/comparability 1 with other stations, 5(c)(i) correct label of alcohol, (two possibilities) 1 5(c)(ii) correct label of mercury, 1 5(d)(i) 30 °C, 1 5(d)(ii) 20 °C, 1
This question in 0460/22 Oct/Nov 2021
Question 18 0460/21 May/June 2022
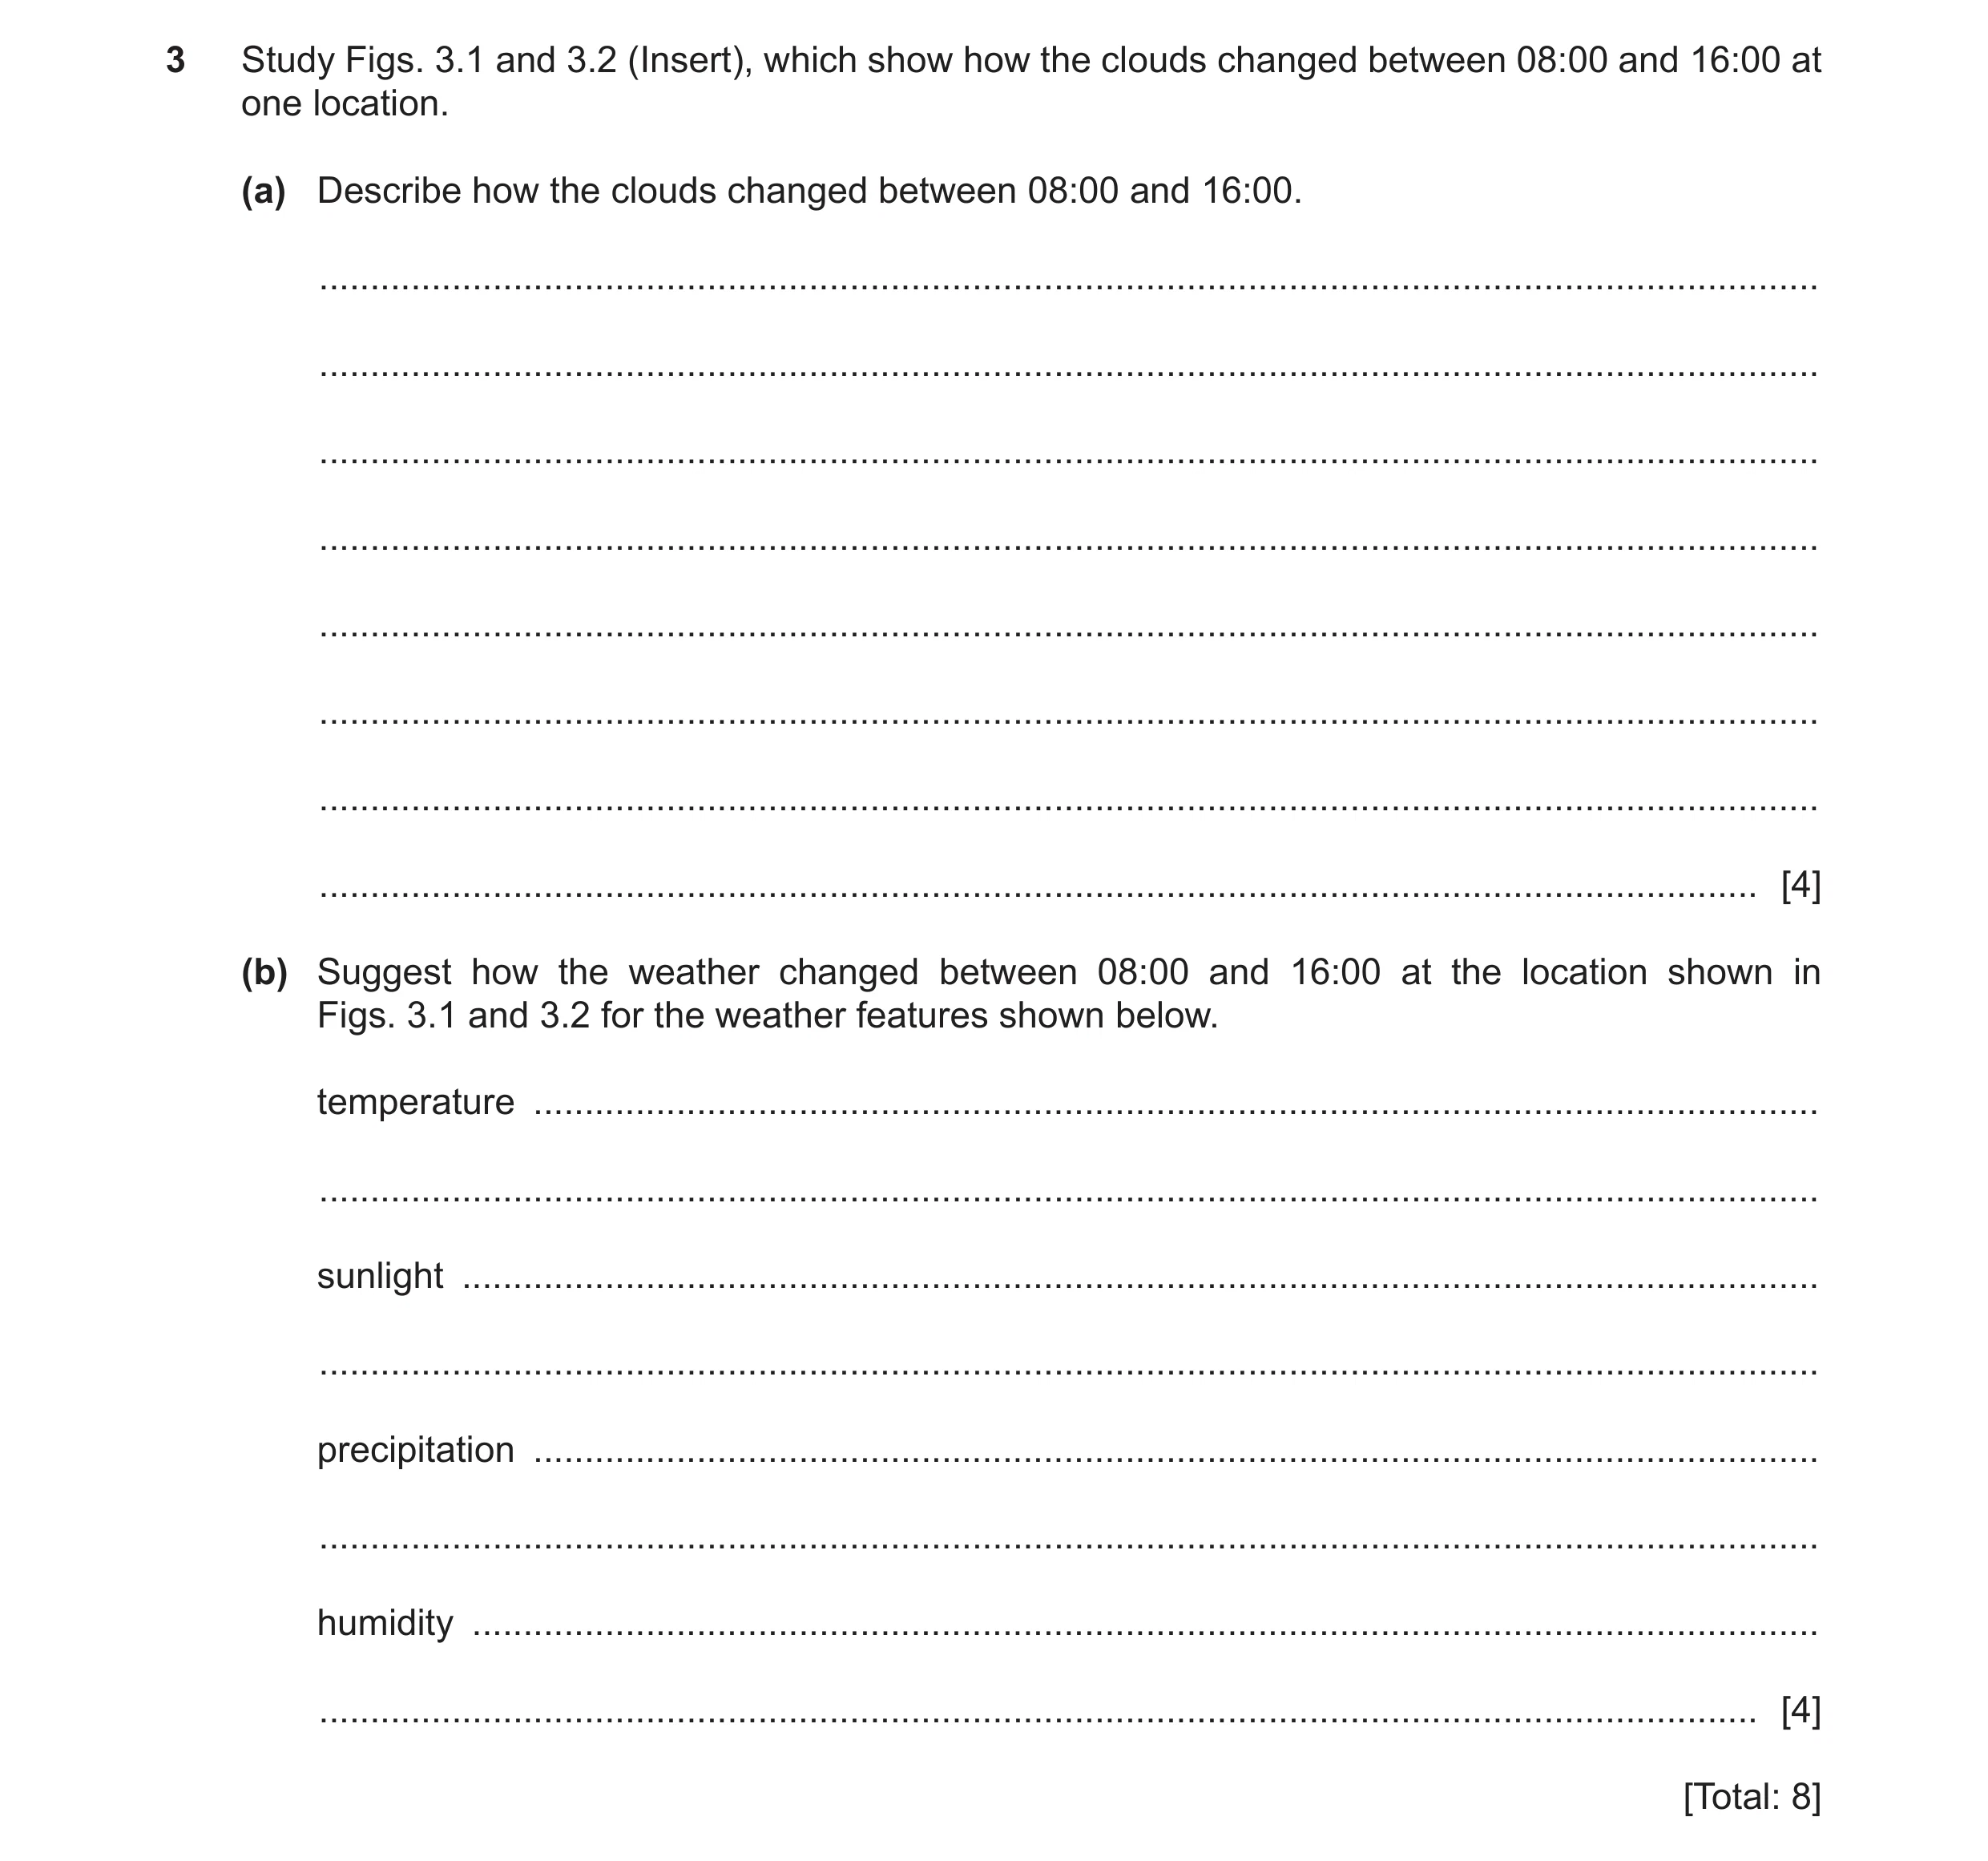
3 Study Figs. 3.1 and 3.2 (Insert), which show how the clouds changed between 08:00 and 16:00 at one location. (a) Describe how the clouds changed between 08:00 and 16:00. … … … … … … … … [4] (b) Suggest how the weather changed between 08:00 and 16:00 at the location shown in Figs. 3.1 and 3.2 for the weather features shown below. temperature … … sunlight … … precipitation … … humidity … … [4] [Total: 8]
8 marks
Mark scheme: 3(a) increased cloud cover 4 2/3 to 7/8 oktas became darker/greyer; became larger/bigger; became denser/thicker/heavier; became higher/taller; cumulus to cumulonimbus; Look for comparatives or pairs of opposites e.g., light v. dark 3(b) Temperature: decreased; 4 Sunlight: decreased; Precipitation: increased; Humidity: increased;
This question in 0460/21 May/June 2022
Q19 · Where tropical storms form 0460/23 May/June 2023
3 Fig. 3.1 shows where tropical storms form. North Asia America typhoons hurricanes hurricanes equator cyclonescyclones cyclonescyclones Key areas in which tropical storms typically form typical path of storm Fig. 3.1 (a) (i) Using Fig. 3.1, describe two physical conditions needed for a tropical storm to form. 1 … 2 … [2] (ii) What is the name of the tropical storms which affect southeast Asia, north of the equator? … [1] (iii) In which direction do the hurricanes affecting the east coast of North America move? … [1] (b) Fig. 3.2 shows the global numbers of people killed by weather hazards from 1980 to 2018. 200 150 number of deaths 100 (000s) 50 0 198019811982198319841985198619871988198919901991199219931994199519961997199819992000200120022003200420052006200720082009201020112012201320142015201620172018 year Fig. 3.2 (i) In which year were the most people killed by weather hazards? … [1] (ii) Suggest reasons why the number of people killed by weather hazards varies each year. … … … … … … [3] [Total: 8]
8 marks
Mark scheme: 3(a)(i) Warm/hot/tropical/high (temperature); 2 Ocean/sea; High humidity. 3(a)(ii) Typhoons. 1 3(a)(iii) North-west/North-east. 1 3(b)(i) 1991. 1 3(b)(ii) Number of events varies (per year); 3 Scale of event/severity varies/power/magnitude (not earthquakes) (per year); Speed of formation; Depends on population density/urban v rural; Depends on the preparedness/education (about what to do); Speed of response; (Access to) emergency relief/medical aid; Level of development/LEDC v MEDC/building condition; Forecasting/warnings (may affect whether people evacuate).
This question in 0460/23 May/June 2023
Question 20 0460/22 Oct/Nov 2023
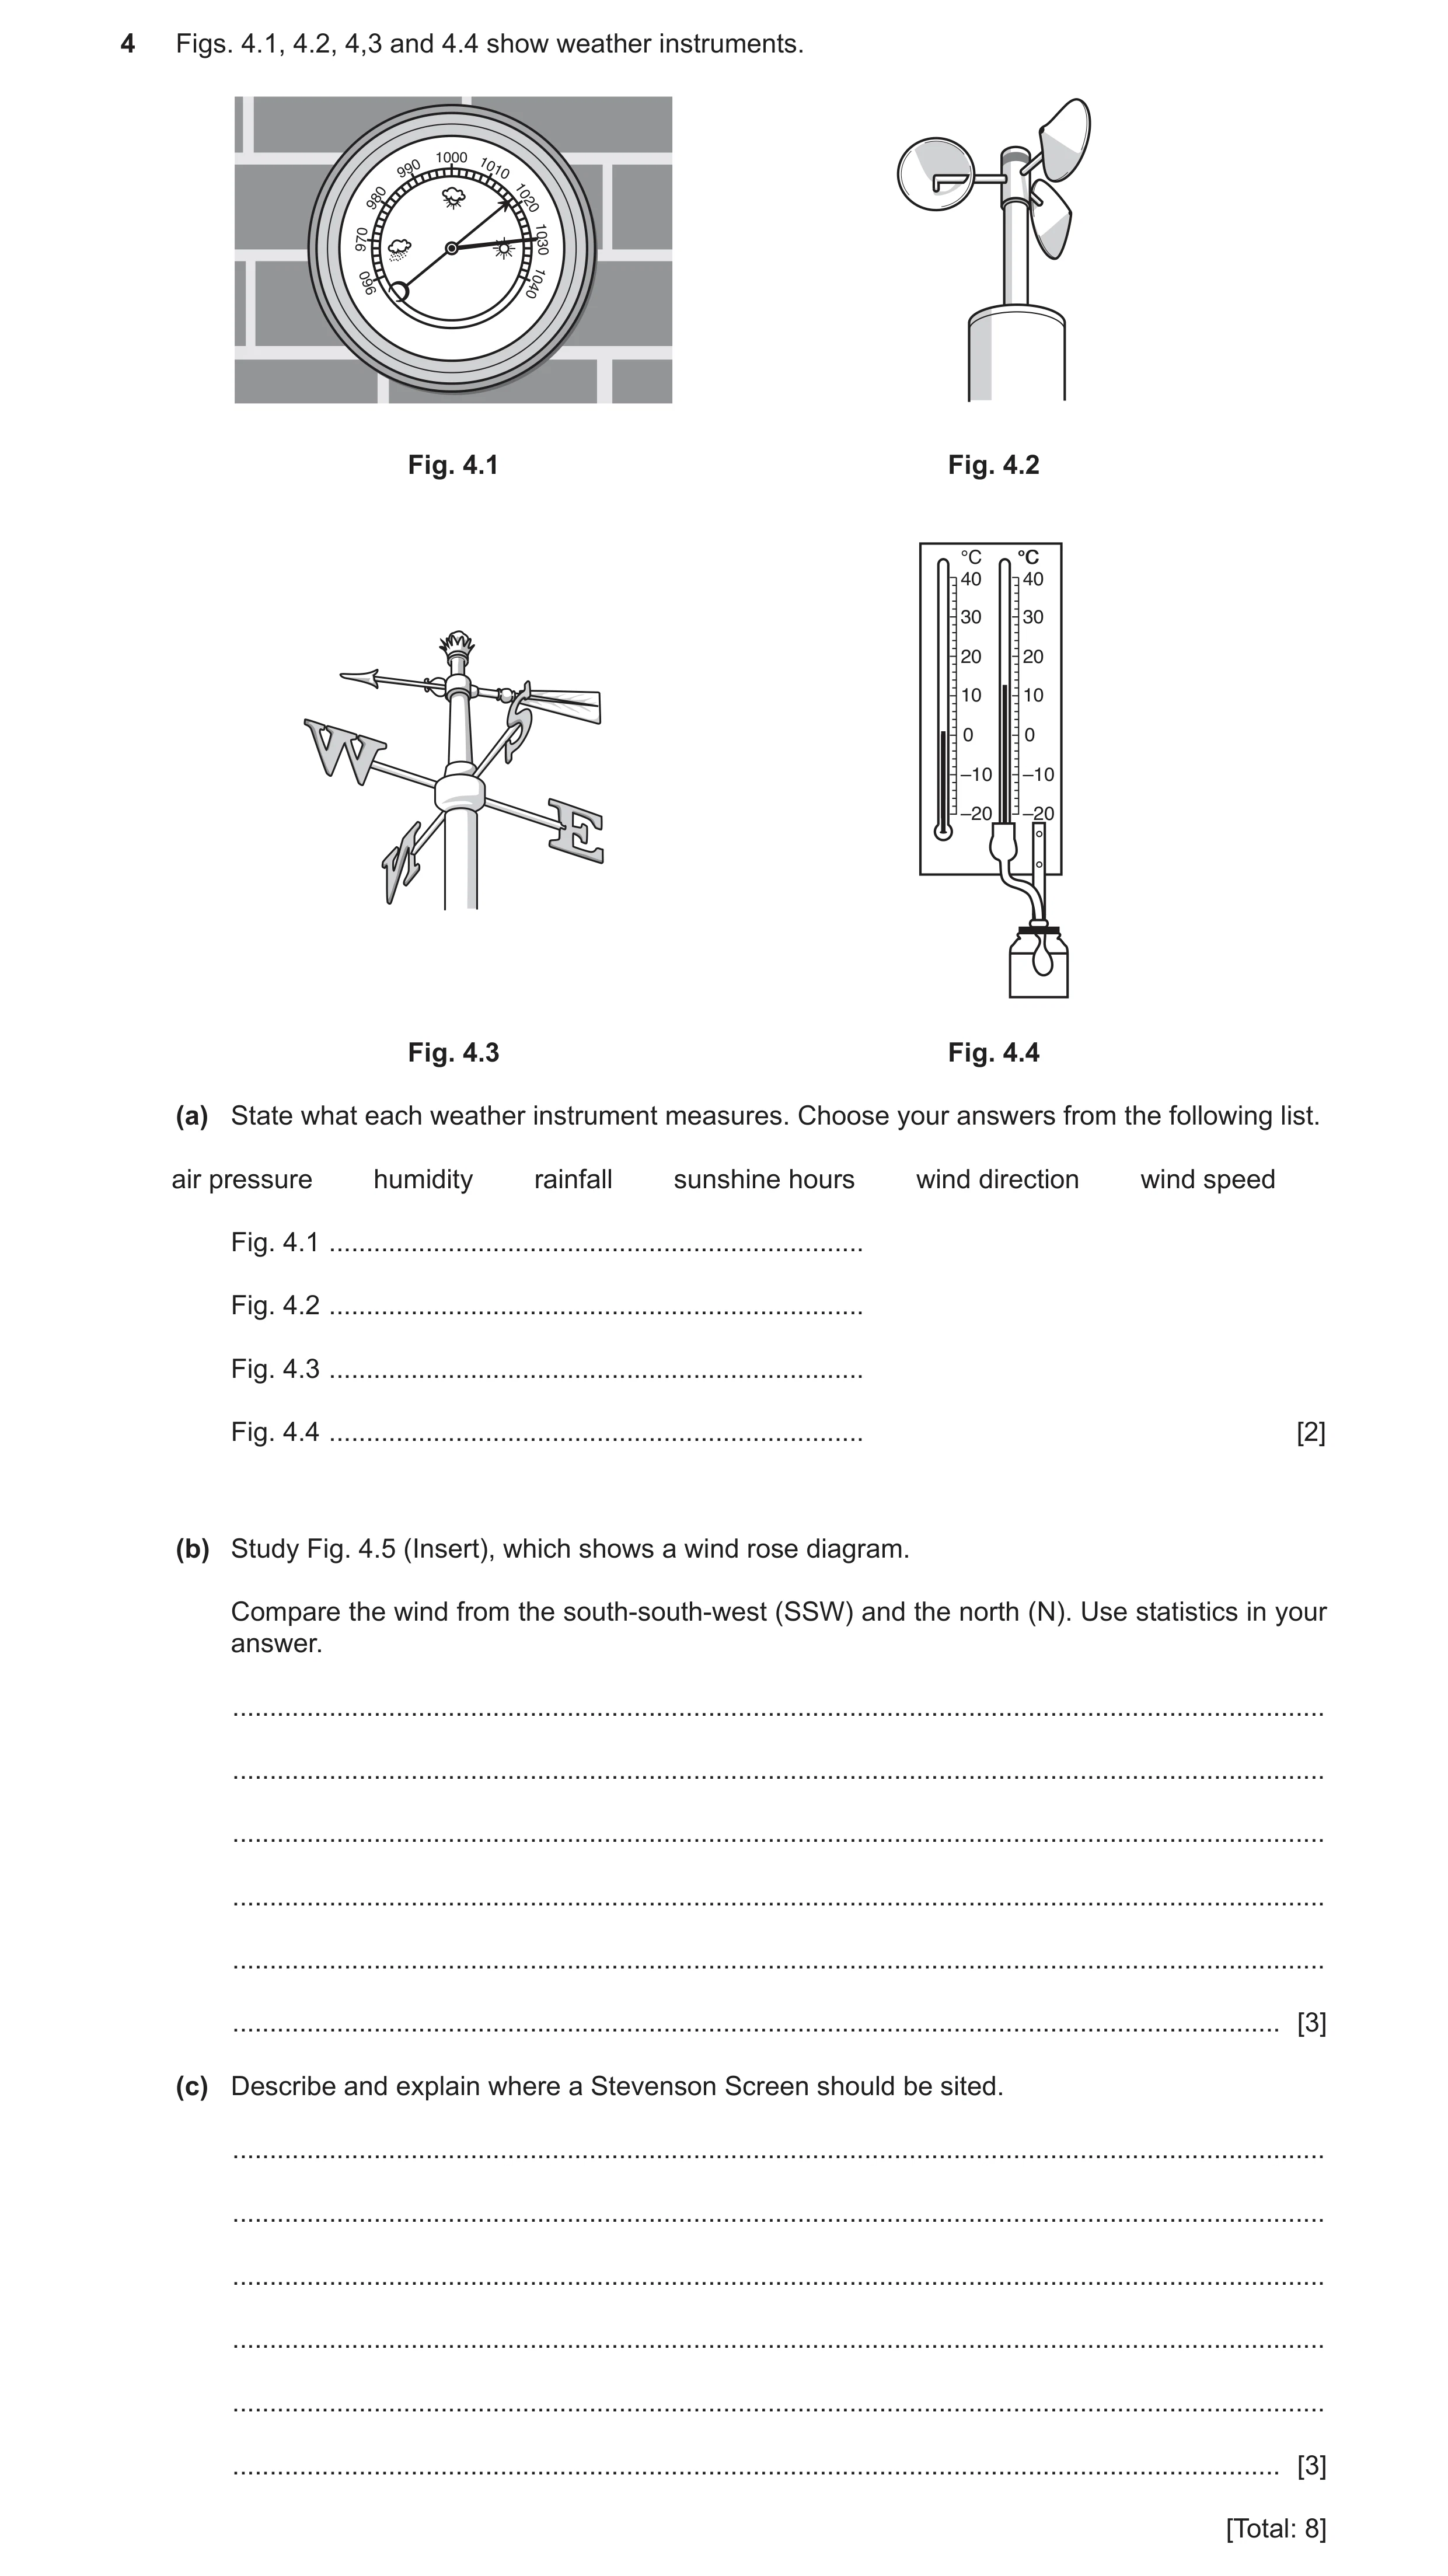
4 Figs. 4.1, 4.2, 4,3 and 4.4 show weather instruments. Fig. 4.1 Fig. 4.2 °C °C°C 40 40 30 30 20 20 10 10 0 0 –10 –10 –20 –20 Fig. 4.3 Fig. 4.4 (a) State what each weather instrument measures. Choose your answers from the following list. air pressure humidity rainfall sunshine hours wind direction wind speed Fig. 4.1 … Fig. 4.2 … Fig. 4.3 … Fig. 4.4 … [2] (b) Study Fig. 4.5 (Insert), which shows a wind rose diagram. Compare the wind from the south‑south‑west (SSW) and the north (N). Use statistics in your answer. … … … … … … [3] (c) Describe and explain where a Stevenson Screen should be sited. … … … … … … [3] [Total: 8]
8 marks
Mark scheme: 4(a) • Fig. 4.1.: Air pressure; 2 • Fig. 4.2.: Wind speed; • Fig. 4.3.: Wind direction; • Fig. 4.4.: Humidity. Note: 3 or 4 correct – 2 marks 1 or 2 correct – 1 mark 4(b) Wind direction 3 • More often from SSW / less often from N; • 10% from SSW v 5.5–5.7% / below 6% from N; Wind speed • Stronger / faster winds from SSW / less strong / slower from N / more variation in SSW / less variation from N; • N most winds 3–5 m / s v SSW most winds 5–8 m / s; • 8–16 (m / s) / 8–11 (m / s) / 11–16 (m / s) / above 11 from SSW v 8–16 (m / s) / 8–11 (m / s) / 11–16 (m / s) not present in north / up to 8 (m / s) from north / max. 8 in N, 16 in SSW. Comparison of categories of wind speed • 0–3 (m / s) (purple): % is lower in North / 1.4–1.6% N v 2% SSW; • 3–5 (m / s) (blue): % is higher in North / 3.5–3.6% N v 3.2–3.4% SSW; • 5–8 (m / s) (orange): % is lower in North / 0.7–0.9% N v 3.2–3.4% SSW. Note: Reserve 1 mark for stats. 4(c) • In open space / away from buildings / away from trees / away from shade; 3 • So air circulates freely / wind not blocked / sunlight not blocked (by buildings and trees) / to avoid buildings giving off heat; • So temperature not lowered / so temperature is measured accurately; • Above / off the ground (ignore references to height); • To avoid heating from the ground / radiating; • In a fenced area; • To keep animals and people away; • On grass; • To avoid reflection / radiation / absorption of heat; • Face away from sun / avoid direct sunlight in Northern hemisphere / Southern hemisphere.
This question in 0460/22 Oct/Nov 2023
Question 21 0460/22 Feb/March 2024
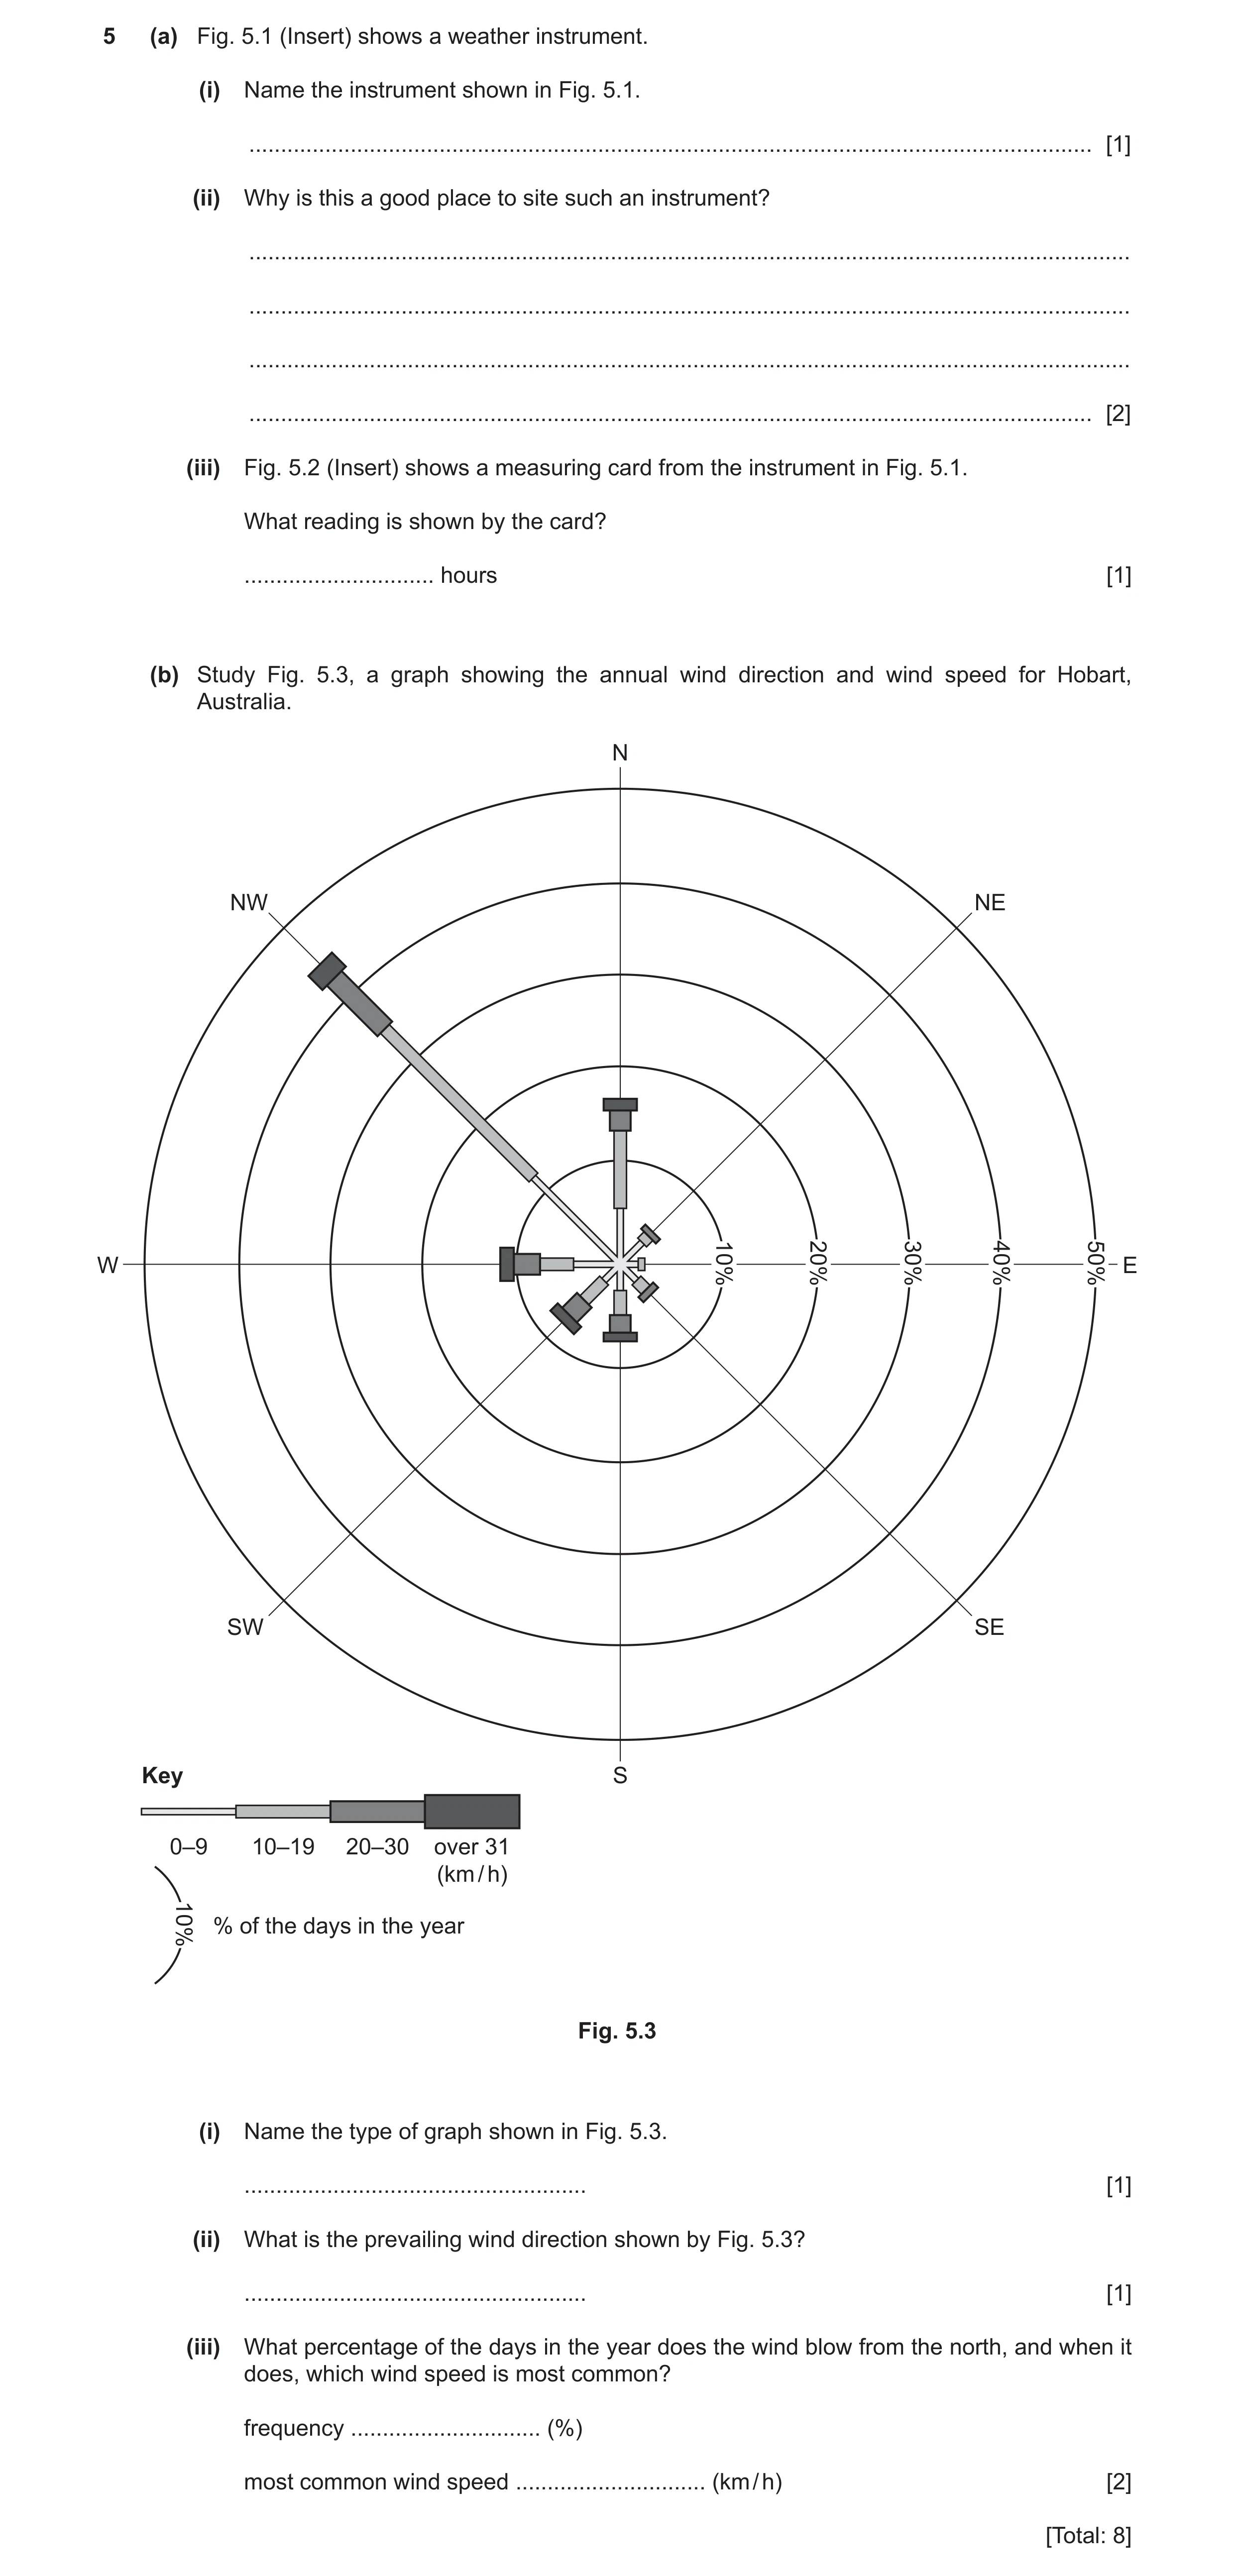
5 (a) Fig. 5.1 (Insert) shows a weather instrument. (i) Name the instrument shown in Fig. 5.1. … [1] (ii) Why is this a good place to site such an instrument? … … … … [2] (iii) Fig. 5.2 (Insert) shows a measuring card from the instrument in Fig. 5.1. What reading is shown by the card? … hours [1] (b) Study Fig. 5.3, a graph showing the annual wind direction and wind speed for Hobart, Australia. N NW NE W 10% 20% 30% 40% 50% E SW SE Key S 0–9 10–19 20–30 over 31 (km / h) % of the days in the year 10% Fig. 5.3 (i) Name the type of graph shown in Fig. 5.3. … [1] (ii) What is the prevailing wind direction shown by Fig. 5.3? … [1] (iii) What percentage of the days in the year does the wind blow from the north, and when it does, which wind speed is most common? frequency … (%) most common wind speed … (km / h) [2] [Total: 8]
8 marks
Mark scheme: 5(a)(i) sunshine recorder/heliograph/pyranometer/a Campbell-Stokes (recorder). 1 5(a)(ii) away from buildings/obstructions/trees; 2 in an open space/area; high up/on a raised platform/at a height (off the ground); not near any reflective surfaces; so it can receive direct rays of the sun/receive sunlight from all directions; ^ gets lots of sunlight. =0 no human contact. 5(a)(iii) 12 (hours). 1 5(b)(i) wind rose or radial graph/chart. 1 ^ rose graph. 5(b)ii) NW. Apply list rule if two directions given. 1 5(b)(iii) 16/16.5/17/17.5 (%); 2 10–19 km/hr.
This question in 0460/22 Feb/March 2024
Q22 · Three instruments, A, B and C, kept at a weather station 0460/22 May/June 2024
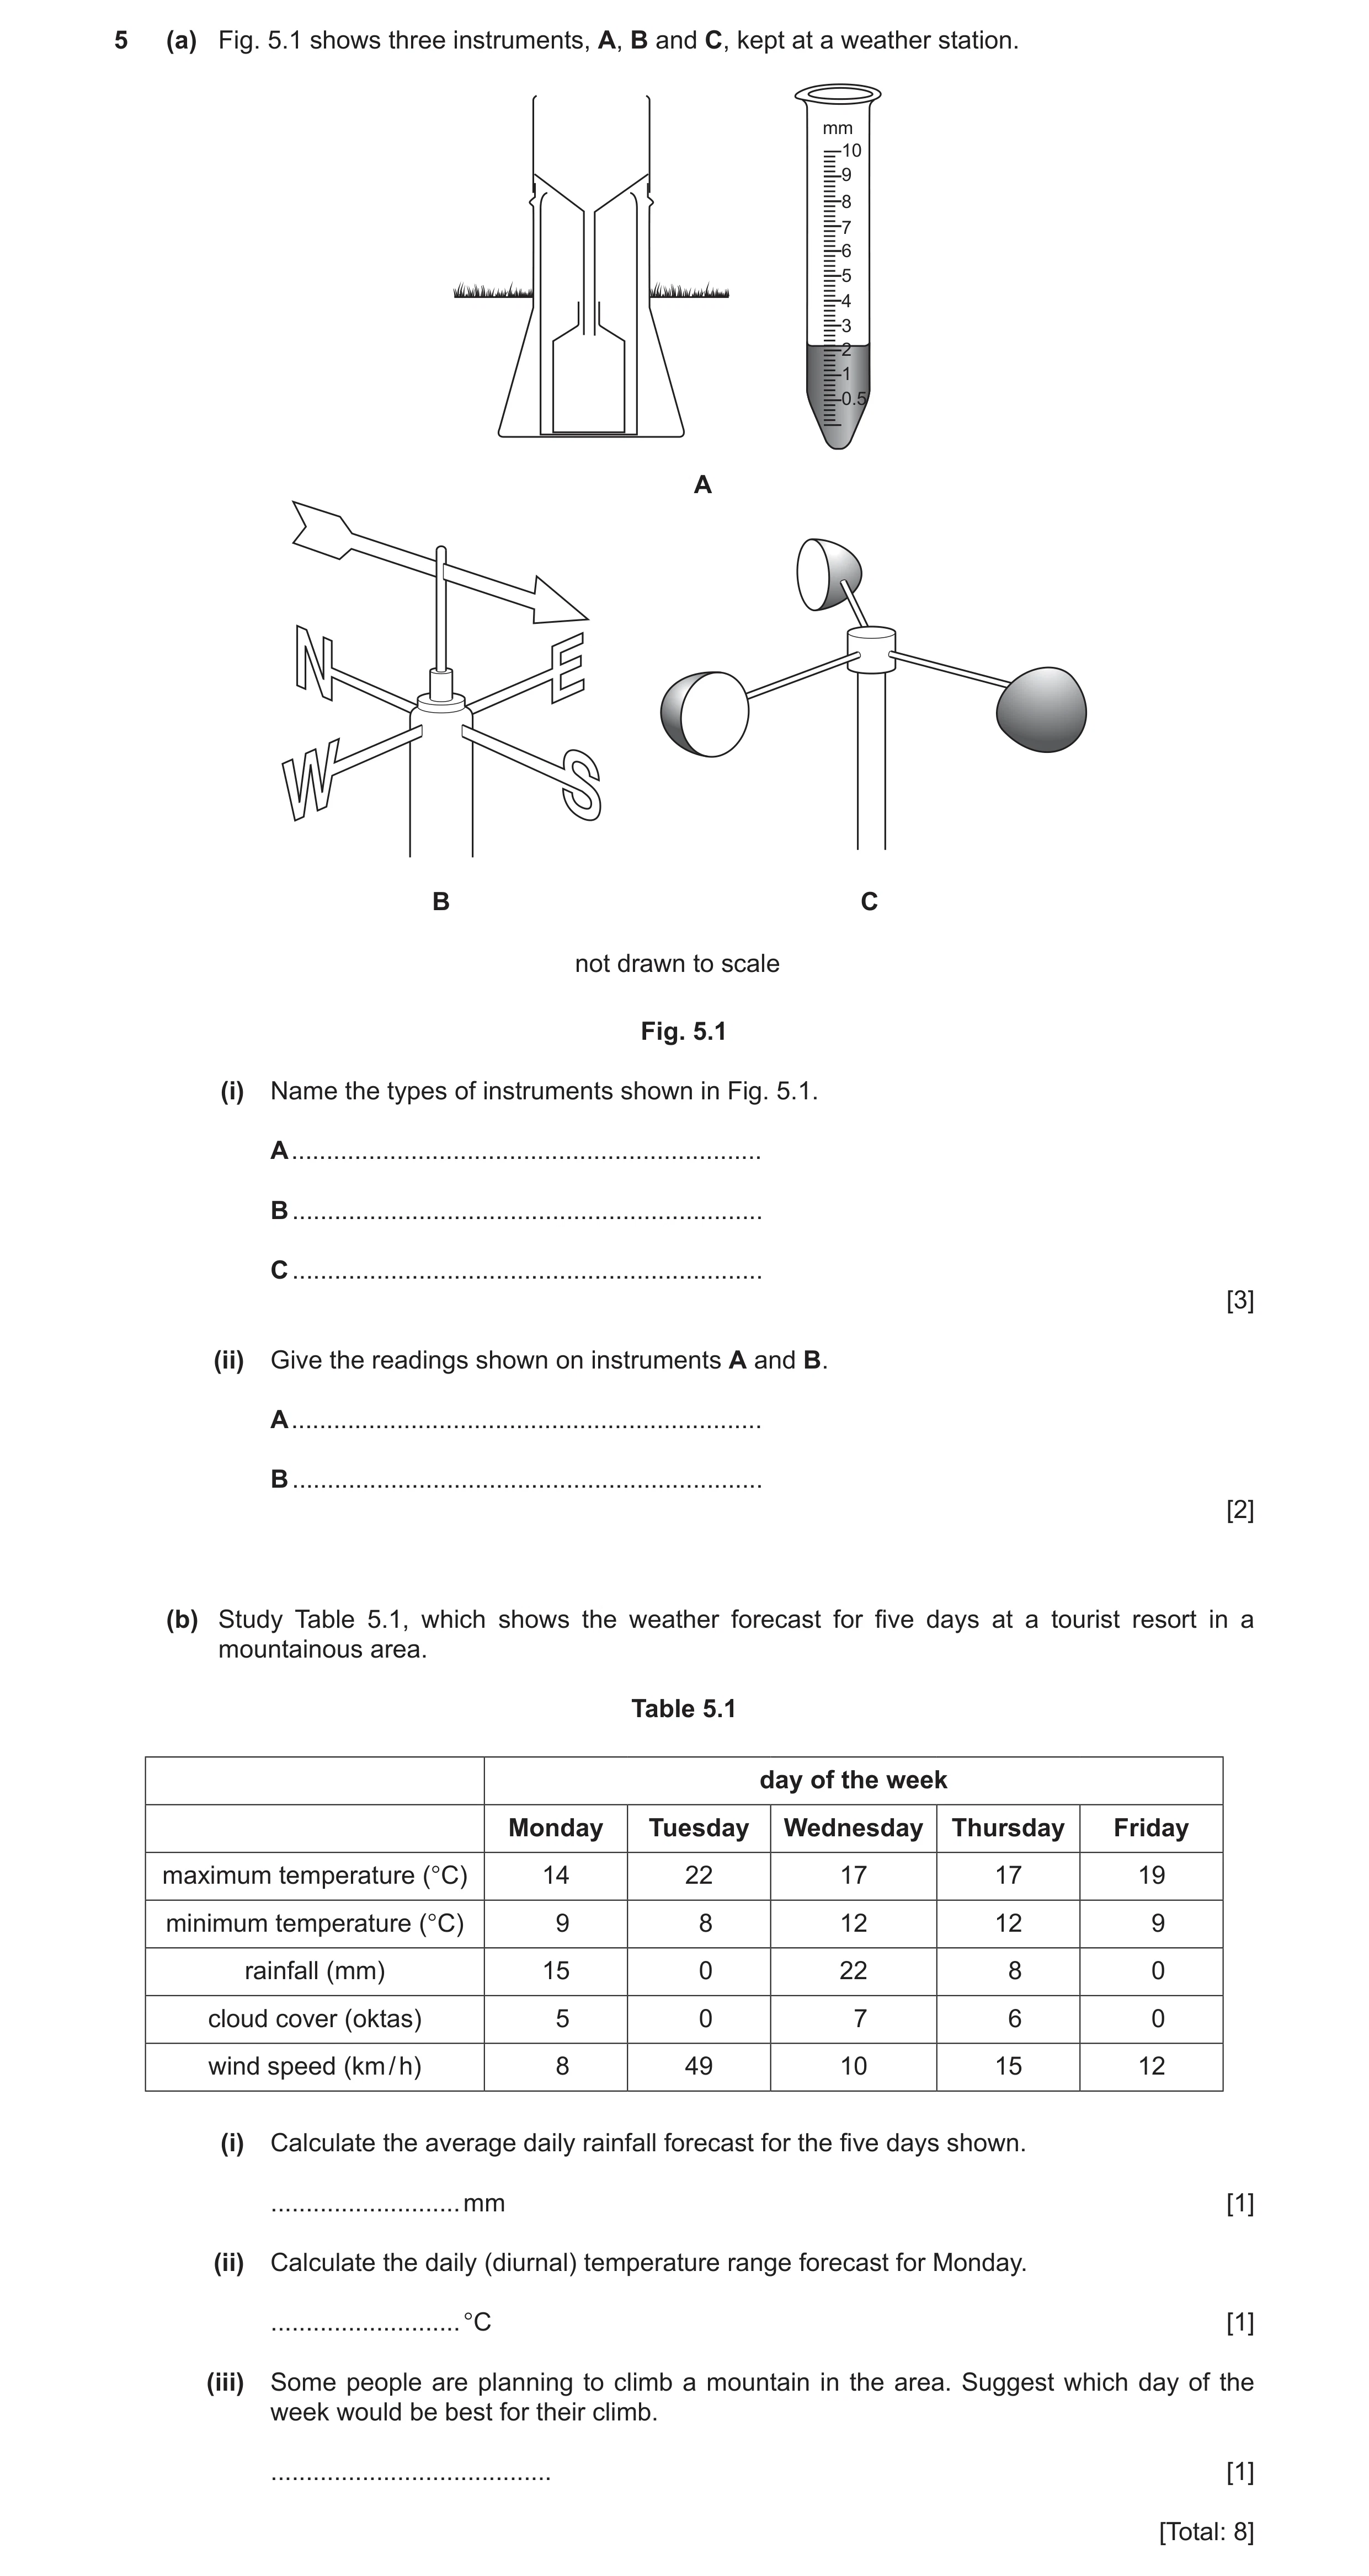
5 (a) Fig. 5.1 shows three instruments, A, B and C, kept at a weather station. mm 10 9 8 7 6 5 4 3 2 1 0.5 A B C not drawn to scale Fig. 5.1 (i) Name the types of instruments shown in Fig. 5.1. A … B … C … [3] (ii) Give the readings shown on instruments A and B. A … B … [2] (b) Study Table 5.1, which shows the weather forecast for five days at a tourist resort in a mountainous area. Table 5.1 day of the week Monday Tuesday Wednesday Thursday Friday maximum temperature (°C) 14 22 17 17 19 minimum temperature (°C) 9 8 12 12 9 rainfall (mm) 15 0 22 8 0 cloud cover (oktas) 5 0 7 6 0 wind speed (km / h) 8 49 10 15 12 (i) Calculate the average daily rainfall forecast for the five days shown. … mm [1] (ii) Calculate the daily (diurnal) temperature range forecast for Monday. … °C [1] (iii) Some people are planning to climb a mountain in the area. Suggest which day of the week would be best for their climb. … [1] [Total: 8]
8 marks
Mark scheme: 5(a)(i) A = Rain gauge 3 B = Wind/weather vane C = Anemometer 5(a)(ii) 2.2 mm 2 (From the) south (wind)/to the north 5(b)(i) 9 (mm) 1 5(b)(ii) 5 (°C) 1 5(b)(iii) Friday 1
This question in 0460/22 May/June 2024
Question 23 0460/21 May/June 2025
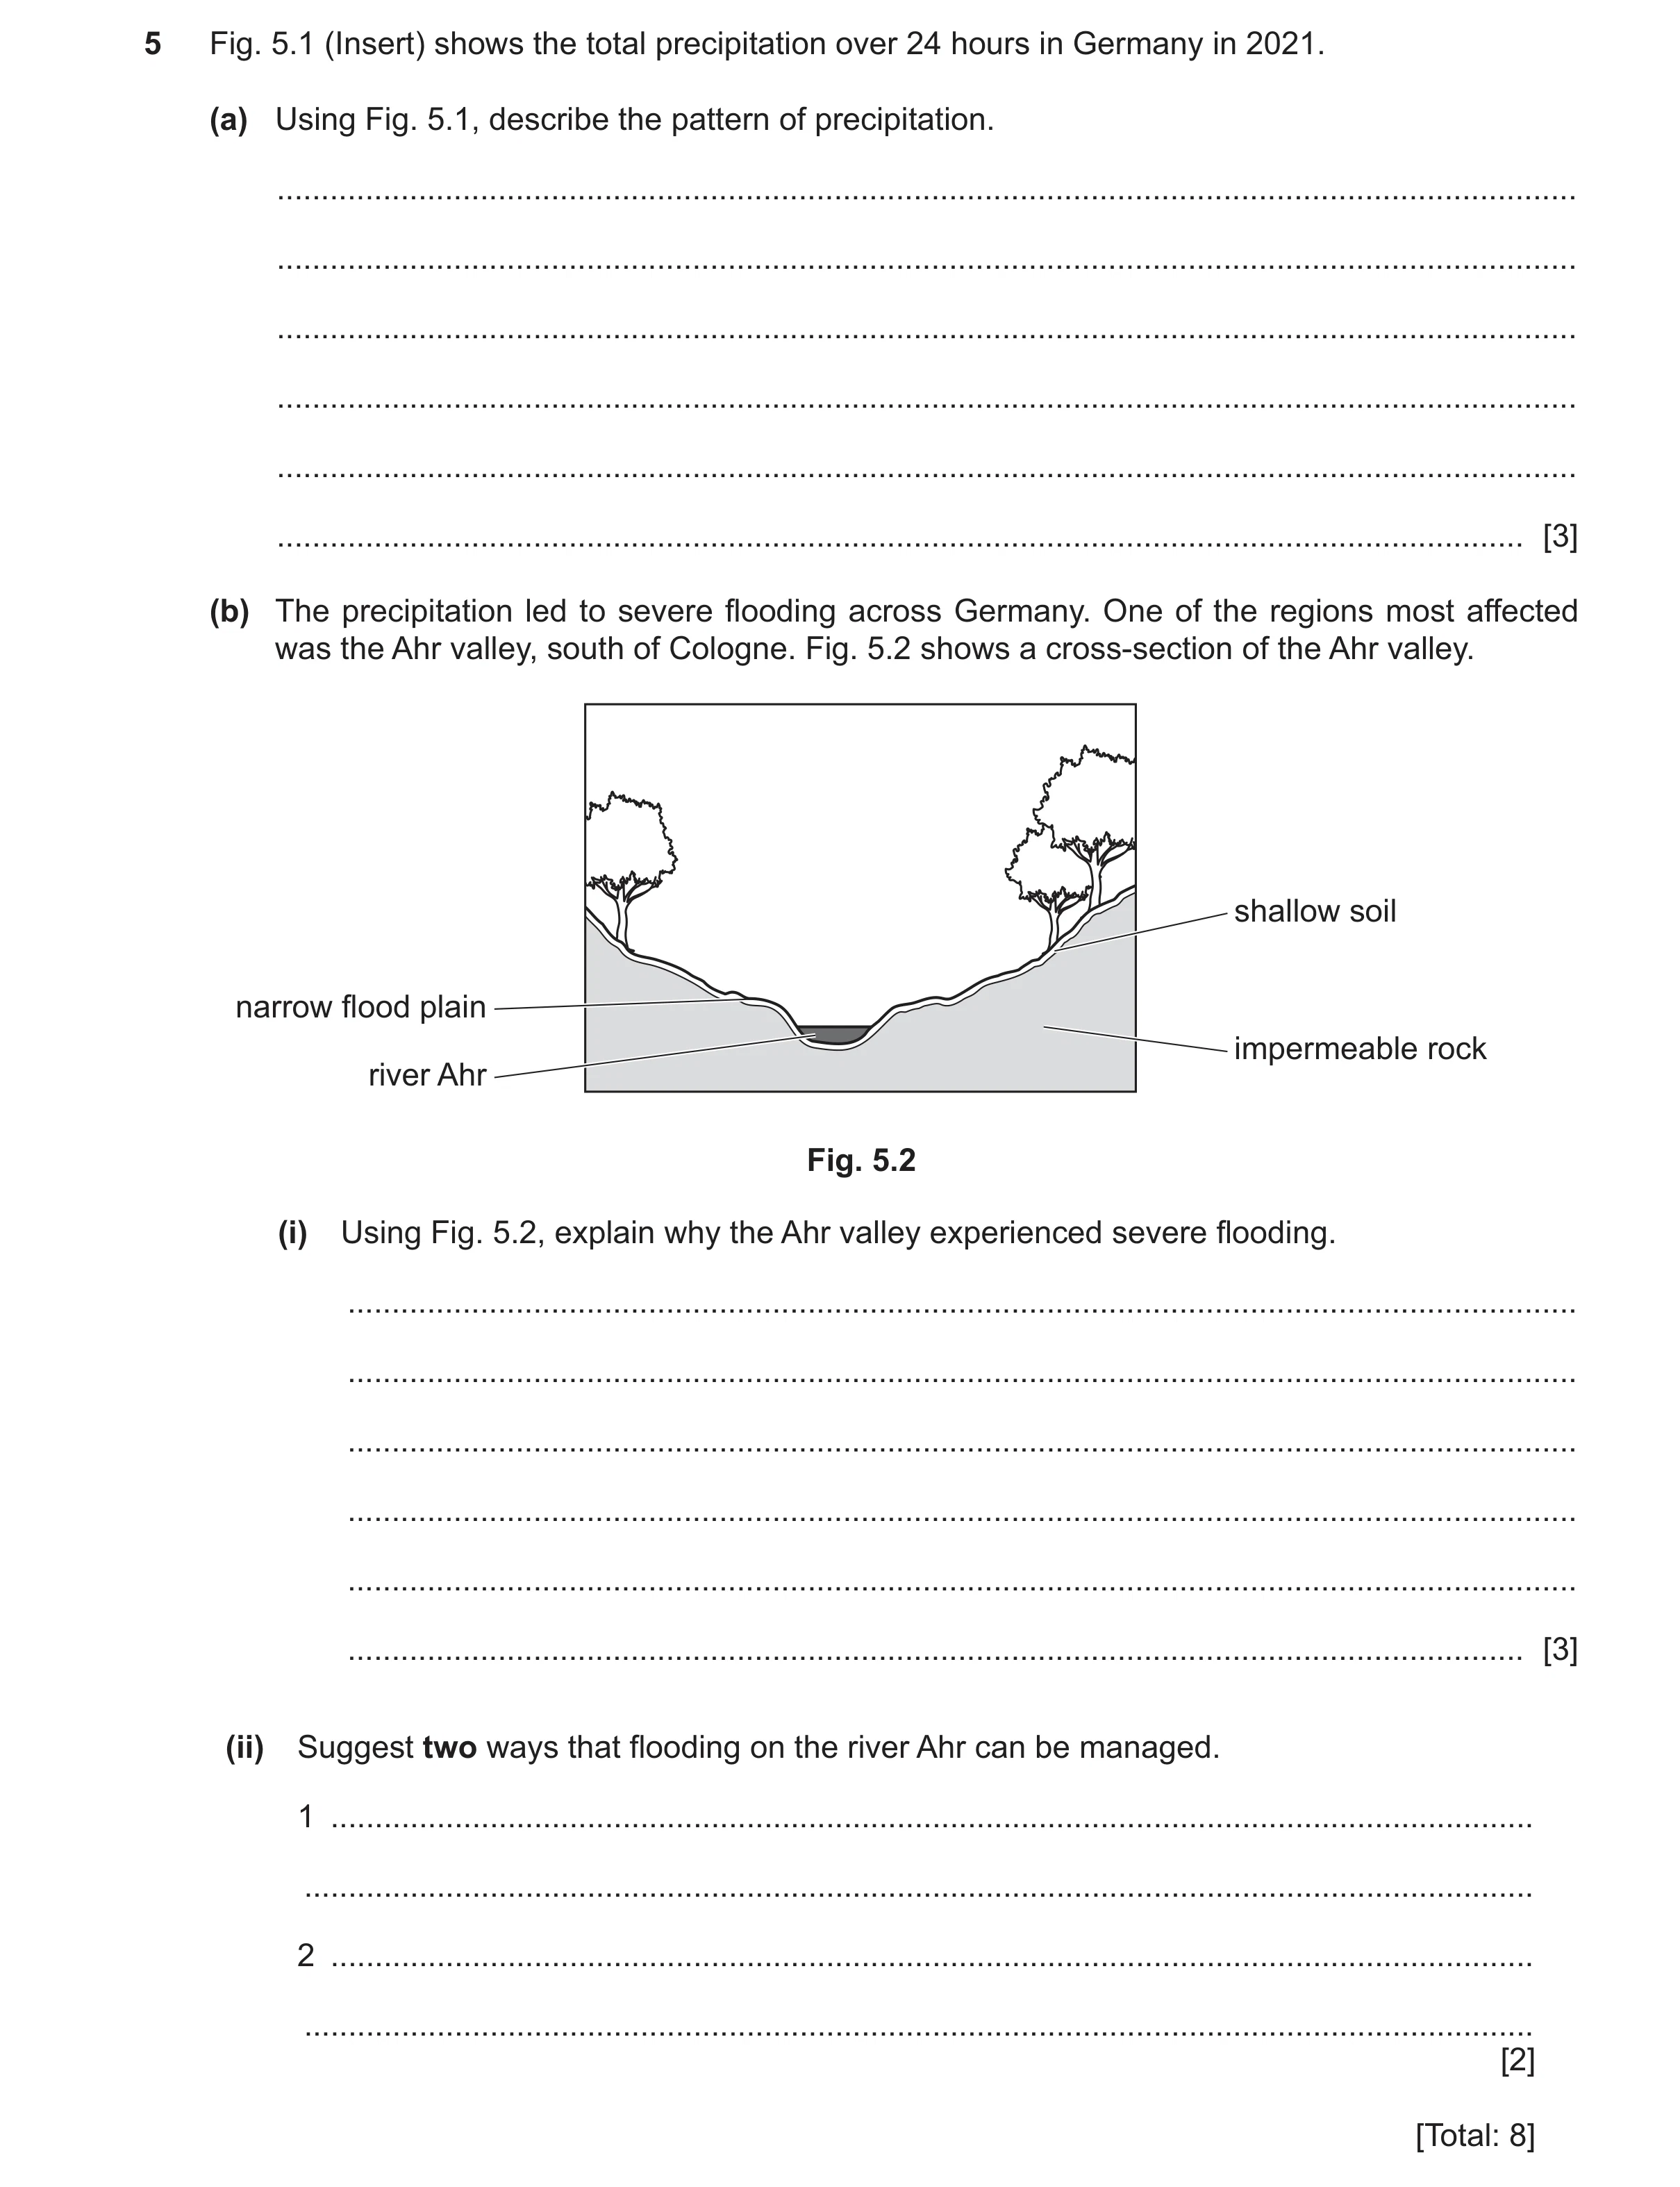
5 Fig. 5.1 (Insert) shows the total precipitation over 24 hours in Germany in 2021. (a) Using Fig. 5.1, describe the pattern of precipitation. … … … … … … [3] (b) The precipitation led to severe flooding across Germany. One of the regions most affected was the Ahr valley, south of Cologne. Fig. 5.2 shows a cross-section of the Ahr valley. shallow soil narrow flood plain impermeable rock river Ahr Fig. 5.2 (i) Using Fig. 5.2, explain why the Ahr valley experienced severe flooding. … … … … … … [3] (ii) Suggest two ways that flooding on the river Ahr can be managed. 1 … … 2 … … [2] [Total: 8]
8 marks
Mark scheme: 5(a) • Uneven; 3 • High(est) in west/high(est) in/around Cologne; • Low(est) in (north-)east/low(est) in/around Berlin; • Mostly low (rainfall); • Moderate/average in south(-west)/south of Stuttgart; • Moderate/average in northwest; • Moderate/average along coast/North Sea/Baltic Sea. Note: Max. 2 for moderate/average 5(b)(i) • Steep slopes increase run-off/faster run-off/shortens time to river; 3 • Impermeable rock reduces infiltration/percolation/increases run-off/faster run-off/shortens time to river; • (Shallow) soils cannot hold/absorb much water/become saturated/limit infiltration; • Narrow river channel cannot hold discharge; • Narrow floodplain cannot hold floodwaters; • Few trees so limited interception. Note: Must have explanation for each point. Correct geographical terms needed. 5(b)(ii) • Dam; 2 • Embankment/manmade/constructing levees; • Dredging/channel deepening; • Straightening; • Afforestation; • Manmade lakes.
This question in 0460/21 May/June 2025
Q24 · A climate graph for Phoenix, in the USA 0460/22 May/June 2025
4 (a) Fig. 4.1 is a climate graph for Phoenix, in the USA. Content removed due to copyright restrictions. Fig. 4.1 (i) Using Fig. 4.1, calculate the annual rainfall. Tick (✓) the correct answer. rainfall tick (✓) (mm) 152 258 367 556 [1] (ii) Describe the pattern of rainfall shown in Fig. 4.1. Do not use statistics in your answer. … … … … … … [3] (b) Fig. 4.2 (Insert) shows some vegetation found in hot deserts. Using Fig. 4.2, explain two ways vegetation adapts to a desert climate. 1 … … … … 2 … … … … [4] [Total: 8]
8 marks
Mark scheme: 4(a)(i) 258 (mm) 1 4(a)(ii) • uneven/seasonal/fluctuates/varies; 3 • there is rainfall every month; • rainy period lasts 9 months; • two peaks; • most/more/highest/higher/very high rain in winter/Dec–Feb/ Jan–Feb/highest February; • least/less/low rain/drier period in April–June/May–June/least in June; • large increase in July/mid–Summer/December; • large decrease in Spring/Autumn/April; • steady/constant decrease from August to November/April to June; • wetter/high(er) rainfall from July through to March/high rainfall apart from April–June. Note: Allow high Jan to March and July to December written in two separate parts of the answer. Must have whole period. Time periods must be as written in the mark scheme. 4(b) • small leaves (1) to reduce evaporation (1); 4 • spines/thorns/spikes (1) to help reduce moisture loss/break up air flow/which can help reduce evaporation (1); • hairy leaves (1) to protect against heat/insulate against cold temperatures/to reduce water loss (1); • plants lose/shed leaves/have no leaves/low number of stomata/close stomata/sunken stomata/leaf pores (1) to help reduce moisture loss/transpire less (1); • plants/seeds lay dormant/look dead (1) for long periods/until rain arrives (1); • cactus/succulents/large body/stems/fleshy/thick leaves (1) to store water/for dry periods (1); • cactus have waxy surfaces/thick cuticle (1) reduce moisture loss/transpiration (1); • low growing (1) to avoid exposure to intense sunlight/reduce water loss/reduce damage from wind (1); • deep/long root systems (1) to tap into underground water/to reach/get to more water (1); • shallow/horizontal root systems (1) to get/catch/collect/obtain water when it rains (1). Note: 2 2 marks – one for method and one for explanation. Must have the adaptation for explanation to be credited. Do not double credit the following terms for explanation i.e. evaporation, moisture loss, transpiration and evapotranspiration; each can be credited once. Where appropriate these terms can be used interchangeably.
This question in 0460/22 May/June 2025
Q25 · A map showing weather conditions in India at mid-day on one day in February 0460/23 May/June 2025
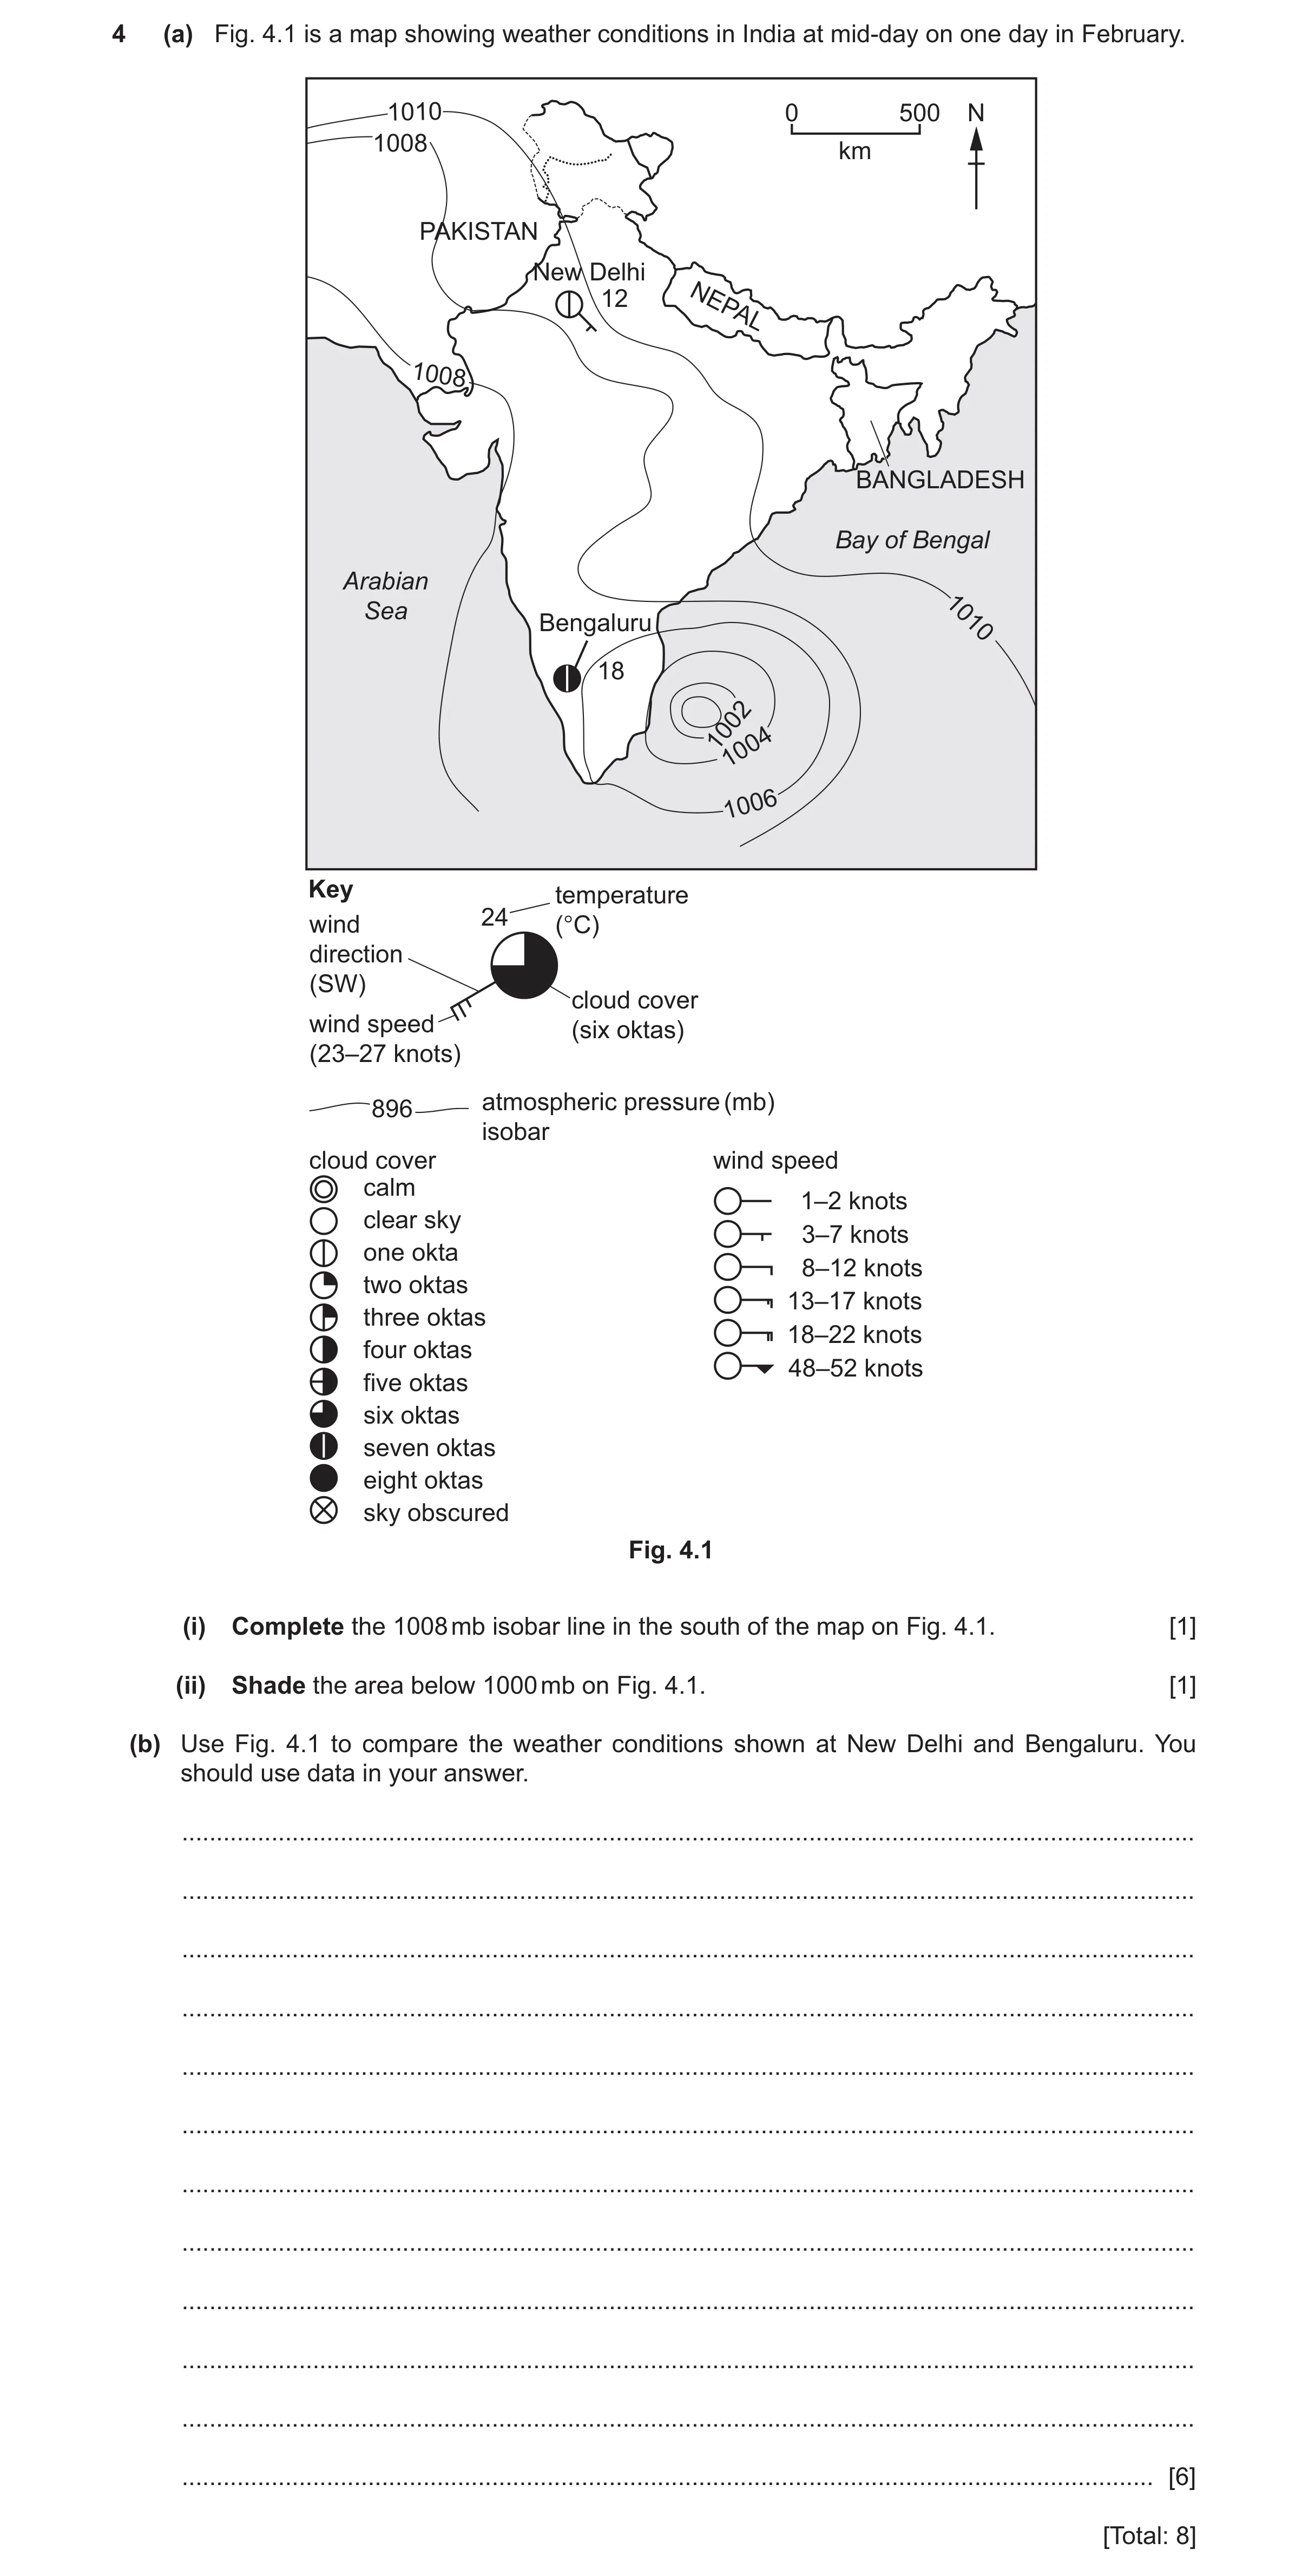
4 (a) Fig. 4.1 is a map showing weather conditions in India at mid-day on one day in February. 1010 0 500 N 1008 km PAKISTAN New Delhi 12 NEPAL 1008 BANGLADESH Bay of Bengal Arabian Sea Bengaluru 1010 18 1002 1004 1006 Key temperature 24 wind (°C) direction (SW) cloud cover wind speed (six oktas) (23–27 knots) atmospheric pressure (mb) 896 isobar cloud cover wind speed calm 1–2 knots clear sky 3–7 knots one okta 8–12 knots two oktas 13–17 knots three oktas 18–22 knots four oktas 48–52 knots five oktas six oktas seven oktas eight oktas sky obscured Fig. 4.1 (i) Complete the 1008 mb isobar line in the south of the map on Fig. 4.1. [1] (ii) Shade the area below 1000 mb on Fig. 4.1. [1] (b) Use Fig. 4.1 to compare the weather conditions shown at New Delhi and Bengaluru. You should use data in your answer. … … … … … … … … … … … … [6] [Total: 8]
8 marks
Mark scheme: 4(a)(i) Isobar 1008 joined in south of map 1 4(a)(ii) Area within isobar 1000 shaded 1 4(b) Lower temperature in New Delhi/higher temperature in Bengaluru 6 12°C in New Delhi and 18 °C in Bengaluru; Higher pressure in New Delhi/lower pressure in Bengaluru 1008/1009/1010 mb in New Delhi and 1006/1007/1008 mb in Bengaluru; Windier in New Delhi/less windy in Bengaluru New Delhi is 3–7 knots and Bengaluru is 1–2 knots; Less cloudy/clearer sky in New Delhi/cloudier in Bengaluru New Delhi is 1 okta and Bengaluru is 7 oktas; Bengaluru has a NE/NNE wind and New Delhi has a SE wind. Note: Must be comparative. Data mark can only be given if comparative statement has been credited. Units must be used at least once per pair. Can extract from separate paragraphs. Allow differences in stats e.g. cloud cover in Bengaluru is 6 oktas higher = 2
This question in 0460/23 May/June 2025
 7 / 39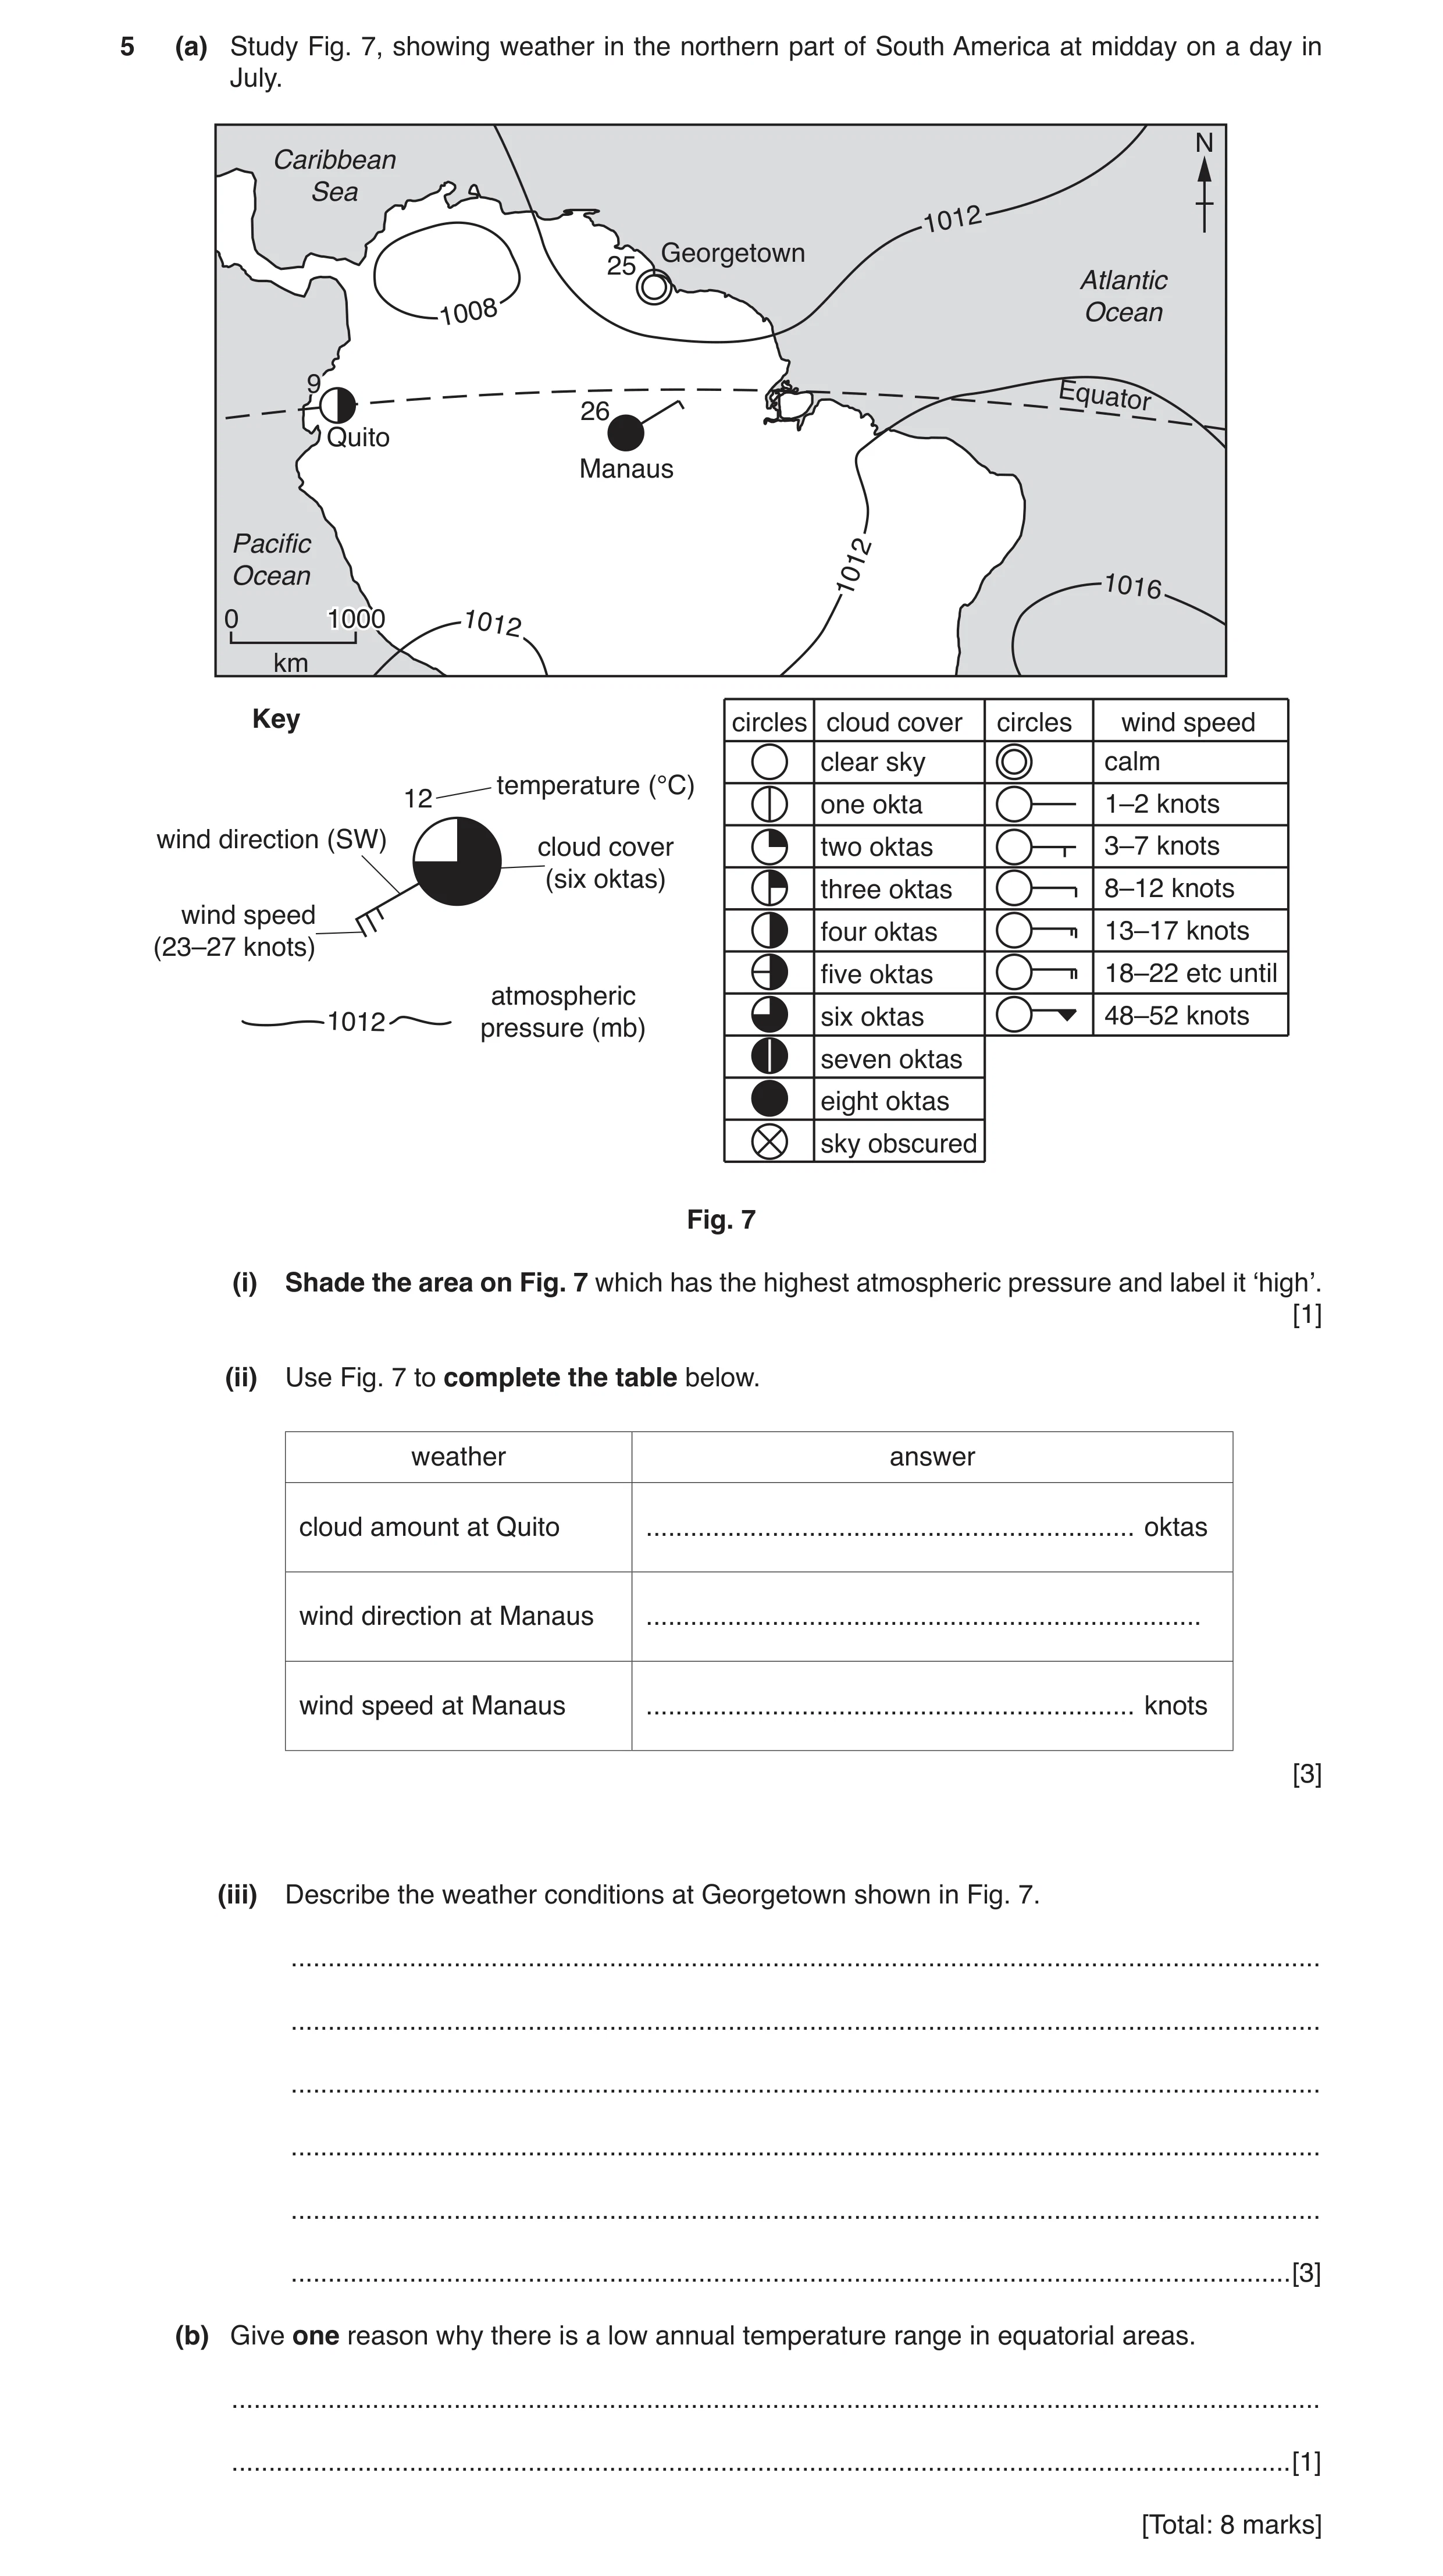
 19 / 39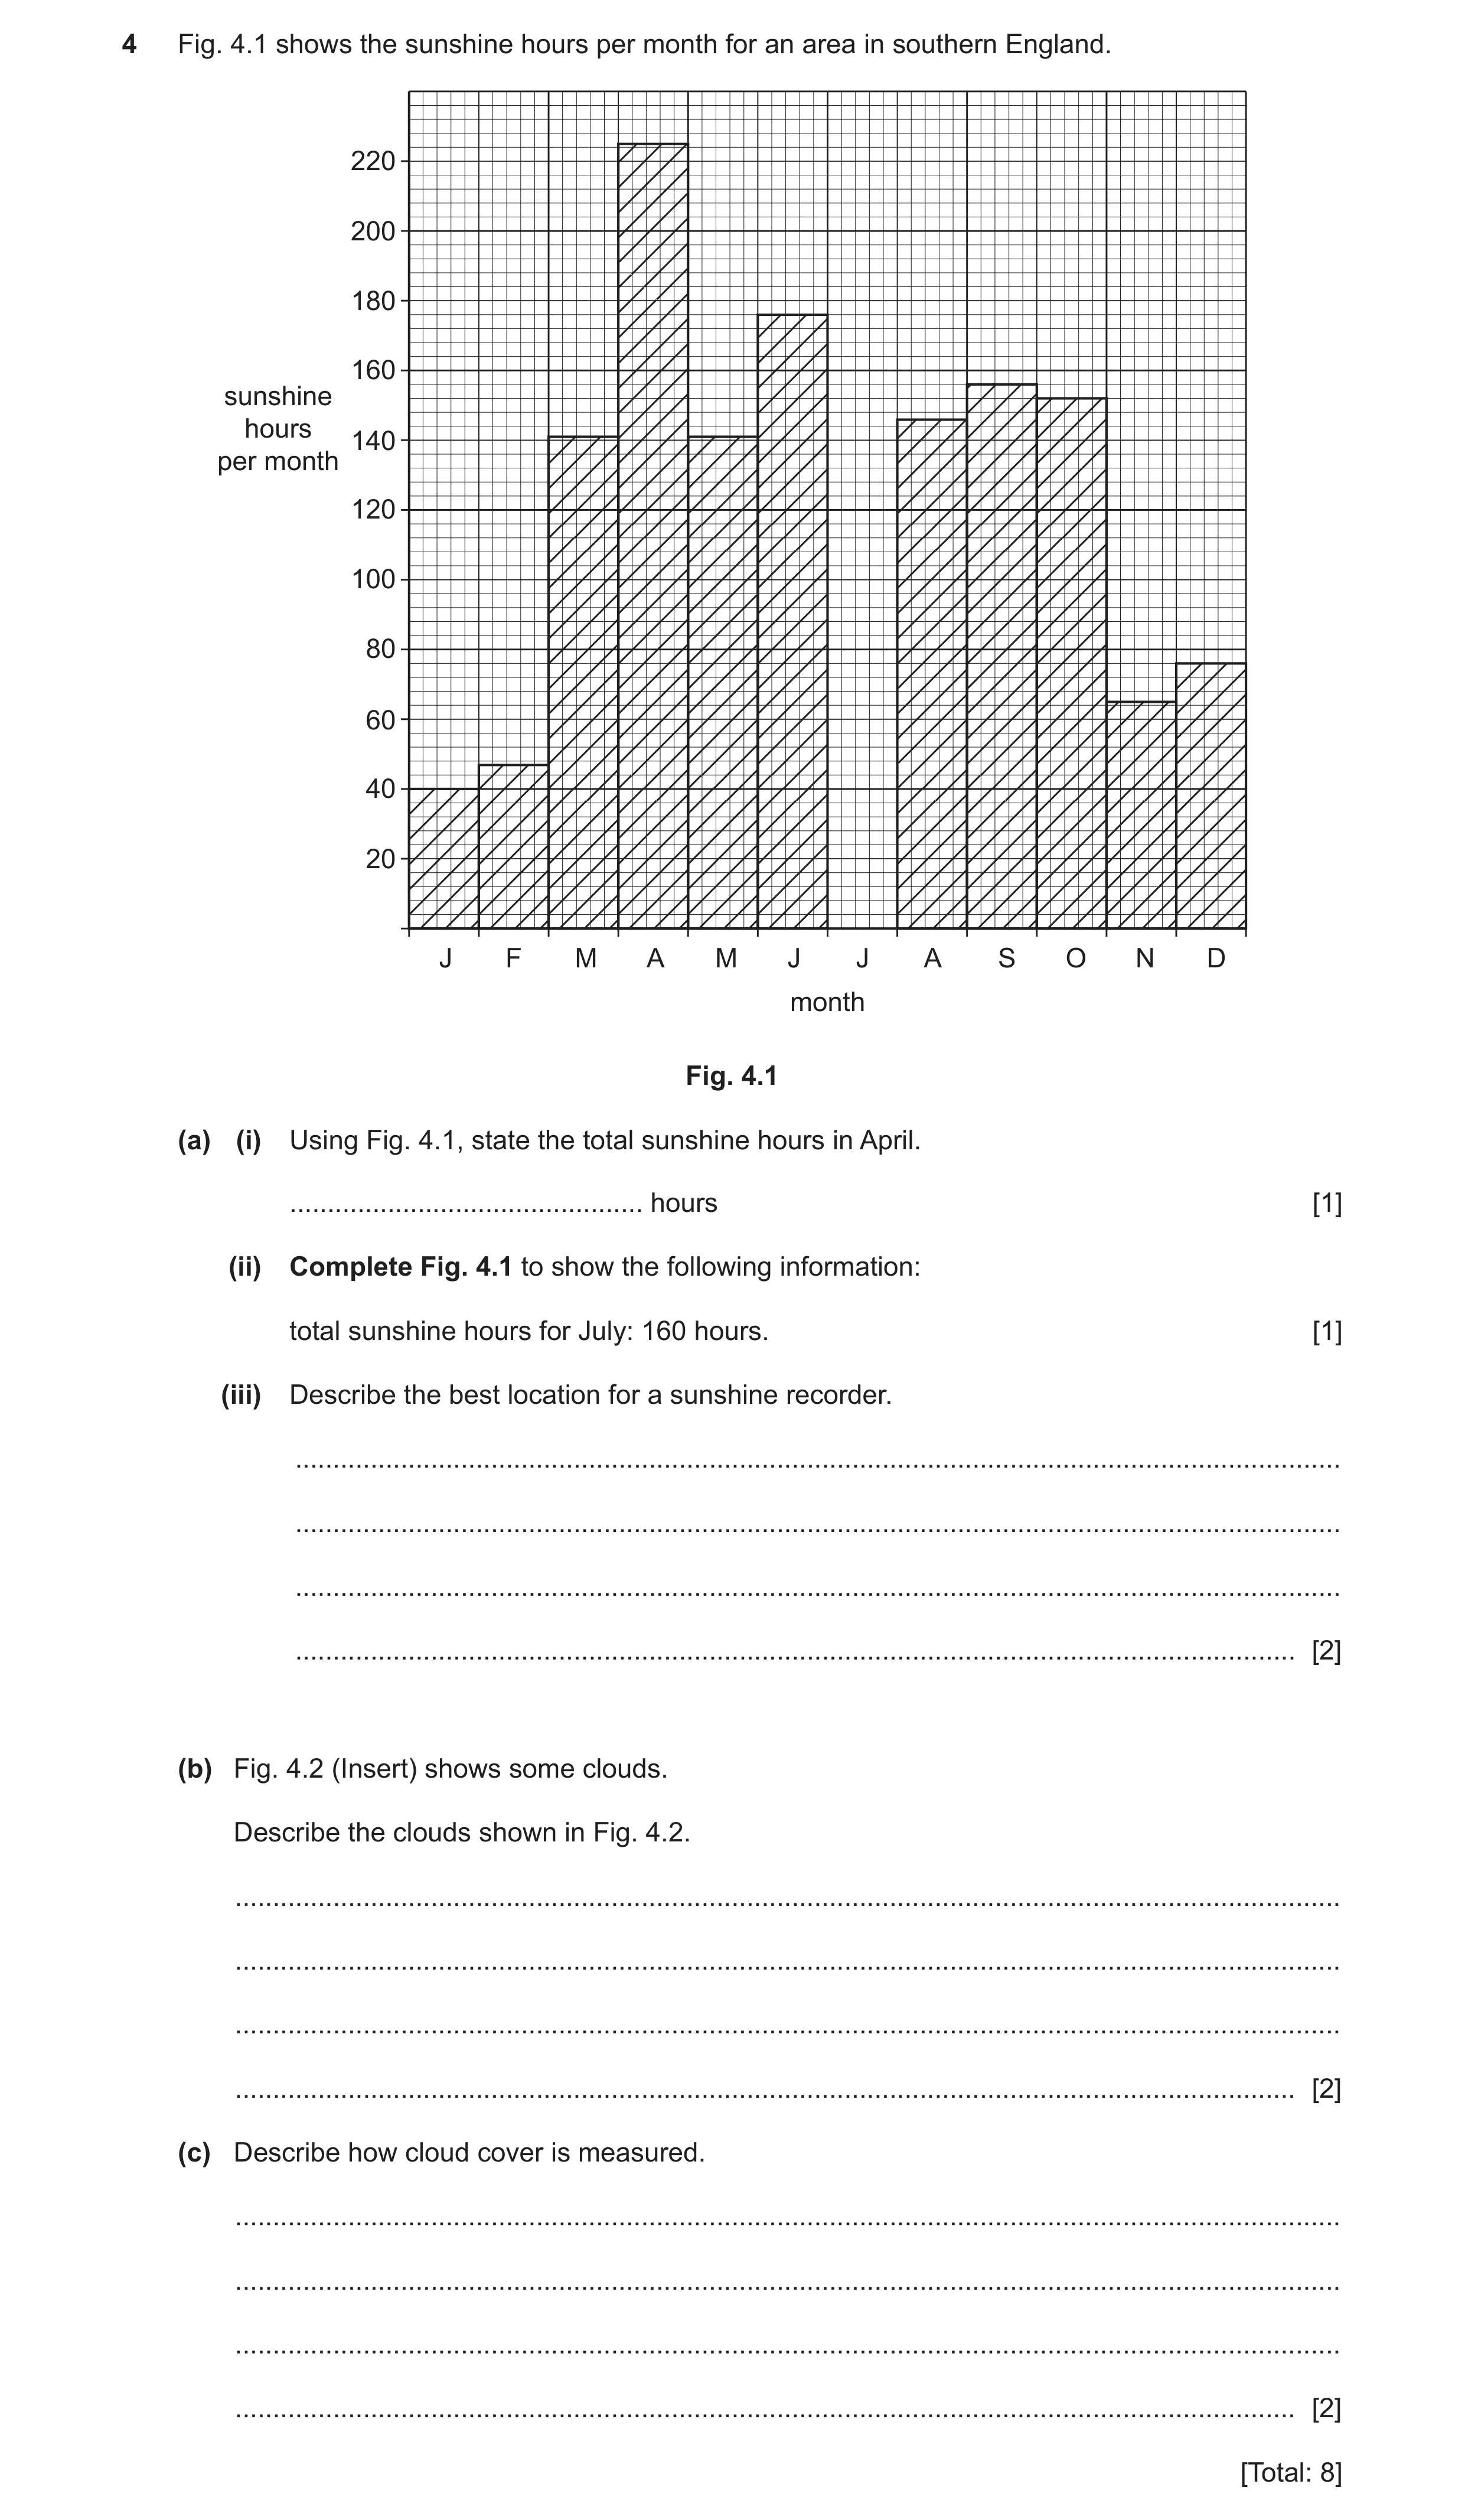
 27 / 39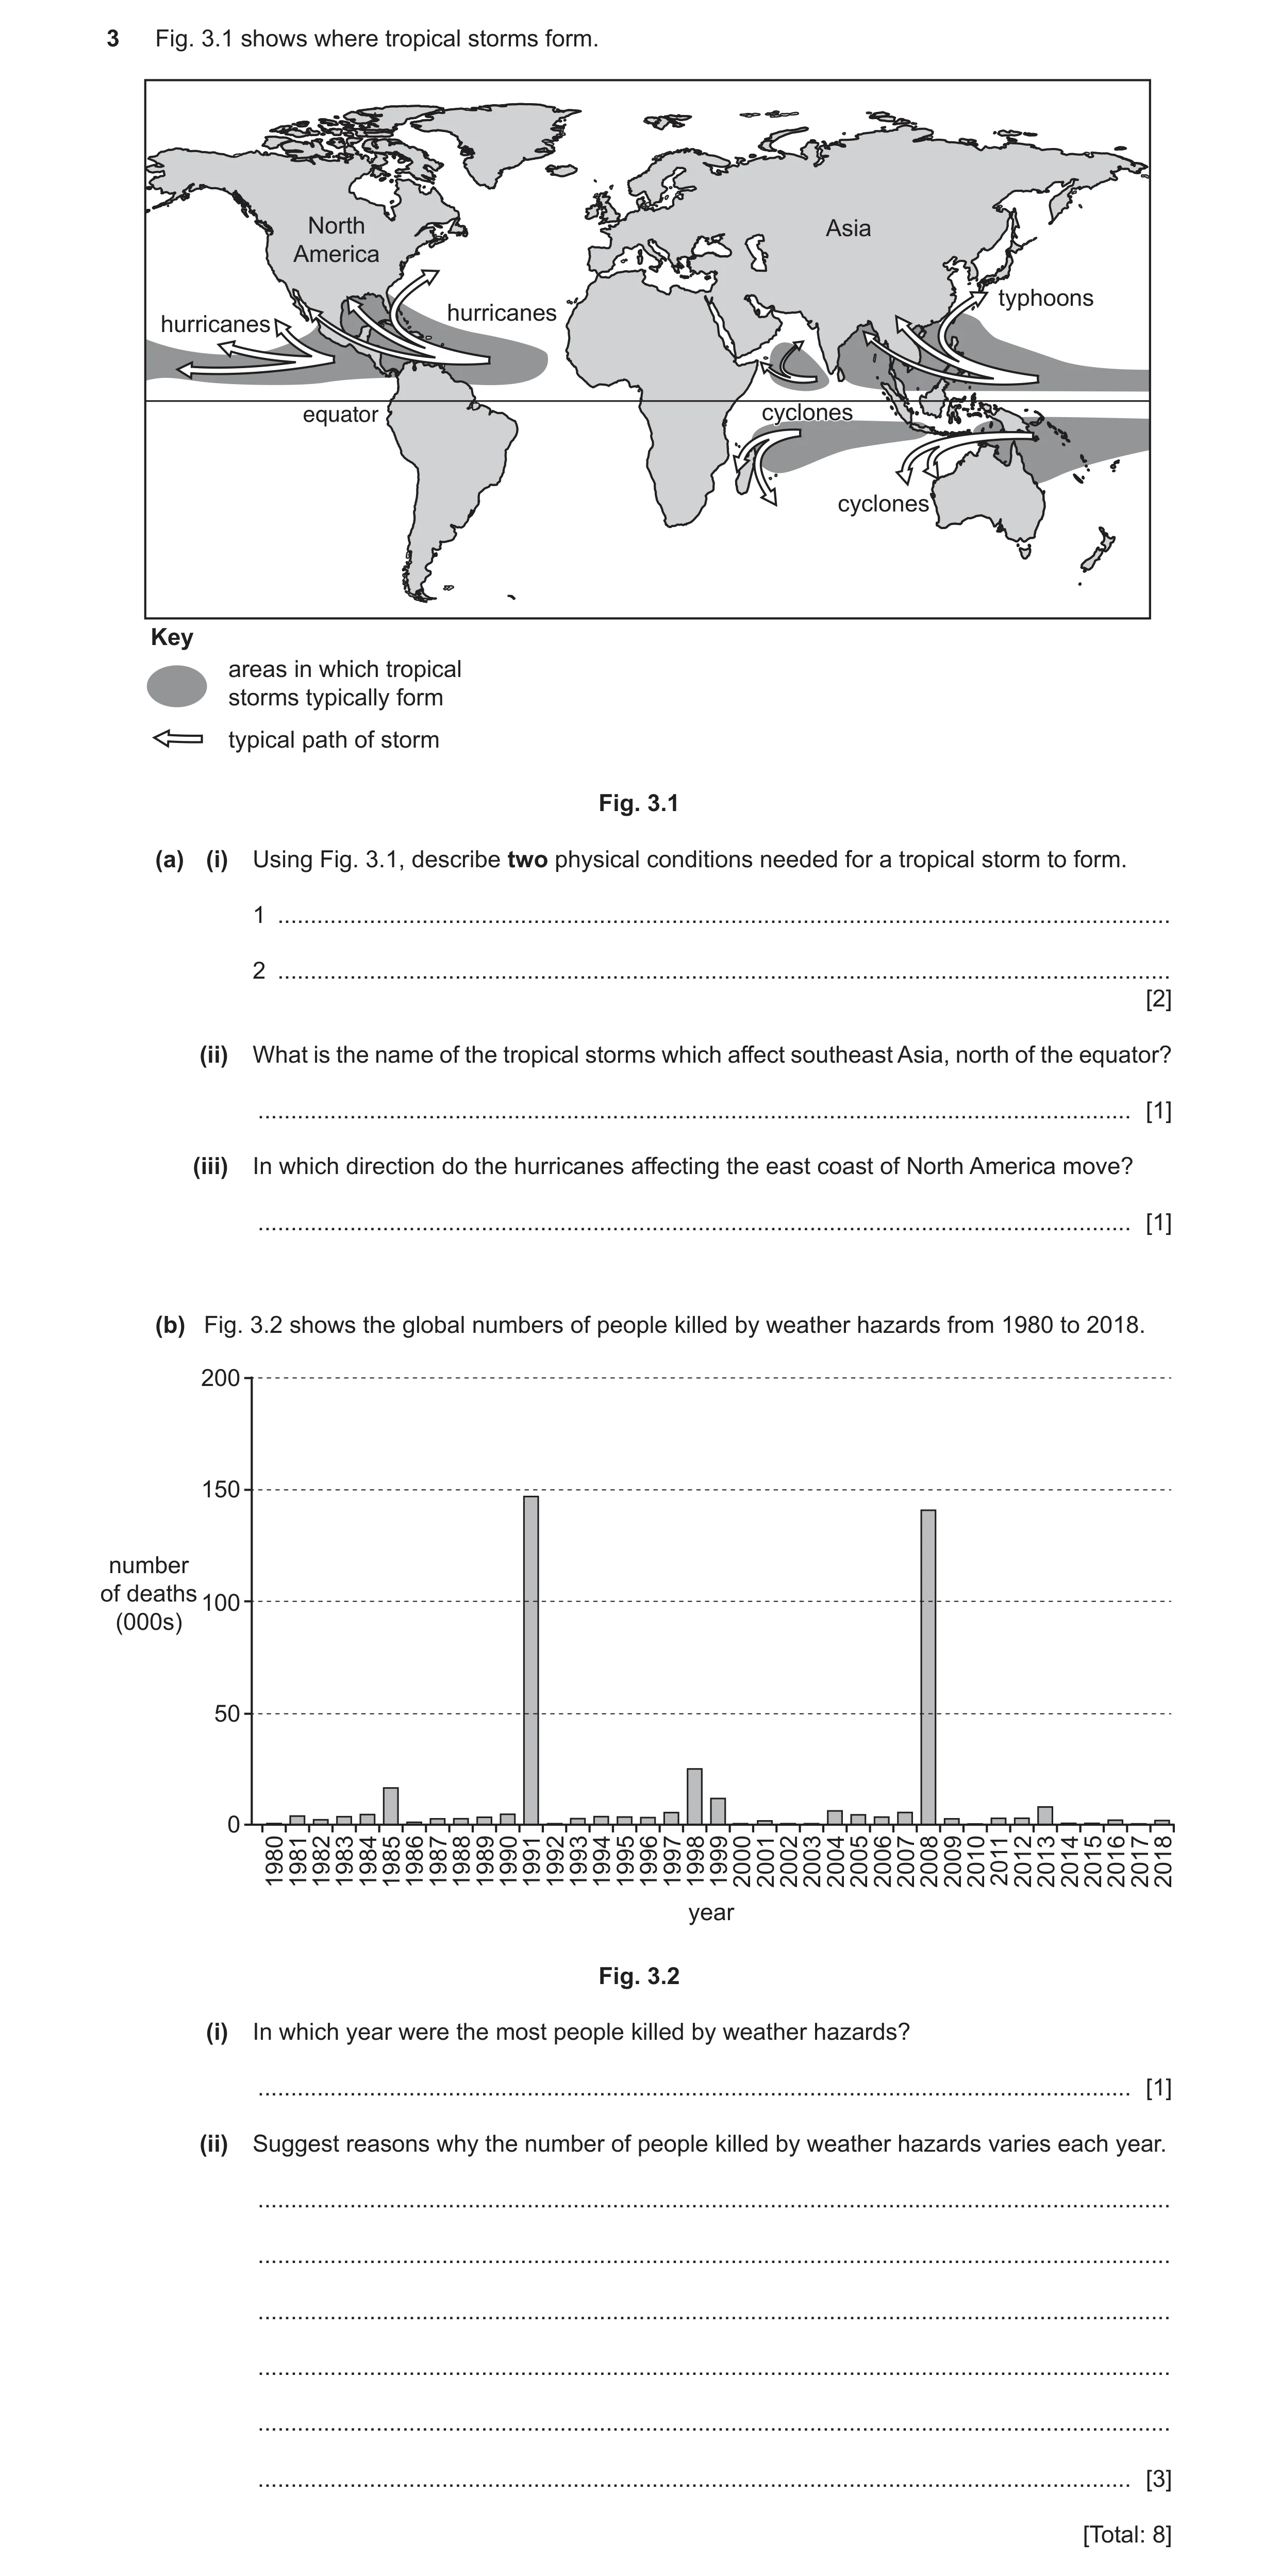
 35 / 39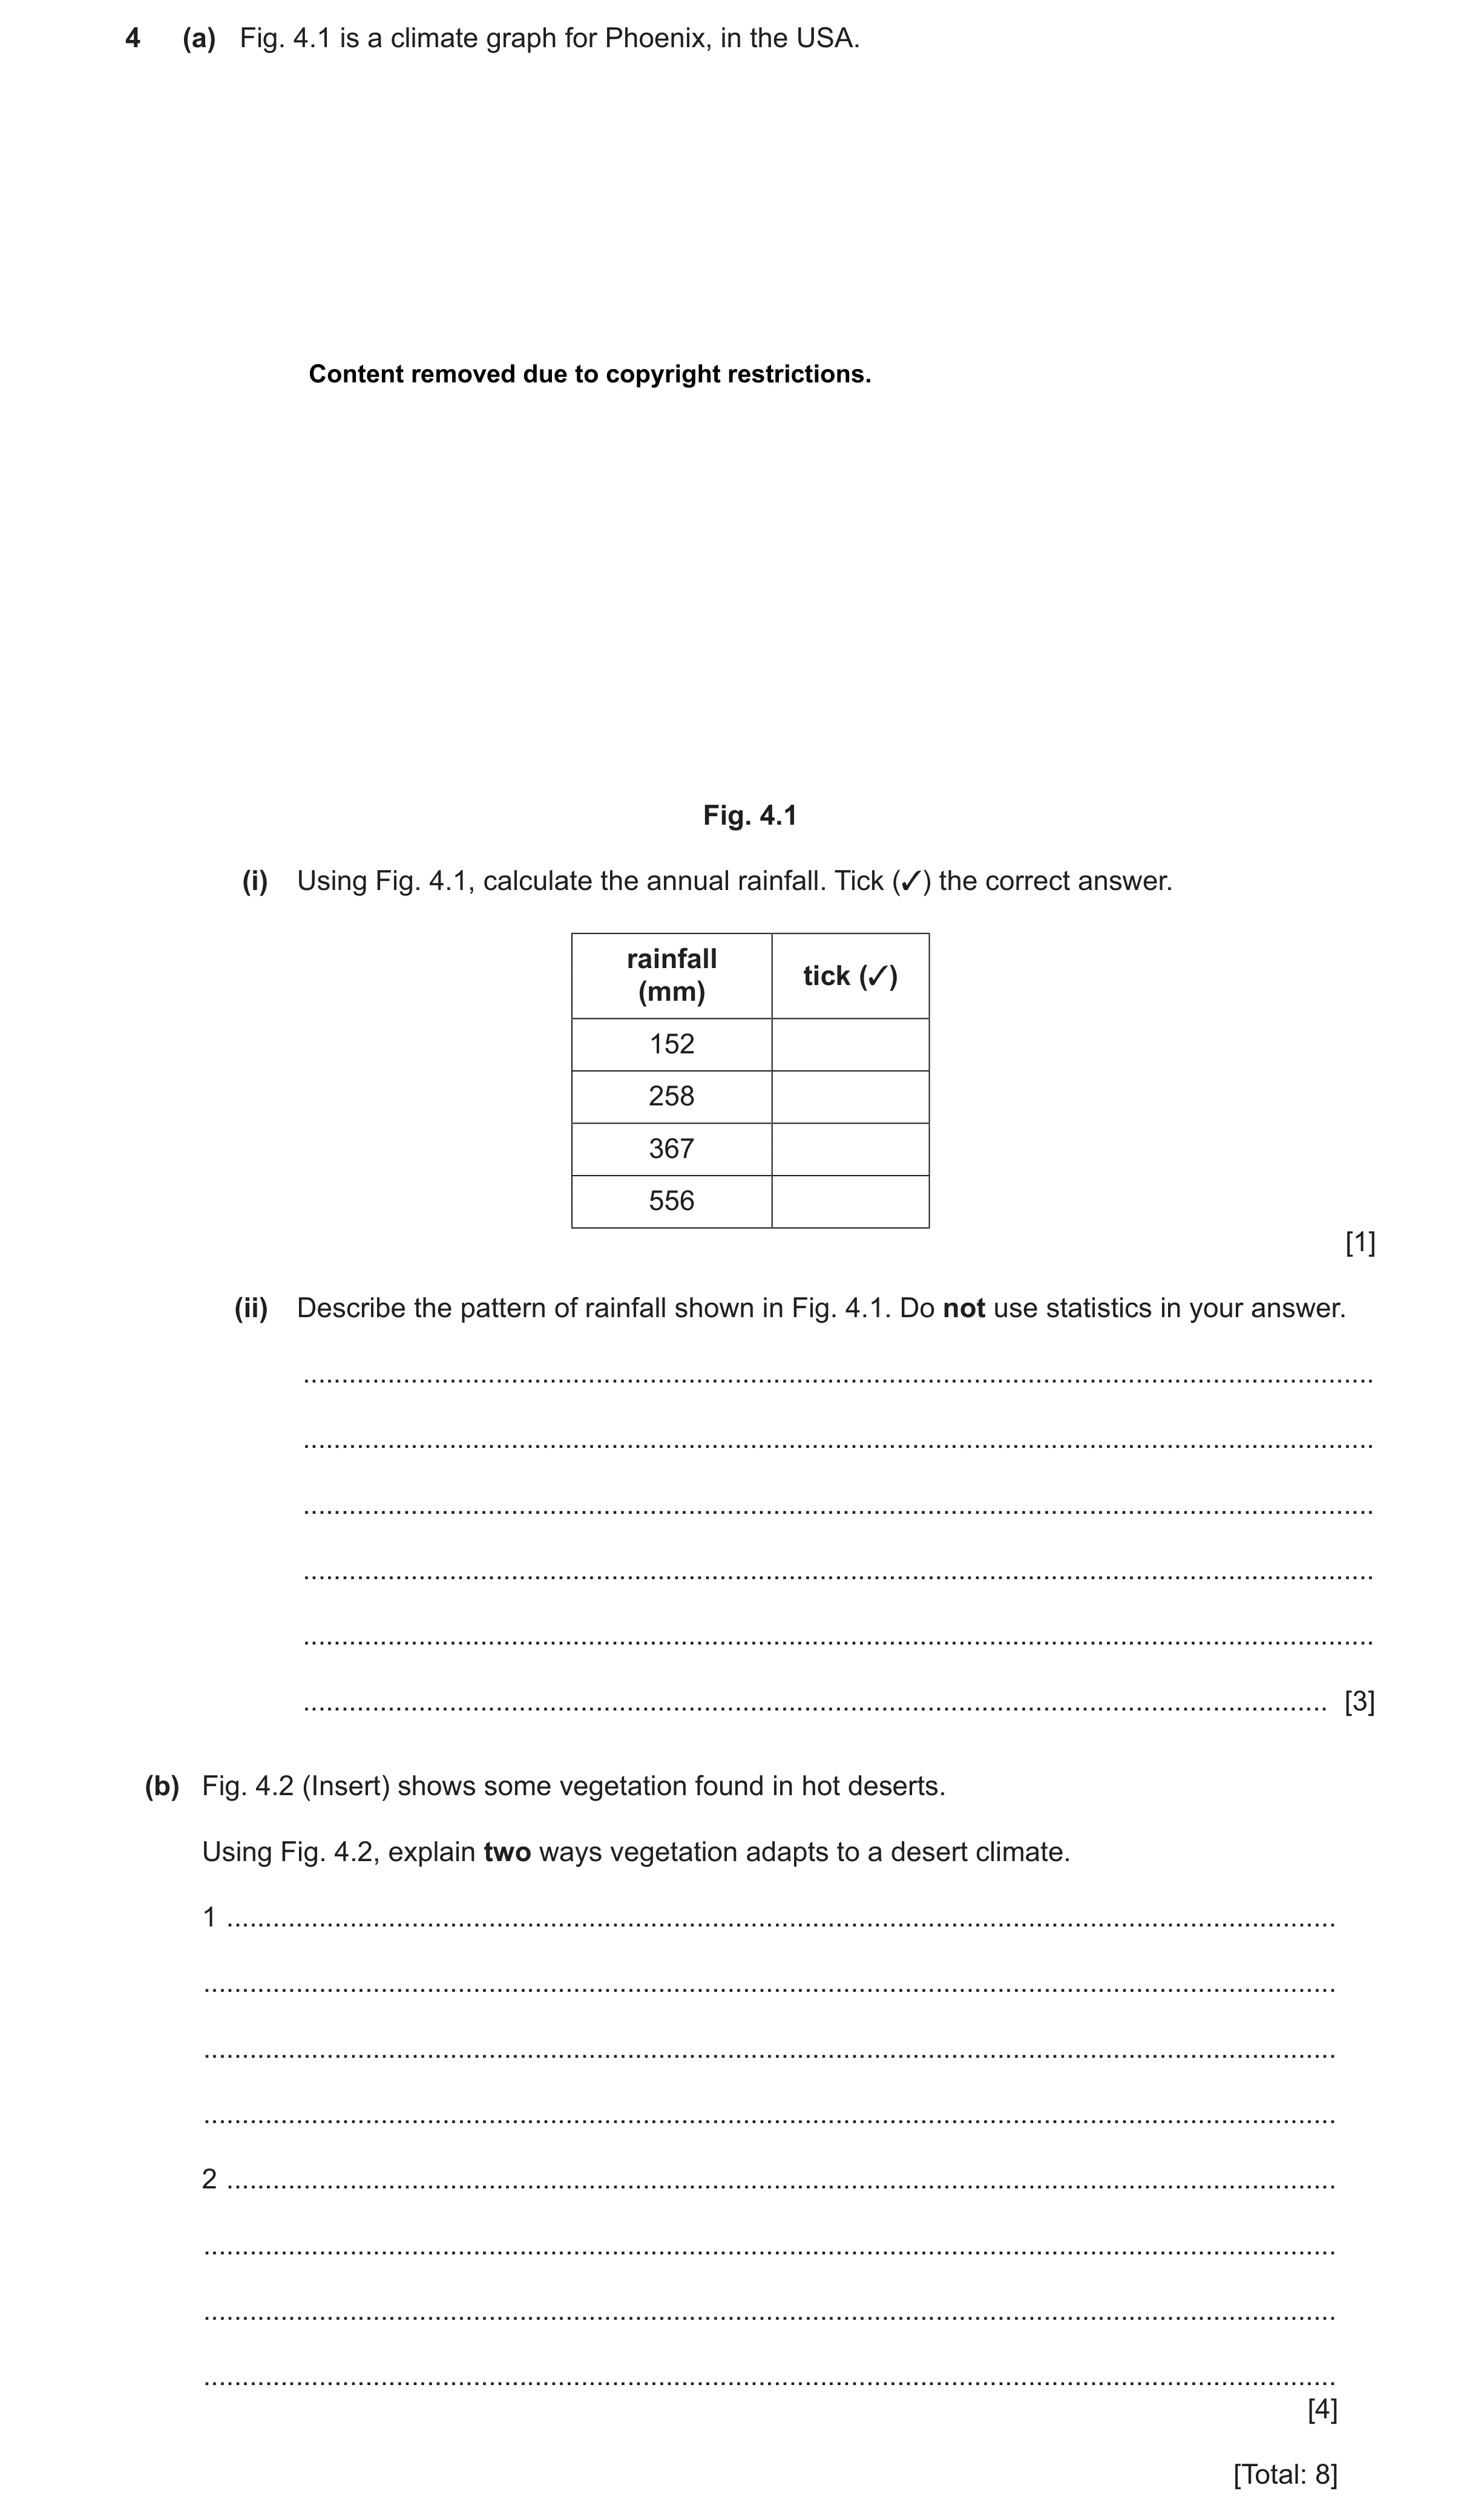
 8
8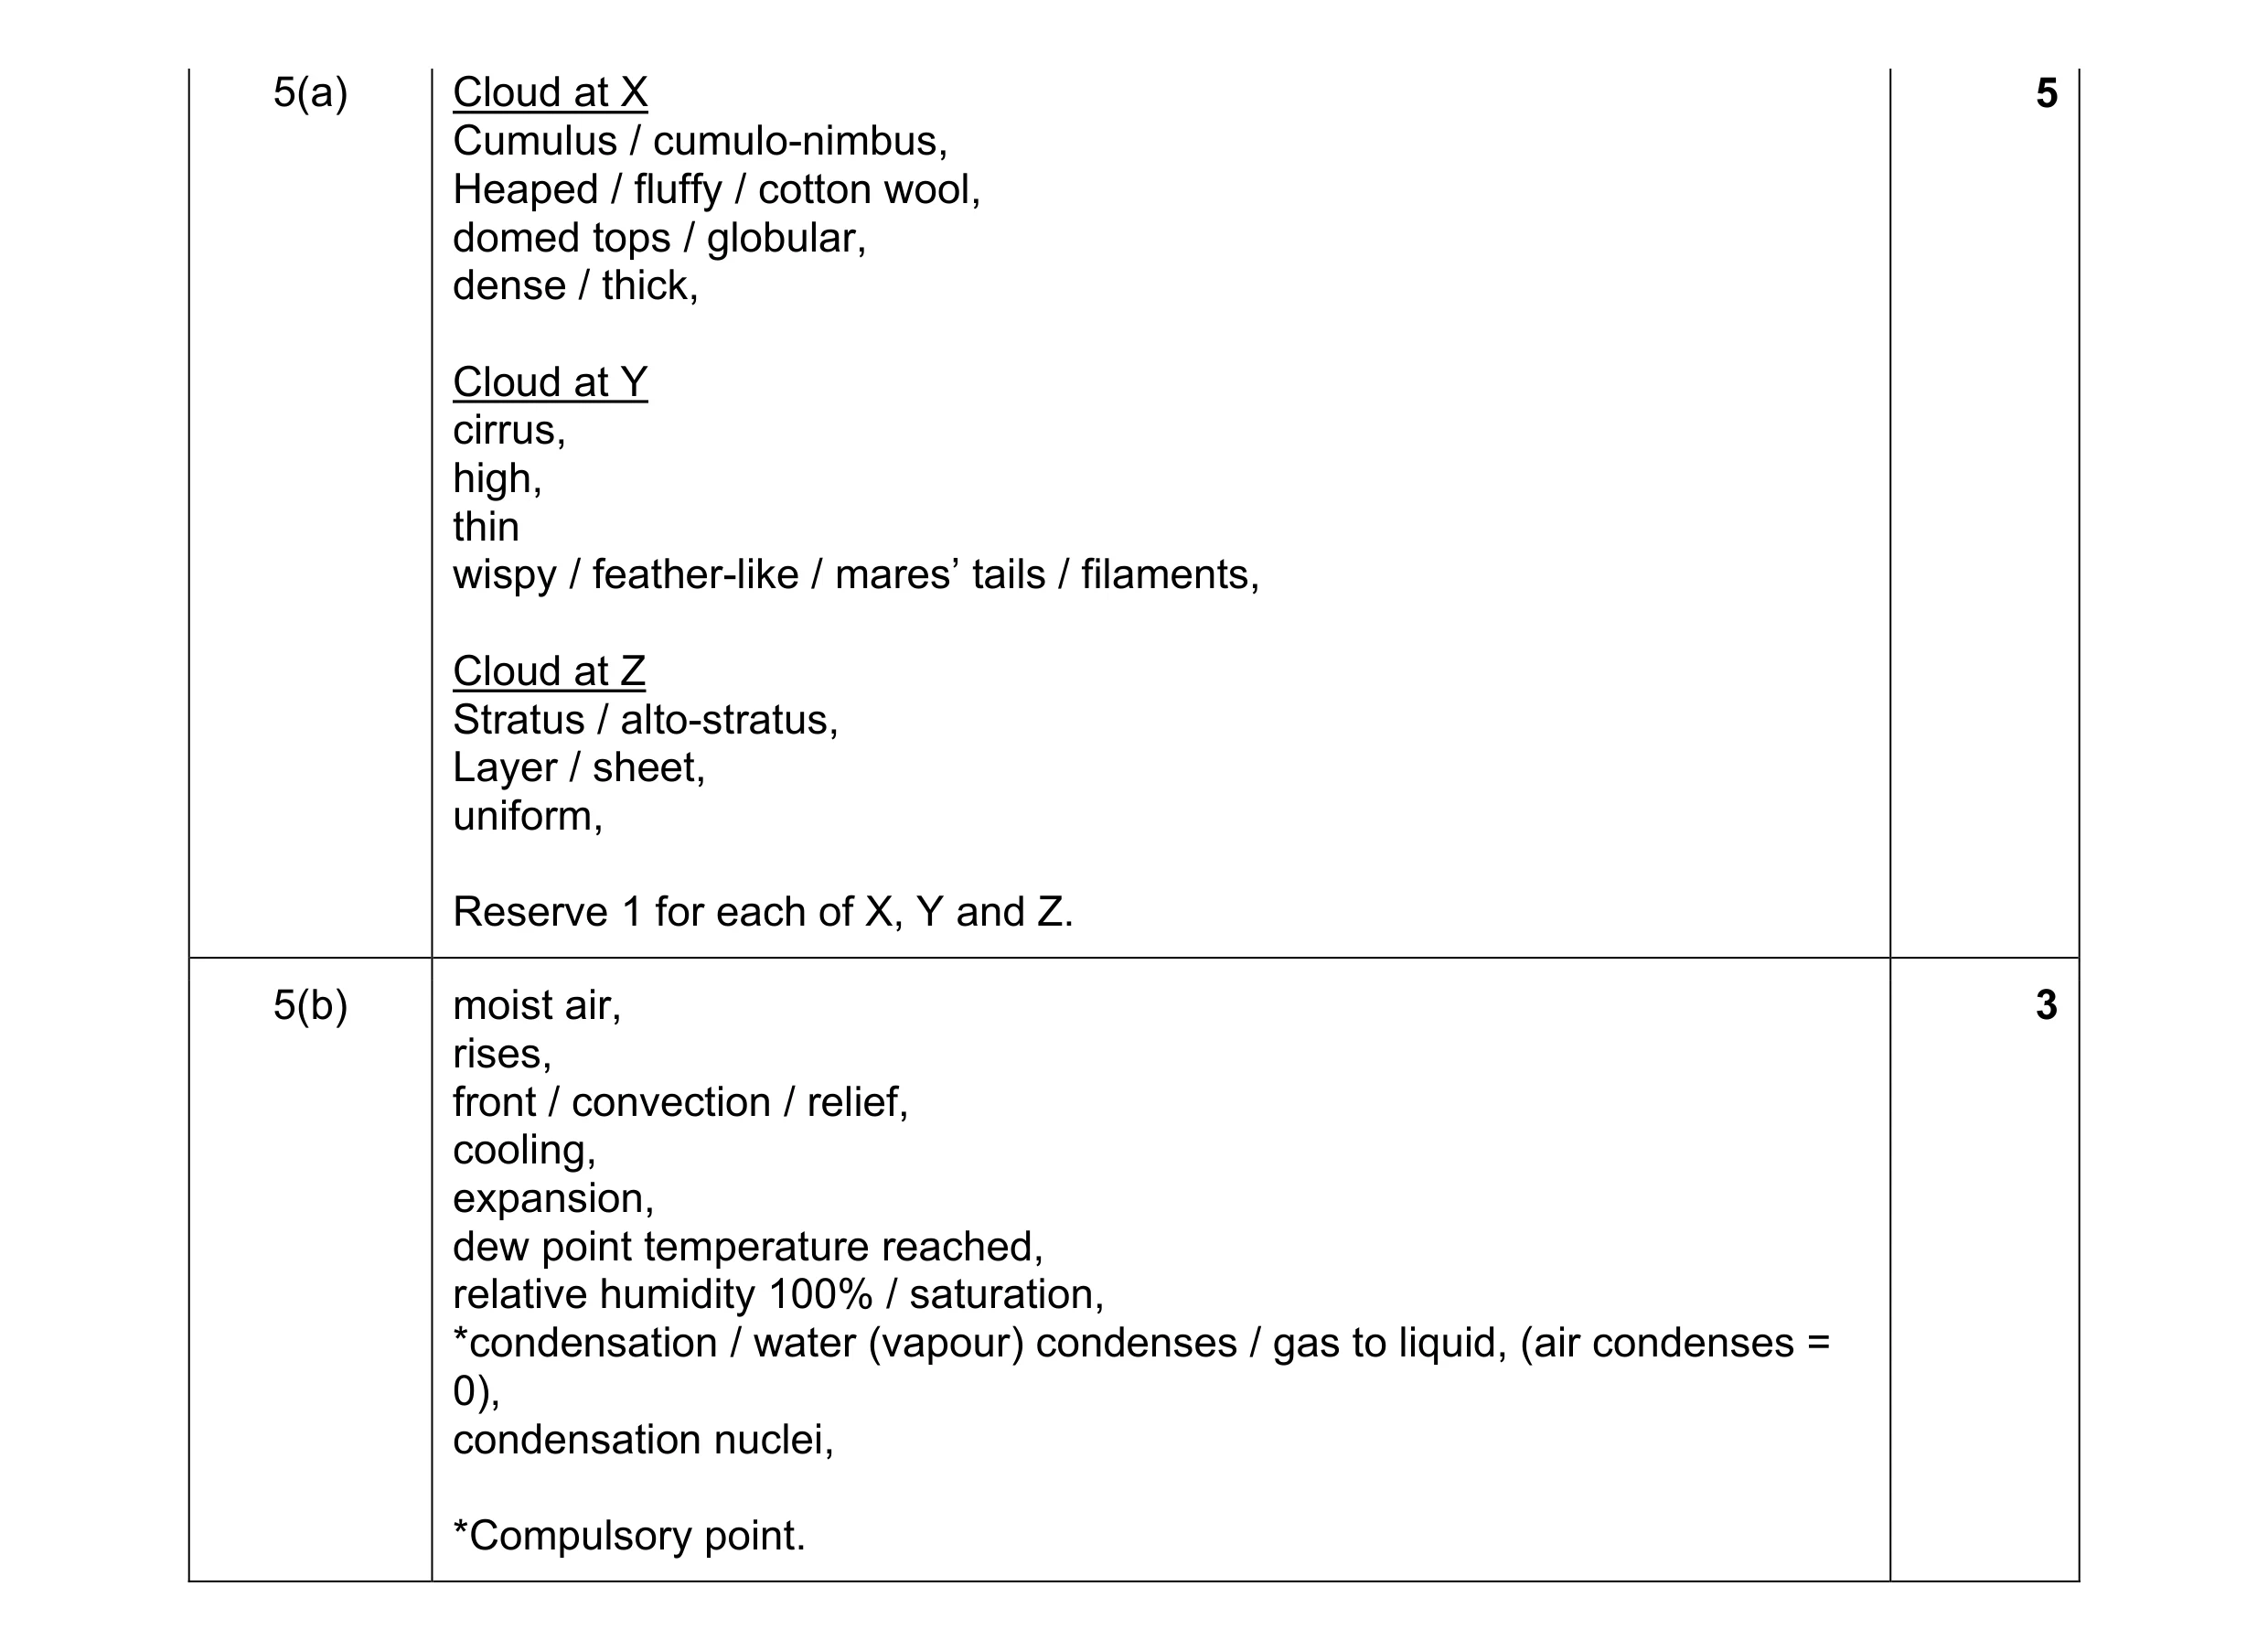 8
8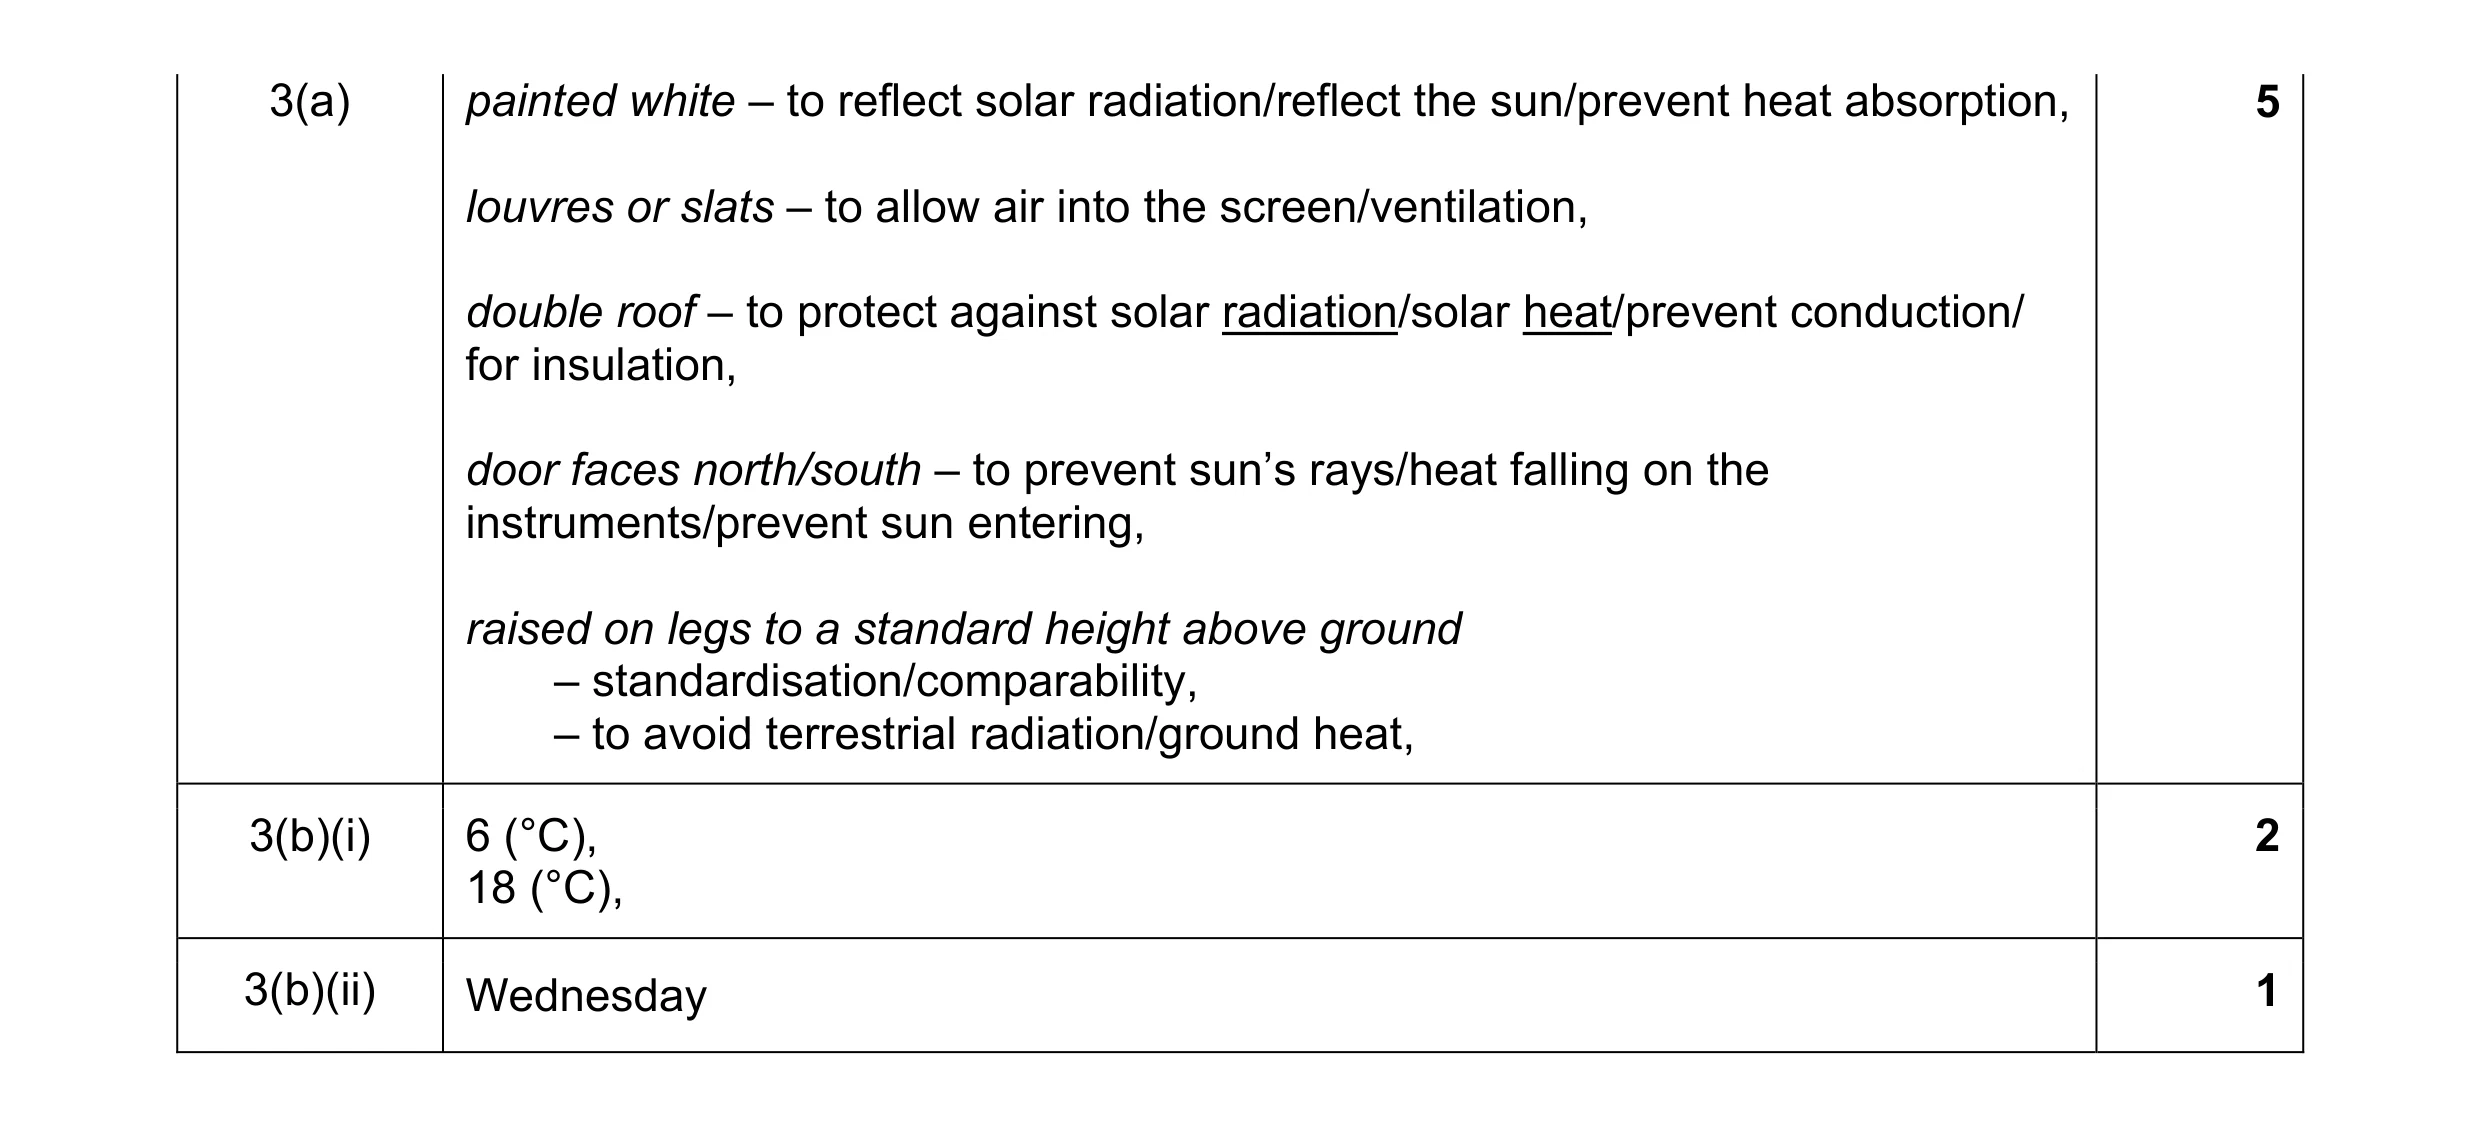 8
8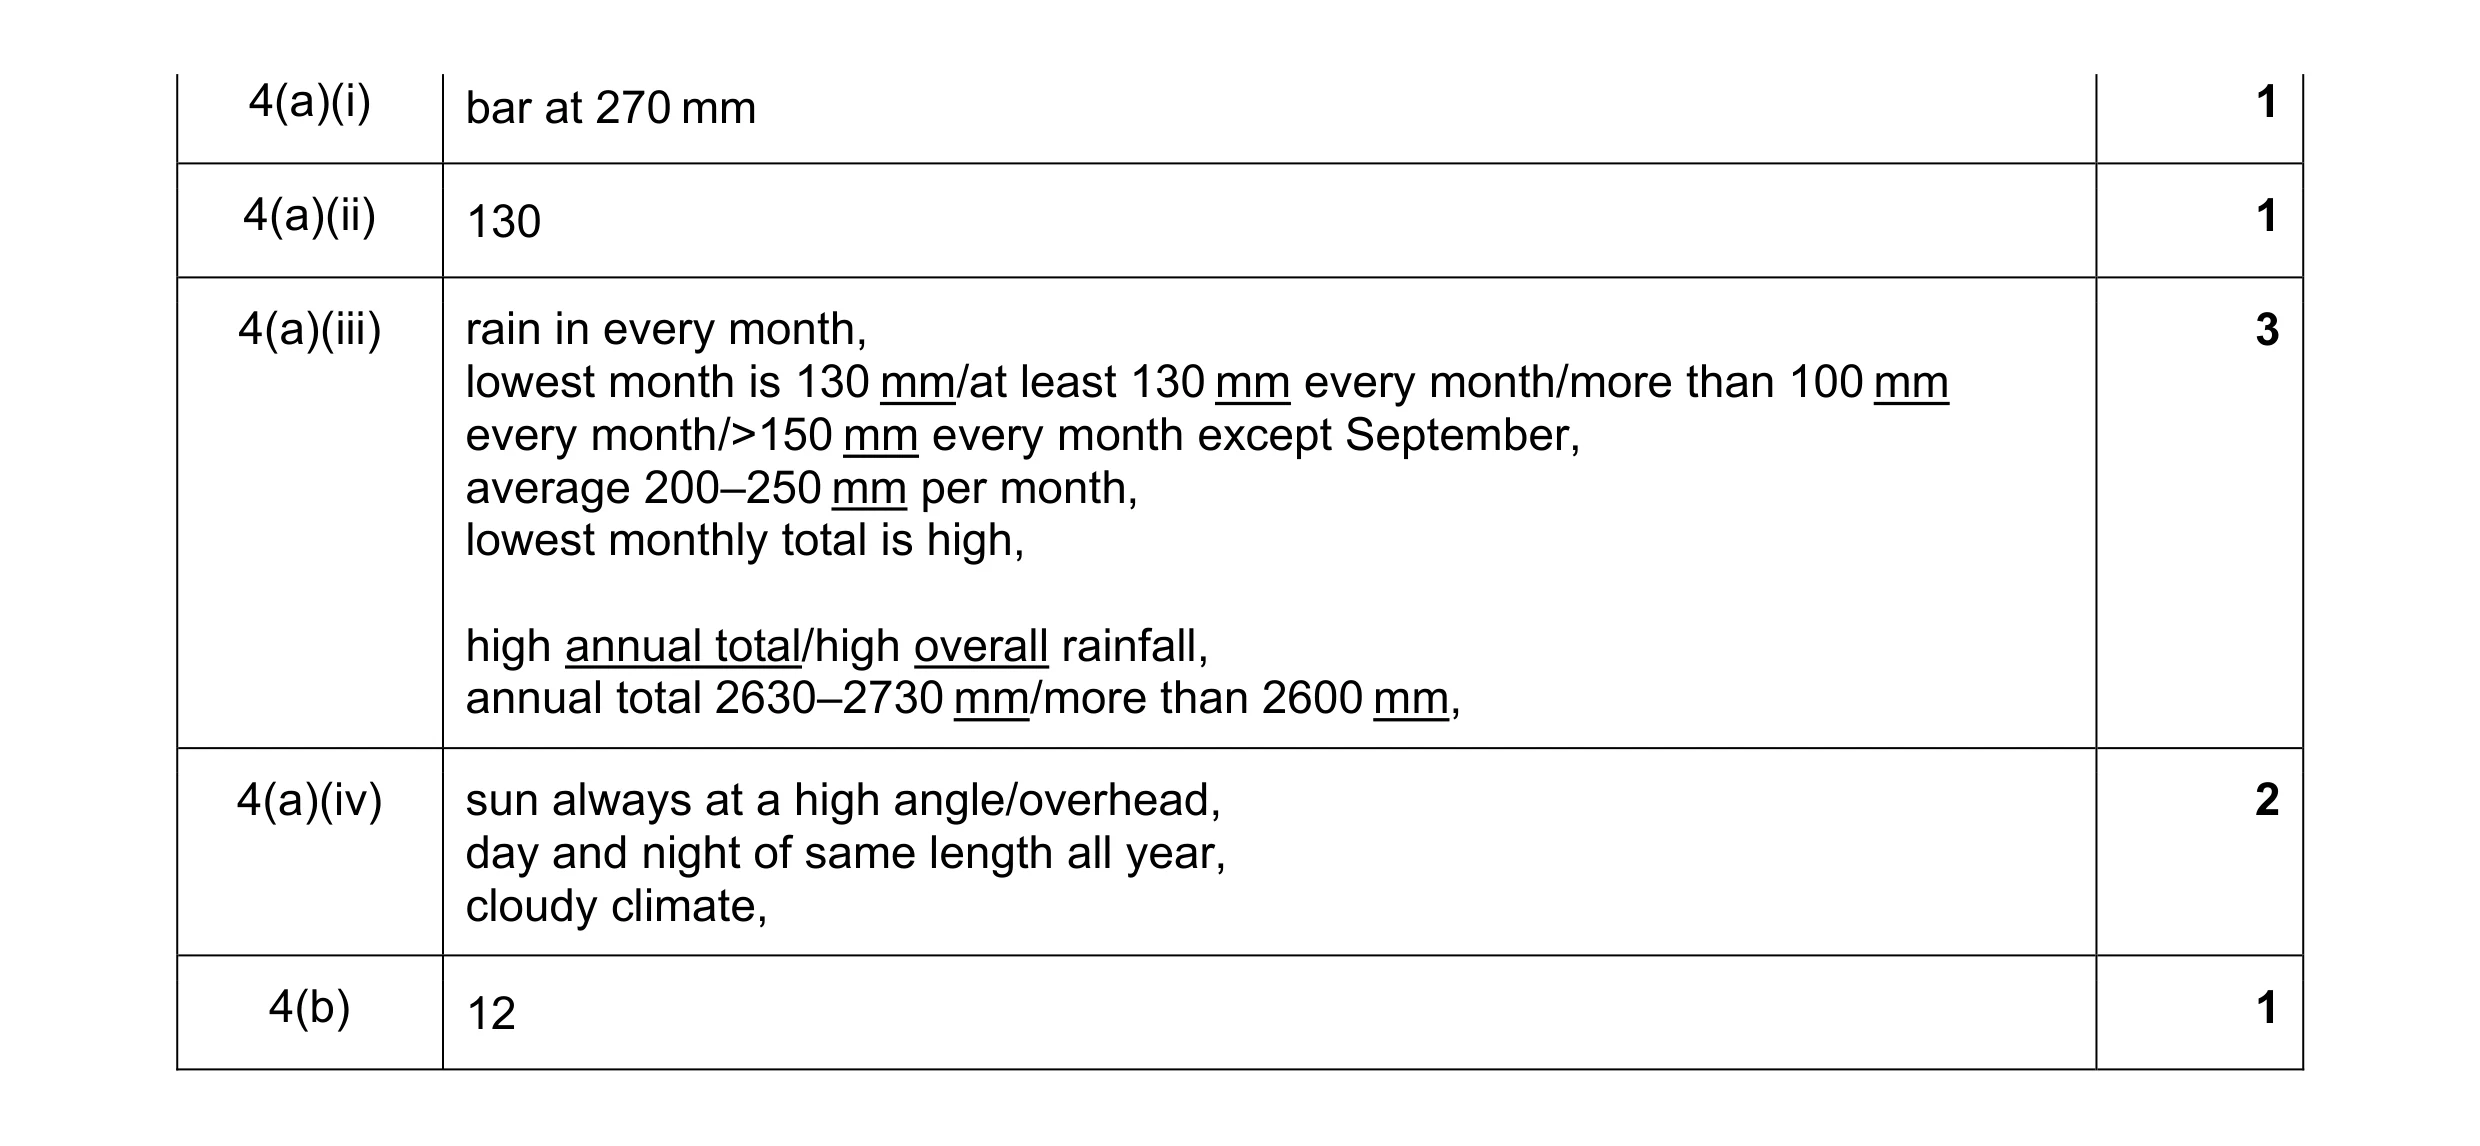 8
8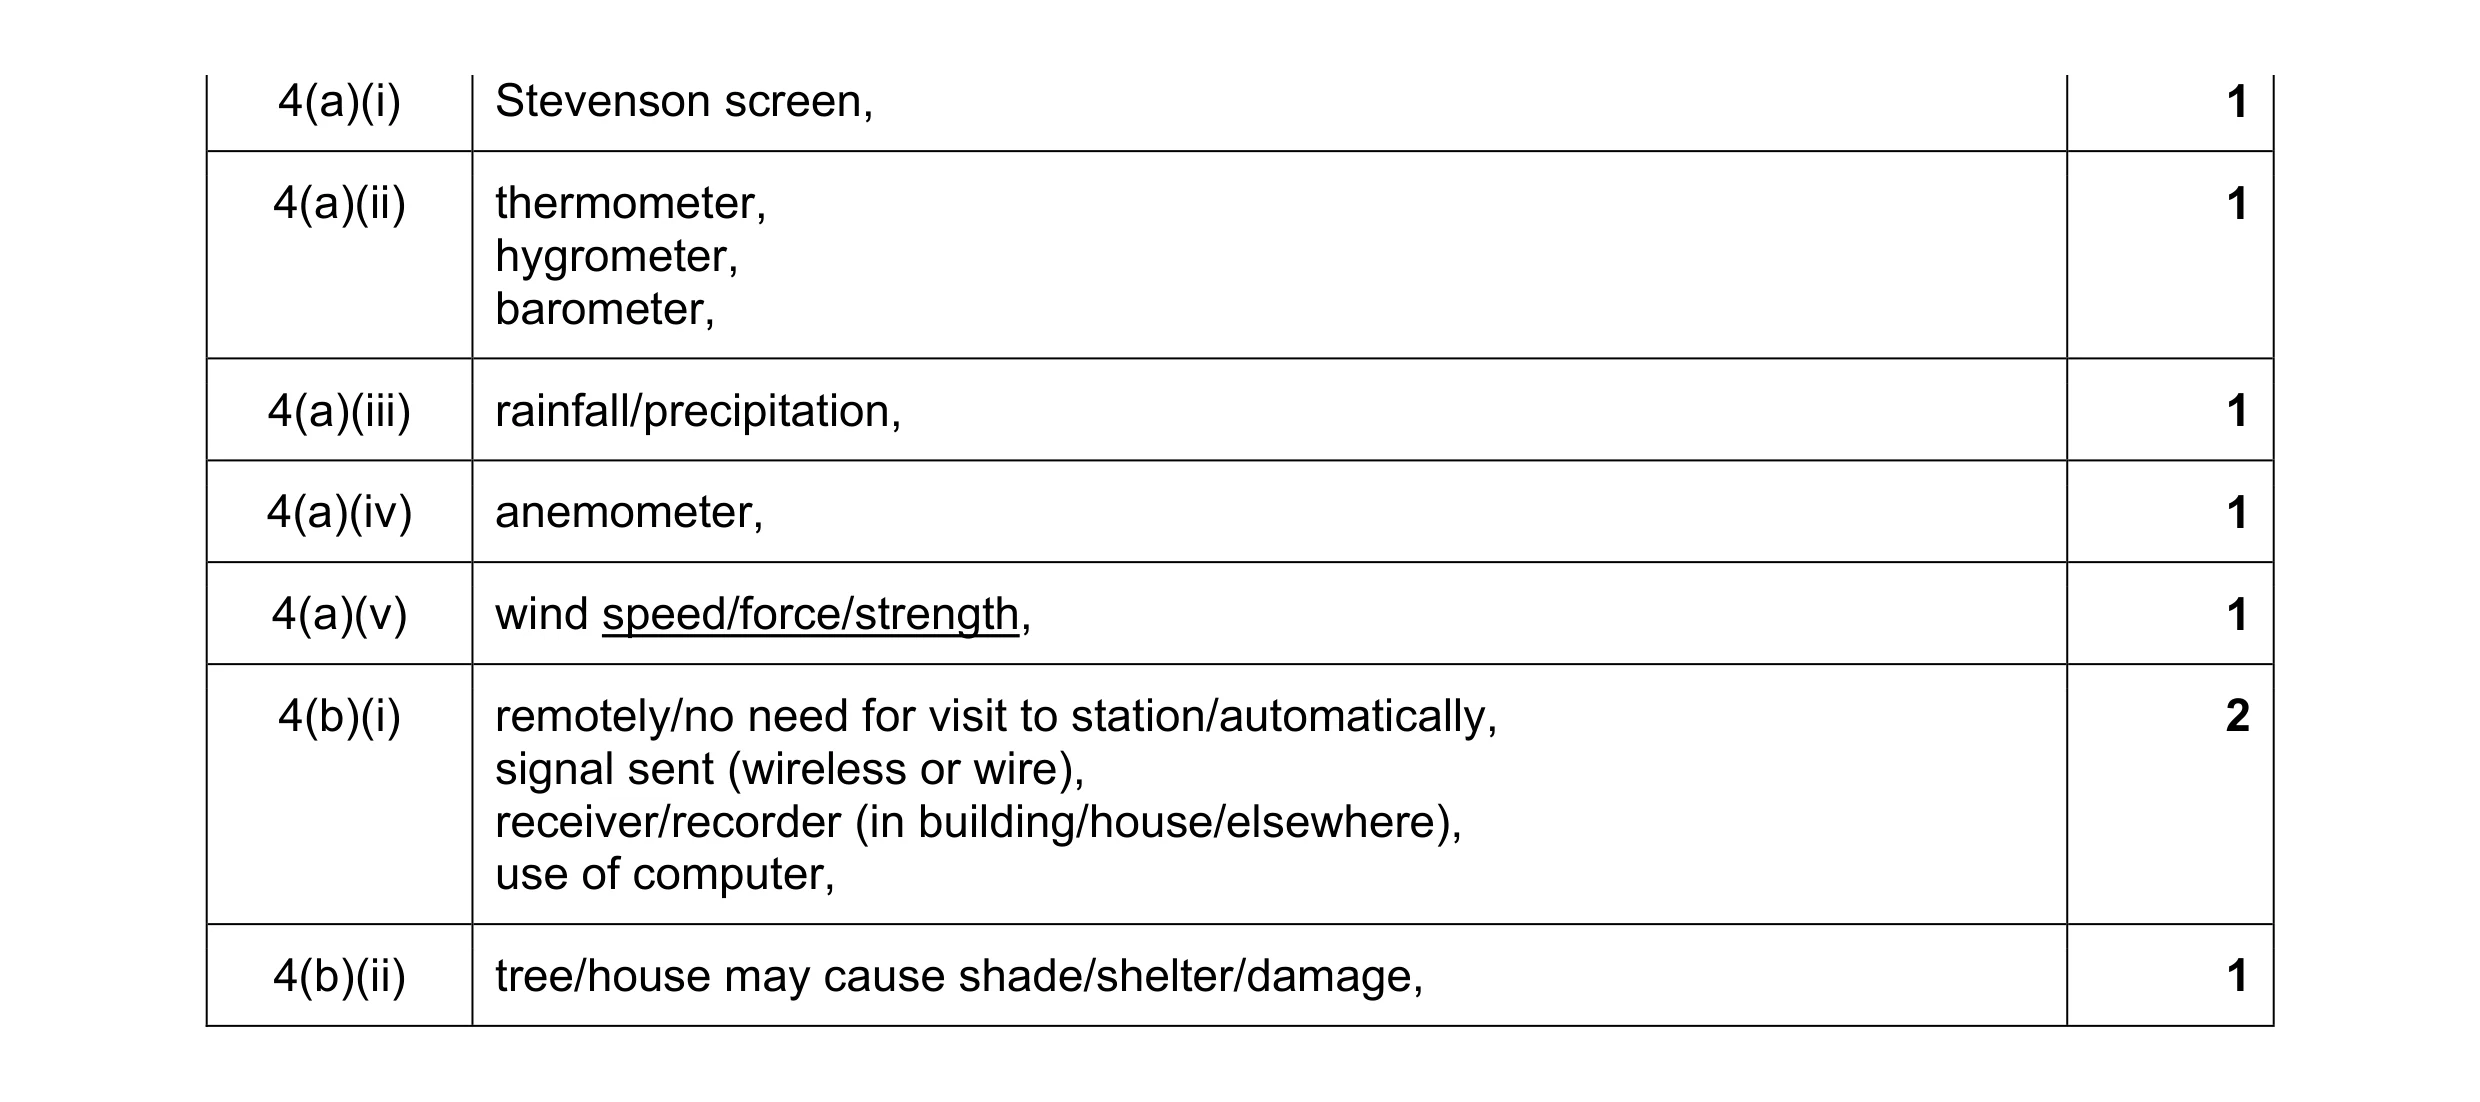 8
8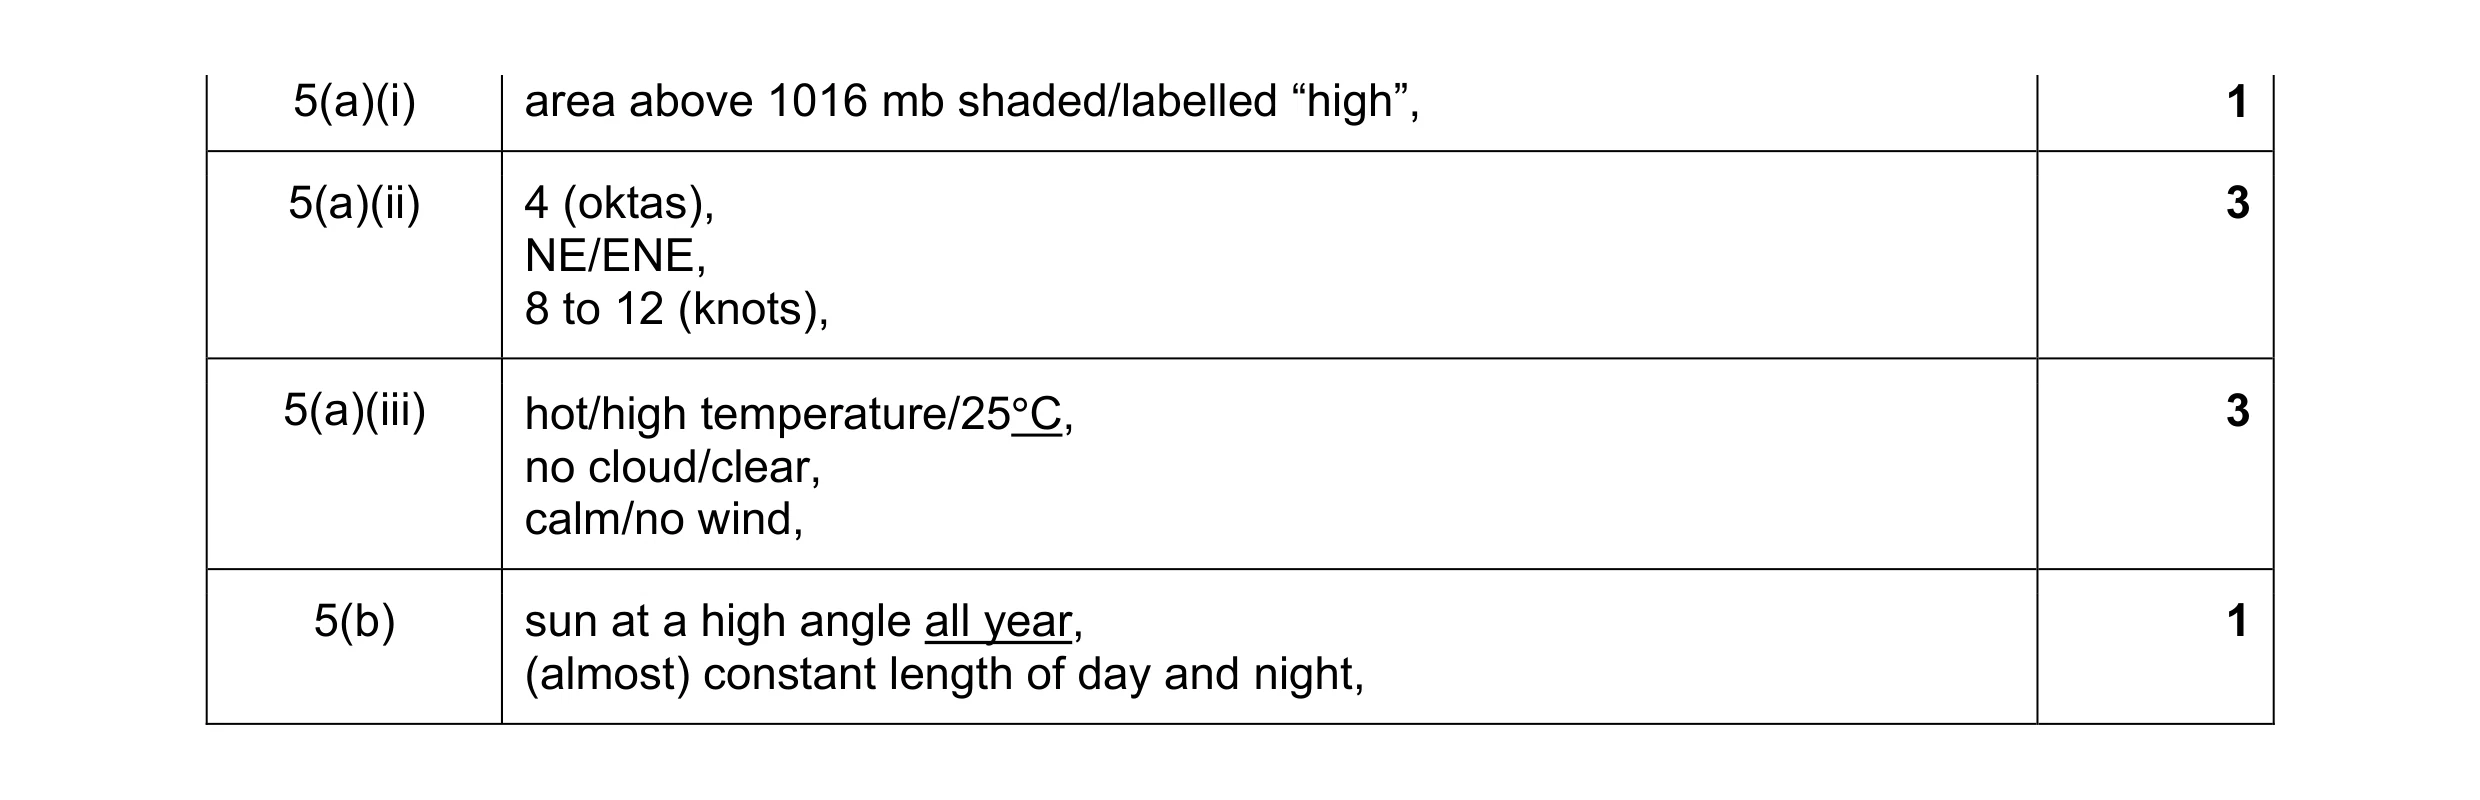 8
8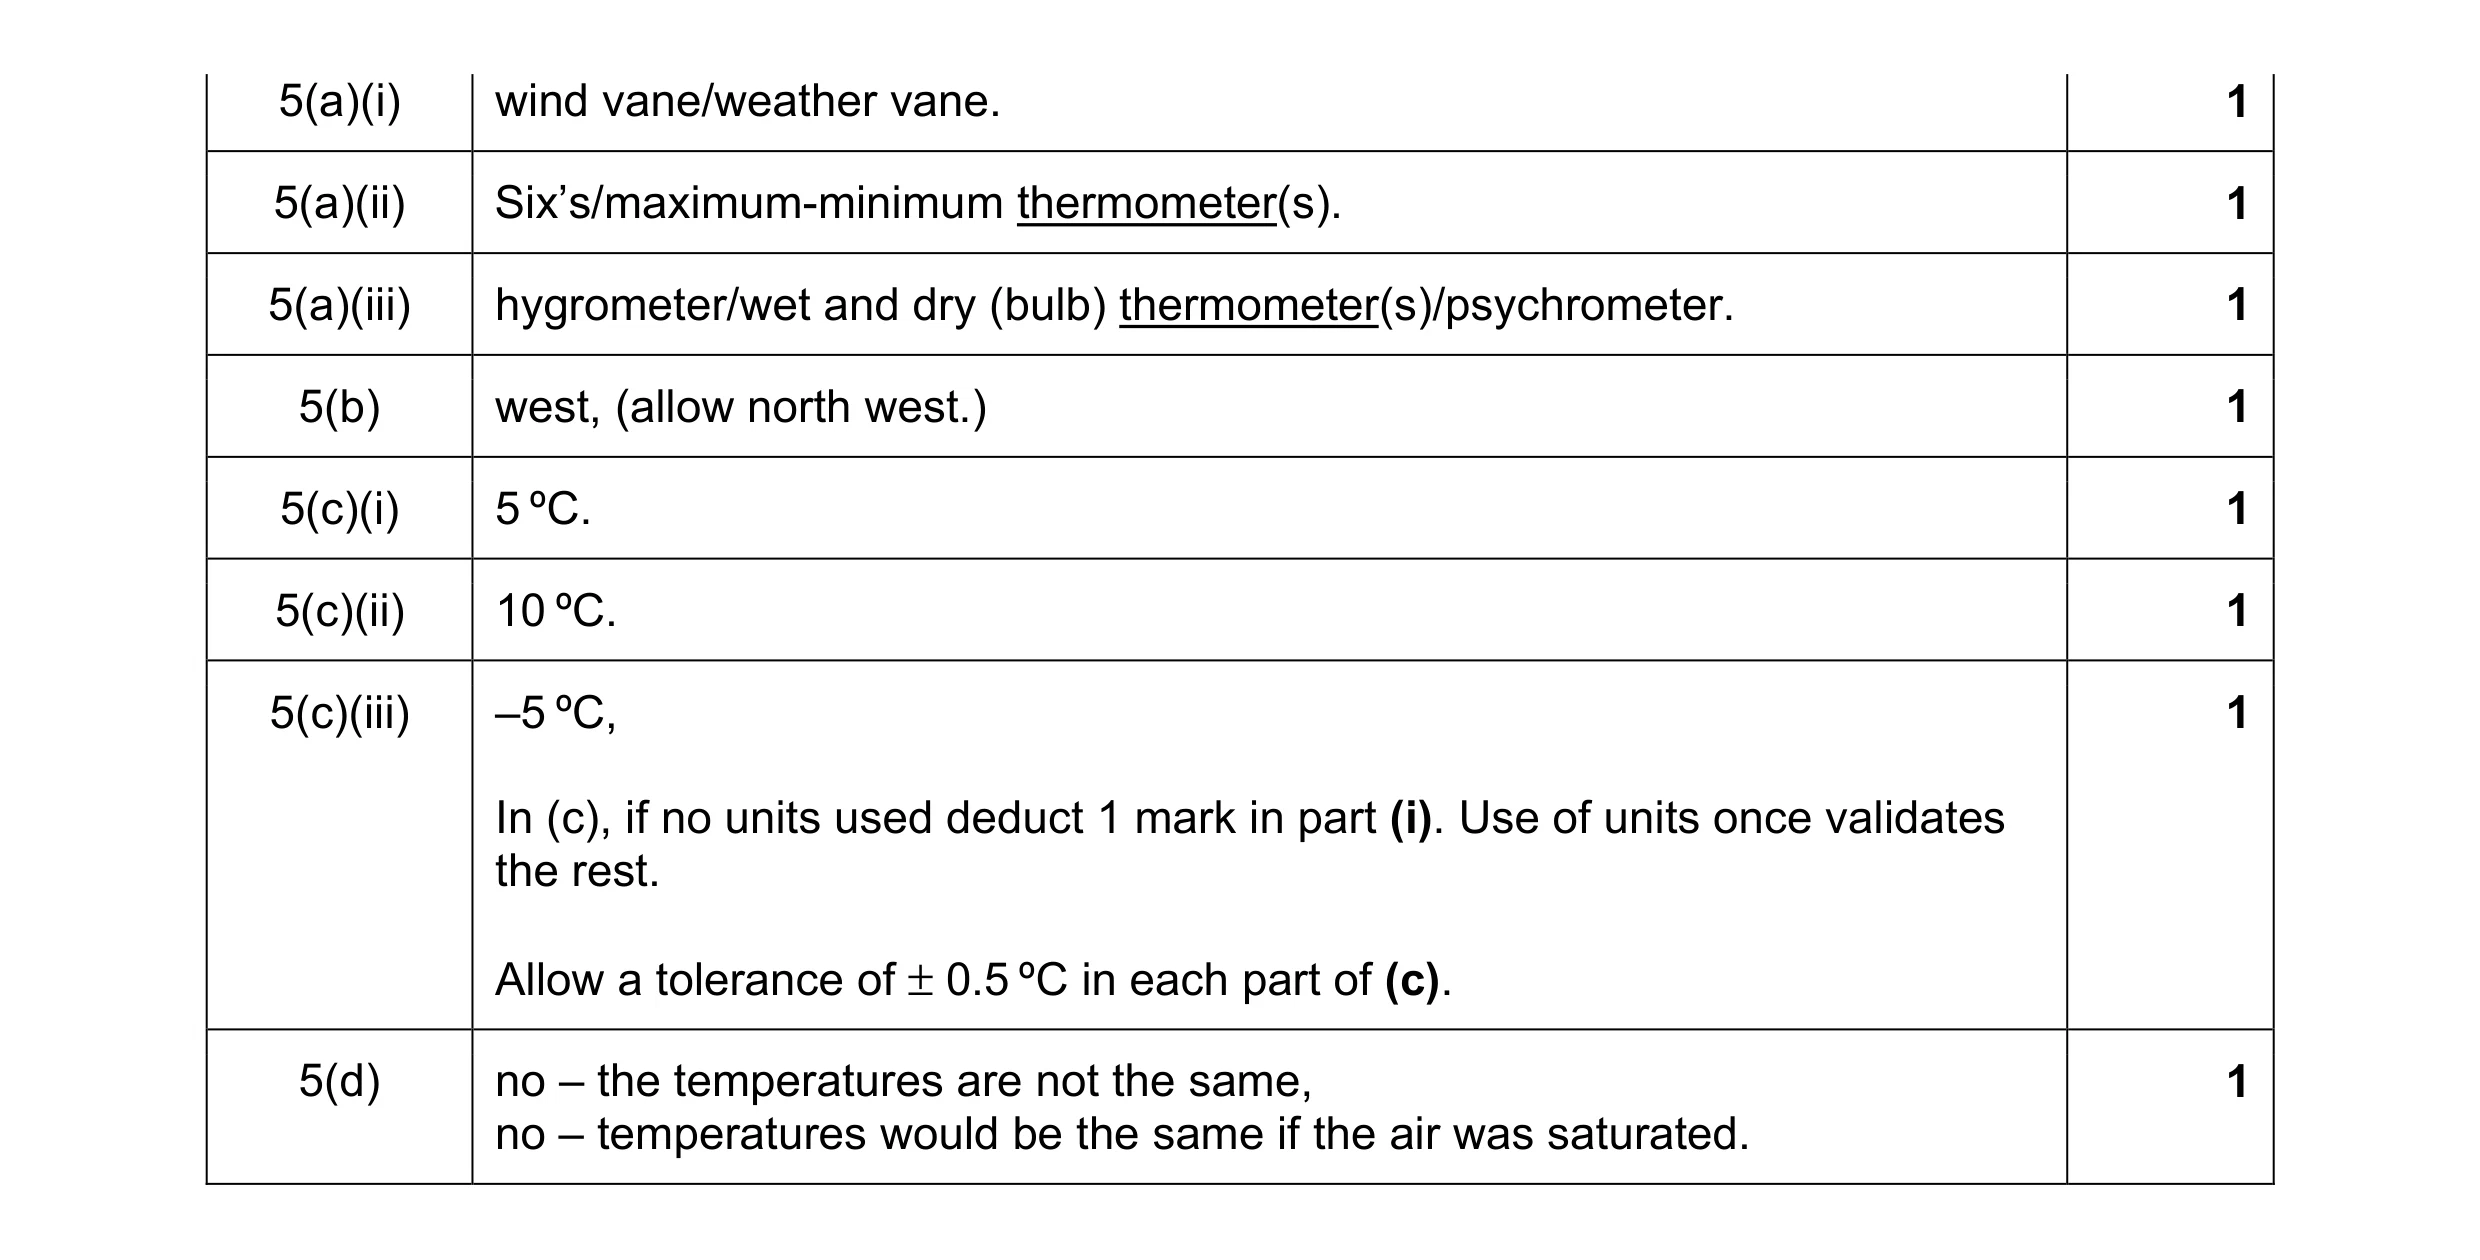 8
8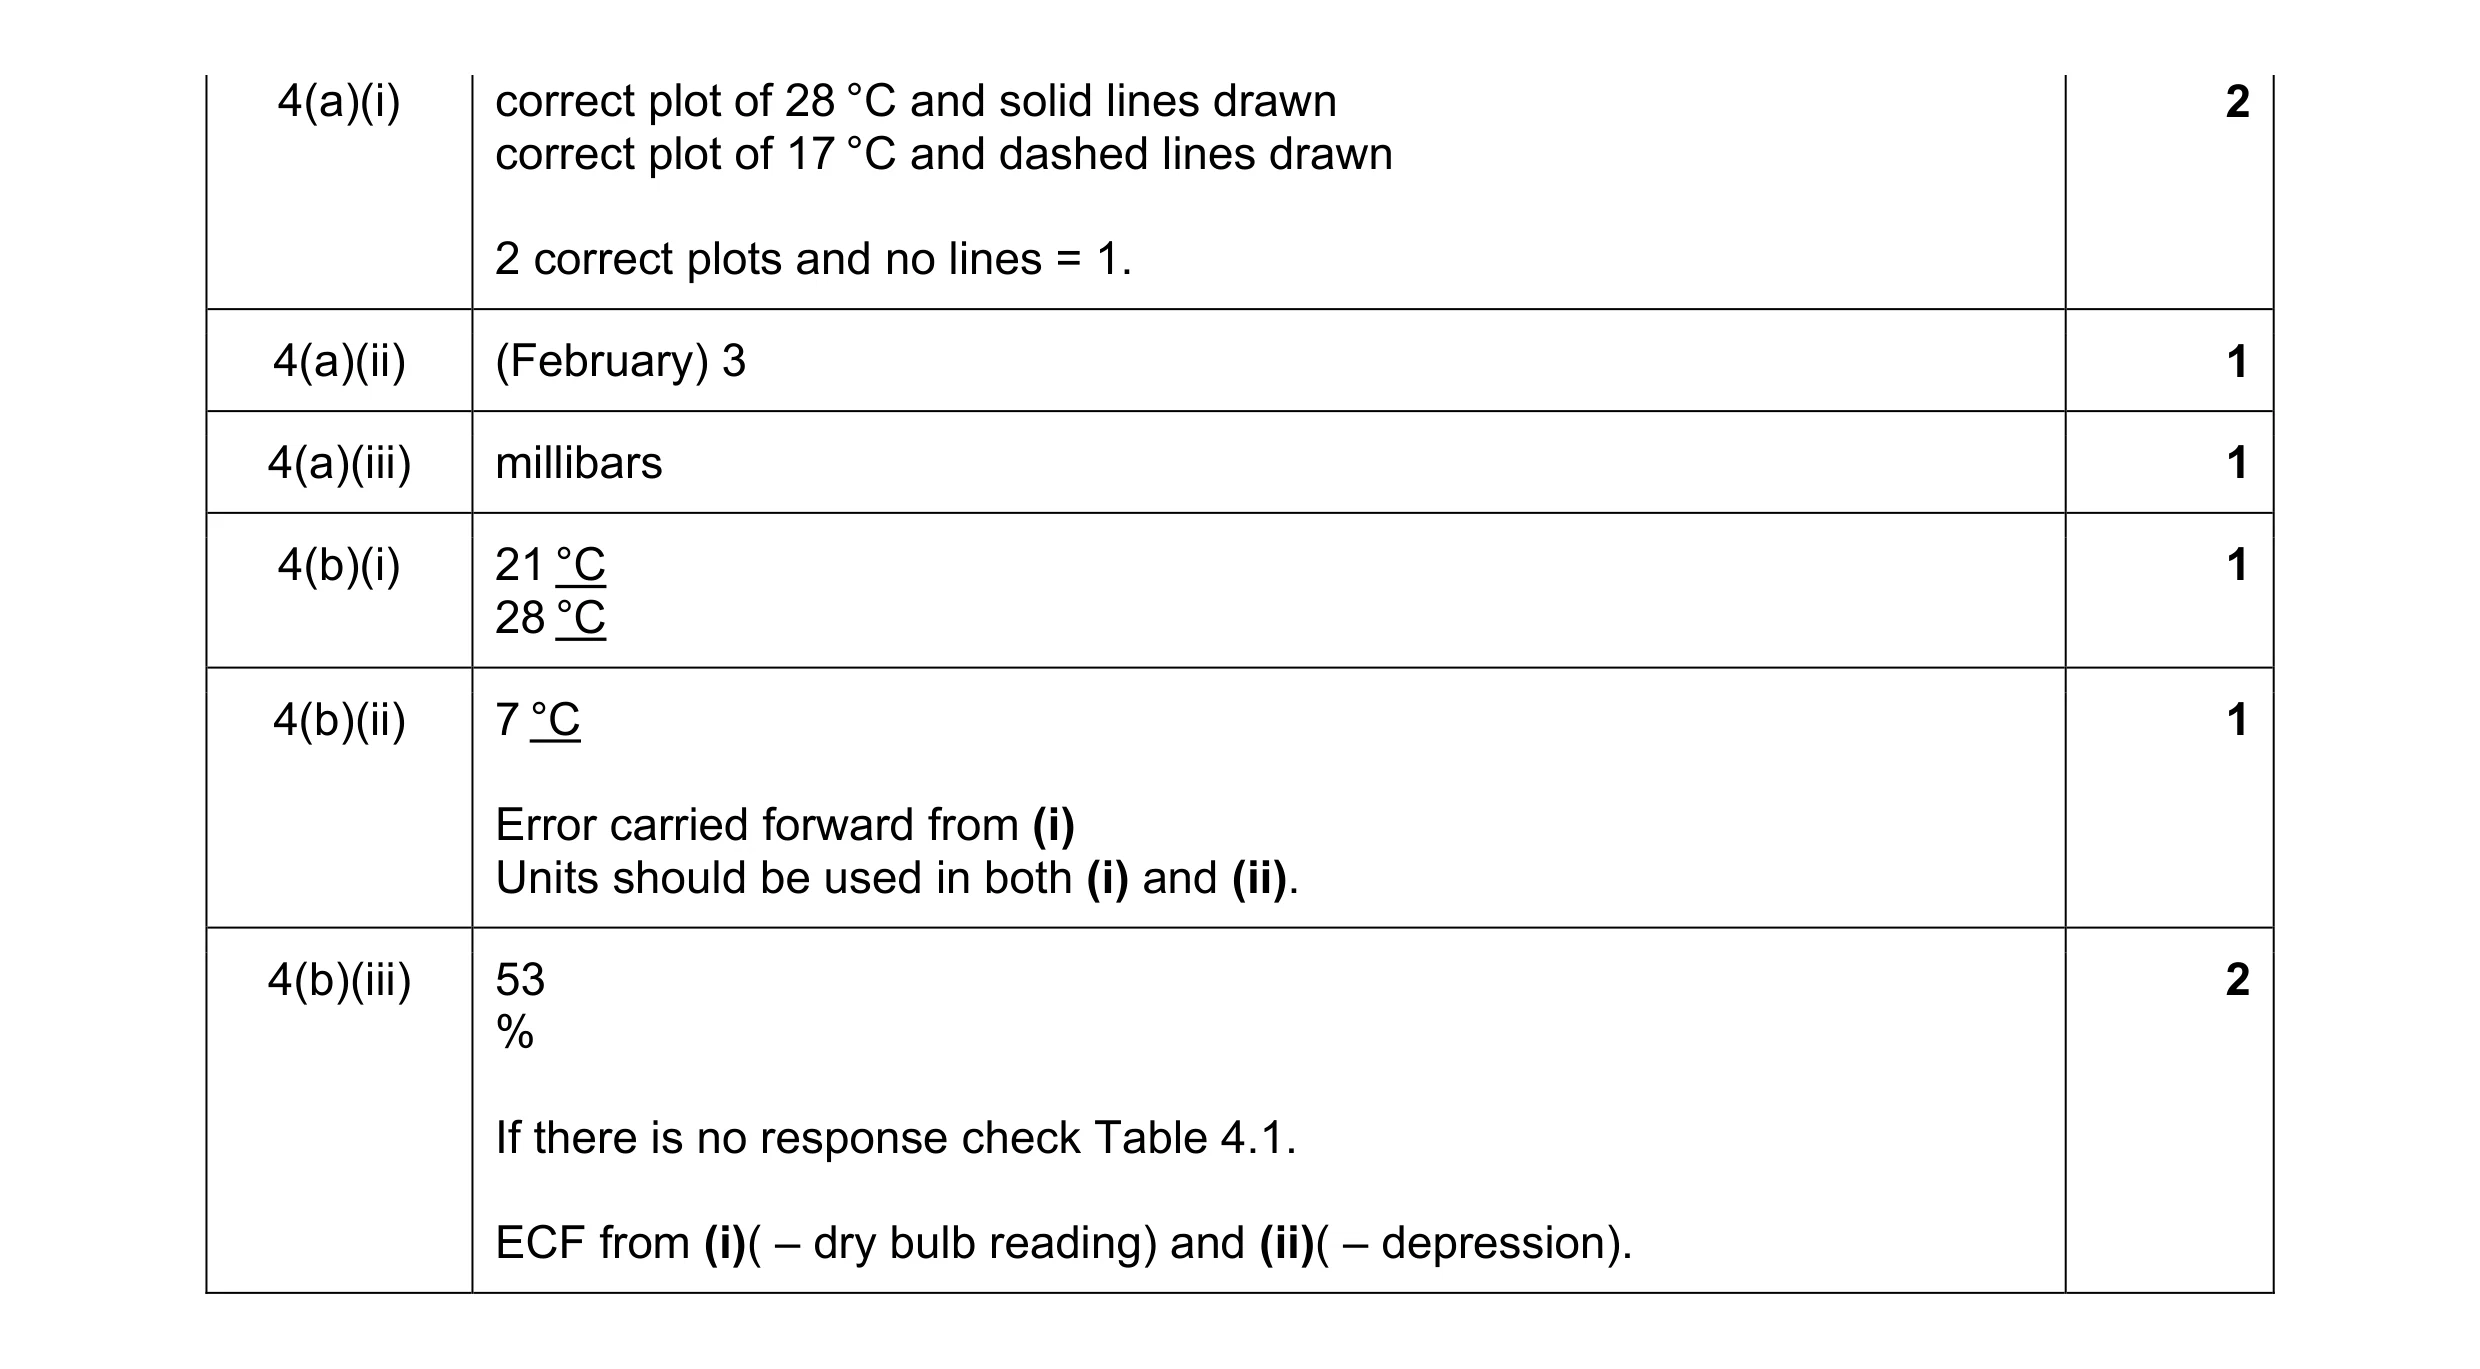 8
8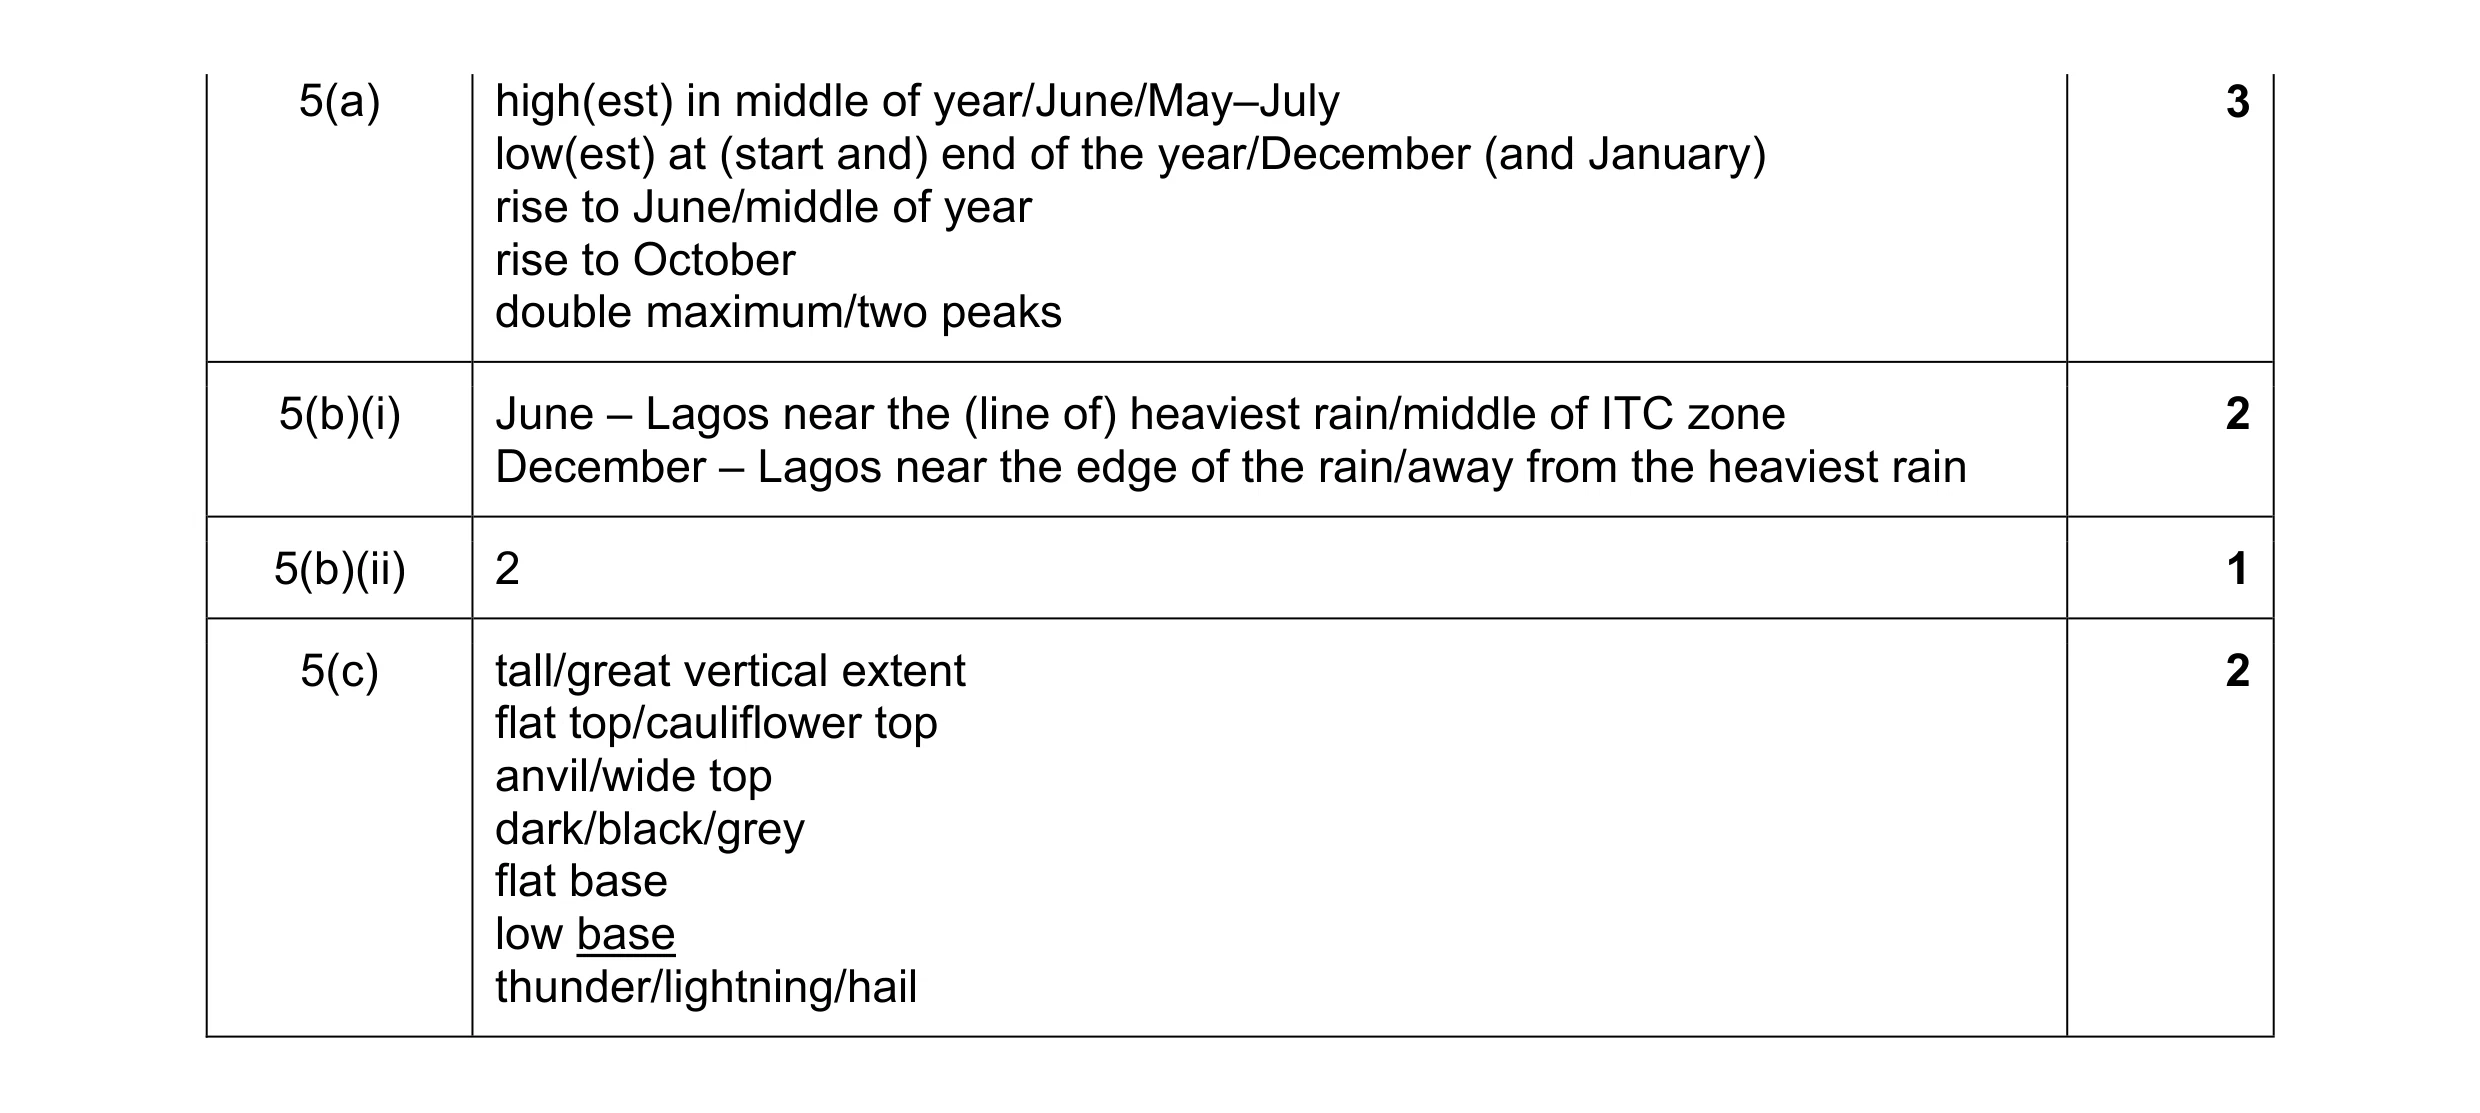 8
8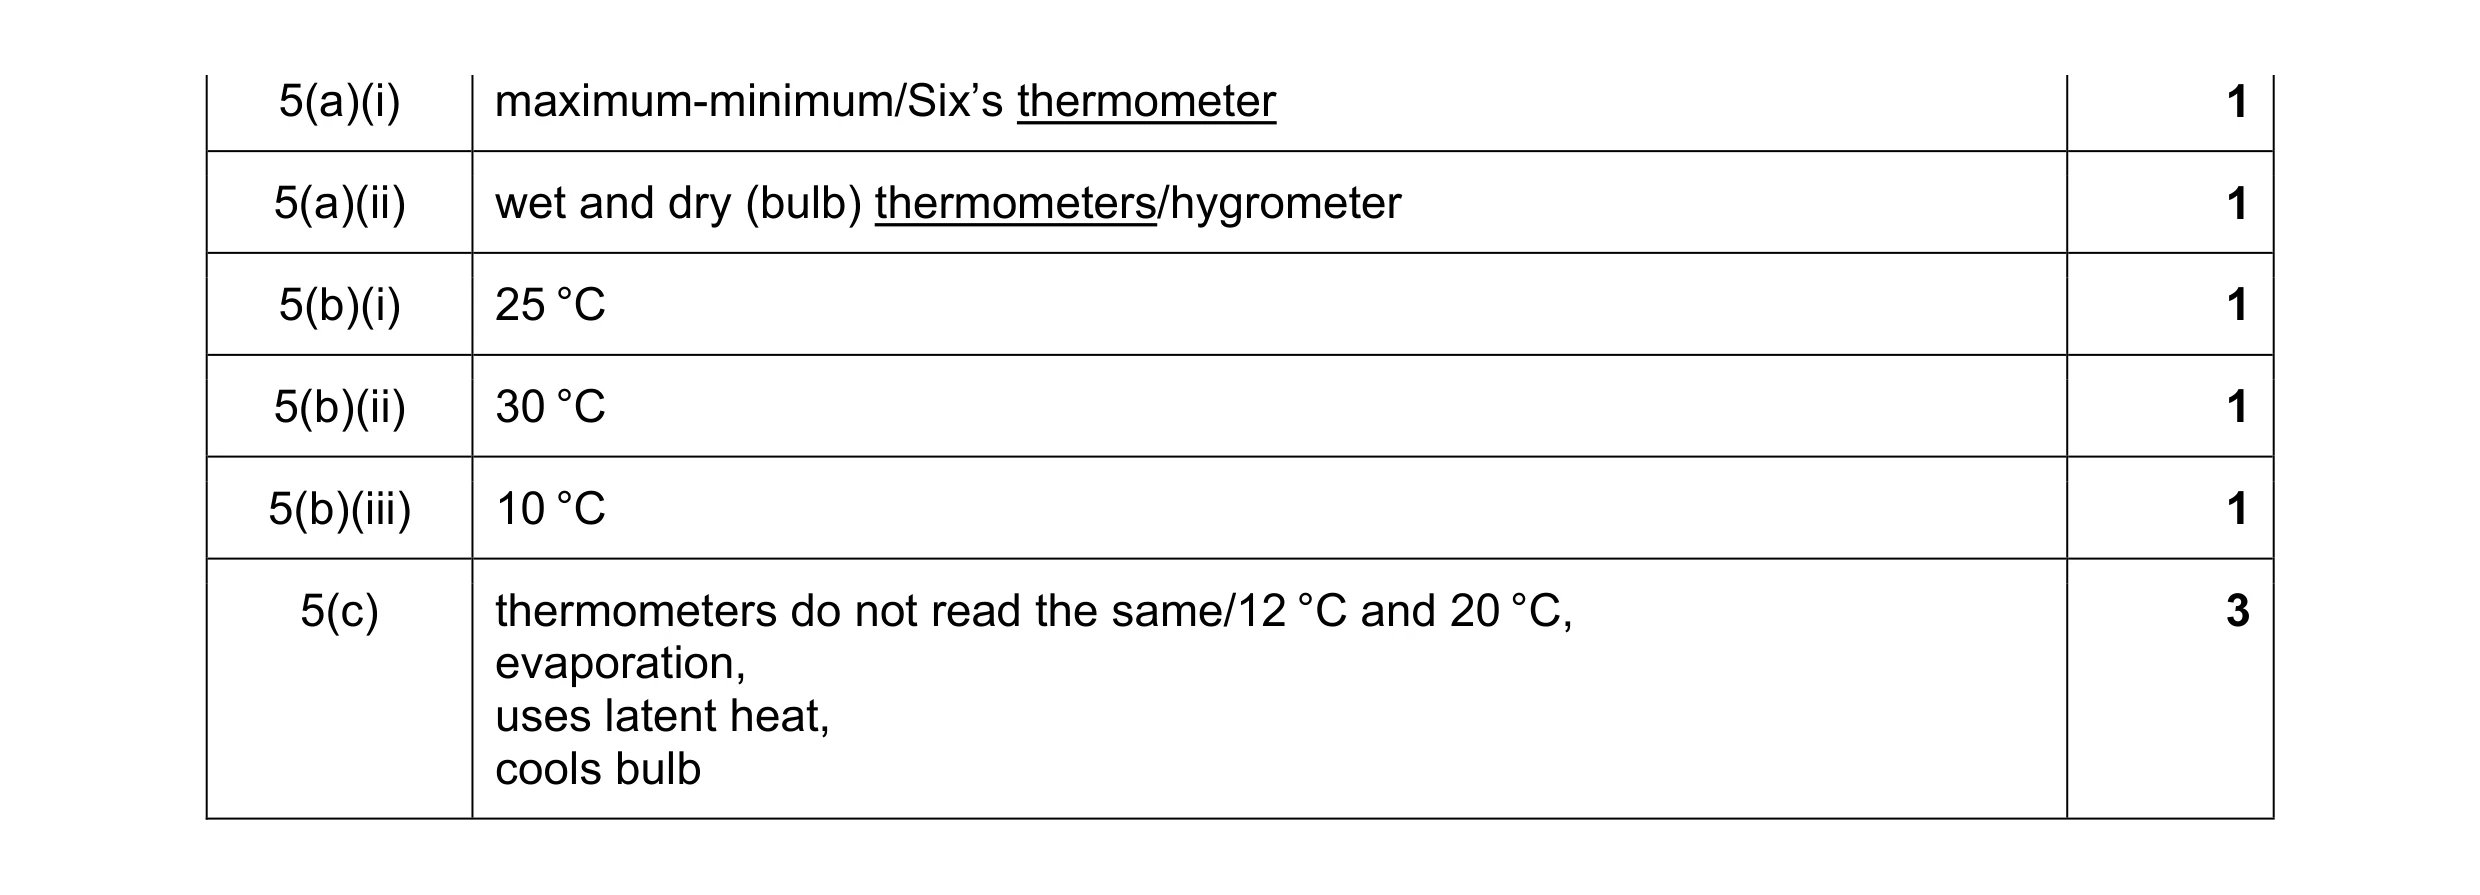 8
8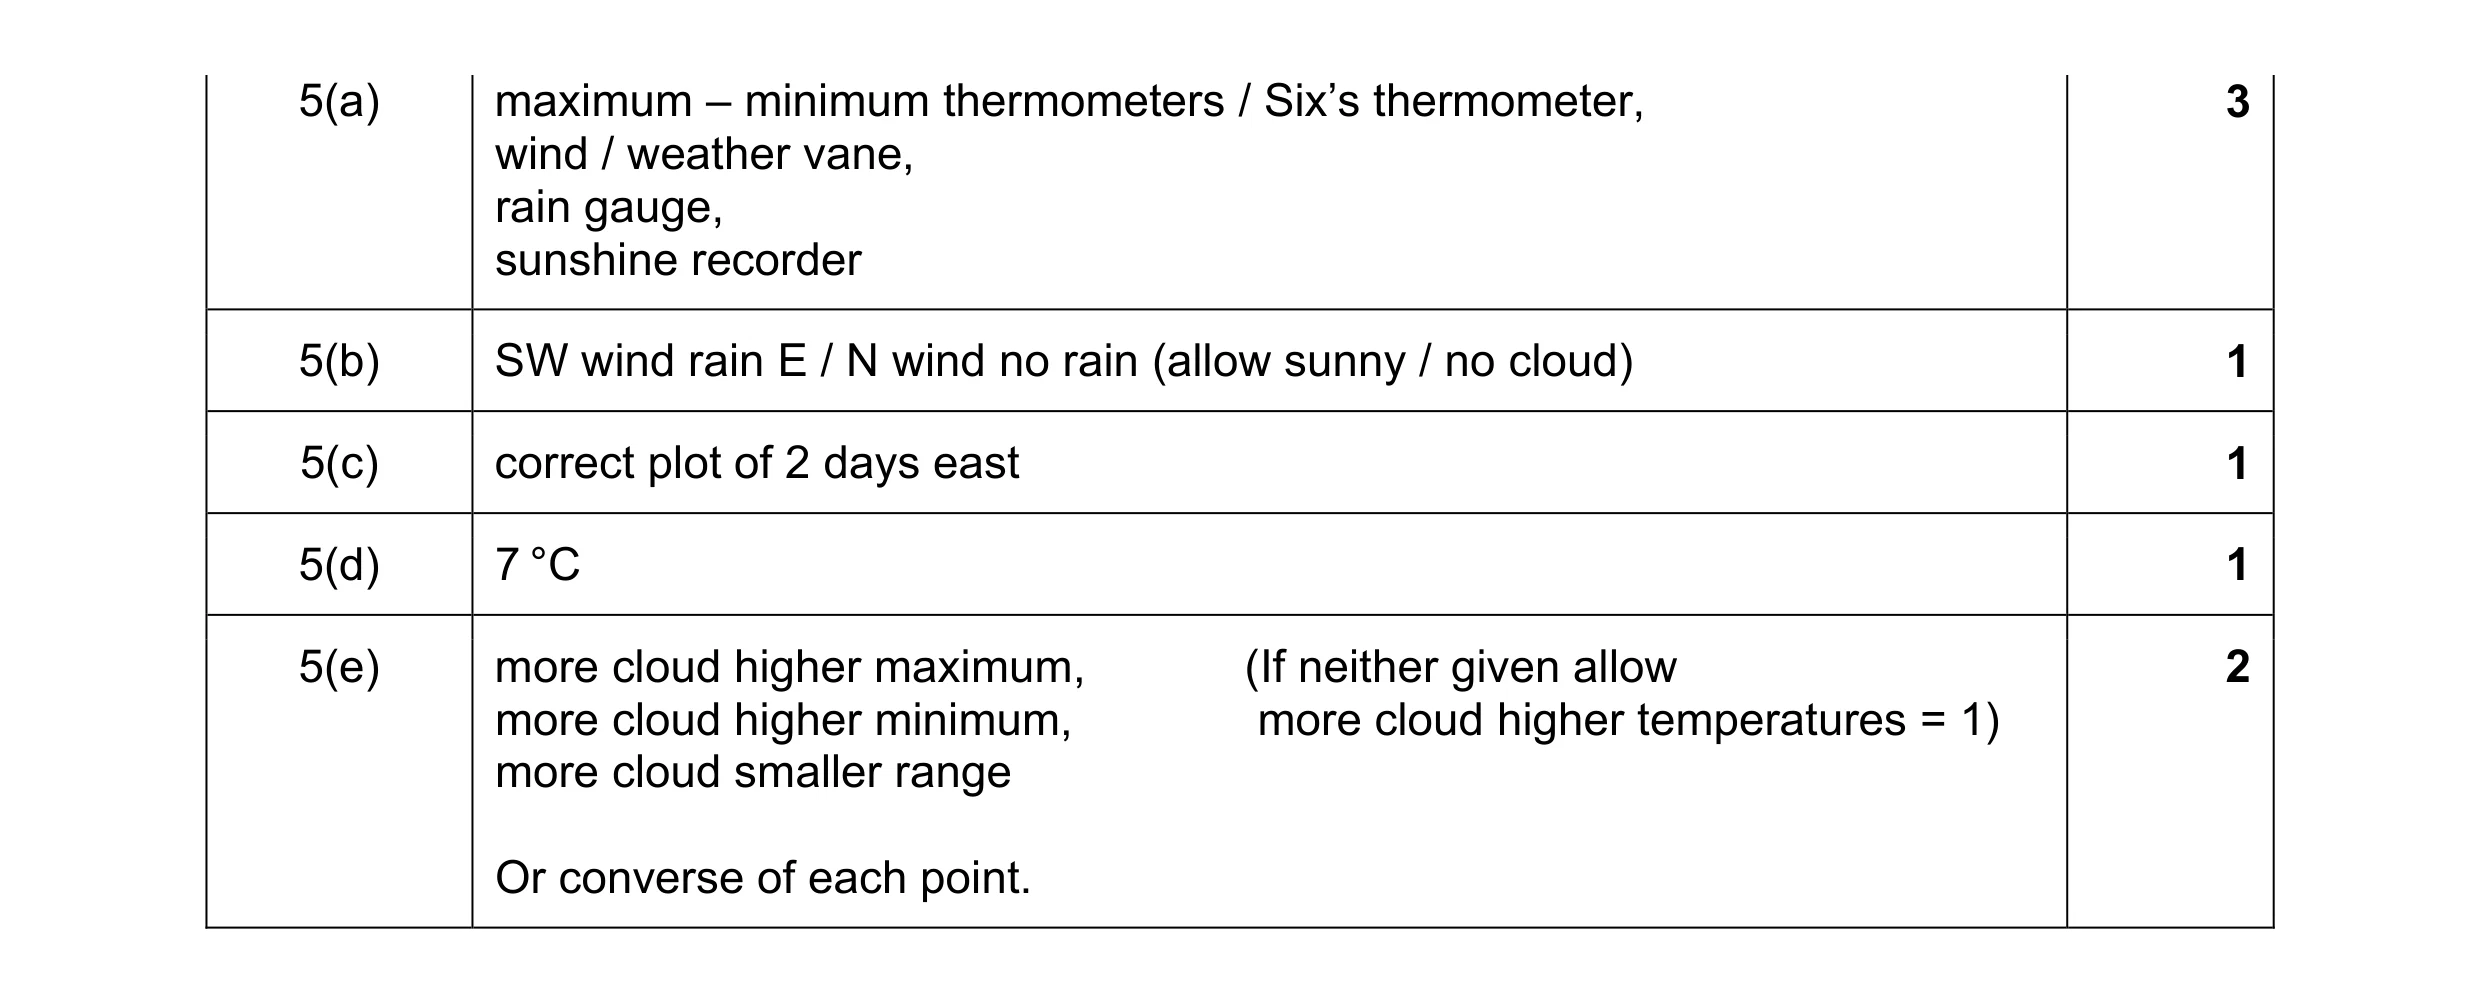 8
8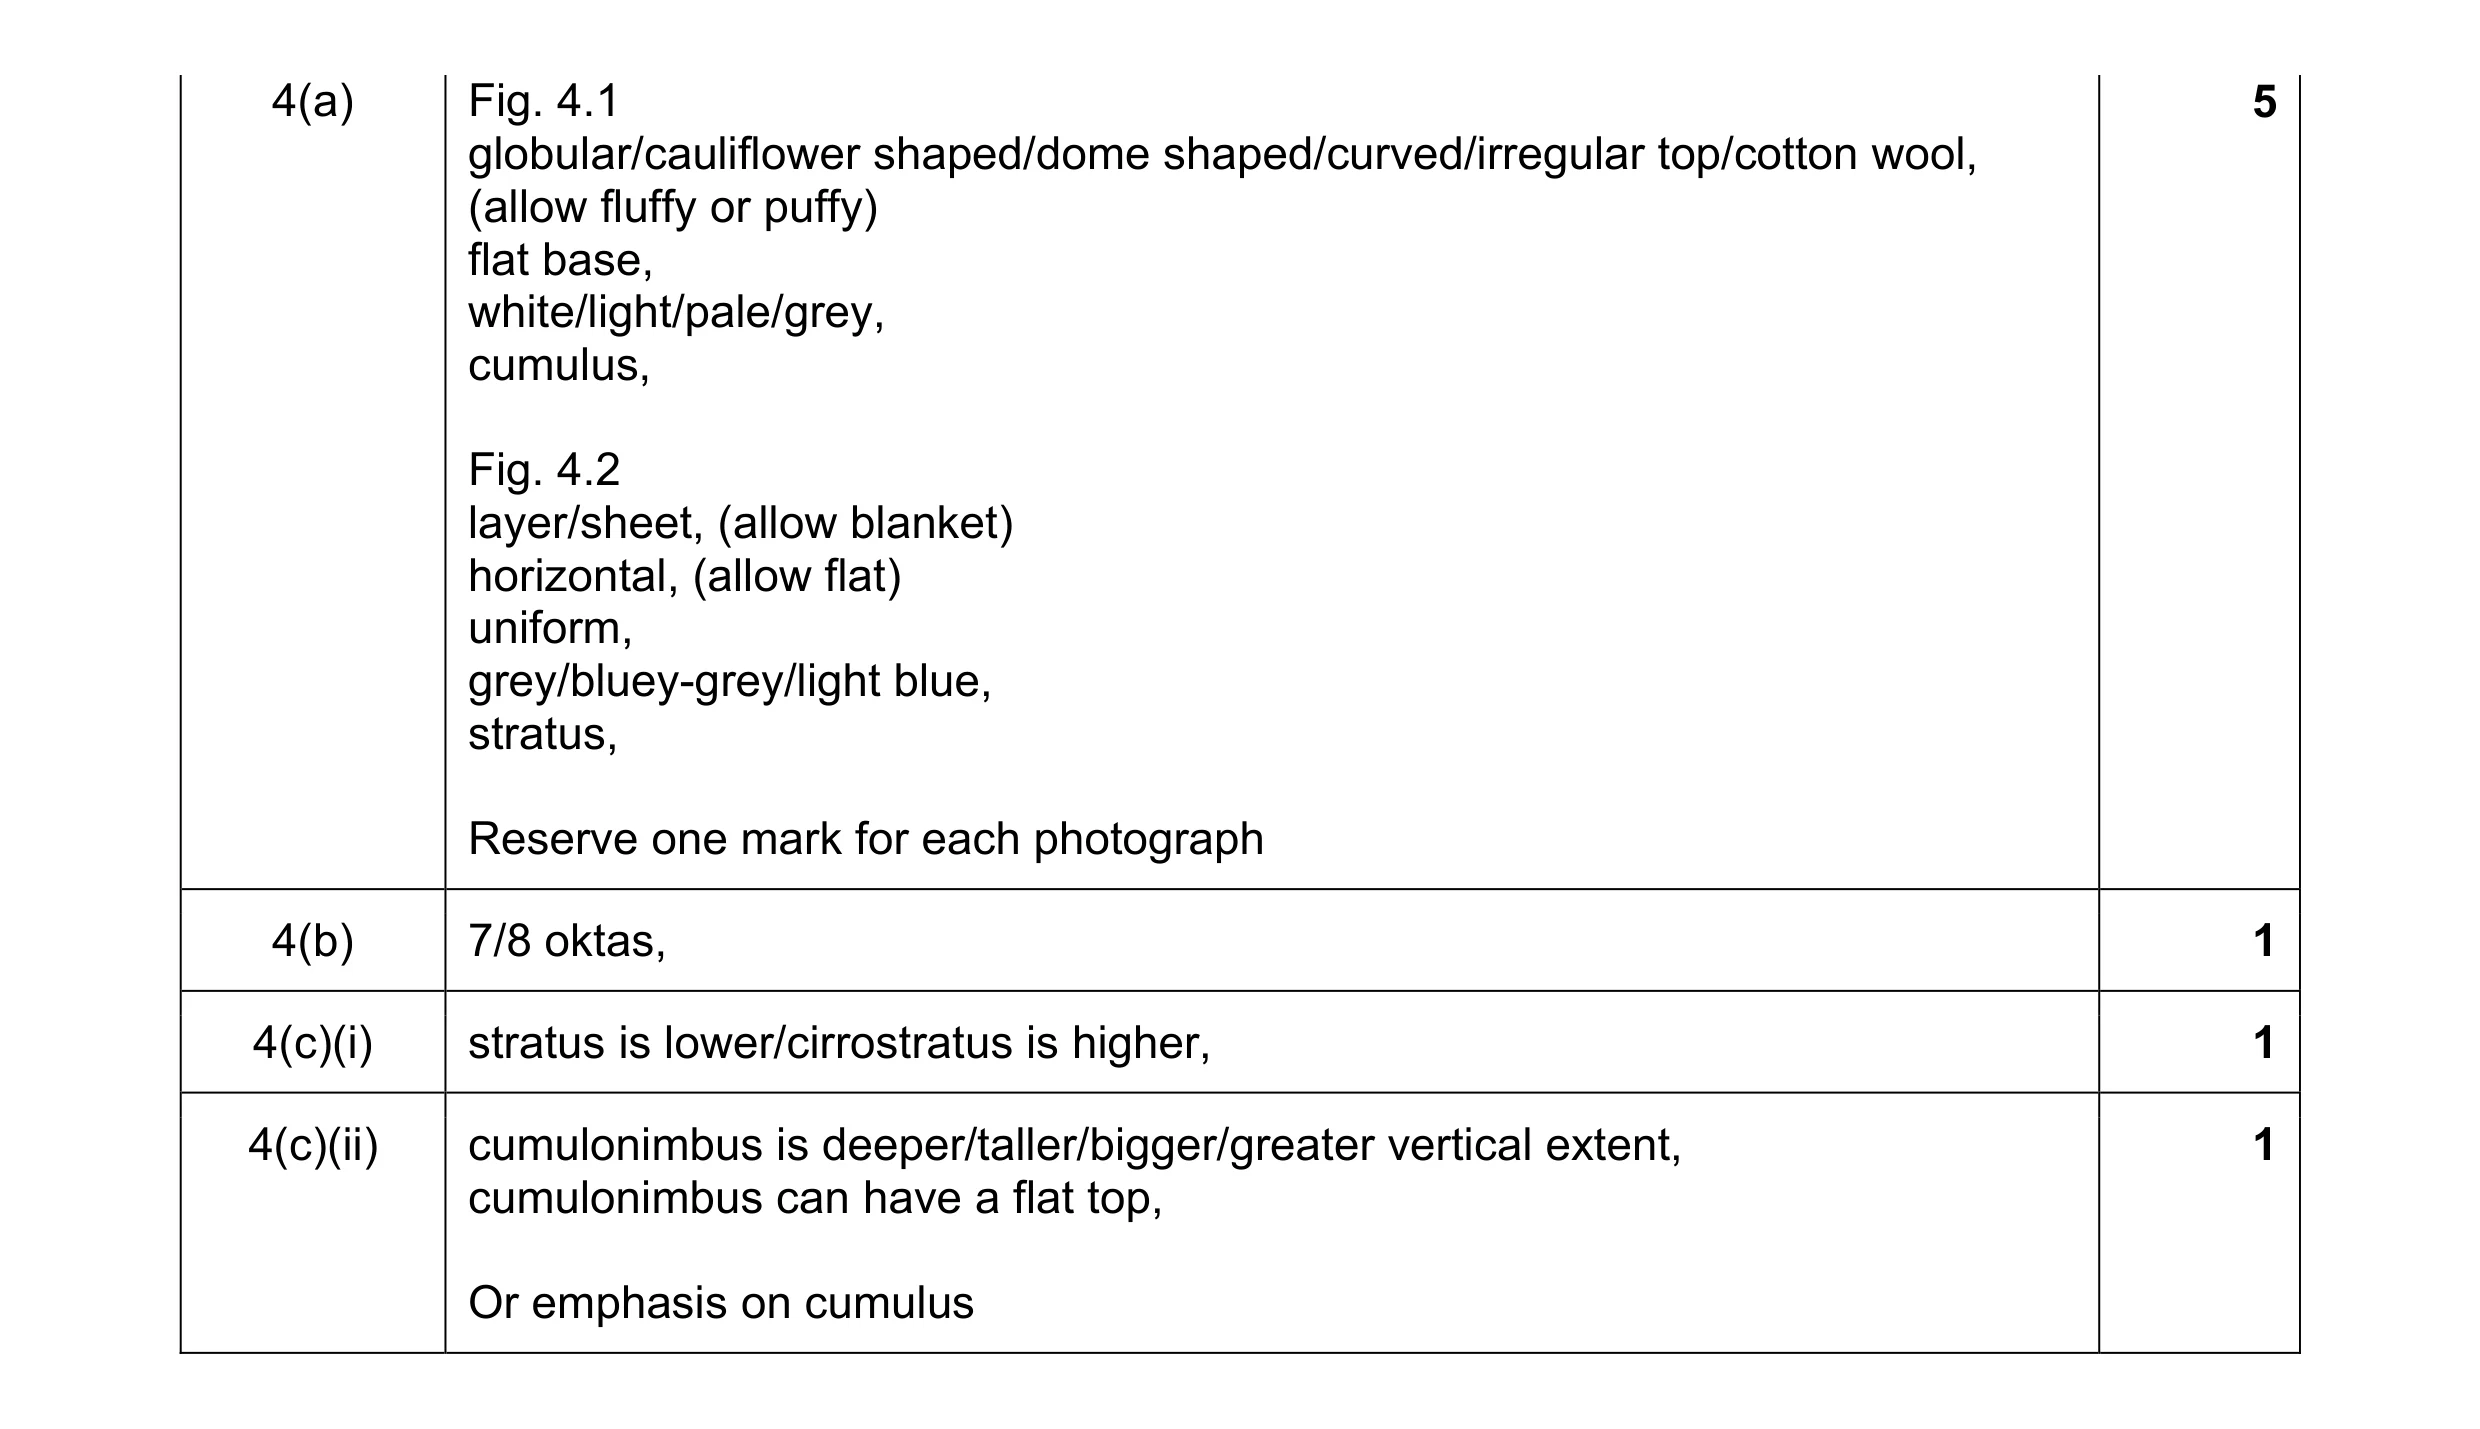 8
8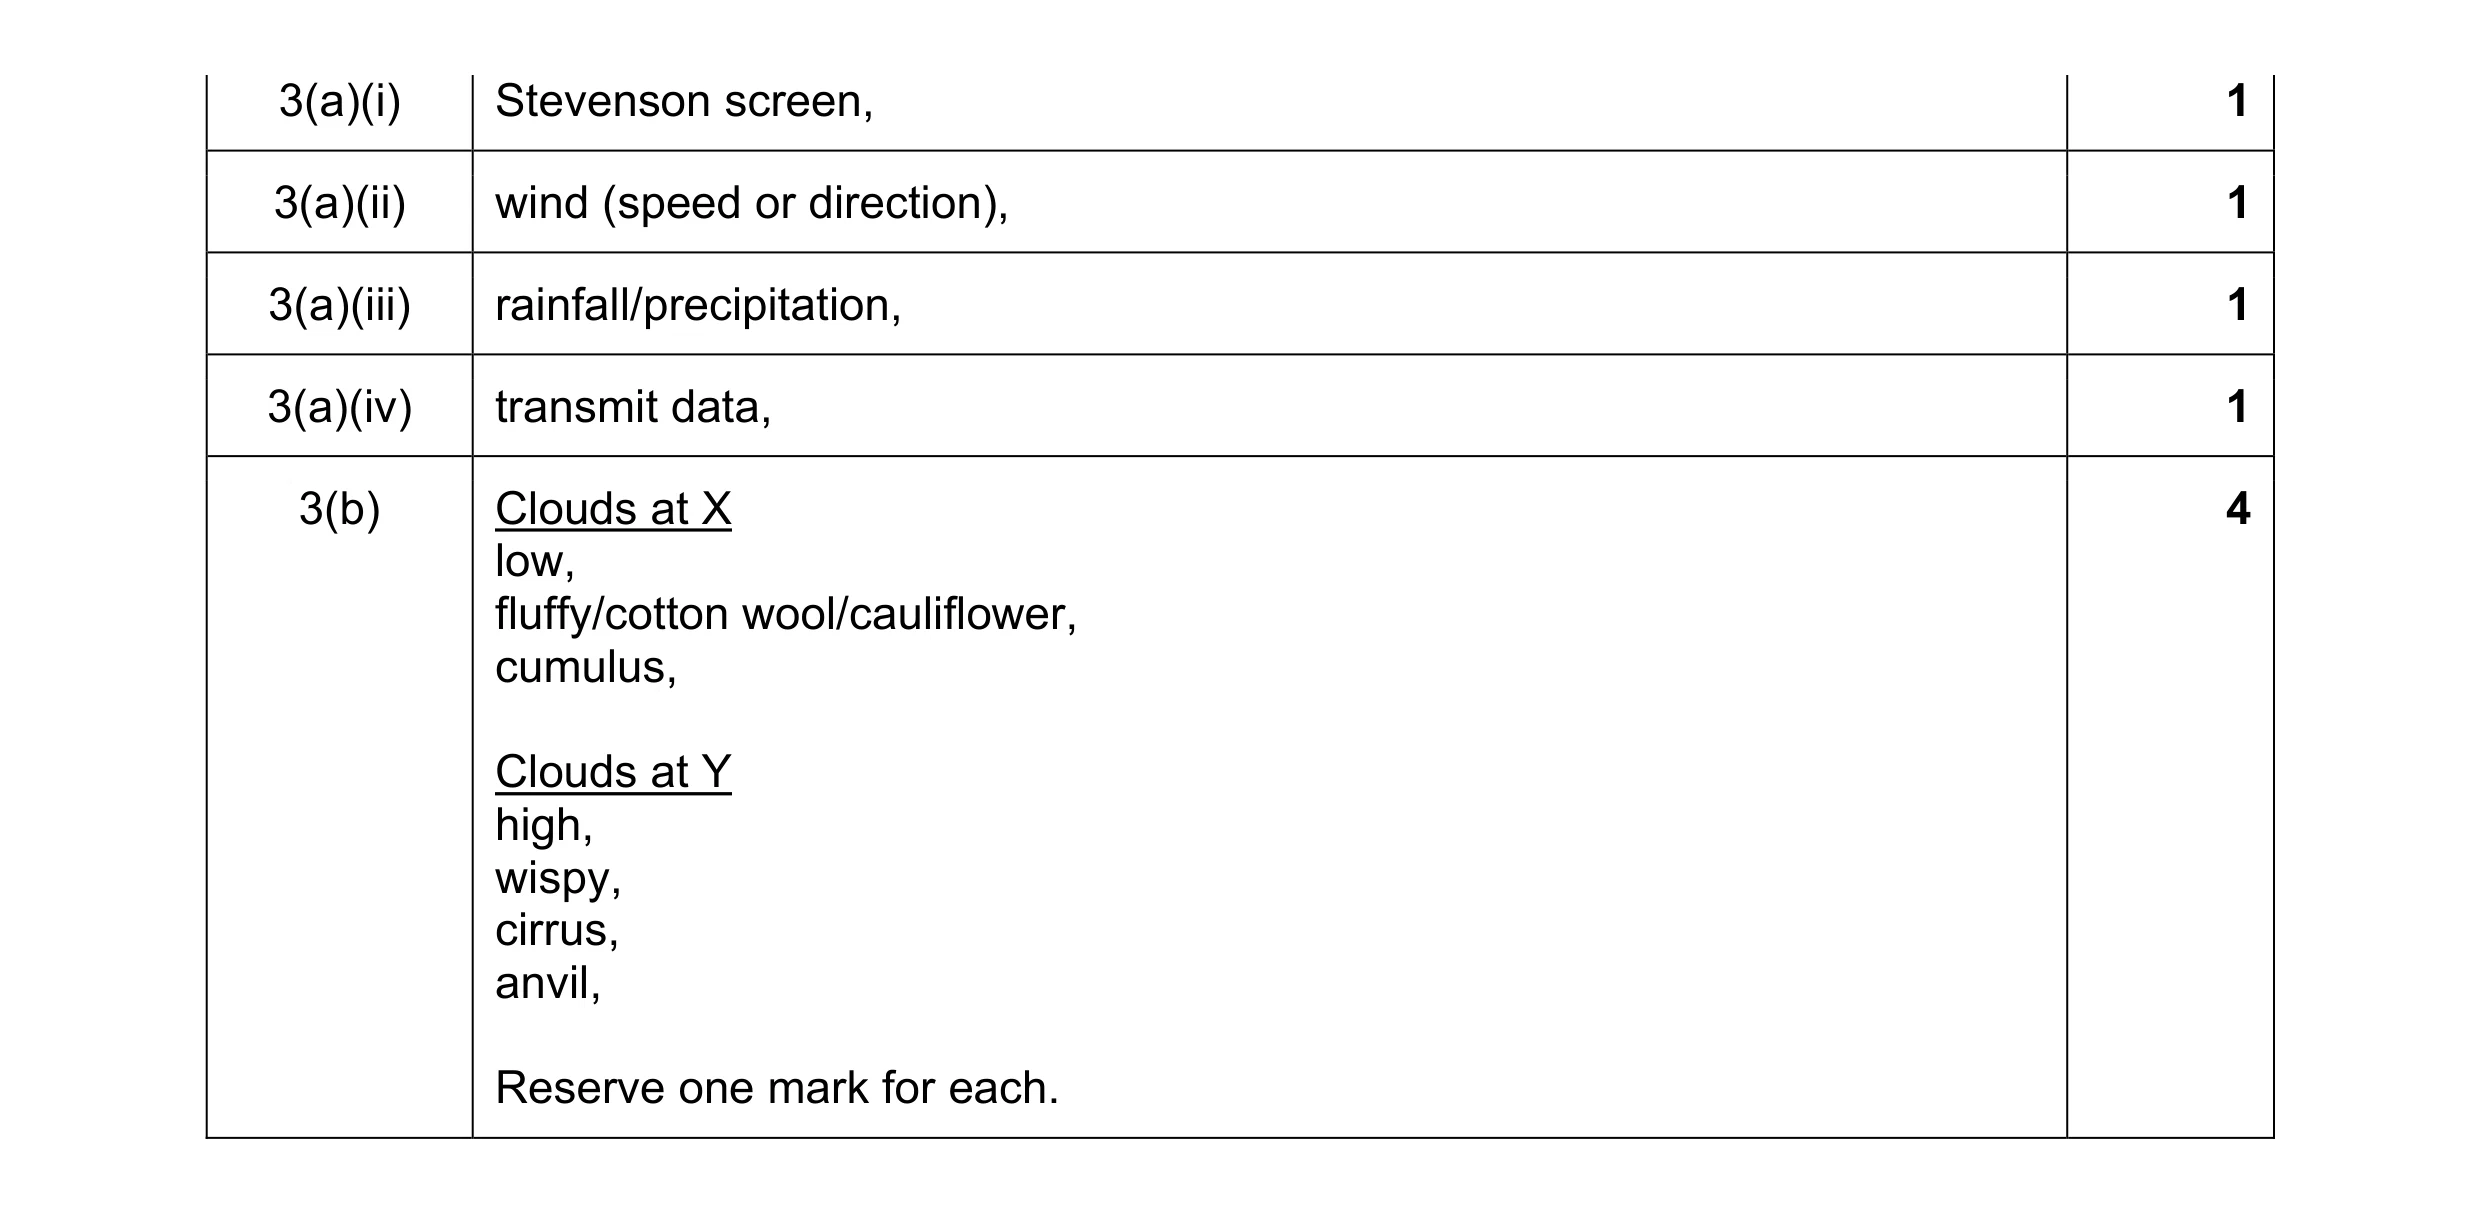 8
8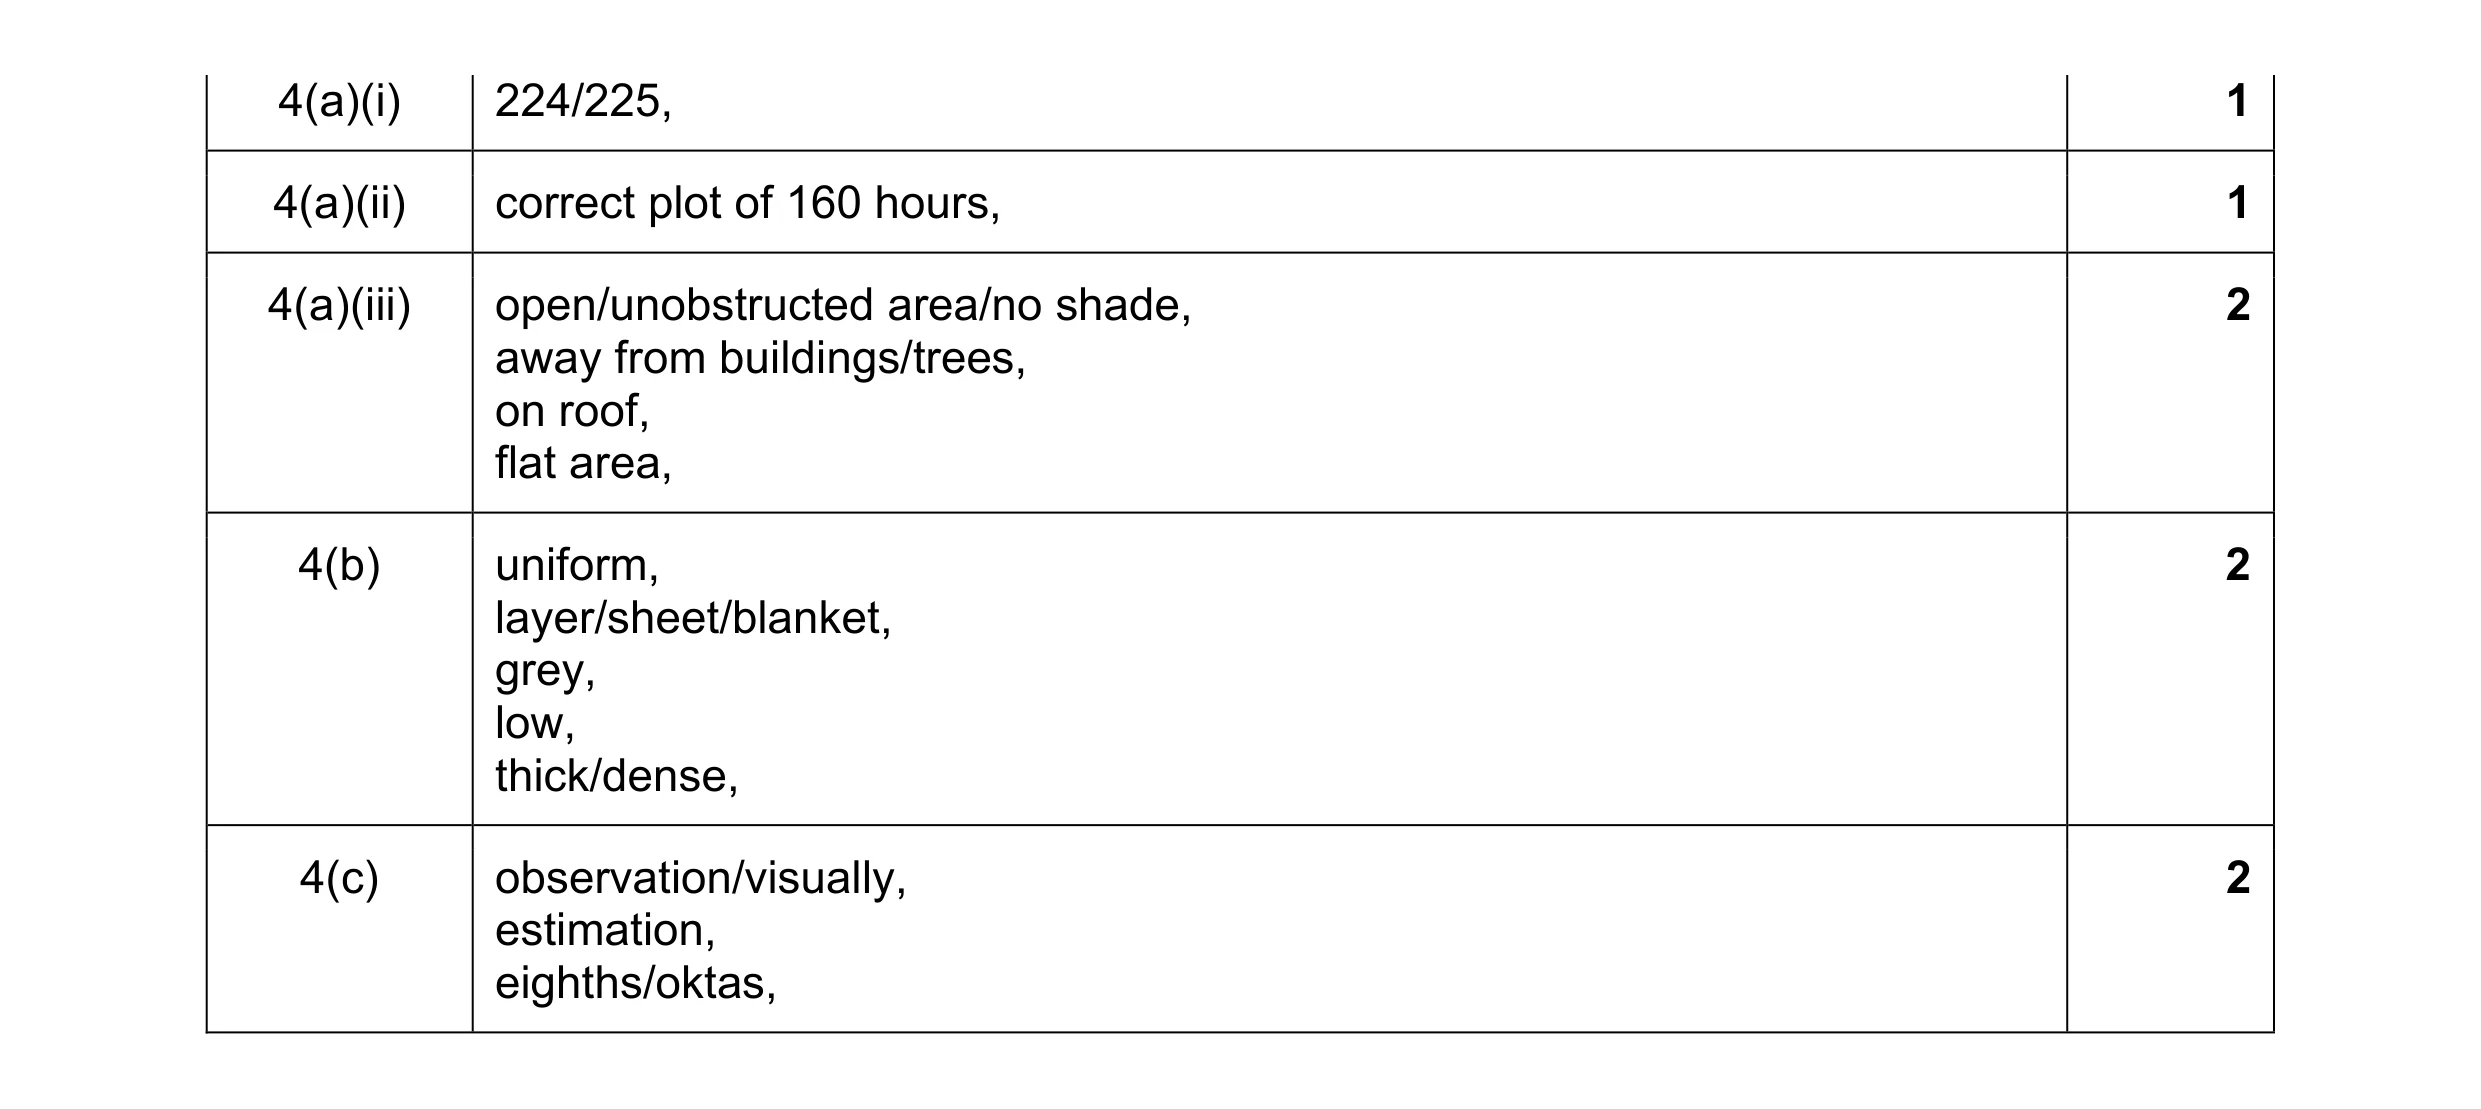 8
8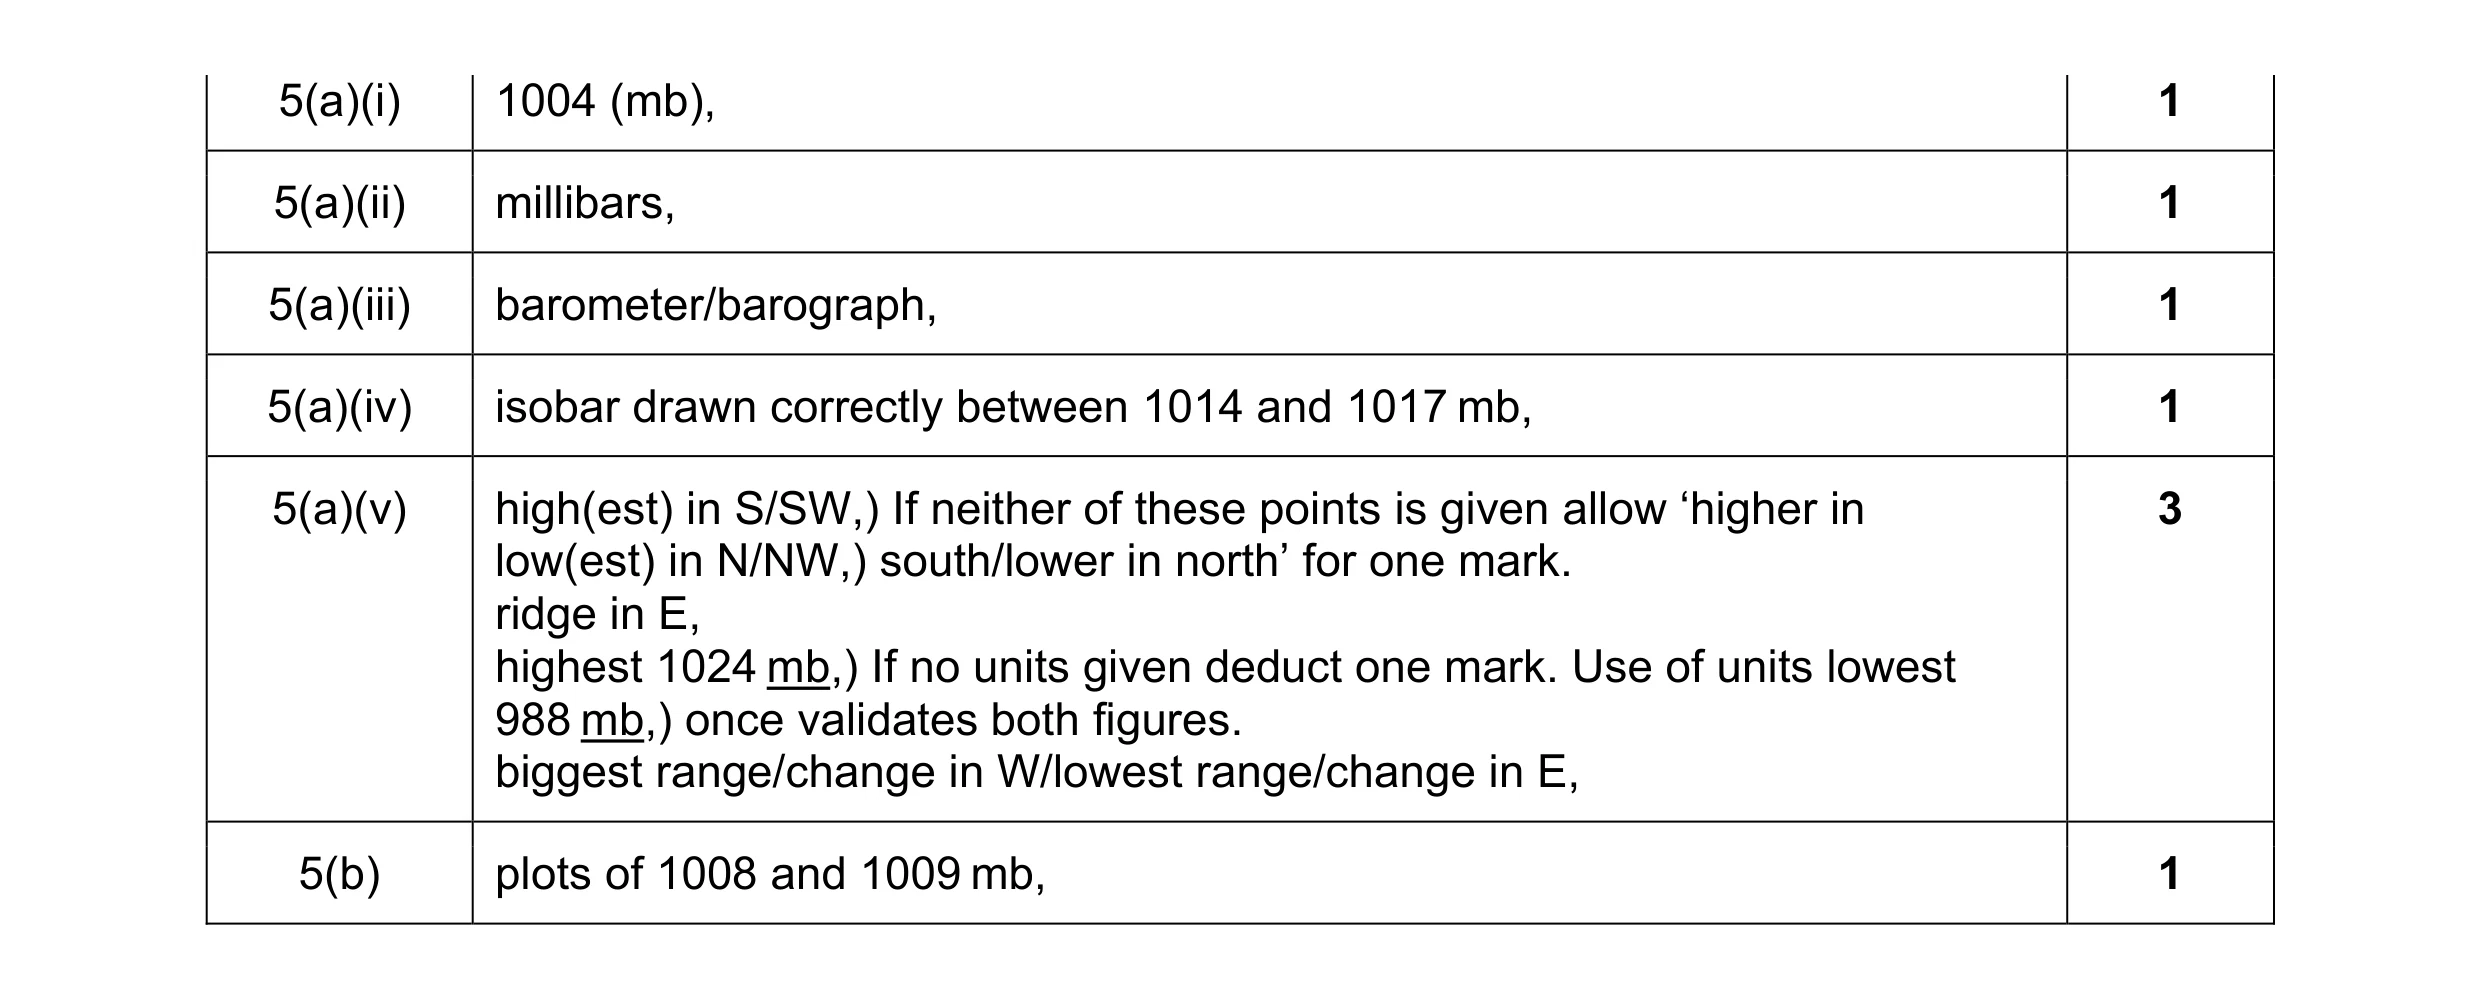 8
8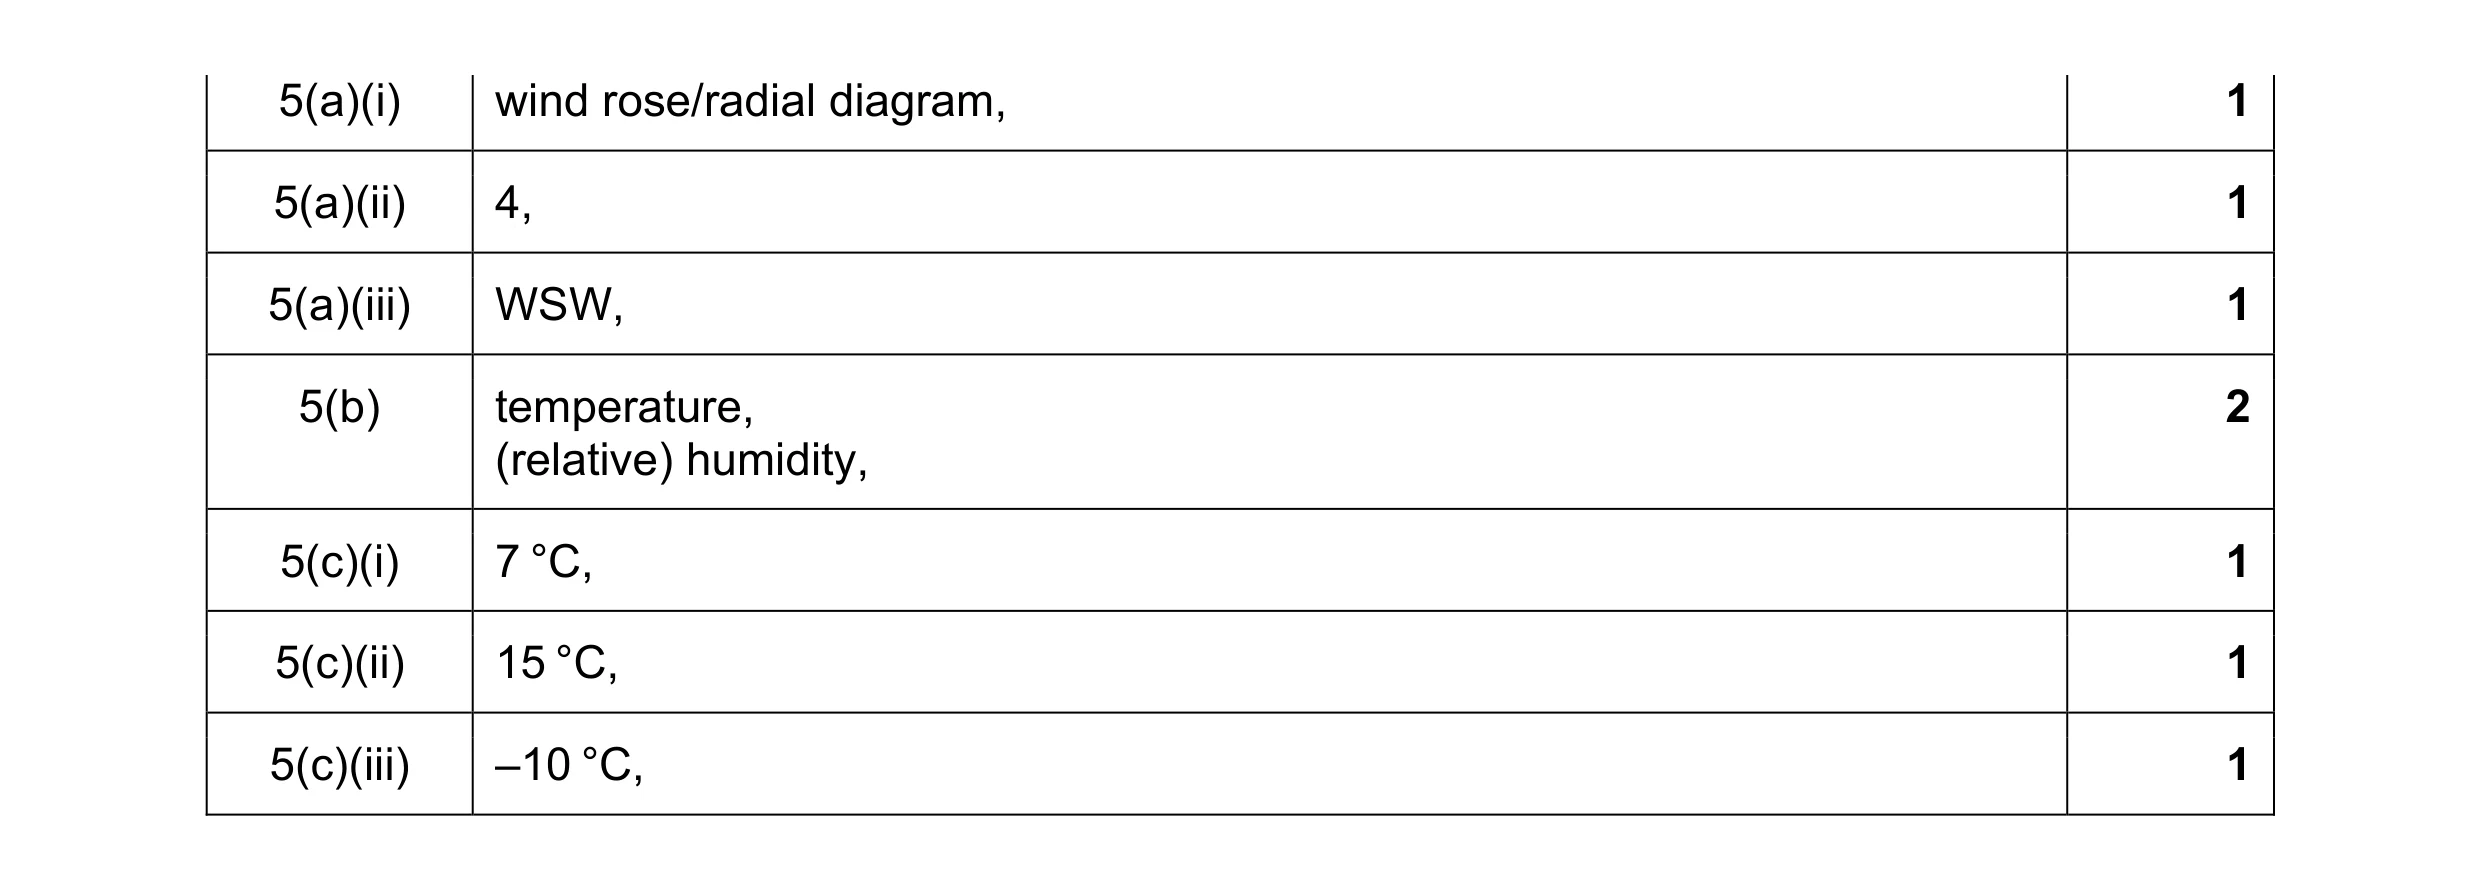 8
8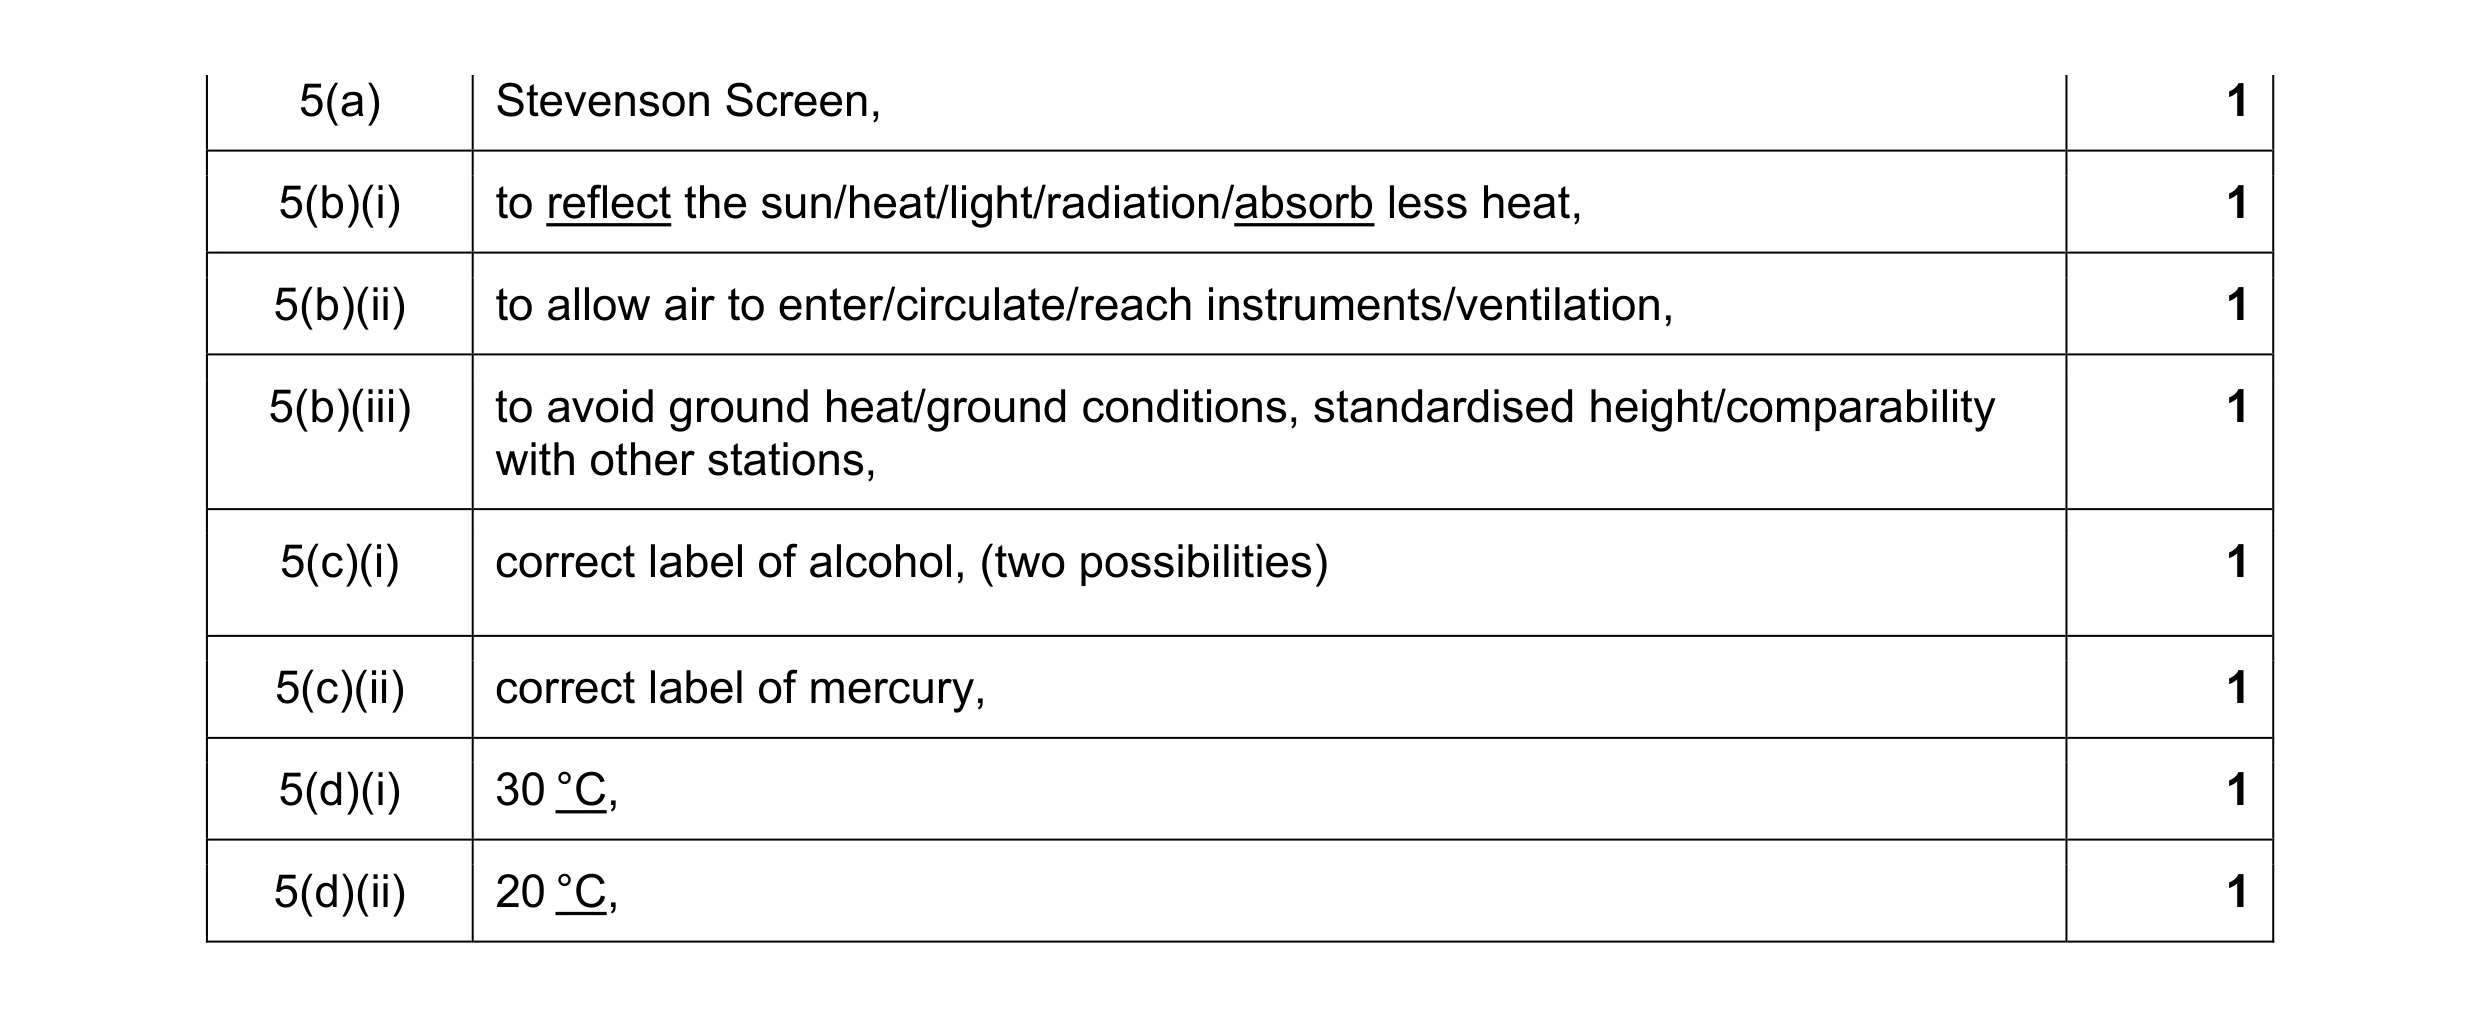 8
8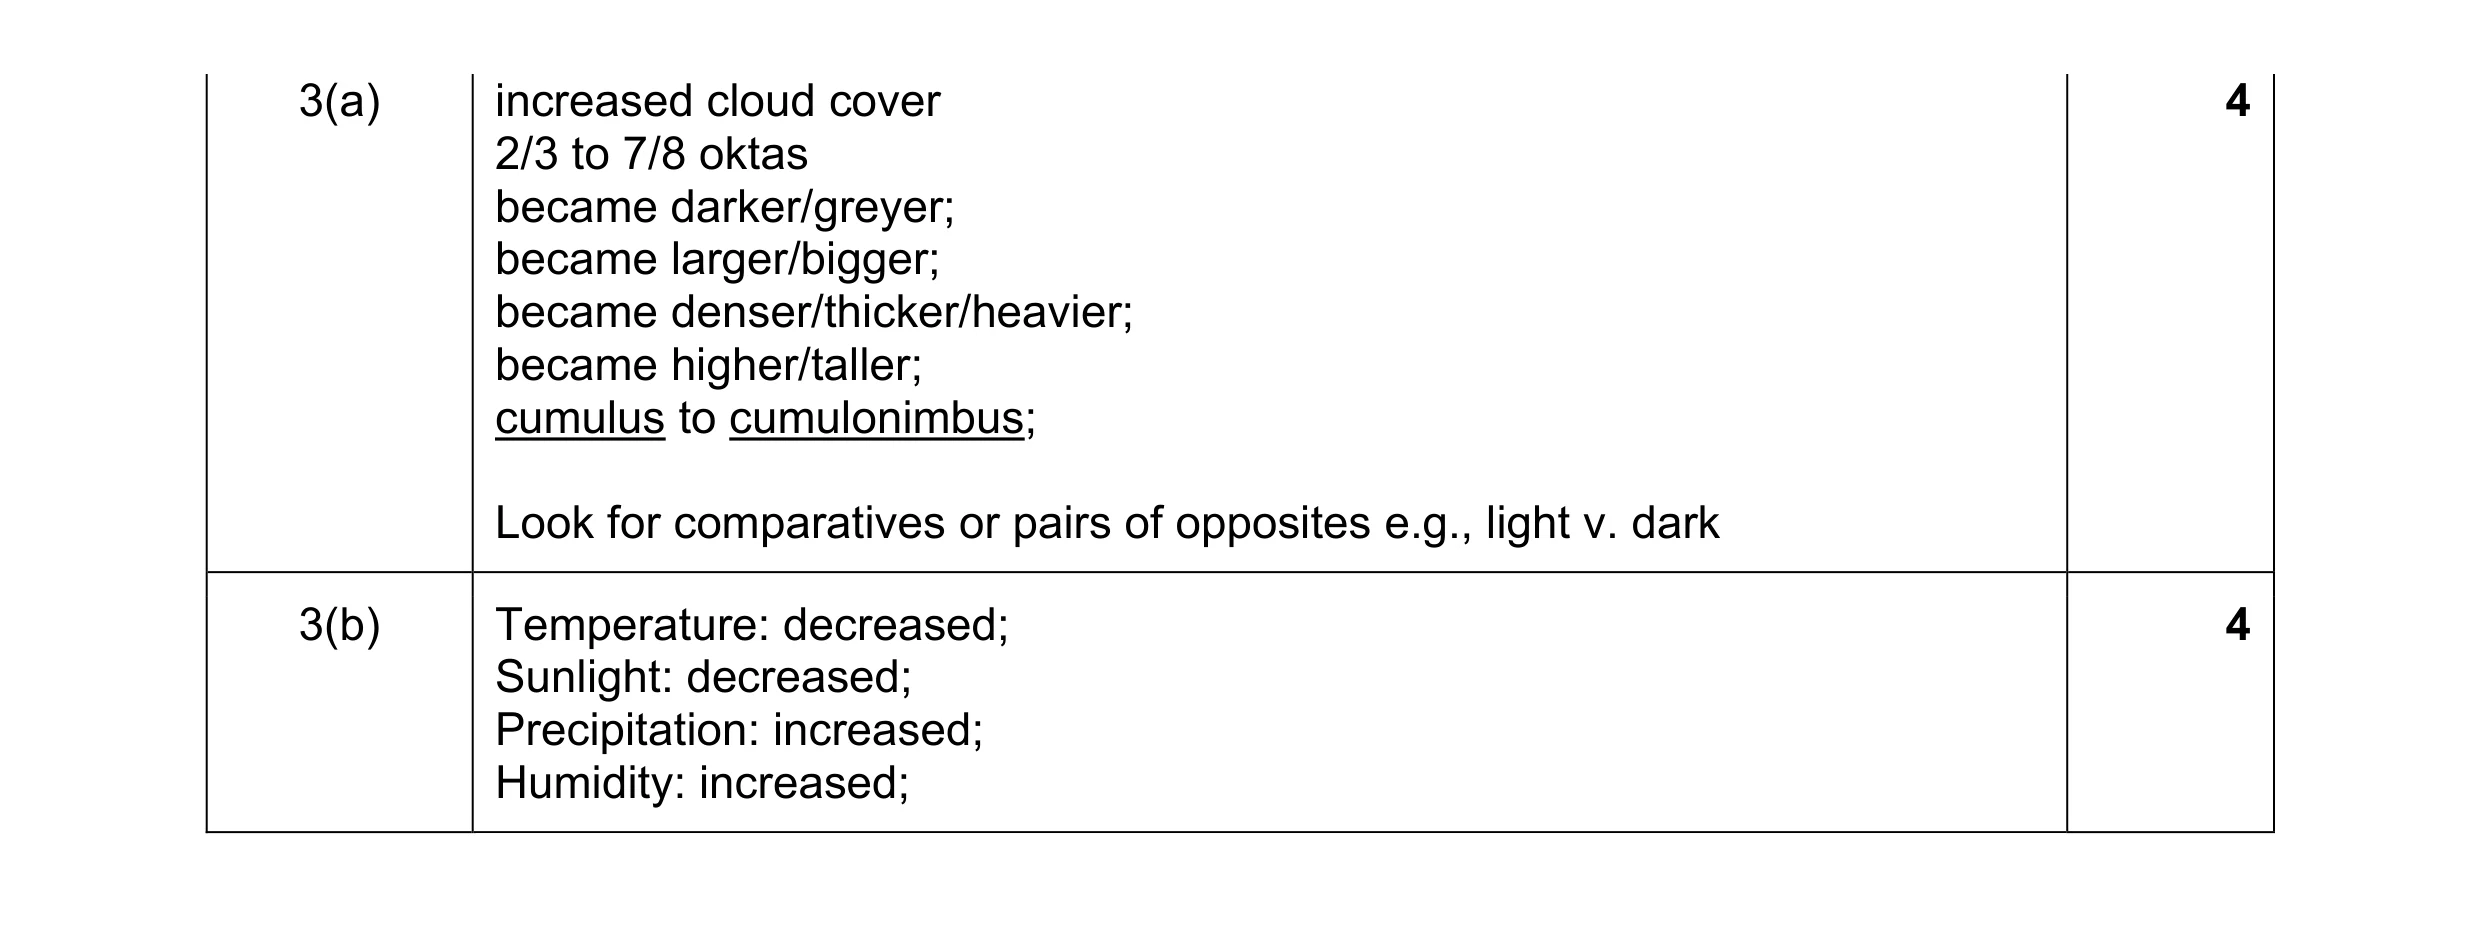 8
8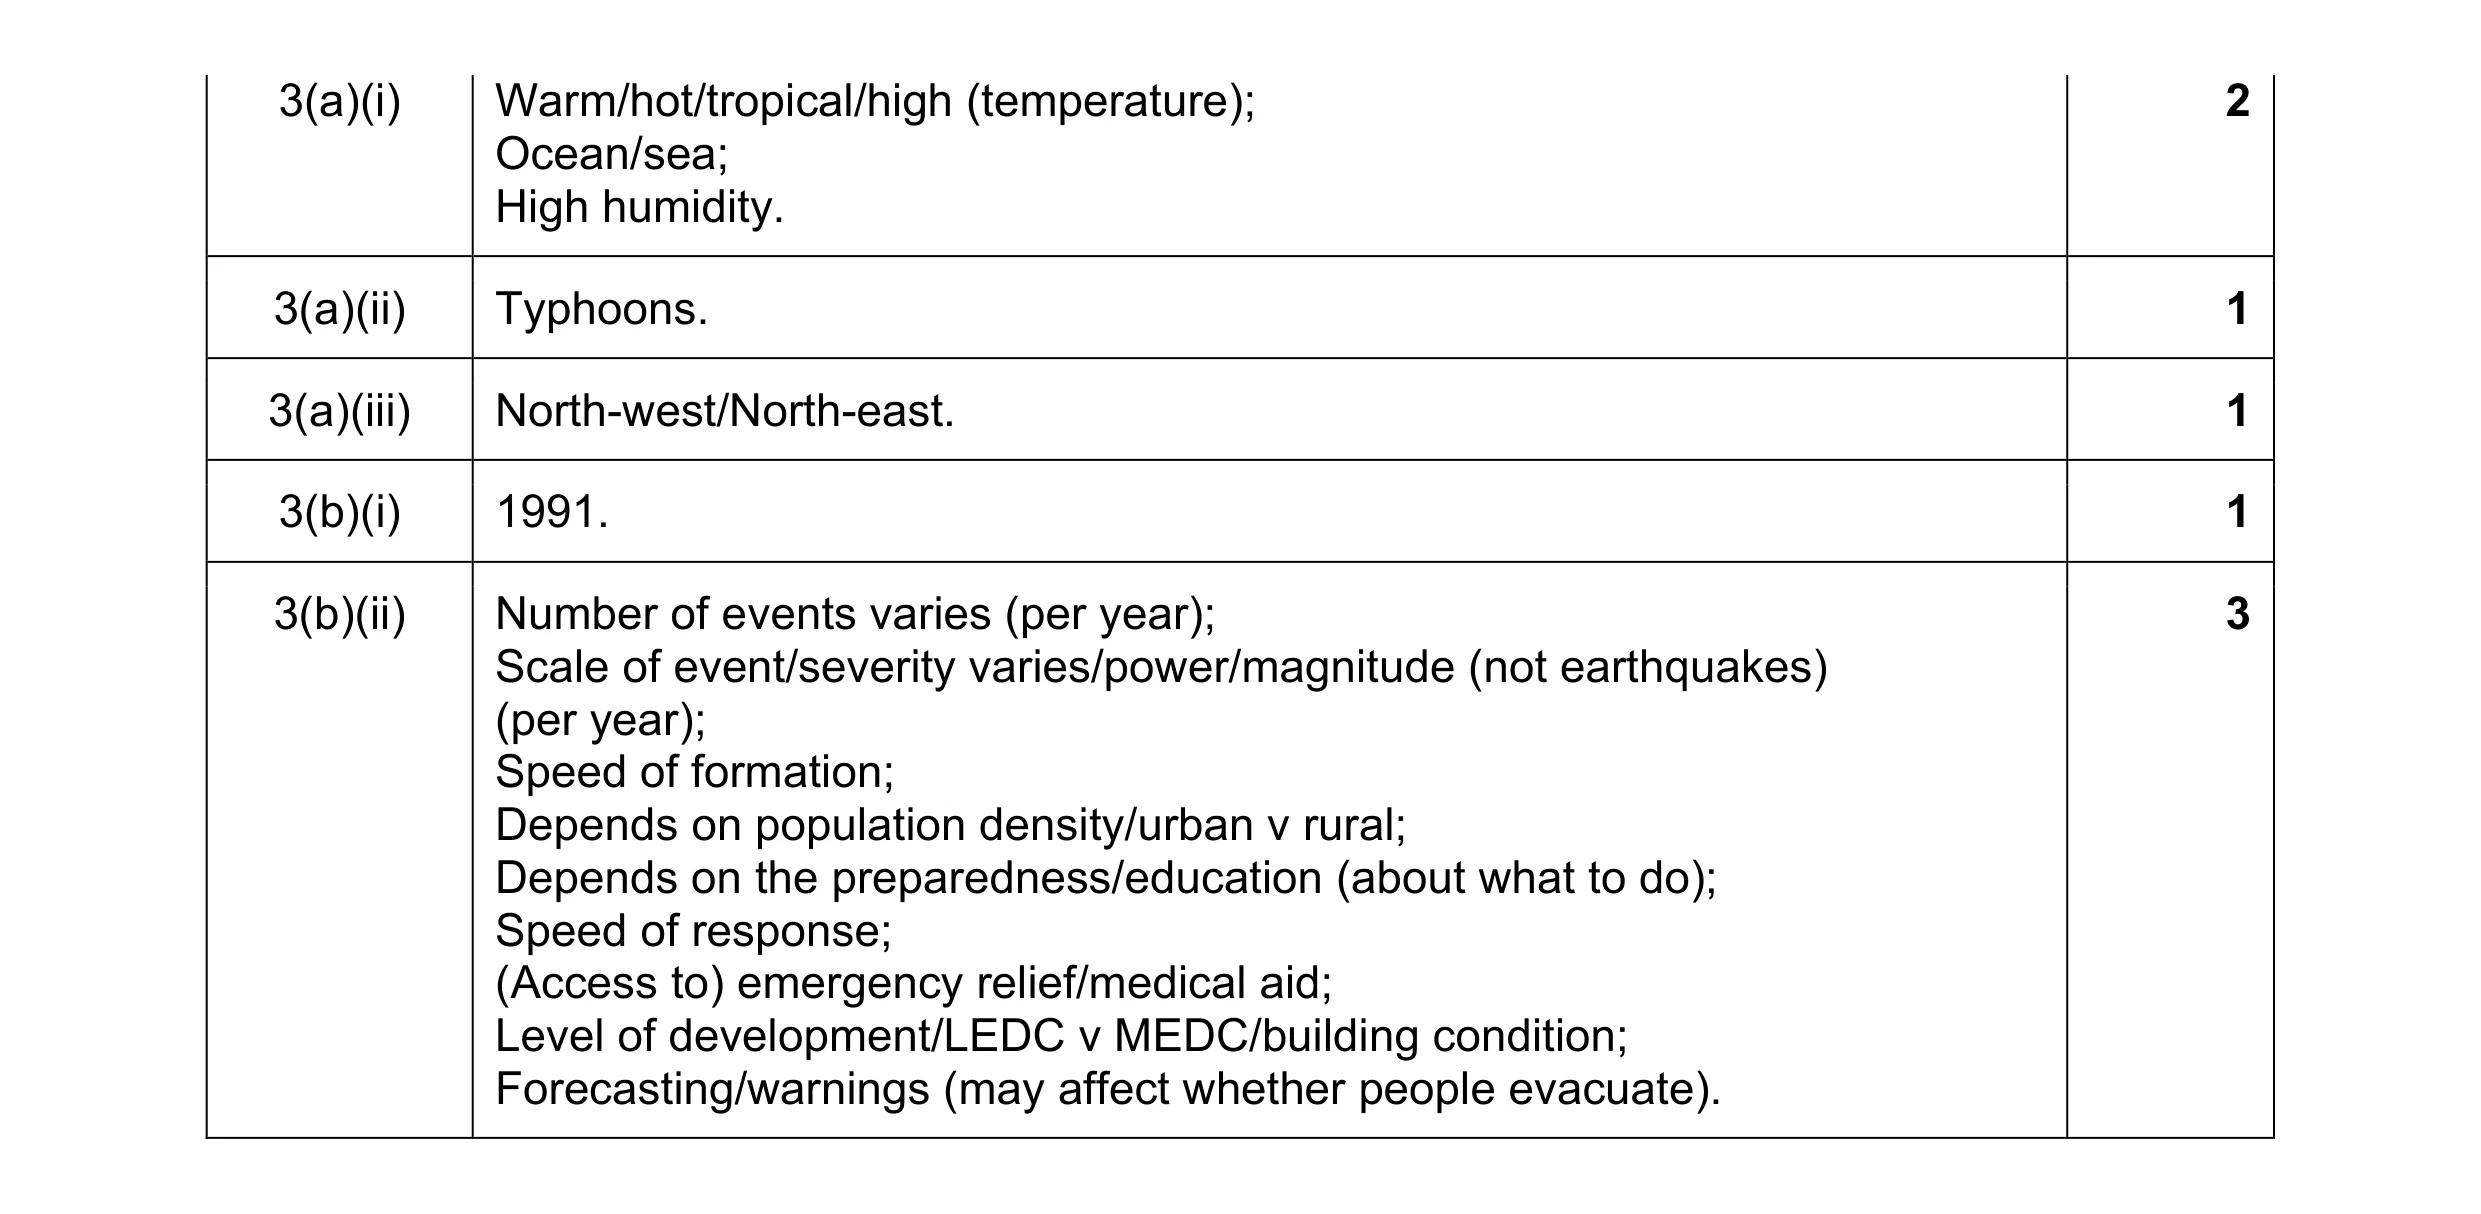 8
8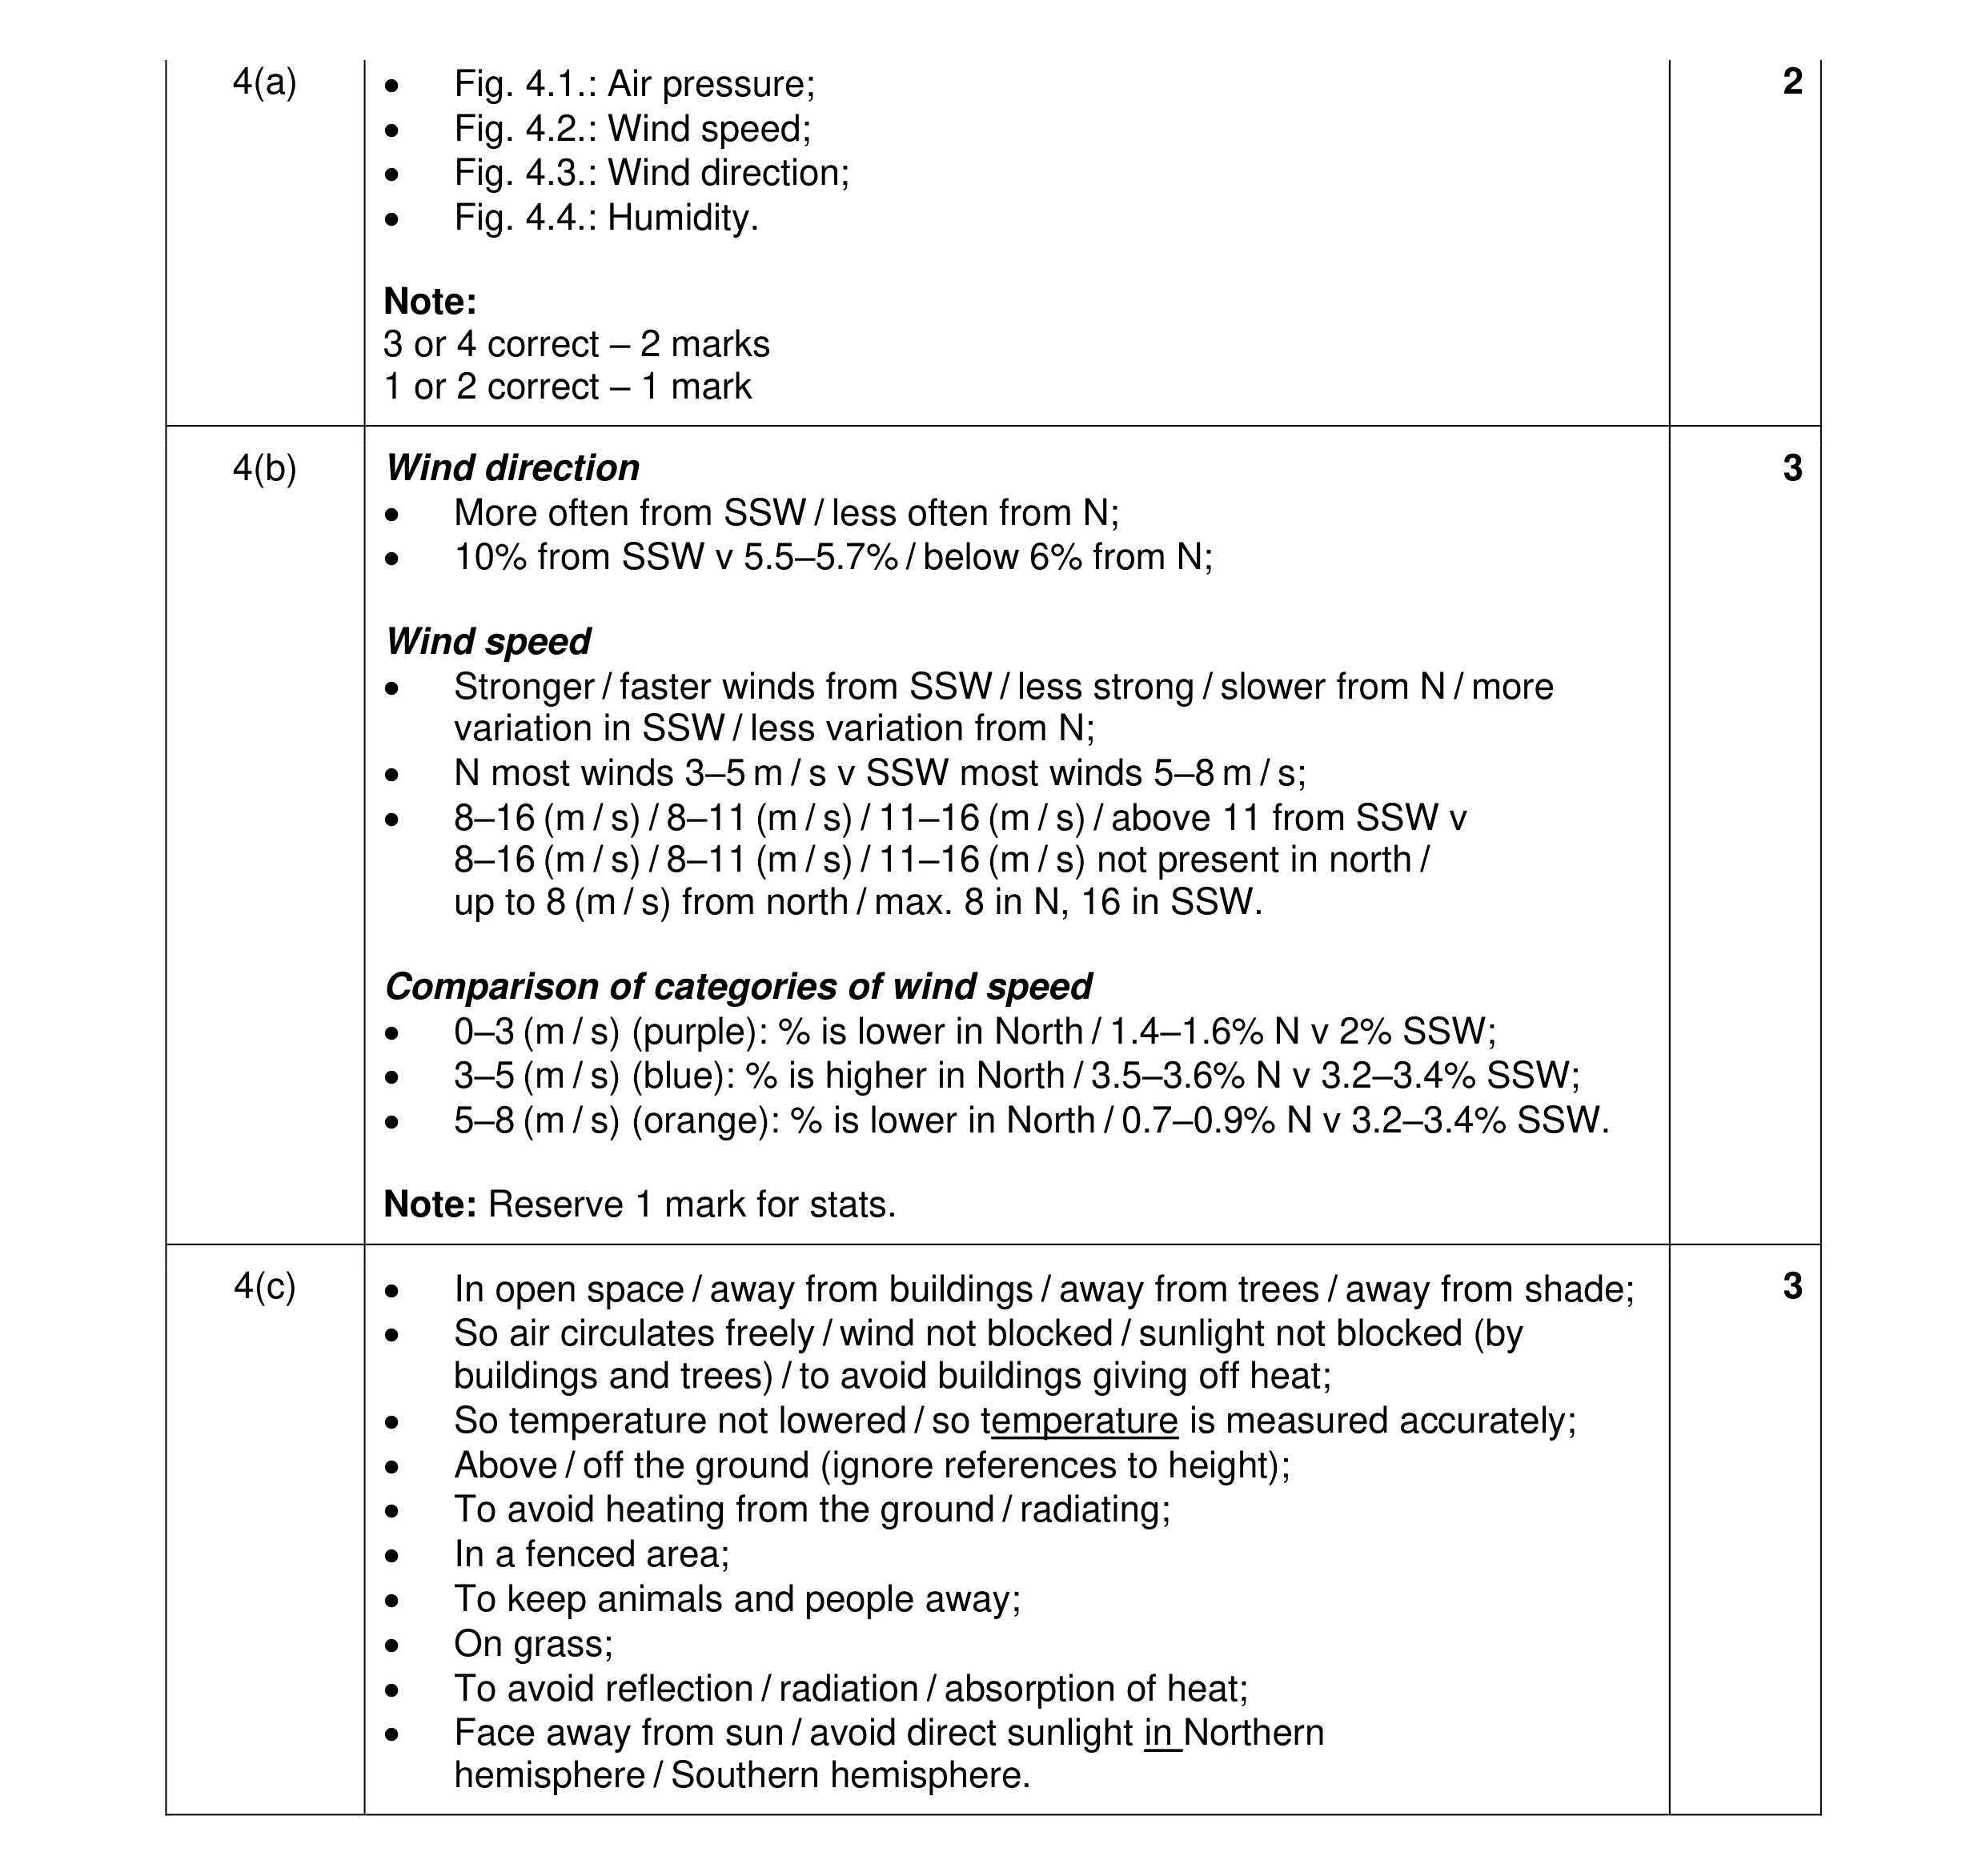 8
8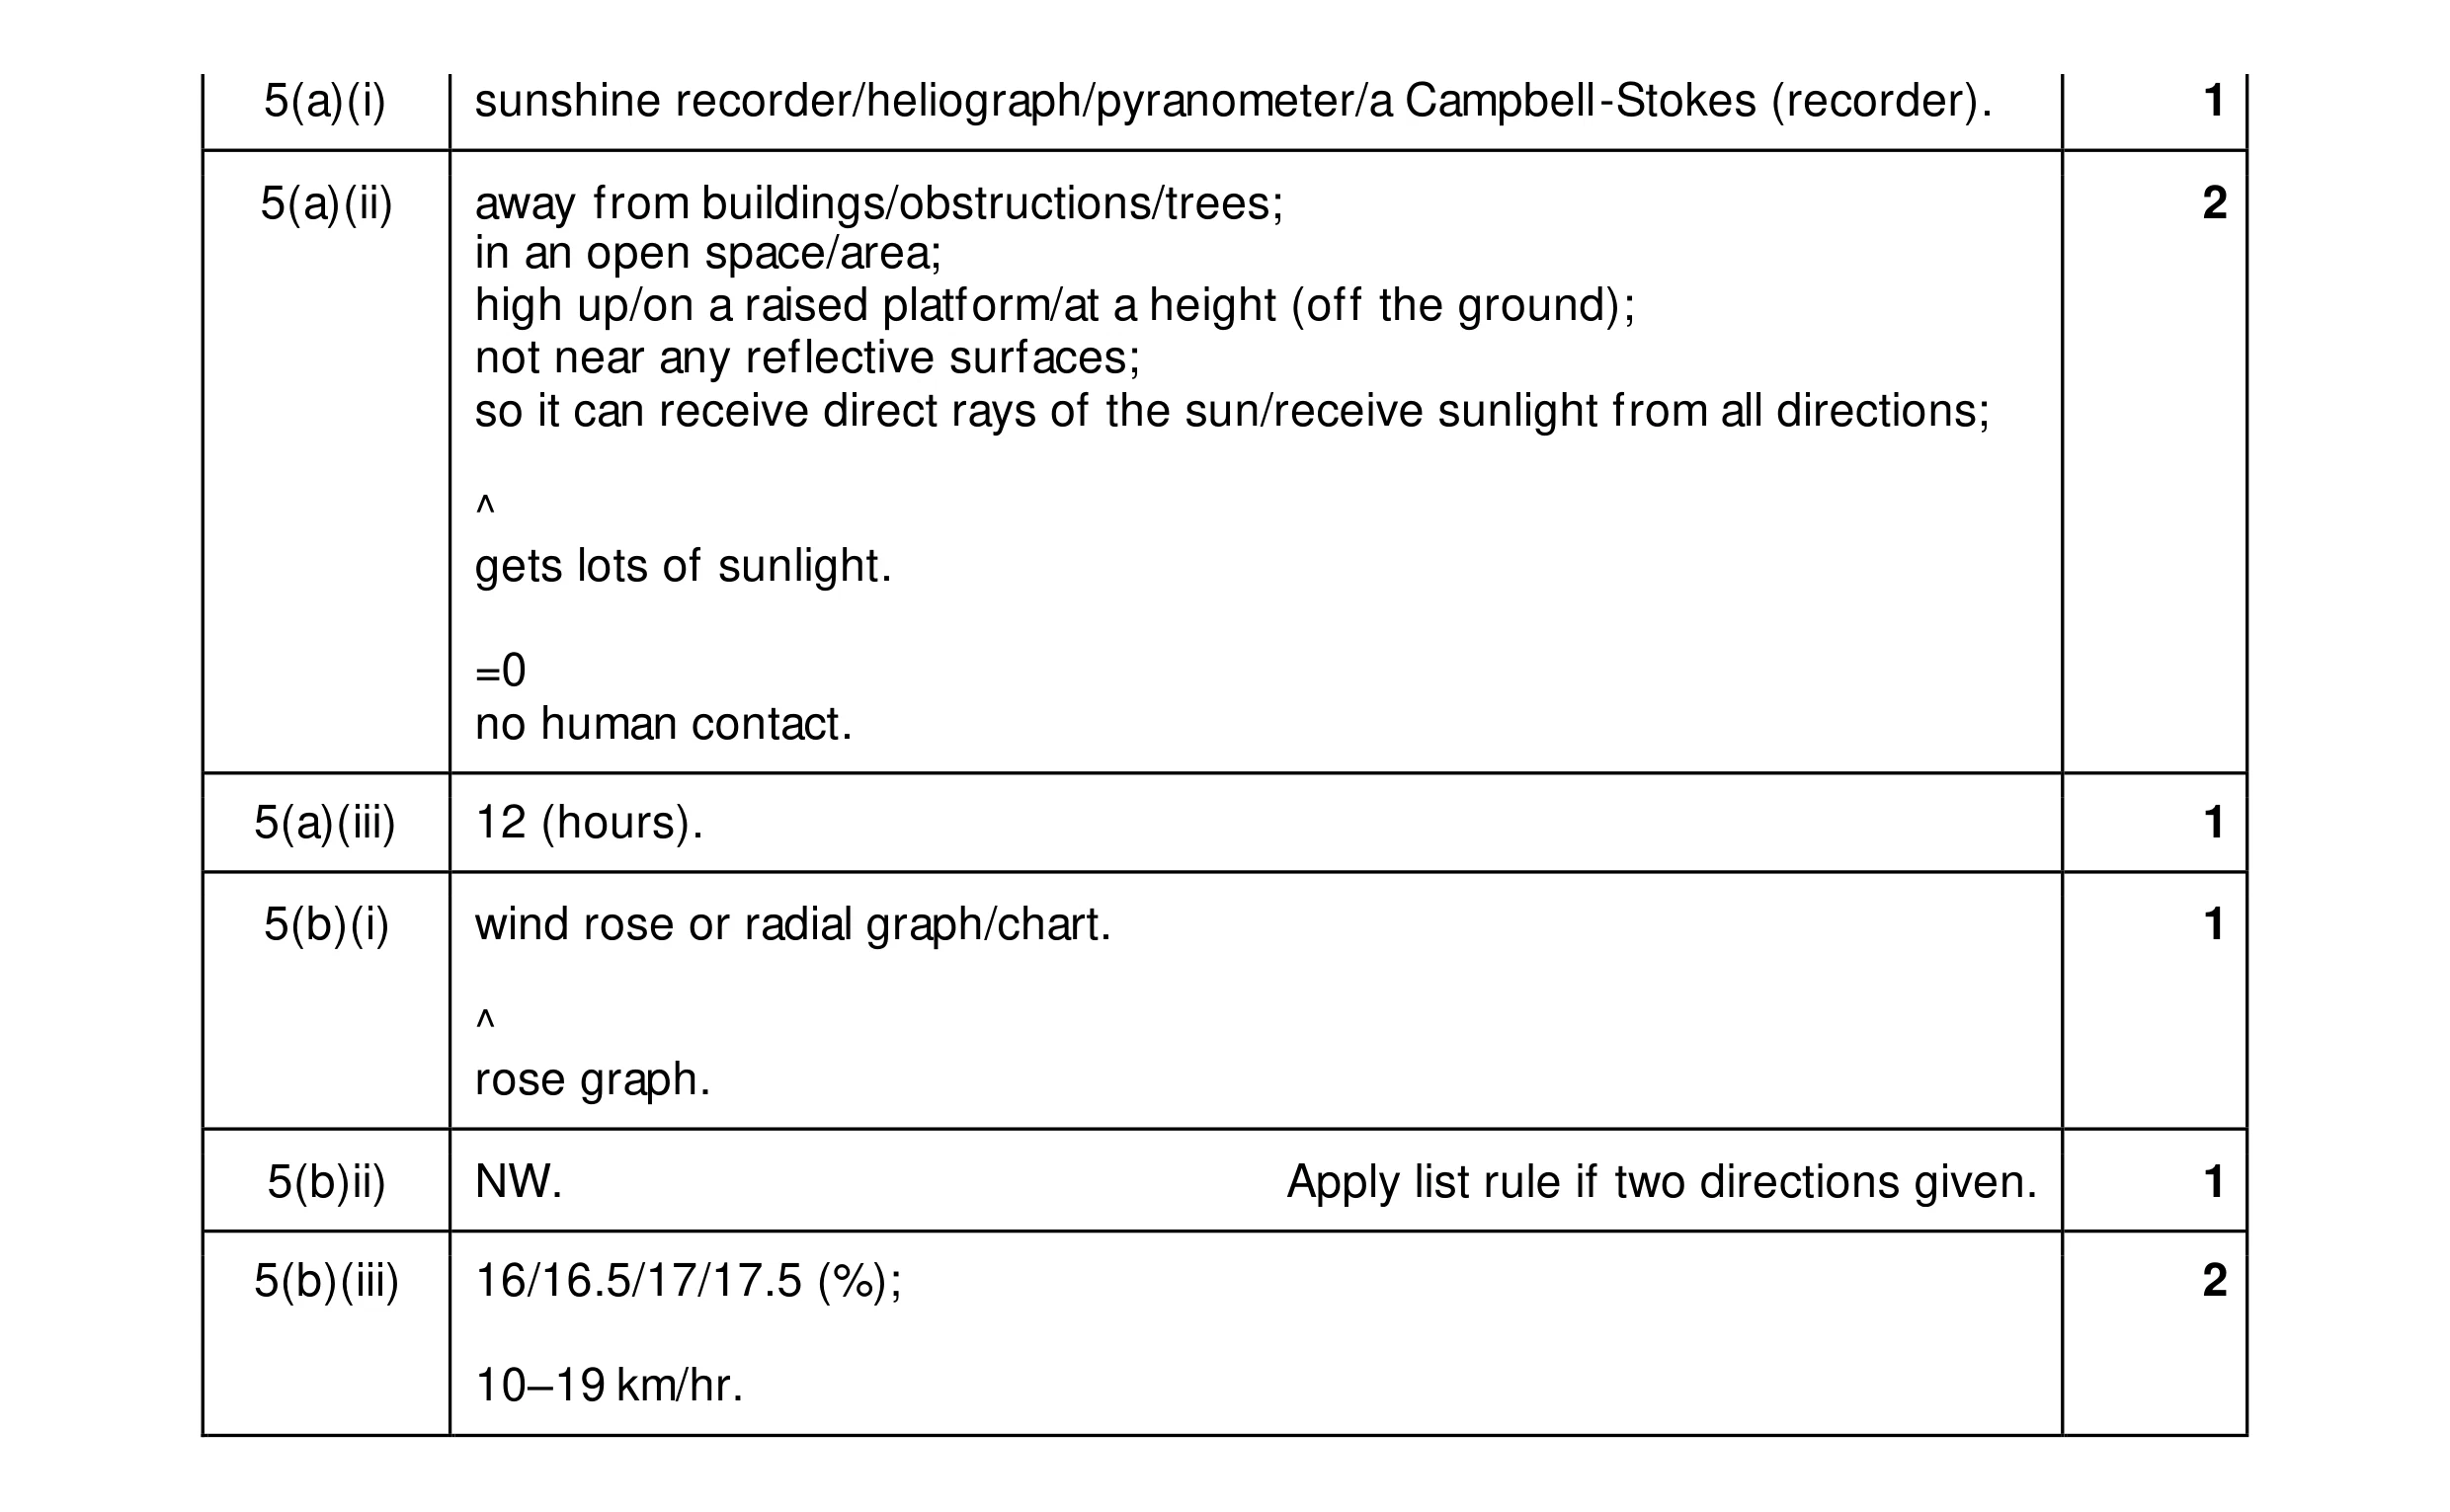 8
8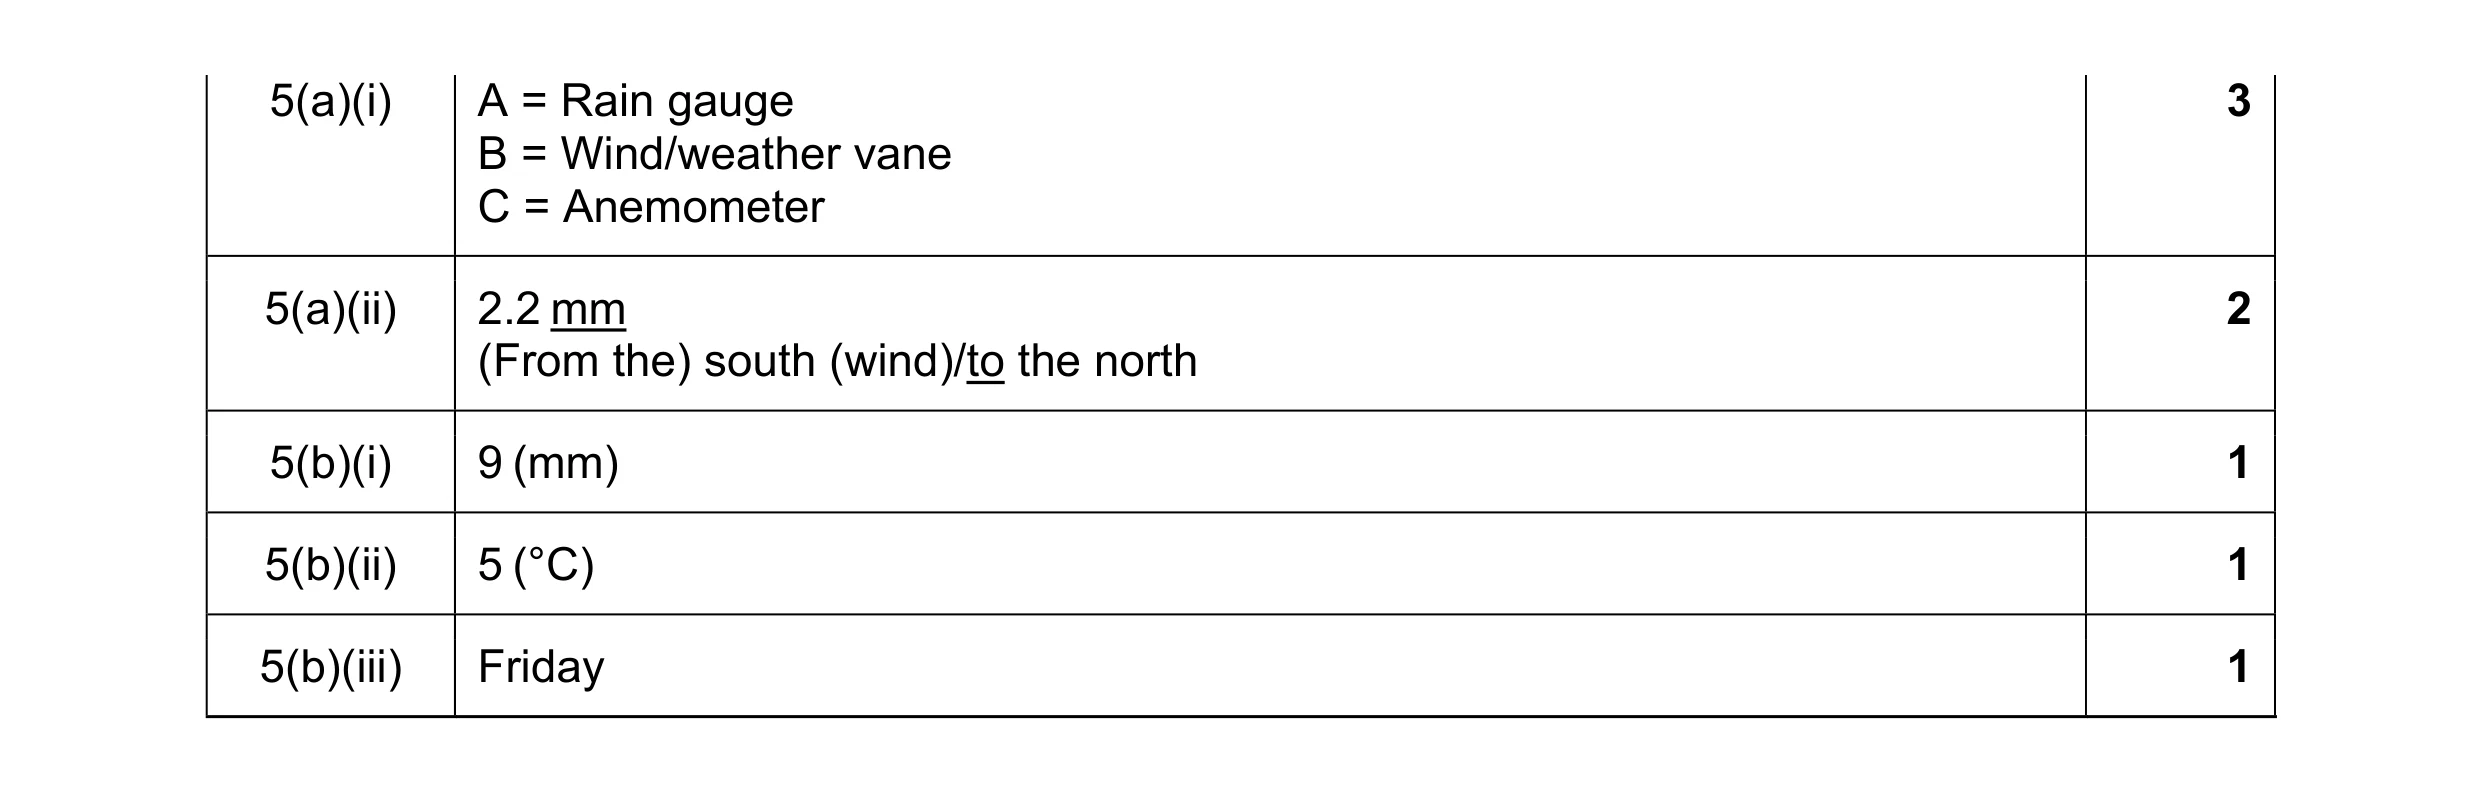 8
8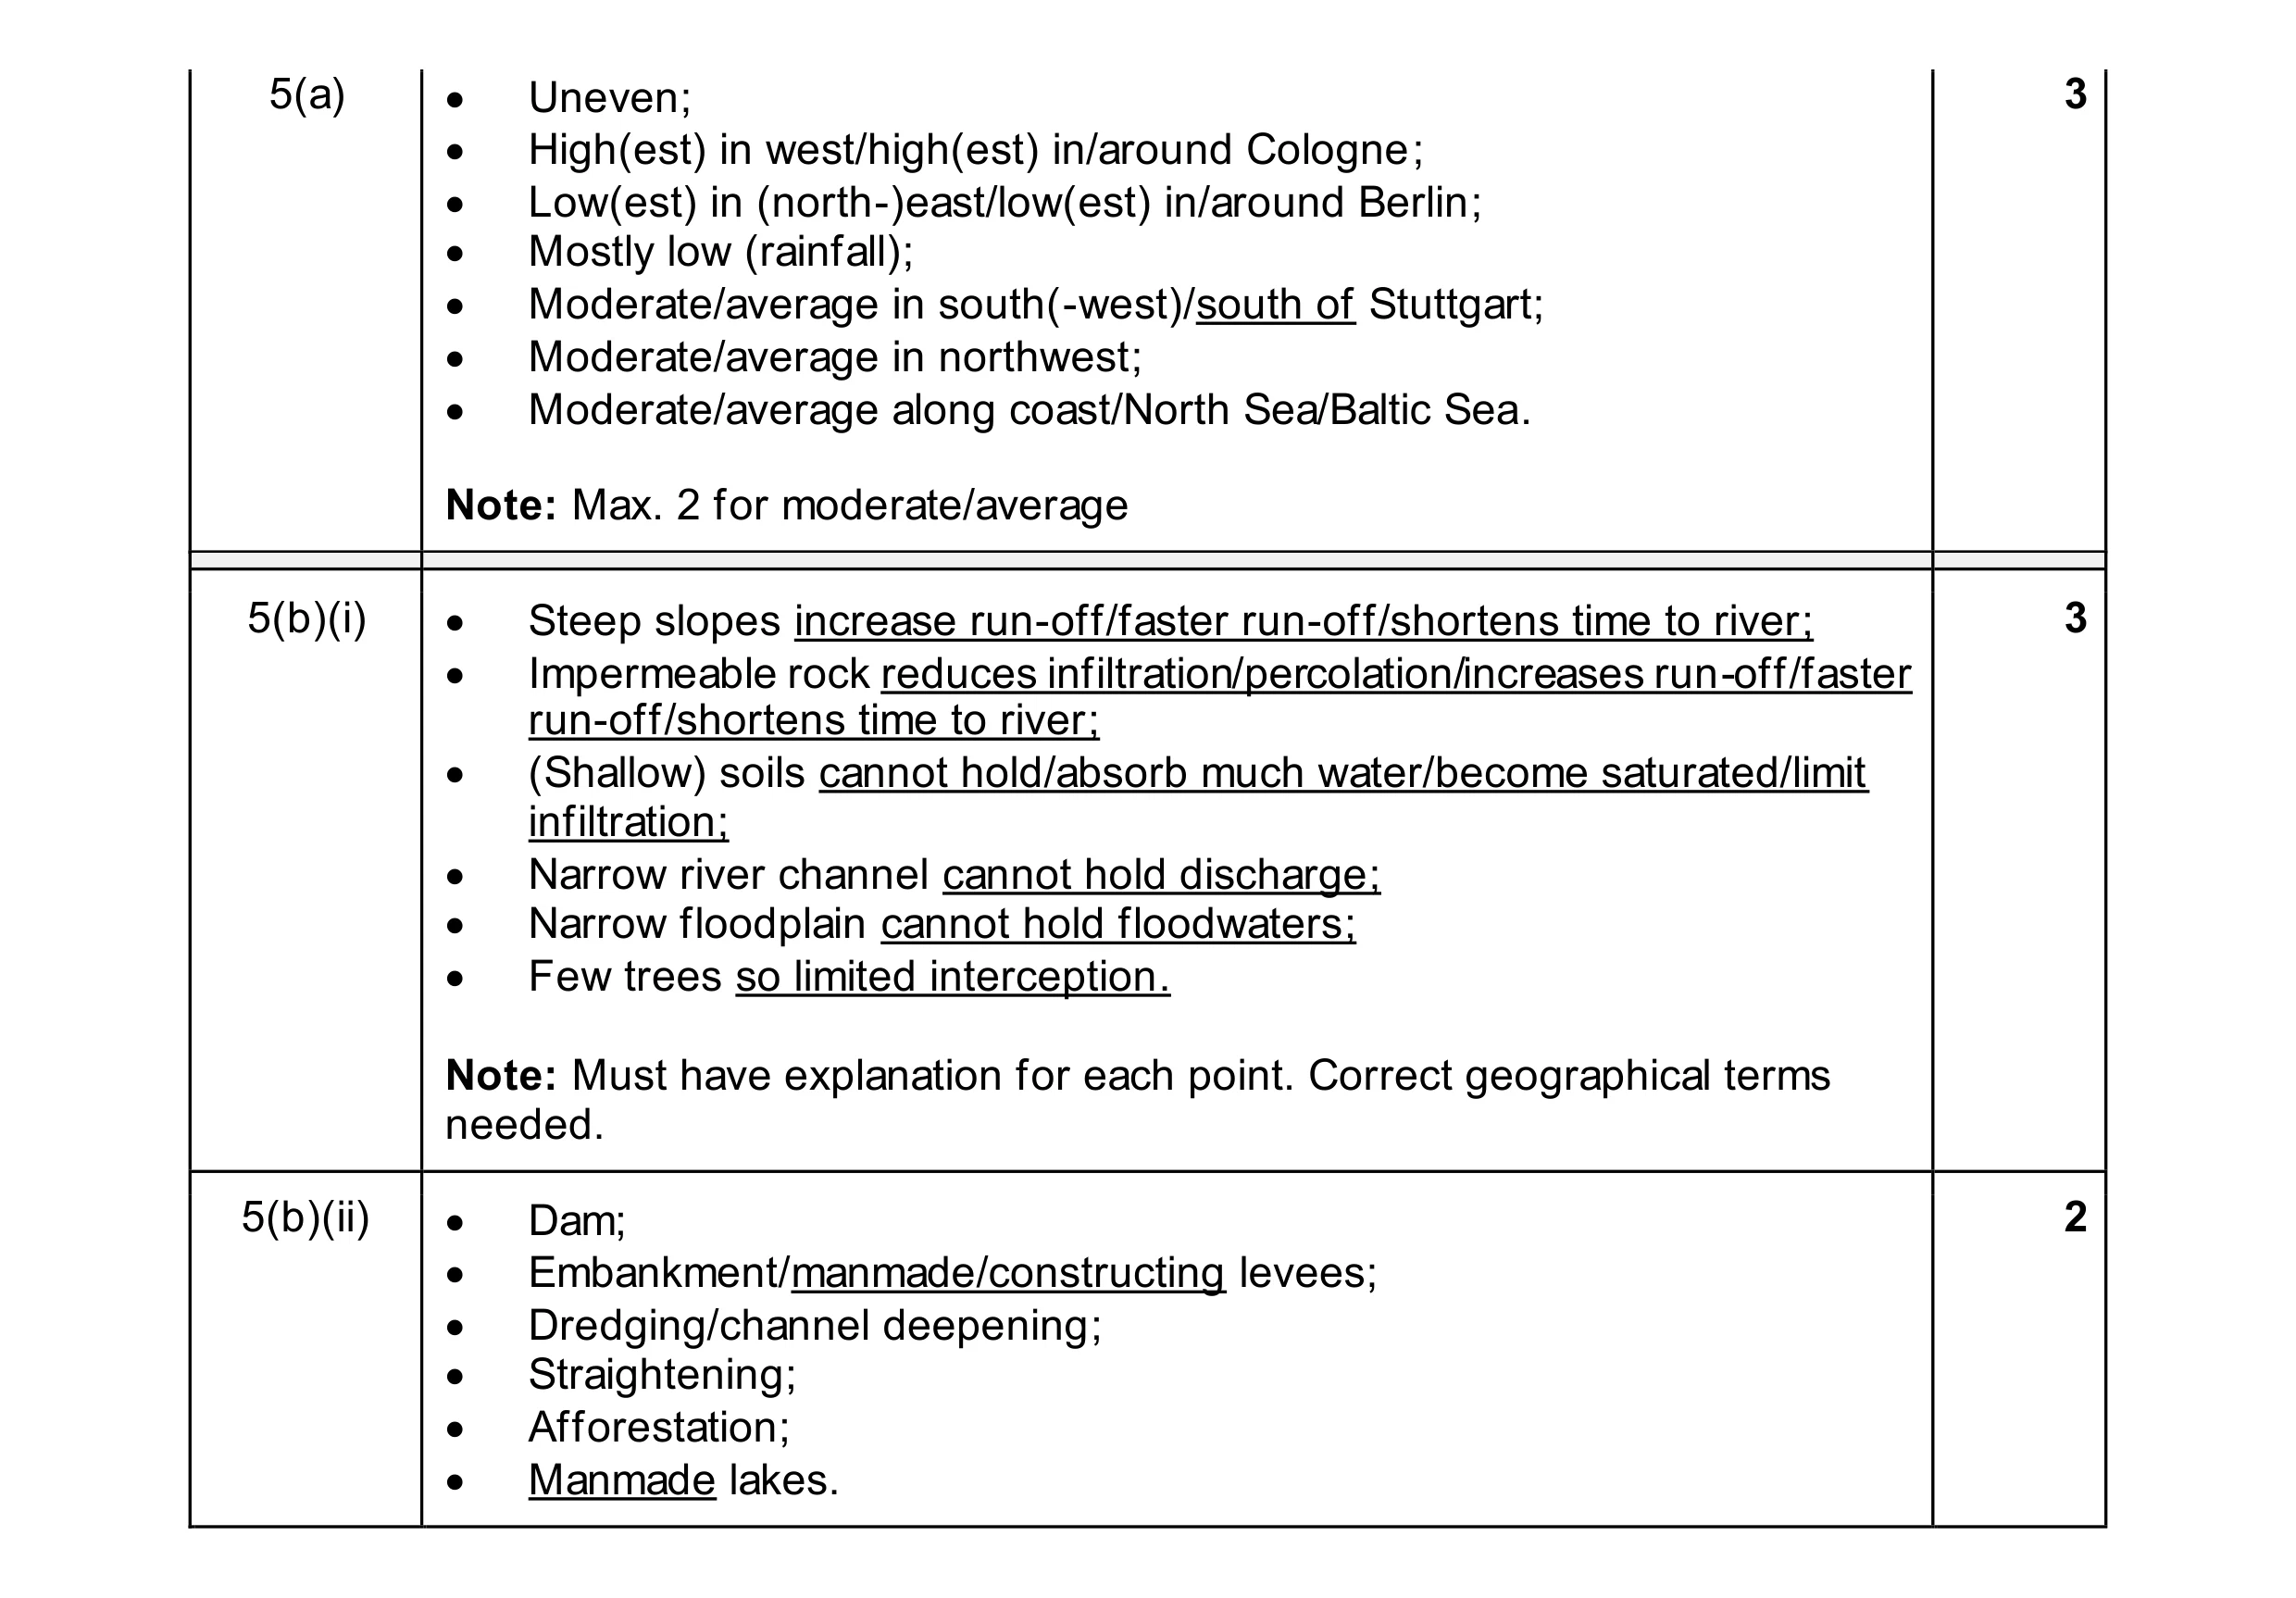 8
8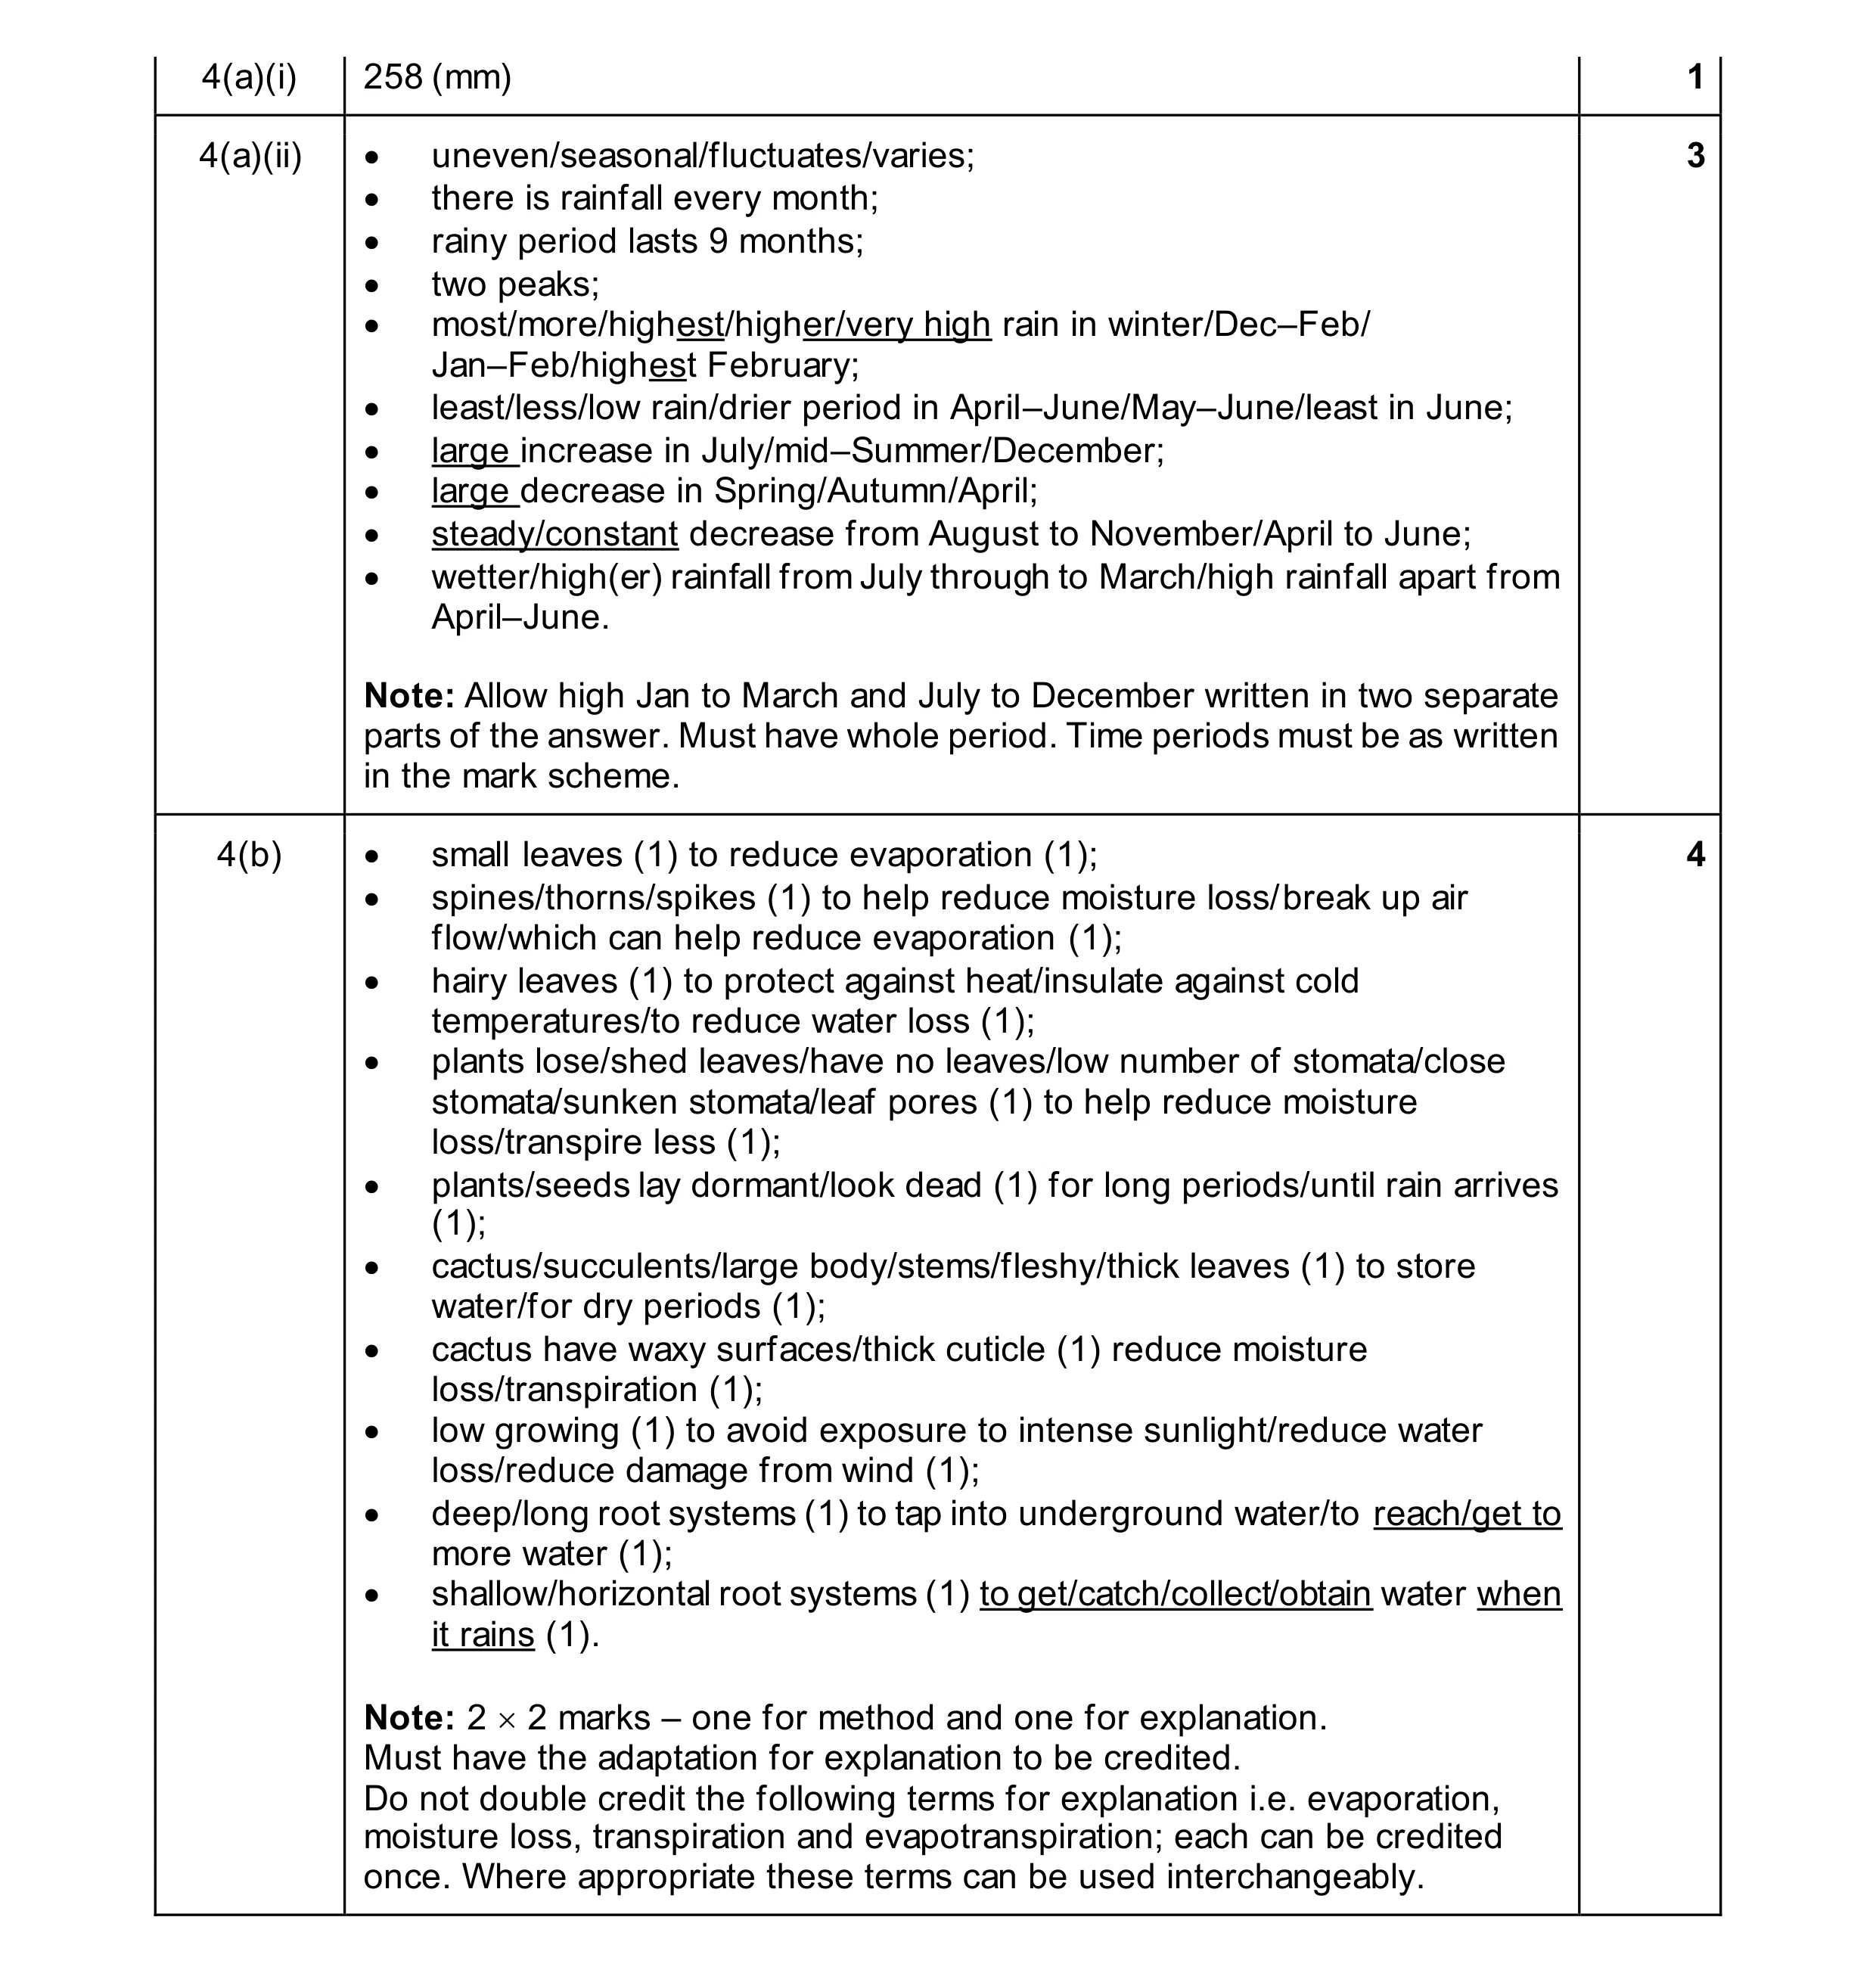 8
8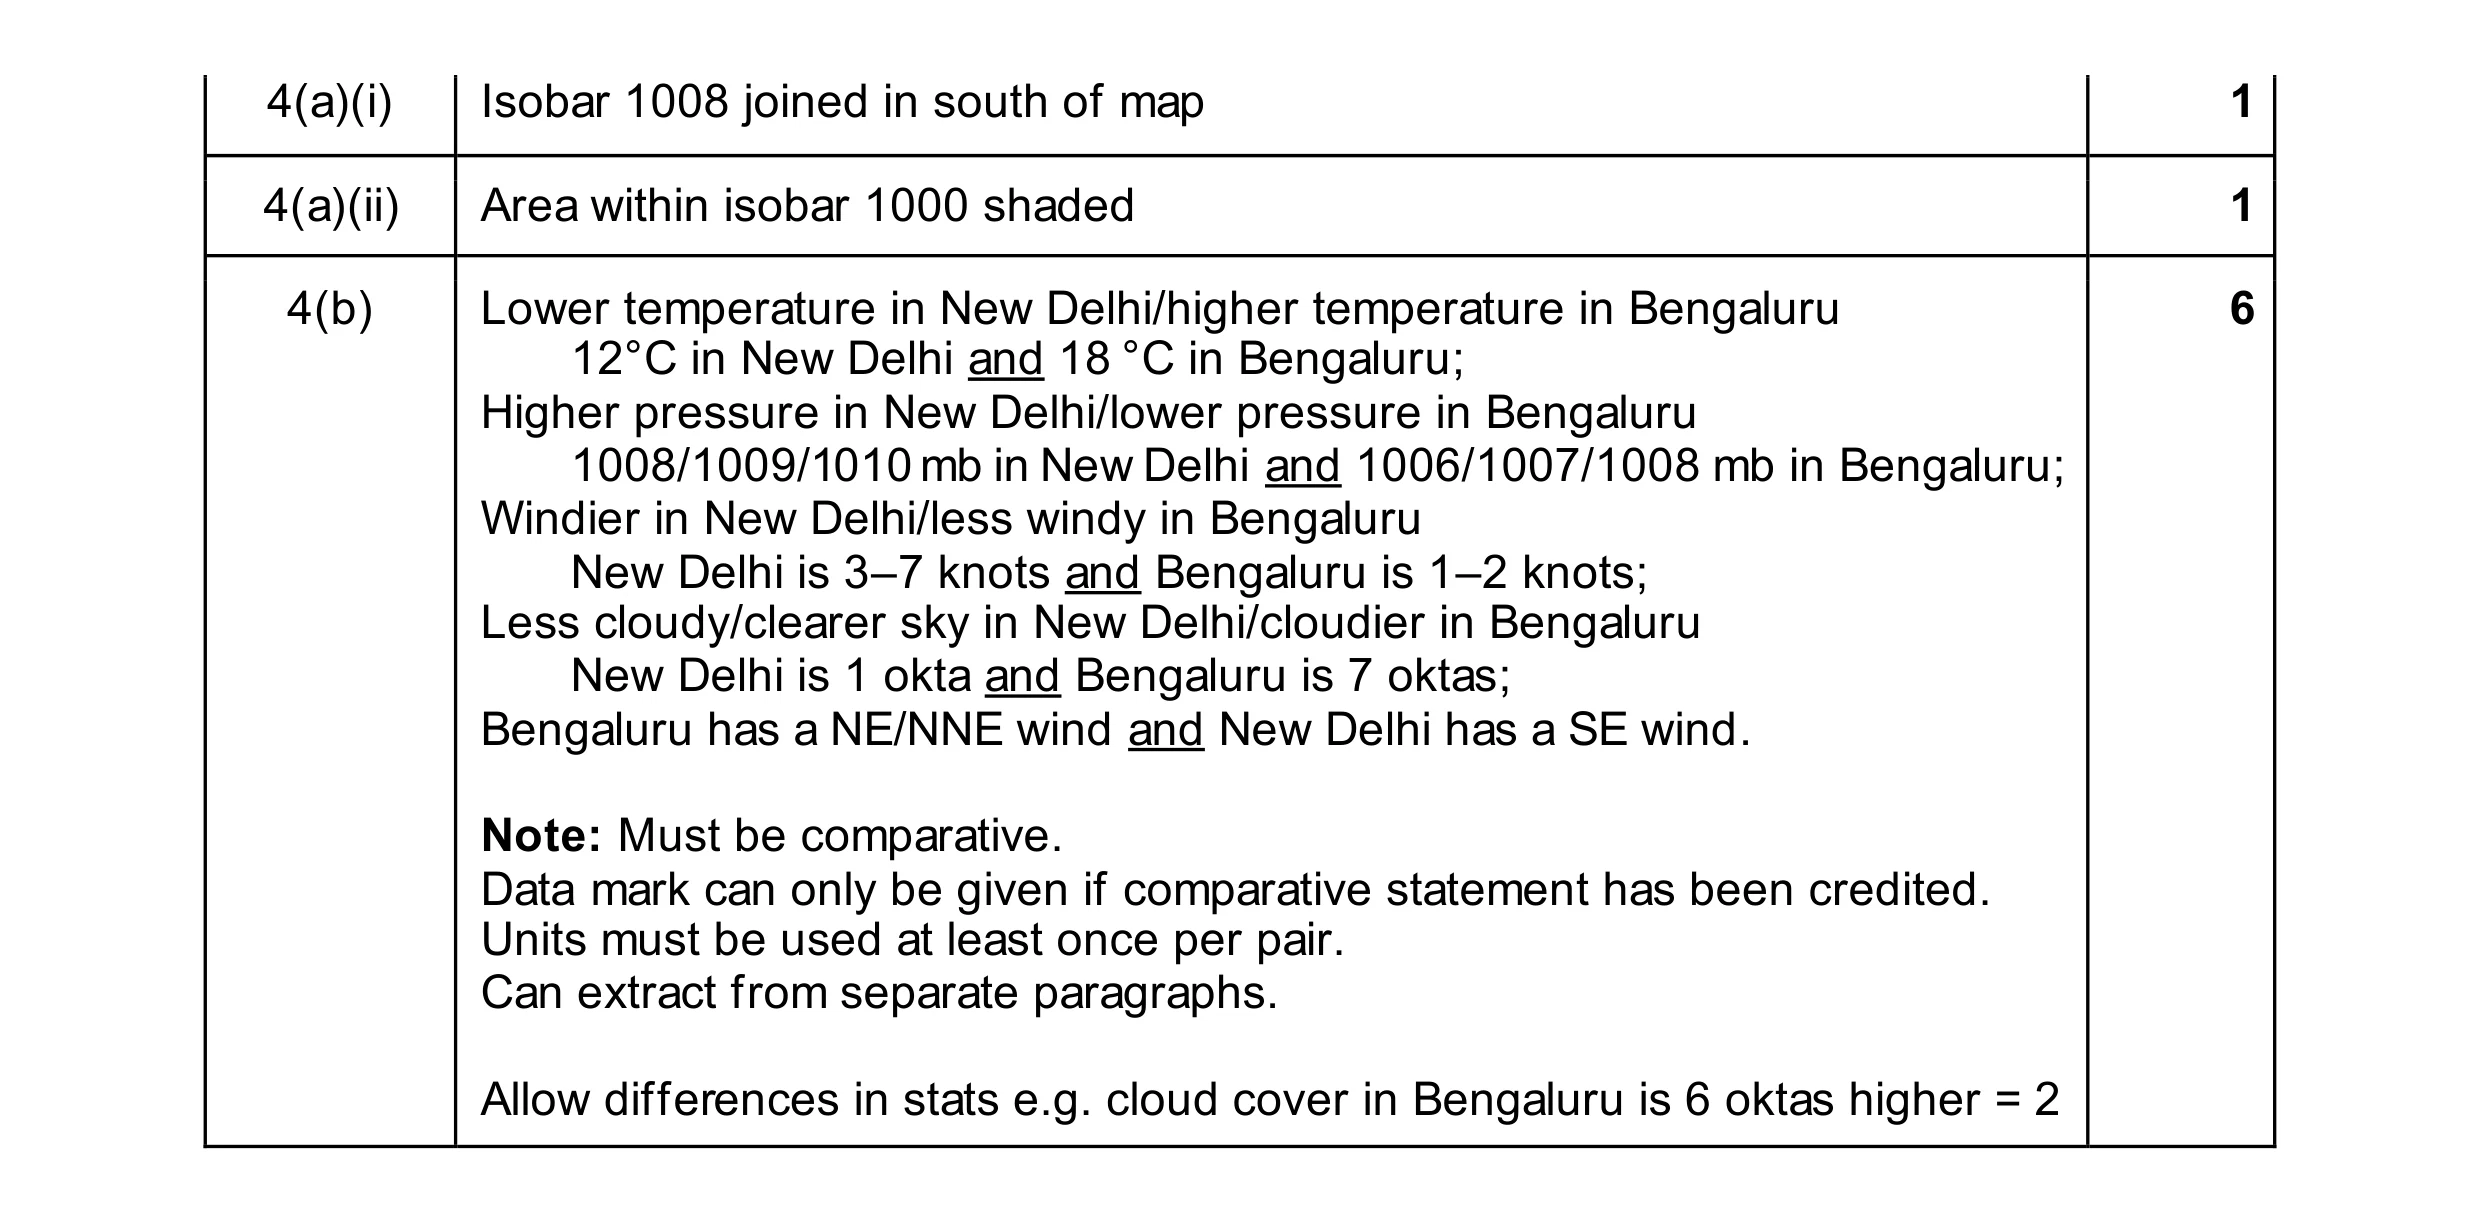 8
8