Cambridge IGCSE Geography 0460 — 2017 May/June Paper 2 · Variant 3
0460/23/M/J/17 · 6 questions · 60 marks · ≈68 min
The question paper and its mark scheme, free to read here and free to download. This is Cambridge’s own paper, exactly as it was sat.
Question paper16 pages



Mark scheme7 pages
Answers below. Sit the paper first if you are practising.
Questions as text
Q1 · Study the map extract, which is for Lillehammer, Norway
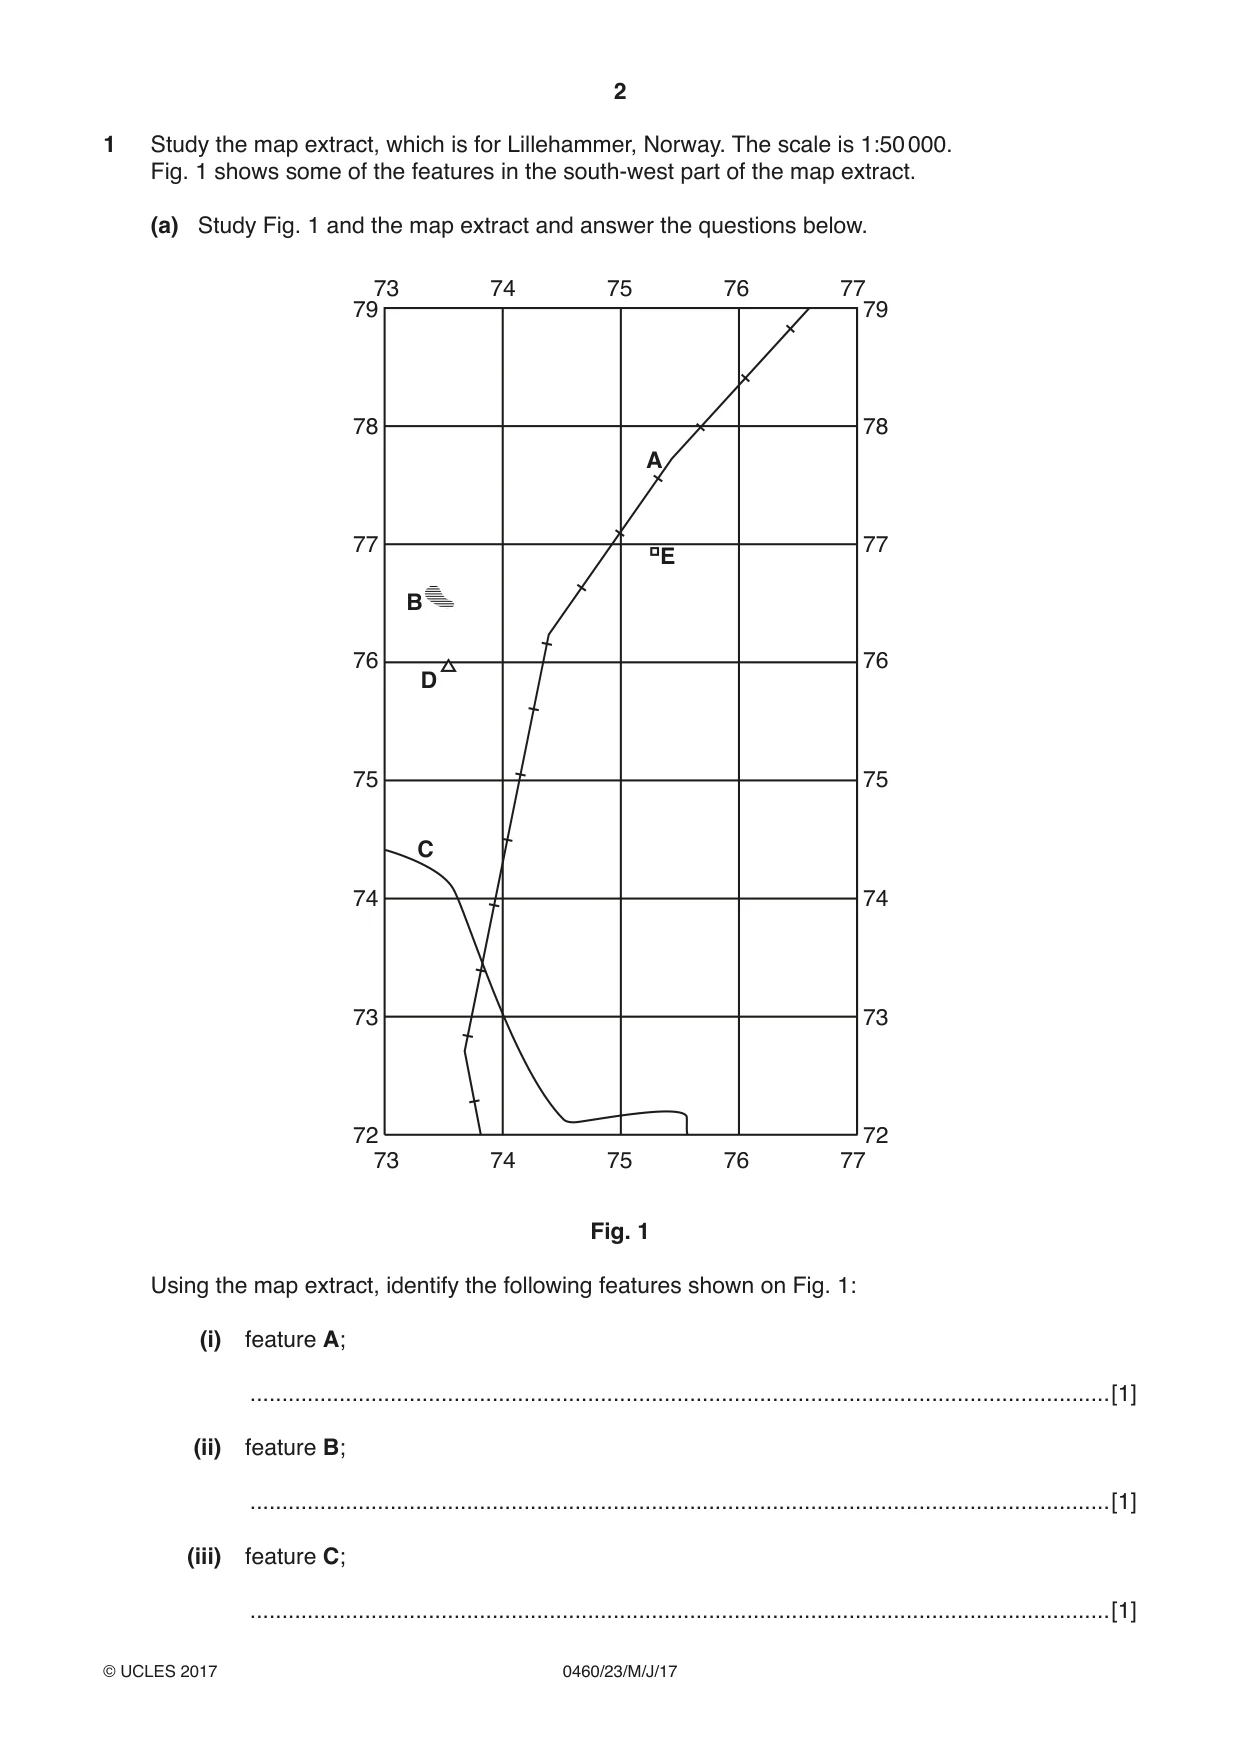
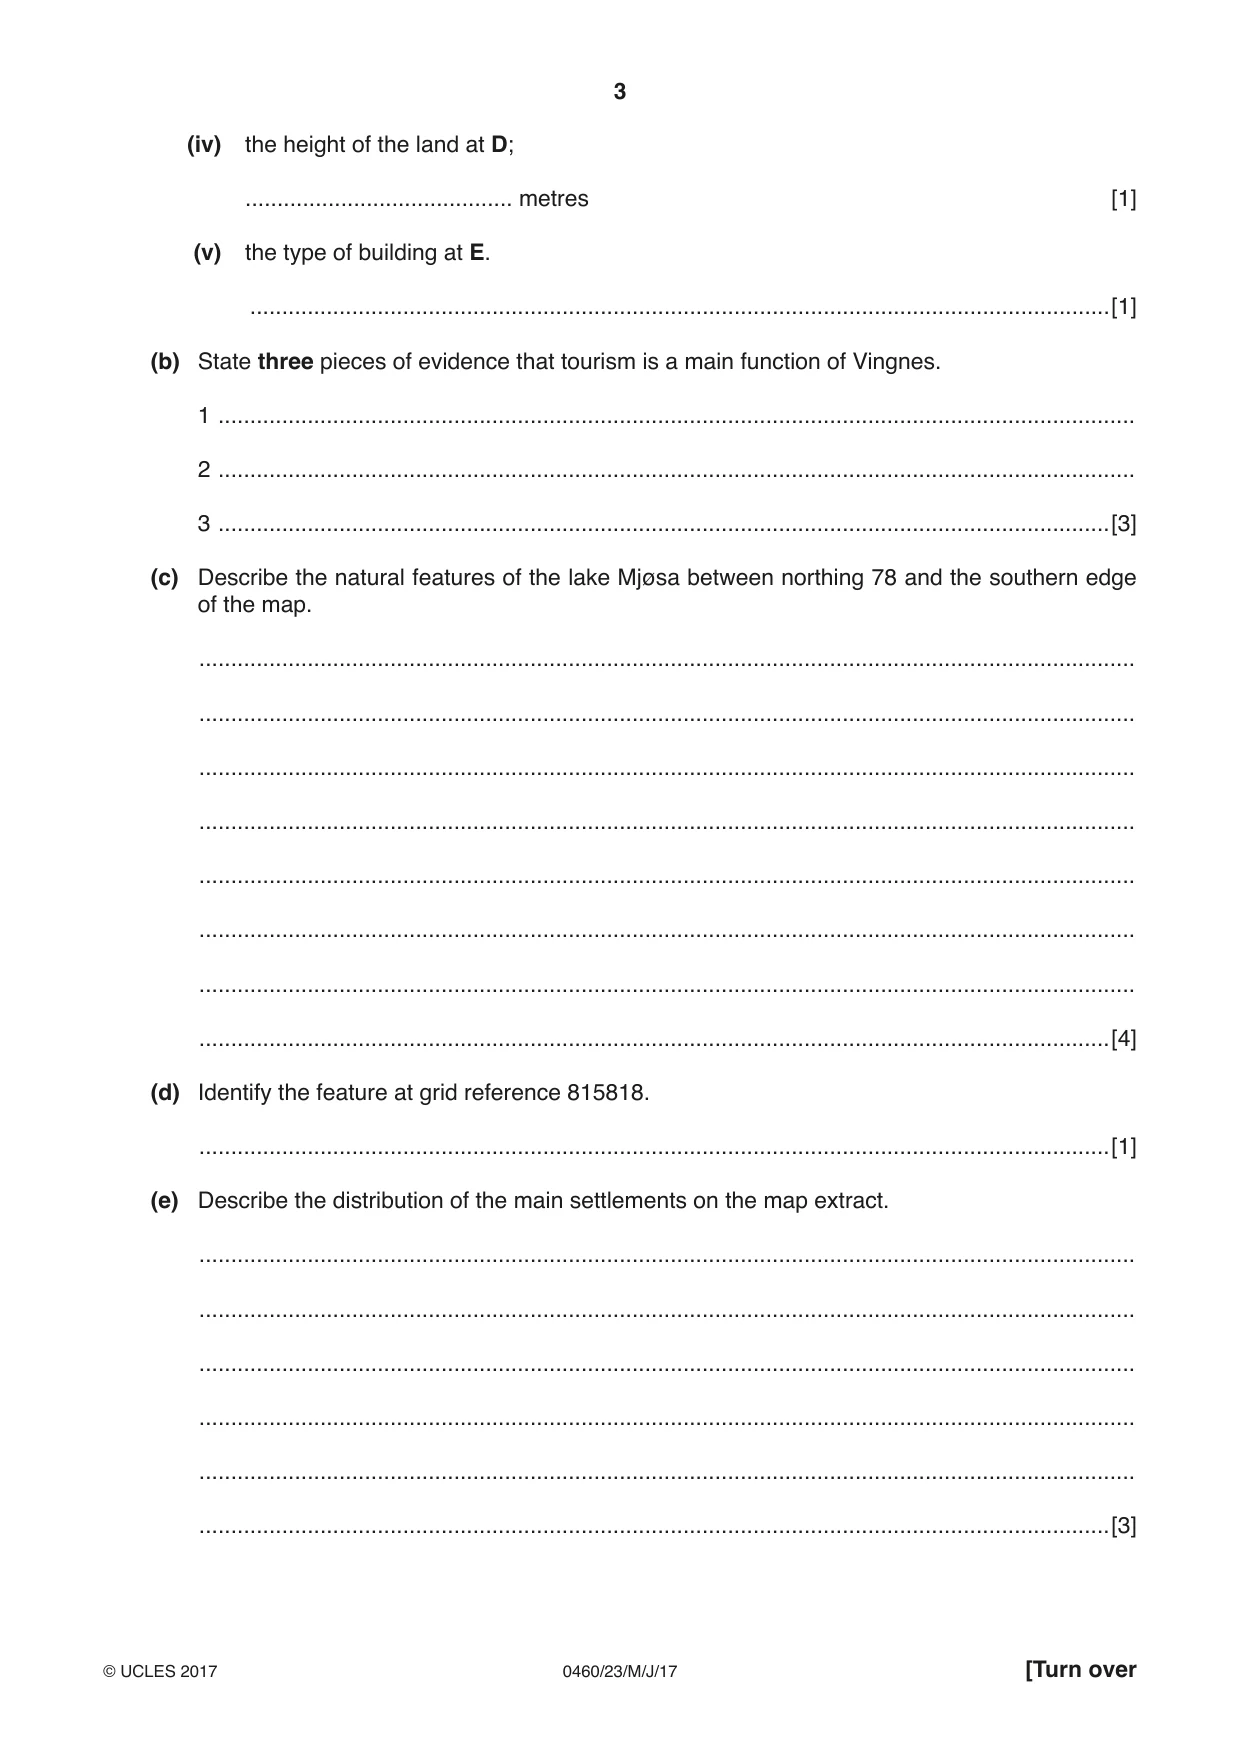
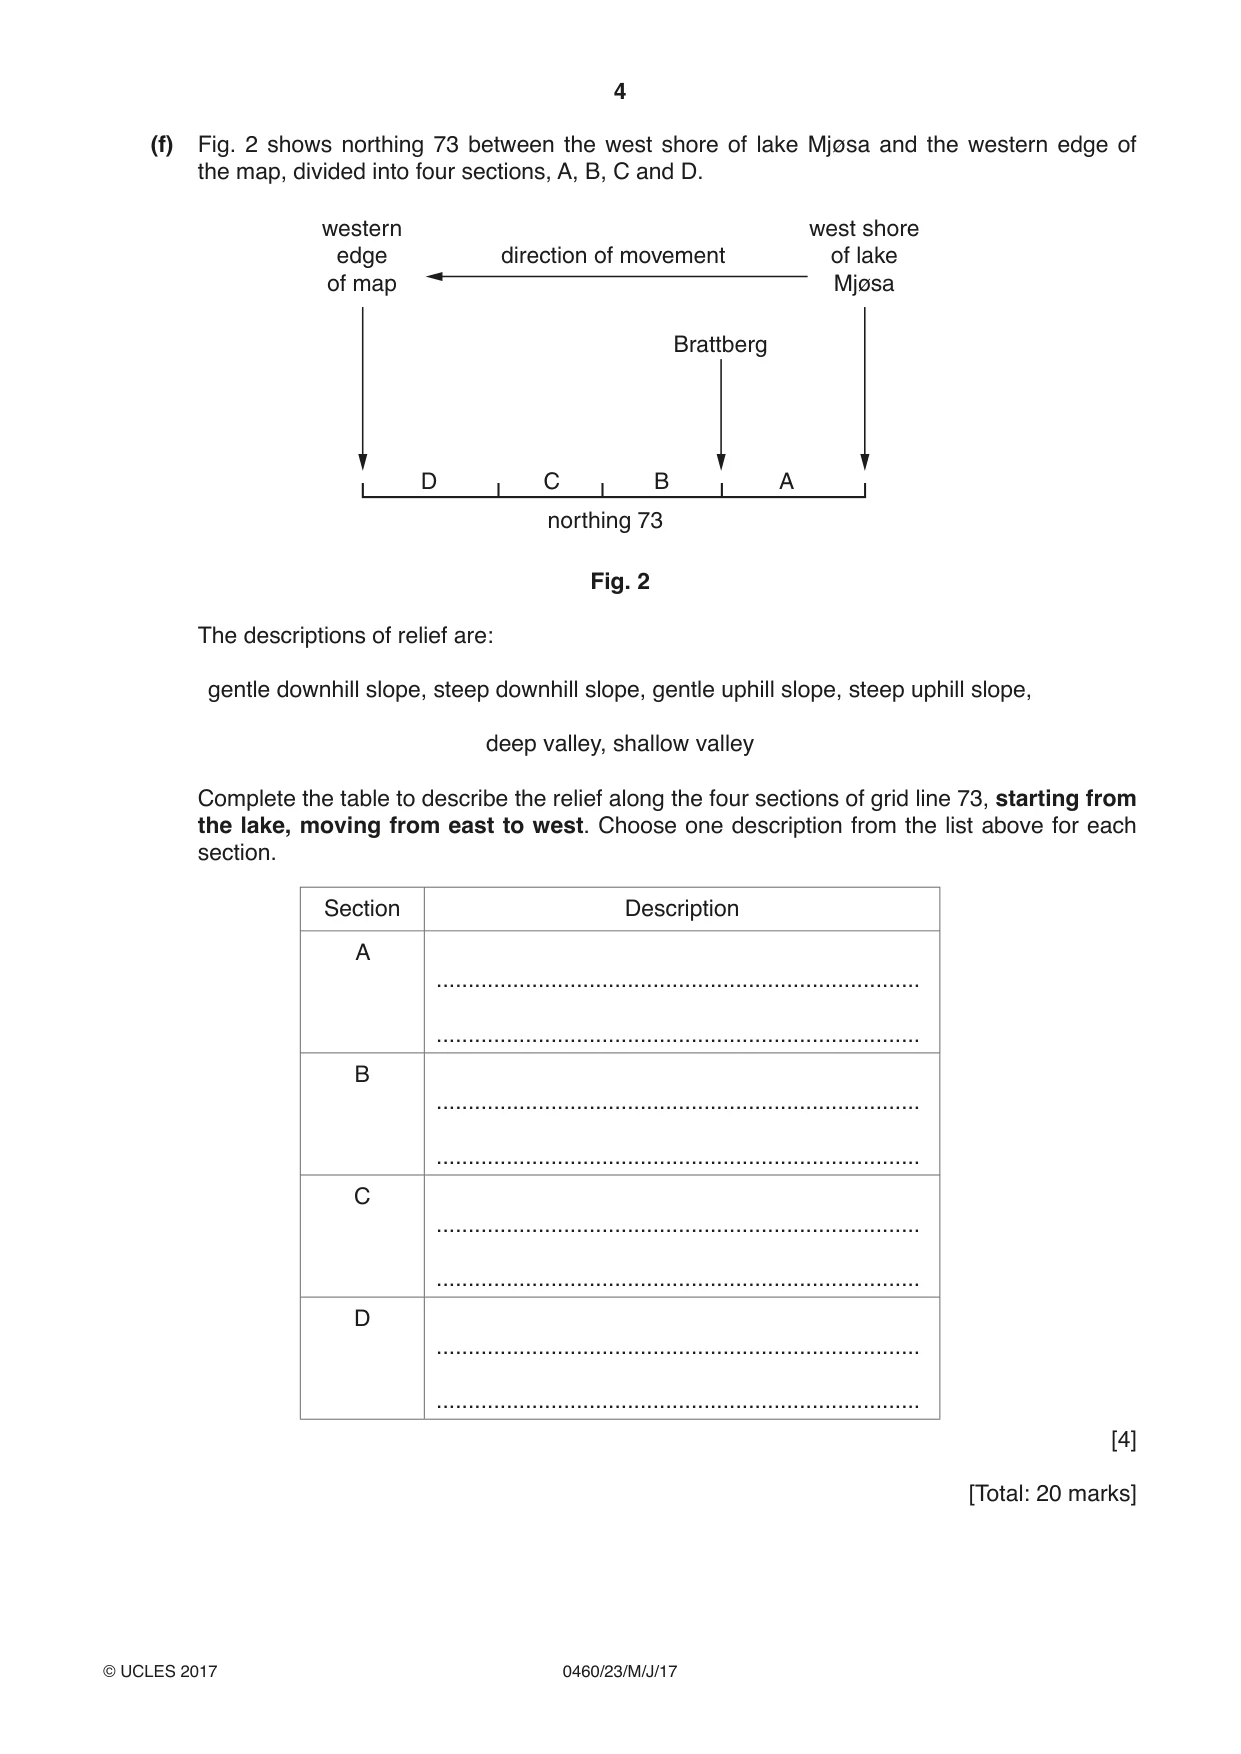
1 Study the map extract, which is for Lillehammer, Norway. The scale is 1:50 000. Fig. 1 shows some of the features in the south-west part of the map extract. (a) Study Fig. 1 and the map extract and answer the questions below. 73 74 75 76 77 79 79 78 78 A 77 77 E B 76 76 D 75 75 C 74 74 73 73 72 72 73 74 75 76 77 Fig. 1 Using the map extract, identify the following features shown on Fig. 1: (i) feature A; .......................................................................................................................................[1] (ii) feature B; .......................................................................................................................................[1] (iii) feature C; .......................................................................................................................................[1] (iv) the height of the land at D; .......................................... metres [1] (v) the type of building at E. .......................................................................................................................................[1] (b) State three pieces of evidence that tourism is a main function of Vingnes. 1 ................................................................................................................................................ 2 ................................................................................................................................................ 3 ............................................................................................................................................[3] (c) Describe the natural features of the lake Mjøsa between northing 78 and the southern edge of the map. ................................................................................................................................................... ................................................................................................................................................... ................................................................................................................................................... ................................................................................................................................................... ................................................................................................................................................... ................................................................................................................................................... ................................................................................................................................................... ...............................................................................................................................................[4] (d) Identify the feature at grid reference 815818. ...............................................................................................................................................[1] (e) Describe the distribution of the main settlements on the map extract. ................................................................................................................................................... ................................................................................................................................................... ................................................................................................................................................... ................................................................................................................................................... ................................................................................................................................................... ...............................................................................................................................................[3] (f) Fig. 2 shows northing 73 between the west shore of lake Mjøsa and the western edge of the map, divided into four sections, A, B, C and D. western west shore edge direction of movement of lake of map Mjøsa Brattberg D C B A northing 73 Fig. 2 The descriptions of relief are: gentle downhill slope, steep downhill slope, gentle uphill slope, steep uphill slope, deep valley, shallow valley Complete the table to describe the relief along the four sections of grid line 73, starting from the lake, moving from east to west. Choose one description from the list above for each section. Section Description A ............................................................................ ............................................................................ B ............................................................................ ............................................................................ C ............................................................................ ............................................................................ D ............................................................................ ............................................................................ [4] [Total: 20 marks]
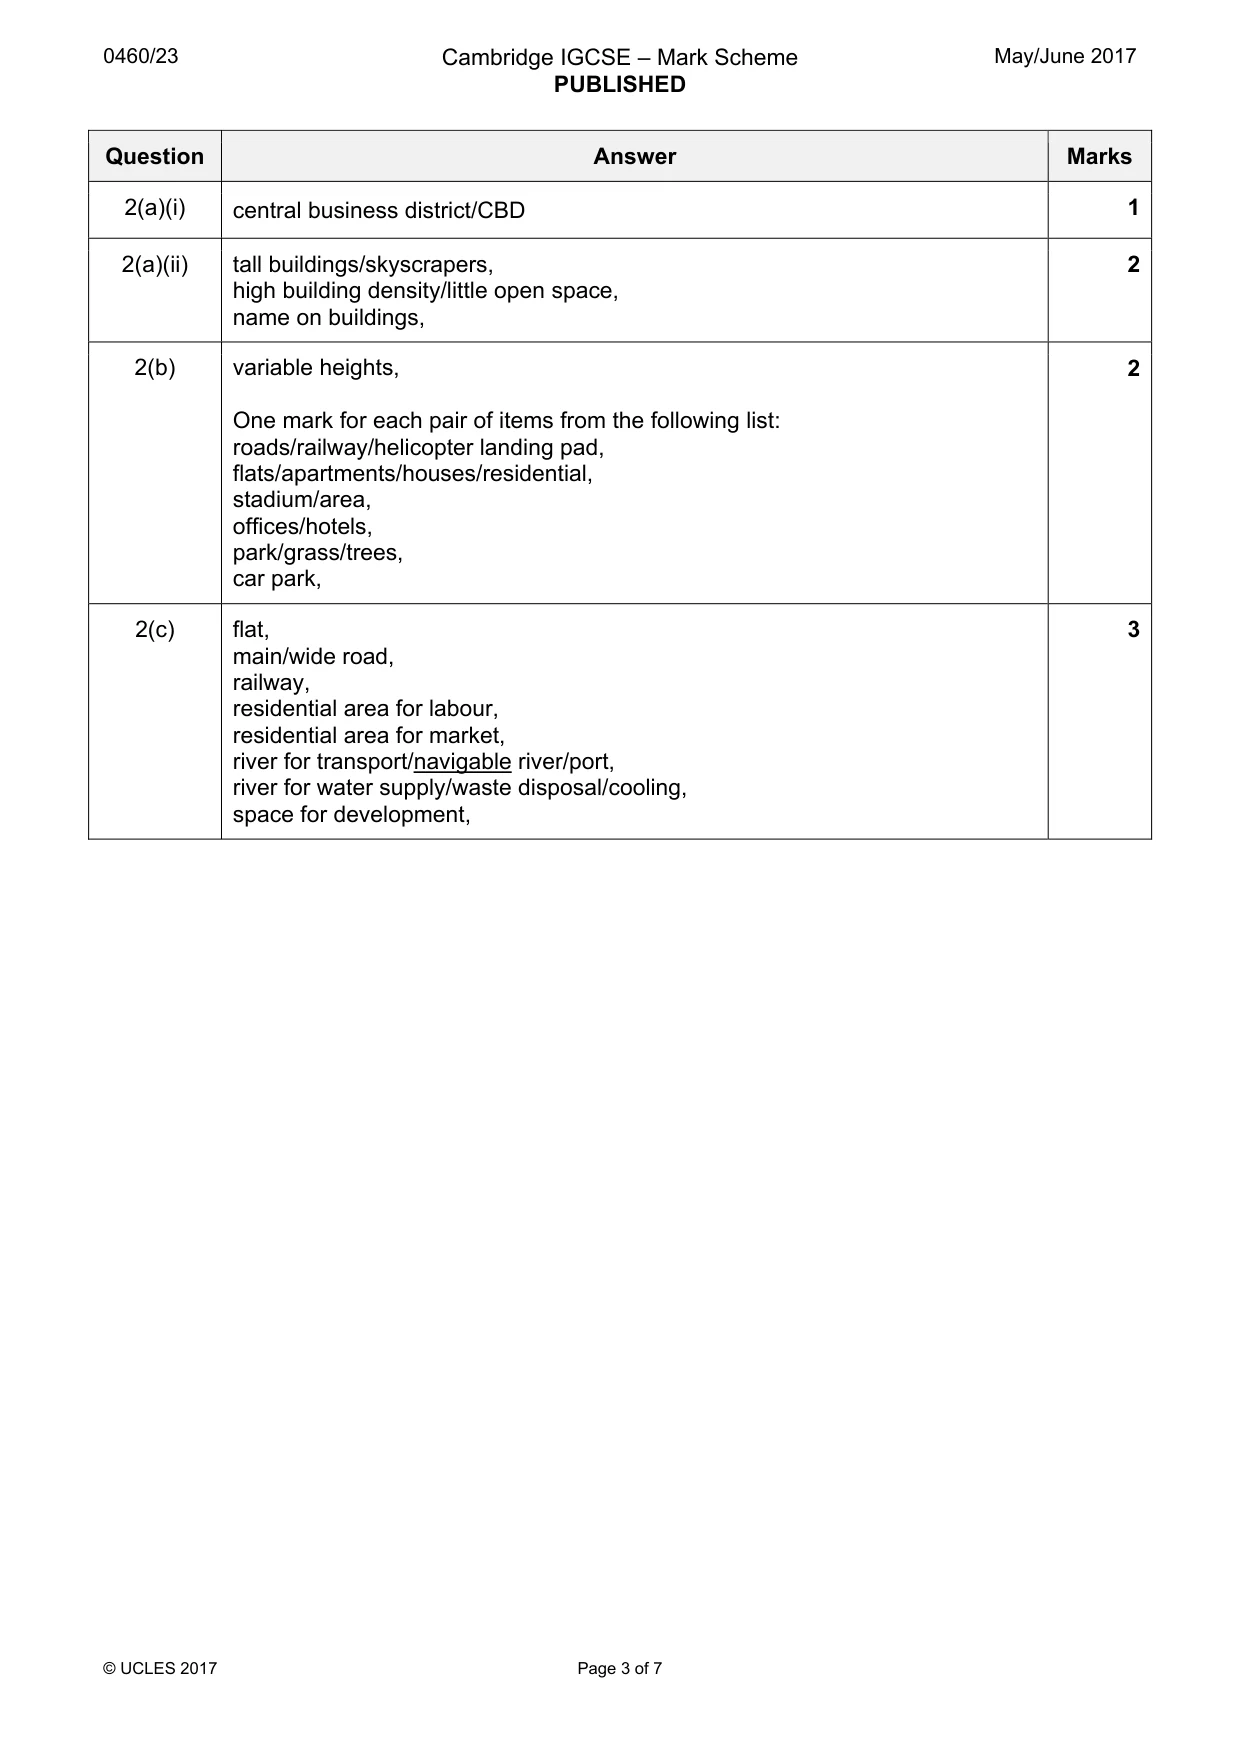
Mark scheme: Question Answer Marks 1(a)(i) power line 1 1(a)(ii) Marsh 1 1(a)(iii) (marked prepared) ski trail 1 1(a)(iv) 673 1 1(a)(v) farm/farmhouse 1 1(b) swimming, 3 ski jump, sports park, (illuminated) ski trail, hotel/lodging, restaurant, nature reserve/nature conservation area, marked footpath, café, boatshed, Credit best three answers given. 1(c) variable width/widens to south/narrows to north, 4 island(s), 119–123 m, nature conservation area/nature reserve, river mouth(s)/tributary(ies), delta, bends/not straight, flow to south, 1(d) trigonometric point, 1 1(e) near lake/lake side/by Mjøsa, 3 both sides (of lake), more on east side, confluence (of rivers/valleys), on low(er)/avoids high(er), on gentle(r)/on flat(ter)/avoids steep(er), in valley(s), on/along roads, 1(f) A steep uphill slope, 4 B gentle uphill slope, C gentle downhill slope D shallow valley, If more information given, credit correct answers unless information is from more than one answer from the list.
Q2 · Study Photographs A, B and C (Insert), which show different urban land use zones of…
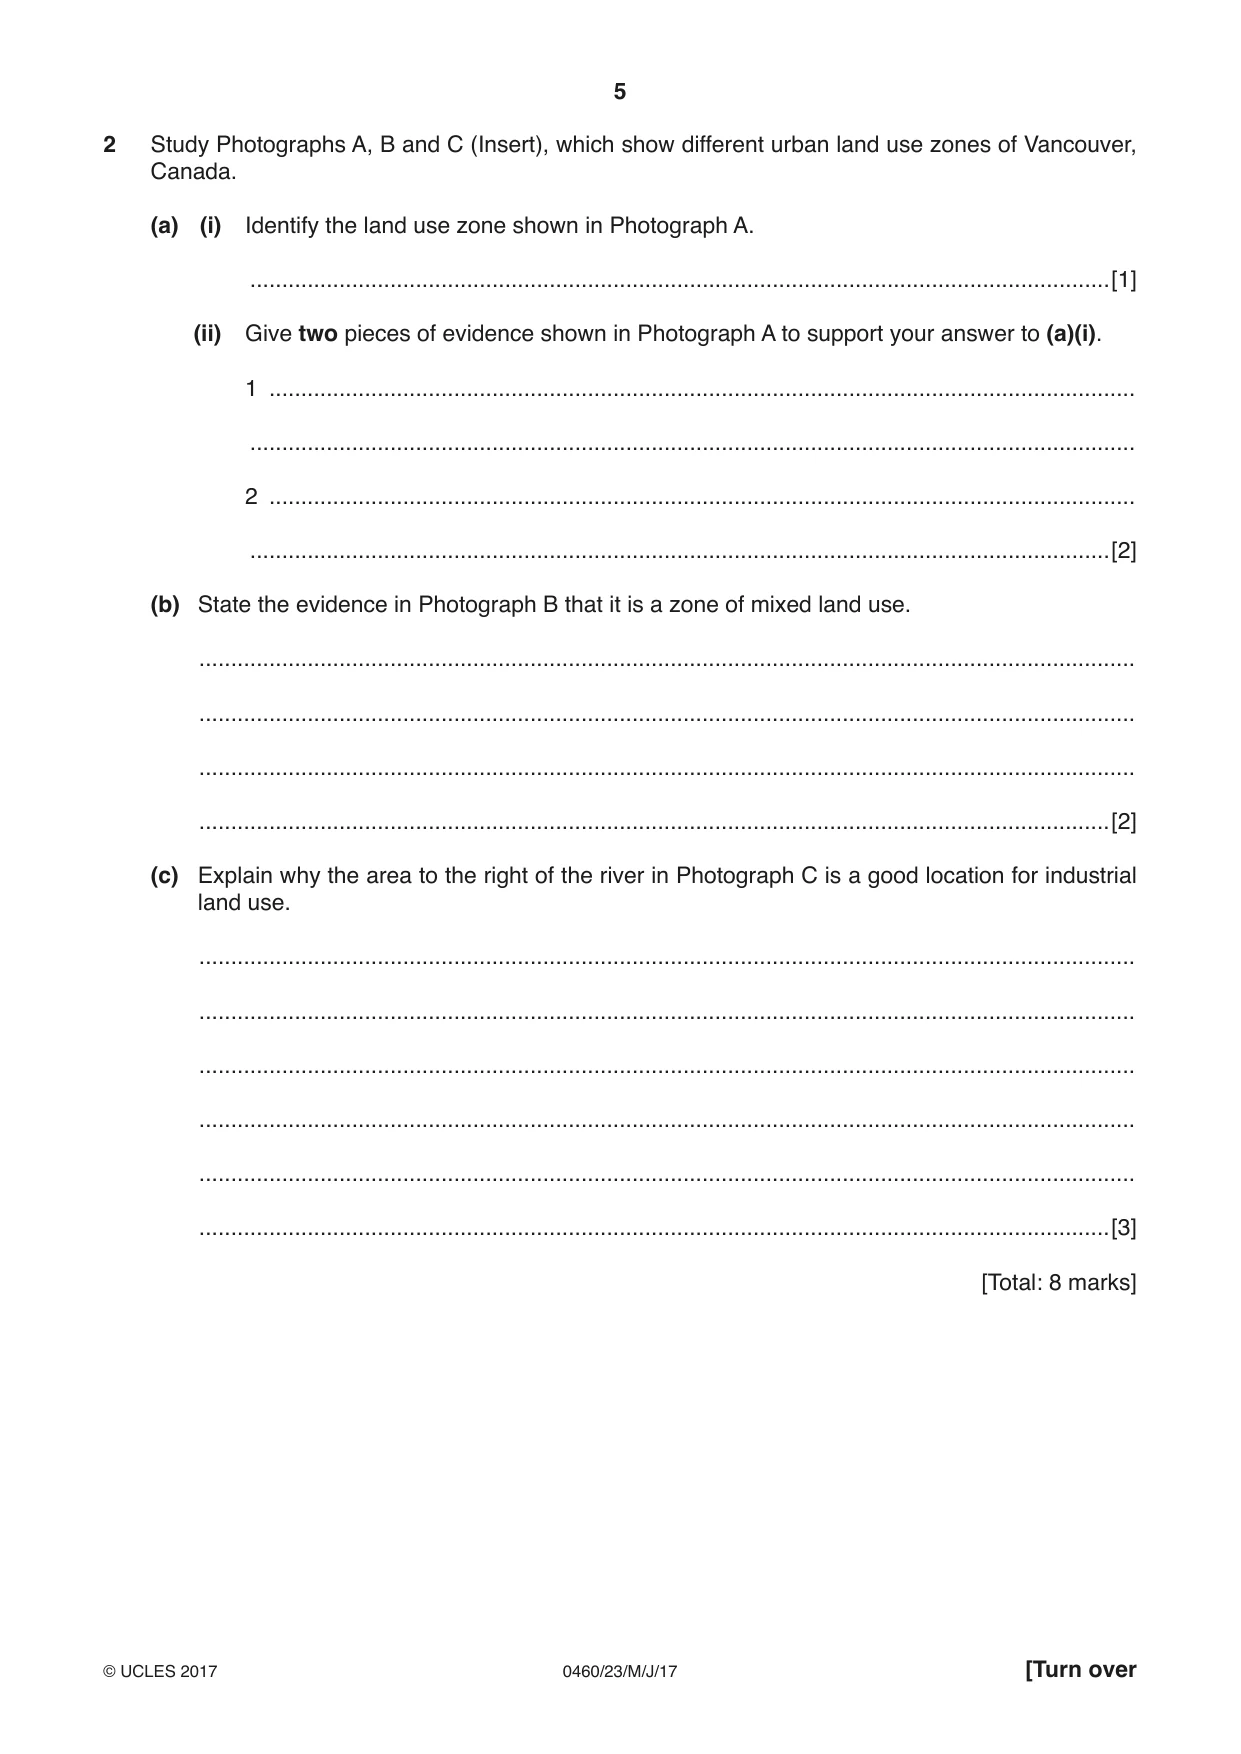
2 Study Photographs A, B and C (Insert), which show different urban land use zones of Vancouver, Canada. (a) (i) Identify the land use zone shown in Photograph A. .......................................................................................................................................[1] (ii) Give two pieces of evidence shown in Photograph A to support your answer to (a)(i). 1 ........................................................................................................................................ ........................................................................................................................................... 2 ........................................................................................................................................ .......................................................................................................................................[2] (b) State the evidence in Photograph B that it is a zone of mixed land use. ................................................................................................................................................... ................................................................................................................................................... ................................................................................................................................................... ...............................................................................................................................................[2] (c) Explain why the area to the right of the river in Photograph C is a good location for industrial land use. ................................................................................................................................................... ................................................................................................................................................... ................................................................................................................................................... ................................................................................................................................................... ................................................................................................................................................... ...............................................................................................................................................[3] [Total: 8 marks]
Mark scheme: 2(a)(i) central business district/CBD 1 2(a)(ii) tall buildings/skyscrapers, 2 high building density/little open space, name on buildings, 2(b) variable heights, 2 One mark for each pair of items from the following list: roads/railway/helicopter landing pad, flats/apartments/houses/residential, stadium/area, offices/hotels, park/grass/trees, car park, 2(c) flat, 3 main/wide road, railway, residential area for labour, residential area for market, river for transport/navigable river/port, river for water supply/waste disposal/cooling, space for development,
Question 3
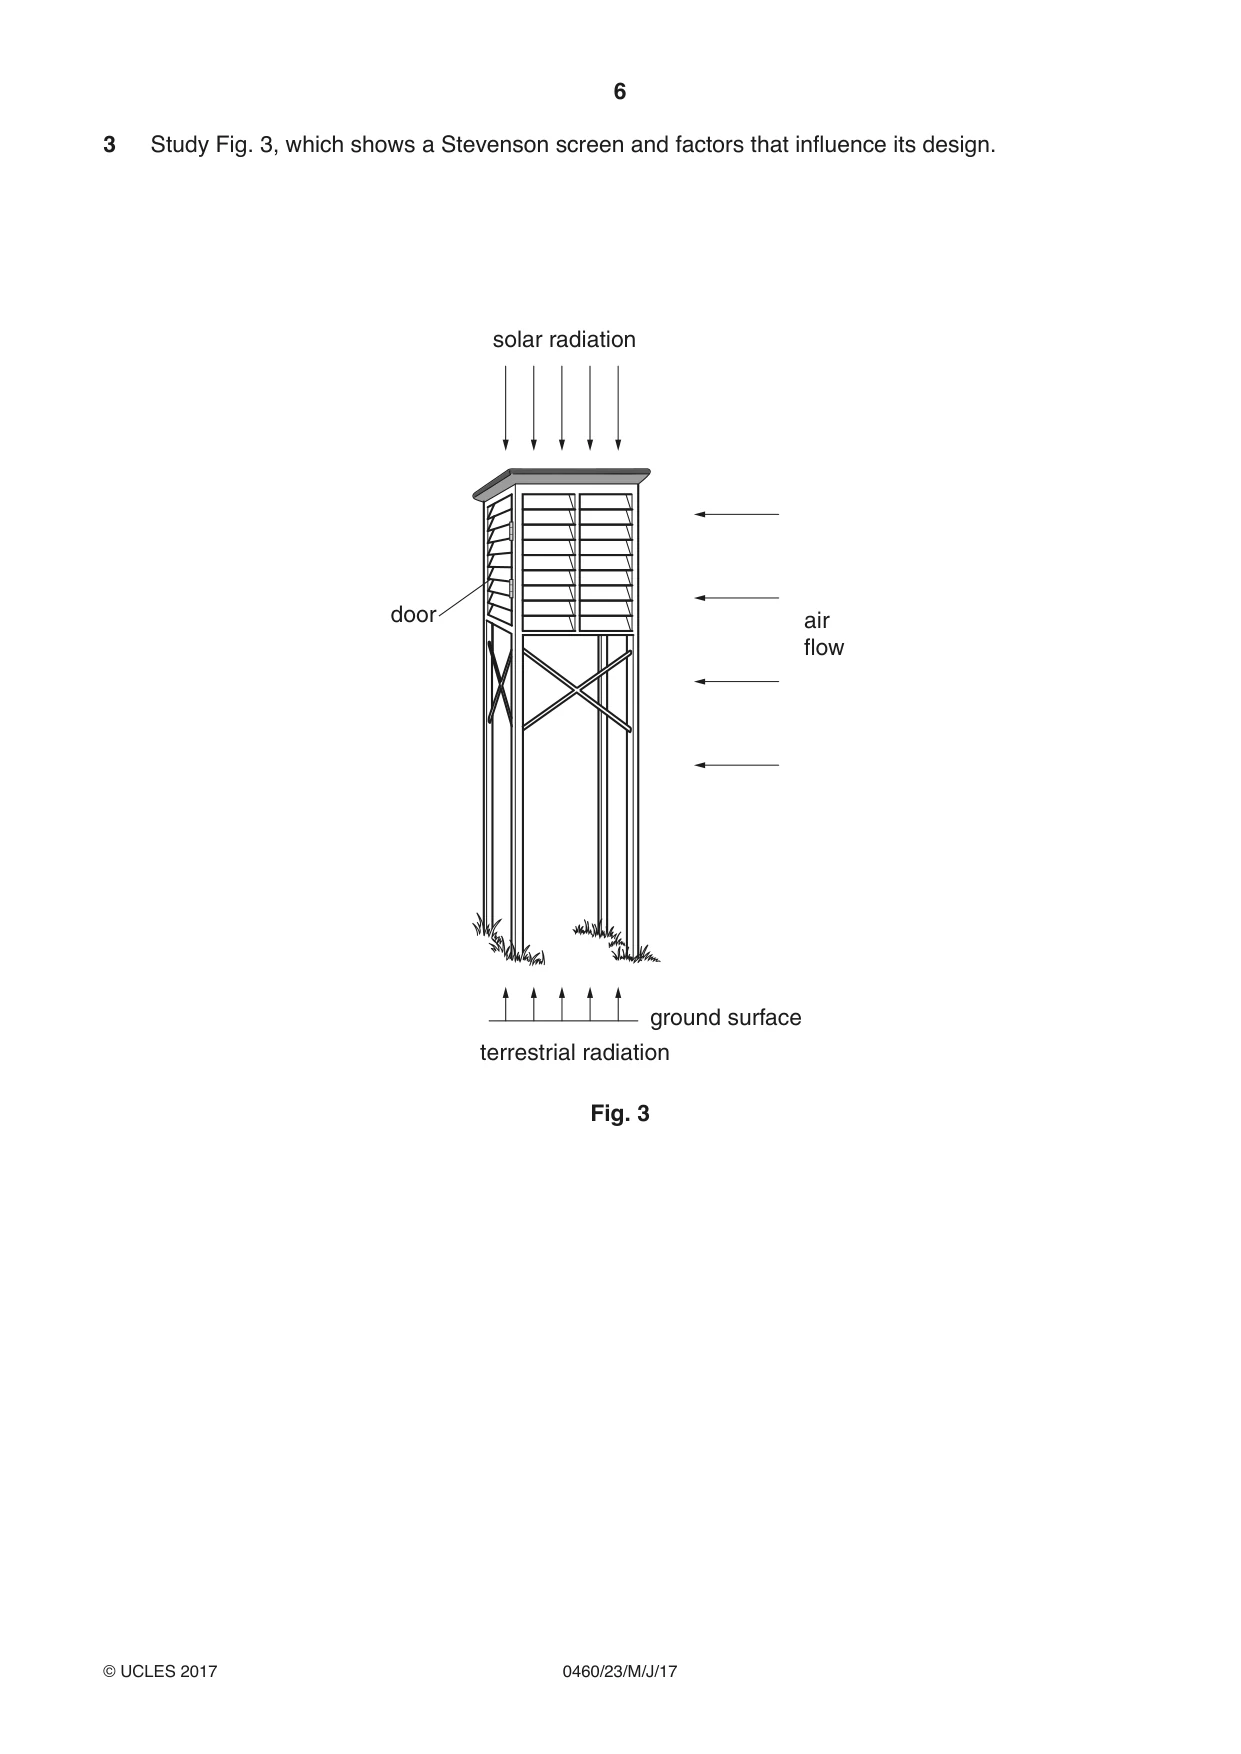
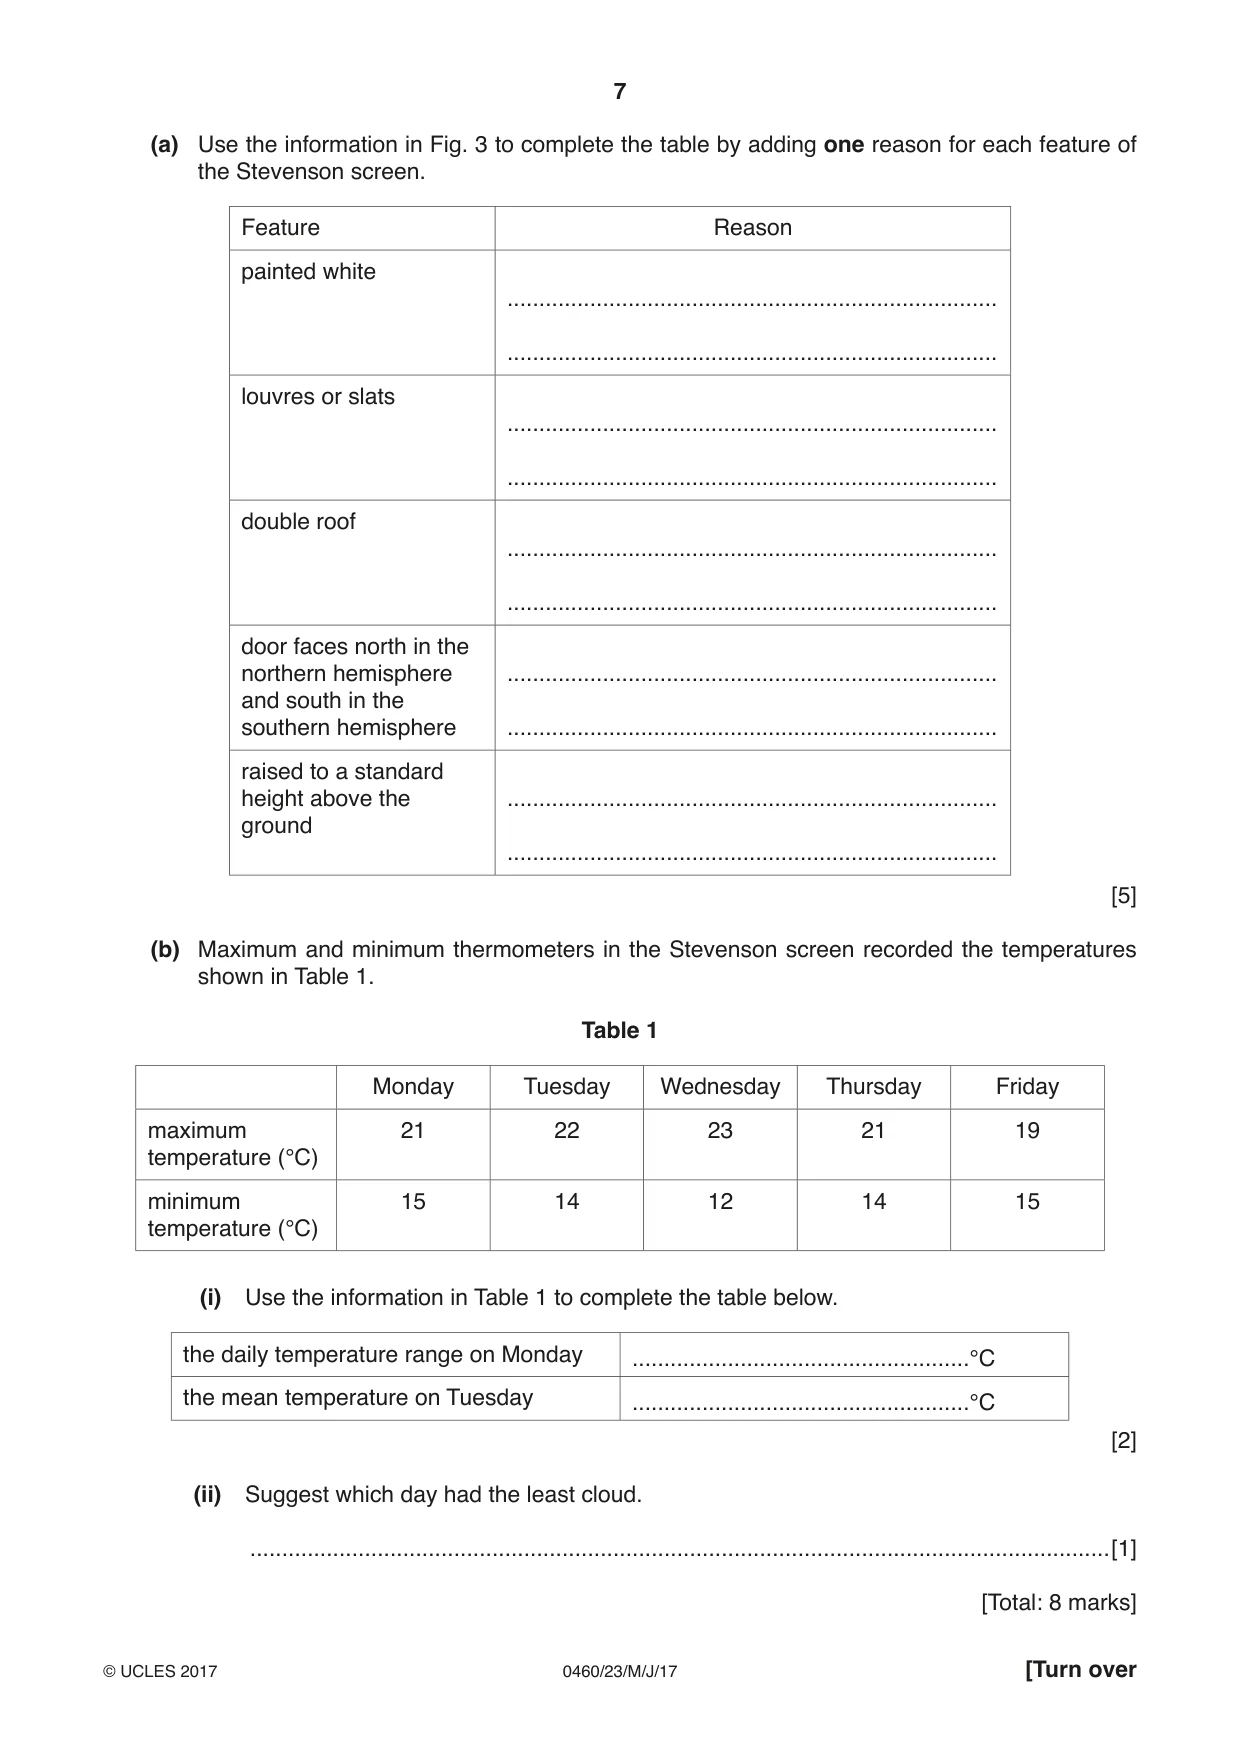
3 Study Fig. 3, which shows a Stevenson screen and factors that influence its design. solar radiation door air flow ground surface terrestrial radiation Fig. 3 (a) Use the information in Fig. 3 to complete the table by adding one reason for each feature of the Stevenson screen. Feature Reason painted white ............................................................................. ............................................................................. louvres or slats ............................................................................. ............................................................................. double roof ............................................................................. ............................................................................. door faces north in the northern hemisphere ............................................................................. and south in the southern hemisphere ............................................................................. raised to a standard height above the ............................................................................. ground ............................................................................. [5] (b) Maximum and minimum thermometers in the Stevenson screen recorded the temperatures shown in Table 1. Table 1 Monday Tuesday Wednesday Thursday Friday maximum 21 22 23 21 19 temperature (°C) minimum 15 14 12 14 15 temperature (°C) (i) Use the information in Table 1 to complete the table below. the daily temperature range on Monday .....................................................°C the mean temperature on Tuesday .....................................................°C [2] (ii) Suggest which day had the least cloud. .......................................................................................................................................[1] [Total: 8 marks]
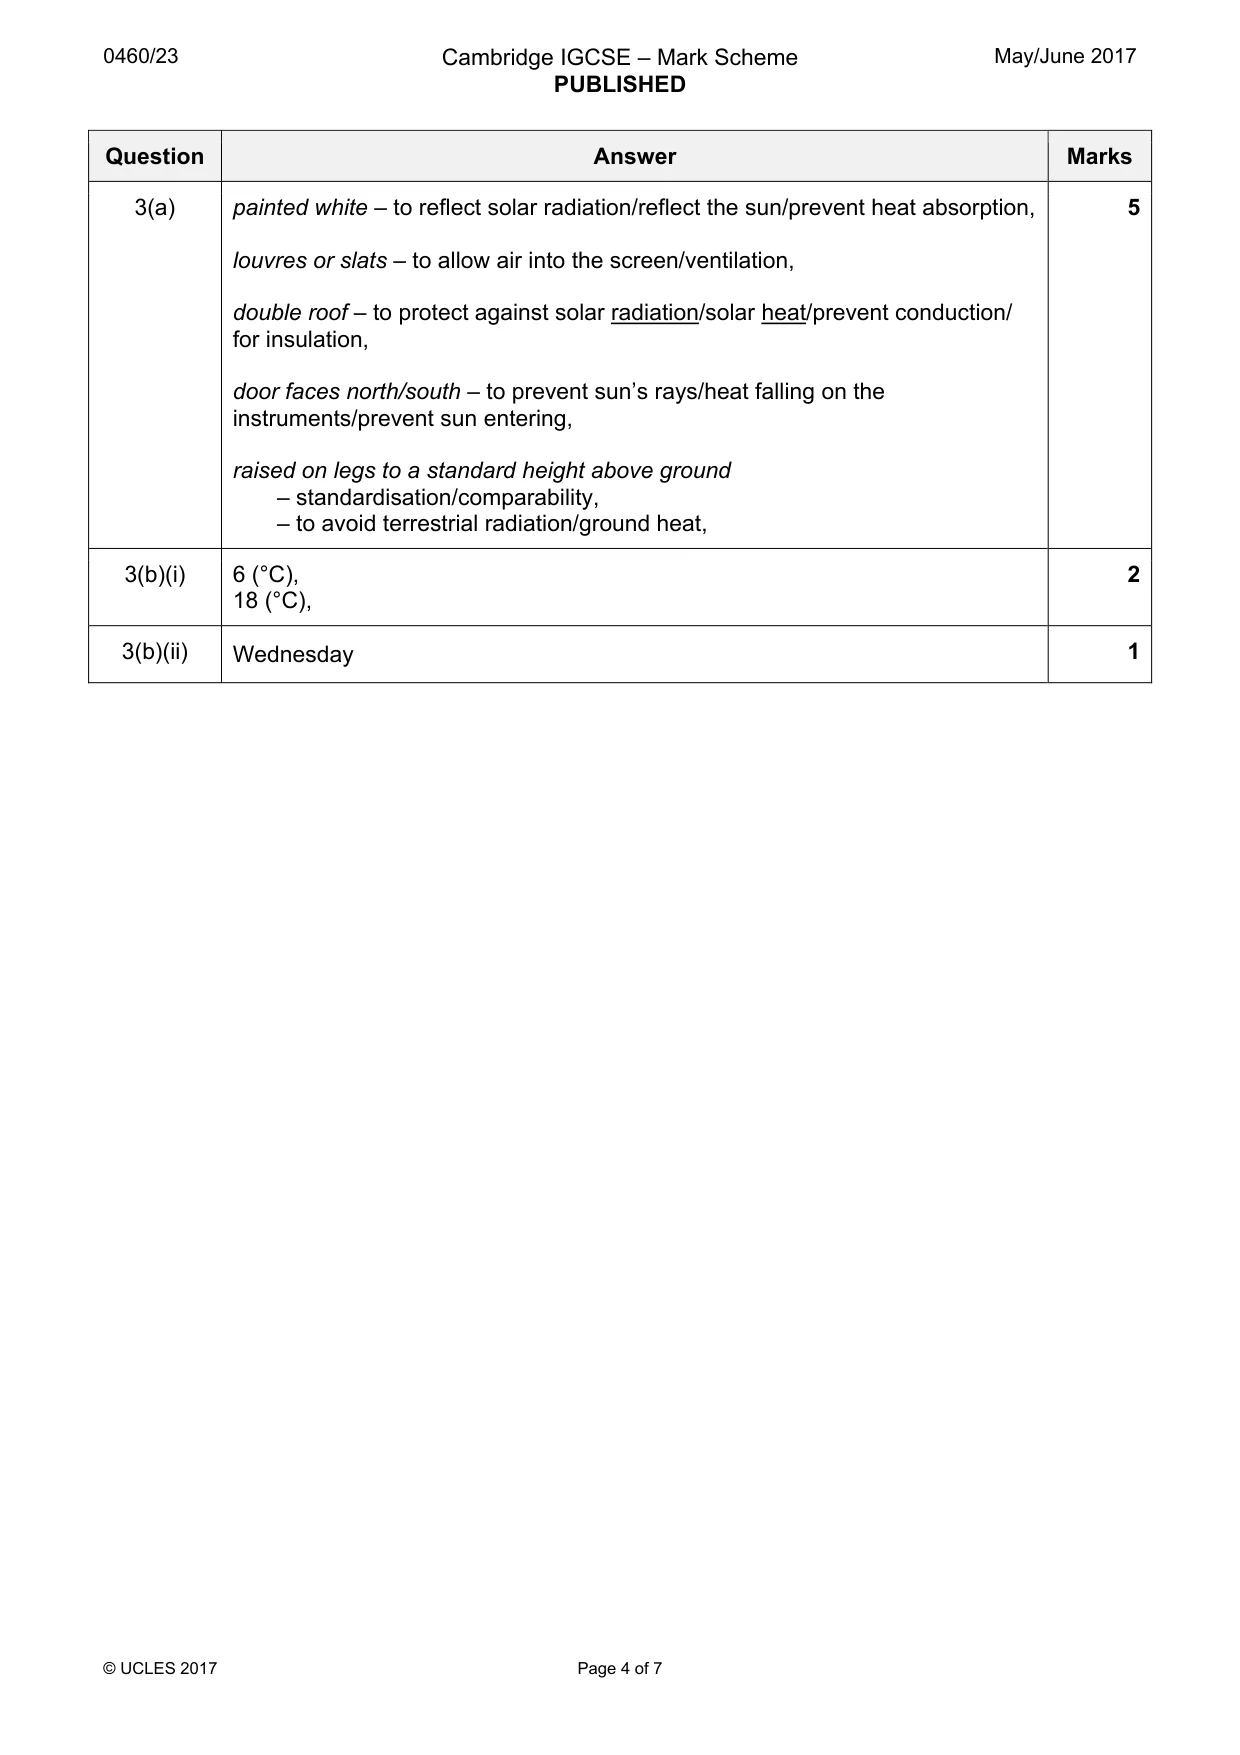
Mark scheme: 3(a) painted white – to reflect solar radiation/reflect the sun/prevent heat absorption, 5 louvres or slats – to allow air into the screen/ventilation, double roof – to protect against solar radiation/solar heat/prevent conduction/ for insulation, door faces north/south – to prevent sun’s rays/heat falling on the instruments/prevent sun entering, raised on legs to a standard height above ground – standardisation/comparability, – to avoid terrestrial radiation/ground heat, 3(b)(i) 6 (°C), 2 18 (°C), 3(b)(ii) Wednesday 1
Question 4
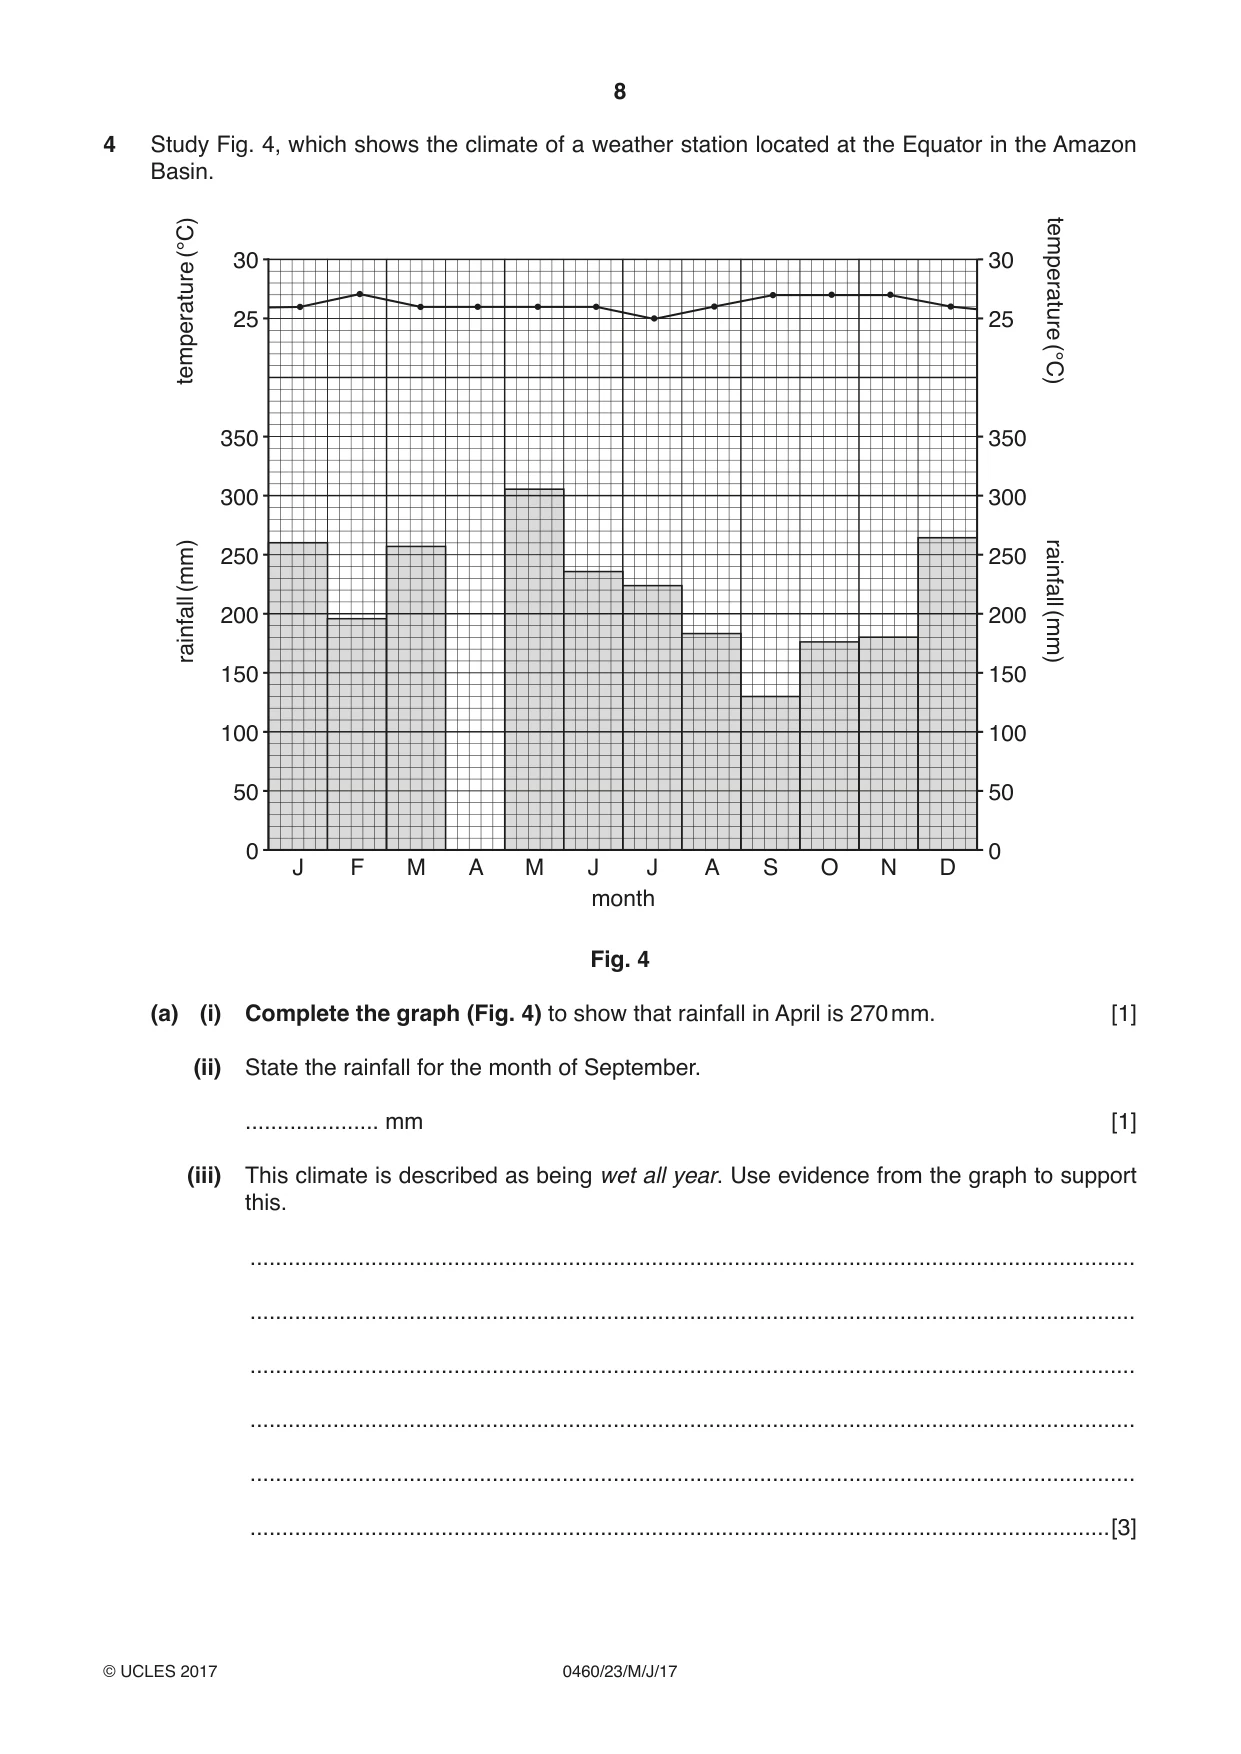
4 Study Fig. 4, which shows the climate of a weather station located at the Equator in the Amazon Basin. (°C) 30 30 25 25 temperature temperature (°C) 350 350 300 300 (mm) 250 250 rainfall rainfall 200 200 (mm) 150 150 100 100 50 50 0 0 J F M A M J J A S O N D month Fig. 4 (a) (i) Complete the graph (Fig. 4) to show that rainfall in April is 270 mm. [1] (ii) State the rainfall for the month of September. ..................... mm [1] (iii) This climate is described as being wet all year. Use evidence from the graph to support this. ........................................................................................................................................... ........................................................................................................................................... ........................................................................................................................................... ........................................................................................................................................... ........................................................................................................................................... .......................................................................................................................................[3] (iv) Suggest two possible reasons why the weather station has a very small annual range of temperature. 1 ........................................................................................................................................ ........................................................................................................................................... 2 ........................................................................................................................................ .......................................................................................................................................[2] (b) State the number of months during a year in which vegetation will be able to grow in places with the climate shown in Fig. 4. ........................................................ [1] [Total: 8 marks]
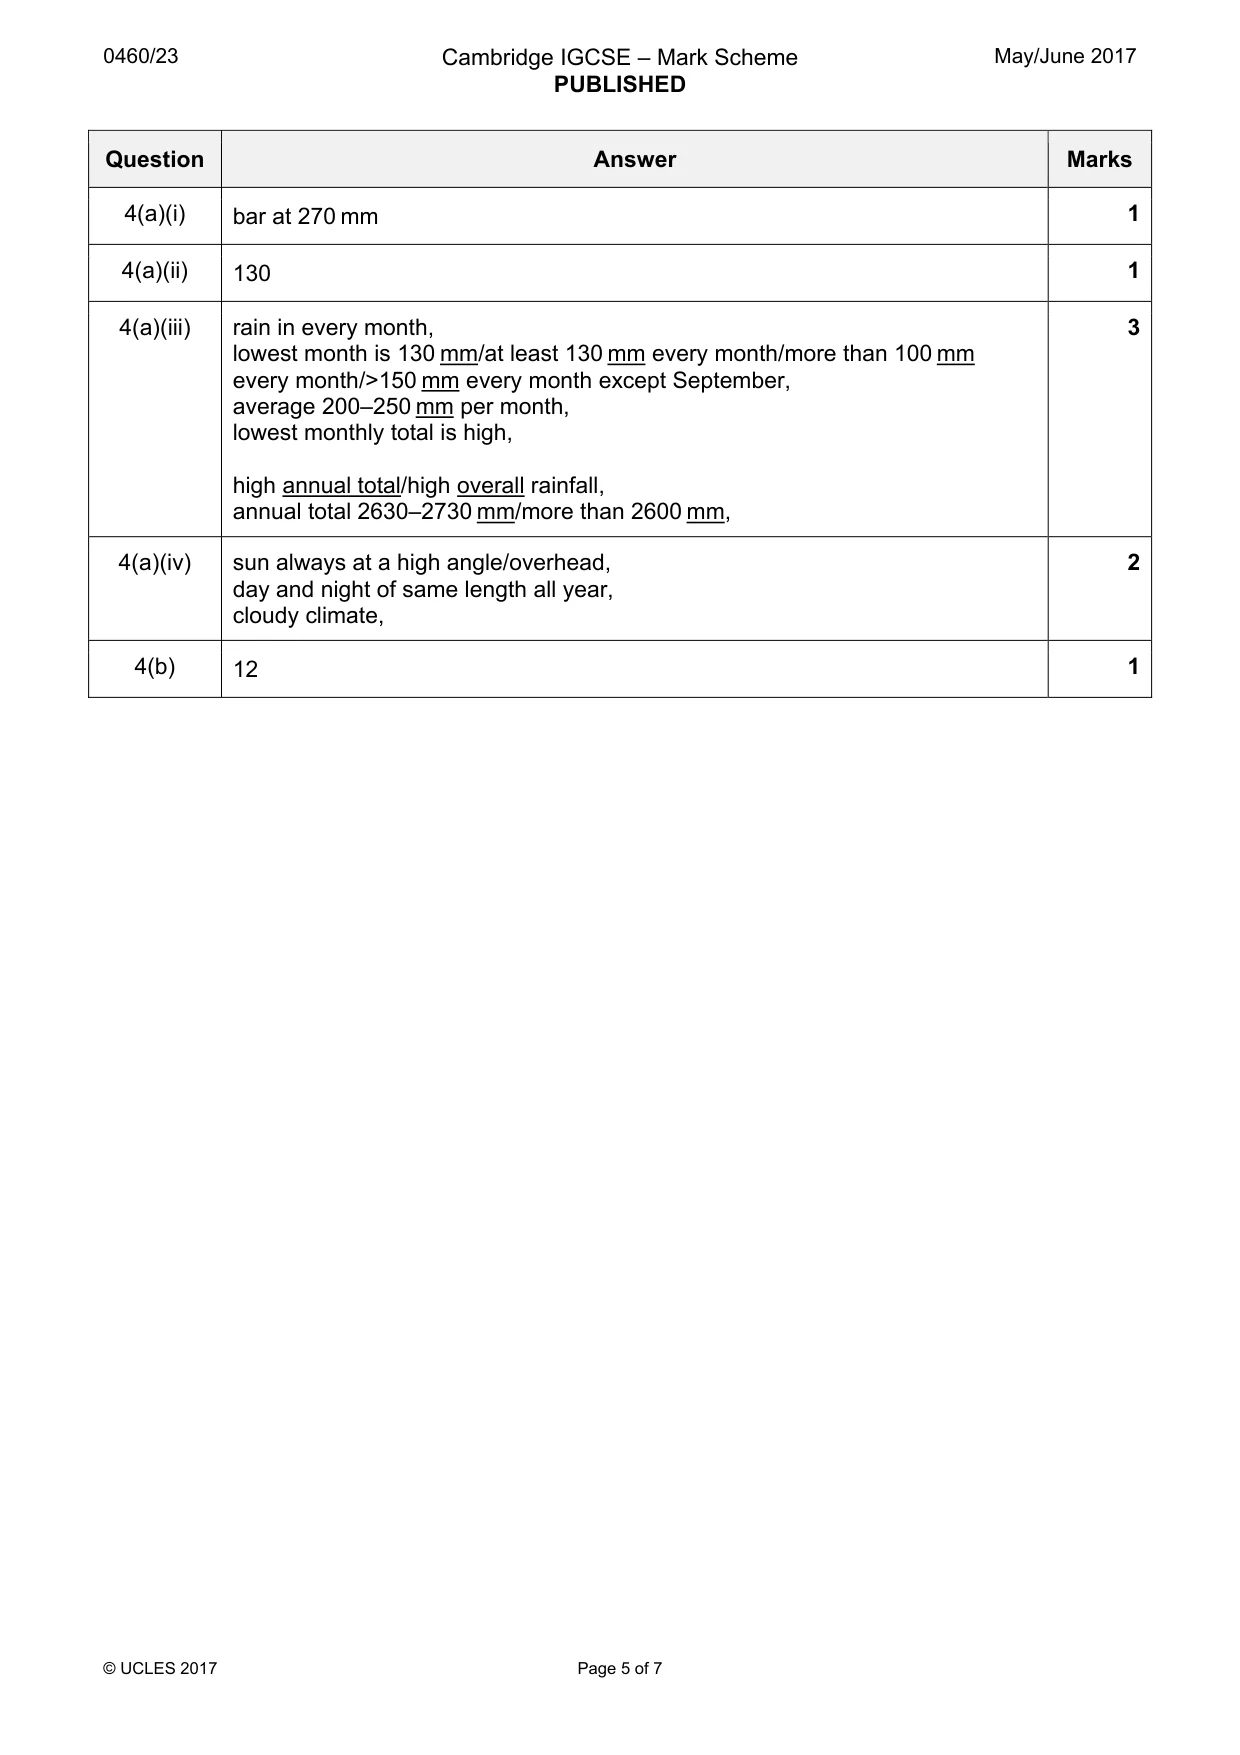
Mark scheme: 4(a)(i) bar at 270 mm 1 4(a)(ii) 130 1 4(a)(iii) rain in every month, 3 lowest month is 130 mm/at least 130 mm every month/more than 100 mm every month/>150 mm every month except September, average 200–250 mm per month, lowest monthly total is high, high annual total/high overall rainfall, annual total 2630–2730 mm/more than 2600 mm, 4(a)(iv) sun always at a high angle/overhead, 2 day and night of same length all year, cloudy climate, 4(b) 12 1
Q5 · Name the type of renewable source of electricity generation that: (i) comes from…
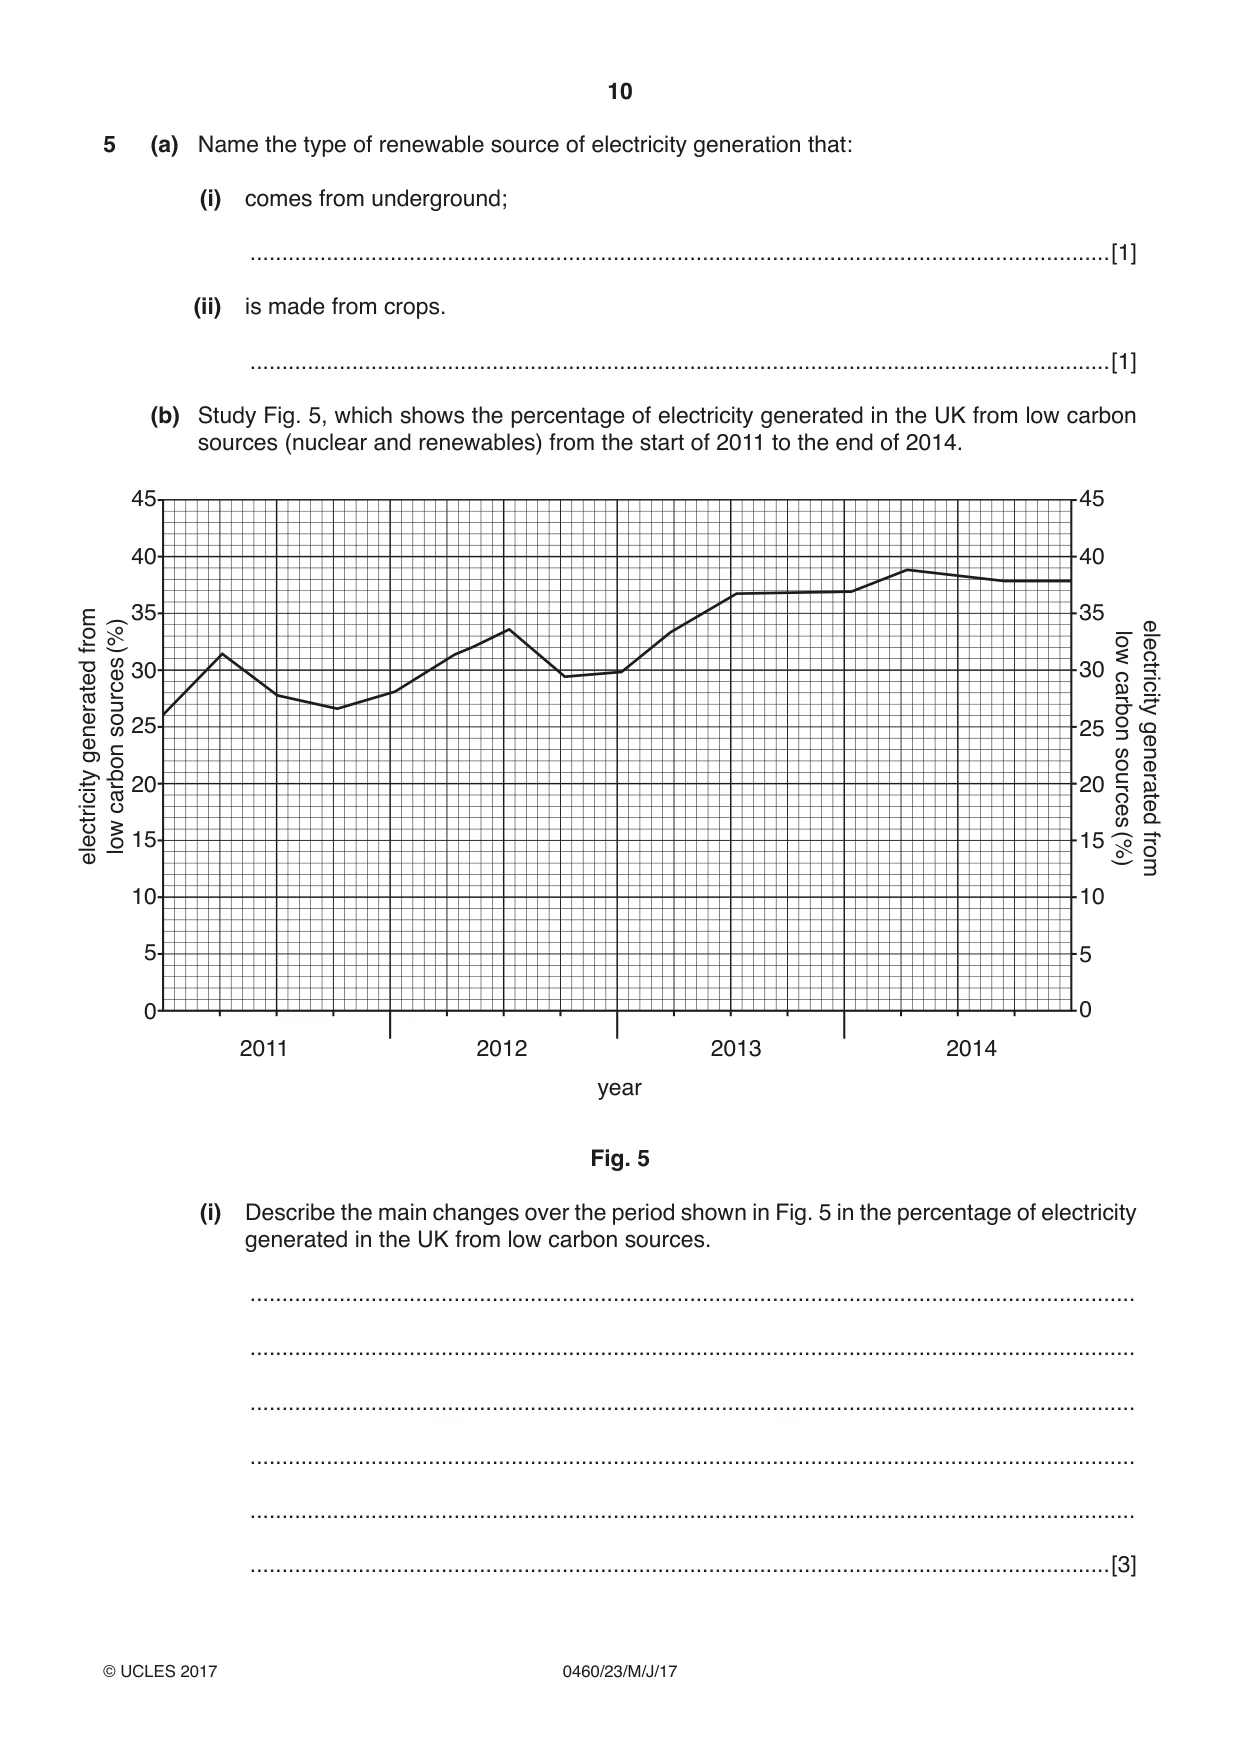
5 (a) Name the type of renewable source of electricity generation that: (i) comes from underground; .......................................................................................................................................[1] (ii) is made from crops. .......................................................................................................................................[1] (b) Study Fig. 5, which shows the percentage of electricity generated in the UK from low carbon sources (nuclear and renewables) from the start of 2011 to the end of 2014. 45 45 40 40 35 35from(%) low 30 30 electricity 25 25 carbongeneratedsources 20 20 carbon sourcesgenerated low15 15electricity (%)from 10 10 5 5 0 0 2011 2012 2013 2014 year Fig. 5 (i) Describe the main changes over the period shown in Fig. 5 in the percentage of electricity generated in the UK from low carbon sources. ........................................................................................................................................... ........................................................................................................................................... ........................................................................................................................................... ........................................................................................................................................... ........................................................................................................................................... .......................................................................................................................................[3] (ii) Suggest possible reasons why the percentage of electricity generated from renewables can reduce from time to time. ........................................................................................................................................... ........................................................................................................................................... ........................................................................................................................................... ........................................................................................................................................... ........................................................................................................................................... .......................................................................................................................................[3] [Total: 8 marks]
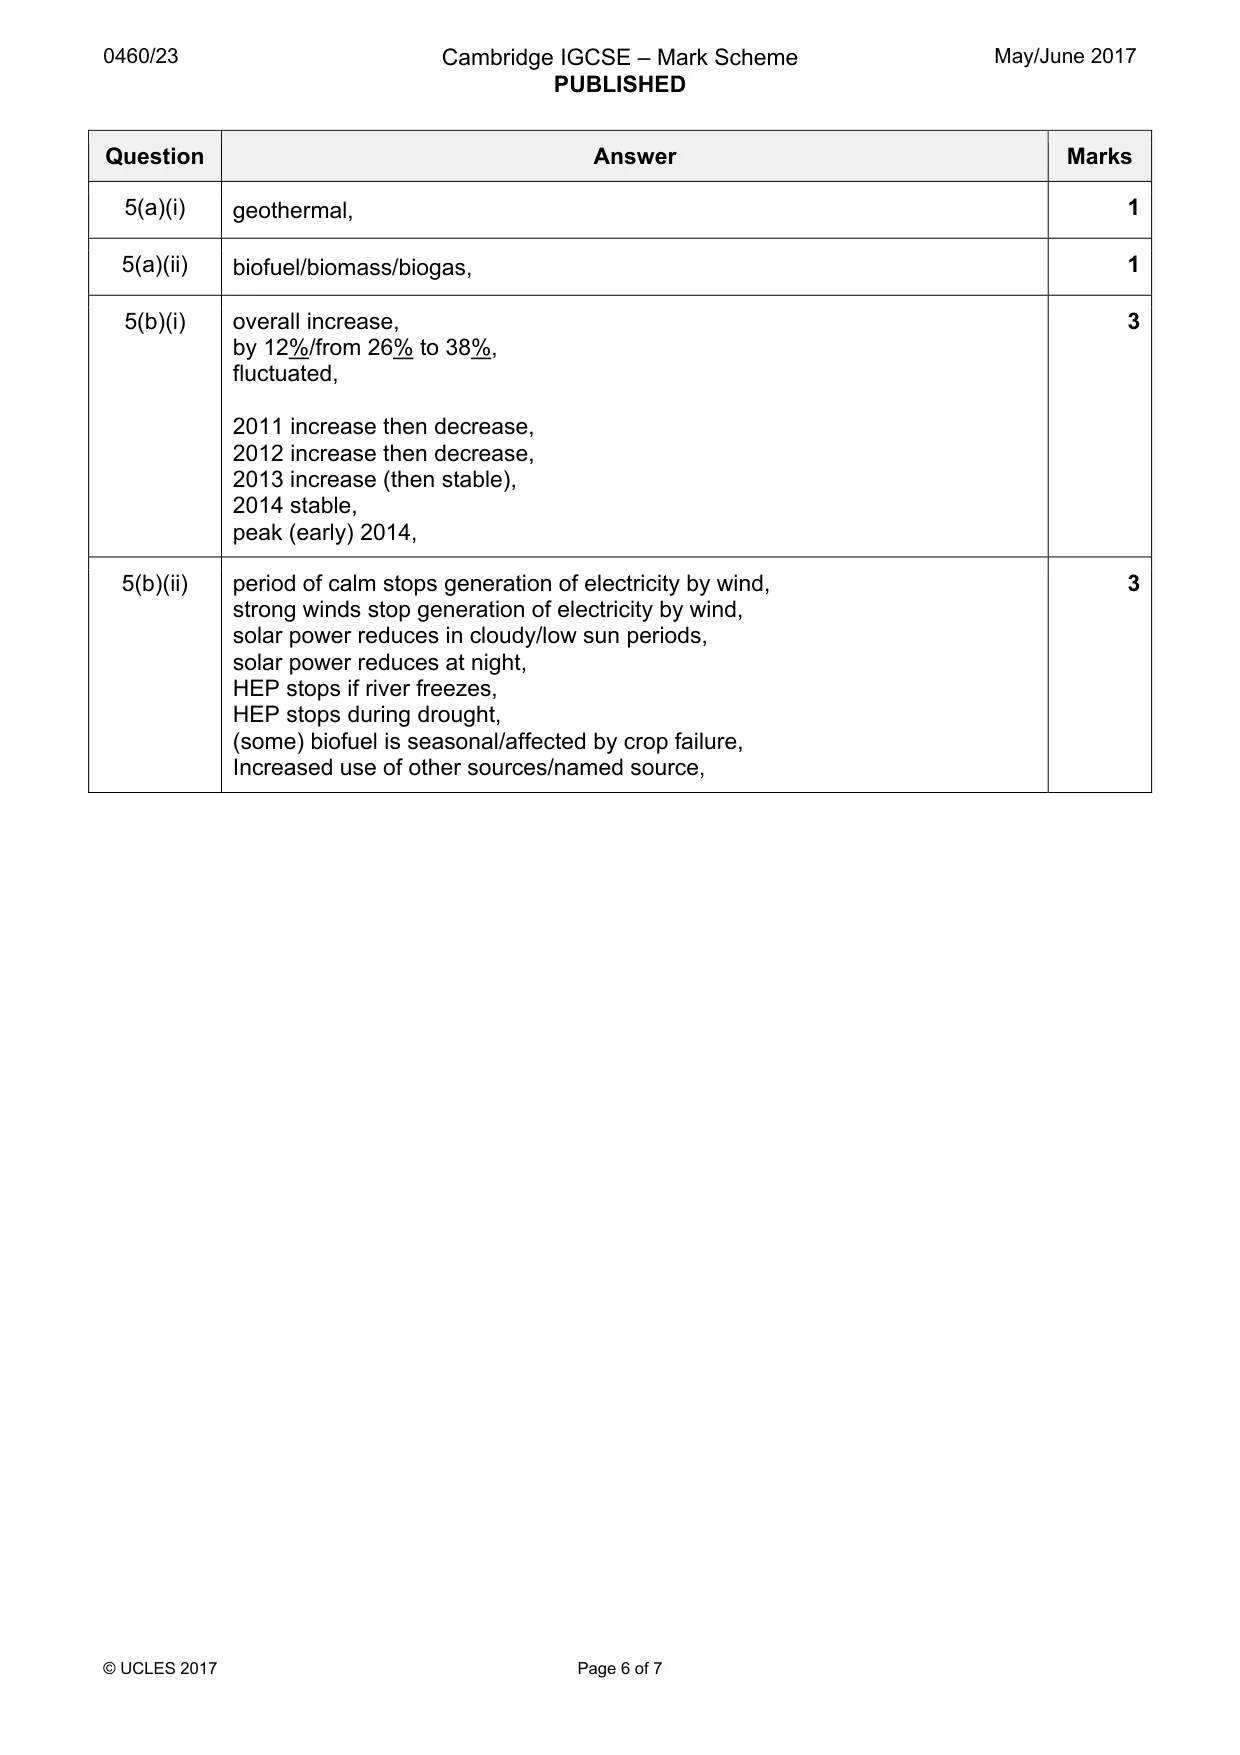
Mark scheme: 5(a)(i) geothermal, 1 5(a)(ii) biofuel/biomass/biogas, 1 5(b)(i) overall increase, 3 by 12%/from 26% to 38%, fluctuated, 2011 increase then decrease, 2012 increase then decrease, 2013 increase (then stable), 2014 stable, peak (early) 2014, 5(b)(ii) period of calm stops generation of electricity by wind, 3 strong winds stop generation of electricity by wind, solar power reduces in cloudy/low sun periods, solar power reduces at night, HEP stops if river freezes, HEP stops during drought, (some) biofuel is seasonal/affected by crop failure, Increased use of other sources/named source,
Question 6
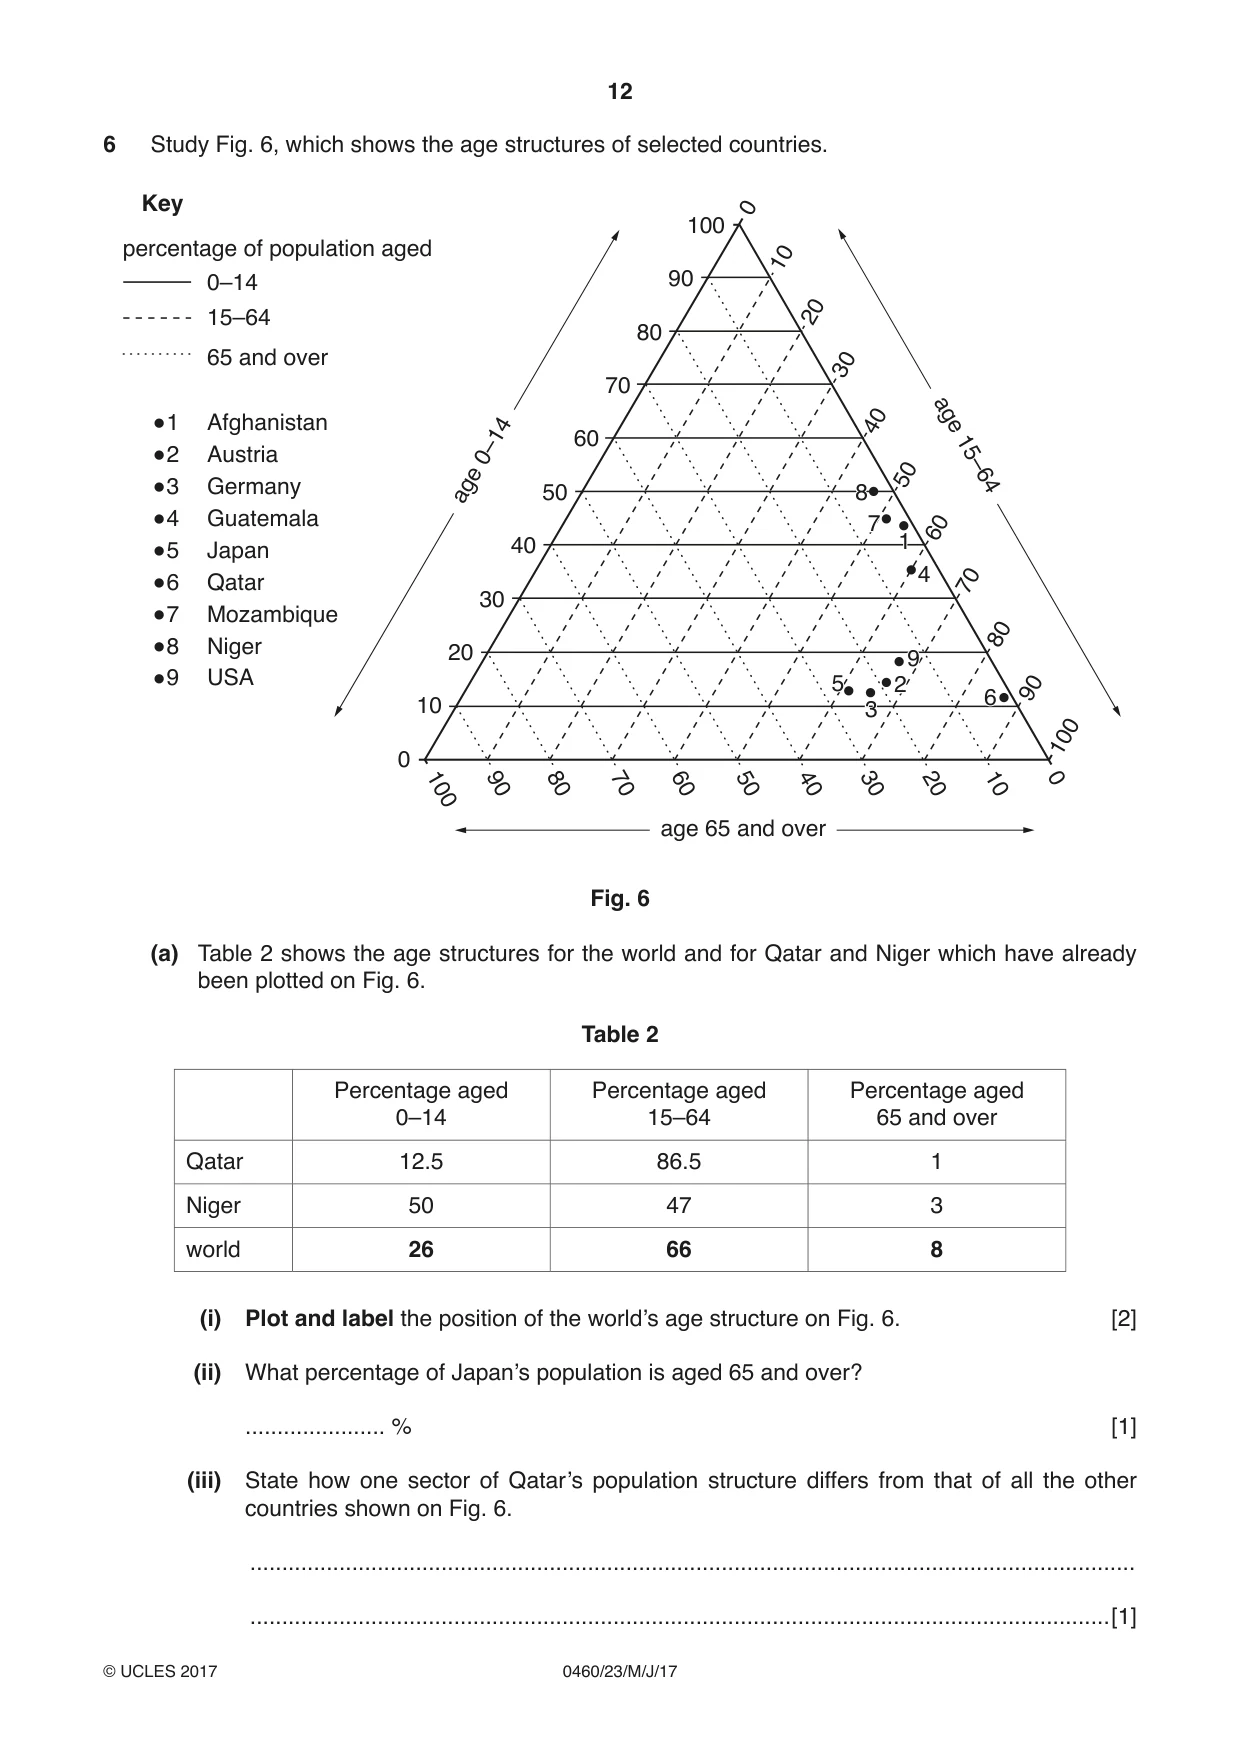
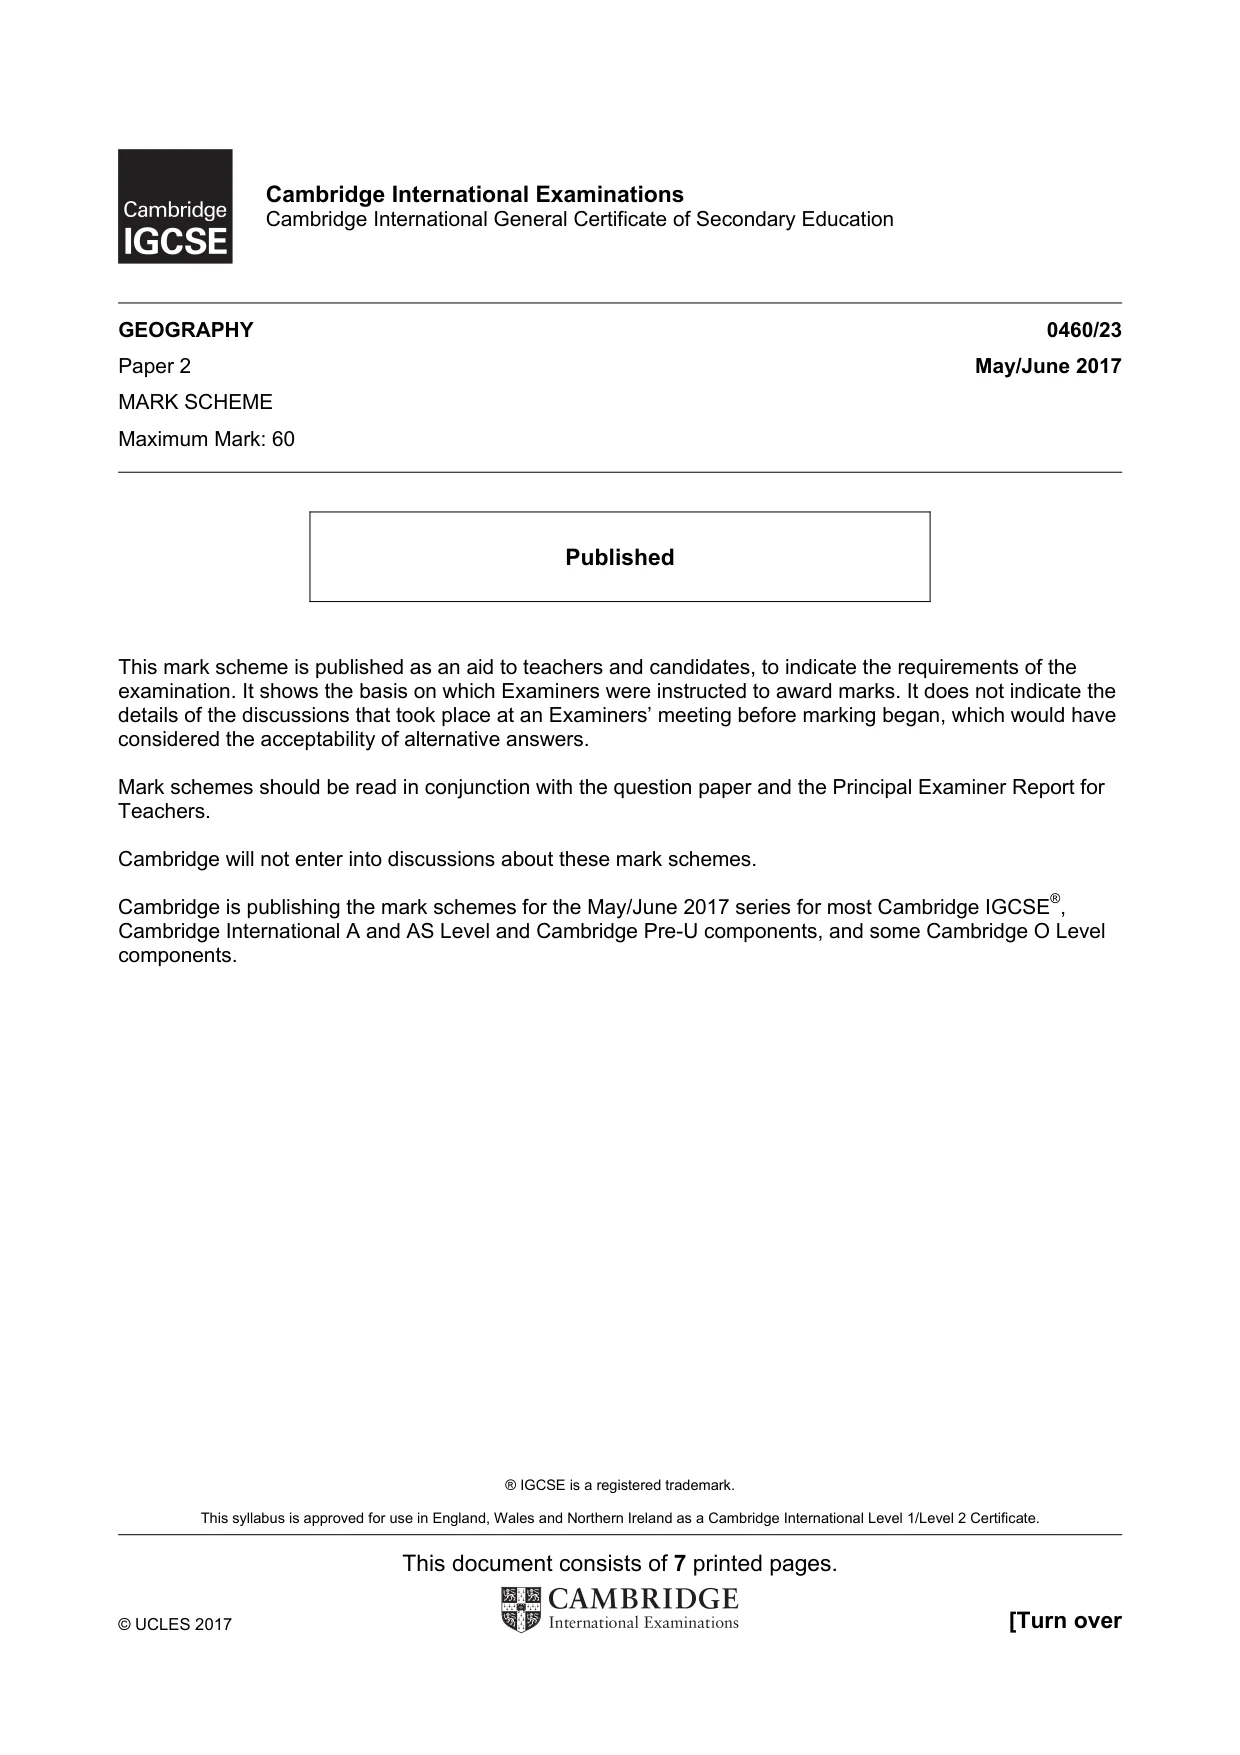
6 Study Fig. 6, which shows the age structures of selected countries. Key 0 100 percentage of population aged 10 0–14 90 15–64 20 80 65 and over 30 70 1 Afghanistan 40 age 60 2 Austria 0–14 15–64 3 Germany age 50 8 50 4 Guatemala 7 60 5 Japan 40 1 4 6 Qatar 70 30 7 Mozambique 80 8 Niger 20 9 9 USA 5 2 90 6 10 3 100 0 100 90 80 70 60 50 40 30 20 10 0 age 65 and over Fig. 6 (a) Table 2 shows the age structures for the world and for Qatar and Niger which have already been plotted on Fig. 6. Table 2 Percentage aged Percentage aged Percentage aged 0–14 15–64 65 and over Qatar 12.5 86.5 1 Niger 50 47 3 world 26 66 8 (i) Plot and label the position of the world’s age structure on Fig. 6. [2] (ii) What percentage of Japan’s population is aged 65 and over? ...................... % [1] (iii) State how one sector of Qatar’s population structure differs from that of all the other countries shown on Fig. 6. ........................................................................................................................................... .......................................................................................................................................[1] (b) (i) Define the term dependent population. ........................................................................................................................................... .......................................................................................................................................[1] (ii) Look at Niger’s population structure in Table 2. Suggest why countries with age structures similar to this find it difficult to develop their economies. ........................................................................................................................................... ........................................................................................................................................... ........................................................................................................................................... ........................................................................................................................................... .......................................................................................................................................[3] [Total: 8 marks] Additional Pages If you use the following lined pages to complete the answer(s) to any question(s), the question number(s) must be clearly shown. .................................................................................................................................................................. .................................................................................................................................................................. .................................................................................................................................................................. .................................................................................................................................................................. .................................................................................................................................................................. .................................................................................................................................................................. .................................................................................................................................................................. .................................................................................................................................................................. .................................................................................................................................................................. .................................................................................................................................................................. .................................................................................................................................................................. .................................................................................................................................................................. .................................................................................................................................................................. .................................................................................................................................................................. .................................................................................................................................................................. .................................................................................................................................................................. .................................................................................................................................................................. .................................................................................................................................................................. .................................................................................................................................................................. .................................................................................................................................................................. .................................................................................................................................................................. .................................................................................................................................................................. .................................................................................................................................................................. .................................................................................................................................................................. ..................................................................................................................................................................
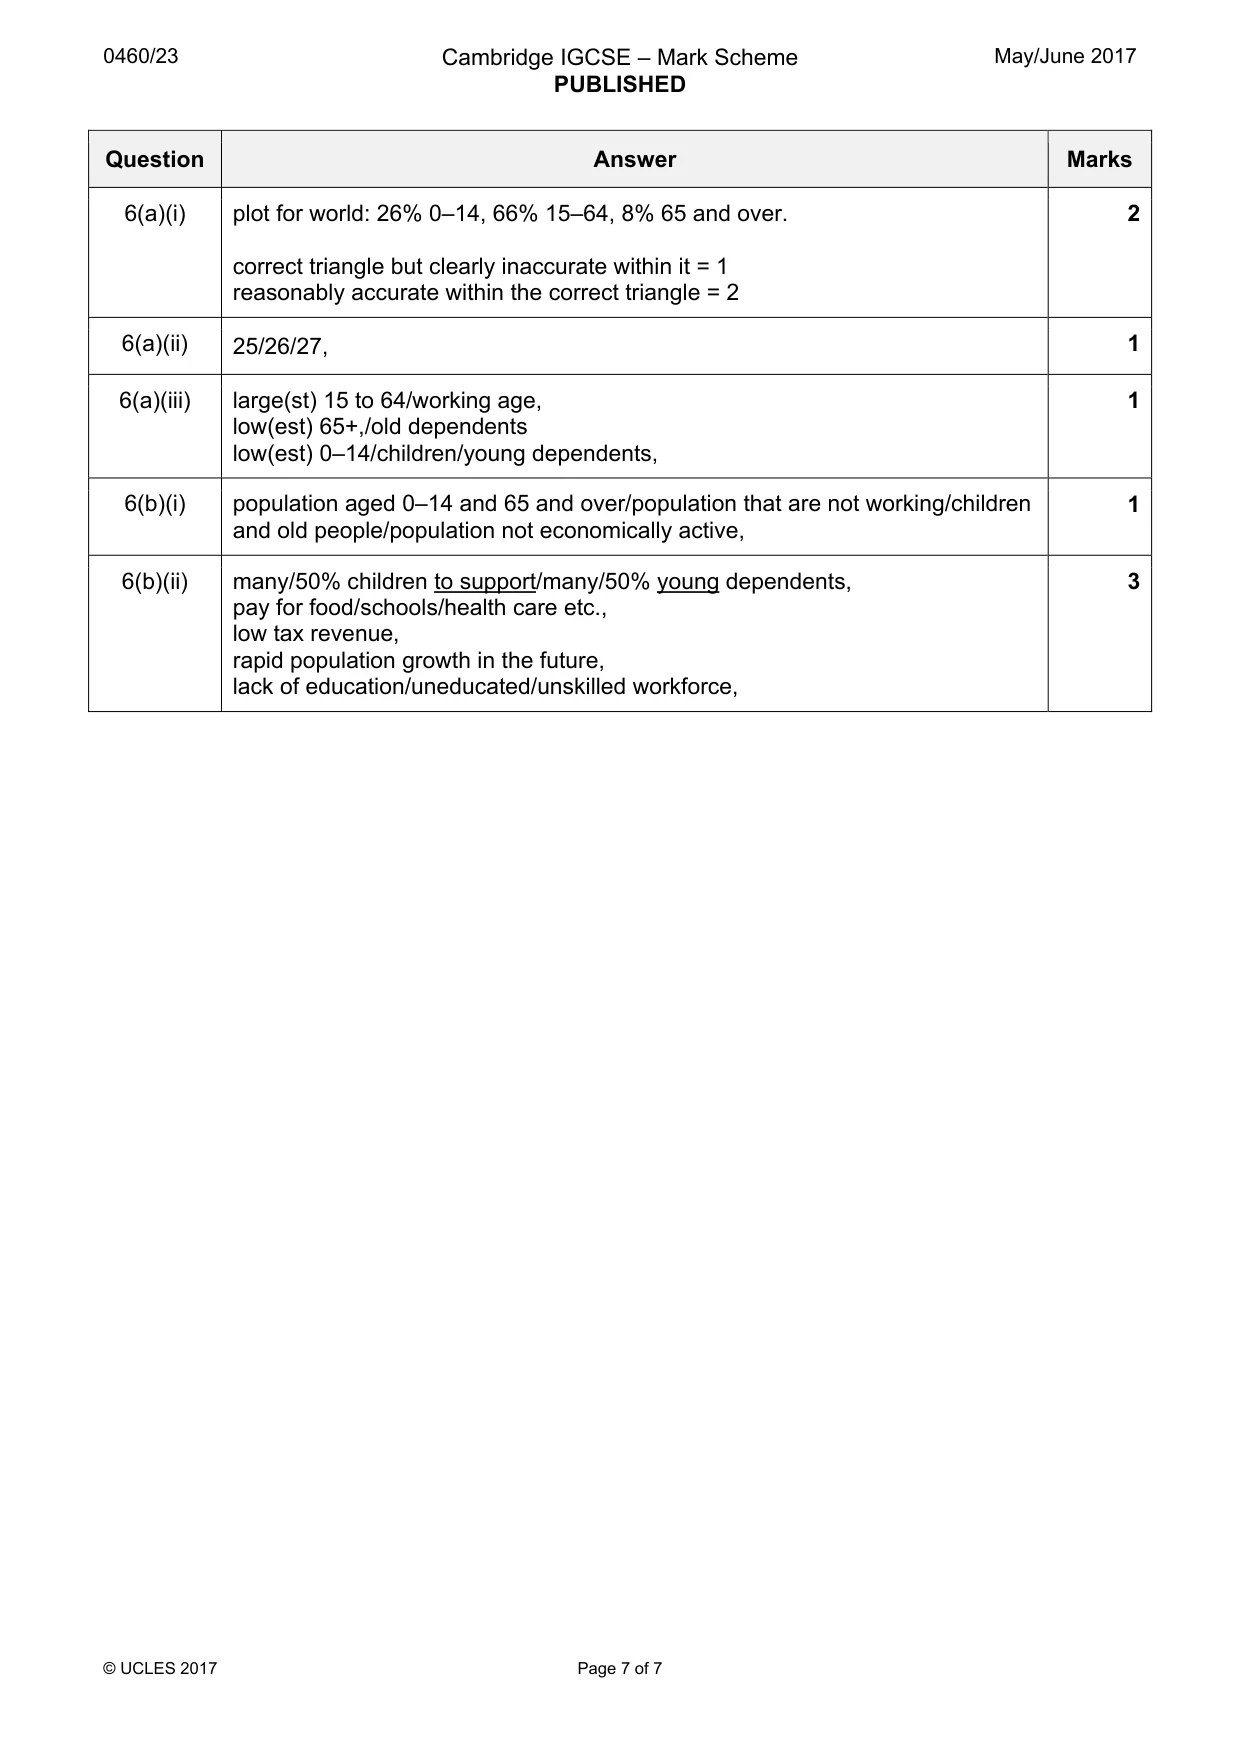
Mark scheme: 6(a)(i) plot for world: 26% 0–14, 66% 15–64, 8% 65 and over. 2 correct triangle but clearly inaccurate within it = 1 reasonably accurate within the correct triangle = 2 6(a)(ii) 25/26/27, 1 6(a)(iii) large(st) 15 to 64/working age, 1 low(est) 65+,/old dependents low(est) 0–14/children/young dependents, 6(b)(i) population aged 0–14 and 65 and over/population that are not working/children 1 and old people/population not economically active, 6(b)(ii) many/50% children to support/many/50% young dependents, 3 pay for food/schools/health care etc., low tax revenue, rapid population growth in the future, lack of education/uneducated/unskilled workforce,
What was in this paper
The subtopics covered by these 6 questions, and how many questions each got. Open one in a new tab to see every Cambridge question on it.
What you needed in this session
Cambridge’s own grade thresholds for 2017 May/June, Paper 2 · Variant 3. A higher threshold means an easier paper — the bar moves with how the cohort did.