Cambridge IGCSE Geography 0460 — 2021 Feb/March Paper 2 · Variant 2
0460/22/F/M/21 · 6 questions · 60 marks · ≈68 min
The question paper and its mark scheme, free to read here and free to download. This is Cambridge’s own paper, exactly as it was sat.
Question paper16 pages


Mark scheme7 pages
Answers below. Sit the paper first if you are practising.
Questions as text
Q1 · Study the map extract for Fortuniès, France
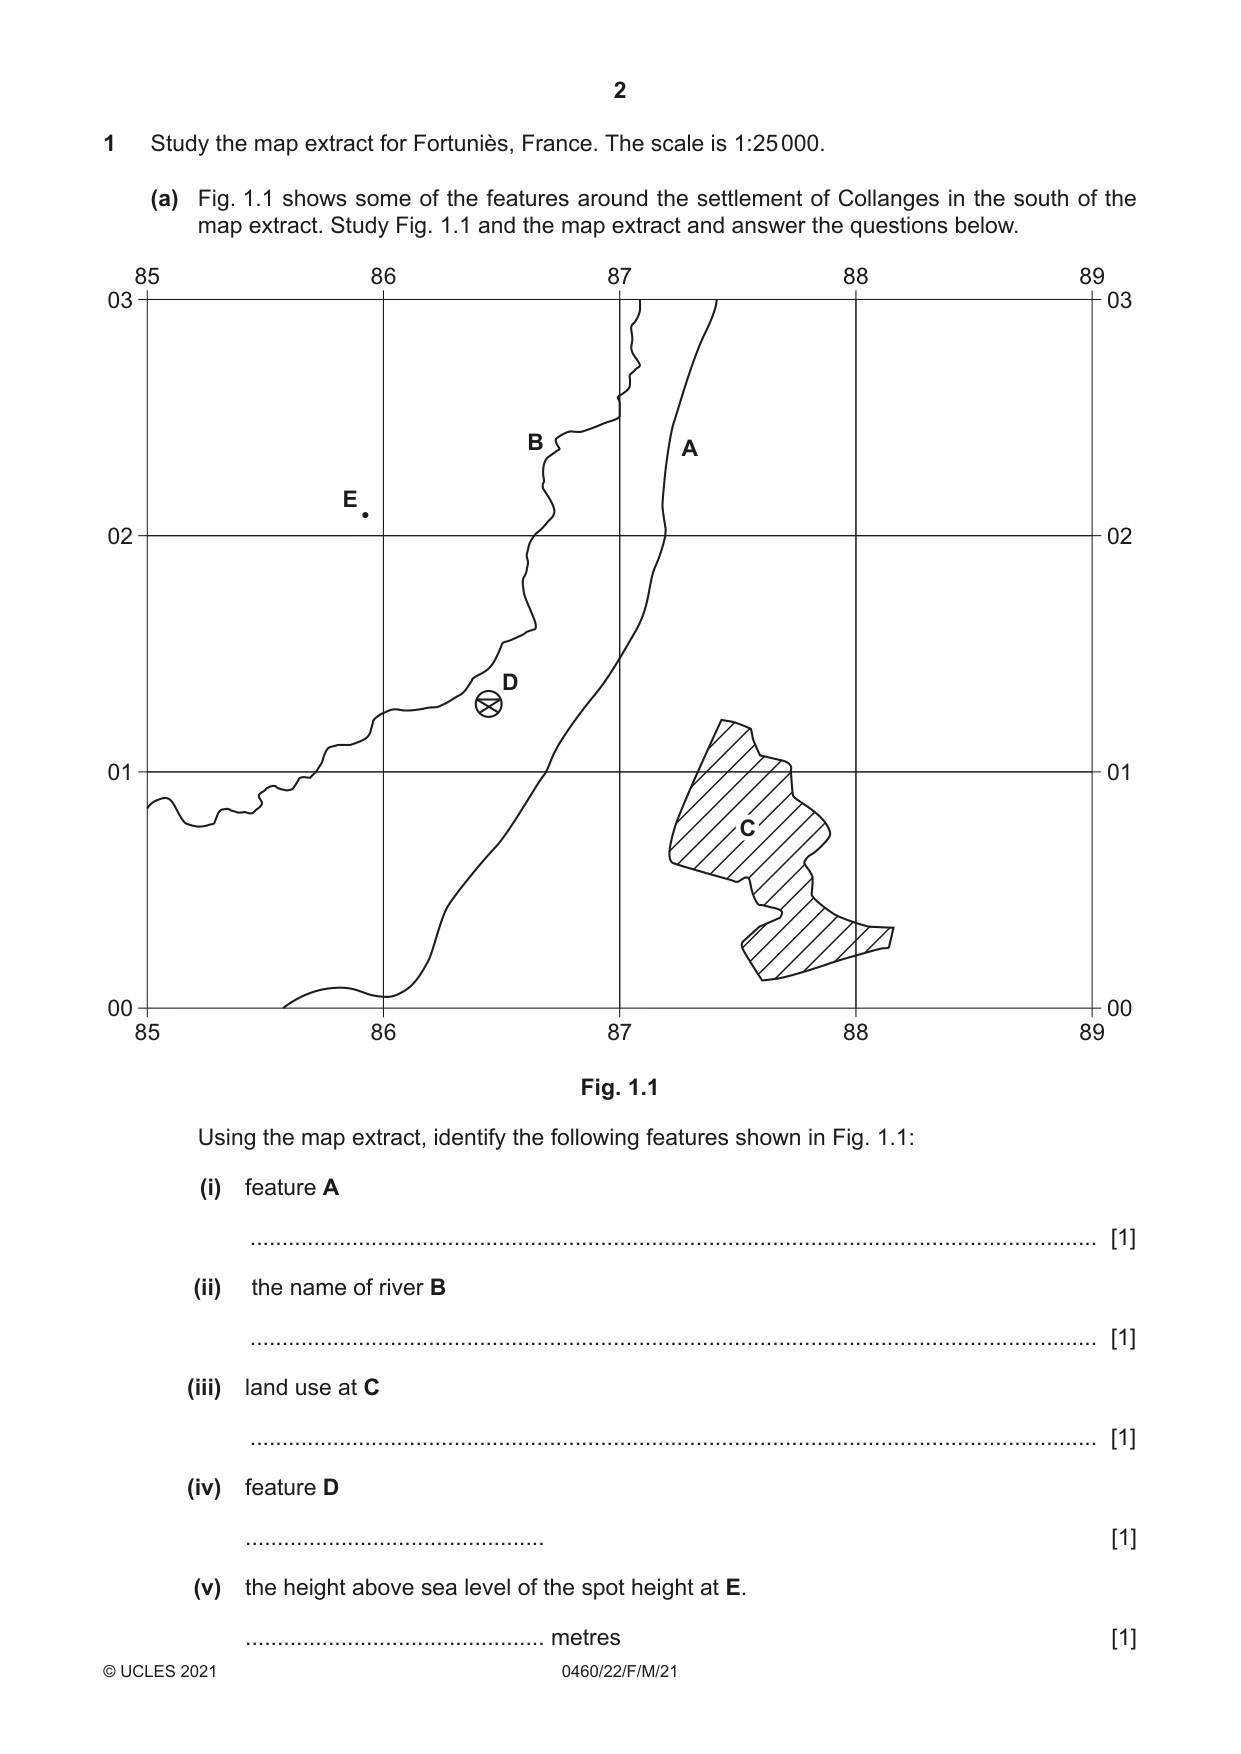
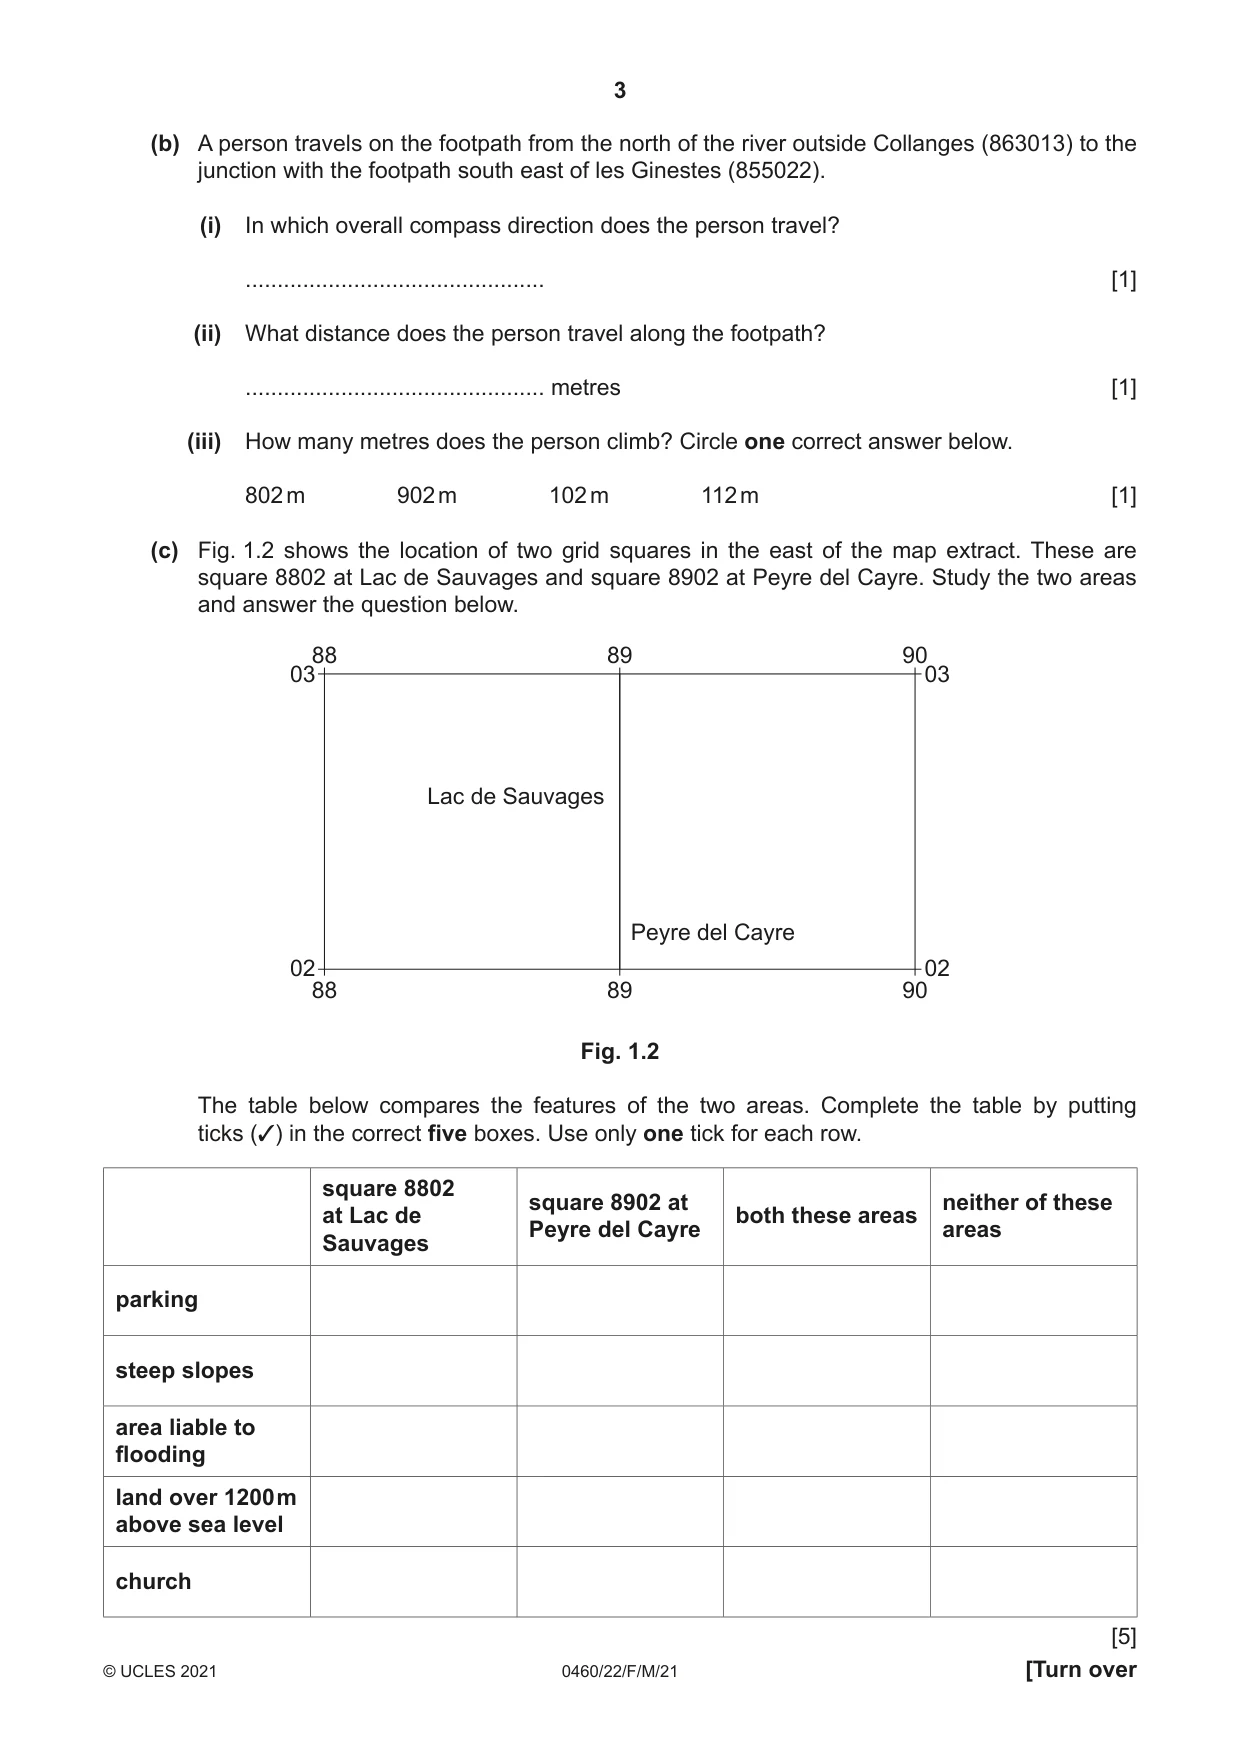
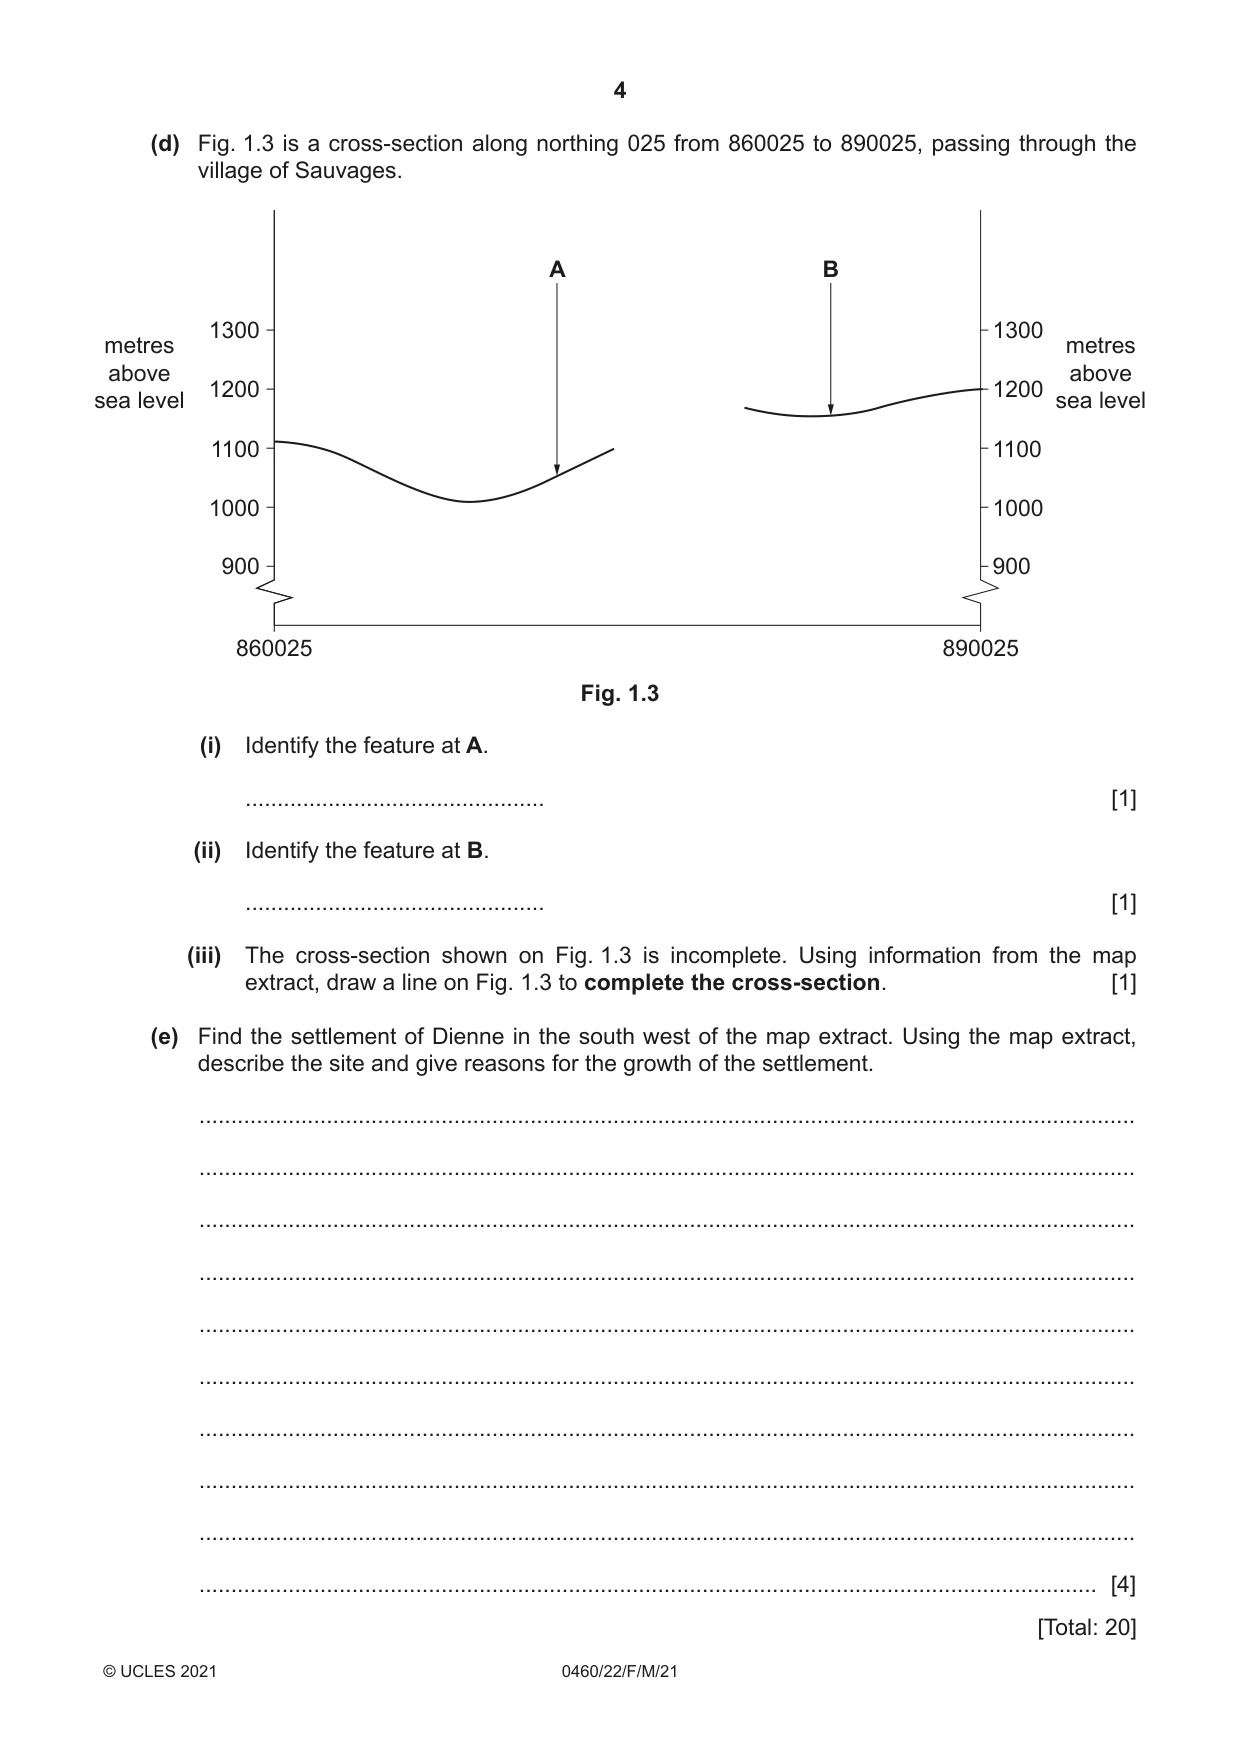
1 Study the map extract for Fortuniès, France. The scale is 1:25 000. (a) Fig. 1.1 shows some of the features around the settlement of Collanges in the south of the map extract. Study Fig. 1.1 and the map extract and answer the questions below. 85 86 87 88 89 03 03 B A E 02 02 D 01 01 C 00 00 85 86 87 88 89 Fig. 1.1 Using the map extract, identify the following features shown in Fig. 1.1: (i) feature A ..................................................................................................................................... [1] (ii) the name of river B ..................................................................................................................................... [1] (iii) land use at C ..................................................................................................................................... [1] (iv) feature D ............................................... [1] (v) the height above sea level of the spot height at E. ............................................... metres [1] (b) A person travels on the footpath from the north of the river outside Collanges (863013) to the junction with the footpath south east of les Ginestes (855022). (i) In which overall compass direction does the person travel? ............................................... [1] (ii) What distance does the person travel along the footpath? ............................................... metres [1] (iii) How many metres does the person climb? Circle one correct answer below. 802 m 902 m 102 m 112 m [1] (c) Fig. 1.2 shows the location of two grid squares in the east of the map extract. These are square 8802 at Lac de Sauvages and square 8902 at Peyre del Cayre. Study the two areas and answer the question below. 88 89 90 03 03 Lac de Sauvages Peyre del Cayre 02 02 88 89 90 Fig. 1.2 The table below compares the features of the two areas. Complete the table by putting ticks (3) in the correct five boxes. Use only one tick for each row. square 8802 square 8902 at neither of these at Lac de both these areas Peyre del Cayre areas Sauvages parking steep slopes area liable to flooding land over 1200 m above sea level church [5] (d) Fig. 1.3 is a cross-section along northing 025 from 860025 to 890025, passing through the village of Sauvages. A B 1300 1300 metres metres above above 1200 1200sea level sea level 1100 1100 1000 1000 900 900 860025 890025 Fig. 1.3 (i) Identify the feature at A. ............................................... [1] (ii) Identify the feature at B. ............................................... [1] (iii) The cross-section shown on Fig. 1.3 is incomplete. Using information from the map extract, draw a line on Fig. 1.3 to complete the cross-section. [1] (e) Find the settlement of Dienne in the south west of the map extract. Using the map extract, describe the site and give reasons for the growth of the settlement. ................................................................................................................................................... ................................................................................................................................................... ................................................................................................................................................... ................................................................................................................................................... ................................................................................................................................................... ................................................................................................................................................... ................................................................................................................................................... ................................................................................................................................................... ................................................................................................................................................... ............................................................................................................................................. [4] [Total: 20]
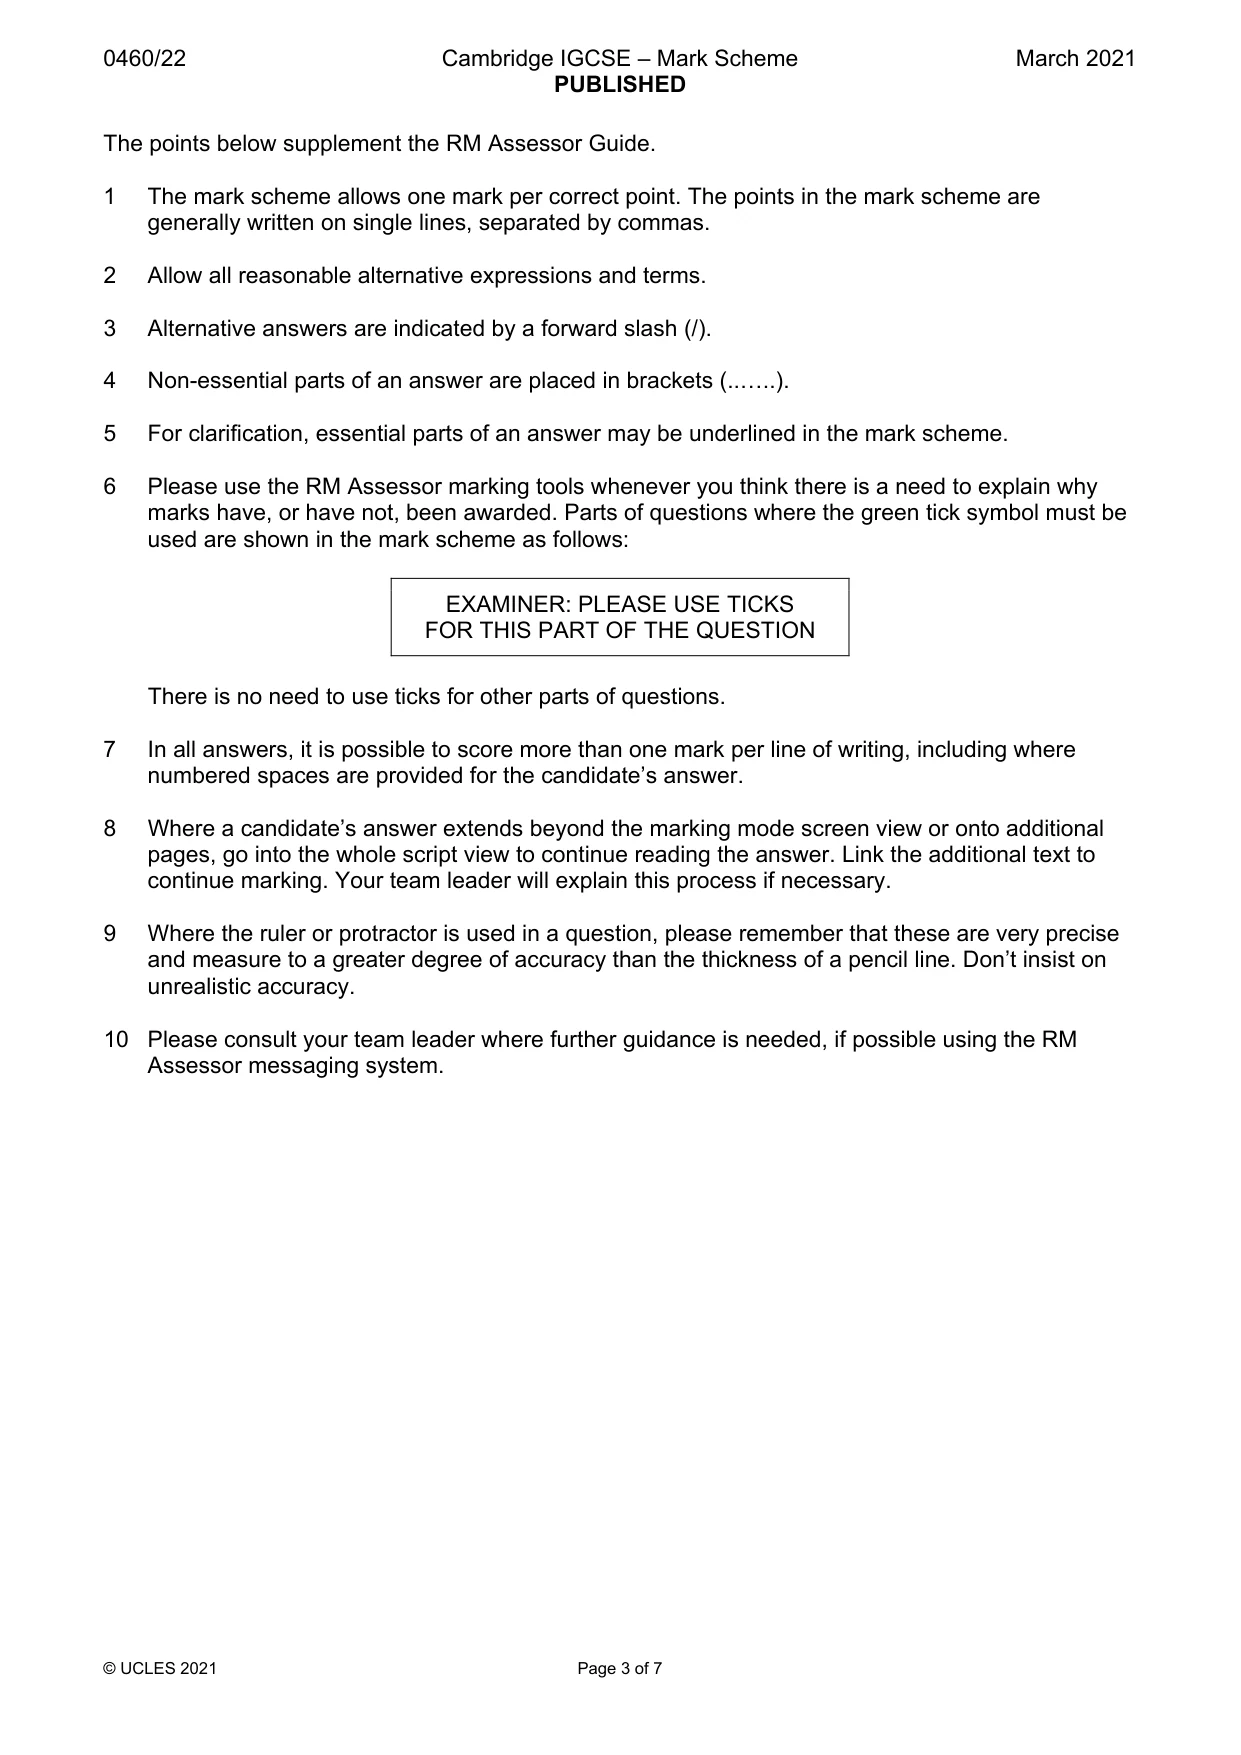
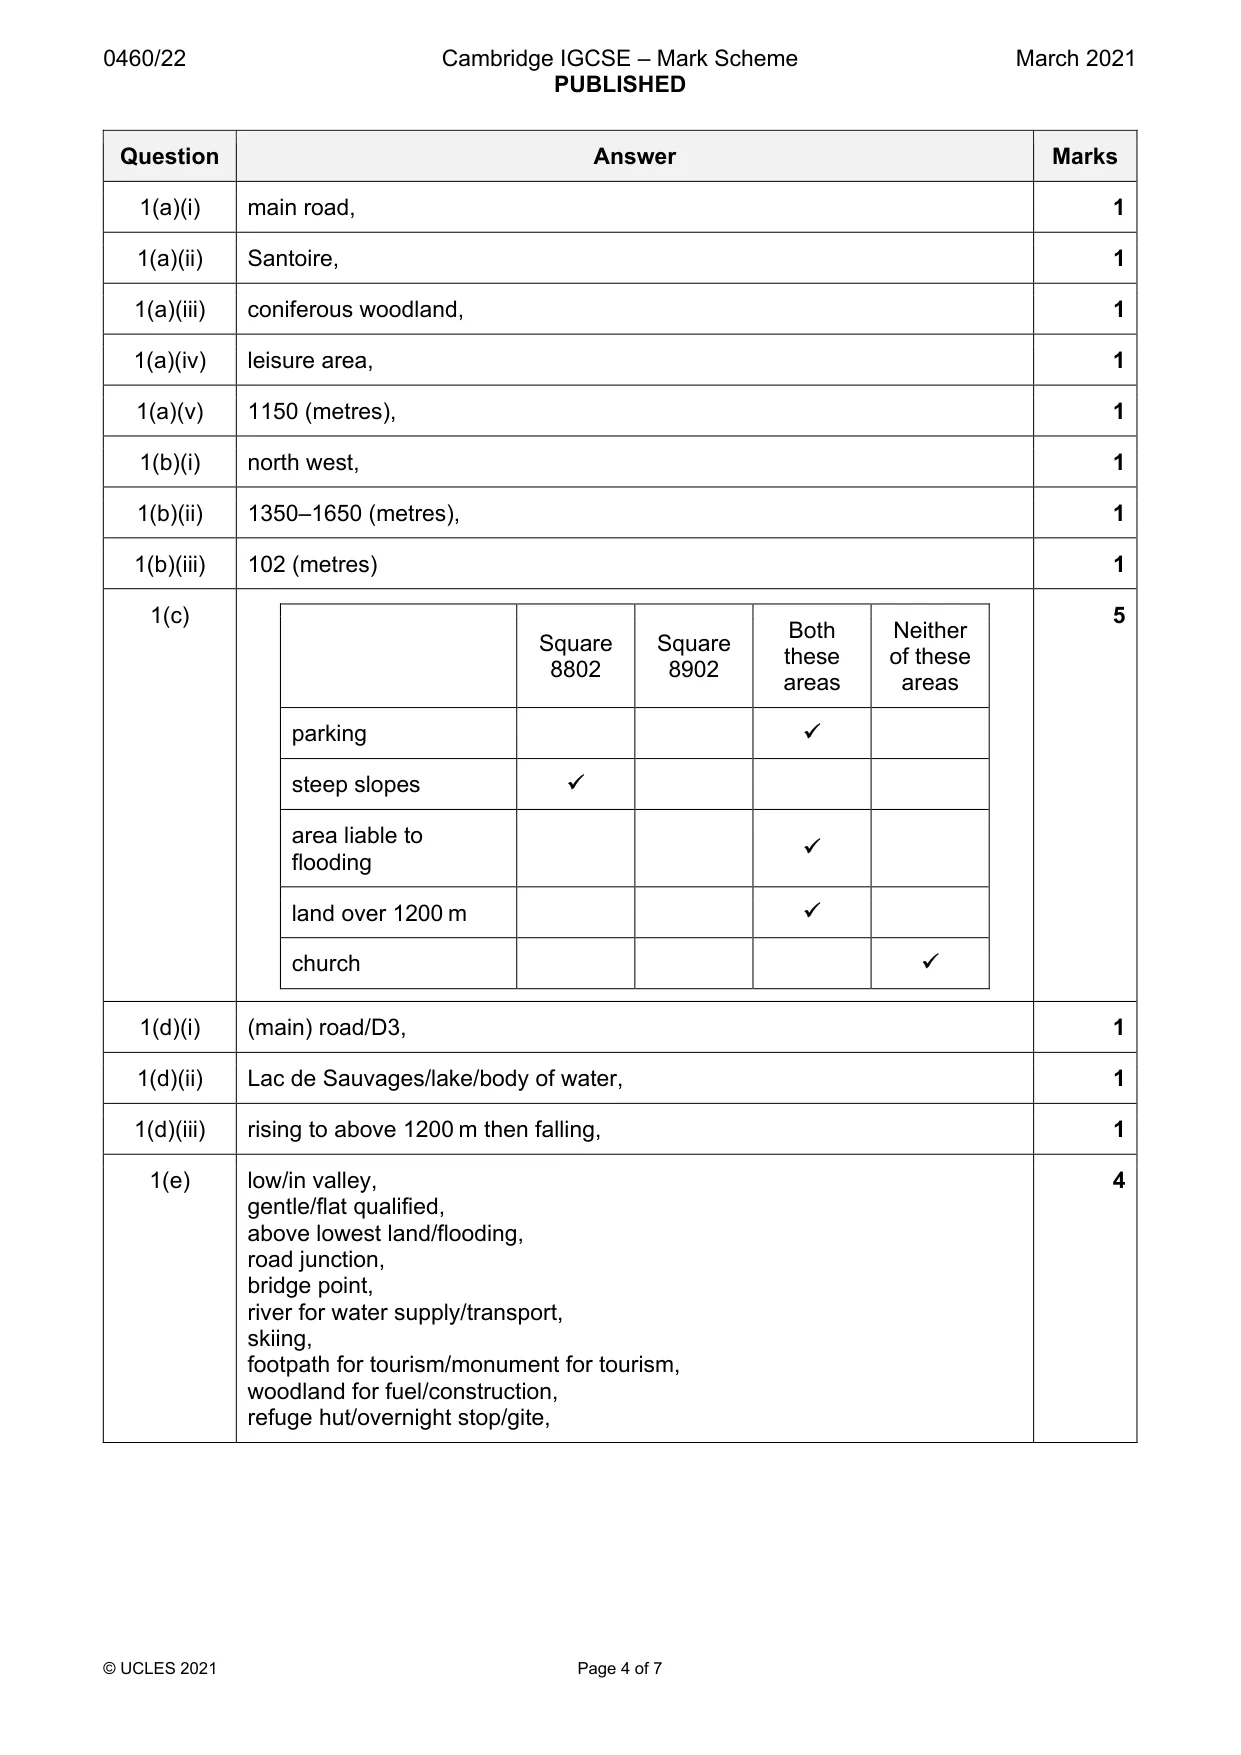
Mark scheme: Question Answer Marks 1(a)(i) main road, 1 1(a)(ii) Santoire, 1 1(a)(iii) coniferous woodland, 1 1(a)(iv) leisure area, 1 1(a)(v) 1150 (metres), 1 1(b)(i) north west, 1 1(b)(ii) 1350–1650 (metres), 1 1(b)(iii) 102 (metres) 1 1(c) 5 Both Neither Square Square these of these 8802 8902 areas areas parking steep slopes area liable to flooding land over 1200 m church 1(d)(i) (main) road/D3, 1 1(d)(ii) Lac de Sauvages/lake/body of water, 1 1(d)(iii) rising to above 1200 m then falling, 1 1(e) low/in valley, 4 gentle/flat qualified, above lowest land/flooding, road junction, bridge point, river for water supply/transport, skiing, footpath for tourism/monument for tourism, woodland for fuel/construction, refuge hut/overnight stop/gite,
Q2 · The change in the percentage of the rural population in the world between 1960 and 2015
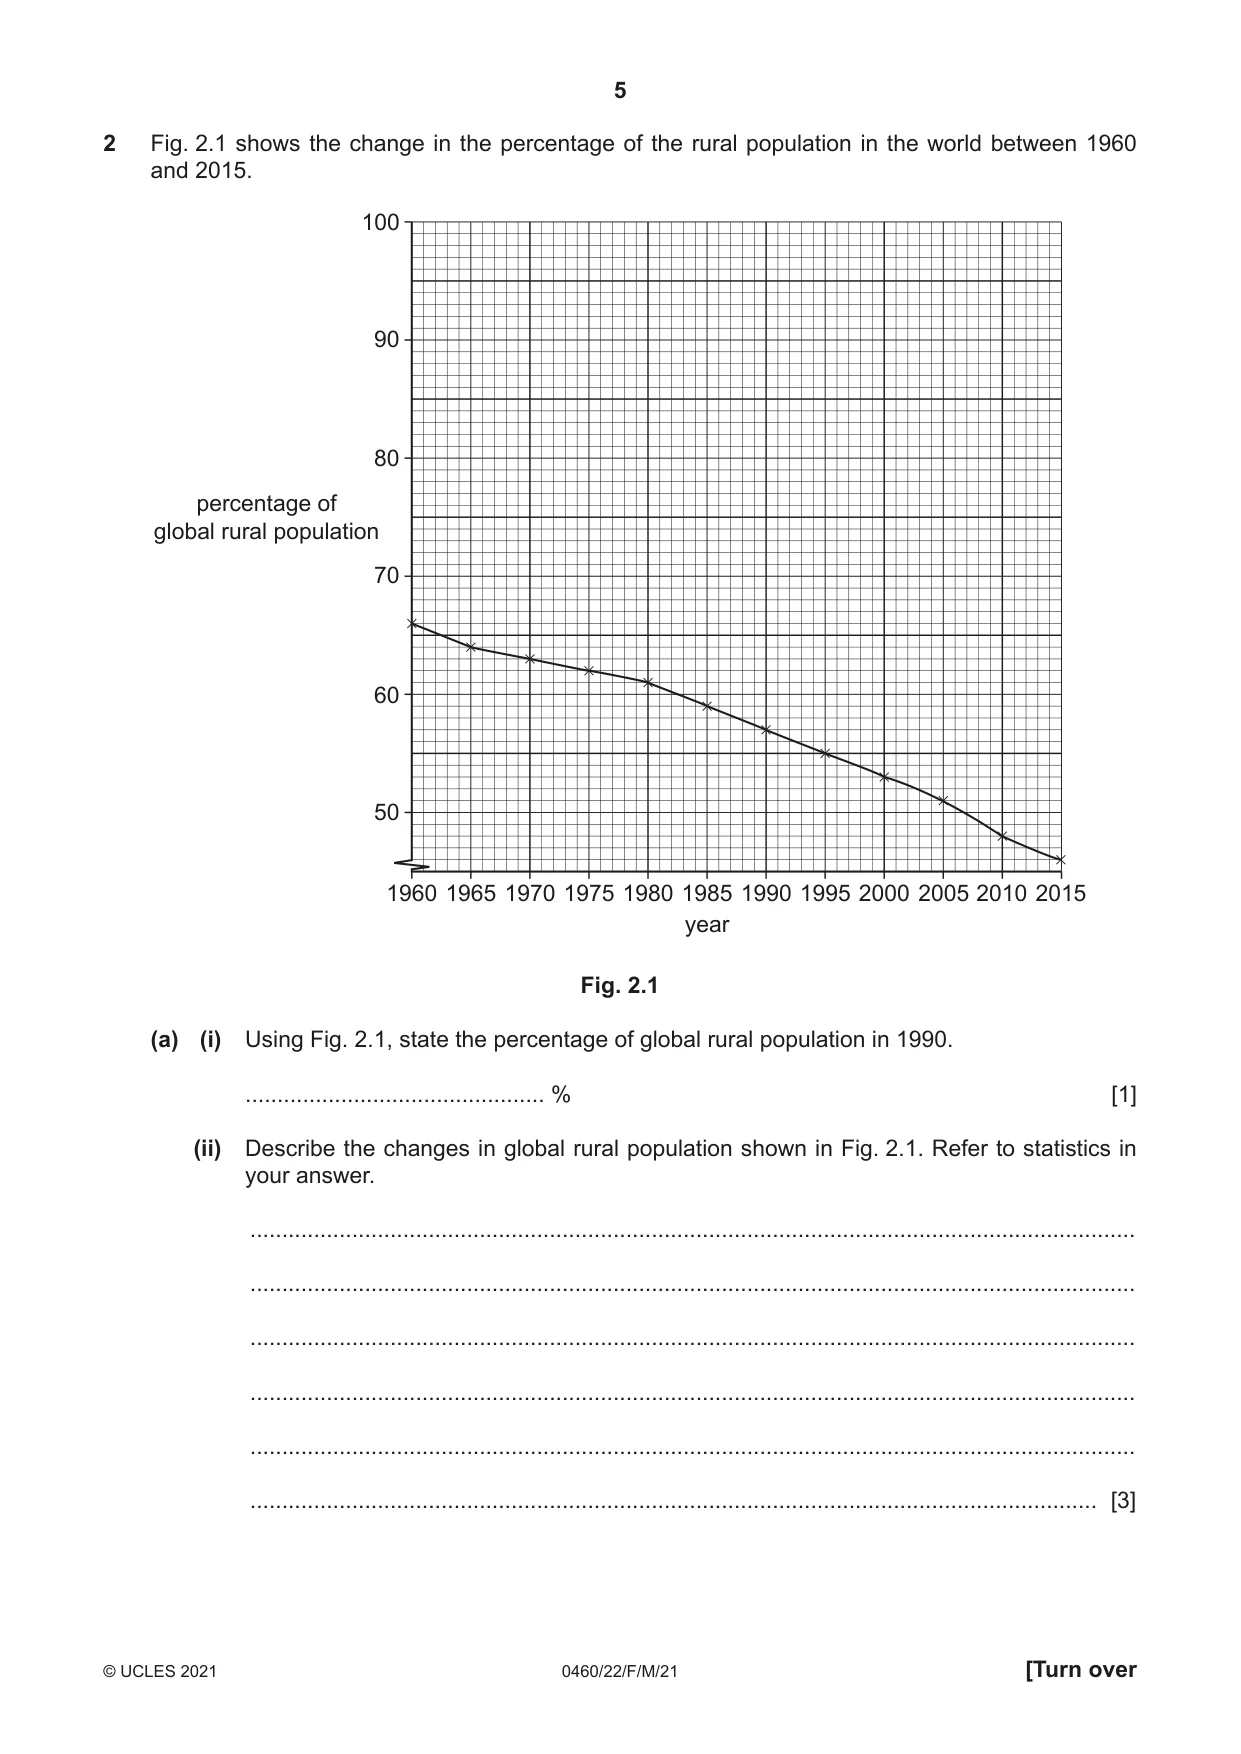
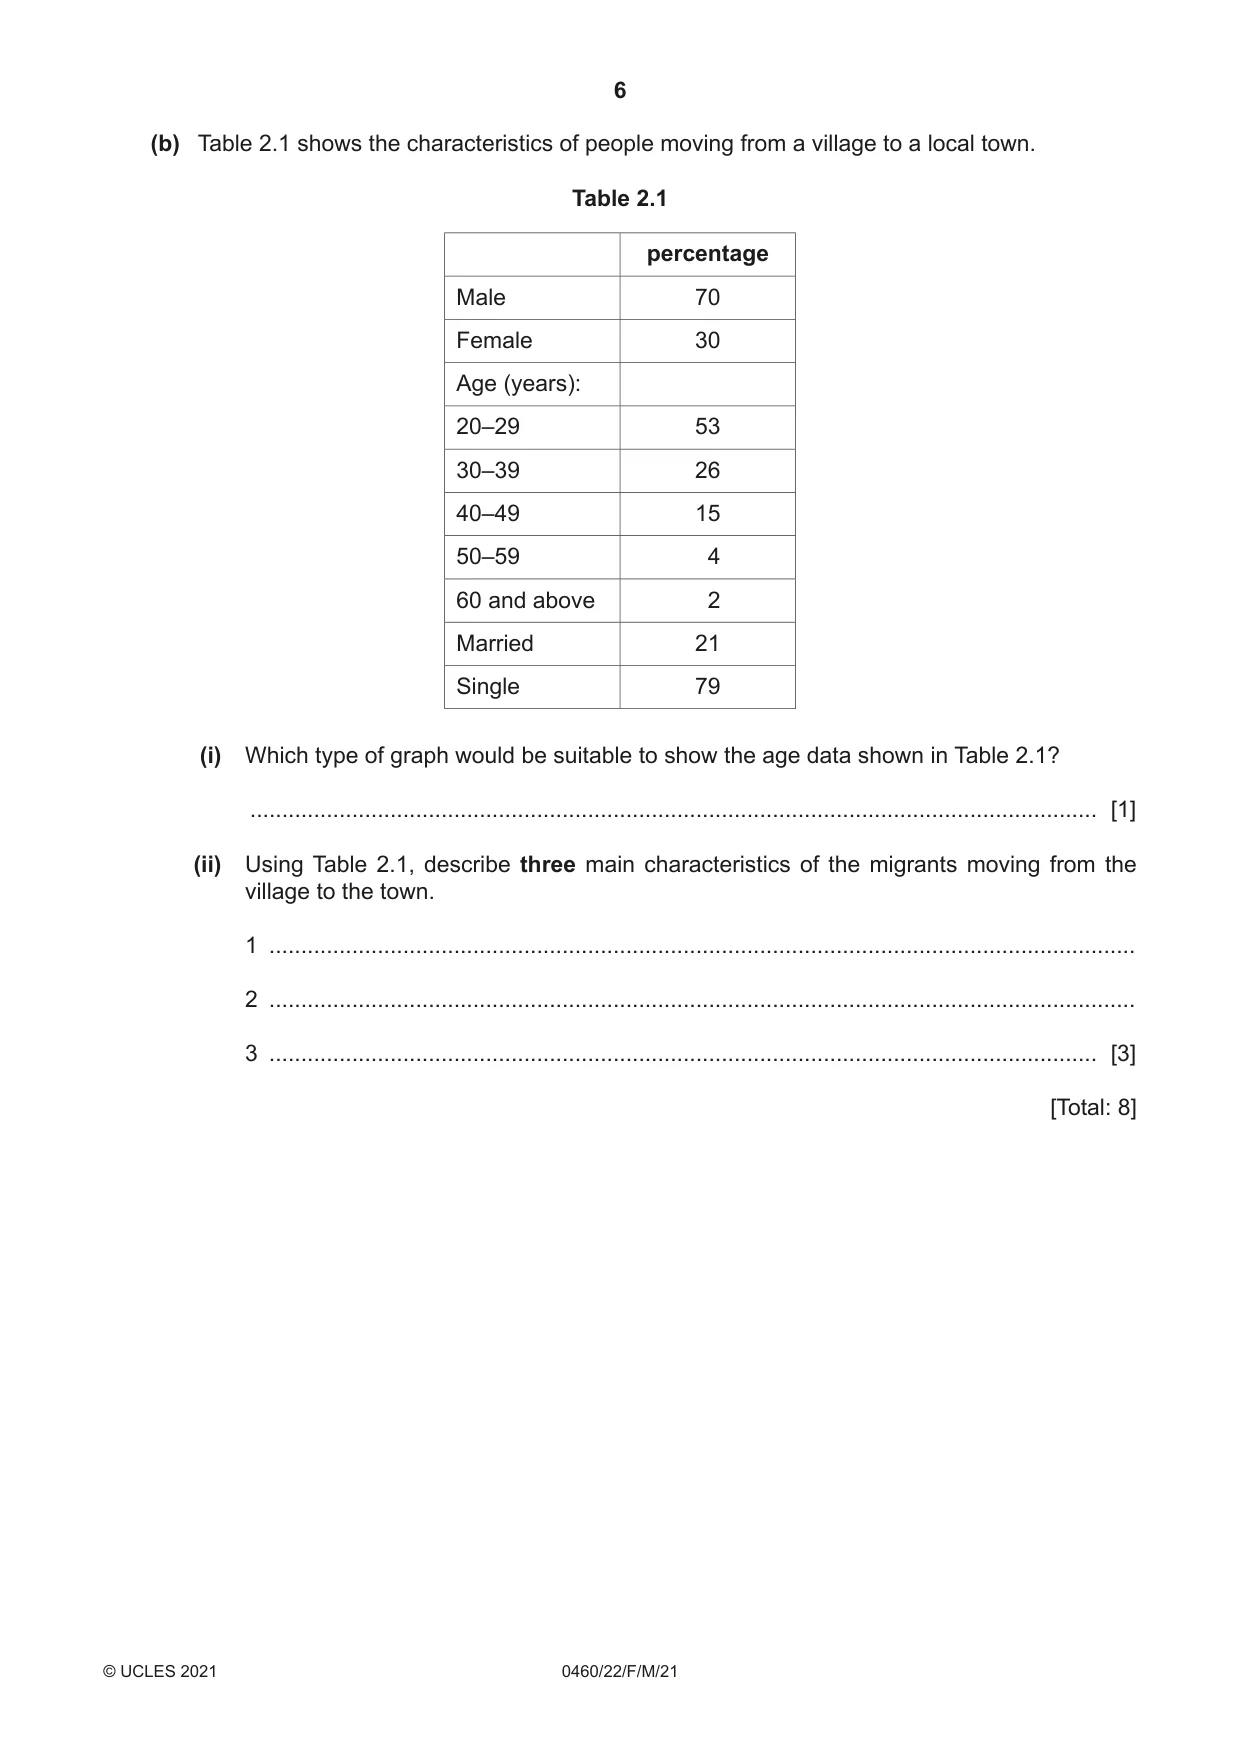
2 Fig. 2.1 shows the change in the percentage of the rural population in the world between 1960 and 2015. 100 90 80 percentage of global rural population 70 60 50 1960 1965 1970 1975 1980 1985 1990 1995 2000 2005 2010 2015 year Fig. 2.1 (a) (i) Using Fig. 2.1, state the percentage of global rural population in 1990. ............................................... % [1] (ii) Describe the changes in global rural population shown in Fig. 2.1. Refer to statistics in your answer. ........................................................................................................................................... ........................................................................................................................................... ........................................................................................................................................... ........................................................................................................................................... ........................................................................................................................................... ..................................................................................................................................... [3] (b) Table 2.1 shows the characteristics of people moving from a village to a local town. Table 2.1 percentage Male 70 Female 30 Age (years): 20–29 53 30–39 26 40–49 15 50–59 4 60 and above 2 Married 21 Single 79 (i) Which type of graph would be suitable to show the age data shown in Table 2.1? ..................................................................................................................................... [1] (ii) Using Table 2.1, describe three main characteristics of the migrants moving from the village to the town. 1 ........................................................................................................................................ 2 ........................................................................................................................................ 3 .................................................................................................................................. [3] [Total: 8]
Mark scheme: 2(a)(i) 57(%), 1 2(a)(ii) decrease, 3 constant/slower then faster, 66 to 46/by 20%, 2(b)(i) pie/bar(s)/divided bar, 1 2(b)(ii) male, 3 young/working age/decrease with age/under 40/20–29, single,
Q3 · What is the correct term for the growth in the percentage of people living in towns and…
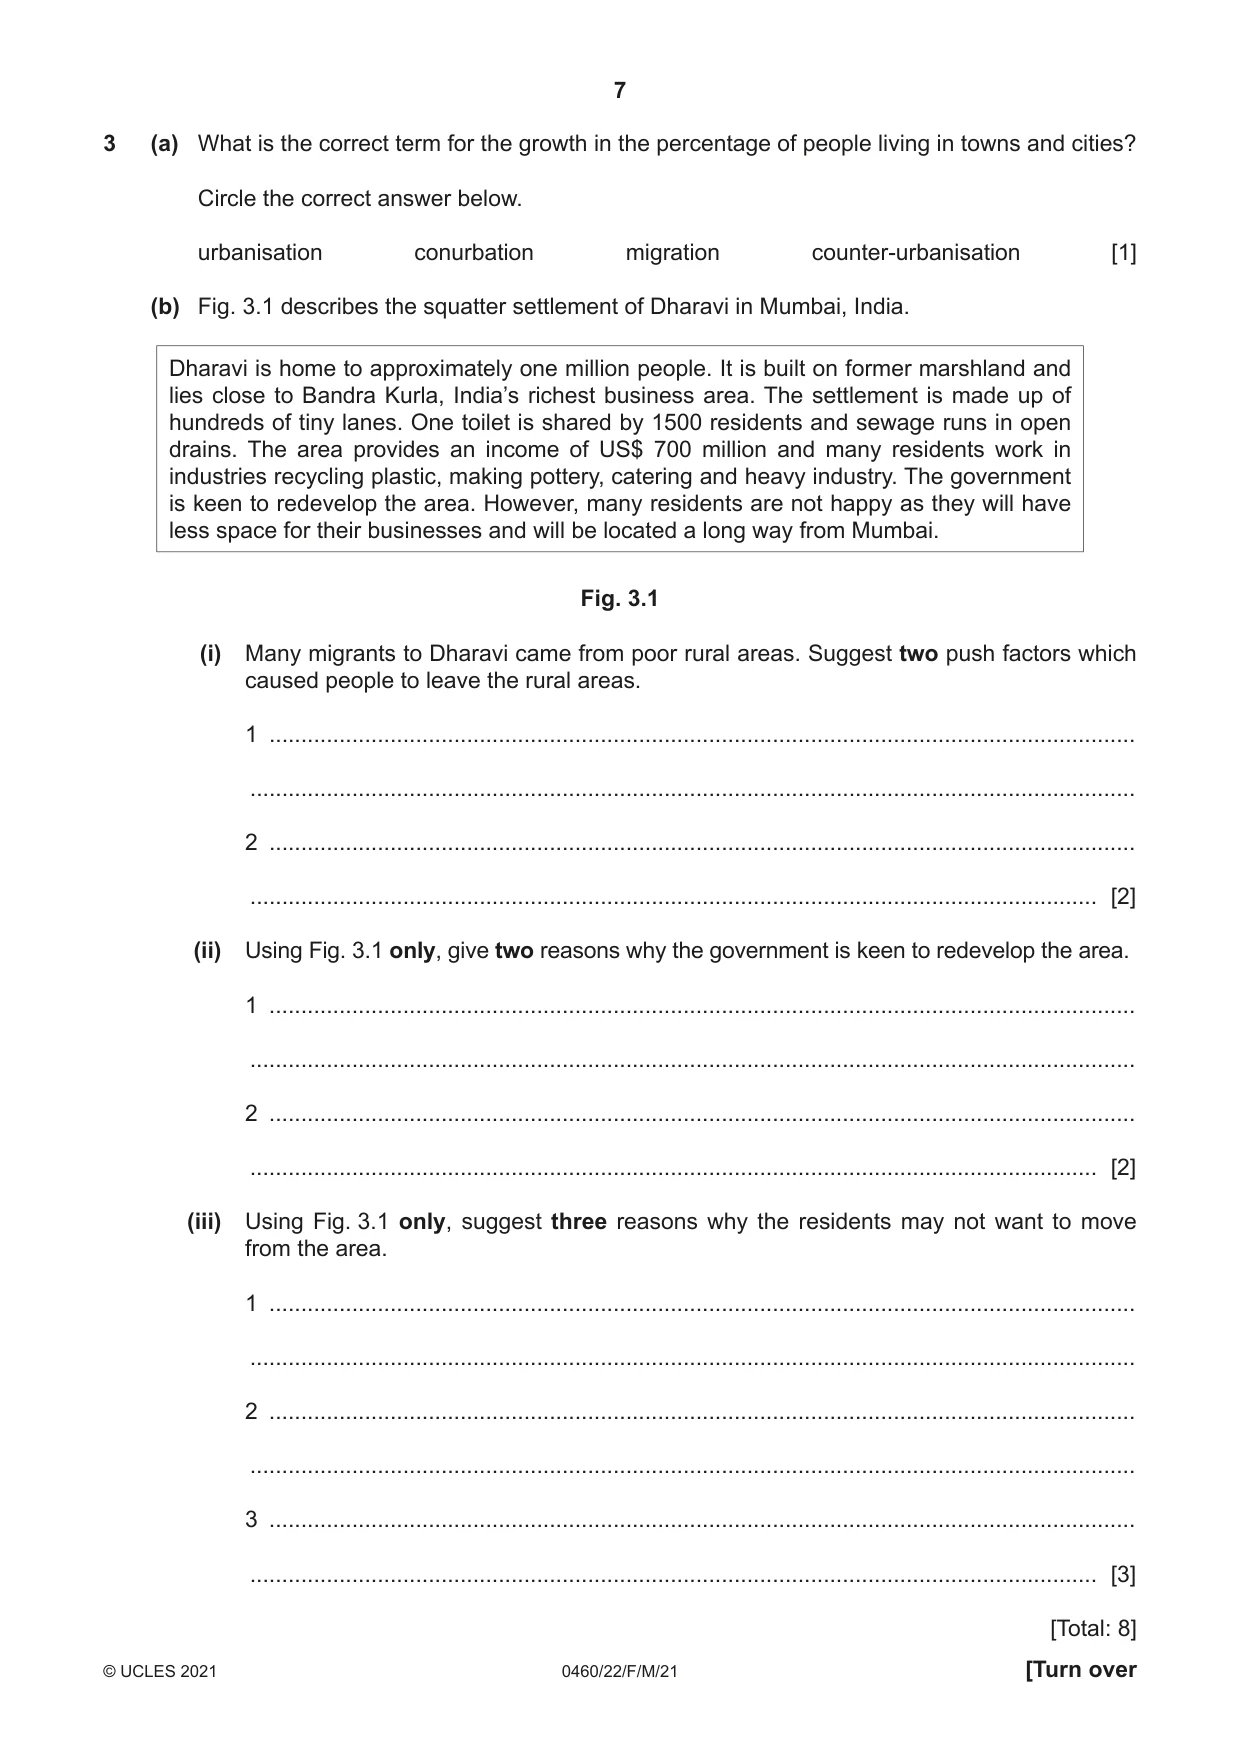
3 (a) What is the correct term for the growth in the percentage of people living in towns and cities? Circle the correct answer below. urbanisation conurbation migration counter-urbanisation [1] (b) Fig. 3.1 describes the squatter settlement of Dharavi in Mumbai, India. Dharavi is home to approximately one million people. It is built on former marshland and lies close to Bandra Kurla, India’s richest business area. The settlement is made up of hundreds of tiny lanes. One toilet is shared by 1500 residents and sewage runs in open drains. The area provides an income of US$ 700 million and many residents work in industries recycling plastic, making pottery, catering and heavy industry. The government is keen to redevelop the area. However, many residents are not happy as they will have less space for their businesses and will be located a long way from Mumbai. Fig. 3.1 (i) Many migrants to Dharavi came from poor rural areas. Suggest two push factors which caused people to leave the rural areas. 1 ........................................................................................................................................ ........................................................................................................................................... 2 ........................................................................................................................................ ..................................................................................................................................... [2] (ii) Using Fig. 3.1 only, give two reasons why the government is keen to redevelop the area. 1 ........................................................................................................................................ ........................................................................................................................................... 2 ........................................................................................................................................ ..................................................................................................................................... [2] (iii) Using Fig. 3.1 only, suggest three reasons why the residents may not want to move from the area. 1 ........................................................................................................................................ ........................................................................................................................................... 2 ........................................................................................................................................ ........................................................................................................................................... 3 ........................................................................................................................................ ..................................................................................................................................... [3] [Total: 8]
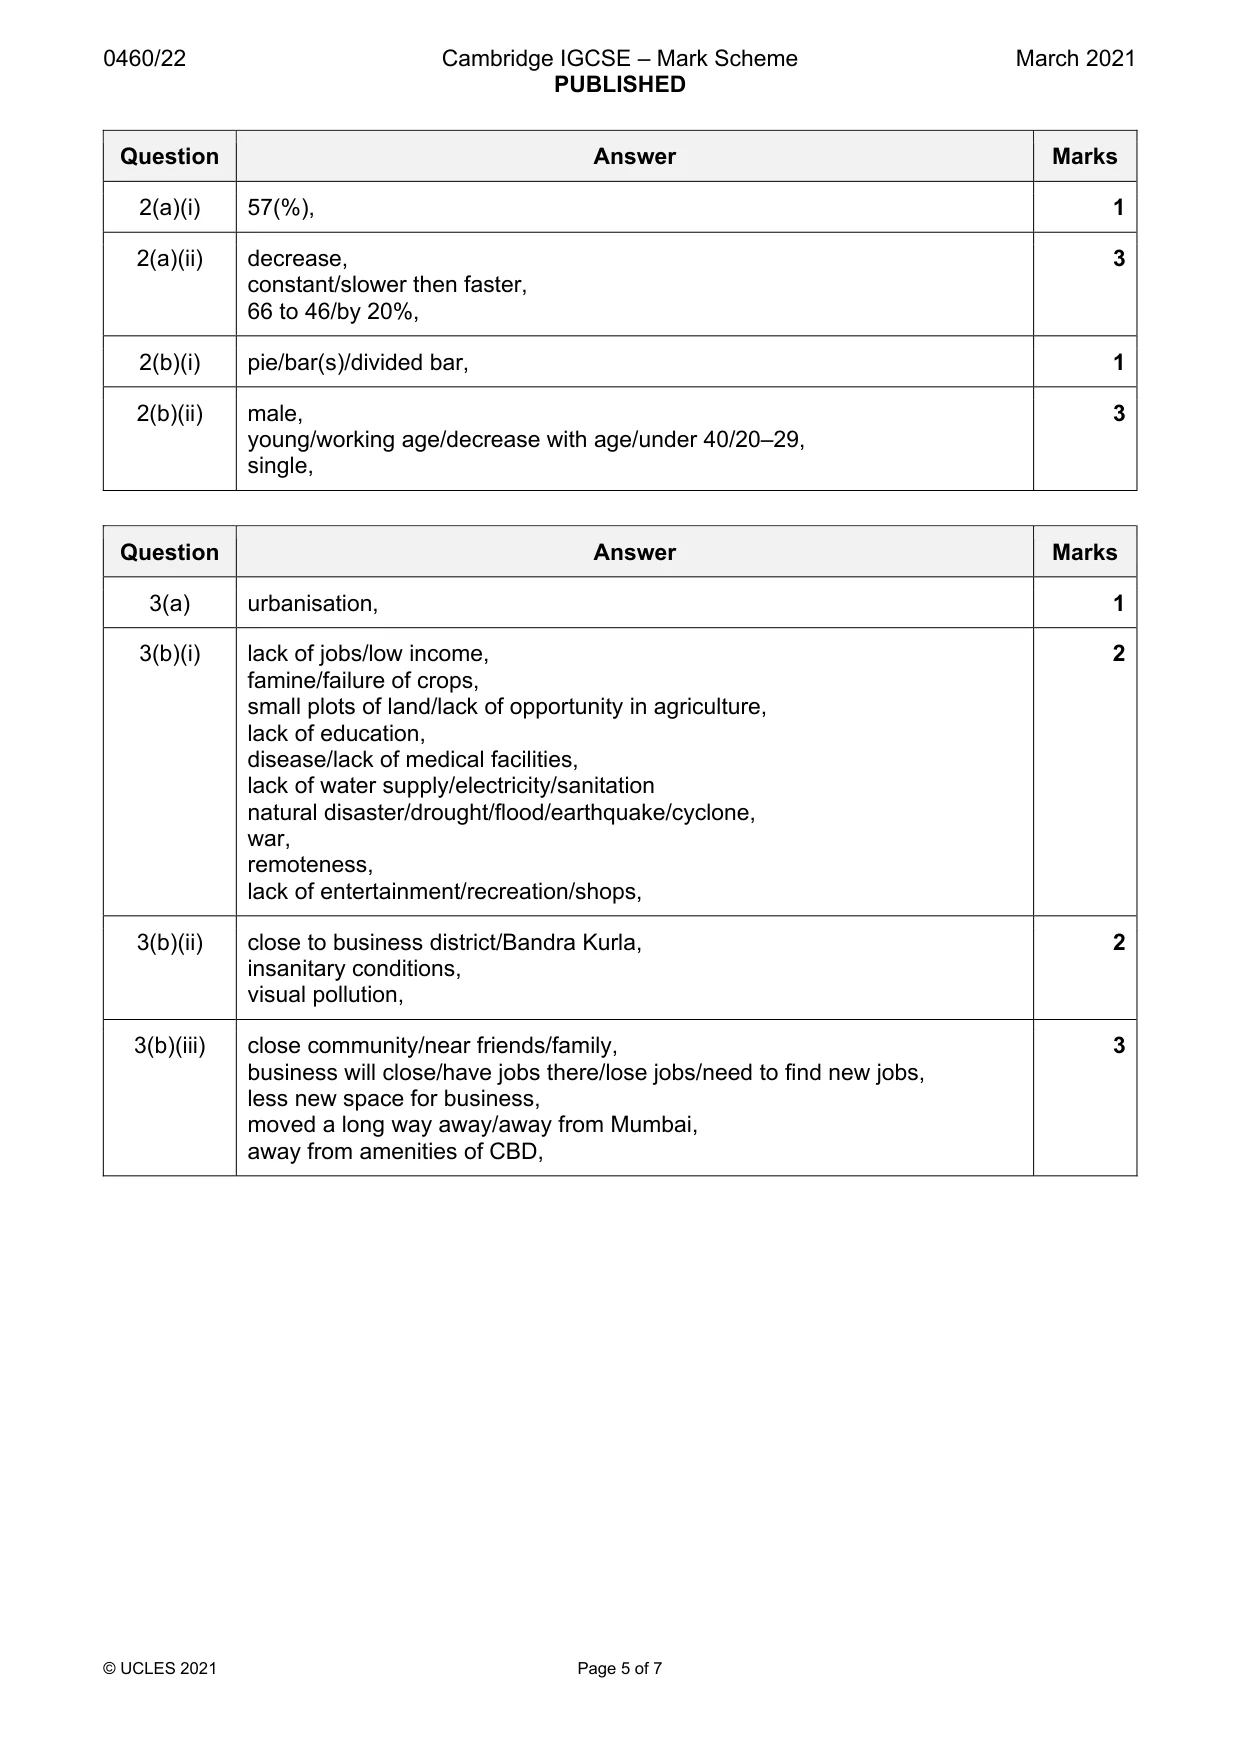
Mark scheme: 3(a) urbanisation, 1 3(b)(i) lack of jobs/low income, 2 famine/failure of crops, small plots of land/lack of opportunity in agriculture, lack of education, disease/lack of medical facilities, lack of water supply/electricity/sanitation natural disaster/drought/flood/earthquake/cyclone, war, remoteness, lack of entertainment/recreation/shops, 3(b)(ii) close to business district/Bandra Kurla, 2 insanitary conditions, visual pollution, 3(b)(iii) close community/near friends/family, 3 business will close/have jobs there/lose jobs/need to find new jobs, less new space for business, moved a long way away/away from Mumbai, away from amenities of CBD,
Q4 · The sunshine hours per month for an area in southern England
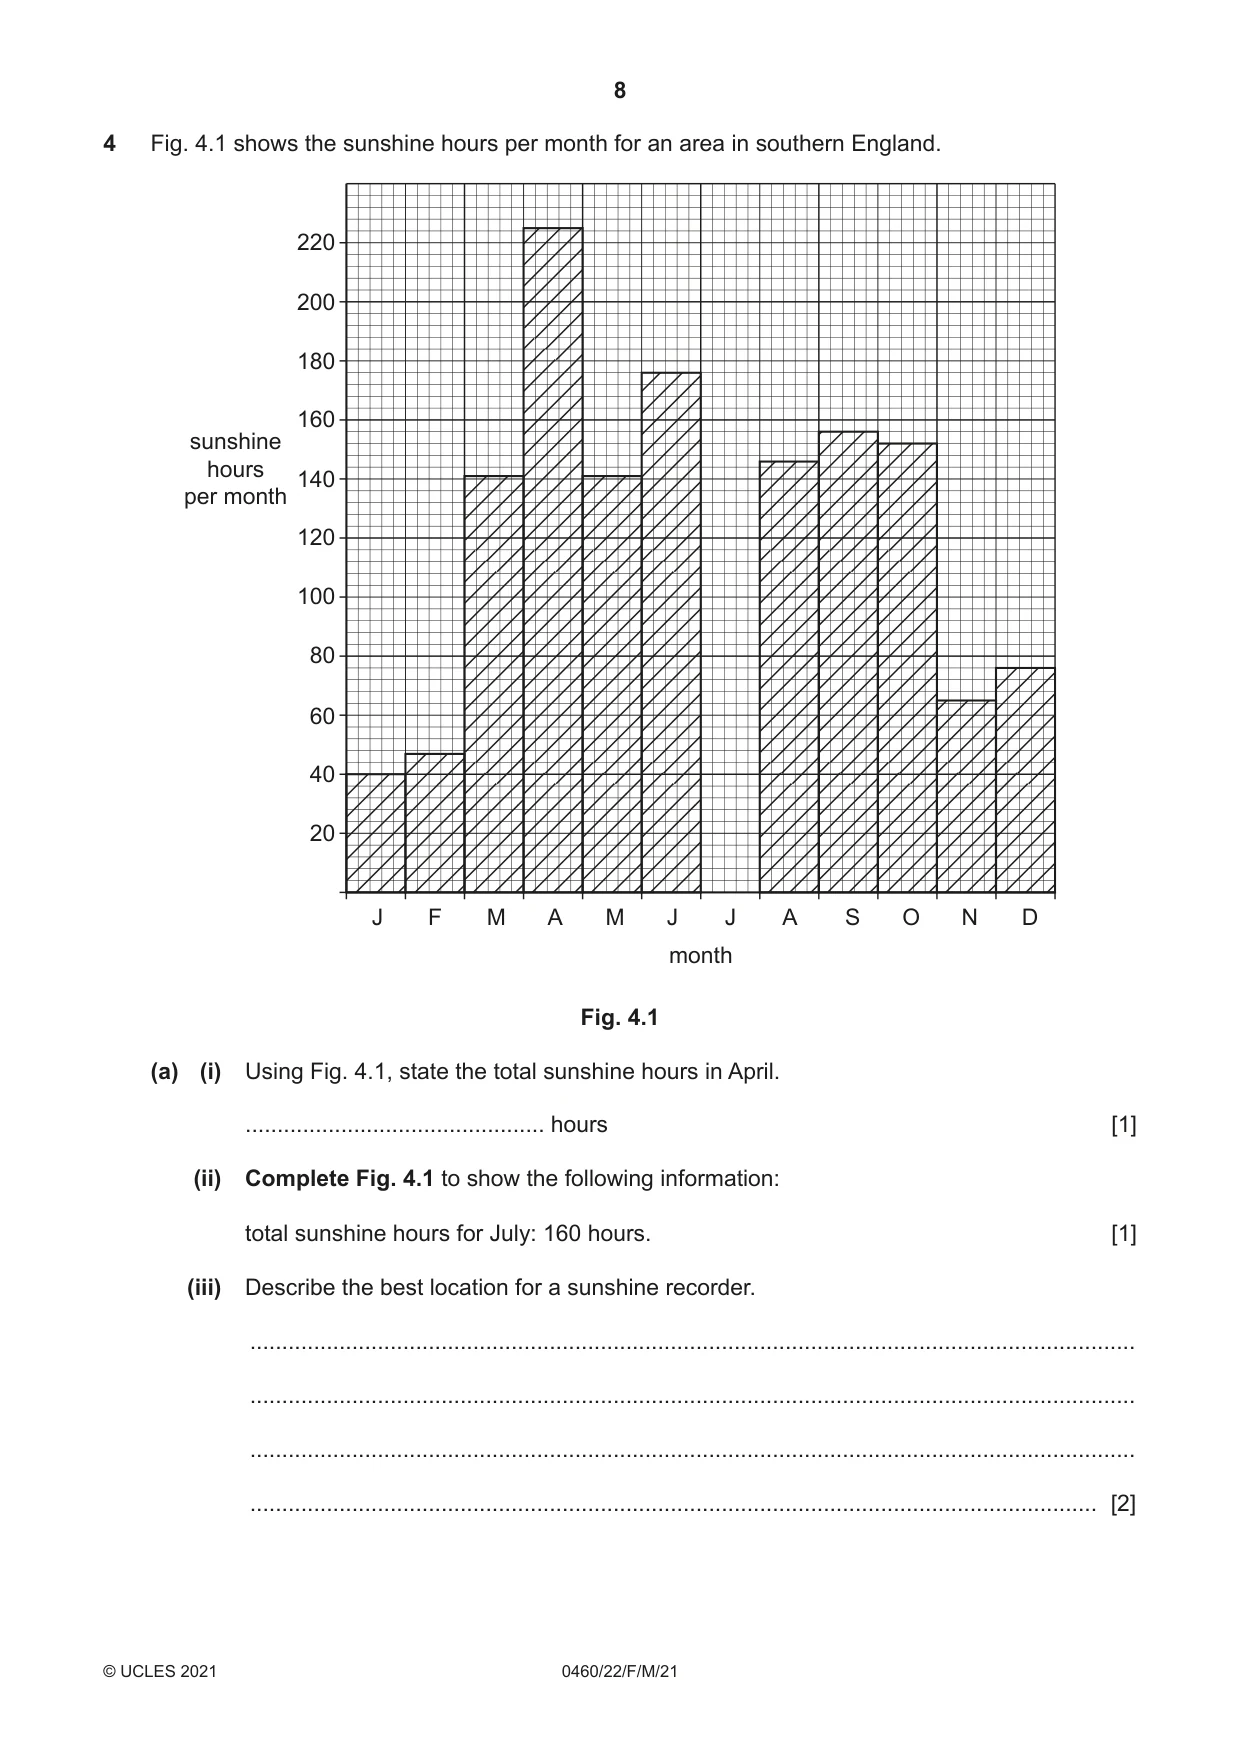
4 Fig. 4.1 shows the sunshine hours per month for an area in southern England. 220 200 180 160 sunshine hours 140 per month 120 100 80 60 40 20 J F M A M J J A S O N D month Fig. 4.1 (a) (i) Using Fig. 4.1, state the total sunshine hours in April. ............................................... hours [1] (ii) Complete Fig. 4.1 to show the following information: total sunshine hours for July: 160 hours. [1] (iii) Describe the best location for a sunshine recorder. ........................................................................................................................................... ........................................................................................................................................... ........................................................................................................................................... ..................................................................................................................................... [2] (b) Fig. 4.2 (Insert) shows some clouds. Describe the clouds shown in Fig. 4.2. ................................................................................................................................................... ................................................................................................................................................... ................................................................................................................................................... ............................................................................................................................................. [2] (c) Describe how cloud cover is measured. ................................................................................................................................................... ................................................................................................................................................... ................................................................................................................................................... ............................................................................................................................................. [2] [Total: 8]
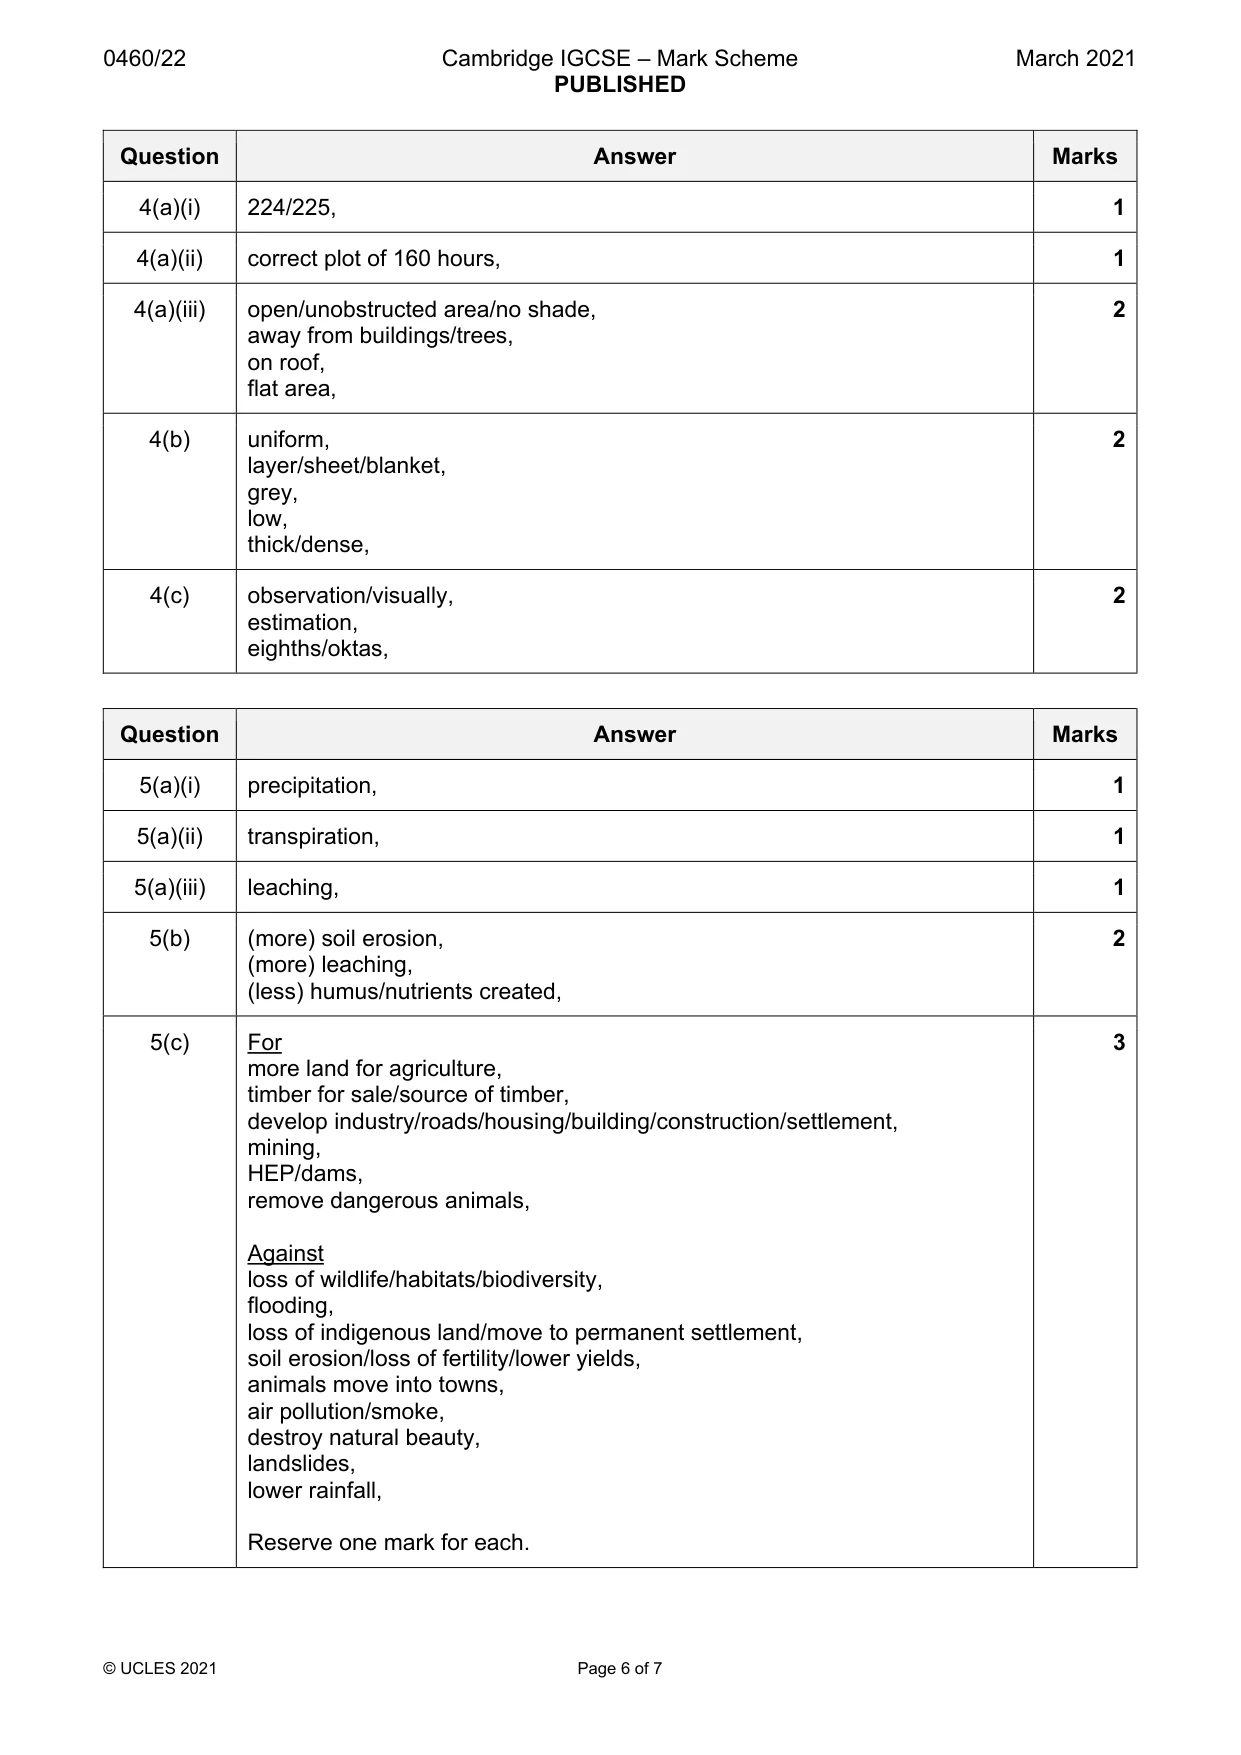
Mark scheme: 4(a)(i) 224/225, 1 4(a)(ii) correct plot of 160 hours, 1 4(a)(iii) open/unobstructed area/no shade, 2 away from buildings/trees, on roof, flat area, 4(b) uniform, 2 layer/sheet/blanket, grey, low, thick/dense, 4(c) observation/visually, 2 estimation, eighths/oktas,
Q5 · A nutrient cycle in a tropical rainforest
5 Fig. 5.1 shows a nutrient cycle in a tropical rainforest. precipitation transpiration trees intercept rainfall and reduce soil erosion leaves fall to floor fungi and bacteria most nutrients rapidly break absorbed by down leaves into plant roots humus more nutrients added to soil some nutrients lost through leaching Fig. 5.1 (a) Fig. 5.1 shows various processes which take place in a tropical rainforest. Identify each of the following processes: (i) rain falling ..................................................................................................................................... [1] (ii) loss of water vapour from trees ..................................................................................................................................... [1] (iii) loss of nutrients from the soil. ..................................................................................................................................... [1] (b) Using Fig. 5.1, identify two reasons why soil becomes more infertile when trees are removed due to deforestation. 1 ................................................................................................................................................ ................................................................................................................................................... 2 ................................................................................................................................................ ............................................................................................................................................. [2] (c) Suggest reasons why some local people are for deforestation and other local people are against it. For ............................................................................................................................................ ................................................................................................................................................... ................................................................................................................................................... ................................................................................................................................................... Against ...................................................................................................................................... ................................................................................................................................................... ................................................................................................................................................... ............................................................................................................................................. [3] [Total: 8]
Mark scheme: 5(a)(i) precipitation, 1 5(a)(ii) transpiration, 1 5(a)(iii) leaching, 1 5(b) (more) soil erosion, 2 (more) leaching, (less) humus/nutrients created, 5(c) For 3 more land for agriculture, timber for sale/source of timber, develop industry/roads/housing/building/construction/settlement, mining, HEP/dams, remove dangerous animals, Against loss of wildlife/habitats/biodiversity, flooding, loss of indigenous land/move to permanent settlement, soil erosion/loss of fertility/lower yields, animals move into towns, air pollution/smoke, destroy natural beauty, landslides, lower rainfall, Reserve one mark for each.
Question 6
6 Fig. 6.1 (Insert) shows a power station generating electricity in Germany. (a) Name one fossil fuel that is used in power stations. ............................................................................................................................................. [1] (b) Using Fig. 6.1, describe the power station and its location. Refer to buildings and location. buildings ................................................................................................................................... ................................................................................................................................................... ................................................................................................................................................... location ..................................................................................................................................... ................................................................................................................................................... ............................................................................................................................................. [3] (c) Using evidence from Fig. 6.1, explain the reasons for the location of the power station. ................................................................................................................................................... ................................................................................................................................................... ................................................................................................................................................... ............................................................................................................................................. [2] (d) Using evidence from Fig. 6.1, suggest two problems that the power station might cause for the local natural environment. 1 ................................................................................................................................................ ................................................................................................................................................... 2 ................................................................................................................................................ ............................................................................................................................................. [2] [Total: 8] Additional Pages If you use the following lined pages to complete the answer(s) to any question(s), the question number(s) must be clearly shown. .................................................................................................................................................................. .................................................................................................................................................................. .................................................................................................................................................................. .................................................................................................................................................................. .................................................................................................................................................................. .................................................................................................................................................................. .................................................................................................................................................................. .................................................................................................................................................................. .................................................................................................................................................................. .................................................................................................................................................................. .................................................................................................................................................................. .................................................................................................................................................................. .................................................................................................................................................................. .................................................................................................................................................................. .................................................................................................................................................................. .................................................................................................................................................................. .................................................................................................................................................................. .................................................................................................................................................................. .................................................................................................................................................................. .................................................................................................................................................................. .................................................................................................................................................................. .................................................................................................................................................................. .................................................................................................................................................................. .................................................................................................................................................................. .................................................................................................................................................................. .................................................................................................................................................................. .................................................................................................................................................................. .................................................................................................................................................................. .................................................................................................................................................................. .................................................................................................................................................................. .................................................................................................................................................................. .................................................................................................................................................................. .................................................................................................................................................................. .................................................................................................................................................................. .................................................................................................................................................................. .................................................................................................................................................................. .................................................................................................................................................................. .................................................................................................................................................................. .................................................................................................................................................................. .................................................................................................................................................................. .................................................................................................................................................................. .................................................................................................................................................................. .................................................................................................................................................................. .................................................................................................................................................................. .................................................................................................................................................................. .................................................................................................................................................................. .................................................................................................................................................................. .................................................................................................................................................................. .................................................................................................................................................................. .................................................................................................................................................................. .................................................................................................................................................................. .................................................................................................................................................................. ..................................................................................................................................................................
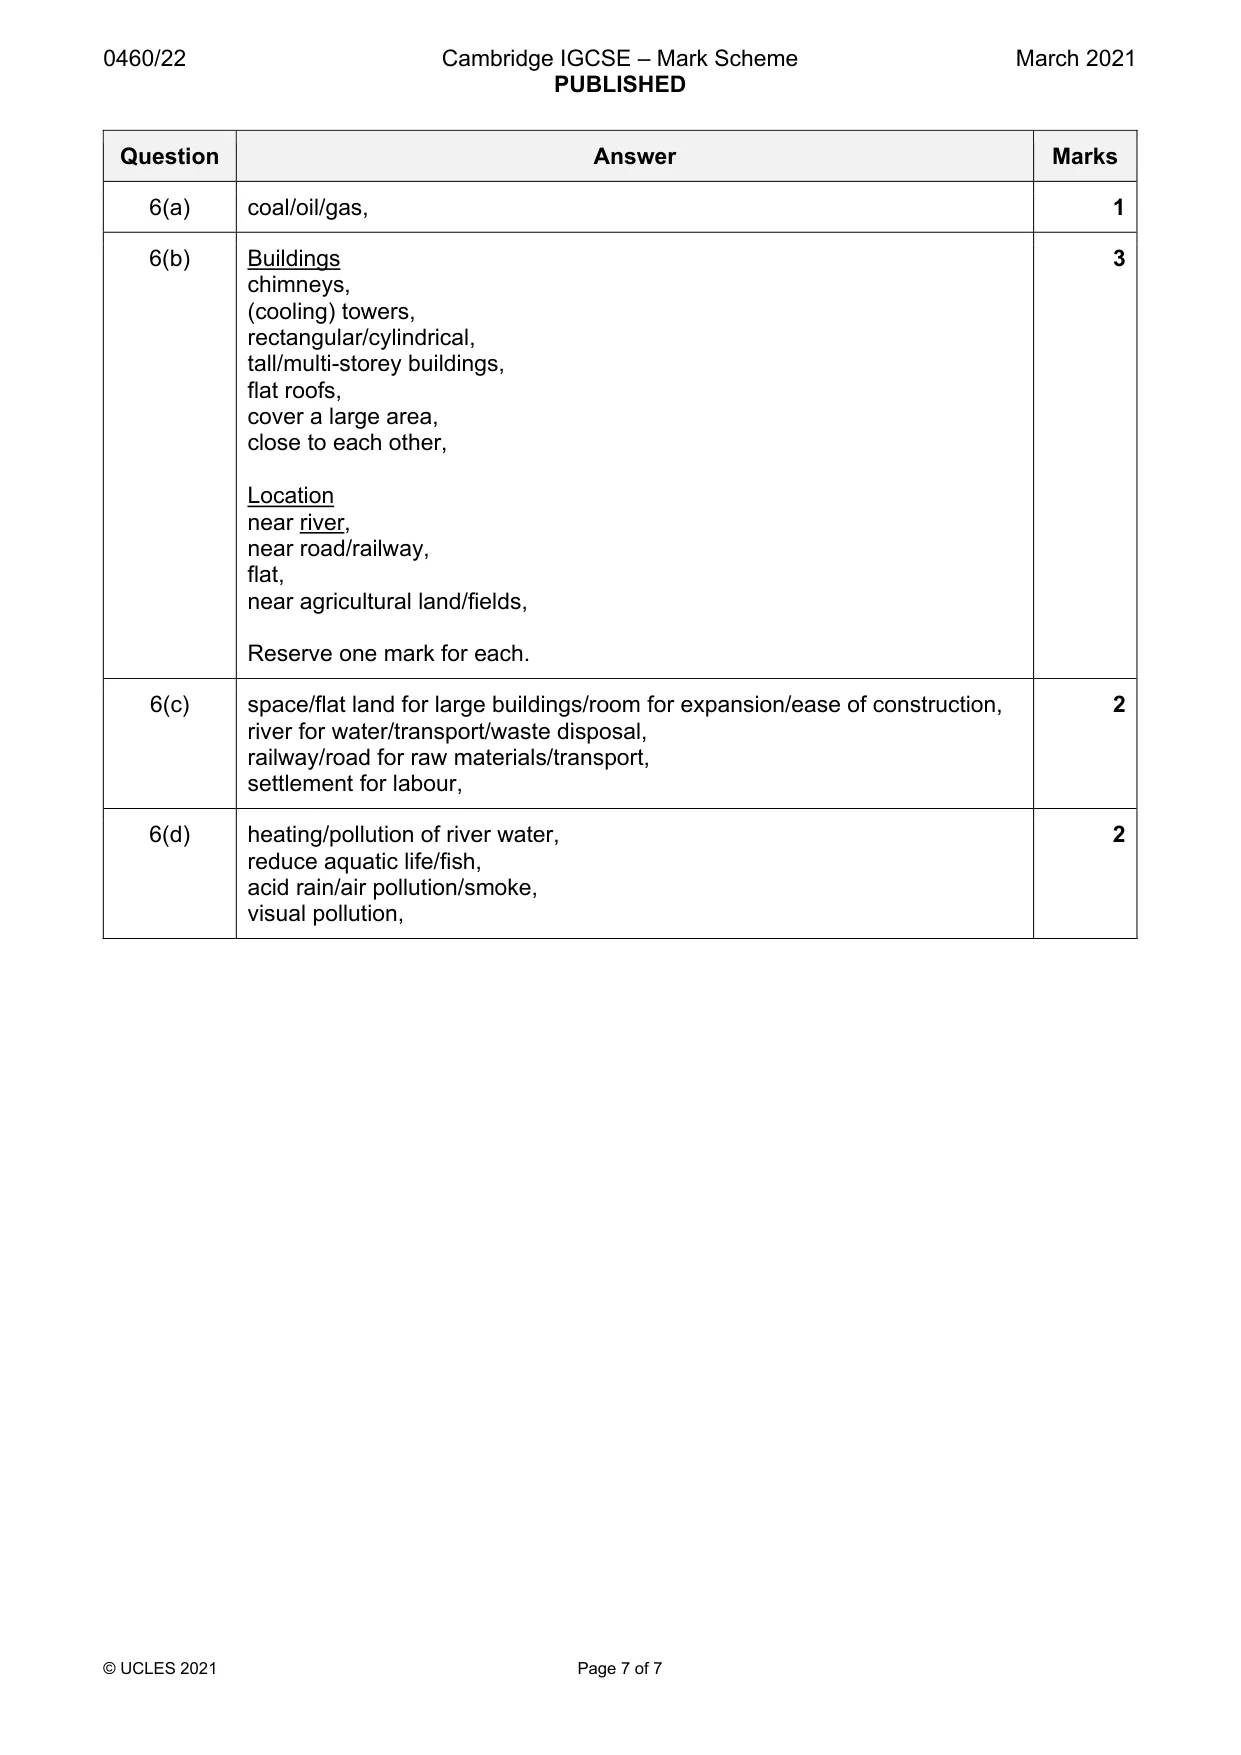
Mark scheme: 6(a) coal/oil/gas, 1 6(b) Buildings 3 chimneys, (cooling) towers, rectangular/cylindrical, tall/multi-storey buildings, flat roofs, cover a large area, close to each other, Location near river, near road/railway, flat, near agricultural land/fields, Reserve one mark for each. 6(c) space/flat land for large buildings/room for expansion/ease of construction, 2 river for water/transport/waste disposal, railway/road for raw materials/transport, settlement for labour, 6(d) heating/pollution of river water, 2 reduce aquatic life/fish, acid rain/air pollution/smoke, visual pollution,
What was in this paper
The subtopics covered by these 6 questions, and how many questions each got. Open one in a new tab to see every Cambridge question on it.
What you needed in this session
Cambridge’s own grade thresholds for 2021 Feb/March, Paper 2 · Variant 2. A higher threshold means an easier paper — the bar moves with how the cohort did.