Cambridge IGCSE Geography 0460 — 2024 Feb/March Paper 2 · Variant 2
0460/22/F/M/24 · 6 questions · 60 marks · ≈68 min
The question paper and its mark scheme, free to read here and free to download. This is Cambridge’s own paper, exactly as it was sat.
Question paper16 pages
Mark scheme12 pages
Answers below. Sit the paper first if you are practising.
Questions as text
Q1 · Study the map extract for the Puy de Dôme, France
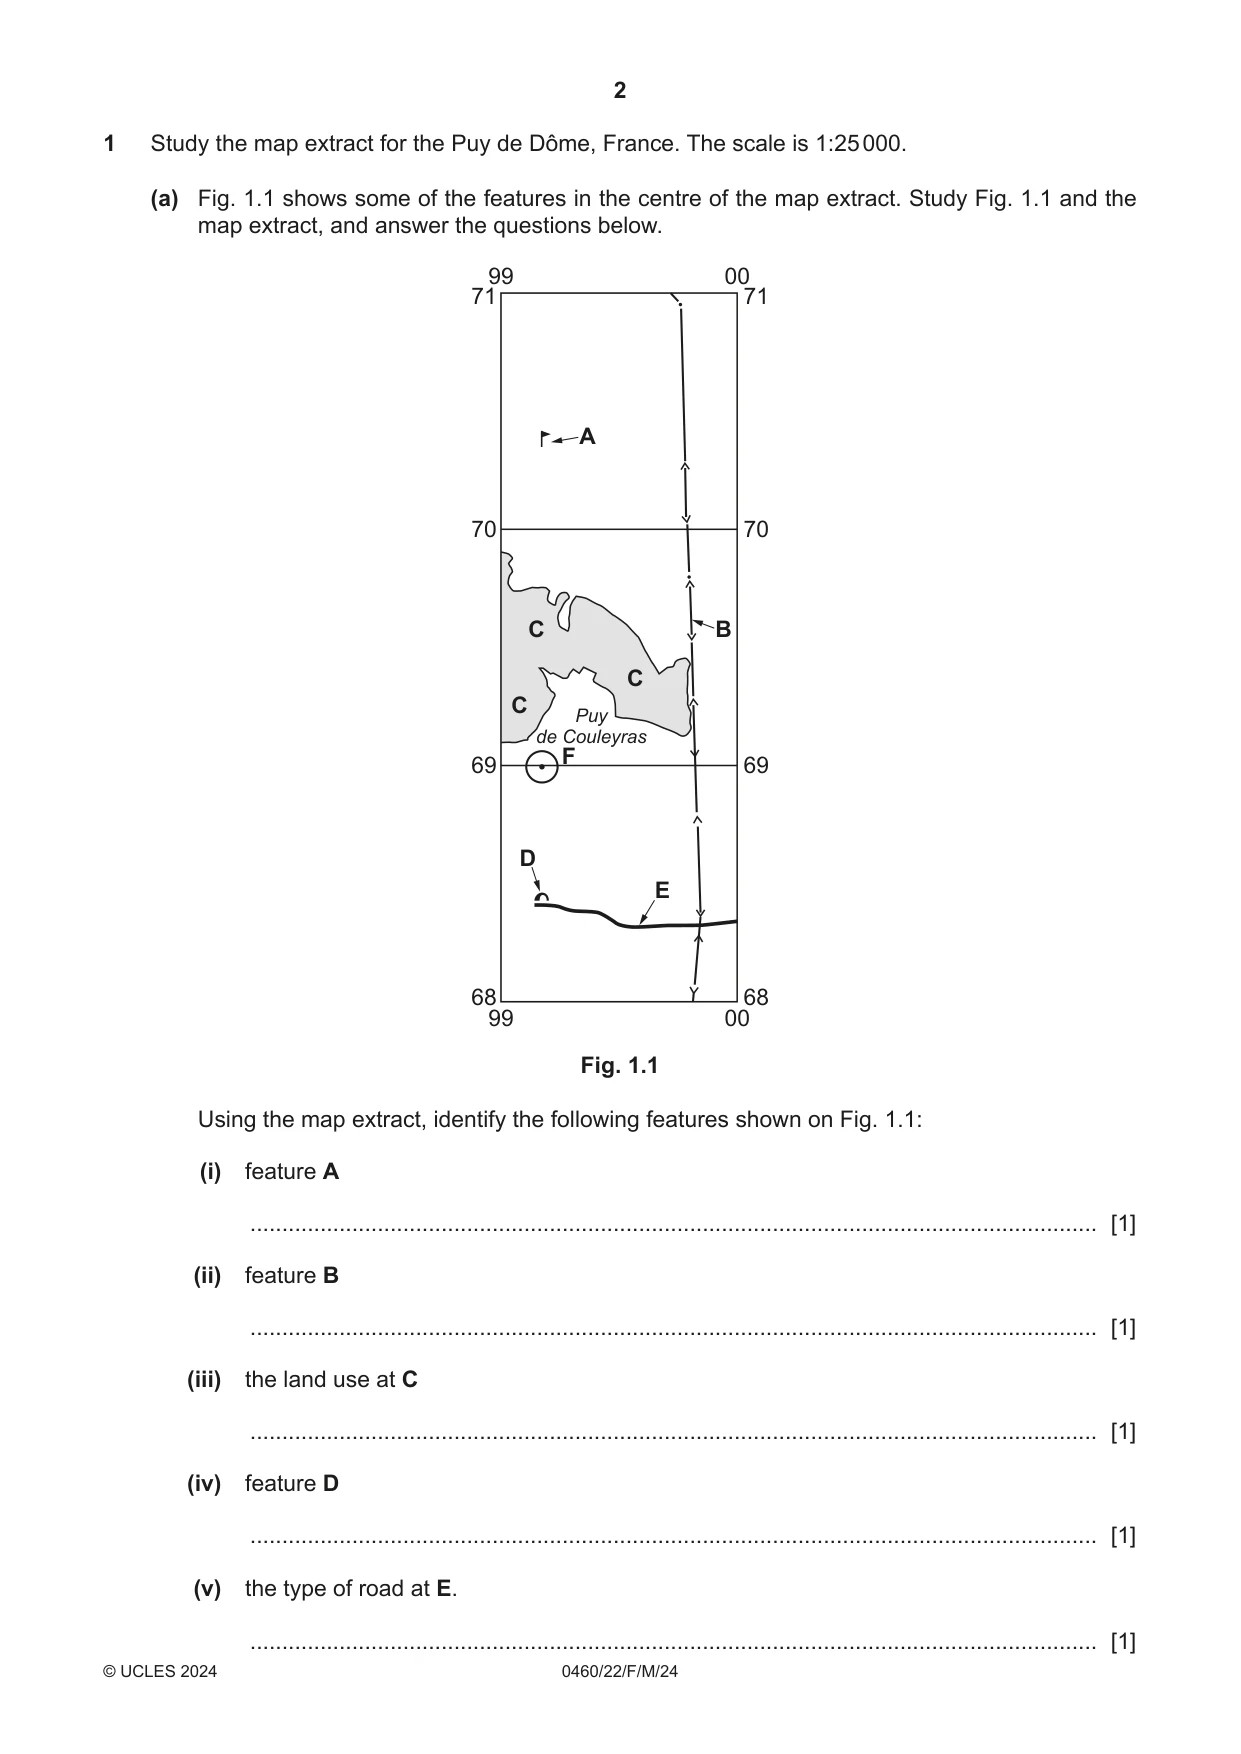
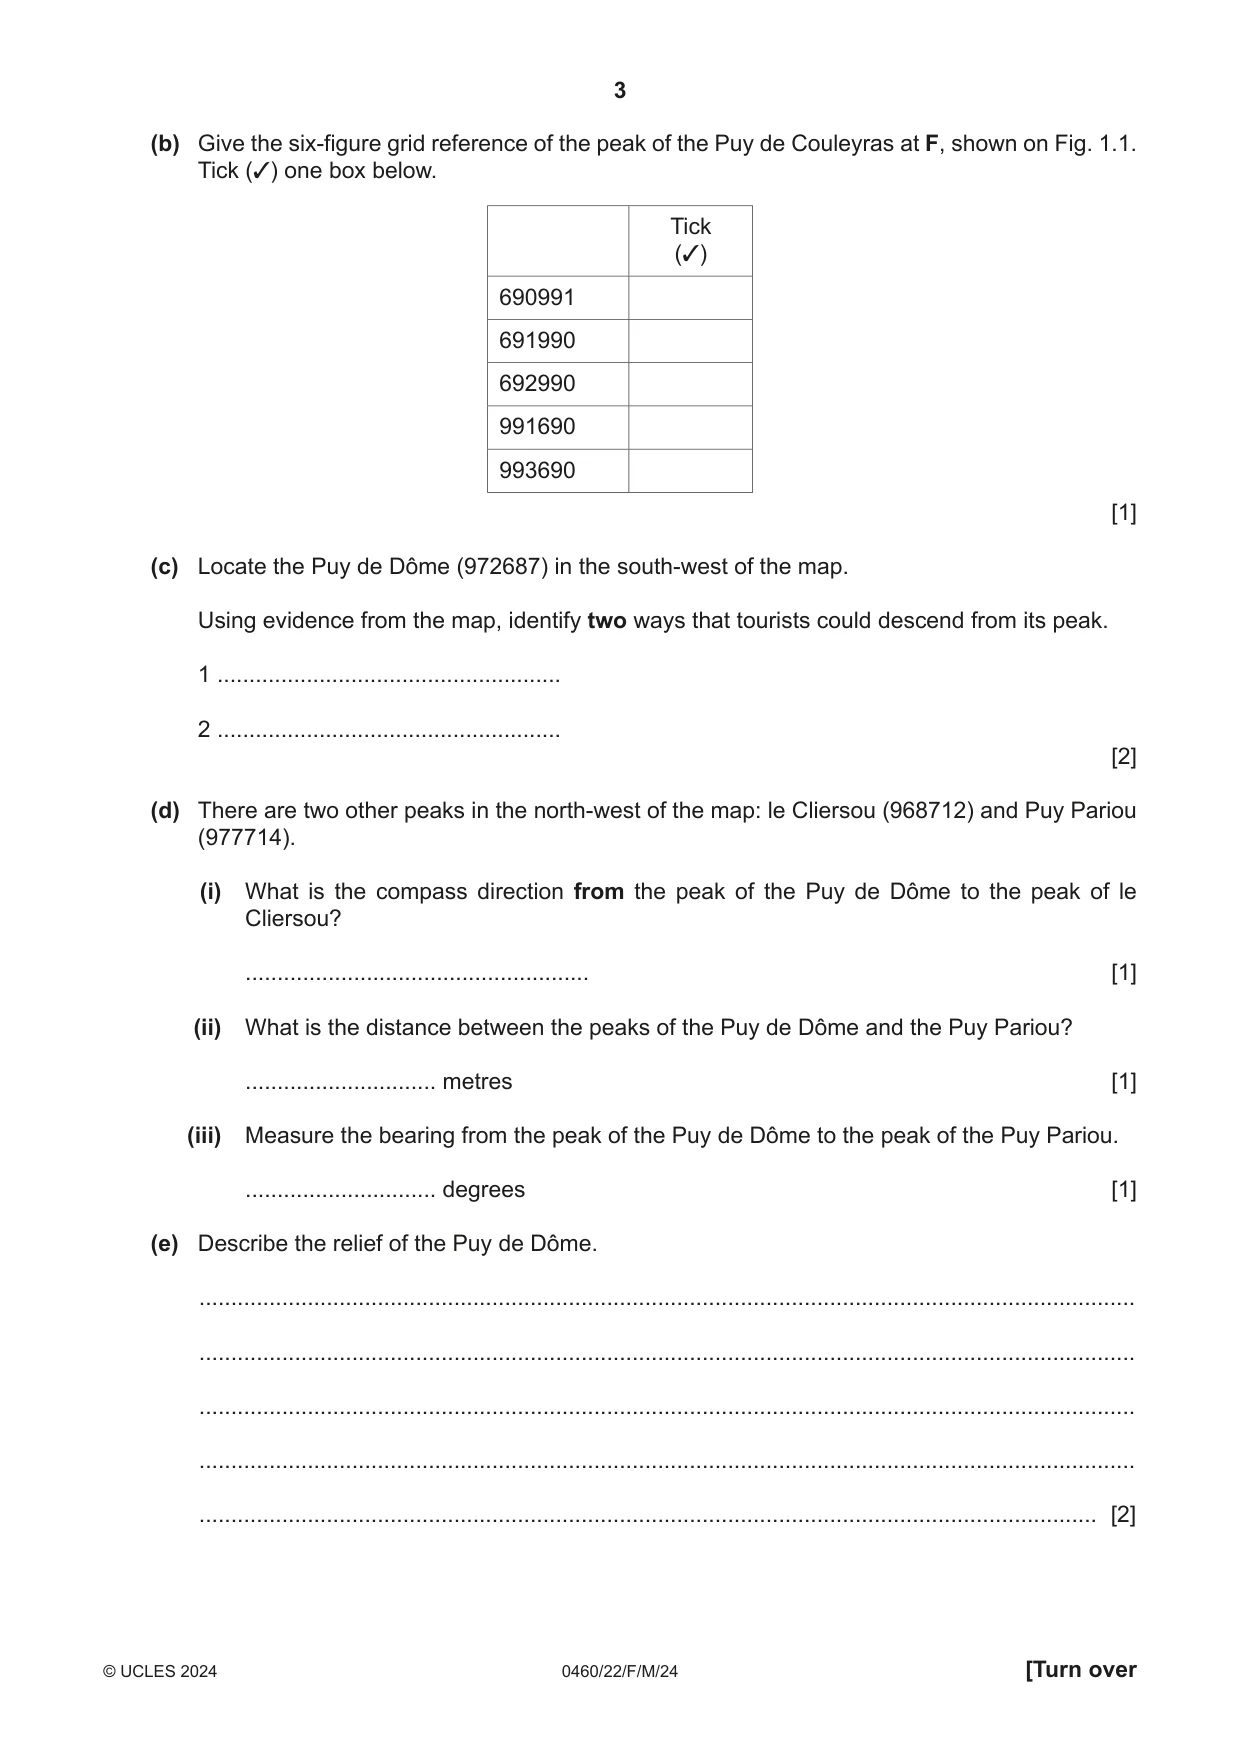
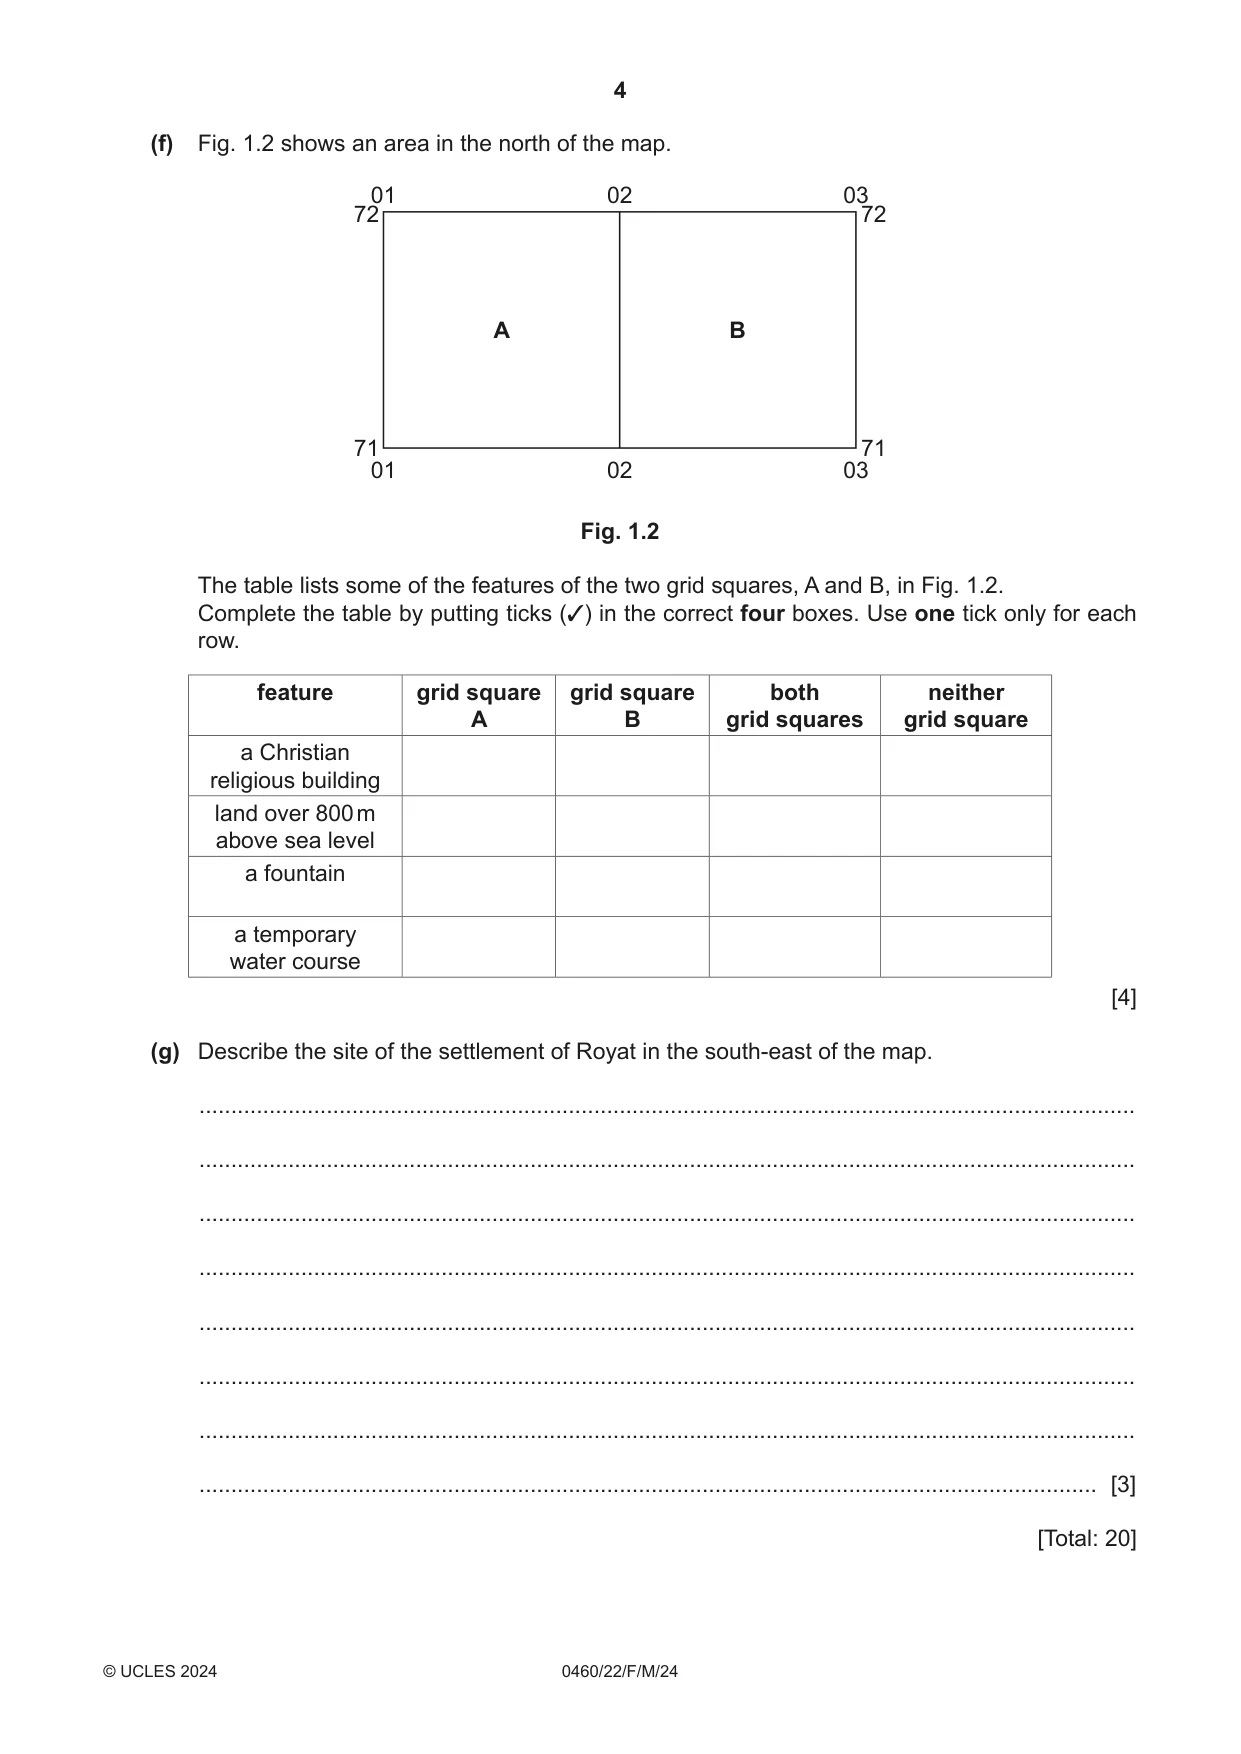
1 Study the map extract for the Puy de Dôme, France. The scale is 1:25 000. (a) Fig. 1.1 shows some of the features in the centre of the map extract. Study Fig. 1.1 and the map extract, and answer the questions below. 99 00 71 71 A 70 70 C B C C Puy de Couleyras F 69 69 D E 68 68 99 00 Fig. 1.1 Using the map extract, identify the following features shown on Fig. 1.1: (i) feature A ..................................................................................................................................... [1] (ii) feature B ..................................................................................................................................... [1] (iii) the land use at C ..................................................................................................................................... [1] (iv) feature D ..................................................................................................................................... [1] (v) the type of road at E. ..................................................................................................................................... [1] (b) Give the six-figure grid reference of the peak of the Puy de Couleyras at F, shown on Fig. 1.1. Tick (3) one box below. Tick (3) 690991 691990 692990 991690 993690 [1] (c) Locate the Puy de Dôme (972687) in the south-west of the map. Using evidence from the map, identify two ways that tourists could descend from its peak. 1 ...................................................... 2 ...................................................... [2] (d) There are two other peaks in the north-west of the map: le Cliersou (968712) and Puy Pariou (977714). (i) What is the compass direction from the peak of the Puy de Dôme to the peak of le Cliersou? ...................................................... [1] (ii) What is the distance between the peaks of the Puy de Dôme and the Puy Pariou? .............................. metres [1] (iii) Measure the bearing from the peak of the Puy de Dôme to the peak of the Puy Pariou. .............................. degrees [1] (e) Describe the relief of the Puy de Dôme. ................................................................................................................................................... ................................................................................................................................................... ................................................................................................................................................... ................................................................................................................................................... ............................................................................................................................................. [2] (f) Fig. 1.2 shows an area in the north of the map. 01 02 03 72 72 A B 71 71 01 02 03 Fig. 1.2 The table lists some of the features of the two grid squares, A and B, in Fig. 1.2. Complete the table by putting ticks (3) in the correct four boxes. Use one tick only for each row. feature grid square grid square both neither A B grid squares grid square a Christian religious building land over 800 m above sea level a fountain a temporary water course [4] (g) Describe the site of the settlement of Royat in the south-east of the map. ................................................................................................................................................... ................................................................................................................................................... ................................................................................................................................................... ................................................................................................................................................... ................................................................................................................................................... ................................................................................................................................................... ................................................................................................................................................... ............................................................................................................................................. [3] [Total: 20]
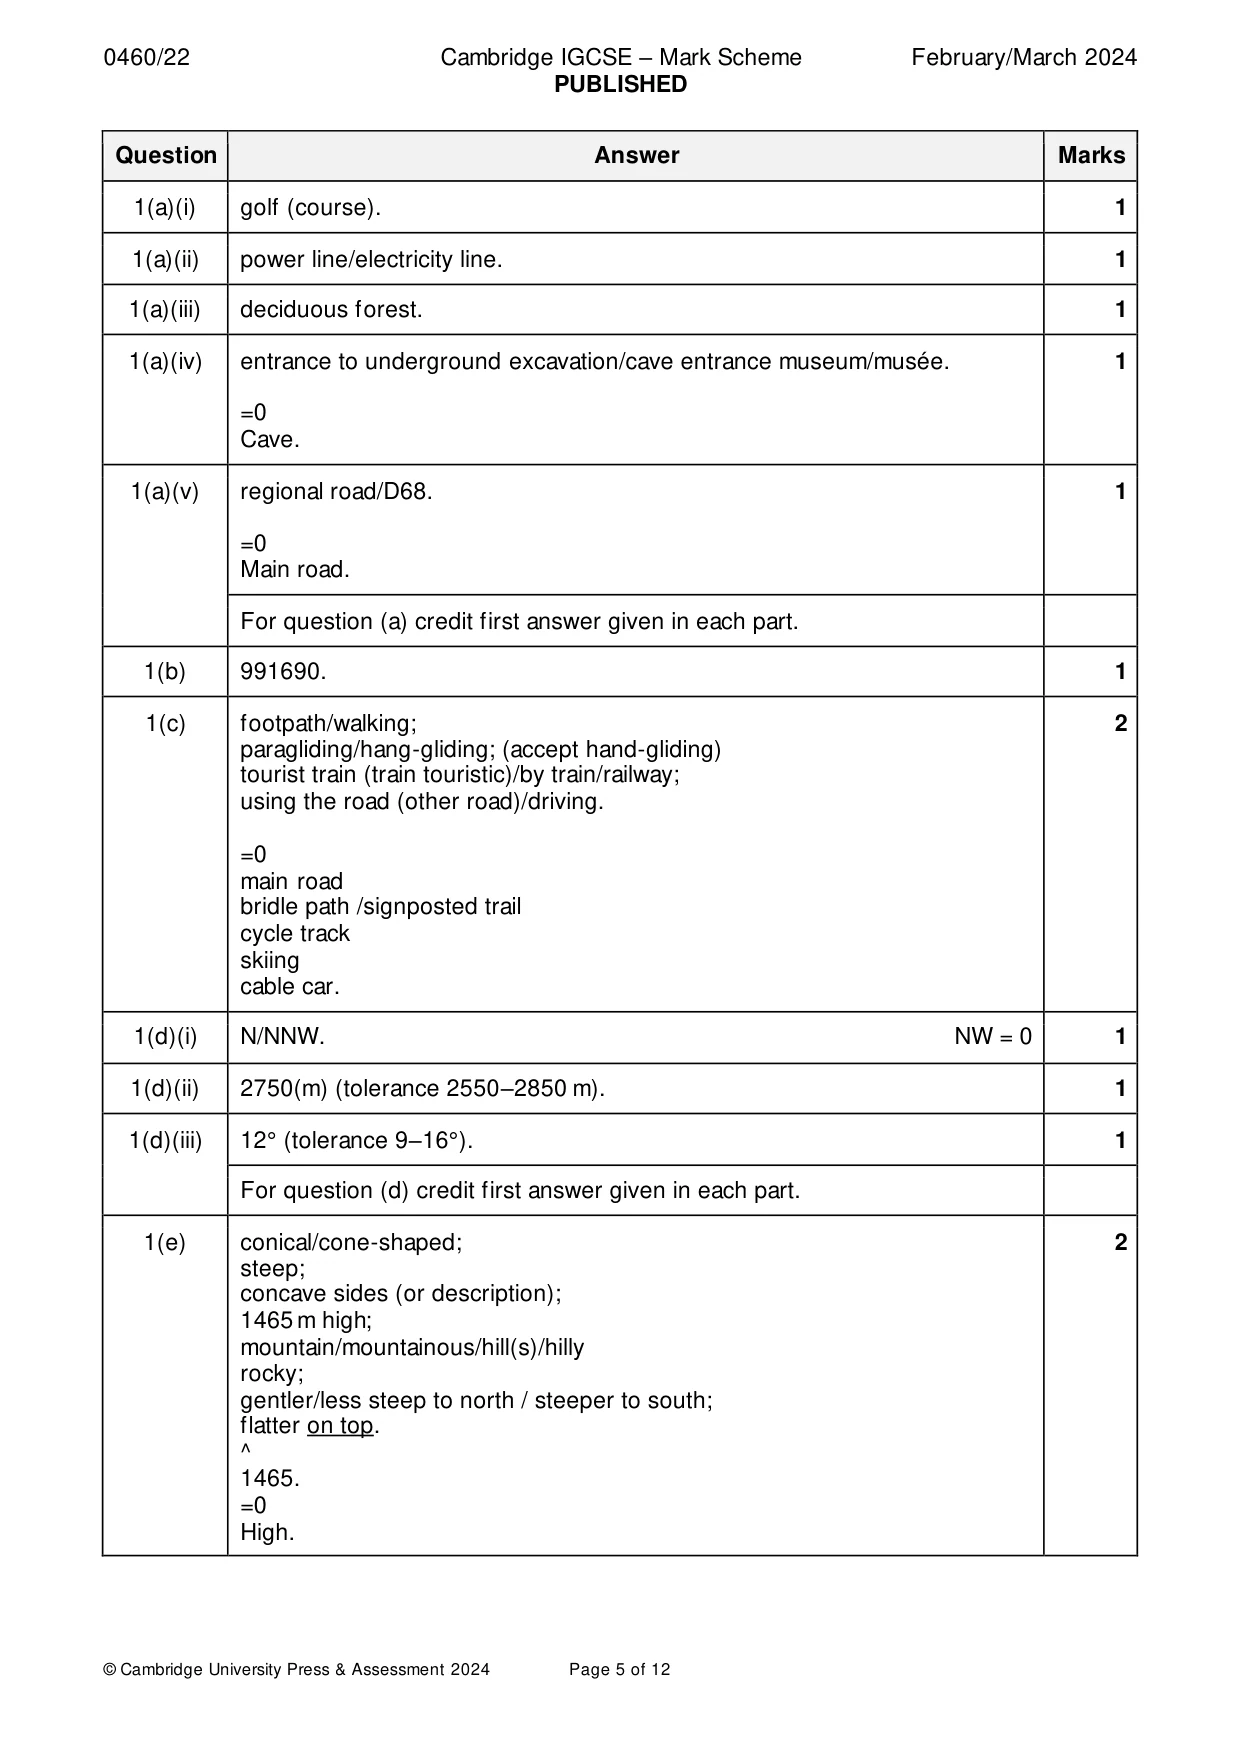
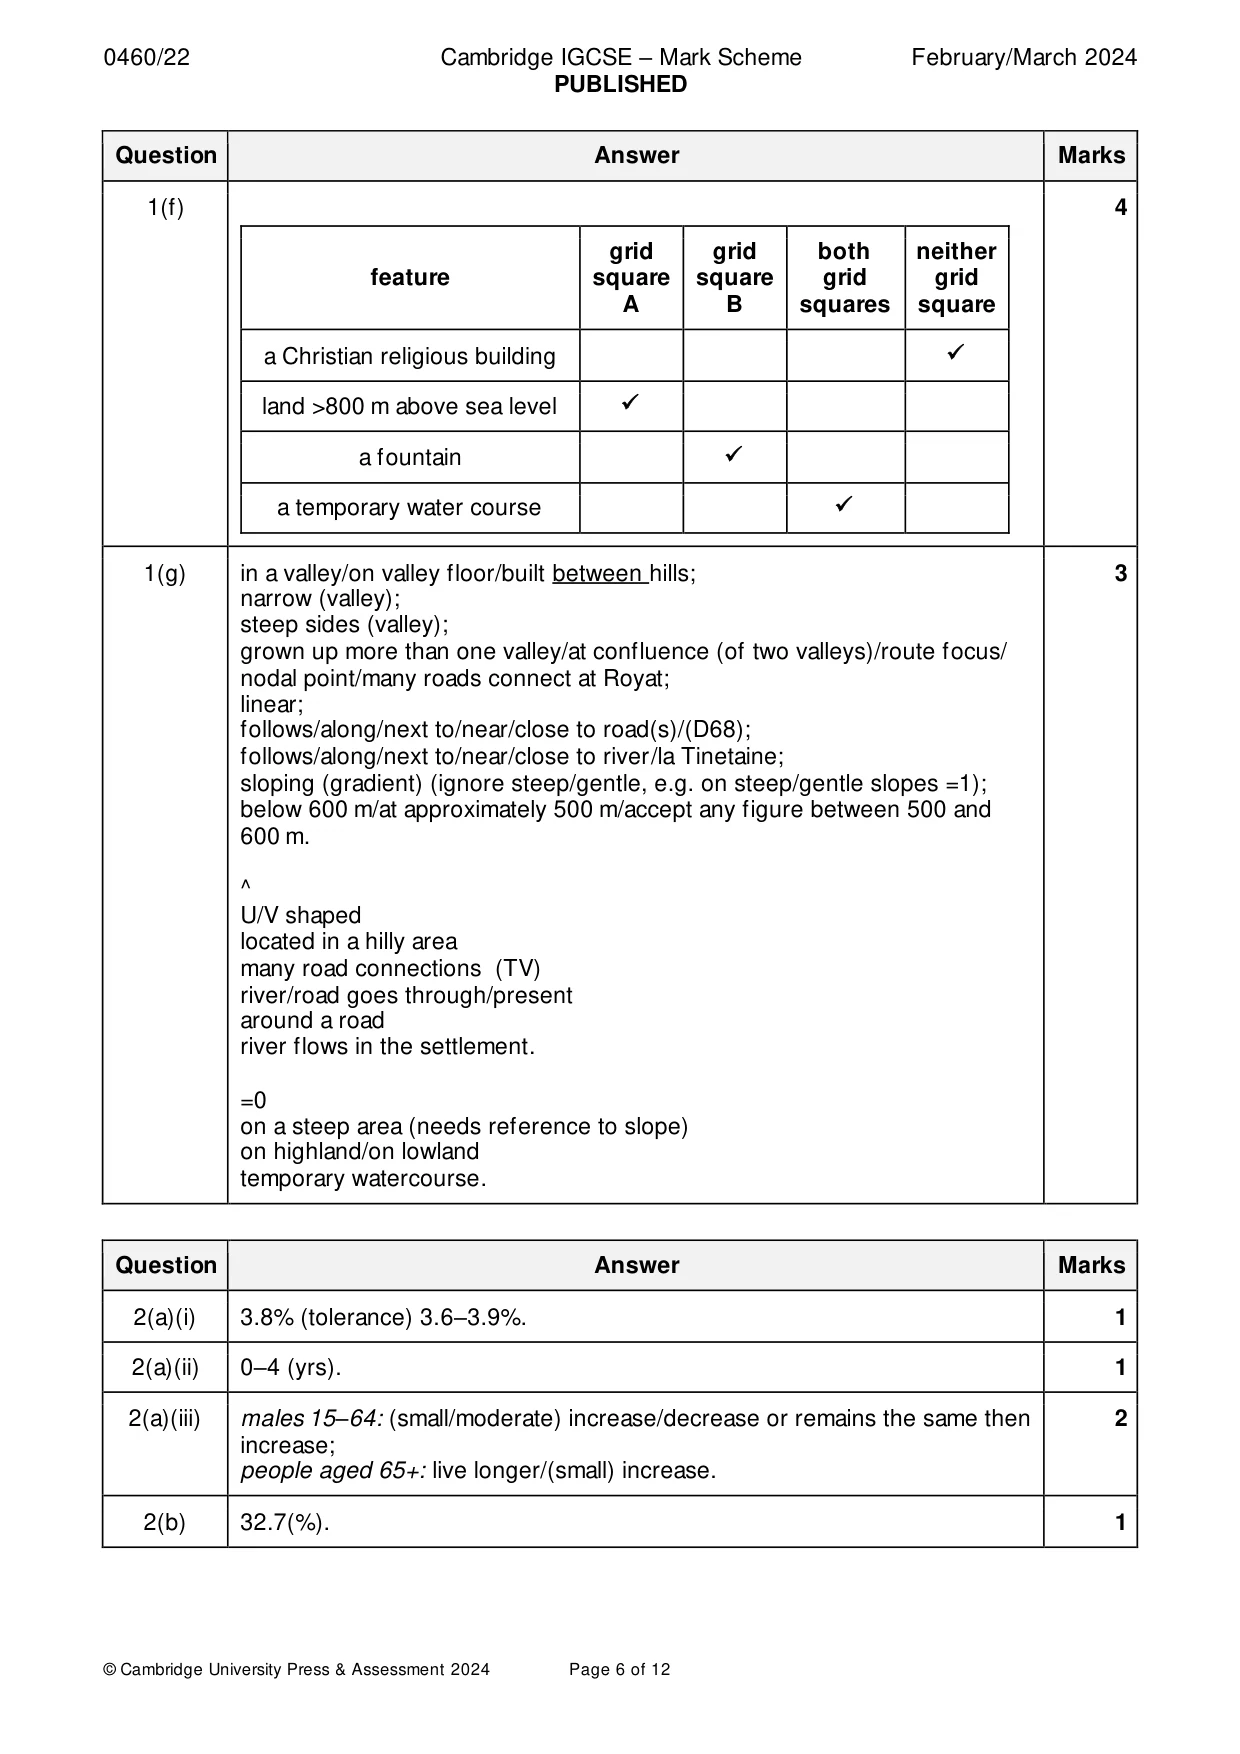
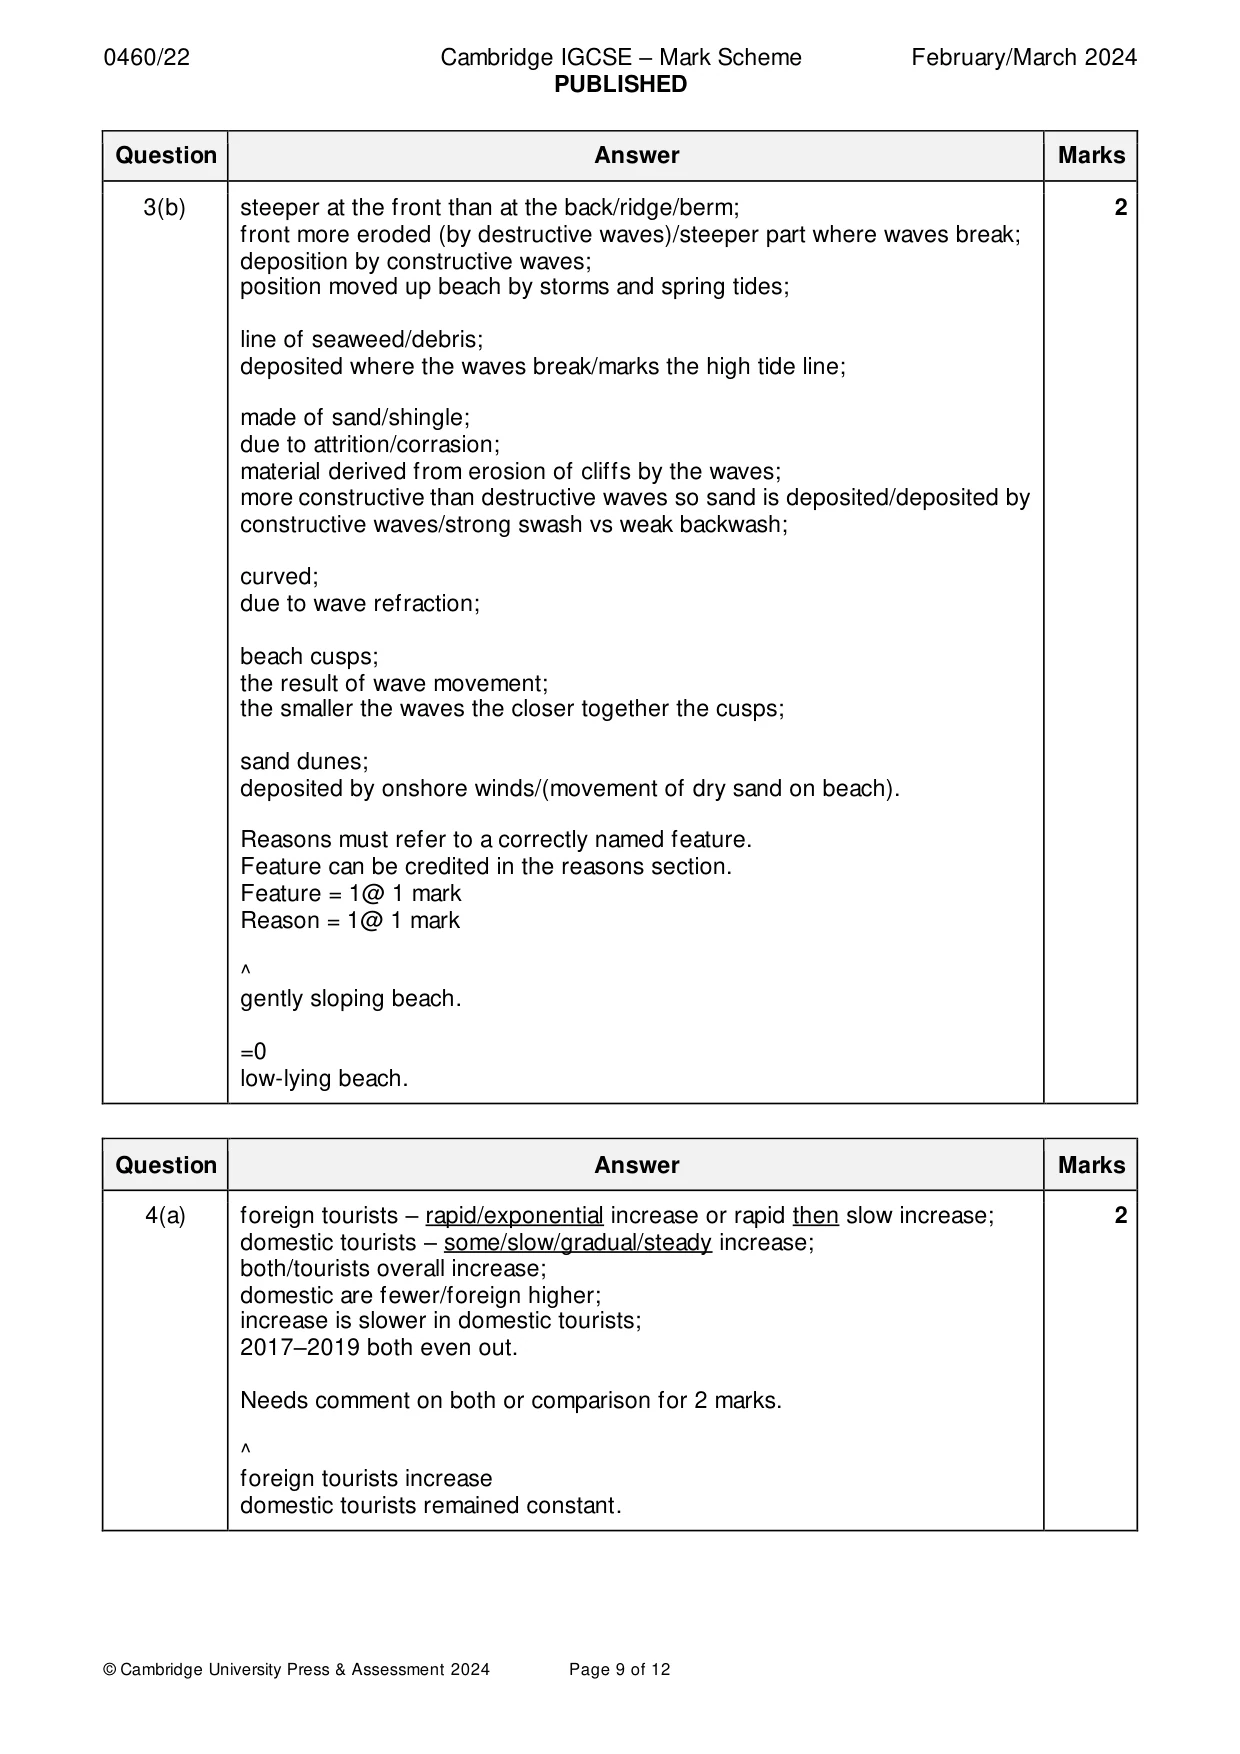
Mark scheme: Question Answer Marks 1(a)(i) golf (course). 1 1(a)(ii) power line/electricity line. 1 1(a)(iii) deciduous forest. 1 1(a)(iv) entrance to underground excavation/cave entrance museum/musée. 1 =0 Cave. 1(a)(v) regional road/D68. 1 =0 Main road. For question (a) credit first answer given in each part. 1(b) 991690. 1 1(c) footpath/walking; 2 paragliding/hang-gliding; (accept hand-gliding) tourist train (train touristic)/by train/railway; using the road (other road)/driving. =0 main road bridle path /signposted trail cycle track skiing cable car. 1(d)(i) N/NNW. NW = 0 1 1(d)(ii) 2750(m) (tolerance 2550–2850 m). 1 1(d)(iii) 12° (tolerance 9–16°). 1 For question (d) credit first answer given in each part. 1(e) conical/cone-shaped; 2 steep; concave sides (or description); 1465 m high; mountain/mountainous/hill(s)/hilly rocky; gentler/less steep to north / steeper to south; flatter on top. ^ 1465. =0 High. 1(f) 4 grid grid both neither feature square square grid grid A B squares square a Christian religious building ✓ land >800 m above sea level ✓ a fountain ✓ a temporary water course ✓ 1(g) in a valley/on valley floor/built between hills; 3 narrow (valley); steep sides (valley); grown up more than one valley/at confluence (of two valleys)/route focus/ nodal point/many roads connect at Royat; linear; follows/along/next to/near/close to road(s)/(D68); follows/along/next to/near/close to river/la Tinetaine; sloping (gradient) (ignore steep/gentle, e.g. on steep/gentle slopes =1); below 600 m/at approximately 500 m/accept any figure between 500 and 600 m. ^ U/V shaped located in a hilly area many road connections (TV) river/road goes through/present around a road river flows in the settlement. =0 on a steep area (needs reference to slope) on highland/on lowland temporary watercourse.
More questions on Settlements (rural and urban) and service provision
Question 2
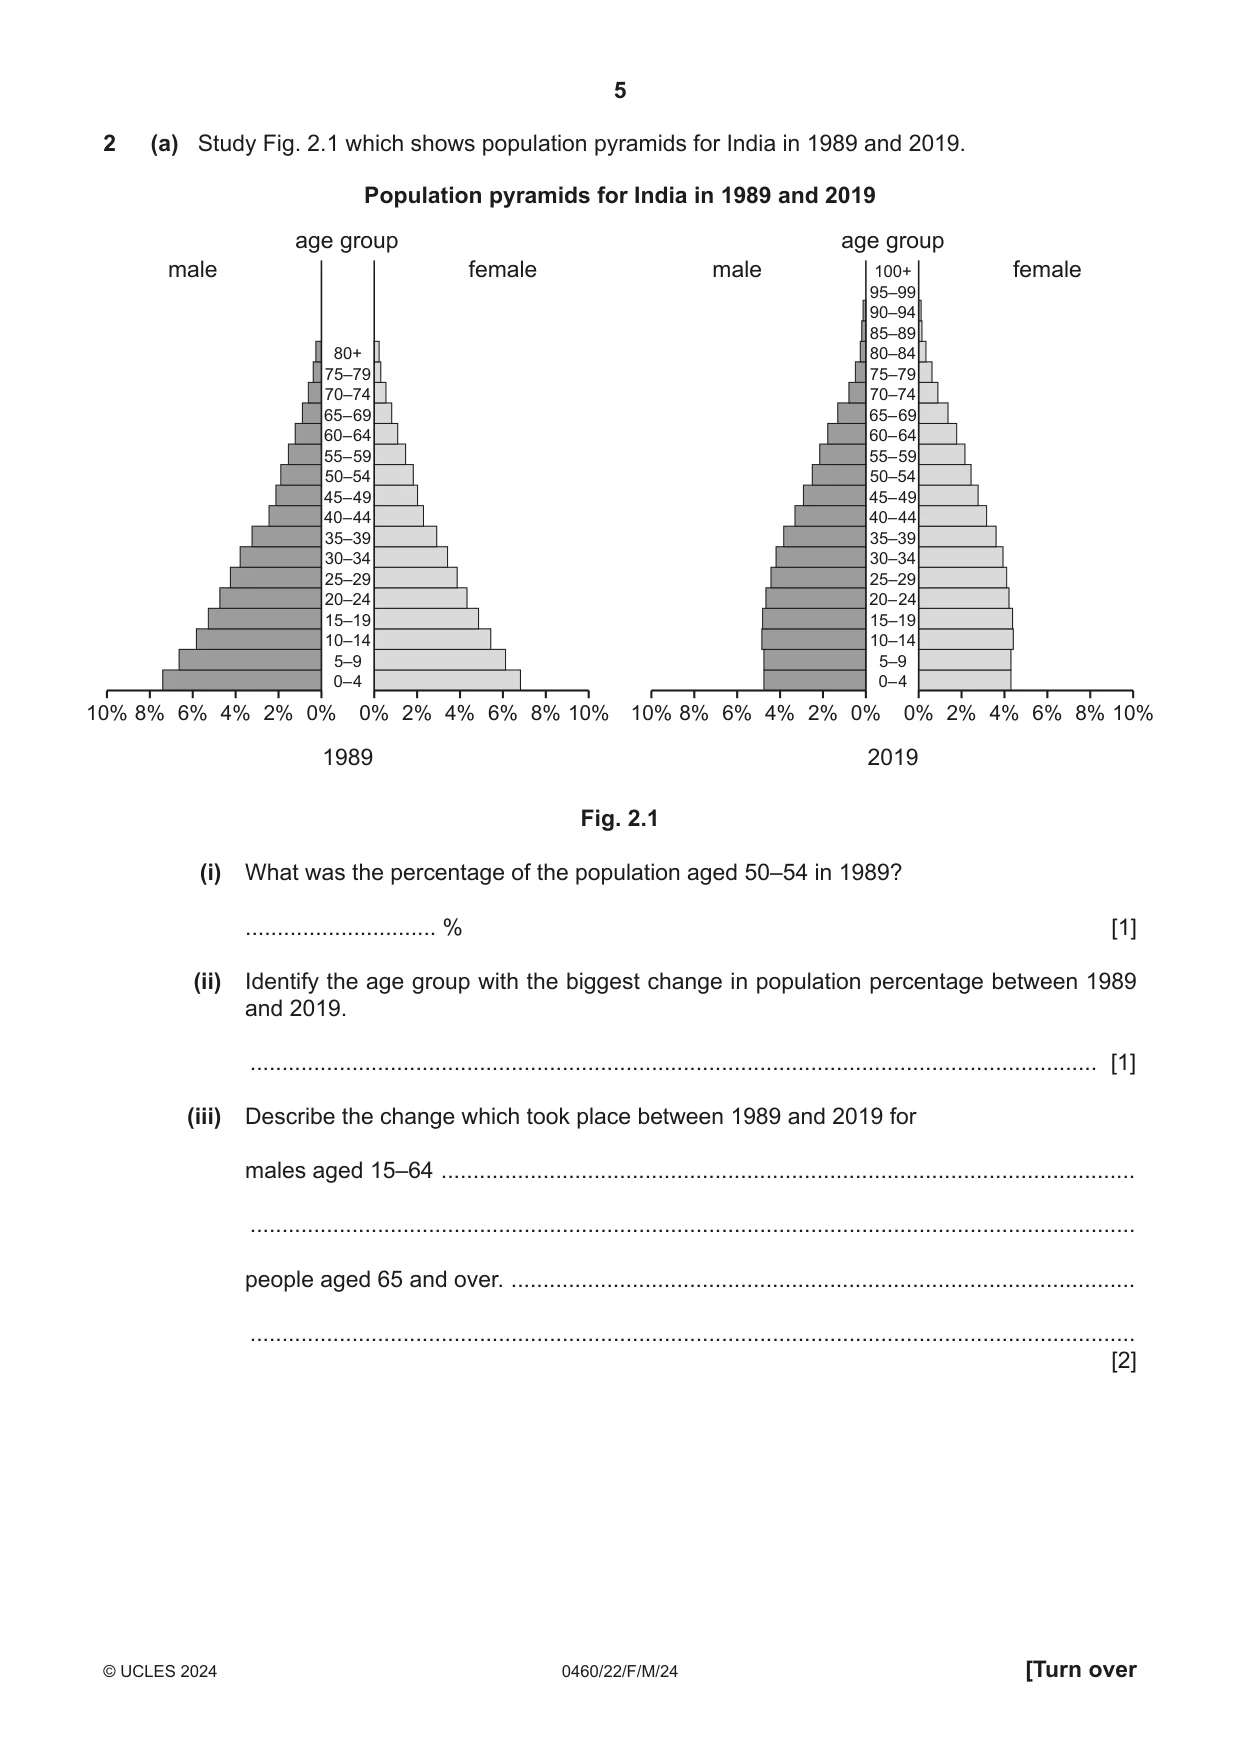
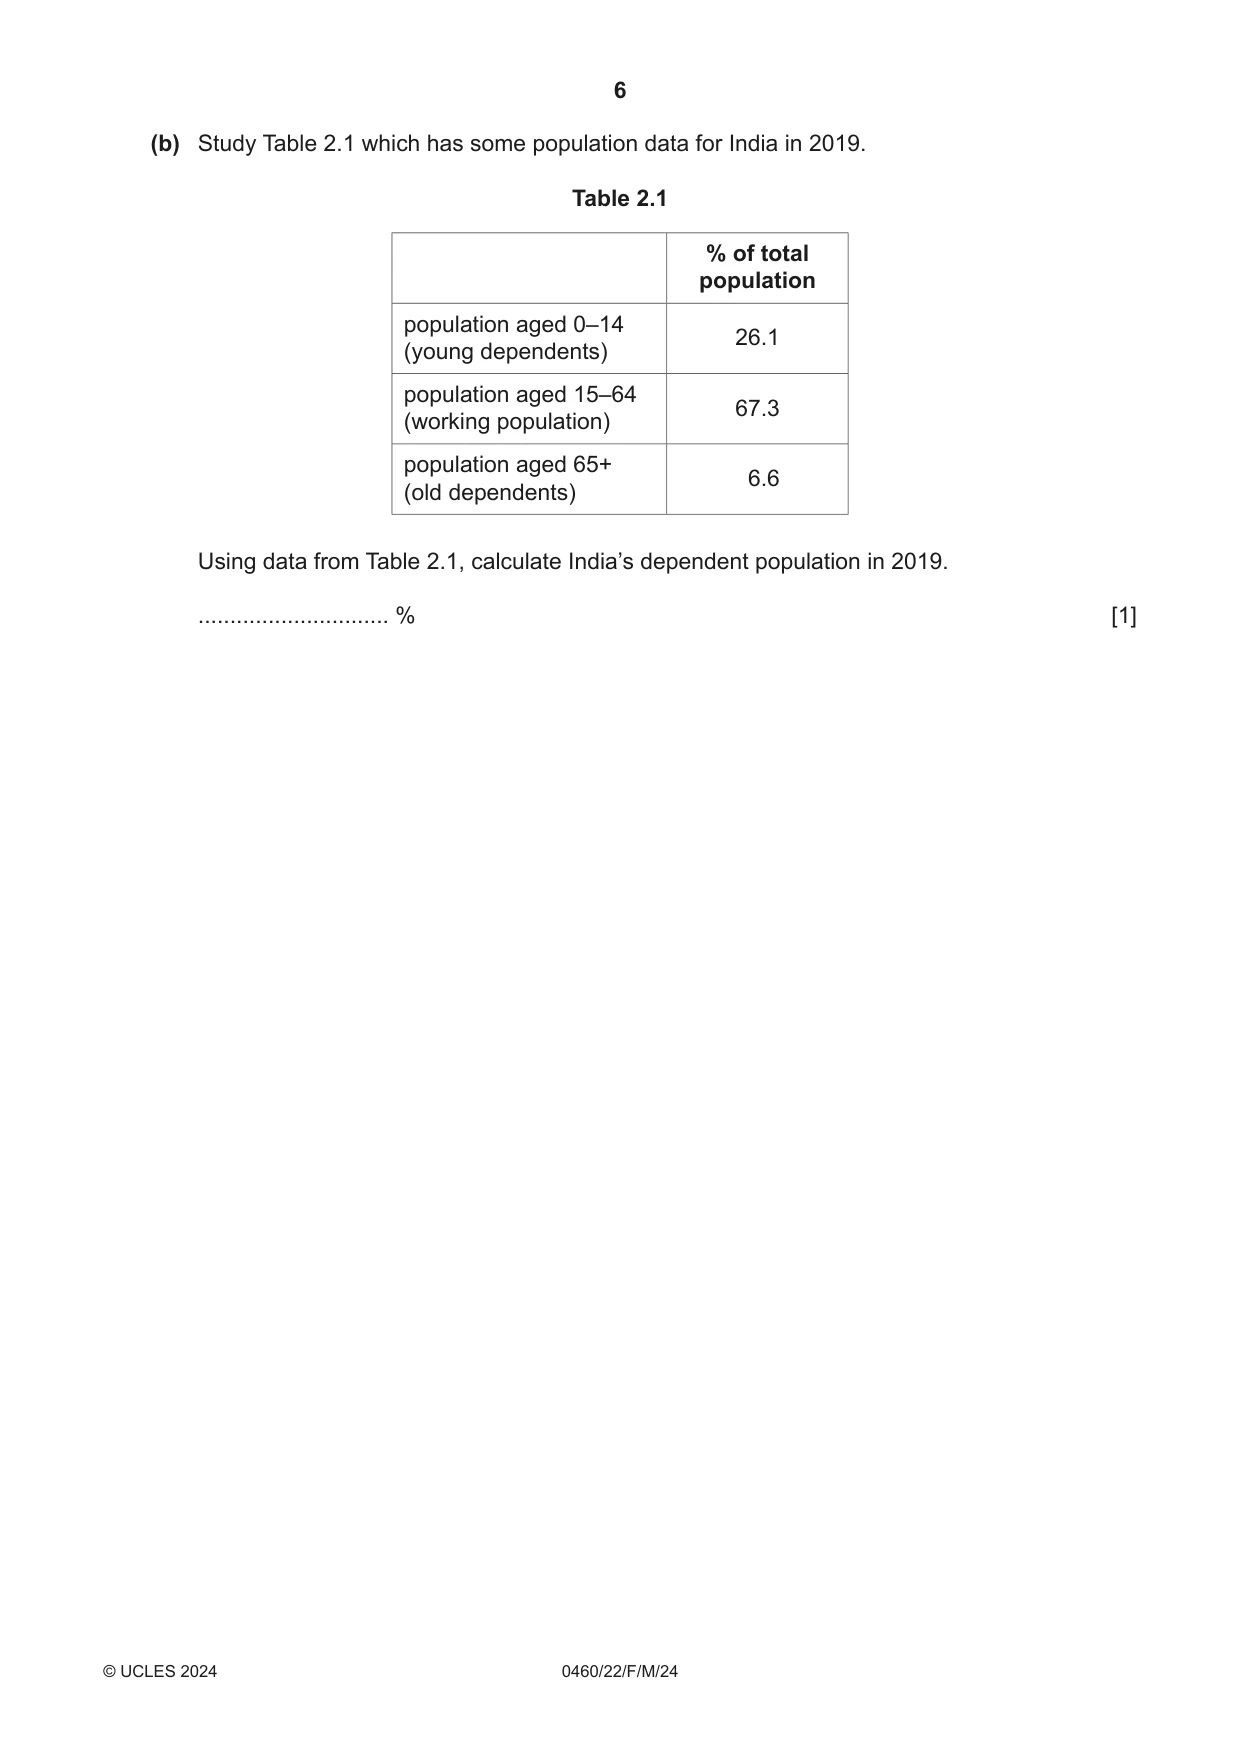
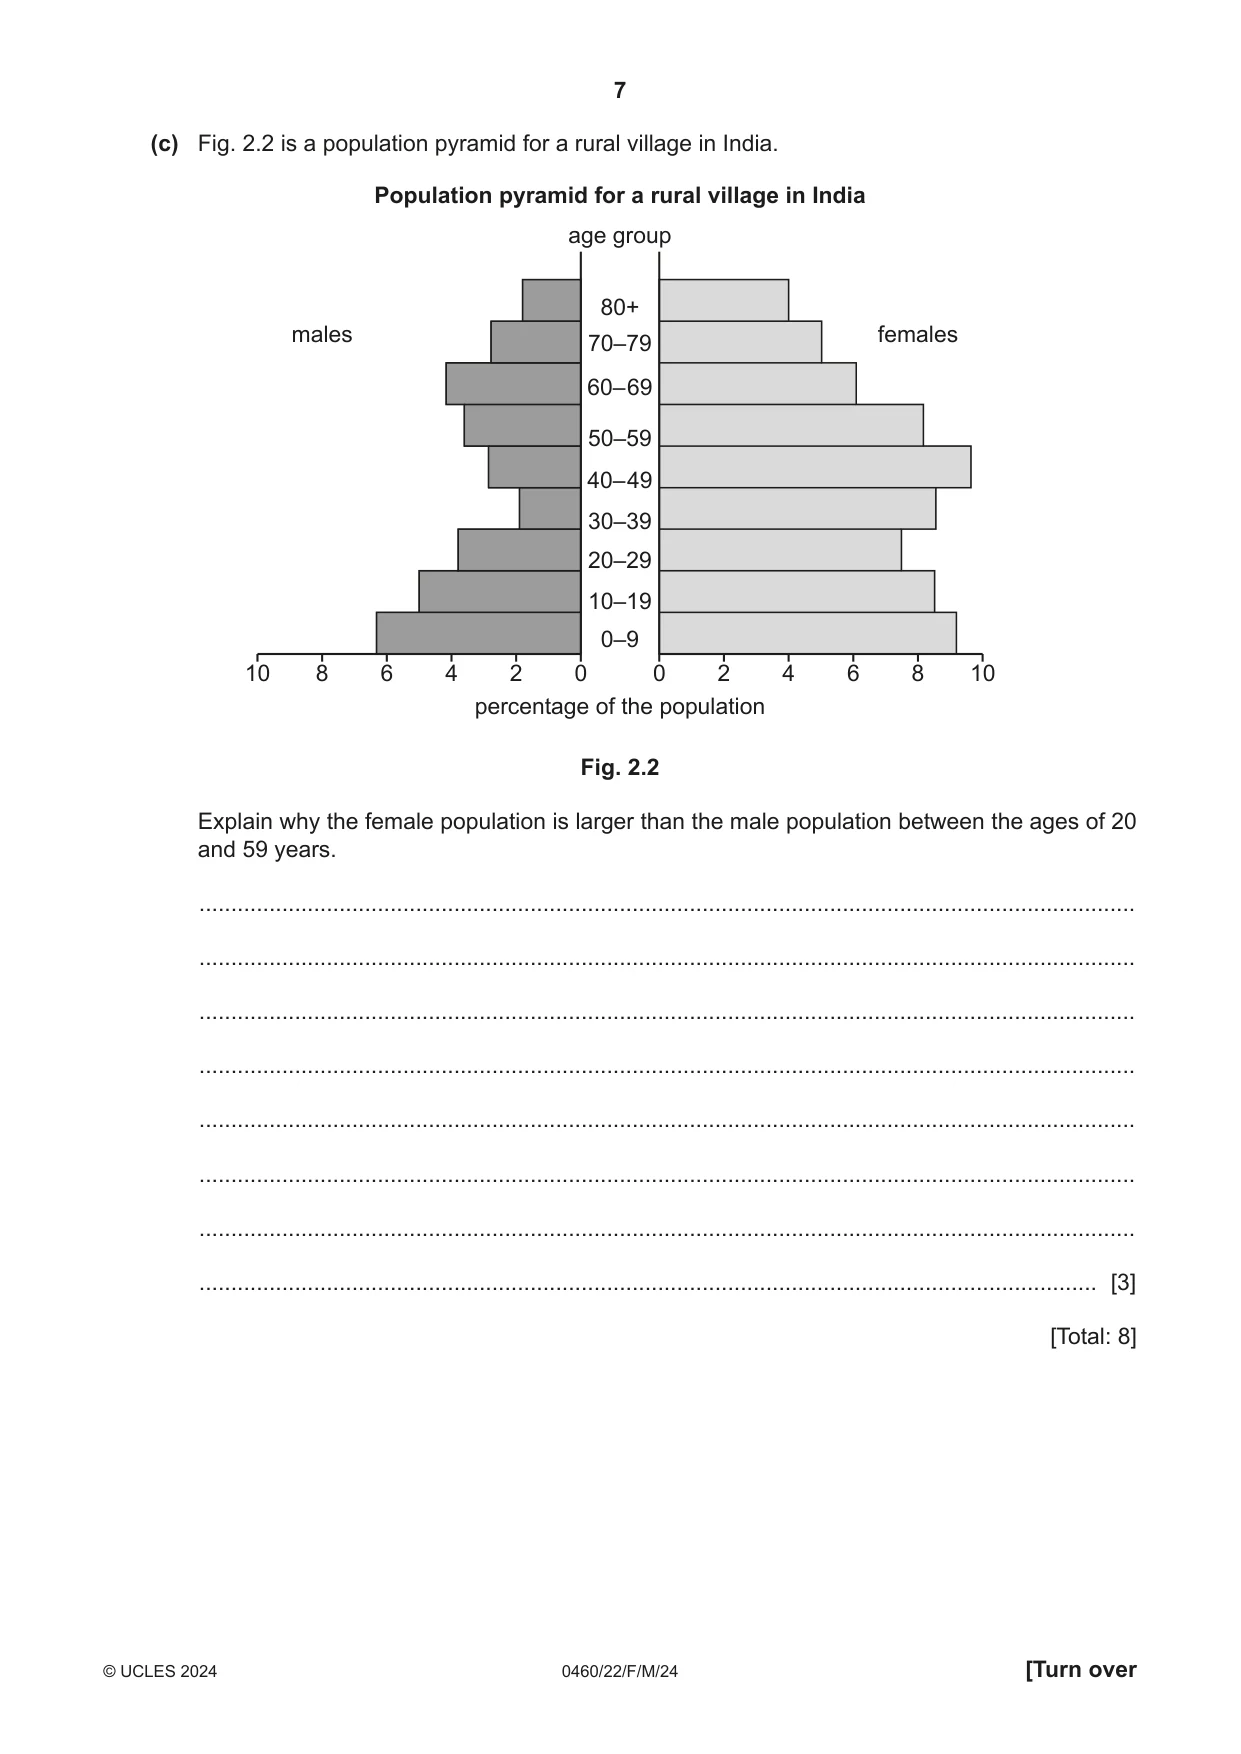
2 (a) Study Fig. 2.1 which shows population pyramids for India in 1989 and 2019. Population pyramids for India in 1989 and 2019 age group age group male female male 100+ female 95–99 90–94 85–89 80+ 80–84 75–79 75–79 70–74 70–74 65– 69 65– 69 60– 64 60– 64 55– 59 55– 59 50–54 50–54 45– 49 45– 49 40– 44 40– 44 35–39 35–39 30–34 30–34 25–29 25–29 20–24 20– 24 15–19 15–19 10–14 10–14 5–9 5–9 0– 4 0– 4 10% 8% 6% 4% 2% 0% 0% 2% 4% 6% 8% 10% 10% 8% 6% 4% 2% 0% 0% 2% 4% 6% 8% 10% 1989 2019 Fig. 2.1 (i) What was the percentage of the population aged 50–54 in 1989? .............................. % [1] (ii) Identify the age group with the biggest change in population percentage between 1989 and 2019. ..................................................................................................................................... [1] (iii) Describe the change which took place between 1989 and 2019 for males aged 15–64 ............................................................................................................. ........................................................................................................................................... people aged 65 and over. .................................................................................................. ........................................................................................................................................... [2] (b) Study Table 2.1 which has some population data for India in 2019. Table 2.1 % of total population population aged 0–14 26.1 (young dependents) population aged 15–64 67.3 (working population) population aged 65+ 6.6 (old dependents) Using data from Table 2.1, calculate India’s dependent population in 2019. .............................. % [1] (c) Fig. 2.2 is a population pyramid for a rural village in India. Population pyramid for a rural village in India age group 80+ males females 70–79 60– 69 50–59 40– 49 30–39 20–29 10–19 0–9 10 8 6 4 2 0 0 2 4 6 8 10 percentage of the population Fig. 2.2 Explain why the female population is larger than the male population between the ages of 20 and 59 years. ................................................................................................................................................... ................................................................................................................................................... ................................................................................................................................................... ................................................................................................................................................... ................................................................................................................................................... ................................................................................................................................................... ................................................................................................................................................... ............................................................................................................................................. [3] [Total: 8]
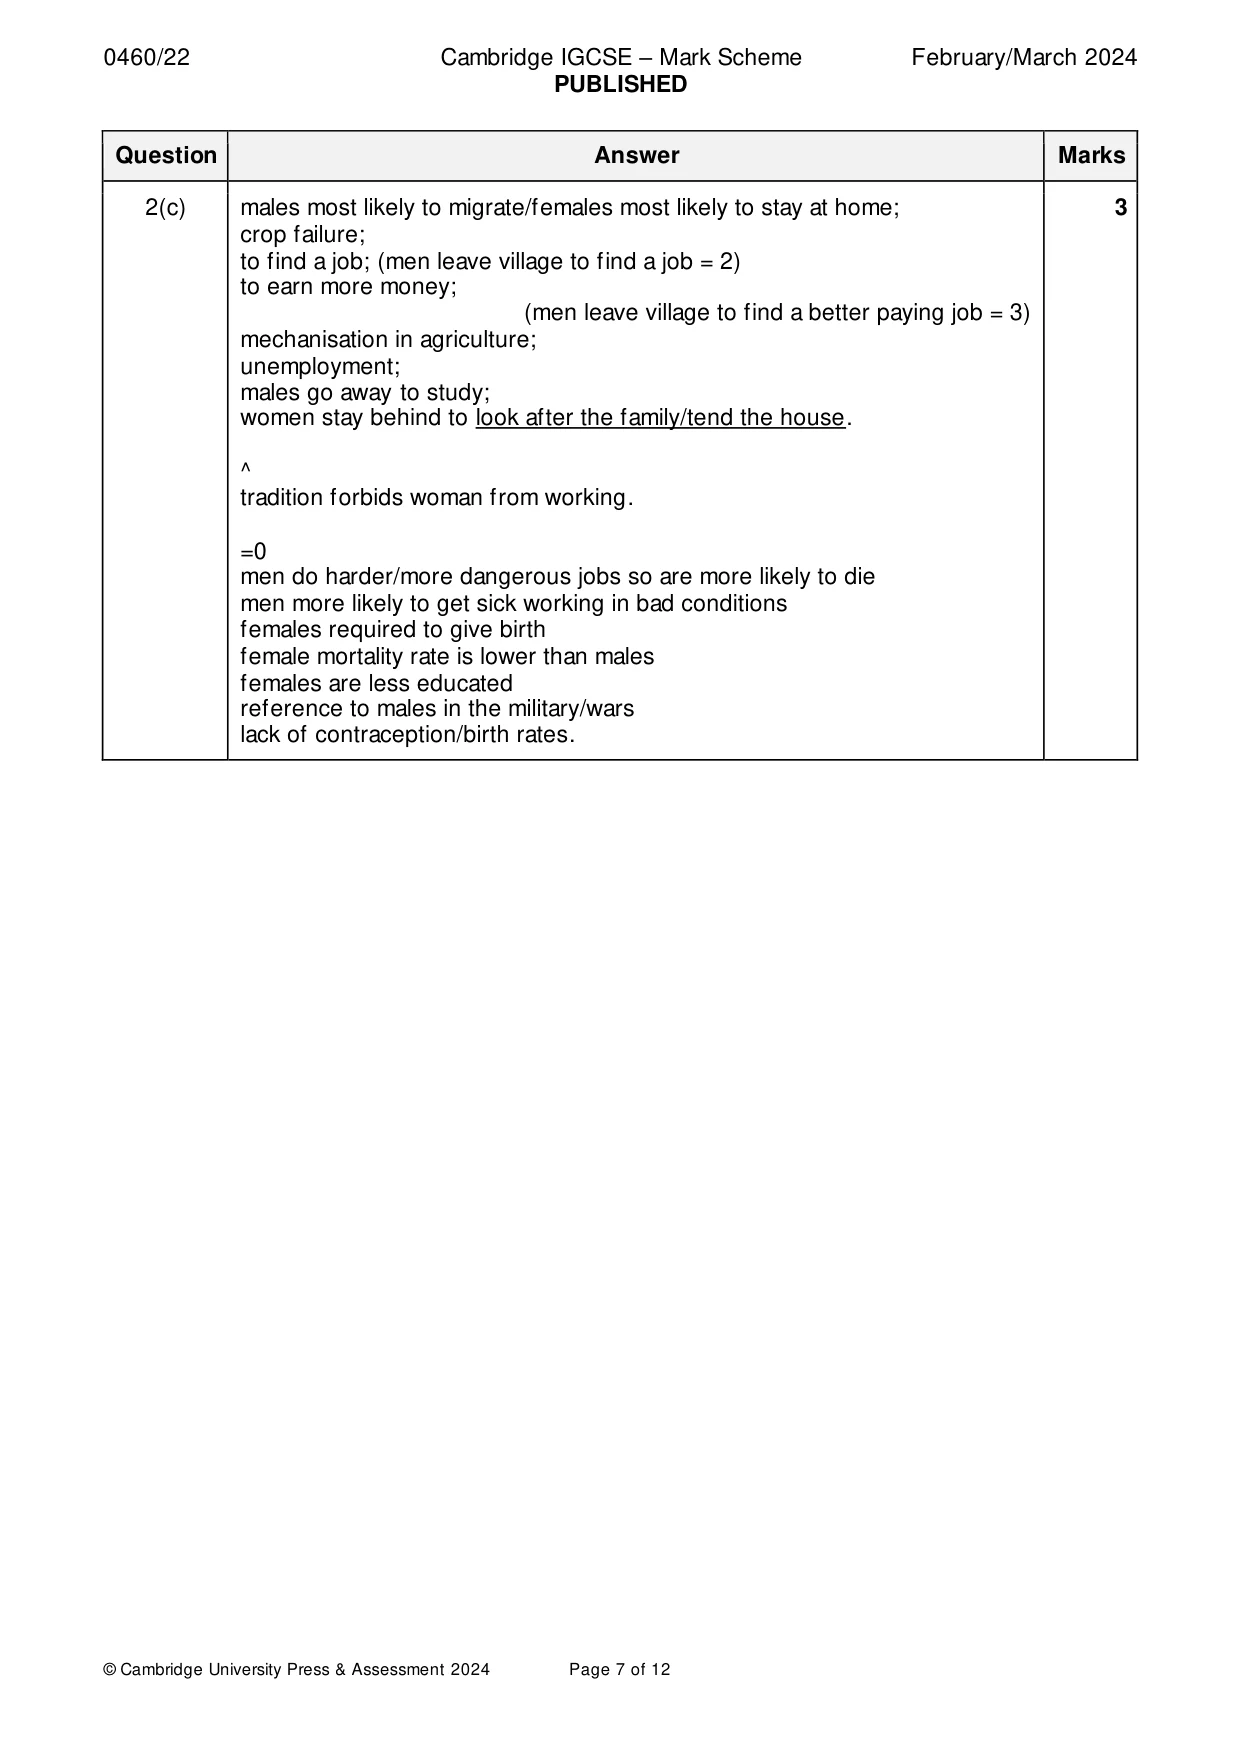
Mark scheme: 2(a)(i) 3.8% (tolerance) 3.6–3.9%. 1 2(a)(ii) 0–4 (yrs). 1 2(a)(iii) males 15–64: (small/moderate) increase/decrease or remains the same then 2 increase; people aged 65+: live longer/(small) increase. 2(b) 32.7(%). 1 2(c) males most likely to migrate/females most likely to stay at home; 3 crop failure; to find a job; (men leave village to find a job = 2) to earn more money; (men leave village to find a better paying job = 3) mechanisation in agriculture; unemployment; males go away to study; women stay behind to look after the family/tend the house. ^ tradition forbids woman from working. =0 men do harder/more dangerous jobs so are more likely to die men more likely to get sick working in bad conditions females required to give birth female mortality rate is lower than males females are less educated reference to males in the military/wars lack of contraception/birth rates.
Question 3
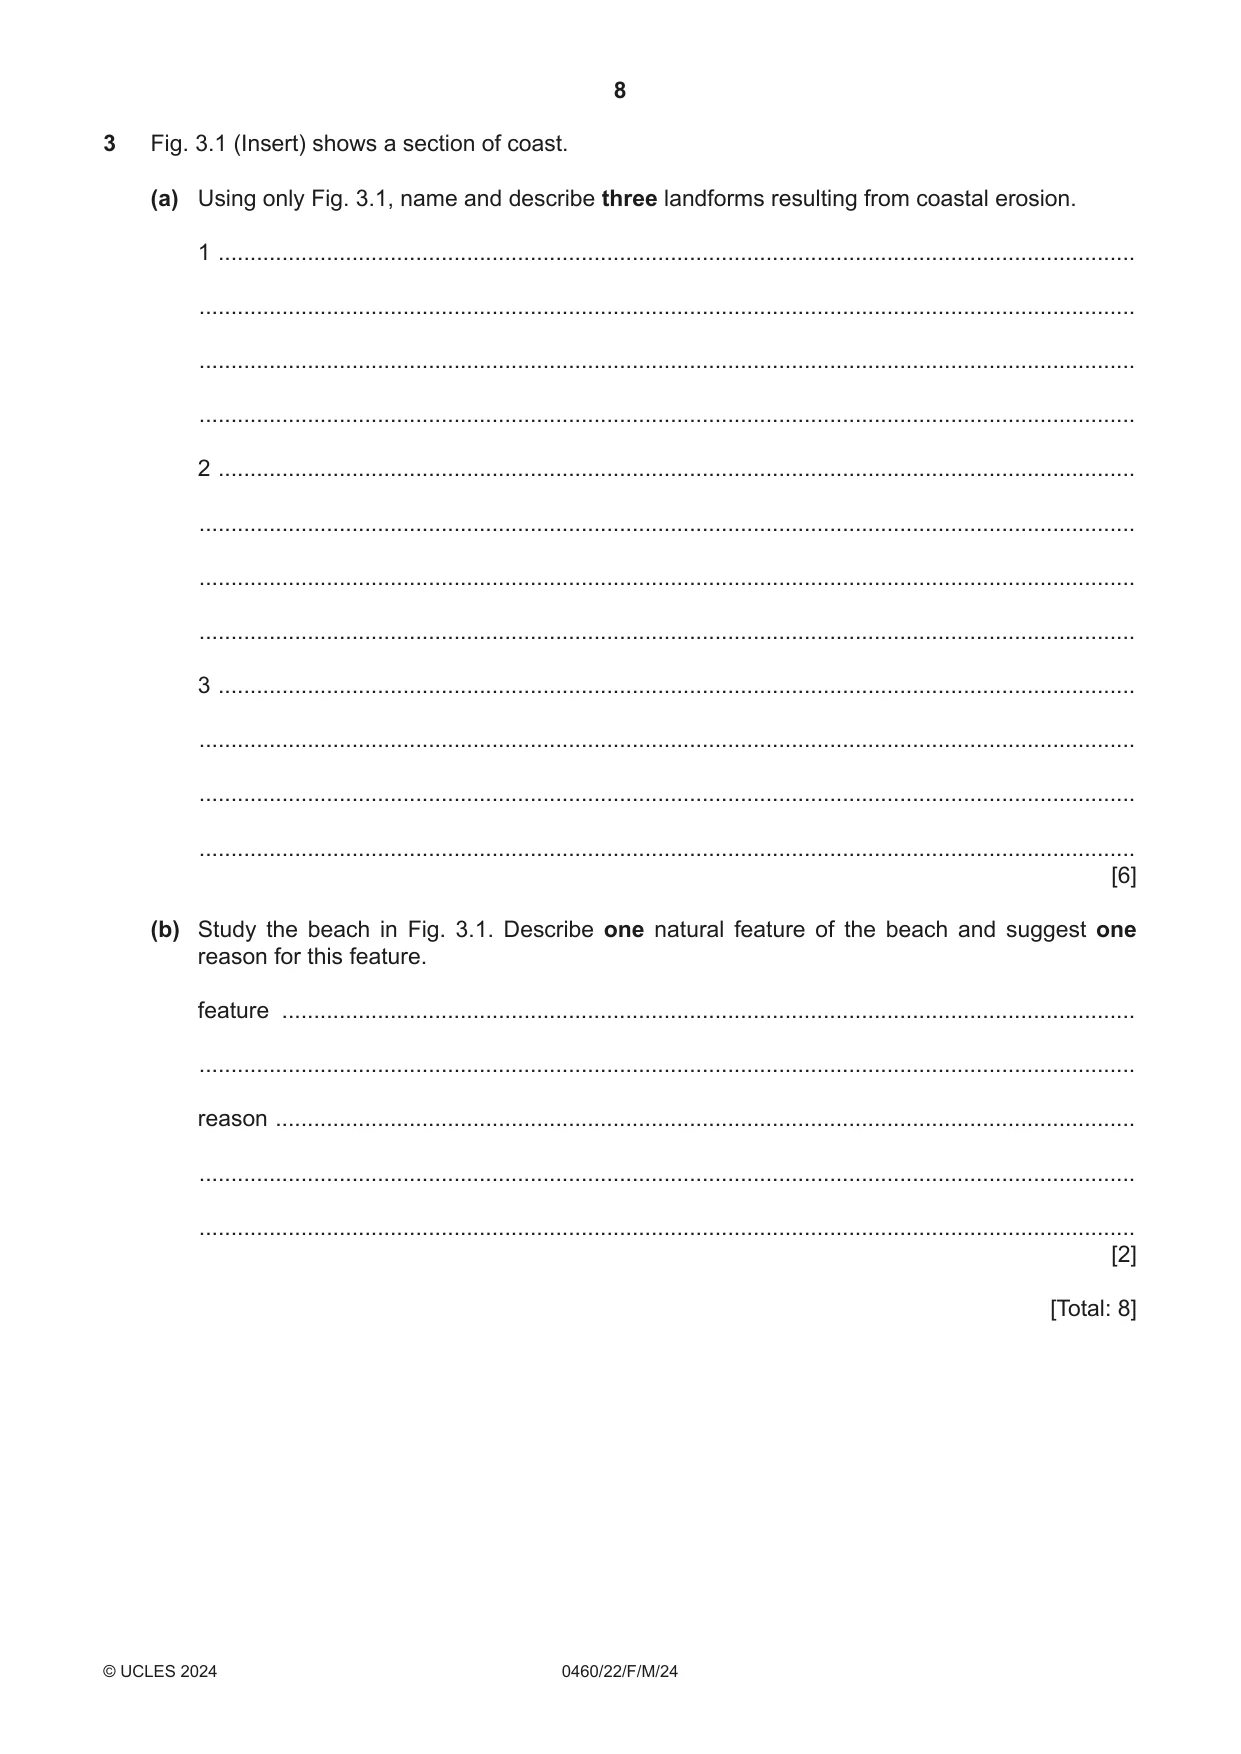
3 Fig. 3.1 (Insert) shows a section of coast. (a) Using only Fig. 3.1, name and describe three landforms resulting from coastal erosion. 1 ................................................................................................................................................ ................................................................................................................................................... ................................................................................................................................................... ................................................................................................................................................... 2 ................................................................................................................................................ ................................................................................................................................................... ................................................................................................................................................... ................................................................................................................................................... 3 ................................................................................................................................................ ................................................................................................................................................... ................................................................................................................................................... ................................................................................................................................................... [6] (b) Study the beach in Fig. 3.1. Describe one natural feature of the beach and suggest one reason for this feature. feature ...................................................................................................................................... ................................................................................................................................................... reason ....................................................................................................................................... ................................................................................................................................................... ................................................................................................................................................... [2] [Total: 8]
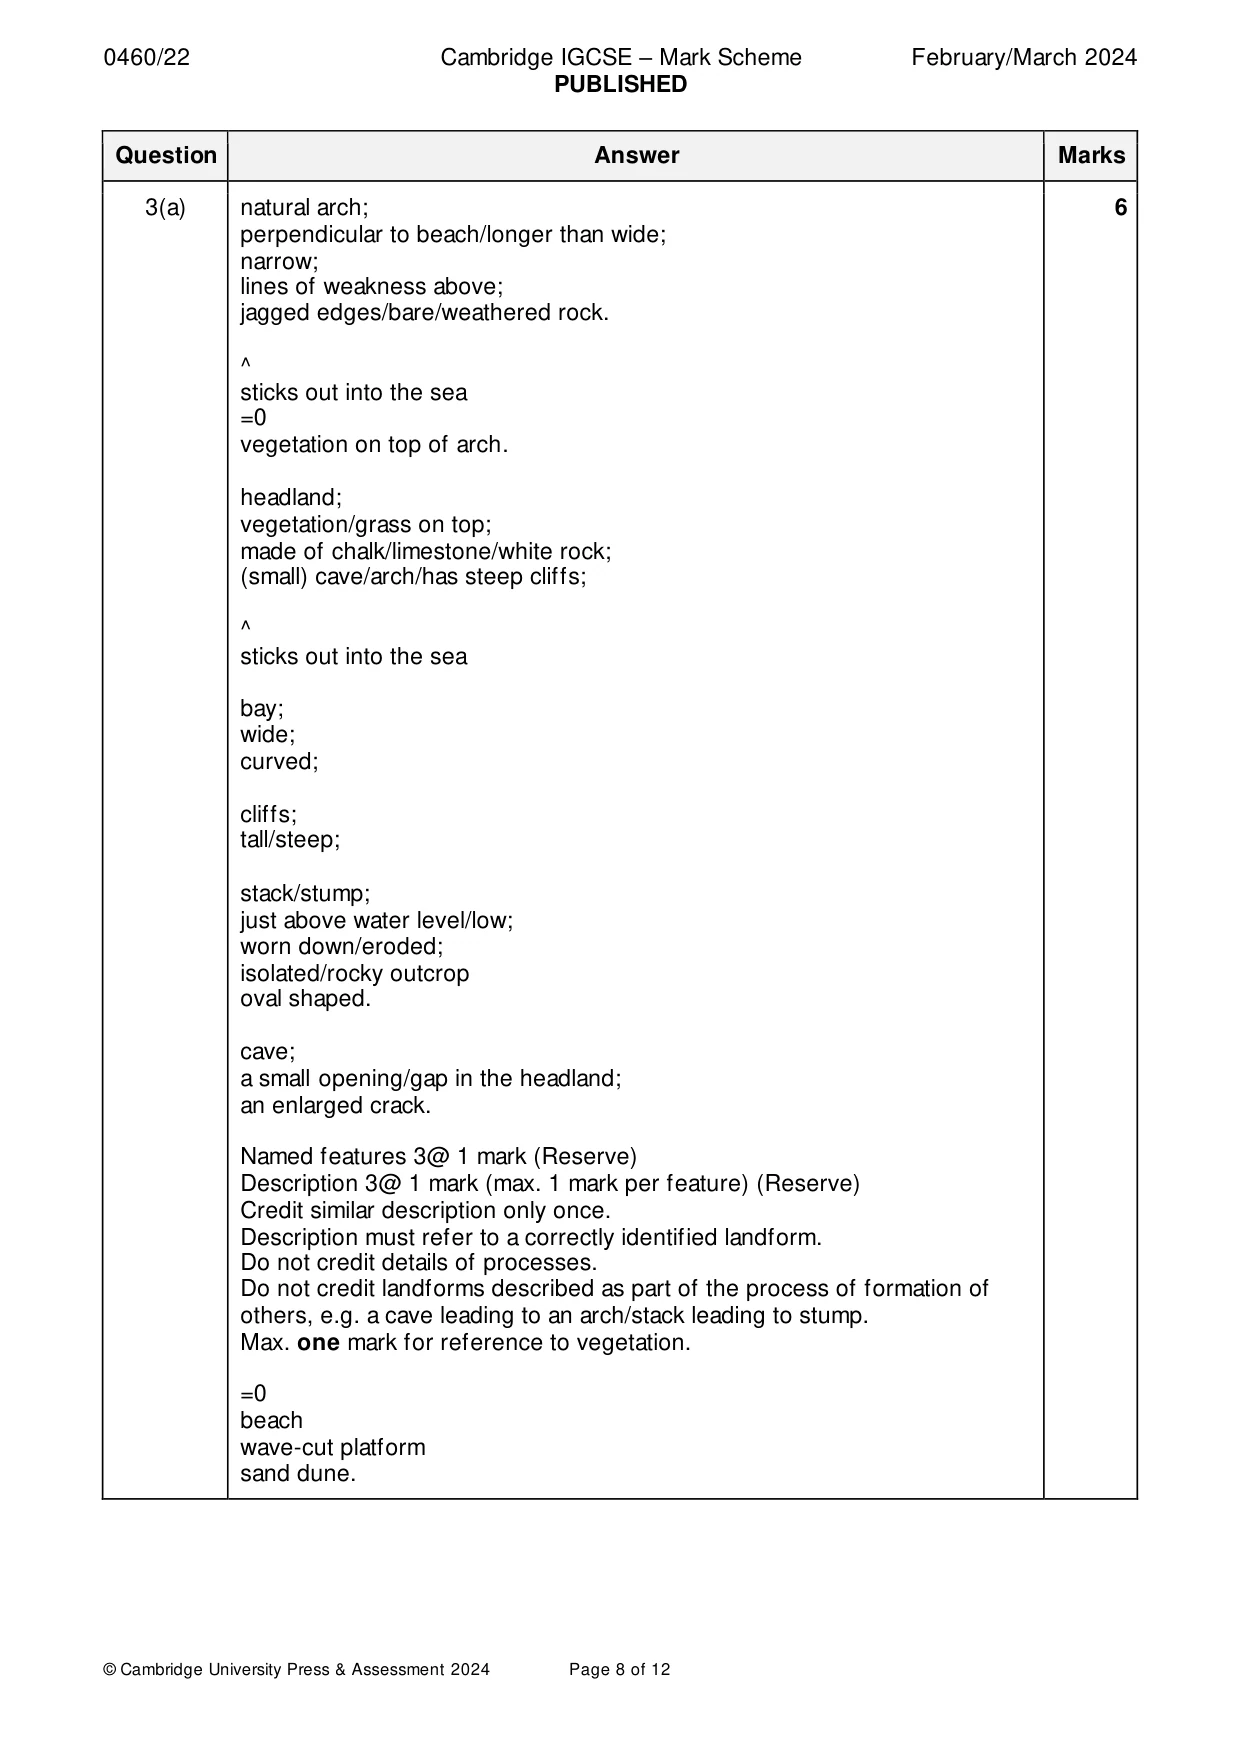
Mark scheme: 3(a) natural arch; 6 perpendicular to beach/longer than wide; narrow; lines of weakness above; jagged edges/bare/weathered rock. ^ sticks out into the sea =0 vegetation on top of arch. headland; vegetation/grass on top; made of chalk/limestone/white rock; (small) cave/arch/has steep cliffs; ^ sticks out into the sea bay; wide; curved; cliffs; tall/steep; stack/stump; just above water level/low; worn down/eroded; isolated/rocky outcrop oval shaped. cave; a small opening/gap in the headland; an enlarged crack. Named features 3@ 1 mark (Reserve) Description 3@ 1 mark (max. 1 mark per feature) (Reserve) Credit similar description only once. Description must refer to a correctly identified landform. Do not credit details of processes. Do not credit landforms described as part of the process of formation of others, e.g. a cave leading to an arch/stack leading to stump. Max. one mark for reference to vegetation. =0 beach wave-cut platform sand dune. 3(b) steeper at the front than at the back/ridge/berm; 2 front more eroded (by destructive waves)/steeper part where waves break; deposition by constructive waves; position moved up beach by storms and spring tides; line of seaweed/debris; deposited where the waves break/marks the high tide line; made of sand/shingle; due to attrition/corrasion; material derived from erosion of cliffs by the waves; more constructive than destructive waves so sand is deposited/deposited by constructive waves/strong swash vs weak backwash; curved; due to wave refraction; beach cusps; the result of wave movement; the smaller the waves the closer together the cusps; sand dunes; deposited by onshore winds/(movement of dry sand on beach). Reasons must refer to a correctly named feature. Feature can be credited in the reasons section. Feature = 1@ 1 mark Reason = 1@ 1 mark ^ gently sloping beach. =0 low-lying beach.
Q4 · The number of domestic and foreign tourist arrivals in Goa, India, from 2012 to 2019
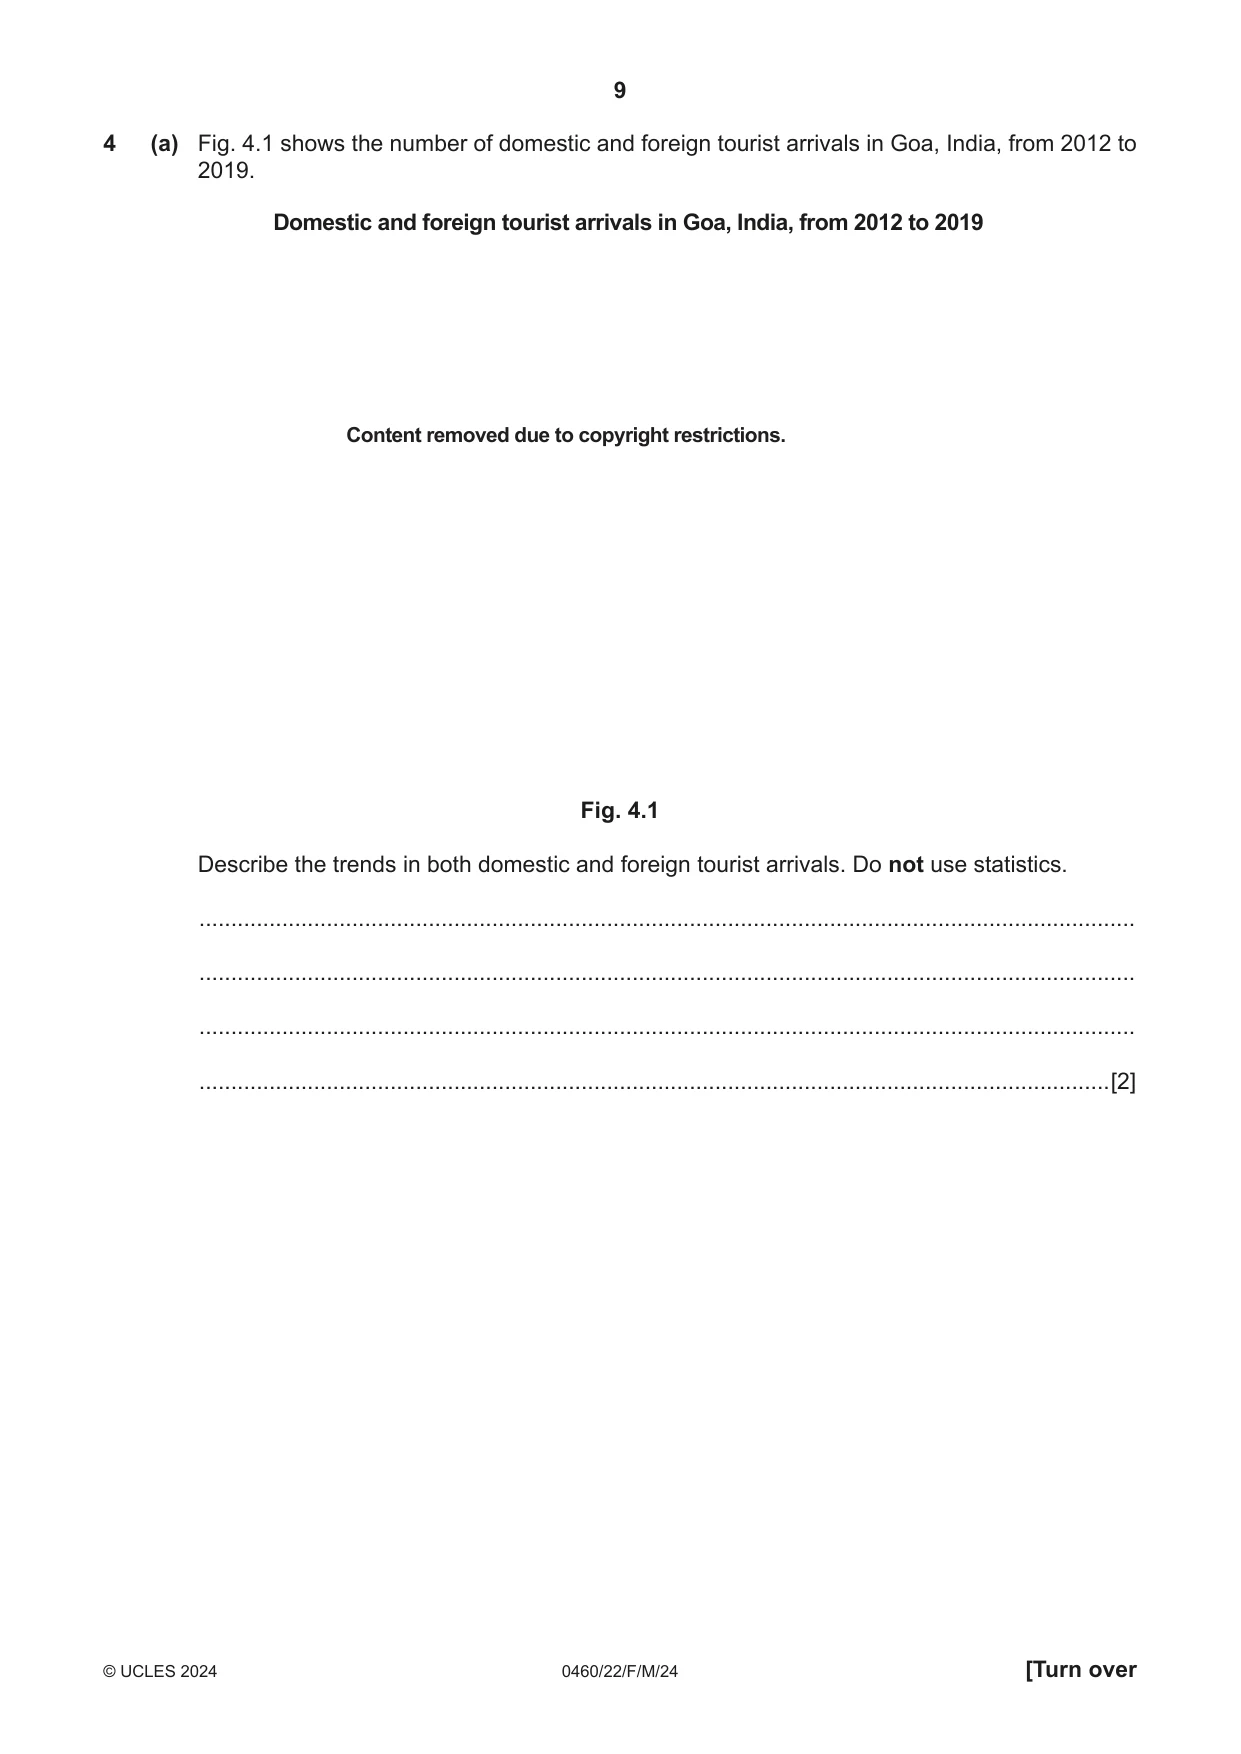
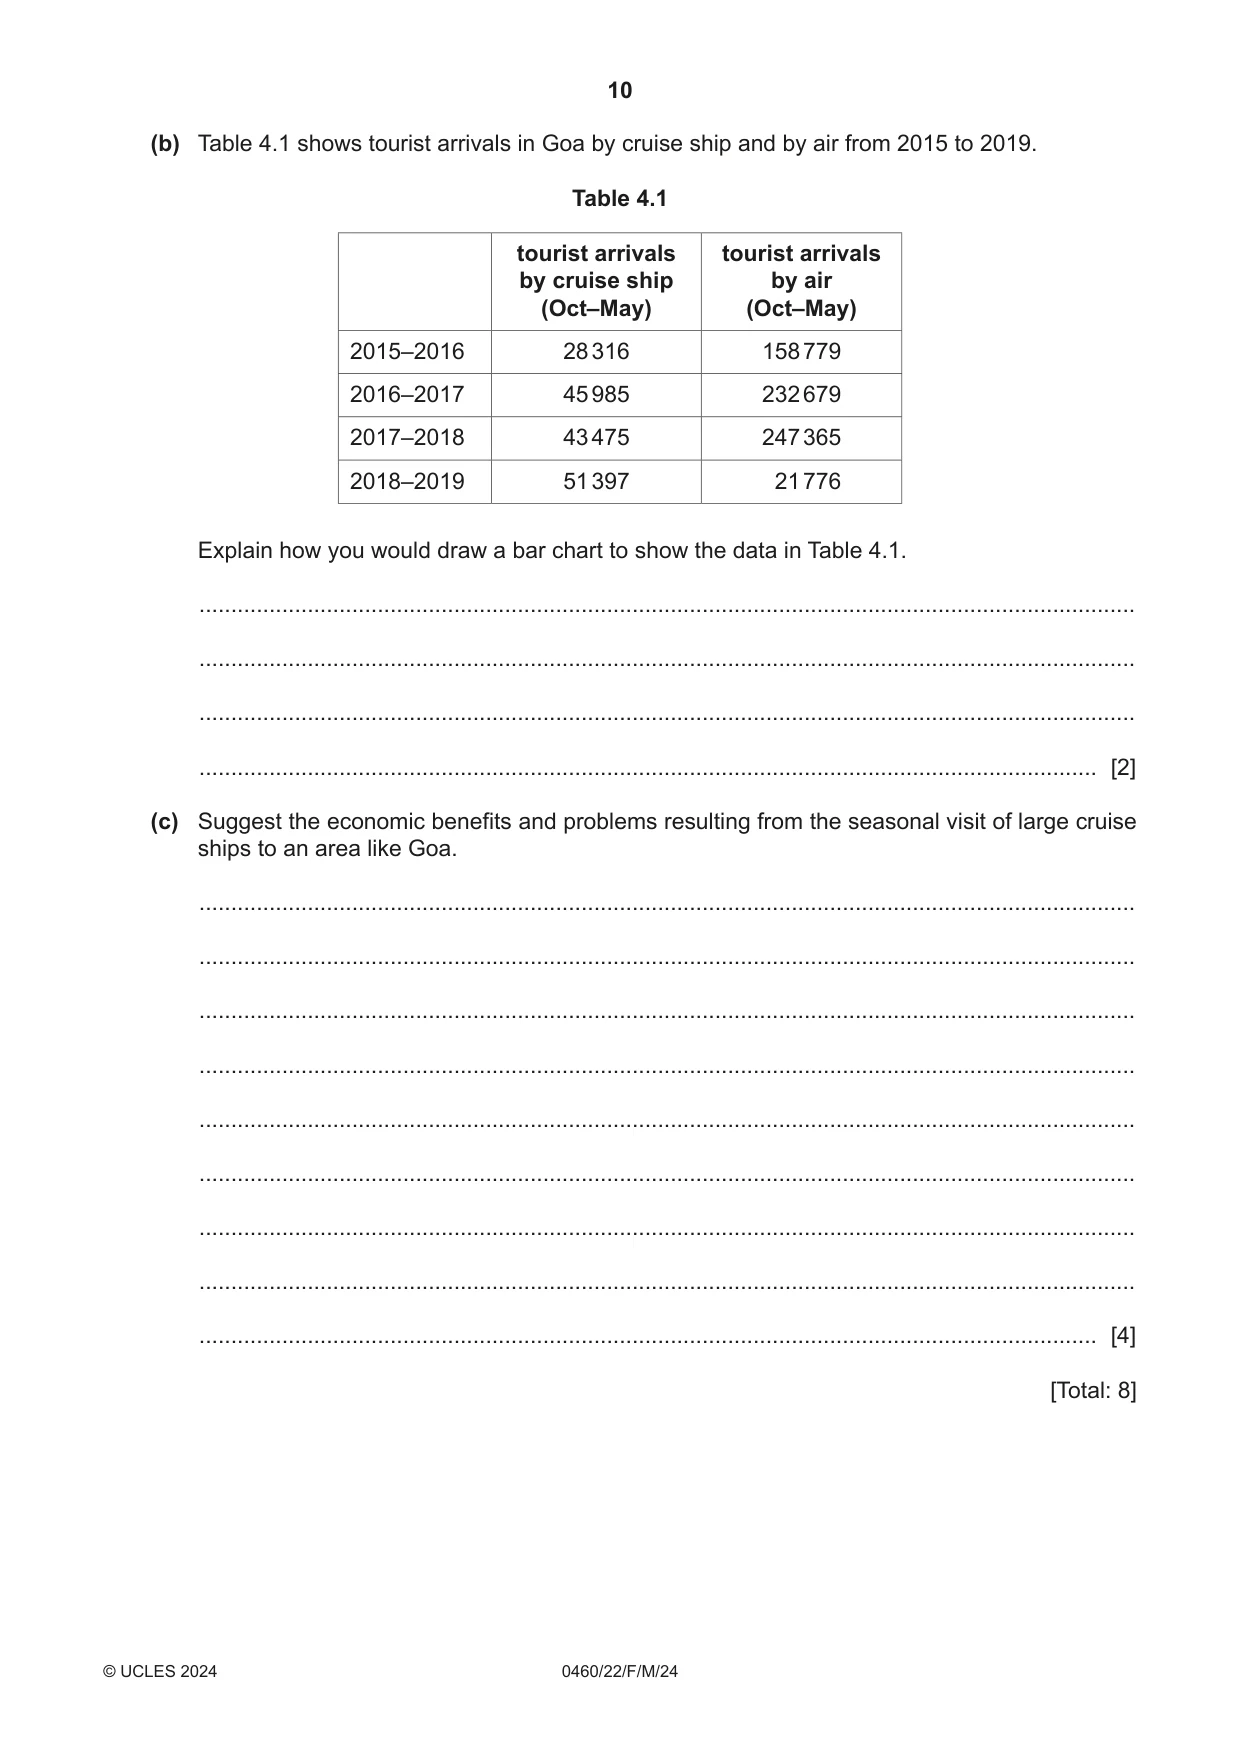
4 (a) Fig. 4.1 shows the number of domestic and foreign tourist arrivals in Goa, India, from 2012 to 2019. Domestic and foreign tourist arrivals in Goa, India, from 2012 to 2019 Content removed due to copyright restrictions. Fig. 4.1 Describe the trends in both domestic and foreign tourist arrivals. Do not use statistics. ................................................................................................................................................... ................................................................................................................................................... ................................................................................................................................................... ...............................................................................................................................................[2] (b) Table 4.1 shows tourist arrivals in Goa by cruise ship and by air from 2015 to 2019. Table 4.1 tourist arrivals tourist arrivals by cruise ship by air (Oct–May) (Oct–May) 2015–2016 28 316 158 779 2016–2017 45 985 232 679 2017–2018 43 475 247 365 2018–2019 51 397 21 776 Explain how you would draw a bar chart to show the data in Table 4.1. ................................................................................................................................................... ................................................................................................................................................... ................................................................................................................................................... ............................................................................................................................................. [2] (c) Suggest the economic benefits and problems resulting from the seasonal visit of large cruise ships to an area like Goa. ................................................................................................................................................... ................................................................................................................................................... ................................................................................................................................................... ................................................................................................................................................... ................................................................................................................................................... ................................................................................................................................................... ................................................................................................................................................... ................................................................................................................................................... ............................................................................................................................................. [4] [Total: 8]
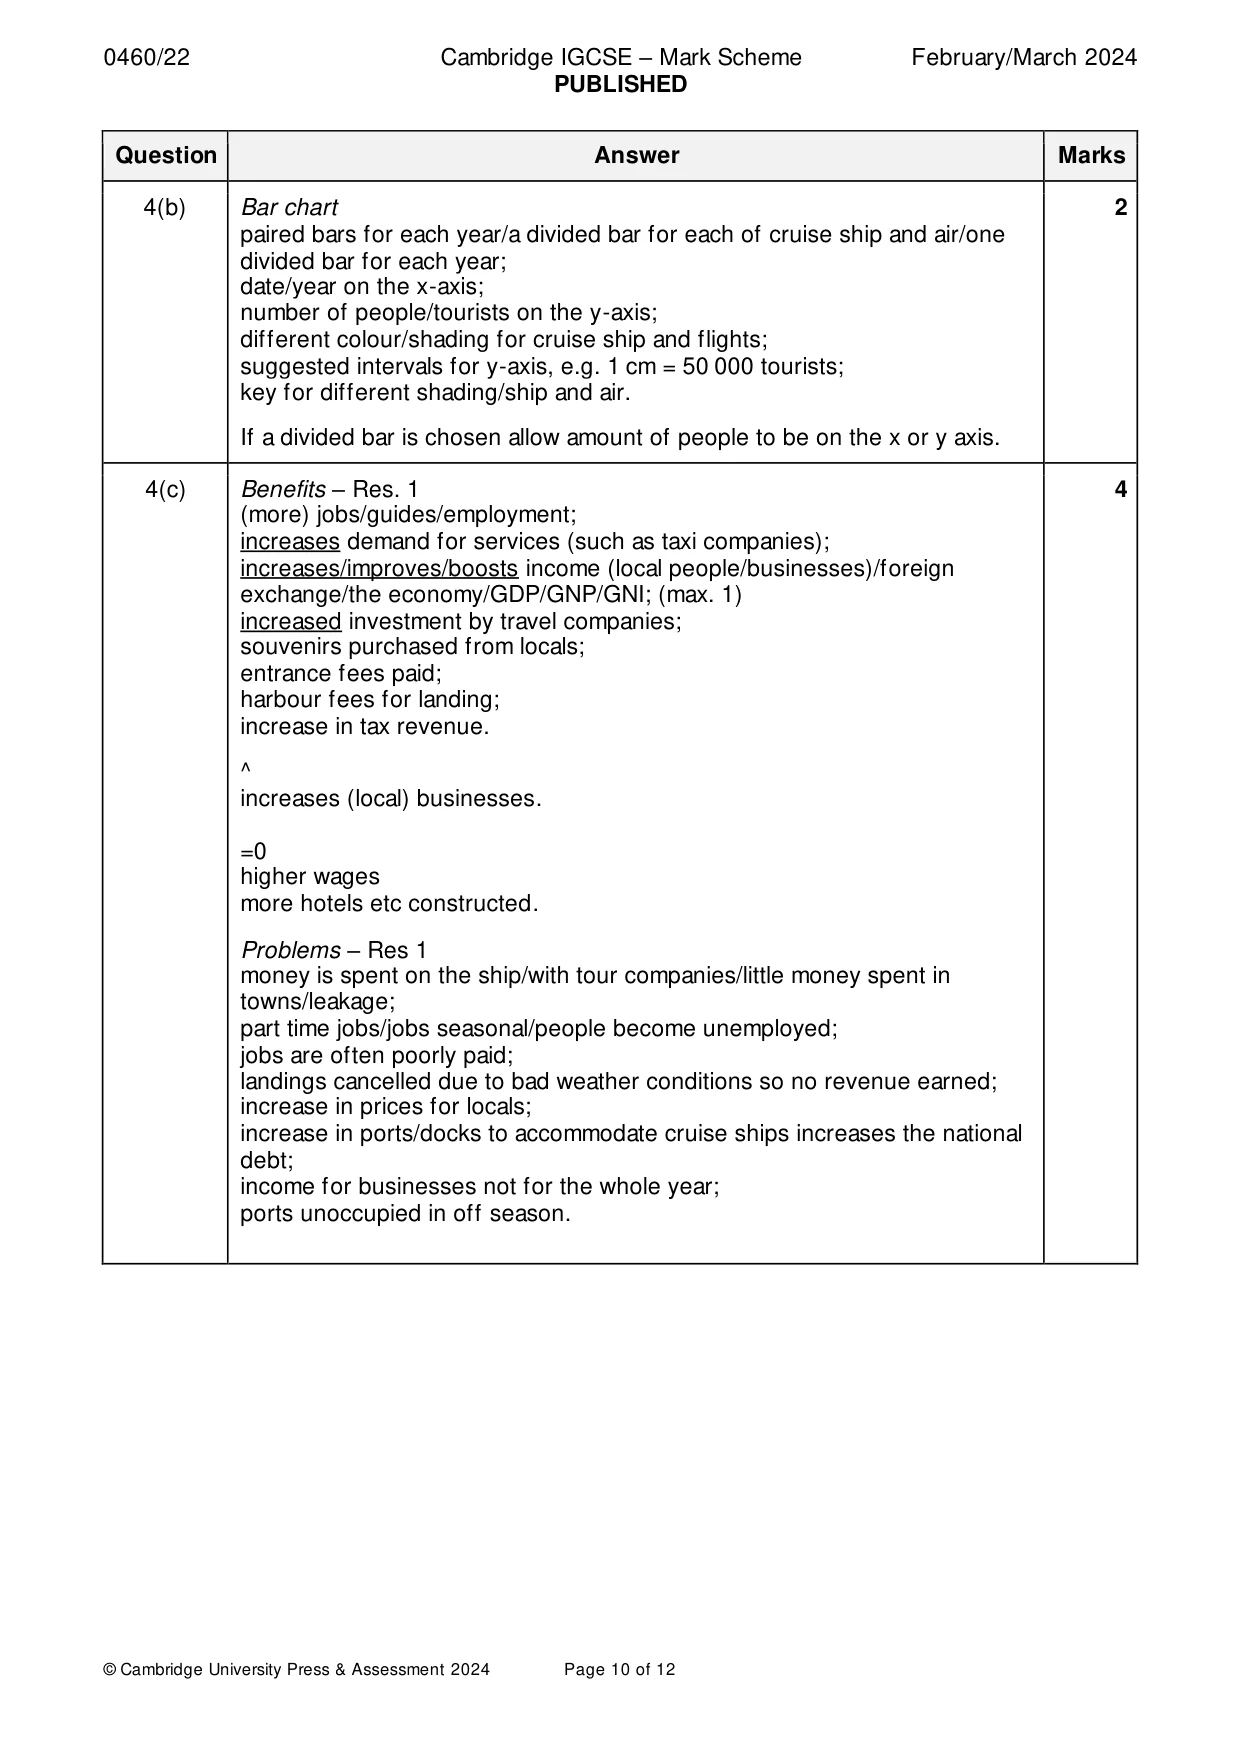
Mark scheme: 4(a) foreign tourists – rapid/exponential increase or rapid then slow increase; 2 domestic tourists – some/slow/gradual/steady increase; both/tourists overall increase; domestic are fewer/foreign higher; increase is slower in domestic tourists; 2017–2019 both even out. Needs comment on both or comparison for 2 marks. ^ foreign tourists increase domestic tourists remained constant. 4(b) Bar chart 2 paired bars for each year/a divided bar for each of cruise ship and air/one divided bar for each year; date/year on the x-axis; number of people/tourists on the y-axis; different colour/shading for cruise ship and flights; suggested intervals for y-axis, e.g. 1 cm = 50 000 tourists; key for different shading/ship and air. If a divided bar is chosen allow amount of people to be on the x or y axis. 4(c) Benefits – Res. 1 4 (more) jobs/guides/employment; increases demand for services (such as taxi companies); increases/improves/boosts income (local people/businesses)/foreign exchange/the economy/GDP/GNP/GNI; (max. 1) increased investment by travel companies; souvenirs purchased from locals; entrance fees paid; harbour fees for landing; increase in tax revenue. ^ increases (local) businesses. =0 higher wages more hotels etc constructed. Problems – Res 1 money is spent on the ship/with tour companies/little money spent in towns/leakage; part time jobs/jobs seasonal/people become unemployed; jobs are often poorly paid; landings cancelled due to bad weather conditions so no revenue earned; increase in prices for locals; increase in ports/docks to accommodate cruise ships increases the national debt; income for businesses not for the whole year; ports unoccupied in off season.
Question 5
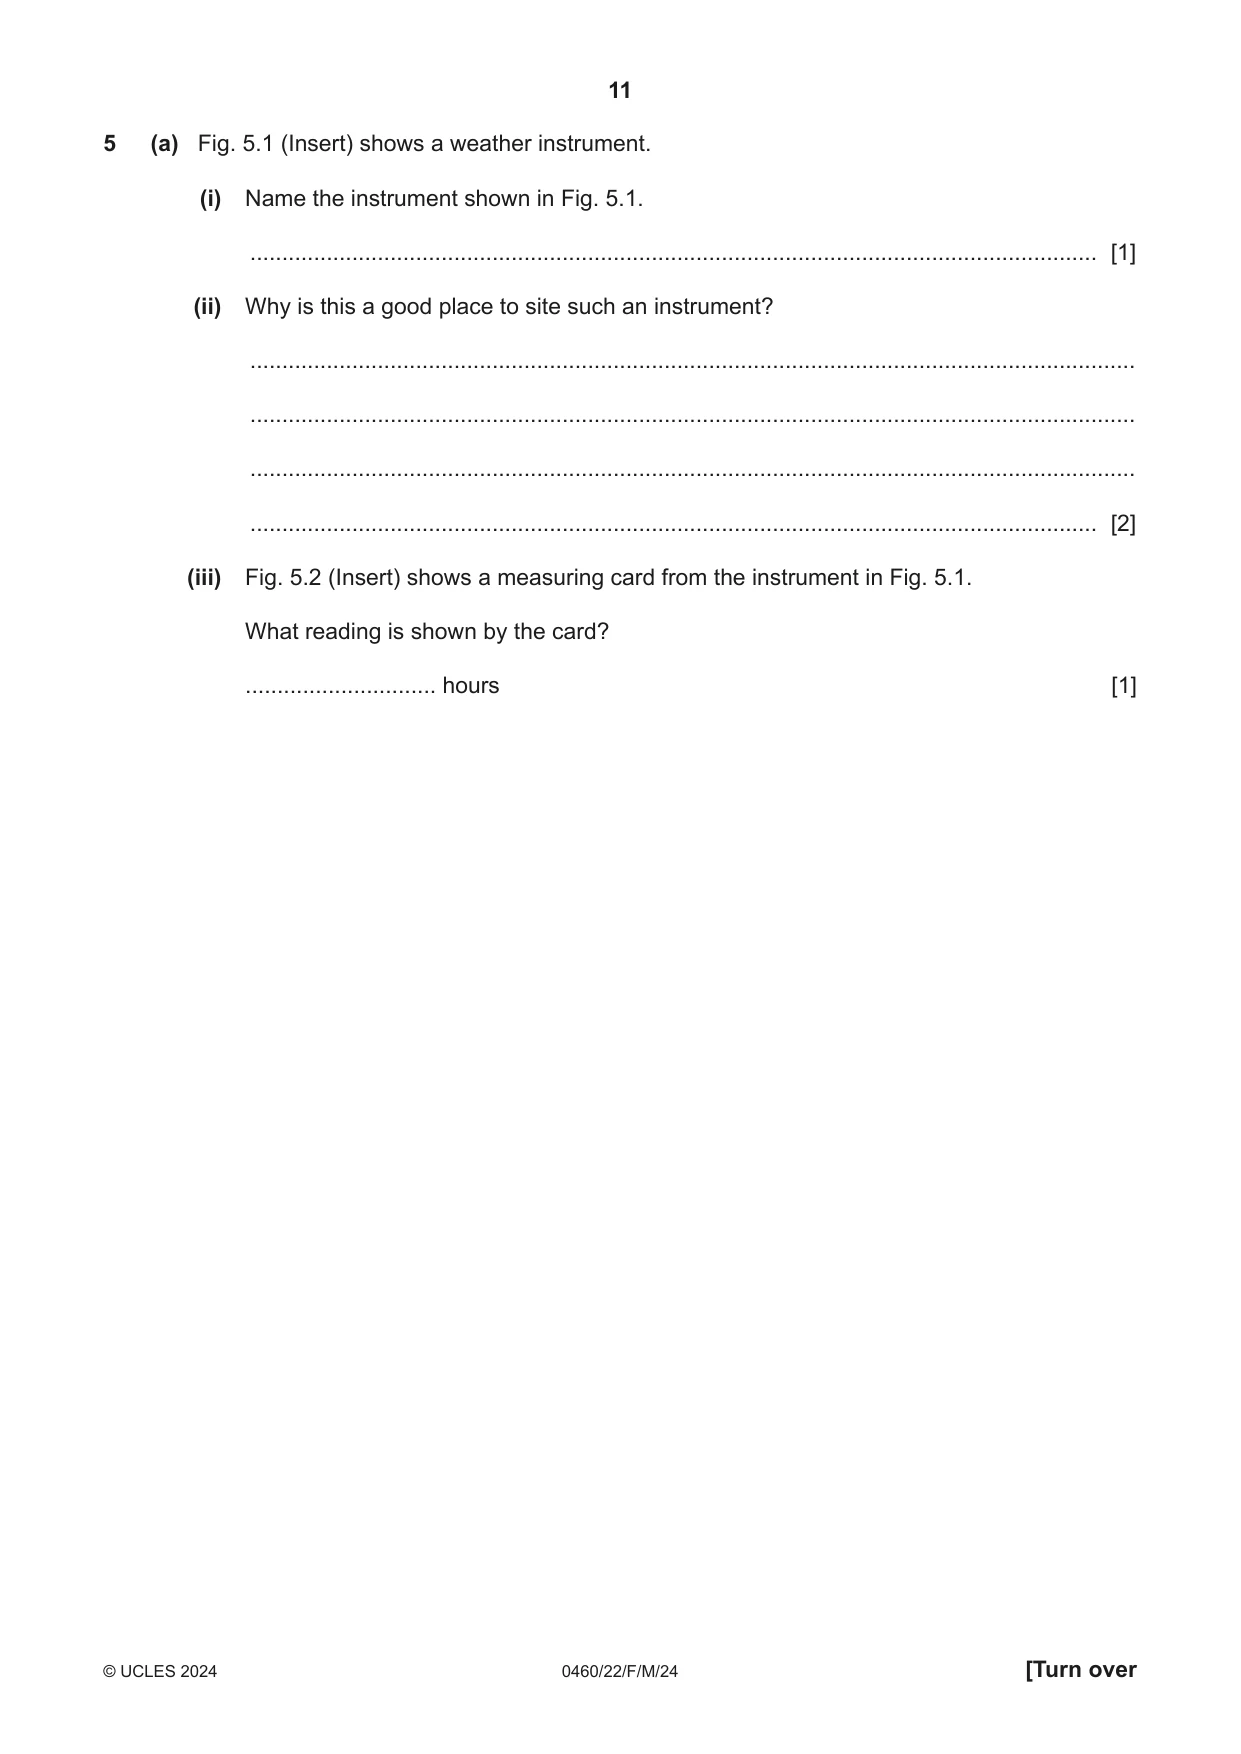
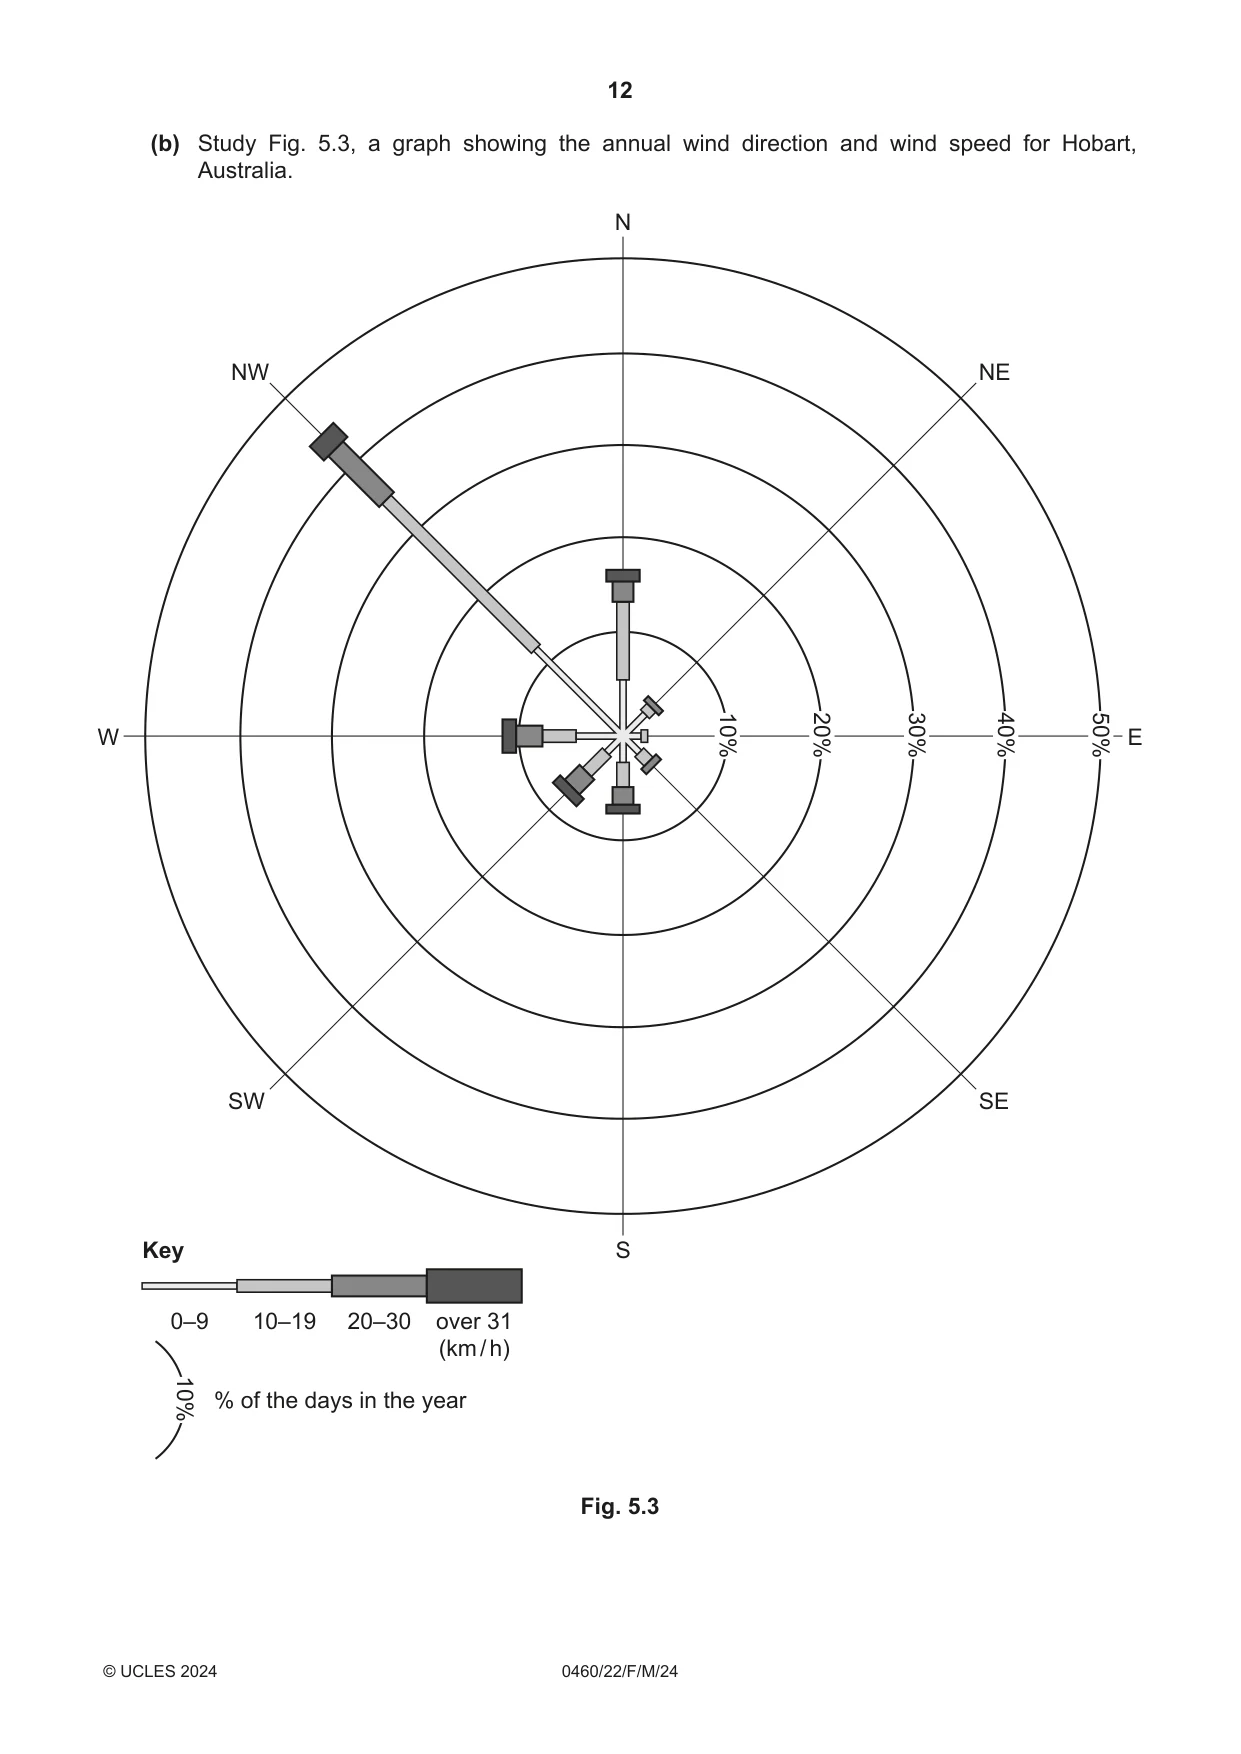
5 (a) Fig. 5.1 (Insert) shows a weather instrument. (i) Name the instrument shown in Fig. 5.1. ..................................................................................................................................... [1] (ii) Why is this a good place to site such an instrument? ........................................................................................................................................... ........................................................................................................................................... ........................................................................................................................................... ..................................................................................................................................... [2] (iii) Fig. 5.2 (Insert) shows a measuring card from the instrument in Fig. 5.1. What reading is shown by the card? .............................. hours [1] (b) Study Fig. 5.3, a graph showing the annual wind direction and wind speed for Hobart, Australia. N NW NE W 10% 20% 30% 40% 50% E SW SE Key S 0–9 10–19 20–30 over 31 (km / h) % of the days in the year 10% Fig. 5.3 (i) Name the type of graph shown in Fig. 5.3. ...................................................... [1] (ii) What is the prevailing wind direction shown by Fig. 5.3? ...................................................... [1] (iii) What percentage of the days in the year does the wind blow from the north, and when it does, which wind speed is most common? frequency .............................. (%) most common wind speed .............................. (km / h) [2] [Total: 8]
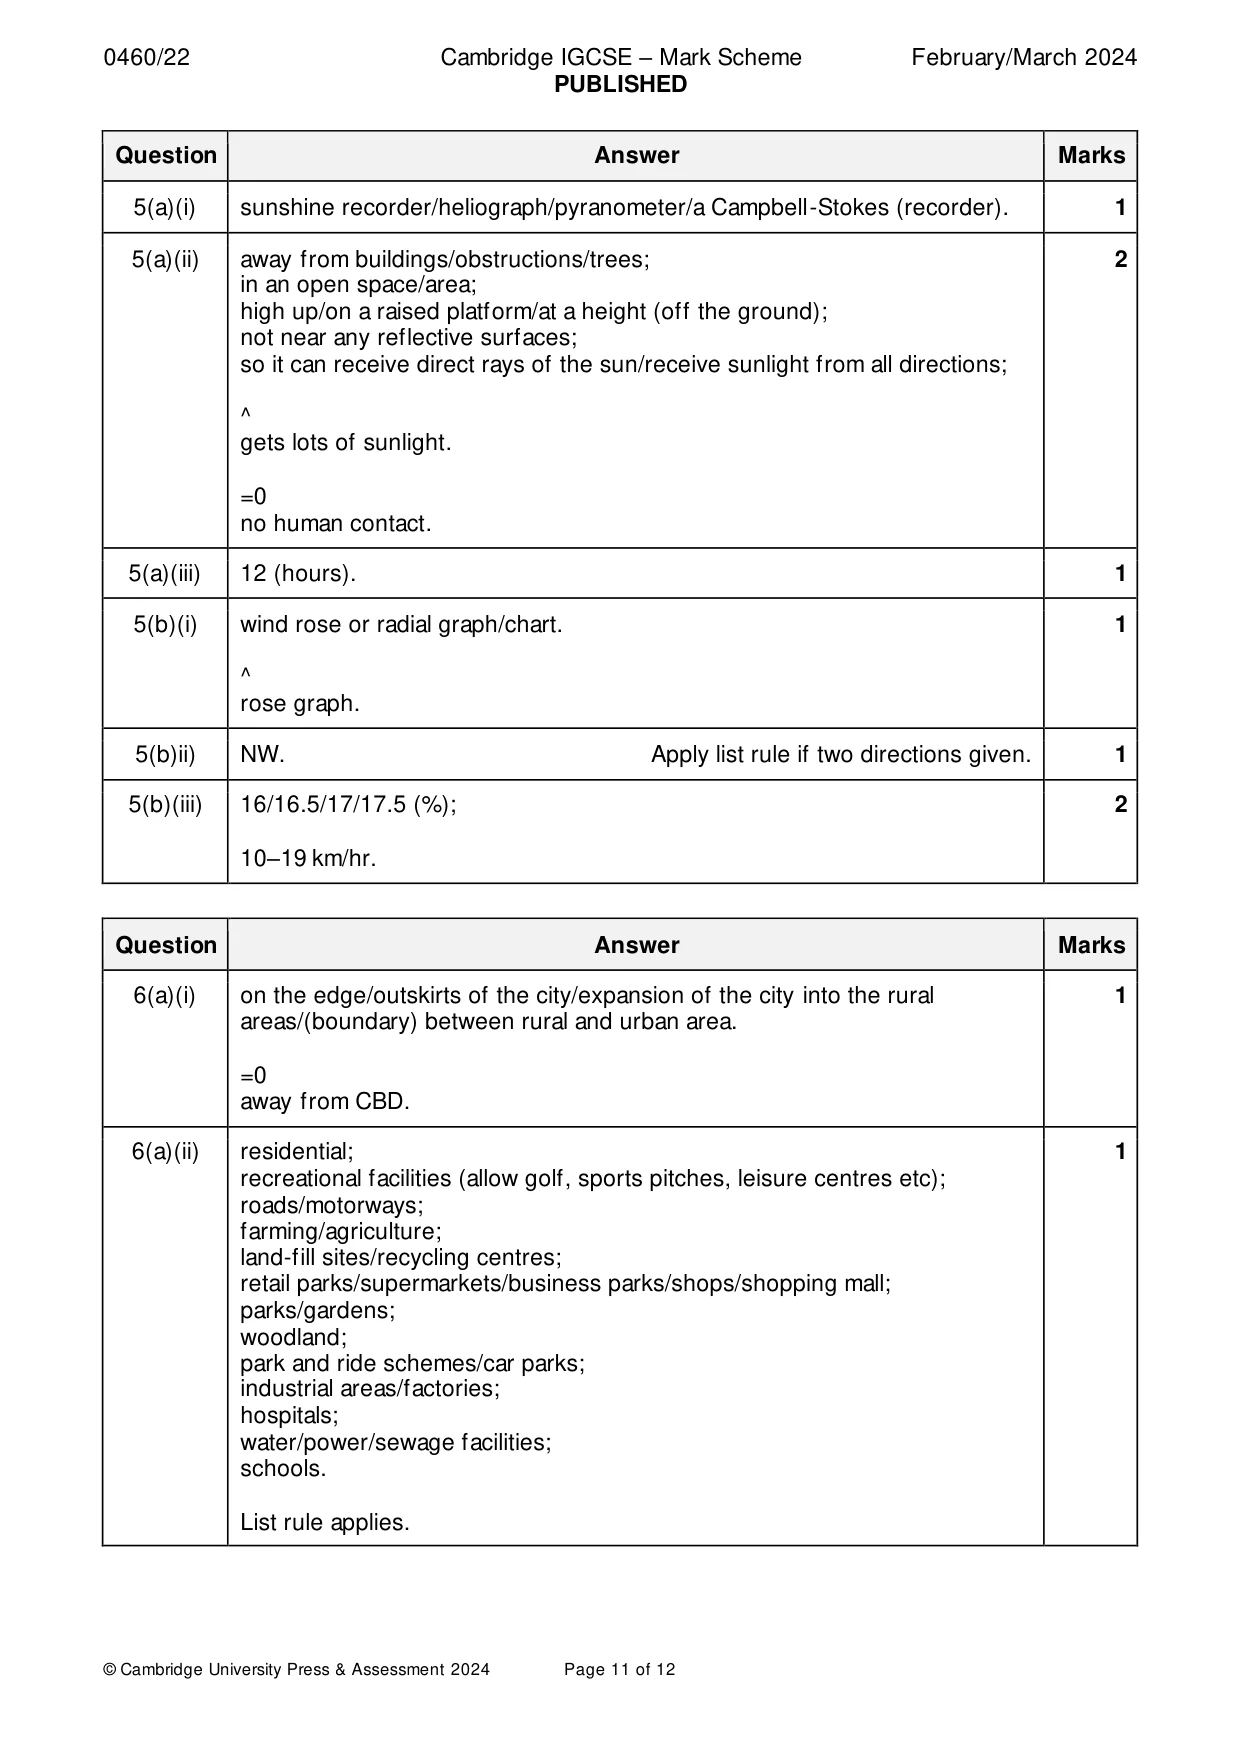
Mark scheme: 5(a)(i) sunshine recorder/heliograph/pyranometer/a Campbell-Stokes (recorder). 1 5(a)(ii) away from buildings/obstructions/trees; 2 in an open space/area; high up/on a raised platform/at a height (off the ground); not near any reflective surfaces; so it can receive direct rays of the sun/receive sunlight from all directions; ^ gets lots of sunlight. =0 no human contact. 5(a)(iii) 12 (hours). 1 5(b)(i) wind rose or radial graph/chart. 1 ^ rose graph. 5(b)ii) NW. Apply list rule if two directions given. 1 5(b)(iii) 16/16.5/17/17.5 (%); 2 10–19 km/hr.
Q6 · Describe the location of the rural-urban fringe in an MEDC city
6 (a) (i) Describe the location of the rural-urban fringe in an MEDC city. ........................................................................................................................................... ..................................................................................................................................... [1] (ii) State a land-use found in the rural-urban fringe. ..................................................................................................................................... [1] (b) Fig. 6.1 (Insert) is a land-use model for an LEDC city. Fig. 6.2 (Insert) is a land-use map of Dar-es-Salaam, a city in Tanzania, an LEDC in Africa. (i) Describe the similarities and differences between the land-use model shown in Fig. 6.1 and the land-use of Dar-es-Salaam shown in Fig. 6.2. ........................................................................................................................................... ........................................................................................................................................... ........................................................................................................................................... ........................................................................................................................................... ........................................................................................................................................... ........................................................................................................................................... ........................................................................................................................................... ........................................................................................................................................... ........................................................................................................................................... ..................................................................................................................................... [4] (ii) Using Fig. 6.2, suggest two physical factors which prevent a city like Dar-es-Salaam from fitting the model of an LEDC city. factor 1 .............................................................................................................................. ........................................................................................................................................... factor 2 .............................................................................................................................. ........................................................................................................................................... [2] [Total: 8] Additional pages If you use the following pages to complete the answer to any question, the question number must be clearly shown. .................................................................................................................................................................. .................................................................................................................................................................. .................................................................................................................................................................. .................................................................................................................................................................. .................................................................................................................................................................. .................................................................................................................................................................. .................................................................................................................................................................. .................................................................................................................................................................. .................................................................................................................................................................. .................................................................................................................................................................. .................................................................................................................................................................. .................................................................................................................................................................. .................................................................................................................................................................. .................................................................................................................................................................. .................................................................................................................................................................. .................................................................................................................................................................. .................................................................................................................................................................. .................................................................................................................................................................. .................................................................................................................................................................. .................................................................................................................................................................. .................................................................................................................................................................. .................................................................................................................................................................. .................................................................................................................................................................. .................................................................................................................................................................. .................................................................................................................................................................. .................................................................................................................................................................. Additional pages If you use the following pages to complete the answer to any question, the question number must be clearly shown. .................................................................................................................................................................. .................................................................................................................................................................. .................................................................................................................................................................. .................................................................................................................................................................. .................................................................................................................................................................. .................................................................................................................................................................. .................................................................................................................................................................. .................................................................................................................................................................. .................................................................................................................................................................. .................................................................................................................................................................. .................................................................................................................................................................. .................................................................................................................................................................. .................................................................................................................................................................. .................................................................................................................................................................. .................................................................................................................................................................. .................................................................................................................................................................. .................................................................................................................................................................. .................................................................................................................................................................. .................................................................................................................................................................. .................................................................................................................................................................. The boundaries and names shown, the designations used and the presentation of material on any maps contained in this question paper/insert do not imply official endorsement or acceptance by Cambridge Assessment International Education concerning the legal status of any country, territory, or area or any of its authorities, or of the delimitation of its frontiers or boundaries.
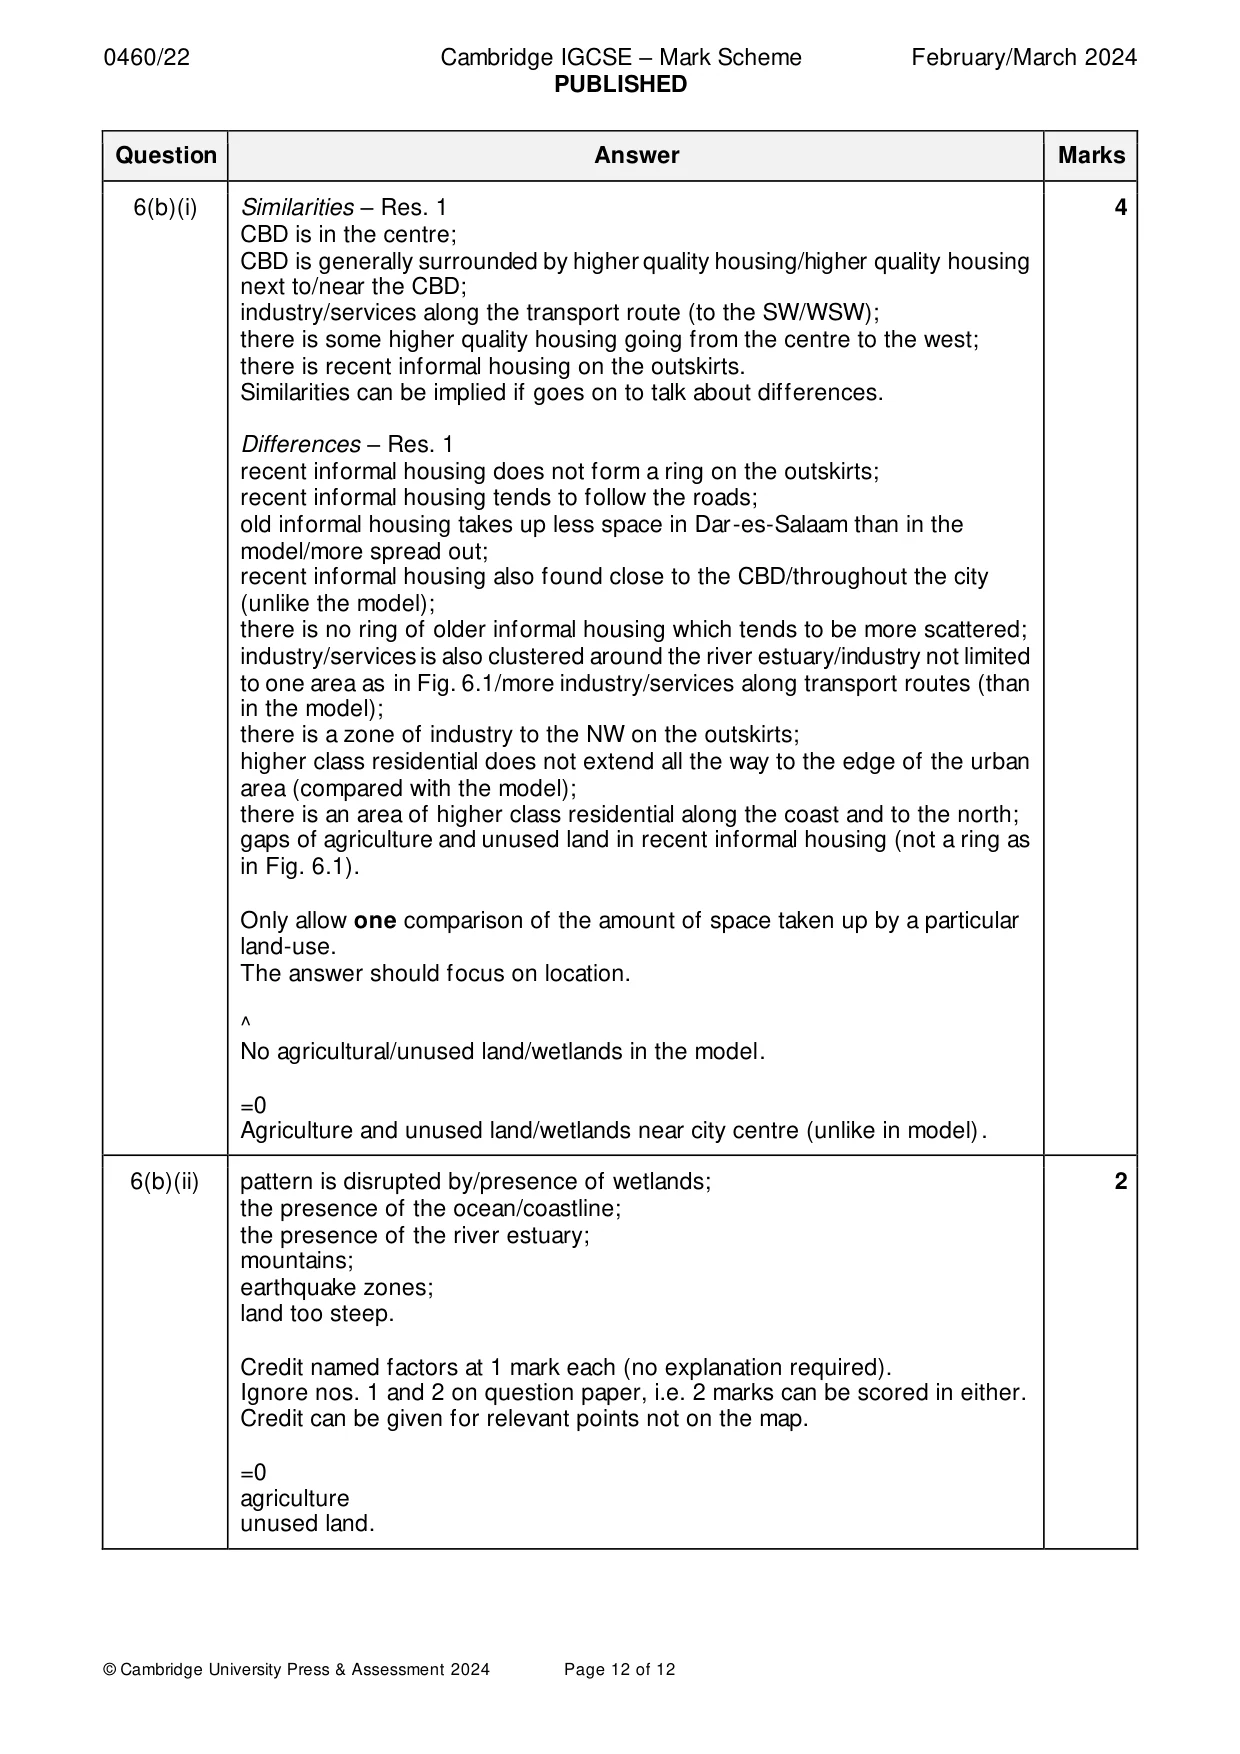
Mark scheme: 6(a)(i) on the edge/outskirts of the city/expansion of the city into the rural 1 areas/(boundary) between rural and urban area. =0 away from CBD. 6(a)(ii) residential; 1 recreational facilities (allow golf, sports pitches, leisure centres etc); roads/motorways; farming/agriculture; land-fill sites/recycling centres; retail parks/supermarkets/business parks/shops/shopping mall; parks/gardens; woodland; park and ride schemes/car parks; industrial areas/factories; hospitals; water/power/sewage facilities; schools. List rule applies. 6(b)(i) Similarities – Res. 1 4 CBD is in the centre; CBD is generally surrounded by higher quality housing/higher quality housing next to/near the CBD; industry/services along the transport route (to the SW/WSW); there is some higher quality housing going from the centre to the west; there is recent informal housing on the outskirts. Similarities can be implied if goes on to talk about differences. Differences – Res. 1 recent informal housing does not form a ring on the outskirts; recent informal housing tends to follow the roads; old informal housing takes up less space in Dar-es-Salaam than in the model/more spread out; recent informal housing also found close to the CBD/throughout the city (unlike the model); there is no ring of older informal housing which tends to be more scattered; industry/services is also clustered around the river estuary/industry not limited to one area as in Fig. 6.1/more industry/services along transport routes (than in the model); there is a zone of industry to the NW on the outskirts; higher class residential does not extend all the way to the edge of the urban area (compared with the model); there is an area of higher class residential along the coast and to the north; gaps of agriculture and unused land in recent informal housing (not a ring as in Fig. 6.1). Only allow one comparison of the amount of space taken up by a particular land-use. The answer should focus on location. ^ No agricultural/unused land/wetlands in the model. =0 Agriculture and unused land/wetlands near city centre (unlike in model). 6(b)(ii) pattern is disrupted by/presence of wetlands; 2 the presence of the ocean/coastline; the presence of the river estuary; mountains; earthquake zones; land too steep. Credit named factors at 1 mark each (no explanation required). Ignore nos. 1 and 2 on question paper, i.e. 2 marks can be scored in either. Credit can be given for relevant points not on the map. =0 agriculture unused land.
What was in this paper
The subtopics covered by these 6 questions, and how many questions each got. Open one in a new tab to see every Cambridge question on it.
What you needed in this session
Cambridge’s own grade thresholds for 2024 Feb/March, Paper 2 · Variant 2. A higher threshold means an easier paper — the bar moves with how the cohort did.