Cambridge IGCSE Geography 0460 — 2025 May/June Paper 2 · Variant 1
0460/21/M/J/25 · 6 questions · 60 marks · 90 min
The question paper and its mark scheme, free to read here and free to download. This is Cambridge’s own paper, exactly as it was sat.
Question paper16 pages


Mark scheme7 pages
Answers below. Sit the paper first if you are practising.
Questions as text
Q1 · Study the map extract for Kungsbacka, Sweden
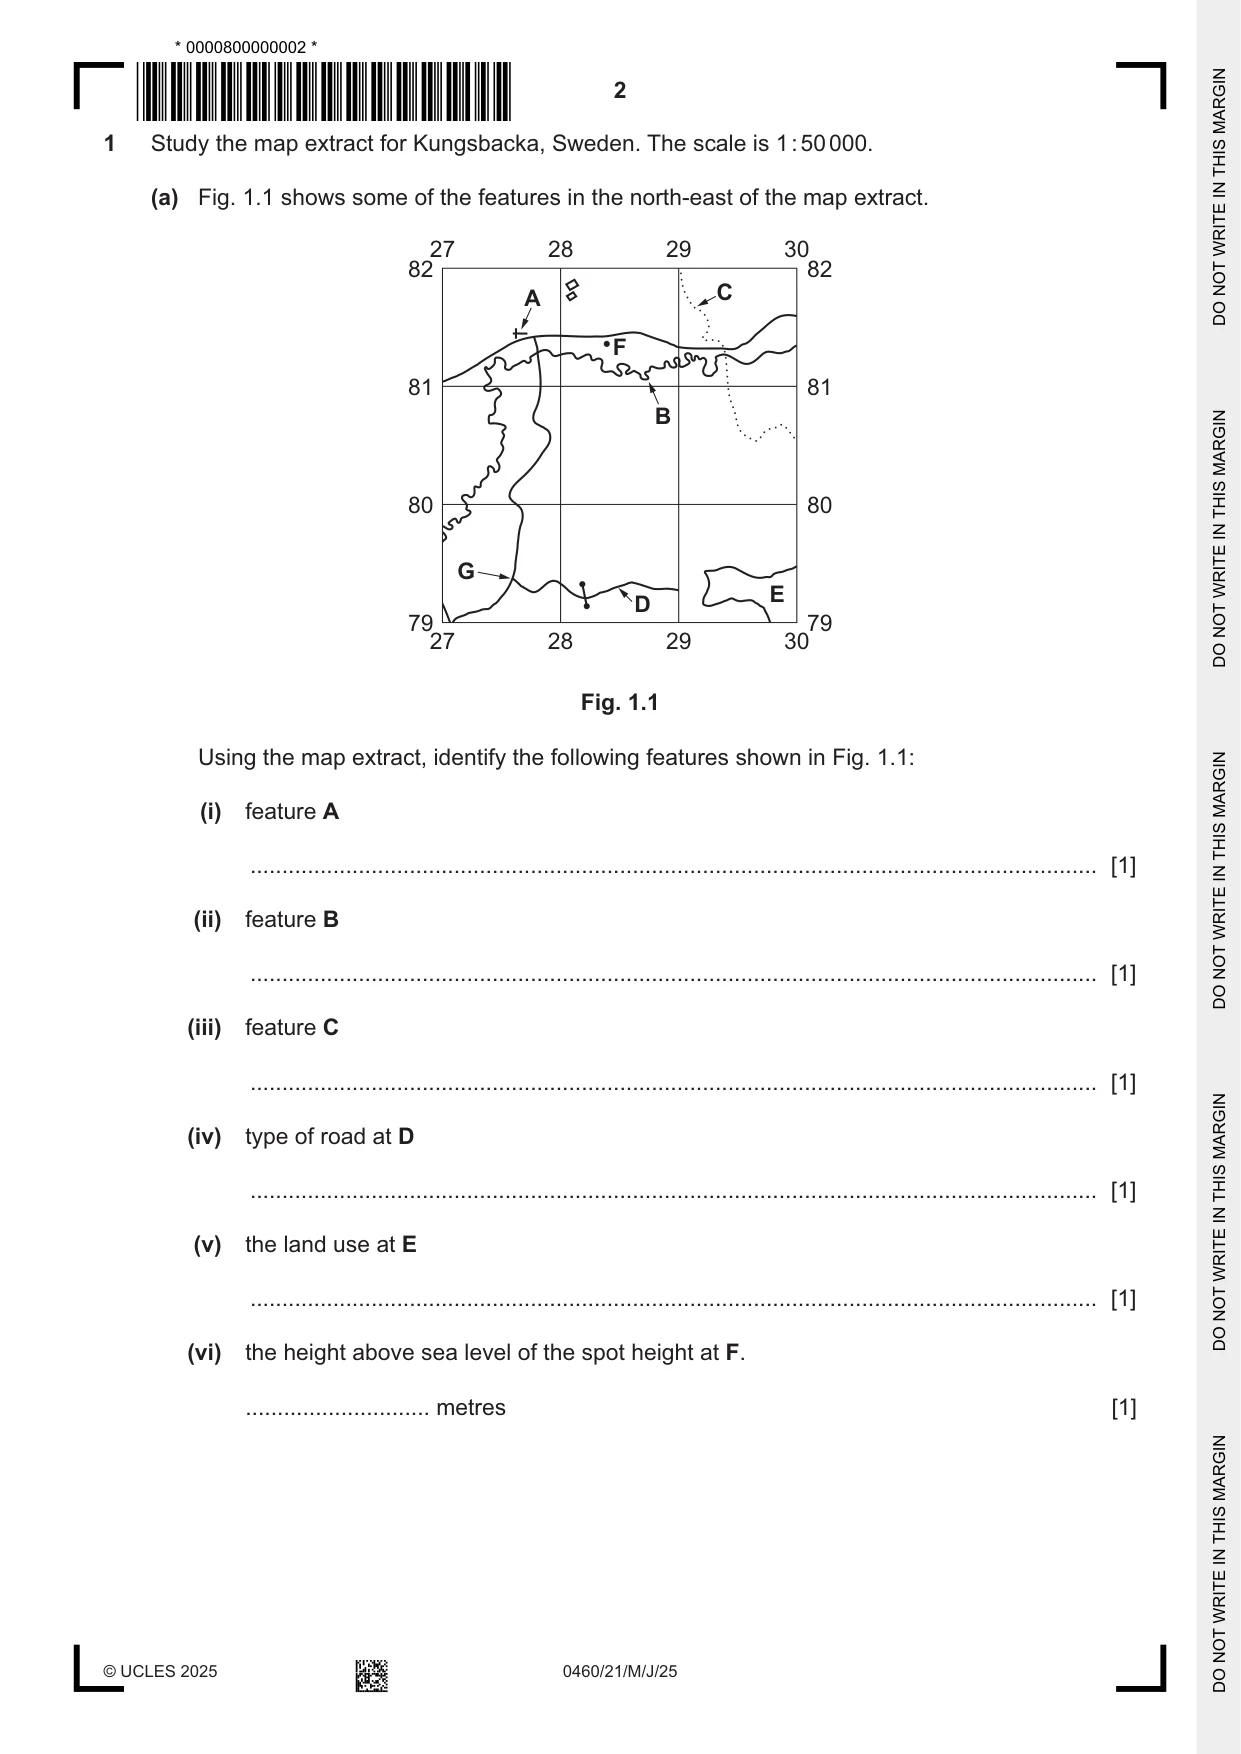
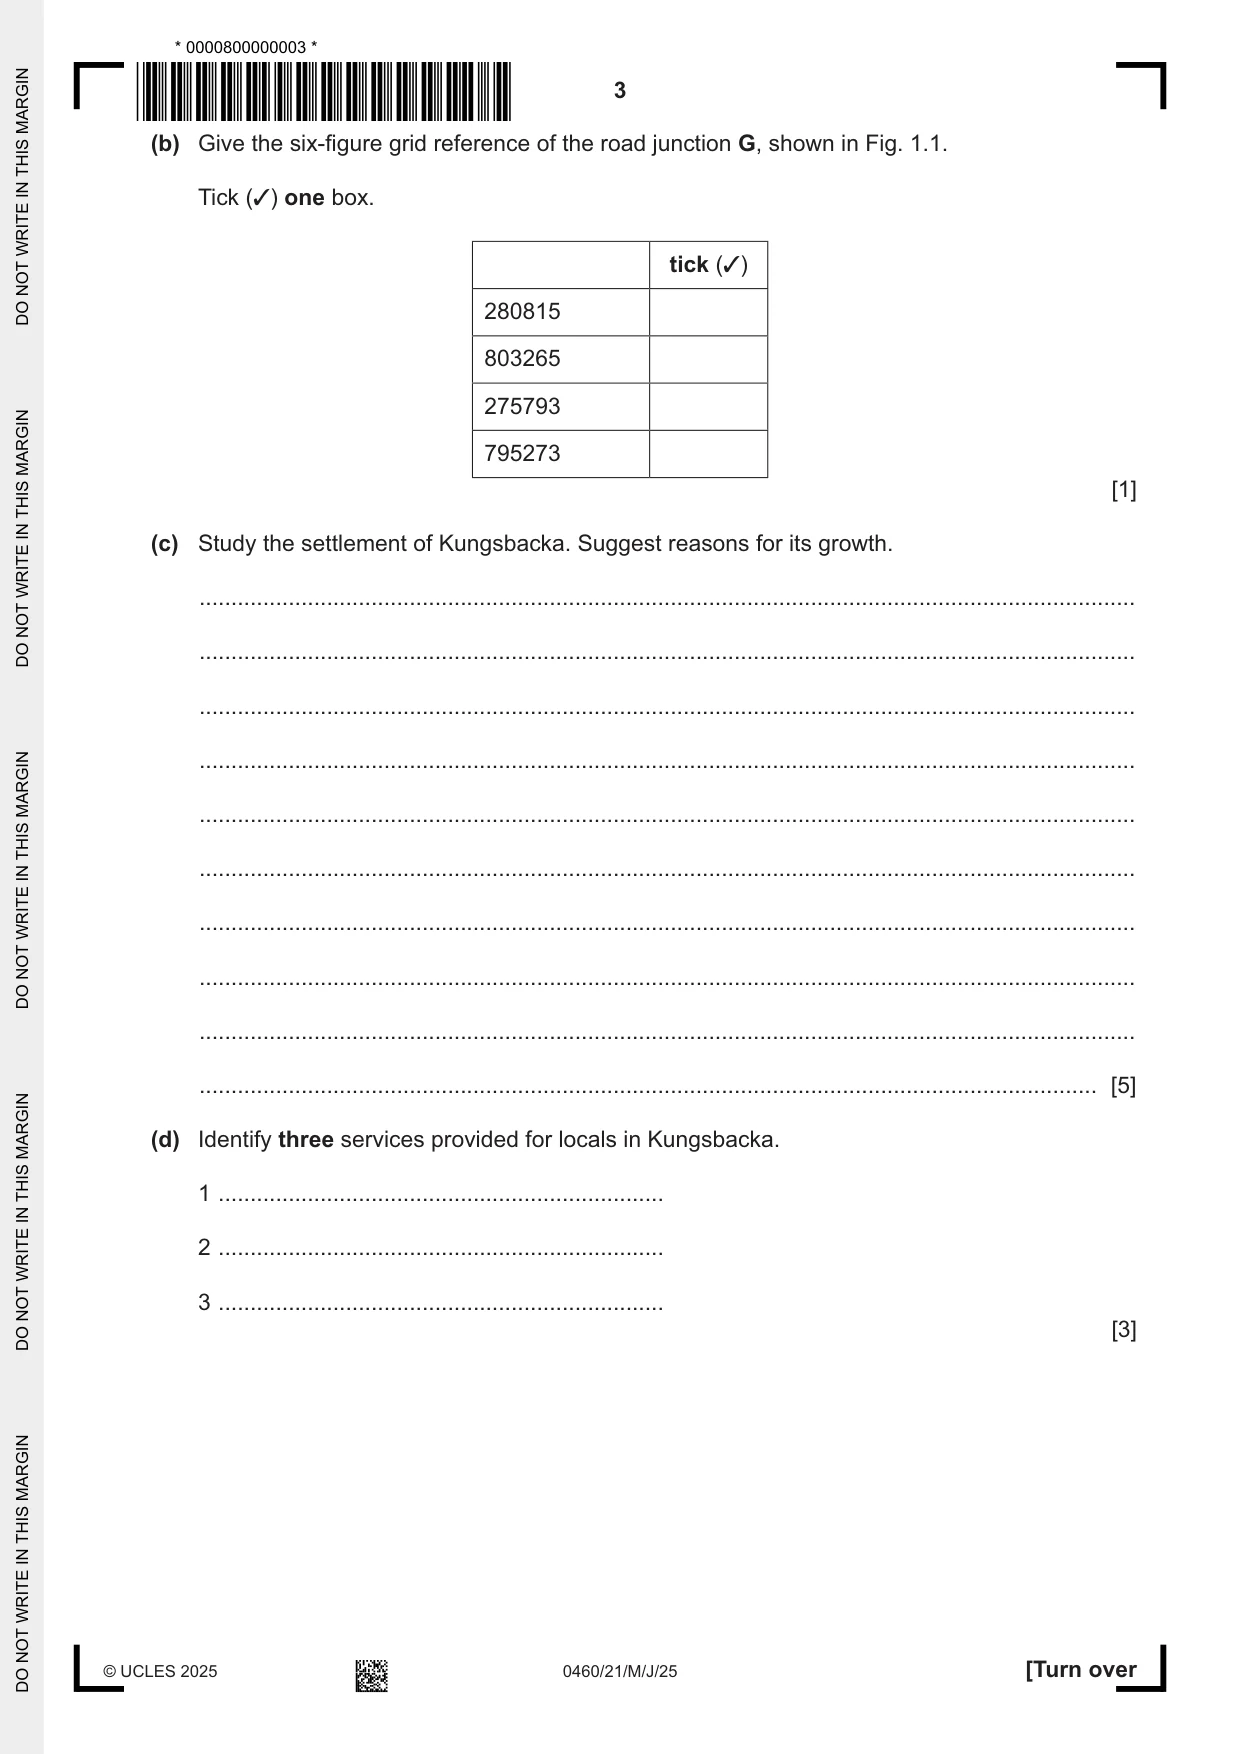
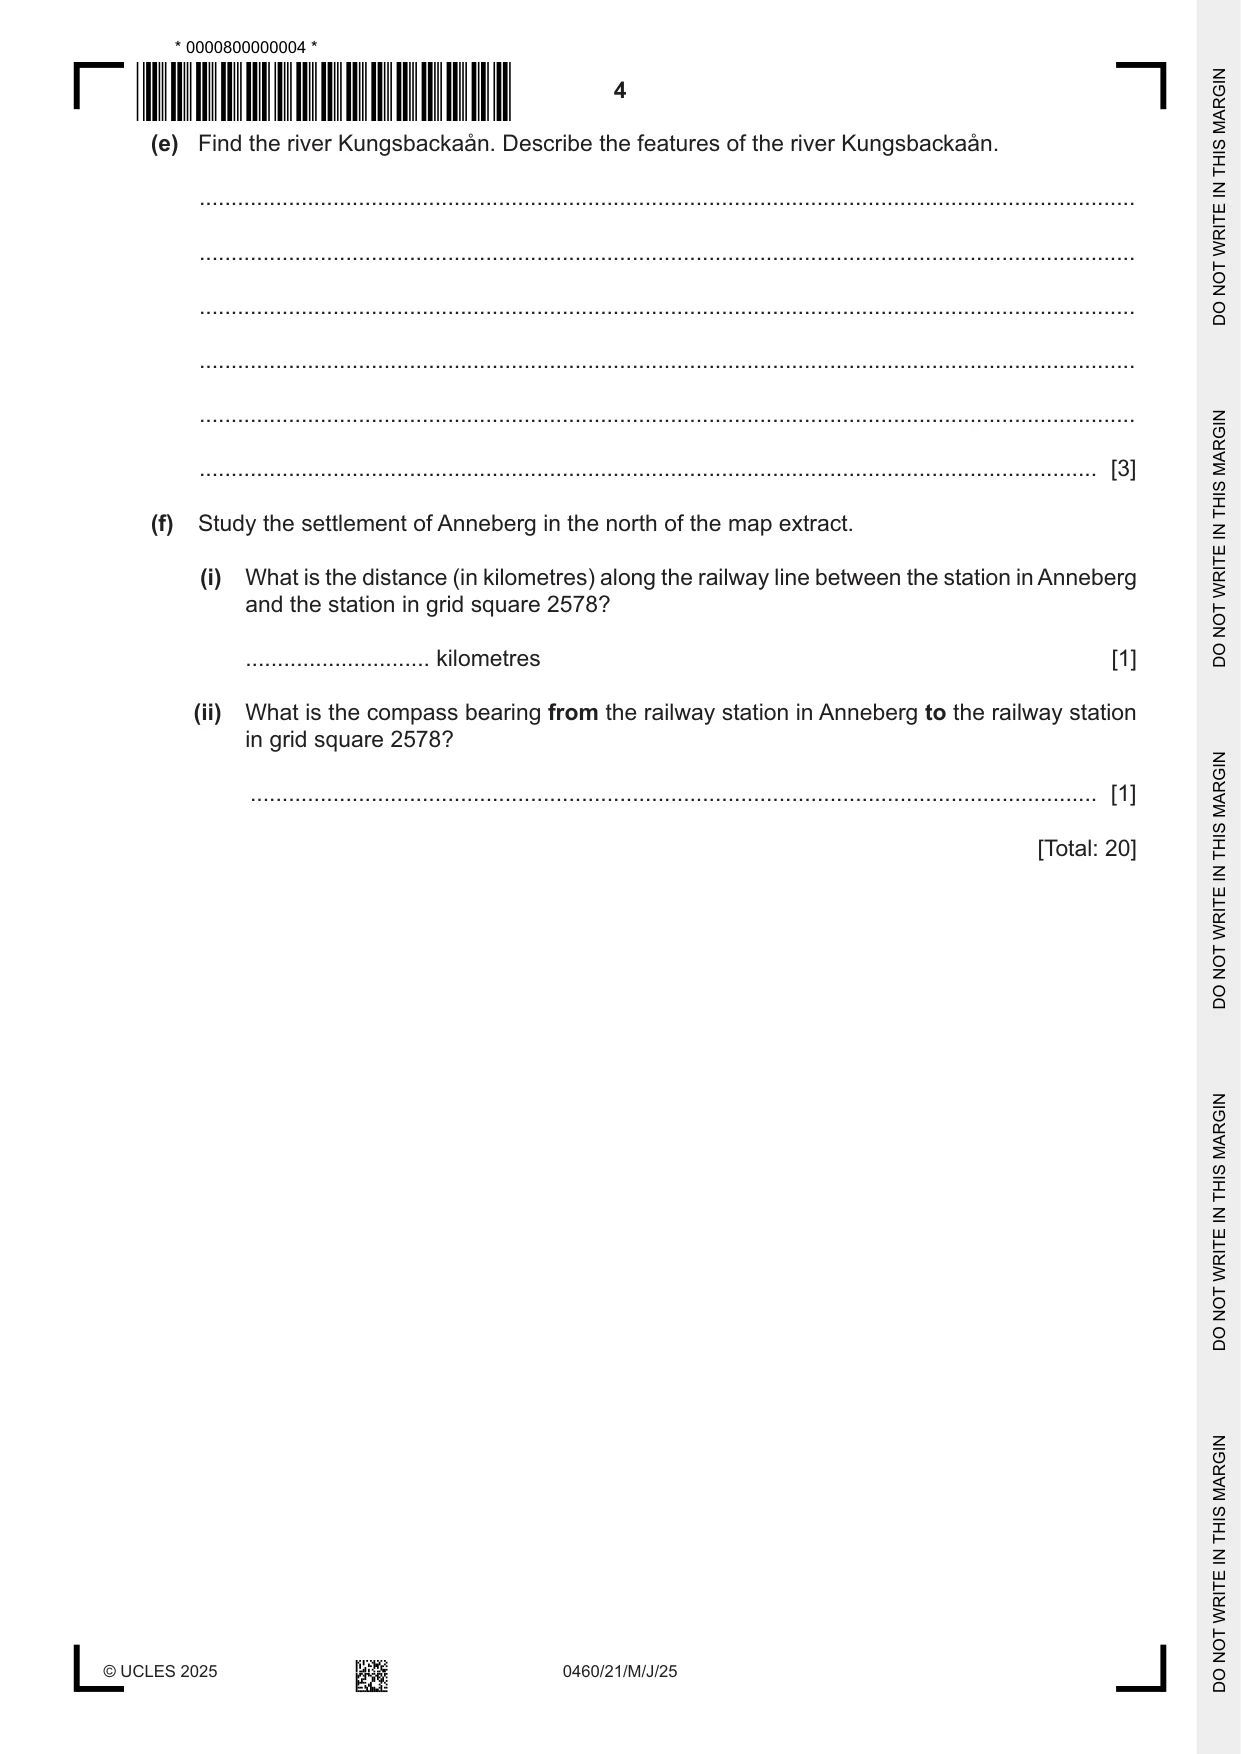
1 Study the map extract for Kungsbacka, Sweden. The scale is 1 : 50 000. (a) Fig. 1.1 shows some of the features in the north-east of the map extract. 27 28 29 30 82 82 A C F 81 81 B 80 80 G E D 79 79 27 28 29 30 Fig. 1.1 Using the map extract, identify the following features shown in Fig. 1.1: (i) feature A ..................................................................................................................................... [1] (ii) feature B ..................................................................................................................................... [1] (iii) feature C ..................................................................................................................................... [1] (iv) type of road at D ..................................................................................................................................... [1] (v) the land use at E ..................................................................................................................................... [1] (vi) the height above sea level of the spot height at F. ............................. metres [1] (b) Give the six-figure grid reference of the road junction G, shown in Fig. 1.1. Tick (3) one box. tick (3) 280815 803265 275793 795273 [1] (c) Study the settlement of Kungsbacka. Suggest reasons for its growth. ................................................................................................................................................... ................................................................................................................................................... ................................................................................................................................................... ................................................................................................................................................... ................................................................................................................................................... ................................................................................................................................................... ................................................................................................................................................... ................................................................................................................................................... ................................................................................................................................................... ............................................................................................................................................. [5] (d) Identify three services provided for locals in Kungsbacka. 1 ...................................................................... 2 ...................................................................... 3 ...................................................................... [3] (e) Find the river Kungsbackaån. Describe the features of the river Kungsbackaån. ................................................................................................................................................... ................................................................................................................................................... ................................................................................................................................................... ................................................................................................................................................... ................................................................................................................................................... ............................................................................................................................................. [3] (f) Study the settlement of Anneberg in the north of the map extract. (i) What is the distance (in kilometres) along the railway line between the station in Anneberg and the station in grid square 2578? ............................. kilometres [1] (ii) What is the compass bearing from the railway station in Anneberg to the railway station in grid square 2578? ..................................................................................................................................... [1] [Total: 20]
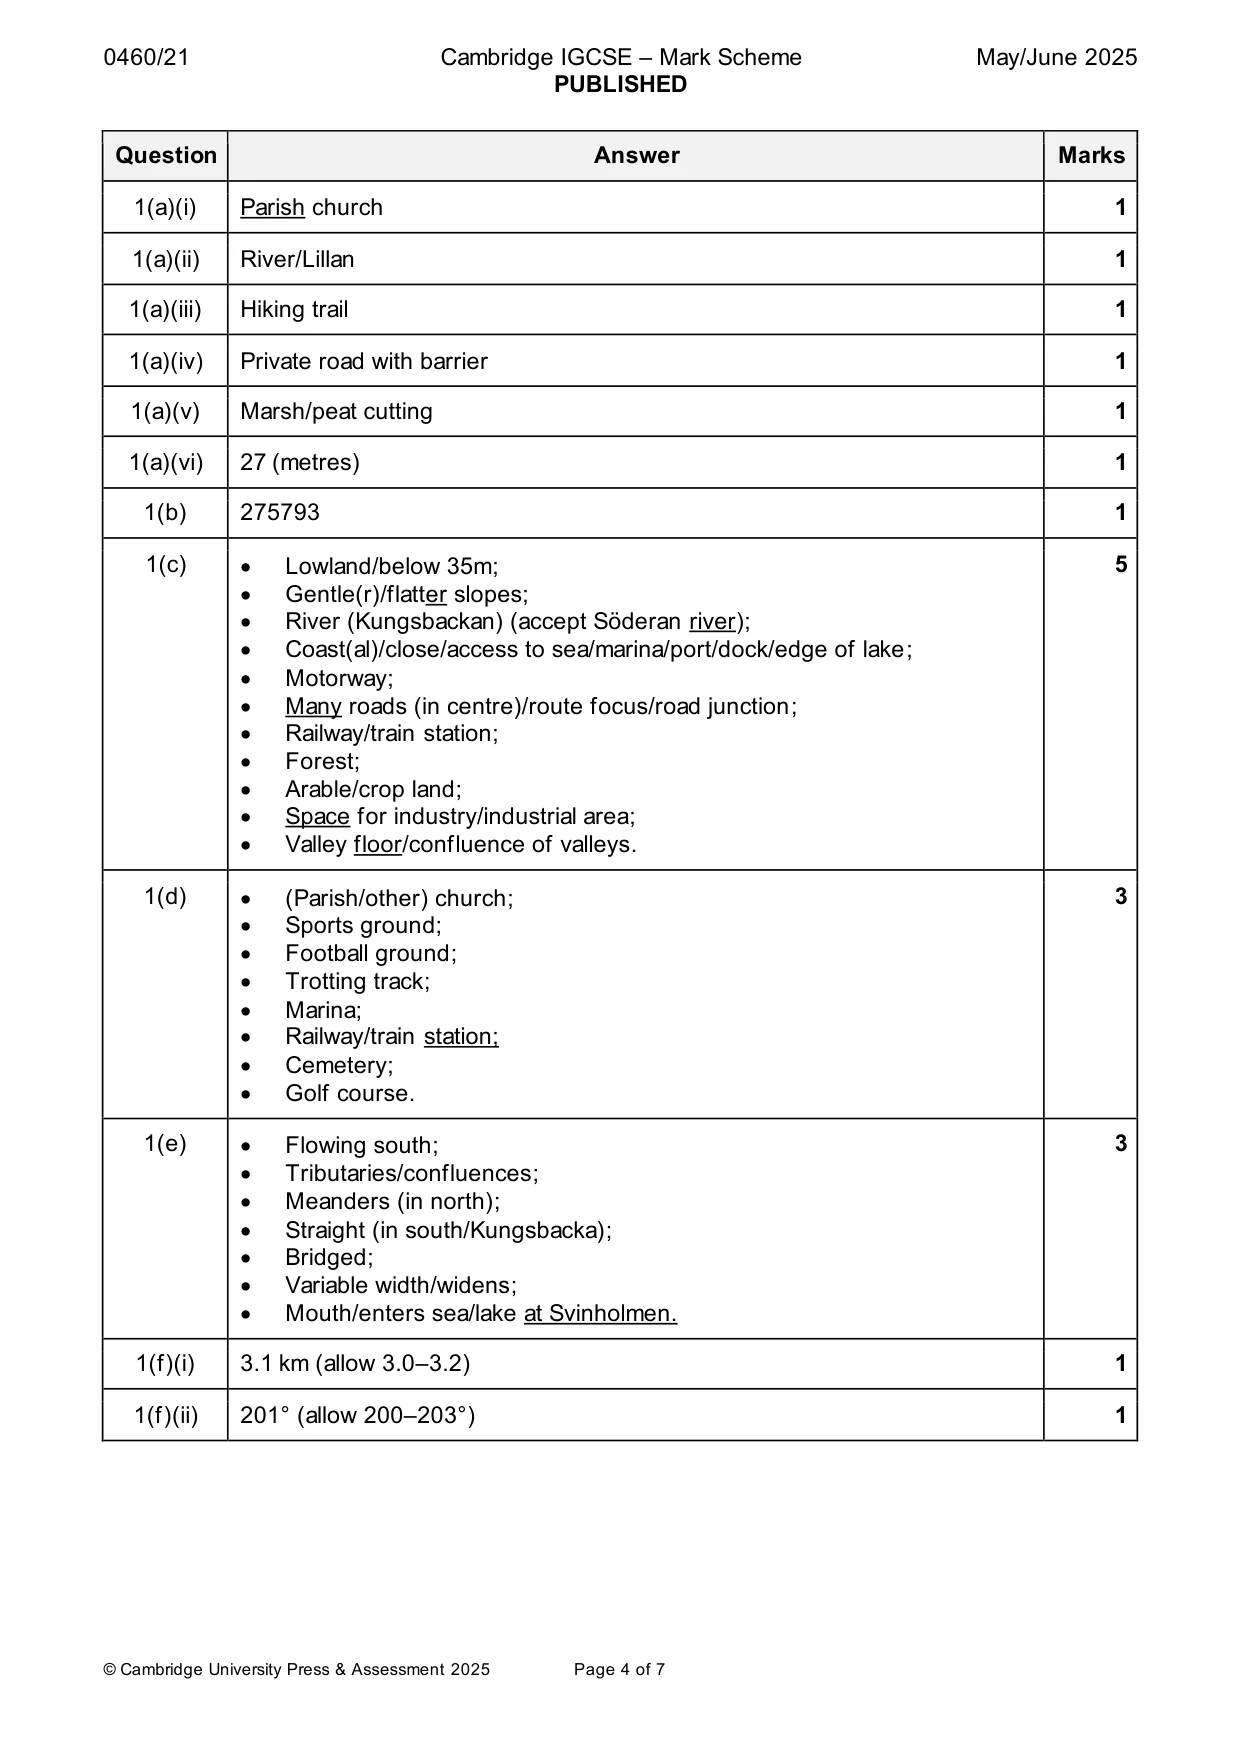
Mark scheme: Question Answer Marks 1(a)(i) Parish church 1 1(a)(ii) River/Lillan 1 1(a)(iii) Hiking trail 1 1(a)(iv) Private road with barrier 1 1(a)(v) Marsh/peat cutting 1 1(a)(vi) 27 (metres) 1 1(b) 275793 1 1(c) • Lowland/below 35m; 5 • Gentle(r)/flatter slopes; • River (Kungsbackan) (accept Söderan river); • Coast(al)/close/access to sea/marina/port/dock/edge of lake; • Motorway; • Many roads (in centre)/route focus/road junction; • Railway/train station; • Forest; • Arable/crop land; • Space for industry/industrial area; • Valley floor/confluence of valleys. 1(d) • (Parish/other) church; 3 • Sports ground; • Football ground; • Trotting track; • Marina; • Railway/train station; • Cemetery; • Golf course. 1(e) • Flowing south; 3 • Tributaries/confluences; • Meanders (in north); • Straight (in south/Kungsbacka); • Bridged; • Variable width/widens; • Mouth/enters sea/lake at Svinholmen. 1(f)(i) 3.1 km (allow 3.0–3.2) 1 1(f)(ii) 201° (allow 200–203°) 1
More questions on Settlements (rural and urban) and service provision
Question 2
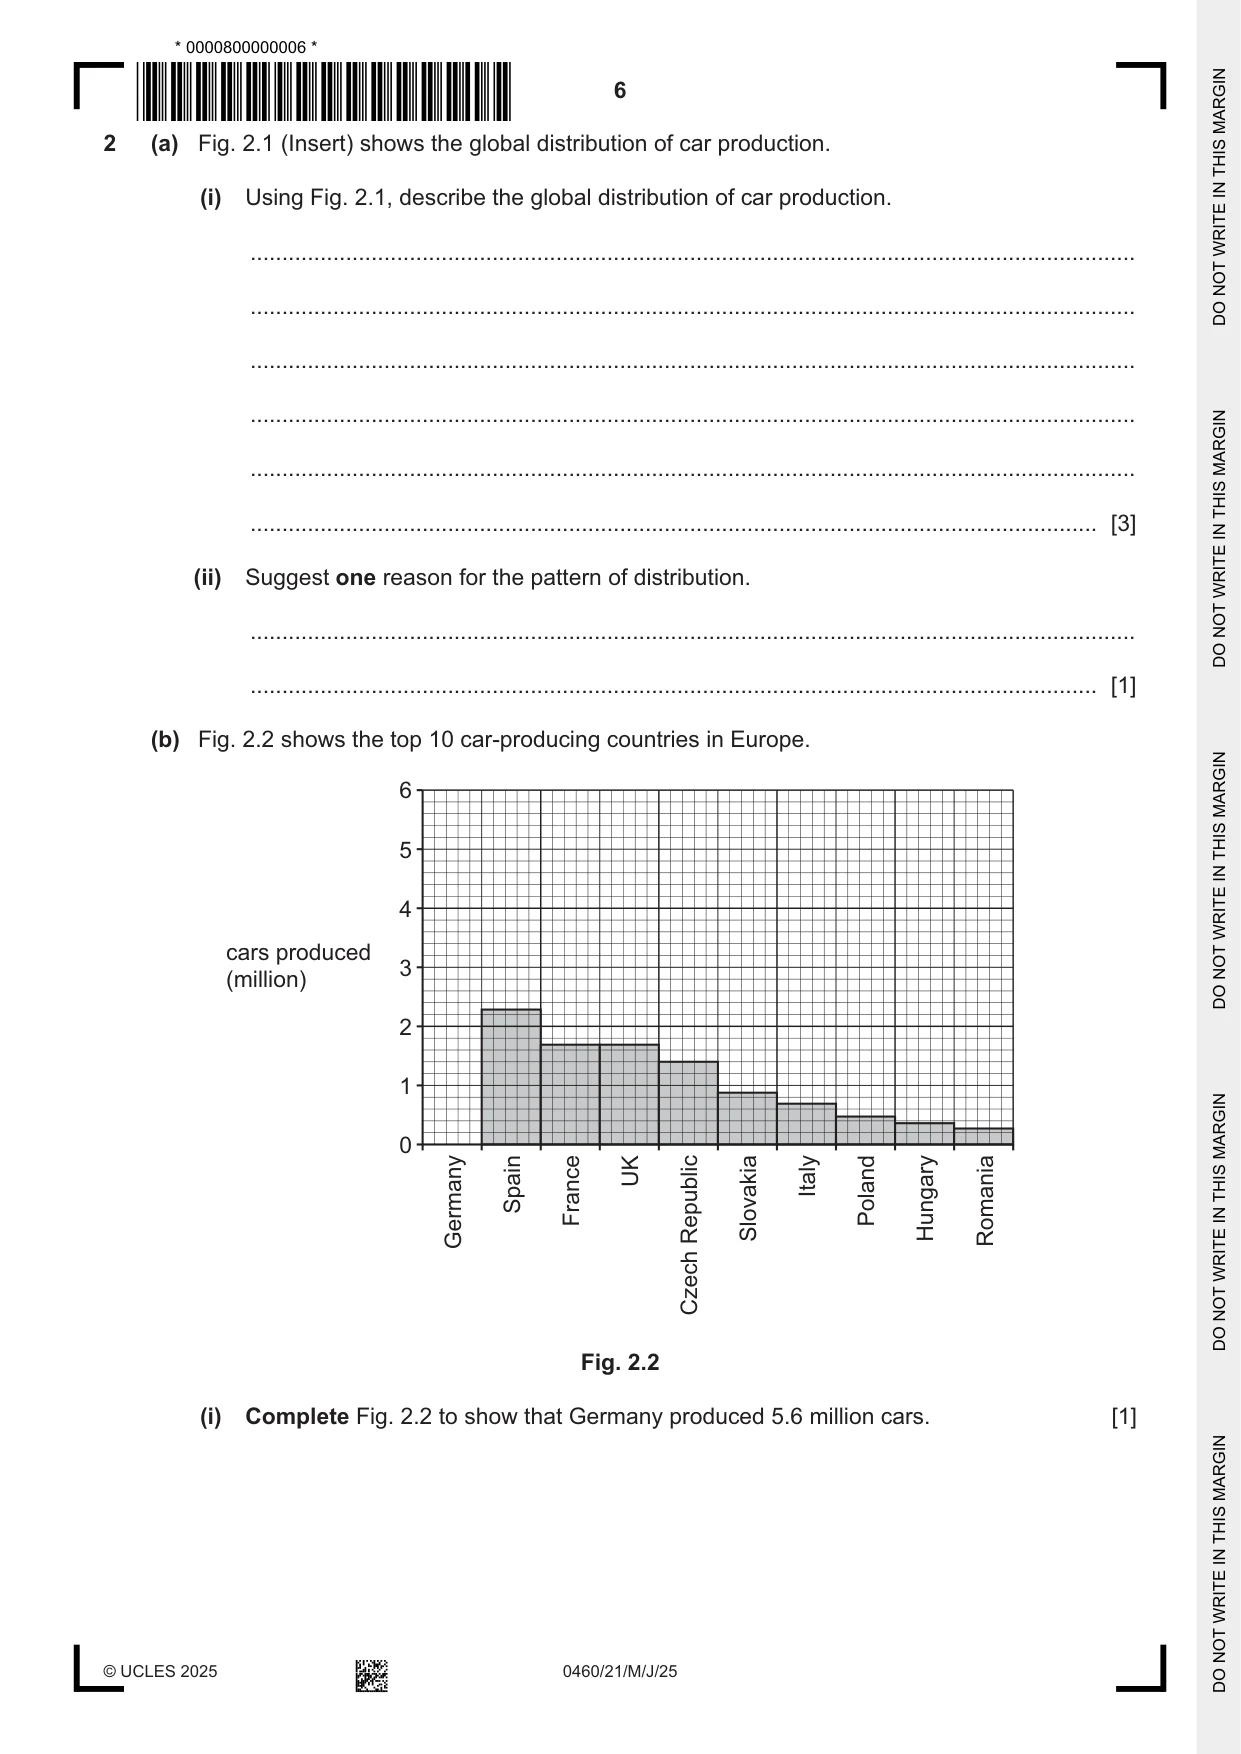
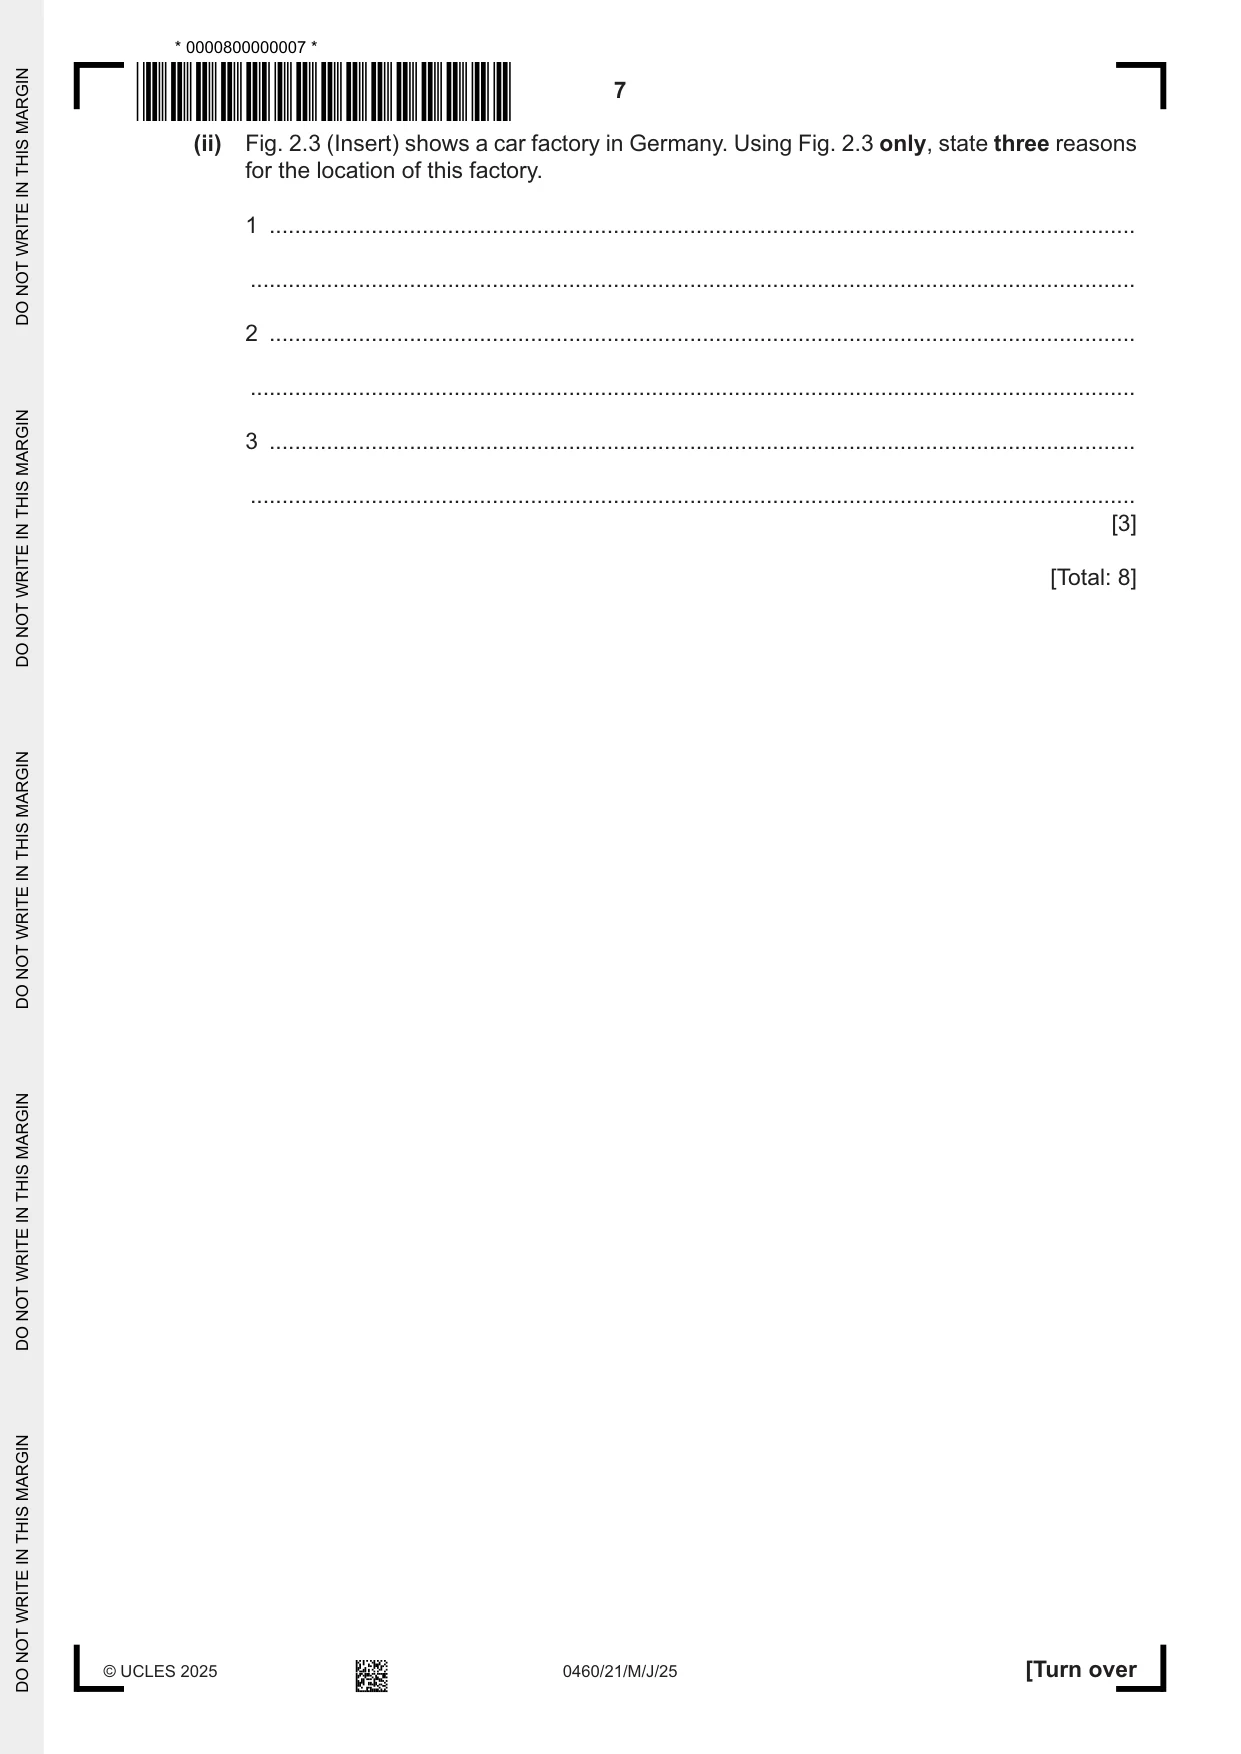
2 (a) Fig. 2.1 (Insert) shows the global distribution of car production. (i) Using Fig. 2.1, describe the global distribution of car production. ........................................................................................................................................... ........................................................................................................................................... ........................................................................................................................................... ........................................................................................................................................... ........................................................................................................................................... ..................................................................................................................................... [3] (ii) Suggest one reason for the pattern of distribution. ........................................................................................................................................... ..................................................................................................................................... [1] (b) Fig. 2.2 shows the top 10 car-producing countries in Europe. 6 5 4 cars produced 3 (million) 2 1 0 Germany Spain France UK Republic Slovakia Italy Poland Hungary Romania Czech Fig. 2.2 (i) Complete Fig. 2.2 to show that Germany produced 5.6 million cars. [1] (ii) Fig. 2.3 (Insert) shows a car factory in Germany. Using Fig. 2.3 only, state three reasons for the location of this factory. 1 ........................................................................................................................................ ........................................................................................................................................... 2 ........................................................................................................................................ ........................................................................................................................................... 3 ........................................................................................................................................ ........................................................................................................................................... [3] [Total: 8]
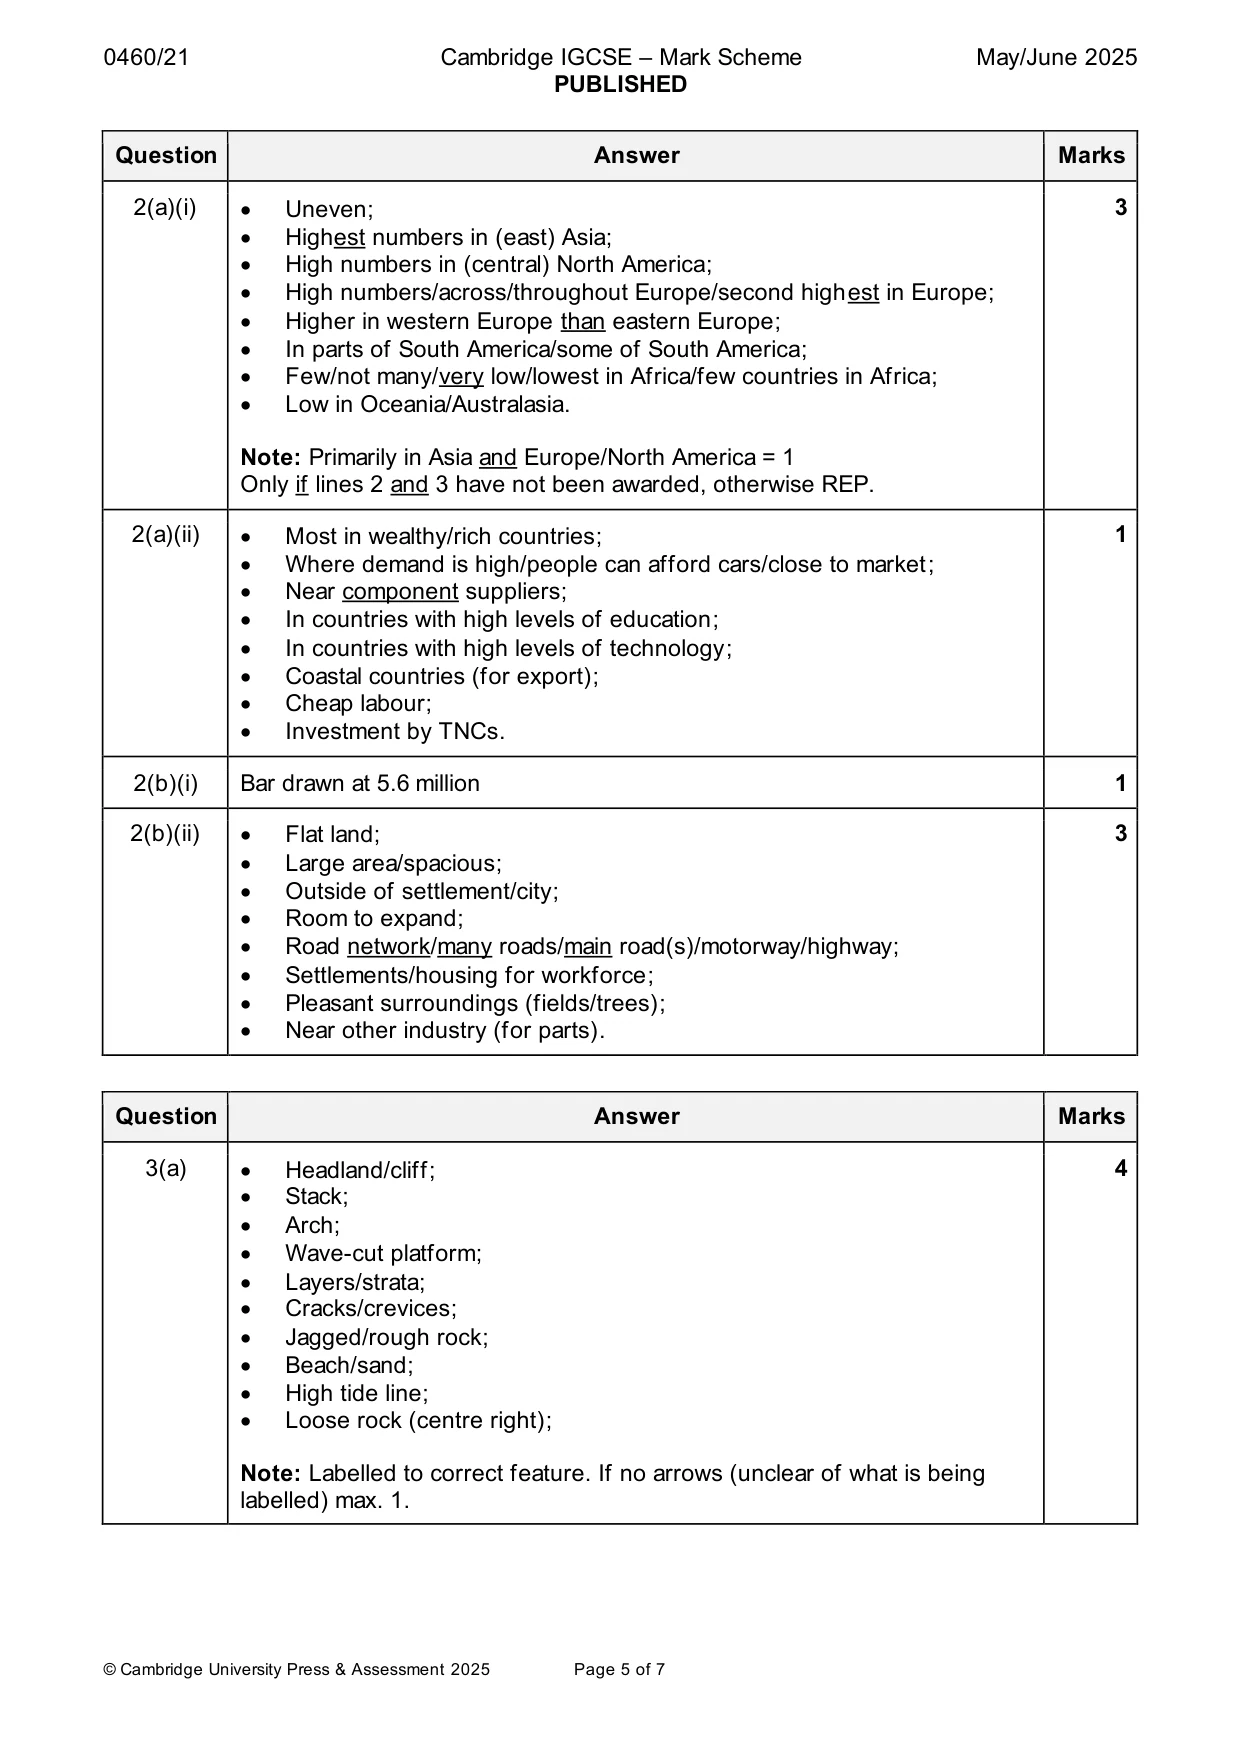
Mark scheme: 2(a)(i) • Uneven; 3 • Highest numbers in (east) Asia; • High numbers in (central) North America; • High numbers/across/throughout Europe/second highest in Europe; • Higher in western Europe than eastern Europe; • In parts of South America/some of South America; • Few/not many/very low/lowest in Africa/few countries in Africa; • Low in Oceania/Australasia. Note: Primarily in Asia and Europe/North America = 1 Only if lines 2 and 3 have not been awarded, otherwise REP. 2(a)(ii) • Most in wealthy/rich countries; 1 • Where demand is high/people can afford cars/close to market; • Near component suppliers; • In countries with high levels of education; • In countries with high levels of technology; • Coastal countries (for export); • Cheap labour; • Investment by TNCs. 2(b)(i) Bar drawn at 5.6 million 1 2(b)(ii) • Flat land; 3 • Large area/spacious; • Outside of settlement/city; • Room to expand; • Road network/many roads/main road(s)/motorway/highway; • Settlements/housing for workforce; • Pleasant surroundings (fields/trees); • Near other industry (for parts).
Question 3
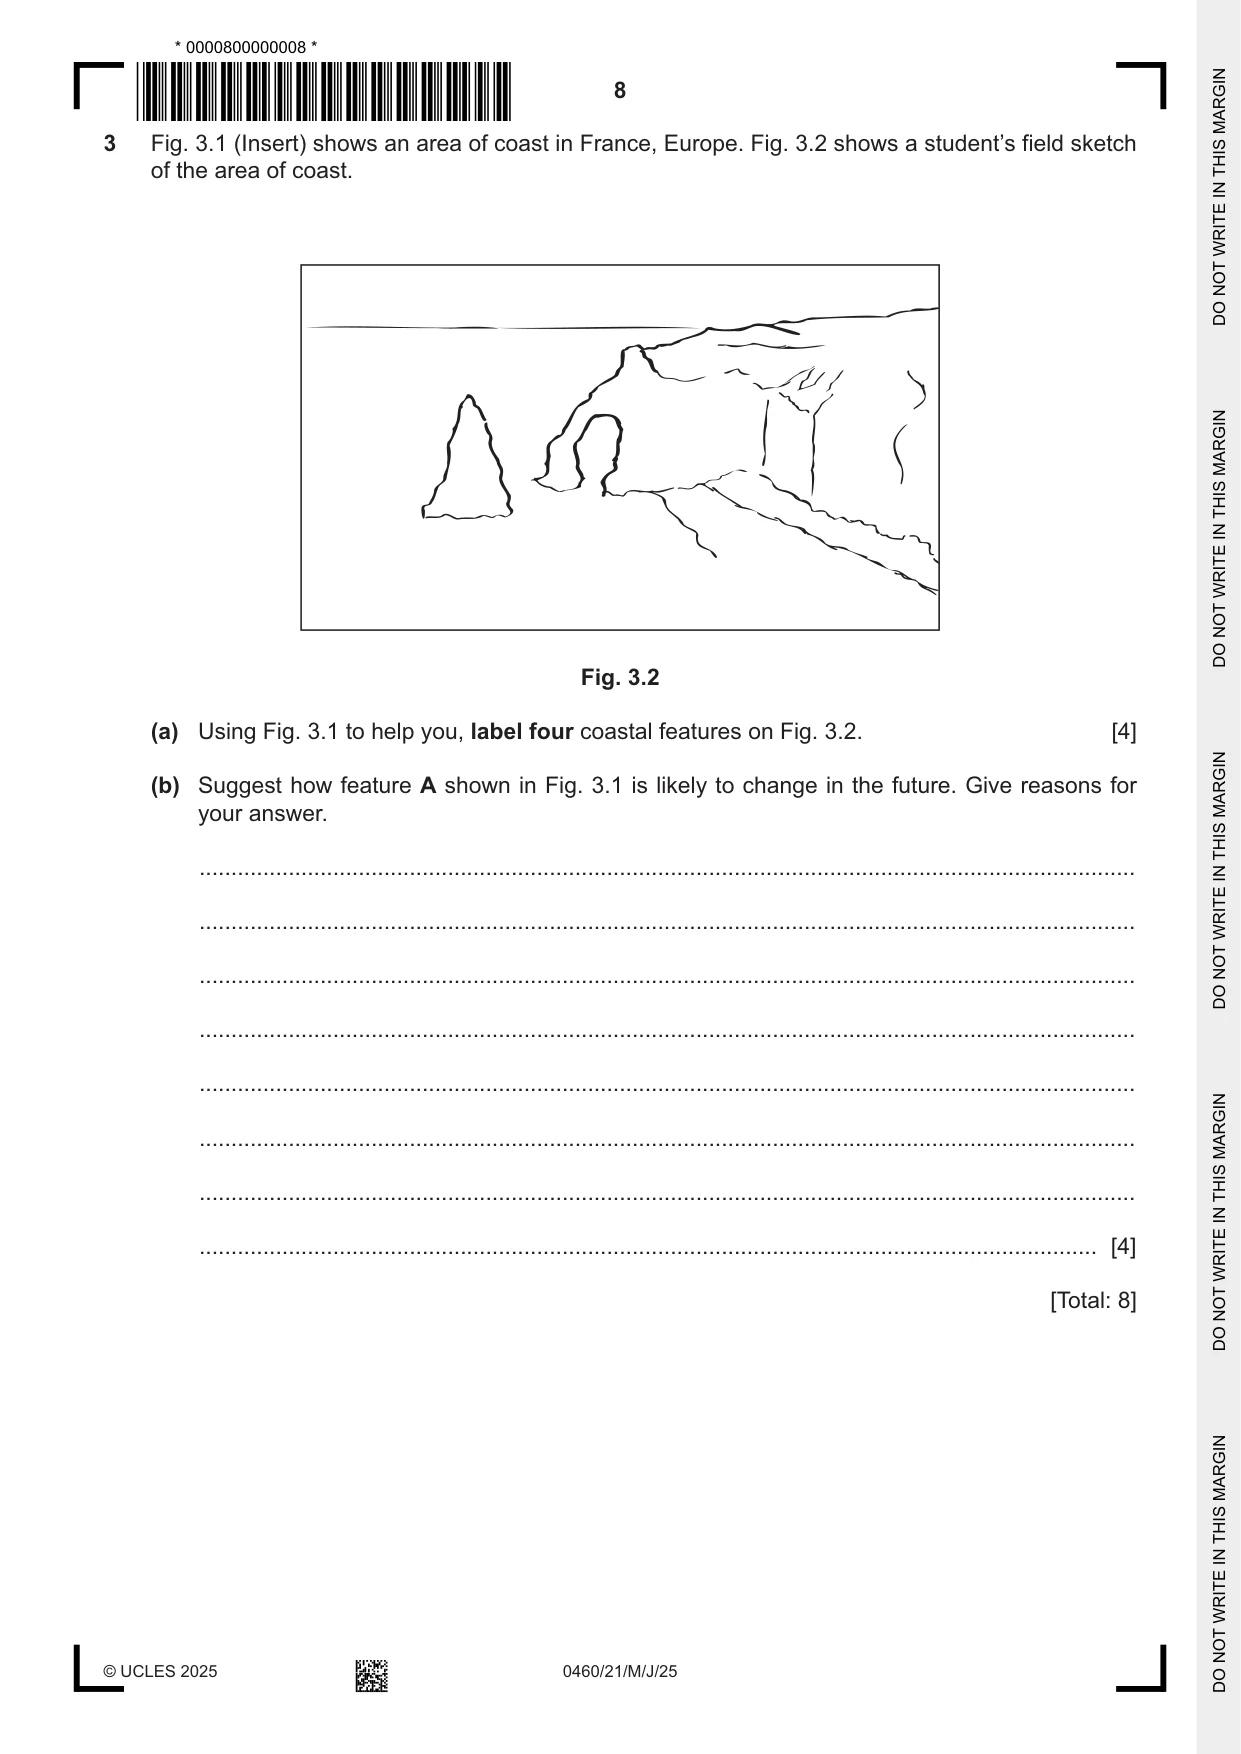
3 Fig. 3.1 (Insert) shows an area of coast in France, Europe. Fig. 3.2 shows a student’s field sketch of the area of coast. Fig. 3.2 (a) Using Fig. 3.1 to help you, label four coastal features on Fig. 3.2. [4] (b) Suggest how feature A shown in Fig. 3.1 is likely to change in the future. Give reasons for your answer. ................................................................................................................................................... ................................................................................................................................................... ................................................................................................................................................... ................................................................................................................................................... ................................................................................................................................................... ................................................................................................................................................... ................................................................................................................................................... ............................................................................................................................................. [4] [Total: 8]
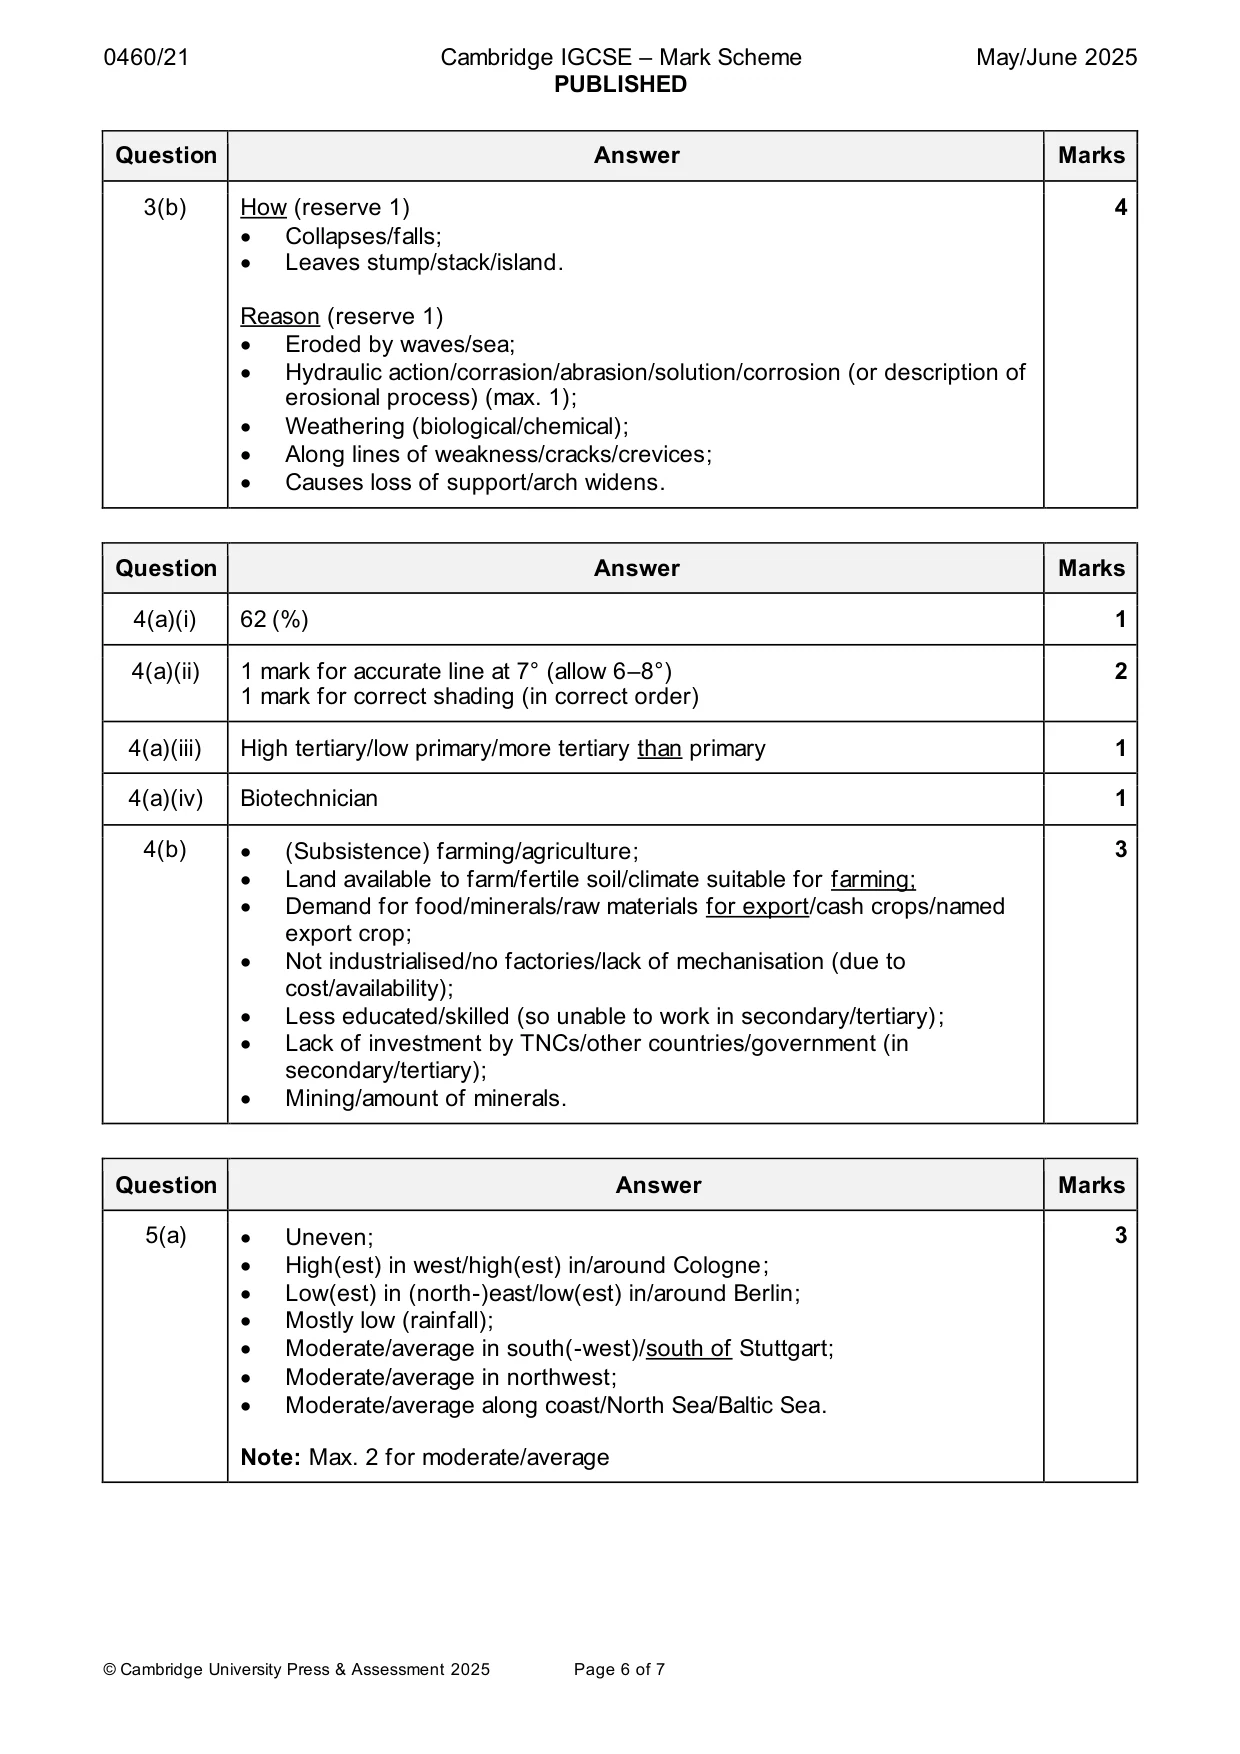
Mark scheme: 3(a) • Headland/cliff; 4 • Stack; • Arch; • Wave-cut platform; • Layers/strata; • Cracks/crevices; • Jagged/rough rock; • Beach/sand; • High tide line; • Loose rock (centre right); Note: Labelled to correct feature. If no arrows (unclear of what is being labelled) max. 1. 3(b) How (reserve 1) 4 • Collapses/falls; • Leaves stump/stack/island. Reason (reserve 1) • Eroded by waves/sea; • Hydraulic action/corrasion/abrasion/solution/corrosion (or description of erosional process) (max. 1); • Weathering (biological/chemical); • Along lines of weakness/cracks/crevices; • Causes loss of support/arch widens.
Q4 · The employment structure of three countries in 2019
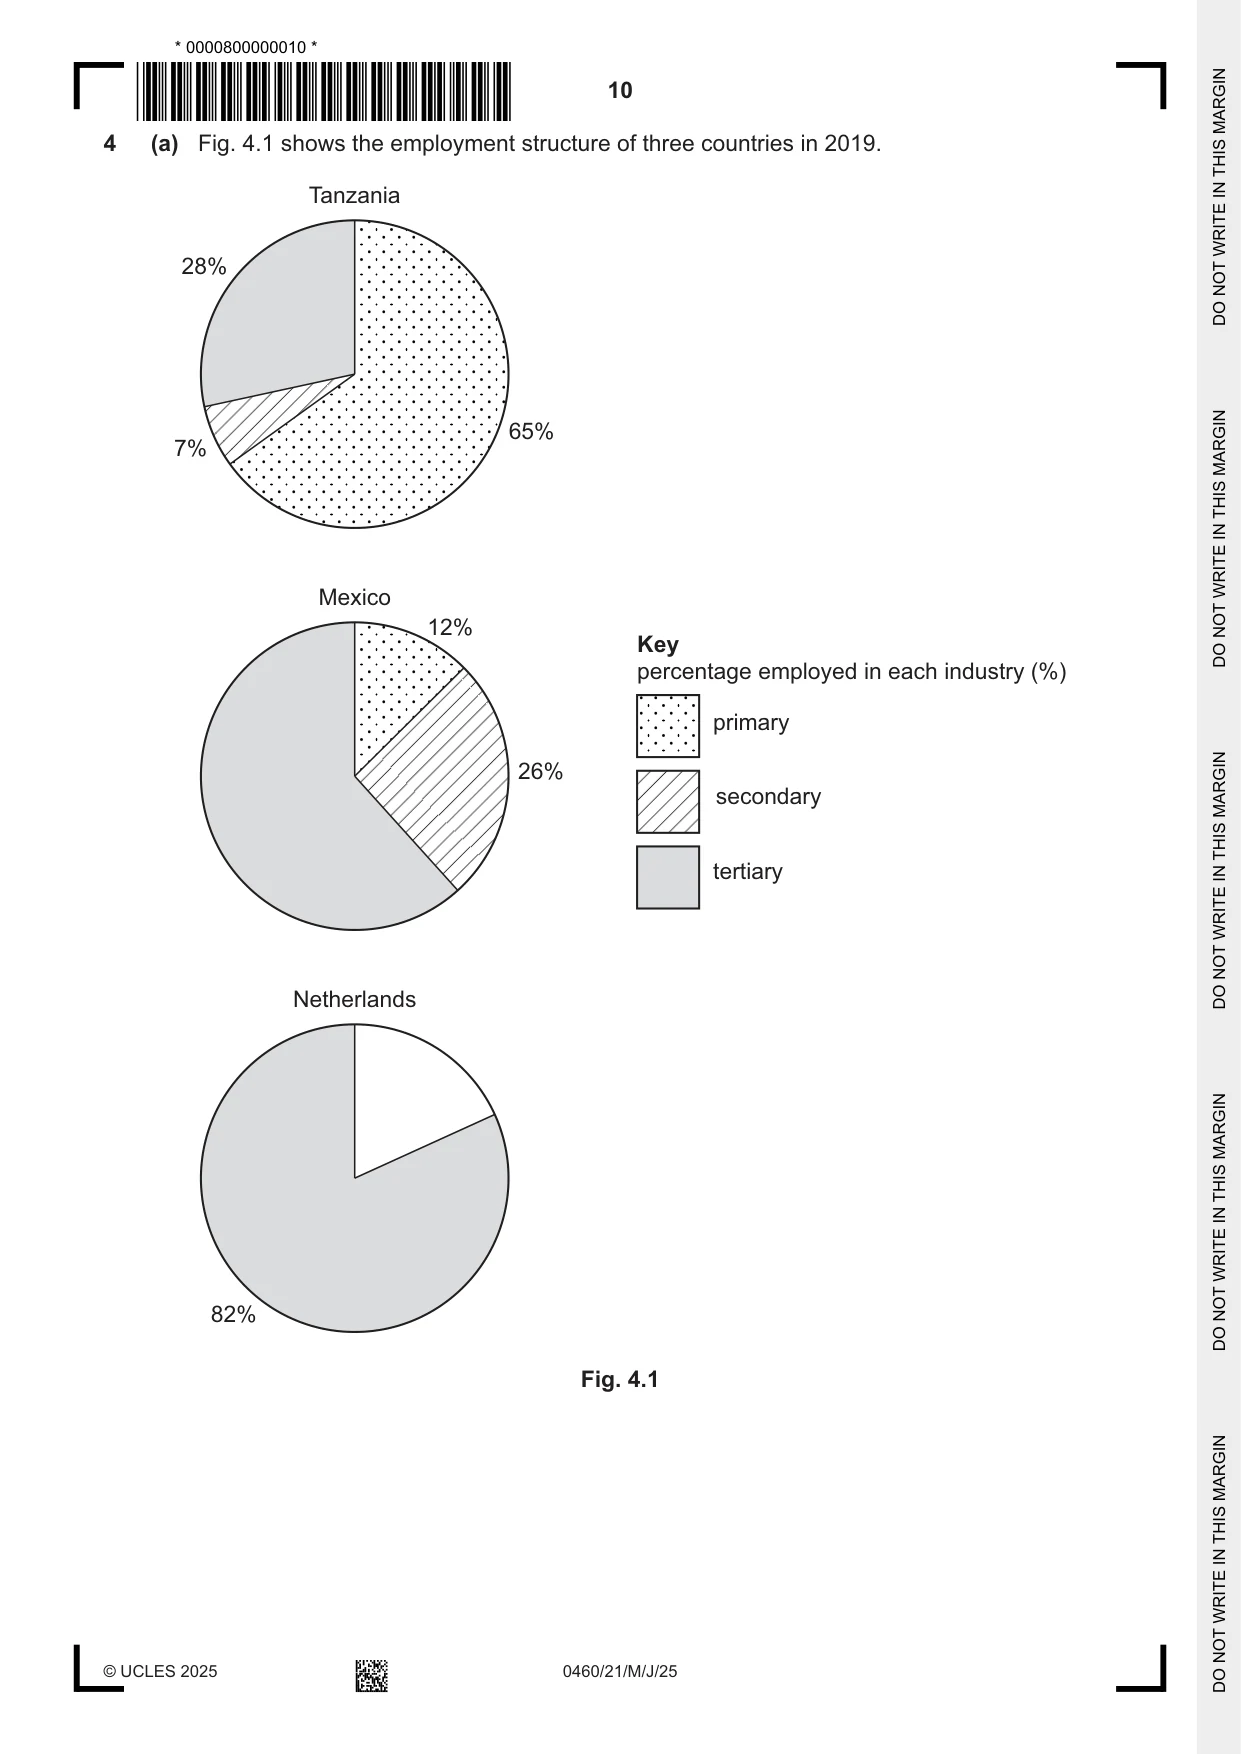
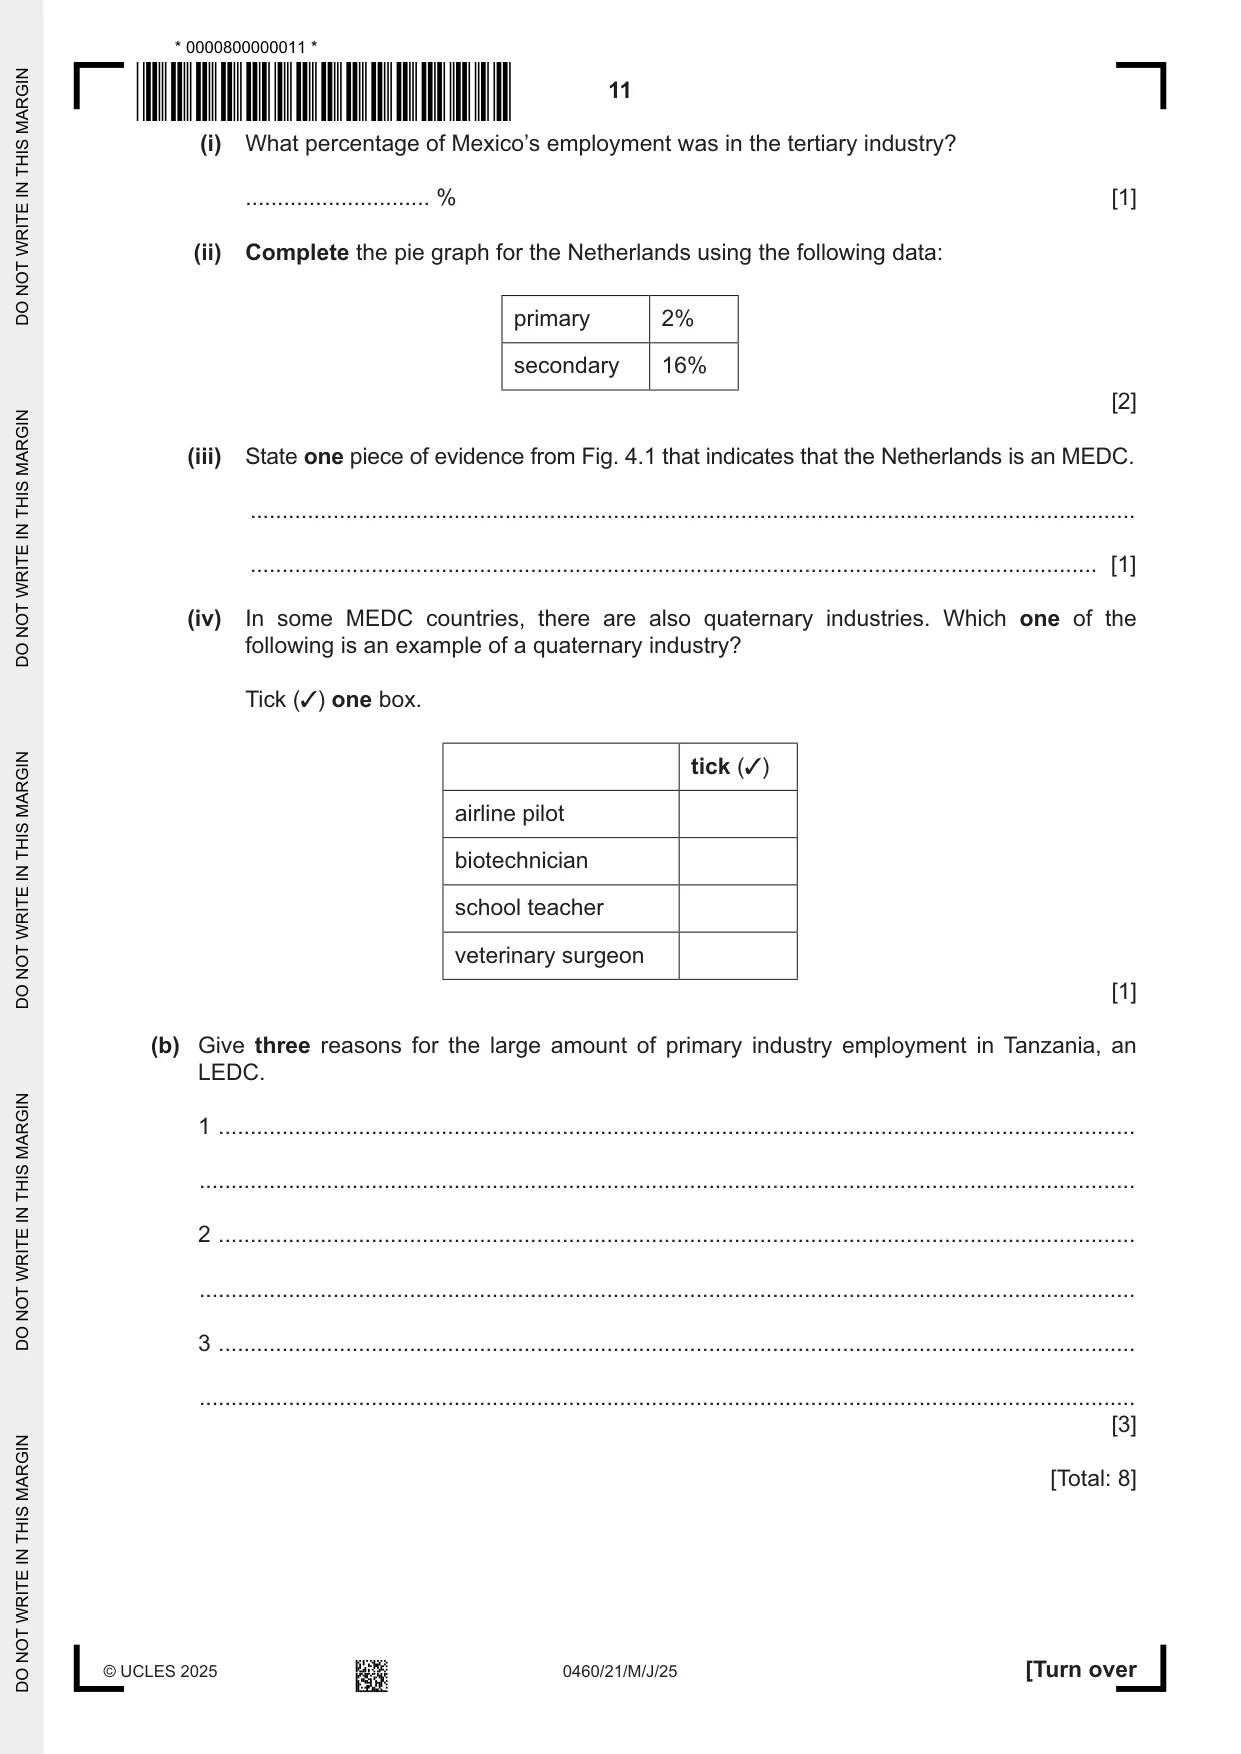
4 (a) Fig. 4.1 shows the employment structure of three countries in 2019. Tanzania 28% 65% 7% Mexico 12% Key percentage employed in each industry (%) primary 26% secondary tertiary Netherlands 82% Fig. 4.1 (i) What percentage of Mexico’s employment was in the tertiary industry? ............................. % [1] (ii) Complete the pie graph for the Netherlands using the following data: primary 2% secondary 16% [2] (iii) State one piece of evidence from Fig. 4.1 that indicates that the Netherlands is an MEDC. ........................................................................................................................................... ..................................................................................................................................... [1] (iv) In some MEDC countries, there are also quaternary industries. Which one of the following is an example of a quaternary industry? Tick (3) one box. tick (3) airline pilot biotechnician school teacher veterinary surgeon [1] (b) Give three reasons for the large amount of primary industry employment in Tanzania, an LEDC. 1 ................................................................................................................................................ ................................................................................................................................................... 2 ................................................................................................................................................ ................................................................................................................................................... 3 ................................................................................................................................................ ................................................................................................................................................... [3] [Total: 8]
Mark scheme: 4(a)(i) 62 (%) 1 4(a)(ii) 1 mark for accurate line at 7° (allow 6–8°) 2 1 mark for correct shading (in correct order) 4(a)(iii) High tertiary/low primary/more tertiary than primary 1 4(a)(iv) Biotechnician 1 4(b) • (Subsistence) farming/agriculture; 3 • Land available to farm/fertile soil/climate suitable for farming; • Demand for food/minerals/raw materials for export/cash crops/named export crop; • Not industrialised/no factories/lack of mechanisation (due to cost/availability); • Less educated/skilled (so unable to work in secondary/tertiary); • Lack of investment by TNCs/other countries/government (in secondary/tertiary); • Mining/amount of minerals.
Question 5
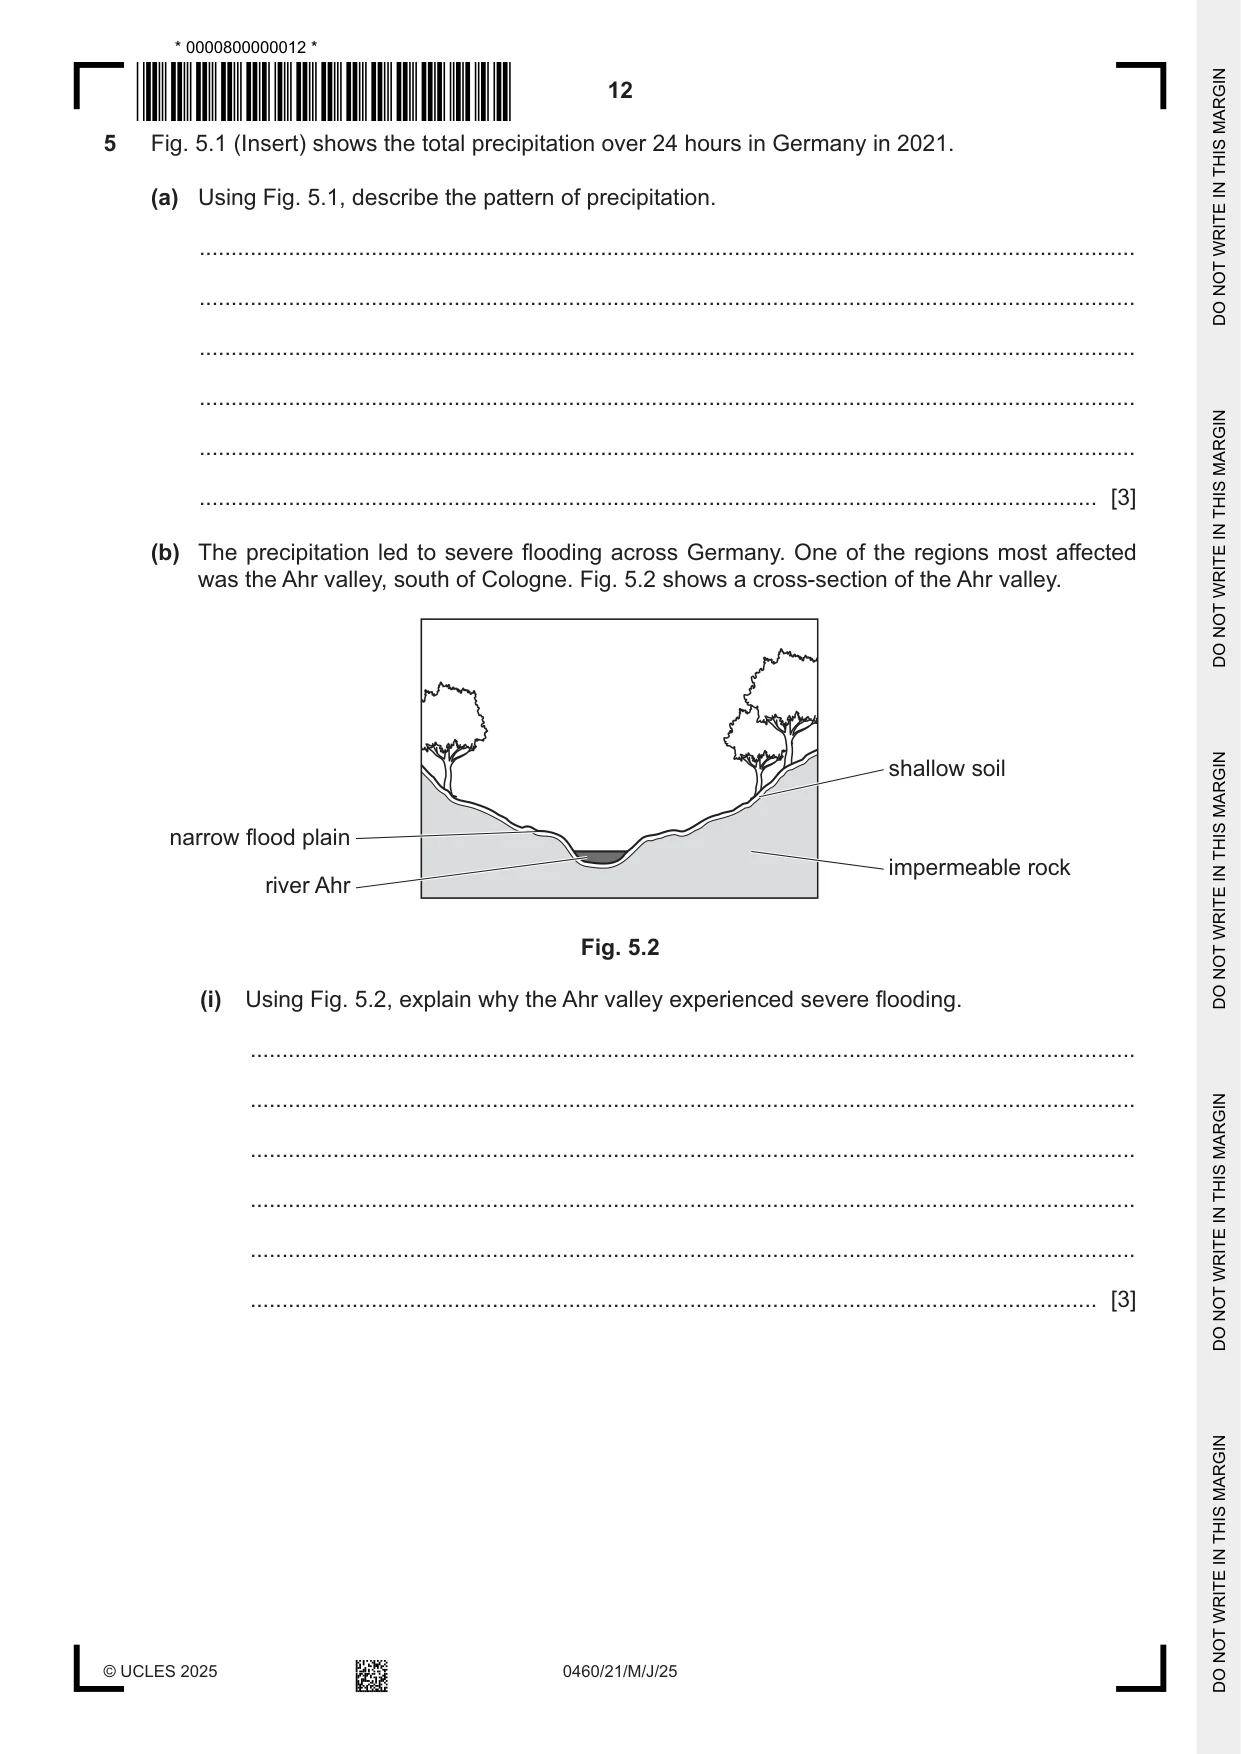
5 Fig. 5.1 (Insert) shows the total precipitation over 24 hours in Germany in 2021. (a) Using Fig. 5.1, describe the pattern of precipitation. ................................................................................................................................................... ................................................................................................................................................... ................................................................................................................................................... ................................................................................................................................................... ................................................................................................................................................... ............................................................................................................................................. [3] (b) The precipitation led to severe flooding across Germany. One of the regions most affected was the Ahr valley, south of Cologne. Fig. 5.2 shows a cross-section of the Ahr valley. shallow soil narrow flood plain impermeable rock river Ahr Fig. 5.2 (i) Using Fig. 5.2, explain why the Ahr valley experienced severe flooding. ........................................................................................................................................... ........................................................................................................................................... ........................................................................................................................................... ........................................................................................................................................... ........................................................................................................................................... ..................................................................................................................................... [3] (ii) Suggest two ways that flooding on the river Ahr can be managed. 1 ........................................................................................................................................ ........................................................................................................................................... 2 ........................................................................................................................................ ........................................................................................................................................... [2] [Total: 8]
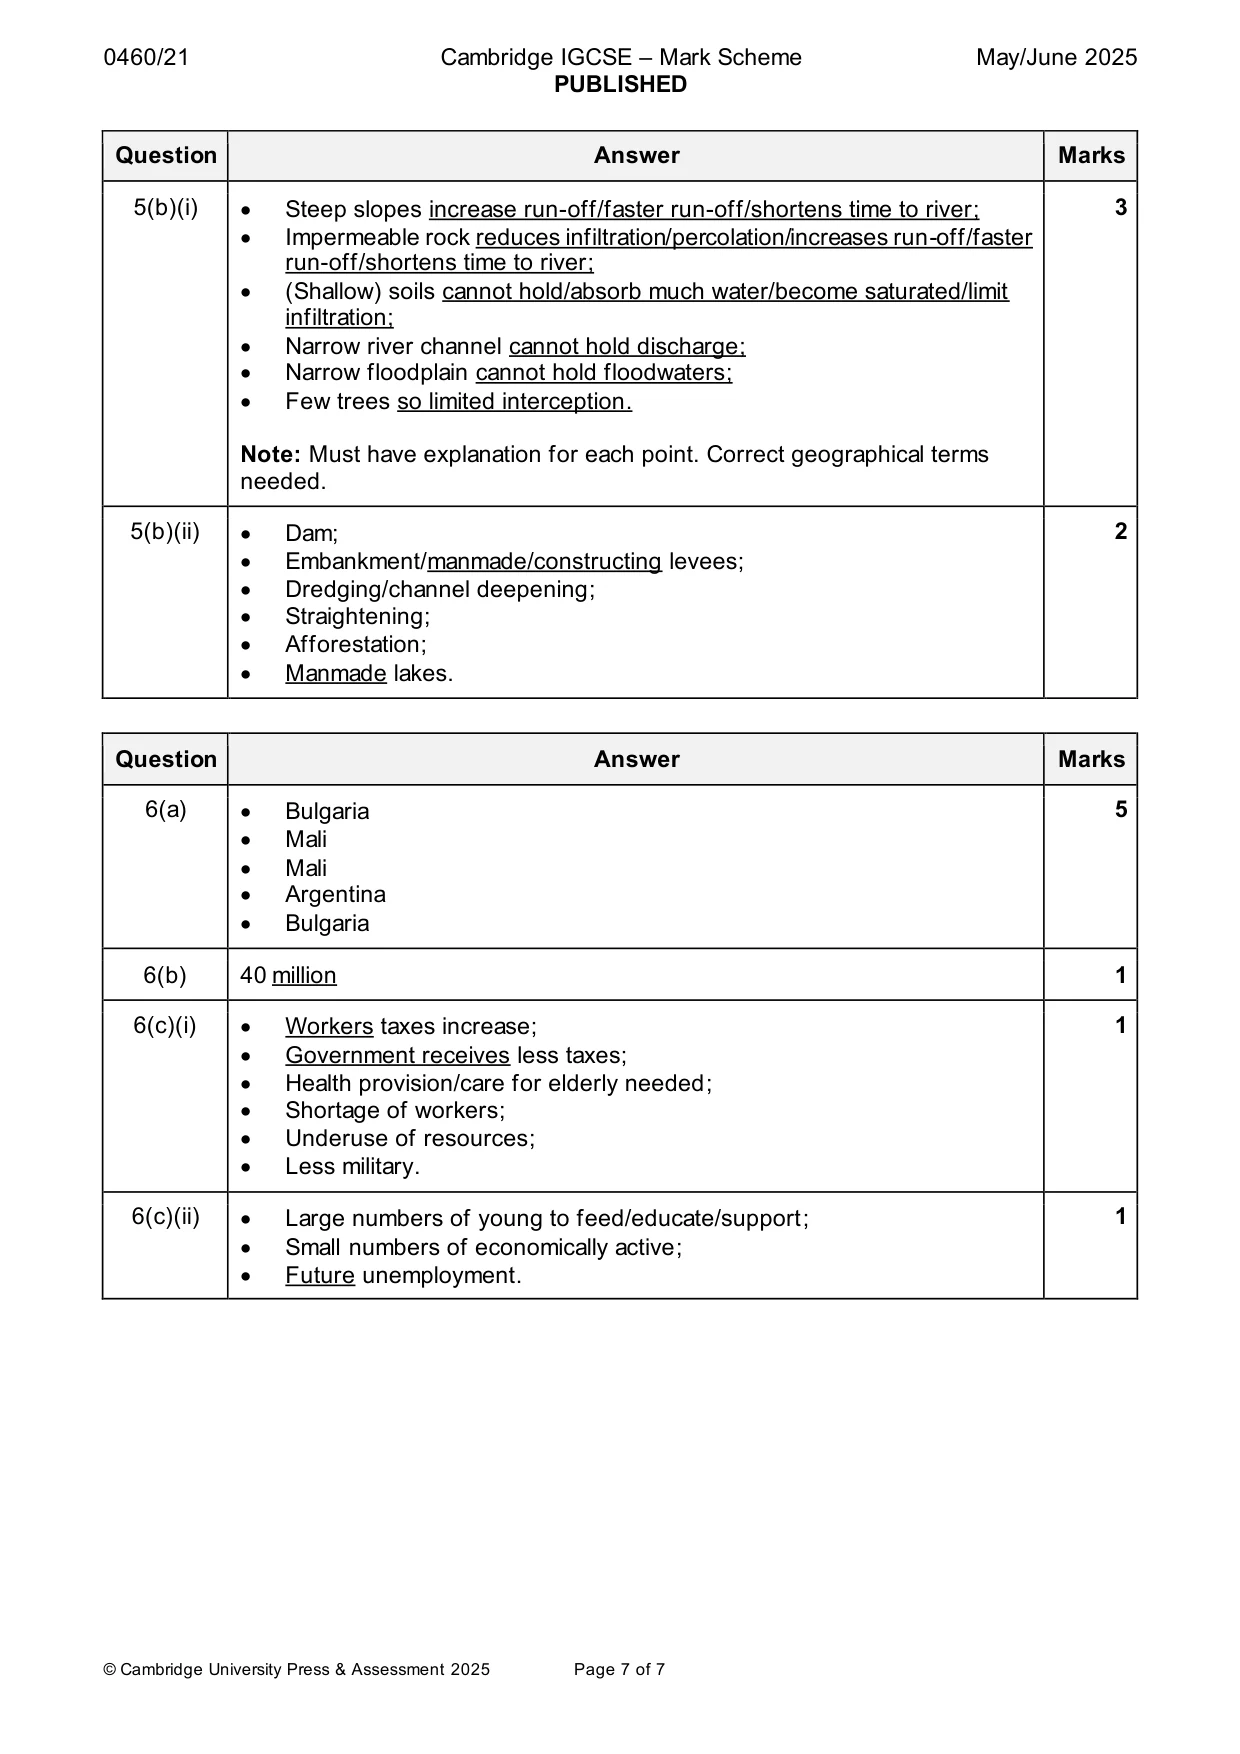
Mark scheme: 5(a) • Uneven; 3 • High(est) in west/high(est) in/around Cologne; • Low(est) in (north-)east/low(est) in/around Berlin; • Mostly low (rainfall); • Moderate/average in south(-west)/south of Stuttgart; • Moderate/average in northwest; • Moderate/average along coast/North Sea/Baltic Sea. Note: Max. 2 for moderate/average 5(b)(i) • Steep slopes increase run-off/faster run-off/shortens time to river; 3 • Impermeable rock reduces infiltration/percolation/increases run-off/faster run-off/shortens time to river; • (Shallow) soils cannot hold/absorb much water/become saturated/limit infiltration; • Narrow river channel cannot hold discharge; • Narrow floodplain cannot hold floodwaters; • Few trees so limited interception. Note: Must have explanation for each point. Correct geographical terms needed. 5(b)(ii) • Dam; 2 • Embankment/manmade/constructing levees; • Dredging/channel deepening; • Straightening; • Afforestation; • Manmade lakes.
Q6 · The population structure of three countries between 1950 and 2020
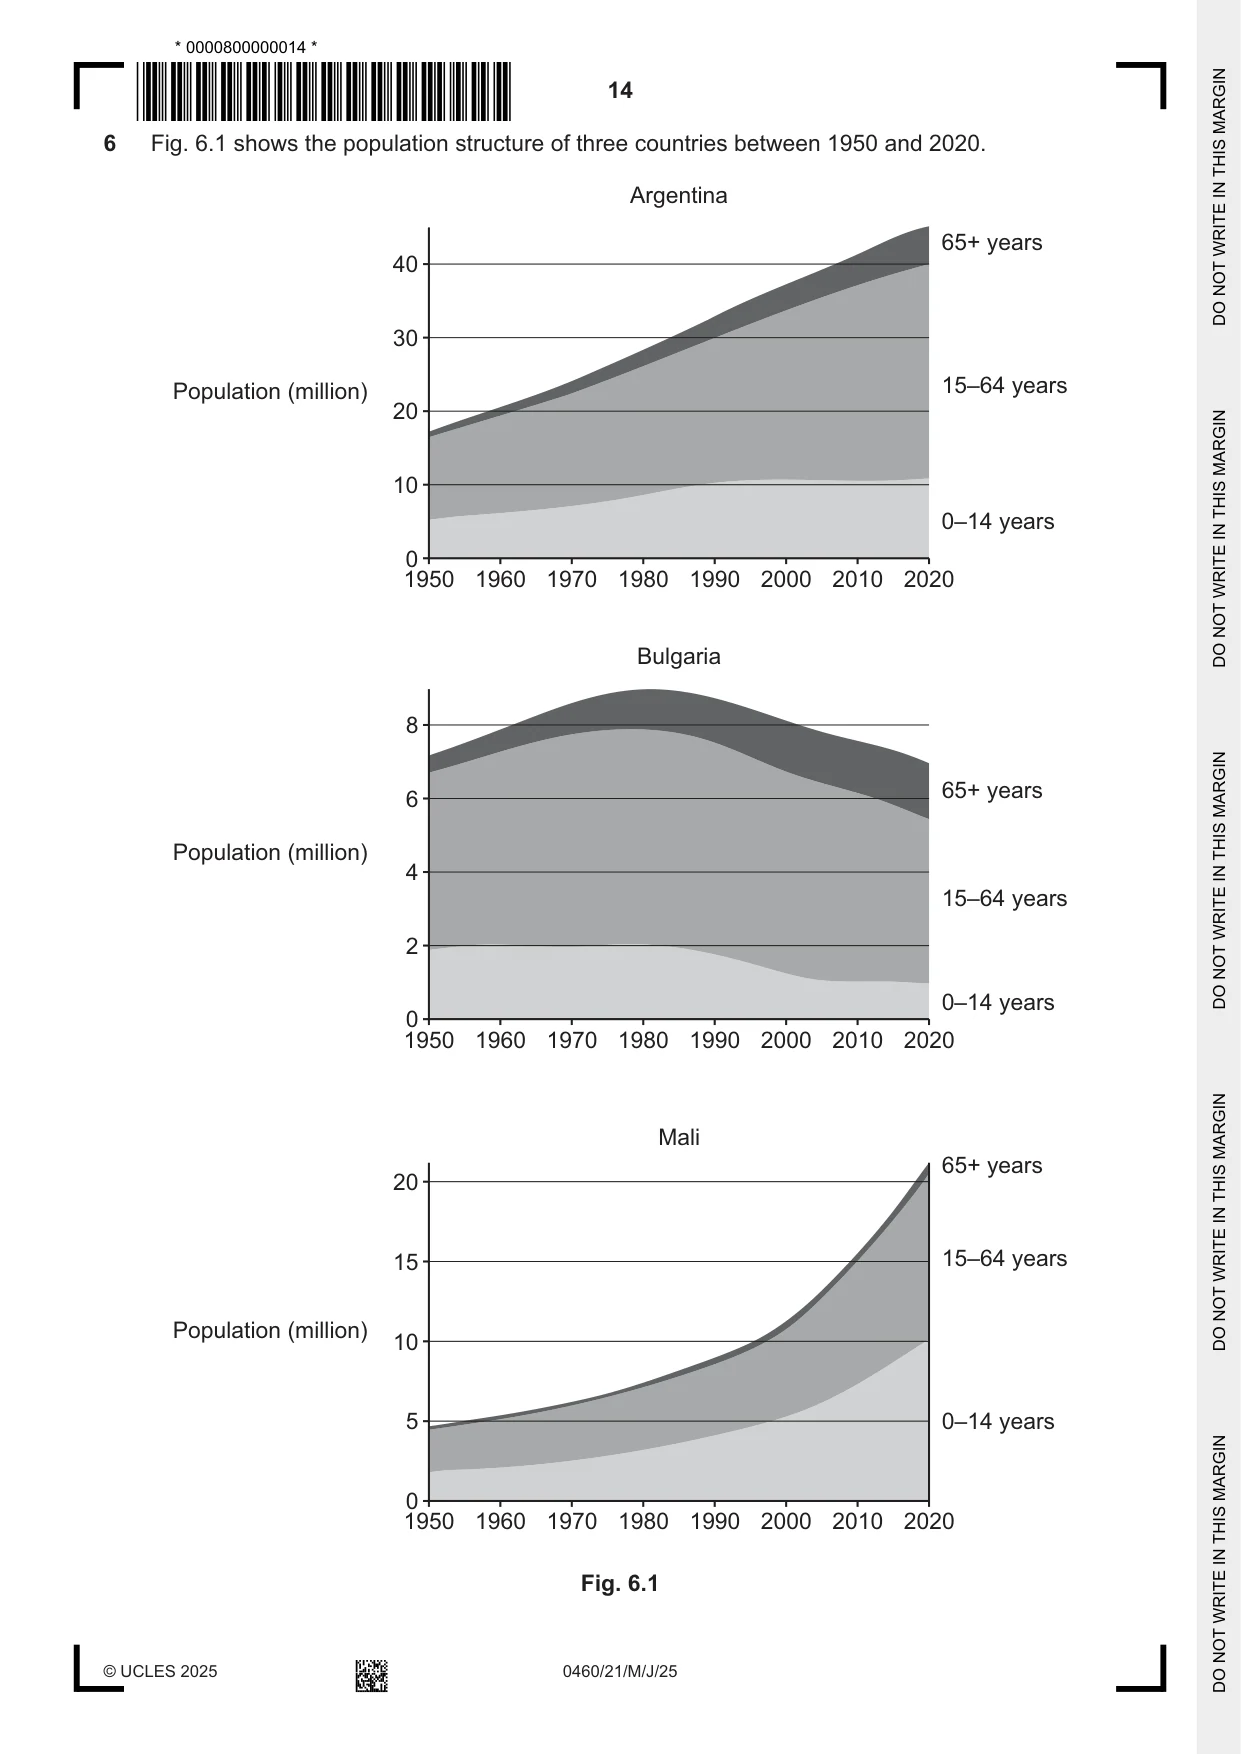
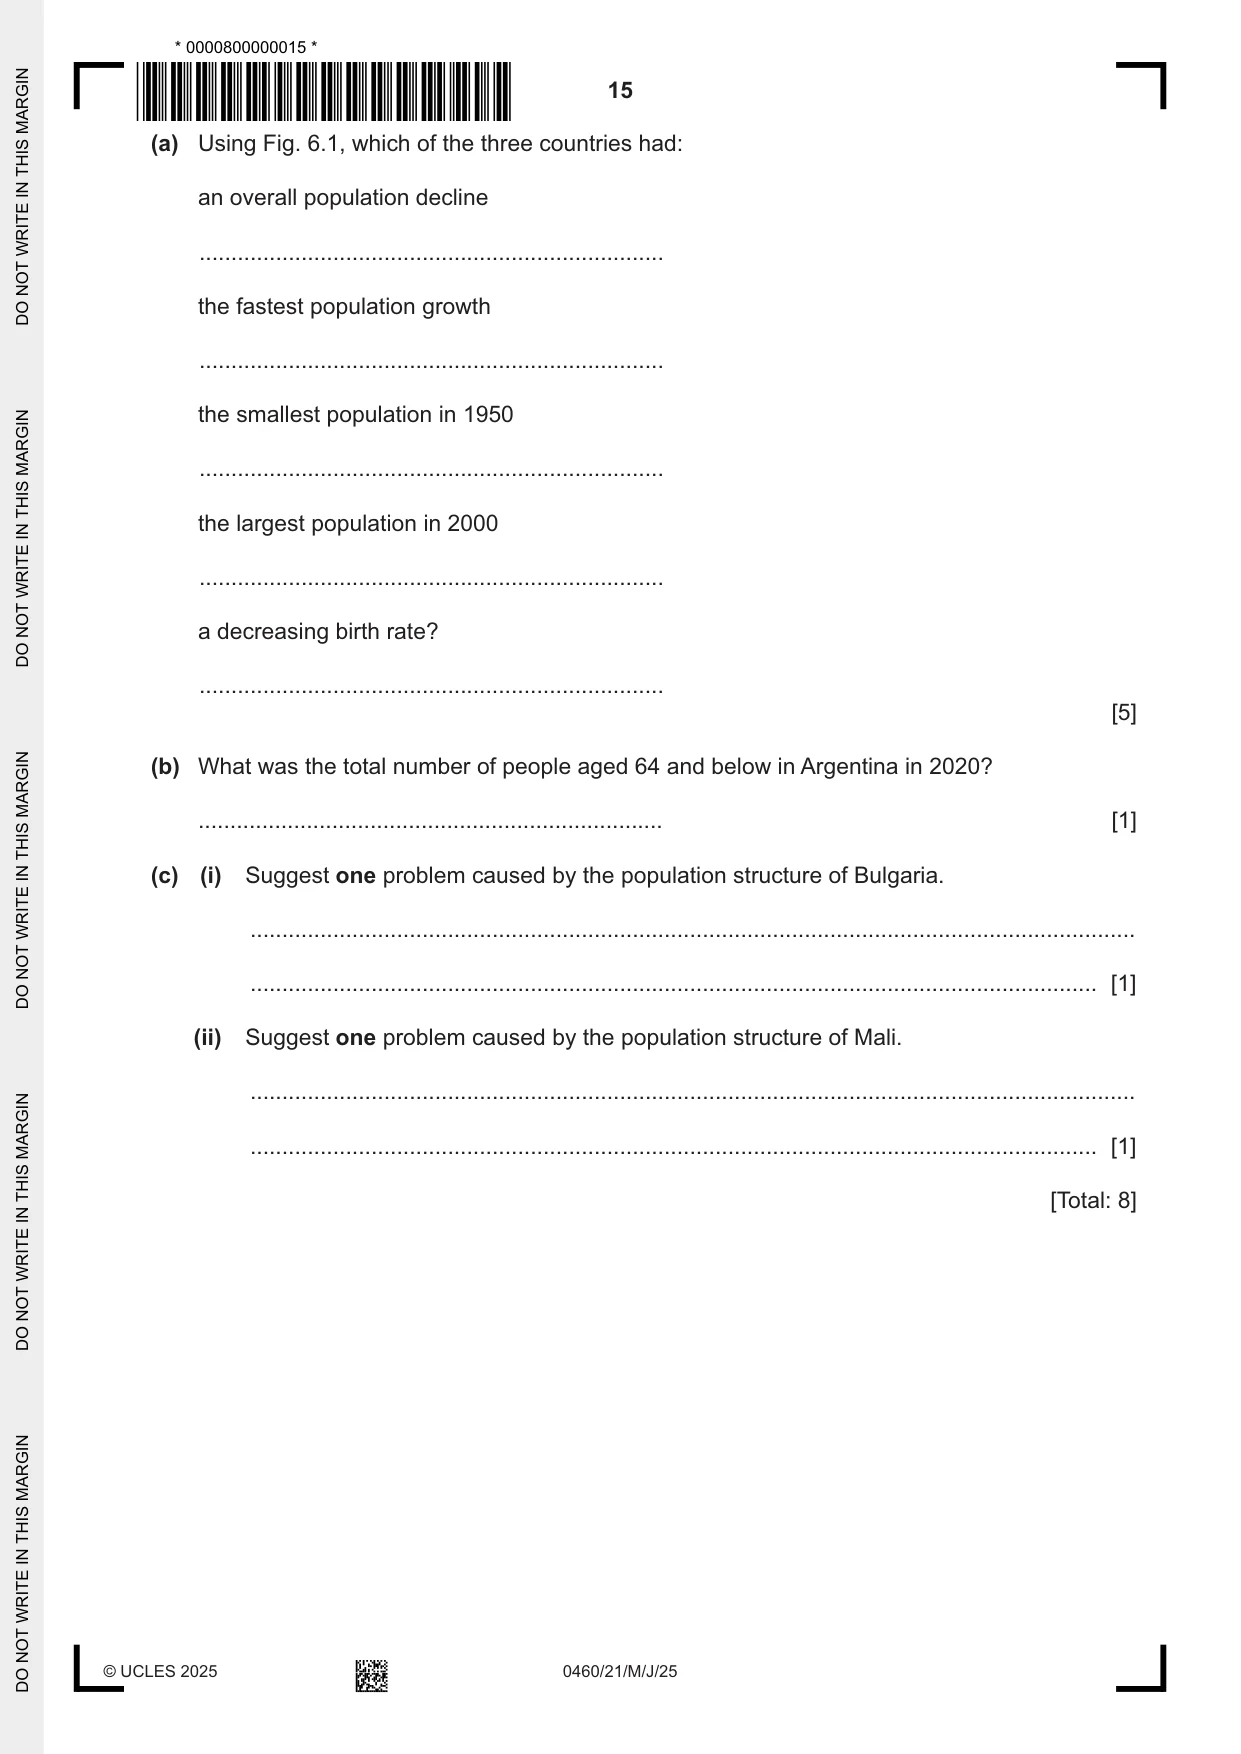
6 Fig. 6.1 shows the population structure of three countries between 1950 and 2020. Argentina 65+ years 40 30 Population (million) 15–64 years 20 10 0–14 years 0 1950 1960 1970 1980 1990 2000 2010 2020 Bulgaria 8 65+ years 6 Population (million) 4 15–64 years 2 0–14 years 0 1950 1960 1970 1980 1990 2000 2010 2020 Mali 65+ years 20 15 15–64 years Population (million) 10 5 0–14 years 0 1950 1960 1970 1980 1990 2000 2010 2020 Fig. 6.1 (a) Using Fig. 6.1, which of the three countries had: an overall population decline ......................................................................... the fastest population growth ......................................................................... the smallest population in 1950 ......................................................................... the largest population in 2000 ......................................................................... a decreasing birth rate? ......................................................................... [5] (b) What was the total number of people aged 64 and below in Argentina in 2020? ......................................................................... [1] (c) (i) Suggest one problem caused by the population structure of Bulgaria. ........................................................................................................................................... ..................................................................................................................................... [1] (ii) Suggest one problem caused by the population structure of Mali. ........................................................................................................................................... ..................................................................................................................................... [1] [Total: 8] Additional page If you use the following page to complete the answer to any question, the question number must be clearly shown. .................................................................................................................................................................. .................................................................................................................................................................. .................................................................................................................................................................. .................................................................................................................................................................. .................................................................................................................................................................. .................................................................................................................................................................. .................................................................................................................................................................. .................................................................................................................................................................. .................................................................................................................................................................. .................................................................................................................................................................. .................................................................................................................................................................. .................................................................................................................................................................. .................................................................................................................................................................. .................................................................................................................................................................. .................................................................................................................................................................. .................................................................................................................................................................. .................................................................................................................................................................. .................................................................................................................................................................. .................................................................................................................................................................. .................................................................................................................................................................. The boundaries and names shown, the designations used and the presentation of material on any maps contained in this question paper/insert do not imply official endorsement or acceptance by Cambridge Assessment International Education concerning the legal status of any country, territory, or area or any of its authorities, or of the delimitation of its frontiers or boundaries.
Mark scheme: 6(a) • Bulgaria 5 • Mali • Mali • Argentina • Bulgaria 6(b) 40 million 1 6(c)(i) • Workers taxes increase; 1 • Government receives less taxes; • Health provision/care for elderly needed; • Shortage of workers; • Underuse of resources; • Less military. 6(c)(ii) • Large numbers of young to feed/educate/support; 1 • Small numbers of economically active; • Future unemployment.
What was in this paper
The subtopics covered by these 6 questions, and how many questions each got. Open one in a new tab to see every Cambridge question on it.
What you needed in this session
Cambridge’s own grade thresholds for 2025 May/June, Paper 2 · Variant 1. A higher threshold means an easier paper — the bar moves with how the cohort did.