Cambridge IGCSE Geography 0460 — 2022 May/June Paper 2 · Variant 1
0460/21/M/J/22 · 6 questions · 60 marks · ≈68 min
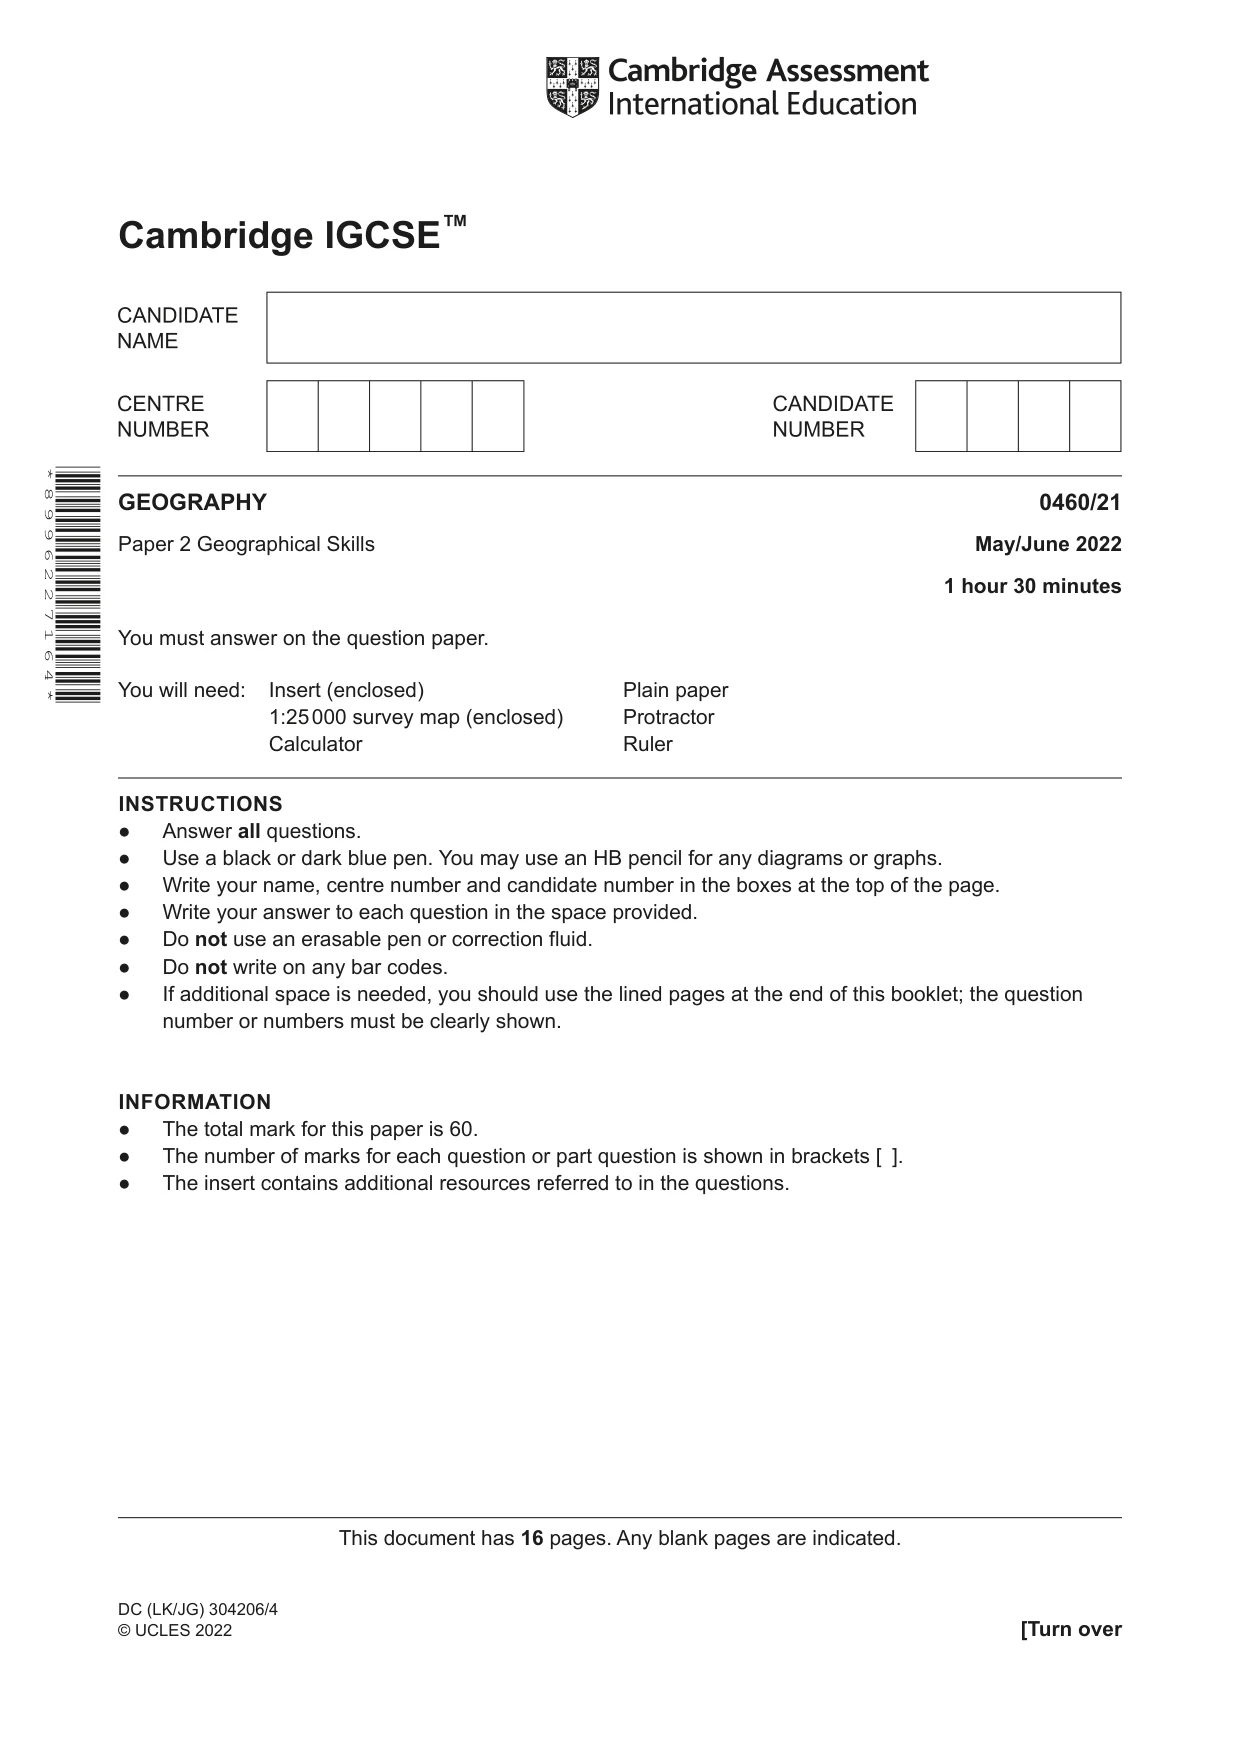
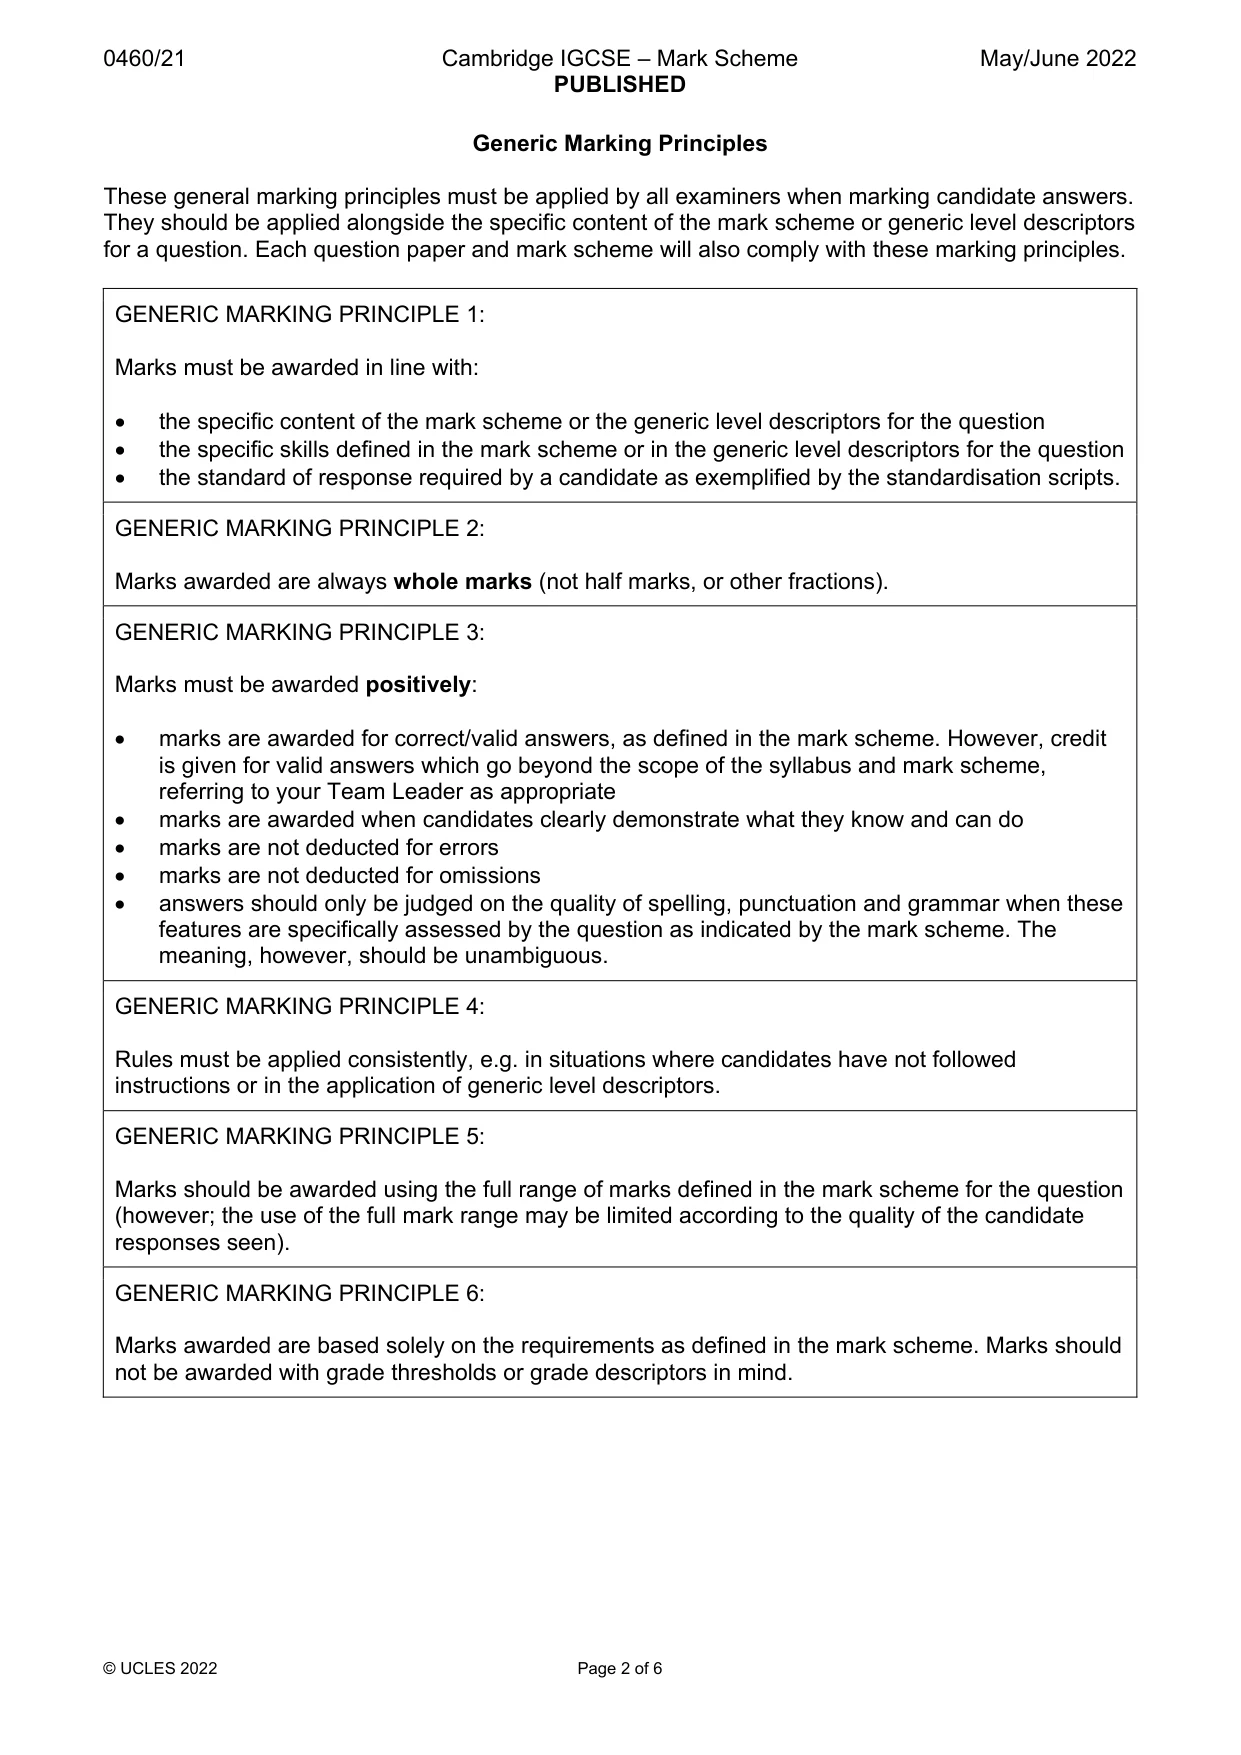
The question paper and its mark scheme, free to read here and free to download. This is Cambridge’s own paper, exactly as it was sat.
Question paper16 pages

Mark scheme6 pages
Answers below. Sit the paper first if you are practising.
Questions as text
Q1 · Study the map extract for Lochwinnoch, Scotland
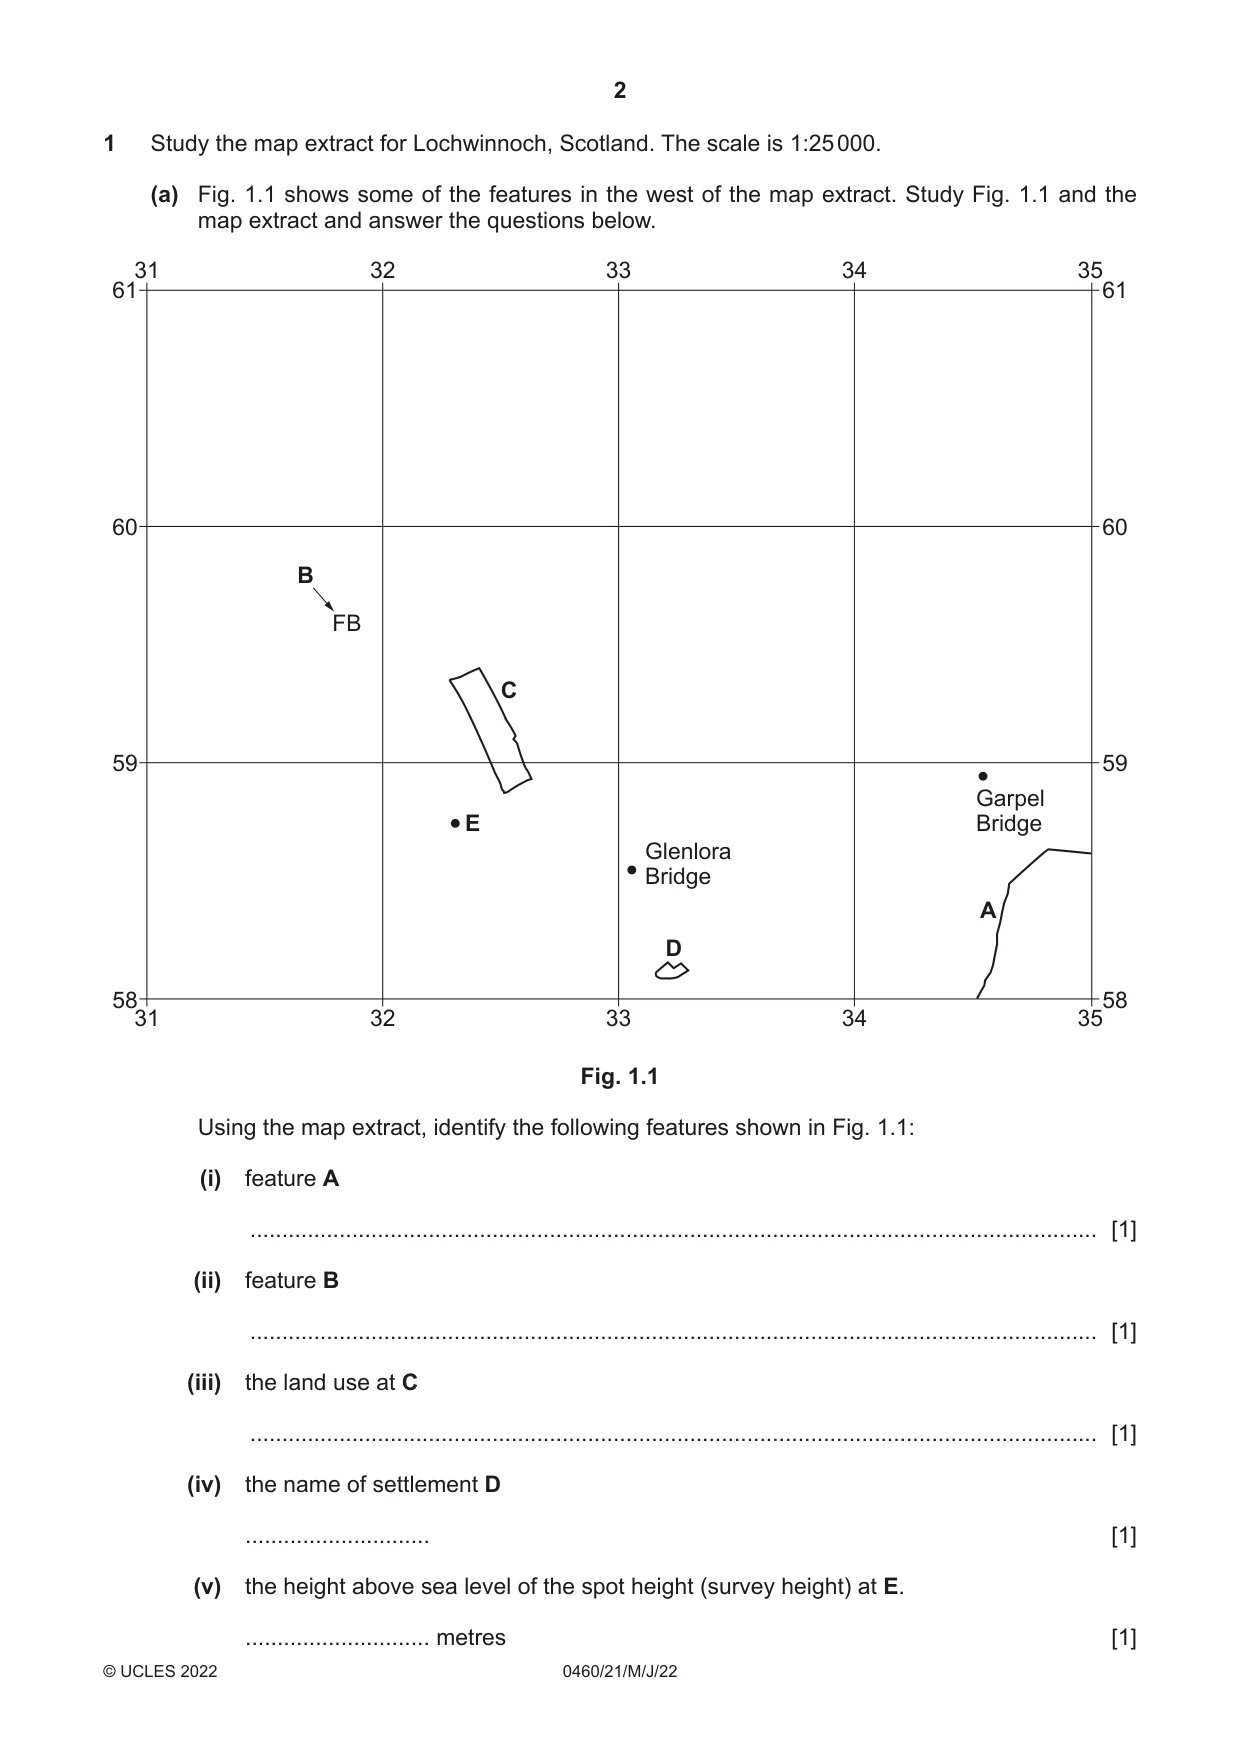
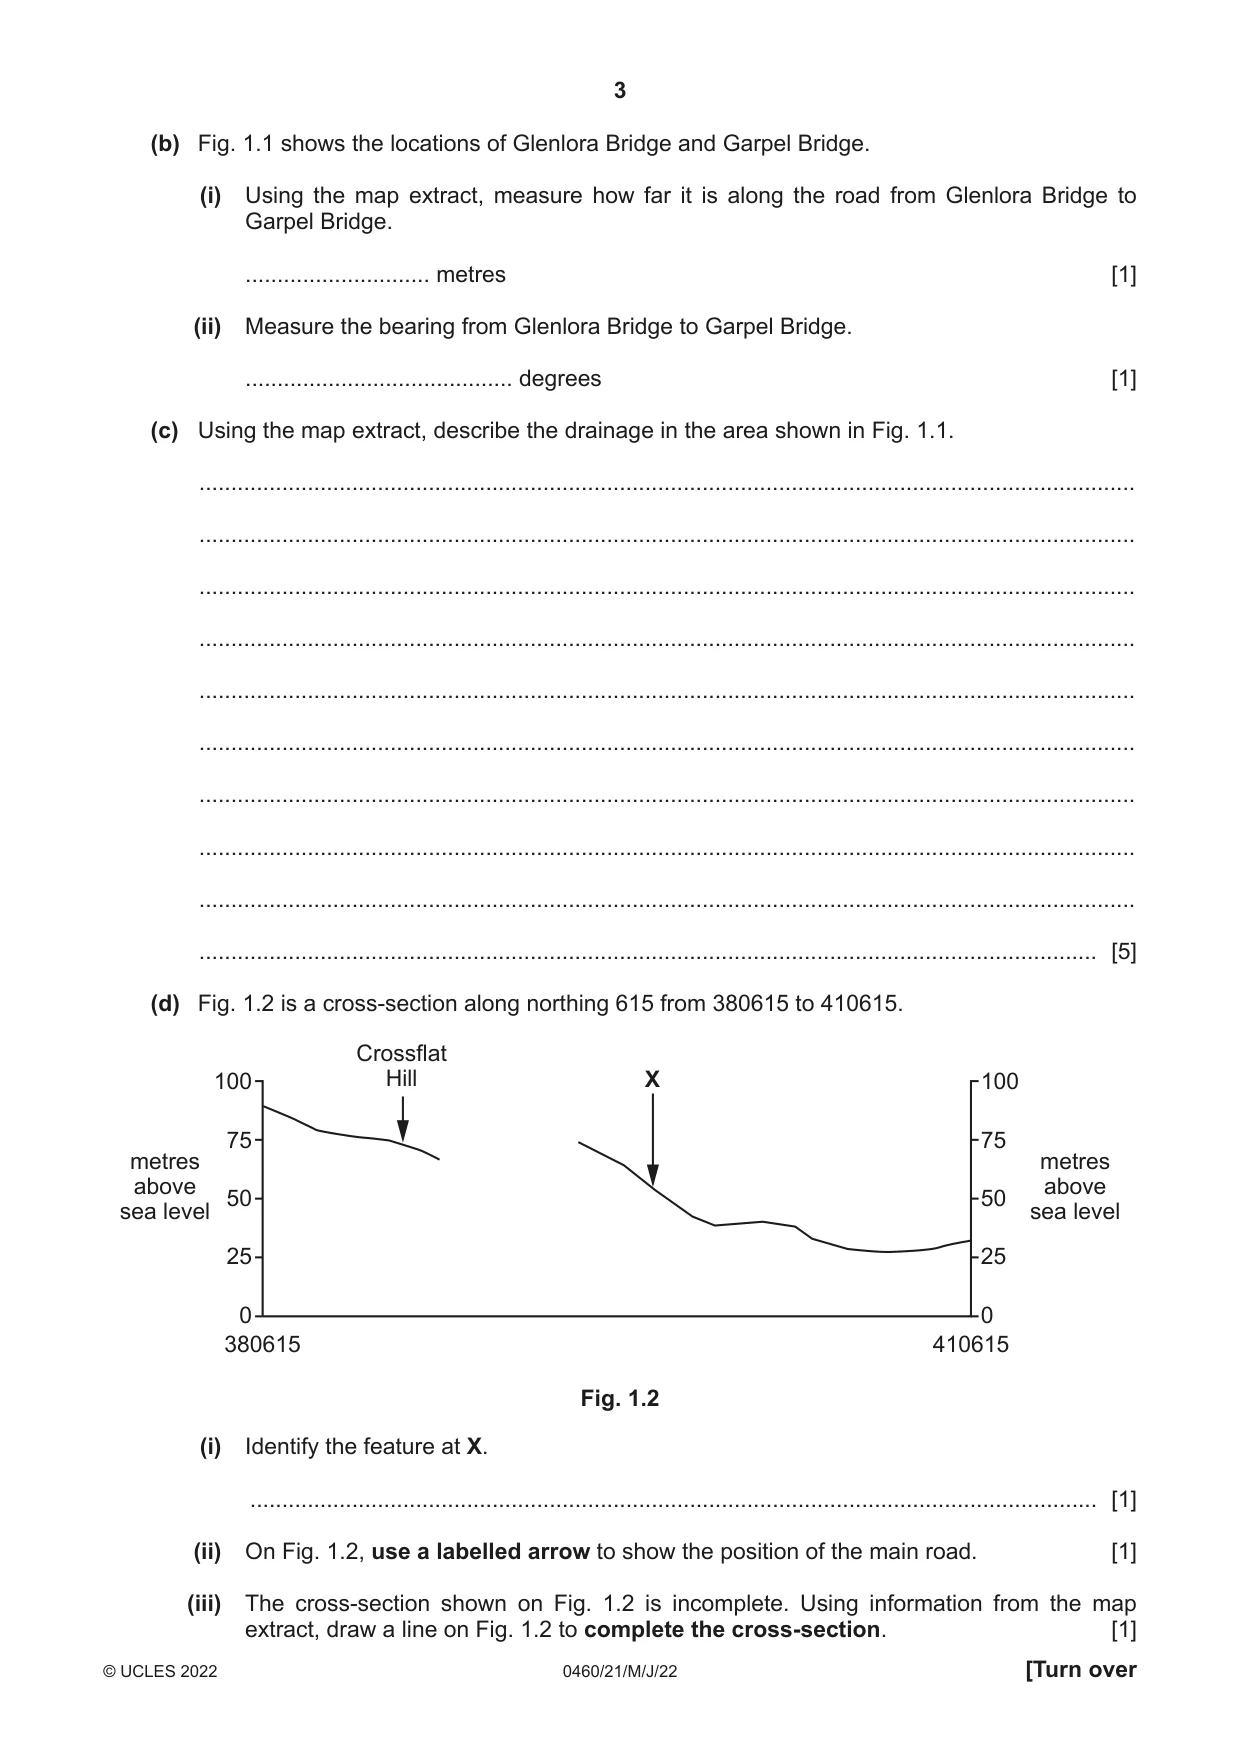
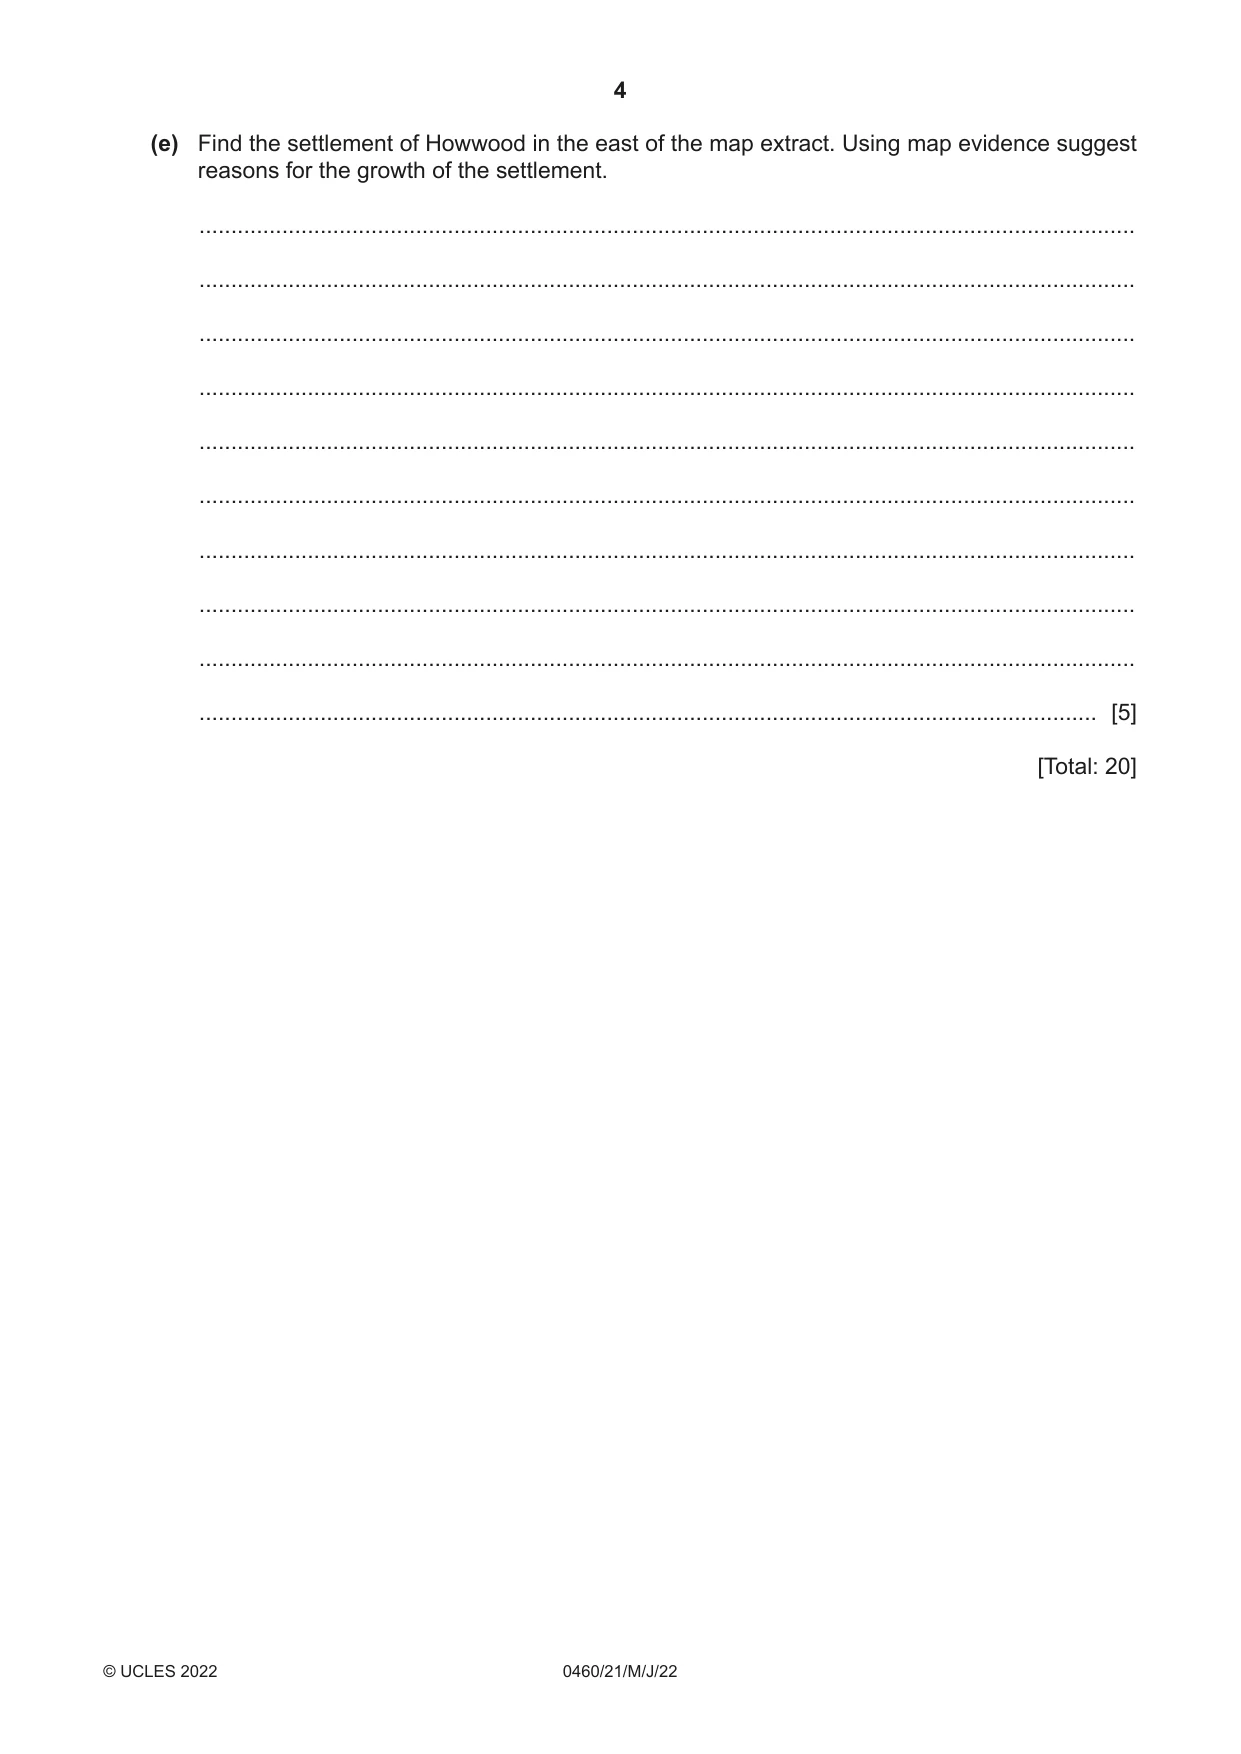
1 Study the map extract for Lochwinnoch, Scotland. The scale is 1:25 000. (a) Fig. 1.1 shows some of the features in the west of the map extract. Study Fig. 1.1 and the map extract and answer the questions below. 31 32 33 34 35 61 61 60 60 B FB C 59 59 Garpel E Bridge Glenlora Bridge A D 58 58 31 32 33 34 35 Fig. 1.1 Using the map extract, identify the following features shown in Fig. 1.1: (i) feature A ..................................................................................................................................... [1] (ii) feature B ..................................................................................................................................... [1] (iii) the land use at C ..................................................................................................................................... [1] (iv) the name of settlement D ............................. [1] (v) the height above sea level of the spot height (survey height) at E. ............................. metres [1] (b) Fig. 1.1 shows the locations of Glenlora Bridge and Garpel Bridge. (i) Using the map extract, measure how far it is along the road from Glenlora Bridge to Garpel Bridge. ............................. metres [1] (ii) Measure the bearing from Glenlora Bridge to Garpel Bridge. .......................................... degrees [1] (c) Using the map extract, describe the drainage in the area shown in Fig. 1.1. ................................................................................................................................................... ................................................................................................................................................... ................................................................................................................................................... ................................................................................................................................................... ................................................................................................................................................... ................................................................................................................................................... ................................................................................................................................................... ................................................................................................................................................... ................................................................................................................................................... ............................................................................................................................................. [5] (d) Fig. 1.2 is a cross-section along northing 615 from 380615 to 410615. Crossflat 100 Hill X 100 75 75 metres metres above above 50 50sea level sea level 25 25 0 0 380615 410615 Fig. 1.2 (i) Identify the feature at X. ..................................................................................................................................... [1] (ii) On Fig. 1.2, use a labelled arrow to show the position of the main road. [1] (iii) The cross-section shown on Fig. 1.2 is incomplete. Using information from the map extract, draw a line on Fig. 1.2 to complete the cross-section. [1] (e) Find the settlement of Howwood in the east of the map extract. Using map evidence suggest reasons for the growth of the settlement. ................................................................................................................................................... ................................................................................................................................................... ................................................................................................................................................... ................................................................................................................................................... ................................................................................................................................................... ................................................................................................................................................... ................................................................................................................................................... ................................................................................................................................................... ................................................................................................................................................... ............................................................................................................................................. [5] [Total: 20]
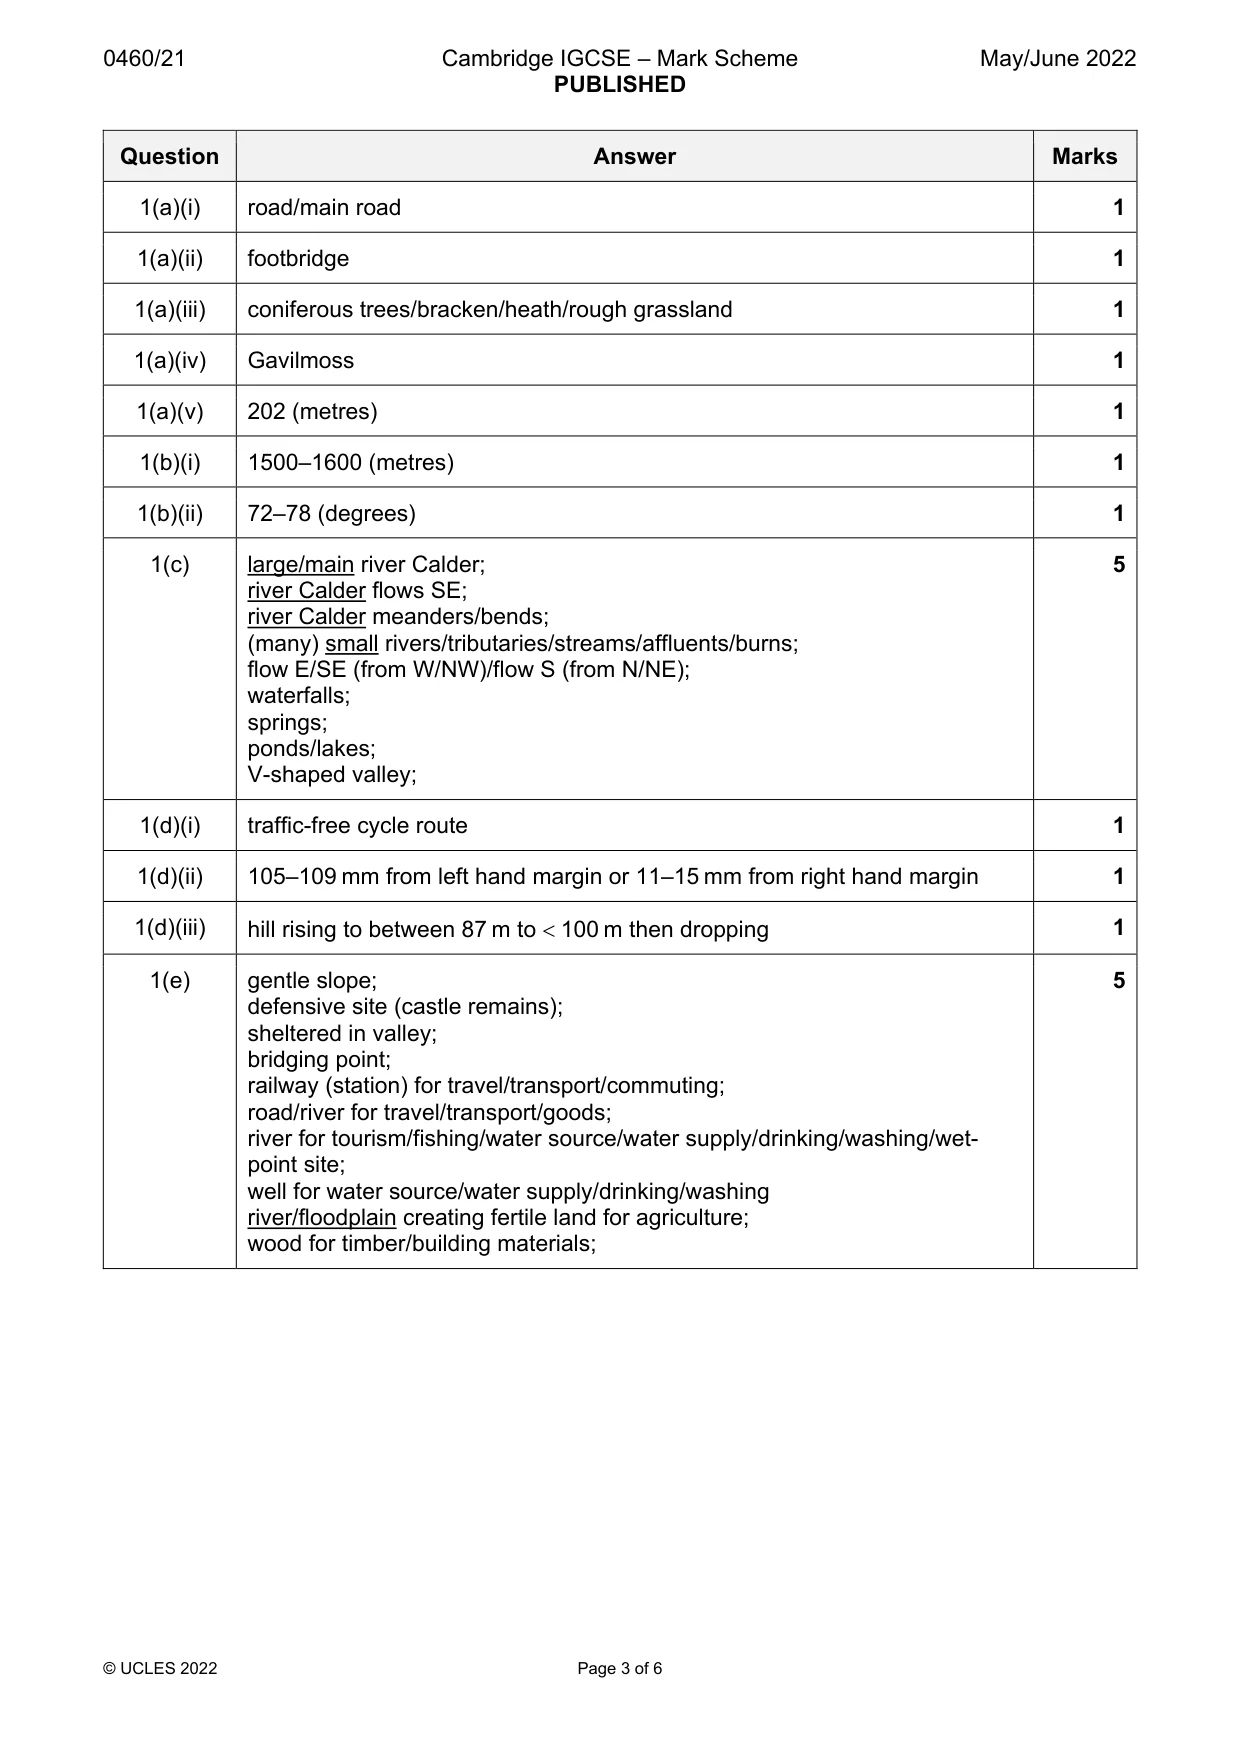
Mark scheme: Question Answer Marks 1(a)(i) road/main road 1 1(a)(ii) footbridge 1 1(a)(iii) coniferous trees/bracken/heath/rough grassland 1 1(a)(iv) Gavilmoss 1 1(a)(v) 202 (metres) 1 1(b)(i) 1500–1600 (metres) 1 1(b)(ii) 72–78 (degrees) 1 1(c) large/main river Calder; 5 river Calder flows SE; river Calder meanders/bends; (many) small rivers/tributaries/streams/affluents/burns; flow E/SE (from W/NW)/flow S (from N/NE); waterfalls; springs; ponds/lakes; V-shaped valley; 1(d)(i) traffic-free cycle route 1 1(d)(ii) 105–109 mm from left hand margin or 11–15 mm from right hand margin 1 1(d)(iii) hill rising to between 87 m to 100 m then dropping 1 1(e) gentle slope; 5 defensive site (castle remains); sheltered in valley; bridging point; railway (station) for travel/transport/commuting; road/river for travel/transport/goods; river for tourism/fishing/water source/water supply/drinking/washing/wet- point site; well for water source/water supply/drinking/washing river/floodplain creating fertile land for agriculture; wood for timber/building materials;
More questions on Settlements (rural and urban) and service provision
Q2 · The change in population density in France from 2010 to 2020
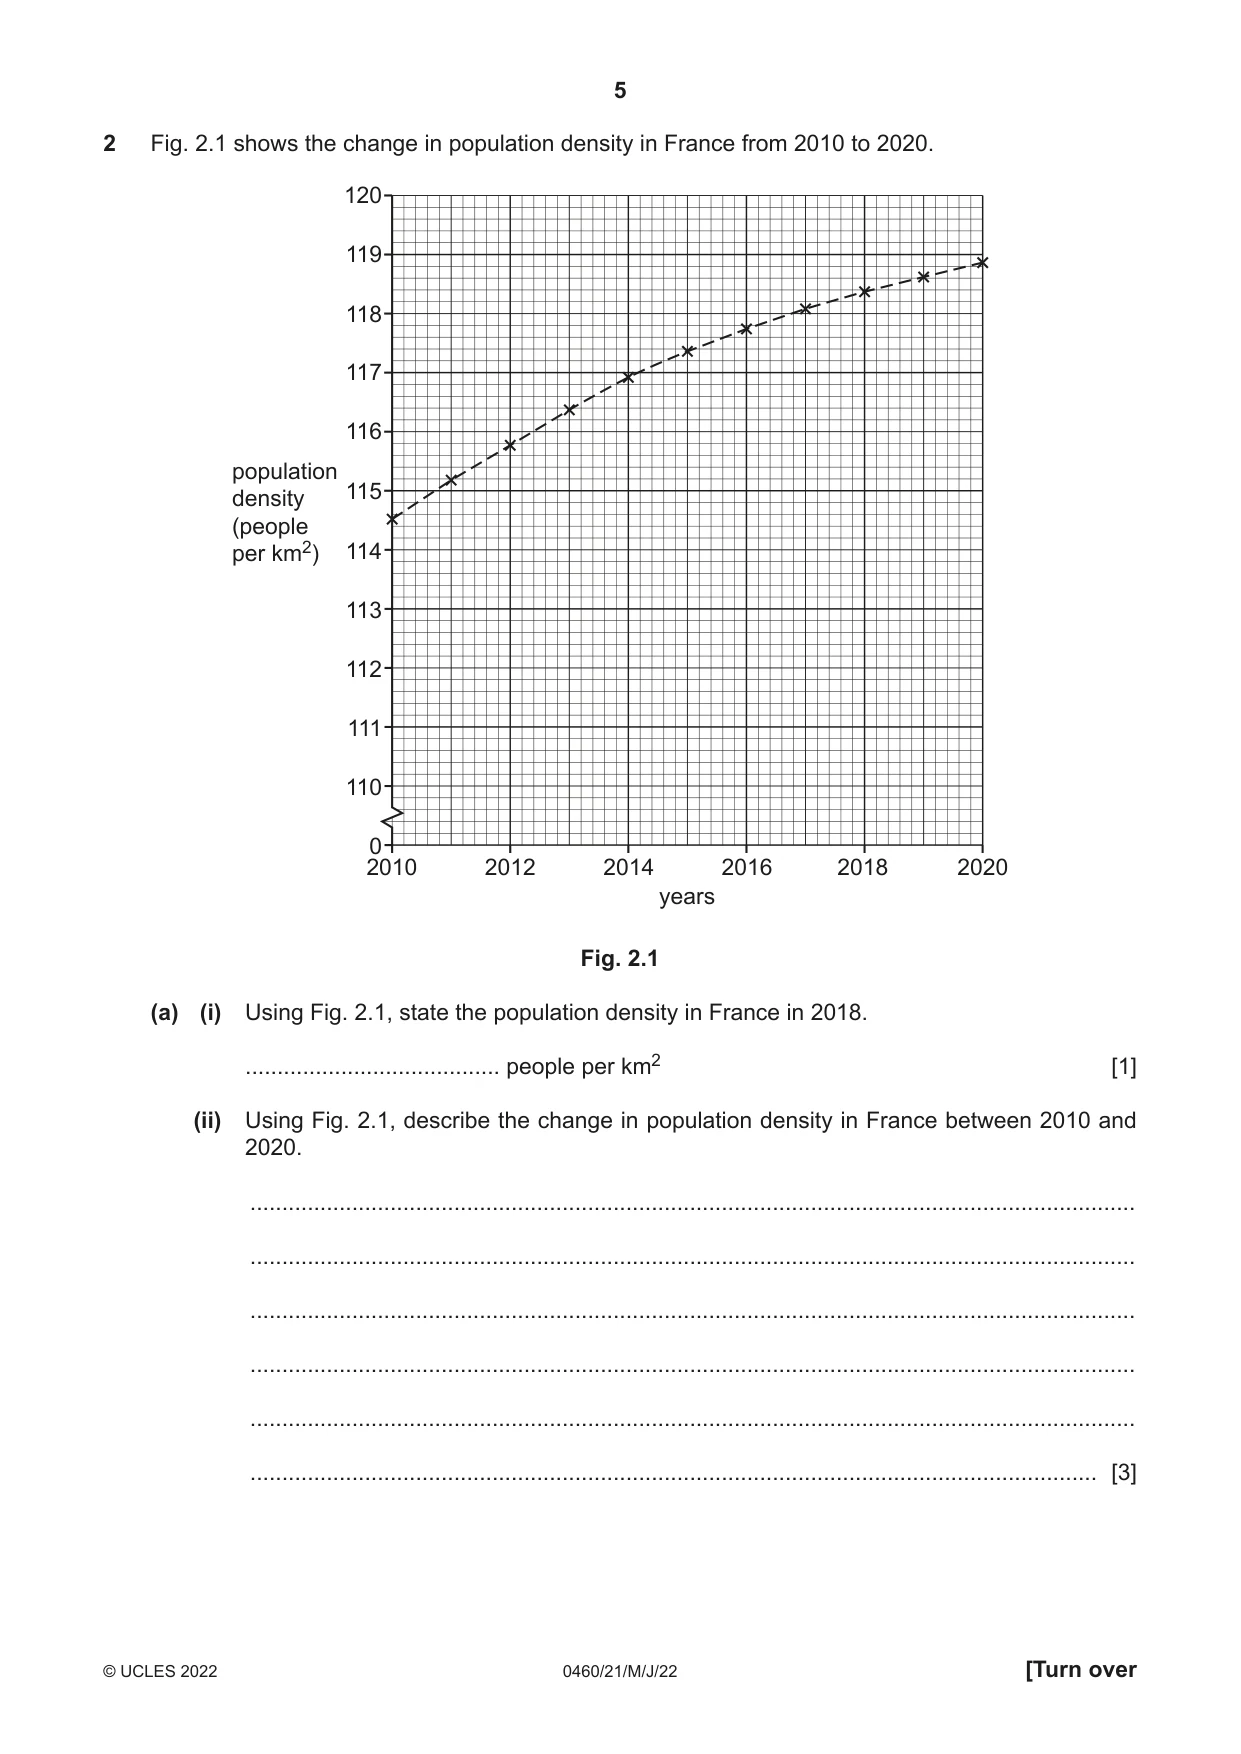
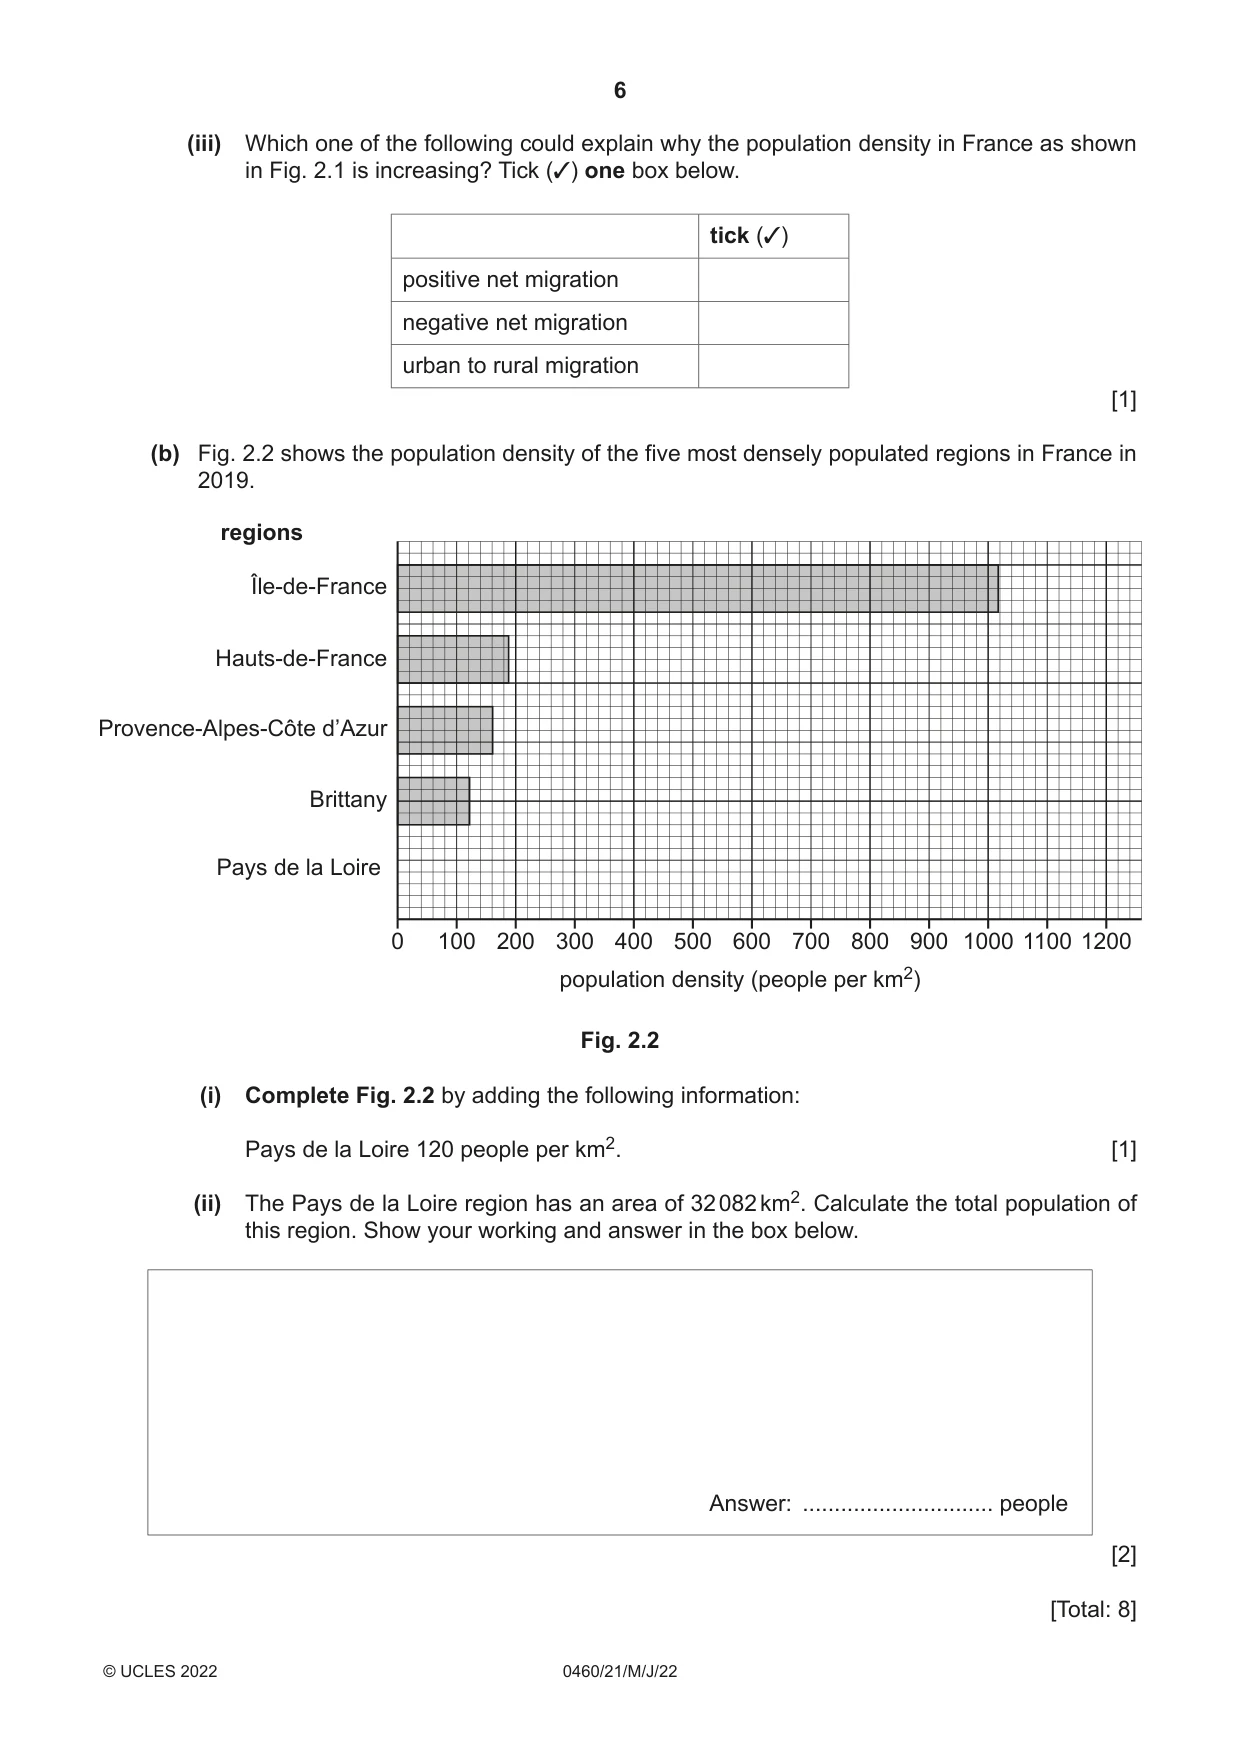
2 Fig. 2.1 shows the change in population density in France from 2010 to 2020. 120 119 118 117 116 population 115 density (people per km2) 114 113 112 111 110 0 2010 2012 2014 2016 2018 2020 years Fig. 2.1 (a) (i) Using Fig. 2.1, state the population density in France in 2018. ........................................ people per km2 [1] (ii) Using Fig. 2.1, describe the change in population density in France between 2010 and 2020. ........................................................................................................................................... ........................................................................................................................................... ........................................................................................................................................... ........................................................................................................................................... ........................................................................................................................................... ..................................................................................................................................... [3] (iii) Which one of the following could explain why the population density in France as shown in Fig. 2.1 is increasing? Tick (3) one box below. tick (3) positive net migration negative net migration urban to rural migration [1] (b) Fig. 2.2 shows the population density of the five most densely populated regions in France in 2019. regions Île-de-France Hauts-de-France Provence-Alpes-Côte d’Azur Brittany Pays de la Loire 0 100 200 300 400 500 600 700 800 900 1000 1100 1200 population density (people per km2) Fig. 2.2 (i) Complete Fig. 2.2 by adding the following information: Pays de la Loire 120 people per km2. [1] (ii) The Pays de la Loire region has an area of 32 082 km2. Calculate the total population of this region. Show your working and answer in the box below. Answer: .............................. people [2] [Total: 8]
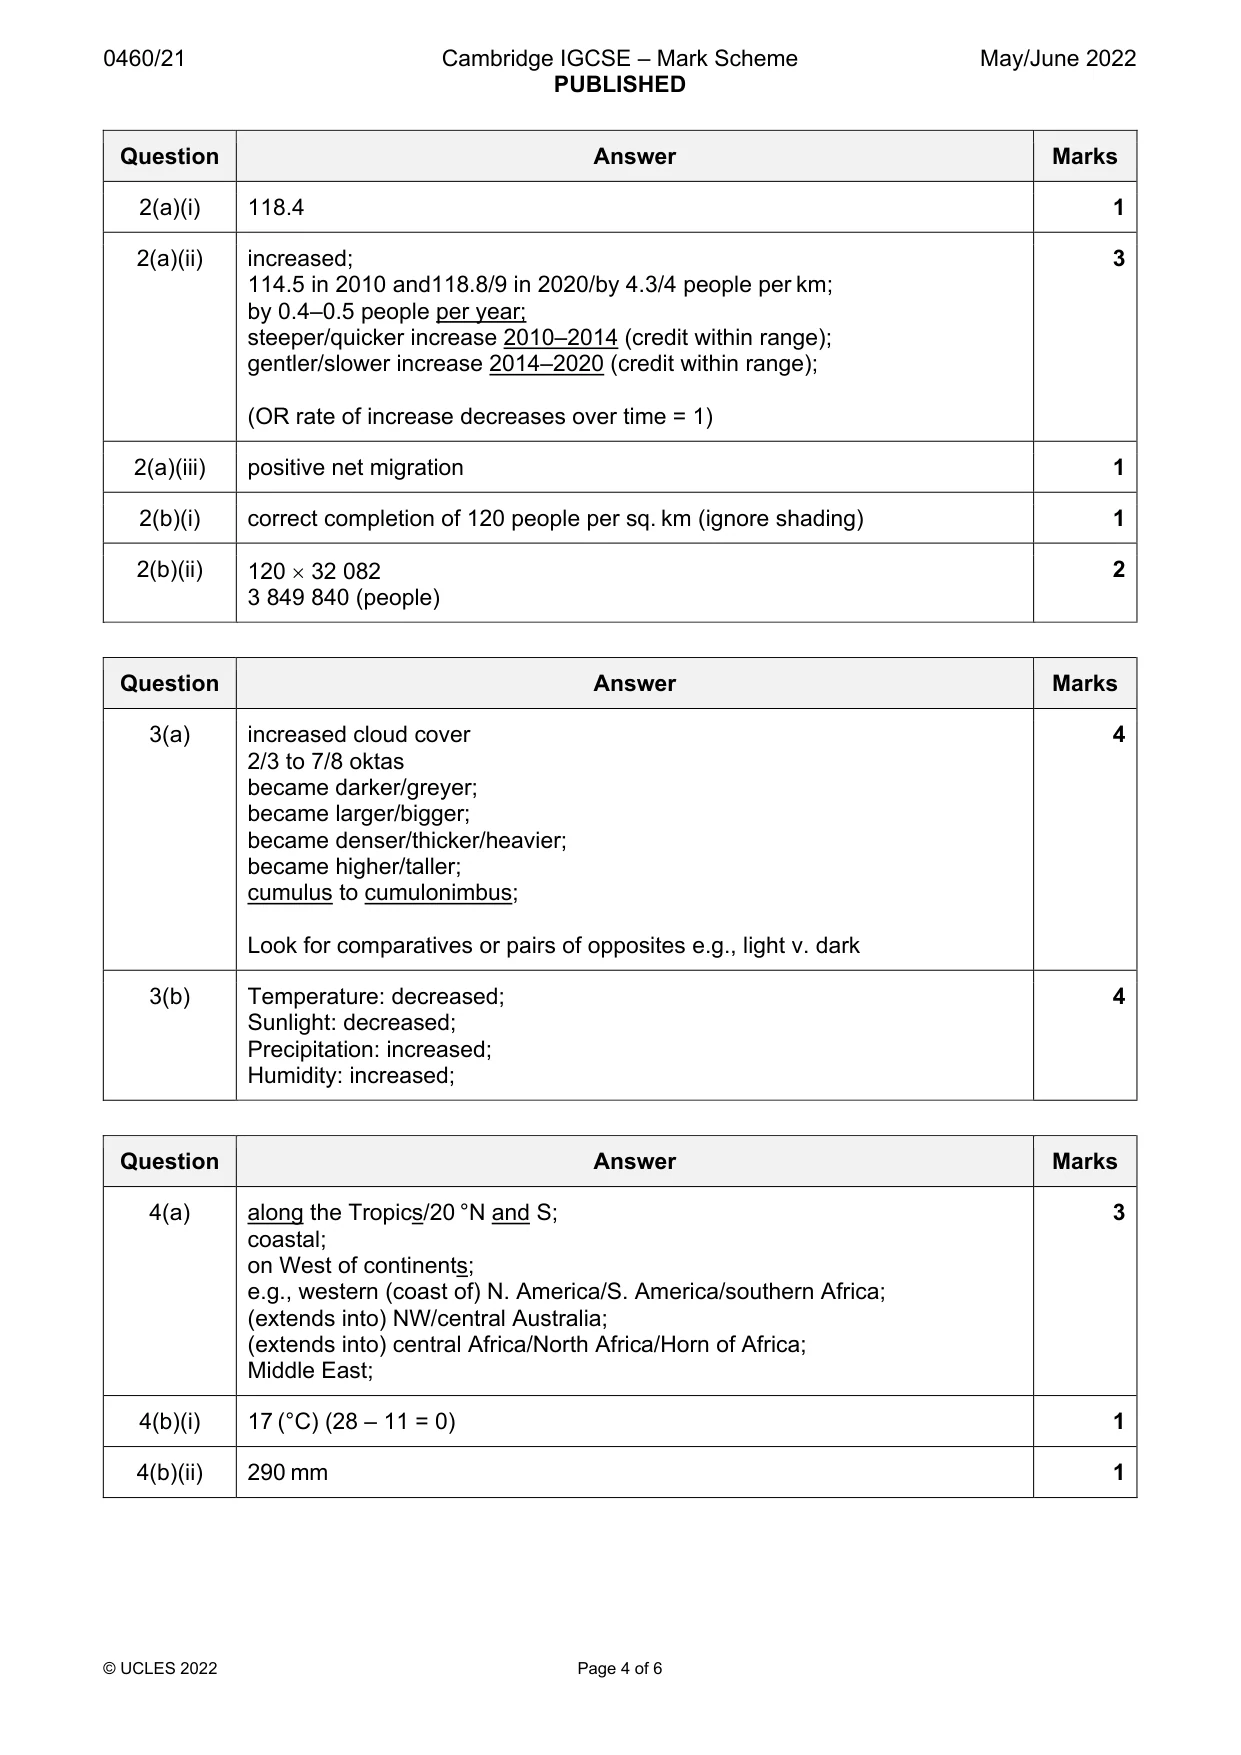
Mark scheme: 2(a)(i) 118.4 1 2(a)(ii) increased; 3 114.5 in 2010 and118.8/9 in 2020/by 4.3/4 people per km; by 0.4–0.5 people per year; steeper/quicker increase 2010–2014 (credit within range); gentler/slower increase 2014–2020 (credit within range); (OR rate of increase decreases over time = 1) 2(a)(iii) positive net migration 1 2(b)(i) correct completion of 120 people per sq. km (ignore shading) 1 2(b)(ii) 120 32 082 2 3 849 840 (people)
Question 3
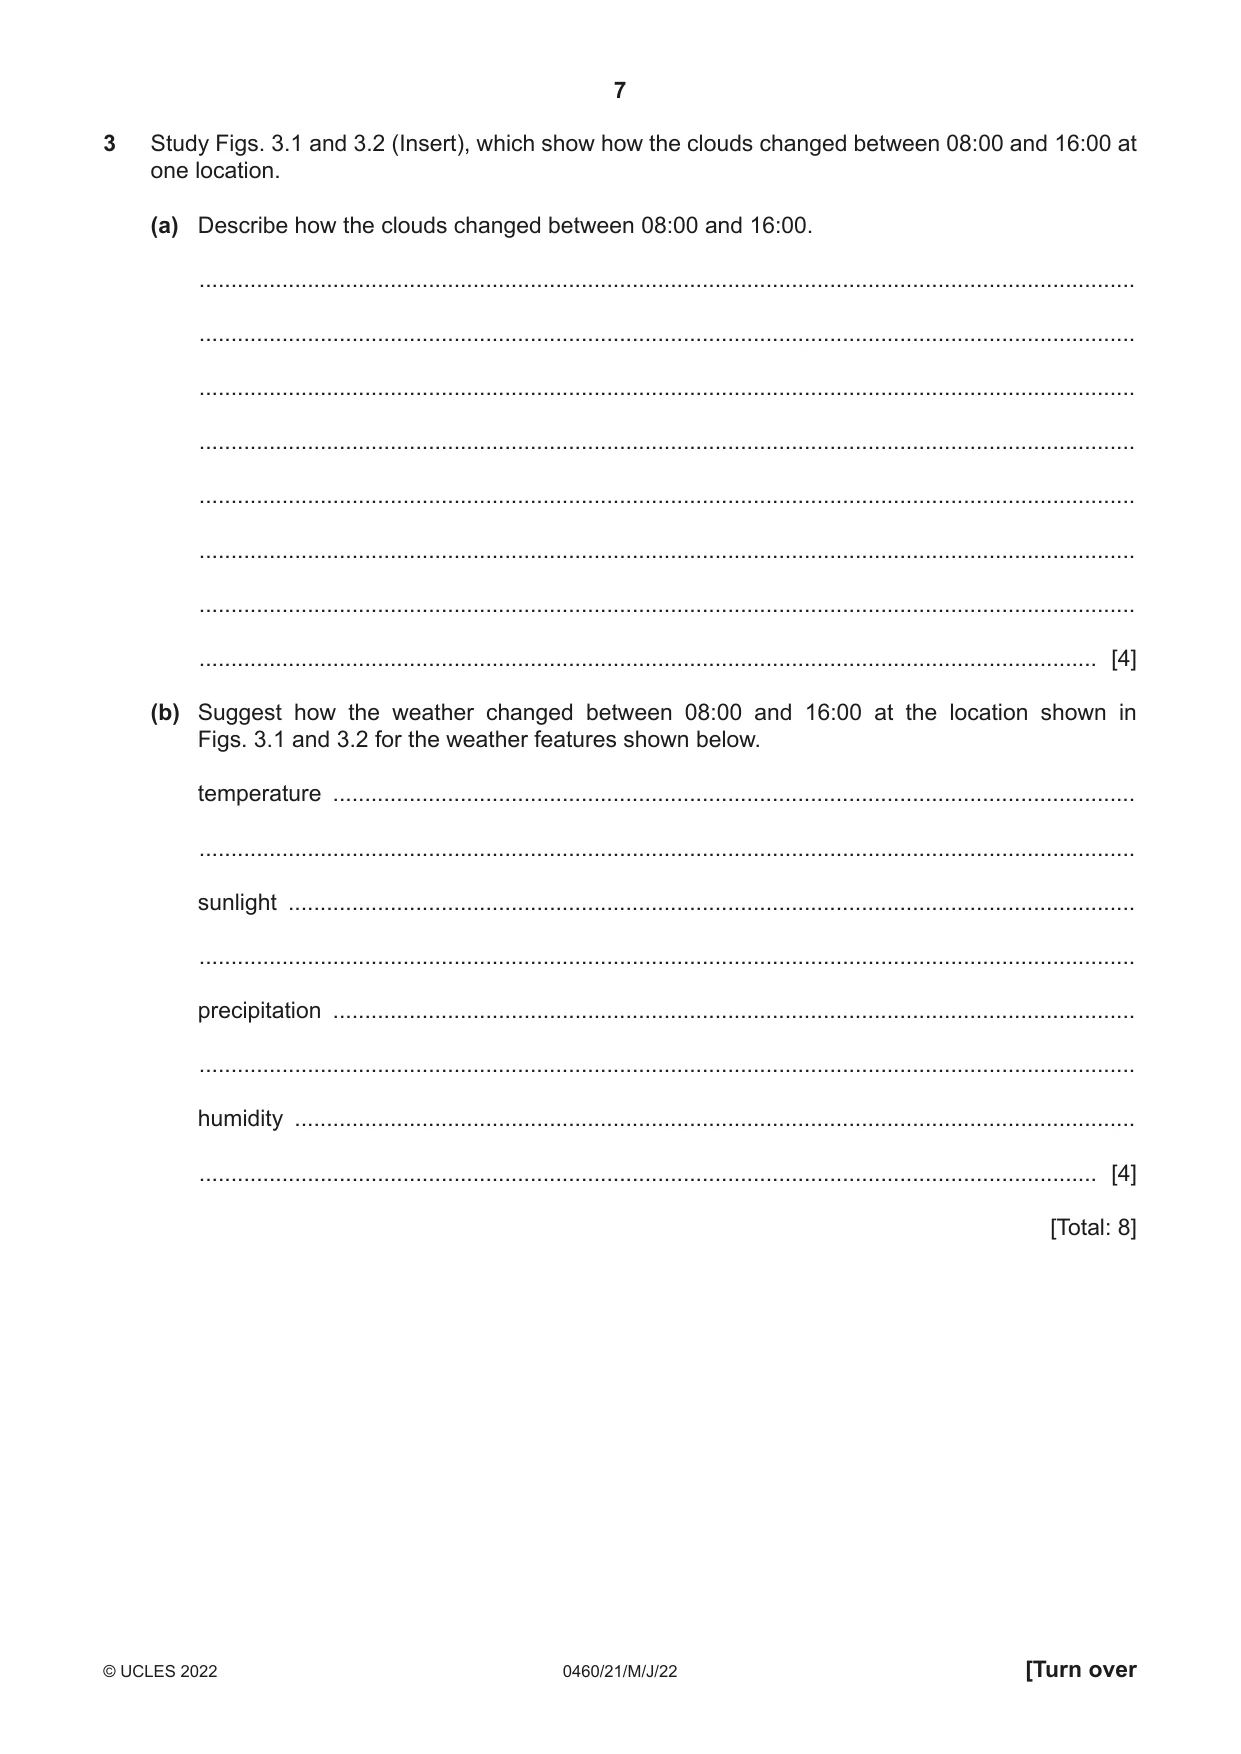
3 Study Figs. 3.1 and 3.2 (Insert), which show how the clouds changed between 08:00 and 16:00 at one location. (a) Describe how the clouds changed between 08:00 and 16:00. ................................................................................................................................................... ................................................................................................................................................... ................................................................................................................................................... ................................................................................................................................................... ................................................................................................................................................... ................................................................................................................................................... ................................................................................................................................................... ............................................................................................................................................. [4] (b) Suggest how the weather changed between 08:00 and 16:00 at the location shown in Figs. 3.1 and 3.2 for the weather features shown below. temperature .............................................................................................................................. ................................................................................................................................................... sunlight ..................................................................................................................................... ................................................................................................................................................... precipitation .............................................................................................................................. ................................................................................................................................................... humidity .................................................................................................................................... ............................................................................................................................................. [4] [Total: 8]
Mark scheme: 3(a) increased cloud cover 4 2/3 to 7/8 oktas became darker/greyer; became larger/bigger; became denser/thicker/heavier; became higher/taller; cumulus to cumulonimbus; Look for comparatives or pairs of opposites e.g., light v. dark 3(b) Temperature: decreased; 4 Sunlight: decreased; Precipitation: increased; Humidity: increased;
Q4 · The locations of hot deserts in the world
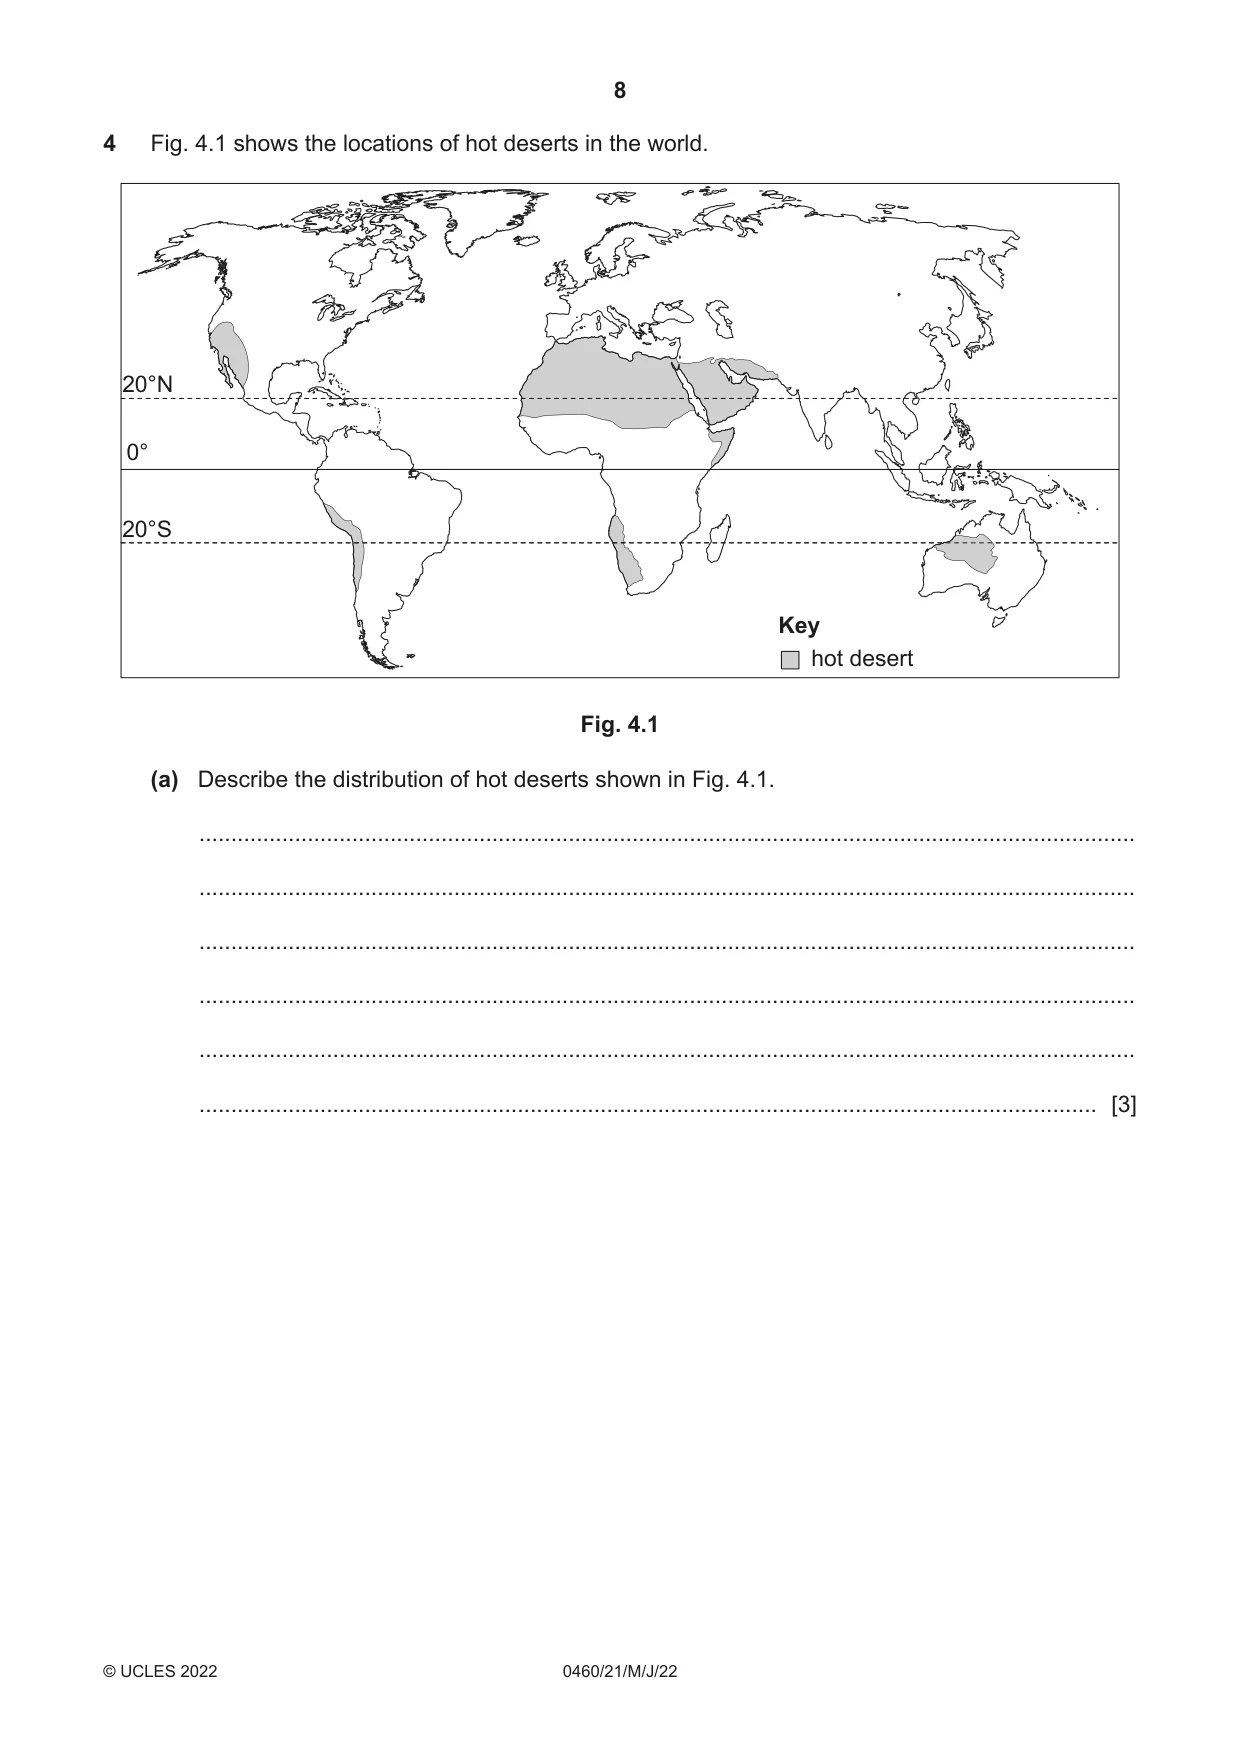
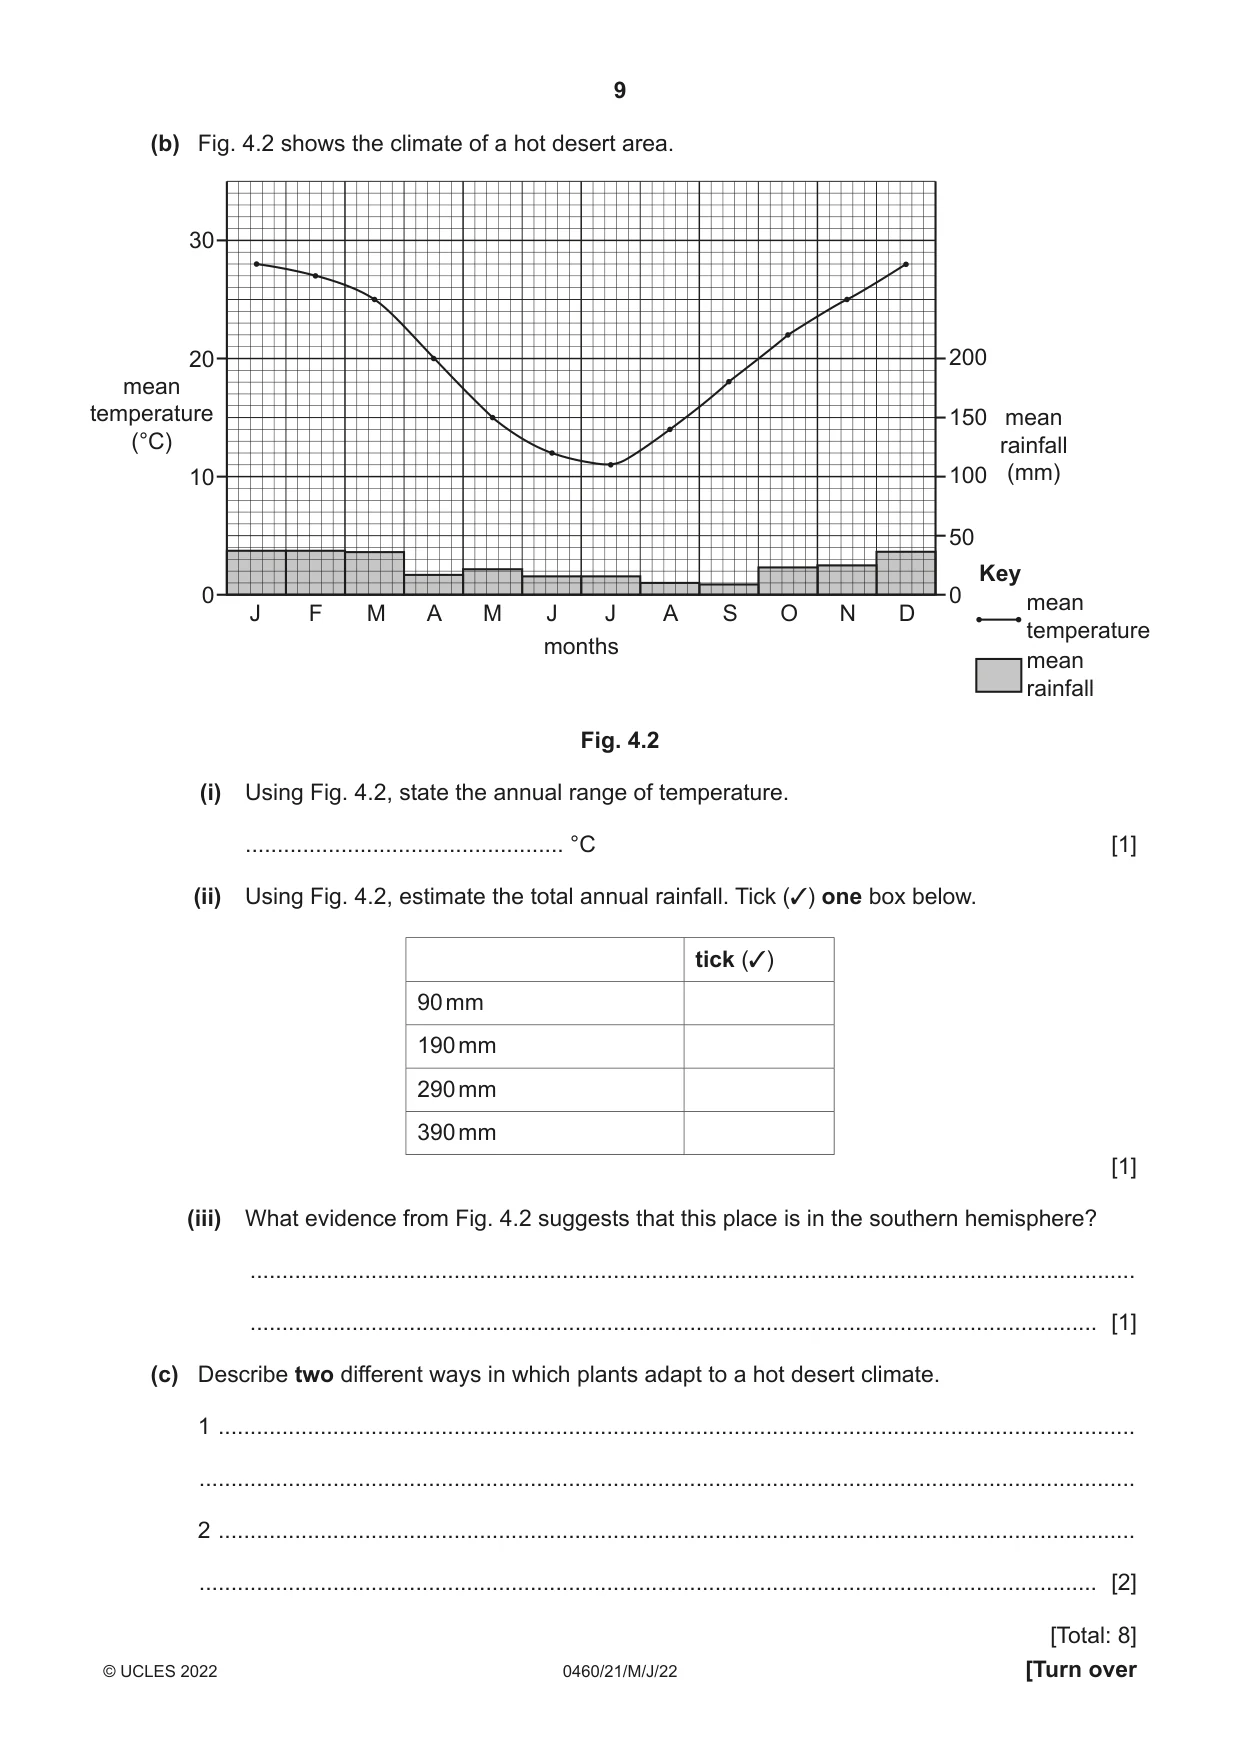
4 Fig. 4.1 shows the locations of hot deserts in the world. 20°N 0° 20°S Key hot desert Fig. 4.1 (a) Describe the distribution of hot deserts shown in Fig. 4.1. ................................................................................................................................................... ................................................................................................................................................... ................................................................................................................................................... ................................................................................................................................................... ................................................................................................................................................... ............................................................................................................................................. [3] (b) Fig. 4.2 shows the climate of a hot desert area. 30 20 200 mean temperature 150 mean (°C) rainfall 10 100 (mm) 50 Key 0 0 mean J F M A M J J A S O N D temperature months mean rainfall Fig. 4.2 (i) Using Fig. 4.2, state the annual range of temperature. .................................................. °C [1] (ii) Using Fig. 4.2, estimate the total annual rainfall. Tick (3) one box below. tick (3) 90 mm 190 mm 290 mm 390 mm [1] (iii) What evidence from Fig. 4.2 suggests that this place is in the southern hemisphere? ........................................................................................................................................... ..................................................................................................................................... [1] (c) Describe two different ways in which plants adapt to a hot desert climate. 1 ................................................................................................................................................ ................................................................................................................................................... 2 ................................................................................................................................................ ............................................................................................................................................. [2] [Total: 8]
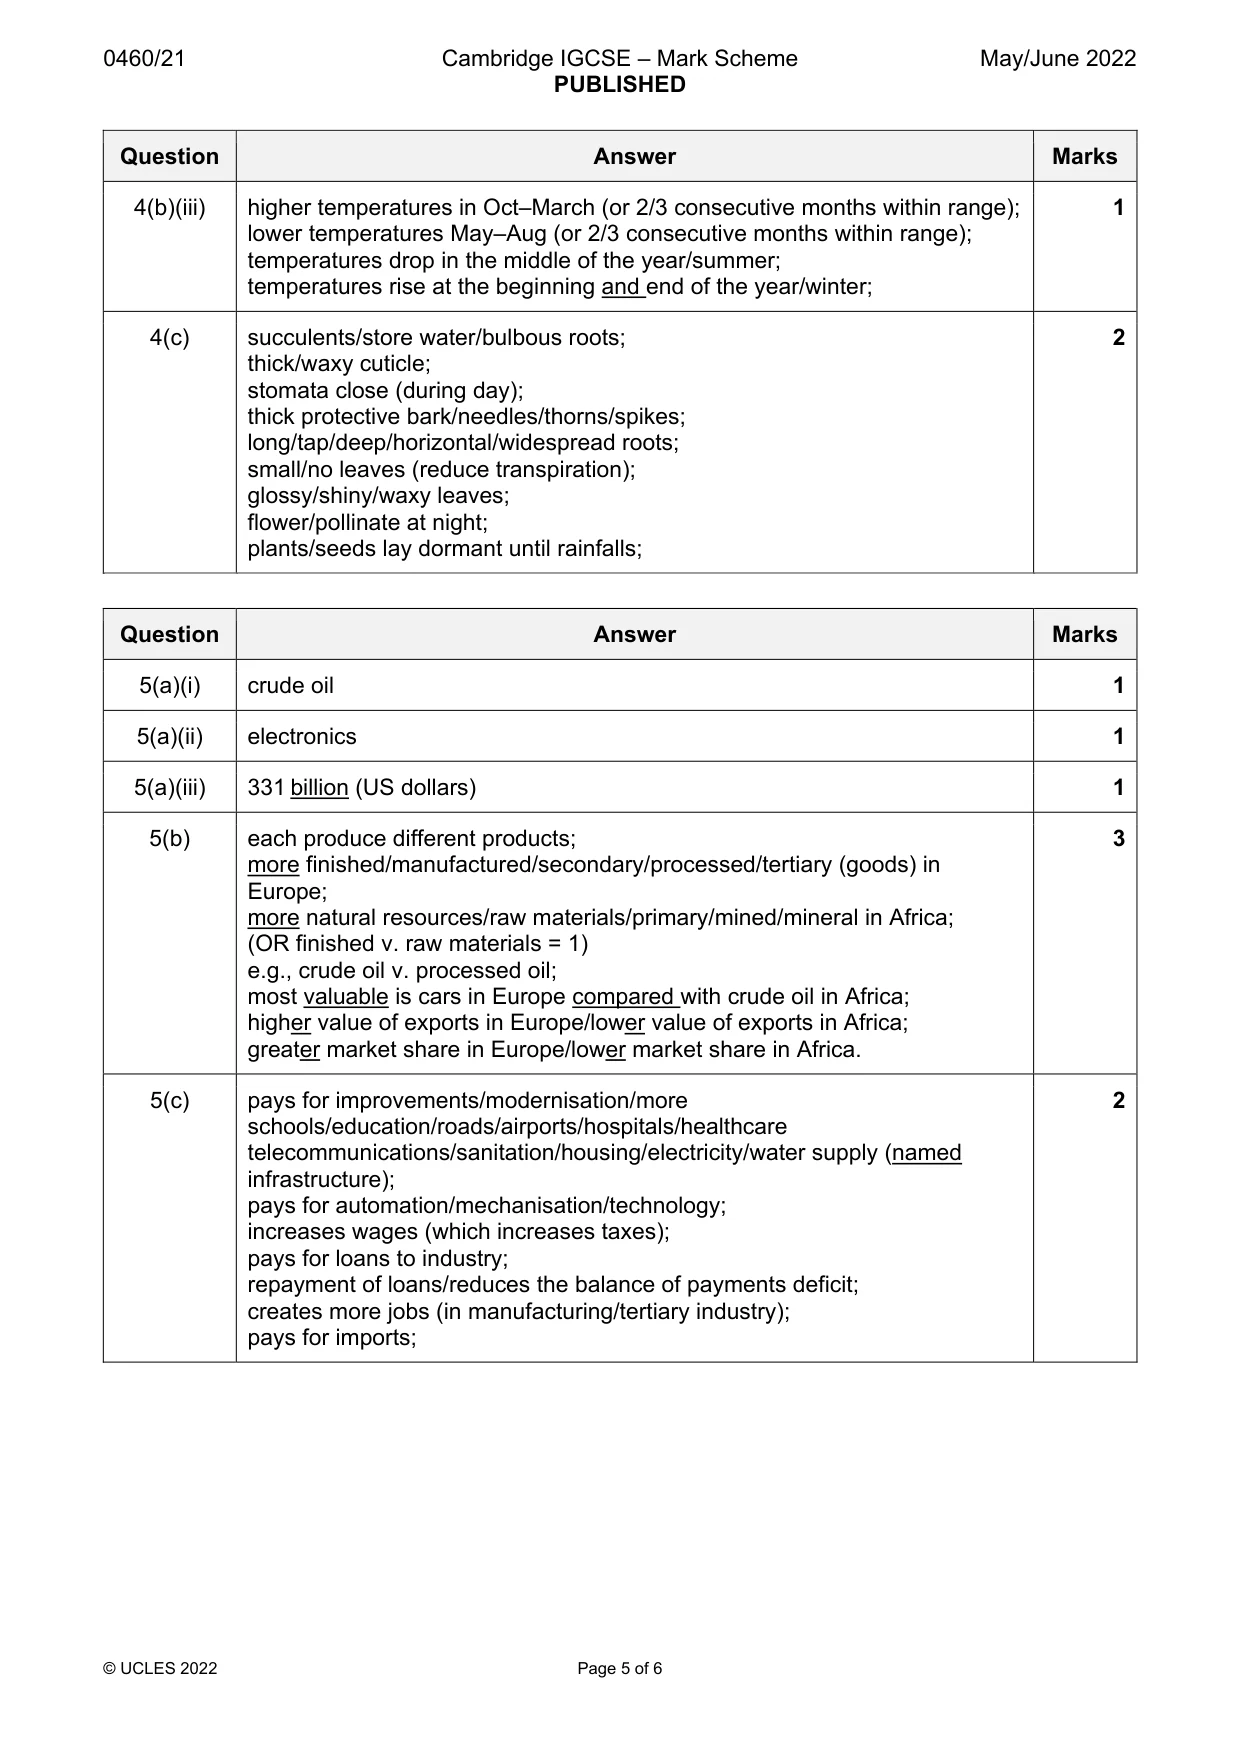
Mark scheme: 4(a) along the Tropics/20 °N and S; 3 coastal; on West of continents; e.g., western (coast of) N. America/S. America/southern Africa; (extends into) NW/central Australia; (extends into) central Africa/North Africa/Horn of Africa; Middle East; 4(b)(i) 17 (°C) (28 – 11 = 0) 1 4(b)(ii) 290 mm 1 4(b)(iii) higher temperatures in Oct–March (or 2/3 consecutive months within range); 1 lower temperatures May–Aug (or 2/3 consecutive months within range); temperatures drop in the middle of the year/summer; temperatures rise at the beginning and end of the year/winter; 4(c) succulents/store water/bulbous roots; 2 thick/waxy cuticle; stomata close (during day); thick protective bark/needles/thorns/spikes; long/tap/deep/horizontal/widespread roots; small/no leaves (reduce transpiration); glossy/shiny/waxy leaves; flower/pollinate at night; plants/seeds lay dormant until rainfalls;
Q5 · The three largest exports for four continents
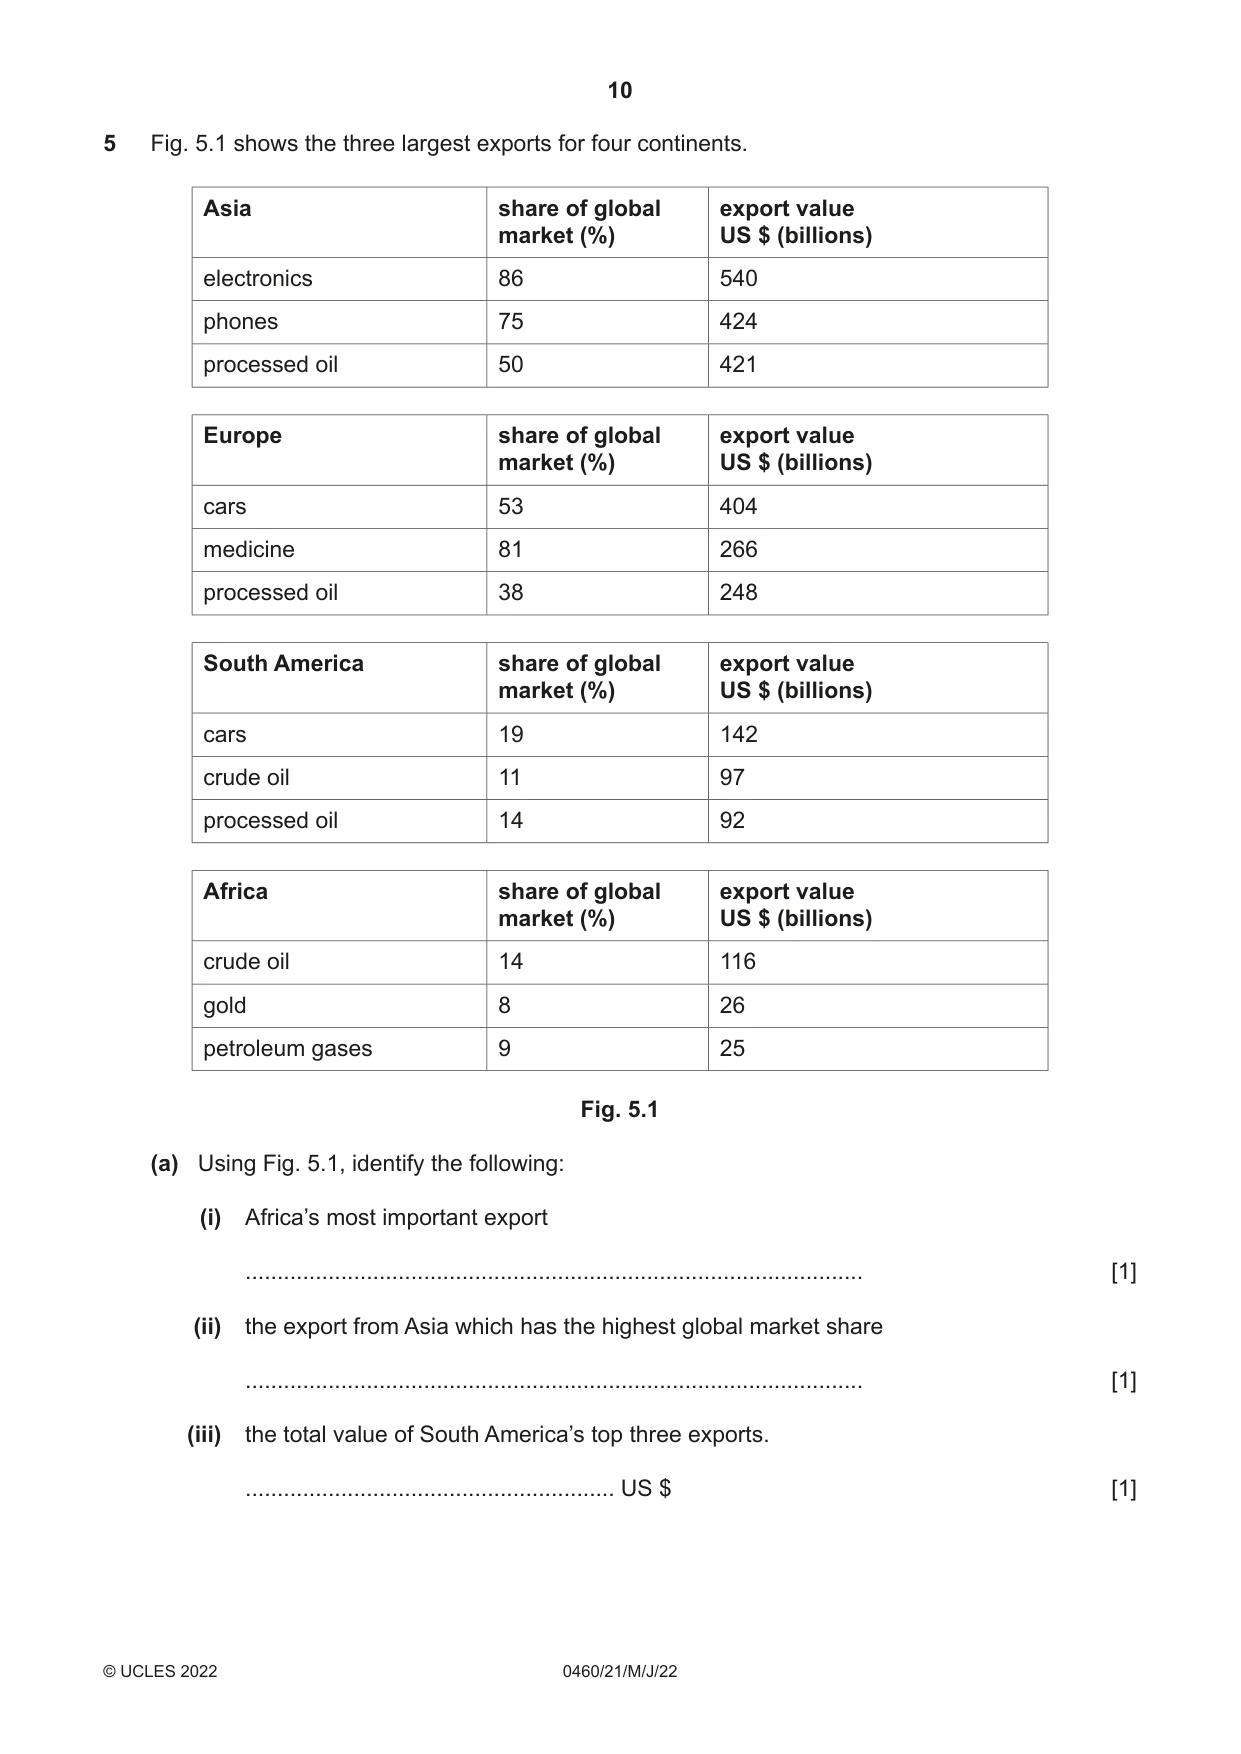
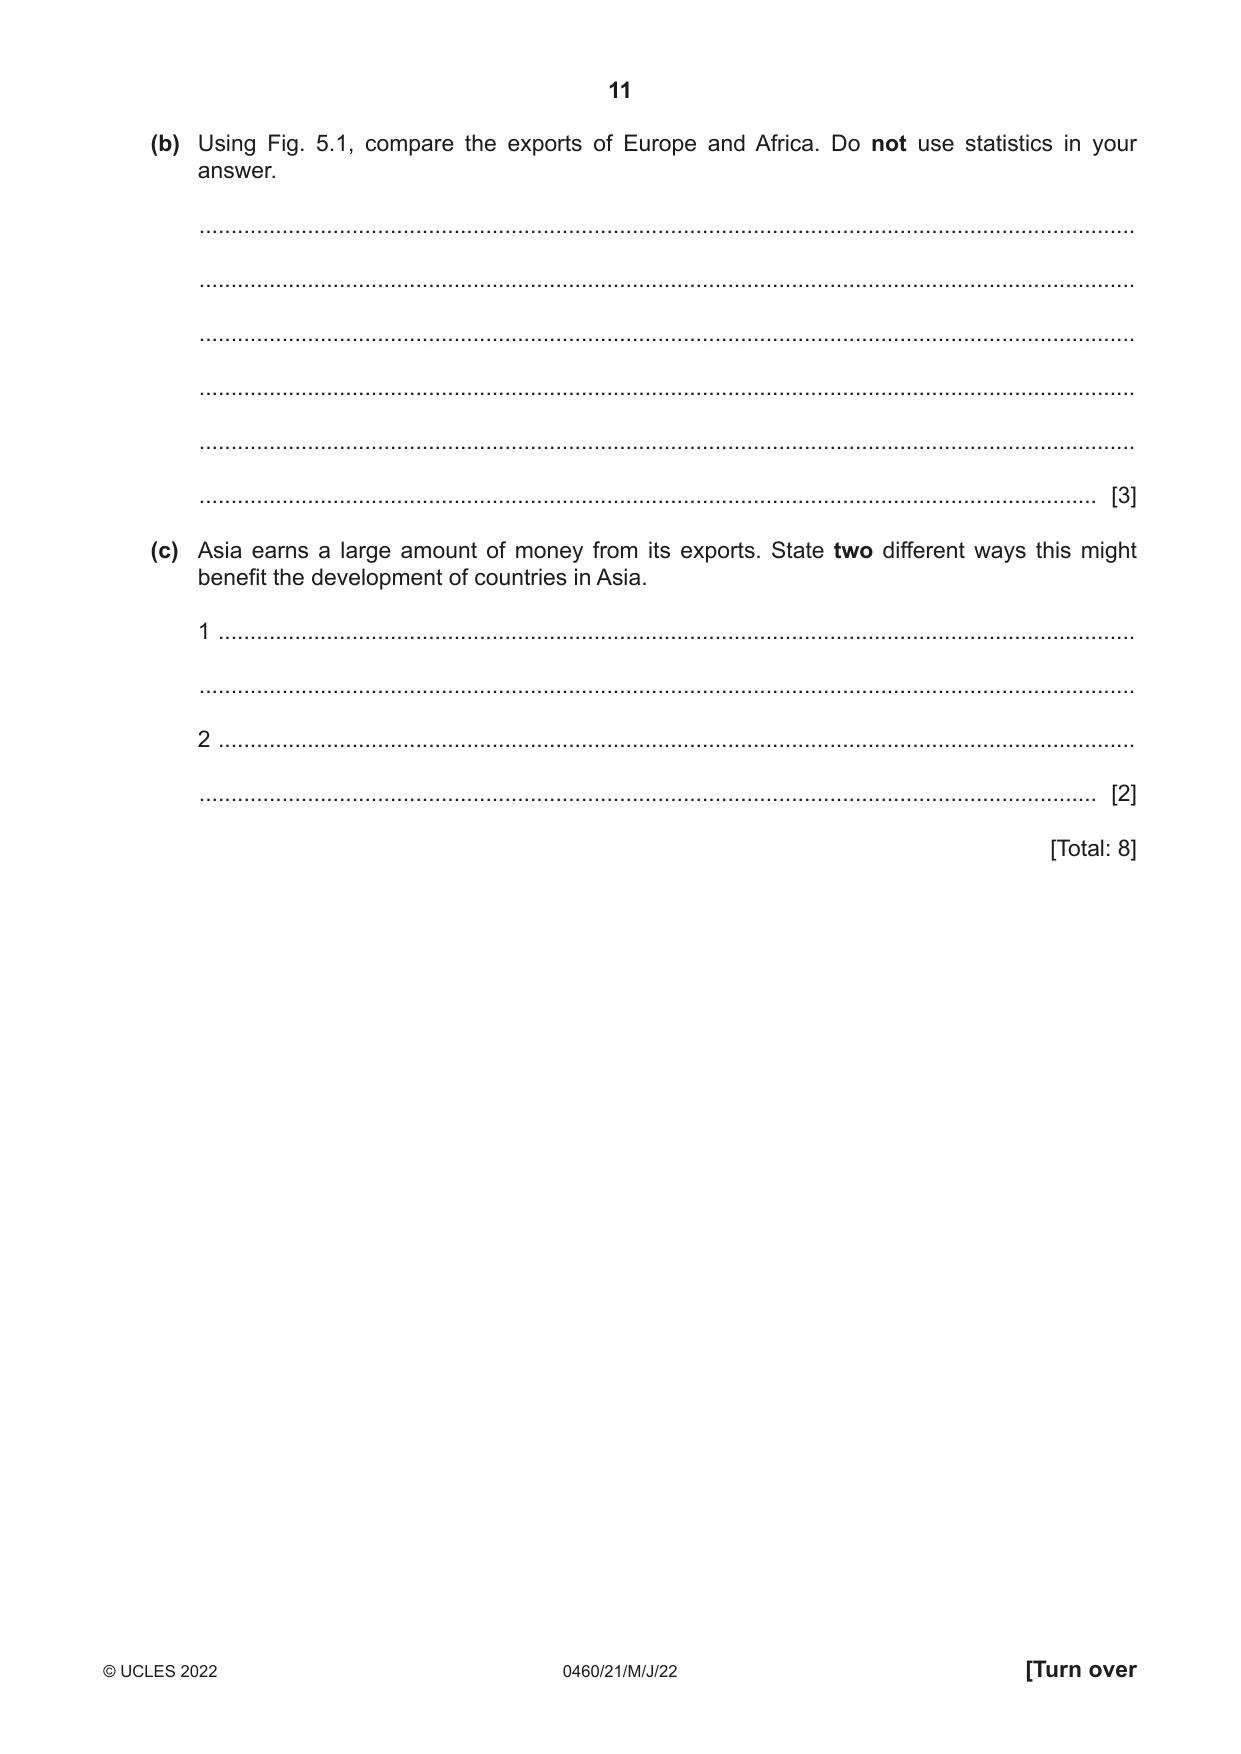
5 Fig. 5.1 shows the three largest exports for four continents. Asia share of global export value market (%) US $ (billions) electronics 86 540 phones 75 424 processed oil 50 421 Europe share of global export value market (%) US $ (billions) cars 53 404 medicine 81 266 processed oil 38 248 South America share of global export value market (%) US $ (billions) cars 19 142 crude oil 11 97 processed oil 14 92 Africa share of global export value market (%) US $ (billions) crude oil 14 116 gold 8 26 petroleum gases 9 25 Fig. 5.1 (a) Using Fig. 5.1, identify the following: (i) Africa’s most important export ................................................................................................. [1] (ii) the export from Asia which has the highest global market share ................................................................................................. [1] (iii) the total value of South America’s top three exports. .......................................................... US $ [1] (b) Using Fig. 5.1, compare the exports of Europe and Africa. Do not use statistics in your answer. ................................................................................................................................................... ................................................................................................................................................... ................................................................................................................................................... ................................................................................................................................................... ................................................................................................................................................... ............................................................................................................................................. [3] (c) Asia earns a large amount of money from its exports. State two different ways this might benefit the development of countries in Asia. 1 ................................................................................................................................................ ................................................................................................................................................... 2 ................................................................................................................................................ ............................................................................................................................................. [2] [Total: 8]
Mark scheme: 5(a)(i) crude oil 1 5(a)(ii) electronics 1 5(a)(iii) 331 billion (US dollars) 1 5(b) each produce different products; 3 more finished/manufactured/secondary/processed/tertiary (goods) in Europe; more natural resources/raw materials/primary/mined/mineral in Africa; (OR finished v. raw materials = 1) e.g., crude oil v. processed oil; most valuable is cars in Europe compared with crude oil in Africa; higher value of exports in Europe/lower value of exports in Africa; greater market share in Europe/lower market share in Africa. 5(c) pays for improvements/modernisation/more 2 schools/education/roads/airports/hospitals/healthcare telecommunications/sanitation/housing/electricity/water supply (named infrastructure); pays for automation/mechanisation/technology; increases wages (which increases taxes); pays for loans to industry; repayment of loans/reduces the balance of payments deficit; creates more jobs (in manufacturing/tertiary industry); pays for imports;
Question 6
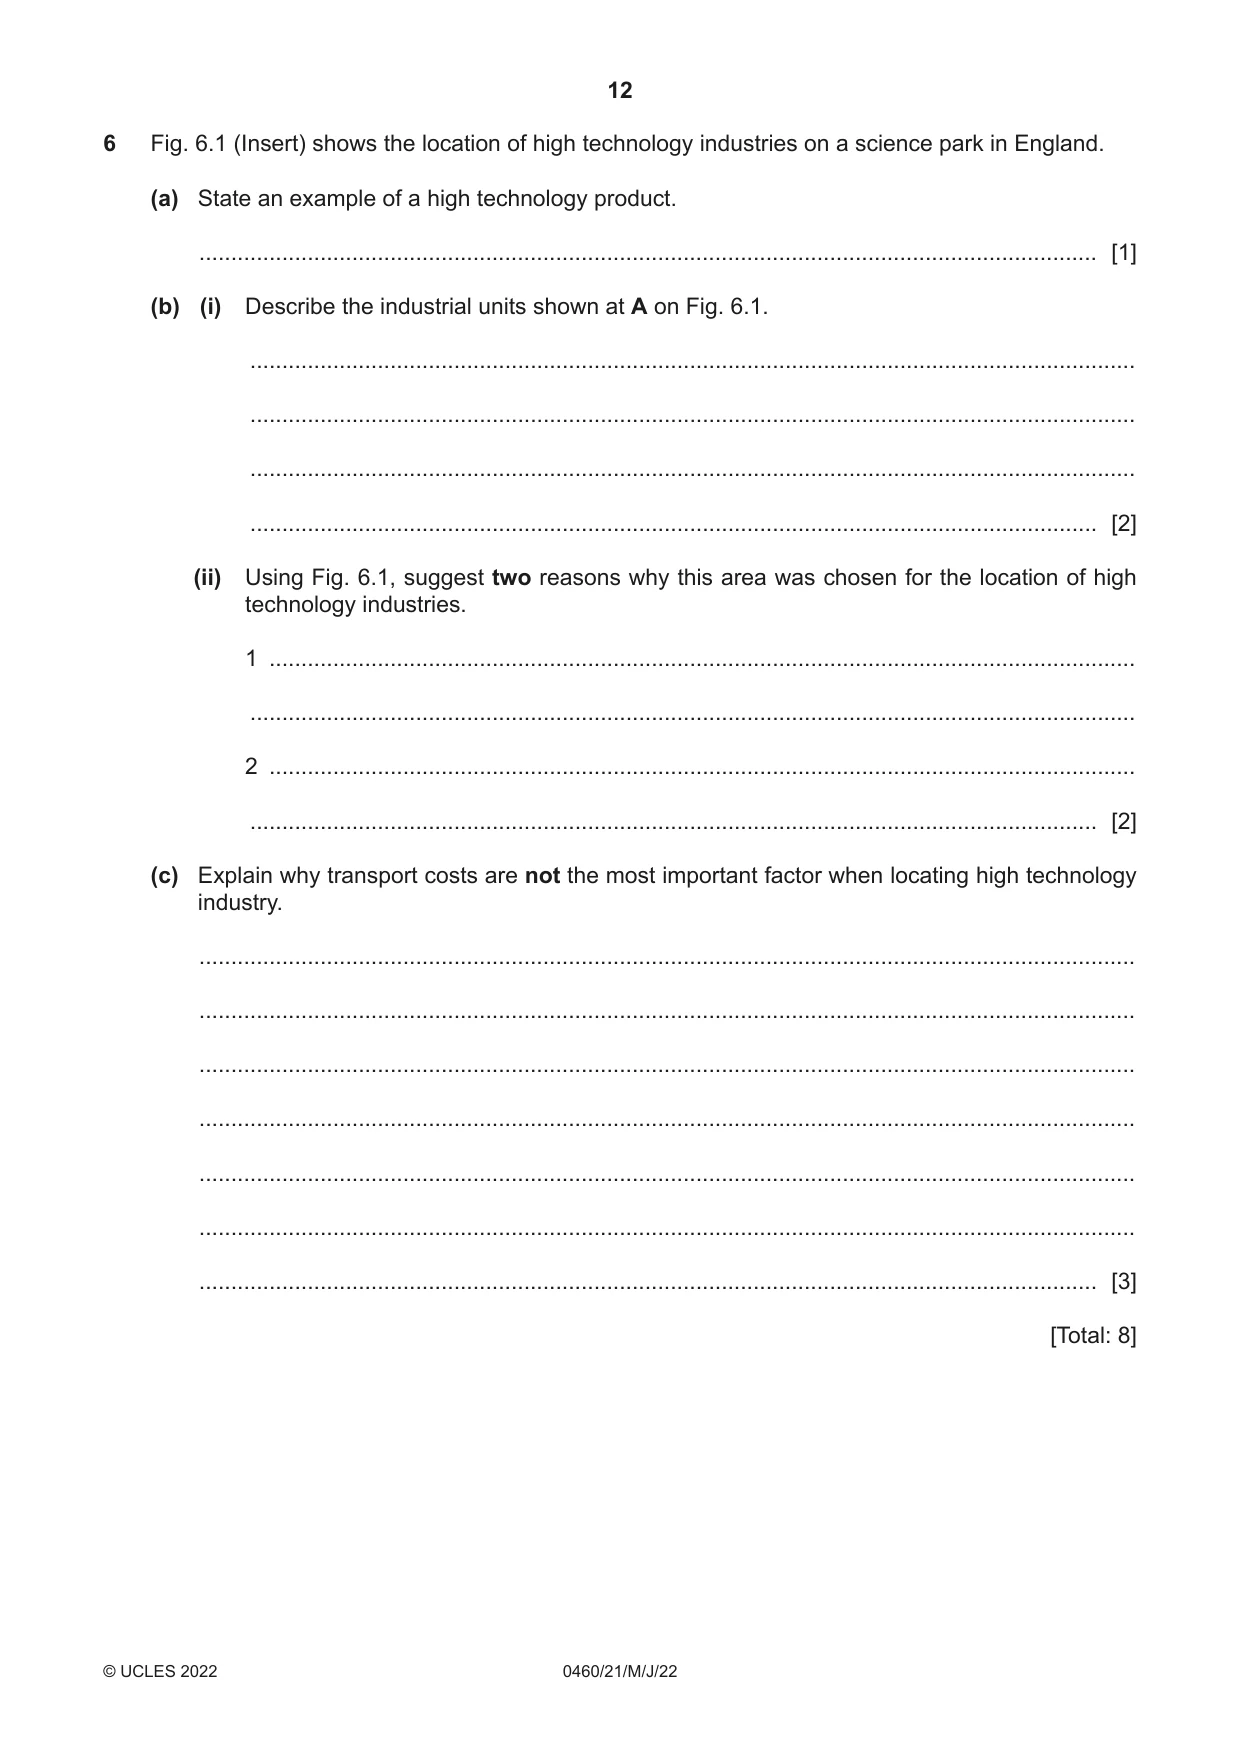
6 Fig. 6.1 (Insert) shows the location of high technology industries on a science park in England. (a) State an example of a high technology product. ............................................................................................................................................. [1] (b) (i) Describe the industrial units shown at A on Fig. 6.1. ........................................................................................................................................... ........................................................................................................................................... ........................................................................................................................................... ..................................................................................................................................... [2] (ii) Using Fig. 6.1, suggest two reasons why this area was chosen for the location of high technology industries. 1 ........................................................................................................................................ ........................................................................................................................................... 2 ........................................................................................................................................ ..................................................................................................................................... [2] (c) Explain why transport costs are not the most important factor when locating high technology industry. ................................................................................................................................................... ................................................................................................................................................... ................................................................................................................................................... ................................................................................................................................................... ................................................................................................................................................... ................................................................................................................................................... ............................................................................................................................................. [3] [Total: 8] Additional pages If you use the following pages to complete the answer to any question, the question number must be clearly shown. .................................................................................................................................................................. .................................................................................................................................................................. .................................................................................................................................................................. .................................................................................................................................................................. .................................................................................................................................................................. .................................................................................................................................................................. .................................................................................................................................................................. .................................................................................................................................................................. .................................................................................................................................................................. .................................................................................................................................................................. .................................................................................................................................................................. .................................................................................................................................................................. .................................................................................................................................................................. .................................................................................................................................................................. .................................................................................................................................................................. .................................................................................................................................................................. .................................................................................................................................................................. .................................................................................................................................................................. .................................................................................................................................................................. .................................................................................................................................................................. .................................................................................................................................................................. .................................................................................................................................................................. .................................................................................................................................................................. .................................................................................................................................................................. .................................................................................................................................................................. .................................................................................................................................................................. .................................................................................................................................................................. .................................................................................................................................................................. .................................................................................................................................................................. .................................................................................................................................................................. .................................................................................................................................................................. .................................................................................................................................................................. .................................................................................................................................................................. .................................................................................................................................................................. .................................................................................................................................................................. .................................................................................................................................................................. .................................................................................................................................................................. .................................................................................................................................................................. .................................................................................................................................................................. .................................................................................................................................................................. .................................................................................................................................................................. .................................................................................................................................................................. .................................................................................................................................................................. .................................................................................................................................................................. .................................................................................................................................................................. .................................................................................................................................................................. .................................................................................................................................................................. .................................................................................................................................................................. .................................................................................................................................................................. .................................................................................................................................................................. .................................................................................................................................................................. .................................................................................................................................................................. ..................................................................................................................................................................
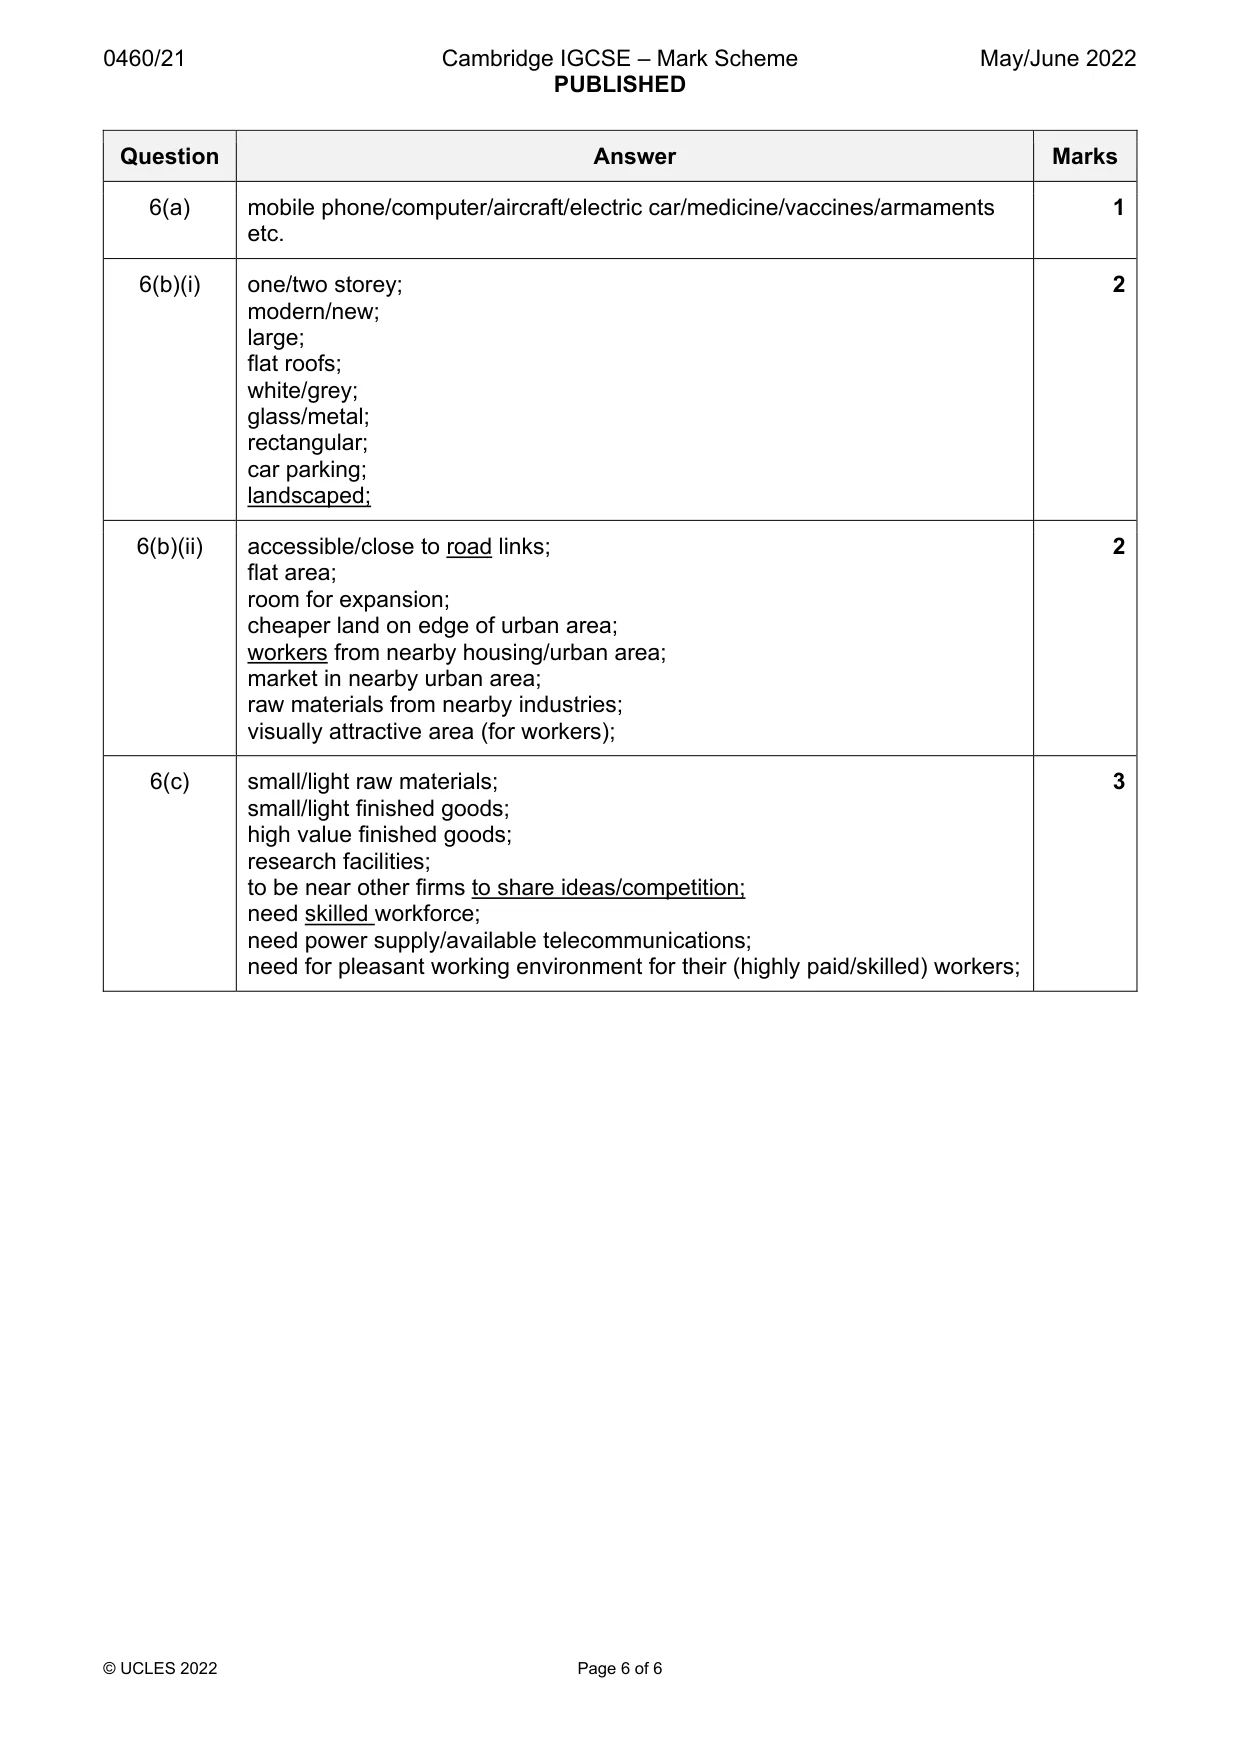
Mark scheme: 6(a) mobile phone/computer/aircraft/electric car/medicine/vaccines/armaments 1 etc. 6(b)(i) one/two storey; 2 modern/new; large; flat roofs; white/grey; glass/metal; rectangular; car parking; landscaped; 6(b)(ii) accessible/close to road links; 2 flat area; room for expansion; cheaper land on edge of urban area; workers from nearby housing/urban area; market in nearby urban area; raw materials from nearby industries; visually attractive area (for workers); 6(c) small/light raw materials; 3 small/light finished goods; high value finished goods; research facilities; to be near other firms to share ideas/competition; need skilled workforce; need power supply/available telecommunications; need for pleasant working environment for their (highly paid/skilled) workers;
What was in this paper
The subtopics covered by these 6 questions, and how many questions each got. Open one in a new tab to see every Cambridge question on it.
What you needed in this session
Cambridge’s own grade thresholds for 2022 May/June, Paper 2 · Variant 1. A higher threshold means an easier paper — the bar moves with how the cohort did.