Cambridge IGCSE Geography 0460 — 2021 Oct/Nov Paper 2 · Variant 1
0460/21/O/N/21 · 6 questions · 60 marks · ≈68 min
The question paper and its mark scheme, free to read here and free to download. This is Cambridge’s own paper, exactly as it was sat.
Question paper16 pages




Mark scheme6 pages
Answers below. Sit the paper first if you are practising.
Questions as text
Q1 · Study the map extract for Bois de Grandval, France
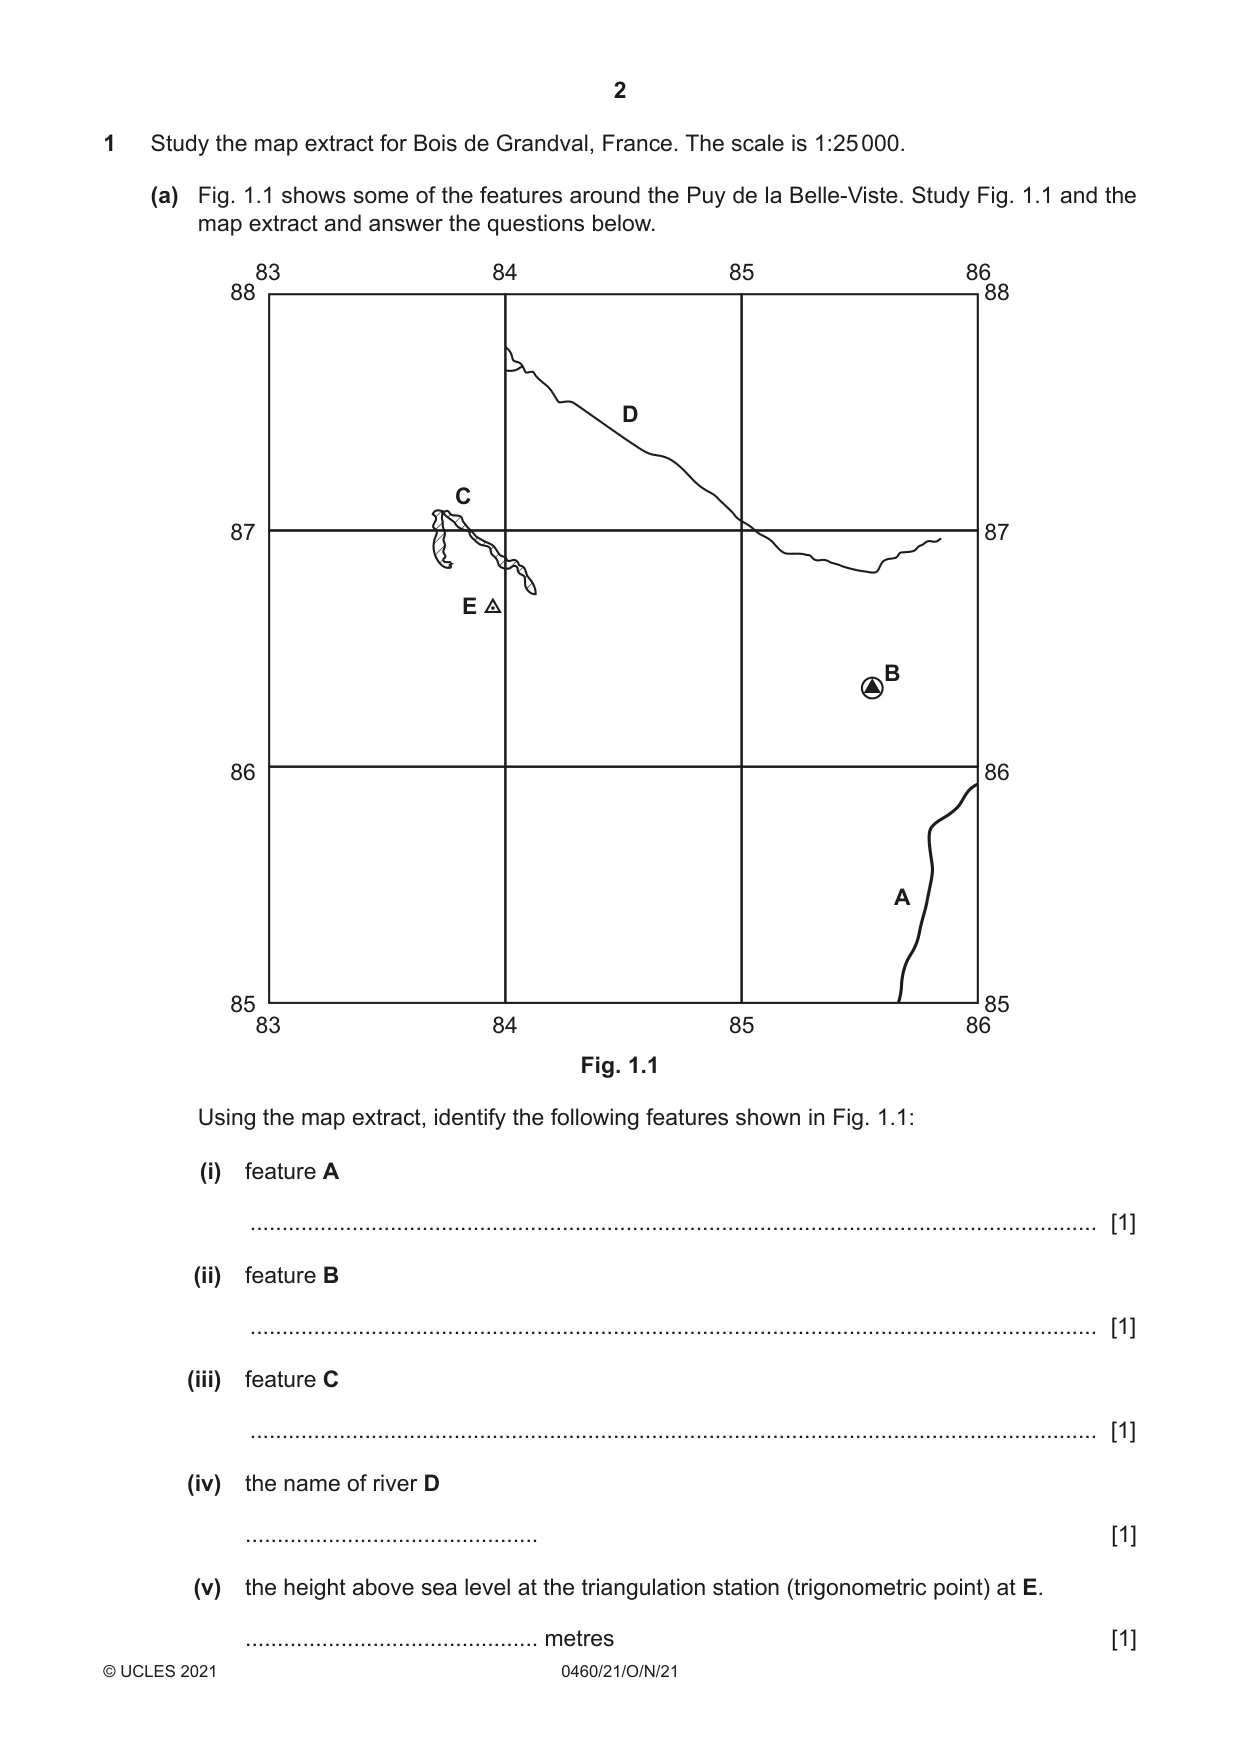
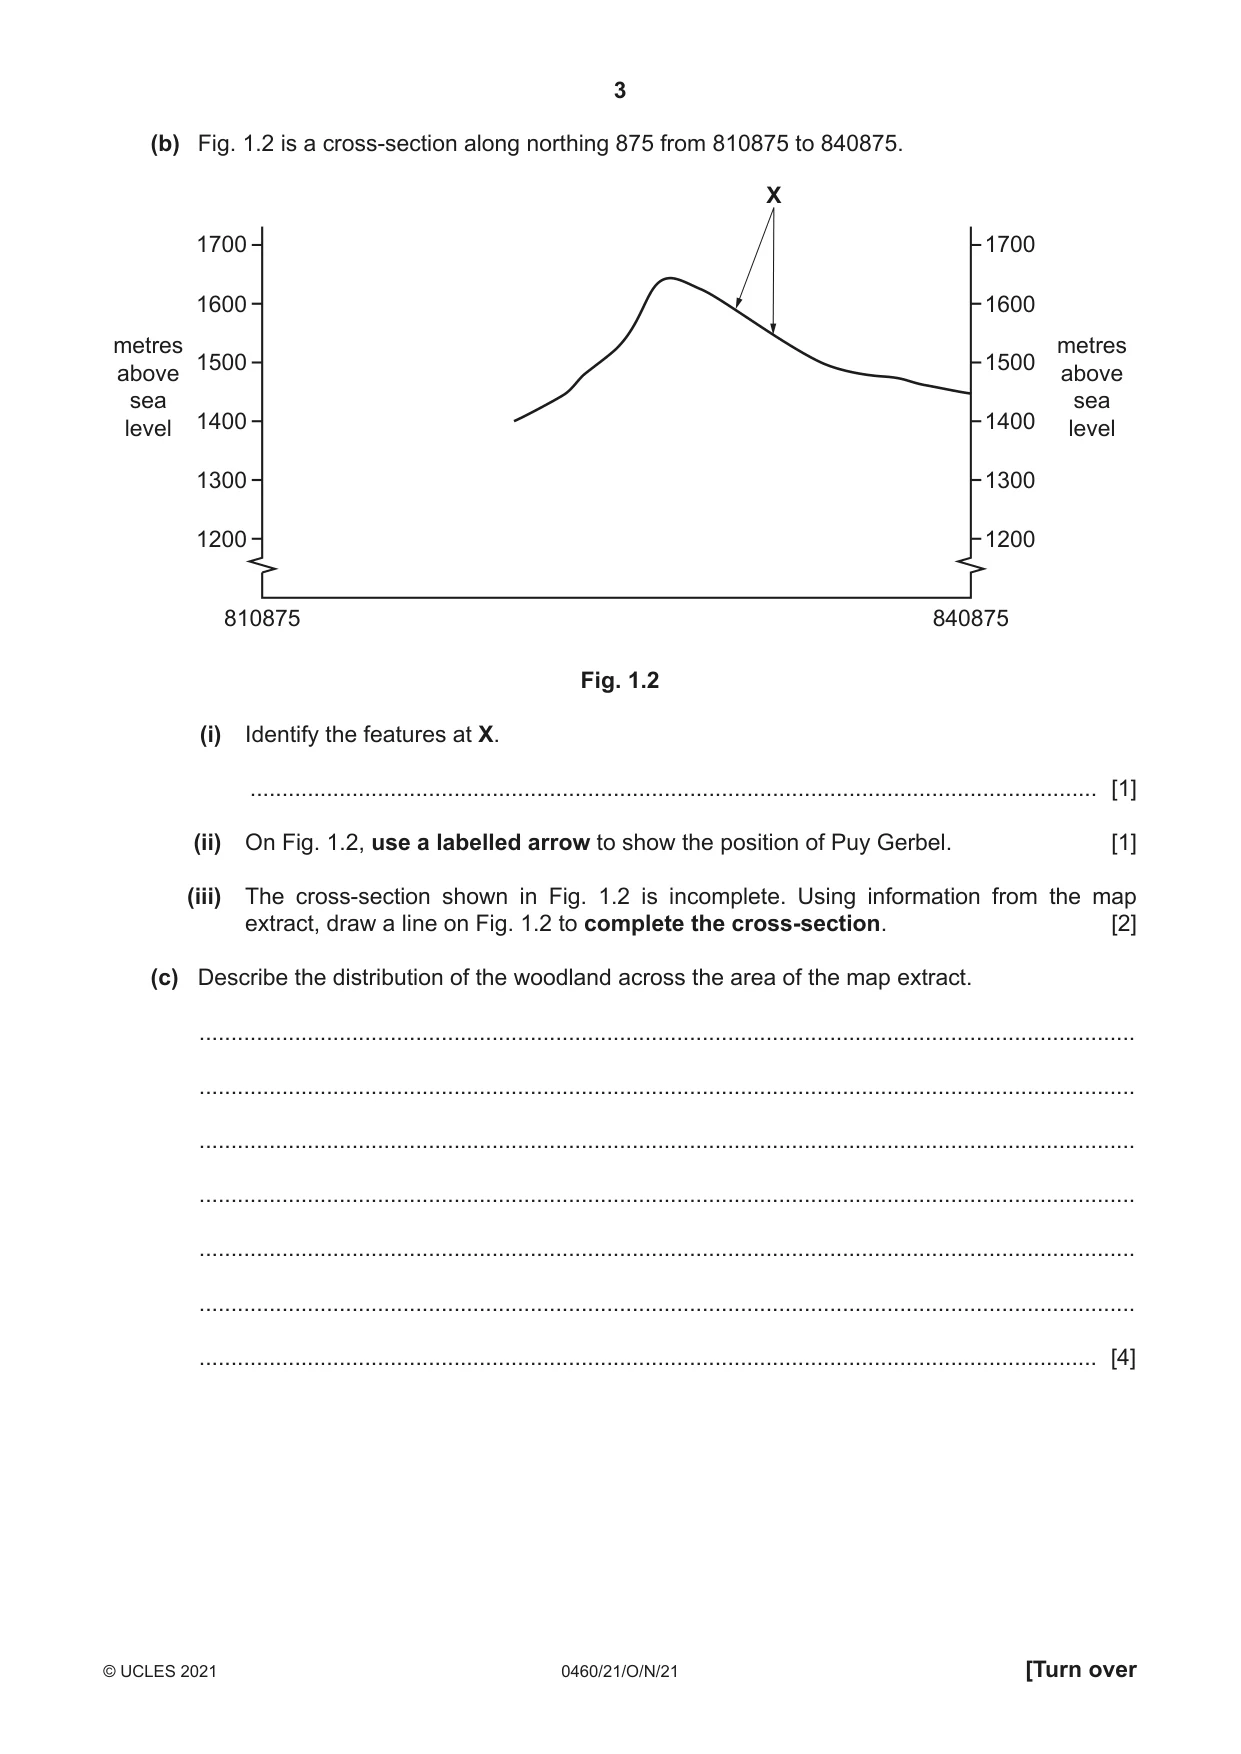
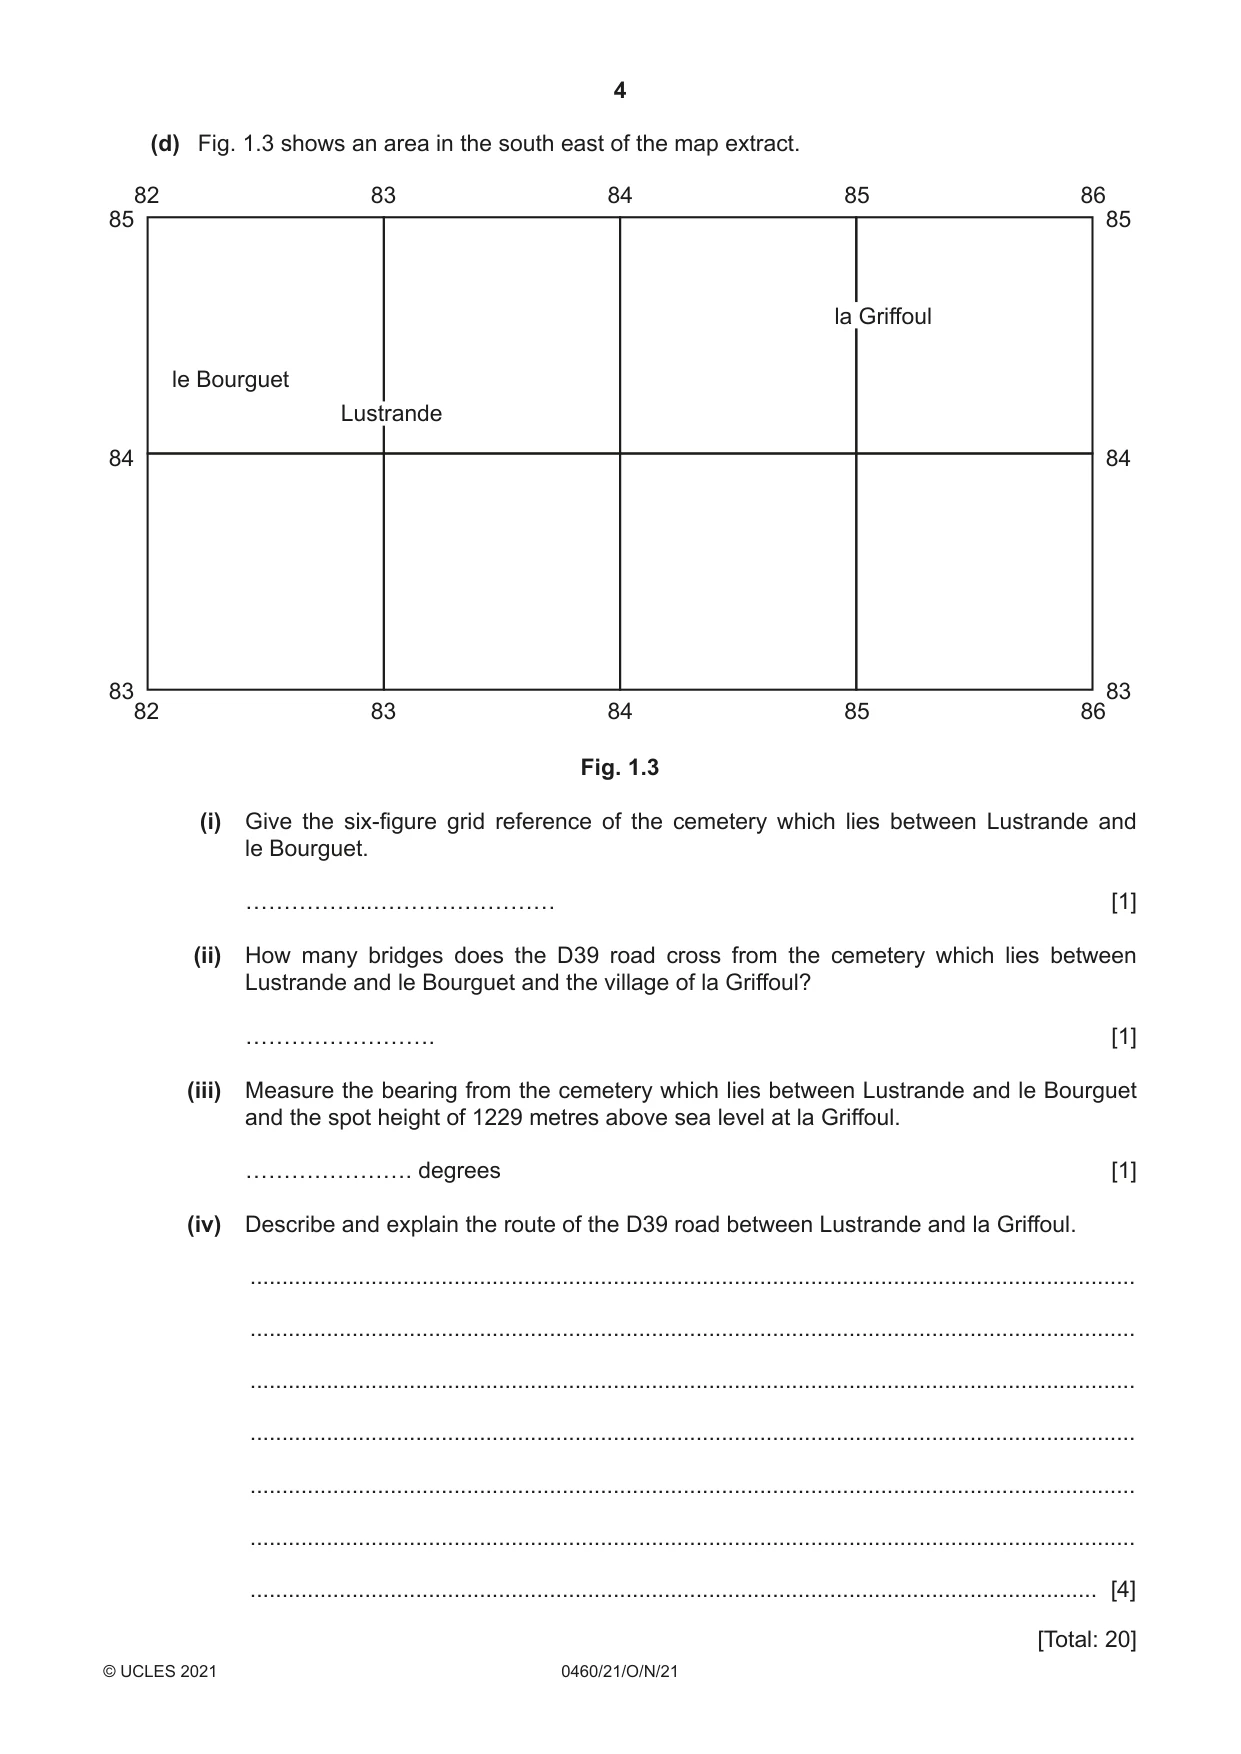
1 Study the map extract for Bois de Grandval, France. The scale is 1:25 000. (a) Fig. 1.1 shows some of the features around the Puy de la Belle-Viste. Study Fig. 1.1 and the map extract and answer the questions below. 83 84 85 86 88 88 D C 87 87 E B 86 86 A 85 85 83 84 85 86 Fig. 1.1 Using the map extract, identify the following features shown in Fig. 1.1: (i) feature A ..................................................................................................................................... [1] (ii) feature B ..................................................................................................................................... [1] (iii) feature C ..................................................................................................................................... [1] (iv) the name of river D .............................................. [1] (v) the height above sea level at the triangulation station (trigonometric point) at E. .............................................. metres [1] (b) Fig. 1.2 is a cross-section along northing 875 from 810875 to 840875. X 1700 1700 1600 1600 metres metres 1500 1500above above sea sea 1400 1400 level level 1300 1300 1200 1200 810875 840875 Fig. 1.2 (i) Identify the features at X. ..................................................................................................................................... [1] (ii) On Fig. 1.2, use a labelled arrow to show the position of Puy Gerbel. [1] (iii) The cross-section shown in Fig. 1.2 is incomplete. Using information from the map extract, draw a line on Fig. 1.2 to complete the cross-section. [2] (c) Describe the distribution of the woodland across the area of the map extract. ................................................................................................................................................... ................................................................................................................................................... ................................................................................................................................................... ................................................................................................................................................... ................................................................................................................................................... ................................................................................................................................................... ............................................................................................................................................. [4] (d) Fig. 1.3 shows an area in the south east of the map extract. 82 83 84 85 86 85 85 la Griffoul le Bourguet Lustrande 84 84 83 83 82 83 84 85 86 Fig. 1.3 (i) Give the six-figure grid reference of the cemetery which lies between Lustrande and le Bourguet. [1] (ii) How many bridges does the D39 road cross from the cemetery which lies between Lustrande and le Bourguet and the village of la Griffoul? [1] (iii) Measure the bearing from the cemetery which lies between Lustrande and le Bourguet and the spot height of 1229 metres above sea level at la Griffoul. …………………. degrees [1] (iv) Describe and explain the route of the D39 road between Lustrande and la Griffoul. ........................................................................................................................................... ........................................................................................................................................... ........................................................................................................................................... ........................................................................................................................................... ........................................................................................................................................... ........................................................................................................................................... ..................................................................................................................................... [4] [Total: 20] TURN PAGE FOR QUESTION 2
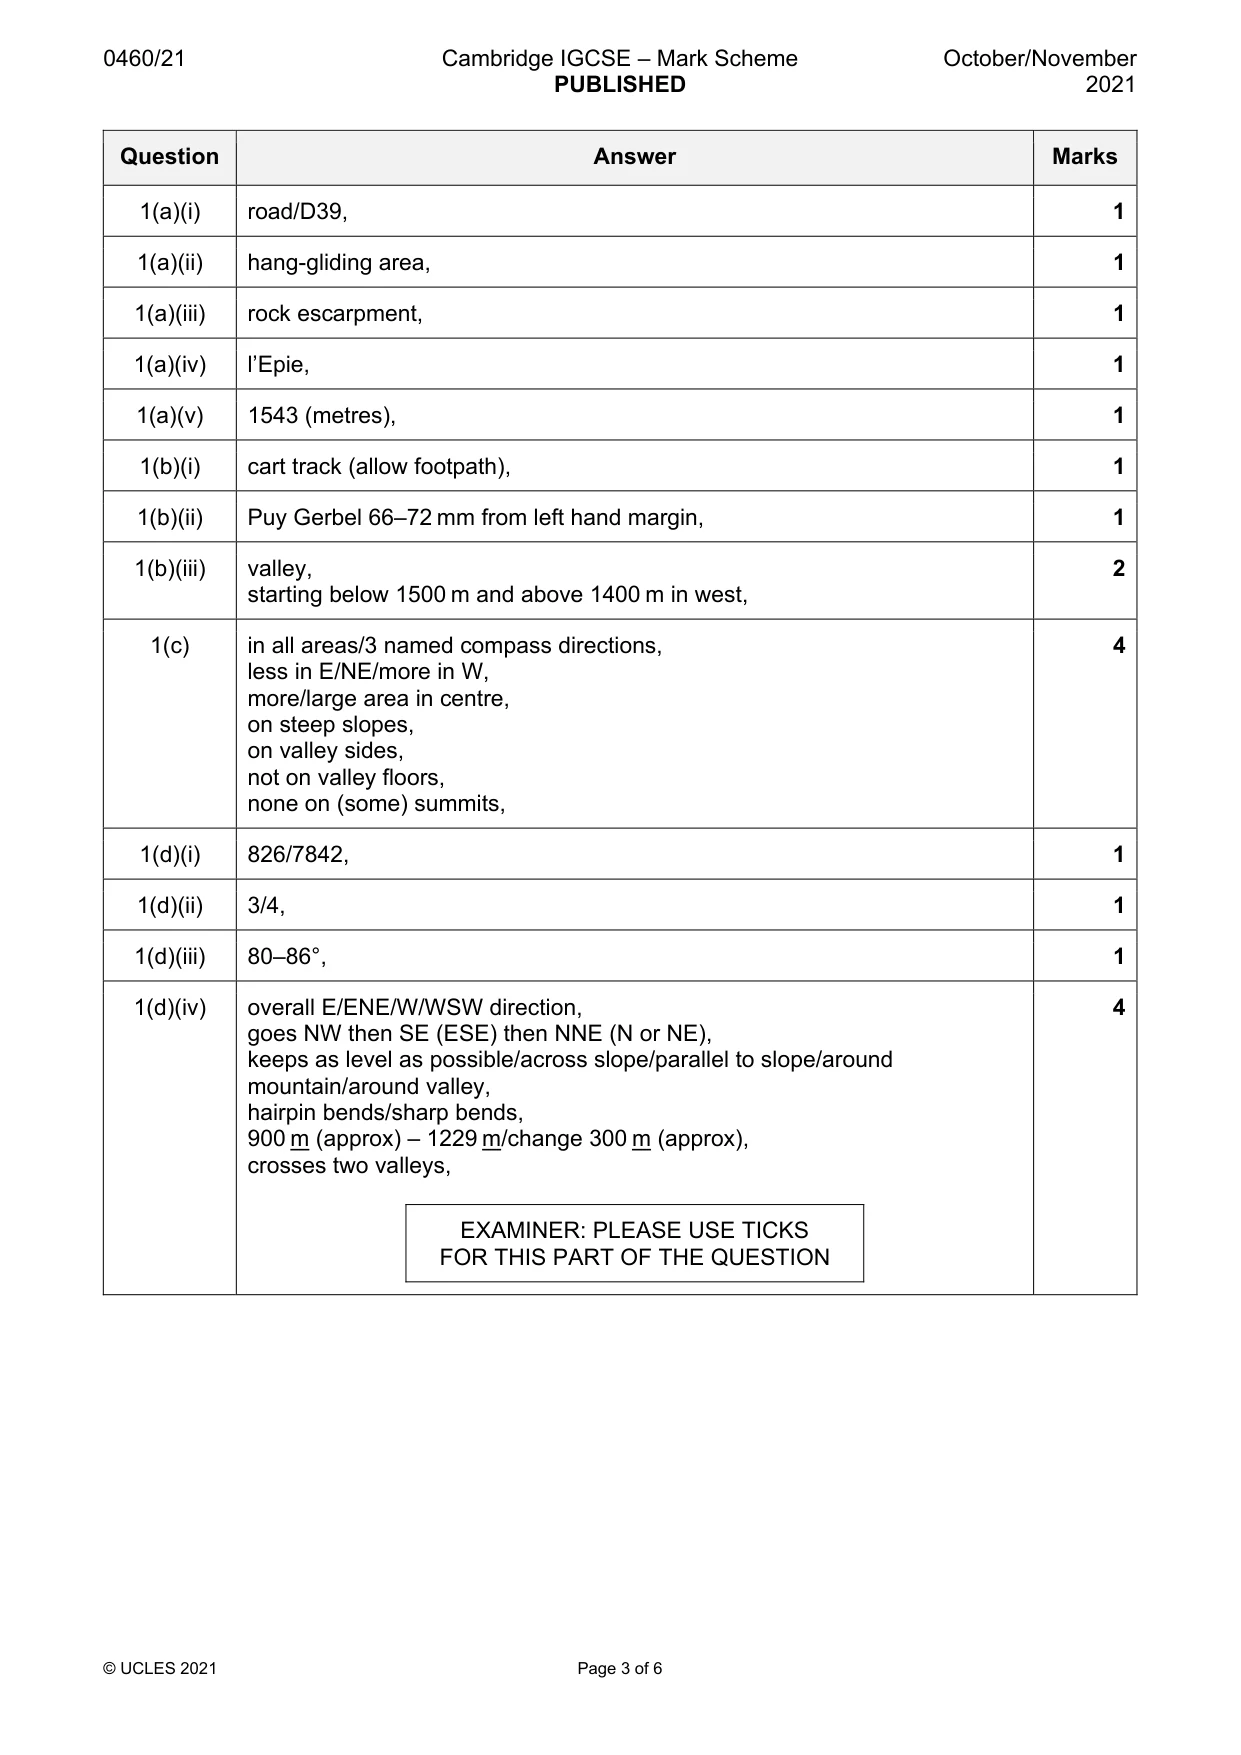
Mark scheme: Question Answer Marks 1(a)(i) road/D39, 1 1(a)(ii) hang-gliding area, 1 1(a)(iii) rock escarpment, 1 1(a)(iv) l’Epie, 1 1(a)(v) 1543 (metres), 1 1(b)(i) cart track (allow footpath), 1 1(b)(ii) Puy Gerbel 66–72 mm from left hand margin, 1 1(b)(iii) valley, 2 starting below 1500 m and above 1400 m in west, 1(c) in all areas/3 named compass directions, 4 less in E/NE/more in W, more/large area in centre, on steep slopes, on valley sides, not on valley floors, none on (some) summits, 1(d)(i) 826/7842, 1 1(d)(ii) 3/4, 1 1(d)(iii) 80–86°, 1 1(d)(iv) overall E/ENE/W/WSW direction, 4 goes NW then SE (ESE) then NNE (N or NE), keeps as level as possible/across slope/parallel to slope/around mountain/around valley, hairpin bends/sharp bends, 900 m (approx) – 1229 m/change 300 m (approx), crosses two valleys, EXAMINER: PLEASE USE TICKS FOR THIS PART OF THE QUESTION
More questions on Settlements (rural and urban) and service provision
Q2 · The distribution of population in southern Pakistan and Fig
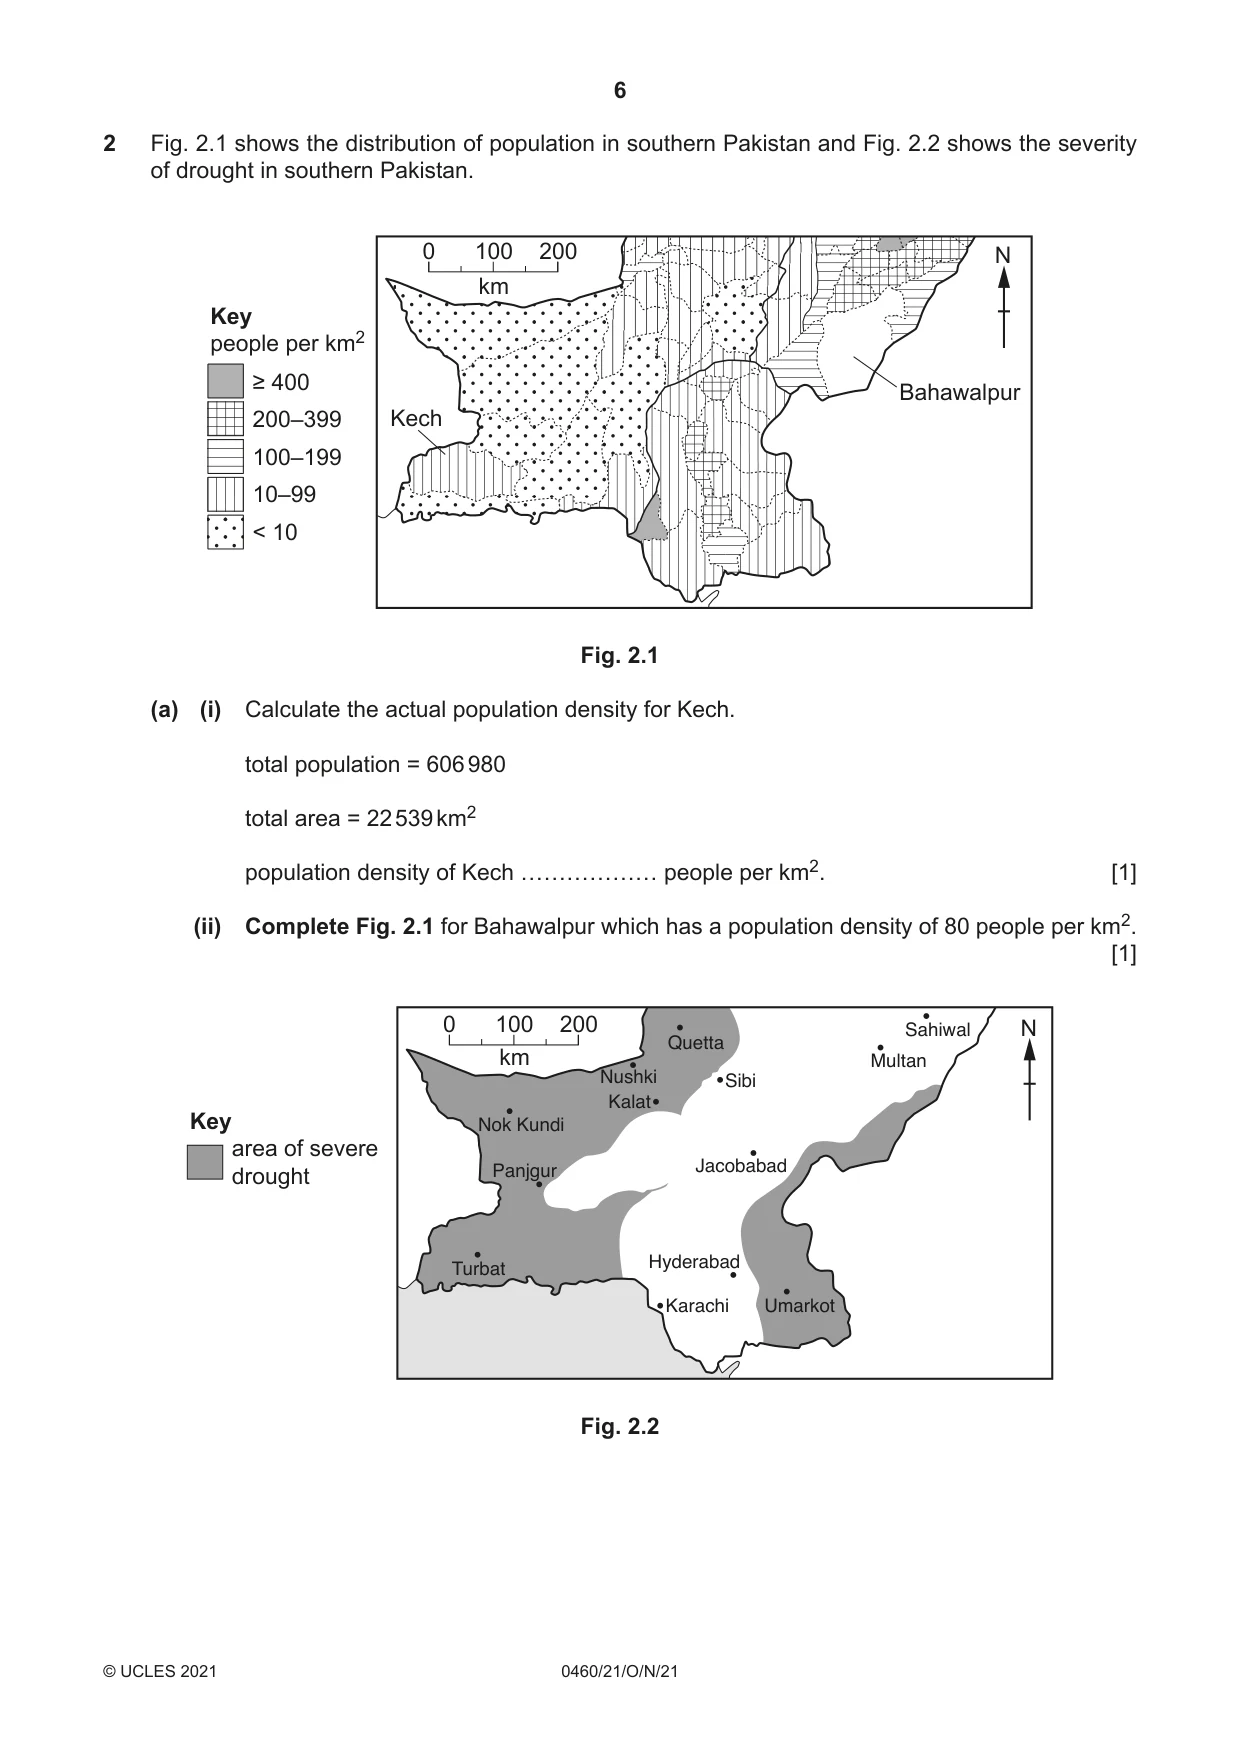
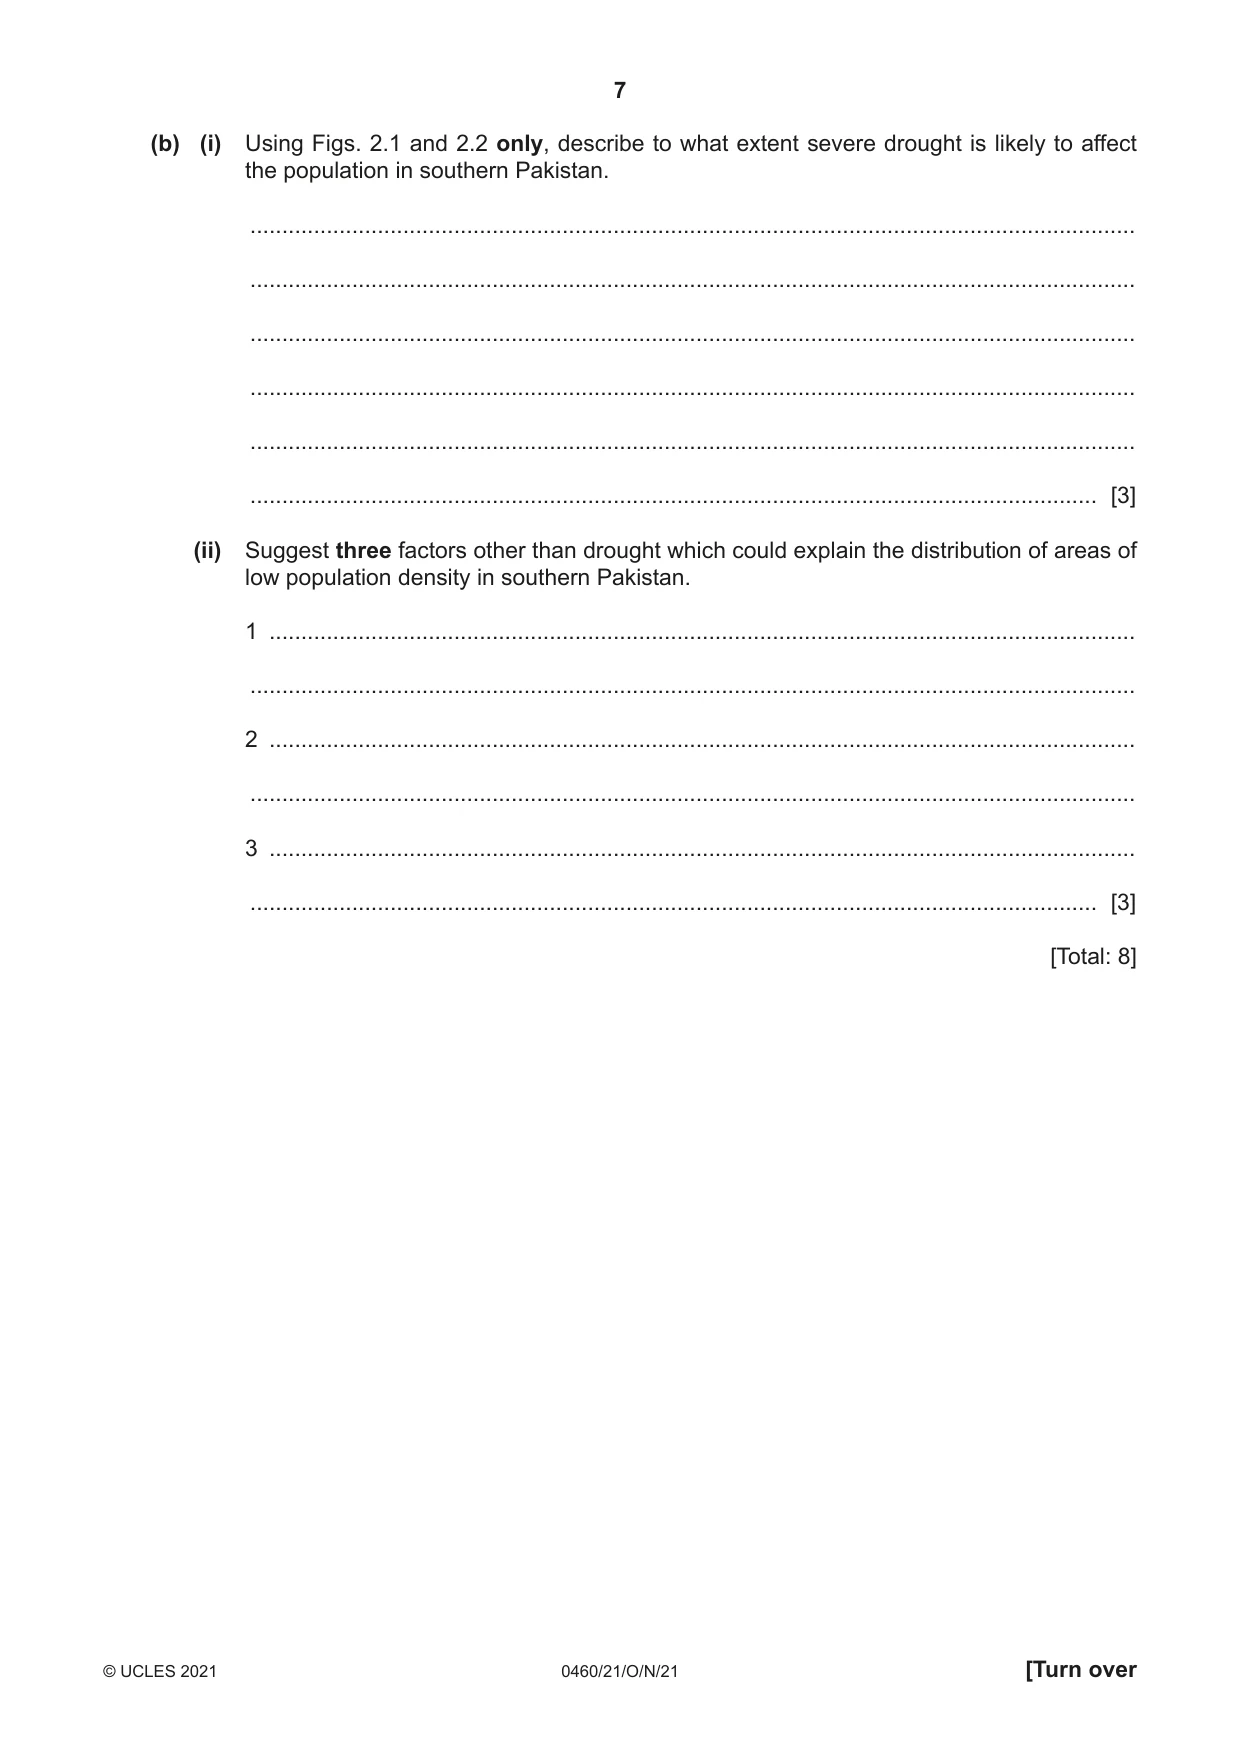
2 Fig. 2.1 shows the distribution of population in southern Pakistan and Fig. 2.2 shows the severity of drought in southern Pakistan. 0 100 200 N km Key people per km2 ≥ 400 Bahawalpur 200–399 Kech 100–199 10–99 < 10 Fig. 2.1 (a) (i) Calculate the actual population density for Kech. total population = 606 980 total area = 22 539 km2 population density of Kech ……………… people per km2. [1] (ii) Complete Fig. 2.1 for Bahawalpur which has a population density of 80 people per km2. [1] 0 100 200 Sahiwal N Quetta km Multan Nushki Sibi Kalat Key Nok Kundi area of severe drought Panjgur Jacobabad Turbat Hyderabad Karachi Umarkot Fig. 2.2 (b) (i) Using Figs. 2.1 and 2.2 only, describe to what extent severe drought is likely to affect the population in southern Pakistan. ........................................................................................................................................... ........................................................................................................................................... ........................................................................................................................................... ........................................................................................................................................... ........................................................................................................................................... ..................................................................................................................................... [3] (ii) Suggest three factors other than drought which could explain the distribution of areas of low population density in southern Pakistan. 1 ........................................................................................................................................ ........................................................................................................................................... 2 ........................................................................................................................................ ........................................................................................................................................... 3 ........................................................................................................................................ ..................................................................................................................................... [3] [Total: 8]
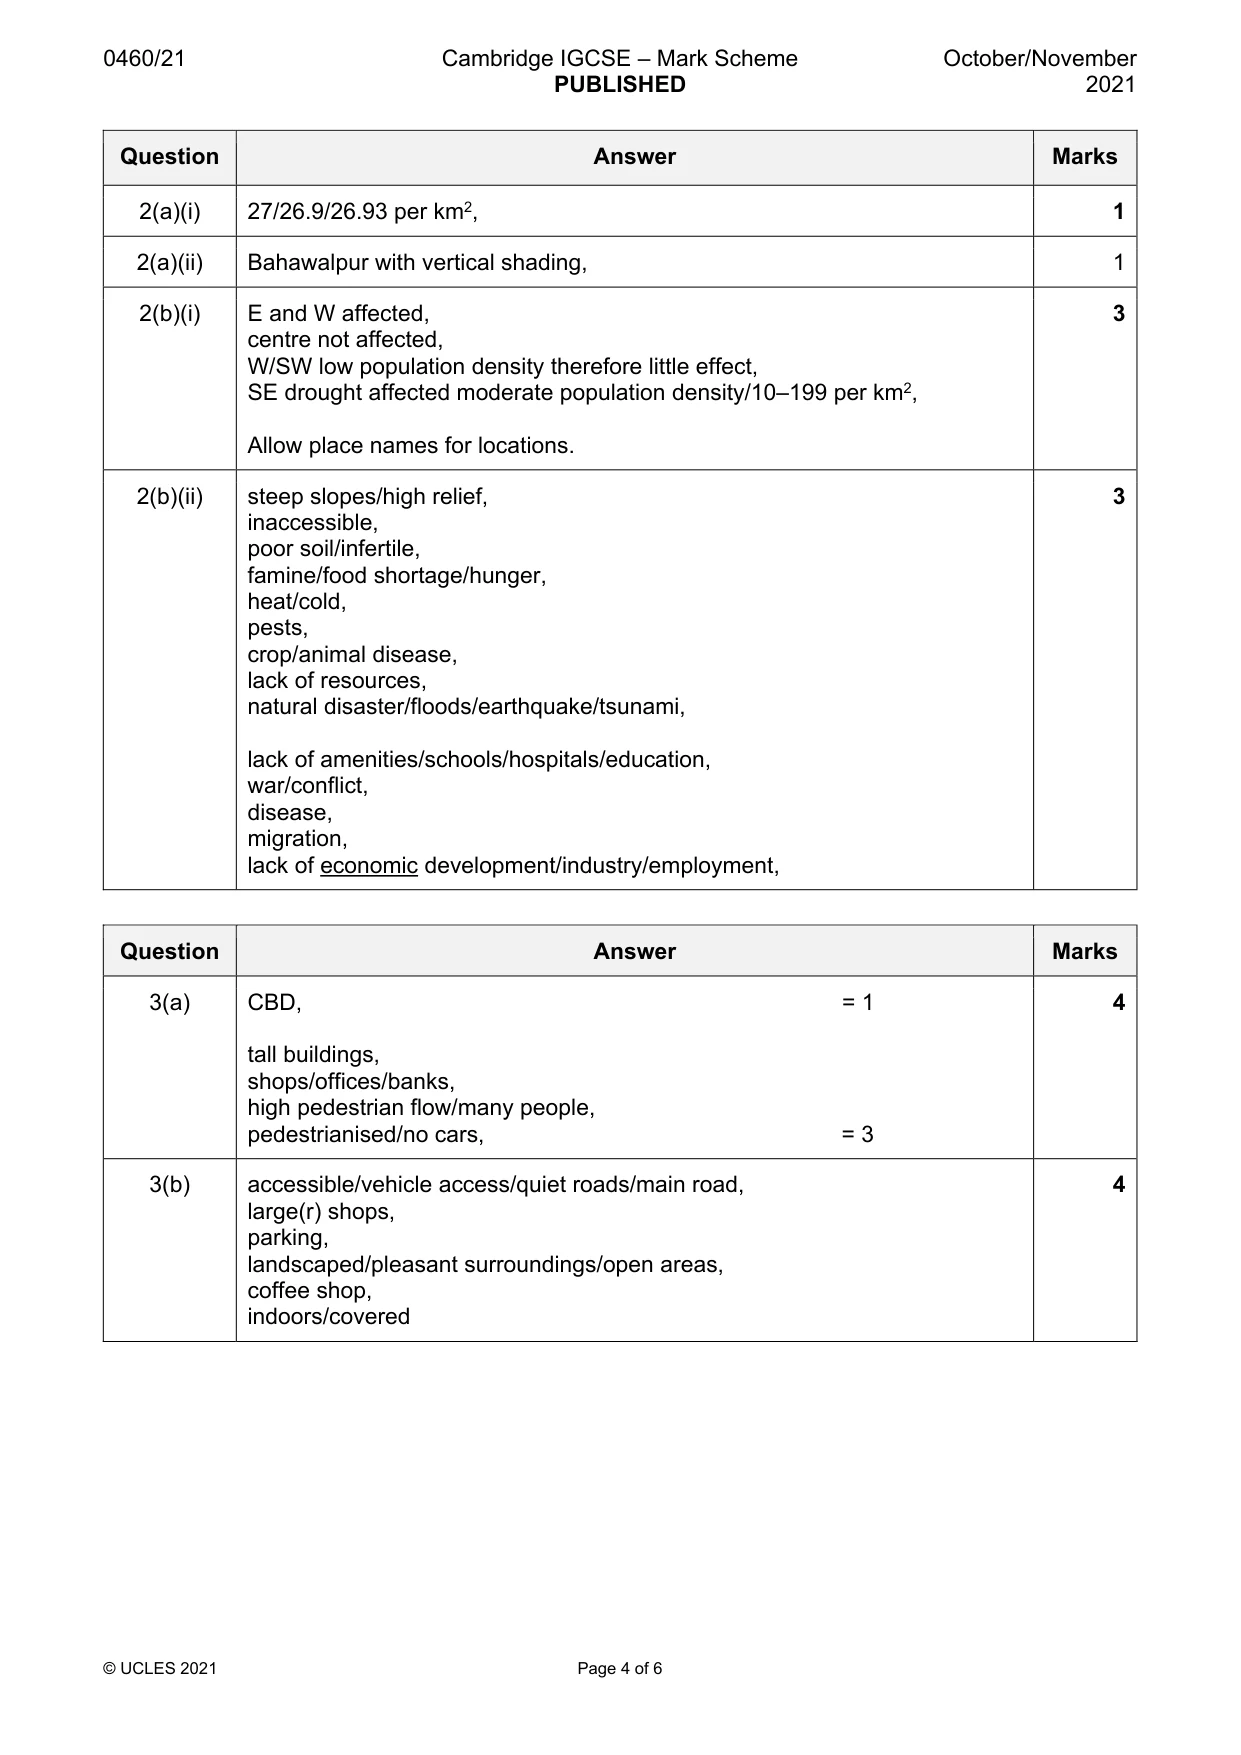
Mark scheme: 2(a)(i) 27/26.9/26.93 per km2, 1 2(a)(ii) Bahawalpur with vertical shading, 1 2(b)(i) E and W affected, 3 centre not affected, W/SW low population density therefore little effect, SE drought affected moderate population density/10–199 per km2, Allow place names for locations. 2(b)(ii) steep slopes/high relief, 3 inaccessible, poor soil/infertile, famine/food shortage/hunger, heat/cold, pests, crop/animal disease, lack of resources, natural disaster/floods/earthquake/tsunami, lack of amenities/schools/hospitals/education, war/conflict, disease, migration, lack of economic development/industry/employment,
Question 3
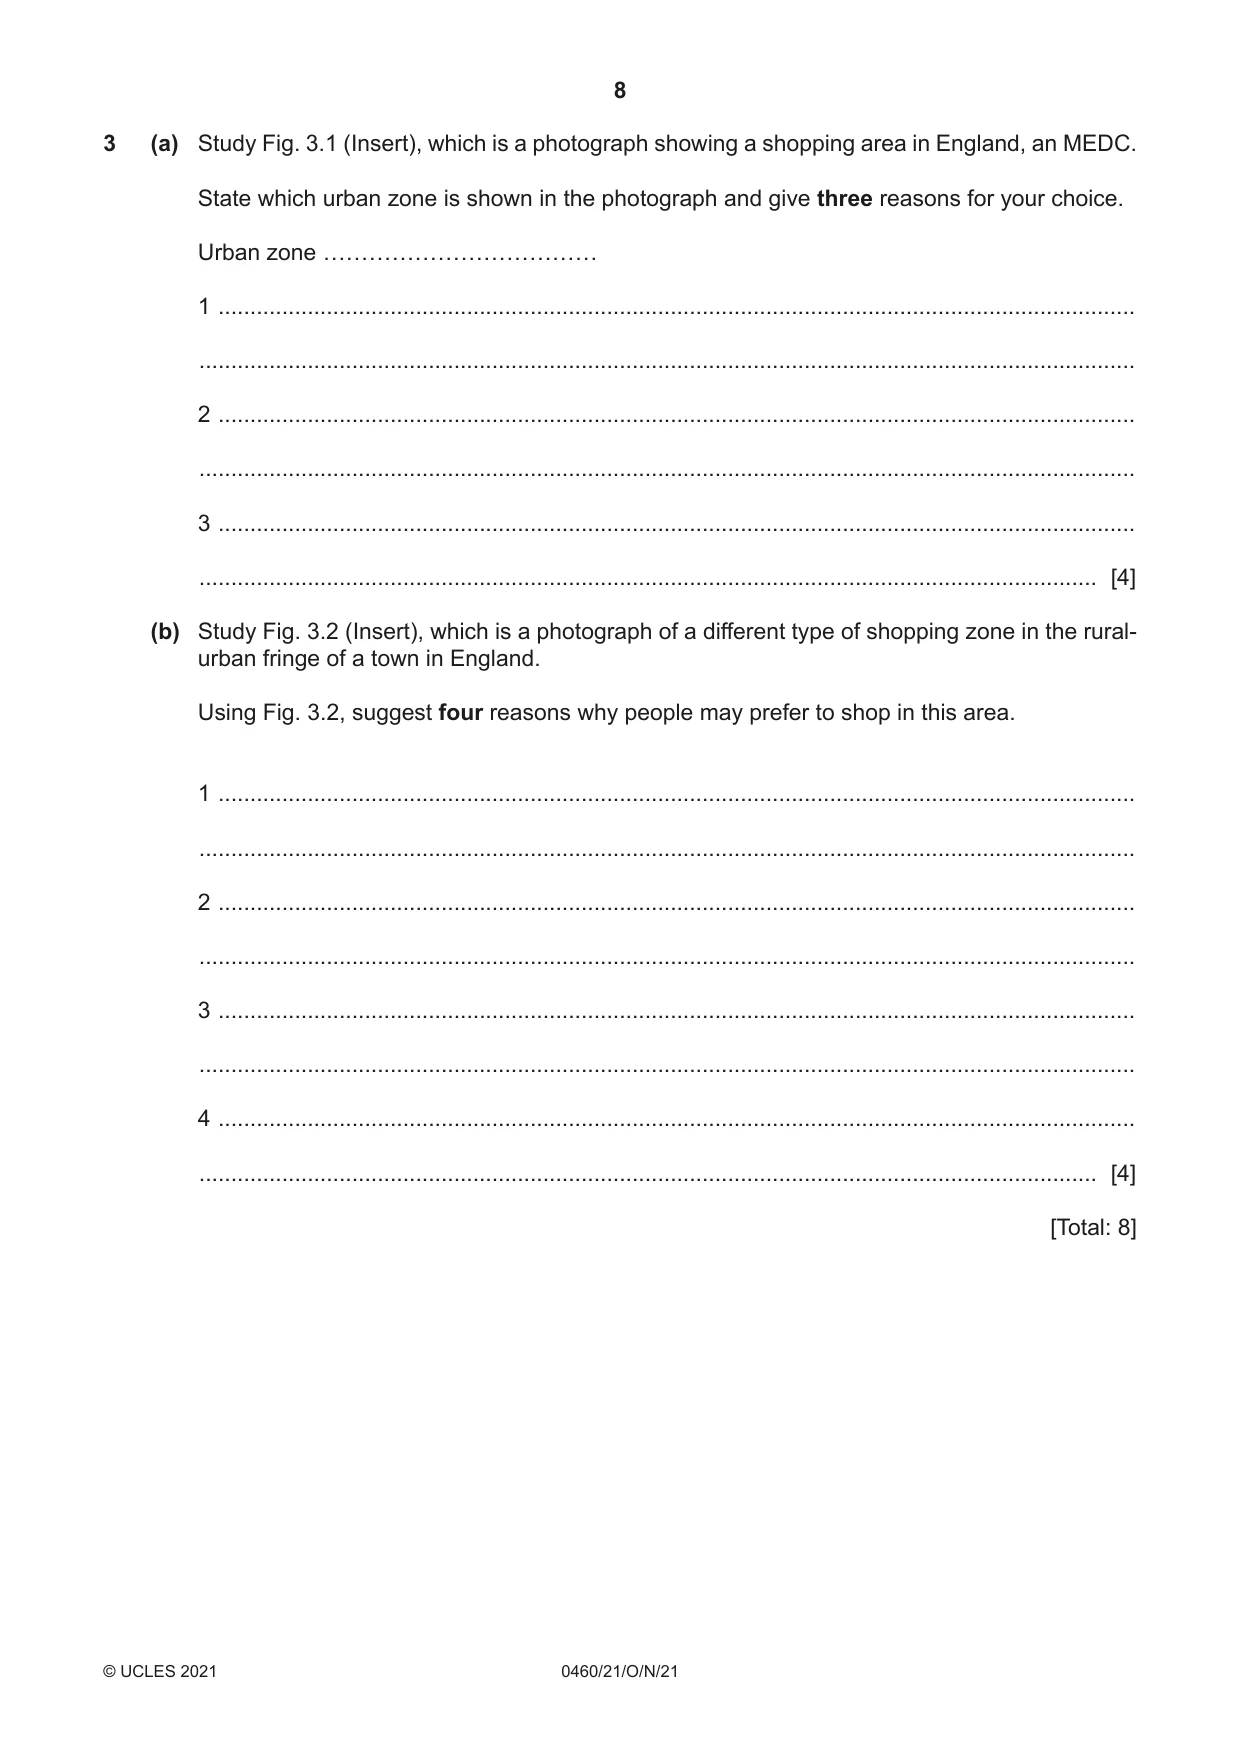
3 (a) Study Fig. 3.1 (Insert), which is a photograph showing a shopping area in England, an MEDC. State which urban zone is shown in the photograph and give three reasons for your choice. Urban zone ……………………………… 1 ................................................................................................................................................ ................................................................................................................................................... 2 ................................................................................................................................................ ................................................................................................................................................... 3 ................................................................................................................................................ ............................................................................................................................................. [4] (b) Study Fig. 3.2 (Insert), which is a photograph of a different type of shopping zone in the rural- urban fringe of a town in England. Using Fig. 3.2, suggest four reasons why people may prefer to shop in this area. 1 ................................................................................................................................................ ................................................................................................................................................... 2 ................................................................................................................................................ ................................................................................................................................................... 3 ................................................................................................................................................ ................................................................................................................................................... 4 ................................................................................................................................................ ............................................................................................................................................. [4] [Total: 8]
Mark scheme: 3(a) CBD, = 1 4 tall buildings, shops/offices/banks, high pedestrian flow/many people, pedestrianised/no cars, = 3 3(b) accessible/vehicle access/quiet roads/main road, 4 large(r) shops, parking, landscaped/pleasant surroundings/open areas, coffee shop, indoors/covered
Question 4
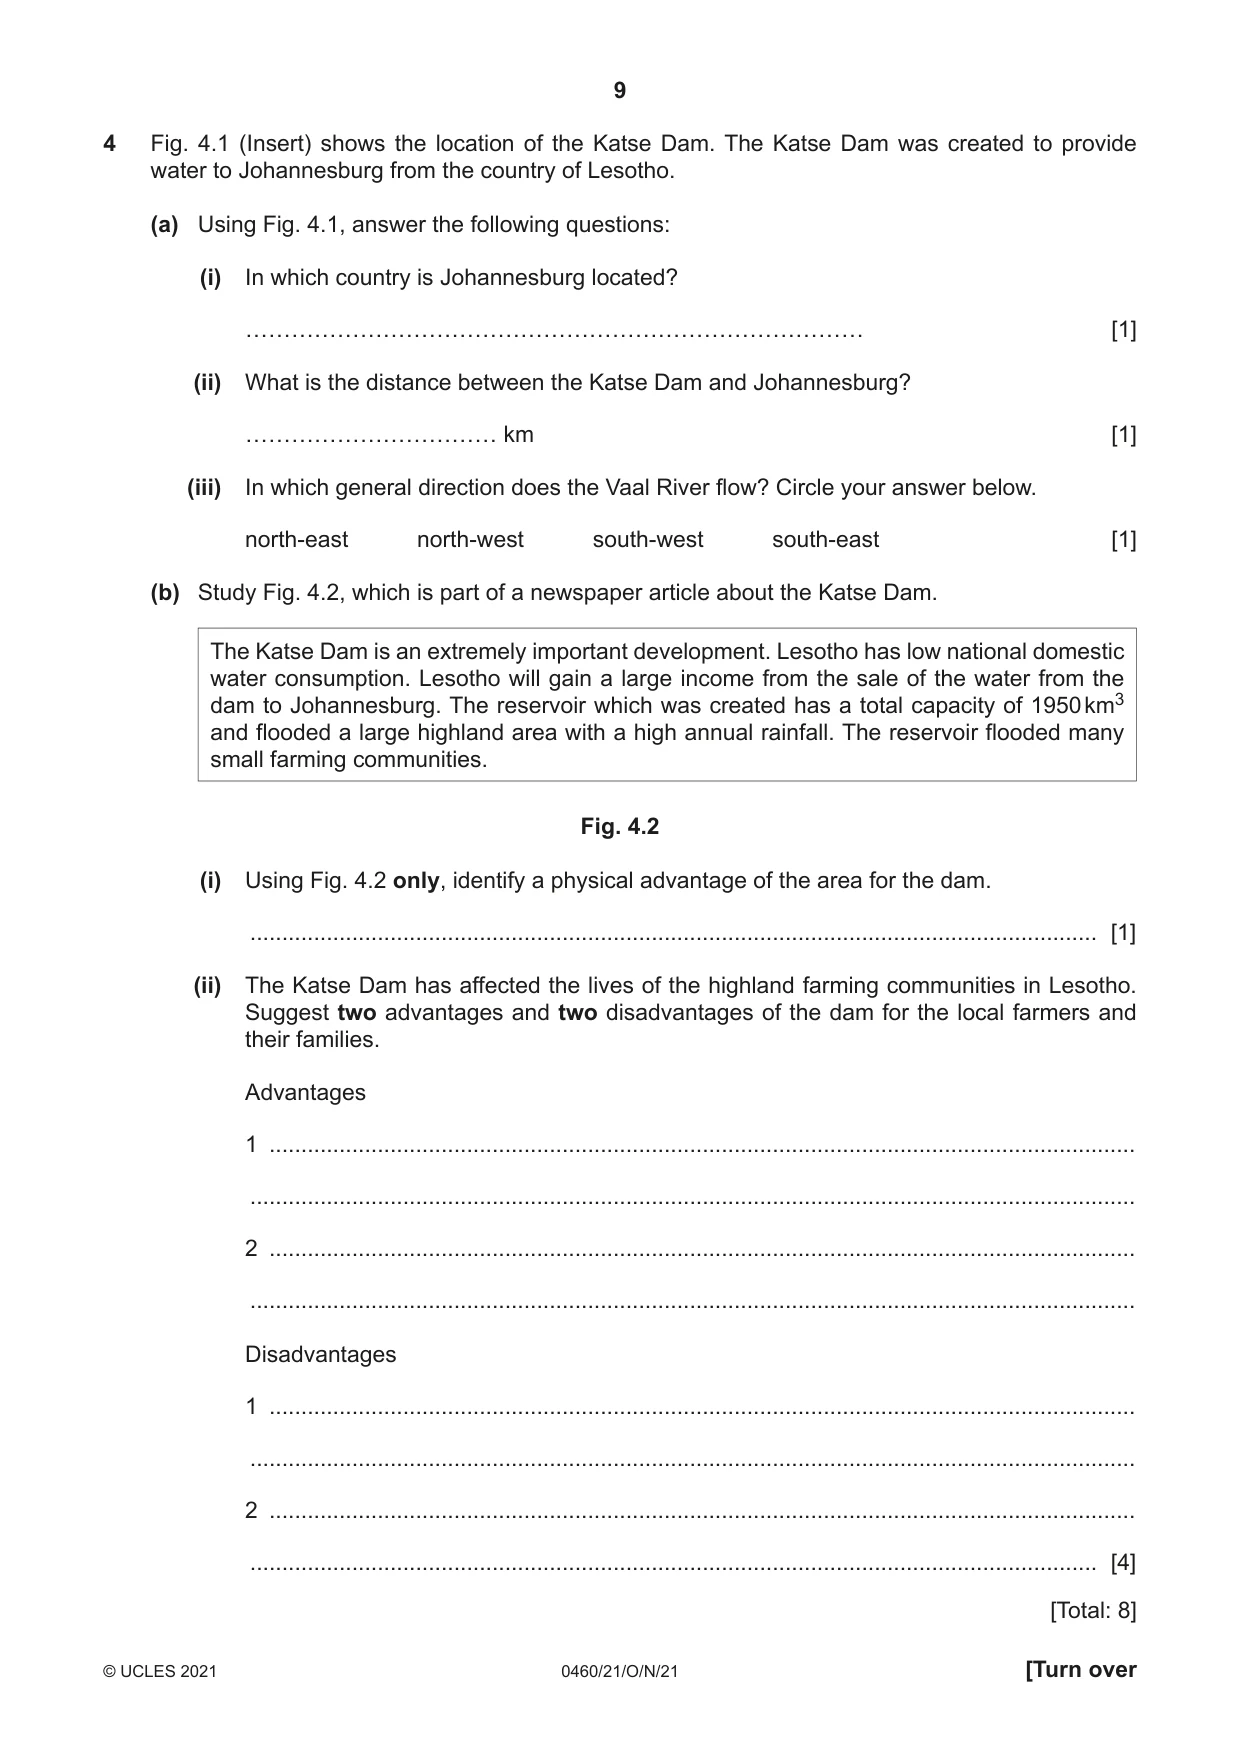
4 Fig. 4.1 (Insert) shows the location of the Katse Dam. The Katse Dam was created to provide water to Johannesburg from the country of Lesotho. (a) Using Fig. 4.1, answer the following questions: (i) In which country is Johannesburg located? [1] (ii) What is the distance between the Katse Dam and Johannesburg? …………………………… km [1] (iii) In which general direction does the Vaal River flow? Circle your answer below. north-east north-west south-west south-east [1] (b) Study Fig. 4.2, which is part of a newspaper article about the Katse Dam. The Katse Dam is an extremely important development. Lesotho has low national domestic water consumption. Lesotho will gain a large income from the sale of the water from the dam to Johannesburg. The reservoir which was created has a total capacity of 1950 km3 and flooded a large highland area with a high annual rainfall. The reservoir flooded many small farming communities. Fig. 4.2 (i) Using Fig. 4.2 only, identify a physical advantage of the area for the dam. ..................................................................................................................................... [1] (ii) The Katse Dam has affected the lives of the highland farming communities in Lesotho. Suggest two advantages and two disadvantages of the dam for the local farmers and their families. Advantages 1 ........................................................................................................................................ ........................................................................................................................................... 2 ........................................................................................................................................ ........................................................................................................................................... Disadvantages 1 ........................................................................................................................................ ........................................................................................................................................... 2 ........................................................................................................................................ ..................................................................................................................................... [4] [Total: 8]
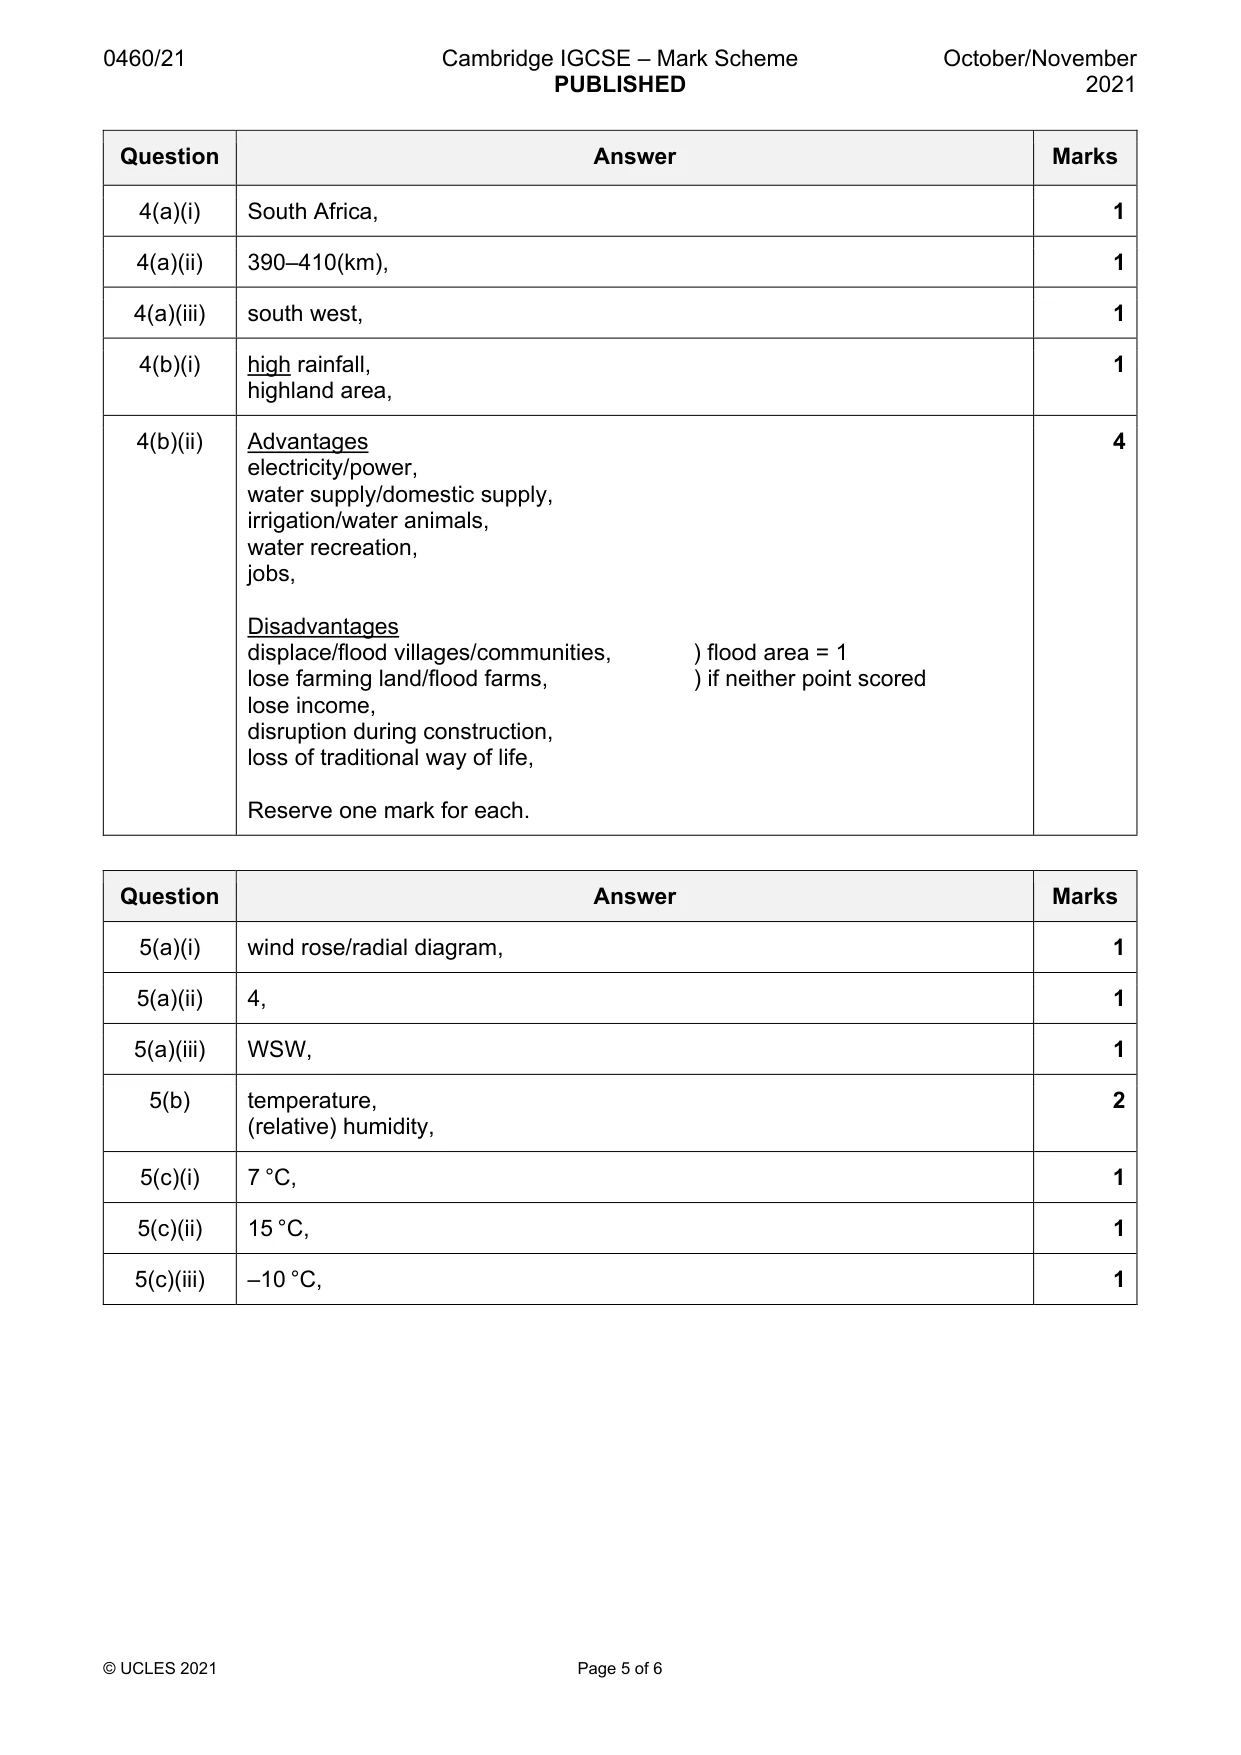
Mark scheme: 4(a)(i) South Africa, 1 4(a)(ii) 390–410(km), 1 4(a)(iii) south west, 1 4(b)(i) high rainfall, 1 highland area, 4(b)(ii) Advantages 4 electricity/power, water supply/domestic supply, irrigation/water animals, water recreation, jobs, Disadvantages displace/flood villages/communities, ) flood area = 1 lose farming land/flood farms, ) if neither point scored lose income, disruption during construction, loss of traditional way of life, Reserve one mark for each.
Question 5
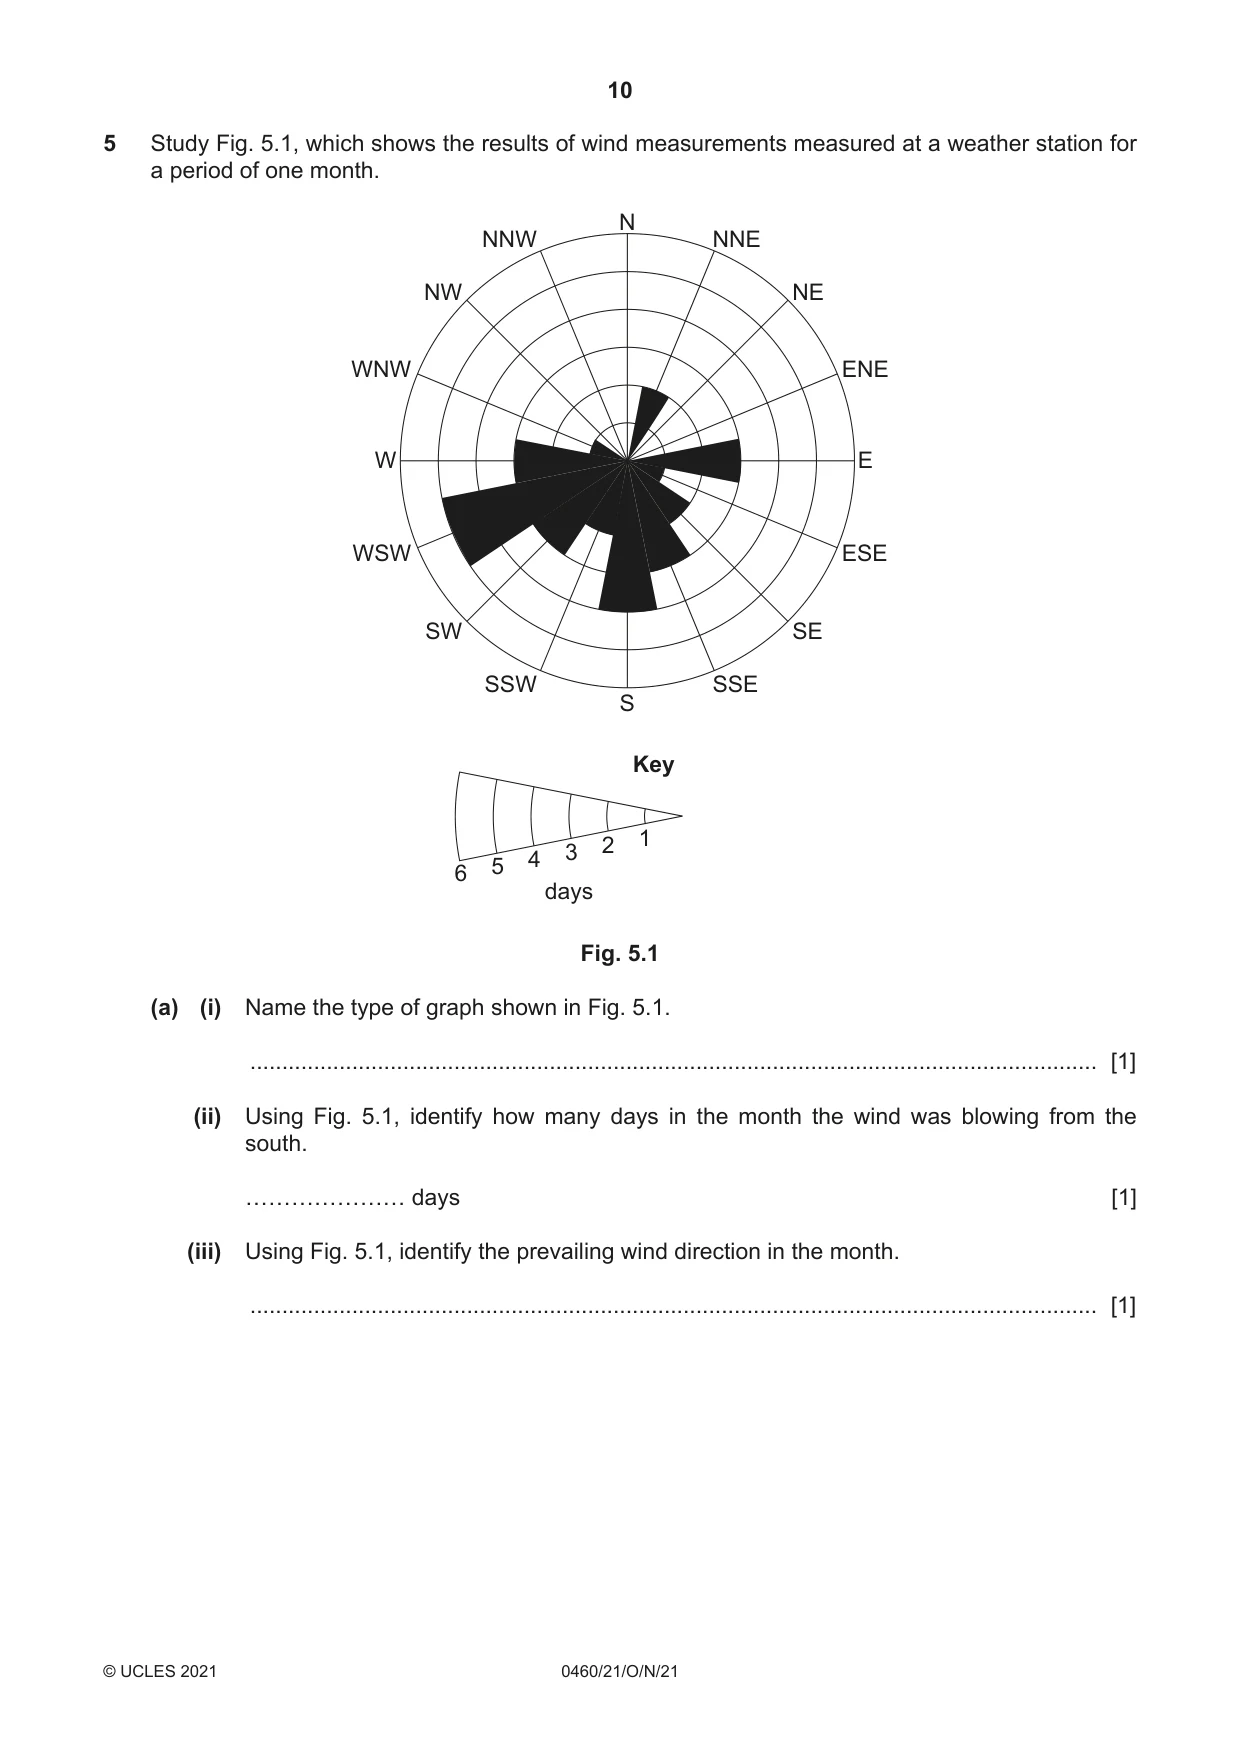
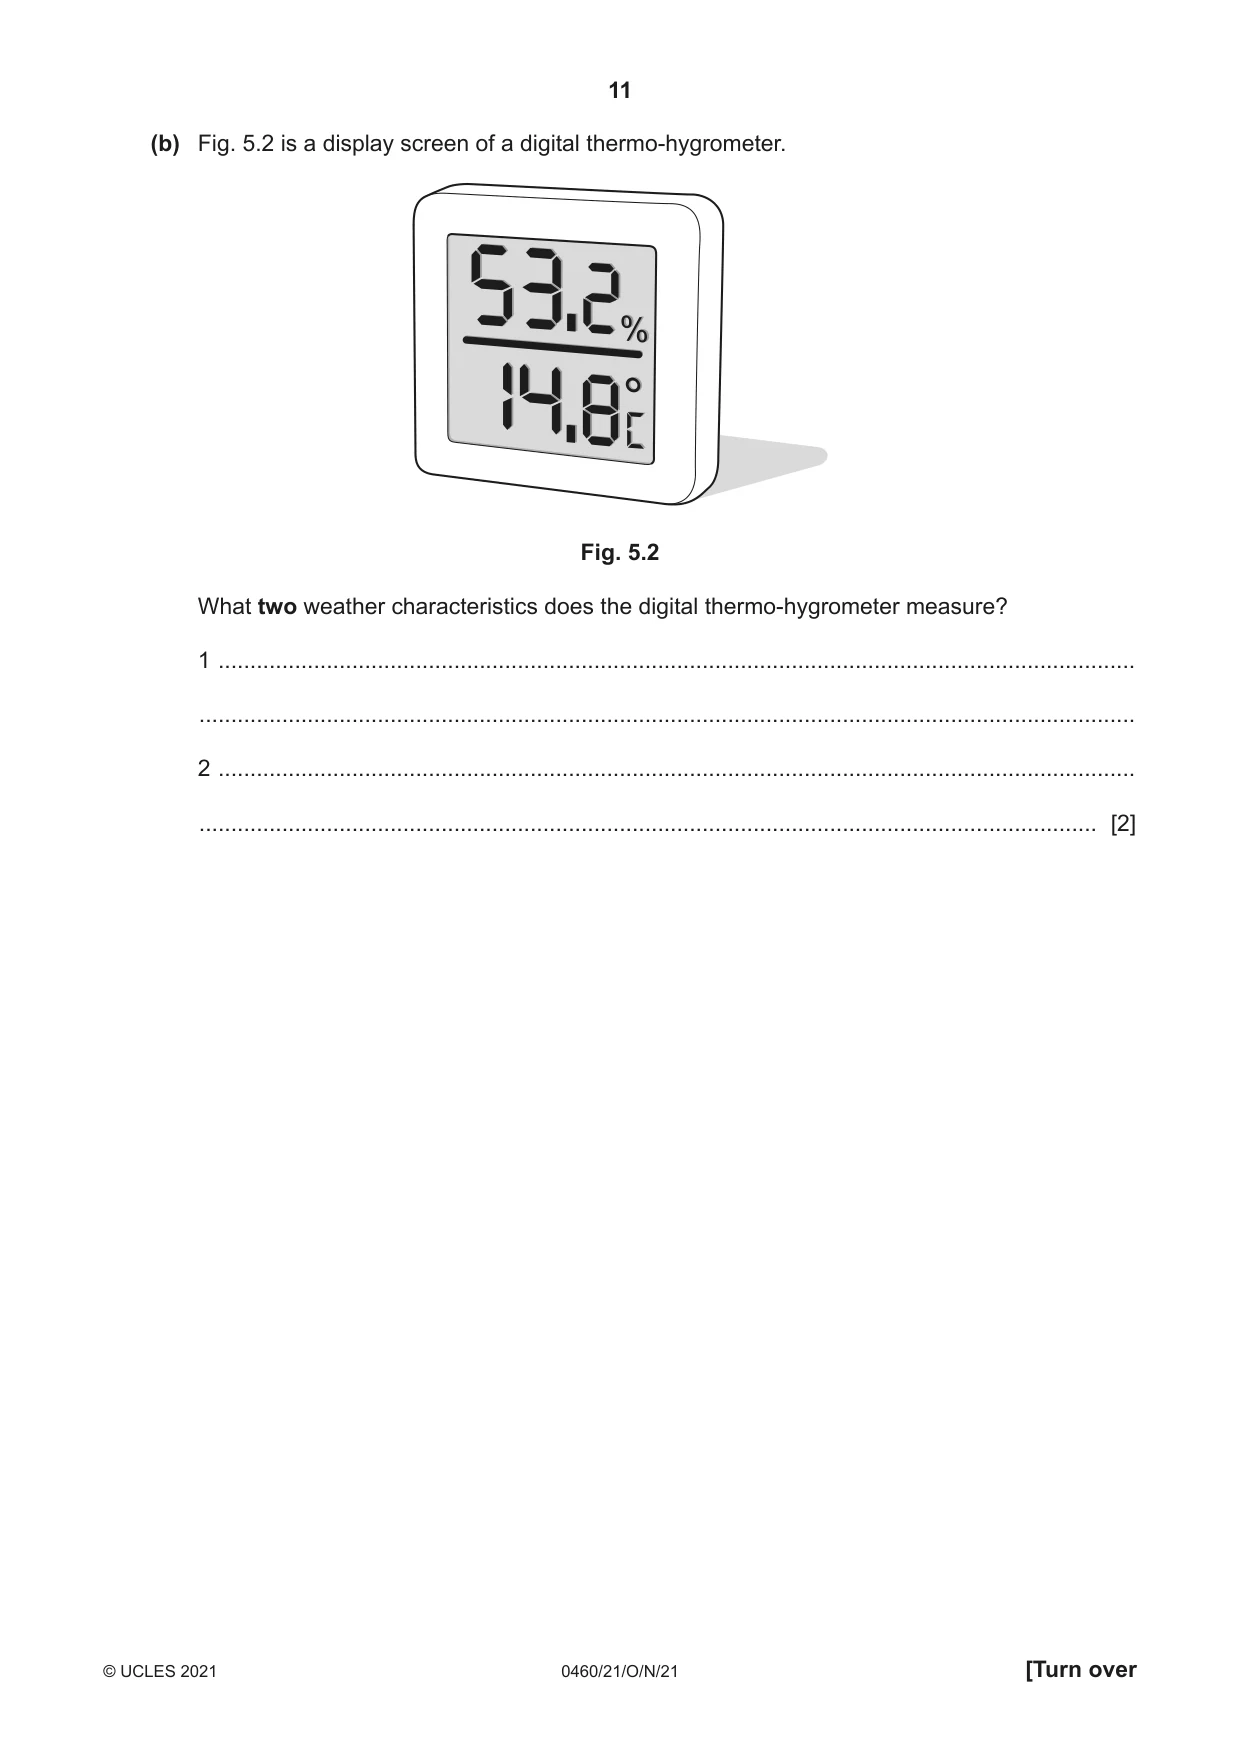
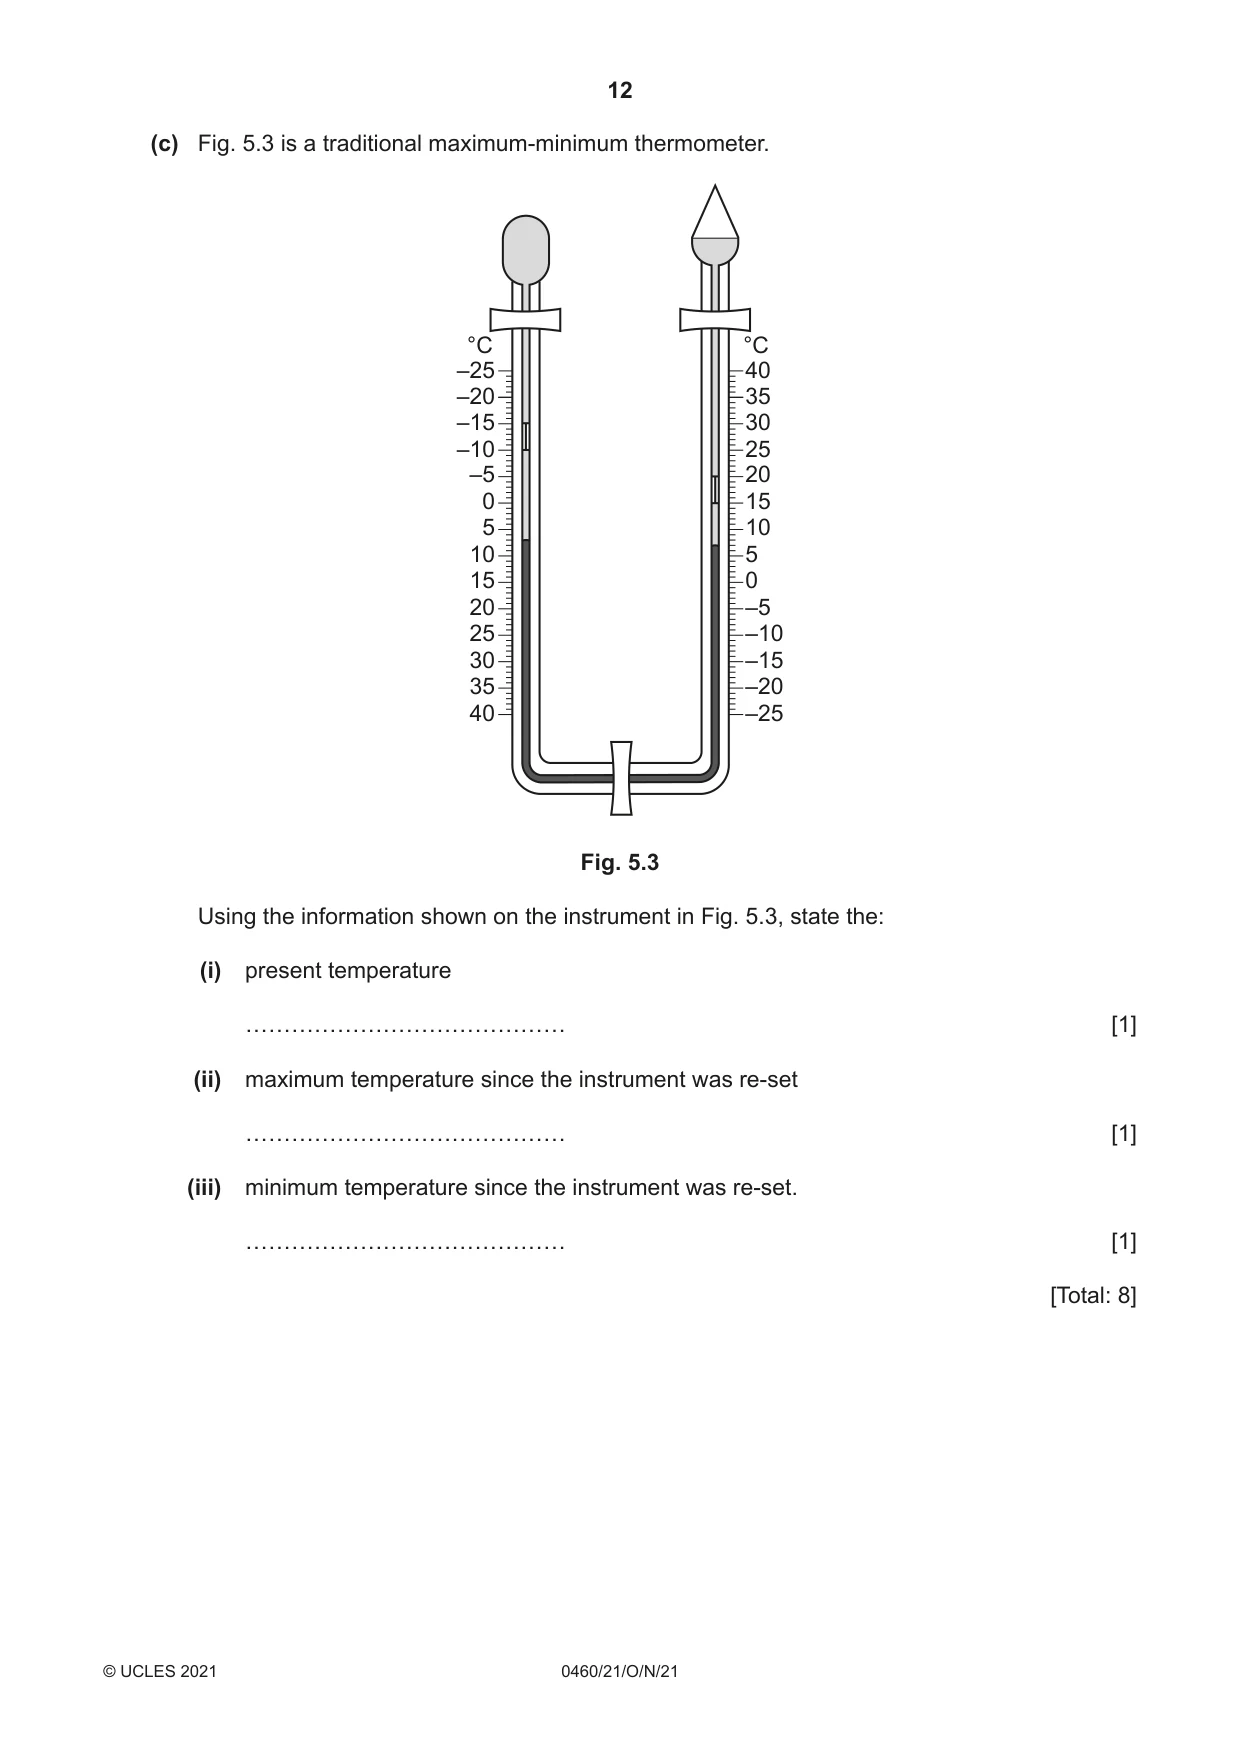
5 Study Fig. 5.1, which shows the results of wind measurements measured at a weather station for a period of one month. N NNW NNE NW NE WNW ENE W E WSW ESE SW SE SSW SSE S Key 1 2 3 4 5 6 days Fig. 5.1 (a) (i) Name the type of graph shown in Fig. 5.1. ..................................................................................................................................... [1] (ii) Using Fig. 5.1, identify how many days in the month the wind was blowing from the south. ………………… days [1] (iii) Using Fig. 5.1, identify the prevailing wind direction in the month. ..................................................................................................................................... [1] (b) Fig. 5.2 is a display screen of a digital thermo-hygrometer. Fig. 5.2 What two weather characteristics does the digital thermo-hygrometer measure? 1 ................................................................................................................................................ ................................................................................................................................................... 2 ................................................................................................................................................ ............................................................................................................................................. [2] (c) Fig. 5.3 is a traditional maximum-minimum thermometer. °C °C –25 40 –20 35 –15 30 –10 25 –5 20 0 15 5 10 10 5 15 0 20 –5 25 –10 30 –15 35 –20 40 –25 Fig. 5.3 Using the information shown on the instrument in Fig. 5.3, state the: (i) present temperature [1] (ii) maximum temperature since the instrument was re-set [1] (iii) minimum temperature since the instrument was re-set. [1] [Total: 8]
Mark scheme: 5(a)(i) wind rose/radial diagram, 1 5(a)(ii) 4, 1 5(a)(iii) WSW, 1 5(b) temperature, 2 (relative) humidity, 5(c)(i) 7 °C, 1 5(c)(ii) 15 °C, 1 5(c)(iii) –10 °C, 1
Q6 · The Human Development Index (HDI) measures levels of human development
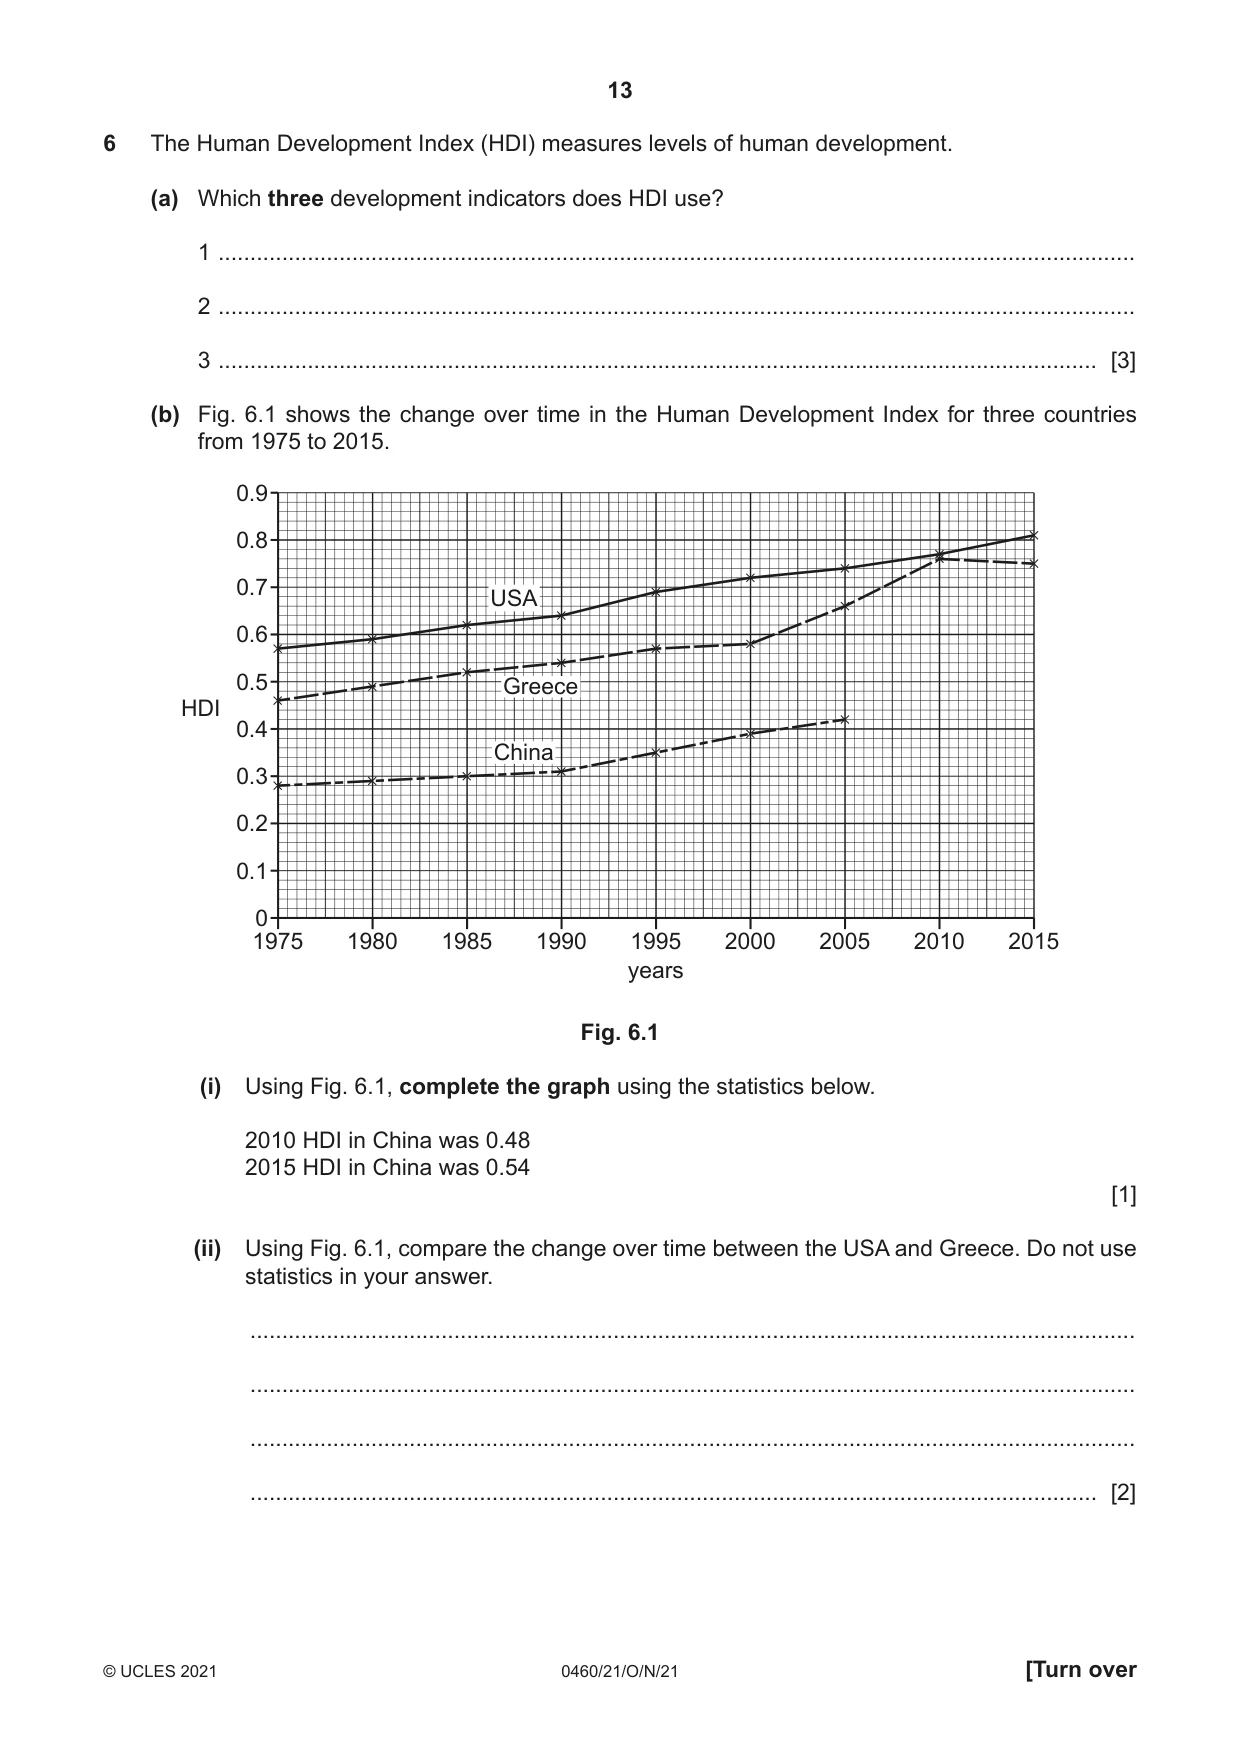
6 The Human Development Index (HDI) measures levels of human development. (a) Which three development indicators does HDI use? 1 ................................................................................................................................................ 2 ................................................................................................................................................ 3 .......................................................................................................................................... [3] (b) Fig. 6.1 shows the change over time in the Human Development Index for three countries from 1975 to 2015. 0.9 0.8 0.7 USA 0.6 0.5 Greece HDI 0.4 China 0.3 0.2 0.1 0 1975 1980 1985 1990 1995 2000 2005 2010 2015 years Fig. 6.1 (i) Using Fig. 6.1, complete the graph using the statistics below. 2010 HDI in China was 0.48 2015 HDI in China was 0.54 [1] (ii) Using Fig. 6.1, compare the change over time between the USA and Greece. Do not use statistics in your answer. ........................................................................................................................................... ........................................................................................................................................... ........................................................................................................................................... ..................................................................................................................................... [2] (iii) Suggest reasons why HDI might vary within a country. ........................................................................................................................................... ........................................................................................................................................... ........................................................................................................................................... ........................................................................................................................................... ........................................................................................................................................... ..................................................................................................................................... [2] [Total: 8] Additional Pages If you use the following pages to complete the answer(s) to any question(s), the question number(s) must be clearly shown. .................................................................................................................................................................. .................................................................................................................................................................. .................................................................................................................................................................. .................................................................................................................................................................. .................................................................................................................................................................. .................................................................................................................................................................. .................................................................................................................................................................. .................................................................................................................................................................. .................................................................................................................................................................. .................................................................................................................................................................. .................................................................................................................................................................. .................................................................................................................................................................. .................................................................................................................................................................. .................................................................................................................................................................. .................................................................................................................................................................. .................................................................................................................................................................. .................................................................................................................................................................. .................................................................................................................................................................. .................................................................................................................................................................. .................................................................................................................................................................. .................................................................................................................................................................. .................................................................................................................................................................. .................................................................................................................................................................. .................................................................................................................................................................. ..................................................................................................................................................................
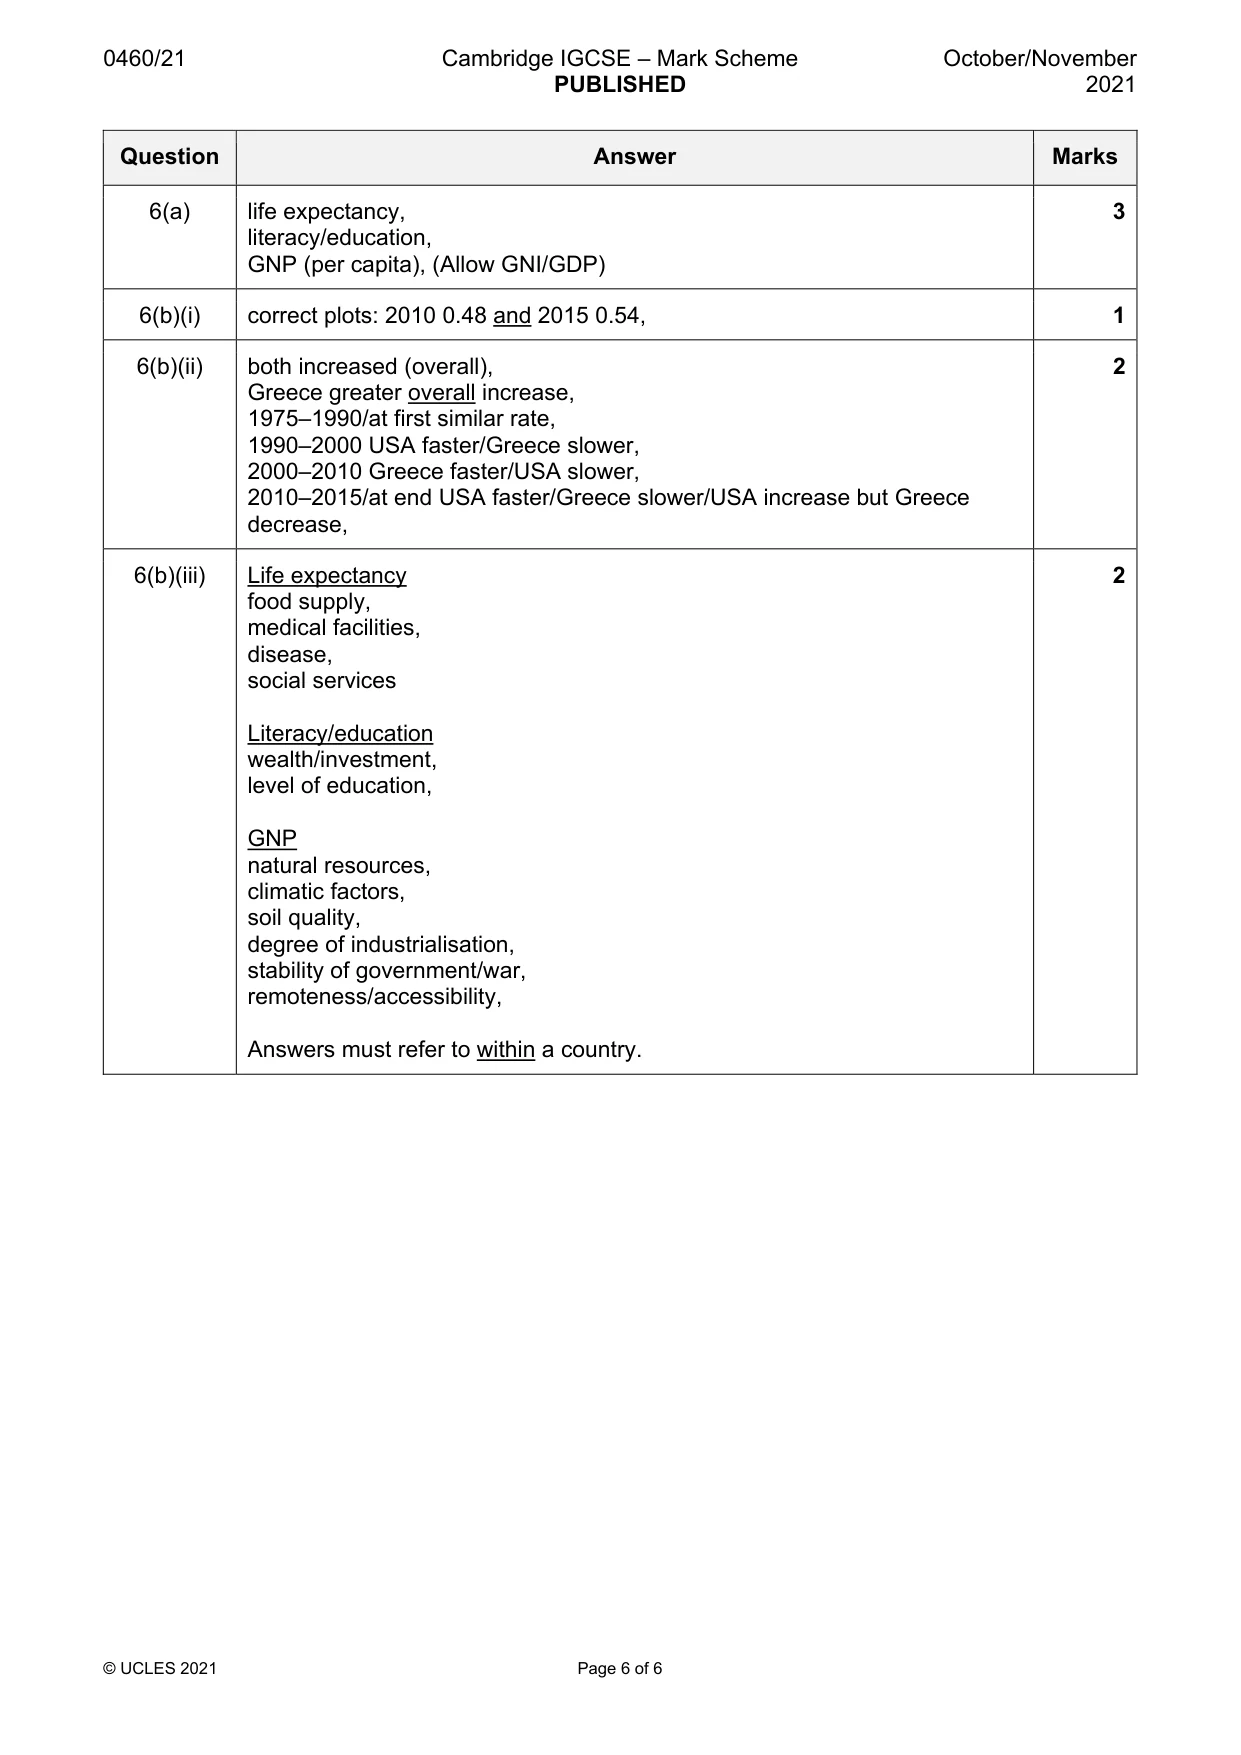
Mark scheme: 6(a) life expectancy, 3 literacy/education, GNP (per capita), (Allow GNI/GDP) 6(b)(i) correct plots: 2010 0.48 and 2015 0.54, 1 6(b)(ii) both increased (overall), 2 Greece greater overall increase, 1975–1990/at first similar rate, 1990–2000 USA faster/Greece slower, 2000–2010 Greece faster/USA slower, 2010–2015/at end USA faster/Greece slower/USA increase but Greece decrease, 6(b)(iii) Life expectancy 2 food supply, medical facilities, disease, social services Literacy/education wealth/investment, level of education, GNP natural resources, climatic factors, soil quality, degree of industrialisation, stability of government/war, remoteness/accessibility, Answers must refer to within a country.
What was in this paper
The subtopics covered by these 6 questions, and how many questions each got. Open one in a new tab to see every Cambridge question on it.
What you needed in this session
Cambridge’s own grade thresholds for 2021 Oct/Nov, Paper 2 · Variant 1. A higher threshold means an easier paper — the bar moves with how the cohort did.