Cambridge IGCSE Geography 0460 — 2017 Feb/March Paper 2 · Variant 2
0460/22/F/M/17 · 6 questions · 60 marks · ≈68 min
The question paper and its mark scheme, free to read here and free to download. This is Cambridge’s own paper, exactly as it was sat.
Question paper16 pages

Mark scheme5 pages
Answers below. Sit the paper first if you are practising.
Questions as text
Q1 · Study the map extract for Ballyvaghan, Ireland
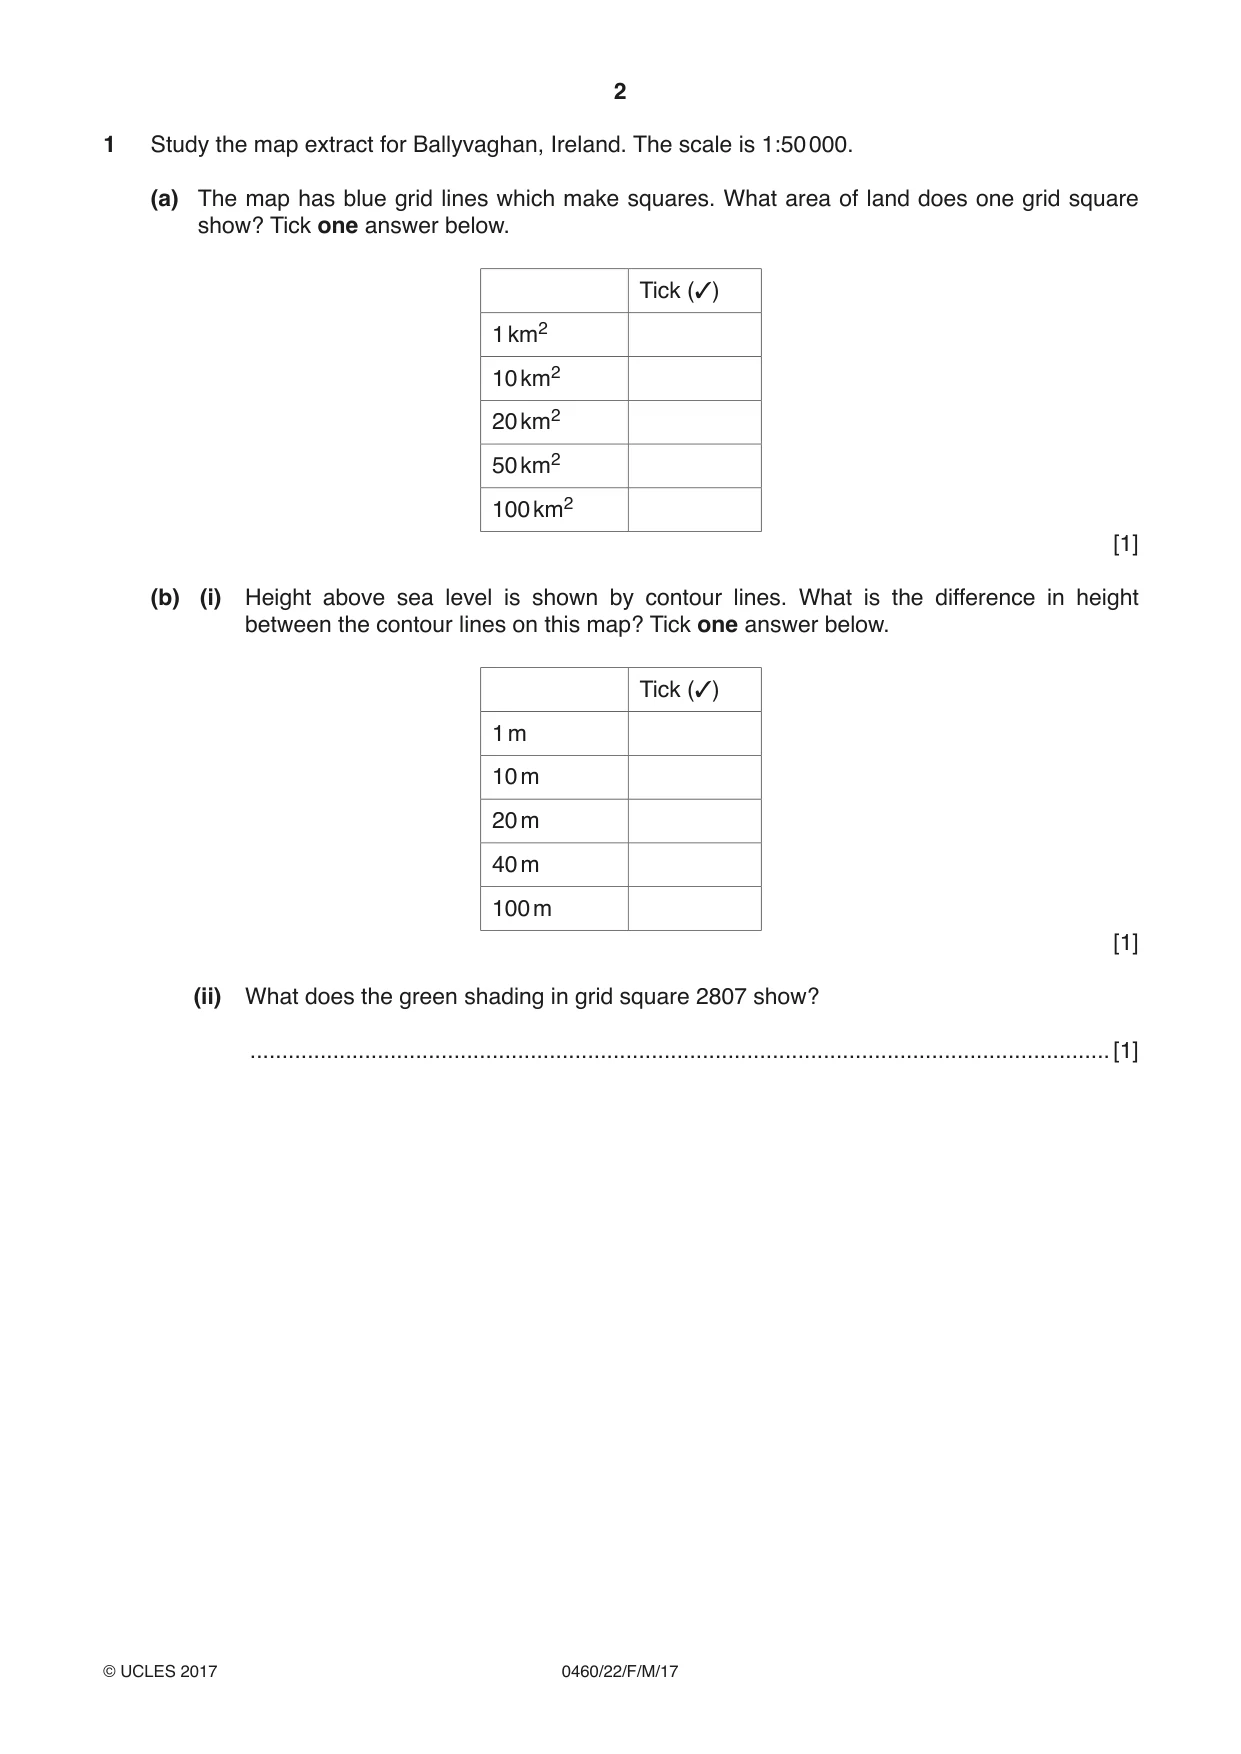
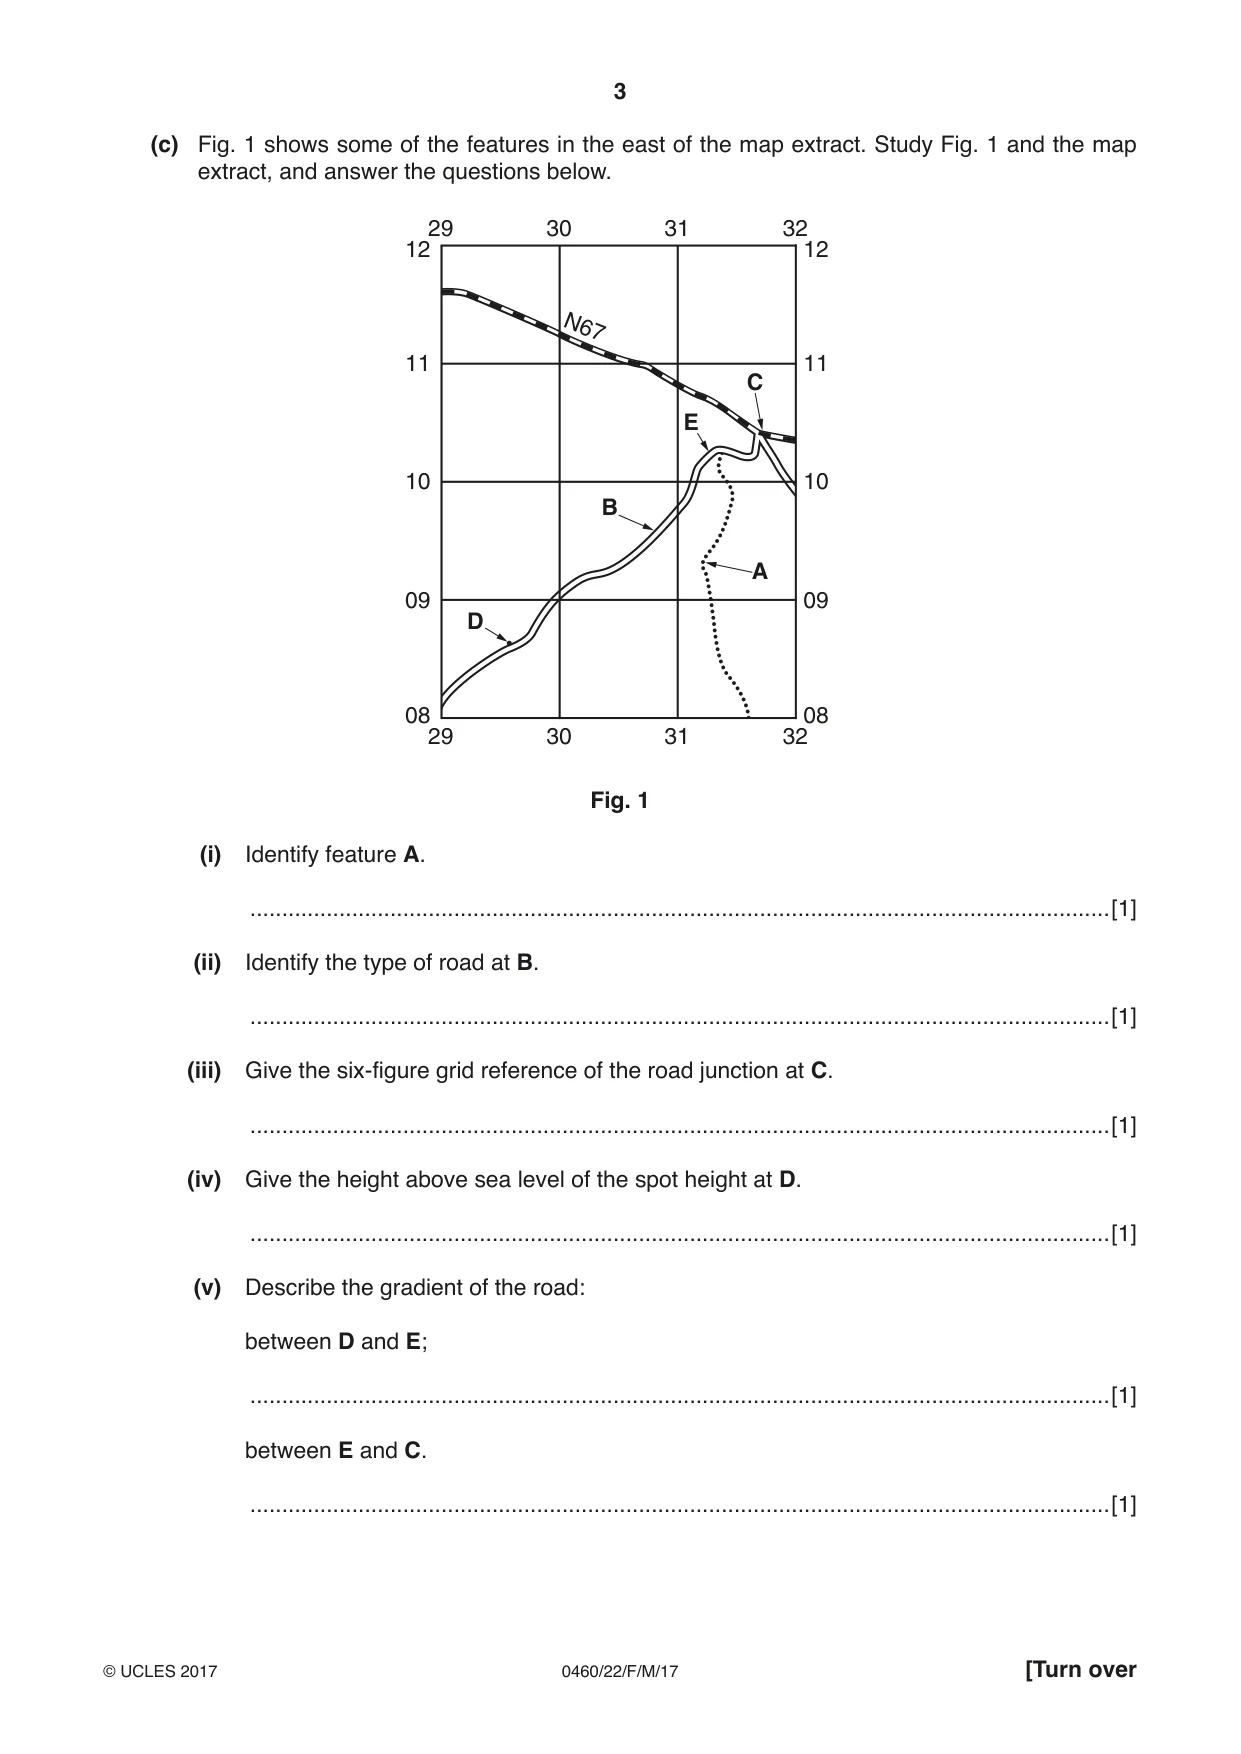
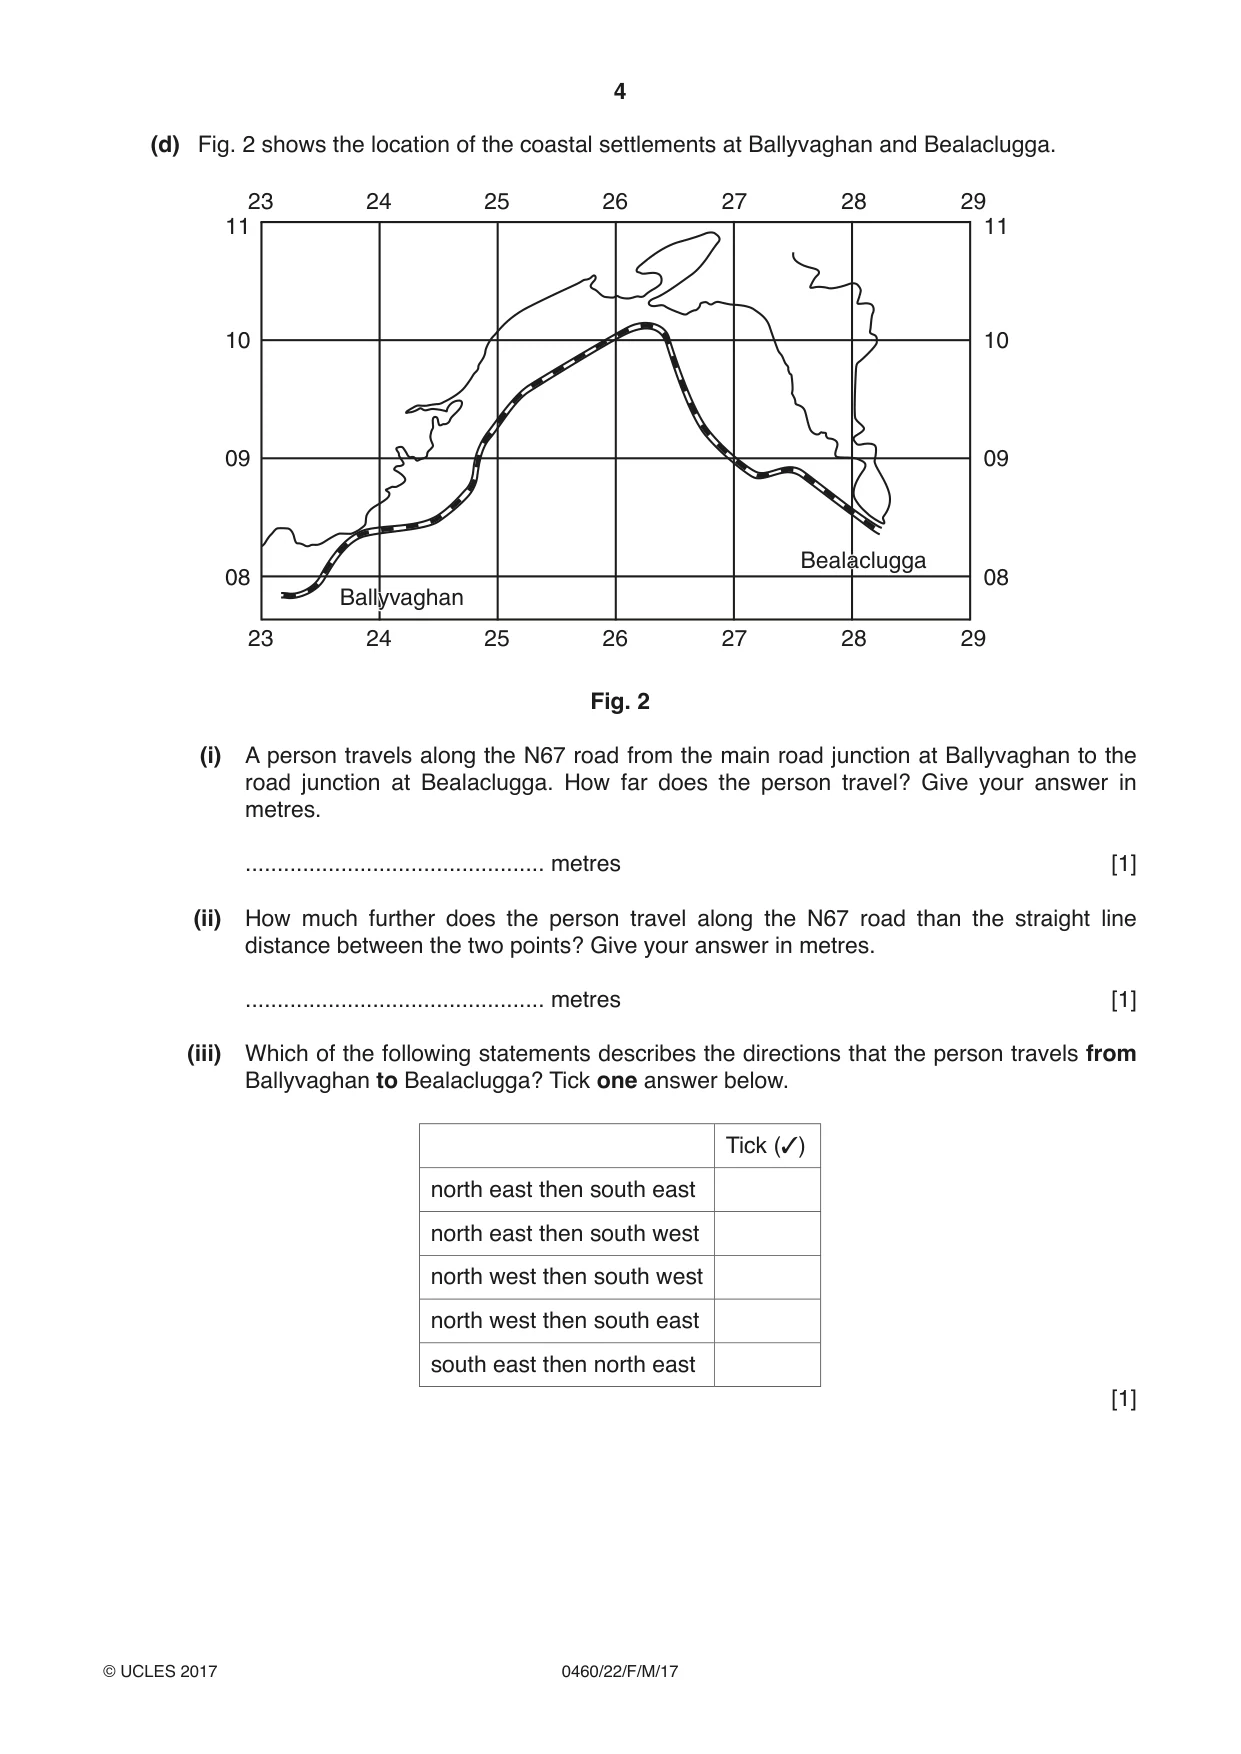
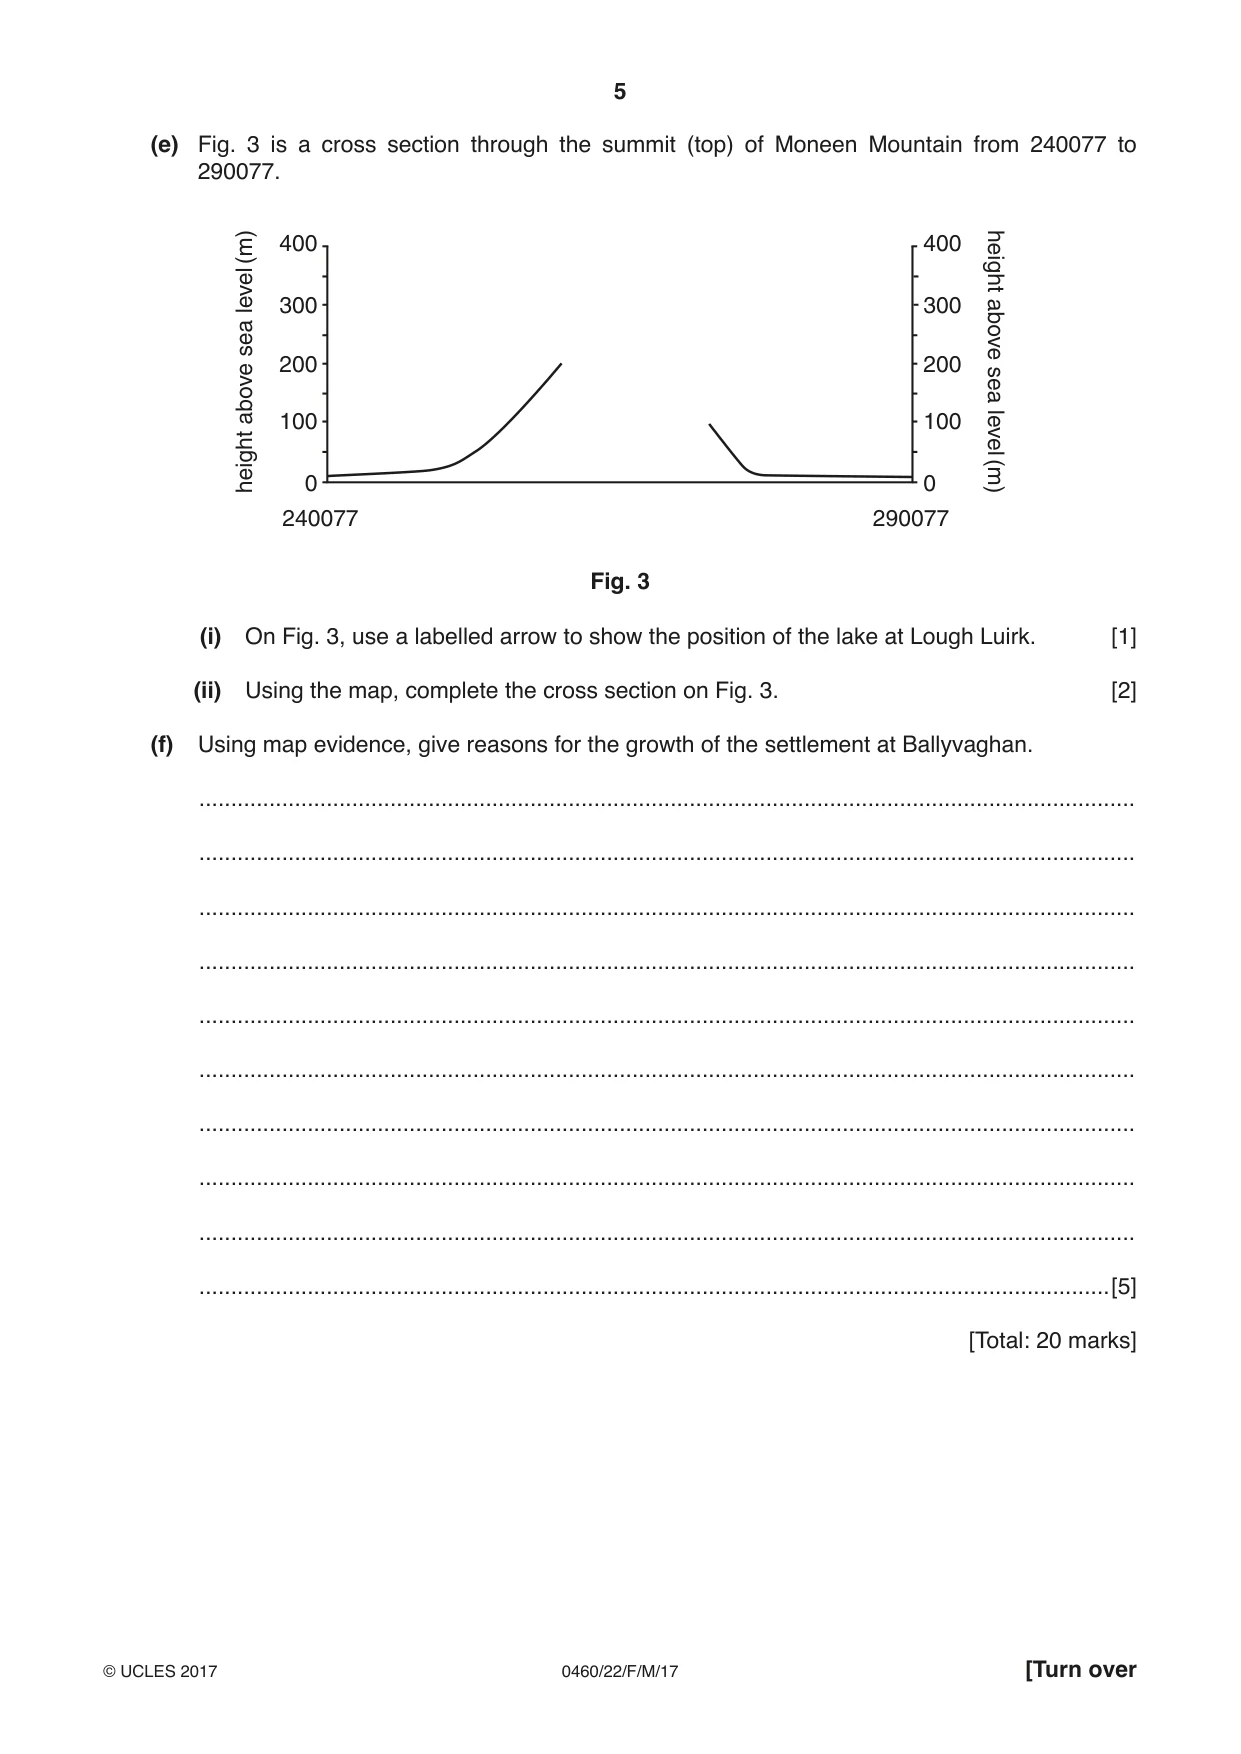
1 Study the map extract for Ballyvaghan, Ireland. The scale is 1:50 000. (a) The map has blue grid lines which make squares. What area of land does one grid square show? Tick one answer below. Tick (3) 1 km2 10 km2 20 km2 50 km2 100 km2 [1] (b) (i) Height above sea level is shown by contour lines. What is the difference in height between the contour lines on this map? Tick one answer below. Tick (3) 1 m 10 m 20 m 40 m 100 m [1] (ii) What does the green shading in grid square 2807 show? .......................................................................................................................................[1] (c) Fig. 1 shows some of the features in the east of the map extract. Study Fig. 1 and the map extract, and answer the questions below. 29 30 31 32 12 12 N67 11 11 C E 10 10 B A 09 09 D 08 08 29 30 31 32 Fig. 1 (i) Identify feature A. .......................................................................................................................................[1] (ii) Identify the type of road at B. .......................................................................................................................................[1] (iii) Give the six-figure grid reference of the road junction at C. .......................................................................................................................................[1] (iv) Give the height above sea level of the spot height at D. .......................................................................................................................................[1] (v) Describe the gradient of the road: between D and E; .......................................................................................................................................[1] between E and C. .......................................................................................................................................[1] (d) Fig. 2 shows the location of the coastal settlements at Ballyvaghan and Bealaclugga. 23 24 25 26 27 28 29 11 11 10 10 09 09 BealacluggaBealaclugga 08 08 BallyvaghanBallyvaghan 23 24 25 26 27 28 29 Fig. 2 (i) A person travels along the N67 road from the main road junction at Ballyvaghan to the road junction at Bealaclugga. How far does the person travel? Give your answer in metres. ............................................... metres [1] (ii) How much further does the person travel along the N67 road than the straight line distance between the two points? Give your answer in metres. ............................................... metres [1] (iii) Which of the following statements describes the directions that the person travels from Ballyvaghan to Bealaclugga? Tick one answer below. Tick (3) north east then south east north east then south west north west then south west north west then south east south east then north east [1] (e) Fig. 3 is a cross section through the summit (top) of Moneen Mountain from 240077 to 290077. (m) 400 400 height level 300 300 sea above 200 200 above sea 100 100 level height 0 0 (m) 240077 290077 Fig. 3 (i) On Fig. 3, use a labelled arrow to show the position of the lake at Lough Luirk. [1] (ii) Using the map, complete the cross section on Fig. 3. [2] (f) Using map evidence, give reasons for the growth of the settlement at Ballyvaghan. ................................................................................................................................................... ................................................................................................................................................... ................................................................................................................................................... ................................................................................................................................................... ................................................................................................................................................... ................................................................................................................................................... ................................................................................................................................................... ................................................................................................................................................... ................................................................................................................................................... ...............................................................................................................................................[5] [Total: 20 marks]
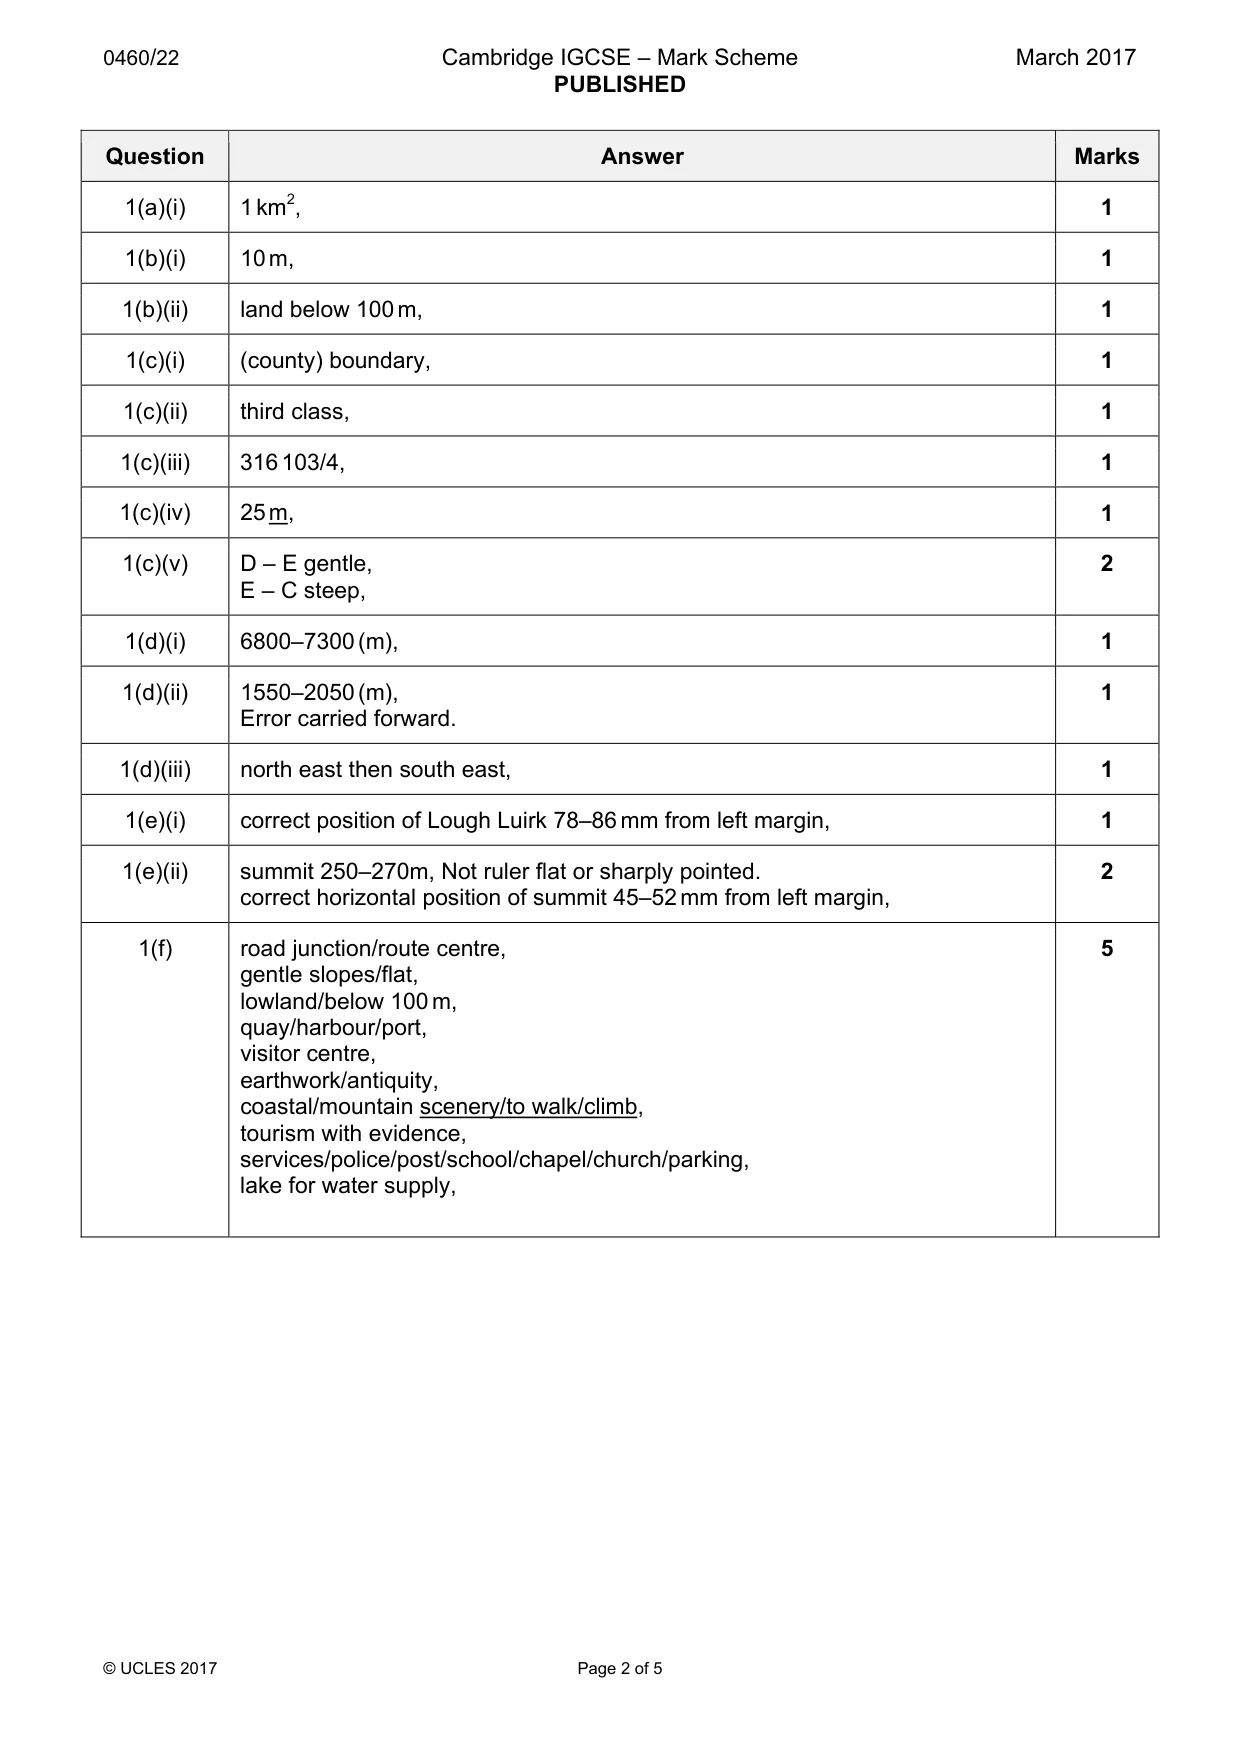
Mark scheme: Question Answer Marks 1(a)(i) 1 km2, 1 1(b)(i) 10 m, 1 1(b)(ii) land below 100 m, 1 1(c)(i) (county) boundary, 1 1(c)(ii) third class, 1 1(c)(iii) 316 103/4, 1 1(c)(iv) 25 m, 1 1(c)(v) D – E gentle, 2 E – C steep, 1(d)(i) 6800–7300 (m), 1 1(d)(ii) 1550–2050 (m), 1 Error carried forward. 1(d)(iii) north east then south east, 1 1(e)(i) correct position of Lough Luirk 78–86 mm from left margin, 1 1(e)(ii) summit 250–270m, Not ruler flat or sharply pointed. 2 correct horizontal position of summit 45–52 mm from left margin, 1(f) road junction/route centre, 5 gentle slopes/flat, lowland/below 100 m, quay/harbour/port, visitor centre, earthwork/antiquity, coastal/mountain scenery/to walk/climb, tourism with evidence, services/police/post/school/chapel/church/parking, lake for water supply,
More questions on Settlements (rural and urban) and service provision
Question 2
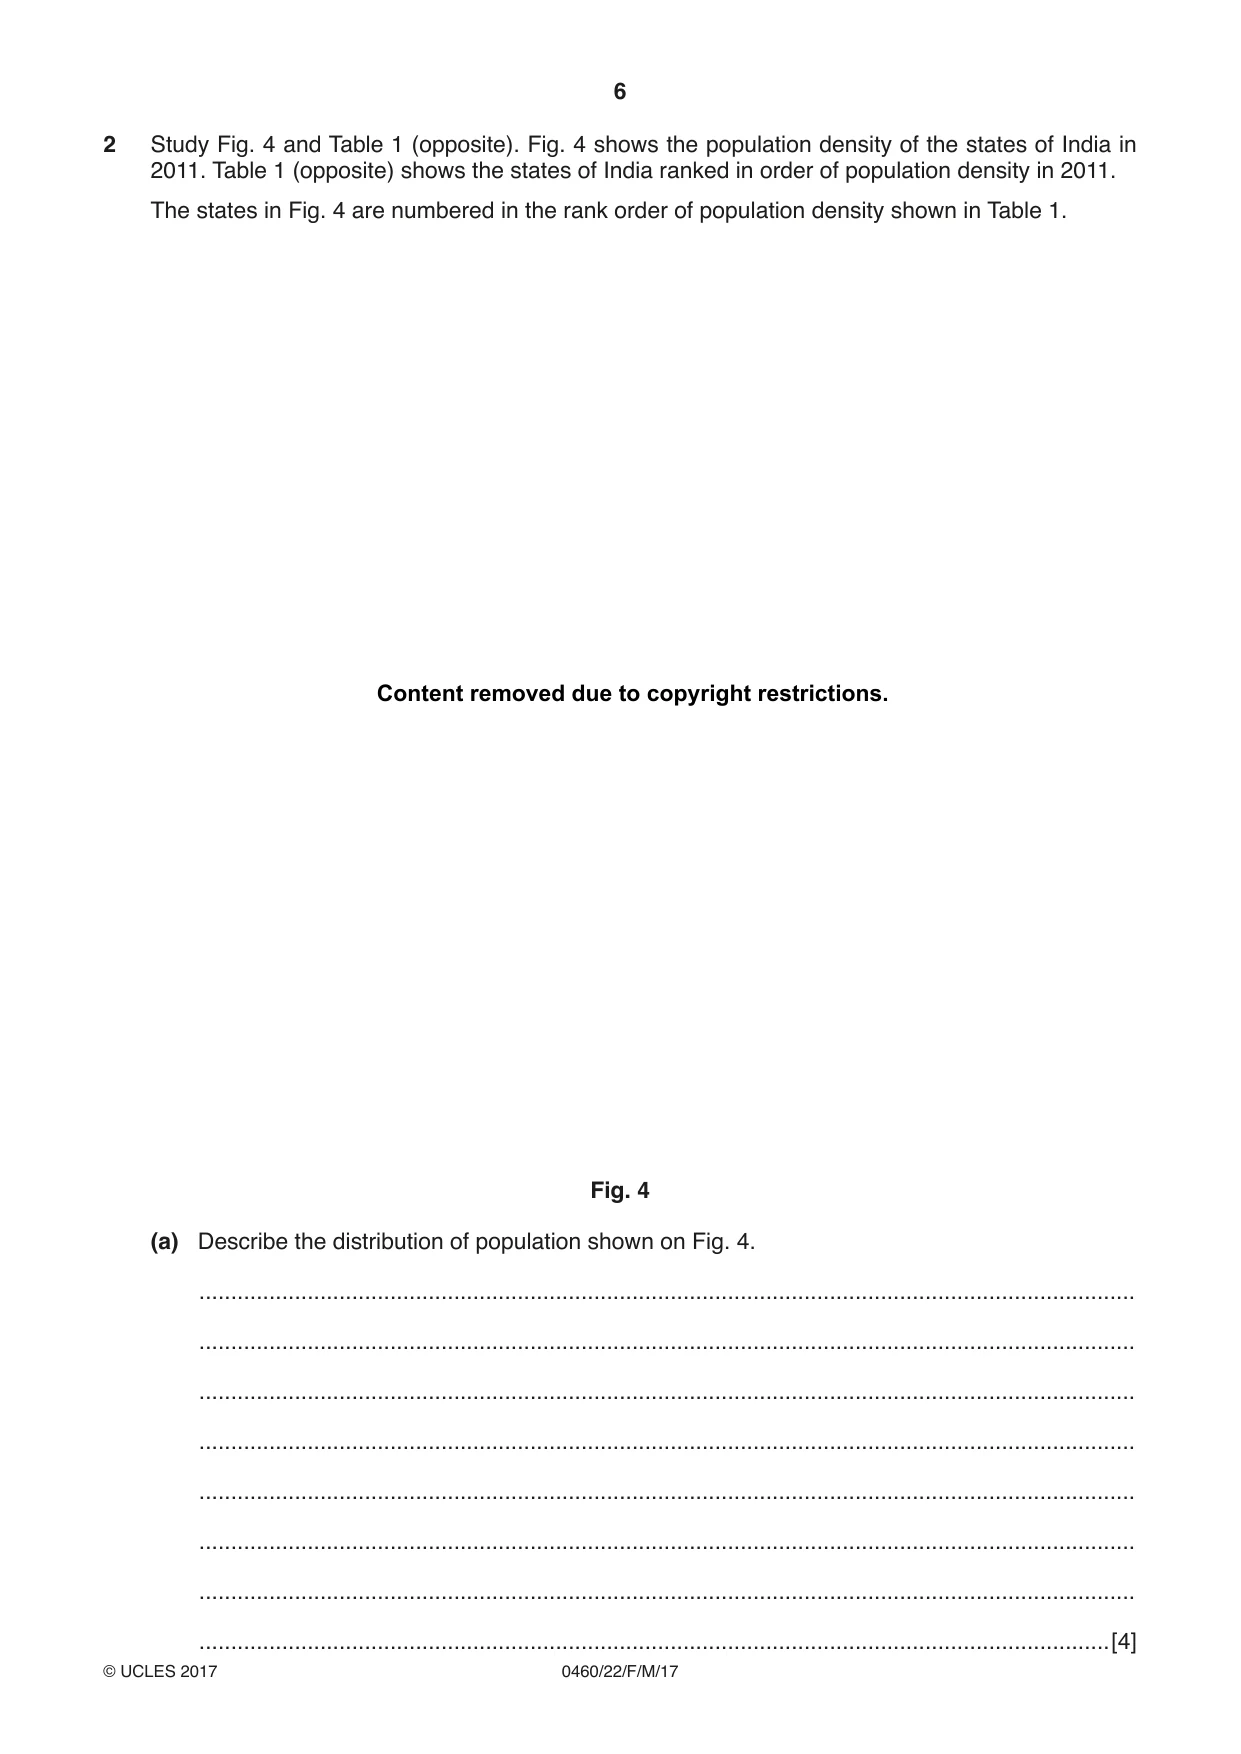
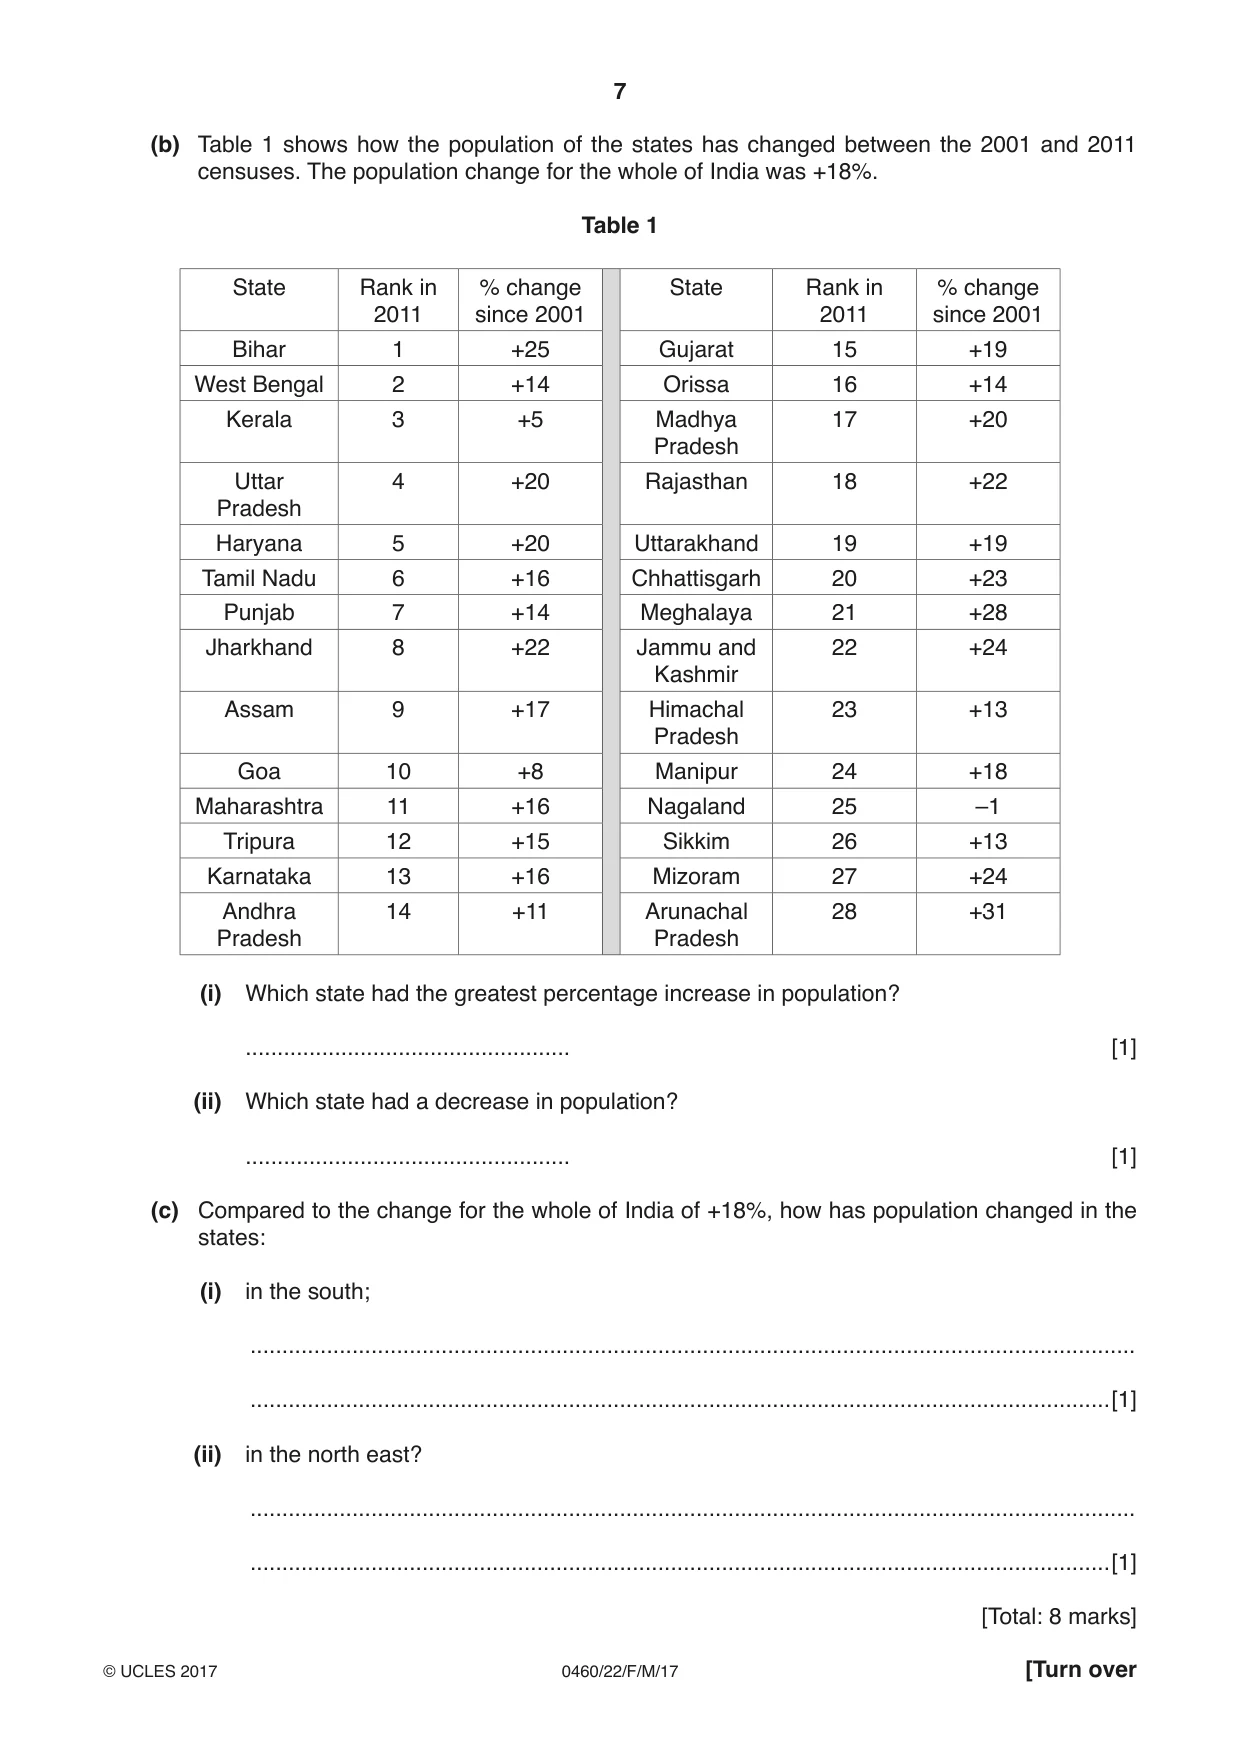
2 Study Fig. 4 and Table 1 (opposite). Fig. 4 shows the population density of the states of India in 2011. Table 1 (opposite) shows the states of India ranked in order of population density in 2011. The states in Fig. 4 are numbered in the rank order of population density shown in Table 1. Content removed due to copyright restrictions. Fig. 4 (a) Describe the distribution of population shown on Fig. 4. ................................................................................................................................................... ................................................................................................................................................... ................................................................................................................................................... ................................................................................................................................................... ................................................................................................................................................... ................................................................................................................................................... ................................................................................................................................................... ...............................................................................................................................................[4] (b) Table 1 shows how the population of the states has changed between the 2001 and 2011 censuses. The population change for the whole of India was +18%. Table 1 State Rank in % change State Rank in % change 2011 since 2001 2011 since 2001 Bihar 1 +25 Gujarat 15 +19 West Bengal 2 +14 Orissa 16 +14 Kerala 3 +5 Madhya 17 +20 Pradesh Uttar 4 +20 Rajasthan 18 +22 Pradesh Haryana 5 +20 Uttarakhand 19 +19 Tamil Nadu 6 +16 Chhattisgarh 20 +23 Punjab 7 +14 Meghalaya 21 +28 Jharkhand 8 +22 Jammu and 22 +24 Kashmir Assam 9 +17 Himachal 23 +13 Pradesh Goa 10 +8 Manipur 24 +18 Maharashtra 11 +16 Nagaland 25 –1 Tripura 12 +15 Sikkim 26 +13 Karnataka 13 +16 Mizoram 27 +24 Andhra 14 +11 Arunachal 28 +31 Pradesh Pradesh (i) Which state had the greatest percentage increase in population? ................................................... [1] (ii) Which state had a decrease in population? ................................................... [1] (c) Compared to the change for the whole of India of +18%, how has population changed in the states: (i) in the south; ........................................................................................................................................... .......................................................................................................................................[1] (ii) in the north east? ........................................................................................................................................... .......................................................................................................................................[1] [Total: 8 marks]
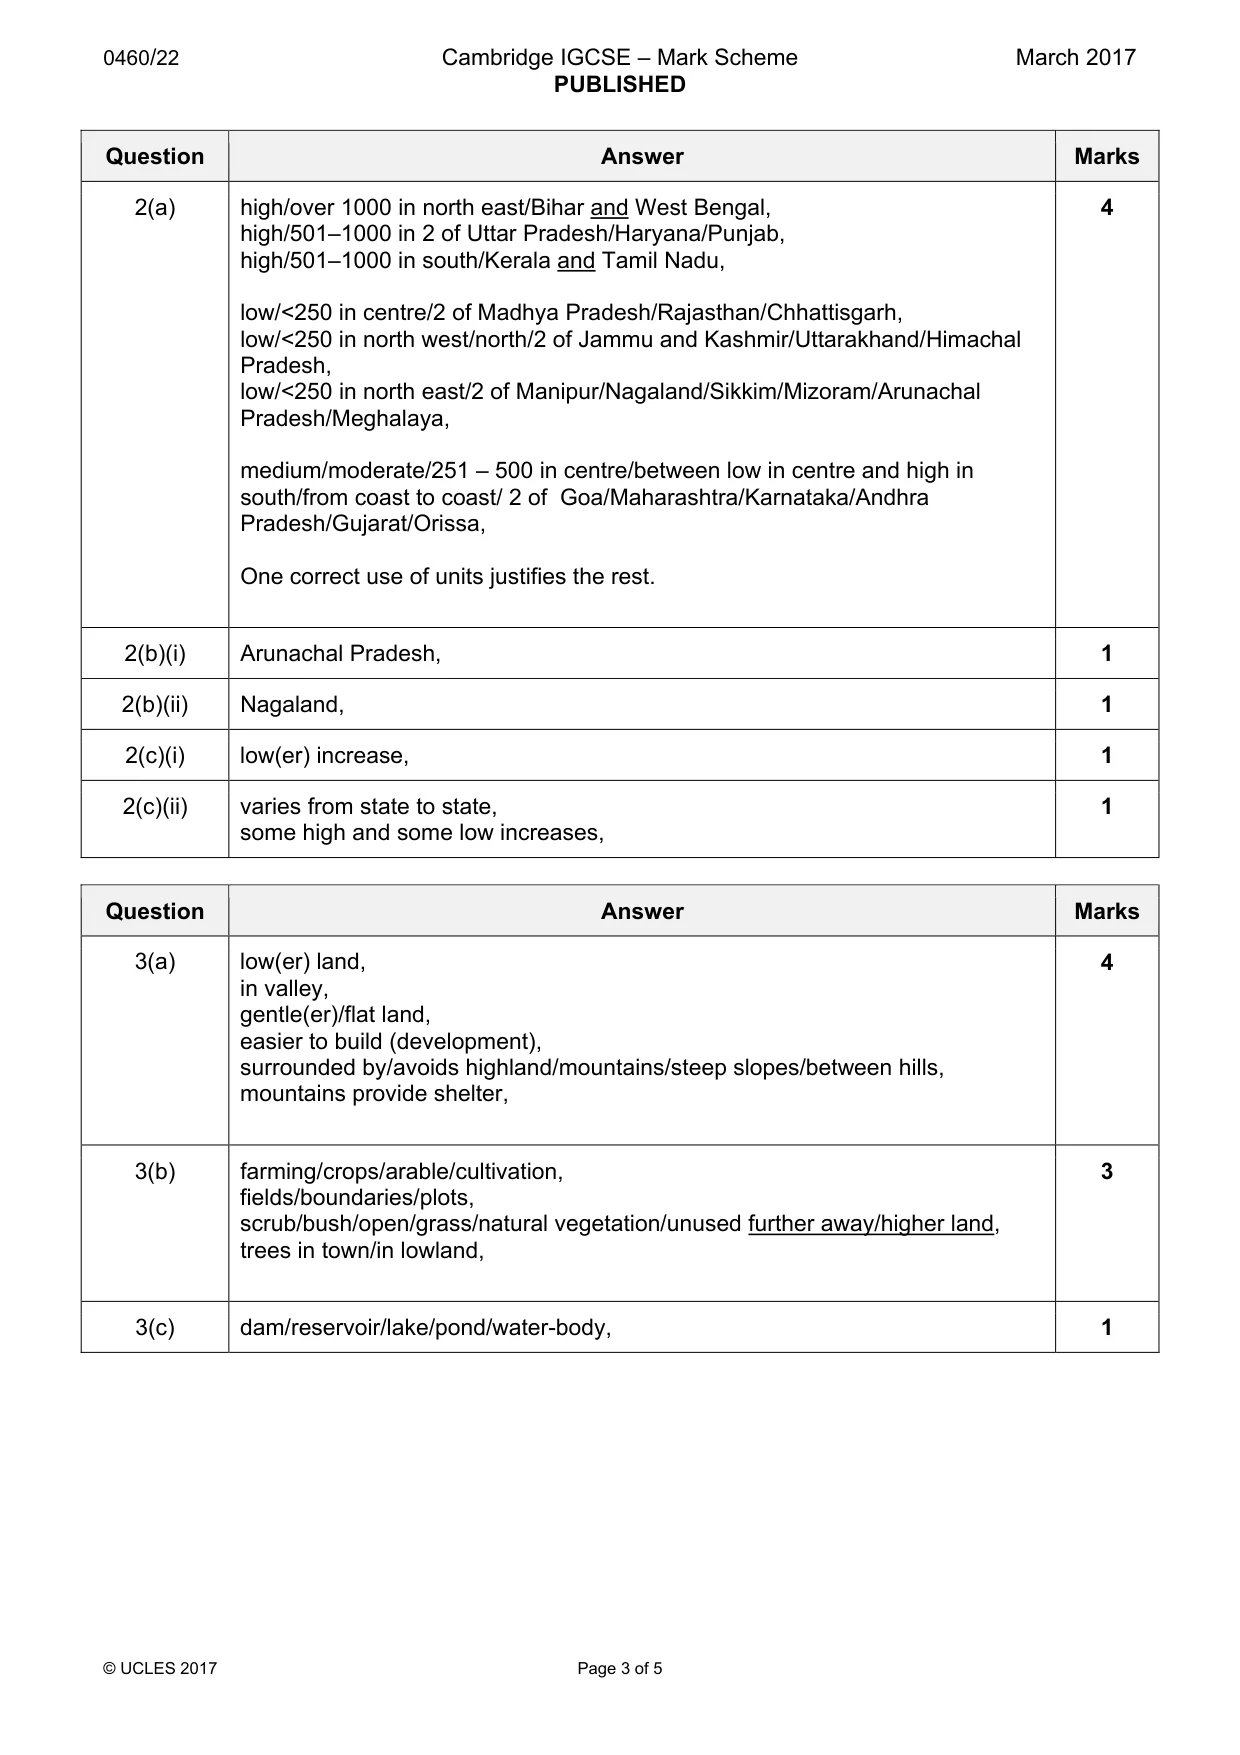
Mark scheme: 2(a) high/over 1000 in north east/Bihar and West Bengal, 4 high/501–1000 in 2 of Uttar Pradesh/Haryana/Punjab, high/501–1000 in south/Kerala and Tamil Nadu, low/<250 in centre/2 of Madhya Pradesh/Rajasthan/Chhattisgarh, low/<250 in north west/north/2 of Jammu and Kashmir/Uttarakhand/Himachal Pradesh, low/<250 in north east/2 of Manipur/Nagaland/Sikkim/Mizoram/Arunachal Pradesh/Meghalaya, medium/moderate/251 – 500 in centre/between low in centre and high in south/from coast to coast/ 2 of Goa/Maharashtra/Karnataka/Andhra Pradesh/Gujarat/Orissa, One correct use of units justifies the rest. 2(b)(i) Arunachal Pradesh, 1 2(b)(ii) Nagaland, 1 2(c)(i) low(er) increase, 1 2(c)(ii) varies from state to state, 1 some high and some low increases,
Q3 · Study Photograph A (Insert), which shows a rural area in South Africa
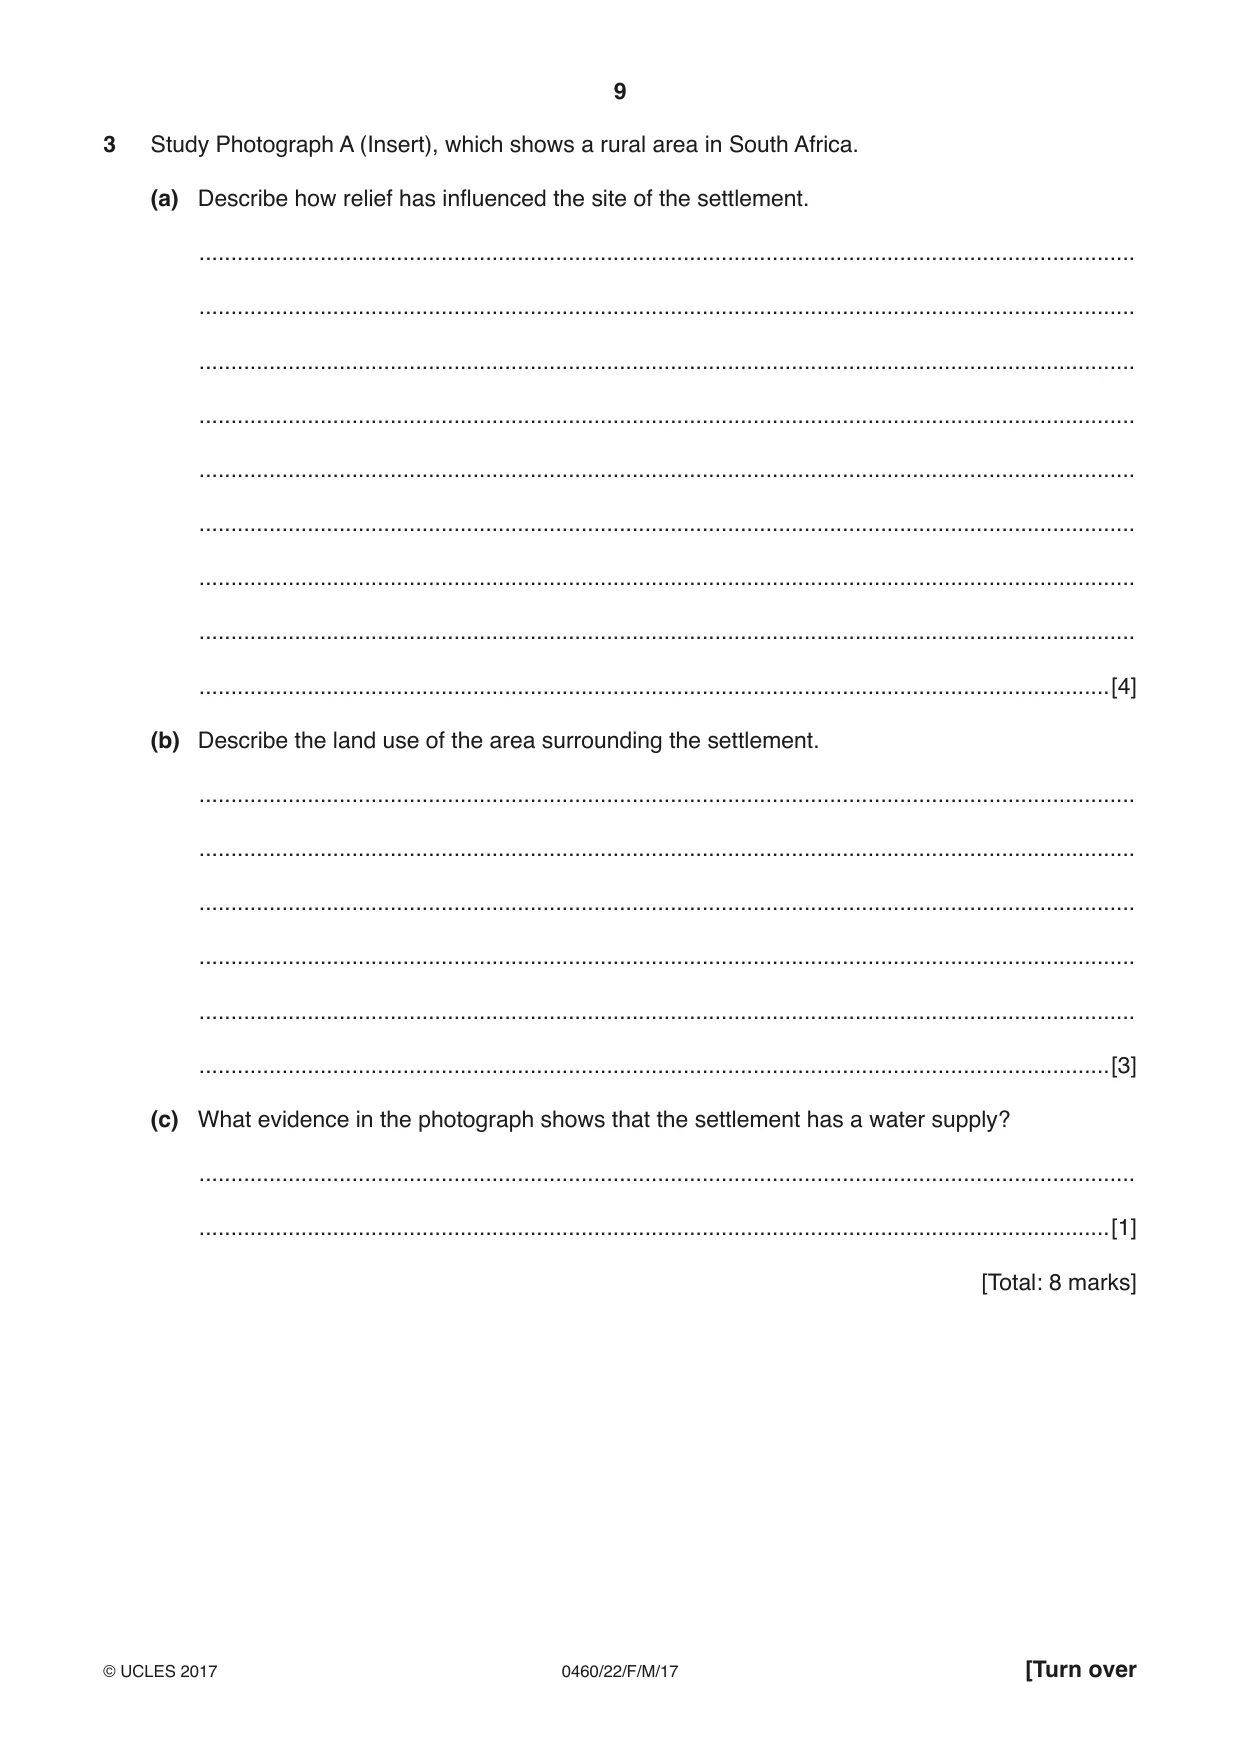
3 Study Photograph A (Insert), which shows a rural area in South Africa. (a) Describe how relief has influenced the site of the settlement. ................................................................................................................................................... ................................................................................................................................................... ................................................................................................................................................... ................................................................................................................................................... ................................................................................................................................................... ................................................................................................................................................... ................................................................................................................................................... ................................................................................................................................................... ...............................................................................................................................................[4] (b) Describe the land use of the area surrounding the settlement. ................................................................................................................................................... ................................................................................................................................................... ................................................................................................................................................... ................................................................................................................................................... ................................................................................................................................................... ...............................................................................................................................................[3] (c) What evidence in the photograph shows that the settlement has a water supply? ................................................................................................................................................... ...............................................................................................................................................[1] [Total: 8 marks]
Mark scheme: 3(a) low(er) land, 4 in valley, gentle(er)/flat land, easier to build (development), surrounded by/avoids highland/mountains/steep slopes/between hills, mountains provide shelter, 3(b) farming/crops/arable/cultivation, 3 fields/boundaries/plots, scrub/bush/open/grass/natural vegetation/unused further away/higher land, trees in town/in lowland, 3(c) dam/reservoir/lake/pond/water-body, 1
More questions on Settlements (rural and urban) and service provision
Question 4
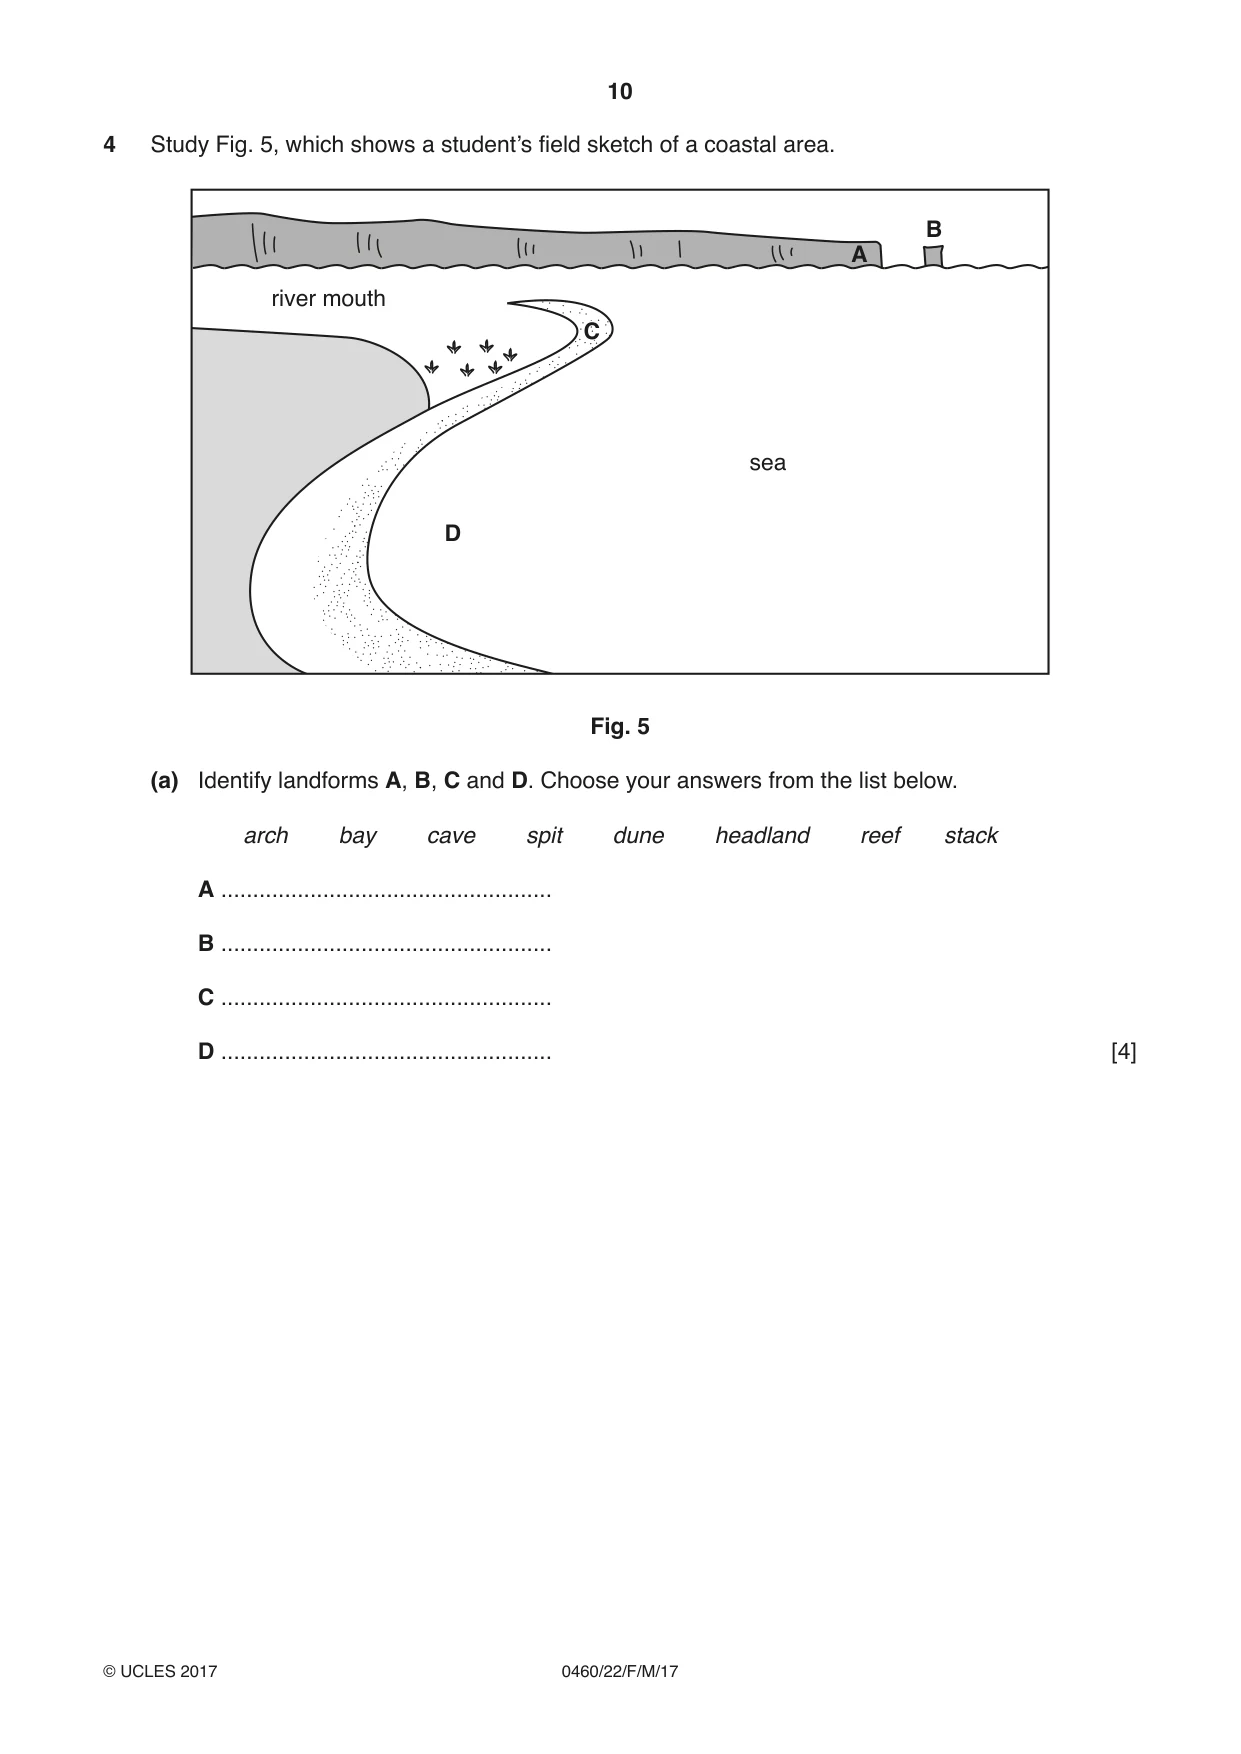
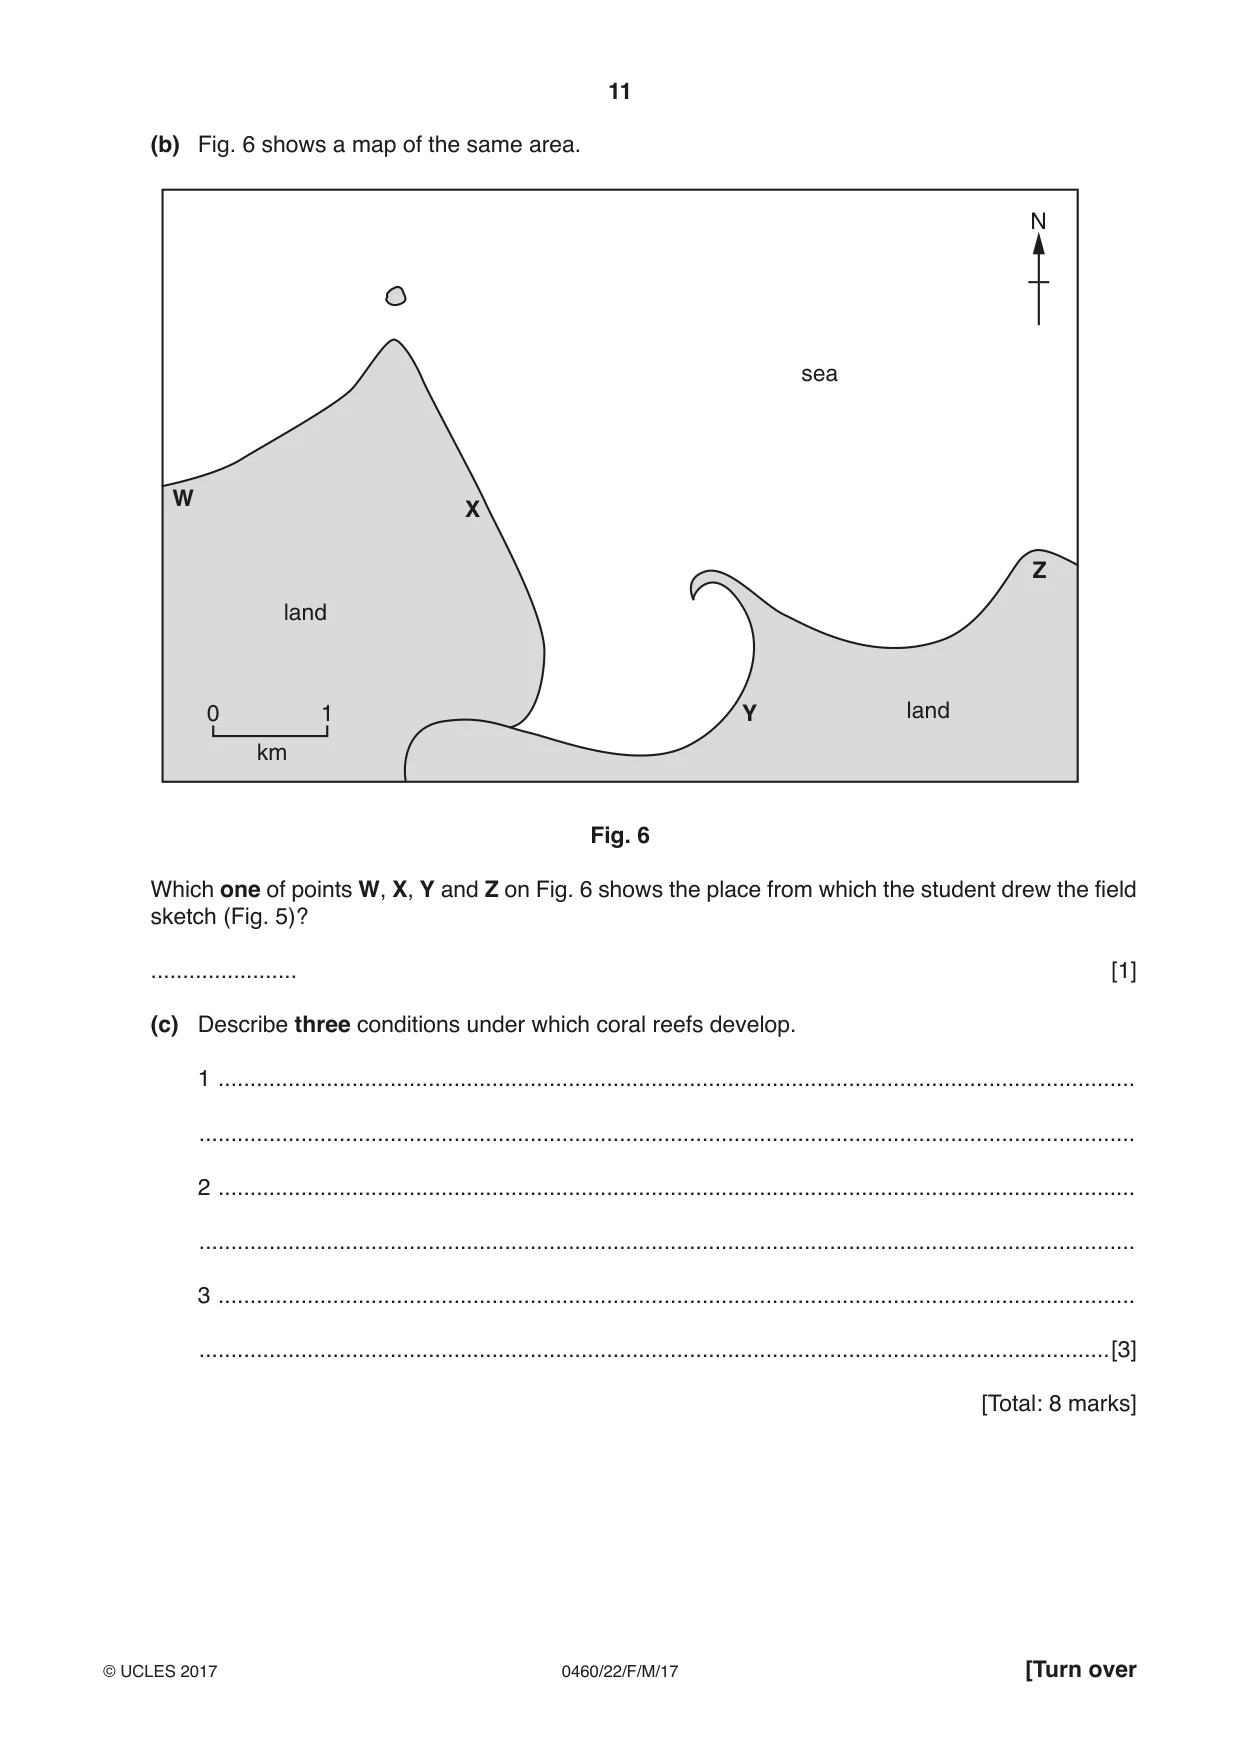
4 Study Fig. 5, which shows a student’s field sketch of a coastal area. B A river mouth C sea D Fig. 5 (a) Identify landforms A, B, C and D. Choose your answers from the list below. arch bay cave spit dune headland reef stack A .................................................... B .................................................... C .................................................... D .................................................... [4] (b) Fig. 6 shows a map of the same area. N sea W X Z land 0 1 Y land km Fig. 6 Which one of points W, X, Y and Z on Fig. 6 shows the place from which the student drew the field sketch (Fig. 5)? ....................... [1] (c) Describe three conditions under which coral reefs develop. 1 ................................................................................................................................................ ................................................................................................................................................... 2 ................................................................................................................................................ ................................................................................................................................................... 3 ................................................................................................................................................ ...............................................................................................................................................[3] [Total: 8 marks]
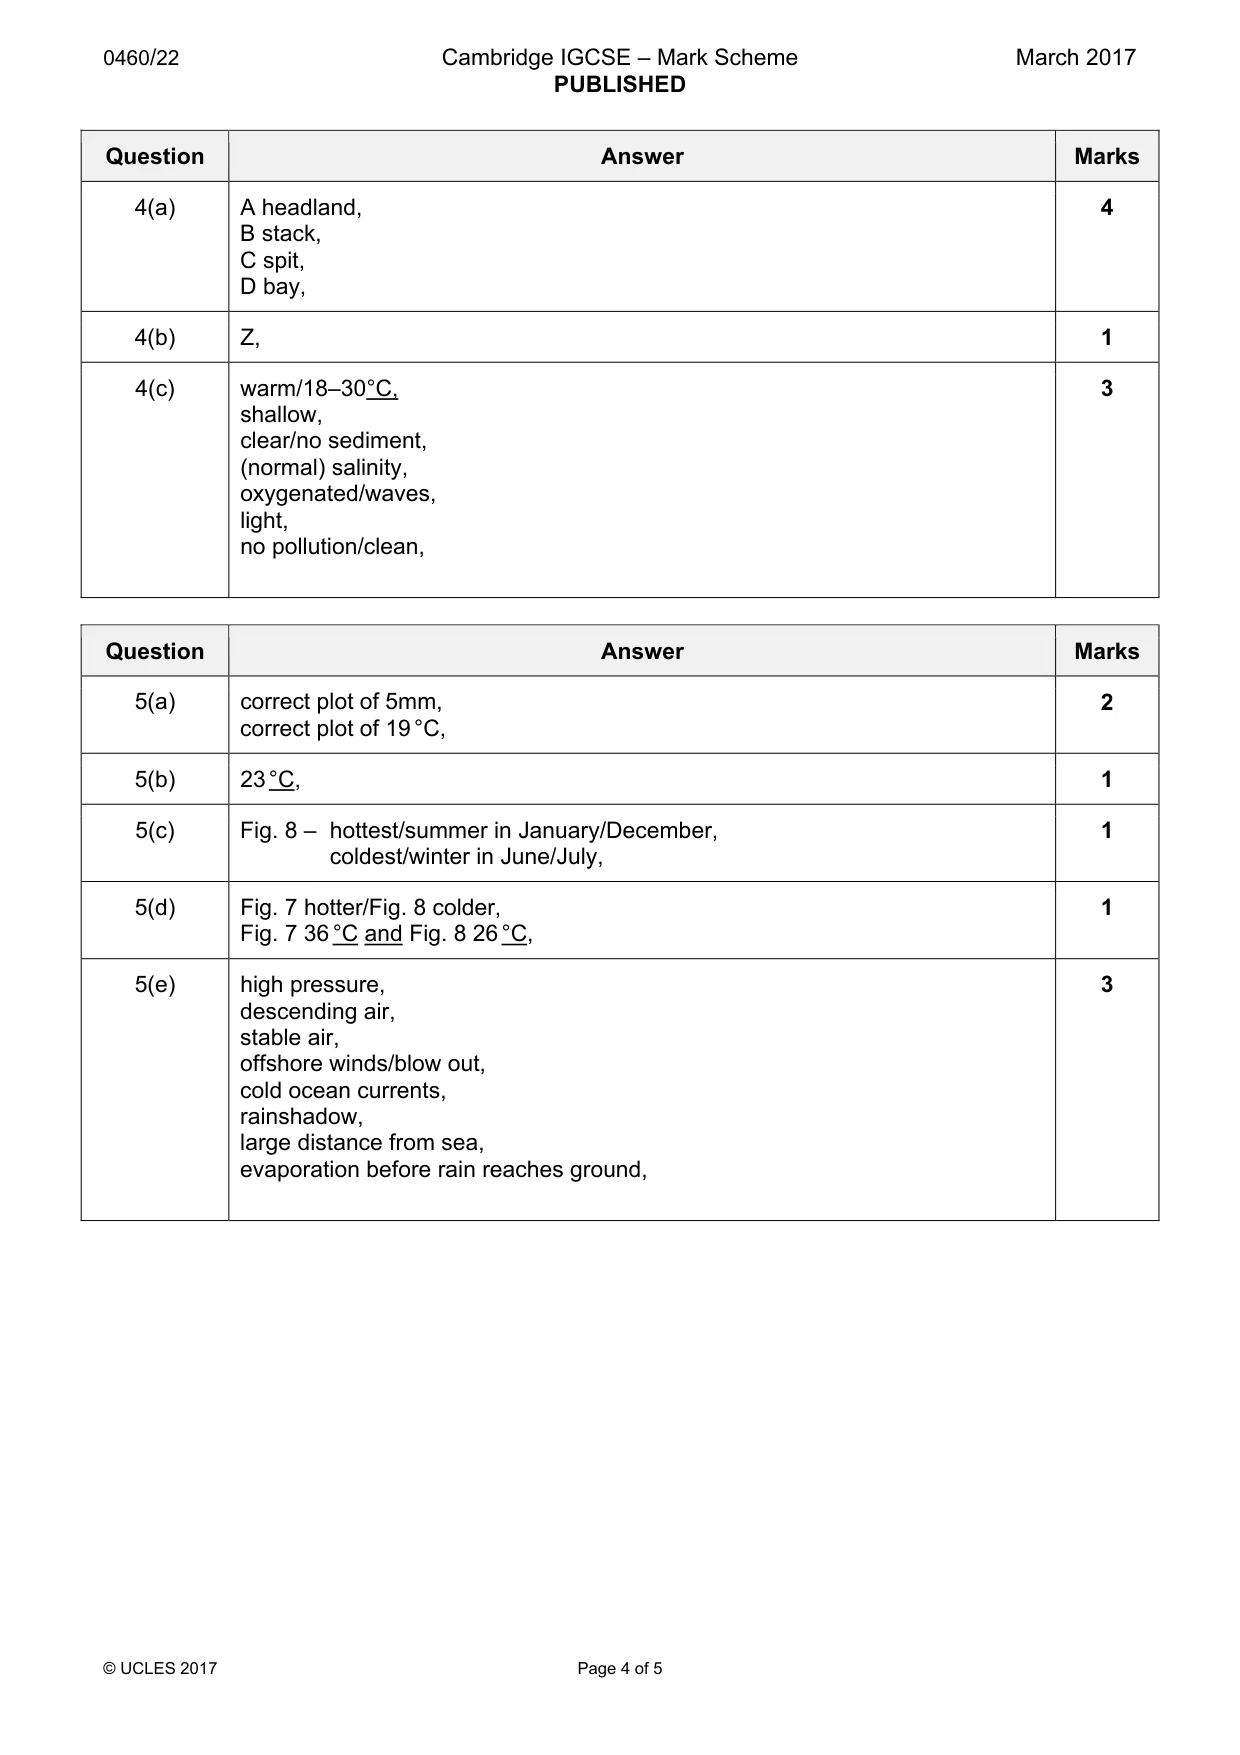
Mark scheme: 4(a) A headland, 4 B stack, C spit, D bay, 4(b) Z, 1 4(c) warm/18–30°C, 3 shallow, clear/no sediment, (normal) salinity, oxygenated/waves, light, no pollution/clean,
Question 5
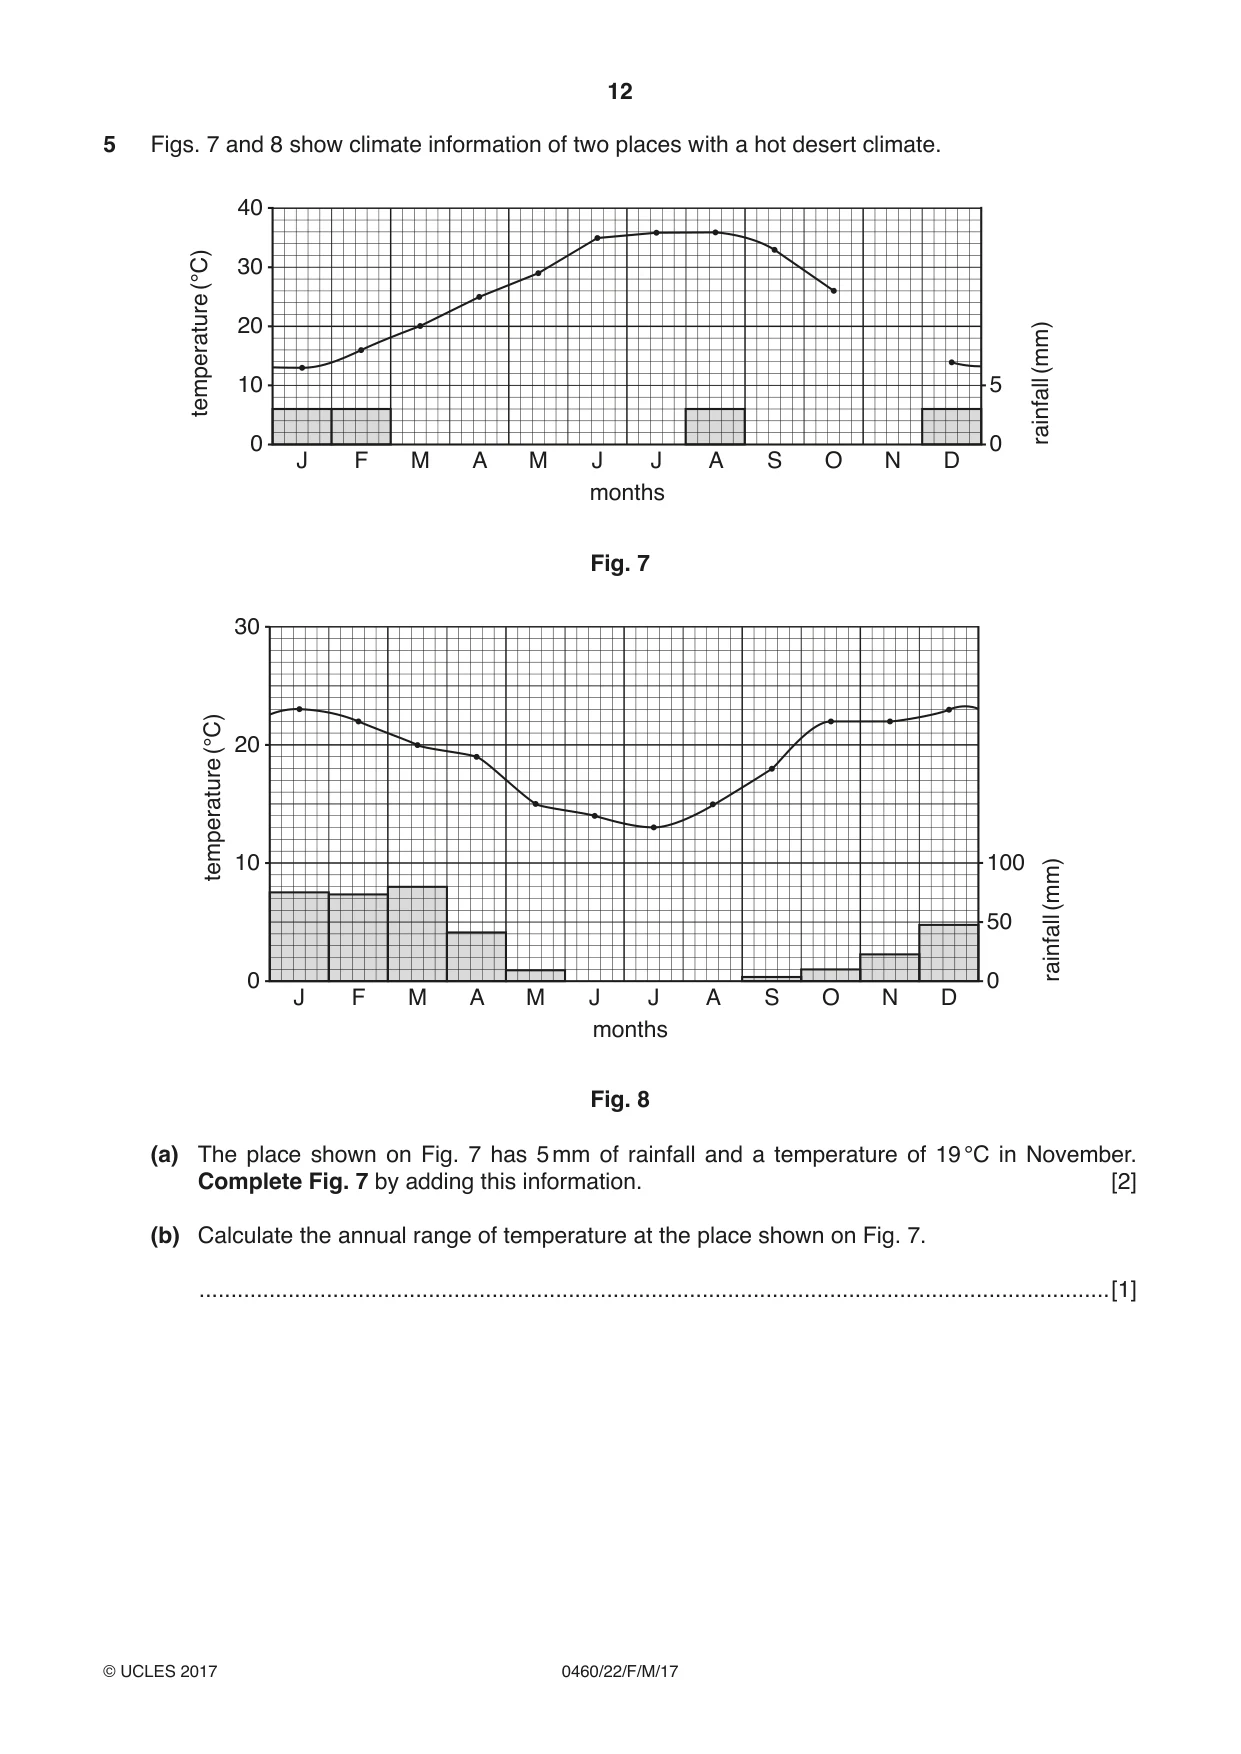
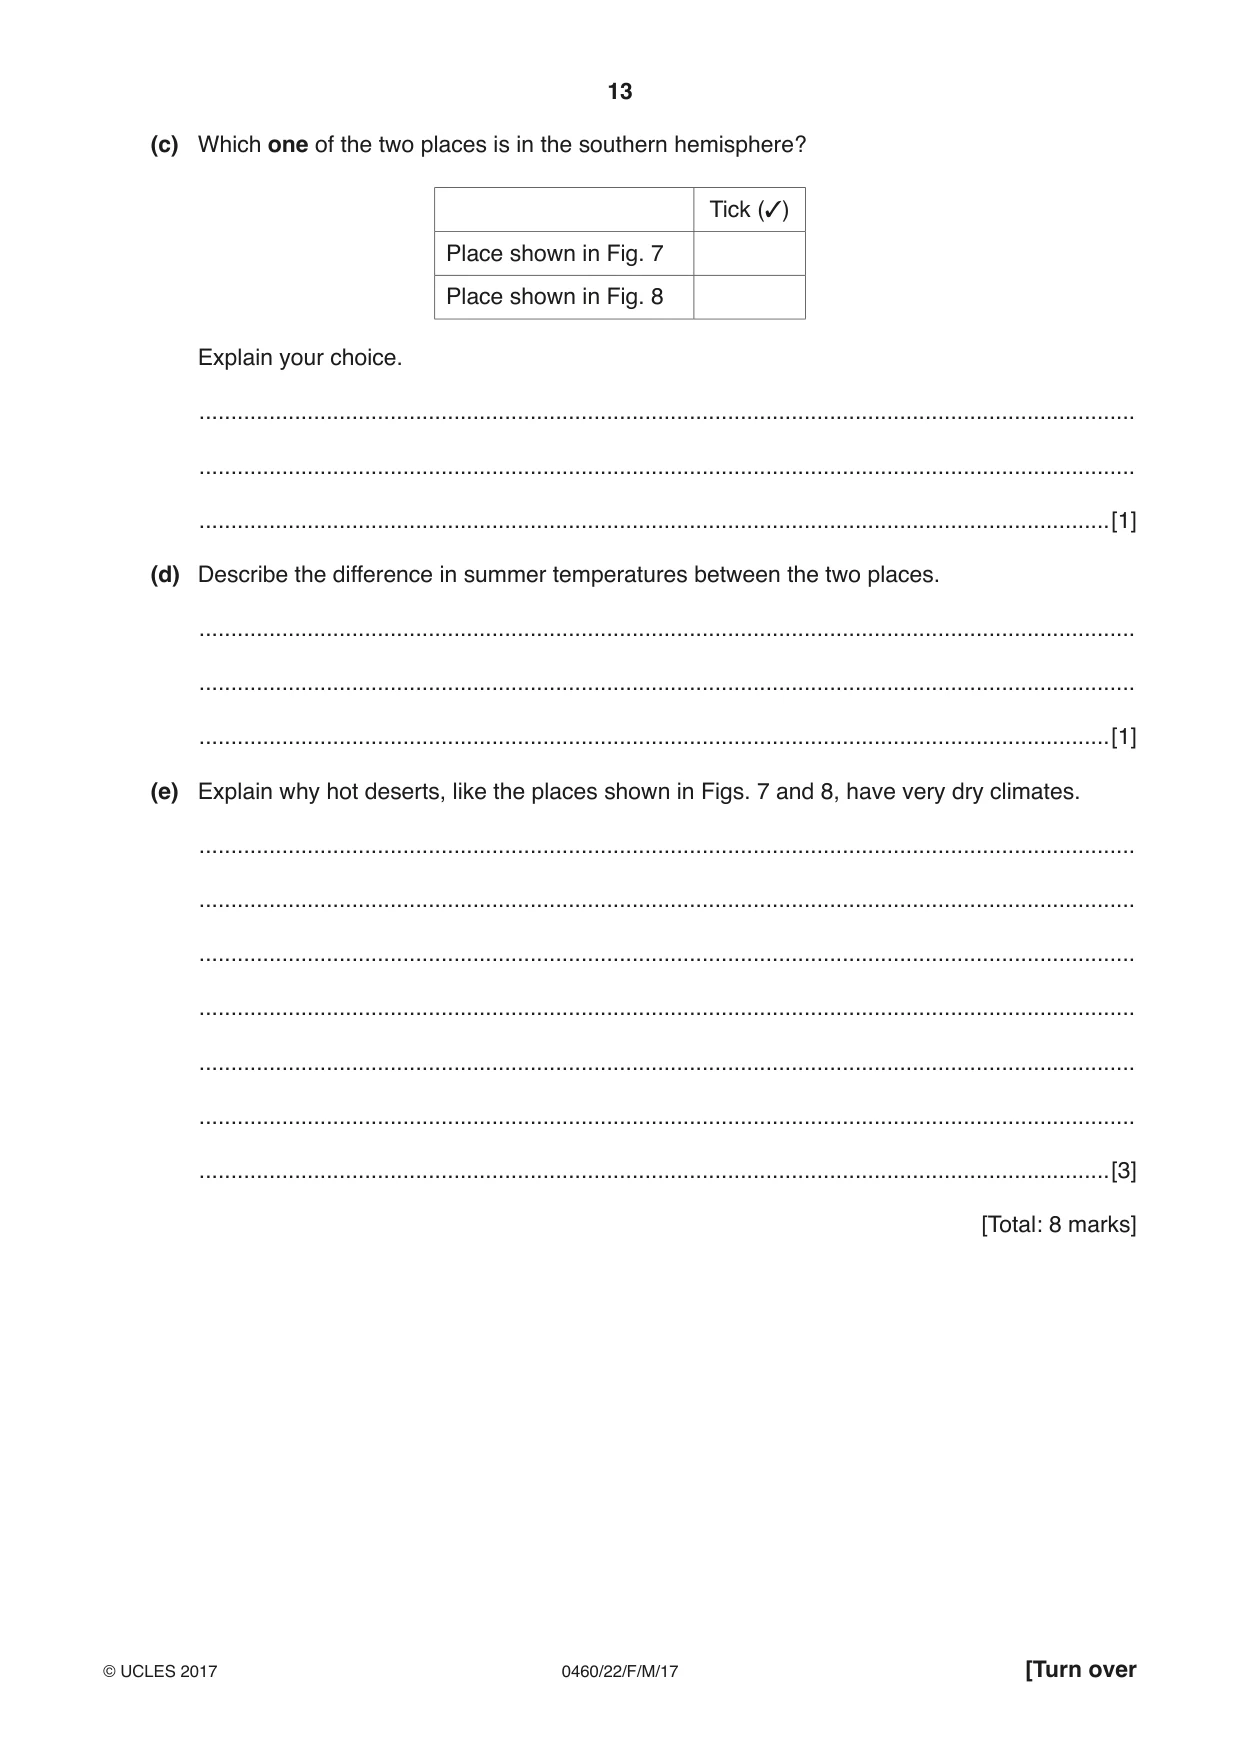
5 Figs. 7 and 8 show climate information of two places with a hot desert climate. 40 (°C) 30 20 (mm) 10 5 temperature rainfall 0 0 J F M A M J J A S O N D months Fig. 7 30 (°C) 20 temperature 10 100 (mm) 50 rainfall 0 0 J F M A M J J A S O N D months Fig. 8 (a) The place shown on Fig. 7 has 5 mm of rainfall and a temperature of 19 °C in November. Complete Fig. 7 by adding this information. [2] (b) Calculate the annual range of temperature at the place shown on Fig. 7. ...............................................................................................................................................[1] (c) Which one of the two places is in the southern hemisphere? Tick (3) Place shown in Fig. 7 Place shown in Fig. 8 Explain your choice. ................................................................................................................................................... ................................................................................................................................................... ...............................................................................................................................................[1] (d) Describe the difference in summer temperatures between the two places. ................................................................................................................................................... ................................................................................................................................................... ...............................................................................................................................................[1] (e) Explain why hot deserts, like the places shown in Figs. 7 and 8, have very dry climates. ................................................................................................................................................... ................................................................................................................................................... ................................................................................................................................................... ................................................................................................................................................... ................................................................................................................................................... ................................................................................................................................................... ...............................................................................................................................................[3] [Total: 8 marks]
Mark scheme: 5(a) correct plot of 5mm, 2 correct plot of 19 °C, 5(b) 23 °C, 1 5(c) Fig. 8 – hottest/summer in January/December, 1 coldest/winter in June/July, 5(d) Fig. 7 hotter/Fig. 8 colder, 1 Fig. 7 36 °C and Fig. 8 26 °C, 5(e) high pressure, 3 descending air, stable air, offshore winds/blow out, cold ocean currents, rainshadow, large distance from sea, evaporation before rain reaches ground,
Q6 · Photographs B and C (Insert) show places where renewable energy sources have been…
6 Photographs B and C (Insert) show places where renewable energy sources have been developed. (a) Identify the renewable energy source in each photograph. Photograph B ..................................................... Photograph C ..................................................... [2] (b) Using evidence from the photographs, suggest why some local people might be for these developments and other local people might be against them. Suggest why local people might be for the developments. ................................................................................................................................................... ................................................................................................................................................... ................................................................................................................................................... ................................................................................................................................................... ................................................................................................................................................... ................................................................................................................................................... ................................................................................................................................................... ................................................................................................................................................... ...............................................................................................................................................[3] Suggest why local people might be against the developments. ................................................................................................................................................... ................................................................................................................................................... ................................................................................................................................................... ................................................................................................................................................... ................................................................................................................................................... ................................................................................................................................................... ................................................................................................................................................... ................................................................................................................................................... ...............................................................................................................................................[3] [Total: 8 marks] Additional Pages If you use the following lined pages to complete the answer(s) to any question(s), the question number(s) must be clearly shown. .................................................................................................................................................................. .................................................................................................................................................................. .................................................................................................................................................................. .................................................................................................................................................................. .................................................................................................................................................................. .................................................................................................................................................................. .................................................................................................................................................................. .................................................................................................................................................................. .................................................................................................................................................................. .................................................................................................................................................................. .................................................................................................................................................................. .................................................................................................................................................................. .................................................................................................................................................................. .................................................................................................................................................................. .................................................................................................................................................................. .................................................................................................................................................................. .................................................................................................................................................................. .................................................................................................................................................................. .................................................................................................................................................................. .................................................................................................................................................................. .................................................................................................................................................................. .................................................................................................................................................................. .................................................................................................................................................................. .................................................................................................................................................................. .................................................................................................................................................................. .................................................................................................................................................................. .................................................................................................................................................................. .................................................................................................................................................................. .................................................................................................................................................................. .................................................................................................................................................................. .................................................................................................................................................................. .................................................................................................................................................................. .................................................................................................................................................................. .................................................................................................................................................................. .................................................................................................................................................................. .................................................................................................................................................................. .................................................................................................................................................................. .................................................................................................................................................................. .................................................................................................................................................................. .................................................................................................................................................................. .................................................................................................................................................................. .................................................................................................................................................................. .................................................................................................................................................................. .................................................................................................................................................................. .................................................................................................................................................................. .................................................................................................................................................................. .................................................................................................................................................................. .................................................................................................................................................................. ..................................................................................................................................................................
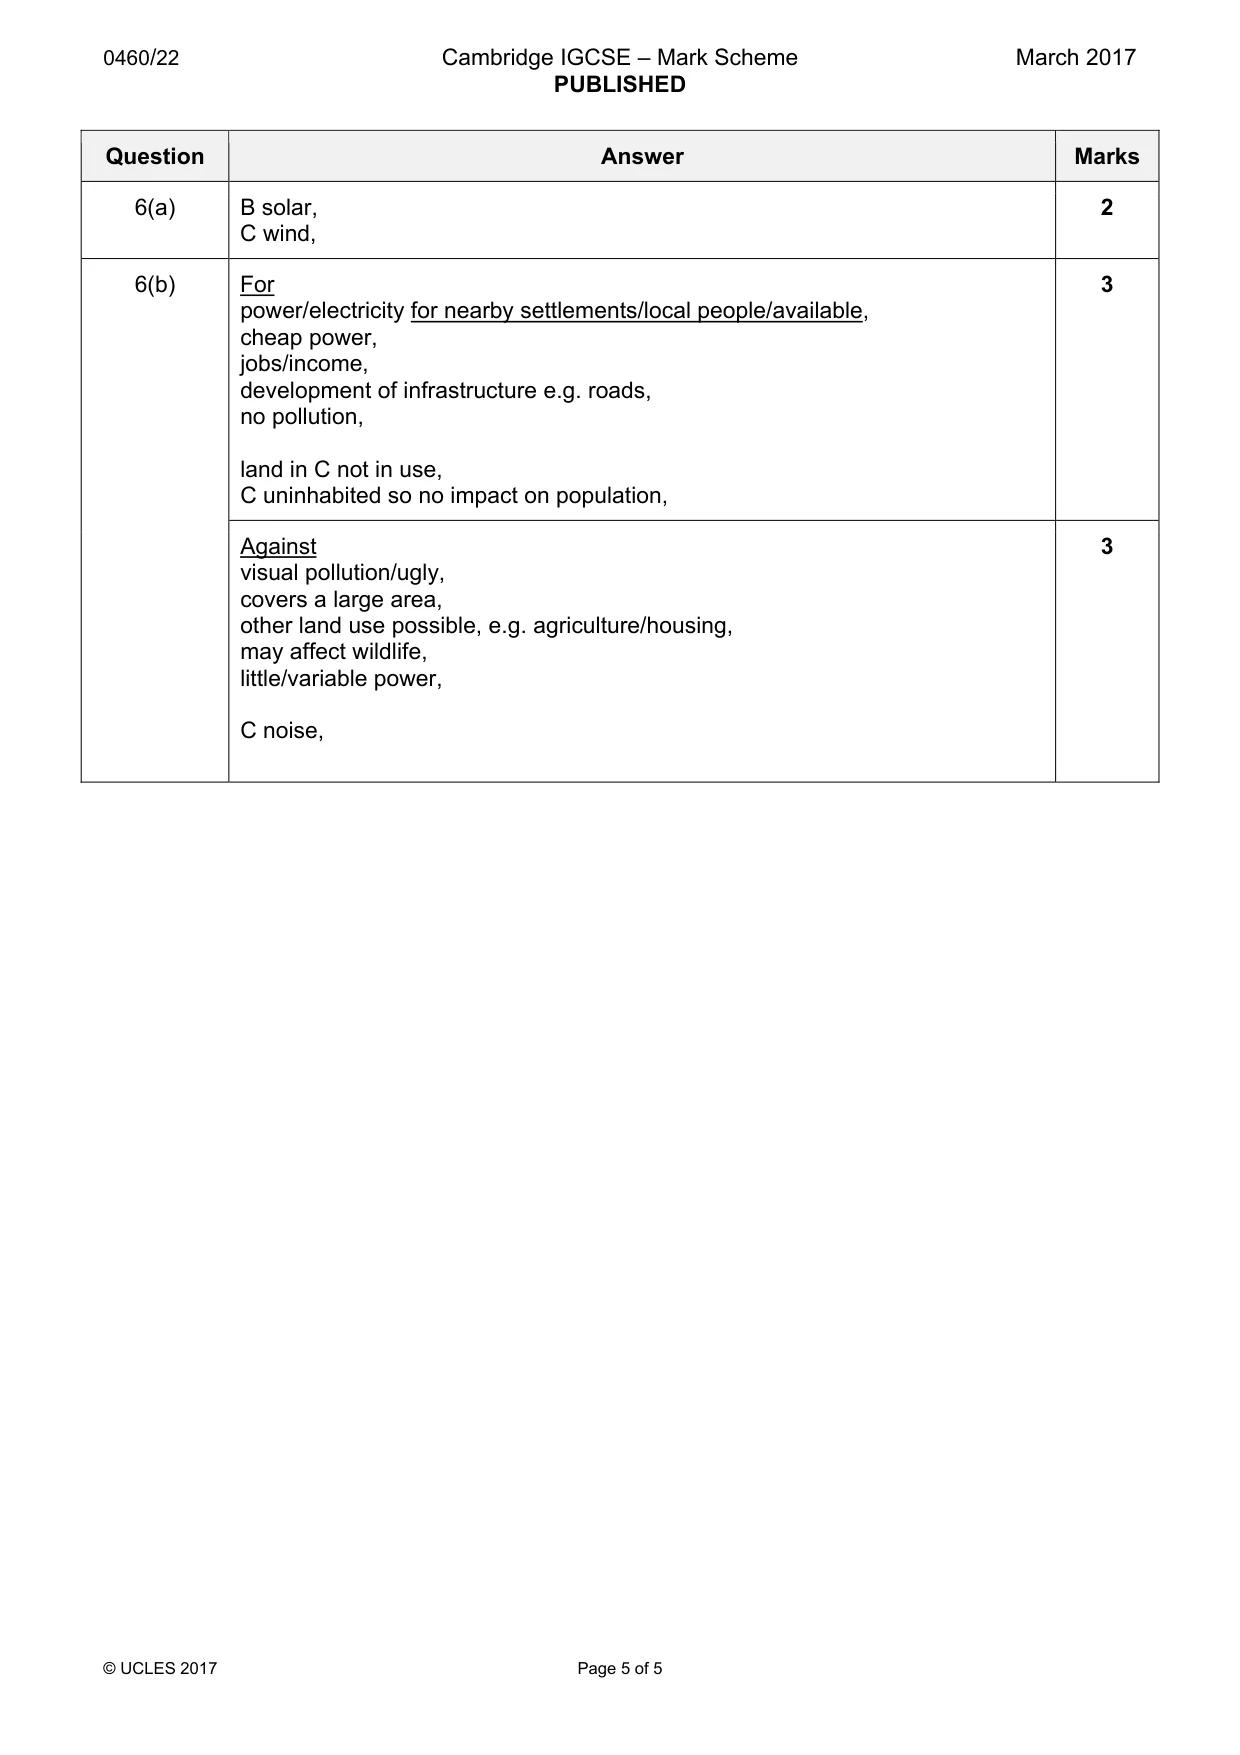
Mark scheme: 6(a) B solar, 2 C wind, 6(b) For 3 power/electricity for nearby settlements/local people/available, cheap power, jobs/income, development of infrastructure e.g. roads, no pollution, land in C not in use, C uninhabited so no impact on population, Against 3 visual pollution/ugly, covers a large area, other land use possible, e.g. agriculture/housing, may affect wildlife, little/variable power, C noise,
What was in this paper
The subtopics covered by these 6 questions, and how many questions each got. Open one in a new tab to see every Cambridge question on it.
What you needed in this session
Cambridge’s own grade thresholds for 2017 Feb/March, Paper 2 · Variant 2. A higher threshold means an easier paper — the bar moves with how the cohort did.