Cambridge IGCSE Geography 0460 — 2017 May/June Paper 2 · Variant 2
0460/22/M/J/17 · 6 questions · 60 marks · ≈68 min
The question paper and its mark scheme, free to read here and free to download. This is Cambridge’s own paper, exactly as it was sat.
Question paper20 pages


Mark scheme7 pages
Answers below. Sit the paper first if you are practising.
Questions as text
Q1 · Study the map extract for Lønavatnet, Norway
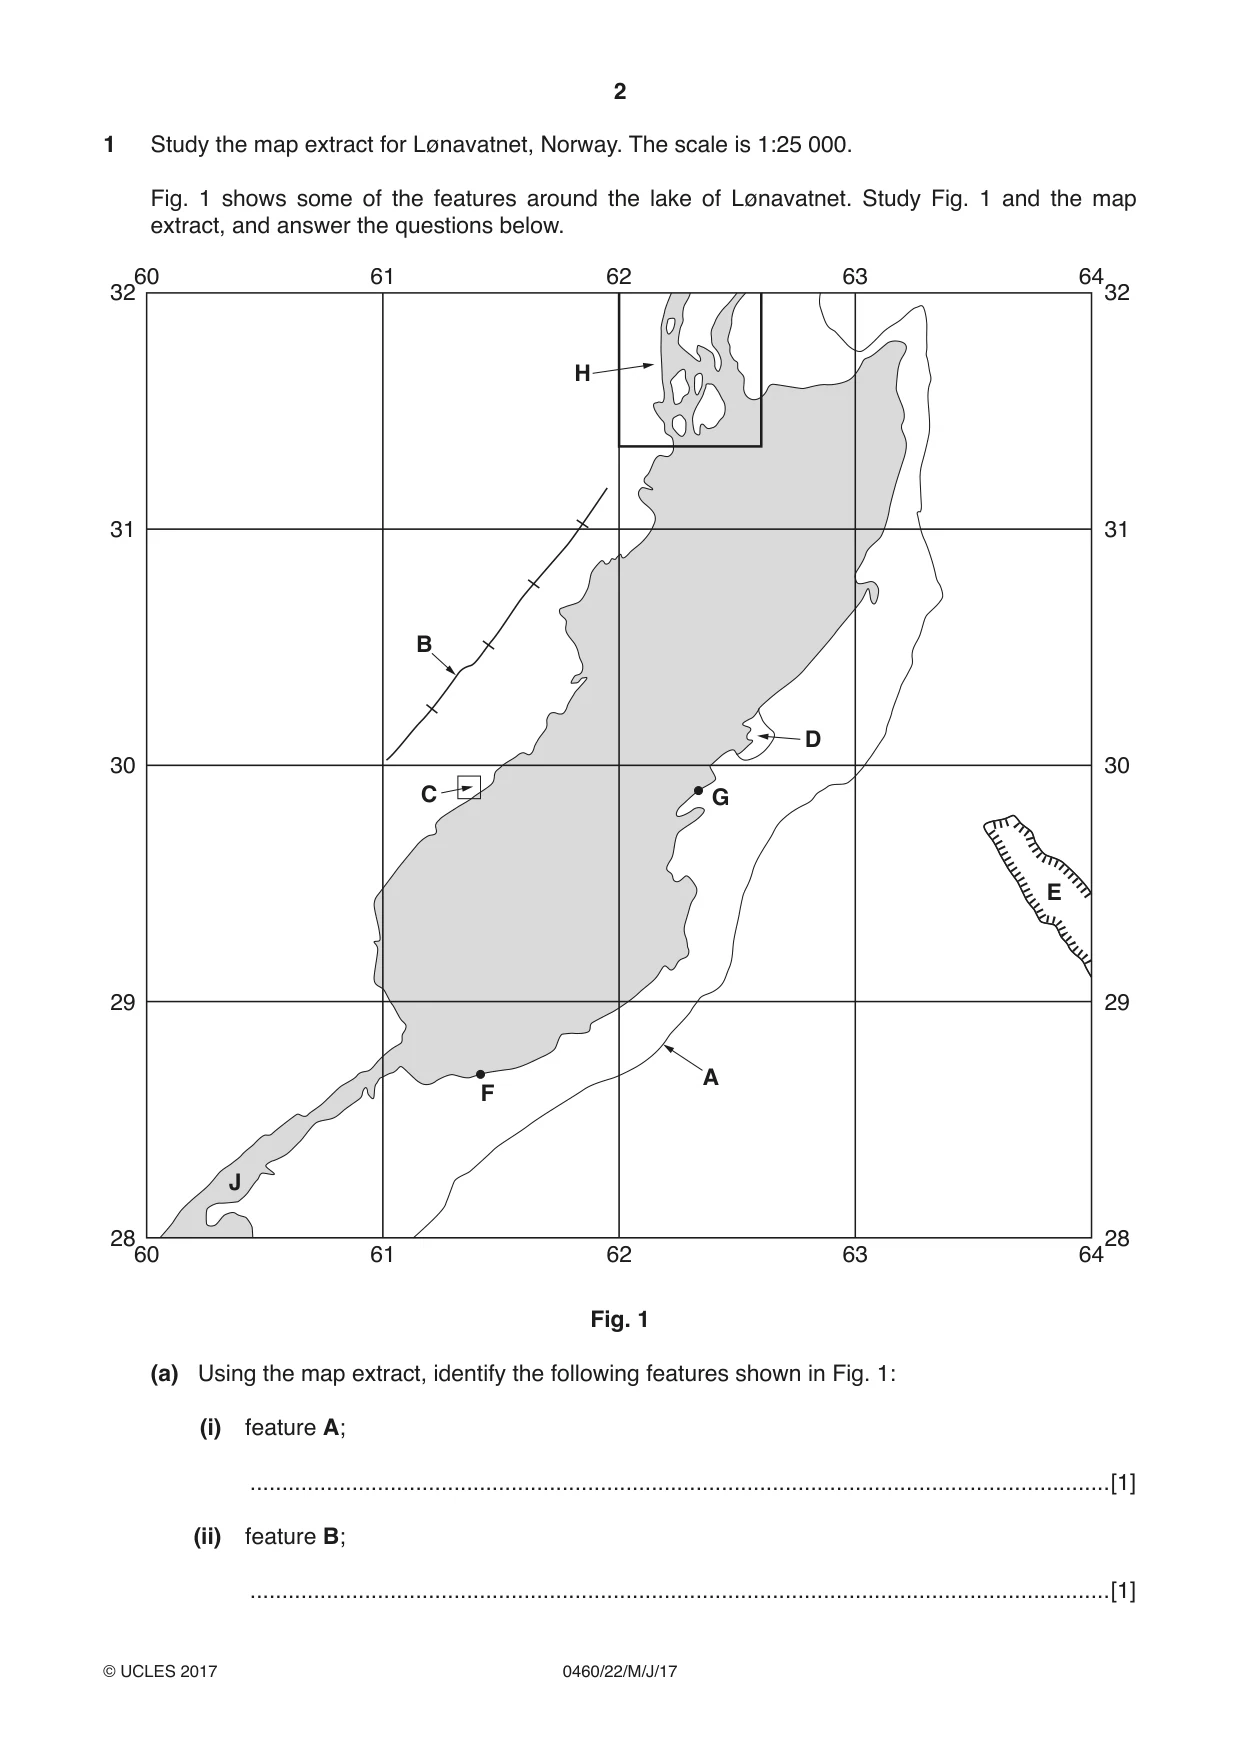
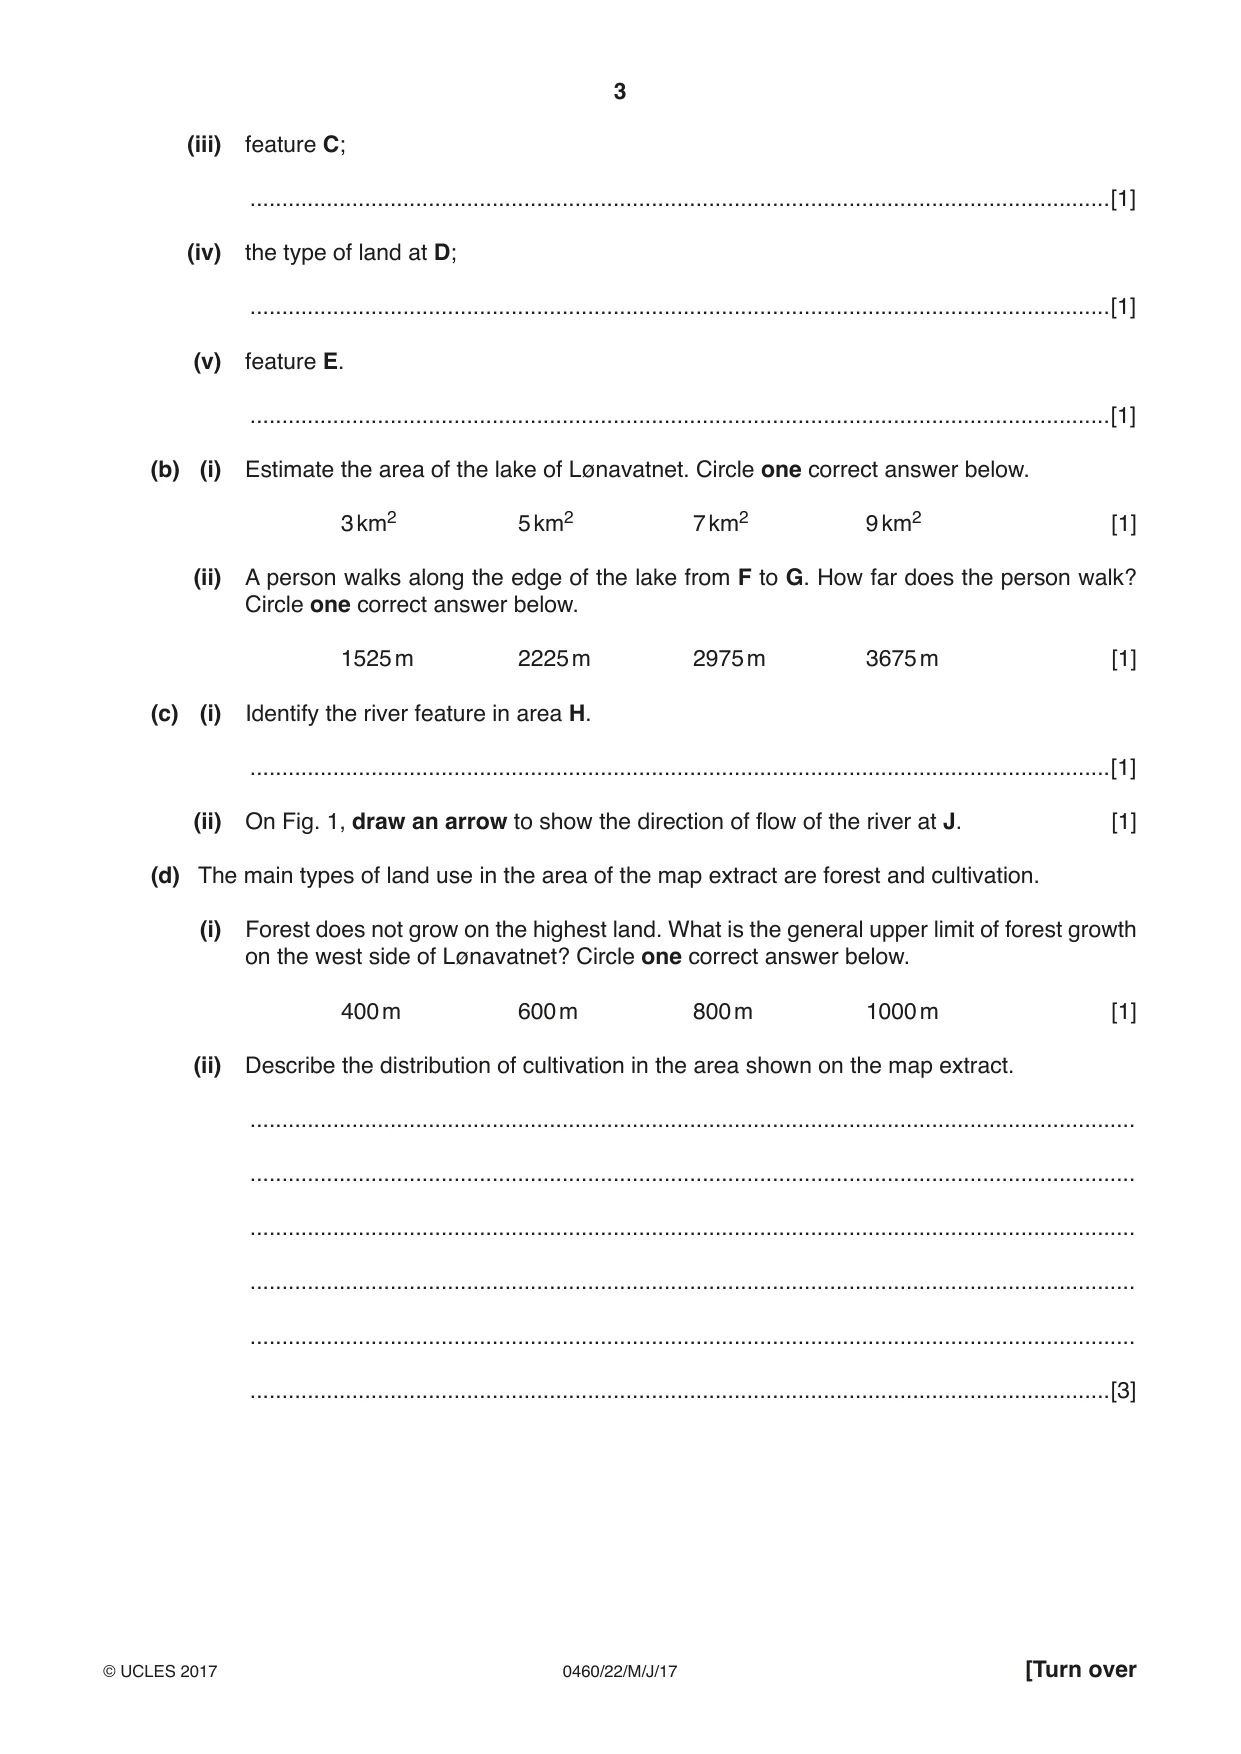
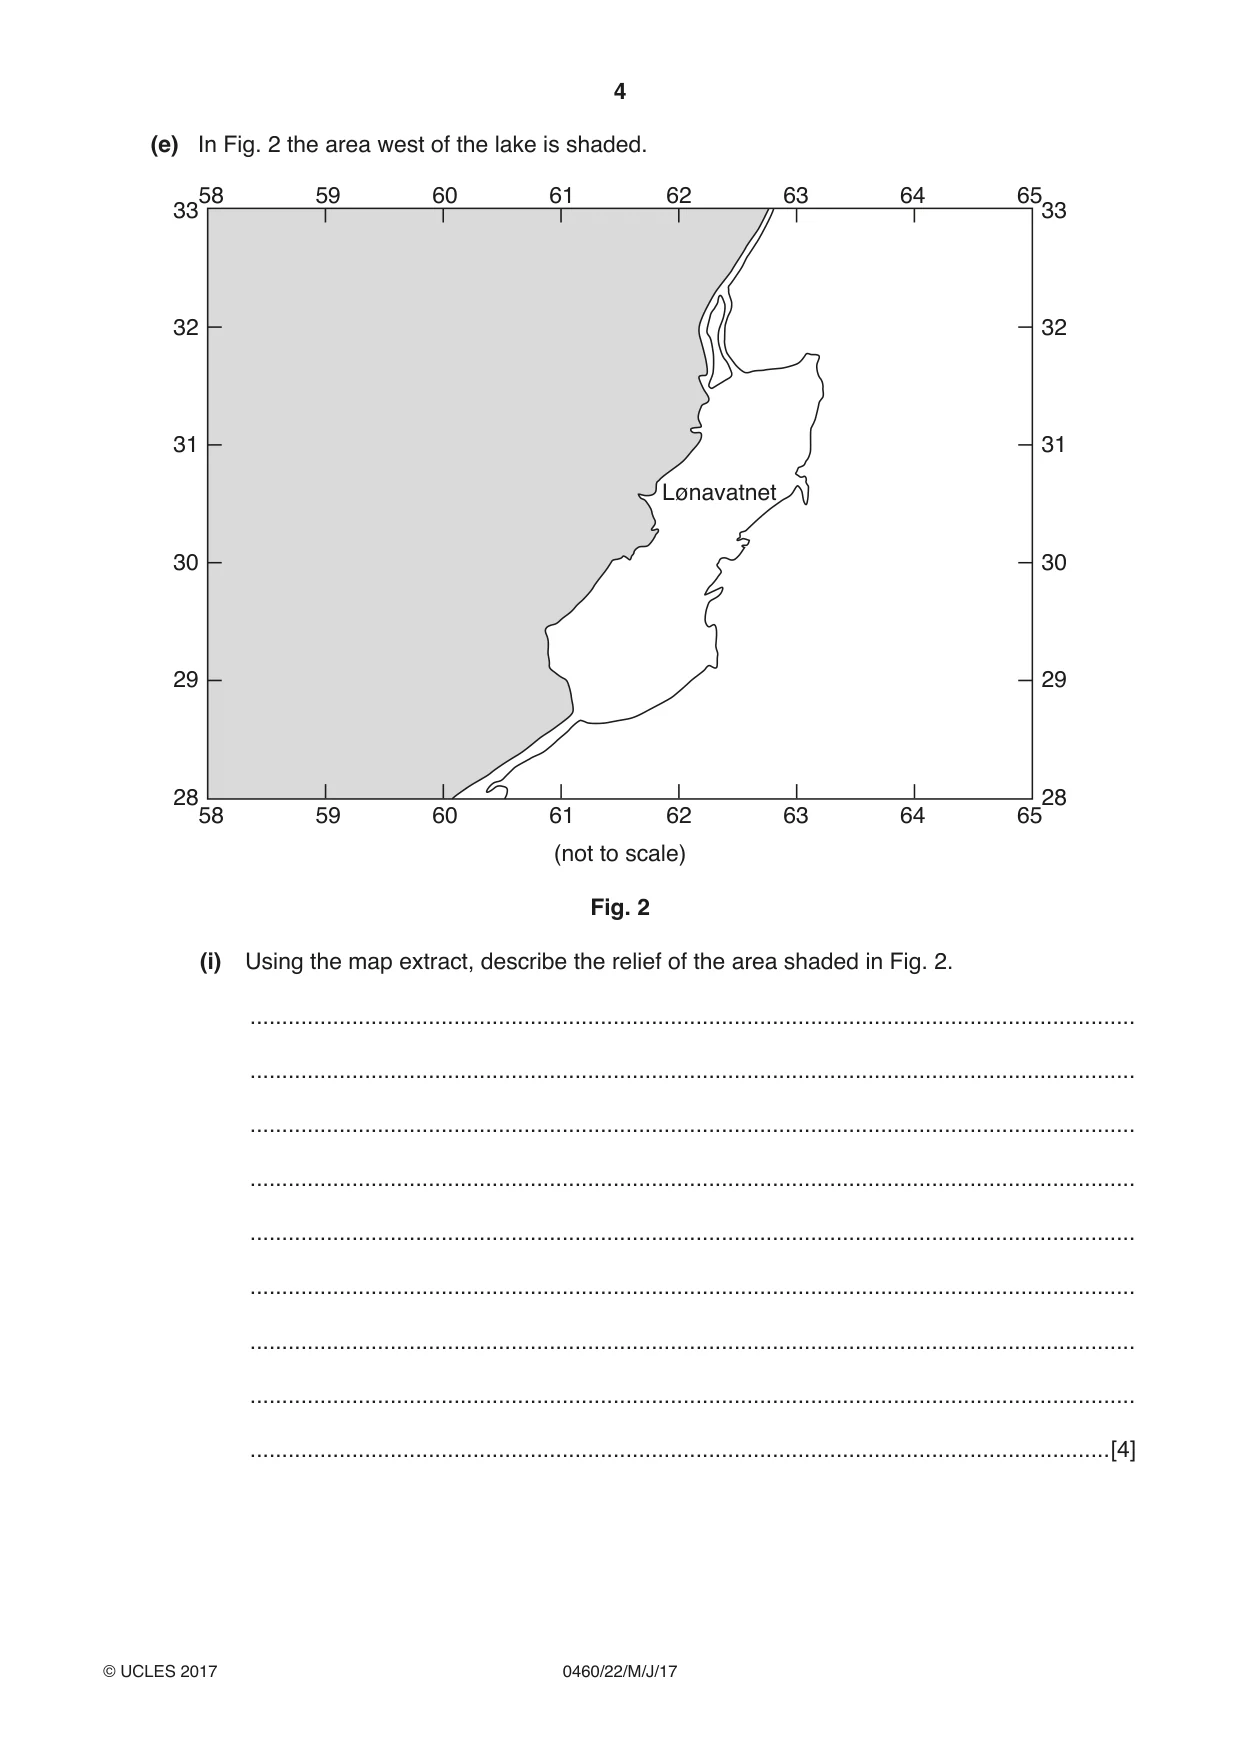
1 Study the map extract for Lønavatnet, Norway. The scale is 1:25 000. Fig. 1 shows some of the features around the lake of Lønavatnet. Study Fig. 1 and the map extract, and answer the questions below. 60 61 62 63 64 32 32 H 31 31 B D 30 30 C G E 29 29 A F J 28 28 60 61 62 63 64 Fig. 1 (a) Using the map extract, identify the following features shown in Fig. 1: (i) feature A; .......................................................................................................................................[1] (ii) feature B; .......................................................................................................................................[1] (iii) feature C; .......................................................................................................................................[1] (iv) the type of land at D; .......................................................................................................................................[1] (v) feature E. .......................................................................................................................................[1] (b) (i) Estimate the area of the lake of Lønavatnet. Circle one correct answer below. 3 km2 5 km2 7 km2 9 km2 [1] (ii) A person walks along the edge of the lake from F to G. How far does the person walk? Circle one correct answer below. 1525 m 2225 m 2975 m 3675 m [1] (c) (i) Identify the river feature in area H. .......................................................................................................................................[1] (ii) On Fig. 1, draw an arrow to show the direction of flow of the river at J. [1] (d) The main types of land use in the area of the map extract are forest and cultivation. (i) Forest does not grow on the highest land. What is the general upper limit of forest growth on the west side of Lønavatnet? Circle one correct answer below. 400 m 600 m 800 m 1000 m [1] (ii) Describe the distribution of cultivation in the area shown on the map extract. ........................................................................................................................................... ........................................................................................................................................... ........................................................................................................................................... ........................................................................................................................................... ........................................................................................................................................... .......................................................................................................................................[3] (e) In Fig. 2 the area west of the lake is shaded. 58 59 60 61 62 63 64 65 33 33 32 32 31 31 Lønavatnet 30 30 29 29 28 28 58 59 60 61 62 63 64 65 (not to scale) Fig. 2 (i) Using the map extract, describe the relief of the area shaded in Fig. 2. ........................................................................................................................................... ........................................................................................................................................... ........................................................................................................................................... ........................................................................................................................................... ........................................................................................................................................... ........................................................................................................................................... ........................................................................................................................................... ........................................................................................................................................... .......................................................................................................................................[4] (ii) Describe the drainage of the area shaded in Fig. 2. ........................................................................................................................................... ........................................................................................................................................... ........................................................................................................................................... ........................................................................................................................................... ........................................................................................................................................... ........................................................................................................................................... .......................................................................................................................................[3] [Total: 20 marks]
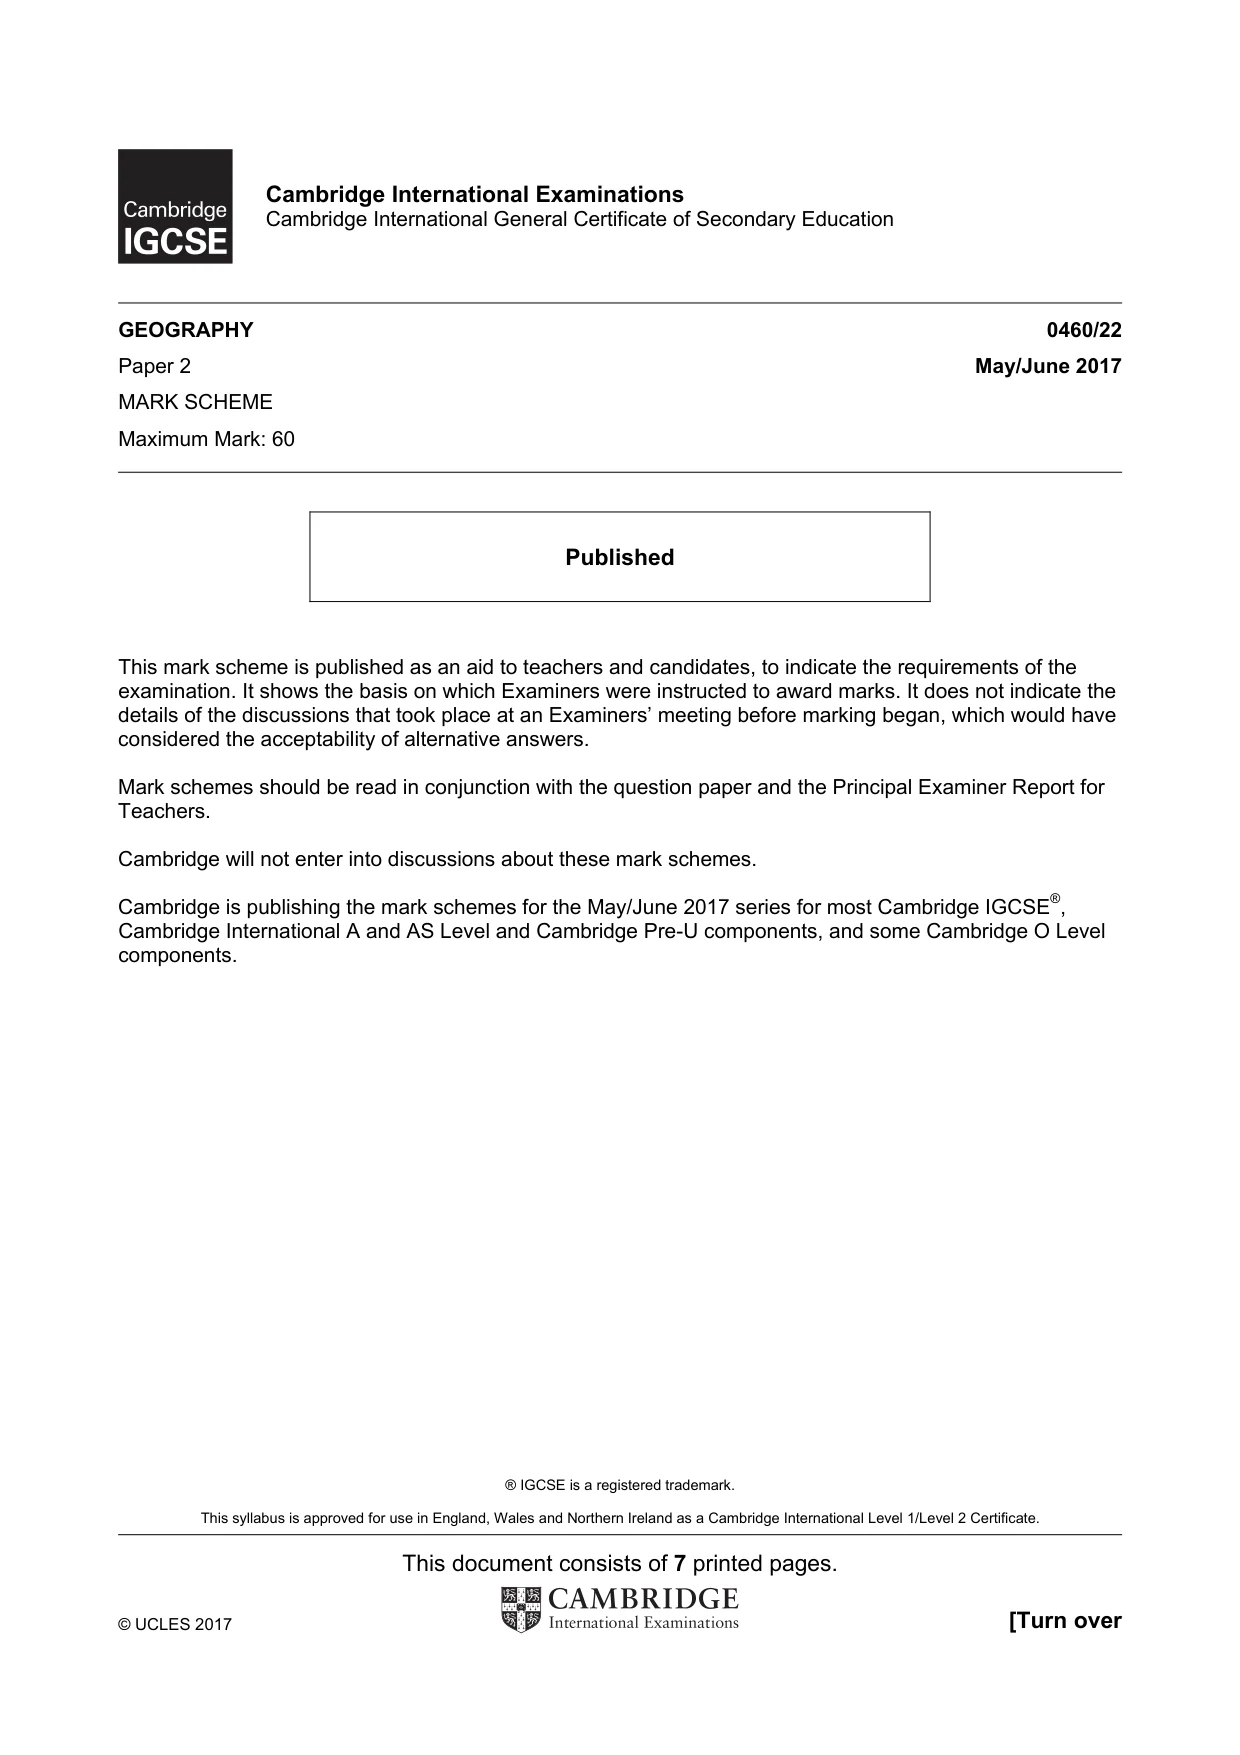
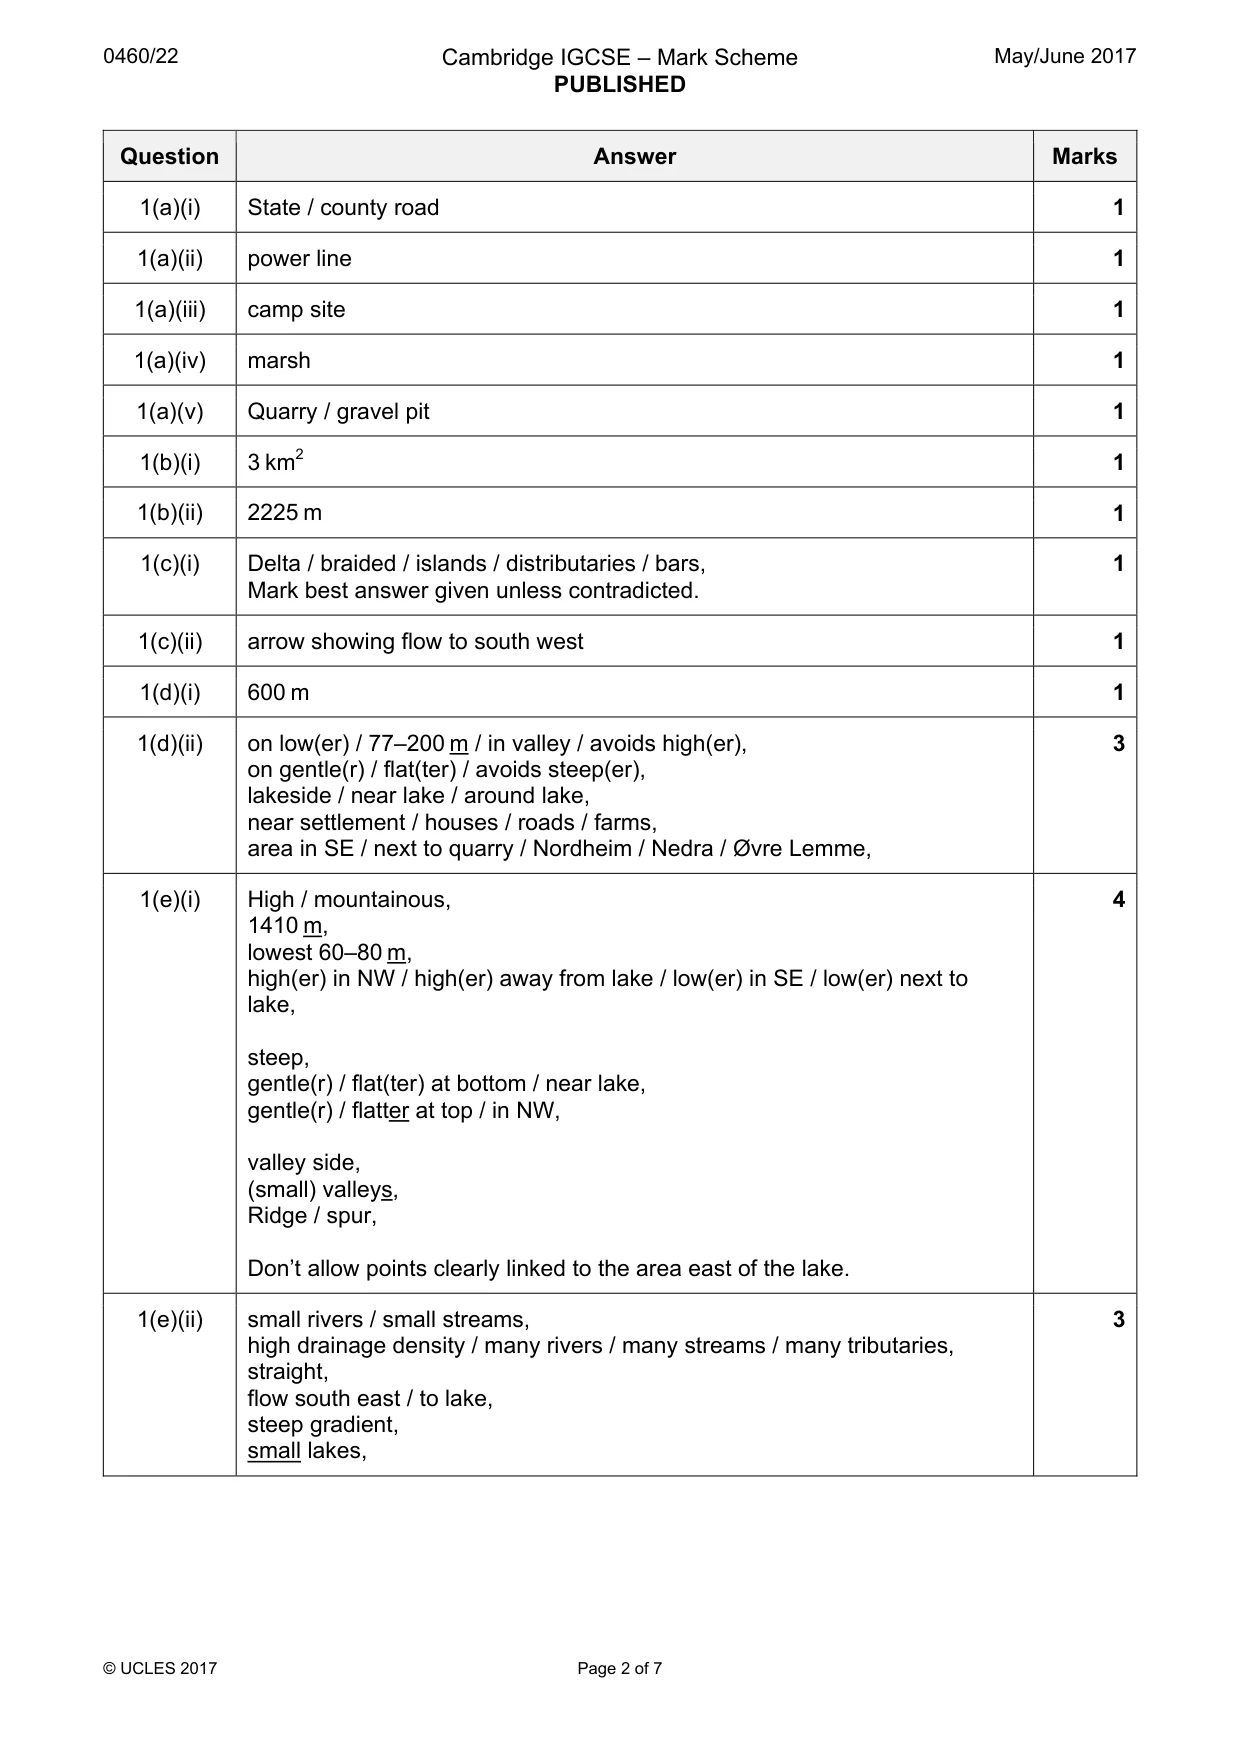
Mark scheme: Question Answer Marks 1(a)(i) State / county road 1 1(a)(ii) power line 1 1(a)(iii) camp site 1 1(a)(iv) marsh 1 1(a)(v) Quarry / gravel pit 1 1(b)(i) 3 km2 1 1(b)(ii) 2225 m 1 1(c)(i) Delta / braided / islands / distributaries / bars, 1 Mark best answer given unless contradicted. 1(c)(ii) arrow showing flow to south west 1 1(d)(i) 600 m 1 1(d)(ii) on low(er) / 77–200 m / in valley / avoids high(er), 3 on gentle(r) / flat(ter) / avoids steep(er), lakeside / near lake / around lake, near settlement / houses / roads / farms, area in SE / next to quarry / Nordheim / Nedra / Øvre Lemme, 1(e)(i) High / mountainous, 4 1410 m, lowest 60–80 m, high(er) in NW / high(er) away from lake / low(er) in SE / low(er) next to lake, steep, gentle(r) / flat(ter) at bottom / near lake, gentle(r) / flatter at top / in NW, valley side, (small) valleys, Ridge / spur, Don’t allow points clearly linked to the area east of the lake. 1(e)(ii) small rivers / small streams, 3 high drainage density / many rivers / many streams / many tributaries, straight, flow south east / to lake, steep gradient, small lakes,
Question 2
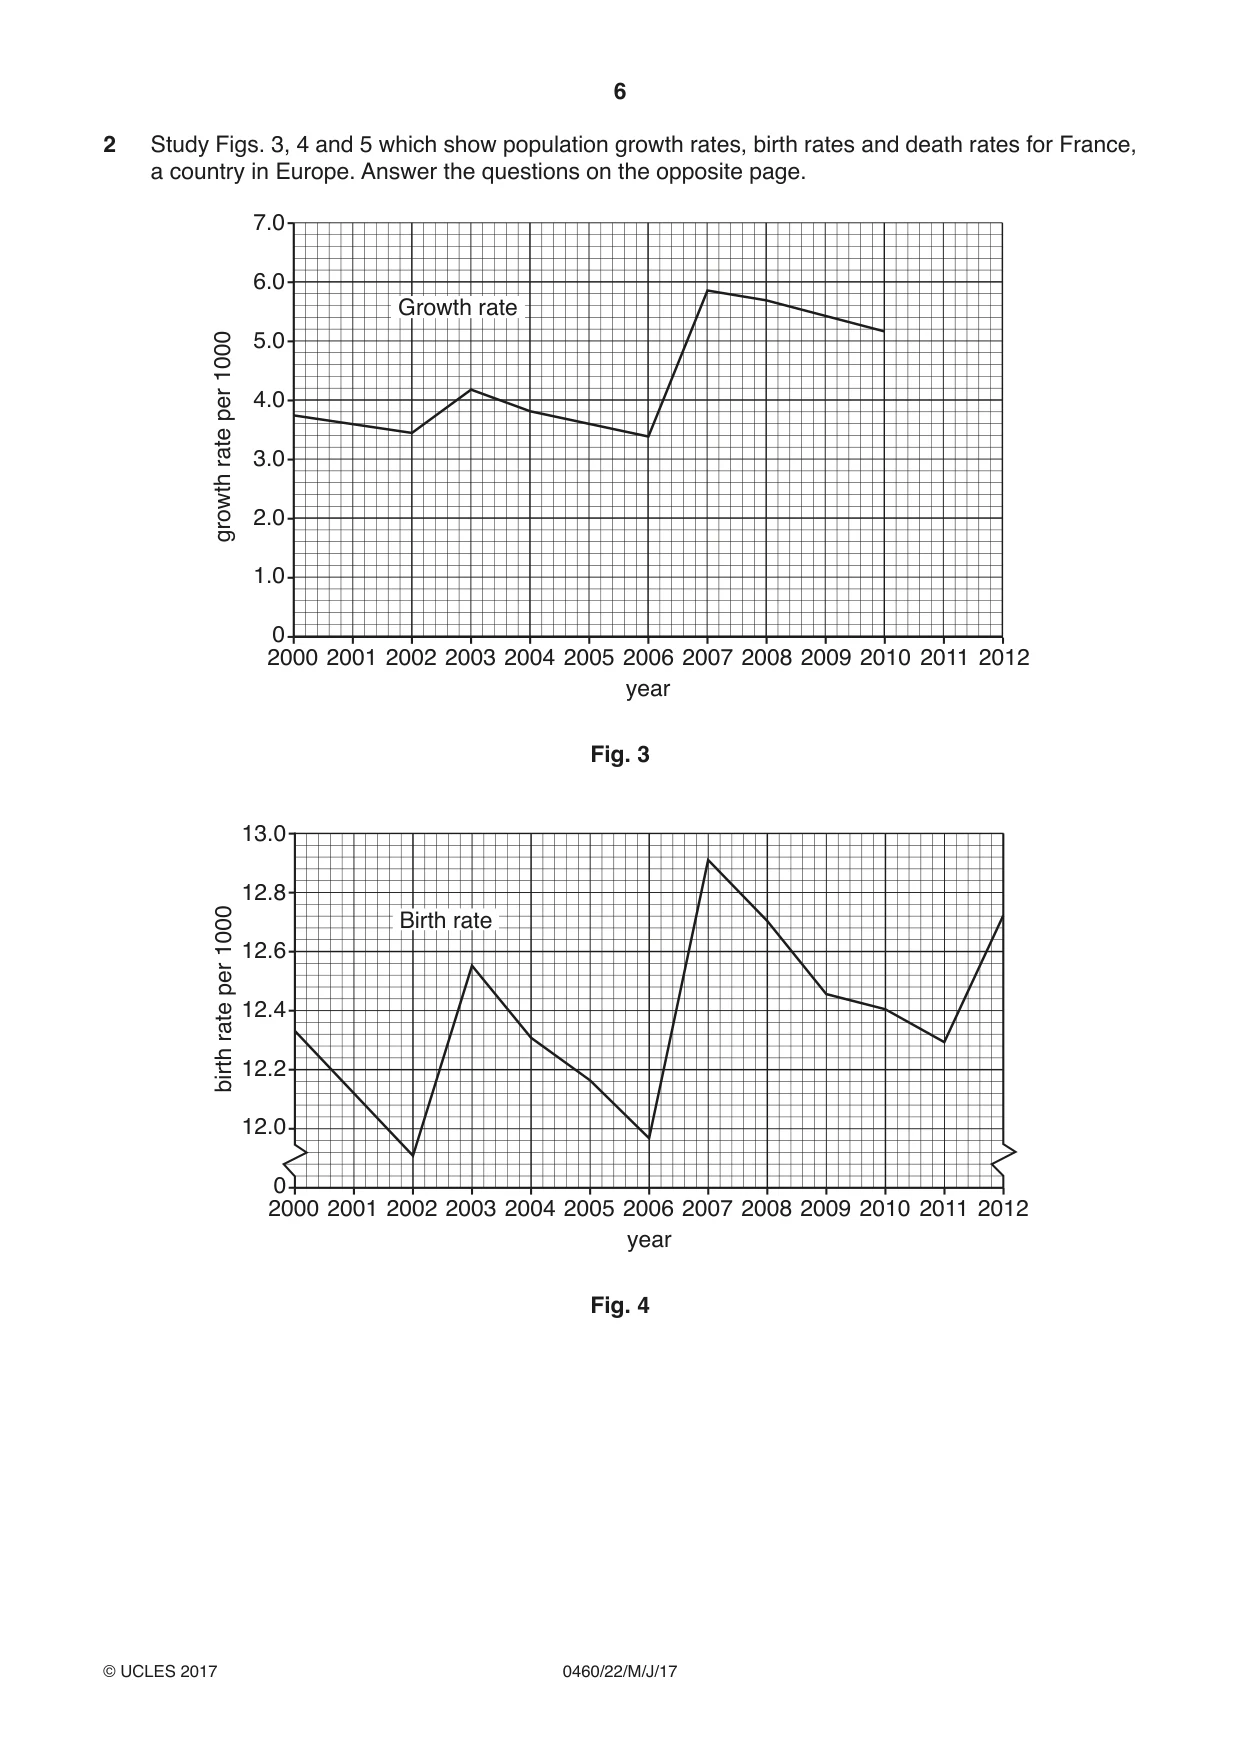
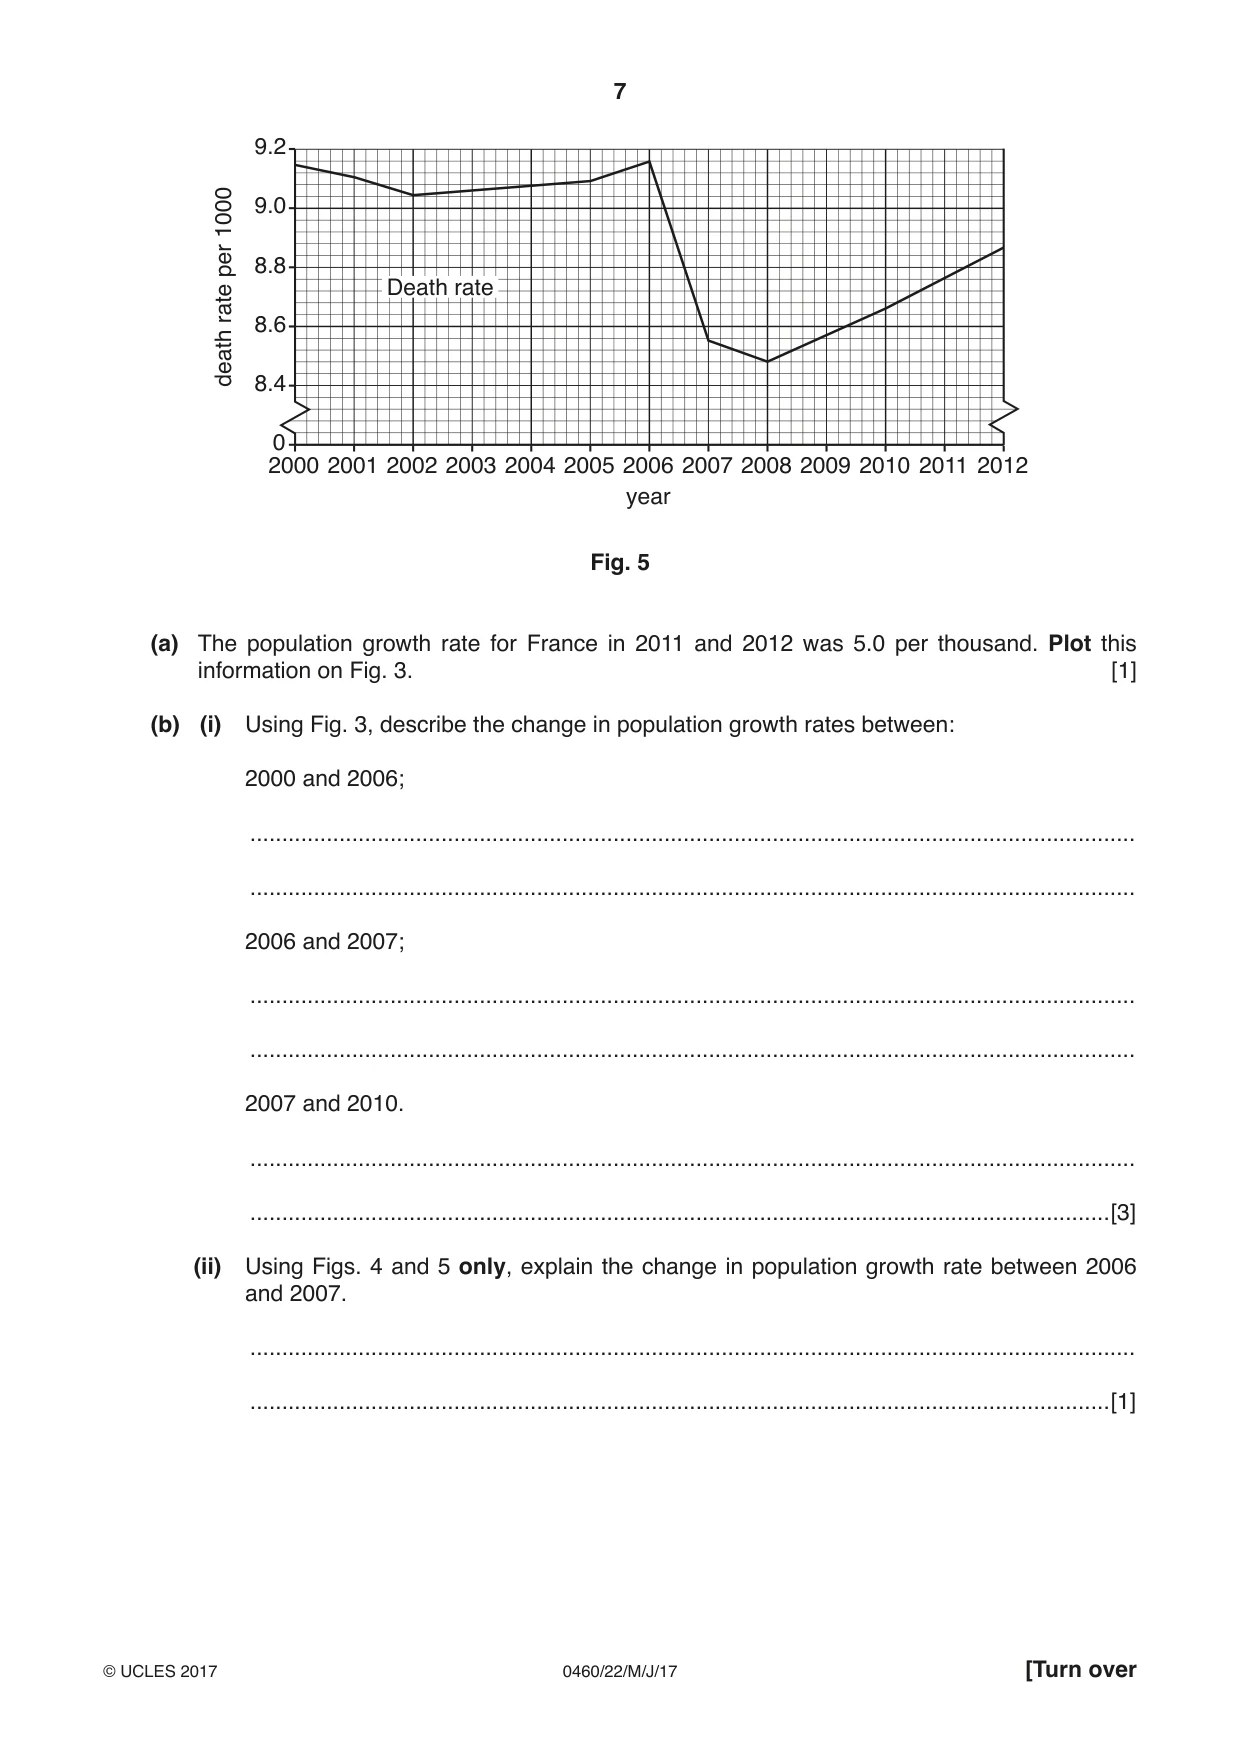
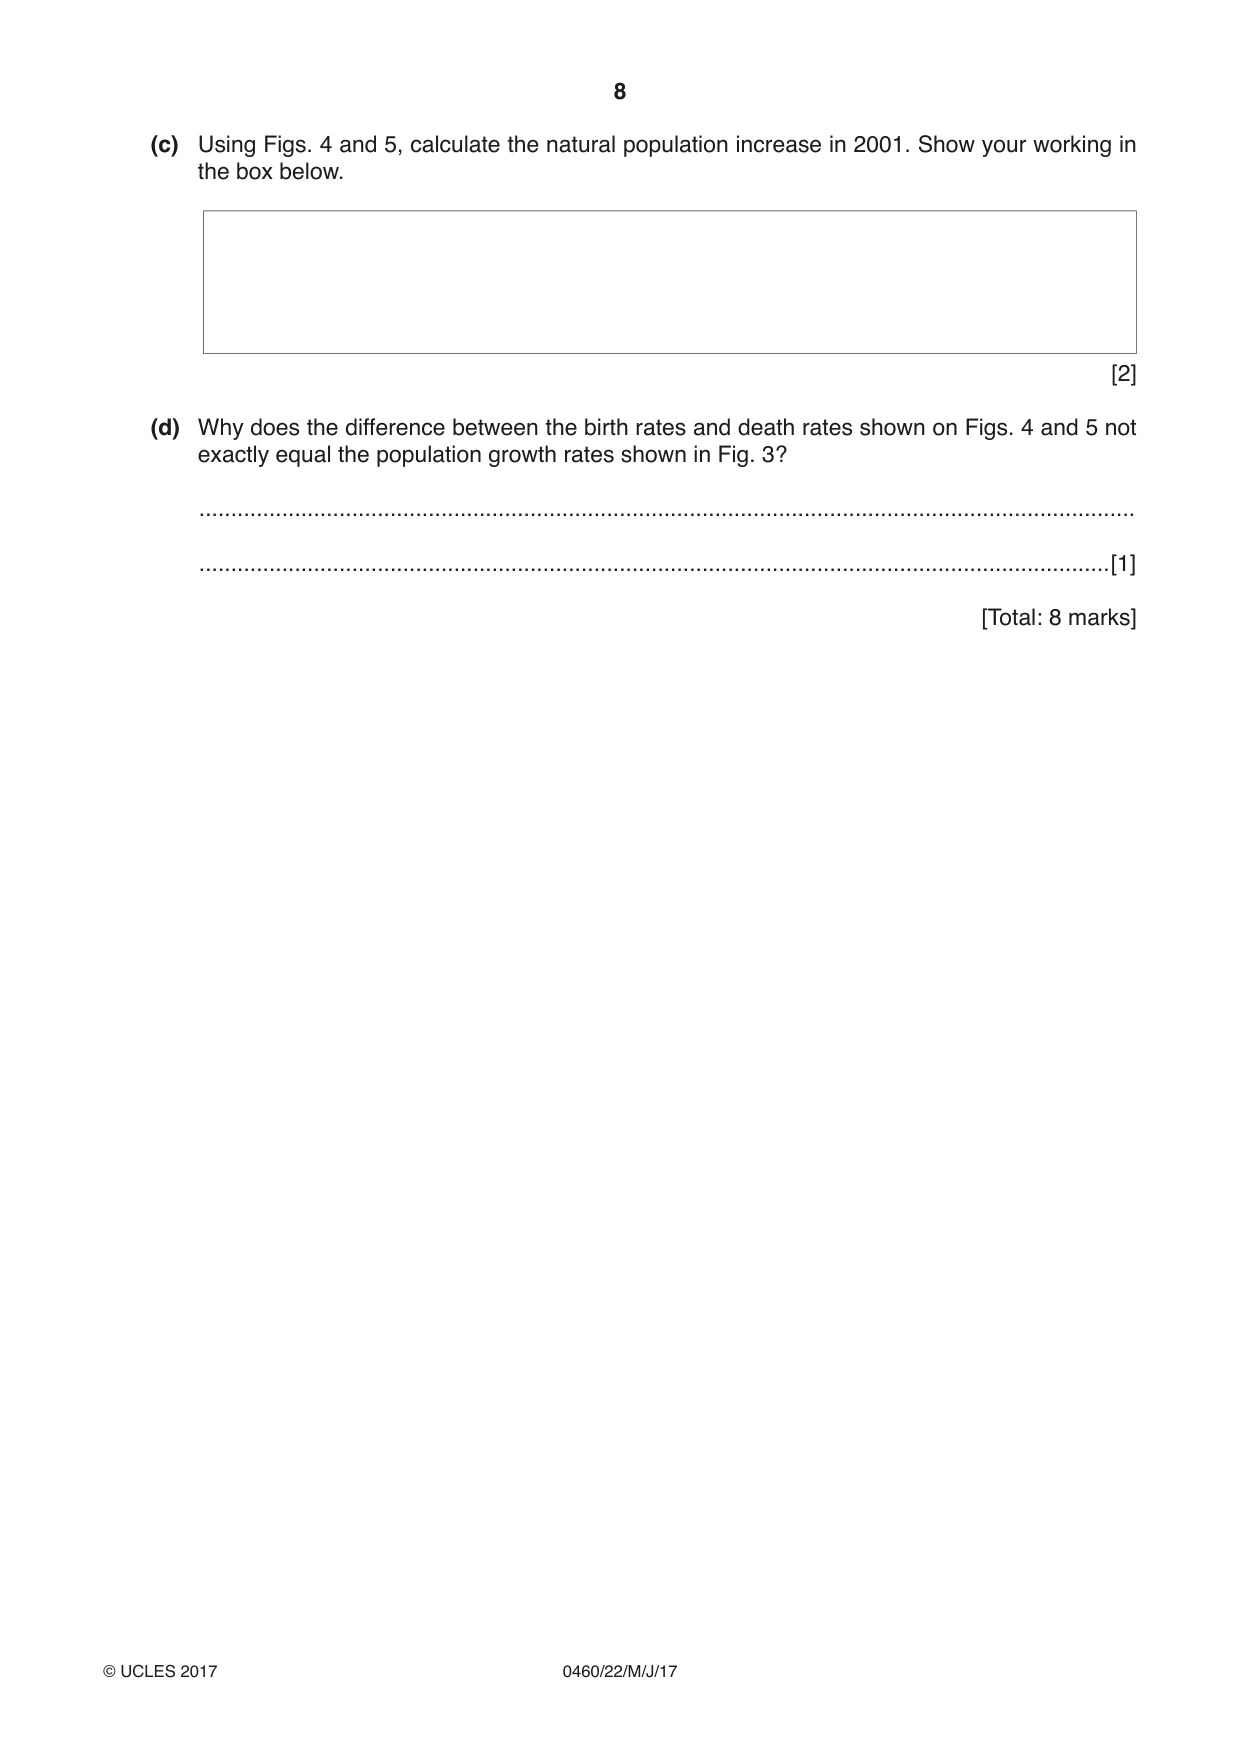
2 Study Figs. 3, 4 and 5 which show population growth rates, birth rates and death rates for France, a country in Europe. Answer the questions on the opposite page. 7.0 6.0 Growth rate 5.0 1000 per 4.0 rate 3.0 2.0 growth 1.0 0 2000 2001 2002 2003 2004 2005 2006 2007 2008 2009 2010 2011 2012 year Fig. 3 13.0 12.8 1000 Birth rate 12.6 per 12.4 rate birth12.2 12.0 0 2000 2001 2002 2003 2004 2005 2006 2007 2008 2009 2010 2011 2012 year Fig. 4 9.2 1000 9.0 per 8.8 Death rate rate 8.6 death 8.4 0 2000 2001 2002 2003 2004 2005 2006 2007 2008 2009 2010 2011 2012 year Fig. 5 (a) The population growth rate for France in 2011 and 2012 was 5.0 per thousand. Plot this information on Fig. 3. [1] (b) (i) Using Fig. 3, describe the change in population growth rates between: 2000 and 2006; ........................................................................................................................................... ........................................................................................................................................... 2006 and 2007; ........................................................................................................................................... ........................................................................................................................................... 2007 and 2010. ........................................................................................................................................... .......................................................................................................................................[3] (ii) Using Figs. 4 and 5 only, explain the change in population growth rate between 2006 and 2007. ........................................................................................................................................... .......................................................................................................................................[1] (c) Using Figs. 4 and 5, calculate the natural population increase in 2001. Show your working in the box below. [2] (d) Why does the difference between the birth rates and death rates shown on Figs. 4 and 5 not exactly equal the population growth rates shown in Fig. 3? ................................................................................................................................................... ...............................................................................................................................................[1] [Total: 8 marks]
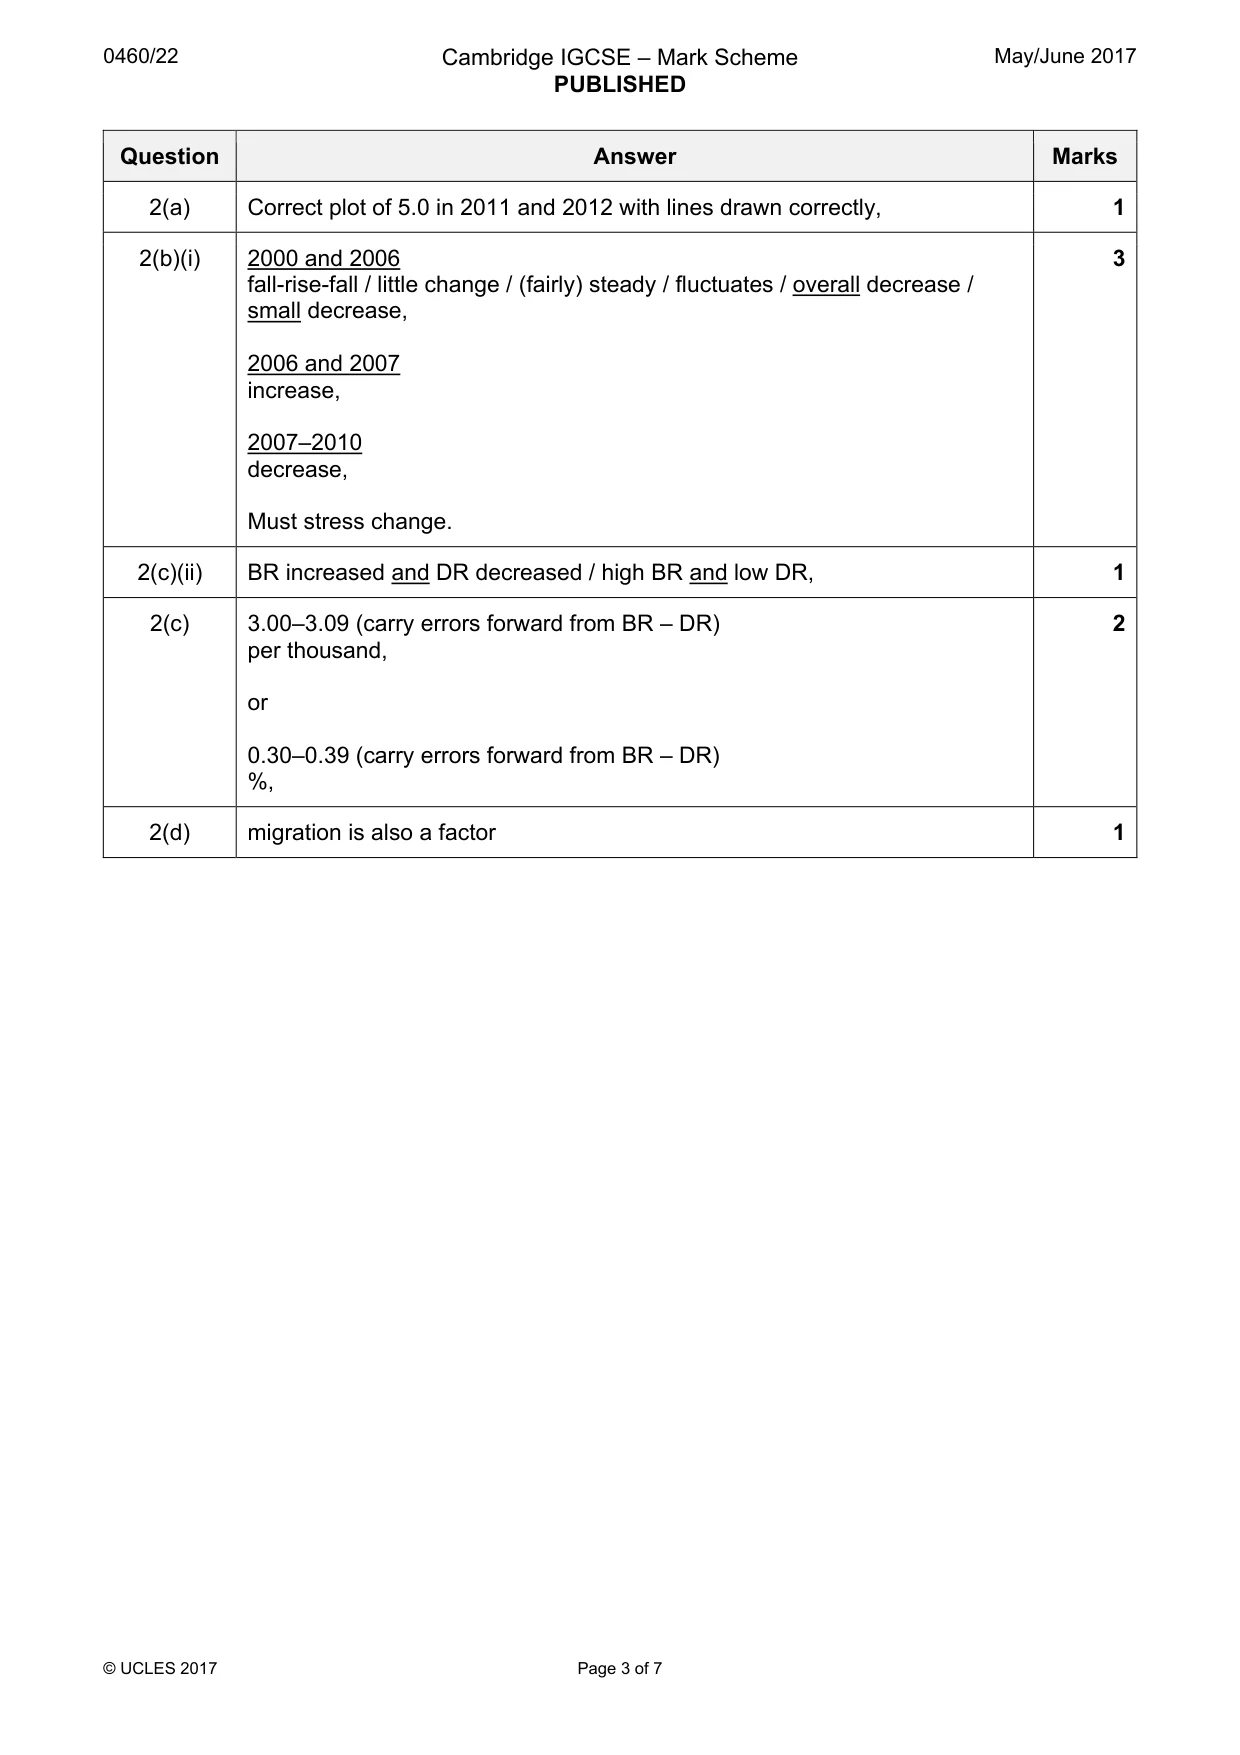
Mark scheme: 2(a) Correct plot of 5.0 in 2011 and 2012 with lines drawn correctly, 1 2(b)(i) 2000 and 2006 3 fall-rise-fall / little change / (fairly) steady / fluctuates / overall decrease / small decrease, 2006 and 2007 increase, 2007–2010 decrease, Must stress change. 2(c)(ii) BR increased and DR decreased / high BR and low DR, 1 2(c) 3.00–3.09 (carry errors forward from BR – DR) 2 per thousand, or 0.30–0.39 (carry errors forward from BR – DR) %, 2(d) migration is also a factor 1
Q3 · Study Photograph A (Insert), which shows a rural area in Africa
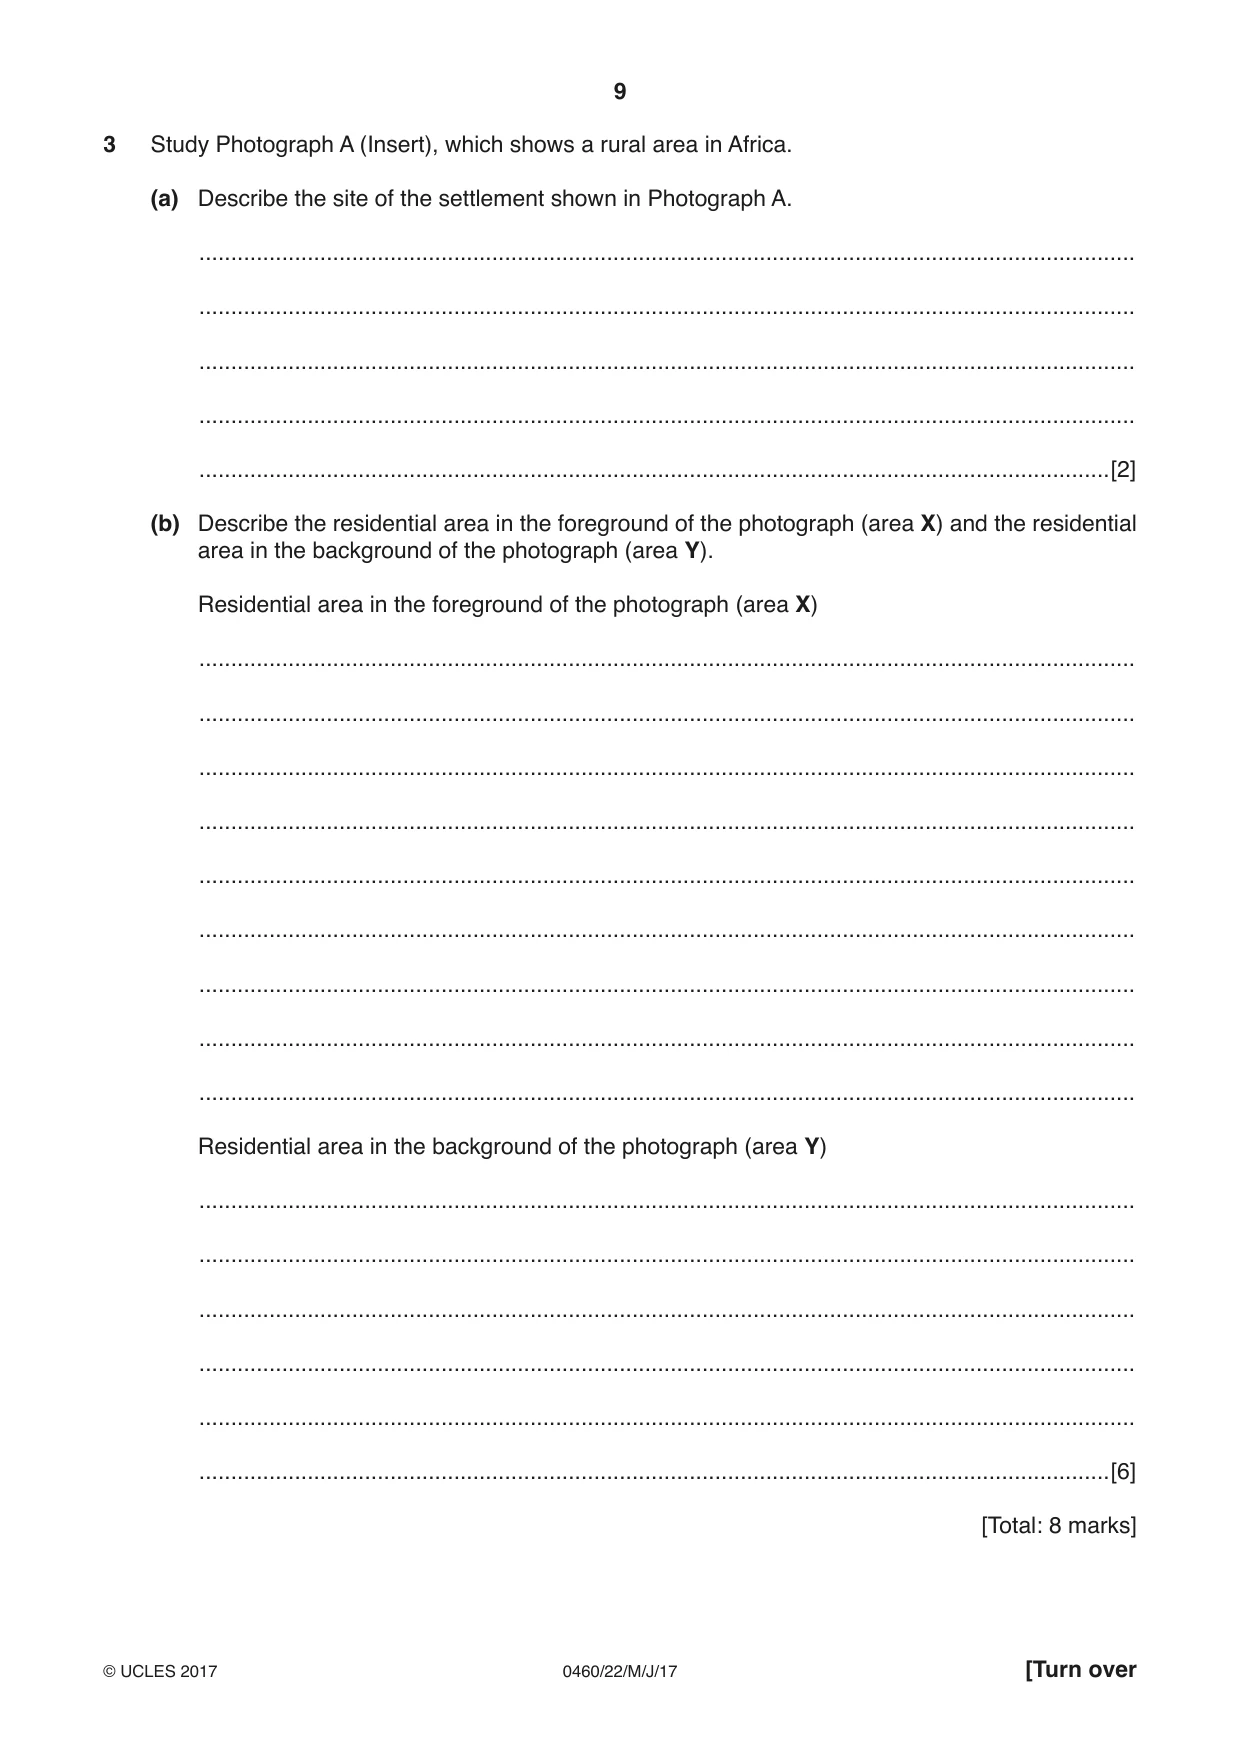
3 Study Photograph A (Insert), which shows a rural area in Africa. (a) Describe the site of the settlement shown in Photograph A. ................................................................................................................................................... ................................................................................................................................................... ................................................................................................................................................... ................................................................................................................................................... ...............................................................................................................................................[2] (b) Describe the residential area in the foreground of the photograph (area X) and the residential area in the background of the photograph (area Y). Residential area in the foreground of the photograph (area X) ................................................................................................................................................... ................................................................................................................................................... ................................................................................................................................................... ................................................................................................................................................... ................................................................................................................................................... ................................................................................................................................................... ................................................................................................................................................... ................................................................................................................................................... ................................................................................................................................................... Residential area in the background of the photograph (area Y) ................................................................................................................................................... ................................................................................................................................................... ................................................................................................................................................... ................................................................................................................................................... ................................................................................................................................................... ...............................................................................................................................................[6] [Total: 8 marks]
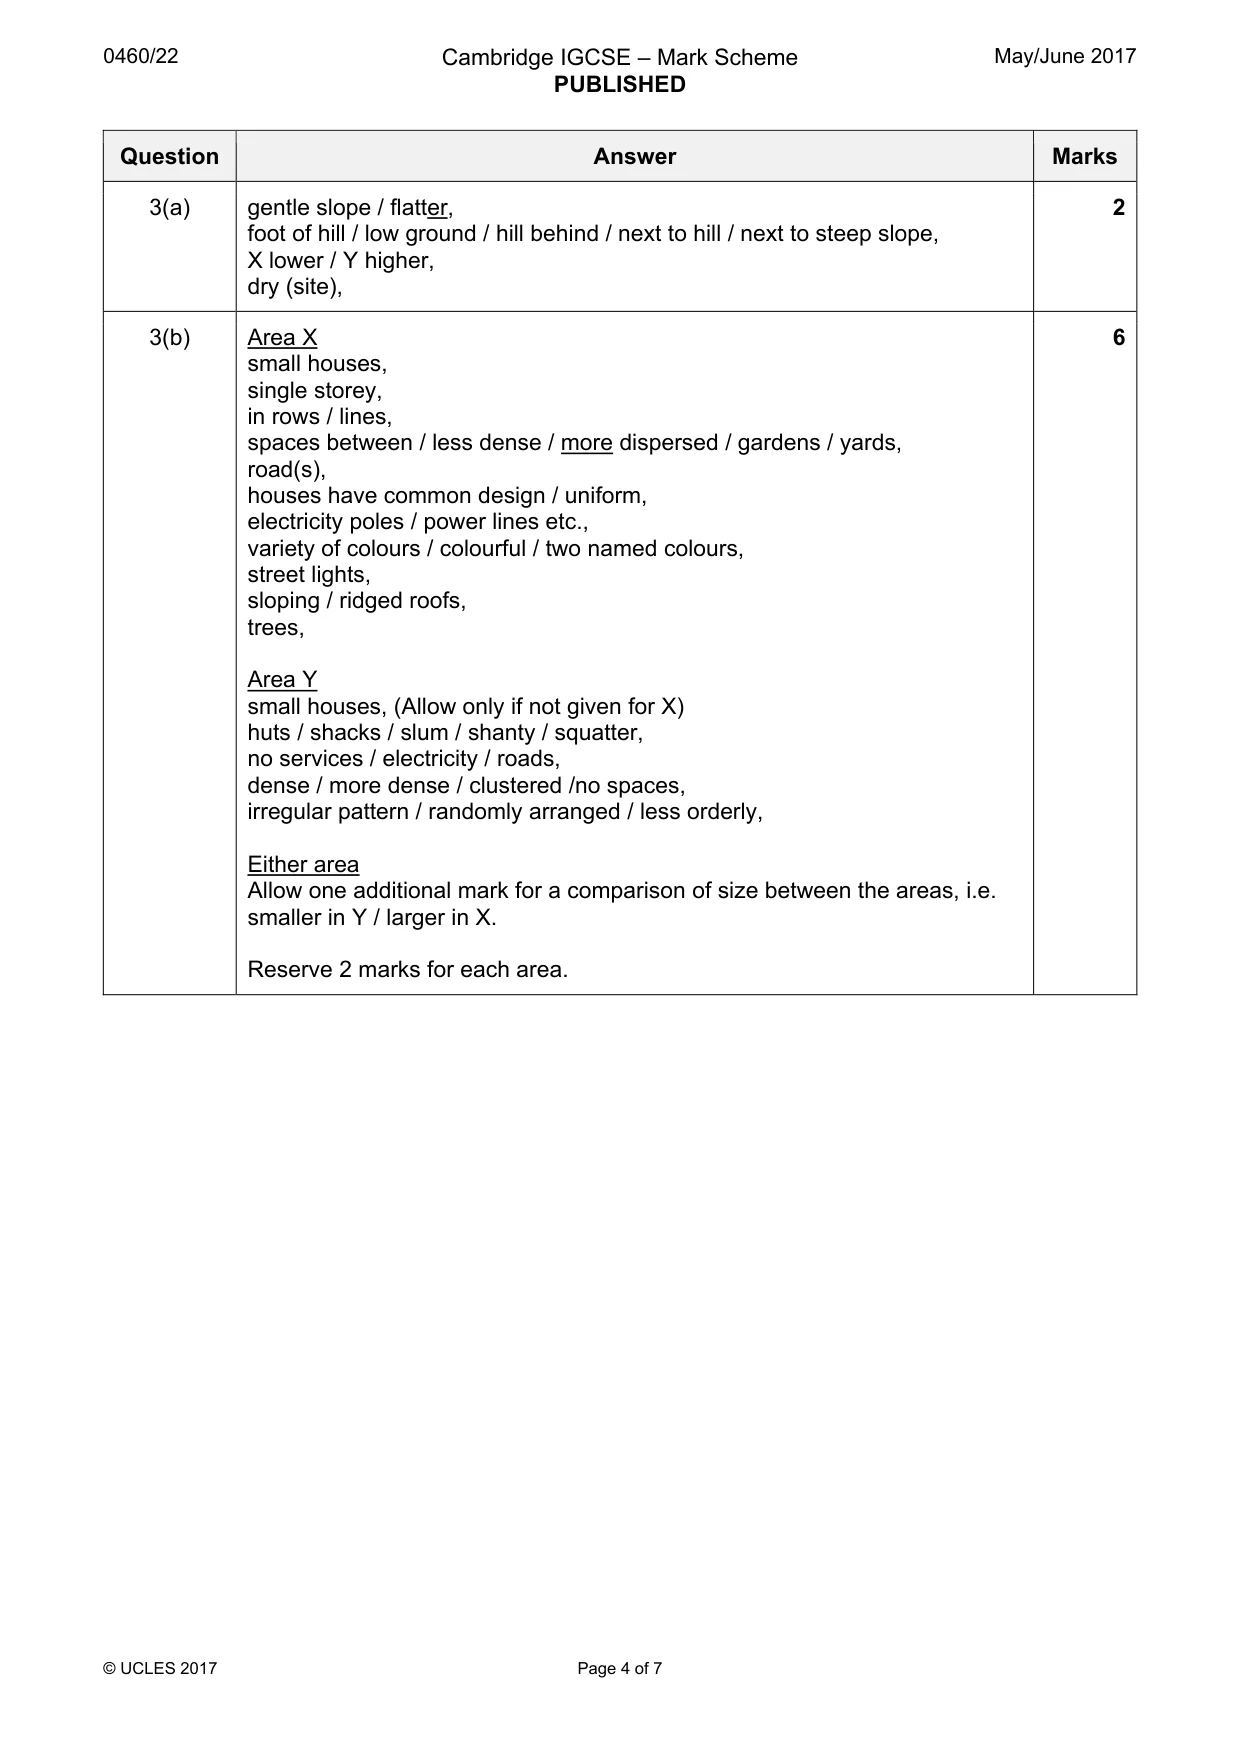
Mark scheme: 3(a) gentle slope / flatter, 2 foot of hill / low ground / hill behind / next to hill / next to steep slope, X lower / Y higher, dry (site), 3(b) Area X 6 small houses, single storey, in rows / lines, spaces between / less dense / more dispersed / gardens / yards, road(s), houses have common design / uniform, electricity poles / power lines etc., variety of colours / colourful / two named colours, street lights, sloping / ridged roofs, trees, Area Y small houses, (Allow only if not given for X) huts / shacks / slum / shanty / squatter, no services / electricity / roads, dense / more dense / clustered /no spaces, irregular pattern / randomly arranged / less orderly, Either area Allow one additional mark for a comparison of size between the areas, i.e. smaller in Y / larger in X. Reserve 2 marks for each area.
More questions on Settlements (rural and urban) and service provision
Q4 · Areas of hot desert in the southern hemisphere
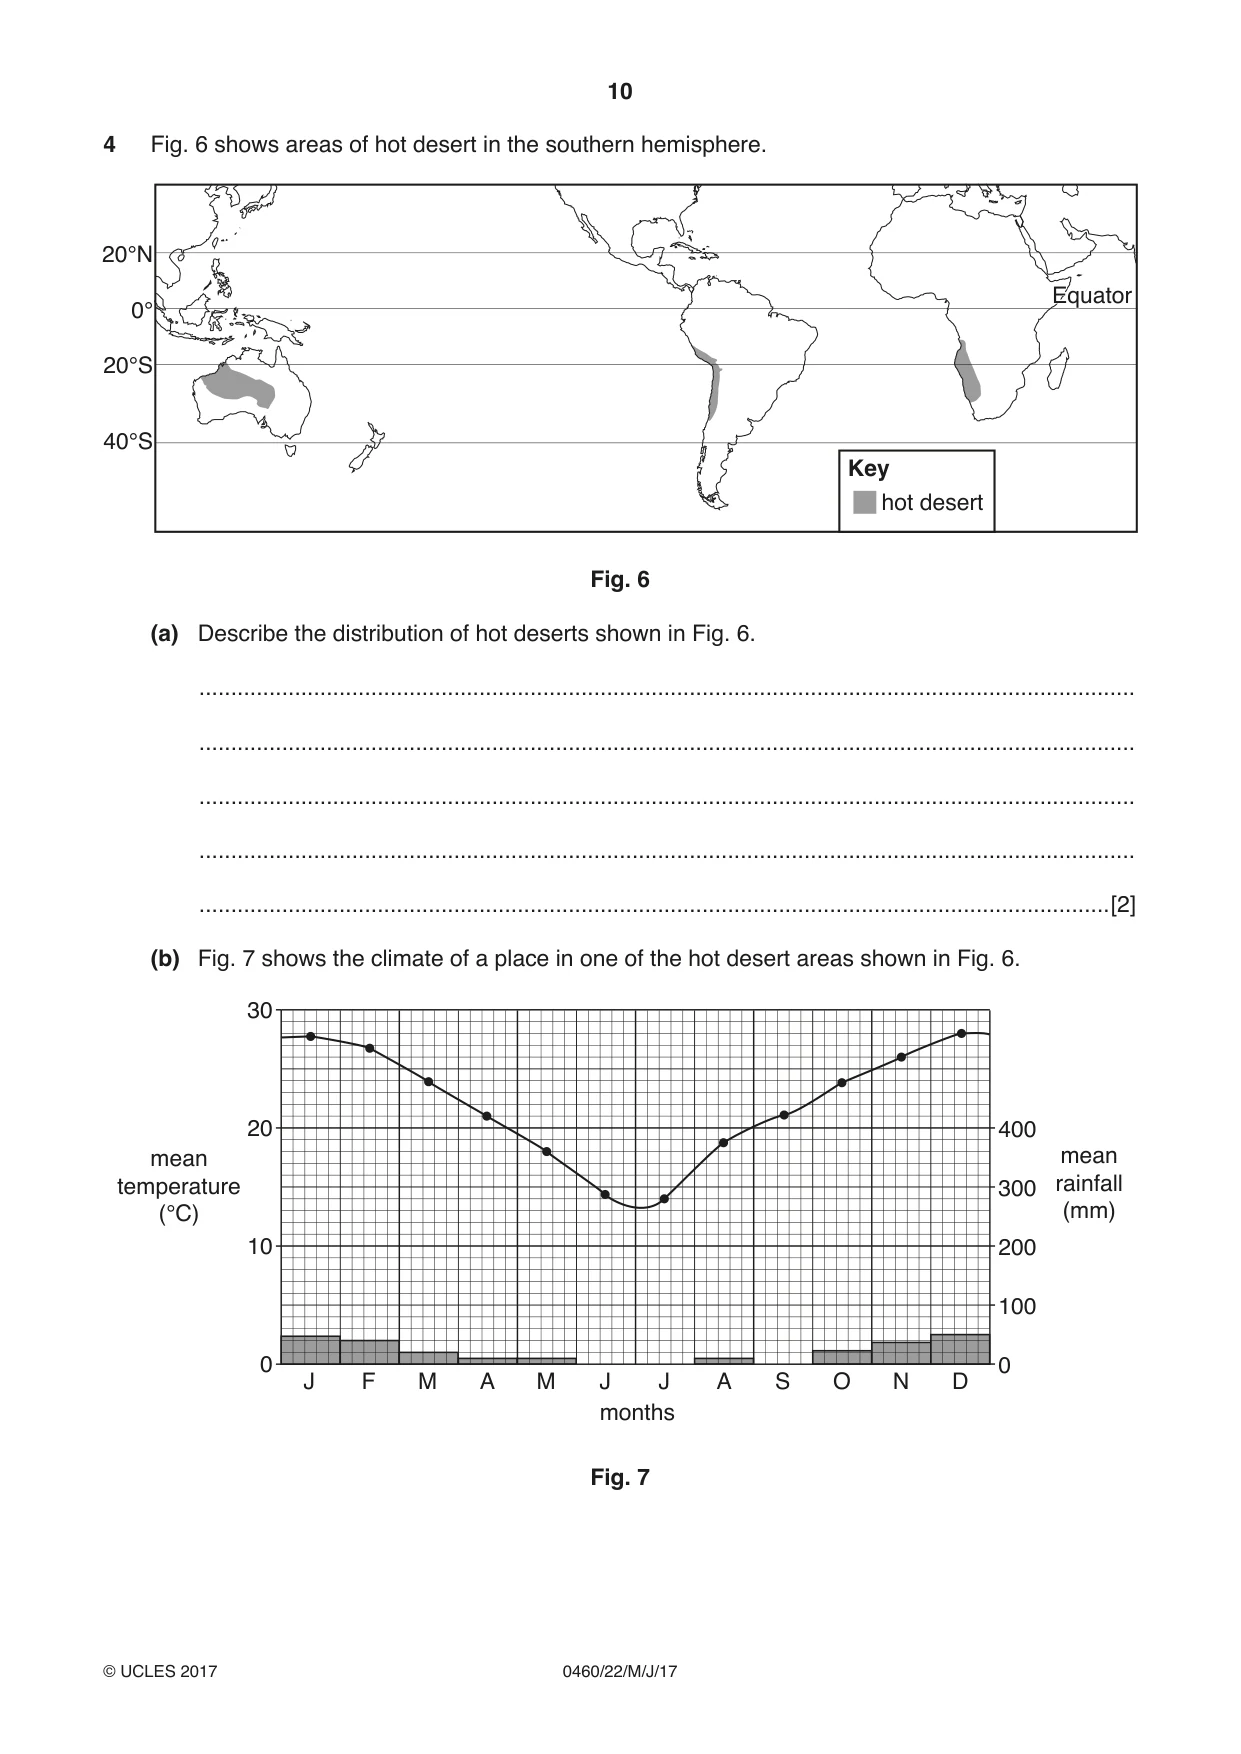
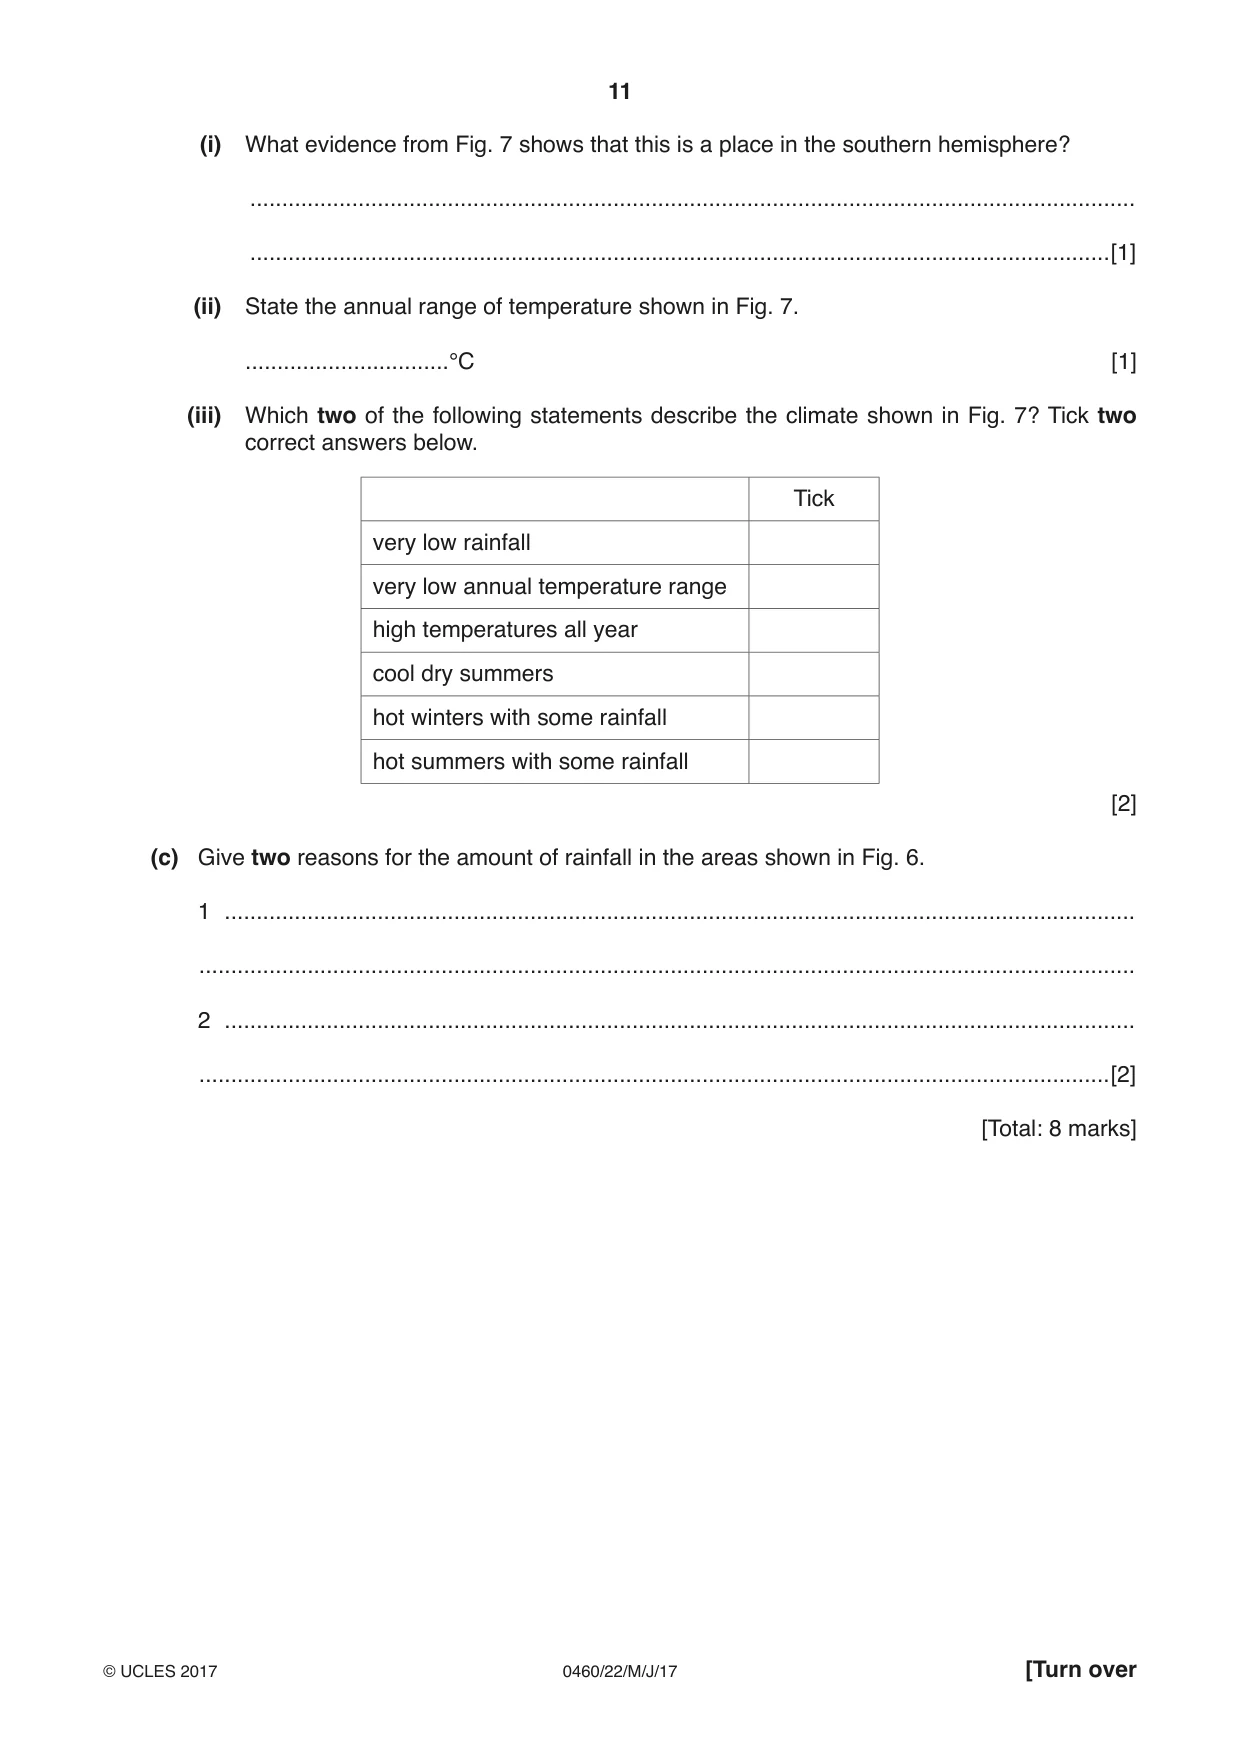
4 Fig. 6 shows areas of hot desert in the southern hemisphere. 20°N EquatorEquator 0° 20°S 40°S Key hot desert Fig. 6 (a) Describe the distribution of hot deserts shown in Fig. 6. ................................................................................................................................................... ................................................................................................................................................... ................................................................................................................................................... ................................................................................................................................................... ...............................................................................................................................................[2] (b) Fig. 7 shows the climate of a place in one of the hot desert areas shown in Fig. 6. 30 20 400 mean mean temperature 300 rainfall (°C) (mm) 10 200 100 0 0 J F M A M J J A S O N D months Fig. 7 (i) What evidence from Fig. 7 shows that this is a place in the southern hemisphere? ........................................................................................................................................... .......................................................................................................................................[1] (ii) State the annual range of temperature shown in Fig. 7. ................................°C [1] (iii) Which two of the following statements describe the climate shown in Fig. 7? Tick two correct answers below. Tick very low rainfall very low annual temperature range high temperatures all year cool dry summers hot winters with some rainfall hot summers with some rainfall [2] (c) Give two reasons for the amount of rainfall in the areas shown in Fig. 6. 1 ............................................................................................................................................... ................................................................................................................................................... 2 ............................................................................................................................................... ...............................................................................................................................................[2] [Total: 8 marks]
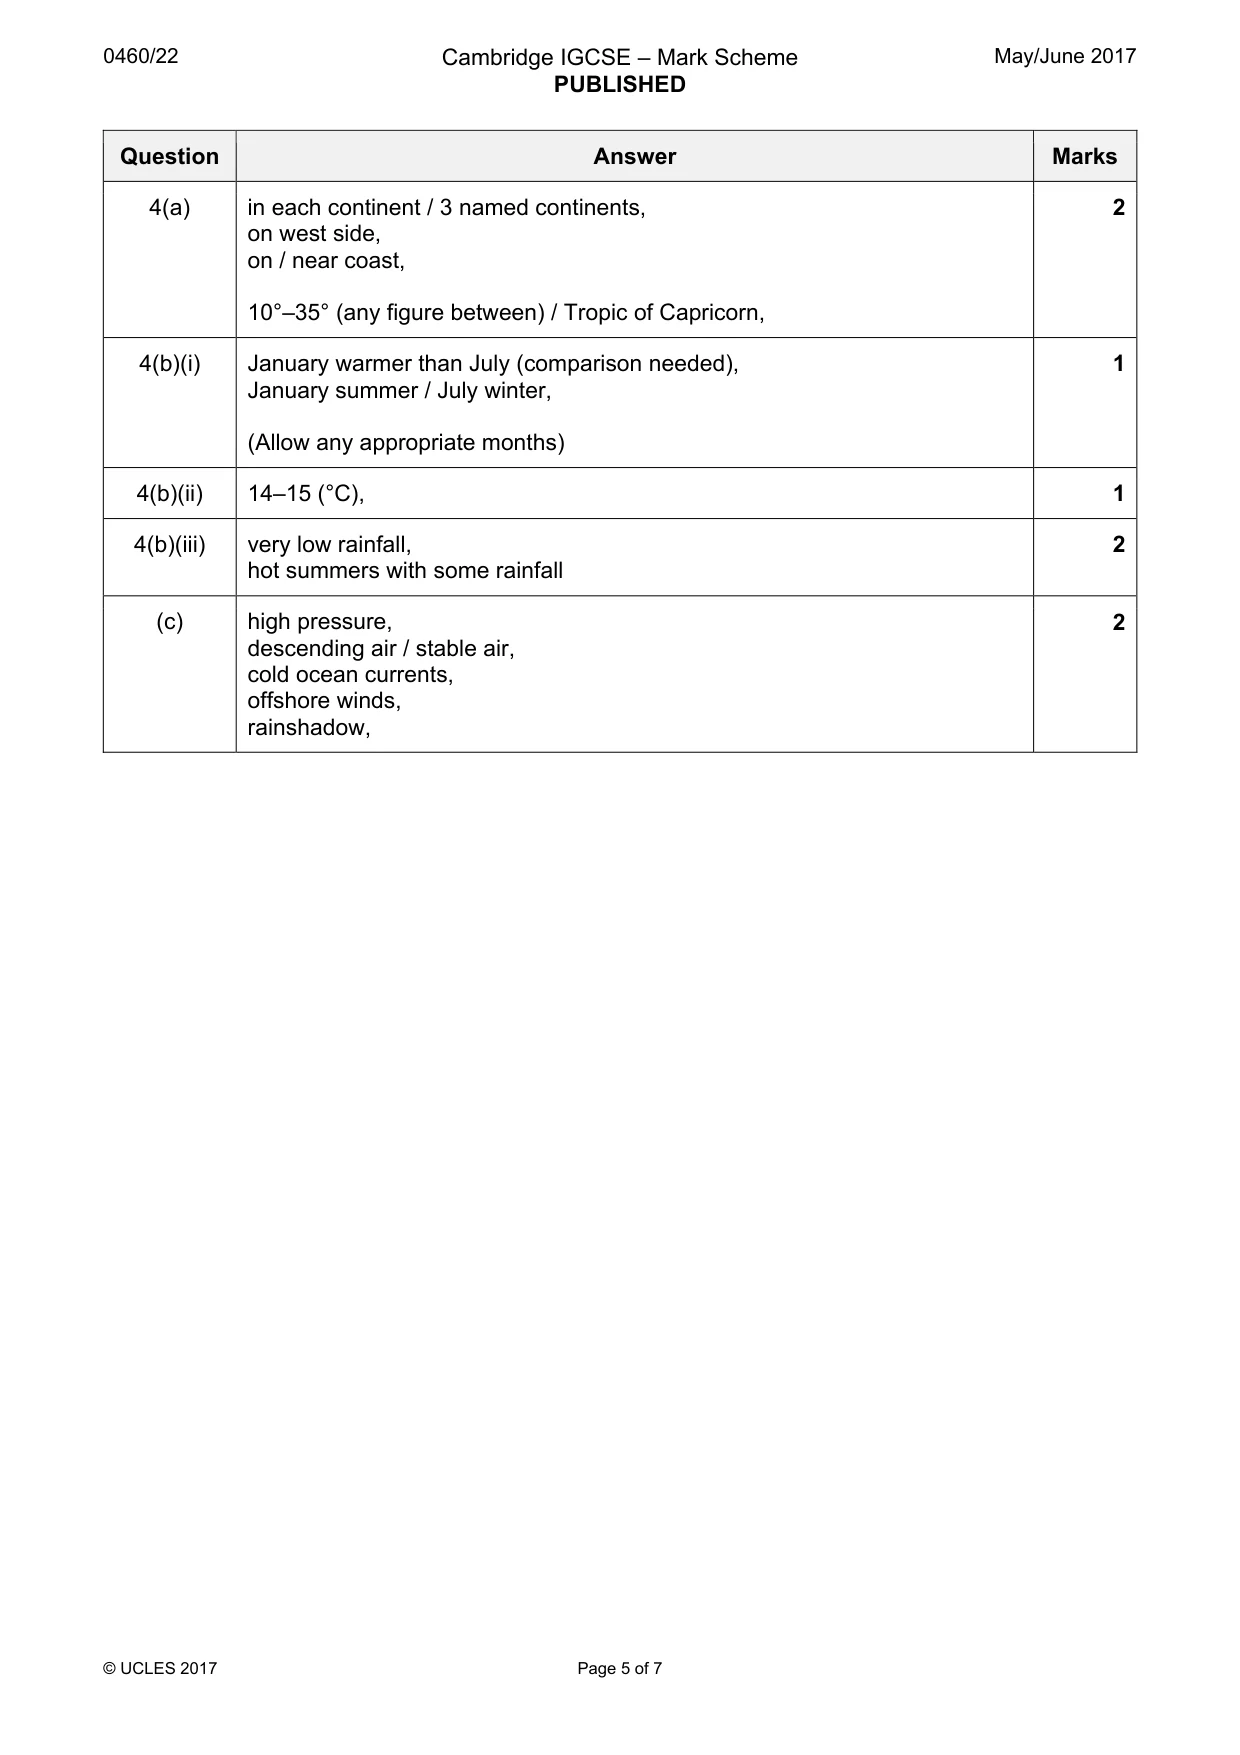
Mark scheme: 4(a) in each continent / 3 named continents, 2 on west side, on / near coast, 10°–35° (any figure between) / Tropic of Capricorn, 4(b)(i) January warmer than July (comparison needed), 1 January summer / July winter, (Allow any appropriate months) 4(b)(ii) 14–15 (°C), 1 4(b)(iii) very low rainfall, 2 hot summers with some rainfall (c) high pressure, 2 descending air / stable air, cold ocean currents, offshore winds, rainshadow,
Q5 · Photographs B and C (Insert) show three types of cloud
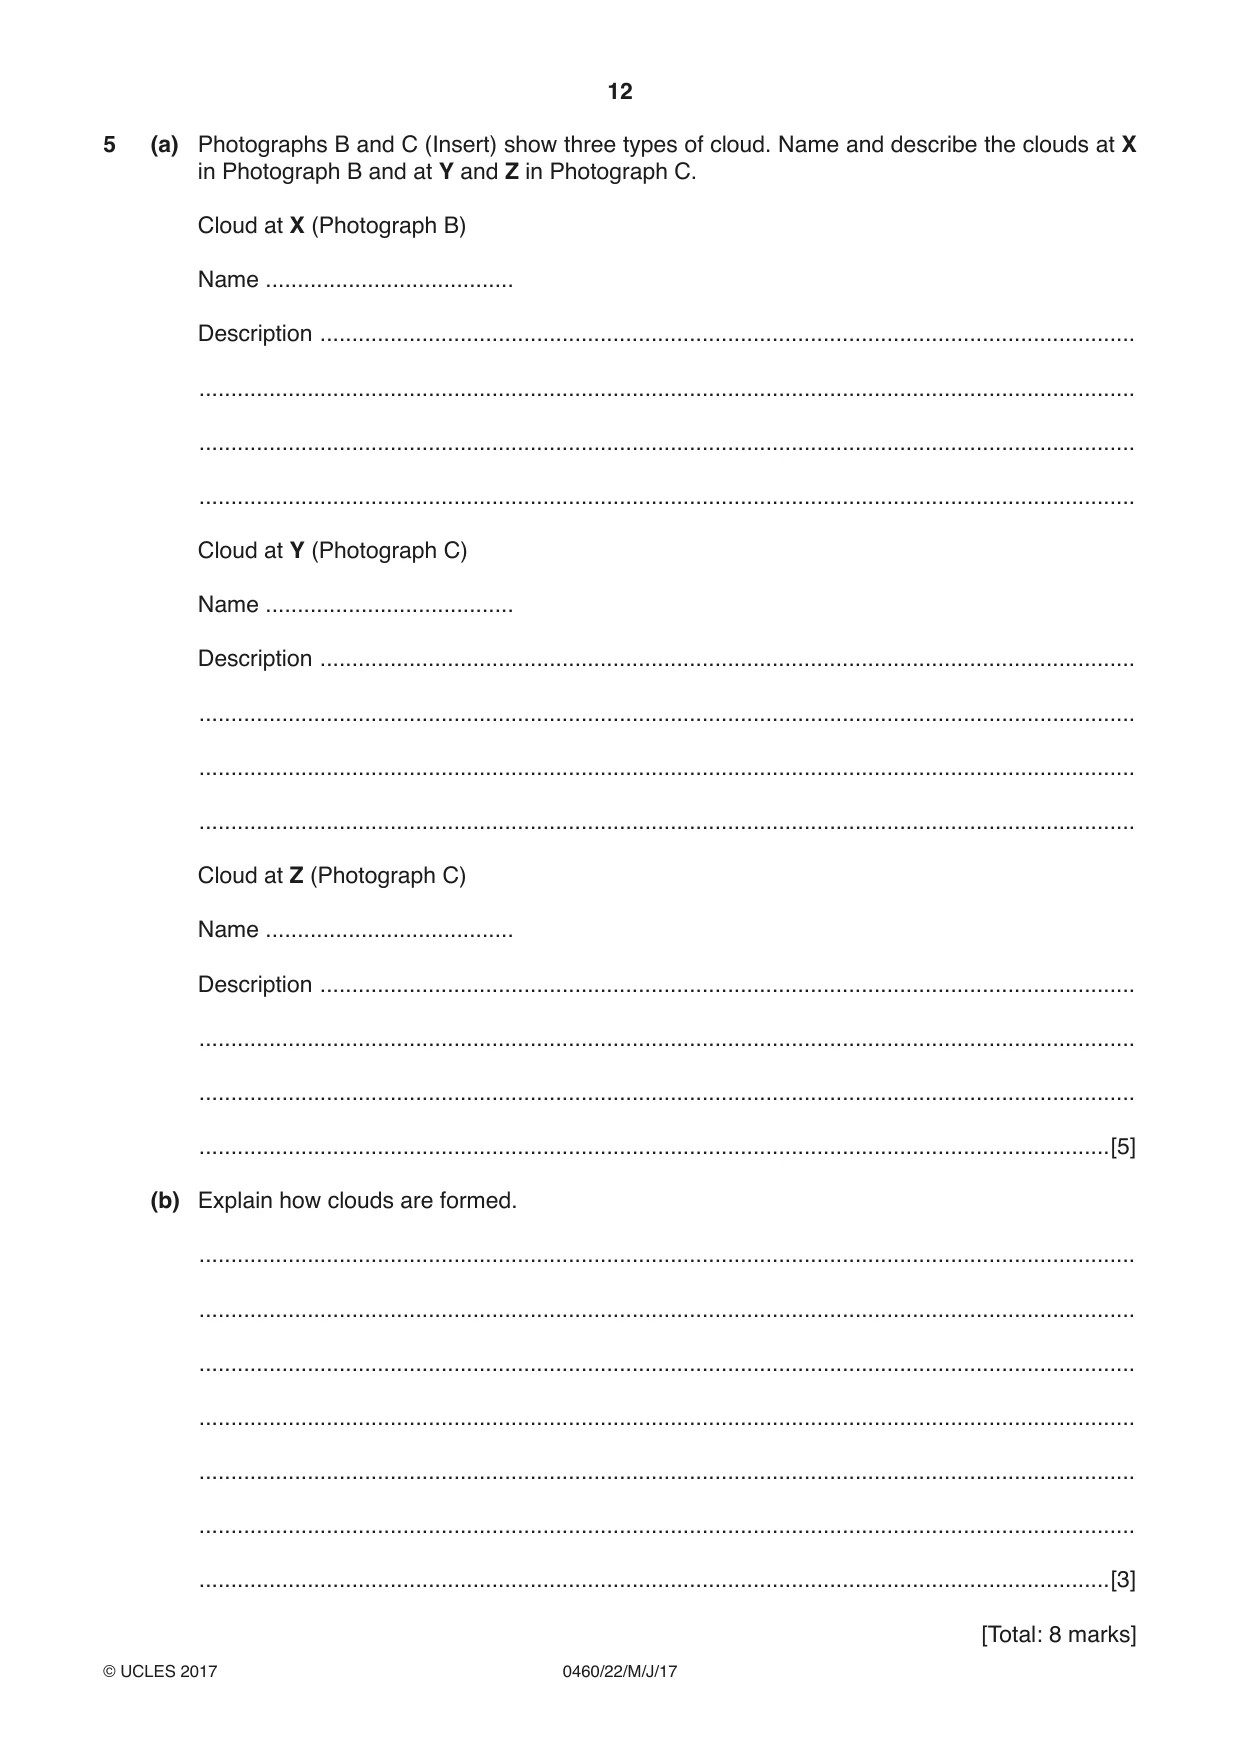
5 (a) Photographs B and C (Insert) show three types of cloud. Name and describe the clouds at X in Photograph B and at Y and Z in Photograph C. Cloud at X (Photograph B) Name ....................................... Description ................................................................................................................................ ................................................................................................................................................... ................................................................................................................................................... ................................................................................................................................................... Cloud at Y (Photograph C) Name ....................................... Description ................................................................................................................................ ................................................................................................................................................... ................................................................................................................................................... ................................................................................................................................................... Cloud at Z (Photograph C) Name ....................................... Description ................................................................................................................................ ................................................................................................................................................... ................................................................................................................................................... ...............................................................................................................................................[5] (b) Explain how clouds are formed. ................................................................................................................................................... ................................................................................................................................................... ................................................................................................................................................... ................................................................................................................................................... ................................................................................................................................................... ................................................................................................................................................... ...............................................................................................................................................[3] [Total: 8 marks] TURN PAGE FOR QUESTION 6
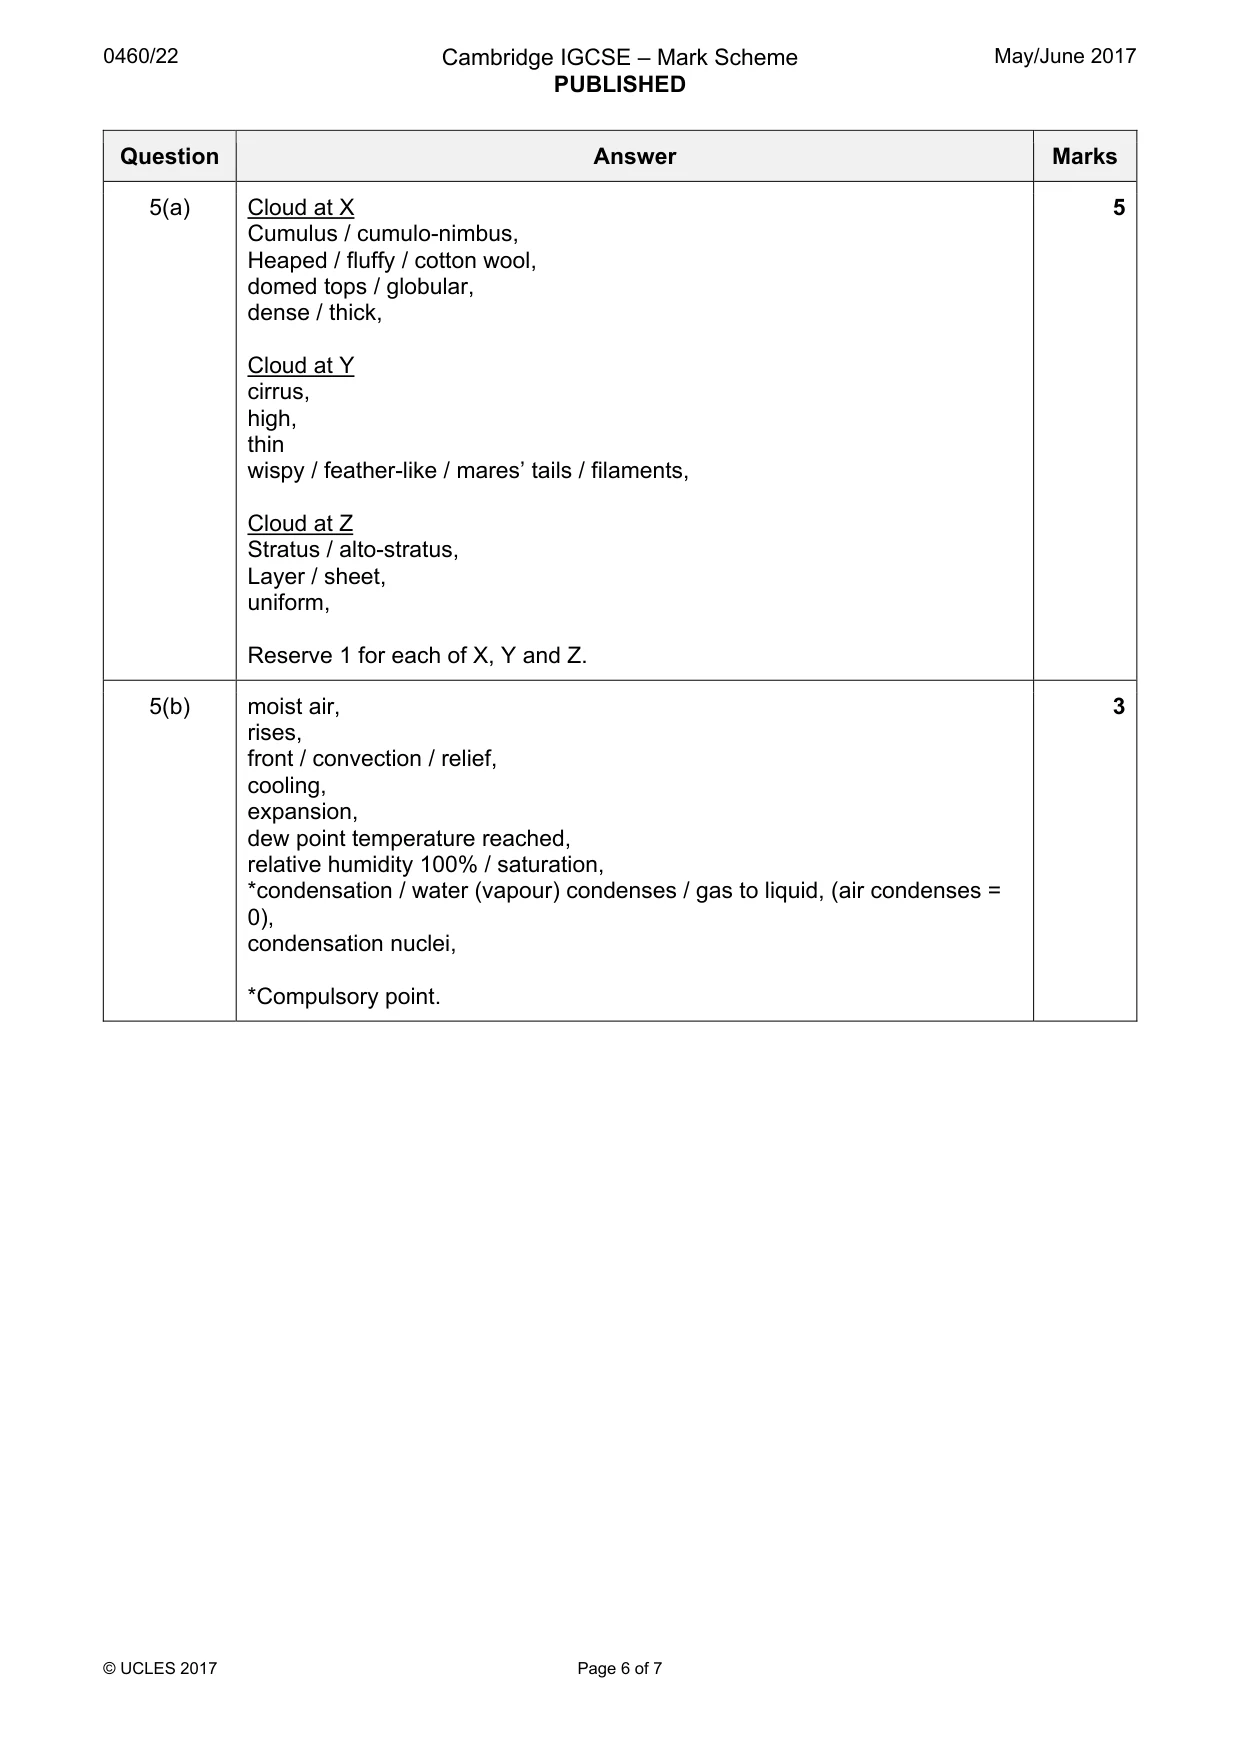
Mark scheme: 5(a) Cloud at X 5 Cumulus / cumulo-nimbus, Heaped / fluffy / cotton wool, domed tops / globular, dense / thick, Cloud at Y cirrus, high, thin wispy / feather-like / mares’ tails / filaments, Cloud at Z Stratus / alto-stratus, Layer / sheet, uniform, Reserve 1 for each of X, Y and Z. 5(b) moist air, 3 rises, front / convection / relief, cooling, expansion, dew point temperature reached, relative humidity 100% / saturation, *condensation / water (vapour) condenses / gas to liquid, (air condenses = 0), condensation nuclei, *Compulsory point.
Question 6
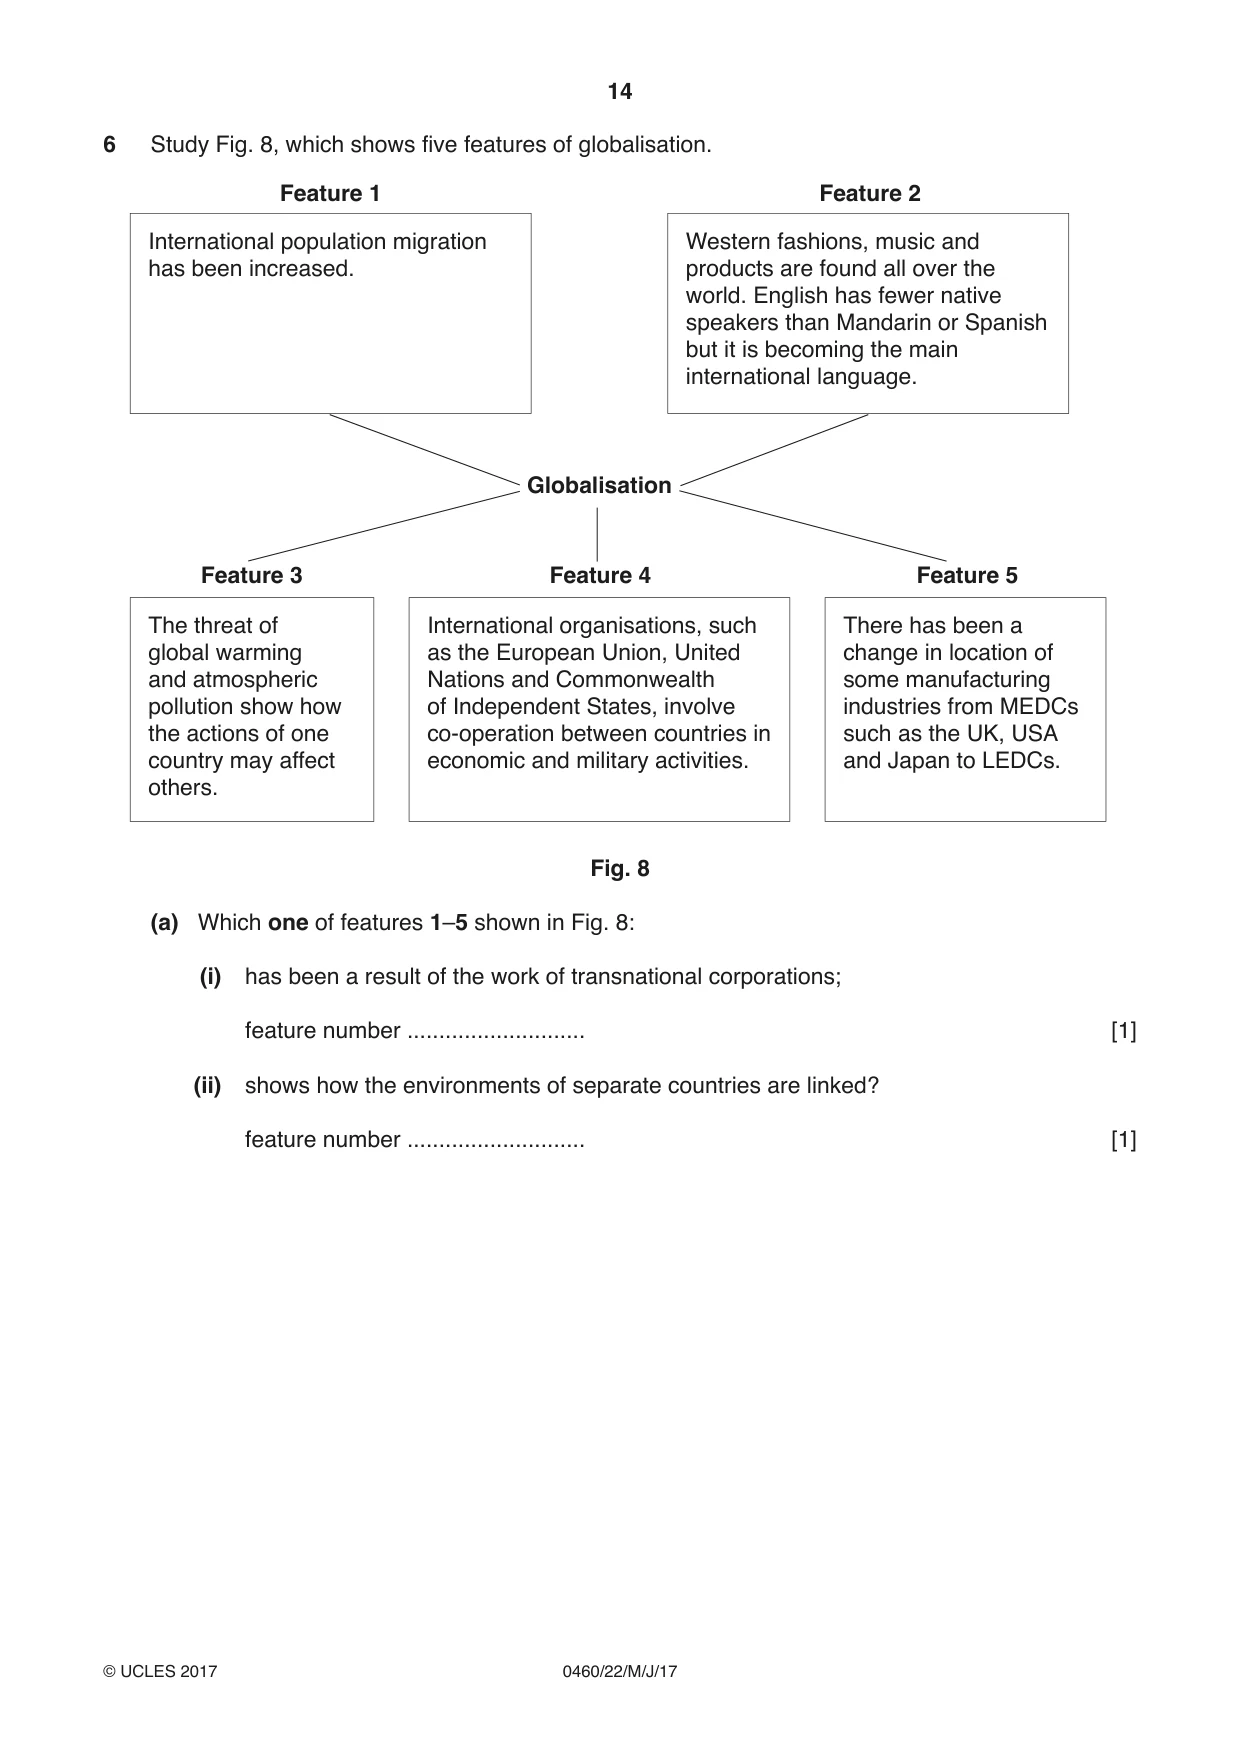
6 Study Fig. 8, which shows five features of globalisation. Feature 1 Feature 2 International population migration Western fashions, music and has been increased. products are found all over the world. English has fewer native speakers than Mandarin or Spanish but it is becoming the main international language. Globalisation Feature 3 Feature 4 Feature 5 The threat of International organisations, such There has been a global warming as the European Union, United change in location of and atmospheric Nations and Commonwealth some manufacturing pollution show how of Independent States, involve industries from MEDCs the actions of one co-operation between countries in such as the UK, USA country may affect economic and military activities. and Japan to LEDCs. others. Fig. 8 (a) Which one of features 1–5 shown in Fig. 8: (i) has been a result of the work of transnational corporations; feature number ............................ [1] (ii) shows how the environments of separate countries are linked? feature number ............................ [1] (b) Suggest how the features of globalisation shown in Fig. 8 may affect the life of a young person in an LEDC. ................................................................................................................................................... ................................................................................................................................................... ................................................................................................................................................... ................................................................................................................................................... ................................................................................................................................................... ................................................................................................................................................... ................................................................................................................................................... ................................................................................................................................................... ................................................................................................................................................... ................................................................................................................................................... ................................................................................................................................................... ................................................................................................................................................... ...............................................................................................................................................[6] [Total: 8 marks] Additional Pages If you use the following lined pages to complete the answer(s) to any question(s), the question number(s) must be clearly shown. .................................................................................................................................................................. .................................................................................................................................................................. .................................................................................................................................................................. .................................................................................................................................................................. .................................................................................................................................................................. .................................................................................................................................................................. .................................................................................................................................................................. .................................................................................................................................................................. .................................................................................................................................................................. .................................................................................................................................................................. .................................................................................................................................................................. .................................................................................................................................................................. .................................................................................................................................................................. .................................................................................................................................................................. .................................................................................................................................................................. .................................................................................................................................................................. .................................................................................................................................................................. .................................................................................................................................................................. .................................................................................................................................................................. .................................................................................................................................................................. .................................................................................................................................................................. .................................................................................................................................................................. .................................................................................................................................................................. .................................................................................................................................................................. ..................................................................................................................................................................
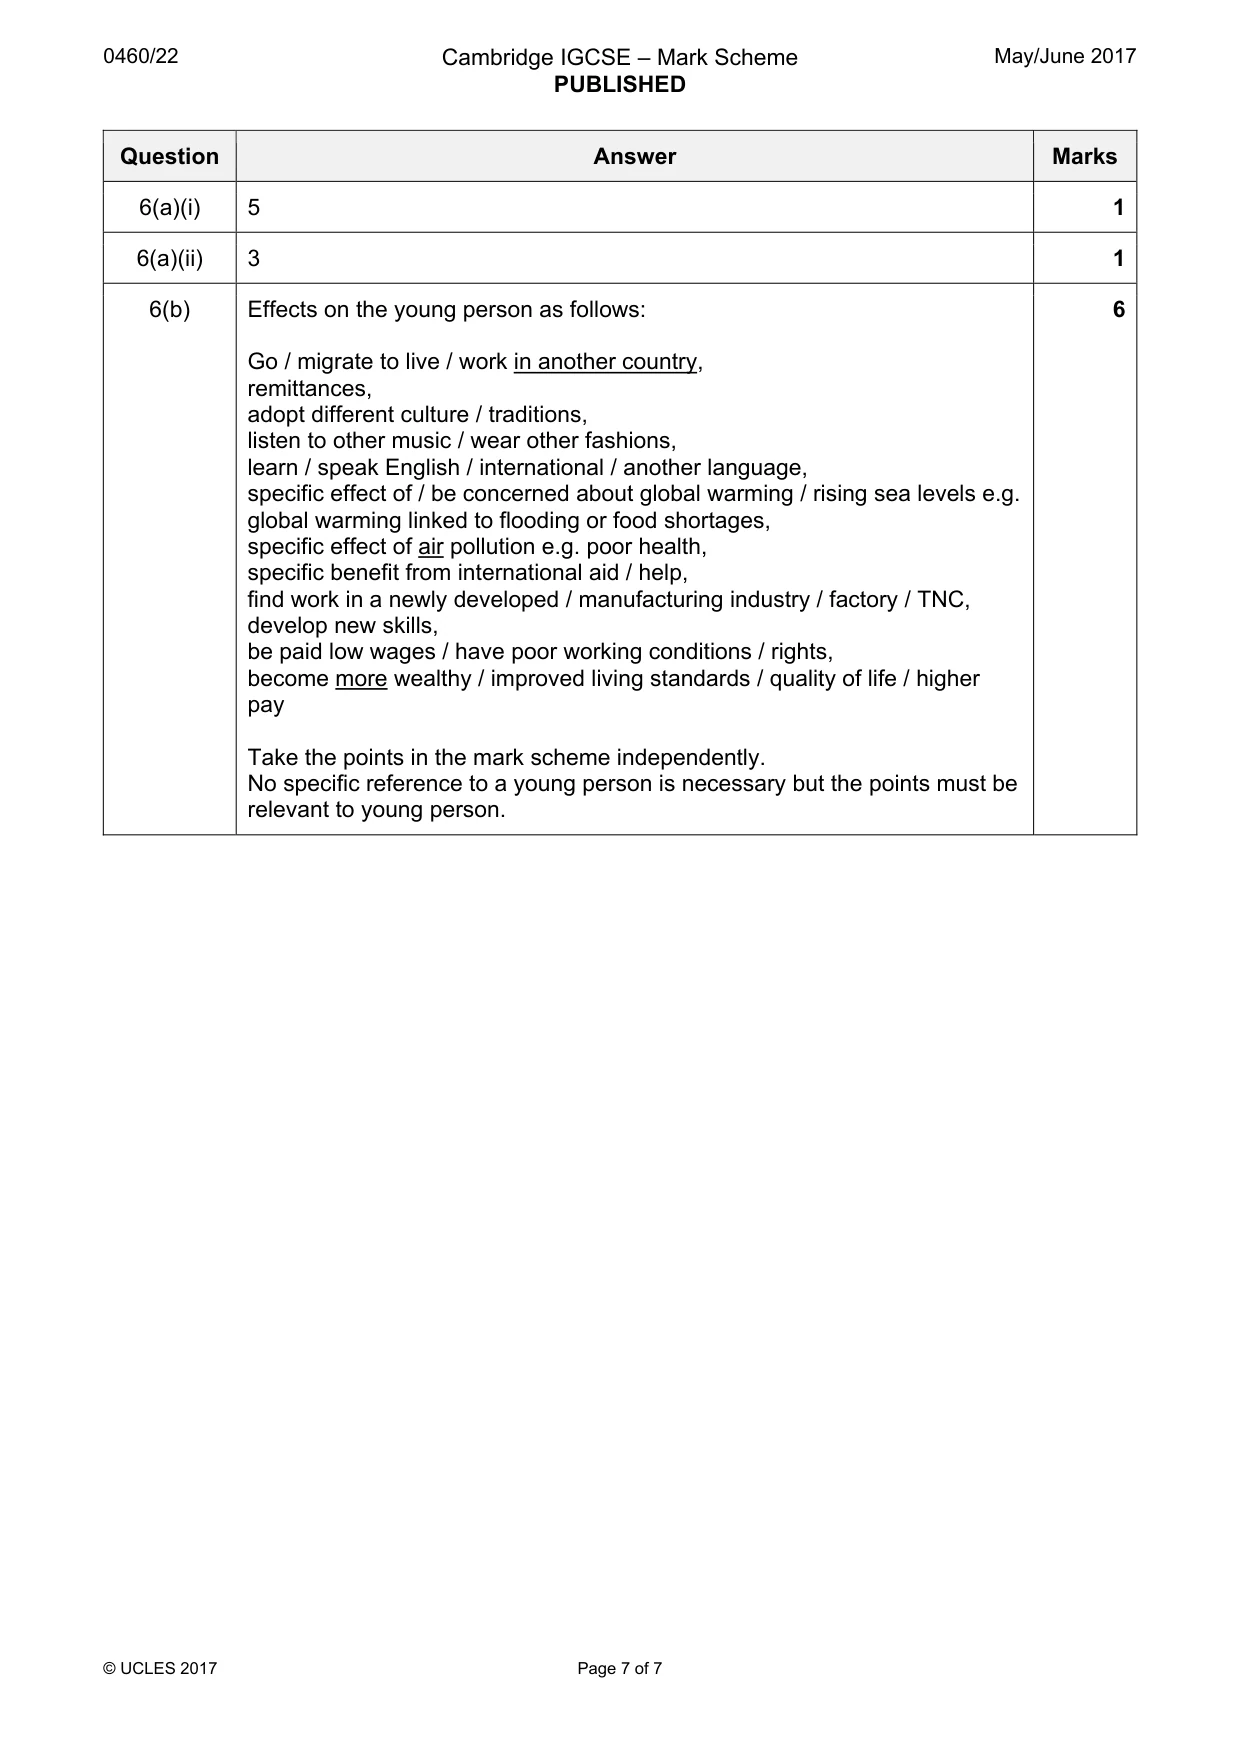
Mark scheme: 6(a)(i) 5 1 6(a)(ii) 3 1 6(b) Effects on the young person as follows: 6 Go / migrate to live / work in another country, remittances, adopt different culture / traditions, listen to other music / wear other fashions, learn / speak English / international / another language, specific effect of / be concerned about global warming / rising sea levels e.g. global warming linked to flooding or food shortages, specific effect of air pollution e.g. poor health, specific benefit from international aid / help, find work in a newly developed / manufacturing industry / factory / TNC, develop new skills, be paid low wages / have poor working conditions / rights, become more wealthy / improved living standards / quality of life / higher pay Take the points in the mark scheme independently. No specific reference to a young person is necessary but the points must be relevant to young person.
More questions on Environmental risks of economic development
What was in this paper
The subtopics covered by these 6 questions, and how many questions each got. Open one in a new tab to see every Cambridge question on it.
What you needed in this session
Cambridge’s own grade thresholds for 2017 May/June, Paper 2 · Variant 2. A higher threshold means an easier paper — the bar moves with how the cohort did.