Cambridge IGCSE Geography 0460 — 2019 Oct/Nov Paper 2 · Variant 3
0460/23/O/N/19 · 6 questions · 60 marks · ≈68 min
The question paper and its mark scheme, free to read here and free to download. This is Cambridge’s own paper, exactly as it was sat.
Question paper20 pages





Mark scheme8 pages
Answers below. Sit the paper first if you are practising.
Questions as text
Q1 · Study the map extract for Knislinge, Sweden
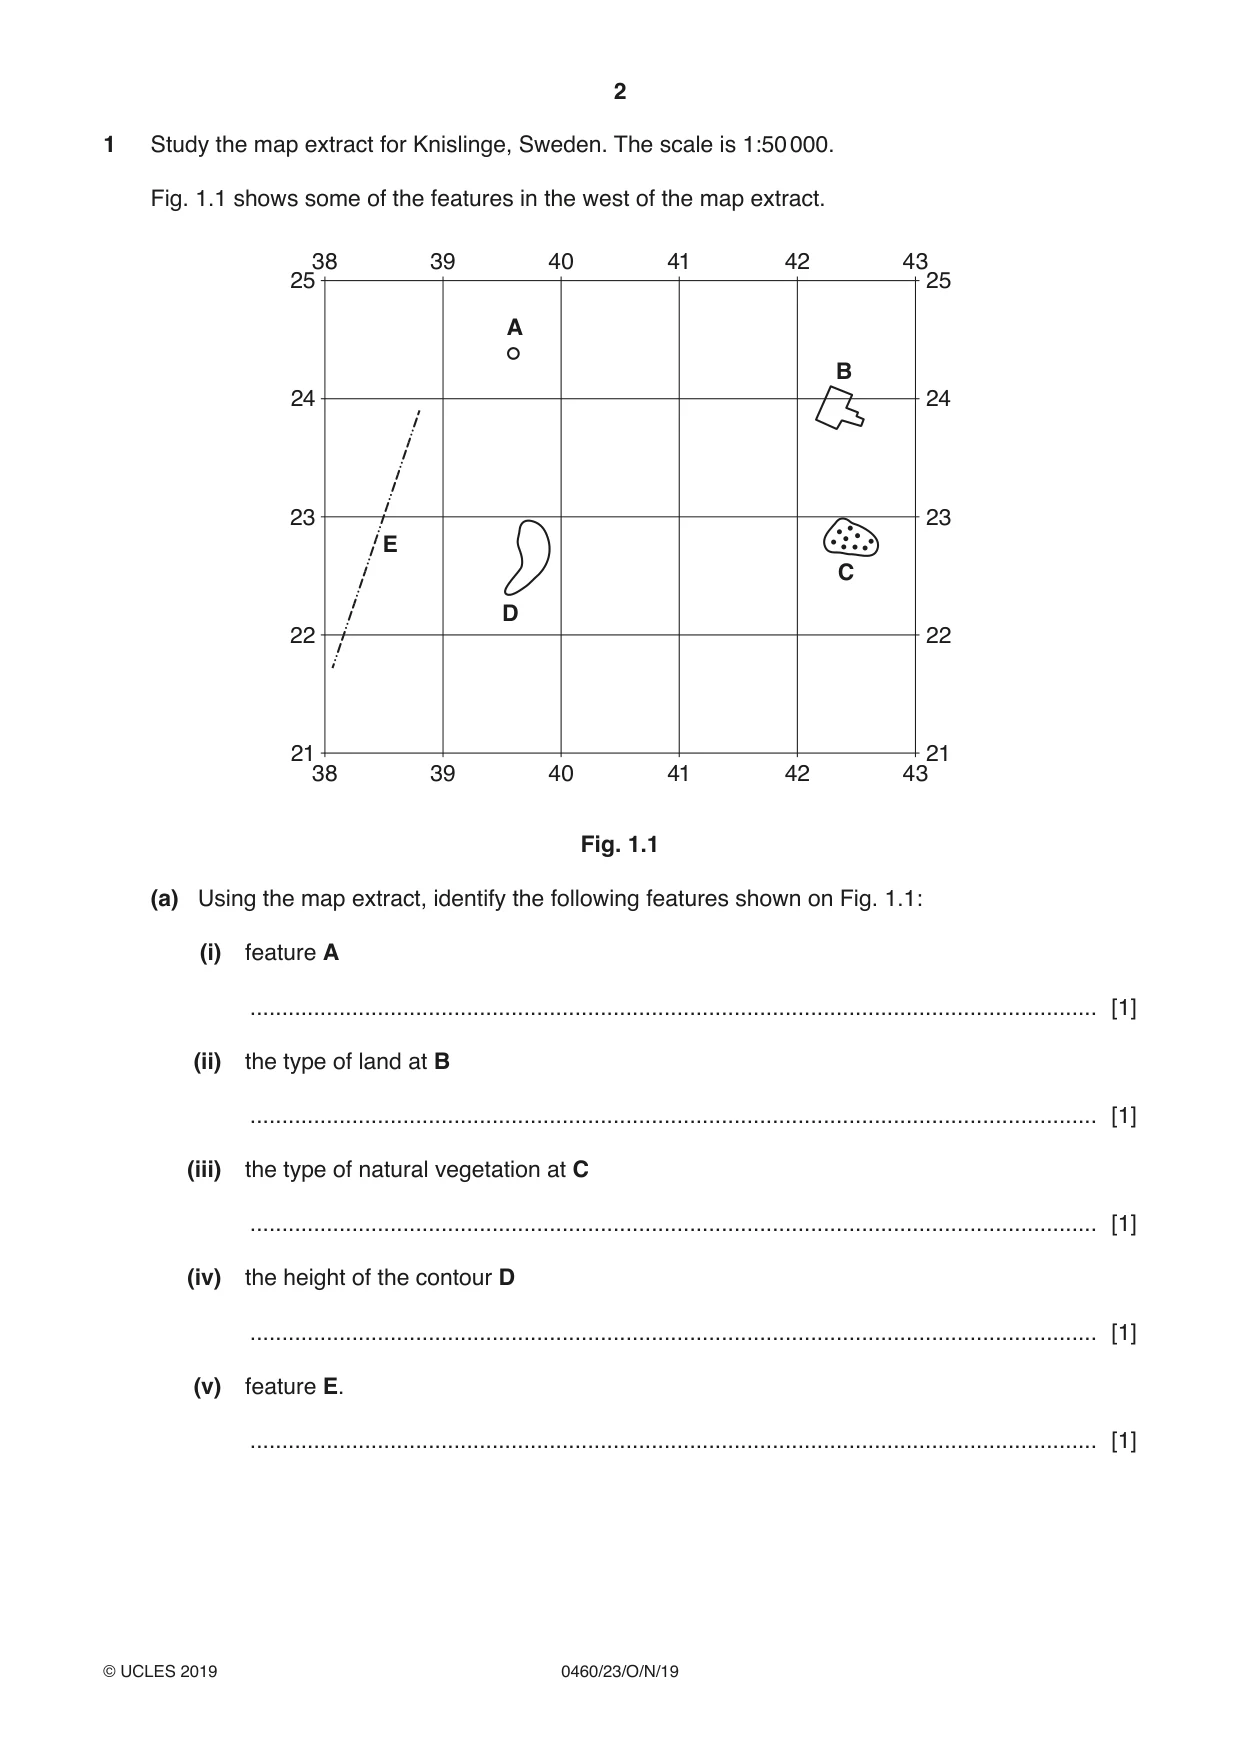
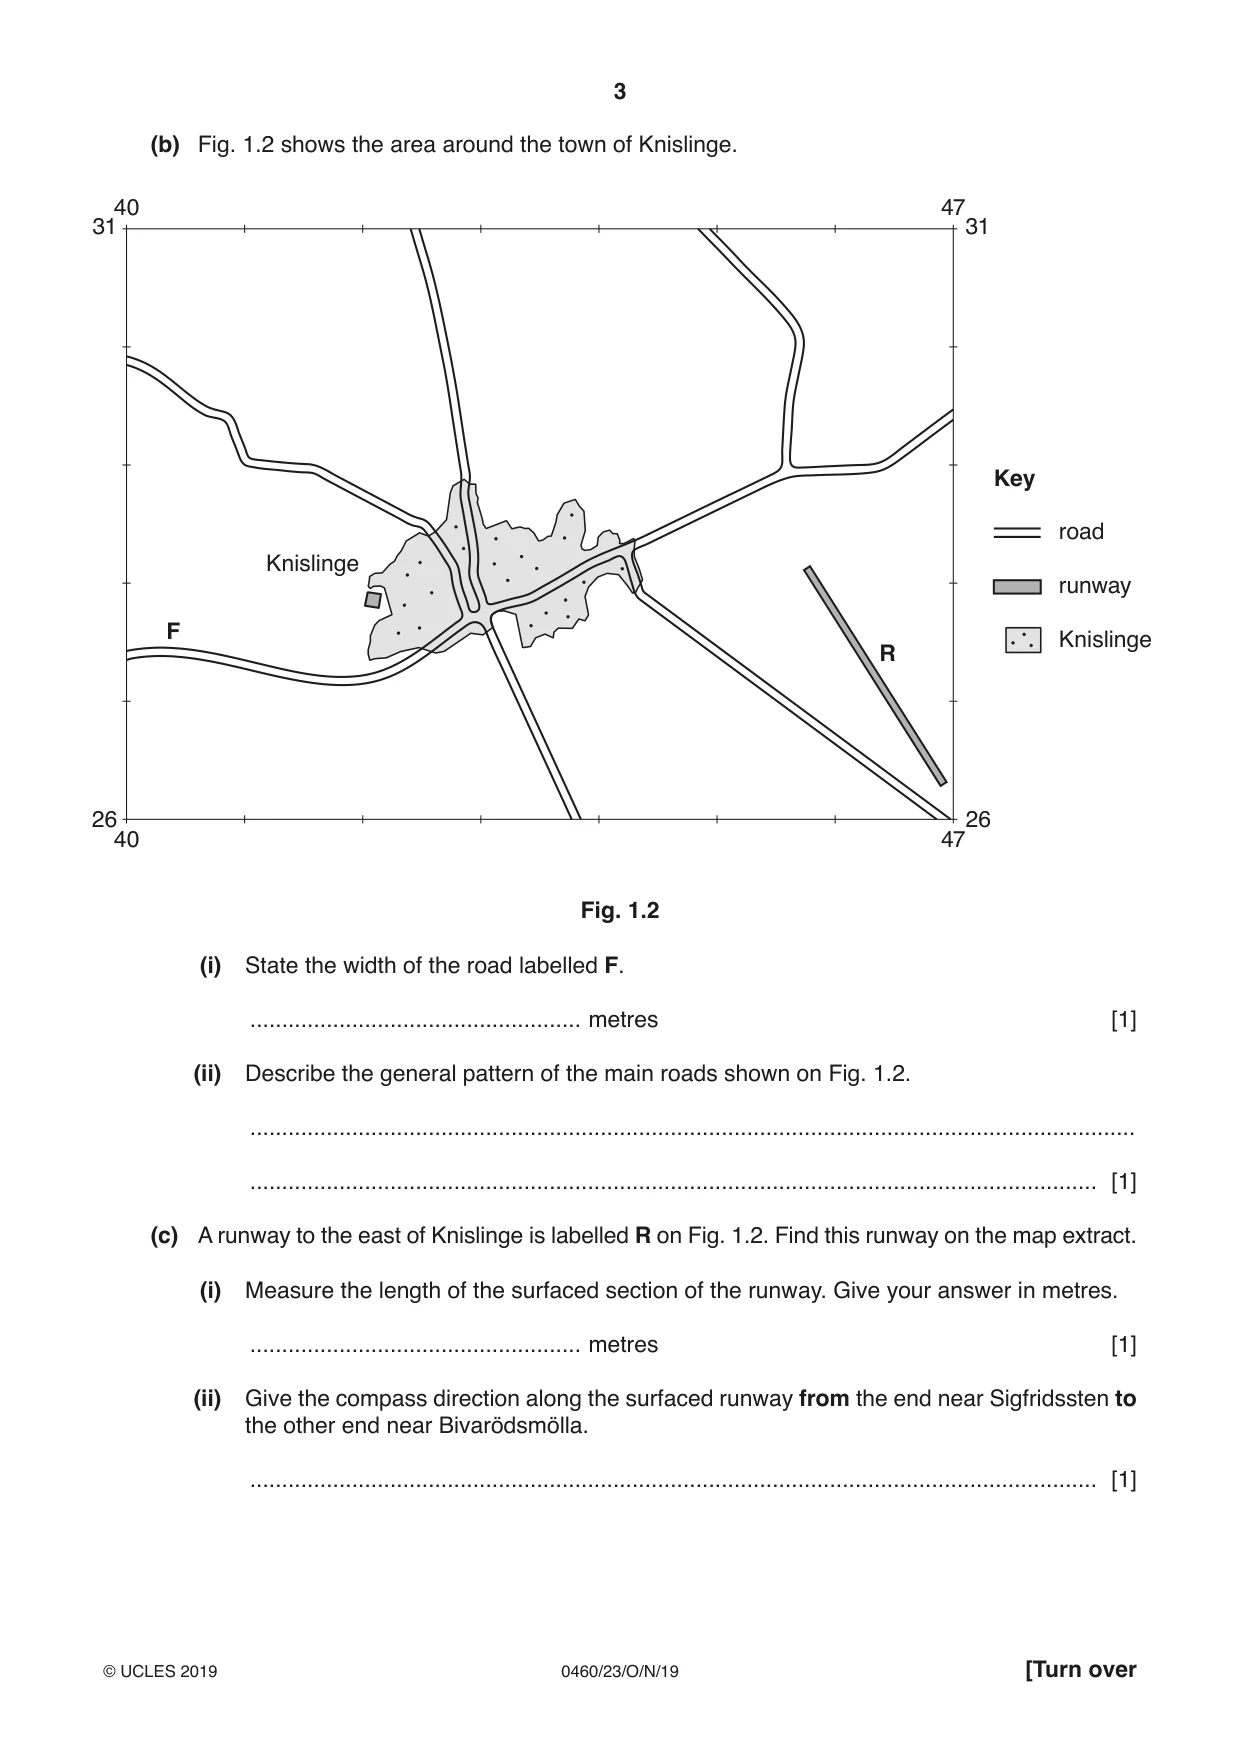
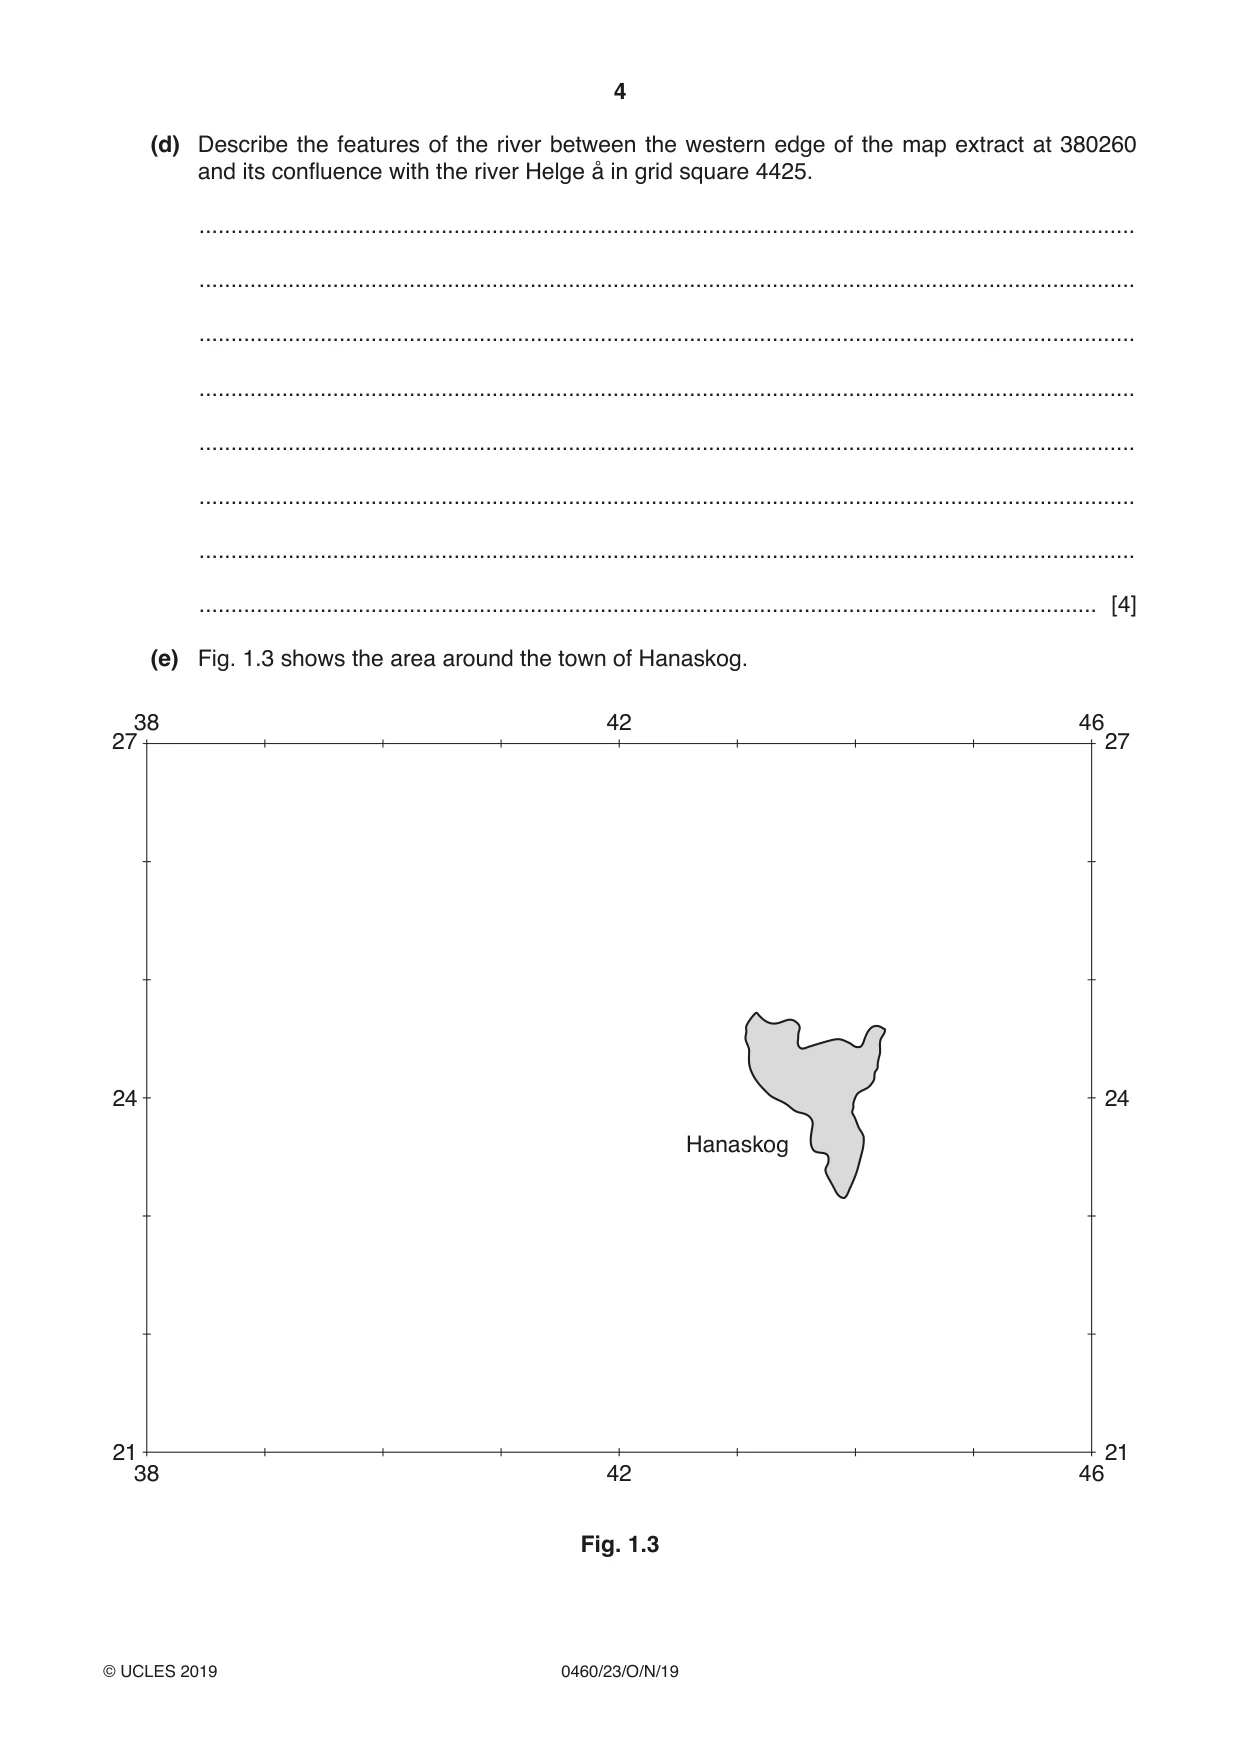
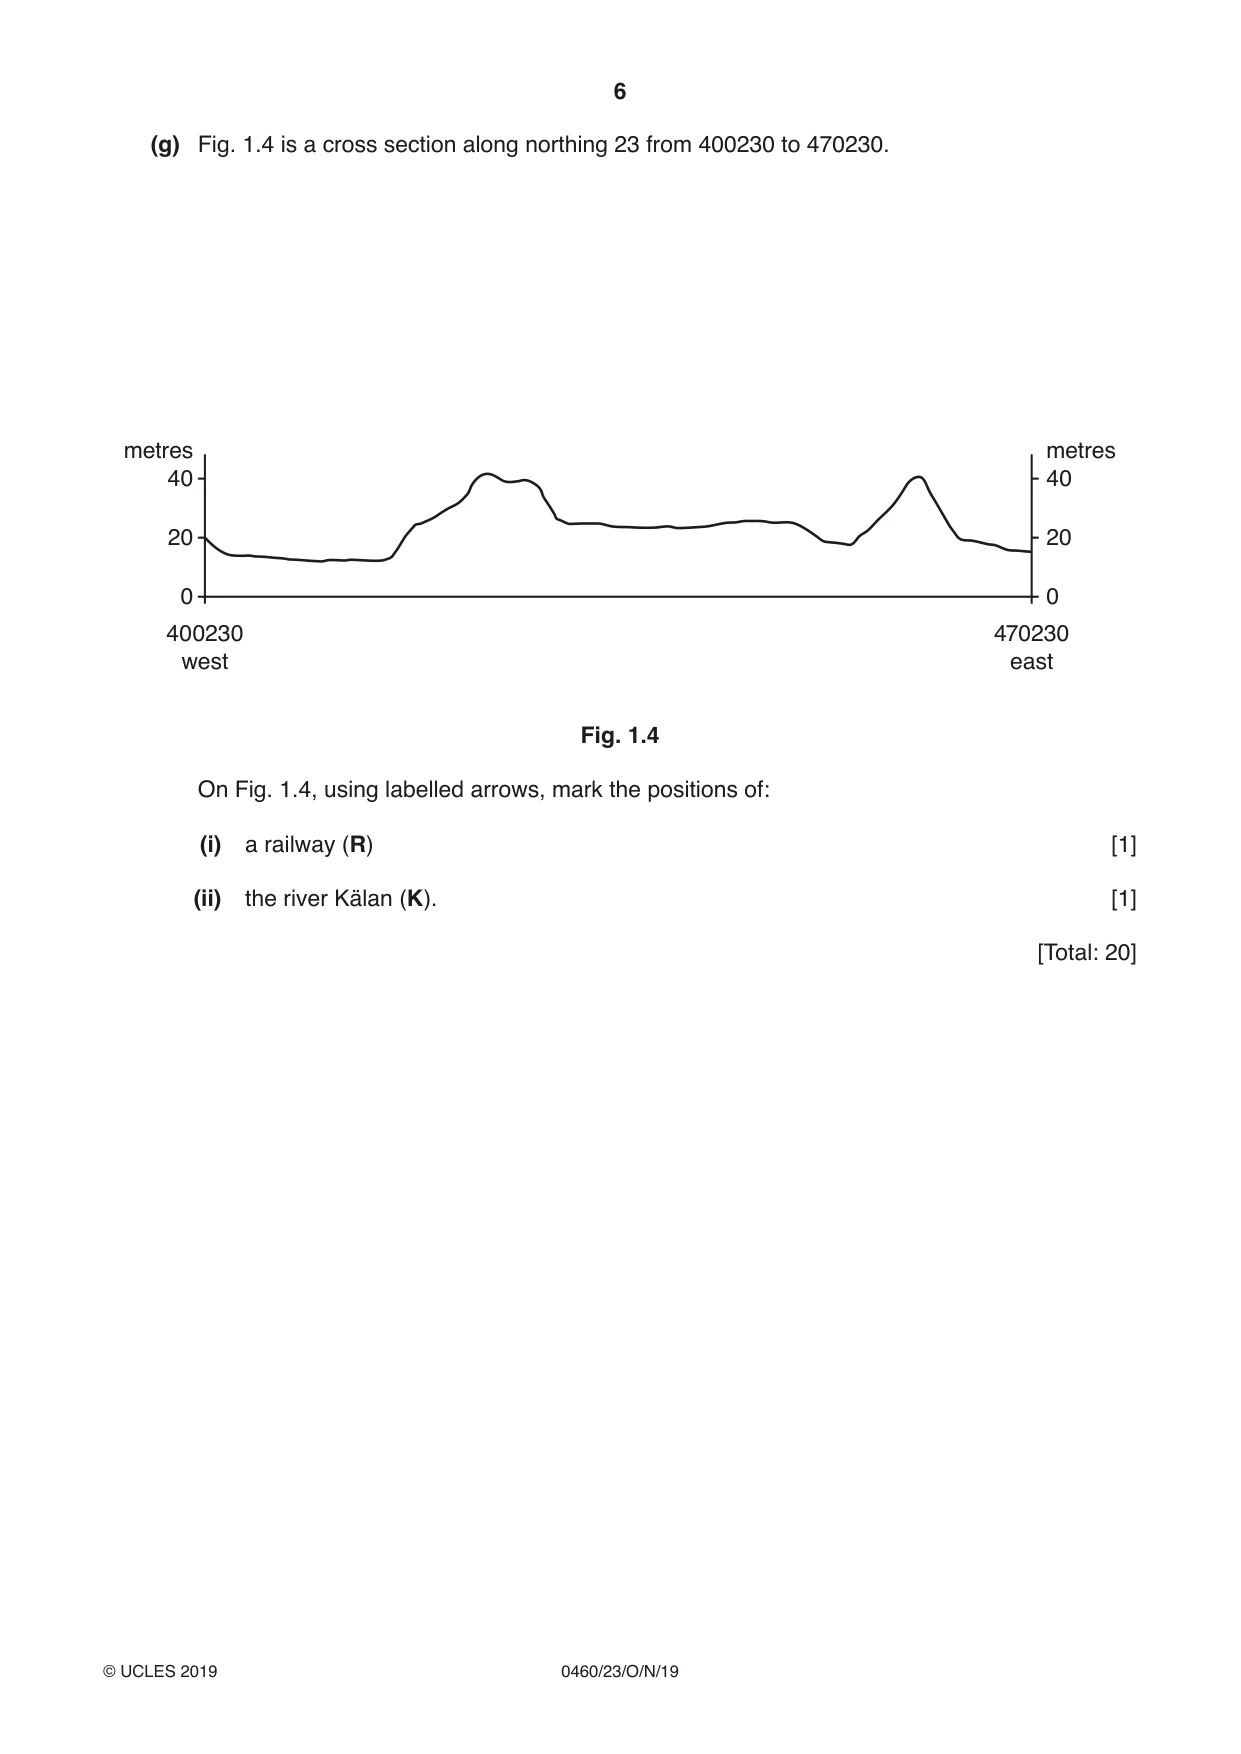
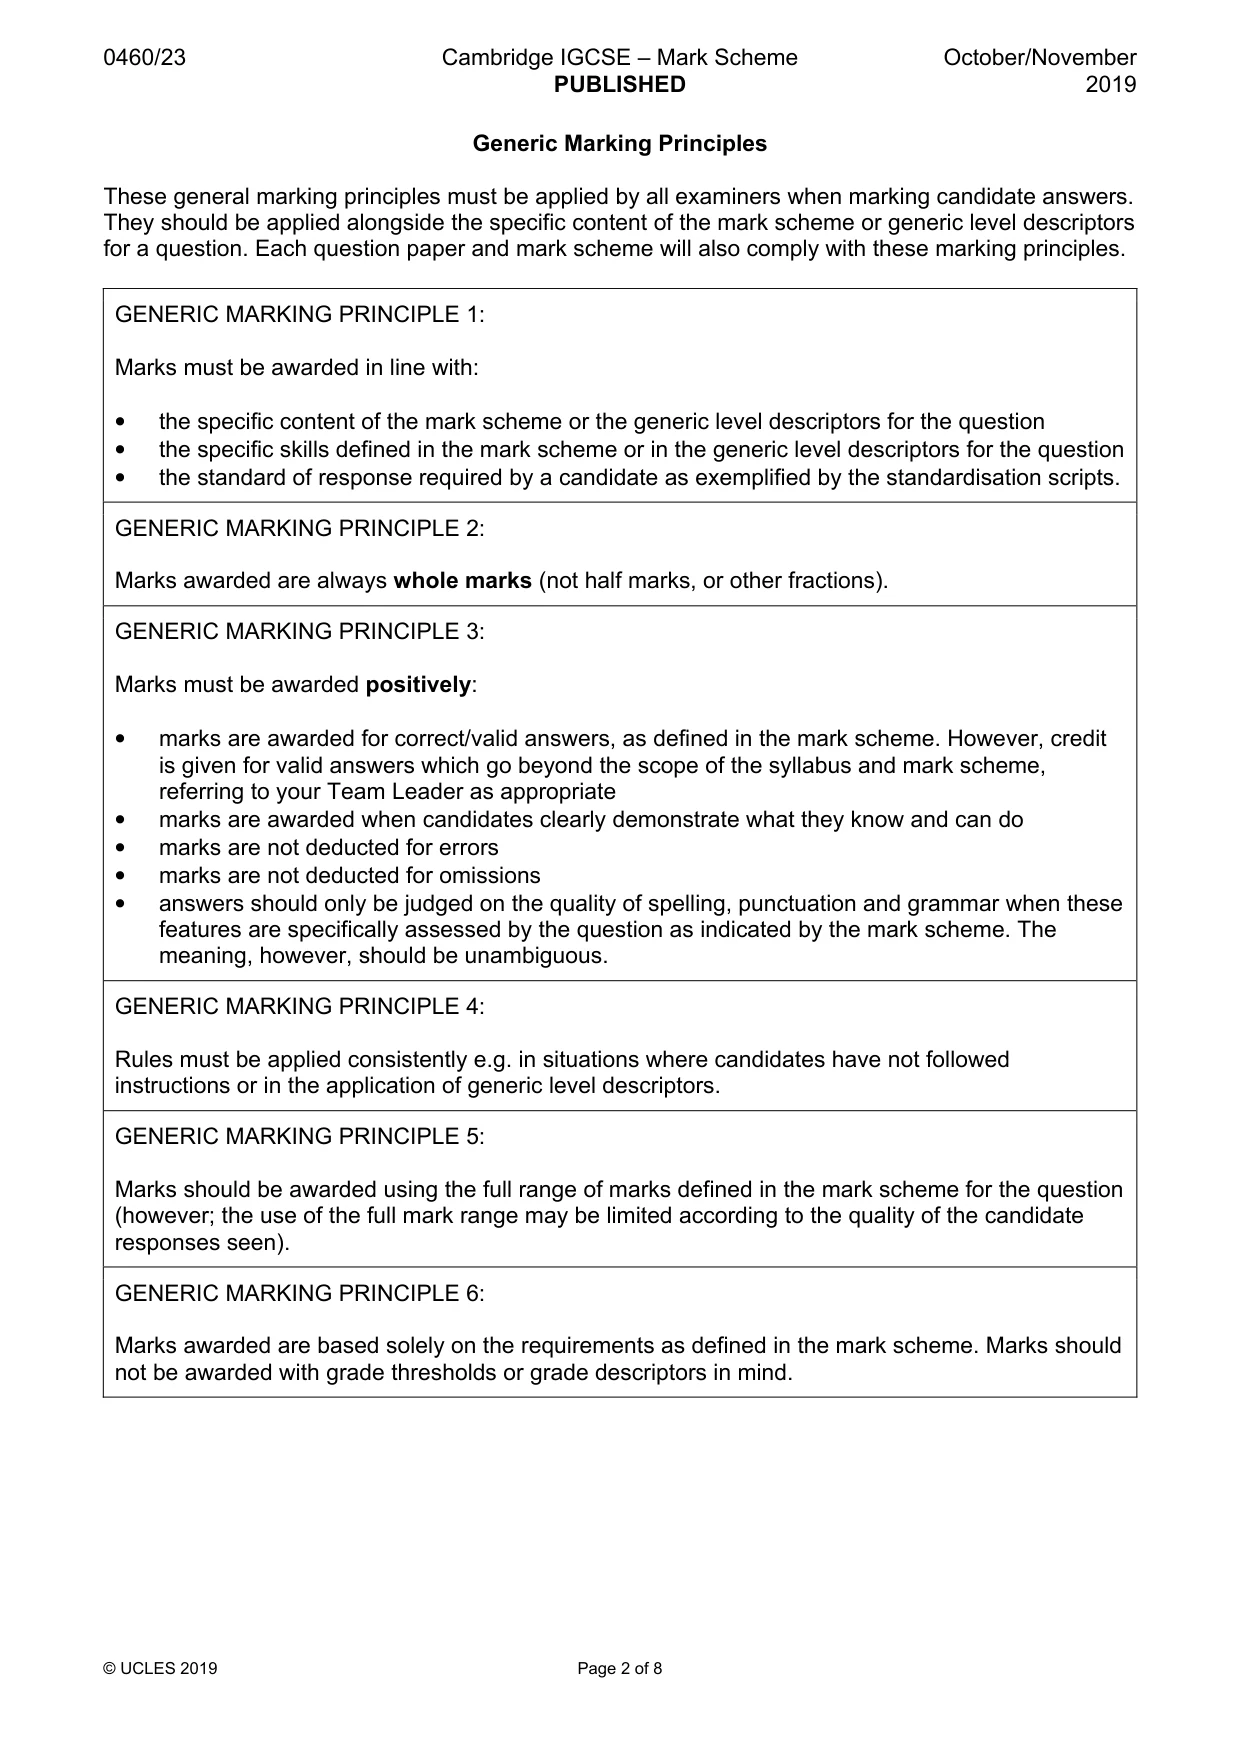
1 Study the map extract for Knislinge, Sweden. The scale is 1:50 000. Fig. 1.1 shows some of the features in the west of the map extract. 38 39 40 41 42 43 25 25 A B 24 24 23 23 E C D 22 22 21 21 38 39 40 41 42 43 Fig. 1.1 (a) Using the map extract, identify the following features shown on Fig. 1.1: (i) feature A ..................................................................................................................................... [1] (ii) the type of land at B ..................................................................................................................................... [1] (iii) the type of natural vegetation at C ..................................................................................................................................... [1] (iv) the height of the contour D ..................................................................................................................................... [1] (v) feature E. ..................................................................................................................................... [1] (b) Fig. 1.2 shows the area around the town of Knislinge. 40 47 31 31 Key road Knislinge runway F Knislinge R 26 26 40 47 Fig. 1.2 (i) State the width of the road labelled F. .................................................... metres [1] (ii) Describe the general pattern of the main roads shown on Fig. 1.2. ........................................................................................................................................... ..................................................................................................................................... [1] (c) A runway to the east of Knislinge is labelled R on Fig. 1.2. Find this runway on the map extract. (i) Measure the length of the surfaced section of the runway. Give your answer in metres. .................................................... metres [1] (ii) Give the compass direction along the surfaced runway from the end near Sigfridssten to the other end near Bivarödsmölla. ..................................................................................................................................... [1] (d) Describe the features of the river between the western edge of the map extract at 380260 and its confluence with the river Helge å in grid square 4425. ................................................................................................................................................... ................................................................................................................................................... ................................................................................................................................................... ................................................................................................................................................... ................................................................................................................................................... ................................................................................................................................................... ................................................................................................................................................... ............................................................................................................................................. [4] (e) Fig. 1.3 shows the area around the town of Hanaskog. 38 42 46 27 27 24 24 Hanaskog 21 21 38 42 46 Fig. 1.3 (i) Using the map extract, describe the distribution of the arable land in the area shown on Fig. 1.3. ........................................................................................................................................... ........................................................................................................................................... ........................................................................................................................................... ..................................................................................................................................... [2] (ii) Using the map extract, state one way in which the distribution of woodland in the area shown on Fig. 1.3 differs from that of the arable land. ........................................................................................................................................... ..................................................................................................................................... [1] (f) Find the lake called Araslövssjön in the south east of the map extract. (i) Name the type of vegetation on the edges of the lake. ..................................................................................................................................... [1] (ii) State one way in which the lake is used. ..................................................................................................................................... [1] (g) Fig. 1.4 is a cross section along northing 23 from 400230 to 470230. metres metres 40 40 20 20 0 0 400230 470230 west east Fig. 1.4 On Fig. 1.4, using labelled arrows, mark the positions of: (i) a railway (R) [1] (ii) the river Kälan (K). [1] [Total: 20]
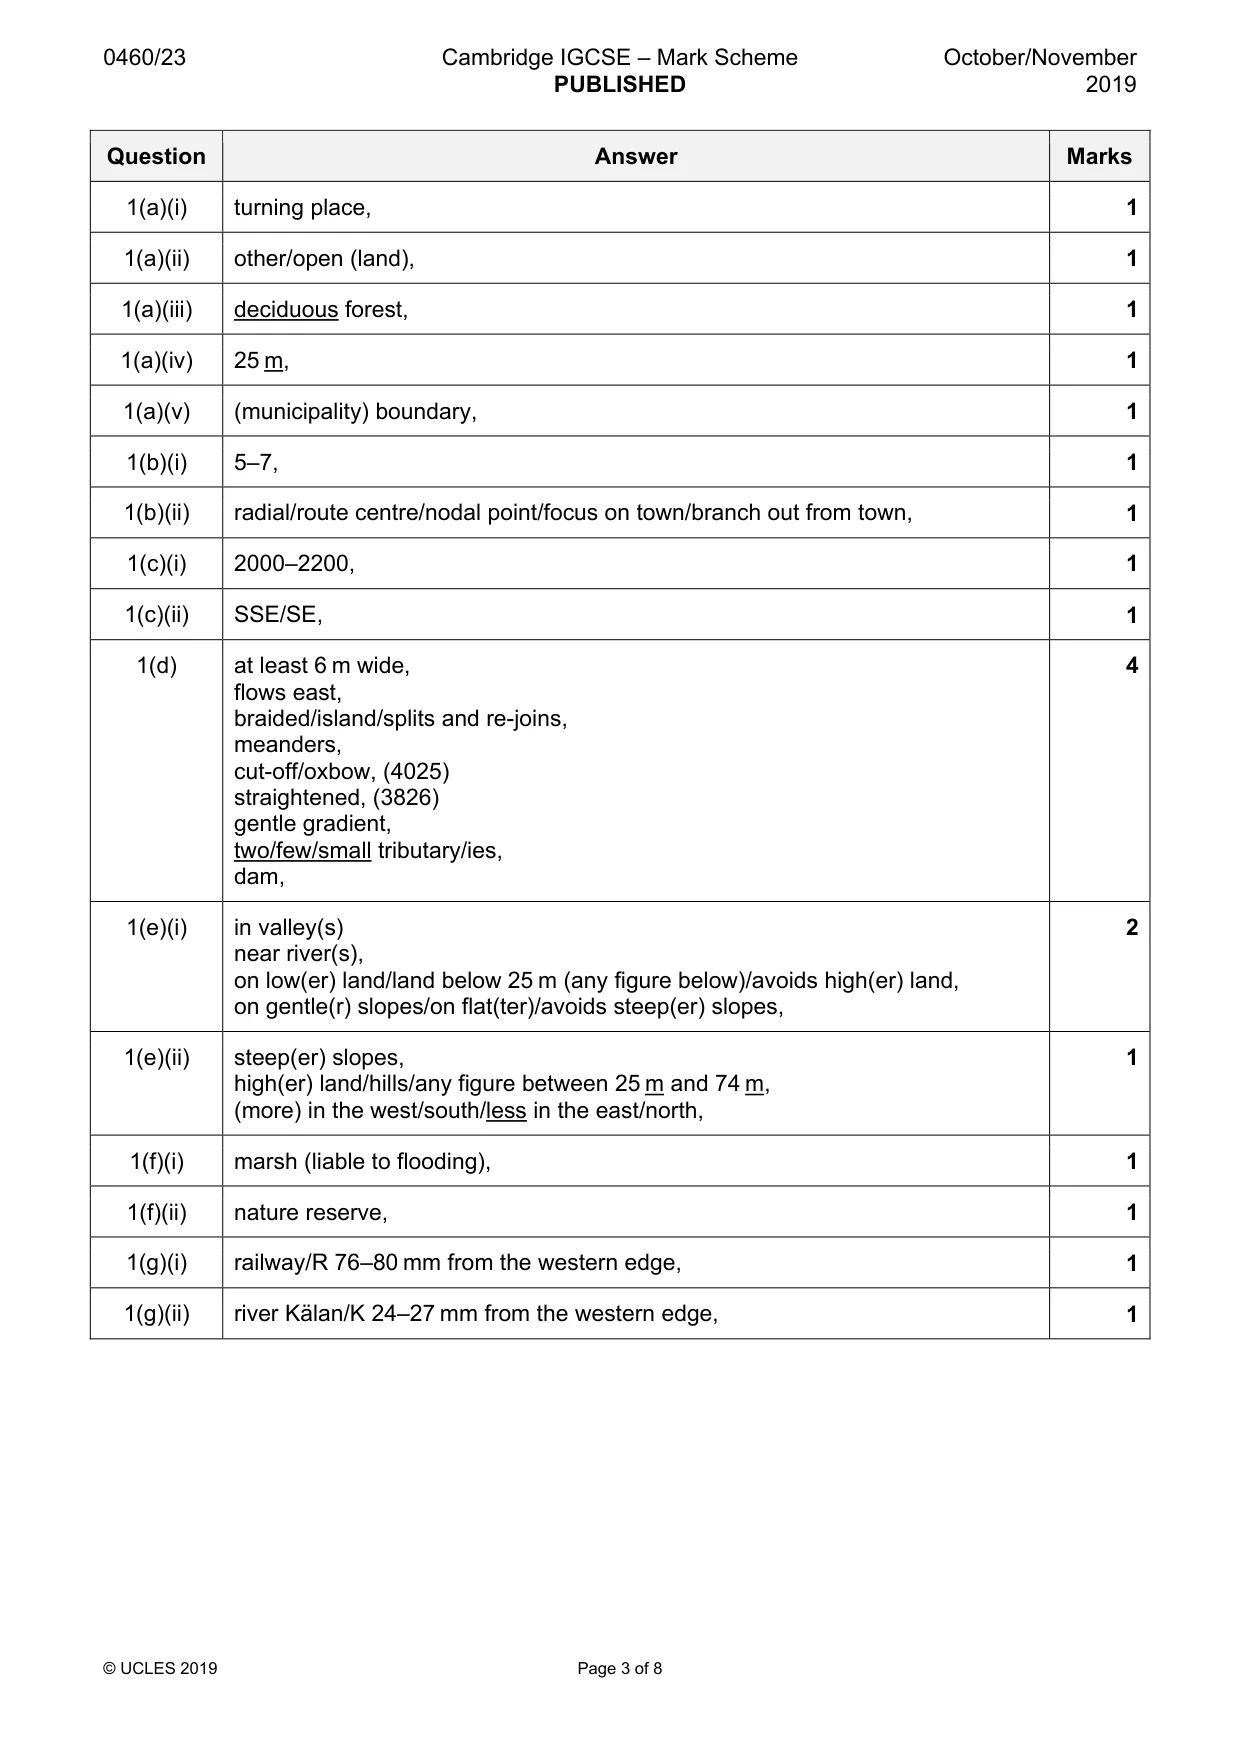
Mark scheme: Question Answer Marks 1(a)(i) turning place, 1 1(a)(ii) other/open (land), 1 1(a)(iii) deciduous forest, 1 1(a)(iv) 25 m, 1 1(a)(v) (municipality) boundary, 1 1(b)(i) 5–7, 1 1(b)(ii) radial/route centre/nodal point/focus on town/branch out from town, 1 1(c)(i) 2000–2200, 1 1(c)(ii) SSE/SE, 1 1(d) at least 6 m wide, 4 flows east, braided/island/splits and re-joins, meanders, cut-off/oxbow, (4025) straightened, (3826) gentle gradient, two/few/small tributary/ies, dam, 1(e)(i) in valley(s) 2 near river(s), on low(er) land/land below 25 m (any figure below)/avoids high(er) land, on gentle(r) slopes/on flat(ter)/avoids steep(er) slopes, 1(e)(ii) steep(er) slopes, 1 high(er) land/hills/any figure between 25 m and 74 m, (more) in the west/south/less in the east/north, 1(f)(i) marsh (liable to flooding), 1 1(f)(ii) nature reserve, 1 1(g)(i) railway/R 76–80 mm from the western edge, 1 1(g)(ii) river Kälan/K 24–27 mm from the western edge, 1
Question 2
2 Fig. 2.1 (Insert) shows population density in Chile in South America. Fig. 2.2 (Insert) shows some influences on population density. Use the information on Figs. 2.1 and 2.2 only to answer the following questions. (a) (i) What is the population density of region 6? ........................... people per square kilometre [1] (ii) In which part of Chile is the region with the highest population density? Circle the correct answer below. centre east north south west [1] (iii) Explain why population density is low in region 2. ........................................................................................................................................... ........................................................................................................................................... ........................................................................................................................................... ........................................................................................................................................... ........................................................................................................................................... ..................................................................................................................................... [3] (iv) Suggest possible difficulties of living in region 8. ........................................................................................................................................... ........................................................................................................................................... ........................................................................................................................................... ..................................................................................................................................... [2] (b) State one advantage of the position of Santiago as the capital of Chile. ................................................................................................................................................... ............................................................................................................................................. [1] [Total: 8]
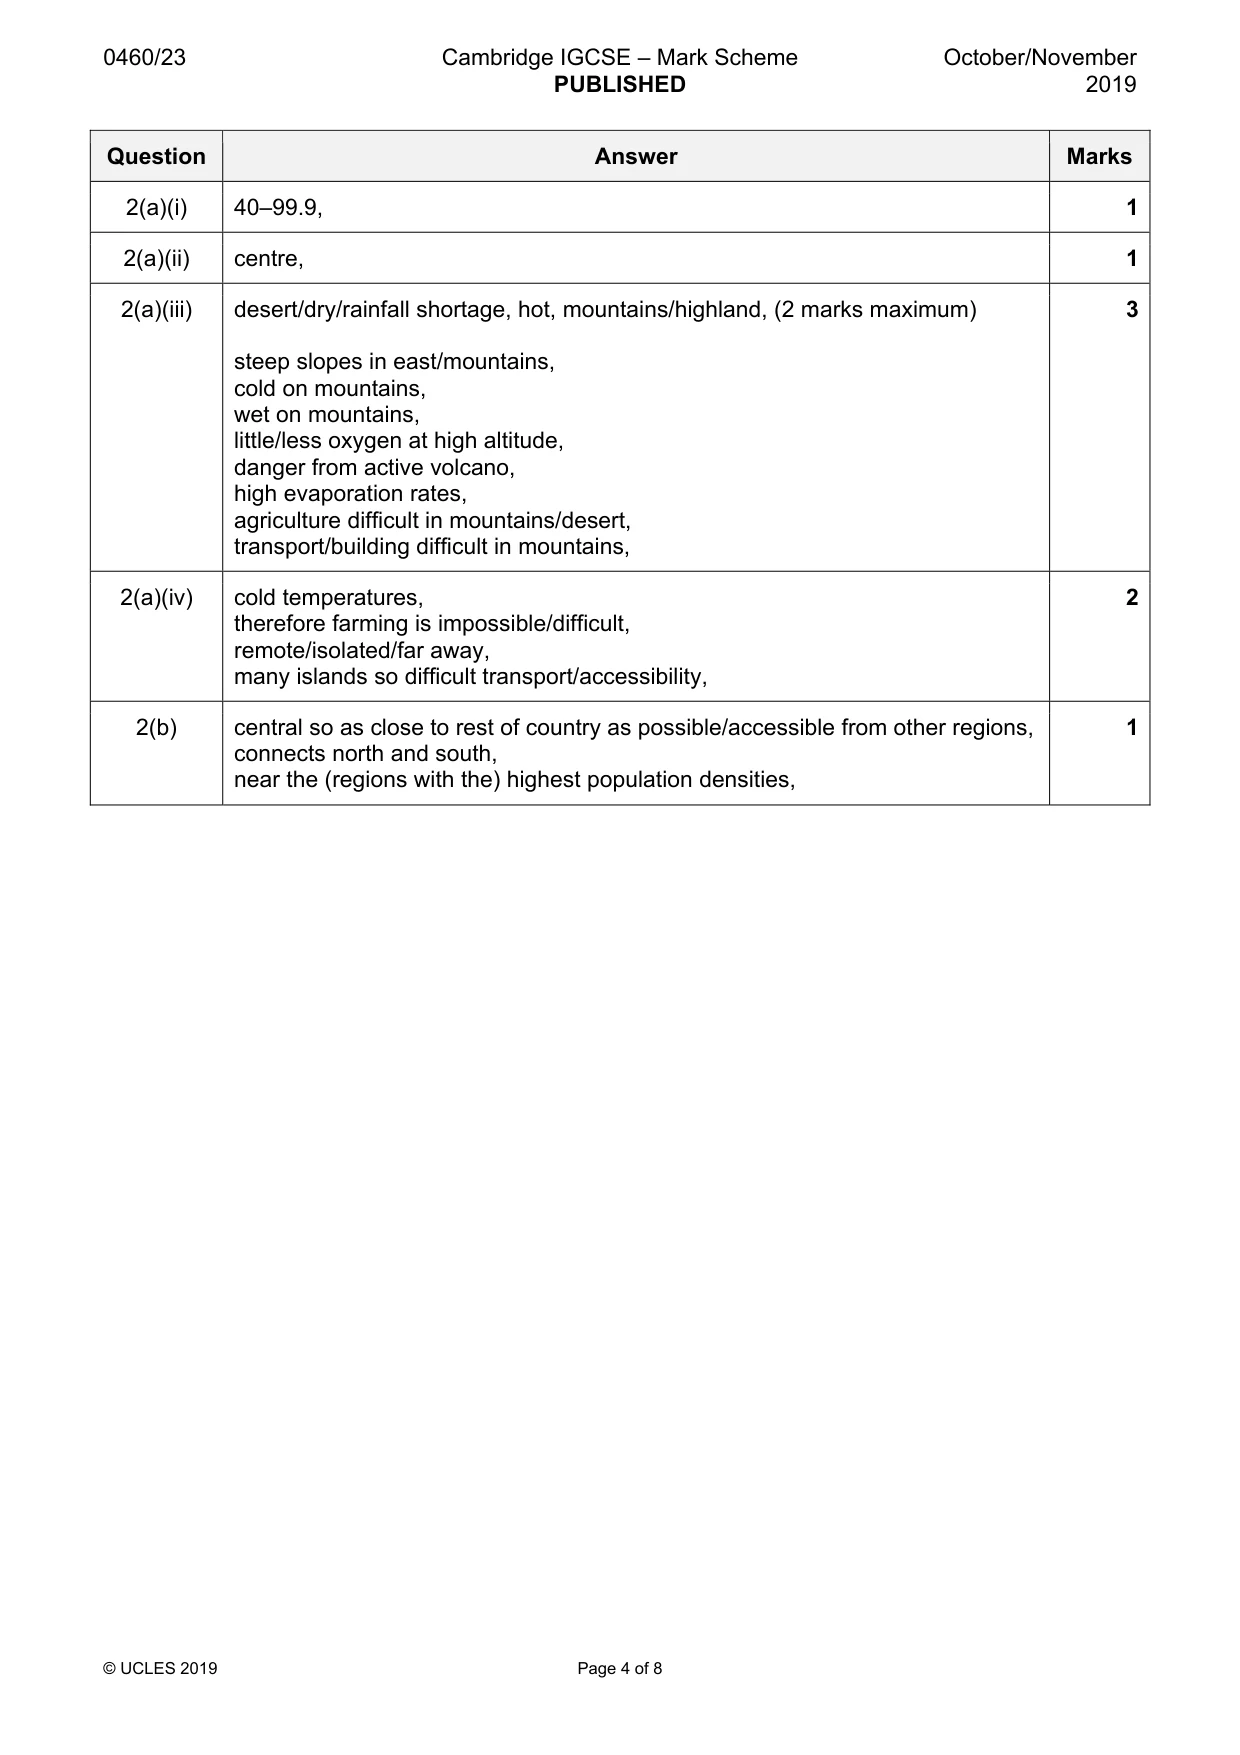
Mark scheme: 2(a)(i) 40–99.9, 1 2(a)(ii) centre, 1 2(a)(iii) desert/dry/rainfall shortage, hot, mountains/highland, (2 marks maximum) 3 steep slopes in east/mountains, cold on mountains, wet on mountains, little/less oxygen at high altitude, danger from active volcano, high evaporation rates, agriculture difficult in mountains/desert, transport/building difficult in mountains, 2(a)(iv) cold temperatures, 2 therefore farming is impossible/difficult, remote/isolated/far away, many islands so difficult transport/accessibility, 2(b) central so as close to rest of country as possible/accessible from other regions, 1 connects north and south, near the (regions with the) highest population densities,
Question 3
3 Study Figs. 3.1 and 3.2 (Insert), which are photographs showing different methods of coastal protection. (a) (i) Describe the beach material in Fig. 3.1. ........................................................................................................................................... ..................................................................................................................................... [1] (ii) Describe the evidence in Fig. 3.1 that the wooden structure is reducing longshore drift. ........................................................................................................................................... ..................................................................................................................................... [1] (b) Fig. 3.2 shows two other methods of coastal protection, F and G. (i) Describe the structures F and G. F ......................................................................................................................................... ........................................................................................................................................... G ........................................................................................................................................ ..................................................................................................................................... [2] (ii) Explain how structure G protects the coast. ........................................................................................................................................... ........................................................................................................................................... ........................................................................................................................................... ..................................................................................................................................... [2] (iii) Some people think that the coastal protection methods seen in Fig. 3.2 should not have been built. Explain why people might be opposed to this coastal protection scheme. ........................................................................................................................................... ........................................................................................................................................... ........................................................................................................................................... ..................................................................................................................................... [2] [Total: 8]
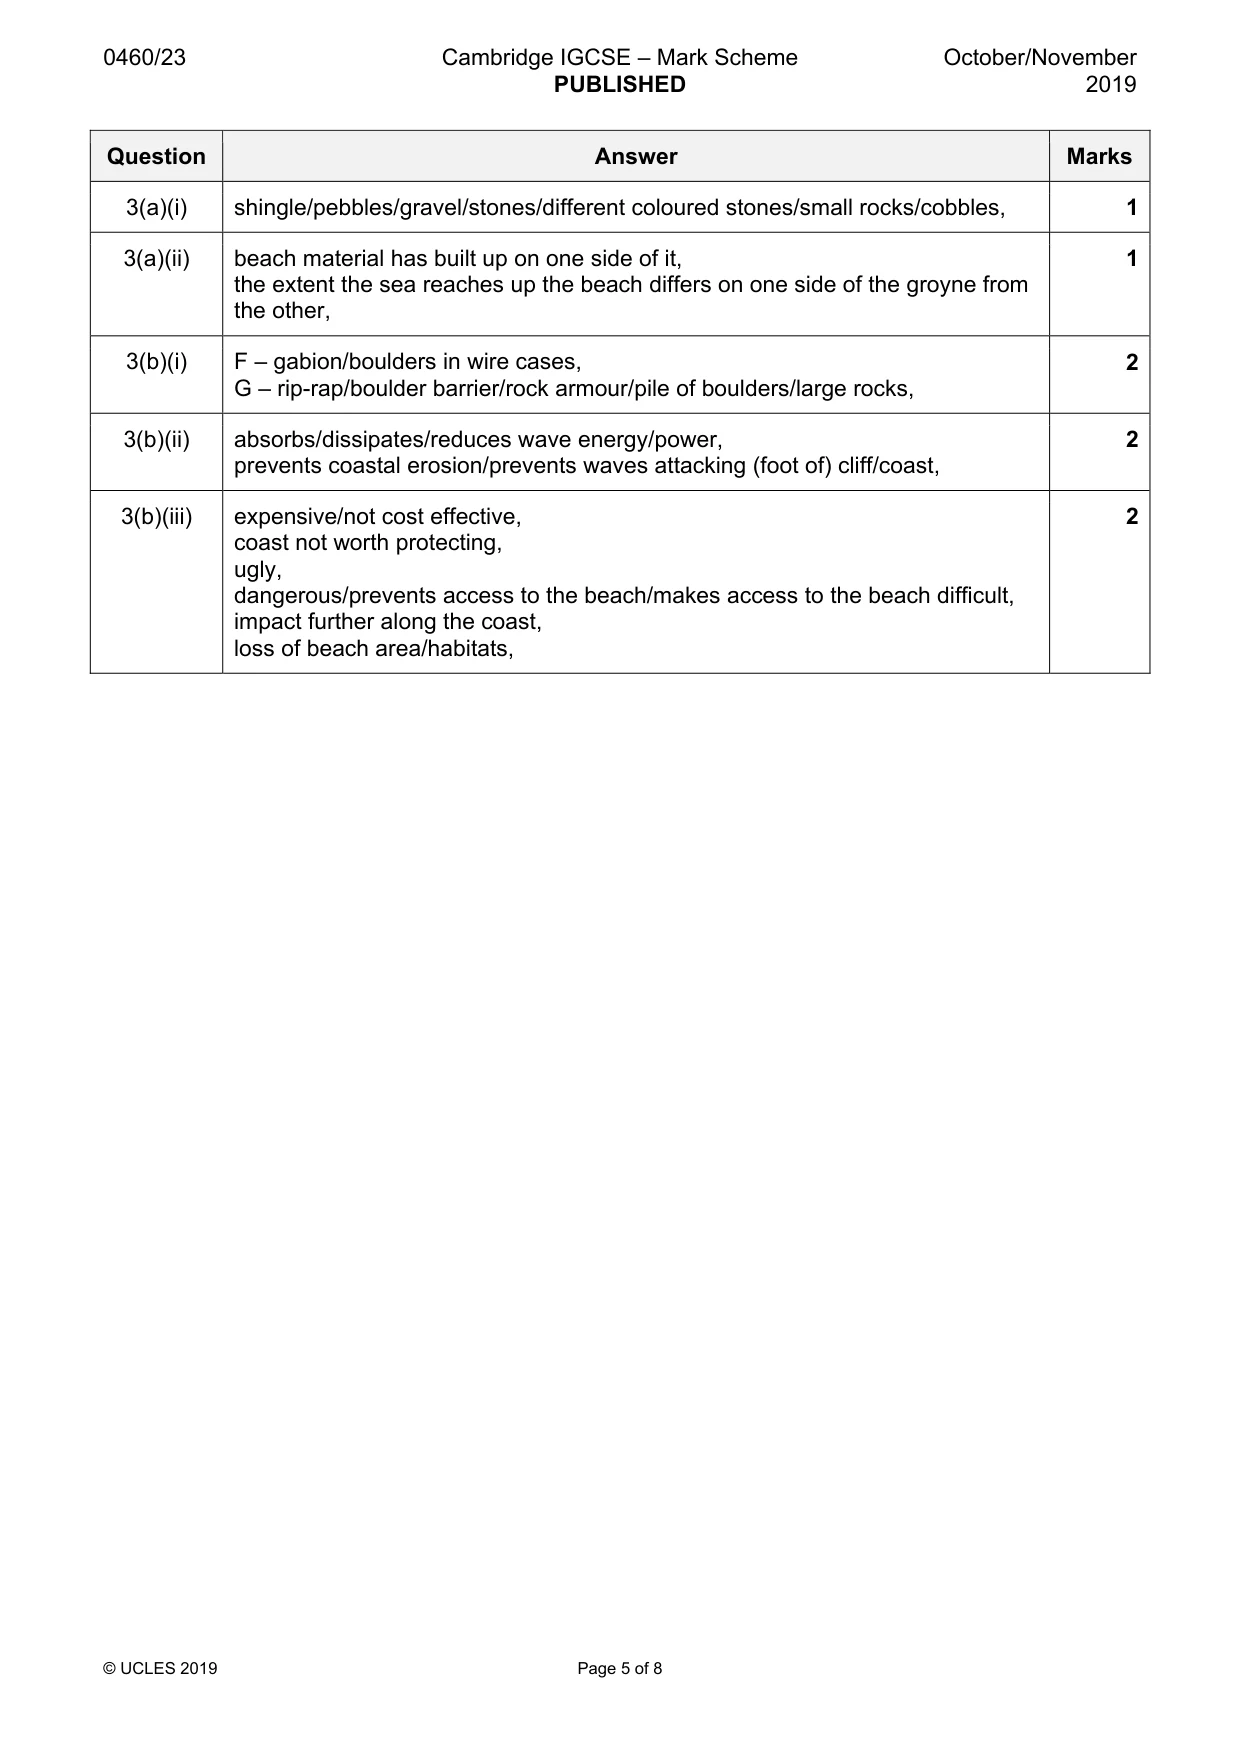
Mark scheme: 3(a)(i) shingle/pebbles/gravel/stones/different coloured stones/small rocks/cobbles, 1 3(a)(ii) beach material has built up on one side of it, 1 the extent the sea reaches up the beach differs on one side of the groyne from the other, 3(b)(i) F – gabion/boulders in wire cases, 2 G – rip-rap/boulder barrier/rock armour/pile of boulders/large rocks, 3(b)(ii) absorbs/dissipates/reduces wave energy/power, 2 prevents coastal erosion/prevents waves attacking (foot of) cliff/coast, 3(b)(iii) expensive/not cost effective, 2 coast not worth protecting, ugly, dangerous/prevents access to the beach/makes access to the beach difficult, impact further along the coast, loss of beach area/habitats,
Question 4
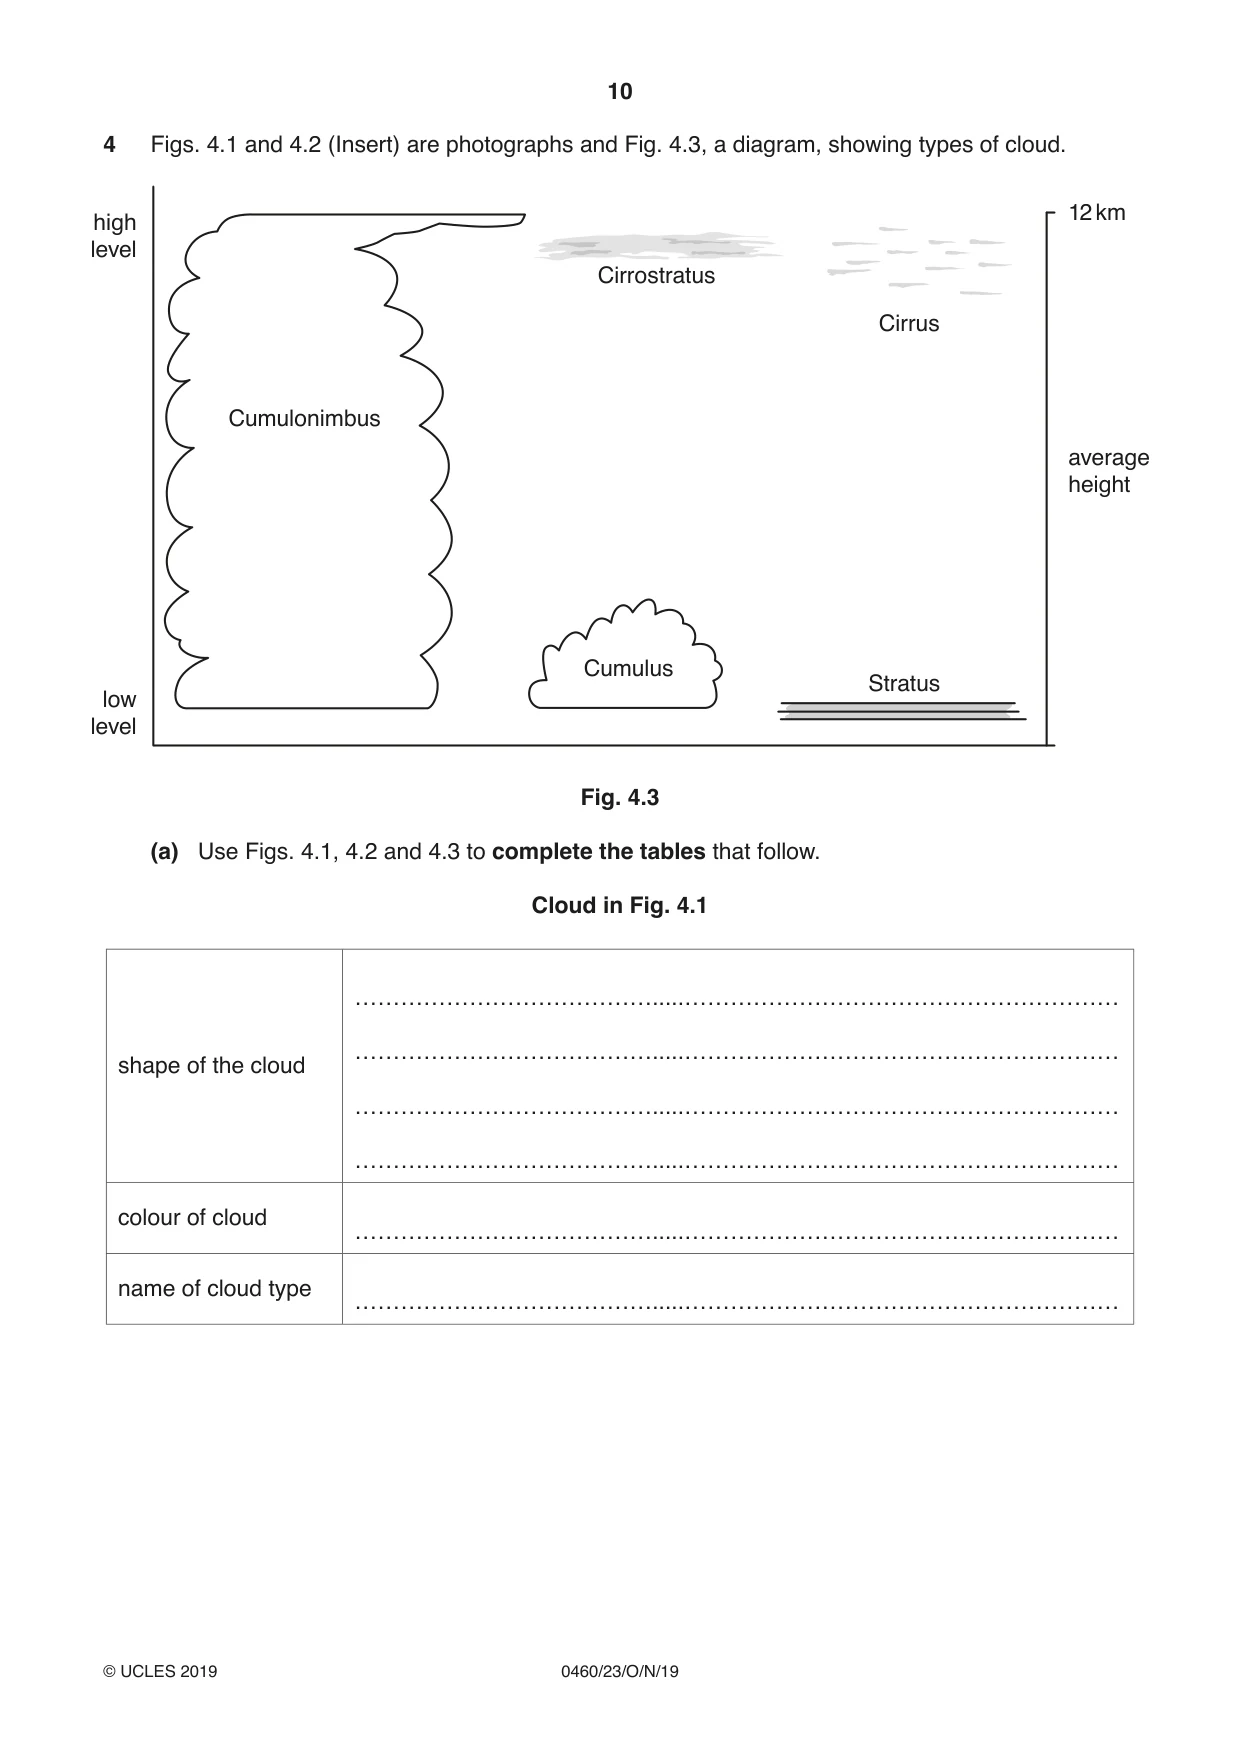
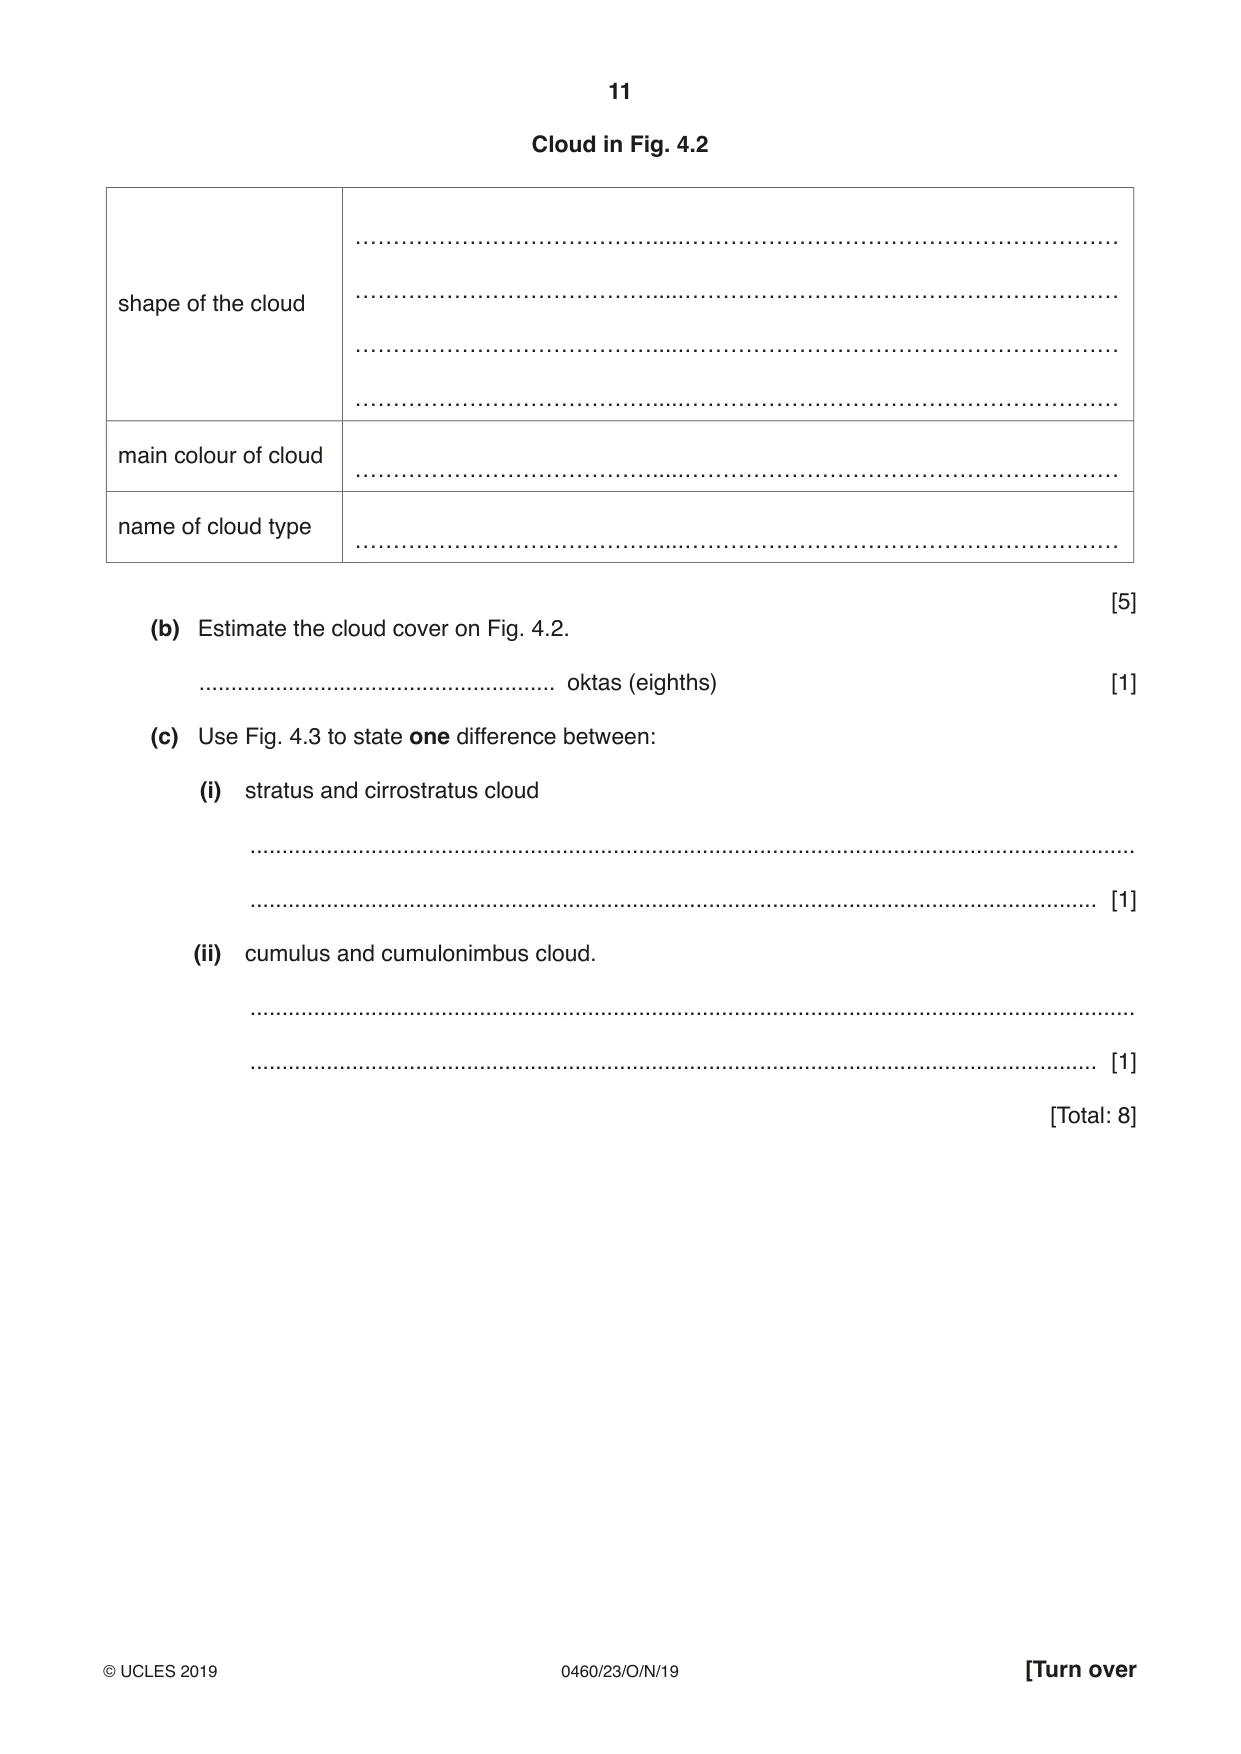
4 Figs. 4.1 and 4.2 (Insert) are photographs and Fig. 4.3, a diagram, showing types of cloud. 12 kmhigh level Cirrostratus Cirrus Cumulonimbus average height Cumulus Stratus low level Fig. 4.3 (a) Use Figs. 4.1, 4.2 and 4.3 to complete the tables that follow. Cloud in Fig. 4.1 shape of the cloud colour of cloud name of cloud type shape of the cloud main colour of cloud name of cloud type [5] (b) Estimate the cloud cover on Fig. 4.2. ........................................................ oktas (eighths) [1] (c) Use Fig. 4.3 to state one difference between: (i) stratus and cirrostratus cloud ........................................................................................................................................... ..................................................................................................................................... [1] (ii) cumulus and cumulonimbus cloud. ........................................................................................................................................... ..................................................................................................................................... [1] [Total: 8]
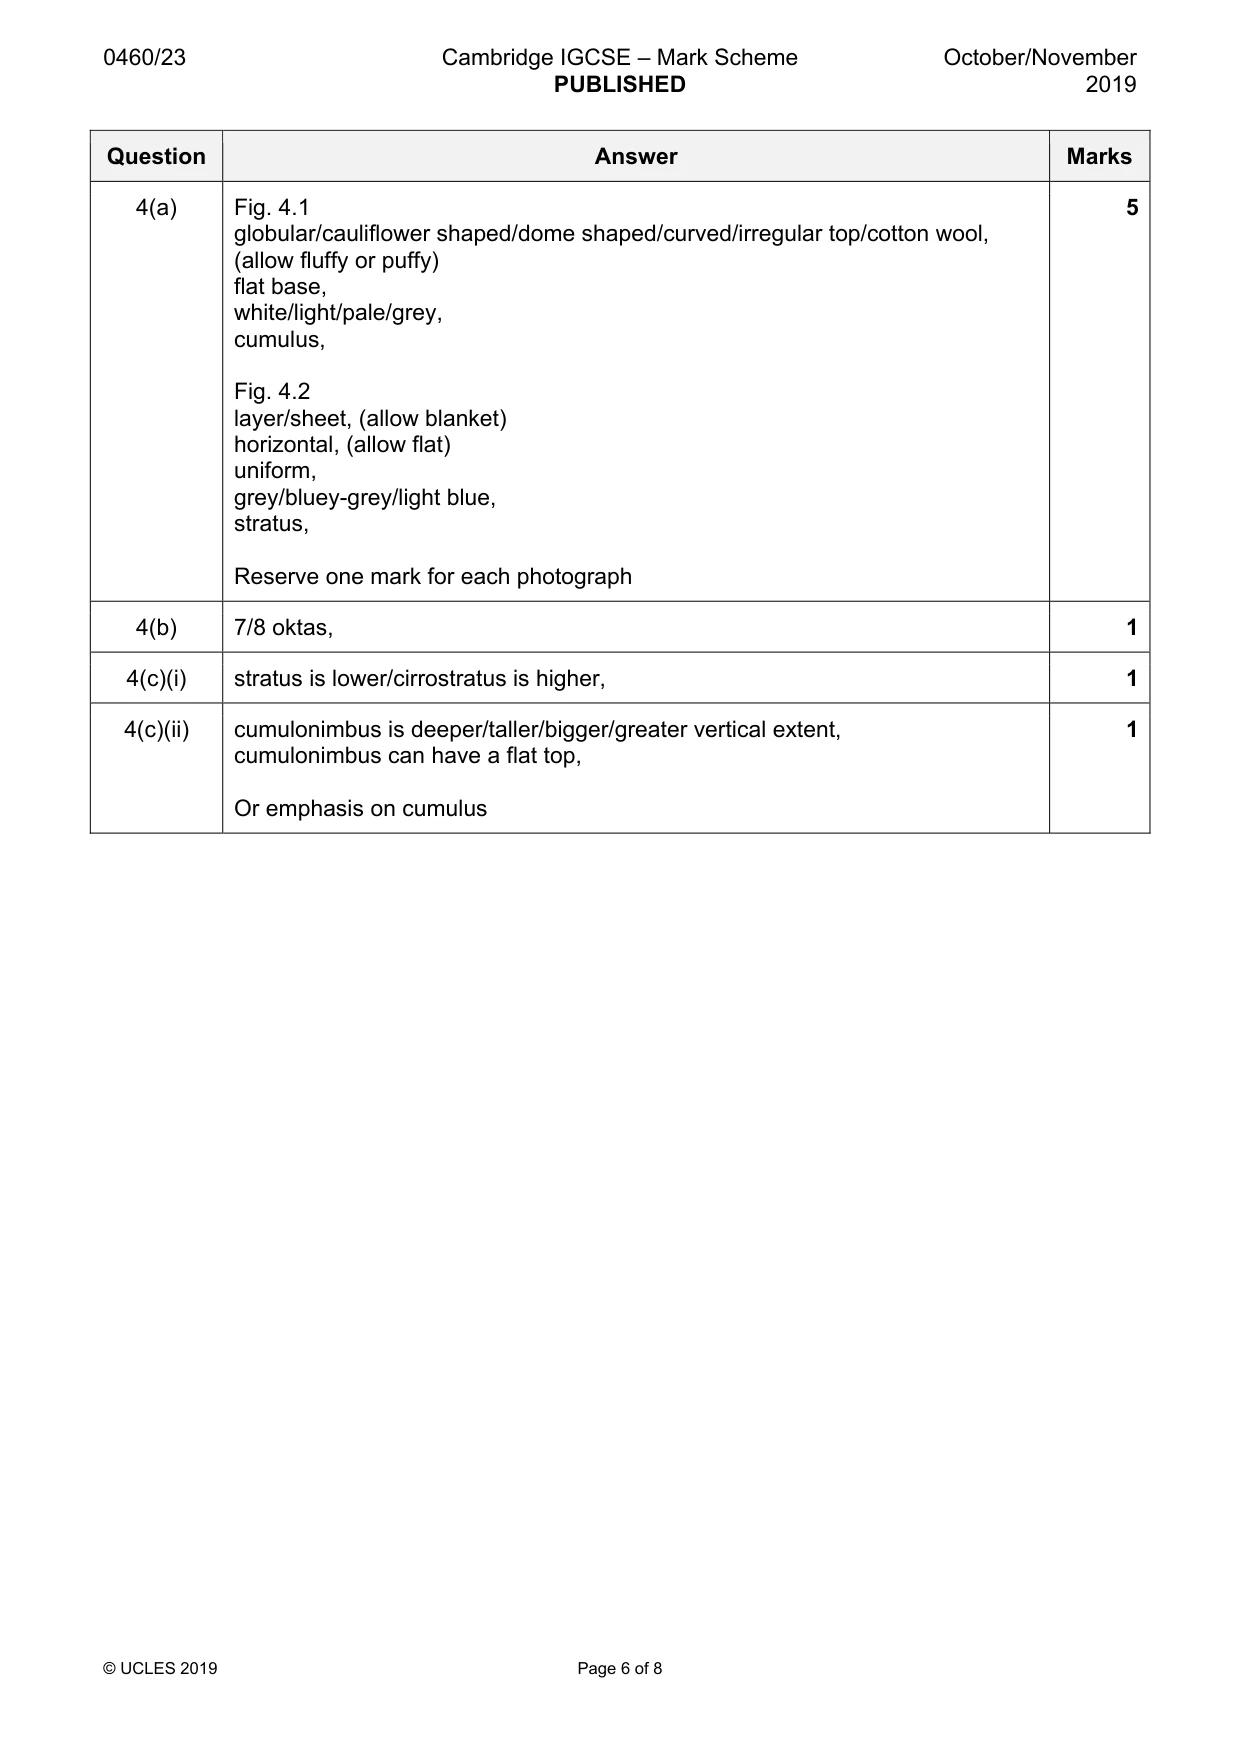
Mark scheme: 4(a) Fig. 4.1 5 globular/cauliflower shaped/dome shaped/curved/irregular top/cotton wool, (allow fluffy or puffy) flat base, white/light/pale/grey, cumulus, Fig. 4.2 layer/sheet, (allow blanket) horizontal, (allow flat) uniform, grey/bluey-grey/light blue, stratus, Reserve one mark for each photograph 4(b) 7/8 oktas, 1 4(c)(i) stratus is lower/cirrostratus is higher, 1 4(c)(ii) cumulonimbus is deeper/taller/bigger/greater vertical extent, 1 cumulonimbus can have a flat top, Or emphasis on cumulus
Q5 · The two stages in the production of aluminium from bauxite
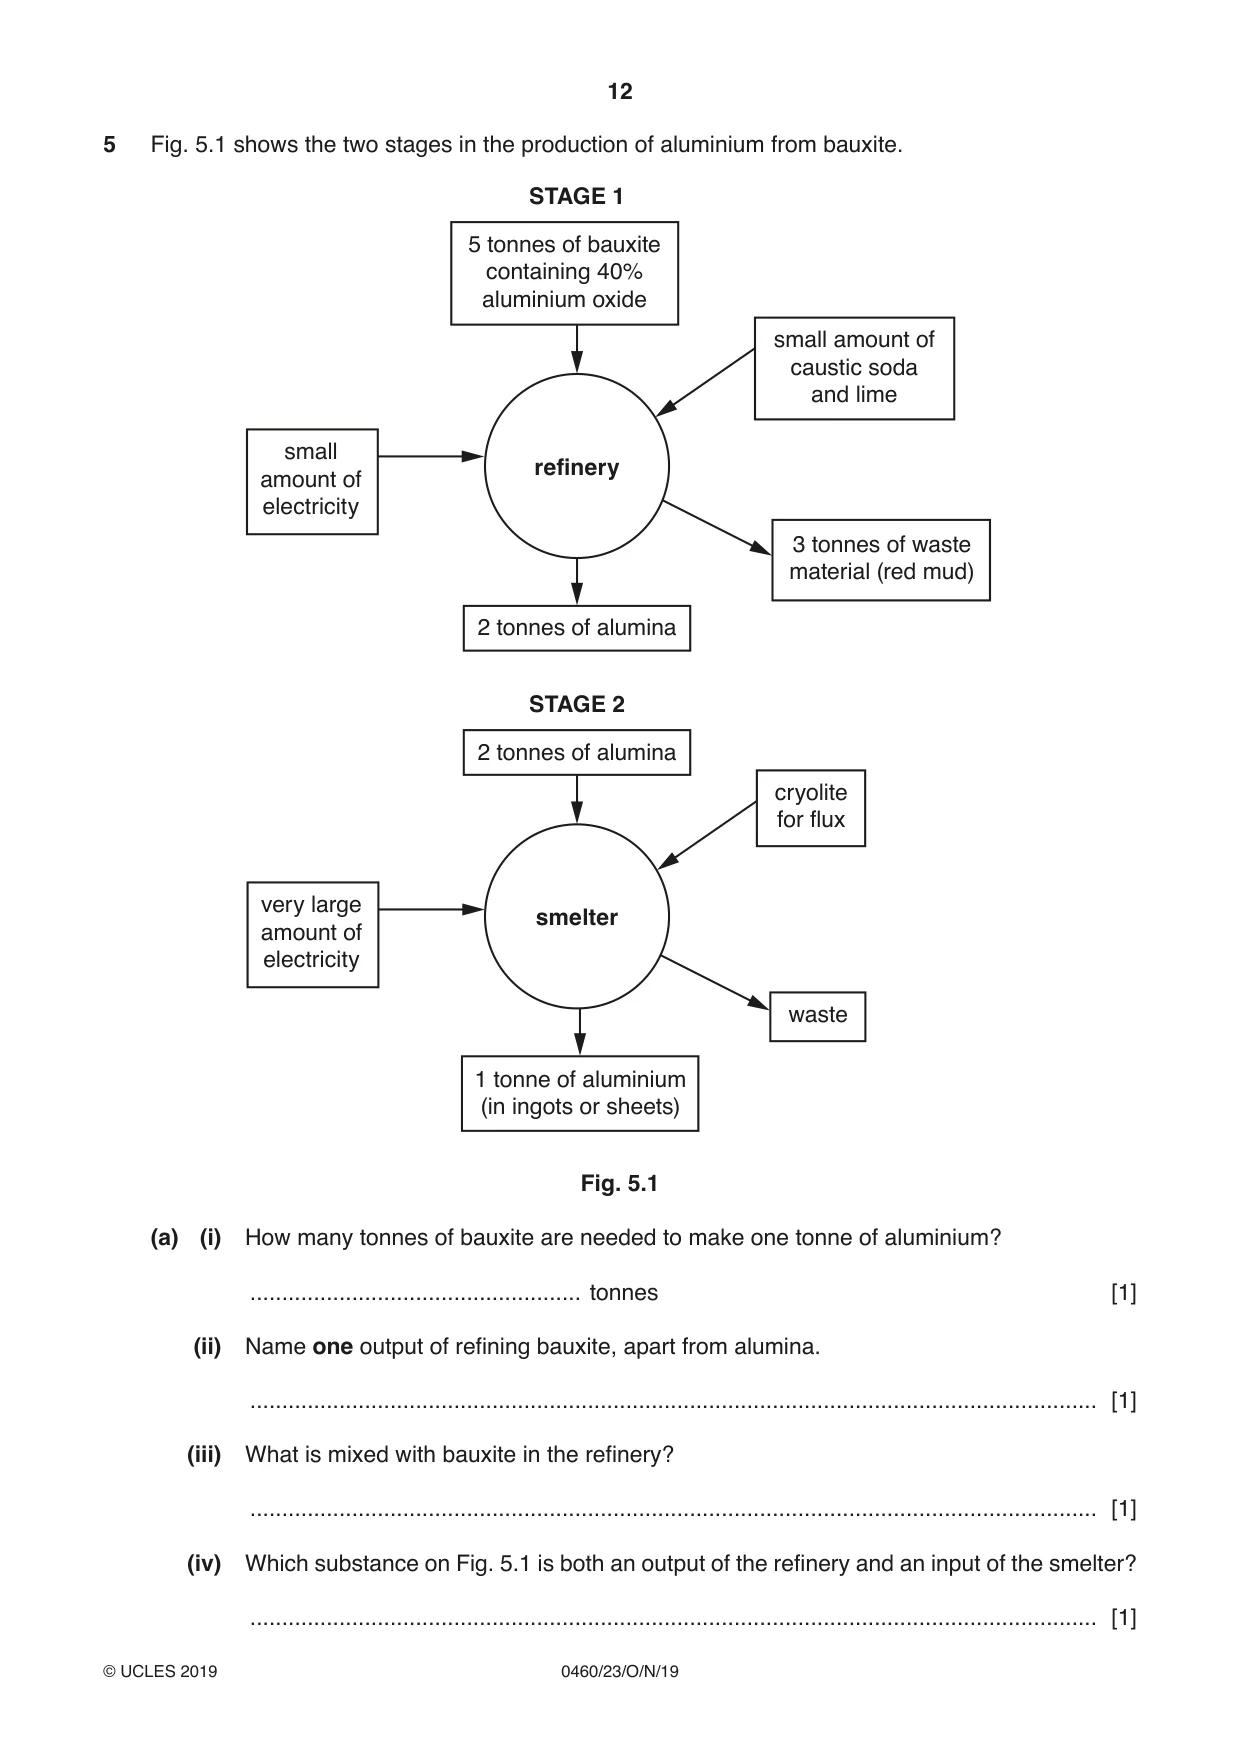
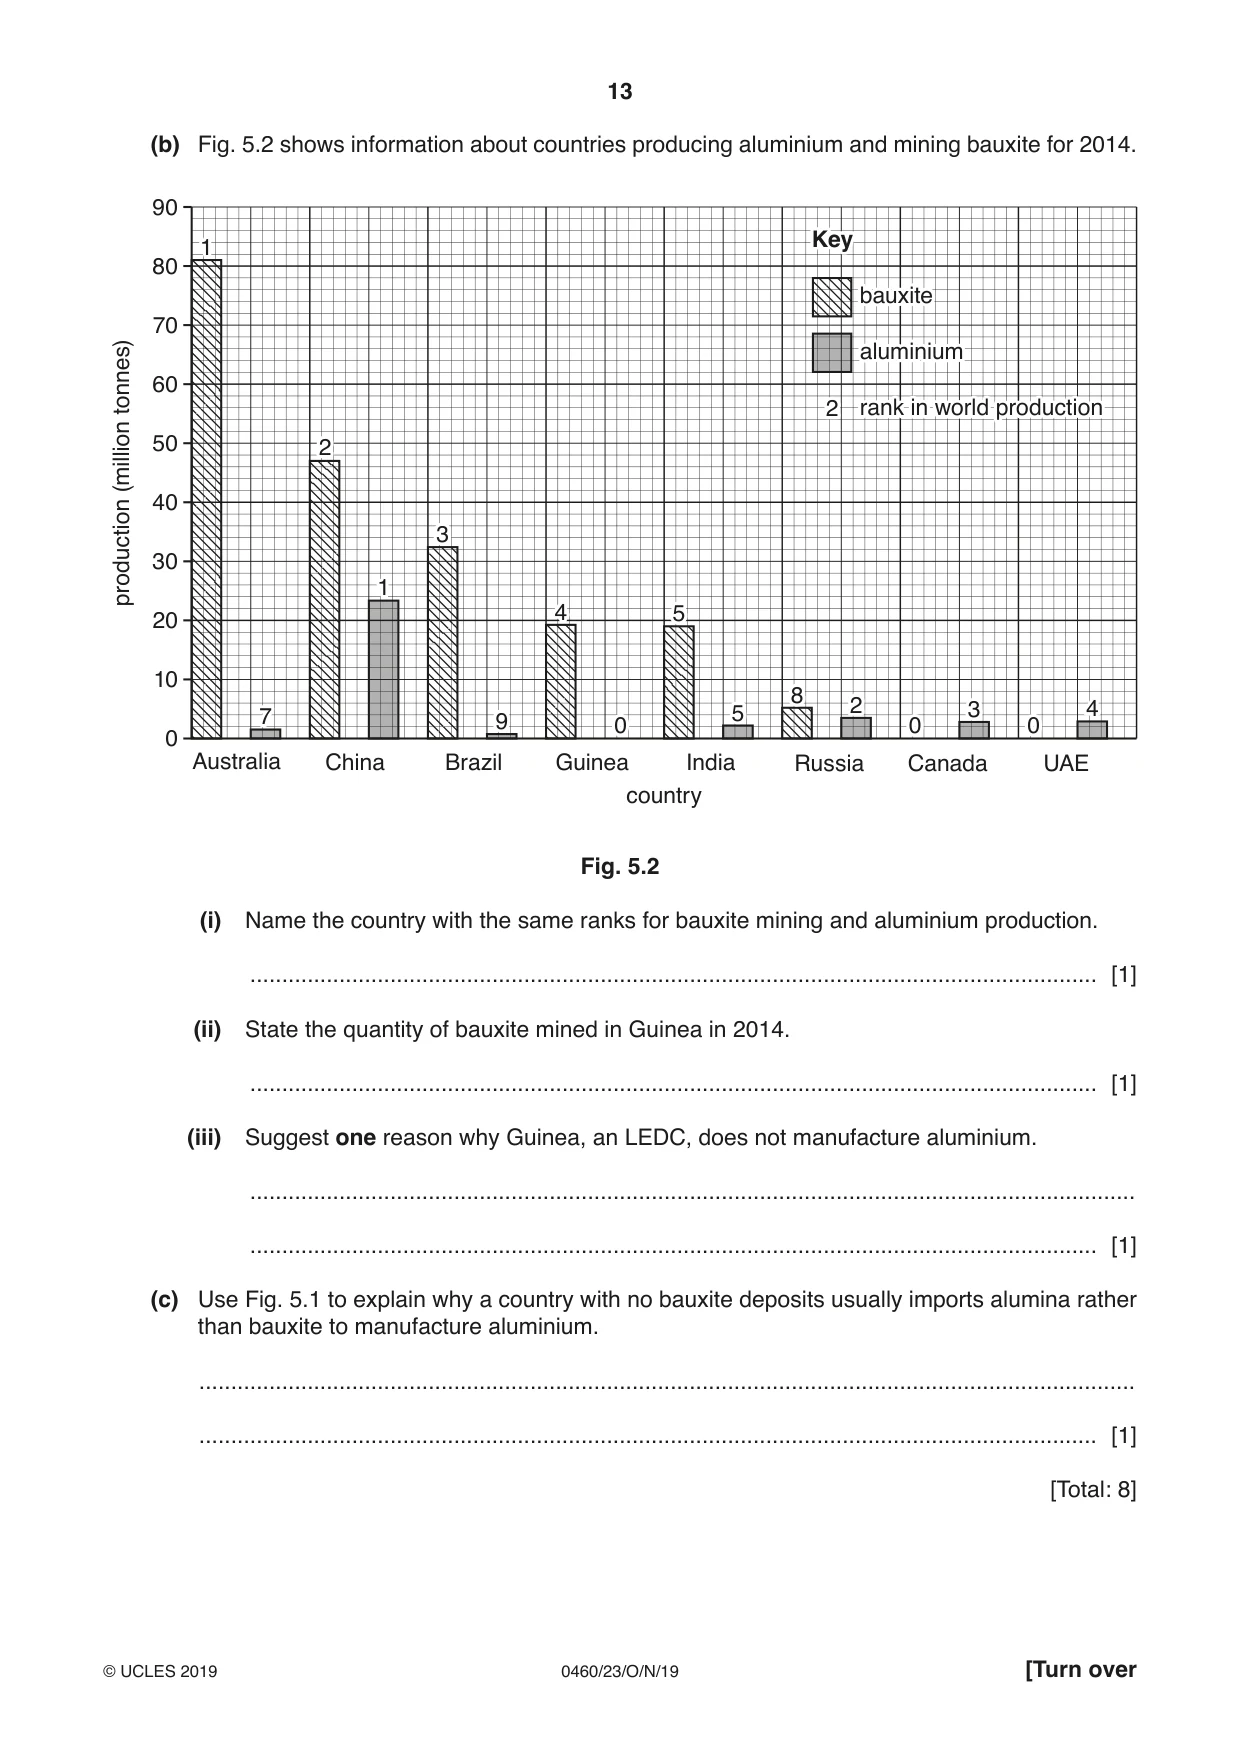
5 Fig. 5.1 shows the two stages in the production of aluminium from bauxite. STAGE 1 5 tonnes of bauxite containing 40% aluminium oxide small amount of caustic soda and lime small refinery amount of electricity 3 tonnes of waste material (red mud) 2 tonnes of alumina STAGE 2 2 tonnes of alumina cryolite for flux very large smelter amount of electricity waste 1 tonne of aluminium (in ingots or sheets) Fig. 5.1 (a) (i) How many tonnes of bauxite are needed to make one tonne of aluminium? .................................................... tonnes [1] (ii) Name one output of refining bauxite, apart from alumina. ..................................................................................................................................... [1] (iii) What is mixed with bauxite in the refinery? ..................................................................................................................................... [1] (iv) Which substance on Fig. 5.1 is both an output of the refinery and an input of the smelter? ..................................................................................................................................... [1] (b) Fig. 5.2 shows information about countries producing aluminium and mining bauxite for 2014. 90 Key 1 80 bauxite 70 aluminium 60tonnes) 2 rank in world production 2(million 50 40 3 30production 1 4 5 20 10 8 2 4 3 7 9 0 5 0 0 0 Australia China Brazil Guinea India Russia Canada UAE country Fig. 5.2 (i) Name the country with the same ranks for bauxite mining and aluminium production. ..................................................................................................................................... [1] (ii) State the quantity of bauxite mined in Guinea in 2014. ..................................................................................................................................... [1] (iii) Suggest one reason why Guinea, an LEDC, does not manufacture aluminium. ........................................................................................................................................... ..................................................................................................................................... [1] (c) Use Fig. 5.1 to explain why a country with no bauxite deposits usually imports alumina rather than bauxite to manufacture aluminium. ................................................................................................................................................... ............................................................................................................................................. [1] [Total: 8]
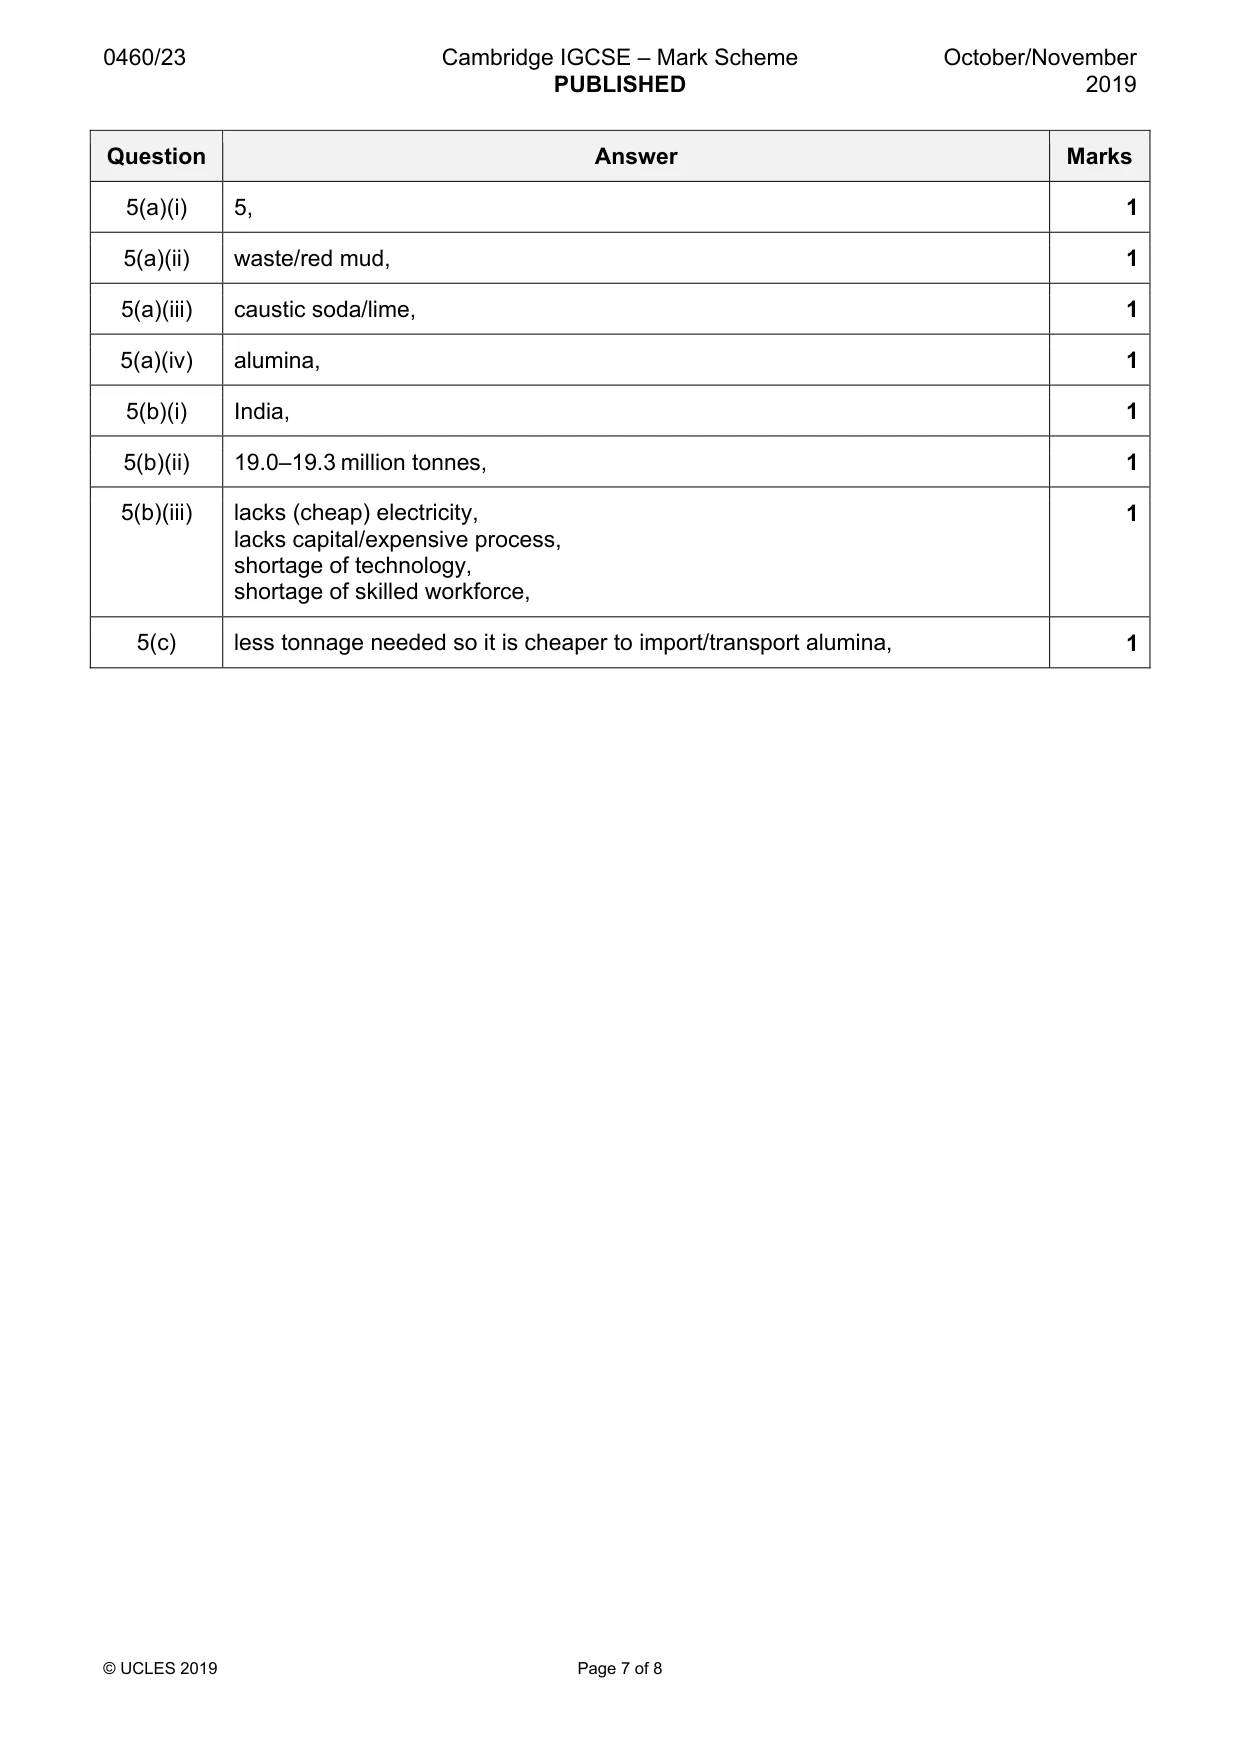
Mark scheme: 5(a)(i) 5, 1 5(a)(ii) waste/red mud, 1 5(a)(iii) caustic soda/lime, 1 5(a)(iv) alumina, 1 5(b)(i) India, 1 5(b)(ii) 19.0–19.3 million tonnes, 1 5(b)(iii) lacks (cheap) electricity, 1 lacks capital/expensive process, shortage of technology, shortage of skilled workforce, 5(c) less tonnage needed so it is cheaper to import/transport alumina, 1
Q6 · Sources of water used in Egypt
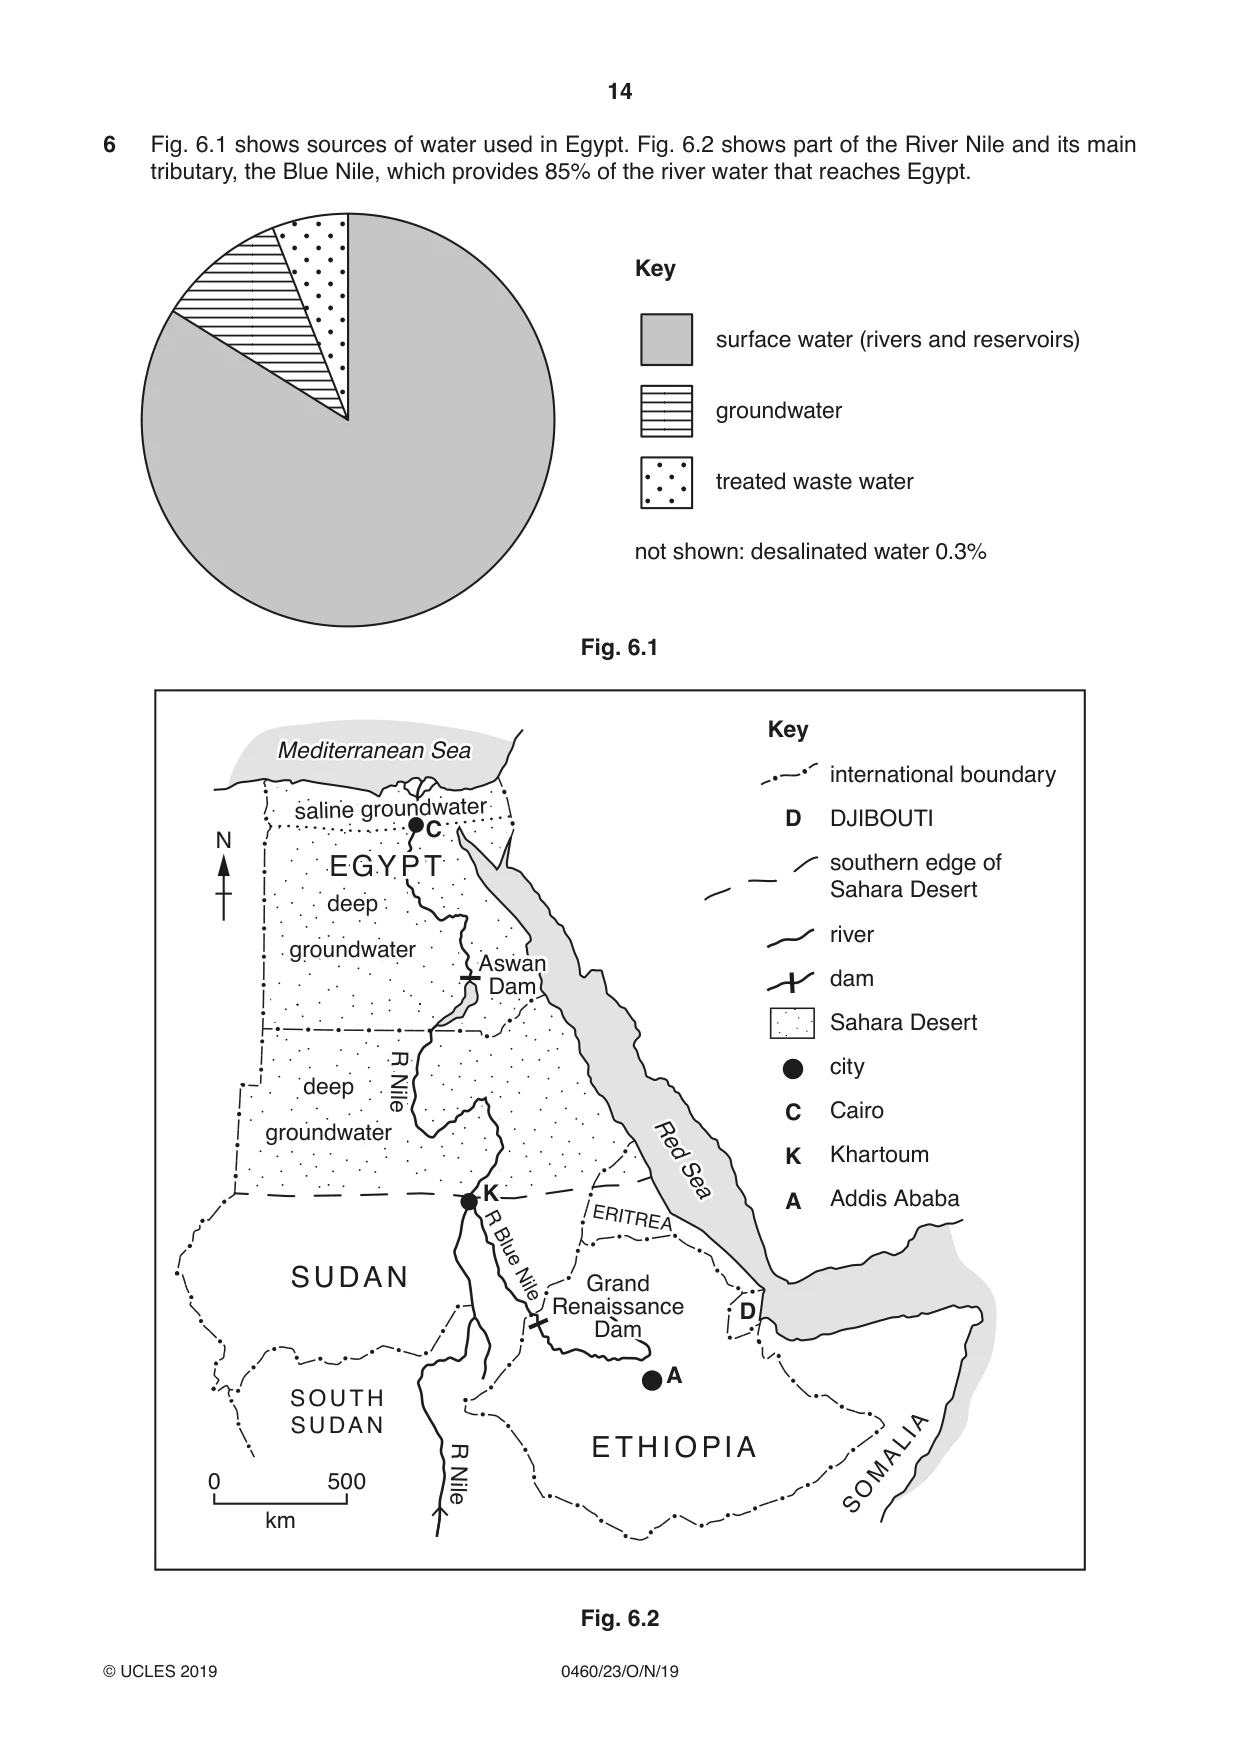
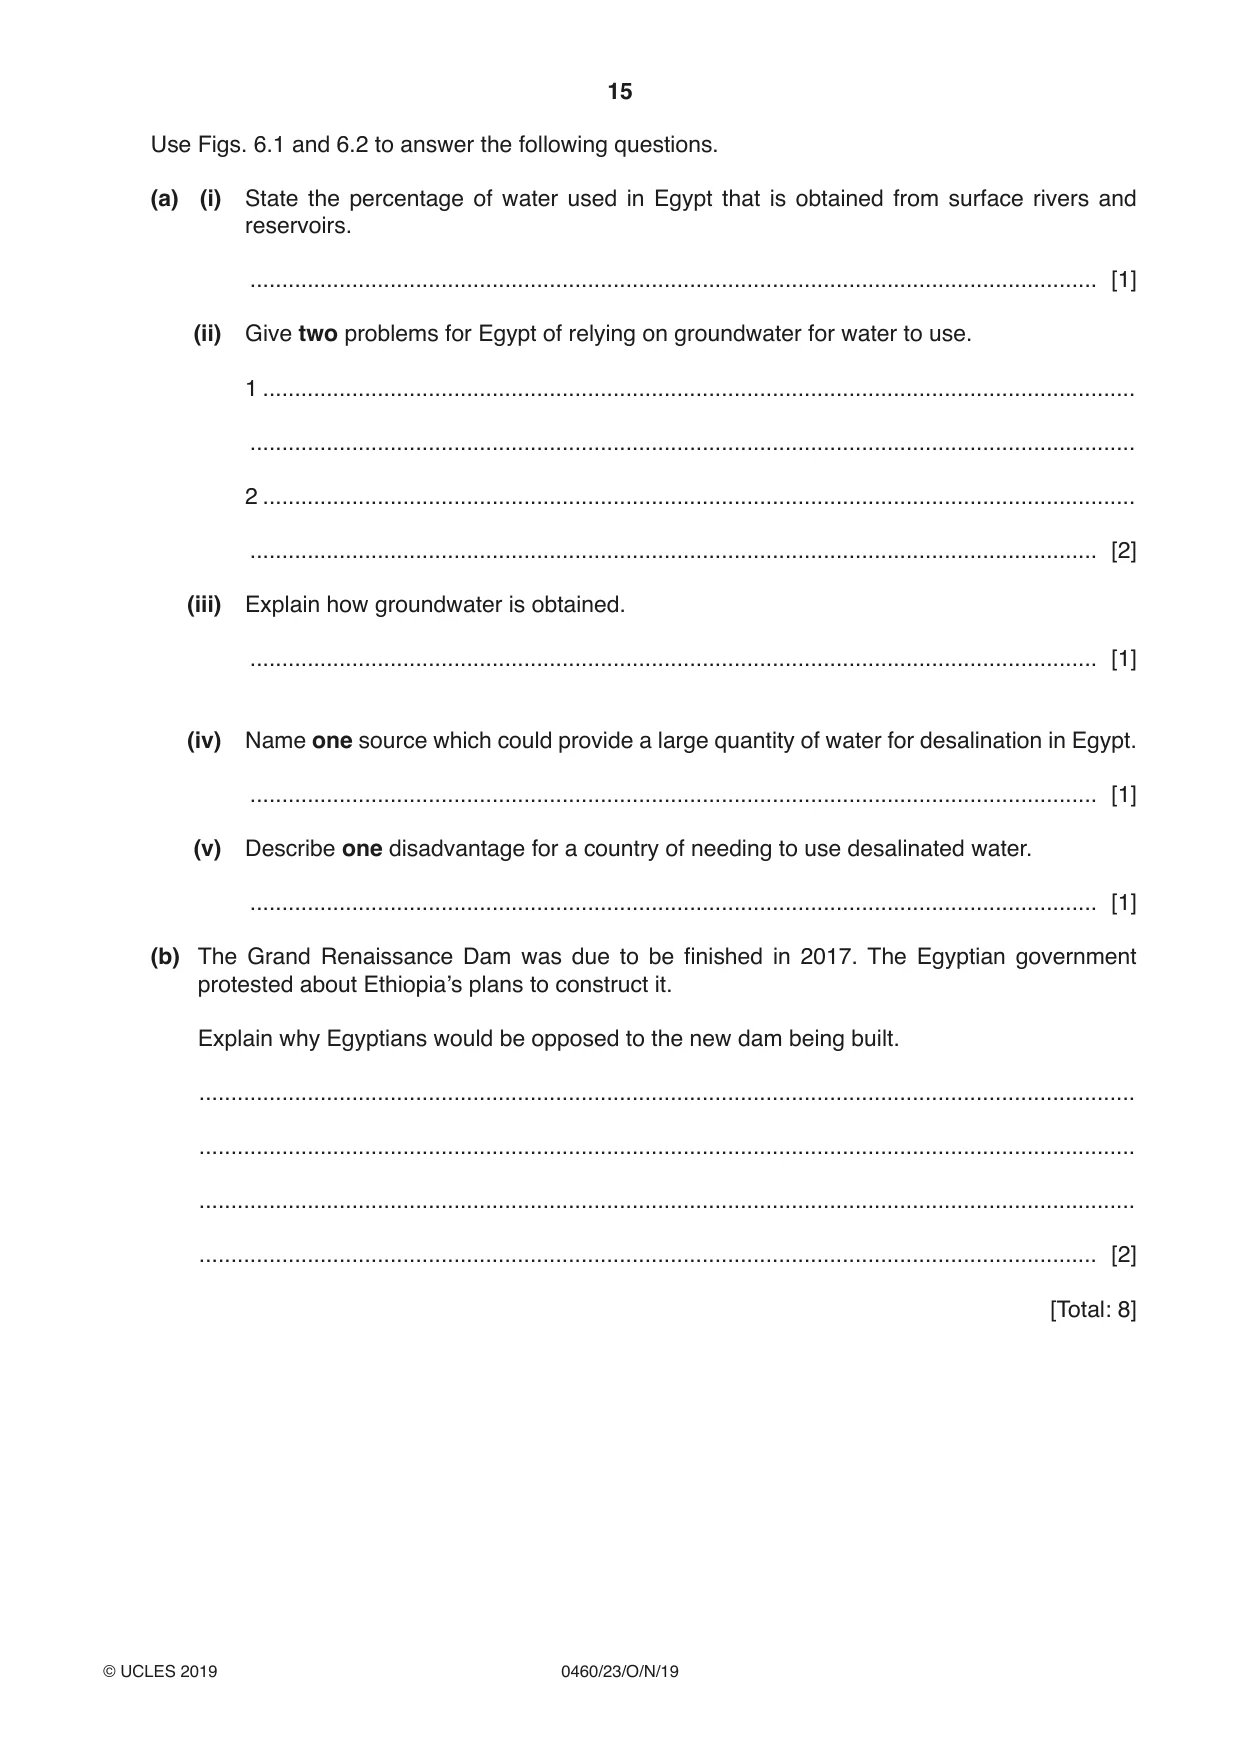
6 Fig. 6.1 shows sources of water used in Egypt. Fig. 6.2 shows part of the River Nile and its main tributary, the Blue Nile, which provides 85% of the river water that reaches Egypt. Key surface water (rivers and reservoirs) groundwater treated waste water not shown: desalinated water 0.3% Fig. 6.1 Key Mediterranean Sea international boundary saline groundwater D DJIBOUTI C N EGYPT southern edge of Sahara Desert deep river groundwater Aswan dam Dam Sahara Desert R city deep Nile C Cairo groundwater Red K Khartoum K Sea A Addis Ababa R ERITREA Blue SUDAN Nile Grand Renaissance D Dam A SOUTH SUDA N R ETHIOPIA ALIA M 0 500 Nile SO km Fig. 6.2 Use Figs. 6.1 and 6.2 to answer the following questions. (a) (i) State the percentage of water used in Egypt that is obtained from surface rivers and reservoirs. ..................................................................................................................................... [1] (ii) Give two problems for Egypt of relying on groundwater for water to use. 1 ......................................................................................................................................... ........................................................................................................................................... 2 ......................................................................................................................................... ..................................................................................................................................... [2] (iii) Explain how groundwater is obtained. ..................................................................................................................................... [1] (iv) Name one source which could provide a large quantity of water for desalination in Egypt. ..................................................................................................................................... [1] (v) Describe one disadvantage for a country of needing to use desalinated water. ..................................................................................................................................... [1] (b) The Grand Renaissance Dam was due to be finished in 2017. The Egyptian government protested about Ethiopia’s plans to construct it. Explain why Egyptians would be opposed to the new dam being built. ................................................................................................................................................... ................................................................................................................................................... ................................................................................................................................................... ............................................................................................................................................. [2] [Total: 8] Additional Pages If you use the following lined pages to complete the answer(s) to any question(s), the question number(s) must be clearly shown. .................................................................................................................................................................. .................................................................................................................................................................. .................................................................................................................................................................. .................................................................................................................................................................. .................................................................................................................................................................. .................................................................................................................................................................. .................................................................................................................................................................. .................................................................................................................................................................. .................................................................................................................................................................. .................................................................................................................................................................. .................................................................................................................................................................. .................................................................................................................................................................. .................................................................................................................................................................. .................................................................................................................................................................. .................................................................................................................................................................. .................................................................................................................................................................. .................................................................................................................................................................. .................................................................................................................................................................. .................................................................................................................................................................. .................................................................................................................................................................. .................................................................................................................................................................. .................................................................................................................................................................. .................................................................................................................................................................. .................................................................................................................................................................. ..................................................................................................................................................................
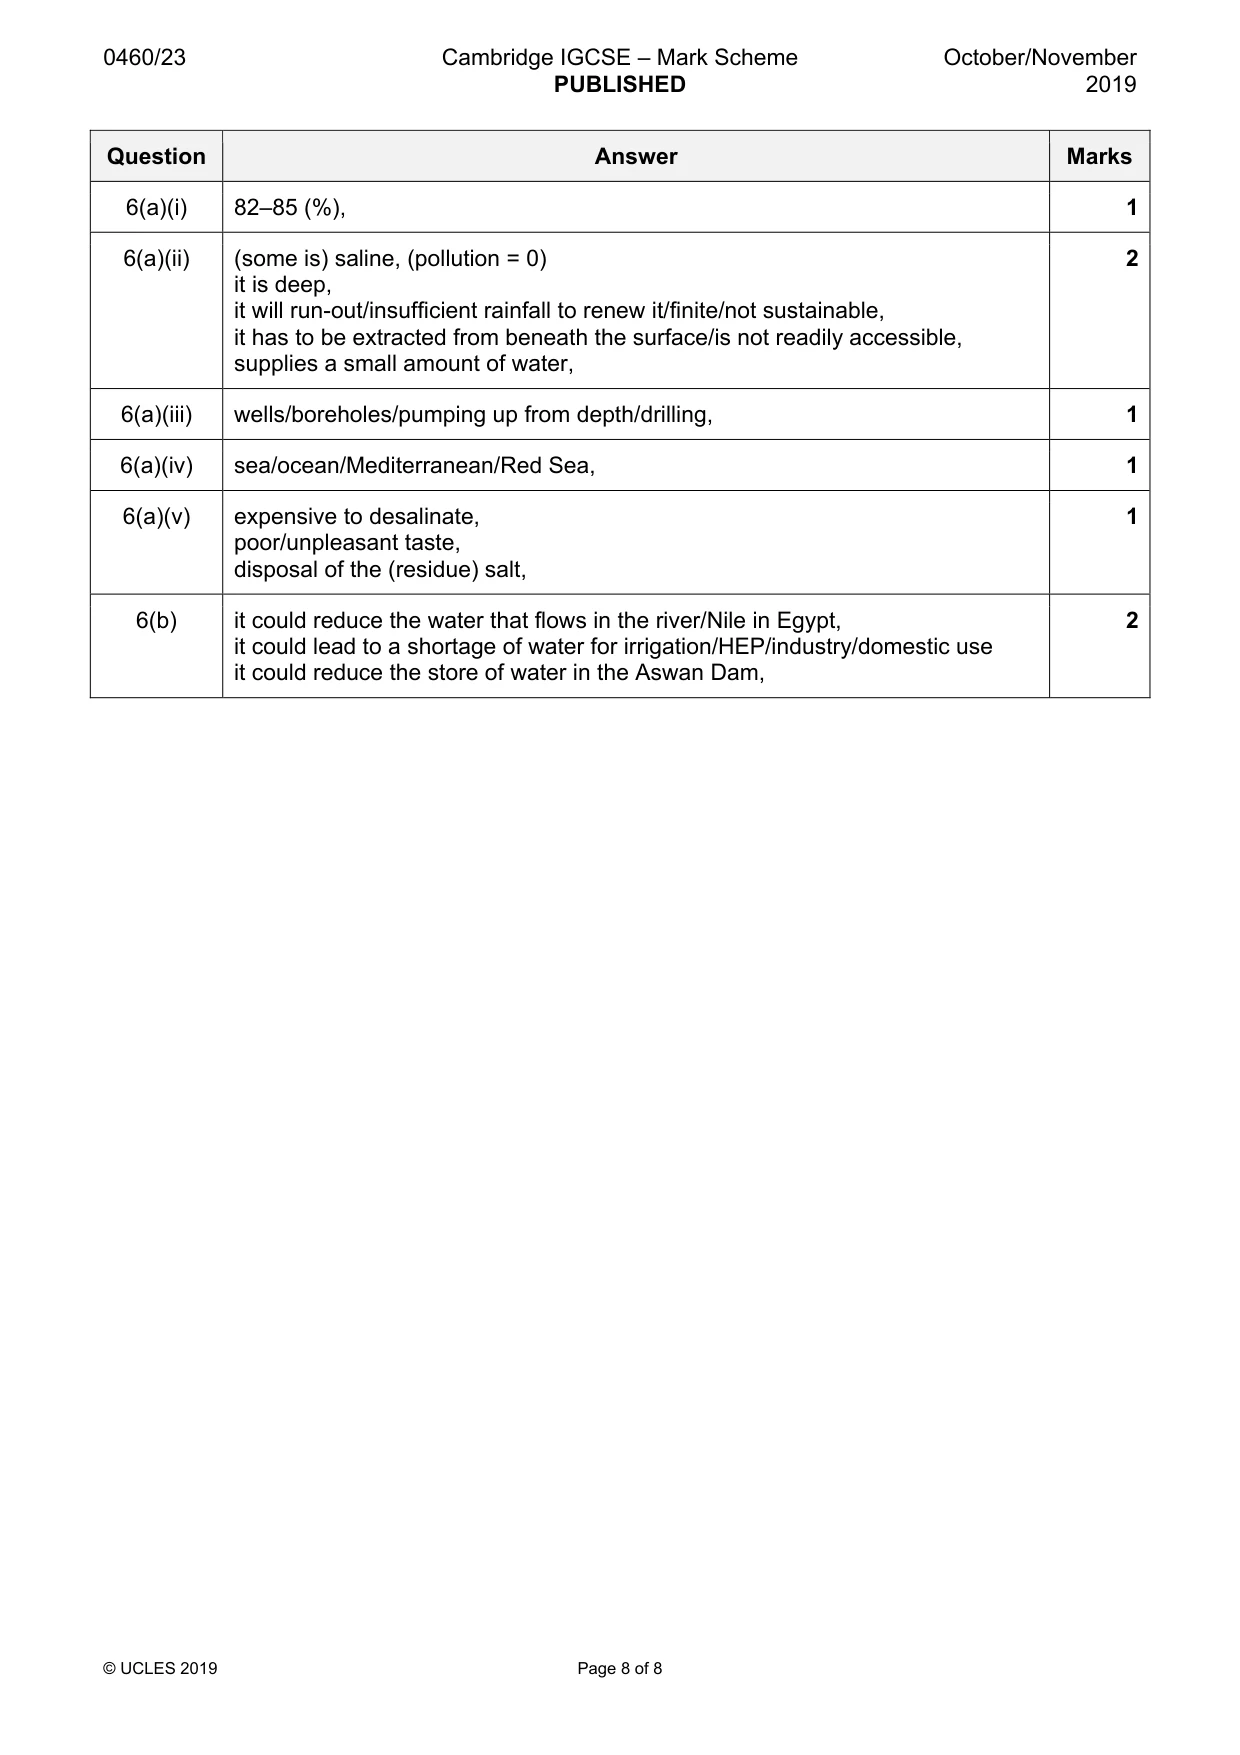
Mark scheme: 6(a)(i) 82–85 (%), 1 6(a)(ii) (some is) saline, (pollution = 0) 2 it is deep, it will run-out/insufficient rainfall to renew it/finite/not sustainable, it has to be extracted from beneath the surface/is not readily accessible, supplies a small amount of water, 6(a)(iii) wells/boreholes/pumping up from depth/drilling, 1 6(a)(iv) sea/ocean/Mediterranean/Red Sea, 1 6(a)(v) expensive to desalinate, 1 poor/unpleasant taste, disposal of the (residue) salt, 6(b) it could reduce the water that flows in the river/Nile in Egypt, 2 it could lead to a shortage of water for irrigation/HEP/industry/domestic use it could reduce the store of water in the Aswan Dam,
What was in this paper
The subtopics covered by these 6 questions, and how many questions each got. Open one in a new tab to see every Cambridge question on it.
What you needed in this session
Cambridge’s own grade thresholds for 2019 Oct/Nov, Paper 2 · Variant 3. A higher threshold means an easier paper — the bar moves with how the cohort did.