Cambridge IGCSE Geography 0460 — 2021 May/June Paper 2 · Variant 3
0460/23/M/J/21 · 6 questions · 60 marks · ≈68 min
The question paper and its mark scheme, free to read here and free to download. This is Cambridge’s own paper, exactly as it was sat.
Question paper20 pages




Mark scheme6 pages
Answers below. Sit the paper first if you are practising.
Questions as text
Q1 · Study the map extract for Thiezac, France
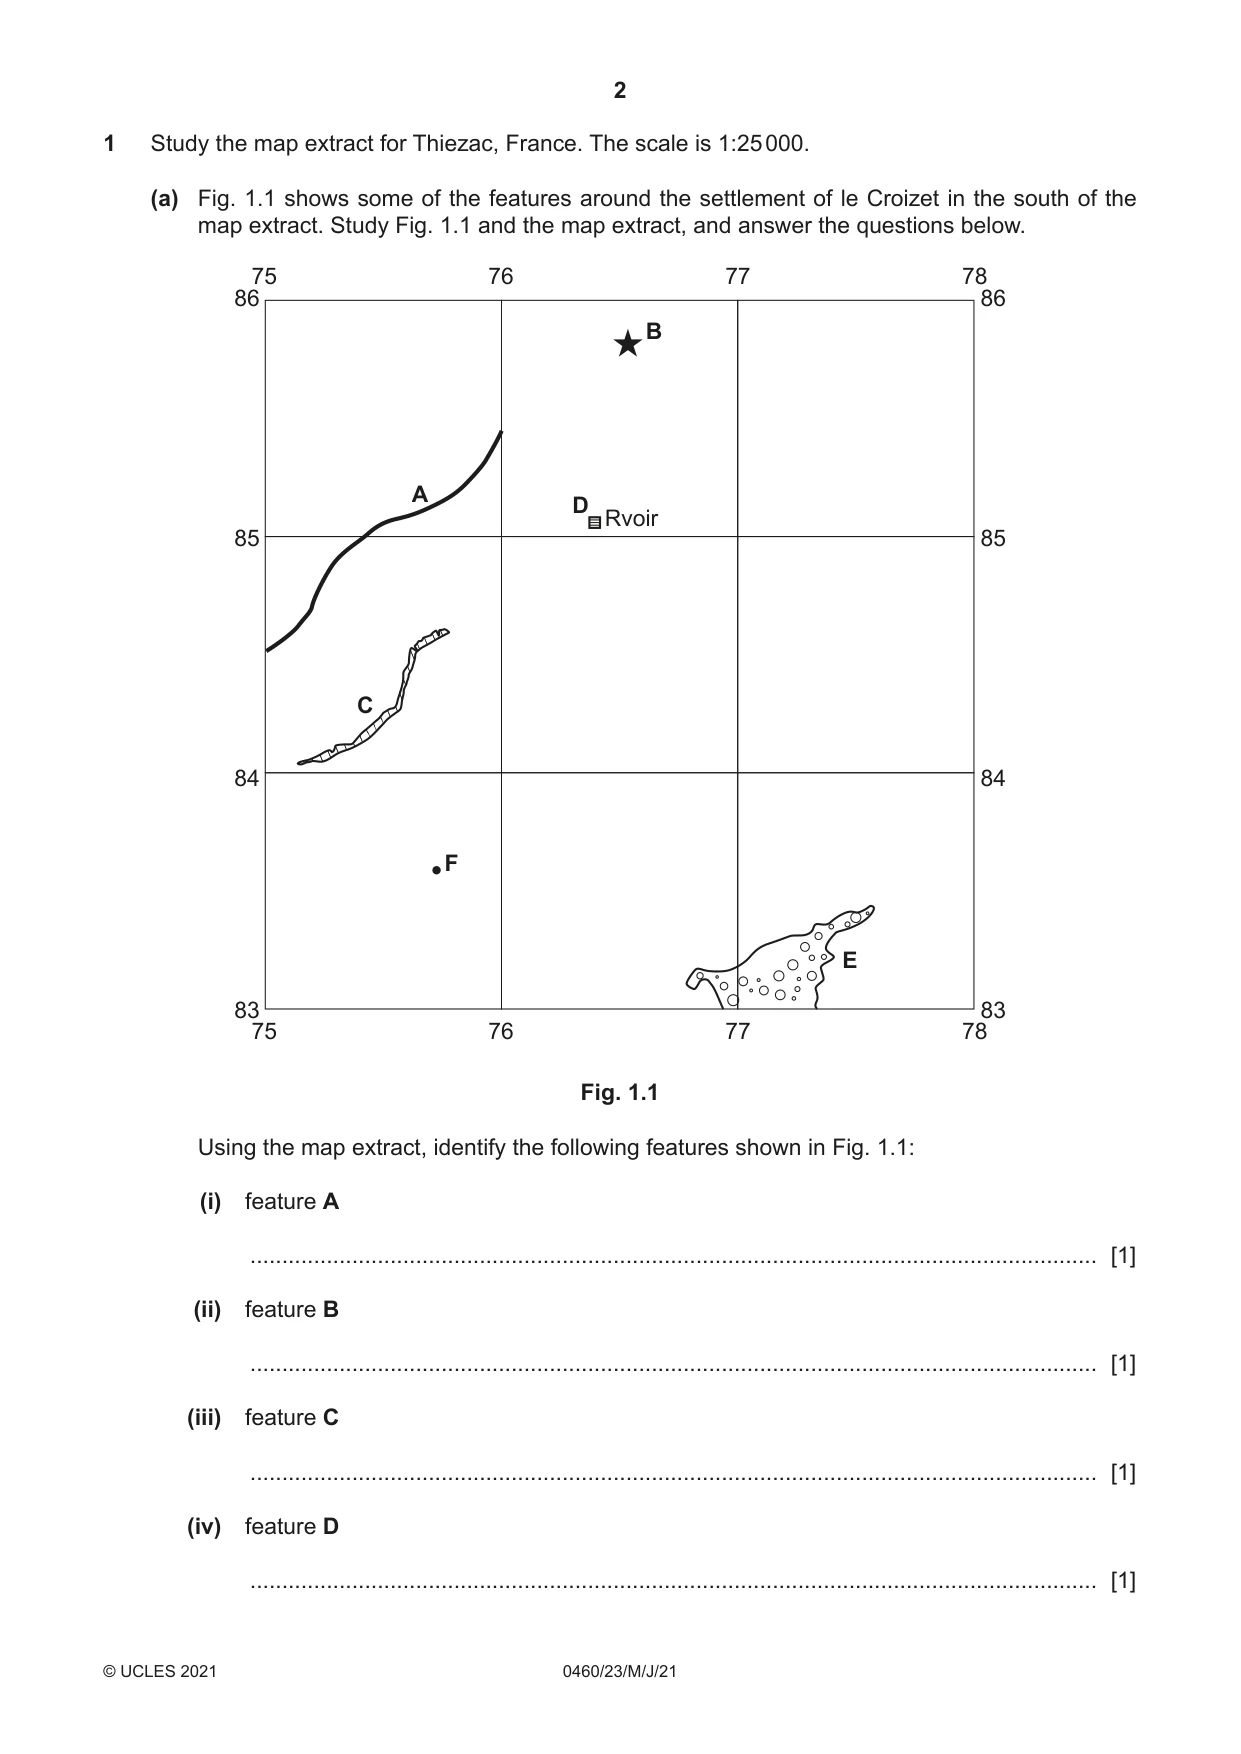
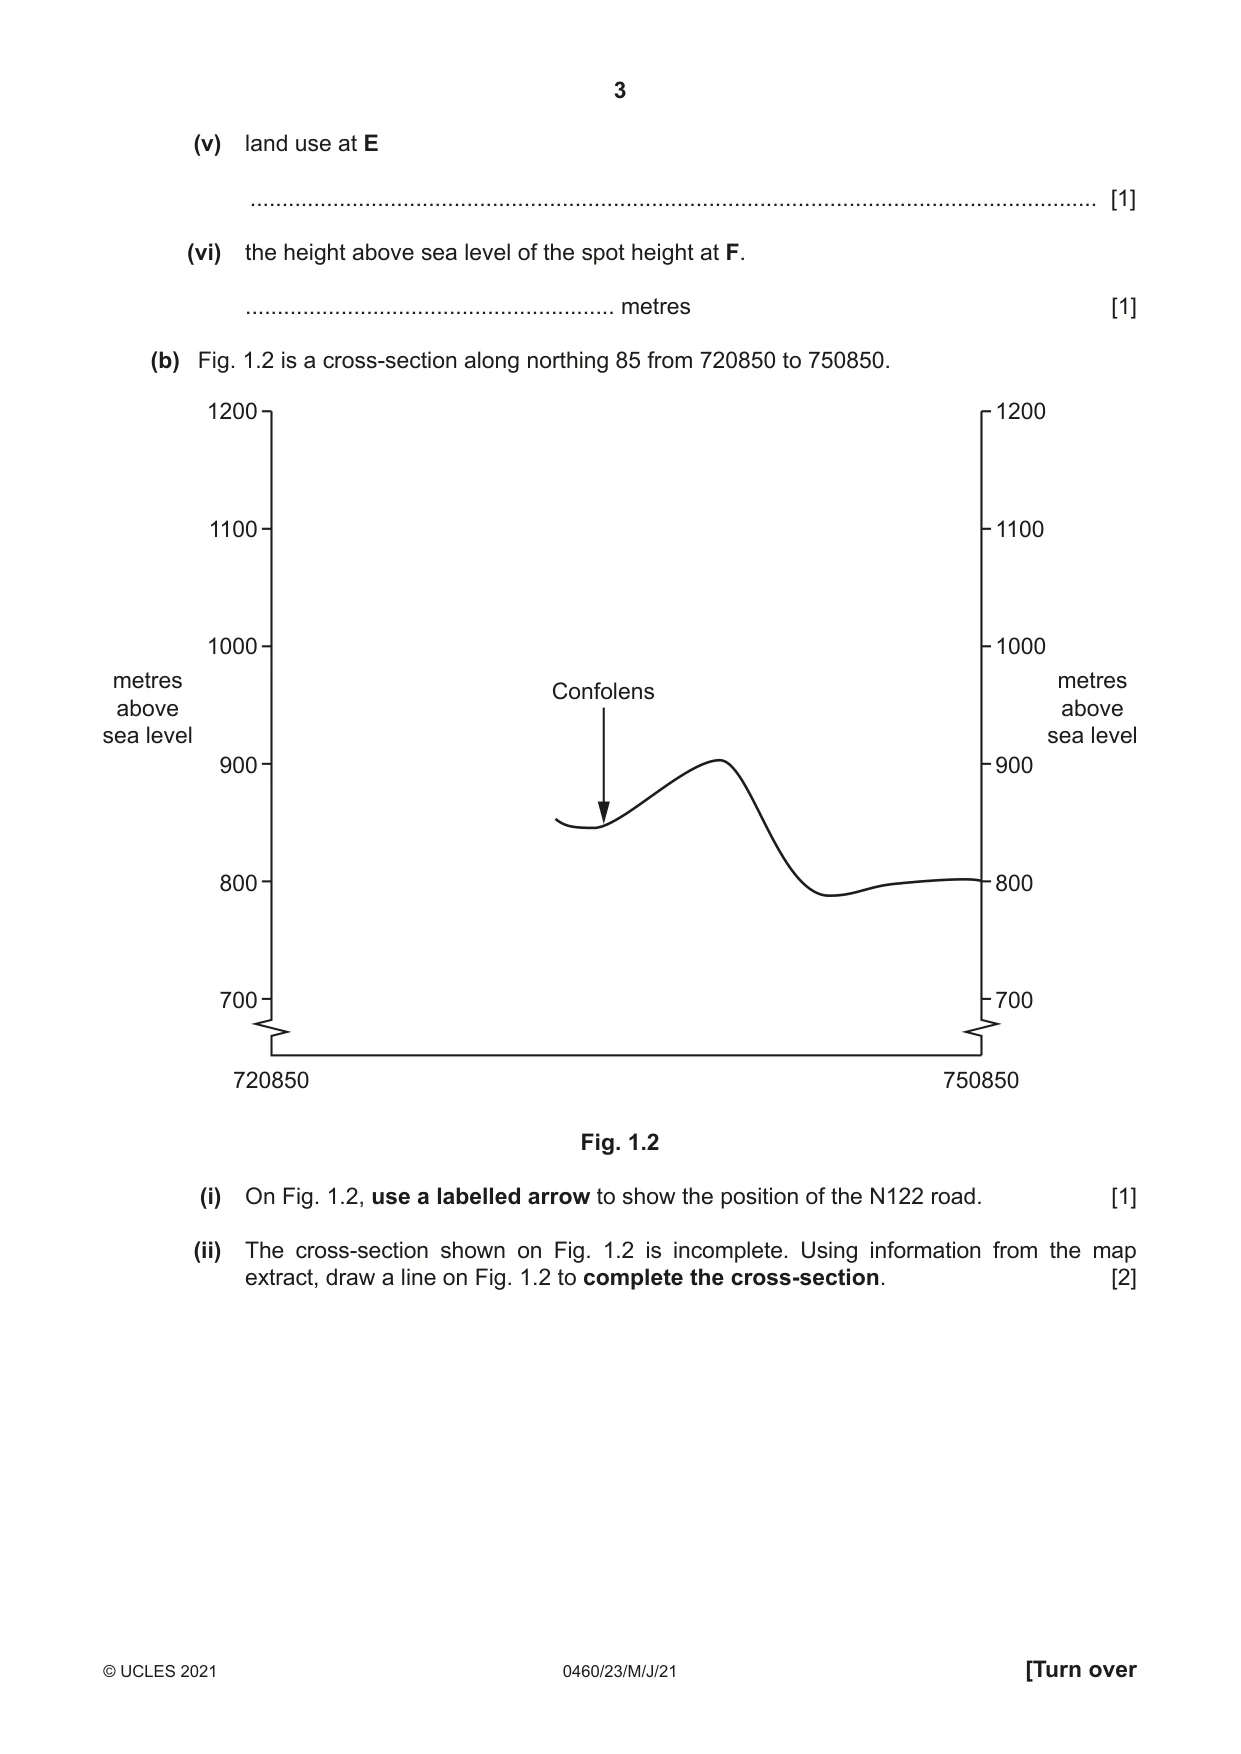
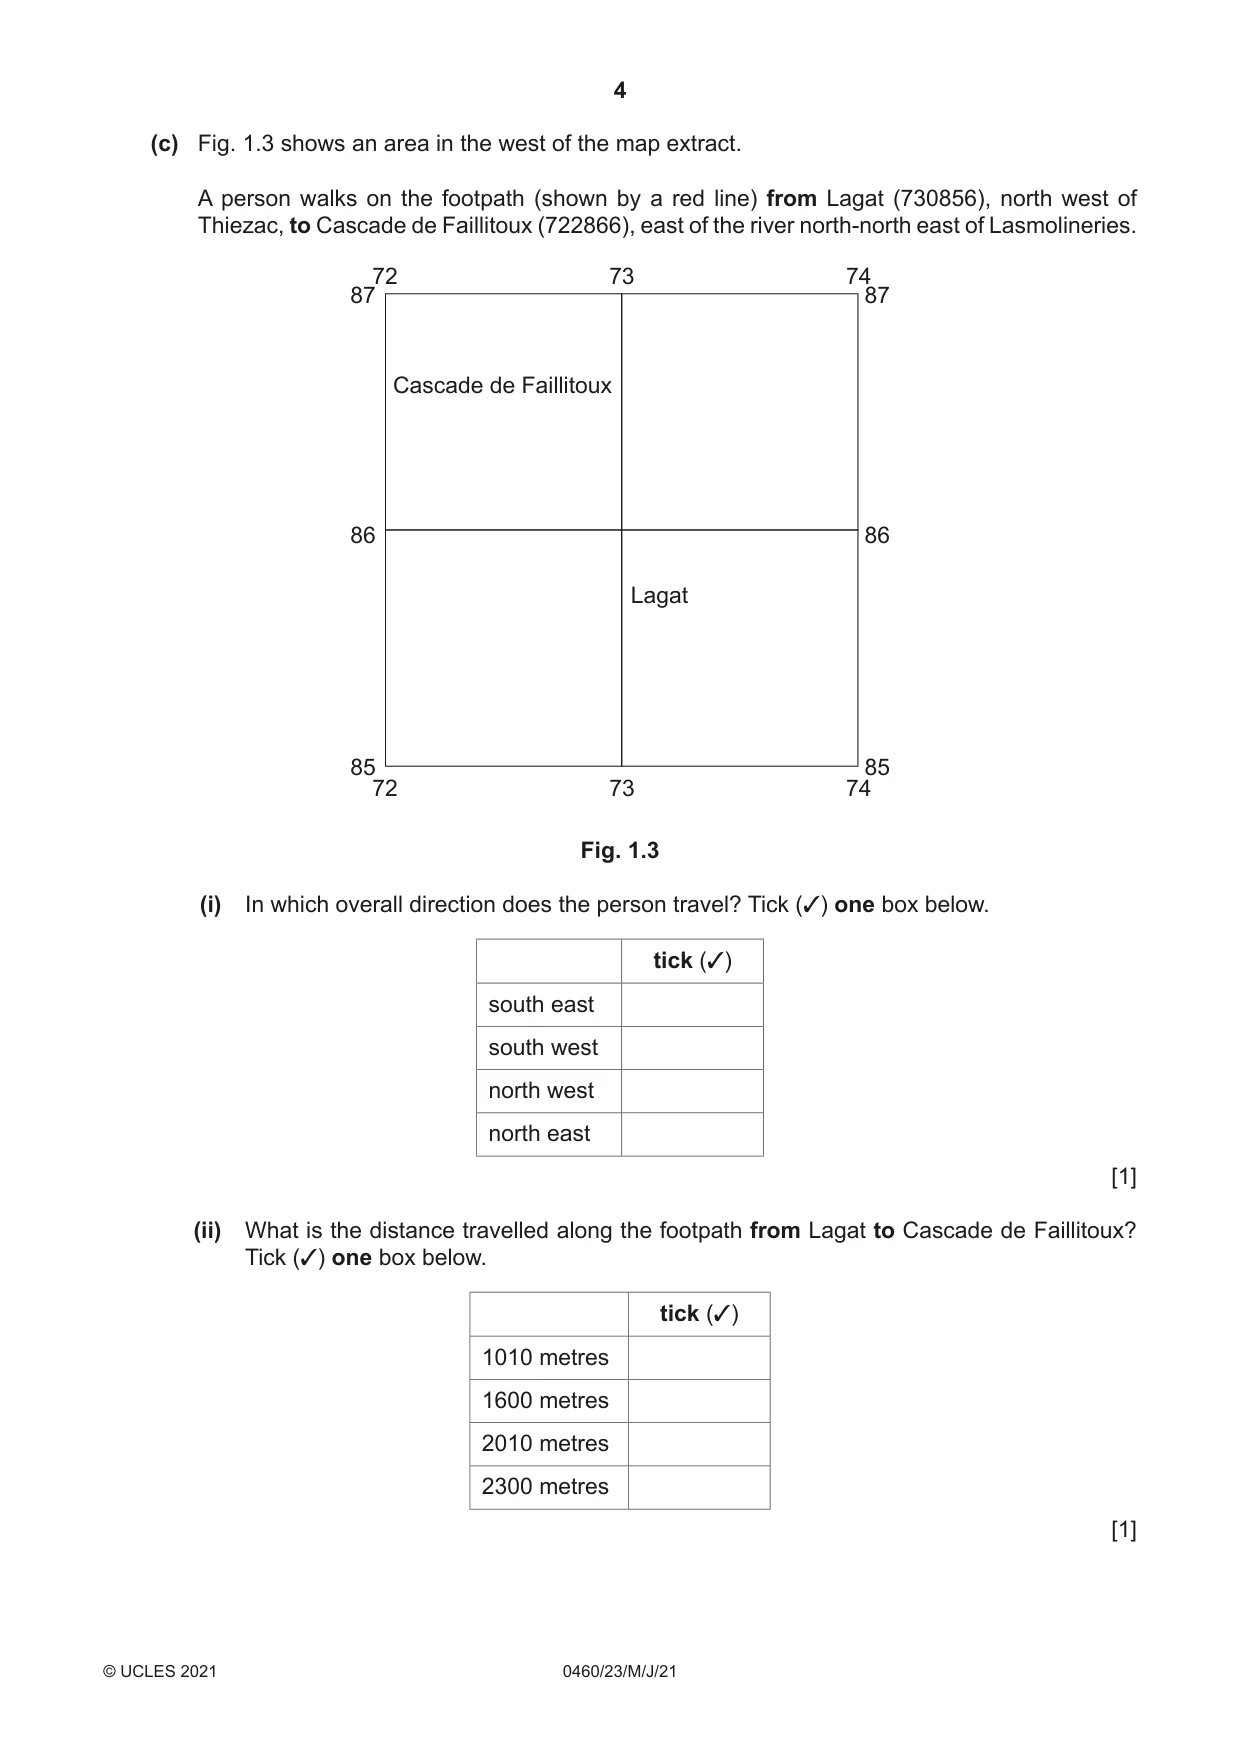
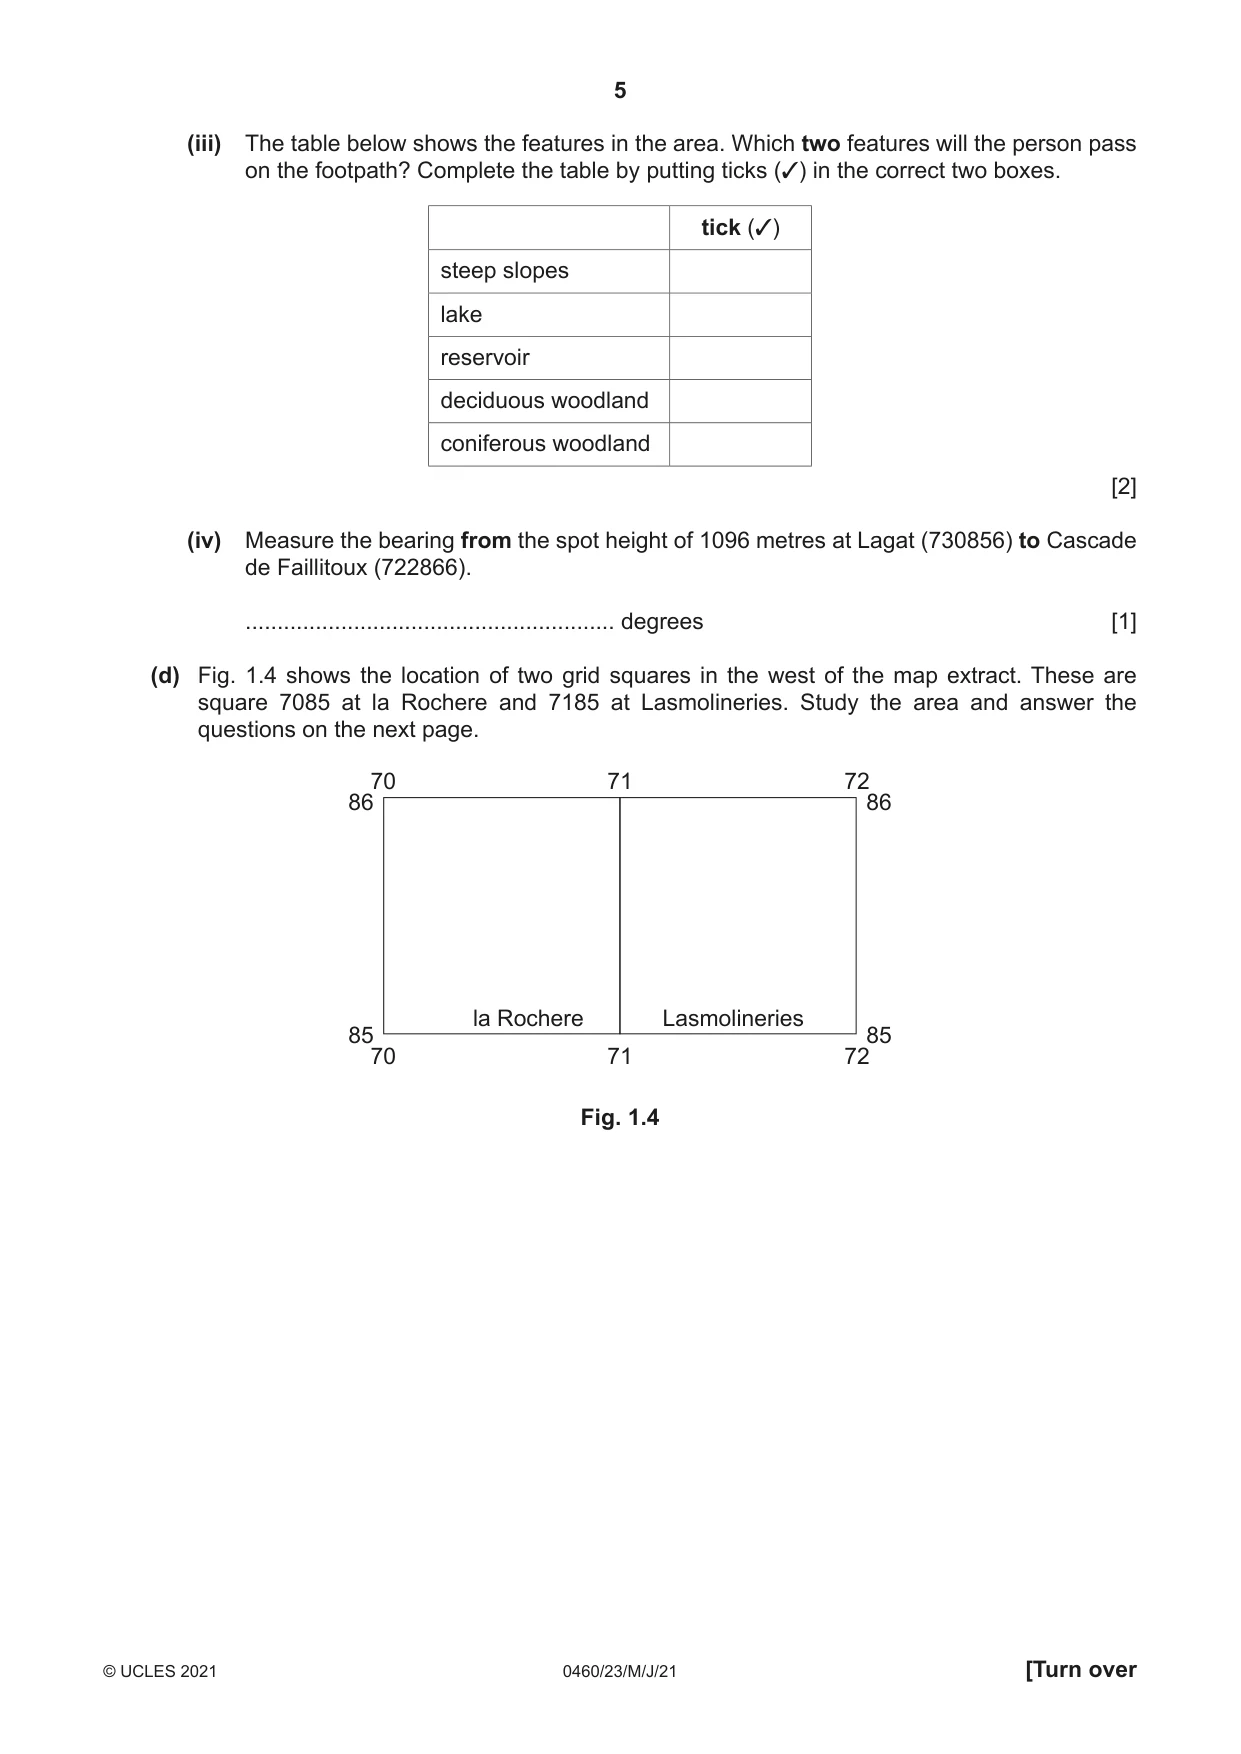
1 Study the map extract for Thiezac, France. The scale is 1:25 000. (a) Fig. 1.1 shows some of the features around the settlement of le Croizet in the south of the map extract. Study Fig. 1.1 and the map extract, and answer the questions below. 75 76 77 78 86 86 B A D Rvoir 85 85 C 84 84 F E 83 83 75 76 77 78 Fig. 1.1 Using the map extract, identify the following features shown in Fig. 1.1: (i) feature A ..................................................................................................................................... [1] (ii) feature B ..................................................................................................................................... [1] (iii) feature C ..................................................................................................................................... [1] (iv) feature D ..................................................................................................................................... [1] (v) land use at E ..................................................................................................................................... [1] (vi) the height above sea level of the spot height at F. .......................................................... metres [1] (b) Fig. 1.2 is a cross-section along northing 85 from 720850 to 750850. 1200 1200 1100 1100 1000 1000 metres metres Confolens above above sea level sea level 900 900 800 800 700 700 720850 750850 Fig. 1.2 (i) On Fig. 1.2, use a labelled arrow to show the position of the N122 road. [1] (ii) The cross-section shown on Fig. 1.2 is incomplete. Using information from the map extract, draw a line on Fig. 1.2 to complete the cross-section. [2] (c) Fig. 1.3 shows an area in the west of the map extract. A person walks on the footpath (shown by a red line) from Lagat (730856), north west of Thiezac, to Cascade de Faillitoux (722866), east of the river north-north east of Lasmolineries. 72 73 74 87 87 Cascade de Faillitoux 86 86 Lagat 85 85 72 73 74 Fig. 1.3 (i) In which overall direction does the person travel? Tick (3) one box below. tick (3) south east south west north west north east [1] (ii) What is the distance travelled along the footpath from Lagat to Cascade de Faillitoux? Tick (3) one box below. tick (3) 1010 metres 1600 metres 2010 metres 2300 metres [1] (iii) The table below shows the features in the area. Which two features will the person pass on the footpath? Complete the table by putting ticks (3) in the correct two boxes. tick (3) steep slopes lake reservoir deciduous woodland coniferous woodland [2] (iv) Measure the bearing from the spot height of 1096 metres at Lagat (730856) to Cascade de Faillitoux (722866). .......................................................... degrees [1] (d) Fig. 1.4 shows the location of two grid squares in the west of the map extract. These are square 7085 at la Rochere and 7185 at Lasmolineries. Study the area and answer the questions on the next page. 70 71 72 86 86 la Rochere Lasmolineries 85 85 70 71 72 Fig. 1.4 Describe the relief and drainage of this area. Relief ................................................................................................................................................... ................................................................................................................................................... ................................................................................................................................................... ................................................................................................................................................... ................................................................................................................................................... ................................................................................................................................................... ................................................................................................................................................... ................................................................................................................................................... Drainage ................................................................................................................................................... ................................................................................................................................................... ................................................................................................................................................... ................................................................................................................................................... ................................................................................................................................................... ................................................................................................................................................... ................................................................................................................................................... ............................................................................................................................................. [6] [Total: 20] TURN PAGE FOR QUESTION 2
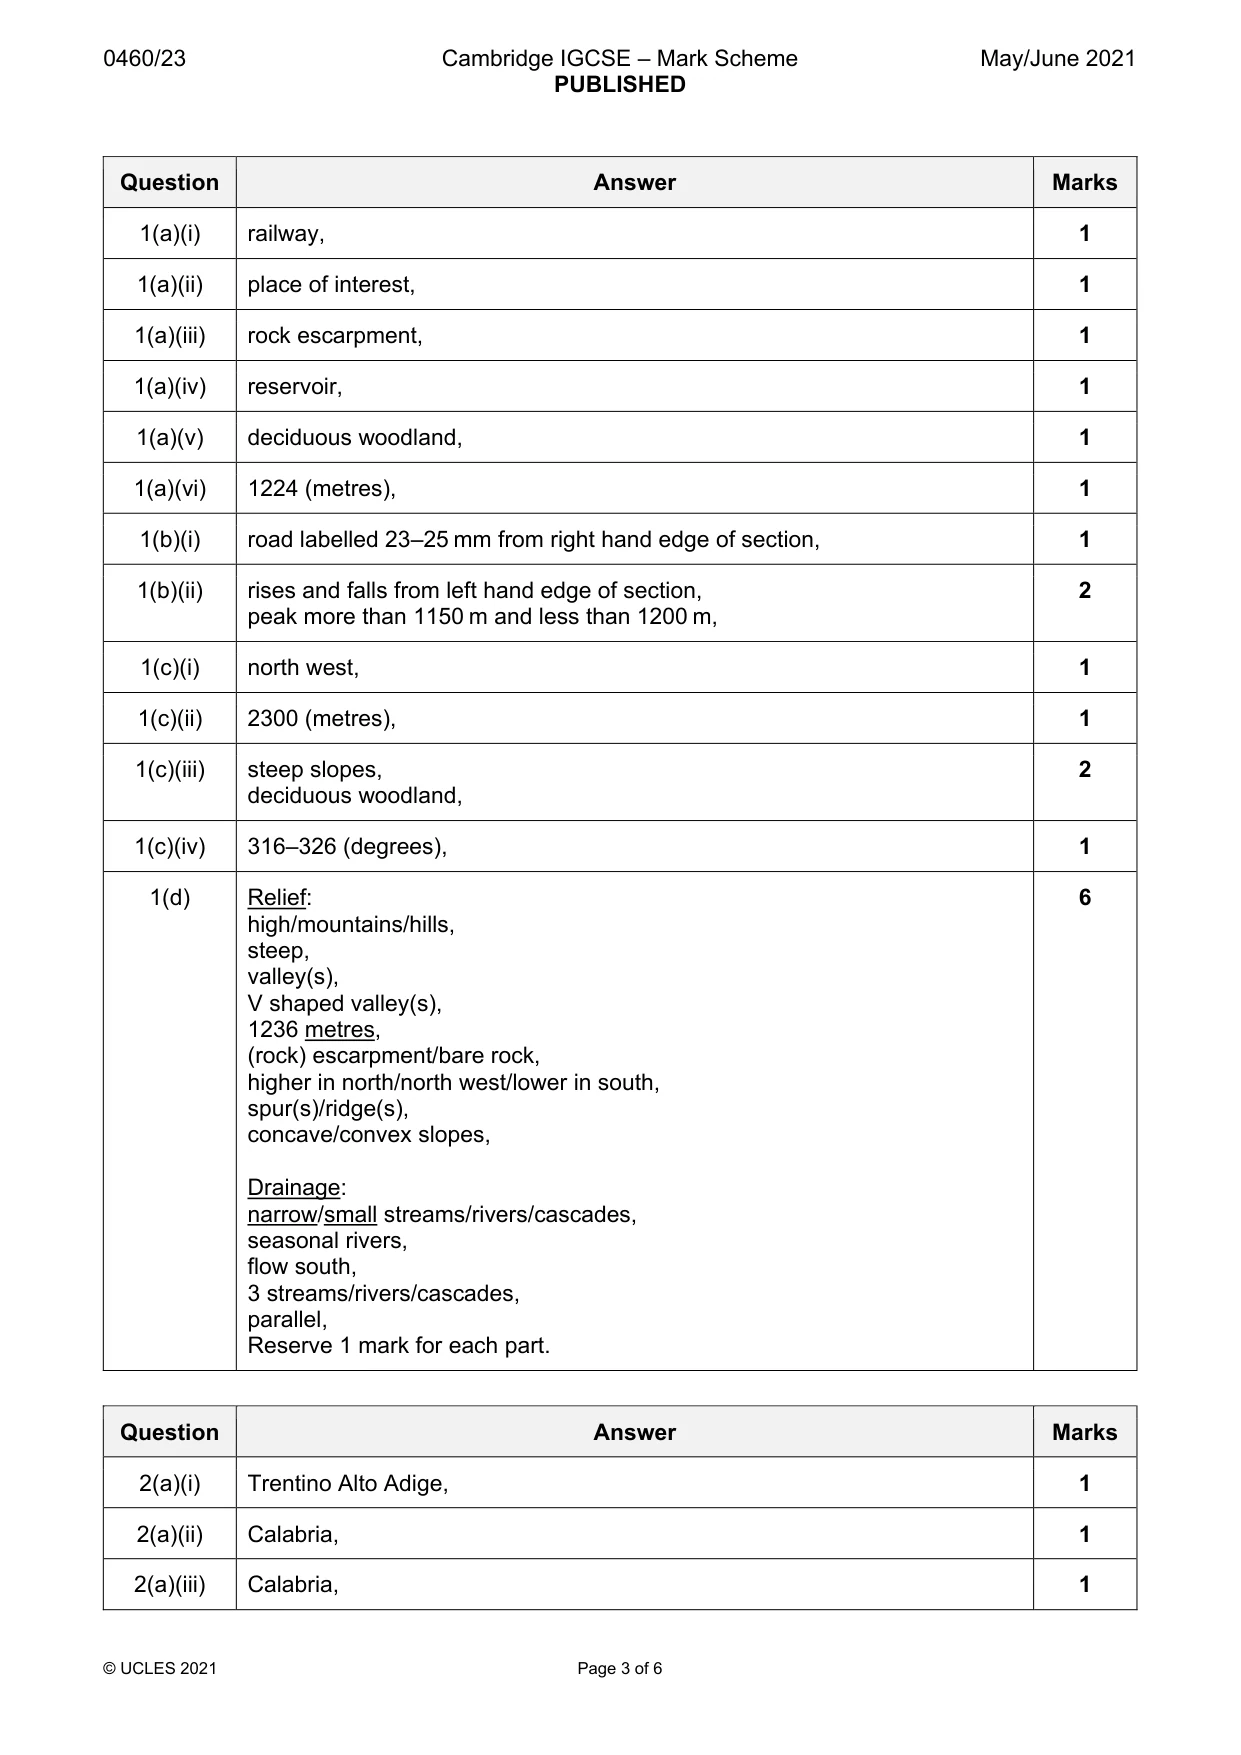
Mark scheme: Question Answer Marks 1(a)(i) railway, 1 1(a)(ii) place of interest, 1 1(a)(iii) rock escarpment, 1 1(a)(iv) reservoir, 1 1(a)(v) deciduous woodland, 1 1(a)(vi) 1224 (metres), 1 1(b)(i) road labelled 23–25 mm from right hand edge of section, 1 1(b)(ii) rises and falls from left hand edge of section, 2 peak more than 1150 m and less than 1200 m, 1(c)(i) north west, 1 1(c)(ii) 2300 (metres), 1 1(c)(iii) steep slopes, 2 deciduous woodland, 1(c)(iv) 316–326 (degrees), 1 1(d) Relief: 6 high/mountains/hills, steep, valley(s), V shaped valley(s), 1236 metres, (rock) escarpment/bare rock, higher in north/north west/lower in south, spur(s)/ridge(s), concave/convex slopes, Drainage: narrow/small streams/rivers/cascades, seasonal rivers, flow south, 3 streams/rivers/cascades, parallel, Reserve 1 mark for each part.
Q2 · Information about population change in four regions in Italy (an MEDC) in 2017
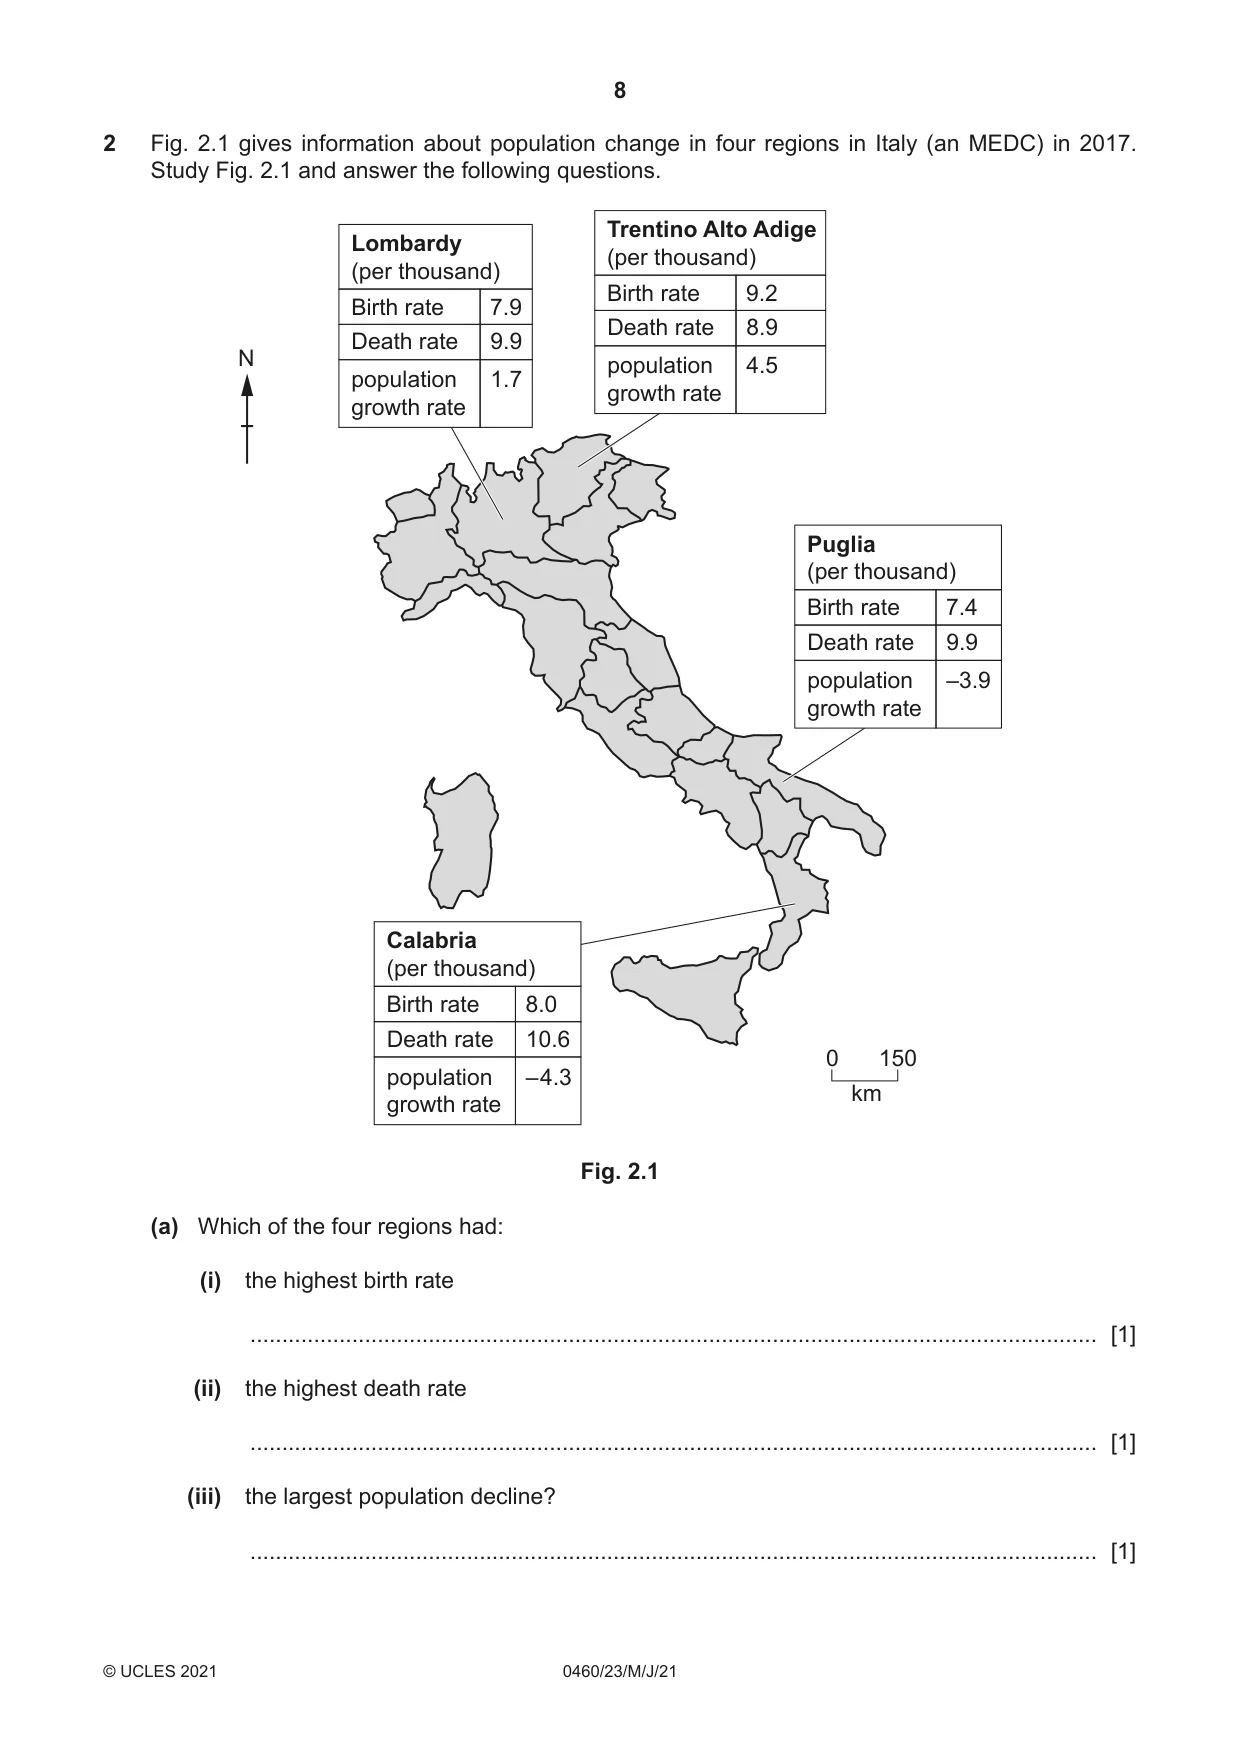
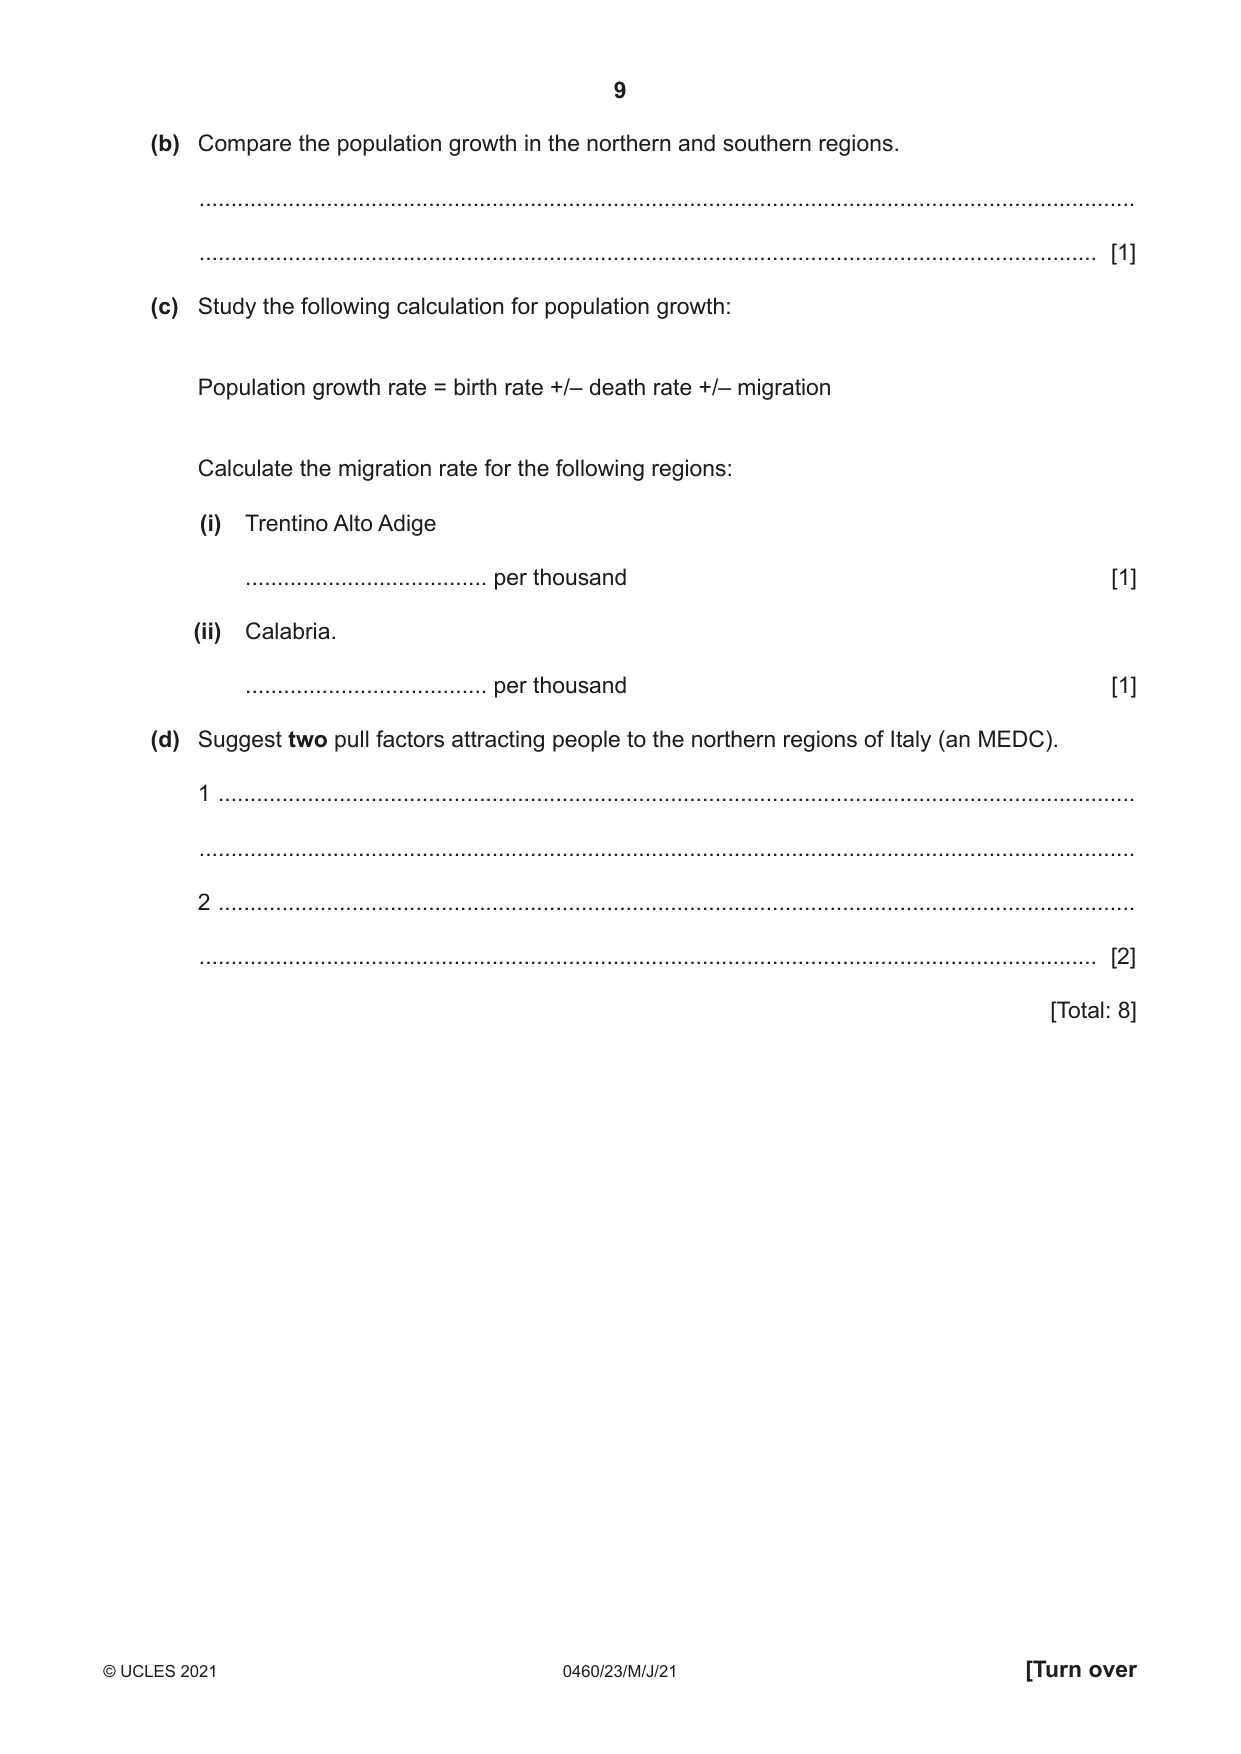
2 Fig. 2.1 gives information about population change in four regions in Italy (an MEDC) in 2017. Study Fig. 2.1 and answer the following questions. Trentino Alto Adige Lombardy (per thousand) (per thousand) Birth rate 9.2 Birth rate 7.9 Death rate 8.9 Death rate 9.9 N population 4.5 population 1.7 growth rate growth rate Puglia (per thousand) Birth rate 7.4 Death rate 9.9 population –3.9 growth rate Calabria (per thousand) Birth rate 8.0 Death rate 10.6 0 150 population – 4.3 km growth rate Fig. 2.1 (a) Which of the four regions had: (i) the highest birth rate ..................................................................................................................................... [1] (ii) the highest death rate ..................................................................................................................................... [1] (iii) the largest population decline? ..................................................................................................................................... [1] (b) Compare the population growth in the northern and southern regions. ................................................................................................................................................... ............................................................................................................................................. [1] (c) Study the following calculation for population growth: Population growth rate = birth rate +/– death rate +/– migration Calculate the migration rate for the following regions: (i) Trentino Alto Adige ...................................... per thousand [1] (ii) Calabria. ...................................... per thousand [1] (d) Suggest two pull factors attracting people to the northern regions of Italy (an MEDC). 1 ................................................................................................................................................ ................................................................................................................................................... 2 ................................................................................................................................................ ............................................................................................................................................. [2] [Total: 8]
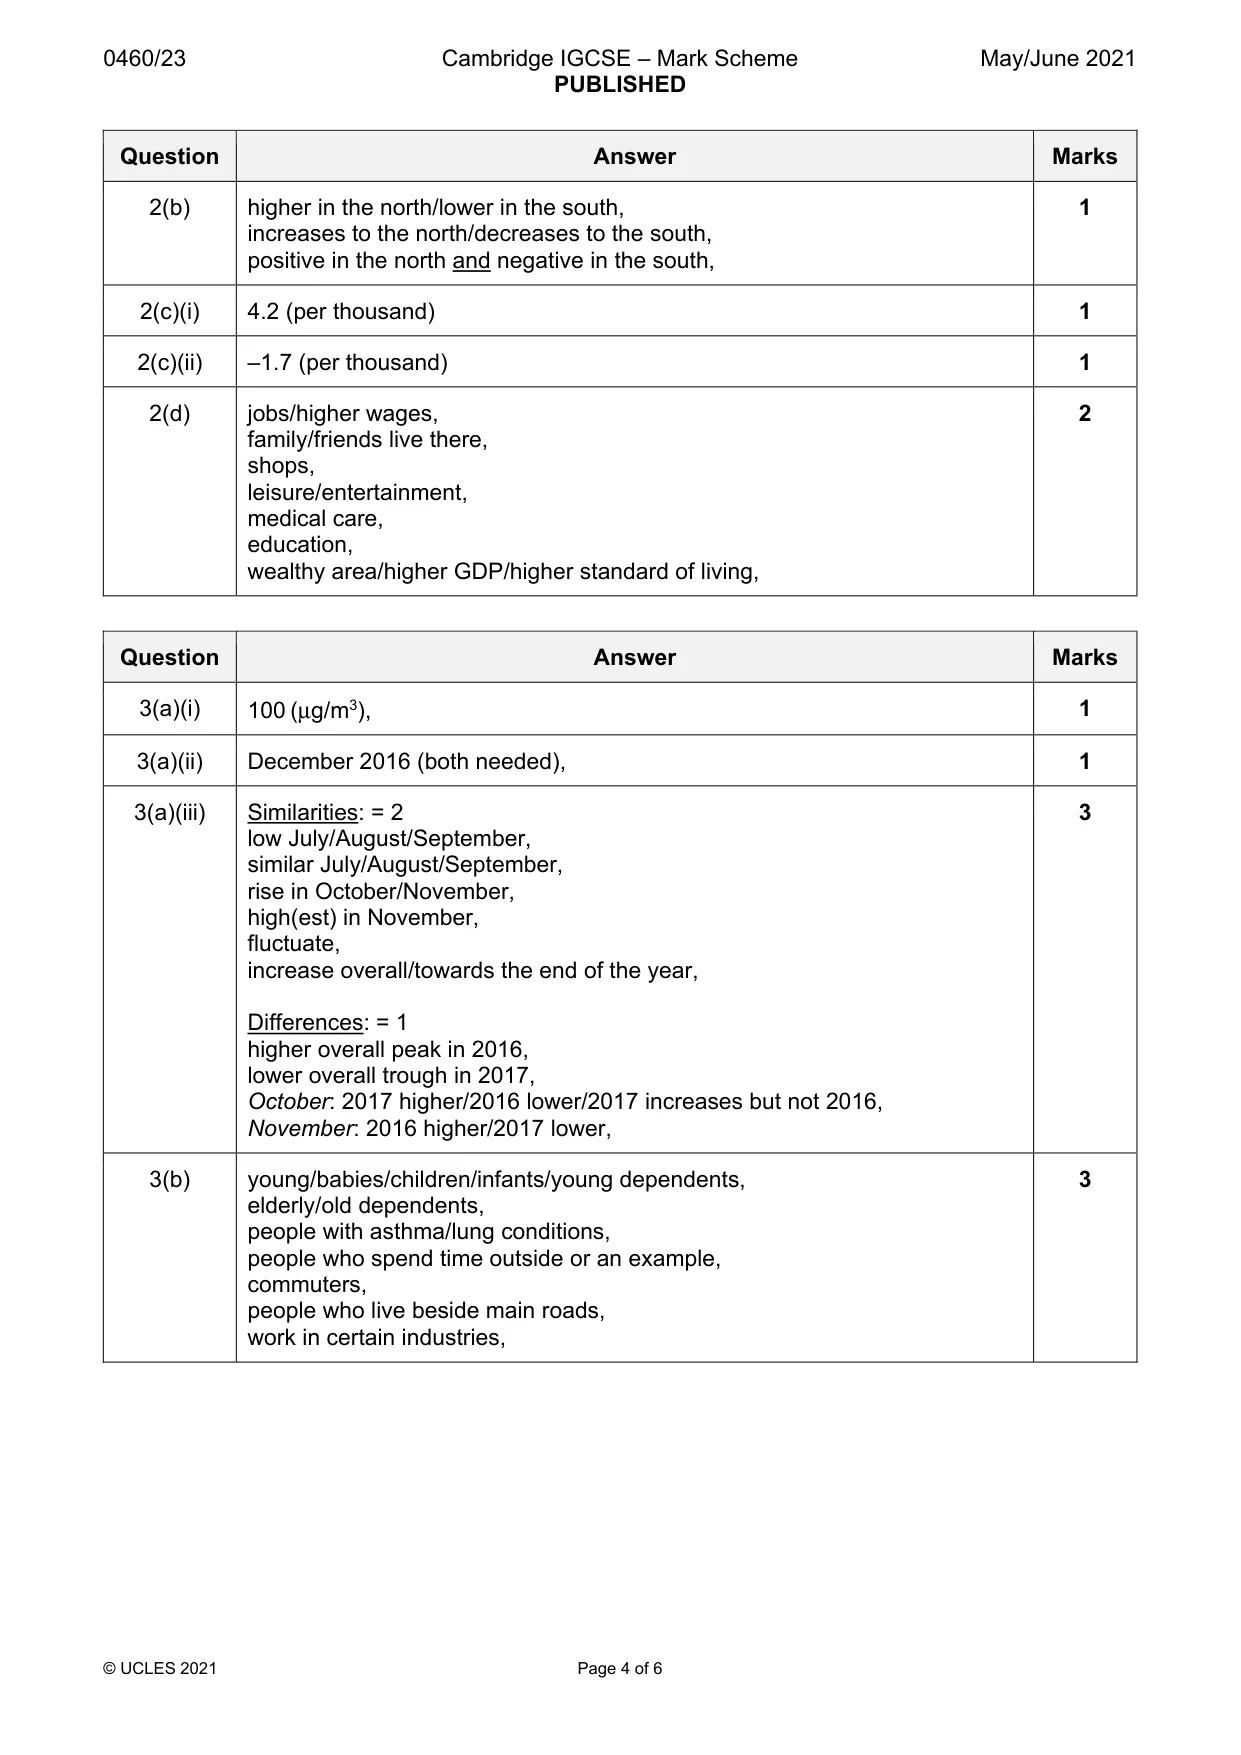
Mark scheme: 2(a)(i) Trentino Alto Adige, 1 2(a)(ii) Calabria, 1 2(a)(iii) Calabria, 1 2(b) higher in the north/lower in the south, 1 increases to the north/decreases to the south, positive in the north and negative in the south, 2(c)(i) 4.2 (per thousand) 1 2(c)(ii) –1.7 (per thousand) 1 2(d) jobs/higher wages, 2 family/friends live there, shops, leisure/entertainment, medical care, education, wealthy area/higher GDP/higher standard of living,
Q3 · Urbanisation causes many problems, including air pollution
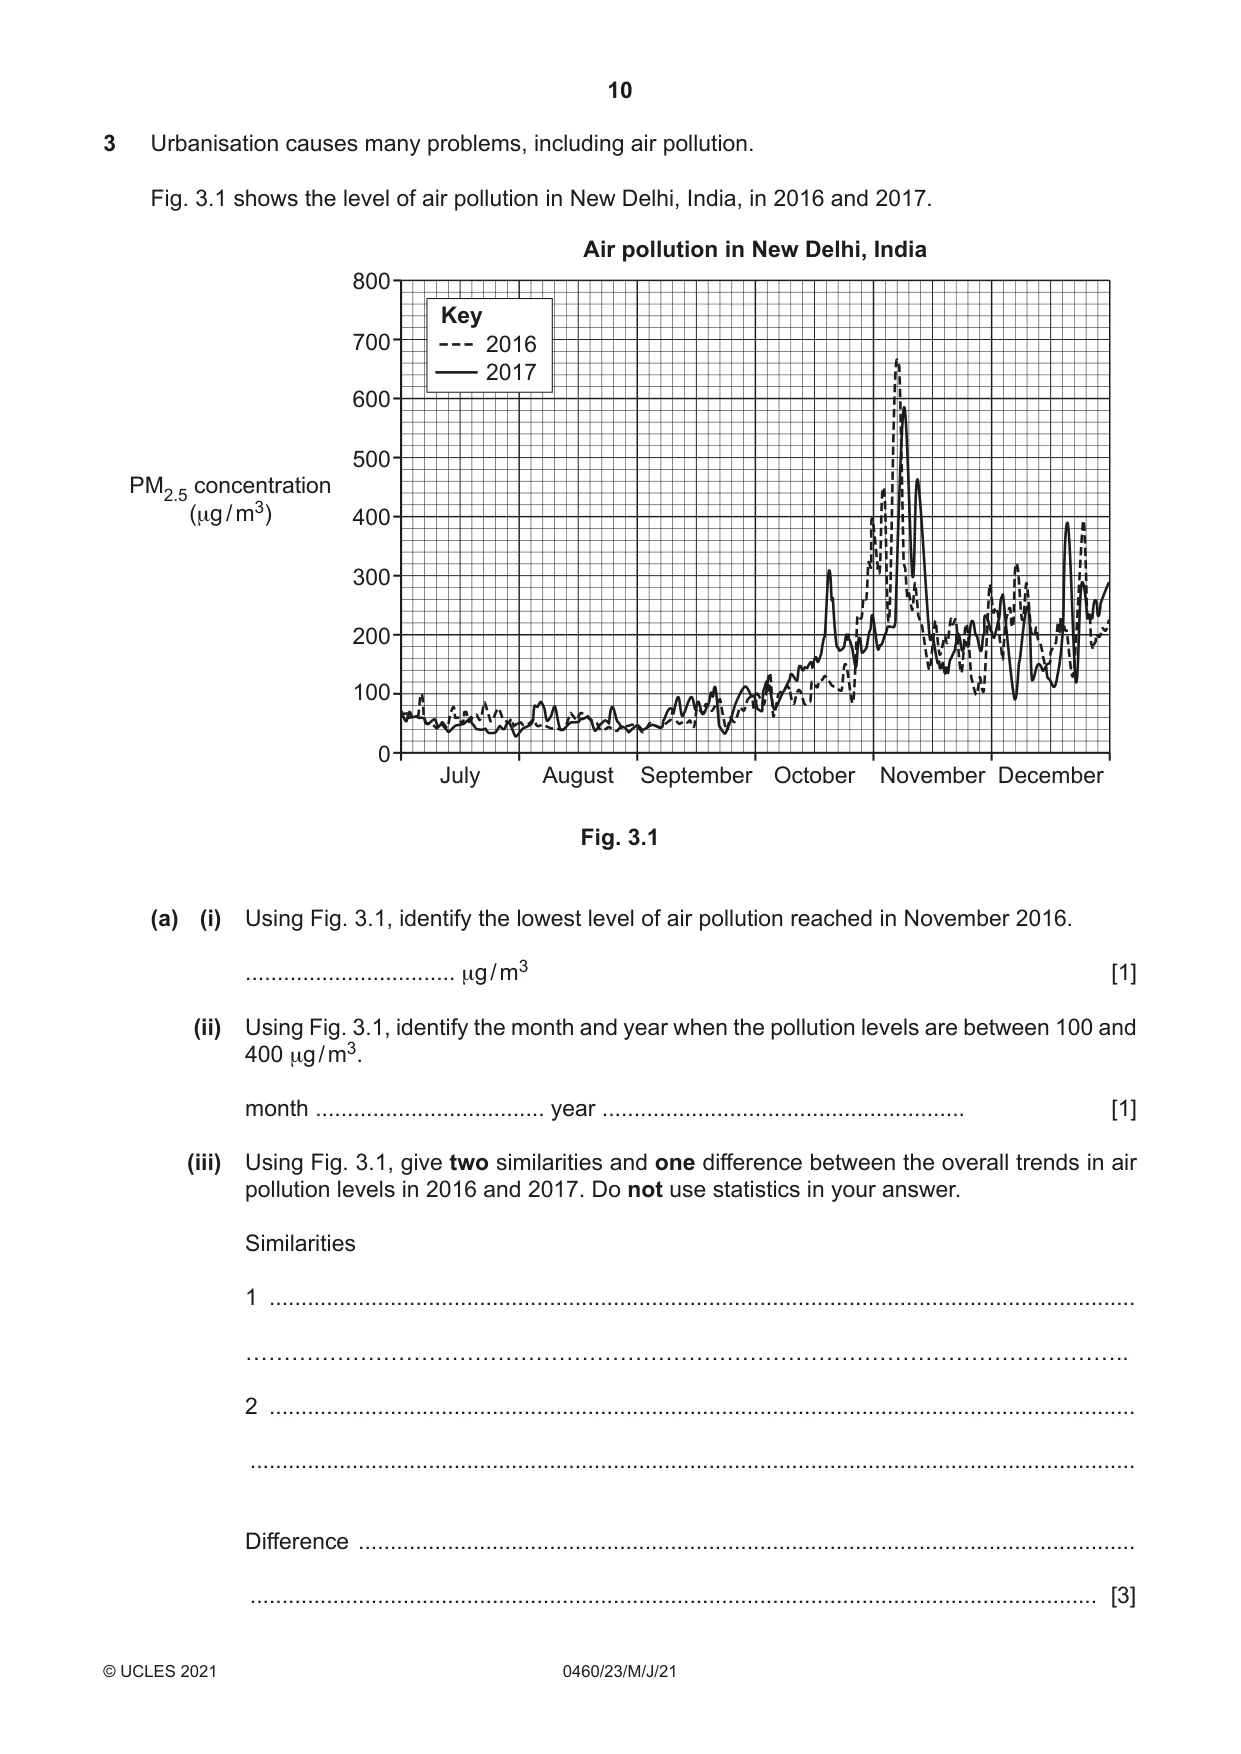
3 Urbanisation causes many problems, including air pollution. Fig. 3.1 shows the level of air pollution in New Delhi, India, in 2016 and 2017. Air pollution in New Delhi, India 800 Key 700 2016 2017 600 500 PM2.5 concentration (μg / m3) 400 300 200 100 0 July August September October November December Fig. 3.1 (a) (i) Using Fig. 3.1, identify the lowest level of air pollution reached in November 2016. ................................. μg / m3 [1] (ii) Using Fig. 3.1, identify the month and year when the pollution levels are between 100 and 400 μg / m3. month .................................... year ......................................................... [1] (iii) Using Fig. 3.1, give two similarities and one difference between the overall trends in air pollution levels in 2016 and 2017. Do not use statistics in your answer. Similarities 1 ........................................................................................................................................ 2 ........................................................................................................................................ ........................................................................................................................................... Difference .......................................................................................................................... ..................................................................................................................................... [3] (b) Suggest three groups of people who are most likely to be badly affected by air pollution. 1 ................................................................................................................................................ 2 ................................................................................................................................................ 3 .......................................................................................................................................... [3] [Total: 8]
Mark scheme: 3(a)(i) 100 (μg/m3), 1 3(a)(ii) December 2016 (both needed), 1 3(a)(iii) Similarities: = 2 3 low July/August/September, similar July/August/September, rise in October/November, high(est) in November, fluctuate, increase overall/towards the end of the year, Differences: = 1 higher overall peak in 2016, lower overall trough in 2017, October: 2017 higher/2016 lower/2017 increases but not 2016, November: 2016 higher/2017 lower, 3(b) young/babies/children/infants/young dependents, 3 elderly/old dependents, people with asthma/lung conditions, people who spend time outside or an example, commuters, people who live beside main roads, work in certain industries,
Question 4
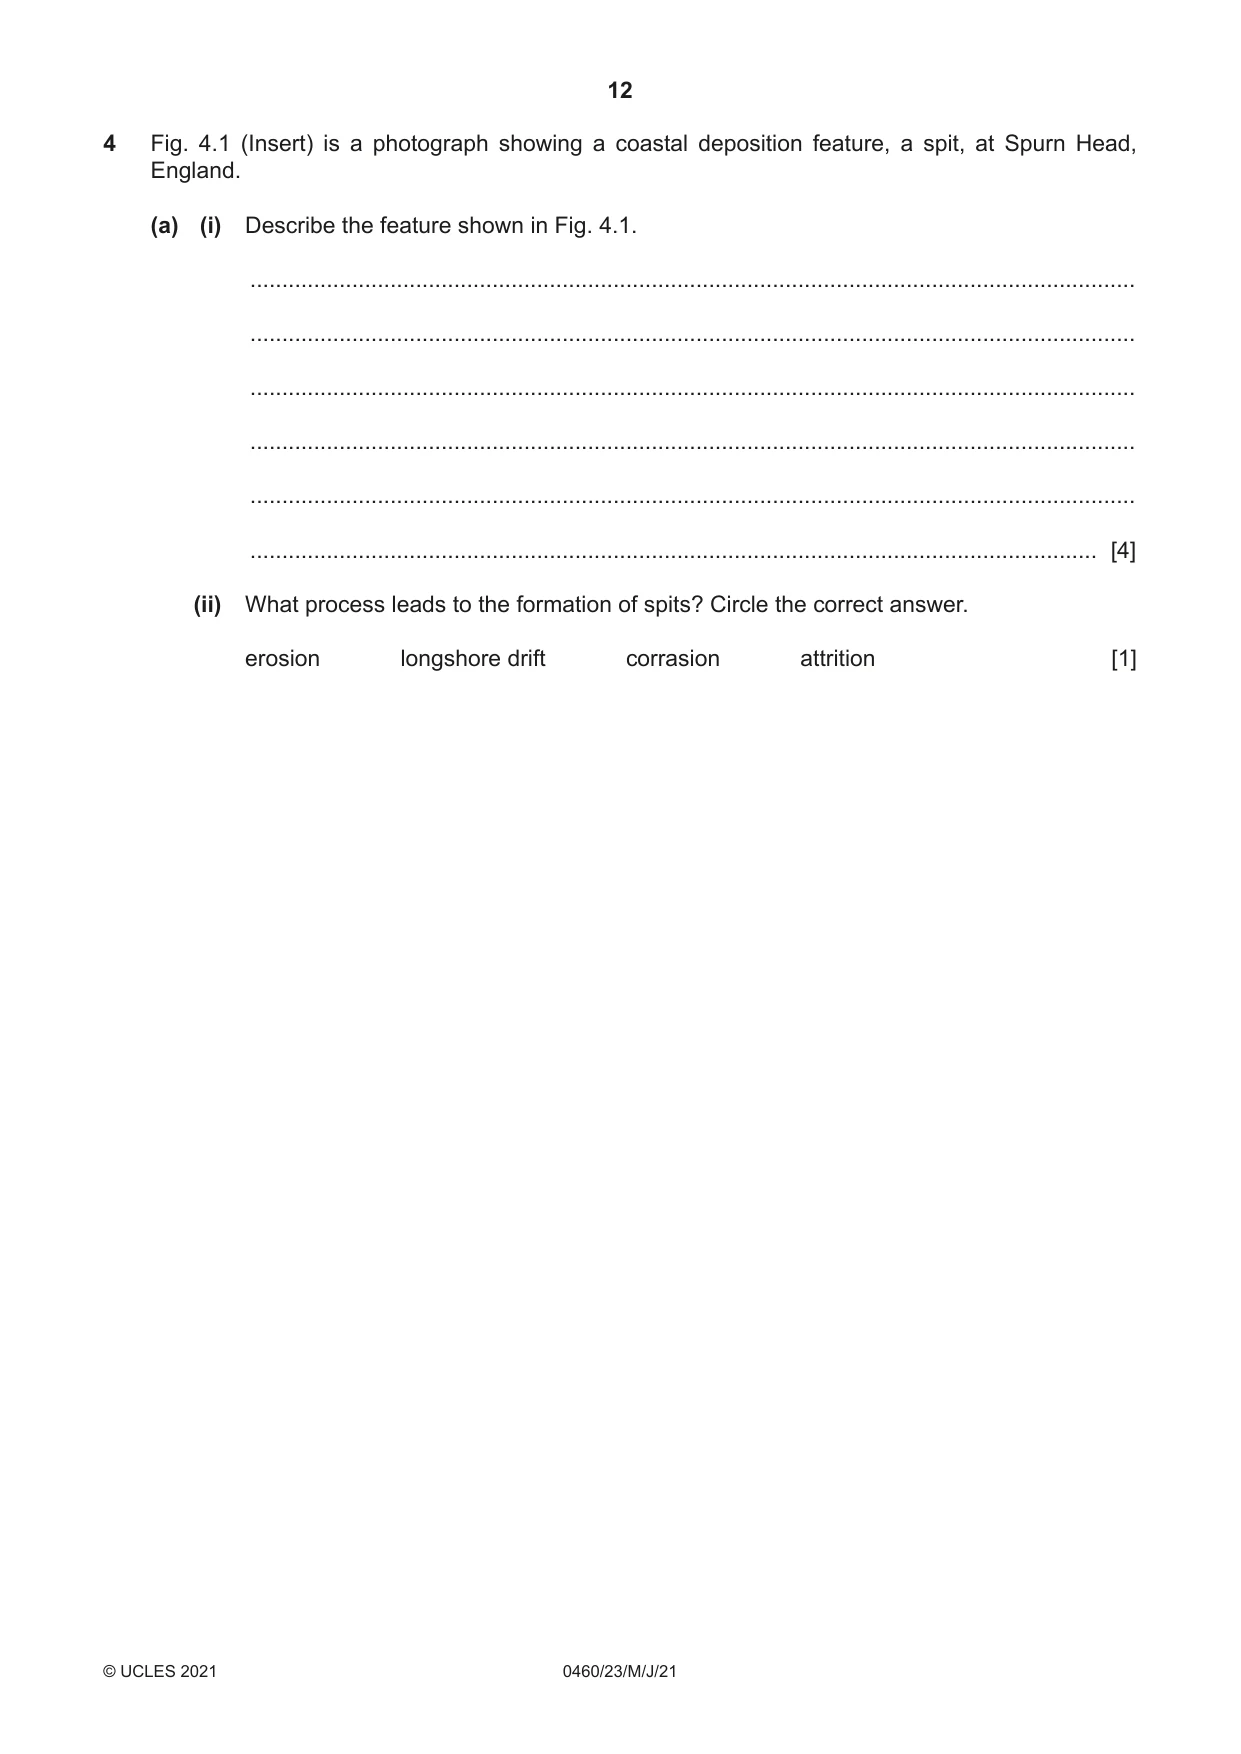
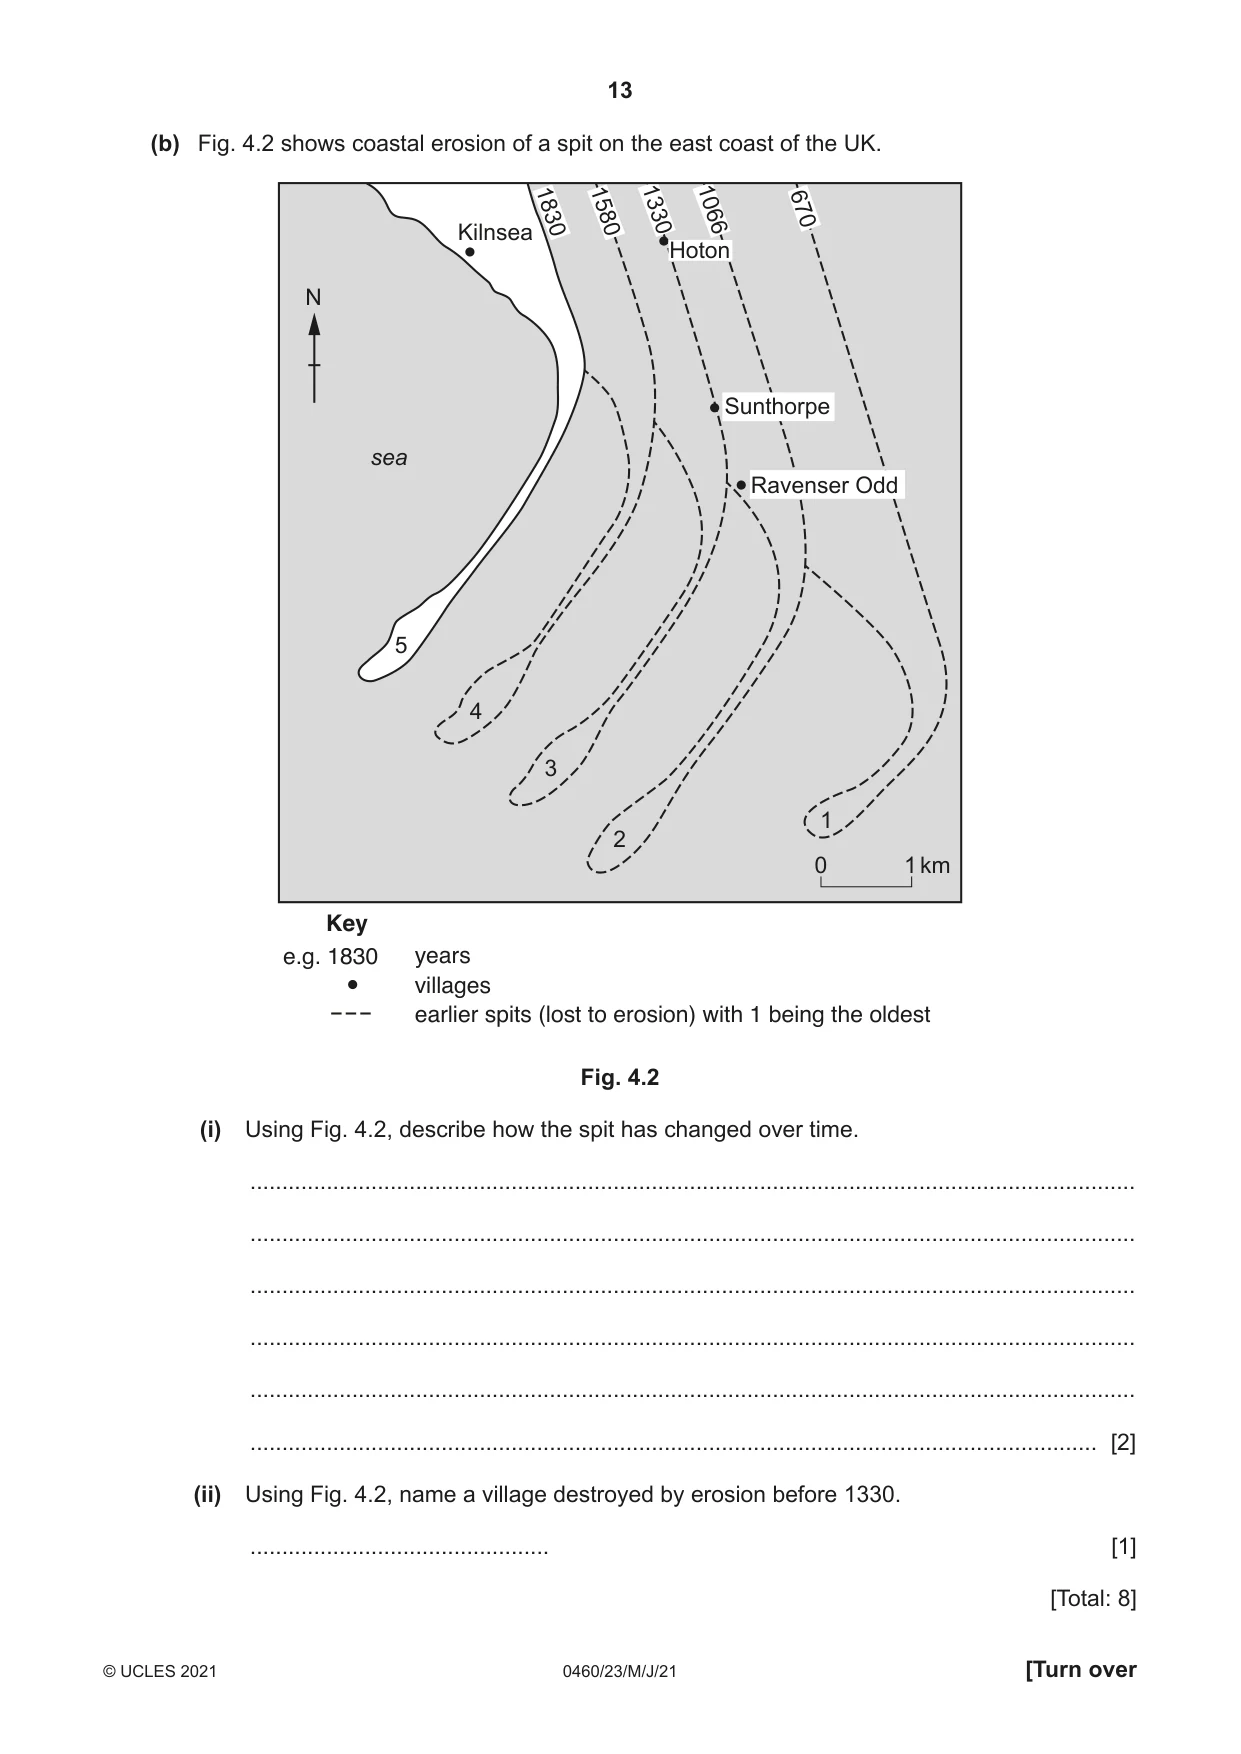
4 Fig. 4.1 (Insert) is a photograph showing a coastal deposition feature, a spit, at Spurn Head, England. (a) (i) Describe the feature shown in Fig. 4.1. ........................................................................................................................................... ........................................................................................................................................... ........................................................................................................................................... ........................................................................................................................................... ........................................................................................................................................... ..................................................................................................................................... [4] (ii) What process leads to the formation of spits? Circle the correct answer. erosion longshore drift corrasion attrition [1] (b) Fig. 4.2 shows coastal erosion of a spit on the east coast of the UK. 1830 1580 1330 1066 670 Kilnsea Hoton N Sunthorpe sea Ravenser Odd 5 4 3 1 2 0 1 km Key e.g. 1830 years villages earlier spits (lost to erosion) with 1 being the oldest Fig. 4.2 (i) Using Fig. 4.2, describe how the spit has changed over time. ........................................................................................................................................... ........................................................................................................................................... ........................................................................................................................................... ........................................................................................................................................... ........................................................................................................................................... ..................................................................................................................................... [2] (ii) Using Fig. 4.2, name a village destroyed by erosion before 1330. ............................................... [1] [Total: 8]
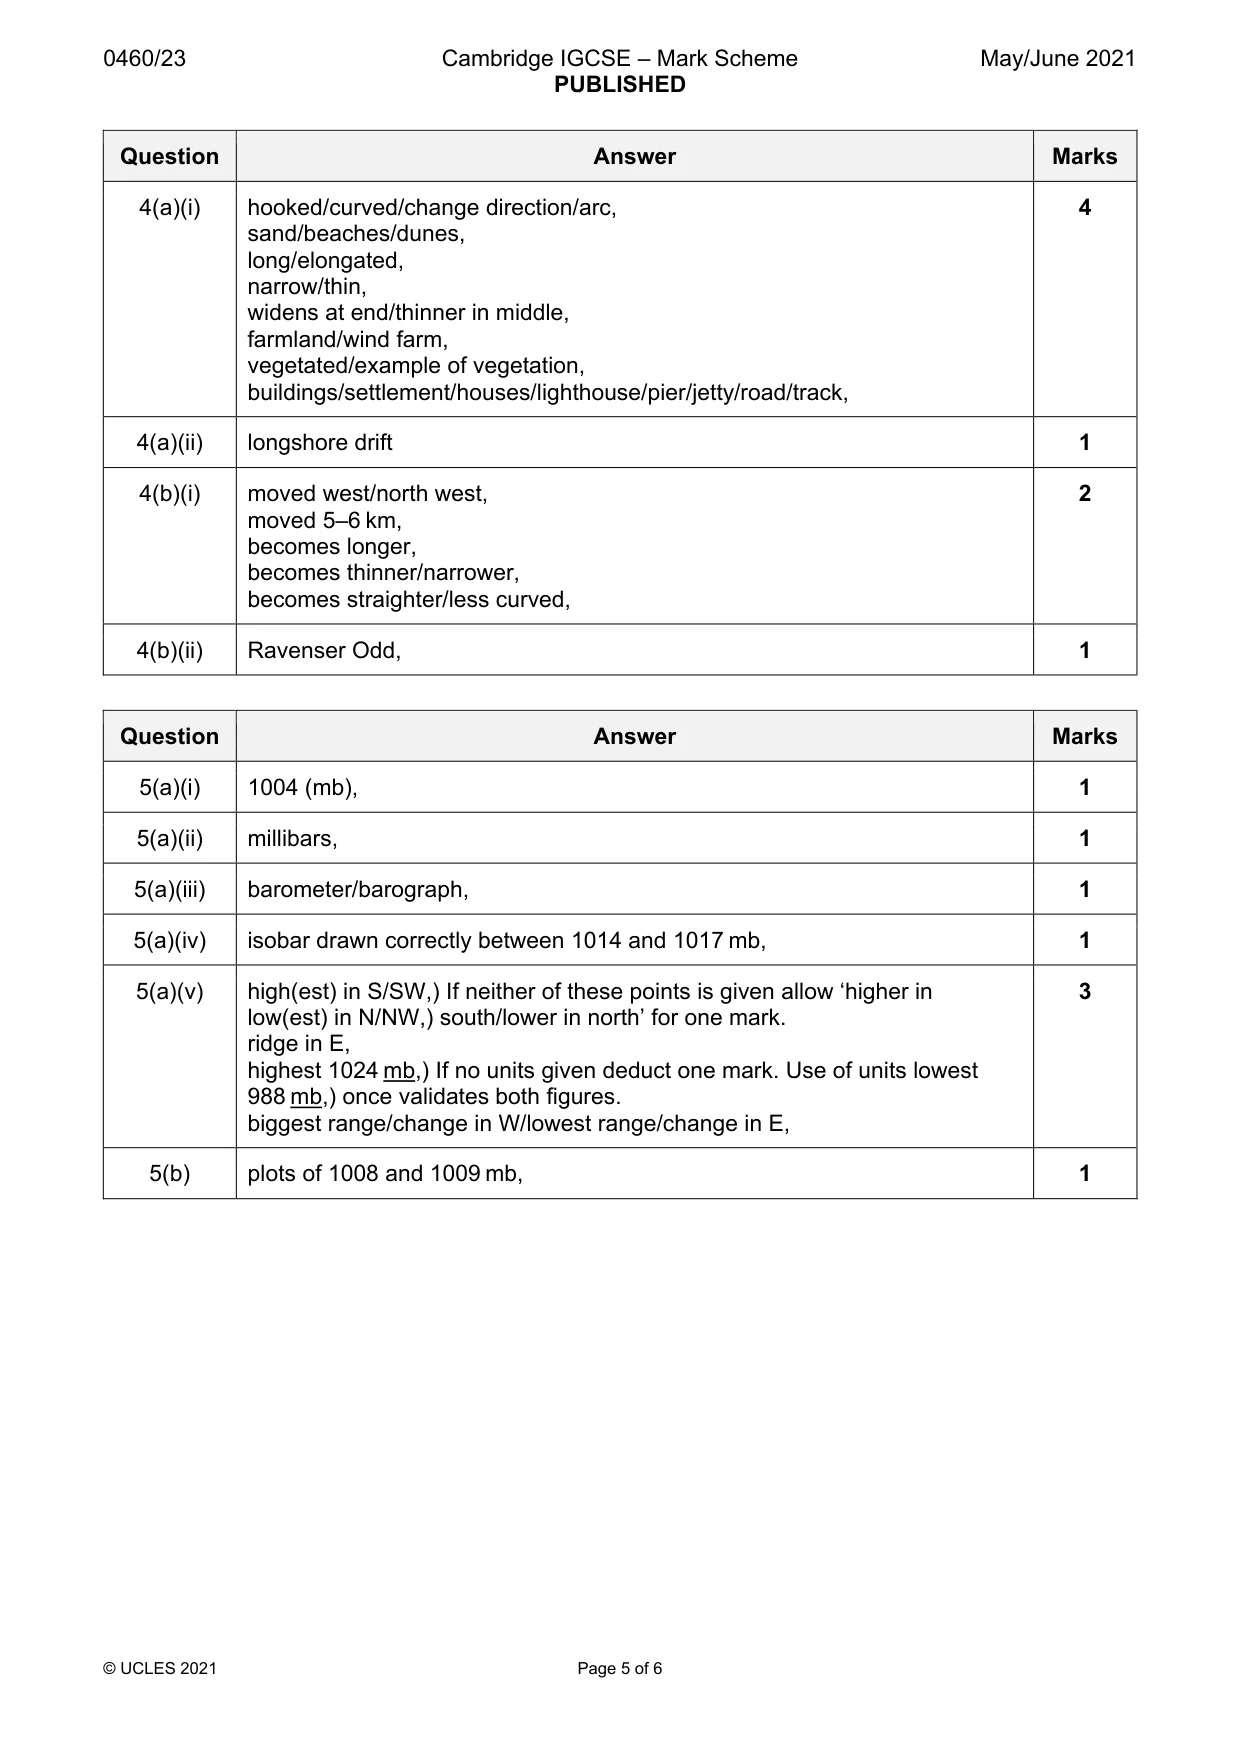
Mark scheme: 4(a)(i) hooked/curved/change direction/arc, 4 sand/beaches/dunes, long/elongated, narrow/thin, widens at end/thinner in middle, farmland/wind farm, vegetated/example of vegetation, buildings/settlement/houses/lighthouse/pier/jetty/road/track, 4(a)(ii) longshore drift 1 4(b)(i) moved west/north west, 2 moved 5–6 km, becomes longer, becomes thinner/narrower, becomes straighter/less curved, 4(b)(ii) Ravenser Odd, 1
Q5 · Isobars join points of equal air pressure on a weather map
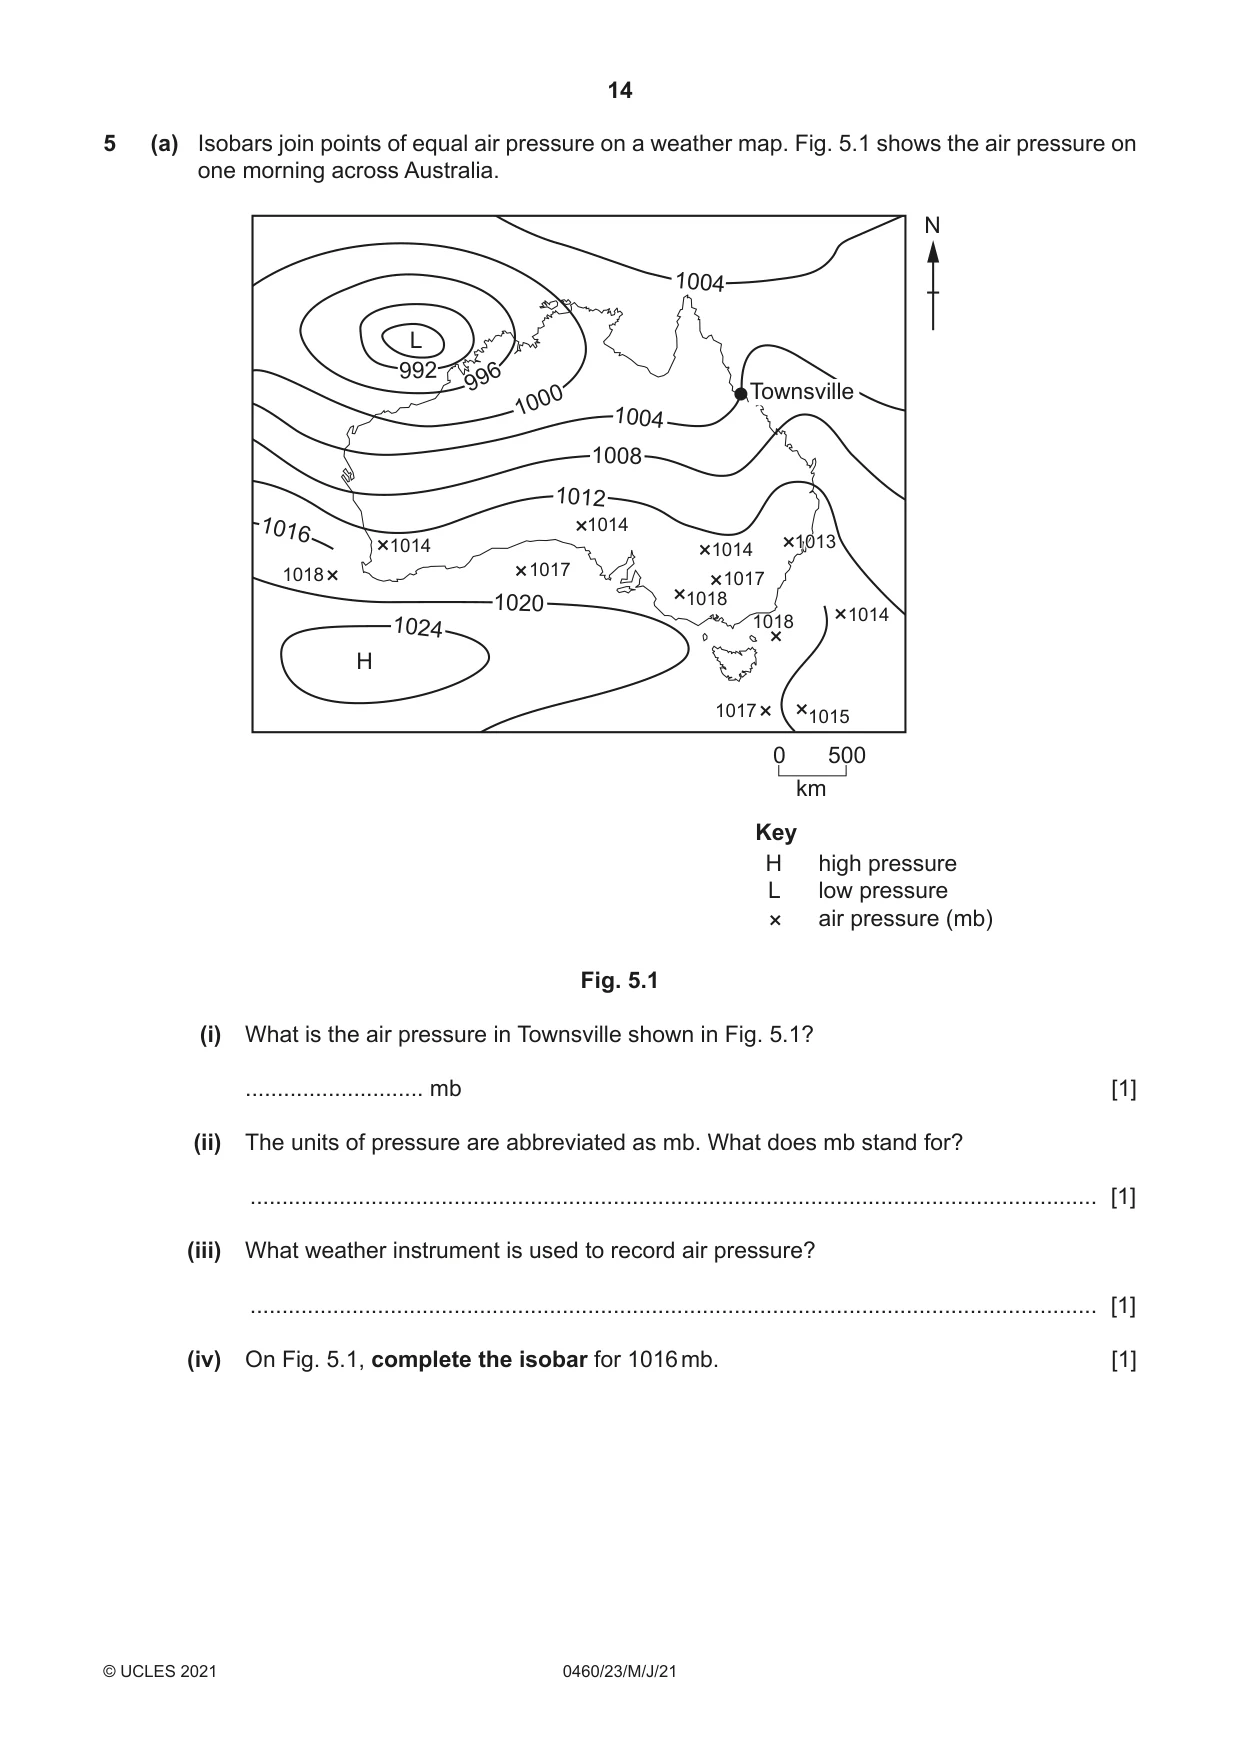
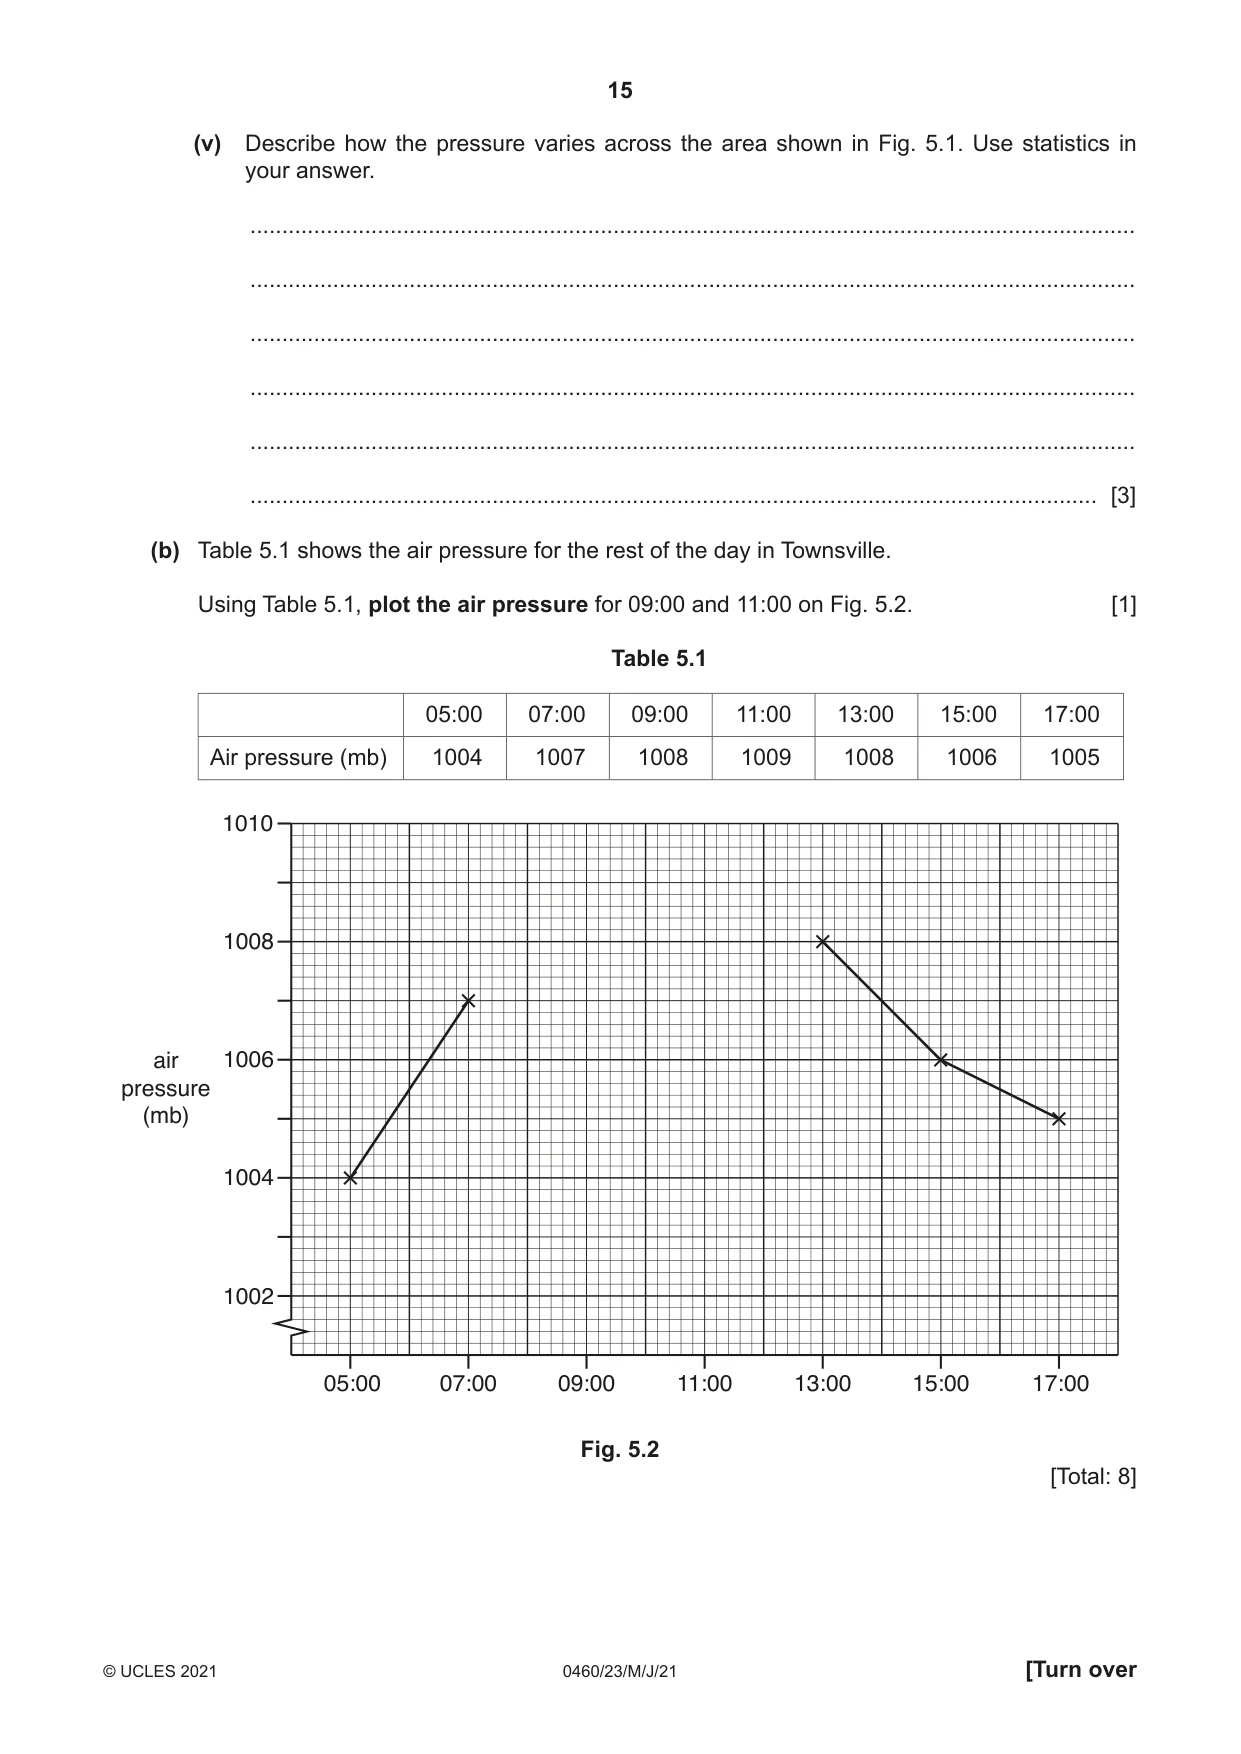
5 (a) Isobars join points of equal air pressure on a weather map. Fig. 5.1 shows the air pressure on one morning across Australia. N 1004 L 992 996 1000 Townsville 1004 1008 1012 1014 1016 1013 1014 1014 1018 1017 1017 1020 1018 1014 1024 1018 H 1017 1015 0 500 km Key H high pressure L low pressure air pressure (mb) Fig. 5.1 (i) What is the air pressure in Townsville shown in Fig. 5.1? ............................ mb [1] (ii) The units of pressure are abbreviated as mb. What does mb stand for? ..................................................................................................................................... [1] (iii) What weather instrument is used to record air pressure? ..................................................................................................................................... [1] (iv) On Fig. 5.1, complete the isobar for 1016 mb. [1] (v) Describe how the pressure varies across the area shown in Fig. 5.1. Use statistics in your answer. ........................................................................................................................................... ........................................................................................................................................... ........................................................................................................................................... ........................................................................................................................................... ........................................................................................................................................... ..................................................................................................................................... [3] (b) Table 5.1 shows the air pressure for the rest of the day in Townsville. Using Table 5.1, plot the air pressure for 09:00 and 11:00 on Fig. 5.2. [1] Table 5.1 05:00 07:00 09:00 11:00 13:00 15:00 17:00 Air pressure (mb) 1004 1007 1008 1009 1008 1006 1005 1010 1008 air 1006 pressure (mb) 1004 1002 05:00 07:00 09:00 11:00 13:00 15:00 17:00 Fig. 5.2 [Total: 8]
Mark scheme: 5(a)(i) 1004 (mb), 1 5(a)(ii) millibars, 1 5(a)(iii) barometer/barograph, 1 5(a)(iv) isobar drawn correctly between 1014 and 1017 mb, 1 5(a)(v) high(est) in S/SW,) If neither of these points is given allow ‘higher in 3 low(est) in N/NW,) south/lower in north’ for one mark. ridge in E, highest 1024 mb,) If no units given deduct one mark. Use of units lowest 988 mb,) once validates both figures. biggest range/change in W/lowest range/change in E, 5(b) plots of 1008 and 1009 mb, 1
Q6 · A systems diagram of an aluminium parts manufacturing company
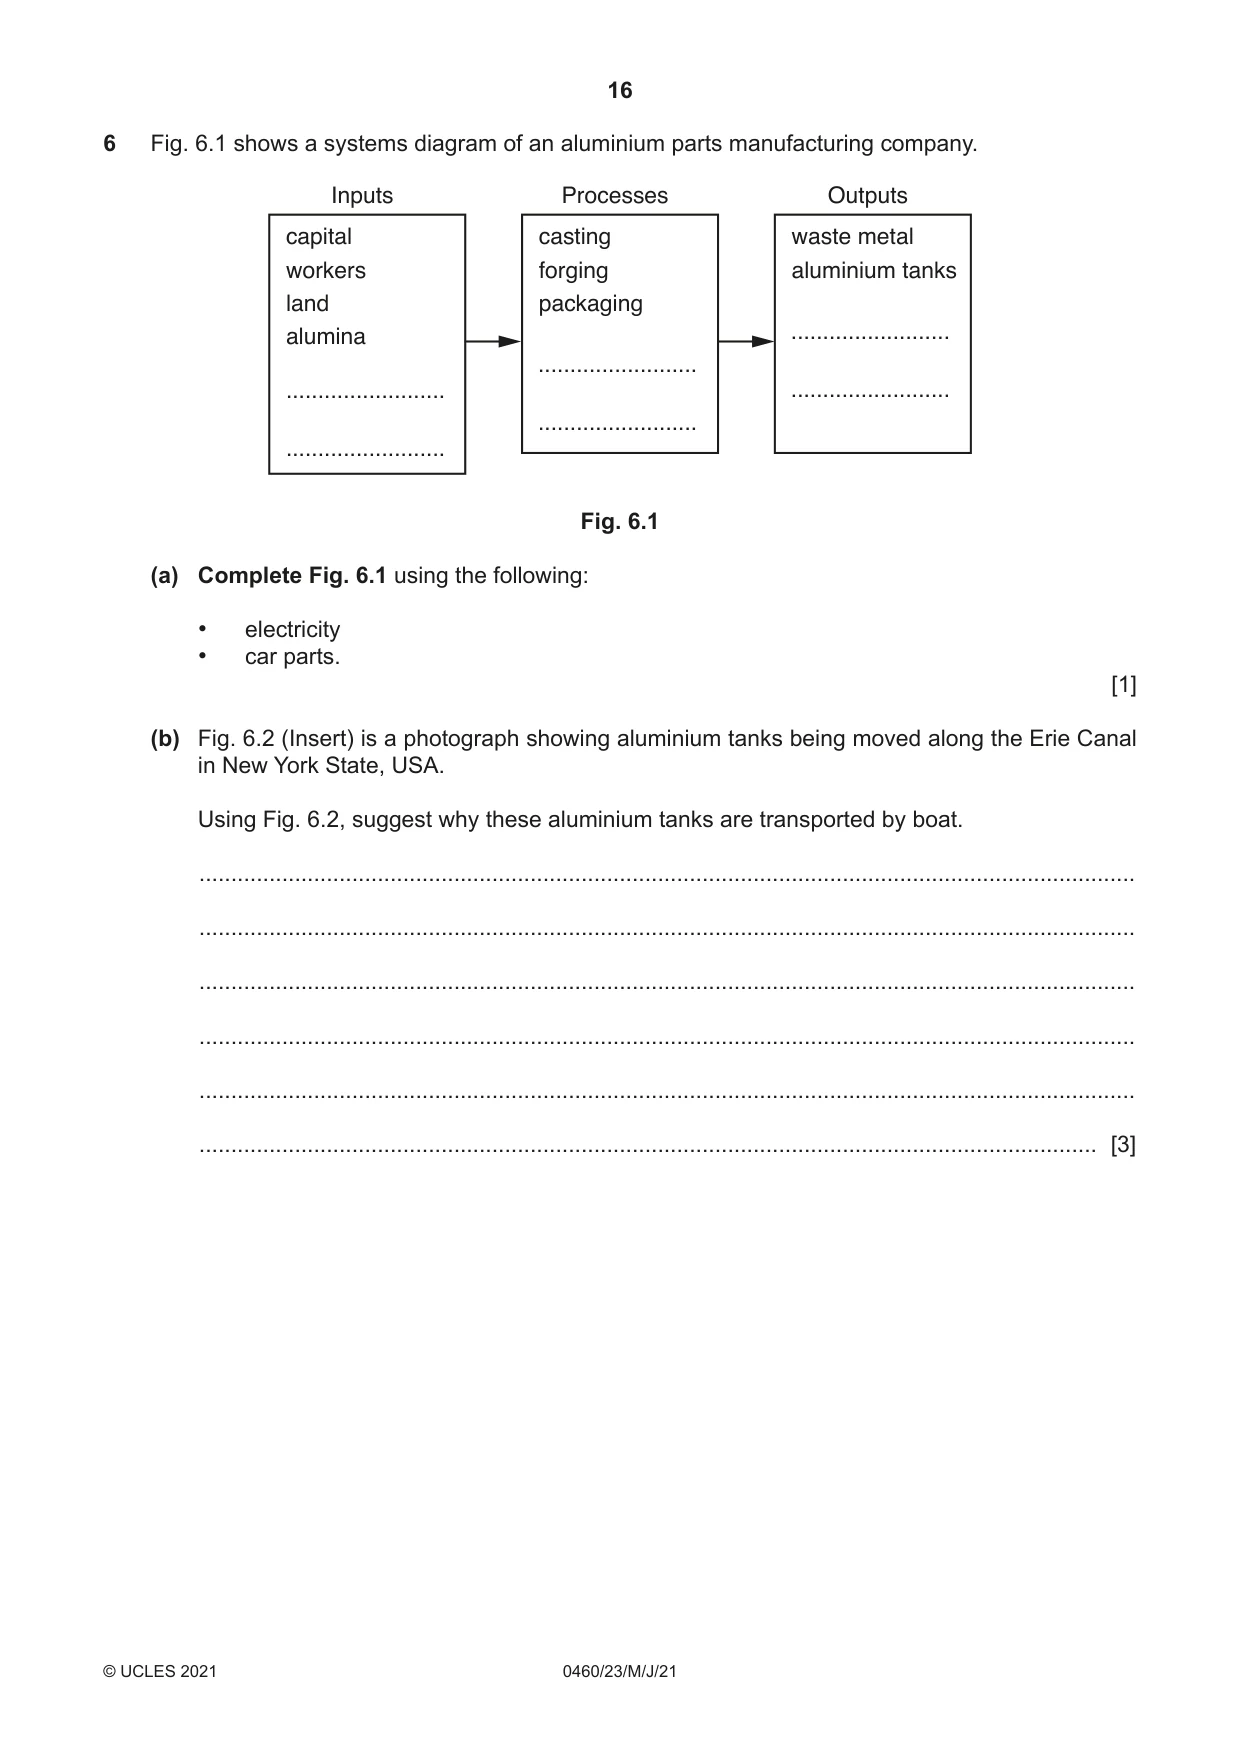
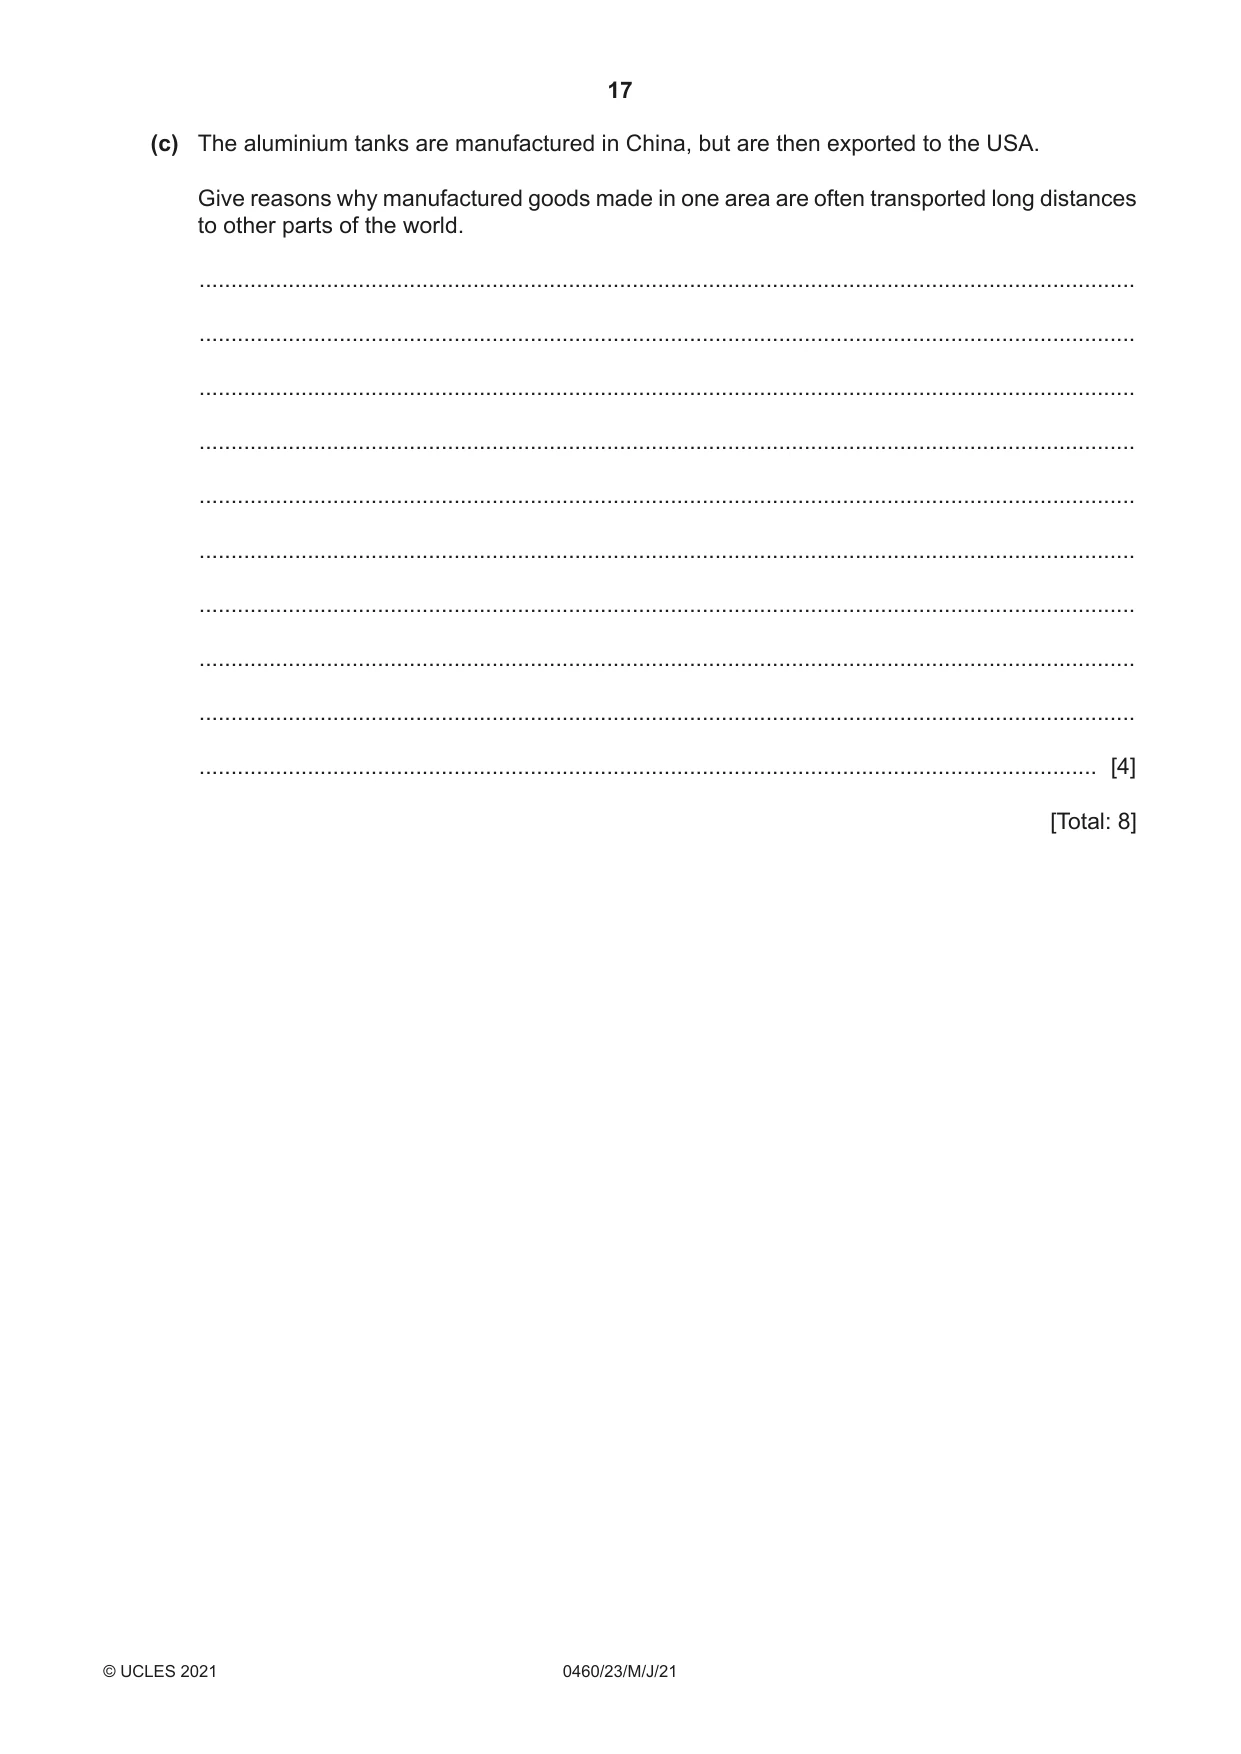
6 Fig. 6.1 shows a systems diagram of an aluminium parts manufacturing company. Inputs Processes Outputs capital casting waste metal workers forging aluminium tanks land packaging alumina ......................... ......................... ......................... ......................... ......................... ......................... Fig. 6.1 (a) Complete Fig. 6.1 using the following: • electricity • car parts. [1] (b) Fig. 6.2 (Insert) is a photograph showing aluminium tanks being moved along the Erie Canal in New York State, USA. Using Fig. 6.2, suggest why these aluminium tanks are transported by boat. ................................................................................................................................................... ................................................................................................................................................... ................................................................................................................................................... ................................................................................................................................................... ................................................................................................................................................... ............................................................................................................................................. [3] (c) The aluminium tanks are manufactured in China, but are then exported to the USA. Give reasons why manufactured goods made in one area are often transported long distances to other parts of the world. ................................................................................................................................................... ................................................................................................................................................... ................................................................................................................................................... ................................................................................................................................................... ................................................................................................................................................... ................................................................................................................................................... ................................................................................................................................................... ................................................................................................................................................... ................................................................................................................................................... ............................................................................................................................................. [4] [Total: 8] Additional Pages If you use the following lined pages to complete the answer(s) to any question(s), the question number(s) must be clearly shown. .................................................................................................................................................................. .................................................................................................................................................................. .................................................................................................................................................................. .................................................................................................................................................................. .................................................................................................................................................................. .................................................................................................................................................................. .................................................................................................................................................................. .................................................................................................................................................................. .................................................................................................................................................................. .................................................................................................................................................................. .................................................................................................................................................................. .................................................................................................................................................................. .................................................................................................................................................................. .................................................................................................................................................................. .................................................................................................................................................................. .................................................................................................................................................................. .................................................................................................................................................................. .................................................................................................................................................................. .................................................................................................................................................................. .................................................................................................................................................................. .................................................................................................................................................................. .................................................................................................................................................................. .................................................................................................................................................................. .................................................................................................................................................................. ..................................................................................................................................................................
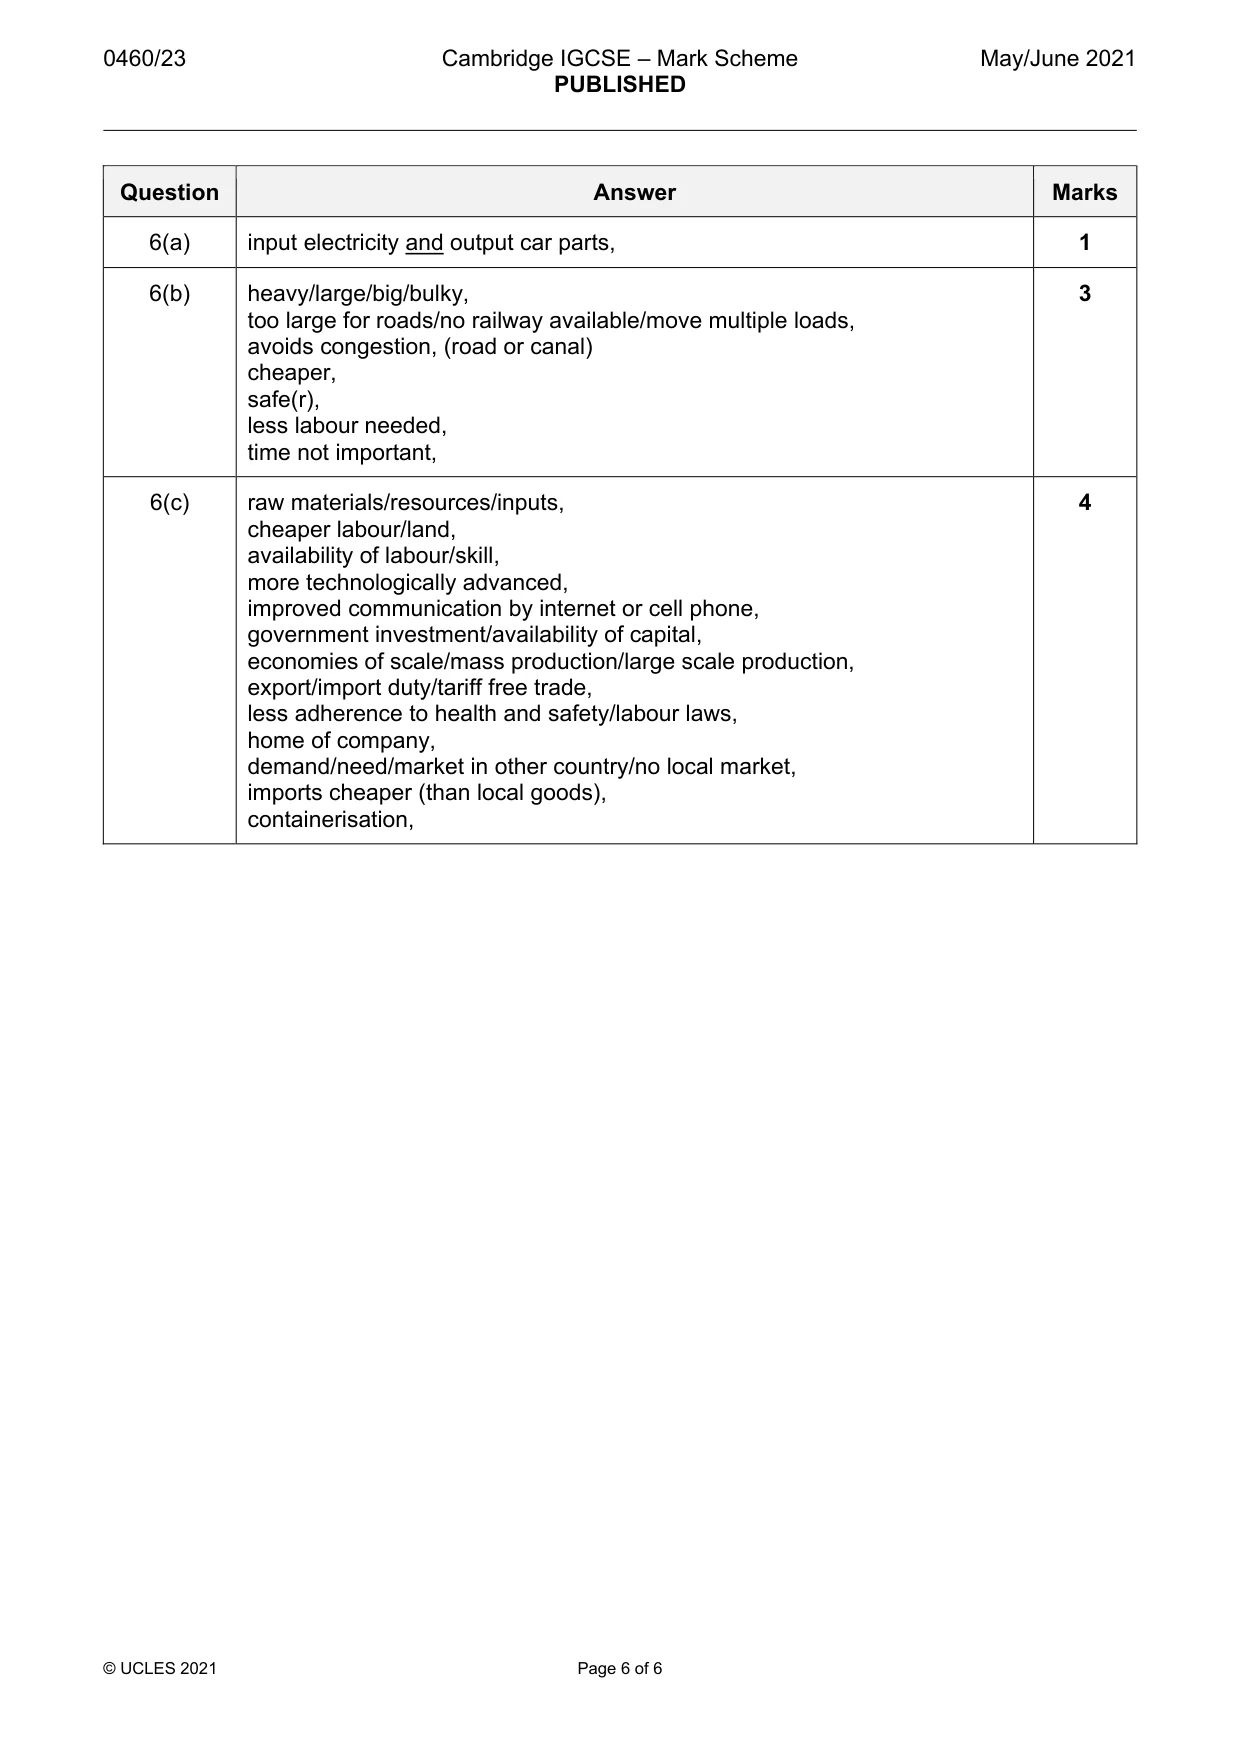
Mark scheme: 6(a) input electricity and output car parts, 1 6(b) heavy/large/big/bulky, 3 too large for roads/no railway available/move multiple loads, avoids congestion, (road or canal) cheaper, safe(r), less labour needed, time not important, 6(c) raw materials/resources/inputs, 4 cheaper labour/land, availability of labour/skill, more technologically advanced, improved communication by internet or cell phone, government investment/availability of capital, economies of scale/mass production/large scale production, export/import duty/tariff free trade, less adherence to health and safety/labour laws, home of company, demand/need/market in other country/no local market, imports cheaper (than local goods), containerisation,
What was in this paper
The subtopics covered by these 6 questions, and how many questions each got. Open one in a new tab to see every Cambridge question on it.
What you needed in this session
Cambridge’s own grade thresholds for 2021 May/June, Paper 2 · Variant 3. A higher threshold means an easier paper — the bar moves with how the cohort did.