Questions as text
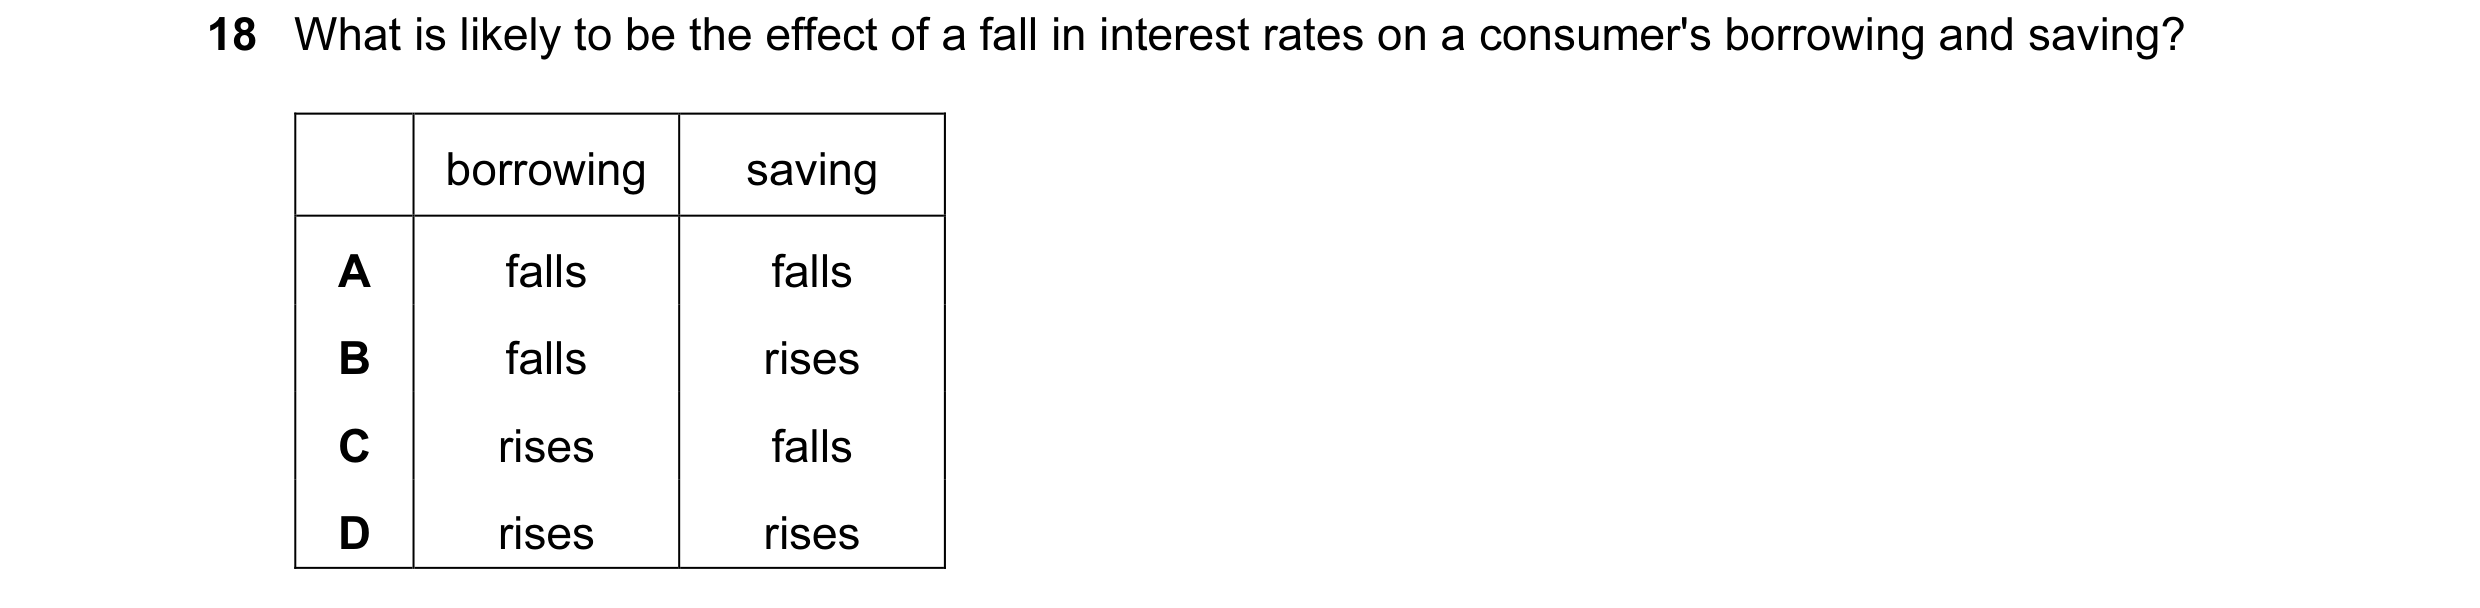
Q1 · What is likely to be the effect of a fall in interest rates on a consumer's borrowing and… 0455/11 Oct/Nov 2004
18 What is likely to be the effect of a fall in interest rates on a consumer's borrowing and saving? borrowing saving A falls falls B falls rises C rises falls D rises rises
1 marks
Answer: C
This question in 0455/11 Oct/Nov 2004
Q2 · What is most likely to cause the percentage of income saved in an economy to rise? 0455/11 Oct/Nov 2004
19 What is most likely to cause the percentage of income saved in an economy to rise? A a rise in consumer confidence B a rise in direct taxation C a rise in unemployment D a rise in wage rates
1 marks
Answer: D
This question in 0455/11 Oct/Nov 2004
Q3 · Which factor is likely to cause an increase in people’s savings? 0455/11 May/June 2006
16 Which factor is likely to cause an increase in people’s savings? A an increase in tax rates B an increase in the interest rate C a reduction in economic uncertainty D a reduction in real wages
1 marks
Answer: B
This question in 0455/11 May/June 2006
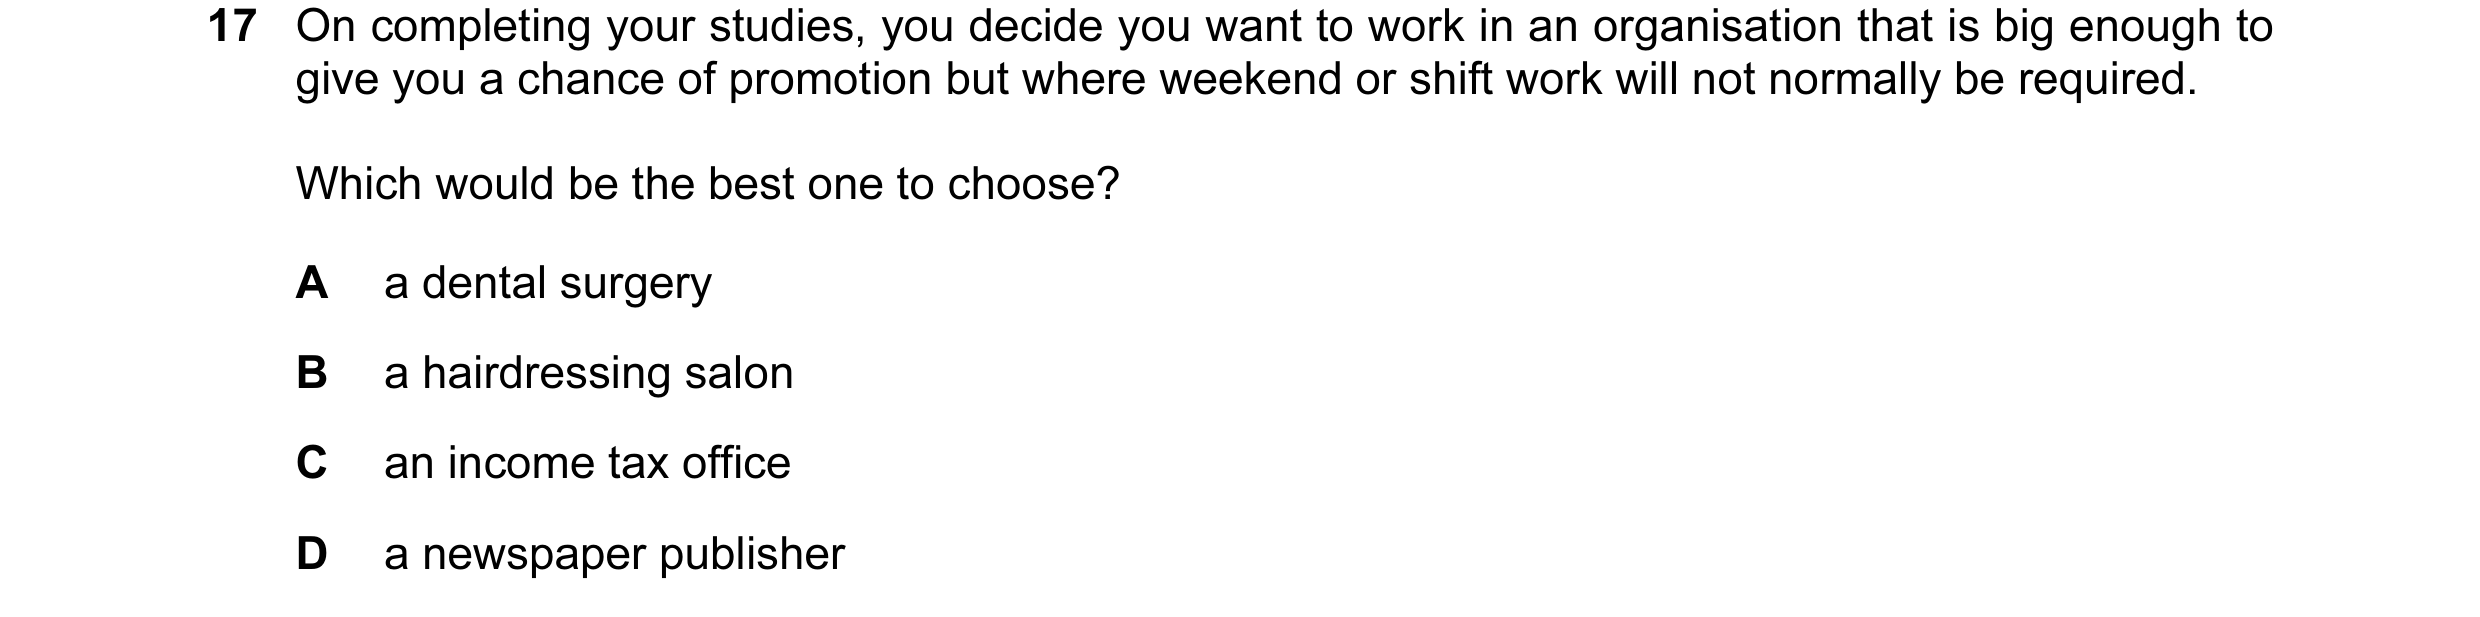
Q4 · On completing your studies, you decide you want to work in an organisation that is big… 0455/11 May/June 2006
17 On completing your studies, you decide you want to work in an organisation that is big enough to give you a chance of promotion but where weekend or shift work will not normally be required. Which would be the best one to choose? A a dental surgery B a hairdressing salon C an income tax office D a newspaper publisher
1 marks
Answer: C
This question in 0455/11 May/June 2006
Q5 · Which group is likely to save the largest proportion of its income? 0455/11 May/June 2007
15 Which group is likely to save the largest proportion of its income? A employed workers B retired people C school students D unemployed workers
1 marks
Answer: A
This question in 0455/11 May/June 2007
Q6 · What is not included in a person’s stock of wealth? 0455/11 May/June 2007
16 What is not included in a person’s stock of wealth? A a gold watch B annual income C an oil painting D company shares
1 marks
Answer: B
This question in 0455/11 May/June 2007
Q7 · What is likely to be found when comparing high income earners with low income earners? 0455/11 May/June 2008
18 What is likely to be found when comparing high income earners with low income earners? A High income earners pay a lower proportion of their income in direct tax. B High income earners spend a lower proportion of their income on food. C High income earners spend a lower proportion of their income on foreign travel. D High income earners save a lower proportion of their income.
1 marks
Answer: B
This question in 0455/11 May/June 2008
Q8 · What would encourage a rise in spending but not a rise in saving? 0455/11 May/June 2008
19 What would encourage a rise in spending but not a rise in saving? A easier credit facilities B more people working C rising interest rates D rising standards of living
1 marks
Answer: A
This question in 0455/11 May/June 2008
Q9 · What might cause an individual to save more? 0455/11 Oct/Nov 2008
18 What might cause an individual to save more? A a rise in direct taxation B a rise in insurance premiums C a rise in interest rates D a rise in the prices of foodstuffs
1 marks
Answer: C
This question in 0455/11 Oct/Nov 2008
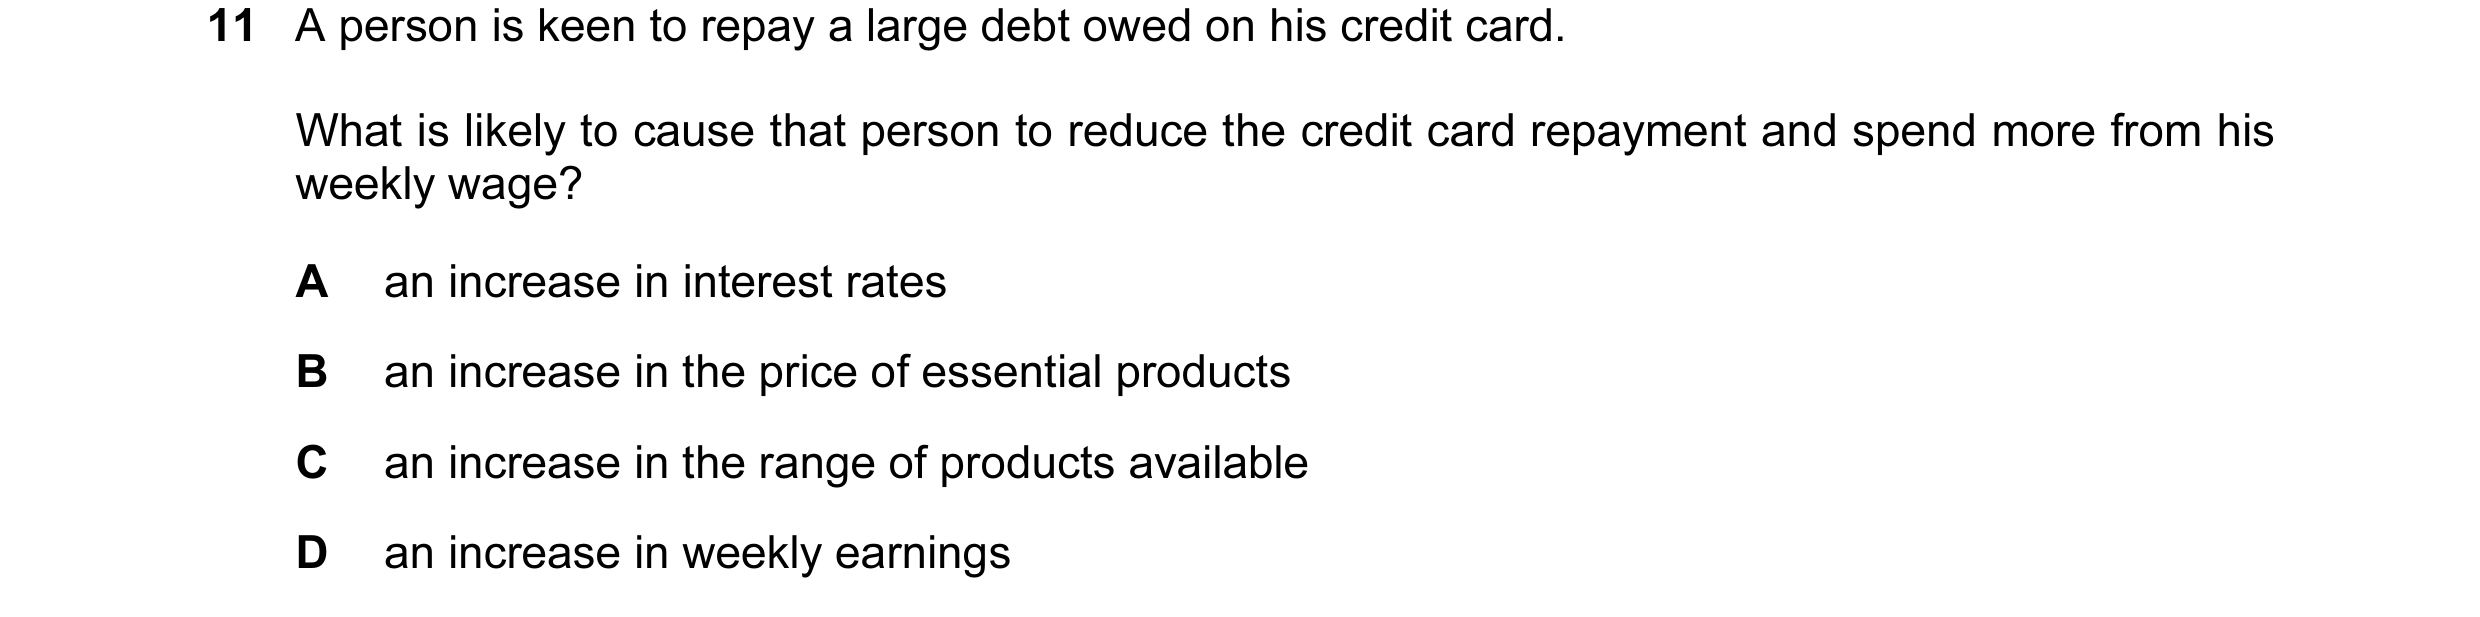
Q10 · A person is keen to repay a large debt owed on his credit card 0455/11 May/June 2009
11 A person is keen to repay a large debt owed on his credit card. What is likely to cause that person to reduce the credit card repayment and spend more from his weekly wage? A an increase in interest rates B an increase in the price of essential products C an increase in the range of products available D an increase in weekly earnings
1 marks
Answer: B
This question in 0455/11 May/June 2009
Q11 · Why might a family increase the proportion of its income it spends on food? 0455/11 Oct/Nov 2009
11 Why might a family increase the proportion of its income it spends on food? A Some of the children start work. B The government increases the benefits it pays to families. C The number of children in the family increases. D The second parent becomes employed.
1 marks
Answer: C
This question in 0455/11 Oct/Nov 2009
Q12 · A person is most likely to save more when there is an increase in a country’s A exchange… 0455/11 May/June 2010
10 A person is most likely to save more when there is an increase in a country’s A exchange rate. B inflation rate. C interest rates. D money supply.
1 marks
Answer: C
This question in 0455/11 May/June 2010
Q13 · A person is most likely to save more when there is an increase in a country’s A exchange… 0455/12 May/June 2010
11 A person is most likely to save more when there is an increase in a country’s A exchange rate. B inflation rate. C interest rates. D money supply.
1 marks
Answer: C
This question in 0455/12 May/June 2010
Q14 · What may cause an individual to save a higher proportion of their income? 0455/11 May/June 2011
10 What may cause an individual to save a higher proportion of their income? A a belief that the price of goods will rise in the future B a fall in the rate of interest paid by the country’s banks C a fear that income will fall in the future D a rise in the individual’s wish to enjoy higher consumption immediately
1 marks
Answer: C
This question in 0455/11 May/June 2011
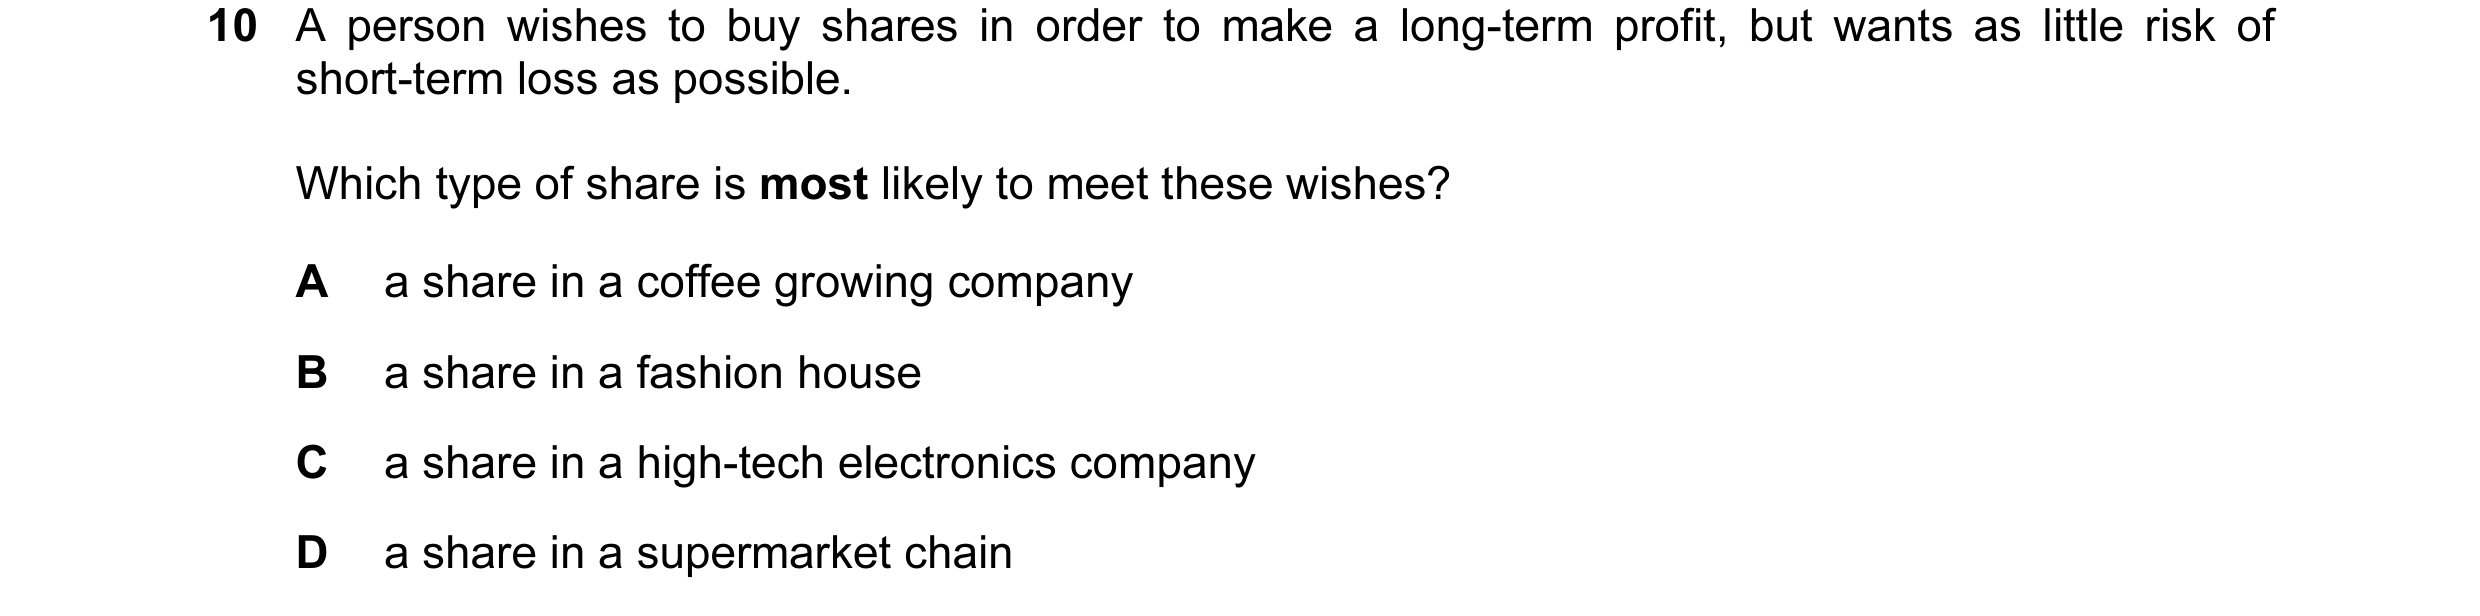
Q15 · A person wishes to buy shares in order to make a long-term profit, but wants as little… 0455/12 May/June 2011
10 A person wishes to buy shares in order to make a long-term profit, but wants as little risk of short-term loss as possible. Which type of share is most likely to meet these wishes? A a share in a coffee growing company B a share in a fashion house C a share in a high-tech electronics company D a share in a supermarket chain
1 marks
Answer: D
This question in 0455/12 May/June 2011
Q16 · What may cause an individual to save a higher proportion of their income? 0455/12 May/June 2011
14 What may cause an individual to save a higher proportion of their income? A a belief that the price of goods will rise in the future B a fall in the rate of interest paid by the country’s banks C a fear that income will fall in the future D a rise in the individual’s wish to enjoy higher consumption immediately
1 marks
Answer: C
This question in 0455/12 May/June 2011
Q17 · What may cause an individual to save a higher proportion of their income? 0455/13 May/June 2011
14 What may cause an individual to save a higher proportion of their income? A a belief that the price of goods will rise in the future B a fall in the rate of interest paid by the country’s banks C a fear that income will fall in the future D a rise in the individual’s wish to enjoy higher consumption immediately
1 marks
Answer: C
This question in 0455/13 May/June 2011
Q18 · Which motive is most likely to increase the wish to open a savings account? 0455/11 Oct/Nov 2011
10 Which motive is most likely to increase the wish to open a savings account? A to have cash immediately available B to prepare for future expenditure C to satisfy essential needs D to widen present consumption choices
1 marks
Answer: B
This question in 0455/11 Oct/Nov 2011
Q19 · Which motive is most likely to increase the wish to open a savings account? 0455/12 Oct/Nov 2011
11 Which motive is most likely to increase the wish to open a savings account? A to have cash immediately available B to prepare for future expenditure C to satisfy essential needs D to widen present consumption choices
1 marks
Answer: B
This question in 0455/12 Oct/Nov 2011
Q20 · Which motive is most likely to increase the wish to open a savings account? 0455/13 Oct/Nov 2011
12 Which motive is most likely to increase the wish to open a savings account? A to have cash immediately available B to prepare for future expenditure C to satisfy essential needs D to widen present consumption choices
1 marks
Answer: B
This question in 0455/13 Oct/Nov 2011
Q21 · What might cause a rise in the proportion of income that a person saves? 0455/11 May/June 2012
12 What might cause a rise in the proportion of income that a person saves? A a fall in interest rates B a fall in population C a fall in real incomes D a fall in the income tax rate
1 marks
Answer: D
This question in 0455/11 May/June 2012
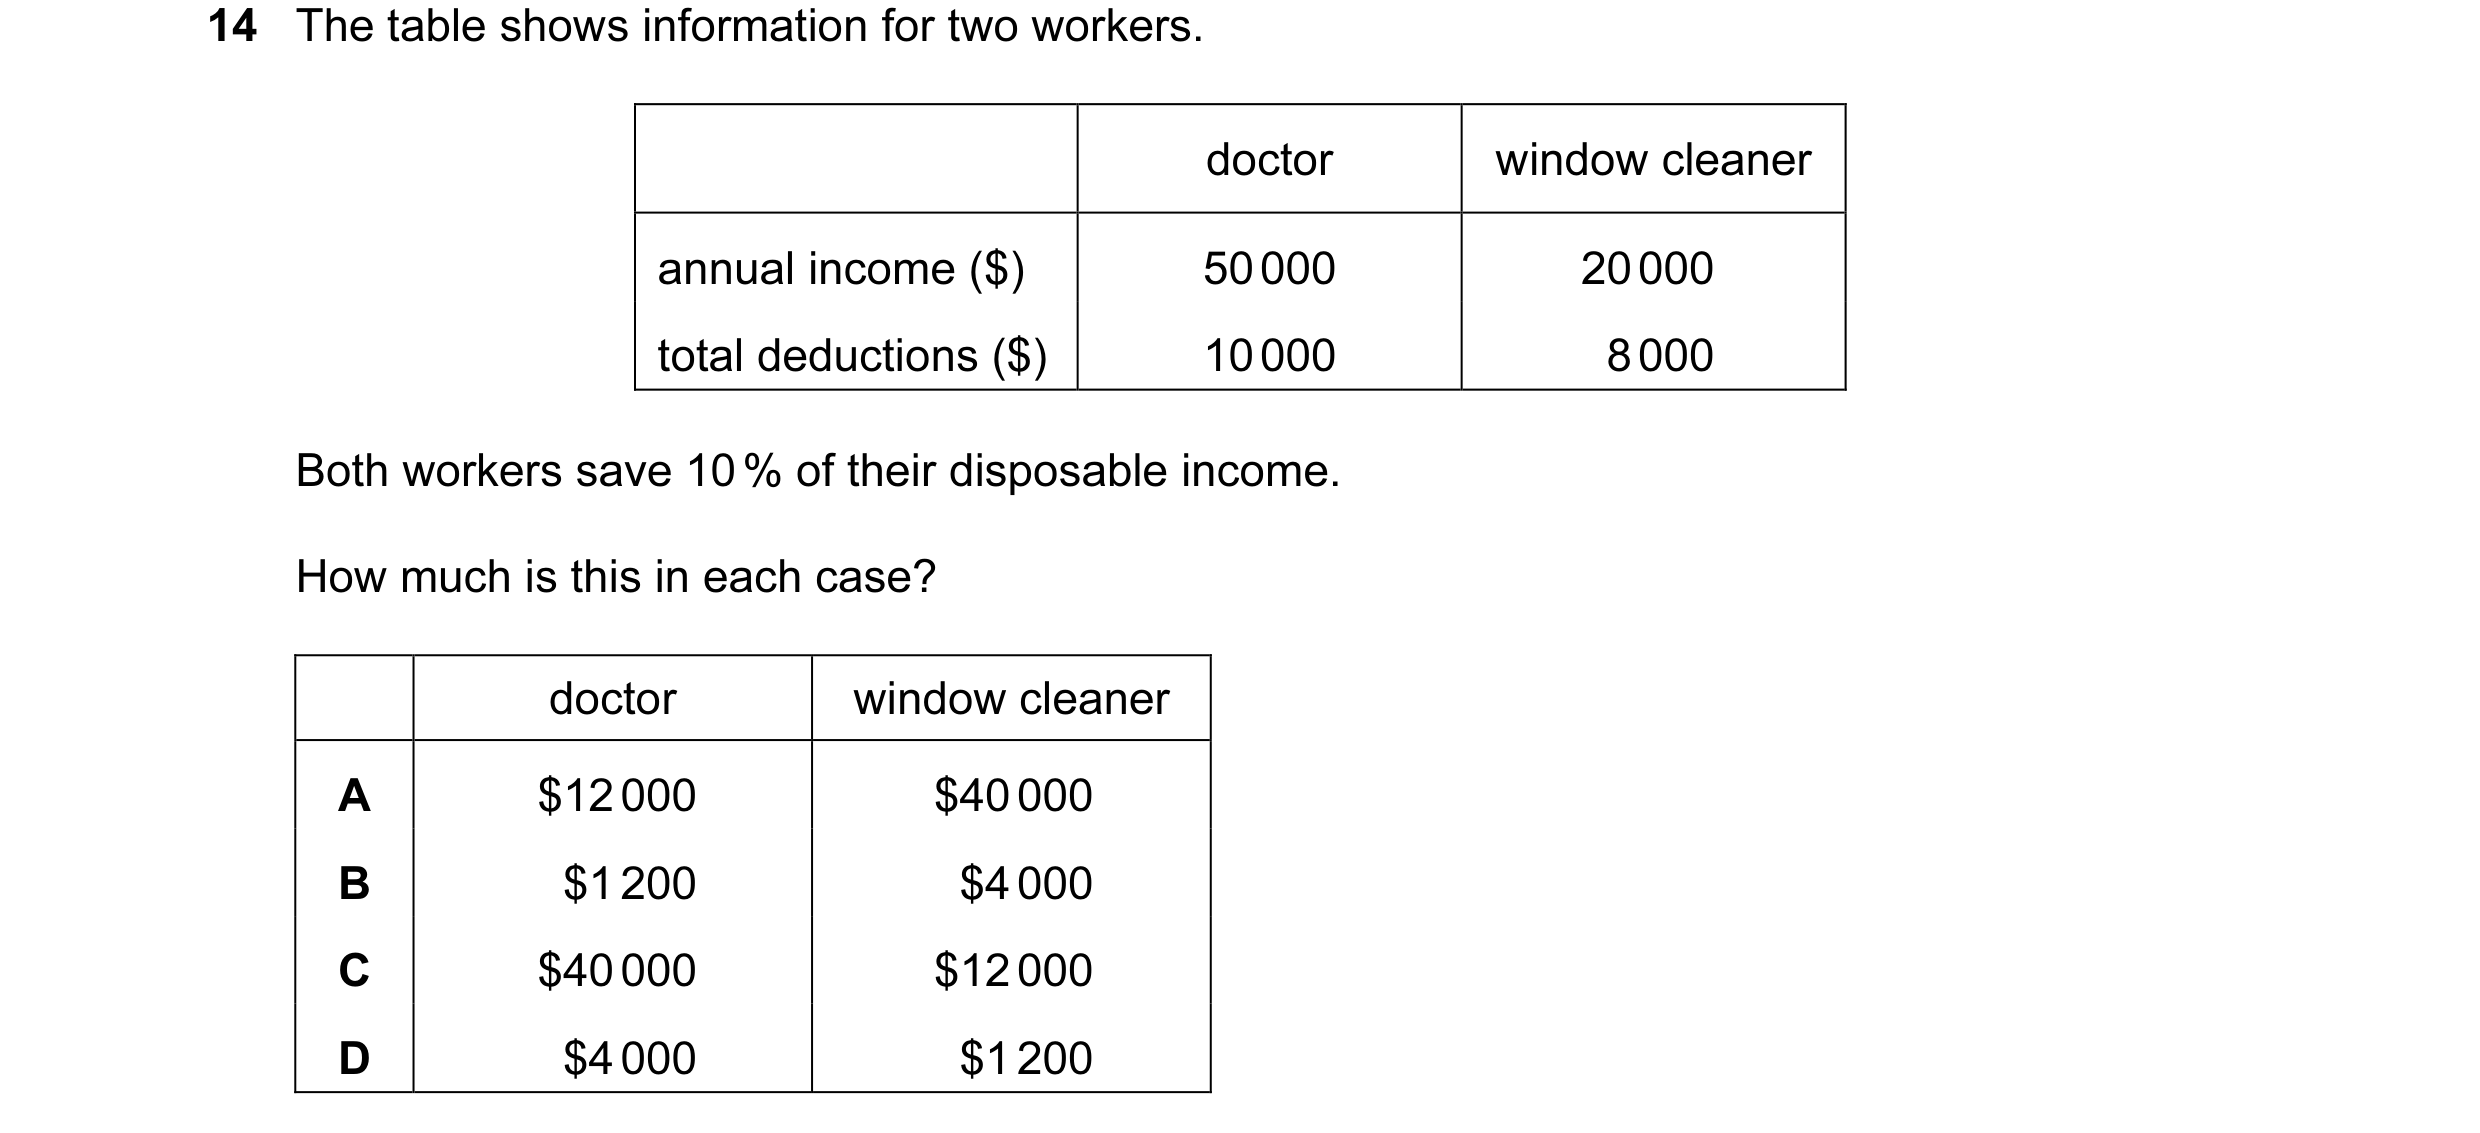
Q22 · The table shows information for two workers 0455/11 May/June 2012
14 The table shows information for two workers. doctor window cleaner annual income ($) 50 000 20 000 total deductions ($) 10 000 8 000 Both workers save 10 % of their disposable income. How much is this in each case? doctor window cleaner A $12 000 $40 000 B $1 200 $4 000 C $40 000 $12 000 D $4 000 $1 200
1 marks
Answer: D
This question in 0455/11 May/June 2012
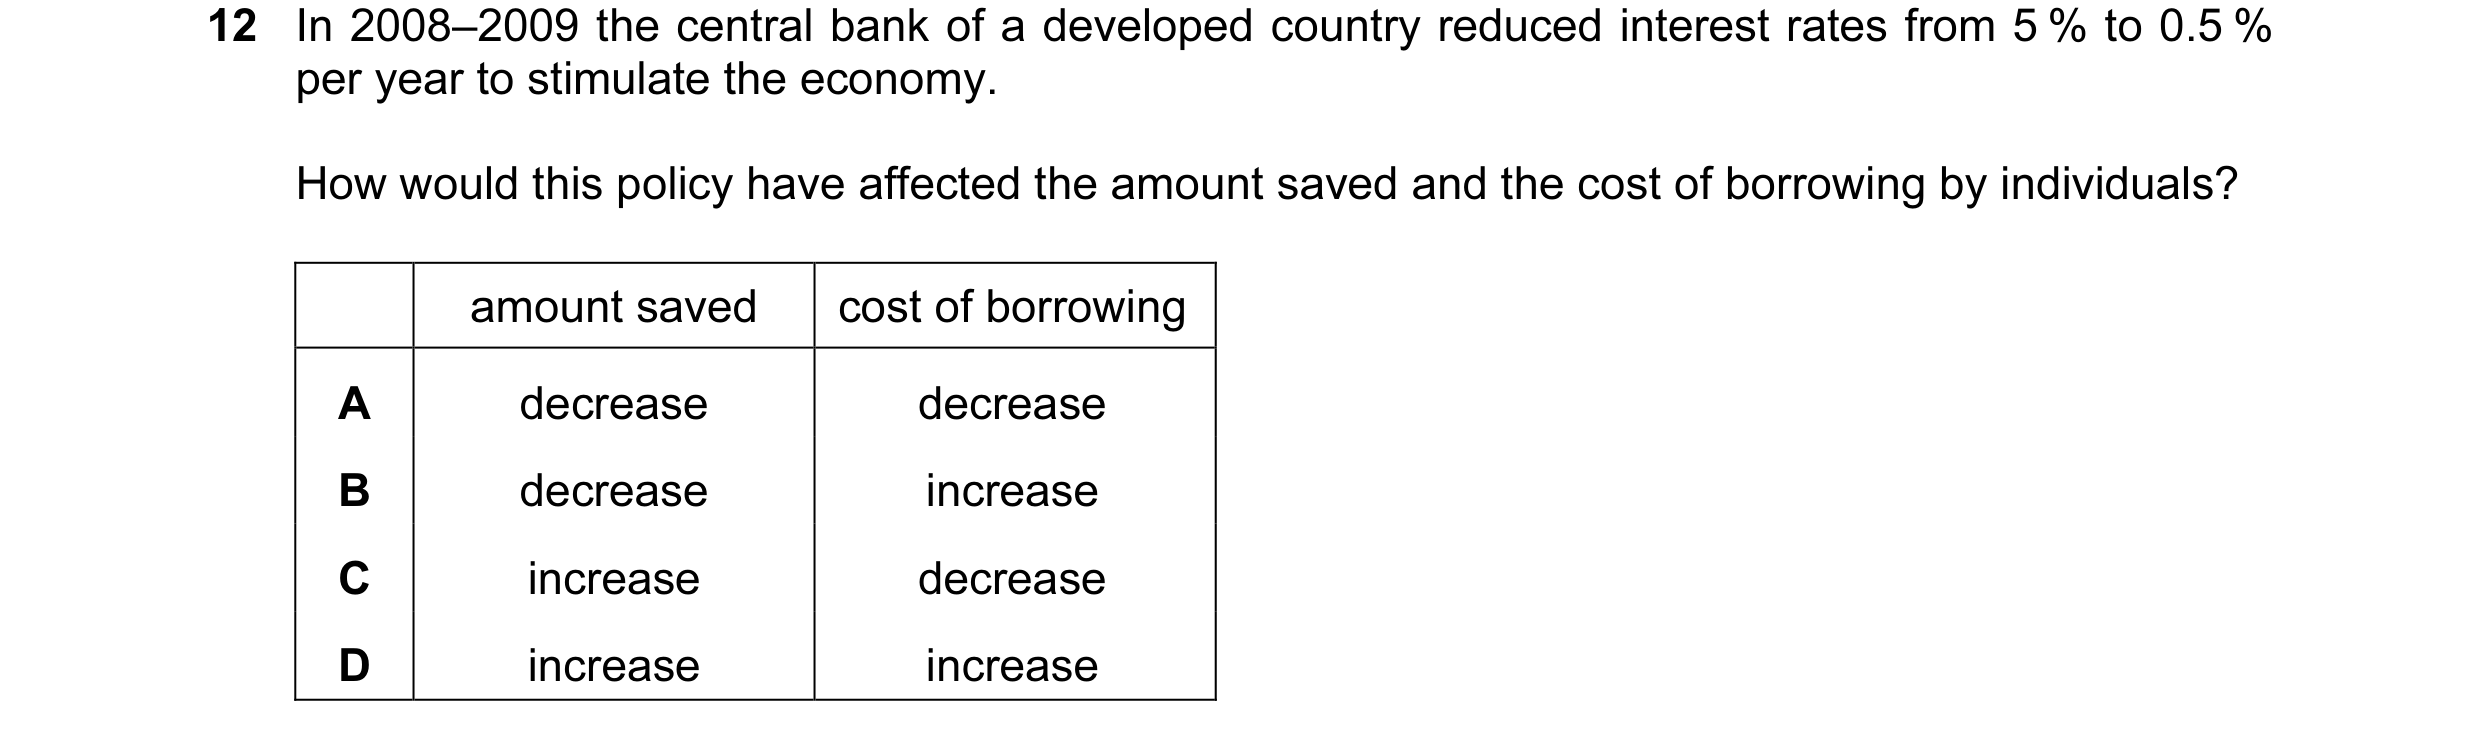
Q23 · In 2008–2009 the central bank of a developed country reduced interest rates from 5 % to… 0455/12 May/June 2012
12 In 2008–2009 the central bank of a developed country reduced interest rates from 5 % to 0.5 % per year to stimulate the economy. How would this policy have affected the amount saved and the cost of borrowing by individuals? amount saved cost of borrowing A decrease decrease B decrease increase C increase decrease D increase increase
1 marks
Answer: A
This question in 0455/12 May/June 2012
Q24 · The table shows information for two workers 0455/12 May/June 2012
14 The table shows information for two workers. doctor window cleaner annual income ($) 50 000 20 000 total deductions ($) 10 000 8 000 Both workers save 10 % of their disposable income. How much is this in each case? doctor window cleaner A $12 000 $40 000 B $1 200 $4 000 C $40 000 $12 000 D $4 000 $1 200
1 marks
Answer: D
This question in 0455/12 May/June 2012
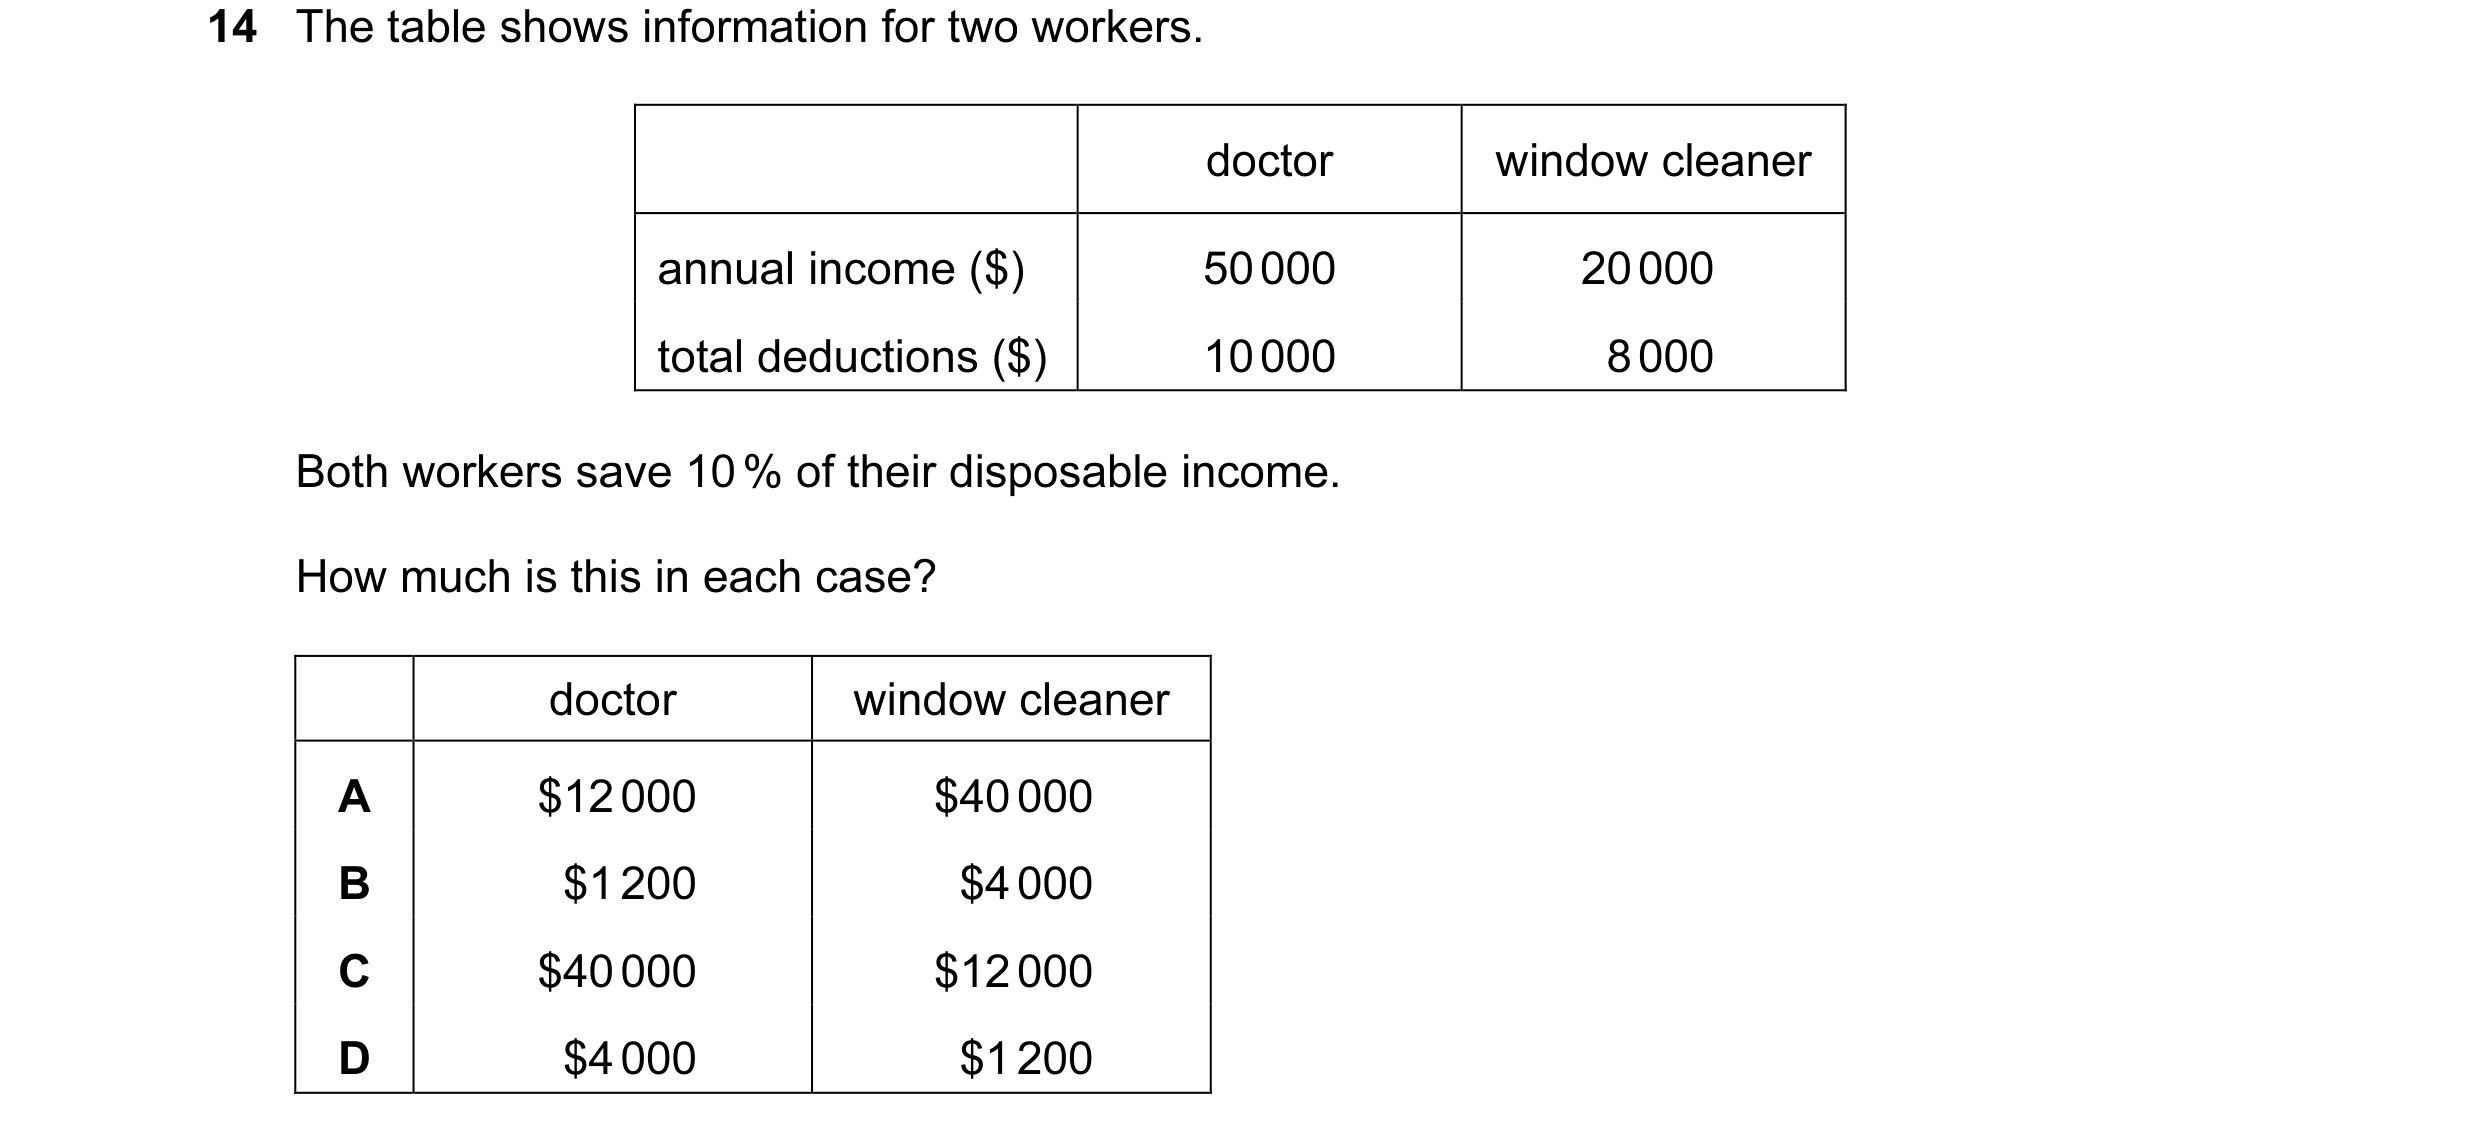
Q25 · The table shows information for two workers 0455/13 May/June 2012
14 The table shows information for two workers. doctor window cleaner annual income ($) 50 000 20 000 total deductions ($) 10 000 8 000 Both workers save 10 % of their disposable income. How much is this in each case? doctor window cleaner A $12 000 $40 000 B $1 200 $4 000 C $40 000 $12 000 D $4 000 $1 200
1 marks
Answer: D
This question in 0455/13 May/June 2012
Q26 · What might encourage a consumer to save rather than to spend? 0455/11 Oct/Nov 2012
3 What might encourage a consumer to save rather than to spend? A being made unemployed B discounts on products C government subsidies to producers D high interest rates
1 marks
Answer: D
This question in 0455/11 Oct/Nov 2012
Q27 · The table shows the proportion of income saved for different age groups 0455/11 Oct/Nov 2012
5 The table shows the proportion of income saved for different age groups. age 15 – 29 30 – 39 40 – 49 50 – 62 63+ % of income saved –34 % – 4 % 18 % 29 % –23 % What can be concluded from this data? A The 50 – 62 age group has the highest level of income. B The 50 – 62 age group saves the highest proportion of its income. C The older age groups earn more than the younger age groups. D The youngest age group spends more than the oldest age group.
1 marks
Answer: B
This question in 0455/11 Oct/Nov 2012
Q28 · What might encourage a consumer to save rather than to spend? 0455/12 Oct/Nov 2012
12 What might encourage a consumer to save rather than to spend? A being made unemployed B discounts on products C government subsidies to producers D high interest rates
1 marks
Answer: D
This question in 0455/12 Oct/Nov 2012
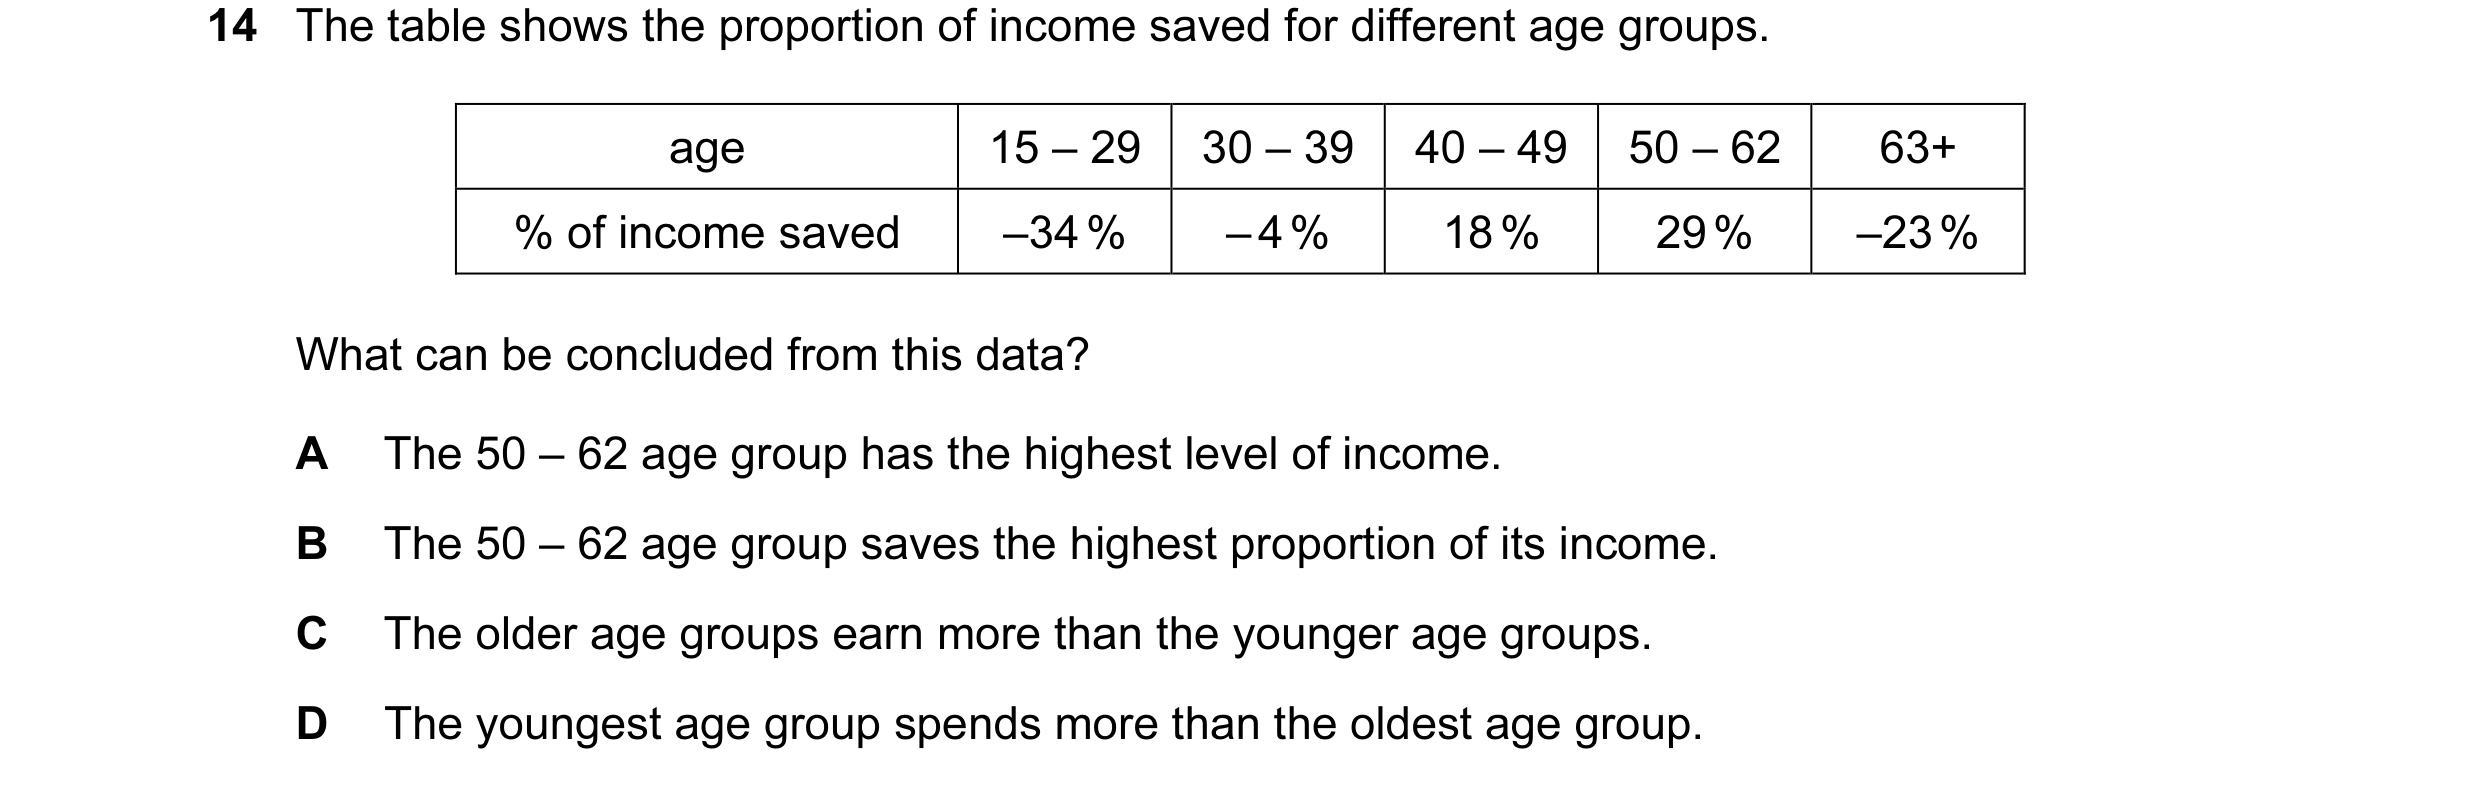
Q29 · The table shows the proportion of income saved for different age groups 0455/12 Oct/Nov 2012
14 The table shows the proportion of income saved for different age groups. age 15 – 29 30 – 39 40 – 49 50 – 62 63+ % of income saved –34 % – 4 % 18 % 29 % –23 % What can be concluded from this data? A The 50 – 62 age group has the highest level of income. B The 50 – 62 age group saves the highest proportion of its income. C The older age groups earn more than the younger age groups. D The youngest age group spends more than the oldest age group.
1 marks
Answer: B
This question in 0455/12 Oct/Nov 2012
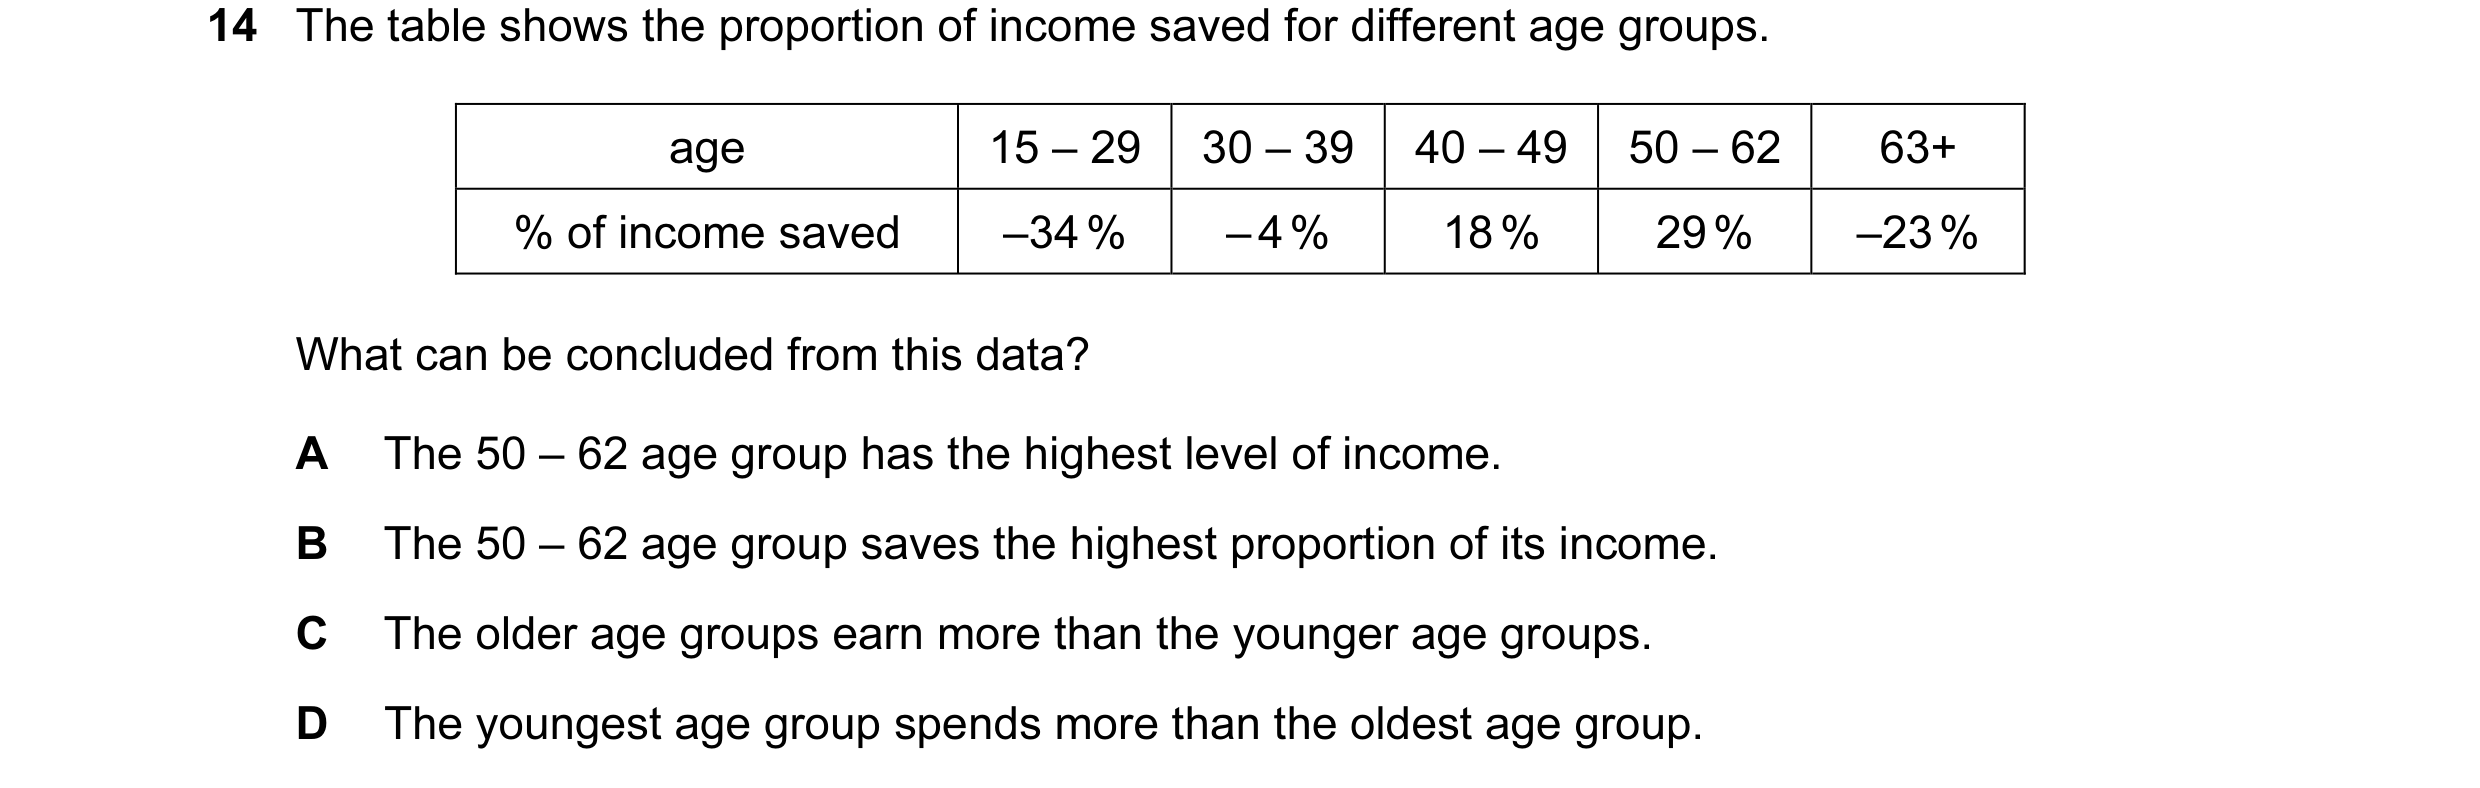
Q30 · The table shows the proportion of income saved for different age groups 0455/13 Oct/Nov 2012
14 The table shows the proportion of income saved for different age groups. age 15 – 29 30 – 39 40 – 49 50 – 62 63+ % of income saved –34 % – 4 % 18 % 29 % –23 % What can be concluded from this data? A The 50 – 62 age group has the highest level of income. B The 50 – 62 age group saves the highest proportion of its income. C The older age groups earn more than the younger age groups. D The youngest age group spends more than the oldest age group.
1 marks
Answer: B
This question in 0455/13 Oct/Nov 2012
Q31 · What is most likely to cause a person to save a larger proportion of their weekly income… 0455/11 May/June 2013
11 What is most likely to cause a person to save a larger proportion of their weekly income rather than spend a larger proportion of their weekly income? A a decrease in the tax on goods and services B a decrease in weekly income C an increase in interest rates D an increase in the range of products available
1 marks
Answer: C
This question in 0455/11 May/June 2013
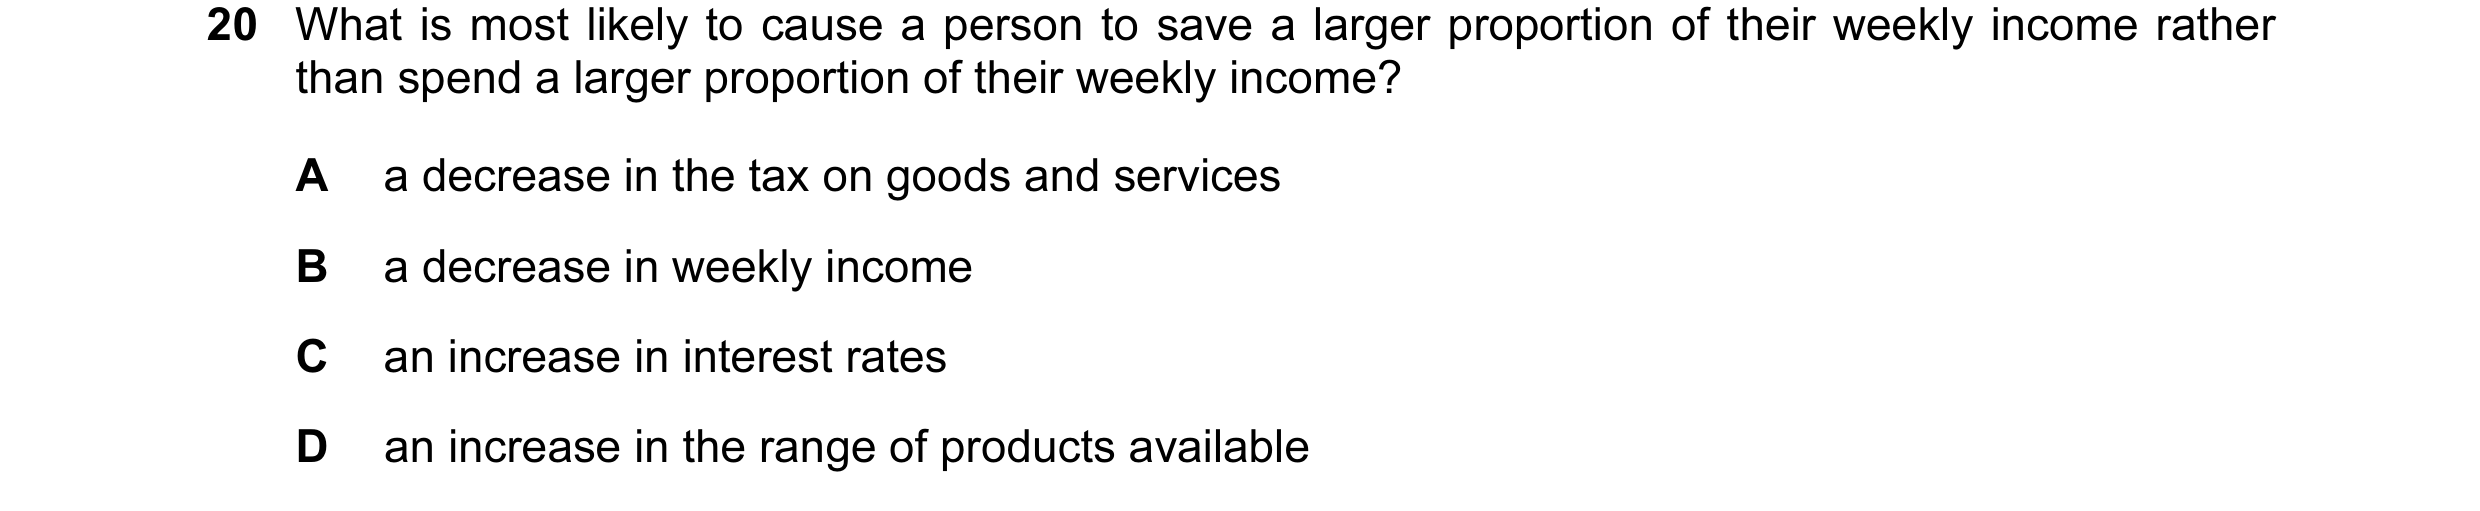
Q32 · What is most likely to cause a person to save a larger proportion of their weekly income… 0455/13 May/June 2013
20 What is most likely to cause a person to save a larger proportion of their weekly income rather than spend a larger proportion of their weekly income? A a decrease in the tax on goods and services B a decrease in weekly income C an increase in interest rates D an increase in the range of products available
1 marks
Answer: C
This question in 0455/13 May/June 2013
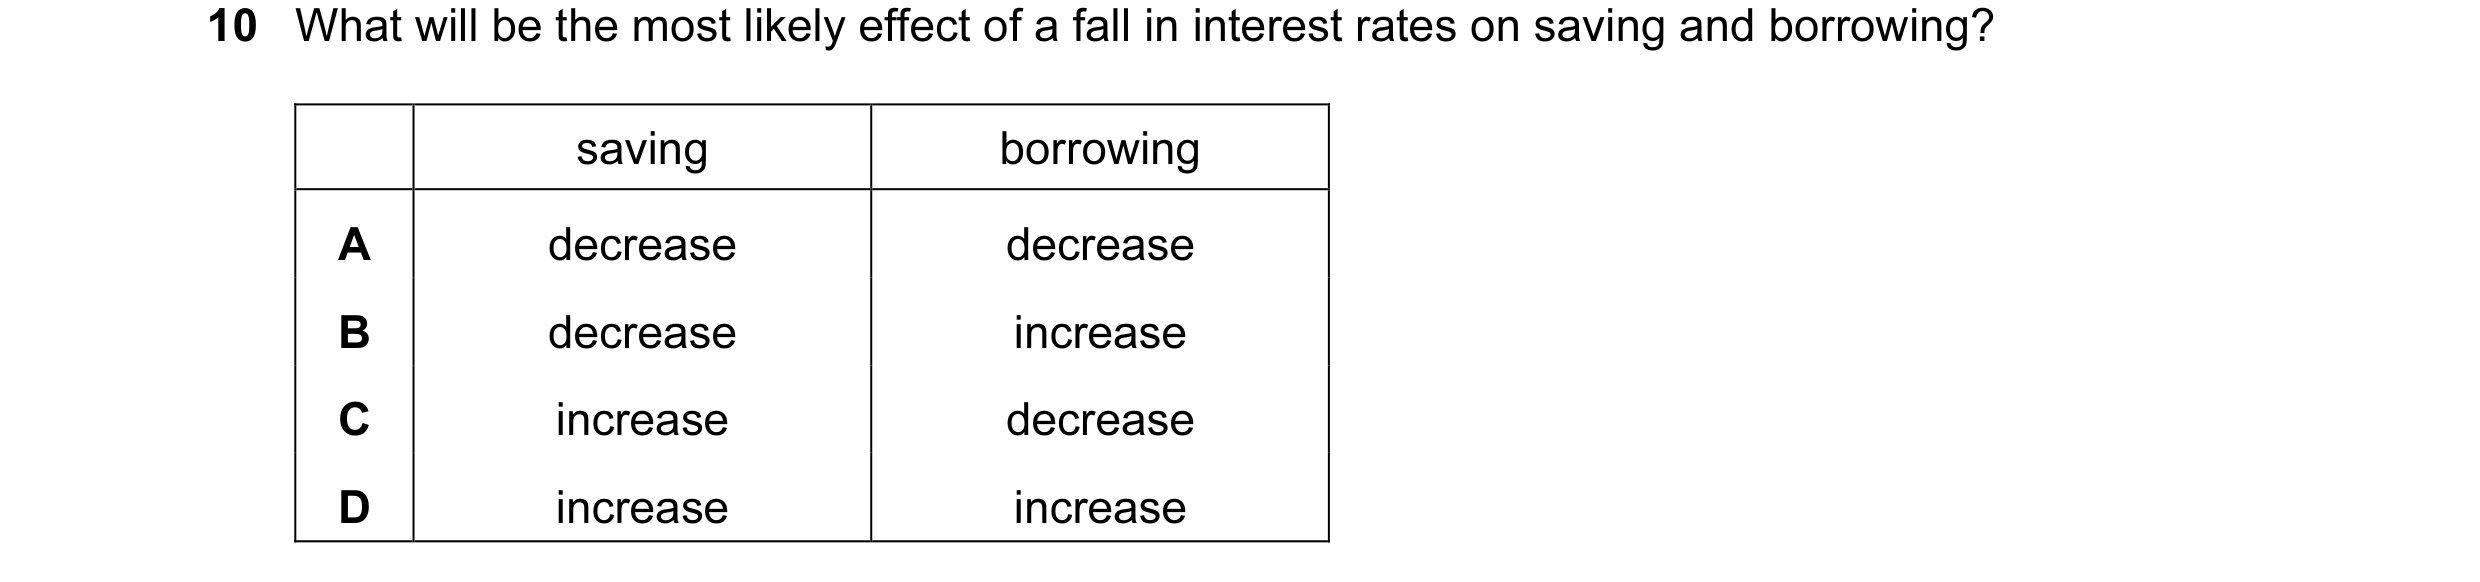
Q33 · What will be the most likely effect of a fall in interest rates on saving and borrowing? 0455/12 Oct/Nov 2013
10 What will be the most likely effect of a fall in interest rates on saving and borrowing? saving borrowing A decrease decrease B decrease increase C increase decrease D increase increase
1 marks
Answer: B
This question in 0455/12 Oct/Nov 2013
Q34 · What may cause an individual to save a higher proportion of their income? 0455/11 May/June 2014
8 What may cause an individual to save a higher proportion of their income? A a belief that the price of goods will rise in the future B a fall in the rate of interest paid by the country’s banks C a fear that income will fall in the future D a rise in the individual’s wish to enjoy higher consumption immediately
1 marks
Answer: C
This question in 0455/11 May/June 2014
Q35 · What may cause an individual to save a higher proportion of their income? 0455/12 May/June 2014
8 What may cause an individual to save a higher proportion of their income? A a belief that the price of goods will rise in the future B a fall in the rate of interest paid by the country’s banks C a fear that income will fall in the future D a rise in the individual’s wish to enjoy higher consumption immediately
1 marks
Answer: C
This question in 0455/12 May/June 2014
Q36 · What may cause an individual to save a higher proportion of their income? 0455/13 May/June 2014
15 What may cause an individual to save a higher proportion of their income? A a belief that the price of goods will rise in the future B a fall in the rate of interest paid by the country’s banks C a fear that income will fall in the future D a rise in the individual’s wish to enjoy higher consumption immediately
1 marks
Answer: C
This question in 0455/13 May/June 2014
Q37 · When might rapid inflation together with low interest rates be a source of concern for a… 0455/11 Oct/Nov 2014
9 When might rapid inflation together with low interest rates be a source of concern for a consumer? A when a consumer lives on a pension linked to the consumer price index B when a consumer needs to use savings for regular expenditure C when a consumer pays a fixed rent for their accommodation D when a consumer wishes to buy a good on credit
1 marks
Answer: B
This question in 0455/11 Oct/Nov 2014
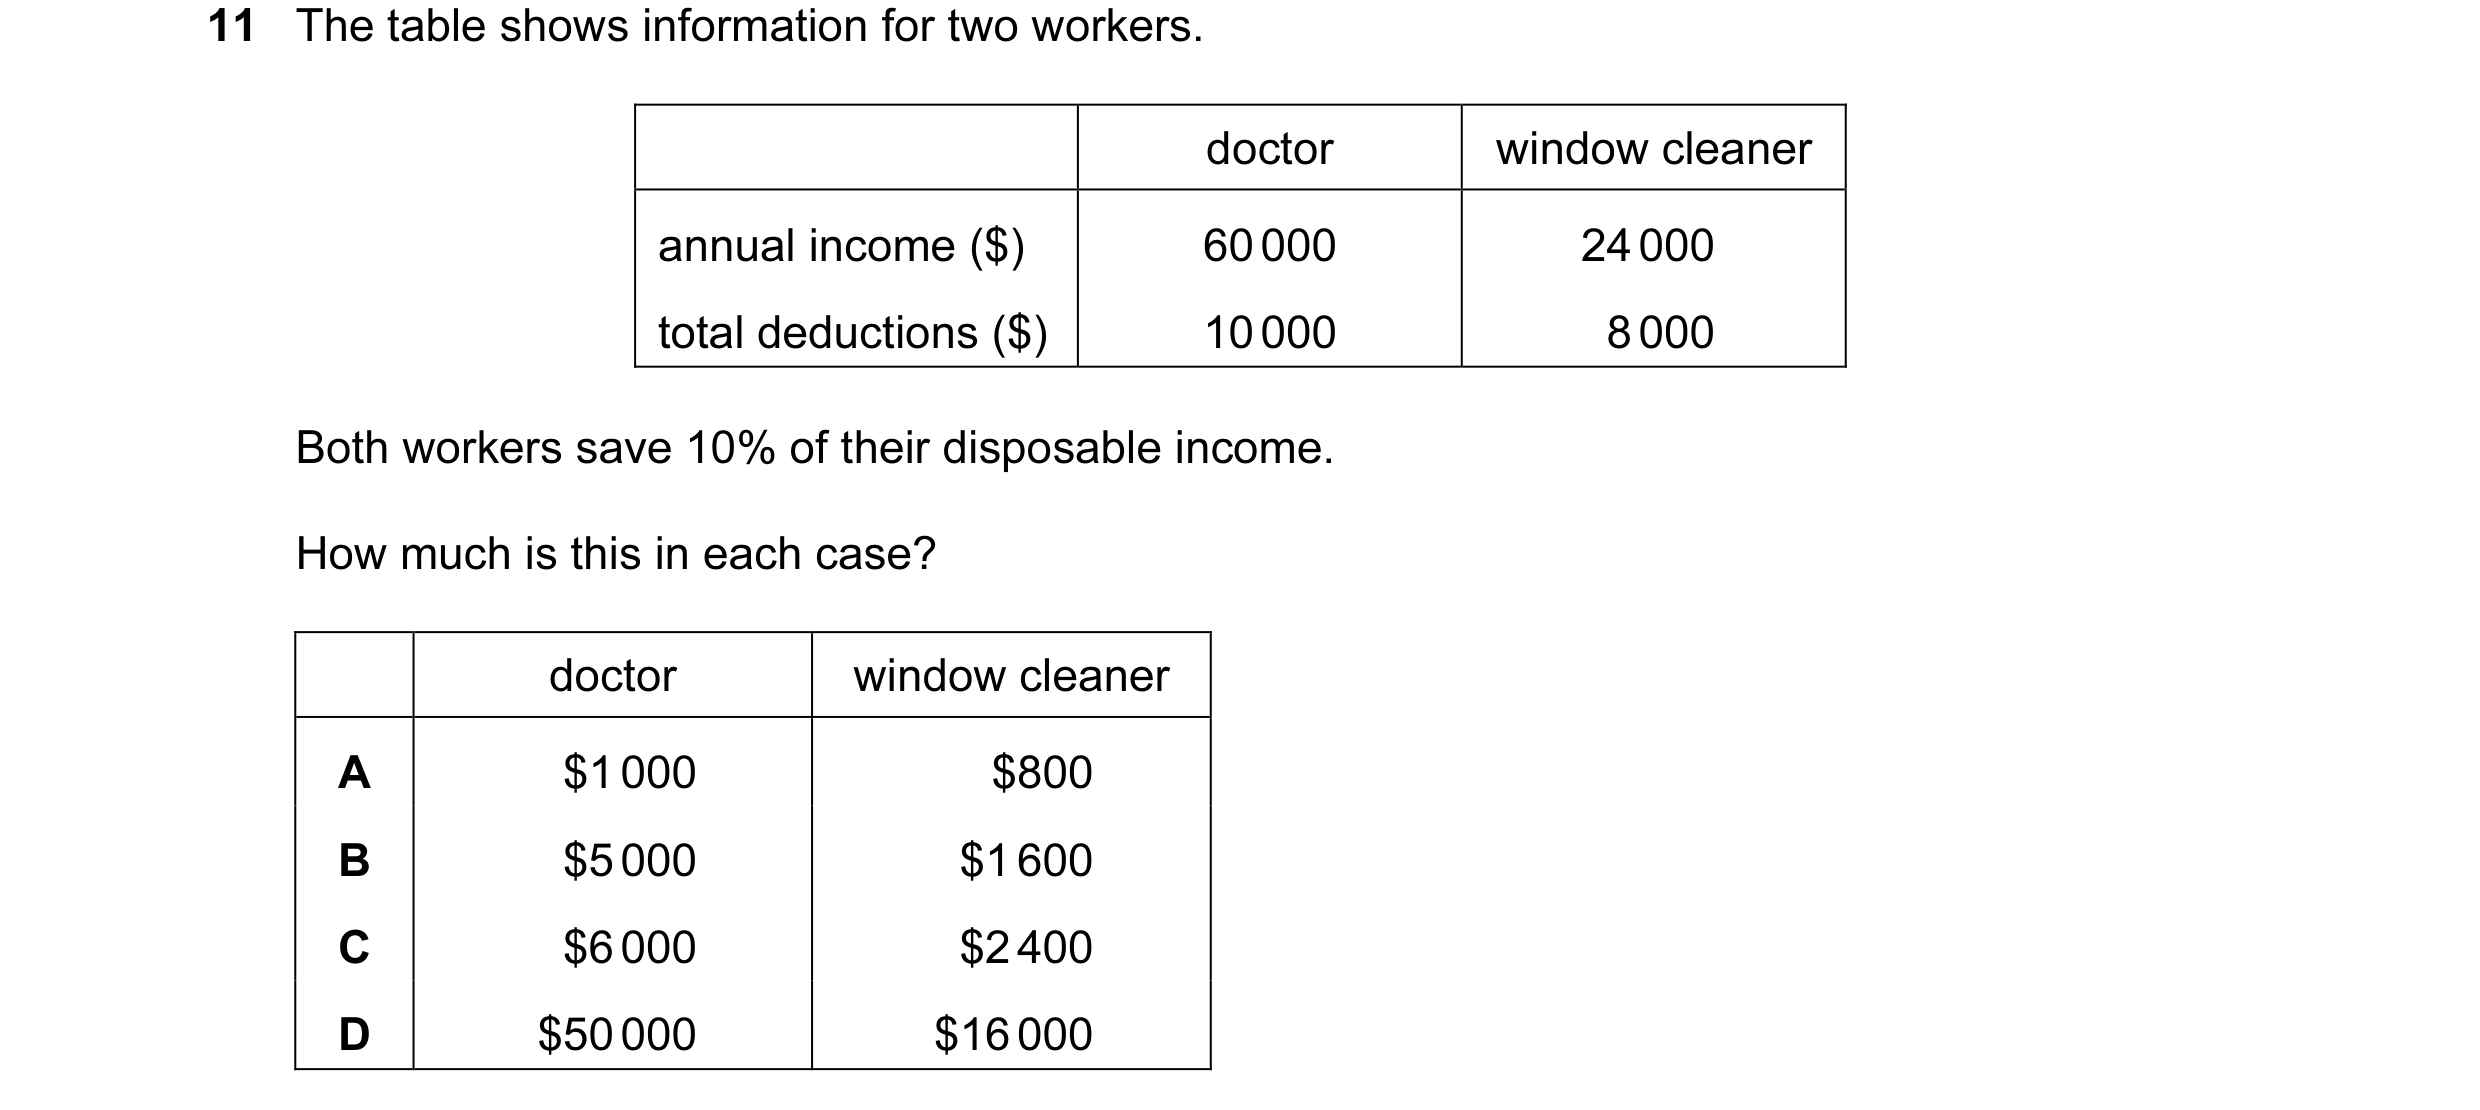
Q38 · The table shows information for two workers 0455/12 Feb/March 2016
11 The table shows information for two workers. doctor window cleaner annual income ($) 60 000 24 000 total deductions ($) 10 000 8 000 Both workers save 10% of their disposable income. How much is this in each case? doctor window cleaner A $1 000 $800 B $5 000 $1 600 C $6 000 $2 400 D $50 000 $16 000
1 marks
Answer: B
This question in 0455/12 Feb/March 2016
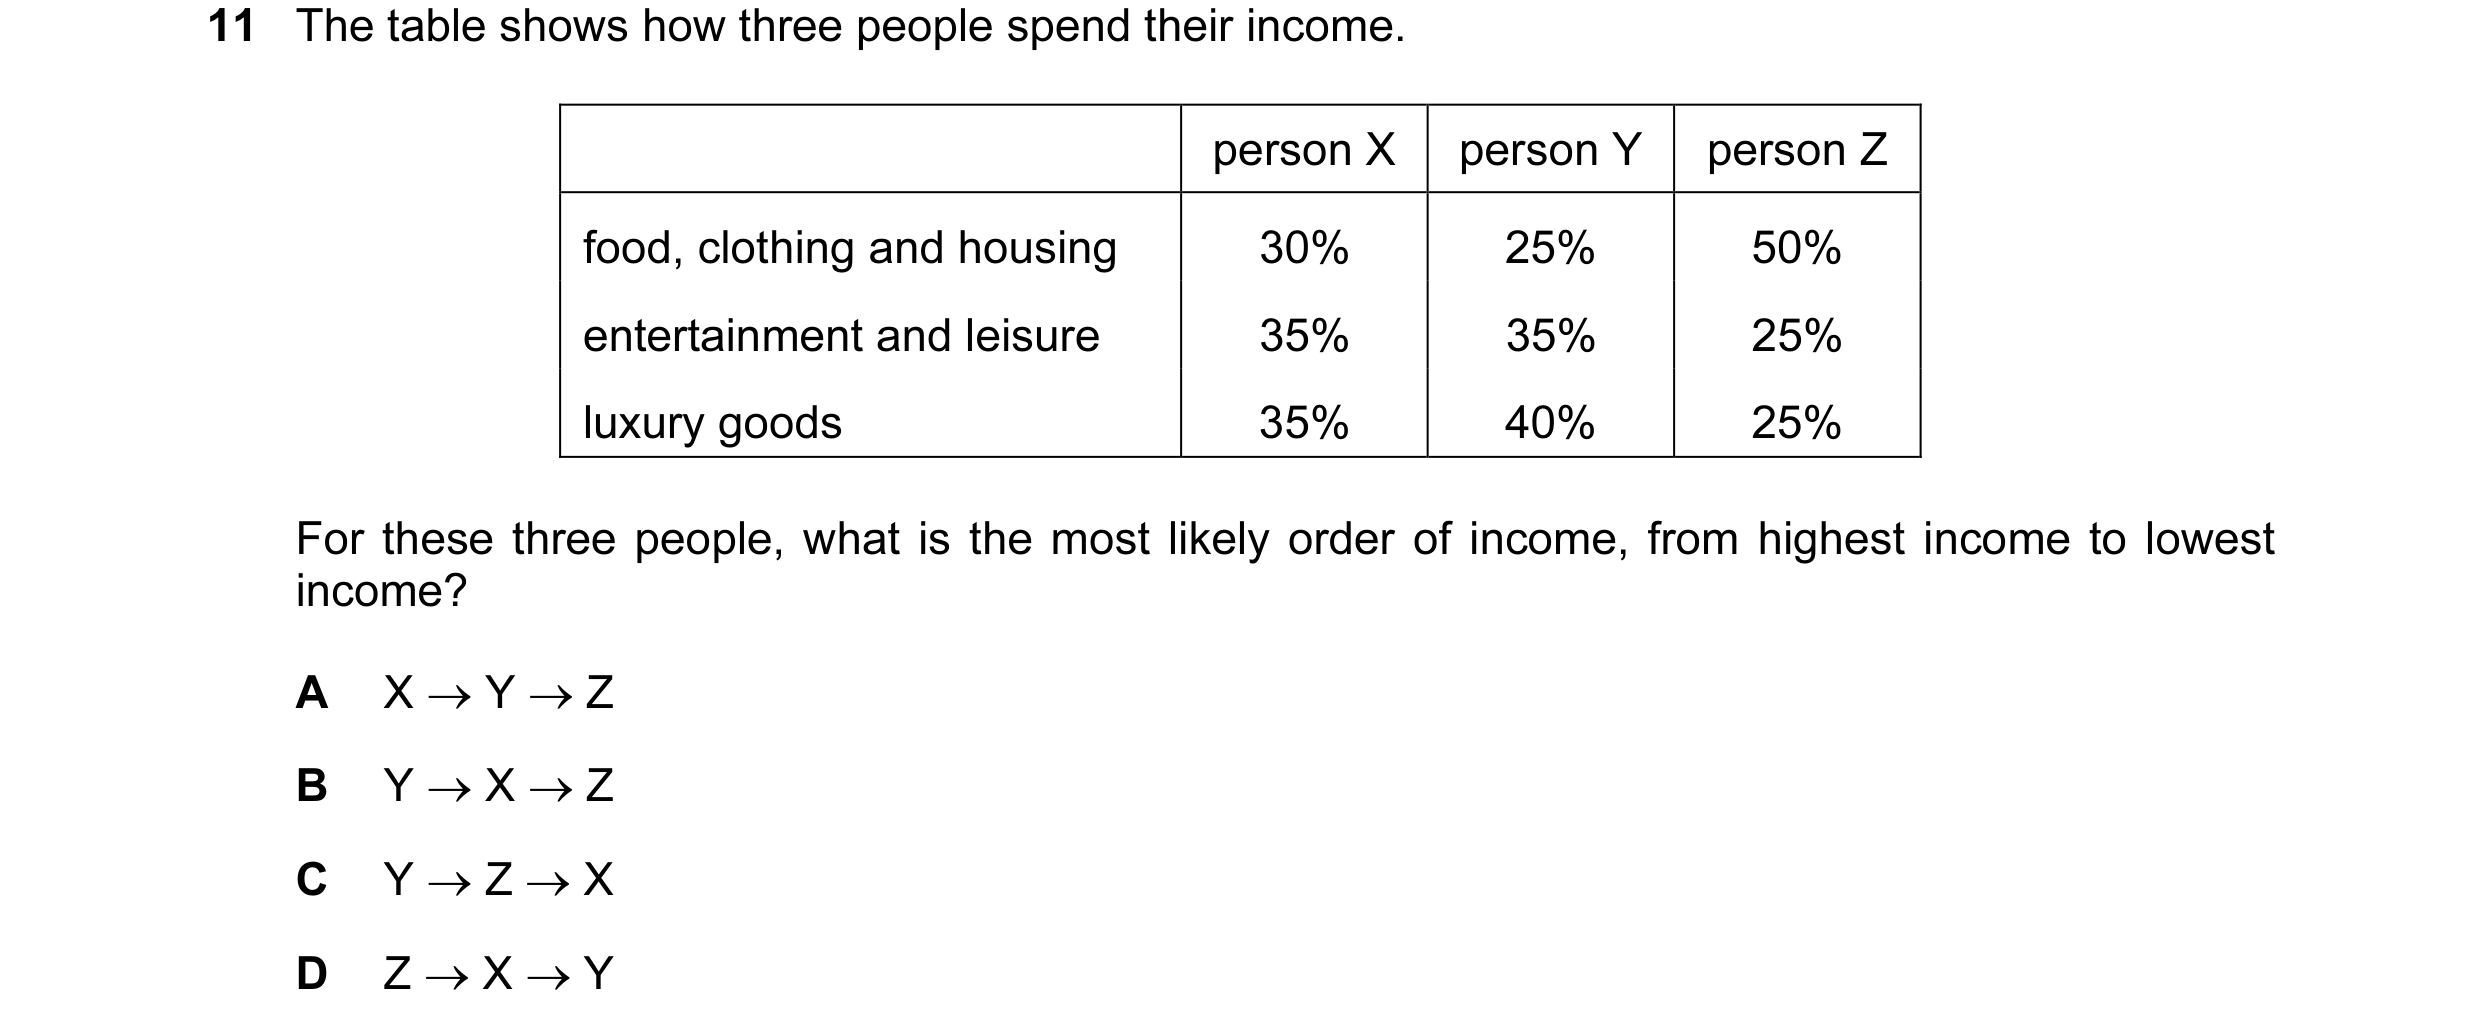
Q39 · The table shows how three people spend their income 0455/11 May/June 2016
11 The table shows how three people spend their income. person X person Y person Z food, clothing and housing 30% 25% 50% entertainment and leisure 35% 35% 25% luxury goods 35% 40% 25% For these three people, what is the most likely order of income, from highest income to lowest income? A X → Y → Z B Y → X → Z C Y → Z → X D Z → X → Y
1 marks
Answer: B
This question in 0455/11 May/June 2016
Q40 · The table shows how three people spend their income 0455/12 May/June 2016
11 The table shows how three people spend their income. person X person Y person Z food, clothing and housing 35% 50% 20% entertainment and leisure 25% 20% 40% luxury goods 40% 30% 40% For these three people, what is the most likely order of income, from lowest income to highest income? A X → Y → Z B Y → X → Z C Y → Z → X D Z → X → Y
1 marks
Answer: B
This question in 0455/12 May/June 2016
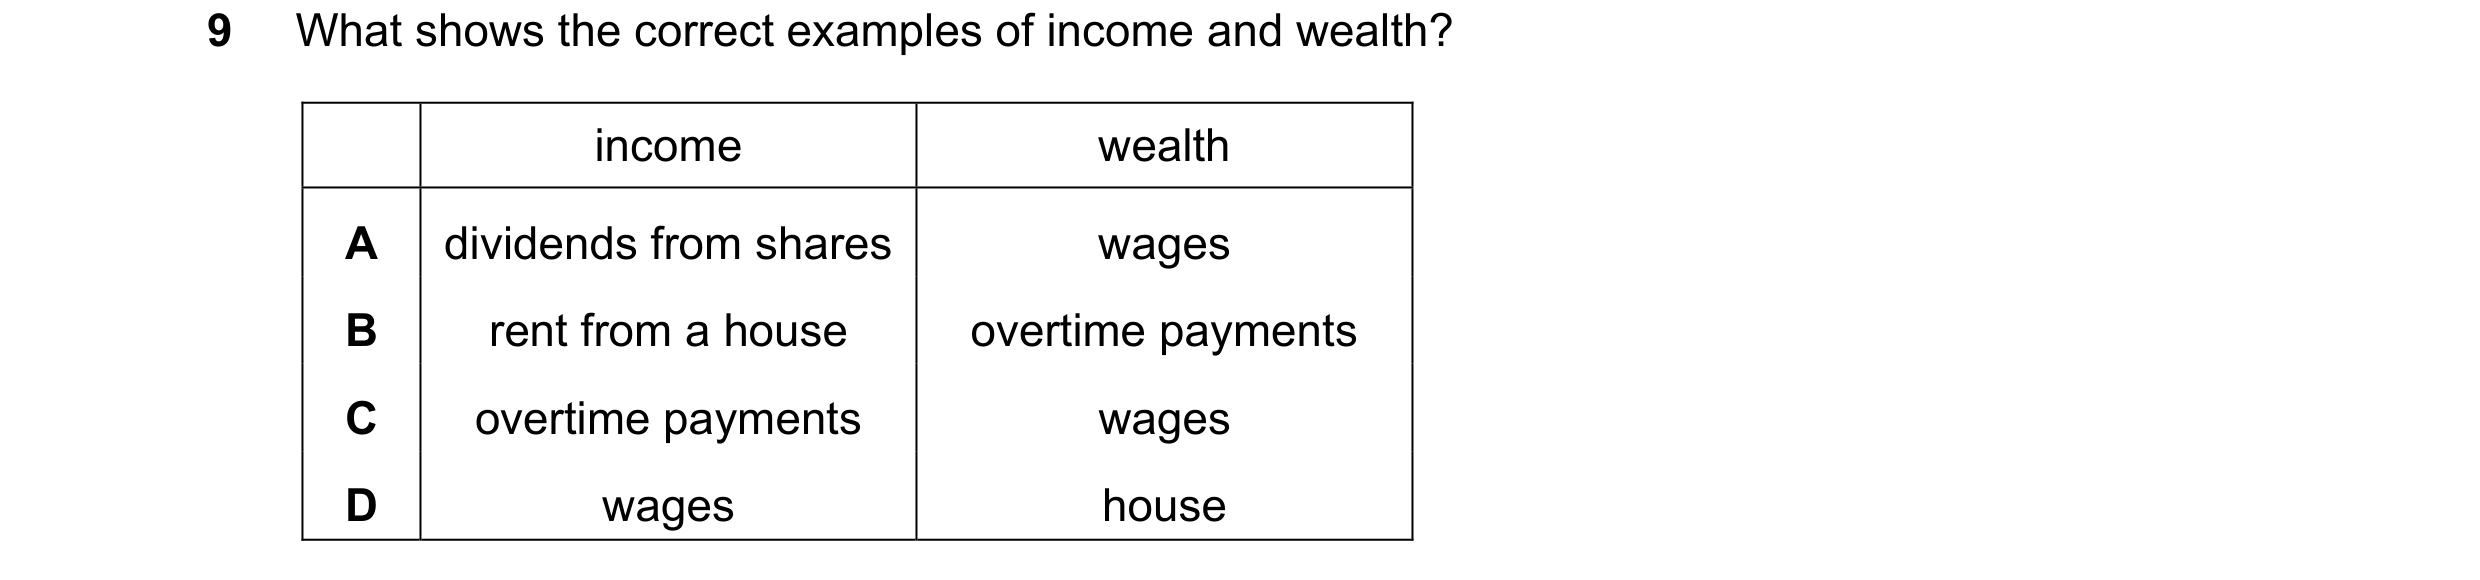
Q41 · What shows the correct examples of income and wealth? 0455/12 Oct/Nov 2016
9 What shows the correct examples of income and wealth? income wealth A dividends from shares wages B rent from a house overtime payments C overtime payments wages D wages house
1 marks
This question in 0455/12 Oct/Nov 2016
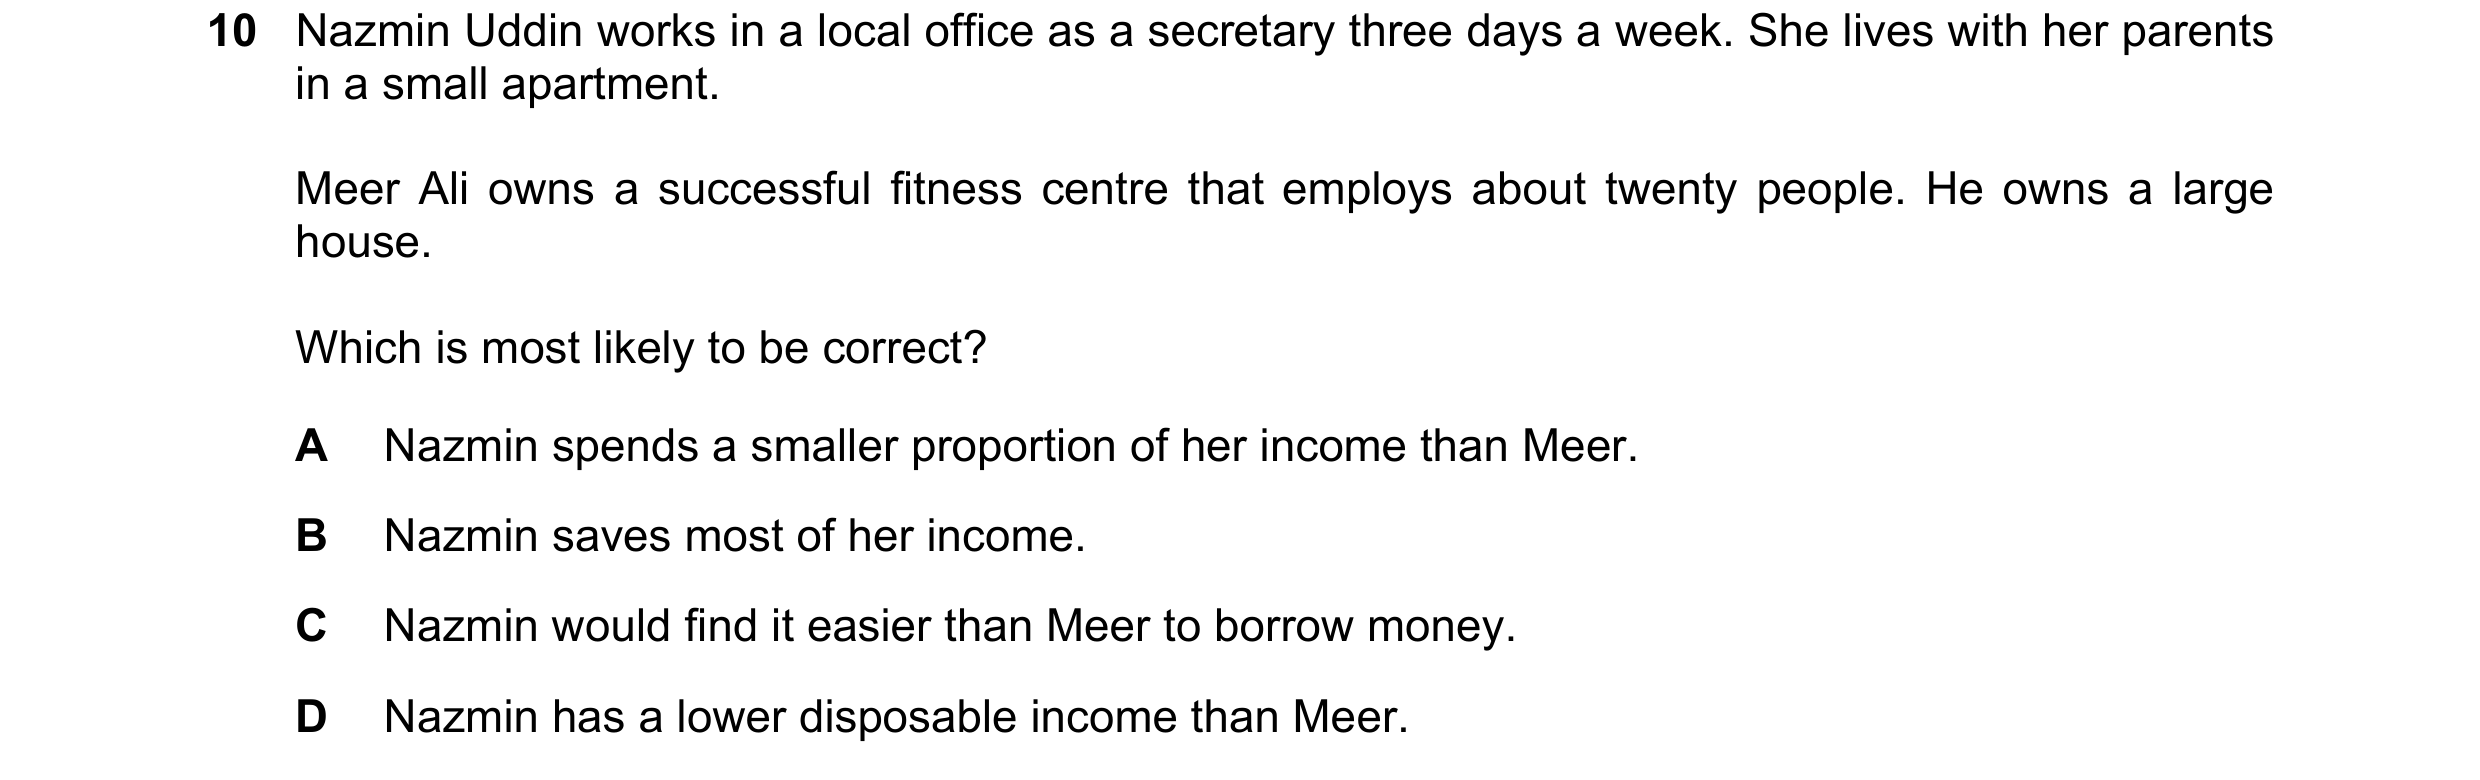
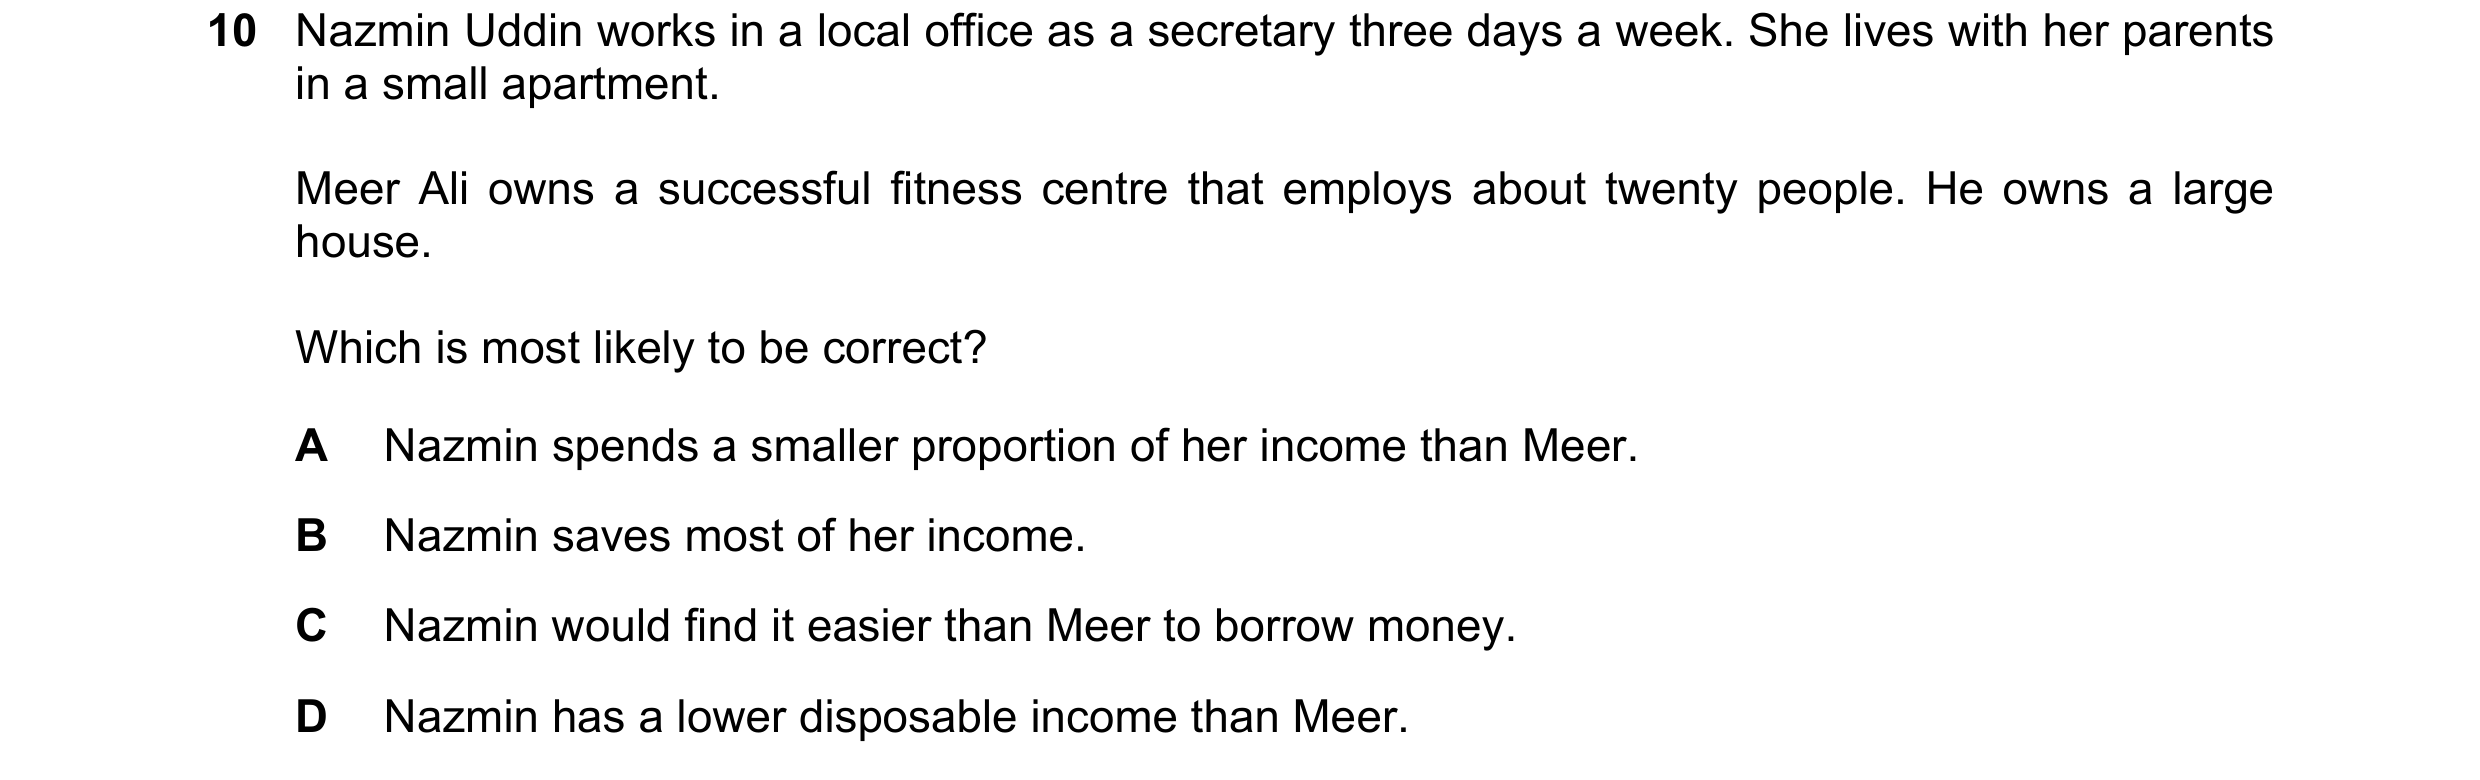
Q42 · Nazmin Uddin works in a local office as a secretary three days a week 0455/12 Oct/Nov 2016
10 Nazmin Uddin works in a local office as a secretary three days a week. She lives with her parents in a small apartment. Meer Ali owns a successful fitness centre that employs about twenty people. He owns a large house. Which is most likely to be correct? A Nazmin spends a smaller proportion of her income than Meer. B Nazmin saves most of her income. C Nazmin would find it easier than Meer to borrow money. D Nazmin has a lower disposable income than Meer.
1 marks
This question in 0455/12 Oct/Nov 2016
Q43 · The table shows how household spending changes with income 0455/12 Oct/Nov 2016
11 The table shows how household spending changes with income. income spending ($ per month) ($ per month) 4000 4150 4300 4375 4600 4650 4900 4900 5200 4975 5500 5275 What is the first level of income shown at which savings are positive? A $4000 B $4600 C $4900 D $5200
1 marks
This question in 0455/12 Oct/Nov 2016
Q44 · What does net income mean? 0455/13 Oct/Nov 2016
9 What does net income mean? A income after allowing for price changes B income after paying regular household bills C income less tax and government deductions D income plus overtime payments
1 marks
Answer: C
This question in 0455/13 Oct/Nov 2016
Q45 · Nazmin Uddin works in a local office as a secretary three days a week 0455/13 Oct/Nov 2016
10 Nazmin Uddin works in a local office as a secretary three days a week. She lives with her parents in a small apartment. Meer Ali owns a successful fitness centre that employs about twenty people. He owns a large house. Which is most likely to be correct? A Nazmin spends a smaller proportion of her income than Meer. B Nazmin saves most of her income. C Nazmin would find it easier than Meer to borrow money. D Nazmin has a lower disposable income than Meer.
1 marks
Answer: D
This question in 0455/13 Oct/Nov 2016
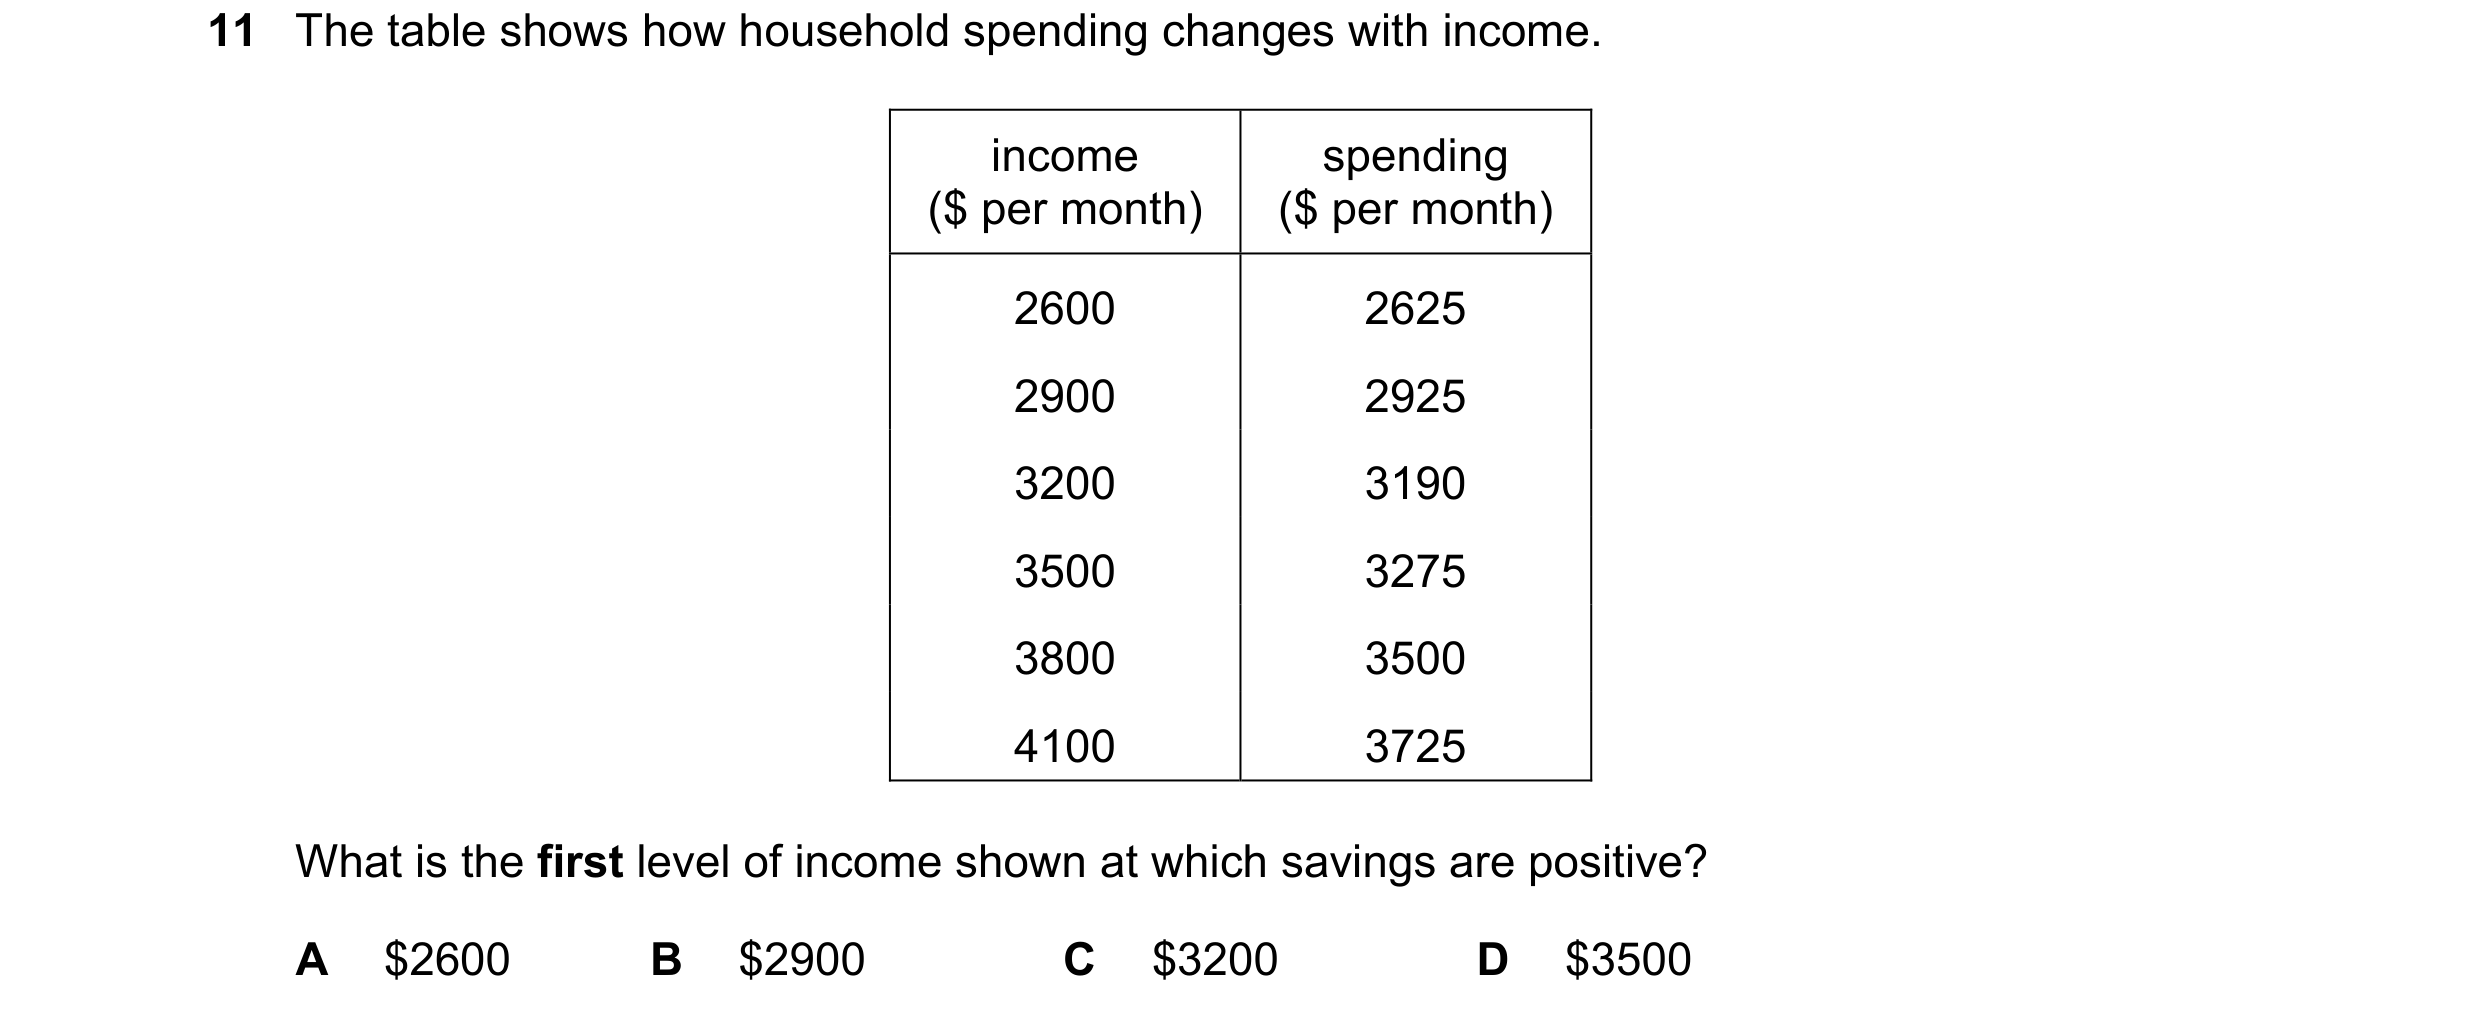
Q46 · The table shows how household spending changes with income 0455/13 Oct/Nov 2016
11 The table shows how household spending changes with income. income spending ($ per month) ($ per month) 2600 2625 2900 2925 3200 3190 3500 3275 3800 3500 4100 3725 What is the first level of income shown at which savings are positive? A $2600 B $2900 C $3200 D $3500
1 marks
Answer: C
This question in 0455/13 Oct/Nov 2016
Q47 · A student needs to borrow $60 000 to pay for a five-year university course in medicine 0455/13 May/June 2017
8 A student needs to borrow $60 000 to pay for a five-year university course in medicine. What would motivate the student to borrow to pay for the course? A Debts must be repaid within the first five years of work. B Further training in hospitals must follow graduation. C High earnings are expected in the long-run. D Many skills gained on the course are non-transferable.
1 marks
Answer: C
This question in 0455/13 May/June 2017
Q48 · What is likely to decrease the level of saving in an economy? 0455/12 Oct/Nov 2017
8 What is likely to decrease the level of saving in an economy? A an increase in the general level of income B an increase in the number of cheap offers in shops C a redistribution of income from poor to rich households D a rise in the rate of interest
1 marks
Answer: B
This question in 0455/12 Oct/Nov 2017
Q49 · The table shows the percentage (%) of income saved by different age groups 0455/11 May/June 2018
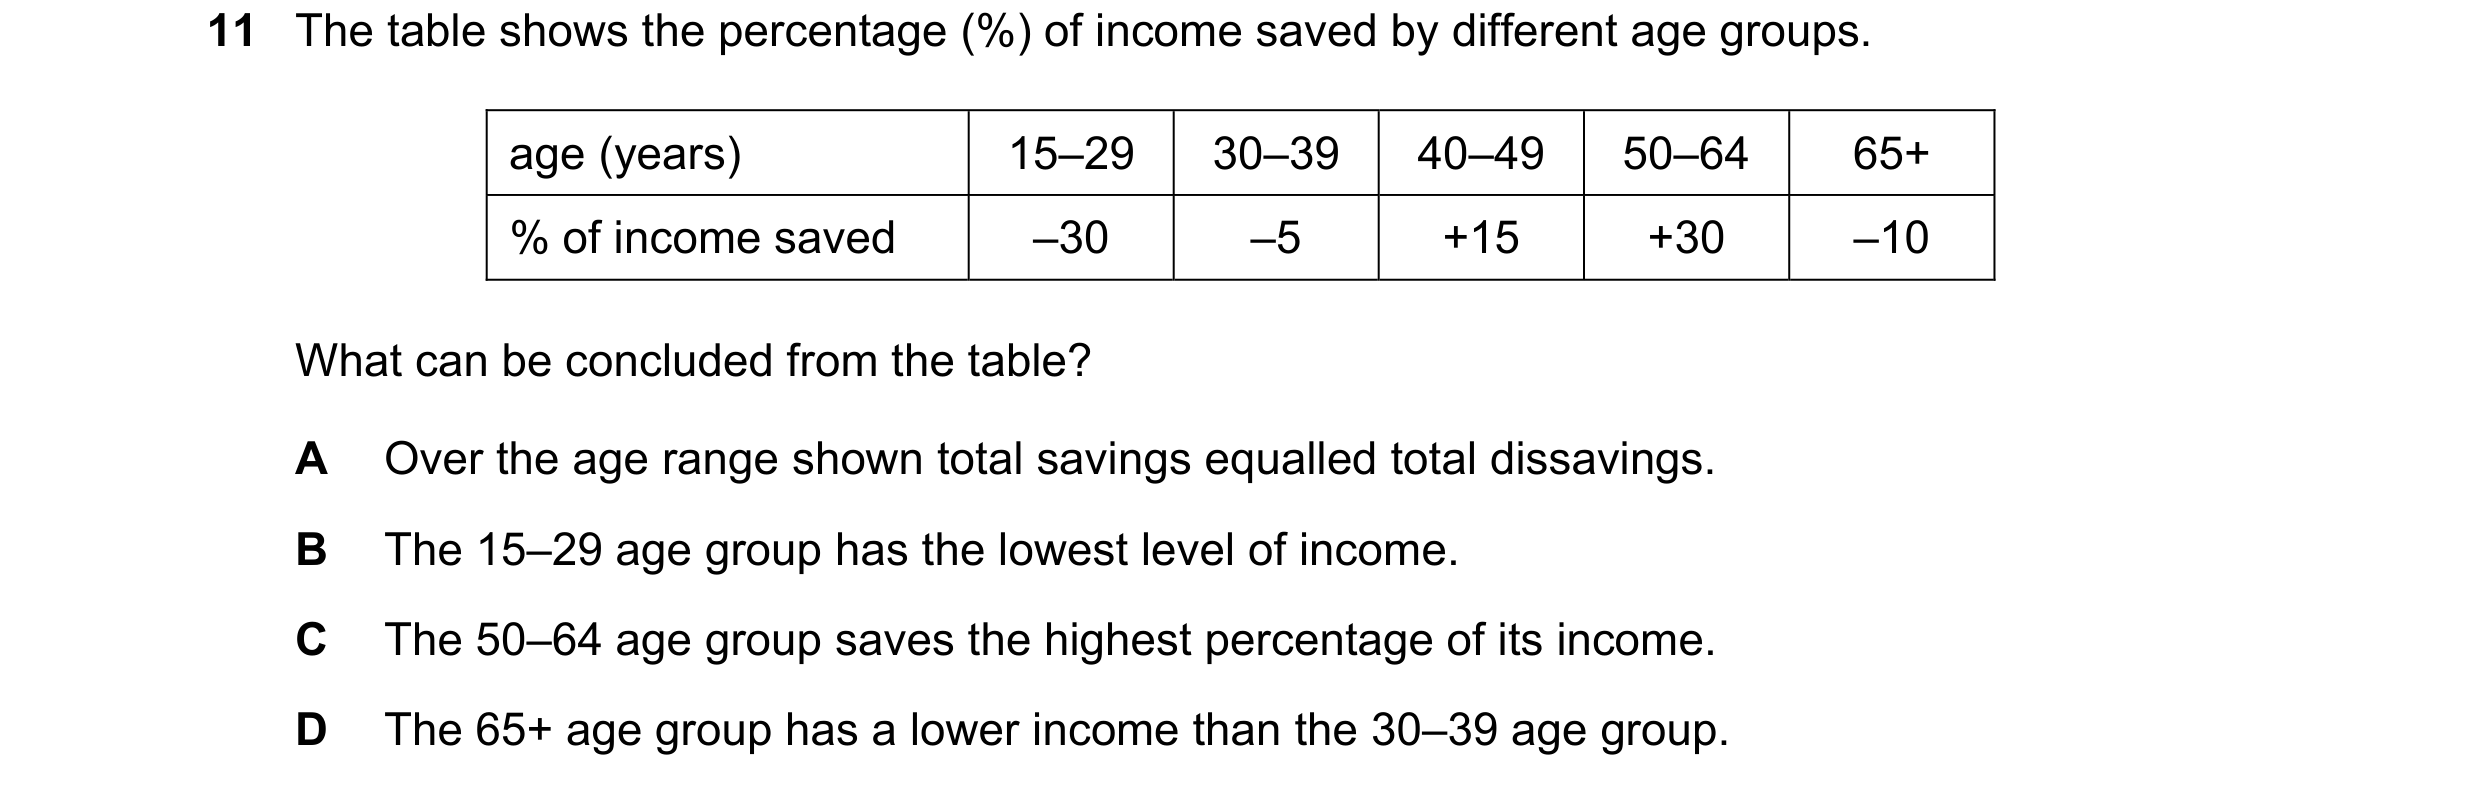
11 The table shows the percentage (%) of income saved by different age groups. age (years) 15–29 30–39 40–49 50–64 65+ % of income saved –30 –5 +15 +30 –10 What can be concluded from the table? A Over the age range shown total savings equalled total dissavings. B The 15–29 age group has the lowest level of income. C The 50–64 age group saves the highest percentage of its income. D The 65+ age group has a lower income than the 30–39 age group.
1 marks
Answer: C
This question in 0455/11 May/June 2018
Q50 · The table shows some information for a computer engineer in 2015 0455/12 May/June 2018
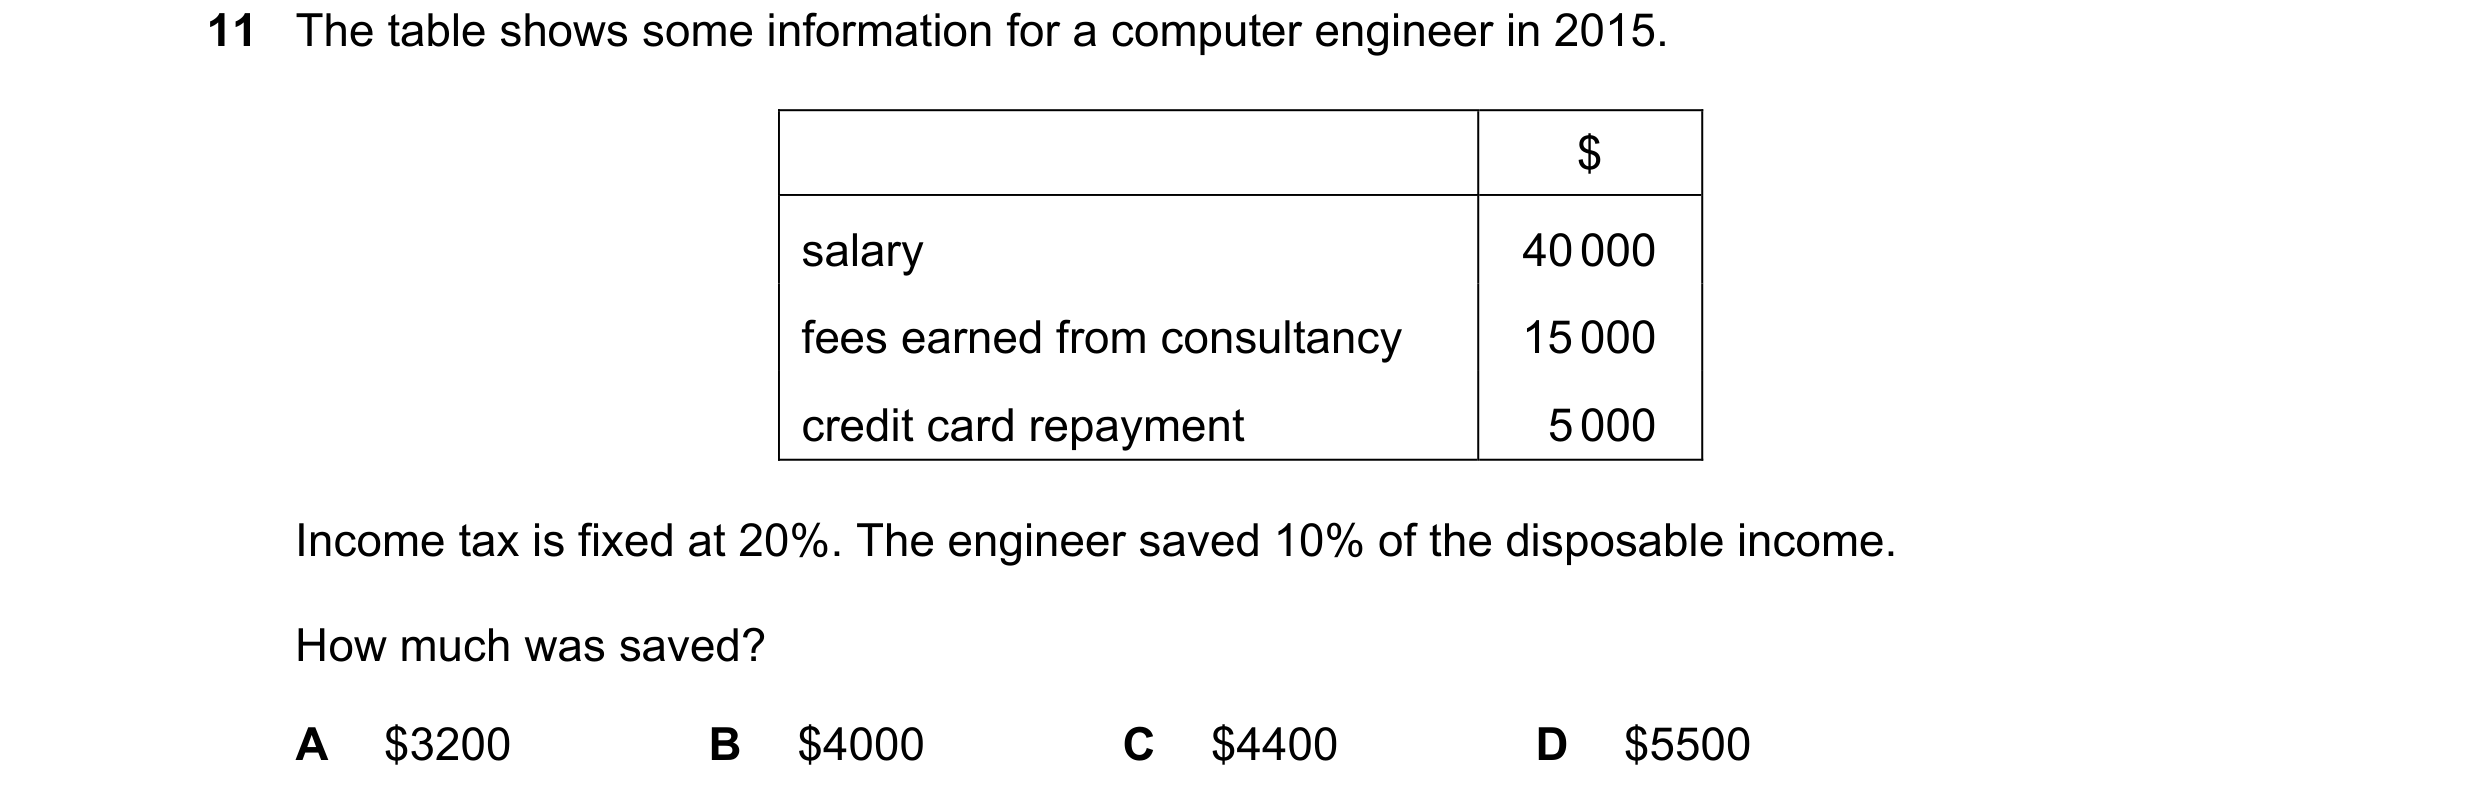
11 The table shows some information for a computer engineer in 2015. $ salary 40 000 fees earned from consultancy 15 000 credit card repayment 5 000 Income tax is fixed at 20%. The engineer saved 10% of the disposable income. How much was saved? A $3200 B $4000 C $4400 D $5500
1 marks
Answer: C
This question in 0455/12 May/June 2018
Q51 · What will cause the level of savings in an economy to rise? 0455/12 Oct/Nov 2018
9 What will cause the level of savings in an economy to rise? A a fall in investment B a fall in real wages C a rise in income taxes D a rise in interest rates
1 marks
Answer: D
This question in 0455/12 Oct/Nov 2018
Q52 · The table shows the weekly values of certain items for the average person in each group 0455/12 Feb/March 2019
11 The table shows the weekly values of certain items for the average person in each group. In which group does the average person save the most? income ($) spending ($) borrowing ($) A employed workers 500 400 50 B retired people 150 140 0 C school students 25 30 5 D unemployed 200 300 100
1 marks
Answer: A
This question in 0455/12 Feb/March 2019
Q53 · What is the most important factor that affects how much a family saves? 0455/11 May/June 2019
10 What is the most important factor that affects how much a family saves? A the income of the family B the level of taxation C the rate of inflation D the reliability of banks
1 marks
Answer: A
This question in 0455/11 May/June 2019
Q54 · What is the most important factor that affects how much a family saves? 0455/12 May/June 2019
10 What is the most important factor that affects how much a family saves? A the income of the family B the level of taxation C the rate of inflation D the reliability of banks
1 marks
Answer: A
This question in 0455/12 May/June 2019
Q55 · What is the most important factor that affects how much a family saves? 0455/13 May/June 2019
10 What is the most important factor that affects how much a family saves? A the income of the family B the level of taxation C the rate of inflation D the reliability of banks
1 marks
Answer: A
This question in 0455/13 May/June 2019
Q56 · The table shows how three people (X, Y and Z) spend their income 0455/12 Oct/Nov 2019
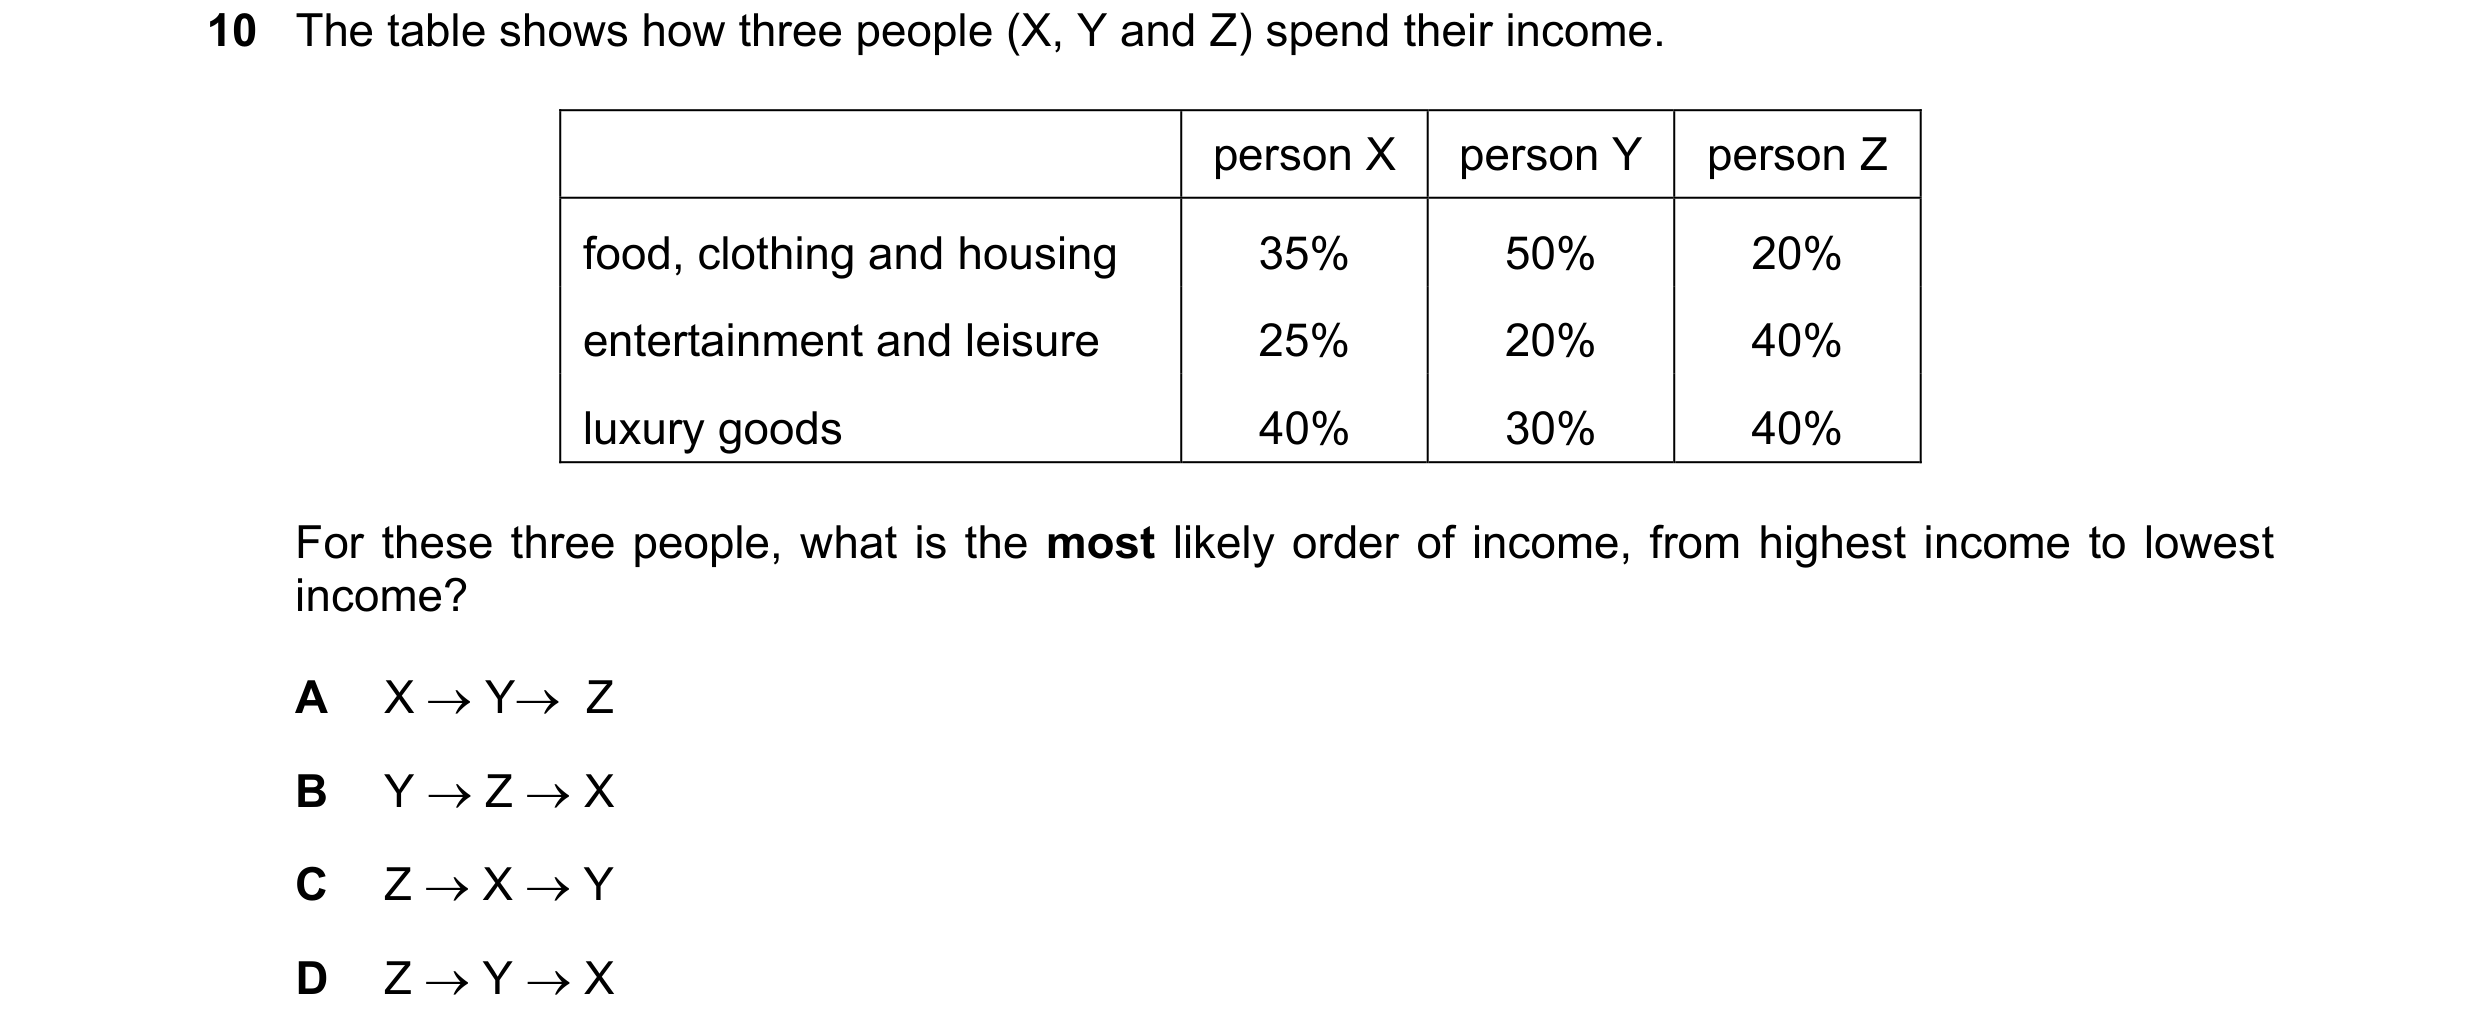
10 The table shows how three people (X, Y and Z) spend their income. person X person Y person Z food, clothing and housing 35% 50% 20% entertainment and leisure 25% 20% 40% luxury goods 40% 30% 40% For these three people, what is the most likely order of income, from highest income to lowest income? A X → Y→ Z B Y → Z → X C Z → X → Y D Z → Y → X
1 marks
Answer: C
This question in 0455/12 Oct/Nov 2019
Q57 · The table shows how three people (X, Y and Z) spend their income 0455/13 Oct/Nov 2019
10 The table shows how three people (X, Y and Z) spend their income. person X person Y person Z food, clothing and housing 35% 50% 20% entertainment and leisure 25% 20% 40% luxury goods 40% 30% 40% For these three people, what is the most likely order of income, from highest income to lowest income? A X → Y→ Z B Y → Z → X C Z → X → Y D Z → Y → X
1 marks
Answer: C
This question in 0455/13 Oct/Nov 2019
Q58 · What is an example of the purchase of a consumer good? 0455/11 May/June 2020
1 What is an example of the purchase of a consumer good? A A farm owner buys a television. B A farm owner buys additional land. C A farm owner buys fertiliser for their crops. D A farm owner buys some farming equipment.
1 marks
Answer: A
This question in 0455/11 May/June 2020
Q59 · Which combination of influences would increase the level of borrowing by a household? 0455/11 May/June 2020
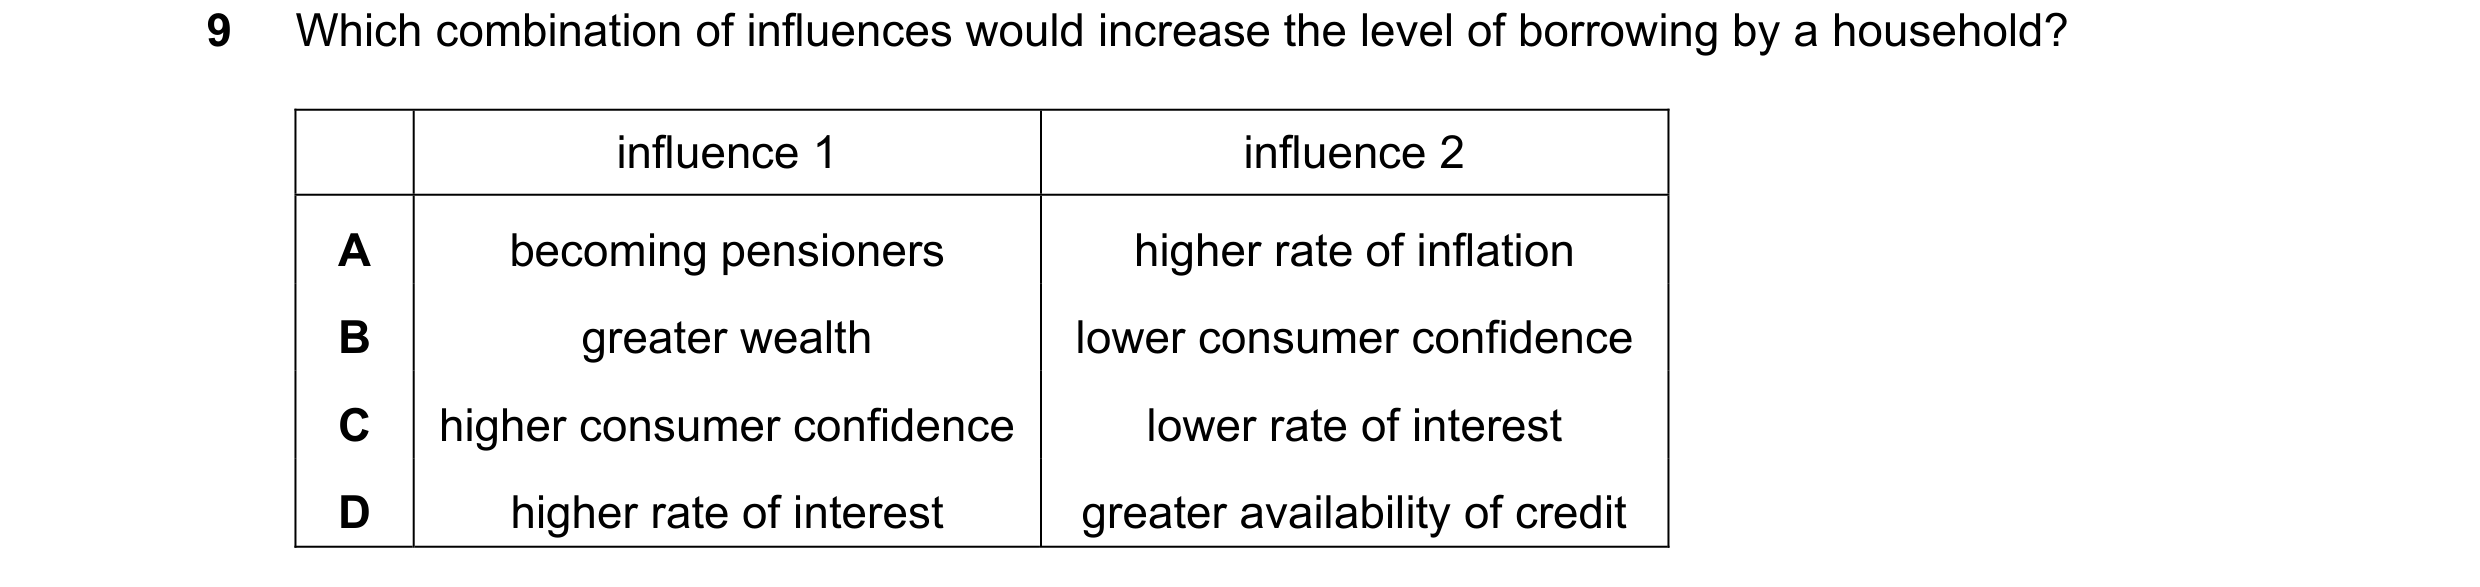
9 Which combination of influences would increase the level of borrowing by a household? influence 1 influence 2 A becoming pensioners higher rate of inflation B greater wealth lower consumer confidence C higher consumer confidence lower rate of interest D higher rate of interest greater availability of credit
1 marks
Answer: C
This question in 0455/11 May/June 2020
Question 60 0455/11 May/June 2020
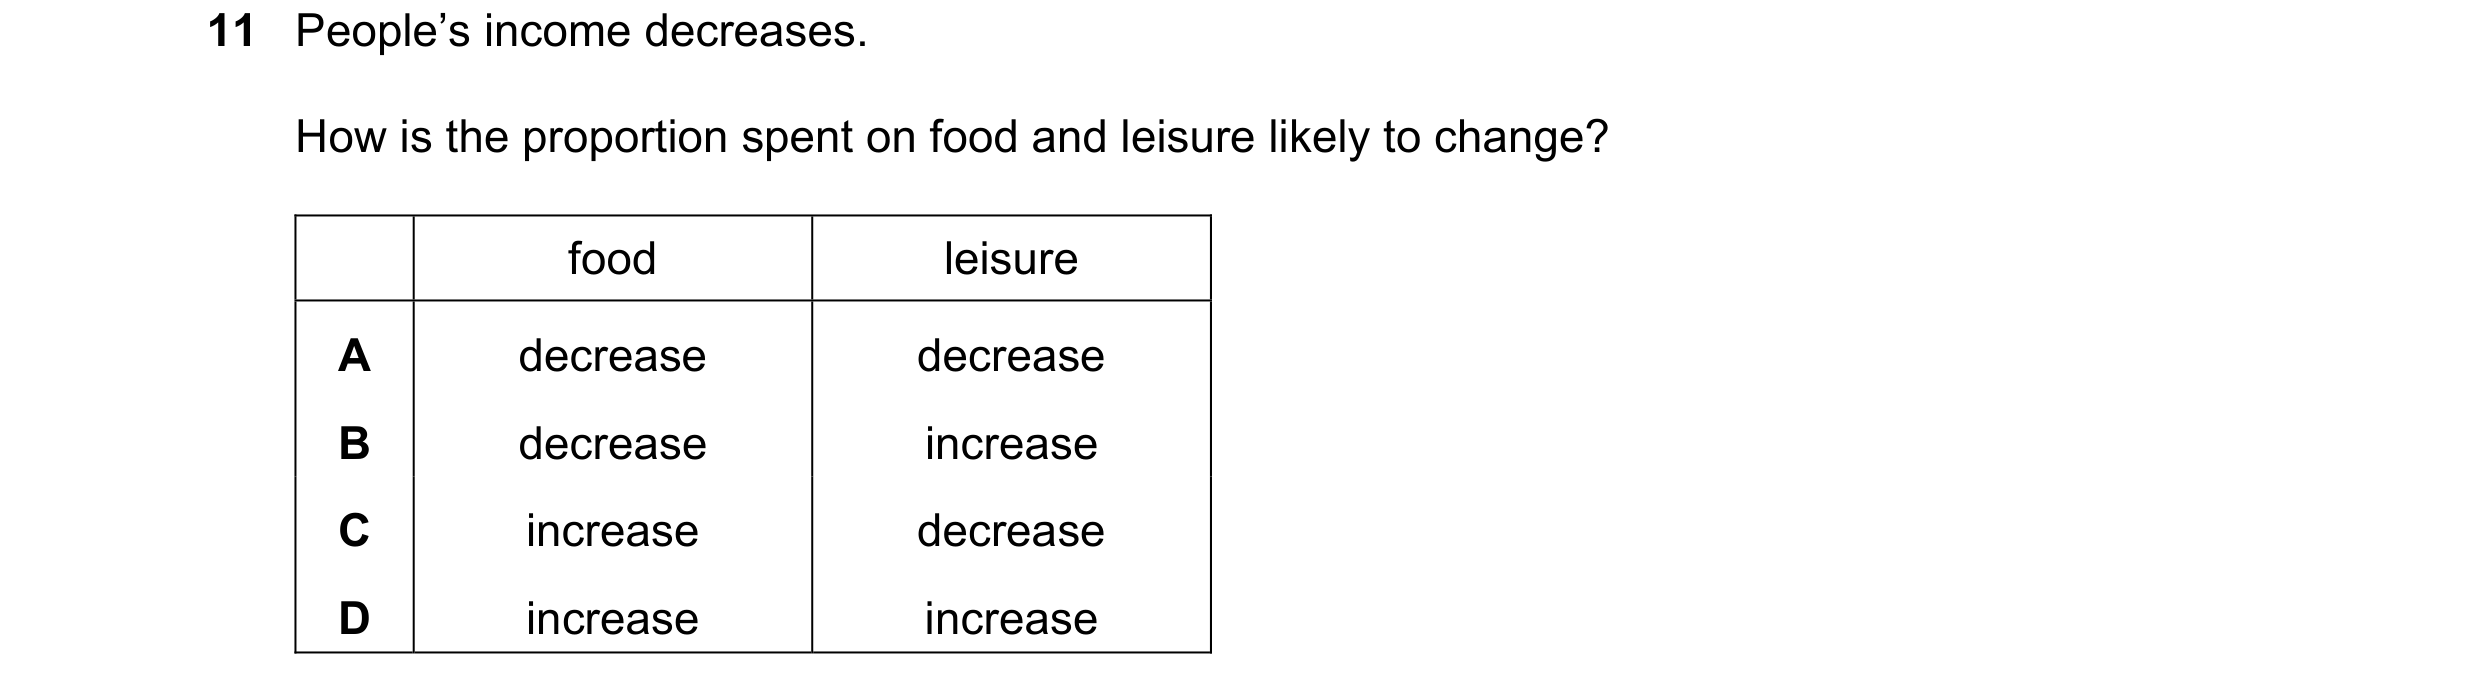
11 People’s income decreases. How is the proportion spent on food and leisure likely to change? food leisure A decrease decrease B decrease increase C increase decrease D increase increase
1 marks
Answer: C
This question in 0455/11 May/June 2020
Q61 · What would most likely cause a person to increase their savings? 0455/12 May/June 2020
9 What would most likely cause a person to increase their savings? A a decision to plan for retirement B a fall in income C a fall in interest rates D a reduction in tax-free saving schemes
1 marks
Answer: A
This question in 0455/12 May/June 2020
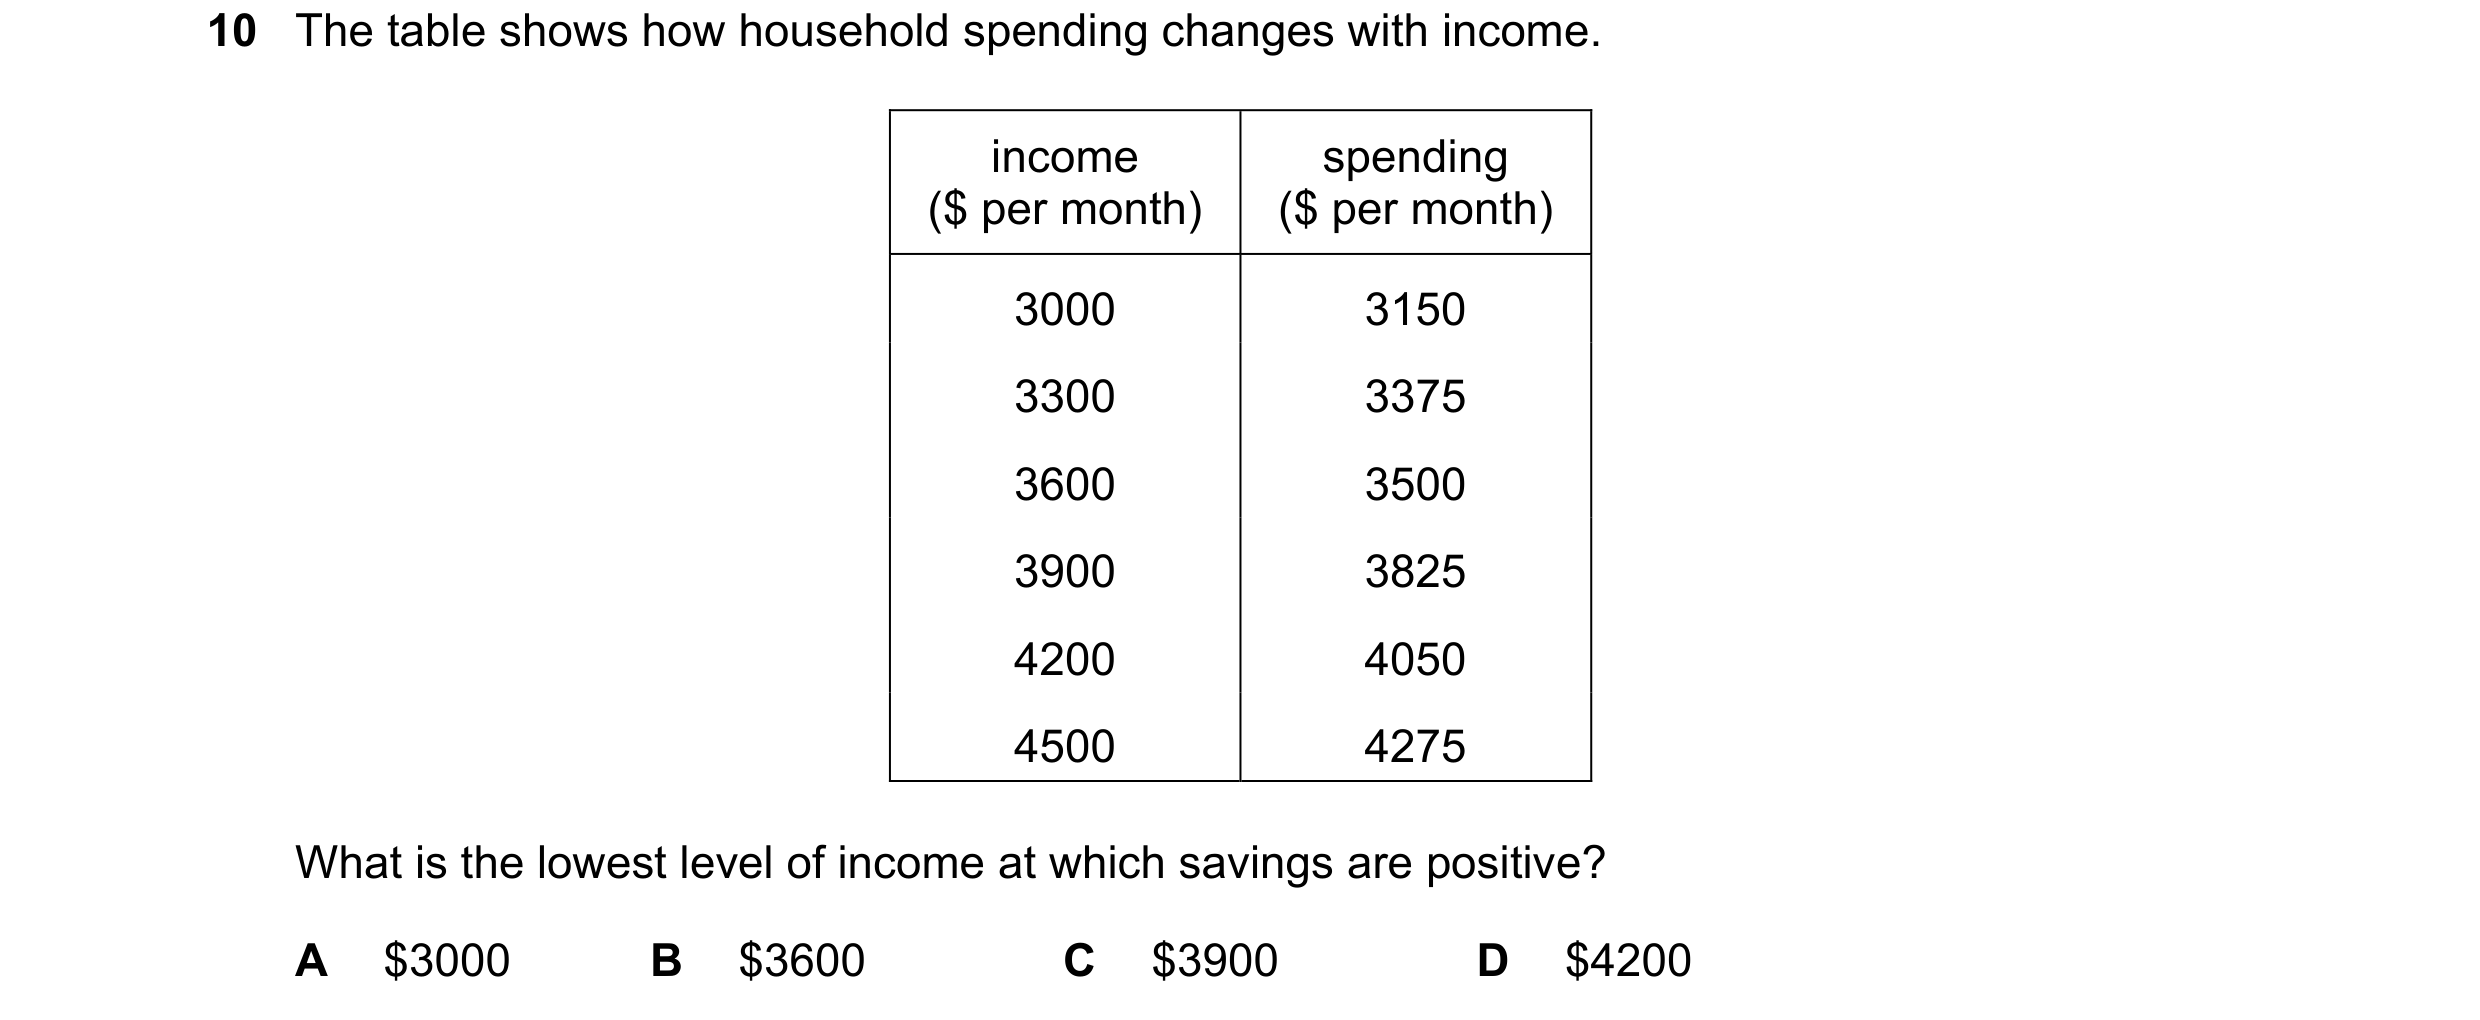
Q62 · The table shows how household spending changes with income 0455/11 Oct/Nov 2020
10 The table shows how household spending changes with income. income spending ($ per month) ($ per month) 3000 3150 3300 3375 3600 3500 3900 3825 4200 4050 4500 4275 What is the lowest level of income at which savings are positive? A $3000 B $3600 C $3900 D $4200
1 marks
Answer: B
This question in 0455/11 Oct/Nov 2020
Q63 · The table shows how household spending changes with income 0455/12 Oct/Nov 2020
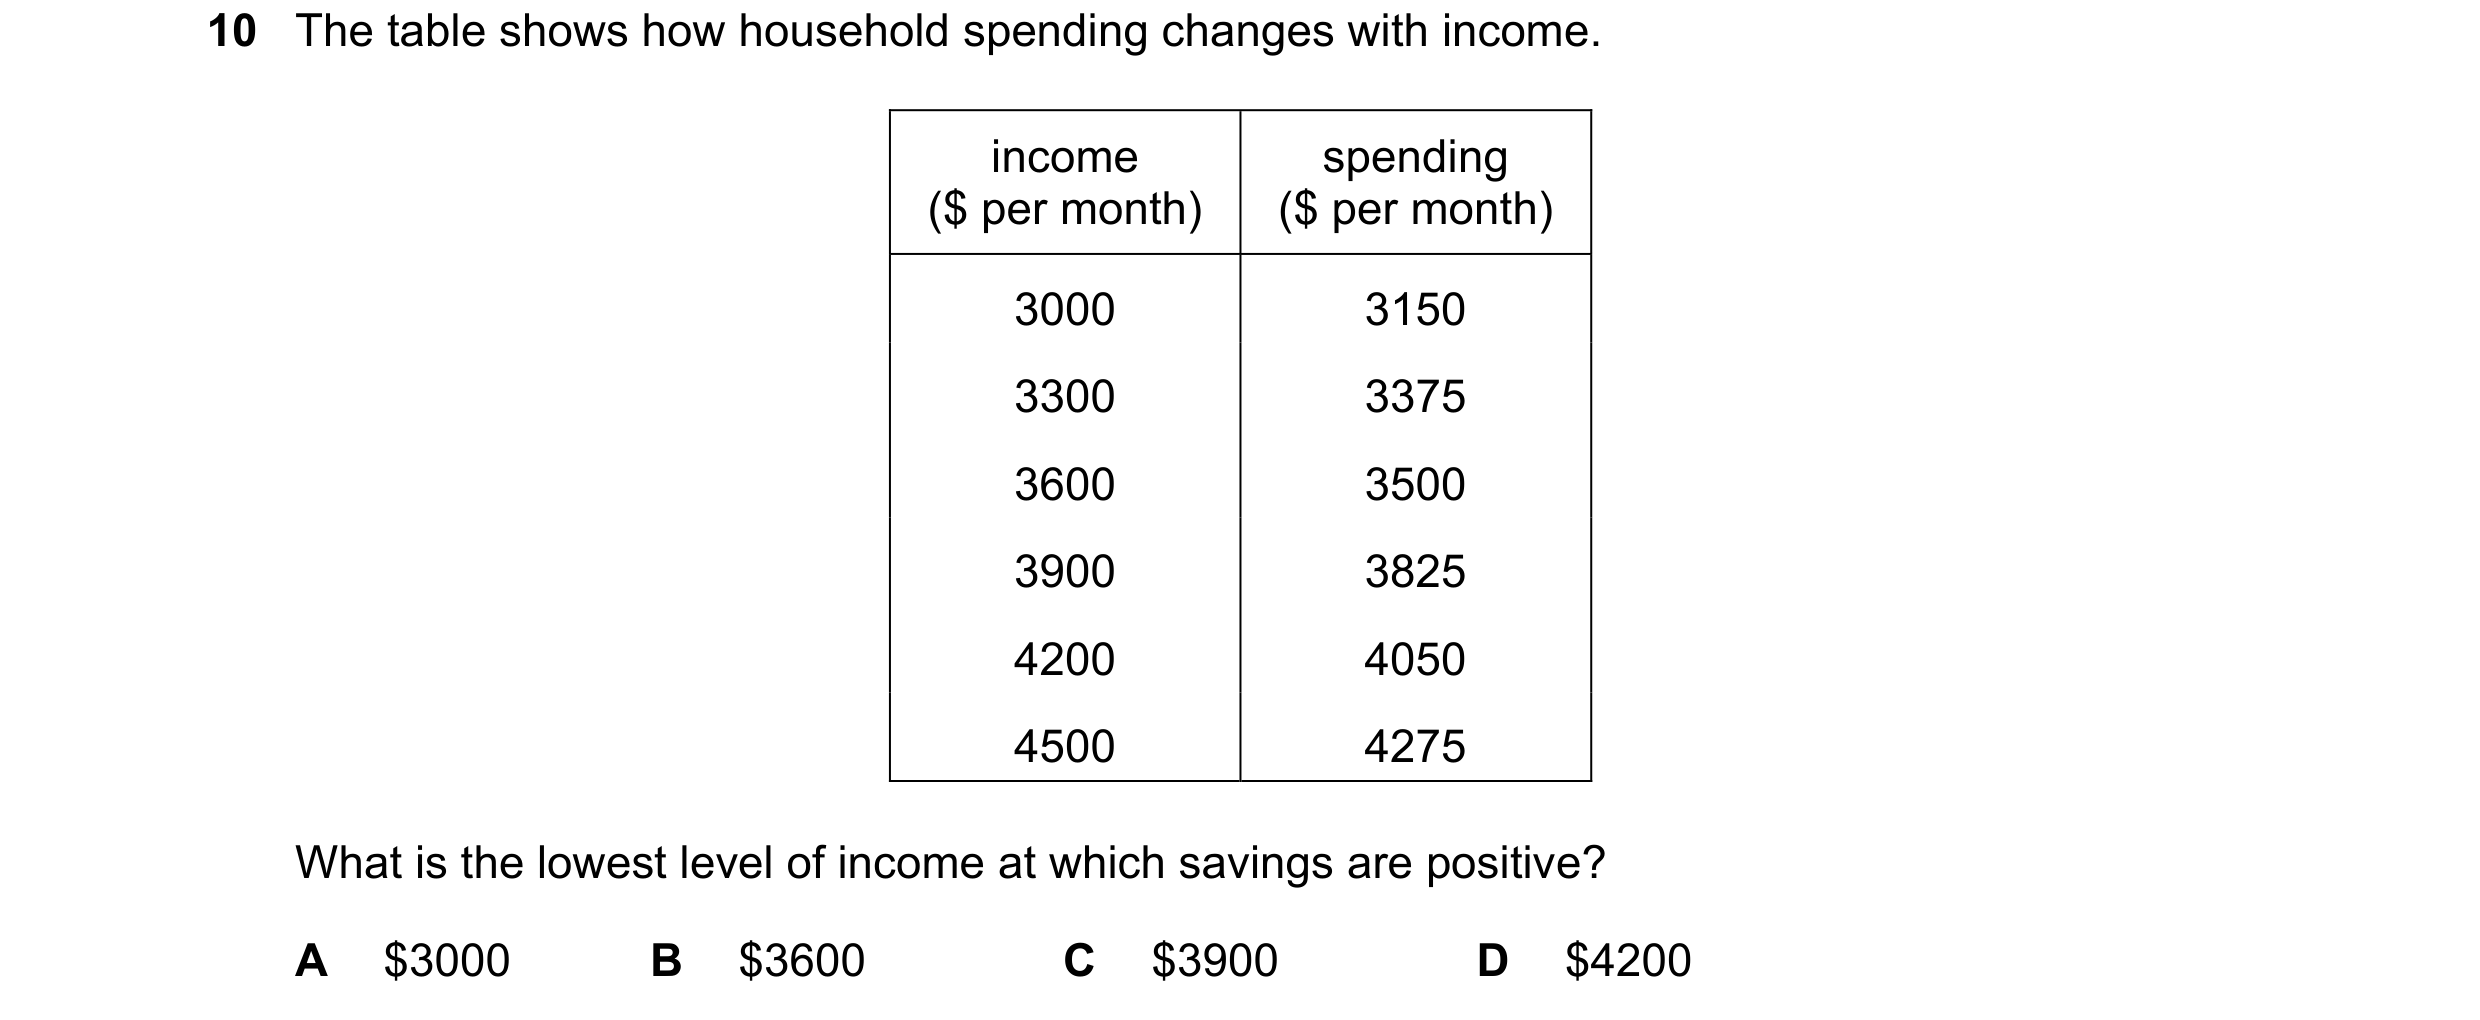
10 The table shows how household spending changes with income. income spending ($ per month) ($ per month) 3000 3150 3300 3375 3600 3500 3900 3825 4200 4050 4500 4275 What is the lowest level of income at which savings are positive? A $3000 B $3600 C $3900 D $4200
1 marks
Answer: B
This question in 0455/12 Oct/Nov 2020
Q64 · The table shows how household spending changes with income 0455/13 Oct/Nov 2020
10 The table shows how household spending changes with income. income spending ($ per month) ($ per month) 3000 3150 3300 3375 3600 3500 3900 3825 4200 4050 4500 4275 What is the lowest level of income at which savings are positive? A $3000 B $3600 C $3900 D $4200
1 marks
Answer: B
This question in 0455/13 Oct/Nov 2020
Q65 · What might cause consumers in a high-income economy to both save more and spend more? 0455/12 May/June 2021
9 What might cause consumers in a high-income economy to both save more and spend more? A an increase in the rate of interest B an increase in wealth C expectation that prices will fall in the future D inflation rising at a faster rate than wages
1 marks
Answer: B
This question in 0455/12 May/June 2021
Q66 · Average incomes rose by 5% but savings did not rise 0455/13 May/June 2021
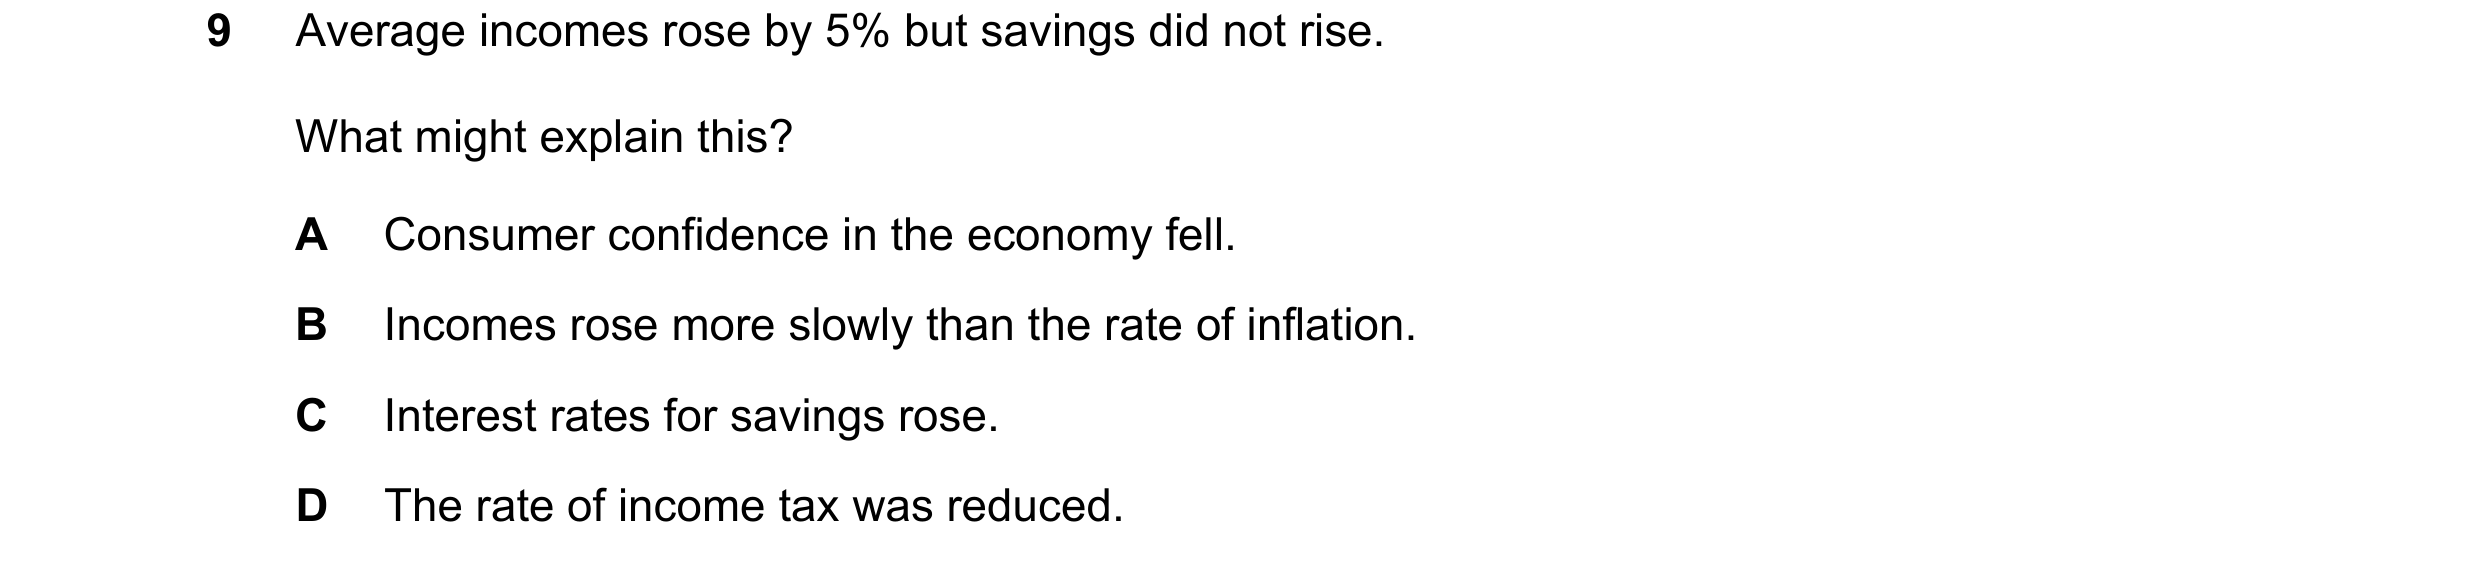
9 Average incomes rose by 5% but savings did not rise. What might explain this? A Consumer confidence in the economy fell. B Incomes rose more slowly than the rate of inflation. C Interest rates for savings rose. D The rate of income tax was reduced.
1 marks
Answer: B
This question in 0455/13 May/June 2021
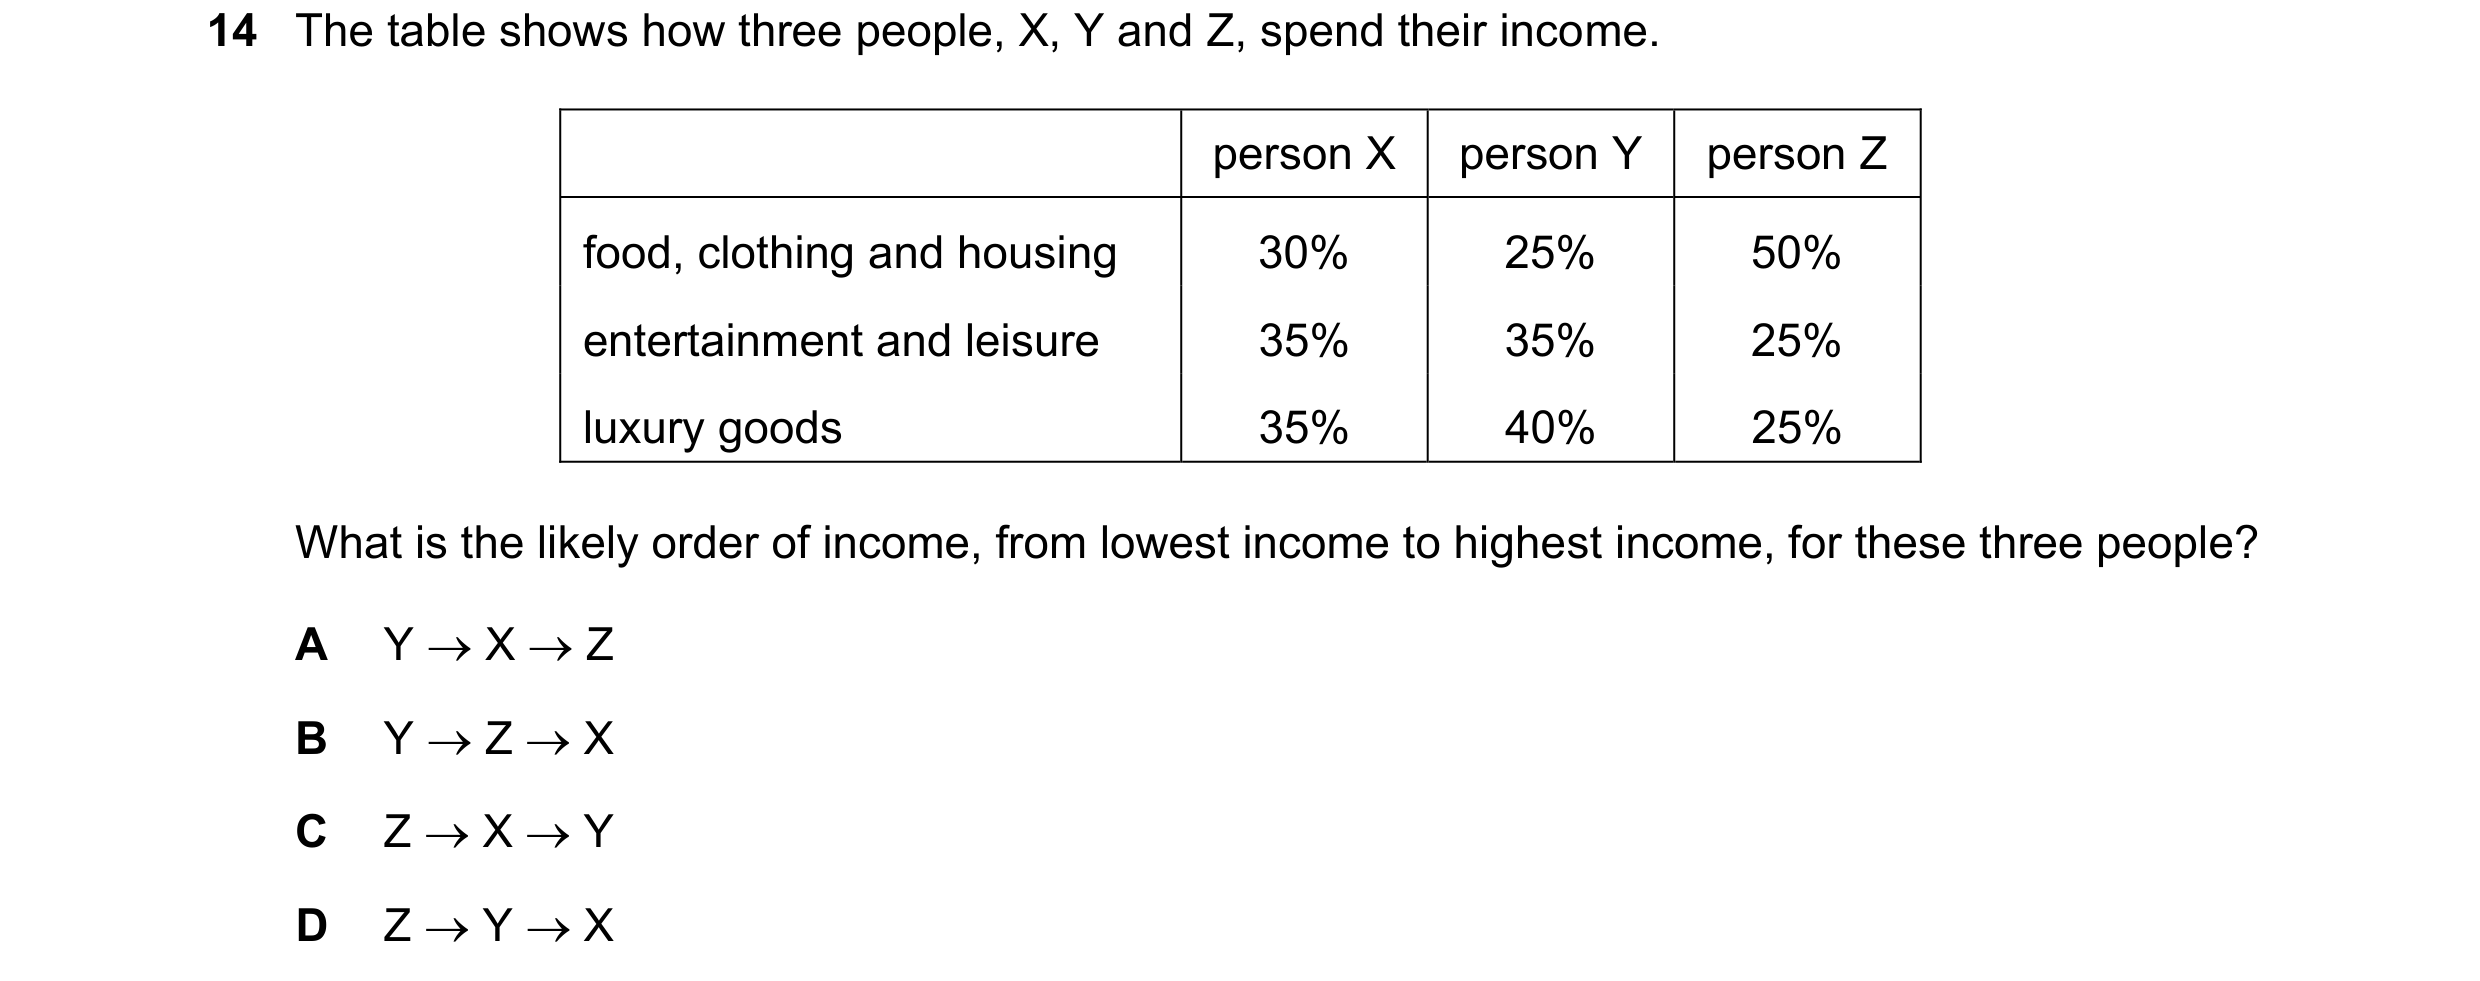
Q67 · The table shows how three people, X, Y and Z, spend their income 0455/11 May/June 2022
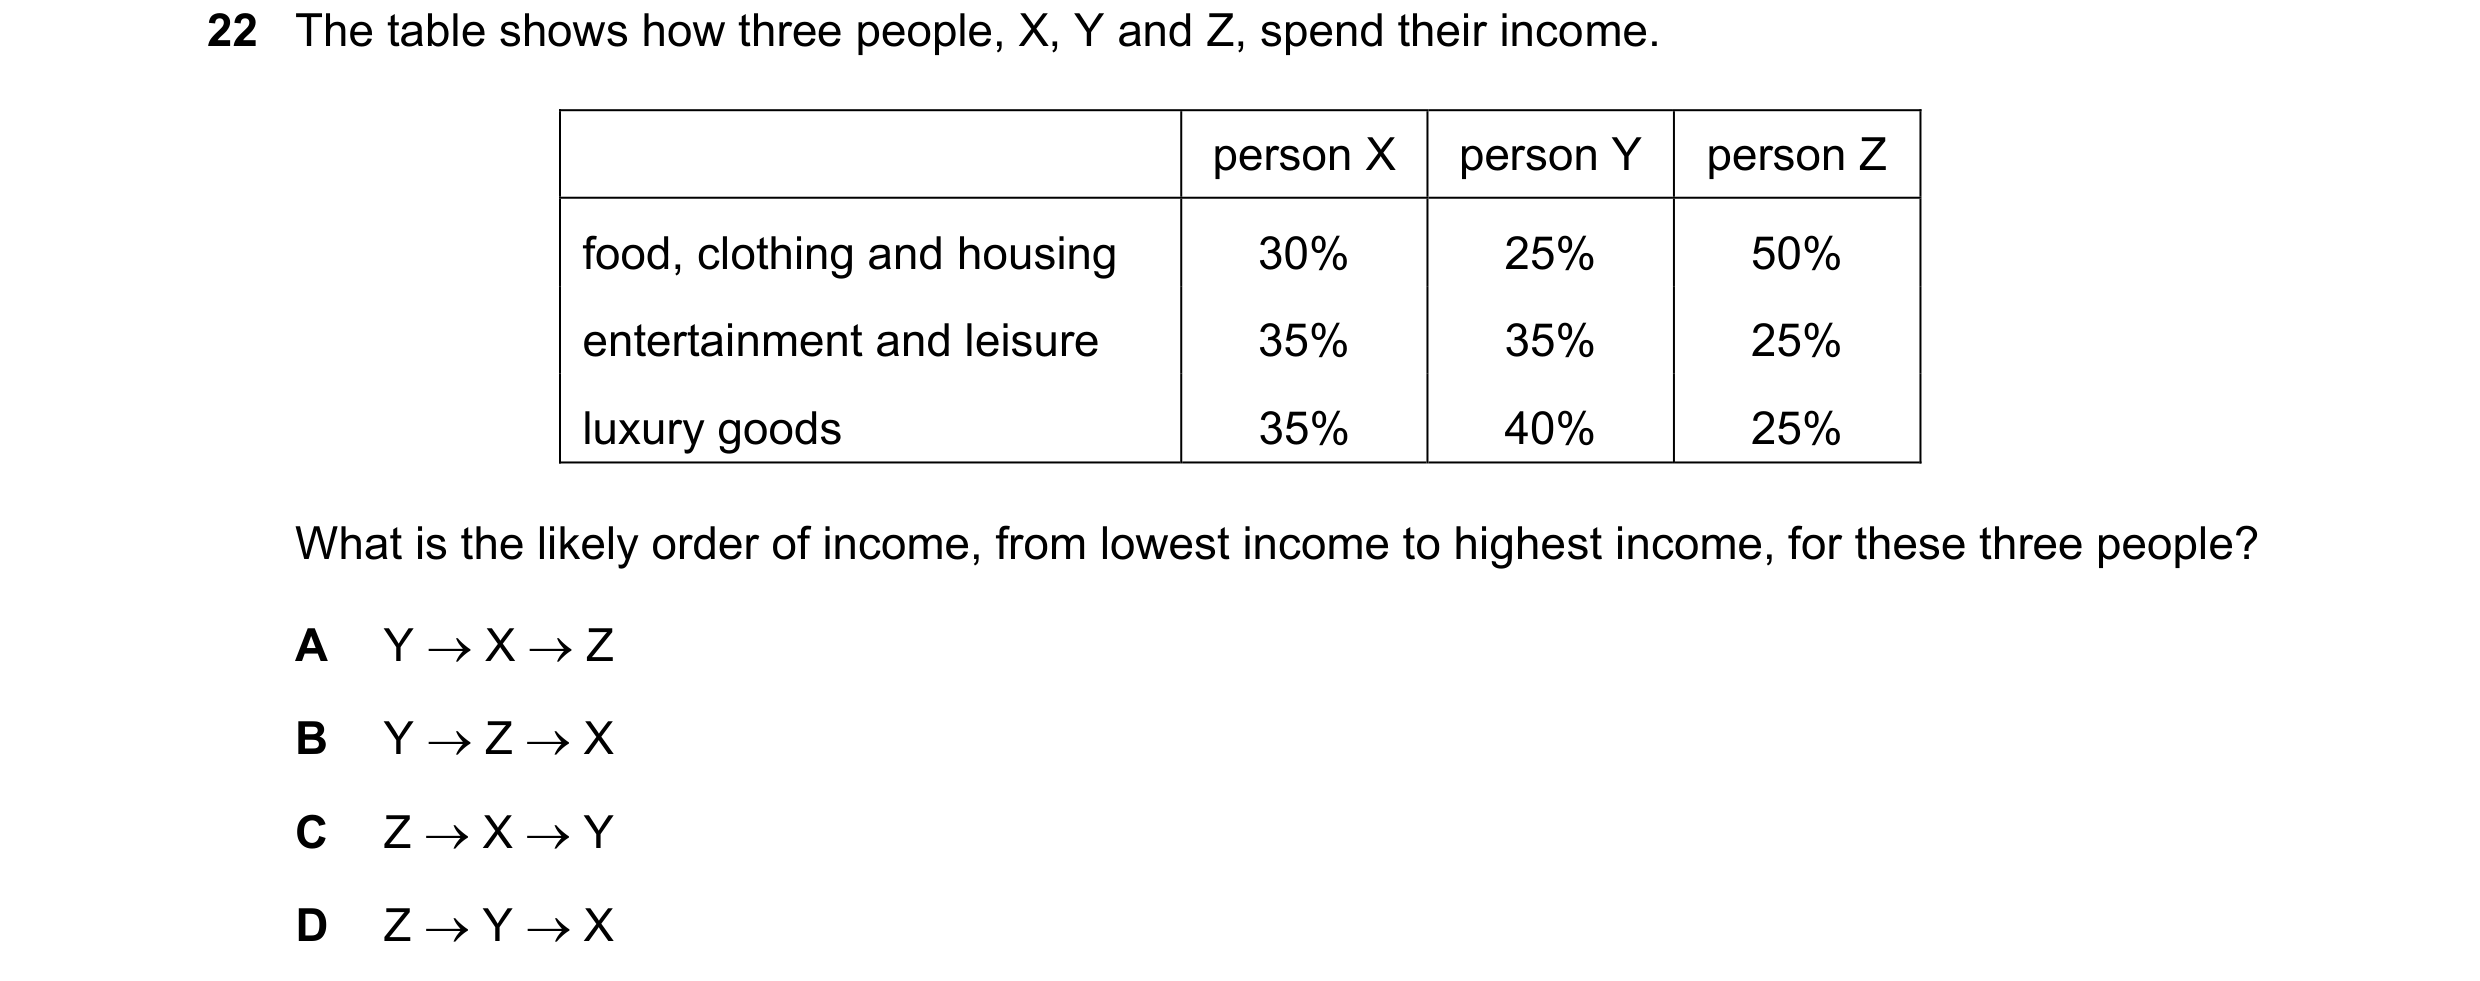
22 The table shows how three people, X, Y and Z, spend their income. person X person Y person Z food, clothing and housing 30% 25% 50% entertainment and leisure 35% 35% 25% luxury goods 35% 40% 25% What is the likely order of income, from lowest income to highest income, for these three people? A Y X Z B Y Z X C Z X Y D Z Y X
1 marks
Answer: C
This question in 0455/11 May/June 2022
Q68 · The table shows how three people, X, Y and Z, spend their income 0455/12 May/June 2022
14 The table shows how three people, X, Y and Z, spend their income. person X person Y person Z food, clothing and housing 30% 25% 50% entertainment and leisure 35% 35% 25% luxury goods 35% 40% 25% What is the likely order of income, from lowest income to highest income, for these three people? A Y X Z B Y Z X C Z X Y D Z Y X
1 marks
Answer: C
This question in 0455/12 May/June 2022
Q69 · What might encourage a consumer to spend less and save more? 0455/13 May/June 2022
13 What might encourage a consumer to spend less and save more? A the expectation that prices will fall B the expectation that prices will rise C the expectation that unemployment will fall D the expectation that real GDP will rise
1 marks
Answer: A
This question in 0455/13 May/June 2022
Q70 · Which statement about different income groups is correct? 0455/11 Oct/Nov 2022
11 Which statement about different income groups is correct? A High-income groups do not need to borrow money. B High-income groups save less money than low-income groups. C Low-income groups find it easier to borrow than high-income groups. D Low-income groups save a smaller percentage of their income than high-income groups.
1 marks
Answer: D
This question in 0455/11 Oct/Nov 2022
Q71 · Which statement about different income groups is correct? 0455/12 Oct/Nov 2022
11 Which statement about different income groups is correct? A High-income groups do not need to borrow money. B High-income groups save less money than low-income groups. C Low-income groups find it easier to borrow than high-income groups. D Low-income groups save a smaller percentage of their income than high-income groups.
1 marks
Answer: D
This question in 0455/12 Oct/Nov 2022
Q72 · Which statement about different income groups is correct? 0455/13 Oct/Nov 2022
11 Which statement about different income groups is correct? A High-income groups do not need to borrow money. B High-income groups save less money than low-income groups. C Low-income groups find it easier to borrow than high-income groups. D Low-income groups save a smaller percentage of their income than high-income groups.
1 marks
Answer: D
This question in 0455/13 Oct/Nov 2022
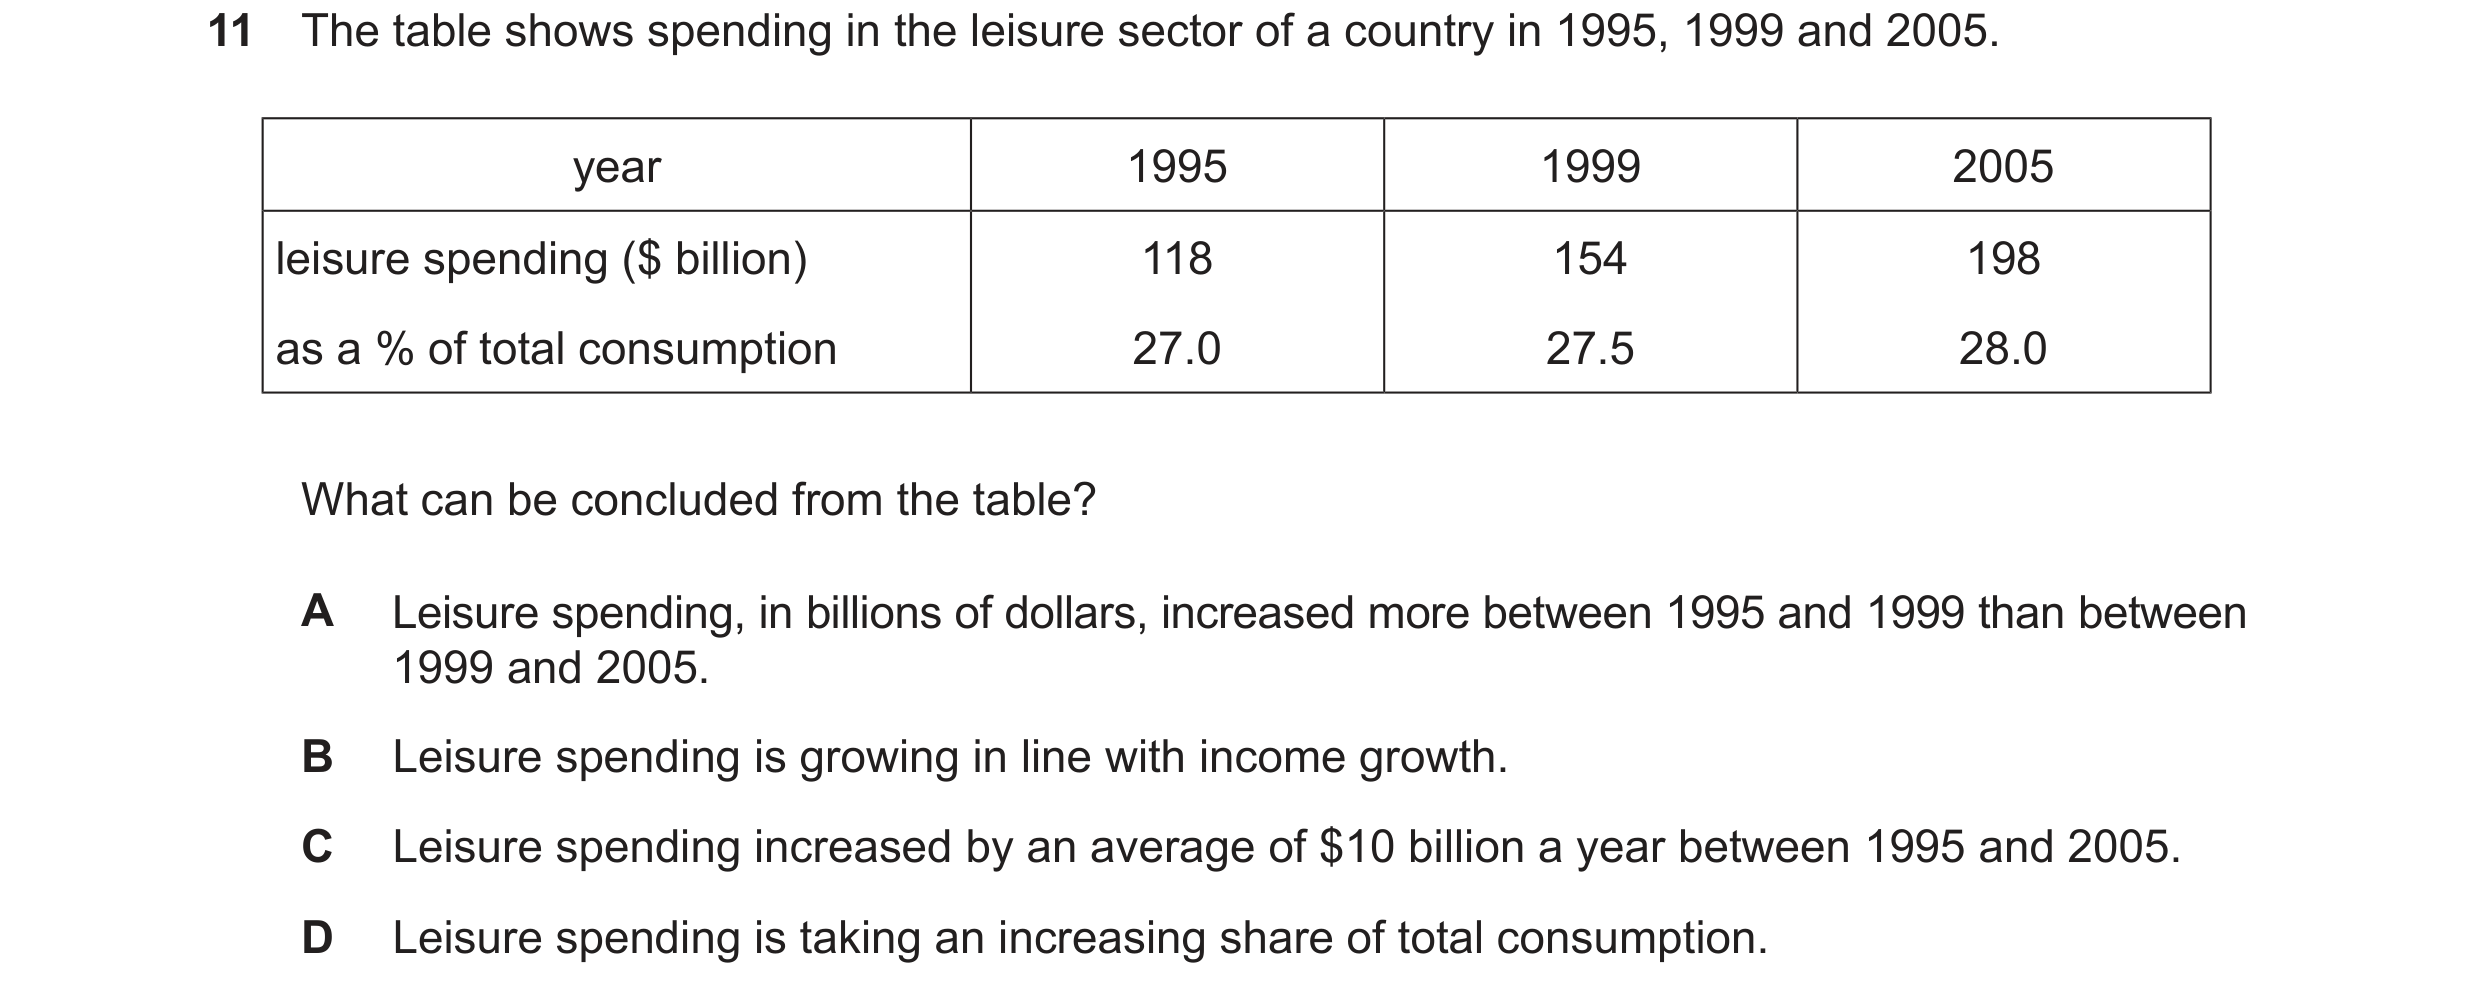
Q73 · The table shows spending in the leisure sector of a country in 1995, 1999 and 2005 0455/12 Feb/March 2023
11 The table shows spending in the leisure sector of a country in 1995, 1999 and 2005.
year 1995 1999
leisure spending ($ billion) 118 154
as a % of total consumption
What can be concluded from the table?
A Leisure spending, in billions of dollars, increased more between 1995 and 1999 than between
1999 and 2005.
B Leisure spending is growing in line with income growth.
Leisure spending increased by an average of $10 billion a year between 1995 and 2005.
Leisure spending is taking an increasing share of total consumption.
1 marks
Answer: D
This question in 0455/12 Feb/March 2023
Q74 · What would be most likely to encourage saving? 0455/11 May/June 2023
19 What would be most likely to encourage saving? A a rise in the exchange rate B a rise in the goods and services tax rate C a rise in the income tax rate D a rise in the interest rate
1 marks
Answer: D
This question in 0455/11 May/June 2023
Q75 · What would cause a decrease in spending by households in a country? 0455/12 May/June 2024
11 What would cause a decrease in spending by households in a country? A a reduction in disposable income B a reduction in the rate of sales tax C lower interest rates D lower savings
1 marks
Answer: A
This question in 0455/12 May/June 2024
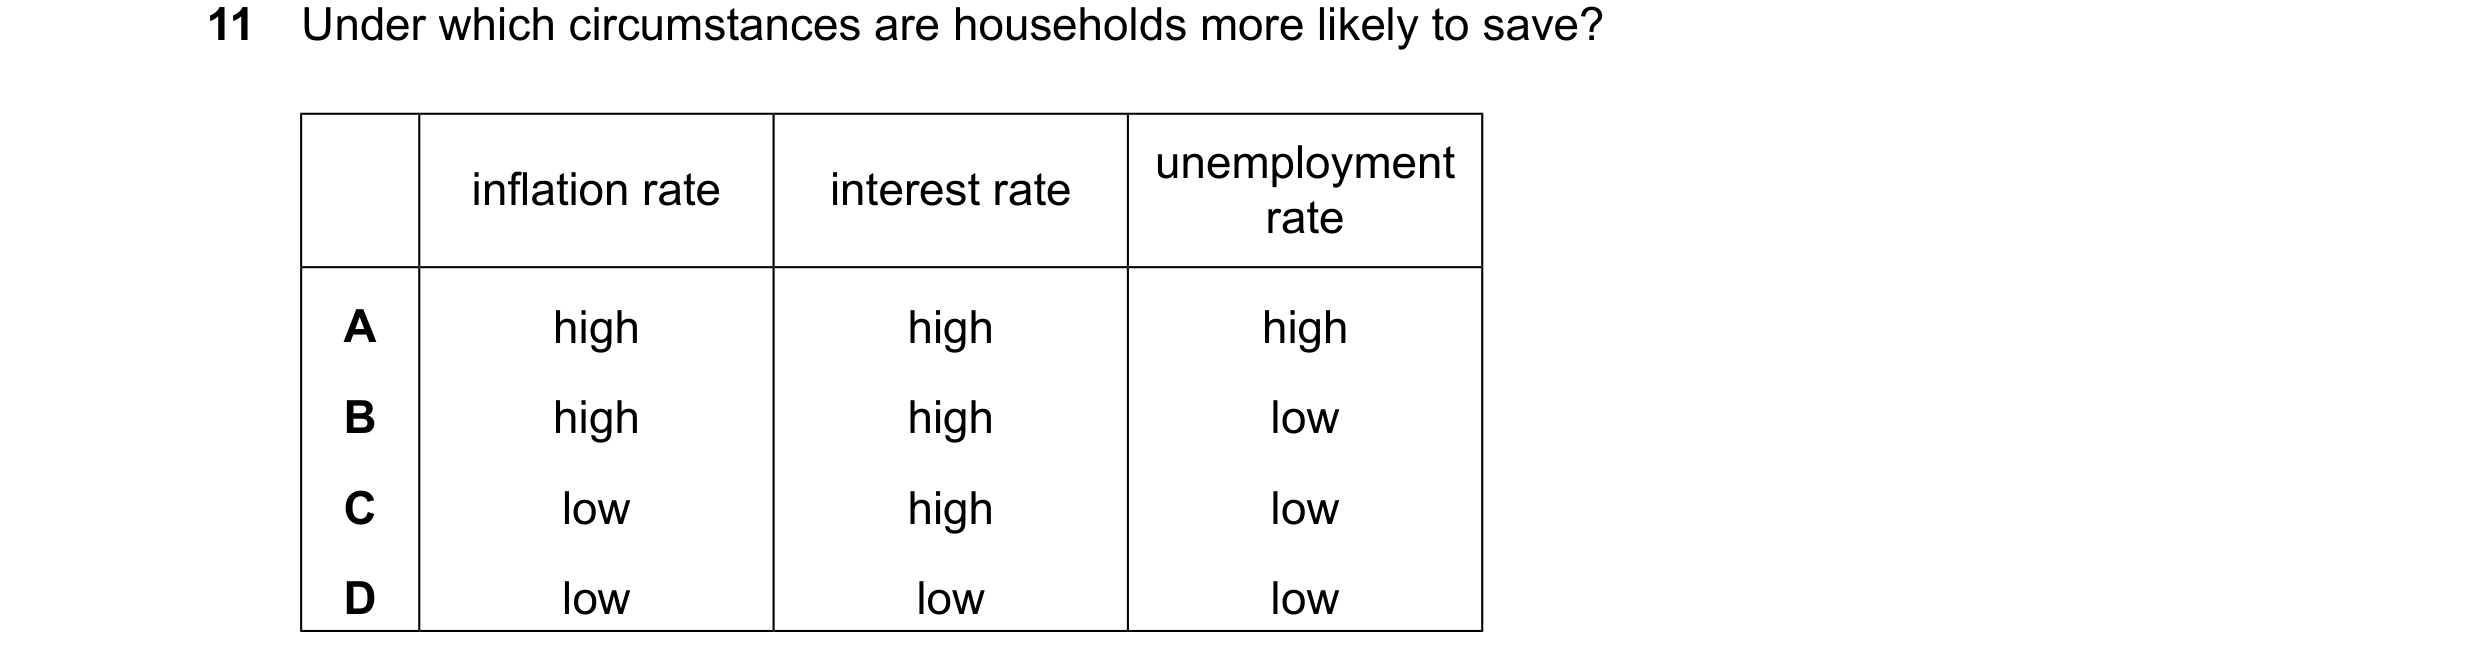
Q76 · Under which circumstances are households more likely to save? 0455/13 Oct/Nov 2024
11 Under which circumstances are households more likely to save? unemployment inflation rate interest rate rate A high high high B high high low C low high low D low low low
1 marks
Answer: C
This question in 0455/13 Oct/Nov 2024
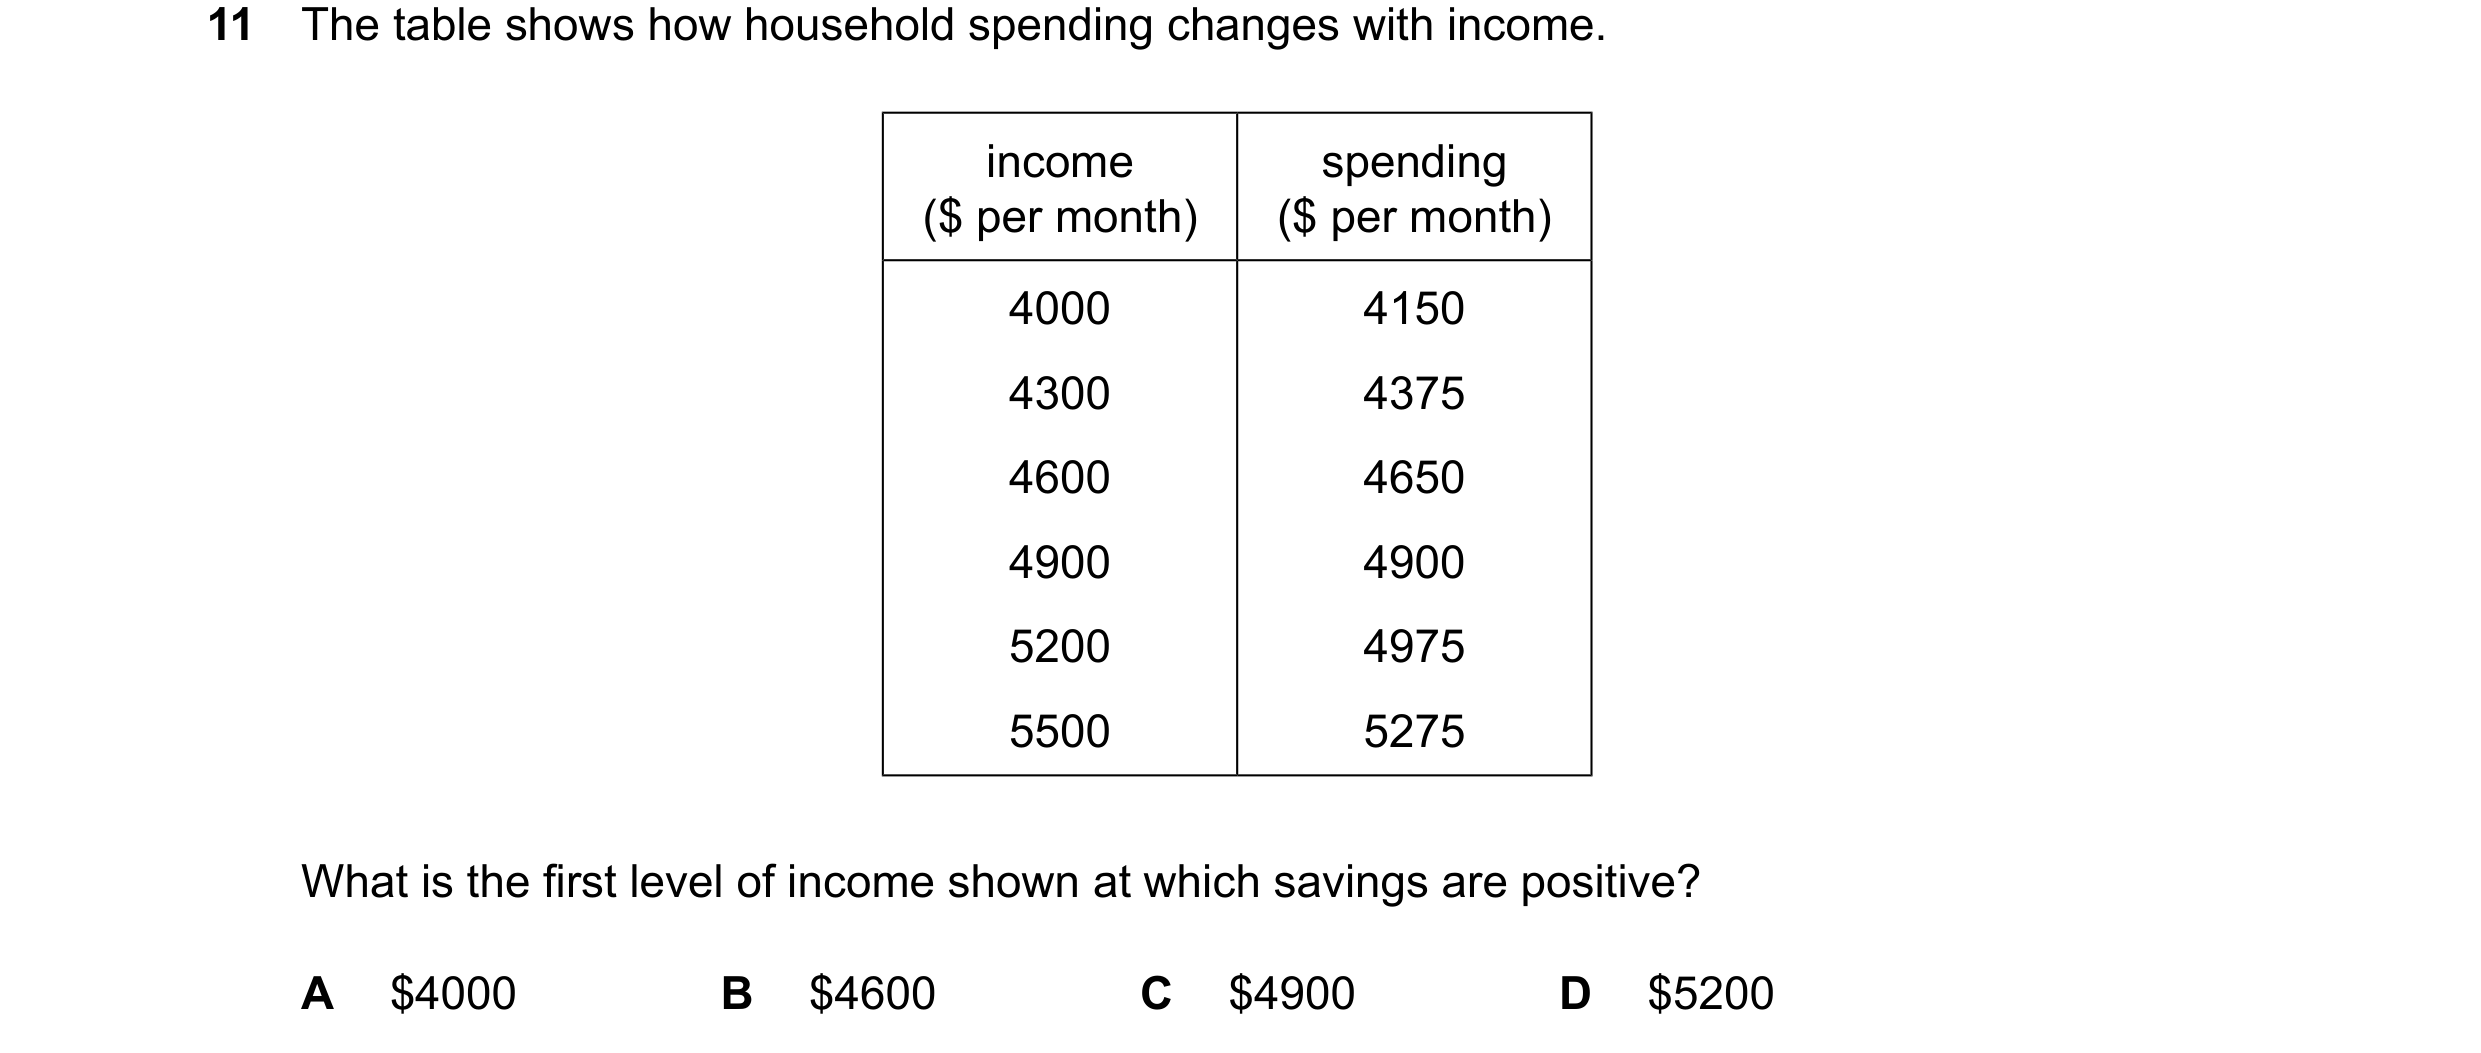
Q77 · The table shows how household spending changes with income 0455/11 Oct/Nov 2025
11 The table shows how household spending changes with income. income spending ($ per month) ($ per month) 4000 4150 4300 4375 4600 4650 4900 4900 5200 4975 5500 5275 What is the first level of income shown at which savings are positive? A $4000 B $4600 C $4900 D $5200
1 marks
Answer: D
This question in 0455/11 Oct/Nov 2025
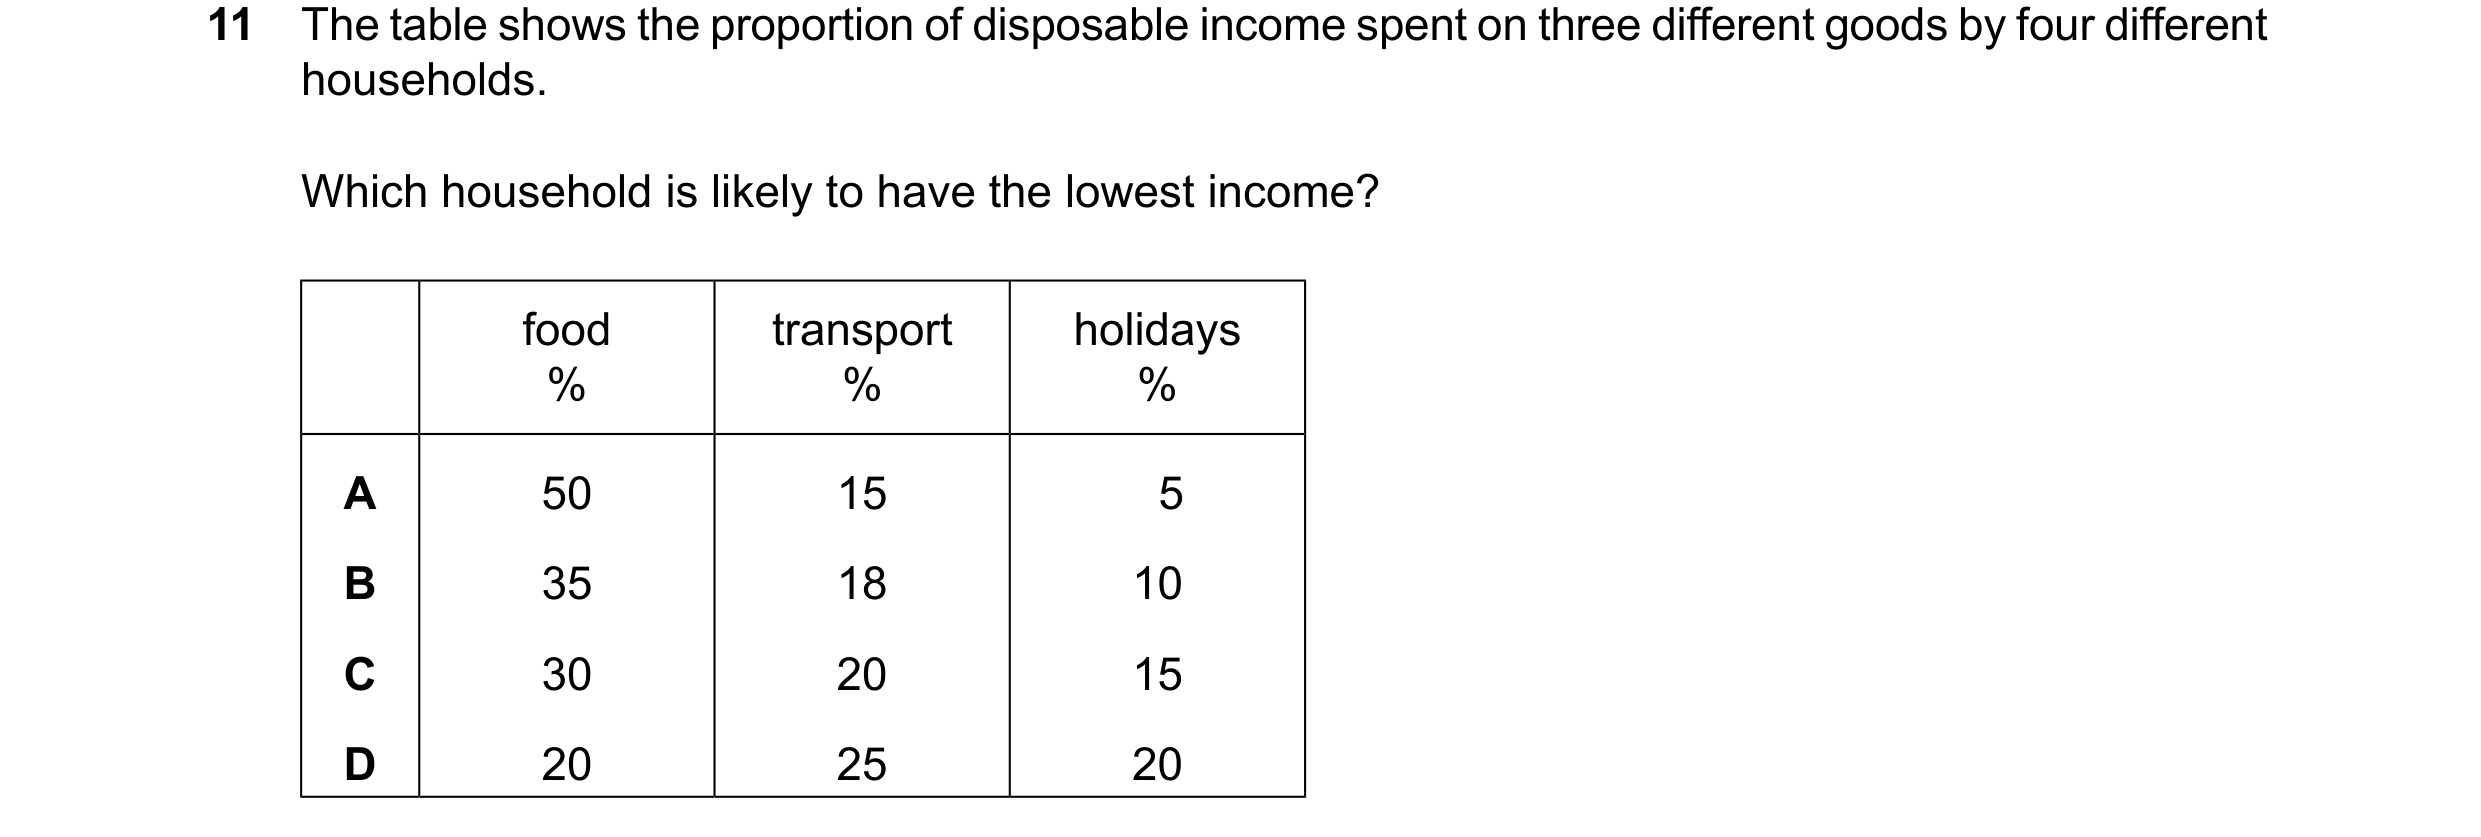
Q78 · The table shows the proportion of disposable income spent on three different goods by… 0455/12 Oct/Nov 2025
11 The table shows the proportion of disposable income spent on three different goods by four different households. Which household is likely to have the lowest income? food transport holidays % % % A 50 15 5 B 35 18 10 C 30 20 15 D 20 25 20
1 marks
Answer: A
This question in 0455/12 Oct/Nov 2025



 1 / 18



 2 / 18



 3 / 18


 4 / 18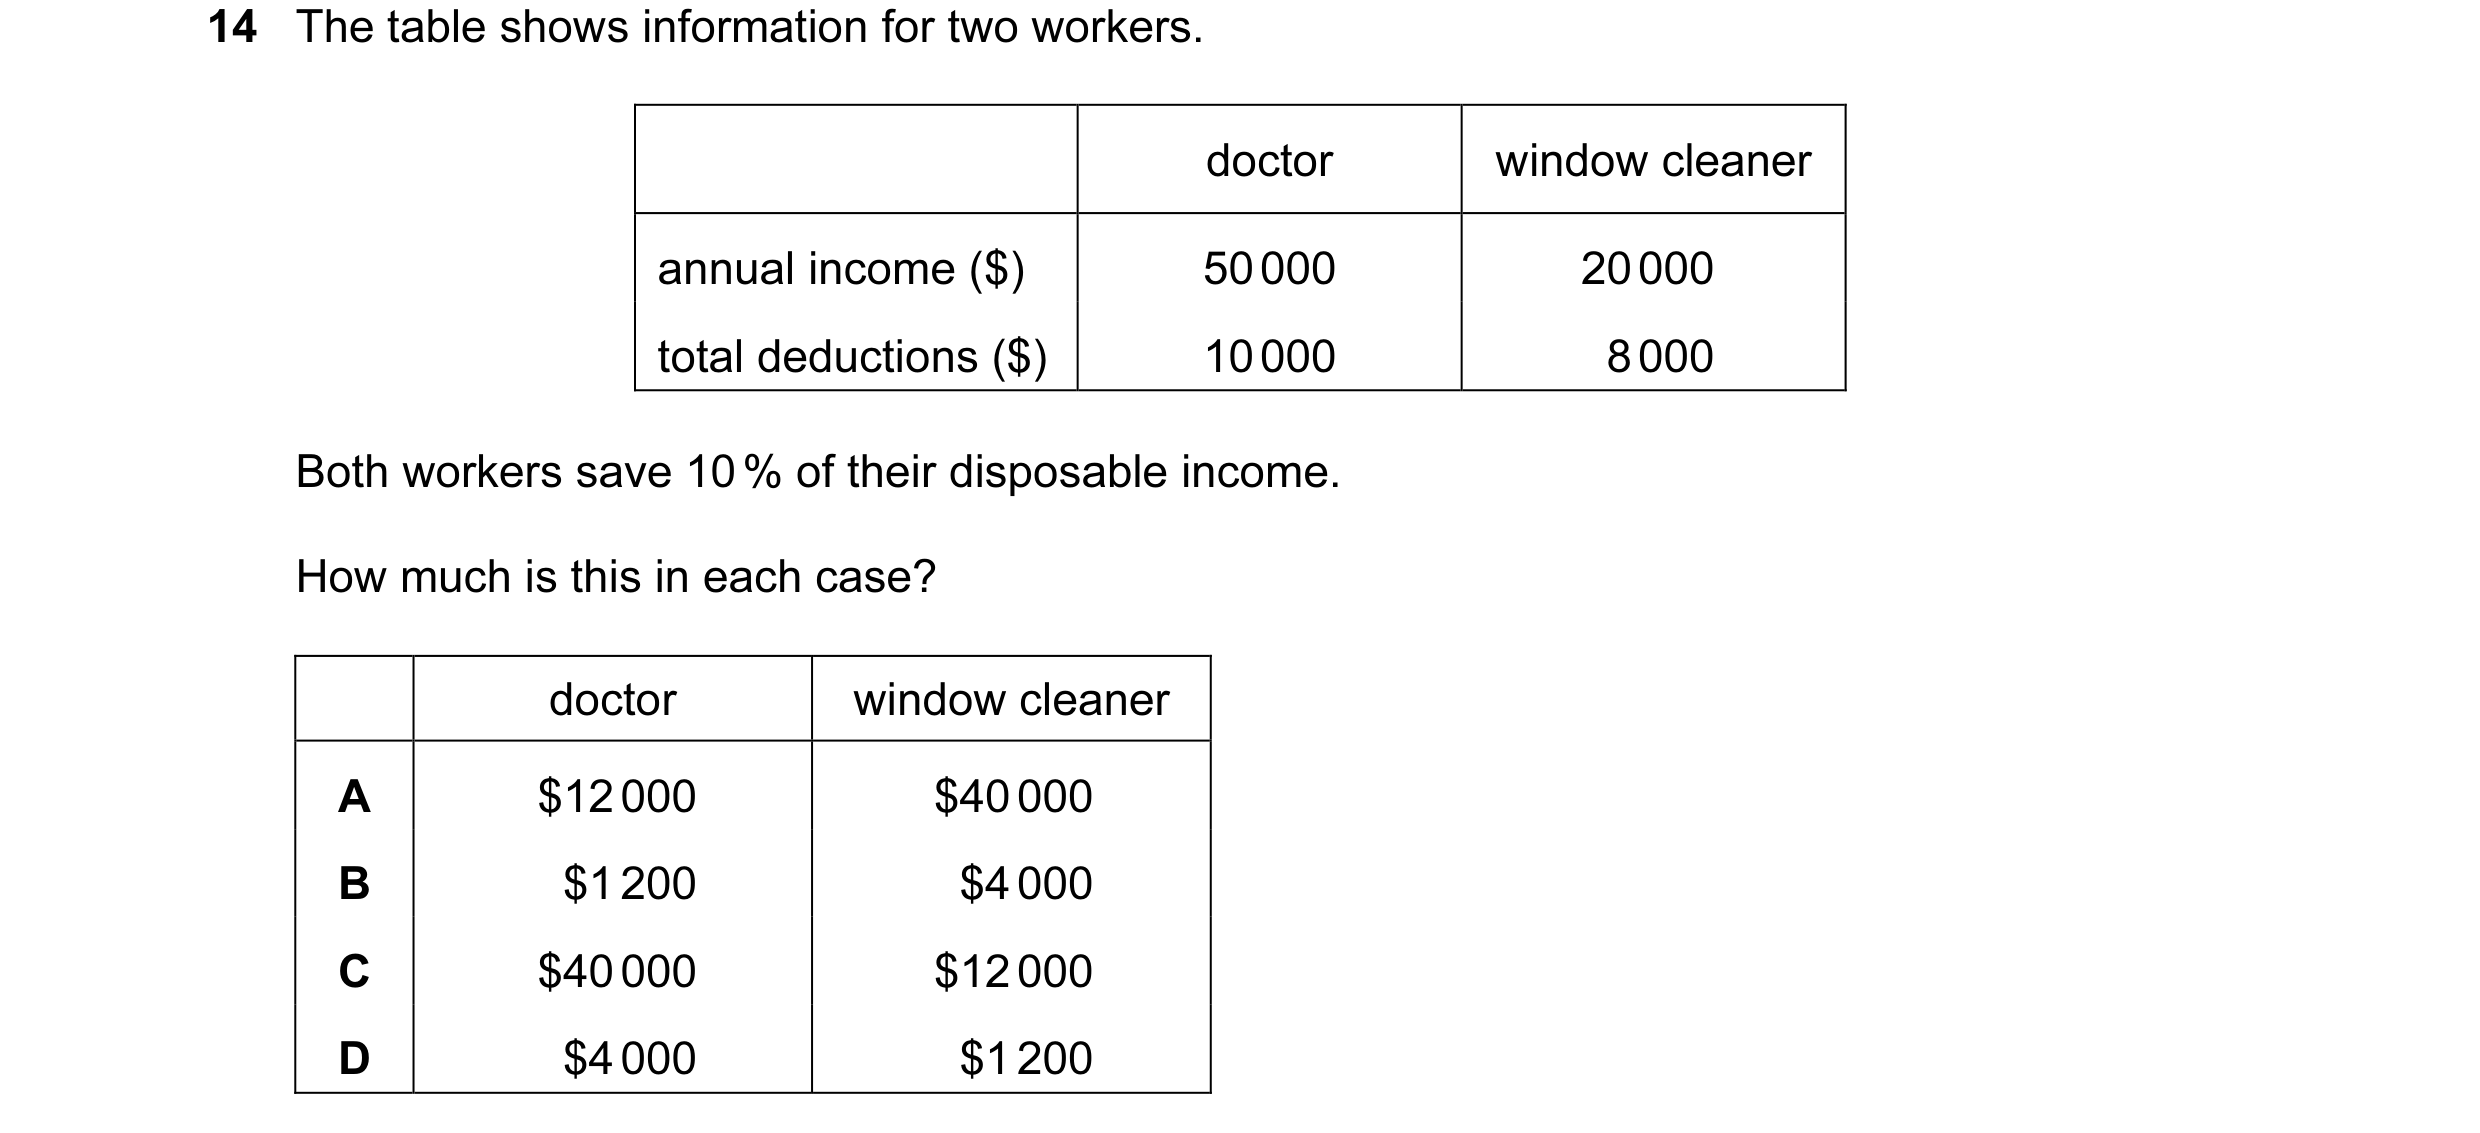
 5 / 18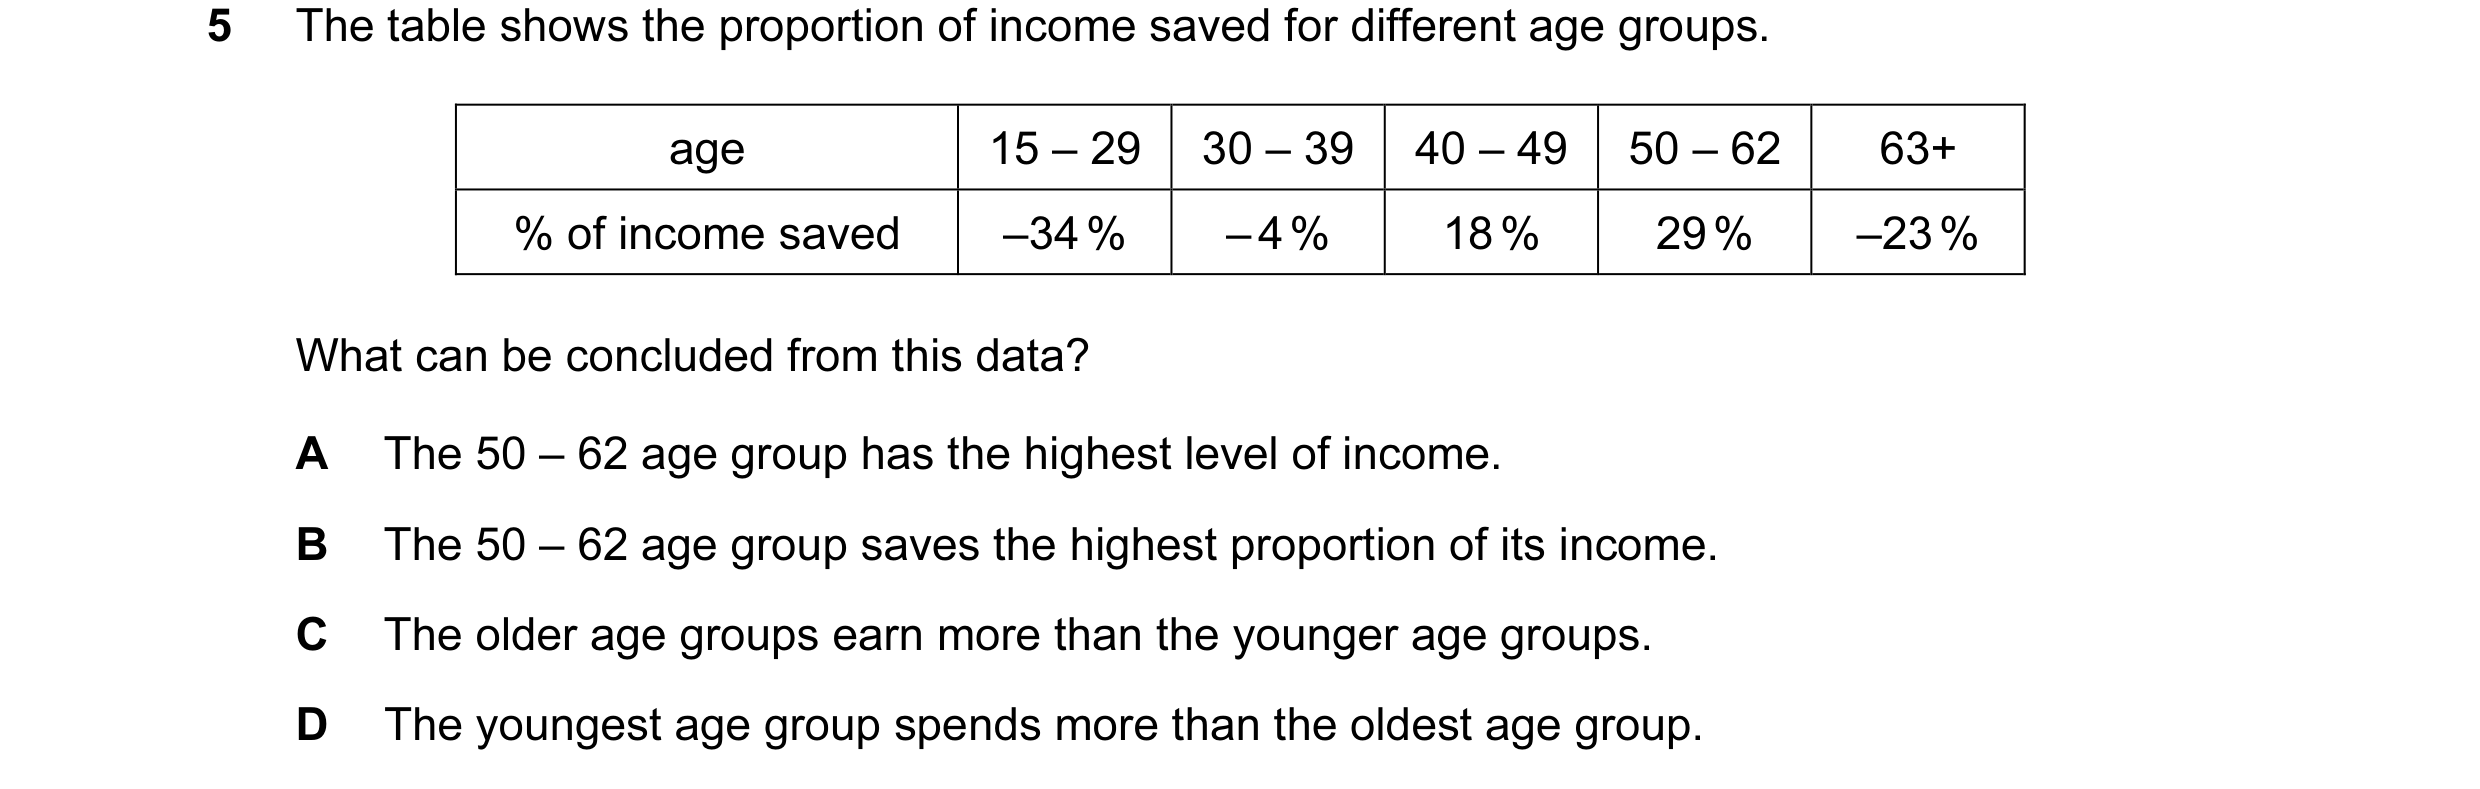

 6 / 18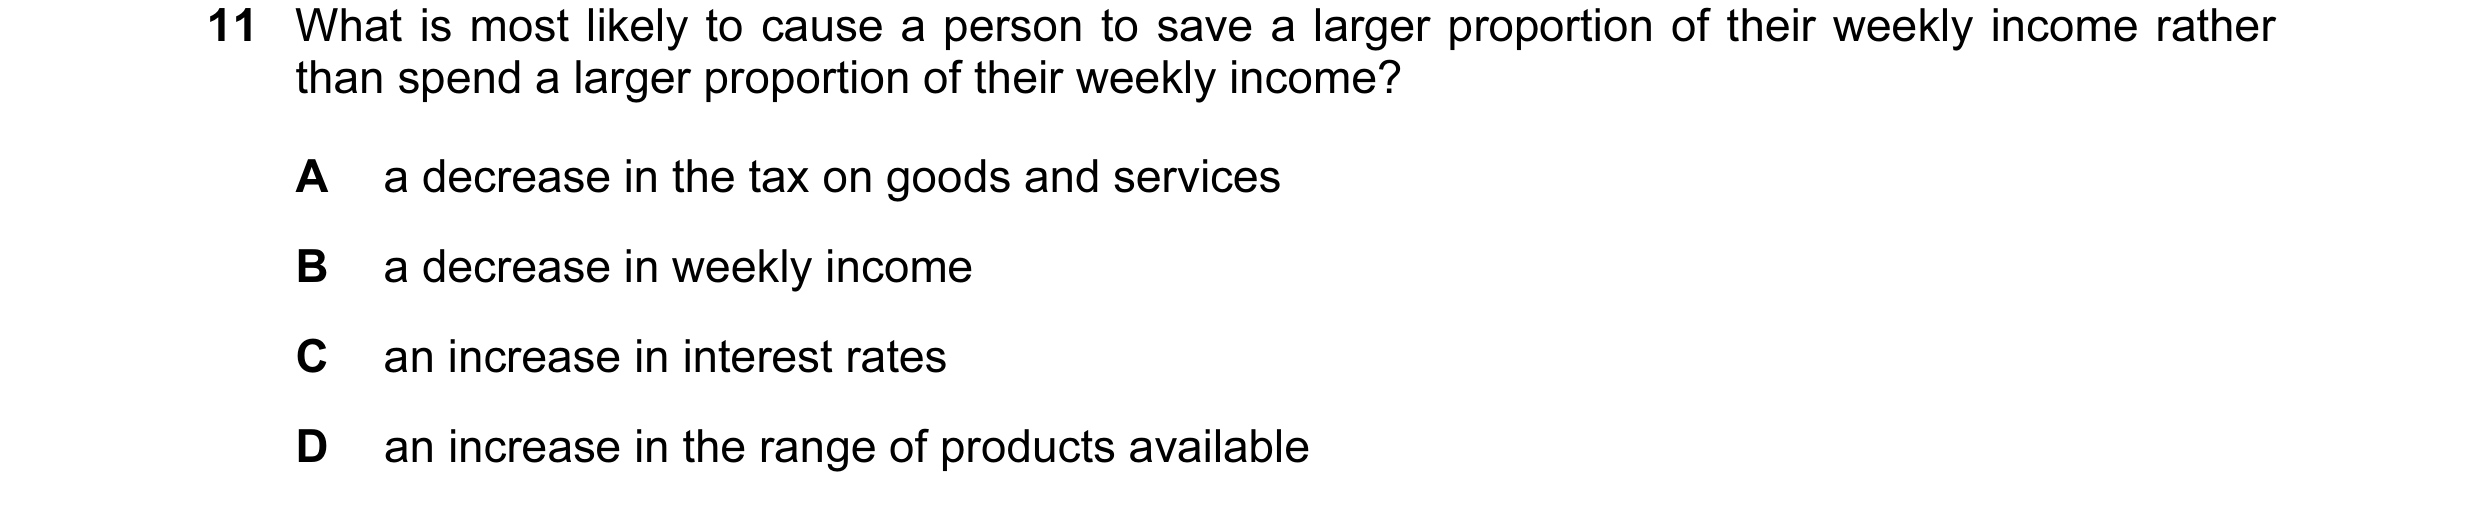


 7 / 18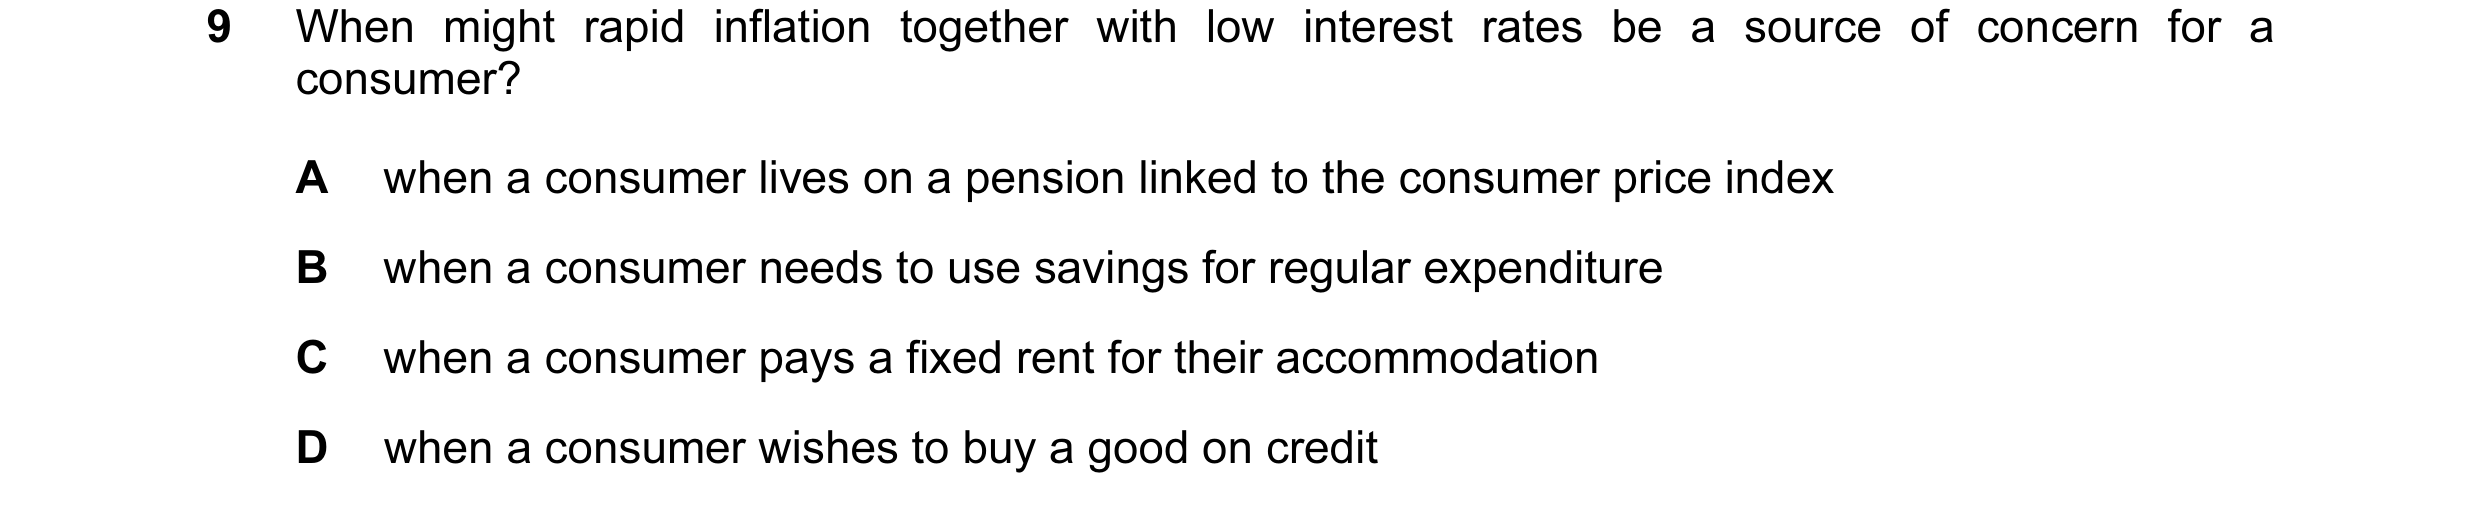
 8 / 18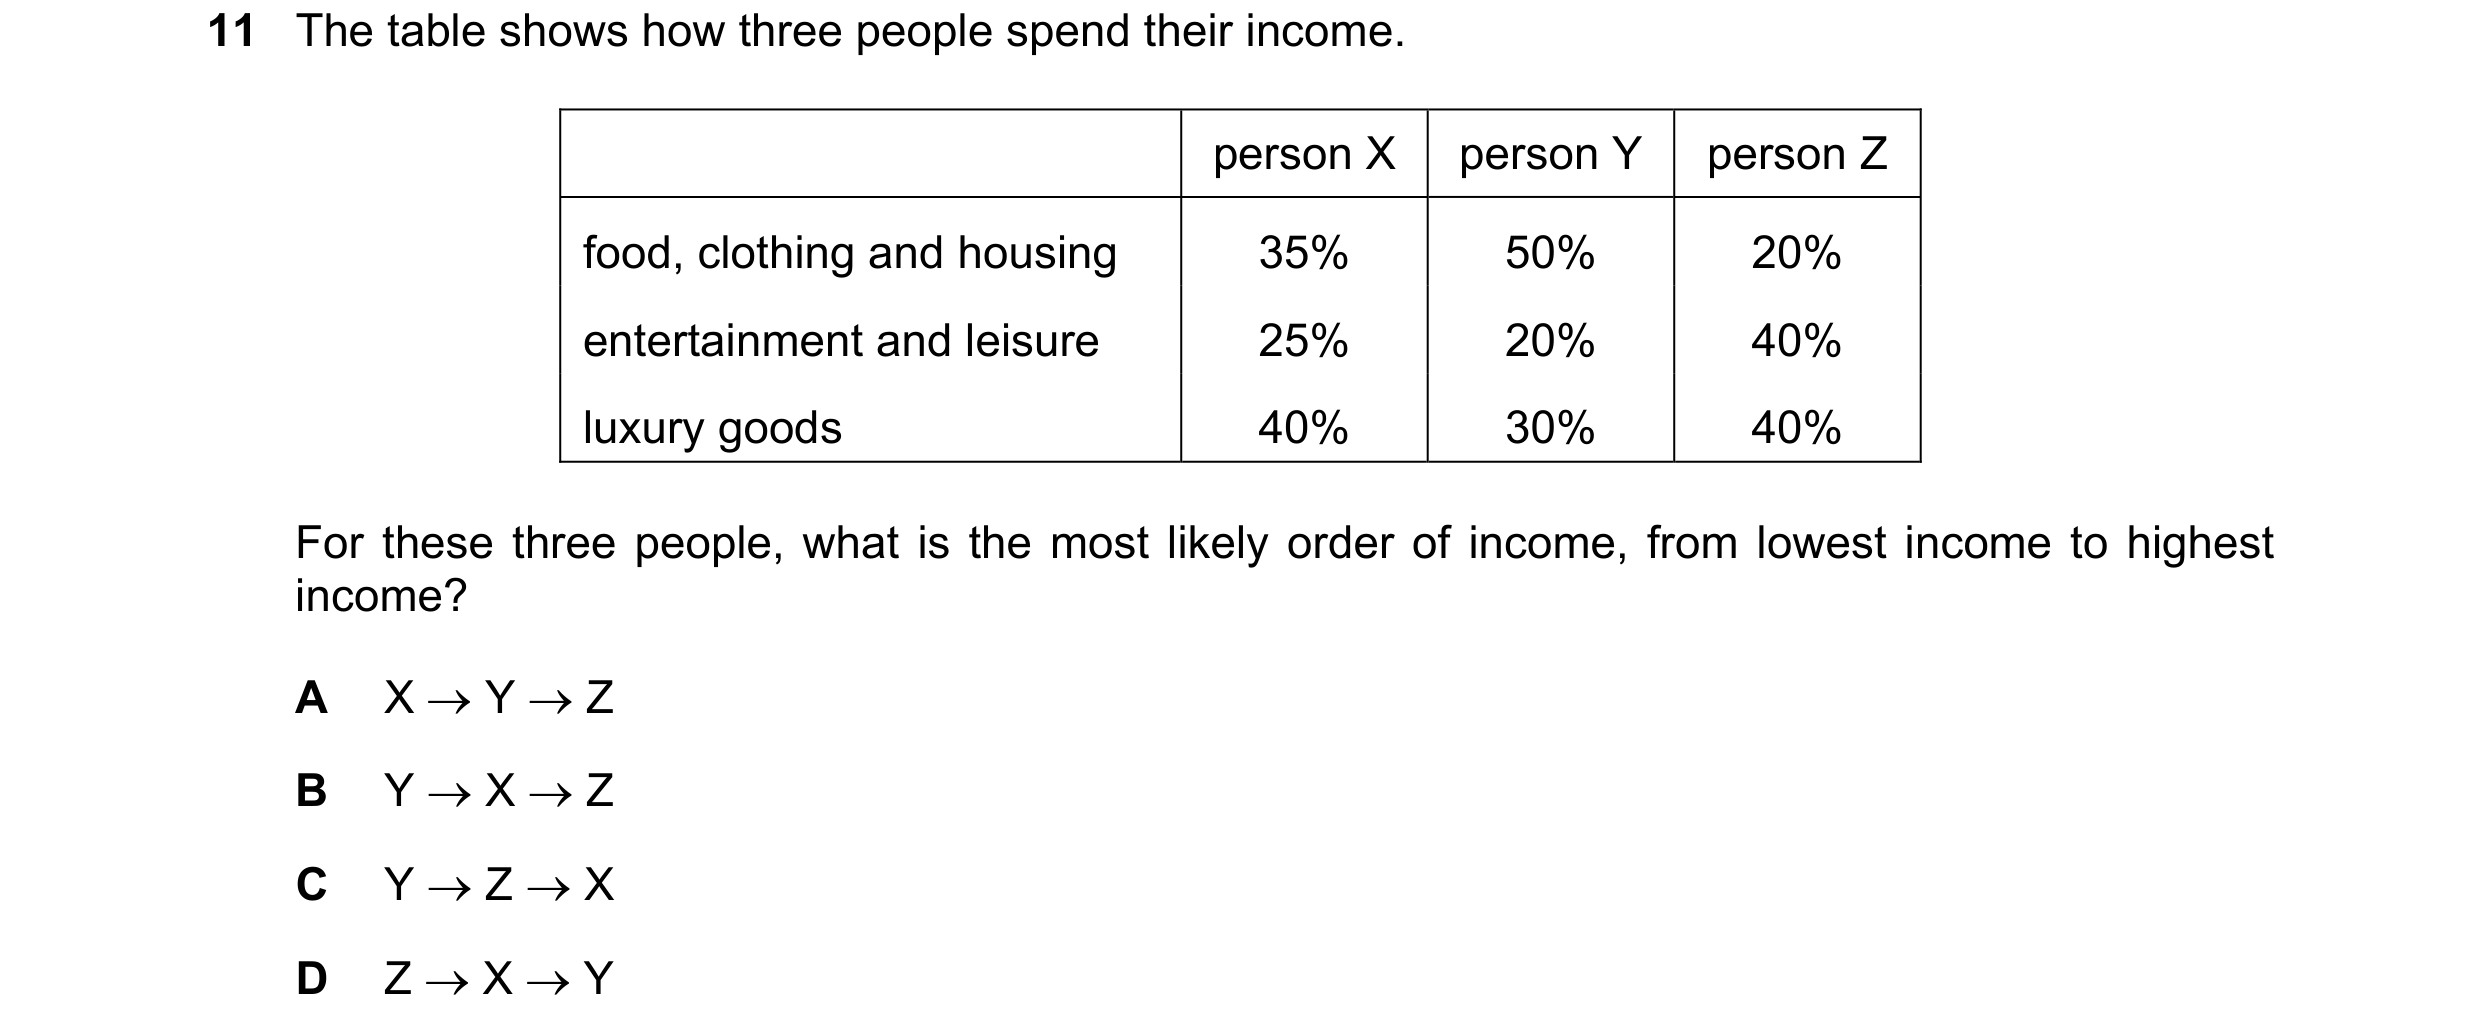
 9 / 18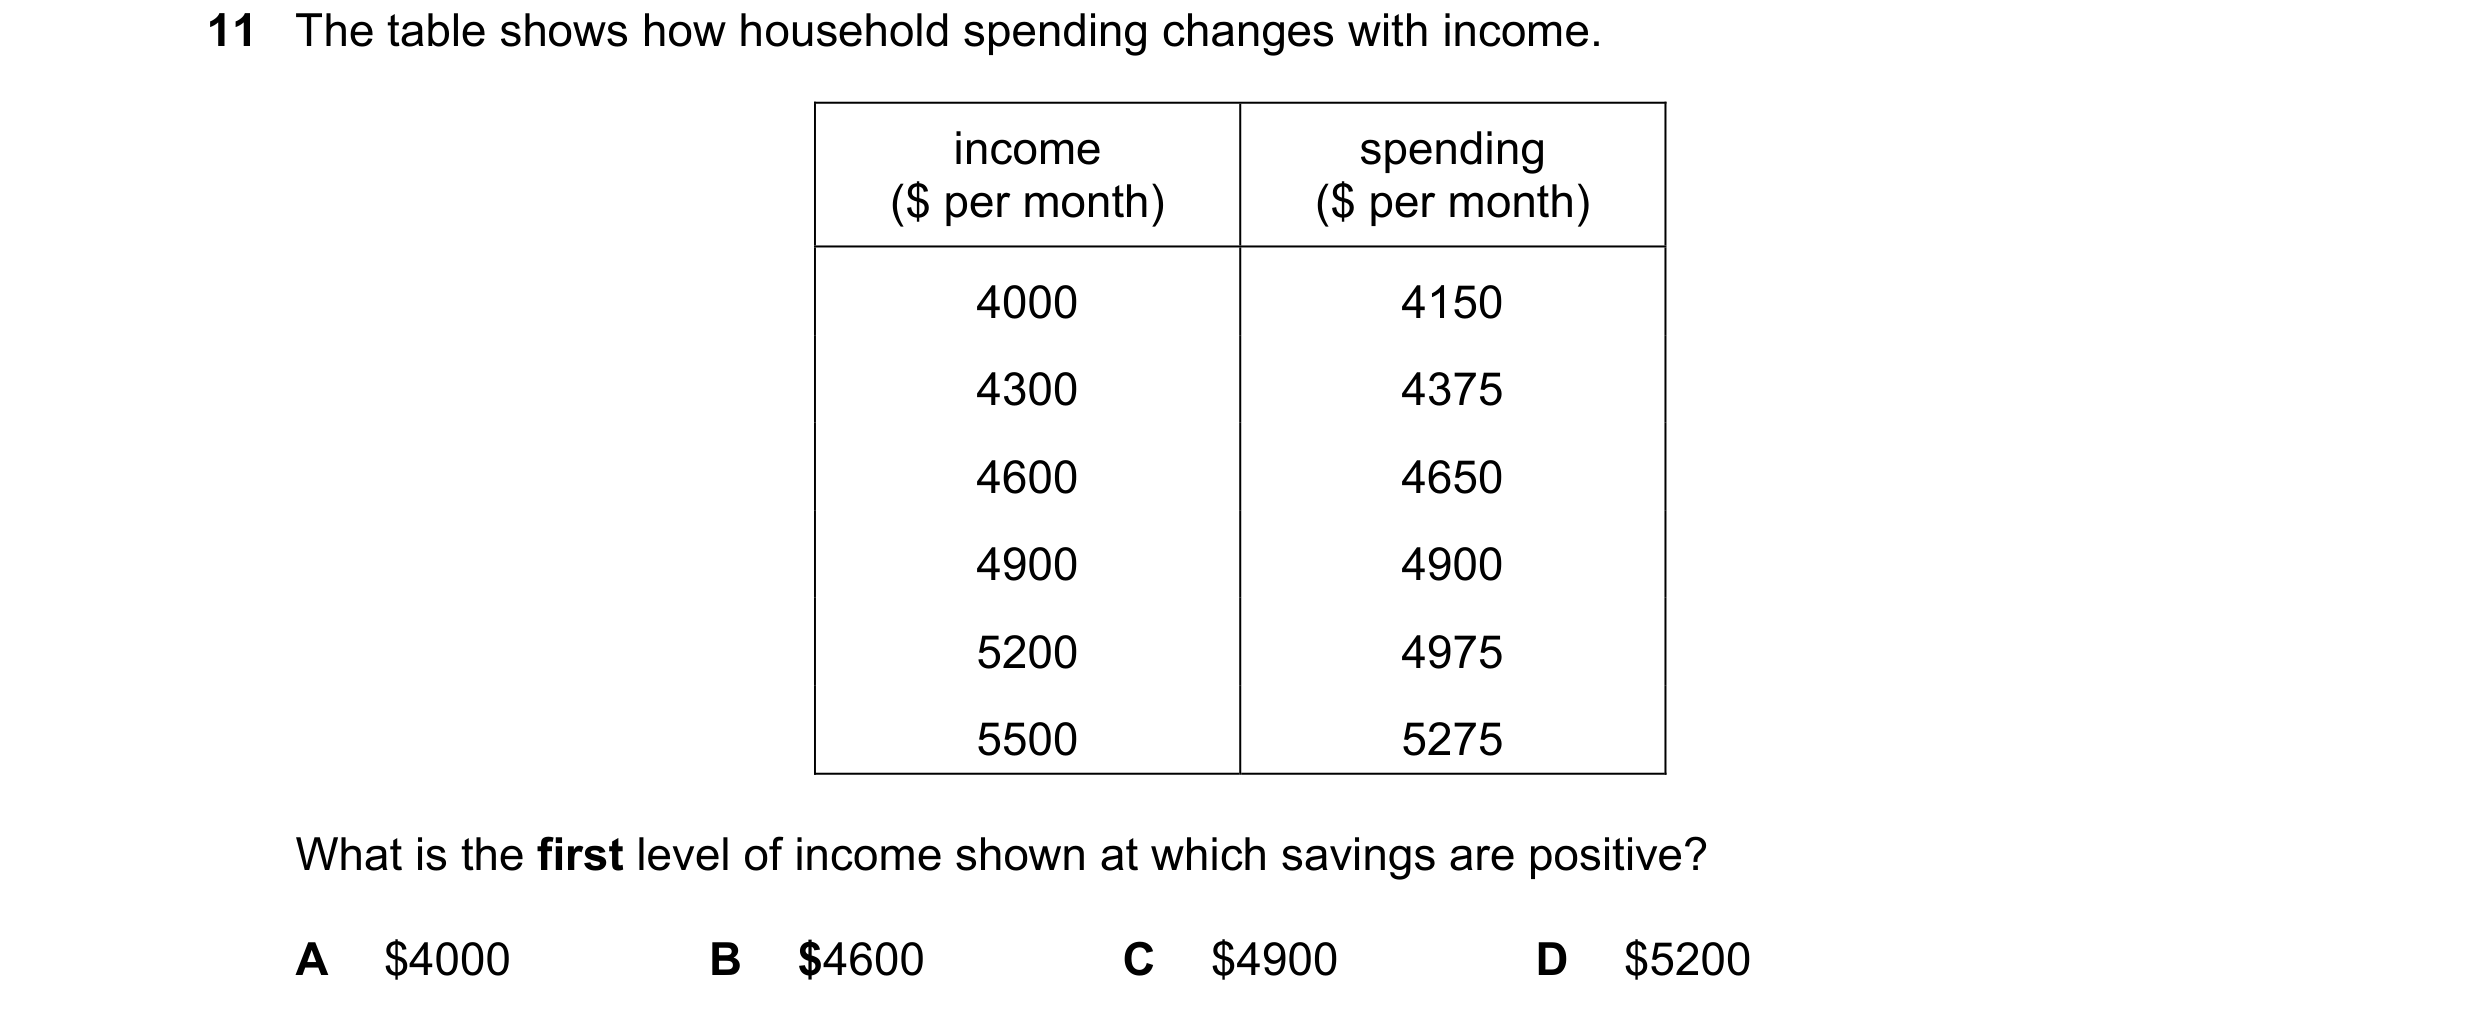

 10 / 18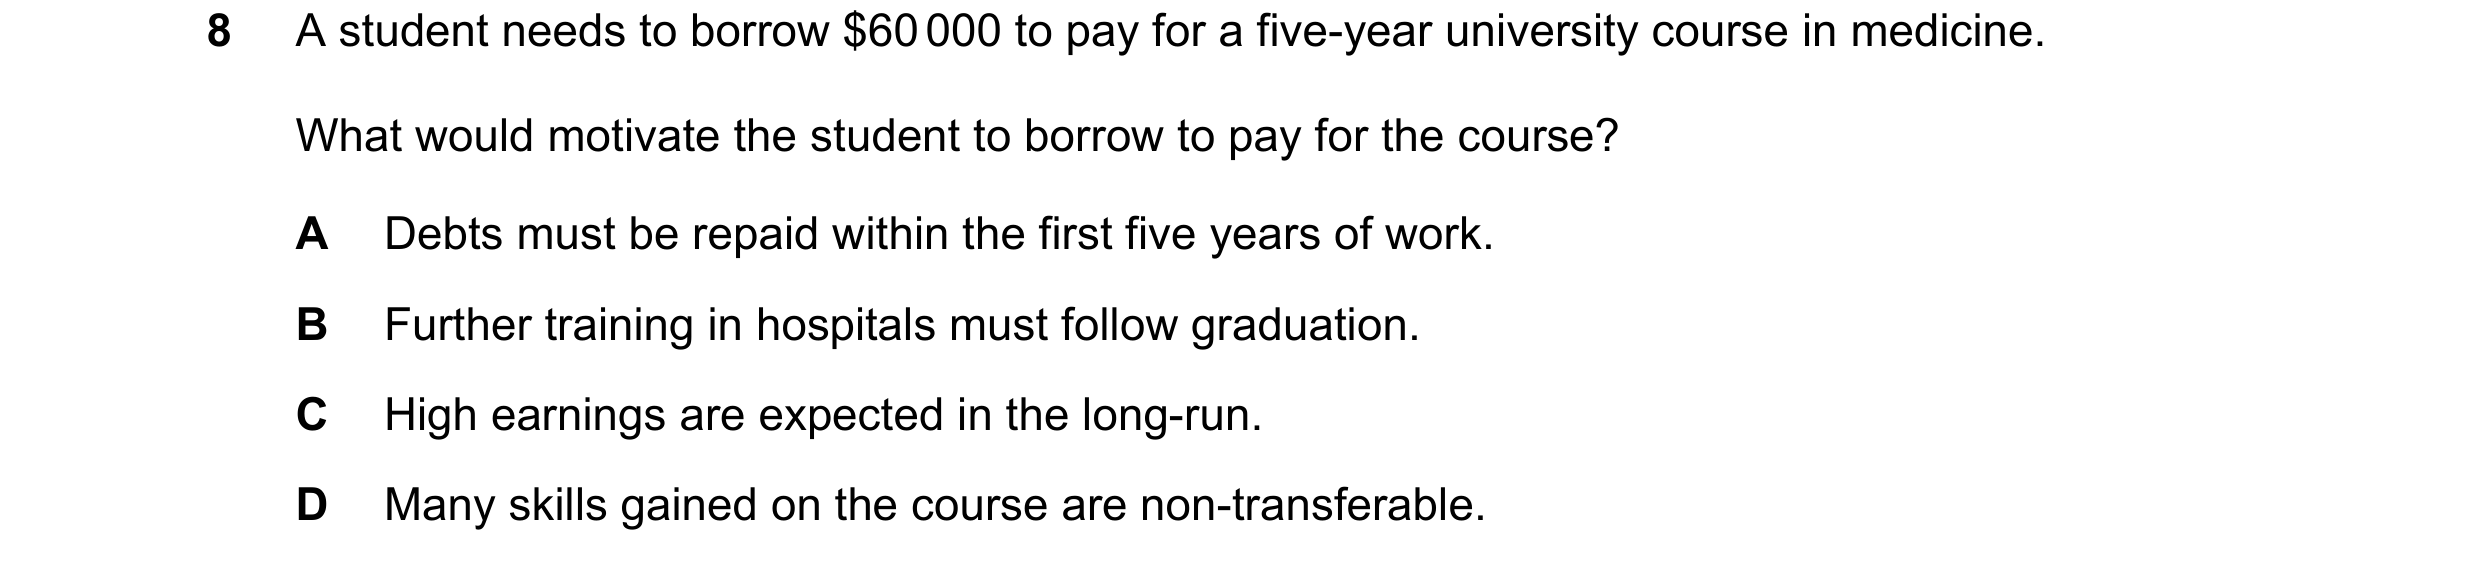

 11 / 18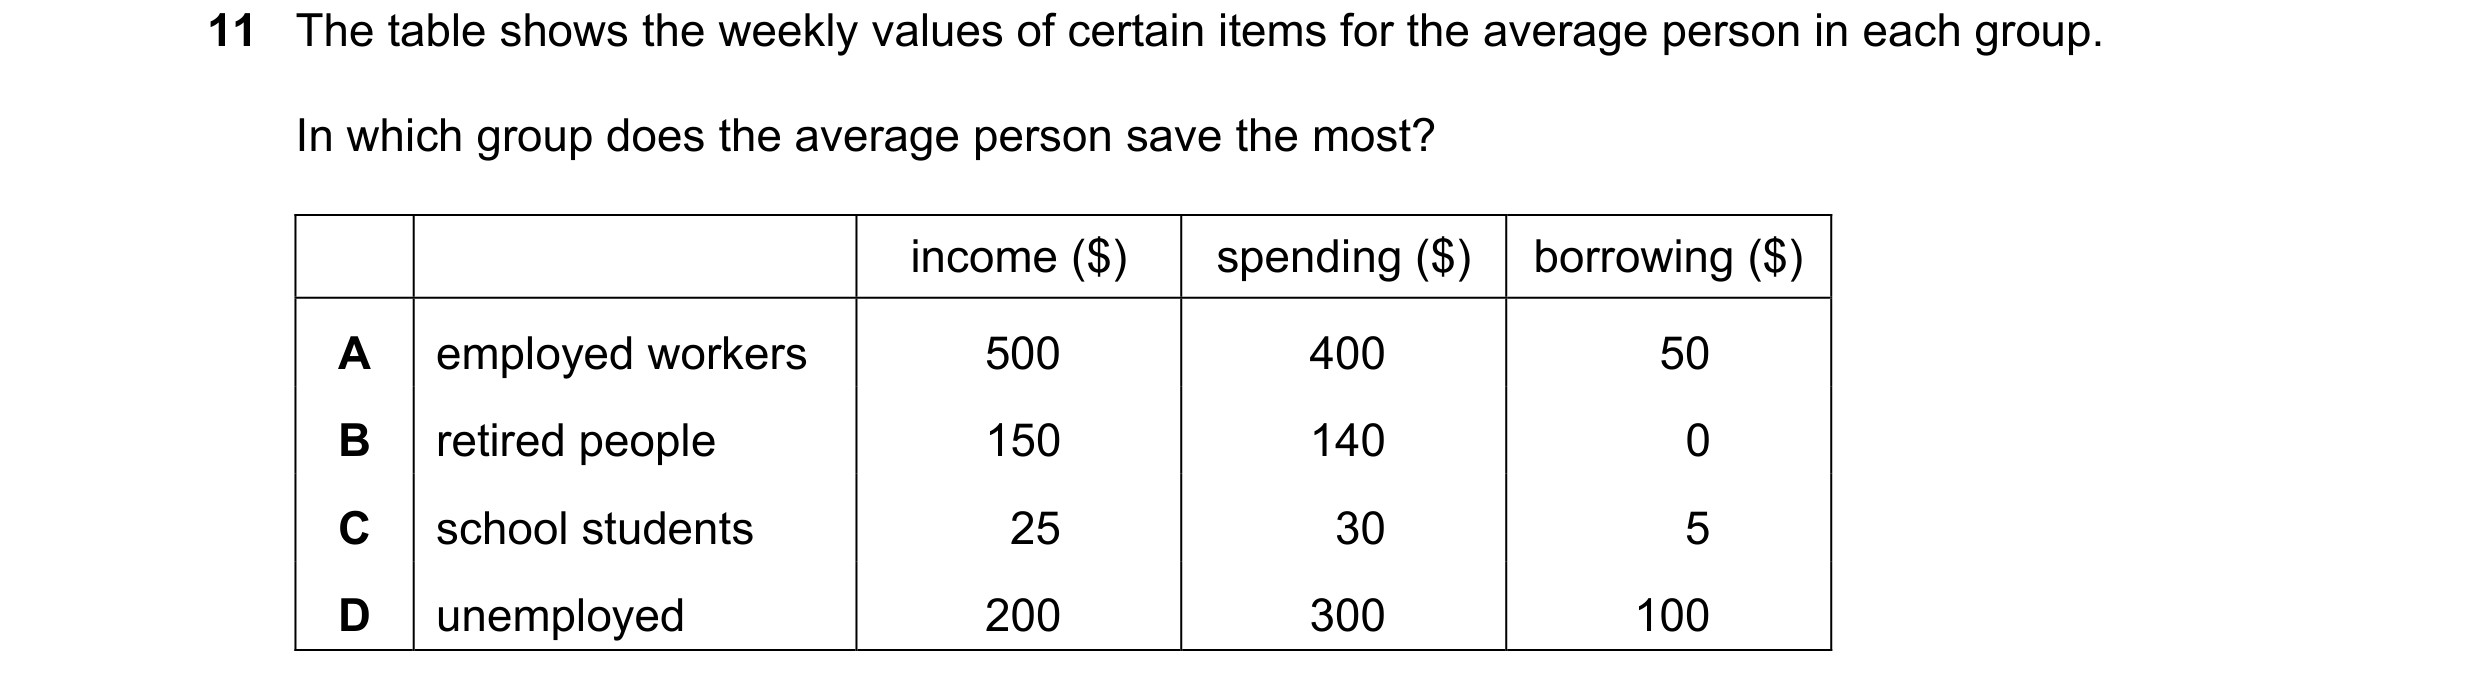



 12 / 18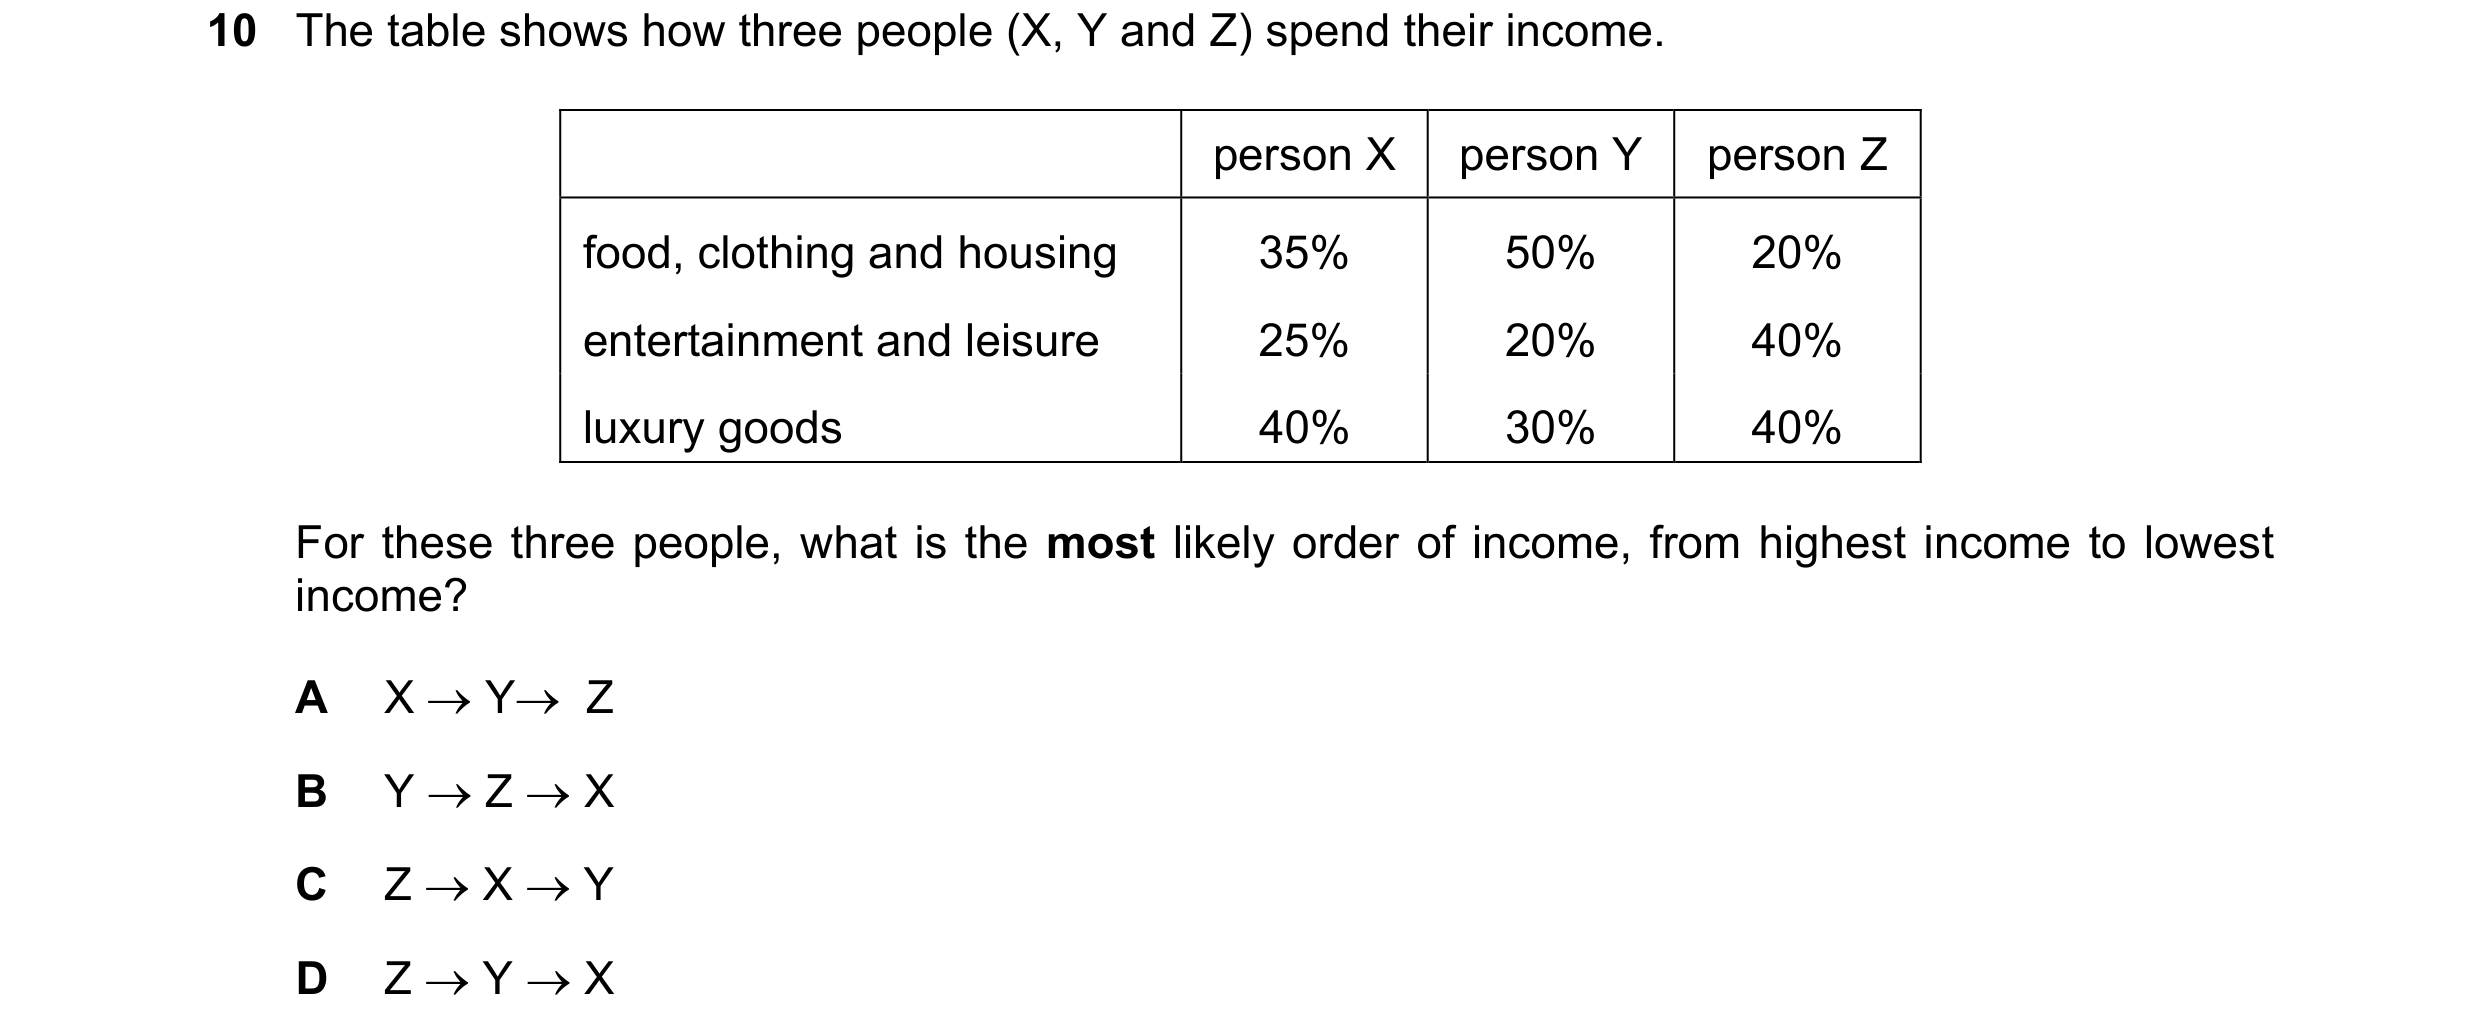

 13 / 18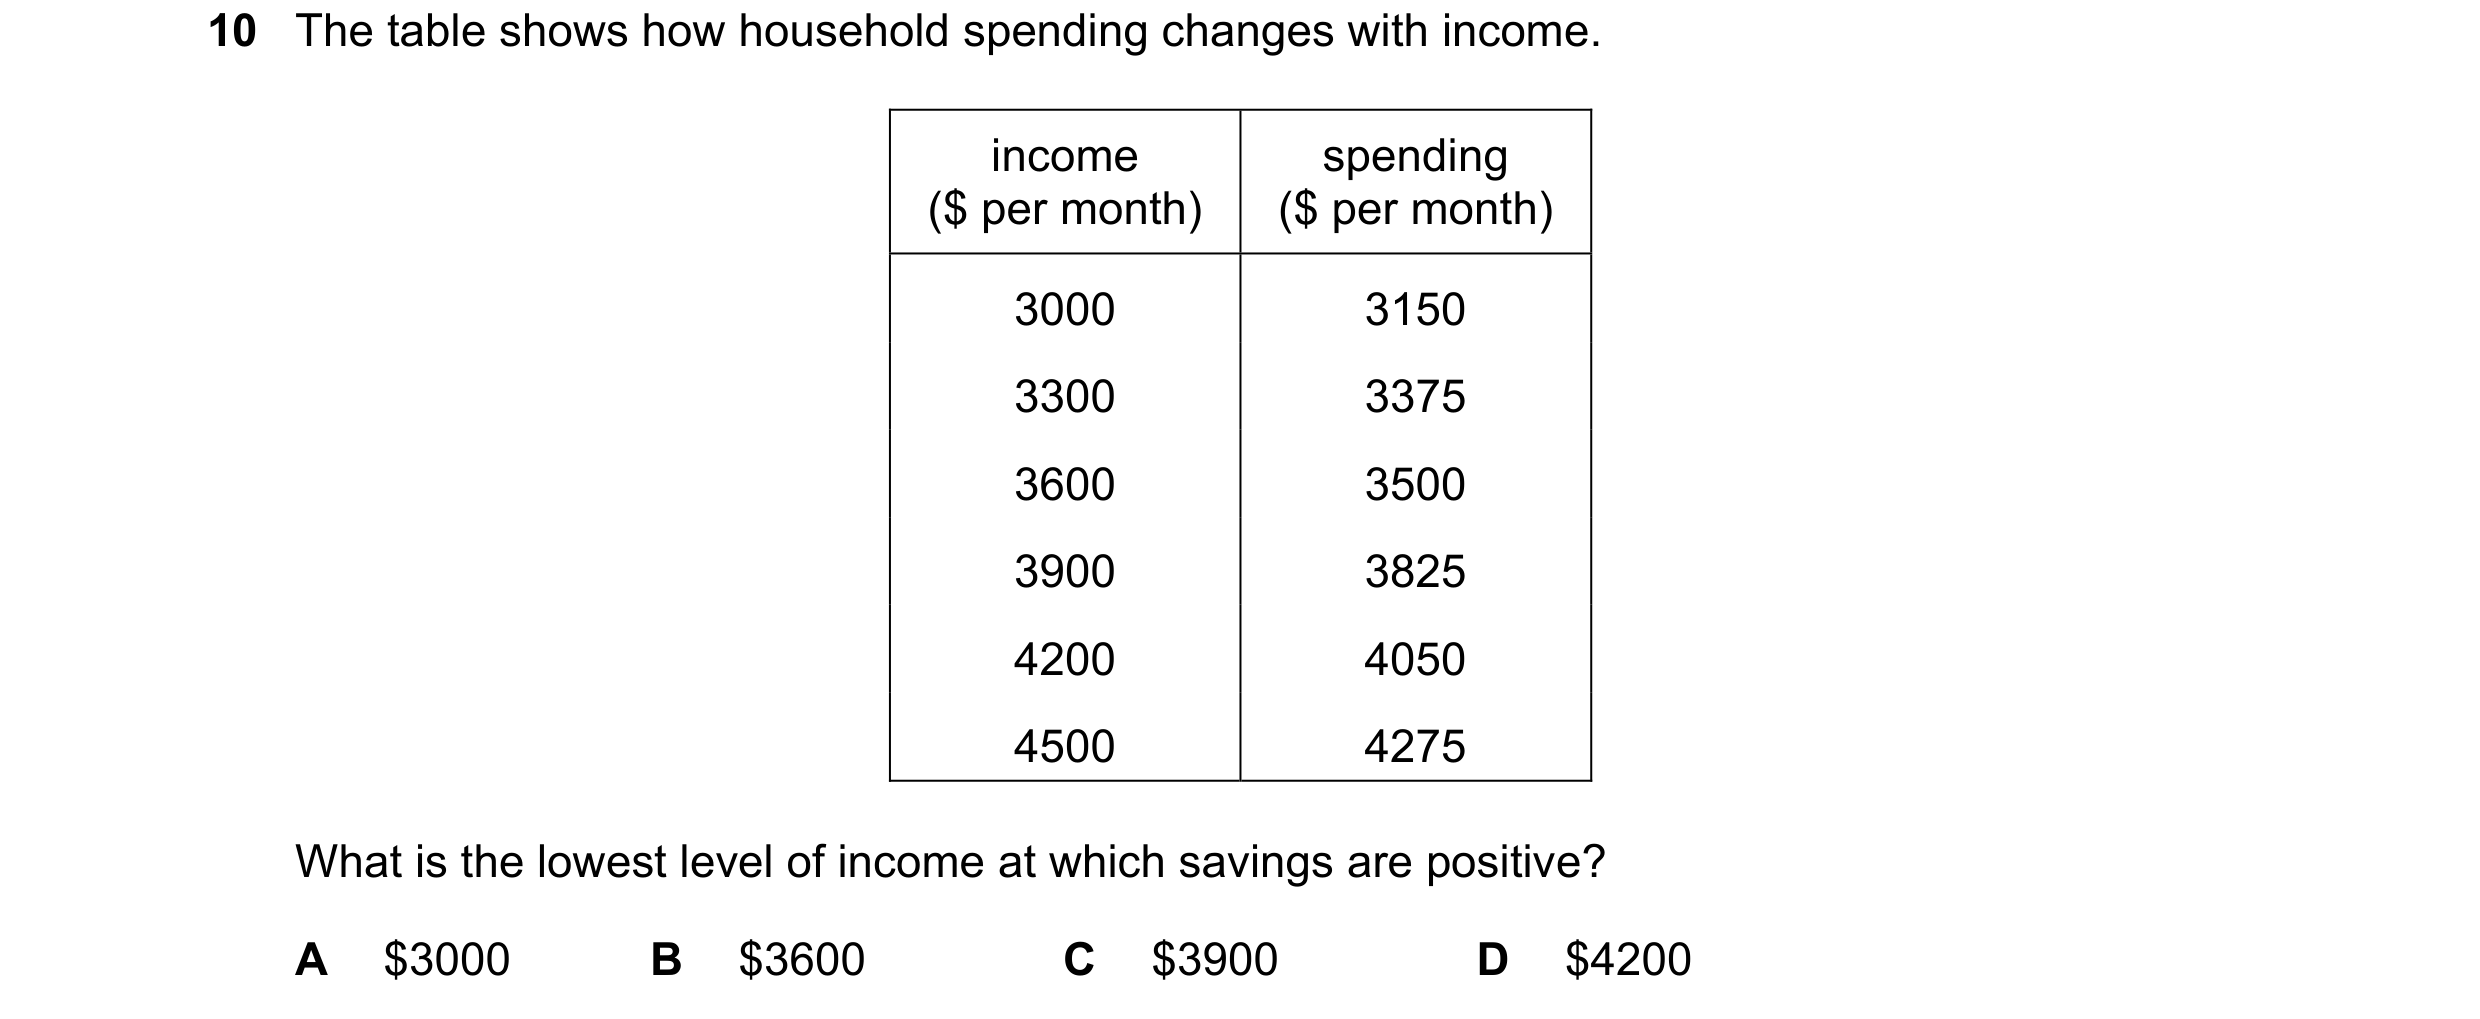
 14 / 18
 15 / 18



 16 / 18

 17 / 18
 18 / 18