Questions as text
Q1 · The time in minutes taken by candidates to answer a question in an examination has… 9709/71 May/June 2009
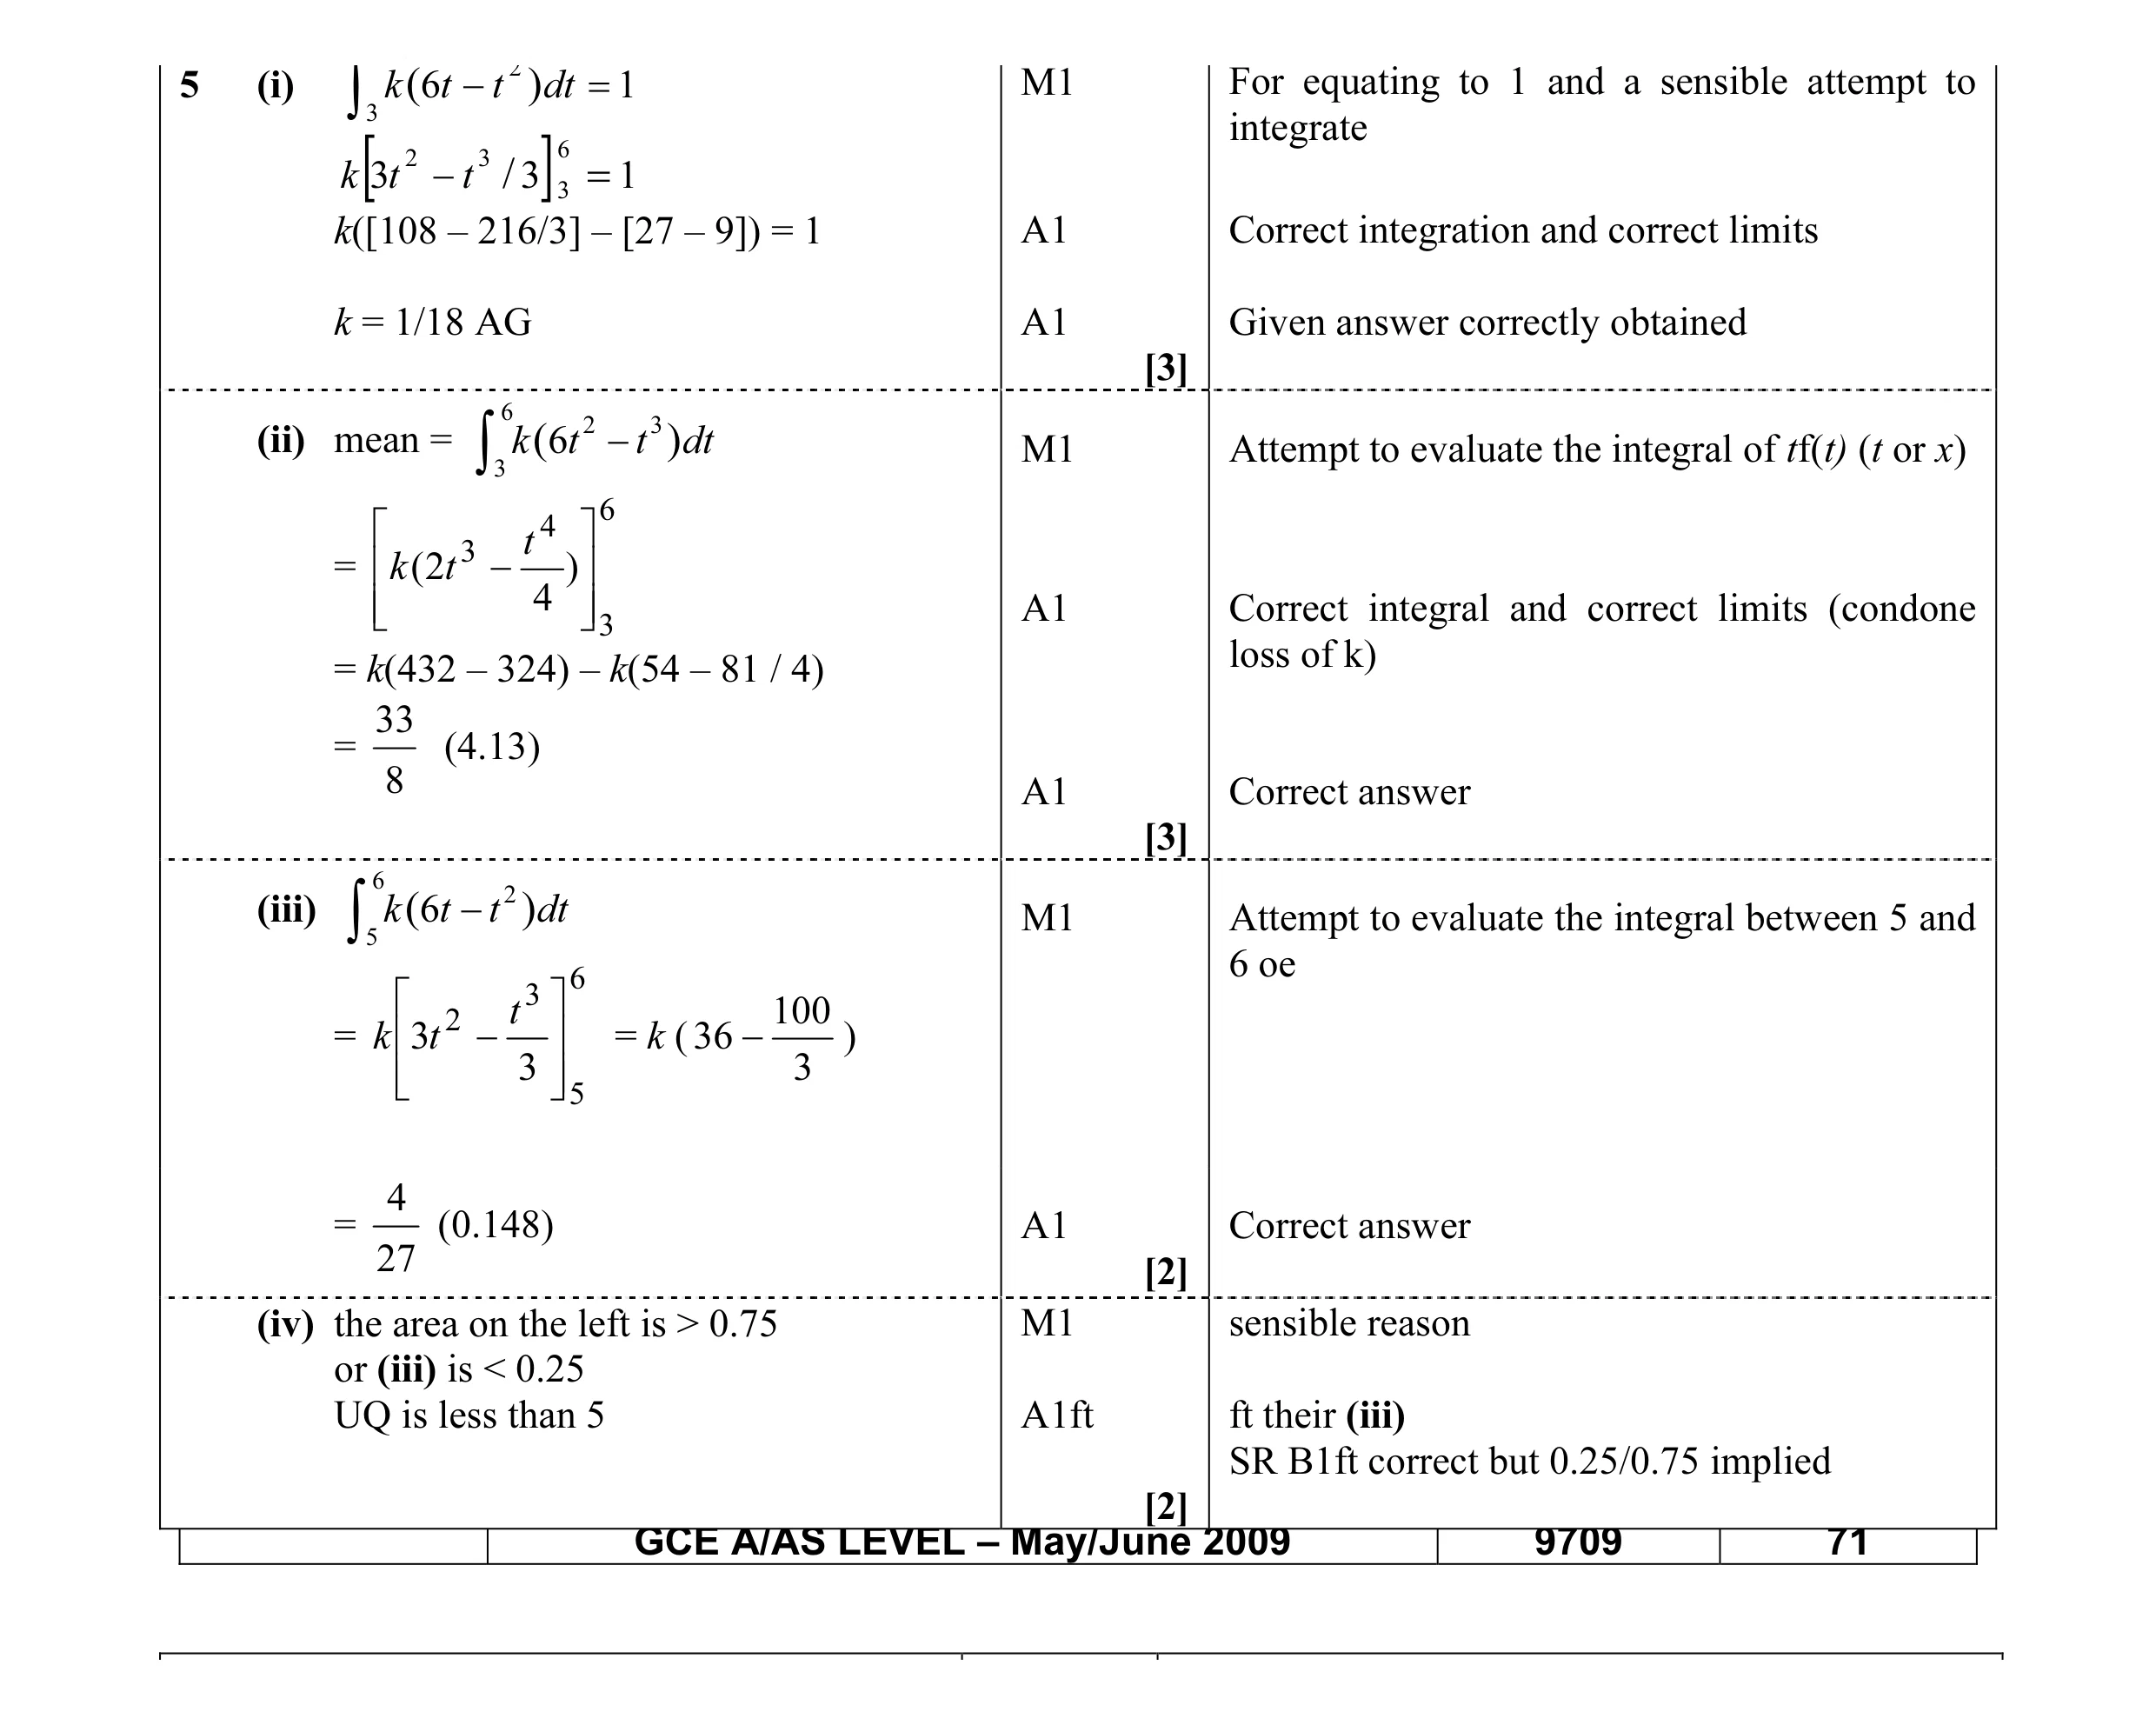
5 The time in minutes taken by candidates to answer a question in an examination has probability density function given by k(6t −t2) 3 ≤t ≤6, f(t) = 0 otherwise, where k is a constant. (i) Show that k = 1 [3] 18. (ii) Find the mean time. [3] (iii) Find the probability that a candidate, chosen at random, takes longer than 5 minutes to answer the question. [2] (iv) Is the upper quartile of the times greater than 5 minutes, equal to 5 minutes or less than 5 minutes? Give a reason for your answer. [2]
10 marks
Mark scheme: 5 (i) ∫ 3 k ( 6t − t 2 ) dt = 1 M1 For equating to 1 and a sensible attempt to integrate 2 3 6 k [3t −t / 3] 3 = 1 k([108 – 216/3] – [27 – 9]) = 1 A1 Correct integration and correct limits k = 1/18 AG A1 Given answer correctly obtained [3] 6 (ii) mean = ∫ 3 k (6t 2 − t 3 ) dt M1 Attempt to evaluate the integral of tf(t) (t or x) 6 4 3 = k ( 2t −t ) A1 Correct integral and correct limits (condone 4 3 loss of k) = k(432 – 324) – k(54 – 81 / 4) 33 = (4.13) 8 A1 Correct answer [3] 6 (iii) ∫ 5 k (6t − t 2) dt M1 Attempt to evaluate the integral between 5 and 6 6 oe 3 100 2 = k 3t −t = k ( 36 − ) 3 5 3 4 = (0.148) A1 Correct answer 27 [2] (iv) the area on the left is > 0.75 M1 sensible reason or (iii) is < 0.25 UQ is less than 5 A1ft ft their (iii) SR B1ft correct but 0.25/0.75 implied [2] GCE A/AS LEVEL – May/June 2009 9709 71
This question in 9709/71 May/June 2009
Q2 · The lengths of sewing needles in travel sewing kits are distributed normally with mean µ… 9709/71 Oct/Nov 2009
2 The lengths of sewing needles in travel sewing kits are distributed normally with mean µ mm and standard deviation 1.5 mm. A random sample of n needles is taken. Find the smallest value of n such that the width of a 95% confidence interval for the population mean is at most 1 mm. [4]
4 marks
Mark scheme: 5.1 1 5.1 2 .196 × < B1 .196 × seen n 2 n B1 Confidence interval halved M1 Solving an equation in their z, 1.5, n (2 and sq rt not needed) n = 35 A1 [4] Correct answer (condone n ≥ 35) ( ) 51 − 48 5
This question in 9709/71 Oct/Nov 2009
Q3 · There are 18 people in Millie’s class 9709/72 Oct/Nov 2009
1 There are 18 people in Millie’s class. To choose a person at random she numbers the people in the class from 1 to 18 and presses the random number button on her calculator to obtain a 3-digit decimal. Millie then multiplies the first digit in this decimal by two and chooses the person corresponding to this new number. Decimals in which the first digit is zero are ignored. (i) Give a reason why this is not a satisfactory method of choosing a person. [1] Millie obtained a random sample of 5 people of her own age by a satisfactory sampling method and found that their heights in metres were 1.66, 1.68, 1.54, 1.65 and 1.57. Heights are known to be normally distributed with variance 0.0052 m2. (ii) Find a 98% confidence interval for the mean height of people of Millie’s age. [3]
4 marks
Mark scheme: 1 (i) doubling only gives even numbers so odd B1 Needs to be aware that odd numbers aren’t numbers not included [1] included .00052 (ii) 98% CI = 1.62 ± 2.326 × M1 Correct shape with 5 seen in denom and 5 their evaluated mean and sd (condone unbiased = 1.62 ± 0.0750 estimate of sample variance). B1 2.326 seen = (1.54, 1.70) A1 correct answer, cwo. Accept 1.55 and 1.70 . [3]
This question in 9709/72 Oct/Nov 2009
Q4 · Random variables Y and X are related by Y = a + bX, where a and b are constants and b > 0 9709/72 Oct/Nov 2009
7 (a) Random variables Y and X are related by Y = a + bX, where a and b are constants and b > 0. The standard deviation of Y is twice the standard deviation of X. The mean of Y is 7.92 and is 0.8 more than the mean of X. Find the values of a and b. [3] (b) Random variables R and S are such that R ∼N(µ, 22) and S ∼N(2µ, 32). It is given that P(R + S > 1) = 0.9. (i) Find µ. [4] (ii) Hence find P(S > R). [3]
10 marks
Mark scheme: 7 (a) Var (Y) = b2Var(X) = 4Var(X) b = 2 (> 0) B1 Correct answer E(Y) = a + 2E(X) = E(X) + 0.8 M1 Using E(Y) = a + 2E(X), their “2”. Correct a + 14.24 = 7.92 equation in a, b subst in, using 0.8 correctly. a = –6.32 A1 Correct answer [3] (b) (i) R + S ~ N(3µ, 13) B1 Correct mean and variance. z = –1.282 or –1.281 B1 Correct z, must be –ve (or –ve implied). 3 µ − 1 1.282 = M1 Standardising and solving, their mean, z, 13 13 (but combined), allow “13” or “√13”. µ = 1.87 A1 Correct answer. [4] (ii) S – R ~ N(µ, 13) B1 ft Correct mean and variance, ft their mean. 0 − µ P[(S – R) > 0] = P z > M1 Standardising and correct area (i.e. > 0.5 for 13 correct), but consistent with their values. = Φ (0.5197) = 0.699 A1 Accept 0.698 [3]
This question in 9709/72 Oct/Nov 2009
Q5 · A random sample of n people were questioned about their internet use 9709/71 May/June 2010
2 A random sample of n people were questioned about their internet use. 87 of them had a high-speed internet connection. A confidence interval for the population proportion having a high-speed internet connection is 0.1129 < p < 0.1771. (i) Write down the mid-point of this confidence interval and hence find the value of n. [3] (ii) This interval is an α% confidence interval. Find α. [4]
7 marks
Mark scheme: 2 (i) 0.145 B1 correct mid-point = 87 / n M1 equating their mid-point with 87 / n n = 600 A1 correct answer [3] .0 1451( − .0 145) (ii) 0.0321 = z × B1 0.0321 seen or implied 600 pq M1 Equating half-width with z × n z = 2.233 Φ(z) = 0.9872 M1 Correct method to find width of CI width of CI is 1 – 2 × (1 – 0.9872) A1 Correct answer α = 97.4% [4] 2 55 − 2 62
This question in 9709/71 May/June 2010
Q6 · In restaurant A an average of 2.2% of tablecloths are stained and, independently, in… 9709/71 May/June 2010
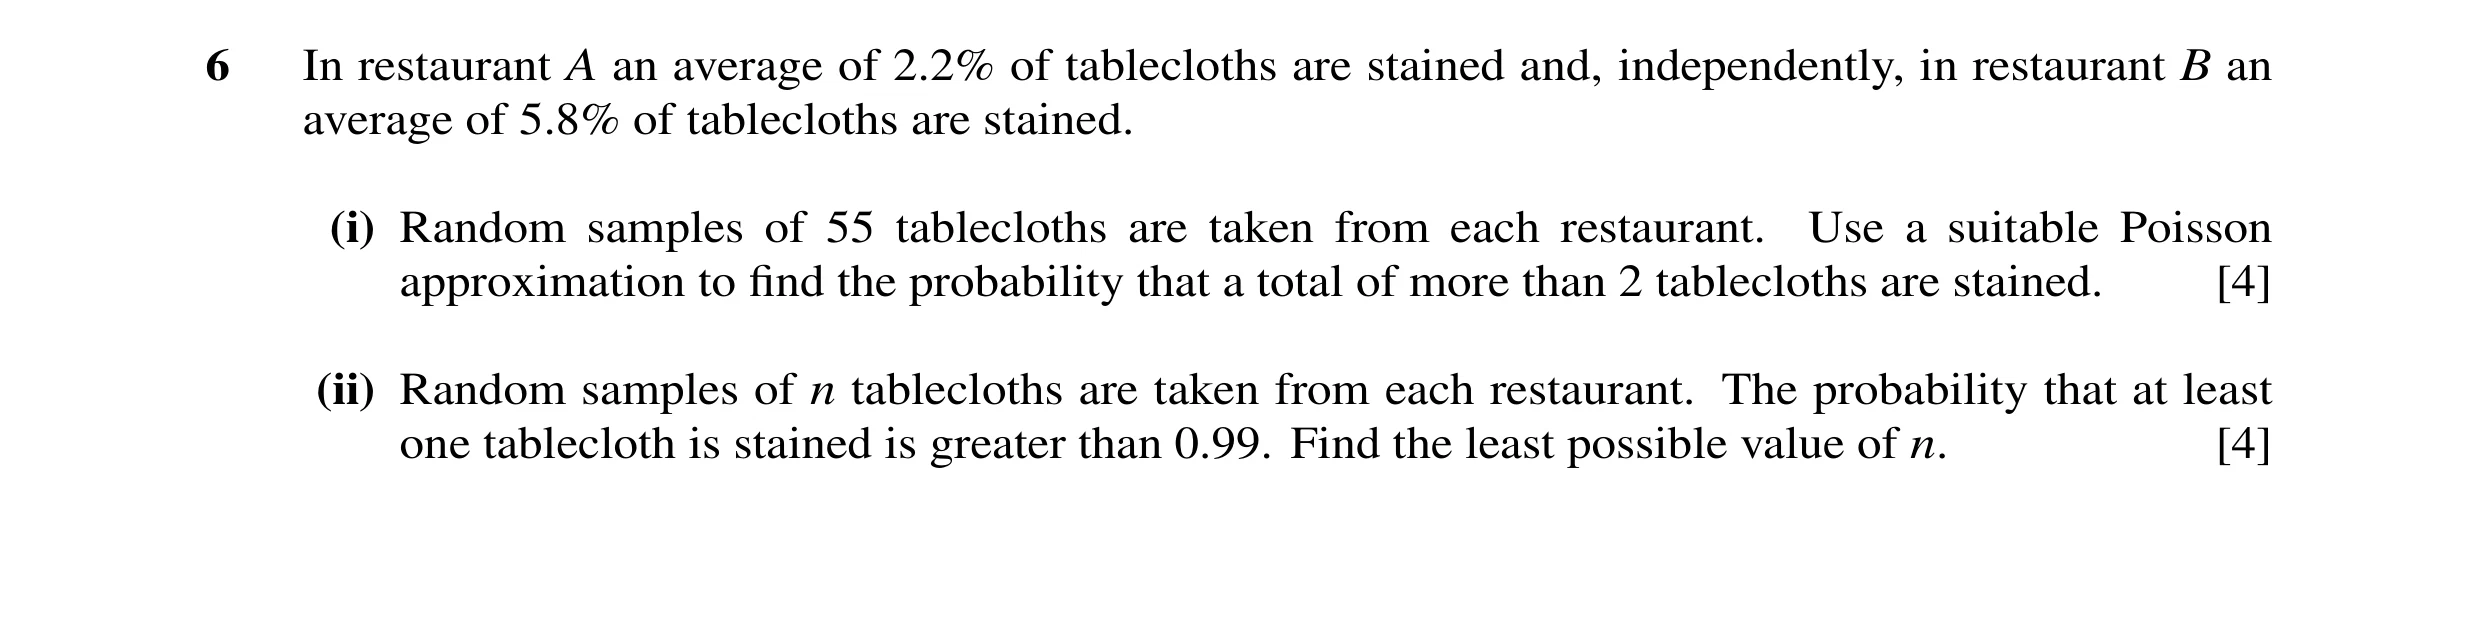
6 In restaurant A an average of 2.2% of tablecloths are stained and, independently, in restaurant B an average of 5.8% of tablecloths are stained. (i) Random samples of 55 tablecloths are taken from each restaurant. Use a suitable Poisson approximation to find the probability that a total of more than 2 tablecloths are stained. [4] (ii) Random samples of n tablecloths are taken from each restaurant. The probability that at least one tablecloth is stained is greater than 0.99. Find the least possible value of n. [4]
8 marks
Mark scheme: 6 (i) λA= np = 0.022 ×55 = 1.21 λB = 0.058 × 55 = 3.19 M1 Two different np (can be implied) total λ = 4.4 A1 Correct total 4.4 (or alt method: 6 correct P(more than 2) = 1 – P(0, 1, 2) combinations 0,0 1,0 etc stated and used) 2 M1 Finding 1 – P(0, 1, 2), Poisson, any mean, allow − 4.4 4.4 = 1 – e 1 + 4.4 + one end error. !2 (Or combinations method – use at least 4 and = 1 – 0.185 find 1 – P(Y2) ) = 0.815 A1 Correct answer [4] (ii) λ = 0.08nλ B1λ Correct λ P(at least 1 stained tablecloth ) = 1 – P(0) 1 – e–0.08n > 0.99λ M1λ Equation of correct form relating their λ and 0.99 0.01 > e–0.08n M1 Valid attempt to solve equation of correct form n > 57.6 by logs or trial and error least value of n = 58 A1 Correct answer [4] (SR Accept use of Binomial leading to n = 57)
This question in 9709/71 May/June 2010
Q7 · In restaurant A an average of 2.2% of tablecloths are stained and, independently, in… 9709/72 May/June 2010
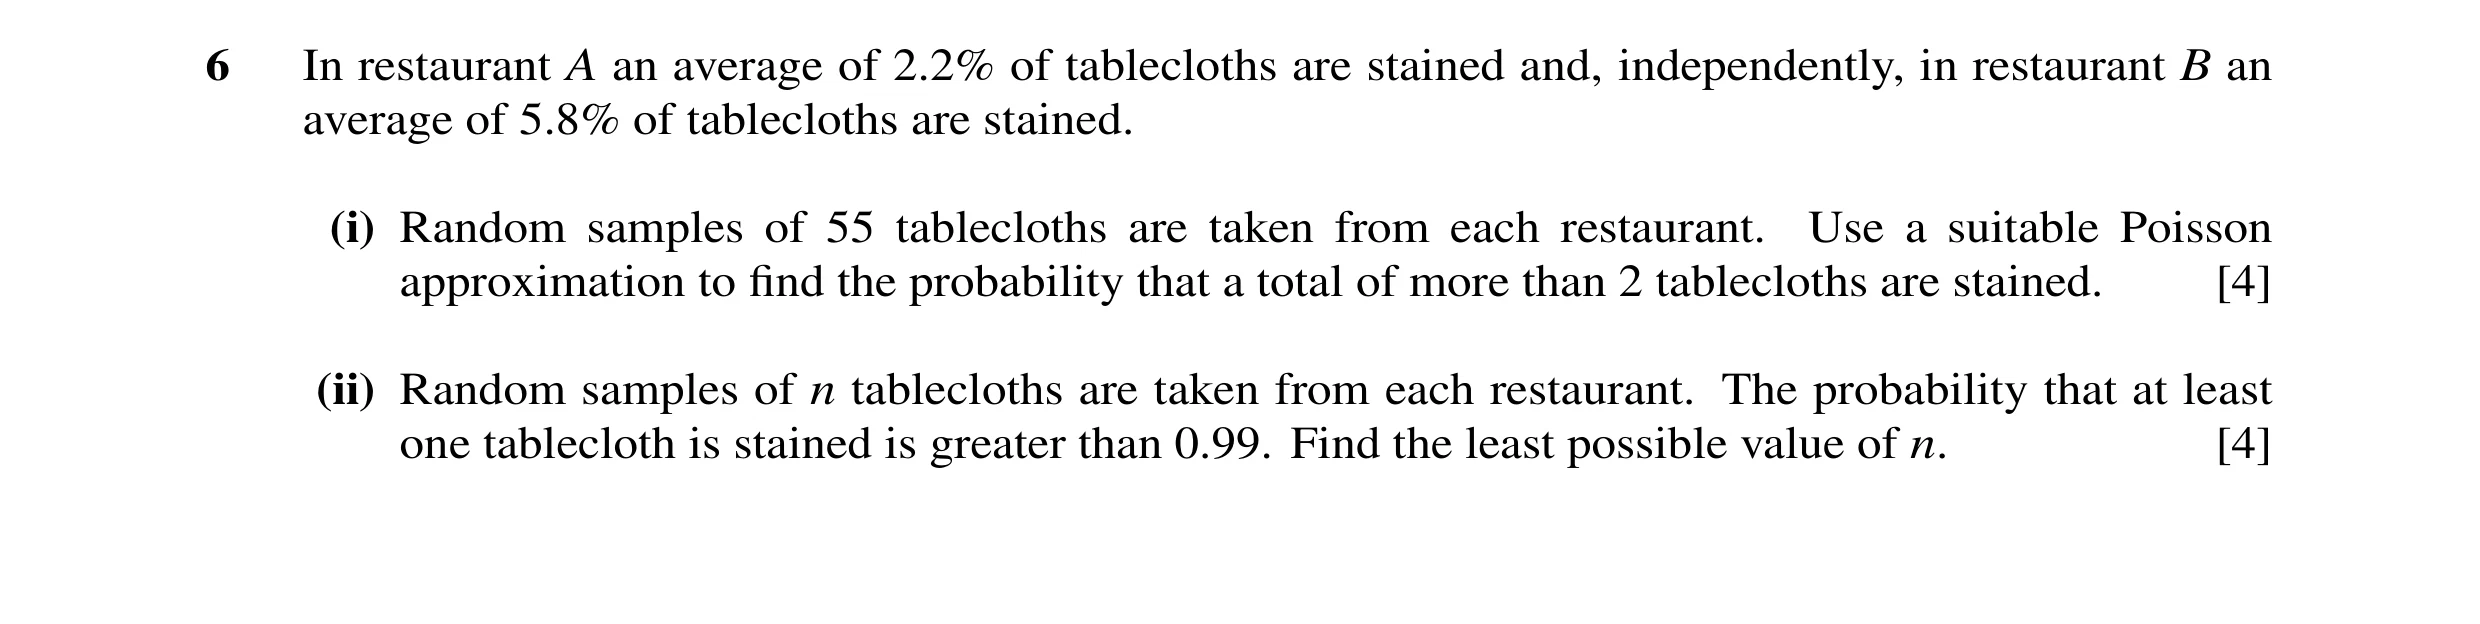
6 In restaurant A an average of 2.2% of tablecloths are stained and, independently, in restaurant B an average of 5.8% of tablecloths are stained. (i) Random samples of 55 tablecloths are taken from each restaurant. Use a suitable Poisson approximation to find the probability that a total of more than 2 tablecloths are stained. [4] (ii) Random samples of n tablecloths are taken from each restaurant. The probability that at least one tablecloth is stained is greater than 0.99. Find the least possible value of n. [4]
8 marks
Mark scheme: 6 (i) λA= np = 0.022 ×55 = 1.21 λB = 0.058 × 55 = 3.19 M1 Two different np (can be implied) total λ = 4.4 A1 Correct total 4.4 (or alt method: 6 correct P(more than 2) = 1 – P(0, 1, 2) combinations 0,0 1,0 etc stated and used) 2 M1 Finding 1 – P(0, 1, 2), Poisson, any mean, allow − 4.4 4.4 = 1 – e 1 + 4.4 + one end error. !2 (Or combinations method – use at least 4 and = 1 – 0.185 find 1 – P(Y2) ) = 0.815 A1 Correct answer [4] (ii) λ = 0.08nλ B1λ Correct λ P(at least 1 stained tablecloth ) = 1 – P(0) 1 – e–0.08n > 0.99λ M1λ Equation of correct form relating their λ and 0.99 0.01 > e–0.08n M1 Valid attempt to solve equation of correct form n > 57.6 by logs or trial and error least value of n = 58 A1 Correct answer [4] (SR Accept use of Binomial leading to n = 57)
This question in 9709/72 May/June 2010
Q8 · Yu Ming travels to work and returns home once each day 9709/73 May/June 2010
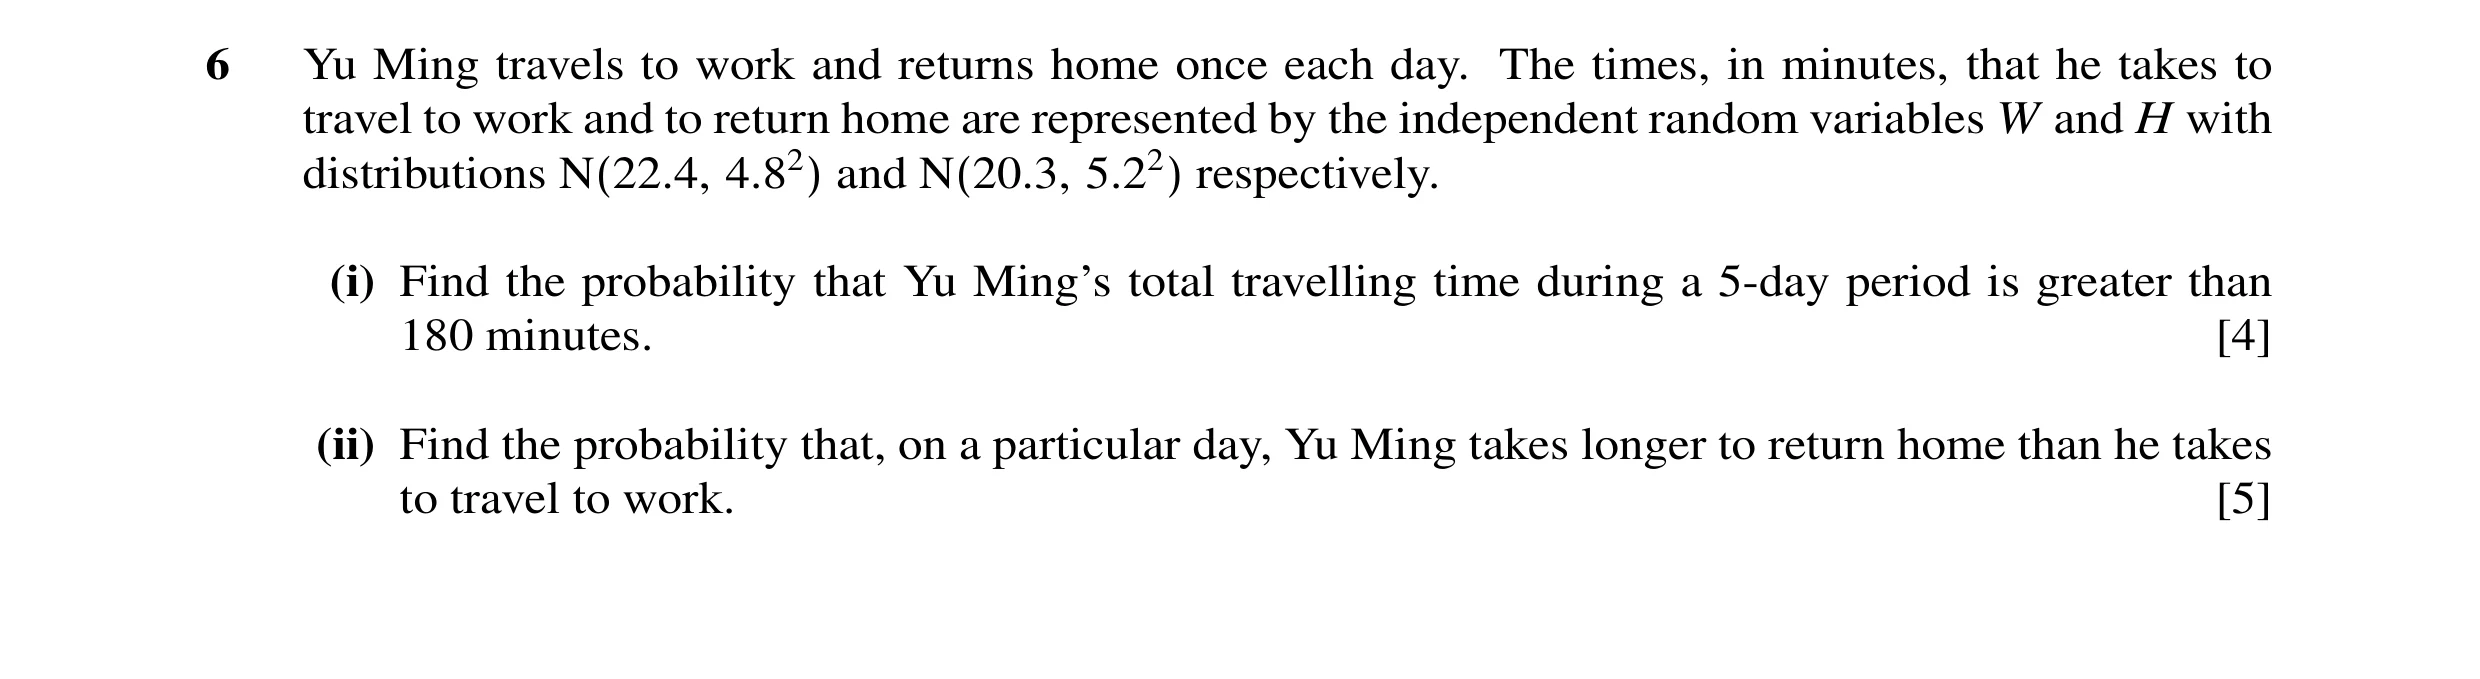
6 Yu Ming travels to work and returns home once each day. The times, in minutes, that he takes to travel to work and to return home are represented by the independent random variables W and H with distributions N(22.4, 4.82) and N(20.3, 5.22) respectively. (i) Find the probability that Yu Ming’s total travelling time during a 5-day period is greater than 180 minutes. [4] (ii) Find the probability that, on a particular day, Yu Ming takes longer to return home than he takes to travel to work. [5]
9 marks
Mark scheme: 6 (i) 5×(22.4 + 20.3) (= 213.5) B1 For correct expression for new mean & 5×(4.82 + 5.22) (= 250.4) B1 For correct expression for new variance 180−"2135." z = (= –2.117) M1 Standardising and use of tables "2504." 1 – Φ(“–2.117”) = Φ(“2.117”) (no sd/var mixes + no cc) = 0.983 (3 sfs) A1 [4] (ii) P(H – W > 0) M1 Or P(W – H < 0) 20.3 – 22.4 (= –2.1) B1 ± 2.1 Correct expression for new mean & 4.82 + 5.22 (= 50.08) B1 Correct expression for new variance 0 − ( −)1.2 z = (= 0.297) M1 Standardising and using tables "50 .08 " 1 – Φ(“0.297”) (no sd/var mixes + no cc) (= 1 – 0.6168) = 0.383 (3 sfs) A1 [5]
This question in 9709/73 May/June 2010
Q9 · A clinic deals only with flu vaccinations 9709/73 May/June 2010
7 A clinic deals only with flu vaccinations. The number of patients arriving every 15 minutes is modelled by the random variable X with distribution Po(4.2). (i) State two assumptions required for the Poisson model to be valid. [2] (ii) Find the probability that (a) at least 1 patient will arrive in a 15-minute period, [2] (b) fewer than 4 patients will arrive in a 10-minute period. [3] (iii) The clinic is open for 20 hours each week. At the beginning of one week the clinic has enough vaccine for 370 patients. Use a suitable approximation to find the probability that this will not be enough vaccine for that week. [4]
11 marks
Mark scheme: 7 (i) Patients arrive at constant mean rate B1 B1 For first correct Patients arrive at random B1 B1 For second correct Patients arrive independently Must be in context Patients arrive singly SR B1 For two correct but not in context [2] (ii) (a) 1 – e–4.2 M1 Correct expression = 0.985 A1 [2] (b) 4.2 × 10/15 oe B1 e–2.8×(1 + 2.8 + 8.2 2 + 8.23 ) M1 Allow extra term e–2.8× 8.2 4 !2 !3 !4 = 0.692 A1 Allow incorrect λ (not 4.2) [3] (iii) N(336, 336) stated or implied B1 3705. − 336 (= 1.882) M1 ft “336”Allow wrong or no cc or no √ 336 1 – Φ(“1.882”) M1 Standardising with correct cc and no √ = 0.0300/0.0299 A1 Allow 0.03 [4]
This question in 9709/73 May/June 2010
Q10 · A book contains 40 000 words 9709/71 Oct/Nov 2010
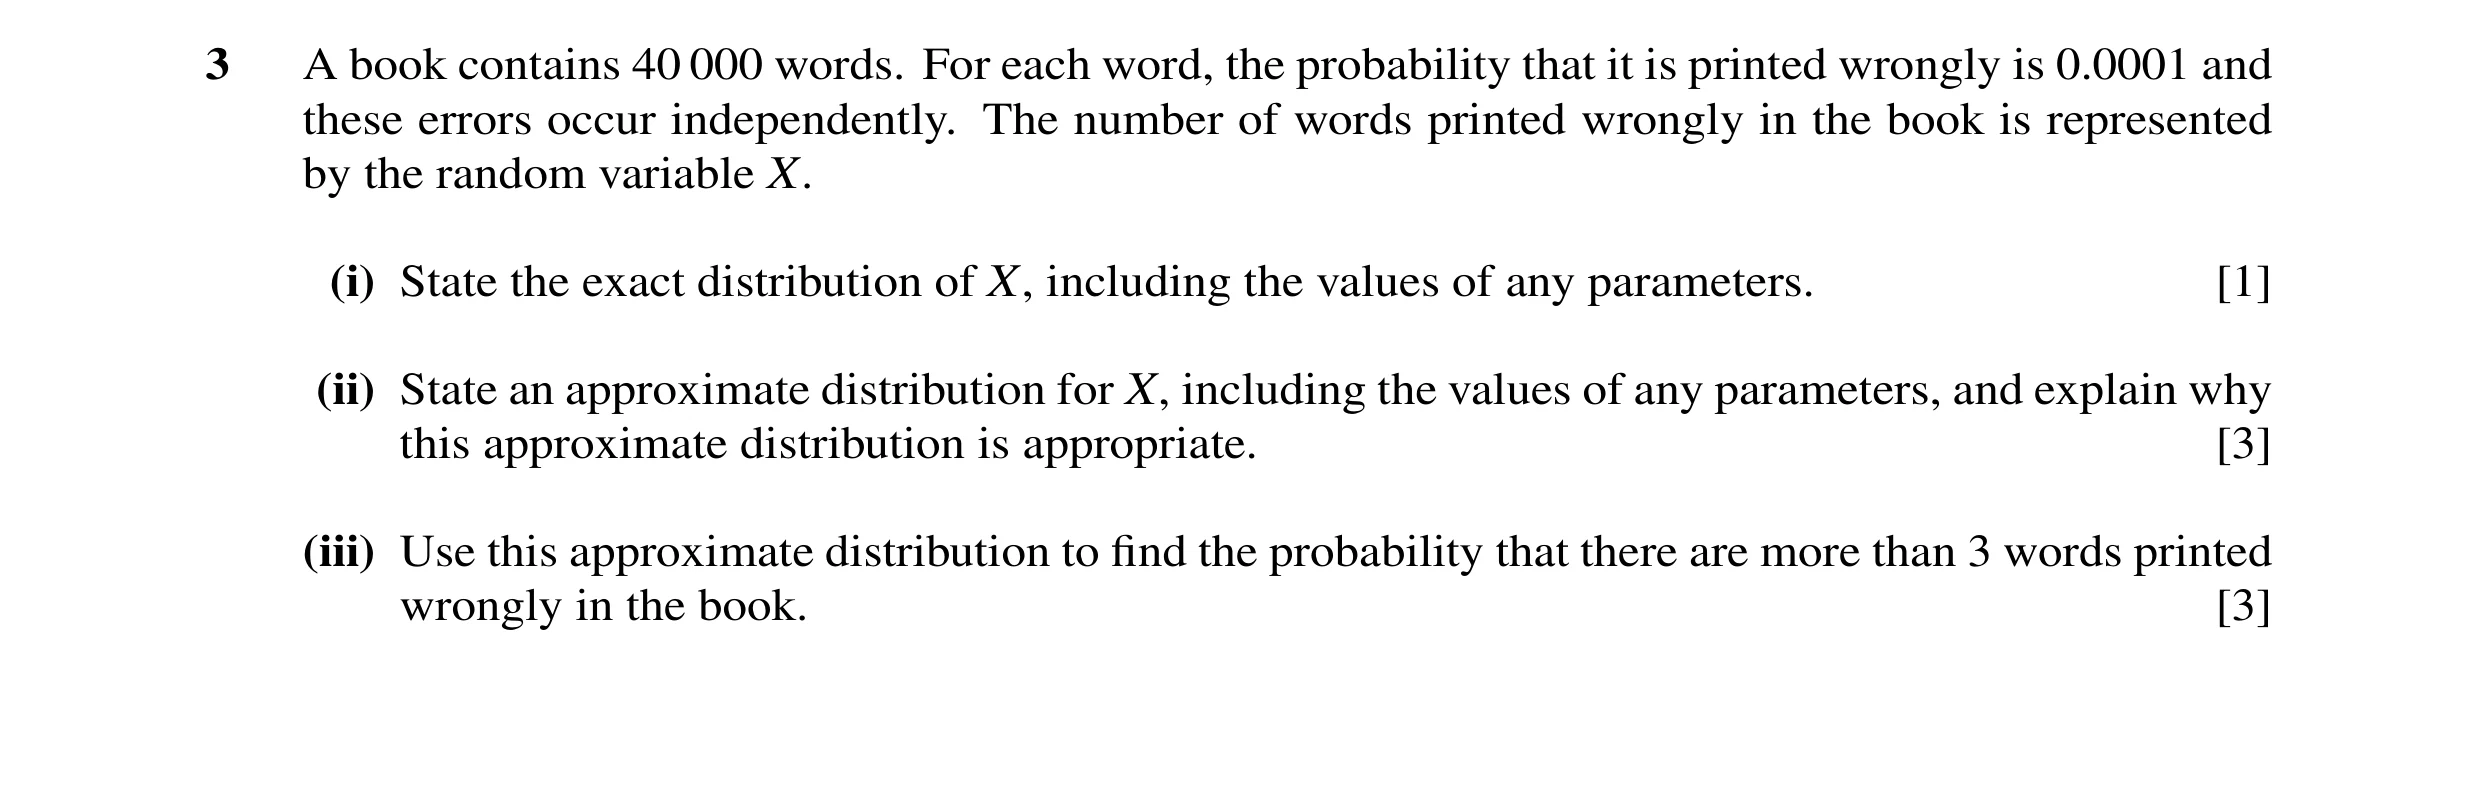
3 A book contains 40 000 words. For each word, the probability that it is printed wrongly is 0.0001 and these errors occur independently. The number of words printed wrongly in the book is represented by the random variable X. (i) State the exact distribution of X, including the values of any parameters. [1] (ii) State an approximate distribution for X, including the values of any parameters, and explain why this approximate distribution is appropriate. [3] (iii) Use this approximate distribution to find the probability that there are more than 3 words printed wrongly in the book. [3]
7 marks
Mark scheme: 3 (i) B(40 000, 0.0001) B1 [1] (ii) Po(4) B1*B1*dep B1 for Po. B1 for 4 n = 40 000 > 50, np = 4 < 5 B1 [3] Accept 40000 large and 0.0001 small (iii) 1 – (P(X < 3) or e −4 1( + 4 + 422 + 4!33 ) ) M1 Allow one end error (any λ) 1 − e −4 1( + 4 + 422 + 4!33 ) M1 Expression of correct form (any λ), no end errors. = 0.567 or 0.566 A1 [3] (OR Use of normal scores M1, standardising M1, standardising with correct cc A1ft, (ii) 0.599. Award A mark only if normal given in (ii)) (OR Binomial M1 expression of correct form allow end error, M1 correct form no end error, A1ft 0.567 or 0.566. Award A mark only if Bin given in (ii)) NB Part (iii) must be Poisson or ft from (ii) for A mark to be awarded. SR If no answer given in (ii) allow BOD for A marks. GCE A LEVEL – October/November 2010 9709 71 1.5 ( ) ∫ d
This question in 9709/71 Oct/Nov 2010
Q11 · The marks of candidates in Mathematics and English in 2009 were represented by the… 9709/71 Oct/Nov 2010
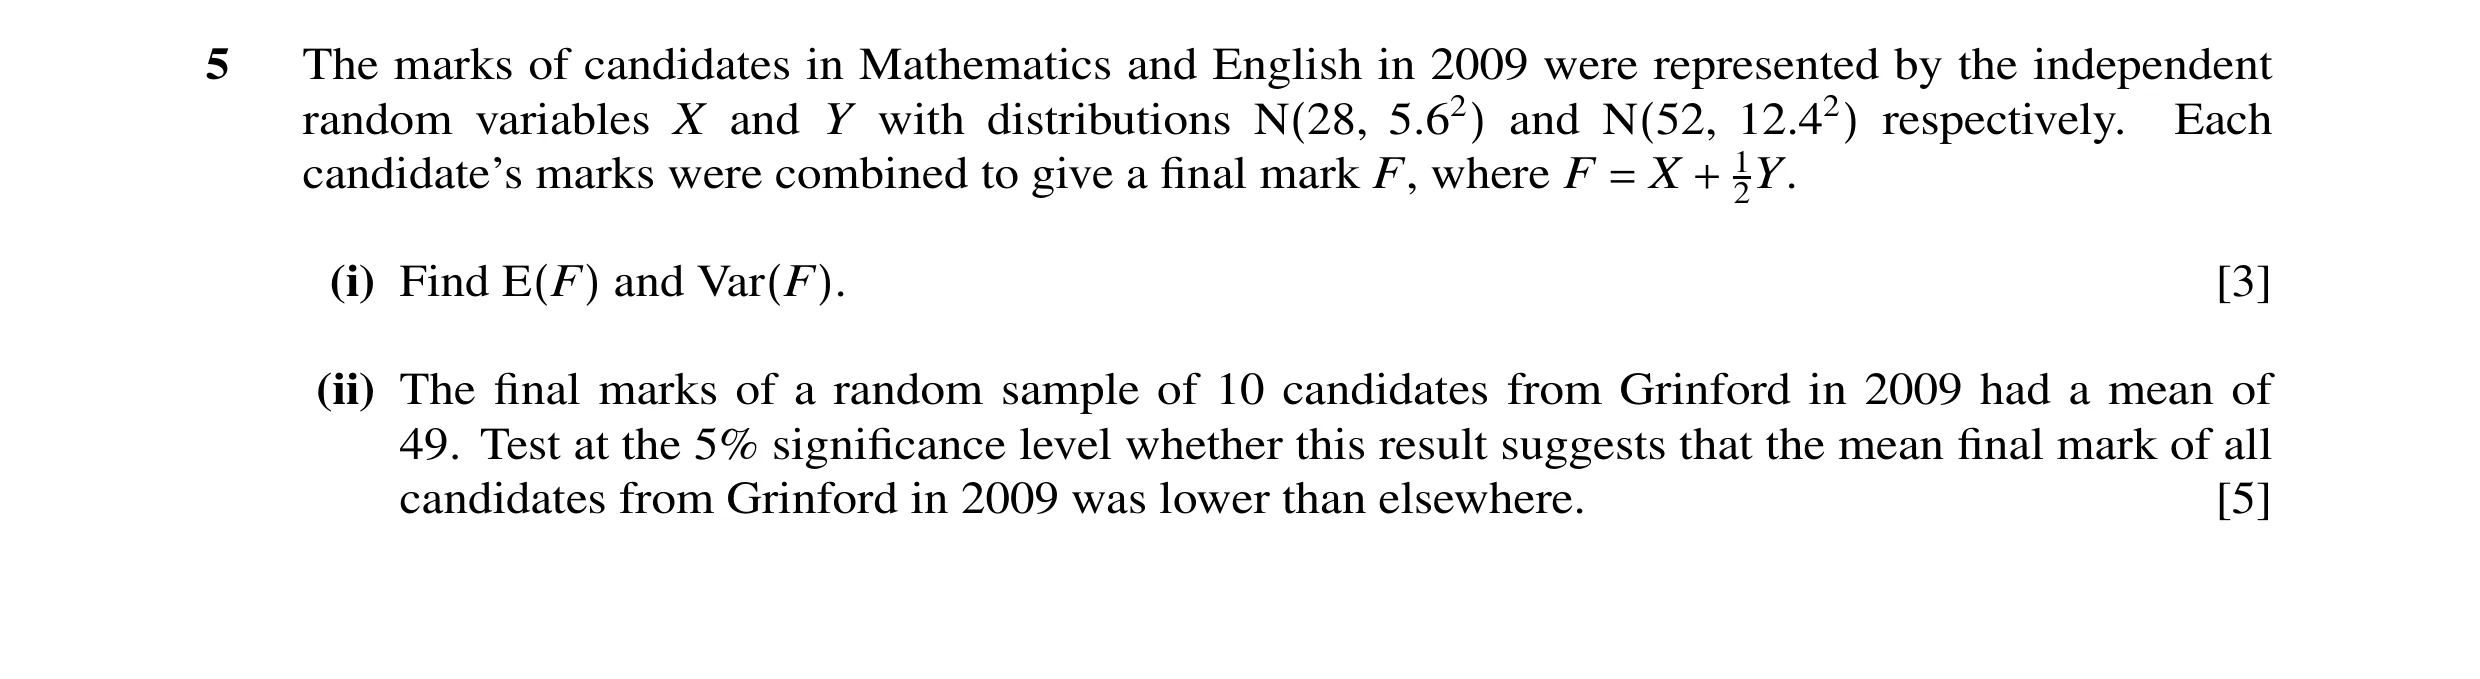
5 The marks of candidates in Mathematics and English in 2009 were represented by the independent random variables X and Y with distributions N(28, 5.62) and N(52, 12.42) respectively. Each candidate’s marks were combined to give a final mark F, where F = X + 12Y. (i) Find E(F) and Var(F). [3] (ii) The final marks of a random sample of 10 candidates from Grinford in 2009 had a mean of 49. Test at the 5% significance level whether this result suggests that the mean final mark of all candidates from Grinford in 2009 was lower than elsewhere. [5]
8 marks
Mark scheme: 5 (i) E(F) = 28 + 1/2 × 52 = 54 B1 Var(F) = 5.62 + 1/4 × 12.42 M1 = 69.8 A1 [3] √69.8 or 8.35: M1A0 (ii) H0: Grinford mean = 54; B1ft Allow “µ”, otherwise undefined H1; Grinford mean < 54 mean: B0 ft their 54 49 − 54 698. M1 Standardising must have √10 10 = –1.89(3) or –1,89(2) allow + A1 Comp with –1.645 (or 1.893 with 1.645) M1 Comp P(z < –1.893) with 0.05 Allow comparison with 1.96 for consistent 2-tail test Evidence that Grinford mean lower A1ft [5] Allow “Accept Grinford mean lower” No contradictions OR Alt methods (x – 54)/(√(69.8/10)) = 1.645 giving x = 49.65 compare with 49 scores M1A1M1A1ft. oe. No mixed methods. GCE A LEVEL – October/November 2010 9709 71 1 1
This question in 9709/71 Oct/Nov 2010
Q12 · A book contains 40 000 words 9709/72 Oct/Nov 2010
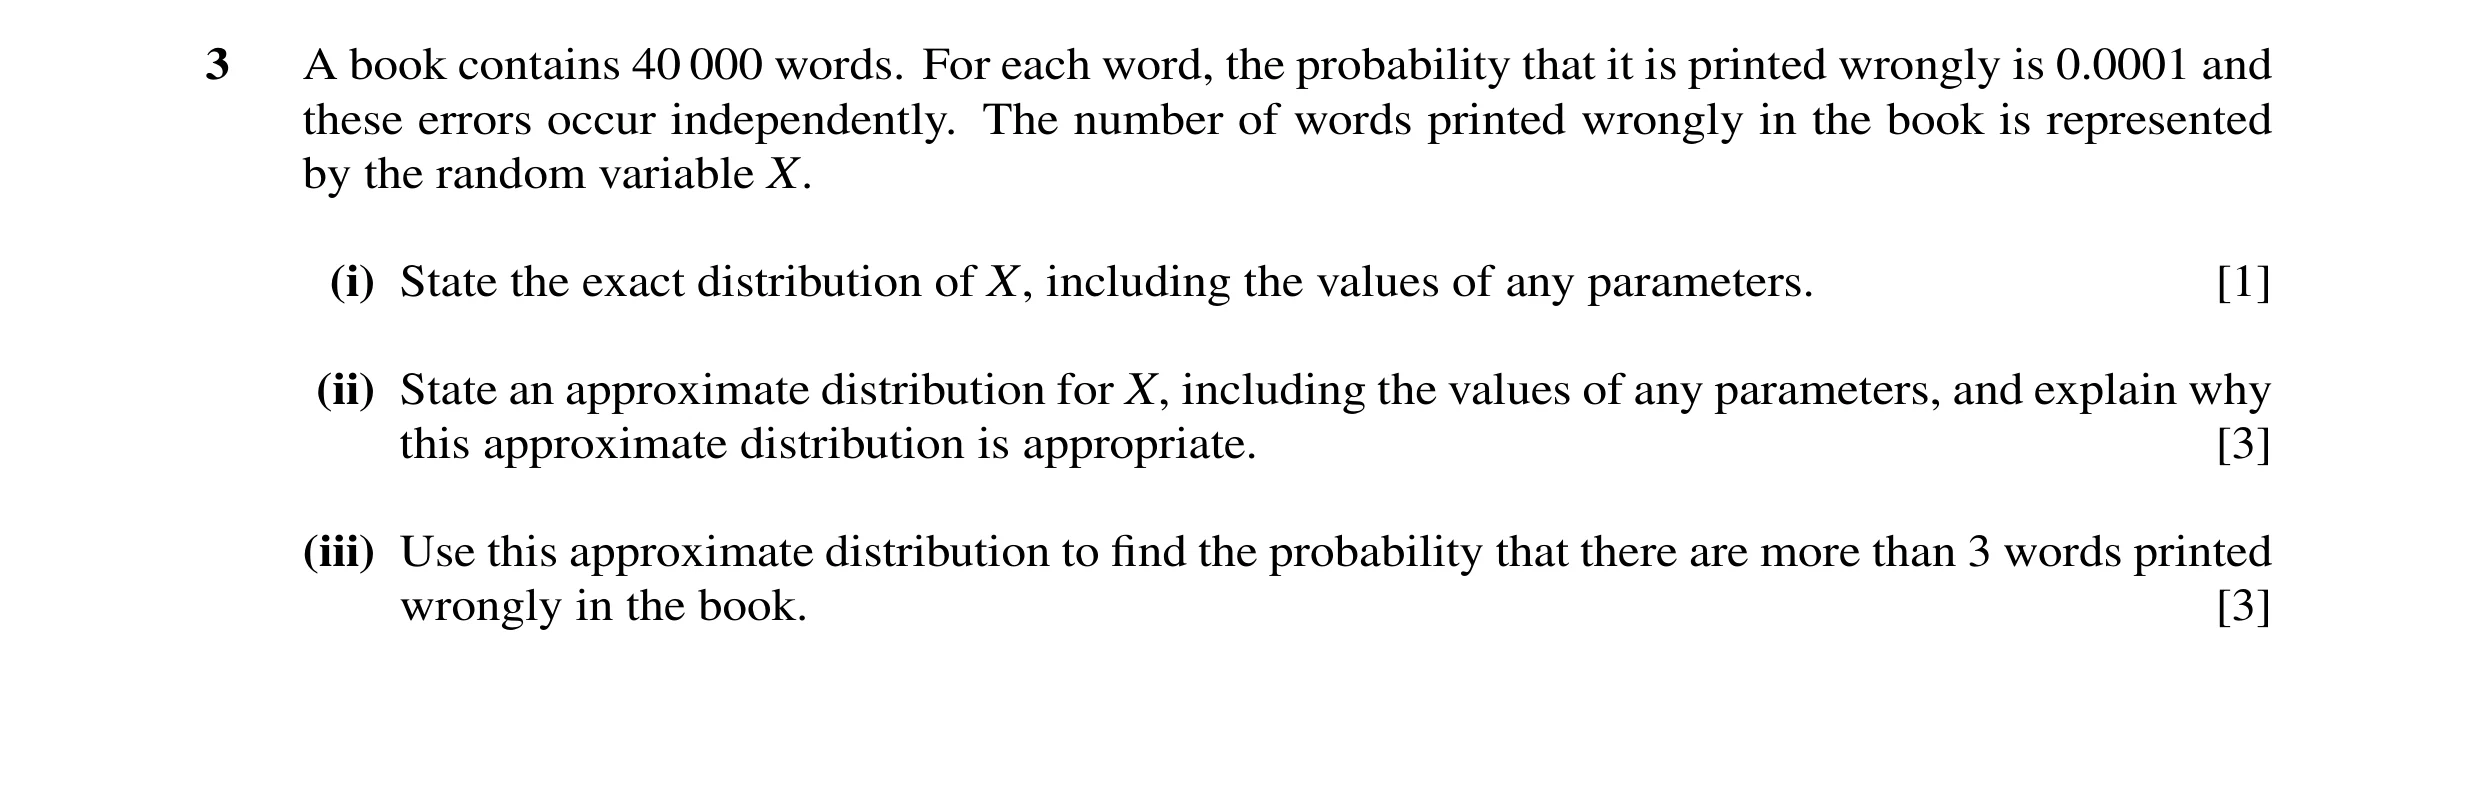
3 A book contains 40 000 words. For each word, the probability that it is printed wrongly is 0.0001 and these errors occur independently. The number of words printed wrongly in the book is represented by the random variable X. (i) State the exact distribution of X, including the values of any parameters. [1] (ii) State an approximate distribution for X, including the values of any parameters, and explain why this approximate distribution is appropriate. [3] (iii) Use this approximate distribution to find the probability that there are more than 3 words printed wrongly in the book. [3]
7 marks
Mark scheme: 3 (i) B(40 000, 0.0001) B1 [1] (ii) Po(4) B1*B1*dep B1 for Po. B1 for 4 n = 40 000 > 50, np = 4 < 5 B1 [3] Accept 40000 large and 0.0001 small (iii) 1 – (P(X < 3) or e −4 1( + 4 + 422 + 4!33 ) ) M1 Allow one end error (any λ) 1 − e −4 1( + 4 + 422 + 4!33 ) M1 Expression of correct form (any λ), no end errors. = 0.567 or 0.566 A1 [3] (OR Use of normal scores M1, standardising M1, standardising with correct cc A1ft, (ii) 0.599. Award A mark only if normal given in (ii)) (OR Binomial M1 expression of correct form allow end error, M1 correct form no end error, A1ft 0.567 or 0.566. Award A mark only if Bin given in (ii)) NB Part (iii) must be Poisson or ft from (ii) for A mark to be awarded. SR If no answer given in (ii) allow BOD for A marks. GCE A LEVEL – October/November 2010 9709 72 1.5 ( ) ∫ d
This question in 9709/72 Oct/Nov 2010
Q13 · The marks of candidates in Mathematics and English in 2009 were represented by the… 9709/72 Oct/Nov 2010
5 The marks of candidates in Mathematics and English in 2009 were represented by the independent random variables X and Y with distributions N(28, 5.62) and N(52, 12.42) respectively. Each candidate’s marks were combined to give a final mark F, where F = X + 12Y. (i) Find E(F) and Var(F). [3] (ii) The final marks of a random sample of 10 candidates from Grinford in 2009 had a mean of 49. Test at the 5% significance level whether this result suggests that the mean final mark of all candidates from Grinford in 2009 was lower than elsewhere. [5]
8 marks
Mark scheme: 5 (i) E(F) = 28 + 1/2 × 52 = 54 B1 Var(F) = 5.62 + 1/4 × 12.42 M1 = 69.8 A1 [3] √69.8 or 8.35: M1A0 (ii) H0: Grinford mean = 54; B1ft Allow “µ”, otherwise undefined H1; Grinford mean < 54 mean: B0 ft their 54 49 − 54 698. M1 Standardising must have √10 10 = –1.89(3) or –1,89(2) allow + A1 Comp with –1.645 (or 1.893 with 1.645) M1 Comp P(z < –1.893) with 0.05 Allow comparison with 1.96 for consistent 2-tail test Evidence that Grinford mean lower A1ft [5] Allow “Accept Grinford mean lower” No contradictions OR Alt methods (x – 54)/(√(69.8/10)) = 1.645 giving x = 49.65 compare with 49 scores M1A1M1A1ft. oe. No mixed methods. GCE A LEVEL – October/November 2010 9709 72 1 1
This question in 9709/72 Oct/Nov 2010
Q14 · A clinic monitors the amount, X milligrams per litre, of a certain chemical in the blood… 9709/73 Oct/Nov 2010
6 A clinic monitors the amount, X milligrams per litre, of a certain chemical in the blood stream of patients. For patients who are taking drug A, it has been found that the mean value of X is 0.336. A random sample of 100 patients taking a new drug, B, was selected and the values of X were found. The results are summarised below. n = 100, Σ x = 43.5, Σx2 = 31.56. (i) Test at the 1% significance level whether the mean amount of the chemical in the blood stream of patients taking drug B is different from that of patients taking drug A. [8] (ii) For the test to be valid, is it necessary to assume a normal distribution for the amount of chemical in the blood stream of patients taking drug B? Justify your answer. [2]
10 marks
Mark scheme: 6 (i) x = 43.5/100 = 0.435 B1 100 31. 56 2 31. 56 2 s = × − .0 435 (=0.3573) M1 s = − .0 435 M0 99 100 100 or Var (= 0.128) or 1/99(31.56-(43.5)2/100) (= 0.3555), or Var (= 0.126) H0: Pop mean (for B) = 0.336 B1 Undefined mean: B0, but allow just H1: Pop mean (for B) ≠ 0.336 “µ” .0435 − .0336 .0435 − .0336 M1 M1 ".03573" ".03555" 100 100 Or xcrit = 0.336 +/-“2.576”√(0.12765/100) = 2.77 (3 sfs) A1 Or xcrit = (0.244 ) or 0.428 A1 z = 2.785 (3 sfs) A0 Zcrit = 2.576 B1 Or use of area – correct 0.005 (2-tail) (or 2.326 consistent with 1-tail test ) or 0.01 (1-tail) Valid comparison with z-value M1 Valid comp P(z > 2.77) with 0.005 or 0.01 Or comp 0.435 with “0.428” Evidence that B amounts diff from A A1ft [8] No errors seen. Conclusion consistent with their H0/H1.No contradictions. (ii) Must state or imply “No” to score these marks n large B1 X approx normally distr or CLT applies B1 [2] B0 for “No” with invalid (or no) reason SR both reasons correct but wrong conclusion scores SR B1. GCE A LEVEL – October/November 2010 9709 73
This question in 9709/73 Oct/Nov 2010
Q15 · G( )x h( )x 1 1 x x 0 1 2 0 1 2 –1 –1 The diagrams show the graphs of two functions, g… 9709/71 May/June 2011
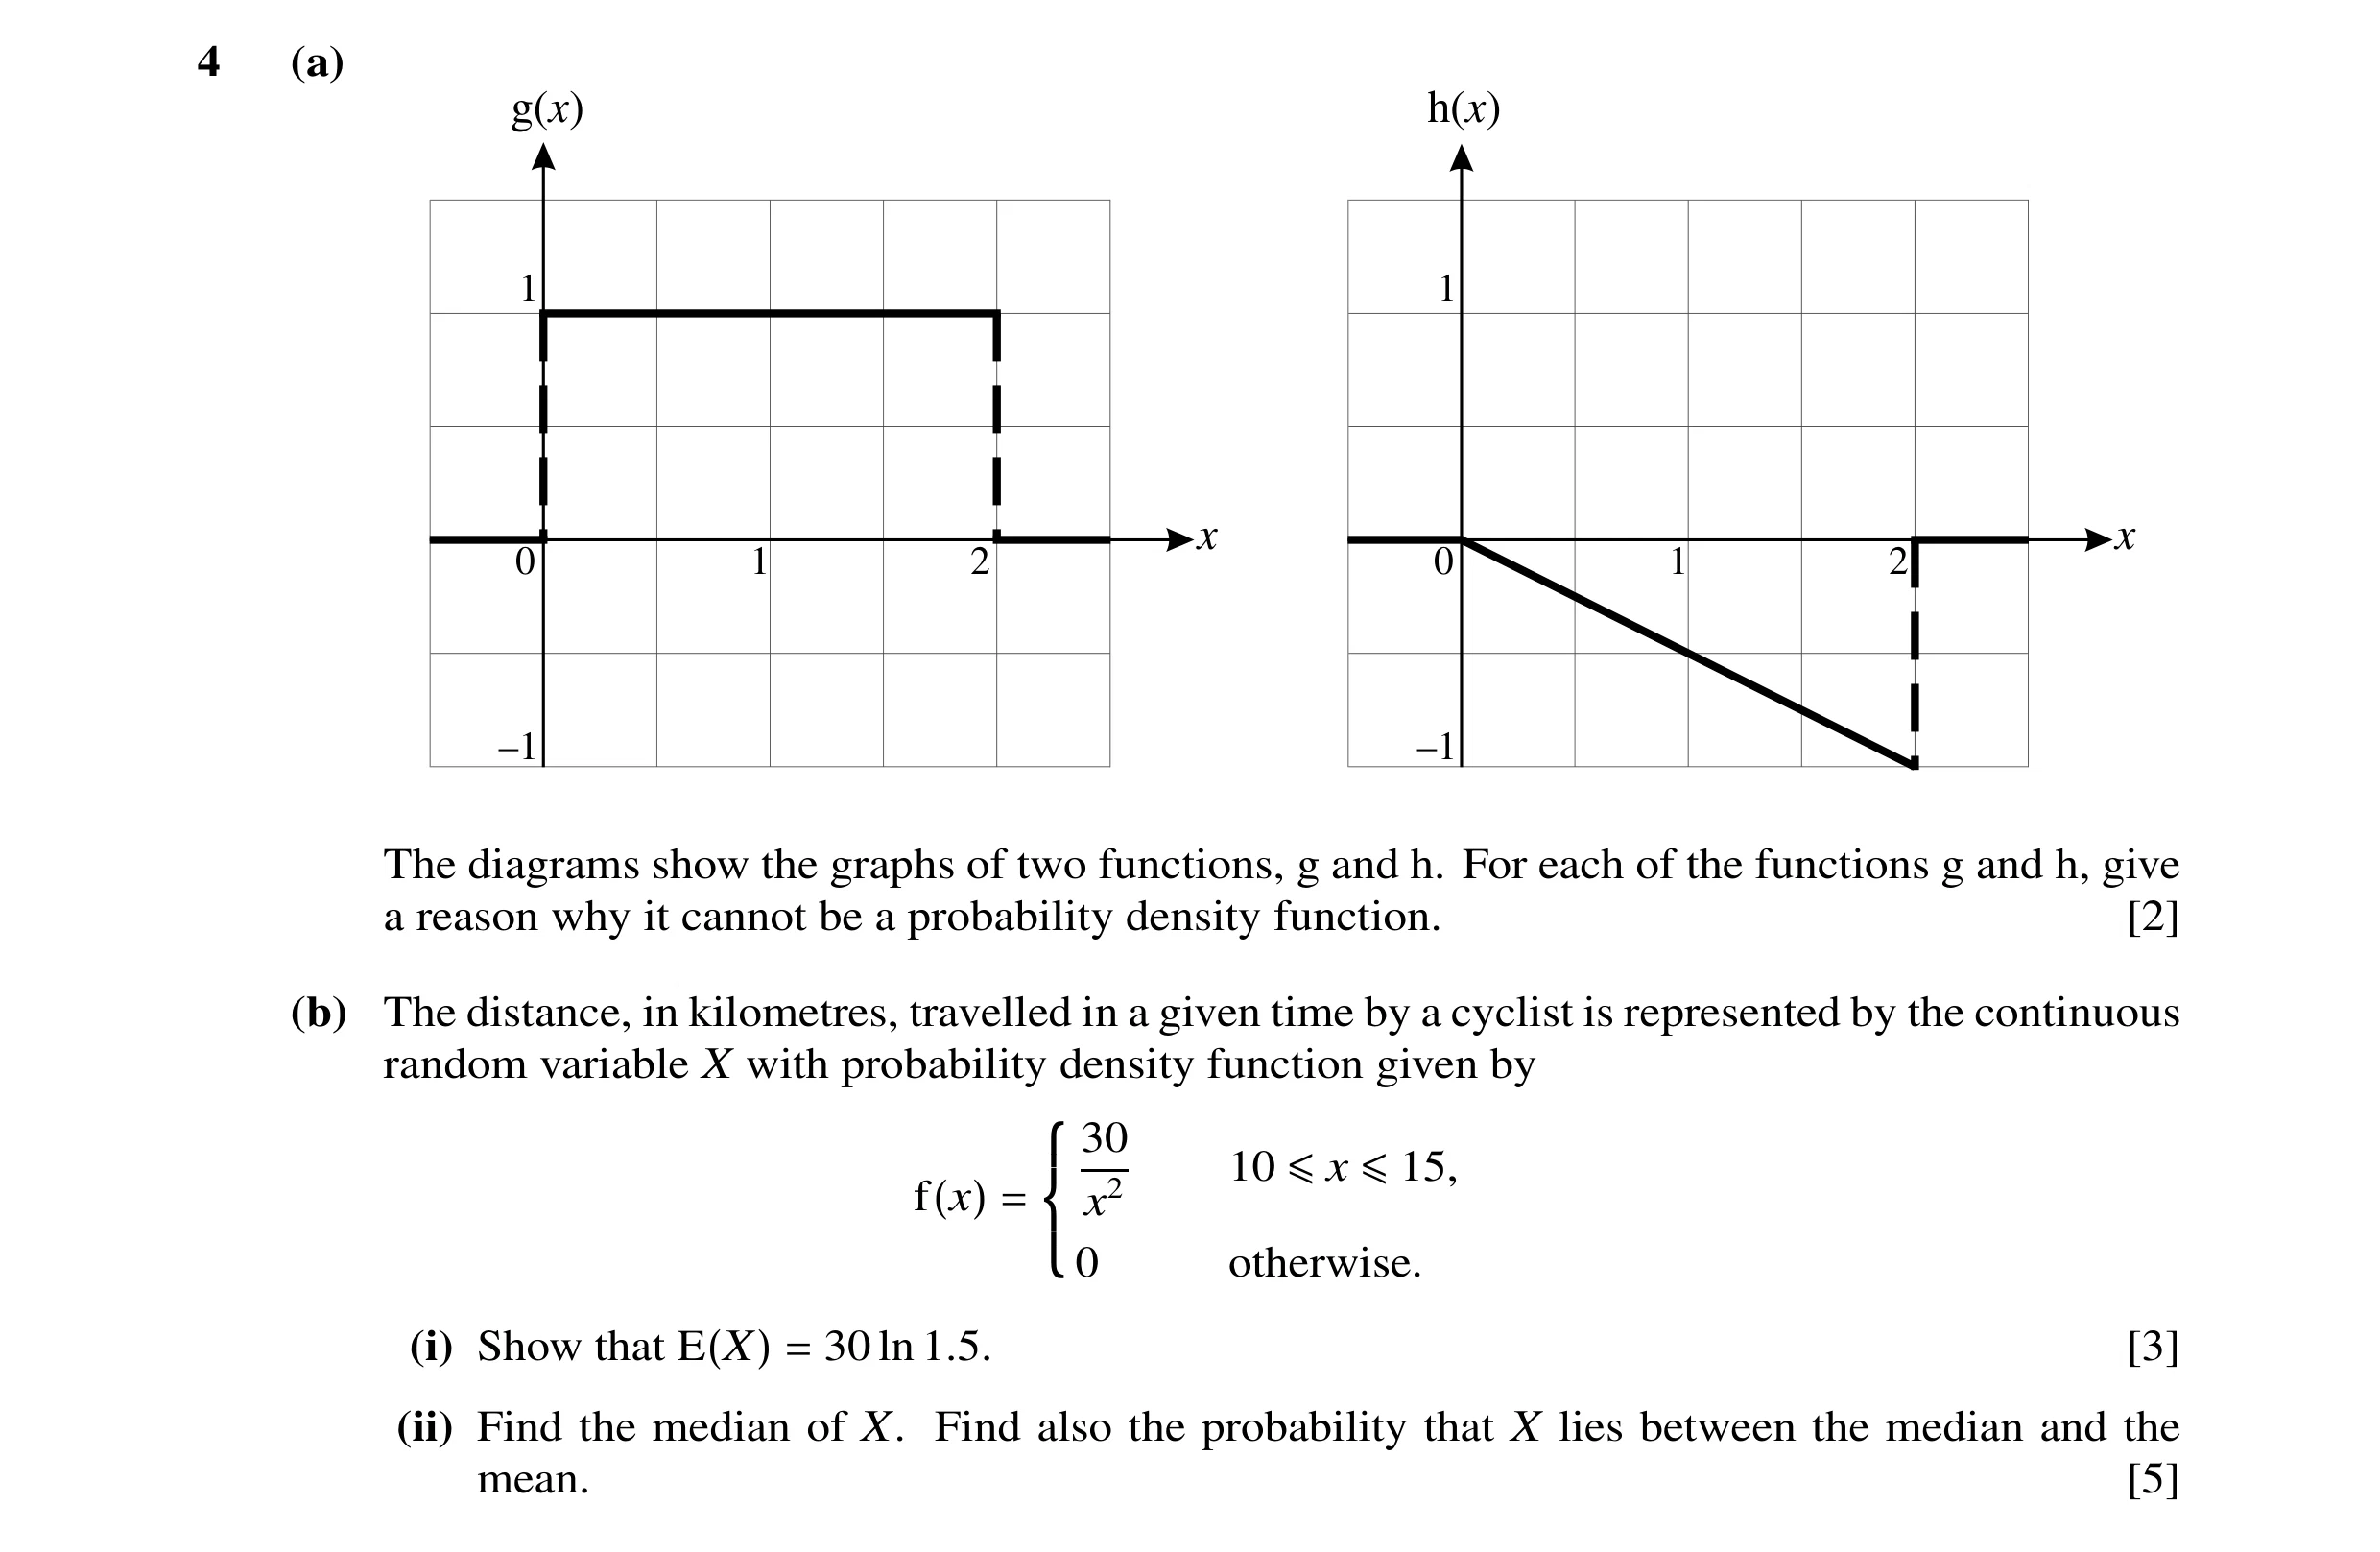
4 (a) g( )x h( )x 1 1 x x 0 1 2 0 1 2 –1 –1 The diagrams show the graphs of two functions, g and h. For each of the functions g and h, give a reason why it cannot be a probability density function. [2] (b) The distance, in kilometres, travelled in a given time by a cyclist is represented by the continuous random variable X with probability density function given by 30 10 ≤x ≤15, x2 f(x) = 0 otherwise. (i) Show that E(X) = 30 ln 1.5. [3] (ii) Find the median of X. Find also the probability that X lies between the median and the mean. [5]
10 marks
Mark scheme: 4 (a) g: Area ≠ 1 or > 1 B1 h: pdf cannot be neg B1 [2] 15 30 (b) (i) dx M1 Attempt integ xf(x), ignore limits ∫ x 10 = [30 ln x ] 1510 A1 Correct integrand and limits = 30(ln15 – ln10) A1 or 30ln(15/10) (= 30ln1.5 AG) [3] m 30 (ii) 2 dx = 0.5 M1 Integ f(x) = 0.5, limits 10 to unknown ∫ x 10 [− 30 x −1 ] 10m = 0.5 A1 Correct integrand, limits and = 0.5 −m30 − ( − 1030 ) = 0.5 m = 12 A1 30 ln1.5 30 2 dx M1 ∫ x '12 ' = 0.0337 (3 sfs) A1 [5] GCE AS/A LEVEL – May/June 2011 9709 71
This question in 9709/71 May/June 2011
Q16 · Previous records have shown that the number of cars entering Bampor on any day has mean… 9709/73 May/June 2011
7 Previous records have shown that the number of cars entering Bampor on any day has mean 352 and variance 121. (i) Find the probability that the mean number of cars entering Bampor during a random sample of 200 days is more than 354. [4] (ii) State, with a reason, whether it was necessary to assume that the number of cars entering Bampor on any day has a normal distribution in order to find the probability in part (i). [2] (iii) It is thought that the population mean may recently have changed. The number of cars entering Bampor during the day was recorded for each of a random sample of 50 days and the sample mean was found to be 356. Assuming that the variance is unchanged, test at the 5% significance level whether the population mean is still 352. [4]
10 marks
Mark scheme: 7 (i) Var( X ) = 121200 or SD of X = 11200 354 − 352 (±) (= ± 2.571) M1 Or with cc attempted. Allow no √ Must 11 200 include 200 or √ 200 A1 2.57(1) or correct expression 1 – Φ(“2.571”) M1 (= 1 – 0.9949) = 0.0051 A1 [4] (ii) (No) “No” must be seen or implied, but gains no marks by itself n is large, B1 n ≥ 30 X (appr) norm distr or CLT applies B1 [2] (SR Both statements correct, but wrong or no conclusion scores B1) (iii) H0: Pop mean = 352 H1: Pop mean ≠ 352 B1 Allow ‘µ’ but not just ‘mean’ 356 − 352 ± ± (= 2.57(1)) M1 Must have √ 50 11 50 A1 Correct statement or 2.57(1) Comp with z = ±1.96 (signs consistent) B1√ Correct comparison, and correct conclusion, Evidence that pop mean has changed [4] follow through one tail test [Total: 10]
This question in 9709/73 May/June 2011
Q17 · Three coats of paint are sprayed onto a surface 9709/71 Oct/Nov 2011
3 Three coats of paint are sprayed onto a surface. The thicknesses, in millimetres, of the three coats have independent distributions N(0.13, 0.022), N(0.14, 0.032) and N(0.10, 0.012). Find the probability that, at a randomly chosen place on the surface, the total thickness of the three coats of paint is less than 0.30 millimetres. [5]
5 marks
Mark scheme: 3 Var(Tot) = 0.022 + 0.032 + 0.012 = 0.0014 B1 Mean(Tot) = 0.37 B1 Tot ~ N(0.37, 0.0014) .030 − .037 (= –1.871) M1 Allow without √. No cc .0'0014 ' Φ(“–1.871”) = 1 – Φ (“1.871”) M1 = 0.0306 or 0.0307 A1 [5] Correct area
This question in 9709/71 Oct/Nov 2011
Q18 · The volumes of juice in bottles of Apricola are normally distributed 9709/71 Oct/Nov 2011
4 The volumes of juice in bottles of Apricola are normally distributed. In a random sample of 8 bottles, the volumes of juice, in millilitres, were found to be as follows. 332 334 330 328 331 332 329 333 (i) Find unbiased estimates of the population mean and variance. [3] A random sample of 50 bottles of Apricola gave unbiased estimates of 331 millilitres and 4.20 millilitres2 for the population mean and variance respectively. (ii) Use this sample of size 50 to calculate a 98% confidence interval for the population mean. [3] (iii) The manufacturer claims that the mean volume of juice in all bottles is 333 millilitres. State, with a reason, whether your answer to part (ii) supports this claim. [1]
7 marks
Mark scheme: 4 (i) Est(µ) = 331(.125) B1 8 "877179" Est(σ2) = −"331. 1252" M1 Allow their Σx2 7 8 = 4.125 or 4.13 A1 [3] (ii) z = 2.326 B1 2.4 331 ± z × M1 Allow incorrect z (≠ 1, 0), not a prob 50 = 330 to 332 (3 sfs) A1 [3] Ignore brackets, if given. CWO (iii) No, because 333 is not within CI B1ft [1] GCE AS/A LEVEL – October/November 2011 9709 71
This question in 9709/71 Oct/Nov 2011
Q19 · Three coats of paint are sprayed onto a surface 9709/72 Oct/Nov 2011
3 Three coats of paint are sprayed onto a surface. The thicknesses, in millimetres, of the three coats have independent distributions N(0.13, 0.022), N(0.14, 0.032) and N(0.10, 0.012). Find the probability that, at a randomly chosen place on the surface, the total thickness of the three coats of paint is less than 0.30 millimetres. [5]
5 marks
Mark scheme: 3 Var(Tot) = 0.022 + 0.032 + 0.012 = 0.0014 B1 Mean(Tot) = 0.37 B1 Tot ~ N(0.37, 0.0014) .030 − .037 (= –1.871) M1 Allow without √. No cc .0'0014 ' Φ(“–1.871”) = 1 – Φ (“1.871”) M1 = 0.0306 or 0.0307 A1 [5] Correct area
This question in 9709/72 Oct/Nov 2011
Q20 · The volumes of juice in bottles of Apricola are normally distributed 9709/72 Oct/Nov 2011
4 The volumes of juice in bottles of Apricola are normally distributed. In a random sample of 8 bottles, the volumes of juice, in millilitres, were found to be as follows. 332 334 330 328 331 332 329 333 (i) Find unbiased estimates of the population mean and variance. [3] A random sample of 50 bottles of Apricola gave unbiased estimates of 331 millilitres and 4.20 millilitres2 for the population mean and variance respectively. (ii) Use this sample of size 50 to calculate a 98% confidence interval for the population mean. [3] (iii) The manufacturer claims that the mean volume of juice in all bottles is 333 millilitres. State, with a reason, whether your answer to part (ii) supports this claim. [1]
7 marks
Mark scheme: 4 (i) Est(µ) = 331(.125) B1 8 "877179" Est(σ2) = −"331. 1252" M1 Allow their Σx2 7 8 = 4.125 or 4.13 A1 [3] (ii) z = 2.326 B1 2.4 331 ± z × M1 Allow incorrect z (≠ 1, 0), not a prob 50 = 330 to 332 (3 sfs) A1 [3] Ignore brackets, if given. CWO (iii) No, because 333 is not within CI B1ft [1] GCE AS/A LEVEL – October/November 2011 9709 72
This question in 9709/72 Oct/Nov 2011
Q21 · Ranjit goes to mathematics lectures and physics lectures 9709/73 Oct/Nov 2011
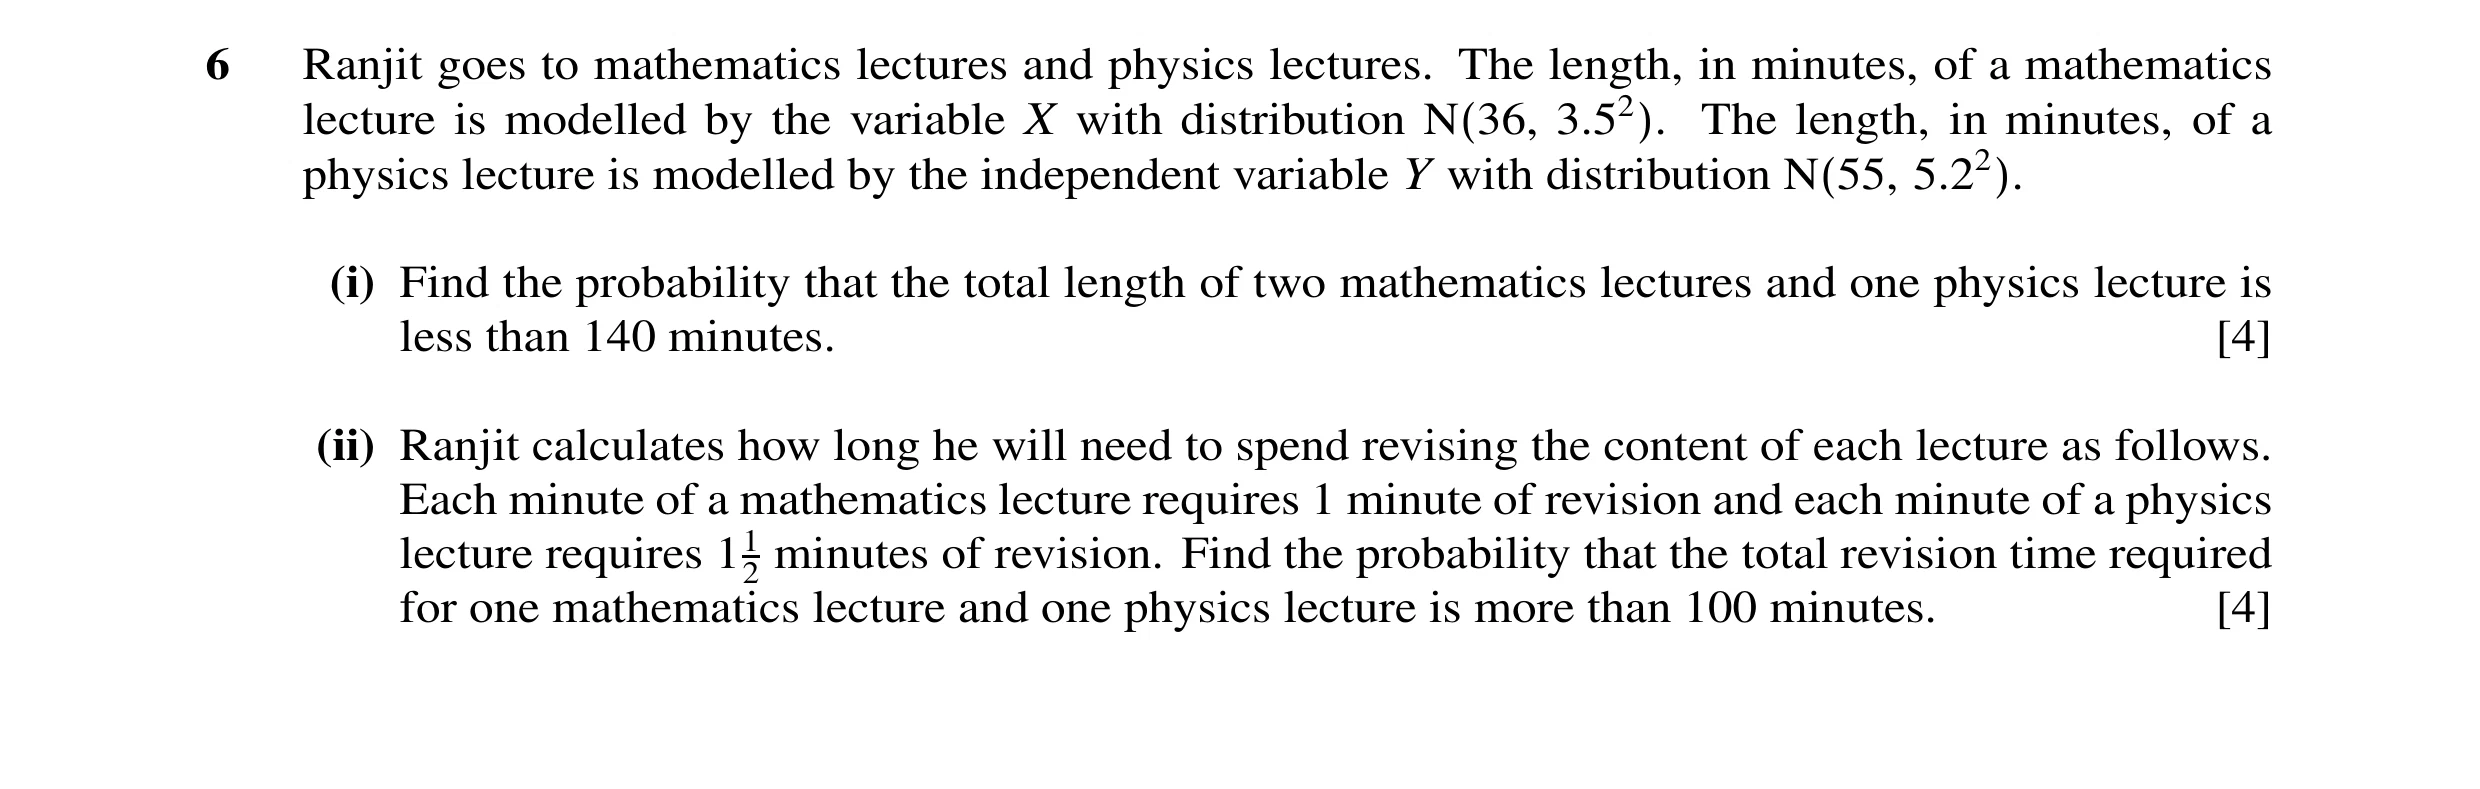
6 Ranjit goes to mathematics lectures and physics lectures. The length, in minutes, of a mathematics lecture is modelled by the variable X with distribution N(36, 3.52). The length, in minutes, of a physics lecture is modelled by the independent variable Y with distribution N(55, 5.22). (i) Find the probability that the total length of two mathematics lectures and one physics lecture is less than 140 minutes. [4] (ii) Ranjit calculates how long he will need to spend revising the content of each lecture as follows. Each minute of a mathematics lecture requires 1 minute of revision and each minute of a physics lecture requires 112 minutes of revision. Find the probability that the total revision time required for one mathematics lecture and one physics lecture is more than 100 minutes. [4]
8 marks
Mark scheme: 6 (i) E(Tot) = 2 × 36 + 55 (= 127) B1 (Or ±13) Var(Tot) = 2 × 3.52 + 5.22 (= 51.54) B1 140 − 127 M1 For standardising with their mean and (= 1.811) var. Allow without √ or with false cc, "51. 54" but their mean and variance must involve parameters from both given distributions Φ(“1.811”) = 0.965 (3 sfs) A1 [4] (ii) E(RM) = 36 + 1.5 × 55 (= 118.5) B1 (Or ±18.5) Var(RM) = 3.52 + 1.52×5.22 (= 73.09) B1 100 − 1185 M1 For standardising with their mean and (= –2.164) var. Allow without √ or with false cc, 73. 09 but their mean and variance must involve parameters from both given distributions 1 – Φ(“–2.164”) = Φ (“2.164”) 0.985 (3 sfs) A1 [4] 1 2
This question in 9709/73 Oct/Nov 2011
Q22 · An examination consists of a written paper and a practical test 9709/71 May/June 2012
2 An examination consists of a written paper and a practical test. The written paper marks (M) have mean 54.8 and standard deviation 16.0. The practical test marks (P) are independent of the written paper marks and have mean 82.4 and standard deviation 4.8. The final mark is found by adding 75% of M to 25% of P. Find the mean and standard deviation of the final marks for the examination. [3]
3 marks
Mark scheme: 2 (0.75 × 54.8 + 0.25 × 82.4 =) 61.7 B1 0.752 × 16.02 + 0.252 × 4.82 M1 No need for √ for M1 (= 145.44) sd = 12.1 (3 sfs) A1 [3]
This question in 9709/71 May/June 2012
Q23 · The lengths of logs are normally distributed with mean 3.5 m and standard deviation 0.12 m 9709/73 Oct/Nov 2012
1 The lengths of logs are normally distributed with mean 3.5 m and standard deviation 0.12 m. Describe fully the distribution of the total length of 8 randomly chosen logs. [3]
3 marks
Mark scheme: 1 Normal with mean 28 B1 Both Var = 0.122 × 8 M1 square & × by 8 or sd = 0.12 × √8 = 0.115 (3 sfs) A1 [3] or sd = 0.339 (3 sfs) clearly stated var / sd Total [3]
This question in 9709/73 Oct/Nov 2012
Q24 · Joshi suspects that a certain die is biased so that the probability of showing a six is… 9709/73 Oct/Nov 2012
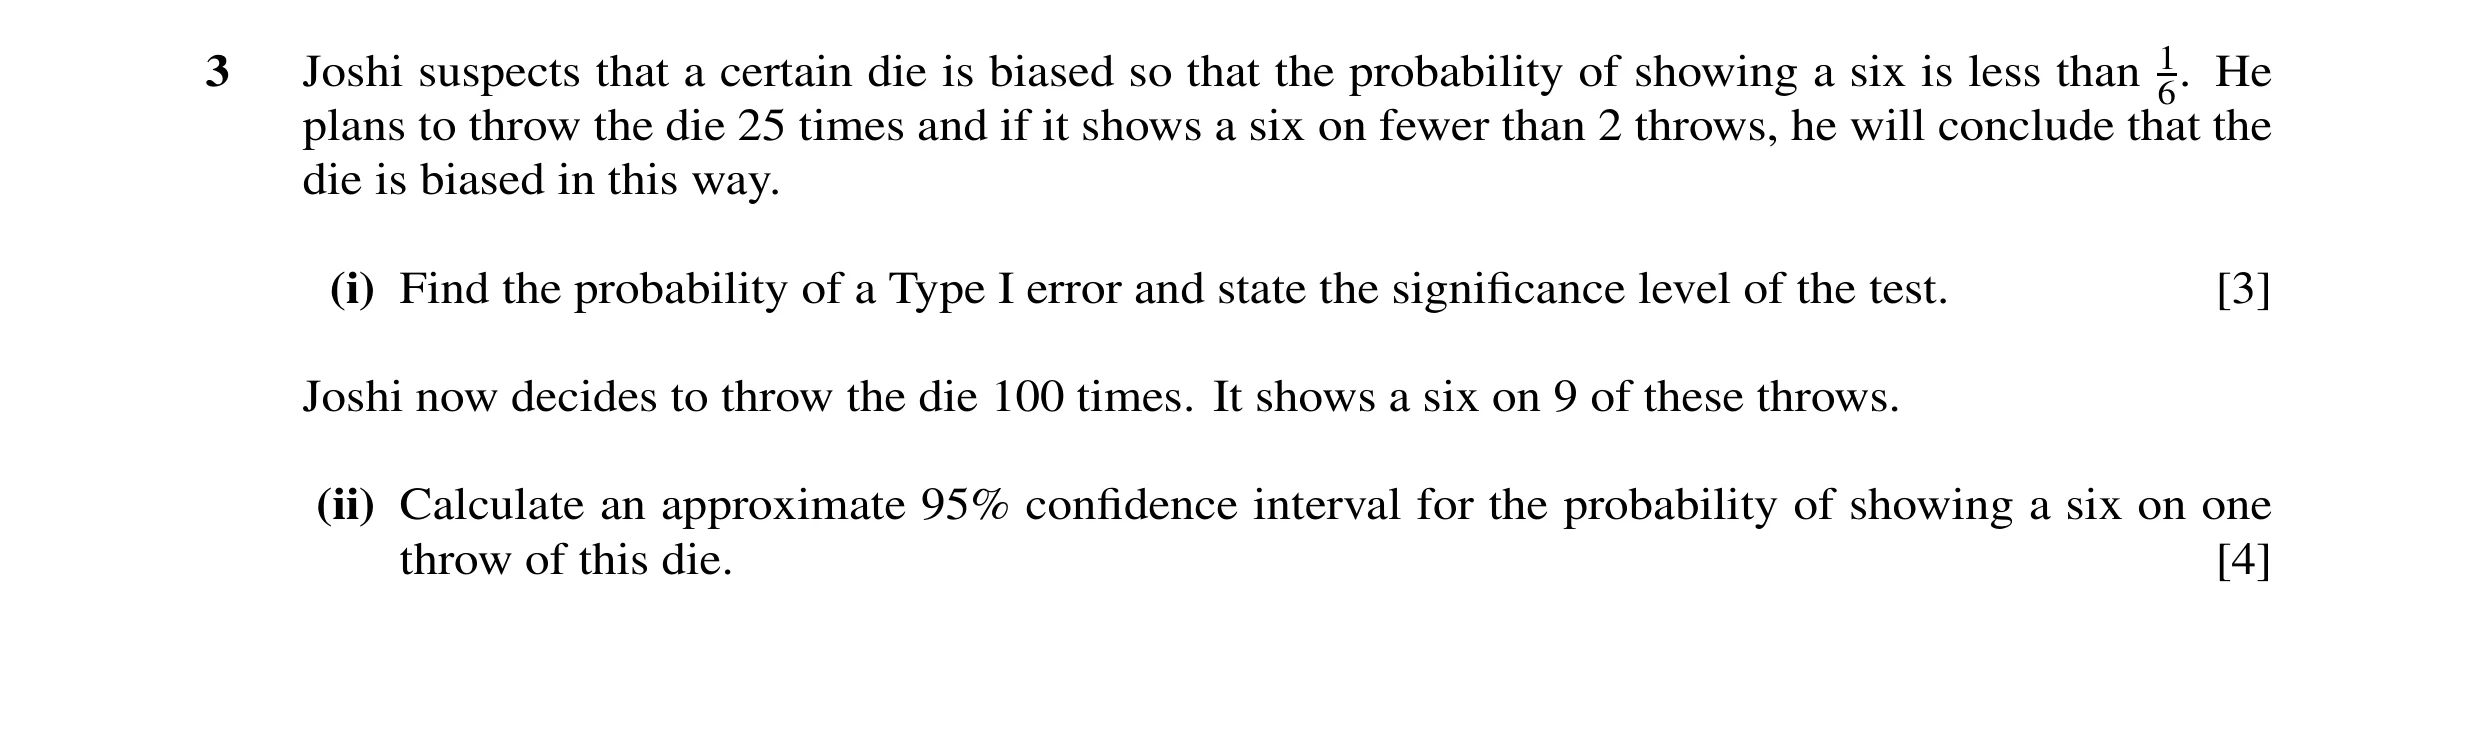
3 Joshi suspects that a certain die is biased so that the probability of showing a six is less than 6.1 He plans to throw the die 25 times and if it shows a six on fewer than 2 throws, he will conclude that the die is biased in this way. (i) Find the probability of a Type I error and state the significance level of the test. [3] Joshi now decides to throw the die 100 times. It shows a six on 9 of these throws. (ii) Calculate an approximate 95% confidence interval for the probability of showing a six on one throw of this die. [4]
7 marks
Mark scheme: 3 (i) 25 24 M1 Allow end errors, but just P(2) implies M0 5 5 1 + 25 Accept p/q mix 6 6 6 = 0.0629 final answer A1 Sig level = 6.29% B1ft [3] ft their P(X < 1) with Binomial used. Allow 6.3% or 6% (ii) .009 × .091 Var (p) ≈ 100 M1 For pq /100 seen ( any p/q ) ( must be probs ) (= 0.000819) B1 z = 1.96 .009 × .091 0.09 ± z M1 For correct form of C.I. ( any p/q ) ( must be probs ) 100 = 0.034 to 0.146 (3 dps) A1 [4] Total [7] GCE A LEVEL – October/November 2012 9709 73
This question in 9709/73 Oct/Nov 2012
Q25 · The mean and variance of the random variable X are 5.8 and 3.1 respectively 9709/73 May/June 2013
1 The mean and variance of the random variable X are 5.8 and 3.1 respectively. The random variable S is the sum of three independent values of X. The independent random variable T is defined by T = 3X + 2. (i) Find the variance of S. [1] (ii) Find the variance of T. [1] (iii) Find the mean and variance of S −T. [3]
5 marks
Mark scheme: 1 (i) 9.3 B1 1 (ii) 27.9 B1 1 (iii) E (S) = 17.4, E(T) = 19.4 M1 For subtracting their E[S] – E[T] can be E (S – T) = – 2.0, A1 non-numerical Var (S – T) = 37.2 B1ft 3 ft (i) & (ii) Adding (i) and (ii) ft non- negative answers only [Total: 5]
This question in 9709/73 May/June 2013
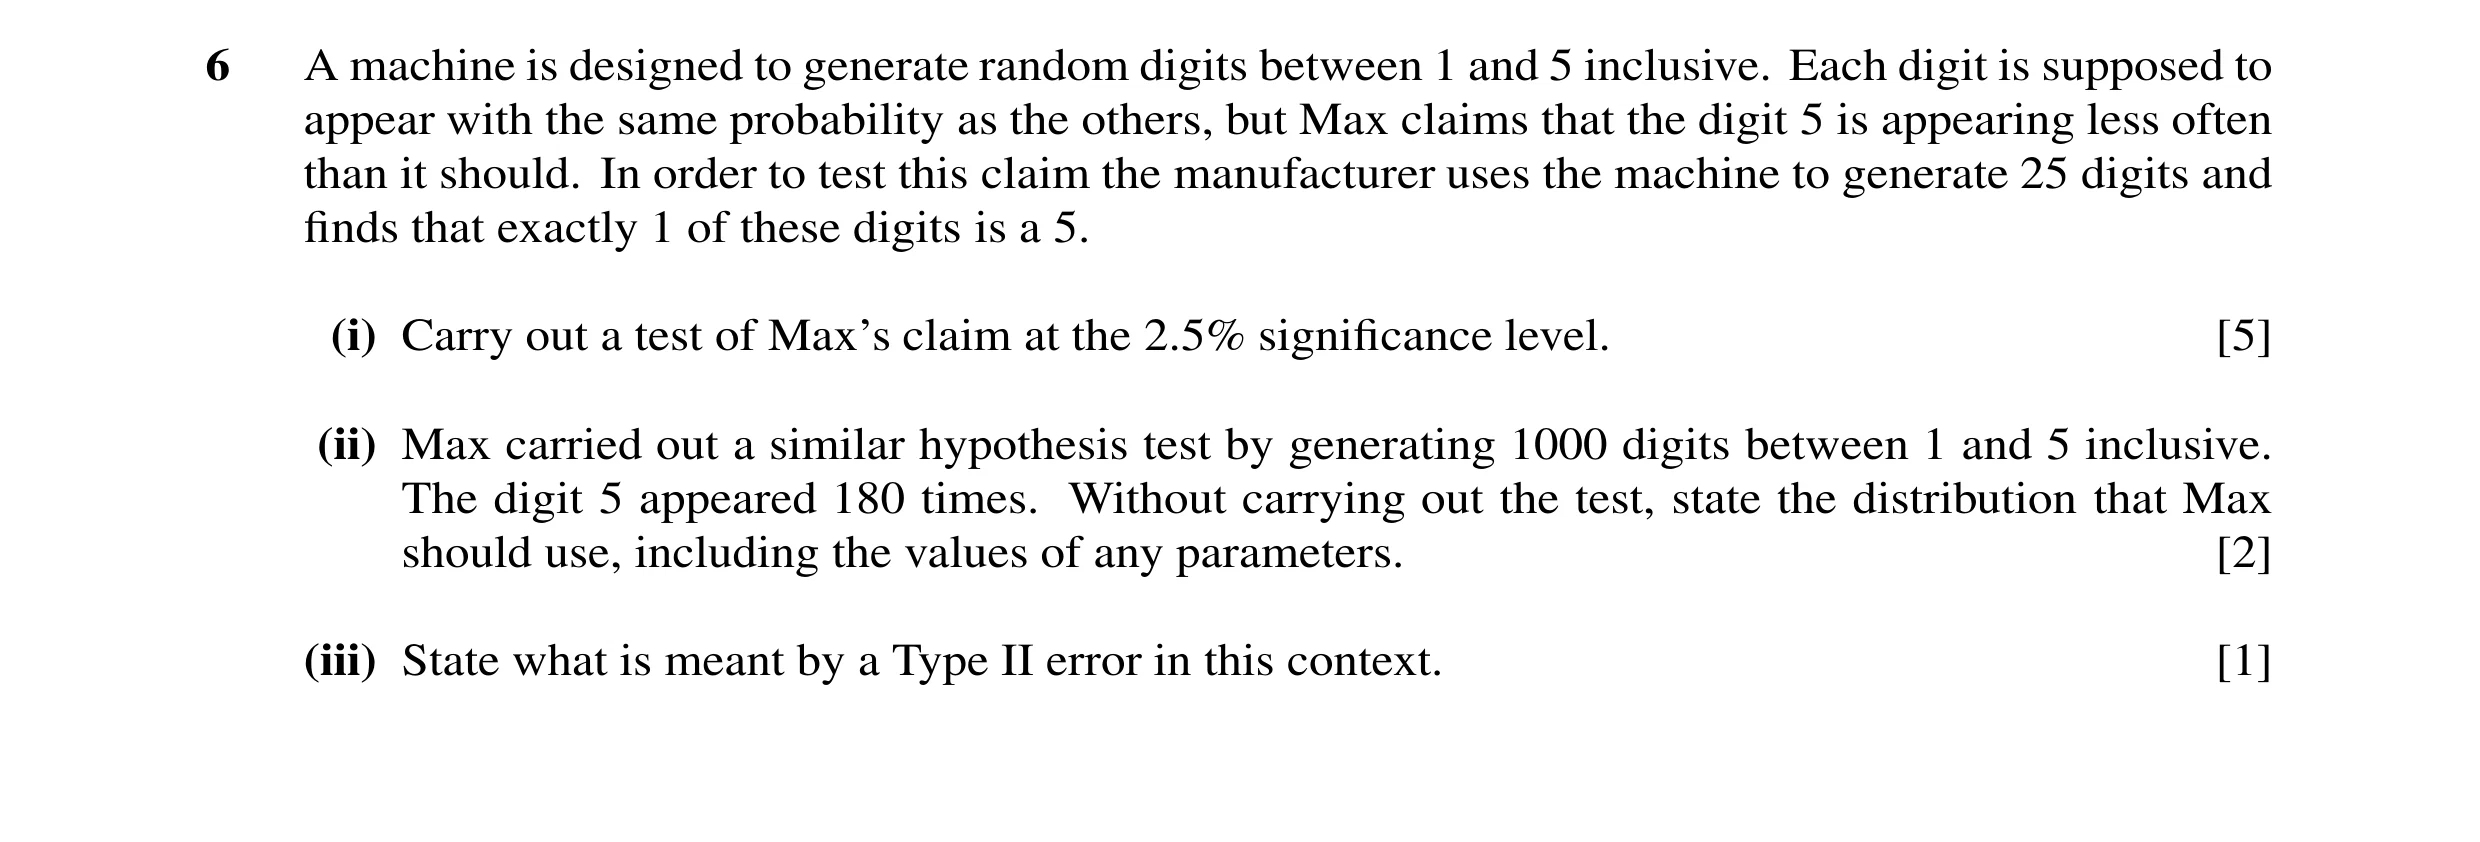
Q26 · A machine is designed to generate random digits between 1 and 5 inclusive 9709/73 May/June 2014
6 A machine is designed to generate random digits between 1 and 5 inclusive. Each digit is supposed to appear with the same probability as the others, but Max claims that the digit 5 is appearing less often than it should. In order to test this claim the manufacturer uses the machine to generate 25 digits and finds that exactly 1 of these digits is a 5. (i) Carry out a test of Max’s claim at the 2.5% significance level. [5] (ii) Max carried out a similar hypothesis test by generating 1000 digits between 1 and 5 inclusive. The digit 5 appeared 180 times. Without carrying out the test, state the distribution that Max should use, including the values of any parameters. [2] (iii) State what is meant by a Type II error in this context. [1]
8 marks
Mark scheme: 6 (i) H0: p = 0.2 H1: p < 0.2 B1 (Allow π) P(0 or 1 5s in 25 | H0) M1 0.825 + 25 × 0.824 × 0.2 Use of B(25,1/5) and P(0) or P(1) or both – may be implied by “0.0274” = 0.0274 (3 s.f.) A1 Comp with 0.025 M1 Valid comparison No evidence (at 2.5% level) to A1 [5] No contradictions support claim SR Use of Normal N(5,4) leading to z = 1.75 or 0.0401 B1* H0 µ = 5 H1 µ < 5 B1. Comparison 1.75 < 1.96 or 0.0401 > 0.025 B1* dep (ii) Normal B1 µ = 200, σ2 = 160 or σ =√160 B1 [2] (iii) Concluding that the machine Not concluding that the machine produces too produces the right proportion of 5s, few 5s although it does. Must be in context although it doesn’t. B1 [1] o.e. No contradictions GCE A LEVEL – May/June 2014 9709 73
This question in 9709/73 May/June 2014
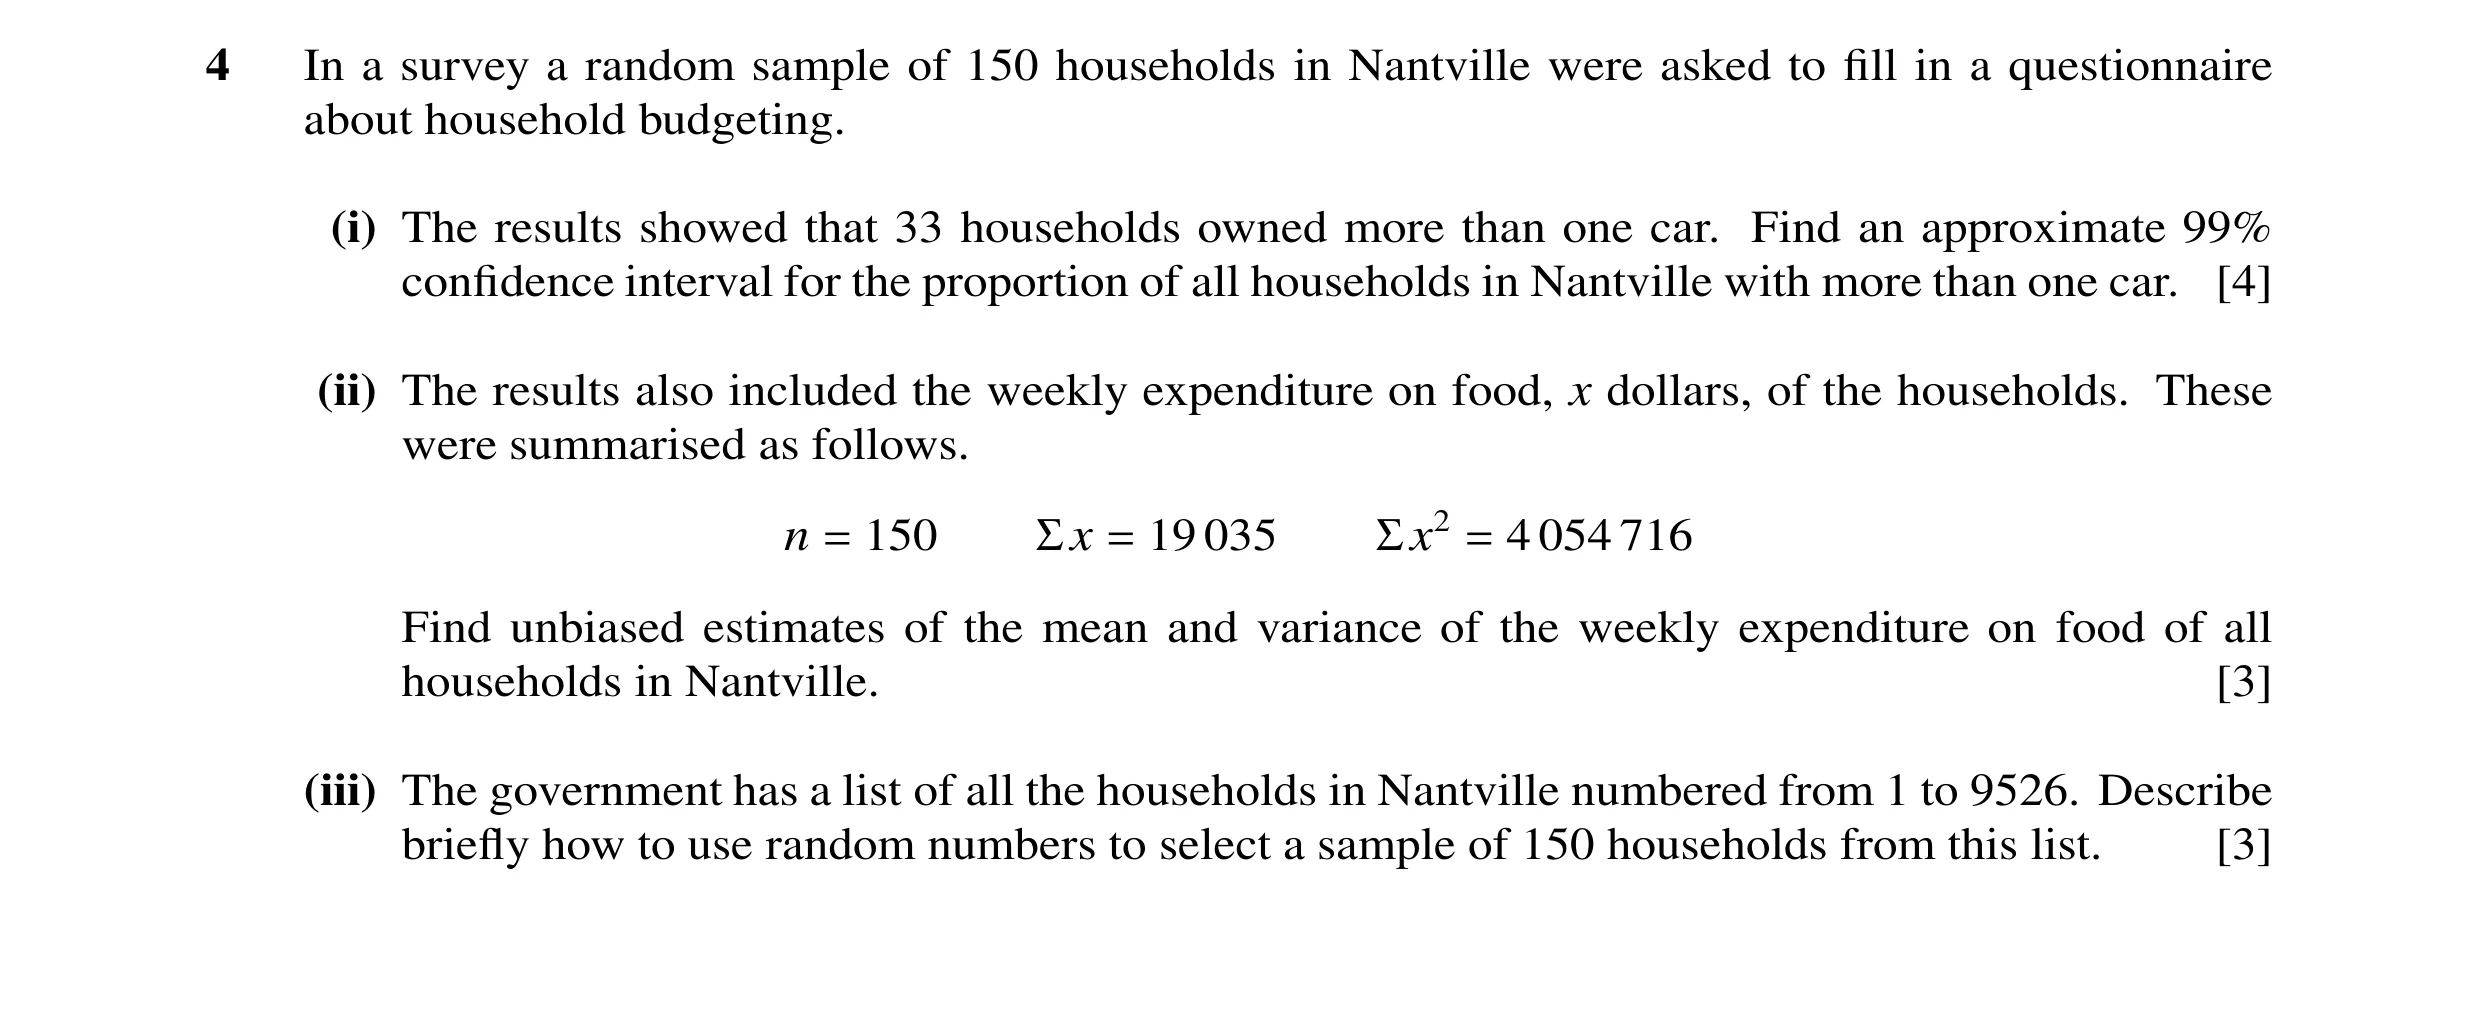
Q27 · In a survey a random sample of 150 households in Nantville were asked to fill in a… 9709/71 Oct/Nov 2014
4 In a survey a random sample of 150 households in Nantville were asked to fill in a questionnaire about household budgeting. (i) The results showed that 33 households owned more than one car. Find an approximate 99% confidence interval for the proportion of all households in Nantville with more than one car. [4] (ii) The results also included the weekly expenditure on food, x dollars, of the households. These were summarised as follows. n = 150 Σx = 19 035 Σx2 = 4 054 716 Find unbiased estimates of the mean and variance of the weekly expenditure on food of all households in Nantville. [3] (iii) The government has a list of all the households in Nantville numbered from 1 to 9526. Describe briefly how to use random numbers to select a sample of 150 households from this list. [3]
10 marks
Mark scheme: 150 1504 (i) Var(Ps) = (= 0.001144) M1 150 Seen. Accept 2.574 to 2.579 z = 2.576 B1 33 ± z√‘0.001144’ M1 Expression of correct form. Any z 150 = 0.133 to 0.307 (3 sf) A1 4 Must be an interval 19035 (ii) (= 126.9 =127(3sf)) B1 150 150 4054716 19035 2 − o.e. M1 For use of a correct formula 149 150 150 = 11001.17 or 11000(3 sf) A1 3 (iii) 4-digit nos. each digit 0-9 B1 Some valid way of generating 4 digit Ignore nos > 9526 B1 random nos Ignore repeats B1 3 from valid method from valid method SR If zero score, full explanation of method for drawing numbers out of a hat can score B1. NB Systematic sampling follows the scheme with first B1 for some way of generating a random starting point. Total: 10 8.4 4 8 2 √
This question in 9709/71 Oct/Nov 2014
Q28 · The number of hours that Mrs Hughes spends on her business in a week is normally… 9709/71 Oct/Nov 2014
5 The number of hours that Mrs Hughes spends on her business in a week is normally distributed with mean - and standard deviation 4.8. In the past the value of - has been 49.5. (i) Assuming that - is still equal to 49.5, find the probability that in a random sample of 40 weeks the mean time spent on her business in a week is more than 50.3 hours. [4] Following a change in her arrangements, Mrs Hughes wishes to test whether - has decreased. She chooses a random sample of 40 weeks and notes that the total number of hours she spent on her business during these weeks is 1920. (ii) (a) Explain why a one-tail test is appropriate. [1] (b) Carry out the test at the 6% significance level. [4] (c) Explain whether it was necessary to use the Central Limit theorem in part (ii)(b). [1]
10 marks
Mark scheme: 8.4 8.4 5 (i) B1 or . Accept 4.8√40 or 4.8² × 40 for 40 40 totals method 50 3. − 49 5. (= 1.054) M1 For standardising with their SD Accept 8.4 ± 40 Accept totals method. No mixed methods 1 – Φ(‘1.054’) M1 For use of tables and finding area consistent with their working = 0.146 (3 sf) A1 4 (ii) (a) Looking for decrease B1 1 (b) H0: Pop mean time spent (or µ) = 49.5 H1: Pop mean time spent (or µ) < 49.5 B1 Not just “mean time spent” 1920 − 495. 40 8.4 (= –1.976) M1 For standardising. Allow ÷ 8.4 40 40 Accept totals method; CV method. No mixed methods ‘1.976’ > 1.555 (or ‘–1.976’ < –1.555) M1 For valid comparison (area comparison 0.024 < 0.06) There is evidence that mean time has A1 4 CWO. No contradictions in conclusions decreased. (c) Population normally distr so No B1 1 Both needed Total: 10
This question in 9709/71 Oct/Nov 2014
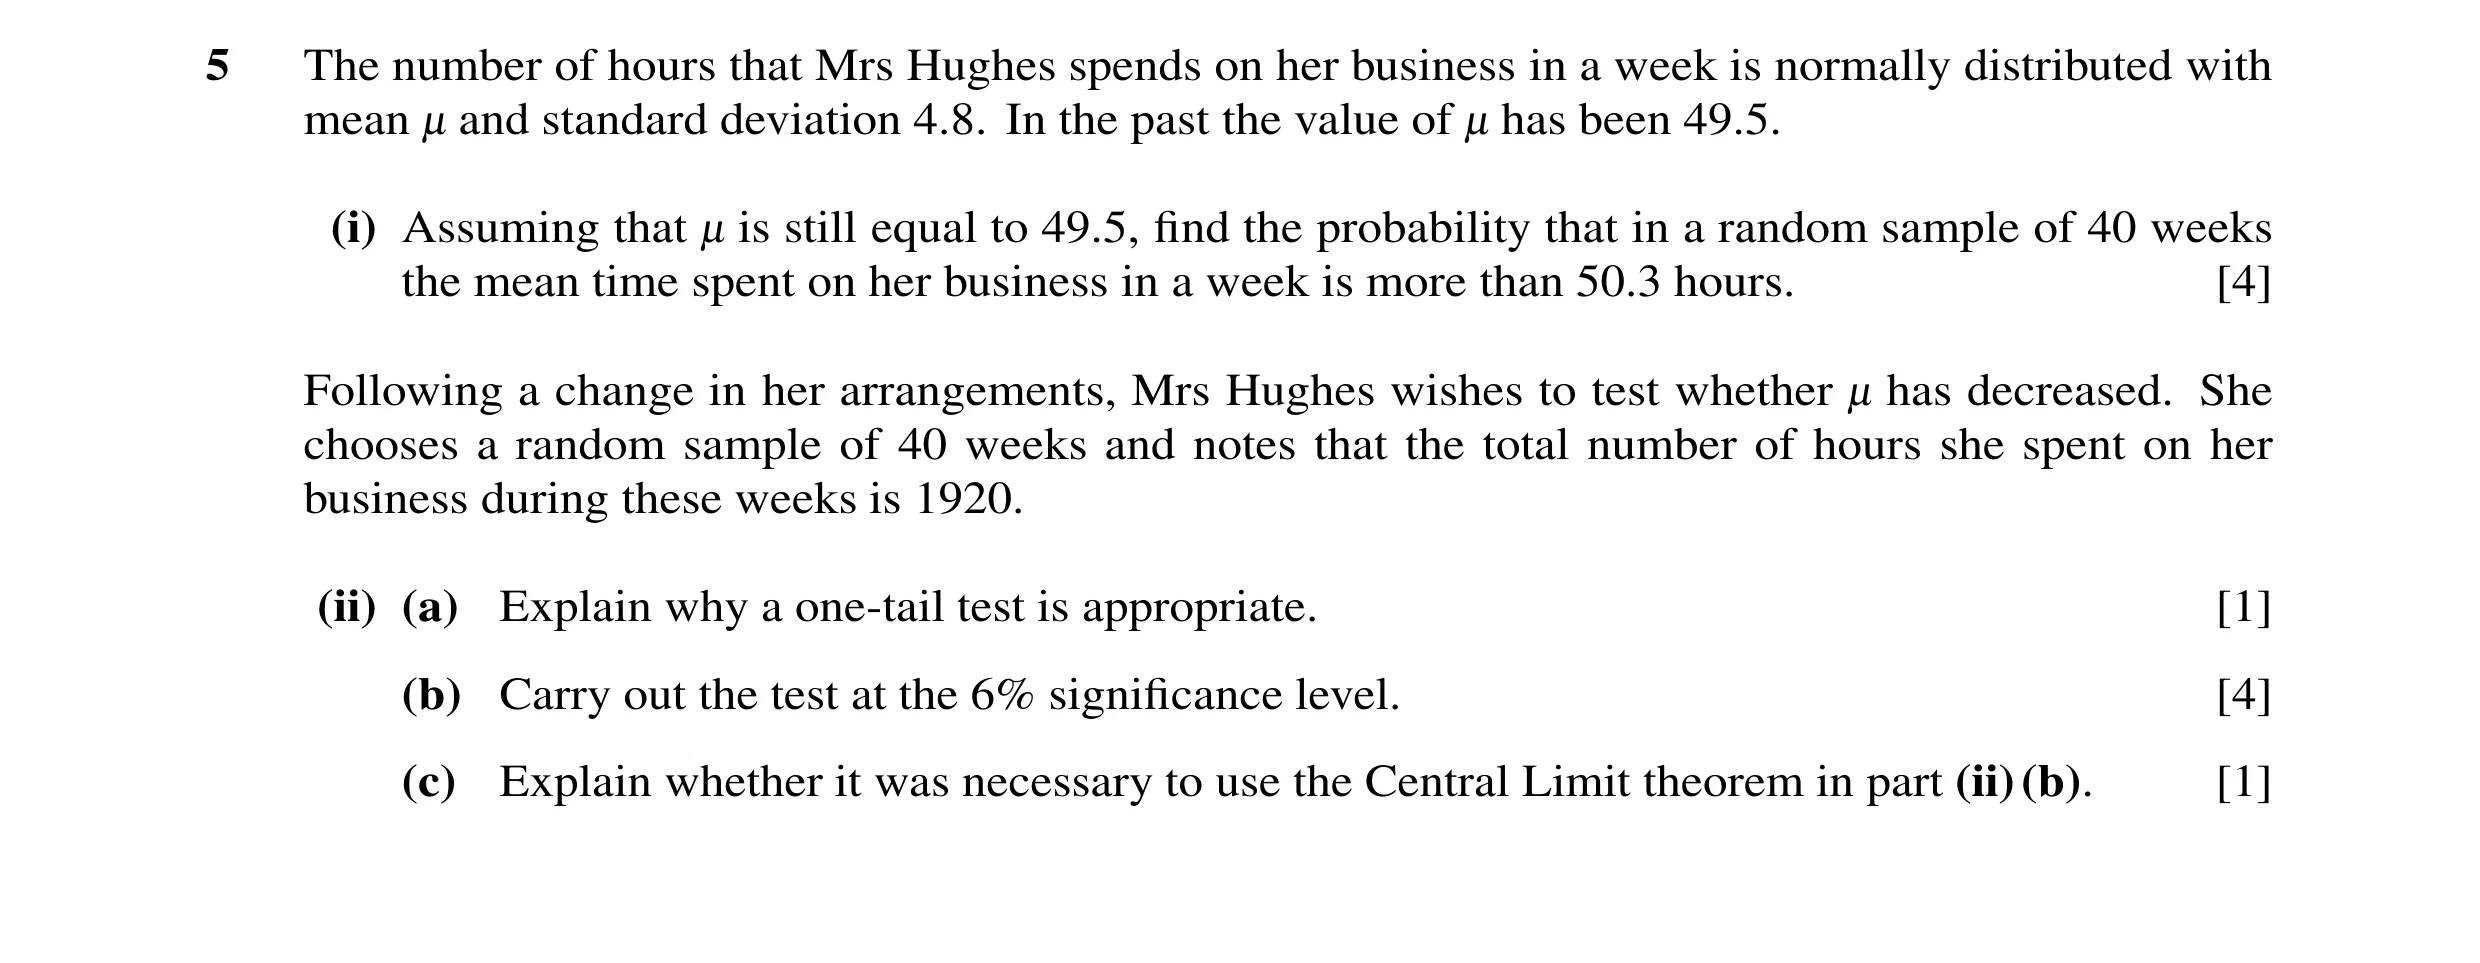
Q29 · The number of hours that Mrs Hughes spends on her business in a week is normally… 9709/72 Oct/Nov 2014
5 The number of hours that Mrs Hughes spends on her business in a week is normally distributed with mean - and standard deviation 4.8. In the past the value of - has been 49.5. (i) Assuming that - is still equal to 49.5, find the probability that in a random sample of 40 weeks the mean time spent on her business in a week is more than 50.3 hours. [4] Following a change in her arrangements, Mrs Hughes wishes to test whether - has decreased. She chooses a random sample of 40 weeks and notes that the total number of hours she spent on her business during these weeks is 1920. (ii) (a) Explain why a one-tail test is appropriate. [1] (b) Carry out the test at the 6% significance level. [4] (c) Explain whether it was necessary to use the Central Limit theorem in part (ii)(b). [1]
10 marks
Mark scheme: 8.4 8.4 5 (i) B1 or . Accept 4.8√40 or 4.8² × 40 for 40 40 totals method 50 3. − 49 5. (= 1.054) M1 For standardising with their SD Accept 8.4 ± 40 Accept totals method. No mixed methods 1 – Φ(‘1.054’) M1 For use of tables and finding area consistent with their working = 0.146 (3 sf) A1 4 (ii) (a) Looking for decrease B1 1 (b) H0: Pop mean time spent (or µ) = 49.5 H1: Pop mean time spent (or µ) < 49.5 B1 Not just “mean time spent” 1920 − 495. 40 8.4 (= –1.976) M1 For standardising. Allow ÷ 8.4 40 40 Accept totals method; CV method. No mixed methods ‘1.976’ > 1.555 (or ‘–1.976’ < –1.555) M1 For valid comparison (area comparison 0.024 < 0.06) There is evidence that mean time has A1 4 CWO. No contradictions in conclusions decreased. (c) Population normally distr so No B1 1 Both needed Total: 10
This question in 9709/72 Oct/Nov 2014
Q30 · The daily times, in minutes, that Yu Ming takes showering, getting dressed and having… 9709/71 May/June 2015
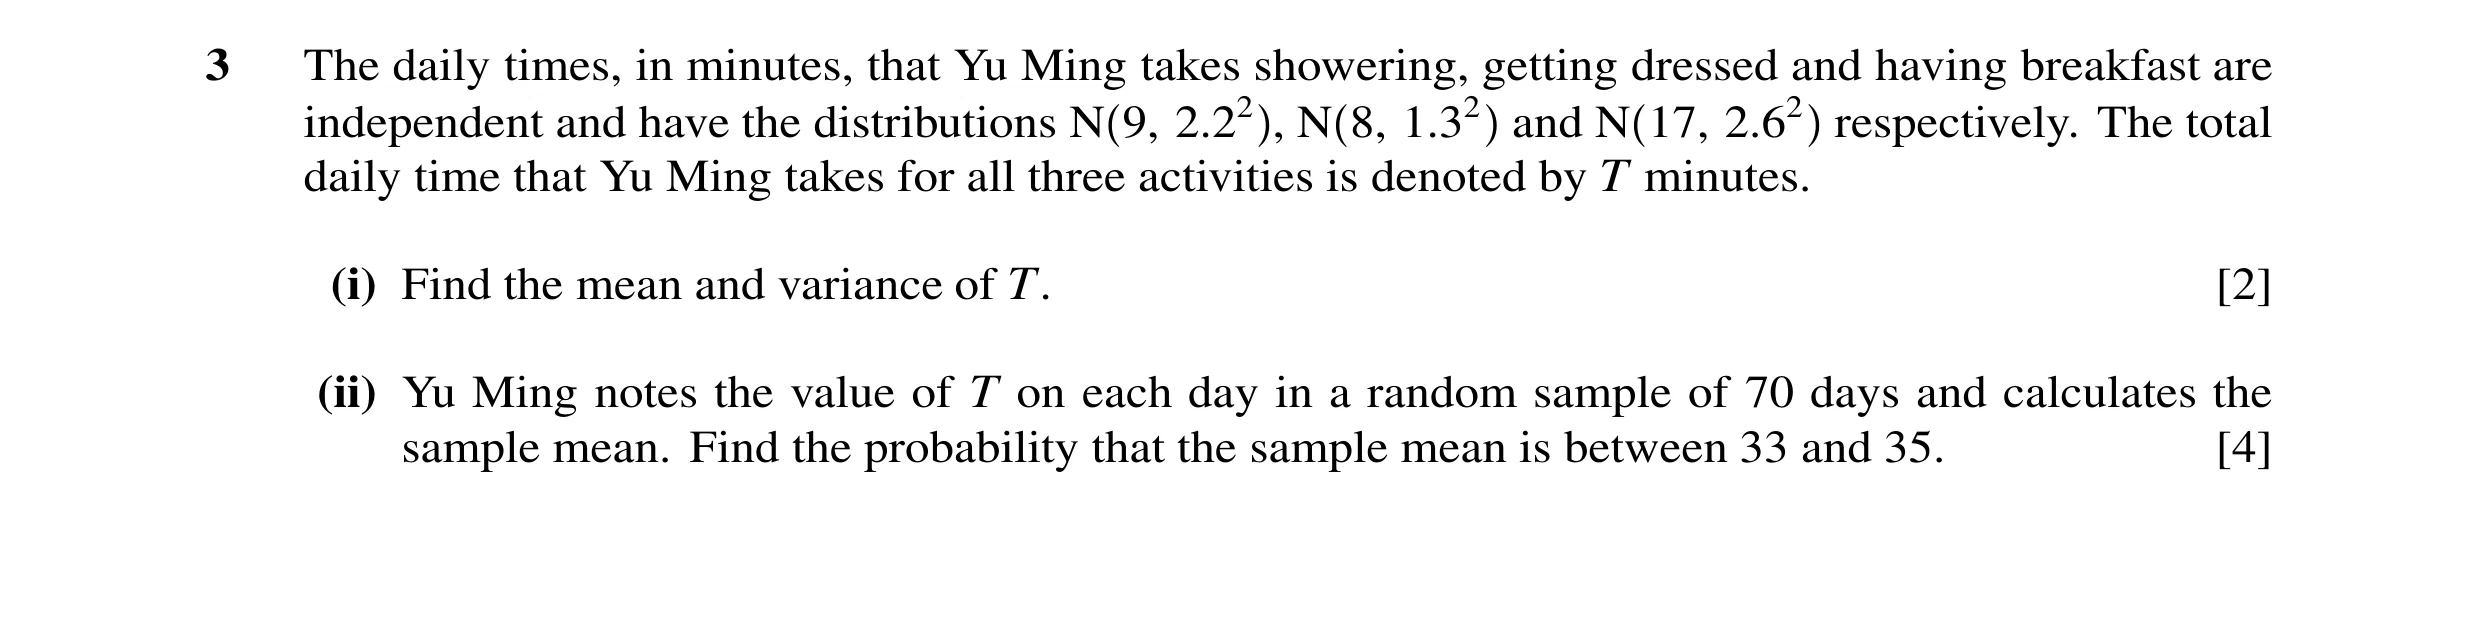
3 The daily times, in minutes, that Yu Ming takes showering, getting dressed and having breakfast are independent and have the distributions N 9, 2.22 , N 8, 1.32 and N 17, 2.62 respectively. The total daily time that Yu Ming takes for all three activities is denoted by T minutes. (i) Find the mean and variance of T. [2] (ii) Yu Ming notes the value of T on each day in a random sample of 70 days and calculates the sample mean. Find the probability that the sample mean is between 33 and 35. [4]
6 marks
Mark scheme: 3 A1 [5] must see this numerical expression, or equiv 2 25.1 .2 83 SR Equating ∫x f(x) to 0.943 scores M1 = = or or or 0.9428 3 3 3 Solving to find a = 1.41 scores A1 (= 0.943 AG) [Total 5] 2 (i) H0: p = 0.2 or µ = 10 H1: p > 0.2 or µ > 10 B1 [1] (ii) N(10, 8) seen or implied B1 2.0 × 8.0 or N ,2.0 125 50 125 − 10 50 − 02 or M1 8 2.050× 8.0 For standardising allow with no or wrong cc A1 = 0.884 M1f comp 1.282 Allow area comparison with 0.188 or comp 1.645 if H1 p ≠ 0.2 Claim not justified A1f [5] Allow accept H0 provided correctly defined. or No evidence to support claim Follow through their test statistic ;dep 1–tail test No Contradictions SR; Use of B(50,0.2) scores B1 provided at least two probabilities calculated. M1 For finding P(X [ 13) allow one end error. A1 for 0.186 [Total: 6] 3 (i) 34 B1 2.22 + 1.32 + 2.62 (=13.29) B1 [2] Accept 13.3 or 3.652 Allow at early stage (ii) 33− '34' (= –2.295) '13.29 ' 70 M1 correct standardisation method for either 35− '34' (= 2.295) '13.29 ' M1 For attempt to use tables to find the 70 probability between two z values ,may be Φ(‘2.295’) – Φ(‘–2.295’) implied by next line M1 For a correct method to find the area between their two z values = Φ(‘2.295’) – (1 – Φ(‘2.295’)) oe A1 [4] = 0.978 (3 sf) [Total: 6]
This question in 9709/71 May/June 2015
Q31 · The volumes, v millilitres, of juice in a random sample of 50 bottles of Cooljoos are… 9709/72 May/June 2015
5 The volumes, v millilitres, of juice in a random sample of 50 bottles of Cooljoos are measured and summarised as follows. n = 50 Σv = 14 800 Σv2 = 4 390 000 (i) Find unbiased estimates of the population mean and variance. [3] (ii) An !% confidence interval for the population mean, based on this sample, is found to have a width of 5.45 millilitres. Find !. [4] Four random samples of size 10 are taken and a 96% confidence interval for the population mean is found from each sample. (iii) Find the probability that these 4 confidence intervals all include the true value of the population mean. [2]
9 marks
Mark scheme: 5 (i) 14800/50 or 296 B1 50 4390000 2 M1 Oe − '296' (= 187.755) 49 50 A1 3 = 188 (3 sf) (ii) '187.755' M1 '187.755' 2 × z × = 5.45 oe If ‘2 ×’ omitted: z × = 5.45 M1 50 A1 50 z = 1.406 or 1.405 z = 2.812 or 2.810 A0 Φ(‘1.406’) (= 0.92 or 0.9199) Φ(‘2.812’) (= 0.9975) M1 α = 99.5 or 99 or 100 M1 A0 α = 84 (2 sf) allow 83.98 A1 4 For complete method to find α SR use of biased var(184) scores M1A1(1.4205) Α=84.5 M1A1 (iii) 0.964 M1 = 0.849 (3 sf) A1 2 Total 9 15 ∫ 2
This question in 9709/72 May/June 2015
Q32 · A die is biased so that the probability that it shows a six on any throw is p 9709/73 May/June 2015
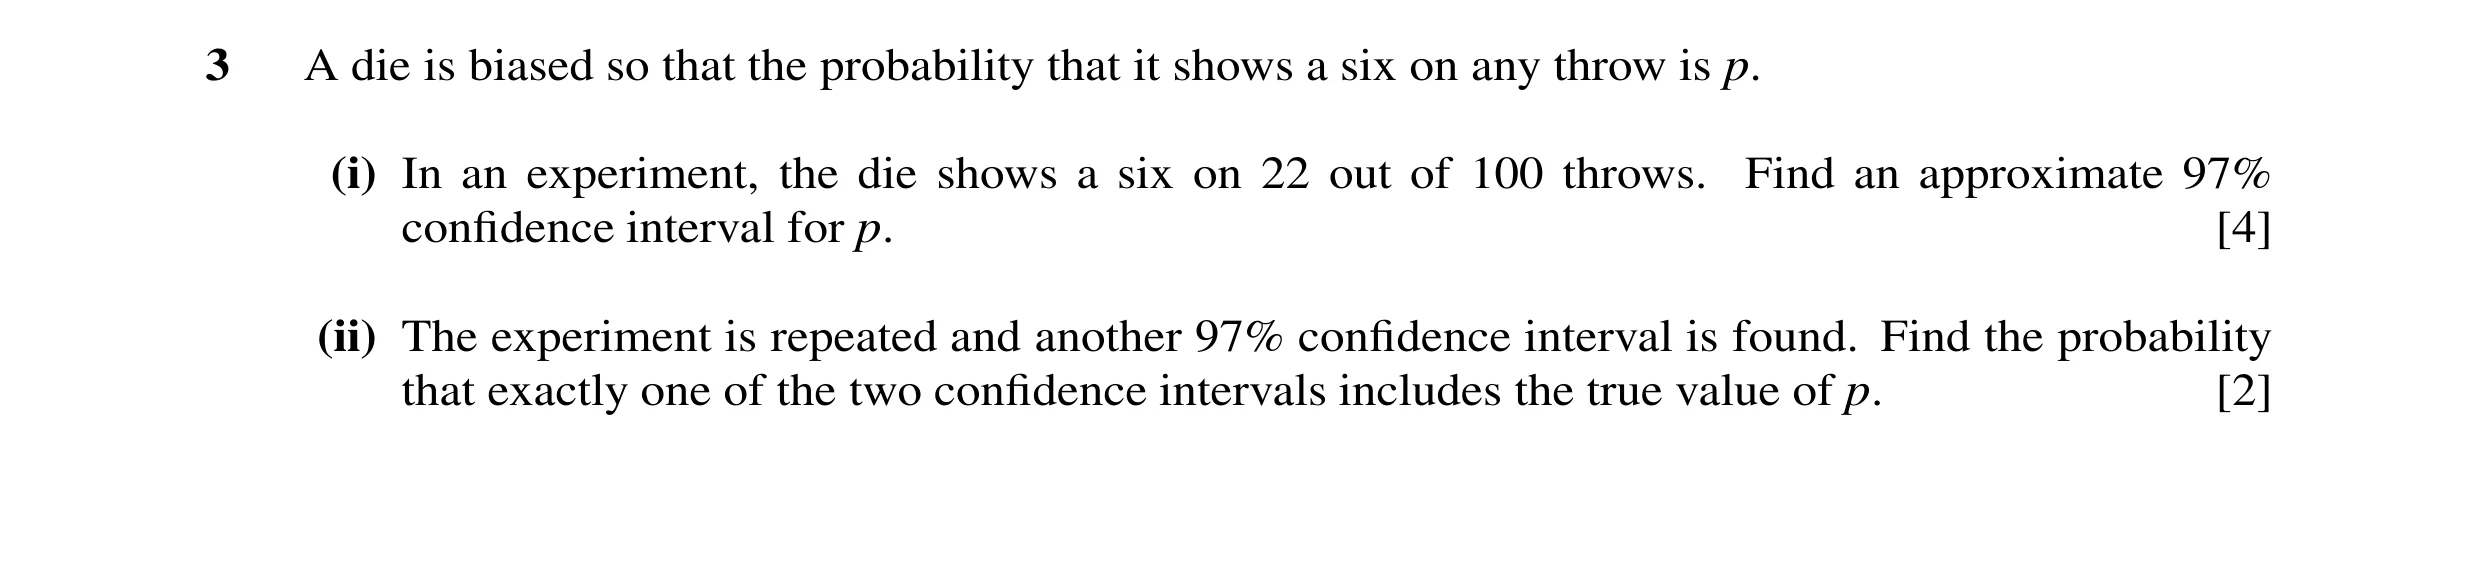
3 A die is biased so that the probability that it shows a six on any throw is p. (i) In an experiment, the die shows a six on 22 out of 100 throws. Find an approximate 97% confidence interval for p. [4] (ii) The experiment is repeated and another 97% confidence interval is found. Find the probability that exactly one of the two confidence intervals includes the true value of p. [2]
6 marks
Mark scheme: .0 22 × (1 .022 ) 3 (i) Var(ps) = M1 pq/100 100 = 429 or .0 001716 250 000 429 .0 22 ± z ' ' M1 Expression of correct form with their variance 250 000 Any z (must be a z value) accept one side only z = 2.17 or 2.168/9 or 2.171 B1 Seen 0.13(0) to 0.31(0) (2 sf) A1 [4] Must be an interval (ii) ‘2’ × (1 – 0.97) × 0.97 M1 = 0.0582 A1 [2] Total 6 1508 ( )
This question in 9709/73 May/June 2015
Q33 · The mean and standard deviation of the time spent by people in a certain library are 29… 9709/71 Oct/Nov 2015
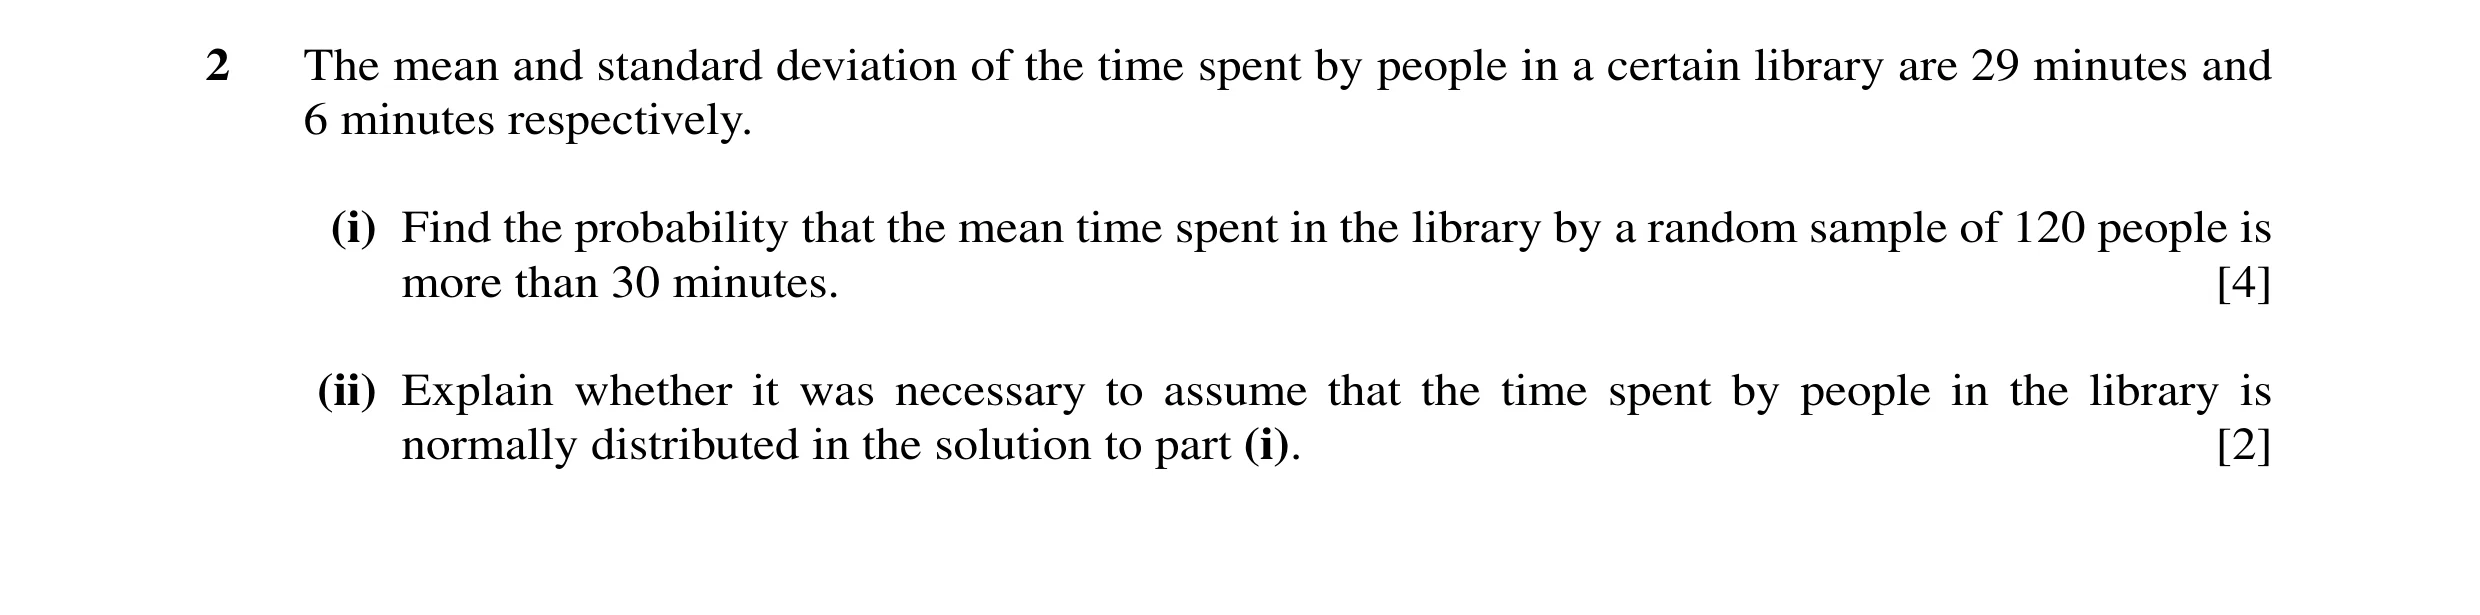
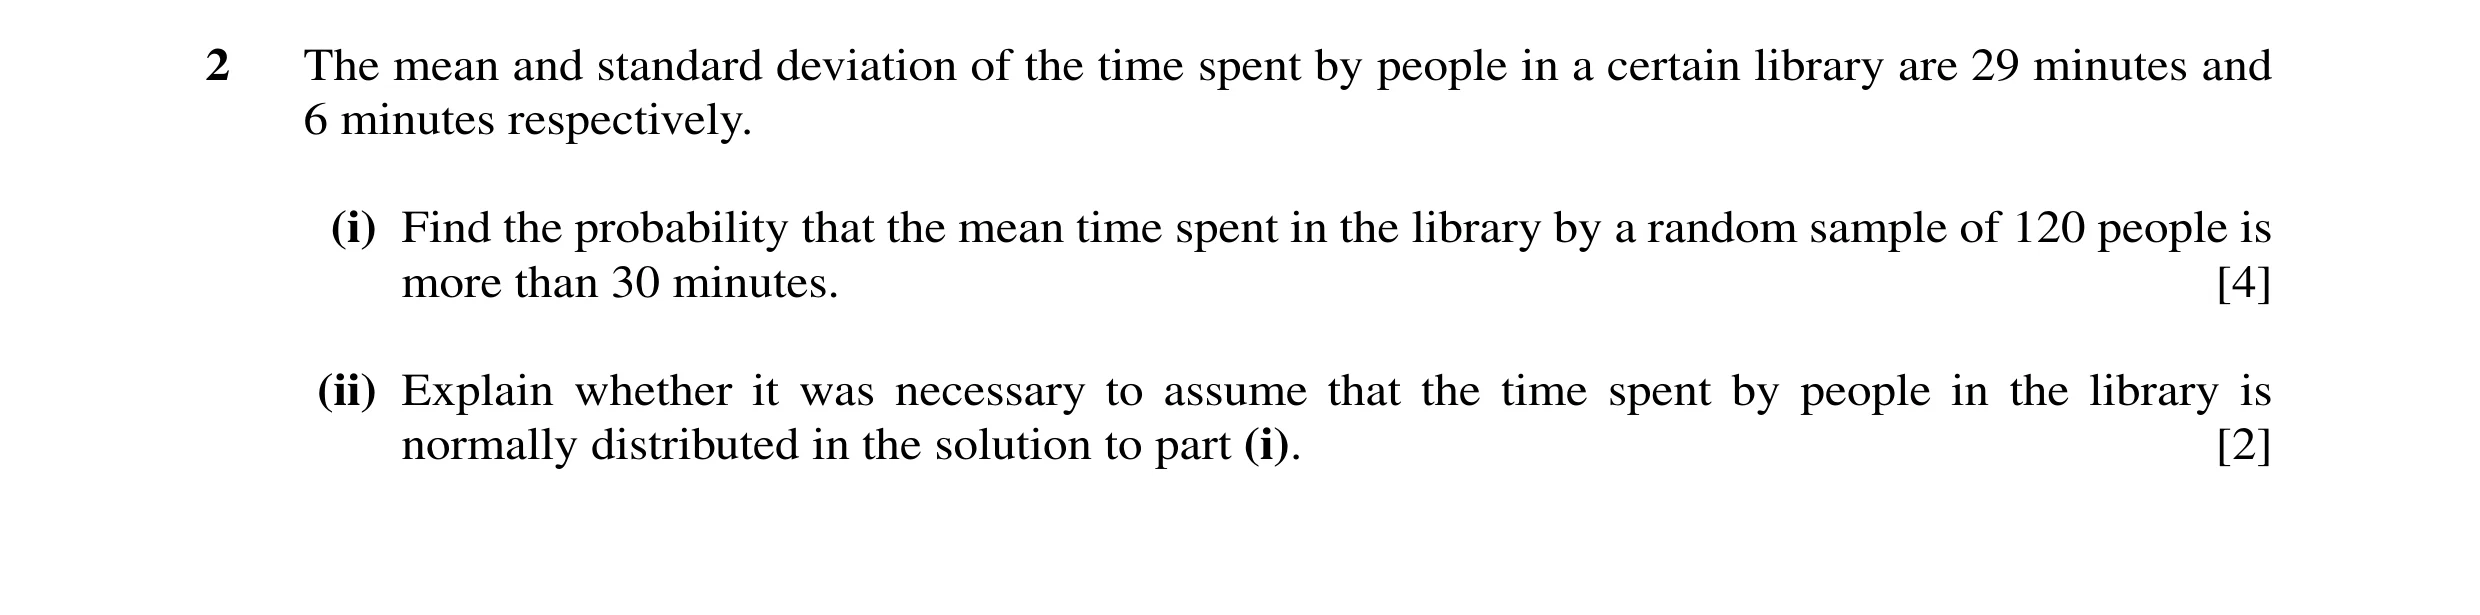
2 The mean and standard deviation of the time spent by people in a certain library are 29 minutes and 6 minutes respectively. (i) Find the probability that the mean time spent in the library by a random sample of 120 people is more than 30 minutes. [4] (ii) Explain whether it was necessary to assume that the time spent by people in the library is normally distributed in the solution to part (i). [2]
6 marks
Mark scheme: 62 (i) B1 Or 6²/120 oe seen oe seen 120 30 − 29 M1 ± (= 1.826) 6 Allow without √120. No sd/var mix 120 M1 P(z > ‘1.826’) = 1 – Φ(‘1.826’) Correct tail consistent with their A1 [4] working = 0.034 (2 sf) 0.0339 (ii) No B1 1st B1 for either comment n is large (⩾30) Sample mean is (appr) normally distrib 2nd B1 for’No’with 2nd comment or The CLT applies oe B1 [2] (No mark for ‘No’ alone) Total: 6 3420
This question in 9709/71 Oct/Nov 2015
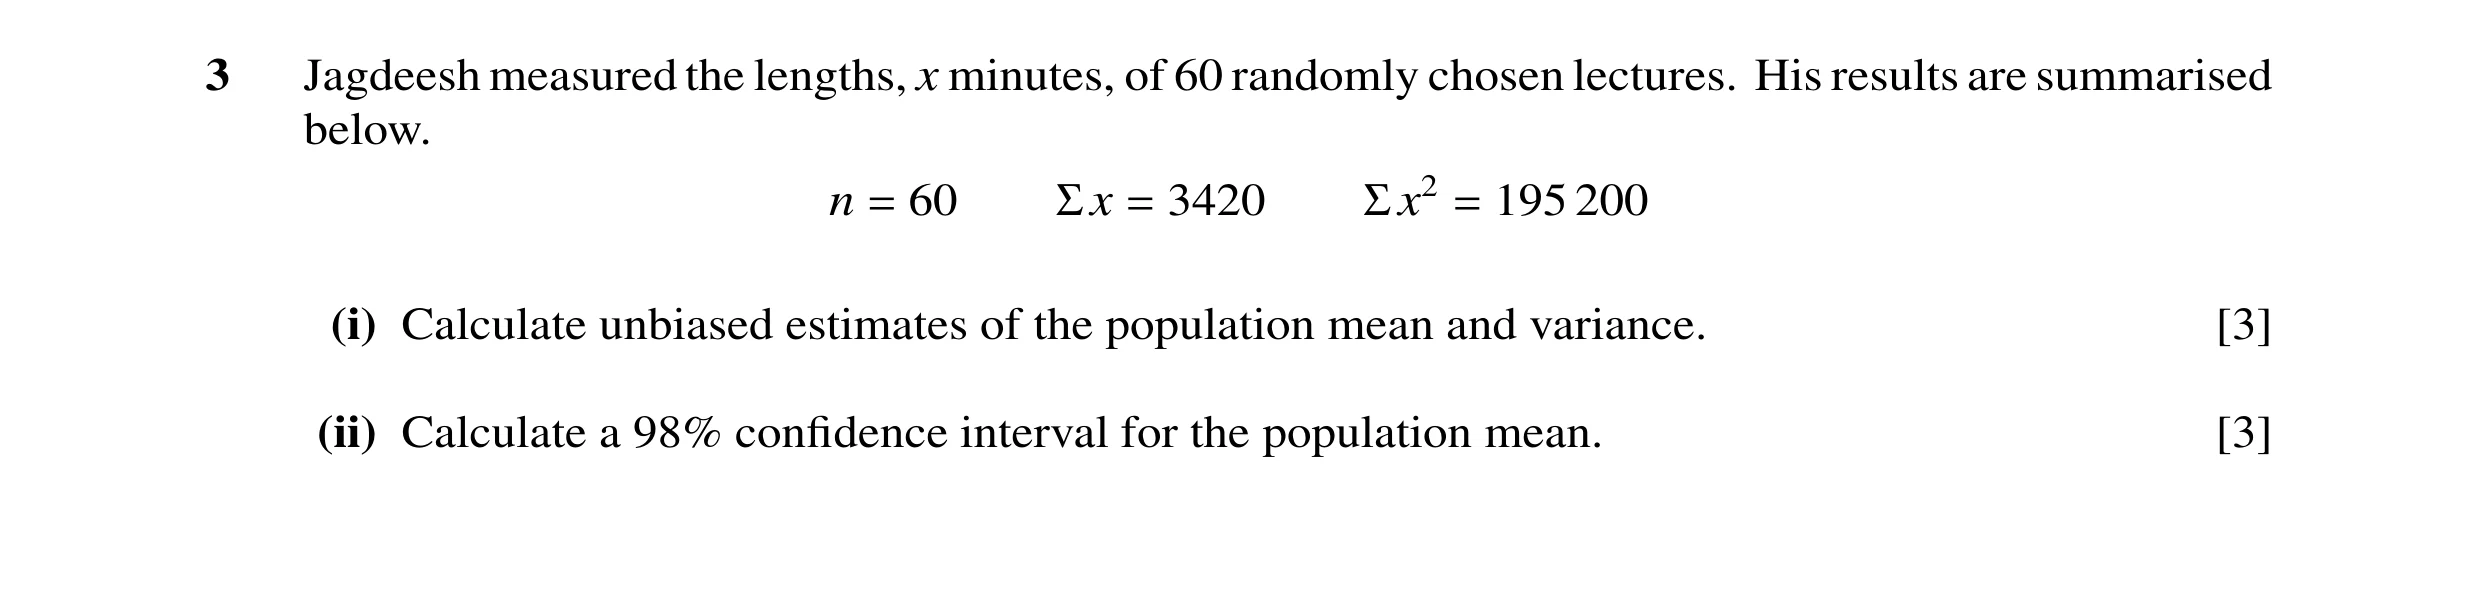
Q34 · Jagdeesh measured the lengths, x minutes, of 60 randomly chosen lectures 9709/71 Oct/Nov 2015
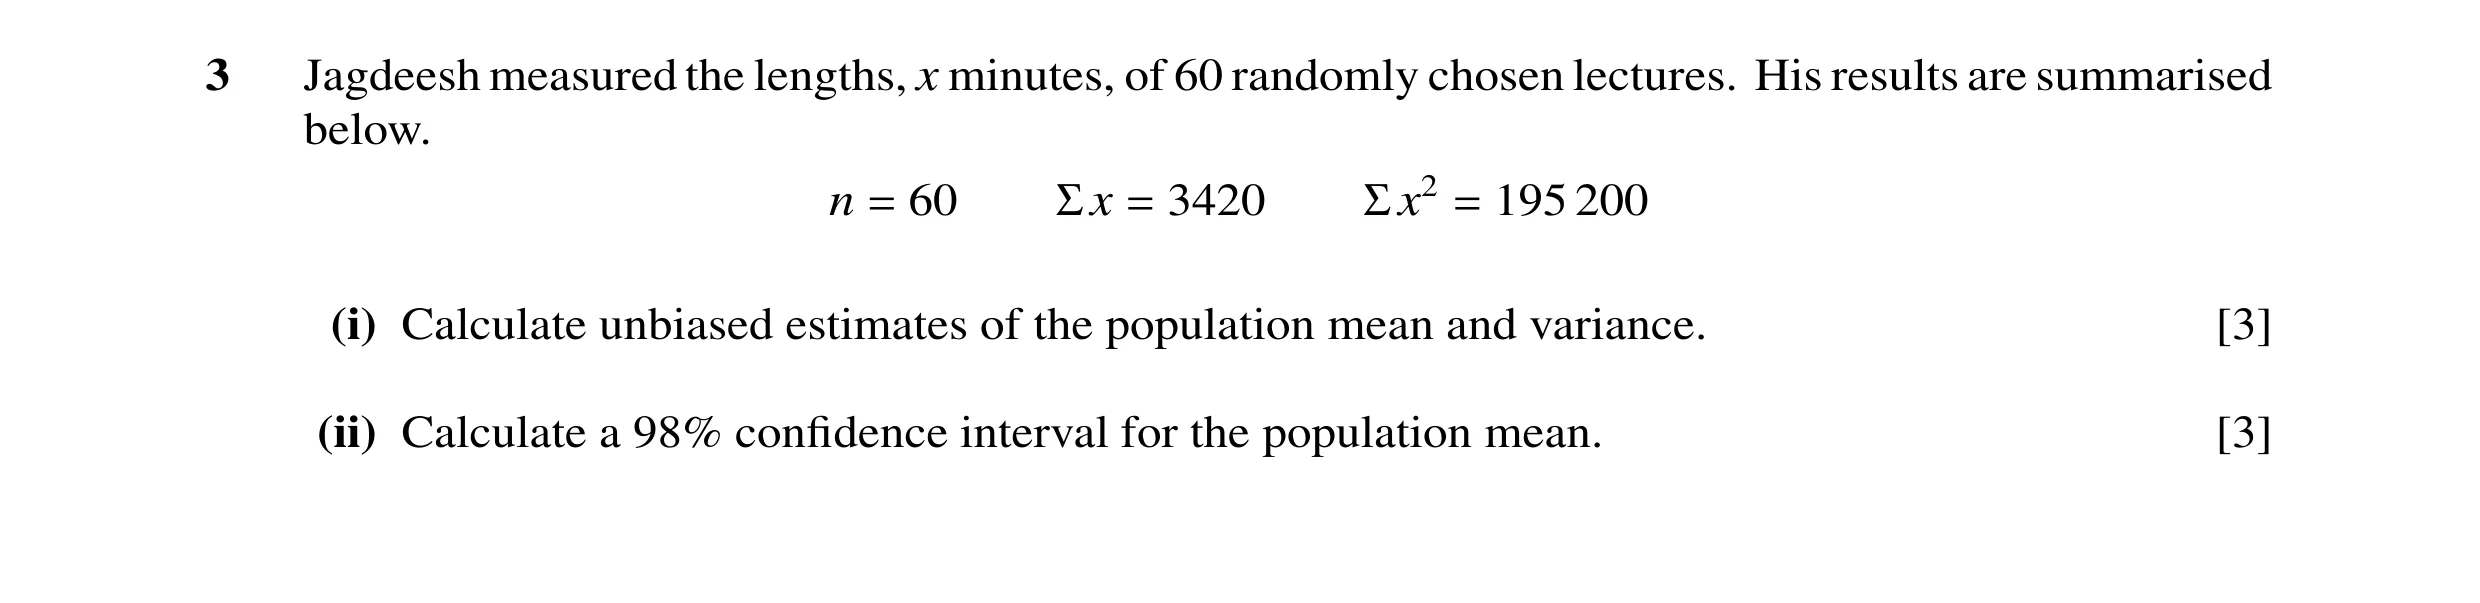
3 Jagdeesh measured the lengths, x minutes, of 60 randomly chosen lectures. His results are summarised below. n = 60 Σx = 3420 Σx2 = 195 200 (i) Calculate unbiased estimates of the population mean and variance. [3] (ii) Calculate a 98% confidence interval for the population mean. [3]
6 marks
Mark scheme: 34203 (i) (= 57 ) B1 60 60 195200 − '57 2' (= 4.40678) M1 Oe 59 60 = 4.41 (3 sf) A1 [3] As final answer (ii) .4'40678' M1 '57 '± z 60 z = 2.326 B1 2.326 – 2.329 (accept 2.33 if no better seen) [56.4 to 57.6] (3 sf) A1 [3] NB: use of biased variance in (ii) can score in full Total: 6 2 ∫
This question in 9709/71 Oct/Nov 2015
Q35 · The weights, in kilograms, of men and women have the distributions N 78, 72 and N 66, 52… 9709/71 Oct/Nov 2015
6 The weights, in kilograms, of men and women have the distributions N 78, 72 and N 66, 52 respectively. (i) The maximum load that a certain cable car can carry safely is 1200 kg. If 9 randomly chosen men and 7 randomly chosen women enter the cable car, find the probability that the cable car can operate safely. [5] (ii) Find the probability that a randomly chosen woman weighs more than a randomly chosen man. [4]
9 marks
Mark scheme: 6 (i) E(T) = 9 × 78 + 7 × 66 (= 1164) B1 Or 9 × 78 + 7 × 66 – 1200 B1 Var(T) = 9 × 7² + 7 × 5² (= 616) M1 ± Allow without √ 1200− '1164 ' (= 1.450) '616 ' P(z < 1.450) = Φ (1.450) M1 = 0.927 (3 sf) A1 [5] Correct tail consistent with their mean (ii) E(D) = 66 – 78 (= –12) B1 Both needed Var(D) = 7² + 5² (= 74) 0 − ('−12' ) M1 ± Allow without √ (= 1.395) 74 P(D > 0) = 1 – Φ (‘1.395’) M1 Correct tail consistent with their mean A1 [4] Similar scheme for P(M – W) < 0 0.0815 (3 sf) Total: 9
This question in 9709/71 Oct/Nov 2015
Q36 · At a certain hospital it was found that the probability that a patient did not arrive for… 9709/71 Oct/Nov 2015
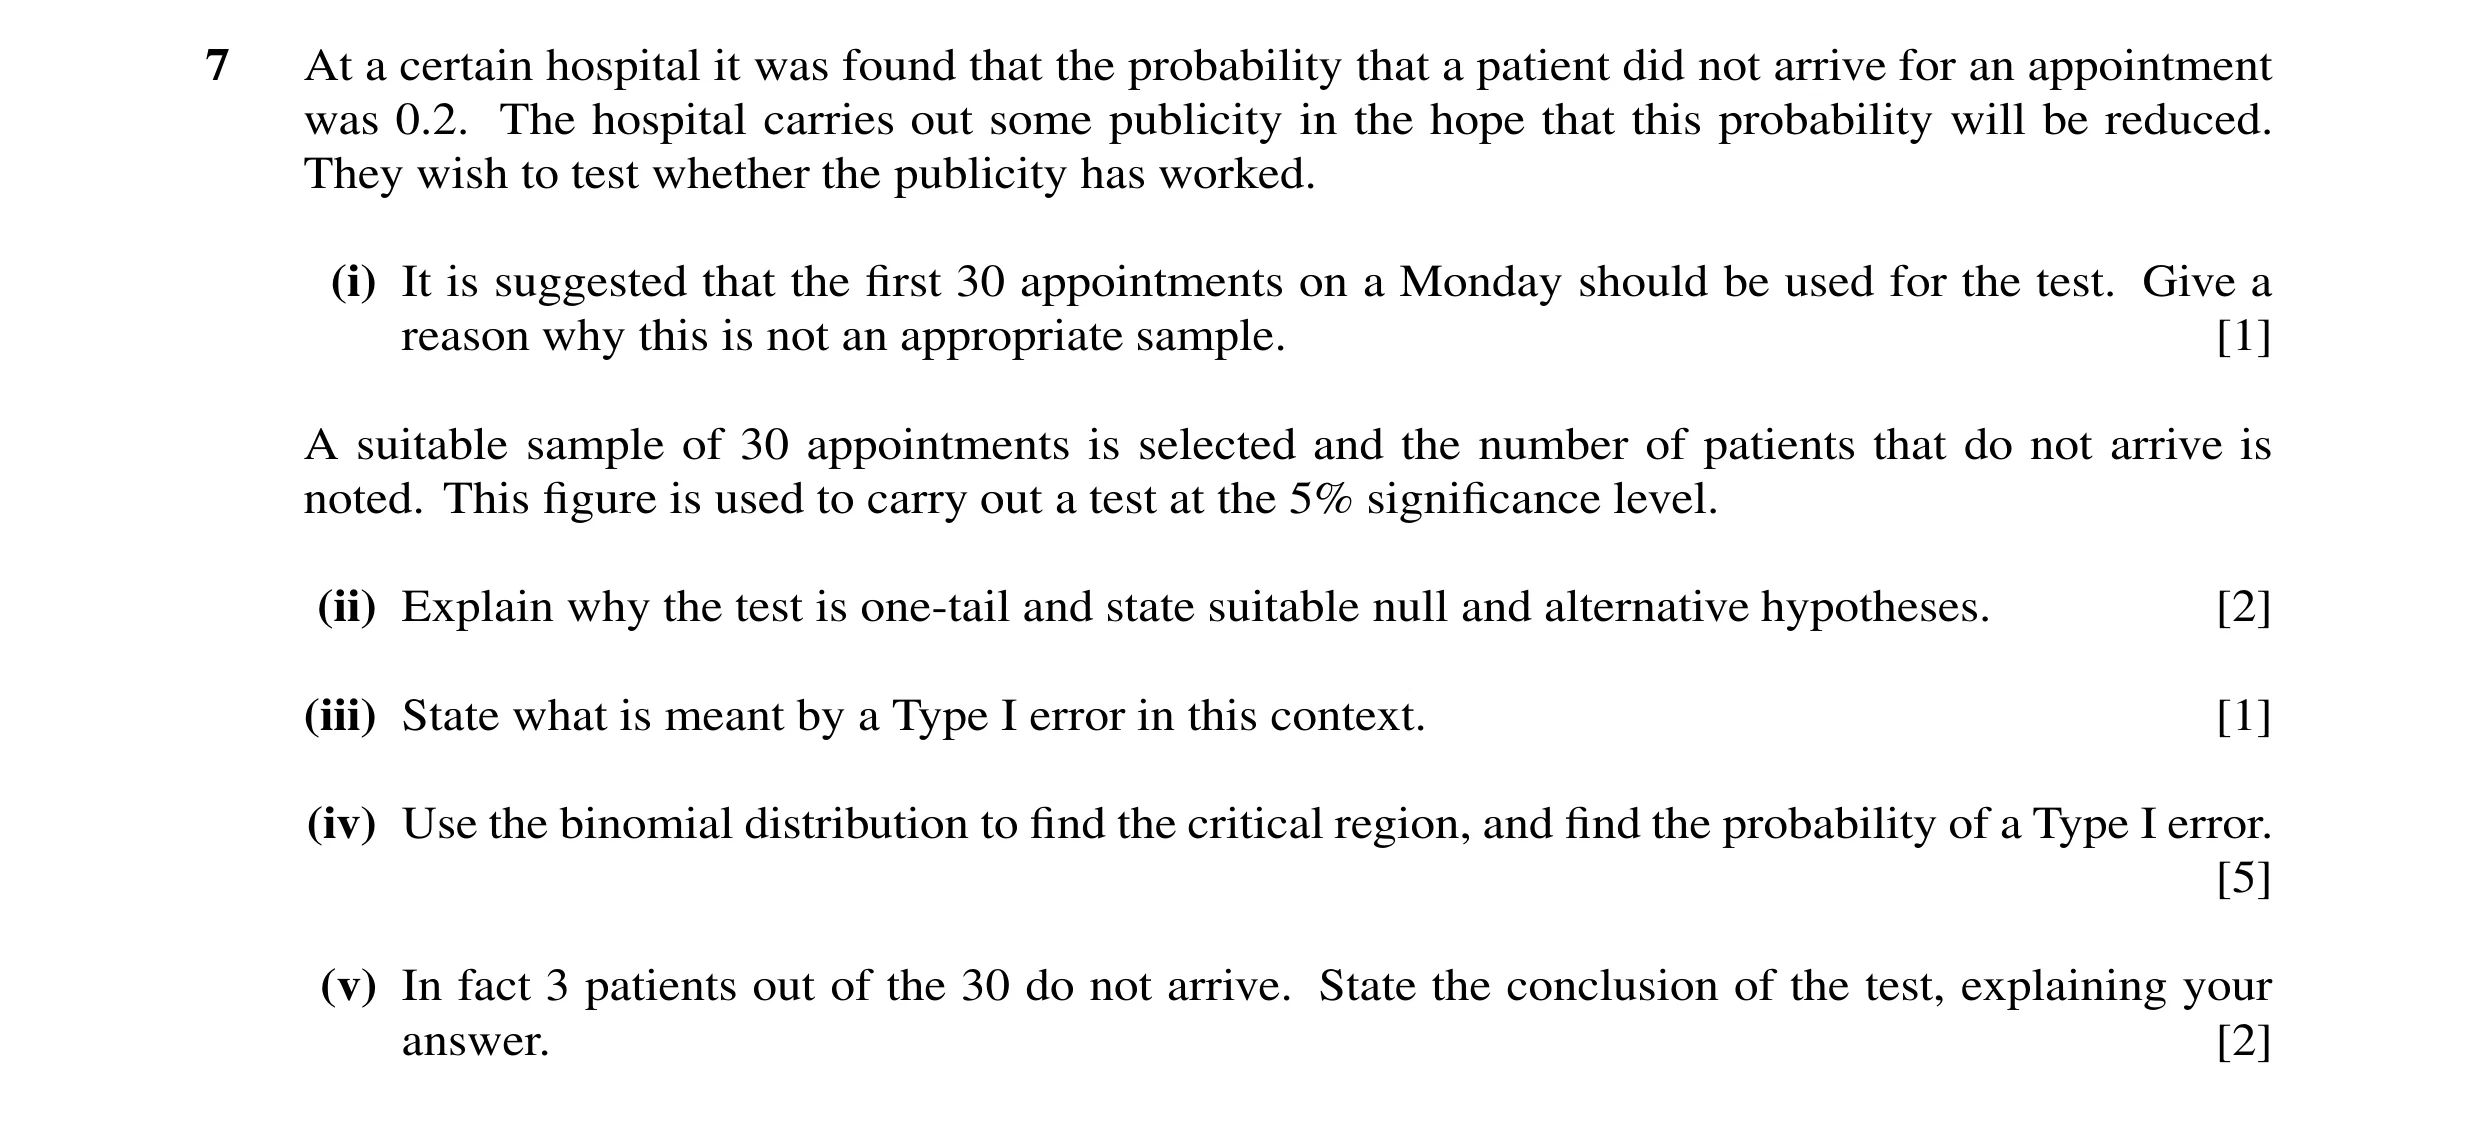
7 At a certain hospital it was found that the probability that a patient did not arrive for an appointment was 0.2. The hospital carries out some publicity in the hope that this probability will be reduced. They wish to test whether the publicity has worked. (i) It is suggested that the first 30 appointments on a Monday should be used for the test. Give a reason why this is not an appropriate sample. [1] A suitable sample of 30 appointments is selected and the number of patients that do not arrive is noted. This figure is used to carry out a test at the 5% significance level. (ii) Explain why the test is one-tail and state suitable null and alternative hypotheses. [2] (iii) State what is meant by a Type I error in this context. [1] (iv) Use the binomial distribution to find the critical region, and find the probability of a Type I error. [5] (v) In fact 3 patients out of the 30 do not arrive. State the conclusion of the test, explaining your answer. [2]
11 marks
Mark scheme: 7 (i) Prob could be different later in day B1 [1] or any explanation why not random or on a different day oe or “Not random” or “Not representative” (ii) Looking for decrease (or improvement) B1 oe H0: P(not arrive) = 0.2 Allow “p = 0.2” H1: P(not arrive) < 0.2 B1 [2] (iii) Concluding that prob has decreased (or B1 [1] In context publicity has worked) when it hasn’t oe (iv) P(X = 0) and P(X = 1) attempted M1 B(30, 0.2) Not nec’y added May be implied by calc P(X ⩽ 2) or P(X ⩽ 3) P(X ⩽ 2) = 0.830 + 30 × 0.829 × 0.2 + M1 30C2 × 0.828 × 0.22 (= 0.0442) Attempt P(X ⩽ 2) B1 P(X ⩽ 3) = 0.830 + 30 × 0.829 × 0.2 + Or ‘0.0442’ + 30C3 × 0.827 × 0.23 = 0.123 30C2×0.828×0.22 + 30C3×0.827×0.23 = 0.123 cr is X ⩽ 2 A1 P(Type I) = 0.0442 (3 sf) A1 [5] (v) 3 is outside cr M1 Comparison of 3 with their cr or P(X ⩽ 3) = 0.123 which is > 0.05 No evidence that p has decreased (or that A1 [2] Correct conclusion. No contradictions publicity has worked) Total: 11 Total for paper: 50
This question in 9709/71 Oct/Nov 2015
Q37 · The mean and standard deviation of the time spent by people in a certain library are 29… 9709/72 Oct/Nov 2015
2 The mean and standard deviation of the time spent by people in a certain library are 29 minutes and 6 minutes respectively. (i) Find the probability that the mean time spent in the library by a random sample of 120 people is more than 30 minutes. [4] (ii) Explain whether it was necessary to assume that the time spent by people in the library is normally distributed in the solution to part (i). [2]
6 marks
Mark scheme: 62 (i) B1 Or 6²/120 oe seen oe seen 120 30 − 29 M1 ± (= 1.826) 6 Allow without √120. No sd/var mix 120 M1 P(z > ‘1.826’) = 1 – Φ(‘1.826’) Correct tail consistent with their A1 [4] working = 0.034 (2 sf) 0.0339 (ii) No B1 1st B1 for either comment n is large (⩾30) Sample mean is (appr) normally distrib 2nd B1 for’No’with 2nd comment or The CLT applies oe B1 [2] (No mark for ‘No’ alone) Total: 6 3420
This question in 9709/72 Oct/Nov 2015
Q38 · Jagdeesh measured the lengths, x minutes, of 60 randomly chosen lectures 9709/72 Oct/Nov 2015
3 Jagdeesh measured the lengths, x minutes, of 60 randomly chosen lectures. His results are summarised below. n = 60 Σx = 3420 Σx2 = 195 200 (i) Calculate unbiased estimates of the population mean and variance. [3] (ii) Calculate a 98% confidence interval for the population mean. [3]
6 marks
Mark scheme: 34203 (i) (= 57 ) B1 60 60 195200 − '57 2' (= 4.40678) M1 Oe 59 60 = 4.41 (3 sf) A1 [3] As final answer (ii) .4'40678' M1 '57 '± z 60 z = 2.326 B1 2.326 – 2.329 (accept 2.33 if no better seen) [56.4 to 57.6] (3 sf) A1 [3] NB: use of biased variance in (ii) can score in full Total: 6 2 ∫
This question in 9709/72 Oct/Nov 2015
Q39 · At a certain hospital it was found that the probability that a patient did not arrive for… 9709/72 Oct/Nov 2015
7 At a certain hospital it was found that the probability that a patient did not arrive for an appointment was 0.2. The hospital carries out some publicity in the hope that this probability will be reduced. They wish to test whether the publicity has worked. (i) It is suggested that the first 30 appointments on a Monday should be used for the test. Give a reason why this is not an appropriate sample. [1] A suitable sample of 30 appointments is selected and the number of patients that do not arrive is noted. This figure is used to carry out a test at the 5% significance level. (ii) Explain why the test is one-tail and state suitable null and alternative hypotheses. [2] (iii) State what is meant by a Type I error in this context. [1] (iv) Use the binomial distribution to find the critical region, and find the probability of a Type I error. [5] (v) In fact 3 patients out of the 30 do not arrive. State the conclusion of the test, explaining your answer. [2]
11 marks
Mark scheme: 7 (i) Prob could be different later in day B1 [1] or any explanation why not random or on a different day oe or “Not random” or “Not representative” (ii) Looking for decrease (or improvement) B1 oe H0: P(not arrive) = 0.2 Allow “p = 0.2” H1: P(not arrive) < 0.2 B1 [2] (iii) Concluding that prob has decreased (or B1 [1] In context publicity has worked) when it hasn’t oe (iv) P(X = 0) and P(X = 1) attempted M1 B(30, 0.2) Not nec’y added May be implied by calc P(X ⩽ 2) or P(X ⩽ 3) P(X ⩽ 2) = 0.830 + 30 × 0.829 × 0.2 + M1 30C2 × 0.828 × 0.22 (= 0.0442) Attempt P(X ⩽ 2) B1 P(X ⩽ 3) = 0.830 + 30 × 0.829 × 0.2 + Or ‘0.0442’ + 30C3 × 0.827 × 0.23 = 0.123 30C2×0.828×0.22 + 30C3×0.827×0.23 = 0.123 cr is X ⩽ 2 A1 P(Type I) = 0.0442 (3 sf) A1 [5] (v) 3 is outside cr M1 Comparison of 3 with their cr or P(X ⩽ 3) = 0.123 which is > 0.05 No evidence that p has decreased (or that A1 [2] Correct conclusion. No contradictions publicity has worked) Total: 11 Total for paper: 50
This question in 9709/72 Oct/Nov 2015
Q40 · A fair six-sided die is thrown 20 times and the number of sixes, X, is recorded 9709/72 Feb/March 2016
1 A fair six-sided die is thrown 20 times and the number of sixes, X, is recorded. Another fair six-sided die is thrown 20 times and the number of odd-numbered scores, Y, is recorded. Find the mean and standard deviation of X + Y. [5]
5 marks
Mark scheme: 1 E(X) = 103 oe Var(X) = 259 oe B1 For E(X) and Var(X) E(Y) = 10 Var(Y) = 5 B1 For E(Y) and Var(Y) OR For E(X) and E(Y) For Var(X) and Var(Y) E(X + Y) = 403 oe or 13.3 (3 sf) B1 Var (X + Y) = " 259 " + "5" M1 For adding 2 (appropriate) variances sd = 370 oe or 2.79 (3 sf) A1 [5] or sd = or 2 × 53
This question in 9709/72 Feb/March 2016
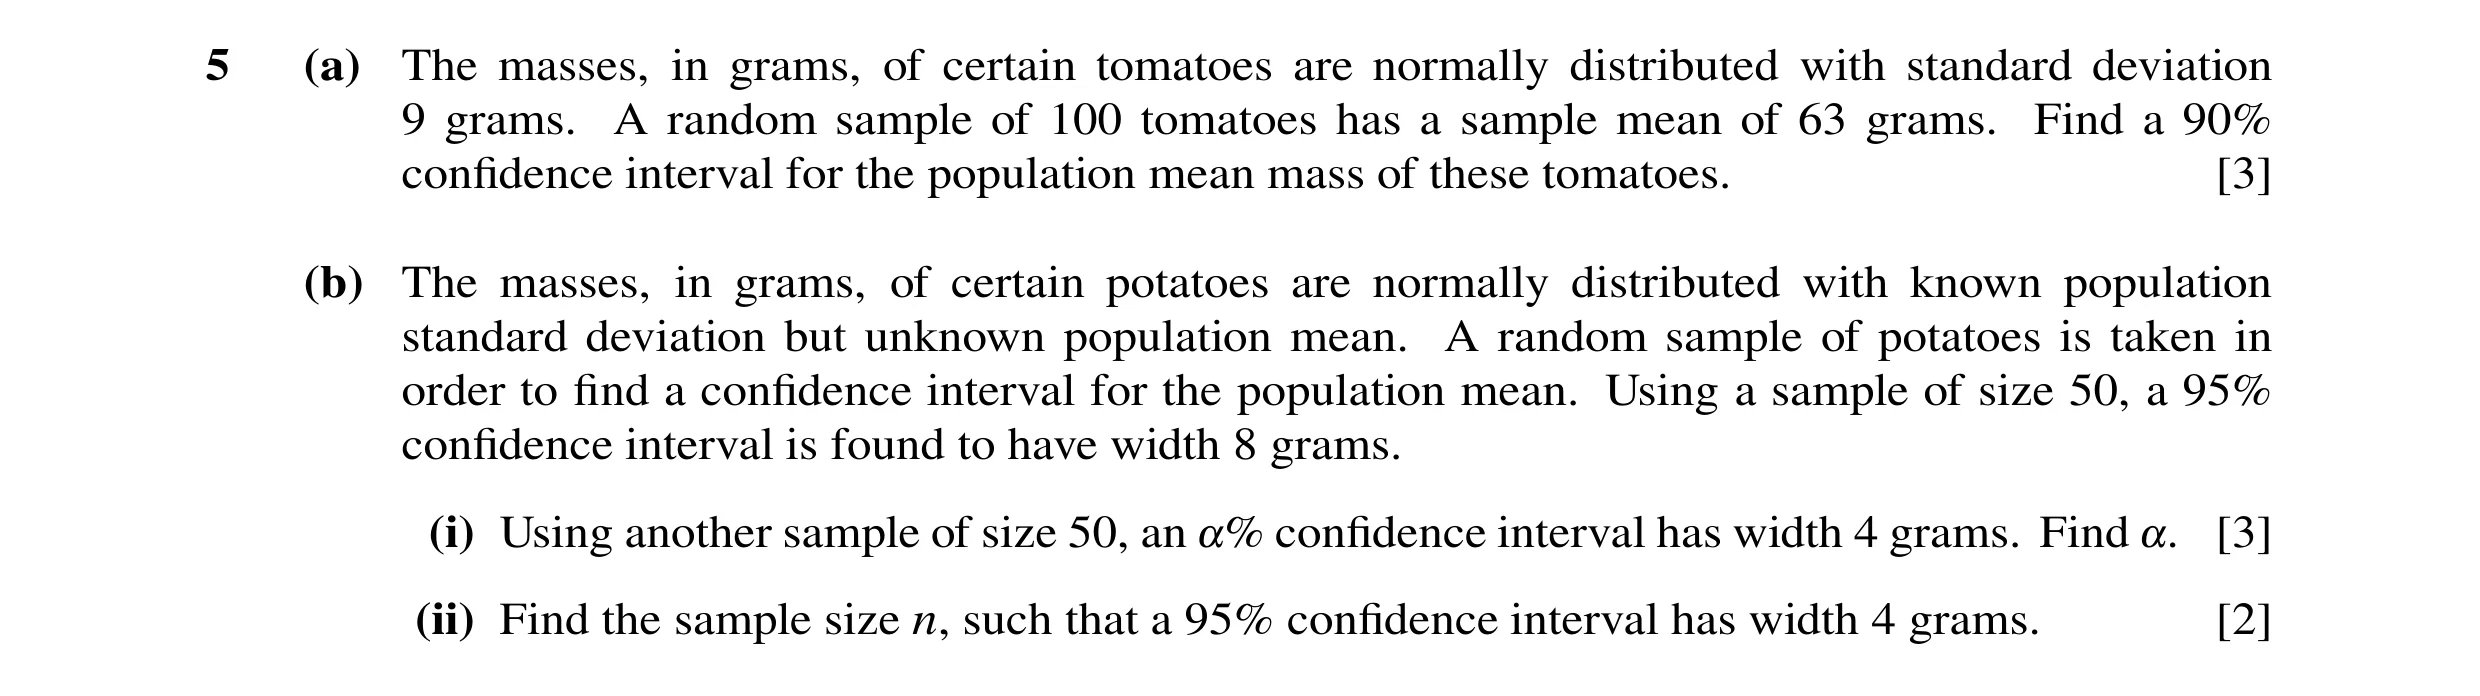
Q41 · The masses, in grams, of certain tomatoes are normally distributed with standard… 9709/72 Oct/Nov 2016
5 (a) The masses, in grams, of certain tomatoes are normally distributed with standard deviation 9 grams. A random sample of 100 tomatoes has a sample mean of 63 grams. Find a 90% confidence interval for the population mean mass of these tomatoes. [3] (b) The masses, in grams, of certain potatoes are normally distributed with known population standard deviation but unknown population mean. A random sample of potatoes is taken in order to find a confidence interval for the population mean. Using a sample of size 50, a 95% confidence interval is found to have width 8 grams. (i) Using another sample of size 50, an !% confidence interval has width 4 grams. Find !. [3] (ii) Find the sample size n, such that a 95% confidence interval has width 4 grams. [2]
8 marks
Mark scheme: 5 (a) 63 ± z × 9 M1 B1 Expression of correct form, any z 100 z = 1.645 B1 Seen 61.5 to 64.5 (3 sf) A1 [3] Must be an interval (b) (i) z = 1.962 (= 0.98) M1 Allow any2 z Φ(“0.98”) (= 0.8365) “0.8365” – (1 – “0.8365”) M1 (= 0.673) α = 67.3 (3 sf) A1 Allow 67 from correct working [3] (ii) 4=(2x’z’x’σ’)/√n M1 Attempt to solve equ of correct form n = 200 A1 [2] SR B1 for n = 100
This question in 9709/72 Oct/Nov 2016
Q42 · A men’s triathlon consists of three parts: swimming, cycling and running 9709/73 Oct/Nov 2016
3 A men’s triathlon consists of three parts: swimming, cycling and running. Competitors’ times, in minutes, for the three parts can be modelled by three independent normal variables with means 34.0, 87.1 and 56.9, and standard deviations 3.2, 4.1 and 3.8, respectively. For each competitor, the total of his three times is called the race time. Find the probability that the mean race time of a random sample of 15 competitors is less than 175 minutes. [5]
5 marks
Mark scheme: 3 N(178, …) B1 stated or implied Var = 3.22 + 4.12 + 3.82 or 41.49 B1 or sd = 6.44 stated or implied 175 − '178' M1 need √15 but allow var / sd mix for (= ‘–1.804’) '41.49' ÷ 15 “41.49” allow cc for method marks M1 independent M1 for area / prob Φ(‘–1.804’) = 1 – Φ (‘1.804’) A1 consistent with working = 0.0356 (3 sf) [5]
This question in 9709/73 Oct/Nov 2016
Q43 · The masses, in kilograms, of cartons of sugar and cartons of flour have the distributions… 9709/72 Feb/March 2017
6 The masses, in kilograms, of cartons of sugar and cartons of flour have the distributions N 78.8, 12.62 and N 62.0, 10.02 respectively. (i) The standard load for a certain crane is 8 cartons of sugar and 3 cartons of flour. The maximum load that can be carried safely by the crane is 900 kg. Stating a necessary assumption, find the percentage of standard loads that will exceed the maximum safe load. [5] … … … … … … … … … … … … … … … … … … … … … … … (ii) Find the probability that a randomly chosen carton of sugar has a smaller mass than a randomly chosen carton of flour. [5] … … … … … … … … … … … … … … … … … … … … … … … … …
10 marks
Mark scheme: 6(i) Assume cartons are random sample(s) B1 or masses of cartons are independent of each other oe E(T) = 816.4 B1 Both Var(T) = 1570.08 z = 900 − "816.4" (= 2.110) M1 "1570.08" 1 – Φ(“2.110”) M1 = 0.0174 = 1.74% (3 sfs) A1 % only (accept 1.7% if 0.0174 seen) Total: 5 6(ii) P(F – S > 0) stated or implied M1 P(S – F < 0) 62.0 – 78.8 (= –16.8) B1 78.8 – 62.0 (= 16.8) & 10.02 + 12.62 (= 258.76) & 12.62 + 10.02 (= 258.76) z = 0 −− (" 16.8") (= 1.044) M1 z = 0"258.76"− "16.8" (= –1.044) "258.76" 1 – Φ(“1.044”) M1 Φ(“–1.044”) = 1 – Φ(“1.044”) (= 1 – 0.8517) A1 = 0.148 (3 sfs) Total: 5
This question in 9709/72 Feb/March 2017
Q44 · In a random sample of 200 shareholders of a company, 103 said that they wanted a change… 9709/73 May/June 2017
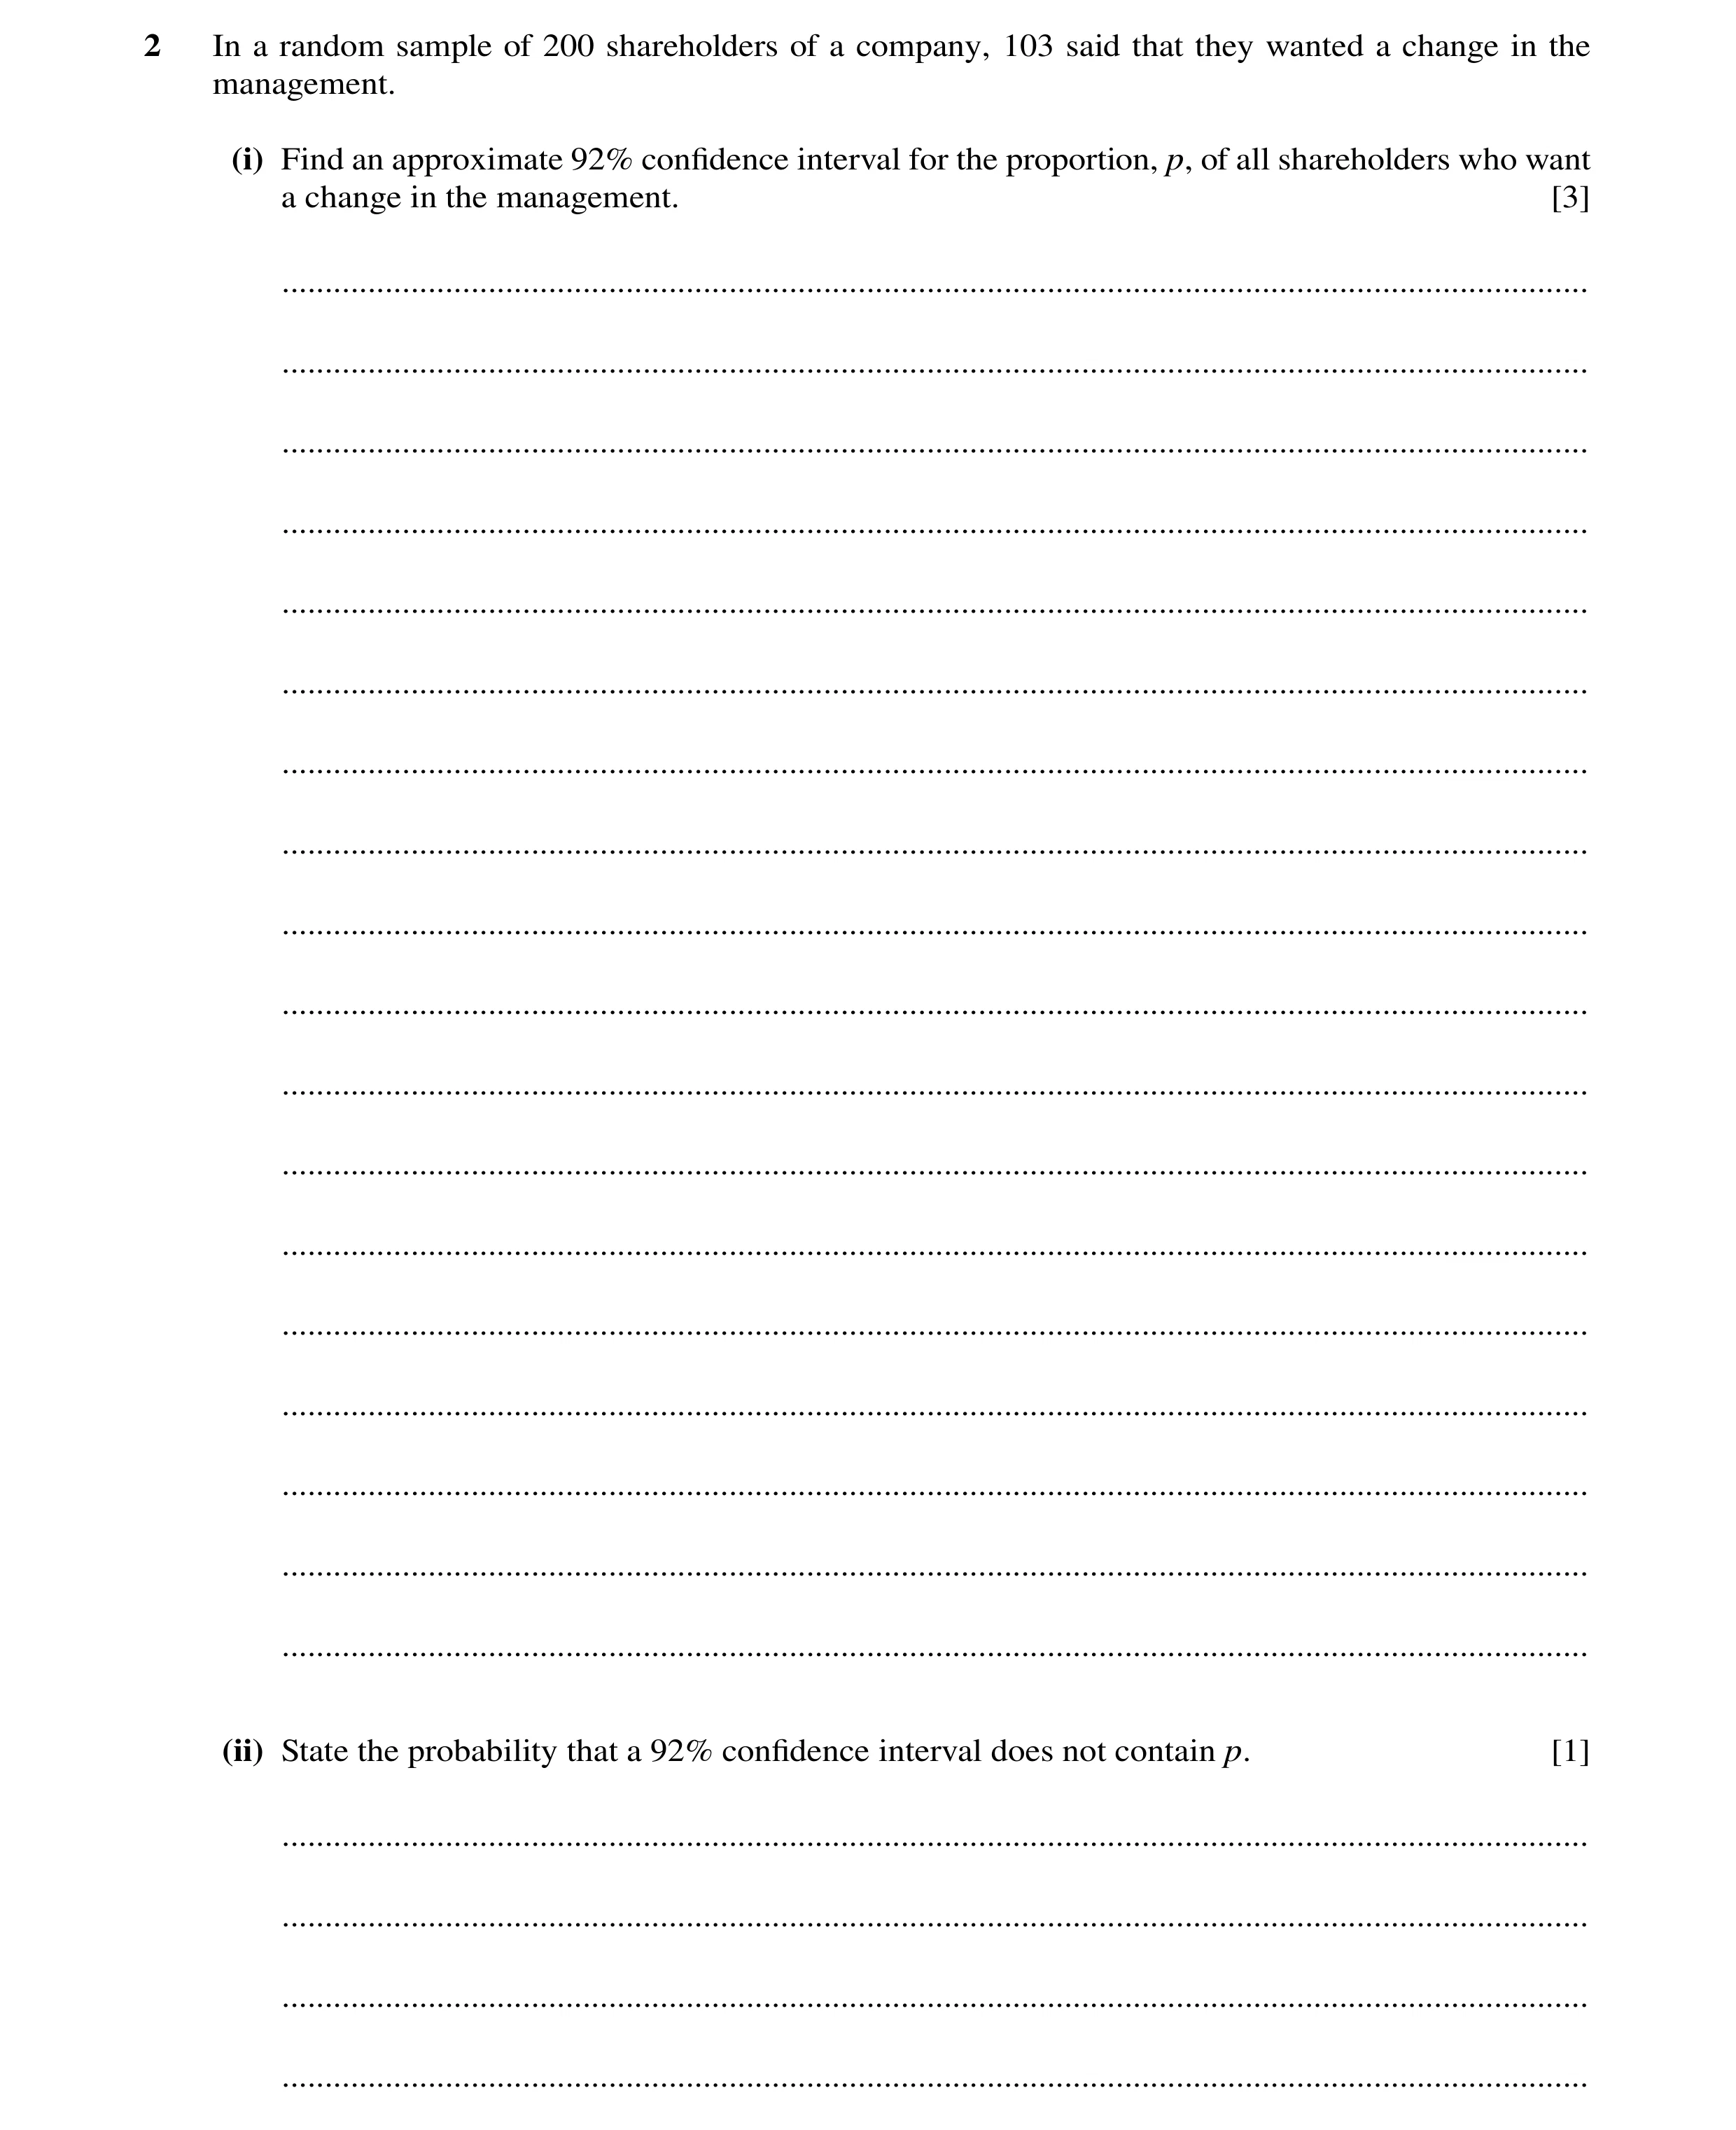
2 In a random sample of 200 shareholders of a company, 103 said that they wanted a change in the management. (i) Find an approximate 92% confidence interval for the proportion, p, of all shareholders who want a change in the management. [3] … … … … … … … … … … … … … … … … … … (ii) State the probability that a 92% confidence interval does not contain p. [1] … … … …
4 marks
Mark scheme: 2(i) z = 1.751 B1 103 200 ± z 103 103 200 200 (1 ) 200 × − oe M1 all correct except for recognisable value of z, allow for one side only = 0.453 to 0.577 (3 sf) as final answer A1 must be an interval Total: 3 2(ii) 0.08 oe 8%, 8/100 B1 SOI
This question in 9709/73 May/June 2017
Q45 · The numbers of barrels of oil, in millions, extracted per day in two oil fields A and B… 9709/71 Oct/Nov 2017
6 The numbers of barrels of oil, in millions, extracted per day in two oil fields A and B are modelled by the independent random variables X and Y respectively, where X ∼N 3.2, 0.42 and Y ∼N 4.3, 0.62 . The income generated by the oil from the two fields is $90 per barrel for A and $95 per barrel for B. (i) Find the mean and variance of the daily income, in millions of dollars, generated by field A. [3] … … … … … … … … … … … … … … … … … … … … … … … (ii) Find the probability that the total income produced by the two fields in a day is at least $670 million. [5] … … … … … … … … … … … … … … … … … … … … … … … … …
8 marks
Mark scheme: 6(i) Mean = 3.2 × 90 = 288 B1 Variance = 0.42 × 902 M1 = 1296 A1 3 6(ii) Mean = ‘288’ + 4.3 × 95 = 696.5 B1 FT Variance = ‘1296’ + 0.62 × 952 = 4545 B1 FT FT their (i) 670 − 696.5 (= -0.393) M1 FT Var provided both given Vars used 4545 standardising (ignore cc) no sd / Var mix 1 – φ(‘–0.393’) = φ(‘0.393) M1 correct area consistent with their working ( i.e. their mean ) = 0.653 (3 sf) A1 5
This question in 9709/71 Oct/Nov 2017
Q46 · The marks in paper 1 and paper 2 of an examination are denoted by X and Y respectively… 9709/72 Oct/Nov 2017
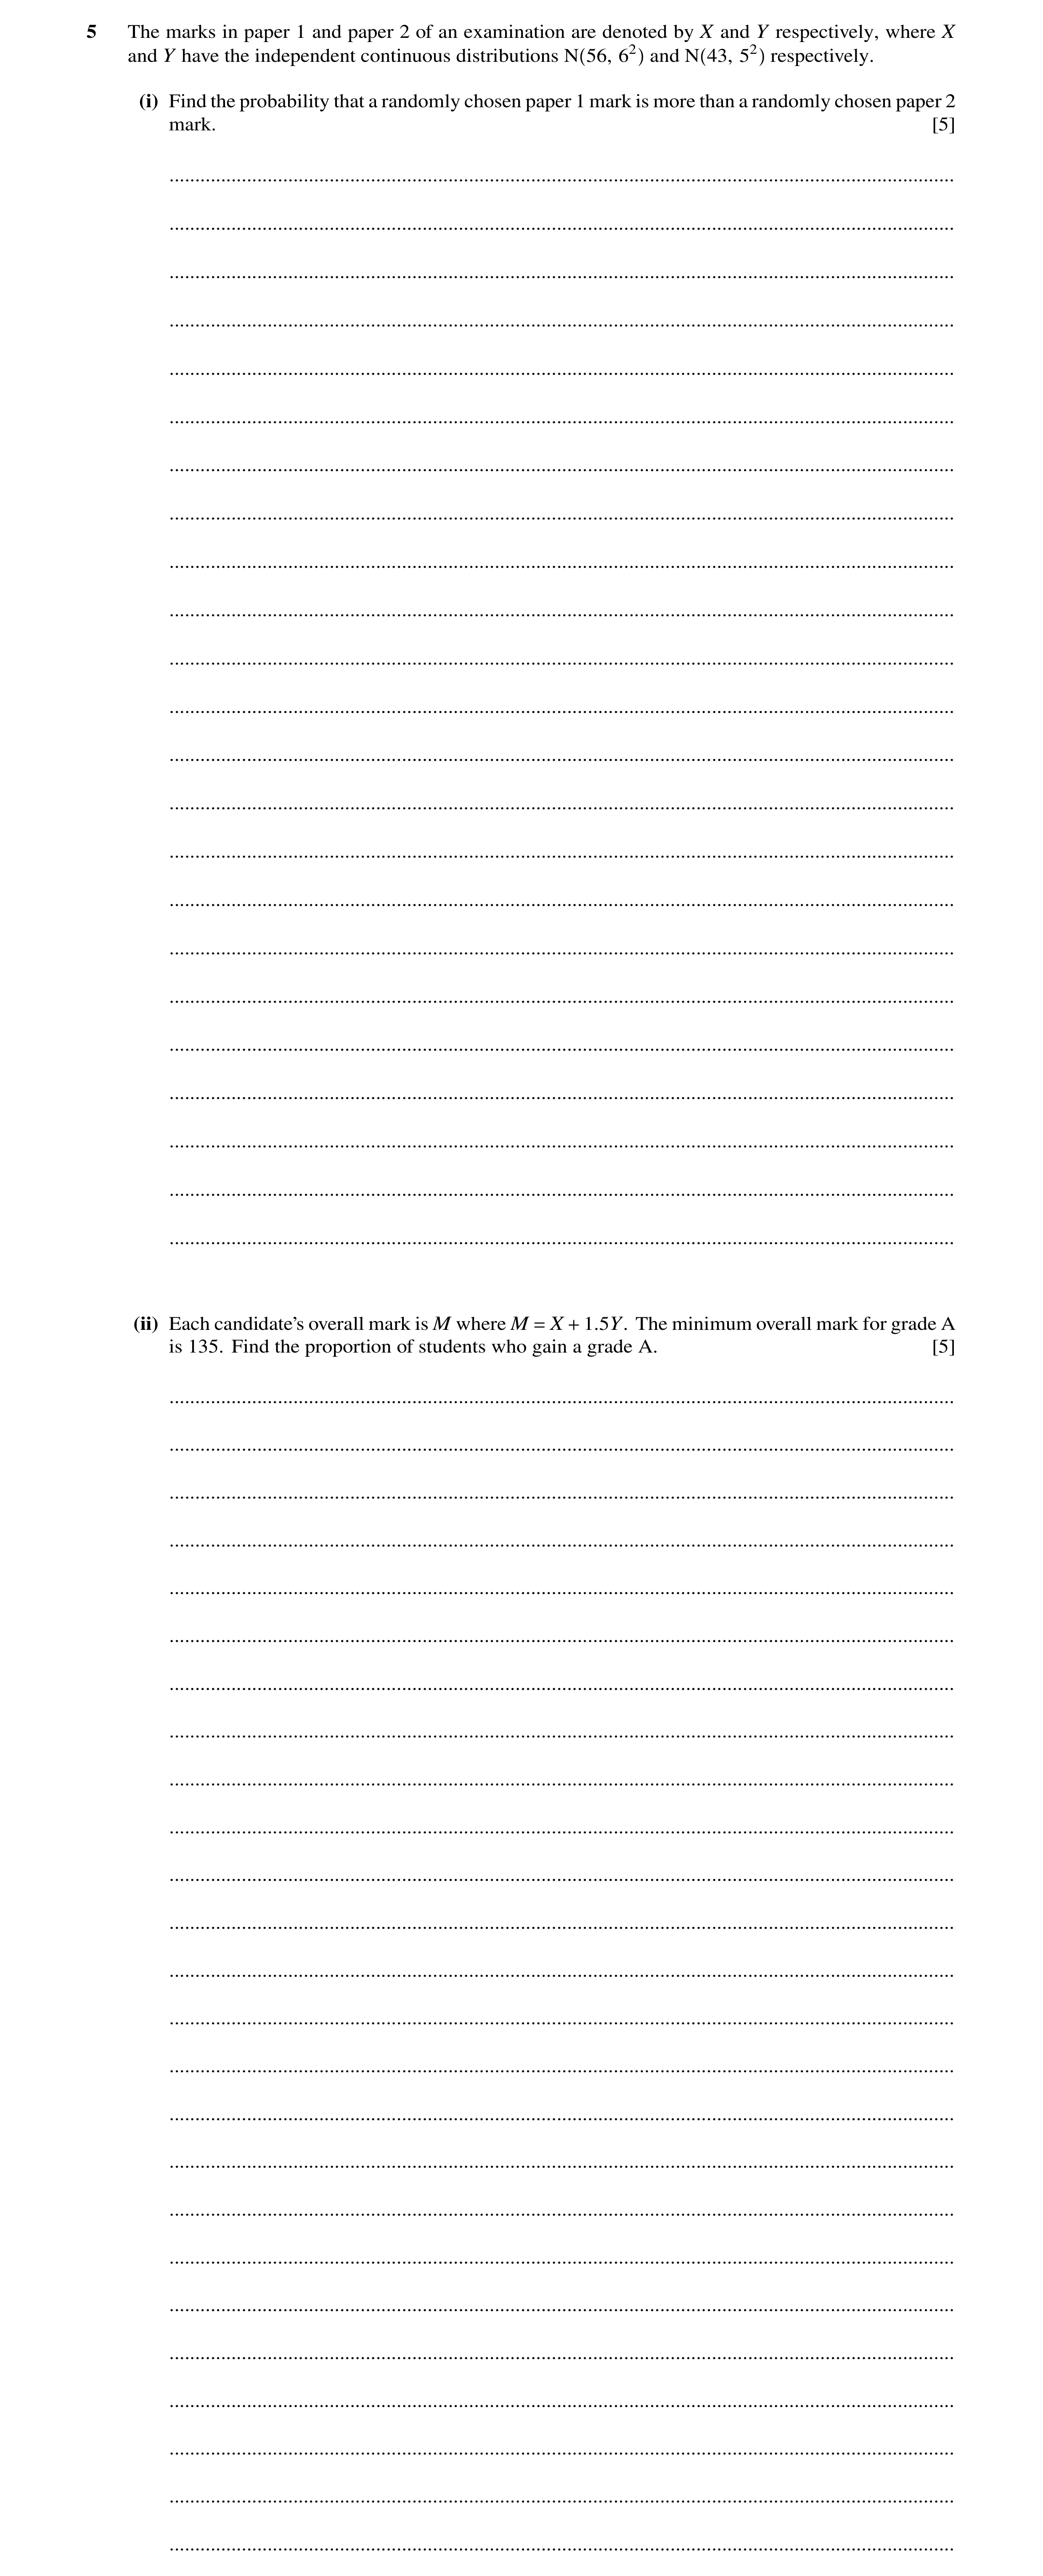
5 The marks in paper 1 and paper 2 of an examination are denoted by X and Y respectively, where X and Y have the independent continuous distributions N 56, 62 and N 43, 52 respectively. (i) Find the probability that a randomly chosen paper 1 mark is more than a randomly chosen paper 2 mark. [5] … … … … … … … … … … … … … … … … … … … … … … … (ii) Each candidate’s overall mark is M where M = X + 1.5Y. The minimum overall mark for grade A is 135. Find the proportion of students who gain a grade A. [5] … … … … … … … … … … … … … … … … … … … … … … … … …
10 marks
Mark scheme: 5(i) E(X − Y) = 56-43 (= 13) B1 Var(X− Y) = 62 + 52 (= 61) M1 ' 61 ' 13 0− (= −1.664) M1 Ignore any attempted cc/no SD/var mixes. var must be attempt at a combination 1 – ɸ('−1.664') = ɸ('1.664') M1 For area consistent with their working = 0.952 (3 sf) A1 Similar scheme for use of Y – X 5 Question Answer Marks Guidance 5(ii) E(M) = 56 +1.5(43) (= 120.5) B1 Var(M) = 62 + 1.52×52 (= 92.25) M1 25 . 92 ' 5. 120 135− (= 1.510) M1 Ignore any attempted cc/no SD/var mixes. var must be attempt at a combination 1 − ɸ('1.510') M1 For area consistent with their working = 0.0655 or 0.0656 or 6.55% or 6.56% (3 sf) As final answer A1 Allow 6.6% or 6.5% or 7% if correct working seen 5
This question in 9709/72 Oct/Nov 2017
Q47 · The numbers of barrels of oil, in millions, extracted per day in two oil fields A and B… 9709/73 Oct/Nov 2017
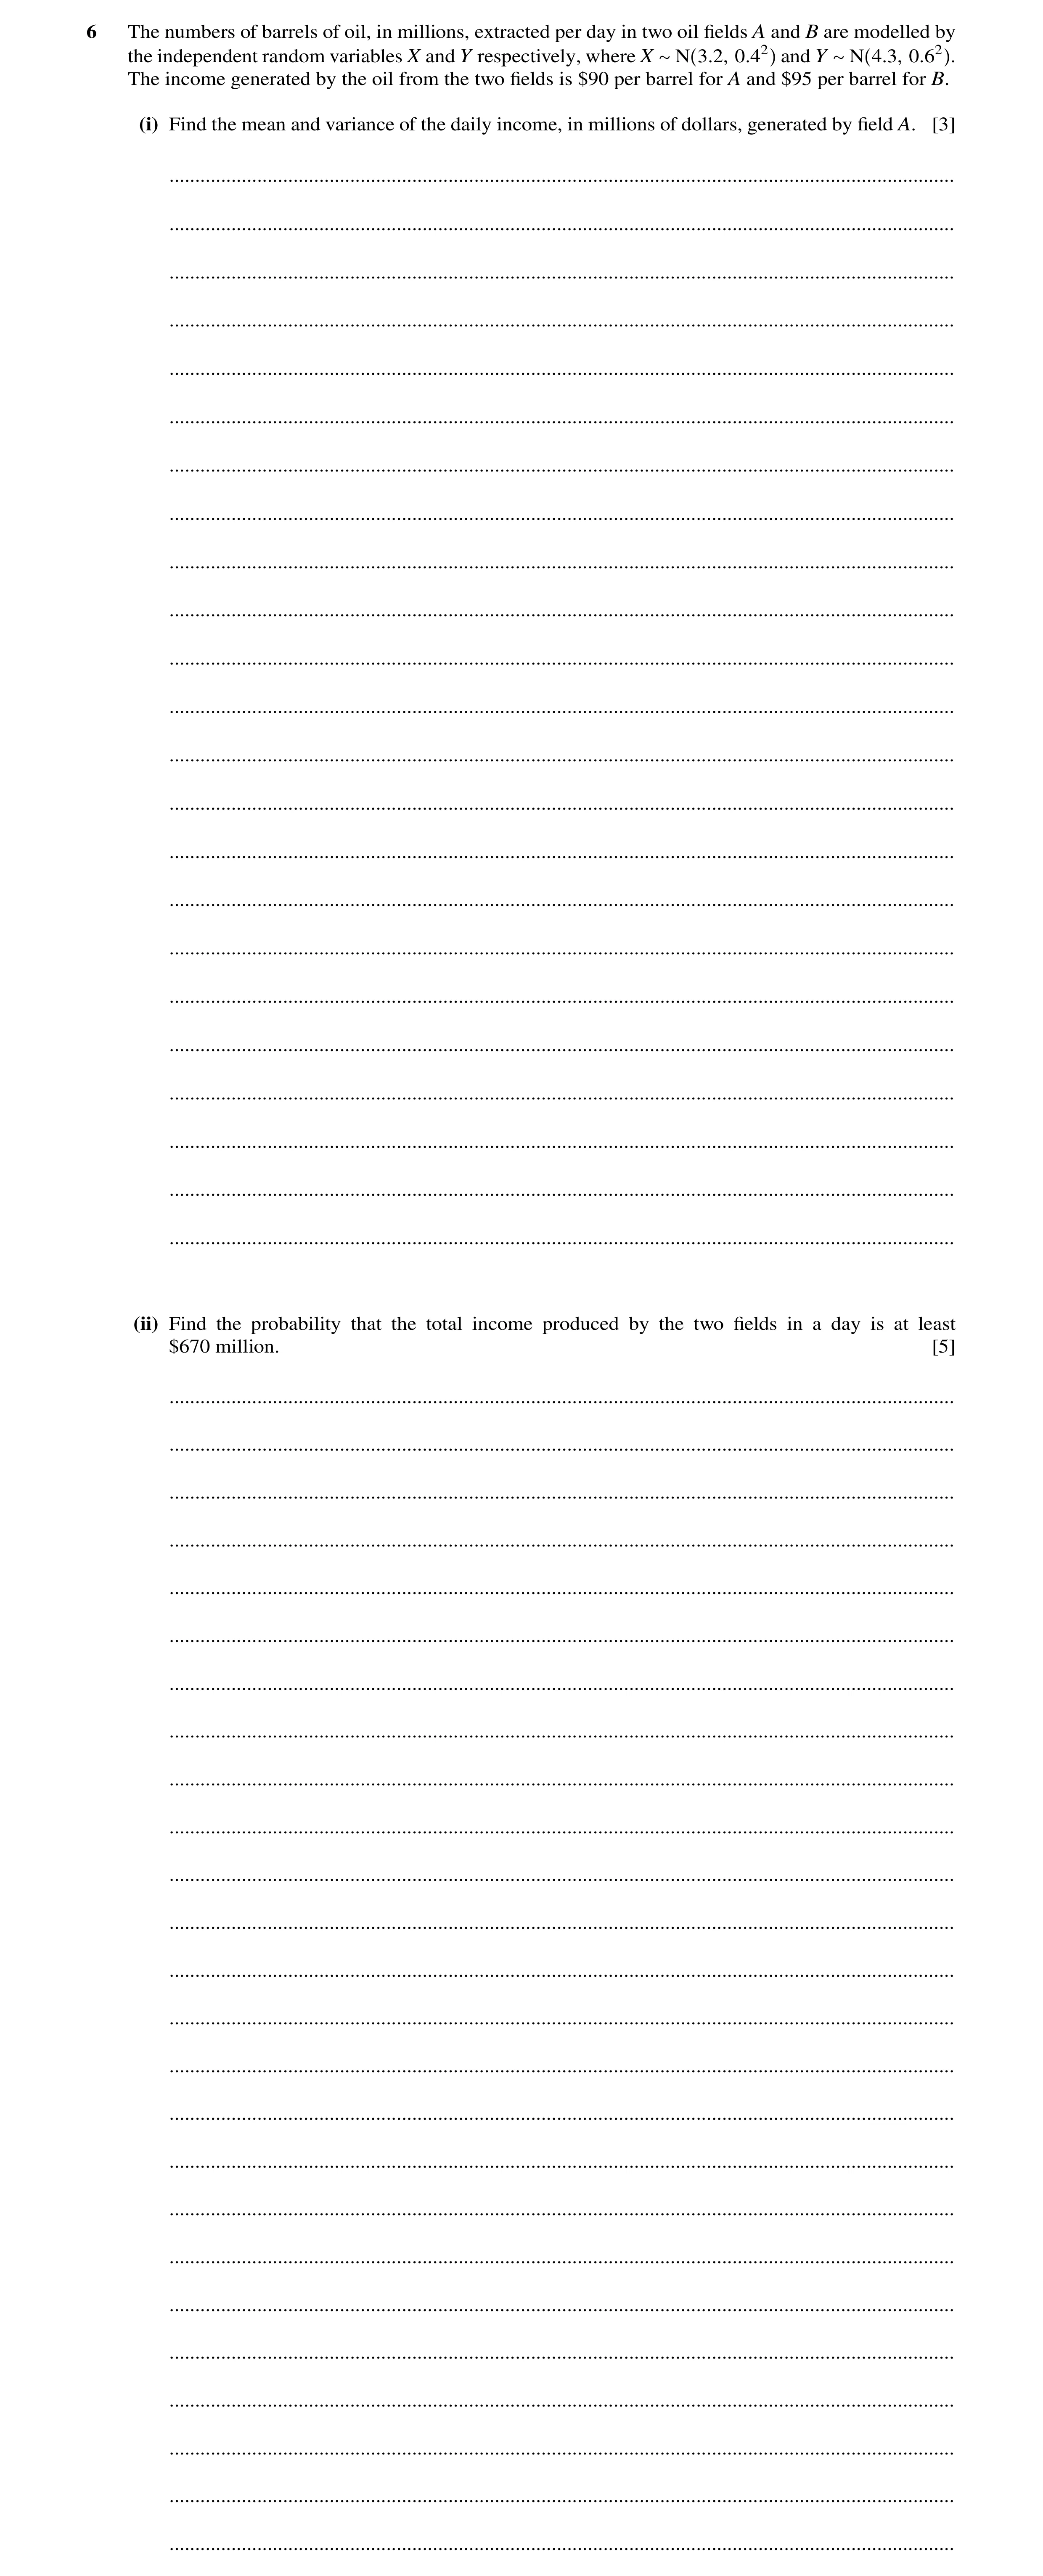
6 The numbers of barrels of oil, in millions, extracted per day in two oil fields A and B are modelled by the independent random variables X and Y respectively, where X ∼N 3.2, 0.42 and Y ∼N 4.3, 0.62 . The income generated by the oil from the two fields is $90 per barrel for A and $95 per barrel for B. (i) Find the mean and variance of the daily income, in millions of dollars, generated by field A. [3] … … … … … … … … … … … … … … … … … … … … … … … (ii) Find the probability that the total income produced by the two fields in a day is at least $670 million. [5] … … … … … … … … … … … … … … … … … … … … … … … … …
8 marks
Mark scheme: 6(i) Mean = 3.2 × 90 = 288 B1 Variance = 0.42 × 902 M1 = 1296 A1 3 6(ii) Mean = ‘288’ + 4.3 × 95 = 696.5 B1 FT Variance = ‘1296’ + 0.62 × 952 = 4545 B1 FT FT their (i) 670 − 696.5 (= -0.393) M1 FT Var provided both given Vars used 4545 standardising (ignore cc) no sd / Var mix 1 – φ(‘–0.393’) = φ(‘0.393) M1 correct area consistent with their working ( i.e. their mean ) = 0.653 (3 sf) A1 5
This question in 9709/73 Oct/Nov 2017
Q48 · A six-sided die is suspected of bias 9709/71 May/June 2018
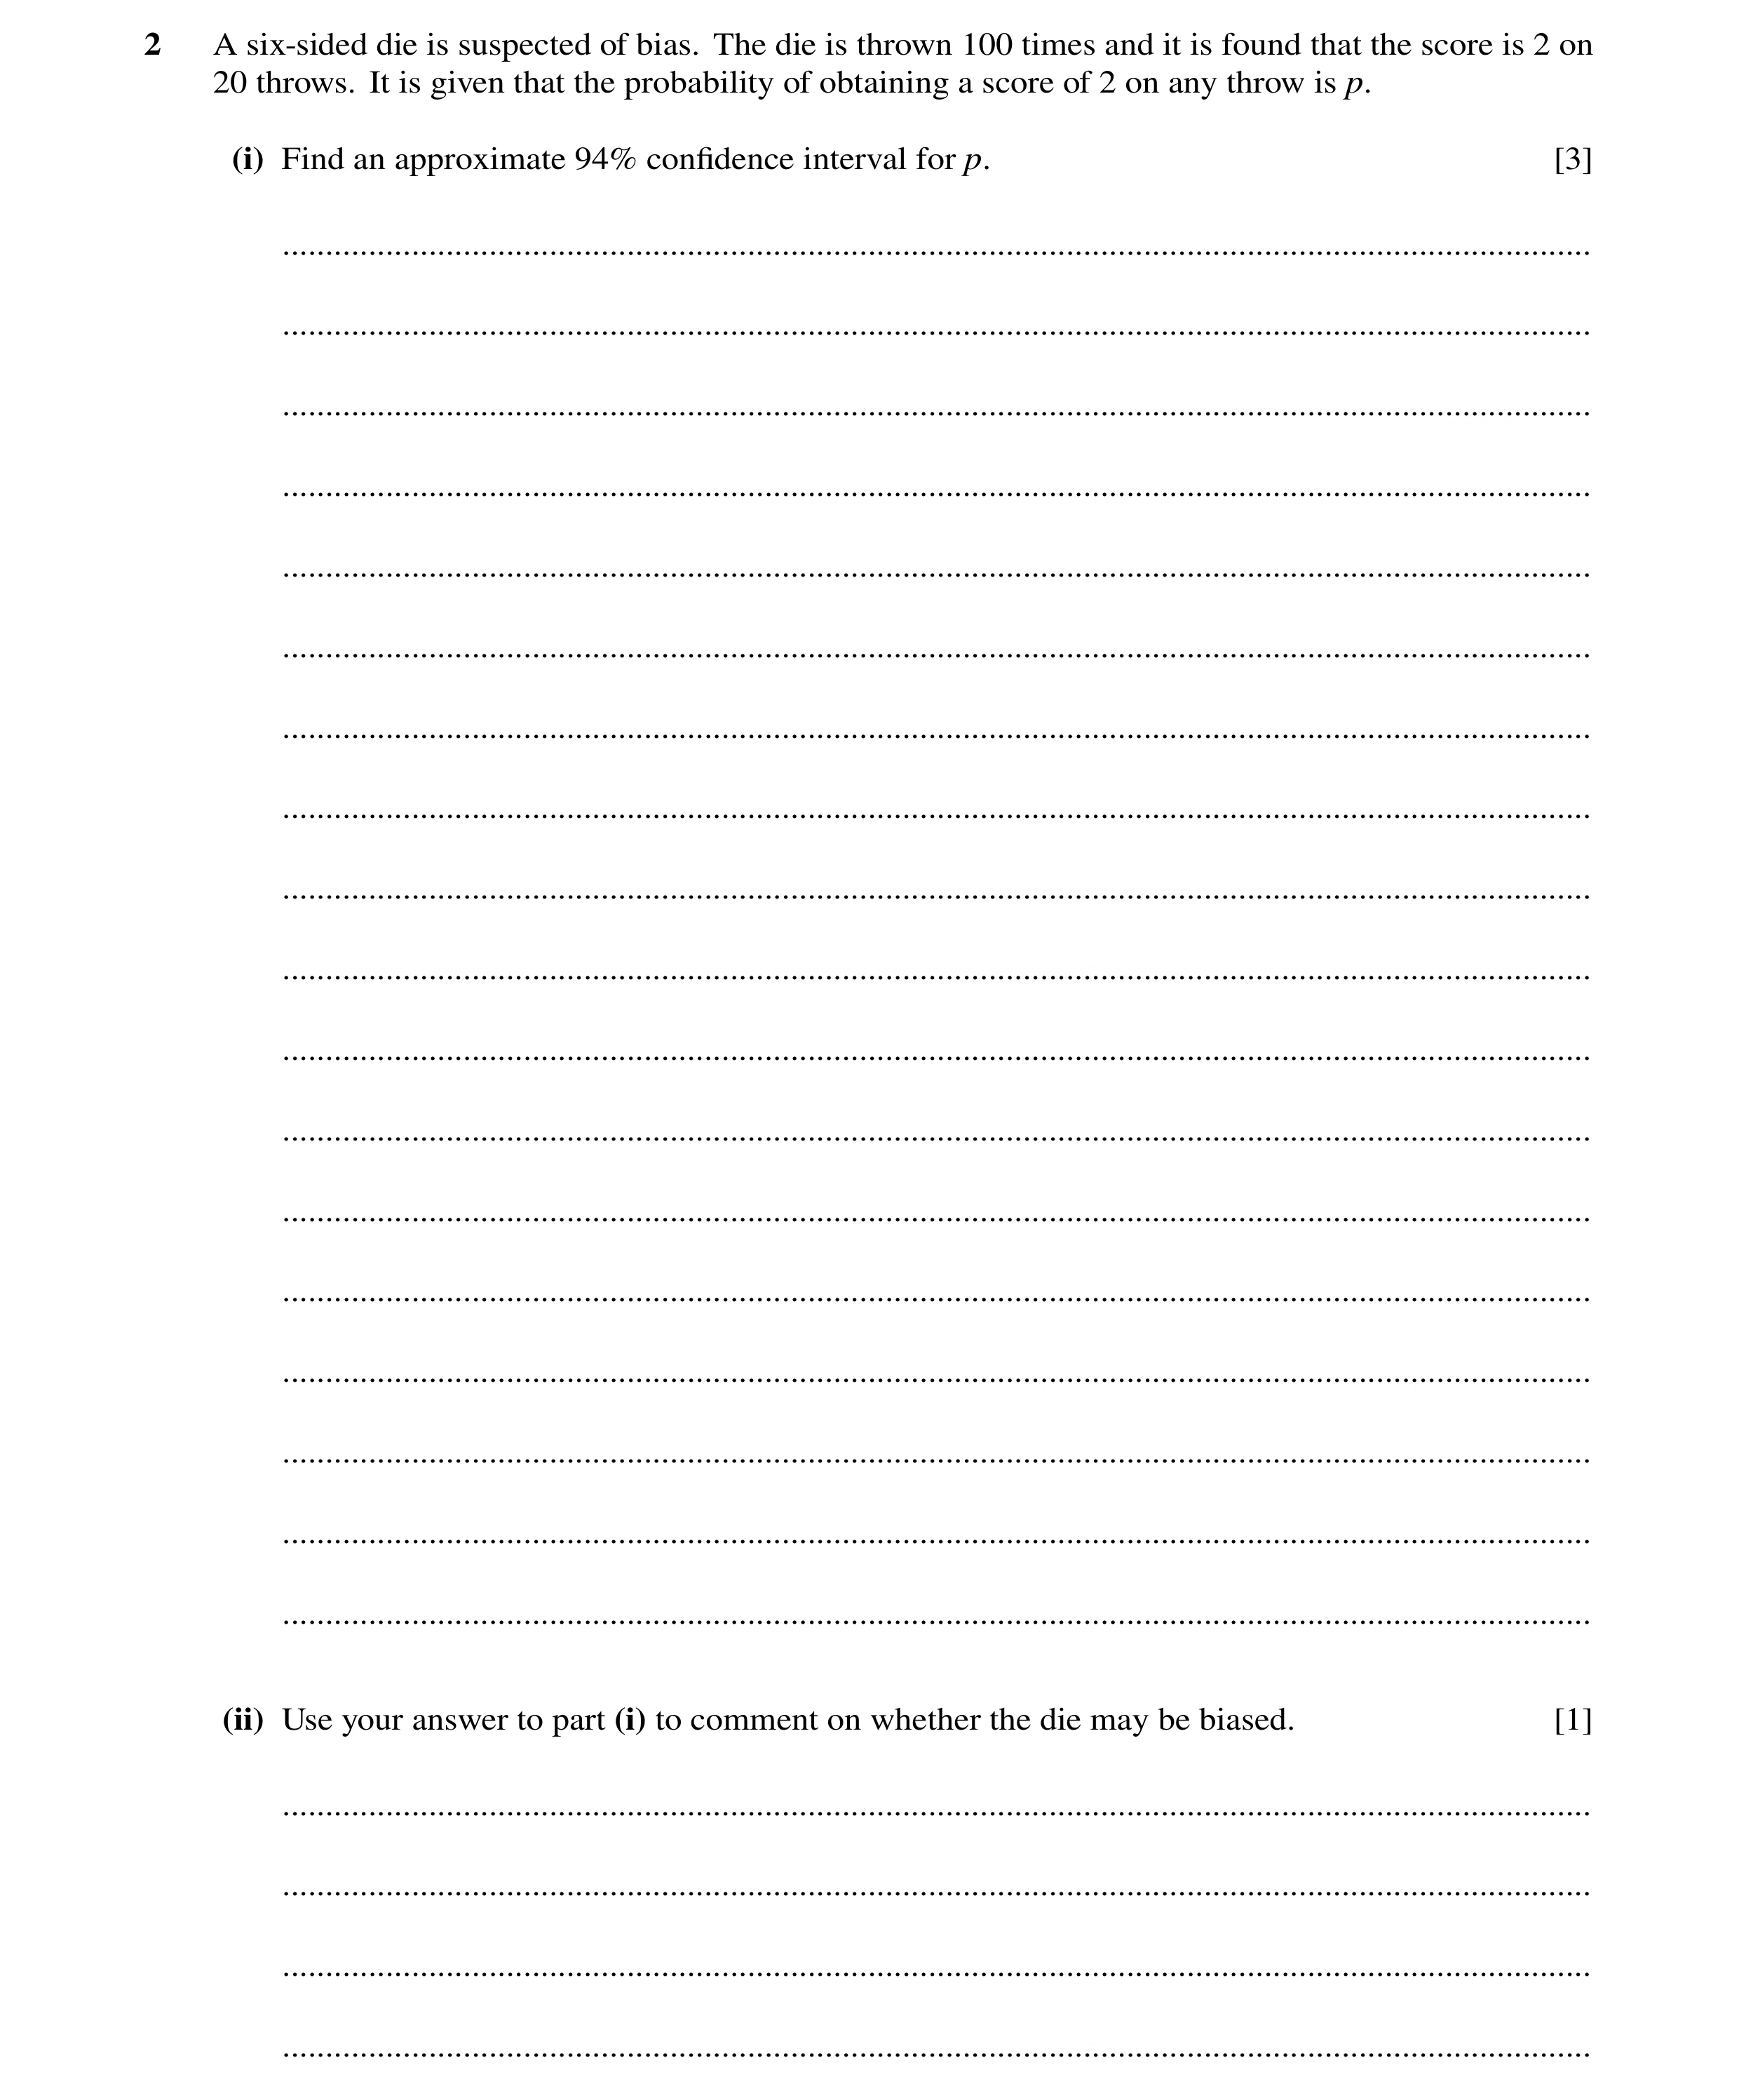
2 A six-sided die is suspected of bias. The die is thrown 100 times and it is found that the score is 2 on 20 throws. It is given that the probability of obtaining a score of 2 on any throw is p. (i) Find an approximate 94% confidence interval for p. [3] … … … … … … … … … … … … … … … … … … (ii) Use your answer to part (i) to comment on whether the die may be biased. [1] … … … …
4 marks
Mark scheme: 2(i) 20 0.2×(1− 0.2) M1 Any z ± z × 100 100 z = 1.881 or 1.882 B1 = 0.125 to 0.275 A1 3 2(ii) 1 6 is within this range B1ft Both statements needed No evidence of bias concerning 2 1
This question in 9709/71 May/June 2018
Q49 · The management of a factory wished to find a range within which the time taken to complete… 9709/72 May/June 2018
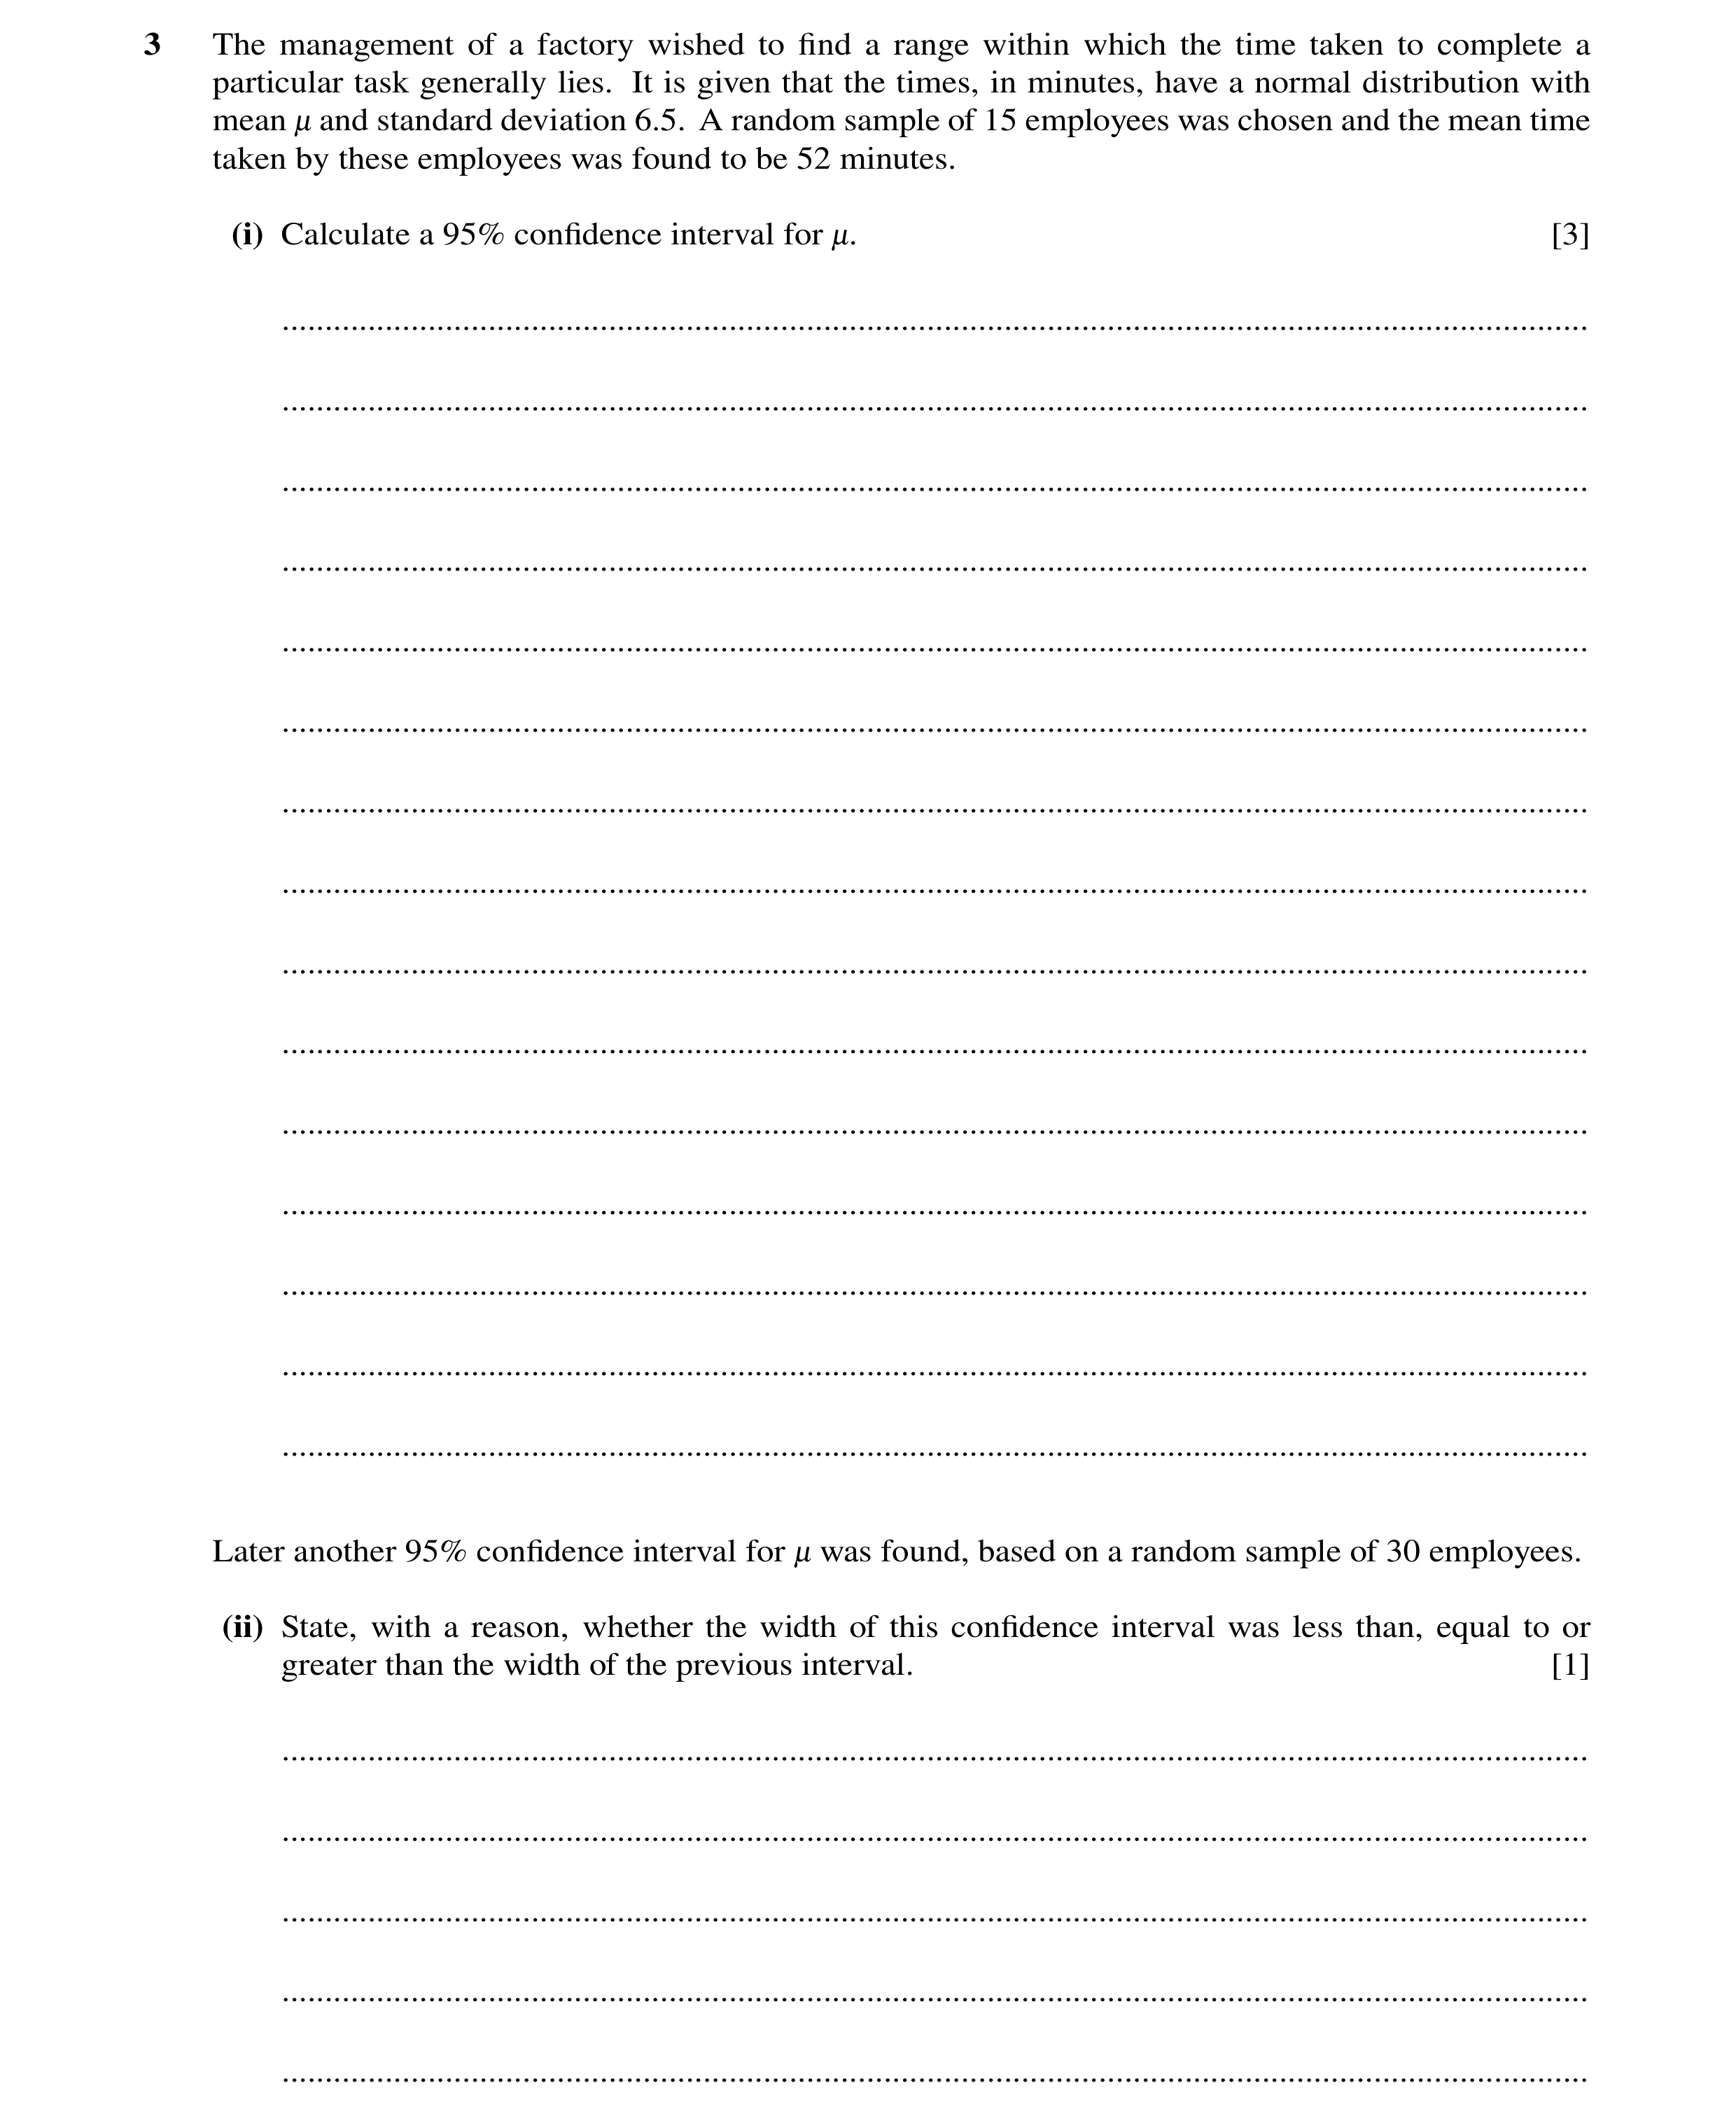
3 The management of a factory wished to find a range within which the time taken to complete a particular task generally lies. It is given that the times, in minutes, have a normal distribution with mean - and standard deviation 6.5. A random sample of 15 employees was chosen and the mean time taken by these employees was found to be 52 minutes. (i) Calculate a 95% confidence interval for -. [3] … … … … … … … … … … … … … … … Later another 95% confidence interval for - was found, based on a random sample of 30 employees. (ii) State, with a reason, whether the width of this confidence interval was less than, equal to or greater than the width of the previous interval. [1] … … … … …
4 marks
Mark scheme: 3(i) 52 ± z × 6.5 15 M1 z = 1.96 B1 Seen or used 48.7 to 55.3 (3 sf) A1 Must be an interval 3 Question Answer Marks Guidance 3(ii) Narrower because more information or because σ n smaller B1 oe Accept ‘sample size is larger’ ‘more employees’ ‘width inversely proportional to sq root of n’ ‘if n increases width decreases’ ‘95% CI is 49.7 to 54.3’ or similar. No contradictions 1
This question in 9709/72 May/June 2018
Q50 · Amy has to choose a random sample from the 265 students in her year at college 9709/73 May/June 2018
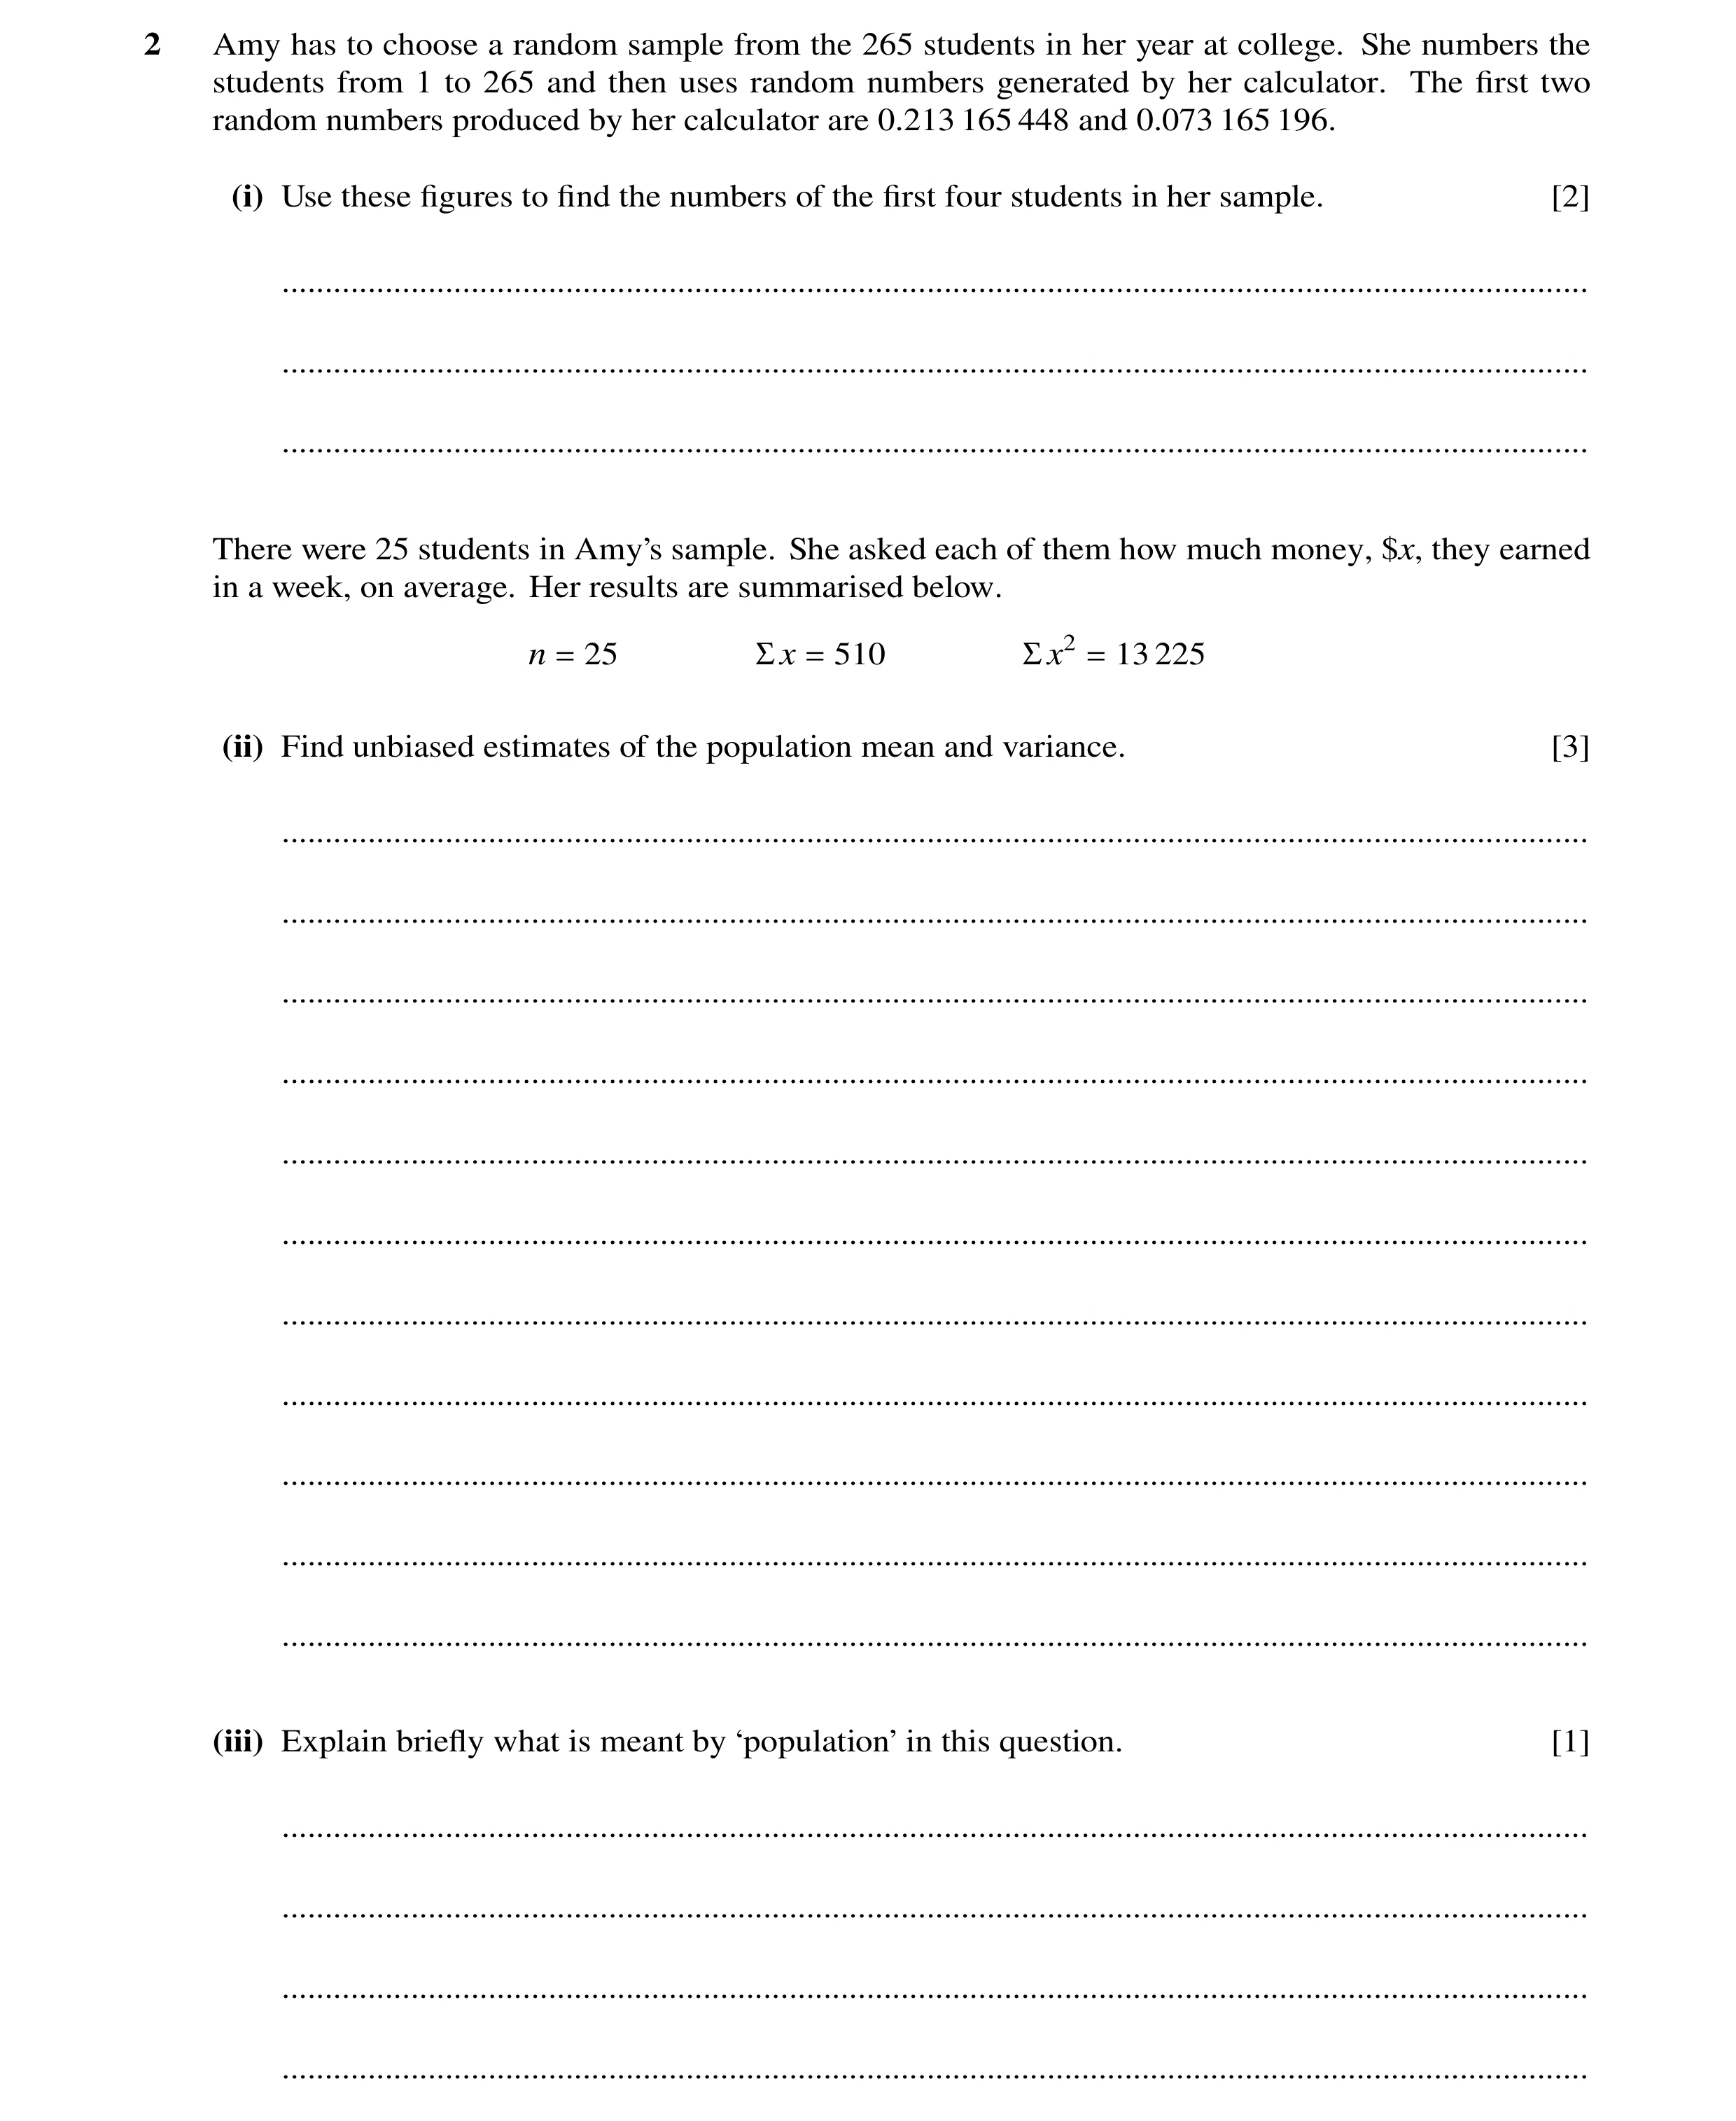
2 Amy has to choose a random sample from the 265 students in her year at college. She numbers the students from 1 to 265 and then uses random numbers generated by her calculator. The first two random numbers produced by her calculator are 0.213 165 448 and 0.073 165 196. (i) Use these figures to find the numbers of the first four students in her sample. [2] … … … There were 25 students in Amy’s sample. She asked each of them how much money, $x, they earned in a week, on average. Her results are summarised below. n = 25 Σ x = 510 Σ x2 = 13 225 (ii) Find unbiased estimates of the population mean and variance. [3] … … … … … … … … … … … (iii) Explain briefly what is meant by ‘population’ in this question. [1] … … … …
6 marks
Mark scheme: 2(i) 213, 165, 73, 196 Allow 073 B1 For 3-digit no, < 265, consisting of three consecutive integers from given digits, backwards or forward. (73 or 073 counts as a 3-digit no.) B1 For another three such. Other answers may be valid. If other method used, method must be clear 2 Question Answer Marks Guidance 2(ii) 510 25 = 102 5 or 20.4 B1 2 25 13225 102 24 25 5 − M1 2 1 510 13225 24 25 − 118 (3 sf) or 2821 24 A1 3 2(iii) (Average) weekly earnings of all students in Amy’s year B1 Not ‘All students in Amy’s year’ 1
This question in 9709/73 May/June 2018
Q51 · Small drops of two liquids, A and B, are randomly and independently distributed in the air 9709/71 Oct/Nov 2018
4 Small drops of two liquids, A and B, are randomly and independently distributed in the air. The average numbers of drops of A and B per cubic centimetre of air are 0.25 and 0.36 respectively. (i) A sample of 10 cm3 of air is taken at random. Find the probability that the total number of drops of A and B in this sample is at least 4. [3] … … … … … … … … … … … … … … … … … … … … … … … (ii) A sample of 100 cm3 of air is taken at random. Use an approximating distribution to find the probability that the total number of drops of A and B in this sample is less than 60. [5] … … … … … … … … … … … … … … … … … … … … … … … … …
8 marks
Mark scheme: 4(i) λ = 10×0.25 + 10×0.36 ( = 6.1 ) B1 1 – e-6.1 (1 + 6.1 + 6.12 2 + 6.13!3 ) M1 1 – P(X ⩽ 3), any λ Allow one end error = 0.857 A1 Allow 0.858 3 4(ii) λ = 61 B1 ft Ft from (i) N(‘61’, ‘61’) M1 N with µ = λ, any λ. May be implied 59.5 − 61 (= –0.192) M1 Standardise with their mean and variance '61' Allow no or wrong cc. not 61/100 Φ(‘–0.192’) = 1 – Φ(‘0.192’) M1 Correct area consistent with their working = 0.424 A1 5
This question in 9709/71 Oct/Nov 2018
Q52 · The times, in months, taken by a builder to build two types of house, P and Q, are… 9709/71 Oct/Nov 2018
5 The times, in months, taken by a builder to build two types of house, P and Q, are represented by the independent variables T1 ∼N 2.2, 0.42 and T2 ∼N 2.8, 0.52 respectively. (i) Find the probability that the total time taken to build one house of each type is less than 6 months. [4] … … … … … … … … … … … … … … … … … … … … … … … (ii) Find the probability that the time taken to build a type Q house is more than 1.2 times the time taken to build a type P house. [5] … … … … … … … … … … … … … … … … … … … … … … … … …
9 marks
Mark scheme: 5(i) T1 + T2 ~ N( 5, 0.42 + 0.52 ) B1 or N( 5, 0.41 ) 6 − 5 (= 1.562) M1 Allow cc '0.41' Φ(‘1.562’) M1 Correct area consistent with their working = 0.941 A1 4 5(ii) Var(T2 - 1.2T1) = 0.52 + 1.22 × 0.42 B1 Or similar using 1.2T1 – T2 (= 0.4804) T2 – 1.2T1 – N(0.16, 0.4804) B1 ft Only ft attempt at combination. no ft for neg var. 0 − '0.16' M1 Standardise with their mean and variance. (= -0.231) Allow cc '0.4804' P(T2 – 1.2T1) > 0 = Φ(‘0.231’) M1 Correct area consistent with their working = 0.591 (3 sfs) A1 5
This question in 9709/71 Oct/Nov 2018
Q53 · The number of eagles seen per hour in a certain location has the distribution Po 1.8 9709/72 Feb/March 2019
5 The number of eagles seen per hour in a certain location has the distribution Po 1.8 . The number of vultures seen per hour in the same location has the independent distribution Po 2.6 . (i) Find the probability that, in a randomly chosen hour, at least 2 eagles are seen. [2] … … … … … … … … … … … … … (ii) Find the probability that, in a randomly chosen half-hour period, the total number of eagles and vultures seen is less than 5. [3] … … … … … … … … … … … … … … … … Alex wants to be at least 99% certain of seeing at least 1 eagle. (iii) Find the minimum time for which she should watch for eagles. [3] … … … … … … … … … … … … … … … …
8 marks
Mark scheme: 5(i) M1 Accept any λ. Accept 1–P(0,1,2) = 0.537 (3 sf) A1 2 5(ii) λ = 2.2 B1 e–2.2(1 + 2.2 + 2 3 4 2.2 2.2 2.2 2! 3! 4! + + ) M1 Attempt expr'n for P(X ⩽ 4),allow one end error, allow any λ = 0.928 (3 sf) or 0.927 A1 3 Question Answer Marks Guidance 5(iii) 1 – e–1.8t ⩾ 0.99 or 1 – e–λ ⩾ 0.99 M1 Condone = signs/incorrect inequality signs e–1.8t ⩽ 0.01 or e–λ ⩽ 0.01 –1.8t ⩽ ln0.01 M1 Valid attempt take logs (must have single term on each side) t ⩾ 2.56 She must watch for at least 2.56 (hours) A1 or 2 hours, 34 mins or better. No errors seen 3
This question in 9709/72 Feb/March 2019
Q54 · At an internet caf´e, the charge for using a computer is 5 cents per minute 9709/71 May/June 2019
1 At an internet caf´e, the charge for using a computer is 5 cents per minute. The number of minutes for which people use a computer has mean 23 and standard deviation 8. (i) Find, in cents, the mean and standard deviation of the amount people pay when using a computer. [2] … … … … … … … … … … (ii) Each day, 15 people use computers independently. Find, in cents, the mean and standard deviation of the total amount paid by 15 people. [3] … … … … … … … … … … …
5 marks
Mark scheme: 1(i) Mean = 115 B1 SD = 40 B1 2 1(ii) Mean = 15 × ‘115’ = 1725 B1ft 15 × ‘40’2 (= 24000) M1 or SD = √15 × ‘40’. ft their (i) SD = √24000 SD = 155 (cents) (3 sf) A1 Accept √24000 SC: Allow correct answers in dollars 3
This question in 9709/71 May/June 2019
Q55 · Ramesh plans to carry out a survey in order to find out what adults in his town think… 9709/71 May/June 2019
6 Ramesh plans to carry out a survey in order to find out what adults in his town think about local sports facilities. He chooses a random sample from the adult members of a tennis club and gives each of them a questionnaire. (i) Give a reason why this will not result in Ramesh having a random sample of adults who live in the town. [1] … … … … (ii) Describe briefly a valid method that Ramesh could use to choose a random sample of adults in the town. [2] … … … … … … … … Ramesh now uses a valid method to choose a random sample of 350 adults from the town. He finds that 47 adults think that the local sports facilities are good. (iii) Calculate an approximate 90% confidence interval for the proportion of all adults in the town who think that the local sports facilities are good. [4] … … … … … … … … … … … … … (iv) Ramesh calculates a confidence interval whose width is 1.25 times the width of this 90% confidence interval. Ramesh’s new interval is an x% confidence interval. Find the value of x. [3] … … … … … … … … … … … … … … … …
10 marks
Mark scheme: 6(i) Biased towards people who like tennis Excludes people who don't like tennis B1 1 6(ii) Obtain a list of all people in the town B1 Use random numbers B1 or, e.g. pick numbers from a hat or other sensible 2 6(iii) Var(p) = 47 47 350 350 (1 ) 350 − (= 0.000332152) M1 z = 1.645 B1 47 47 350 350 (1 ) 47 350 350 z − ± M1 Must be a z value 0.104 to 0.164 (3 sf) A1 Must be an interval 4 6(iv) 1.25 × 1.645 (= 2.056) M1 or 1.25 × their width ÷ 2 ÷ their 47 47 350 350 (1 ) 350 − (Complete method) Φ(‘2.056’) (= 0.980) M1 Attempt Φ(their z) x = 96 (2 sf) A1 Allow 0.96 (2 sf) CWO 3
This question in 9709/71 May/June 2019
Q56 · The random variable X has mean 372 and standard deviation 54 9709/72 May/June 2019
2 The random variable X has mean 372 and standard deviation 54. (i) Describe fully the distribution of the mean of a random sample of 36 values of X. [3] … … … … … … … … … … (ii) The distribution in part (i) might be either exact or approximate. State a condition under which the distribution is exact. [1] … … … … … … … … … … … …
4 marks
Mark scheme: 2(i) Normal with mean 372 B1 sd = 54 36 M1 or variance = 2 54 36 M1 (= 9) A1 (= 81) A1 3 2(ii) Pop normal B1 Allow X is normal 1
This question in 9709/72 May/June 2019
Q57 · Each day at a certain doctor’s surgery there are 70 appointments available in the morning… 9709/73 May/June 2019
7 Each day at a certain doctor’s surgery there are 70 appointments available in the morning and 60 in the afternoon. All the appointments are filled every day. The probability that any patient misses a particular morning appointment is 0.04, and the probability that any patient misses a particular afternoon appointment is 0.05. All missed appointments are independent of each other. Use suitable approximating distributions to answer the following. (i) Find the probability that on a randomly chosen morning there are at least 3 missed appointments. [3] … … … … … … … … … … … (ii) Find the probability that on a randomly chosen day there are a total of exactly 6 missed appointments. [3] … … … … … … … … … … … … … … … (iii) Find the probability that in a randomly chosen 10-day period there are more than 50 missed appointments. [4] … … … … … … … … … … … … … … … … …
10 marks
Mark scheme: 7(i) M1 1 – e-2.8(1 + 2.8 + 2 2.8 2 ) ) M1 Any λ allowing one end error = 0.531or 0.53(0) (3 sf) A1 SC Binomial 0.534 B1 3 7(ii) Use of Po(5.8) M1 May be implied e-5.8 × 6 5.8 6! M1 Any λ = 0.16(0) (3 sf) A1 3 Question Answer Marks Guidance 7(iii) Use of N(58, 58) M1 May be implied or N(58, 55.38) 50.5 '58' '58' − (= -0.985) M1 Standardised with their values, allow wrong or incorrect cc Φ('0.985') M1 Correct area consistent with their working or ( ) Φ "1.008 = 0.838 (3 sf) A1 or 0.843 4
This question in 9709/73 May/June 2019
Q58 · On average, 1 in 150 components made by a certain machine are faulty 9709/72 Oct/Nov 2019
1 On average, 1 in 150 components made by a certain machine are faulty. The random variable X denotes the number of faulty components in a random sample of 500 components. (i) Describe fully the distribution of X. [2] … … … … (ii) State a suitable approximating distribution for X, giving a justification for your choice. [2] … … … … … (iii) Use your approximating distribution to find the probability that the sample will include at least 3 faulty components. [3] … … … … … … … … … … …
7 marks
Mark scheme: 1(i) Binomial B1 n = 500 and 1 150 p = or 0.00667 B1 Or 1 B 500,150 for B1B1 2 1(ii) Poisson B1 n large and mean = 10 3 or 3.3 or better, which is < 5 B1 Accept n > 50 2 1(iii) 2 10 3 10 10 3 1 1 3 2 e − − × + + M1 1-P(X = 0, 1, 2) = 1 – 0.353 A1 Correct expression with λ=3.3 or better = 0.647 (3 sf) A1 SC Use of Binomial scores B1 for 0.648. Use of Normal scores B1 for 0.67(0) to 0.677 3
This question in 9709/72 Oct/Nov 2019
Q59 · The random variable X has mean 2.4 and variance 3.1 9709/73 Oct/Nov 2019
1 The random variable X has mean 2.4 and variance 3.1. (i) The random variable Y is the sum of four independent values of X. Find the mean and variance of Y. [2] … … … … … … … … … … … (ii) The random variable Z is defined by Z = 4X −3. Find the mean and variance of Z. [2] … … … … … … … … … … …
4 marks
Mark scheme: 1(i) 9.6, 12.4 B1 B1 2 1(ii) 6.6, 49.6 B1 B1 2
This question in 9709/73 Oct/Nov 2019

 1 / 37
 2 / 37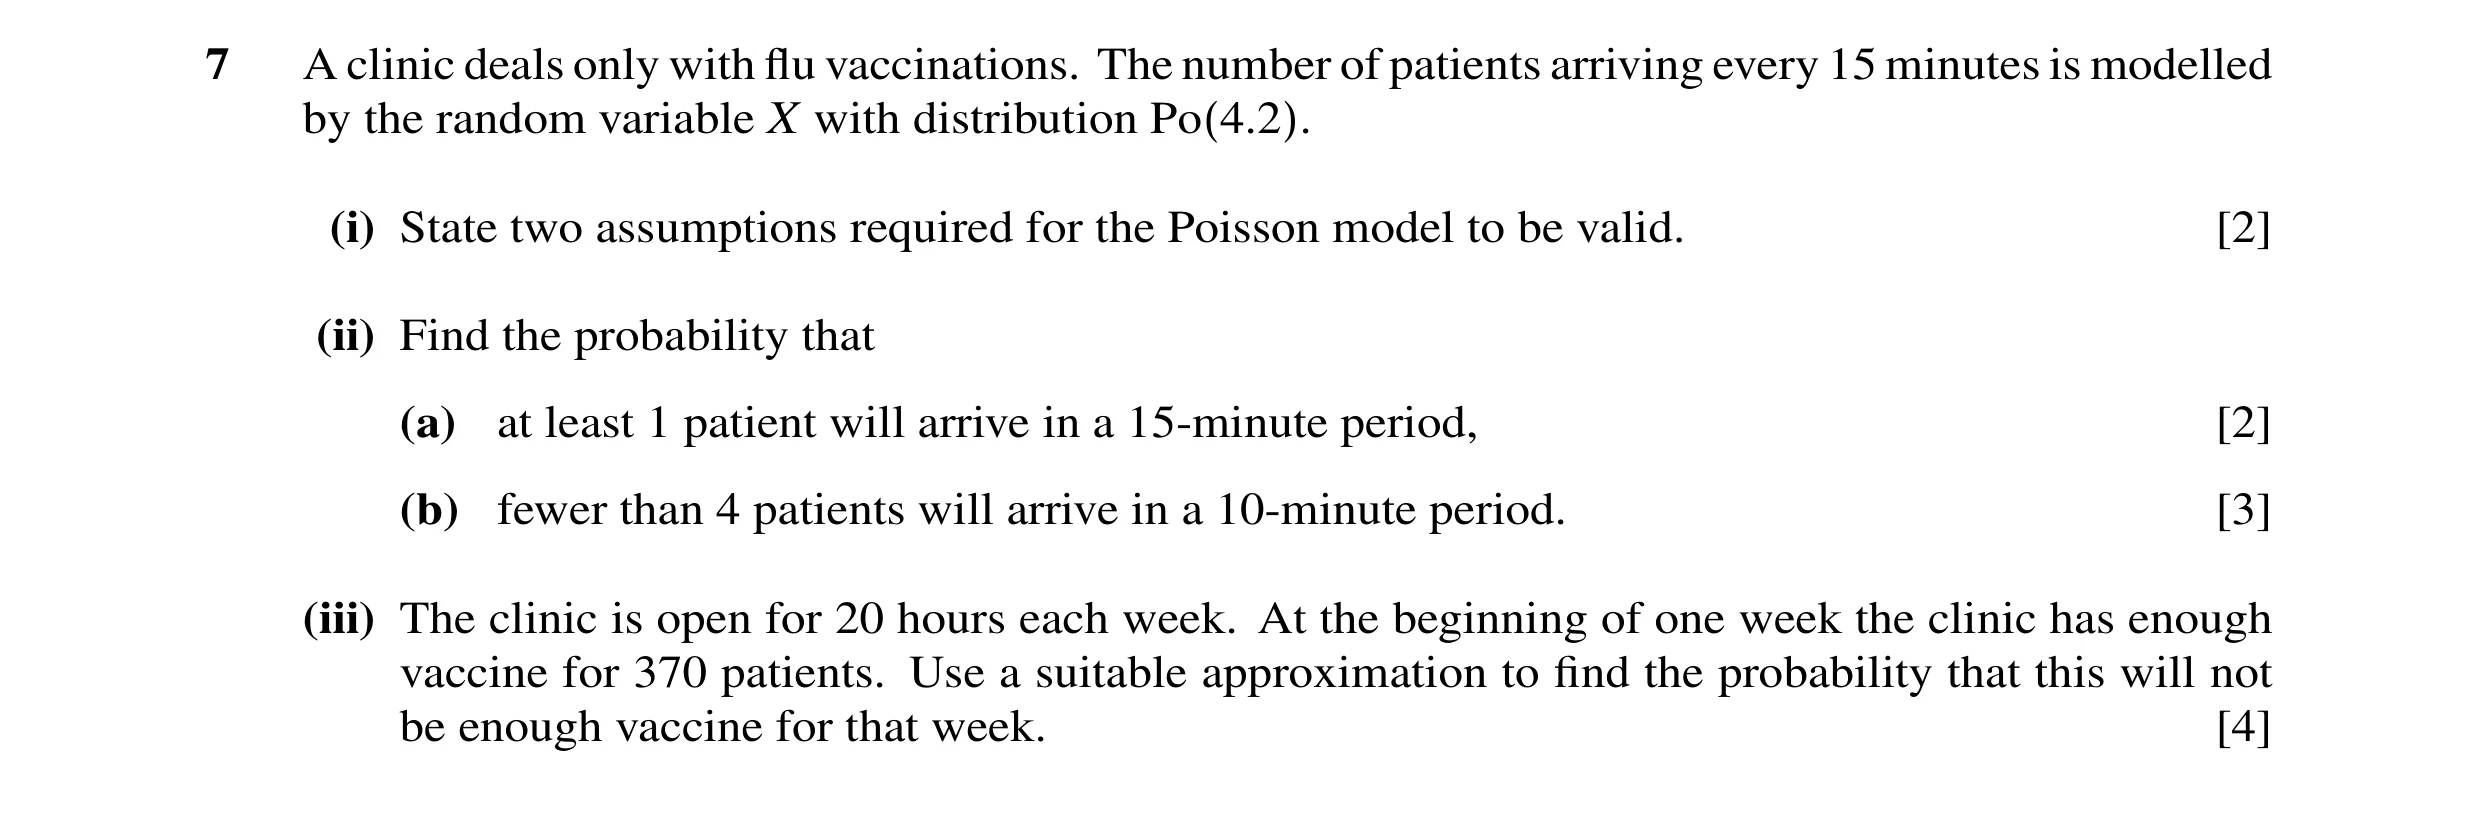
 3 / 37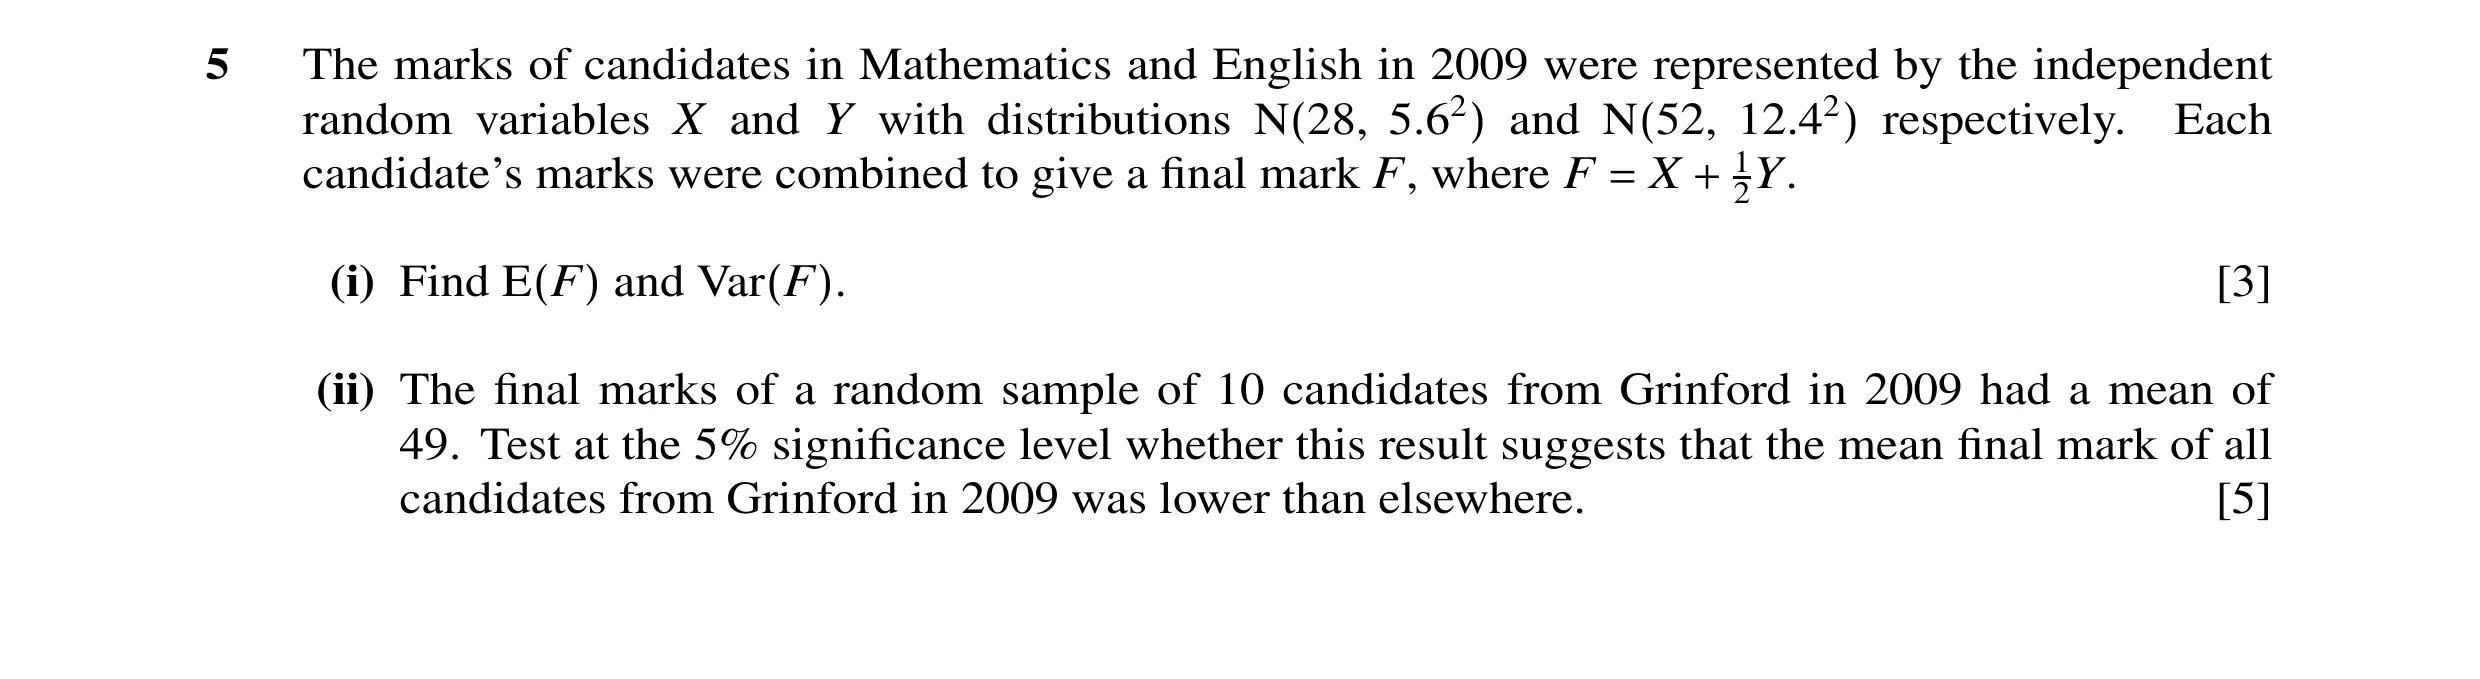
 4 / 37

 5 / 37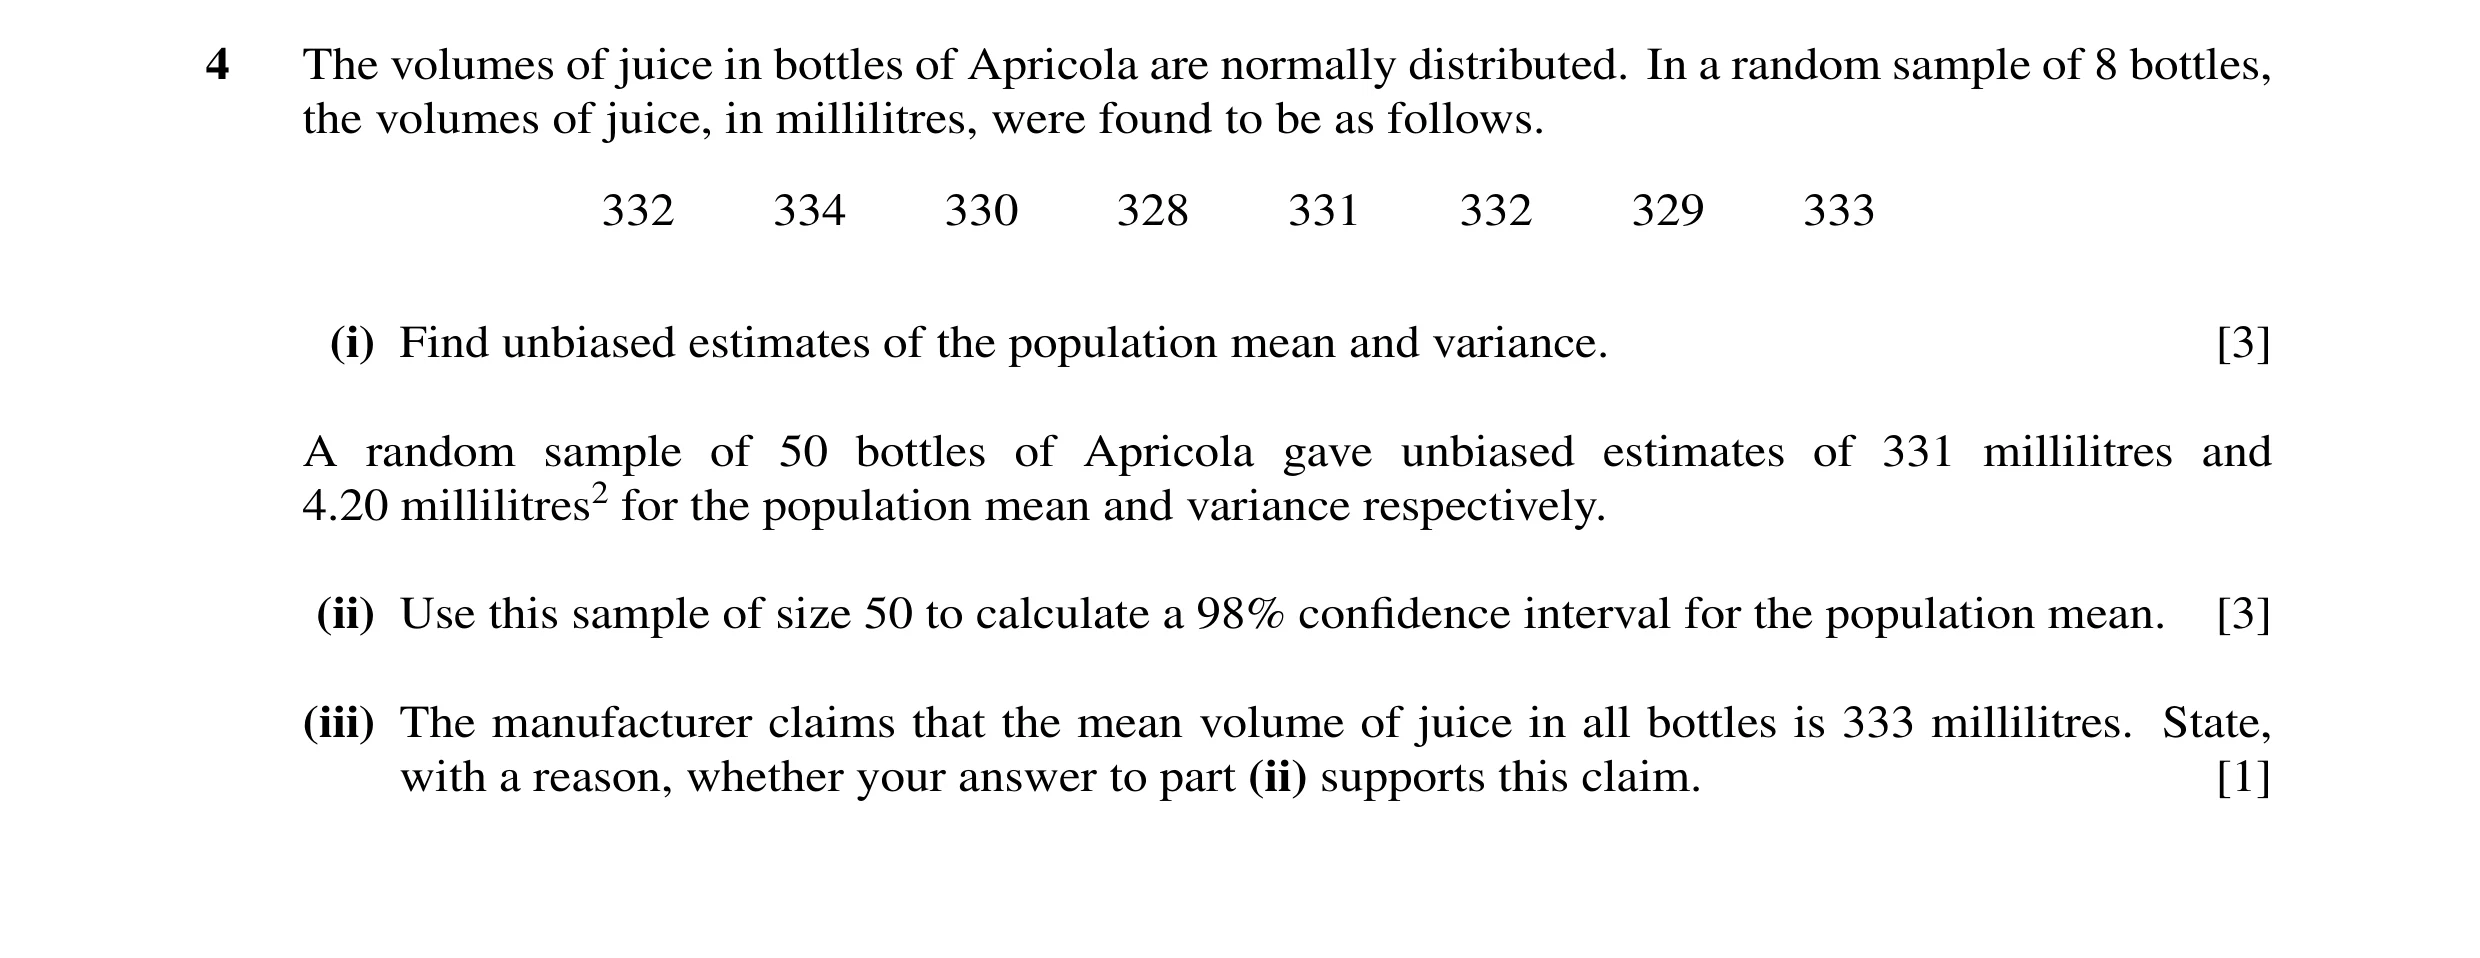


 6 / 37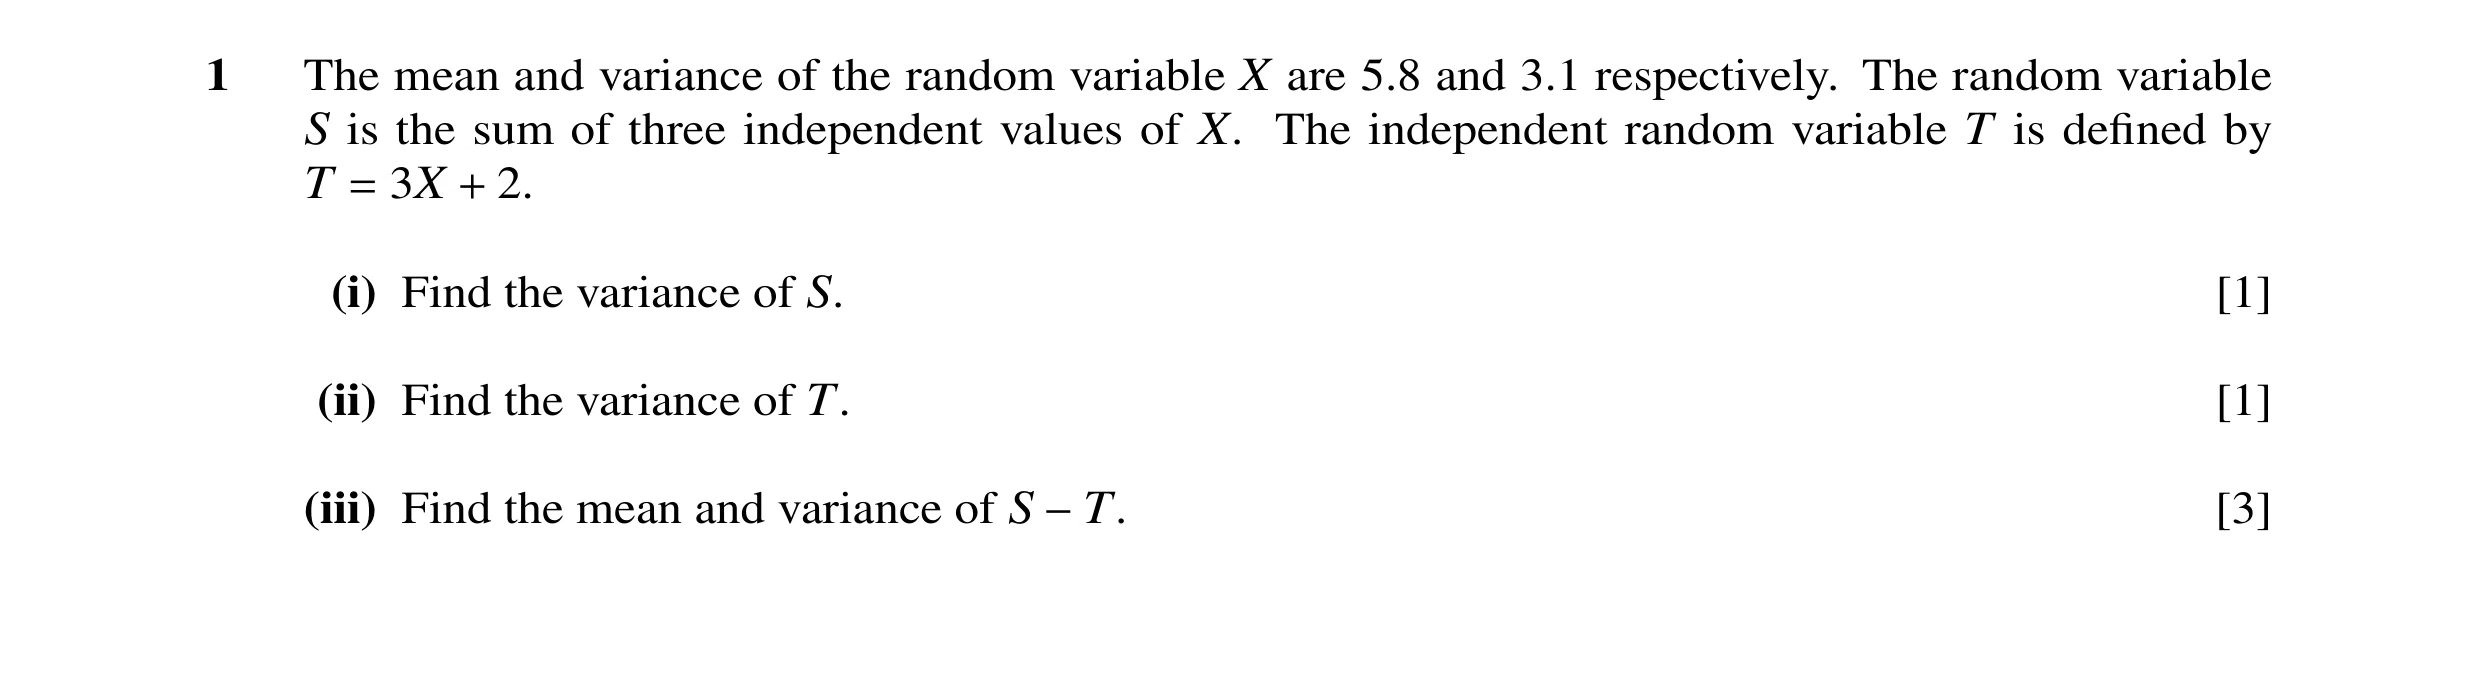
 7 / 37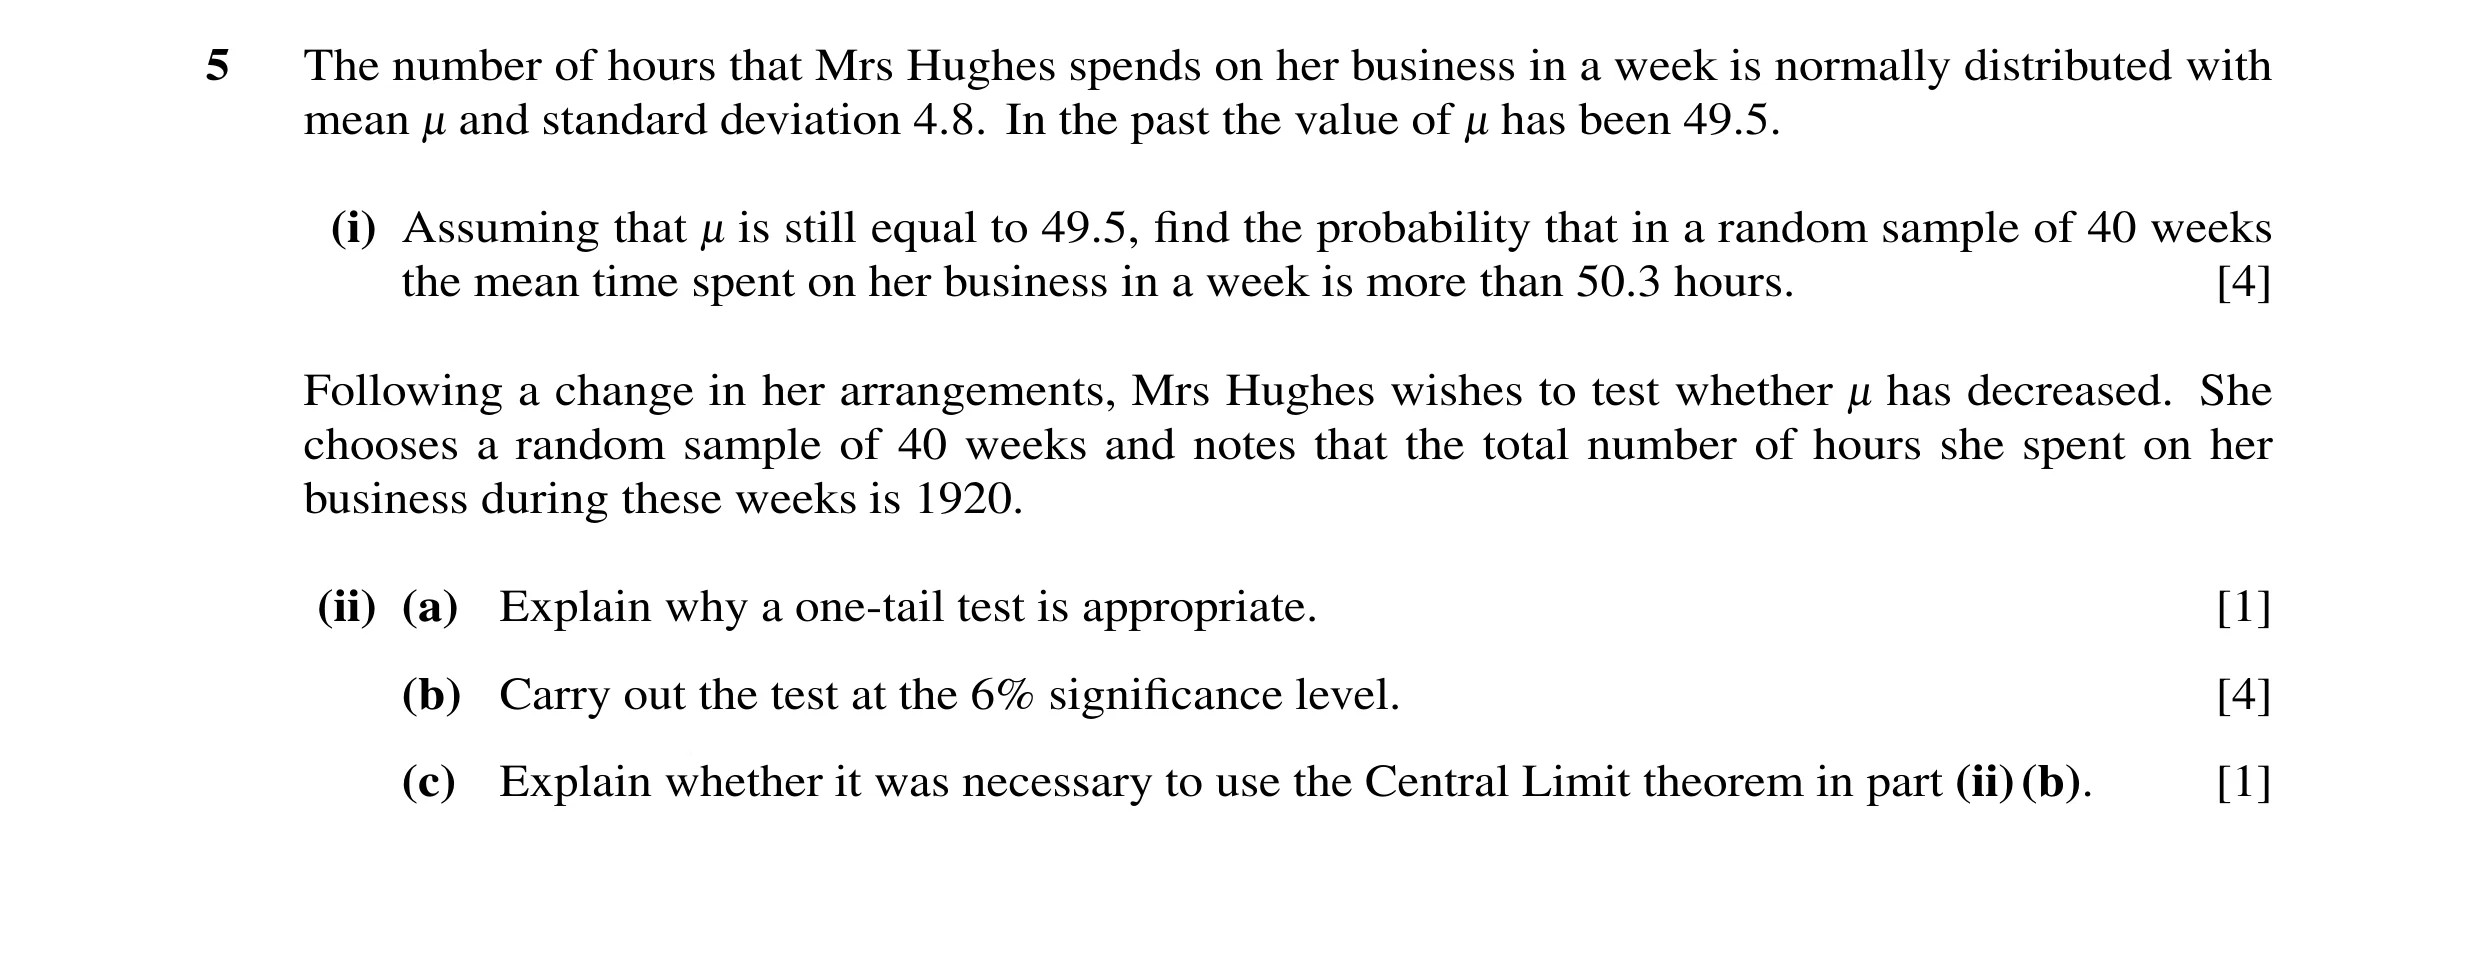
 8 / 37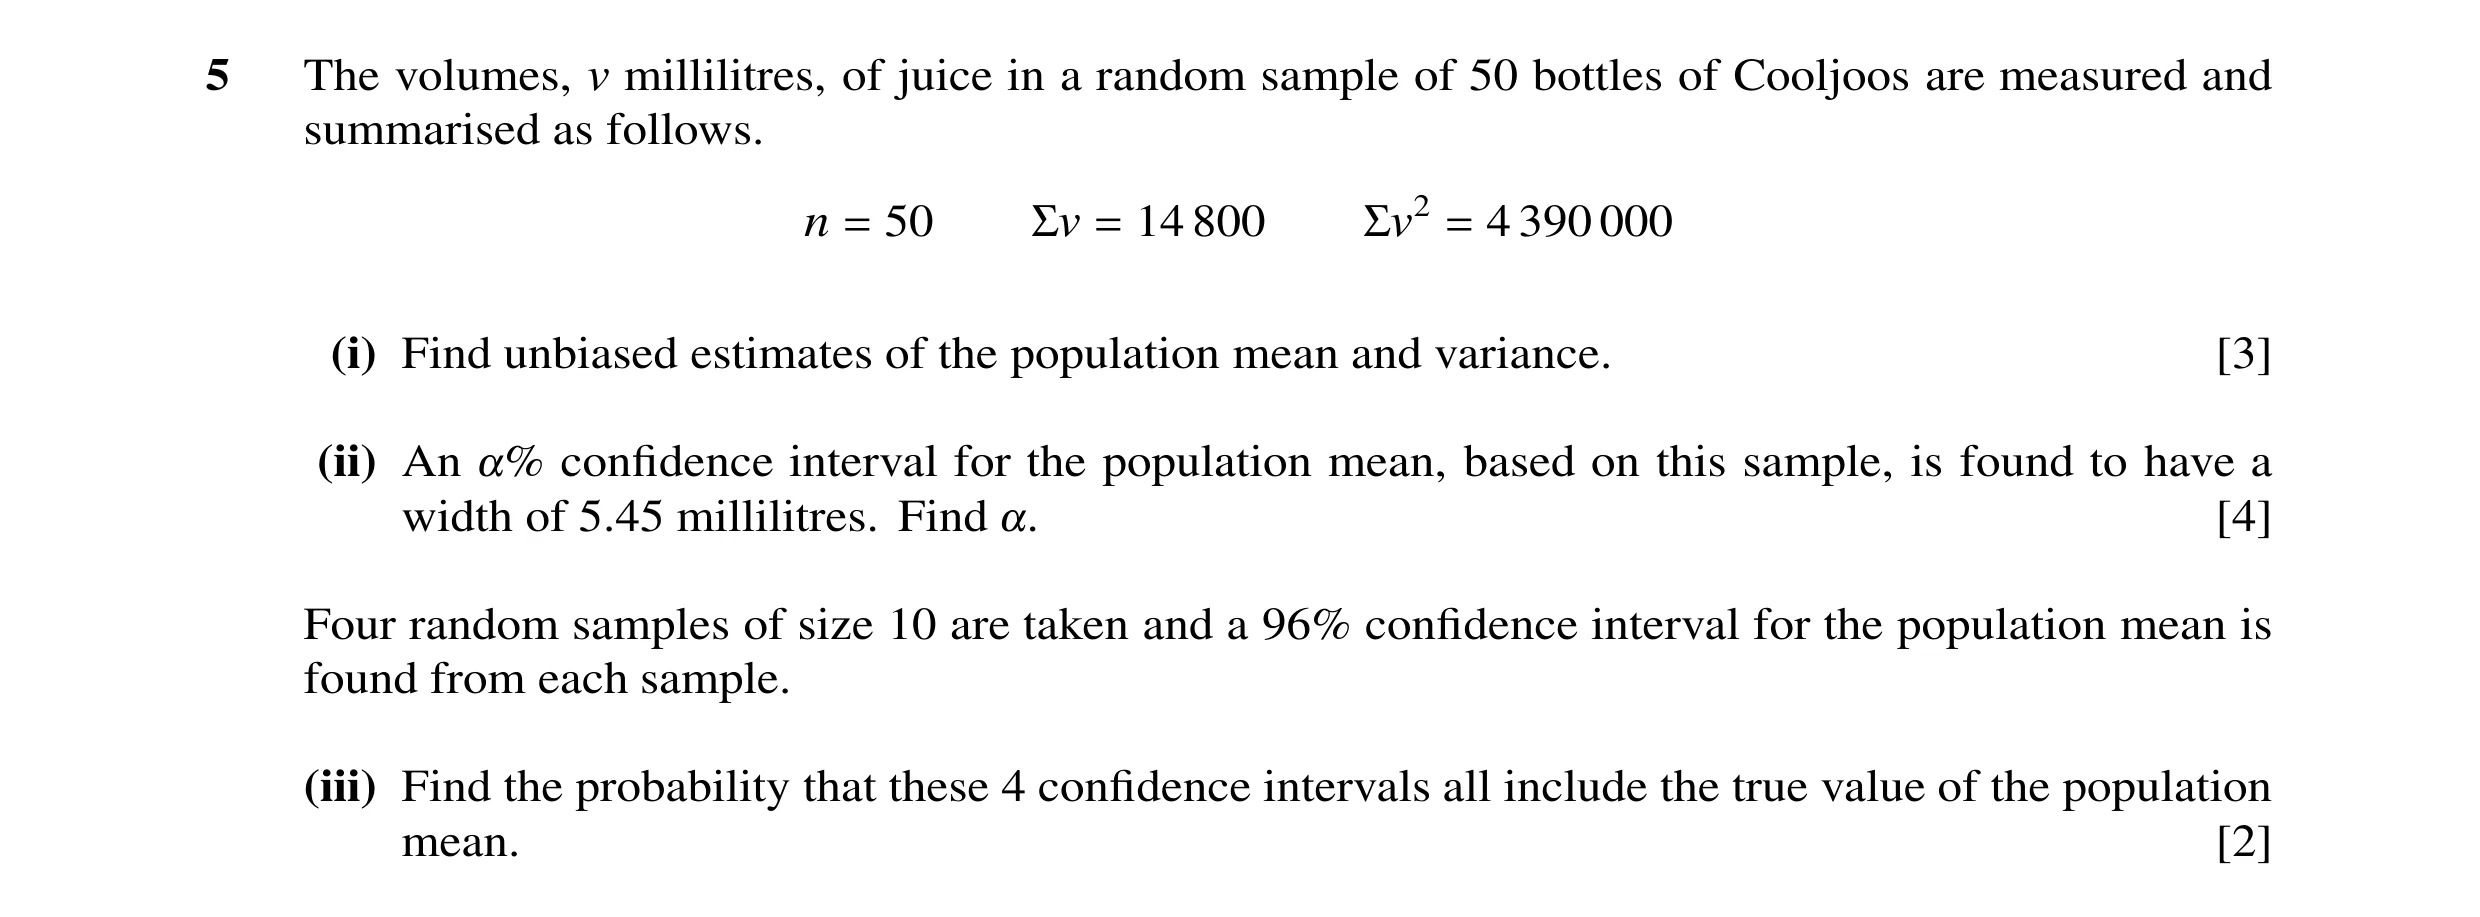
 9 / 37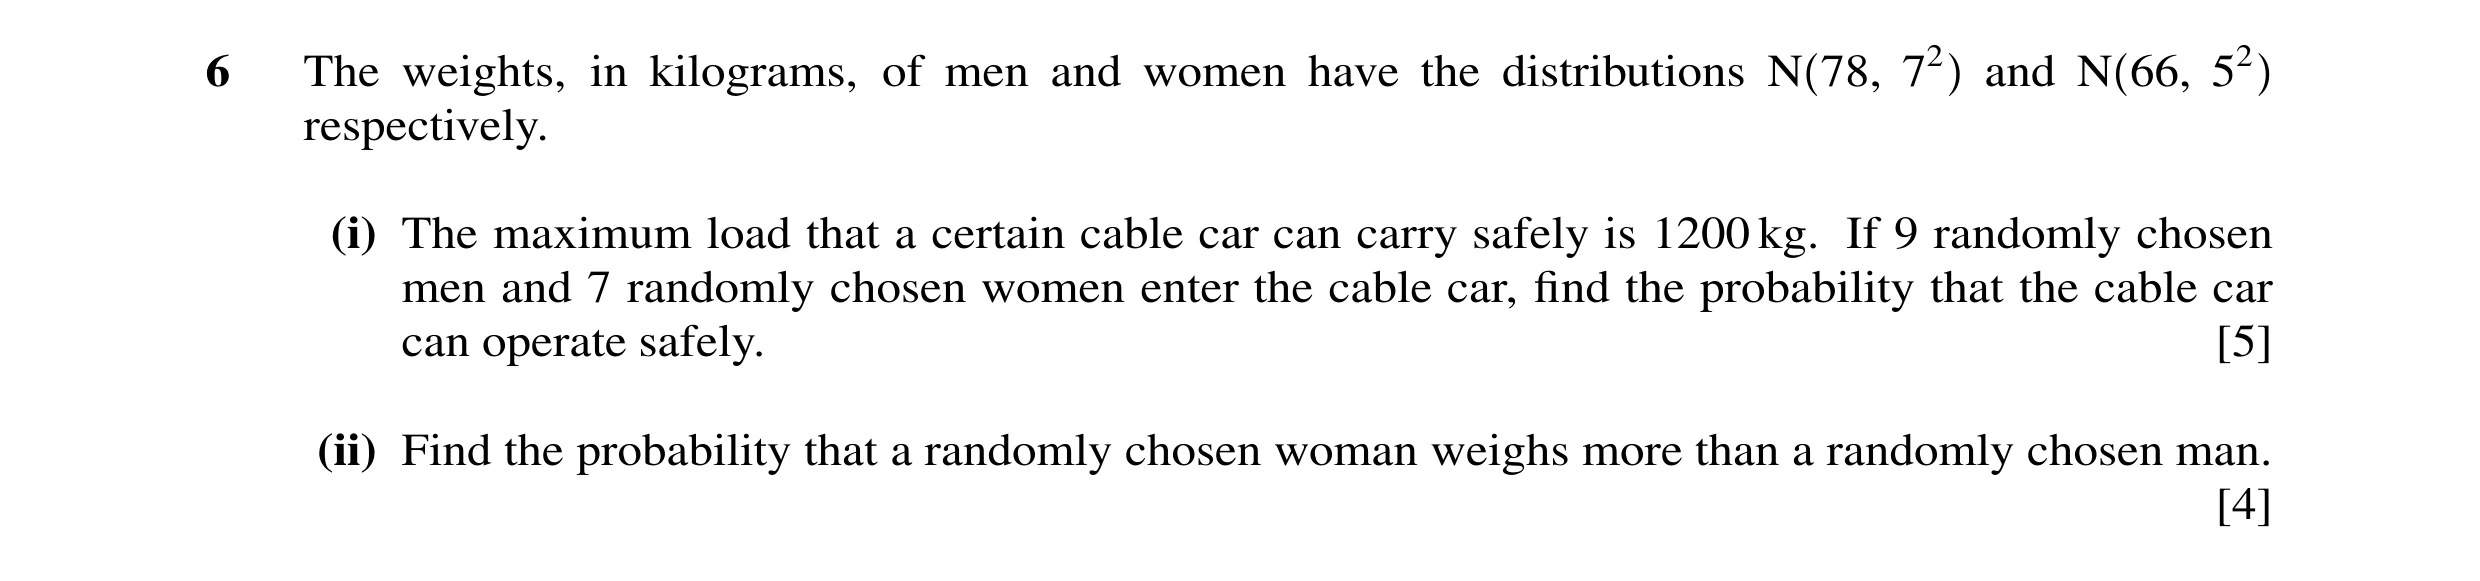
 10 / 37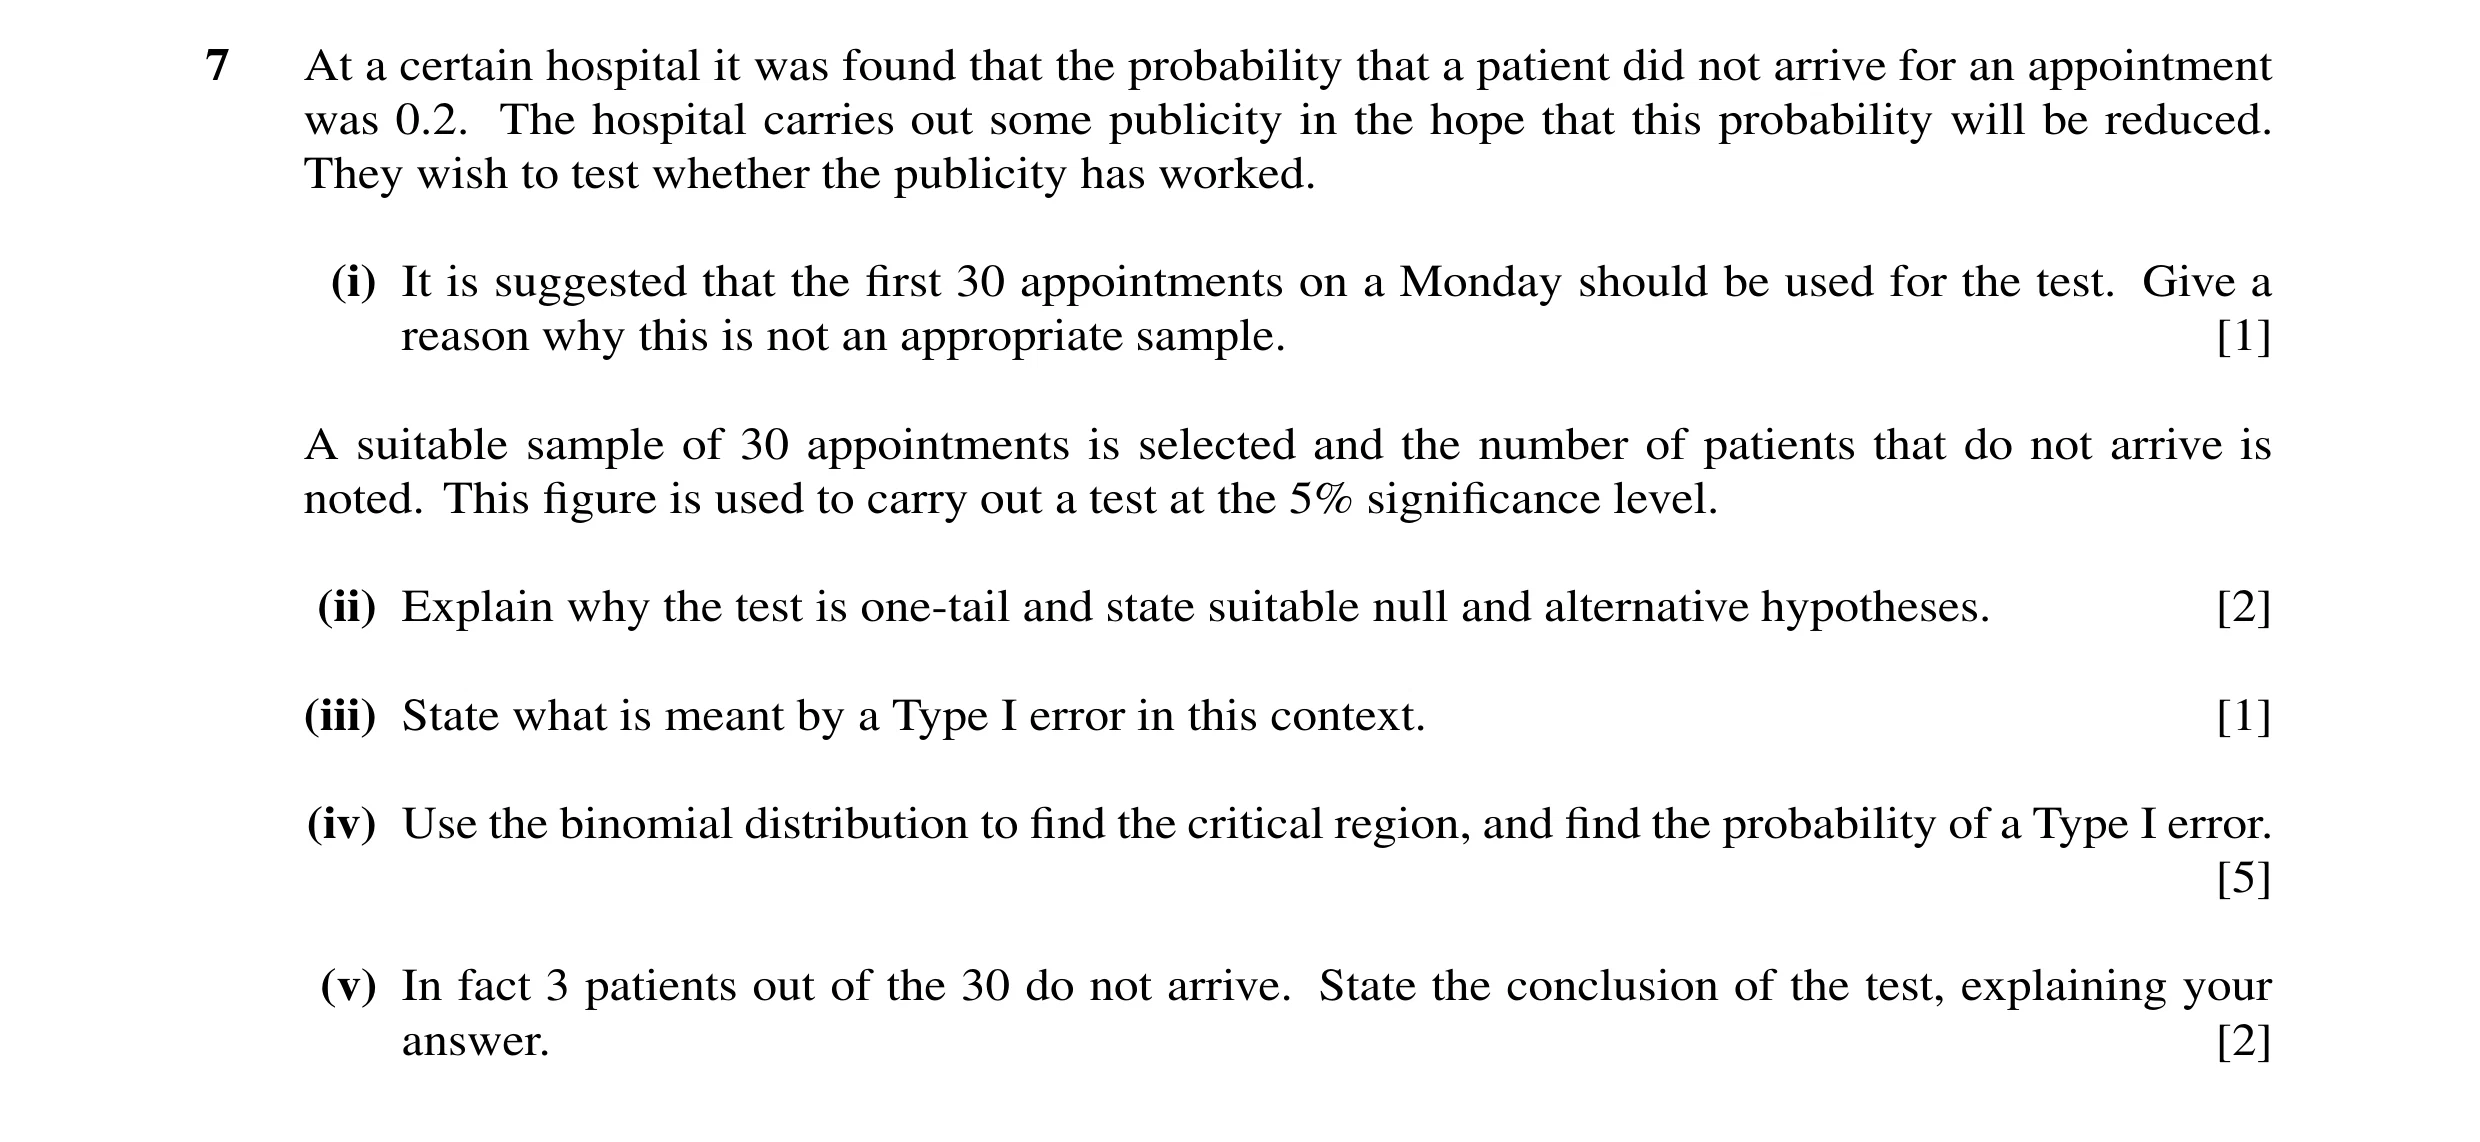

 11 / 37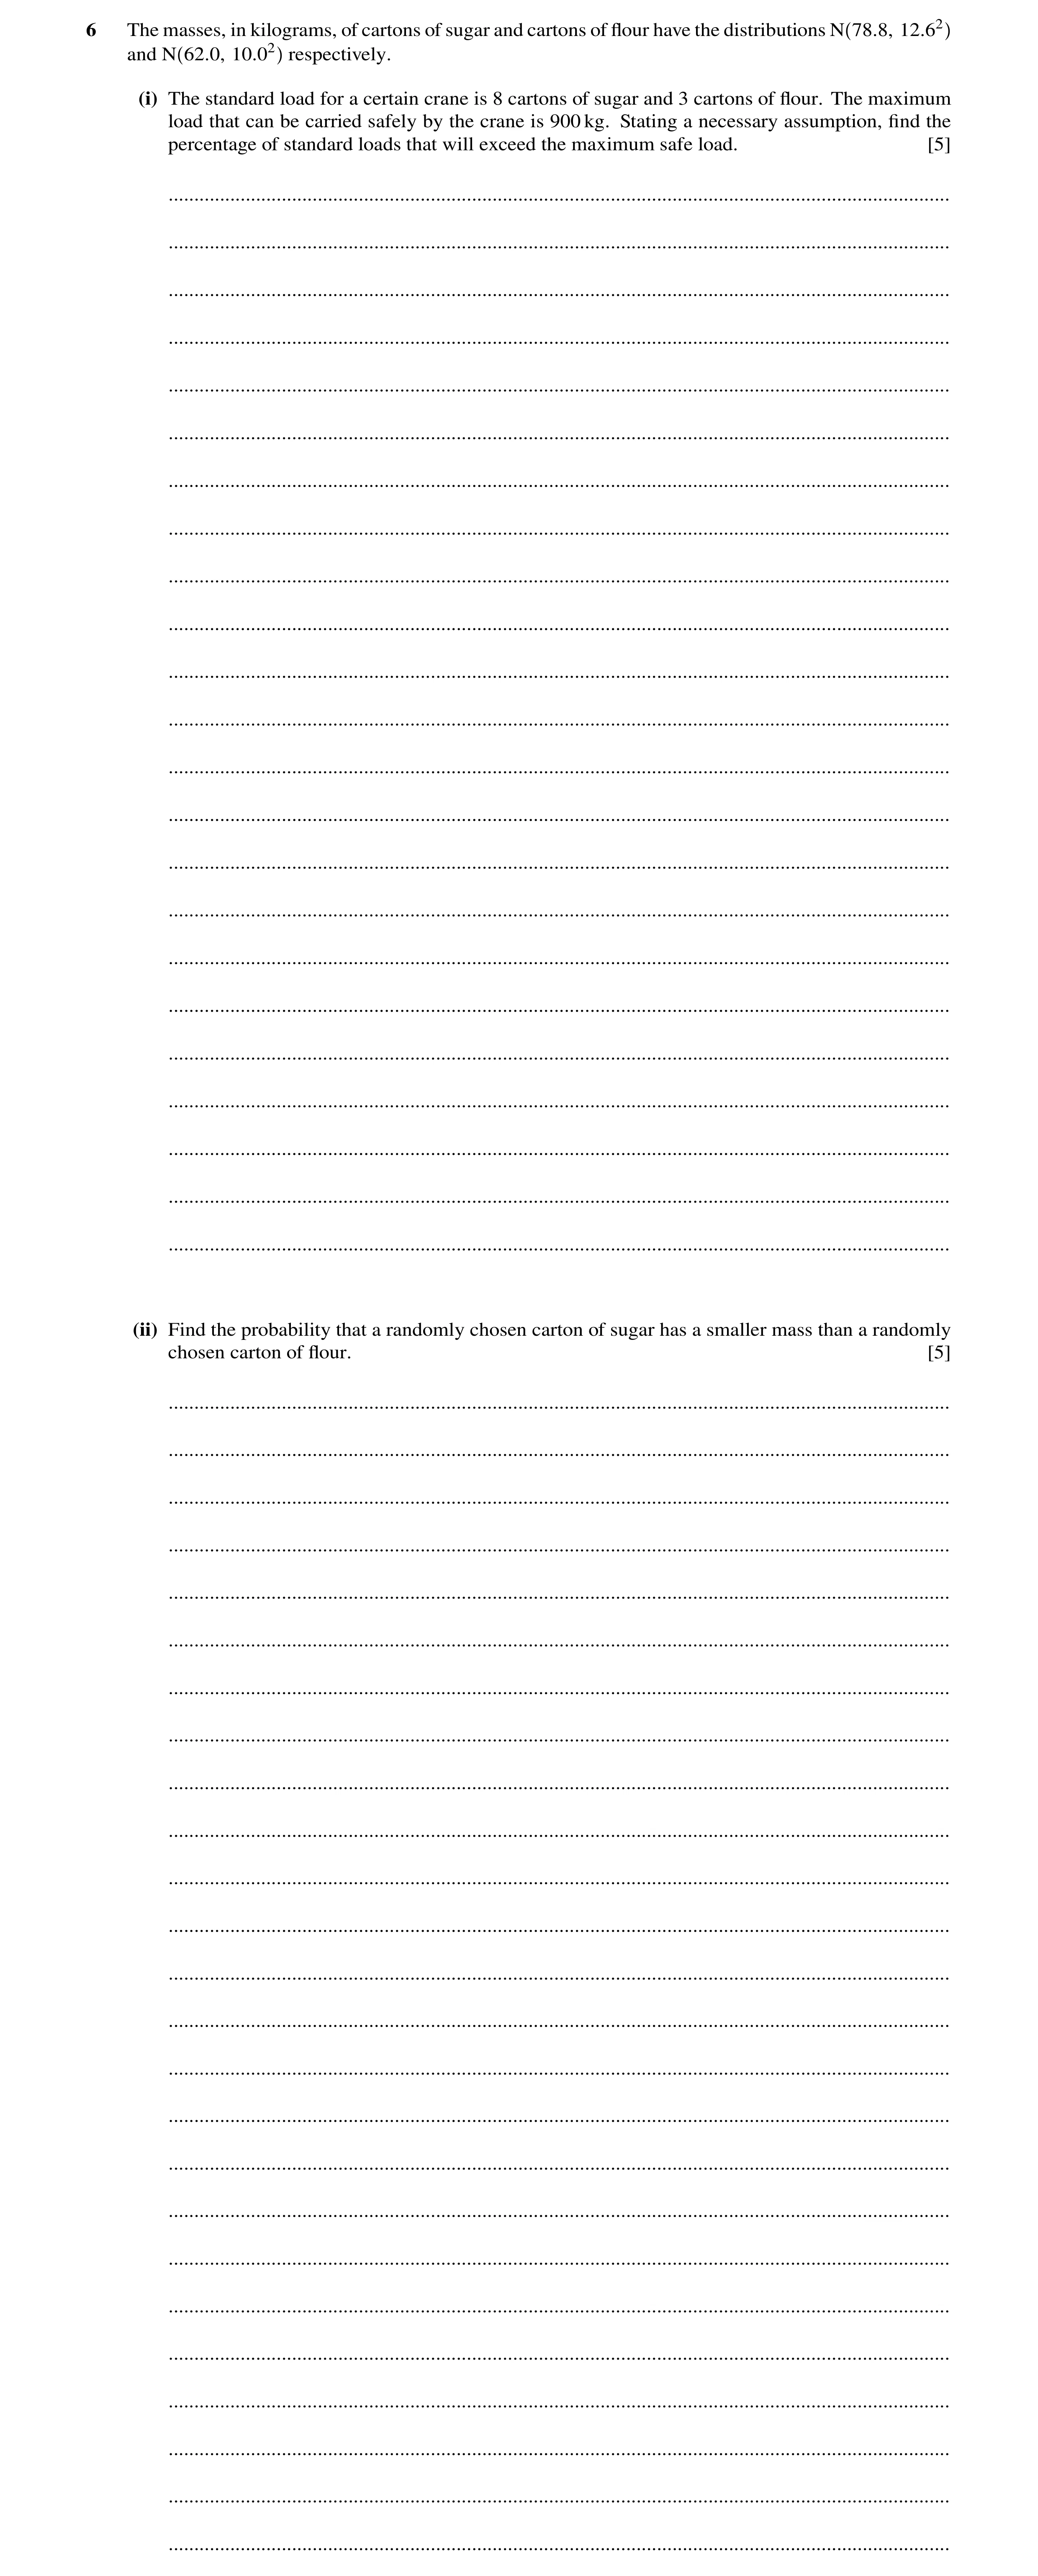
 14 / 37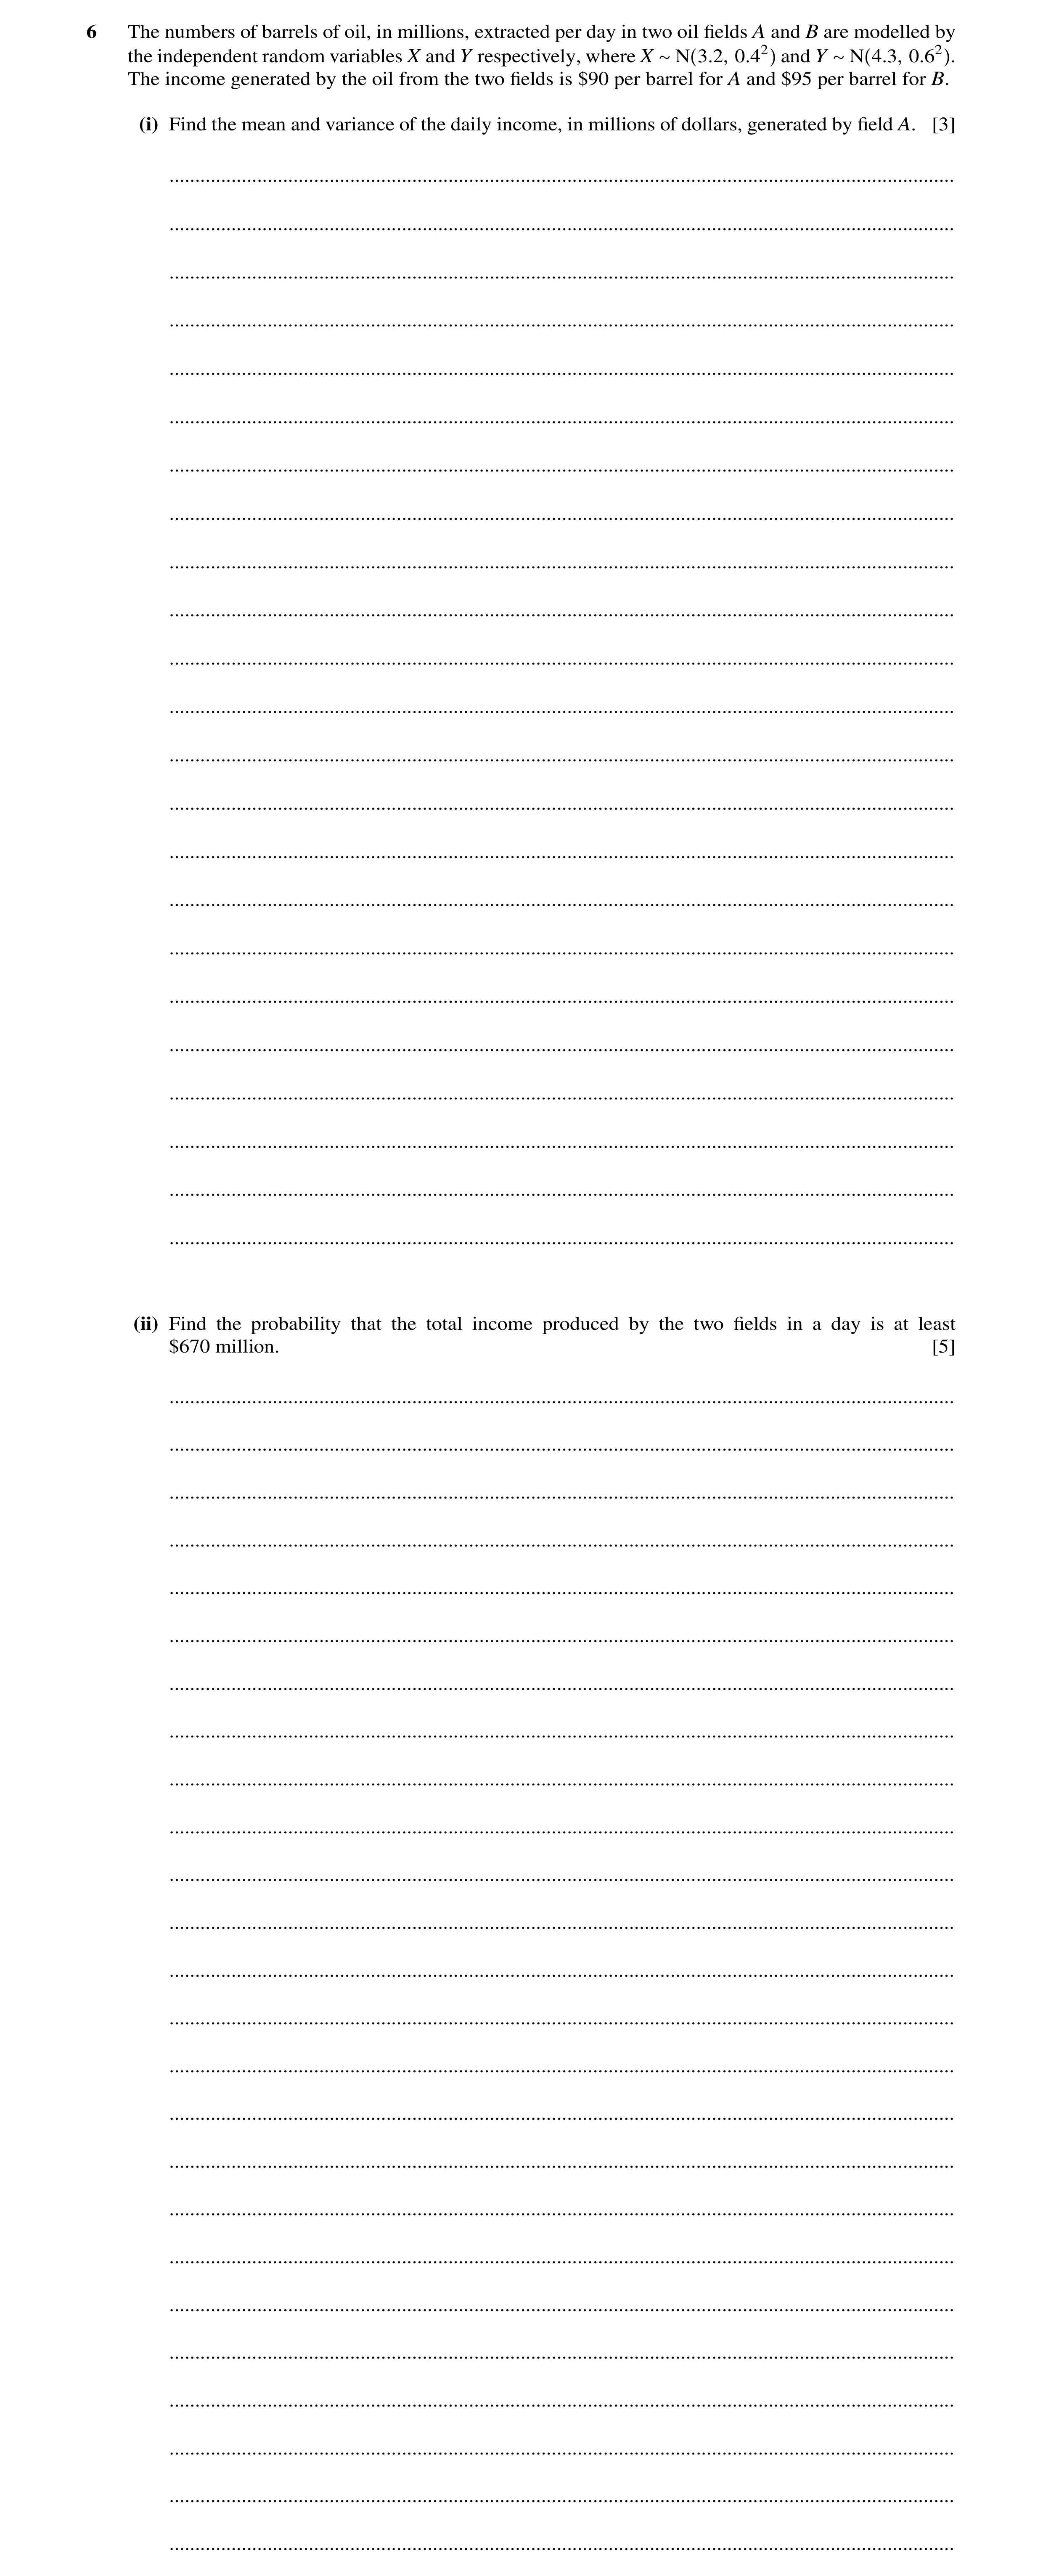
 21 / 37
 22 / 37
 23 / 37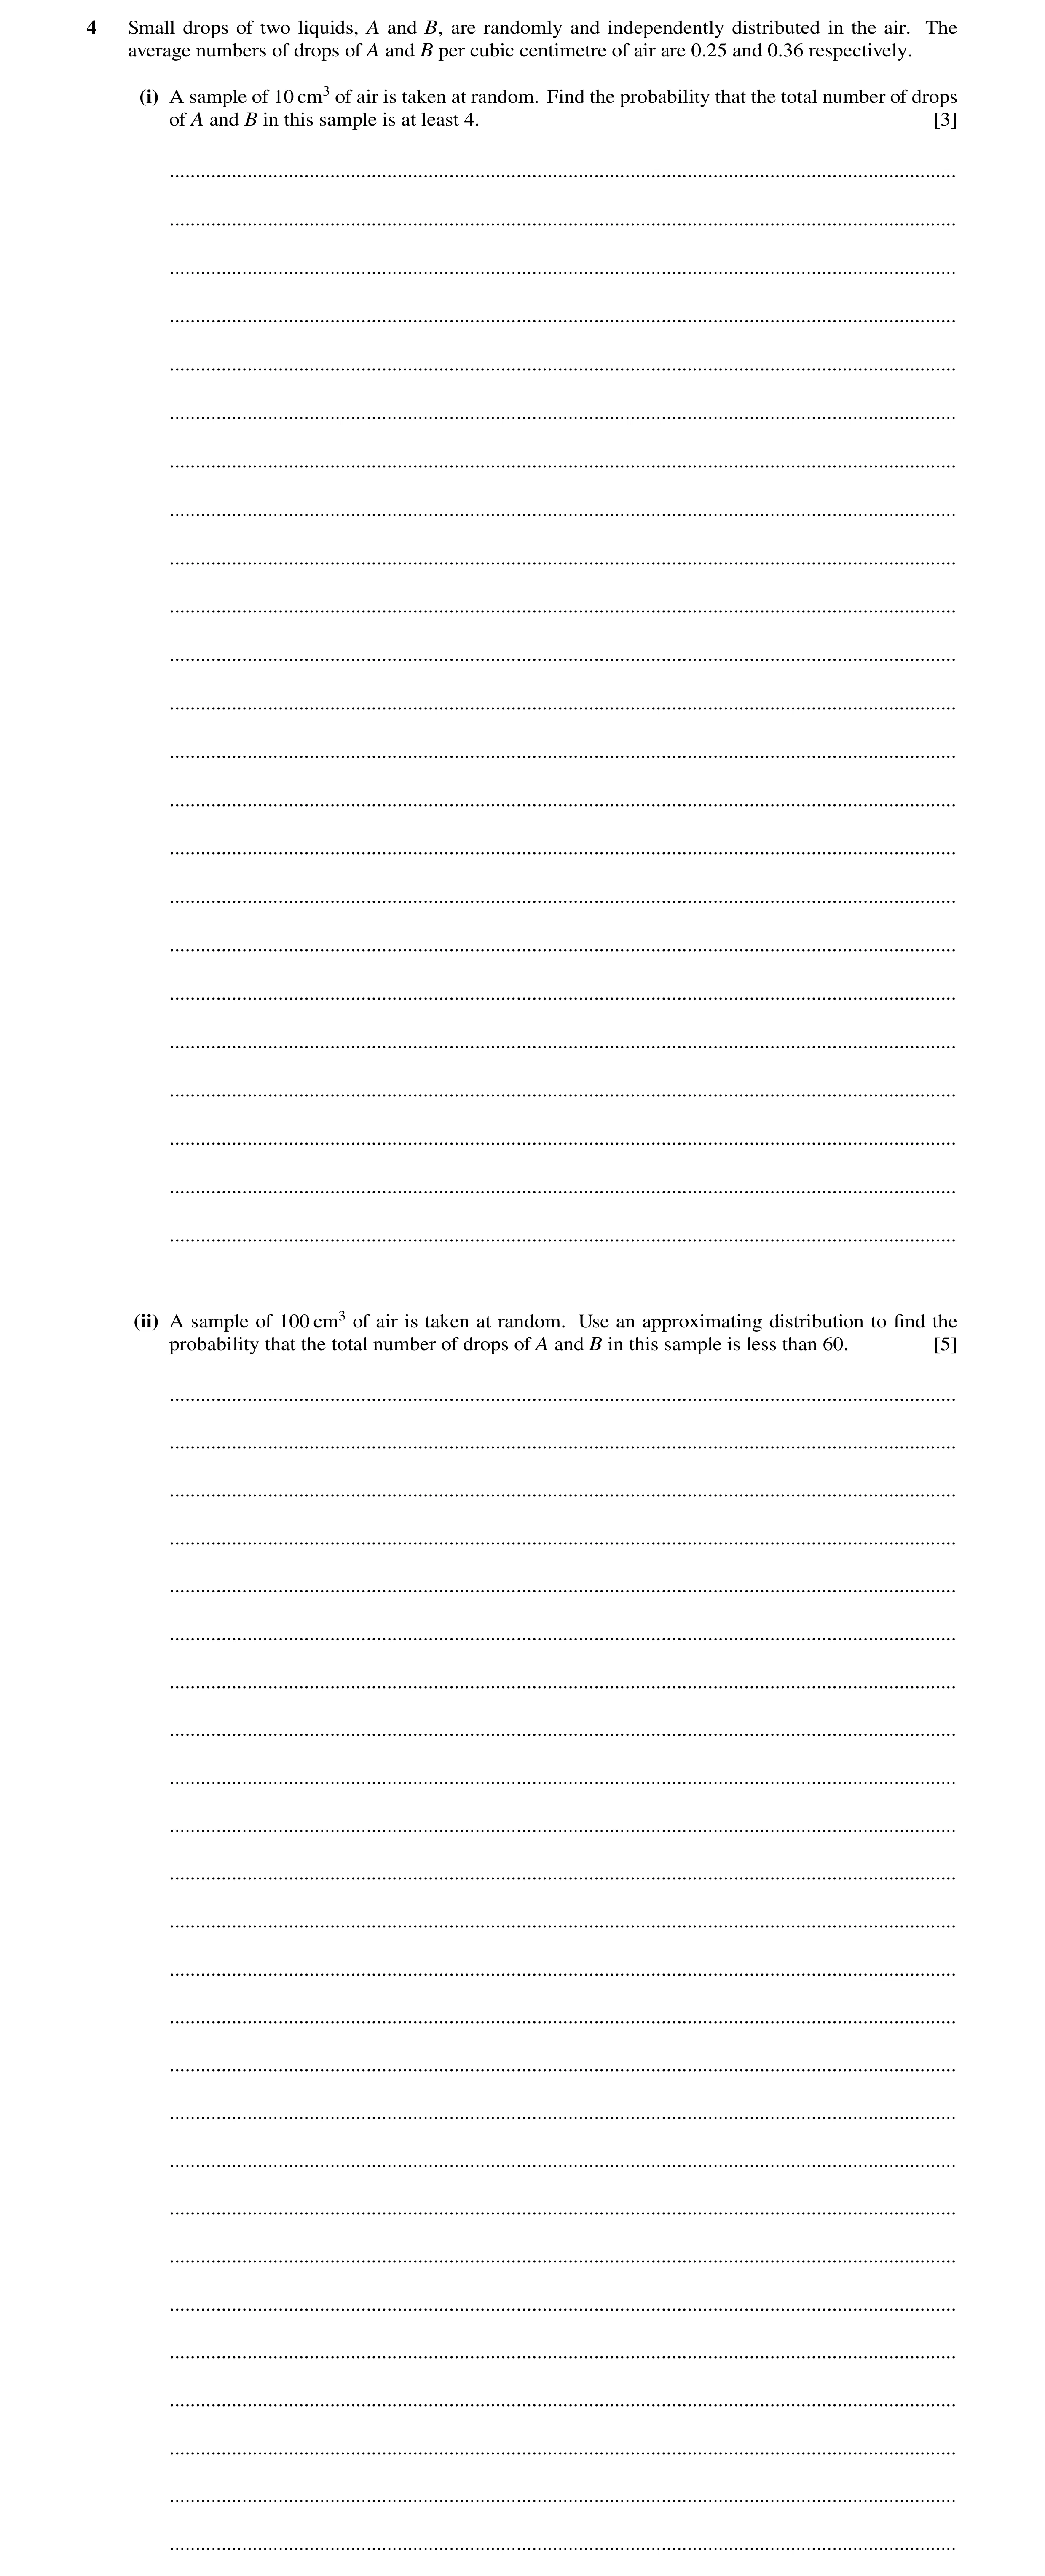
 30 / 37
 33 / 37
 36 / 37
 37 / 37
 10
10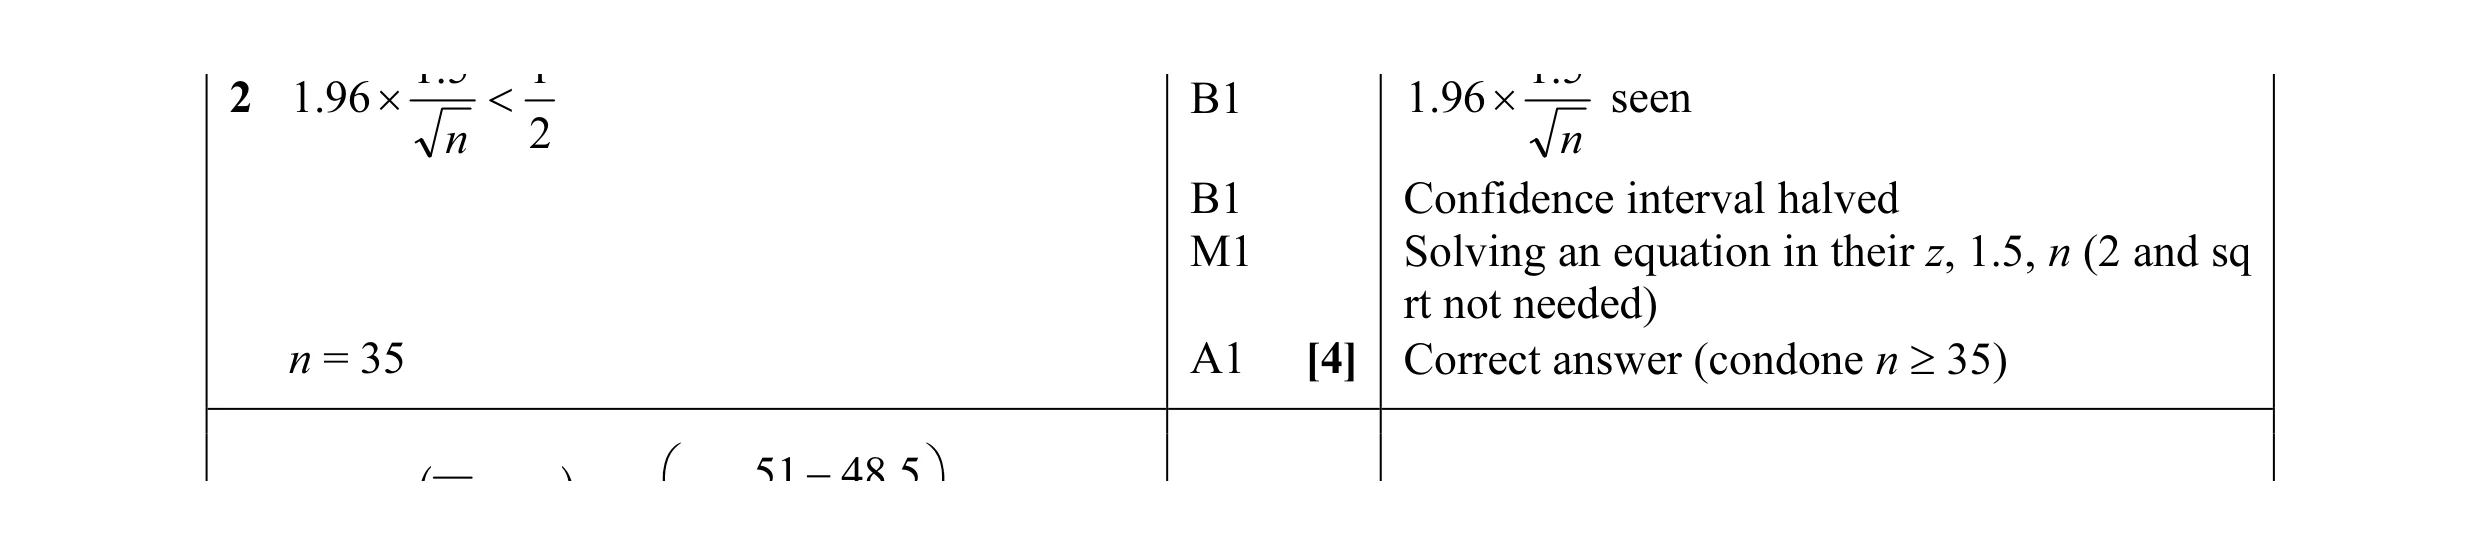 4
4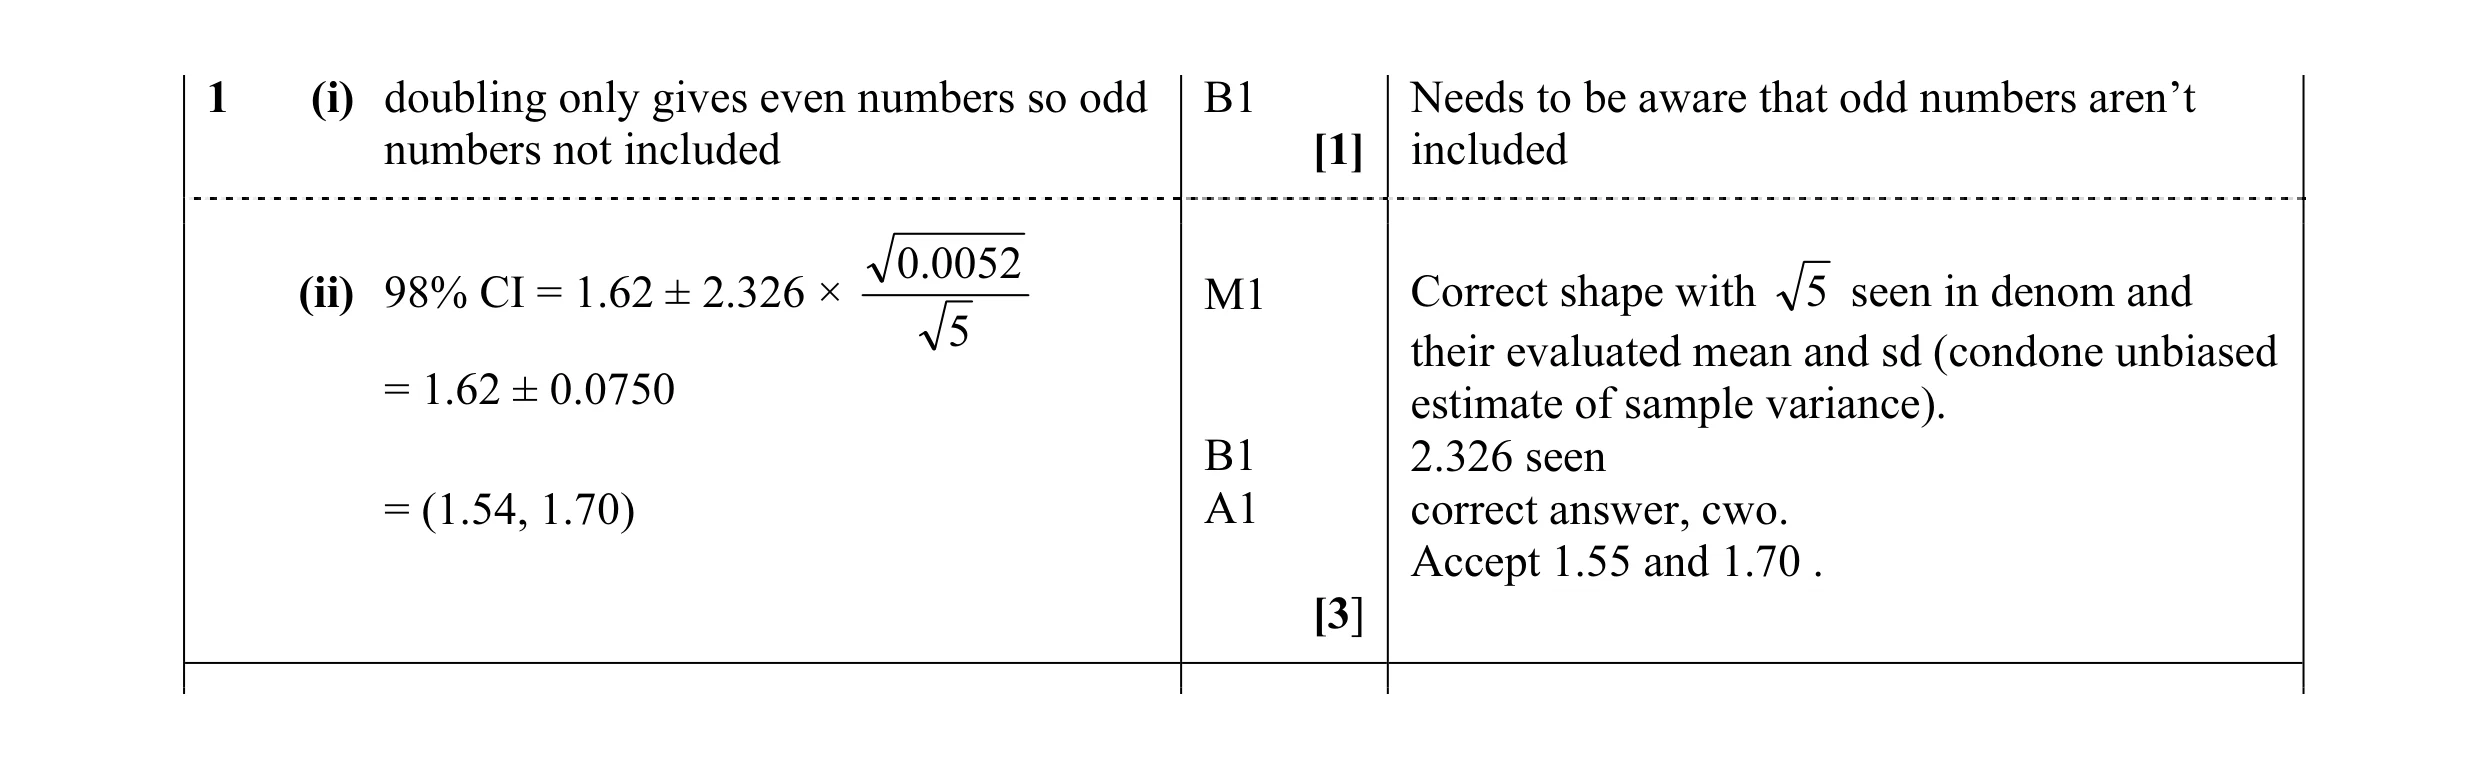 4
4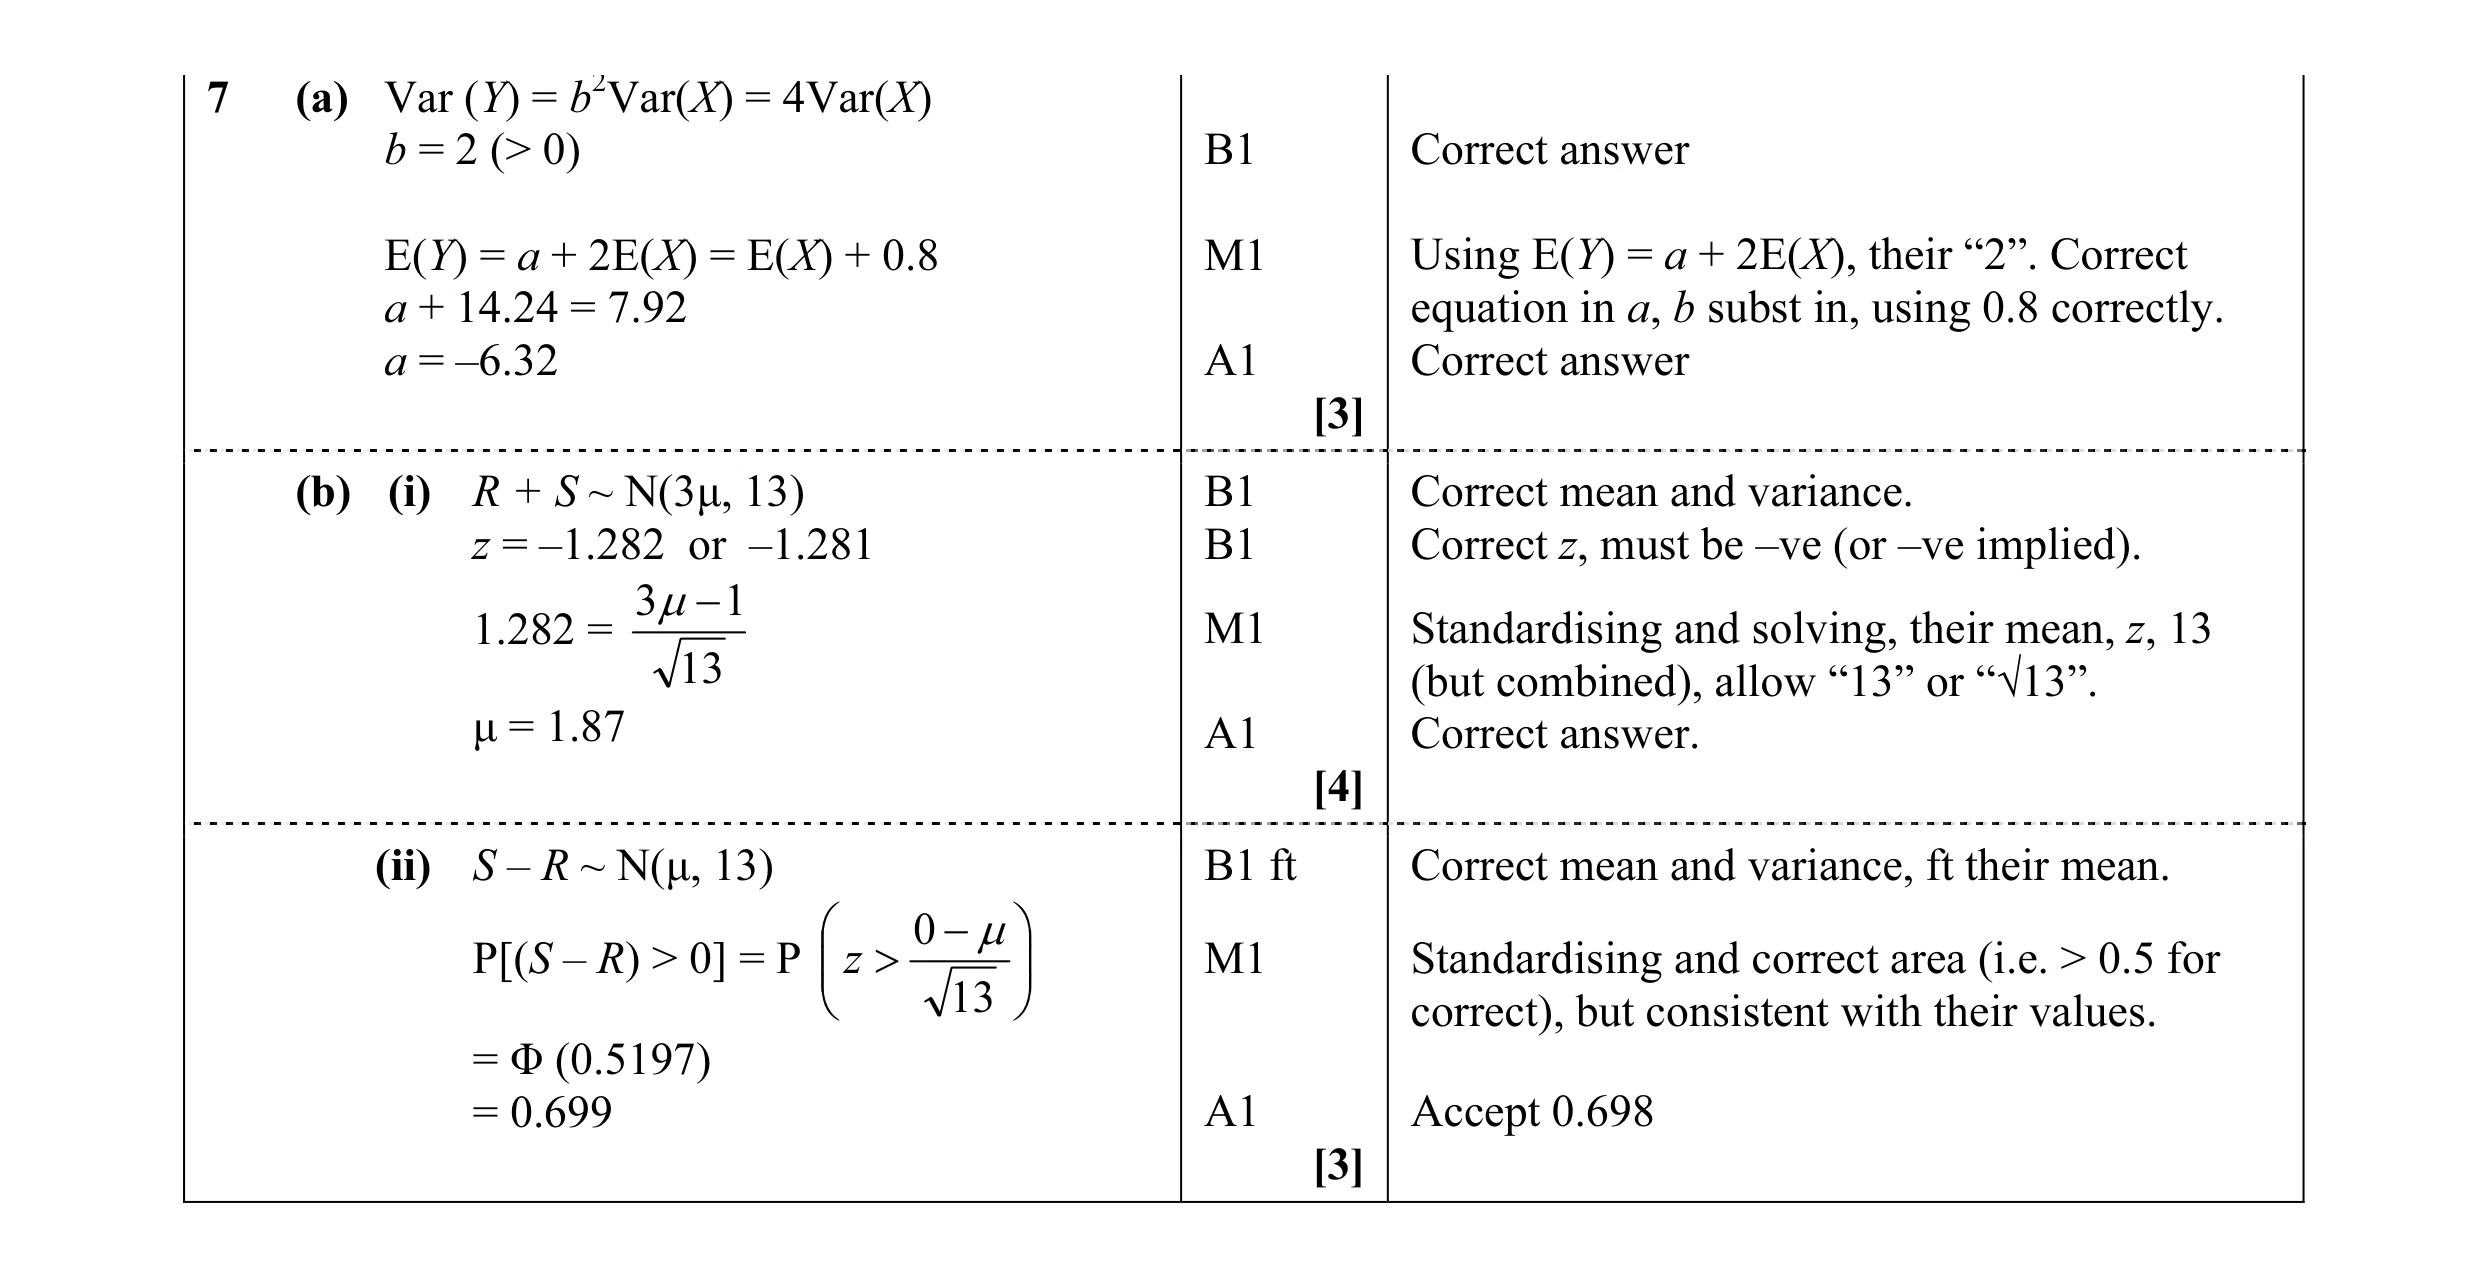 10
10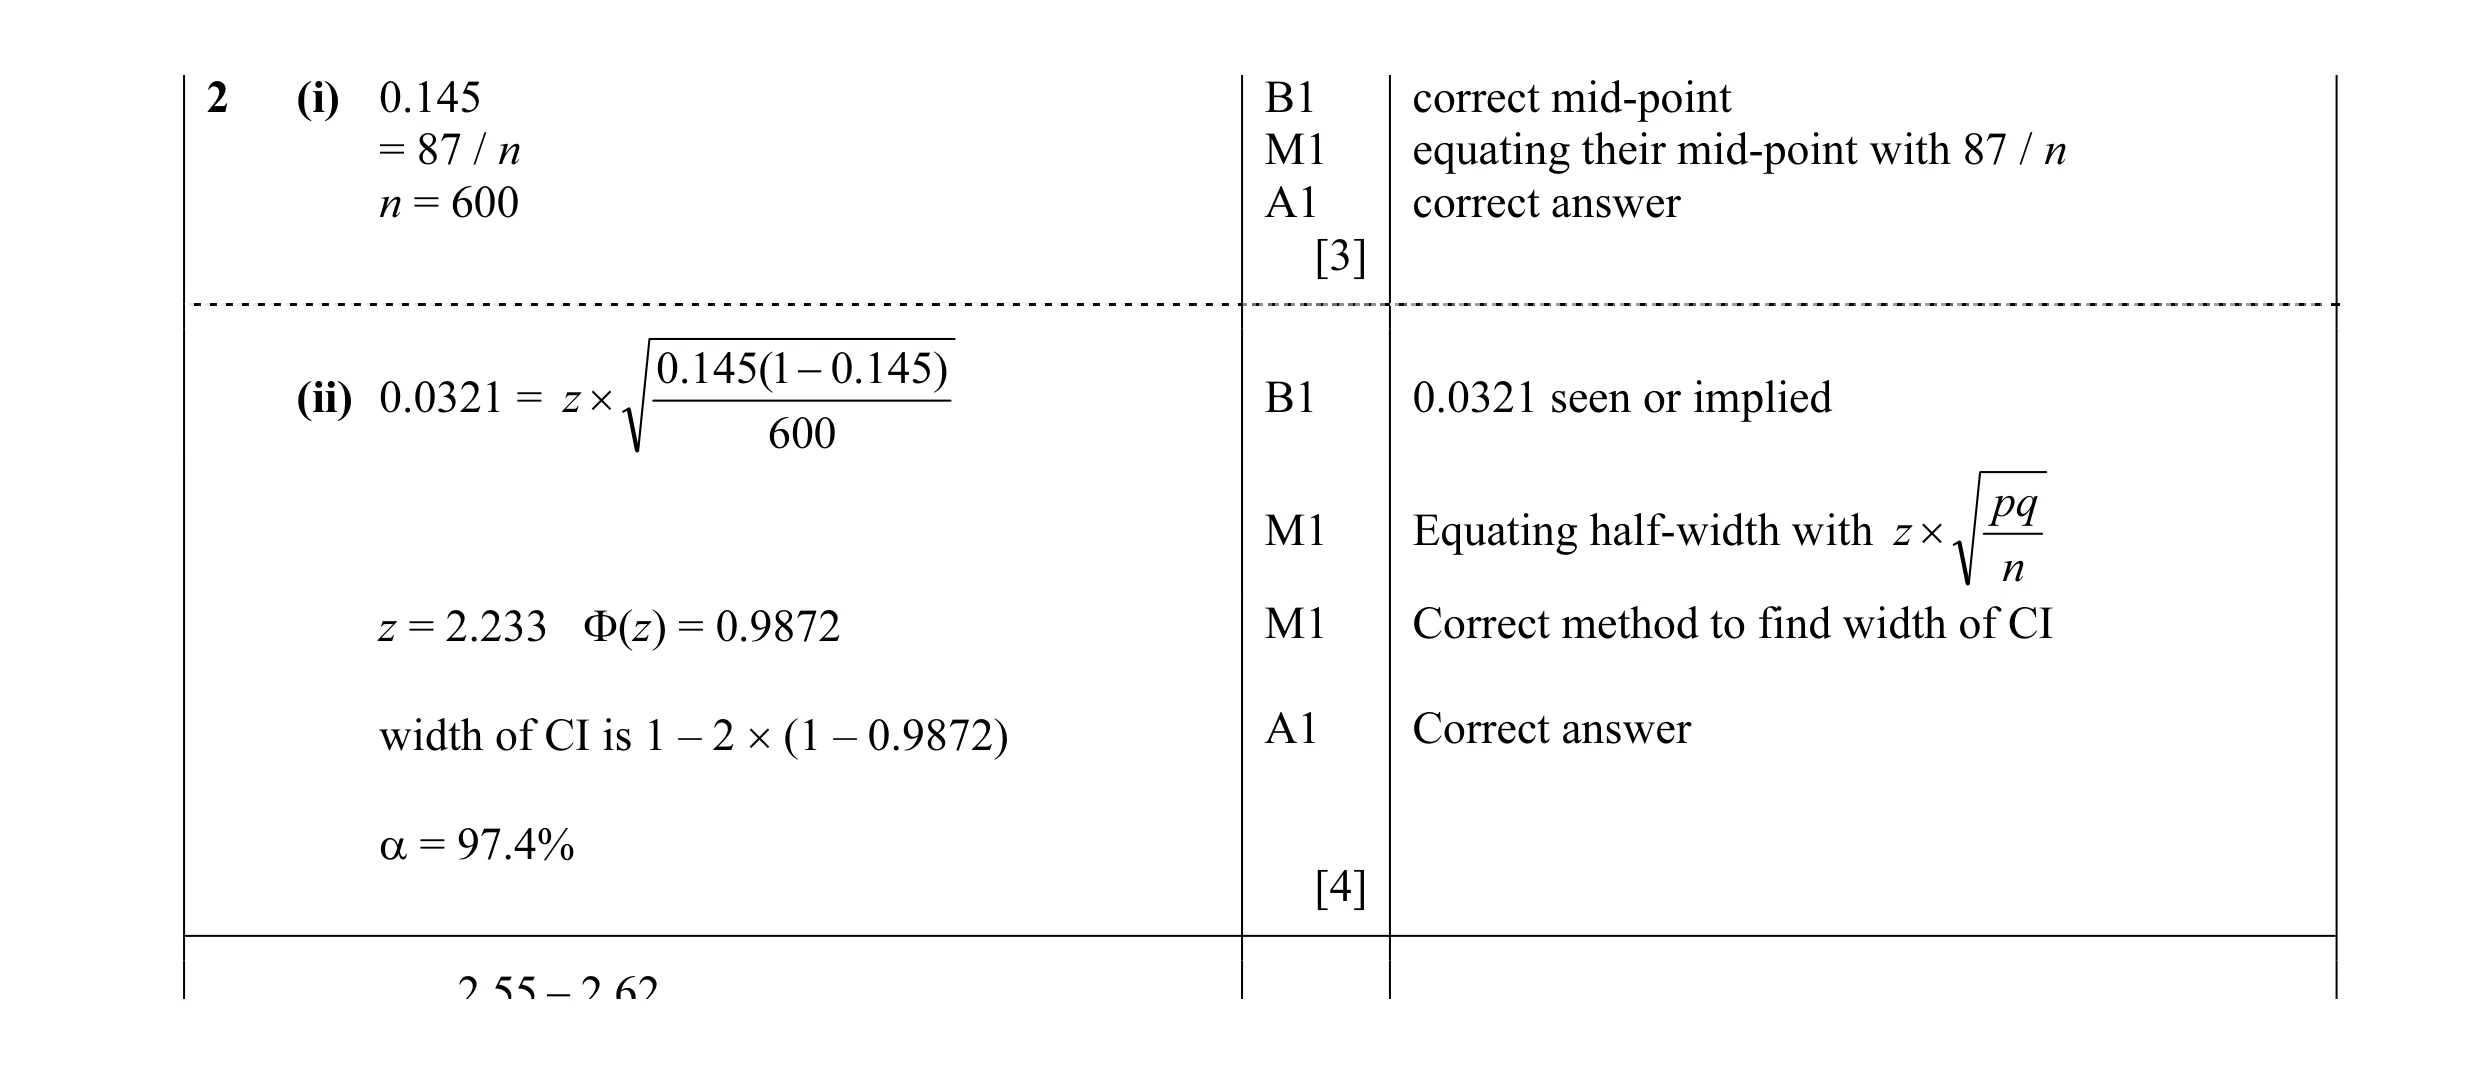 7
7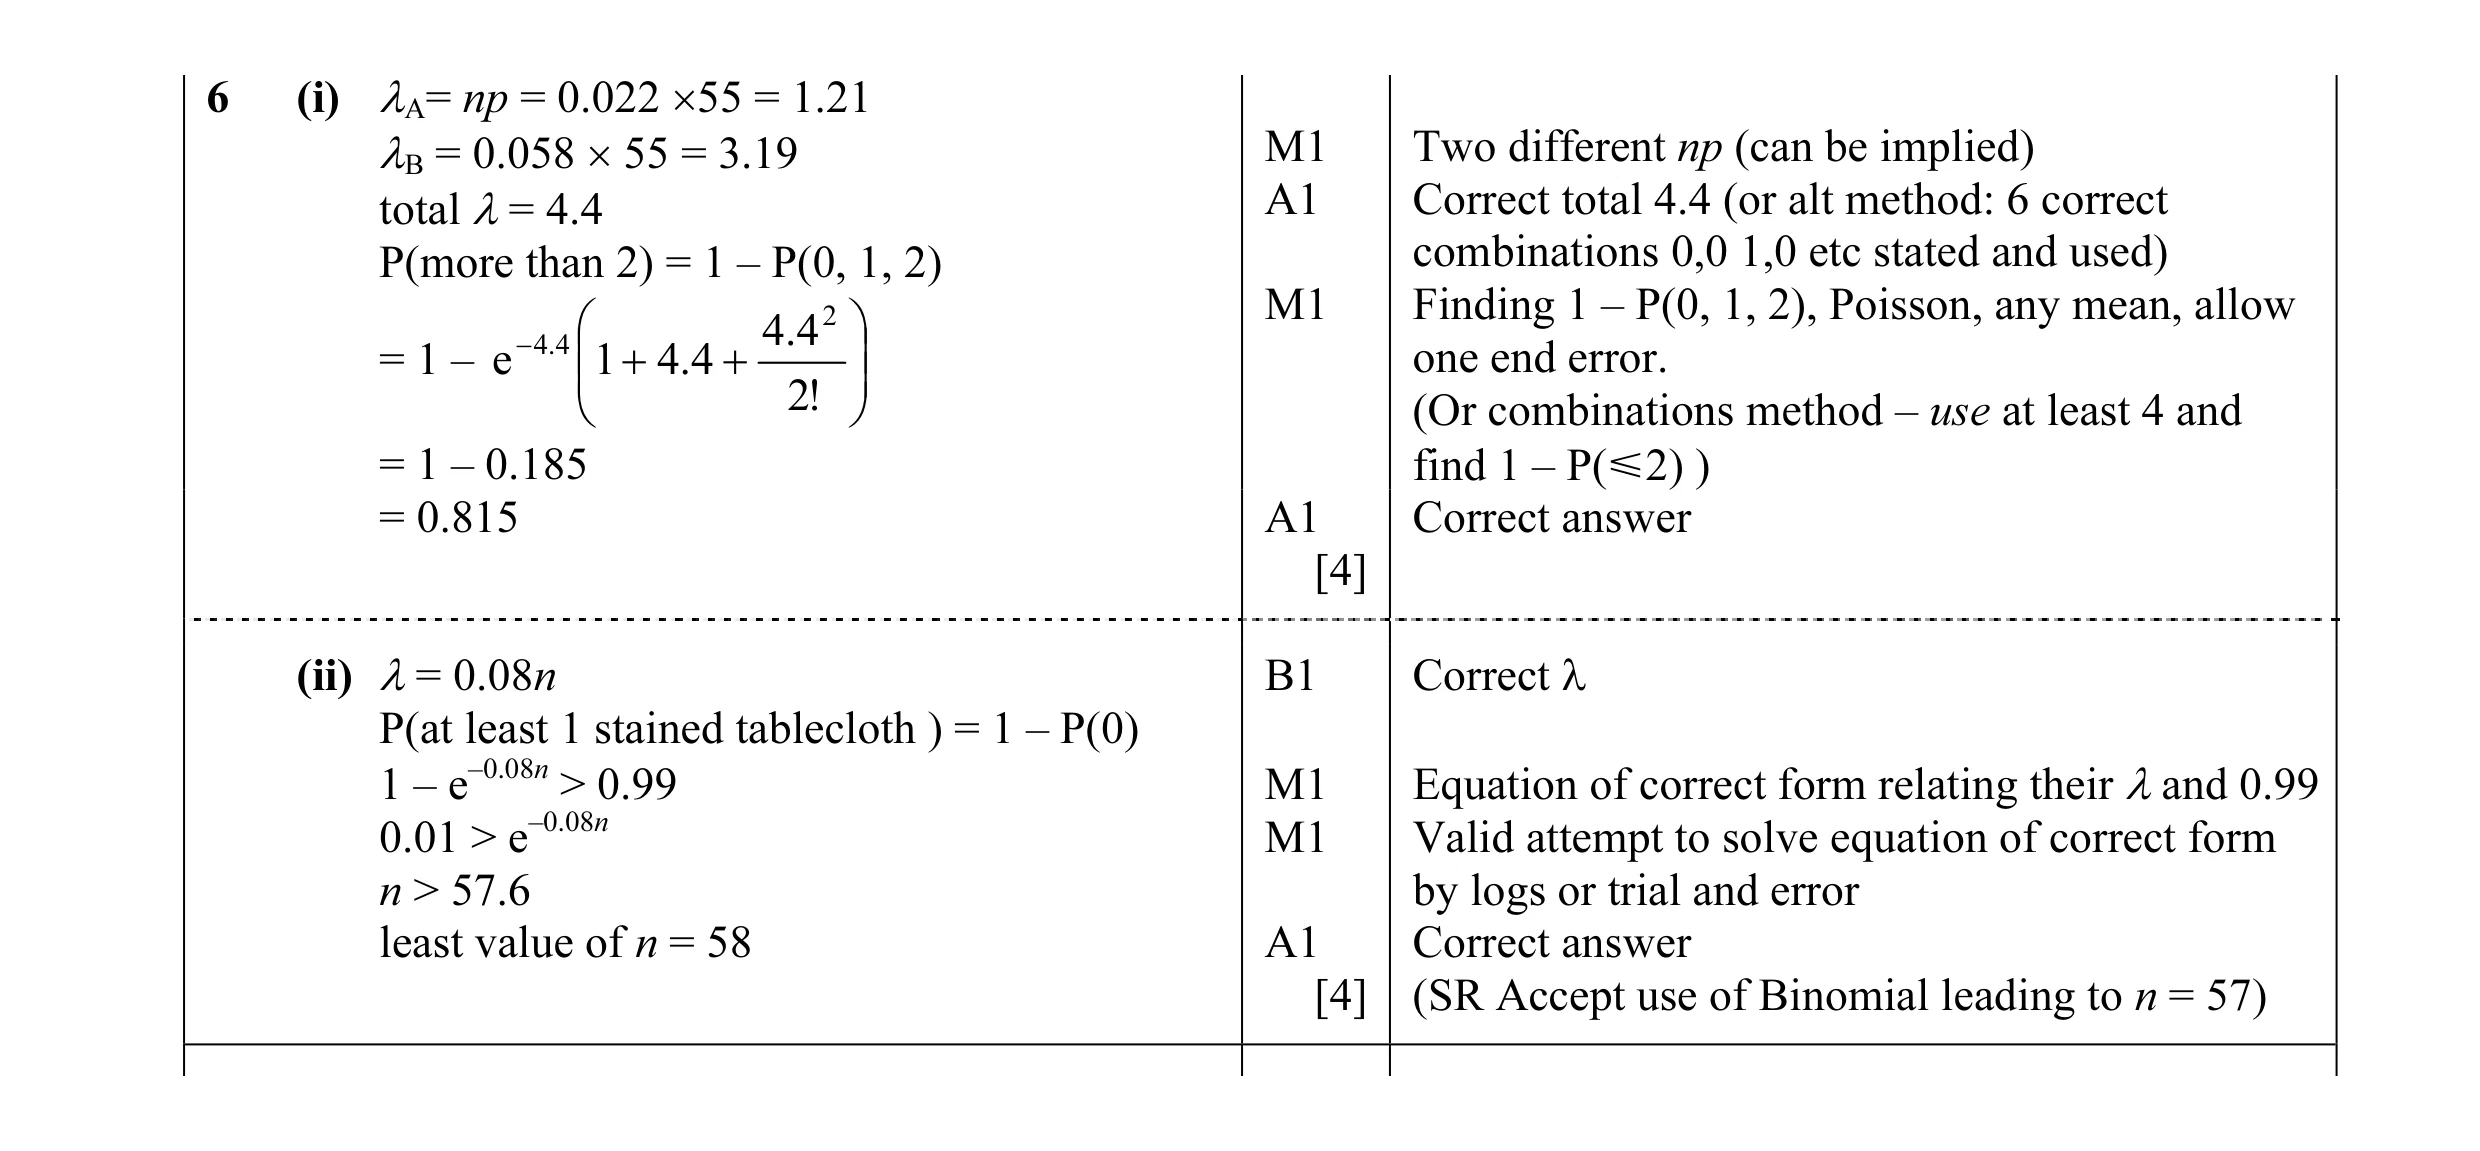 8
8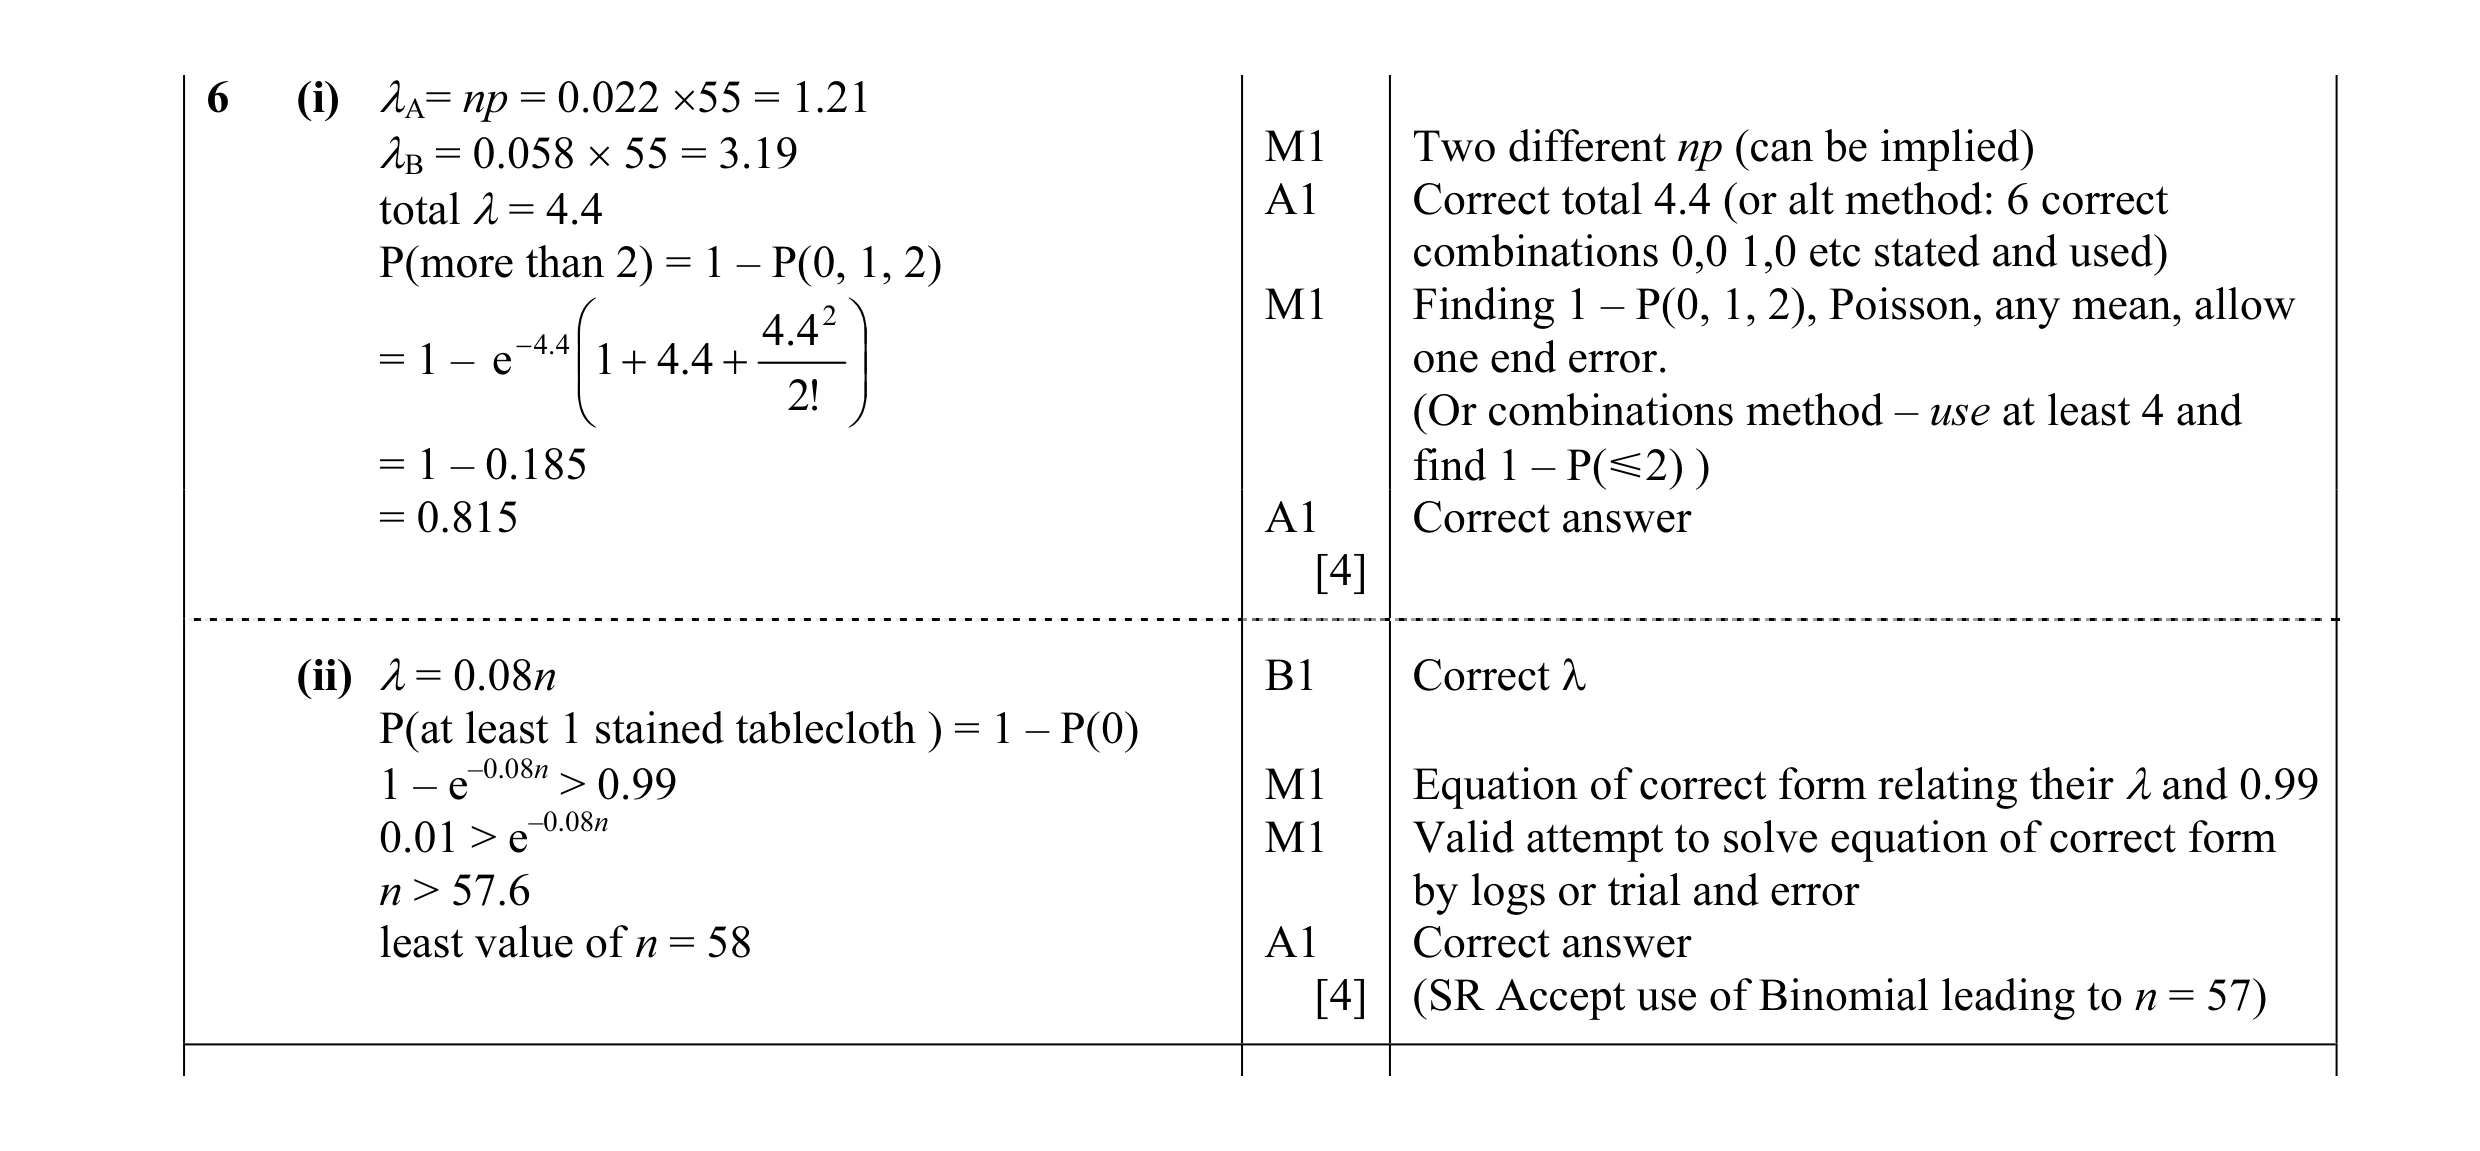 8
8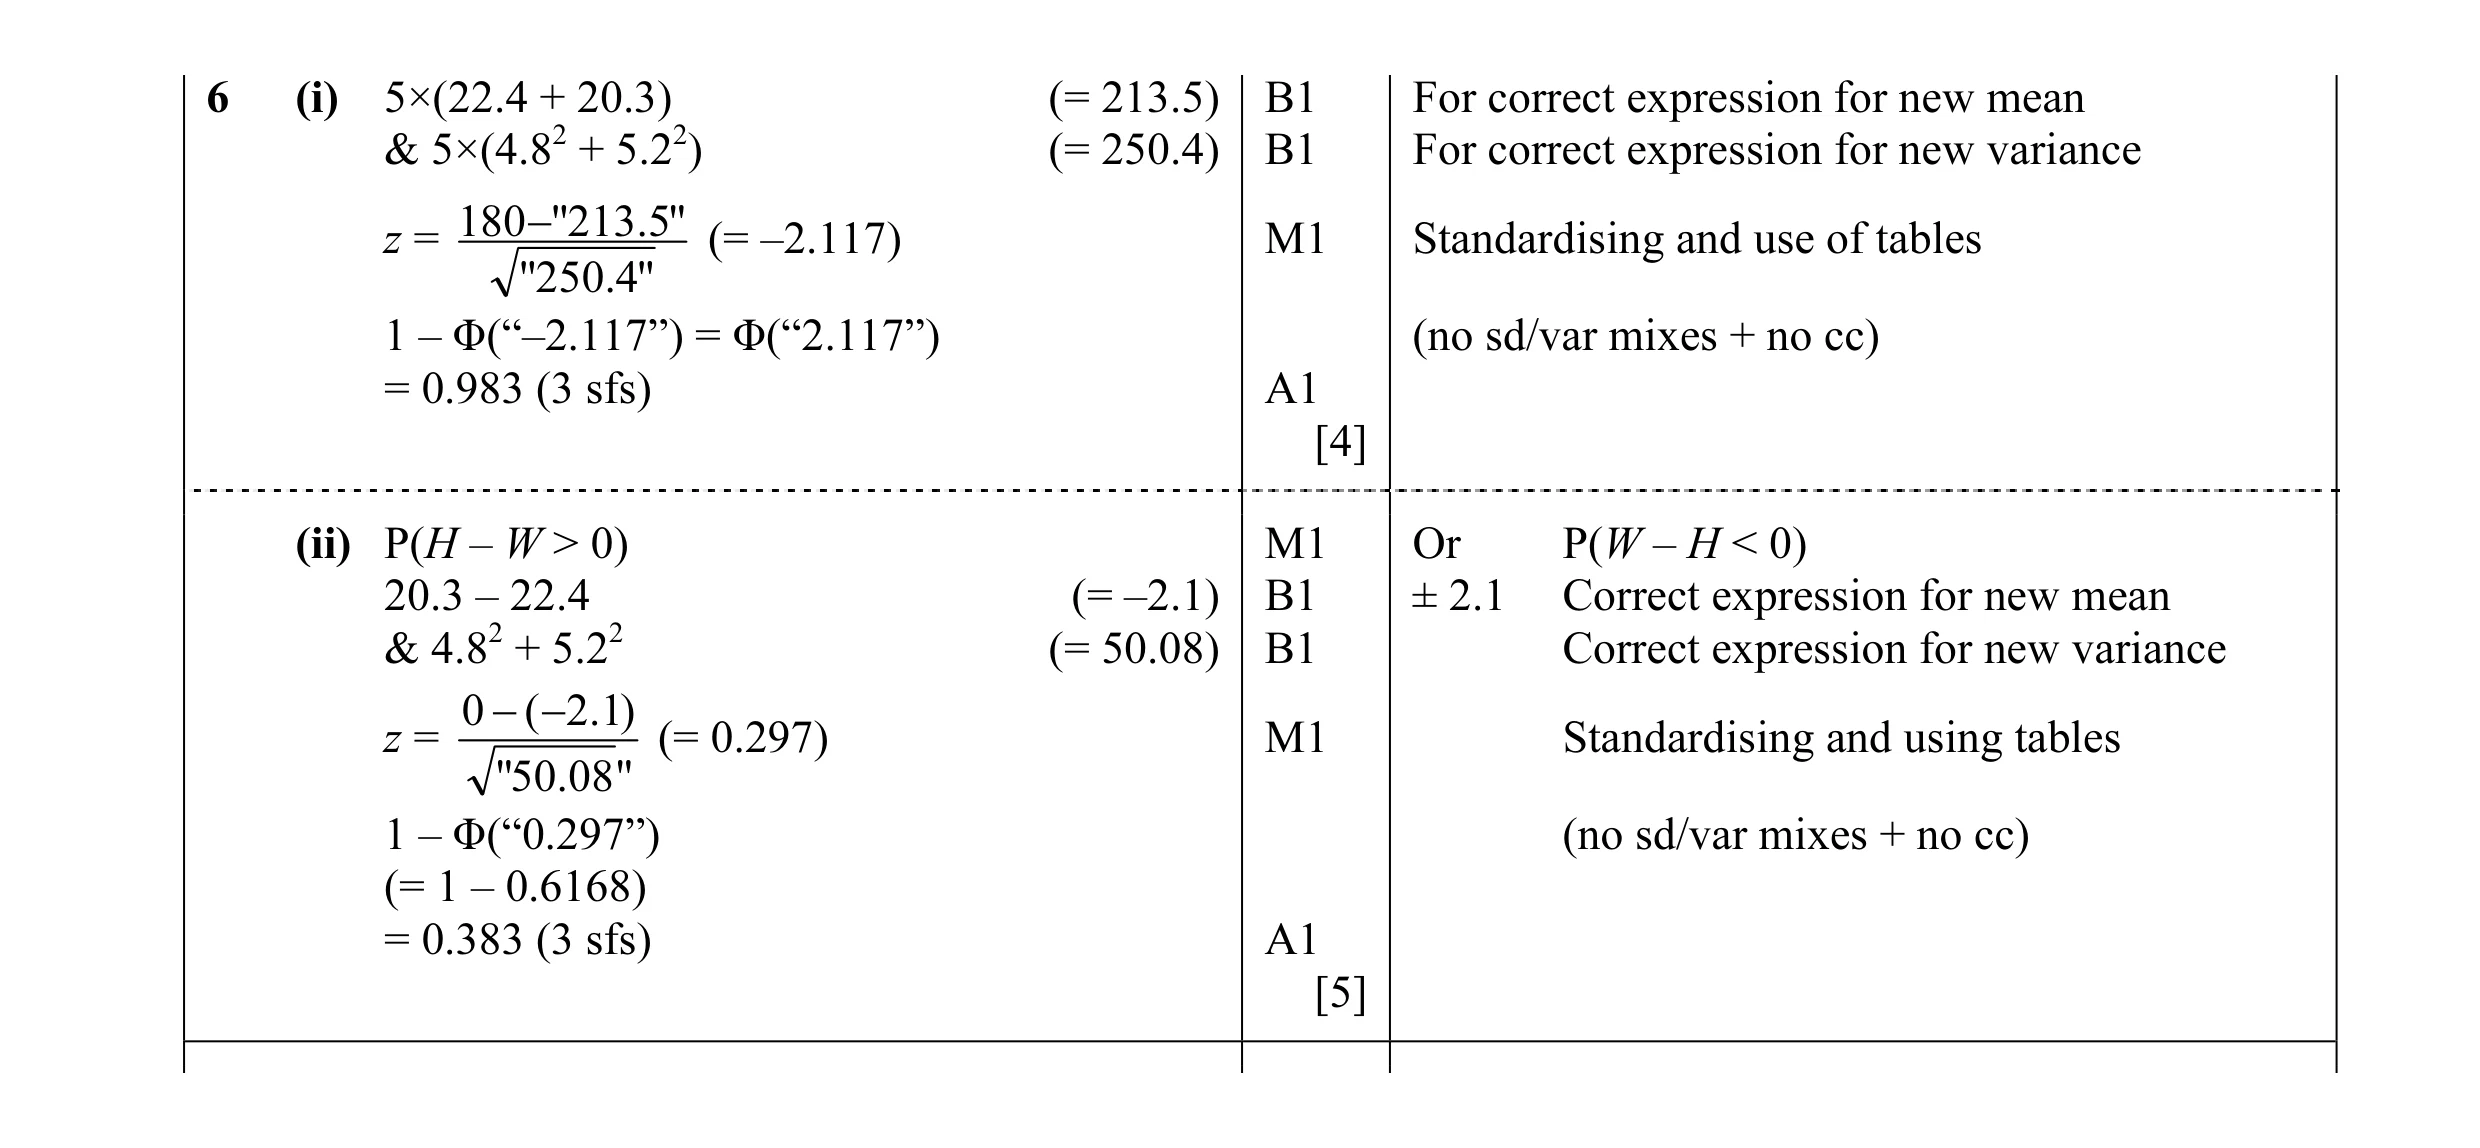 9
9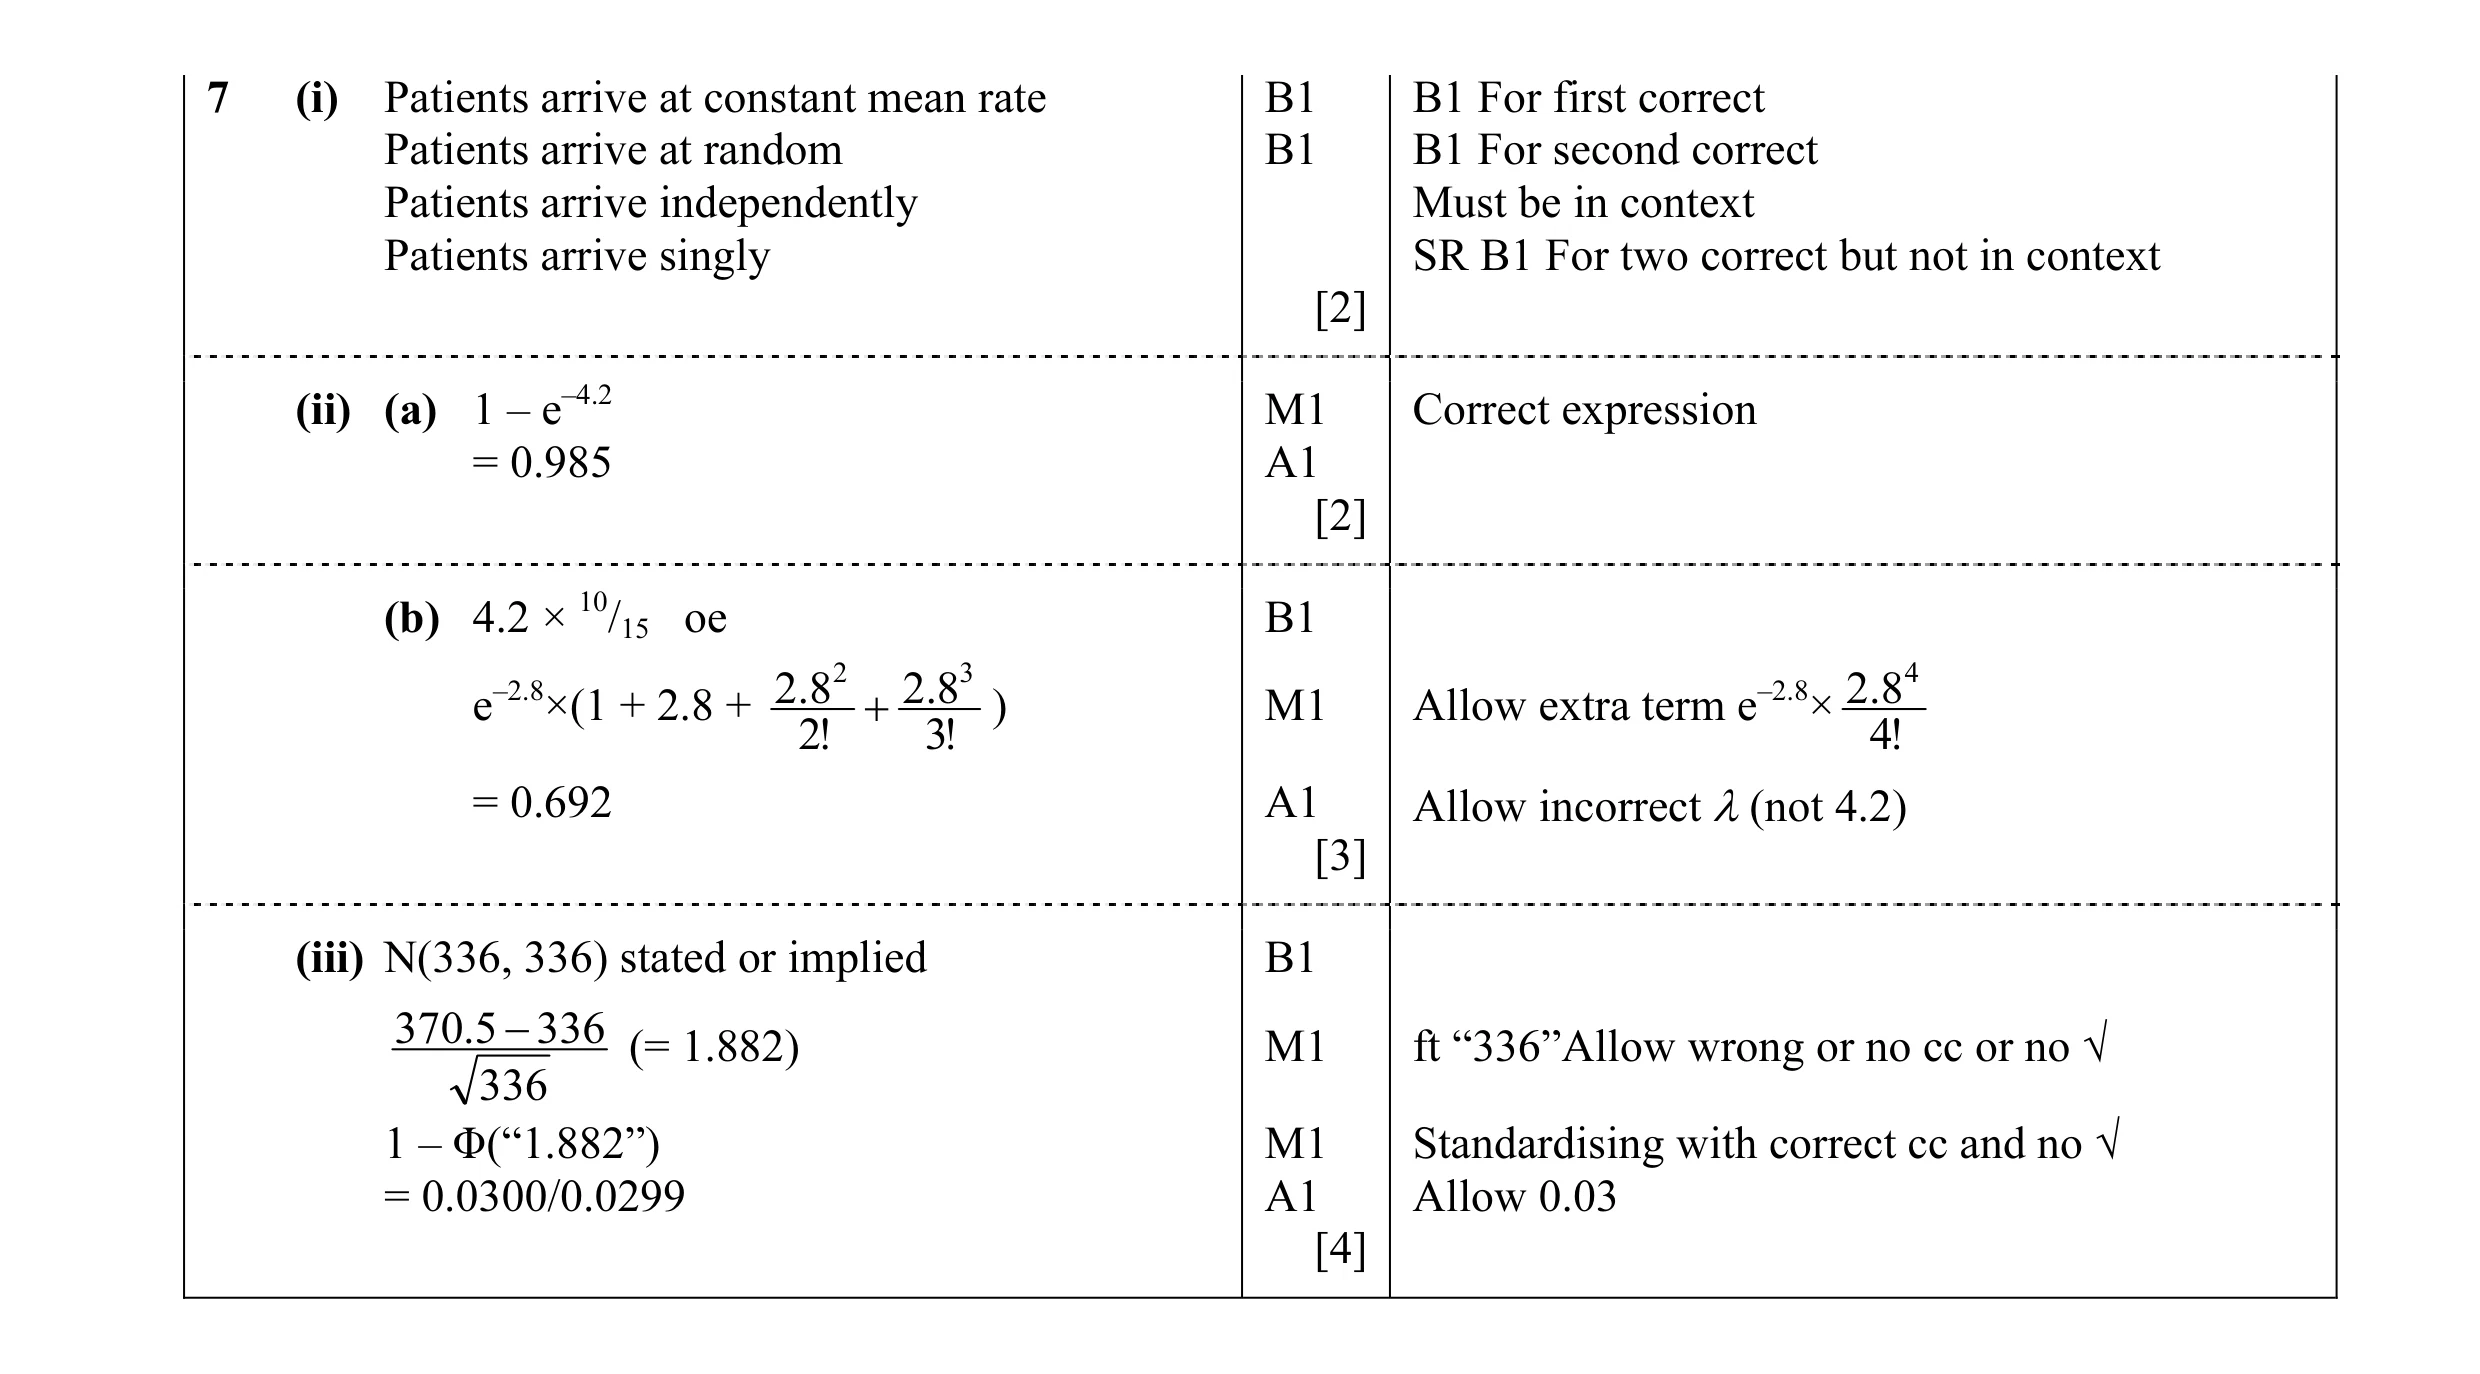 11
11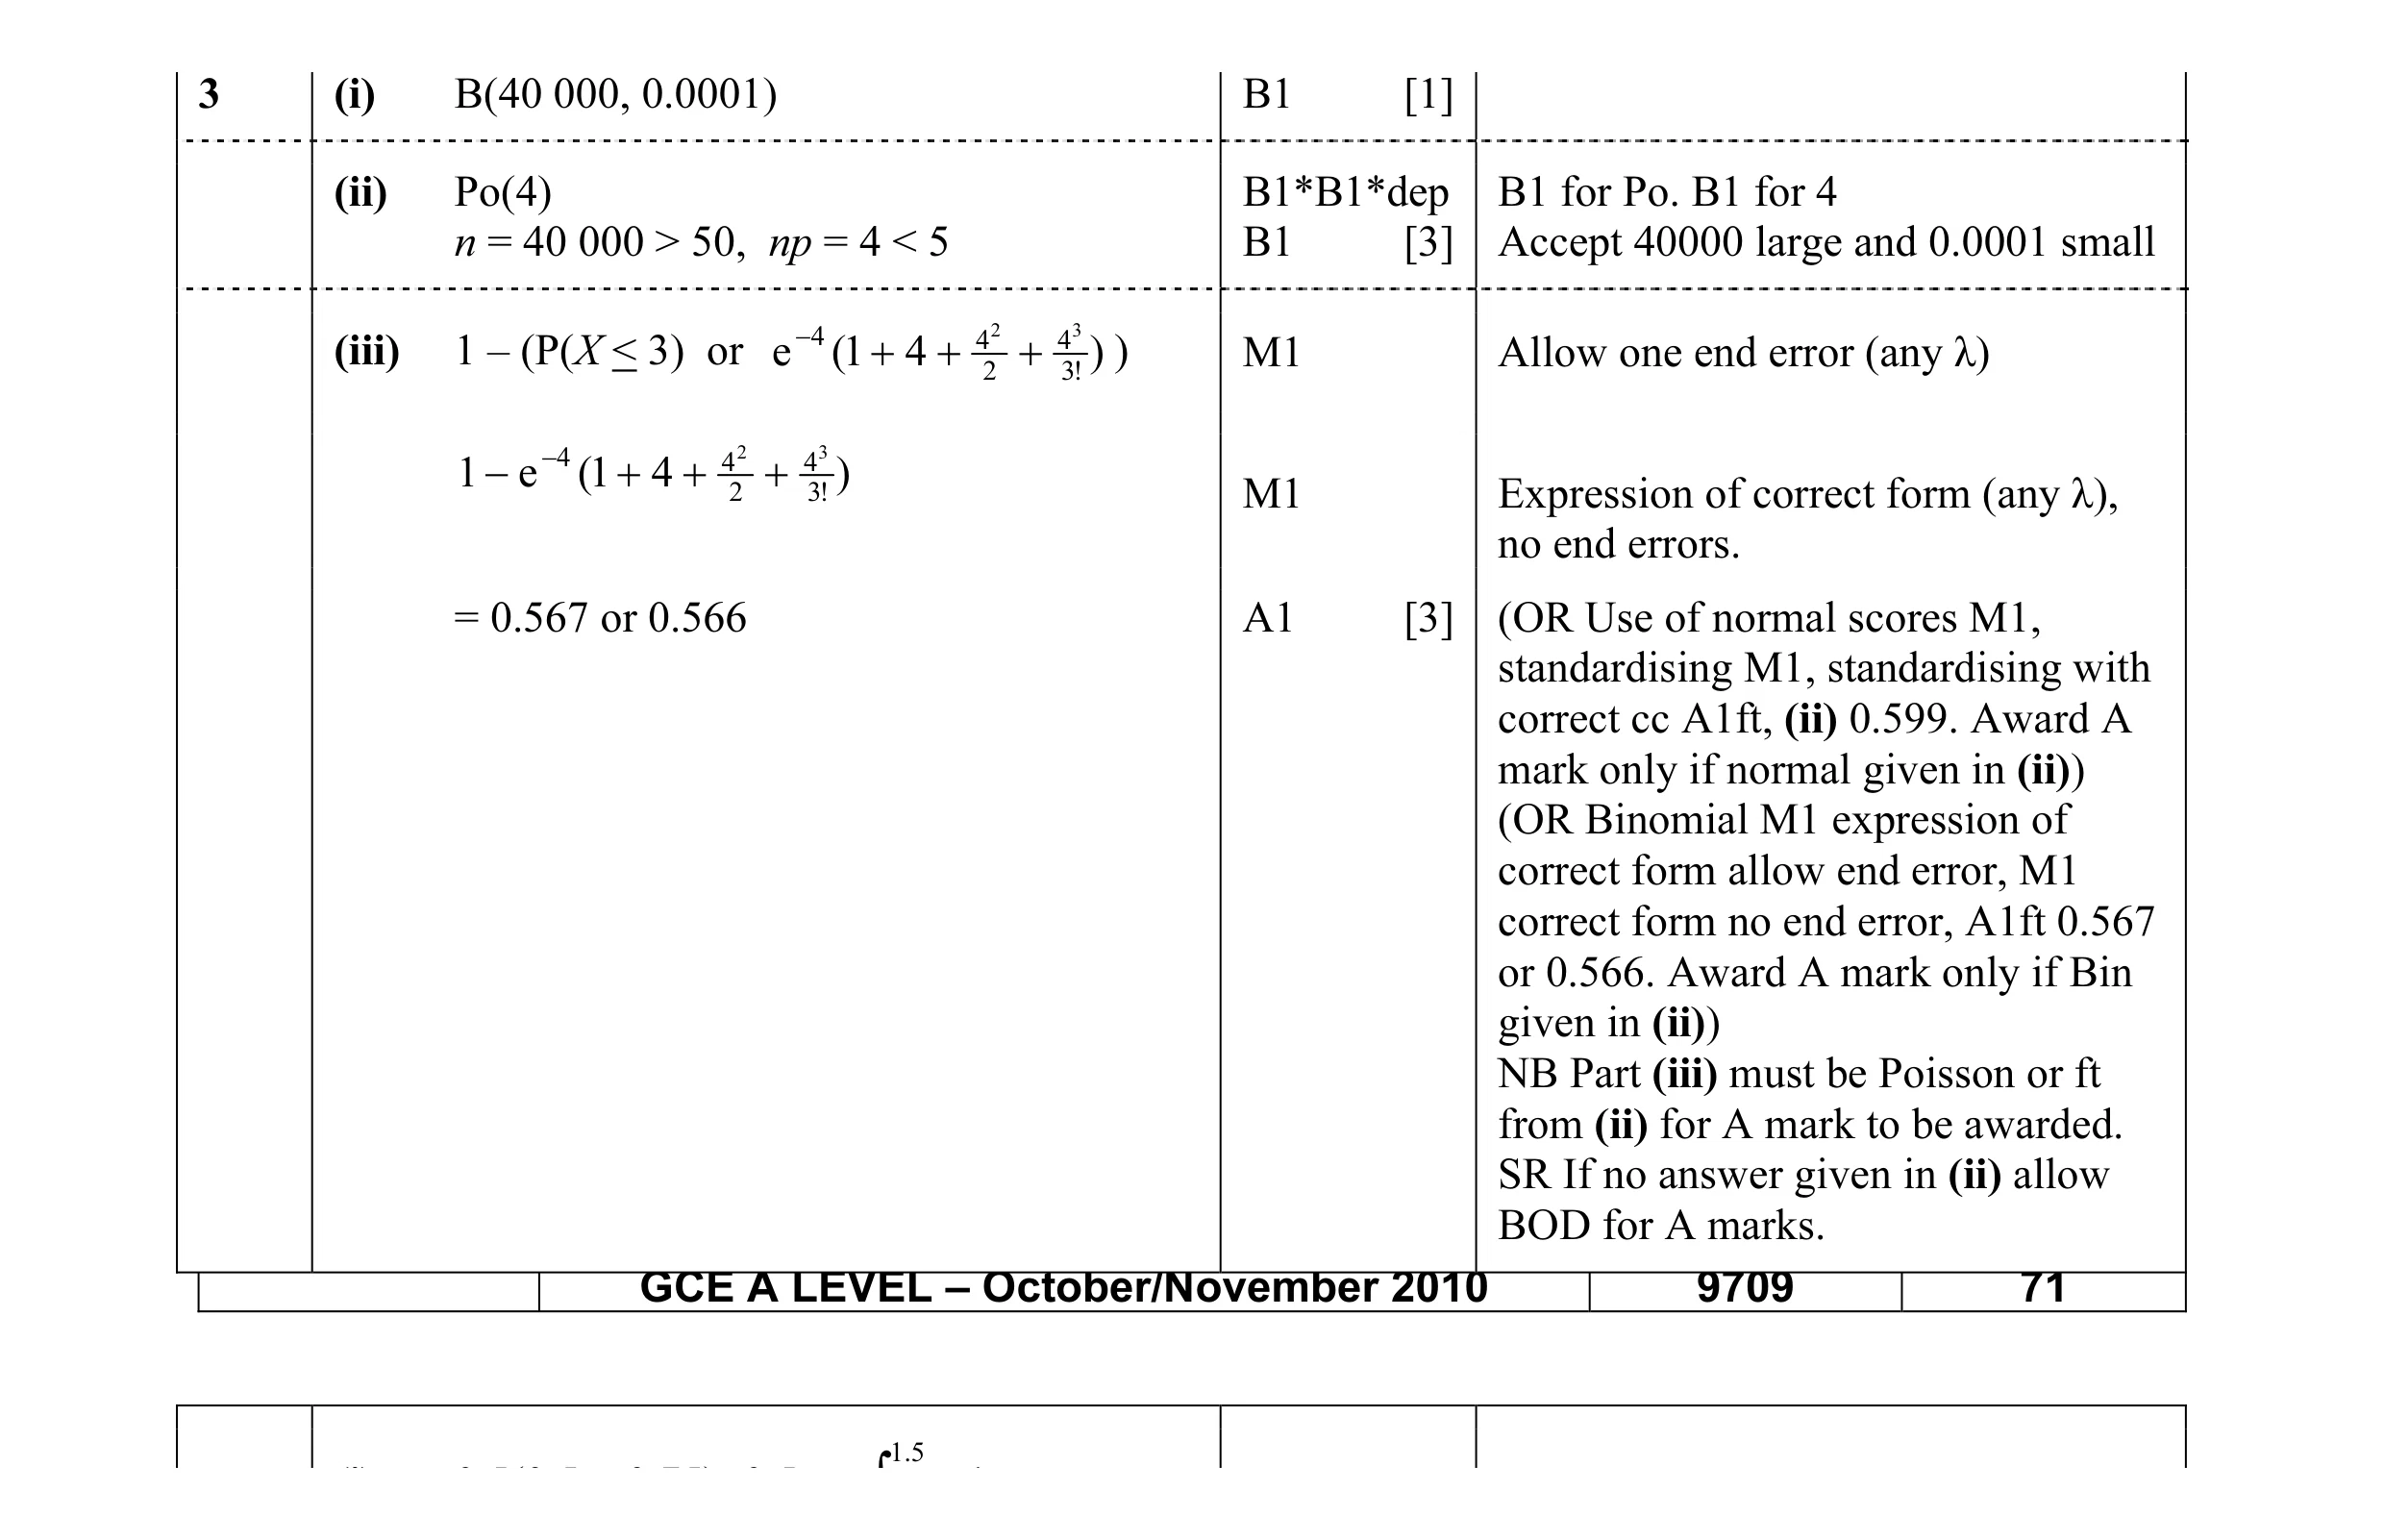 7
7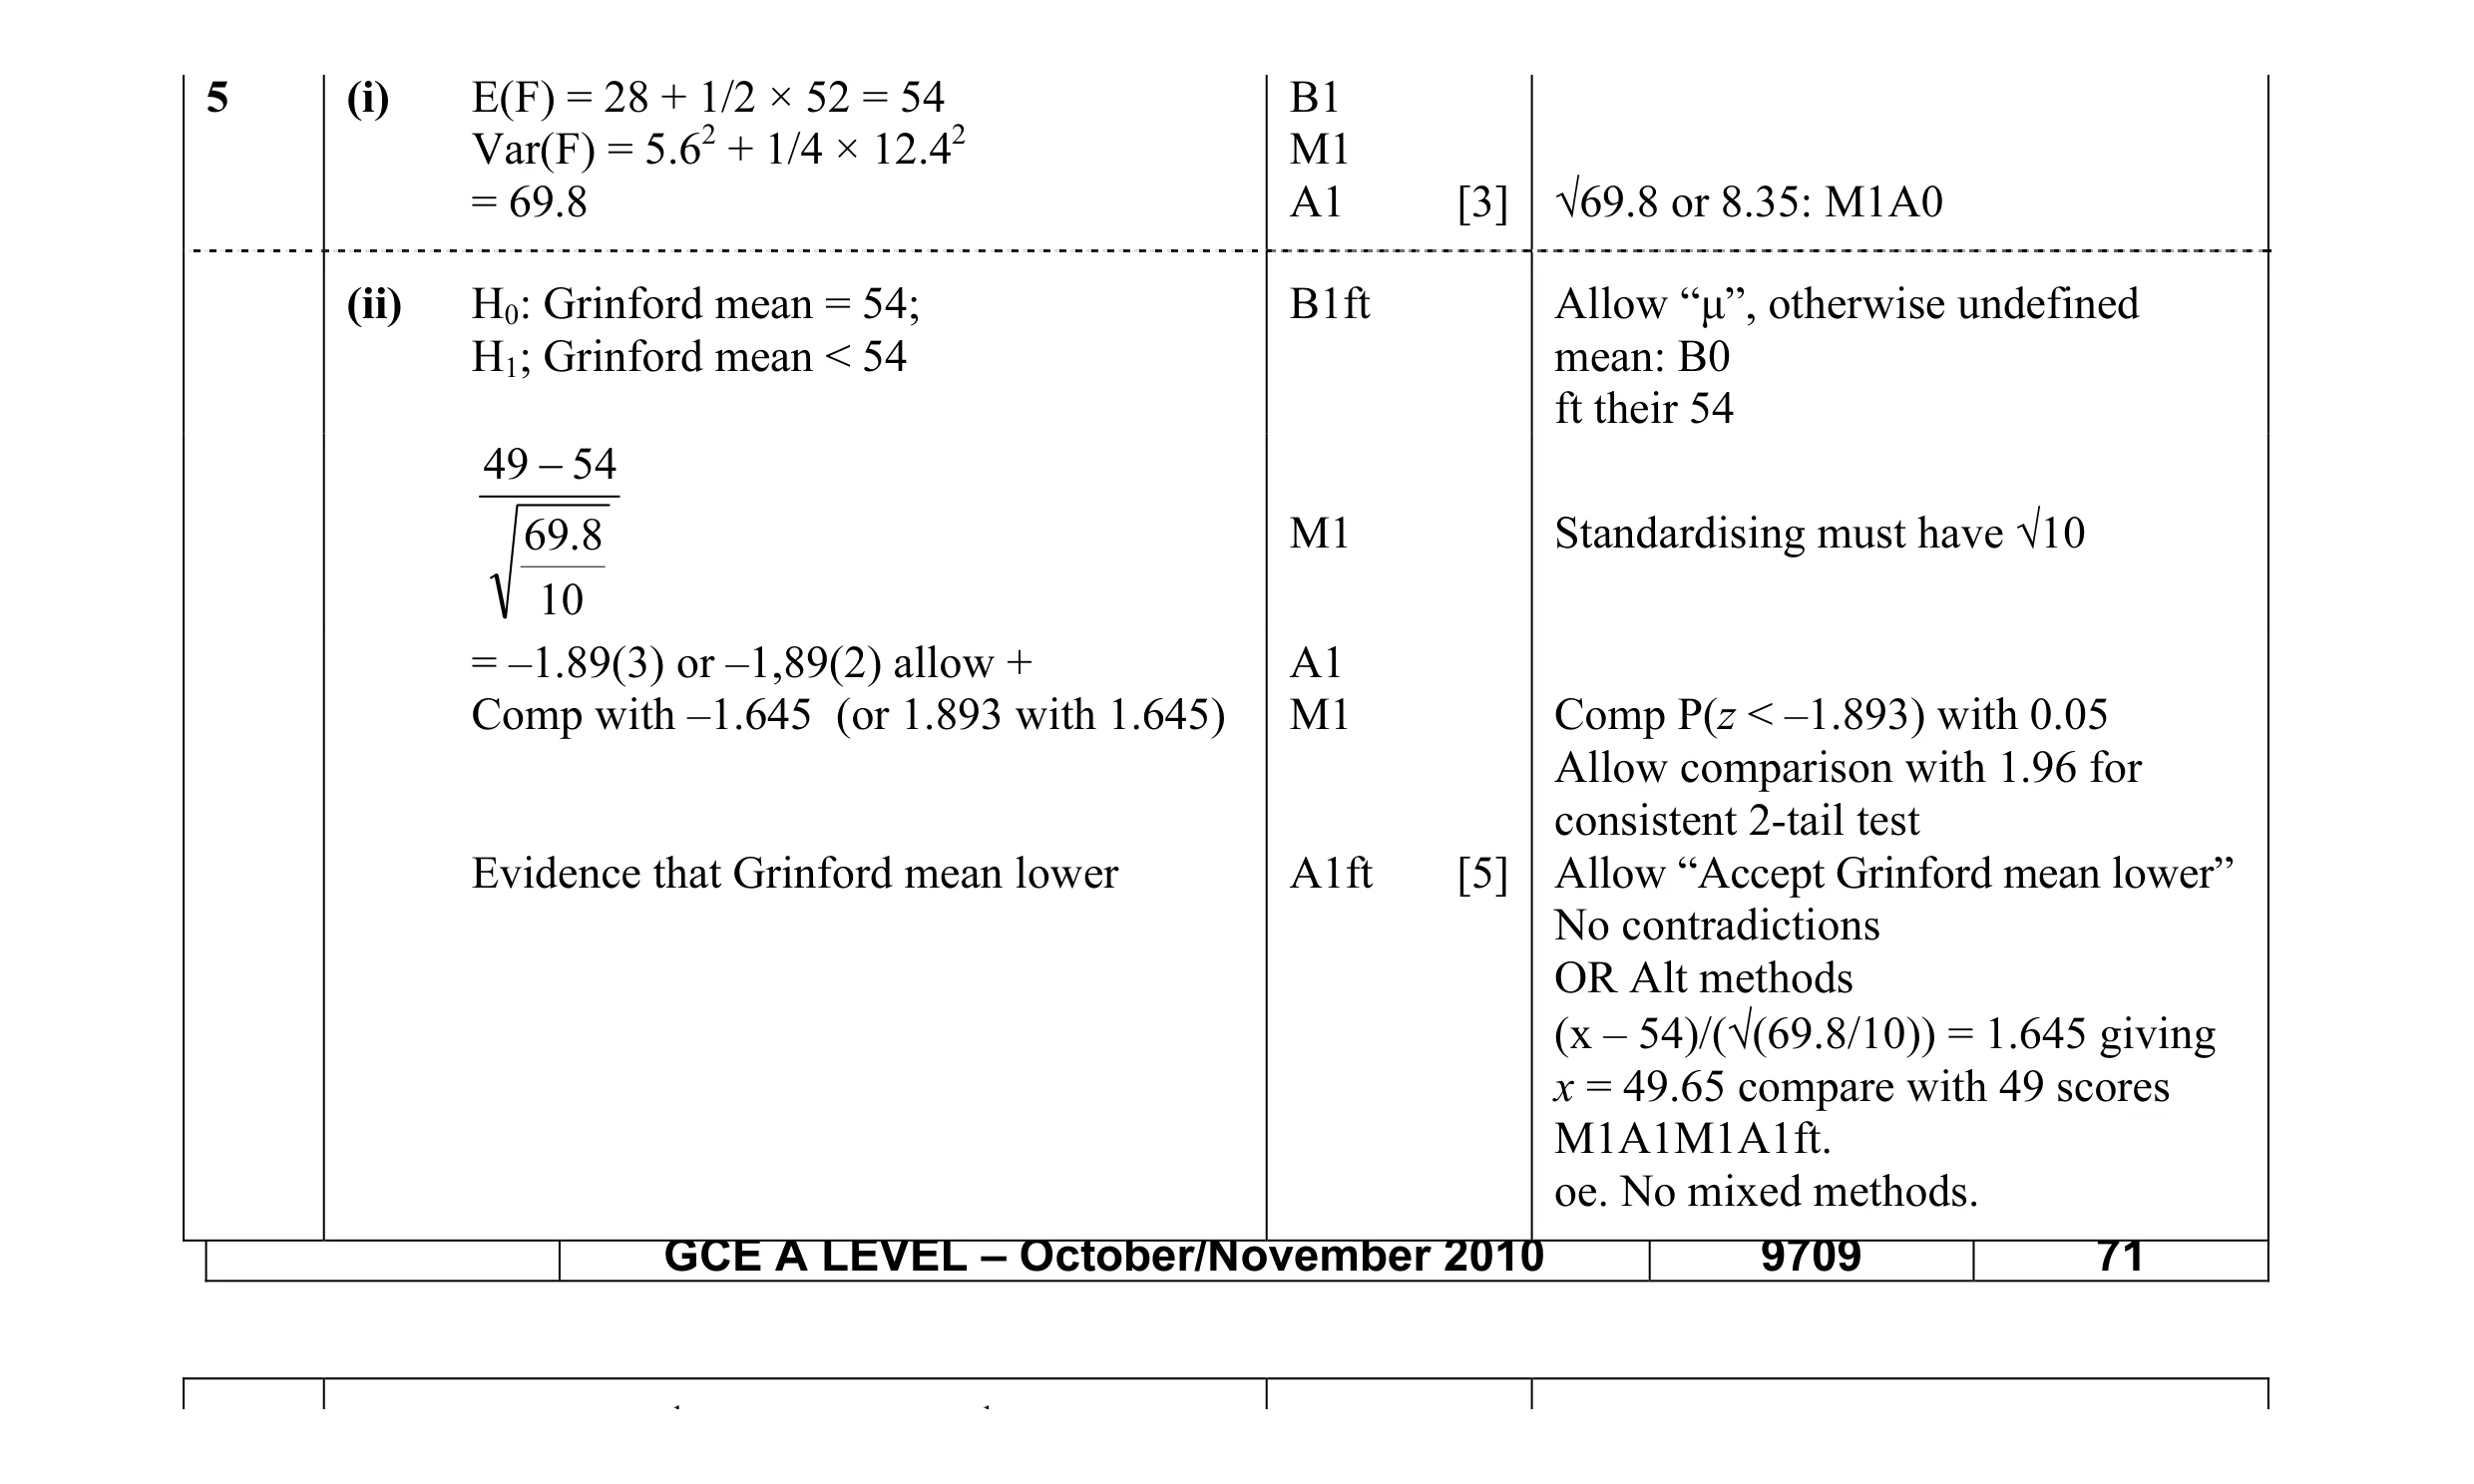 8
8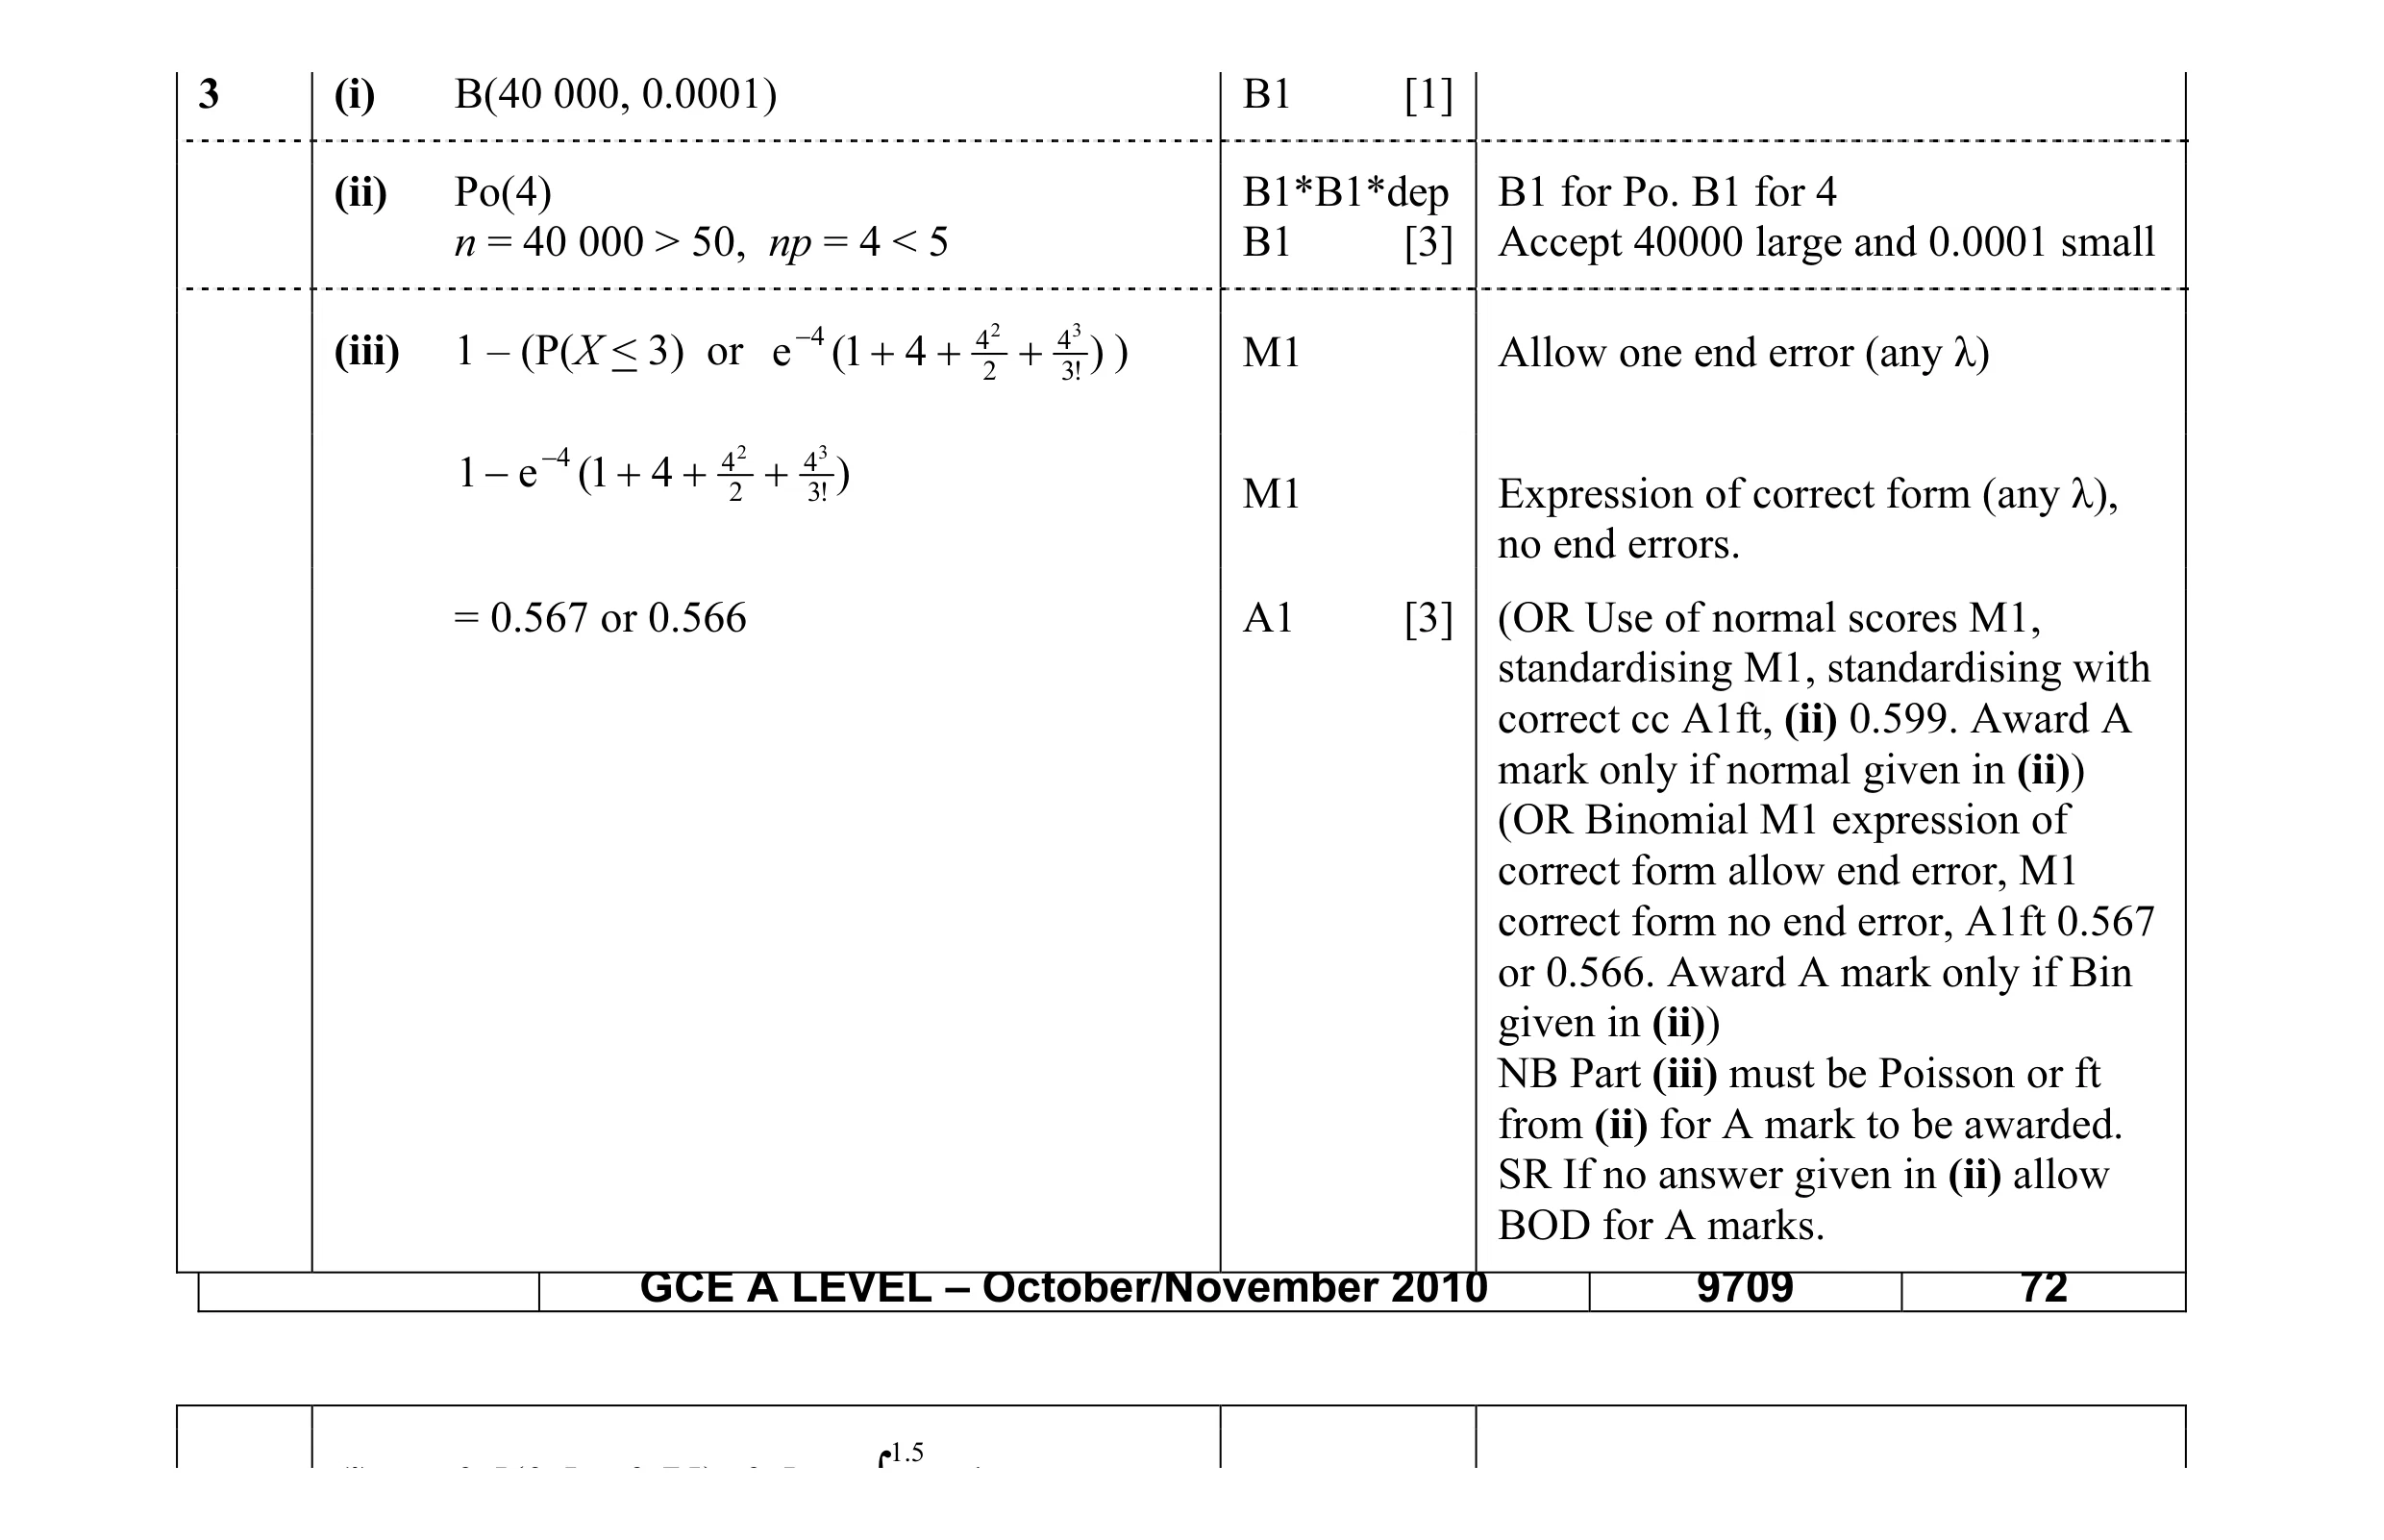 7
7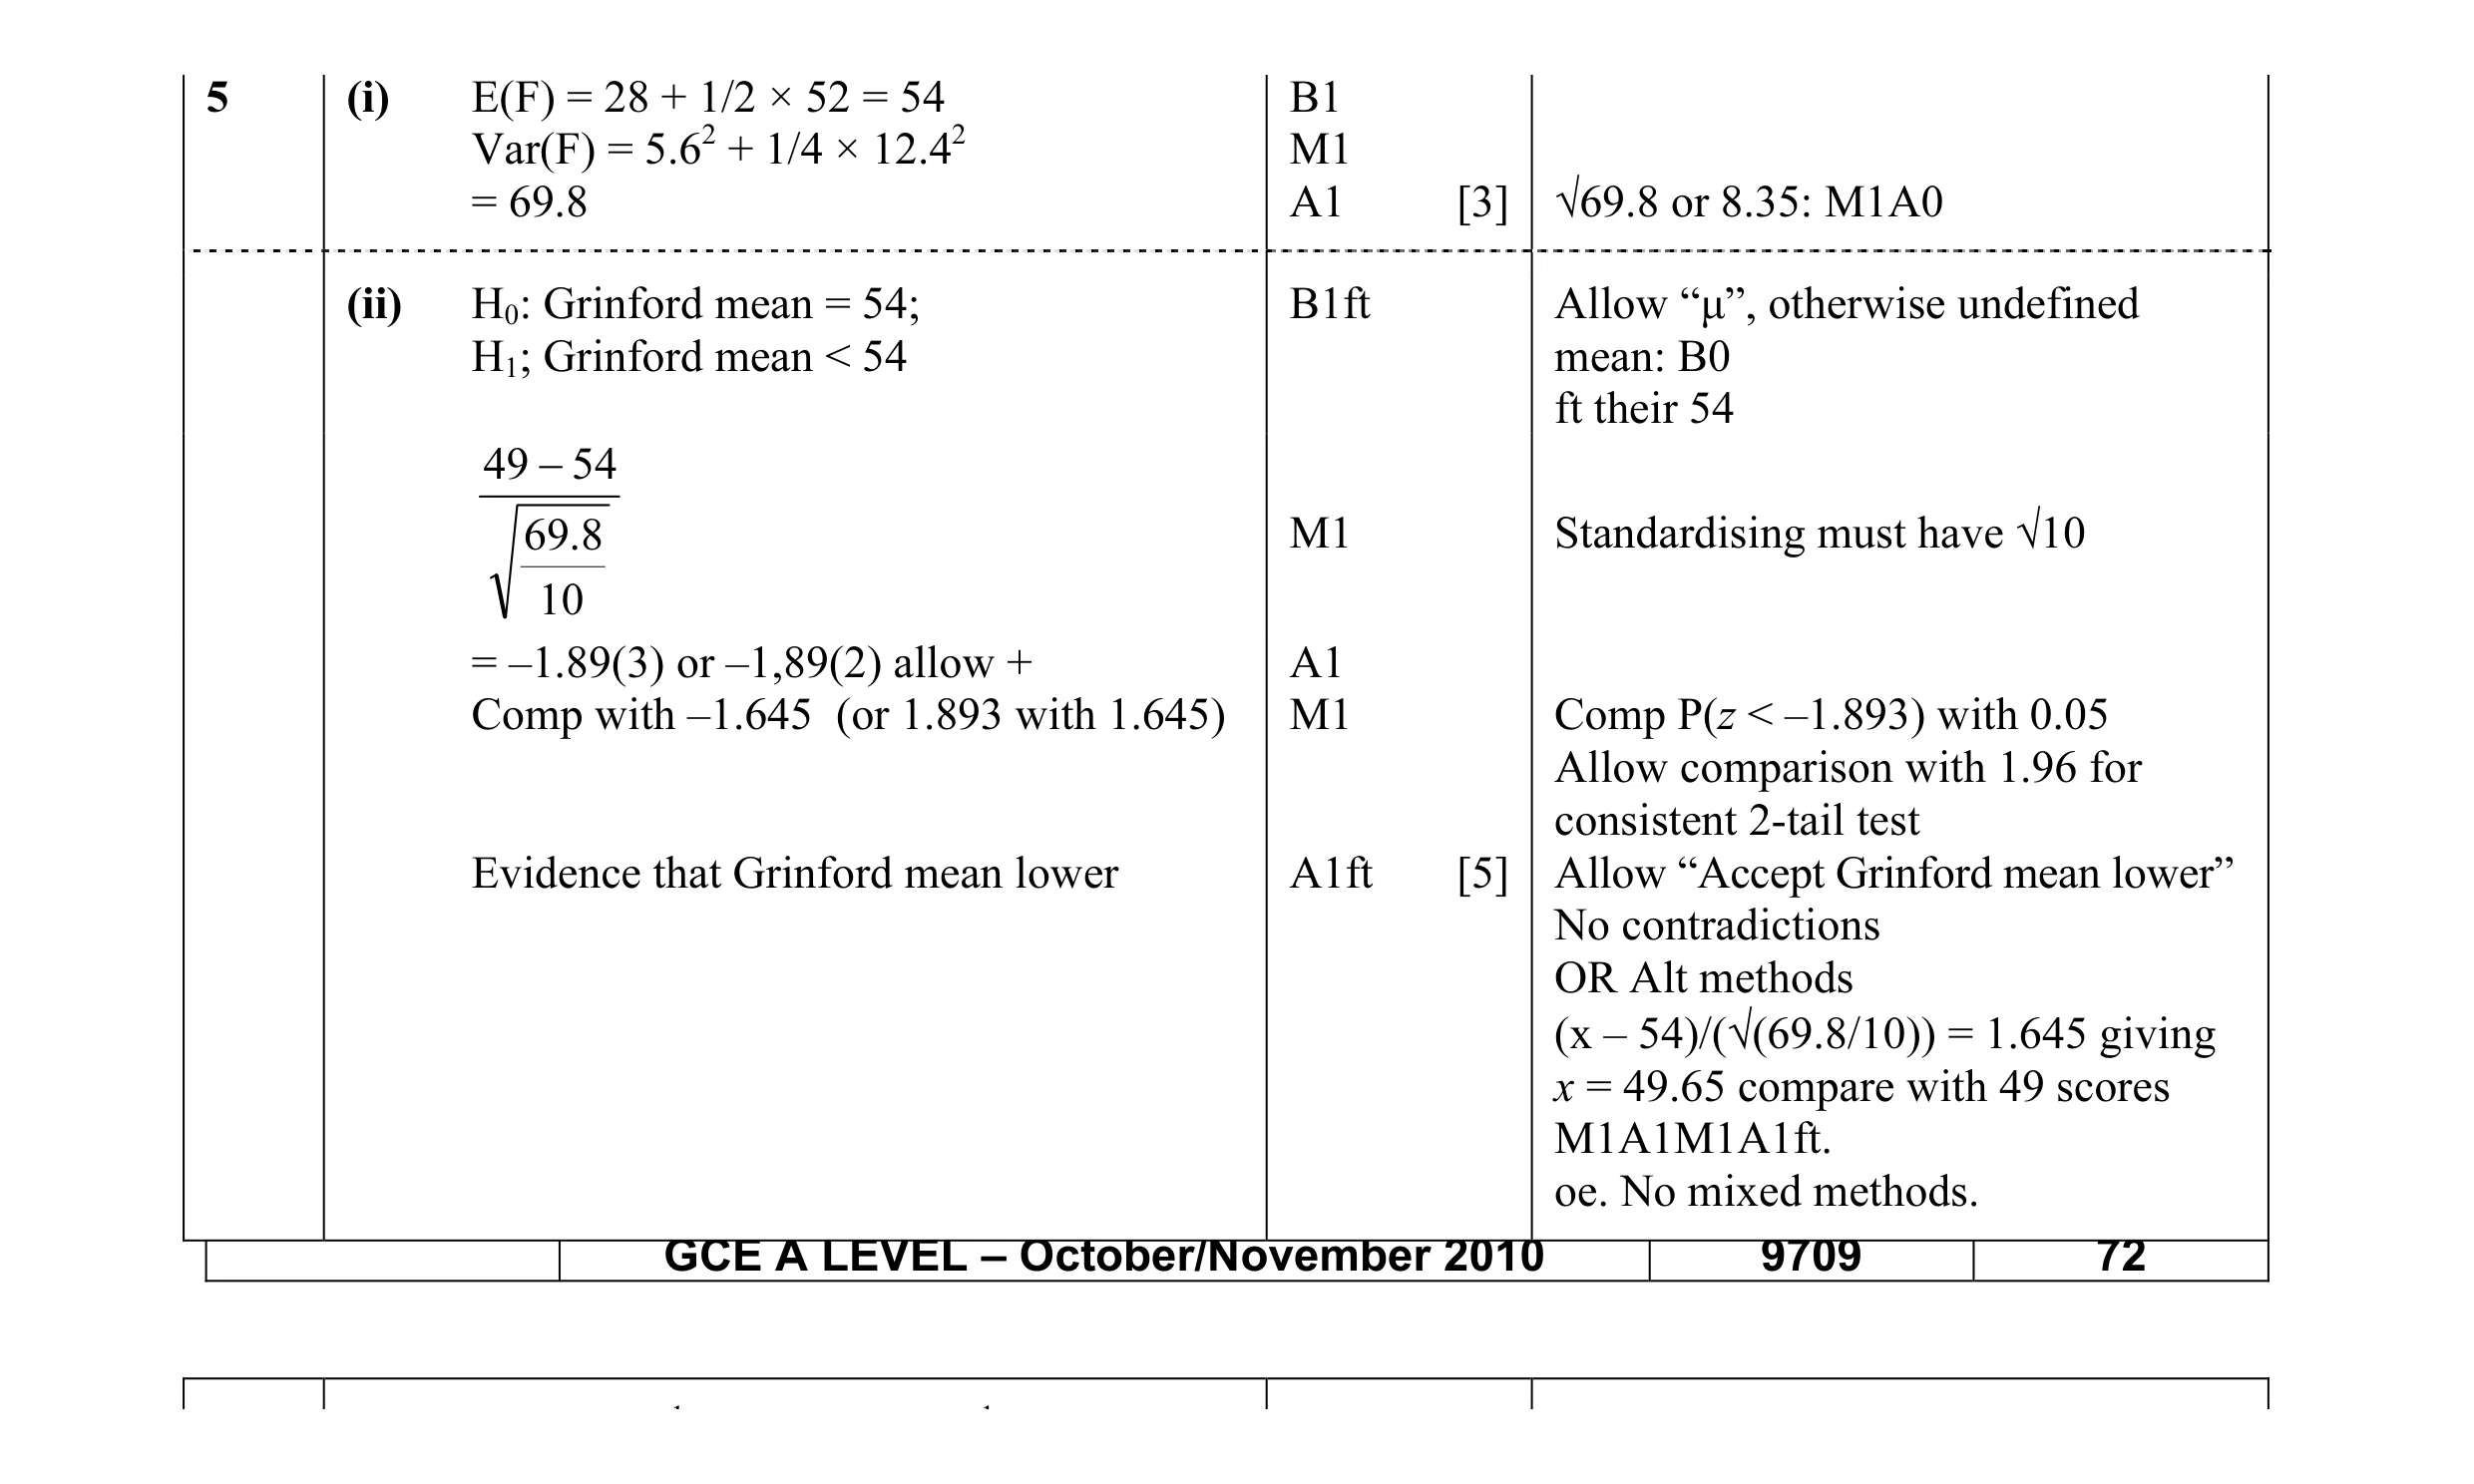 8
8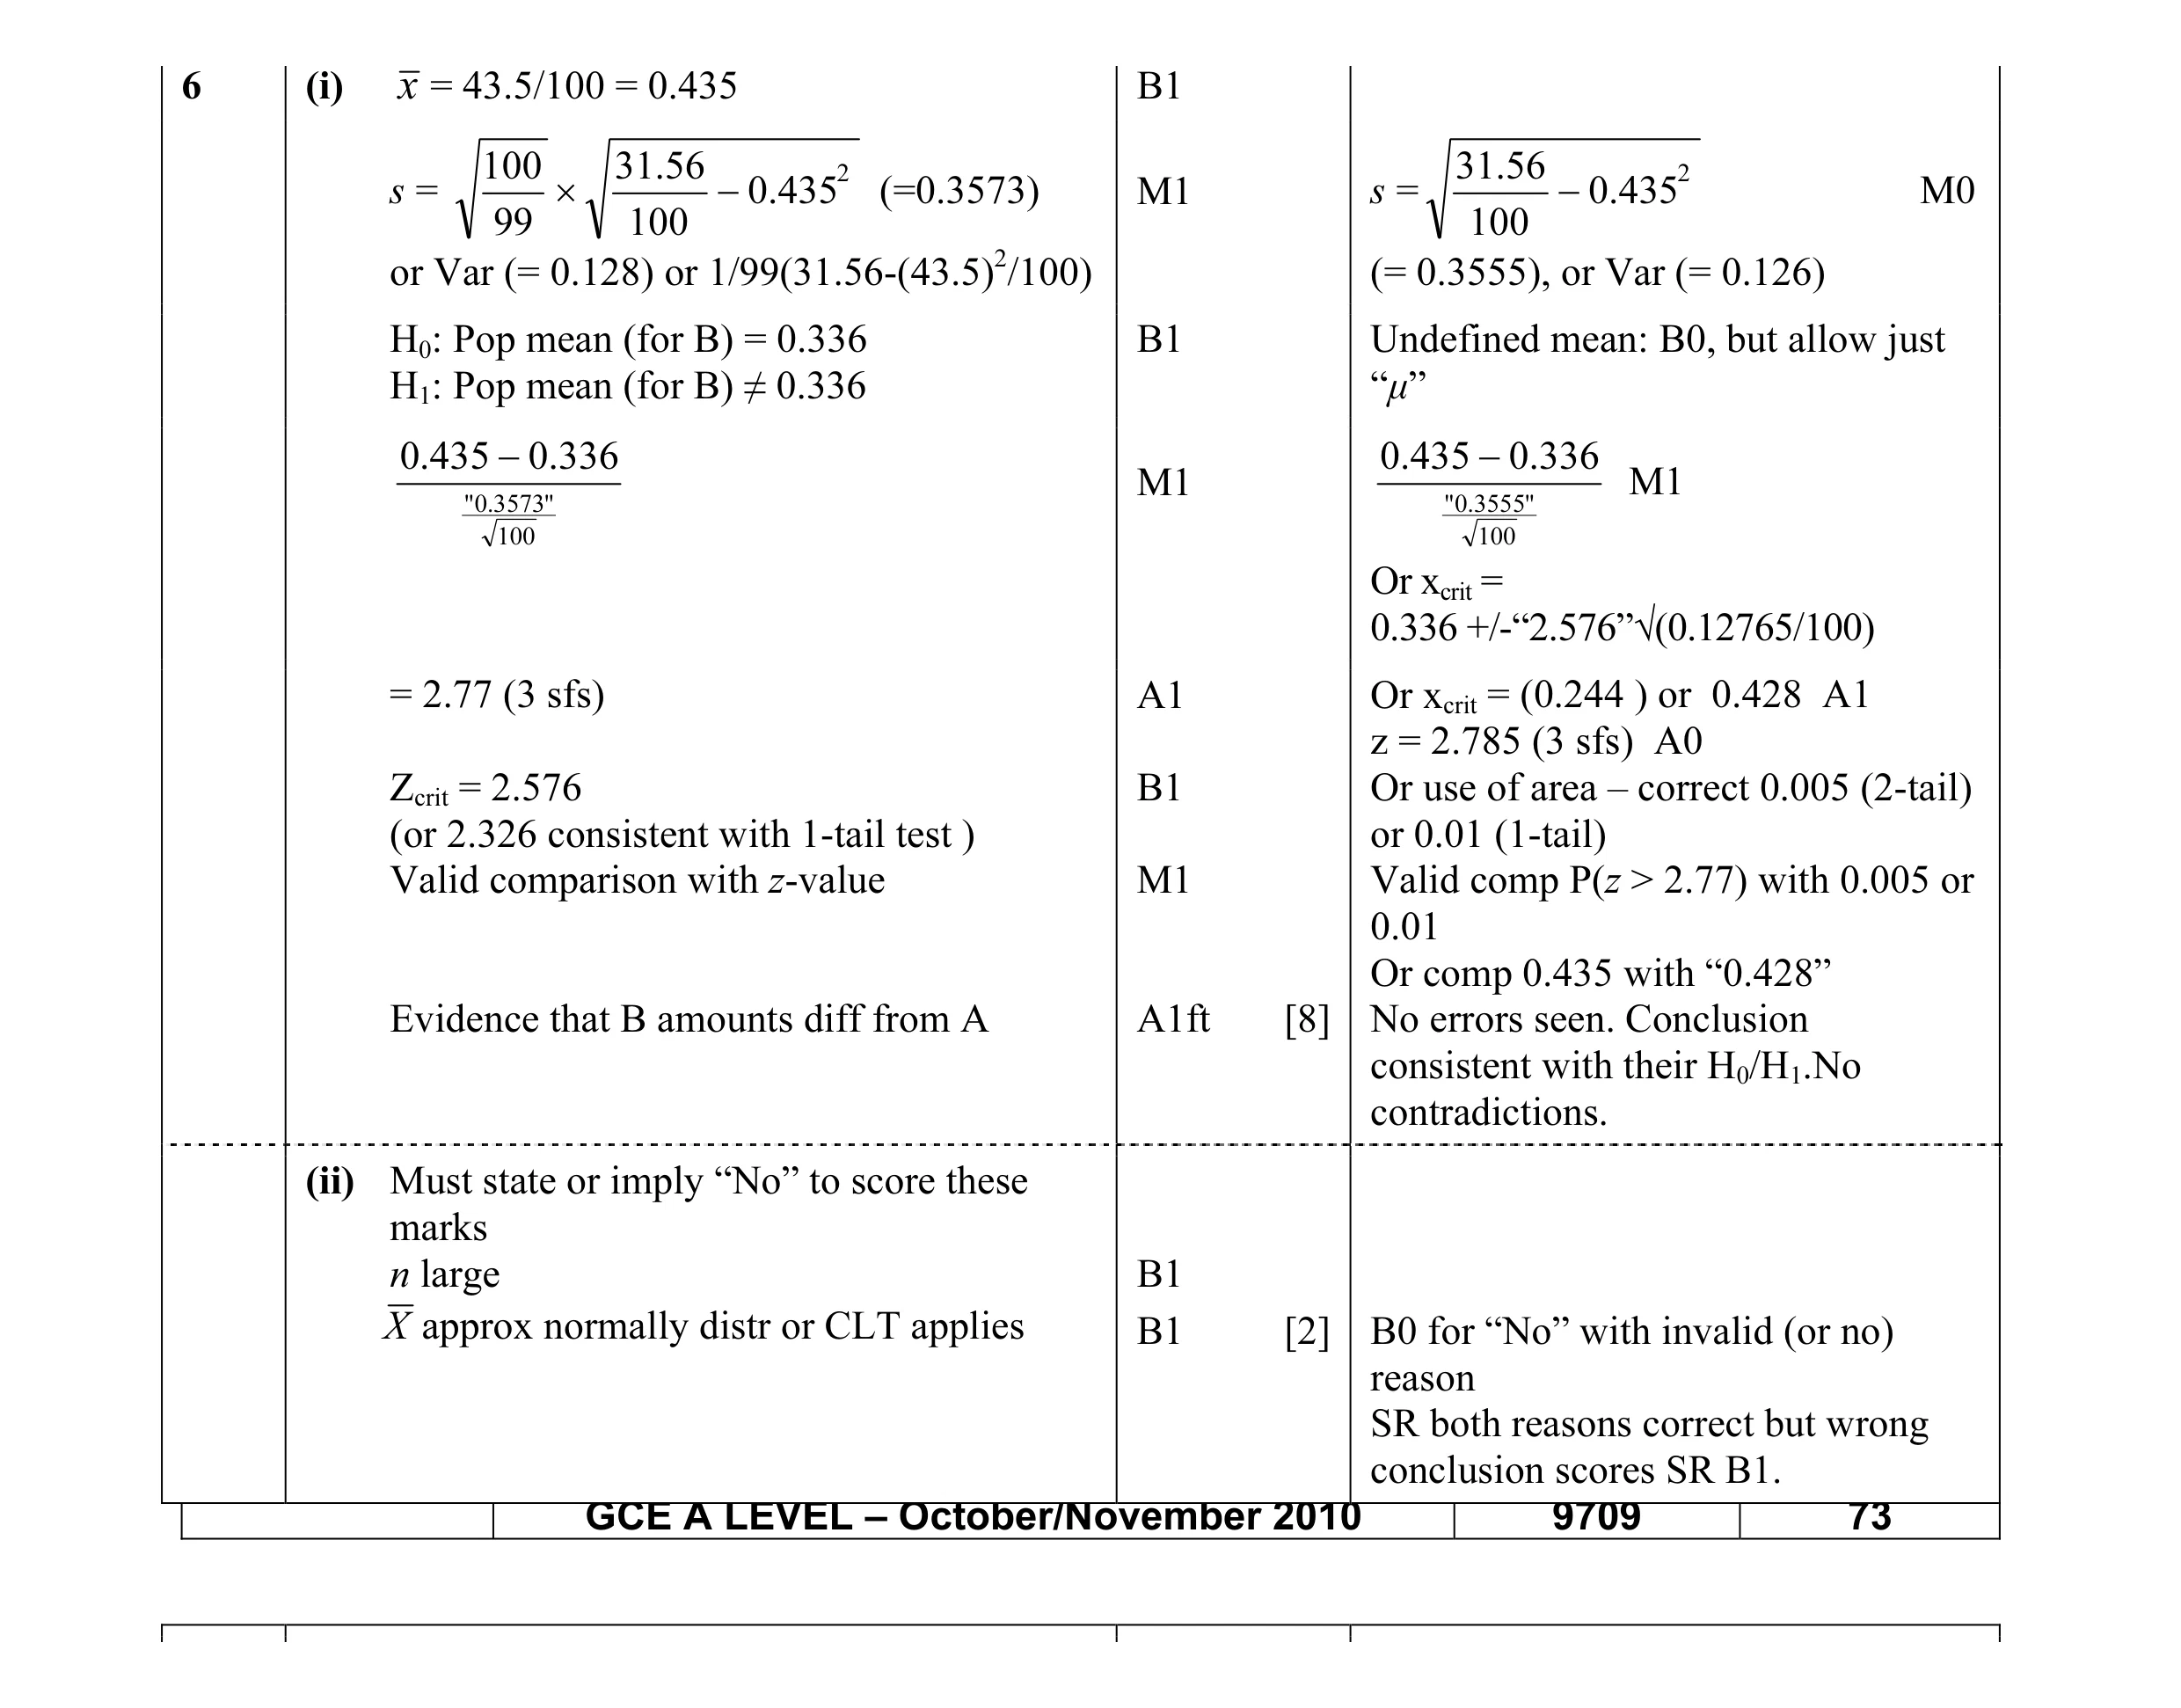 10
10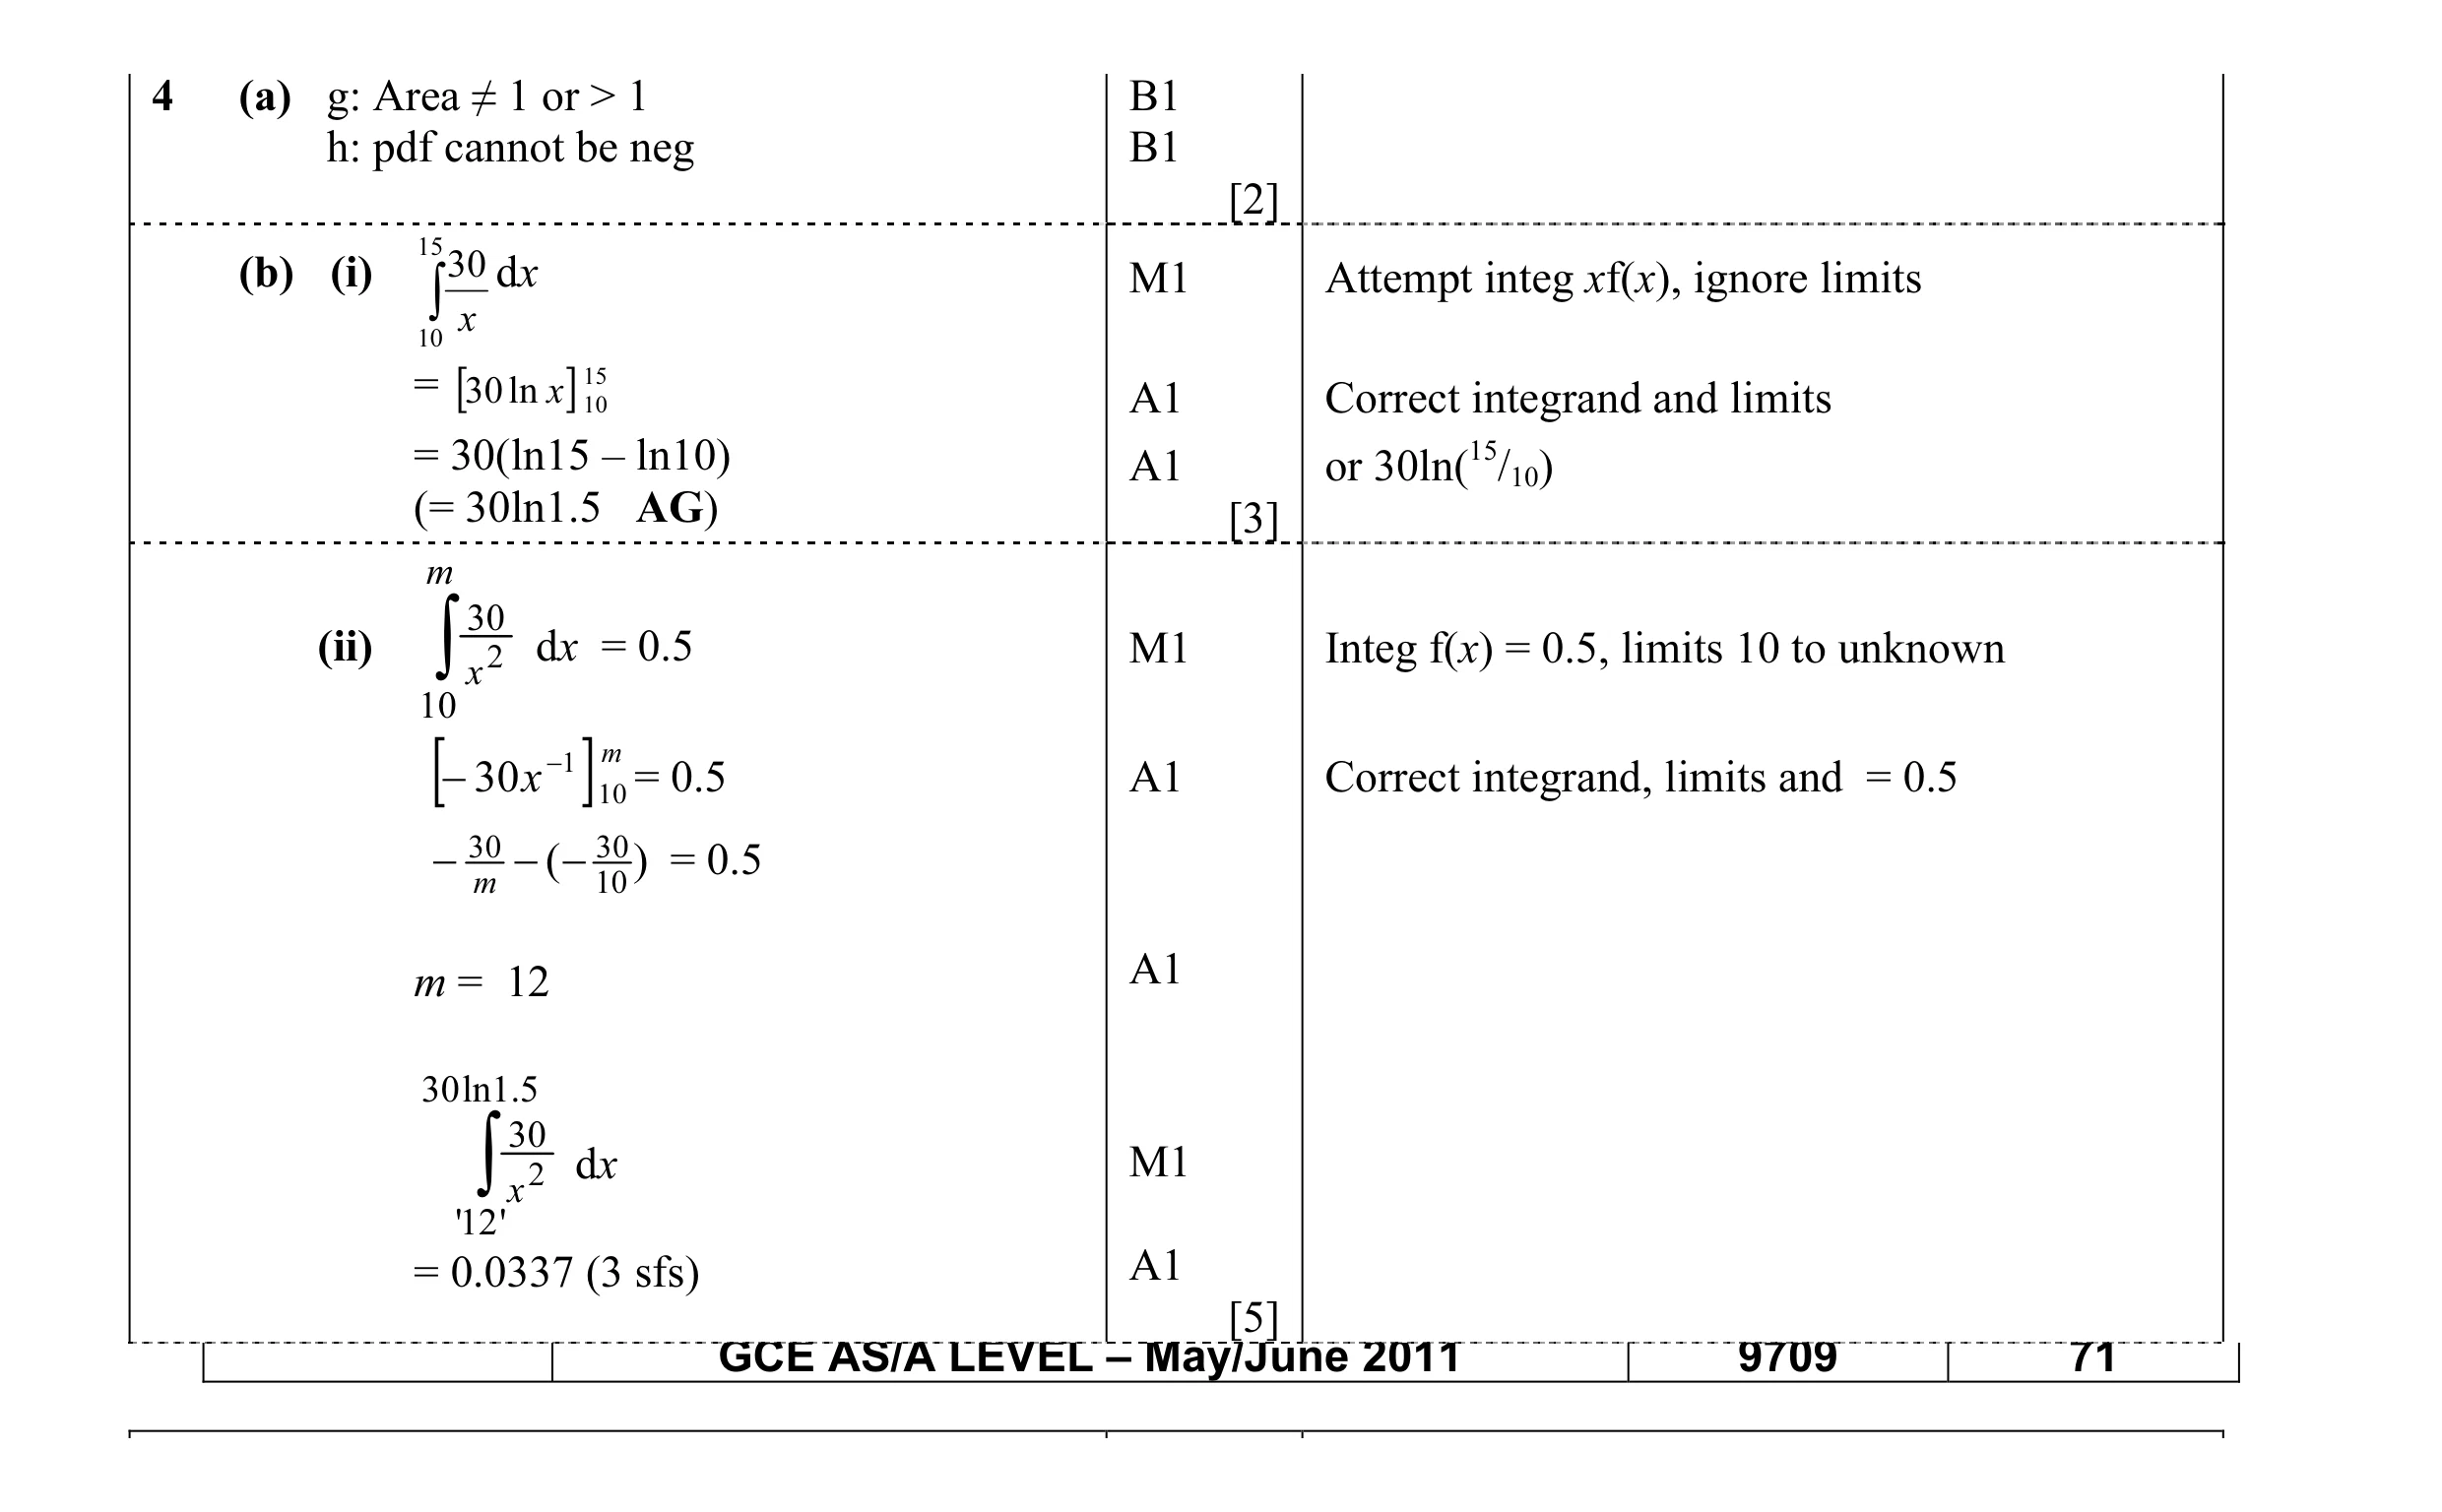 10
10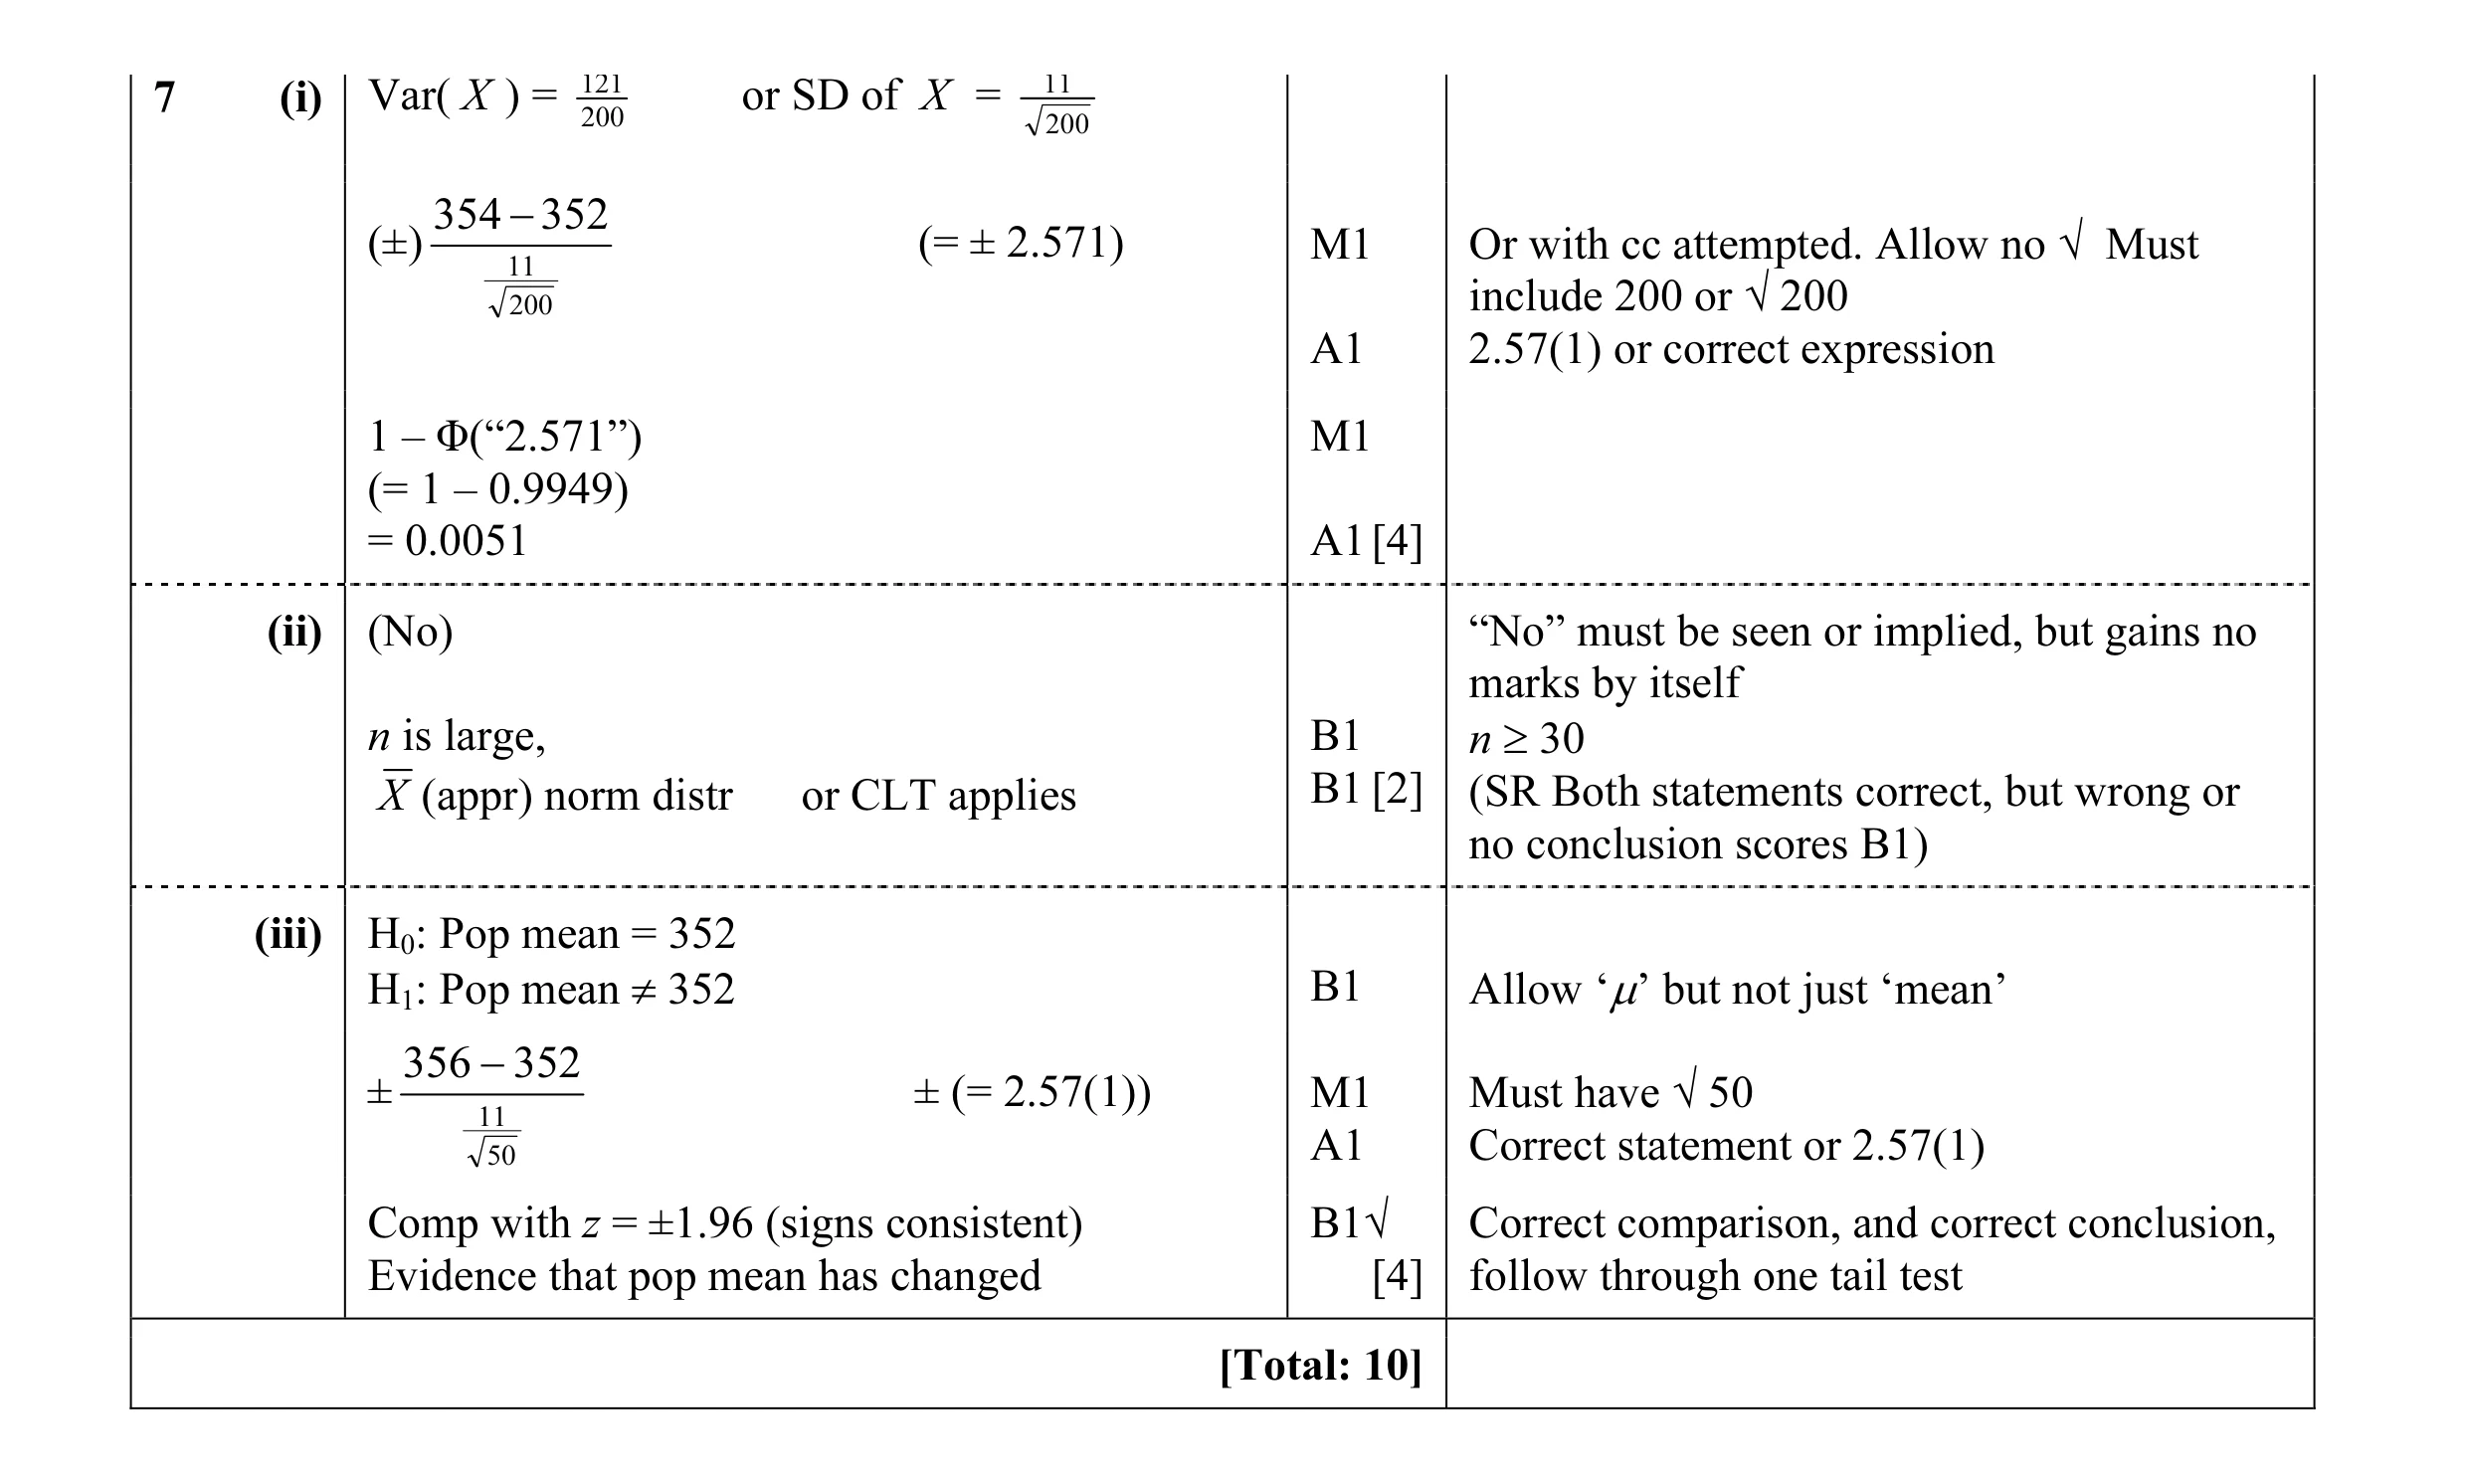 10
10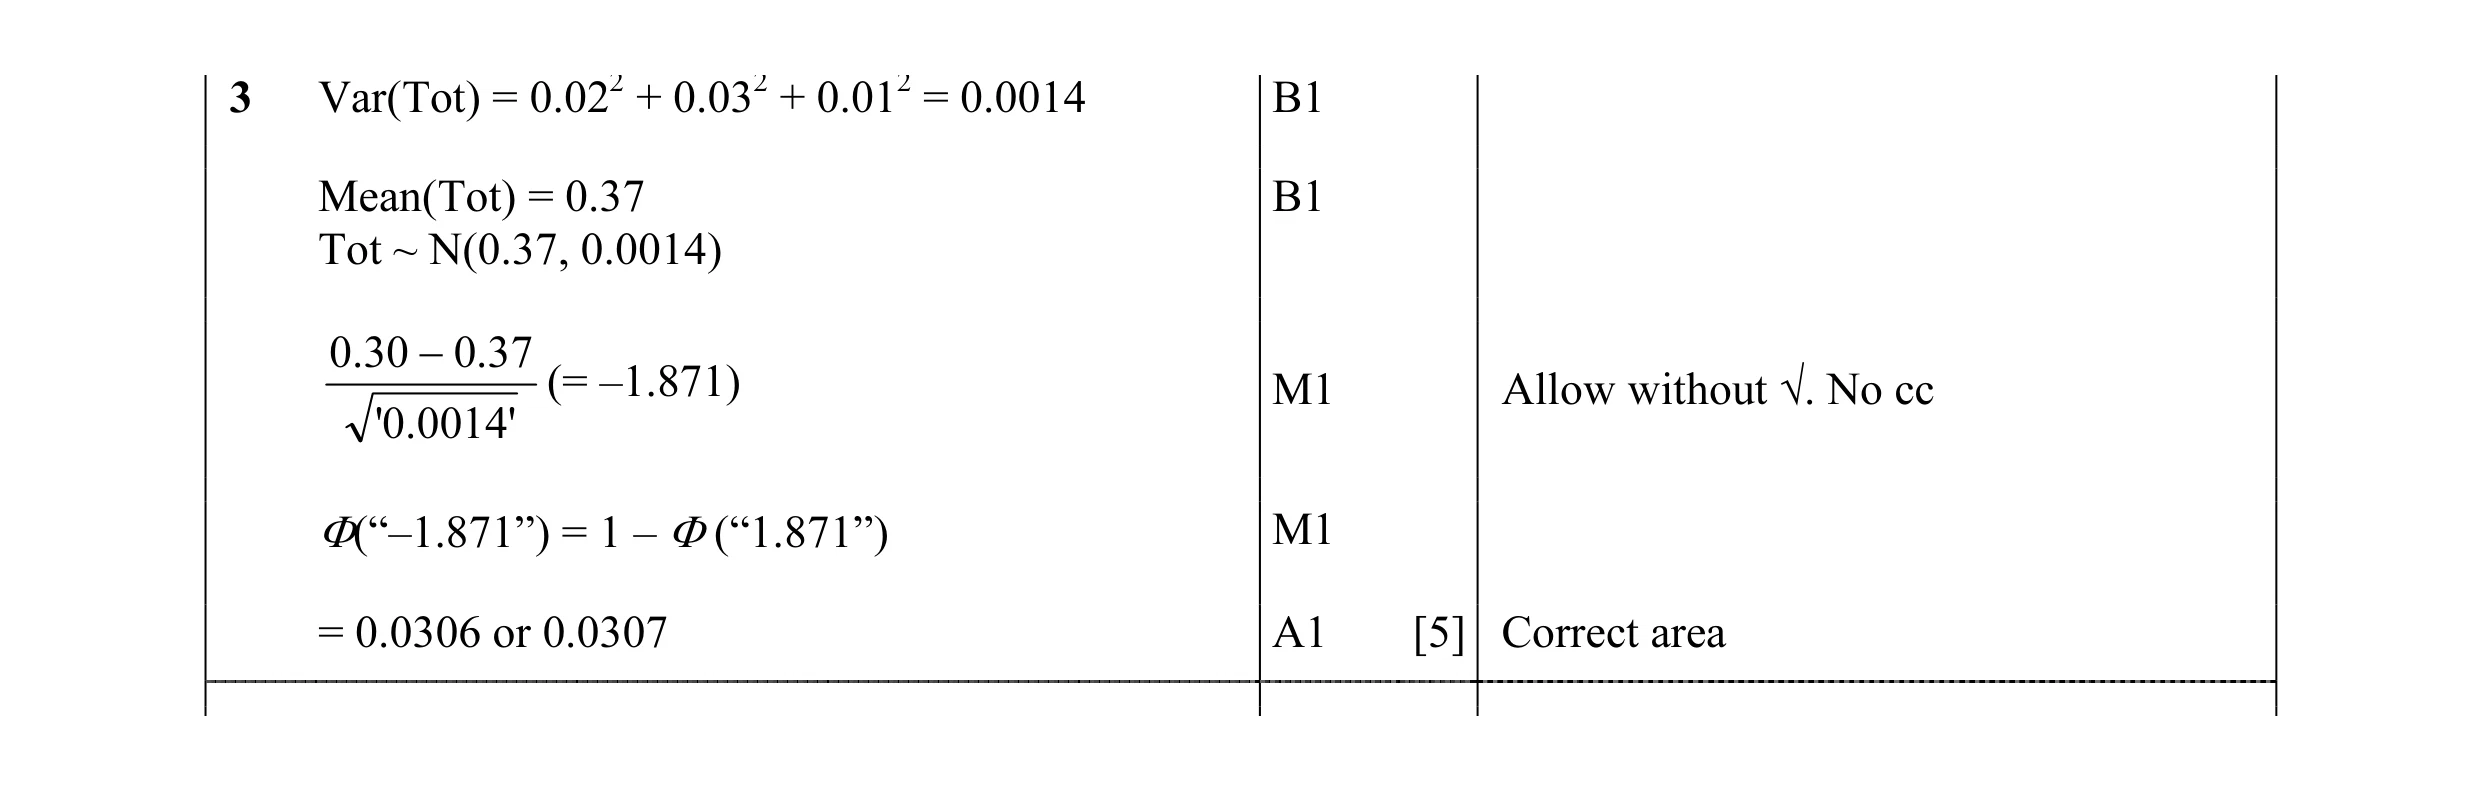 5
5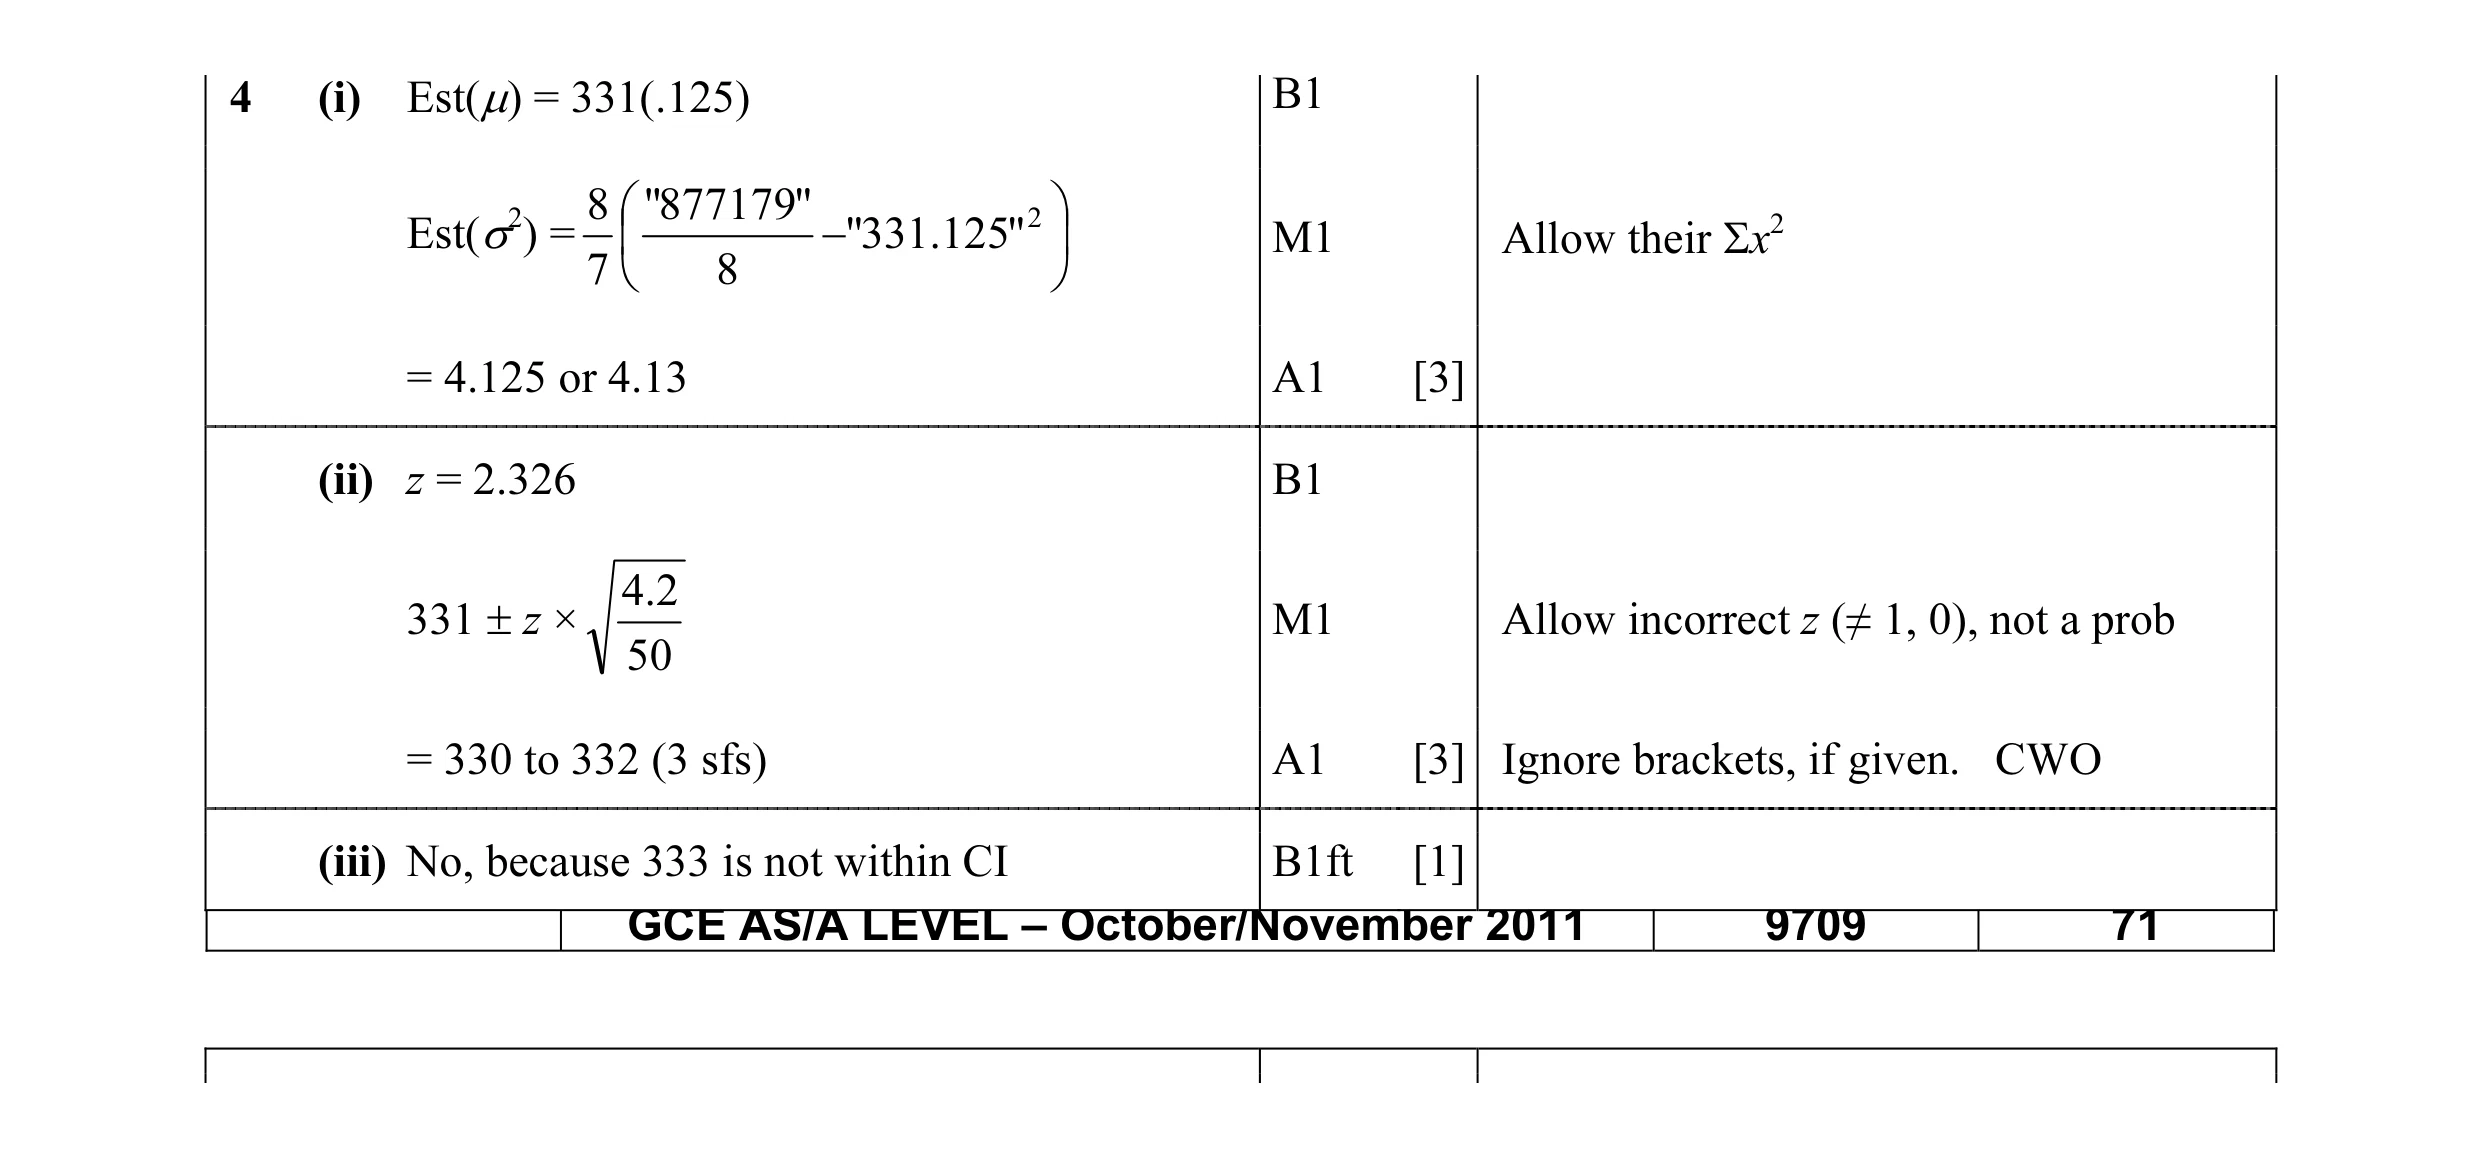 7
7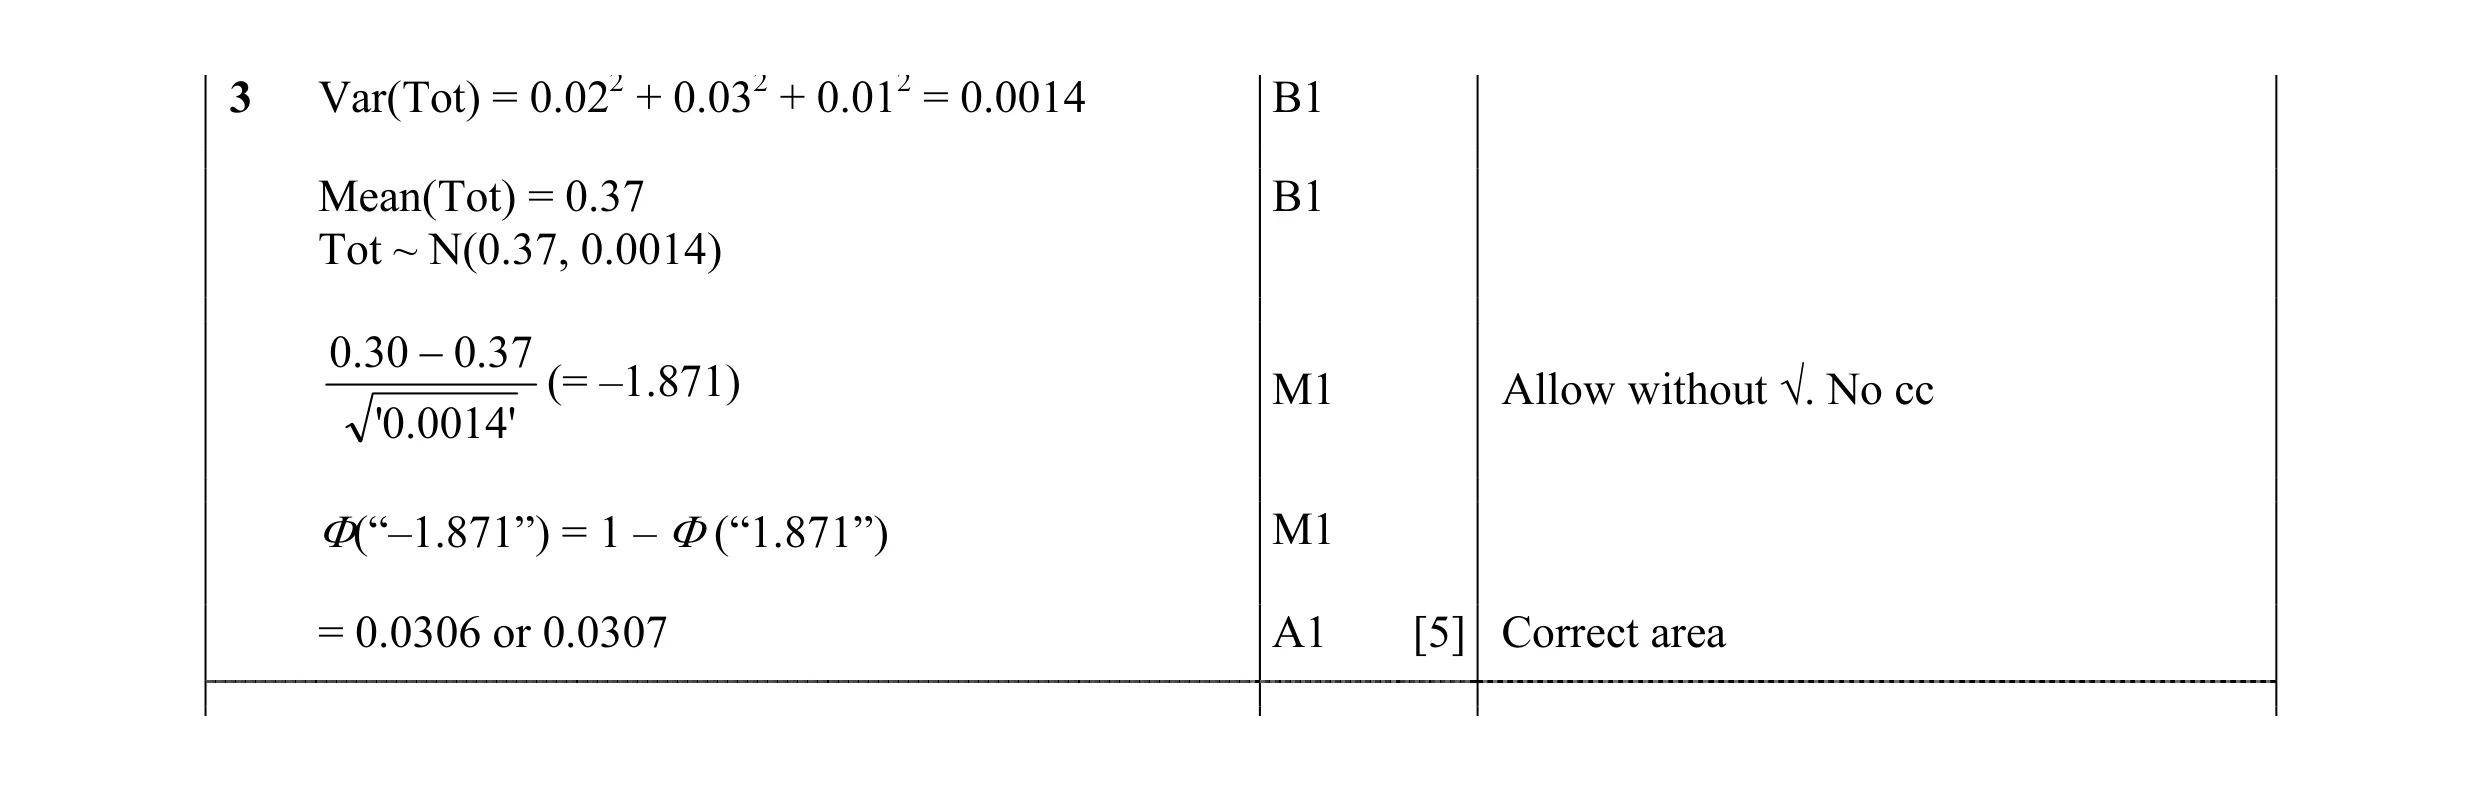 5
5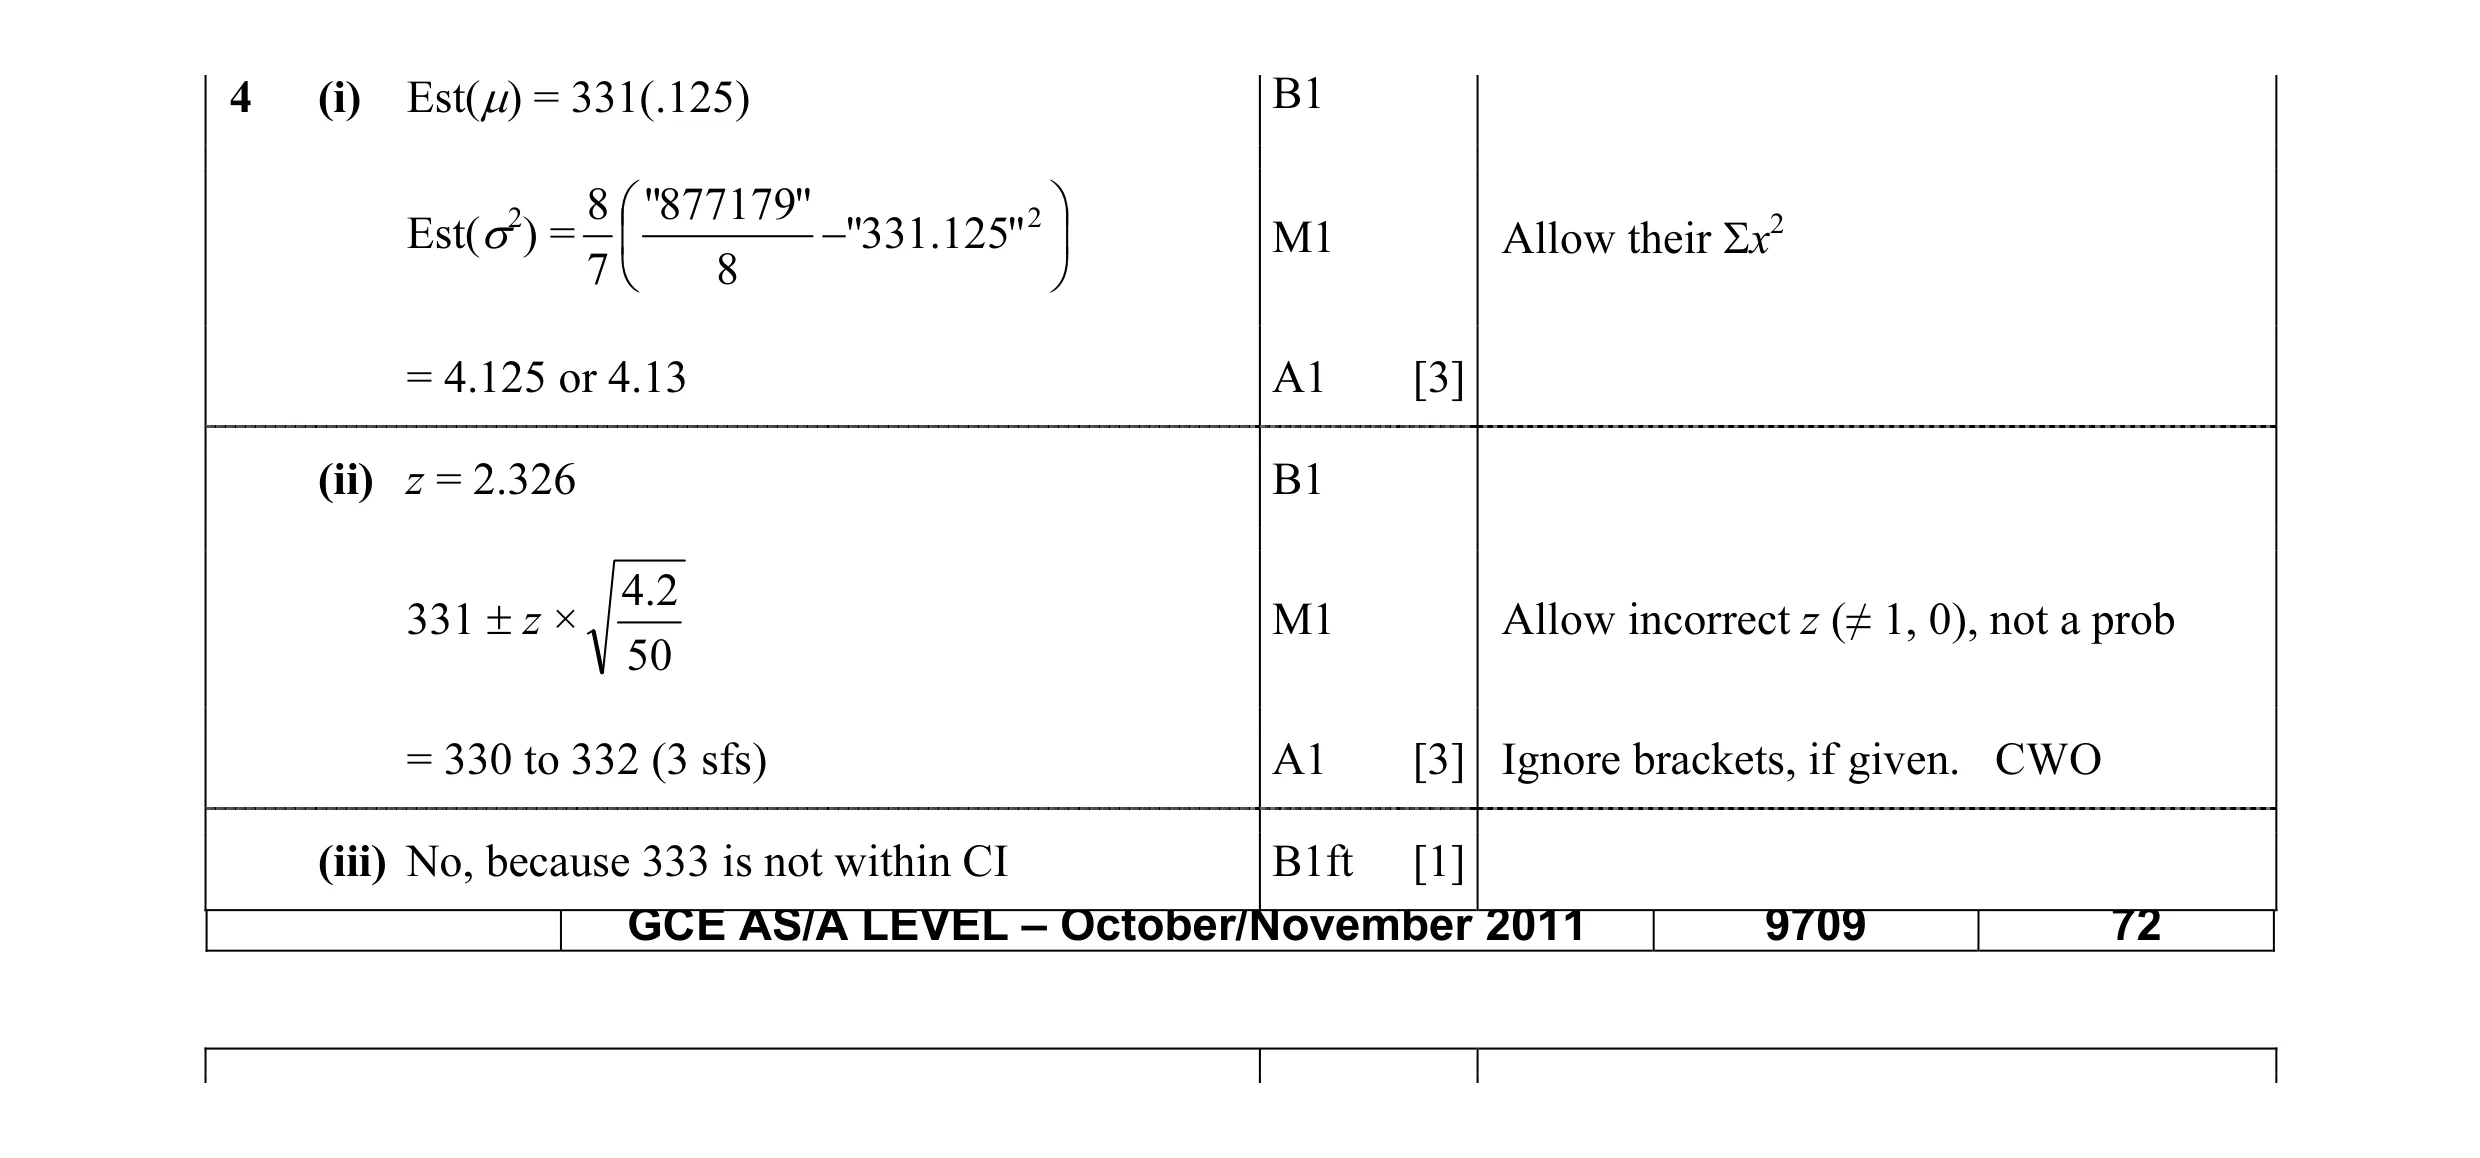 7
7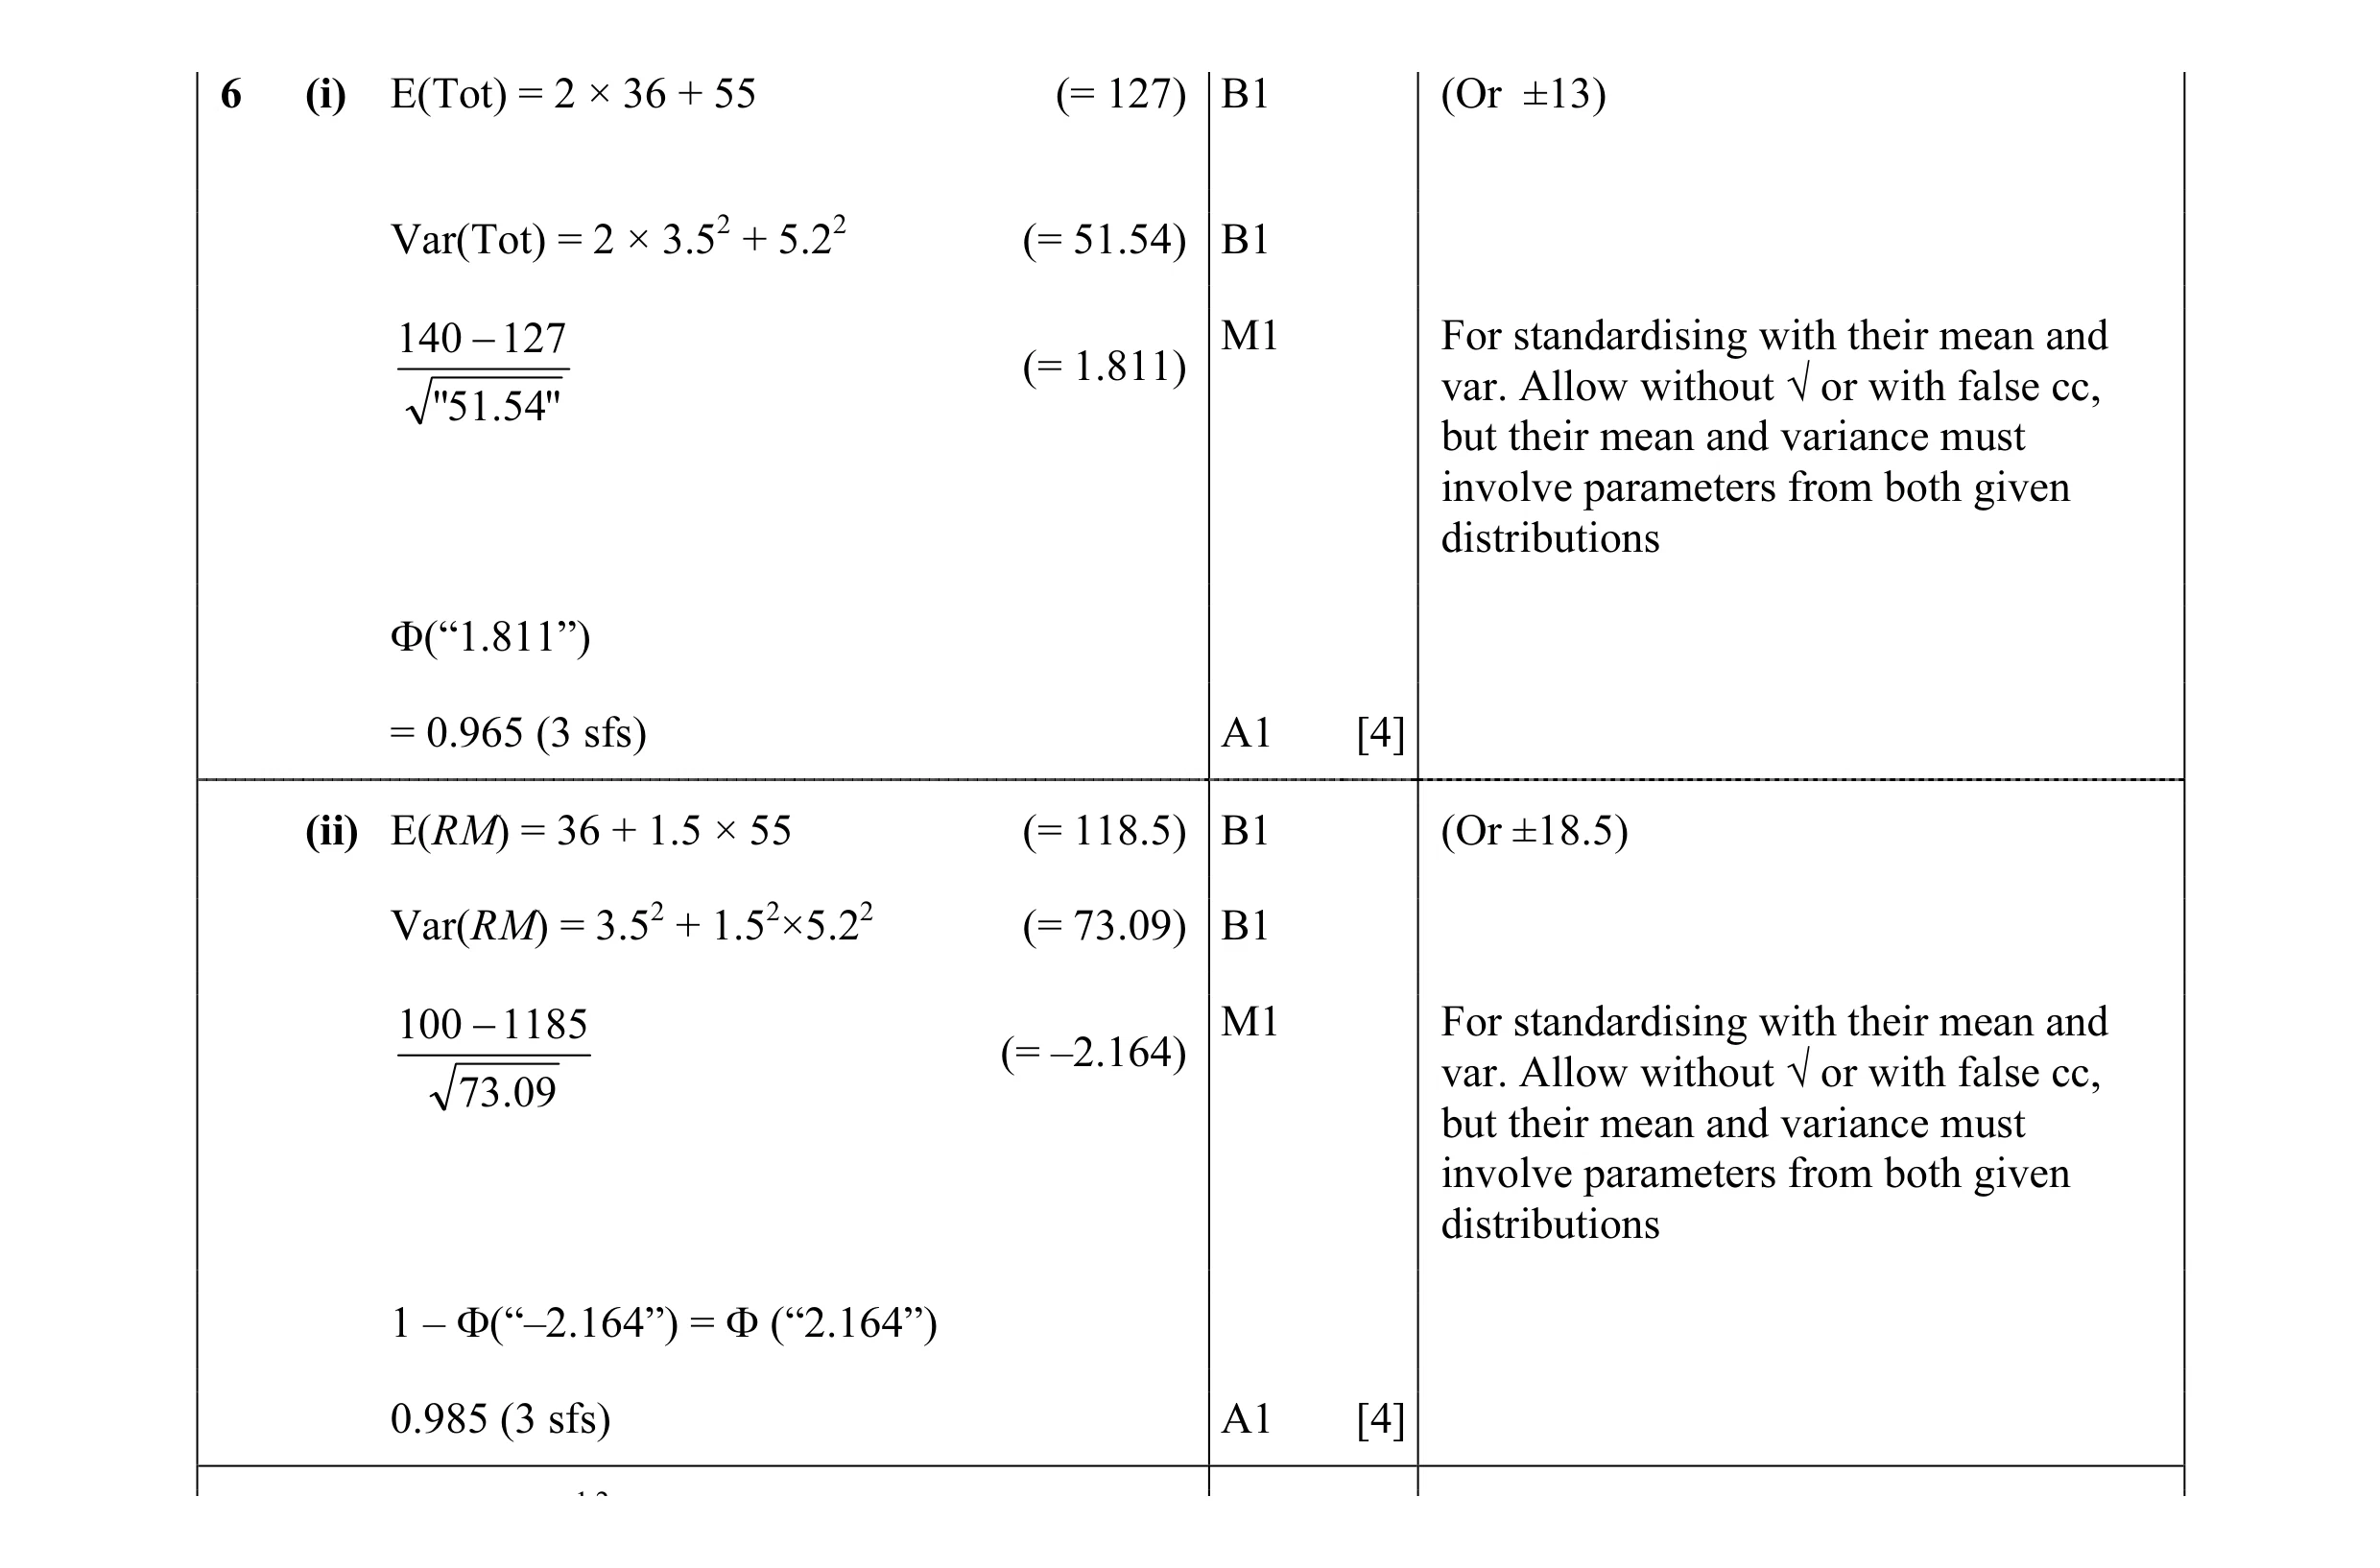 8
8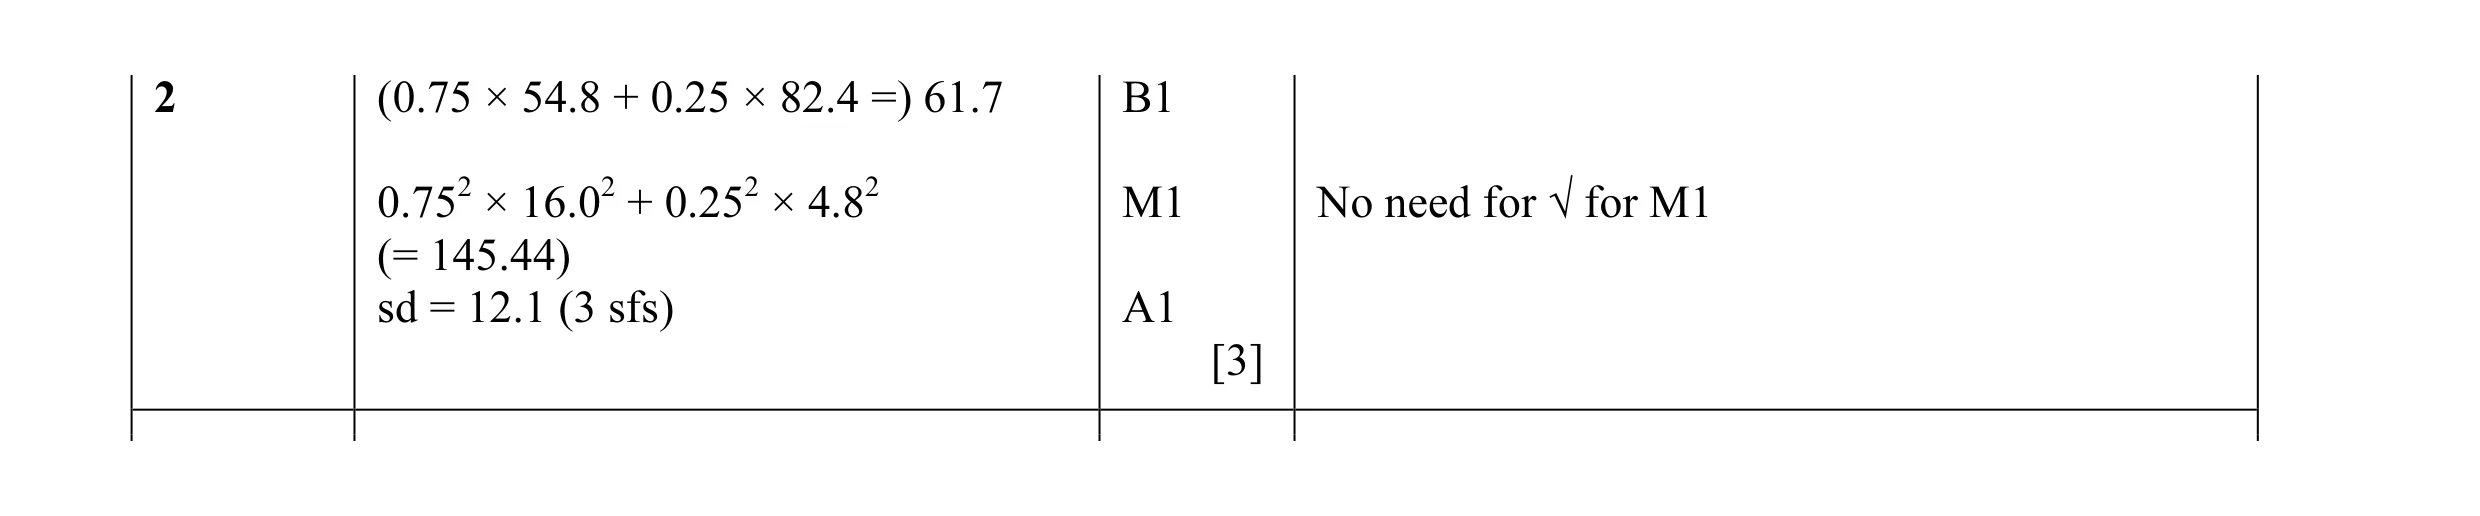 3
3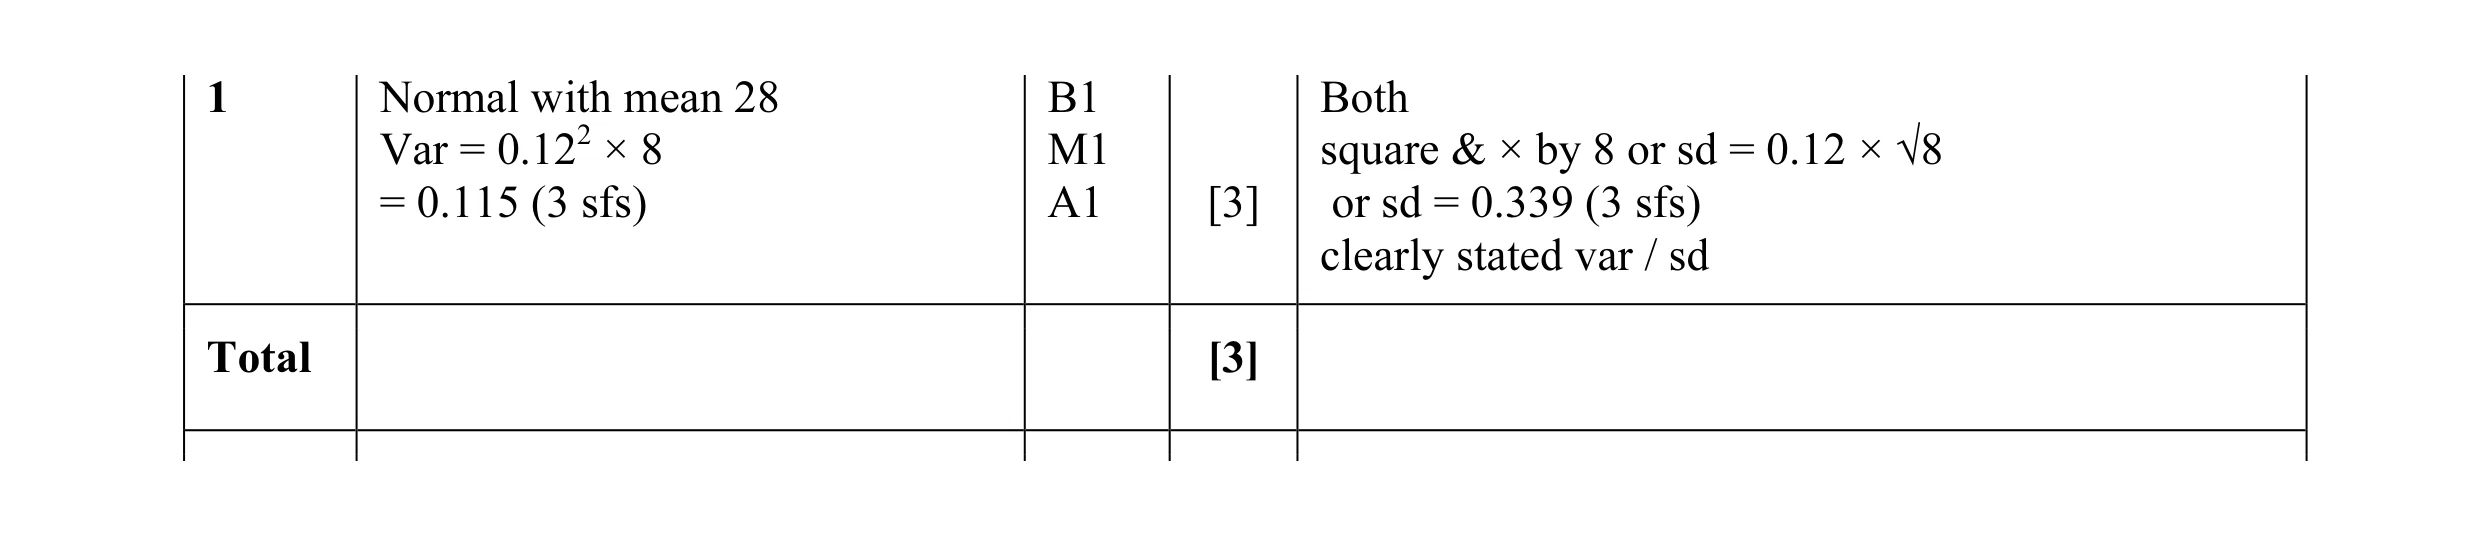 3
3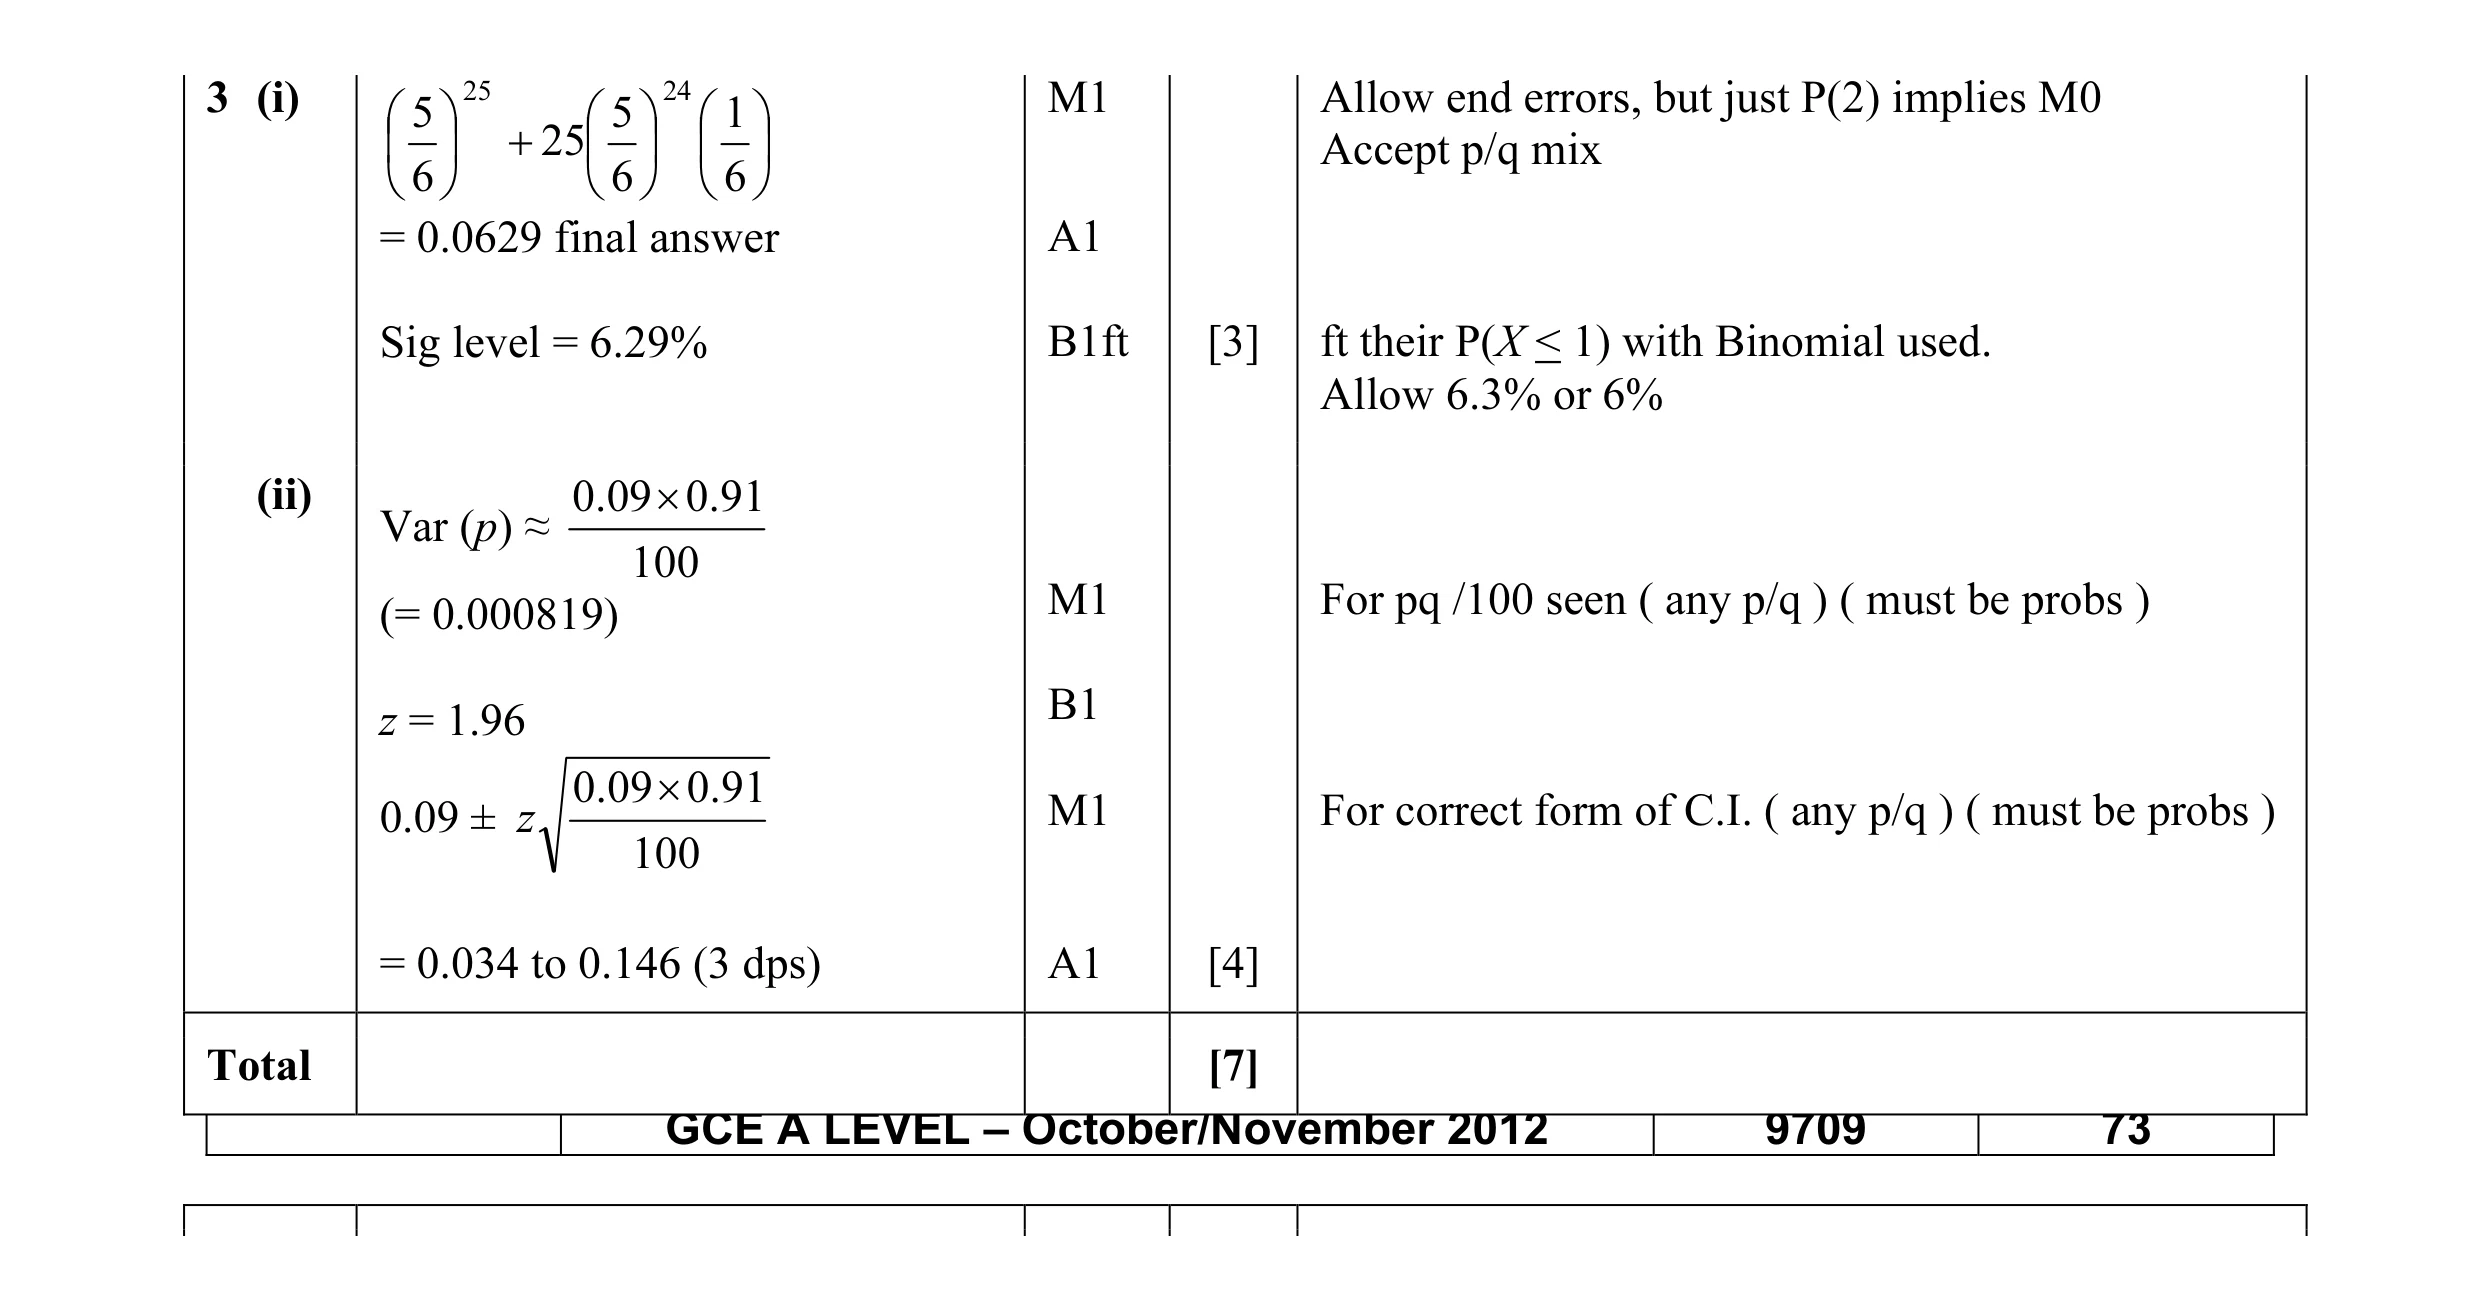 7
7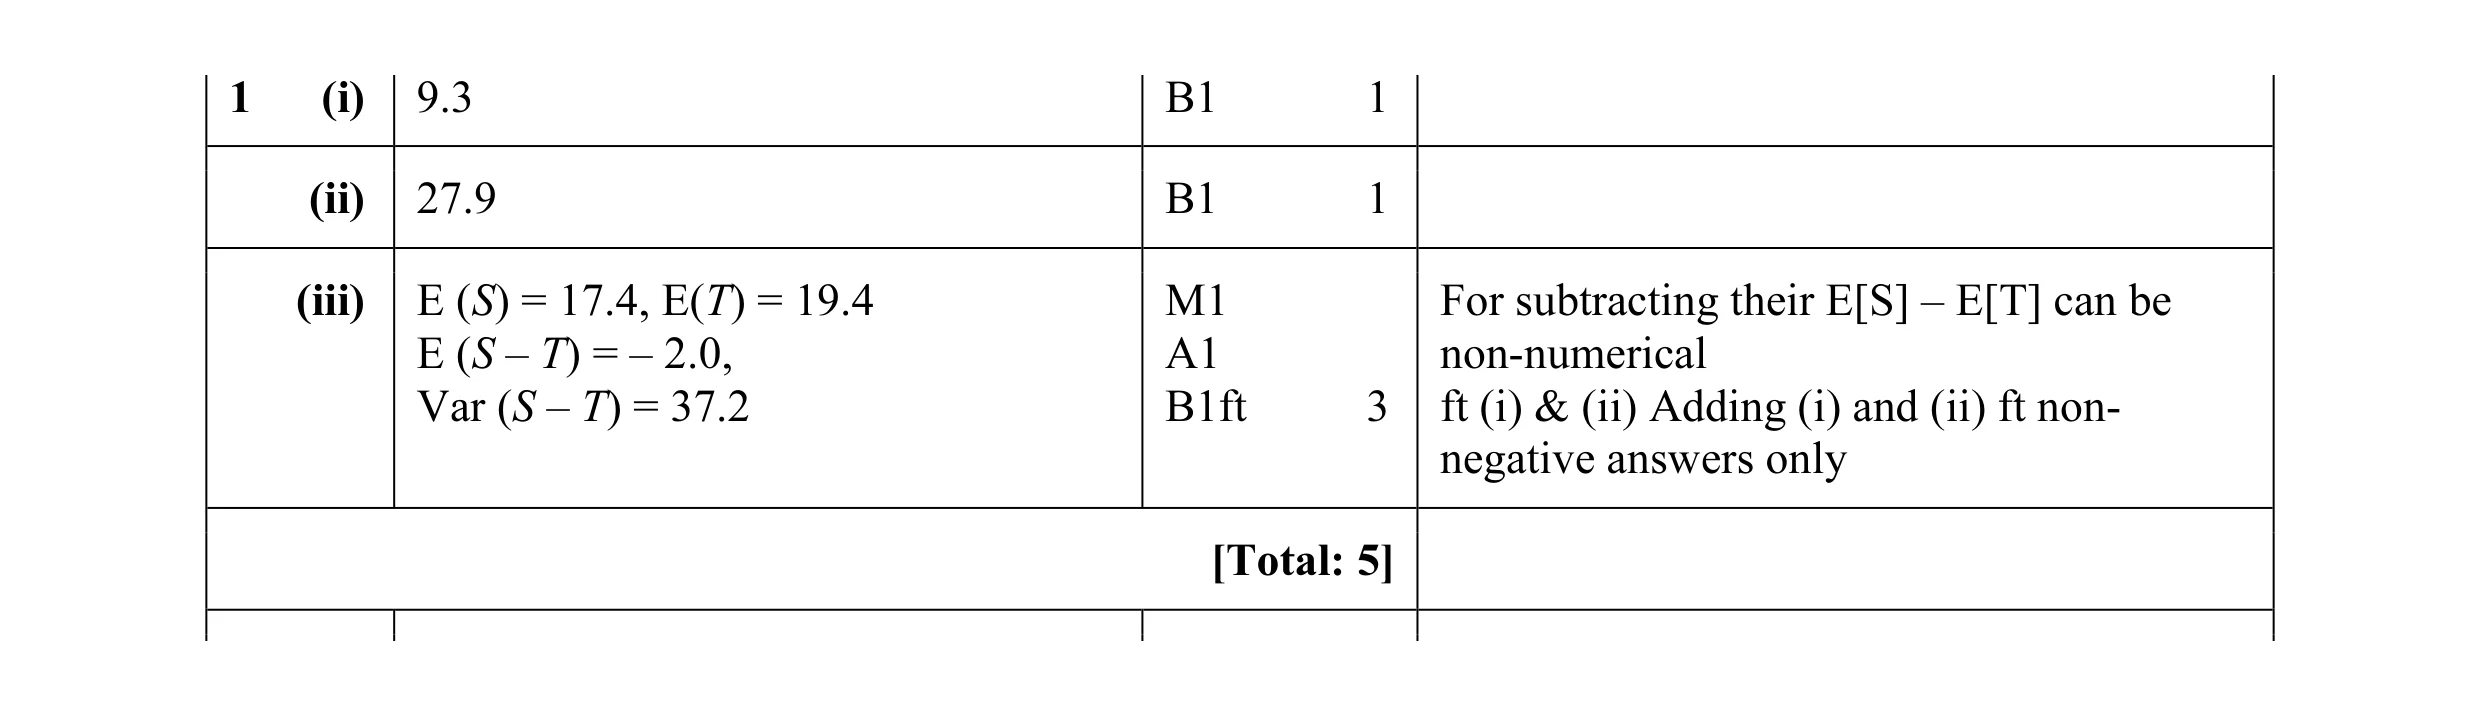 5
5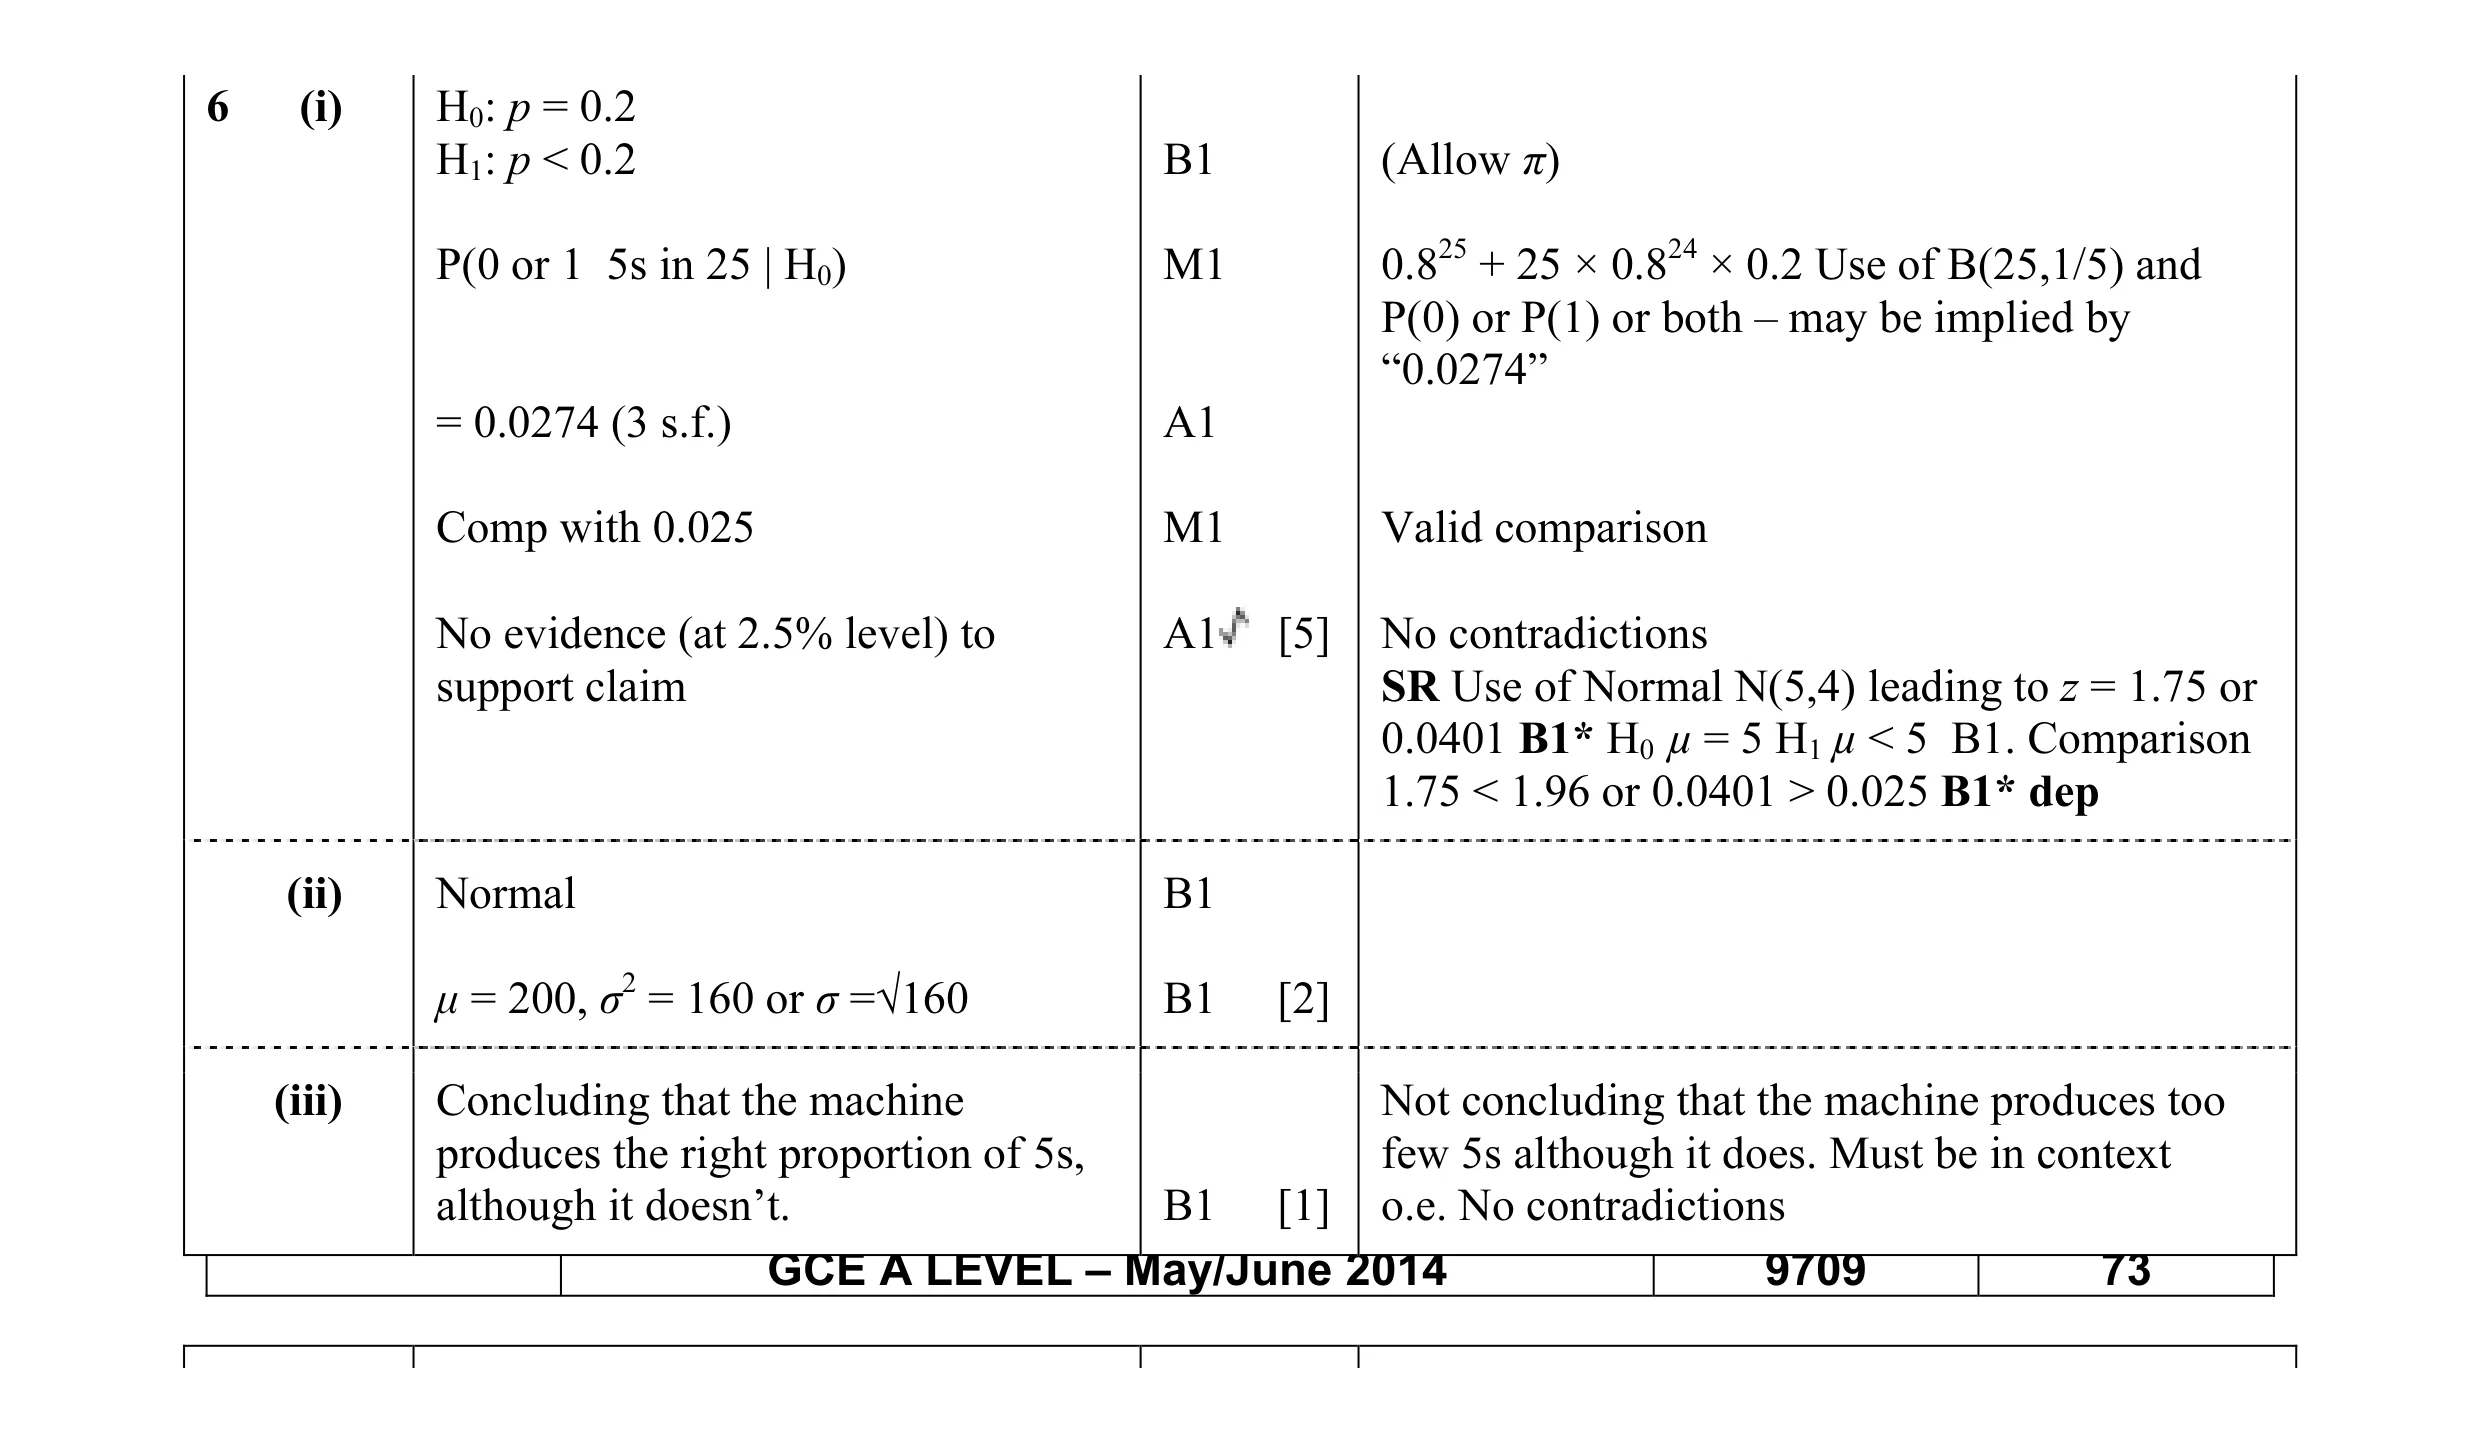 8
8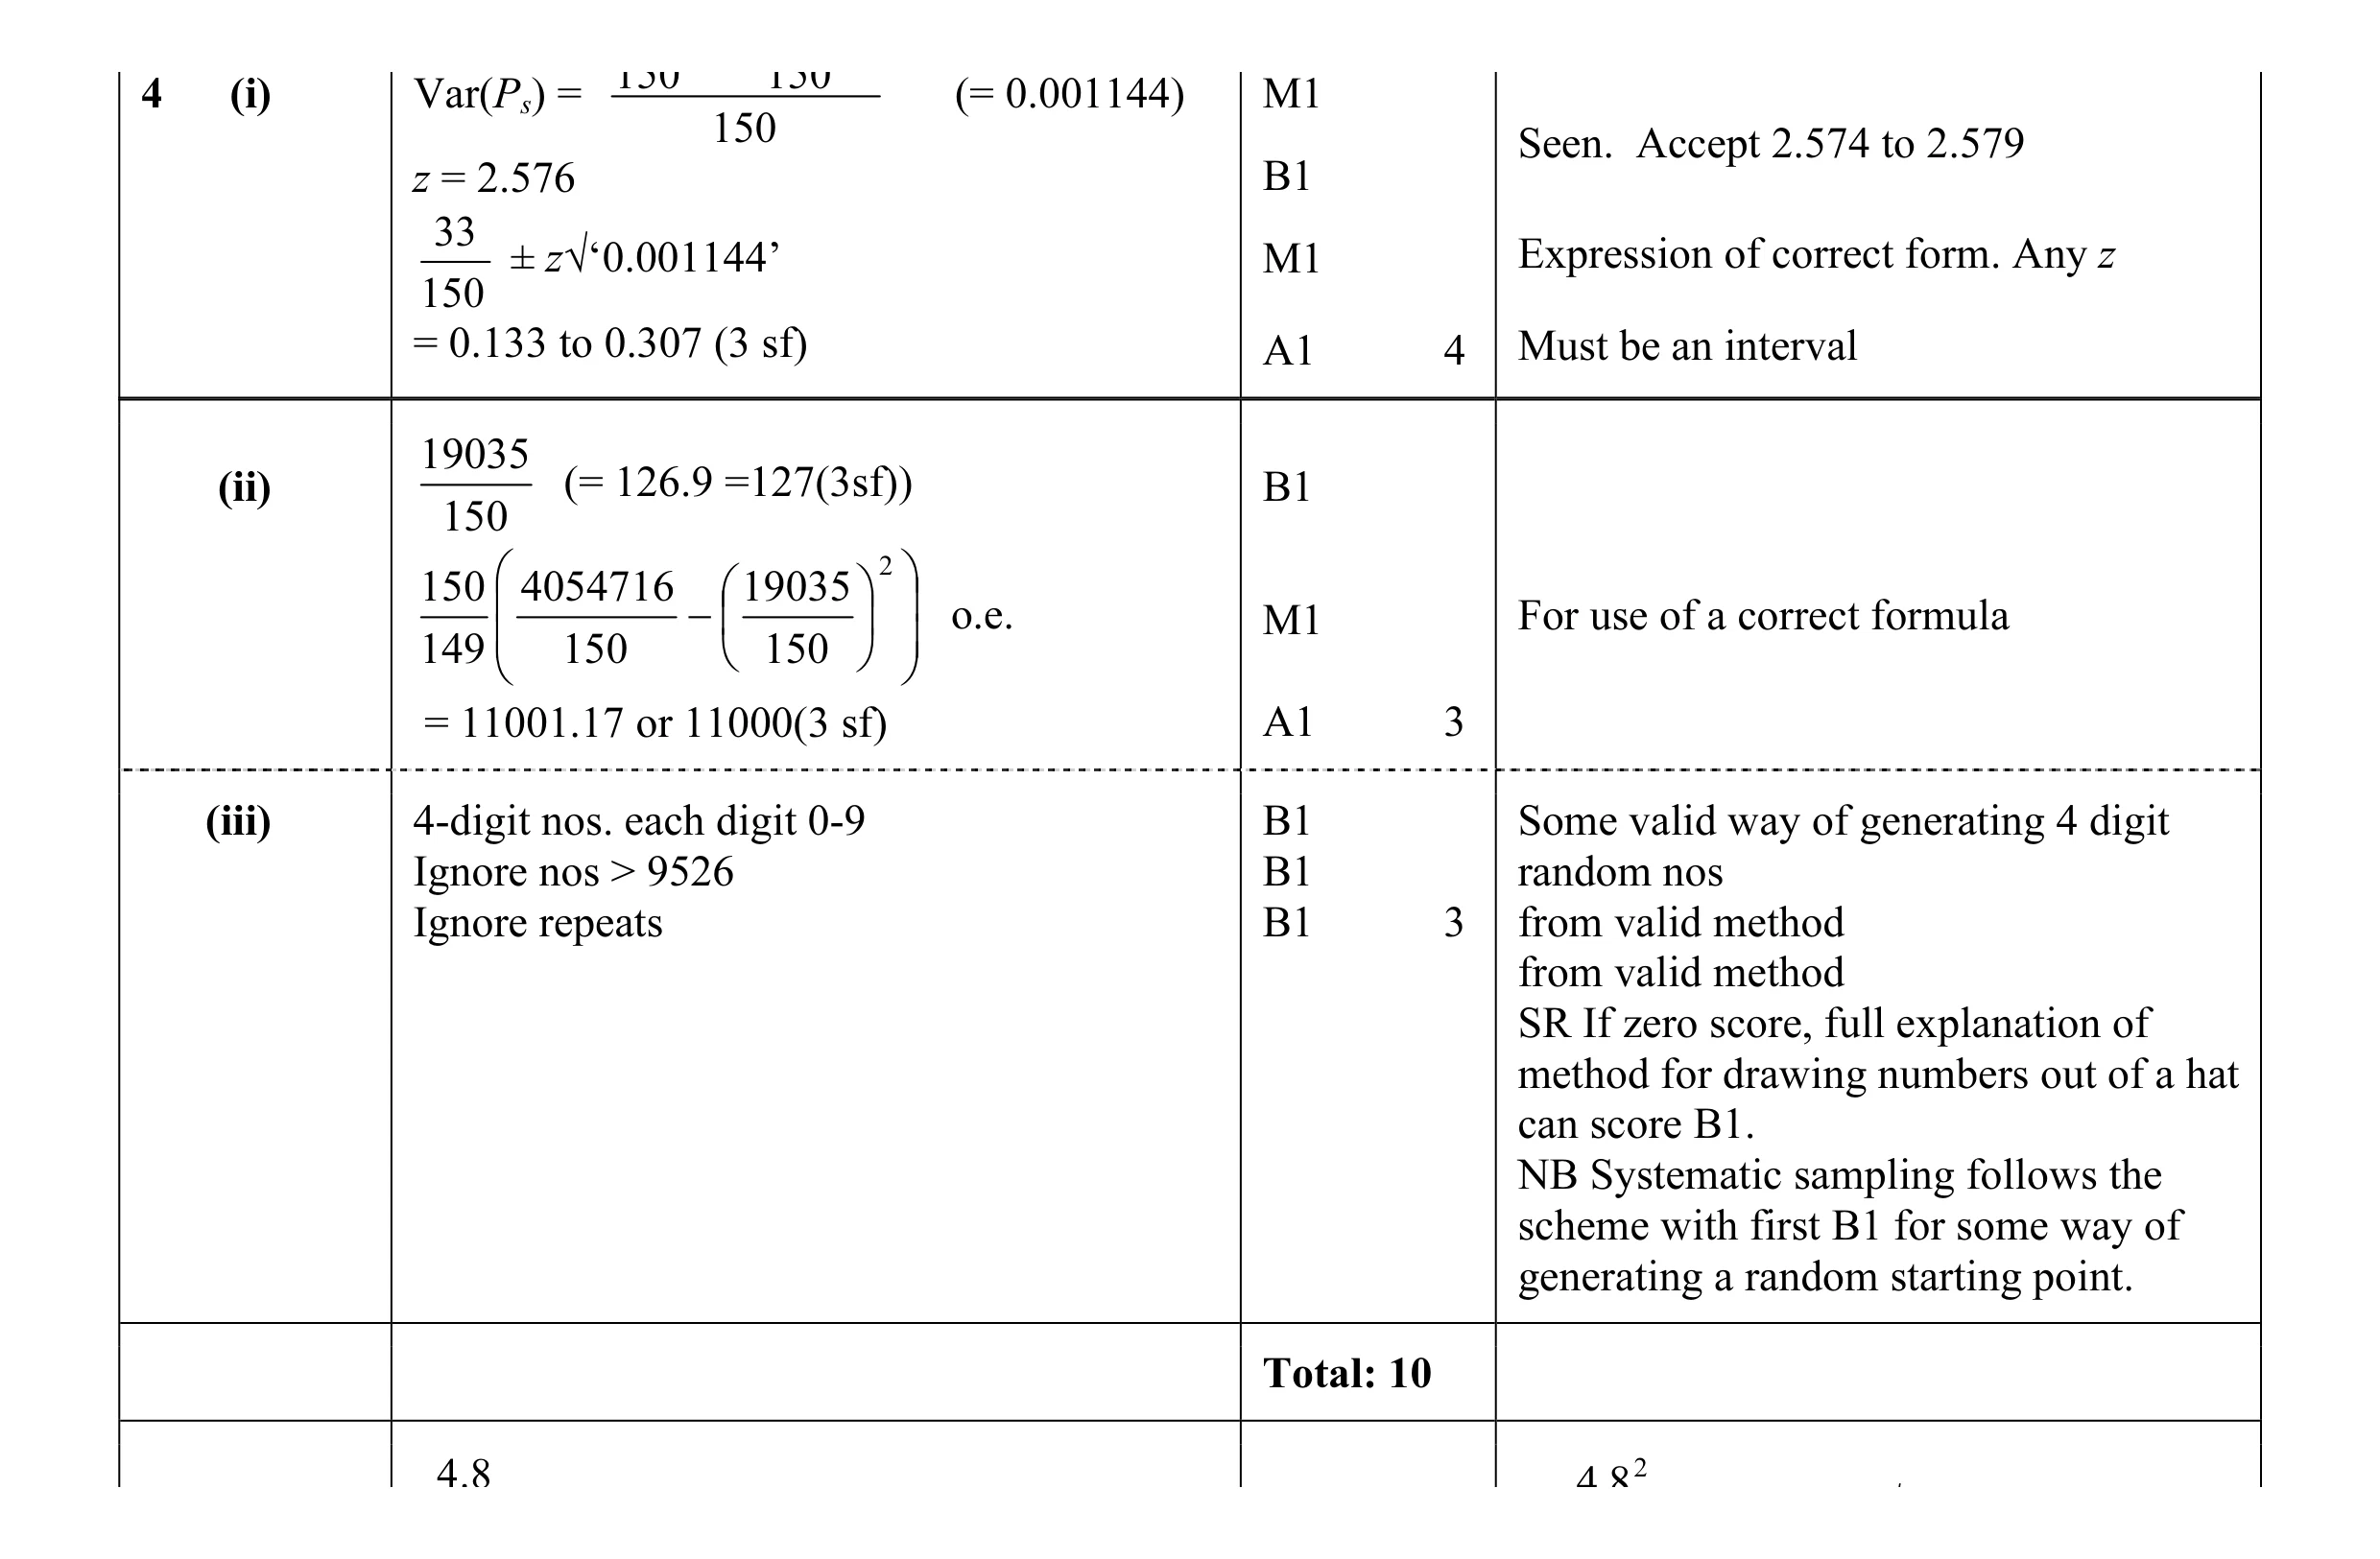 10
10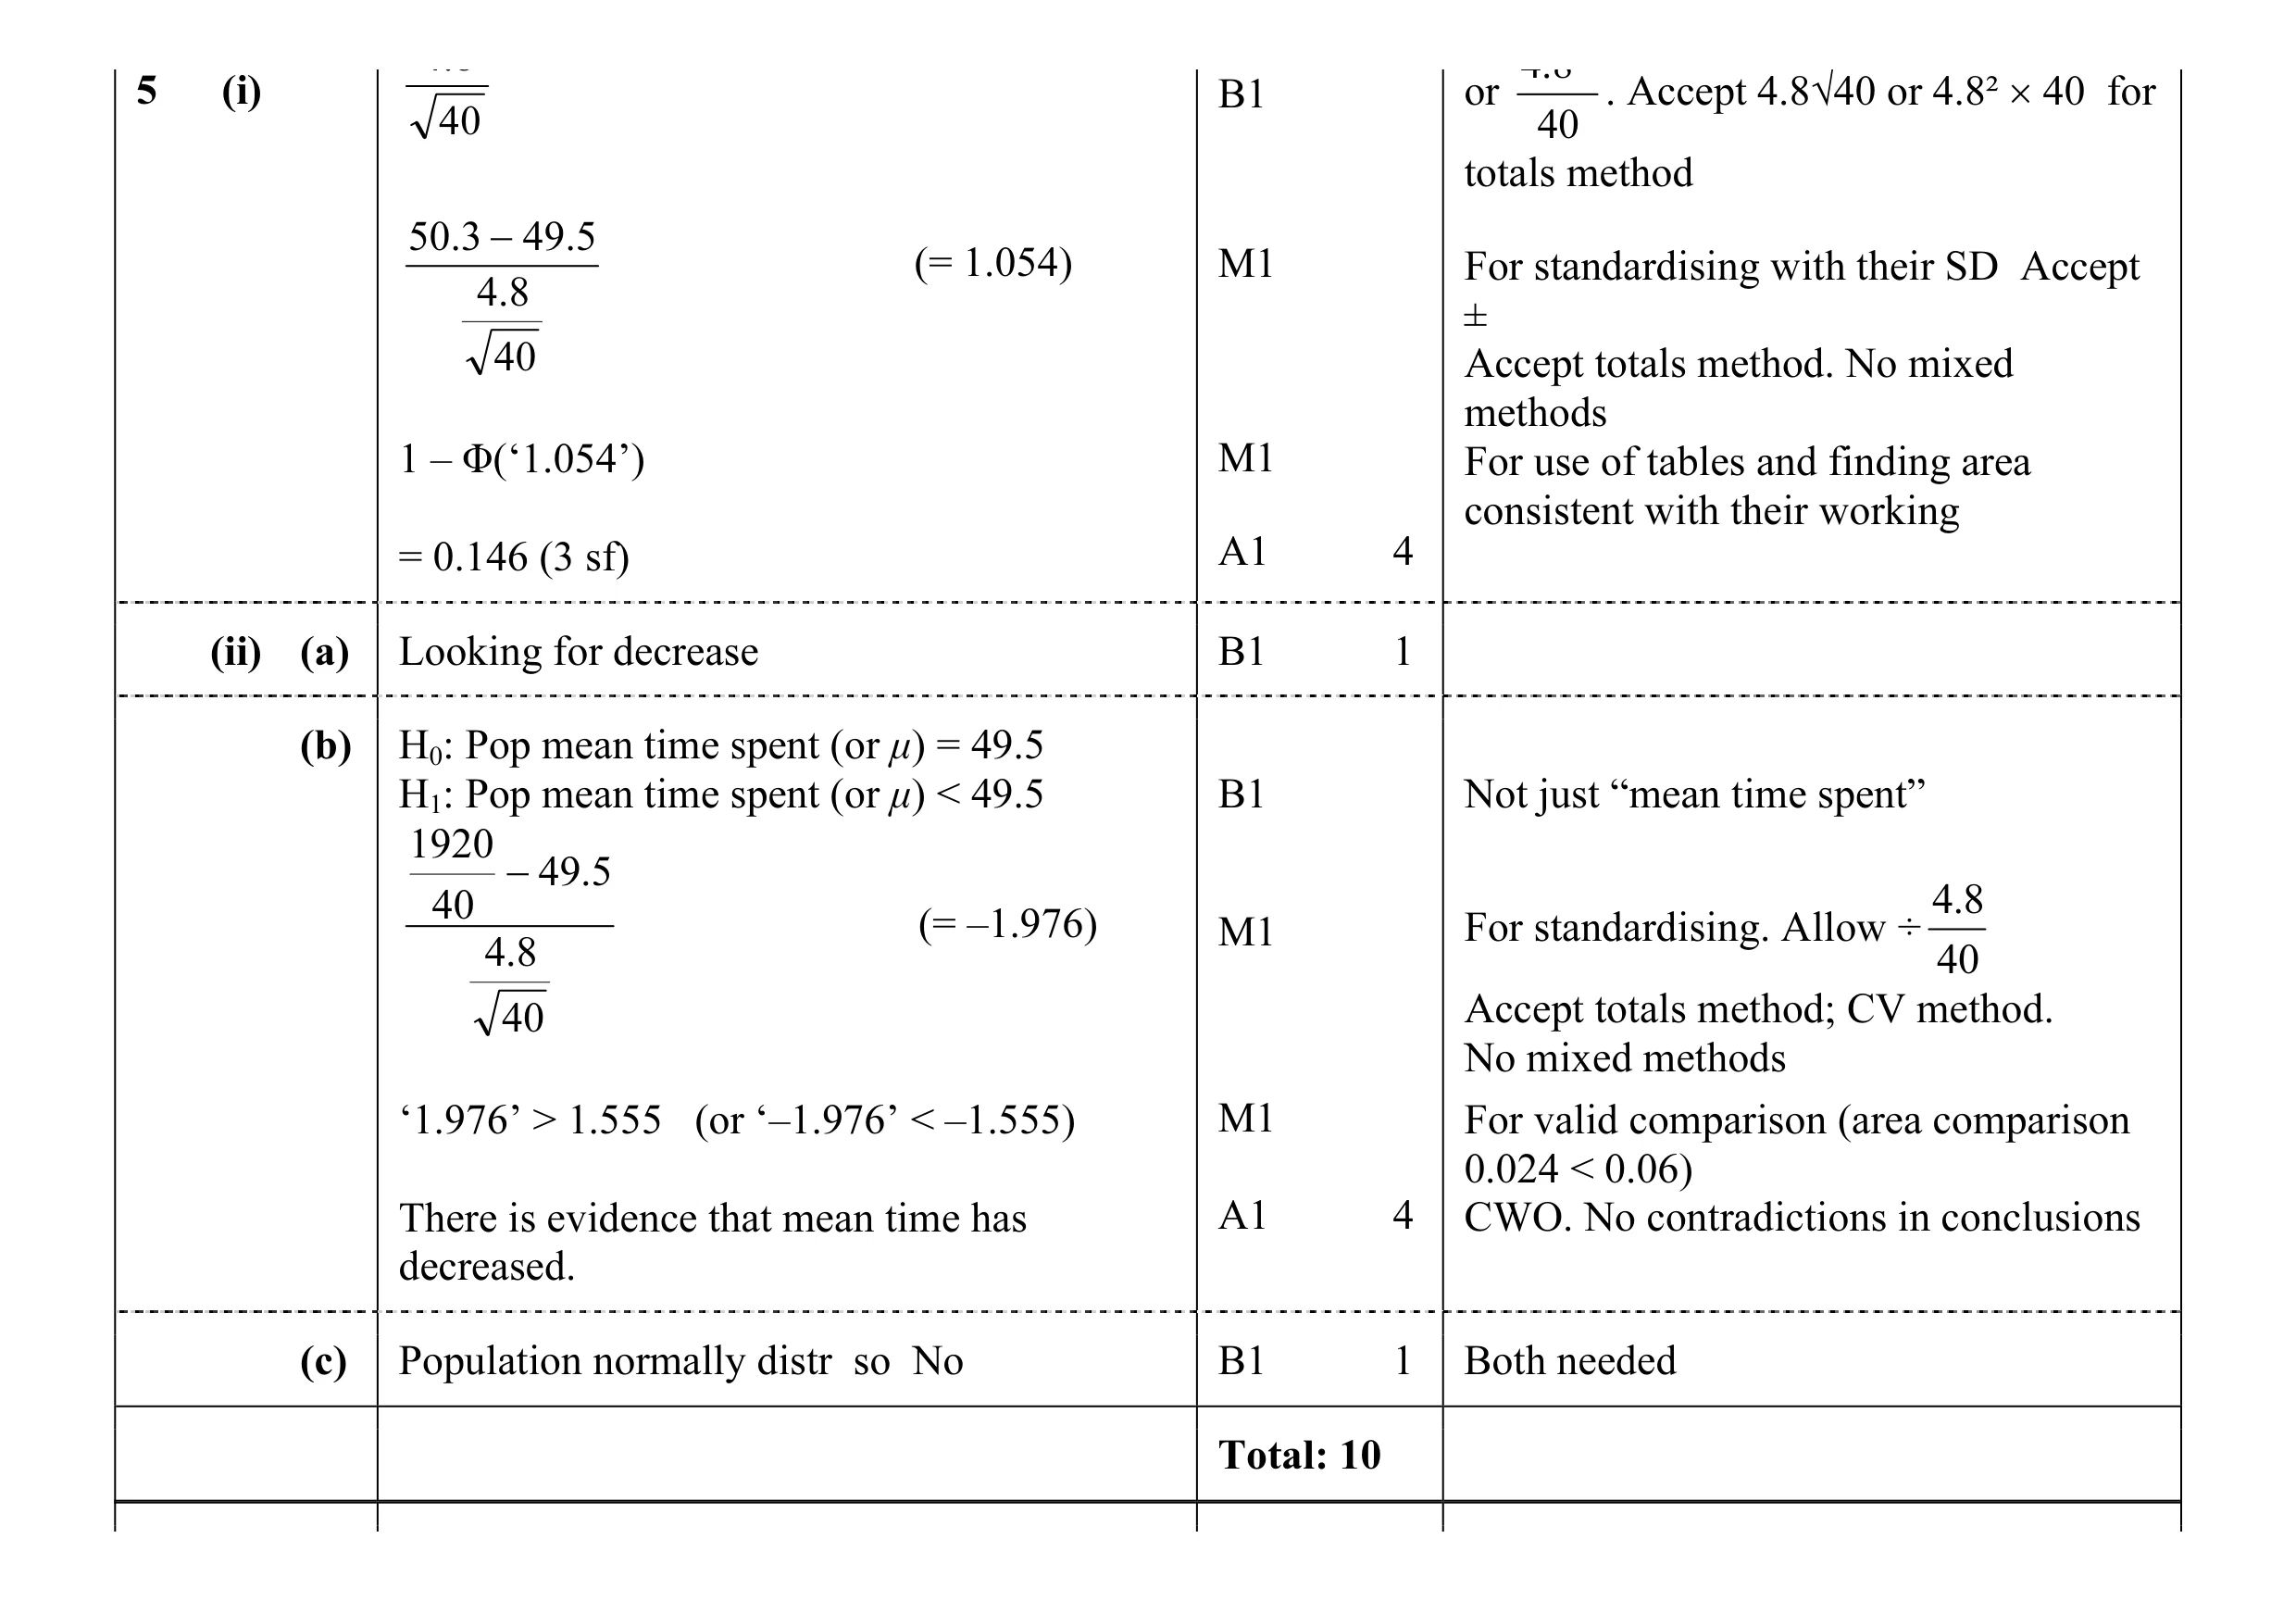 10
10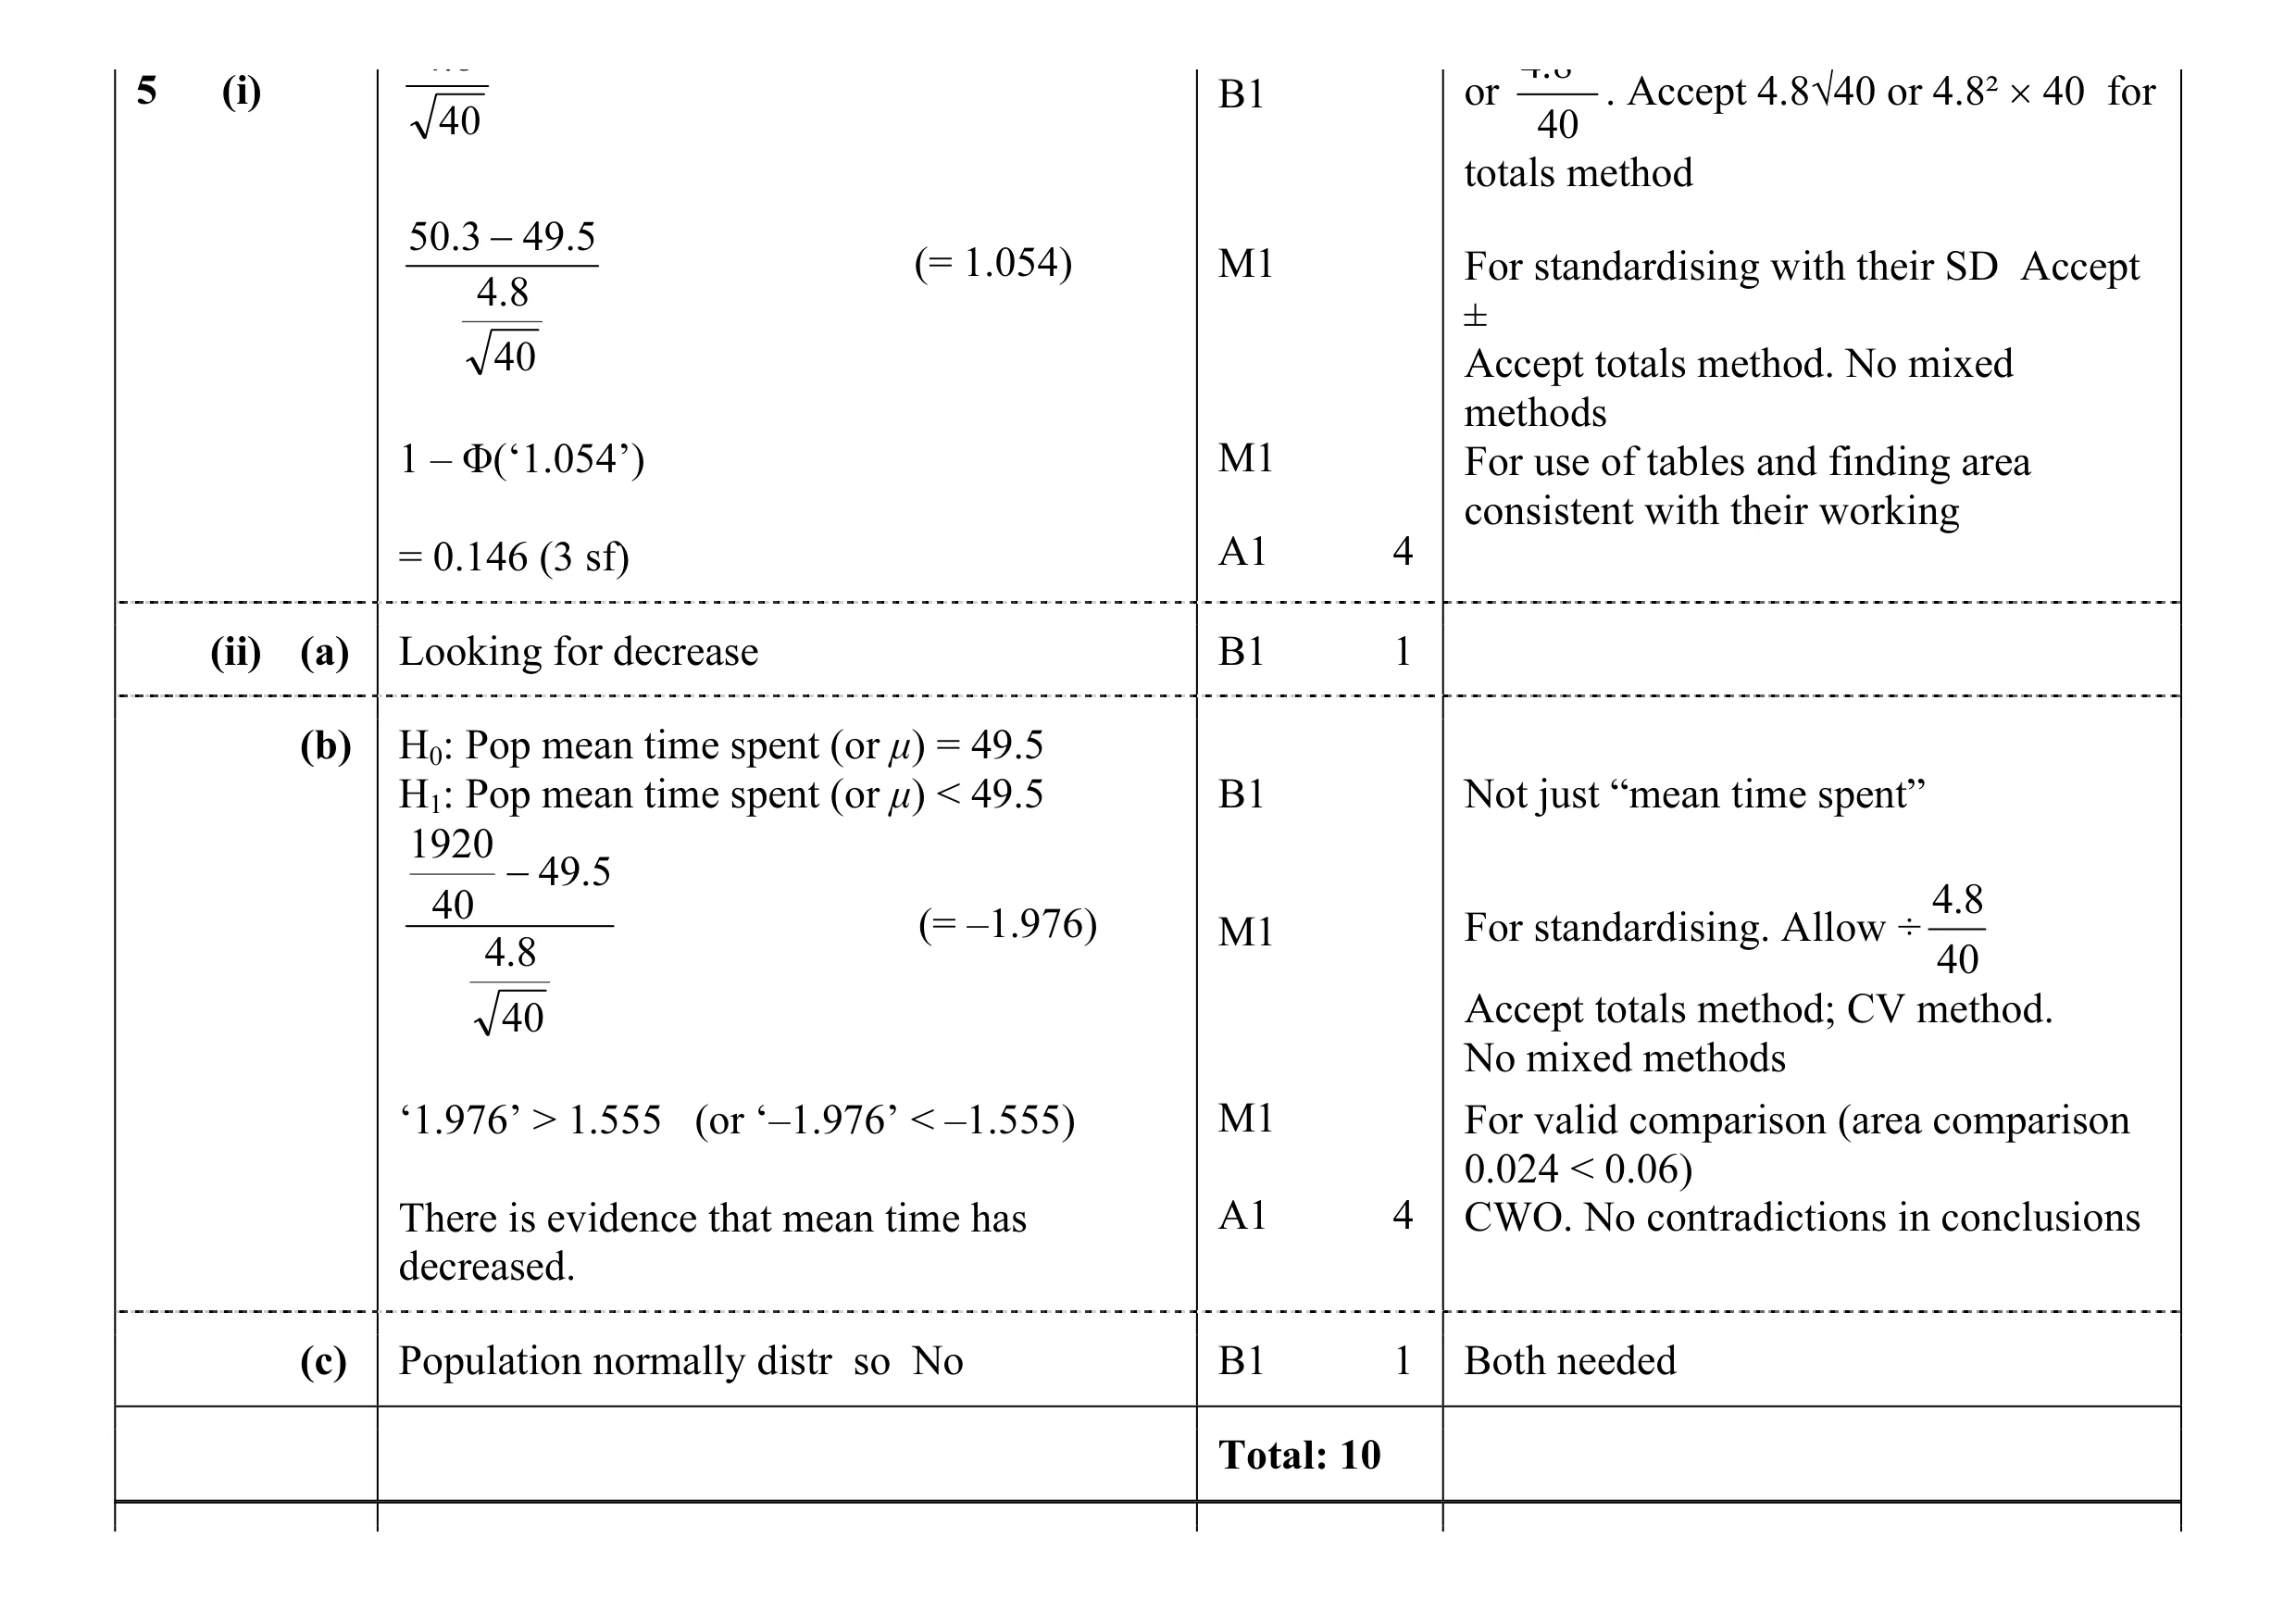 10
10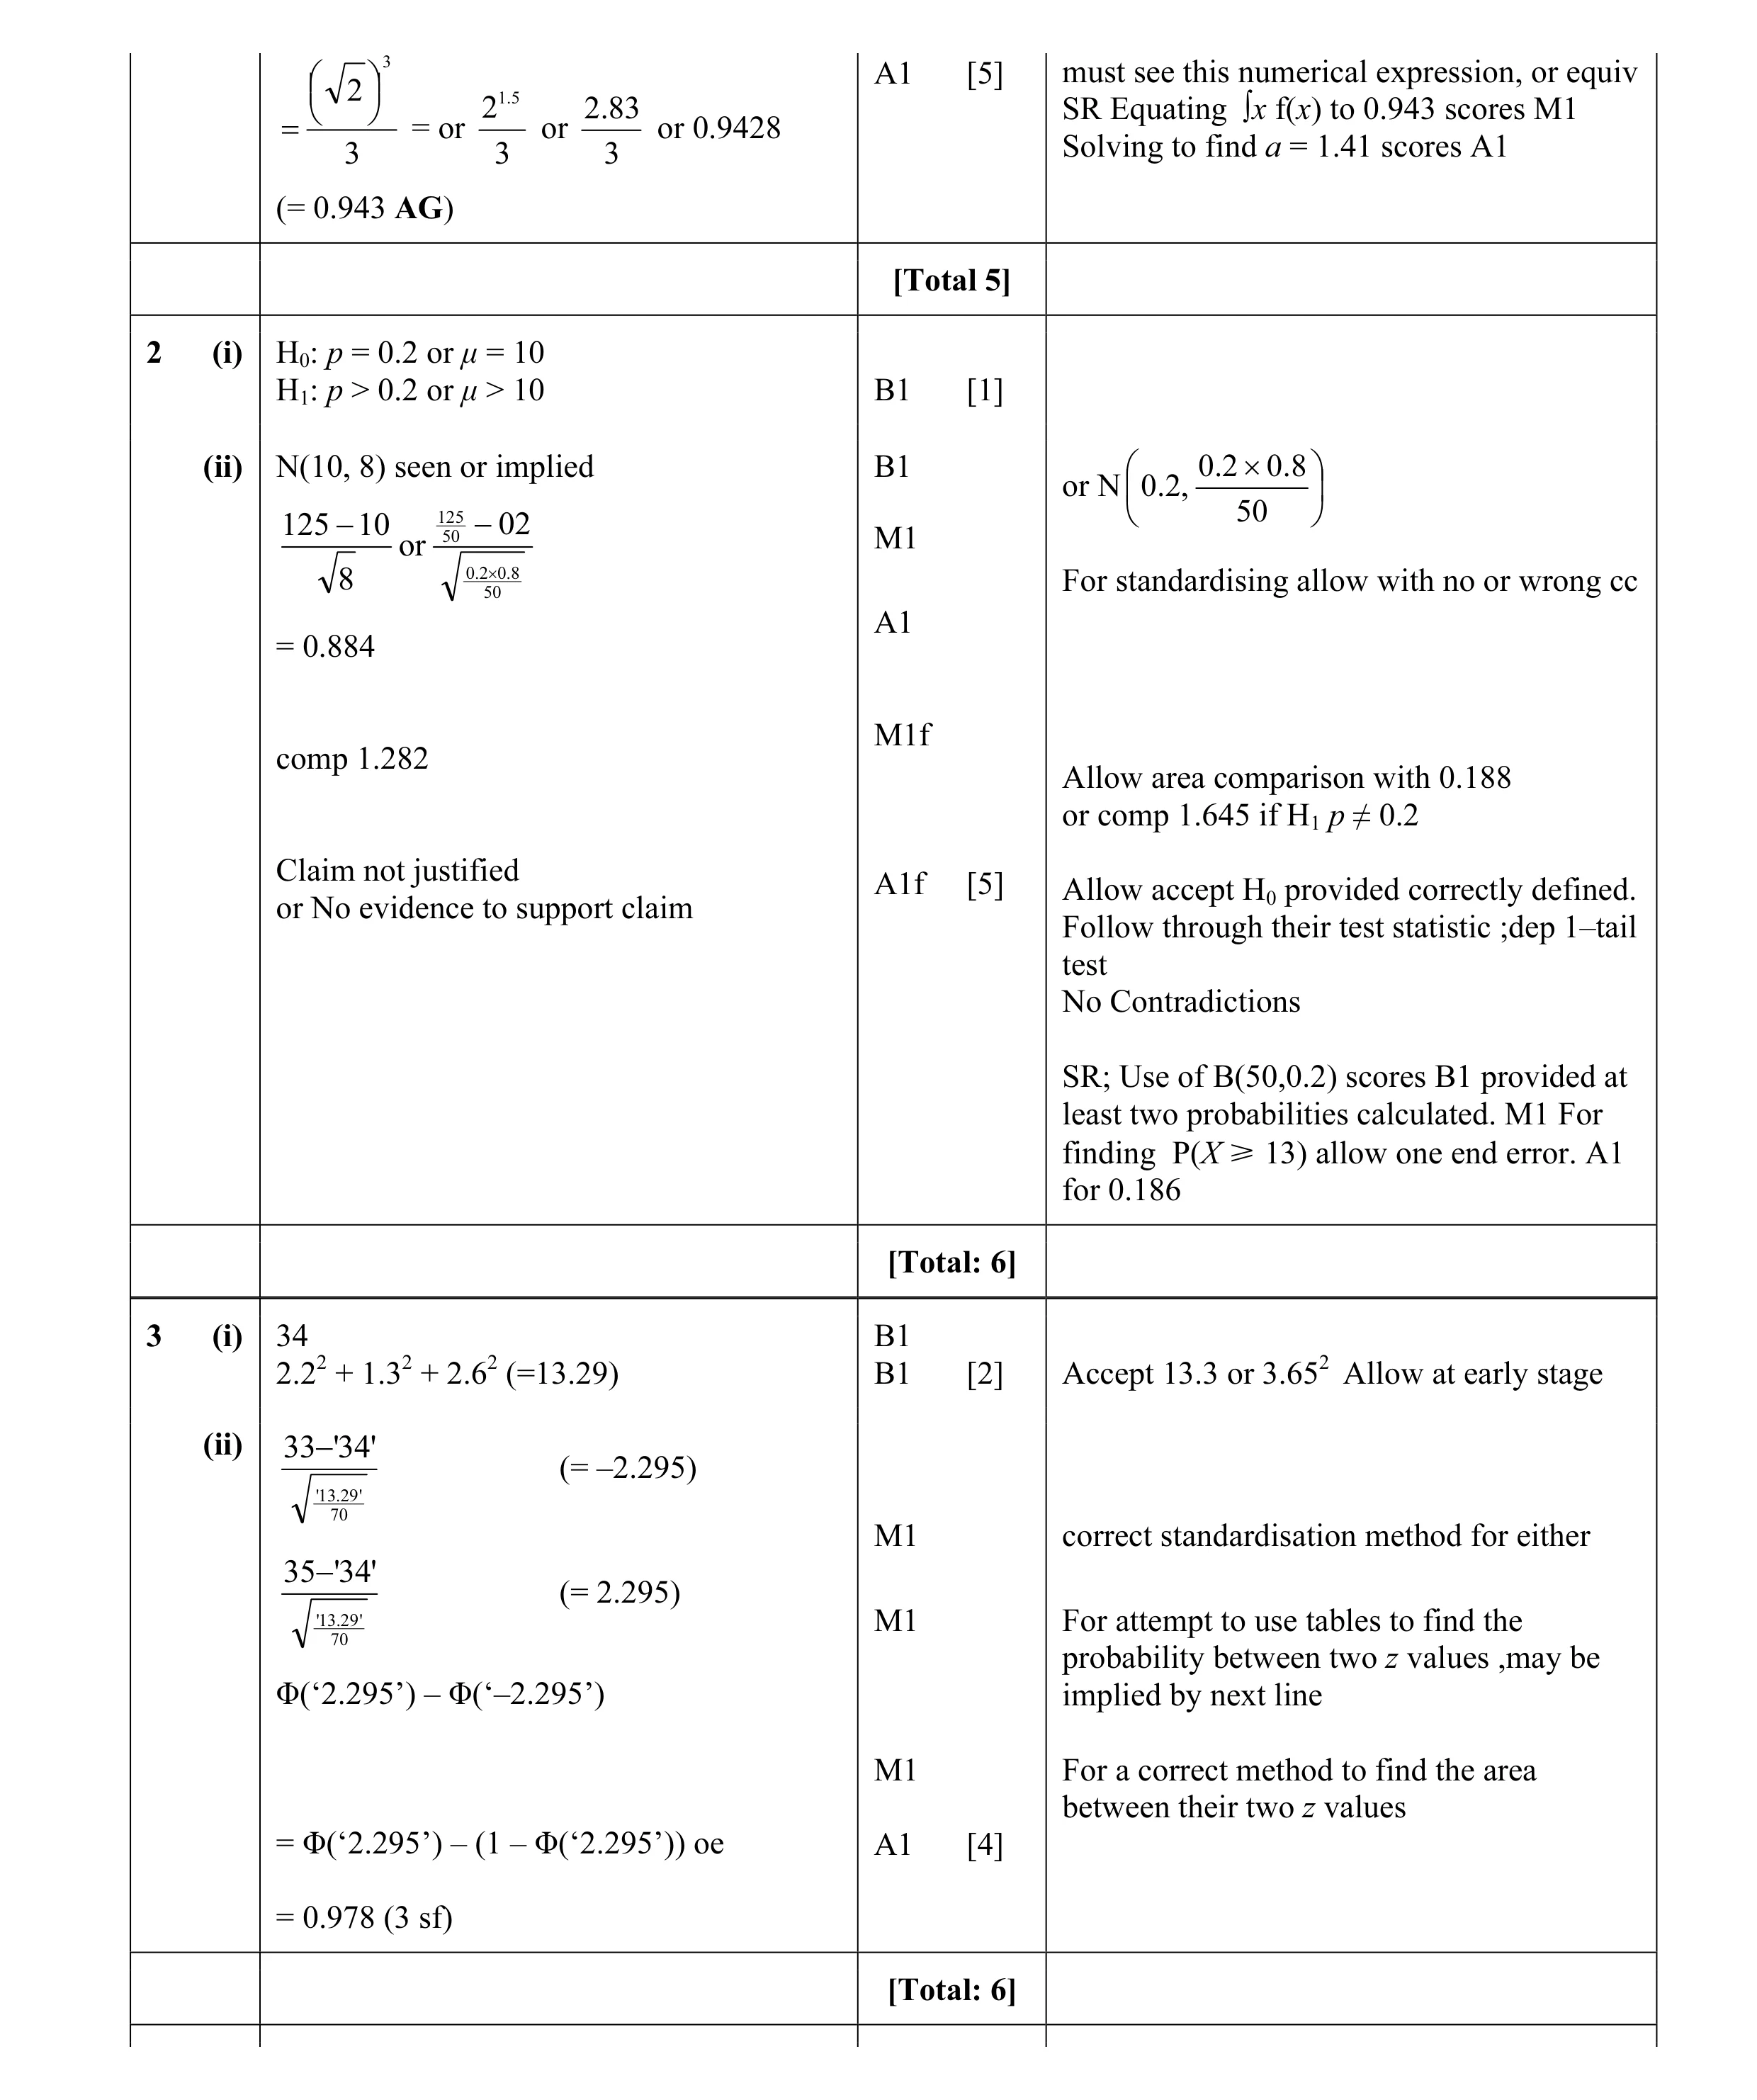 6
6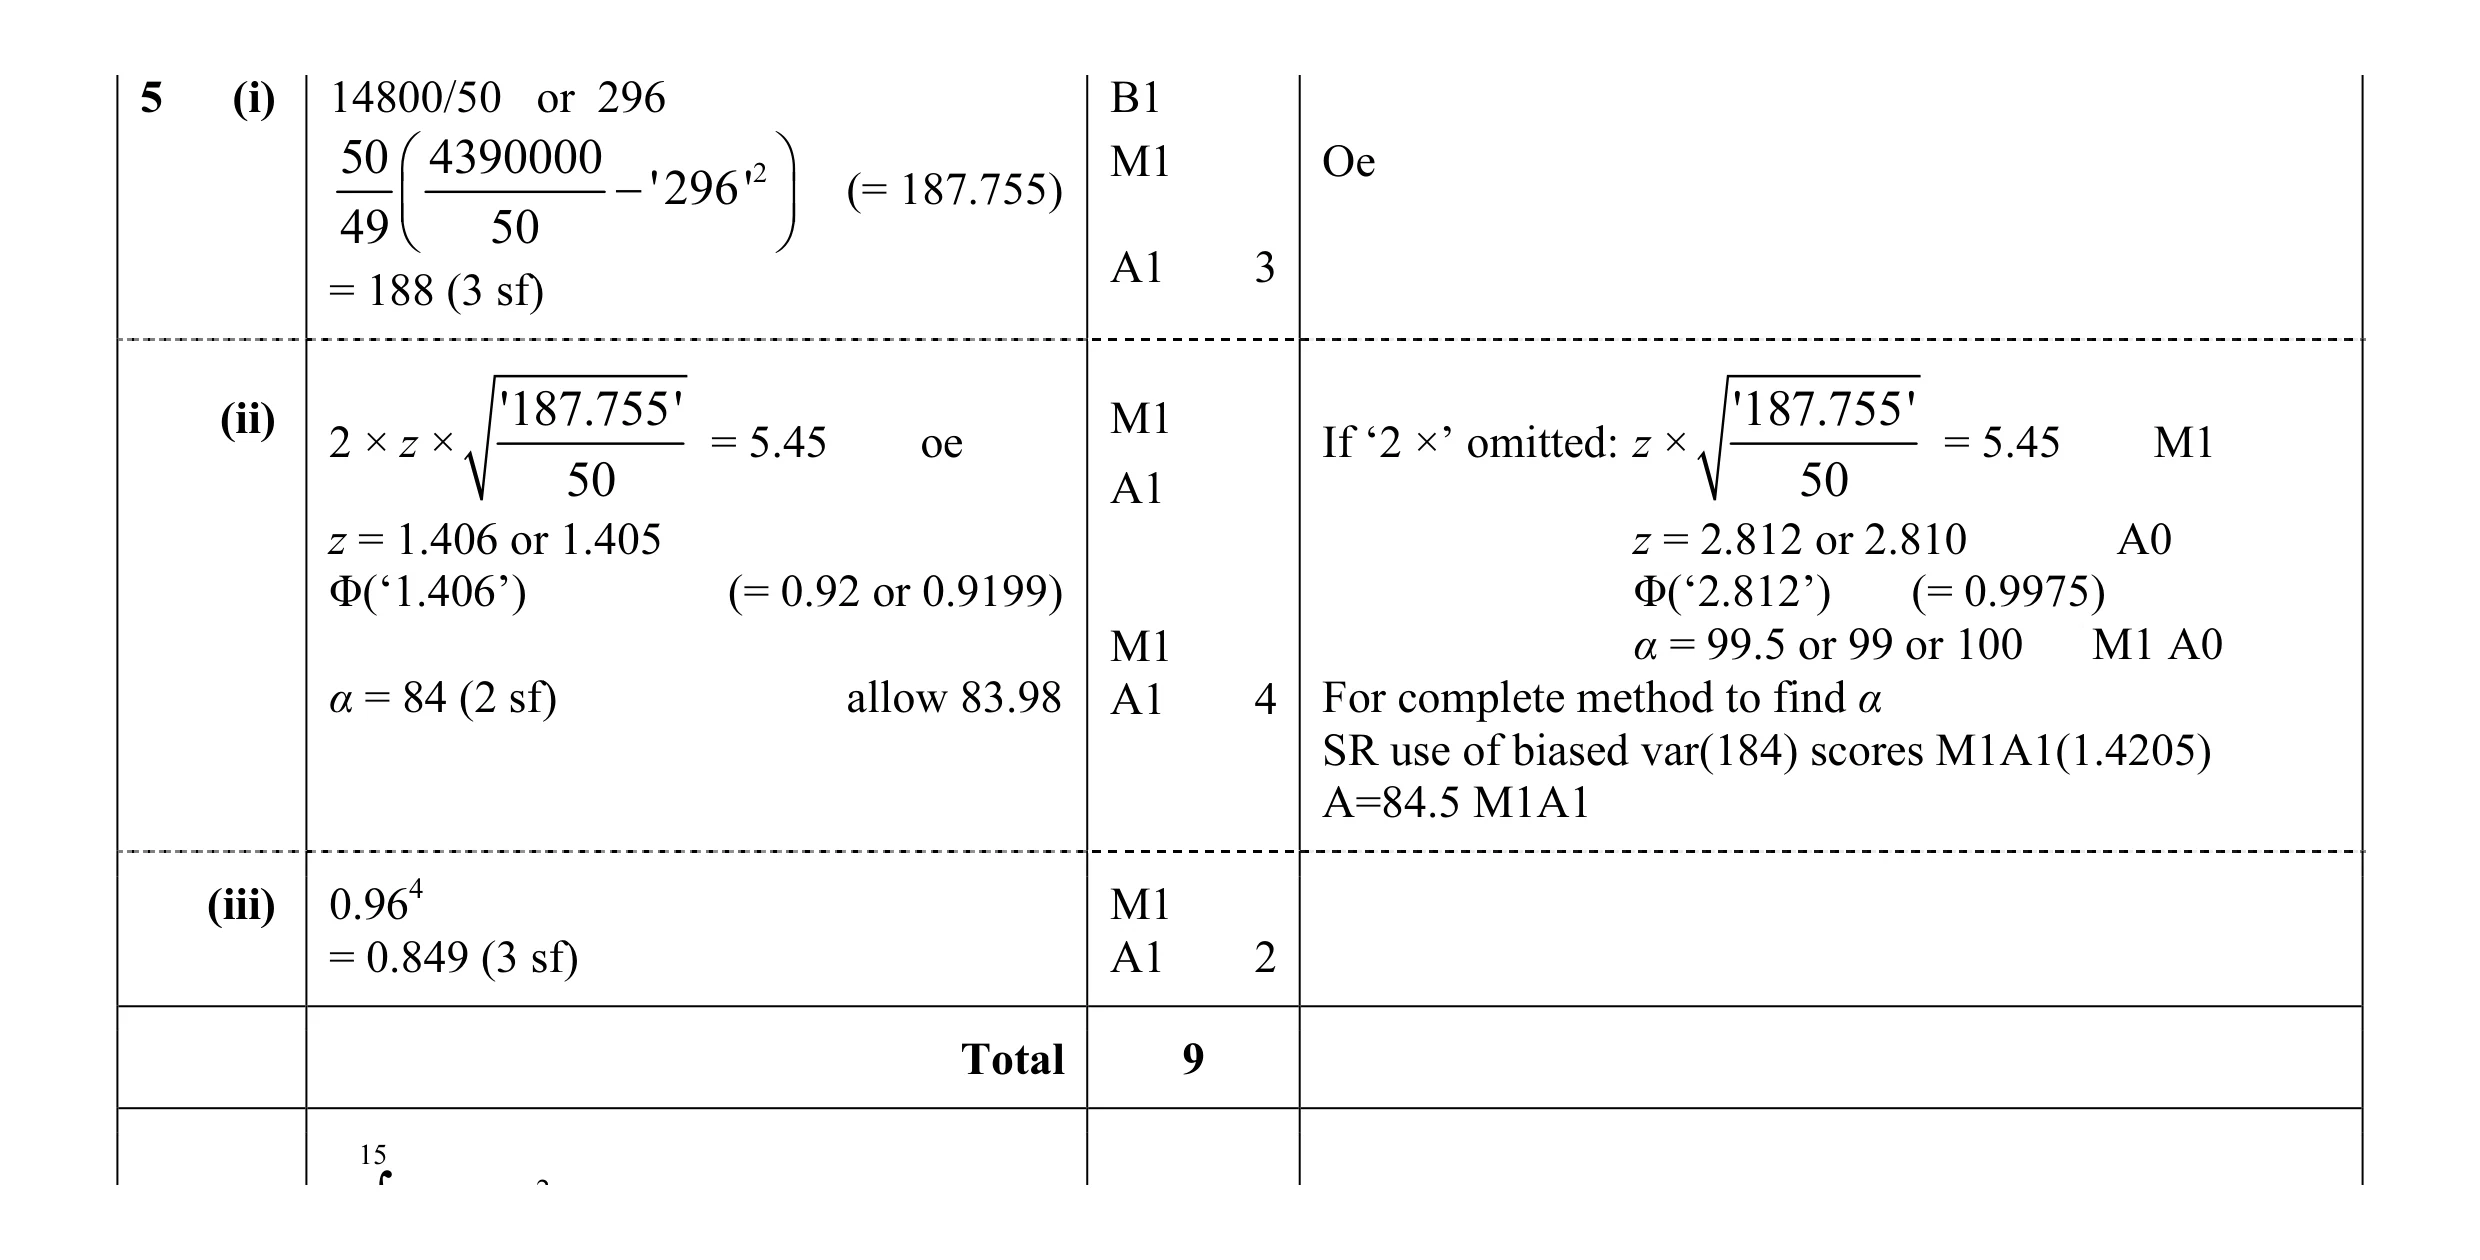 9
9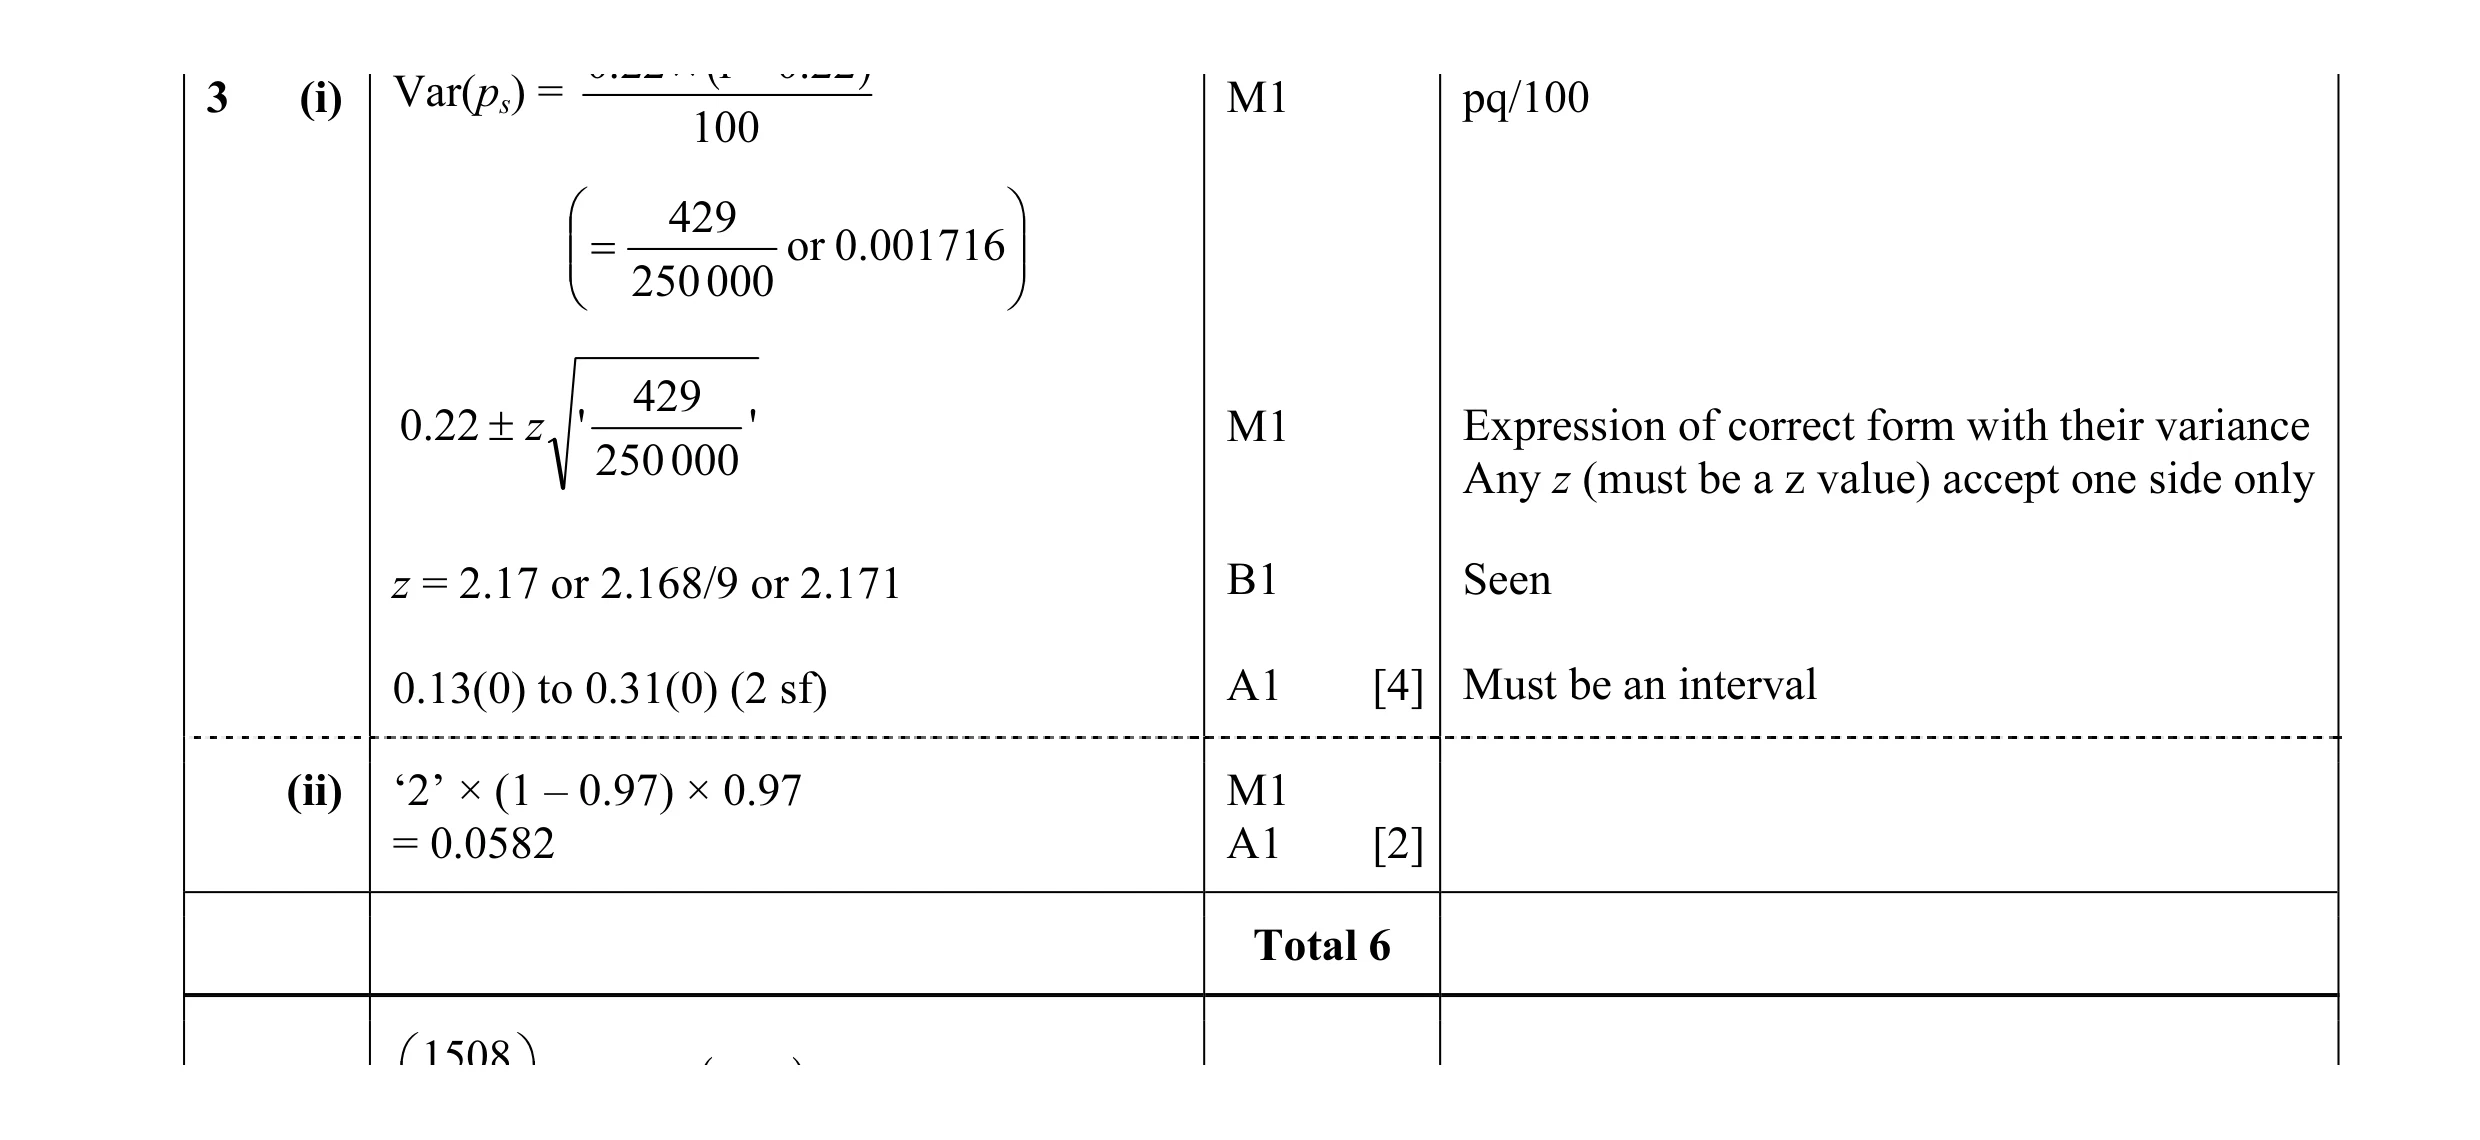 6
6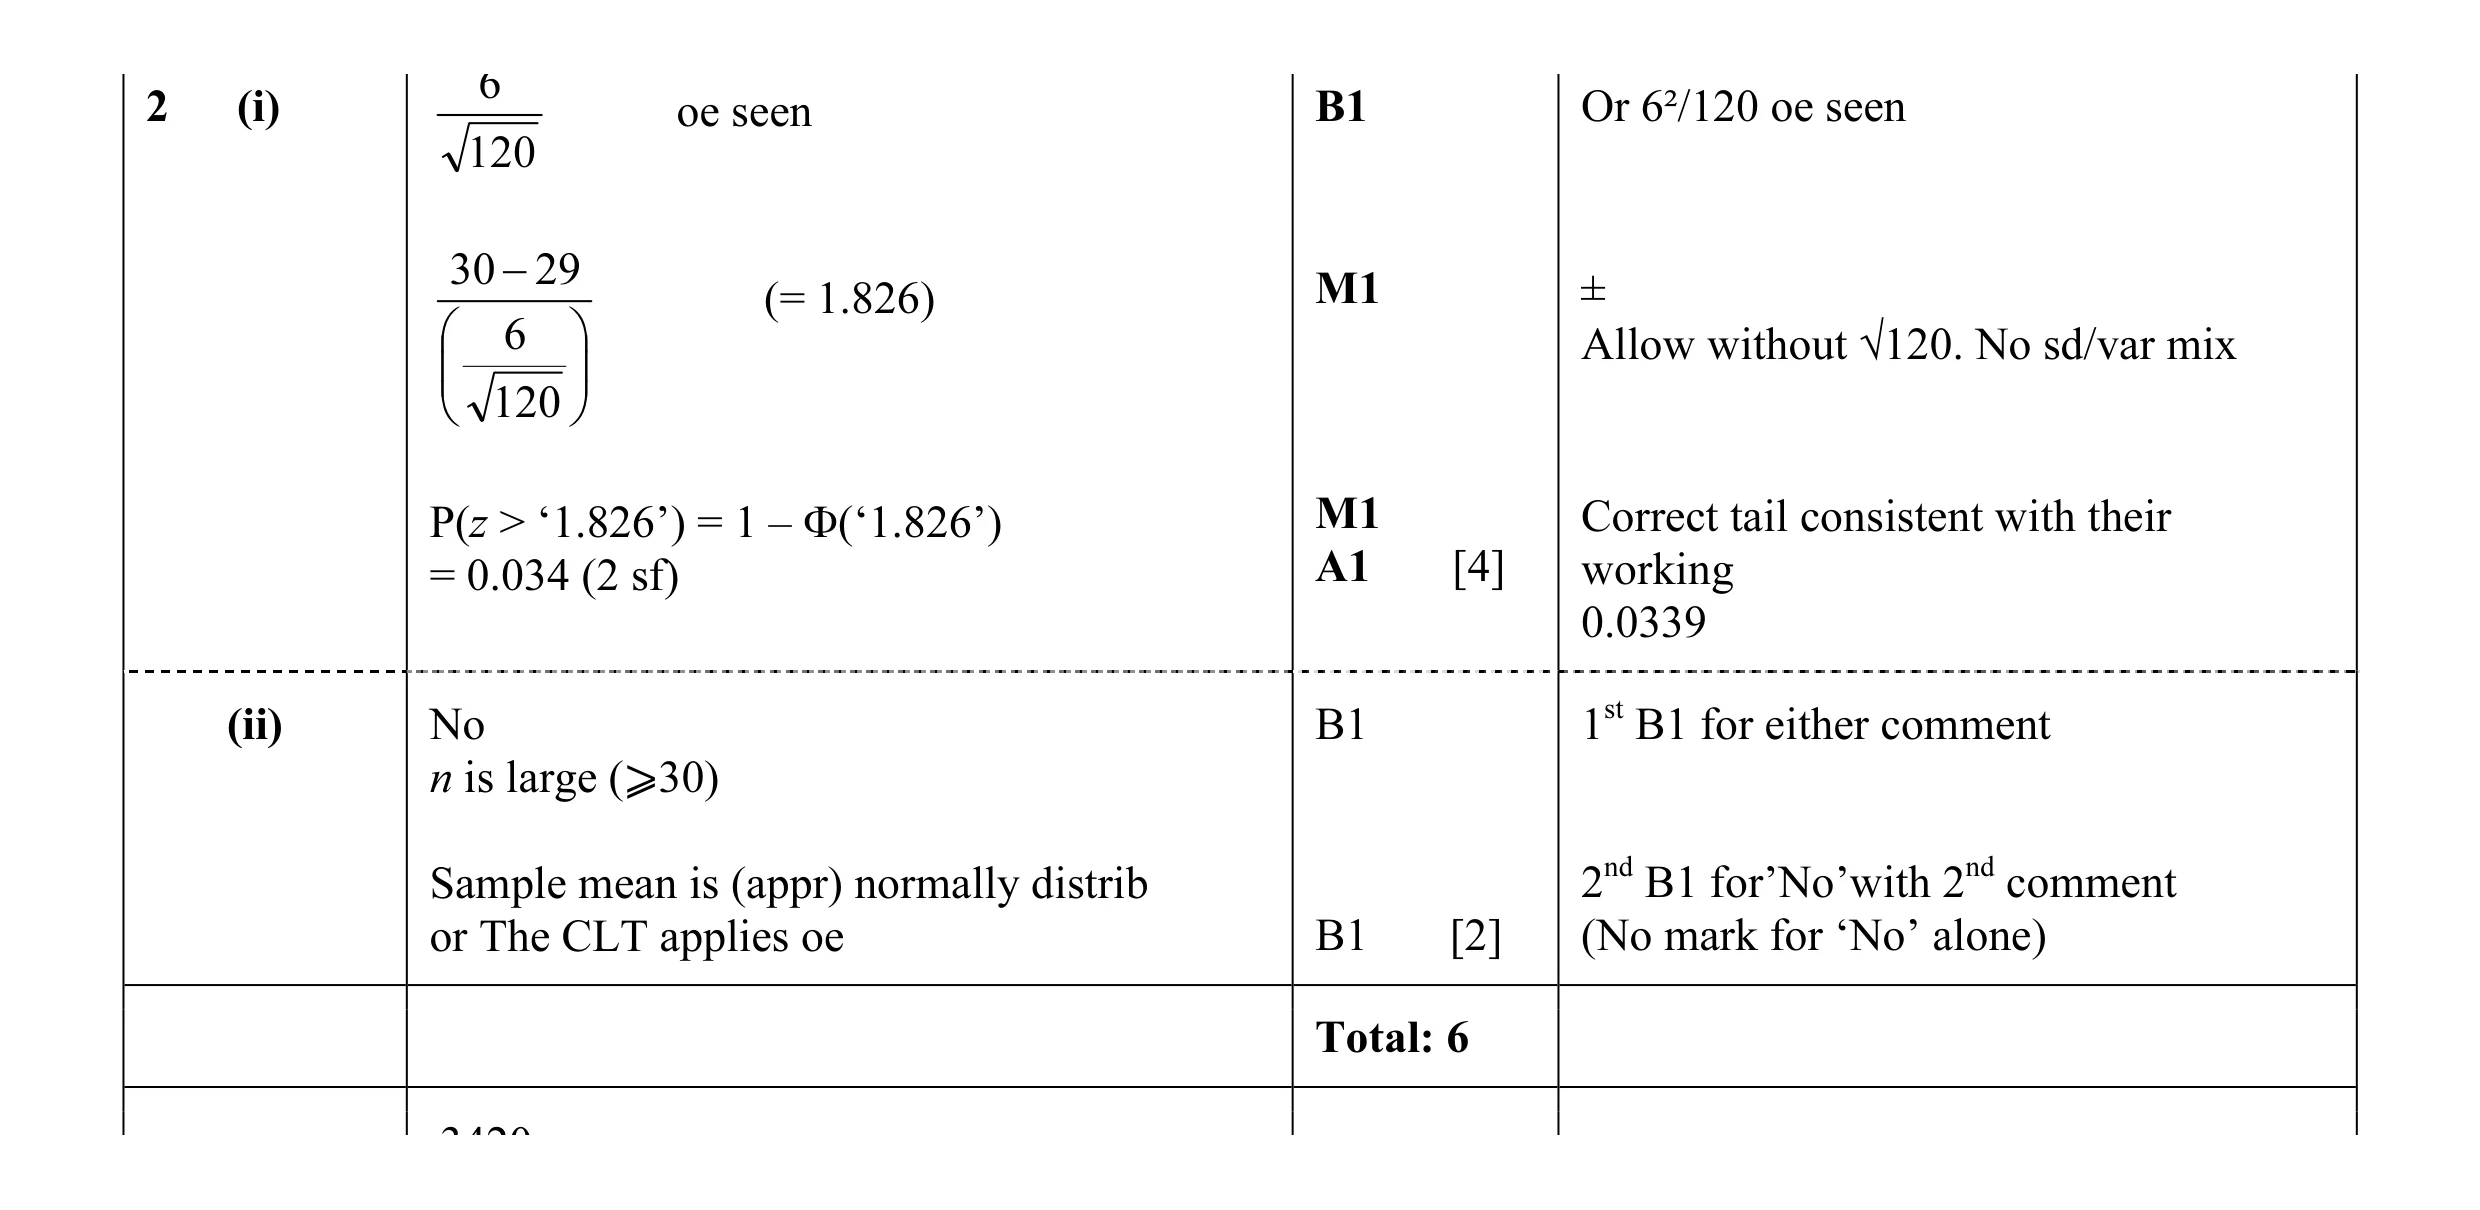 6
6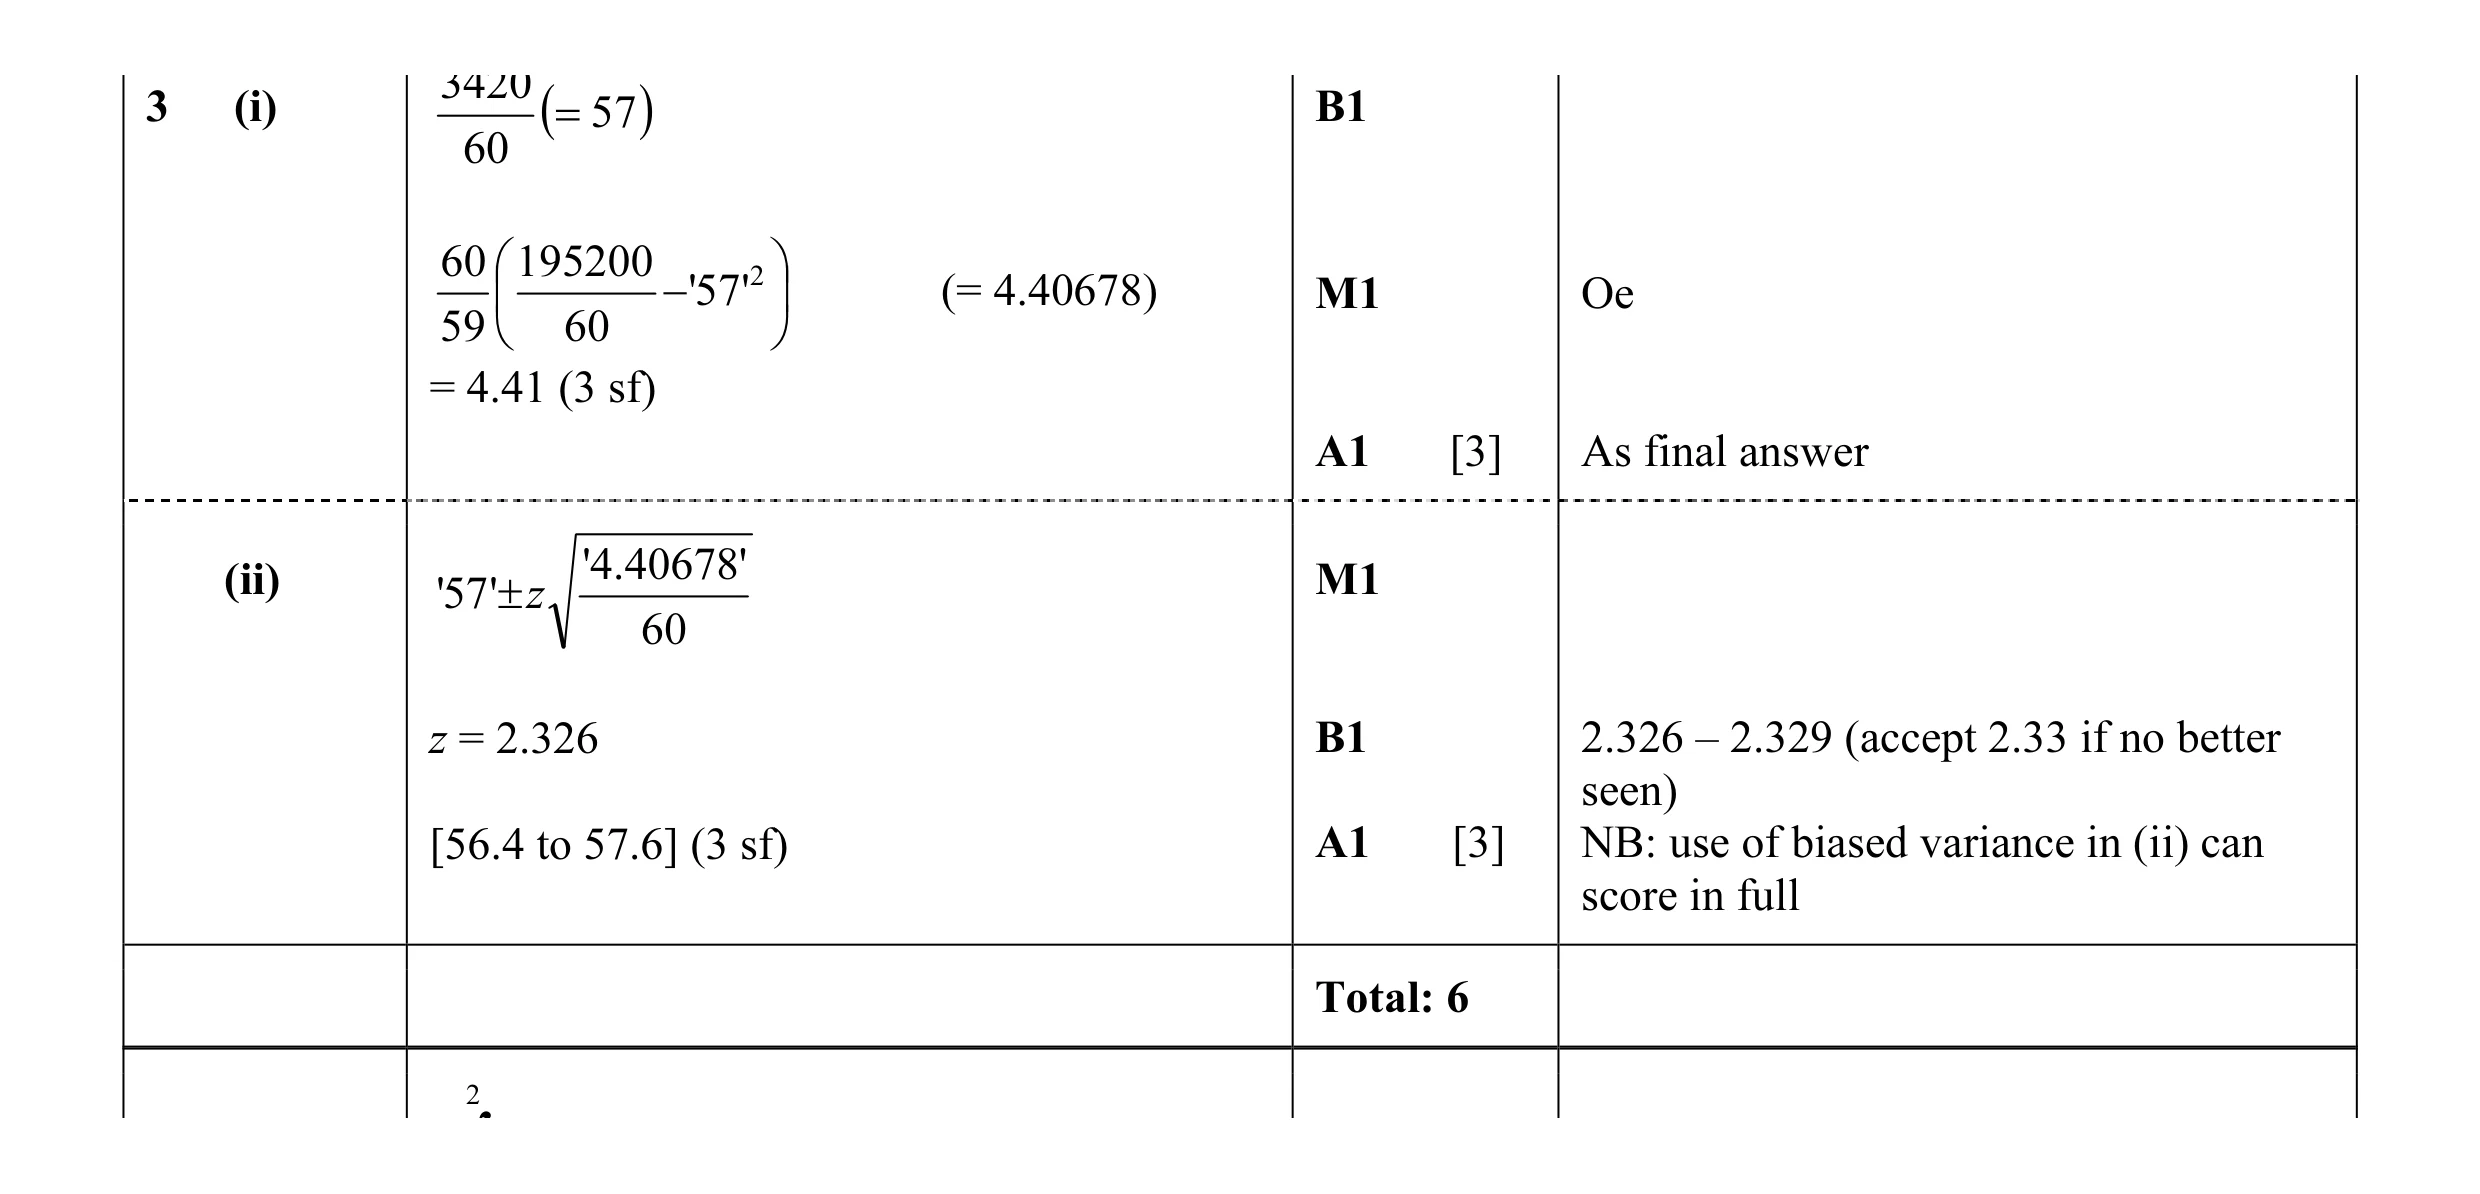 6
6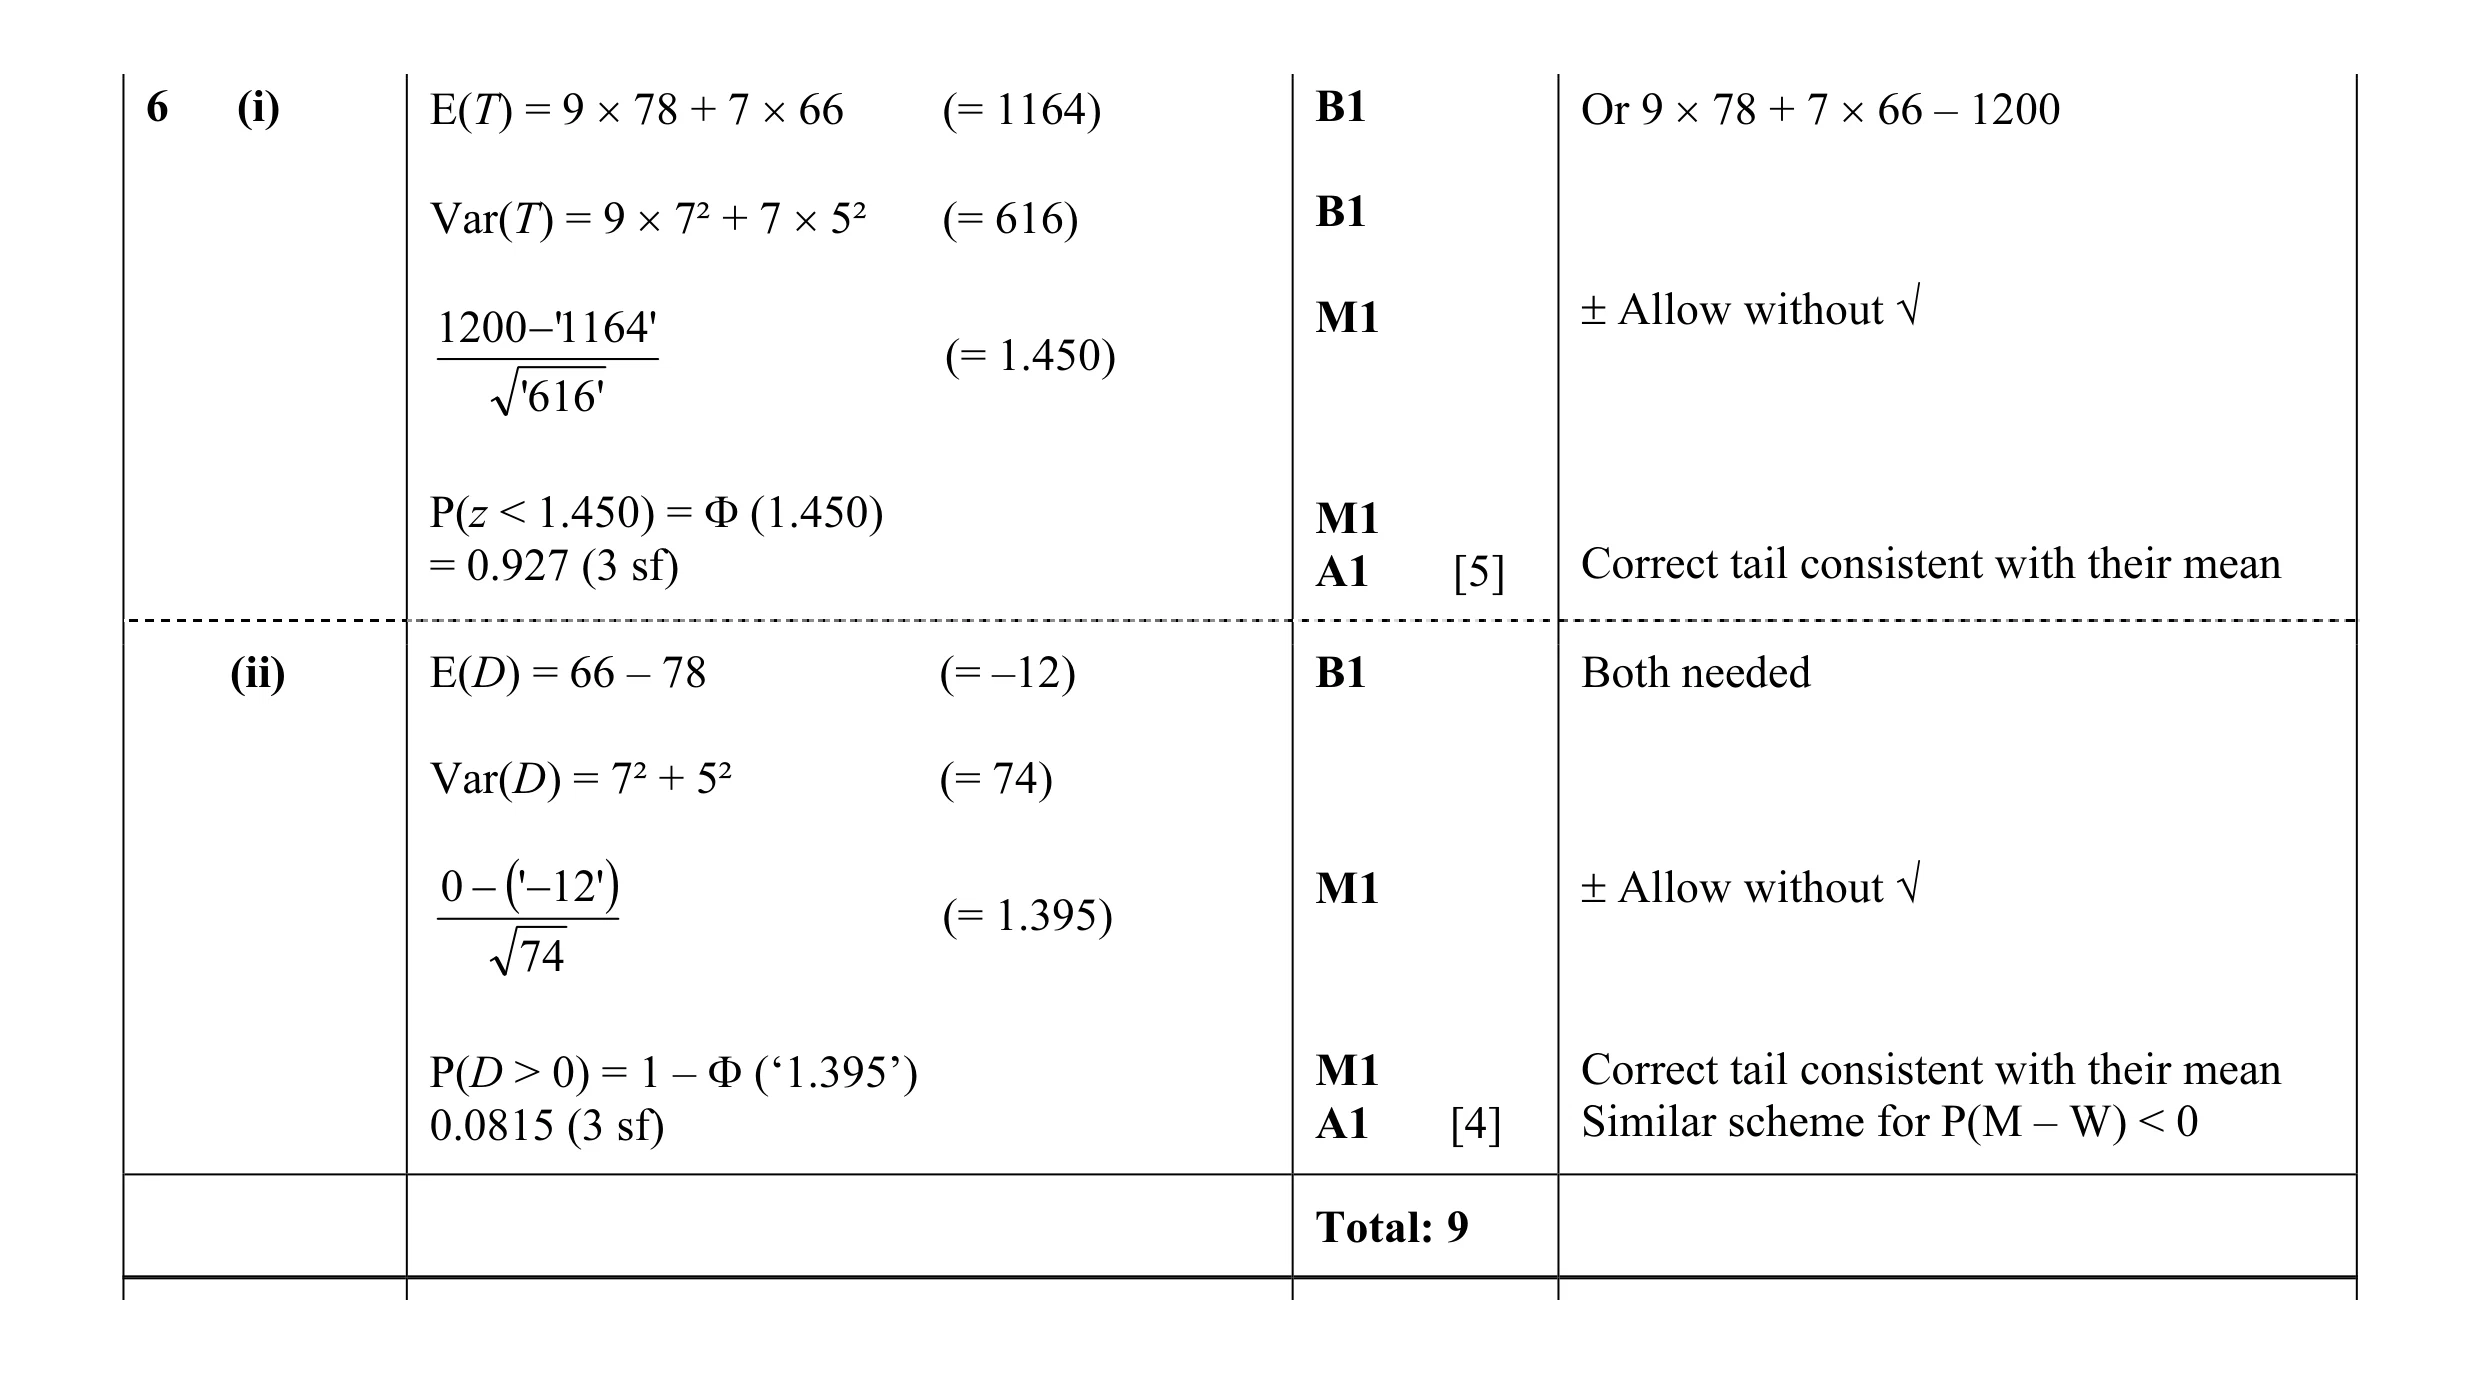 9
9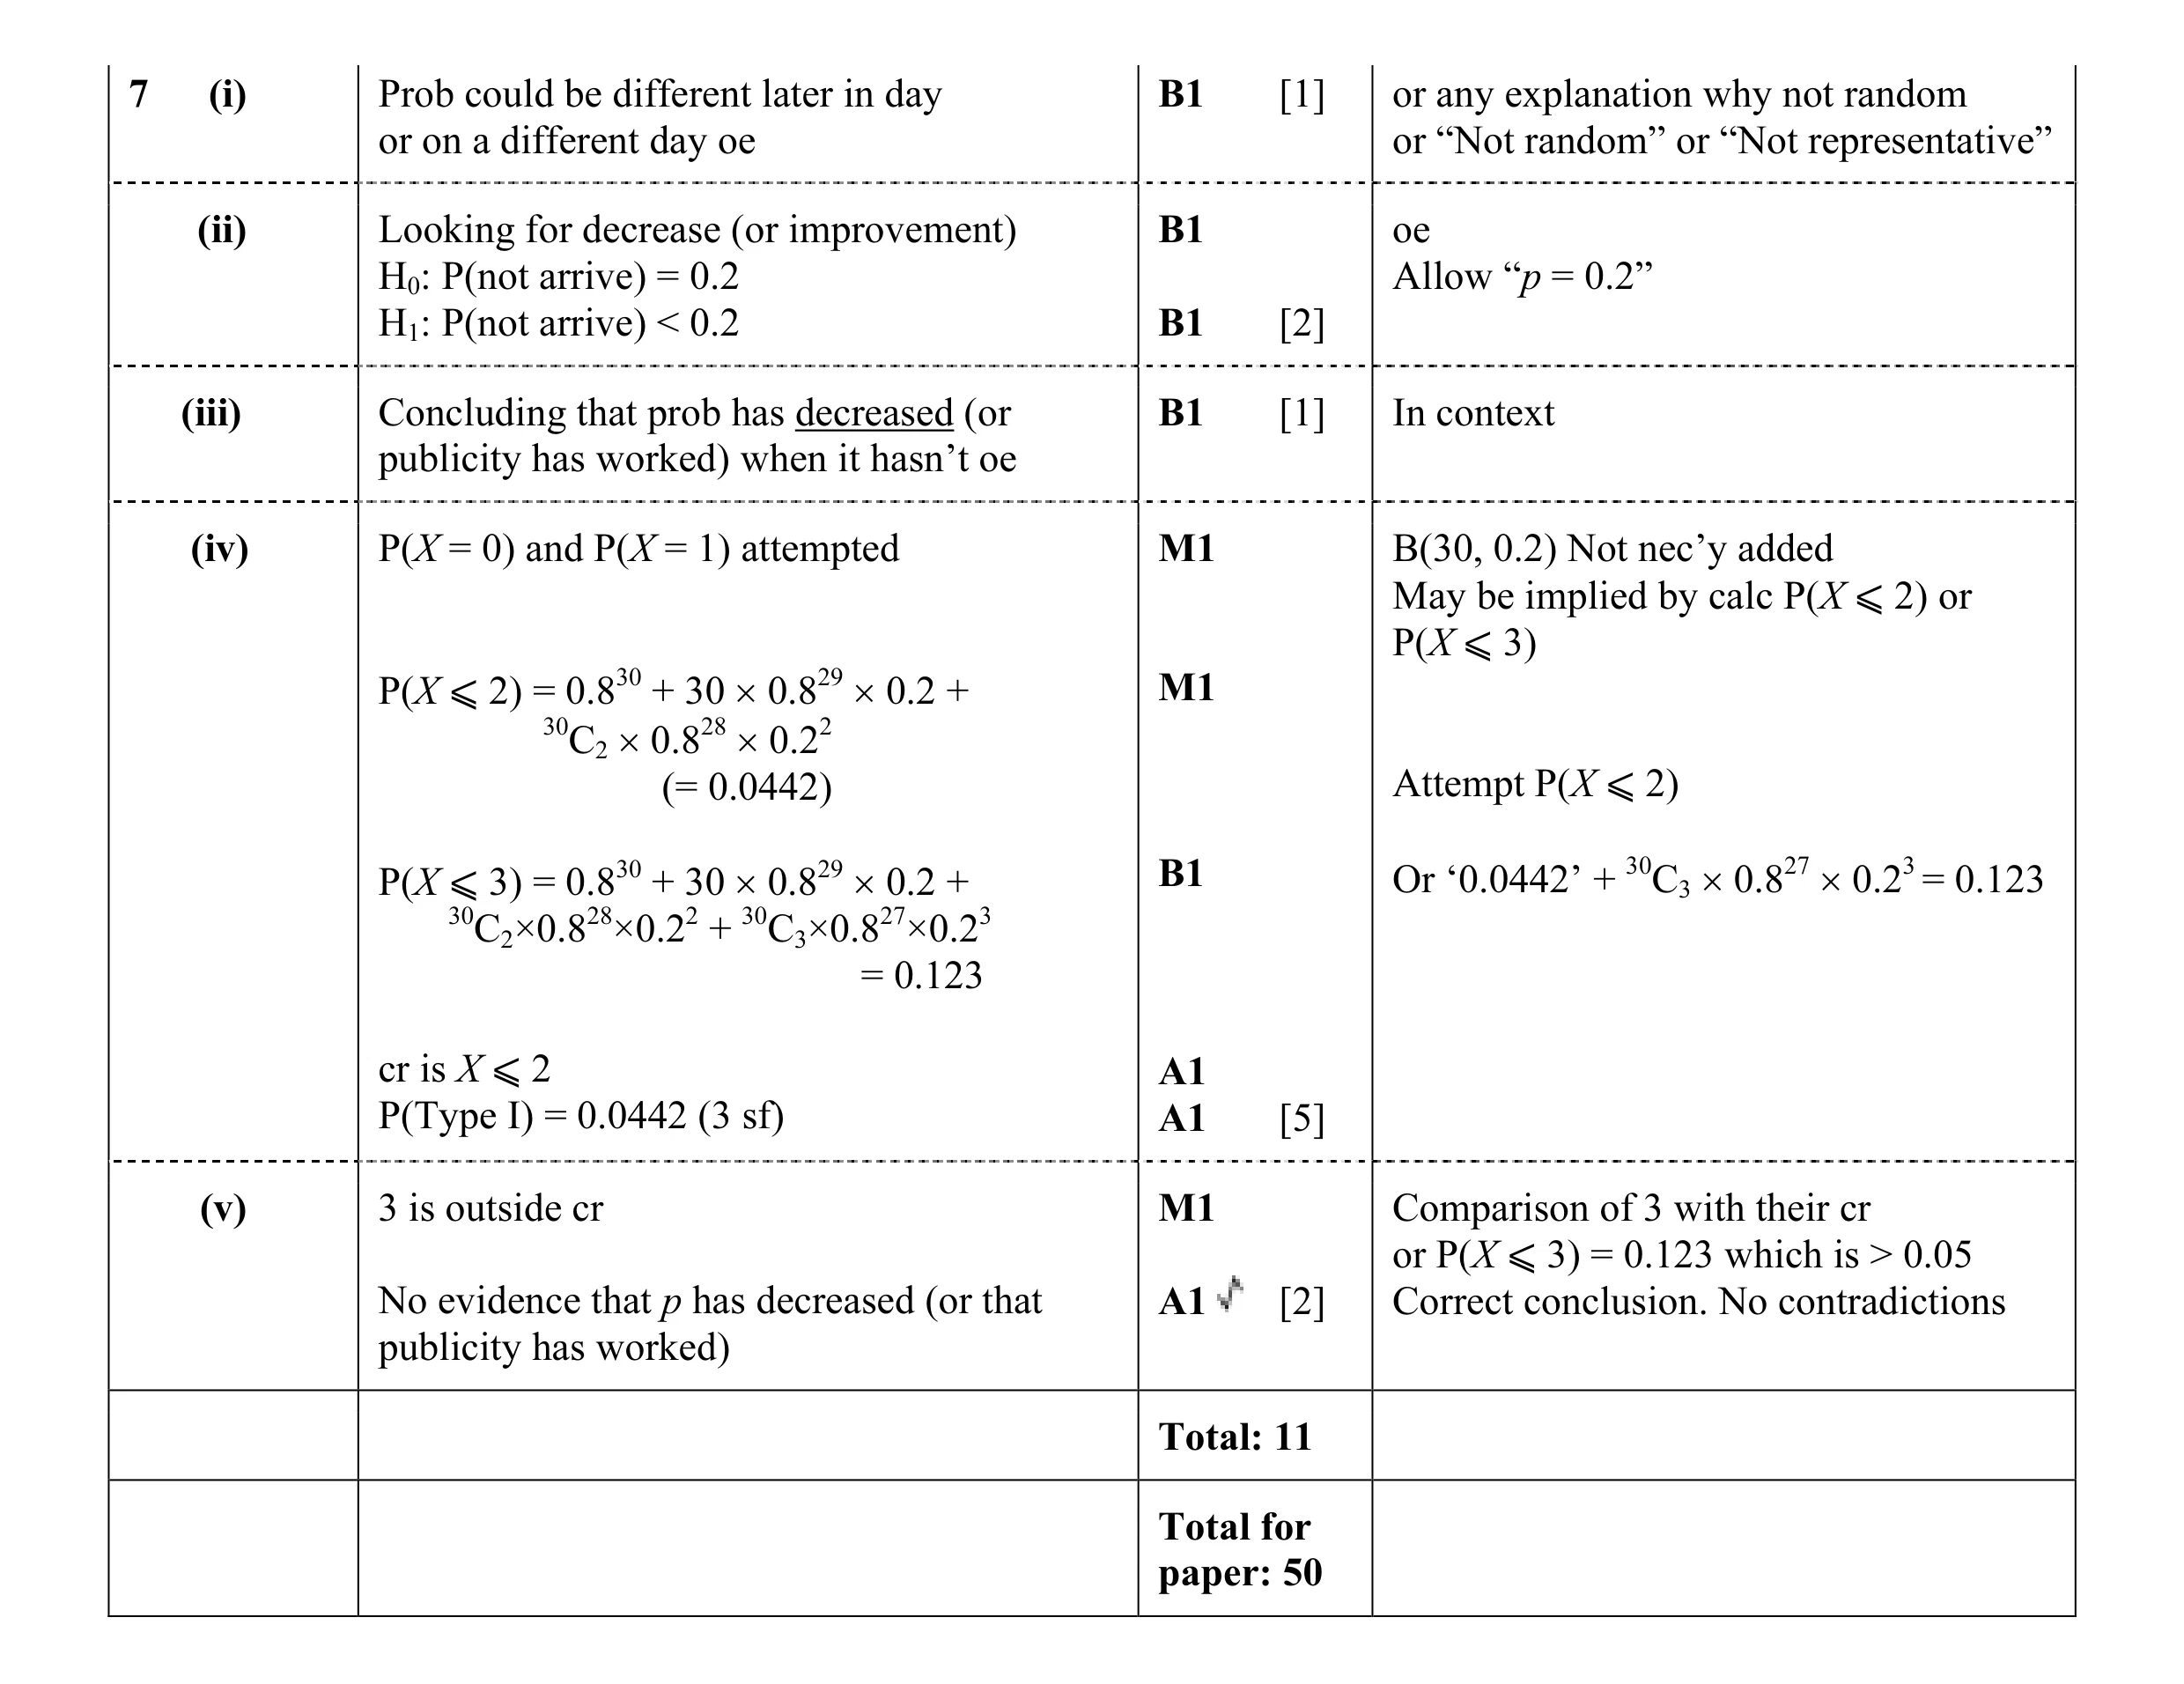 11
11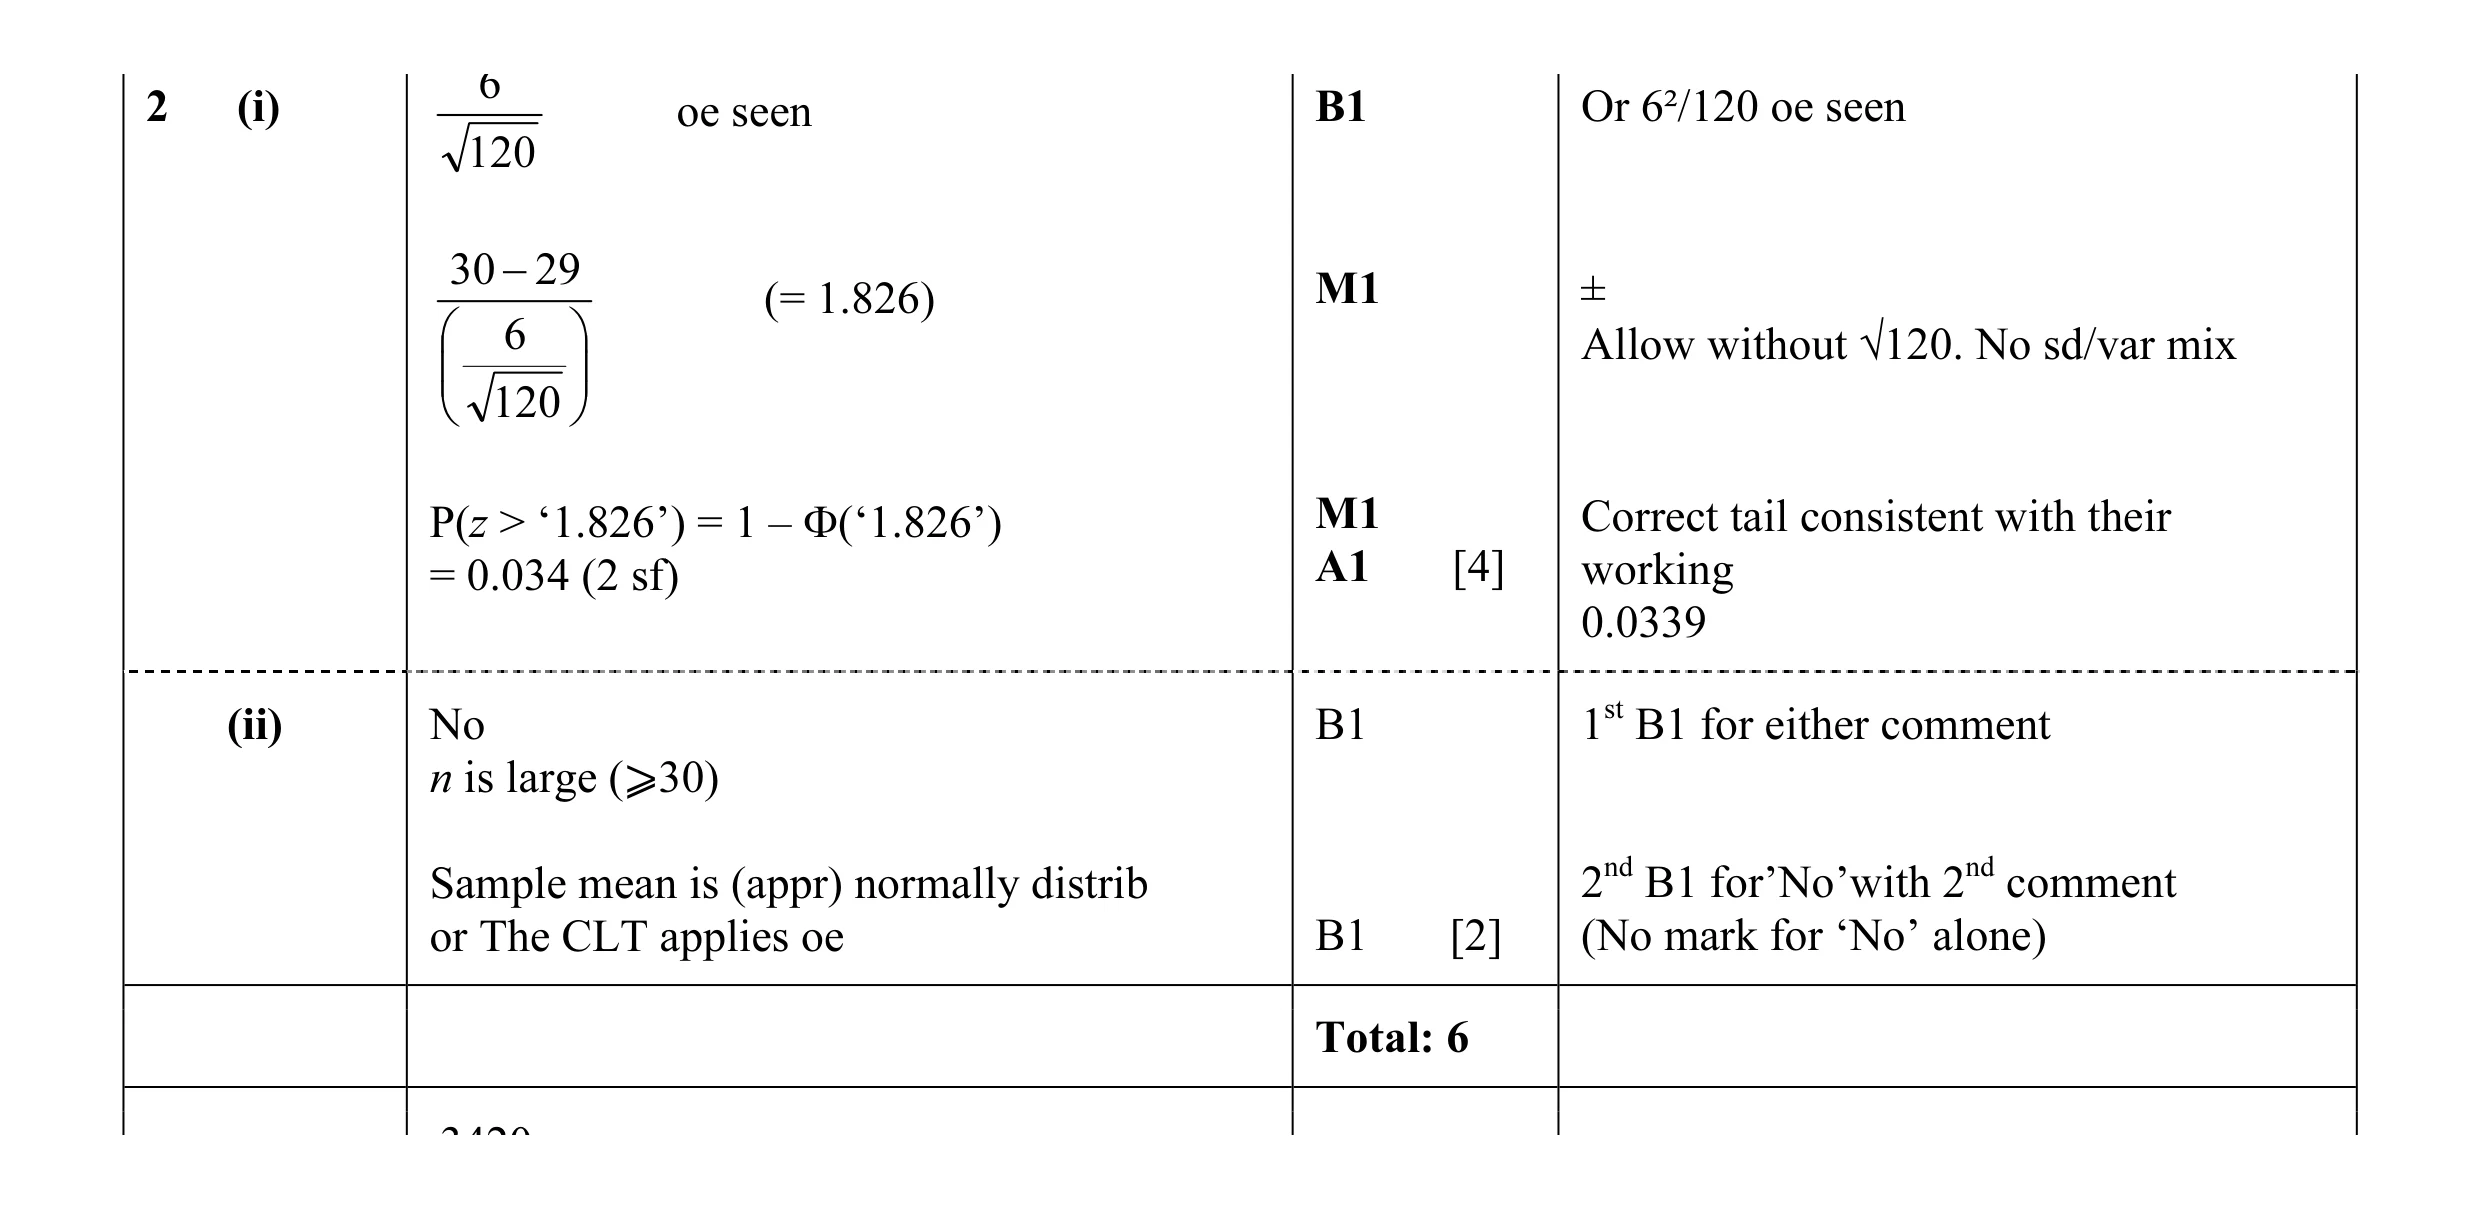 6
6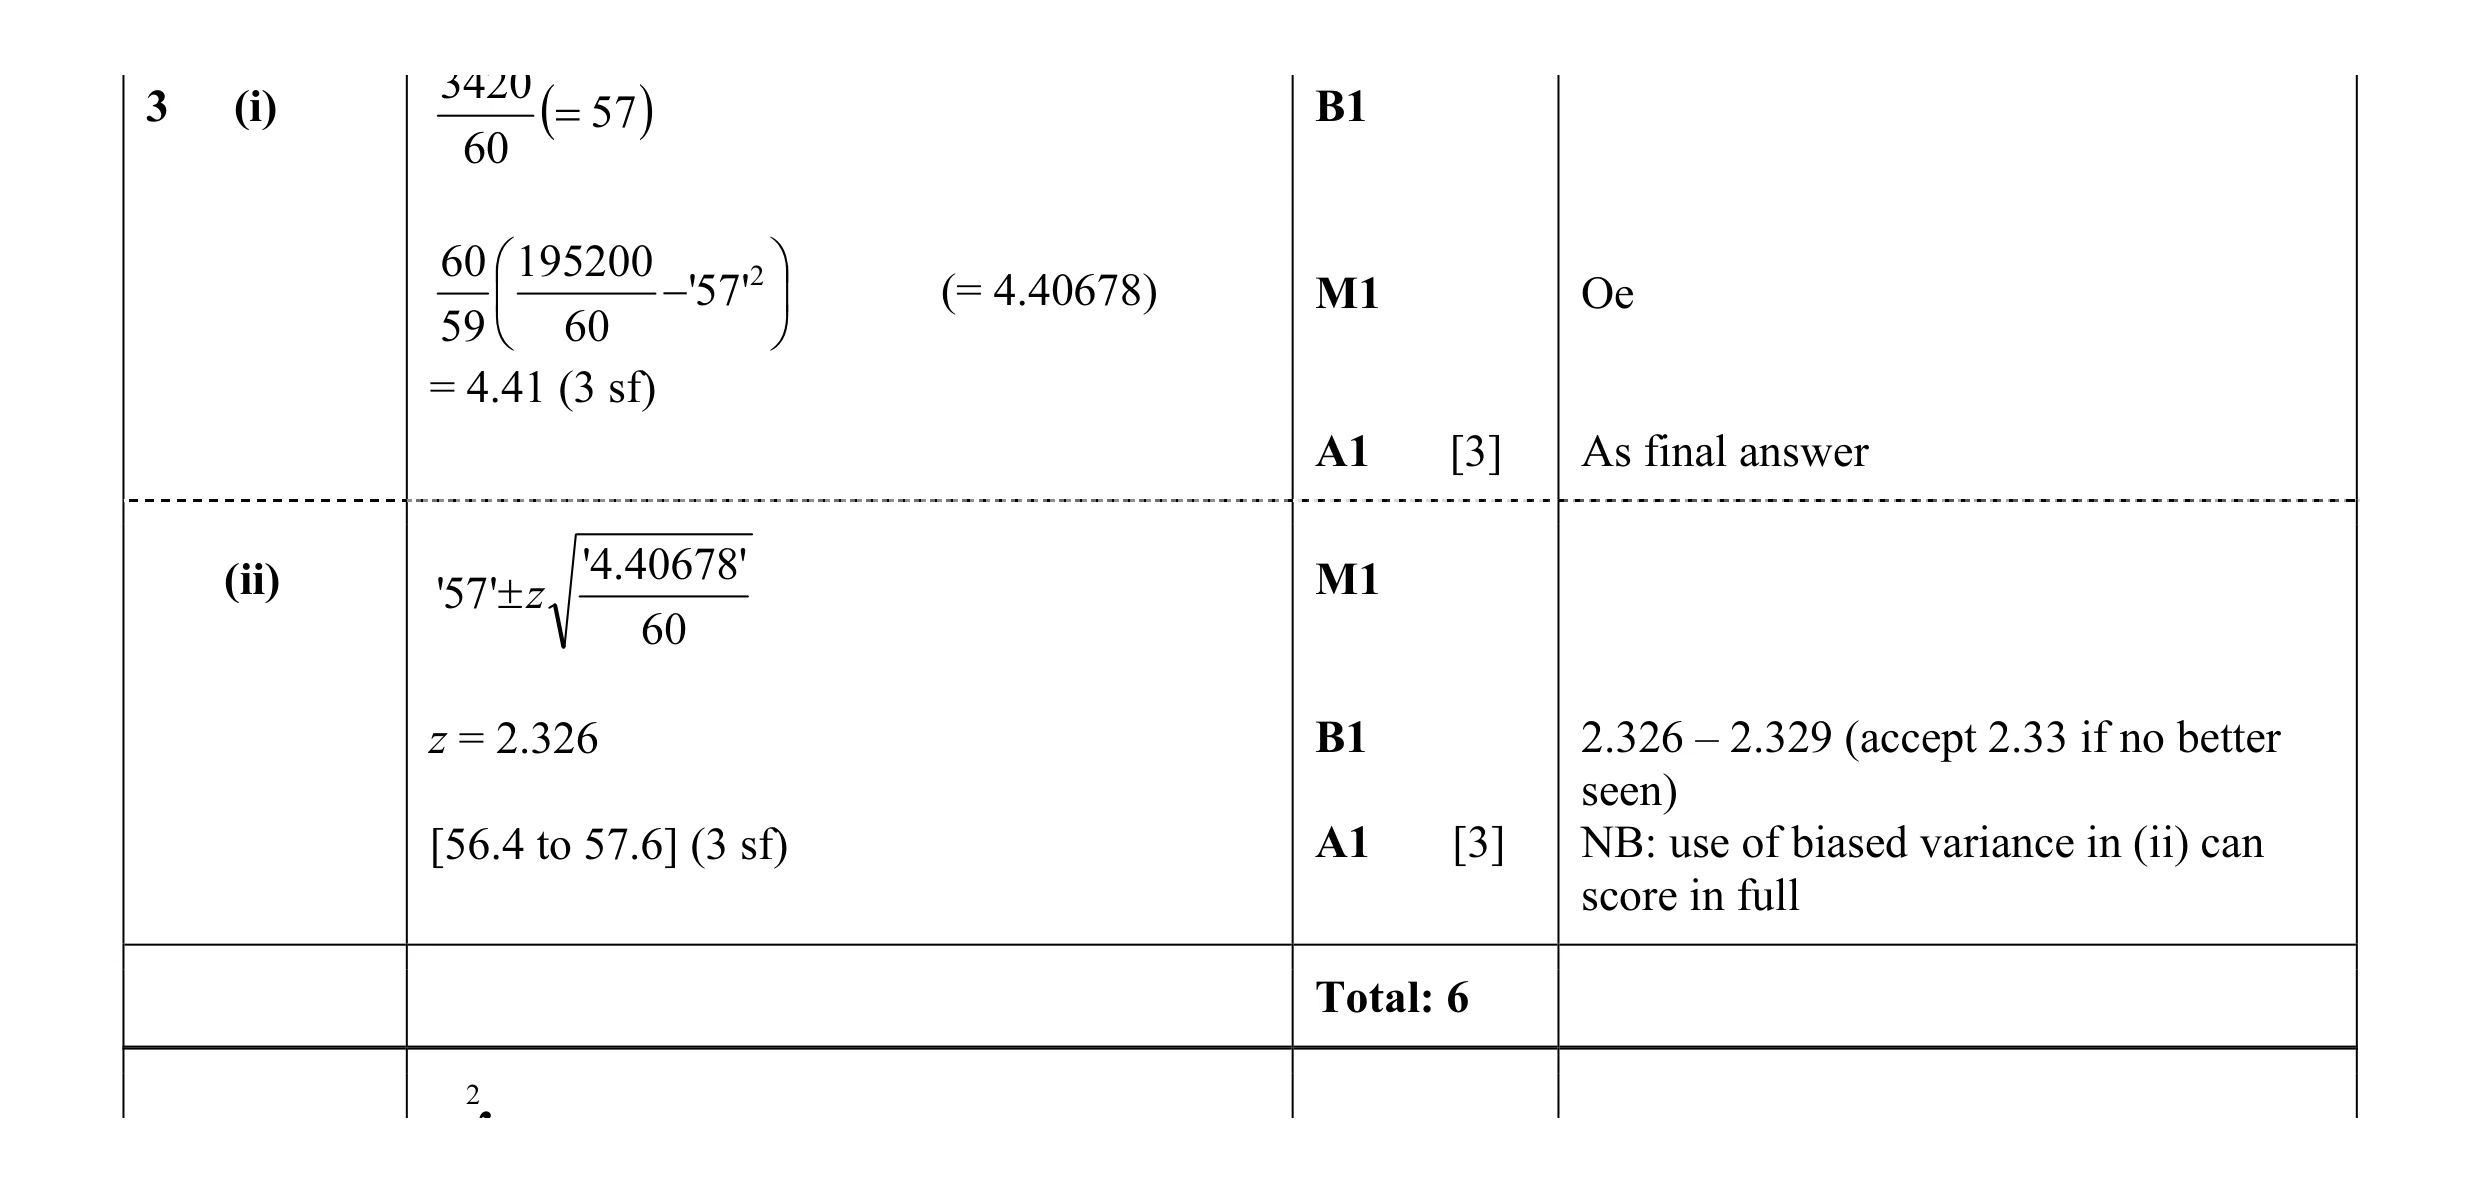 6
6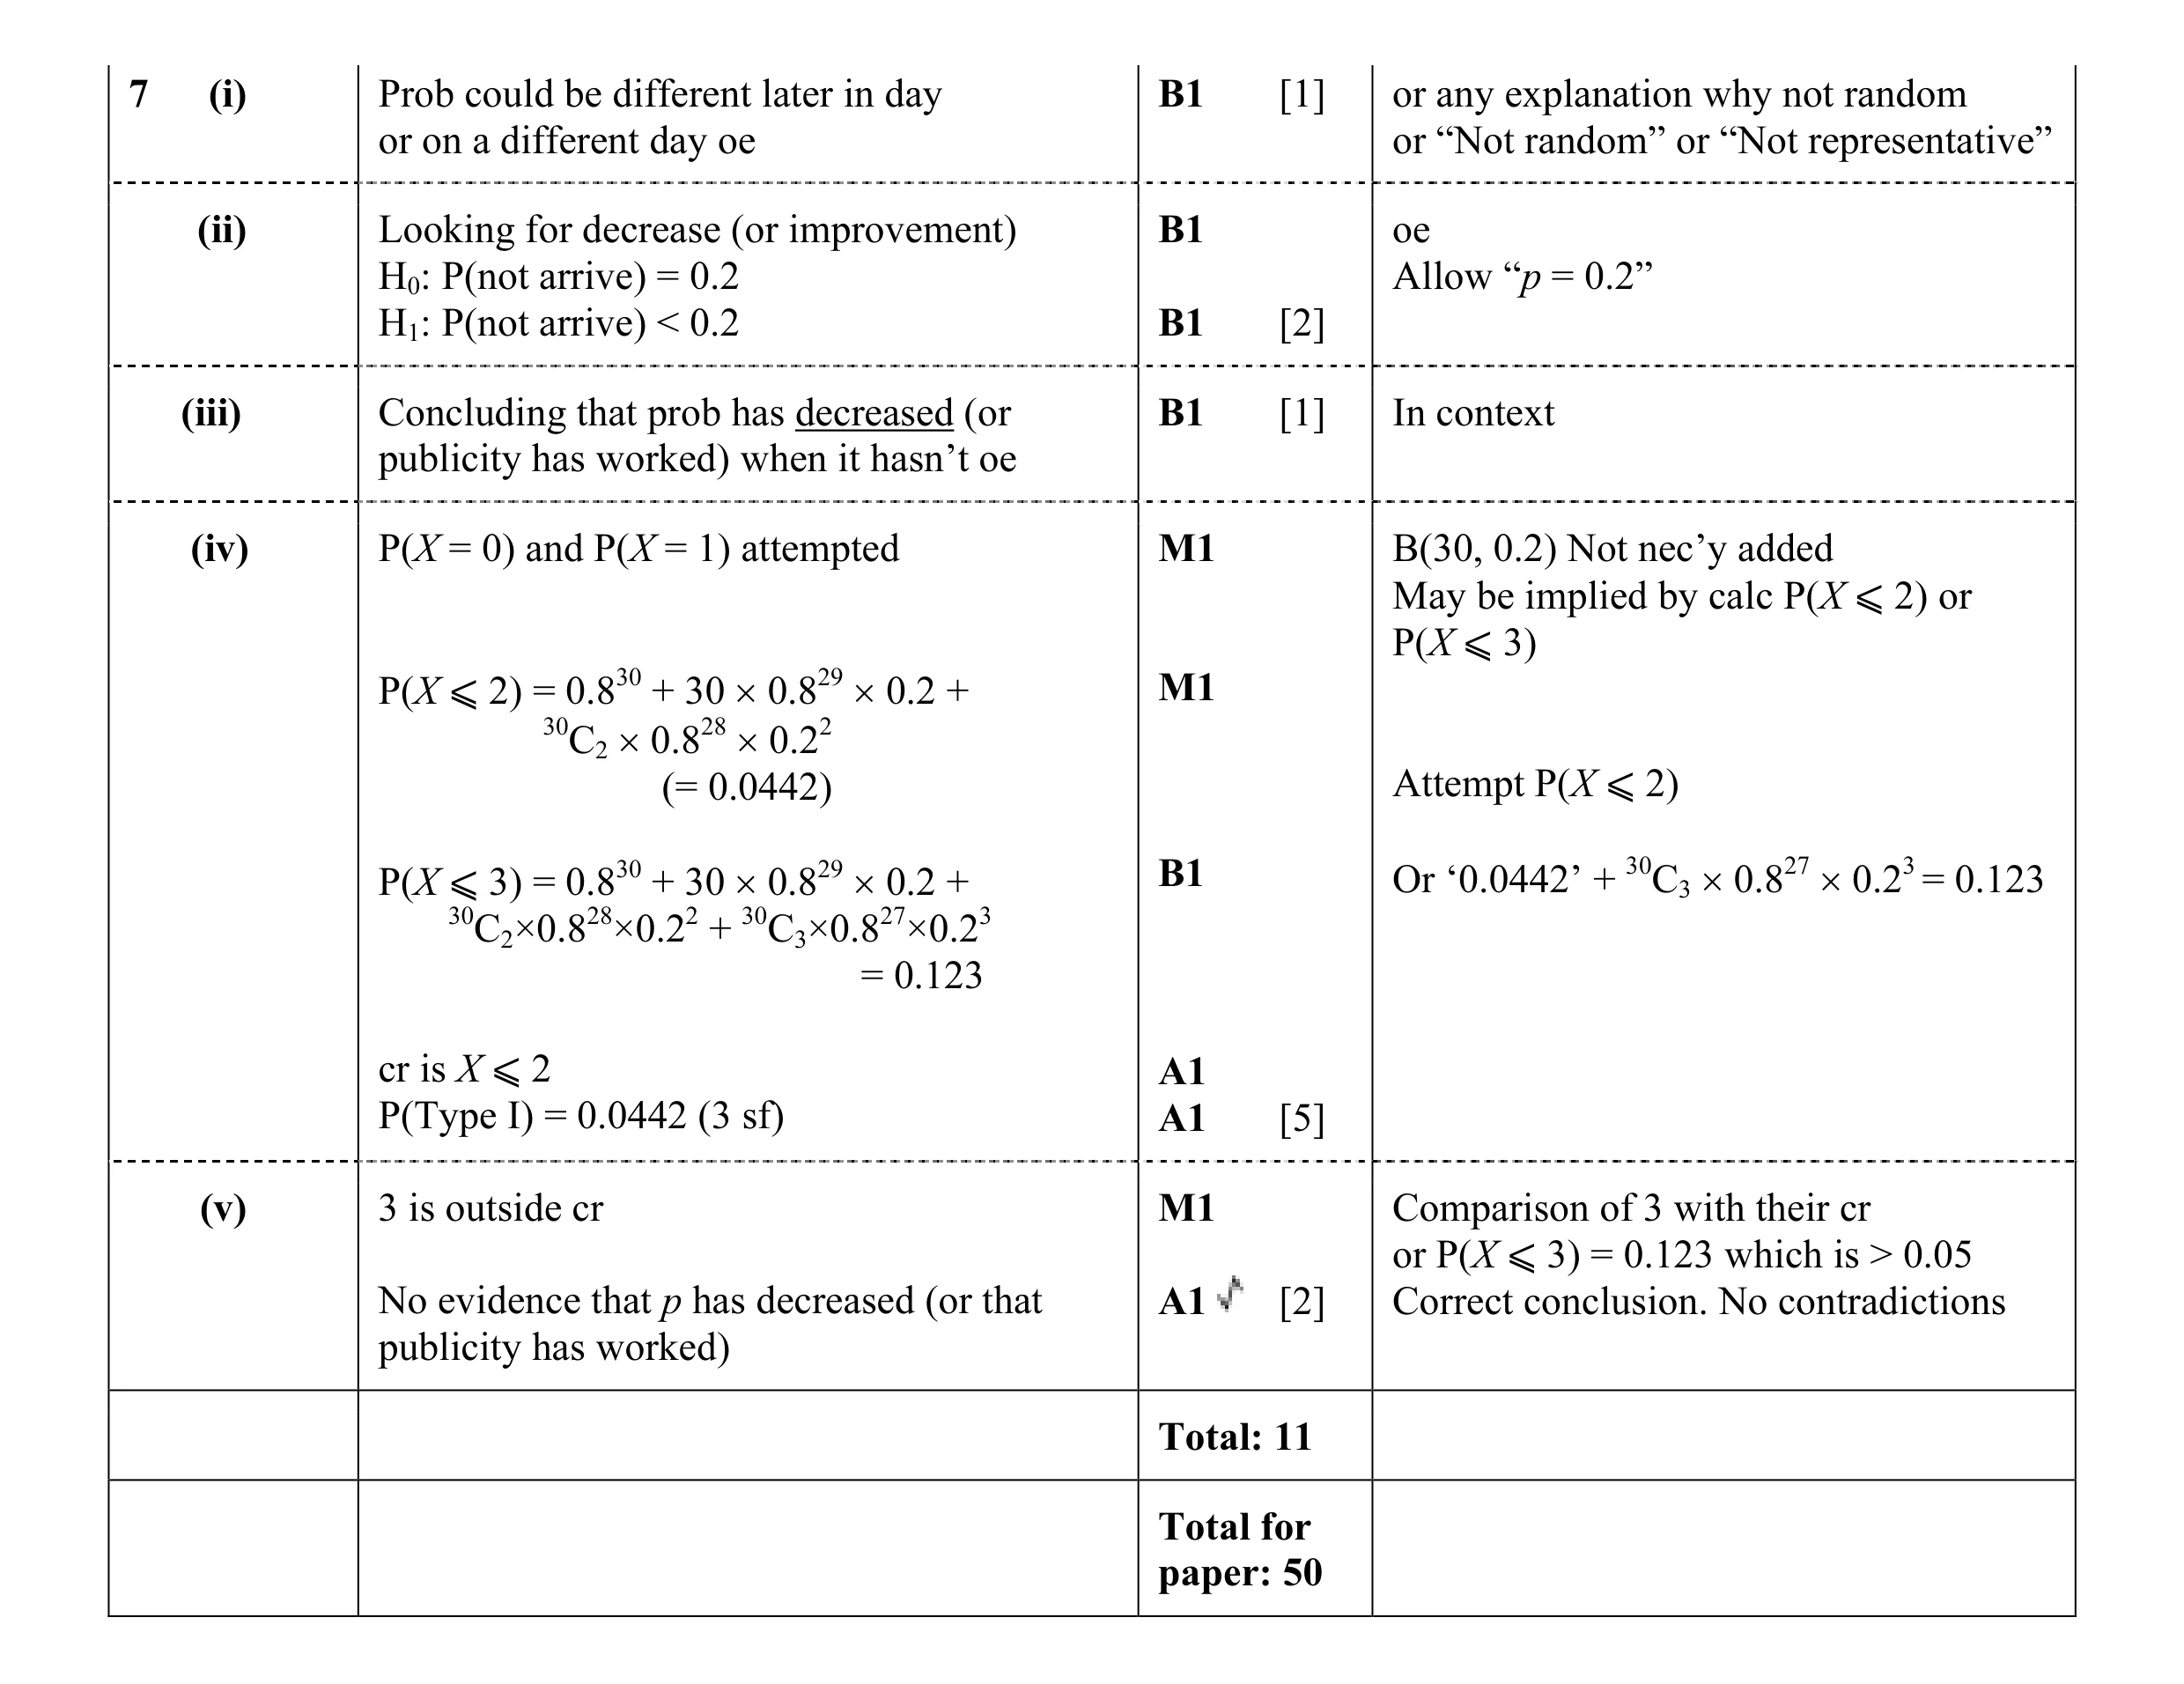 11
11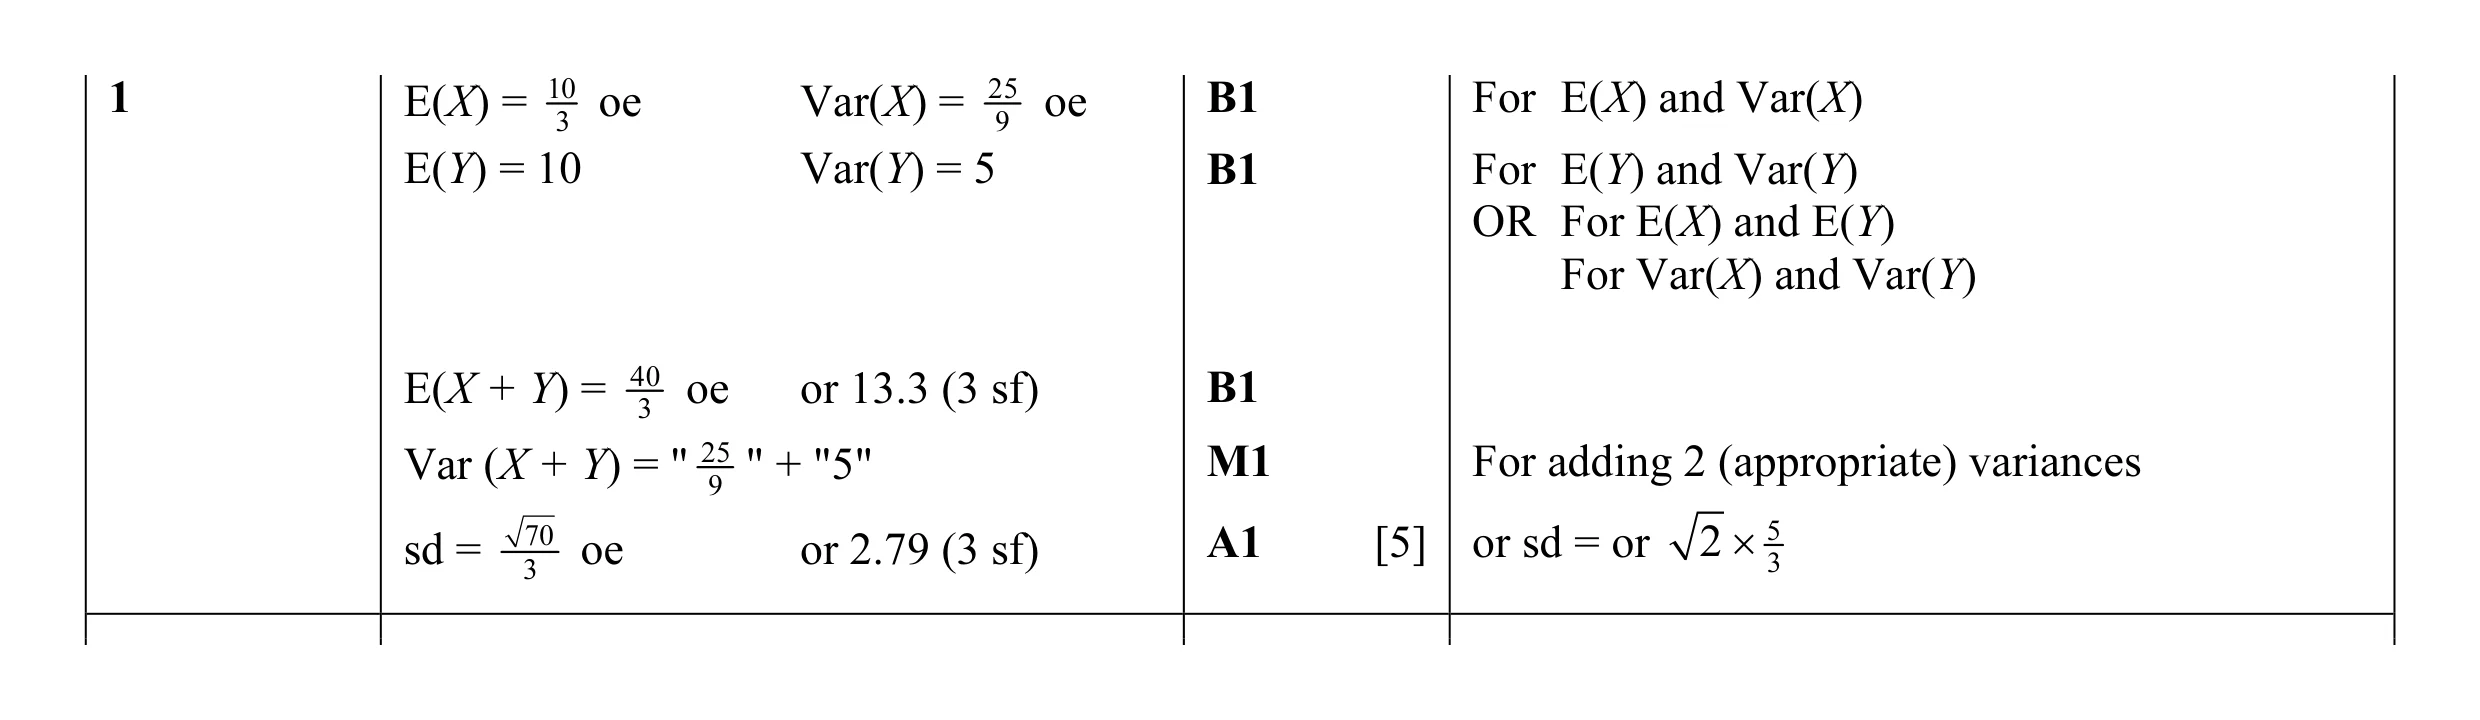 5
5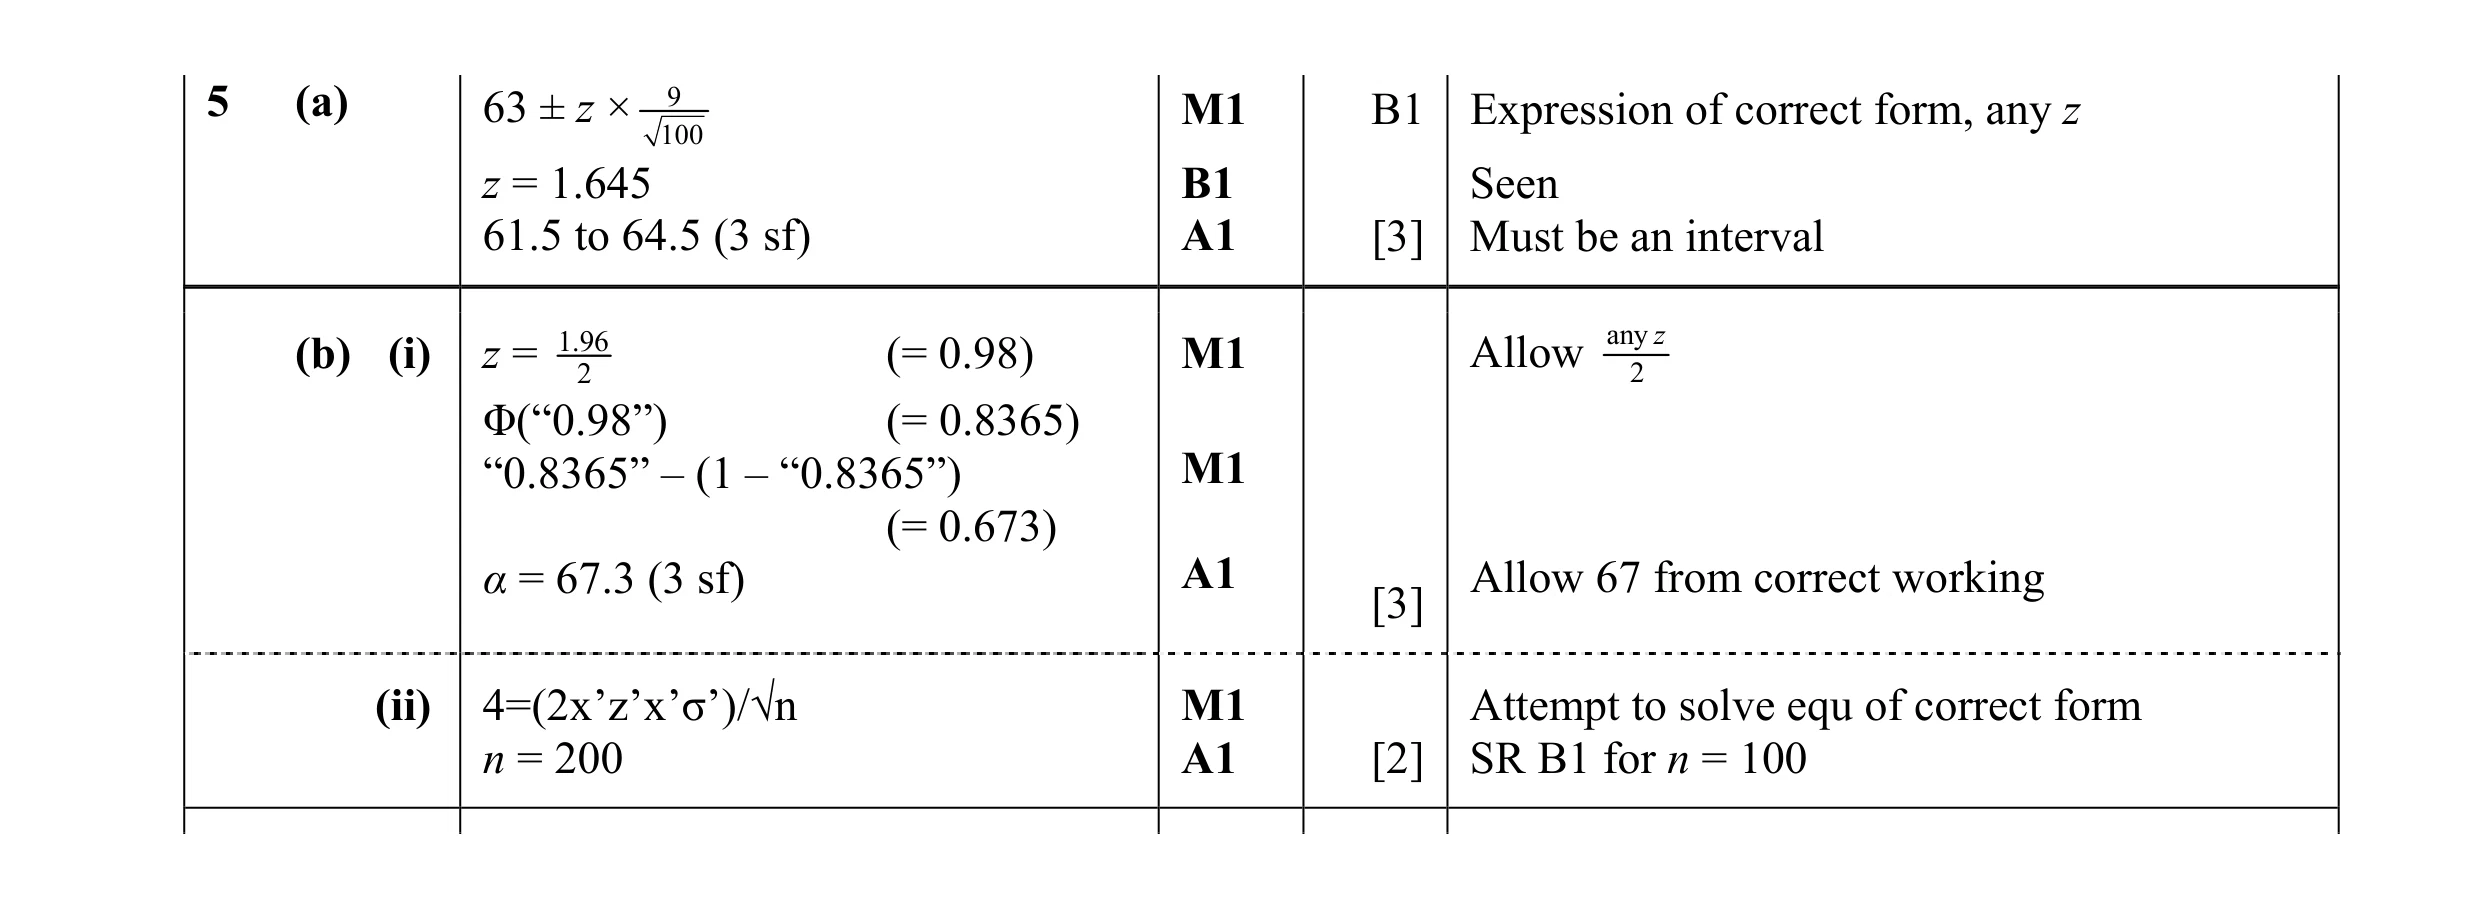 8
8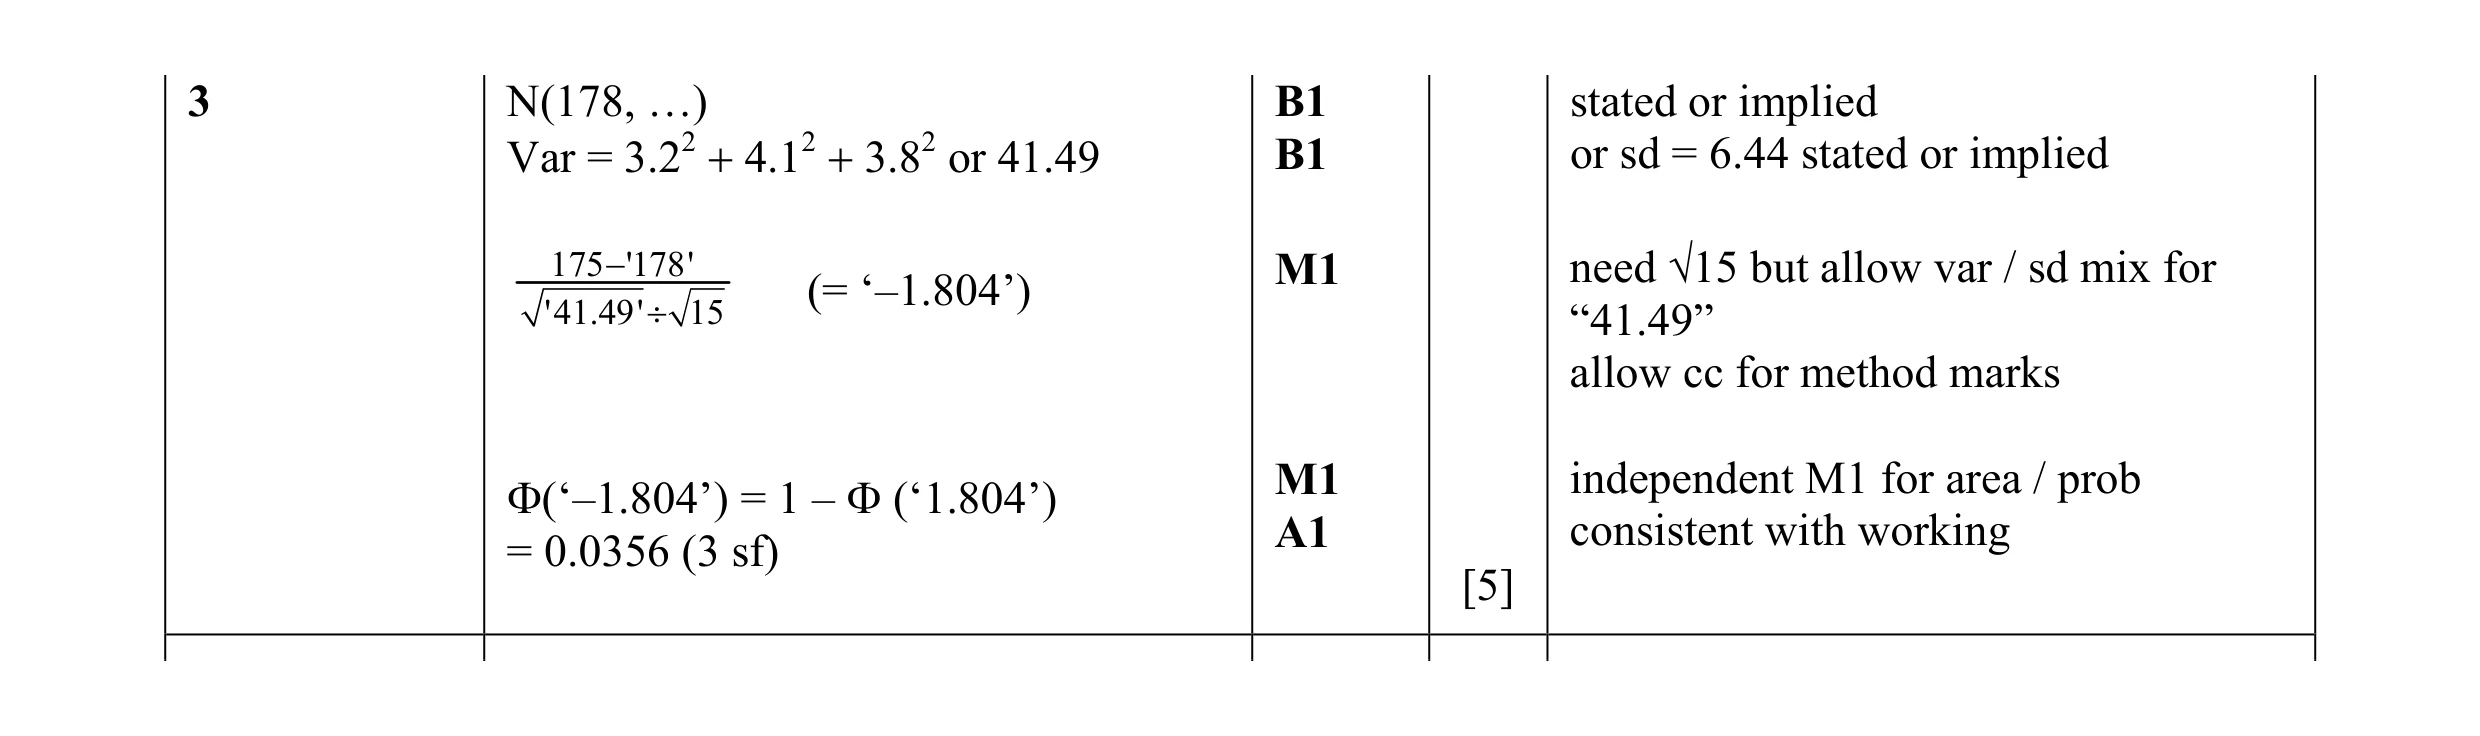 5
5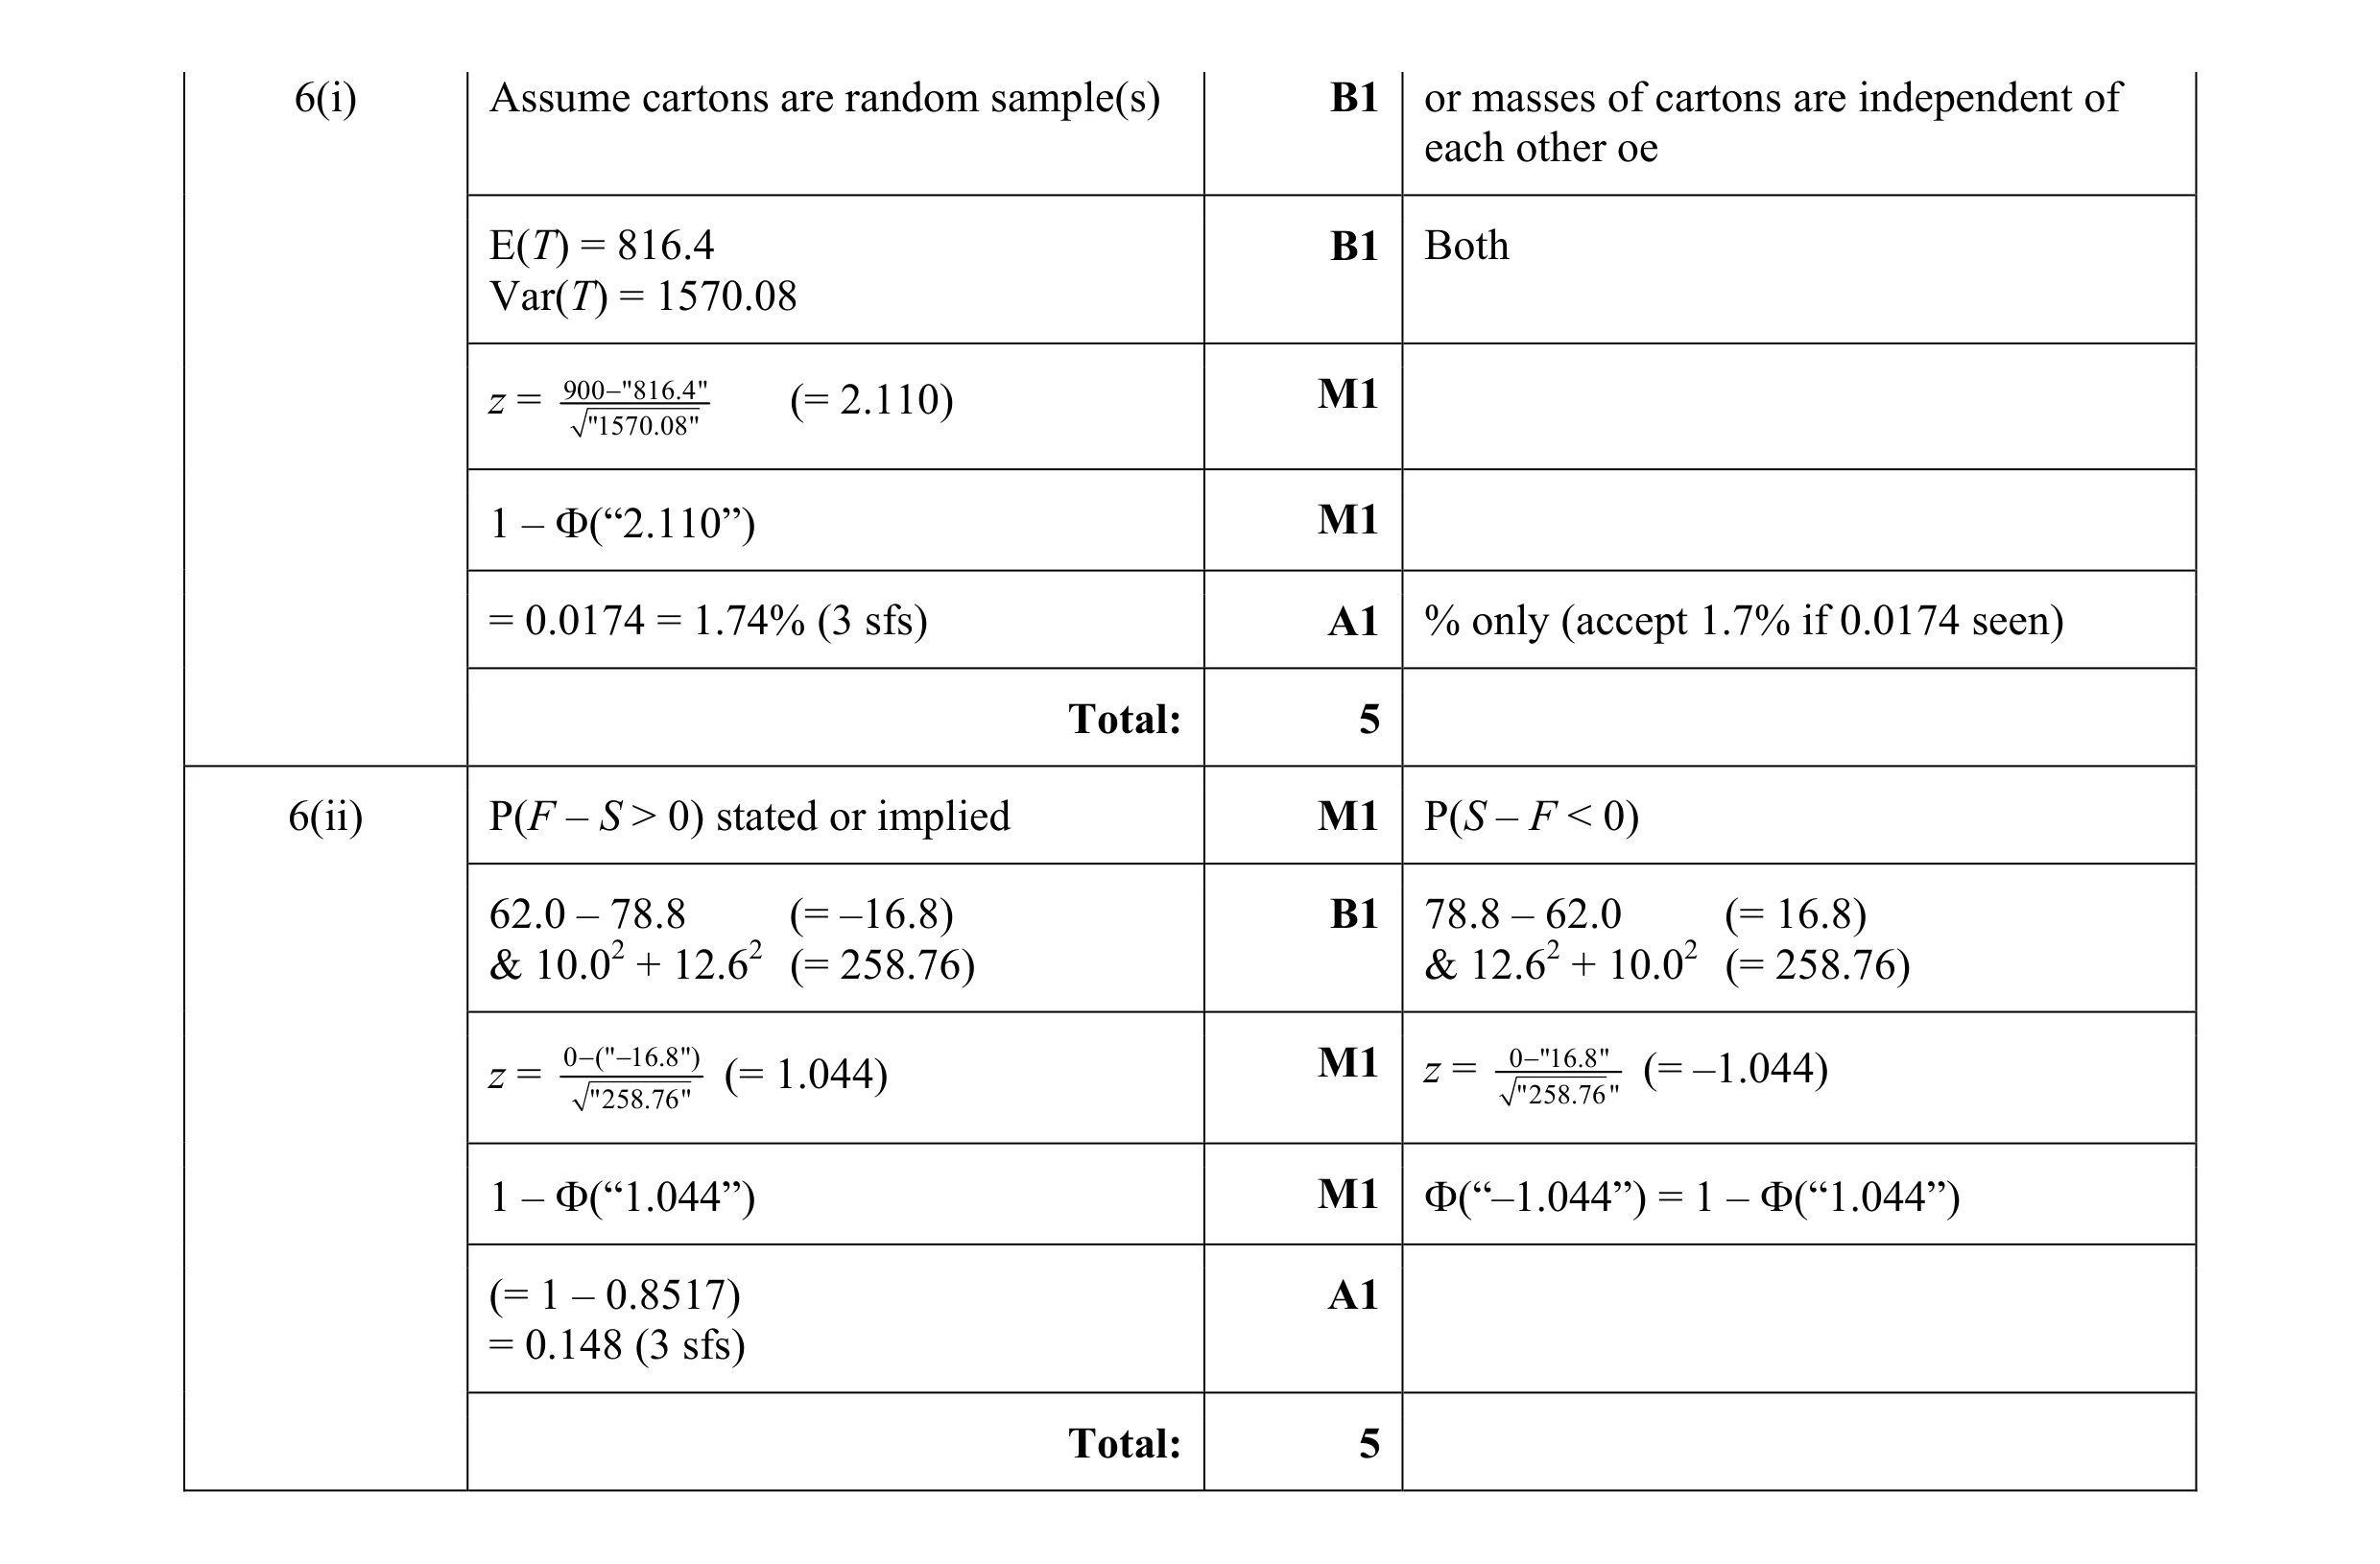 10
10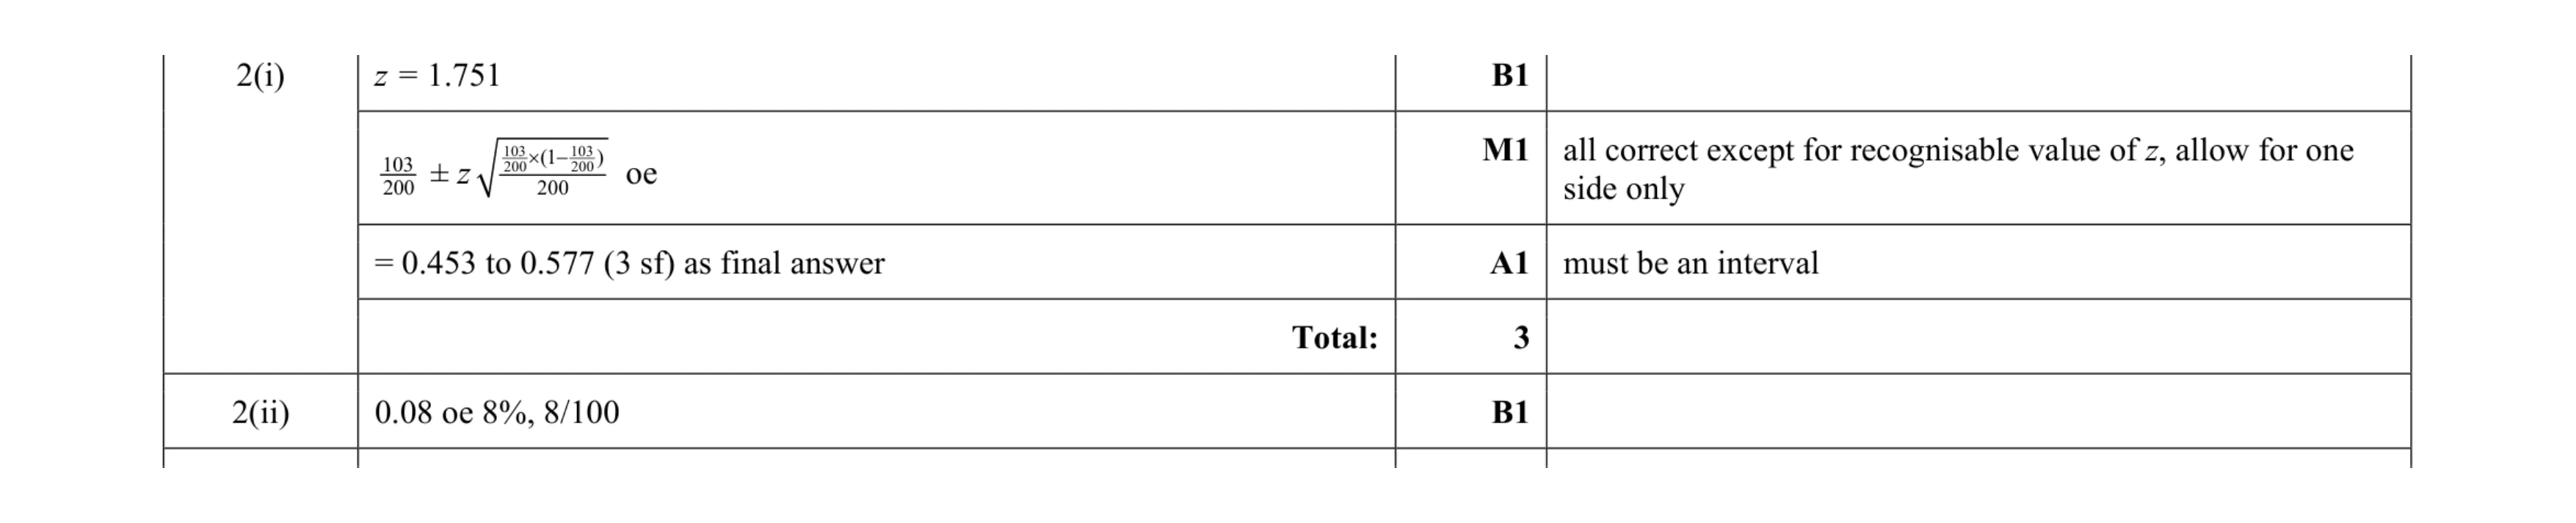 4
4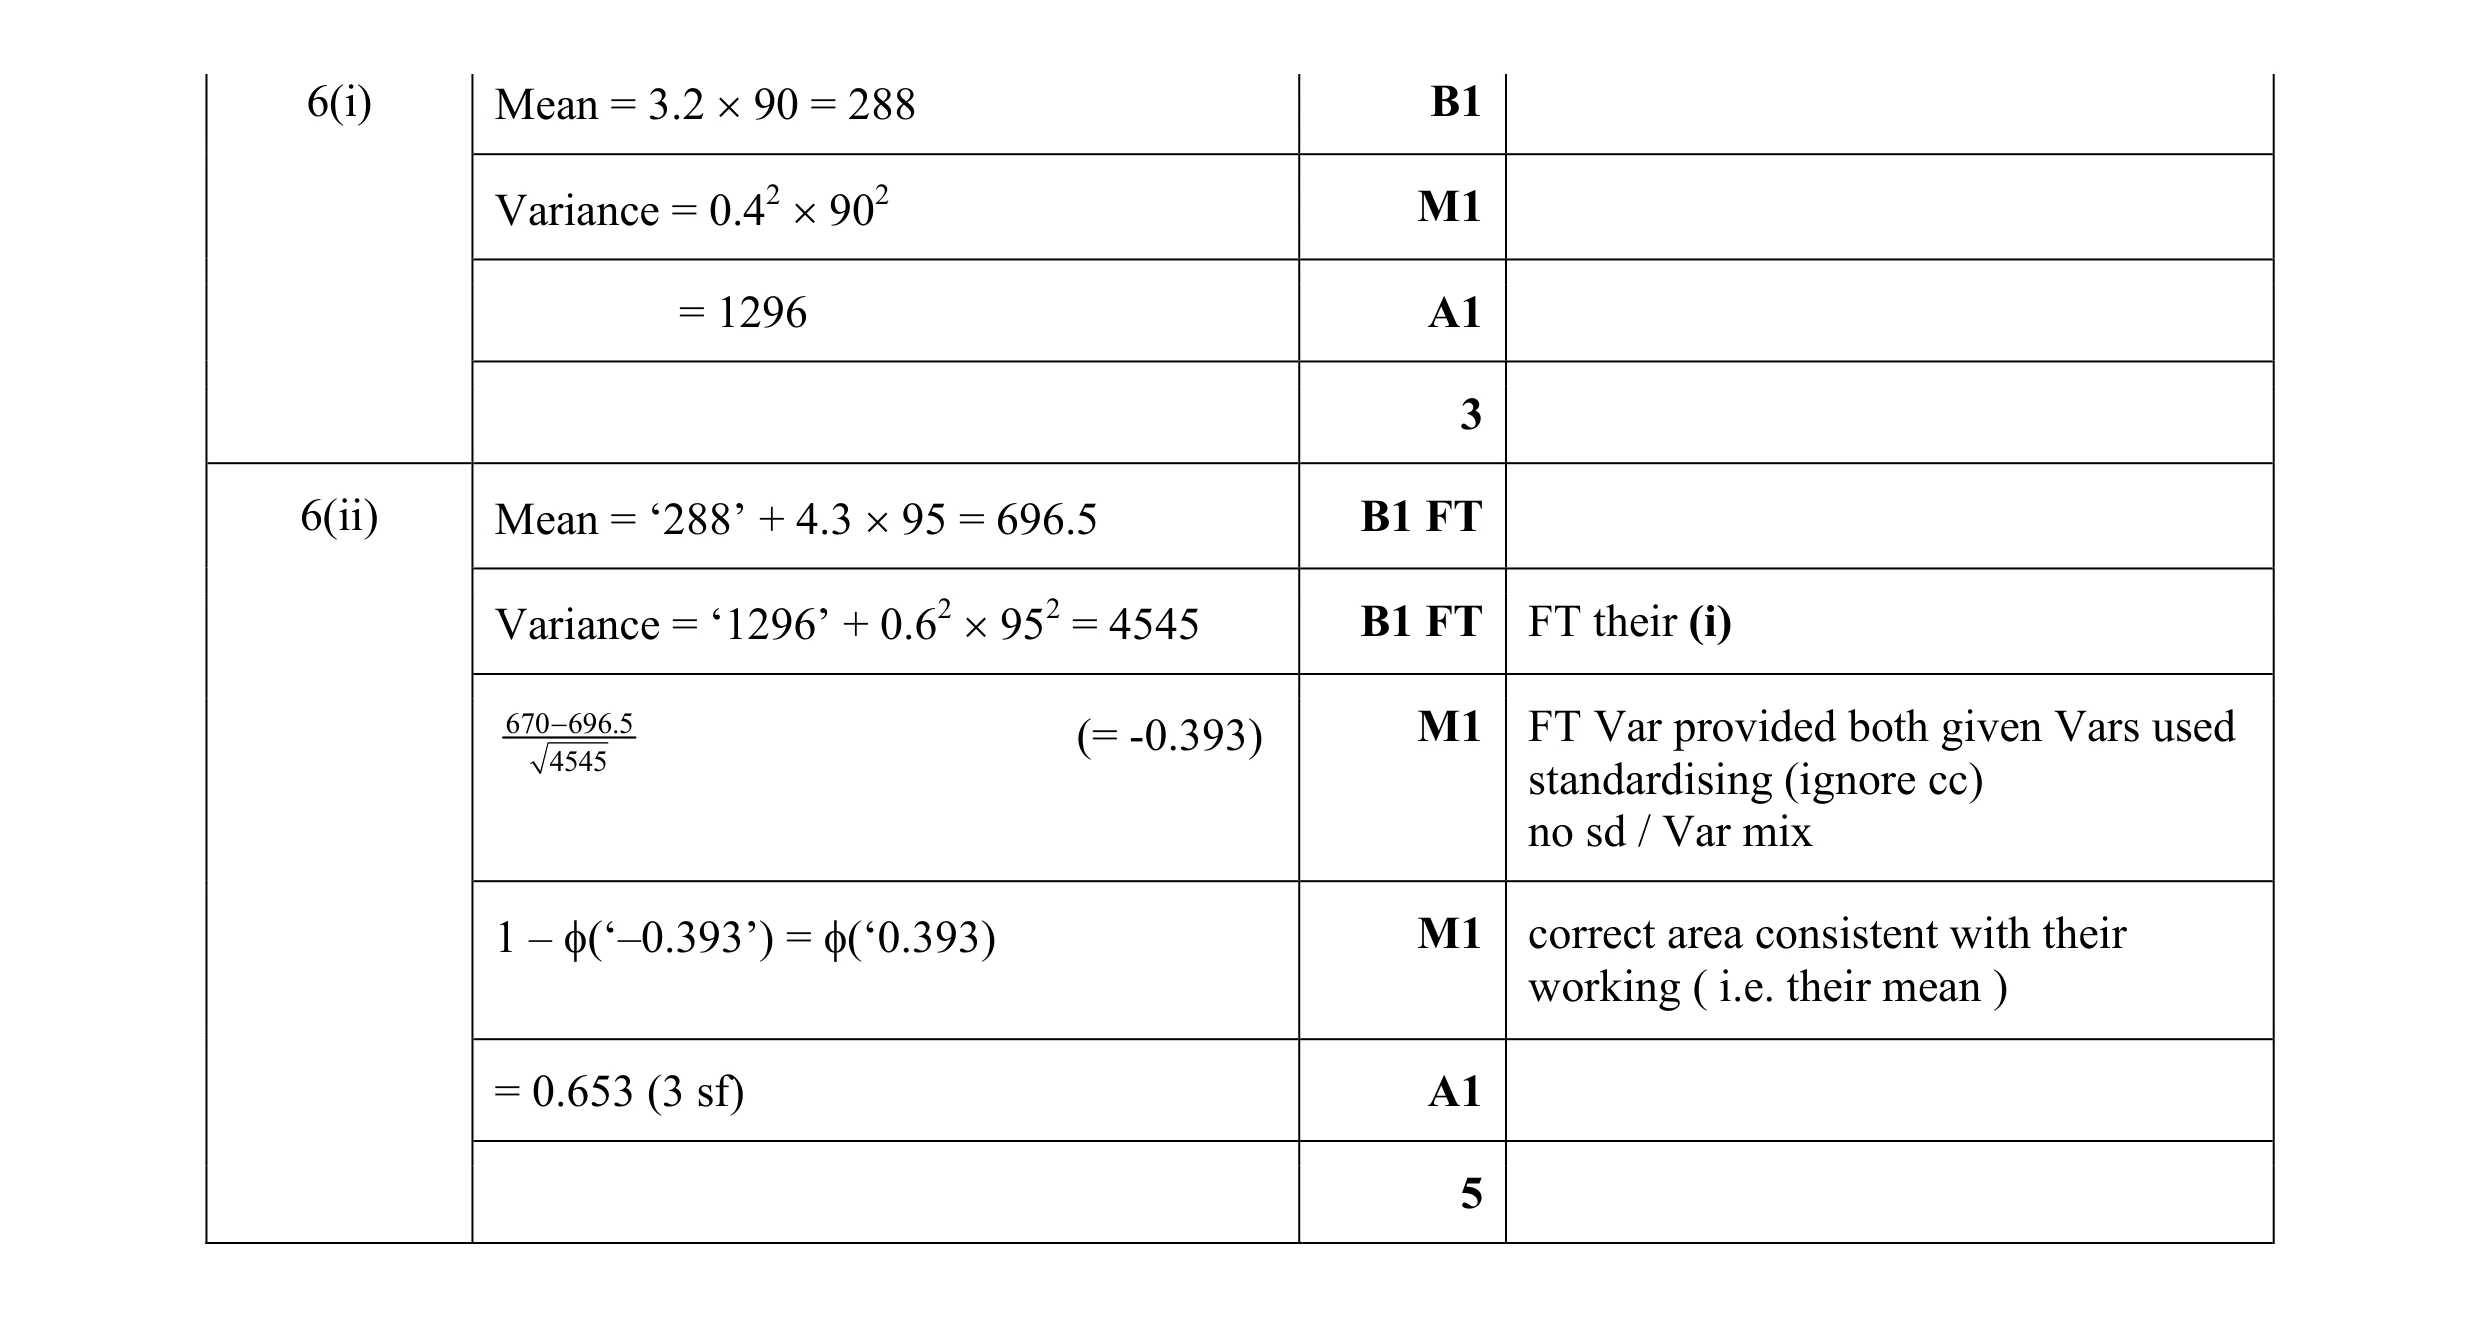 8
8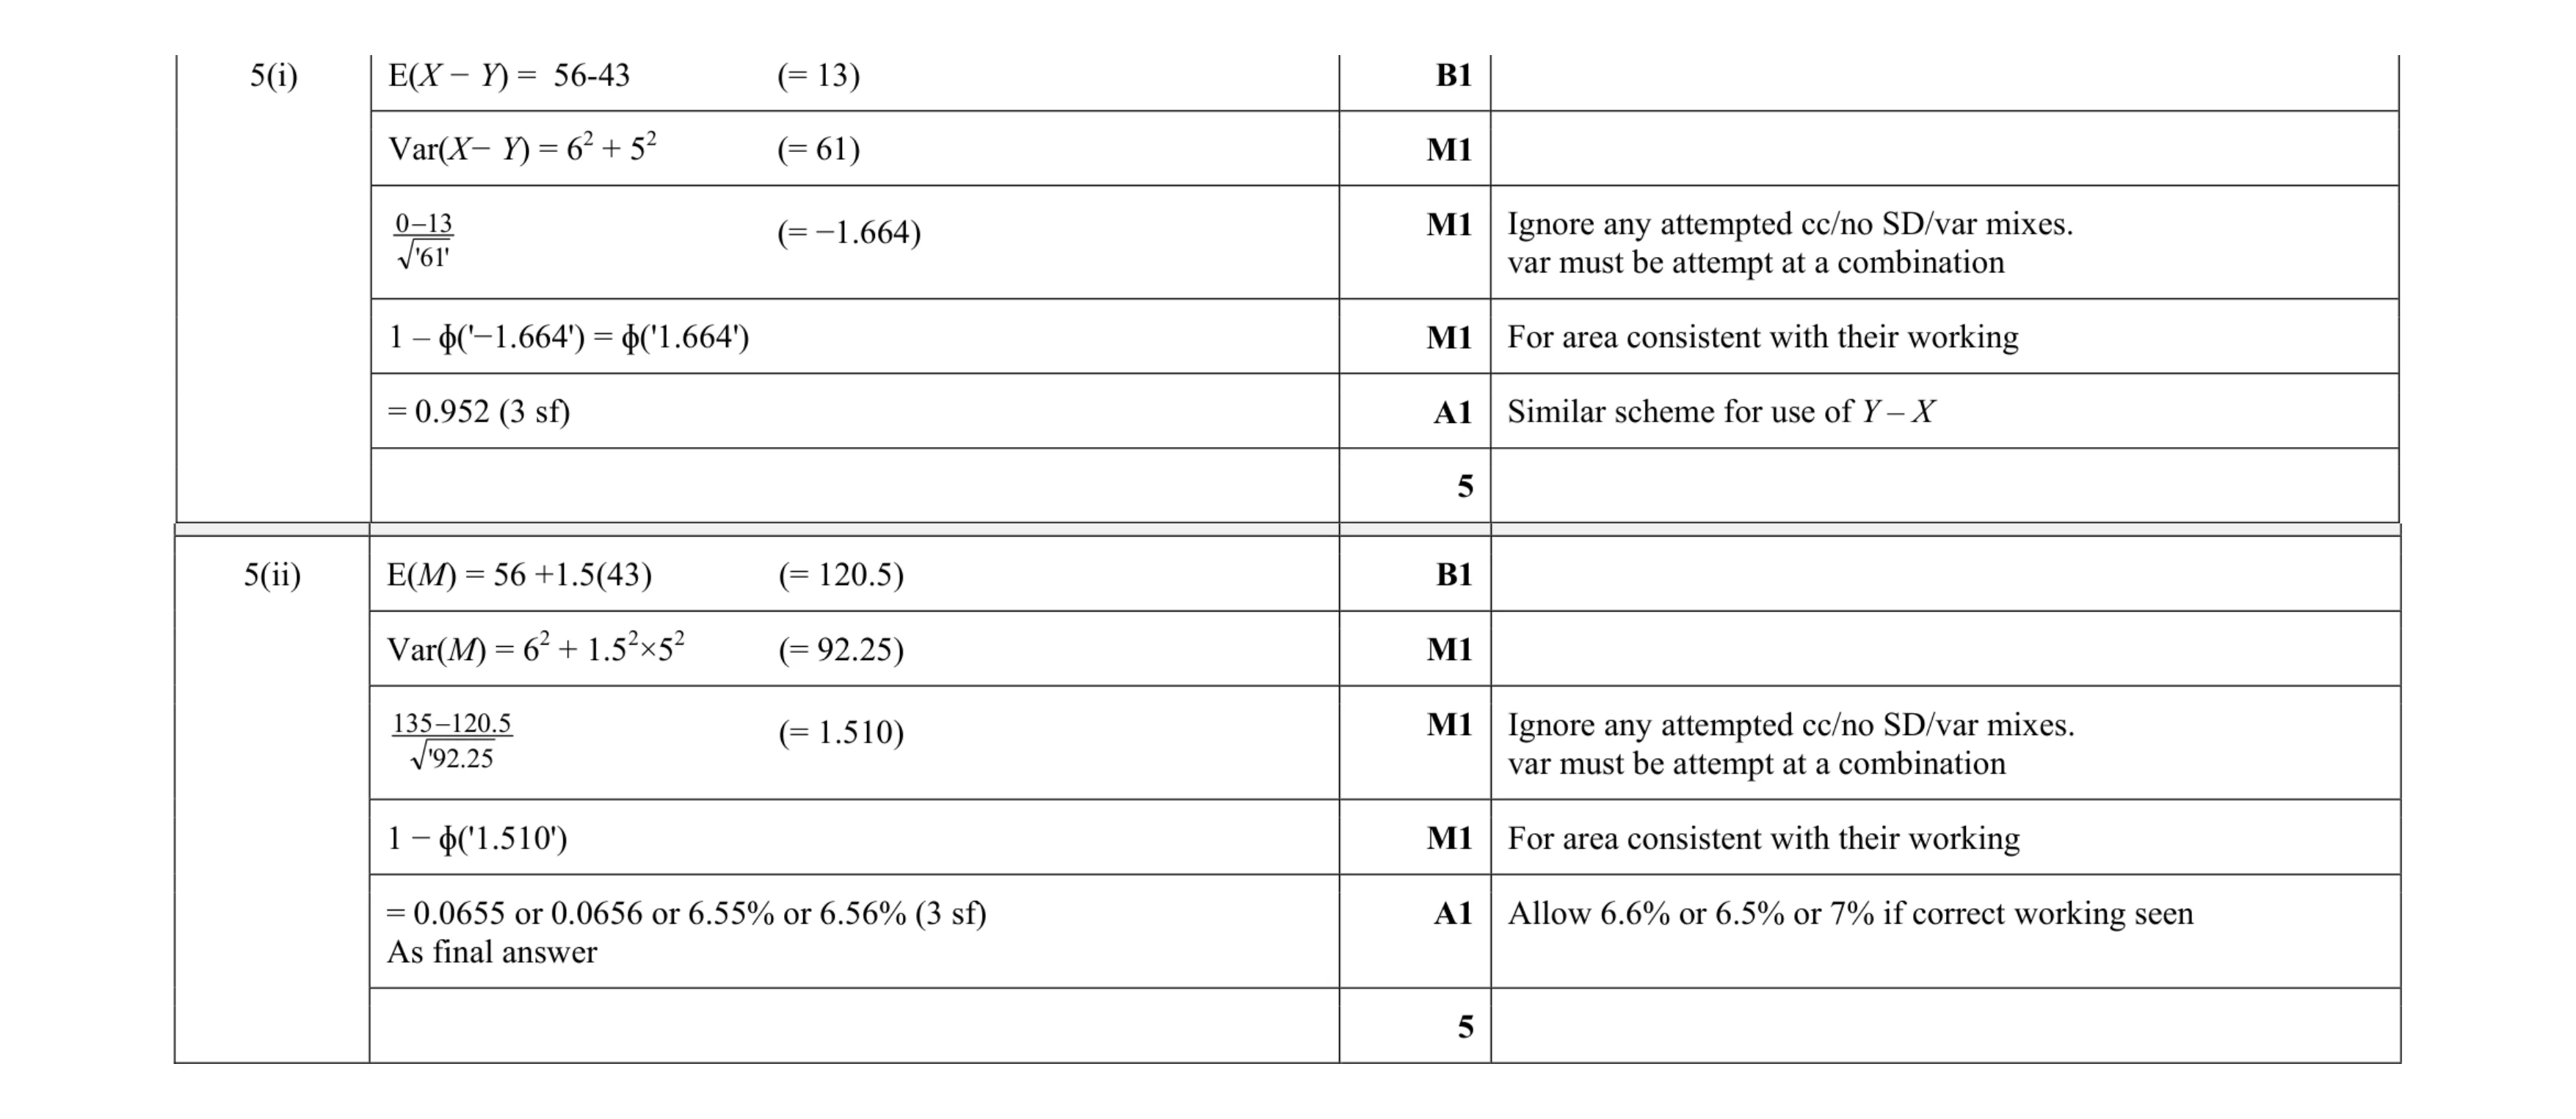 10
10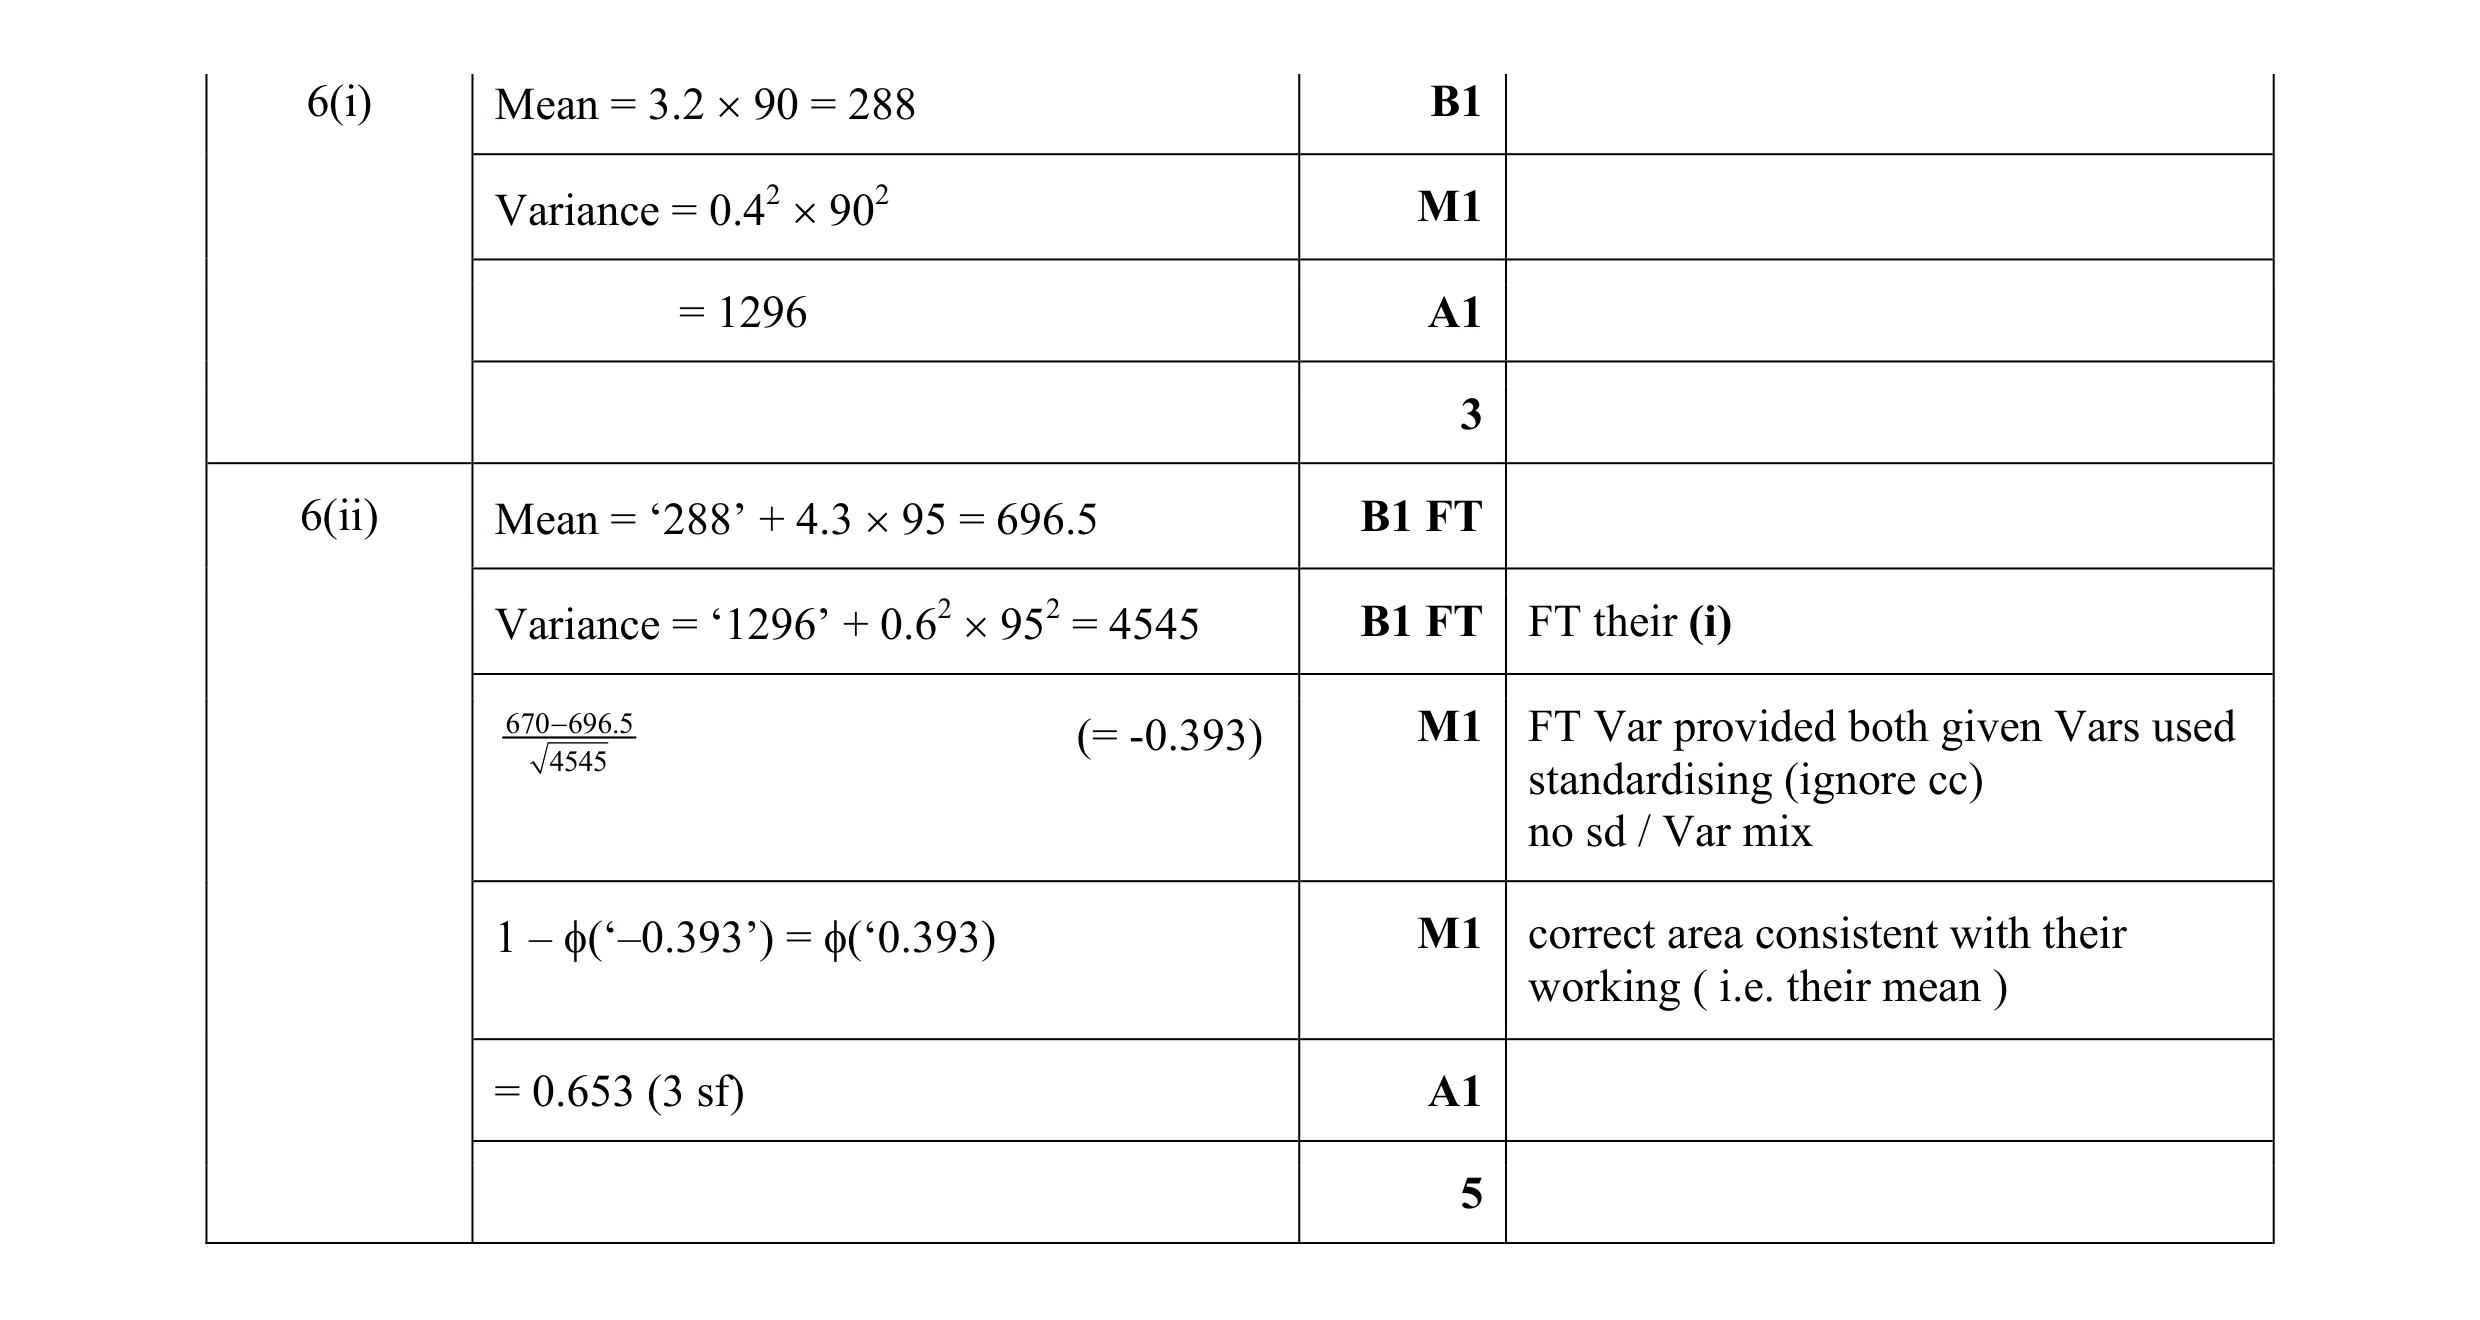 8
8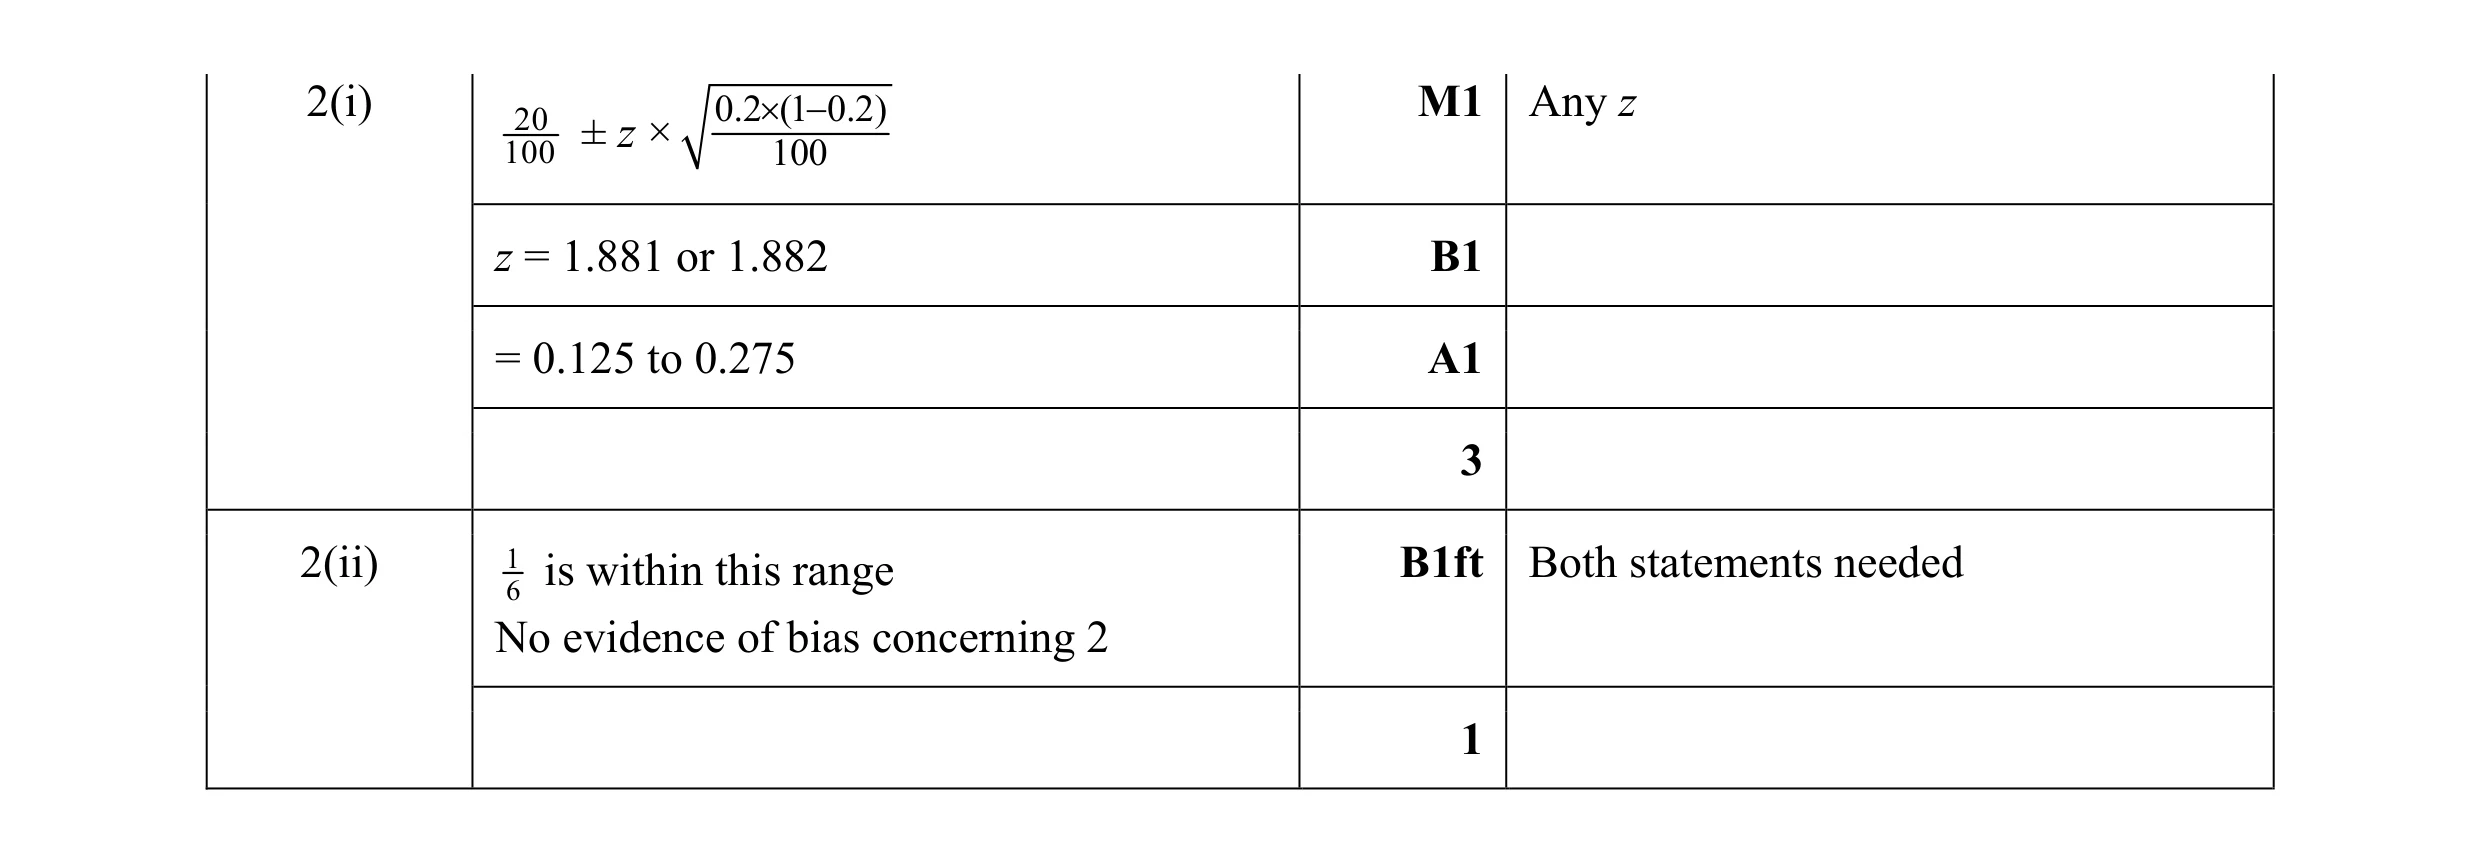 4
4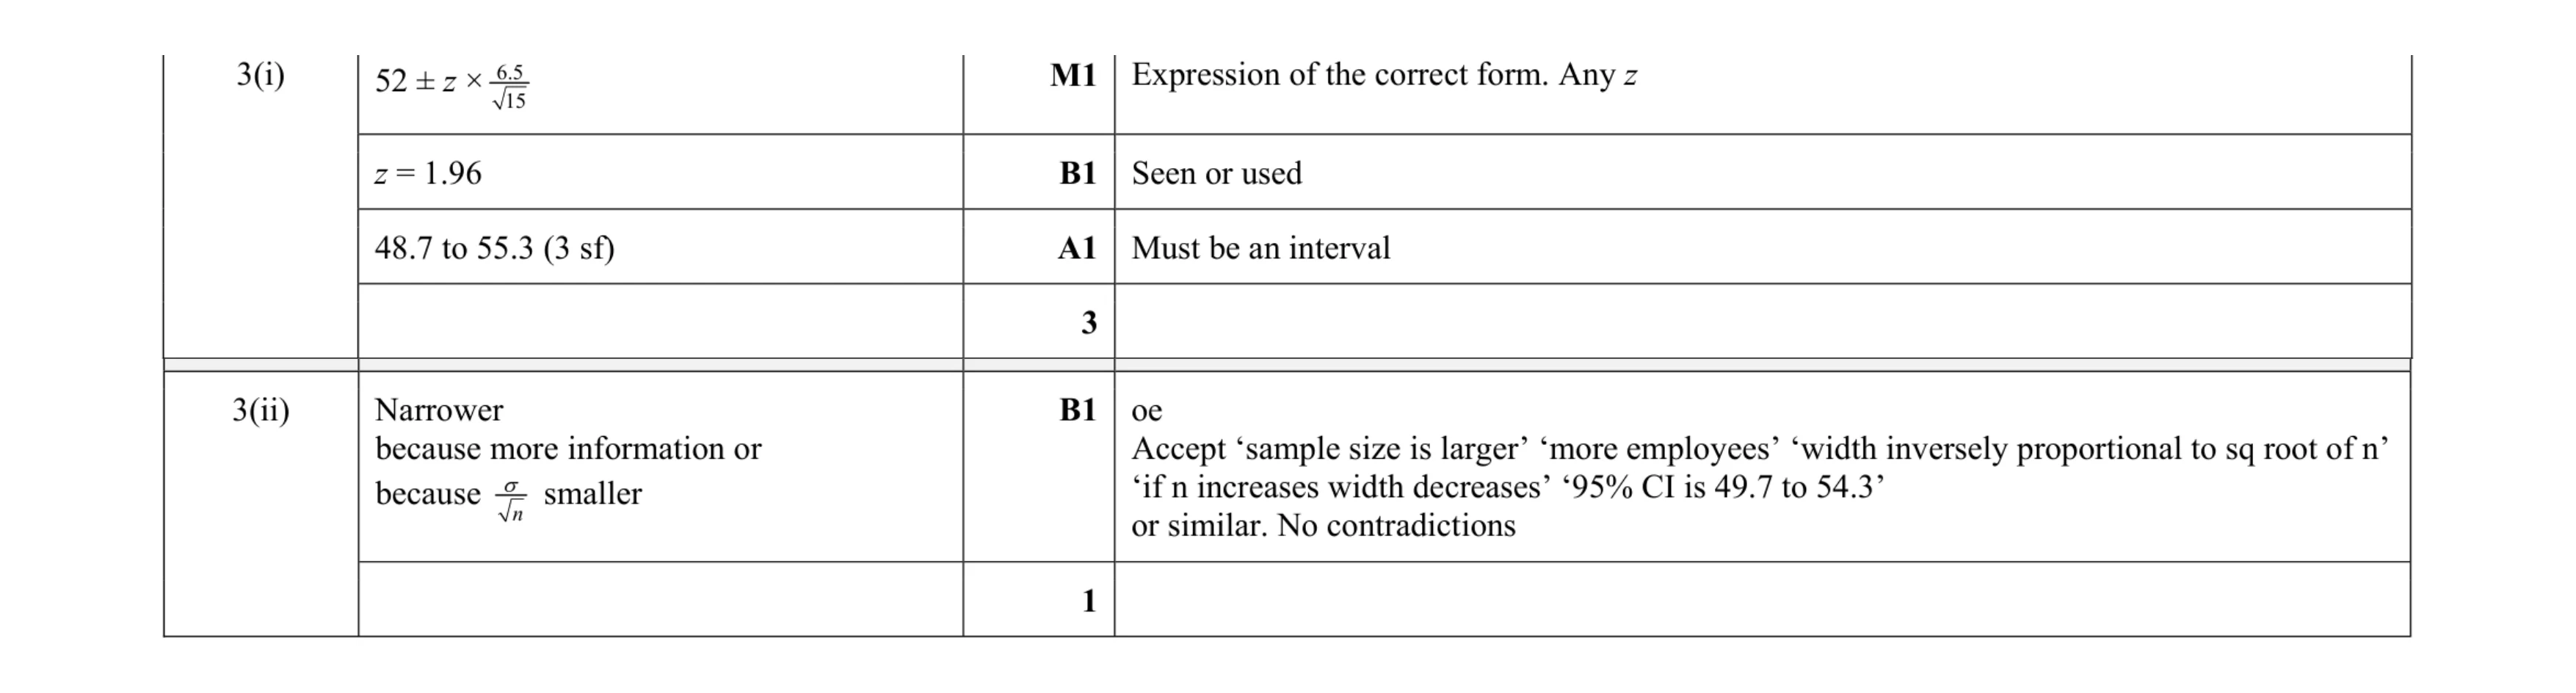 4
4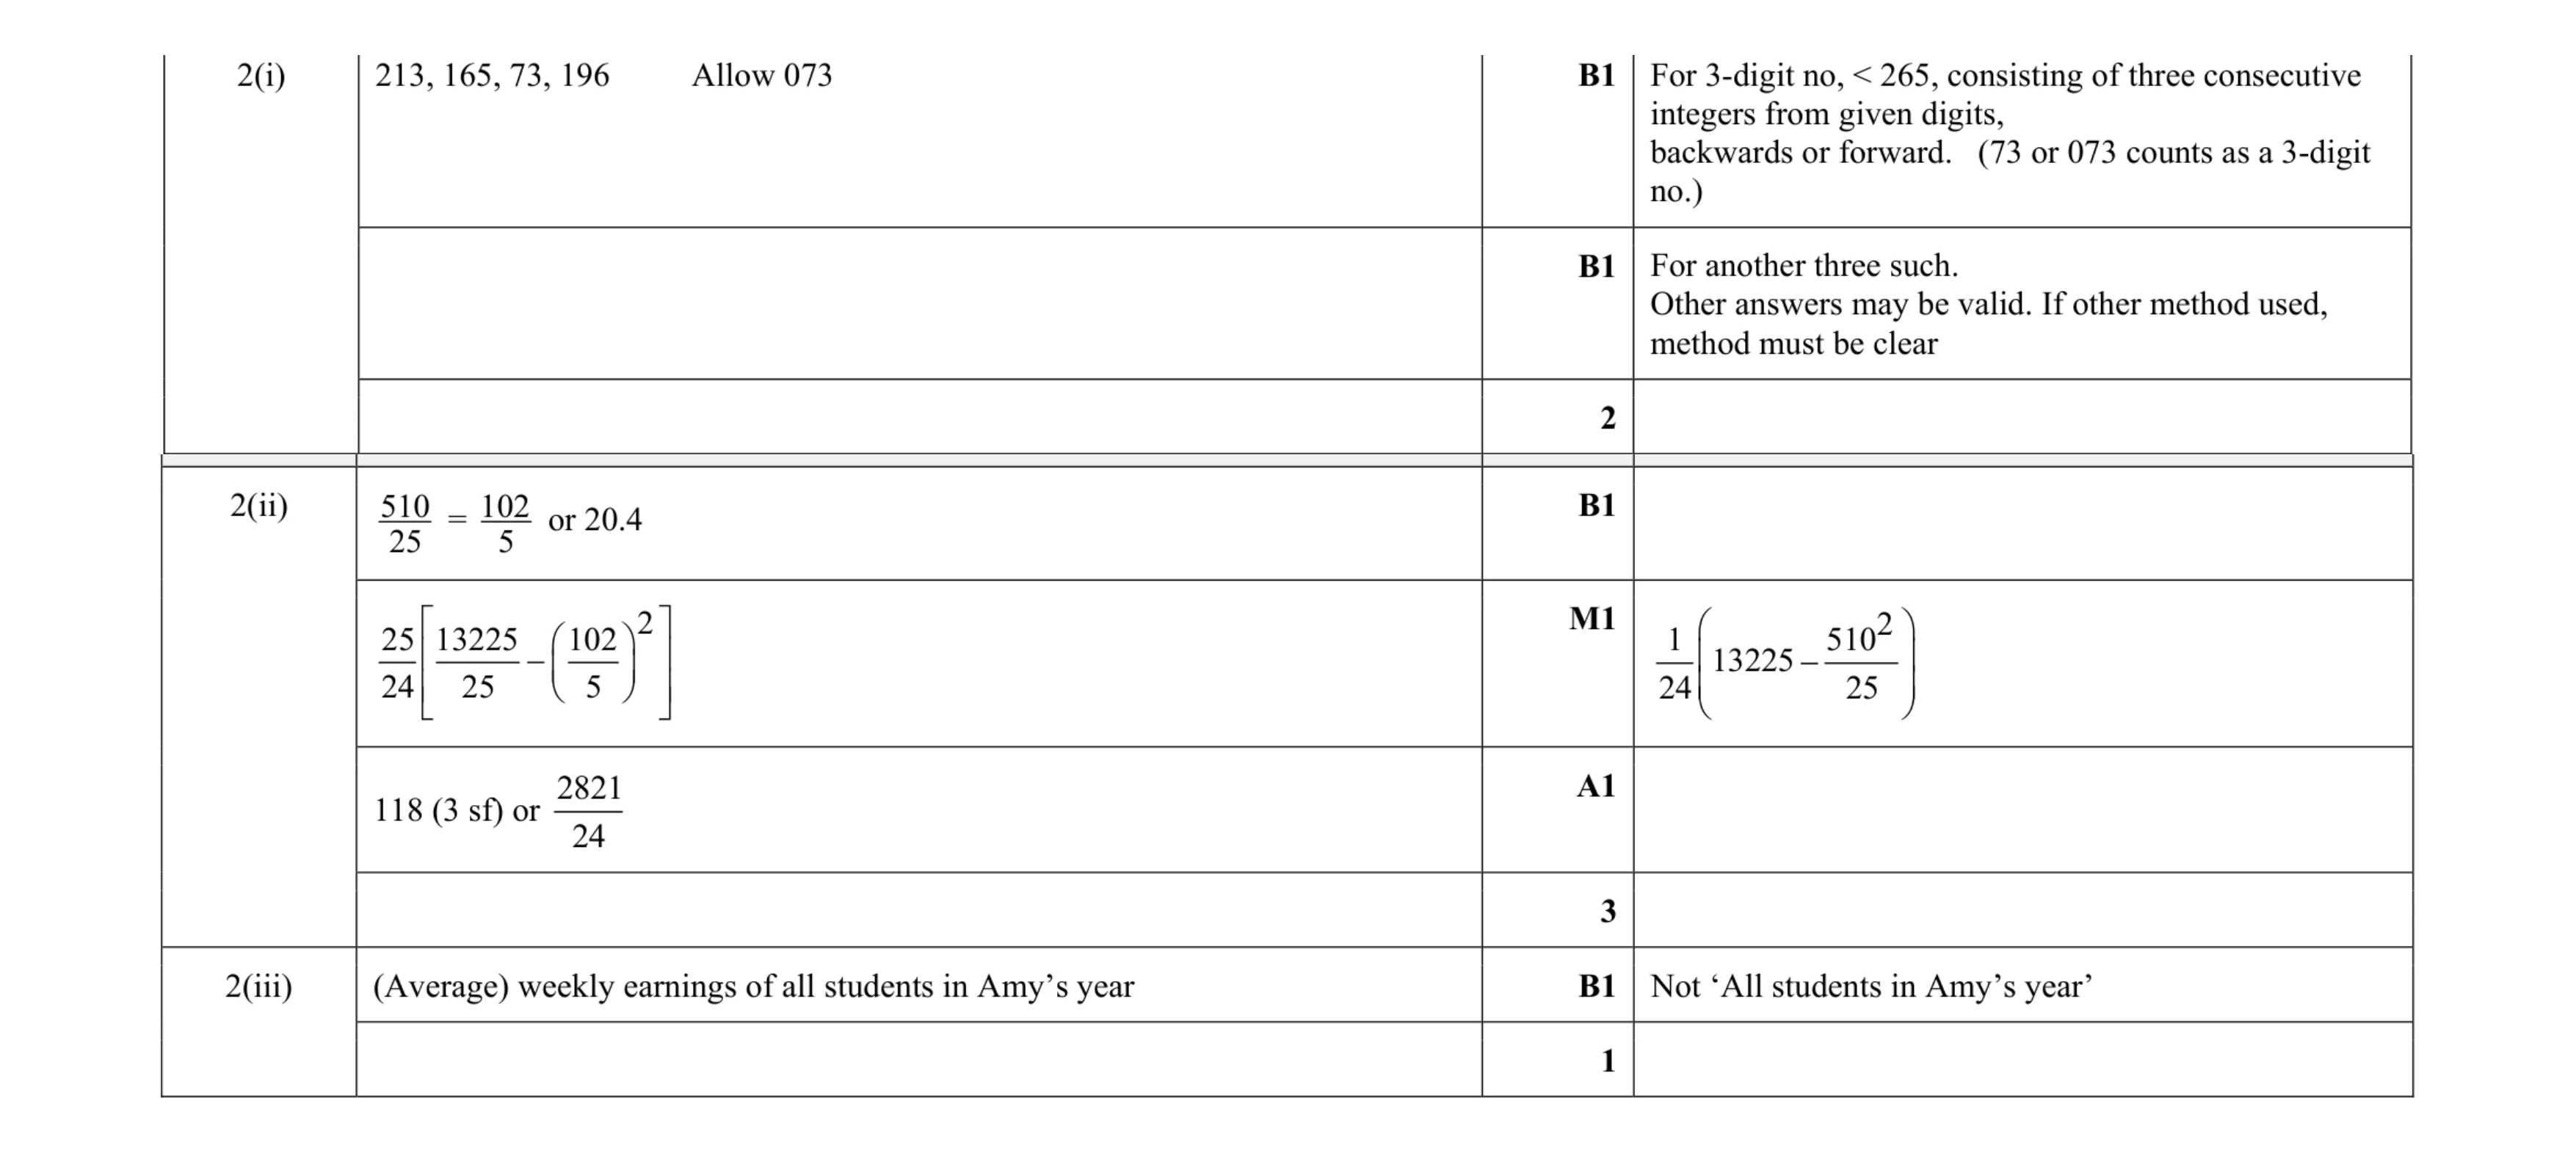 6
6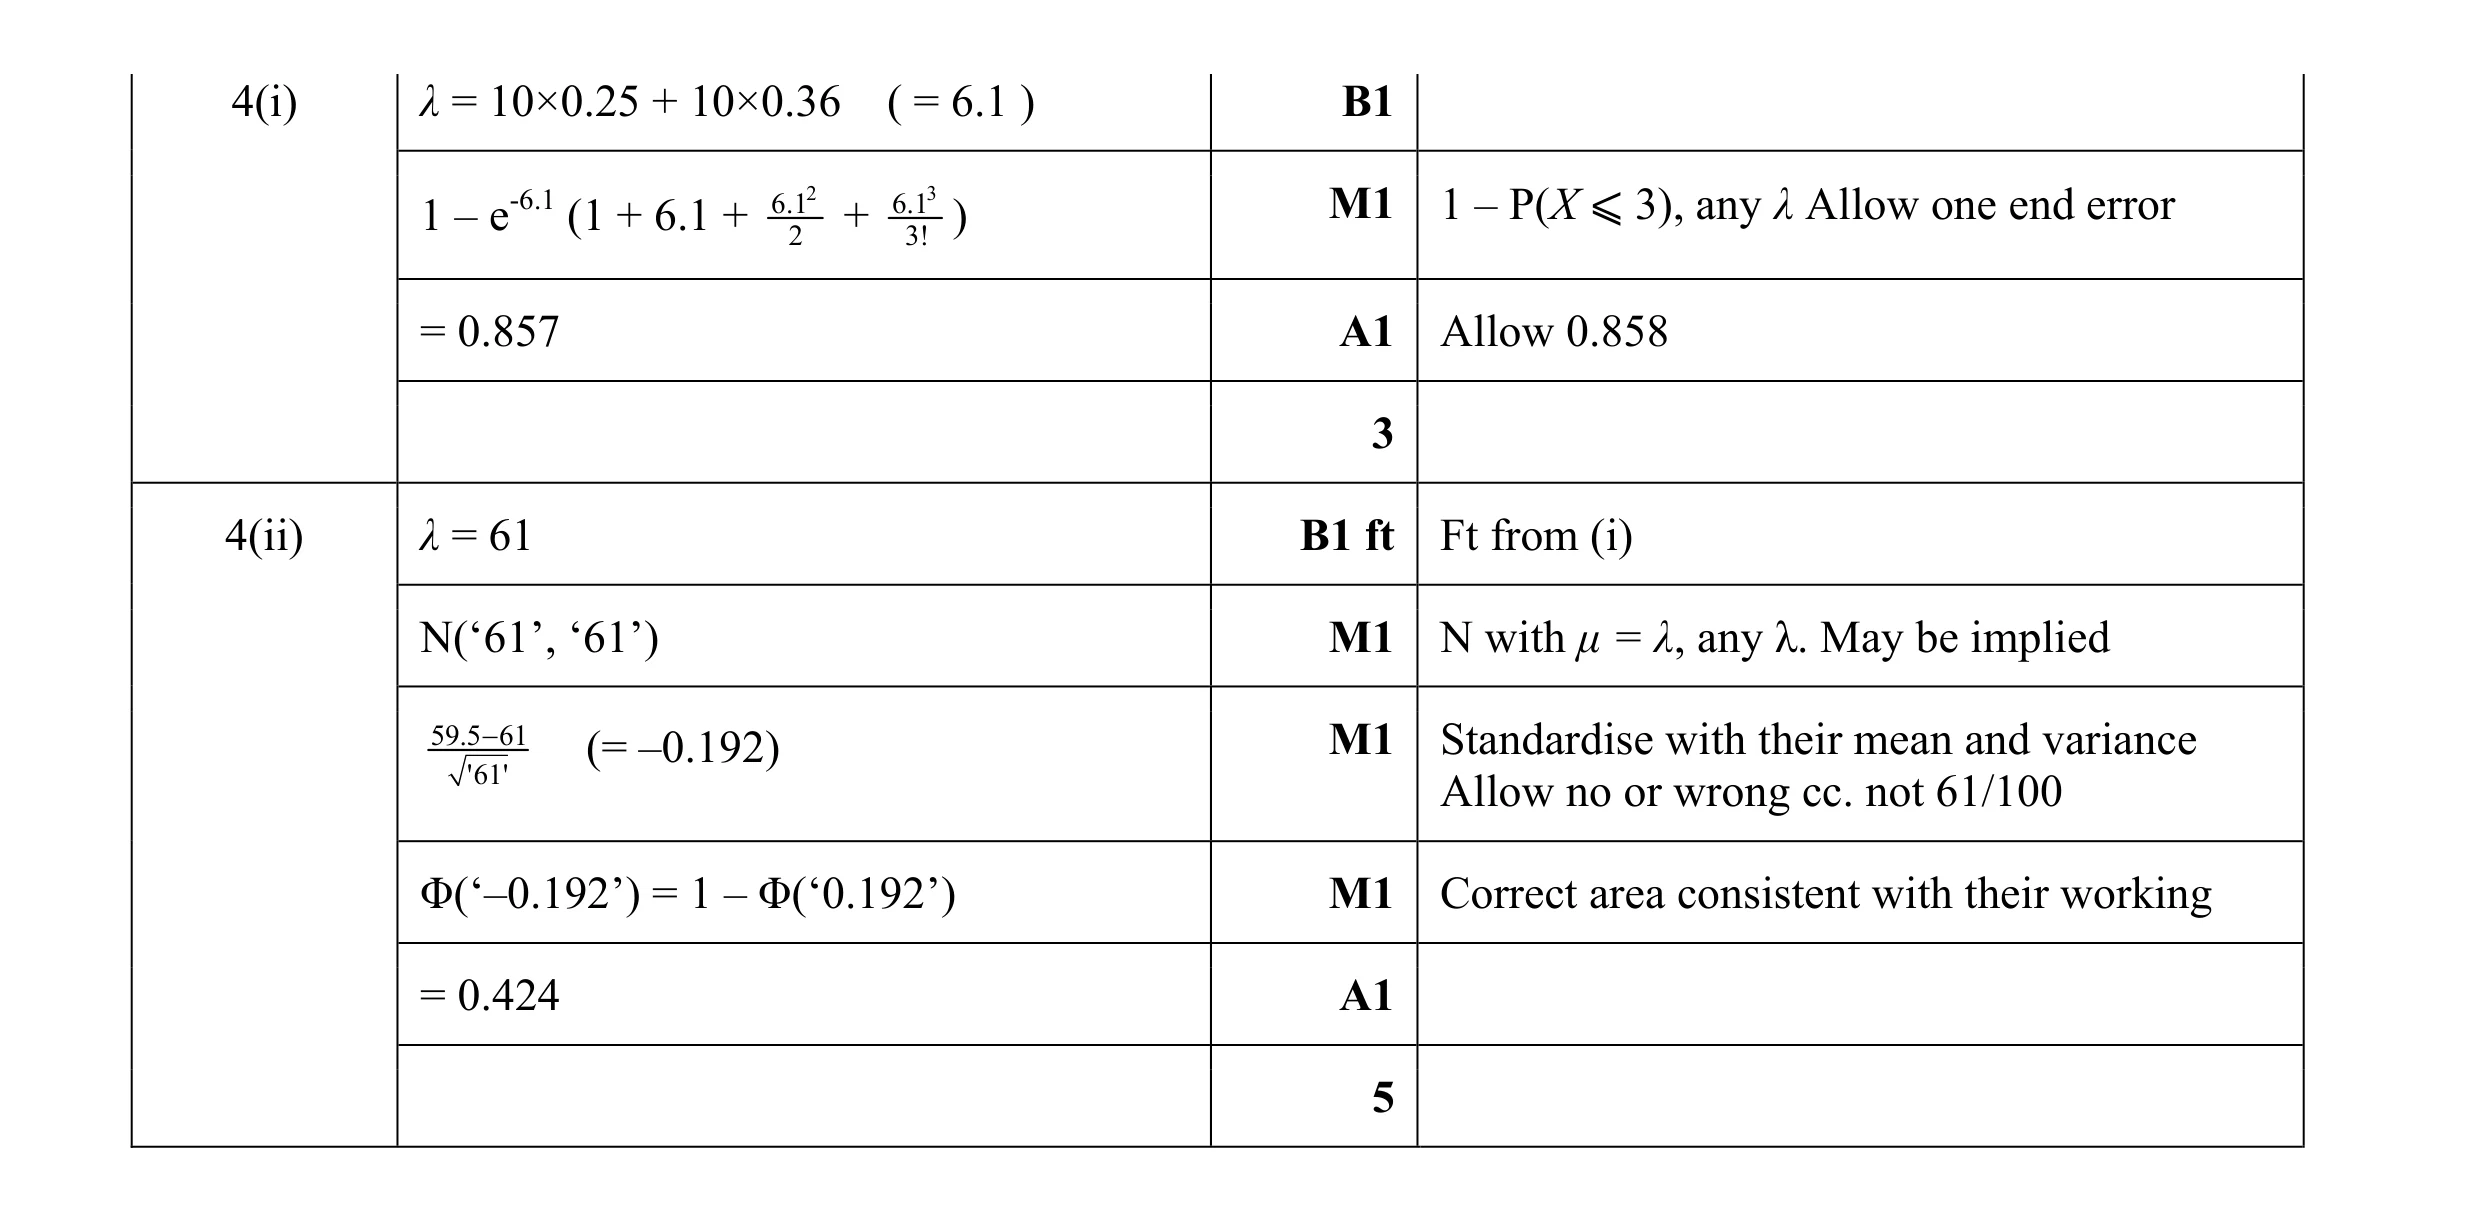 8
8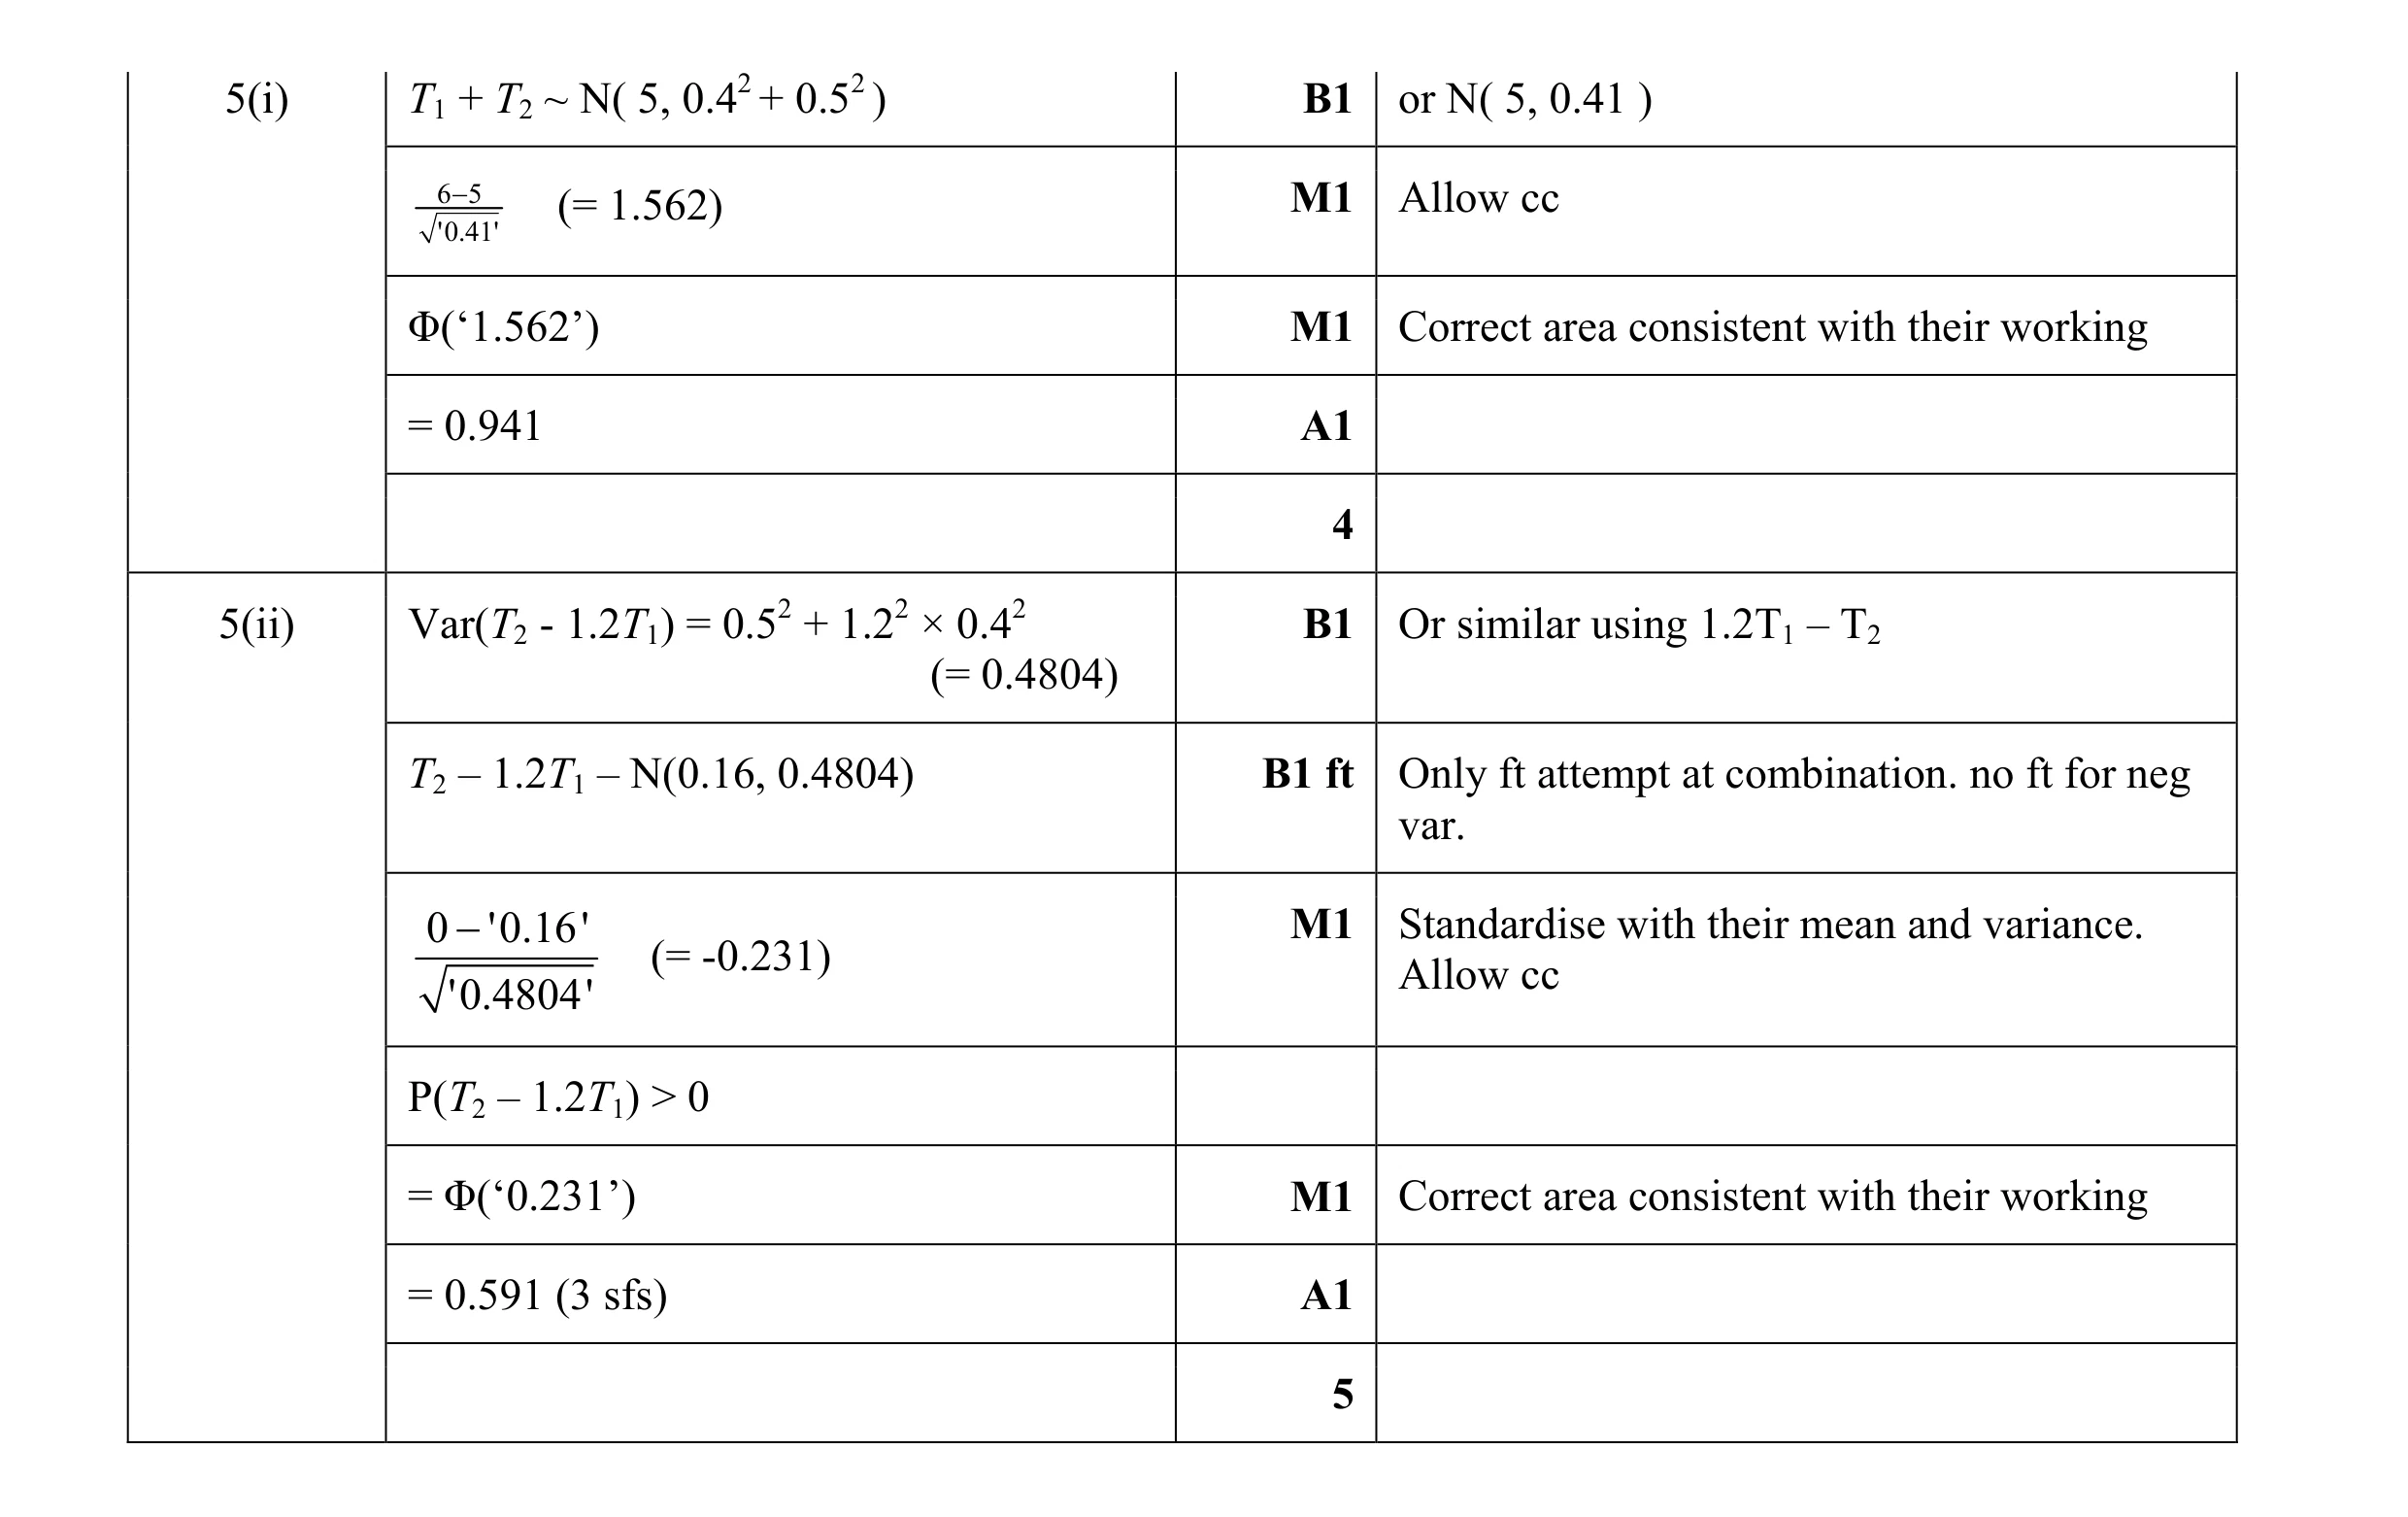 9
9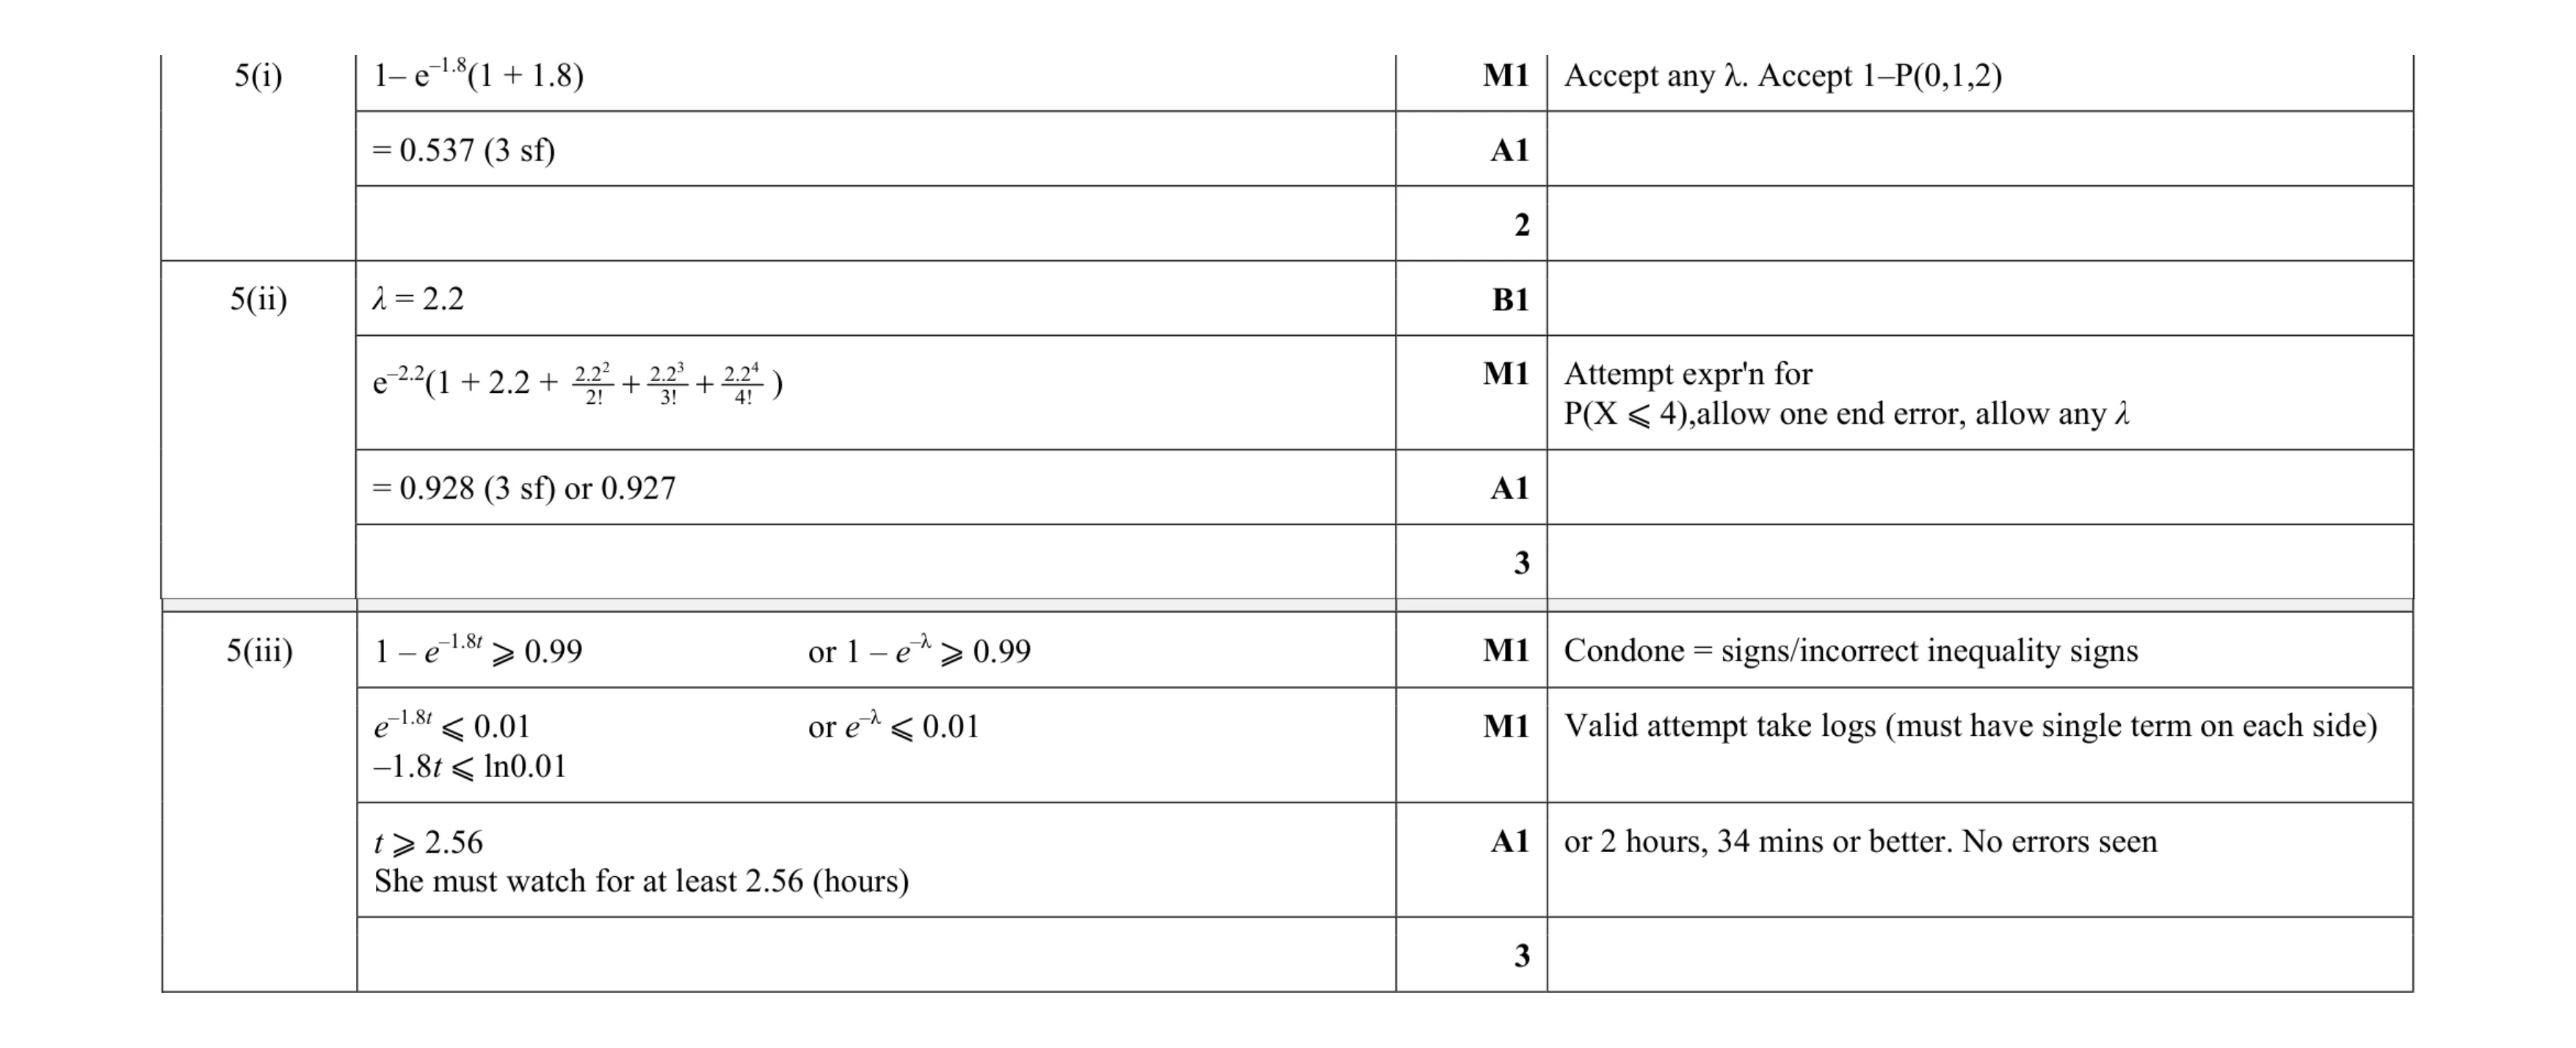 8
8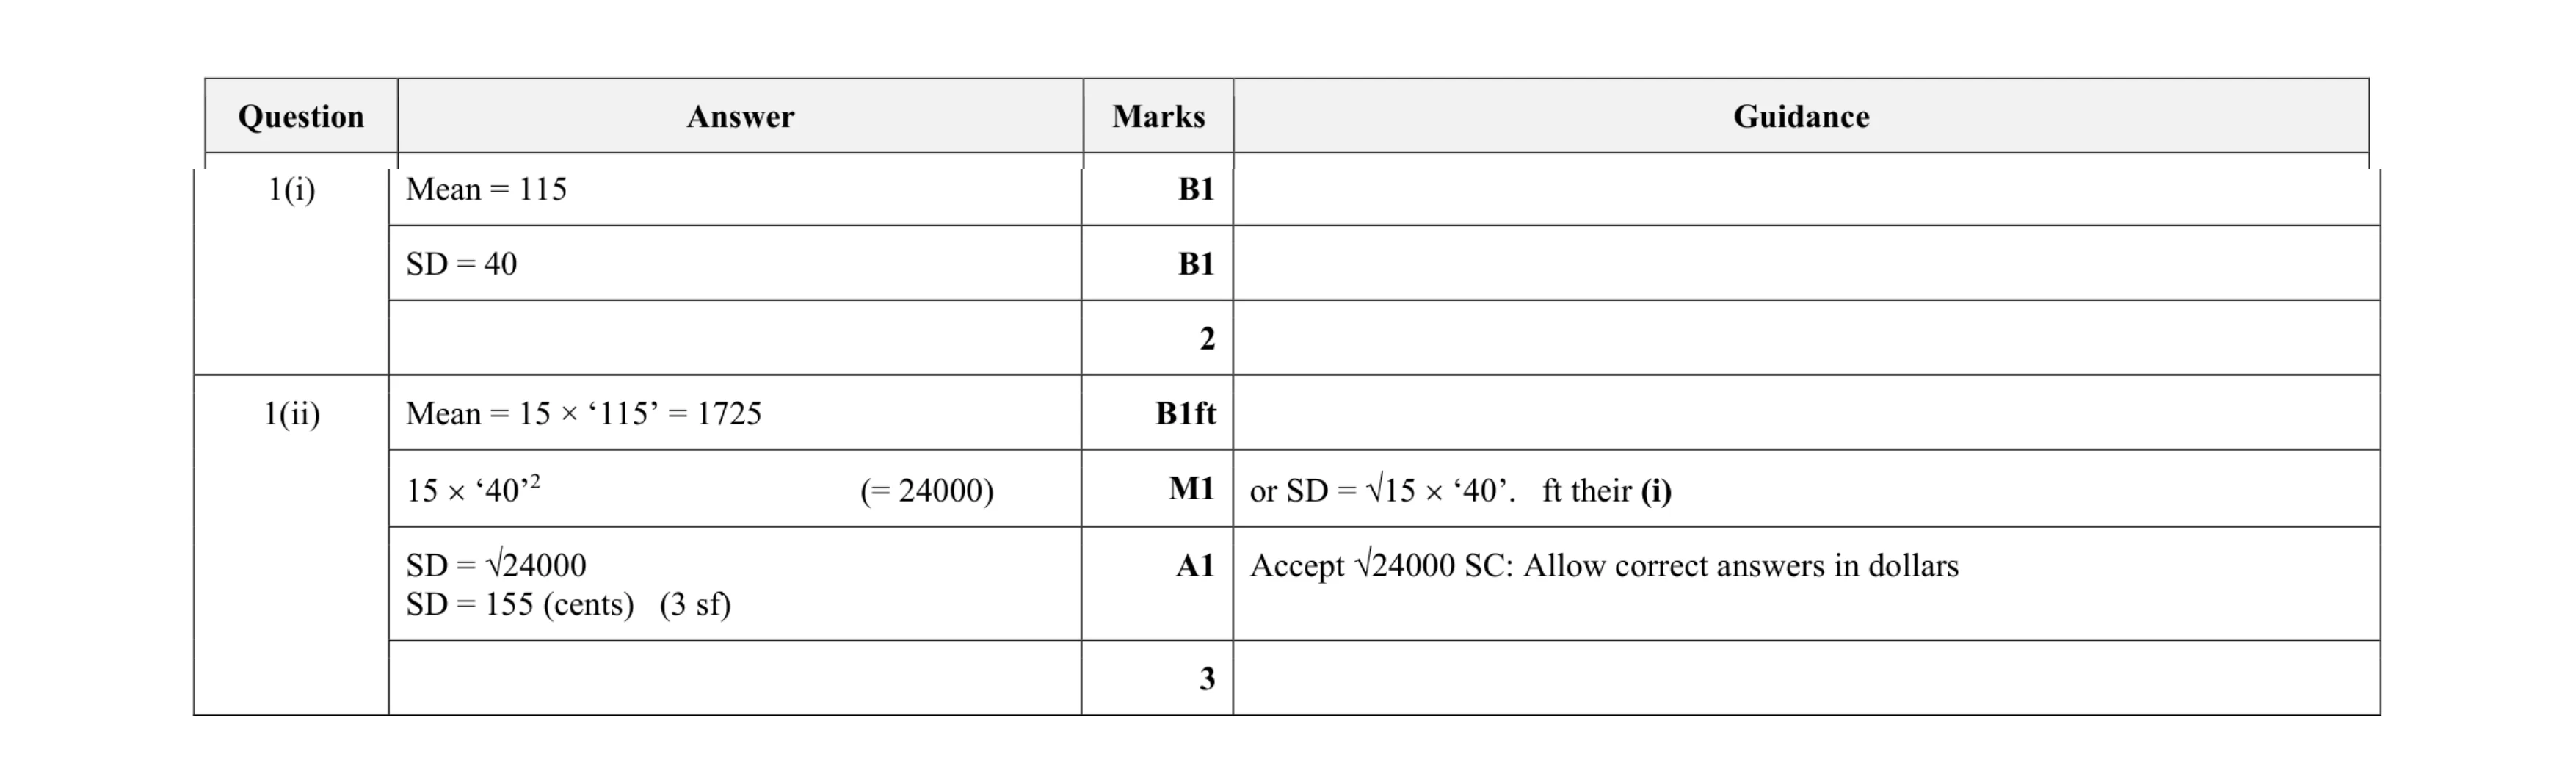 5
5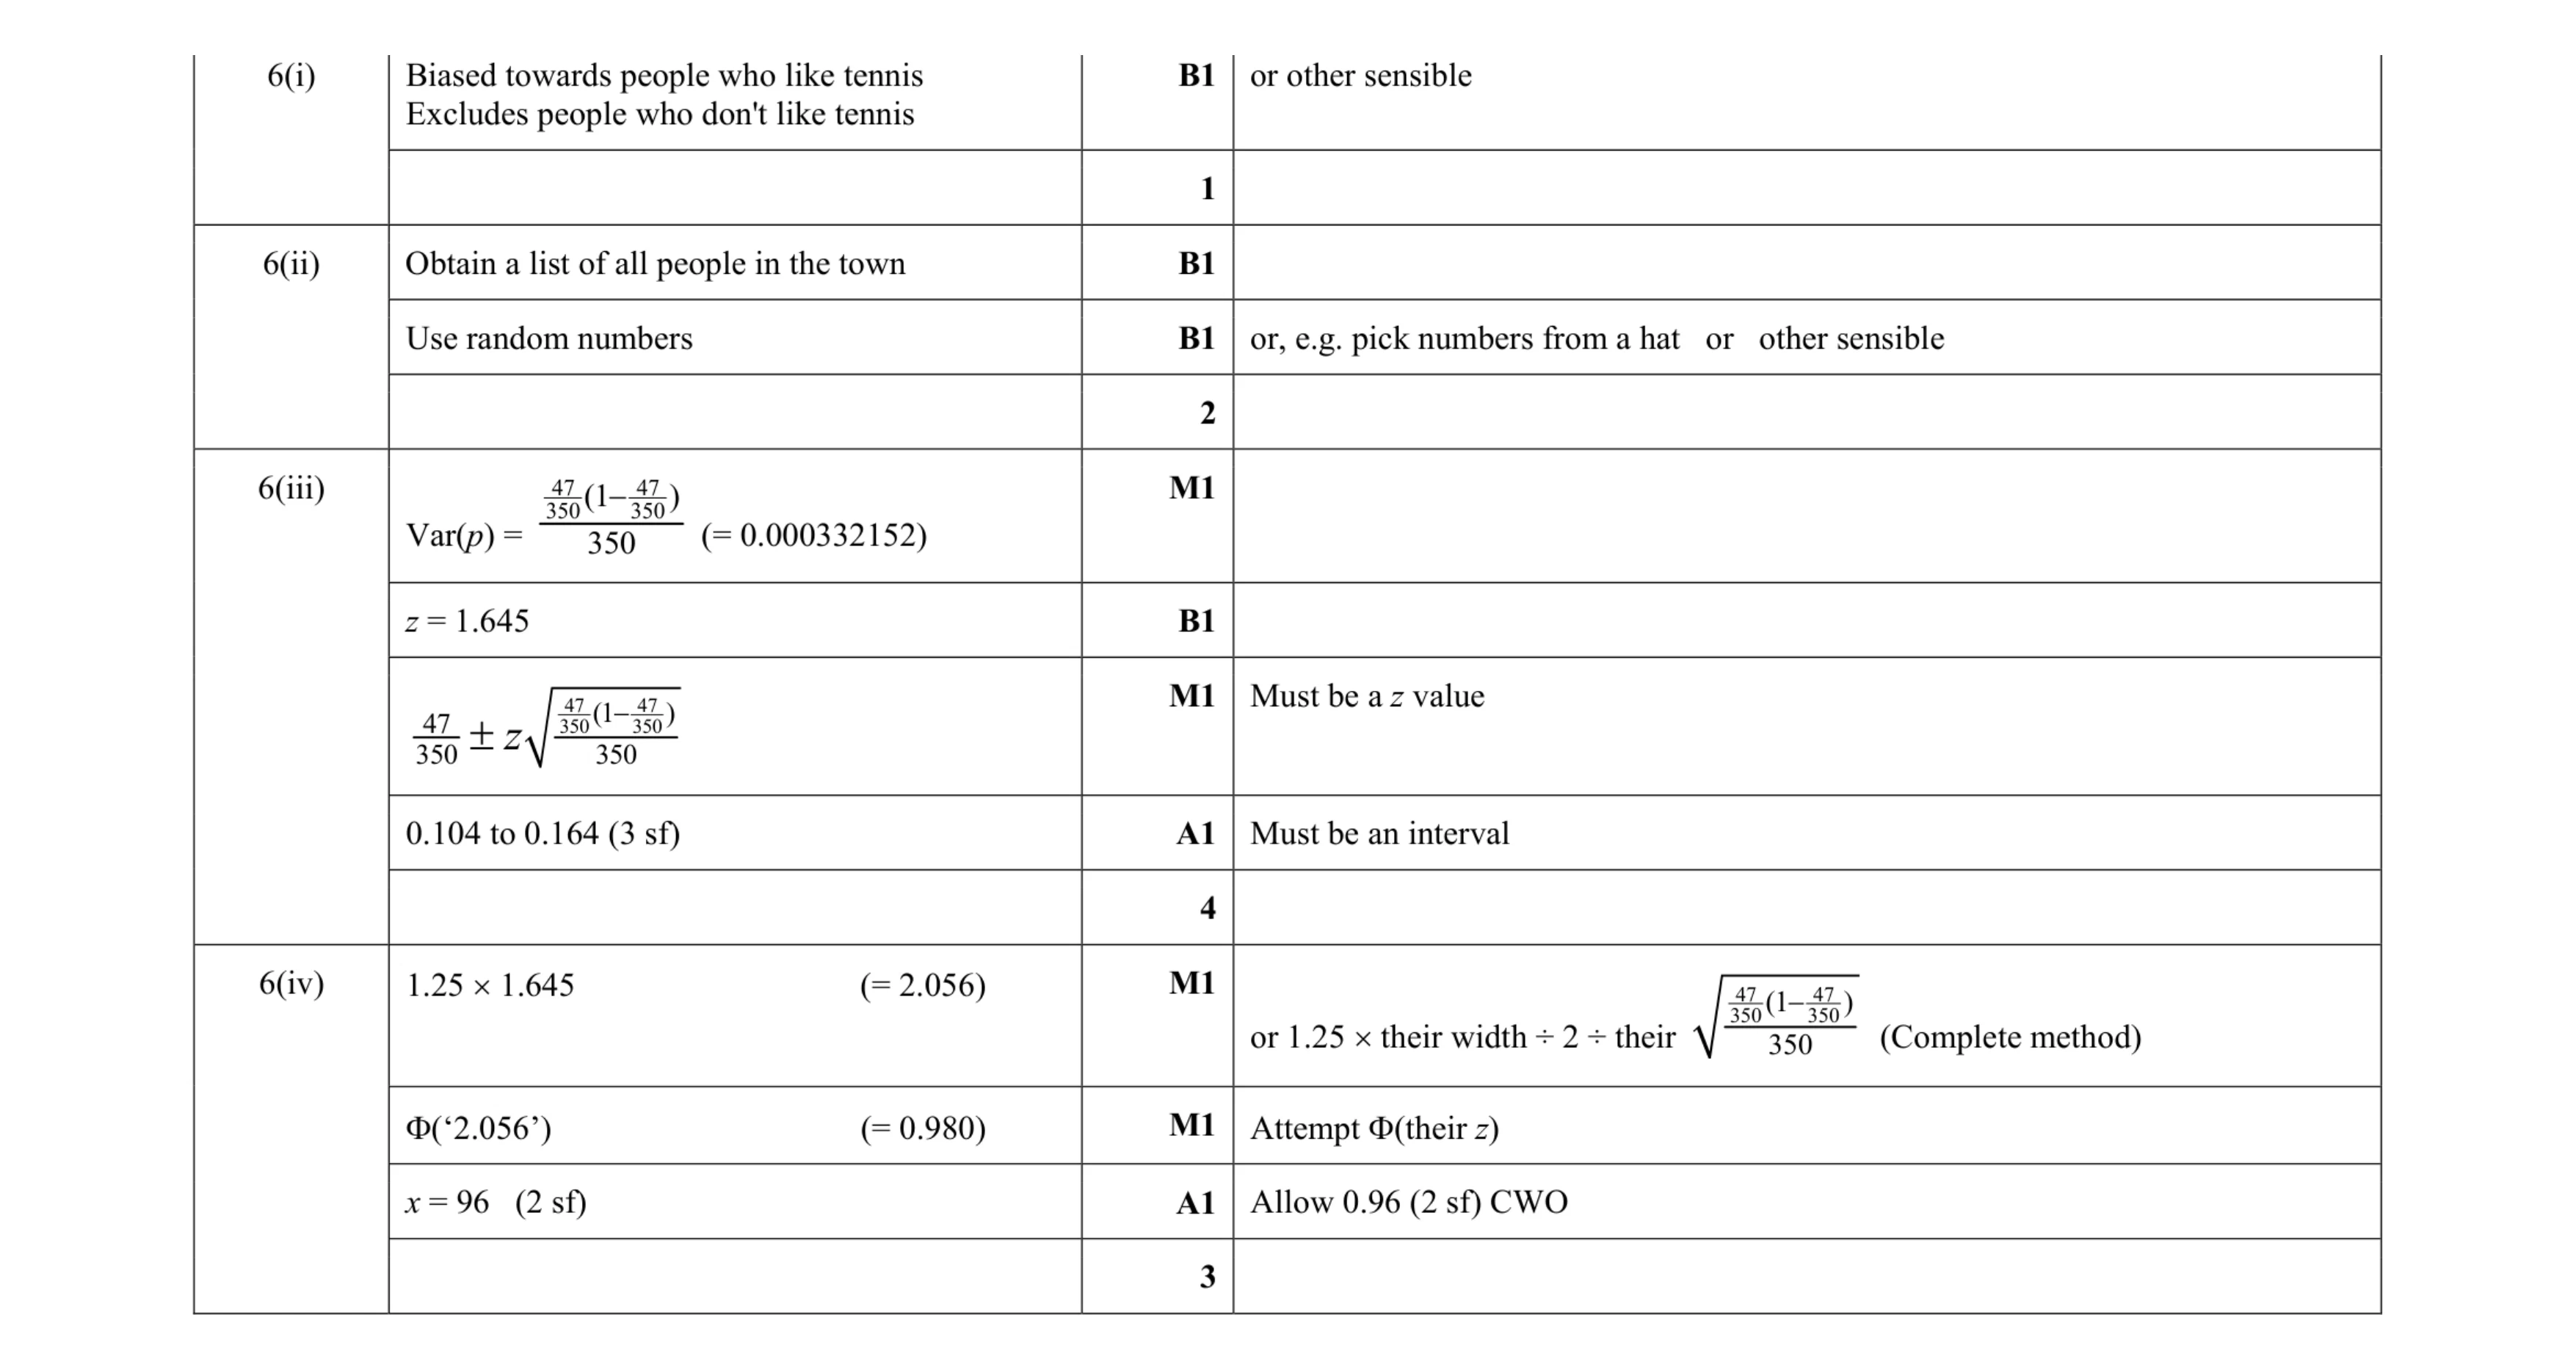 10
10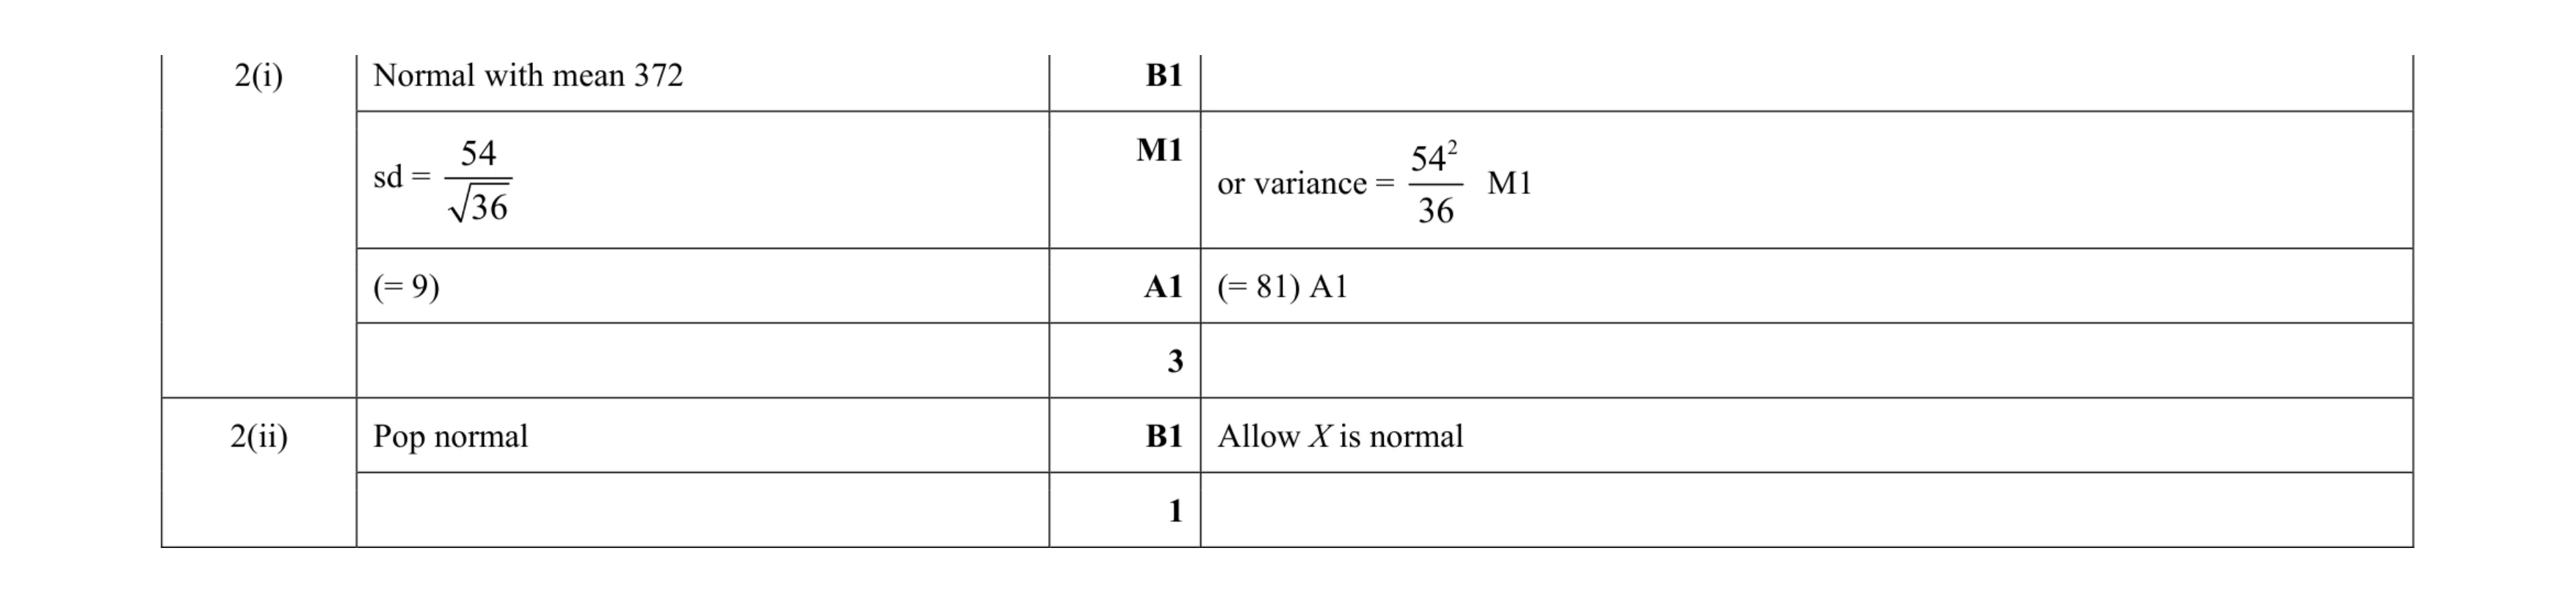 4
4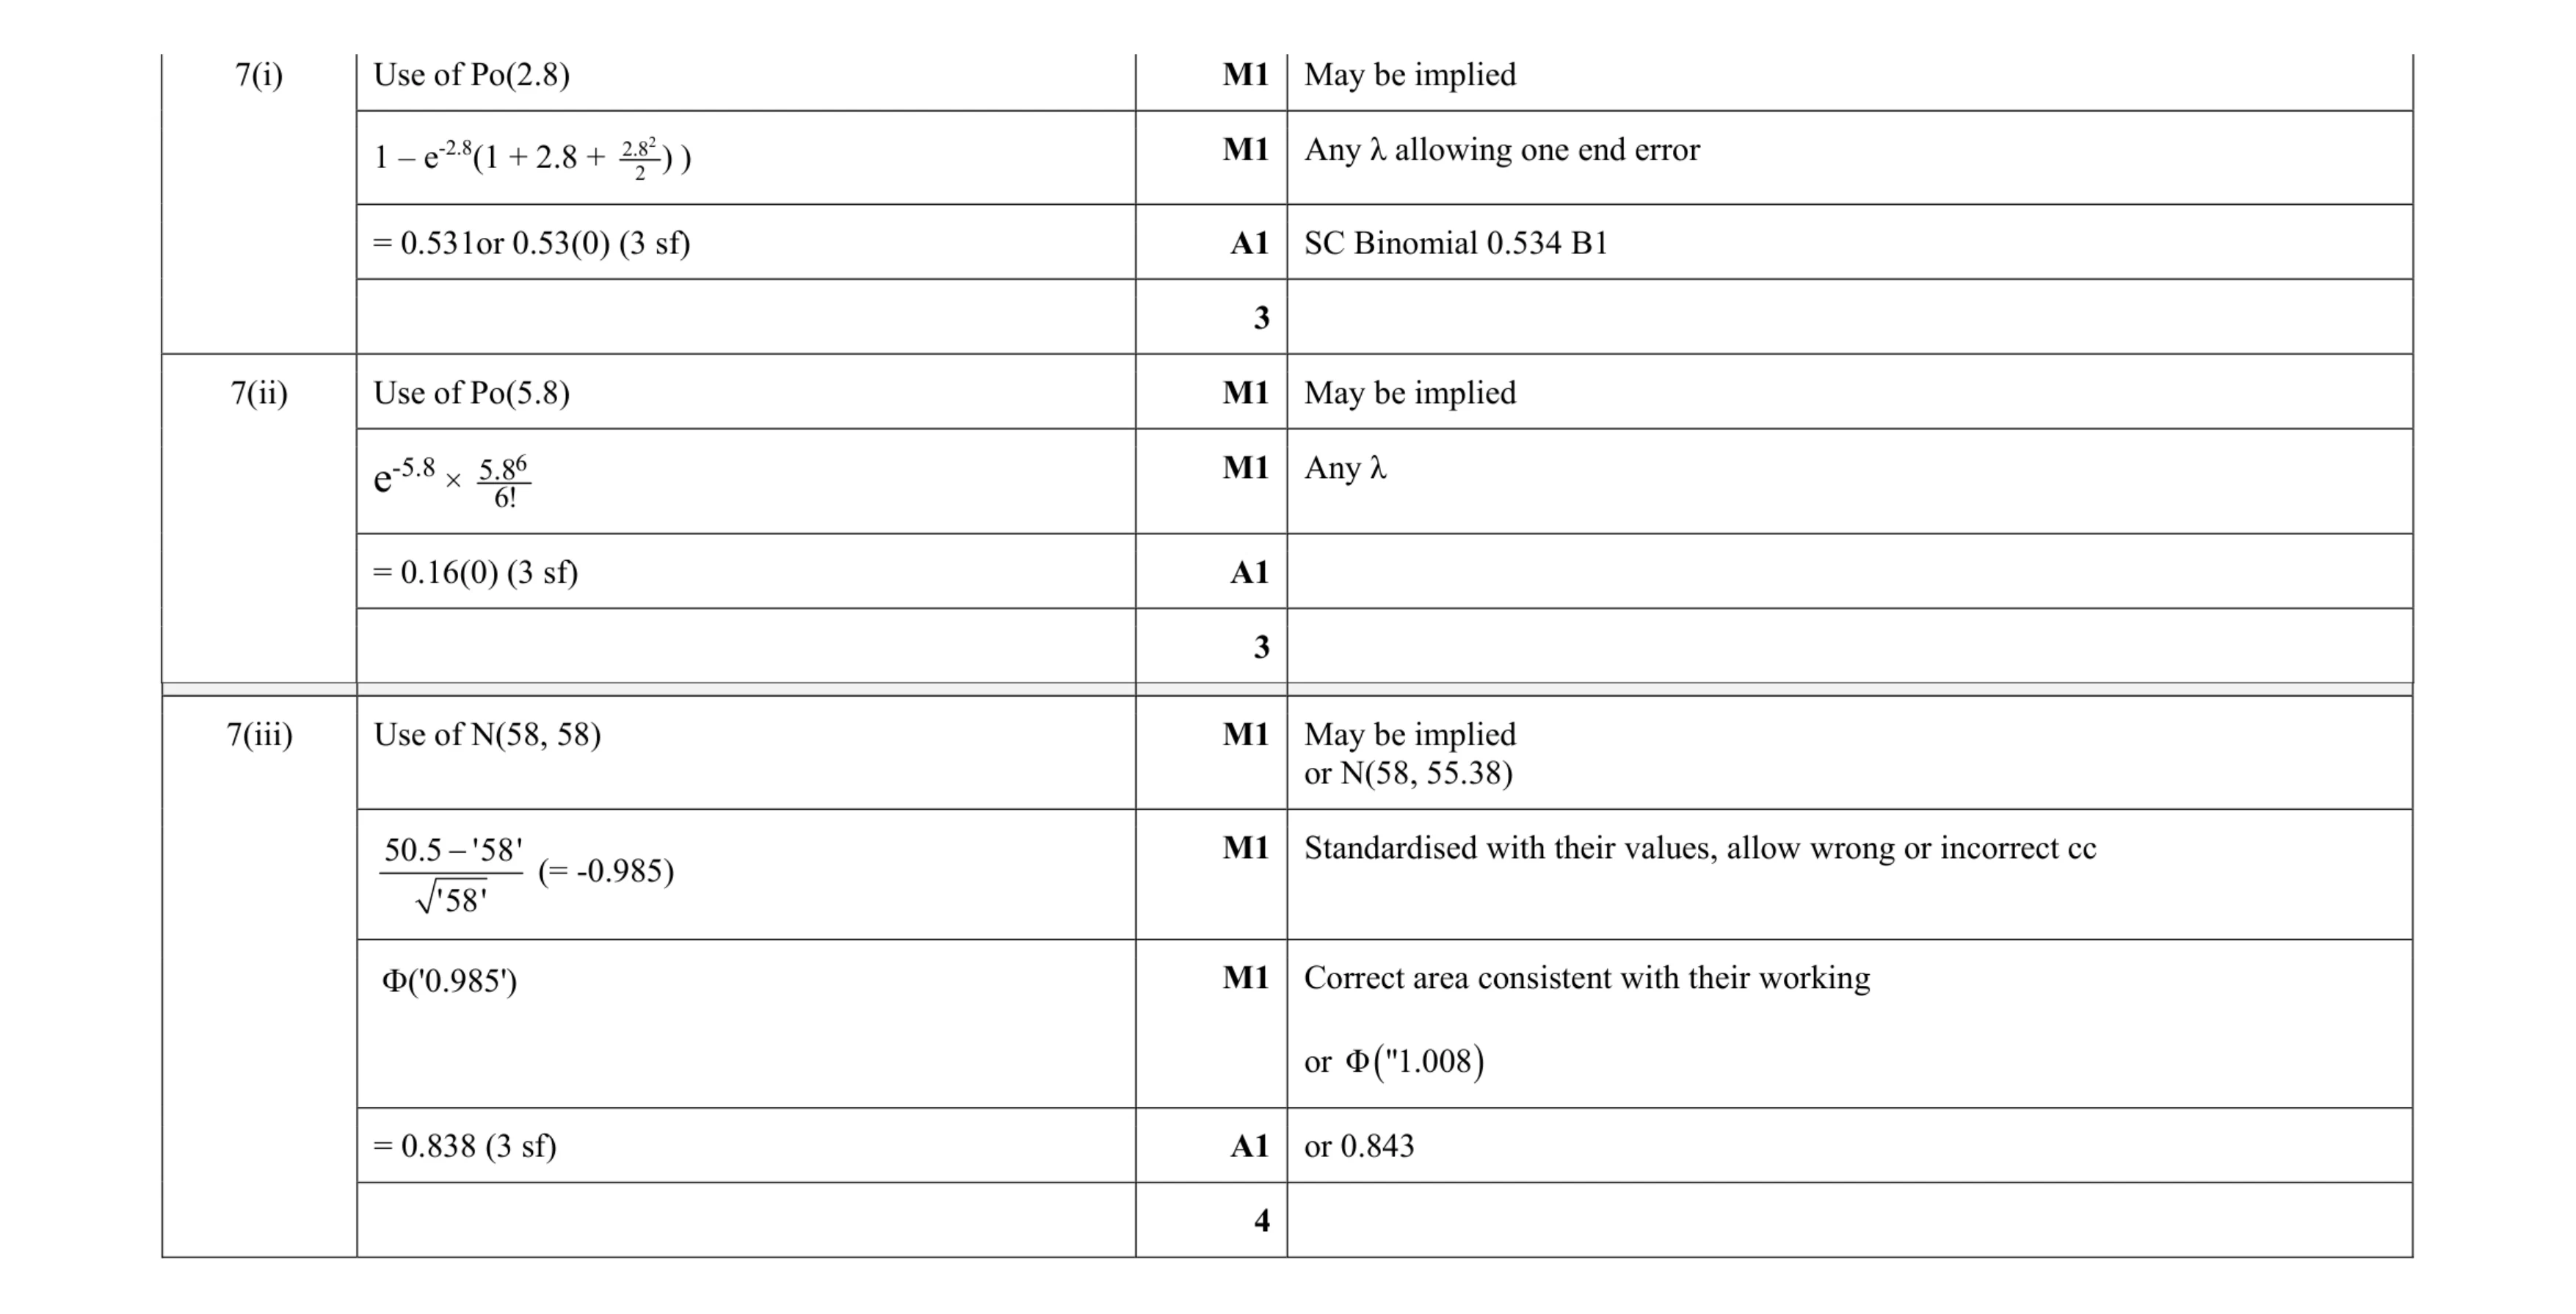 10
10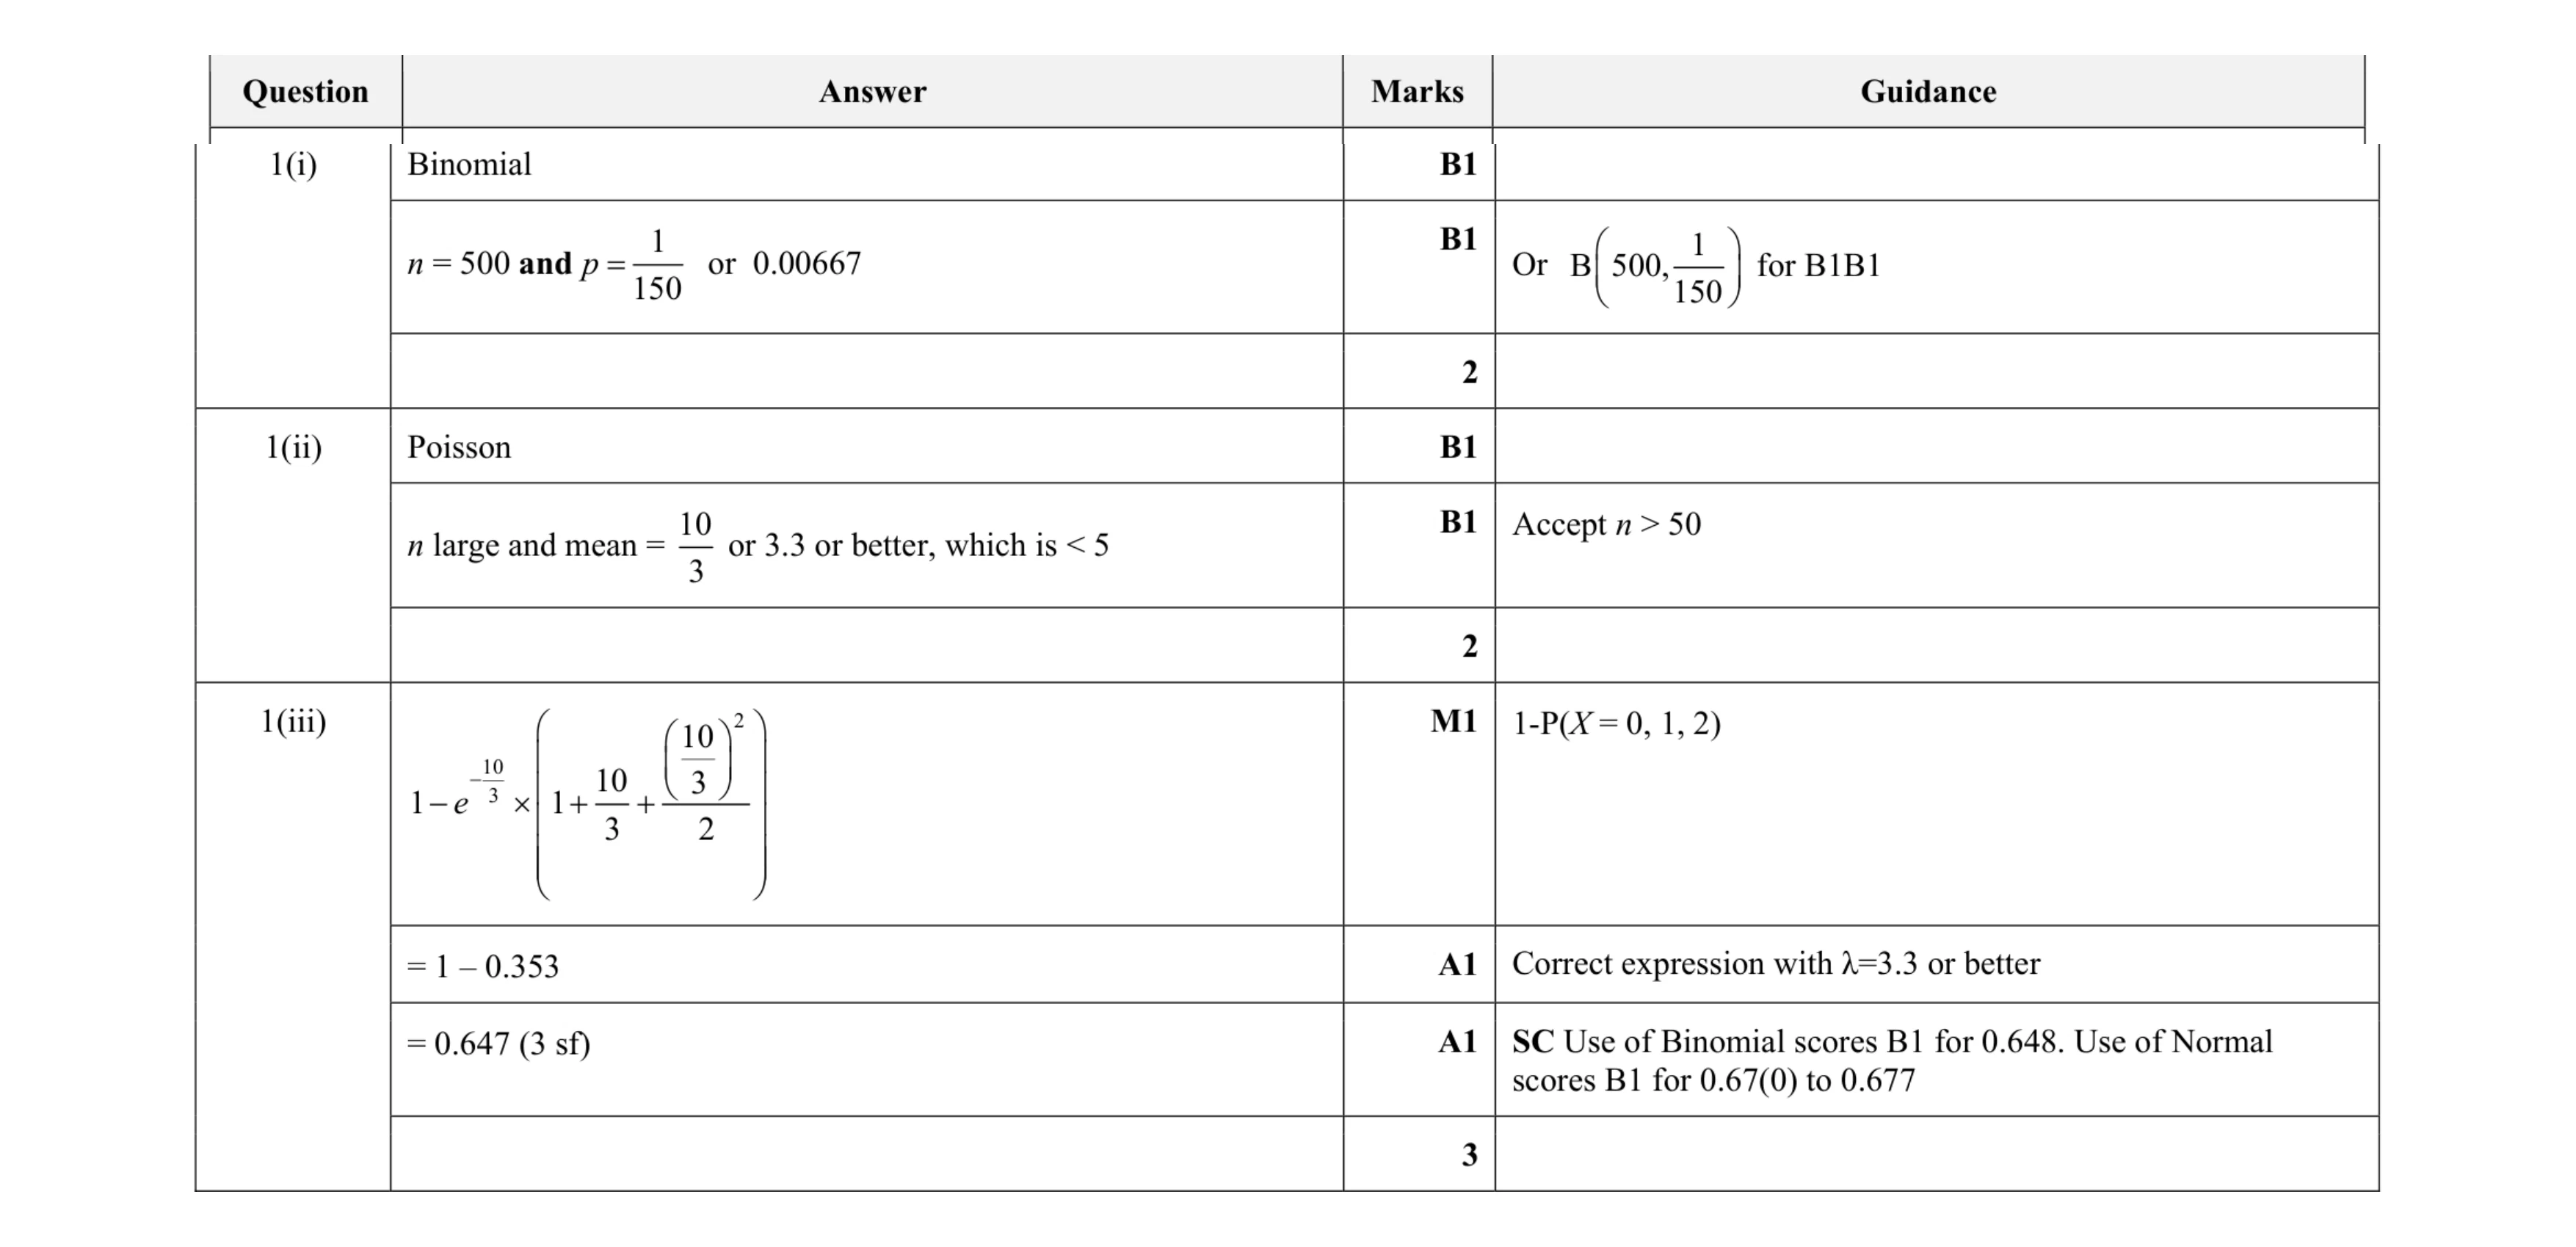 7
7 4
4