Cambridge A Level Mathematics 9709 — 2012 May/June Paper 7 · Variant 1
9709/71/M/J/12 · 7 questions · 50 marks · ≈56 min
The question paper and its mark scheme, free to read here and free to download. This is Cambridge’s own paper, exactly as it was sat.
Question paper4 pages

Mark scheme6 pages
Answers below. Sit the paper first if you are practising.
Questions as text
Q1 · The weights, in grams, of packets of sugar are distributed with mean µ and standard…
1 The weights, in grams, of packets of sugar are distributed with mean µ and standard deviation 23. A random sample of 150 packets is taken. The mean weight of this sample is found to be 494 g. Calculate a 98% confidence interval for µ. [3]
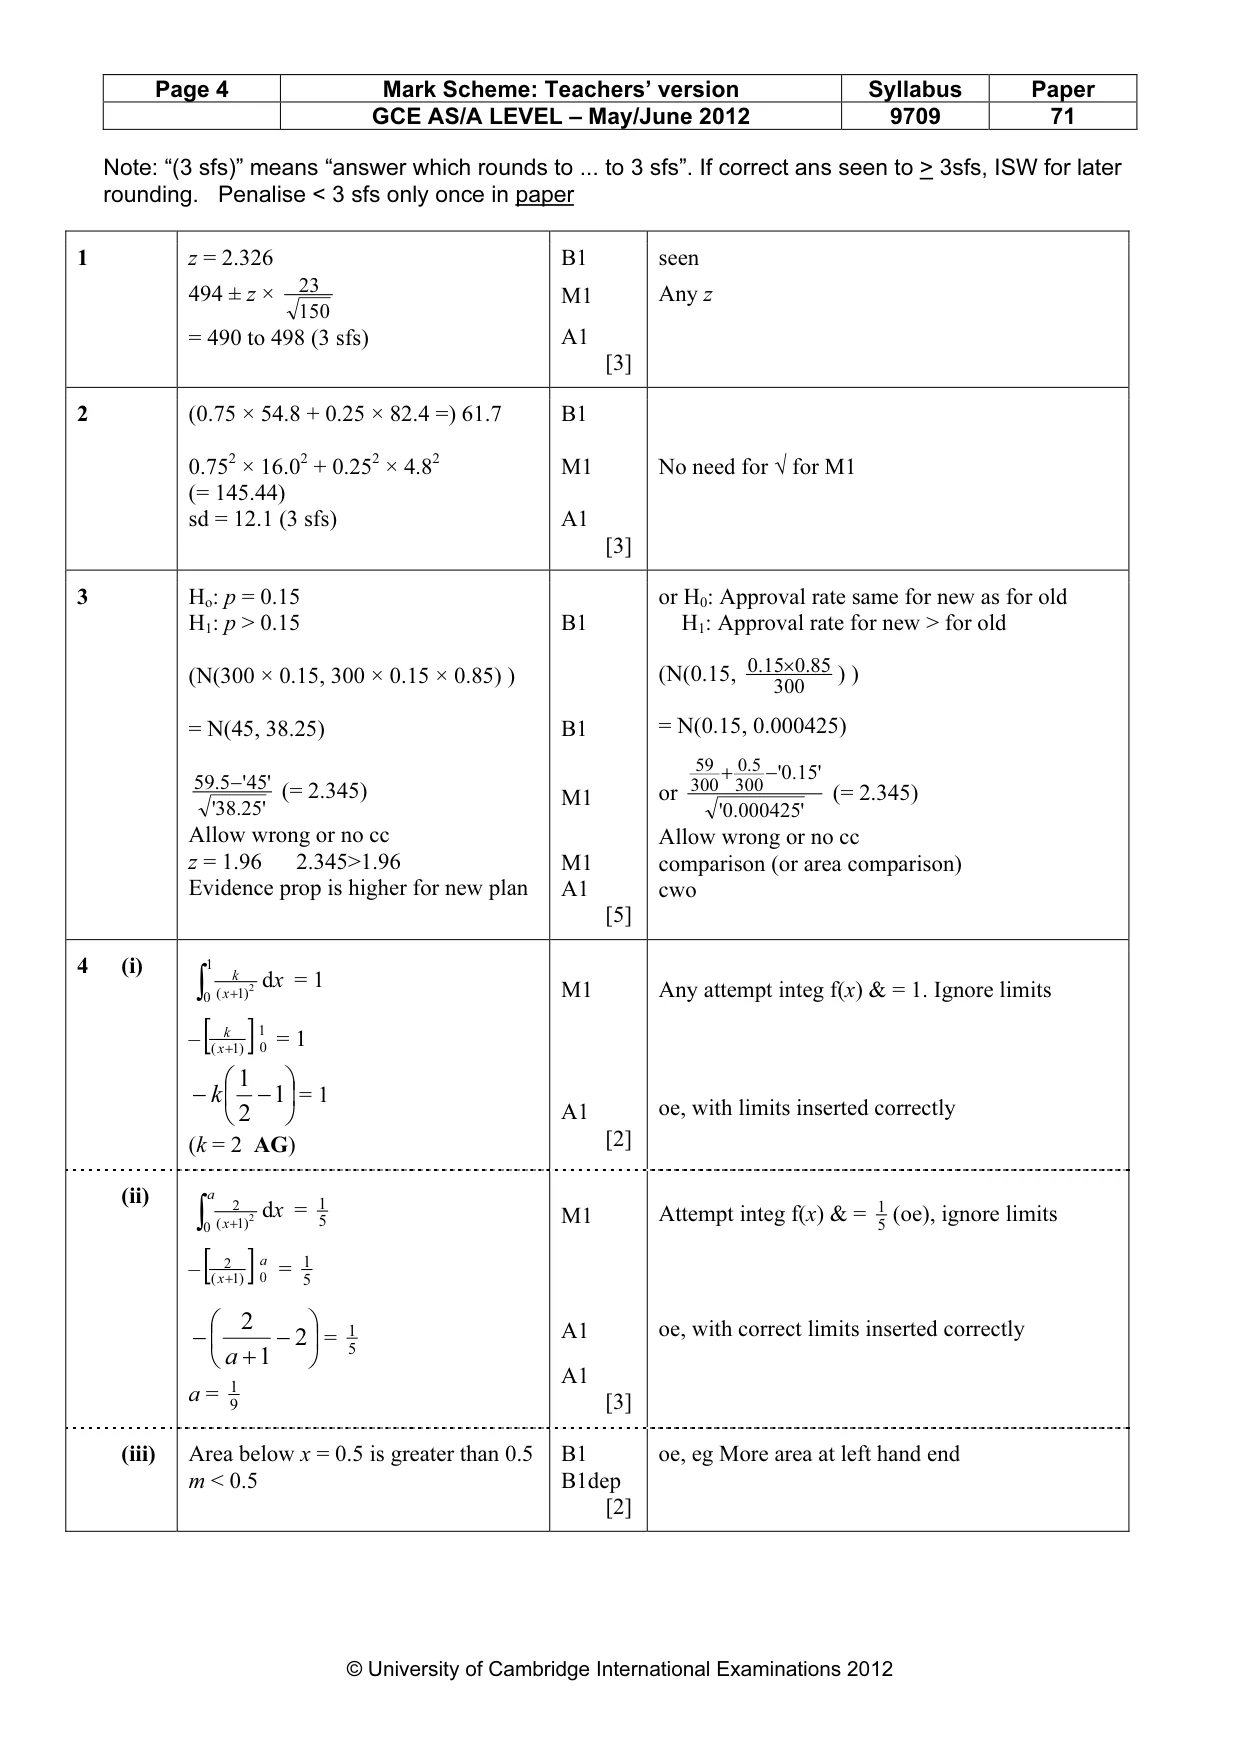
Mark scheme: 1 z = 2.326 B1 seen 23 494 ± z × M1 Any z 150 = 490 to 498 (3 sfs) A1 [3]
Q2 · An examination consists of a written paper and a practical test
2 An examination consists of a written paper and a practical test. The written paper marks (M) have mean 54.8 and standard deviation 16.0. The practical test marks (P) are independent of the written paper marks and have mean 82.4 and standard deviation 4.8. The final mark is found by adding 75% of M to 25% of P. Find the mean and standard deviation of the final marks for the examination. [3]
Mark scheme: 2 (0.75 × 54.8 + 0.25 × 82.4 =) 61.7 B1 0.752 × 16.02 + 0.252 × 4.82 M1 No need for √ for M1 (= 145.44) sd = 12.1 (3 sfs) A1 [3]
Q3 · When the council published a plan for a new road, only 15% of local residents approved…
3 When the council published a plan for a new road, only 15% of local residents approved the plan. The council then published a revised plan and, out of a random sample of 300 local residents, 60 approved the revised plan. Is there evidence, at the 2.5% significance level, that the proportion of local residents who approve the revised plan is greater than for the original plan? [5]
Mark scheme: 3 Ho: p = 0.15 or H0: Approval rate same for new as for old H1: p > 0.15 B1 H1: Approval rate for new > for old 0.15× 0.85 (N(300 × 0.15, 300 × 0.15 × 0.85) ) (N(0.15, ) ) 300 = N(45, 38.25) B1 = N(0.15, 0.000425) 59 5.0 + − .0'15' 595. − ' 45' 300 300 (= 2.345) M1 or (= 2.345) '38.25' .0'000425' Allow wrong or no cc Allow wrong or no cc z = 1.96 2.345>1.96 M1 comparison (or area comparison) Evidence prop is higher for new plan A1 cwo [5]
Q4 · The random variable X has probability density function given by k 0 ≤x ≤1, (x + 1)2 f(x)…
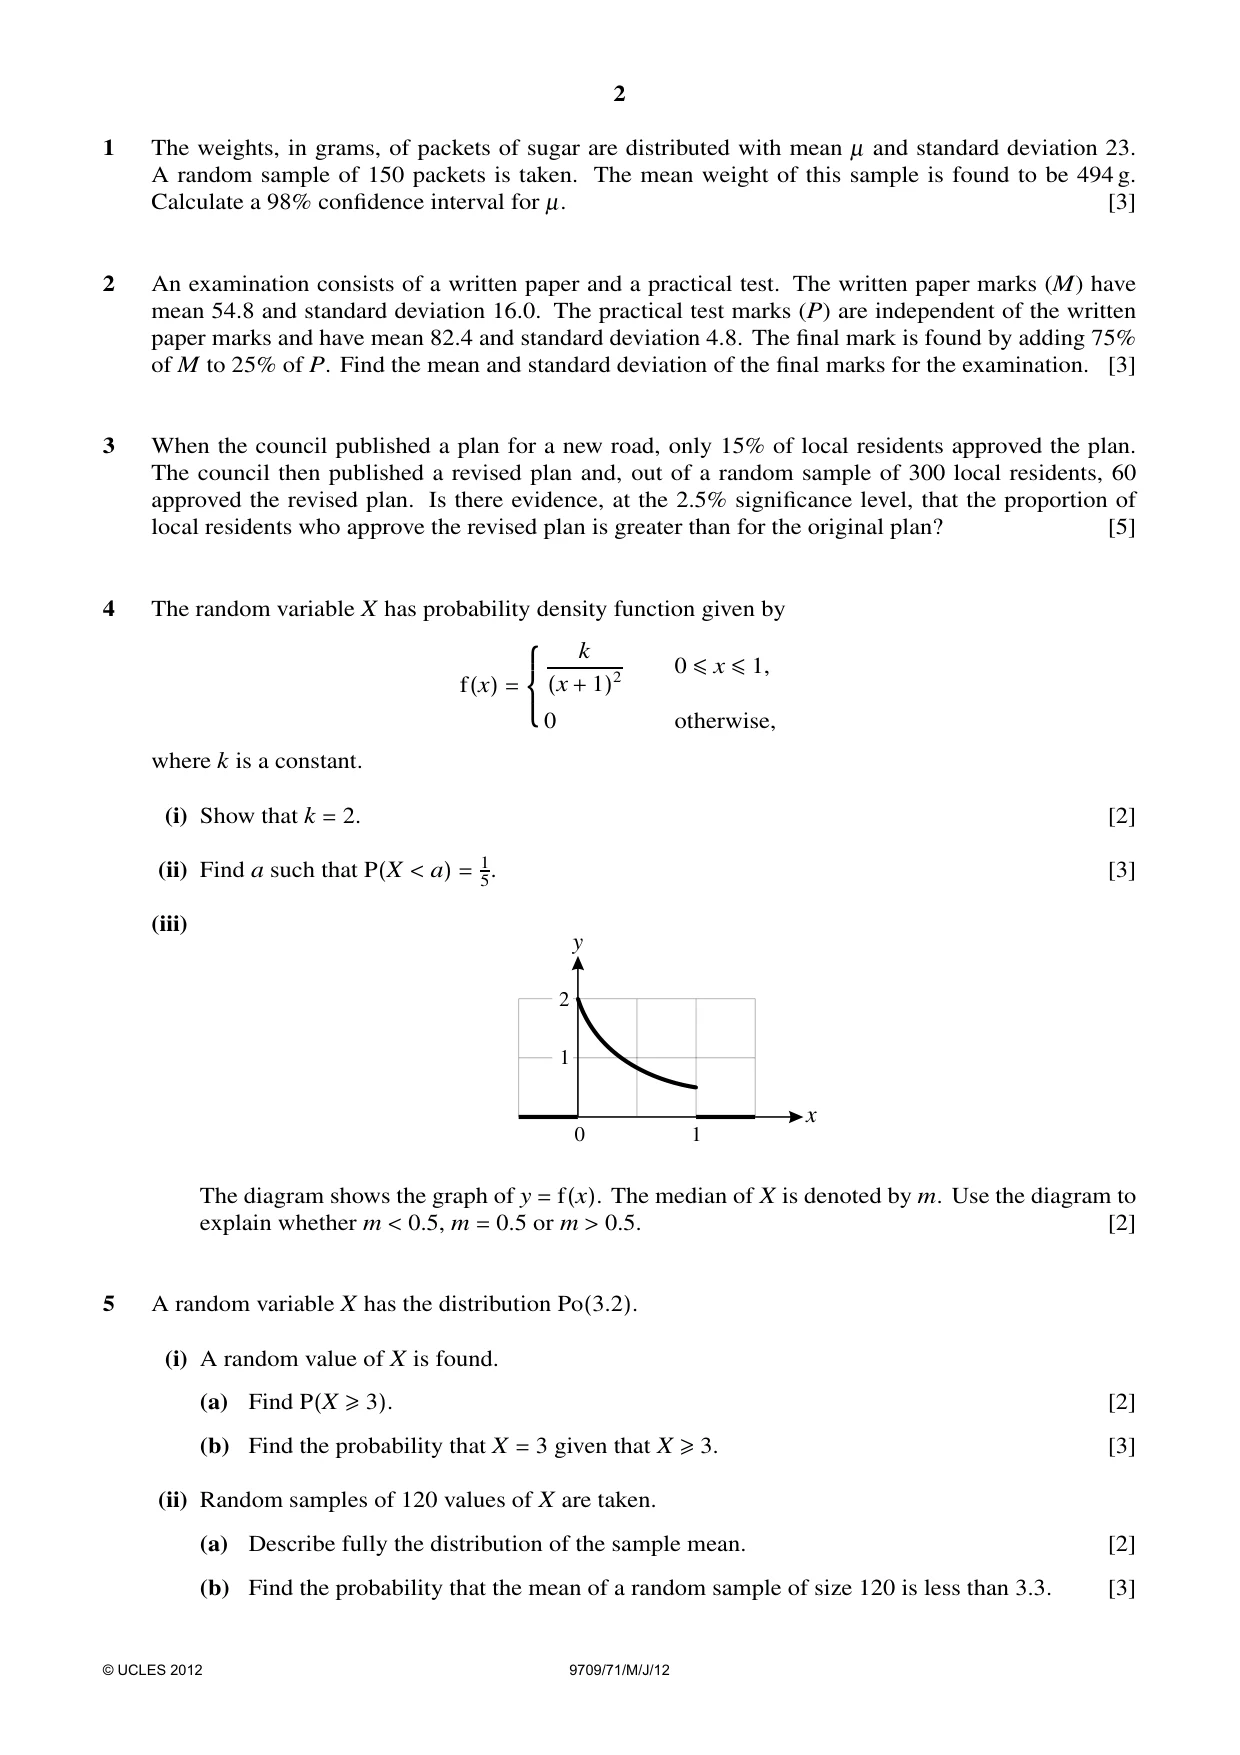
4 The random variable X has probability density function given by k 0 ≤x ≤1, (x + 1)2 f(x) = 0 otherwise, where k is a constant. (i) Show that k = 2. [2] (ii) Find a such that P(X < a) = 15. [3] (iii) y 2 1 x 0 1 The diagram shows the graph of y = f(x). The median of X is denoted by m. Use the diagram to explain whether m < 0.5, m = 0.5 or m > 0.5. [2]
Mark scheme: 4 (i) 1 k ∫ 0 ( x +1) 2 d x = 1 M1 Any attempt integ f(x) & = 1. Ignore limits 1 k 0 = 1 –[( x +1) ] 1 − k − 1 = 1 2 A1 oe, with limits inserted correctly (k = 2 AG) [2] a (ii) 2 d x = 1 ( x + 1) 2 5 M1 Attempt integ f(x) & = 15 (oe), ignore limits ∫ 0 2 a = 1 –[( x +1) ] 0 5 2 1 A1 oe, with correct limits inserted correctly − − 2 = 5 a + 1 A1 a = 1 9 [3] (iii) Area below x = 0.5 is greater than 0.5 B1 oe, eg More area at left hand end m < 0.5 B1dep [2] GCE AS/A LEVEL – May/June 2012 9709 71
Q5 · A random variable X has the distribution Po(3.2)
5 A random variable X has the distribution Po(3.2). (i) A random value of X is found. (a) Find P(X ≥3). [2] (b) Find the probability that X = 3 given that X ≥3. [3] (ii) Random samples of 120 values of X are taken. (a) Describe fully the distribution of the sample mean. [2] (b) Find the probability that the mean of a random sample of size 120 is less than 3.3. [3]
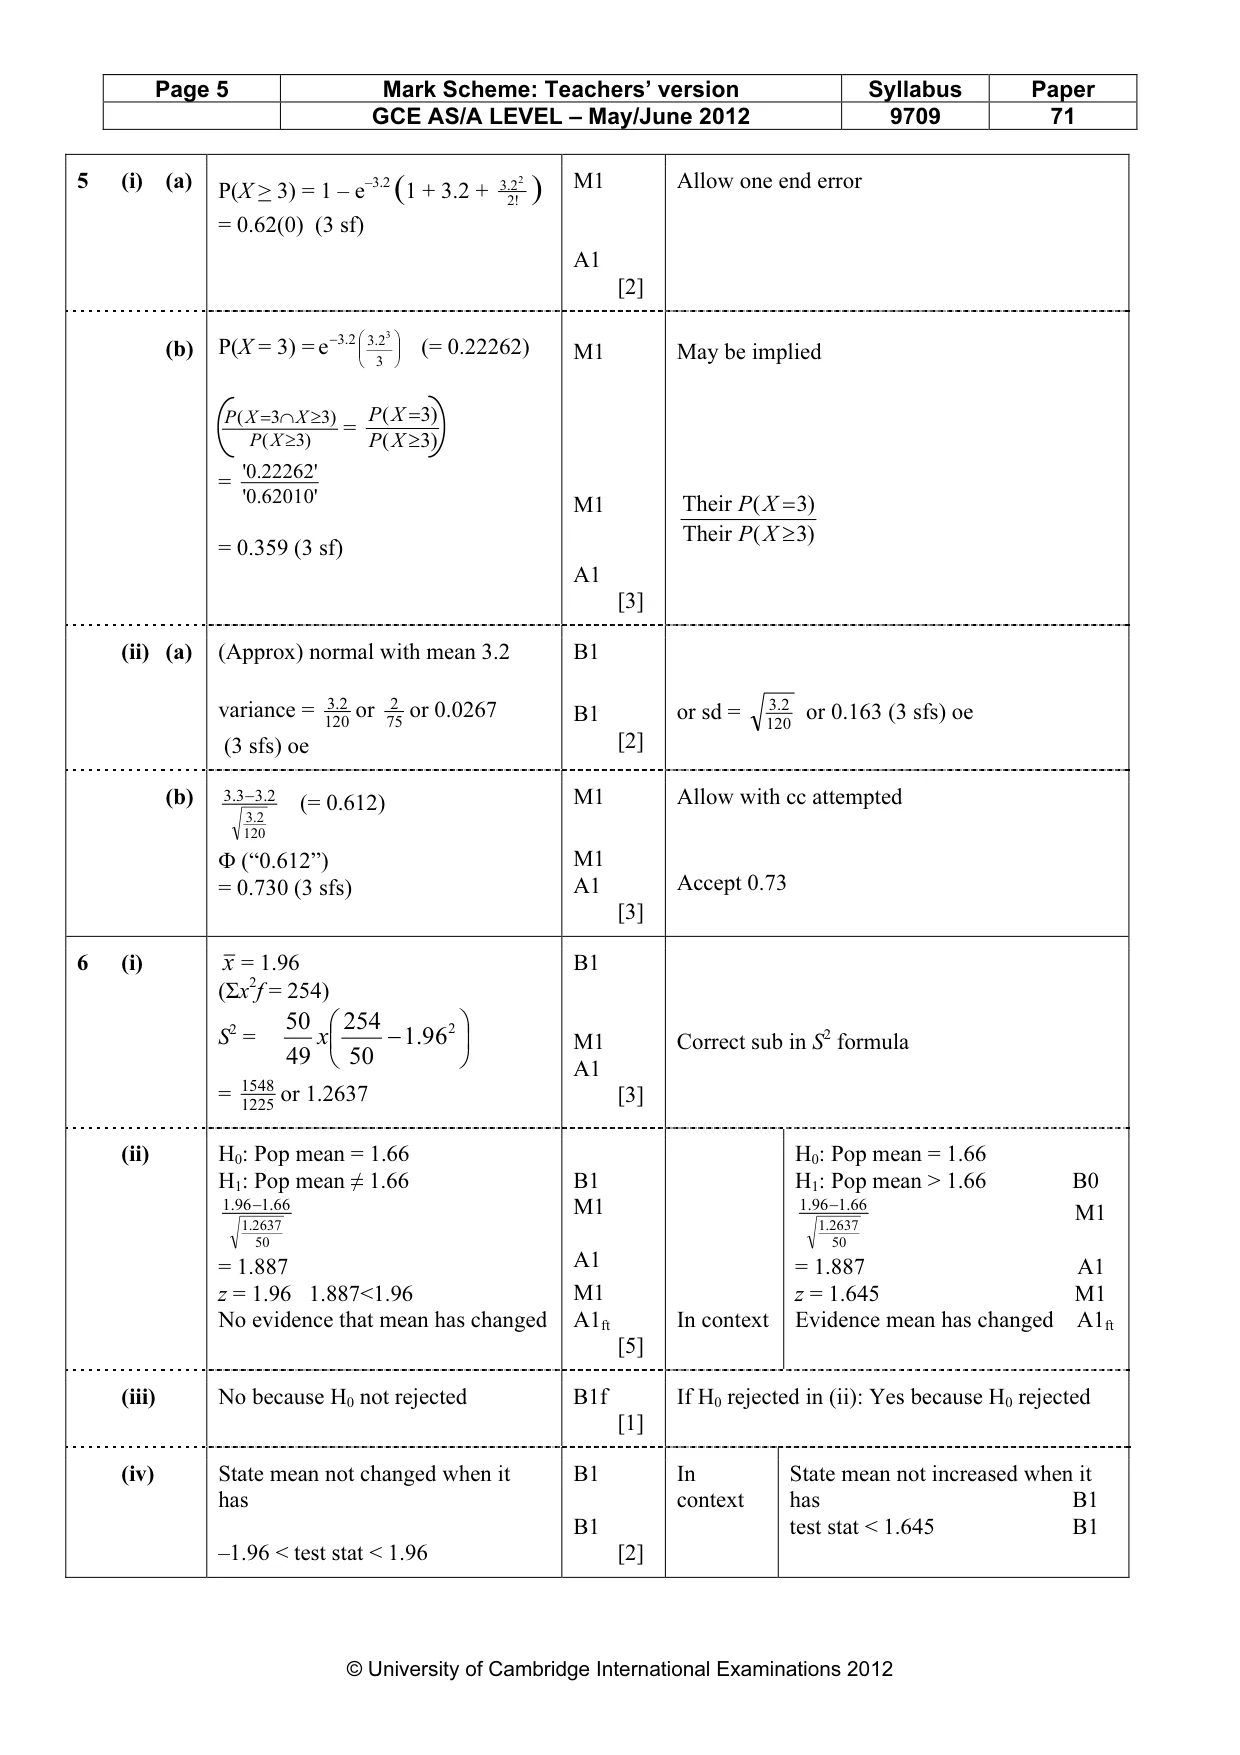
Mark scheme: 5 (i) (a) 2.3 2 M1 Allow one end error P(X > 3) = 1 – e–3.2 (1 + 3.2 + 2! ) = 0.62(0) (3 sf) A1 [2] 3 2.3 (b) P(X = 3) = e −2.3 (= 0.22262) M1 May be implied 3 P ( X = 3∩ X ≥ 3) P ( X = 3) = P ( X ≥ 3) P ( X ≥ 3) .0'22262 ' = .0'62010 ' M1 Their P ( X = 3) Their P ( X ≥ 3) = 0.359 (3 sf) A1 [3] (ii) (a) (Approx) normal with mean 3.2 B1 2.3 or variance = 120 75 2 or 0.0267 B1 or sd = 1202.3 or 0.163 (3 sfs) oe (3 sfs) oe [2] (b) 3.3 − 2.3 (= 0.612) M1 Allow with cc attempted 2.3 120 Φ (“0.612”) M1 = 0.730 (3 sfs) A1 Accept 0.73 [3]
Q6 · A survey taken last year showed that the mean number of computers per household in…
6 A survey taken last year showed that the mean number of computers per household in Branley was 1.66. This year a random sample of 50 households in Branley answered a questionnaire with the following results. Number of computers 0 1 2 3 4 > 4 Number of households 5 12 18 10 5 0 (i) Calculate unbiased estimates for the population mean and variance of the number of computers per household in Branley this year. [3] (ii) Test at the 5% significance level whether the mean number of computers per household has changed since last year. [5] (iii) Explain whether it is possible that a Type I error may have been made in the test in part (ii). [1] (iv) State what is meant by a Type II error in the context of the test in part (ii), and give the set of values of the test statistic that could lead to a Type II error being made. [2]
Mark scheme: 6 (i) x = 1.96 B1 (Σx2f = 254) 50 254 2 S2 = x − .1 96 M1 Correct sub in S2 formula 49 50 A1 = 1548 or 1.2637 [3] 1225 (ii) H0: Pop mean = 1.66 H0: Pop mean = 1.66 H1: Pop mean ≠ 1.66 B1 H1: Pop mean > 1.66 B0 .196 −.1 66 M1 .196 −.1 66 M1 .1 2637 .1 2637 50 50 A1 = 1.887 = 1.887 A1 z = 1.96 1.887<1.96 M1 z = 1.645 M1 No evidence that mean has changed A1ft In context Evidence mean has changed A1ft [5] (iii) No because H0 not rejected B1f If H0 rejected in (ii): Yes because H0 rejected [1] (iv) State mean not changed when it B1 In State mean not increased when it has context has B1 B1 test stat < 1.645 B1 –1.96 < test stat < 1.96 [2] GCE AS/A LEVEL – May/June 2012 9709 71
Q7 · At work Jerry receives emails randomly at a constant average rate of 15 emails per hour
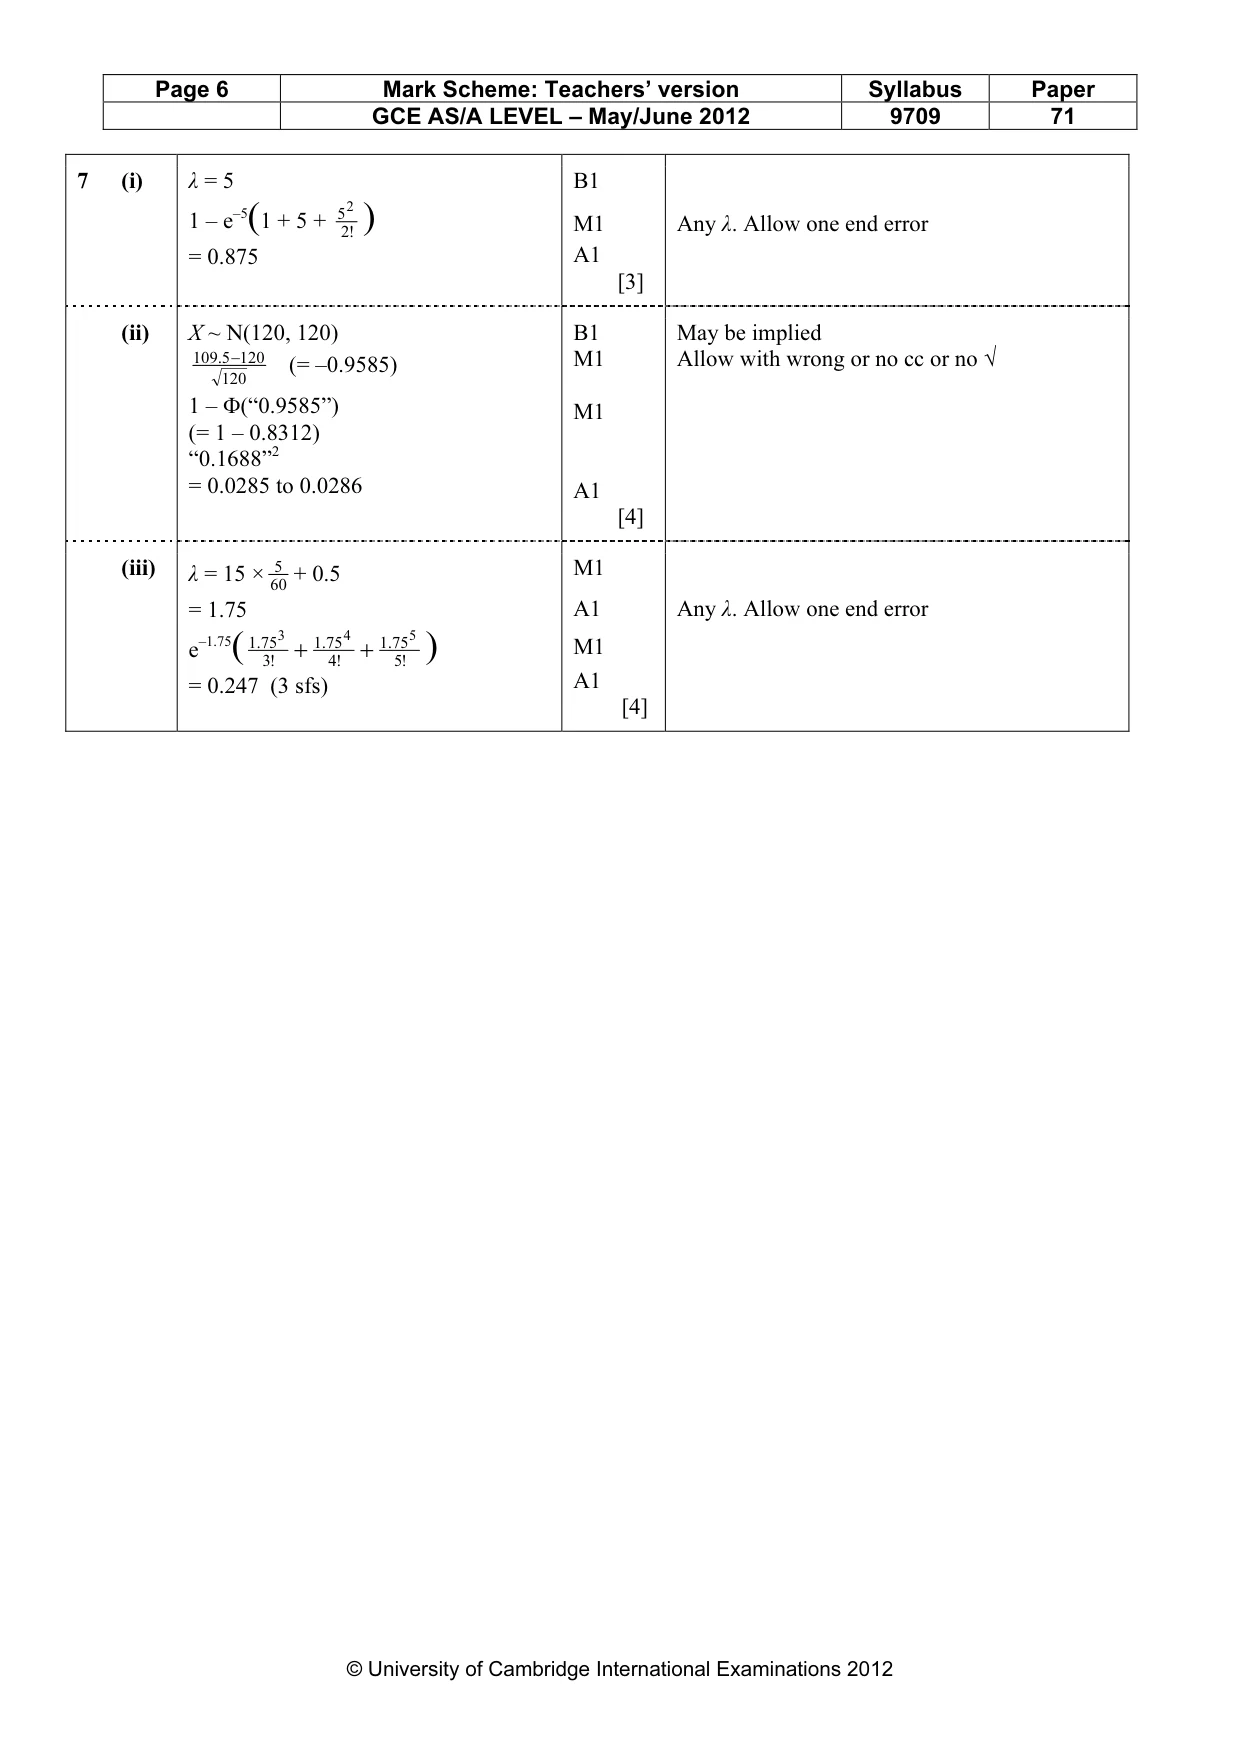
7 At work Jerry receives emails randomly at a constant average rate of 15 emails per hour. (i) Find the probability that Jerry receives more than 2 emails during a 20-minute period at work. [3] (ii) Jerry’s working day is 8 hours long. Find the probability that Jerry receives fewer than 110 emails per day on each of 2 working days. [4] (iii) At work Jerry also receives texts randomly and independently at a constant average rate of 1 text every 10 minutes. Find the probability that the total number of emails and texts that Jerry receives during a 5-minute period at work is more than 2 and less than 6. [4]
Mark scheme: 7 (i) λ = 5 B1 52 1 – e–5(1 + 5 + !2 ) M1 Any λ. Allow one end error = 0.875 A1 [3] (ii) X ~ N(120, 120) B1 May be implied 1095. −120 (= –0.9585) M1 Allow with wrong or no cc or no √ 120 1 – Φ(“0.9585”) M1 (= 1 – 0.8312) “0.1688”2 = 0.0285 to 0.0286 A1 [4] (iii) λ = 15 × 5 + 0.5 M1 60 = 1.75 A1 Any λ. Allow one end error M1 + + e–1.75( .175!3 3 .175 4 .175 5 !4 !5 ) = 0.247 (3 sfs) A1 [4]
What was in this paper
The subtopics covered by these 7 questions, and how many questions each got. Open one in a new tab to see every Cambridge question on it.
What you needed in this session
Cambridge’s own grade thresholds for 2012 May/June, Paper 7 · Variant 1. A higher threshold means an easier paper — the bar moves with how the cohort did.