Cambridge A Level Mathematics 9709 — 2010 May/June Paper 7 · Variant 2
9709/72/M/J/10 · 7 questions · 50 marks · ≈56 min
The question paper and its mark scheme, free to read here and free to download. This is Cambridge’s own paper, exactly as it was sat.
Question paper4 pages

Mark scheme6 pages
Answers below. Sit the paper first if you are practising.
Questions as text
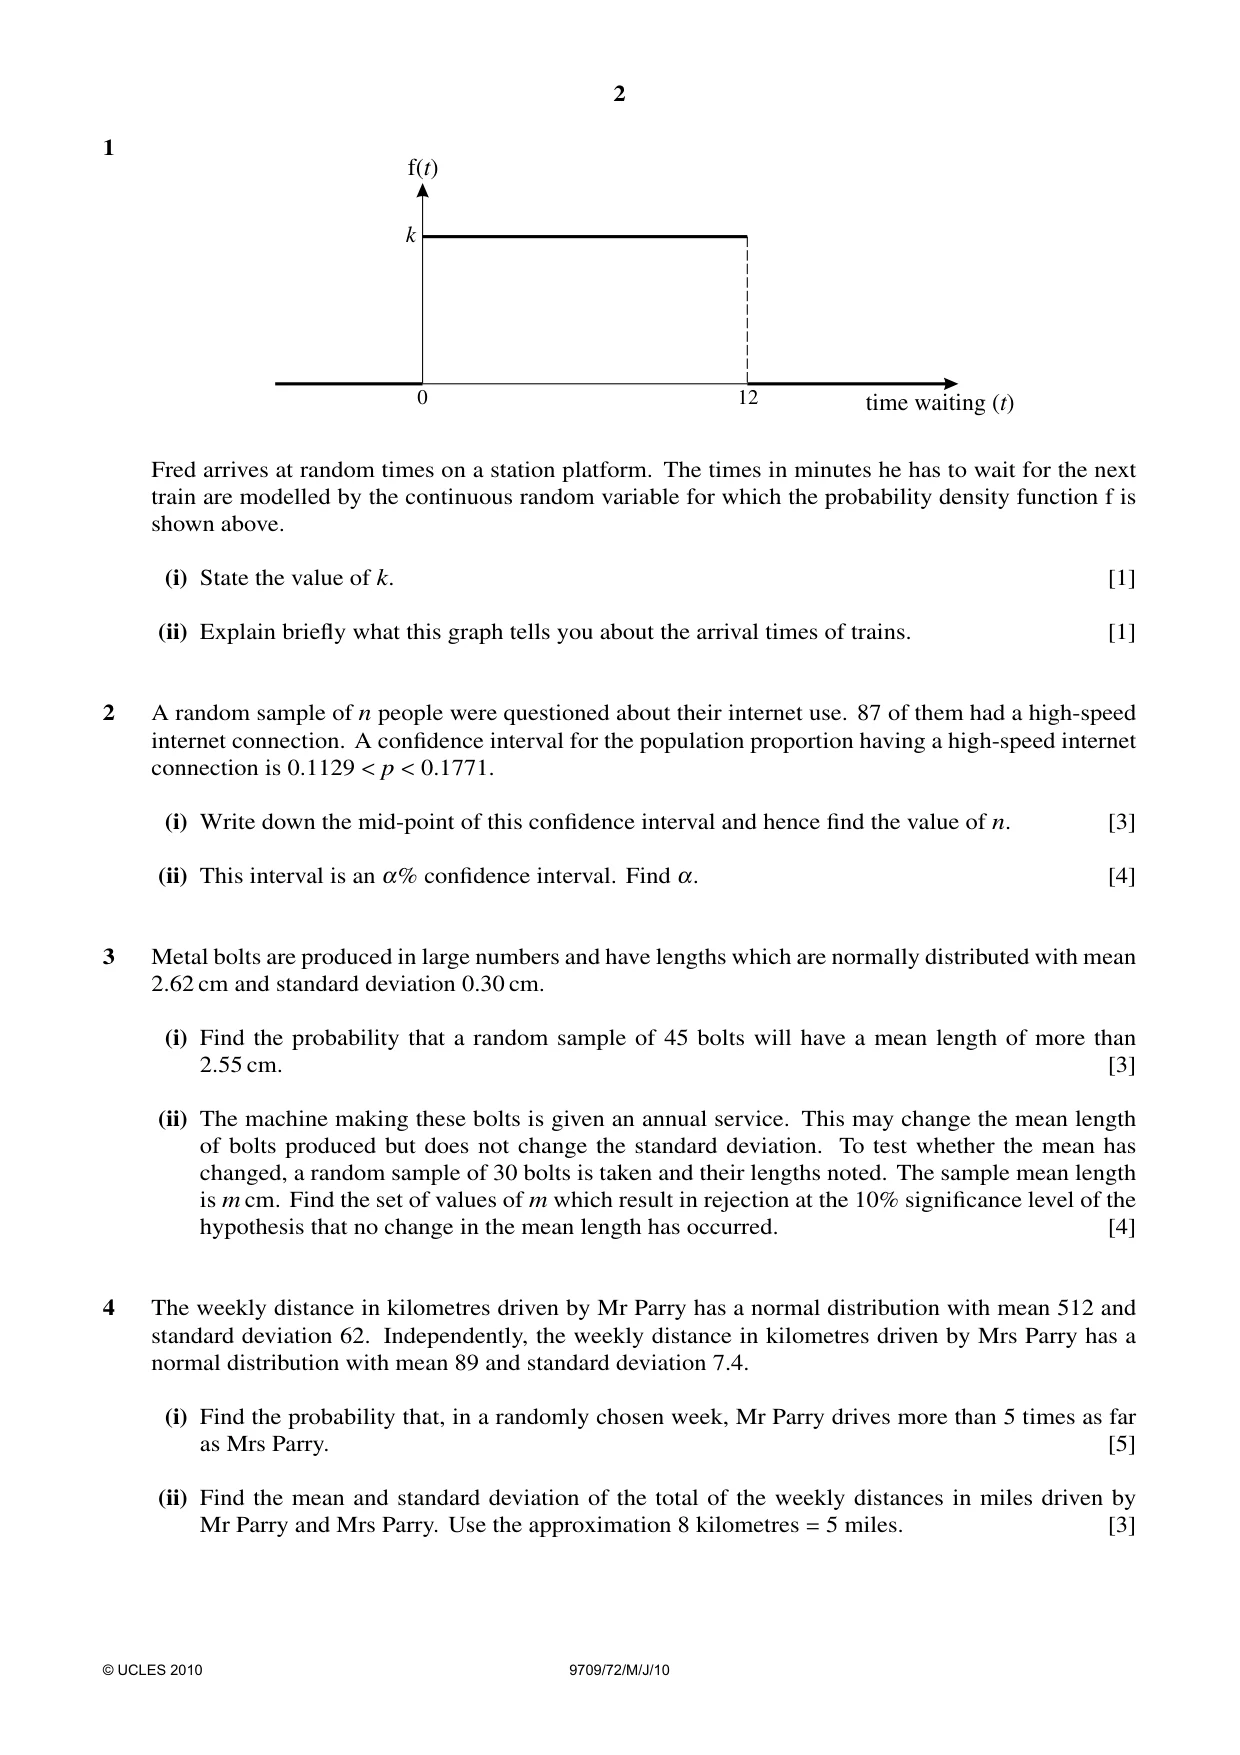
Q1 · F()t k 0 12 time waiting ()t Fred arrives at random times on a station platform
1 f()t k 0 12 time waiting ()t Fred arrives at random times on a station platform. The times in minutes he has to wait for the next train are modelled by the continuous random variable for which the probability density function f is shown above. (i) State the value of k. [1] (ii) Explain briefly what this graph tells you about the arrival times of trains. [1]
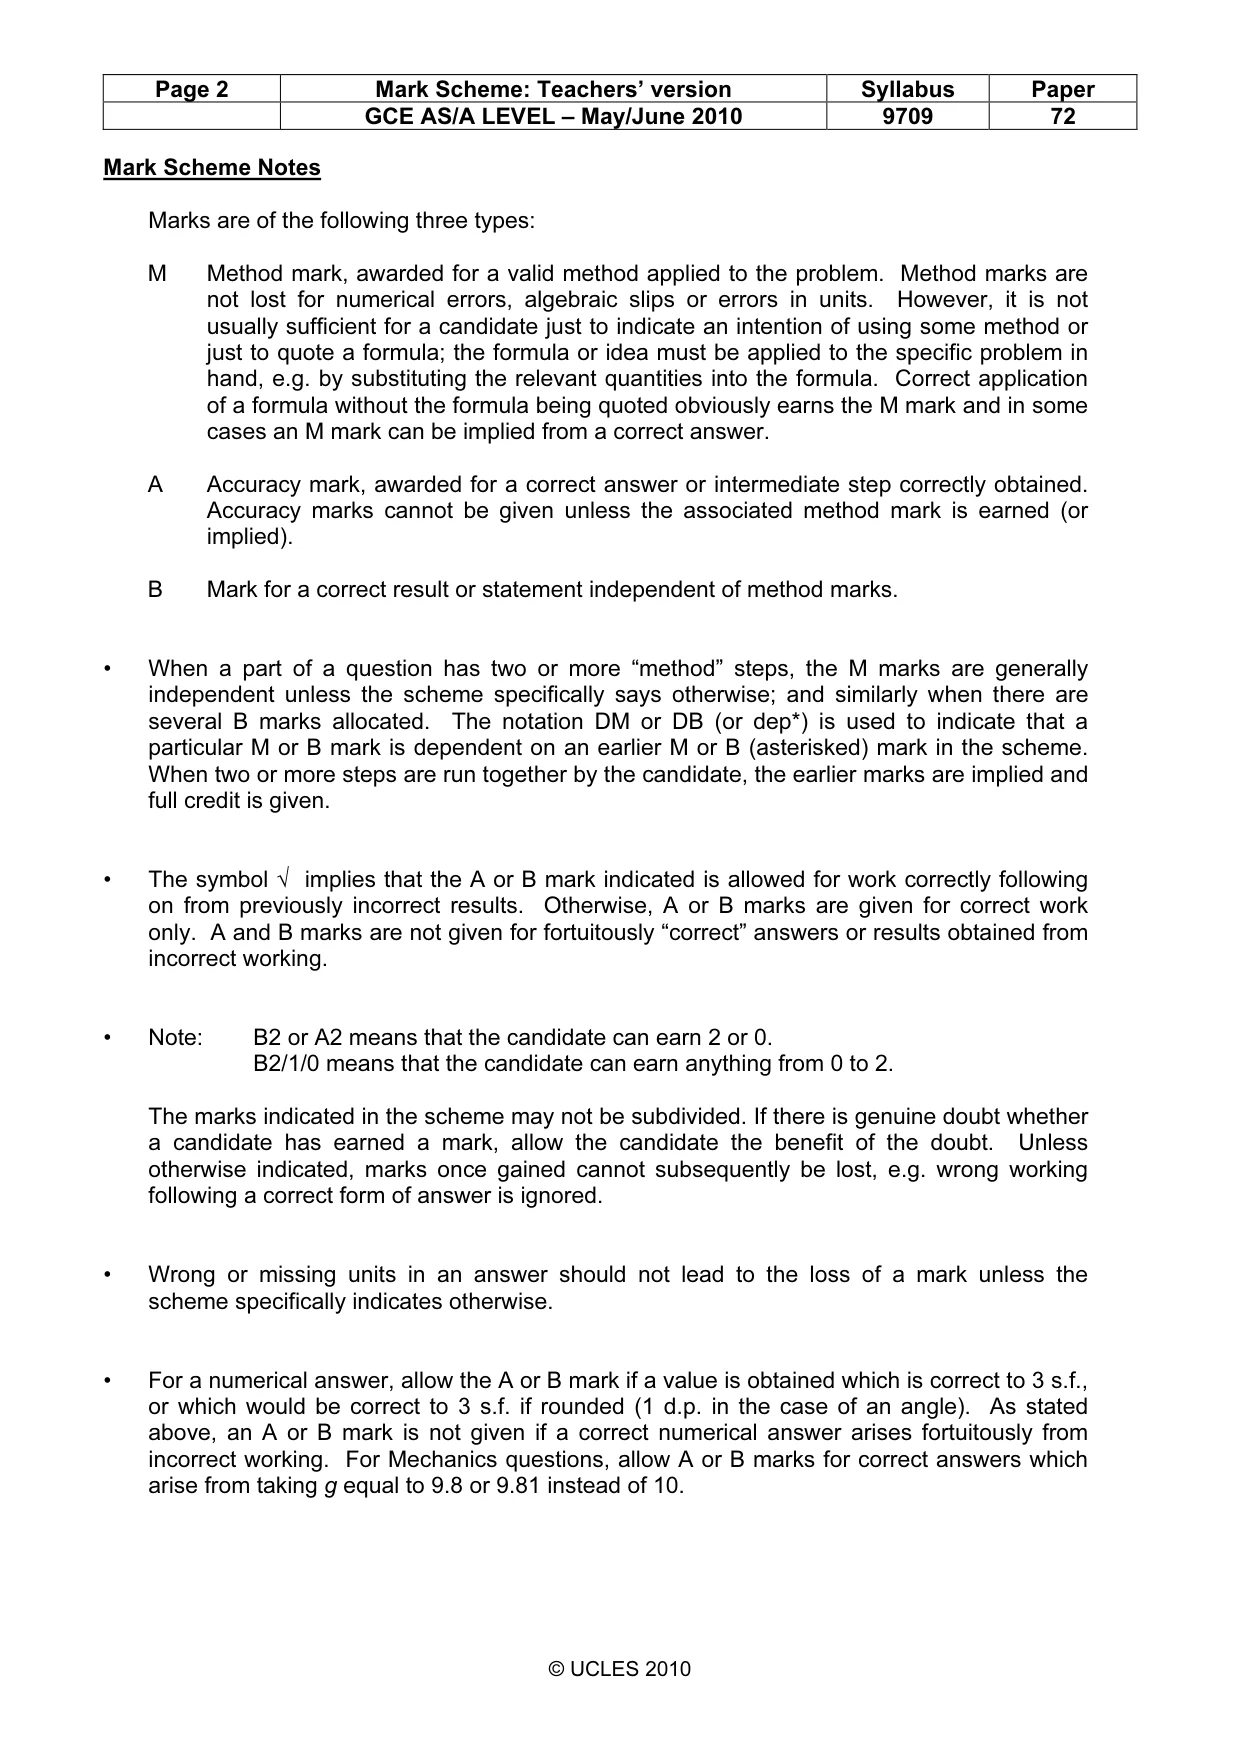
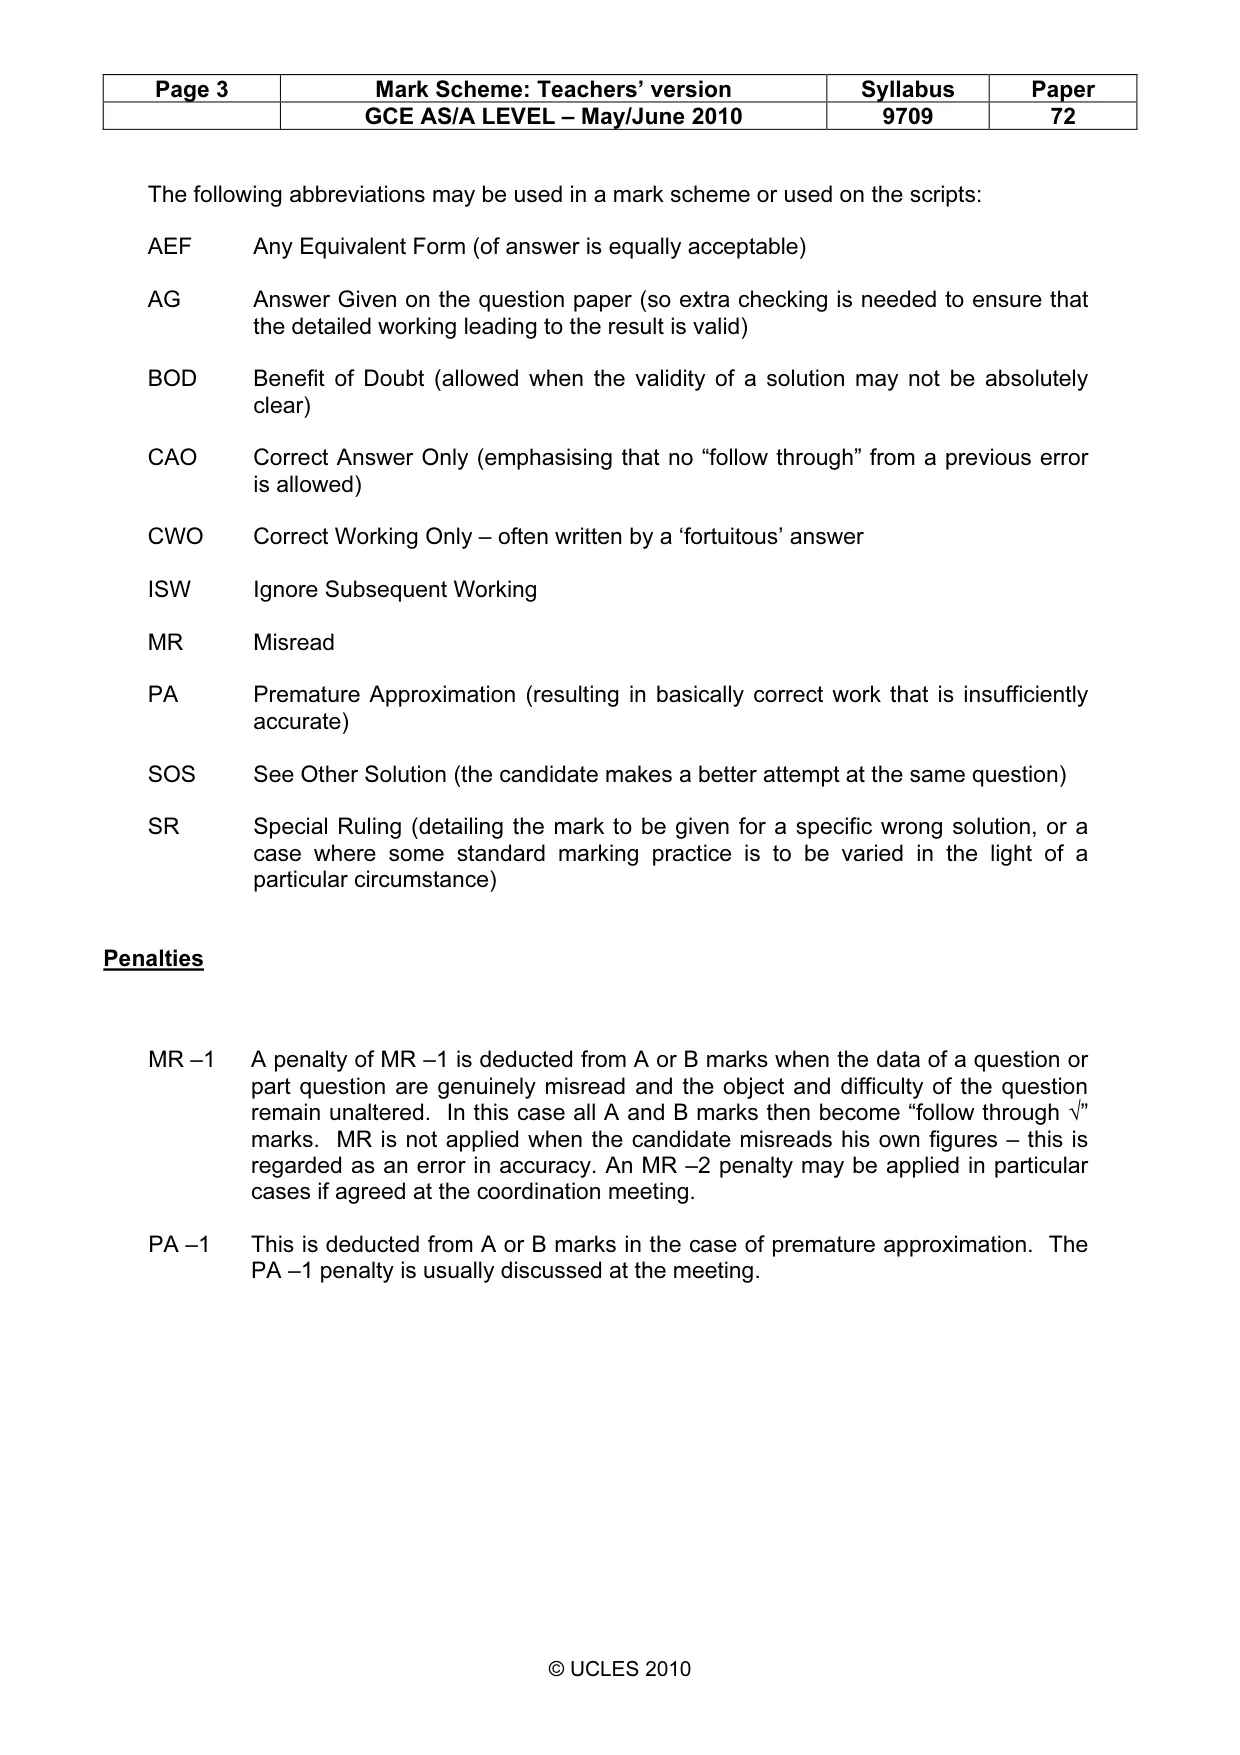
Mark scheme: 1 (i) 1/12 B1 Accept 0.0833 [1] (ii) trains arrive every 12 minutes B1 must have ‘every 12 minutes’ [1]
Q2 · A random sample of n people were questioned about their internet use
2 A random sample of n people were questioned about their internet use. 87 of them had a high-speed internet connection. A confidence interval for the population proportion having a high-speed internet connection is 0.1129 < p < 0.1771. (i) Write down the mid-point of this confidence interval and hence find the value of n. [3] (ii) This interval is an α% confidence interval. Find α. [4]
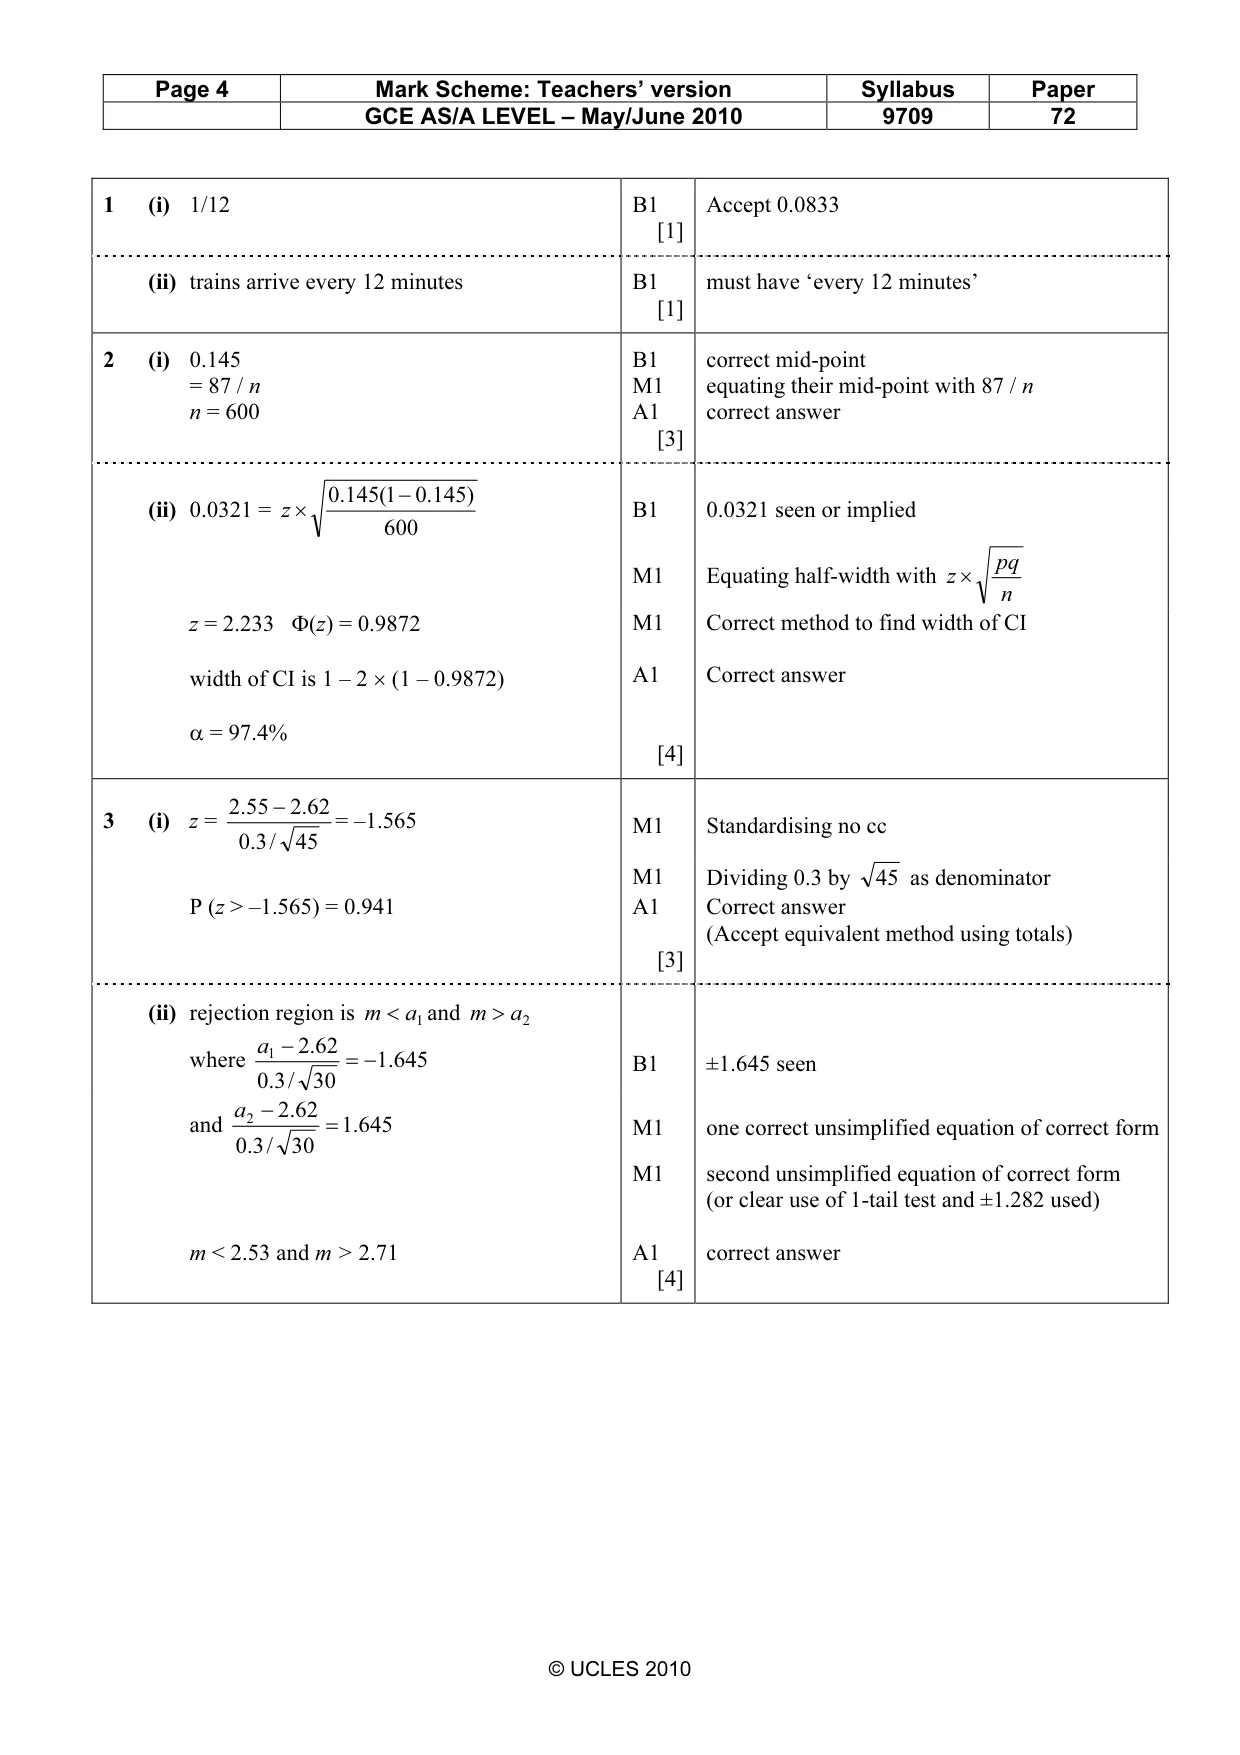
Mark scheme: 2 (i) 0.145 B1 correct mid-point = 87 / n M1 equating their mid-point with 87 / n n = 600 A1 correct answer [3] .0 1451( − .0 145) (ii) 0.0321 = z × B1 0.0321 seen or implied 600 pq M1 Equating half-width with z × n z = 2.233 Φ(z) = 0.9872 M1 Correct method to find width of CI width of CI is 1 – 2 × (1 – 0.9872) A1 Correct answer α = 97.4% [4] 2 55 − 2 62
Q3 · Metal bolts are produced in large numbers and have lengths which are normally distributed…
3 Metal bolts are produced in large numbers and have lengths which are normally distributed with mean 2.62 cm and standard deviation 0.30 cm. (i) Find the probability that a random sample of 45 bolts will have a mean length of more than 2.55 cm. [3] (ii) The machine making these bolts is given an annual service. This may change the mean length of bolts produced but does not change the standard deviation. To test whether the mean has changed, a random sample of 30 bolts is taken and their lengths noted. The sample mean length is m cm. Find the set of values of m which result in rejection at the 10% significance level of the hypothesis that no change in the mean length has occurred. [4]
Mark scheme: .2 55 .2 62 3 (i) z = = –1.565 M1 Standardising no cc 3.0 / 45 M1 Dividing 0.3 by 45 as denominator P (z > –1.565) = 0.941 A1 Correct answer (Accept equivalent method using totals) [3] (ii) rejection region is m < 1a and m > a 2 a1 − .262 where = −.1645 B1 ±1.645 seen 3.0 / 30 a 2 − .262 and = .1645 M1 one correct unsimplified equation of correct form 3.0 / 30 M1 second unsimplified equation of correct form (or clear use of 1-tail test and ±1.282 used) m < 2.53 and m > 2.71 A1 correct answer [4] GCE AS/A LEVEL – May/June 2010 9709 72 2 2
Q4 · The weekly distance in kilometres driven by Mr Parry has a normal distribution with mean…
4 The weekly distance in kilometres driven by Mr Parry has a normal distribution with mean 512 and standard deviation 62. Independently, the weekly distance in kilometres driven by Mrs Parry has a normal distribution with mean 89 and standard deviation 7.4. (i) Find the probability that, in a randomly chosen week, Mr Parry drives more than 5 times as far as Mrs Parry. [5] (ii) Find the mean and standard deviation of the total of the weekly distances in miles driven by Mr Parry and Mrs Parry. Use the approximation 8 kilometres = 5 miles. [3]
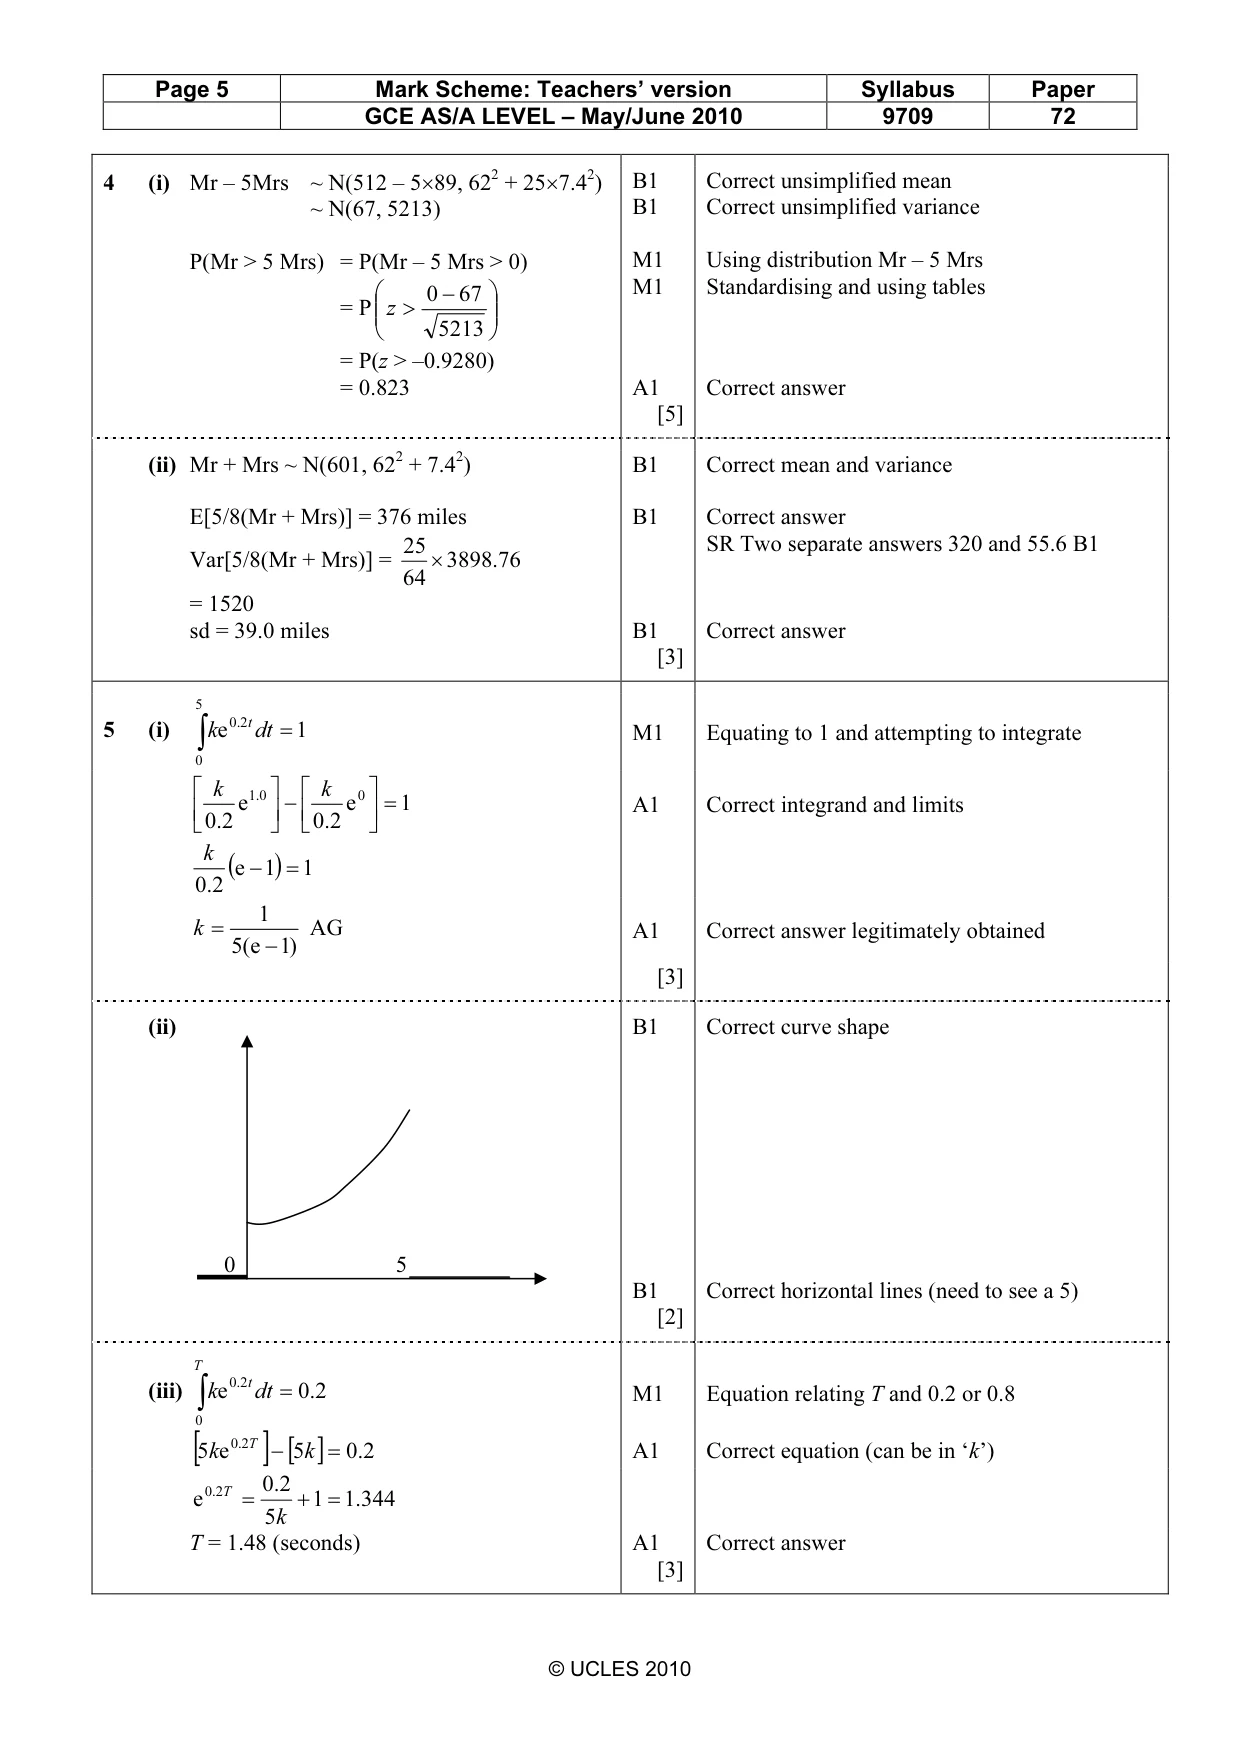
Mark scheme: 4 (i) Mr – 5Mrs ~ N(512 – 5×89, 622 + 25×7.42) B1 Correct unsimplified mean ~ N(67, 5213) B1 Correct unsimplified variance P(Mr > 5 Mrs) = P(Mr – 5 Mrs > 0) M1 Using distribution Mr – 5 Mrs 0 − 67 M1 Standardising and using tables = P z > 5213 = P(z > –0.9280) = 0.823 A1 Correct answer [5] (ii) Mr + Mrs ~ N(601, 622 + 7.42) B1 Correct mean and variance E[5/8(Mr + Mrs)] = 376 miles B1 Correct answer 25 SR Two separate answers 320 and 55.6 B1 Var[5/8(Mr + Mrs)] = × 3898.76 64 = 1520 sd = 39.0 miles B1 Correct answer [3] 5 ∫ 0 2 t
Q5 · The random variable T denotes the time in seconds for which a firework burns before…
5 The random variable T denotes the time in seconds for which a firework burns before exploding. The probability density function of T is given by ke0.2t 0 ≤t ≤5, f(t) = 0 otherwise, where k is a constant. 1 (i) Show that k = [3] 5(e −1). (ii) Sketch the probability density function. [2] (iii) 80% of fireworks burn for longer than a certain time before they explode. Find this time. [3]
Mark scheme: M1 Equating to 1 and attempting to integrate5 (i) ∫ ke 2.0 t dt = 1 0 k 0.1 k 0 e − e = 1 A1 Correct integrand and limits 2.0 2.0 k (e − 1) = 1 2.0 1 k = AG A1 Correct answer legitimately obtained 5e( − )1 [3] (ii) B1 Correct curve shape 0 5 B1 Correct horizontal lines (need to see a 5) [2] T M1 Equation relating T and 0.2 or 0.8 (iii) ∫ ke 2.0 tdt = 2.0 0 2.0T [5 ke ] − [5 k ] = 2.0 A1 Correct equation (can be in ‘k’) 2.0 T 2.0 e = + 1 = .1344 5 k T = 1.48 (seconds) A1 Correct answer [3] GCE AS/A LEVEL – May/June 2010 9709 72
Q6 · In restaurant A an average of 2.2% of tablecloths are stained and, independently, in…
6 In restaurant A an average of 2.2% of tablecloths are stained and, independently, in restaurant B an average of 5.8% of tablecloths are stained. (i) Random samples of 55 tablecloths are taken from each restaurant. Use a suitable Poisson approximation to find the probability that a total of more than 2 tablecloths are stained. [4] (ii) Random samples of n tablecloths are taken from each restaurant. The probability that at least one tablecloth is stained is greater than 0.99. Find the least possible value of n. [4]
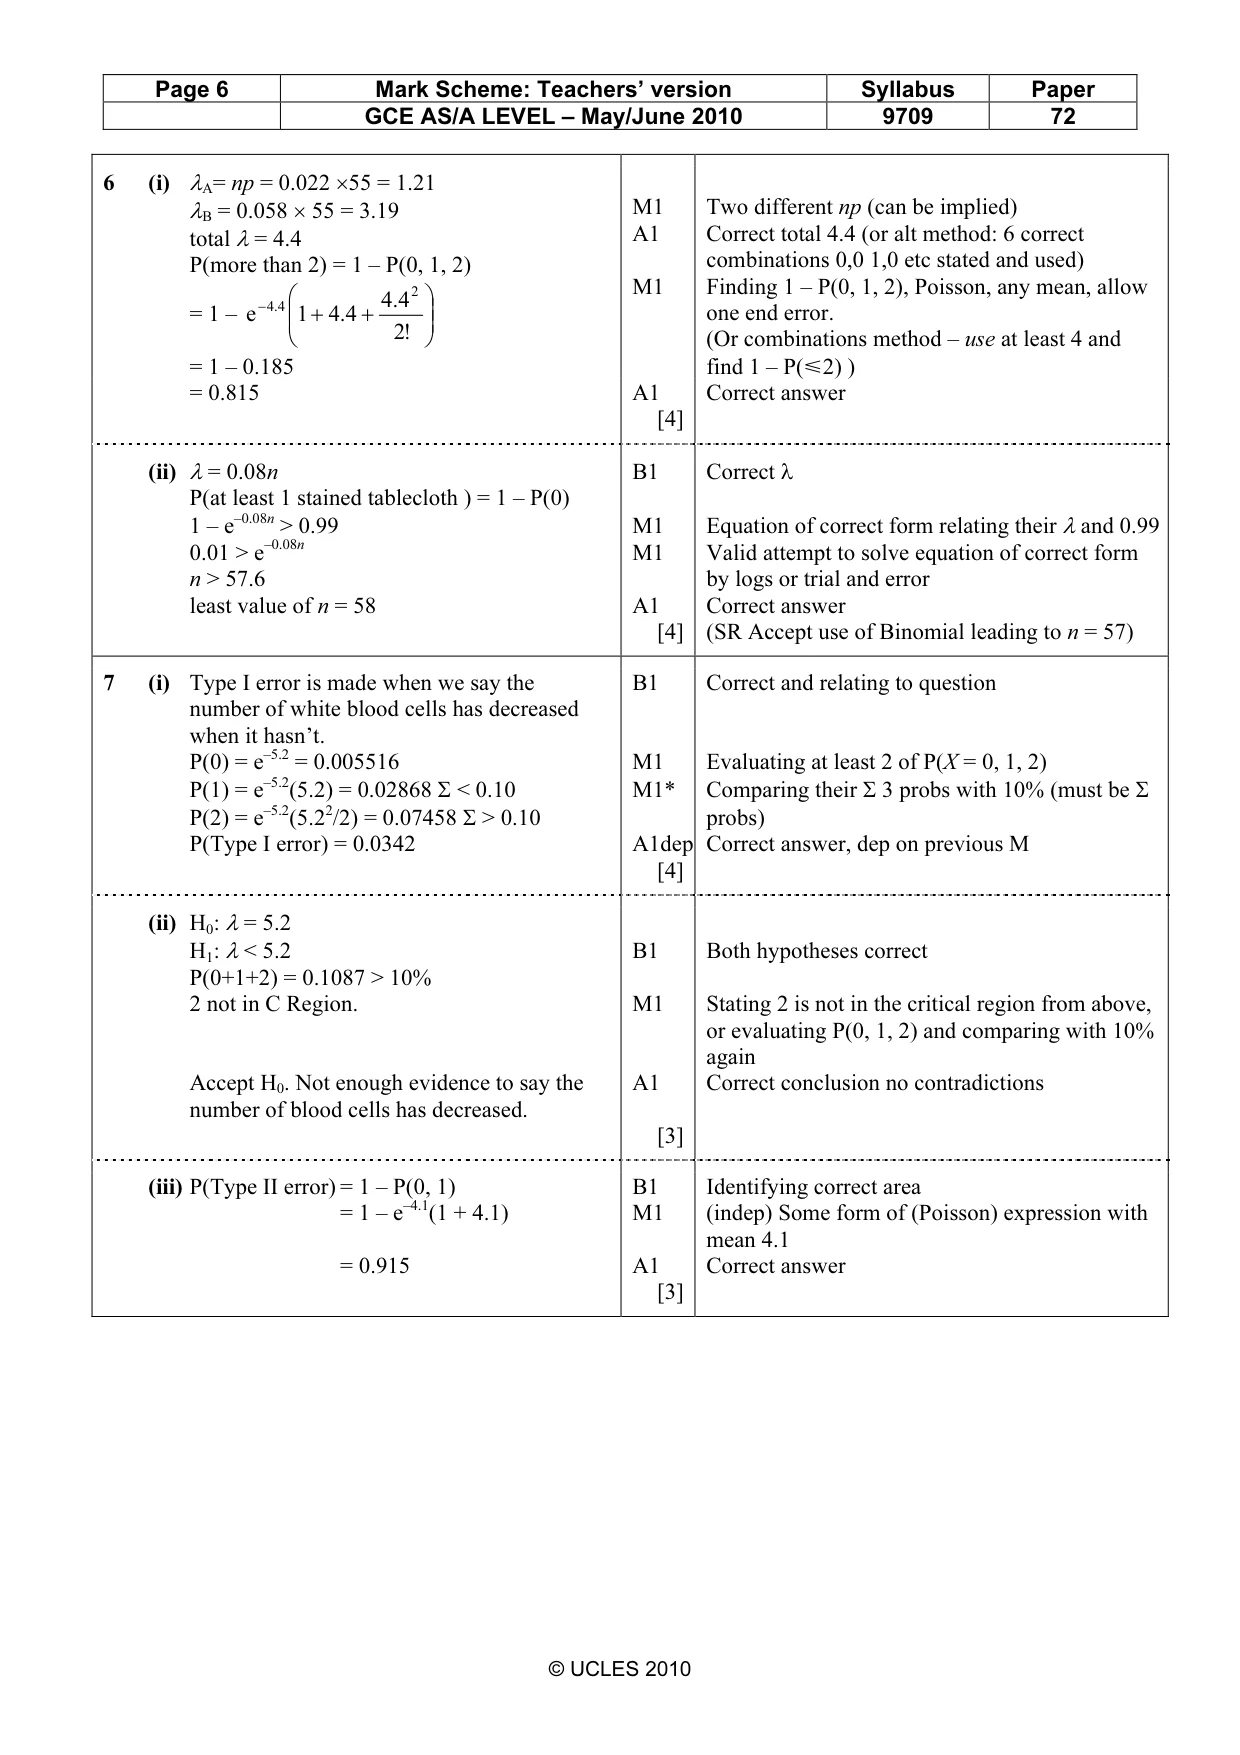
Mark scheme: 6 (i) λA= np = 0.022 ×55 = 1.21 λB = 0.058 × 55 = 3.19 M1 Two different np (can be implied) total λ = 4.4 A1 Correct total 4.4 (or alt method: 6 correct P(more than 2) = 1 – P(0, 1, 2) combinations 0,0 1,0 etc stated and used) 2 M1 Finding 1 – P(0, 1, 2), Poisson, any mean, allow − 4.4 4.4 = 1 – e 1 + 4.4 + one end error. !2 (Or combinations method – use at least 4 and = 1 – 0.185 find 1 – P(Y2) ) = 0.815 A1 Correct answer [4] (ii) λ = 0.08nλ B1λ Correct λ P(at least 1 stained tablecloth ) = 1 – P(0) 1 – e–0.08n > 0.99λ M1λ Equation of correct form relating their λ and 0.99 0.01 > e–0.08n M1 Valid attempt to solve equation of correct form n > 57.6 by logs or trial and error least value of n = 58 A1 Correct answer [4] (SR Accept use of Binomial leading to n = 57)
Q7 · A hospital patient’s white blood cell count has a Poisson distribution
7 A hospital patient’s white blood cell count has a Poisson distribution. Before undergoing treatment the patient had a mean white blood cell count of 5.2. After the treatment a random measurement of the patient’s white blood cell count is made, and is used to test at the 10% significance level whether the mean white blood cell count has decreased. (i) State what is meant by a Type I error in the context of the question, and find the probability that the test results in a Type I error. [4] (ii) Given that the measured value of the white blood cell count after the treatment is 2, carry out the test. [3] (iii) Find the probability of a Type II error if the mean white blood cell count after the treatment is actually 4.1. [3]
Mark scheme: 7 (i) Type I error is made when we say the B1 Correct and relating to question number of white blood cells has decreased when it hasn’t. P(0) = e–5.2 = 0.005516 M1 Evaluating at least 2 of P(X = 0, 1, 2) P(1) = e–5.2(5.2) = 0.02868 Σ < 0.10 M1*Σ Comparing their Σ 3 probs with 10% (must be Σ P(2) = e–5.2(5.22/2) = 0.07458 Σ > 0.10 Σ probs) Σ P(Type I error) = 0.0342 A1dep Correct answer, dep on previous M [4] (ii) H0: λ = 5.2 λ λ H1: λ < 5.2 B1λ Both hypotheses correct λ P(0+1+2) = 0.1087 > 10% 2 not in C Region. M1 Stating 2 is not in the critical region from above, or evaluating P(0, 1, 2) and comparing with 10% again Accept H0. Not enough evidence to say the A1 Correct conclusion no contradictions number of blood cells has decreased. [3] (iii) P(Type II error) = 1 – P(0, 1) B1 Identifying correct area = 1 – e–4.1(1 + 4.1) M1 (indep) Some form of (Poisson) expression with mean 4.1 = 0.915 A1 Correct answer [3]
What was in this paper
The subtopics covered by these 7 questions, and how many questions each got. Open one in a new tab to see every Cambridge question on it.
What you needed in this session
Cambridge’s own grade thresholds for 2010 May/June, Paper 7 · Variant 2. A higher threshold means an easier paper — the bar moves with how the cohort did.