Cambridge A Level Mathematics 9709 — 2015 May/June Paper 7 · Variant 3
9709/73/M/J/15 · 6 questions · 50 marks · ≈56 min
The question paper and its mark scheme, free to read here and free to download. This is Cambridge’s own paper, exactly as it was sat.
Question paper4 pages

Mark scheme7 pages
Answers below. Sit the paper first if you are practising.
Questions as text
Q1 · Jyothi wishes to choose a representative sample of 5 students from the 82 members of her…
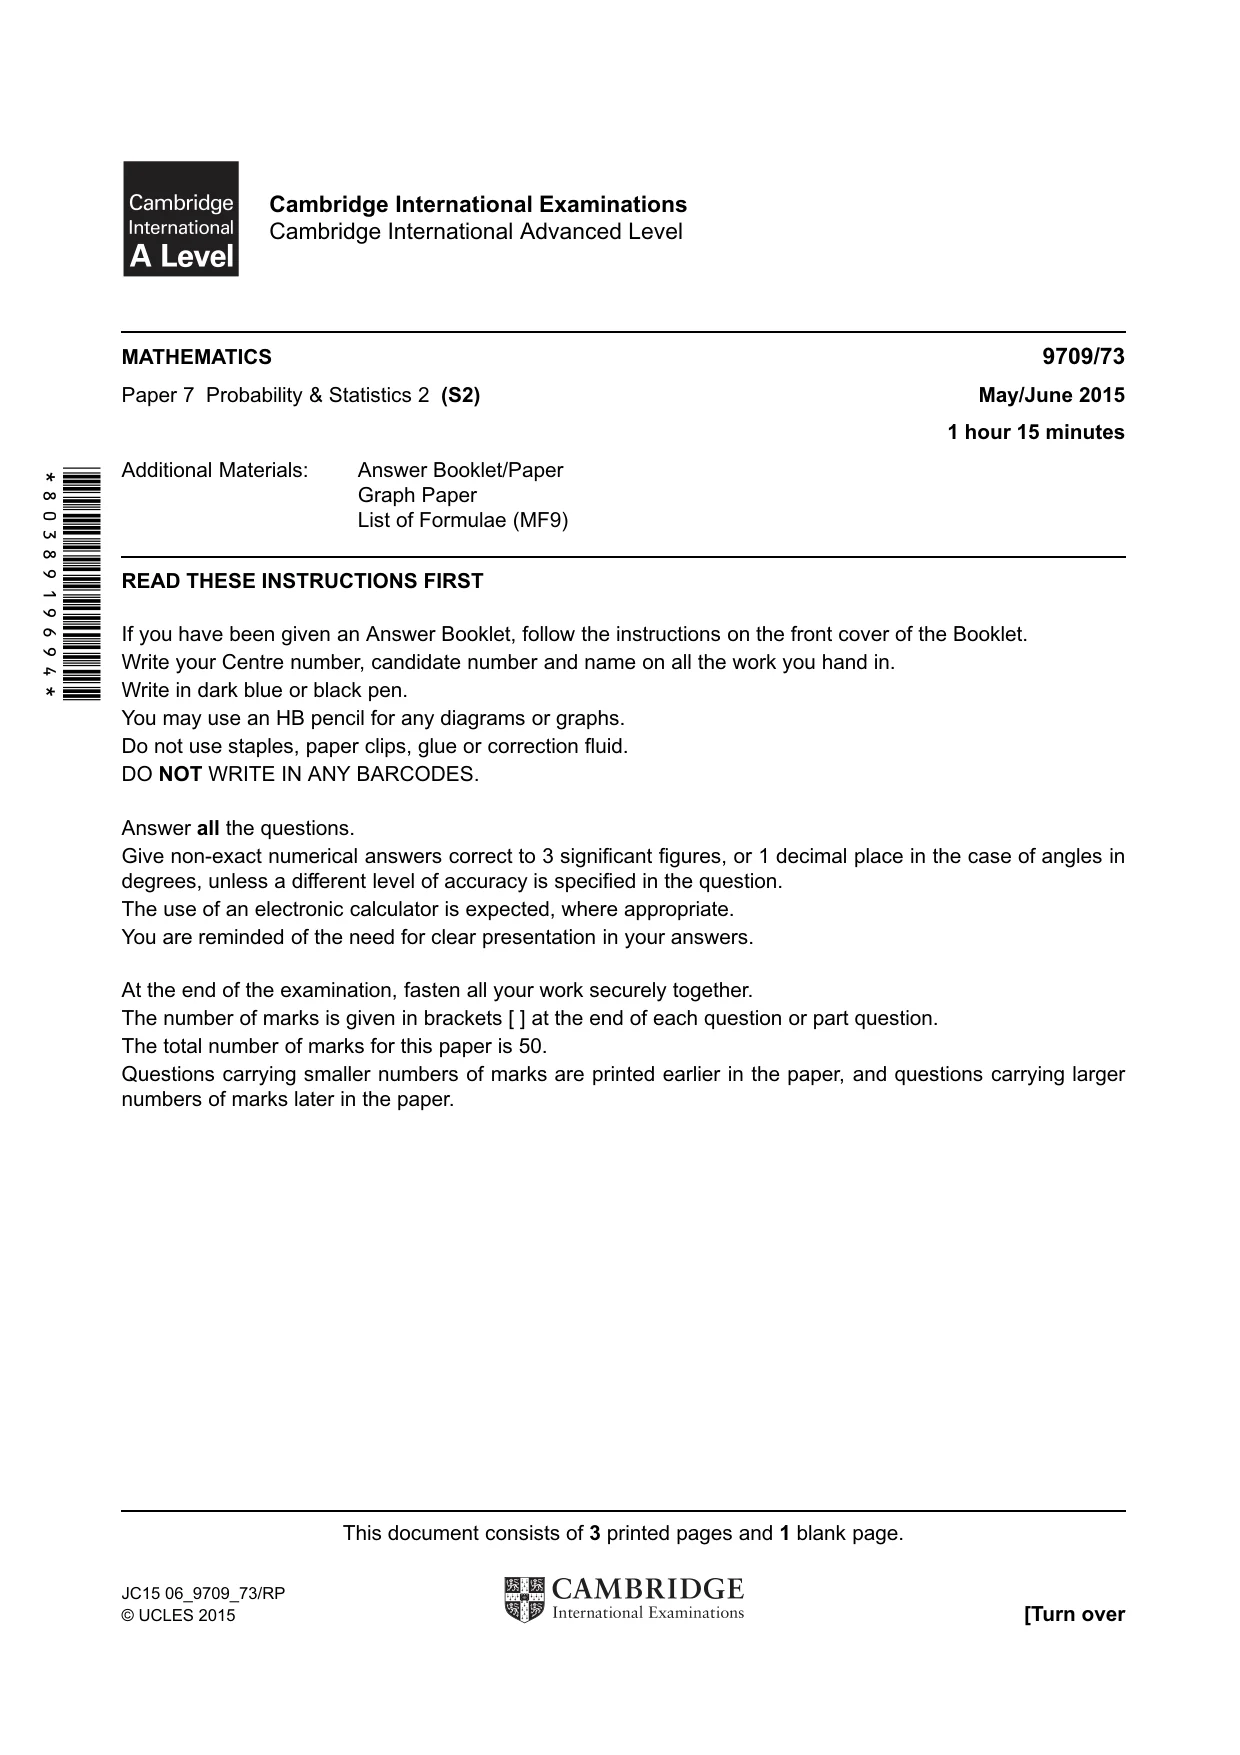
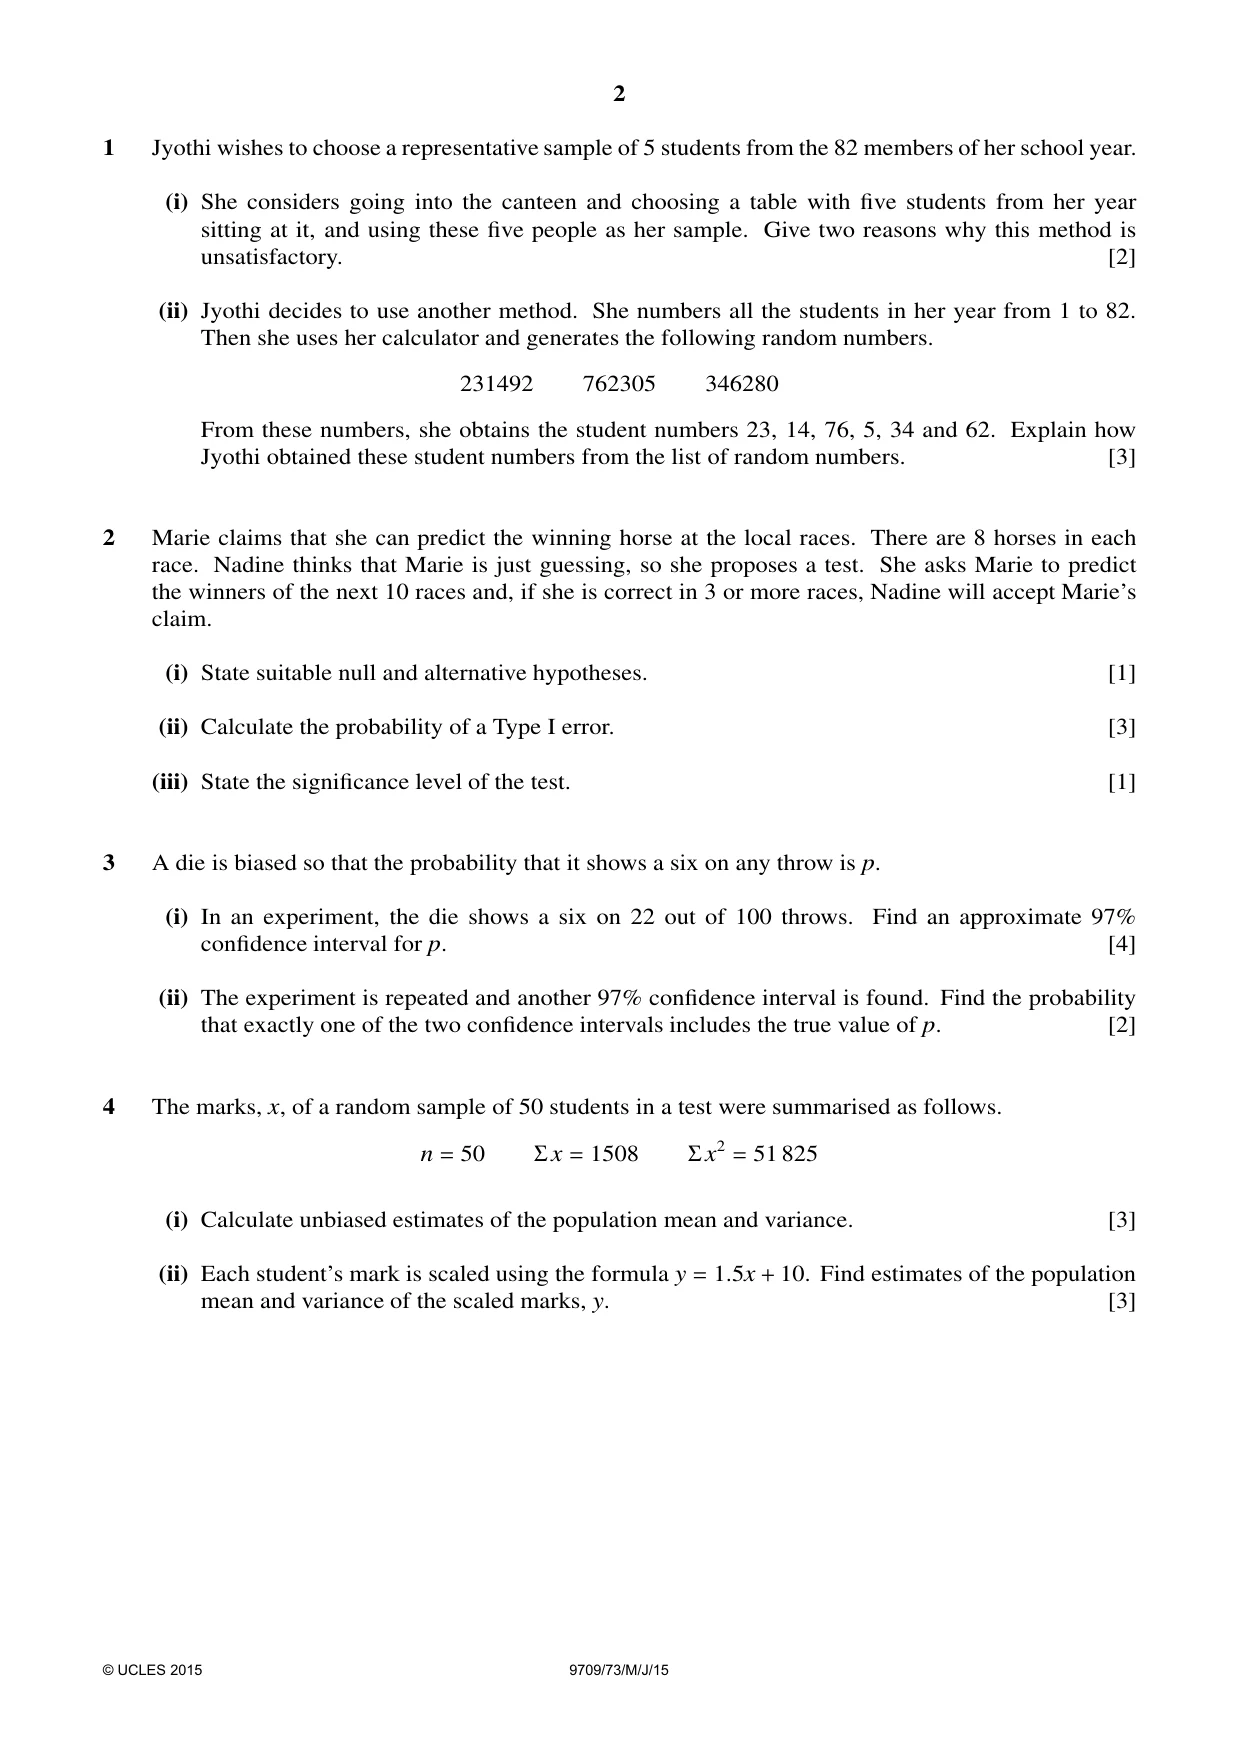
1 Jyothi wishes to choose a representative sample of 5 students from the 82 members of her school year. (i) She considers going into the canteen and choosing a table with five students from her year sitting at it, and using these five people as her sample. Give two reasons why this method is unsatisfactory. [2] (ii) Jyothi decides to use another method. She numbers all the students in her year from 1 to 82. Then she uses her calculator and generates the following random numbers. 231492 762305 346280 From these numbers, she obtains the student numbers 23, 14, 76, 5, 34 and 62. Explain how Jyothi obtained these student numbers from the list of random numbers. [3]
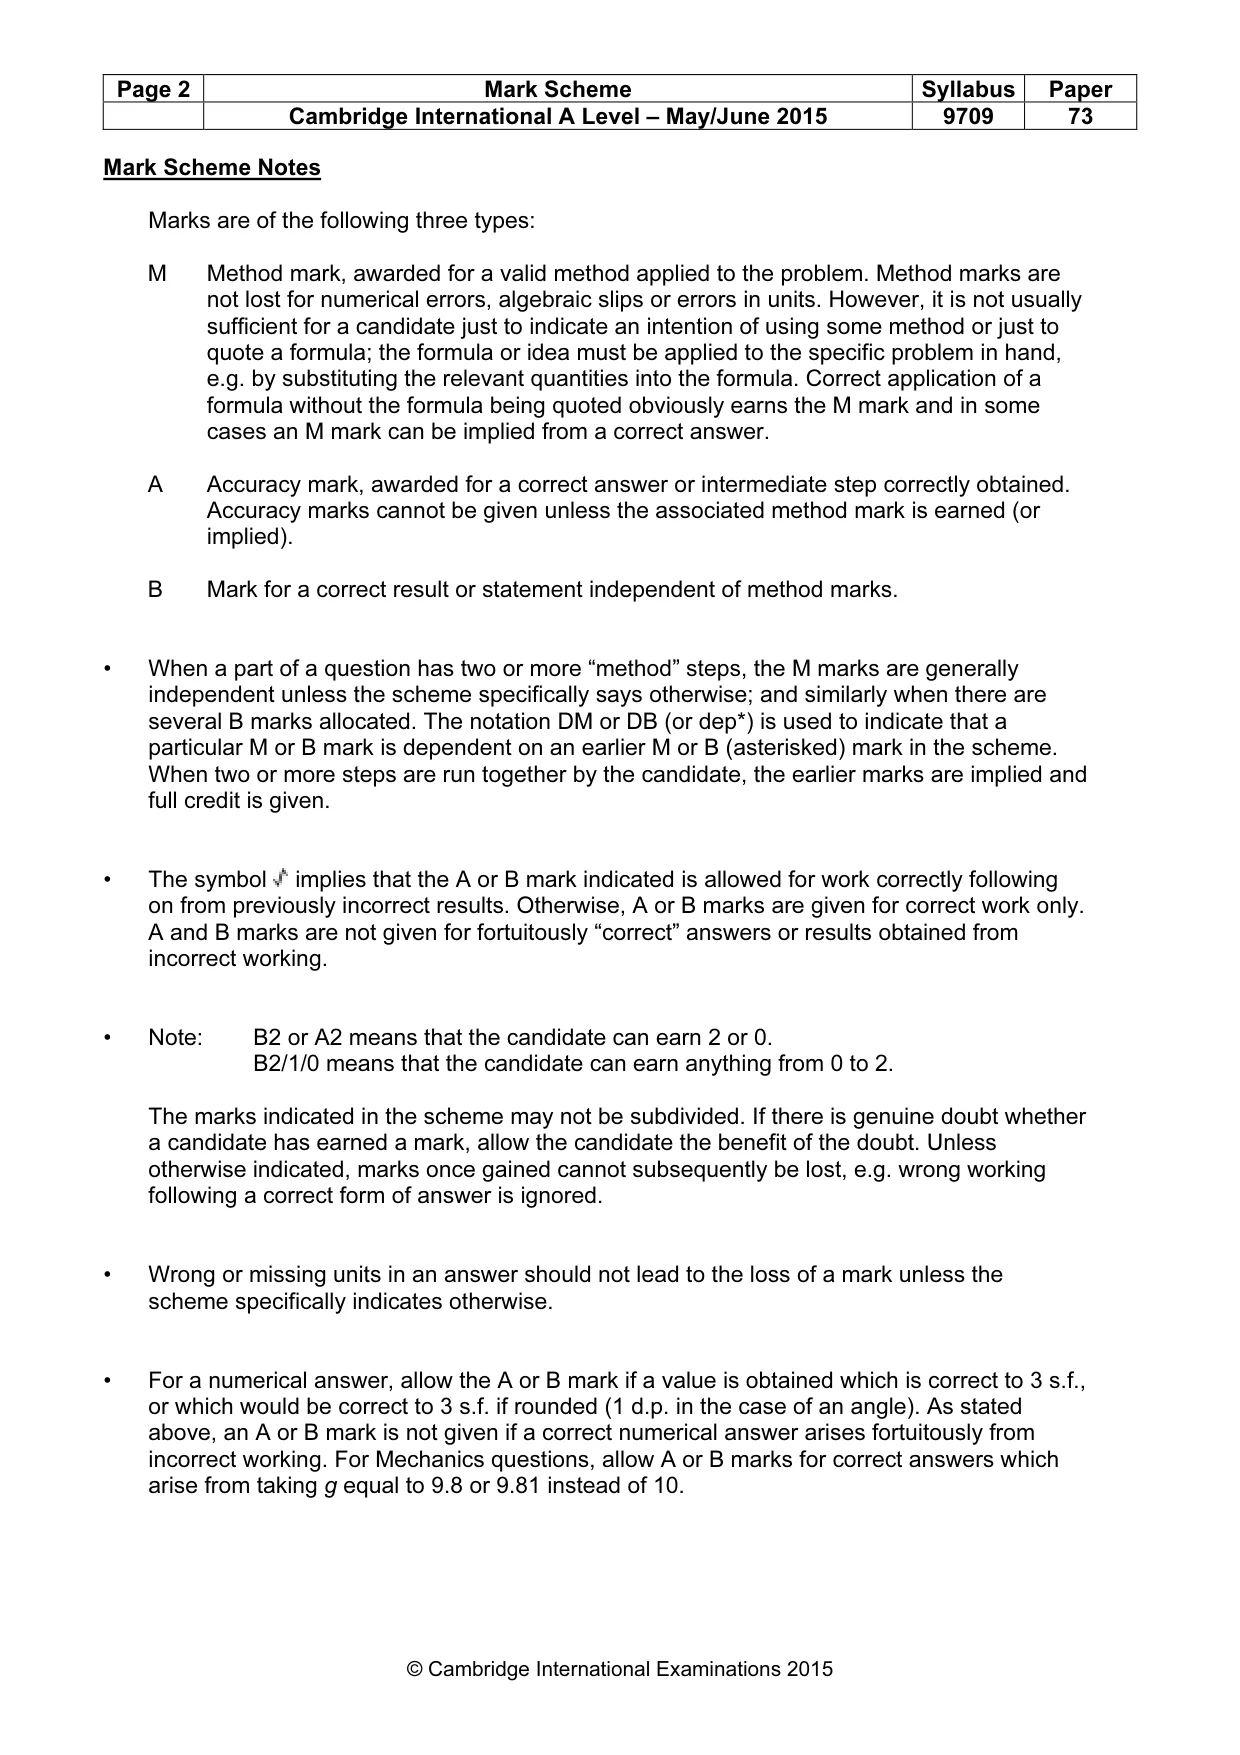
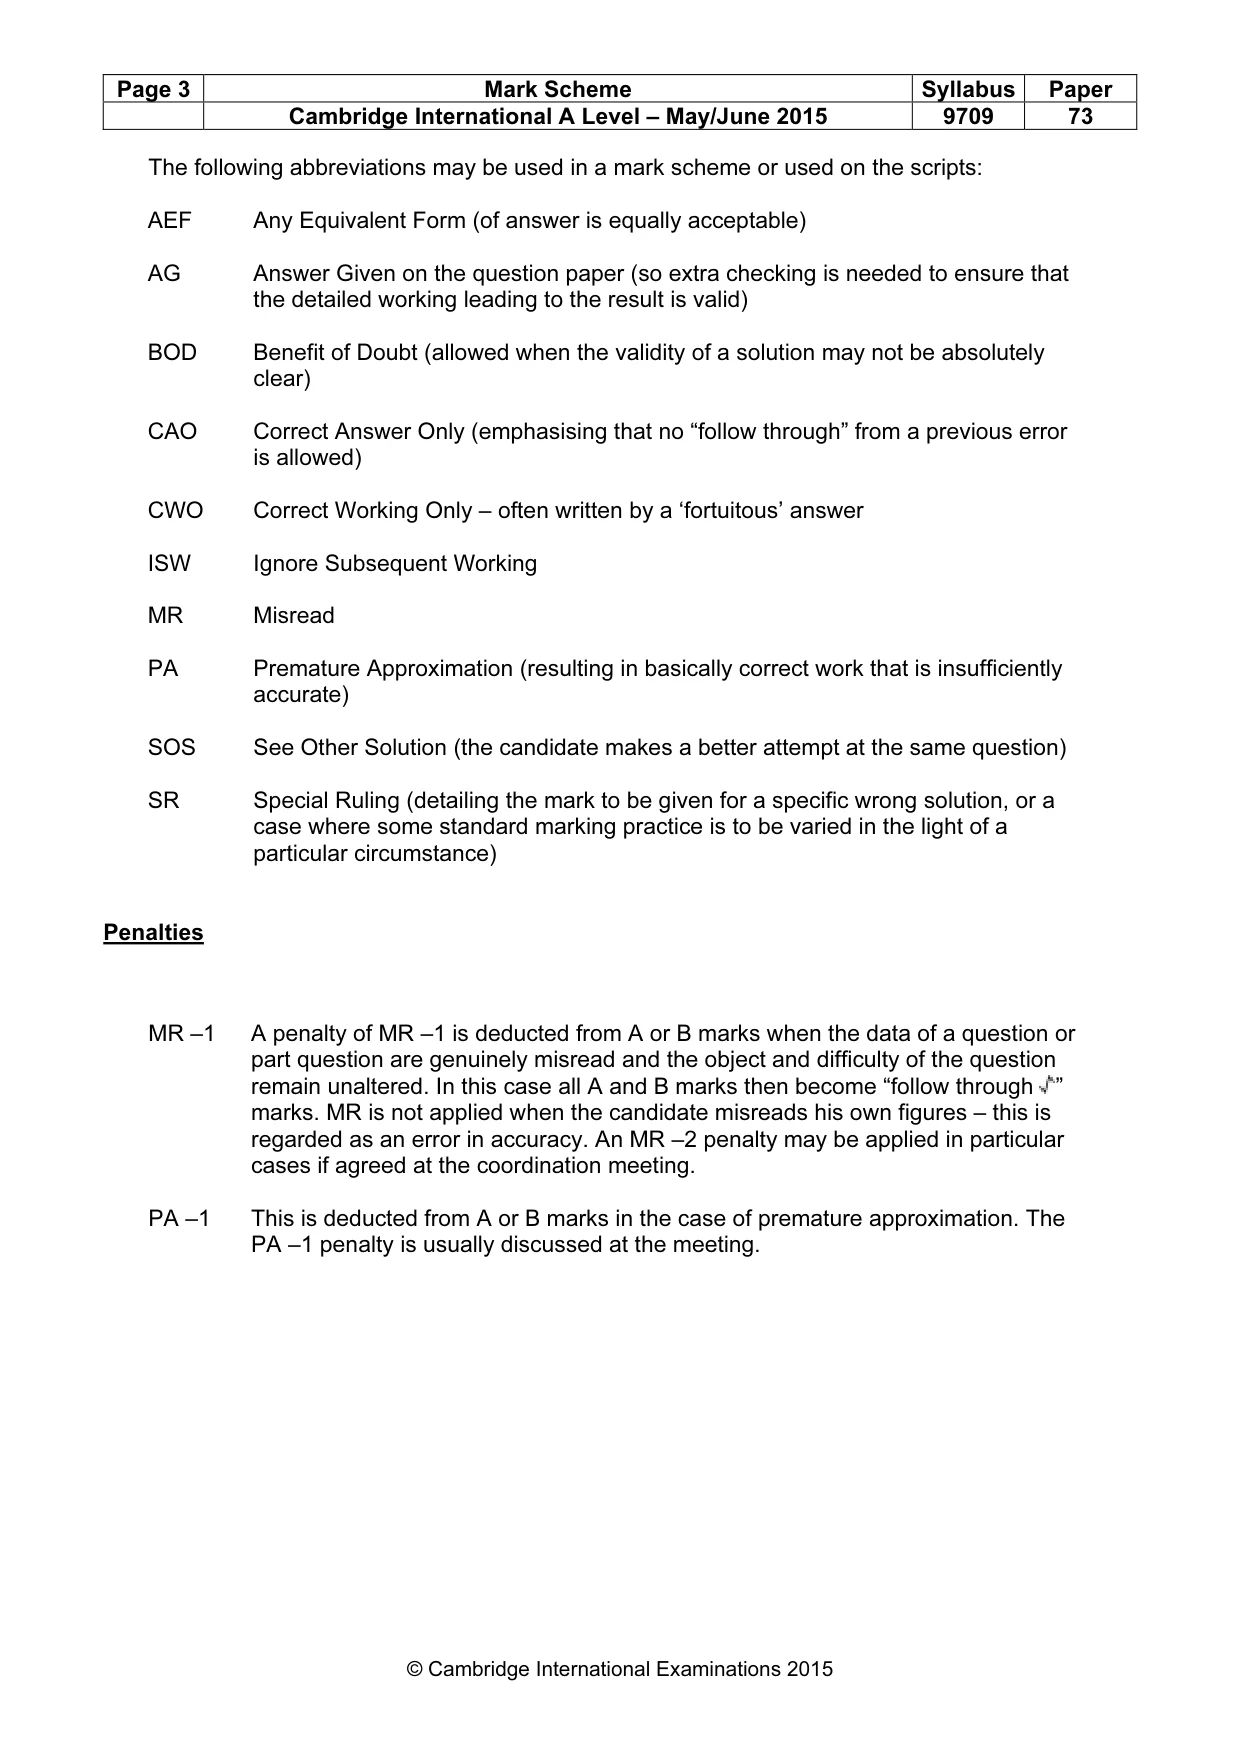
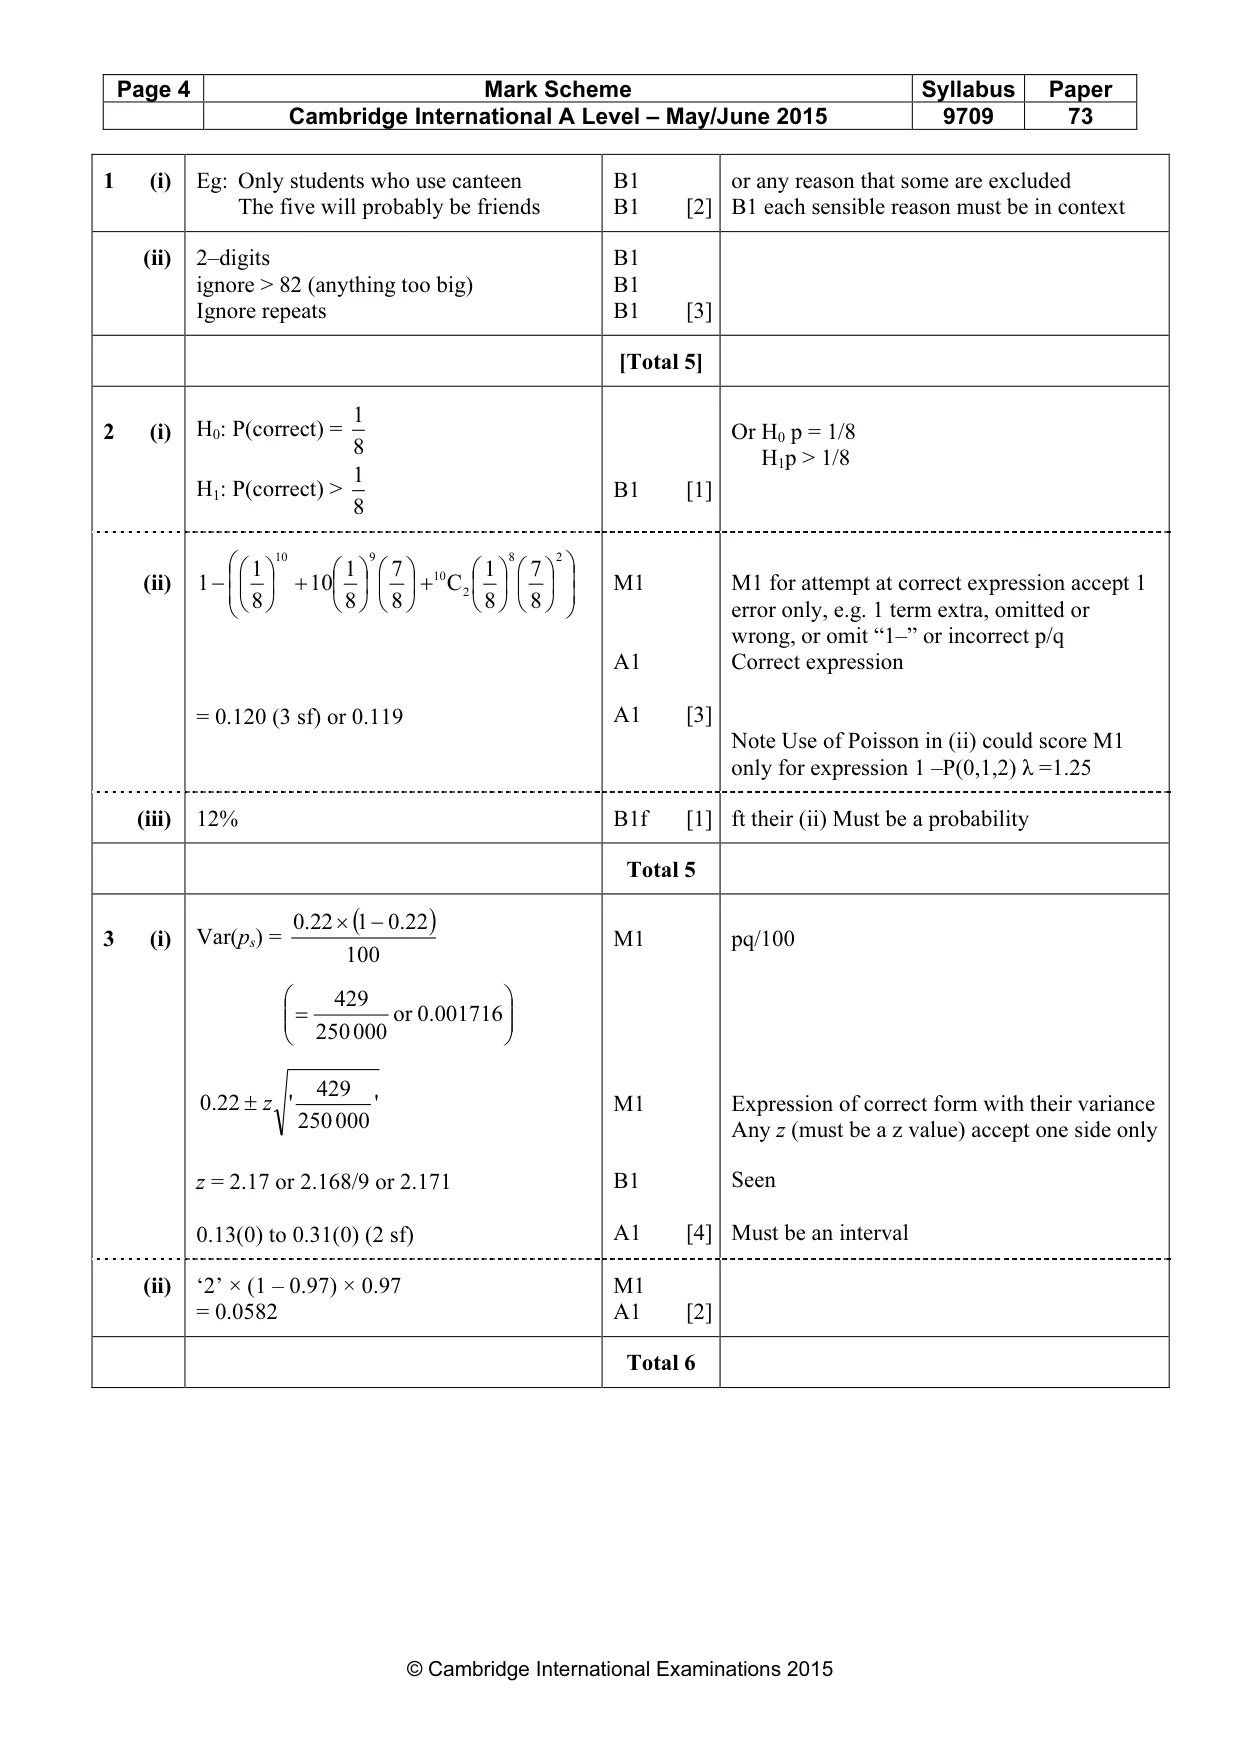
Mark scheme: 1 (i) Eg: Only students who use canteen B1 or any reason that some are excluded The five will probably be friends B1 [2] B1 each sensible reason must be in context (ii) 2–digits B1 ignore > 82 (anything too big) B1 Ignore repeats B1 [3] [Total 5] 1 ( )
Q2 · Marie claims that she can predict the winning horse at the local races
2 Marie claims that she can predict the winning horse at the local races. There are 8 horses in each race. Nadine thinks that Marie is just guessing, so she proposes a test. She asks Marie to predict the winners of the next 10 races and, if she is correct in 3 or more races, Nadine will accept Marie’s claim. (i) State suitable null and alternative hypotheses. [1] (ii) Calculate the probability of a Type I error. [3] (iii) State the significance level of the test. [1]
Mark scheme: 1 2 (i) H0: P(correct) = Or H0 p = 1/8 8 Or H1p > 1/8 1 H1: P(correct) > B1 [1] 8 1 10 1 9 7 10 1 8 7 2 M1 M1 for attempt at correct expression accept 1 + 10 + C 2 (ii) 1 − 8 8 8 8 8 error only, e.g. 1 term extra, omitted or wrong, or omit “1–” or incorrect p/q A1 Correct expression = 0.120 (3 sf) or 0.119 A1 [3] Note Use of Poisson in (ii) could score M1 only for expression 1 –P(0,1,2) λ =1.25 (iii) 12% B1f [1] ft their (ii) Must be a probability Total 5 .0 22 × (1 − .022 ) ( )
Q3 · A die is biased so that the probability that it shows a six on any throw is p
3 A die is biased so that the probability that it shows a six on any throw is p. (i) In an experiment, the die shows a six on 22 out of 100 throws. Find an approximate 97% confidence interval for p. [4] (ii) The experiment is repeated and another 97% confidence interval is found. Find the probability that exactly one of the two confidence intervals includes the true value of p. [2]
Mark scheme: .0 22 × (1 .022 ) 3 (i) Var(ps) = M1 pq/100 100 = 429 or .0 001716 250 000 429 .0 22 ± z ' ' M1 Expression of correct form with their variance 250 000 Any z (must be a z value) accept one side only z = 2.17 or 2.168/9 or 2.171 B1 Seen 0.13(0) to 0.31(0) (2 sf) A1 [4] Must be an interval (ii) ‘2’ × (1 – 0.97) × 0.97 M1 = 0.0582 A1 [2] Total 6 1508 ( )
Q4 · The marks, x, of a random sample of 50 students in a test were summarised as follows
4 The marks, x, of a random sample of 50 students in a test were summarised as follows. n = 50 Σx = 1508 Σx2 = 51 825 (i) Calculate unbiased estimates of the population mean and variance. [3] (ii) Each student’s mark is scaled using the formula y = 1.5x + 10. Find estimates of the population mean and variance of the scaled marks, y. [3]
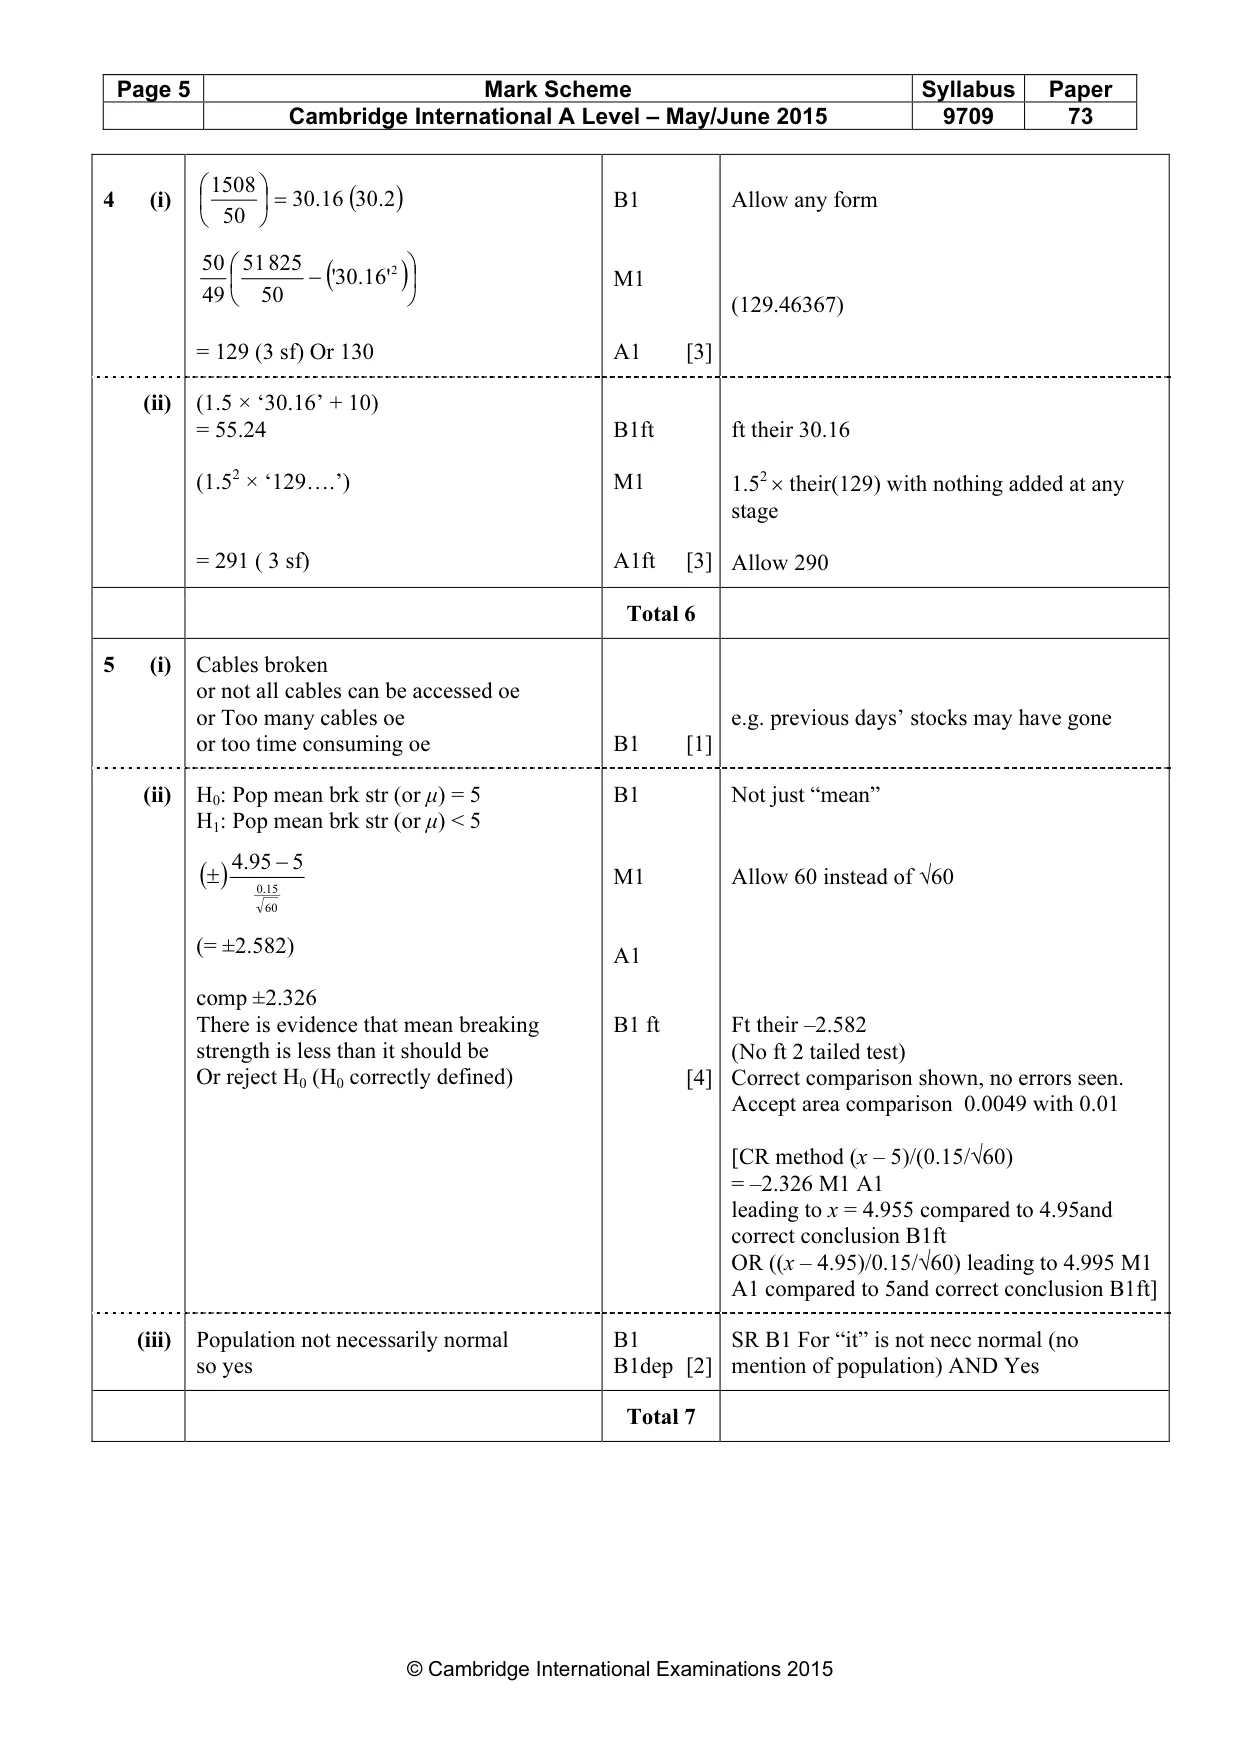
Mark scheme: 1508 4 (i) = 30 . 16 (30 2. ) B1 Allow any form 50 50 51 825 − ('30 . 16 2' ) M1 49 50 (129.46367) = 129 (3 sf) Or 130 A1 [3] (ii) (1.5 × ‘30.16’ + 10) = 55.24 B1ft ft their 30.16 (1.52 × ‘129….’) M1 1.52 × their(129) with nothing added at any stage = 291 ( 3 sf) A1ft [3] Allow 290 Total 6
Q5 · The mean breaking strength of cables made at a certain factory is supposed to be 5 tonnes
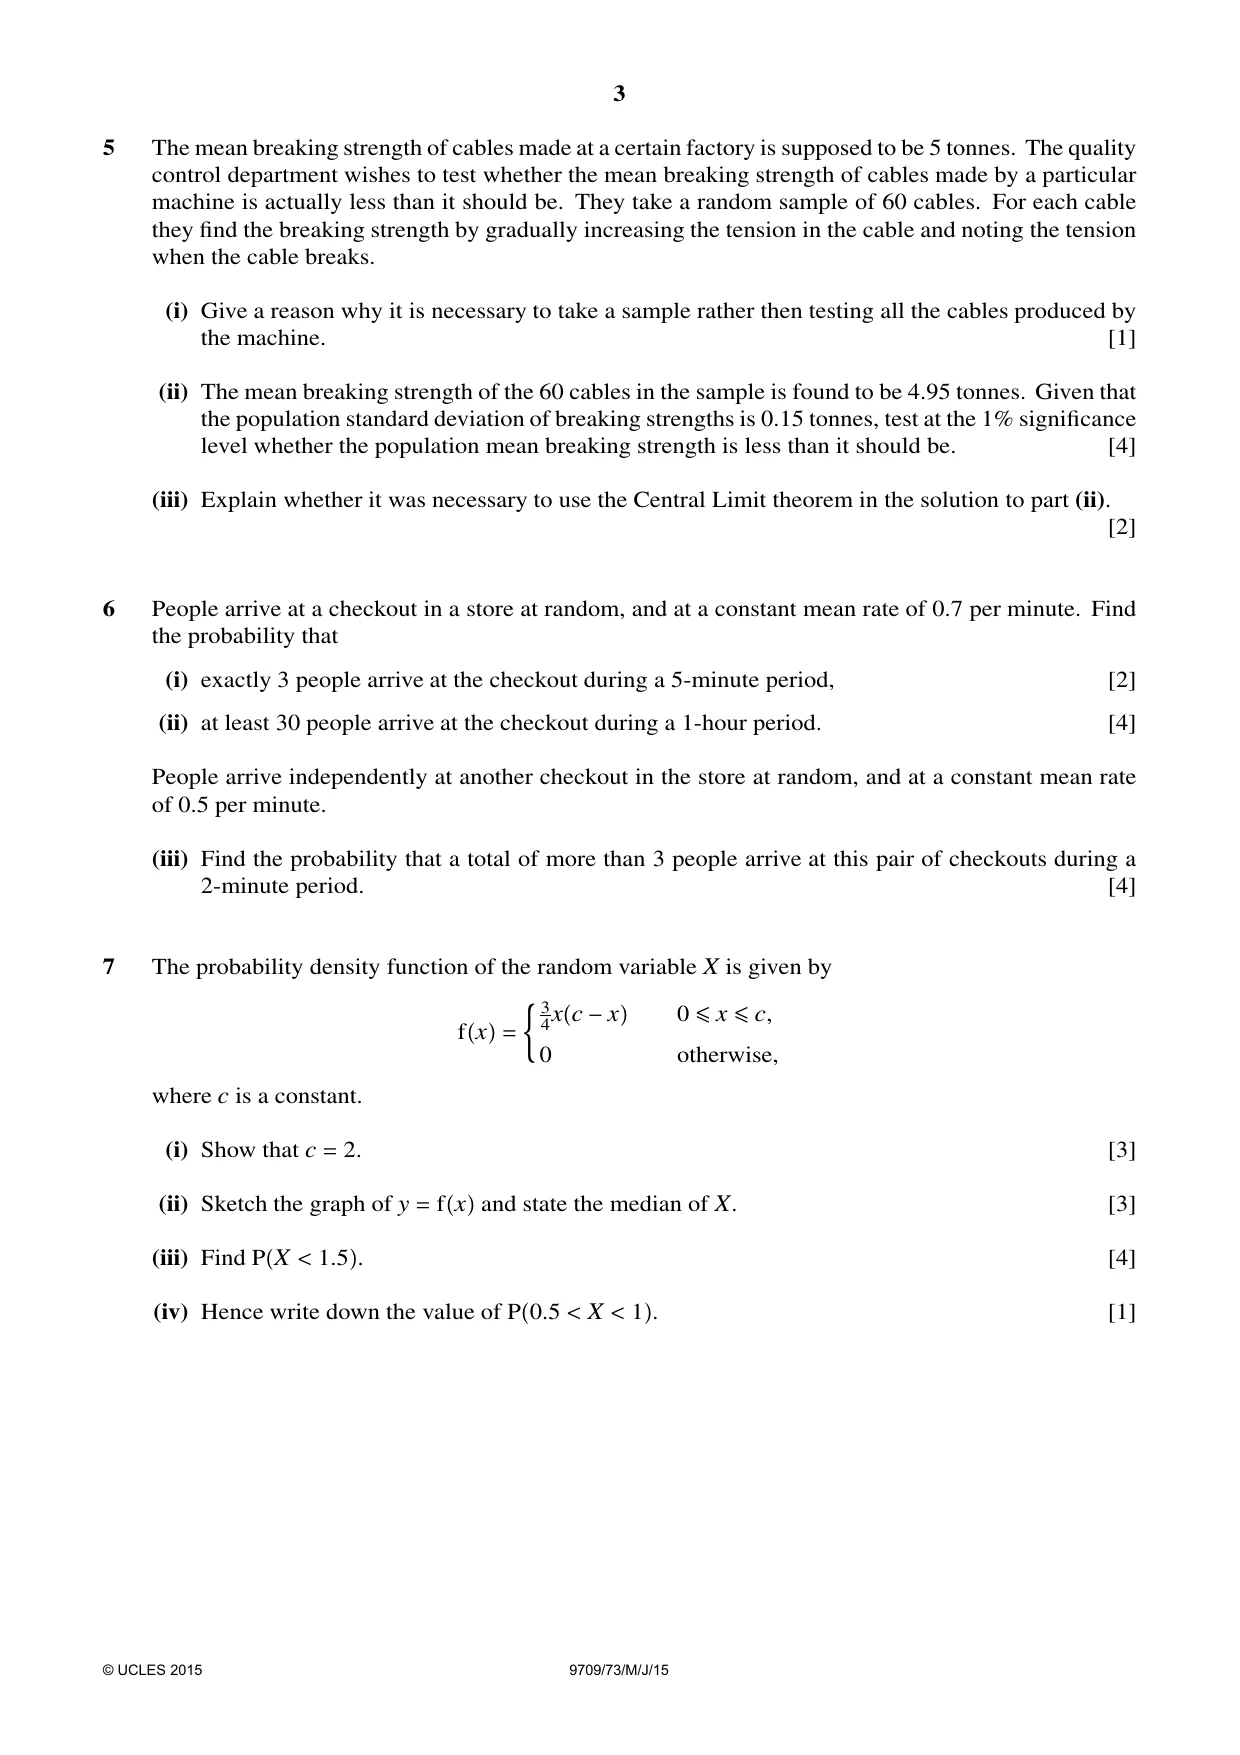
5 The mean breaking strength of cables made at a certain factory is supposed to be 5 tonnes. The quality control department wishes to test whether the mean breaking strength of cables made by a particular machine is actually less than it should be. They take a random sample of 60 cables. For each cable they find the breaking strength by gradually increasing the tension in the cable and noting the tension when the cable breaks. (i) Give a reason why it is necessary to take a sample rather then testing all the cables produced by the machine. [1] (ii) The mean breaking strength of the 60 cables in the sample is found to be 4.95 tonnes. Given that the population standard deviation of breaking strengths is 0.15 tonnes, test at the 1% significance level whether the population mean breaking strength is less than it should be. [4] (iii) Explain whether it was necessary to use the Central Limit theorem in the solution to part (ii). [2]
Mark scheme: 5 (i) Cables broken or not all cables can be accessed oe or Too many cables oe e.g. previous days’ stocks may have gone or too time consuming oe B1 [1] (ii) H0: Pop mean brk str (or µ) = 5 B1 Not just “mean” H1: Pop mean brk str (or µ) < 5 .4 95 − 5 (± ) M1 Allow 60 instead of √60 .015 60 (= ±2.582) A1 comp ±2.326 There is evidence that mean breaking B1 ft Ft their –2.582 strength is less than it should be (No ft 2 tailed test) Or reject H0 (H0 correctly defined) [4] Correct comparison shown, no errors seen. Accept area comparison 0.0049 with 0.01 [CR method (x – 5)/(0.15/√60) = –2.326 M1 A1 leading to x = 4.955 compared to 4.95and correct conclusion B1ft OR ((x – 4.95)/0.15/√60) leading to 4.995 M1 A1 compared to 5and correct conclusion B1ft] (iii) Population not necessarily normal B1 SR B1 For “it” is not necc normal (no so yes B1dep [2] mention of population) AND Yes Total 7 3 5 5.3 3
Q6 · People arrive at a checkout in a store at random, and at a constant mean rate of 0.7 per…
6 People arrive at a checkout in a store at random, and at a constant mean rate of 0.7 per minute. Find the probability that (i) exactly 3 people arrive at the checkout during a 5-minute period, [2] (ii) at least 30 people arrive at the checkout during a 1-hour period. [4] People arrive independently at another checkout in the store at random, and at a constant mean rate of 0.5 per minute. (iii) Find the probability that a total of more than 3 people arrive at this pair of checkouts during a 2-minute period. [4]
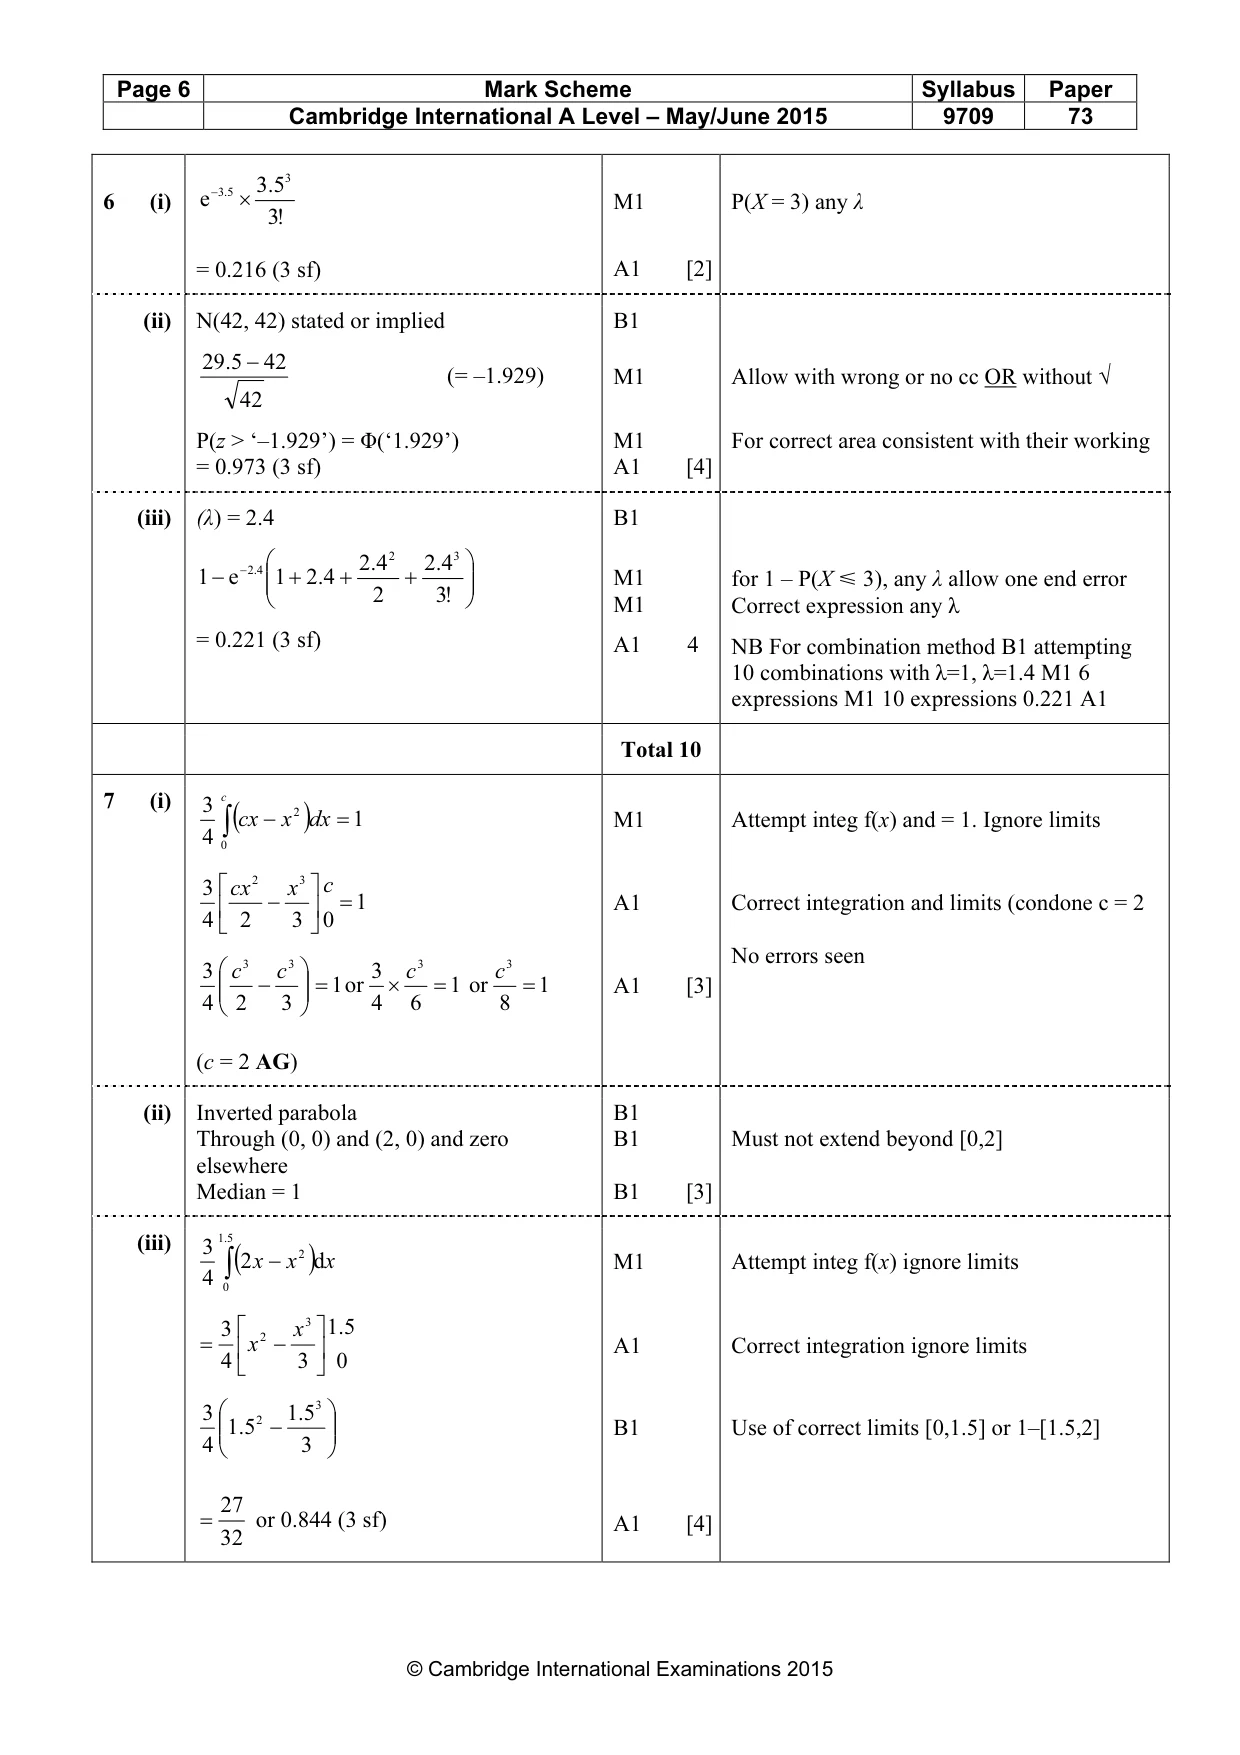
Mark scheme: − 5.3 5.3 6 (i) e × M1 P(X = 3) any λ !3 = 0.216 (3 sf) A1 [2] (ii) N(42, 42) stated or implied B1 29 5. − 42 (= –1.929) M1 Allow with wrong or no cc OR without √ 42 P(z > ‘–1.929’) = Φ(‘1.929’) M1 For correct area consistent with their working = 0.973 (3 sf) A1 [4] (iii) (λ) = 2.4 B1 − 4.2 4.2 2 4.2 3 1 − e 1 + 4.2 + + M1 for 1 – P(X Y 3), any λ allow one end error 2 !3 M1 Correct expression any λ = 0.221 (3 sf) A1 4 NB For combination method B1 attempting 10 combinations with λ=1, λ=1.4 M1 6 expressions M1 10 expressions 0.221 A1 Total 10
What was in this paper
The subtopics covered by these 6 questions, and how many questions each got. Open one in a new tab to see every Cambridge question on it.
What you needed in this session
Cambridge’s own grade thresholds for 2015 May/June, Paper 7 · Variant 3. A higher threshold means an easier paper — the bar moves with how the cohort did.