Cambridge A Level Mathematics 9709 — 2015 Oct/Nov Paper 7 · Variant 2
9709/72/O/N/15 · 7 questions · 50 marks · ≈56 min
The question paper and its mark scheme, free to read here and free to download. This is Cambridge’s own paper, exactly as it was sat.
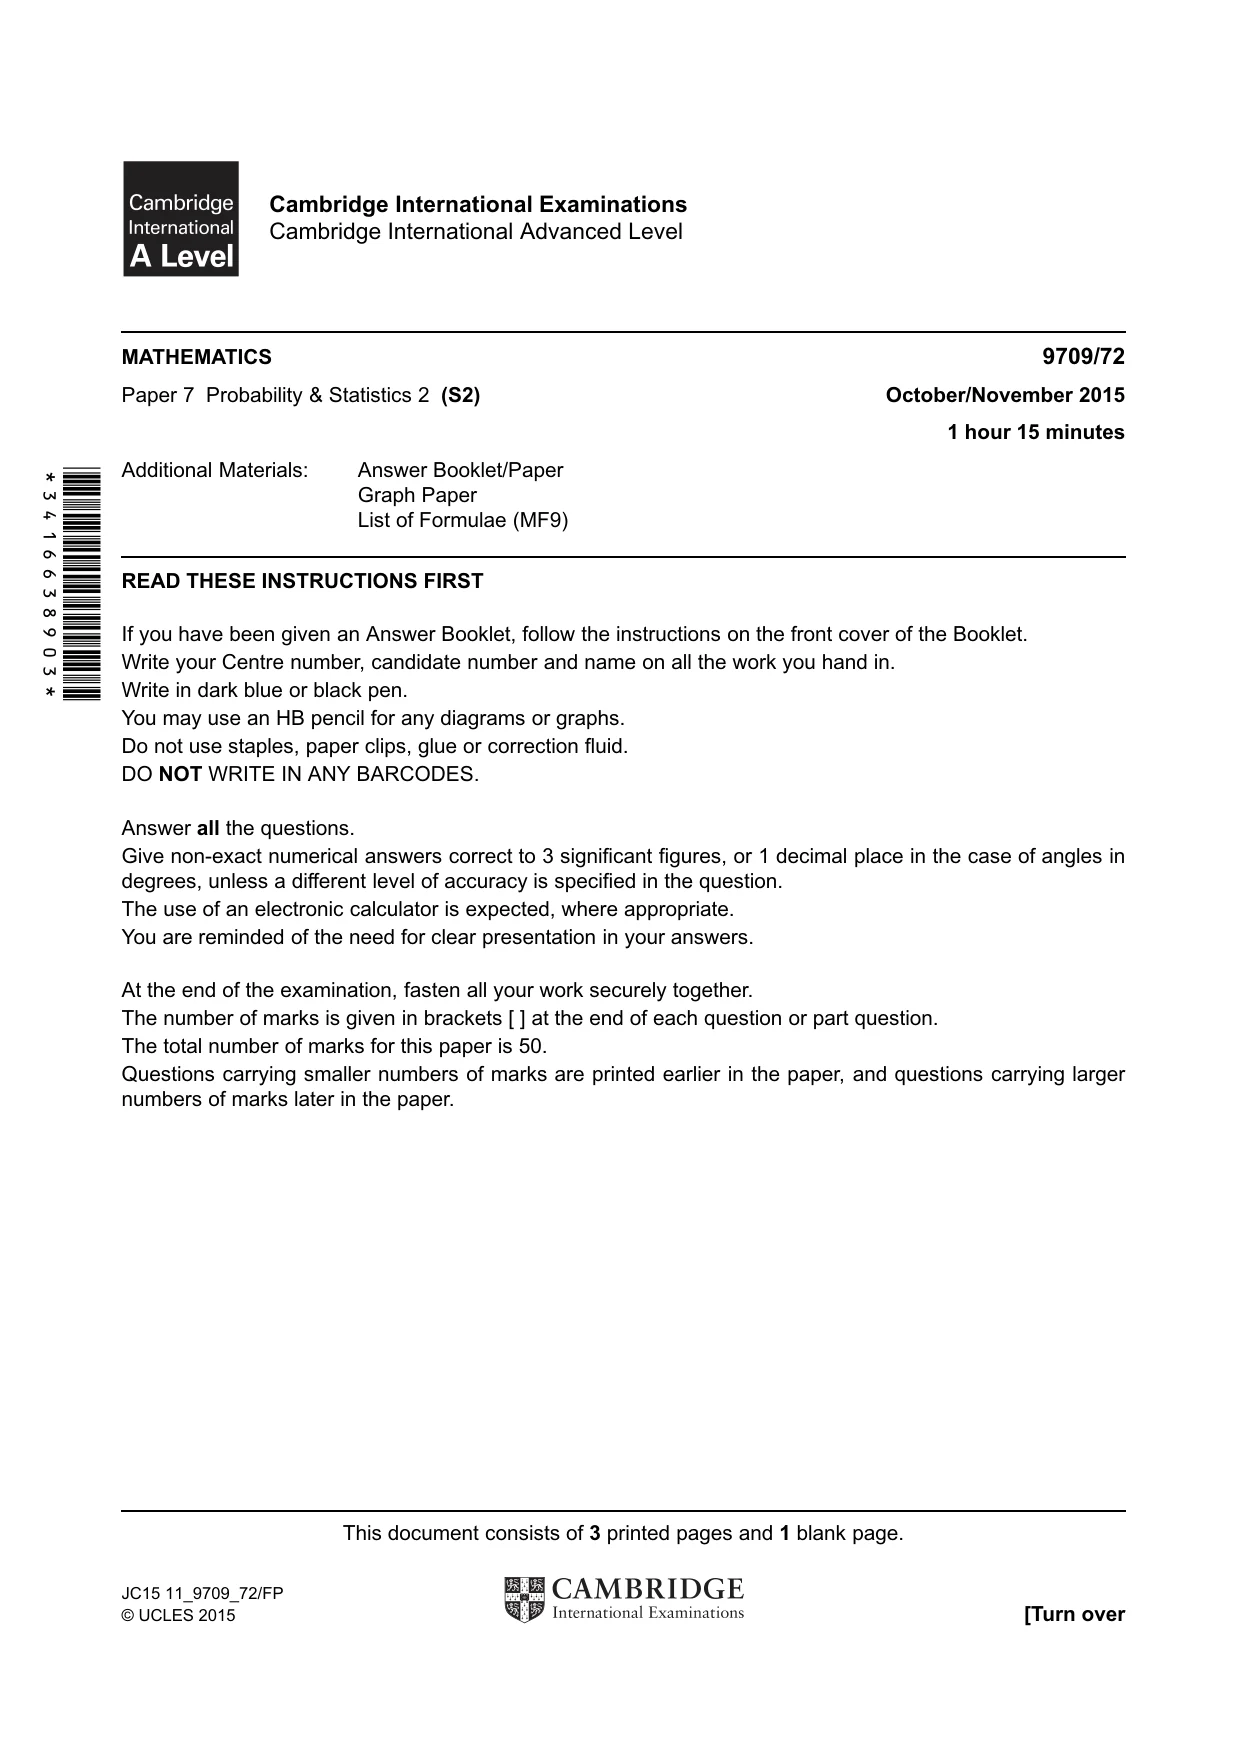
Question paper4 pages

Mark scheme7 pages
Answers below. Sit the paper first if you are practising.
Questions as text
Q1 · Failures of two computers occur at random and independently
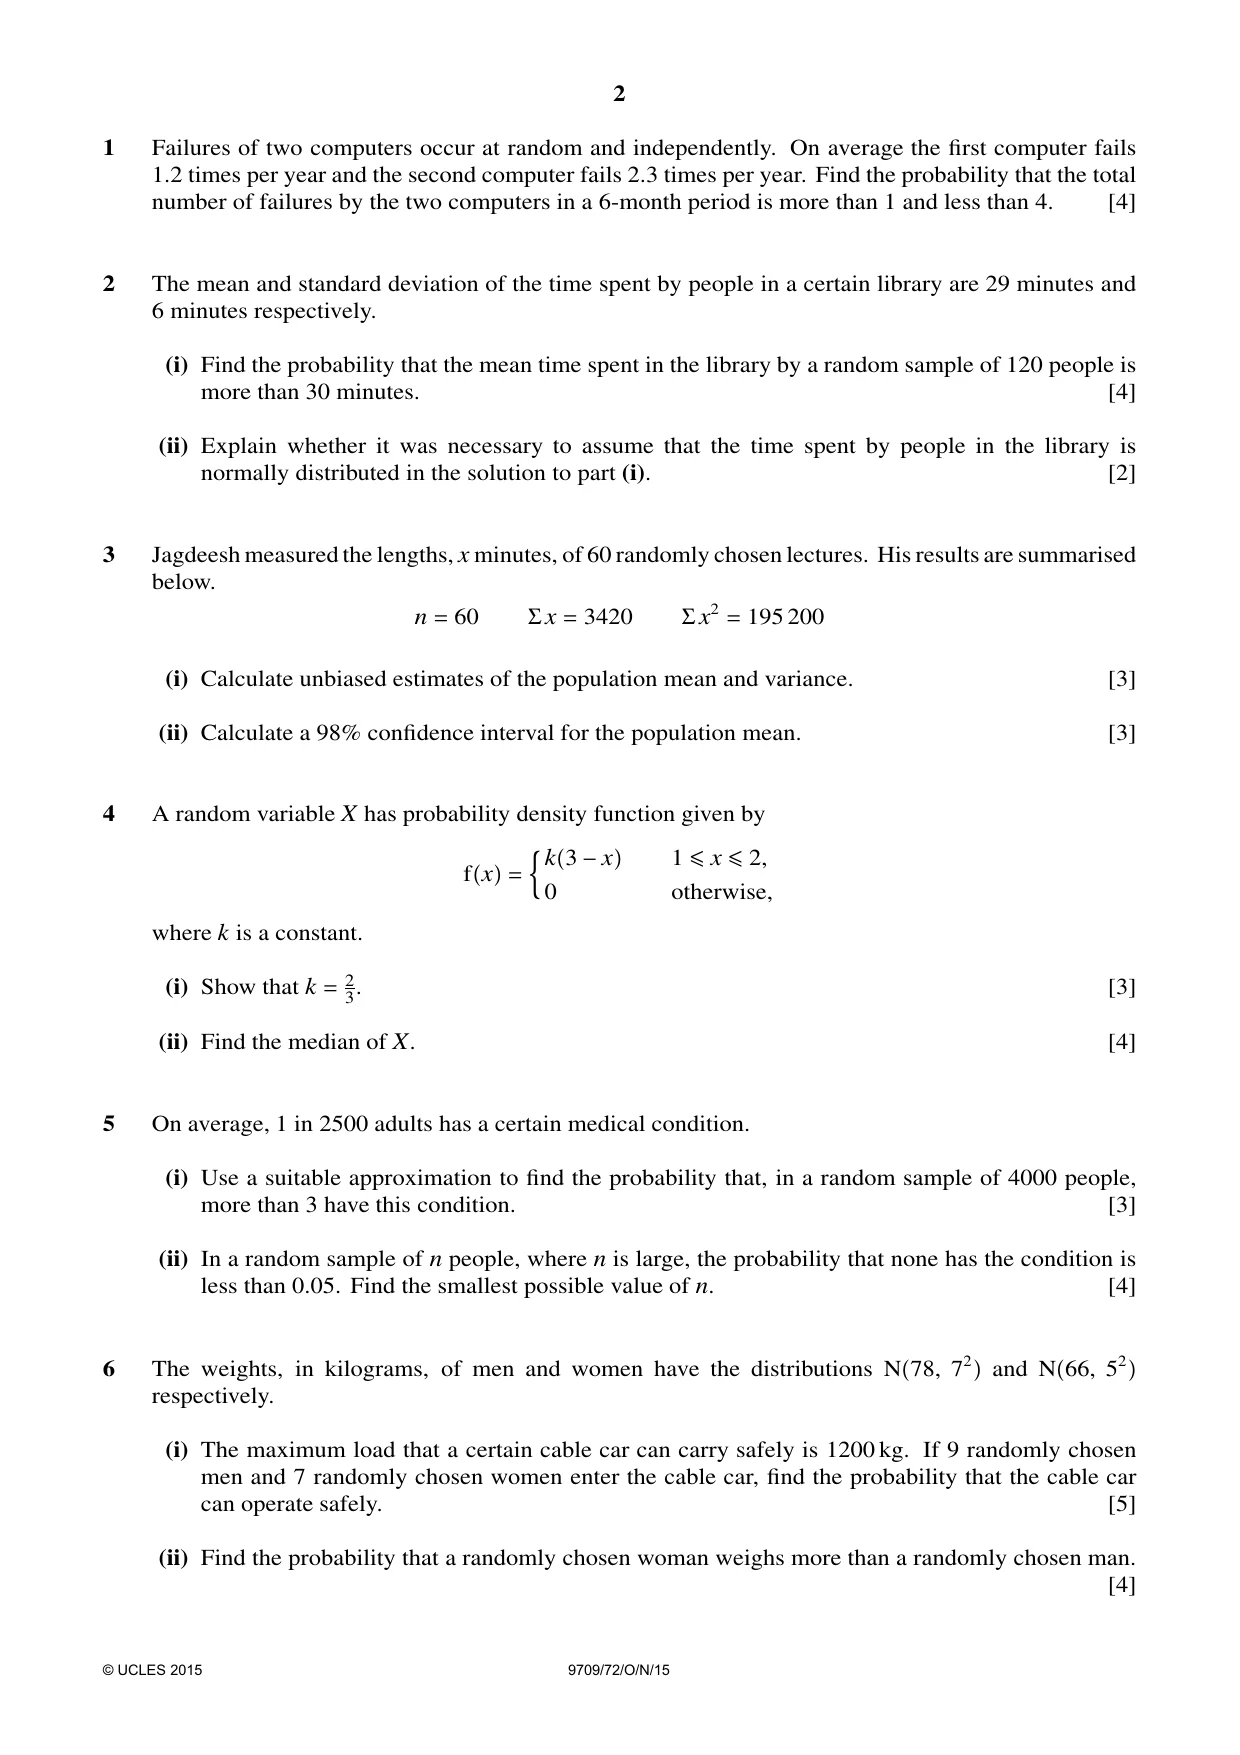
1 Failures of two computers occur at random and independently. On average the first computer fails 1.2 times per year and the second computer fails 2.3 times per year. Find the probability that the total number of failures by the two computers in a 6-month period is more than 1 and less than 4. [4]
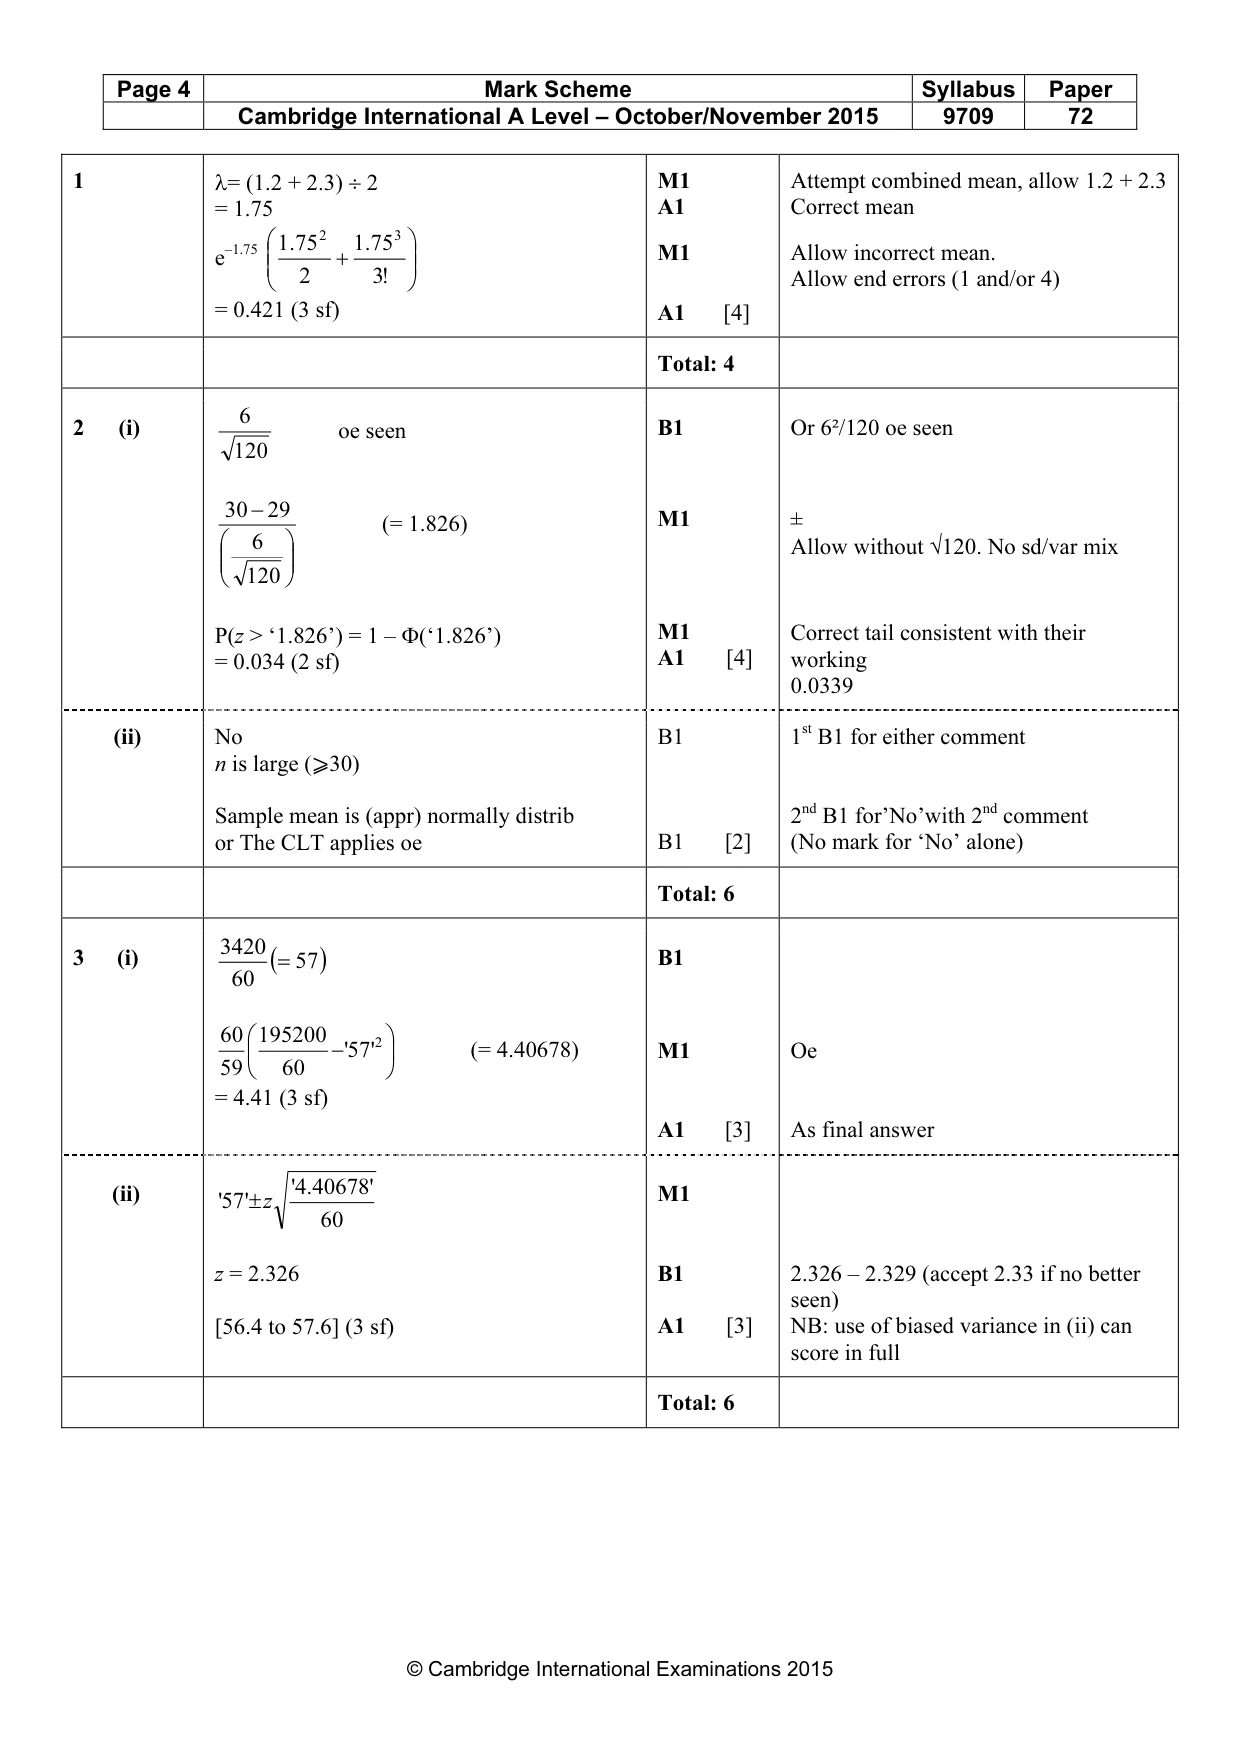
Mark scheme: 1 λ= (1.2 + 2.3) ÷ 2 M1 Attempt combined mean, allow 1.2 + 2.3 A1 Correct mean = 1.75 .1 75 2 .175 3 M1 Allow incorrect mean. + e–1.75 2 !3 Allow end errors (1 and/or 4) = 0.421 (3 sf) A1 [4] Total: 4 6
Q2 · The mean and standard deviation of the time spent by people in a certain library are 29…
2 The mean and standard deviation of the time spent by people in a certain library are 29 minutes and 6 minutes respectively. (i) Find the probability that the mean time spent in the library by a random sample of 120 people is more than 30 minutes. [4] (ii) Explain whether it was necessary to assume that the time spent by people in the library is normally distributed in the solution to part (i). [2]
Mark scheme: 62 (i) B1 Or 6²/120 oe seen oe seen 120 30 − 29 M1 ± (= 1.826) 6 Allow without √120. No sd/var mix 120 M1 P(z > ‘1.826’) = 1 – Φ(‘1.826’) Correct tail consistent with their A1 [4] working = 0.034 (2 sf) 0.0339 (ii) No B1 1st B1 for either comment n is large (⩾30) Sample mean is (appr) normally distrib 2nd B1 for’No’with 2nd comment or The CLT applies oe B1 [2] (No mark for ‘No’ alone) Total: 6 3420
Q3 · Jagdeesh measured the lengths, x minutes, of 60 randomly chosen lectures
3 Jagdeesh measured the lengths, x minutes, of 60 randomly chosen lectures. His results are summarised below. n = 60 Σx = 3420 Σx2 = 195 200 (i) Calculate unbiased estimates of the population mean and variance. [3] (ii) Calculate a 98% confidence interval for the population mean. [3]
Mark scheme: 34203 (i) (= 57 ) B1 60 60 195200 − '57 2' (= 4.40678) M1 Oe 59 60 = 4.41 (3 sf) A1 [3] As final answer (ii) .4'40678' M1 '57 '± z 60 z = 2.326 B1 2.326 – 2.329 (accept 2.33 if no better seen) [56.4 to 57.6] (3 sf) A1 [3] NB: use of biased variance in (ii) can score in full Total: 6 2 ∫
Q4 · A random variable X has probability density function given by D k 3 −x 1 ≤x ≤2, f x = 0…
4 A random variable X has probability density function given by D k 3 −x 1 ≤x ≤2, f x = 0 otherwise, where k is a constant. (i) Show that k = 2 [3] 3. (ii) Find the median of X. [4]
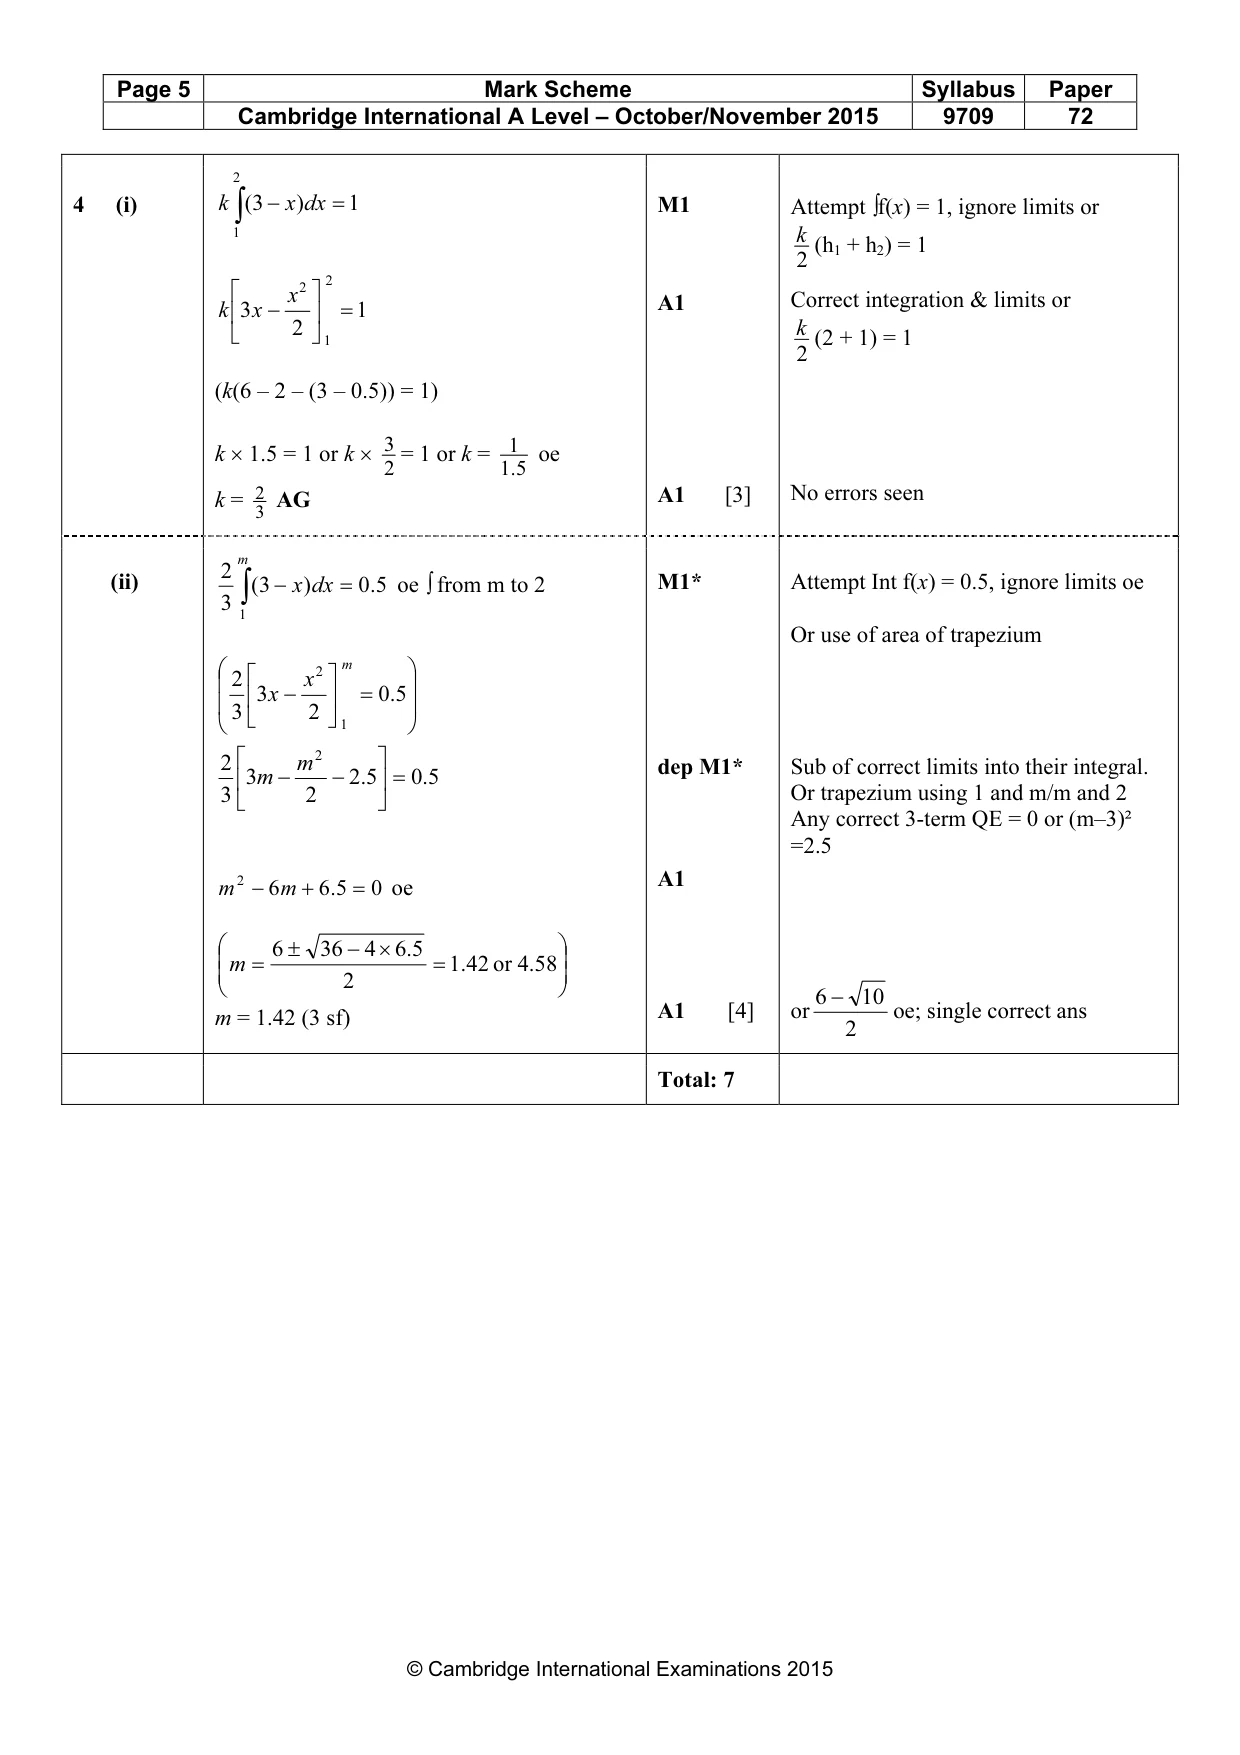
Mark scheme: Attempt ∫f(x) = 1, ignore limits or4 (i) k ∫ (3 − x ) d x = 1 M1 1 k (h1 + h2) = 1 2 2 2 A1 Correct integration & limits or k 3 x −x = 1 2 k 1 (2 + 1) = 1 2 (k(6 – 2 – (3 – 0.5)) = 1) 3 1 k × 1.5 = 1 or k × = 1 or k = oe 2 5.1 k = 2 AG A1 [3] No errors seen 3 m 2 (ii) 3 ∫ ( 3 − x ) d x = 5.0 oe ∫ from m to 2 M1* Attempt Int f(x) = 0.5, ignore limits oe 1 Or use of area of trapezium 2 m 2 x 3 x − = 5.0 3 2 1 2 2 dep M1* Sub of correct limits into their integral. 3m −m − 5.2 = 5.0 3 2 Or trapezium using 1 and m/m and 2 Any correct 3-term QE = 0 or (m–3)² =2.5 2 A1 m −m6 + 5.6 = 0 oe 6 ± 36 − 4 × 5.6 m = = .1 42 or .4 58 2 6 − 10 A1 [4] or oe; single correct ans m = 1.42 (3 sf) 2 Total: 7
Q5 · On average, 1 in 2500 adults has a certain medical condition
5 On average, 1 in 2500 adults has a certain medical condition. (i) Use a suitable approximation to find the probability that, in a random sample of 4000 people, more than 3 have this condition. [3] (ii) In a random sample of n people, where n is large, the probability that none has the condition is less than 0.05. Find the smallest possible value of n. [4]
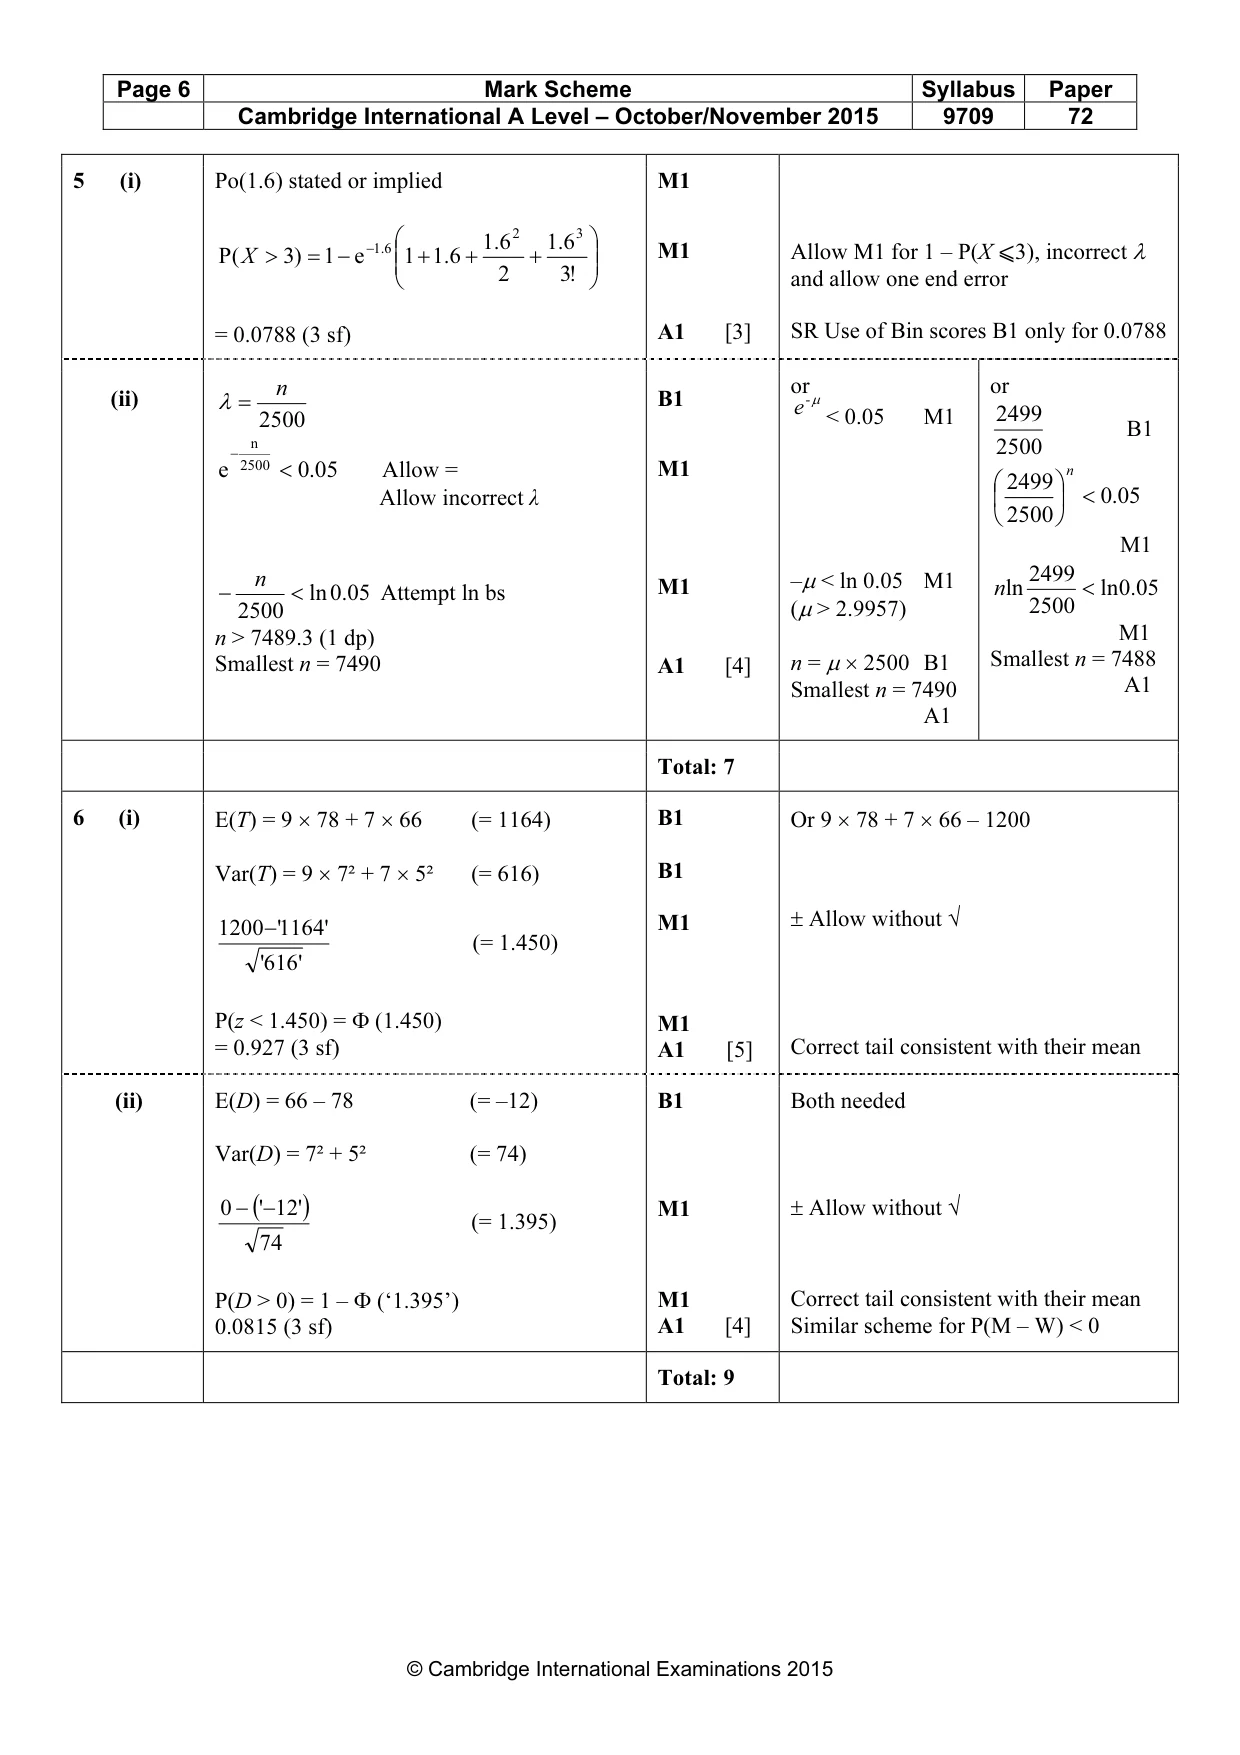
Mark scheme: 5 (i) Po(1.6) stated or implied M1 6.1 2 6.1 3 M1 + P ( X > 3) = 1 − e −6.1 1 + 6.1 + Allow M1 for 1 – P(X ⩽3), incorrect λ 2 !3 and allow one end error A1 [3] SR Use of Bin scores B1 only for 0.0788 = 0.0788 (3 sf) n or or (ii) B1 µ λ = -e 2500 < 0.05 M1 2499 B1 n 2500 − e 2500 < .005 Allow = M1 n 2499 Allow incorrect λ < .005 2500 M1 2499 n M1 –µ < ln 0.05 M1 nln < ln .005 − < ln .005 Attempt ln bs 2500 (µ > 2.9957) 2500 n > 7489.3 (1 dp) M1 Smallest n = 7490 A1 [4] n = µ × 2500 B1 Smallest n = 7488 Smallest n = 7490 A1 A1 Total: 7
Q6 · The weights, in kilograms, of men and women have the distributions N 78, 72 and N 66, 52…
6 The weights, in kilograms, of men and women have the distributions N 78, 72 and N 66, 52 respectively. (i) The maximum load that a certain cable car can carry safely is 1200 kg. If 9 randomly chosen men and 7 randomly chosen women enter the cable car, find the probability that the cable car can operate safely. [5] (ii) Find the probability that a randomly chosen woman weighs more than a randomly chosen man. [4]
Mark scheme: 6 (i) E(T) = 9 × 78 + 7 × 66 (= 1164) B1 Or 9 × 78 + 7 × 66 – 1200 B1 Var(T) = 9 × 7² + 7 × 5² (= 616) M1 ± Allow without √ 1200− '1164 ' (= 1.450) '616 ' P(z < 1.450) = Φ (1.450) M1 = 0.927 (3 sf) A1 [5] Correct tail consistent with their mean (ii) E(D) = 66 – 78 (= –12) B1 Both needed Var(D) = 7² + 5² (= 74) 0 − ('−12' ) M1 ± Allow without √ (= 1.395) 74 P(D > 0) = 1 – Φ (‘1.395’) M1 Correct tail consistent with their mean A1 [4] Similar scheme for P(M – W) < 0 0.0815 (3 sf) Total: 9
Q7 · At a certain hospital it was found that the probability that a patient did not arrive for…
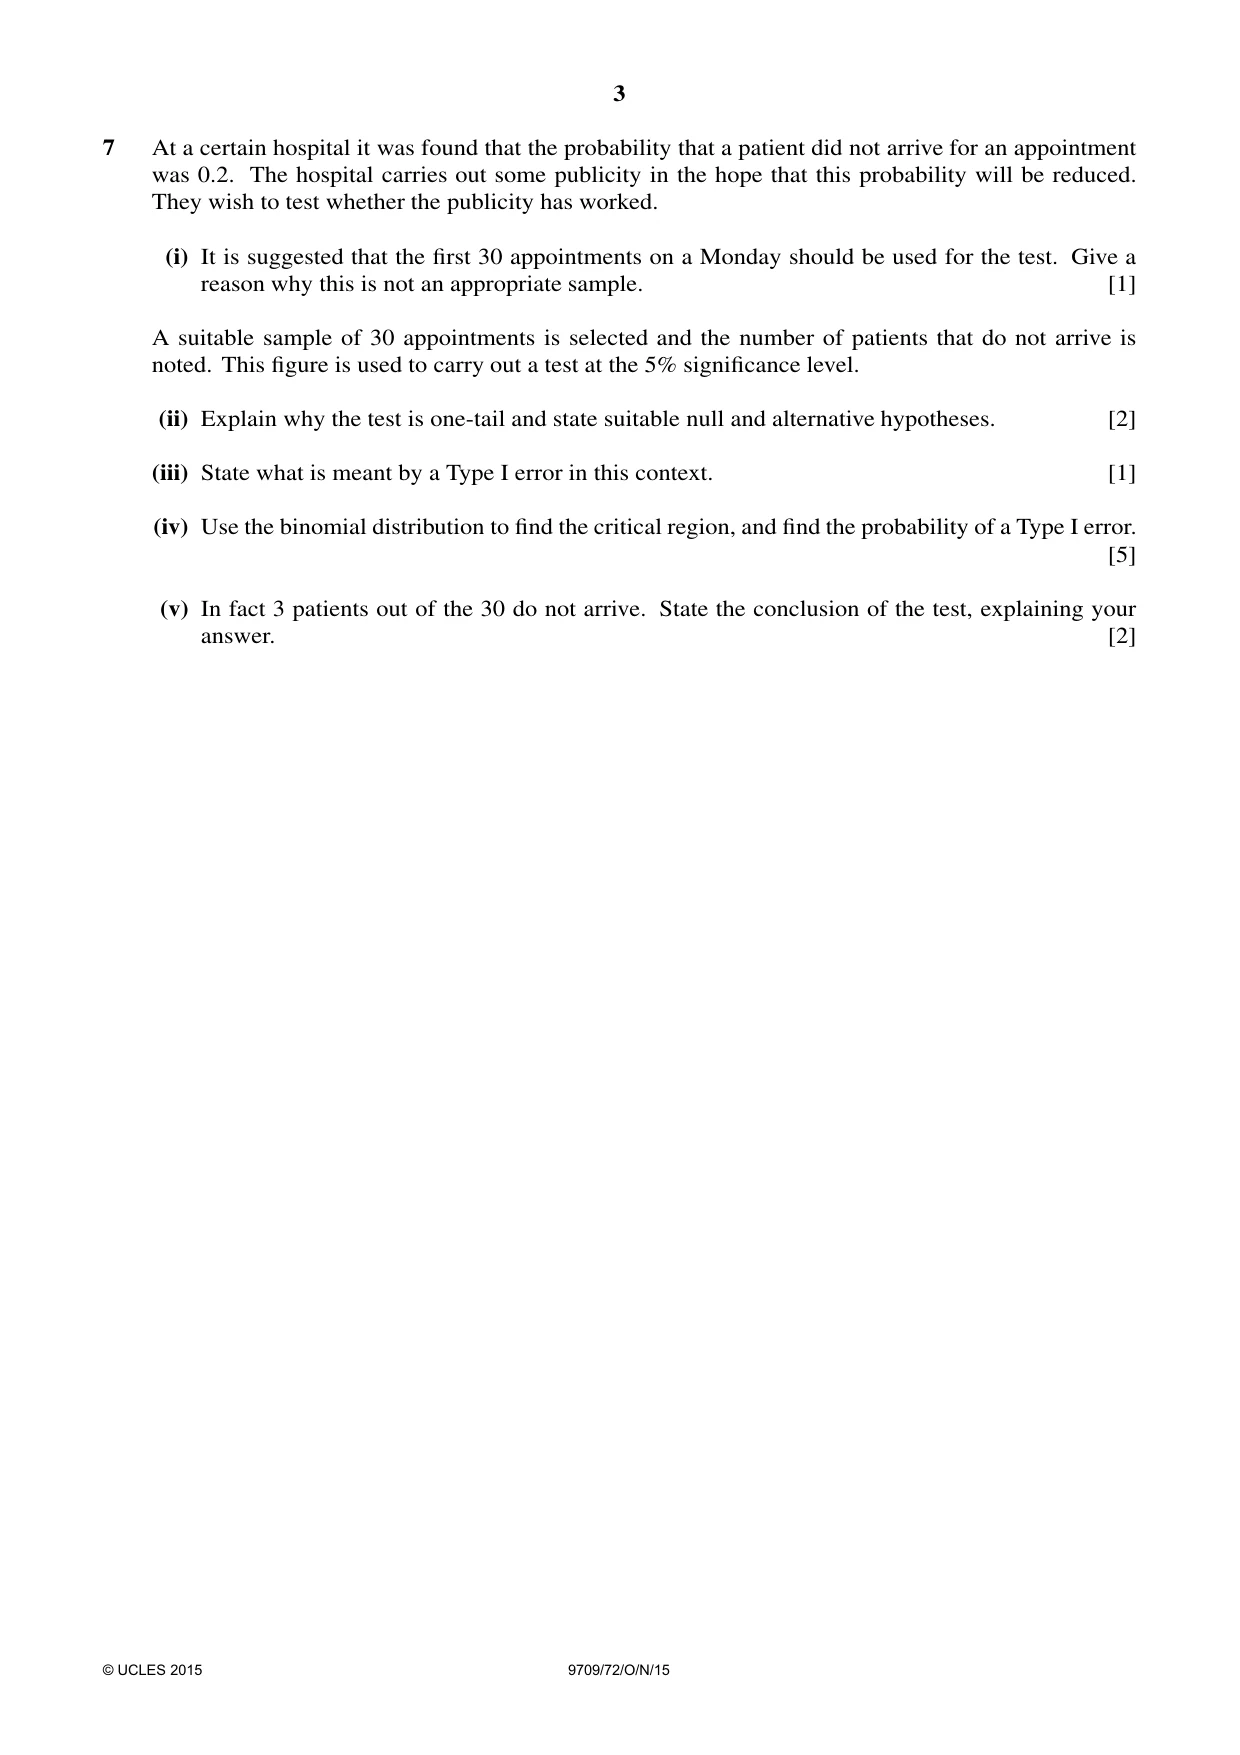
7 At a certain hospital it was found that the probability that a patient did not arrive for an appointment was 0.2. The hospital carries out some publicity in the hope that this probability will be reduced. They wish to test whether the publicity has worked. (i) It is suggested that the first 30 appointments on a Monday should be used for the test. Give a reason why this is not an appropriate sample. [1] A suitable sample of 30 appointments is selected and the number of patients that do not arrive is noted. This figure is used to carry out a test at the 5% significance level. (ii) Explain why the test is one-tail and state suitable null and alternative hypotheses. [2] (iii) State what is meant by a Type I error in this context. [1] (iv) Use the binomial distribution to find the critical region, and find the probability of a Type I error. [5] (v) In fact 3 patients out of the 30 do not arrive. State the conclusion of the test, explaining your answer. [2]
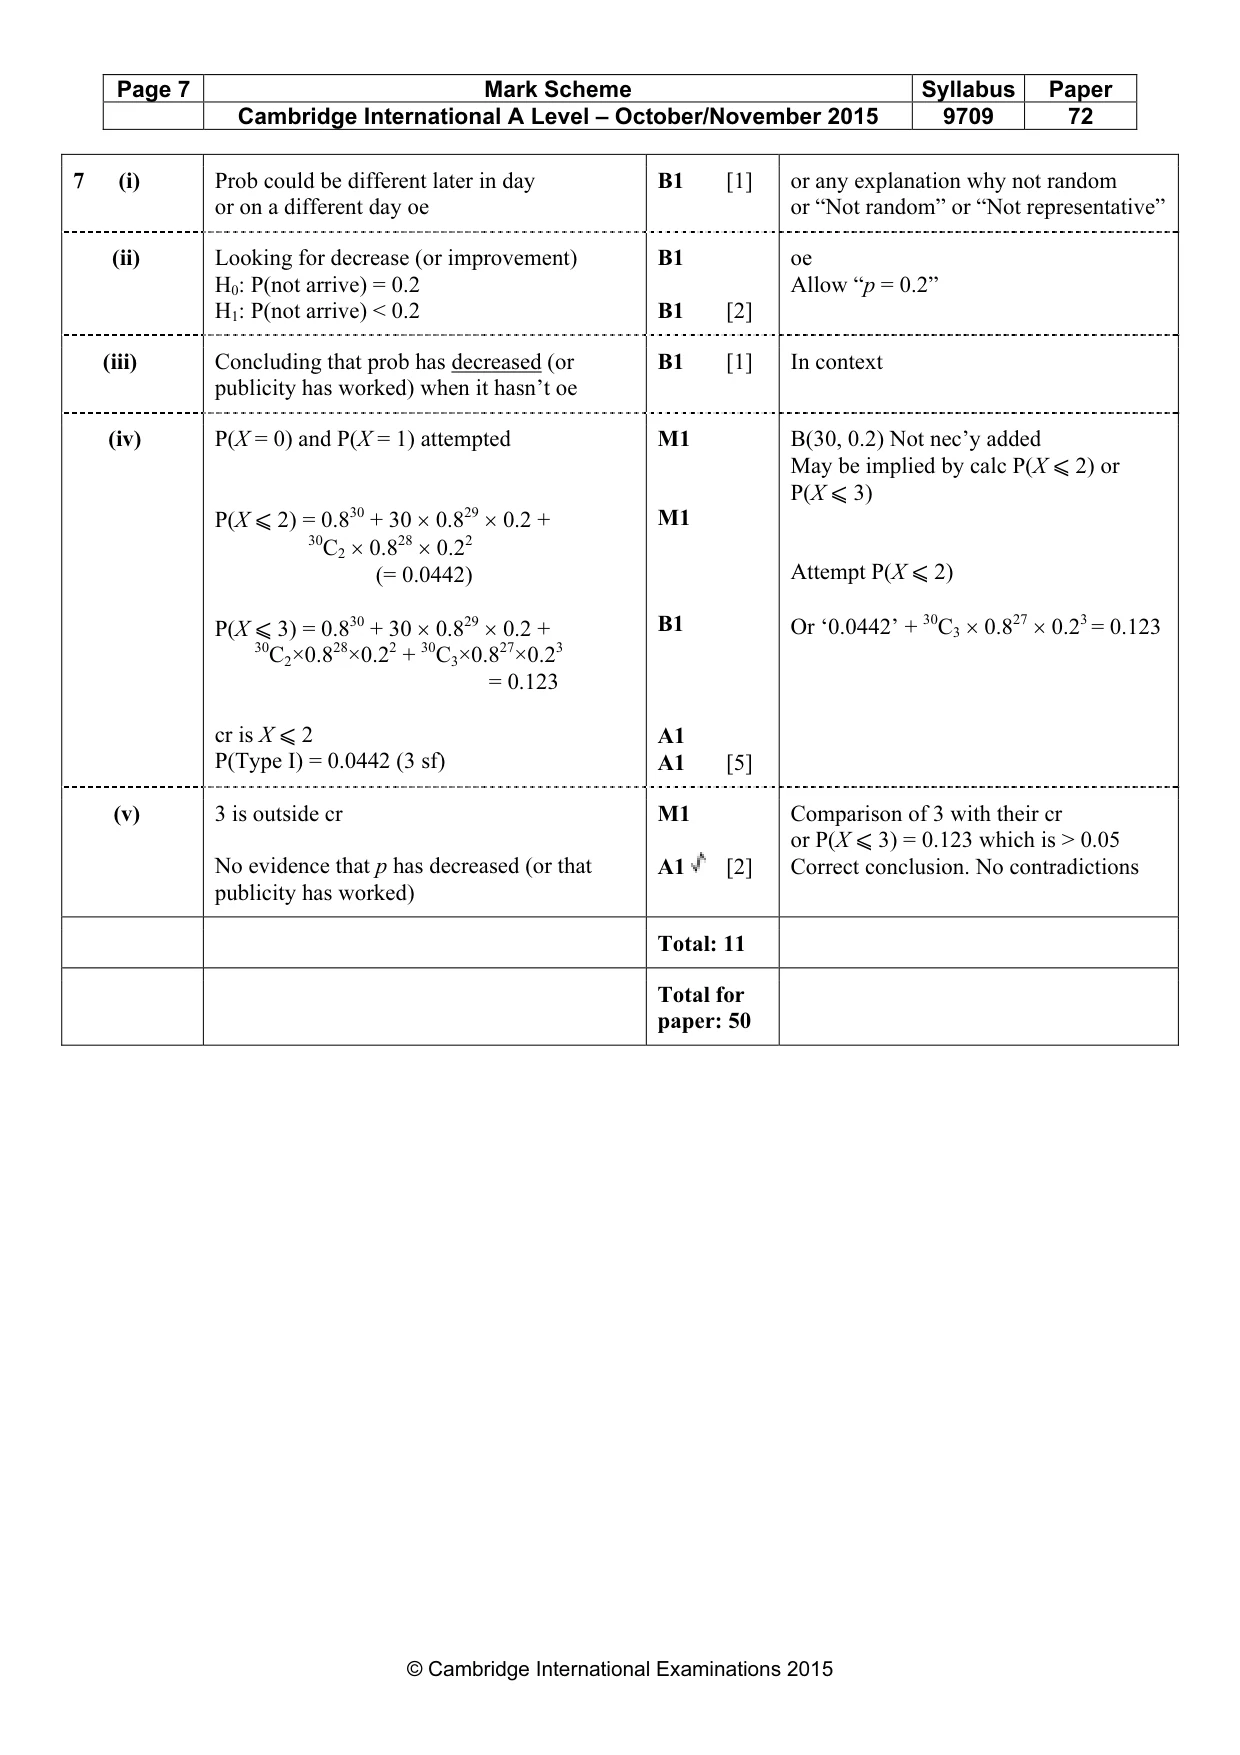
Mark scheme: 7 (i) Prob could be different later in day B1 [1] or any explanation why not random or on a different day oe or “Not random” or “Not representative” (ii) Looking for decrease (or improvement) B1 oe H0: P(not arrive) = 0.2 Allow “p = 0.2” H1: P(not arrive) < 0.2 B1 [2] (iii) Concluding that prob has decreased (or B1 [1] In context publicity has worked) when it hasn’t oe (iv) P(X = 0) and P(X = 1) attempted M1 B(30, 0.2) Not nec’y added May be implied by calc P(X ⩽ 2) or P(X ⩽ 3) P(X ⩽ 2) = 0.830 + 30 × 0.829 × 0.2 + M1 30C2 × 0.828 × 0.22 (= 0.0442) Attempt P(X ⩽ 2) B1 P(X ⩽ 3) = 0.830 + 30 × 0.829 × 0.2 + Or ‘0.0442’ + 30C3 × 0.827 × 0.23 = 0.123 30C2×0.828×0.22 + 30C3×0.827×0.23 = 0.123 cr is X ⩽ 2 A1 P(Type I) = 0.0442 (3 sf) A1 [5] (v) 3 is outside cr M1 Comparison of 3 with their cr or P(X ⩽ 3) = 0.123 which is > 0.05 No evidence that p has decreased (or that A1 [2] Correct conclusion. No contradictions publicity has worked) Total: 11 Total for paper: 50
What was in this paper
The subtopics covered by these 7 questions, and how many questions each got. Open one in a new tab to see every Cambridge question on it.
What you needed in this session
Cambridge’s own grade thresholds for 2015 Oct/Nov, Paper 7 · Variant 2. A higher threshold means an easier paper — the bar moves with how the cohort did.