Cambridge A Level Mathematics 9709 — 2009 Oct/Nov Paper 7 · Variant 2
9709/72/O/N/09 · 7 questions · 50 marks · ≈56 min
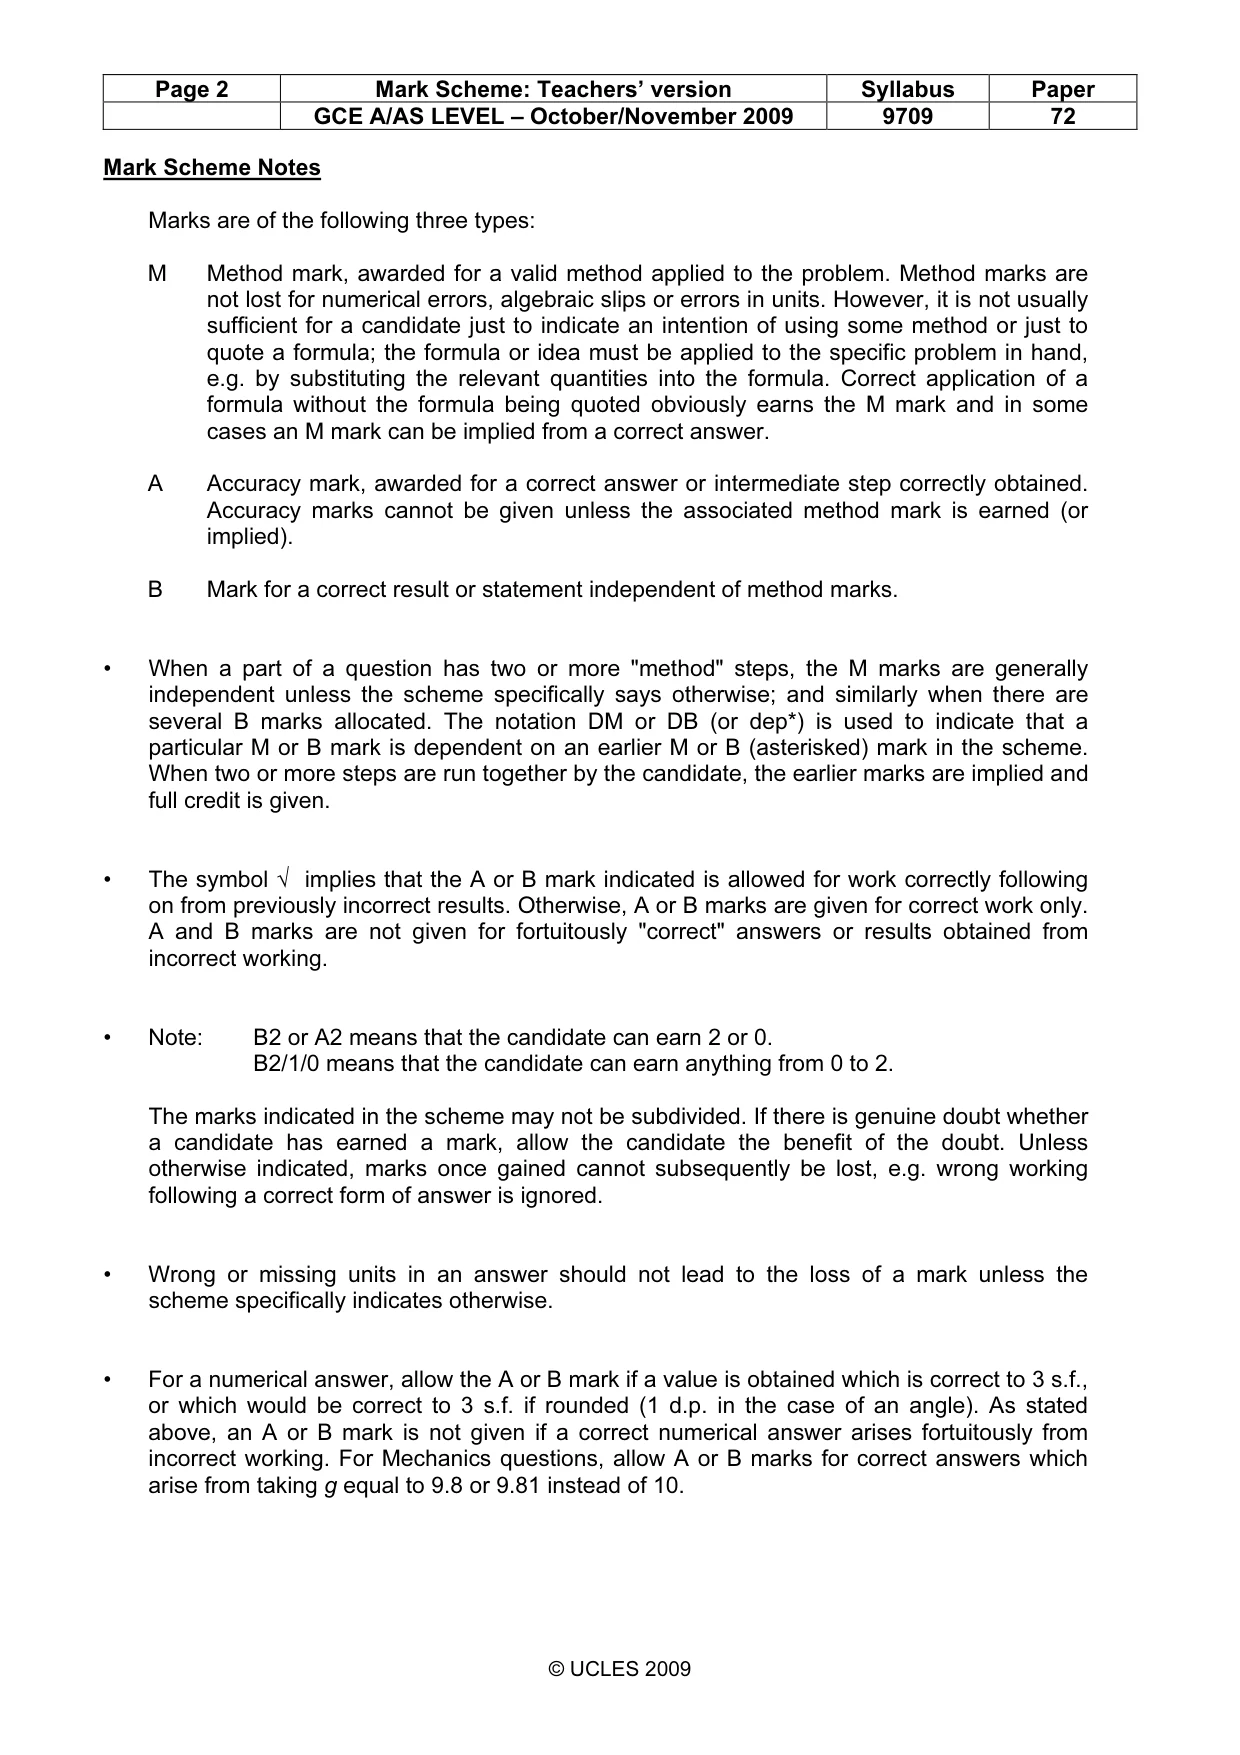
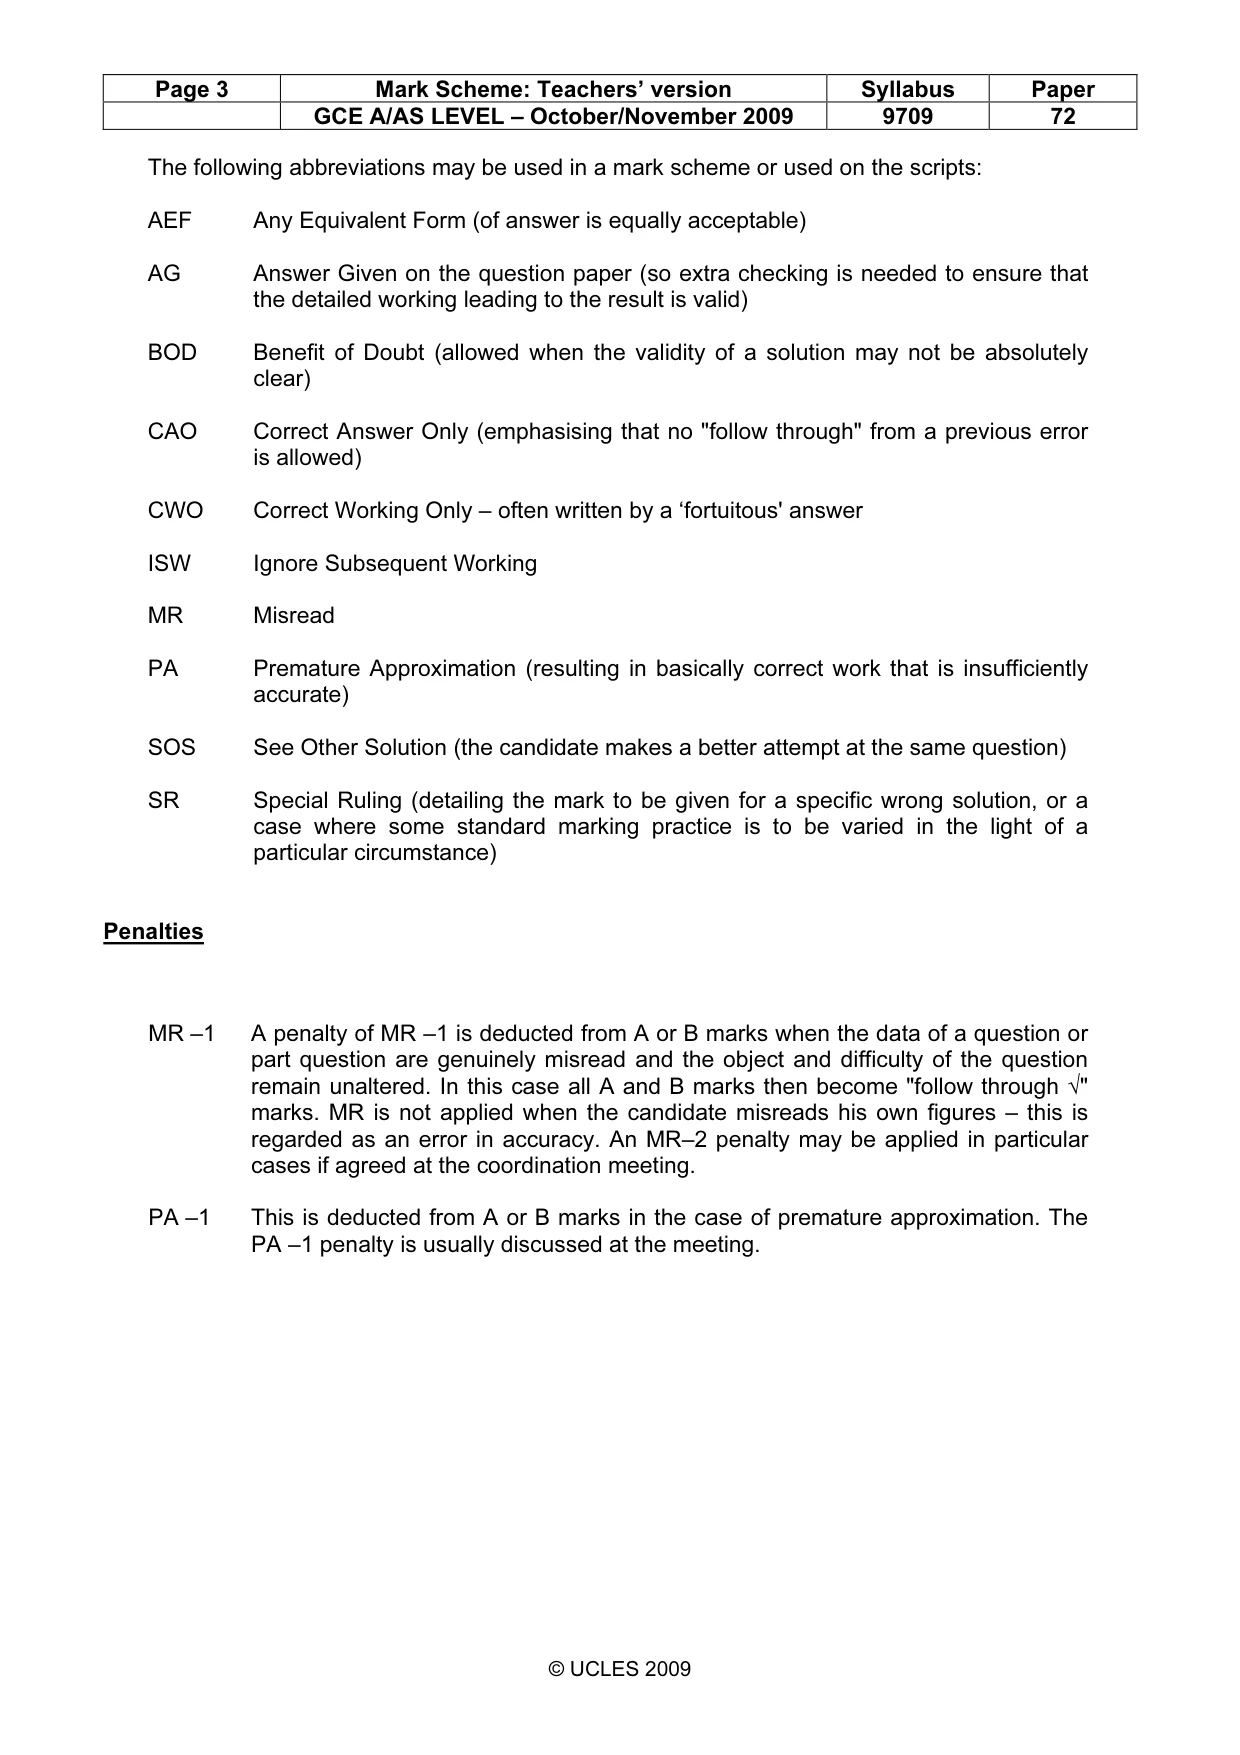
The question paper and its mark scheme, free to read here and free to download. This is Cambridge’s own paper, exactly as it was sat.
Question paper4 pages
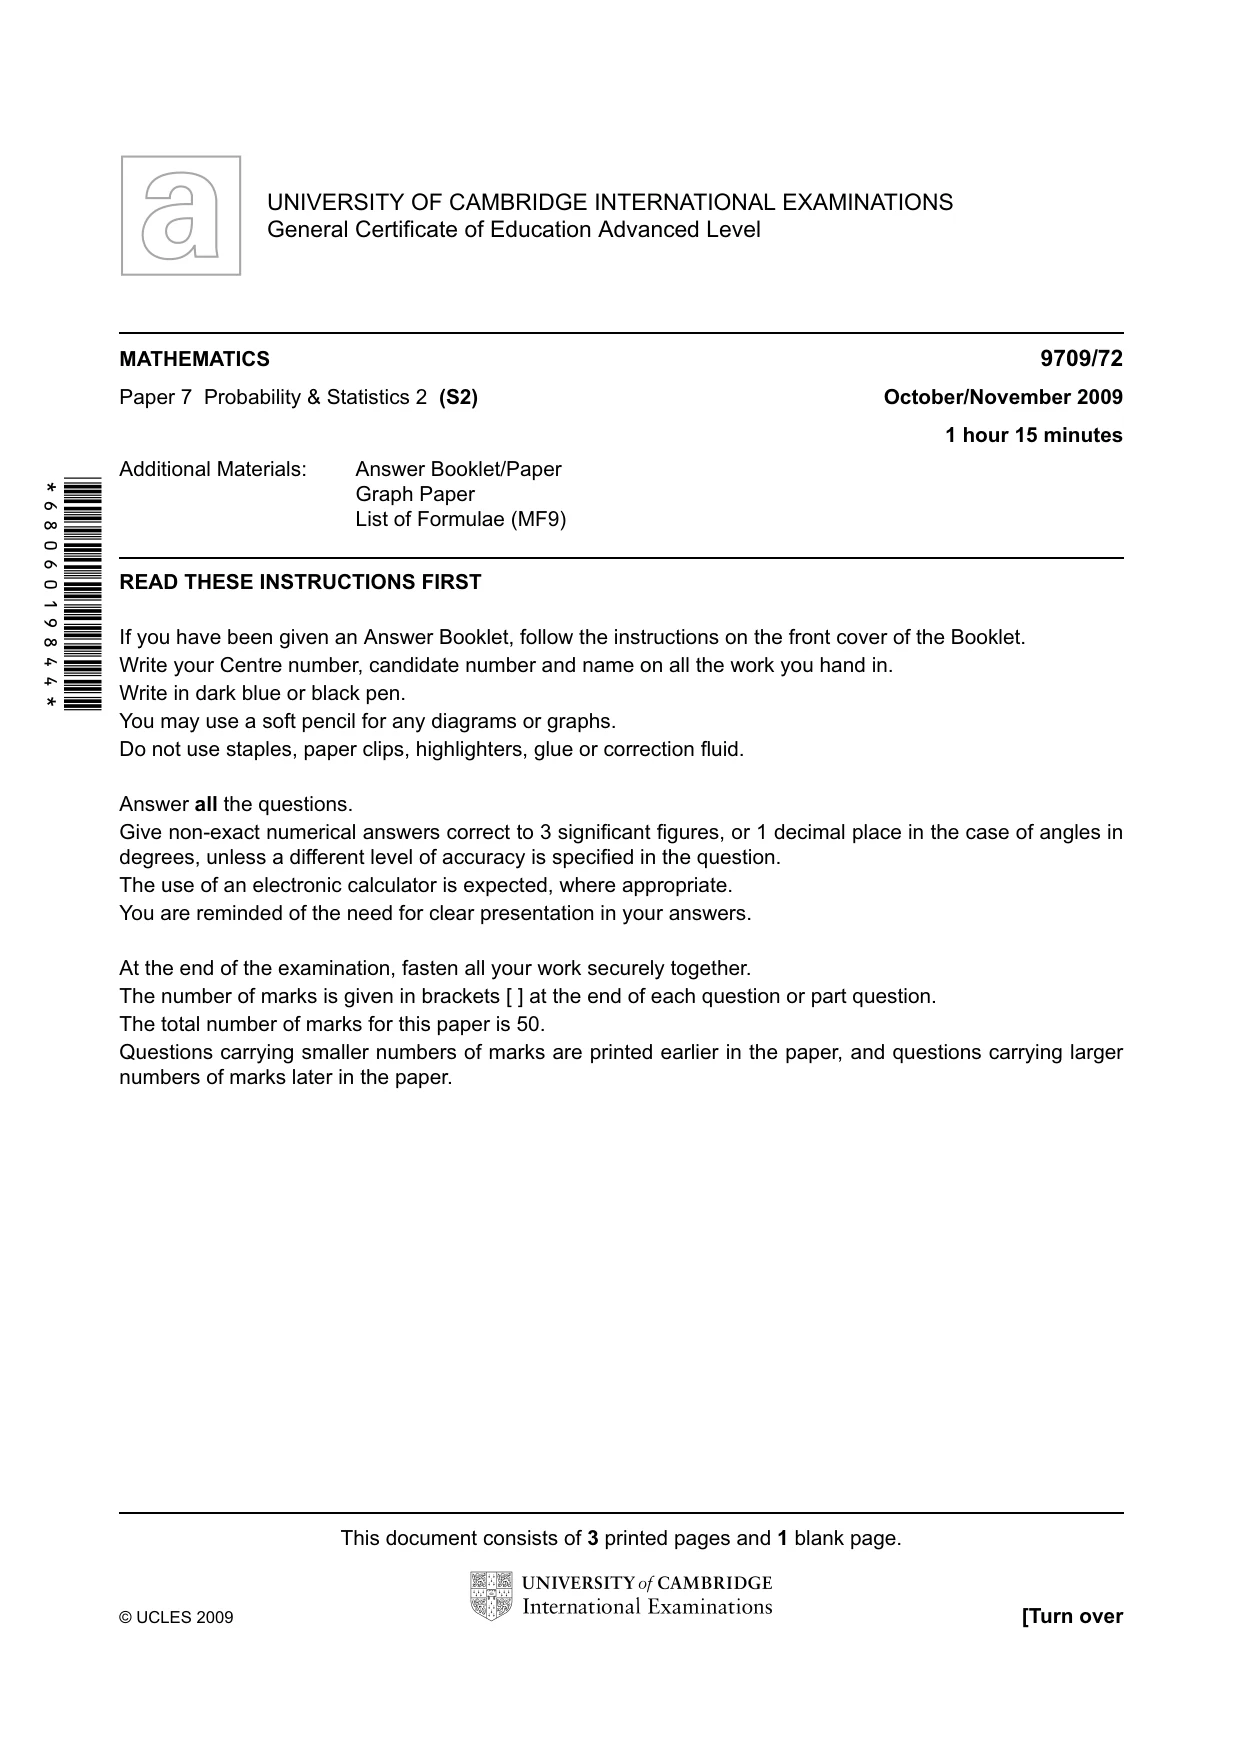
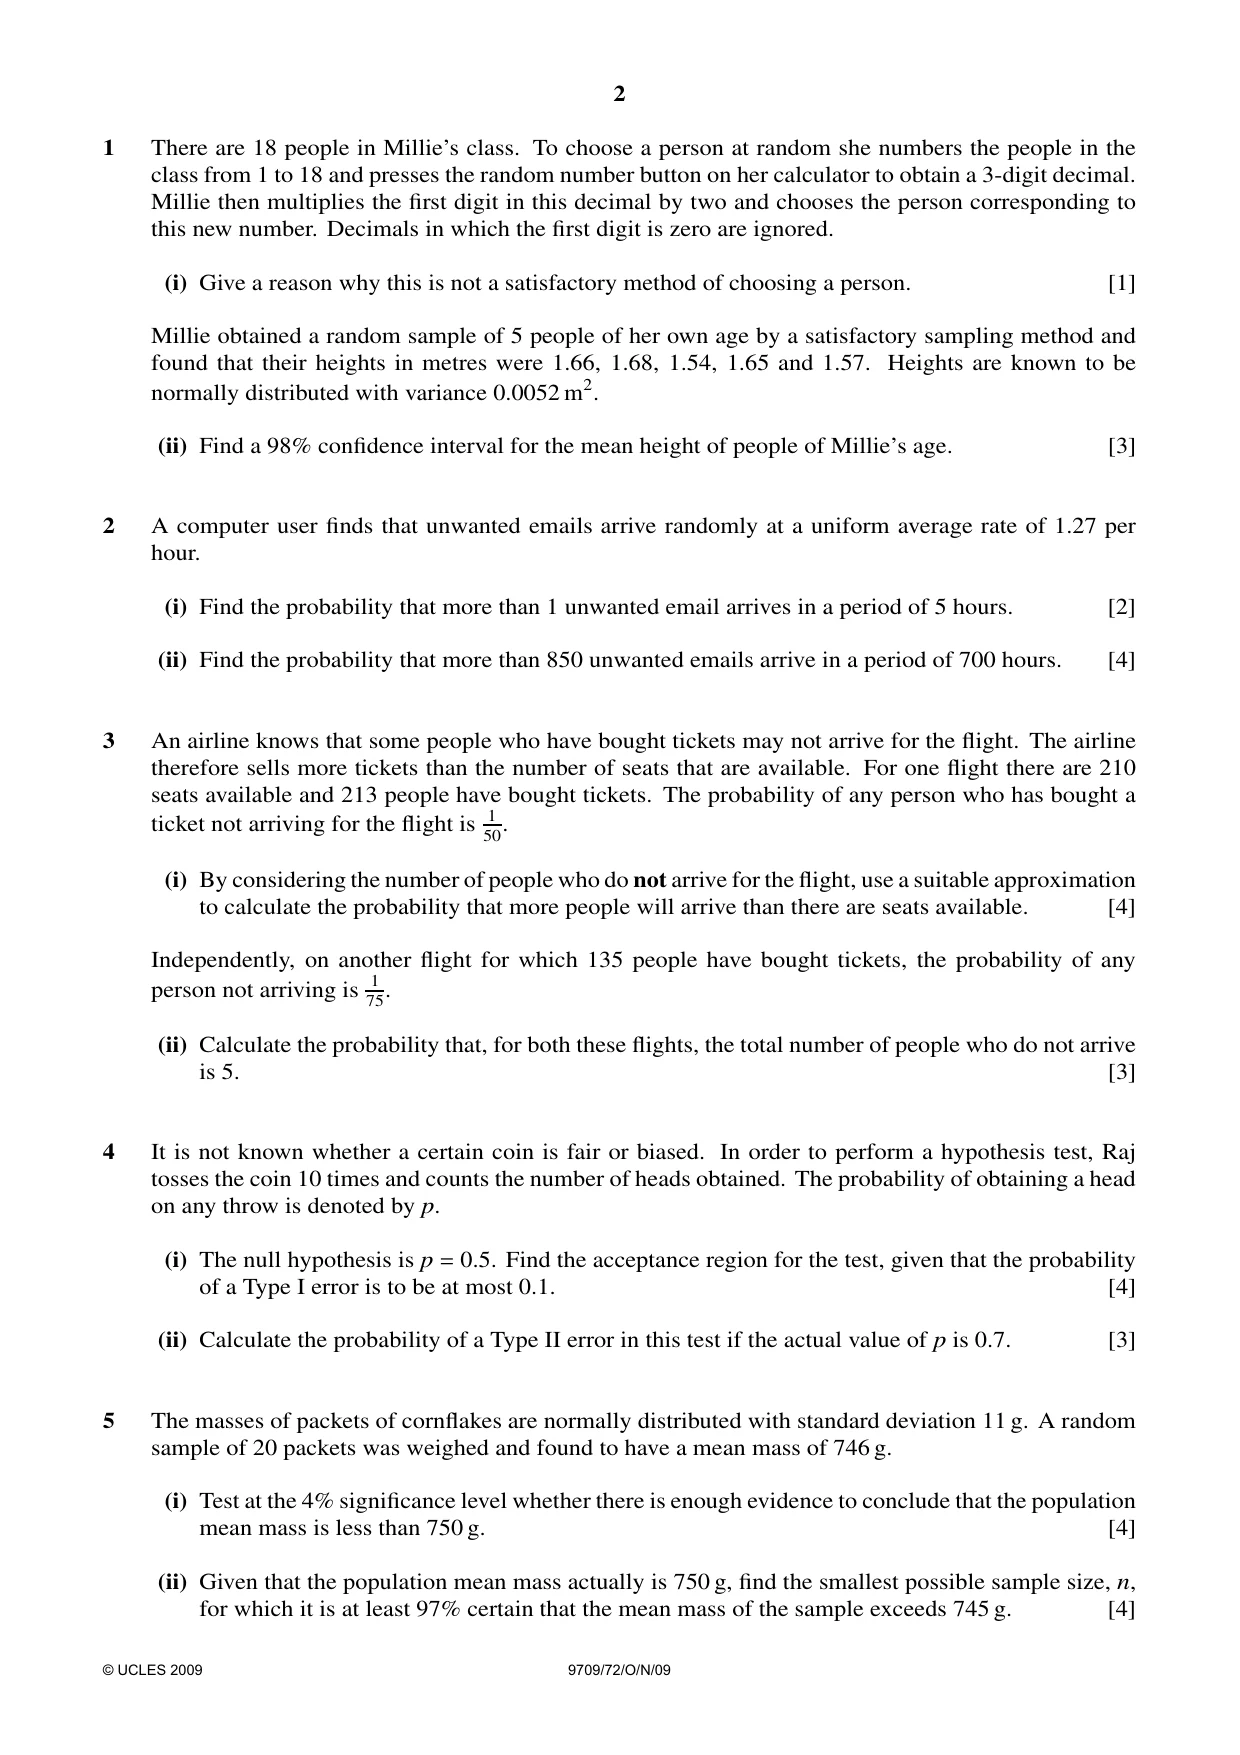
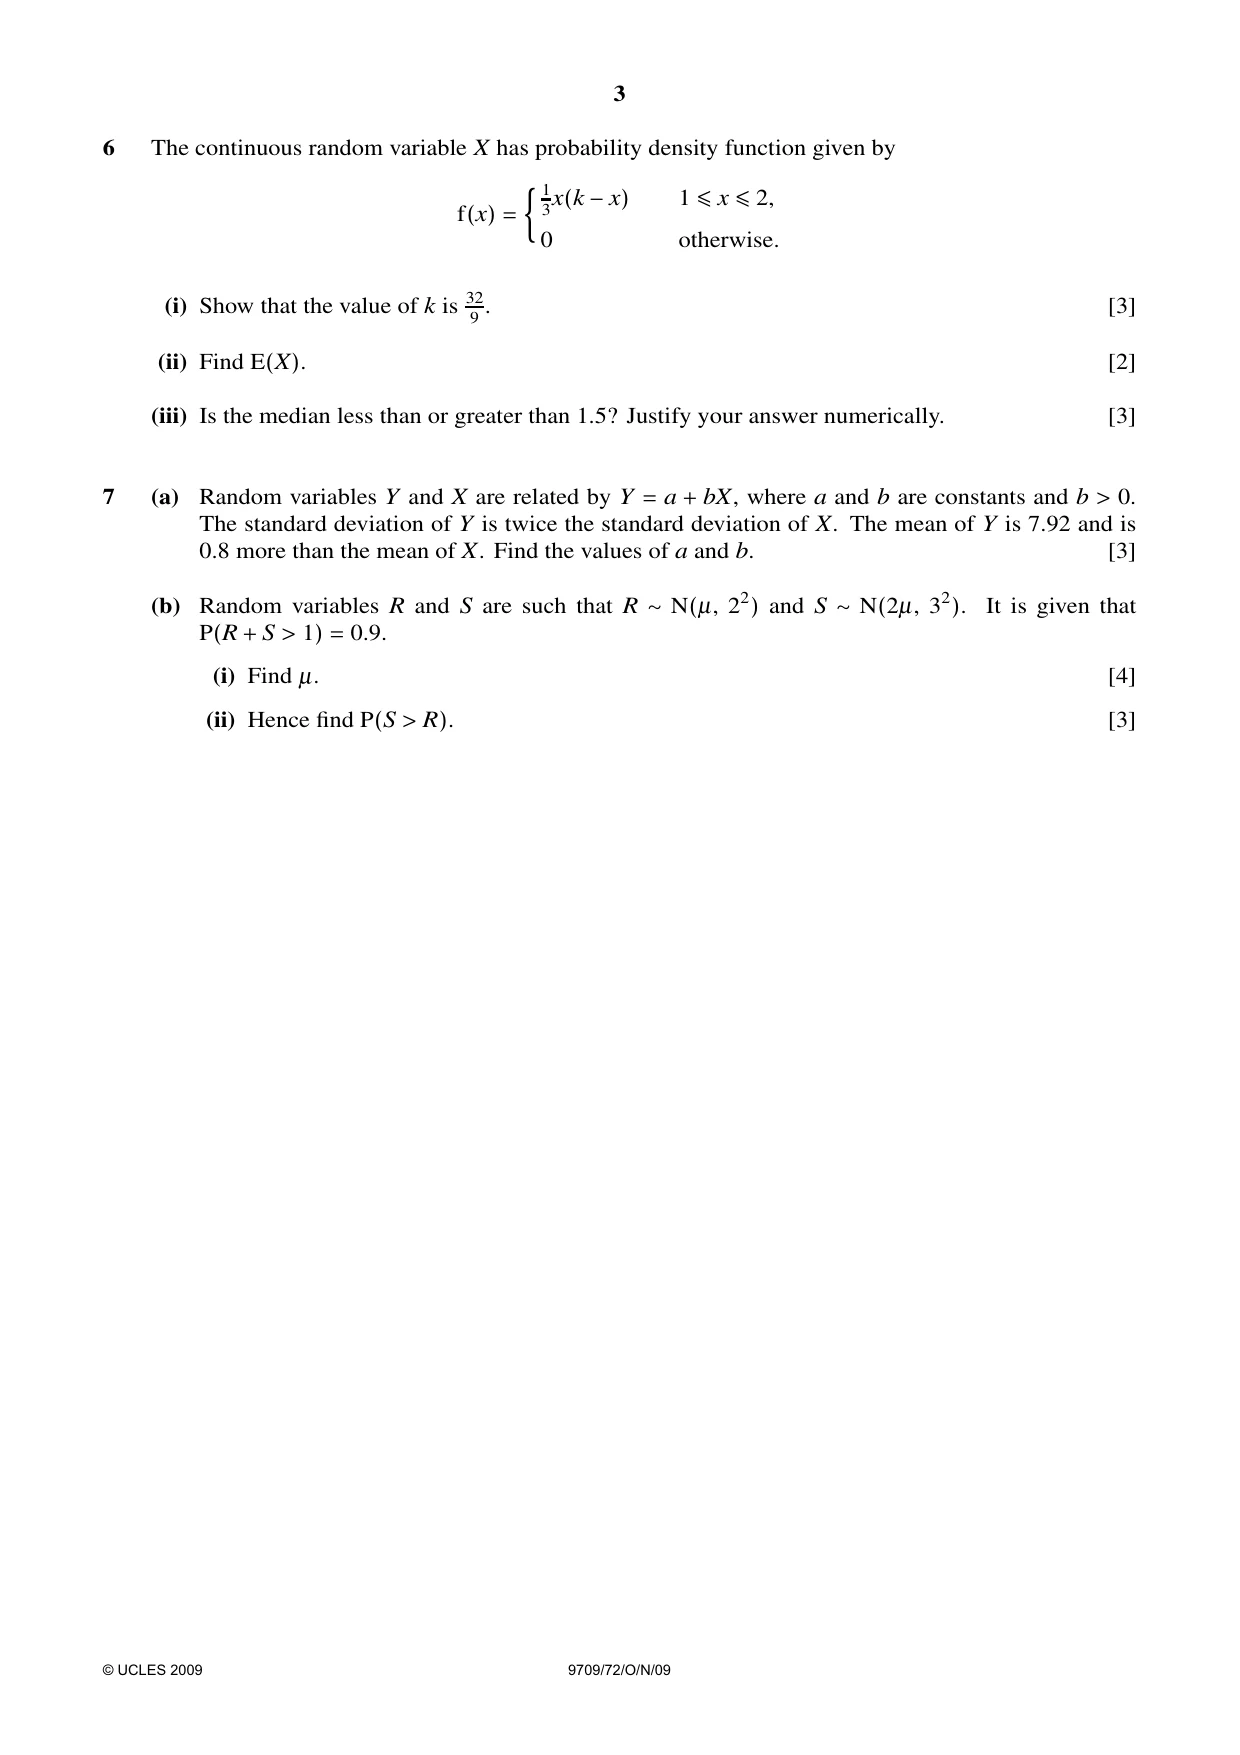

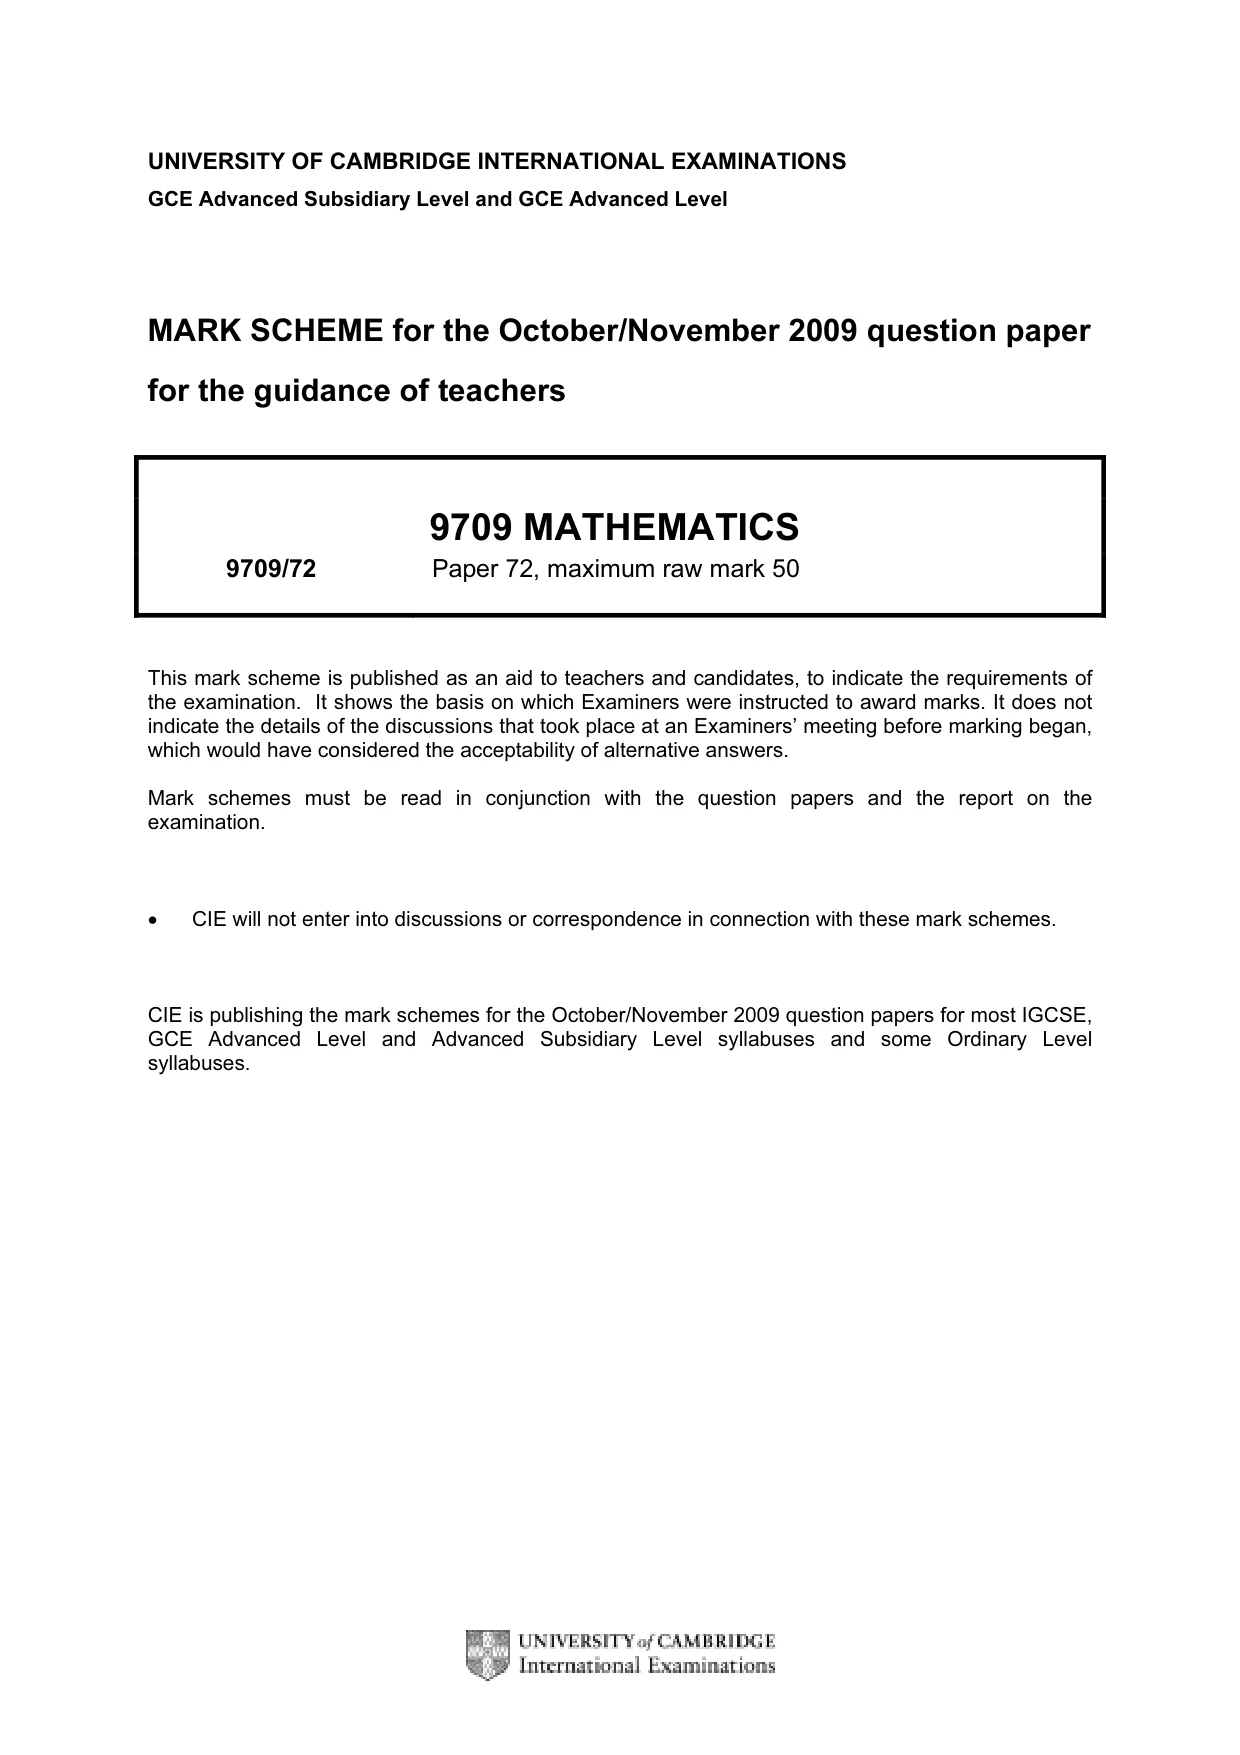
Mark scheme6 pages
Answers below. Sit the paper first if you are practising.
Questions as text
Q1 · There are 18 people in Millie’s class
1 There are 18 people in Millie’s class. To choose a person at random she numbers the people in the class from 1 to 18 and presses the random number button on her calculator to obtain a 3-digit decimal. Millie then multiplies the first digit in this decimal by two and chooses the person corresponding to this new number. Decimals in which the first digit is zero are ignored. (i) Give a reason why this is not a satisfactory method of choosing a person. [1] Millie obtained a random sample of 5 people of her own age by a satisfactory sampling method and found that their heights in metres were 1.66, 1.68, 1.54, 1.65 and 1.57. Heights are known to be normally distributed with variance 0.0052 m2. (ii) Find a 98% confidence interval for the mean height of people of Millie’s age. [3]
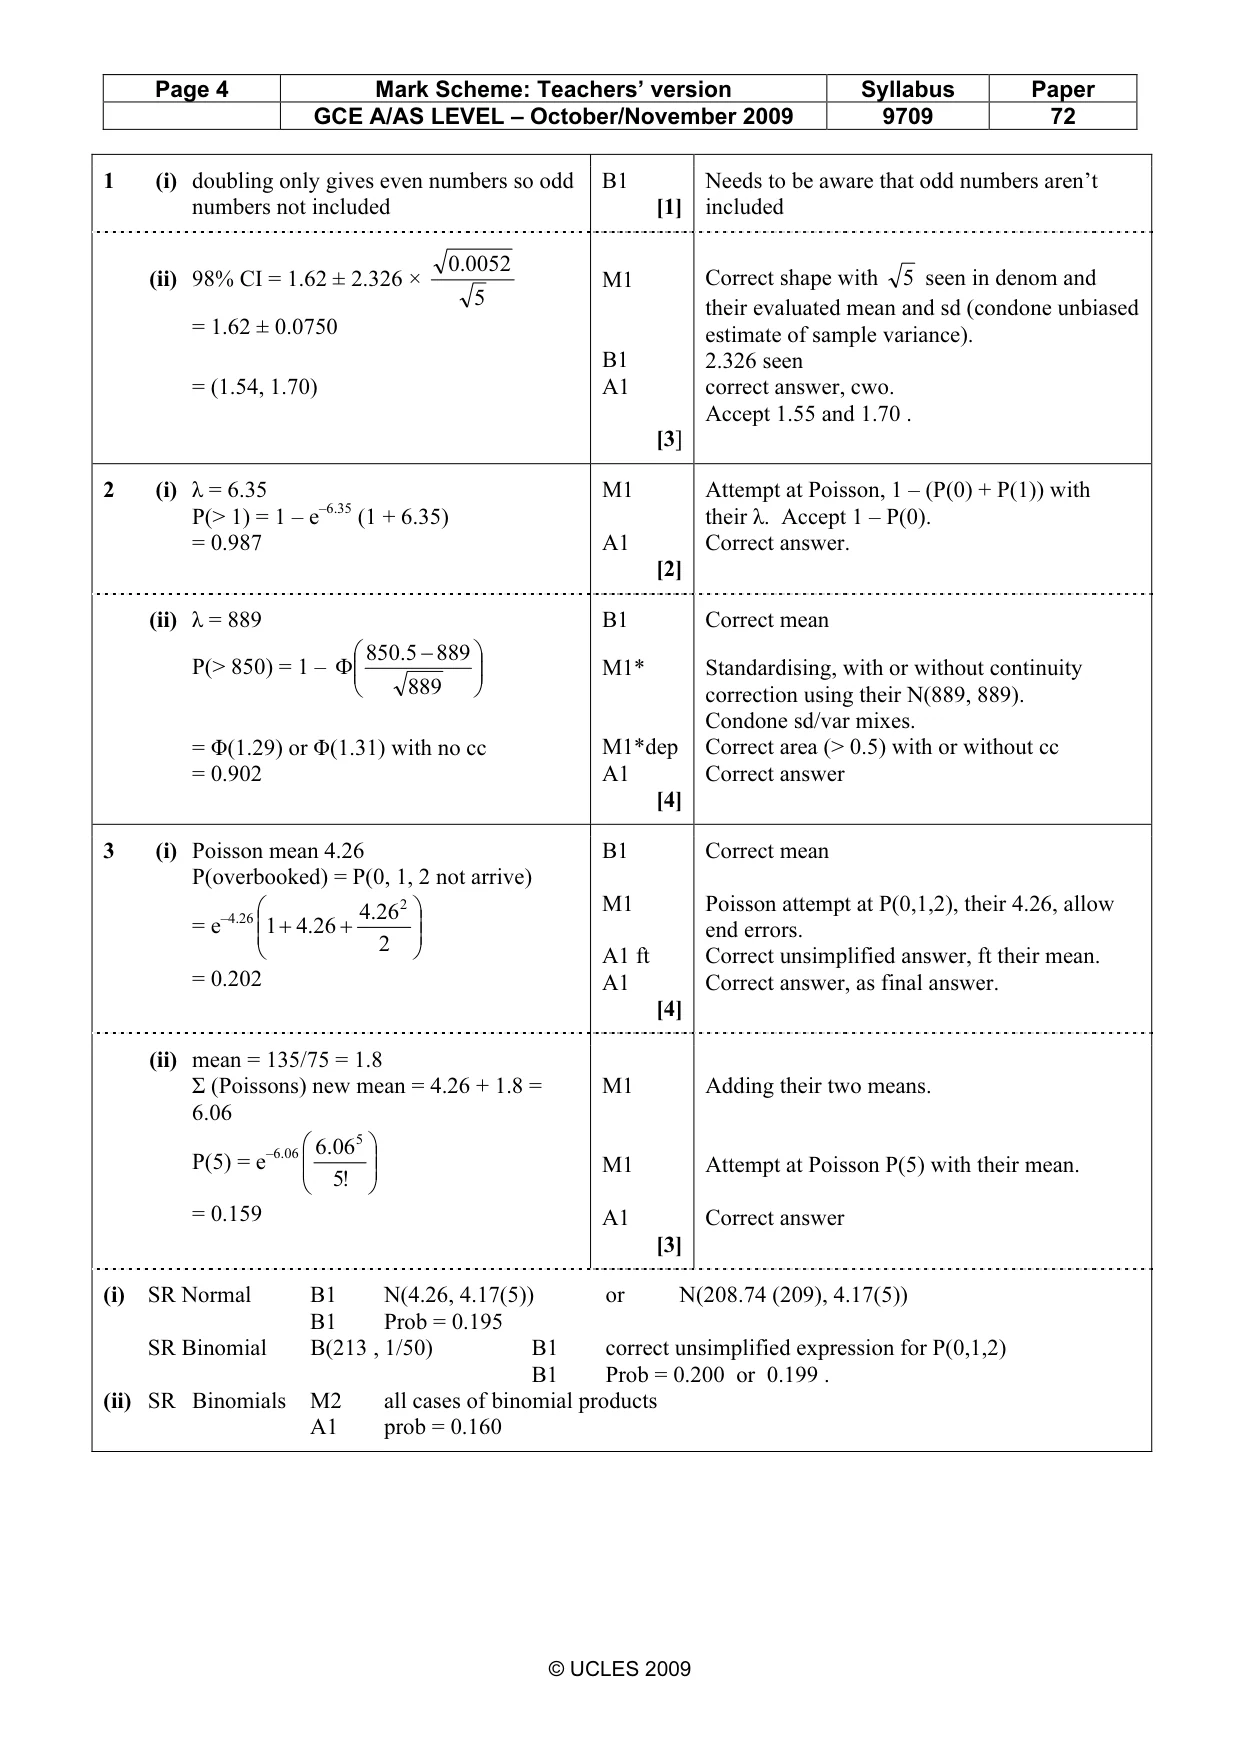
Mark scheme: 1 (i) doubling only gives even numbers so odd B1 Needs to be aware that odd numbers aren’t numbers not included [1] included .00052 (ii) 98% CI = 1.62 ± 2.326 × M1 Correct shape with 5 seen in denom and 5 their evaluated mean and sd (condone unbiased = 1.62 ± 0.0750 estimate of sample variance). B1 2.326 seen = (1.54, 1.70) A1 correct answer, cwo. Accept 1.55 and 1.70 . [3]
Q2 · A computer user finds that unwanted emails arrive randomly at a uniform average rate of…
2 A computer user finds that unwanted emails arrive randomly at a uniform average rate of 1.27 per hour. (i) Find the probability that more than 1 unwanted email arrives in a period of 5 hours. [2] (ii) Find the probability that more than 850 unwanted emails arrive in a period of 700 hours. [4]
Mark scheme: 2 (i) λ = 6.35 M1 Attempt at Poisson, 1 – (P(0) + P(1)) with P(> 1) = 1 – e–6.35 (1 + 6.35) their λ. Accept 1 – P(0). = 0.987 A1 Correct answer. [2] (ii) λ = 889 B1 Correct mean 8505. − 889 P(> 850) = 1 – Φ M1* Standardising, with or without continuity 889 correction using their N(889, 889). Condone sd/var mixes. = Φ(1.29) or Φ(1.31) with no cc M1*dep Correct area (> 0.5) with or without cc = 0.902 A1 Correct answer [4]
Q3 · An airline knows that some people who have bought tickets may not arrive for the flight
3 An airline knows that some people who have bought tickets may not arrive for the flight. The airline therefore sells more tickets than the number of seats that are available. For one flight there are 210 seats available and 213 people have bought tickets. The probability of any person who has bought a ticket not arriving for the flight is 50.1 (i) By considering the number of people who do not arrive for the flight, use a suitable approximation to calculate the probability that more people will arrive than there are seats available. [4] Independently, on another flight for which 135 people have bought tickets, the probability of any person not arriving is 75.1 (ii) Calculate the probability that, for both these flights, the total number of people who do not arrive is 5. [3]
Mark scheme: 3 (i) Poisson mean 4.26 B1 Correct mean P(overbooked) = P(0, 1, 2 not arrive) .426 2 M1 Poisson attempt at P(0,1,2), their 4.26, allow = e–4.26 1 + .426 + end errors. 2 A1 ft Correct unsimplified answer, ft their mean. = 0.202 A1 Correct answer, as final answer. [4] (ii) mean = 135/75 = 1.8 Σ (Poissons) new mean = 4.26 + 1.8 = M1 Adding their two means. 6.06 .606 5 P(5) = e–6.06 M1 Attempt at Poisson P(5) with their mean. !5 = 0.159 A1 Correct answer [3] (i) SR Normal B1 N(4.26, 4.17(5)) or N(208.74 (209), 4.17(5)) B1 Prob = 0.195 SR Binomial B(213 , 1/50) B1 correct unsimplified expression for P(0,1,2) B1 Prob = 0.200 or 0.199 . (ii) SR Binomials M2 all cases of binomial products A1 prob = 0.160 GCE A/AS LEVEL – October/November 2009 9709 72 10
Q4 · It is not known whether a certain coin is fair or biased
4 It is not known whether a certain coin is fair or biased. In order to perform a hypothesis test, Raj tosses the coin 10 times and counts the number of heads obtained. The probability of obtaining a head on any throw is denoted by p. (i) The null hypothesis is p = 0.5. Find the acceptance region for the test, given that the probability of a Type I error is to be at most 0.1. [4] (ii) Calculate the probability of a Type II error in this test if the actual value of p is 0.7. [3]
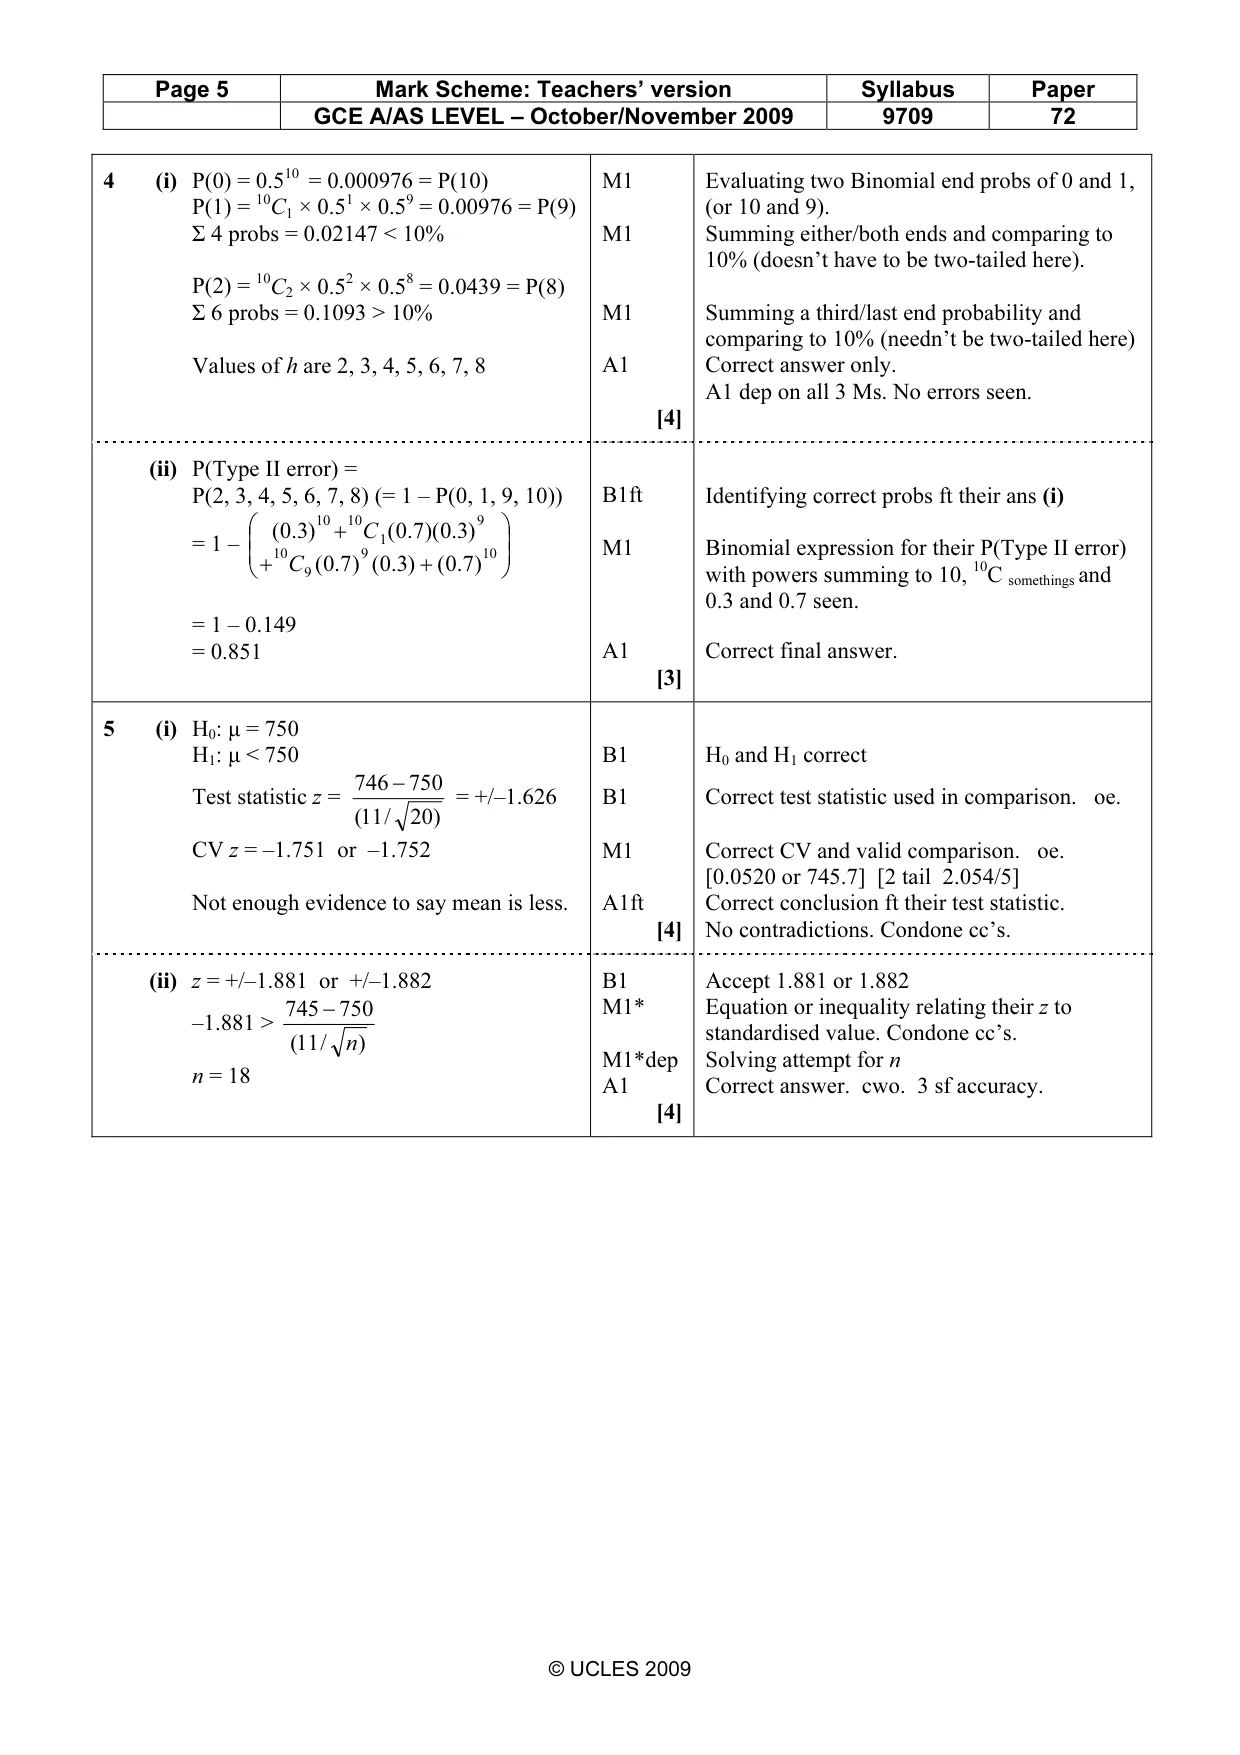
Mark scheme: 4 (i) P(0) = 0.510 = 0.000976 = P(10) M1 Evaluating two Binomial end probs of 0 and 1, P(1) = 10C1 × 0.51 × 0.59 = 0.00976 = P(9) (or 10 and 9). Σ 4 probs = 0.02147 < 10% M1 Summing either/both ends and comparing to 10% (doesn’t have to be two-tailed here). P(2) = 10C2 × 0.52 × 0.58 = 0.0439 = P(8) Σ 6 probs = 0.1093 > 10% M1 Summing a third/last end probability and comparing to 10% (needn’t be two-tailed here) Values of h are 2, 3, 4, 5, 6, 7, 8 A1 Correct answer only. A1 dep on all 3 Ms. No errors seen. [4] (ii) P(Type II error) = P(2, 3, 4, 5, 6, 7, 8) (= 1 – P(0, 1, 9, 10)) B1ft Identifying correct probs ft their ans (i) ( 3.0) 10 + 10 C 1 ( 7.0 )( )3.0 9 M1 Binomial expression for their P(Type II error) = 1 – 10 9 10 + C 9 ( 7.0 ) ( 3.0) + ( 7.0 ) with powers summing to 10, 10C somethings and 0.3 and 0.7 seen. = 1 – 0.149 = 0.851 A1 Correct final answer. [3]
Q5 · The masses of packets of cornflakes are normally distributed with standard deviation 11 g
5 The masses of packets of cornflakes are normally distributed with standard deviation 11 g. A random sample of 20 packets was weighed and found to have a mean mass of 746 g. (i) Test at the 4% significance level whether there is enough evidence to conclude that the population mean mass is less than 750 g. [4] (ii) Given that the population mean mass actually is 750 g, find the smallest possible sample size, n, for which it is at least 97% certain that the mean mass of the sample exceeds 745 g. [4]
Mark scheme: 5 (i) H0: µ = 750 H1: µ < 750 B1 H0 and H1 correct 746 − 750 Test statistic z = = +/–1.626 B1 Correct test statistic used in comparison. oe. (11 / 20) CV z = –1.751 or –1.752 M1 Correct CV and valid comparison. oe. [0.0520 or 745.7] [2 tail 2.054/5] Not enough evidence to say mean is less. A1ft Correct conclusion ft their test statistic. [4] No contradictions. Condone cc’s. (ii) z = +/–1.881 or +/–1.882 B1 Accept 1.881 or 1.882 745 − 750 M1* Equation or inequality relating their z to –1.881 > standardised value. Condone cc’s. (11 / n ) M1*dep Solving attempt for n n = 18 A1 Correct answer. cwo. 3 sf accuracy. [4] GCE A/AS LEVEL – October/November 2009 9709 72 2 x ∫ M1 E i 1 d i i
Q6 · The continuous random variable X has probability density function given by 13x(k −x) 1 ≤x…
6 The continuous random variable X has probability density function given by 13x(k −x) 1 ≤x ≤2, f(x) = 0 otherwise. (i) Show that the value of k is 32 . [3] 9 (ii) Find E(X). [2] (iii) Is the median less than or greater than 1.5? Justify your answer numerically. [3]
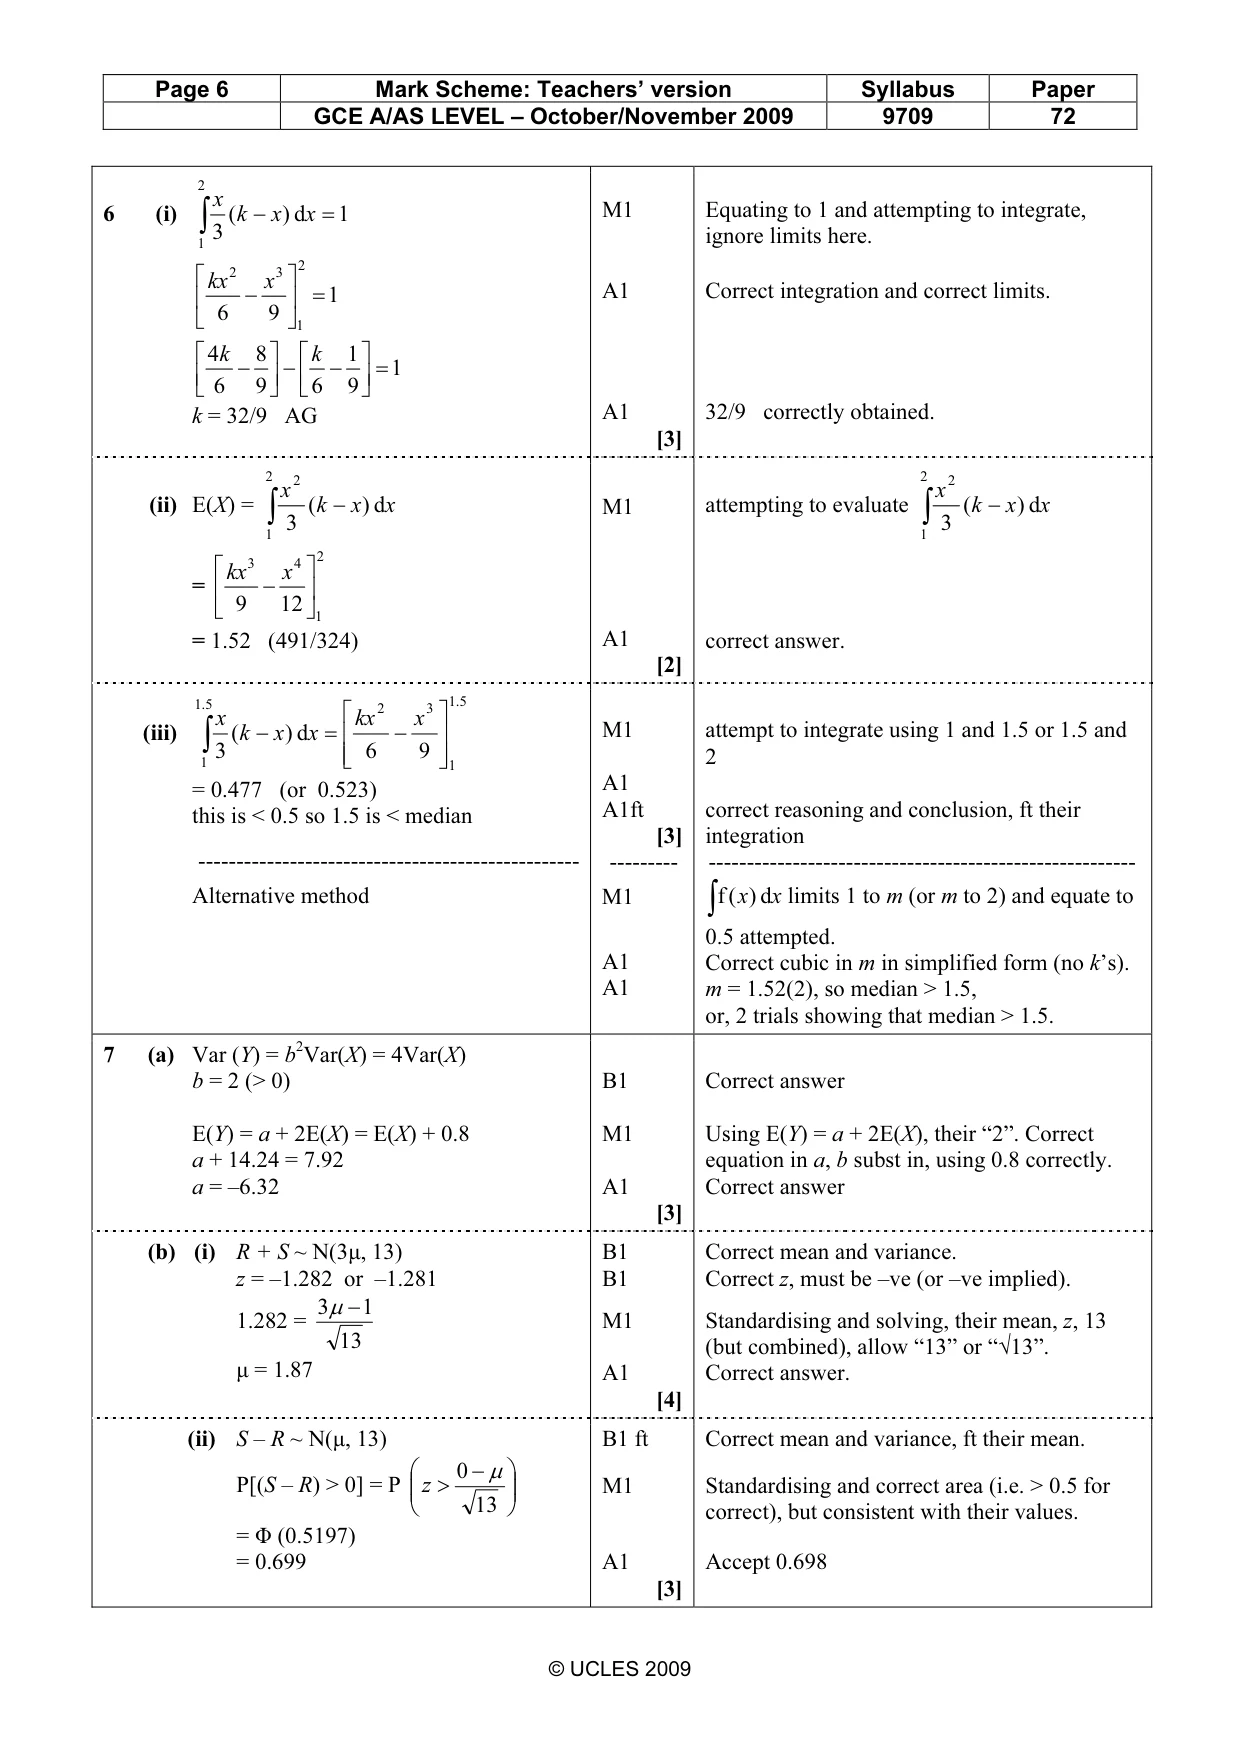
Mark scheme: x 6 (i) ∫ 3 ( k − x ) dx = 1 M1 Equating to 1 and attempting to integrate, 1 ignore limits here. 2 kx 2 3 A1 Correct integration and correct limits. −x = 1 6 9 1 4 k 8 k 1 − − − = 1 6 9 6 9 k = 32/9 AG A1 32/9 correctly obtained. [3] 2 2 2 2 x x (ii) E(X) = ∫ 3 ( k − x ) dx M1 attempting to evaluate ∫ 3 ( k − x ) dx 1 1 2 kx 3 4 = −x 9 12 1 = 1.52 (491/324) A1 correct answer. [2] 5.1 2 3 5.1 x kx x − M1 attempt to integrate using 1 and 1.5 or 1.5 and (iii) ∫ 3 ( k − x ) dx = 6 9 1 1 2 A1 = 0.477 (or 0.523) A1ft correct reasoning and conclusion, ft their this is < 0.5 so 1.5 is < median [3] integration -------------------------------------------------- --------- -------------------------------------------------------- Alternative method M1 ∫ f ( x ) dx limits 1 to m (or m to 2) and equate to 0.5 attempted. A1 Correct cubic in m in simplified form (no k’s). A1 m = 1.52(2), so median > 1.5, or, 2 trials showing that median > 1.5. 2
Q7 · Random variables Y and X are related by Y = a + bX, where a and b are constants and b > 0
7 (a) Random variables Y and X are related by Y = a + bX, where a and b are constants and b > 0. The standard deviation of Y is twice the standard deviation of X. The mean of Y is 7.92 and is 0.8 more than the mean of X. Find the values of a and b. [3] (b) Random variables R and S are such that R ∼N(µ, 22) and S ∼N(2µ, 32). It is given that P(R + S > 1) = 0.9. (i) Find µ. [4] (ii) Hence find P(S > R). [3]
Mark scheme: 7 (a) Var (Y) = b2Var(X) = 4Var(X) b = 2 (> 0) B1 Correct answer E(Y) = a + 2E(X) = E(X) + 0.8 M1 Using E(Y) = a + 2E(X), their “2”. Correct a + 14.24 = 7.92 equation in a, b subst in, using 0.8 correctly. a = –6.32 A1 Correct answer [3] (b) (i) R + S ~ N(3µ, 13) B1 Correct mean and variance. z = –1.282 or –1.281 B1 Correct z, must be –ve (or –ve implied). 3 µ − 1 1.282 = M1 Standardising and solving, their mean, z, 13 13 (but combined), allow “13” or “√13”. µ = 1.87 A1 Correct answer. [4] (ii) S – R ~ N(µ, 13) B1 ft Correct mean and variance, ft their mean. 0 − µ P[(S – R) > 0] = P z > M1 Standardising and correct area (i.e. > 0.5 for 13 correct), but consistent with their values. = Φ (0.5197) = 0.699 A1 Accept 0.698 [3]
What was in this paper
The subtopics covered by these 7 questions, and how many questions each got. Open one in a new tab to see every Cambridge question on it.
What you needed in this session
Cambridge’s own grade thresholds for 2009 Oct/Nov, Paper 7 · Variant 2. A higher threshold means an easier paper — the bar moves with how the cohort did.