Cambridge A Level Mathematics 9709 — 2011 Oct/Nov Paper 7 · Variant 3
9709/73/O/N/11 · 7 questions · 50 marks · ≈56 min
The question paper and its mark scheme, free to read here and free to download. This is Cambridge’s own paper, exactly as it was sat.
Question paper4 pages
Mark scheme7 pages
Answers below. Sit the paper first if you are practising.
Questions as text
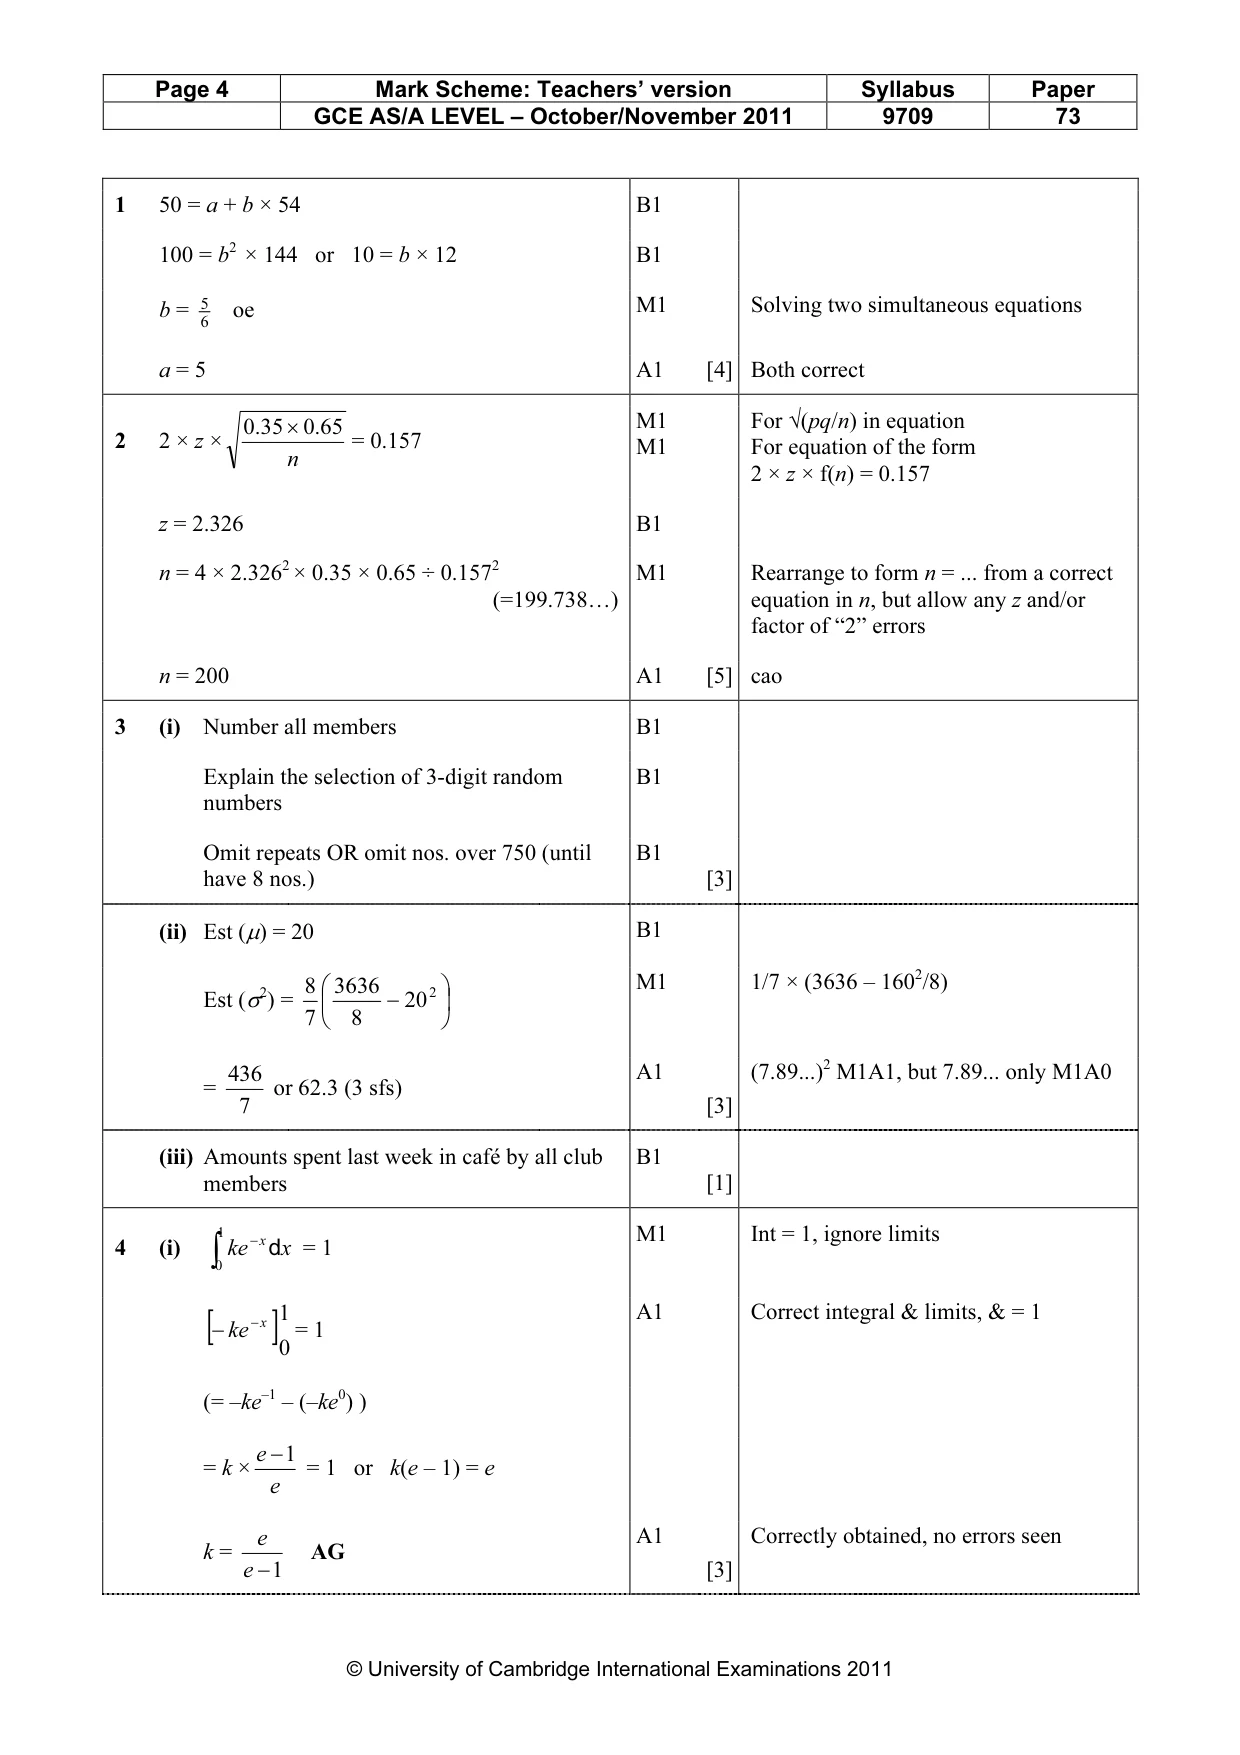
Q1 · Test scores, X, have mean 54 and variance 144
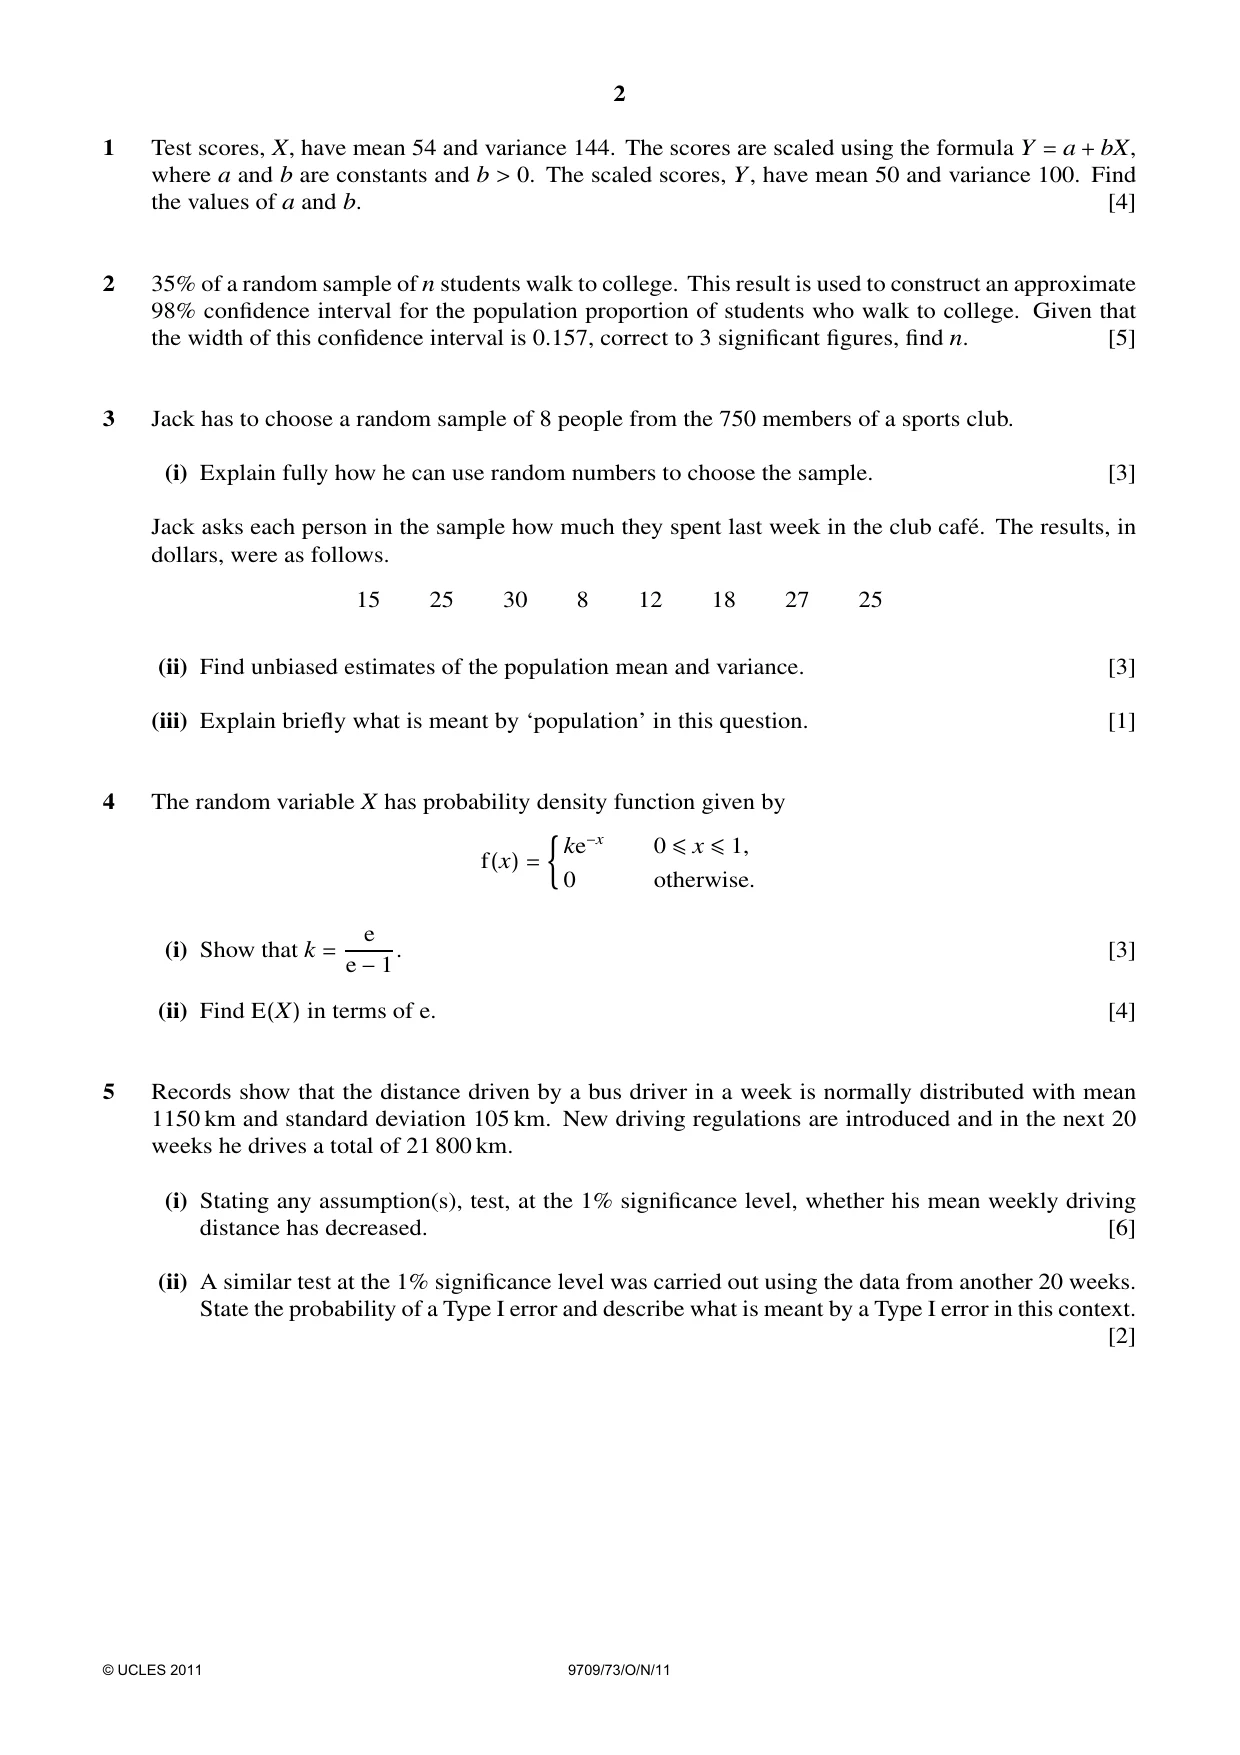
1 Test scores, X, have mean 54 and variance 144. The scores are scaled using the formula Y = a + bX, where a and b are constants and b > 0. The scaled scores, Y, have mean 50 and variance 100. Find the values of a and b. [4]
Mark scheme: 1 50 = a + b × 54 B1 100 = b2 × 144 or 10 = b × 12 B1 b = 5 oe M1 Solving two simultaneous equations 6 a = 5 A1 [4] Both correct 0 35 × 0 65 M1 For √(pq/n) in equation
Q2 · 35% of a random sample of n students walk to college
2 35% of a random sample of n students walk to college. This result is used to construct an approximate 98% confidence interval for the population proportion of students who walk to college. Given that the width of this confidence interval is 0.157, correct to 3 significant figures, find n. [5]
Mark scheme: .0 35 × .0 65 (pq ) q 2 2 × z × = 0.157 M1 For equation of the form n 2 × z × f(n) = 0.157 z = 2.326 B1 n = 4 × 2.3262 × 0.35 × 0.65 ÷ 0.1572 M1 Rearrange to form n = ... from a correct (=199.738…) equation in n, but allow any z and/or factor of “2” errors n = 200 A1 [5] cao
Q3 · Jack has to choose a random sample of 8 people from the 750 members of a sports club
3 Jack has to choose a random sample of 8 people from the 750 members of a sports club. (i) Explain fully how he can use random numbers to choose the sample. [3] Jack asks each person in the sample how much they spent last week in the club caf´e. The results, in dollars, were as follows. 15 25 30 8 12 18 27 25 (ii) Find unbiased estimates of the population mean and variance. [3] (iii) Explain briefly what is meant by ‘population’ in this question. [1]
Mark scheme: 3 (i) Number all members B1 Explain the selection of 3-digit random B1 numbers Omit repeats OR omit nos. over 750 (until B1 have 8 nos.) [3] (ii) Est (µ) = 20 B1 8 3636 2 M1 1/7 × (3636 – 1602/8) Est (σ2) = − 20 7 8 436 A1 (7.89...)2 M1A1, but 7.89... only M1A0 = or 62.3 (3 sfs) 7 [3] (iii) Amounts spent last week in café by all club B1 members [1] 1 M1 Int = 1 ignore limits ∫
Q4 · The random variable X has probability density function given by ke−x 0 ≤x ≤1, f(x) = 0…
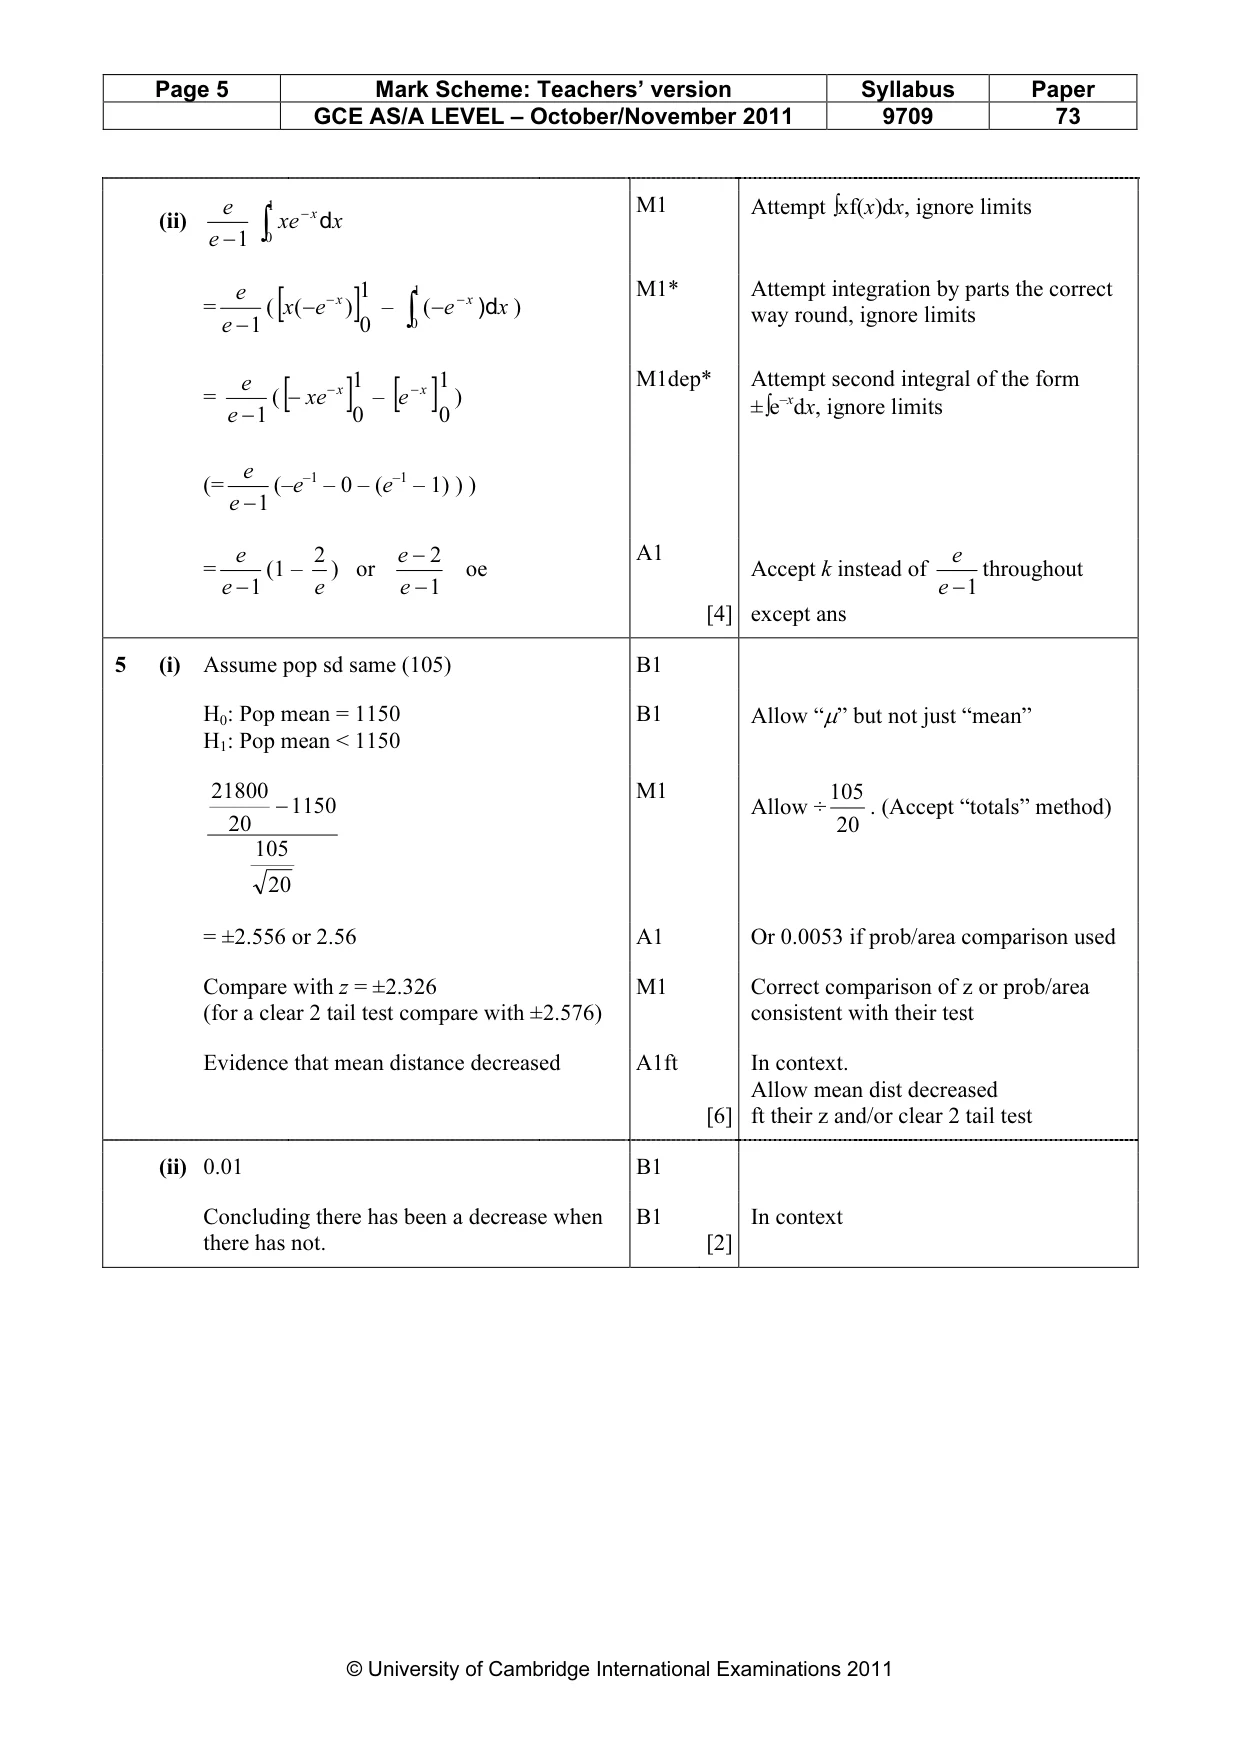
4 The random variable X has probability density function given by ke−x 0 ≤x ≤1, f(x) = 0 otherwise. e (i) Show that k = [3] e −1. (ii) Find E(X) in terms of e. [4]
Mark scheme: − M1 Int 1, ignore limits 4 (i) ∫0 ke xd x = 1 = 1 [− ke − x ]01 A1 Correct integral & limits, & = 1 (= –ke–1 – (–ke0) ) e − 1 = k × = 1 or k(e – 1) = e e e A1 Correctly obtained, no errors seen k = AG e − 1 [3] GCE AS/A LEVEL – October/November 2011 9709 73 e 1 − M1 Attempt ∫xf(x)dx, ignore limits (ii) e − 1 ∫0 xe xd x e − x 1 1 − x M1* Attempt integration by parts the correct = – ∫0 ( − e )dx ) way round, ignore limits ([x ( − e ) ]0 e − 1 e x 1 − x 1 M1dep* Attempt second integral of the form = ([− xe− – [e ) ±∫e–xdx, ignore limits e − 1 ]0 ]0 e (= (–e–1 – 0 – (e–1 – 1) ) ) e − 1 e 2 e − 2 A1 e = (1 – ) or oe Accept k instead of throughout e − 1 e e − 1 e − 1 [4] except ans
Q5 · Records show that the distance driven by a bus driver in a week is normally distributed…
5 Records show that the distance driven by a bus driver in a week is normally distributed with mean 1150 km and standard deviation 105 km. New driving regulations are introduced and in the next 20 weeks he drives a total of 21 800 km. (i) Stating any assumption(s), test, at the 1% significance level, whether his mean weekly driving distance has decreased. [6] (ii) A similar test at the 1% significance level was carried out using the data from another 20 weeks. State the probability of a Type I error and describe what is meant by a Type I error in this context. [2]
Mark scheme: 5 (i) Assume pop sd same (105) B1 H0: Pop mean = 1150 B1 Allow “µ” but not just “mean” H1: Pop mean < 1150 21800 M1 105 − 1150 Allow ÷ . (Accept “totals” method) 20 20 105 20 = ±2.556 or 2.56 A1 Or 0.0053 if prob/area comparison used Compare with z = ±2.326 M1 Correct comparison of z or prob/area (for a clear 2 tail test compare with ±2.576) consistent with their test Evidence that mean distance decreased A1ft In context. Allow mean dist decreased [6] ft their z and/or clear 2 tail test (ii) 0.01 B1 Concluding there has been a decrease when B1 In context there has not. [2] GCE AS/A LEVEL – October/November 2011 9709 73
Q6 · Ranjit goes to mathematics lectures and physics lectures
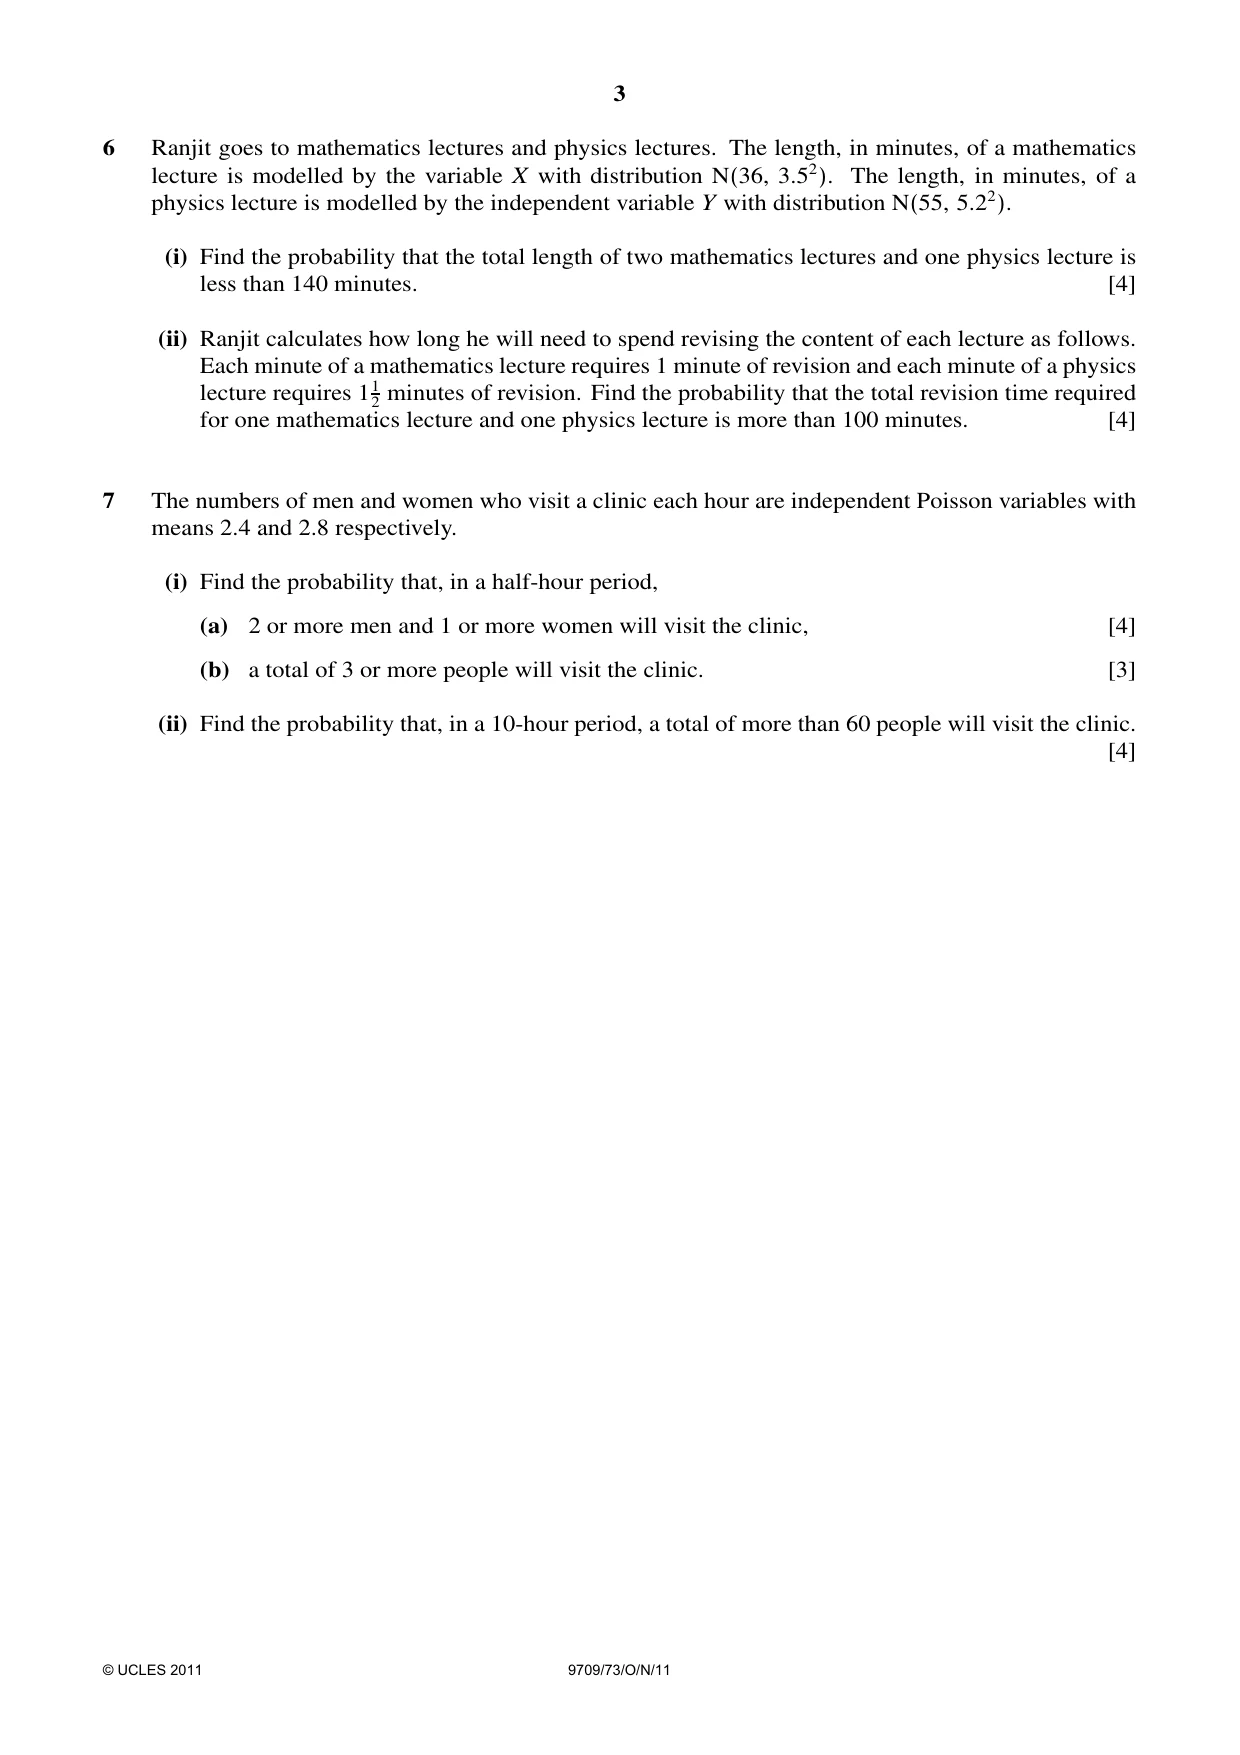
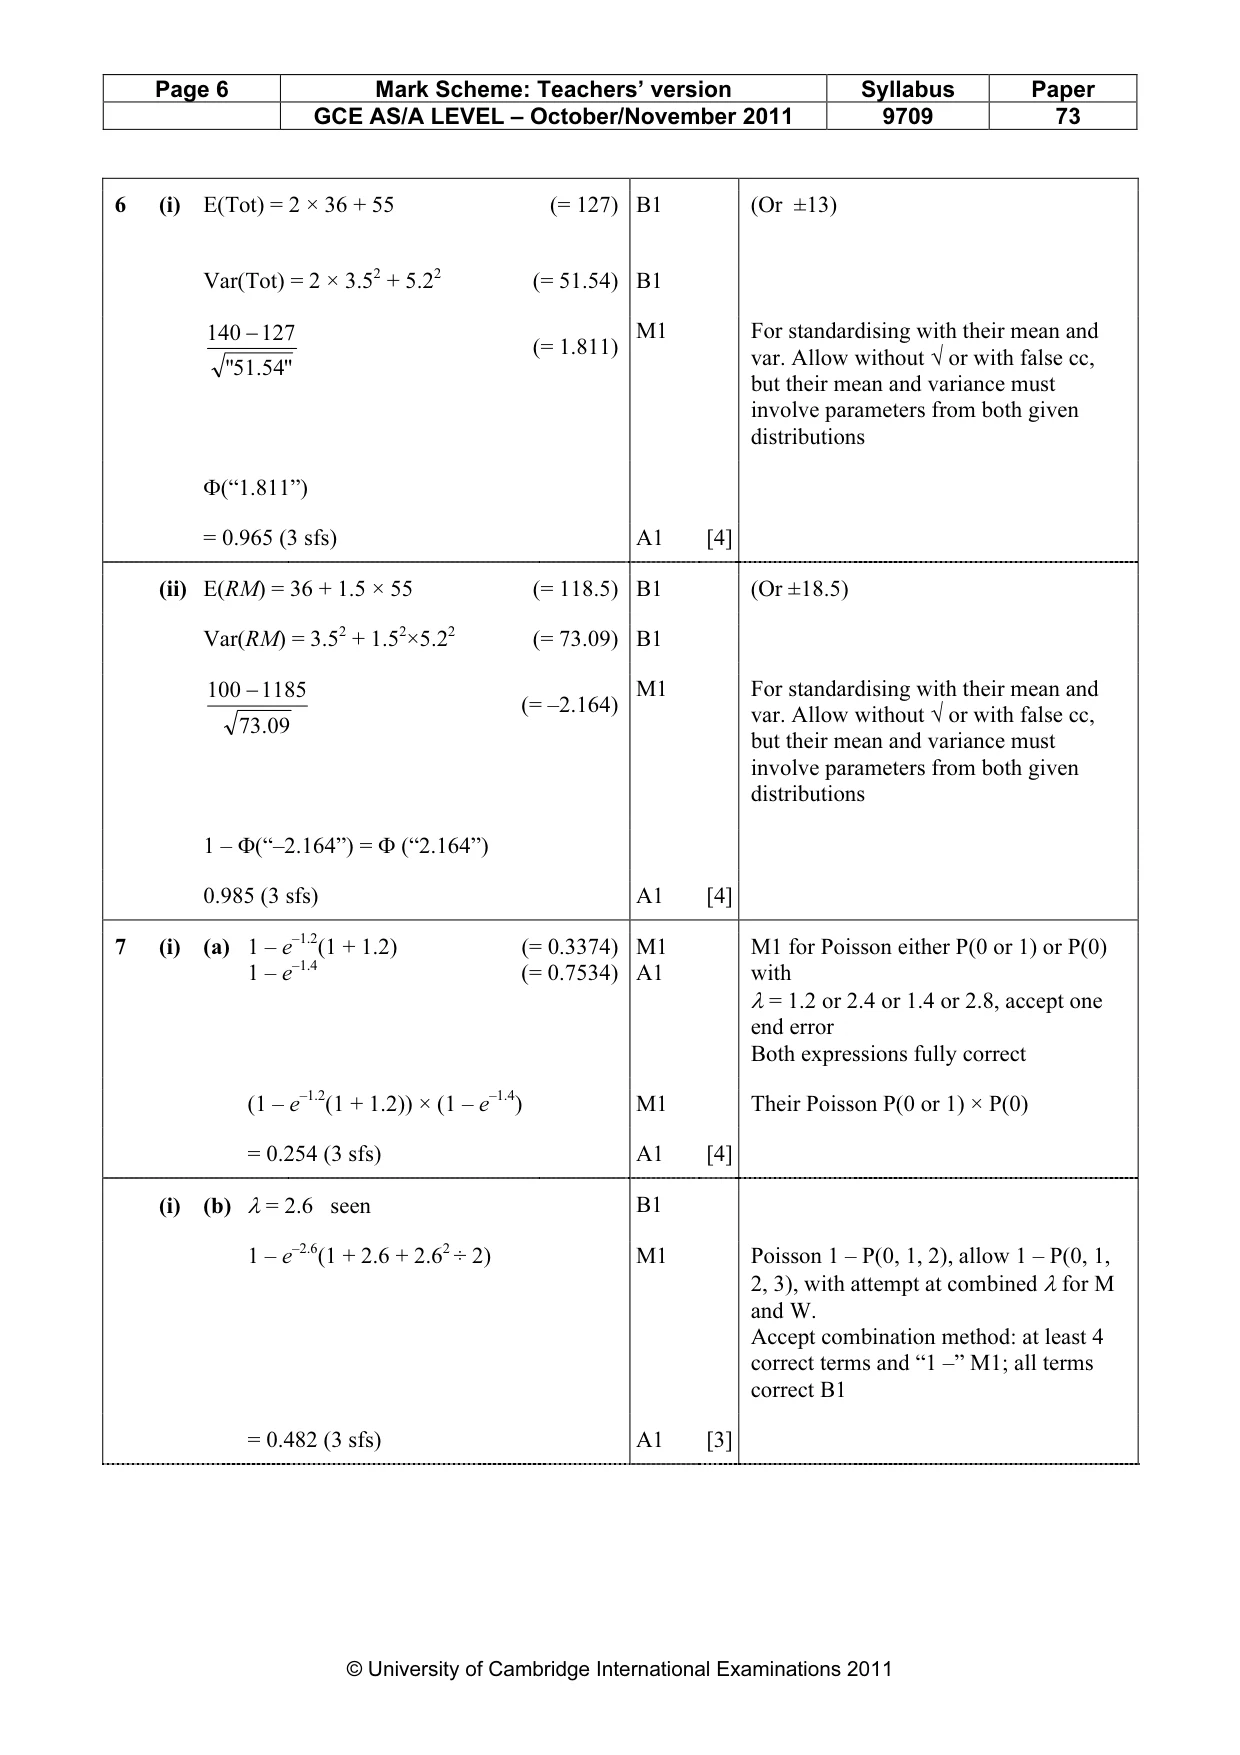
6 Ranjit goes to mathematics lectures and physics lectures. The length, in minutes, of a mathematics lecture is modelled by the variable X with distribution N(36, 3.52). The length, in minutes, of a physics lecture is modelled by the independent variable Y with distribution N(55, 5.22). (i) Find the probability that the total length of two mathematics lectures and one physics lecture is less than 140 minutes. [4] (ii) Ranjit calculates how long he will need to spend revising the content of each lecture as follows. Each minute of a mathematics lecture requires 1 minute of revision and each minute of a physics lecture requires 112 minutes of revision. Find the probability that the total revision time required for one mathematics lecture and one physics lecture is more than 100 minutes. [4]
Mark scheme: 6 (i) E(Tot) = 2 × 36 + 55 (= 127) B1 (Or ±13) Var(Tot) = 2 × 3.52 + 5.22 (= 51.54) B1 140 − 127 M1 For standardising with their mean and (= 1.811) var. Allow without √ or with false cc, "51. 54" but their mean and variance must involve parameters from both given distributions Φ(“1.811”) = 0.965 (3 sfs) A1 [4] (ii) E(RM) = 36 + 1.5 × 55 (= 118.5) B1 (Or ±18.5) Var(RM) = 3.52 + 1.52×5.22 (= 73.09) B1 100 − 1185 M1 For standardising with their mean and (= –2.164) var. Allow without √ or with false cc, 73. 09 but their mean and variance must involve parameters from both given distributions 1 – Φ(“–2.164”) = Φ (“2.164”) 0.985 (3 sfs) A1 [4] 1 2
Q7 · The numbers of men and women who visit a clinic each hour are independent Poisson…
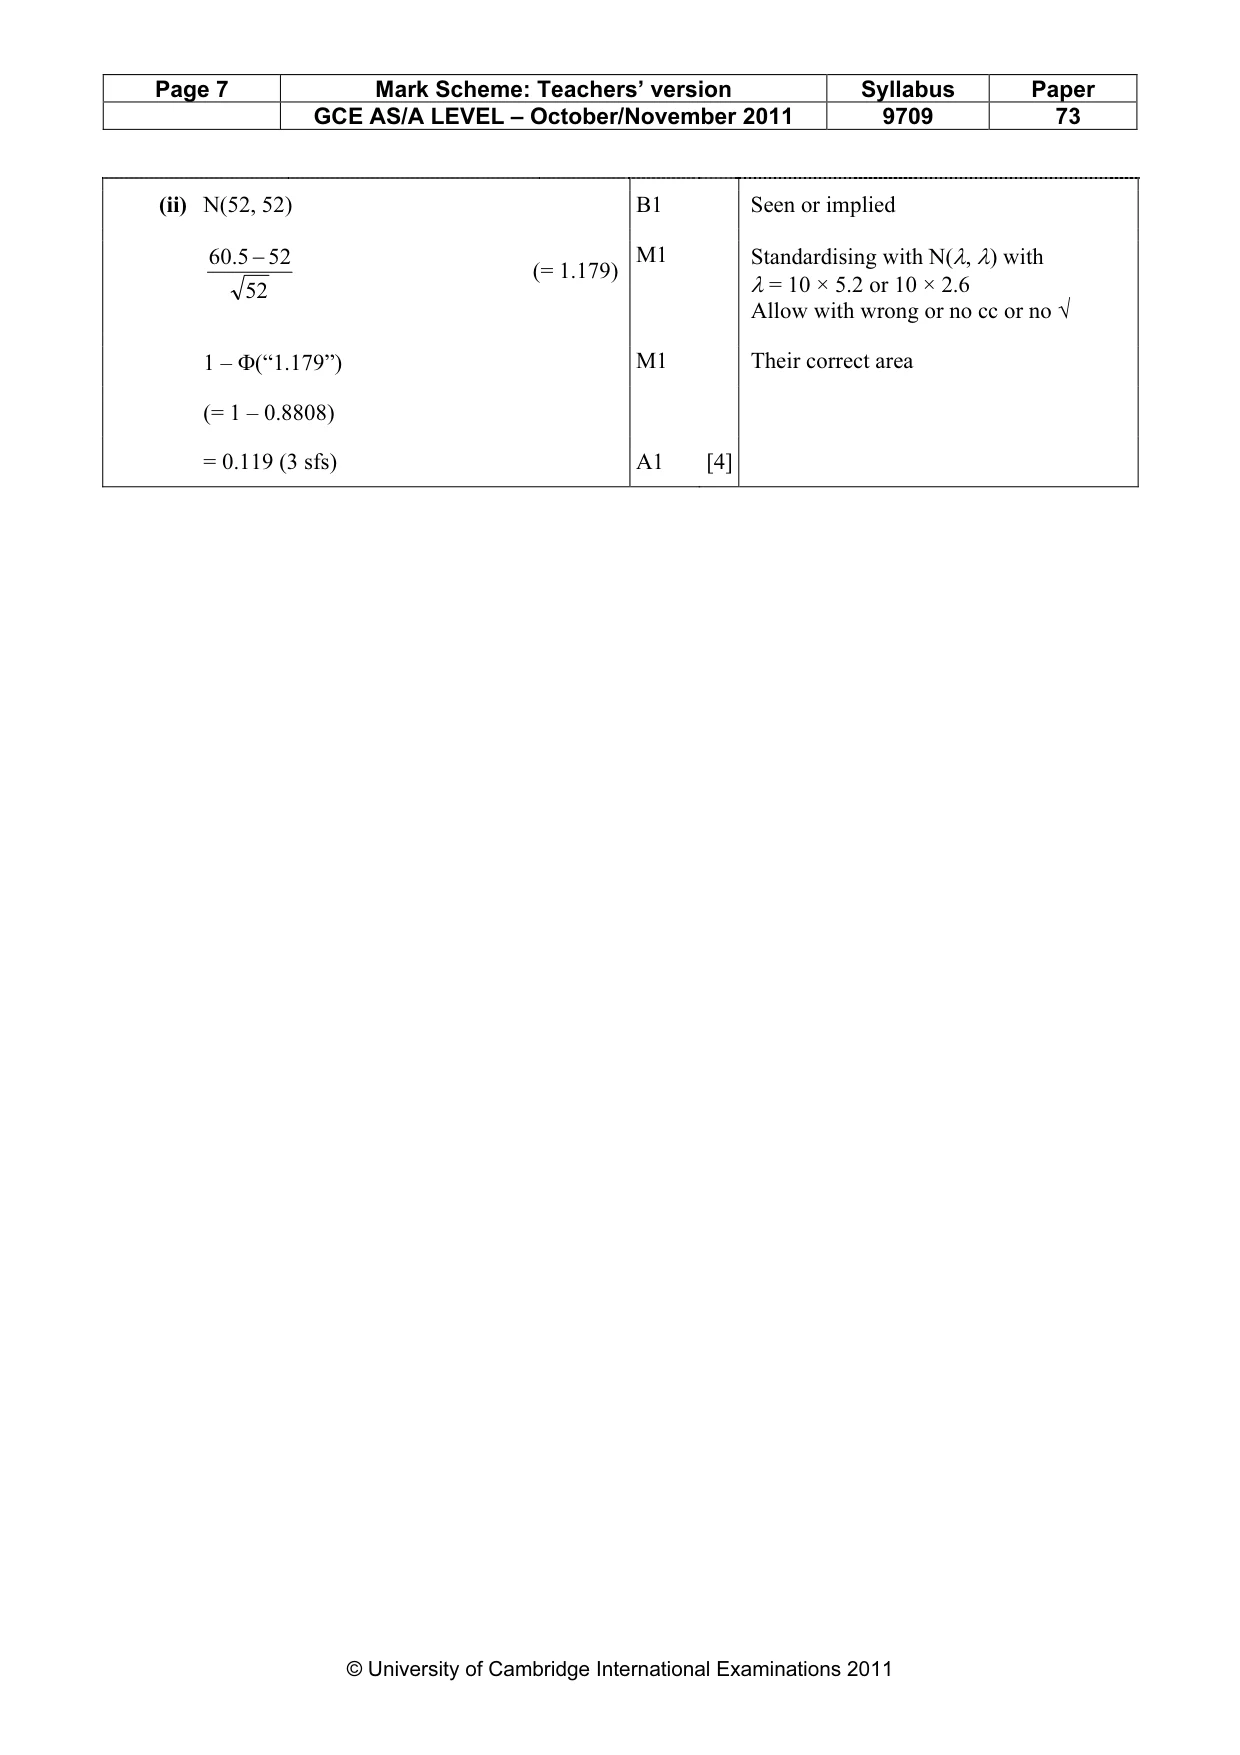
7 The numbers of men and women who visit a clinic each hour are independent Poisson variables with means 2.4 and 2.8 respectively. (i) Find the probability that, in a half-hour period, (a) 2 or more men and 1 or more women will visit the clinic, [4] (b) a total of 3 or more people will visit the clinic. [3] (ii) Find the probability that, in a 10-hour period, a total of more than 60 people will visit the clinic. [4]
Mark scheme: 7 (i) (a) 1 – e–1.2(1 + 1.2) (= 0.3374) M1 M1 for Poisson either P(0 or 1) or P(0) 1 – e–1.4 (= 0.7534) A1 with λ = 1.2 or 2.4 or 1.4 or 2.8, accept one end error Both expressions fully correct (1 – e–1.2(1 + 1.2)) × (1 – e–1.4) M1 Their Poisson P(0 or 1) × P(0) = 0.254 (3 sfs) A1 [4] (i) (b) λ = 2.6 seen B1 1 – e–2.6(1 + 2.6 + 2.62 ÷ 2) M1 Poisson 1 – P(0, 1, 2), allow 1 – P(0, 1, 2, 3), with attempt at combined λ for M and W. Accept combination method: at least 4 correct terms and “1 –” M1; all terms correct B1 = 0.482 (3 sfs) A1 [3] GCE AS/A LEVEL – October/November 2011 9709 73 (ii) N(52, 52) B1 Seen or implied 605. − 52 M1 Standardising with N(λ, λ) with (= 1.179) 52 λ = 10 × 5.2 or 10 × 2.6 Allow with wrong or no cc or no √ 1 – Φ(“1.179”) M1 Their correct area (= 1 – 0.8808) = 0.119 (3 sfs) A1 [4]
What was in this paper
The subtopics covered by these 7 questions, and how many questions each got. Open one in a new tab to see every Cambridge question on it.
What you needed in this session
Cambridge’s own grade thresholds for 2011 Oct/Nov, Paper 7 · Variant 3. A higher threshold means an easier paper — the bar moves with how the cohort did.