Cambridge A Level Mathematics 9709 — 2010 May/June Paper 7 · Variant 3
9709/73/M/J/10 · 7 questions · 50 marks · ≈56 min
The question paper and its mark scheme, free to read here and free to download. This is Cambridge’s own paper, exactly as it was sat.
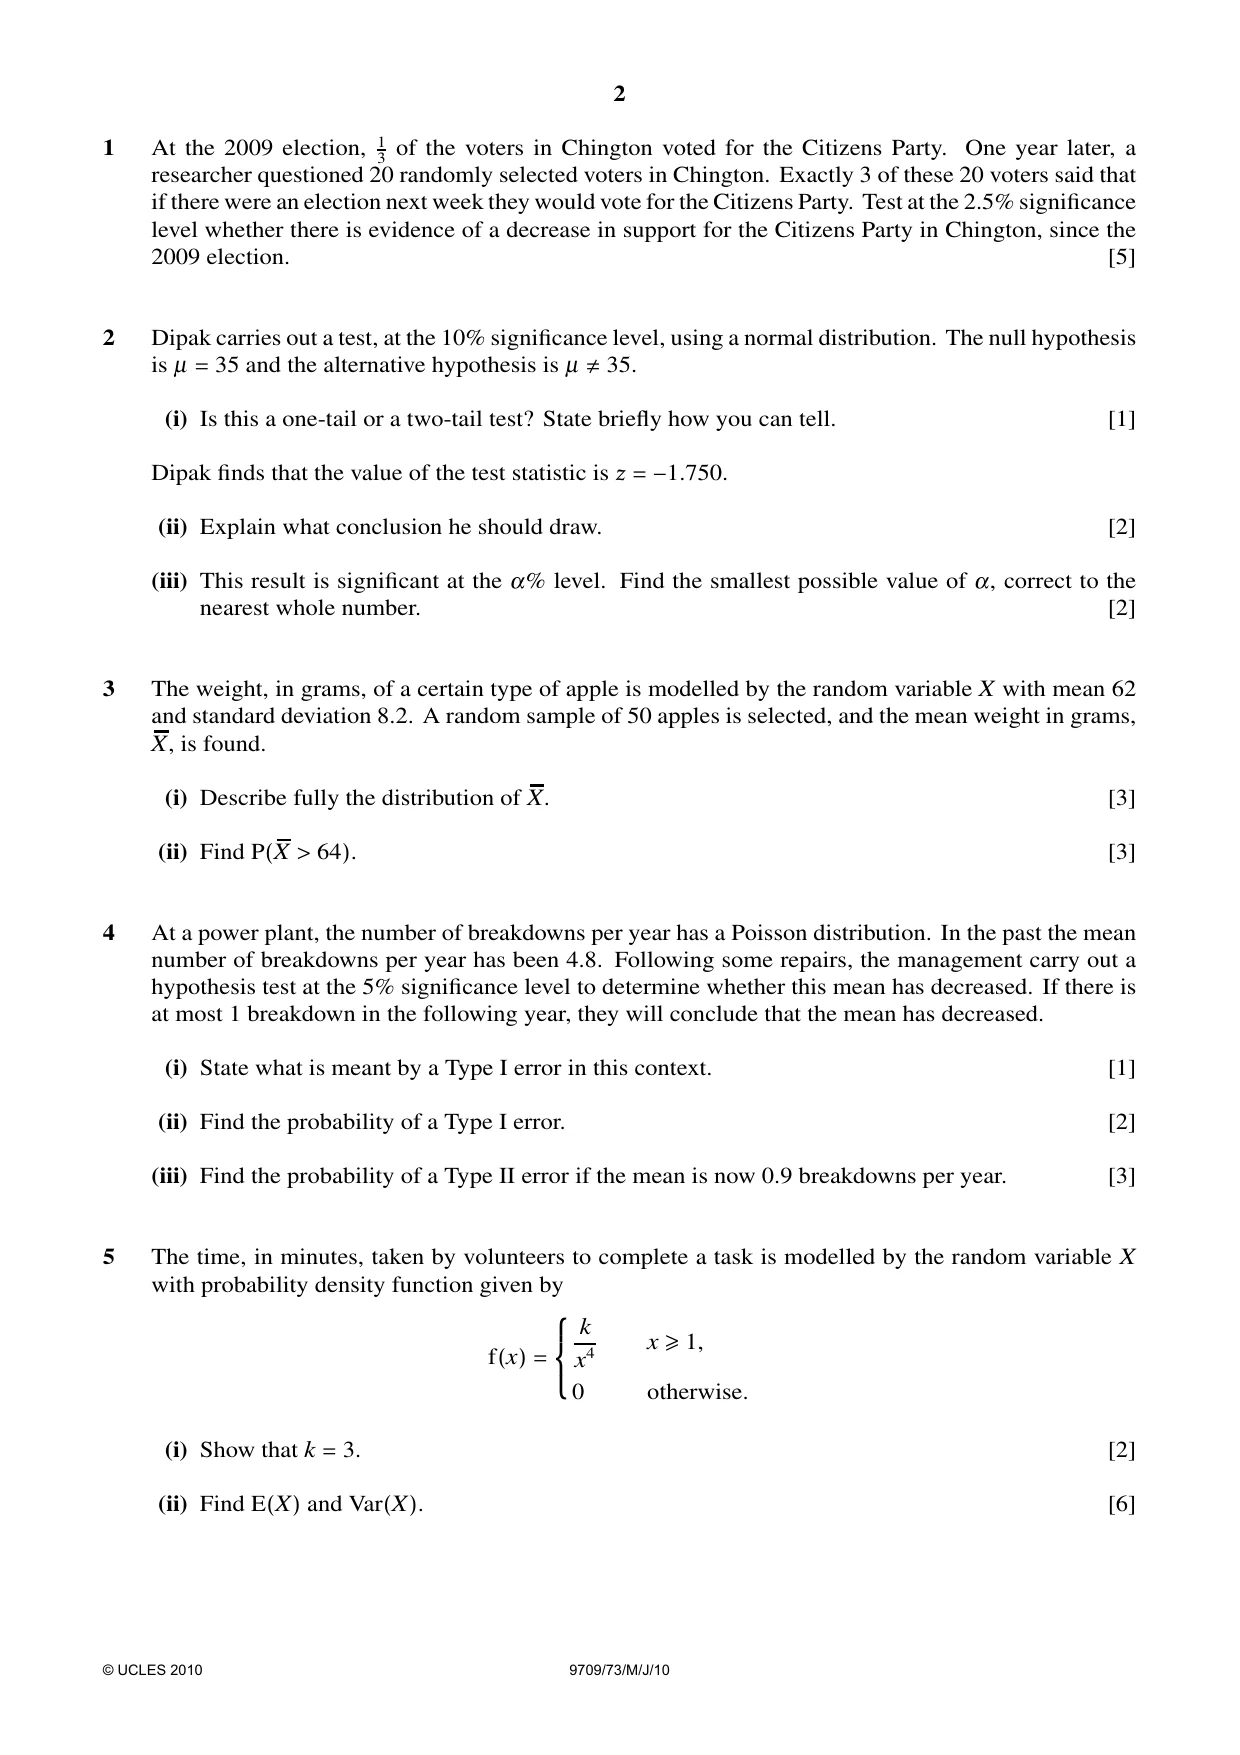
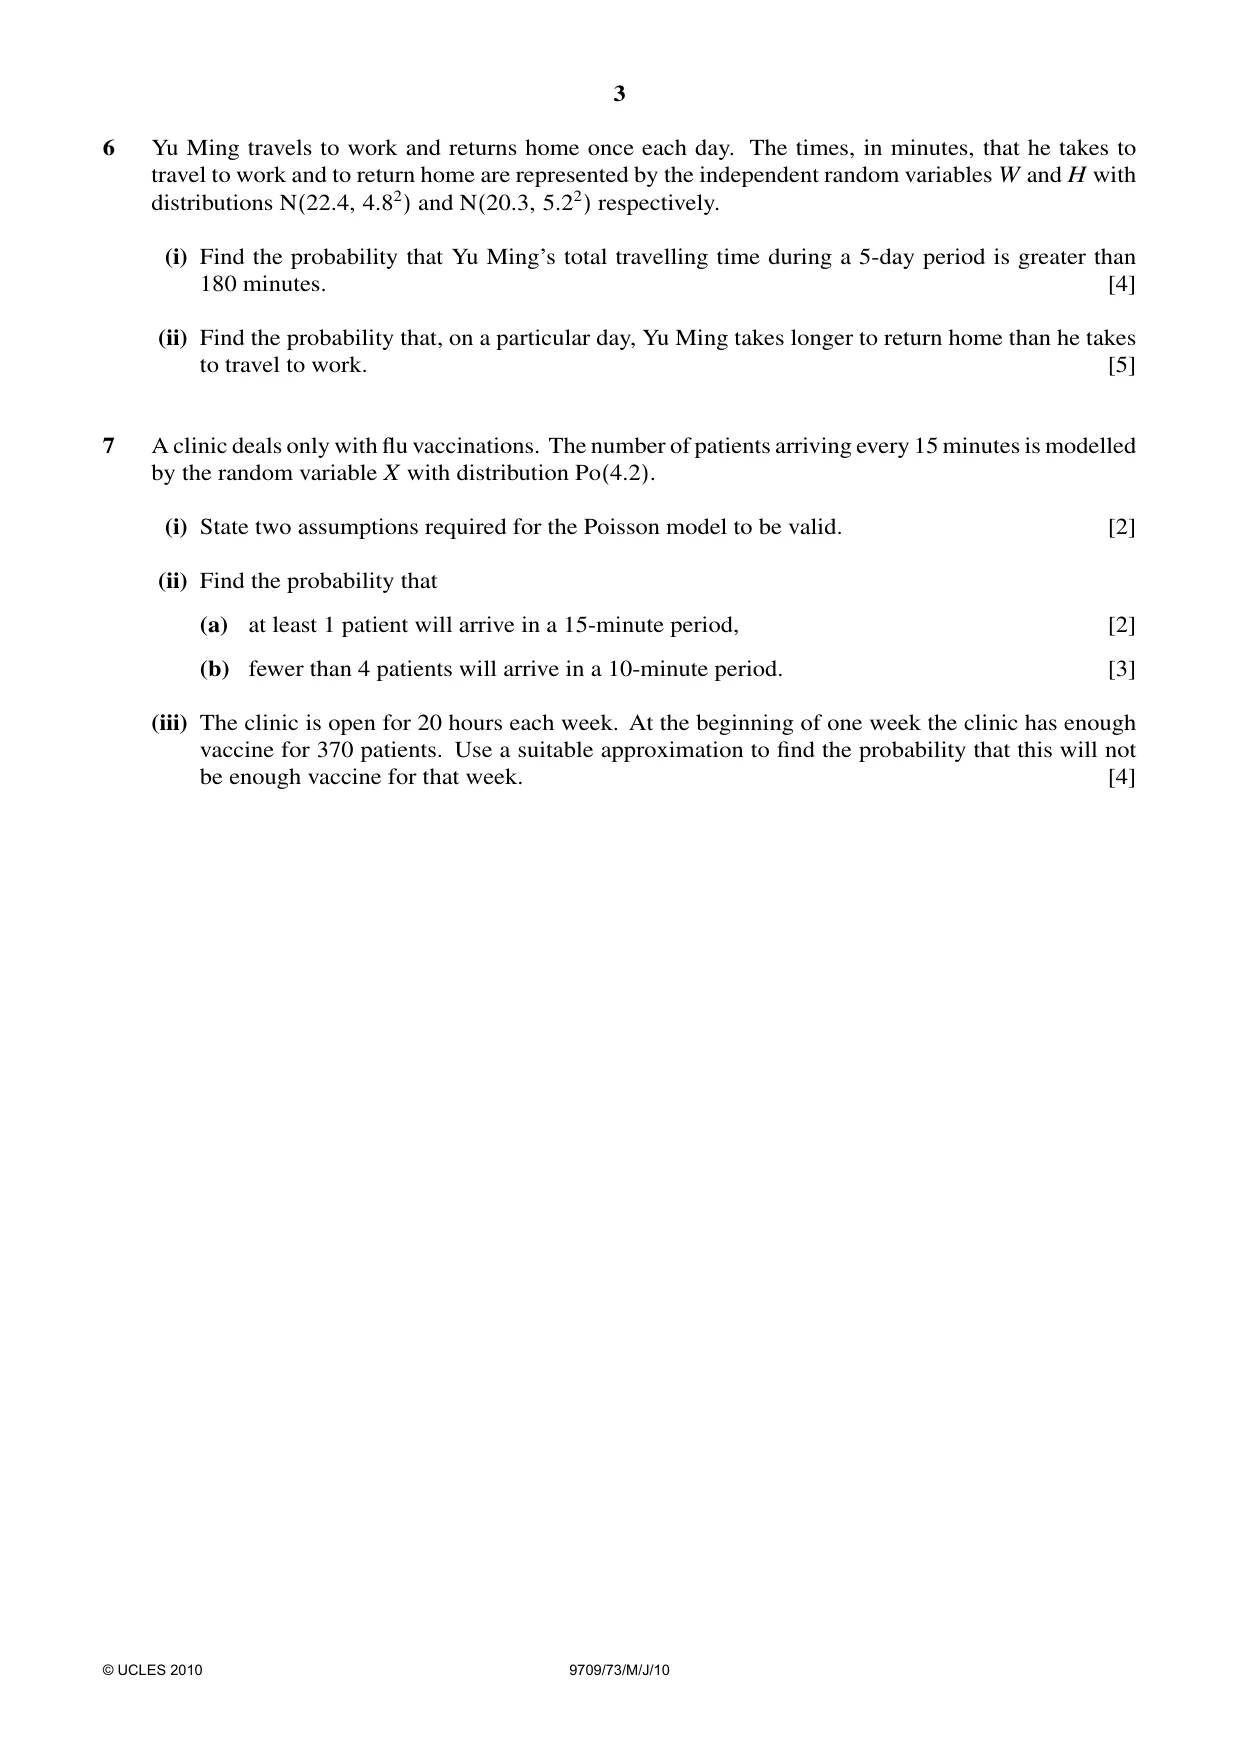
Question paper4 pages

Mark scheme6 pages
Answers below. Sit the paper first if you are practising.
Questions as text
Q1 · At the 2009 election, 13 of the voters in Chington voted for the Citizens Party
1 At the 2009 election, 13 of the voters in Chington voted for the Citizens Party. One year later, a researcher questioned 20 randomly selected voters in Chington. Exactly 3 of these 20 voters said that if there were an election next week they would vote for the Citizens Party. Test at the 2.5% significance level whether there is evidence of a decrease in support for the Citizens Party in Chington, since the 2009 election. [5]
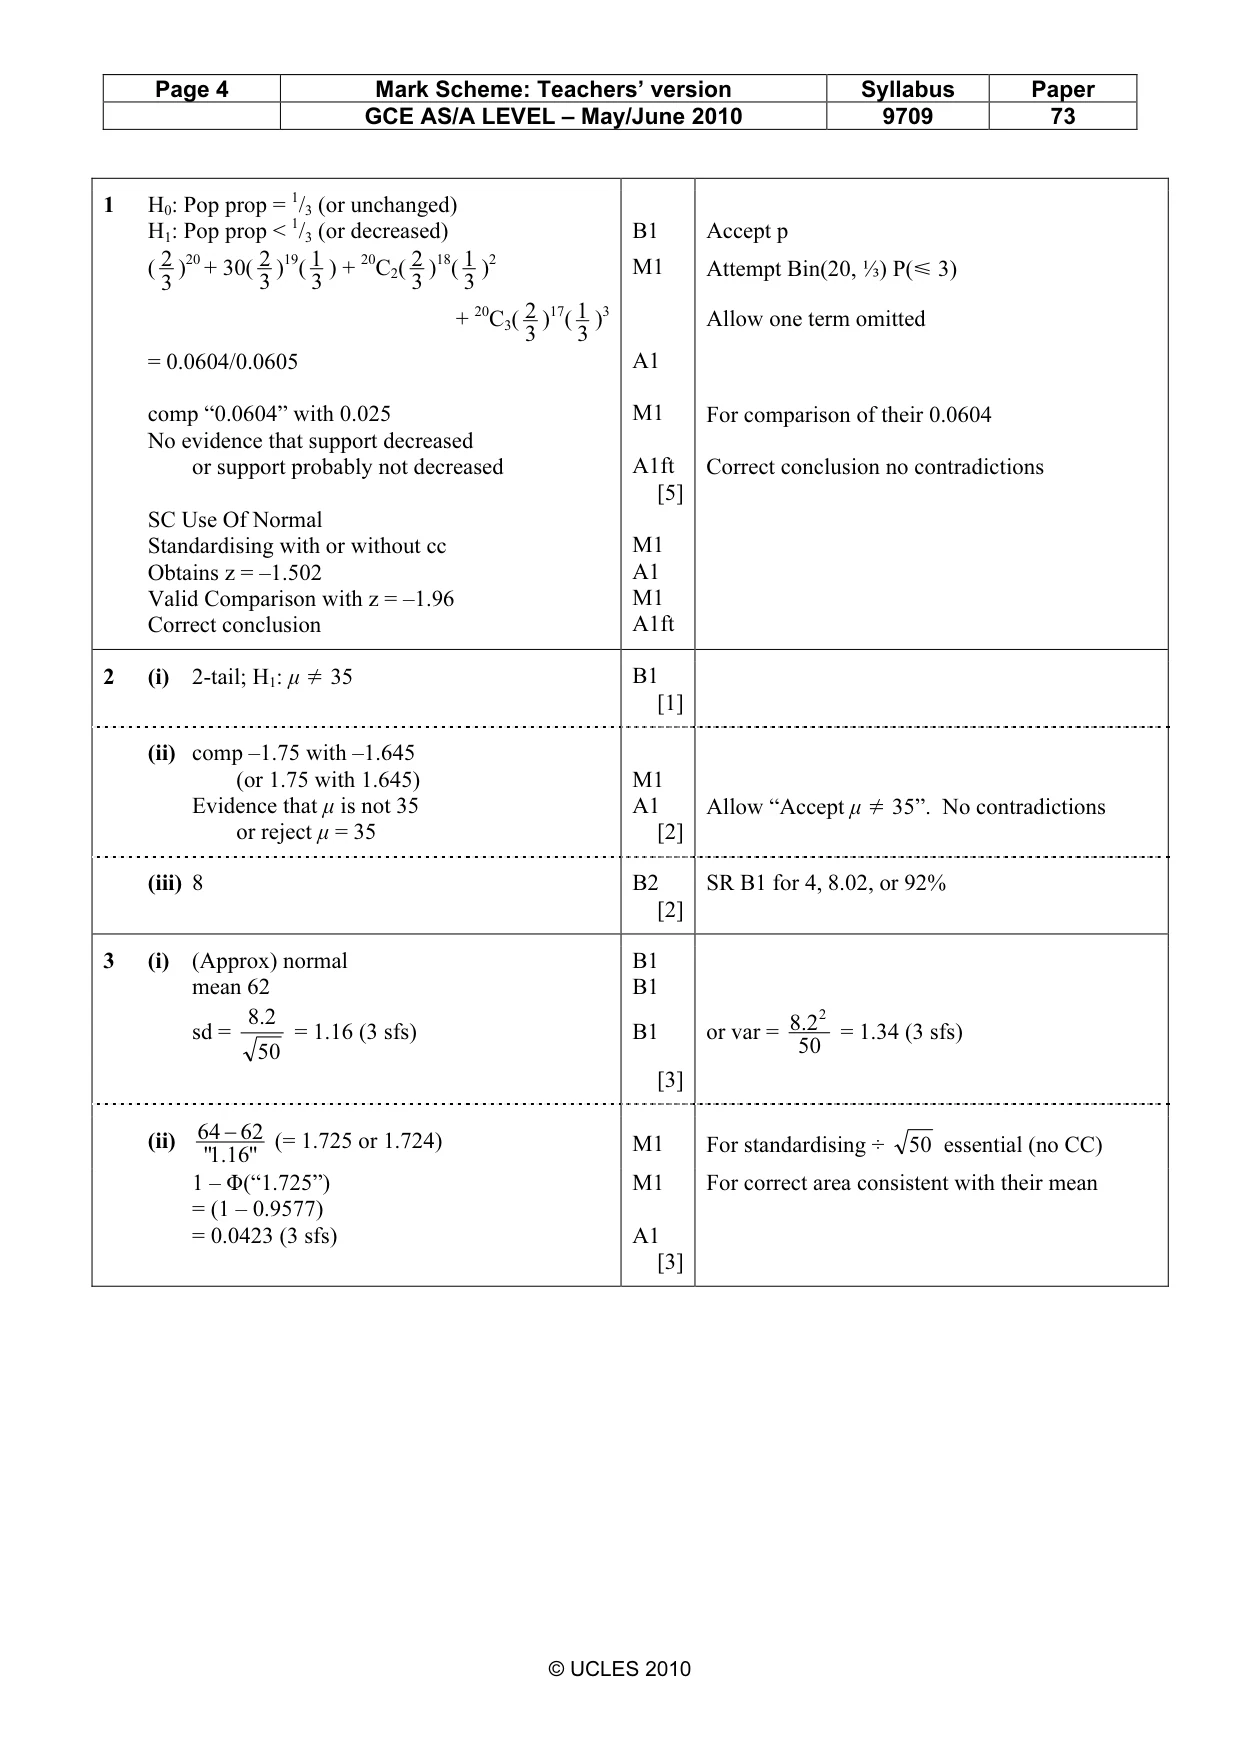
Mark scheme: 1 H0: Pop prop = 1/3 (or unchanged) H1: Pop prop < 1/3 (or decreased) B1 Accept p 2 2 1 2 1 ( )20 + 30( )19( ) + 20C2( )18( )2 M1 Attempt Bin(20, ⅓) P(Y 3) 3 3 3 3 3 2 1 + 20C3( )17( )3 Allow one term omitted 3 3 = 0.0604/0.0605 A1 comp “0.0604” with 0.025 M1 For comparison of their 0.0604 No evidence that support decreased or support probably not decreased A1ft Correct conclusion no contradictions [5] SC Use Of Normal Standardising with or without cc M1 Obtains z = –1.502 A1 Valid Comparison with z = –1.96 M1 Correct conclusion A1ft
Q2 · Dipak carries out a test, at the 10% significance level, using a normal distribution
2 Dipak carries out a test, at the 10% significance level, using a normal distribution. The null hypothesis is µ = 35 and the alternative hypothesis is µ ≠35. (i) Is this a one-tail or a two-tail test? State briefly how you can tell. [1] Dipak finds that the value of the test statistic is ß = −1.750. (ii) Explain what conclusion he should draw. [2] (iii) This result is significant at the α% level. Find the smallest possible value of α, correct to the nearest whole number. [2]
Mark scheme: 2 (i) 2-tail; H1: µ ¸ 35 B1 [1] (ii) comp –1.75 with –1.645 (or 1.75 with 1.645) M1 Evidence that µ is not 35 A1 Allow “Accept µ ¸ 35”. No contradictions or reject µ = 35 [2] (iii) 8 B2 SR B1 for 4, 8.02, or 92% [2]
Q3 · The weight, in grams, of a certain type of apple is modelled by the random variable X…
3 The weight, in grams, of a certain type of apple is modelled by the random variable X with mean 62 and standard deviation 8.2. A random sample of 50 apples is selected, and the mean weight in grams, X, is found. (i) Describe fully the distribution of X. [3] (ii) Find P(X > 64). [3]
Mark scheme: 3 (i) (Approx) normal B1 mean 62 B1 2.8 2.8 2 sd = = 1.16 (3 sfs) B1 or var = = 1.34 (3 sfs) 50 50 [3] 64 − 62 (ii) (= 1.725 or 1.724) M1 For standardising ÷ 50 essential (no CC) .1" 16" 1 – Φ(“1.725”) M1 For correct area consistent with their mean = (1 – 0.9577) = 0.0423 (3 sfs) A1 [3] GCE AS/A LEVEL – May/June 2010 9709 73
Q4 · At a power plant, the number of breakdowns per year has a Poisson distribution
4 At a power plant, the number of breakdowns per year has a Poisson distribution. In the past the mean number of breakdowns per year has been 4.8. Following some repairs, the management carry out a hypothesis test at the 5% significance level to determine whether this mean has decreased. If there is at most 1 breakdown in the following year, they will conclude that the mean has decreased. (i) State what is meant by a Type I error in this context. [1] (ii) Find the probability of a Type I error. [2] (iii) Find the probability of a Type II error if the mean is now 0.9 breakdowns per year. [3]
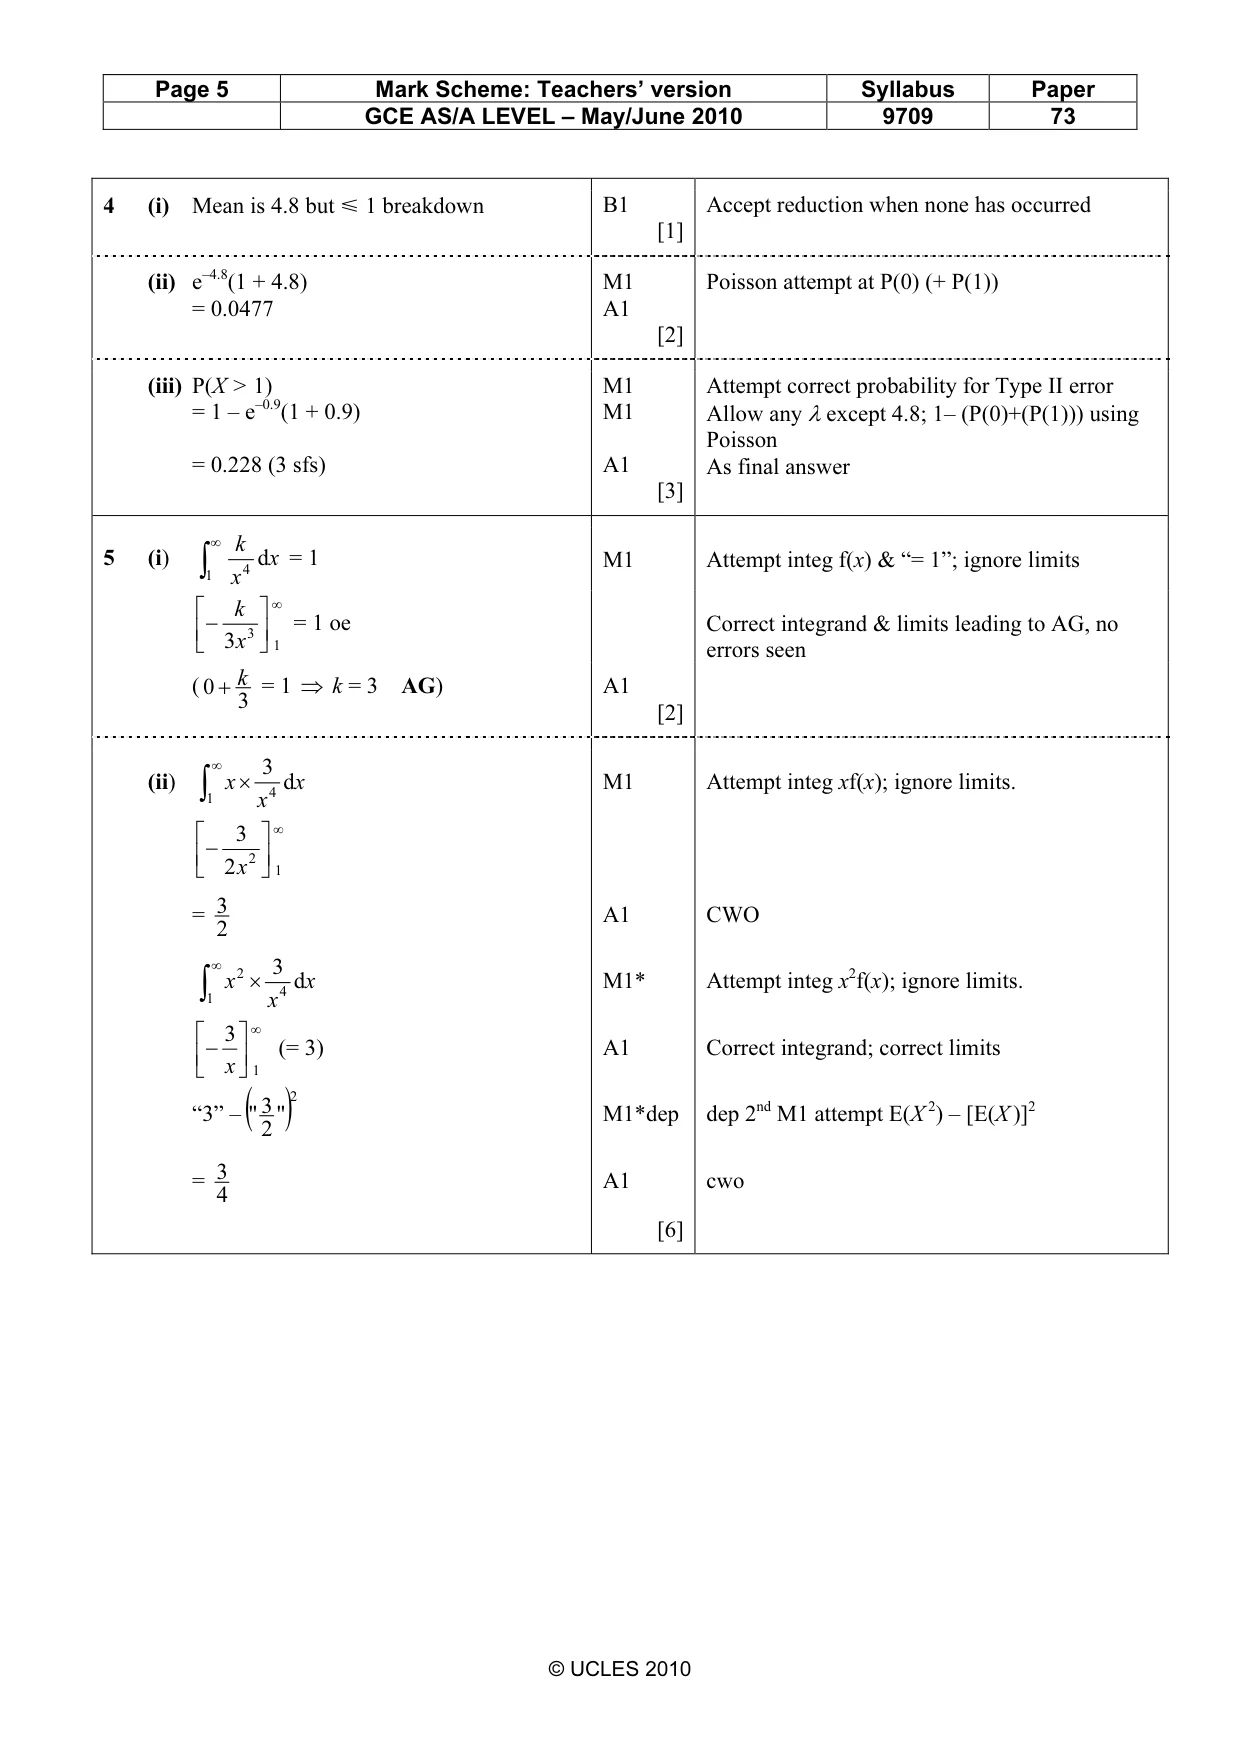
Mark scheme: 4 (i) Mean is 4.8 but Y 1 breakdown B1 Accept reduction when none has occurred [1] (ii) e–4.8(1 + 4.8) M1 Poisson attempt at P(0) (+ P(1)) = 0.0477 A1 [2] (iii) P(X > 1) M1 Attempt correct probability for Type II error = 1 – e–0.9(1 + 0.9) M1 Allow any λ except 4.8; 1– (P(0)+(P(1))) using Poisson = 0.228 (3 sfs) A1 As final answer [3] ∞ k ∫
Q5 · The time, in minutes, taken by volunteers to complete a task is modelled by the random…
5 The time, in minutes, taken by volunteers to complete a task is modelled by the random variable X with probability density function given by k x ≥1, x4 f(x) = 0 otherwise. (i) Show that k = 3. [2] (ii) Find E(X) and Var(X). [6]
Mark scheme: k d x = 1 M1 Attempt integ f(x) & “= 1”; ignore limits 45 (i) ∫1 x ∞ − k = 1 oe Correct integrand & limits leading to AG, no 3 3x 1 errors seen k ( 0 + = 1 ⇒ k = 3 AG) A1 3 [2] ∞ 3 dx M1 Attempt integ xf(x); ignore limits. 4 (ii) ∫1 x × x − 3 ∞ 2 x 2 1 3 = A1 CWO 2 ∞ 3 dx M1* Attempt integ x2f(x); ignore limits. 4 ∫1 x 2 × x − 3 ∞ (= 3) A1 Correct integrand; correct limits x 1 3 2 “3” –(" ") M1*dep dep 2nd M1 attempt E(X 2) – [E(X )]2 2 3 = A1 cwo 4 [6] GCE AS/A LEVEL – May/June 2010 9709 73
Q6 · Yu Ming travels to work and returns home once each day
6 Yu Ming travels to work and returns home once each day. The times, in minutes, that he takes to travel to work and to return home are represented by the independent random variables W and H with distributions N(22.4, 4.82) and N(20.3, 5.22) respectively. (i) Find the probability that Yu Ming’s total travelling time during a 5-day period is greater than 180 minutes. [4] (ii) Find the probability that, on a particular day, Yu Ming takes longer to return home than he takes to travel to work. [5]
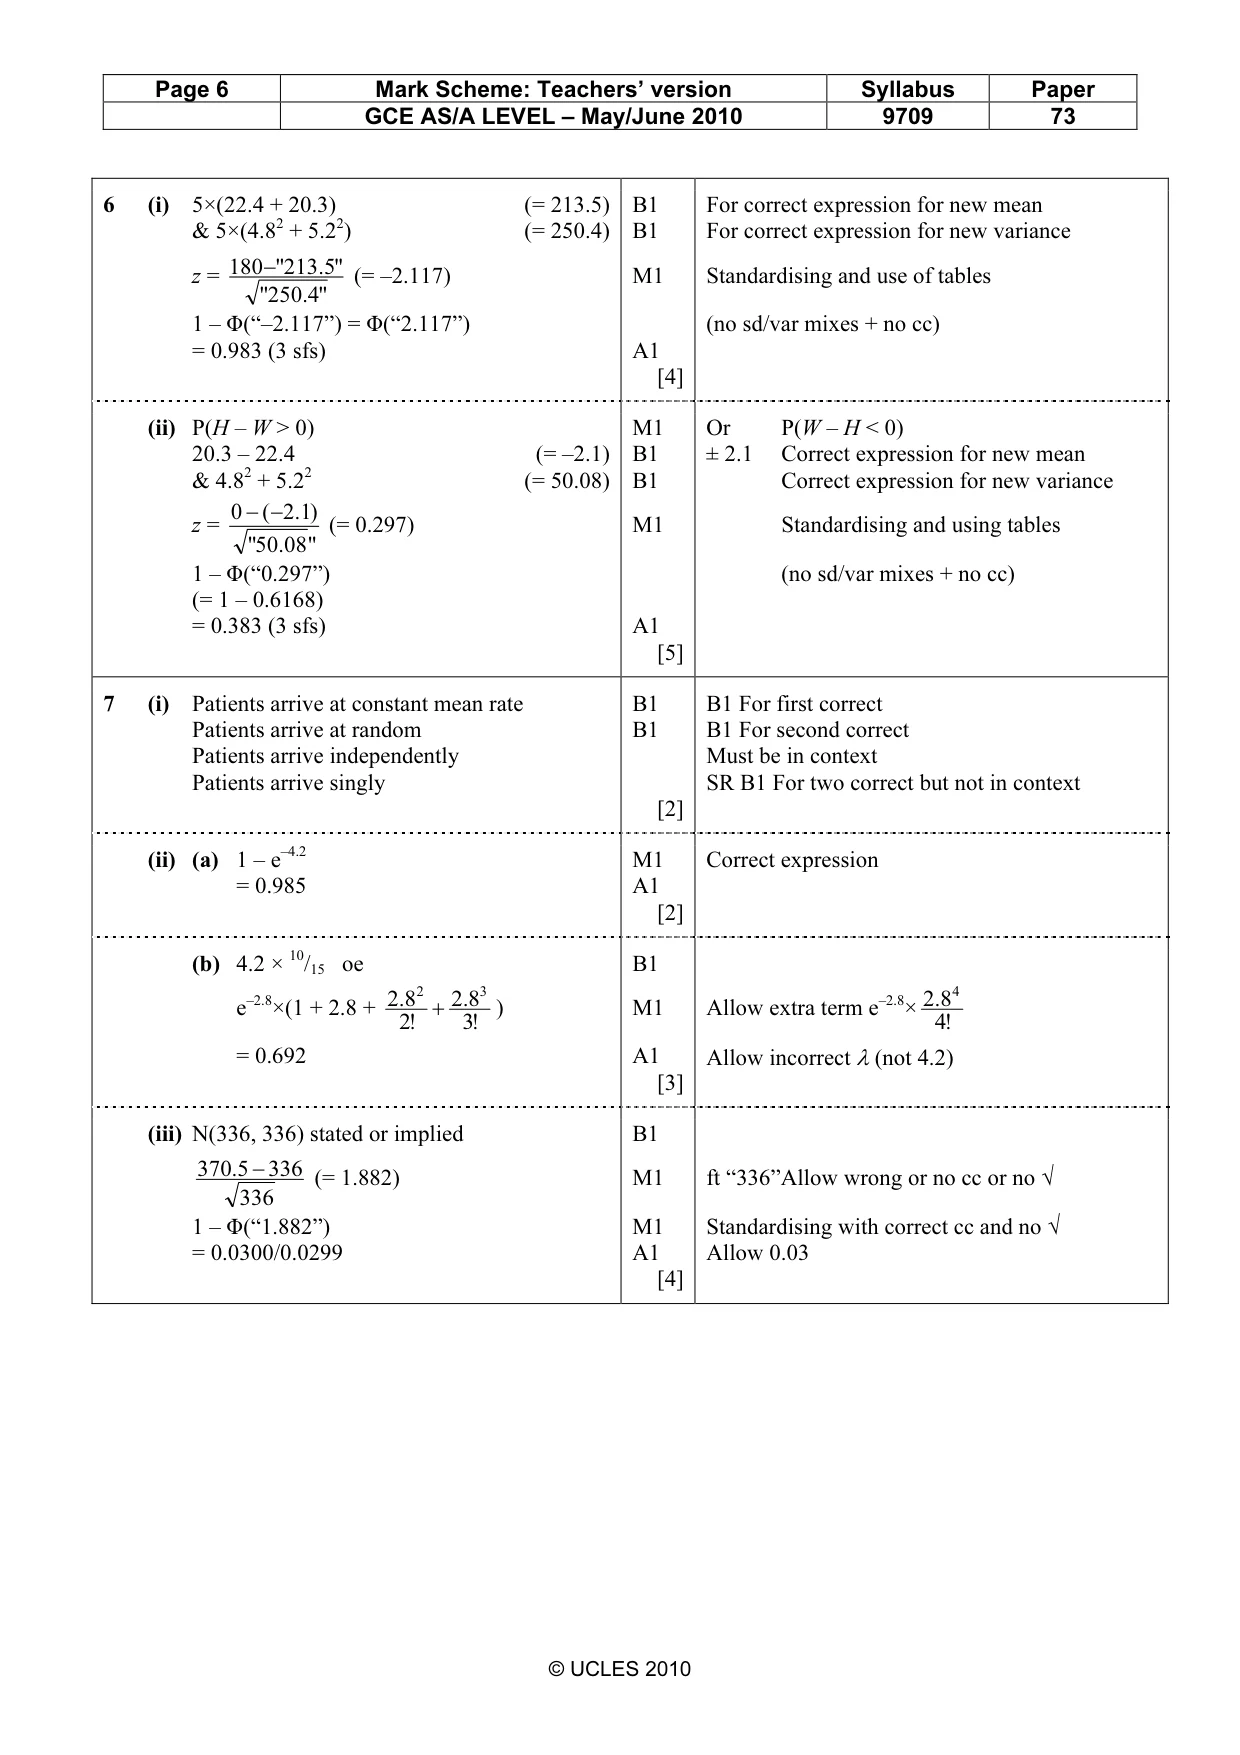
Mark scheme: 6 (i) 5×(22.4 + 20.3) (= 213.5) B1 For correct expression for new mean & 5×(4.82 + 5.22) (= 250.4) B1 For correct expression for new variance 180−"2135." z = (= –2.117) M1 Standardising and use of tables "2504." 1 – Φ(“–2.117”) = Φ(“2.117”) (no sd/var mixes + no cc) = 0.983 (3 sfs) A1 [4] (ii) P(H – W > 0) M1 Or P(W – H < 0) 20.3 – 22.4 (= –2.1) B1 ± 2.1 Correct expression for new mean & 4.82 + 5.22 (= 50.08) B1 Correct expression for new variance 0 − ( −)1.2 z = (= 0.297) M1 Standardising and using tables "50 .08 " 1 – Φ(“0.297”) (no sd/var mixes + no cc) (= 1 – 0.6168) = 0.383 (3 sfs) A1 [5]
Q7 · A clinic deals only with flu vaccinations
7 A clinic deals only with flu vaccinations. The number of patients arriving every 15 minutes is modelled by the random variable X with distribution Po(4.2). (i) State two assumptions required for the Poisson model to be valid. [2] (ii) Find the probability that (a) at least 1 patient will arrive in a 15-minute period, [2] (b) fewer than 4 patients will arrive in a 10-minute period. [3] (iii) The clinic is open for 20 hours each week. At the beginning of one week the clinic has enough vaccine for 370 patients. Use a suitable approximation to find the probability that this will not be enough vaccine for that week. [4]
Mark scheme: 7 (i) Patients arrive at constant mean rate B1 B1 For first correct Patients arrive at random B1 B1 For second correct Patients arrive independently Must be in context Patients arrive singly SR B1 For two correct but not in context [2] (ii) (a) 1 – e–4.2 M1 Correct expression = 0.985 A1 [2] (b) 4.2 × 10/15 oe B1 e–2.8×(1 + 2.8 + 8.2 2 + 8.23 ) M1 Allow extra term e–2.8× 8.2 4 !2 !3 !4 = 0.692 A1 Allow incorrect λ (not 4.2) [3] (iii) N(336, 336) stated or implied B1 3705. − 336 (= 1.882) M1 ft “336”Allow wrong or no cc or no √ 336 1 – Φ(“1.882”) M1 Standardising with correct cc and no √ = 0.0300/0.0299 A1 Allow 0.03 [4]
What was in this paper
The subtopics covered by these 7 questions, and how many questions each got. Open one in a new tab to see every Cambridge question on it.
What you needed in this session
Cambridge’s own grade thresholds for 2010 May/June, Paper 7 · Variant 3. A higher threshold means an easier paper — the bar moves with how the cohort did.