Cambridge A Level Mathematics 9709 — 2011 Oct/Nov Paper 7 · Variant 2
9709/72/O/N/11 · 7 questions · 50 marks · ≈56 min
The question paper and its mark scheme, free to read here and free to download. This is Cambridge’s own paper, exactly as it was sat.
Question paper4 pages
Mark scheme6 pages
Answers below. Sit the paper first if you are practising.
Questions as text
Q1 · The random variable X has the distribution Po(1.3)
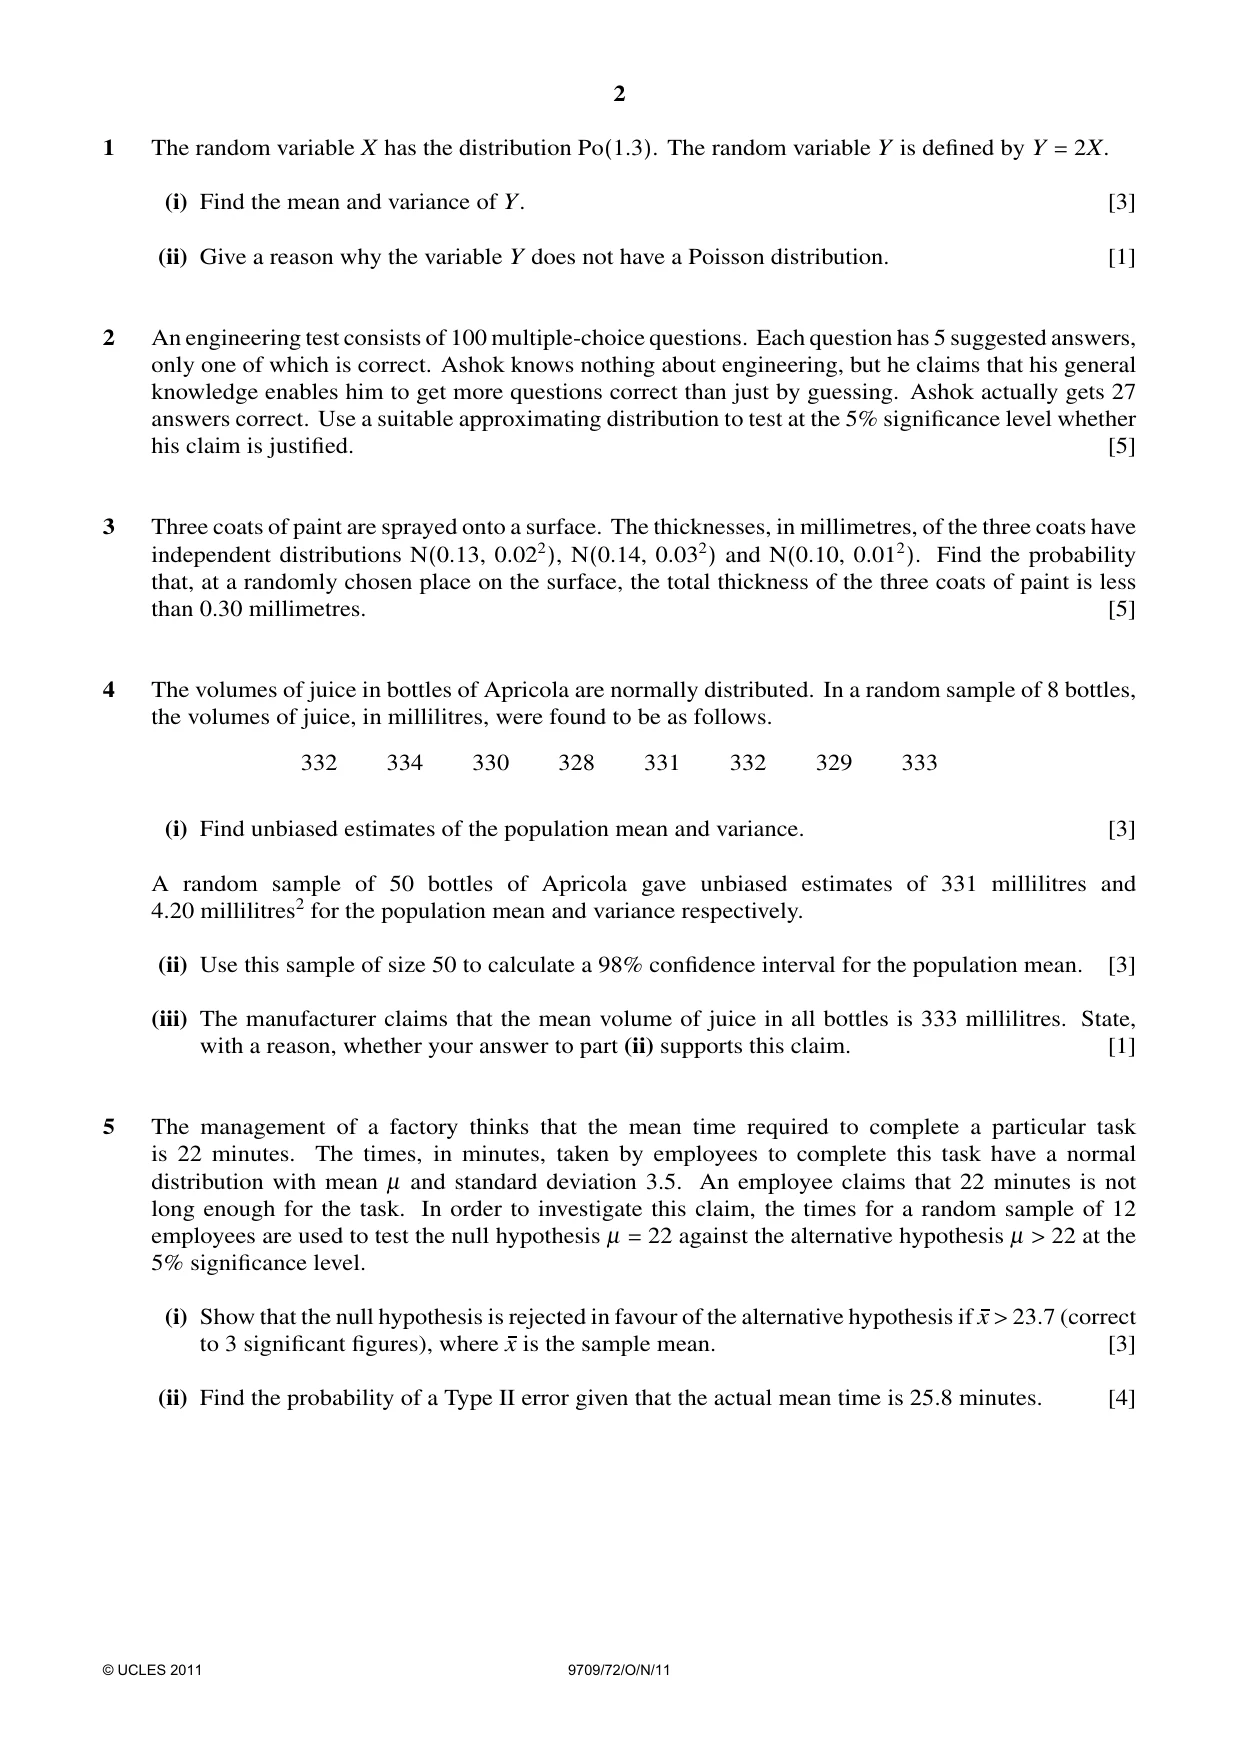
1 The random variable X has the distribution Po(1.3). The random variable Y is defined by Y = 2X. (i) Find the mean and variance of Y. [3] (ii) Give a reason why the variable Y does not have a Poisson distribution. [1]
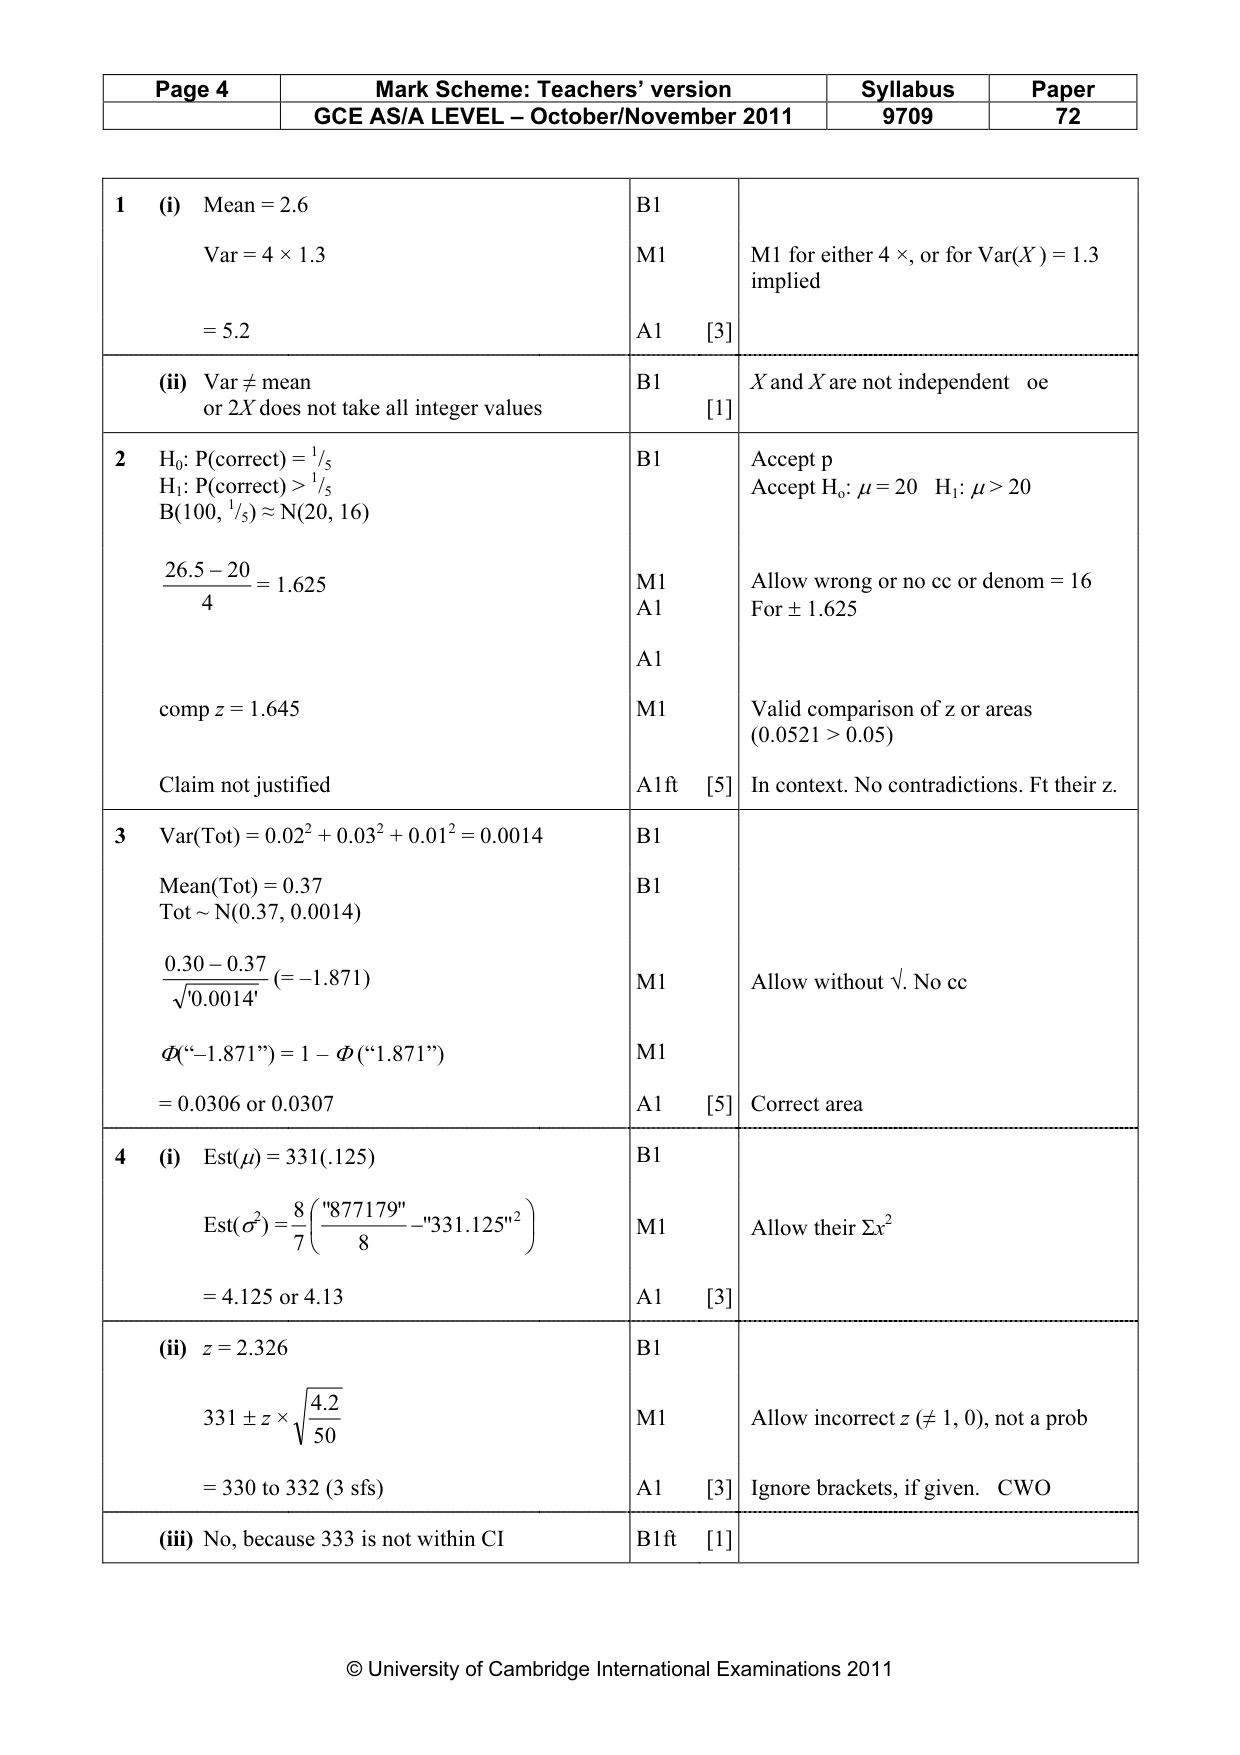
Mark scheme: 1 (i) Mean = 2.6 B1 Var = 4 × 1.3 M1 M1 for either 4 ×, or for Var(X ) = 1.3 implied = 5.2 A1 [3] (ii) Var ≠ mean B1 X and X are not independent oe or 2X does not take all integer values [1] 1
Q2 · An engineering test consists of 100 multiple-choice questions
2 An engineering test consists of 100 multiple-choice questions. Each question has 5 suggested answers, only one of which is correct. Ashok knows nothing about engineering, but he claims that his general knowledge enables him to get more questions correct than just by guessing. Ashok actually gets 27 answers correct. Use a suitable approximating distribution to test at the 5% significance level whether his claim is justified. [5]
Mark scheme: 2 H0: P(correct) = 1/5 B1 Accept p H1: P(correct) > 1/5 Accept Ho: µ = 20 H1: µ > 20 B(100, 1/5) ≈ N(20, 16) 265. − 20 = 1.625 M1 Allow wrong or no cc or denom = 16 4 A1 For ± 1.625 A1 comp z = 1.645 M1 Valid comparison of z or areas (0.0521 > 0.05) Claim not justified A1ft [5] In context. No contradictions. Ft their z. 2 2 2
Q3 · Three coats of paint are sprayed onto a surface
3 Three coats of paint are sprayed onto a surface. The thicknesses, in millimetres, of the three coats have independent distributions N(0.13, 0.022), N(0.14, 0.032) and N(0.10, 0.012). Find the probability that, at a randomly chosen place on the surface, the total thickness of the three coats of paint is less than 0.30 millimetres. [5]
Mark scheme: 3 Var(Tot) = 0.022 + 0.032 + 0.012 = 0.0014 B1 Mean(Tot) = 0.37 B1 Tot ~ N(0.37, 0.0014) .030 − .037 (= –1.871) M1 Allow without √. No cc .0'0014 ' Φ(“–1.871”) = 1 – Φ (“1.871”) M1 = 0.0306 or 0.0307 A1 [5] Correct area
Q4 · The volumes of juice in bottles of Apricola are normally distributed
4 The volumes of juice in bottles of Apricola are normally distributed. In a random sample of 8 bottles, the volumes of juice, in millilitres, were found to be as follows. 332 334 330 328 331 332 329 333 (i) Find unbiased estimates of the population mean and variance. [3] A random sample of 50 bottles of Apricola gave unbiased estimates of 331 millilitres and 4.20 millilitres2 for the population mean and variance respectively. (ii) Use this sample of size 50 to calculate a 98% confidence interval for the population mean. [3] (iii) The manufacturer claims that the mean volume of juice in all bottles is 333 millilitres. State, with a reason, whether your answer to part (ii) supports this claim. [1]
Mark scheme: 4 (i) Est(µ) = 331(.125) B1 8 "877179" Est(σ2) = −"331. 1252" M1 Allow their Σx2 7 8 = 4.125 or 4.13 A1 [3] (ii) z = 2.326 B1 2.4 331 ± z × M1 Allow incorrect z (≠ 1, 0), not a prob 50 = 330 to 332 (3 sfs) A1 [3] Ignore brackets, if given. CWO (iii) No, because 333 is not within CI B1ft [1] GCE AS/A LEVEL – October/November 2011 9709 72
Q5 · The management of a factory thinks that the mean time required to complete a particular…
5 The management of a factory thinks that the mean time required to complete a particular task is 22 minutes. The times, in minutes, taken by employees to complete this task have a normal distribution with mean µ and standard deviation 3.5. An employee claims that 22 minutes is not long enough for the task. In order to investigate this claim, the times for a random sample of 12 employees are used to test the null hypothesis µ = 22 against the alternative hypothesis µ > 22 at the 5% significance level. (i) Show that the null hypothesis is rejected in favour of the alternative hypothesis if x > 23.7 (correct to 3 significant figures), where x is the sample mean. [3] (ii) Find the probability of a Type II error given that the actual mean time is 25.8 minutes. [4]
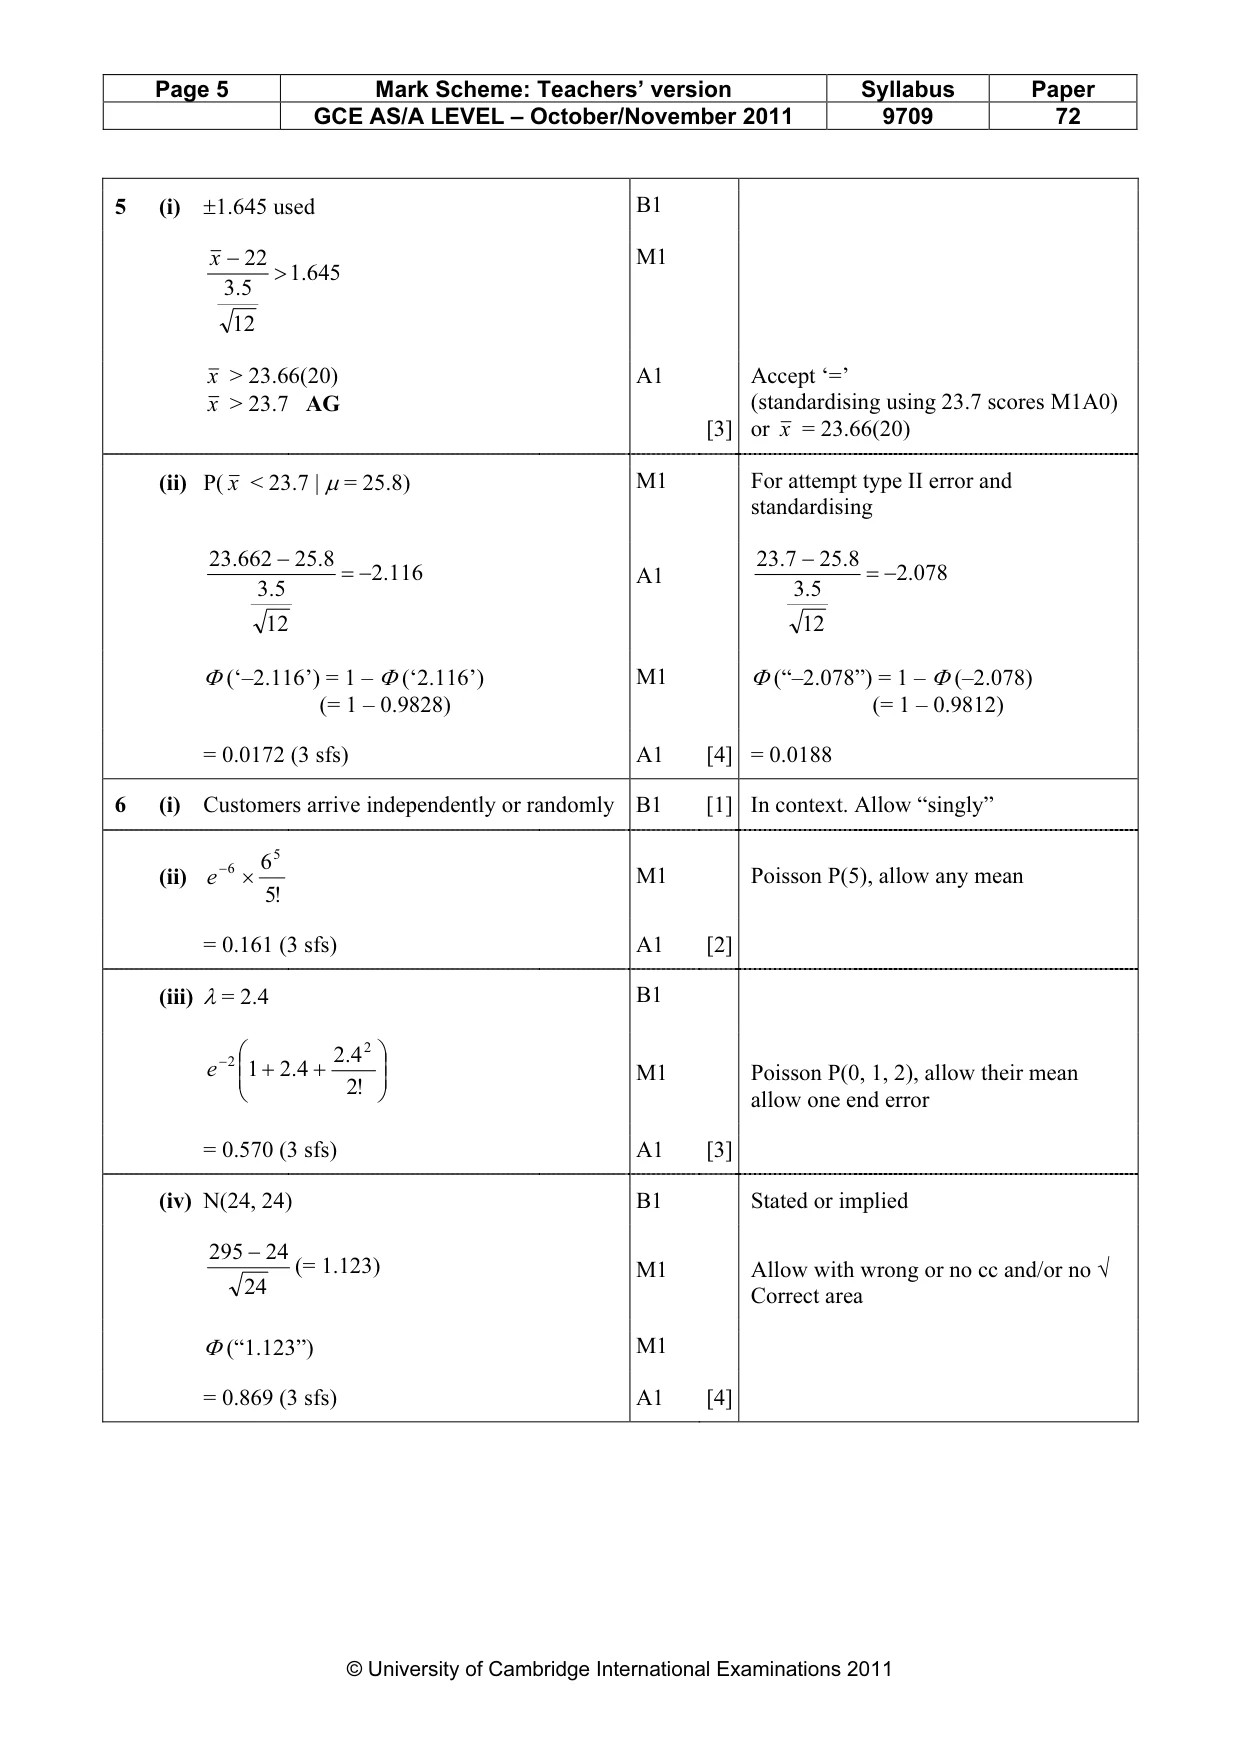
Mark scheme: 5 (i) ±1.645 used B1 x − 22 M1 > .1645 5.3 12 x > 23.66(20) A1 Accept ‘=’ x > 23.7 AG (standardising using 23.7 scores M1A0) [3] or x = 23.66(20) (ii) P( x < 23.7 | µ = 25.8) M1 For attempt type II error and standardising 23.662 − 258. 237. − 258. = −.2116 A1 = −.2078 5.3 5.3 12 12 Φ (‘–2.116’) = 1 – Φ (‘2.116’) M1 Φ (“–2.078”) = 1 – Φ (–2.078) (= 1 – 0.9828) (= 1 – 0.9812) = 0.0172 (3 sfs) A1 [4] = 0.0188
Q6 · Customers arrive at an enquiry desk at a constant average rate of 1 every 5 minutes
6 Customers arrive at an enquiry desk at a constant average rate of 1 every 5 minutes. (i) State one condition for the number of customers arriving in a given period to be modelled by a Poisson distribution. [1] Assume now that a Poisson distribution is a suitable model. (ii) Find the probability that exactly 5 customers will arrive during a randomly chosen 30-minute period. [2] (iii) Find the probability that fewer than 3 customers will arrive during a randomly chosen 12-minute period. [3] (iv) Find an estimate of the probability that fewer than 30 customers will arrive during a randomly chosen 2-hour period. [4]
Mark scheme: 6 (i) Customers arrive independently or randomly B1 [1] In context. Allow “singly” − 6 65 (ii) e × M1 Poisson P(5), allow any mean !5 = 0.161 (3 sfs) A1 [2] (iii) λ = 2.4 B1 − 2 4.2 2 e 1 + 4.2 + M1 Poisson P(0, 1, 2), allow their mean !2 allow one end error = 0.570 (3 sfs) A1 [3] (iv) N(24, 24) B1 Stated or implied 295 − 24 (= 1.123) M1 Allow with wrong or no cc and/or no √ 24 Correct area Φ (“1.123”) M1 = 0.869 (3 sfs) A1 [4] GCE AS/A LEVEL – October/November 2011 9709 72
Q7 · 4 4 4 4 2 2 2 2 t u v w 0 1 0 1 0 1 0 1 Fig
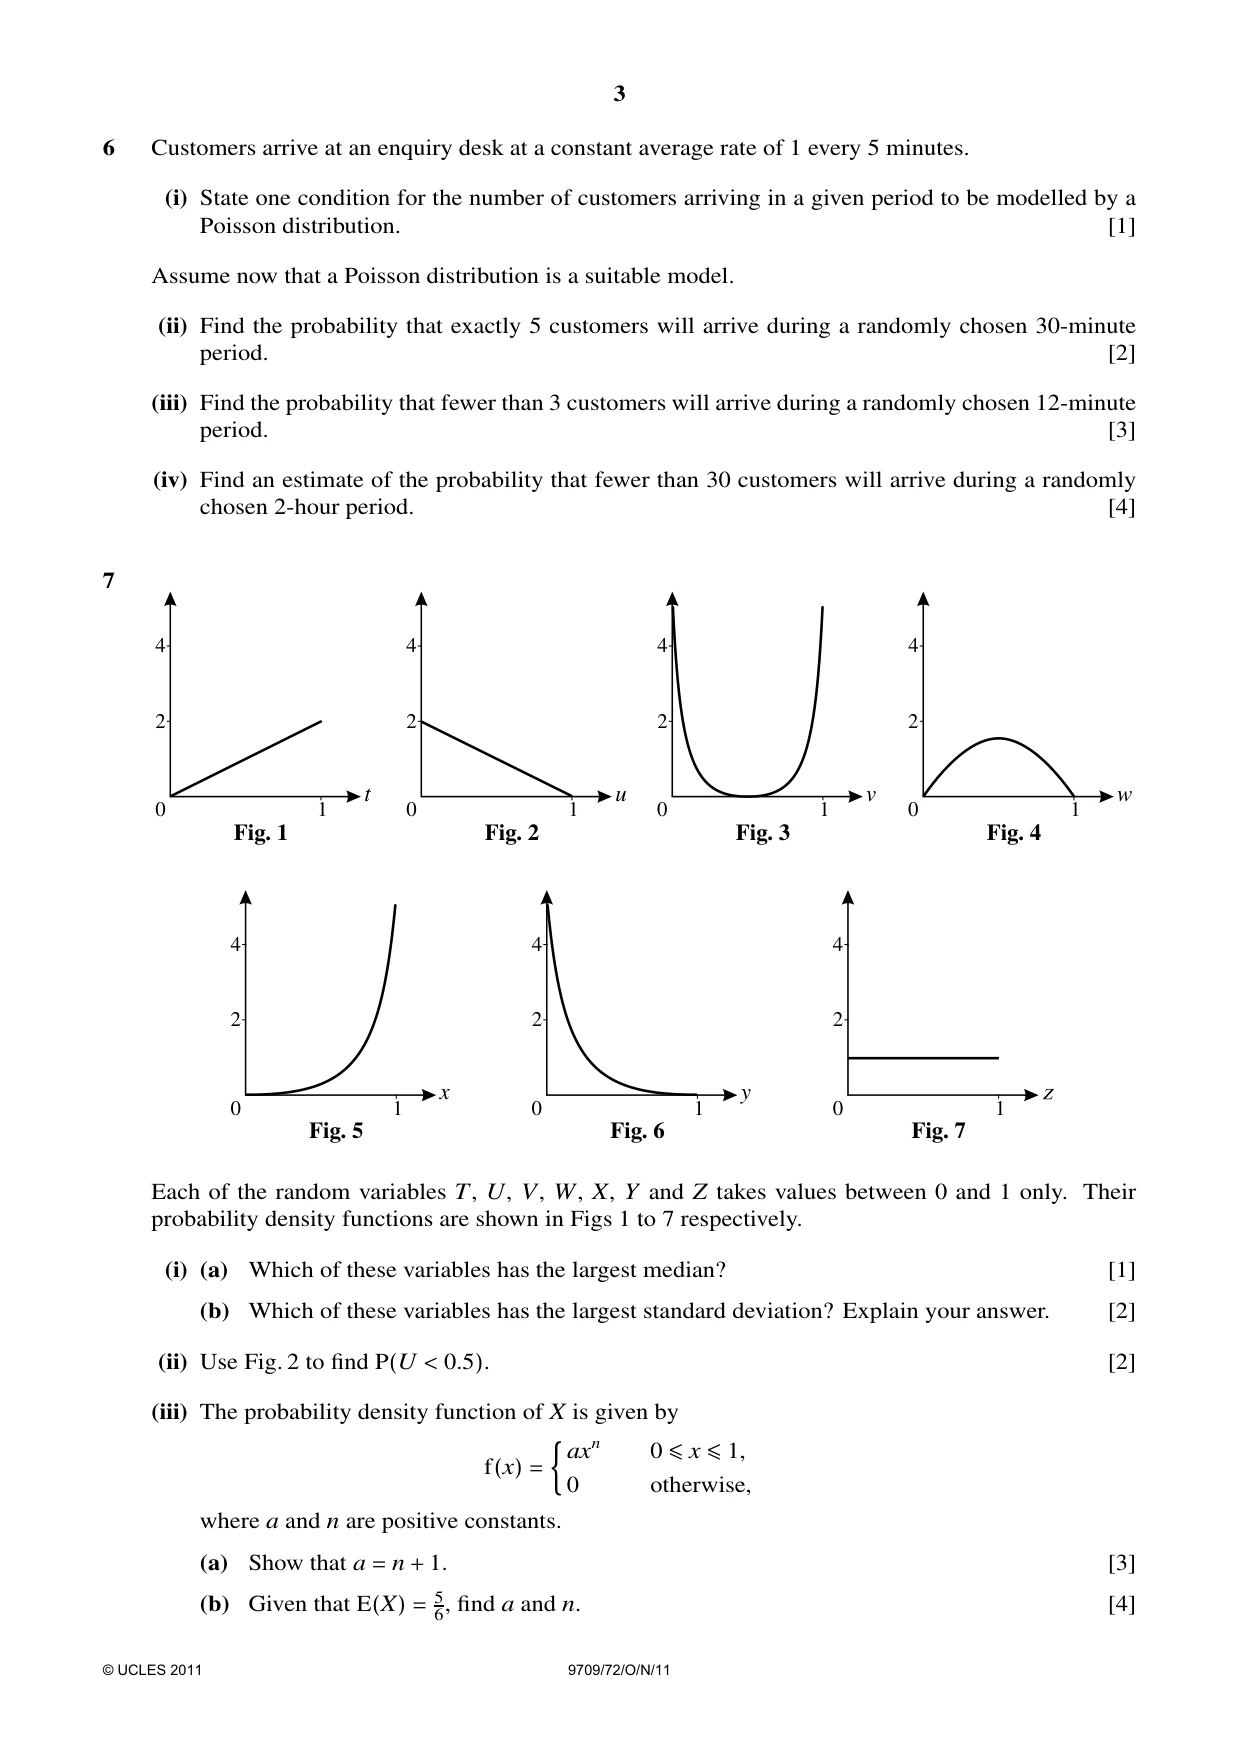
7 4 4 4 4 2 2 2 2 t u v w 0 1 0 1 0 1 0 1 Fig. 1 Fig. 2 Fig. 3 Fig. 4 4 4 4 2 2 2 z x y 0 1 0 1 0 1 Fig. 5 Fig. 6 Fig. 7 Each of the random variables T, U, V, W, X, Y and Z takes values between 0 and 1 only. Their probability density functions are shown in Figs 1 to 7 respectively. (i) (a) Which of these variables has the largest median? [1] (b) Which of these variables has the largest standard deviation? Explain your answer. [2] (ii) Use Fig. 2 to find P(U < 0.5). [2] (iii) The probability density function of X is given by axn 0 ≤x ≤1, f(x) = 0 otherwise, where a and n are positive constants. (a) Show that a = n + 1. [3] (b) Given that E(X) = 56, find a and n. [4]
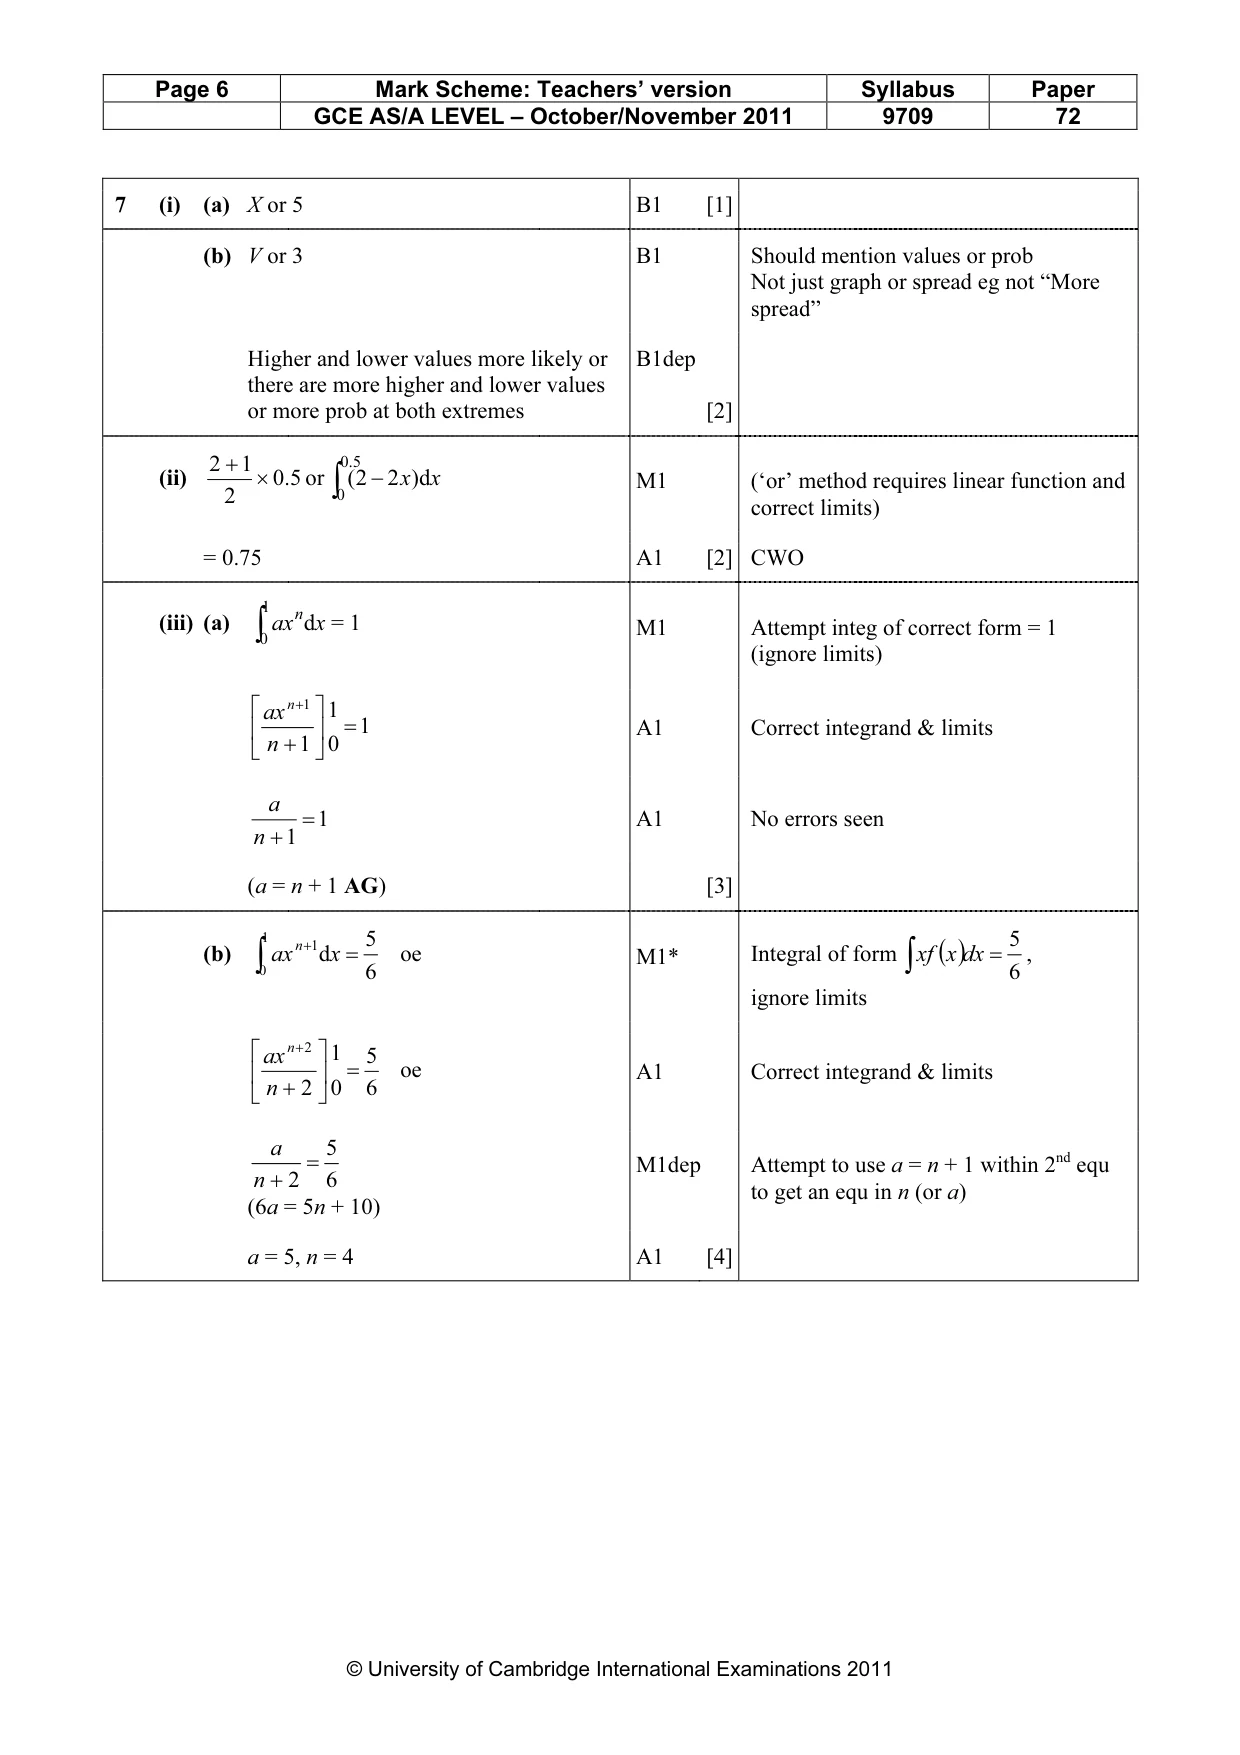
Mark scheme: 7 (i) (a) X or 5 B1 [1] (b) V or 3 B1 Should mention values or prob Not just graph or spread eg not “More spread” Higher and lower values more likely or B1dep there are more higher and lower values or more prob at both extremes [2] 2 + 1 5.0 (ii) M1 (‘or’ method requires linear function and × 5.0 or∫0 ( 2 − 2 x ) d x 2 correct limits) = 0.75 A1 [2] CWO 1 M1 Attempt integ of correct form = 1 (iii) (a) ∫0 axn dx = 1 (ignore limits) ax n +1 1 = 1 A1 Correct integrand & limits n + 1 0 a = 1 A1 No errors seen n + 1 (a = n + 1 AG) [3] 1 5 5 n +1 = , M1* Integral of form ∫ xf ( x )dx (b) ∫0 ax dx = 6 oe 6 ignore limits ax n + 2 1 5 = oe A1 Correct integrand & limits n + 2 0 6 a 5 = M1dep Attempt to use a = n + 1 within 2nd equ n + 2 6 to get an equ in n (or a) (6a = 5n + 10) a = 5, n = 4 A1 [4]
What was in this paper
The subtopics covered by these 7 questions, and how many questions each got. Open one in a new tab to see every Cambridge question on it.
What you needed in this session
Cambridge’s own grade thresholds for 2011 Oct/Nov, Paper 7 · Variant 2. A higher threshold means an easier paper — the bar moves with how the cohort did.