Cambridge A Level Mathematics 9709 — 2013 May/June Paper 7 · Variant 3
9709/73/M/J/13 · 5 questions · 50 marks · ≈56 min
The question paper and its mark scheme, free to read here and free to download. This is Cambridge’s own paper, exactly as it was sat.
Question paper4 pages
Mark scheme6 pages
Answers below. Sit the paper first if you are practising.
Questions as text
Q1 · The mean and variance of the random variable X are 5.8 and 3.1 respectively
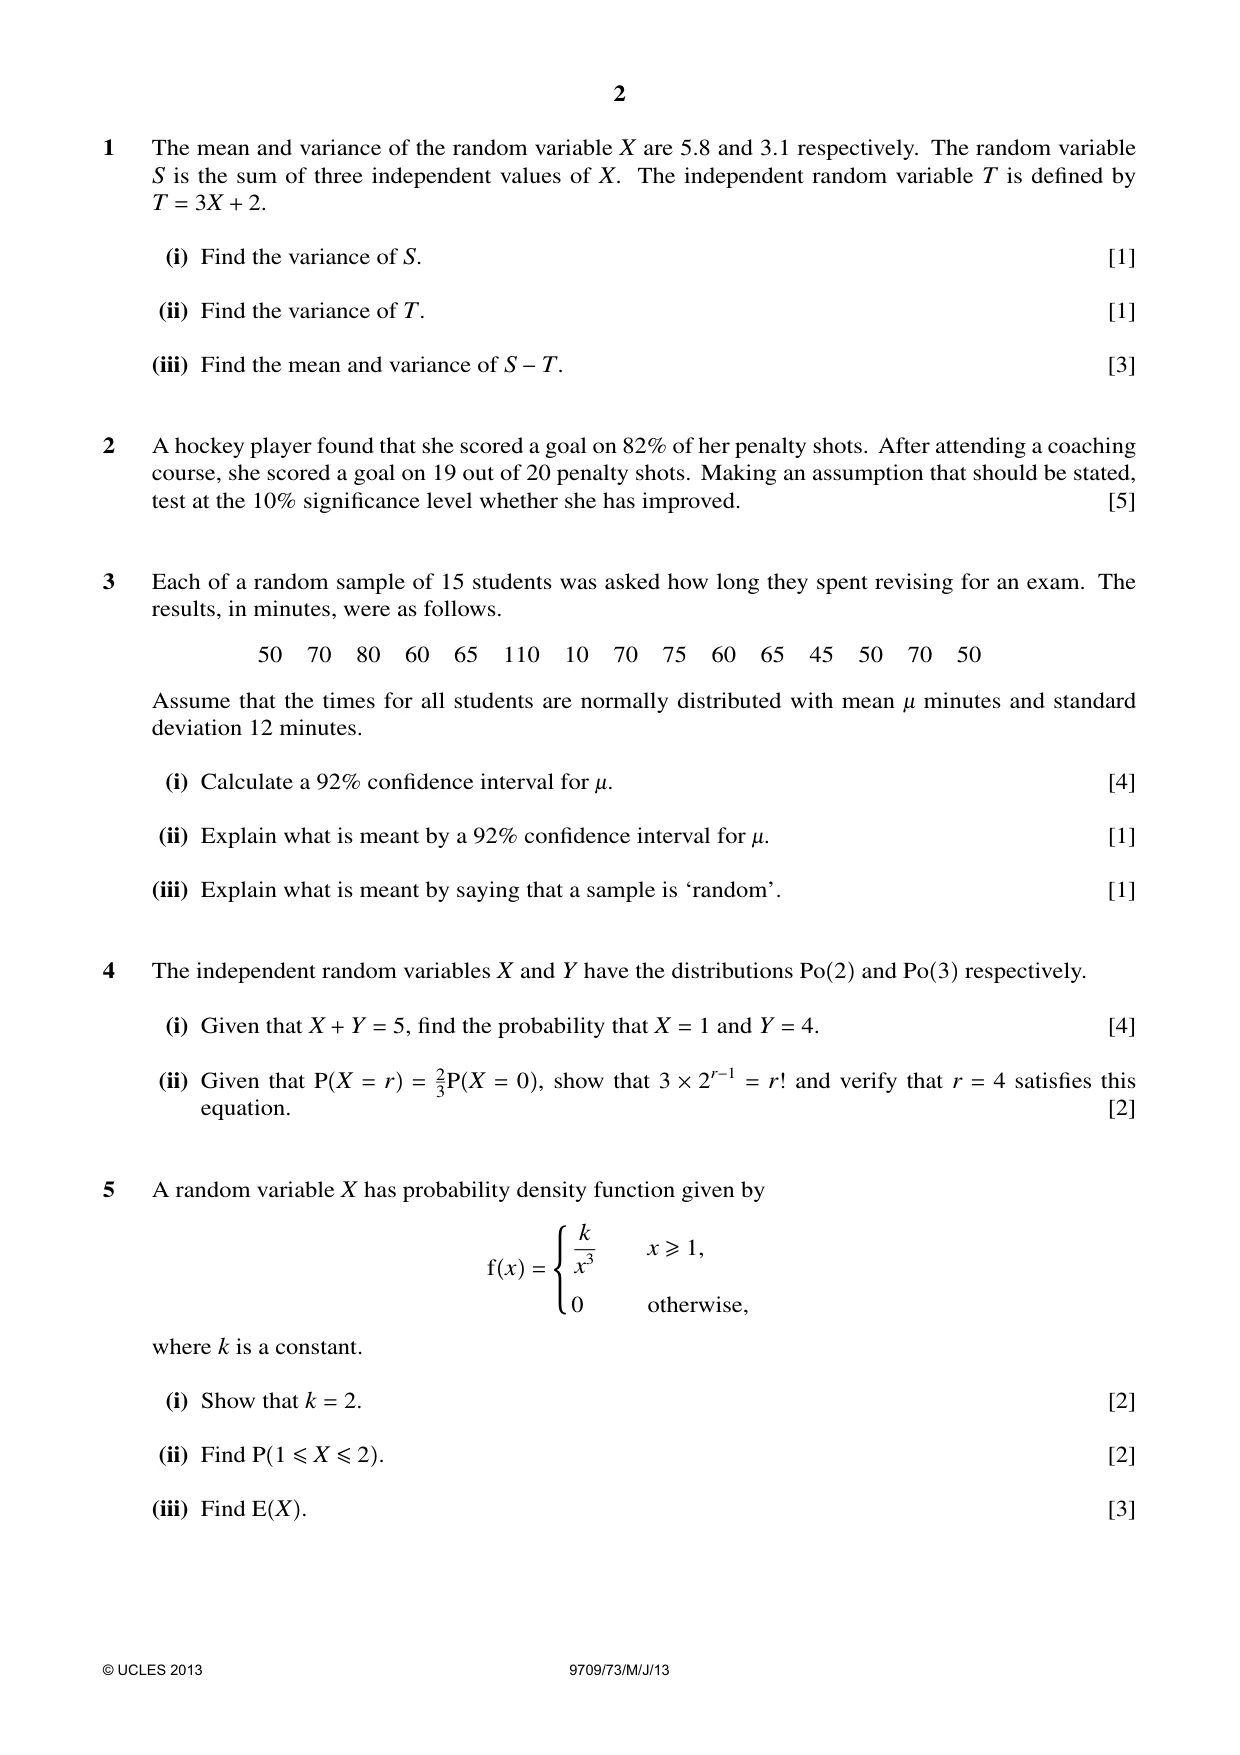
1 The mean and variance of the random variable X are 5.8 and 3.1 respectively. The random variable S is the sum of three independent values of X. The independent random variable T is defined by T = 3X + 2. (i) Find the variance of S. [1] (ii) Find the variance of T. [1] (iii) Find the mean and variance of S −T. [3]
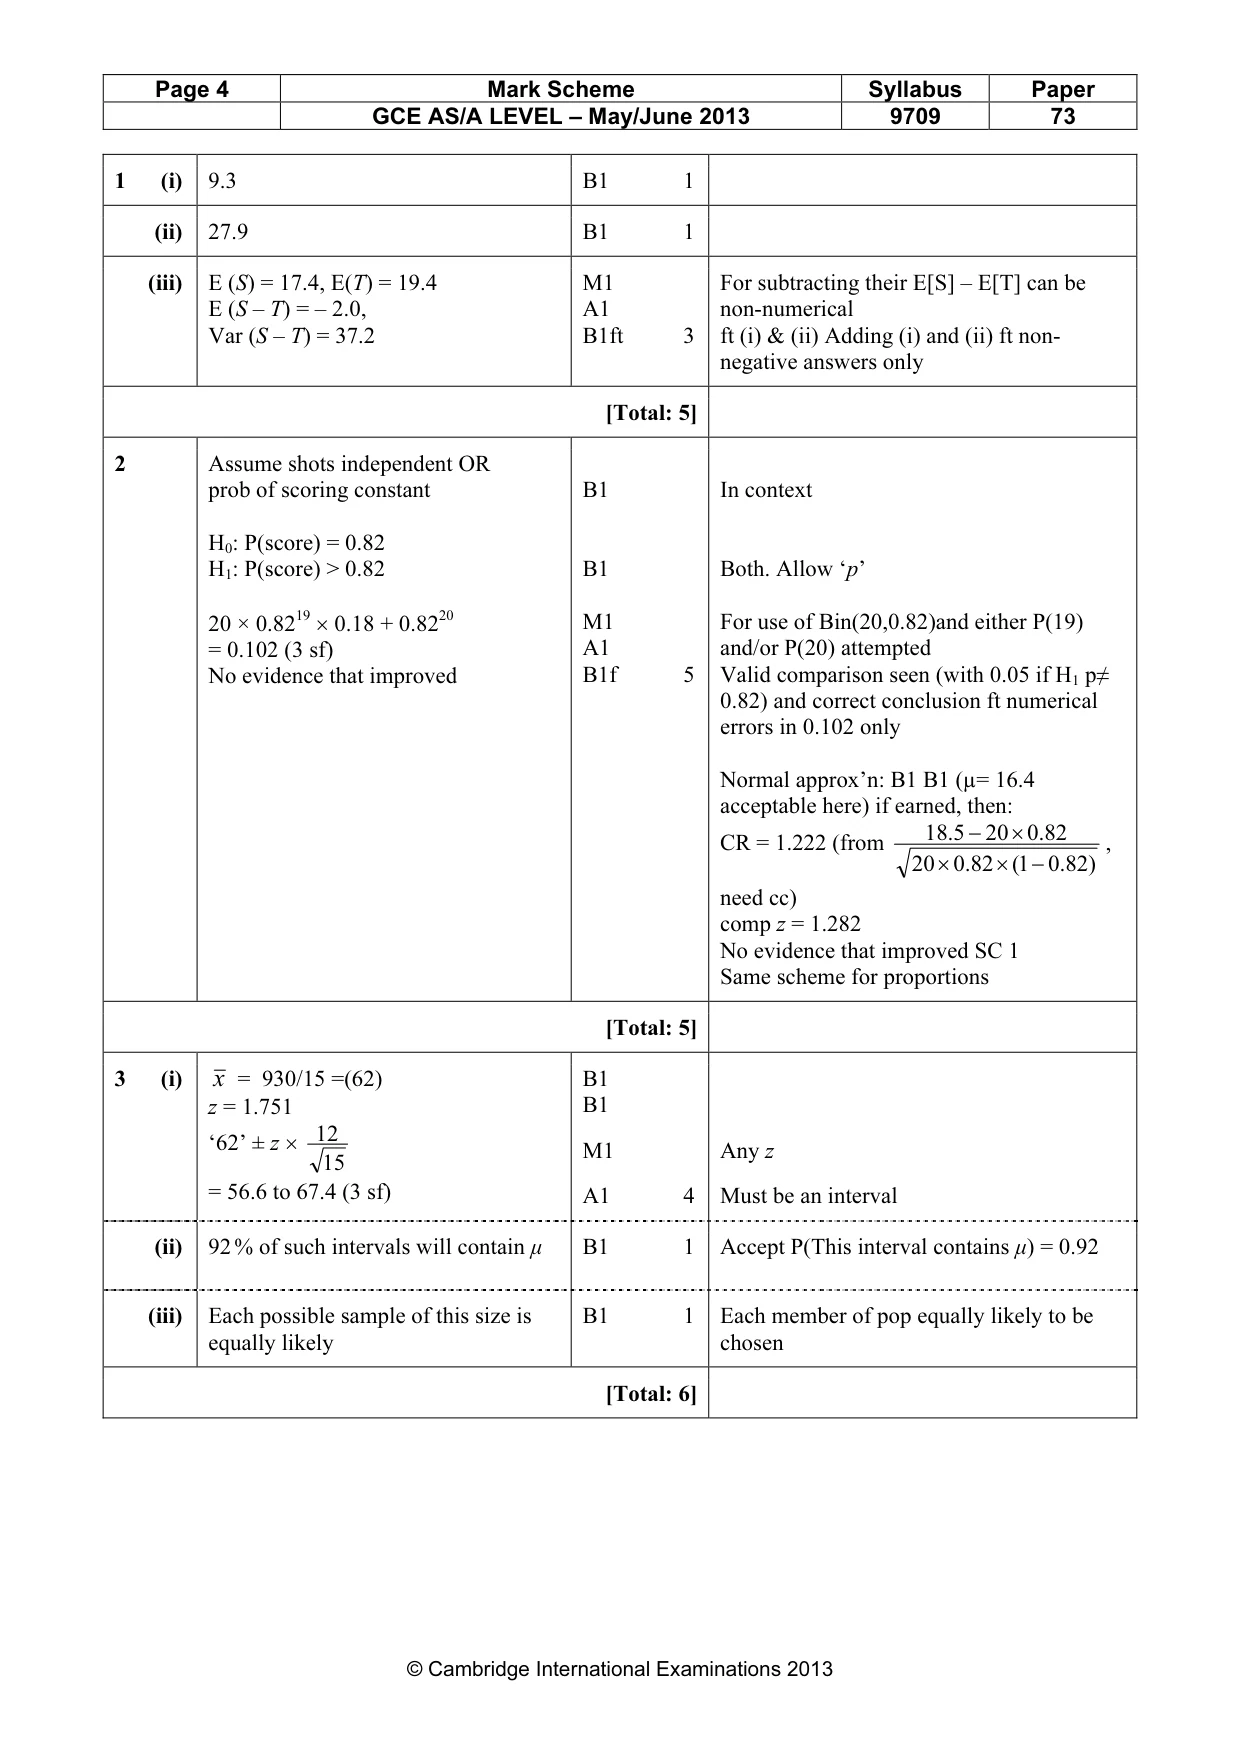
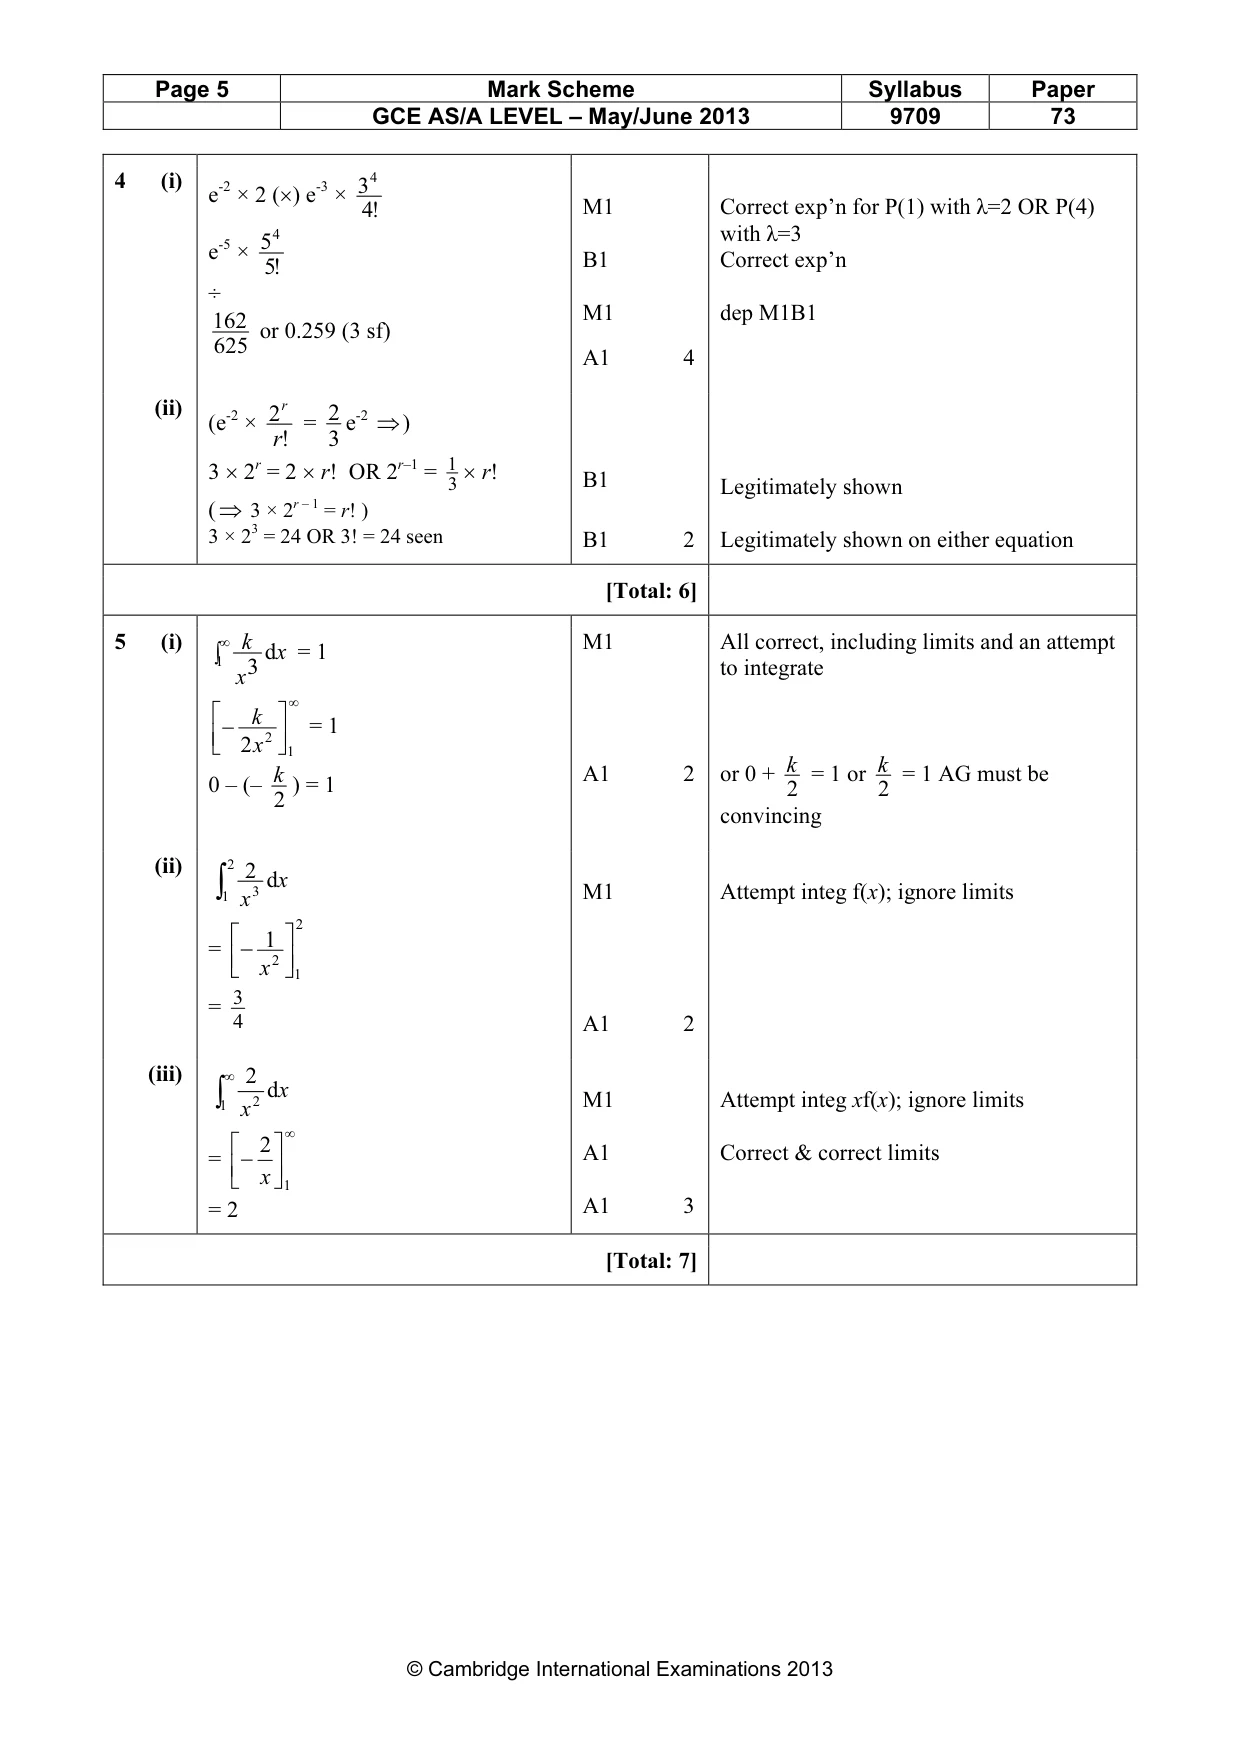
Mark scheme: 1 (i) 9.3 B1 1 (ii) 27.9 B1 1 (iii) E (S) = 17.4, E(T) = 19.4 M1 For subtracting their E[S] – E[T] can be E (S – T) = – 2.0, A1 non-numerical Var (S – T) = 37.2 B1ft 3 ft (i) & (ii) Adding (i) and (ii) ft non- negative answers only [Total: 5]
Q2 · A hockey player found that she scored a goal on 82% of her penalty shots
2 A hockey player found that she scored a goal on 82% of her penalty shots. After attending a coaching course, she scored a goal on 19 out of 20 penalty shots. Making an assumption that should be stated, test at the 10% significance level whether she has improved. [5]
Mark scheme: 2 Assume shots independent OR prob of scoring constant B1 In context H0: P(score) = 0.82 H1: P(score) > 0.82 B1 Both. Allow ‘p’ 20 × 0.8219 × 0.18 + 0.8220 M1 For use of Bin(20,0.82)and either P(19) = 0.102 (3 sf) A1 and/or P(20) attempted No evidence that improved B1f 5 Valid comparison seen (with 0.05 if H1 p≠ 0.82) and correct conclusion ft numerical errors in 0.102 only Normal approx’n: B1 B1 (µ= 16.4 acceptable here) if earned, then: 185. − 20 × .082 CR = 1.222 (from , 20 × .082 × 1( − .082) need cc) comp z = 1.282 No evidence that improved SC 1 Same scheme for proportions [Total: 5]
Q3 · Each of a random sample of 15 students was asked how long they spent revising for an exam
3 Each of a random sample of 15 students was asked how long they spent revising for an exam. The results, in minutes, were as follows. 50 70 80 60 65 110 10 70 75 60 65 45 50 70 50 Assume that the times for all students are normally distributed with mean - minutes and standard deviation 12 minutes. (i) Calculate a 92% confidence interval for -. [4] (ii) Explain what is meant by a 92% confidence interval for -. [1] (iii) Explain what is meant by saying that a sample is ‘random’. [1]
Mark scheme: 3 (i) x = 930/15 =(62) B1 z = 1.751 B1 12 ‘62’ ± z × M1 Any z 15 = 56.6 to 67.4 (3 sf) A1 4 Must be an interval (ii) 92 % of such intervals will contain µ B1 1 Accept P(This interval contains µ) = 0.92 (iii) Each possible sample of this size is B1 1 Each member of pop equally likely to be equally likely chosen [Total: 6] GCE AS/A LEVEL – May/June 2013 9709 73
Q6 · Calls arrive at a helpdesk randomly and at a constant average rate of 1.4 calls per hour
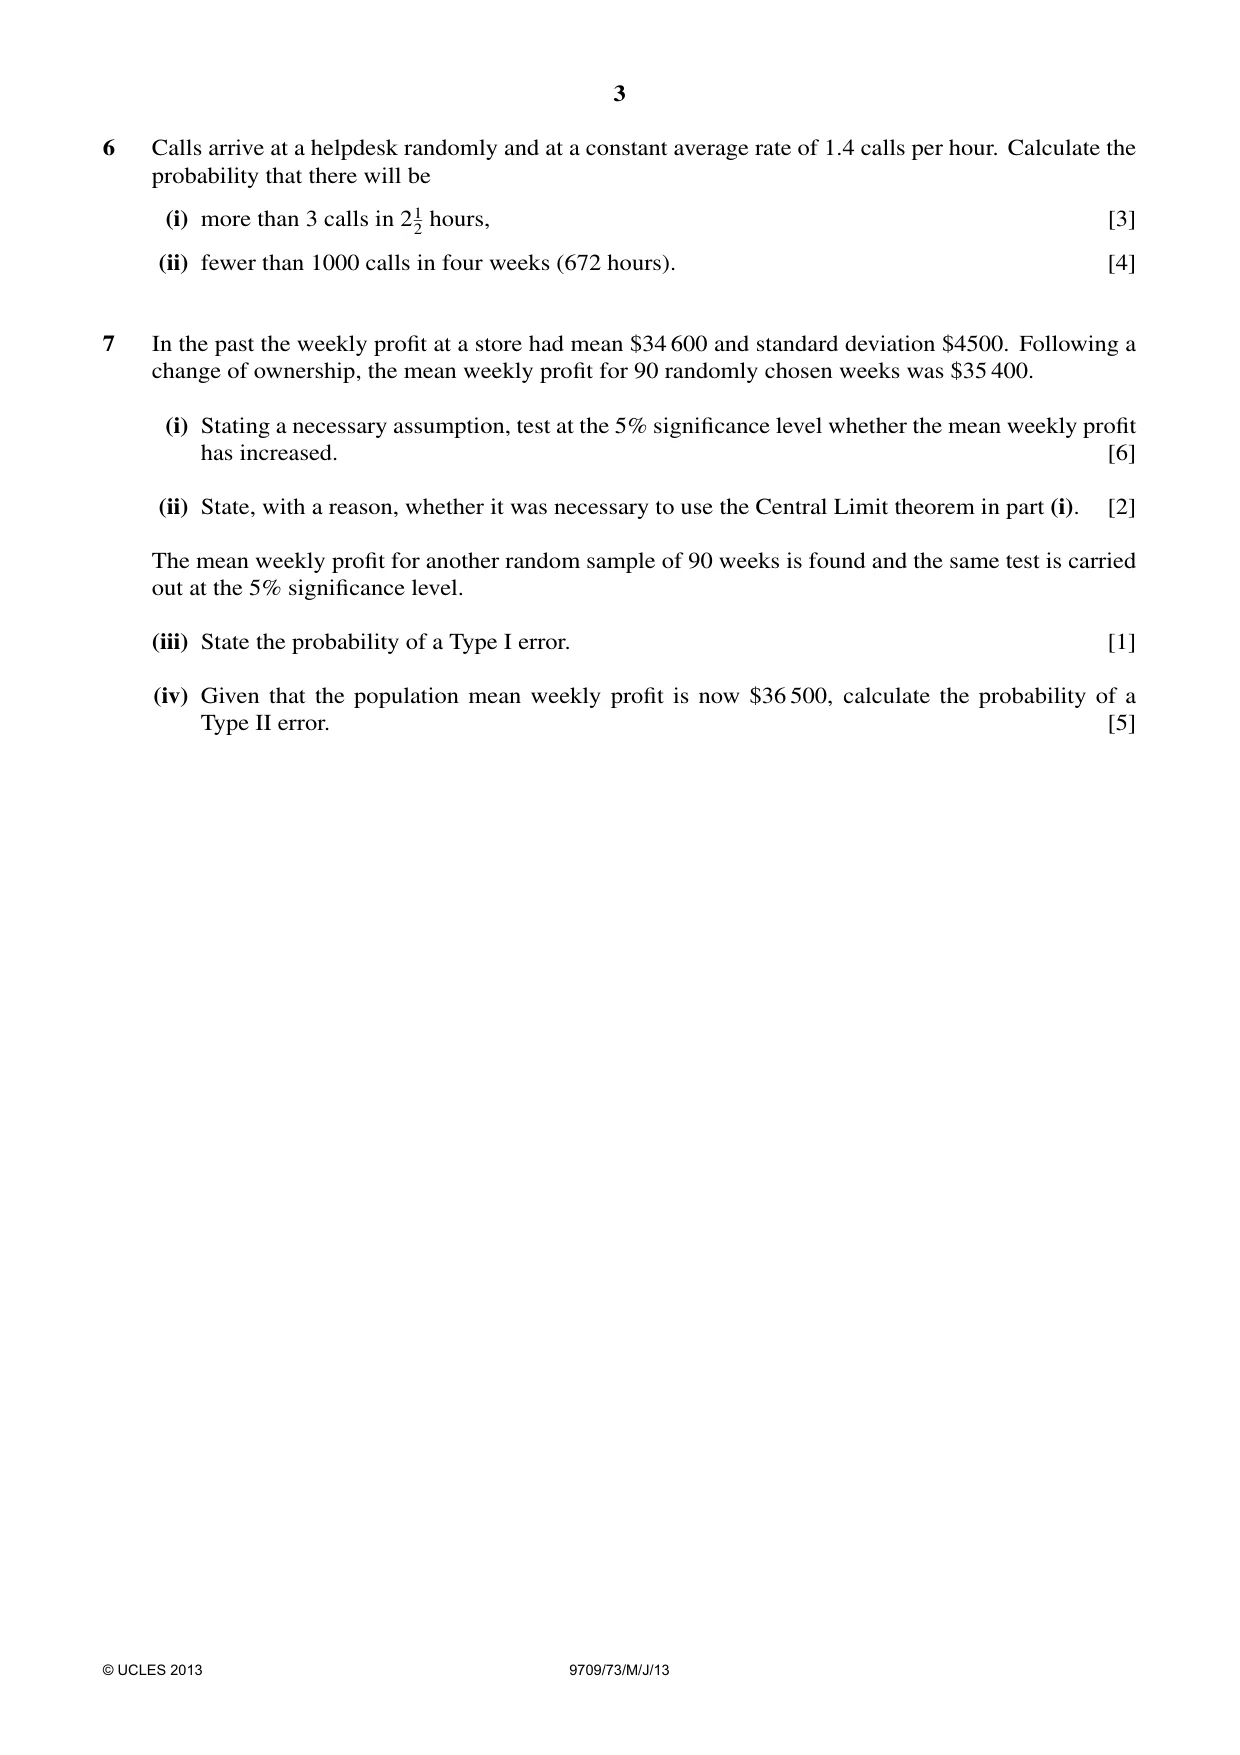
6 Calls arrive at a helpdesk randomly and at a constant average rate of 1.4 calls per hour. Calculate the probability that there will be (i) more than 3 calls in 212 hours, [3] (ii) fewer than 1000 calls in four weeks (672 hours). [4]
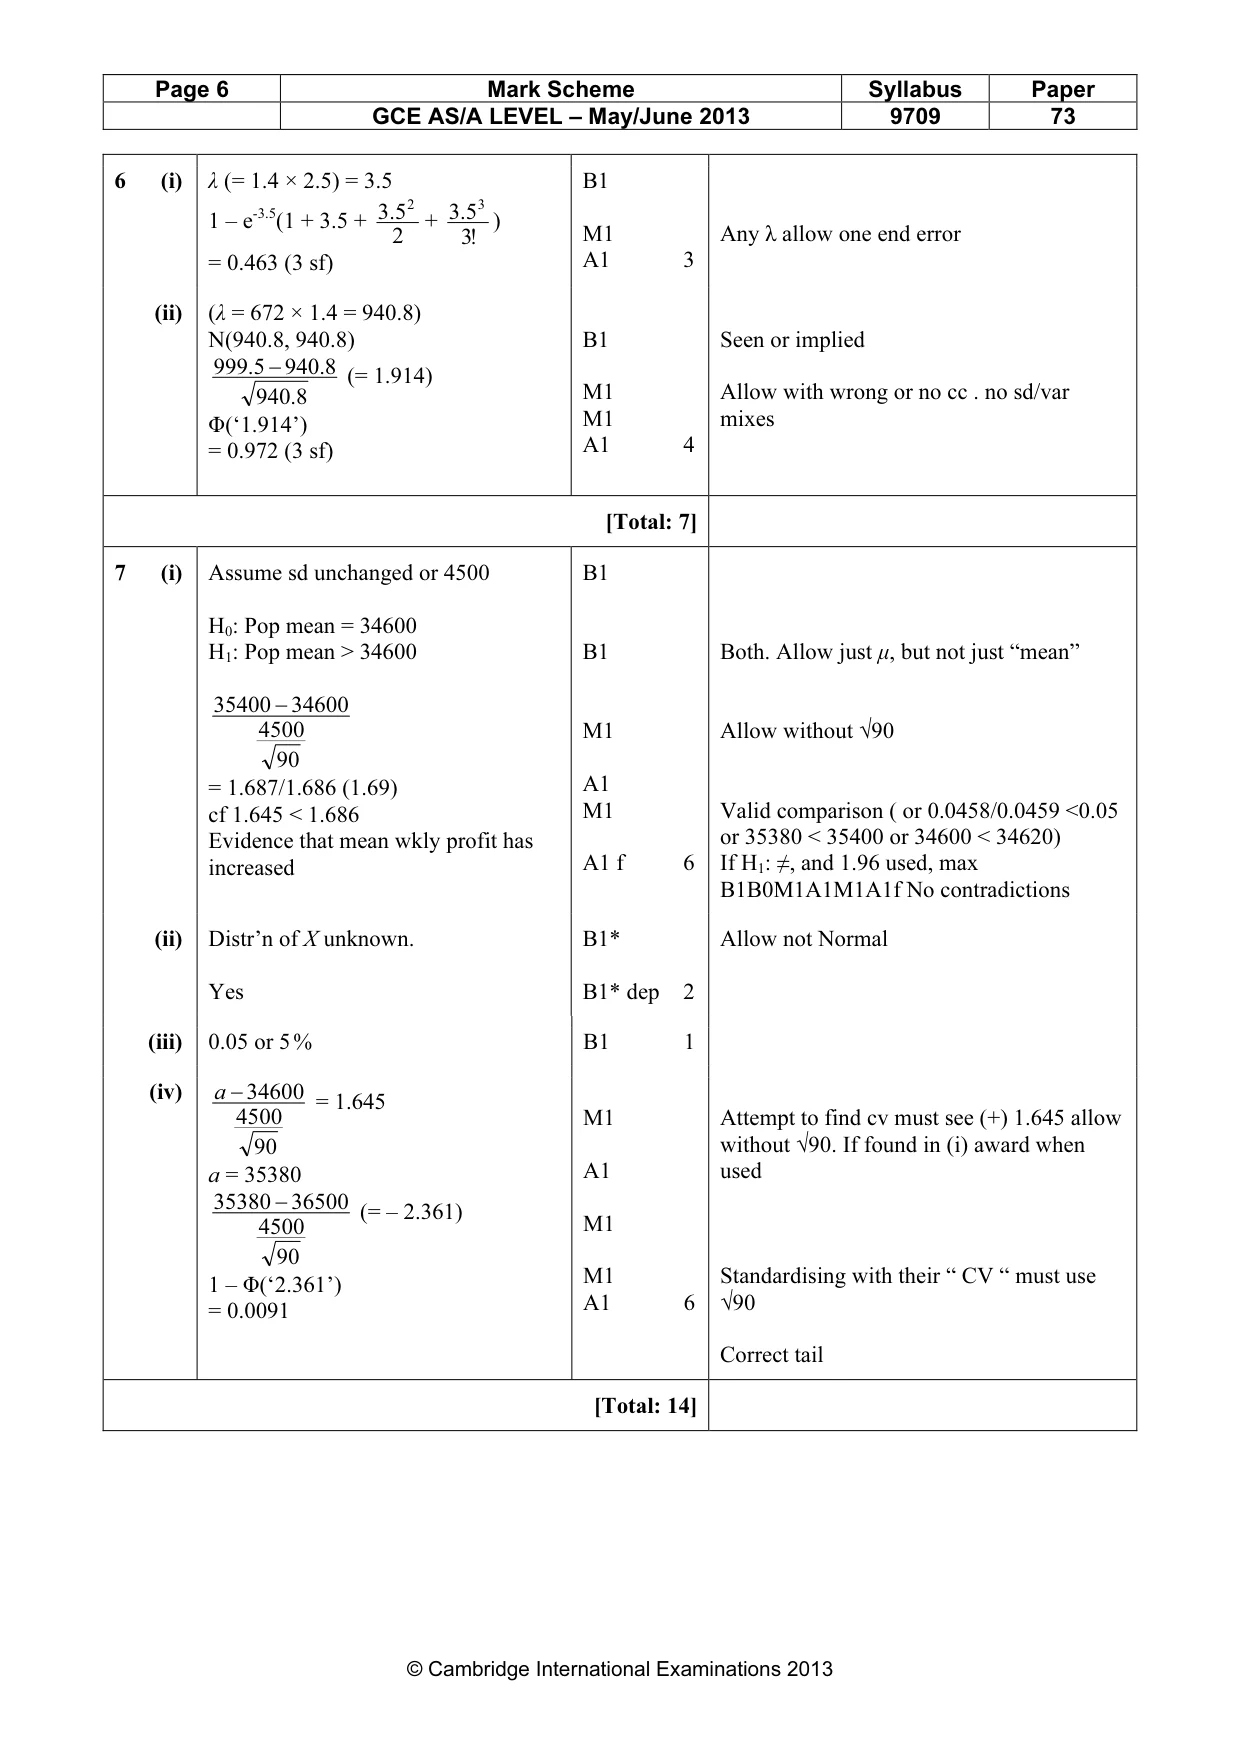
Mark scheme: 6 (i) λ (= 1.4 × 2.5) = 3.5 B1 5.3 2 5.3 3 1 – e-3.5(1 + 3.5 + + ) 2 !3 M1 Any λ allow one end error = 0.463 (3 sf) A1 3 (ii) (λ = 672 × 1.4 = 940.8) N(940.8, 940.8) B1 Seen or implied 9995. − 9408. (= 1.914) 9408. M1 Allow with wrong or no cc . no sd/var Φ(‘1.914’) M1 mixes = 0.972 (3 sf) A1 4 [Total: 7]
Q7 · In the past the weekly profit at a store had mean $34 600 and standard deviation $4500
7 In the past the weekly profit at a store had mean $34 600 and standard deviation $4500. Following a change of ownership, the mean weekly profit for 90 randomly chosen weeks was $35 400. (i) Stating a necessary assumption, test at the 5% significance level whether the mean weekly profit has increased. [6] (ii) State, with a reason, whether it was necessary to use the Central Limit theorem in part (i). [2] The mean weekly profit for another random sample of 90 weeks is found and the same test is carried out at the 5% significance level. (iii) State the probability of a Type I error. [1] (iv) Given that the population mean weekly profit is now $36 500, calculate the probability of a Type II error. [5]
Mark scheme: 7 (i) Assume sd unchanged or 4500 B1 H0: Pop mean = 34600 H1: Pop mean > 34600 B1 Both. Allow just µ, but not just “mean” 35400 − 34600 4500 M1 Allow without √90 90 = 1.687/1.686 (1.69) A1 cf 1.645 < 1.686 M1 Valid comparison ( or 0.0458/0.0459 <0.05 Evidence that mean wkly profit has or 35380 < 35400 or 34600 < 34620) increased A1 f 6 If H1: ≠, and 1.96 used, max B1B0M1A1M1A1f No contradictions (ii) Distr’n of X unknown. B1* Allow not Normal Yes B1* dep 2 (iii) 0.05 or 5 % B1 1 (iv) a − 34600 = 1.645 4500 M1 Attempt to find cv must see (+) 1.645 allow 90 without √90. If found in (i) award when a = 35380 A1 used 35380 − 36500 (= – 2.361) 4500 M1 90 M1 Standardising with their “ CV “ must use 1 – Φ(‘2.361’) A1 6 √90 = 0.0091 Correct tail [Total: 14]
What was in this paper
The subtopics covered by these 5 questions, and how many questions each got. Open one in a new tab to see every Cambridge question on it.
What you needed in this session
Cambridge’s own grade thresholds for 2013 May/June, Paper 7 · Variant 3. A higher threshold means an easier paper — the bar moves with how the cohort did.