Cambridge A Level Mathematics 9709 — 2014 Oct/Nov Paper 7 · Variant 1
9709/71/O/N/14 · 4 questions · 50 marks · ≈56 min
The question paper and its mark scheme, free to read here and free to download. This is Cambridge’s own paper, exactly as it was sat.
Question paper4 pages
Mark scheme6 pages
Answers below. Sit the paper first if you are practising.
Questions as text
Q2 · The probability that a randomly chosen plant of a certain kind has a particular defect is…
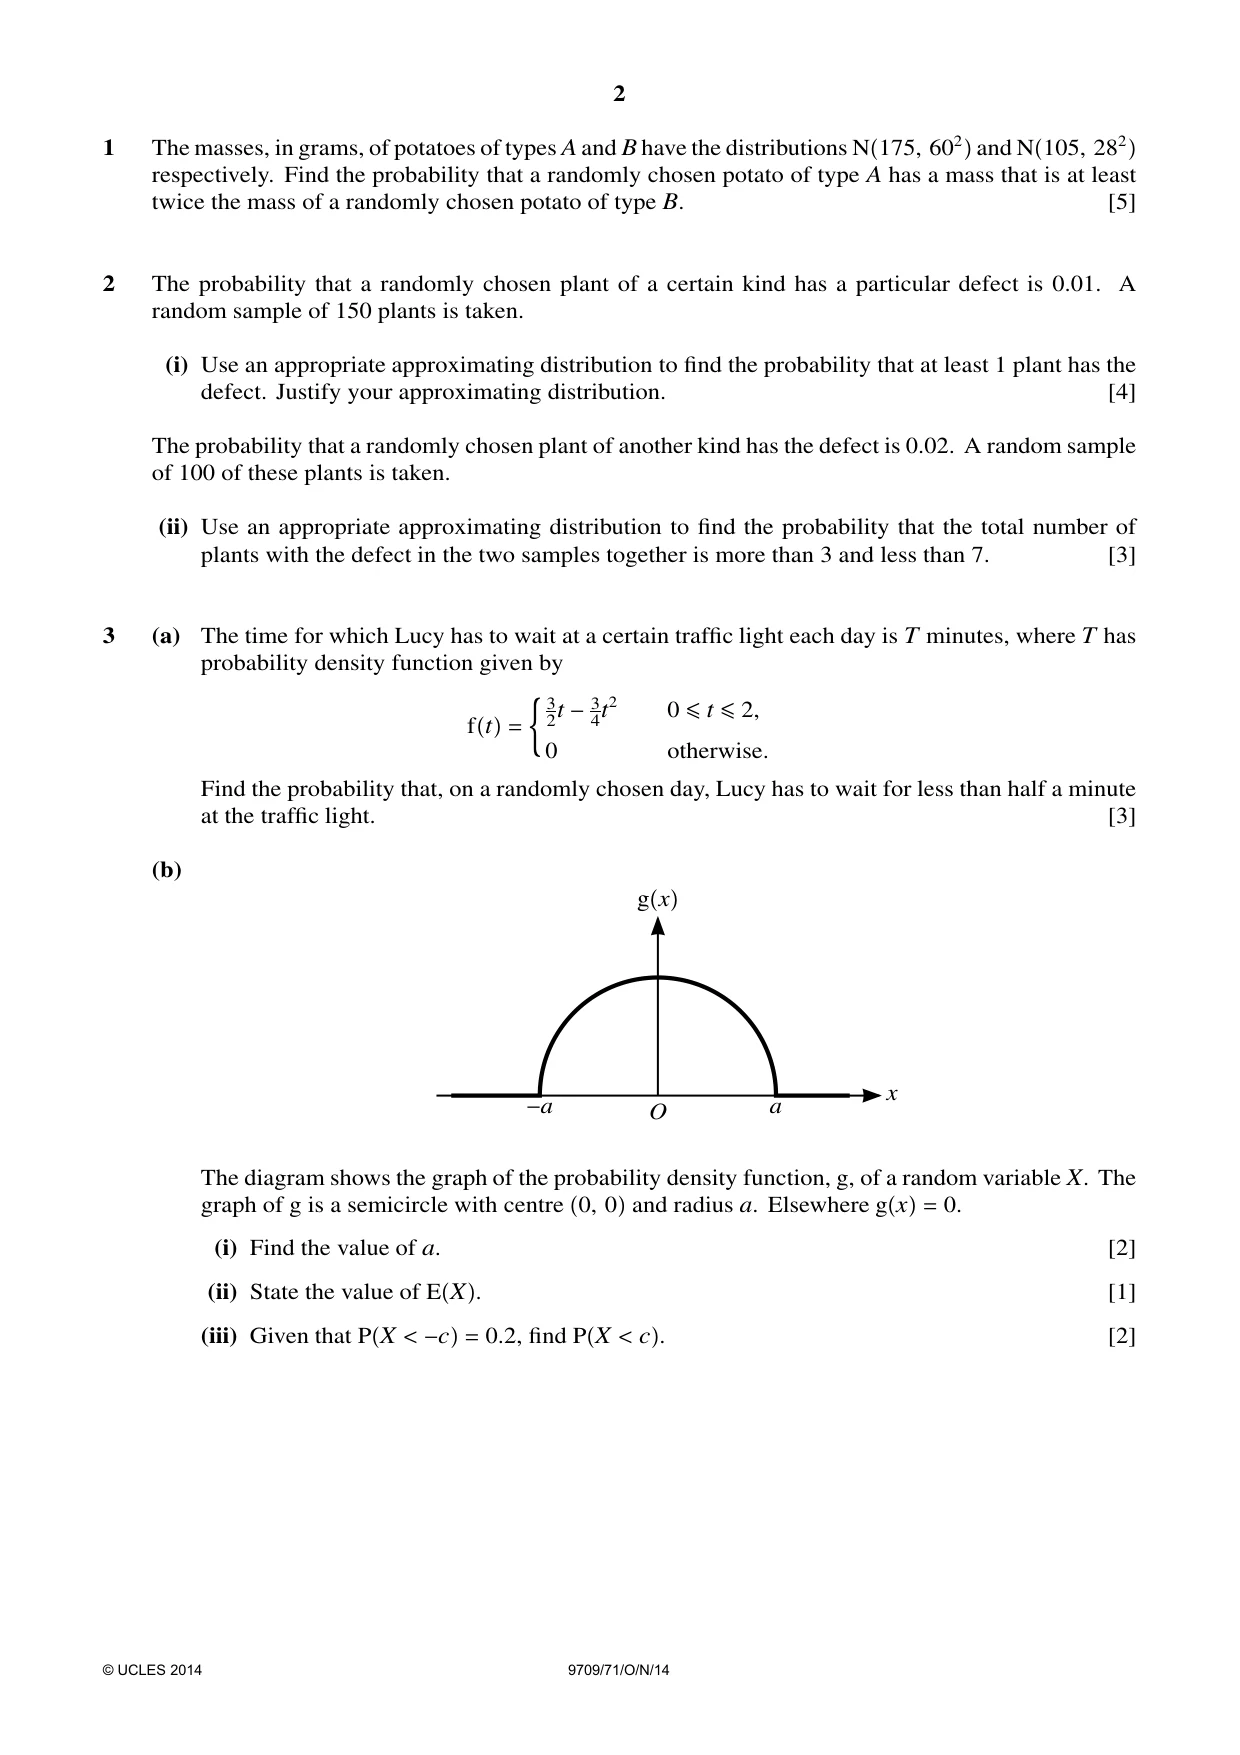
2 The probability that a randomly chosen plant of a certain kind has a particular defect is 0.01. A random sample of 150 plants is taken. (i) Use an appropriate approximating distribution to find the probability that at least 1 plant has the defect. Justify your approximating distribution. [4] The probability that a randomly chosen plant of another kind has the defect is 0.02. A random sample of 100 of these plants is taken. (ii) Use an appropriate approximating distribution to find the probability that the total number of plants with the defect in the two samples together is more than 3 and less than 7. [3]
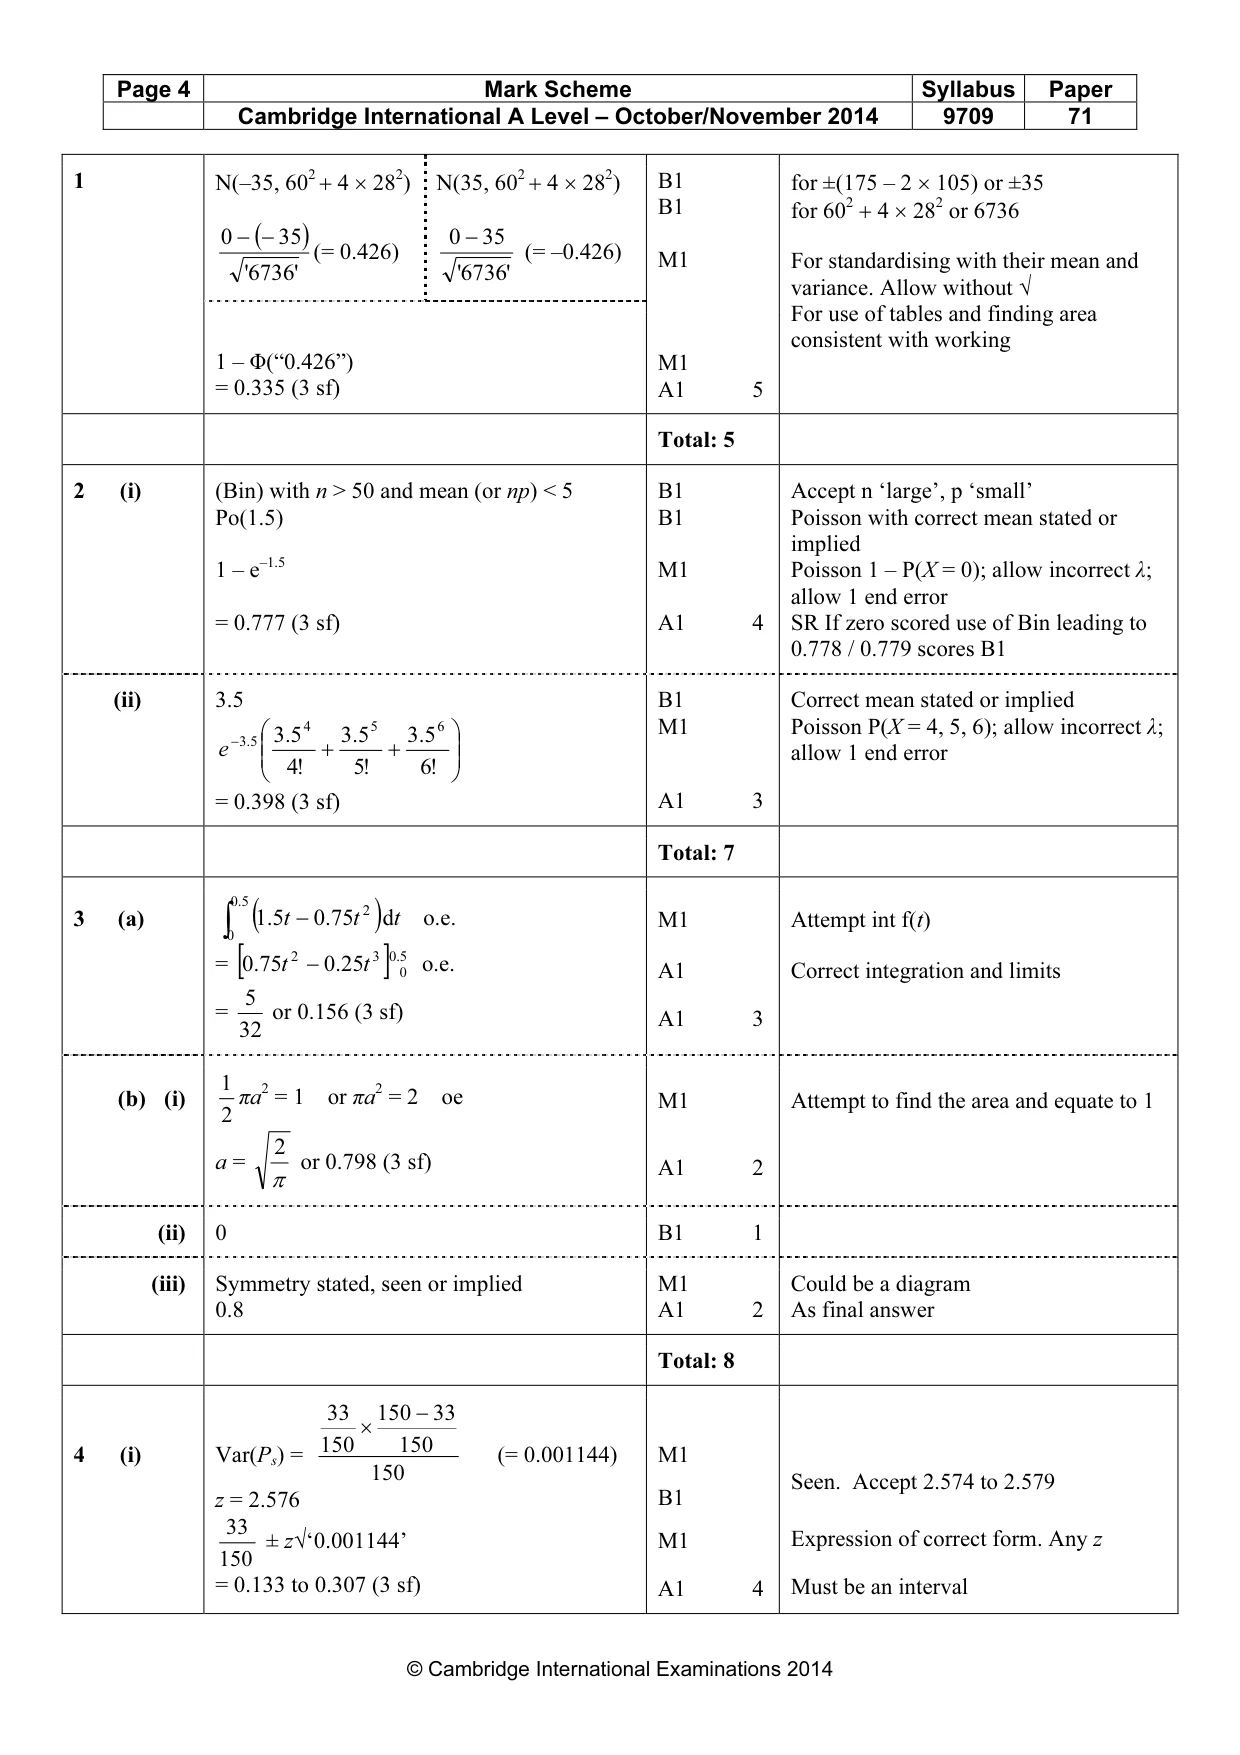
Mark scheme: 2 (i) (Bin) with n > 50 and mean (or np) < 5 B1 Accept n ‘large’, p ‘small’ Po(1.5) B1 Poisson with correct mean stated or implied 1 – e–1.5 M1 Poisson 1 – P(X = 0); allow incorrect λ; allow 1 end error = 0.777 (3 sf) A1 4 SR If zero scored use of Bin leading to 0.778 / 0.779 scores B1 (ii) 3.5 B1 Correct mean stated or implied − 5.3 5.3 4 5.3 5 5.3 6 M1 Poisson P(X = 4, 5, 6); allow incorrect λ; e + + allow 1 end error !4 !5 !6 = 0.398 (3 sf) A1 3 Total: 7 5.0 2 ( ) ∫
Q4 · In a survey a random sample of 150 households in Nantville were asked to fill in a…
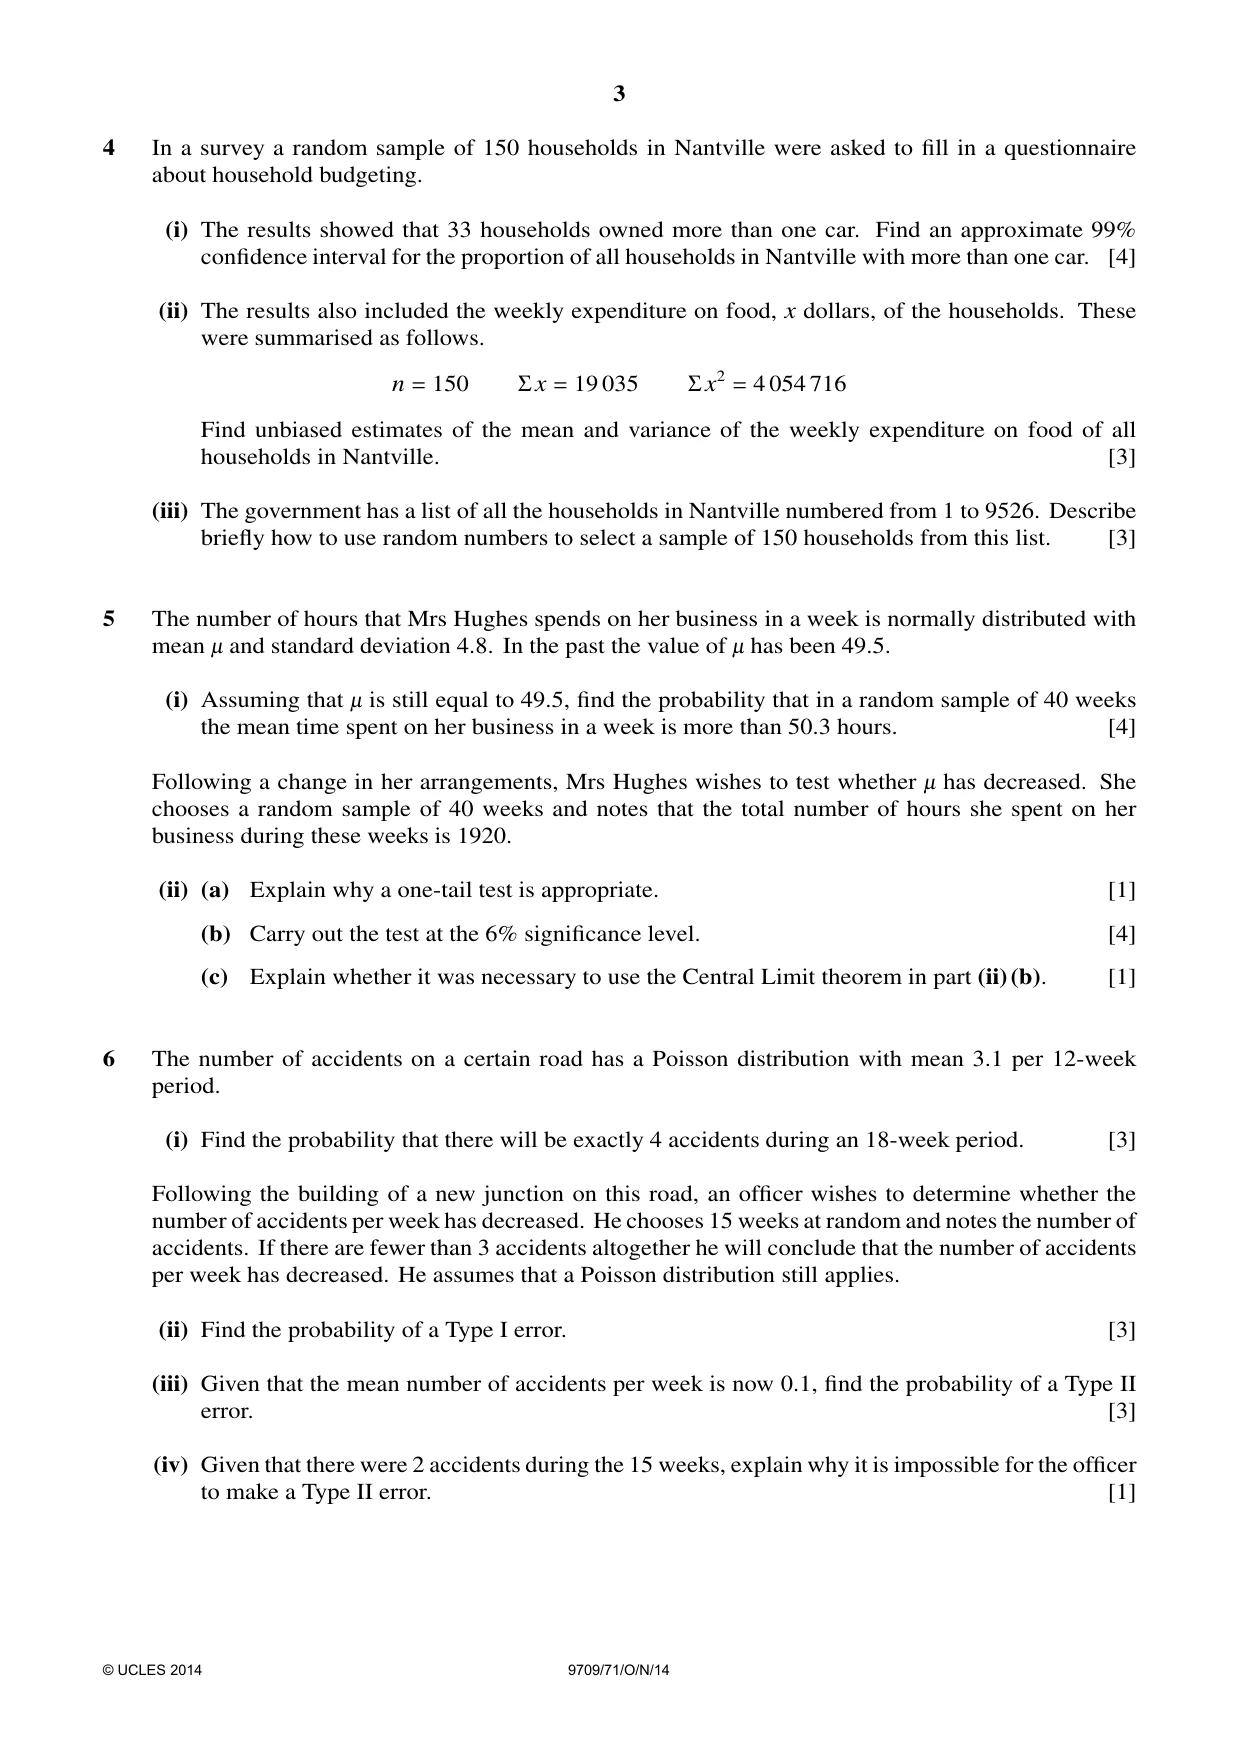
4 In a survey a random sample of 150 households in Nantville were asked to fill in a questionnaire about household budgeting. (i) The results showed that 33 households owned more than one car. Find an approximate 99% confidence interval for the proportion of all households in Nantville with more than one car. [4] (ii) The results also included the weekly expenditure on food, x dollars, of the households. These were summarised as follows. n = 150 Σx = 19 035 Σx2 = 4 054 716 Find unbiased estimates of the mean and variance of the weekly expenditure on food of all households in Nantville. [3] (iii) The government has a list of all the households in Nantville numbered from 1 to 9526. Describe briefly how to use random numbers to select a sample of 150 households from this list. [3]
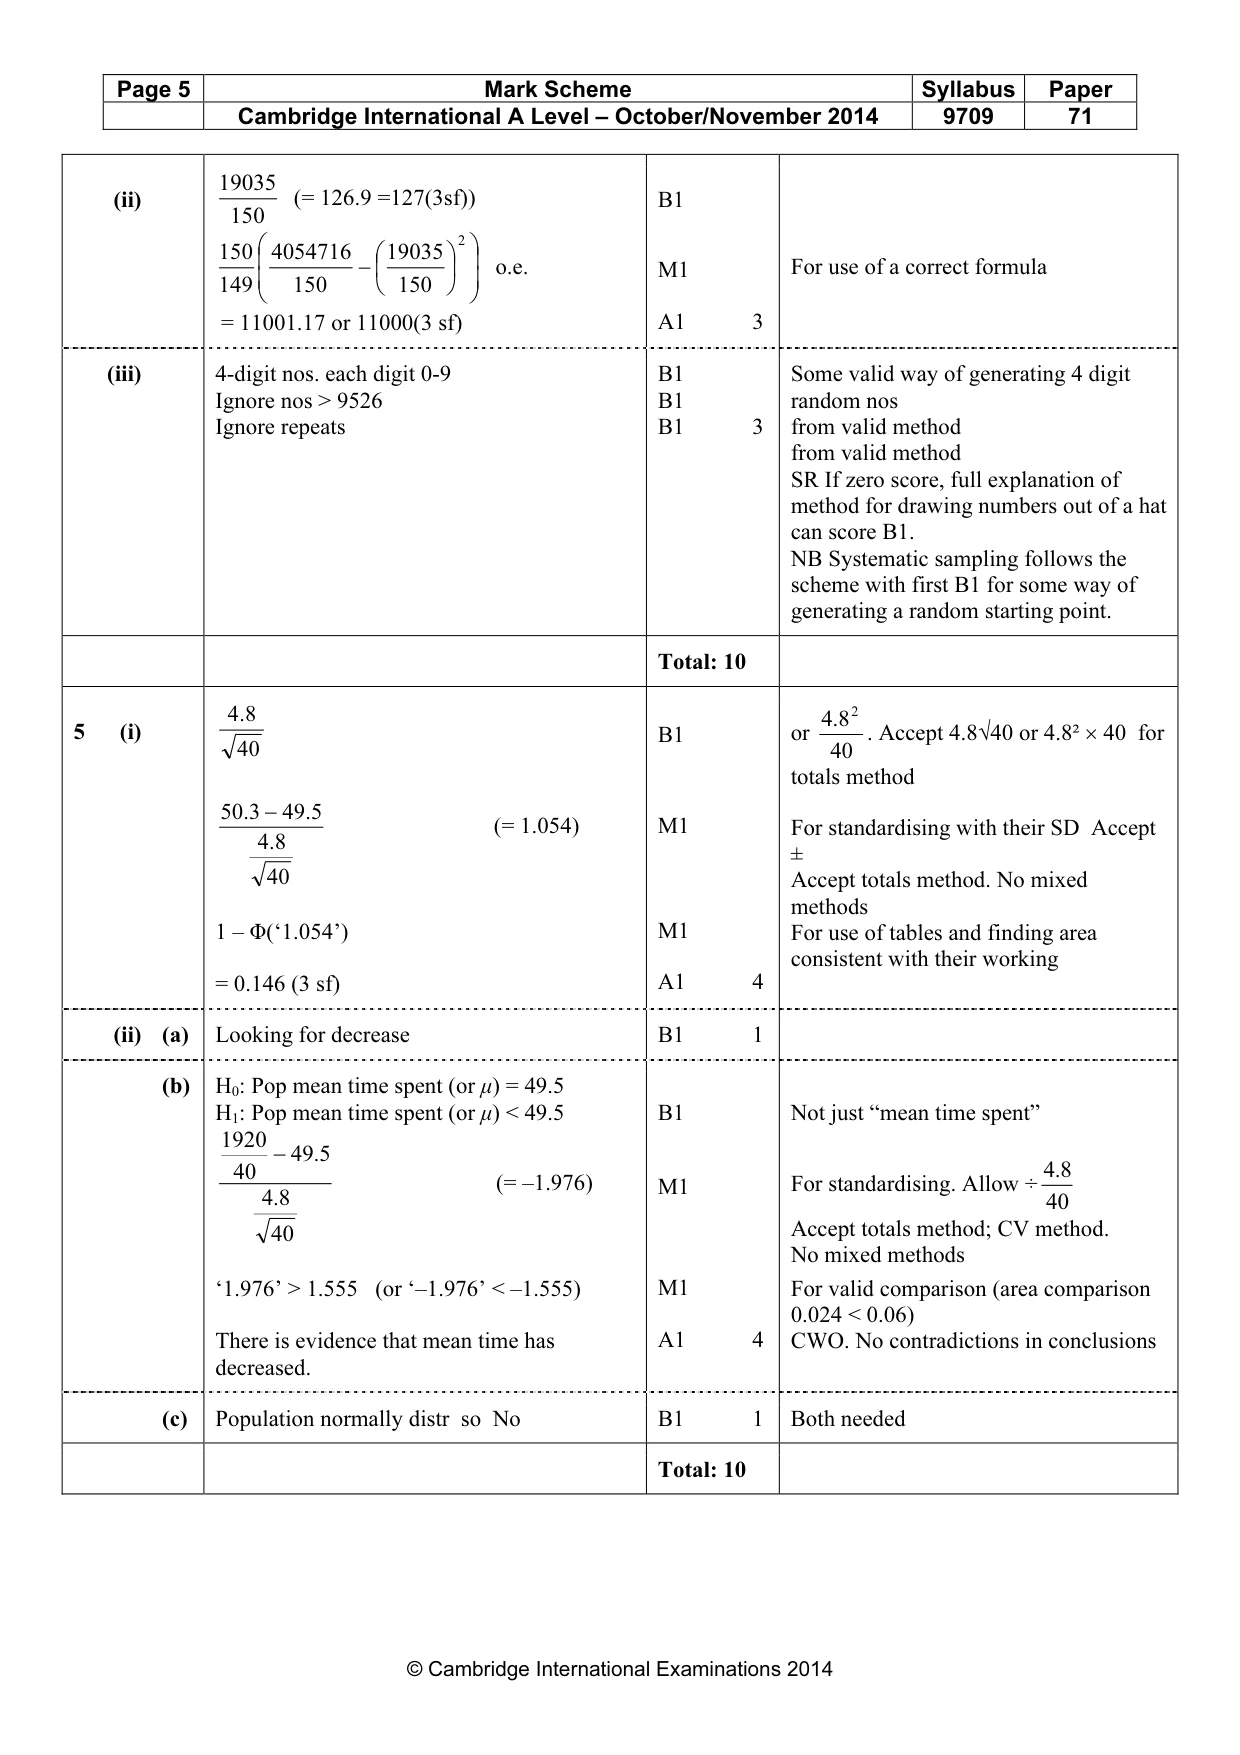
Mark scheme: 150 1504 (i) Var(Ps) = (= 0.001144) M1 150 Seen. Accept 2.574 to 2.579 z = 2.576 B1 33 ± z√‘0.001144’ M1 Expression of correct form. Any z 150 = 0.133 to 0.307 (3 sf) A1 4 Must be an interval 19035 (ii) (= 126.9 =127(3sf)) B1 150 150 4054716 19035 2 − o.e. M1 For use of a correct formula 149 150 150 = 11001.17 or 11000(3 sf) A1 3 (iii) 4-digit nos. each digit 0-9 B1 Some valid way of generating 4 digit Ignore nos > 9526 B1 random nos Ignore repeats B1 3 from valid method from valid method SR If zero score, full explanation of method for drawing numbers out of a hat can score B1. NB Systematic sampling follows the scheme with first B1 for some way of generating a random starting point. Total: 10 8.4 4 8 2 √
Q5 · The number of hours that Mrs Hughes spends on her business in a week is normally…
5 The number of hours that Mrs Hughes spends on her business in a week is normally distributed with mean - and standard deviation 4.8. In the past the value of - has been 49.5. (i) Assuming that - is still equal to 49.5, find the probability that in a random sample of 40 weeks the mean time spent on her business in a week is more than 50.3 hours. [4] Following a change in her arrangements, Mrs Hughes wishes to test whether - has decreased. She chooses a random sample of 40 weeks and notes that the total number of hours she spent on her business during these weeks is 1920. (ii) (a) Explain why a one-tail test is appropriate. [1] (b) Carry out the test at the 6% significance level. [4] (c) Explain whether it was necessary to use the Central Limit theorem in part (ii)(b). [1]
Mark scheme: 8.4 8.4 5 (i) B1 or . Accept 4.8√40 or 4.8² × 40 for 40 40 totals method 50 3. − 49 5. (= 1.054) M1 For standardising with their SD Accept 8.4 ± 40 Accept totals method. No mixed methods 1 – Φ(‘1.054’) M1 For use of tables and finding area consistent with their working = 0.146 (3 sf) A1 4 (ii) (a) Looking for decrease B1 1 (b) H0: Pop mean time spent (or µ) = 49.5 H1: Pop mean time spent (or µ) < 49.5 B1 Not just “mean time spent” 1920 − 495. 40 8.4 (= –1.976) M1 For standardising. Allow ÷ 8.4 40 40 Accept totals method; CV method. No mixed methods ‘1.976’ > 1.555 (or ‘–1.976’ < –1.555) M1 For valid comparison (area comparison 0.024 < 0.06) There is evidence that mean time has A1 4 CWO. No contradictions in conclusions decreased. (c) Population normally distr so No B1 1 Both needed Total: 10
Q6 · The number of accidents on a certain road has a Poisson distribution with mean 3.1 per…
6 The number of accidents on a certain road has a Poisson distribution with mean 3.1 per 12-week period. (i) Find the probability that there will be exactly 4 accidents during an 18-week period. [3] Following the building of a new junction on this road, an officer wishes to determine whether the number of accidents per week has decreased. He chooses 15 weeks at random and notes the number of accidents. If there are fewer than 3 accidents altogether he will conclude that the number of accidents per week has decreased. He assumes that a Poisson distribution still applies. (ii) Find the probability of a Type I error. [3] (iii) Given that the mean number of accidents per week is now 0.1, find the probability of a Type II error. [3] (iv) Given that there were 2 accidents during the 15 weeks, explain why it is impossible for the officer to make a Type II error. [1]
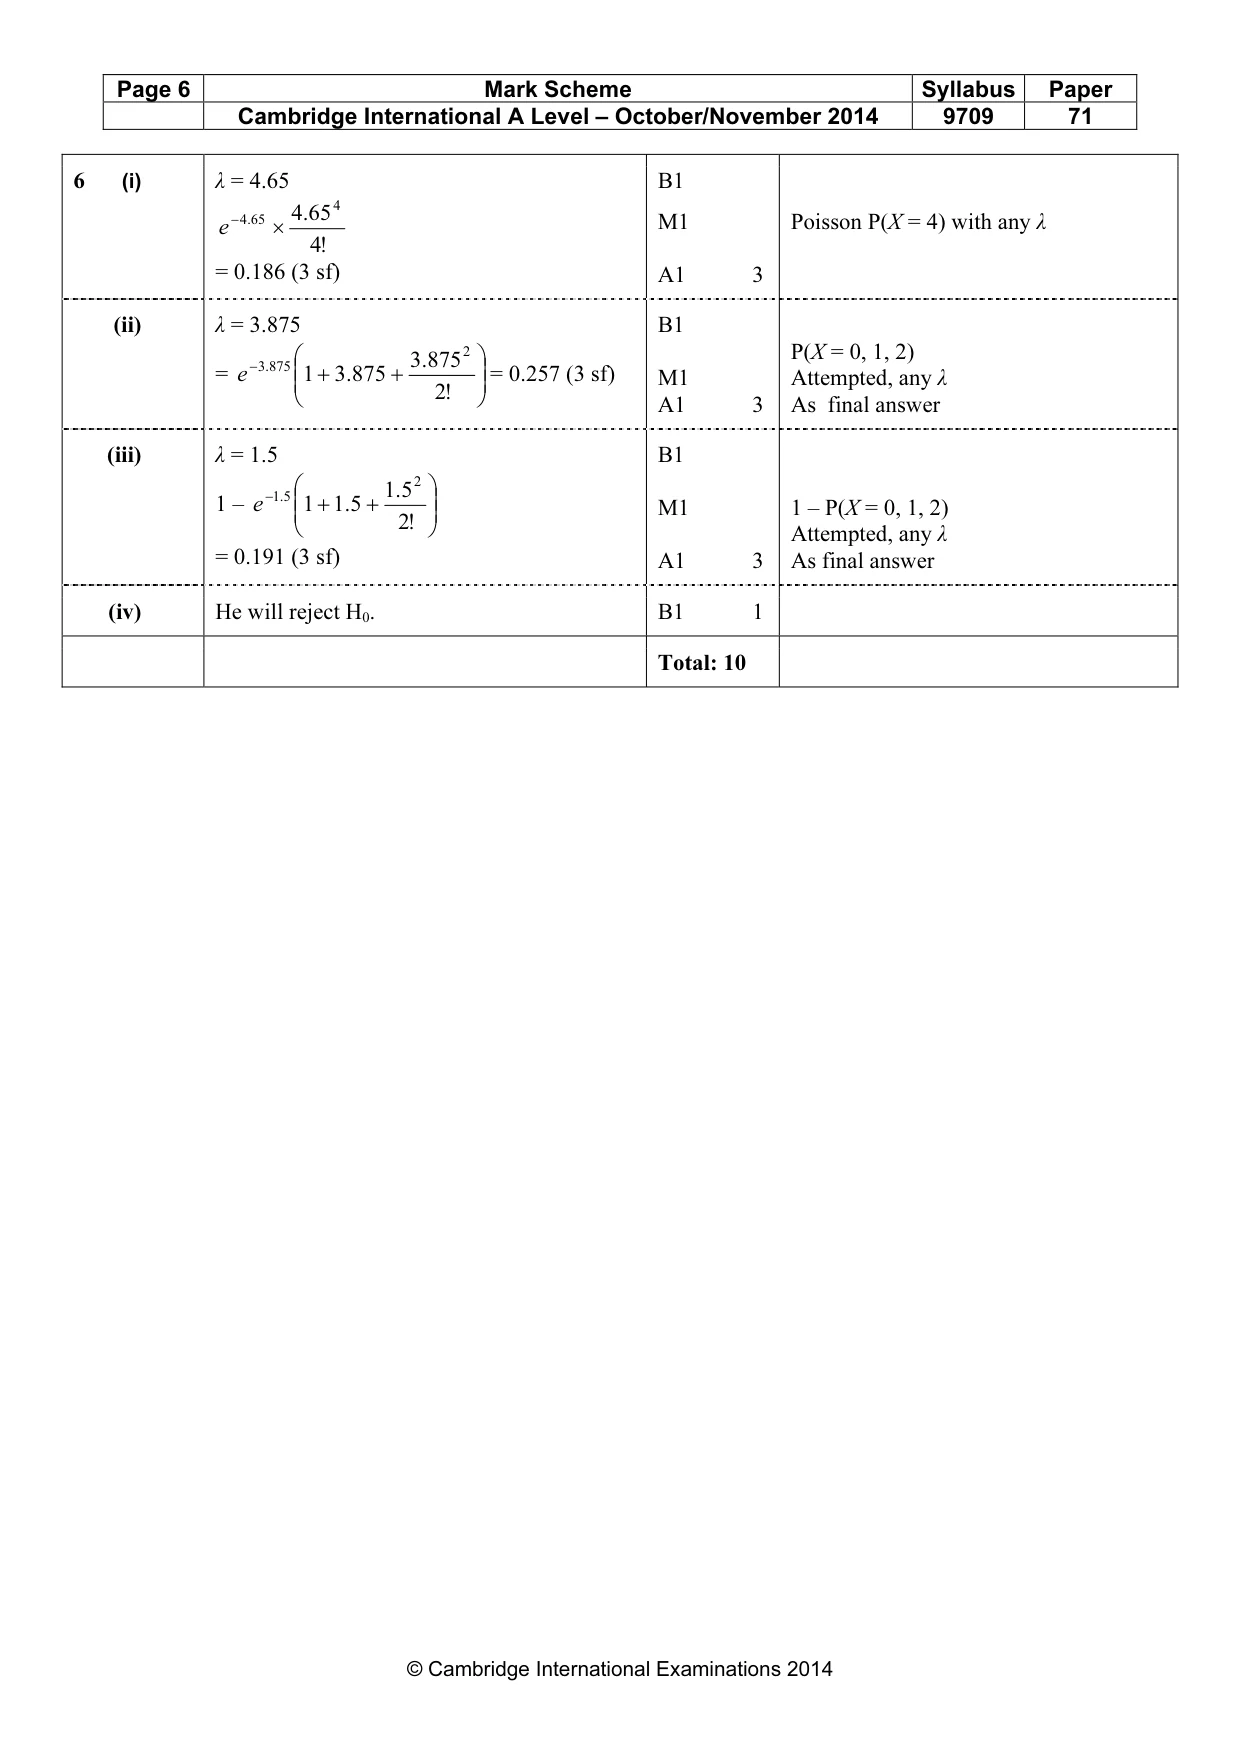
Mark scheme: 6 (i) λ = 4.65 B1 − .4 65 .4 65 4 e × M1 Poisson P(X = 4) with any λ !4 = 0.186 (3 sf) A1 3 (ii) λ = 3.875 B1 − .3 875 .3875 2 P(X = 0, 1, 2) = e 1 + .3875 + = 0.257 (3 sf) M1 Attempted, any λ !2 A1 3 As final answer (iii) λ = 1.5 B1 −5.1 5.1 2 1 – e 1 + 5.1 + M1 1 – P(X = 0, 1, 2) !2 Attempted, any λ = 0.191 (3 sf) A1 3 As final answer (iv) He will reject H0. B1 1 Total: 10
What was in this paper
The subtopics covered by these 4 questions, and how many questions each got. Open one in a new tab to see every Cambridge question on it.
What you needed in this session
Cambridge’s own grade thresholds for 2014 Oct/Nov, Paper 7 · Variant 1. A higher threshold means an easier paper — the bar moves with how the cohort did.