Cambridge A Level Mathematics 9709 — 2009 Oct/Nov Paper 7 · Variant 1
9709/71/O/N/09 · 7 questions · 50 marks · ≈56 min
The question paper and its mark scheme, free to read here and free to download. This is Cambridge’s own paper, exactly as it was sat.
Question paper4 pages
Mark scheme6 pages
Answers below. Sit the paper first if you are practising.
Questions as text
Q1 · 2% of biscuits on a production line are broken
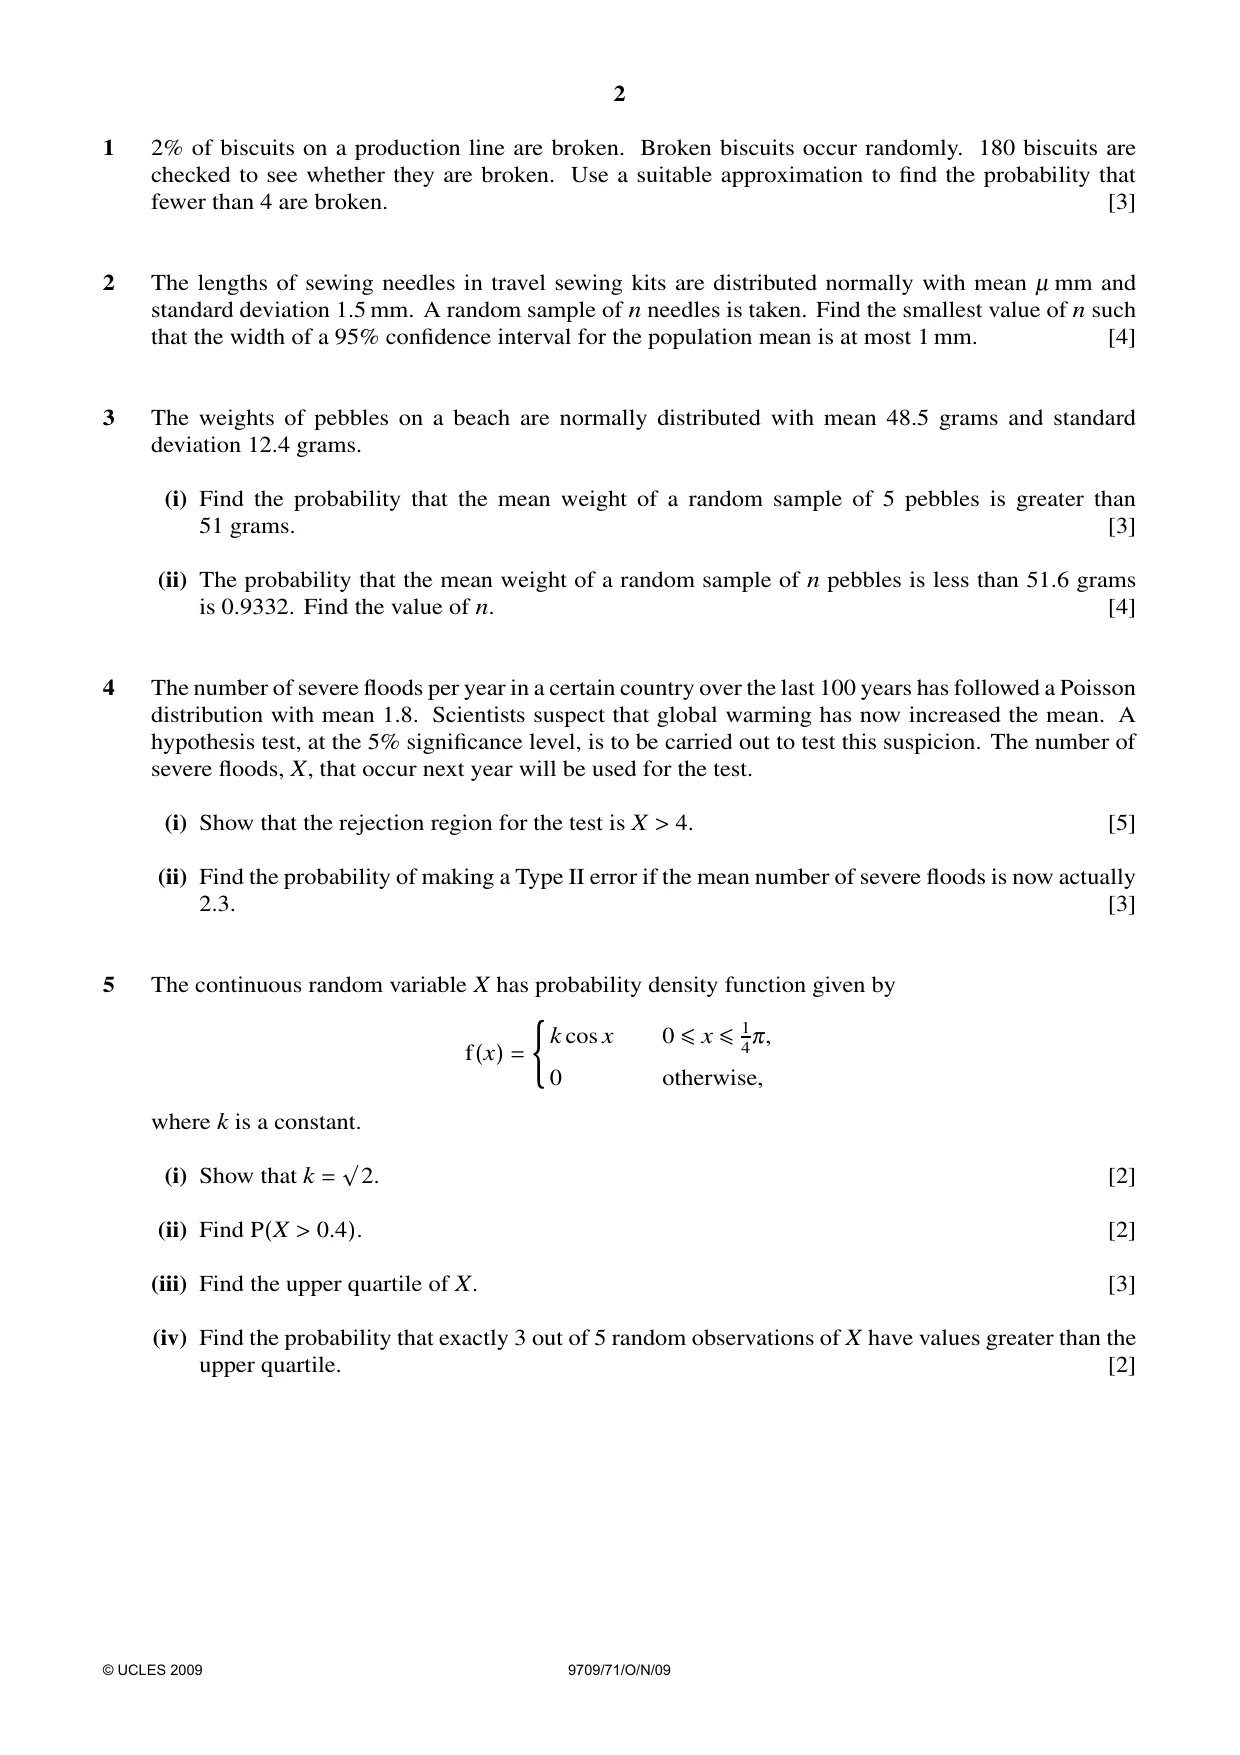
1 2% of biscuits on a production line are broken. Broken biscuits occur randomly. 180 biscuits are checked to see whether they are broken. Use a suitable approximation to find the probability that fewer than 4 are broken. [3]
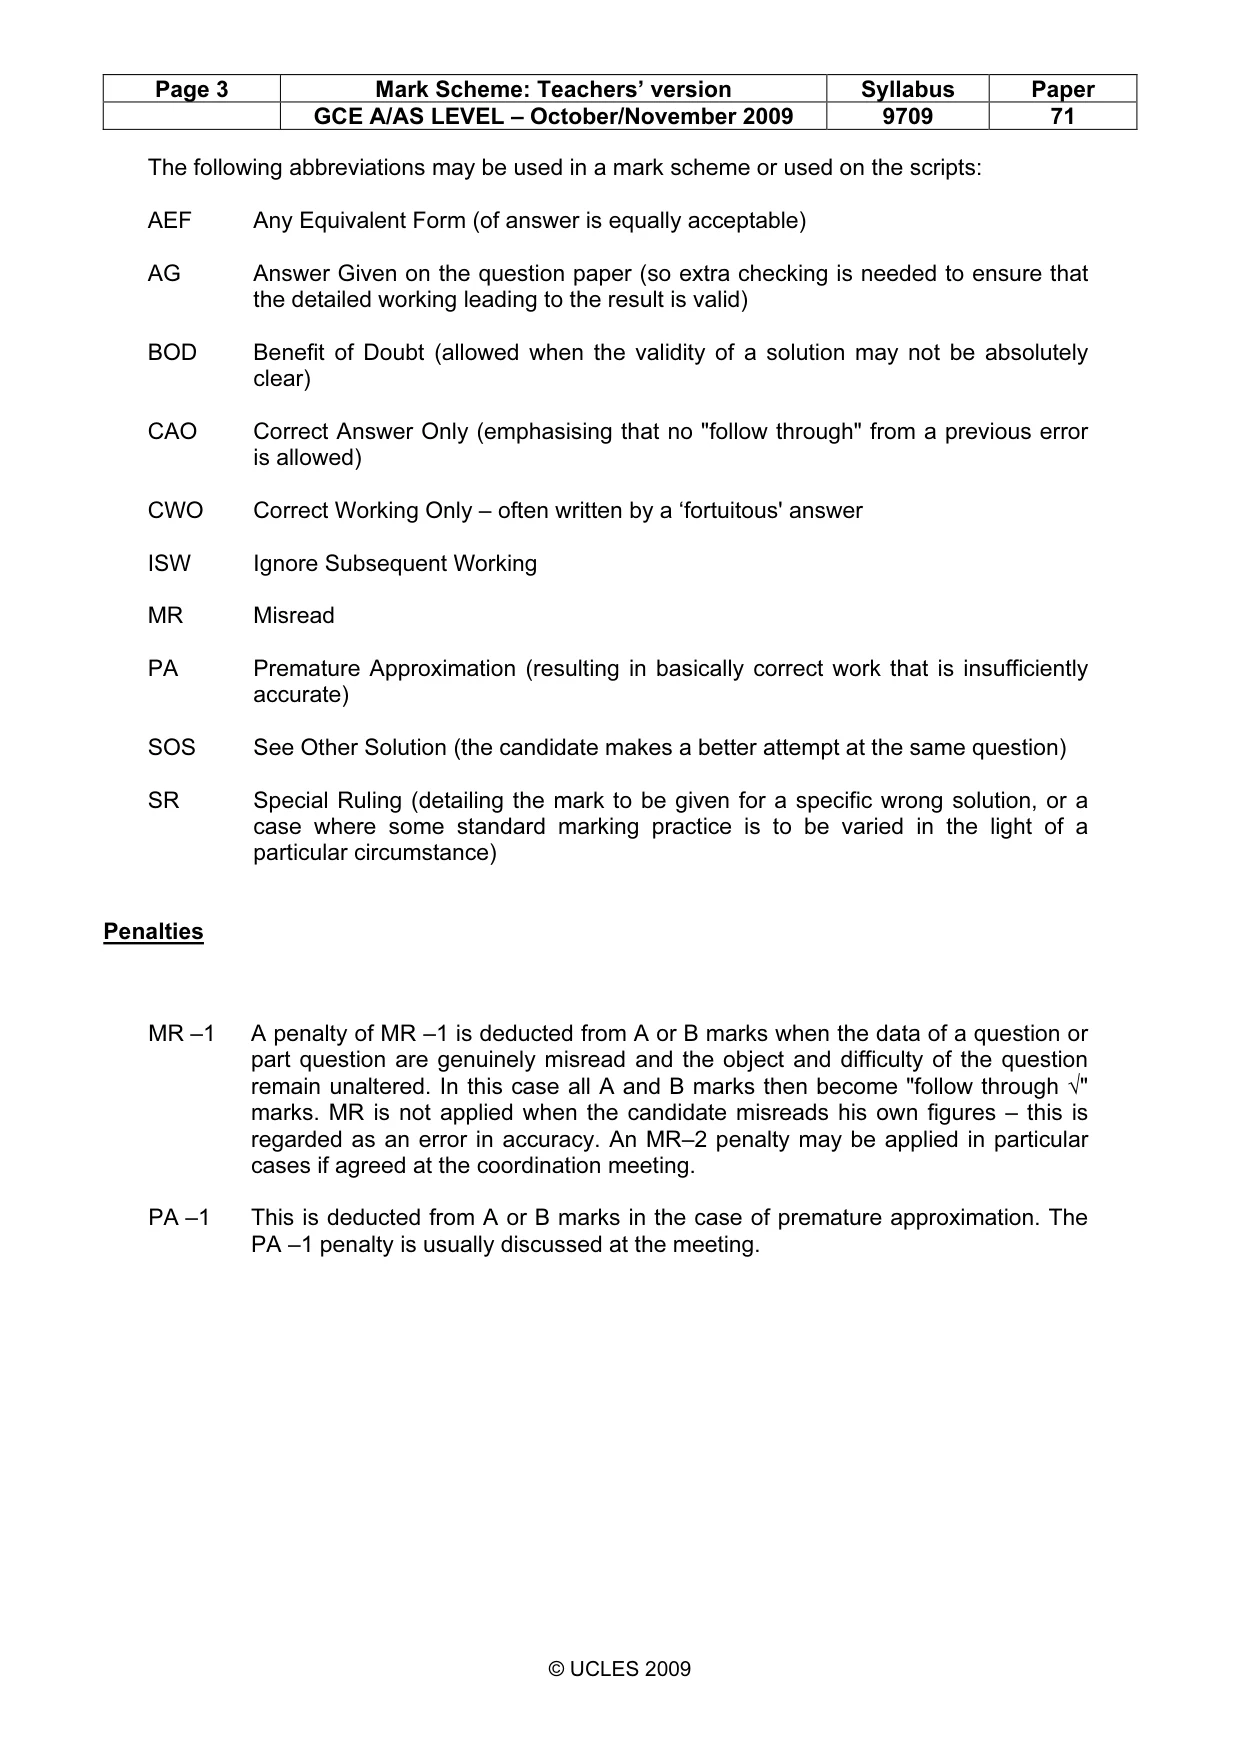
Mark scheme: 1 X ~ B(180, 0.02) ~ Po(3.6) B1 Poisson with mean 180 × 0.02 P(X < 4) = e–3.6 (1 + 3.6 + 3.62 / 2 + 3.63 / 6) M1 Poisson attempt with their λ allow end errors = 0.515 A1 [3] Correct answer SR1 Use of Bin scores B1 only for ans 0.514 SR2 Use of Normal scores B1 only for 0.479 1 5 1 1 5
Q2 · The lengths of sewing needles in travel sewing kits are distributed normally with mean µ…
2 The lengths of sewing needles in travel sewing kits are distributed normally with mean µ mm and standard deviation 1.5 mm. A random sample of n needles is taken. Find the smallest value of n such that the width of a 95% confidence interval for the population mean is at most 1 mm. [4]
Mark scheme: 5.1 1 5.1 2 .196 × < B1 .196 × seen n 2 n B1 Confidence interval halved M1 Solving an equation in their z, 1.5, n (2 and sq rt not needed) n = 35 A1 [4] Correct answer (condone n ≥ 35) ( ) 51 − 48 5
Q3 · The weights of pebbles on a beach are normally distributed with mean 48.5 grams and…
3 The weights of pebbles on a beach are normally distributed with mean 48.5 grams and standard deviation 12.4 grams. (i) Find the probability that the mean weight of a random sample of 5 pebbles is greater than 51 grams. [3] (ii) The probability that the mean weight of a random sample of n pebbles is less than 51.6 grams is 0.9332. Find the value of n. [4]
Mark scheme: 51 485. 3 (i) P(W > 51) = P z > M1 Standardising with 51 and mean 48.5 124. / 5 = 1 – Φ(0.451) M1 Standardising using √5 = 1 – 0.674 = 0.326 A1 [3] Correct answer (ii) z = 1.5 or 1.499 B1 1.5 or 1.499 seen 516. − 485. = 1.5 M1 Standardising must have n (no cc) (124. / n ) n = 6 M1 Attempt to solve equation with n , their z in n = 36 A1 [4] correct answer
Q4 · The number of severe floods per year in a certain country over the last 100 years has…
4 The number of severe floods per year in a certain country over the last 100 years has followed a Poisson distribution with mean 1.8. Scientists suspect that global warming has now increased the mean. A hypothesis test, at the 5% significance level, is to be carried out to test this suspicion. The number of severe floods, X, that occur next year will be used for the test. (i) Show that the rejection region for the test is X 4. [5] > (ii) Find the probability of making a Type II error if the mean number of severe floods is now actually 2.3. [3]
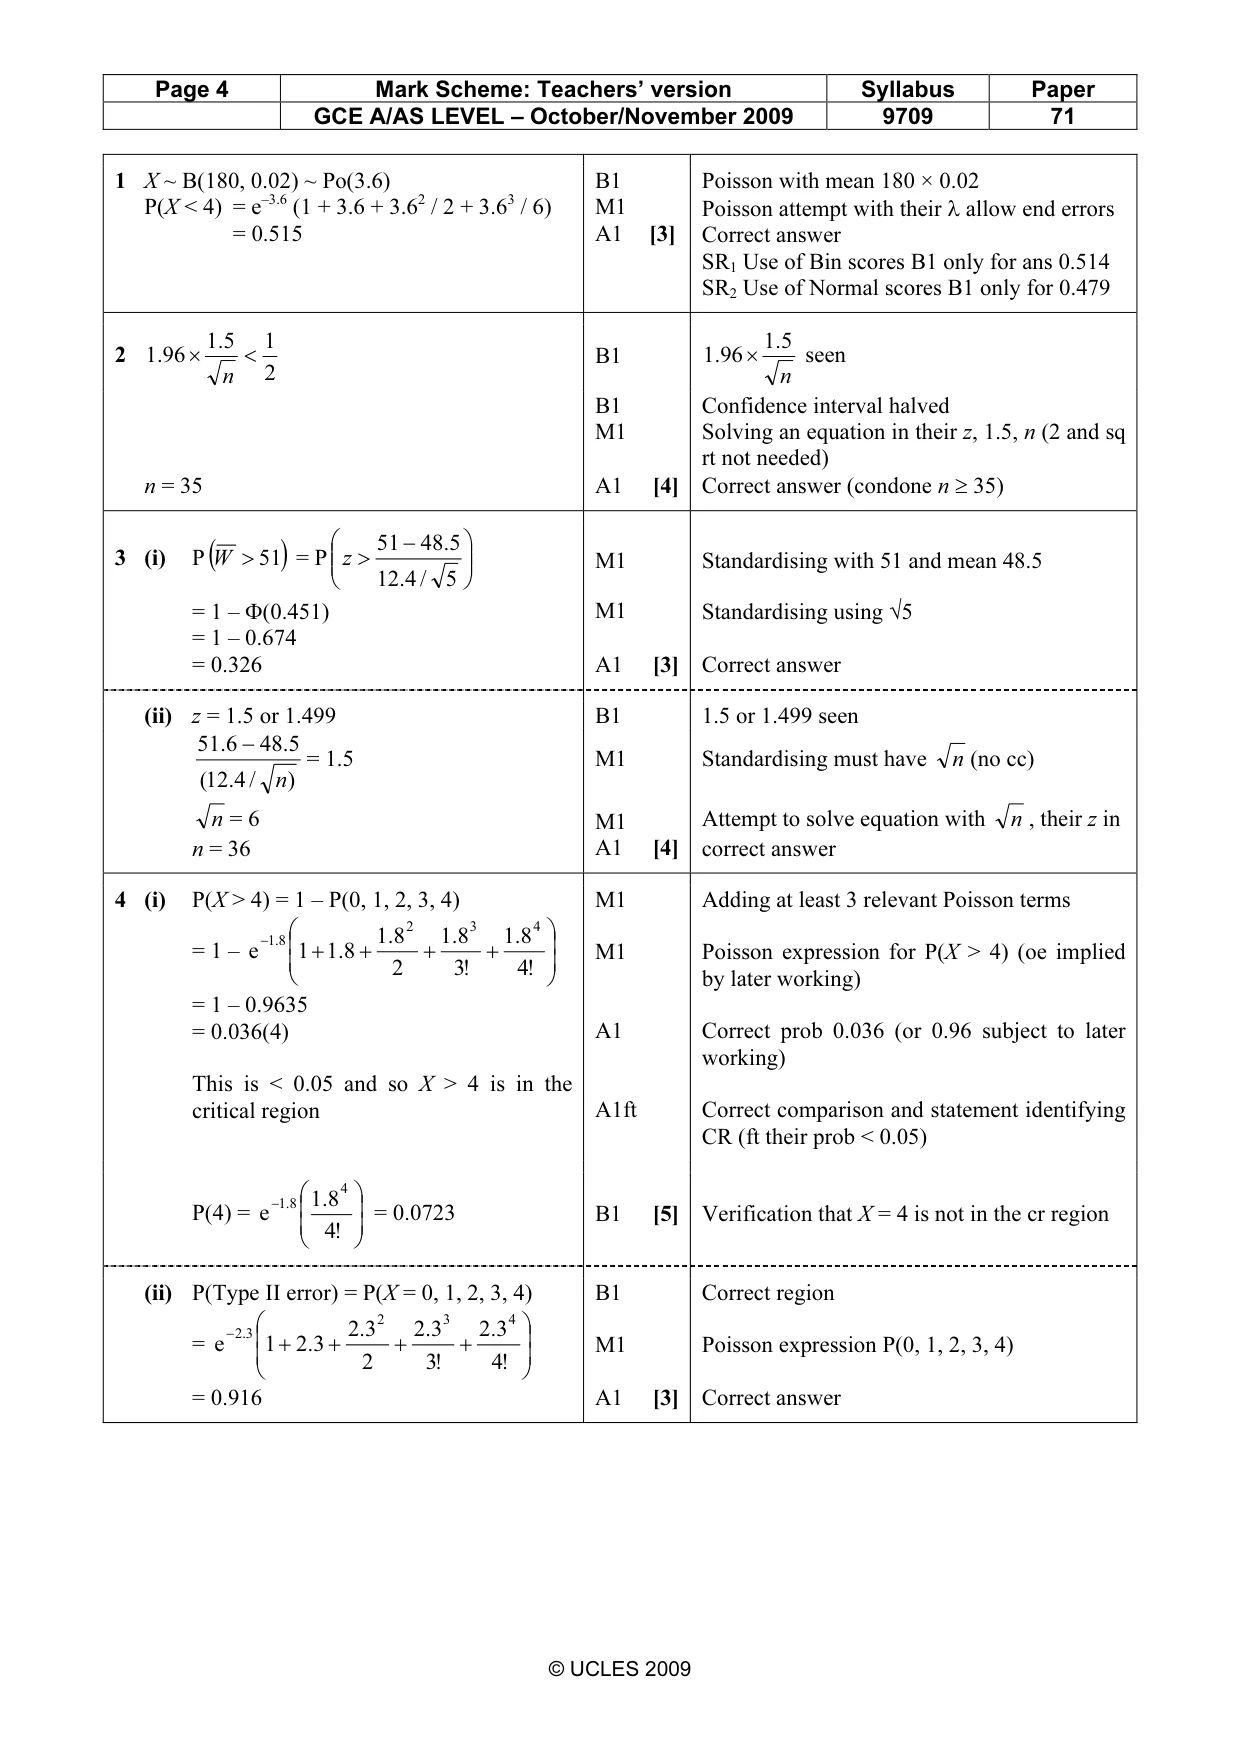
Mark scheme: 4 (i) P(X > 4) = 1 – P(0, 1, 2, 3, 4) M1 Adding at least 3 relevant Poisson terms −8.1 8.1 2 8.1 3 8.1 4 M1 Poisson expression for P(X > 4) (oe implied = 1 – e 1 + 8.1 + 2 + !3 + !4 by later working) = 1 – 0.9635 = 0.036(4) A1 Correct prob 0.036 (or 0.96 subject to later working) This is < 0.05 and so X > 4 is in the critical region A1ft Correct comparison and statement identifying CR (ft their prob < 0.05) −8.1 8.1 4 B1 [5] Verification that X = 4 is not in the cr region P(4) = e !4 = 0.0723 (ii) P(Type II error) = P(X = 0, 1, 2, 3, 4) B1 Correct region − 3.2 3.2 2 3.2 3 3.2 4 M1 Poisson expression P(0, 1, 2, 3, 4) = e 1 + 3.2 + 2 + !3 + !4 = 0.916 A1 [3] Correct answer GCE A/AS LEVEL – October/November 2009 9709 71 π / 4 ∫
Q5 · The continuous random variable X has probability density function given by cos x 0 ≤x…
5 The continuous random variable X has probability density function given by cos x 0 ≤x ≤14π, f(x) = (k0 otherwise, where k is a constant. (i) Show that k √2. [2] = [2] (ii) Find P(X > 0.4). (iii) Find the upper quartile of X. [3] (iv) Find the probability that exactly 3 out of 5 random observations of X have values greater than the upper quartile. [2]
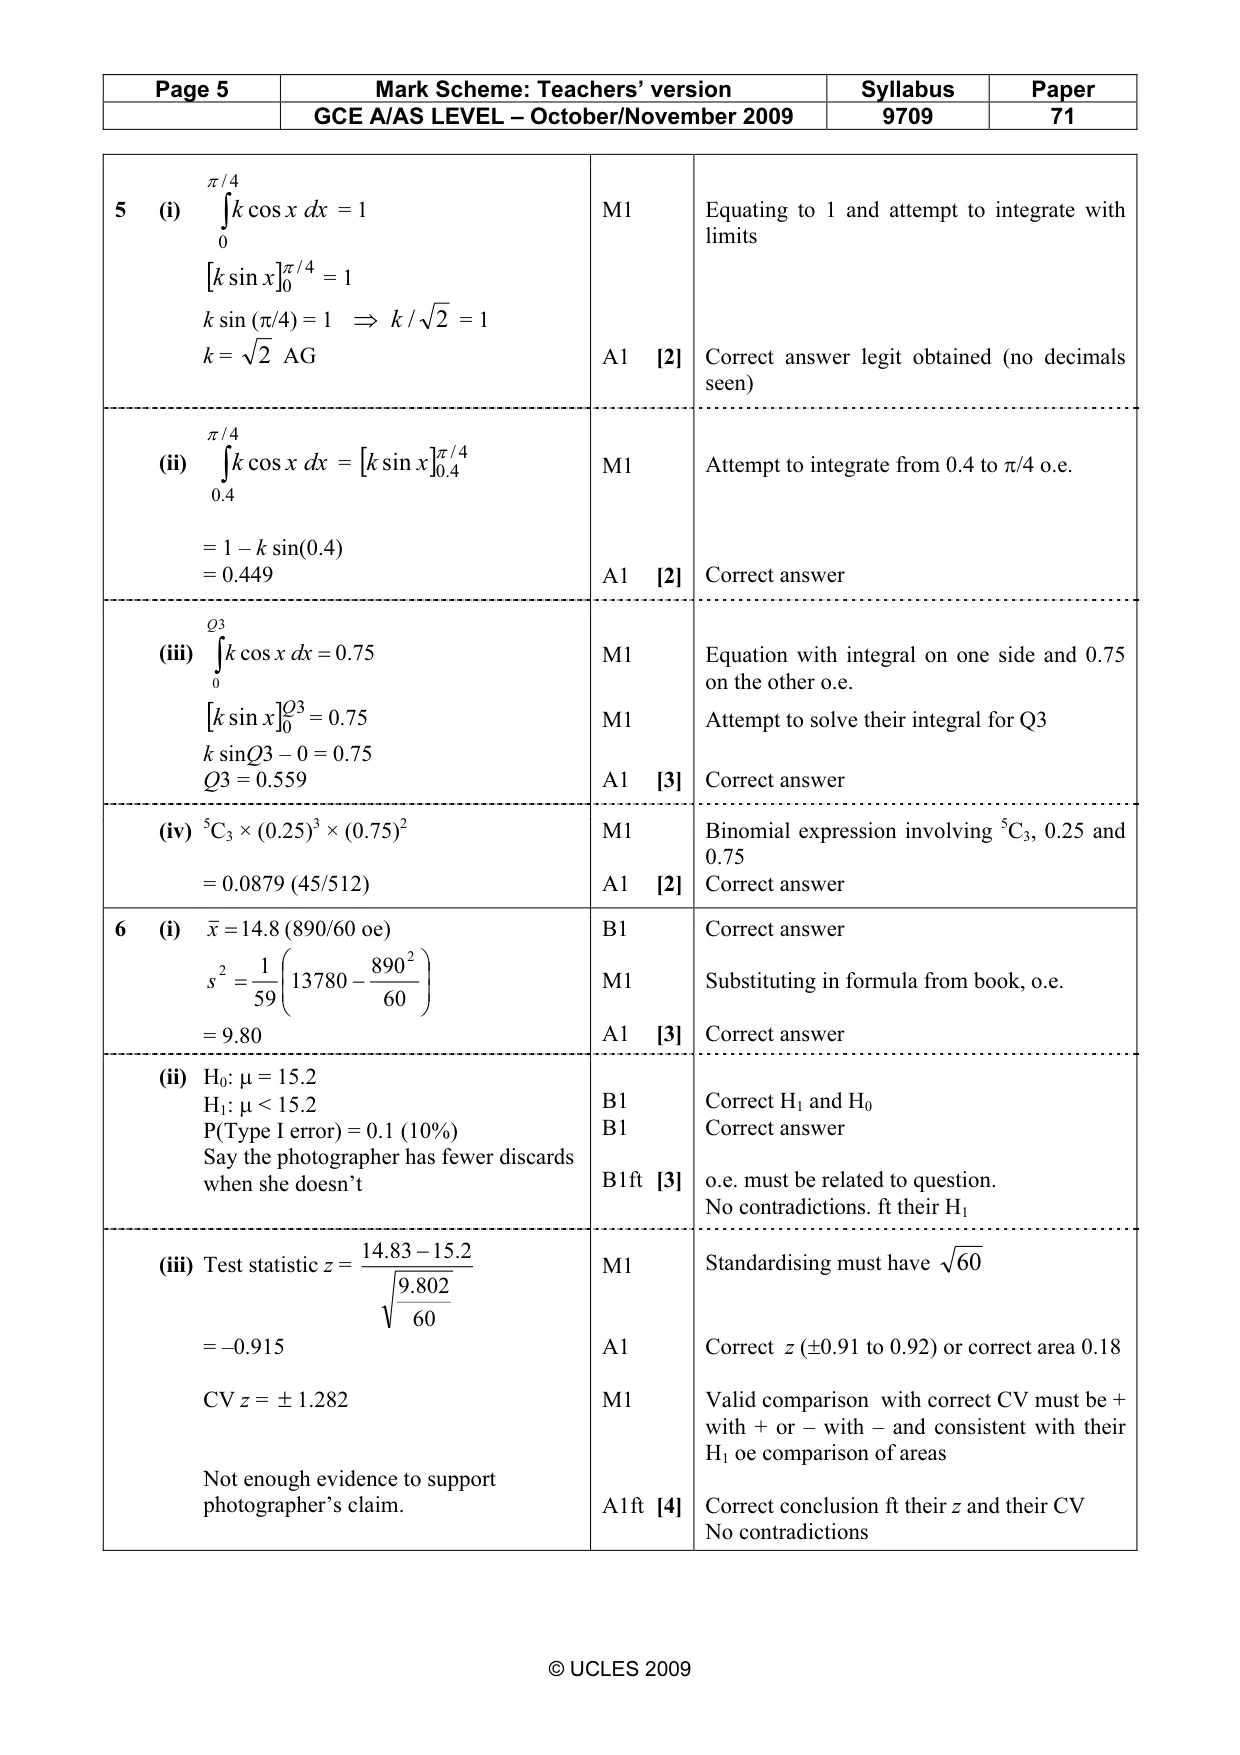
Mark scheme: 5 (i) = 1 M1 Equating to 1 and attempt to integrate with k∫ cos x dx 0 limits [k sin x ]π0 / 4 = 1 k sin (π/4) = 1 ⇒ k / 2 = 1 k = 2 AG A1 [2] Correct answer legit obtained (no decimals seen) π / 4 = [k sin x ]π4.0/ 4 M1 Attempt to integrate from 0.4 to π/4 o.e. (ii) ∫ k cos x dx 4.0 = 1 – k sin(0.4) = 0.449 A1 [2] Correct answer Q 3 M1 Equation with integral on one side and 0.75 (iii) ∫ k cos x dx = .075 0 on the other o.e. = 0.75 M1 Attempt to solve their integral for Q3 [k sin x ]Q0 3 k sinQ3 – 0 = 0.75 Q3 = 0.559 A1 [3] Correct answer (iv) 5C3 × (0.25)3 × (0.75)2 M1 Binomial expression involving 5C3, 0.25 and 0.75 = 0.0879 (45/512) A1 [2] Correct answer
Q6 · Photographers often need to take many photographs of families until they find a photograph…
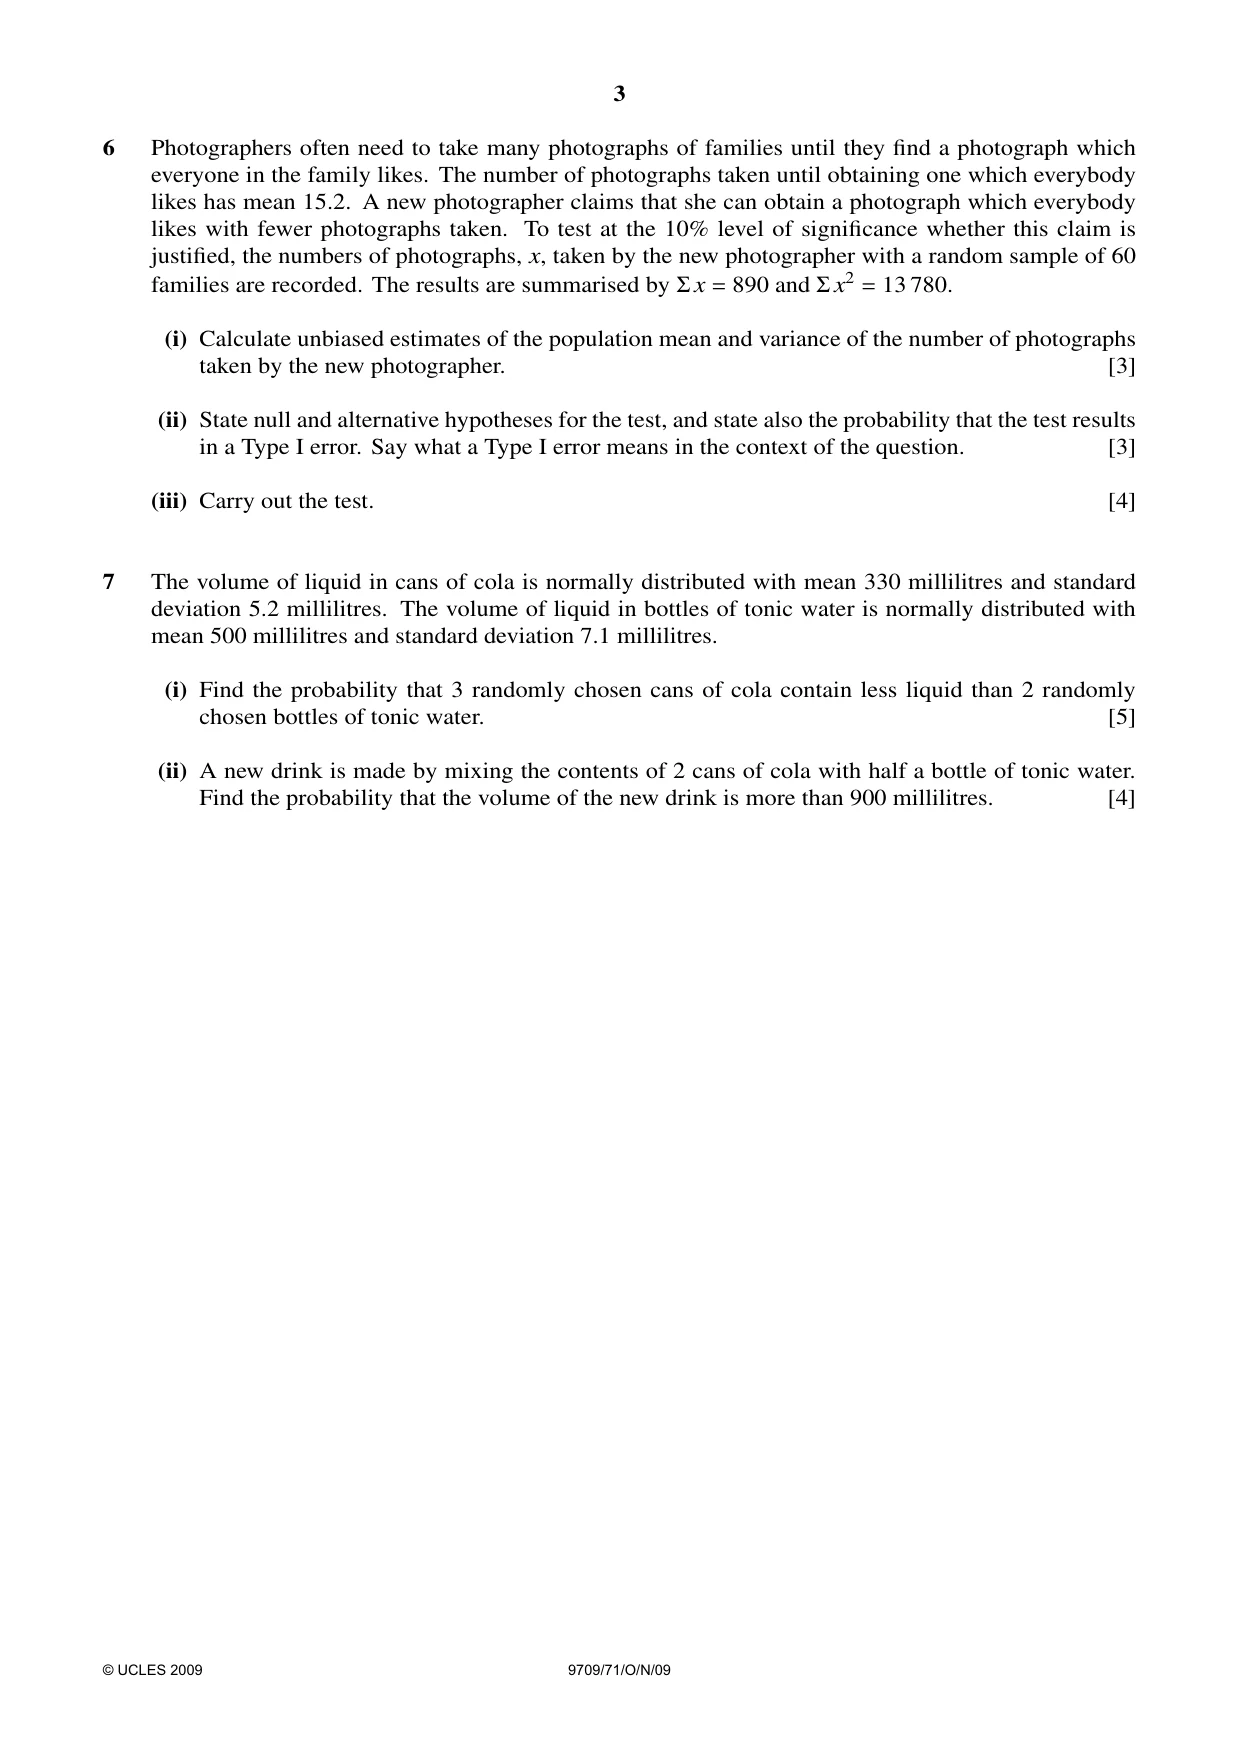
6 Photographers often need to take many photographs of families until they find a photograph which everyone in the family likes. The number of photographs taken until obtaining one which everybody likes has mean 15.2. A new photographer claims that she can obtain a photograph which everybody likes with fewer photographs taken. To test at the 10% level of significance whether this claim is justified, the numbers of photographs, x, taken by the new photographer with a random sample of 60 families are recorded. The results are summarised by Σ x 890 and Σ x2 13 780. = = (i) Calculate unbiased estimates of the population mean and variance of the number of photographs taken by the new photographer. [3] (ii) State null and alternative hypotheses for the test, and state also the probability that the test results in a Type I error. Say what a Type I error means in the context of the question. [3] (iii) Carry out the test. [4]
Mark scheme: 6 (i) x = 148. (890/60 oe) B1 Correct answer 2 1 890 2 s = 59 13780 − 60 M1 Substituting in formula from book, o.e. = 9.80 A1 [3] Correct answer (ii) H0: µ = 15.2 H1: µ < 15.2 B1 Correct H1 and H0 P(Type I error) = 0.1 (10%) B1 Correct answer Say the photographer has fewer discards when she doesn’t B1ft [3] o.e. must be related to question. No contradictions. ft their H1 14.83 − 152. (iii) Test statistic z = M1 Standardising must have 60 .9802 60 = –0.915 A1 Correct z (±0.91 to 0.92) or correct area 0.18 CV z = ± 1.282 M1 Valid comparison with correct CV must be + with + or – with – and consistent with their H1 oe comparison of areas Not enough evidence to support photographer’s claim. A1ft [4] Correct conclusion ft their z and their CV No contradictions GCE A/AS LEVEL – October/November 2009 9709 71 2
Q7 · The volume of liquid in cans of cola is normally distributed with mean 330 millilitres…
7 The volume of liquid in cans of cola is normally distributed with mean 330 millilitres and standard deviation 5.2 millilitres. The volume of liquid in bottles of tonic water is normally distributed with mean 500 millilitres and standard deviation 7.1 millilitres. (i) Find the probability that 3 randomly chosen cans of cola contain less liquid than 2 randomly chosen bottles of tonic water. [5] (ii) A new drink is made by mixing the contents of 2 cans of cola with half a bottle of tonic water. Find the probability that the volume of the new drink is more than 900 millilitres. [4]
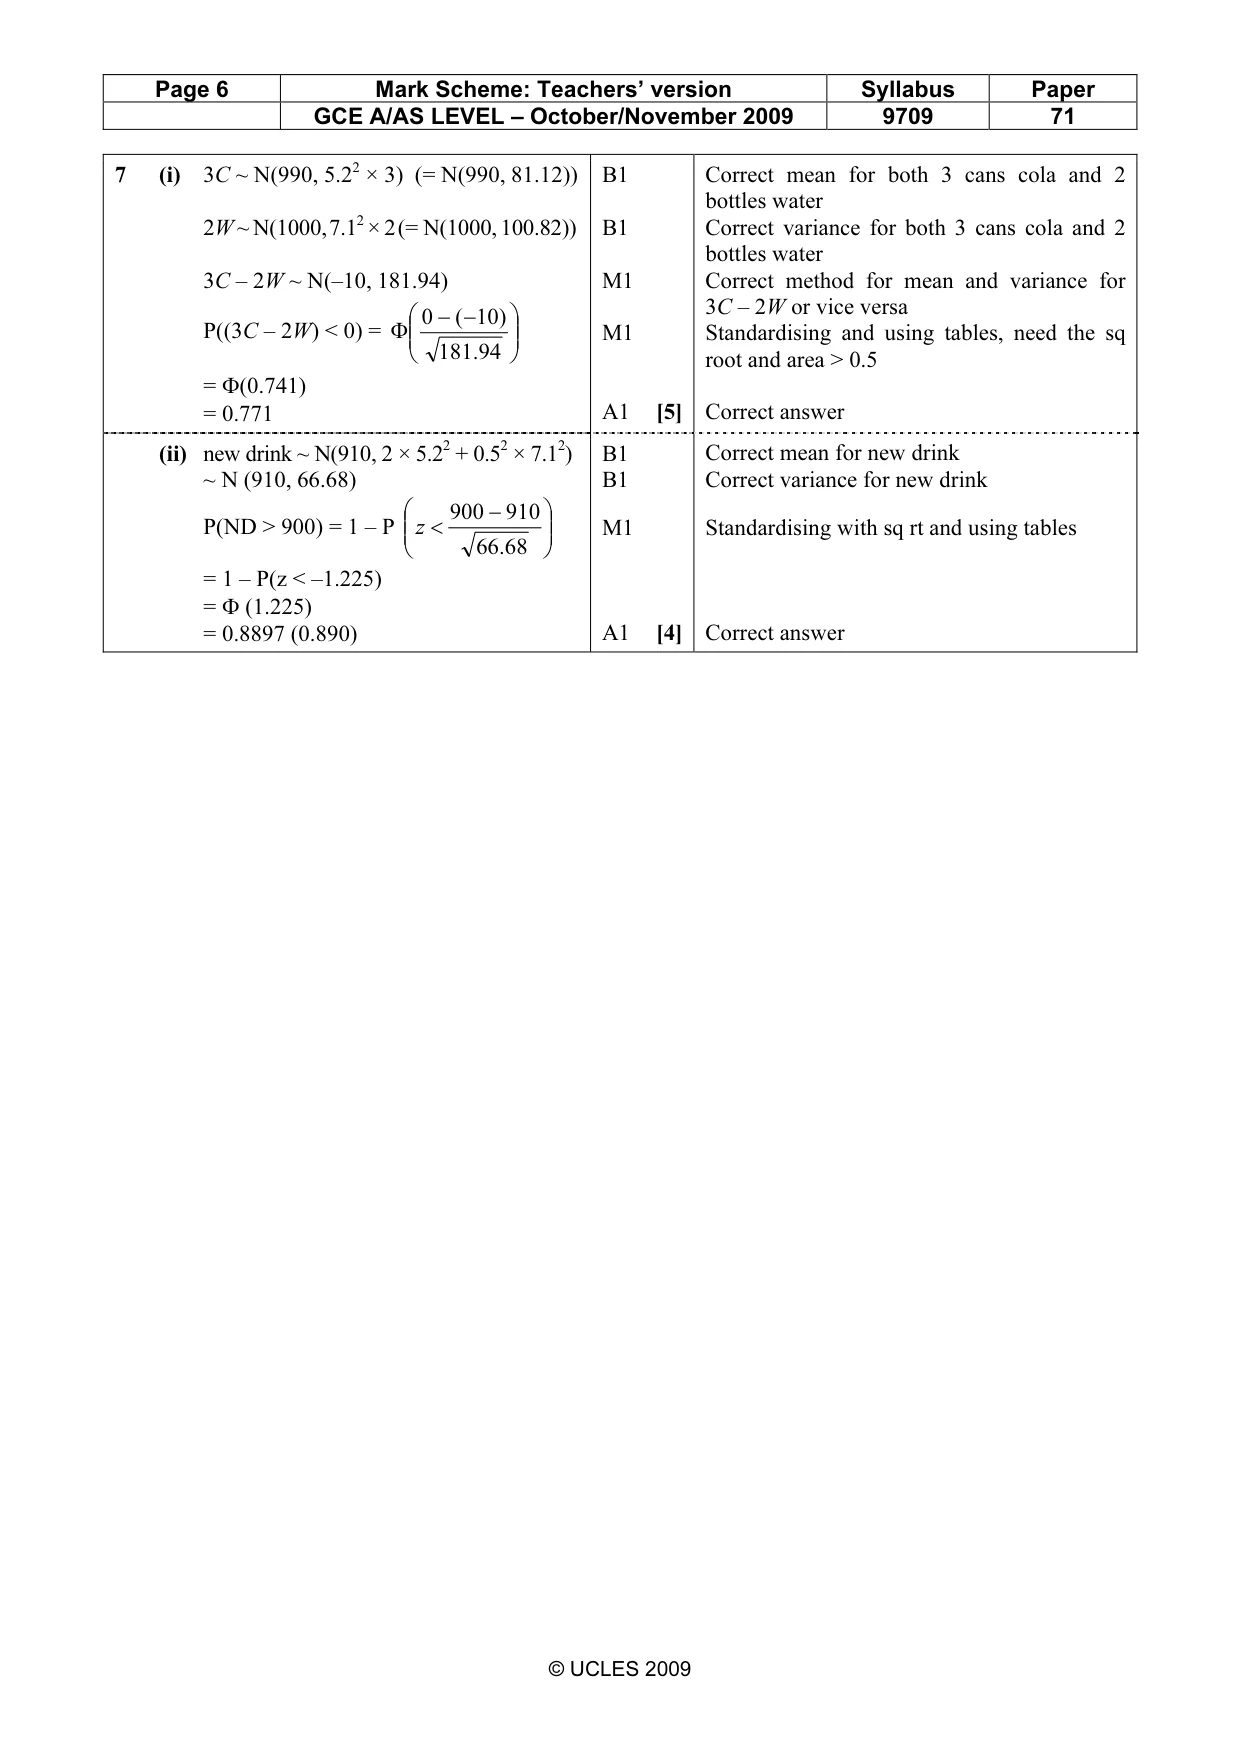
Mark scheme: 7 (i) 3C ~ N(990, 5.22 × 3) (= N(990, 81.12)) B1 Correct mean for both 3 cans cola and 2 bottles water 2W ~ N(1000, 7.12 × 2 (= N(1000, 100.82)) B1 Correct variance for both 3 cans cola and 2 bottles water 3C – 2W ~ N(–10, 181.94) M1 Correct method for mean and variance for 3C – 2W or vice versa 0 − ( −10) P((3C – 2W) < 0) = Φ M1 Standardising and using tables, need the sq 181.94 root and area > 0.5 = Φ(0.741) = 0.771 A1 [5] Correct answer (ii) new drink ~ N(910, 2 × 5.22 + 0.52 × 7.12) B1 Correct mean for new drink ~ N (910, 66.68) B1 Correct variance for new drink 900 − 910 P(ND > 900) = 1 – P z < M1 Standardising with sq rt and using tables 66.68 = 1 – P(z < –1.225) = Φ (1.225) = 0.8897 (0.890) A1 [4] Correct answer
What was in this paper
The subtopics covered by these 7 questions, and how many questions each got. Open one in a new tab to see every Cambridge question on it.
What you needed in this session
Cambridge’s own grade thresholds for 2009 Oct/Nov, Paper 7 · Variant 1. A higher threshold means an easier paper — the bar moves with how the cohort did.